handbook on - mechanical properties of rocks
548
HANDBOOK ON MECHANICAL PROPERTIES OF ROCKS VOLUME 12 R. D. LAMA • V. S. VUTUKURI SERIES ON ROCK AND SOIL MECHANICS tm shortening «onoation f TRANSTECH PUBLICATIONS
-
Upload
khangminh22 -
Category
Documents
-
view
0 -
download
0
Transcript of handbook on - mechanical properties of rocks
HANDBOOK ON
MECHANICAL PROPERTIES OF ROCKSVOLUME 12
R. D. LAMA • V. S. VUTUKURI
SERIES ON ROCK AND SOIL MECHANICS
tm
shortening «onoation
f TRANSTECH PUBLICATIONS


H andbook on M echanical Properties o f Rocks

O ther volumes in the Series on Rock and Soil Mechanics
W. Dreyer:The Science of Rock Mechanics
Part I Strength Properties of Rocks1972
T. H. Hanna: Foundation Instrumentation
1973
C. E. Gregory:Explosives for North American Engineers
1973
M. & A. Reimbert: Retaining Walls Vol. I
— Anchorages and Sheet Piling -1974
Vutukuri, Lama, Saluja: Handbook on Mechanical Properties
o f Rocks Vol. I1974
M. & A. Reimbert:Retaining Walls Vol. II
- Study of Passive Resistance in Foundation Structures —1976
H. R. Hardy, Jr. & F. W. Leighton:First Conference on Acoustic Emission/Microseismic Activity
in Geologic Structures and Materials1977
L. L. Karafiath & E. A. Nowatzki:Soil Mechanics for Off-Road Vehicle Engineering
1978
Baguelin, Jezequel, Shields:The Pressuremeter and Foundation
Engineering 1978
R. I). Lama & V. S. Vutukuri:Handbook on Mechanical Properties
of Rocks Vol. II + III 1978
Editor-in-Chief Professor Dr. H. Wohlbier

K.K 2010 K iv i V'94 [
Series on Rock and Soil Mechanics Vol. 3 ( 19 7 8 ) No. 3
H A N D BO O KON
M ECHANICAL PROPERTIES OF ROCKS
- Testing Techniques and Results -
Volume IV
by
R. D. Lama
CSIRO Division of Applied
Australilied Geomechanics [ stralia
V. S. V u t u k u r i
Department of Mining Engineering Broken Hill Division
University of N e w South Wales Australia
First Printing1978
u
T R A N S T E C H P U B L I C A T I O N S
HZ J/,v 6 6 /
Lt 3734/1987
Distributed by T R A N S T E C H S. A.
C H -4711 Aedermannsdorf , Switzerland
C op yr ight © 1978 by Trans Tech Publications
Clausthal, G erm any
International Standard Book N u m b e r
ISBN 0 - 8 7 8 4 9 - 0 2 3 - X
Printed in Germany
by Druckerei E. Jungfer, Herzberg
This book, or parts thereof , m ay not be reproduced in any form w i th o u t the written permission o f the publisher. All rights reserved.

FOREWORD
T h e subject o f rock m echanics has gained increasing acceptance as a necessary input in the design o f m ining and civil engineering works. In addition o f these traditional fields o f application, changing political and econom ic conditions have resulted in the need to store oil and other m aterials underground, to dispose o f nuclear waste m aterials and to develop underground factories and carparks in o rd er to preserve the surface environm ent.These ever grow ing dem ands have created an urgent need for the developm ent o f a variety o f design m ethods and practical solutions in rock mechanics and these needs have generated a dem and for inform ation on all aspects o f the behaviour o f rock and rock masses. This inform ation is currently scattered throughout the scientific and technical literature and the design engineer o r research w orker is faced with the form idable task o f locating such inform ation before em barking upon a specific study.T he authors o f the four volumes o f the "H andbook on M echanical Properties o f Rocks“ have done a com m endable service in bringing together a significant proportion o f the available inform ation on rock and rock m ass behaviour. This com pilation o f d a ta is all the m ore useful because the au tho rs have not attem pted to im pose too m any o f ‘their own interpretations upon the inform ation but have presented data accom panied by a range o f possible theoretical explanations. This approach m akes these volumes useful as a starting point for the research w orker or for the design engineer who does not wish to rely on the few standard text book solutions which are available.T his volume, con tain ing discussions on the m echanical behaviour o f jo inted rock and the classification o f rock, touches on the very heart o f practical rock m echanics which is m ore concerned with the response o f the rock mass than with the behaviour o f laboratory specimens. Because o f the practical difficulty and enorm ous expense o f full scale in situ tests on rock m ass behaviour, the understanding o f this subject has been built up from model studies on equivalent m aterials and from theoretical m odels o f the interaction o f the elem ents which fonn the rock m ass. T he m ajor studies which have contributed to this field o f knowledge have been summarised in this volume and it is hoped that this sum m ary will encourage others to carry out further work to enhance ou r understanding o f this im portant subject.
February 1978 D r . E v e r t H o e k
Principal, G older Associates Ltd.(F onnerly Professor o f Rock M echanics,
Imperial College, London).

CO N TEN TS
Volume IV
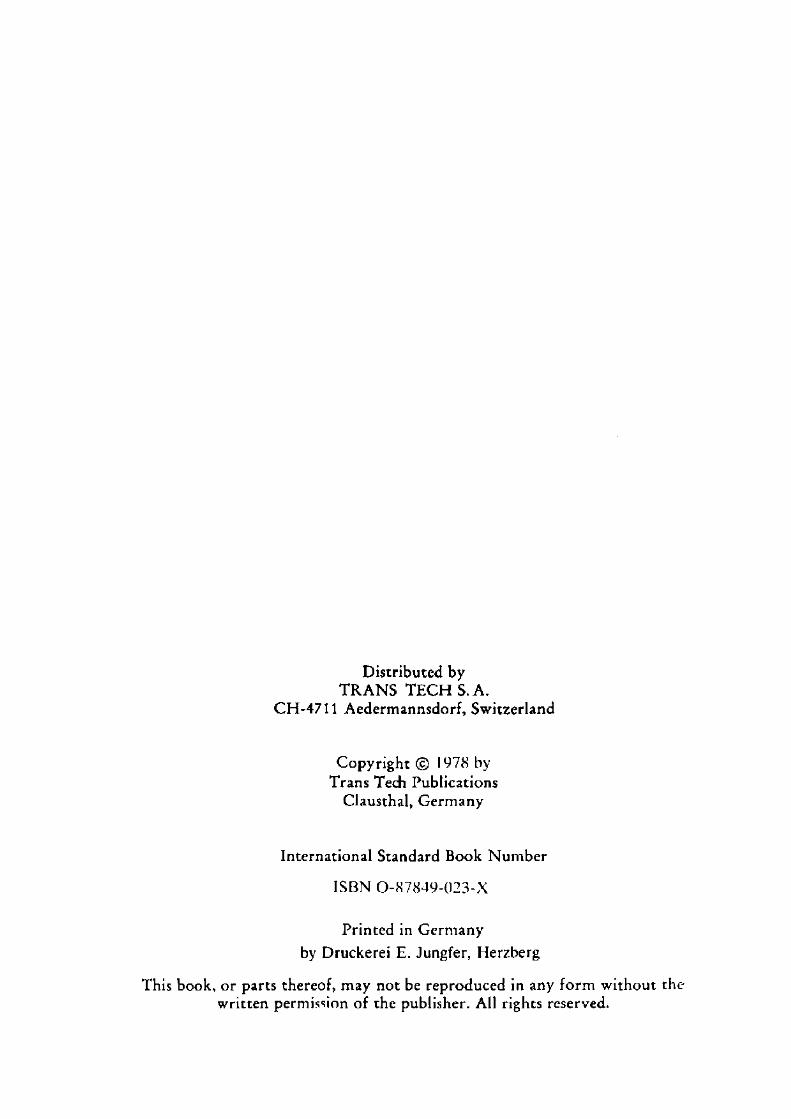
10. Mechanical Behaviour of Jointed Rock10.1. In tro d u c tio n ................................................................................................ 110.2. Theory o f Sliding A long a Jo in t............................................................ 310.3. Influence o f the C onfiguration o f the System w ith
Respect to the Stress F ie ld ...................................................................... 1910.3.1. Single Joint O r ie n ta t io n ......................................................................... 1910.3.2. Double or M ultiple Joint O rien ta tio n ................................................. 2410.4. Behaviour D uring Sliding A long J o in t s ............................................. 2810.4.1. Investigations on Friction along Jo in ts ............................................... 2810.4.2. Factors Influencing Frictional Resistance o f Rock S u rfaces ....... 5310.4.3. D ilatation o f J o in ts .................................................................................. 8710.4.4. Scale Effect in J o in ts .............................................................................. 9010.4.5. Physical Process o f Sliding between Joint S urfaces......................... 9310.4.6. Phenom enon o f S tick-slip ....................................................................... 9910.5. F racture o f Jointed Rock in Uniaxial C o m p ress io n ......................... I l l10.6. Fracture o f Jointed Rock in Tension...................................................... 14110.7. Fracture o f Jointed Rock in Direct Shear............................................. 15010.8. Fracture o f Jointed Rock in M ultiaxial C om pression....................... 16610.8.1. Biaxial C o n d itio n s ..................................................................................... 16610.8.2. Triaxial C o n d itio n s .................................................................................. 17210.9. Summ ary an d C o n c lu s io n s ................................................................... 188
References to C hapter 1 0 ......................................................................... 191Uncited References to C hapter 10......................................................... 199
11. Classification of Rock11.1. In tro d u c tio n ................................................................................................ 20511.2. M inerals and R ocks................................................................................... 20611.3. Geological Classification o f R o c k s ...................................................... 21611.4. Defects in R o c k s ....................................................................................... 22511.4.1. Fabric D e fe c ts ............................................................................................ 22511.4.2. S tructural D e fe c ts ..................................................................................... 23211.5. Joint Survey and Joint A nalysis............................................................... 24911.6. Errors in Joint S u rv ey s ............................................................................... 26711.7. Rock W eathering and C lassification ....................................................... 26911.8. Classification o f Intact R o c k ................................................................... 27411.9. Classification o f Rock In S i t u ................................................................. 282
C O N T E N T S
11.10. Rock Classification for U nderground E xcavations.......................... 28^11.10.1. South African G eom echanics C lassification....................................... 28^11.10.2. Rock Structure R ating ( R S R ) ............................................................... 29211.10.3. Rock M ass Q u a l i ty .................................................................................... 29911.11. S um m ary ........................................................................................................ 305
References to C hap ter 1 1 ......................................................................... 30"7Uncited References to C hap ter 1 1 .......................................................... 312
12. Miscellaneous Properties o f Rock12.1. In tro d u c tio n ................................................................................................. 31712.2. D e n s ity .......................................................................................................... 31712.2.1. G rain D ensity .............................................................................................. 31812.2.2. Bulk D ensity ................................................................................................. 32112.3. P o rosity .......................................................................................................... 32712.3.1. Total Porosity .............................................................................................. 32812.3.2. A pparent P o ro s ity ...................................................................................... 32812.3.3. Effect o f Porosity on M echanical Properties o f R o ck s ................... 34612.4. W ater C o n te n t ............................................................................................ 35112.5. Void I n d e x ................................................................................................... 35212.6. P e rm eab ility ................................................................................................. 35612.6.1. L aboratory Tests for D eterm ination o f Perm eability o f Rock
S pecim ens...................................................................................................... 35812.6.2. Perm eability o f Rock M asses In S i t u .................................................. 36812.7. Swelling and Slake-D urability Index P ro p e r tie s .............................. 38012.7.1. Swelling Pressure Index under C onditions o f Zero
Volume C h a n g e ........................................................................................... 38112.7.2. Swelling Strain Index for a Radially Confined Specimen with
Axial Pressure............................................................................................... 38312.7.3. Swelling Strain Developed in an Unconfined Specim en................. 38412.7.4. Slake-D urability I n d e x ............................................................................. 38912.8. G rain S iz e ..................................................................................................... 393
References to C hapter 1 2 ......................................................................... 399Uncited References to C hap ter 1 2 ......................................................... 403
Appendix VStereographic P ro jec tio n s ......................................................................... 407References to Appendix V ....................................................................... 418
Appendix VIDefinition o f Some Rock Mechanics Terms....................................... 419
C O N T E N T S
Appendix VIIIm perial, M etric and SI U n i t s ................................................................ 463A bout the A u th o rs ...................................................................................... 4 6 8A uthor Index for Volume I V .................................................................. 4 7 0Subject Index for Volume I V .................................................................. 4 7 6A uthor Index for Volumes I-IV ............................................................. 479Subject Index for Volumes I-IV ............................................................. 503
T ables o f C ontents
V o lu m e I ................................................................................................... 5 1 7
V o lu m e II ................................................................................................. 5 2 0V olum e III .............................................................................................. 522


C H A P T E R 10
Mechanical Behaviour of Jointed Rock
10.1. Introduction
The rock in its m ost general form is an anisotropic, discontinuous mass containing cracks, fissures, jo in ts, faults and bedding planes with varying degrees o f cohesion a long these discontinuities. The accepted m athem atical models for the analysis o f stresses, strains and stability o f rock structures which have been so frequently applied in the last half century in civil engineering and mine design have alw ays been associated w ith a param eter o f doubt in the minds of practical engineers. In the last 15 years, greater effort has been concentrated on testing rock m asses in situ and this has brought out very clearly the enorm ous variations tha t exist in the mechanical behaviour o f the rock from place to place. A practical design engineer is convinced that a continuum m odel approach to the problem s o f rock design cannot be accepted and that any acceptable solution m ust take in to accoun t not only the anisotropy o f the rock mass but also the d iscontinuities w hich play a far m ore im portan t role in the stability o f a rock- structure. A s such, the fundam ental concepts o f rock mechanics design can be sum m arised as follows:
1. F o r m ost o f the rock engineering problem s, the engineering properties o f a rock m ass depend far m ore on the system o f geological separations within the rock m ass than on the strength o f the rock m aterial itself.
2. The streng th o f a rock mass is in fact its residual strength which, together with its an iso tropy , is governed by the interlocking bonds o f the unit ' ‘elem ents" form ing the rock mass.
3. The defo rm ab ility o f a rock mass and its anisotropy results predom inantly from the displacem ents o f the unit elements com posing the structure o f the rock mass.
7 M E C H A N I C A L B E H A V I O U R O F J O I N T E D R O C K
The first problem , therefore, in the study o f the properties o f a rock mass is the determ ination o f the character o f the discontinuities. Recently som e w orks on this subject have been published and it is noted tha t the jo in t surfaces m ay be very sm ooth like slickensides to quite rough like the ones obtained in tensile fractures ( M u l l e r , 1963; W a g n e r , 1964; W o h n l i c h , 1968; F e c k e r , 1970; B ock , 1971). Based upon the study o f the discontinuities, there exists an opinion tha t a rock mass m ay be represented by some sort o f a clastic model.
The principal feature o f a unit clastic model is that it is anisotropic and has a lim ited num ber o f clearly defined axes o f symmetry. A three-dim ensional rock m ass m ay be represented by a randon distribution o f individual units, the unit being an iso tropic both with respect to the physical properties and shape. The shape and size o f the unit is determ ined by the param eters o f the rock system which the m odel is supposed to represent.
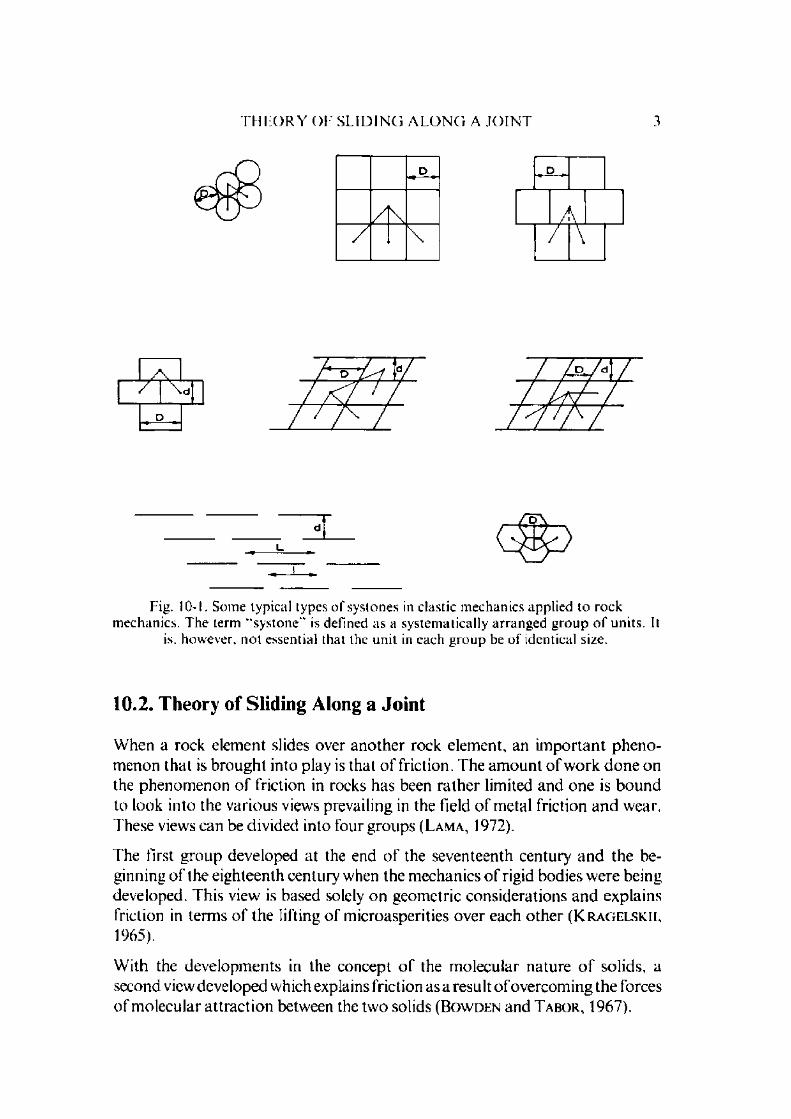
A num ber o f shapes o f the elem ental units have been proposed and used in clastic m echanics approach by different workers in solving different problem s ( L i t w in is z y n , 1964; T r o l l o p e , 1968). In the field o f rock m echanics, some o f the m ost com m on units and their shapes (in two dim ensions) have been circular, square, rectangular, parallelogram and hexagonal (Fig. 10-1). F rom the theoretical standpoin t, it is evident that the shape o f the unit will restrict the physical na tu re o f the forces generated between the units and hence influence the mechanical behaviour o f the system. No com parative study has been m ade as yet of the systems with different elemental shapes to bring out the differences. But in the last 10 years or so, em phasis has been placed on studying the factors which influence the behaviour o f a simplified model o f a jo in ted rock m ass consisting o f sliding plates o r blocks. A num ber o f theoretical and model studies have been carried o u t which have yielded interesting results. Some o f these studies have been very im aginative bu t still not very realistic due to the absence o f any reliable d a ta on the nature, d istribution, m ethod o f classification and the properties of the jo in ts which exist in rocks. Nevertheless, the results o f these studies perrr.it one to conclude that the mechanical behaviour o f the jo in ted rock system is dependent upon the following factors:1 .T h e m echanical behaviour o f the individual elements constitu ting the
system. This has been dealt in detail in C hapters 2 to 5 (Vol. I), in C hapters 6 and 7 (Vol. II) and in C hapter 9 (Vol. III).
2. The sliding characteristics o f joints.3. The configuration o f the system.4. The opera ting stress field.
The influence o f these factors and m ethods used for determ ining the frictional properties o f jo in ts along w ith the factors influencing frictional behaviour are discussed. The influence o f jo in ts on the uniaxial compressive strength, tensle strength , shear strength and the behaviour under m ultiaxial stress field is given.
T H E O R Y O F S L I D I N G A L O N G A J O I N T 3
Fig. 10-1. Some typical types o f systones in clastic mechanics applied to rock mechanics. The term “ systone" is defined as a systematically arranged group o f units. It
is. however, n o t essential that the unit in each group be o f identical size.
10.2. Theory of Sliding Along a Joint
W hen a rock elem ent slides over ano ther rock elem ent, an im portan t phenomenon that is brought into play is that o f friction. The am ount o f work done on the phenom enon o f friction in rocks has been ra ther limited and one is bound to look into the various views prevailing in the field o f metal friction and wear. These views can be divided into four groups (L a m a . 1972).
The first group developed at the end o f the seventeenth century and the beginning o f the eighteenth century when the m echanics o f rigid bodies were being developed. This view is based solely on geom etric considerations and explains friction in term s o f the lifting o f m icroasperities over each other ( K r a g e l s k ii , 1965).
W ith the developm ents in the concept o f the m olecular nature o f solids, a second view developed which explains friction as a result o f overcom ing the forces o f m olecular a ttraction between the two solids (B o w d e n and T a b o r , 1967).

4 M E C H A N I C A L B E H A V I O U R O F J O I N T E D R O C K
The third group visualises friction arising from the deform ation o f certa in am ount o f m aterial which is penetrated on one solid by the asperity o f the o th e r solid. As movement takes place a wave o f deform ation moves ahead and th e resistance to m otion is introduced by the displacem ent o f the m aterial s u r rounding the asperity.
The fourth group considers a com posite theory, which also includes C o u l o m b ’s theory, representing friction as resulting from interlocking o f the surface roughnesses and the lifting o f the microasperities over each other.
The m echanism o f friction in brittle m aterials such as rocks is bound to be slightly different. The concept o f m olecular attraction and plastic deform ation at low stress levels is likely to be absent. On the other hand, it may be expected that due to the developm ent o f tensile stresses in the wedge type asperities, they may fail. By e r l e e (1966), basing his interpretation on the theory o f linear elasticity, considers that tips o f asperities which are subjected to a norm al force and lateral (shear) force, crush to a certain extent under the action o f the norm al force and, on application o f the shear force, induced tensile stresses locally exceed the tensile strength. If all possible shapes o f asperities are equally probable, the applied shear stress, r and the normal stress, <xn can be related to each o ther as follows (E in s t h in , Br u h n and H ir s c h f e l d , 1970):
T = C\ + — + c2 (10.1)
where c , , c2 = constants independent o f the material and
°J- = ratio o f tensile to compressive strength, e. g. ^ 0.1 for rock
and the value o f —according to the above formula w orks ou t to be 0.1 to 0.15
d e p e n d in g u p o n th e s h a p e o f th e a s p e r i ty w h ic h is m u c h lo w e r th a n e x p e r im e n ta l v a lu e s . B y e r l e e ’s th e o ry d o e s n o t ta k e in to c o n s id e r a t io n th e in f lu e n c e o f in te r lo c k in g o f a s p e r itie s .
The influence o f various factors on friction and the values obtained for different rocks by different investigators under varied conditions a re discussed later. Here, it m ay only be m entioned that the coefficient values are quite different from those predicted above which indicates that there is definitely some other phenom enon contributing to the high values o f the coefficients.
N e w l a n d and A l l e l y (1957) were probably the first to indicate that shear is not an intrinsic property but depends upon the average angle o f deviation of particle displacem ents from the direction o f the applied stress. P a t to n (1966a, b) studied the influence o f asperities and the phenom enon o f inter

T H E O R Y O F S L I D I N G A L O N G A J O I N T 5
locking on the failure envelopes. He tested kaoline and plaster mixes with different angles o f inclination o f asperities (/ = 25 . 35 , 45 ) and different num bers o f asperities. He found that the failure envelope o f the specimens with / = 25 can be represented by a straight line (A), (Fig. 10-2). but for specim ens with / = 35 and /' = 45 . each envelope has to be represented by two straight lines (B and C). The line (D) represents the residual strength o f all the
n o r m a l l o a d ( N ) , l b f
Fig. 10-2. Fa ilu re envelopes for specimens with different inclinations o f teeth(a fte r P a t t o n , 1966a).
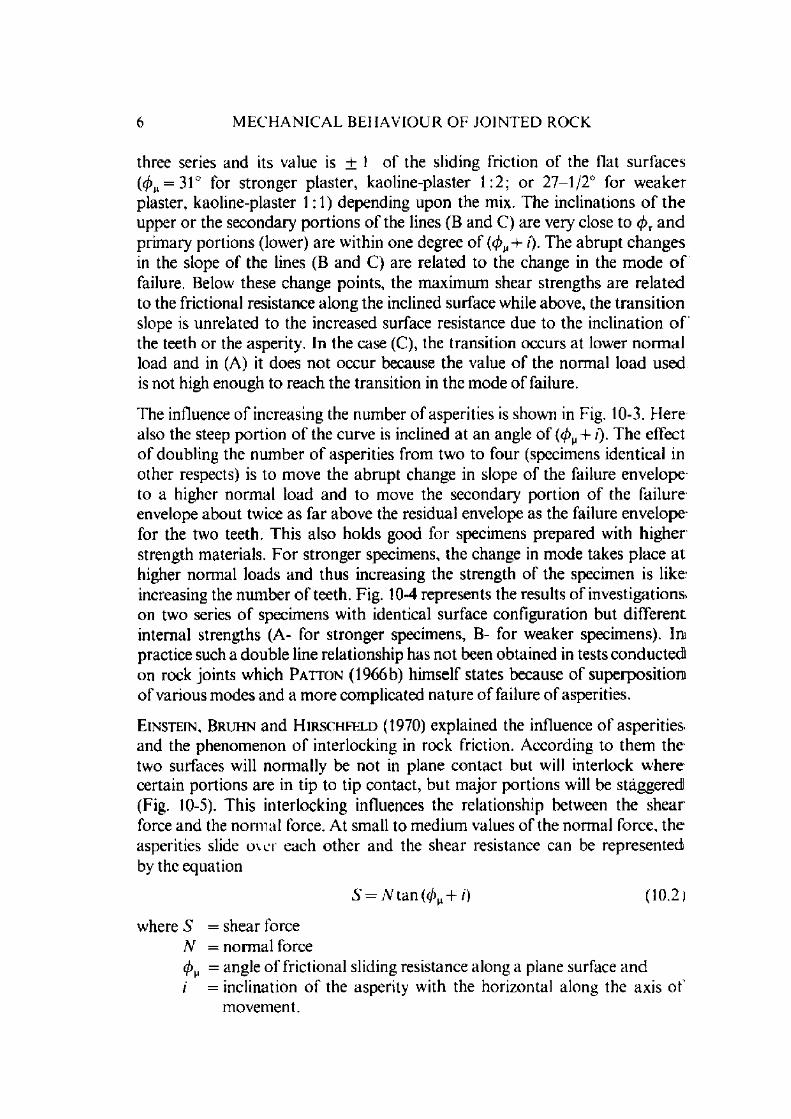
6 M E C H A N I C A L B E H A V I O U R O F J O I N T E D R O C K
three series and its value is ± 1 o f the sliding friction o f the flat surfaces (0 M = 31° for stronger plaster, kaoline-plaster 1 :2 ; o r 27-1/2° for w eaker plaster, kaoline-plaster 1:1) depending upon the mix. The inclinations o f th e upper o r the secondary portions o f the lines (B and C) are very close to (f)T a n d prim ary portions (lower) are within one degree o f ($ M+ /). The abrup t changes in the slope o f the lines (B and C) are related to the change in the m ode o f failure. Below these change points, the m axim um shear strengths are related to the frictional resistance along the inclined surface while above, the transition slope is unrelated to the increased surface resistance due to the inclination o f the teeth or the asperity. In the case (C), the transition occurs at lower norm al load and in (A) it does no t occur because the value o f the norm al load used is not high enough to reach the transition in the m ode o f failure.
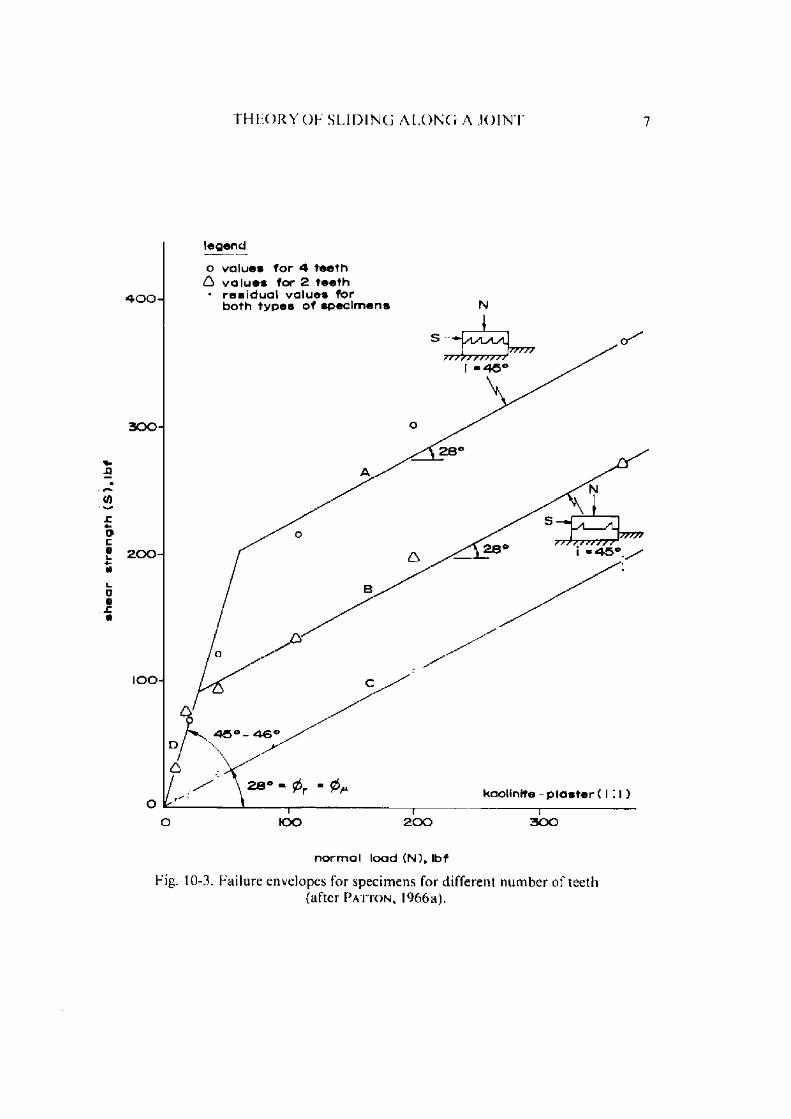
The influence o f increasing the num ber o f asperities is shown in Fig. 10-3. H ere also the steep portion o f the curve is inclined at an angle o f (</>M+ /). T he effect o f doubling the num ber o f asperities from two to four (specimens identical in o ther respects) is to m ove the abrupt change in slope o f the failure envelope to a higher norm al load and to move the secondary portion o f the failure envelope about twice as far above the residual envelope as the failure envelope for the two teeth. This also holds good for specimens prepared with higher strength materials. F o r stronger specimens, the change in m ode takes place a t higher norm al loads and thus increasing the strength o f the specimen is like- increasing the num ber o f teeth. Fig. 10-4 represents the results o f investigations, on two series o f specimens with identical surface configuration but different internal strengths (A- for stronger specimens, B- for weaker specimens). Ini practice such a double line relationship has not been obtained in tests conducted! on rock jo in ts which P a t t o n (1966 b) him self states because o f superposition o f various modes and a m ore com plicated nature o f failure o f asperities.
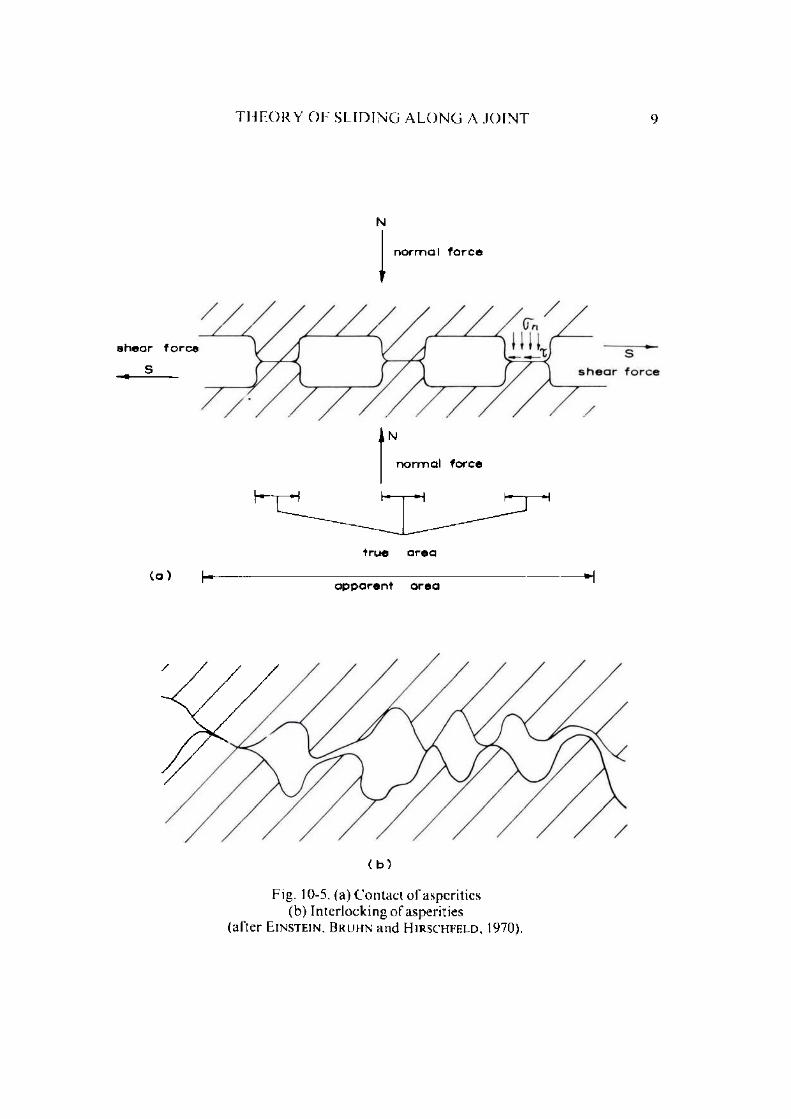
E in s t e in , Br u h n and H ir s c h f e l d (1970) explained the influence o f asperities and the phenom enon o f interlocking in rock friction. According to them the two surfaces will norm ally be not in plane contact but will interlock where certain portions are in tip to tip contact, but m ajor portions will be staggered (Fig. 10-5). This interlocking influences the relationship between the shear force and the norm al force. At small to medium values o f the norm al force, the asperities slide o \e r each other and the shear resistance can be represented by the equation
S = N tan (</>M + 0 (10.2)
where 5 = shear forceN = norm al force</>M = angle o f frictional sliding resistance along a plane surface andi = inclination o f the asperity with the horizontal along the axis o f
movement.
shea
r st
reng
th
(S),
lbf
T H E O R Y O F S L I D I N G A L O N G A J O I N T 7
n o r m a l lo a d (N ) , lb f
Fig. 10-3. Failure envelopes for specimens for different num ber o f teeth(a f te r P a t t o n , l% 6 a ) .

shea
r st
ren
gth
(S),
lbf
8 M E C H A N I C A L B E H A V I O U R O F J O I N T E D R O C K
n o r m a l l o a d ( N ) , l b f
Fig. 10-4. Failure envelopes o f specimens with different internal strengths(a fte r P a t t o n , 1966a).
T H E O R Y O F S L I D I N G A L O N G A J O I N T 9
N
n o r m a l f o r c e
N
n o r m a l f o r c e
( b )
Fig. 10-5. (a) C ontact o f asperities (b) Interlocking of asperities
(after E i n s t e i n , BRUHNand H i r s c h f e l d , 1970).
10 M E C H A N I C A L B E H A V I O U R O F J O I N T E D R O C K
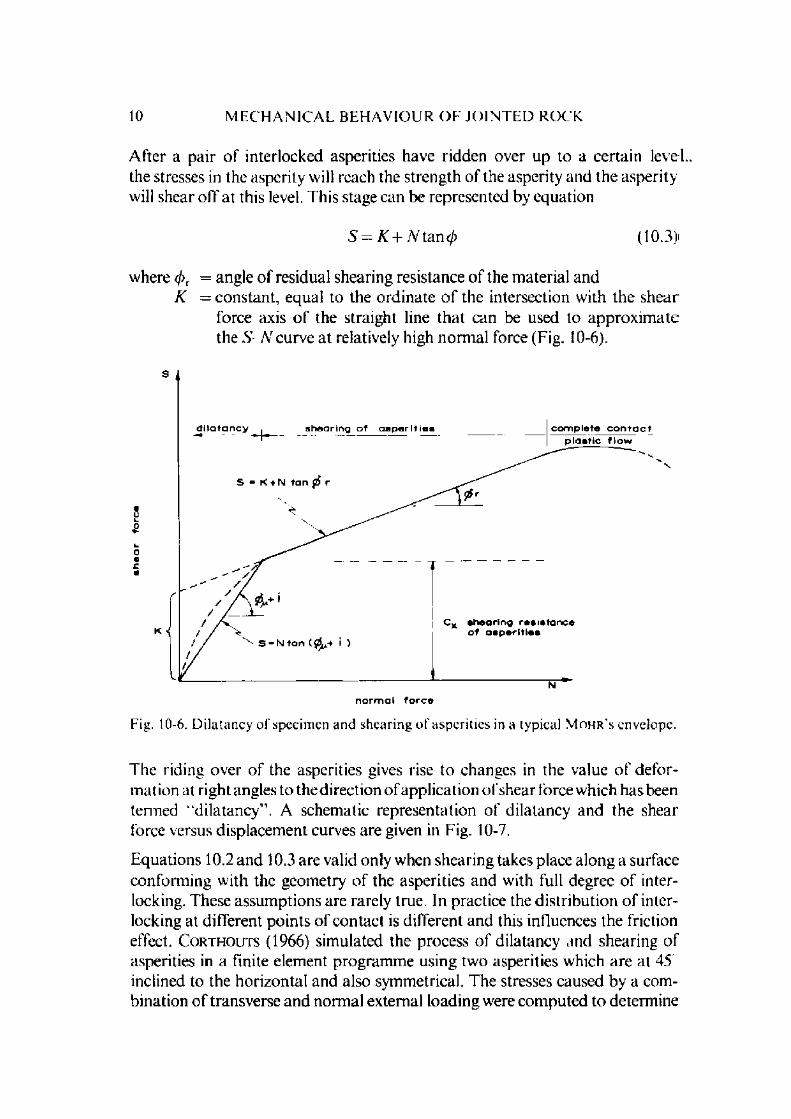
After a pair o f interlocked asperities have ridden over up to a certain level the stresses in the asperity will reach the strength o f the asperity and the asperity will shear o ff at this level. This stage can be represented by equation
S = K + N tan cj) (10.3)
where (j)r = angle o f residual shearing resistance o f the m aterial andK = constant, equal to the ordinate o f the intersection with the shear
force axis o f the straight line tha t can be used to approx im ate the S N curve at relatively high norm al force (Fig. 10-6).
Fig. 10-6. D ilatancy o f specimen and shearing o f asperities in a typical M o h r ' s envelope.
The riding over o f the asperities gives rise to changes in the value o f deform ation at right angles to the direction o f application o f shear force which has been termed “dilatancy” . A schem atic representation o f d ilatancy and the shear force versus displacem ent curves are given in Fig. 10-7.
Equations 10.2 and 10.3 are valid only when shearing takes place along a surface conform ing with the geom etry o f the asperities and with full degree o f interlocking. These assum ptions are rarely true. In practice the d istribution o f interlocking at different points o f contact is different and this influences the friction effect. C o r t h o u t s (1966) sim ulated the process o f dilatancy and shearing o f asperities in a finite element program m e using two asperities which are at 45 inclined to the horizontal and also symmetrical. The stresses caused by a com bination o f transverse and norm al external loading were com puted to determ ine

I H E O R Y O F S L I D IN G A L O N G A JO IN T
N
N
Fig. 10-7. T h e m echanism o f d ila tancy and shearing o f the asperity with the co r respond ing load displacement curves.
(a) Initial state (before displacement)(b) D isplacem ent with d ila tancy and shear at a later stage
(c) Shearing w ithout dilatancy (after E i n s t e i n , B r u h n and H i r s c h f l l d , 1970).

M E C H A N I C A L B E H A V I O U R O F J O I N T E D R O C K
if in any elem ent along the line B — C — D (Fig. 10-8) the tensile stresses are greater than the tensile strength. The transverse and norm al loads are changed till the tensile stress is greater than the tensile strength when the shearing o ff o f the asperity takes place and then the external loading conditions are term inated. If no failure occurs due to tensile stresses, the com puter program m e checks if the average shear stress along the line B —C (Fig. 10-8a) is greater than that allowed by the relationship
t , = <7ntan</>M (10.4)
where r, = shear strength o f the m aterial and nn = norm al stress.
n o r m a l f o r c e
s h e a r f o r c e
n o r m a l f o r c e
s h e a r f o r c e
(d i l a t a n c y
b )
Fig. 10-8. Analytica l model used by C o r t h o u i s (1966) for finite element analysis. T he model consists o f two asperities subjected to normal and shear forces.
(a) Initial situation (b) First step after sliding.

T H E O R Y O F S L I D I N G A L O N G A J O I N T 13
If the average m obilised shear stress r is greater than <7n ta n 0 M i.e. if sliding and dilatancy occur, a small displacem ent A along B —C is in troduced and the com puting cycle is repeated to check if the shear failure occurs in the asperity or if fu rther d ilatancy will take place. T aking </>M = 11.3 C o r t h o u t s obtained the bilinear M o h r ' s envelope as shown in Fig. 10-9. A ccording to the static relationship o f Eq. 10.2, the slope o f the two linear po rtions o f the envelope should be (0 M+ / ‘) and o r 56.3° and 11.3°. The corresponding values for the envelopes determ ined using the finite elem ent m ethod were 71.5 and 15.6 showing thereby large discrepancies.
n o rm a l lo a d in g (s t re s s u n its )
Fig. 10-9. C om p ariso n between the M o h r ' s envelopes for two asperities obtained by C o r t h o u t s (1966) for the case show n in Fig. 10-8
( 0 M = 11.3 , a l = 3090 lbf/ in2).
A ccording to L a d a n y i and A r c h a m b a u l t (1969), the fact that the experim ental envelopes deviate from the b ilinear model and lie considerably lower is due, firstly, to the sensible loss o f interlock before failure as a result o f sm all displacem ent w hich is essential to m obilise the sliding friction and, secondly, the non- uniform stress d is tribu tion on the surface o f the asperities which partially break the asperities before the m axim um strength is reached. As such m ore detailed analysis o f the shear test is required.

14 M E C H A N I C A L B E H A V I O U R O F J O I N T E D R O C K
R o w e , B a r d e n and L e e (1964) considered the direct shear test in detail. A ccording to them , the shear force S m ay be divided into 3 com ponents
S
w here S l
S 2
*$3
(10.5)
= shear force com ponent due to external work done in dilating against the external norm al force N
= shear force com ponent due to additional internal work done in friction due to dilatancy and
= shear force com ponent due to work done in internal friction if' the specimen did not change in volume in shear.
W ith reference to Fig. 10-10, it can be seen tha t
civStd.x = N d y ; S , = N - f
d x10.6 )
o r
S, = N tan /= N V
w here V = ra te o f dilation at failure, i.e. ~ .a x
Fig. 10-10. Definition o f the dilation rate V and the shear area ratio o f as.
Since (S2cos/) is the shear stress parallel to the plane o f sliding and ( S sin/) is the to ta l force nonnal to the plane arising simply because o f the dilation w'hen / 0
S 2 cos / = S sin / tan
= 5tan/tan<jfr^
= S V tan c/>M
(107)
(108)

I ' H E O R Y O F S L I D I N G A L O N G A J O I N ! 15
A s it shall be shown later tha t the value o f /* is not constant and depends upon the roughness o f the surface, asperity orientation, etc.. E quation 10.8 can better be w ritten down as
5 2 = S V tan 0,
where 0, denotes the statistical average value o f the friction angle w hen sliding occurs along the irregularities o f different orientations.
R o w e , B a r d e n and L e e (1964) gave the value o f 0 f = 0 M for highly packed sand, but for loose media its value m ay be </), = 4- 50%.
W hen there is no dilation, i.e. an ideally flat surface
5 3 = N tan 4\i (10.9)
Thus, from Eqs. 10.6, 10.8 and 10.9
S = N tan / + S tan i tan </>M + N tan (j\,
o r ~ = tan / + ^ tan / tan r/>M + tan (fiyi
= ta n(</>u+ /) (10.10)
Thus the equation obtained by substitu ting the values o f 5 2, S3 in Eq. 10.5 is the sam e as Eq. 10.2.
L a d a n y i and A r c h a m b a u l t (1969) carried the argum ent fu rther by stating that by shearing along an irregular rock surface there is the fourth com ponent which occurs as a result o f the shearing o f the teeth and the value o f this com ponent (S4) may be determ ined by assum ing that all the teeth are sheared o ff a t the base. The shear force, S4 then may be equal to
S4 = A K + N tan r/>0 (10.11)
where A = to ta l projected area o f the teeth at the plane o f shear andK and r/;0 = the C o u l o m b shear param eters related to the strength o f the rocksubstance.
In reality, in shearing along an irregular surface the two modes o f failure occur sim ultaneously, i.e. sliding and shearing. If the asperities are sheared o f f only over a portion o f the projected area given by, A s, i.e. I ' A A S and sliding occurs over the area ( A —A s), then the to tal shear force can be written by,
S = ( S Y -F S 2 + S3) (1 — c/s) -f S4as (10 .12)
where </s = A J A and is called the shear area ratio.

16 M E C H A N I C A L B E H A V I O U R O F J O I N T E D R O C K
Substituting the values o f S {, S 2, S 3, S4 m Eq. 10 . 12, and dividing by the area A s the following expression is obtained for the conventional shear strength r:
S _ o n(1_ -c p ( V + t a n 0 M) + (<rnt a n n n n , ^ 1 - 0 - f l J K t a n ^ 1 '
W hen K = 0,
r = rrn (1 — tfJ ta n < ^ + £/s(<7ntan</>0 + A') (10.14)
which gives the shear strength o f a partially cemented flat shear plane o r a discontinuous jo in t surface.
F o r engineering practice the use o f these equations requires the know ledge o f the param eters as, 0 O, K„ and K. The value o f 0 M can be obtained by perform ing tests at low norm al pressure for Hat surfaces such tha t as— 0 and the value can be calculated from the relationship
= T f V W i h " ° - ' 5>
which has been obtained from Eq. 10.13 by putting a s = 0.
T o overcome the difficulty o f determ ining the value o f K and r/>0 (or 0 r) and keeping in view that M o h r ' s envelope will not consist o f two straight lines but o f an initially curved shape (shown dotted in Fig. 10-6) as a result o f different heights and inclinations o f a m ultiple o f asperities which get sheared o ff at different stages, a m odification o f the above is necessary. The initial stage o f the M o h r 's envelope is also associated with large dilatancy in the direction norm al to the plane o f sliding. If the dilatancy is restricted at this stage (as may happen in nature), this will tend to m agnify the influence o f interlocking and the M o h r 's evelope assum es a straight line curve. As such, L a d a n y i and A r c h a m b a u l t (1969) used the parabolic law proposed by F a ir h u r s t (1964) instead o f the original straight line concept. According to F a ir h u r s t (1964)
where n = <7--— (7
ac = uniaxial compressive strength o f solid rock rr, = uniaxial tensile strength o f solid rock and m = (n + 1)‘
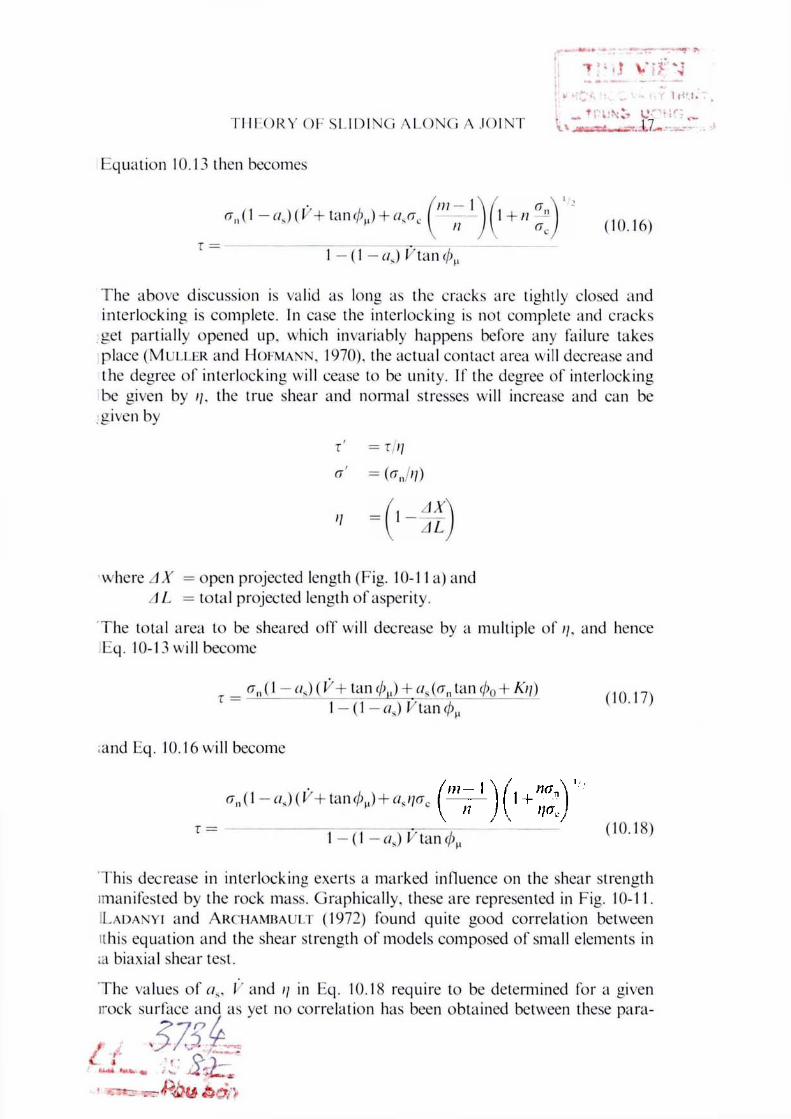
E quation 10.13 then becomes
<rn (1 — as) ( K + tan 0 M) + c/s<t,m — 1
// (10.16)T = 1 - (1 - as) K tan
T h e above discussion is valid as long as the cracks arc tightly closed and in terlocking is com plete. In case the interlocking is not com plete and cracks get partially opened up. which invariably happens before any failure takes p lace ( M u l l e r and H o f m a n n , 1970), the actual contact area will decrease and the degree o f interlocking will cease to be unity. If the degree o f interlocking be given by //, the true shear and norm al stresses will increase and can be given by
where A X = open projected length (Fig. 10-11 a) and A L = to tal projected length o f asperity.
T he to tal area to be sheared o ff will decrease by a m ultiple o f ;/, and hence E q . 10-13 will become
This decrease in interlocking exerts a m arked influence on the shear strength im anifested by the rock mass. G raphically , these are represented in Fig. 10-11. ILa d a n y i and A r c h a m b a u l t (1972) found quite good correlation between tthis equation and the shear strength o f m odels com posed o f small elem ents in id biaxial shear test.
The values o f c/s, V and // in Eq. 10.18 require to be determ ined for a given irock surface and as yet no correlation has been obtained between these para-
t ' = tM
<*' = K / ' / )
T = flnU - f l s ) ( ^ + tan 0 U) + as(an tan <ft0+ & 7) 1 - ( 1 - t f s) K tan (10.17)
and Eq. 10.16 will become
<rn(l “ tfsM K + tan^H tfs/ycr,
(10.18)T =1 — (1 —as) V tan r/>M
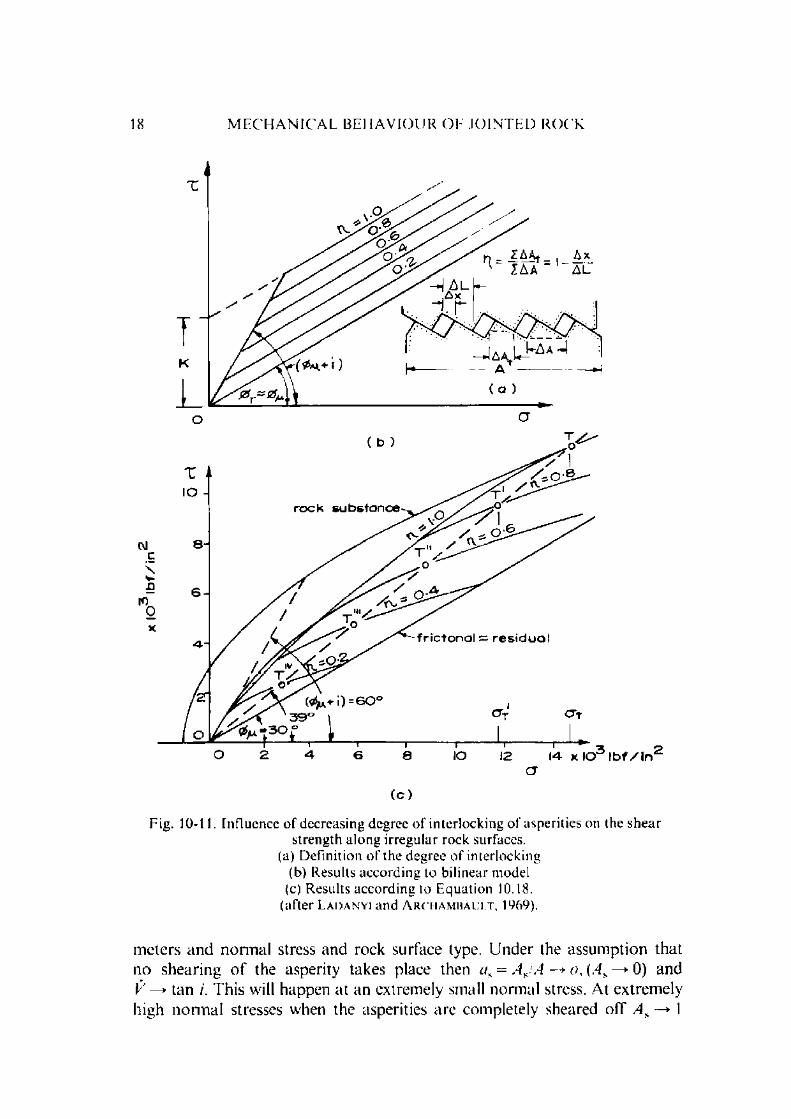
18 M E C H A N I C A L B E H A V I O U R O K J O I N T E D ROC K
( c )
Kig. 10-11. Influence o f decreasing degree o f interlocking o f asperities on the shear strength along irregular rock surfaces.
(a) Definition o f the degree o f interlocking(b) Results according to bilinear model
(c) Results according to E quation 10.18.(after L a d a n y i and A r c h a m b a u l t . 1969).
m eters and norm al stress and rock surface type. U nder the assum ption that no shearing o f the asperity takes place then as = A J A —> on(As —> 0) and V —► tan i. This will happen a t an extremely small norm al stress. At extremely high norm al stresses when the asperities are completely sheared off A s —>► 1

S Y S I T M C O N F I G U R A T I O N A N D S T R E S S F I E L D 19
and V —> 0. At interm ediate values o f norm al stress, the values o f c/s and V will vary from 0 to 1 with as increasing from 0 to 1 with increase in stress and V decreasing from 1 to 0. A pproxim ate values o f the two can be obtained from the following relationships under the limits 0 < <rn < rr,:
(7 \ k 11 - ^ (10.19)
o T)
tan / (10.20)G T J
w here o { = transition norm al stress at which as= 1 and V = 0
A , = constan t ^ and
k 2 = constant ^ 4.
The value o f oT could be taken as the point w here the norm al stress is so high that the pre-existing jo in t has no influence on the specimen strength and this represents the intersection o f the M o h r envelope for the jo in t w ith the M o h r envelope for the rock substance (Fig. 10-11; point T on the envelope) whichcorresponds to the line with an inclination o f 39 and passing th rough theorigin (M (x ;i . 1966) separating the region o f ductile and brittle failures. The inclination is only an average value o f different rock types and varies fromrock to rock, for example, granites have higher value and lim estones lower(M o g i , 1972). By e r l e e (1968a) also expressed that the inclination does not seem to be independent o f the rock type.
10.3. Influence of the Configuration of the System with Respect to the Stress Field
The influence o f the configuration o f the join t system with respect to the stress field is a complex problem and studies have been m ade only in a lim ited num ber o f simple cases. M ost o f the theoretical studies conducted so far relate to the following aspects:1. Single jo in t orientation.2. D ouble o r m ultiple jo in t orientation.
10.3.1. Single Jo in t O r ien ta t ion
The influence o f a single jo in t orien tation has been explained by considering a two dim ensional theory, assum ing that the simple criterion o f slip along a plane as given by Eq. 10-3 applies. In a biaxial plane stress case, it can be easily proved that (Fig. 10-12)
20 M E C H A N I C A L B E H A V I O U R O F J O I N T E D R O C K
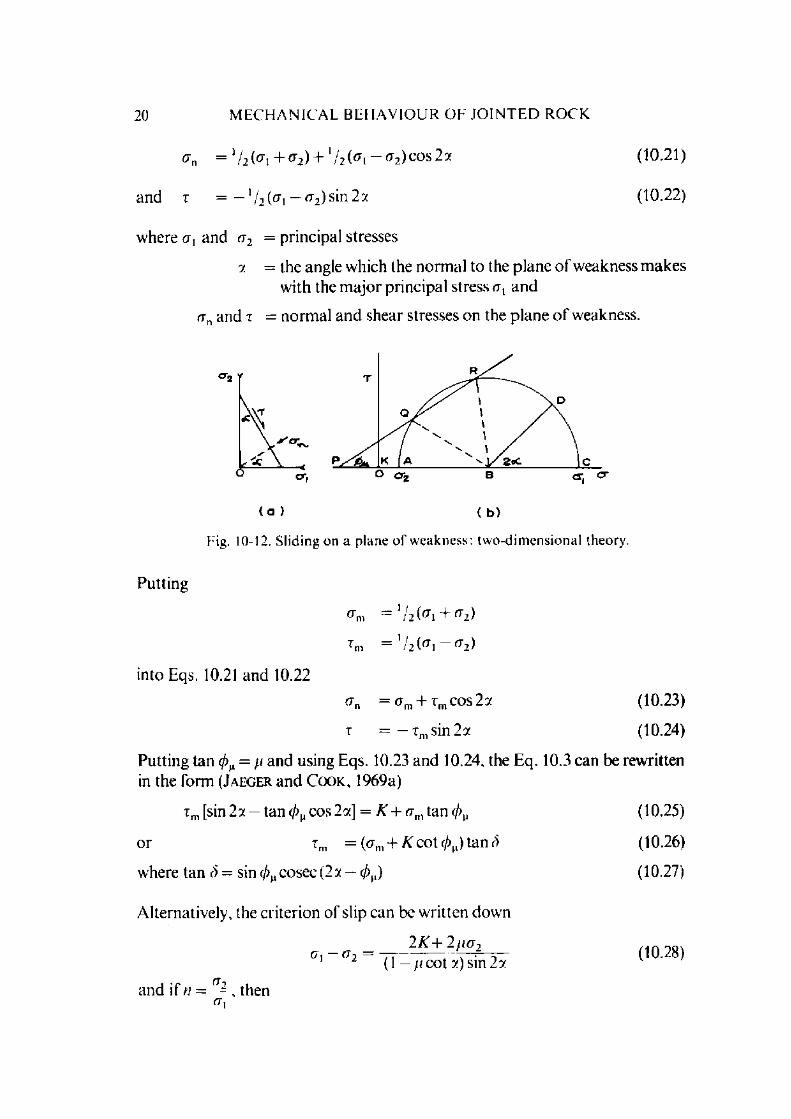
= xh ( a \ + ^ 2) + Xh ( a \ - t f 2 ) c° s 2 2
a n d i = — 1/ 2 <(Ti “ ^ 2) s in - :z
w h e re a , a n d <x2
( 10.21)
(10.22)
= principal stresses
y = the angle which the norm al to the plane o f weakness m akes with the m ajor principal stress and
cj and t = norm al and shear stresses on the plane o f weakness.
( a ) ( b )
Putting
Fig. 10-12. Sliding on a plane o f weakness : two-dim ensional theory.
<*m = ' l 2^ \ + t72)
Tm = ' l 2 (a \ - < 7 2 )
into Eqs. 10.21 and 10.22
a n = CTm + T m C O s 2 a
t = — Tm sin 2a
(10.23)
(10.24)
Putting tan = // and using Eqs. 10.23 and 10.24, the Eq. 10.3 can be rewritten in the fo rm (J a e g e r and C o o k , 1969a)
i m [sin 2 y — tan 0 M cos 2 y] = K + tan </>M
or t m = (am+ K co t </>M) tan S
where tan S = sin cosec (2y — </>M)
Alternatively, the criterion o f slip can be w ritten down
2 K + 2 ncj22 (1 - / / c o t^ ) s in 2 y
(10.25)
(10.26)
(10.27)
(10.28)
o->and if n = , then<7\
S Y S T E M C O N F I G U R A T I O N A N D S T R E S S F I E L D
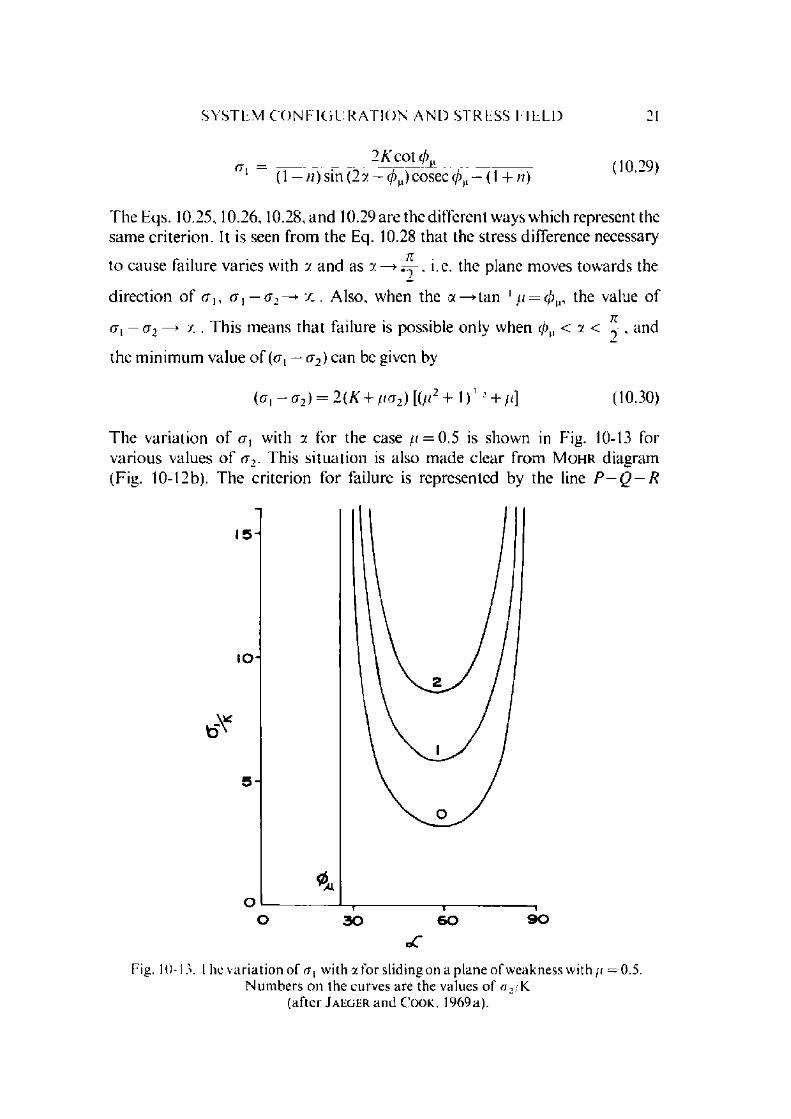
2/Ccot(/.)M (1 — ri) sin (2 y — cosec — (1 + /?) (10.29)
T h eE q s. 10.25,10.26.10.28, and 10.29 are the different ways which represent the sam e criterion. It is seen from the Eq. 10.28 that the stress difference necessary
to cause failure varies with y and as y —► — , i.e. the plane m oves tow ards the
direction o f g {, g x — g 2 —> x . Also, when the a —>tan 1 // = c/>M, the value o f
rr, — rr2 —► x . This means th a t failure is possible only when </>M < y < y , and
the m inim um value o f (rr, — a 2) can be given by
(G\ — g2) = 2(A'-F fiG2) [(fi2 + ! ) ' ’ + /<] 10.30)
The variation o f a , with y for the case // = 0.5 is shown in Fig. 10-13 for various values o f g 2 . This situation is also m ade clear from M o h r diagram (Fig. 10-12b). The criterion for failure is represented by the line P —Q —R
io -
A l
30 60 S O
j :
Fig. 10-13. I he varia tion o f o x with y. for sliding on a plane o f weakness with // = 0.5. N u m b ers o n the curves are the values o f (t2/K
(after J aeger and C o o k , 1969a).
M E C H A N I C A L B E H A V I O U R O F J O I N T E D R O C K
inclined a t an angle to the 0 — a axis and m aking an intercept O P = — K co t on this axis. I f g x and g2 are the principal stresses, the nonnal and shear stresses across the plane whose norm al is inclined at 7 to the direction are represented by the point D on the M o h r circle on A C as diam eter. If D lies in e ither o f the arcs A — Q or R - C , these stresses will not be sufficient to cause slip bu t if it lies in the arc Q — R , then stresses will be sufficient to cause slip.
T he above theory is applicable for (/) the sliding across open jo in ts in which case K will be the shear strength o f the jo in t and // the coefficient o f friction o f the jo in t; (/'/) the sliding along filled jo in ts where K will be the shear strength o f the filling m aterial and // coefficient o f internal friction o f the filling m aterial: (iii) the anisotropic m aterial with parallel planes o f weakness which behave in the sam e way as m aterials with planes o f weaknesses.
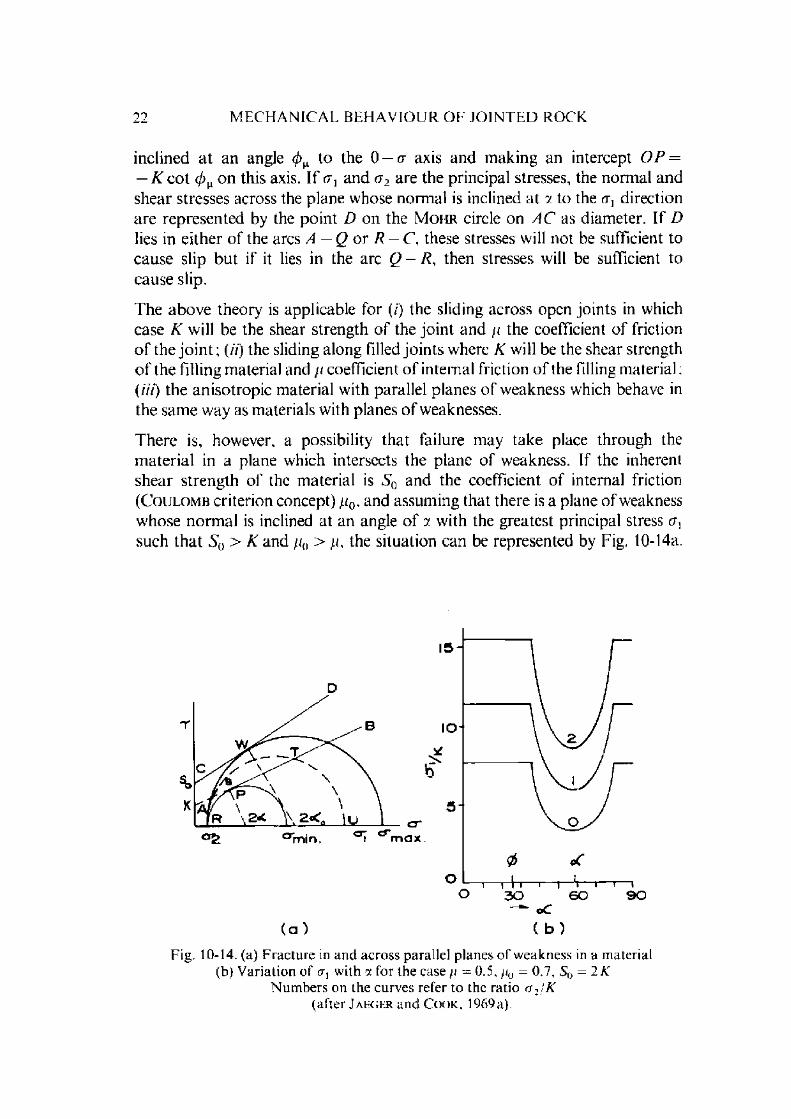
T here is, however, a possibility that failure may take place through the m ateria l in a plane which intersects the plane o f weakness. If the inherent shear strength o f the m aterial is S 0 and the coefficient o f internal friction ( C o u l o m b criterion concept) //0, and assum ing that there is a plane o f weakness w hose norm al is inclined at an angle o f y. with the greatest principal stress a, such th a t S 0 > K and //0 > //, the situation can be represented by Fig. 10-14a.
( a ) ( b )
Fig. 10-14. (a) Fracture in and across parallel planes o f weakness in a material (b) Variation of a , with y. for the case // = 0.5, //0 = 0.7, 50 = 2 K
N um bers on the curves refer to the ratio g 2IK (after Ja e g e r and C o o k , 1969a).
S Y S IT M C O N F I G U R A T I O N A N D S T R F S S F I F L D 23
A s already shown, failure is possible when < a < ~ , and the criterion o f
slip between these limits can be represented by Eq. 10.28 w hich can be rew ritten as follows:
^ i = ^ 2 + 7| t t H —; (10.31)(1 - / / c o t 7) (sin 27)
F o r a given value o f a 2, the m inim um value o f rr, (<xniin) occurs when
1tan 2^ = —/'
ffmin = <72 + 2(X’ + //(72) [ ( / r + 1)' -+/<)] (10.32)
11 the value o f a2 is constan t, and a, is increased, to the point when crl = <xmin, failure will occur on the plane represented by the line A — B (Fig. 10-14a), i.e. a long the plane o f w eakness 7, but if it is possible to increase the stress conditions such that rr, = <rmax, then failure is possible along the plane represented by the line C — D (Fig. 10-14a), i.e. along the plane o f weakness 70. Since the line C — D represents the M o h r envelope for the solid m aterial, the m axim um value o f rr, can then be represented by
^max = ^2 + 2 (S 0H-/i0(T2)[(/i5+ 1 ) ' 2 + //0] (10.33)
Thus m inim um and m axim um values o f o x are represented by Eqs. 10.32 and 10.33 when the angle o f possible failure varies from 7 to Tq. The varia tion o f rr, with 7 for a particu lar case is shown in Fig. 10.14b. The influence o f the stress value cj2 is simply to raise the curves up. It shall be o f interest to state that the experim ental results obtained by a num ber o f investigators are m ore o r less in accordance with the above (H o e k , 1964: J a e g e r and R o s e n g r e n , 1969: E in s t e in , B r u h n a n d H ir s c h f e l d , 1970: H o R iN o a n d E l l ic k s o n , 1970).
A nother very simple way o f representation which is quite useful from practical engineering point o f view is by m aking use o f the ctJo2 ratio. T hus in M o h r circle representation when the norm al stresses and shear stresses can be represented by Eqs. 10.21 and 10.22 and the equilibrium criterion by Eq. 10.3; by putting Eqs. 10.21 and 10.22 in to Eq. 10.3 and rearranging it, the equilibrium condition can be put as
a = o2 [sin (2a - <ftu) + sin 0„] + 2 Acos</\, (10 34)1 s in (2 a — —sin</>M
or when K = 0
£ l = + (10.35)(J2 sin (27 — 0 M) — sin </>M
24 M E C H A N I C A L B E H A V I O U R O F J O I N T E D R O C K
The results o f Eq. 10.35 when plotted in po lar co-ordinates for different v a lu es o f g , /<r2 and </>M and a, are shown in Fig. 10-17 (consider the parabolas fo r each jo in t set separately). This indicates that decreasing the value o f cj)yi is to m ake the region o f slippage w ider and hence increasing the chance o f slippage.
10.3.2. D o u b le o r M ult ip le Jo in t O rien ta t ion
The case o f a multiple jo in t orientation can be studied by considering a th ree d im ensional case. The three dim ensional case can be represented quite easily by M o h r 's representation. Fig. 10-12b can be slightly modified by shifting th e line o f origin from 0 to the point P which m eans that the different stresses
cr, and a 2 have been increased by the am ount O P = - . Similarly, if there be
any pore pressure to be taken into account, this can easily be done by m ak in g use o f the “ effective stress concept" which replaces rr,, a2 and <r3 by rr, — /?, ° 2 ~ P ' (J?>~P- Thus for a general case, M o h r envelope can be represented by replacing the values o f n , , rx2, <t3, by the effective stress values as follows:
G\' = G\ — p + (K/n)Gi — °2 ~ / 7 + W /0 (10.36)( j^ = ai - p + (K/n)
and C oulomb’s criterion is reduced to
r = //(j (10.37)
Tw o extrem e cases can be considered; first when o[ > cij = <t3, and second o[ = cj2 > <x3. In the first case there is symmetry about the a[ axis and in the second case there is sym m etry abou t the a 3 axis. These cases can be represented by Fig. 10-15a, assum ing that a[ is the greatest principal stress and tr3 is the least principal stress, the value o f rr2' lies between the two extremes. The line 0 — C represents the failure criterion. The sliding can take place only when the norm als to the jo in ts correspond to the points on the arc M and N and m ake an angle 7, and y.2 with the a[ direction. This result can also be represented in Fig. 10-15b which shows the direction o f the principal stress in an octant o f a unit sphere. U nder the conditions o f o x > o 2 = <r3, possible slip planes are those w hose norm als m ake angles y.x and y.2 with a[ and lie in the zone A BCD sym m etrical about o[ axis. U nder the conditions a[ = a2 > <r3, possible slip p lanes are those whose norm als m ake angles o f 90 — a, and 90 - y.2 with rr3 and lie in the zone A D E F symm etrical about the rr3 axis.
This m akes very clear the influence o f the interm ediate stress as it varies between the two extremes (interm ediate principal stress ai changes from
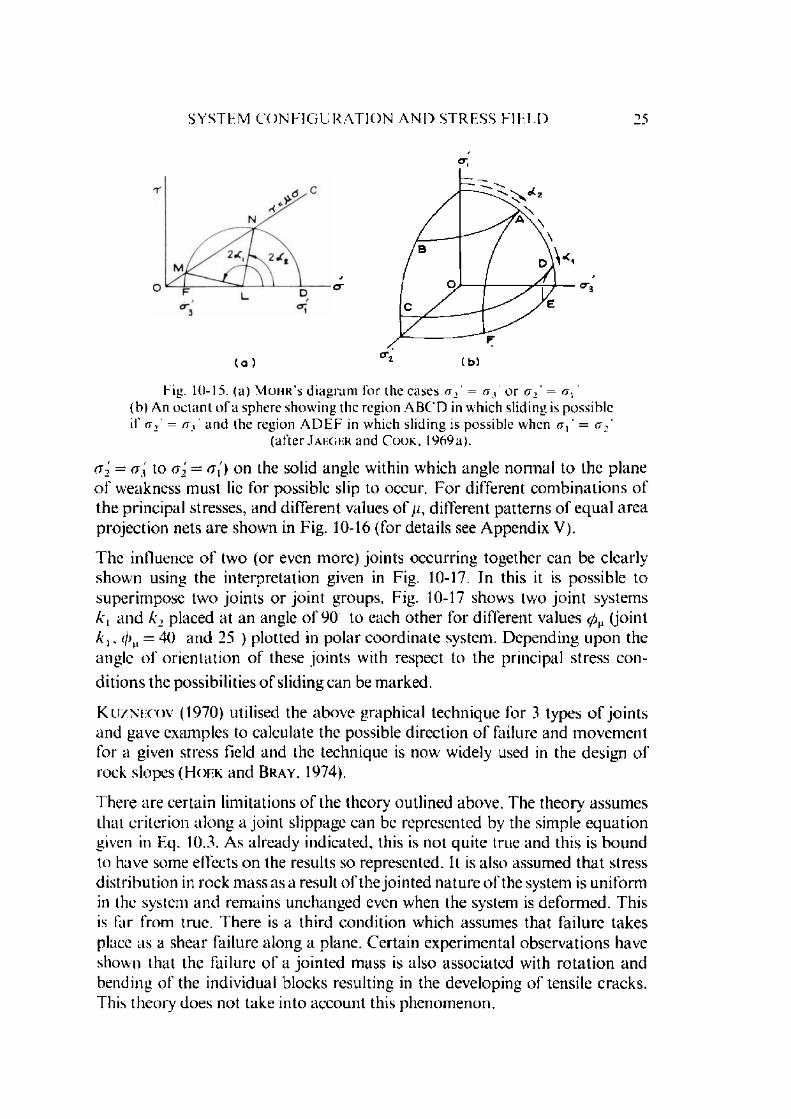
S Y S T E M C O N F I G U R A T I O N A N D S T R E S S F I E L D 25
Fig. 10-15. (a) M o h r ' s d ia g ra m for th e cases a2' = o r o2' =(b) An oc tan t o f a sphere showing the region A B C D in which sliding is possible if o z = and the region A D E F in which sliding is possible when <t, ' = cr2
(after J aeger and C o o k , 1969a).
cr, = to (72 = a[) on the solid angle within which angle nonnal to the plane o f weakness m ust lie for possible slip to occur. F o r different com binations o f the principal stresses, and different values o f /i , different patterns o f equal area projection nets are shown in Fig. 10-16 (for details see Appendix V).
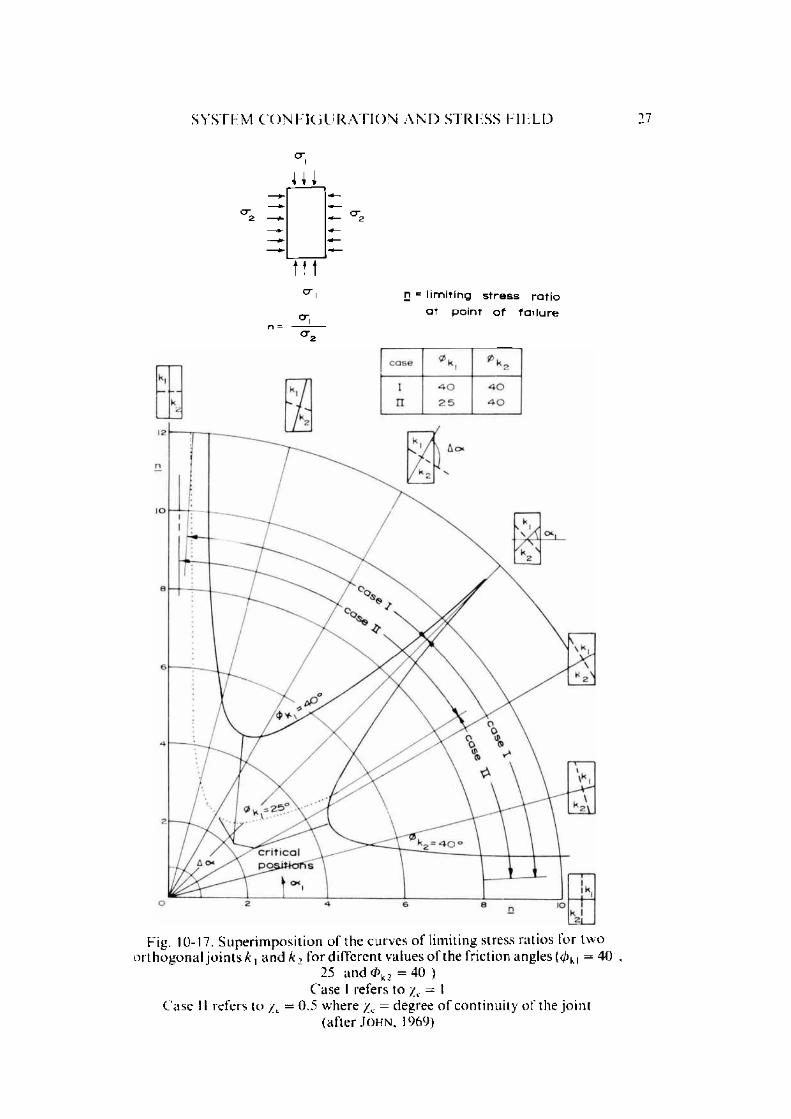
T he influence o f two (or even m ore) jo in ts occurring together can be clearly show n using the in terpretation given in Fig. 10-17. In this it is possible to superim pose two jo in ts or jo in t groups. Fig. 10-17 shows two jo in t systems k x and k 2 placed a t an angle o f 90 to each o ther for different values (joint k i , (p^ = 40 and 25 ) plotted in po lar coordinate system. D epending upon the angle o f orien tation o f these jo in ts with respect to the principal stress cond itions the possibilities o f sliding can be m arked.
K u zn eco v (1970) utilised the above g raph ical techn ique for 3 types o f jo in ts an d gave exam ples to calcu la te the possible d irec tion o f failure and m ovem en t for a given stress field and the techn ique is now w idely used in the design o f rock slopes (H oek a n d Bray , 1974).
There are certain lim itations o f the theory outlined above. The theory assum es that criterion a long a joint slippage can be represented by the simple equation given in Eq. 10.3. As already indicated, this is not quite true and this is bound to have some effects on the results so represented. It is also assumed th a t stress d istribution in rock mass as a result o f the jo in ted nature o f the system is uniform in the system and rem ains unchanged even when the system is deform ed. This is far from true. There is a third condition which assum es that failure takes place as a shear failure along a plane. Certain experim ental observations have shown that the failure o f a jo in ted mass is also associated with ro ta tio n and bending o f the individual blocks resulting in the developing o f tensile cracks. This theory does not take into account this phenom enon.

valu
es
of
26 M E C H A N I C A L B E H A V I O U R O F J O I N T E D R O C K
o
O-l
02
0 3
Jb" 0 - 4
0 5
0 6
0 8
IO
O O GO O Oo o oO O Oo o o*%'m° ° y - o i °y.- o -2'CT.
( a )
O I
02
0 4
0 -5
O 6
0 8
IO
9©ooo o oo o ooooooo
jj. * 0 3 3 jo. mO S ~ 7 ^ “ I'O
( b )
Fig. 10-16. Equal area projections showing the areas (shaded) where slip is possible
(a) for li = and various values o f a --, and3
(b) for —7 = 0.1 and various values o f ° 1, and //
(after J aeger and R osengren , 1969).
S Y S T E M C O N F I G U R A T I O N A N D S T R E S S F I E L D
cr2
ttt°"i
cr,
n «= lim it in g s tre s s r a t io
a t p o in t o f f a i lu r e
Fig. 10-17. S uperim position o f the curves o f limiting stress ratios tor two o r th o g o n a l jo in ts A-, an d k 2 for different values o f the friction angles (</>k, = 40 ,
25 and <Pk2 = 4 0 )Case I refers to ye = 1
Case II refers to / c = 0.5 where / c = degree o f continuity o f the jo in t(a f te r J o h n , 1969)

28 M E C H A N I C A L B E H A V I O U R O F J O I N T E D R O C K
10.4. Behaviour During Sliding Along Joints
10.4.1. Investigations on Fric t ion a long Jo in ts
A num ber o f techniques have been used by various investigators for s tu d y in g friction along rock jo ints. These techniques m ay be grouped into the fo llow ing classes (Fig. 10-18):1. Slider sliding over ano ther surface2. C onventional shear box test3. D ouble shear test4. T riaxial test5. R o ta tio n o f cylinders6. In situ shear tests
Principles underlying the above m ethods are given below. F or m ore d e ta ils o f som e o f these tests refer to C hapters 4,5 (Vol. I) and 8 (Vol. III).
N
(a)
. s r(b )
Fig. 10-18. Systems o f m easuring friction properties a long jo in ts (a) Slider sliding on an o th er surface
(b) C onventional shear box test arrangem ent (c) D oub le shear test arrangem ent
(d) Triaxial test arrangem ent (e) R otation o f cylinders
(0 In situ shear test.
( f )
1. Slider sliding over another surface
It is perhaps the oldest m ethod o f investigating friction and was used for de term ining the sliding characteristics o f m inerals and rocks by H o r n and D e e r e (1962), B y e r l e e (1967a) and J a e g e r and C o o k (1969b). There are two varia tions o f the m ethod. In the first case a small slider is m ade to slide on a large surface in which case the norm al load applied cannot be too large. In this system (Fig. 10-18a), while the larger surface is always fresh, it is the same surface o f the slider which is in contact. The m ethod is m ore suitable for wear

B l ' H A V I O l R D U R I N G S L I D I N G A L O N G J O I N T S 29
A ,B - 5 0 M P a h yd ra u lic cy lin d ers C ,D ,E - lo a d ce lls
F - a ir bellow s
I - u p p e r b lock
I I - lo w e r b lo c k
1 , 2 , 3 , 4 , 5 - L V D T fo r v e r t ic a l& h o r iz o n ta l d isp lacem ent
Q - n o rm a l fo rce S( + S 2~ s h e a r fo rce
L _ J r-rn 1 11—f - -Tzr
. in k i
Fig. 10-19. Large friction machine (a) Overall view o f m achine
(b) Location o f cylinders, load cells and L.V.D.T.s (after R engers, 1971)

30 M E C H A N I C A L B E H A V I O U R O F J O I N T E D R O C K
than for friction studies except perhaps when the residual friction values a re needed. The m ethod, however, does no t represent conditions tha t occur im nature.
A m odification o f the technique was used by R e n g e r s (1971) w here the size o f the two sliding blocks is no t the sam e and the size o f the surfaces is large. The im portan t problem posed by such an arrangem ent is that it is difficult to ensure uniform ity o f norm al load over the whole o f the surface at different stages o f movement o f blocks. R e n g e r s solved this difficulty by building a special loading m achine where the norm al force is applied by a ir-pressure-rubber bellows (Fig. 10-19). The horizontal load (shear force) is applied through a set o f two cylinders and the shear force is m easured by a load cell. The m achine has a friction plane o f 600 cm 2 (93 in2) and a norm al stress 50 M Pa (7252 lbf/in2) with maximum relative m ovem ent o f the specimens 200 mm (7.9 in). This design has the following advantages:1. Regulation o f norm al pressure w ithout loss o f force2. U niform norm al load sim ilar to dead weight load3. U niform norm al load independent o f the position o f the slider4. Possibility o f following any loading path (dependency between norm al force
and dilatancy) by program m ing a ir pressure in the bellows.
M ore recently, a num ber o f servo-controlled shear m achines have been designed and put into operation using this m ethod in the USA (U .S .B .M . Spokane M ining Research Centre), West G erm any (Institu te o f Soil M echanics and R ock M echanics at University o f K arlsruhe) and C SIR O A ustralia (Division o f Applied G eom echanics at Syndal, Vic.).
The m ethod has certain advantages over o ther methods. It perm its ease o f determ ination o f d ilatation and a relatively greater am ount o f m ovem ent between the surfaces. The value o f the norm al force can be easily selected a t will and the sliding surfaces are available for inspection at any stage o f the test.
2. Conventional shear box test
Conventional shear box was used by a num ber o f investigators ( Y e v d o k i m o v and S a p e g i n , 1967; K r s m a n o v i c , 1967; H o e k and P e n t z , 1969; L a m a , 1974b). The system has all the advantages o f the first m ethod while perm itting determ ination o f the initial peak shear strength. The m ethod consists o f setting the rock specimens, prism atic o r cylindrical o r o f irregular shape, with the jo in t plane at the m id-half o f the shear box. A simple arrangem ent used by L o c h e r (1968) is shown in Fig. 10-20. The rock specimen is cast in m ortar with the jo in t plane accurately located a t the predeterm ined position in the mould. Two hydraulic jacks exert the norm al force (N) and the shear force (S ) and the

B E H A V I O U R D U R I N G S L I D I N G A L O N G J O I N T S 31
test equipm ent is capable o f giving a m ovem ent o f 1 cm (0.394 in). Since the transm ission o f the norm al force is through proving rings, the system suffers from the disadvantage that any d ila ta tion o r contraction (-ve dilatation) changes the value o f the norm al force. If the norm al and the shear forces can simultaneously be recorded, the arrangem ent gives an easy way o f directly determ ining the norm al shear force envelope.
Fig. 10-20. Schem atic layout o f shear testing appara tus :1. Sample2. M o rta r
3. D iscontinu ity to be tested 4. D oub le steel form
5. Exchangeable shoes transm itting force S 6. M anom ete r for high loads and control o f force N
7. Proving ring for force N (p roving ring for force S not shown) (after L o c h l -r , 1968).

32 M E C H A N I C A L B E H A V I O U R O F J O I N T E D R O C K
K r s m a n o v ic (1967) perform ed large size laboratory shear tests to determ inie the jo in t properties. The arrangem ent used by him is given in Fig. 10-21. Thte norm al force is applied through two hydraulic cylinders o f 0.25 M N (25 to n ) each and the shear force by four cylinders (two on each side) o f 0.25 M N (25 ton) each. The setting o f the apparatus is such that the applied sheair force m akes an angle o f 4 with the shear surface so that shear strength evem at small norm al loads can be determ ined w ith m inim um o f disturbance. Thie shear box can accom m odate specimens o f 40 cm x 40 cm x 20 cm (15.7 in x x 15.7 in x 7.9 in) w ith the shearing area o f abou t 1600 cm 2 (248 in2). It s im u la tes the cond itions o f d irect shear to be obtained at norm al stresses up to 3.92 M P;a (568 lb f/in2) and shear stress o f 7.84 M Pa (1136 lbf/in2), intensities which arce norm ally met in the design o f large civil engineering foundation structures.
Fig. 10 21. Schematic d iagram o f the 0.5/1.0 M N (50/100 ions) capacityshearing ap para tus
(after K r s m a n o v ic . 1967).
W hen vertical load is applied through hydraulic cylinders, the m easurem ent o f d ila ta tio n is not possible. The change in pressures in the cylinders applying vertical load m ay be m onitored using pressure transducers. The system has also the d isadvan tage that vertical constraint o f the specimens is uncertain unless it is m on ito red and that correction for the friction in the bearings must he m ade.
f*--------------------------------------------------------- 2 3 7 0 -------------------------------------------------- *1
J P L j r u
— m
l i p
R
B E H A V I O U R D U R I N G S L I D I N G A L O N G J O I N T S 33
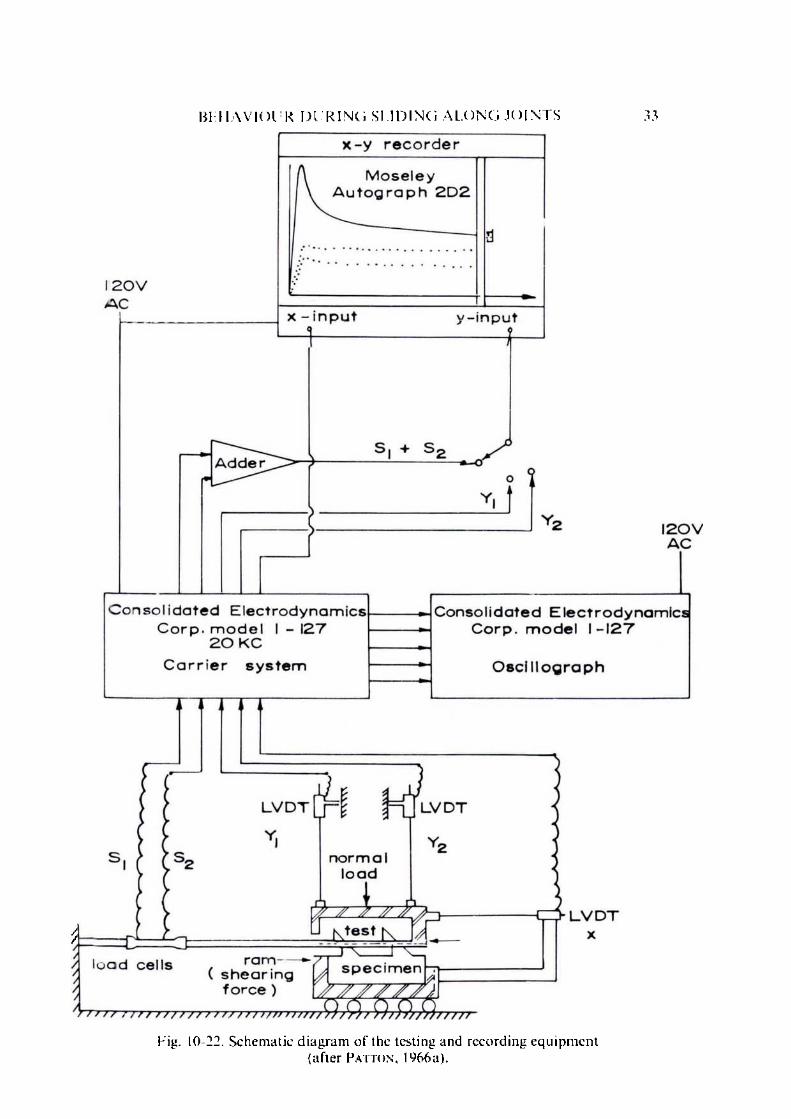
Fig. 10-22. Schem atic d iagram o f the testing and recording equ ipm ent(after P a t t o n , 1966a).

34 M E C H A N I C A L B E H A V I O U R O F J O I N T E D R O C K
P a t t o n (1966a) used a direct shear m achine with the m odification that no rm al force remains stationary and the bearing friction was greatly elim inated by m aking the lower block move on the roller bearings the upper block rem aining in a stationary position (Fig. 10-22). The shear force is m easured by two load cells attached to the tension tie bar. The vertical and the horizon tal displacements are m easured by using LVDT-s. The m ethod has the advantage that dilatation can be m easured for any value o f norm al force. A sim ilar arrangem ent was also used by C o u l s o n (1970).
3. Double shear test
A m odification o f the single shear test is the double shear test (see also section 4.4.3) where the shear load is applied through a testing machine or a jack and the norm al load by a horizontal jack . The principle o f the test is shown in Fig. 10-18c and was used by a num ber o f investigators ( H o s k in s . J a e g e r and R o s e n g r e n , 1968; R o s e n g r e n , 1968; J a e g e r and R o s e n g r e n , 1969; D ie t e r ic h , 1972). H o s k in s , J a e g e r and R o s e n g r e n (1968) used 30.5 cm (12 in) square blocks sliding between two o ther blocks supported at the base while the displacem ent o f the central block was m easured by an LVDT and the lateral load was applied through a fiat jack.
The method is particularly useful for the determ ination o f friction along the contact surfaces o f a rock o r frictional force along a surface which has been artificially prepared but the m ethod is not useful when shear along a discontinuous (unseparated) jo in t is to be studied.
4. Triaxial test
Triaxial apparatus has been m ost extensively used and was perhaps the first m ethod o f studying the behaviour o f any discontinuity. The m ethod was perhaps first used by the U .S . Bureau o f Reclam ation (1954) for testing the bond strength between m ortar and aggregate and then by J a e g e r (1959) for the study o f the sliding o f a variety o f artificially prepared jo in t surfaces in rocks.
The method consists in using a cylindrical specimen (for details o f equipm ent see C hapter 5) with the jo in t plane suitably oriented at an angle j to the axis o f the specimen and subjecting it to a given value o f lateral and axial pressures in a triaxial cell. The norm al and shear stresses can be calculated by the relationship (Fig. 10-18d)
0’n = (73 + ((Ti —^ 3 ) sin2 7 (10.38)
r = (a-, — 0 3 ) sin y cos v (10.39)
B E H A V I O U R D U R I N G S L I D I N G A L O N G J O I N T S 35
where a , = axial stress<r3 = lateral stress andy = angle o f inclination o f the discontinuity with the principal
stress <r,.
This m ethod was also used for the study o f the residual sliding characteristics o f fractured surfaces by L a n e and H e c k (1964). M u r r e l l (1965), H o b b s (1966. 1970). B y e r l e e and B r a c e (1968). B y e r l e e (1975) and m any others because o f its simplicity in obtaining a fracture surface under different stress conditions.
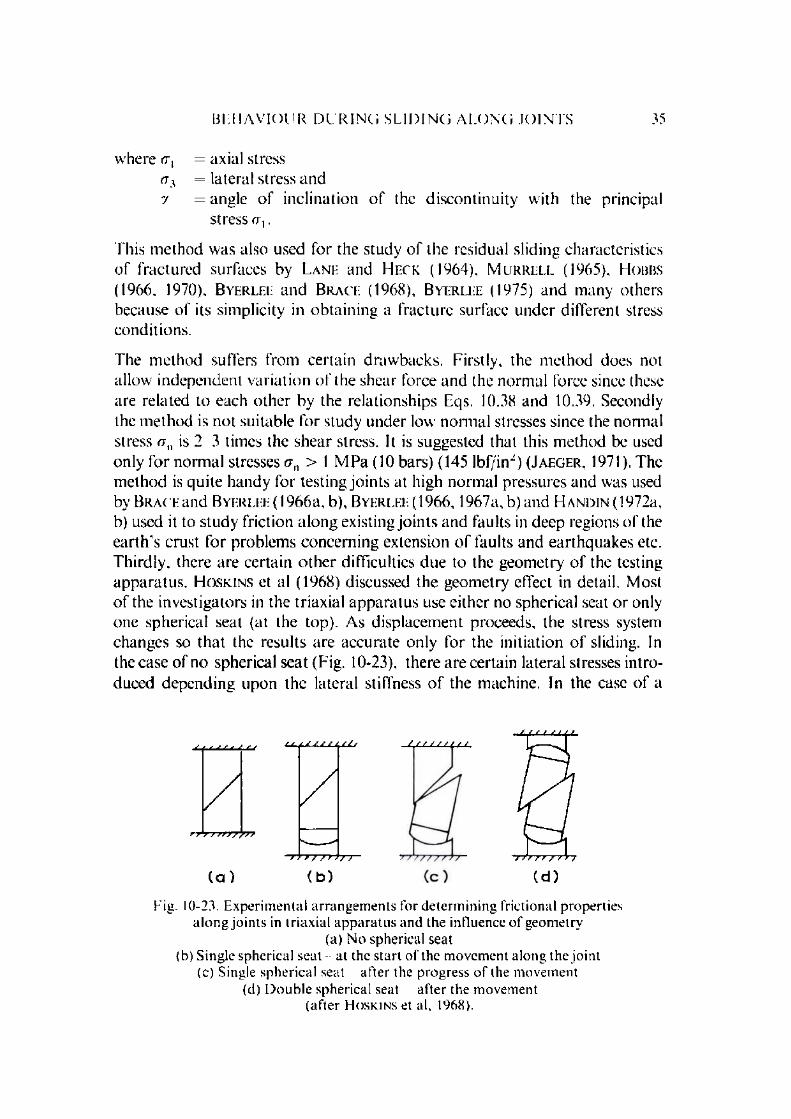
The m ethod suffers from certain draw backs. Firstly, the m ethod does not allow independent variation o f the shear force and the norm al force since these are related to each o ther by the relationships Eqs. 10.38 and 10.39. Secondly the m ethod is not suitable for study under low norm al stresses since the normal stress <7n is 2 3 times the shear stress. It is suggested that this m ethod be used only for norm al stresses a n > 1 M Pa (10 bars) (145 lbf/in~) ( J a e g e r , 1971). The m ethod is quite handy for testing jo in ts at high norm al pressures and was used by B r a c e and B y e r l e e ( 1966a. b). B y e r l e e (1966. 1967a, b )an d H a n d i n (1972a, b) used it to study friction a long existing jo in ts and faults in deep regions o f the earth 's crust for problem s concerning extension o f faults and earthquakes etc. Thirdly, there are certain o th er difficulties due to the geom etry o f the testing apparatus. H o s k i n s et al (1968) discussed the geom etry effect in detail. Most o f the investigators in the triaxial apparatus use either no spherical seat o r only one spherical seat (at the top). As displacem ent proceeds, the stress system changes so tha t the results are accurate only for the initiation o f sliding. In the case o f no spherical seat (Fig. 10-23), there are certain lateral stresses introduced depending upon the lateral stiffness o f the machine. In the case o f a
/ lzL
( a )
/ , / / / / / < / /
( b )
Fig. 10-23. Experim ental a r rangem ents for determ ining frictional properties a long jo in ts in triaxial ap p a ra tu s and the influence o f geometry
(a) N o spherical seat(b) Single spherical seat at the start o f the m ovem ent along the joint
(c) Single spherical seat after the progress o f the movement(d) D oub le spherical seat after the movement
(after H o s k in s et al. 1968).
36 M E C H A N I C A L B E H A V I O U R O F J O I N T E D R O C K
single spherical seat there is ro ta tion o f the part o f the specimen in contact with the spherical seat while the o ther part does not change its position. The use o f tw o spherical seats (Fig. 10-23d) allows contact to be retained over the whole o f the surfaces, but the area o f contact changes and frictional and lateral forces are in troduced at the seats. The best m ethod seems to be to use a pair o f hardened steel washers with ‘m olybond ' between the ends o f the specimen and the p latens (Fig. 10-18d) where the situation can be really described as ‘running in ' and behav iour can be studied in the range after the failure has been initiated. H ow ever, an appropria te correction in the value o f the norm al force needs to be applied as the area o f contact decreases with advancem ent o f m ovem ent a long the plane. Also, there could be problem s associated with the tendency o f spherical seats to lock under high norm al stresses.
5. Rotation o f cylinders
T he m ethod consists o f pressing together two hollow cylinders (Fig. 10-18e) under axial load N and a torque M is applied so as to rotate them along their axis. T he two cylinders slide over each o ther a t the surfaces o f their contact. This type o f apparatus was built by N .G .W . C o o k at the M ining Research L abora to ry , Johannesburg, South Africa. The system has the advantage that a large am o u n t o f sliding can be obtained w ithout disturbing the geom etry of the system . Also it allows the study o f the influence o f w ater on friction by in troducing it in the inside o f the hollow cylinders. The m ethod is applicable bo th to artificially m ade as well as natural jo in ts when cores can be obtained with the jo in t plane at right angle to the core axis. However, the m easurem ent o f d ila ta tio n is difficult.
The m ethod has been used by a num ber o f investigators ( K u t t f - r . 1974; C h r i s t e n s e n et al, 1974. also see C hapter 8). L aboratory studies on Westerly g ran ite in torsion ( C h r i s t e n s e n et al, 1974) gave friction values w hich agree w ith those obtained by B y e r l e e (1968) in triaxial cell.
T orsional shear strength d rops with increase in axial stress on specimens as it exceeds a certain limiting value and this aspect should be borne in m ind while evaluating results by this m ethod. This results in lower cohesion values than ob ta ined from conventional tests ( D u r a n d and C o m es . 1974).
6. Testing of joints in situ
T he determ ination o f jo in t properties in large scale in situ tests is being increasingly adapted in civil engineering w orks in site investigation and in m ary cases this represents the m ost im portant mechanical property in determinir.g the foundation conditions o f structures and slope stability analysis. In the last 10 years, a num ber o f tests have been conducted in many countries to determine
B E H A V I O U R D U R I N G S L I D I N G A L O N G J O I N TS 37
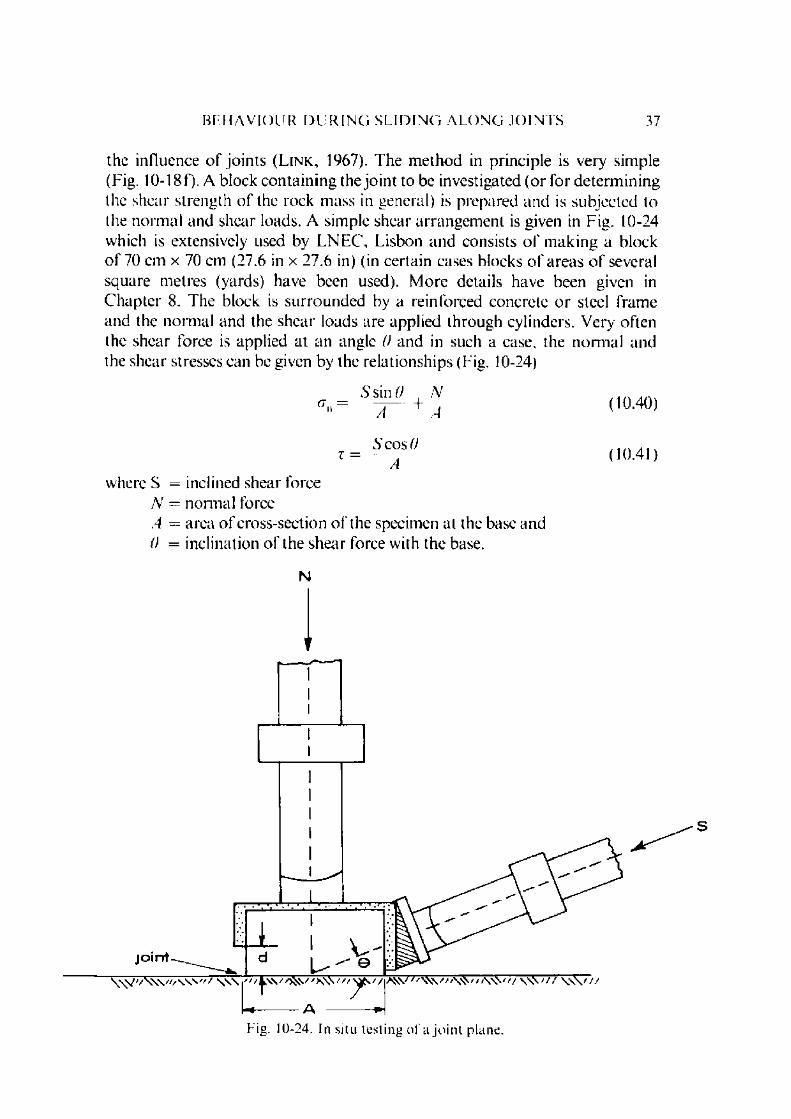
the influence o f jo in ts ( L i n k , 1967). The m ethod in principle is very simple (Fig. 10-18 f). A block contain ing the jo in t to be investigated (o r for determ ining the shear strength o f the rock mass in general) is prepared and is subjected to the norm al and shear loads. A simple shear arrangem ent is given in Fig. 10-24 which is extensively used by LN EC , Lisbon and consists o f m aking a block o f 70 cm x 70 cm (27.6 in x 27.6 in) (in certain cases blocks o f areas o f several square m etres (yards) have been used). M ore details have been given in C hapter 8. The block is surrounded by a reinforced concrete o r steel fram e and the norm al and the shear loads are applied through cylinders. Very often the shear force is applied at an angle 0 and in such a case, the norm al and the shear stresses can be given by the relationships (Fig. 10-24)
S’ sin 0 N a<rn — —-j h ^ (10.40)
t = SC™ ° (10.41)A
where S = inclined shear force N = norm al forceA = area o f cross-section o f the specimen at the base and 0 = inclination o f the shear force with the base.
N
38 M E C H A N I C A L B E H A V I O U R O F J O I N T E D R O C K
The value o f 0 may vary from test to test, but in case it is in the range from 30 to 40 , it is very usual to m ake N = 0 and thus only one hydraulic ja ck is necessary. W hen two jacks are applied, the geometry o f the test should be such tha t the axes o f the jacks pass th rough the centre o f the base o f the specimen.
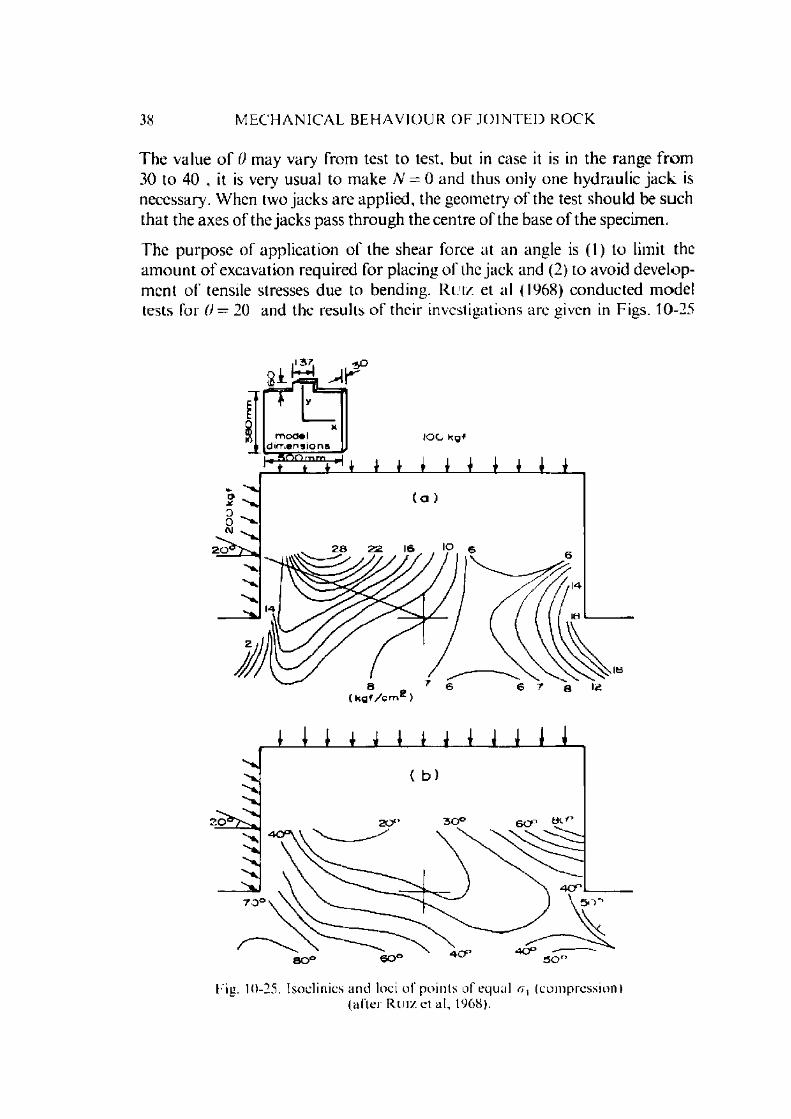
The purpose o f application o f the shear force at an angle is (1) to limit the am ount o f excavation required for placing o f the jack and (2) to avoid developm ent o f tensile stresses due to bending. R u iz et al (1968) conducted m odel tests for 0 = 20 and the results o f their investigations are given in Figs. 10-25
Fig. 10-25. Isoclinics and loci o f points o f equal rr, (compression) (after R u iz et al, 1968).

B E H A V I O U R D U R I N G S L I D I N G A L O N G J O I N T S 39
and 10-26. These clearly indicate the existence o f non-uniform stress d istribution at the base o f the block and also the existence o f tensile stresses. This, very often, leads to failure occurring in the plane o f the base o f the block but running in the block or below in the rock.
lO O k g fi
~ C max
Fig. 10 26. Zone o f tensile stresses. Shear and normal stresses at the base o f the block(after R u iz et al, 1968).
40 M E C H A N I C A L B E H A V I O U R O F J O I N T E D R O C K
T o avoid development o f tensile stresses, R o c h a (1964) suggested tha t the value o f c/(Fig. 10-24) plays an im portan t role. According to him the value o f d should be so chosen that
A NS = I { W A 2 )
in which case the tension due to bending will equal com pression. I f the value o f S is above this limit, tensile stresses m ay occur and it is advisable to check the occurrence o f tensile cracks in the test. The usual value o f d m ay be taken as A Aj —j► , depending upon the angle o f friction o f the rock, provided N is not
very small.
There is another factor which is very im portant and influences the results greatly. There m ay be concentration o f the shear stresses which are higher the lower the value o f d. (It is in general noted that the shear strength decreases with increase in the value o f d.) T o avoid this, the shear force fram e should be as rigid as possible. The best arrangem ent naturally would be to apply the shear force w ith the plane to be investigated placed in the centre o f the specimen. But this arrangem ent is m ore costly both in term s o f equipm ent and conduct o f tests.
Types of surfaces investigated
A num ber o f different types o f surfaces have been studied from the point o f friction properties. These are given below:
Laboratory shear surfaces produced in direct shear or triaxial tests ( J a e g e r , 1959; M a u r e r . 1966; H o b b s , 1970; D o n a t h , F r u t h and O l s s o n , 1972). These surfaces are normally quite irregular and contain a considerable am ount o f de- trital m aterial depending upon the test conditions producing the shear surface and the rock type while having the advantage o f producing a surface under known stress conditions.
Laboratory extension surfaces produced by tensile test (B y e r l e e , 1967b; Ba r t o n , 1971a, b; R e n g e r s , 1971; S c h n e id e r , 1972; L a m a , 1975a). The surfaces are very rough and highly interlocked.
C ut and polished surfaces. They are easily prepared by cutting the specimens and then polishing them if so desired. Such surfaces have been studied by the m ajority o f investigators. These are characterised by flatness but still complete contact (100% contact area) may not be attained particularly on larger specimens.

B E H A V I O U R D U R I N G S L I D I N G A L O N G J O I N T S 41
A rt ificially com bined surfaces produced from cast m odels with different shapes o f th e asperities. They have been studied to sim ulate different types o f roughnesses and to throw light on the mechanism o f friction (P a t t o n , 1966a, b; L a j t a i , 1969a. b: L a d a n y i and A r c h a m b a u l t , 1972). The behaviour obtained is n a tu ra lly dependent upon the shape o f the surface and the model m aterial.
N aitural jo in ts o f different types, filled and unfilled, as obtained from cores. T h ese have been studied by a num ber o f investigators. Tests have also been co n d u cted in situ. These give a direct insight into the property o f the jo in t but resu lts ob ta ined are difficult to correlate in the absence o f any data about the jo in t surface. Since a large num ber o f factors influence the behaviour o f the jo in t , the results may be highly scattered even when the rock type and the place o f sam pling is the same. O n the o ther hand, they are costly but have direct ap p lica tio n in the design under the conditions.
Loading sequence in testing of joint properties
In th e conduct o f the test, two variations are possible.
1. T h e sam ples m ay be tested at a fixed value o f an giving a shear stress versus d isp lacem ent (r — As) curve. From this curve the values o f t „ i r as well as the values o f shear strength at any specified displacem ent As can be read off. The tests m ay be conducted at different values o f rrn for different specimens and the r — /As curves for different values o f an m ay be draw n ( K r s m a n o v ic and L a n g o f , 1964; K r s m a n o v ic , 1967). A typical curve obtained in such a test a lo n g with an idealised curve is given in Fig. 10-27. The peak and residual shear stresses (o r any o ther value o f shear stress for a given displacem ent) are plotted against the norm al stress to obtain the M o h r envelope for the joint.
F ig. 10-27. (a) Typical curve o f shear stress against displacement for a natural joint,(b) Idealised curve
(after J alglr, 1971).
42 M E C H A N I C A L B E H A V I O U R O F J O I N T E D R O C K
T he test suffers from the disadvantage tha t specimens from the sam e jo in t vary considerably and hence a wide scatter in results may be expected even for the sam e jo in t. Besides, a num ber o f tests have to be perform ed on different specim ens to determ ine the shear envelope for the jo in t.
2. In the second case, the sample can be tested where the value o f the norm al stress a n can be varied once the peak for a particu lar value o f a n is passed and the conditions have been stabilised. The norm al stress can be changed in steps by certain specific am ounts (either increased o r decreased). It may, however, be kept in view that the results obtained in the two cases m ay be different since the properties o f the sliding surface at any tim e are dependent upon the norm al stress to which it has been subjected. Besides, the properties change w ith sliding.
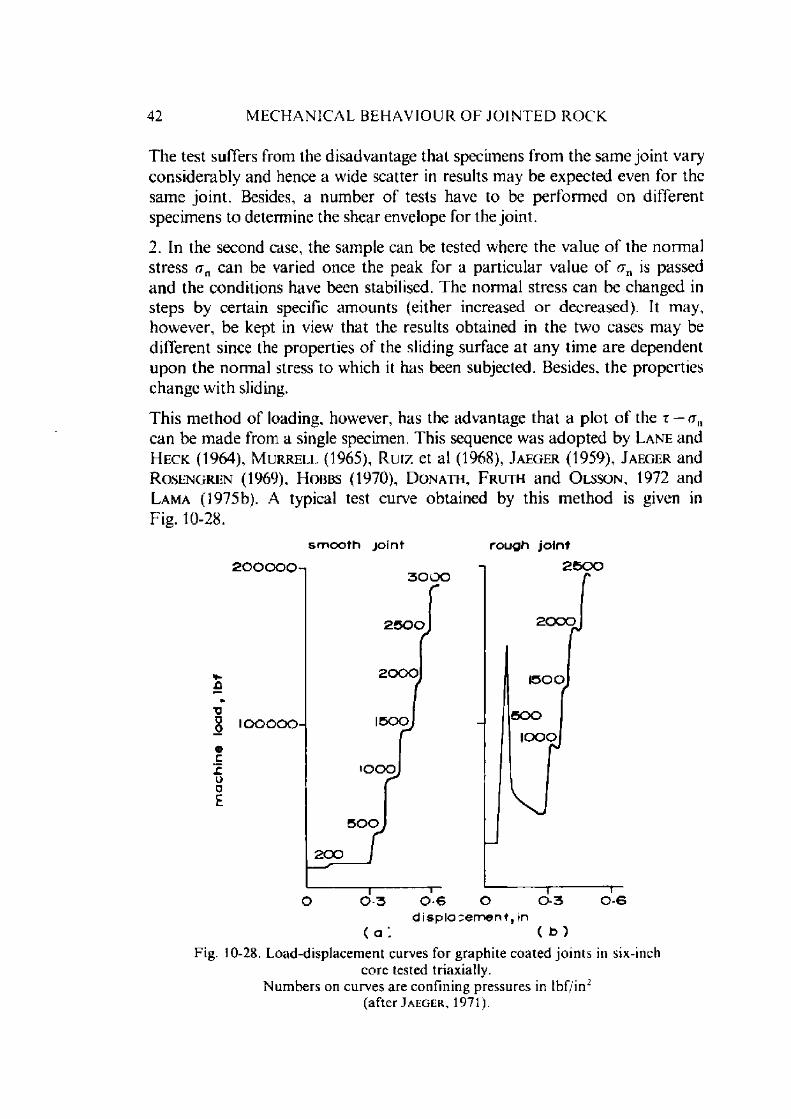
This m ethod o f loading, however, has the advantage tha t a plot o f the r — on can be m ade from a single specimen. This sequence was adop ted by L a n e and H e c k (1964), M u r r e l l (1965), R u iz et al (1968), J a e g e r (1959), J a e g e r and R o s e n g r e n (1969), H o b b s (1970), D o n a t h , F r u i h and O l s s o n , 1972 and L a m a (1975b). A typical test curve obtained by this m ethod is given in Fig. 10-28.
s m o o t h j o i n t r o u g h j o i n t
d i s p l a c e m e n t , in ( a ; ( b )
Fig. 10-28. Load-displacem ent curves for graphite coa ted jo in ts in six-inchcore tested triaxially.
N um bers on curves are confining pressures in lb f/ in2 (after J a e g e r , 1971).

B E H A V I O U R D U R I N G S L I D I N G A L O N G J O I N T S 43
Recording the roughness of joint surfaces
R e n g e r s (1971) developed a very useful m ethod o f m easuring and recording the surface roughness o f jo in ts, though most o f the investigators confine them selves only to the m easurem ent o f roughness by using a profilograph o r stereo- m icroscopy, depending upon the size o f the surface.
R e n g e r s (1970, 1971) used a stereo depth m easuring m icroscope (Fig. 10-29). A rock sam ple o r its negative (silicone rubber cast) is moved parallel to the reference plane with the help o f a suitable m icrom eter o r screw arrangem ent while a floating m ark in the optical system o f the stereo depth m easuring m icroscope is m oved up and down to keep it on the surface. The horizontal and the vertical m ovem ents o f the floating m ark are recorded on an X- Y recorder with ap p ro p ria te enlargem ent (5X 20X). The m ethod gives an accuracy o f profiling better than 0.1 mm (0.004 in) for 10X.
Fig. 10-29. Stereo depth measurem ent microscope (after R e n g e r s , 1971).
F o r larger size specim ens, a profilograph was developed by F e c k e r and R e n g e r s (1971) (Fig. 10-30). This profilograph is suitable for surfaces 20 200 cm (8 80 in) long. The guide arm o f the profilograph is m ounted on the surface parallel to the direction along which the profile is required to be
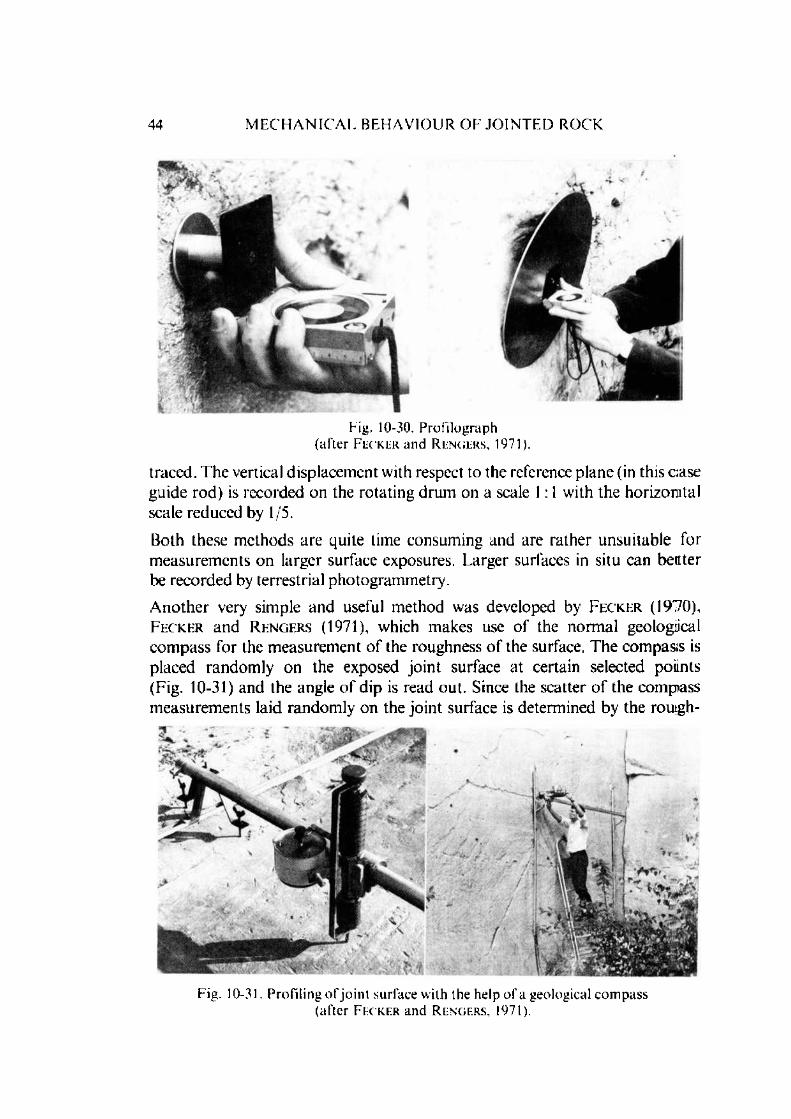
44 M E C H A N I C A L B E H A V I O U R O F J O I N T E D R O C K
Fig. 10-30. Profilograph (after F e c k e r and R f.n g e r s , 1971).
traced. T he vertical displacem ent with respect to the reference plane (in this c.ase guide rod) is recorded on the rotating drum on a scale 1:1 with the ho rizo n ta l scale reduced by 1/5.
Both these m ethods are quite time consum ing and are ra ther unsuitable for m easurem ents on larger surface exposures. Larger surfaces in situ can bettter be recorded by terrestrial photogram m etry.
A nother very simple and useful m ethod was developed by F e c k e r (1970), F e c k e r and R e n g e r s (1971), which makes use o f the norm al geological com pass for the m easurem ent o f the roughness o f the surface. The compas;s is placed random ly on the exposed jo in t surface at certain selected poiints (Fig. 10-31) and the angle o f dip is read out. Since the scatter o f the com pass m easurem ents laid random ly on the jo in t surface is determ ined by the rou.gh-
Fig. 10-31. Profiling o f jo in t surface with the help of a geological com pass (after F e c k e r and R e n g e r s , 1971).
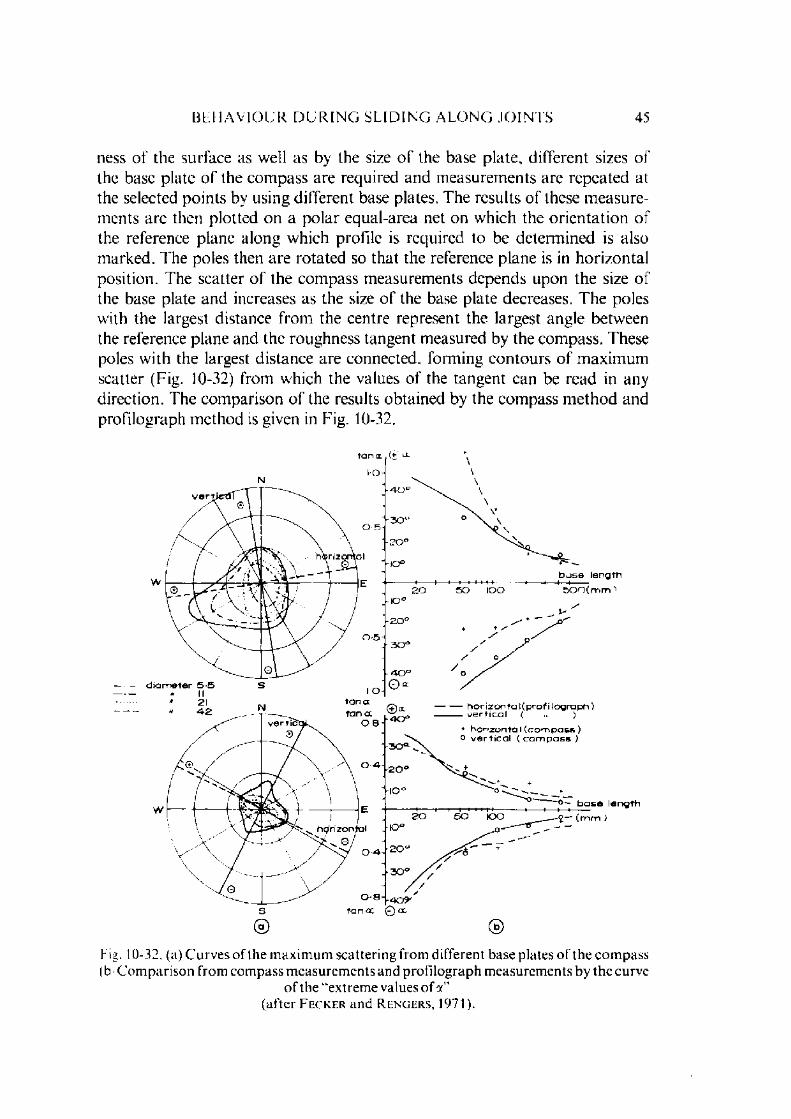
B E H A V I O U R D U R I N G S L I D I N G A L O N G J O I N T S 45
ness o f the surface as well as by the size o f the base plate, different sizes o f the base plate o f the com pass are required and m easurem ents are repeated at the selected points by using different base plates. The results o f these m easurements are then plotted on a po la r equal-area net on which the o rien ta tion o f the reference plane along which profile is required to be determ ined is also m arked. The poles then are rotated so that the reference plane is in horizontal position. The scatter o f the com pass m easurem ents depends upon the size o f the base plate and increases as the size o f the base plate decreases. T he poles with the largest distance from the centre represent the largest angle between the reference plane and the roughness tangent m easured by the com pass. These poles w ith the largest distance are connected, forming contours o f m axim um scatter (Fig. 10-32) from which the values o f the tangent can be read in any direction. The com parison o f the results obtained by the com pass m ethod and profilograph m ethod is given in Fig. 10-32.
© ©
Fig. 10-32. (a) C urves of the m axim um scattering from different base plates o f the com pass (b C om parison from com pass m easurem ents and profilograph measurem ents by the curve
o f the “extreme values o f a"(after F e c k e r and R e n g e r s , 1971).

46 M E C H A N I C A L B E H A V I O U R O F J O I N T E D R O C K
G o o d m a n , H e u z e and O h n is h i (1972) determ ined the influence o f the length o f the observation base (in o ther w ords the size o f the base plate or d istance between tw o m easuring points by profilograph m ethod) with the average slope angle for surfaces o f different roughnesses (sawed, sawed and sandblasted , split) in specimens o f size 12.07 cm x 12.07 cm (4.75 in x 4.75 in). They found tha t when the observation length was increased from 12.7 m m (0.5 in) to a few centim etres (inches) there is a sharp decrease in slope angle.
Description o f the surface roughness o f joints
Because o f the non-repetitive stochastic nature o f the asperities o f the jo in t surfaces, their description in term s o f any trigonom etric function as usually done in the case o f m etal surfaces is not possible. Simply profiling the surface and determ ining the tangent value at the various points do not give very useful results particularly when certain com parative data are required.
O ne o f the simplest m ethods is to describe the average height o f the asperity, bu t the values so obtained are not very useful. R e n g e r s (1971) adopted the trigonom etric function (tangent values) as used in the description o f the m etal surfaces in a very special way. An asperity is described by the angle between the horizontal base plane o f the asperity and the tangent to its surface a t the base ( K r a g e l s k ii , 1965). The m ethod consists o f choosing a reference plane parallel to the largest observable extension o f the separation plane (when roughness m easurem ents on different scales are m ade, the reference planes are taken parallel). On the profile obtained, m easuring points are laid with a m utual distance L m easured parallel to the reference plane (Fig. 10-33). The distance L is usually taken as 1 mm (0.04 in) which depending upon the m ethod o f profilographing o r the recording scale may correspond to 0 .1—20 mm (0.004 — 0.8 in) (for stereom icroscope scale 10:1; 0.1 mm (0.004 in ); profilograph
Fig. 10-33. R epresentation o f surface roughness (after R e n g e r s , 1971).
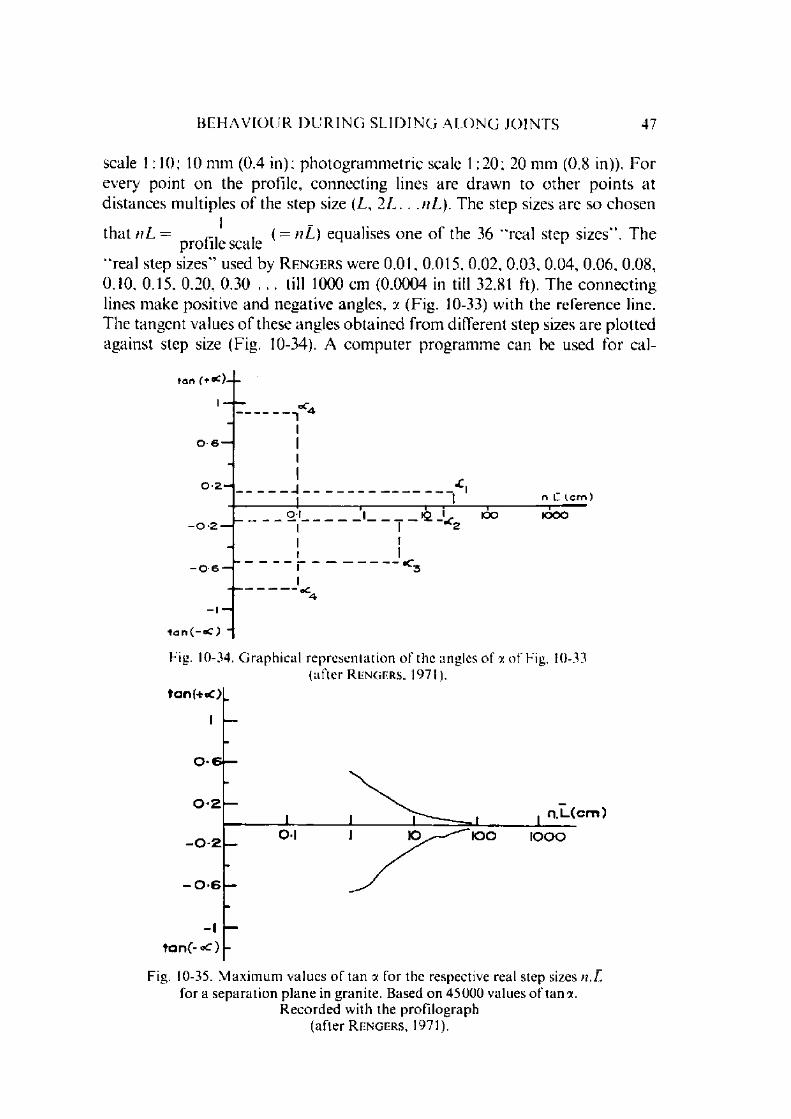
B E H A V I O U R D U R I N G S L I D I N G A L O N G J O I N T S 47
scale 1:10; 10 mm (0.4 in); photogram m etric scale 1:20; 20 mm (0.8 in)). For every point on the profile, connecting lines are draw n to o ther points at distances multiples o f the step size (L , 2L. . .nL). The step sizes are so chosen
that nL ( = nL) equalises one o f the 36 “ real step sizes". Theprofile scale
' ‘real step sizes" used by R engers were 0.01, 0.015, 0.02, 0.03, 0.04, 0.06, 0.08,0.10, 0.15, 0.20, 0.30 . . . till 1000 cm (0.0004 in till 32.81 ft). The connecting lines m ake positive and negative angles, y (Fig. 10-33) with the reference line. The tangent values o f these angles obtained from different step sizes are plotted against step size (Fig. 10-34). A com puter program m e can be used for cal-
ton ( + oc)__
0 -6 —1
0 -2 -
O-l , ' o on C I c m )
lOOO- 0-2 —
- 0 6 —
•tan ( - oC ) “
Fig. 10-34. G raph ica l representa tion o f the angles o f a o f Fig. 10-33 (after R e n g e r s , 1971).
Fig. 10-35. M axim um values o f tan a for the respective real step sizes n .L f o r a separation p lane in granite. Based on 45000 values o f tana .
R ecorded with the profilograph (after R e n g e r s , 1971).
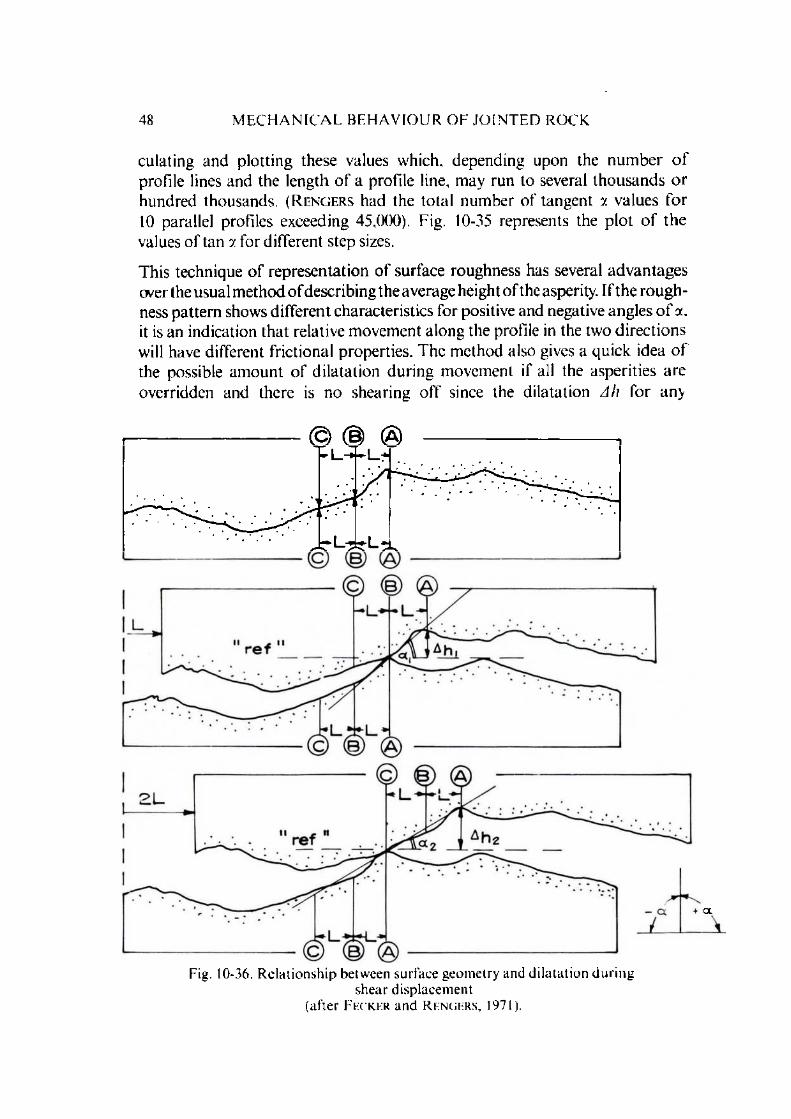
48 M E C H A N I C A L B E H A V I O U R O E J O I N T E D R O C K
dila ting and plotting these values which, depending upon the num ber o f profile lines and the length o f a profile line, m ay run to several thousands o r hundred thousands. ( R e n g e r s had the total num ber o f tangent y values fo r 10 parallel profiles exceeding 45.000). Fig. 10-35 represents the plot o f the values o f tan y for different step sizes.
This technique o f representation o f surface roughness has several advantages over the usual m ethod o f describing the average height o f the asperity. I f the roughness pattern shows different characteristics for positive and negative angles o f y. it is an indication that relative m ovement along the profile in the two directions will have different frictional properties. The m ethod also gives a quick idea o f the possible am ount o f d ilatation during movement if all the asperities are overridden and there is no shearing off since the dilatation Ah for any
Fig. 10-36. Relationship between surface geometry and dilatation du ringshear displacement
(after F e c k e r and R e n g e r s , 1971).
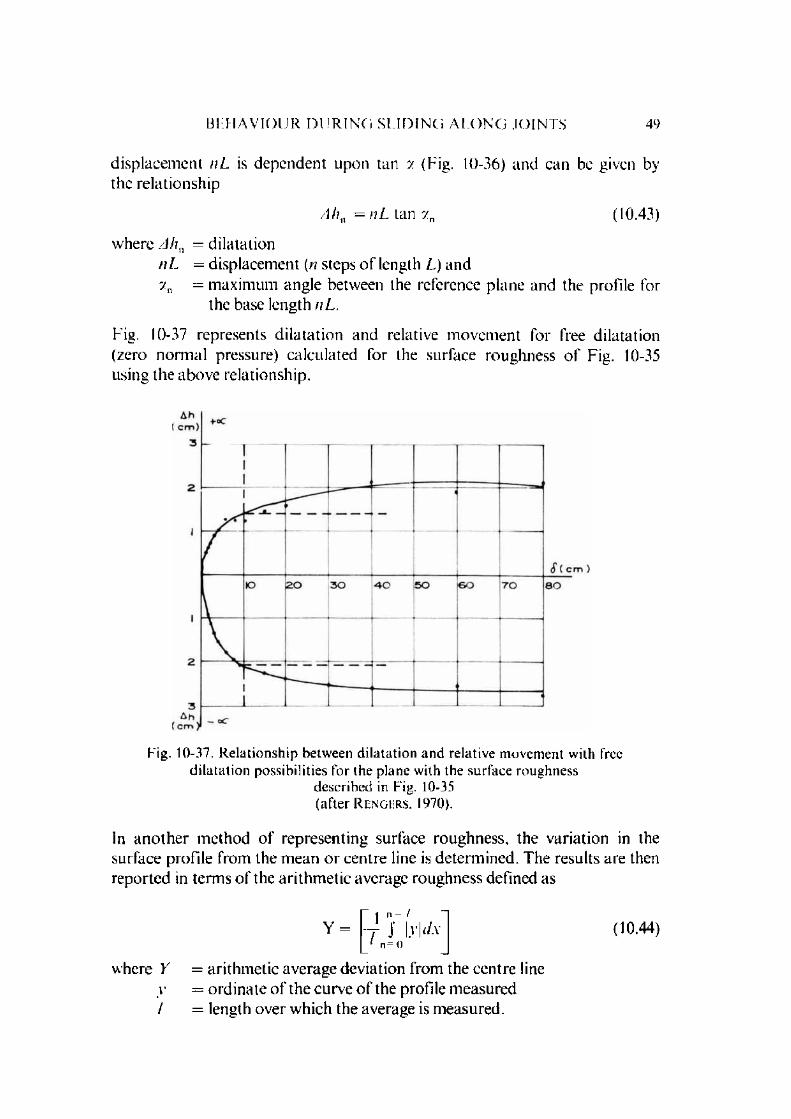
B E H A V I O U R D U R I N G S L I D I N G A L O N G J O I N T S 49
displacem ent n L is dependent upon tan y (Fig. 10-36) and can be given by the relationship
A h n = n L tan ?n (10.43)
where A h n = dilatationn L = displacem ent (// steps o f length L) andy.n = m axim um angle between the reference plane and the profile for
the base length nL.
Fig. 10-37 represents d ila ta tion and relative m ovem ent for free dilatation (zero norm al pressure) calculated for the surface roughness o f Fig. 10-35 using the above relationship.
Fig. 10-37. Relationship between d ilatation and relative m ovem ent with free d ilatation possibilities for the plane with the surface roughness
described in Fig. 10-35 (after R engfrs, 1970).
In an o th er m ethod o f representing surface roughness, the variation in the surface profile from the m ean o r centre line is determ ined. The results are then reported in term s o f the arithm etic average roughness defined as
Y = T .!' I.'V-V1 n = 0
10.44)
where Y = arithm etic average deviation from the centre linev = ordinate o f the curve o f the profile m easured/ = length over w hich the average is m easured.
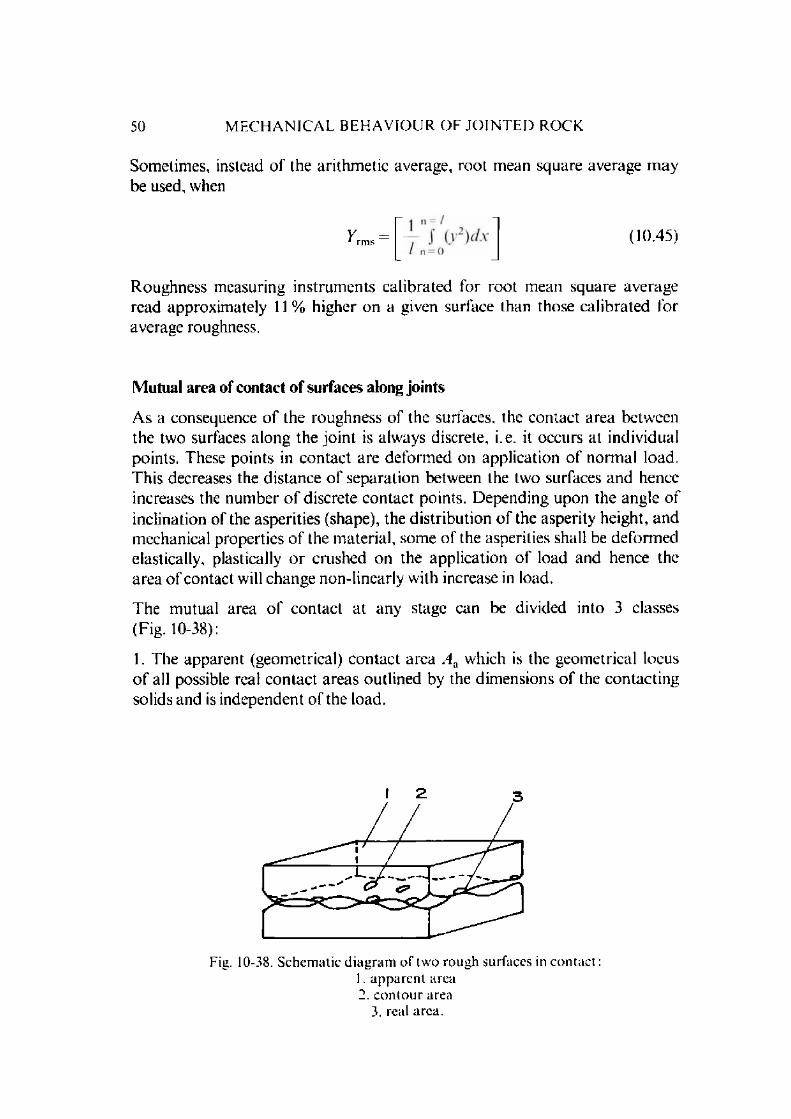
50 M E C H A N I C A L B E H A V I O U R O F J O I N T E D R O C K
Sometimes, instead o f the arithm etic average, root mean square average m ay be used, when
Roughness measuring instrum ents calibrated for root mean square average read approxim ately 11 % higher on a given surface than those calibrated for average roughness.
Mutual area of contact o f surfaces along joints
As a consequence o f the roughness o f the surfaces, the contact area between the two surfaces along the jo in t is always discrete, i.e. it occurs at individual points. These points in contact are deform ed on application o f norm al load. This decreases the distance o f separation between the two surfaces and hence increases the num ber o f discrete contact points. Depending upon the angle o f inclination of the asperities (shape), the distribution o f the asperity height, and mechanical properties o f the m aterial, some o f the asperities shall be deform ed elastically, plastically o r crushed on the application o f load and hence the area o f contact will change non-linearly with increase in load.
The m utual area o f contact a t any stage can be divided into 3 classes (Fig. 10-38):
1. The apparent (geom etrical) contact area A.d which is the geom etrical locus o f all possible real contact areas outlined by the dim ensions o f the contacting solids and is independent o f the load.
(10.45)
2 3
Fig. 10-38. Schematic d iagram o f two rough surfaces in contact:1. apparen t area2. co n to u r area
3. real area.

B E H A V I O U R D U R I N G S L I D I N G A L O N G J O I N TS 51
2. The con tour area A c w hich is the area constitu ted by the deform ation o f the surface undulations. The real contact areas are situated within the con tour a rea ; the latter depends upon the geom etrical outline o f the surface and the load.
3. The real (physical) area o f contact A r is the sum o f all the small areas over w hich the two surfaces touch. This real area is a function o f the geometrical c o n to u r o f the individual irregularities and the load on each. The m ost im p o rtan t characteristic o f the real area is the contact density which is given by the num ber o f spots per unit area.
It is usually convenient to express the areas in dim ensionless quantities:
* - At>h = Aac (10.46)
A'l.\ = , = >1l X I]2
** a
N o w ork has been done on the area o f contact between jo in t surfaces in rocks. In the field o f m etal friction, where the surfaces in contact are m echanically prepared by som e form o f repetitive processes (cutting, milling, polishing) a num ber o f m odels have been developed to calculate the area theoretically. Some special cases are as follows ( K r a g e l s k i i , 1965):
(a) Elastic contact between two rough surfaces:(/) M odels involving hem ispherical asperities in contact with a rigid plane. (/'/) M odels involving an assembly o f rods.
(b) Elastic-plastic contact between a rough surface and a rigid plane w ithout w ork hardening.
N one o f these theoretical m odels can be applied for rocks for in these idealisations, the am plitude and shape are repetitive in terms o f their frequency which is not so true in case o f jo in ts except in special cases such as planes o f discontinuities w ith ripple m arks. The exact d istribution and shape o f asperities on rock surfaces have not been studied so far and it is not possible to predict which o f the m odels will fit best.
N o w ork has so far been done on the m easurem ent o f the surface o f contact along jo in ts. T o a limited extent, m ethods used in metal friction studies m ay be applied for determ ining the real area o f contact o f rock surfaces. The m ethods used in m etal friction can be divided into the following groups:1. W hen both the bodies in contact are opaque.2. W hen both the bodies in contact are translucent.

52 M E C H A N I C A L B E H A V I O U R O F J O I N T E D R O C K
/. (a ) Electrical resistance method :
Bo w d e n a n d T a b o r (1939) m a d e u se o f th e c h a n g e s in e lec t r ic a l r e s is tan c e f o r t h e m e a s u r e m e n t o f a c t u a l a r e a o f c o n t a c t b e tw e e n a m o v i n g a n d a s t a t i o n a r y s u r f a c e . T h e m e t h o d is n o t f ree f r o m e r r o r , b e c a u s e t h e m a g n i t u d e o f re s is ta n c e is n o t o n l y d e p e n d e n t u p o n th e to ta l a r e a o f c o n t a c t b u t a l s o o n th e d i a m e t e r o f t h e i n d i v id u a l r e g io n s w i th in th e a r e a . H o l m (1946) g a v e a d e ta i l e d a n a ly s i s o f t h e m e t h o d . T h e t o t a l r e s is ta n c e o f a r o u g h s u r fa c e is g iv en b y :
R2 = a J><+a <10-47)4 R/. 4//././J,
w here R 2 = to ta l resistance o f a rough surface/. = conductivityR = co n to u r radius"a = num ber o f individual contact spots andP\ = rad ius o f each o f these regions.
T he difficulty experienced with rock is that the values o f R. n.A and are no t easy to determ ine.
1. (b ) Adhesion method'.
In this m ethod a layer o f radioactive isotope o r a luminous phosphor is applied to one o f the surfaces which on slight rubbing is transferred to the o ther surface. The in tensity o f the radiations per unit area is then measured. The m ethod is quite sim ple but the m ajor disadvantage is the difficulty o f controlling the thickness o f the applied layer o f the m aterial containing the rad ioactive isotope o r the phosphor since the intensity o f radiations is dependent upon its thickness.
A no ther ap p ro ach to the adhesion m ethod is by using a paint containing small quan tities o f a fluorescent m aterial and photographing it which permits high co n trast pictures o f paint thickness o f 0.01 —0.1 // (3.9 x 10 — 3.9 x 10 6 in)i.e. 10-100 tim es sm aller than usual paint films. Both the layer o f the painttransferred to the second surface and that remaining on the first can be determ ined. As an alternative, a paint o f silver can be applied by electrodeposition . The points which are obtained by transfer o f silver to the secondm em ber can then be examined in polarised light. A m ore rough technique is to use the pain t to cover the surface which gives contrast pictures when rubbed o ff o r transferred to the second surface. These contrast spots can then be m etered to determ ine the contact area.

B E H A V I O U R D U R I N G S L I D I N G A L O N G J O I N T S 53
2. Light deflection method:
T he m ethod requires the m aking o f transparent m oulds o f the tw o surfaces w hose con tact areas are required to be determ ined. The princip le underlying the m ethod is that when a light beam passes from a m edium o f high density to a m edium o f low density, it is deflected from its original d irection. W hen the two surfaces are put together and a parallel beam o f light is d irected th rough one o f them (Fig. 10-39). the light passes undeflected at the regions o f con tact while at o ther points it is scattered. The regions o f con trast can directly be observed or photographed. The m ethod is suitable for the study o f rough surfaces but not for very sm ooth surfaces because light can be transm itted th rough very small a ir gaps and this results in a slight overestim ation o f the a rea o f contact. This e rro r may som etim es be 30 40 % for sm ooth surfaces.
Fig. 10-39. Path o f a light beam in two transparent surfaces in con tac t .
10.4.2. F ac to rs Influencing Fric tional Resistance o f Rock Surfaces
V arious factors that influence friction between the jo in t surfaces a re :1. R oughness o f the surface2. D isplacem ent history3. N o n n a l load4. W ater5. Filling m aterial.
Their influence in detail is discussed below.

54 M E C H A N I C A L B E H A V I O U R O F J O I N T E D R O C K
1. Roughness
Surface roughness is perhaps the m ost im portan t factor influencing friction between jo in t surfaces. T s c h e b o t a r i o f f and W e l c h (1948) perform ed friction tests betw een quartz blocks sliding over quartz particles which were first polished and then roughened. They found tha t while the frictional coefficient for polished mineral particles under dessicator (CaCl2) conditions was 0.106, its value rose to 0.370 for roughened particles.
R i p l e y and L e e (1961) tested specimens o f sandstone, siltstone and shale. The frictional values so m easured were corrected for dilatation (sliding up) and found th a t coefficient values so obtained were higher for rough surfaces than for ground surfaces (Table 1).
T A B L E 1
S l id in g r e s i s t a n c e f r ic t io n a n g le s o b ta in e d f r o m p la n e a n d r o u g h s u r f a c e s
(after R i p l e y an d L e e , 1961)
P lane surfaces N a tu ra l rough surfaces(Series B) (Series A)
2.3 in (58 m m ) 6 in (150 m m ) d iam etersquare
C o rrec ted M easuredG ro u n d Sand-sm o o th blast lower peak lower peak
S an d s to n e 25 29° 27° 36 40 54S ilts tone 25 31 32 34 43 47
31* 45*
21 24 26 34
Shale 26 27 24 35 26 35
25 39 31 39
* Test no t ca rr ied beyond peak value.
T he results o f E i n s t e i n et al (1969) are contrary to the conclusions o f R i p le y and L ee . E i n s t e i n et al com pared the M o h r ' s envelope for sliding along a pre-existing jo in t w ith the M o h r ' s envelope for “ residual sliding” (sliding along a failure surface form ed after fracturing which is w ithout doubt rougher) for gypsum plaster as a m odel m aterial. They reported that both the envelopes have the sam e inclination with the difference that the apparent intercept on the r axis is greater for rougher surfaces.
H o r n and D e e r e (1962) found that etching o f the polished quartz in a stror.g solution o f am m onium bifluoride and w ater for 30 m inutes slightly lowered
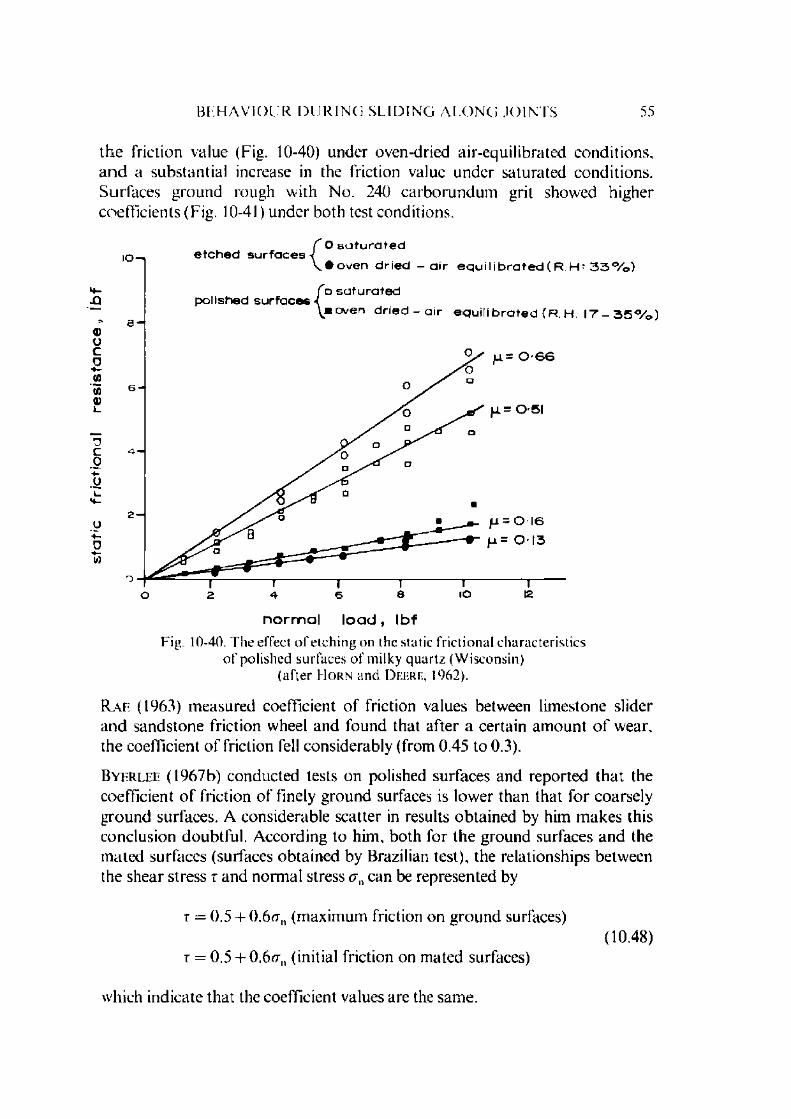
B E H A V I O U R D U R I N G S L I D I N G A L O N G J O I N T S 55
th e friction value (Fig. 10-40) under oven-dried air-equilibrated conditions, a n d a substantial increase in the friction value under saturated conditions. Surfaces ground rough with N o. 240 carborundum grit showed higher coefficients (Fig. 10-41) under both test conditions.
n o r m a l l o a d , IbfFig. 10-40. T he effect o f e tching on the static frictional characteristics
o f polished surfaces o f milky quar tz (Wisconsin)(after H o r n and D e e r e , 1962).
R a j : (1963) m easured coefficient o f friction values between lim estone slider and sandstone friction wheel and found that after a certain am ount o f wear, the coefficient o f friction fell considerably (from 0.45 to 0.3).
By e r l e e (1967b) conducted tests on polished surfaces and reported tha t the coefficient o f friction o f finely ground surfaces is lower than that for coarsely ground surfaces. A considerable scatter in results obtained by him m akes this conclusion doubtful. A ccording to him, both for the ground surfaces and the m ated surfaces (surfaces obtained by Brazilian test), the relationships between the shear stress r and norm al stress a n can be represented by
r = 0.5 + 0.6<Tn (m axim um friction on ground surfaces)(10.48)
r = 0.5 + 0.6rrn (initial friction on m ated surfaces)
which indicate that the coefficient values are the same.
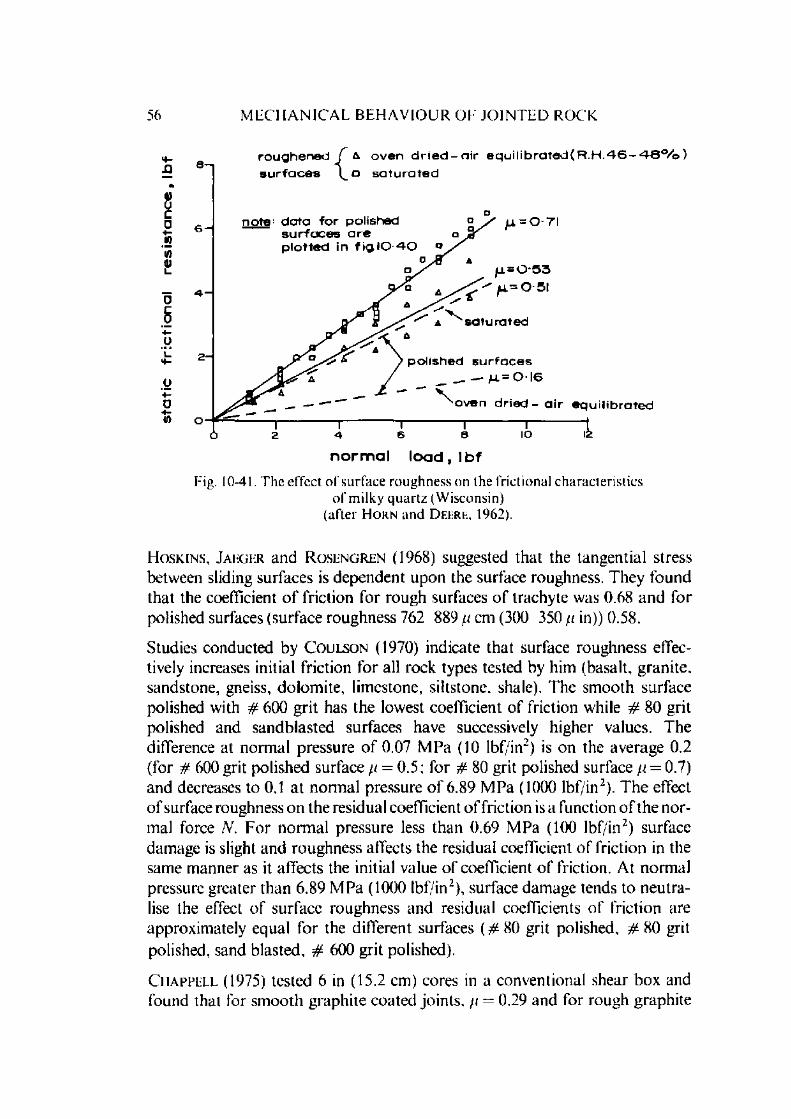
56 M E C H A N I C A L B E H A V I O U R O E J O I N T E D R O C K
r o u g h e n e d T a o v e n d r i e d - n i r e q u i l i b r a t e d ( R . H . 4 - 6 - 4 8 % ) s u r f a c e s \ a s a t u r a t e d
0 2 4 6 8 lO 12
n o r m a l l o a d , l b f
Eig. 10-41. The effect o f surface roughness on the frictional characteristicso f milky quartz (Wisconsin)
(after H o r n and D e er e , 1%2).
H o s k i n s , J a e g e r and R o s e n g r e n (1968) suggested that the tangential stress between sliding surfaces is dependent upon the surface roughness. They found that the coefficient o f friction for rough surfaces o f trachyte was 0.68 and for polished surfaces (surface roughness 762 889 // cm (300 350 // in)) 0.58.
Studies conducted by C o u l s o n (1970) indicate that surface roughness effectively increases initial friction for all rock types tested by him (basalt, granite, sandstone, gneiss, dolom ite, limestone, siltstone, shale). The sm ooth surface polished with # 600 grit has the lowest coefficient o f friction while # 80 grit polished and sandblasted surfaces have successively higher values. The difference at norm al pressure o f 0.07 M Pa (10 lbf/in2) is on the average 0.2 (for # 600 grit polished surface // = 0.5; for # 80 grit polished surface // = 0.7) and decreases to 0.1 at norm al pressure o f 6.89 M Pa (1000 lbf/in2). The effect o f surface roughness on the residual coefficient o f friction is a function o f the normal force N. F o r norm al pressure less than 0.69 M Pa (100 lbf/in2) surface dam age is slight and roughness affects the residual coefficient o f friction in the same m anner as it affects the initial value o f coefficient o f friction. At norm al pressure greater than 6.89 M Pa (1000 lbf/in2), surface dam age tends to neu tralise the effect o f surface roughness and residual coefficients o f friction are approxim ately equal for the different surfaces ( # 80 grit polished, # 80 grit polished, sand blasted, # 600 grit polished).
C h a p p e l l (1975) tested 6 in (15.2 cm) cores in a conventional shear box and found that for sm ooth graphite coated jo ints, // = 0.29 and for rough graphite

B E H A V I O U R D U R I N G S L I D I N G A L O N G J O I N T S 57
c o a te d jo ints. // = 0.42. F o r sim ilar sm ooth and rough jo in ts tested by J a e g e r 1 1971) in a triaxial m achine, the values are 0.15 and 0.31 while on 2 in (5.04 cm) c o re s R o s e n g r e n (1968). in triaxial tests, found values o f 0.2 and 0.44 respectively. The test technique did influence the results, but in all cases, the rough su rfaces gave higher values.
W o rk conducted at the C entre for Tectonophysics, Texas A & VI University ( H a n d i n ’, 1972b) has shown very interesting results. The experim ents were con d u cted in a triaxial cell using cylindrical specimens which had been cut at a certa in angle (29 37 ) to the specimen axis. Tests on Tennessee sandstone w ith the cut prepared with different roughnesses (saw cut average roughness 1651 // cm (650 // in), # 80 grit wheel polished average roughness 1219 // cm (480 // in), light # 600 grit lapping average roughness 1016 // cm (400 // in), extensive # 6 0 0 grit lapping average roughness 813 // cm (320 // in)) were carried out. The results showed that both sm oother and rougher surfaces w ere stronger and that stress drops (stick-slips) are generally greater than for the 1016 // cm (400 /* in) surface (Fig. 10-42). The values o f the coefficient of friction showed these are higher both for highly sm ooth and rough surfaces (F ig. 10-43).
Fig. 10-42. Differential stress versus shorten ing curves for Tennessee sandstone obtained for various surface roughnesses. All tests were done at a confining pressure of
140 bars, room tem pera tu re and a constan t rate o f shortening o f 10 4/s(after H a n d i n , 1972b).

58 M E C H A N I C A L B E H A V I O U R O F J O I N T E D R O C K
i-------------------------1------------------------- 1--------------------------13 0 0 4 0 0 3 0 0 6 0 0 7 0 O
s u r f a c e r o u g h n e s s , ^ in
Fig. 10-43. Coefficient o f friction, //, versus surface roughness in microinches. Values were calculated at the ultimate strength for each experiment. All experim ents w ere
conduc ted at 140 bars confining pressure, room tem perature and a constan t rateo f shortening o f 10 4/s (after H a n d i n , 1972 b).
It is suspected that both dilation and relative ro tation o f the block influence the values o f friction obtained and if these influences can be accounted for, the final friction value will be independent o f the nature o f the surface. D ila tion correction can be easily incorporated using the concept given in Eq. 10.10 bu t the ro ta tional correction is not easy to apply. At high norm al loads, the possibility o f ro tation is decreased and the // approaches the value o f sm ooth jo in ts. T h a t is why H a n d i n (1972b) observed high values for both highly sm ooth and rough joints. A t higher pressures, the frictional value will tend to equal th a t o f a sm ooth surface as indicated in Fig. 10-44.
2. Displacement history
It is a com m on observation in m any in situ and laboratory shear tests that the shear force increases with displacem ent until it reaches a m axim um value and then drops to a certain residual value.

Bl H A V I O l R I X R I N G S L I D I N C i A L O N G J O I N T S 59
2 0
tf)
$L.
<DTD
C.0y
16
14
o IO
o>§ 8
n o r m a l l o a d N , = 2 9 5 0 kg f , r o t = f , ( 0 0 0 4 8 )
N 2 = • 4 ^ 7 ,O k g f 2 r o t = f 2 ( 0 0 0 3 3 )
N 3 = 7 4 8 0 k g f 3 r o t = f 3 ( O O O I )
N 4 = l 0 4 0 0 k g f 4 r o t = f4 ( 0 0 0 0 8 )
2 2 5 4 5 6 7 5 9 0 11 2 5
n o rm a l load, kgf x KD
Fig. 10-44. The effect o f ro tation on the correction for the apparen t angle o f fric tion to give the angle o f friction fo r a sm ooth jo in t. Values in brackets give ro tation angle (rad ians)
( a f t e r C h a p p l l l , 1975).
B y e r l e e (1966) conducted tests on W esterly granite specimens o f 3 to 8 cm (1.2 to 3.1 in) long, 1.58 cm (0.62 in) d iam eter with sliding surface 45 to the axis o f the specimens and found that for ground specimens frictional force increased w ith displacem ent until a m axim um was reached after approxim ately 0.1 cm (0.04 in) o f sliding and then decreased to a constant value afte r abou t0.5 cm (0.22 in) o f relative displacem ent between the two surfaces. The difference in the m axim um and residual values o f frictional force w as only abou t 7% .
Ba r t o n ( 1 9 7 1 a , b ) c o n d u c t e d a se r ie s o f te s ts o n r o u g h te n s io n jo in ts in a w e a k m o d e l m a t e r i a l a n d r e p o r t e d t h a t p e a k s t r e n g th r e a c h e d a f t e r t a n g e n t i a l d i s p l a c e m e n t s o f a p p r o x i m a t e l y 1 % o f th e le n g th o f t h e j o i n t a n d th a t t h e d r o p o f th e p e a k s t r e n g t h t o w a r d s r e s id u a l s t r e n g th o c c u r r e d a t a d i s p l a c e m e n t o f a p p r o x i m a t e l y 1 0 % o f th e le n g th o f t h e j o i n t .
H o s k i n s , J a e g e r and R o s e n g r e n (1968), testing friction properties o f labo ratory prepared surfaces in a double shear apparatus, showed that at different norm al loads, the frictional force for rough surfaces first increases rapidly with d isplacem ent and subsequently a t a steadily decreasing rate. The shear force
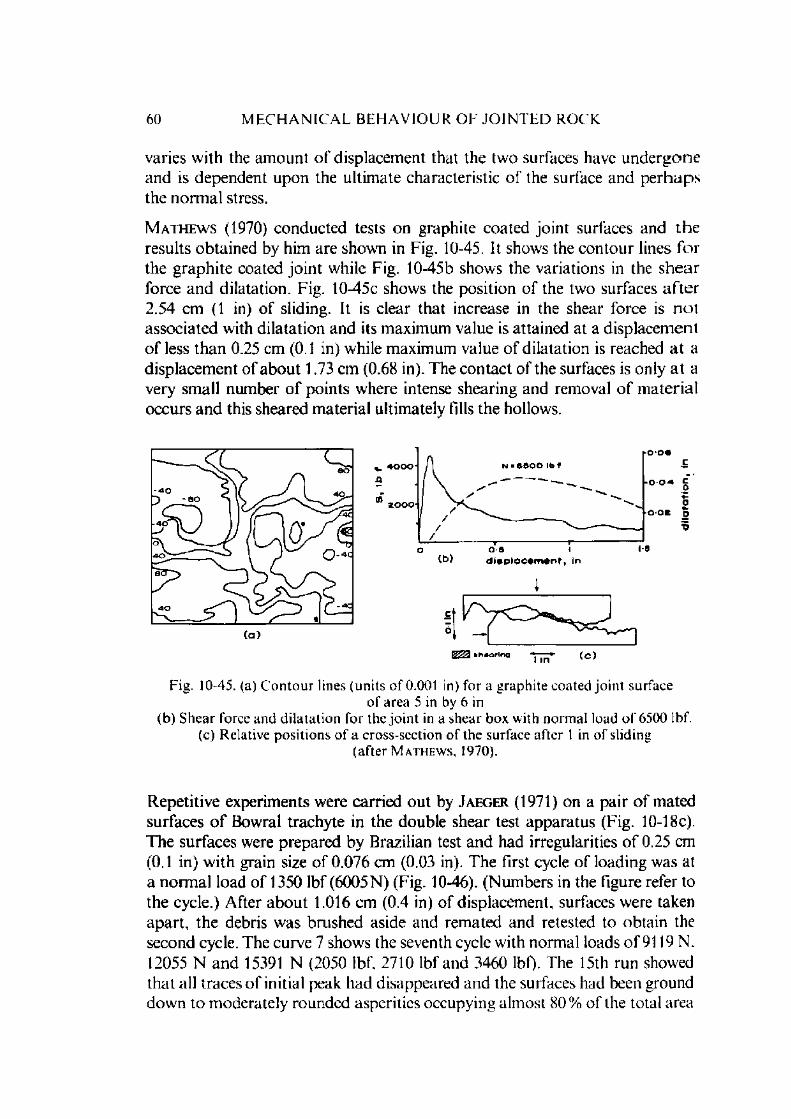
60 M E C H A N I C A L B E H A V I O U R O F J O I N T E D R O C K
varies w ith the am ount o f displacem ent that the two surfaces have u n d erg o n e and is dependent upon the ultim ate characteristic o f the surface and p e rh a p s the norm al stress.
M a t h e w s (1970) conducted tests on graphite coated jo in t surfaces and t h e results obtained by him are shown in Fig. 10-45. It shows the con tour lines fo r the g raph ite coated jo in t while Fig. 10-45b shows the variations in the sh e a r force and dilatation. Fig. 10-45c shows the position o f the two surfaces a f te r 2.54 cm (1 in) o f sliding. It is clear that increase in the shear force is n o t associated with dilatation and its m axim um value is attained at a d isplacem ent o f less than 0.25 cm (0.1 in) while m axim um value o f dilatation is reached a t a d isplacem ent o f abou t 1.73 cm (0.68 in). The contact o f the surfaces is only a t a very sm all num ber o f points where intense shearing and removal o f m ateria l occurs and this sheared m aterial ultim ately fills the hollows.
Fig. 10-45. (a) C o n to u r lines (units o f 0.001 in) for a graphite coated jo in t surfaceo f area 5 in by 6 in
(b) S hear force and dila ta tion for the jo in t in a shear box with norm al load o f 6500 Ibf. (c) Relative positions o f a cross-section o f the surface after 1 in o f sliding
(after M a t h e w s , 1970).
R epetitive experim ents were carried out by J a e g e r (1971) on a pair o f mated surfaces o f Bowral trachyte in the double shear test apparatus (Fig. 10-18c). T he surfaces were prepared by Brazilian test and had irregularities o f 0.25 cm (0.1 in) w ith grain size o f 0.076 cm (0.03 in). T he first cycle o f loading was at a n o n n a l load o f 1350 lbf (6005N ) (Fig. 10-46). (N um bers in the figure refer to the cycle.) A fter abou t 1.016 cm (0.4 in) o f displacem ent, surfaces w'ere taken ap art, the debris was brushed aside and rem ated and retested to obtain the second cycle. The curve 7 show's the seventh cycle with nonnal loads o f 9119 N. 12055 N and 15391 N (2050 lbf, 2710 lbf and 3460 lbf). The 15th run showed that all traces o f initial peak had disappeared and the surfaces had been ground dow n to m oderately rounded asperities occupying alm ost 80% o f the total area
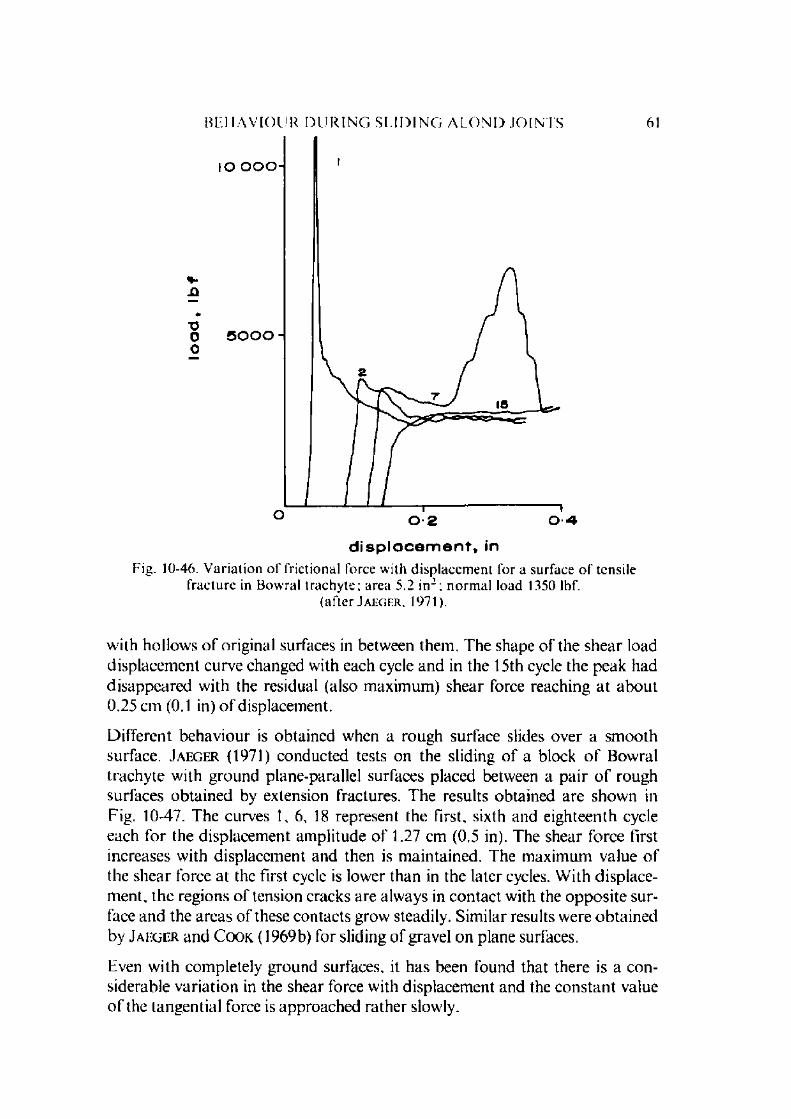
B E H A V I O U R D U R I N G S L I D I N G A L O N D J O I N T S 61
d i s p l a c e m e n t , inFig. 10-46. Variation o f frictional force with d isplacement for a surface o f tensile
fracture in Bowral trachyte; area 5.2 in 2; norm al load 1350 lbf.(after J a e g e r , 1971).
w ith hollows o f original surfaces in between them. The shape o f the shear load displacem ent curve changed with each cycle and in the 15th cycle the peak had d isappeared with the residual (also m axim um ) shear force reaching a t abou t0.25 cm (0.1 in) o f displacement.
D ifferent behaviour is obtained when a rough surface slides over a sm ooth surface. J a e g e r (1971) conducted tests on the sliding o f a block o f Bowral trachyte w ith ground plane-parallel surfaces placed between a pair o f rough surfaces obtained by extension fractures. The results obtained are shown in Fig. 10-47. The curves 1 ,6 , 18 represent the first, sixth and eighteenth cycle each for the displacem ent am plitude o f 1.27 cm (0.5 in). The shear force first increases with displacem ent and then is m aintained. The m axim um value o f the shear force at the first cycle is lower than in the later cycles. W ith displacem ent, the regions o f tension cracks are always in contact with the opposite surface and the areas o f these contacts grow steadily. Sim ilar results were obtained by J a e g e r and C o o k (1969b) for sliding o f gravel on plane surfaces.
Even with com pletely ground surfaces, it has been found that there is a considerable variation in the shear force with displacem ent and the constan t value o f the tangential force is approached ra ther slowly.

62 M E C H A N I C A L B E H A V I O U R O F J O I N T E D R O C K
d i s p l a c e m e n t , in
Fig. 10-47. Variation o f frictional force with displacement for sliding o f surfaces o f extension fractures on a flat surface
(after J a e g e r , 1971).
W ith natu ra l jo in ts which are rather discontinuous, the shear force usually rises to a peak value with small displacem ent and then falls sharply. This peak is followed by considerable fluctuations before the residual value is reached ( K r s m a n o v i c , 1967).
A ccording to P a t t o n (1966a), the effective width o f the asperity (i.e. length a long the base o f the asperity) plays an im portant role in the shear force d isplacem ent behaviour o f a jo in t. Fig. 10-48 represents the shear strength
d i s p l a c e m e n t (x ) in t e r m s o f t o t a l l e n g t h o f t o o t h
Fig. 10-48. S hear strength displacement curve (after P a t t o n , 1966a).

m H A V I O U R D U R I N G S L I D I N G A L O N G J O I N T S 63
curve for 3 specimens with different values o f norm al loads 7V3 > /V2 > /V ,. The peak values obtained are dependent upon the position o f shearing o f the asperities. W hen the specimen is sheared o ff along the base o f the asperity (/V3) the highest value is obtained at a small displacem ent (0.1 x asperity base) followed by the residual shear strength. W hen the shearing takes place after a certain am ount o f displacem ent along the asperity ( N 2 and N ,). the highest value o f shear strength obtained is lower. Residual values are obtained when the displacem ent reaches a value o f 1.0 x asperity base.
C o u l s o n 's (1970) results on lapped sandstone surfaces show that the displacement required to reach residual shear strength is dependent upon rock type, surface roughness, m oisture and the type o f surface dam age m anifested during shearing. W hen polishing and profuse gouging occur, the shear strength increases w ith further displacem ent. The developm ent o f indurated crust and low gouging is associated with decreasing shear strength with displacem ent. The increase in pressure results in decreasing the displacem ent required for residual shear s treng th o f joints.
D r k n n o n and H a n d y (1972) found that for tests on clean blocks o f lim estone at norm al stress o f 0.98 M Pa (142 lbf/in2) (10 kgf/cm 2) and under, the coefficient o f friction tended to rem ain stable o r slowly rose, but for tests w ith debris introduced in between the blocks, the initial static coefficient o f friction ranged from 0.406 to 0.551 and clim bed rapidly to values m uch above those reached on tests with clean blocks, reaching in one case a value o f 1.002 (Fig. 10-49).
cu m u la t iv e s l ip , c m
Fig. 10-49. Increase o f coefficient o f static friction with slip. Test 9 9 C, 10 kg f/cm 2, at 125 C, debris test
(after D r e n n o n and H a n d y , 1972).

J a e g e r and R o s e n g r e n (1969) divided the displacem ent behaviour o f the jo in ts according to the nature o f the jo in t (T able 2). The corresponding characteristic curves are given in Fig. 10-50.
64 M E C H A N I C A L B E H A V I O U R O F J O I N T E D R O C K
( a )
( c )Fig. 10-50. Types o f load d isp lacem ent curves for natural joints.
F o r descrip tion see Table 2 (after J a e g e r an d R o s e n g r e n , 1969).
Very conclusive evidence o f the shape o f the curve as a function o f the surface geometry is given by S c h n e i d e r (1972) and L ama (1975b). Using 3 different geometries obtained in tension tests (granite, sandstone and limestone) and producing replicas using plaster o f Paris as the model m aterial, S c h n e i d e r (1972) conducted tests at different no rm al pressures. The results are sum m arised in Fig. 10-51. The properties o f the m odel material rem aining constant, the shear stress-displacement curve is different for different surfaces. The granite surface is m uch rougher w hile the limestone surface is rather smooth. The first gives a peak shear strength followed by a d rop in its value while the second gives alm ost no drop in shear strength with displacement. The curve for sandstone which has m edium surface roughness has shear characteristics somewhat in between. Similarly, d ila tion is higher for rougher jo in ts and smaller for sm oother joints.

shea
r st
ress
,
T ,
kg
/ c
m
B E H A V I O U R D U R I N G S L I D I N G A L O N G J O I N T S 65
o
d i s p l a c e m e n t , s , c m
Fig. 10-51. Shear stress d isp lacem ent and dilation-displacement curves for the different roughnesses using gypsum as a model material
A granite; B sa n d s to n e ; C limestone (after S c h n e i d e r , 1972).

66 M E C H A N I C A L . B E H A V I O U R O F J O I N T E D R O C K
T A B L E 2
L oad-displacem ent curve charac teristics
( a f te r J a eg er a n d R o s e n g r e n , 1969)
T y p e o f b eh av io u r C haracteris tic jo in ts
A. N o slip until peak load Jo in ts with large interlockingthen g ra d u a l d ro p o f f to asperities ; bedding planesresidual value Fig. 10-50(a) with cross ripples; faults
with cross slickensides o r grooves.
B. Well defined initial slip Jo in ts with hard , fairly sm oothw hich co n t in u es a t co n s tan t surfaces; also N a rran d e raload Fig. 10-50(b) quartz ite .
C. Well def ined initial slip Relatively rough, chlorite orw hich o n t in u es with rising g rap h ite coated surfaces; veryload Fig. 10-50(c) sm o o th hard surfaces.
D. C o n t in u o u s cu rv a tu re o f F au l ts with sm ooth or polishedload d isp lacem en t curve Fig. 10-50(d)
chloritic surfaces.
O fi -
0-2 -(-)0 4 -
Fig. 10-52. Influence o f direction o f d isplacement on the shear behaviour o f model jo in ts o f m arb le surface obtained in a Brazilian test (model material gypsum).
a n = 0.289 M Pa: Displacement ra te = 0.12 mm min.(after Lama, 1975 b).
B E H A V I O U R D U R I N G S L I D I N G A L O N G J O I N T S 67
Roughness produced in different directions is not the same depending upon grain orientation and fracture anisotropy. This affects the surface geom etry and the shear-displacem ent curve. The results obtained by L a m a (1975b) where the tests were conducted using the same geom etry and same m odel m aterial but the shear direction was changed are shown in Fig. 10-52. The phenom enon is not simple but is influenced by the m aterial property and interaction between the m aterial property and the surface geom etry ( L a m a , 1975b). This view has also been expressed by D o n a t h , F r u t h and O l s s o n (1972).
3. Normal stress
T he value o f the coefficient o f friction // does not rem ain constant w ith change in the value o f the norm al stress. The residual frictional force from which the coefficient o f friction is calculated is not only due to pure sliding o f the two blocks but is also influenced by the crushing o f the broken asperities, and rolling and induration into the enclosing surfaces. The possibility o f crushing o f these pieces increases w ith increase in the value o f the norm al force and hence at higher values o f norm al force, the m ovem ent shall be m ore and m ore governed by turning o f the crushed pieces and less and less due to shearing o f the asperities. As such, the value o f the frictional coefficient calculated is likely to be smaller with higher value o f norm al force.
I I a n d i n and S t e a r n s (1964) found that the coefficient o f friction at a higher norm al stress is lower than at lower values o f norm al stress fo r dolom ite, limestone and sandstone. They suggested that the existence o f lower friction coefficients at higher norm al stresses was because the surfaces becam e sm oother. R a l e i g h and P a t e r s o n (1965) also found that the coefficient o f friction o f peridotite sliding on shear surfaces decreased w ith confining pressure.
J a e g e r and Ccx)K (1969b) reported that for spherical trachyte con tacts sliding on trachyte with varying areas o f contact at higher norm al loads the value o f / / = 0.32 and at lower norm al loads // = 0.48. C o u l s o n (1970) found that the result o f increasing norm al pressure from 0.069 to 6.89 M Pa (10 to 1000 lbf/in2) is to reduce the initial coefficient o f friction for all surface roughnesses from 5 to 20% . In the case o f rocks with low porosity and low strength an increase in the coefficient o f friction with an increase in norm al pressure was observed. He explained this as being due to deep penetration o f the asperities in to the opposing surface upon application o f norm al pressure. This asperity penetration and surface interaction increases with increase in norm al pressure.
M a u r e r (1966) conducted several tests on sandstone, limestone, m arble, shale, dolom ite, granite and basalt a t various norm al pressures and found tha t the coefficient o f friction when determ ined from residual shear resistance is dependent upon norm al stress and decreases as contact pressure increases. A ccording

68 M E C H A N I C A L B E H A V I O U R O F J O I N T E D R O C K
to him, the friction coefficient can be related to the norm al pressure by the equation
tan 0 r = tf(<7n)k (10.49)
T he values o f a and k are given in Table 3.
T A B L E 3
T he values o f a and k in Eq. 10.49
(after M a u r i r . 1966)
R ock type Cl k
B eekm antow n dolom ite 36.0 0.60
Berea sandstone 6.4 0.80
C ar th ag e marble 29.0 0.63
C hico limestone 22.0 0.65
G eorg ia granite 46.0 0.55
Ind iana limestone 60.0 0.46
K n ip p a basalt 48.5 0.56
R ush Springs sandstone 14.0 0.71
Seminole shale 3.7 0.73
The coefficients o f friction for stronger rocks are nearly equal decreasing from 1.8 to 0.8 as the norm al pressure is increased from 13.79 M Pa (2000 lbf/in2) to the uniaxial compressive strength o f the rock. The coefficients o f friction for w eaker rocks are also m uch the same as for stronger rocks and the friction angle is independent o f the strength o f the rock.
H o b b s (1970) conducted tests on broken cylindrical specimens o f coal m easure rocks in a triaxial cell with a single spherical seat (top). The specimens were first subjected to a given confining pressure 20.7 M Pa (3000 lbf/in2) and then axially loaded to failure. The pressure was then raised by increm ents and the axial load to cause slip at each increm ent was determ ined. He found that shear and normal stresses to cause m ovem ent o f the broken cylinders can be represented by the relationship
t = k ( p nf (10.50)
w here k and a are constants.
T he values o f k and a found by him are given in Table 4.
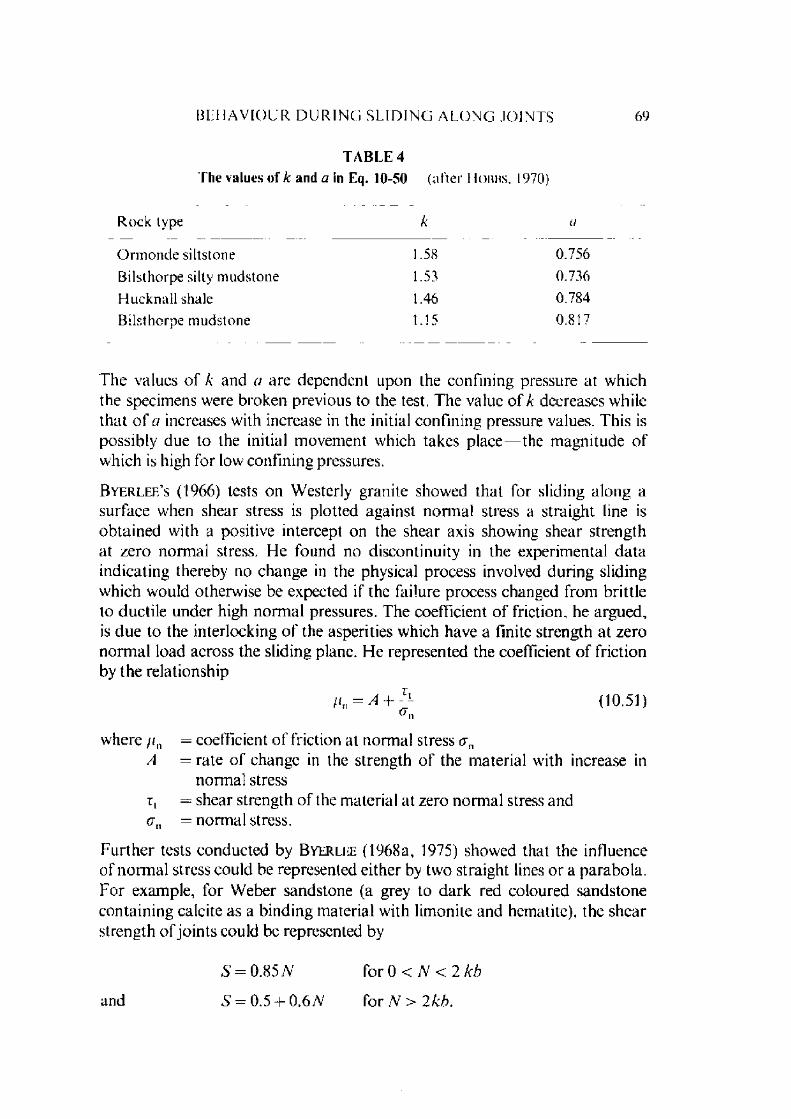
B E H A V I O U R D U R I N G S L I D I N G A L O N G J O I N T S 69
T A B L E 4
T he values o f k and a in Eq. 10-50 (after Hobbs, 1970)
R o ck type k a
O rm o n d e siltstone 1.58 0.756
B ils thorpe silty m udstone 1.53 0.736
H u ck n a ll shale 1.46 0.784
B ils thorpe m u d s to n e 1.15 0.817
T he values o f k and a are dependent upon the confining pressure at which the specimens were broken previous to the test. The value o f k decreases while tha t o f a increases with increase in the initial confining pressure values. This is possibly due to the initial movement which takes place the m agnitude o f which is high for low confining pressures.
B y e r l e e ’s (1966) tests on W esterly granite showed that for sliding along a surface when shear stress is plotted against norm al stress a straight line is obtained with a positive intercept on the shear axis showing shear strength at zero norm al stress. He found no discontinuity in the experimental data indicating thereby no change in the physical process involved during sliding which would otherwise be expected if the failure process changed from brittle to ductile under high norm al pressures. The coefficient o f friction, he argued, is due to the interlocking o f the asperities which have a finite strength a t zero norm al load across the sliding plane. He represented the coefficient o f friction by the relationship
= + i (10.51)
where //n = coefficient of' friction at norm al stress a nA = rate o f change in the strength o f the m aterial with increase in
norm al stressi, = shear strength o f the m aterial at zero norm al stress and cjn = norm al stress.
F urther tests conducted by B y e r l e e (1968a, 1975) showed that the influence o f norm al stress could be represented either by two straight lines o r a parabola. For exam ple, for W eber sandstone (a grey to dark red coloured sandstone containing calcite as a binding m aterial with limonite and hematite), the shear strength o f jo in ts could be represented by
5 = 0 .85N for 0 < N < 2 kb
an d 5 = 0.5 + 0.6 N f o r N > 2kb.

70 M E C H A N I C A L B E H A V I O U R O F J O I N T E D R O C K
A t low er values a power law o f the form given in Eq. 10.50 best describes the shear and norm al stress behaviour.
D r e n n o n and H a n d y (1972) determ ined the coefficient o f friction o f lim estone in bo th sm ooth slip and in the load and unload modes o f stick slip. They found that during initial loading static coefficient o f friction o f fresh blocks ranged from 0.198 to 0.533, being low at low norm al stresses and high at high norm al stresses. They also observed th a t at low norm al stresses, the value o f static coefficient o f friction varied considerably depending upon the past frictional history o f the specimen.
N
n o r m a l l o a d ( N ) , I t ) f
Fig. 10-53. Shear s trength displacem ent envelopes (after Pa t t o n . 1966a).
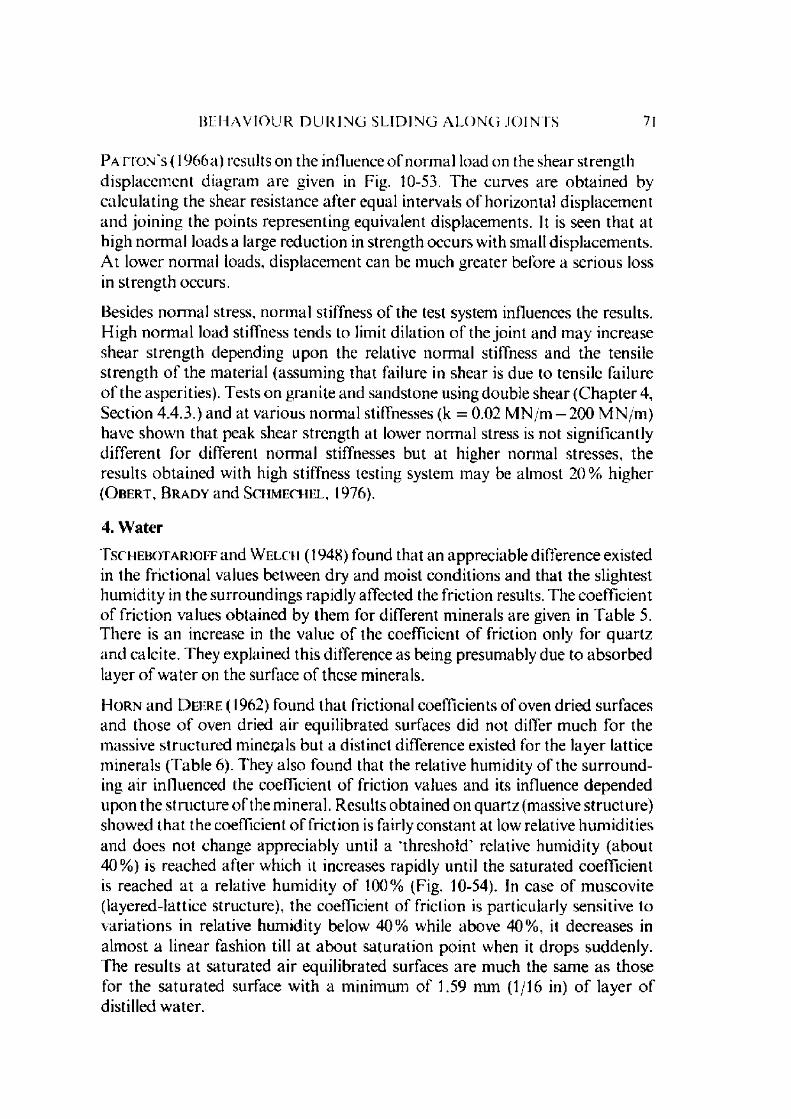
B E H A V I O U R D U R I N G S L I D I N G A L O N G J O I N T S 71
P a t t o n ' s (1966a) results on the influence o f norm al load on the shear strength d isplacem ent diagram are given in Fig. 10-53. The curves are ob ta ined by calcu lating the shear resistance after equal intervals o f horizontal displacem ent and jo in ing the points representing equivalent displacem ents. It is seen tha t at high norm al loads a large reduction in strength occurs with small displacem ents. A t lower norm al loads, displacem ent can be m uch greater before a serious loss in streng th occurs.
Besides norm al stress, norm al stiffness o f the test system influences the results. H igh norm al load stiffness tends to limit dilation o f the jo in t and m ay increase shear strength depending upon the relative norm al stiffness and the tensile strength o f the m aterial (assum ing that failure in shear is due to tensile failure o f the asperities). Tests on granite and sandstone using double shear (C hapter 4, Section 4.4.3.) and at various norm al stillnesses (k = 0.02 M N /m -2 0 0 M N /m ) have shown that peak shear strength at lower norm al stress is not significantly d ifferent fo r different norm al stiffnesses but at higher norm al stresses, the results ob tained with high stiffness testing system m ay be alm ost 20% higher ( O b e r t , B r a d y and S c h m e c h e l , 1976).
4. Water
TscHEBOTARiOFFand W e l c h (1948) found tha t an apprec iab le d ifference existed in the fric tio n a l values betw een d ry and m oist co n d itio n s and tha t the slightest h u m id ity in the su rro u n d in g s rap id ly affected the fric tion results. T he coeffic ien t o f fric tion values o b ta in ed by them for d ifferent m inerals are given in T ab le 5. T h ere is an increase in the value o f the coefficient o f friction only fo r q u a rtz an d calcite . T hey explained th is d ifference as being presum ably due to ab so rb ed layer o f w a te r on the surface o f these m inerals.
I I o r n and D e e r e (1962) found that frictional coefficients o f oven dried surfaces and those o f oven dried a ir equilibrated surfaces did not differ m uch for the massive structu red m inerals but a distinct difference existed for the layer lattice m inerals (Table 6). They also found that the relative hum idity o f the su rro u n d ing a ir influenced the coefficient o f friction values and its influence depended upon the s tructu re o f the m ineral. Results obtained on quartz (massive s tructure) showed th a t the coefficient o f friction is fairly constant at low relative hum idities and does not change appreciably until a ‘threshold ' relative hum idity (about 40% ) is reached after which it increases rapidly until the saturated coefficient is reached a t a relative hum idity o f 100% (Fig. 10-54). In case o f m uscovite (layered-lattice structure), the coefficient o f friction is particularly sensitive to varia tions in relative hum idity below' 40% while above 40% , it decreases in alm ost a linear fashion till at abou t saturation point when it drops suddenly. The results a t saturated air equilibrated surfaces are m uch the same as those for the satu rated surface w ith a m inim um o f 1.59 mm (1/16 in) o f layer o f distilled w ater.
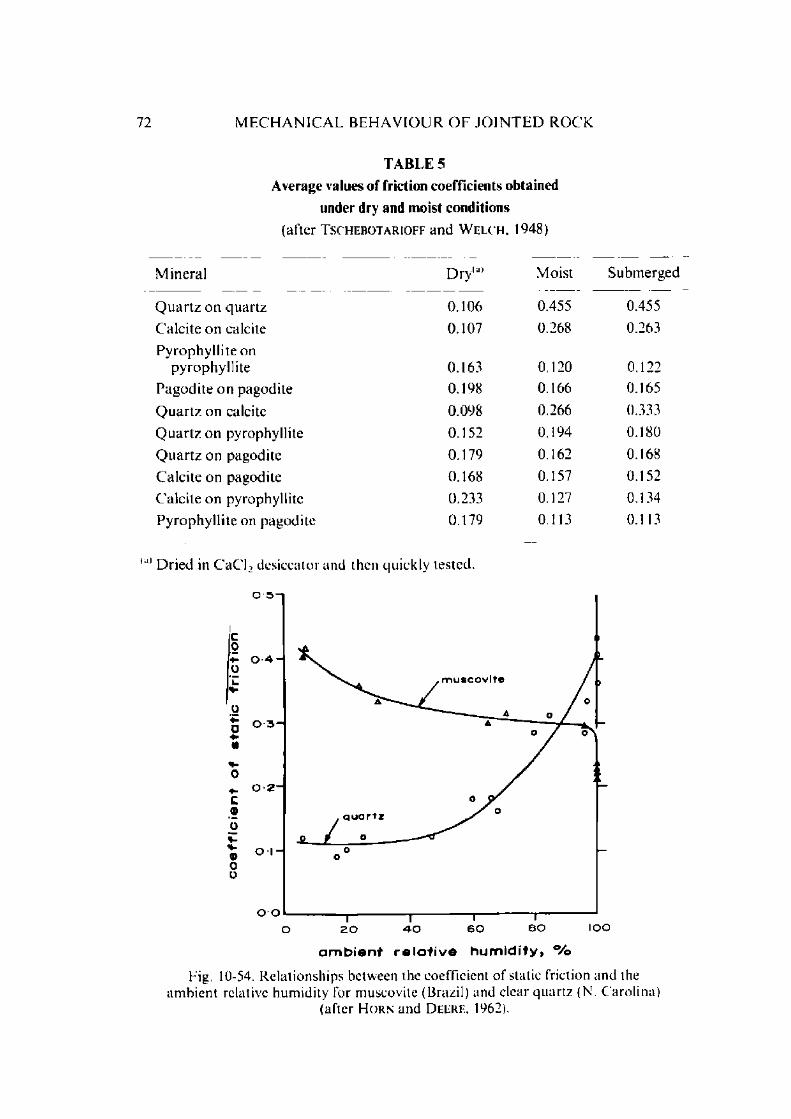
72 M E C H A N I C A L B E H A V I O U R O F J O I N T E D R O C K
T A B L E 5
A verage values o f friction coefficients obtained
under dry and m oist conditions
(after T sc h e b o t a r io ff an d W e l c h , 1948)
M inera l D ry (a) M oist Subm erged
Q u a r tz o n q u a r tz 0.106 0.455 0.455
C alc ite o n calcite 0.107 0.268 0.263
P y rophy ll i te on pyrophy ll i te 0.163 0.120 0.122
P ag o d i te o n pagodite 0.198 0.166 0.165
Q u a r tz o n calcite 0.098 0.266 0.333
Q u a r tz o n pyrophyllite 0.152 0.194 0.180
Q u a r tz on pagod ite 0.179 0.162 0.168
C alc i te o n pagodite 0.168 0.157 0.152
C alc i te o n pyrophyllite 0.233 0.127 0.134
P y rophy ll i te on pagod ite 0.179 0.113 0.113
(il> D ried in C a C L desiccator and then quickly tested.
a m b i e n t r e l a t i v e h u m i d i t y , °/o
Fig. 10-54. Relationships between the coefficient o f static friction and the am bien t relative humidity for muscovite (Brazil) and clear quar tz (N. Carolina)
(after H o r n and D eere , 1962).

B E H A V I O U R D U R I N G SL I D I N G A L O N D J O I N T S 73
T h e influence o f m oisture on the coefficient o f friction depends upon the crystal s tru c tu re o f the m ineral. W ater acts as an anti-lubricant in case o f massive (th ree dim ensional) crystal structures (quartz, m icrocline feldspar, calcite) w hile it serves as a lubricant in case o f layered-lattrce (two dim ensional) m inerals (m uscovite, biotite, phlogopite, chlorite etc.)- The ratio o f the coefficient o f static friction for satu rated and oven-dried surfaces o f massive structure m inerals varies from 3 to 7 and for the layered-lattice m inerals from 0.4 to 0.6 (Table 6).
This differential behaviour o f w ater was explained by H a r d y and 1 I a r d y (1919) as being the action o f w ater which reduces the mobility o f the adsorbed film com posed o f highly oriented molecules. The force field associated w ith the p o la r m olecules d isrup ts the orientation o f the adsorbed layer increasing friction. This phenom enon was dem onstrated by M e n t e r (1950) who showed by electron diffraction studies the influence o f d isorientation o f the m olecules o f a boundary lubricant on increase in the frictional resistance.
B r o m w e l l (1966) showed that the coefficient o f friction o f dry chem ically clean polished quartz is 0.9 and that this rem ains unchanged when w etted. This indicates that w ater is basically neutral to quartz and that its an tilubri- cating influence is due to its reaction with the lubricant boundary layer. L a m b e a n d W h i t m a n (1969) have given a further discussion on the an tilubricating influence o f water.
A com pletely different view point was put forw ard by B y e r l e e (1966). A ccording to him. the influence o f the fluid is to increase attractive force between the surfaces due to the surface tension effect. It is possible that for polished surfaces, this plays a certain role.
H o r n and D e e r e (1962) investigated the influence o f non-polar and po lar fluids. They reported tha t the influence o f high polarity fluids (water, ethylene glycol, am ylam ine) on frictional coefficient was much m ore than the non -po lar fluids (carbon tetrachloride, decahydronaphthalene). They explainded tha t the influence o f these fluids on the layer-lattice m inerals is governed by two param eters: (/) scratching o f the surface during rubbing. (//*) cohesive force that exists between fresh cleavage faces o f layer-lattice minerals. But the phenom enon is not clear as yet.
T he above results arc based upon tests on minerals sliding one over the o ther under extrem ely small norm al loads o r under free sliding conditions. The results o f experim ents conducted by J a e g e r (1959) on soaked specimens o f sandstone and granitic gneiss showed a ra ther slight decrease in the coefficient o f sliding friction. N o pore pressure m easurem ents were taken and hence it is n o t clear if change in the pore pressure did not influence the results. It is well know n that in case o f undrained-w et specimens the effective stress theory is applicable. Pore pressure greatly influences the sliding force due to decreased effective
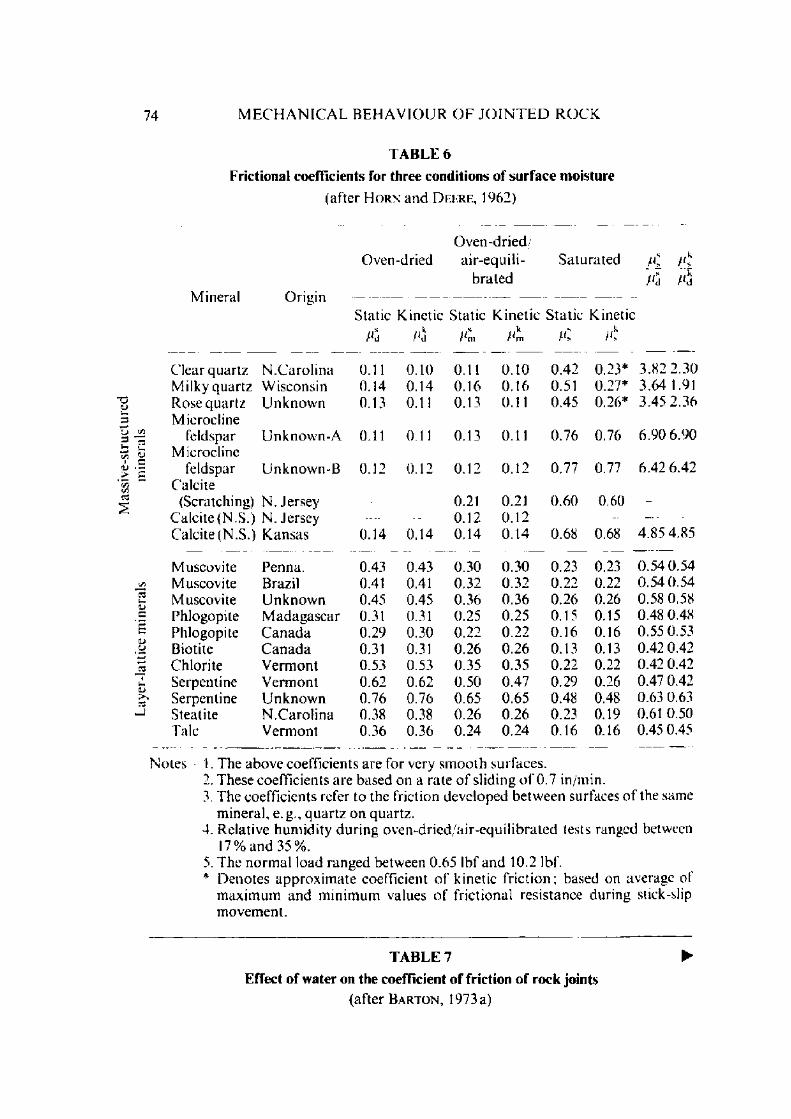
Laye
r-la
ttice
m
iner
als
min
eral
s74 M E C H A N I C A L B E H A V I O U R O F J O I N T E D R O C K
T A B L E 6
Frictional coefficients for th ree conditions o f su rfa c e m oisture
(after H o r n an d D eer e , 1962)
O v e n -d r ied /O ven-dried a ir-equili- S a tu ra ted /xj
b ra te d /*JjM ineral Origin
Static K inetic S tatic K inetic S ta t ic Kinetic
Md A / 'm / 'm Ms / 's
Clear quar tz N .C a ro l in a 0.11 0.10 0.11 0.10 0.42 0.23* 3.82 2.30M ilky quar tz W isconsin 0.14 0.14 0.16 0 .16 0.51 0.27* 3.64 1.91Rose quar tz U n k n o w n 0.13 0.11 0.13 0.11 0.45 0.26* 3.45 2.36M icrocline
feldspar U n k n o w n -A 0.11 0.11 0.13 0.11 0.76 0.76 6.90 6.90M icrocline
feldspar U n k n o w n -B 0.12 0.12 0.12 0.12 0.77 0.77 6.42 6.42Calcite
(Scratching) N. Jersey — — 0.21 0.21 0.60 0.60Calcite (N.S.) N. Jersey — 0.12 0.12Calcite (N.S.) K ansas 0.14 0.14 0.14 0.14 0.68 0.68 4.85 4.85
M uscovite Penna. 0.43 0.43 0.30 0.30 0.23 0.23 0.54 0.54M uscovite Brazil 0.41 0.41 0.32 0.32 0.22 0.22 0.54 0.54M uscovite U n k n o w n 0.45 0.45 0.36 0.36 0.26 0.26 0.58 0.58Phlogopite M ad ag asca r 0.31 0.31 0.25 0.25 0.15 0.15 0.48 0.48Phlogopite C a n a d a 0.29 0.30 0.22 0.22 0.16 0.16 0.55 0.53Biotite C a n a d a 0.31 0.31 0.26 0.26 0.13 0.13 0.42 0.42Chlorite V erm ont 0.53 0.53 0.35 0.35 0.22 0.22 0.42 0.42Serpentine V erm ont 0.62 0.62 0.50 0.47 0.29 0.26 0.47 0.42Serpentine U n k n o w n 0.76 0.76 0.65 0.65 0.48 0.48 0.63 0.63Steatite N .C a ro lin a 0.38 0.38 0.26 0.26 0.23 0.19 0.61 0.50Talc V erm ont 0.36 0.36 0.24 0.24 0.16 0.16 0.45 0.45
N otes 1. The above coefficients are for very sm o o th surfaces.2. These coefficients are based on a ra te o f s liding o f 0.7 in/min.3. The coefficients refer to the fric tion developed be tw een surfaces o f the same
m ineral, e .g ., q u a r tz on quartz .4. Relative hum id ity d u r in g ov en -d r ied /a ir -eq u ilib ra ted tests ranged between
17% an d 35% .5. The n o rm al load ranged between 0.65 lb f an d 10.2 lbf.* D enotes ap p ro x im a te coefficient o f kinetic fr ic t ion ; based on average o f
m ax im u m an d m in im um values o f fr ic tional resistance during stick-slip m ovem ent.
T A B L E 7
E ffect o f w ater on the coefficient o f friction o f rock joints(after B a r t o n , 1973 a)
►
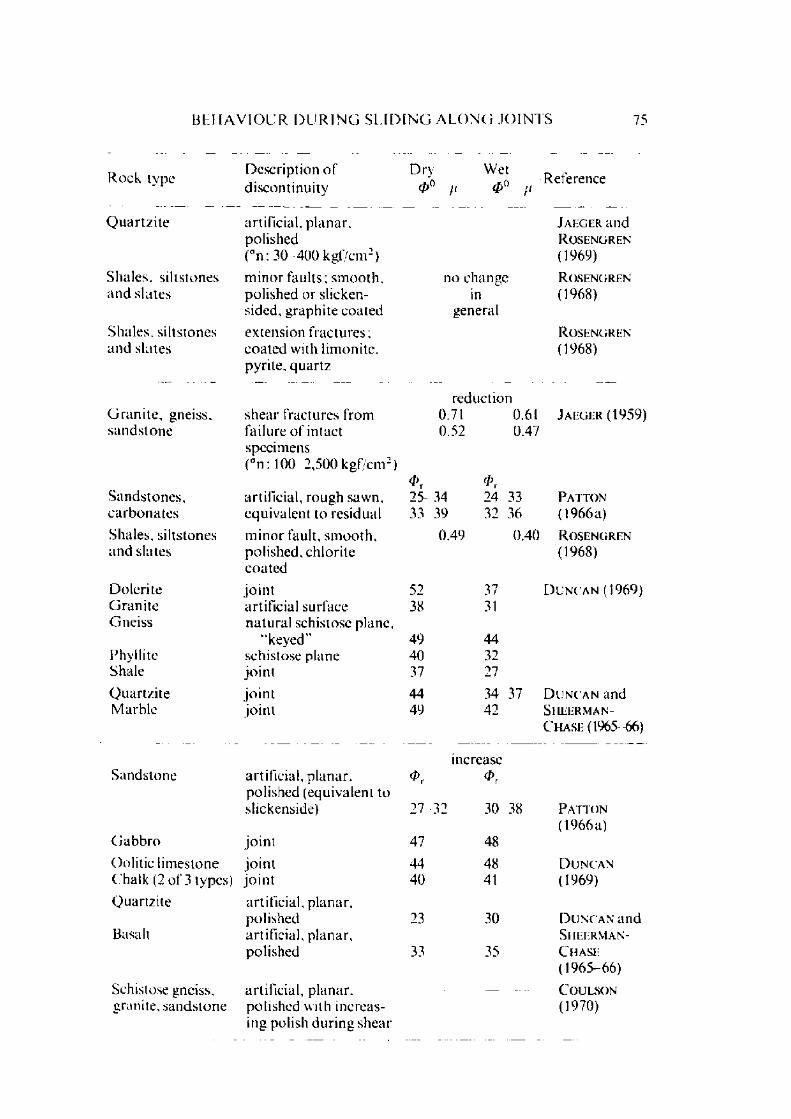
B E H A V I O U R D U R I N G S L I D I N G A L O N G J O I N T S 75
R o ck typeD escrip tion o f d iscon tinu ity
D n(/>'h r
Wet0 ° //
Reference
Q u a r tz i te artificial, p lanar . J aeger a n dpolished R o se n g r e n
( ° n :3 0 400 k g f /cm 2) (1969)
Shales , siltstones m in o r fau lts ; sm oo th . no change R o se n g r e n
a n d sla tes polished o r slicken- in (1968)sided, g raph ite coa ted general
Shales , s iltstones extension fractu res; R o se n g r e nan d slates co a ted w ith limonite . (1968)
pyrite, q u a r tz
reductionG ra n i te , gneiss. sh ea r fractures from 0.71 0.61 J a eg er (1959)s a n d s to n e failure o f in tact 0.52 0.47
specim ens( ° n : 100 2,500 kg f /cm 2)
S ands tones , artific ial, ro ugh sawn. 2 5 - 34 24 33 P a tto n
c a rb o n a te s equivalen t to residual 33 39 32 36 (1966 a)
Shales, s ilts tones m in o r fault, sm o o th . 0.49 0.40 R o se n g r e nan d slates polished, ch lorite (1968)
coa ted
D olerite jo in t 52 37 D u n c a n (1969)G ra n i te artificial surface 38 31G neiss n a tu ra l schistose plane.
“ keyed” 49 44Phyllite schistose p lane 40 32Shale jo in t 37 27
Q u artz i te jo in t 44 34 37 D u n c a n andM arb le jo in t 49 42 Sheerman-
C h a s e (1965 66)
increaseSandstone artificial, p lanar , <*>r
polished (equivalent toslickenside) 27 32 30 38 P a tto n
(1966 a)G a b b ro jo in t 47 48
Oolitic l im estone jo in t 44 48 D u ncanChalk (2 o f 3 types) jo in t 40 41 (1969)
Q uartzite artific ial, p lanar .po lished 23 30 D u n c a n and
Basalt artific ial, p lanar . S hherman-polished 33 35 C hasi:
(1965- 66)
Schistose gneiss. artific ial, p lanar . — COULSONgranite, san d s to n e po lished with increas (1970)
ing polish d u r in g shear

76 M E C H A N I C A L B E H A V I O U R O F J O I N T E D R O C K
value o f the norm al force and this phenom enon is am ply d em o n stra ted by M o r g e n s t e r n (1970). B y e r l e e ' s (1967b) tests showed that the pore pressure strongly influences the coefficient values so calculated and should be taken into account to avoid anom alous results. It is seen th a t law o f effective stress holds good for jo in t surfaces ( B y e r l e e , 1975) and even very high pressures may develop when jo in ts slide past each o ther (G (X )d m a n . H e u z e and O h n i s h i , 1972).
Table 7 gives the results obtained by a num ber o f w orkers on the frictional coefficient o f rocks when wet o r dry. Tests conducted by J a e g e r (1959) and J a e g e r and R o s e n g r e n (1969) were at high norm al pressures but the o ther tests are a t relatively low norm al pressures. The polished surfaces in general are not affected by the presence o f w ater while rough surfaces show a slight decrease. J a e g e r (1959) suggested the ease o f developm ent o f slickenside in wet jo in ts causing reduction in shear strength o f rough jo in ts is due to adverse effect o f m oisture on the tensile strength o f the rock m aterial. C ertain other factors such as displacem ent rate and tem perature have been investigated by som e w orkers. H a n d i n (1972a, b) and D i e t e r i c h (1972) reported results on the tim e-dependent behaviour o f jo in ts. In general, the coefficients o f friction of jo in ts w ere found to rem ain constan t o r to increase with loading duration depending on the roughness o f the jo in t surfaces and on the am oun t of accum ulated gouge. Stress drops during unstable sliding on effectively sm ooth jo in t surfaces o r on unfilled jo in ts becam e greater as well. Thus, for the type of jo in ts which were studied by them , it appears that the long-term ultimate strength o f jo ints m ight actually exceed the short-term strength.
W a w e r s i k and B r o w n (1973) also m ade a few m easurem ents on granite specim ens containing artificially created tension jo in ts. These measurements suggest th a t creep on rough, unfilled jo in ts is negligibly small. The coefficient o f friction on such jo in ts was found to increase with the time that the joint surfaces were subjected toconstan t norm al and shear stresses. These observations co rro b o ra te results o f H a n d i n (1972a, b) and D i e t e r i c h (1972).
D o n a t h , F r u t h and O l s s o n (1972) have examined the influence o f strain rate on the coefficient o f friction o f sandstone, limestone and slate. The effect seems to be very unsystematic. Sim ilar results were obtained by L a m a (1975a) on a num ber o f rocks including granite, sandstone, limestone, m arble using sav cu t, polished, tensile fracture surfaces at displacem ent rates from 0.67 to 0.()()()(1 m m /s. T he effect o f displacem ent rate seems to be overridden by the difference in the surfaces obtained and m aterial property changes in each test specimen. W hen the same surface is reproduced using a controlled m odel m aterial, the influence o f the displacem ent rate becomes m ore discernible. The results obtained by L a m a ( 1975a) are shown in Figs. 10-55 to 10-58. It looks that at lower norm al stresses there is some form o f dynamic friction effect and the coefficient

dila
tatio
n +
shea
r st
ress
,
kg
/cm
B E H A V I O U R D U R I N G S L I D I N G A L O N G J O I N T S 77
( + )I O 1 5
displacement , m m
I ig. 10-55. Shear and dilatation behav iour of model jo in ts o f marble surface o b ta ined in Brazilian test (model material gypsum) a t a n = 0.289 M Pa and at different
displacement rates (after L a m a . 1975a).
0 5 IO 1-5 2 0
d i s p l a c e m e n t , m m
)o 0-2
O O 2
C - )0 5
I ig. 10-56. Shear and dilatation behaviour o f model jo in ts o f m arble surface o b ta in ed in Brazilian test (model material gypsum) at a n = 0.539 M Pa and at different
displacement rates (after L a m a , 1975a).

dil
atat
ion
she
ar
stre
ss,
kg
/cm
"78 M E C H A N I C A L B E H A V I O U R O F J O I N T E D R O C K
0 6
0 - 4 (-
0 2 L
d i s p l a c e m e n t , m m
; -)
Fig. 10-57. S h ear and dilatation behaviour o f model jo in ts o f m arble surface obtained in Brazilian test (model material gypsum) at <rn = 1.008 M P a an d at different
displacement rates (after L a m a , 1975a).
T A B L E 8
C oefficient o f friction o f g ran ite (tension joints) a t an = 9.30 kgf/cm 2 (0.97 M P a) (13.5 lb f/ in2)
(after L a m a . 1975b)
D isp lacem en t ra te cj>
40 m m /m in . 32.1
1.22 m m /m in . 32.1
0 .1 8 m m /m in . 33.1
0.024 m m /m in . 35.3

B E H A V I O U R D U R I N G S L I D I N G A L O N G J O I N T S 79
Eo\
m m / m i n
rr\rr. / rr. i n
_I_) 5 I O 1-5
d i s p l a c e m e r i t , m r
201 _
3 0
( + ) O 4 •-
c0 0 2 -
0O r — = 2
____________________ ______________ -------- —0
"6 O 2 - 1 1( - ) 0 - 5 1 O
H g . 10-58. Shear an d d i la ta t io n behaviour o f model jo in ts o f marble surface o b ta in ed in Brazilian test (model materia l gypsum) at a n = 2.005 M Pa and at different
displacem ent rates (after L a m a . 1975a).
o f friction has a slightly sm aller value at high displacem ent rates. A t higher norm al stresses, the m aterial property plays a more im portant role and the coefficient o f friction increases and has a higher value at high displacem ent rates. The curve a t 1.22 m m /m in displacem ent rate tends to rise with increasing norm al stress. Values obtained for granite are given in Table 8.
The influence o f tem peratu re has been found to increase the coefficient o f friction o f sandstone and decrease that o f limestone whilst slate surface was unaffected by it (Fig. 10-59).
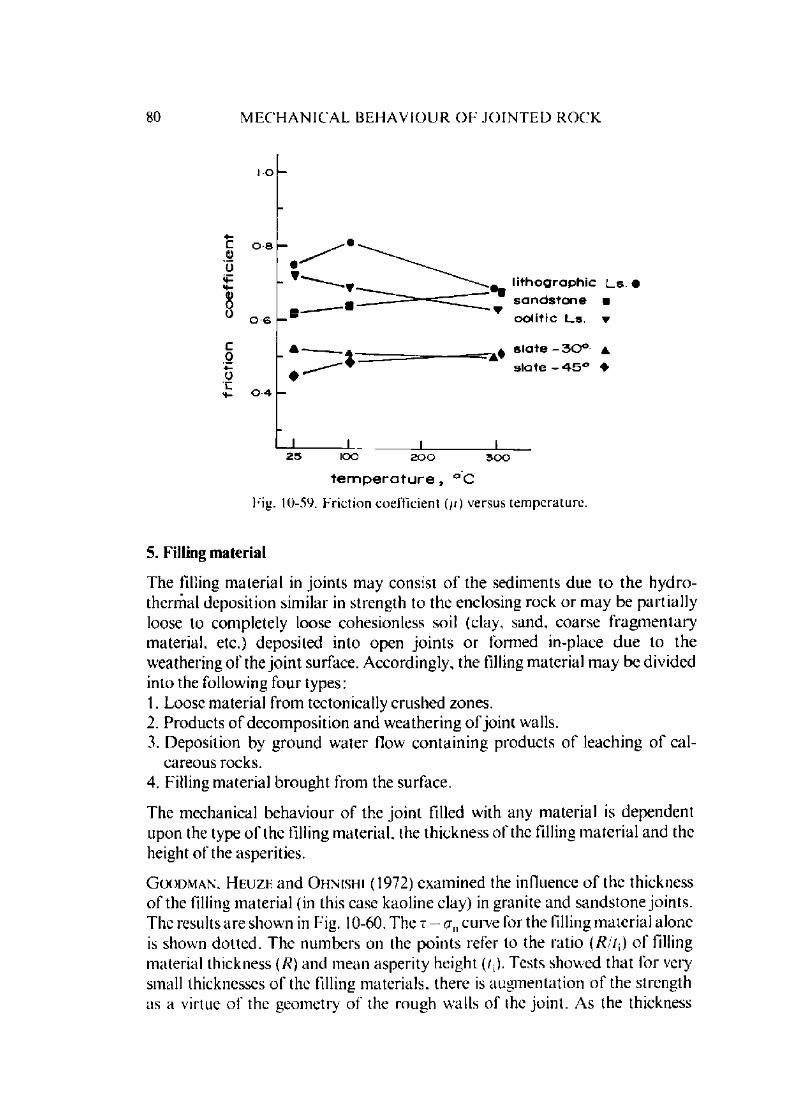
so M E C H A N I C A L B E H A V I O U R O F J O I N T E D R O C K
1 0
c 0 8 1)
c0•«-oL.
0 6
0 4
_L
l i t h o g r a p h i c L s • s a n d s t o n e ■ o o l i t i c L s . ▼
s l a t e - 3 0 ° a
s l a t e - - 4 5 ° ♦
2 5 IOO 2 0 0 3 0 0
t e m p e r a t u r e , ° CFig. 10-59. Friction coefficient (//) versus temperature.
5. Filling material
The Filling m aterial in jo in ts m ay consist o f the sedim ents due to the hydro- thermal deposition sim ilar in strength to the enclosing rock o r m ay be partia lly loose to completely loose cohesionless soil (clay, sand, coarse fragm entary material, etc.) deposited into open jo in ts o r formed in-place due to the weathering o f the jo in t surface. Accordingly, the filling m aterial m ay be divided into the following four types:1. Loose m aterial from techn ica lly crushed zones.2. Products o f decom position and w eathering o f joint walls.3. Deposition by ground w ater flow con tain ing products o f leaching o f cal
careous rocks.4. Filling m aterial brought from the surface.
The mechanical behaviour o f the jo in t 111 led with any m aterial is dependent upon the type o f the filling m aterial, the thickness o f the filling m ateria l and the height o f the asperities.
G(X)dman, H fu zk and O hnish i (1972) exam ined the influence o f the thickness o f the filling m aterial (in this case kaoline clay) in granite and sandstone joints. The results are shown in Fig. 10-60. The r — crn curve for the filling m aterial alone is shown dotted . The num bers on the points refer to the ratio (R/ t j) o f filling m aterial thickness (R) and m ean asperity height (/;). Tests showed that for very small thicknesses o f the filling m aterials, there is augm entation o f the strength as a virtue o f the geom etry o f the rough walls o f the jo in t. As the thickness
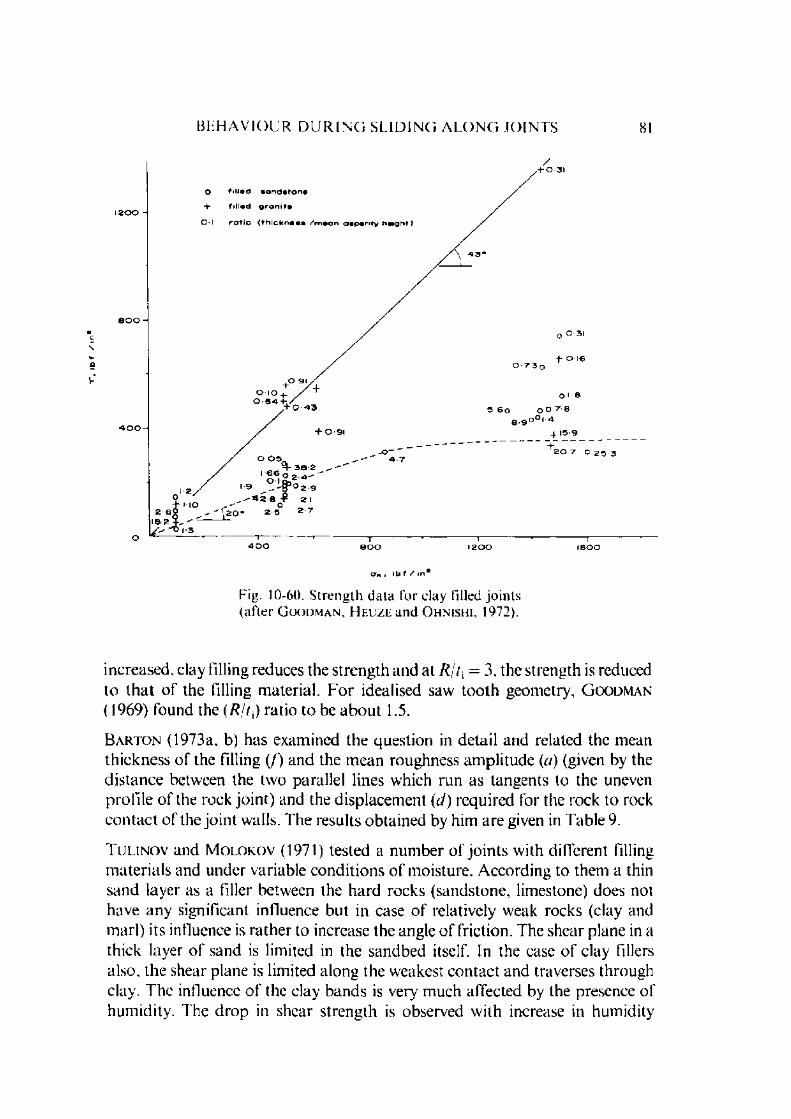
B E H A V I O U R D U R I N G S L I D I N G A L O N G J O I N T S 81
O n . l b f / i n *
Fig. 10-60. S trength da ta for clay filled jo in ts (after G o o d m a n . I Ih u z l and O h n i s h i , 1972).
increased, clay filling reduces the strength and at Rj tx = 3, the strength is reduced to th a t o f the filling m aterial. F o r idealised saw too th geometry, G (X )d m an(1969) found the (Rj t j) ratio to be abou t 1.5.
B a r t o n (1973a, b) has examined the question in detail and related the mean thickness o f the filling ( /) and the m ean roughness am plitude (a ) (given by the d istance between the two parallel lines which run as tangents to the uneven profile o f the rock jo in t) and the displacem ent (cl) required for the rock to rock con tac t o f the join t walls. The results obtained by him are given in Table 9.
T u l i n o v and M o l o k o v (1971) tested a num ber o f jo in ts with different filling m aterials and under variable conditions o f m oisture. A ccording to them a thin sand layer as a filler between the hard rocks (sandstone, limestone) does not have any significant influence but in case o f relatively weak rocks (clay and m arl) its influence is ra ther to increase the angle o f friction. The shear plane in a thick layer o f sand is limited in the sandbed itself. In the case o f clay fillers also, the shear plane is limited along the weakest contact and traverses through clay. The influence o f the clay bands is very much affected by the presence o f hum idity. The d rop in shear strength is observed with increase in humidity
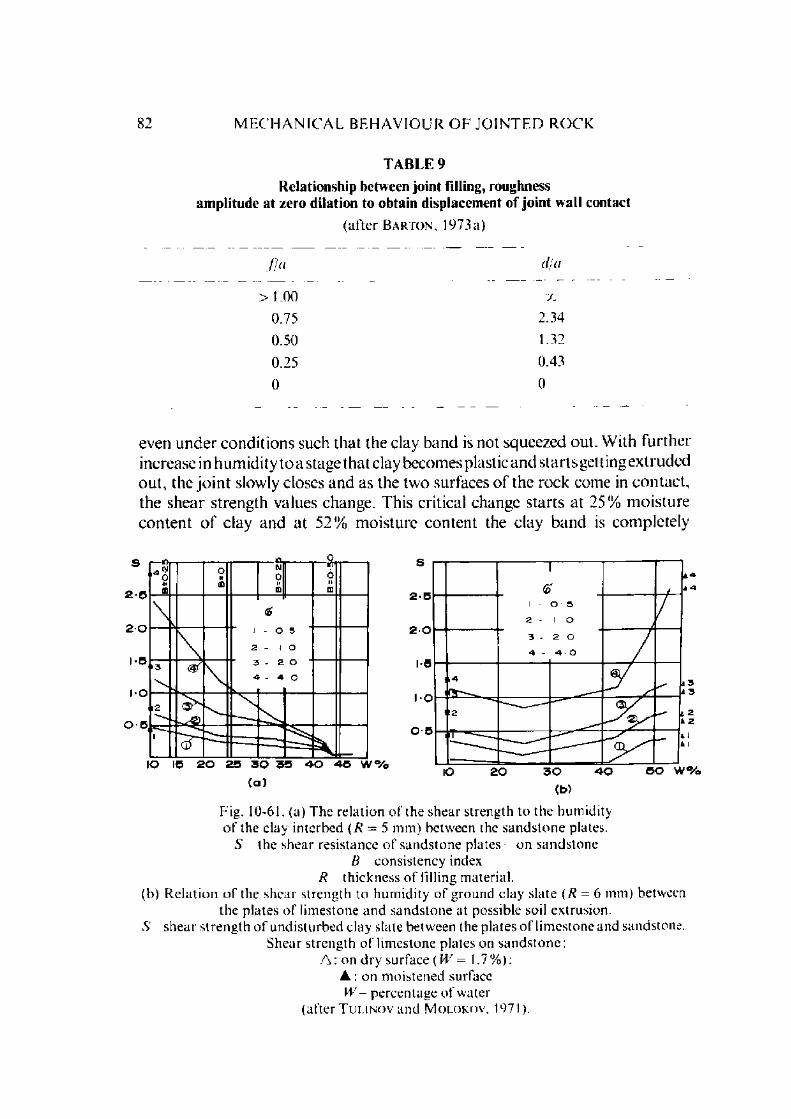
82 M E C H A N I C A L B E H A V I O U R O F J O I N T E D R O C K
T A B L E 9
R elationship between jo in t filling, roughness am plitude a t zero d ilation to obtain displacem ent o f jo in t w all contact
(a fte r B a r t o n , 1973a)
J l“ d/a
> 1 .0 0 CO
0.75 2.34
0.50 1.32
0.25 0.43
0 0
even under conditions such that the clay band is not squeezed out. W ith fu rther increase in hum idity to a stage that clay becom es plastic and s tarts get tingextruded ou t, the jo in t slowly closes and as the two surfaces o f the rock come in con tact, the shear strength values change. This critical change starts at 25% m oisture conten t o f clay and at 52% m oisture content the clay band is com pletely
Fig. 10-61. (a) The relation o f the shear s trength to the humidity o f the clay interbed (A’ = 5 mm) between the sandstone plates.
S the shear resistance o f sandstone plates on sandstone B consistency index
R thickness o f filling material.(b) Relation o f the shear strength to hum idity o f ground clay slate (R = 6 mm) between
the plates o f limestone and sandstone at possible soil extrusion.S shear s trength o f undisturbed clay slate between the plates o f limestone and sandstone.
Shear strength o f limestone plates on sandstone:A : on dry surface ( W = 1.7%);
▲ : on moistened surface W percentage o f water
(after T u l i n o v and M o l o k o v , 1971).

B E H A V I O U R D U R I N G S L I D I N G A L O N G J O I N T S S3
e x tru d ed out (this experim ent was conducted with 6 mm (0.24 in) clay band betw een limestone and sandstone plates) and the original value o f the shear s tre n g th o f the joint is achieved (Fig. 10-61). In the case o f coarse fragm entary filling m aterial, the shear plane is also located within the thick layer o f filling m a te ria l independent o f the sm oothness o r roughness o f the joint. The coefficient o f friction increases with increase in the fragment size from 2 mm to 20 30 mm (0.079 in to 0.787 1.181 in) and further increase in fragm ent size does not exert any influence on the friction coefficient (Fig. iO-62). Curve 1 refers to the case o f a com pacted filling m aterial and curve 2 refers to the case o f a loose filling m aterial. The coefficient o f friction in the form er case is about 20 to 25 % h igher than the latter case.
Fig. 10-62. Coefficient o f internal friction fragments d iam eter relation0 lum p test results
1 sandstone on sandstone2 limestone on sandstone
3 limestone on sandstone with fine-grained sand between them 4 limestone on sandstone on moistened surface
(after T ulinov and M olokov . 1971).
W hen crushed stone with clay is present as a filling m aterial, the shear resistanceis mainly determ ined by the hum idity o f the clay com ponent. W ith h ard dryclay, the crushed stone has alm ost no influence and the coefficient o f 1 riction is that o f clay. At sem ihard semiplastic consistency, the shear strength goes up with increase in fragm ent content percentage from 20- 30% up to 90% . A t fully plastic consistency, the fragm entary m aterial affects very m uch the shear resistance only at fragm ent content percentage from 60 75% upwards. The range o f values o f residual angle o f friction for a variety o f clays and clay m ixtures is given in Fig. 10-63. The influence o f grain size on the

84 M E C H A N I C A L B E H A V I O U R O F J O I N T E D R O C K
residual friction angles determ ined assum ing thickness o f the jo in t fillings is large enough not to be influenced by the jo in t wall asperities is given in Table 10. Some highly plastic clays m ay have friction angle o f 5 to 12°.
c h l o r i t e
t o Ic b i o t i t e
clay f rac t ion ( < 2 p ) ; %
Fig. 10-63. D ependence o f residual shear strength on clay fraction (after S k e m p t o n , 1964).
T A B L E 10
F riction angle, </>r, for silts, sands and gravel
(after T e r z a g h i an d P ec k , 1967)
M ateria l<*>r
Loose D ense
Sand, round grains, un ifo rm 27.5 34
Sand, angu lar grains, well g raded 33 45
Sand gravel 35 50
Silt sandy 27 to 33 30 to 34
Inorganic silt 27 to 30 30 to 35
The influence o f rate o f shearing or time has not been determ ined on filled rock joints. But tests conducted on certain m arine clays ( S k e m p t o n and H u t c h i n s o n . 1969: B j e r r u m . 1973) show that the long term strength m ay be taken 10 to 15% lower and that in overconsolidated clays reduction in strength be taken as 0.5 to 2% per log cycle o f time.
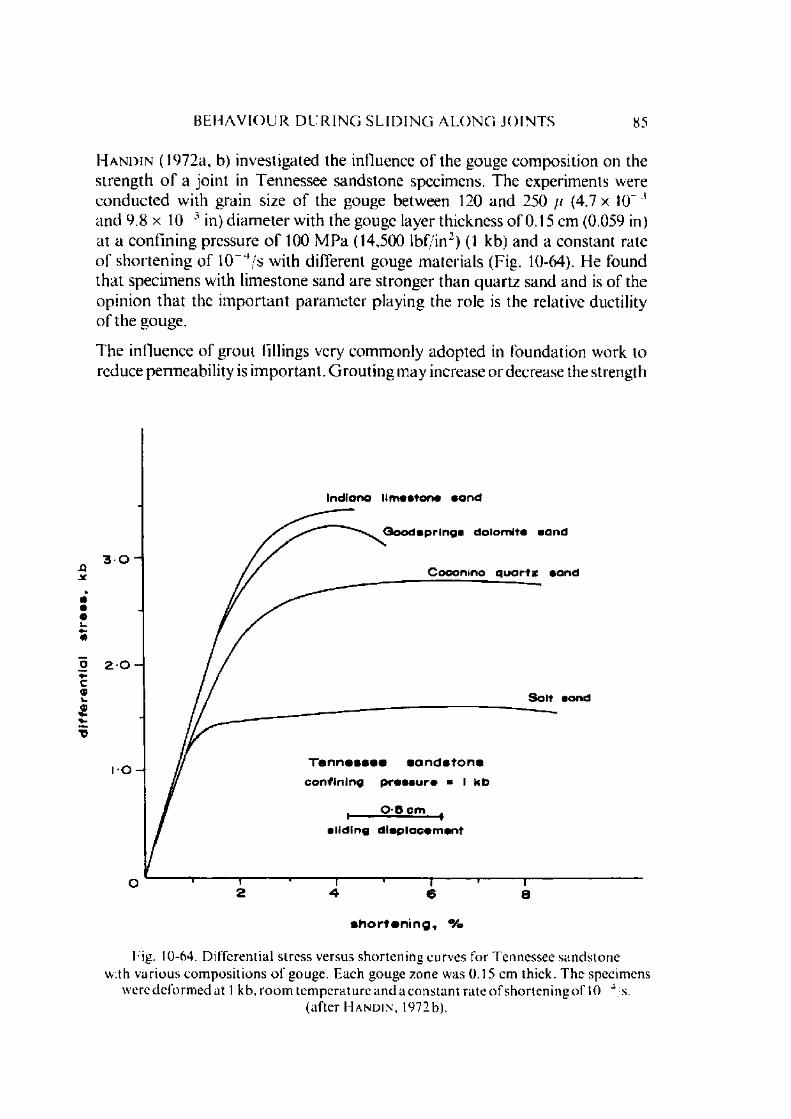
dif
fere
nti
al
stre
ss,
kb
B E H A V I O U R D U R I N G S L I D I N G A L O N G J O I N T S 85
H and in (1972a, b) investigated the influence o f the gouge com position on the strength o f a joint in Tennessee sandstone specimens. The experiments were conducted with grain size o f the gouge between 120 and 250 // (4.7 x 10 ' and 9.8 x 10 3 in) d iam eter with the gouge layer thickness o f 0.15 cm (0.059 in) at a confining pressure o f 100 M Pa (14,500 lb f/in2) (1 kb) and a constant rate o f shorten ing o f 10 ~*/s with different gouge m aterials (Fig. 10-64). I le found tha t specim ens with lim estone sand are stronger than quartz sand and is o f the opin ion tha t the im portan t param eter playing the role is the relative ductility o f the gouge.
The influence o f grout fillings very com m only adopted in foundation work to reduce perm eability is im portan t. G rou ting may increase o r decrease the strength
s h o r t e n i n g , %
l ig . 10-64. Differential stress versus shortening curves for Tennessee sandstone with various com positions o f gouge. Each gouge zone was 0.15 cm thick. The specimens
were deform ed at 1 kb, ro o m tem perature an d a constant rate o f shortening o f 10 4 s.(after H a n d i n , 1972b).
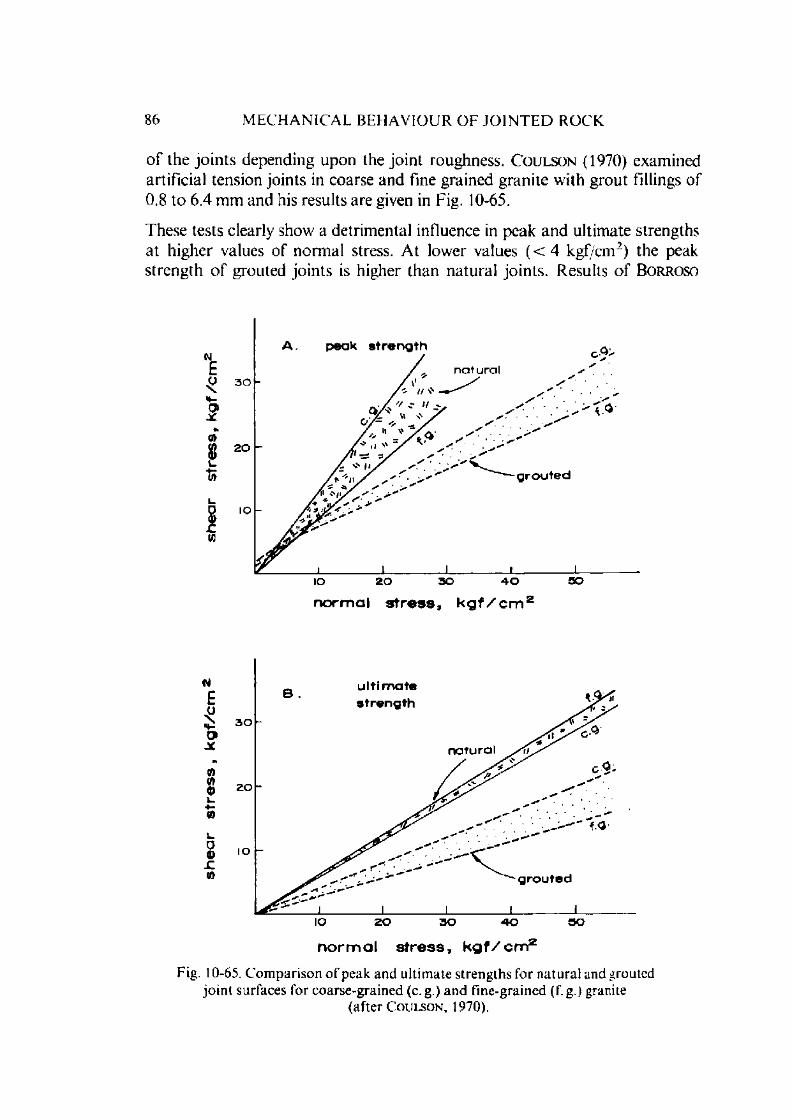
86 M E C H A N I C A L B E H A V I O U R O F J O I N T E D R O C K
o f the jo in ts depending upon the jo in t roughness. C o u l s o n (1970) exam ined artificial tension jo in ts in coarse and fine grained granite w ith grout fillings o f0.8 to 6.4 m m and his results are given in Fig. 10-65.
These tests clearly show a detrim ental influence in peak and ultim ate strengths a t higher values o f norm al stress. A t lower values ( < 4 kgf/cm 2) the peak strength o f grouted jo in ts is higher than natural jo in ts. Results o f B o r r o s o
n orm al s t ress , k g f / c m 2
n o r m a l s t ress , k g f / c m 2
Fig. 10-65. Com parison o f peak and ultimate strengths for natural and grouted jo in t surfaces for coarse-grained (e.g.) and fine-grained (f.g.) granite
(a f te r C o u l so n , 1970).
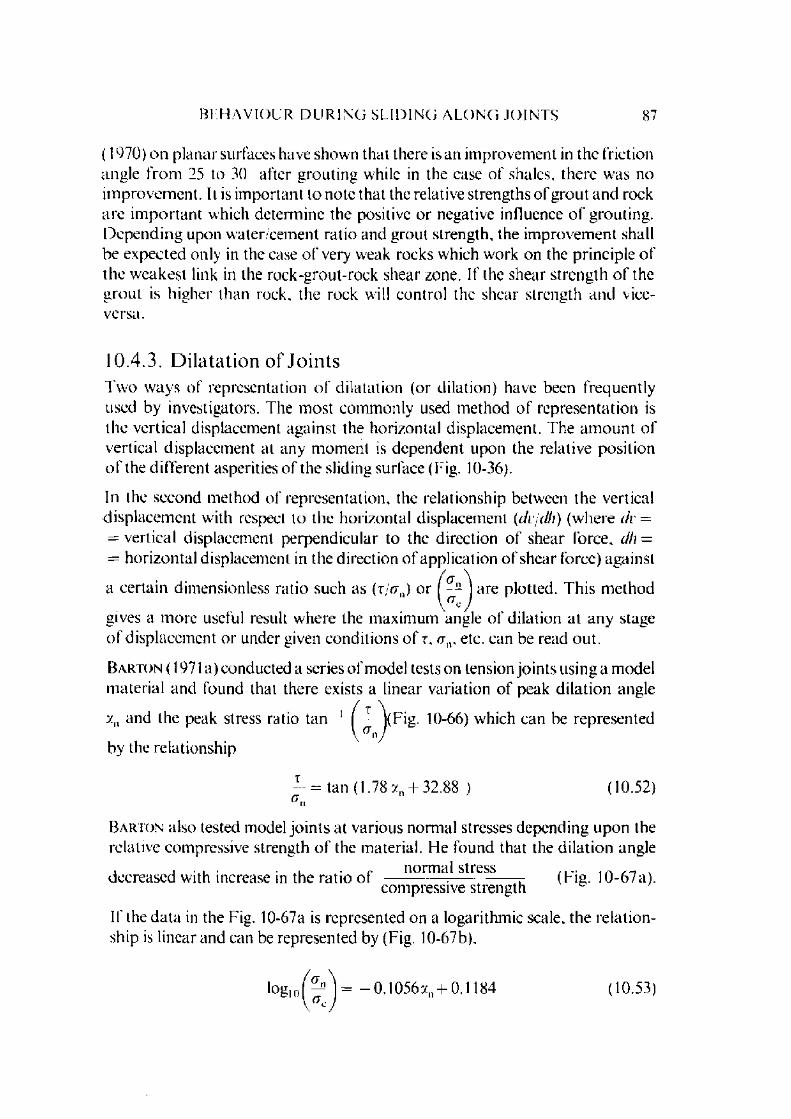
B E H A V I O U R D U R I N G S L I D I N G A L O N G J O I N T S 87
(1970) on p lanar surfaces have shown that there is an improvement in the friction angle fro m 25 to 30 after grouting while in the case o f shales, there was no im provem ent. It is im portant to note that the relative strengths o f g rou t and rock a re im portan t which determ ine the positive o r negative influence o f grouting. D epend ing upon water cem ent ratio and grout strength, the im provem ent shall be expected only in the case o f very weak rocks which work on the principle o f the w eakest link in the rock-grout-rock shear zone. If the shear strength o f the grout is higher than rock, the rock will control the shear strength and vice- versa.
10.4.3. D ila ta t ion o f Jo in tsT w o w ays o f representation o f dilatation (or dilation) have been frequently used by investigators. The m ost com m only used m ethod o f representation is the vertical displacement against the horizontal displacem ent. The am oun t o f vertical displacem ent at any m om ent is dependent upon the relative position o f the different asperities o f the sliding surface (Fig. 10-36).
In the second m ethod o f representation, the relationship between the vertical d isplacem ent with respect to the horizontal displacement (dv/dh) (w here dv = = vertical displacem ent perpendicular to the direction o f shear force, dh = = horizontal displacement in the direction o f application o f shear force) against
a certain dimensionless ratio such as (t/cjJ o r are plotted. This m ethod
gives a m ore useful result w here the maximum angle o f dilation at any stage o f displacem ent or under given conditions o f r, <rn, etc. can be read out.
B a r t o n (1971 a ) c o n d u c te d a s e r ie s o f m o d e l te s ts o n t e n s io n j o i n t s u s in g a m o d e l m a t e r i a l a n d f o u n d t h a t t h e r e e x is ts a l in e a r v a r i a t io n o f p e a k d i l a t i o n a n g le
a n and the peak stress ratio tan 1 ^(Fig. 10-66) which can be represented
by the relationship
— = t a n (1 .78 a n + 32 .8 8 ) (1 0 .5 2 )"n
B a r t o n also tested model jo in ts at various nonnal stresses depending upon therelative compressive strength o f the m aterial. Lie found that the d ilation angle
. . . . r n o r m a l s t re s s irv .d e c r e a s e d w ith in c re a se in th e r a t i o o t . (E ig . 1 0 - 6 7 a).
c o m p r e s s iv e s t r e n g th
If the data in the Fig. 10-67a is represented on a logarithm ic scale, the re la tionship is linear and can be represented by (Fig. 10-67b),
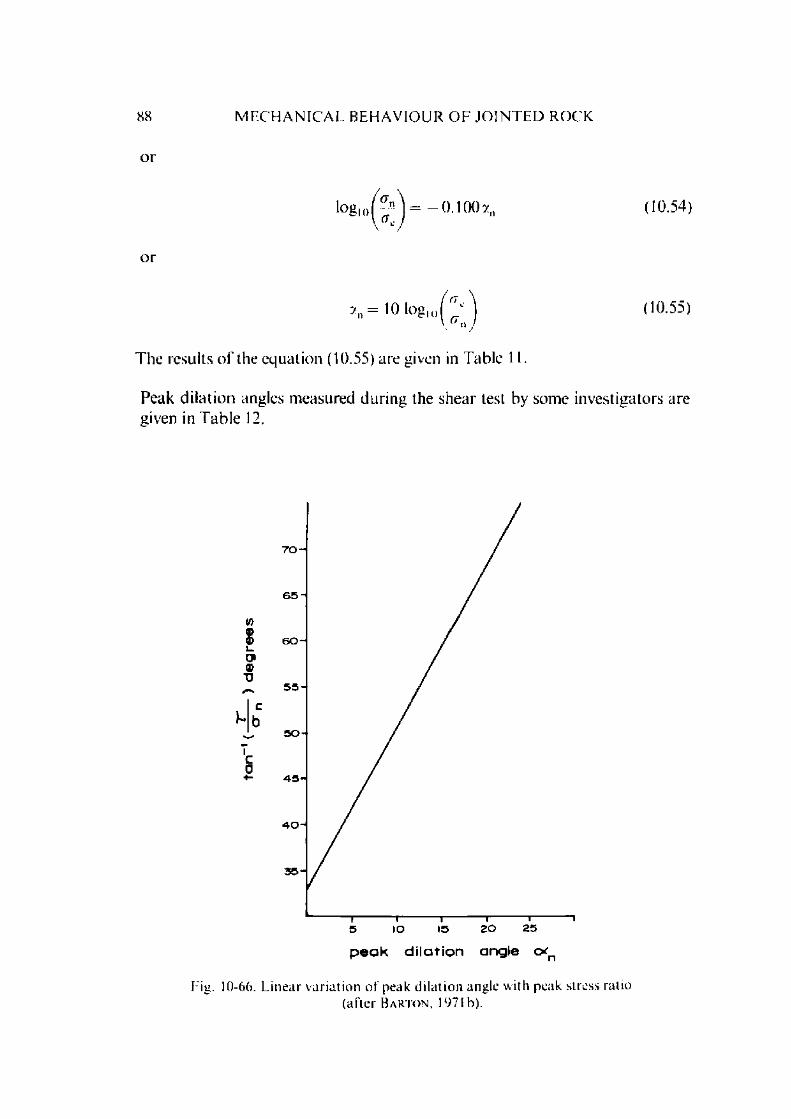
l ° g ,o M n = —0.100?,, (10.54)
'A, = 10 logw h ) (10.55)
The results o f the equation (10.55) are given in Table 11.
Peak d ila tion angles m easured during the shear test by some investigators are given in T able 12.
88 M E C H A N I C A L B E H A V I O U R O F J O I N T E D R O C K
p e a k d i l a t i o n a n g l e c*n
Fig. 10-66. Linear variation o f peak dilation angle with peak stress ratio(after B a r t o n , 1971 b).

dim
ensi
onle
ss
rati
oBl H A V I O U R D U R I N G S L I D I N G A L O N G J O I N T S 89
p e a k d i l a t i o n a n g l e o<n
Fig. 10-67. (a) V ariation o f peak dilation angle with ratio o f norm al stressto compressive strength.
(b) Linear variation o f peak dilation angle with logarithmic ratio o f norm al stress to compressive strength
(after B a r t o n , 1971 b).

90 M E C H A N I C A L B E H A V I O U R O E J O I N T E D R O C K
T A B L E 11
Results o f Eq. 10.55
(a f te r Ba r t o n , 1971 b)
n a n, d eg rees
1.0 0
10 10
100 20
1000 30
10.4.4. Scale Effect in Jo in ts
As already dem onstrated , the properties o f rock specimens are dependent upon the dim ensions o f the specimens and it is obviously necessary to investigate the behaviour o f the jo in t properties with respect to the area o f cross-section o f the jo in t.
In the discussion on the m easurem ent o f the roughness o f the jo in t surface, it has been pointed out that the angle o f the asperity a, which represents roughness o f the surface is dependent upon the base so chosen. As such, the value o f the inclination o f the asperity (/) shall be dependent upon the scale a t which these have been m easured and represented. Since the shear strength o f the jo in t surface is dependent upon the angle (/), it is probable that the jo in t properties determ ined from small laboratory specimens o f 5.1 to 15.2 cm (2 to 6 in) size and even from sm aller in situ tests 0.91 to 3.05 m (3 to 10 ft) will not represent the true values since these small specim ens could only represent the second and th ird o rder surface roughnesses. This is likely to be m ore true for the rough tension jo in ts and some faults than for sm ooth joints. Also, the inclination values o f the first and second order discontinuities are quite different and difficult to take into account in field analysis o f slopes. An exam ple o f the d ifferent values so obtained is given in Fig. 10-68.
B a r t o n (1971b) conducted a series o f tests on 4 different m odel m aterials representing the same prototype at different scale ratios. He. however, found no significant size relationship for rough tension joints. According to him small steep asperities seem to control the peak strength to a greater degree than the large am plitude low-inclination asperities o f the first order. These become im portan t only at considerably higher norm al stresses at displacem ents greater than those required to develop peak strength.

B L H A V I O U R D l R I N G S L I D I N G A L O N G J O I N T S 91
TABLE 12Peak dilation angles measured during shear tests
(a f te r B a r t o n , 1973a)
R ock type ((Tc, kg f c m 2)
D escrip tion o f joints
N o . o f tests
M ean a n ( k g f /c n r )
M ean r (kgf /cm 2)
M eana0■An
R eference
C o a rs e na tu ra l .g ra ined u n d u la t in g 8 1.12 1.84 24.0G ra n d iron s tain ing.C ou lee calcite 1 7.05 7.19 15.0 C ou lso ng ran ite and ep ido tc 2 21.1 25.9 13.0 (1970)(1675) present in
variousc o m b in a t io n s
Fine-grained natu ra l .G ra n d u n d u la t in g 4 1.08 1.03 7.6C ou lee sm o o th ; 2 7.15 5.59 6.2 C o u lso ngran ite calcite an d (1970)(1985) zeolite
present
1 lackensack natura l . 2 1.06 1.01 8.5silts tone un d u la t in g ; 3 1.03 2.60 30.1(1252) m ost surfaces 4 3.48 6.27 21.5
covered with 4 7.08 12.7 24.5 C ou lso nthin layer o f 4 20.9 31.8 20.4 (1970)calcite 2 35.0 47.9 16.6
3 56.2 58.8 6.6Sandstone natu ra l . 3 1 to 2.5 18 R iplly(1240) u n d u la t in g
open jo in ts(approx .) (approx .) an d L ei:
(1961)Siltstone n a tu ra l , 5 1 to 10 13.5 R ipley(575) u ndu la t ing
open jo in ts(approx .) (approx.) a n d L ee
(1961)
Blackstone rough. 2 12.5 25.8 23.4granite undu la ting , 2 14.3 37.2 19.2(2040) artificial
extensionfractures
1 17.5 52.9 20.2
G ran ite rough. 1 1.5 4.5 24.0 R engers(1504) undu la ting . 2 3.5 9.2 18.7 (1971)
artificial 1 6.5 18.5 22.0extension 2 14.0 21.0 19.0fractures

92 M E C H A N I C A L B E H A V I O U R O F J O I N T E D R O C K
a p p r o x i m a t e s c a l e • I in ■ I f t
Fig. 10-68. An example o f a d iscontinu ity illustrating first and secondo rd e r irregularities
(after P a t t o n , 1966a).
S e r a f im a n d G u e r r e i r o (1968) a n a ly s e d in s i tu s h e a r te s ts o n d i f f e re n t a r e a s o f c r o s s - s e c t io n o f t h e s p e c im e n s [5 m 2 (53.8 f t 2). 16 m 2 (172.2 f t 2) a n d 30 m 2 (322.9 f t 2 )]. T h e 16 m 2 (172.2 f t 2 ) t e s t s w e r e p e r f o r m e d b y J im e n e z S a l a s a n d U r i e l (1964) in S p a i n a n d 30 m 2 (322.9 f t2) b y R uiz a n d d e C a m a r g o (1966) in B raz i l . M o r e d e t a i l e d d i s c u s s io n o f s ize e f fec ts a n d tes t t e c h n iq u e s o f in s i tu s h e a r is g iven in C h a p t e r 8. s e c t i o n 8.10. It is s u g g e s te d t h a t f o r th e s t r e n g th o f m a s s e s t h a t h a v e j o i n t s s e p a r a t e d b y la rg e d i s ta n c e s , a n a r e a o f th e o r d e r o f t e n s o f s q u a r e m e t r e s ( y a rd s ) is p r o b a b l y th e m a x i m u m t h a t c a n b e u se d . W h e n s tu d y i n g th e s t r e n g th a l o n g f a u l ts , j o i n t s o r p l a n e s o f s t r a t i f ic a t io n , p r o b a b l y a n a r e a o f s o m e t e n t h s o f a s q u a r e m e t r e ( ^ 5 f t 2 ) is a d e q u a te .
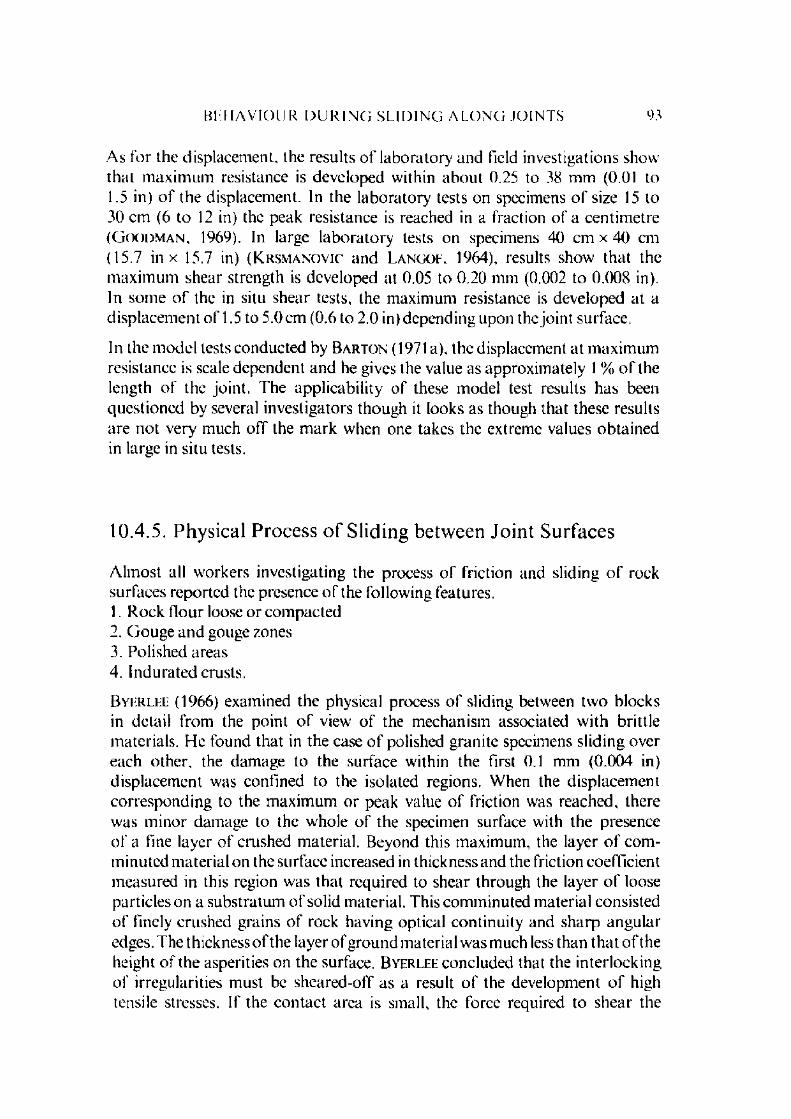
B1 1 1 A V I O I J R D U R I N G S L I D I N G A L O N G J O I N T S 93
A s for the displacem ent, the results o f laboratory and field investigations show that m axim um resistance is developed within abou t 0.25 to 38 mm (0.01 to 1.5 in) o f the displacem ent. In the laboratory tests on specimens o f size 15 to 30 cm (6 to 12 in) the peak resistance is reached in a fraction o f a centim etre (G (X )d m a n , 1969). In large labora to ry tests on specimens 40 cm x 40 cm (15.7 in x 15.7 in) ( K r s m a n o v i c and L a n g o f , 1964), results show tha t the m axim um shear strength is developed at 0.05 to 0.20 mm (0.002 to 0.008 in). In som e o f the in situ shear tests, the m axim um resistance is developed at a d isplacem ent o f 1.5 to 5.0 cm (0.6 to 2.0 in) depending upon the jo in t surface.
In the m odel tests conducted by B a r t o n (1971 a), the displacem ent at m axim um resistance is scale dependent and he gives the value as approxim ately 1 % o f the length o f the jo in t. The applicability o f these m odel test results has been questioned by several investigators though it looks as though that these results are not very m uch o ff the m ark when one takes the extreme values obtained in large in situ tests.
10.4.5. Physical Process o f Sliding between Jo in t Surfaces
A lm ost all w orkers investigating the process o f friction and sliding o f rock surfaces reported the presence o f the following features.1. Rock flour loose o r com pacted2. G ouge and gouge zones3. Polished areas4. Indurated crusts.
B y e r l e e (1966) examined the physical process o f sliding between tw o blocks in detail from the point o f view o f the m echanism associated w ith brittle m aterials. H e found that in the case o f polished granite specimens sliding over each other, the dam age to the surface within the first 0.1 mm (0.004 in) displacem ent was confined to the isolated regions. When the displacem ent corresponding to the m axim um or peak value o f friction was reached, there was m inor dam age to the whole o f the specimen surface with the presence o f a fine layer o f crushed m aterial. Beyond this m axim um , the layer o f com m inuted m aterial on the surface increased in thickness and the friction coefficient measured in this region was that required to shear through the layer o f loose particles on a substratum o f solid m aterial. This com m inuted m aterial consisted o f finely crushed grains o f rock having optical continuity and sharp angular edges. The thickness o f the layer o f ground m aterial was much less than th a t o f the height o f the asperities on the surface. B y e r l e e concluded that the interlocking o f irregularities m ust be sheared-off as a result o f the developm ent o f high tensile stresses. If the contact area is small, the force required to shear the

94 M E C H A N I C A L B E H A V I O U R O F J O I N T E D R O C K
asperities is small and vice-versa. The physical process involved in the sliding when the contact between the surfaces is confined to isolated regions is no different from the physical process when the co n tac t is m ade over the w hole o f the surface.
P a t t o n (1 9 6 6 a ) w h e n e x a m i n i n g th e in f lu e n c e o f th e n u m b e r o f t e e th c o n s i d e r e d t h a t w h e n tw o s u r fa c e s h a v e a s p e r i t i e s s h e a r e d o f f , th e s h e a r in g f o r c e a c t s p r im a r i ly o n th e e x te r n a l t e e th a n d th e s e a r e s h e a r e d o f f b e f o r e th e fu l l l e n g th o f t h e c e n t r a l te e th c a n b e u t i l i sed . T h e p h e n o m e n o n o f f r ic t io n a l s l id in g is t h e n o f p ro g re s s iv e f a i lu r e o f th e a s p e r i t i e s w i th d i s p l a c e m e n t a n d n o t t h e f a i l u r e o f a l l th e in te r lo c k in g a s p e r i t i e s a t o n e t im e .
H o s k i n s , J a e g e r and R o s e n g r e n (1968) found a great deal o f surface dam age and slickenside with rough surfaces, but for sm ooth surfaces on which stick-slip oscillations have taken place there was very little evidence o f surface dam age. T he measured surface roughness did not increase and there was little evidence o f detrital m aterial o r fracturing o f crystals.
J a e g e r (1971) concluded that with sliding o f rough surfaces which are a t first in intim ate contact (completely interlocked), the contact is lost except in a few regions where intense shearing and rem oval o f m aterial take place. This sheared m aterial fills the hollows giving the end result a surface o f gouge m aterial. In cases, where the rough surface slides over a relatively flat surface, the highest spots o f the rough surface are worn down and m ay also score the originally flat surface. In such cases, the same regions o f the rough surface are always in contact w ith the opposite and the result is a gradual increase in the contact area with progress in displacement. At places o f con tac t where profuse gouge m aterial is form ed the rubbing blocks m ay fail by indirect tension caused by local stress at contacts.
C o u l s o n (1970) examined the phenom enon o f surface dam age in quite detail. He classified the types o f dam age o r w ear o f the sliding surface into 3 m ain categories (Fig. 10-69) namely, polishing, induration , and rock flour and gouge. C o u l s o n found that gouging and generation o f rock Hour is chiefly associated w ith rougher and sandblasted surfaces.
U nder a microscope, it was observed that the gouge m aterial and rock flour consists o f small discrete angular particles which could be separated from their neighbours with absence o f any fusion in between them, indicating the absence o f any plastic deform ation. ( C o u l s o n ’s tests were conducted at and the rocks tested by him were limestones, sandstone and granite.) The com pacted gouge flour in the gouge trough gives the appearance o f a typical slickenside (Fig. 10-70) and chatter m arks sim ilar to those associated with rock being abraded at the base o f m oving glaciers. At the bottom of the gouge

B E H A V I O U R D U R I N G S E I D I N G A E O N G J O I N T S 95
s u r f a c e d a m a g e c l a s s i f i c a t i o n d e s c r i p t i o n o f d a m a g e
G6
G 5
G 3
G 2
■oc0
s e v e r e g o u g in g o v e r > I O % o f a r e a , e x t e n s i v e e x t e r n a l c o m p a c t i o n o f r o c k f l o u r o u t s i d e g o u g e z o n e s
s e v e r e g o u g in g o v e r > 10% o f a r e a , l i t t l e o r n o e x t e r n a l c o m p a c t i o n o f r o c k f l o u r o u t s i d e g o u g e z o n e s
l o c a l g o u g in g o v e r < ) 0 0/o o f a r e a , e x t e n s i v e e x t e r n a l c o m p a c t io n o f r o c k f l o u r o u t s i d e g o u g e z o n e s
l o c a l g o u g in g o v e r < 10% o f a r e a , l i t t l e o r n o e x t e r n a l c o m p a c t i o n o f r o c k f l o u r o u t s i d e g o u g e z o n e s
h a r d r o c k s u r f a c e s s e p a r a t e d by l a y e r o f e x t e r n a l l y c o m p a c t e d r o c k f l o u r , s u r f a c e p o r e s f i l l e d
r o c k f l o u r f i l l i n g s u r f a c e p o r e s i n c o m p l e t e l y , s o m e lo o s e p o w d e r o n s u r f a c e
g r a i n s l o o s e n e d o r d is lo d g e d b u t n o t f r a c t u r e d
s u r f a c ea p p e a r a n c e
u n c h a n g e d
O ' / t h i n i n d u r a t e d / s u r f a c e c r u e t
i n d u r a t e d s u r f a c e c r u e t m in o r g o u g in g
s u r f a c e p o l is h e d , l i t t l e o r no p o w d e r
s u r f a c e p o l is h e d ,f i n e p o w d e r a n d / o r
m in o r g o u g e
Fig. 10-69. Surface d am age classification system (after C o u l so n , 1970).
m aterial appear step like features opposing the direction o f shear (contrary to that o f the structural geology concept) with dip o f 17-1/2 and an average dip o f 20 . These step like features are sim ilar to the “ R i e d e l shears'* observed by many investigators (first reported by C l o o s (1928) and R i e d e l (1929)), the
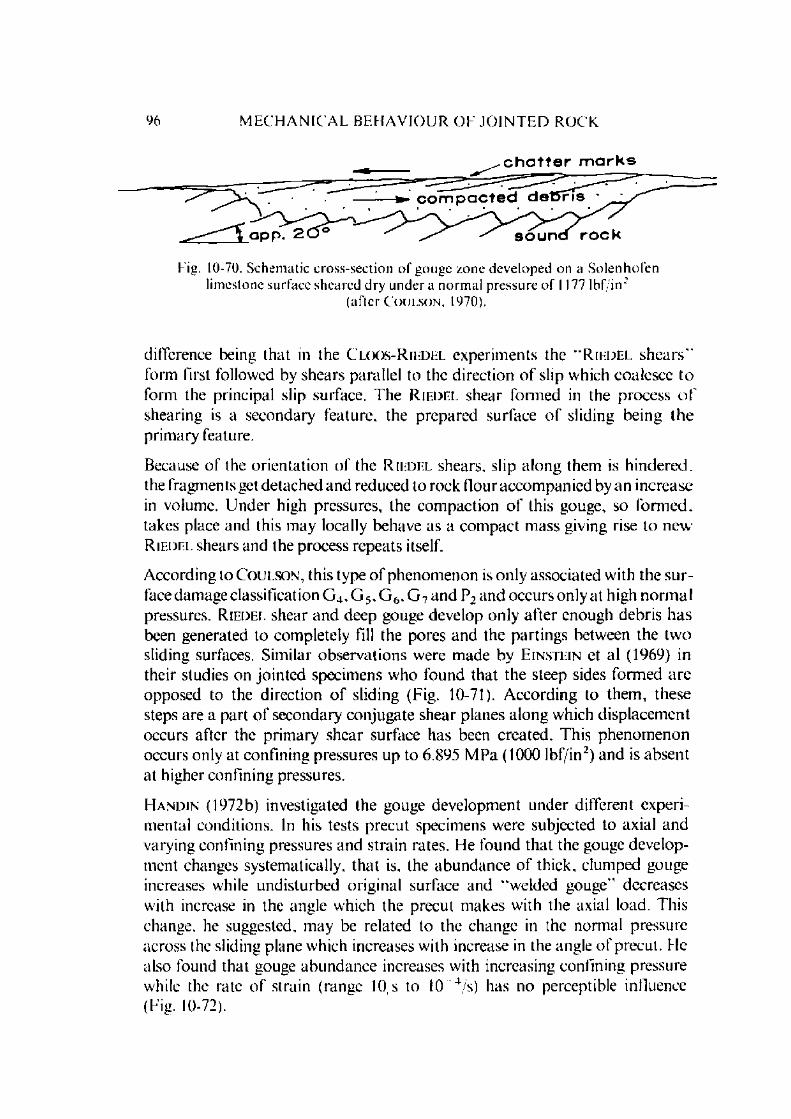
96 M E C H A N I C A L B E H A V I O U R O F J O I N T E D R O C K
Eig. 10-70. Schematic cross-section o f gouge zone developed on a Solenhofen limestone surface sheared dry under a norm al pressure o f 1177 lbf/in2
(after C oijlson. 1970).
d iffe ren ce being th a t in th e C loos- R ied el e x p e rim e n ts th e “ R ie d el s h e a r s ” fo rm first fo llow ed by sh e a rs p a ra lle l to th e d ire c tio n o f s lip w h ich c o a le sce to fo rm the p rin c ip a l slip su rface . T h e R ied el sh e a r fo rm e d in the p ro c e ss of sh e a rin g is a se co n d a ry fe a tu re , th e p re p a re d su rfa c e o f s lid in g b e in g th e p rim a ry fea tu re .
Because o f the orientation o f the R ie d e l shears, slip along them is h indered , the fragments get detached and reduced to rock flour accom panied by an increase in volume. U nder high pressures, the com paction o f this gouge, so form ed, takes place and this may locally behave as a com pact m ass giving rise to new R ie d e l shears and the process repeats itself.
According to C o u l s o n , this type o f phenom enon is only associated with the su rface dam age classification G 4, G 5, G 6, G 7 and P2 and occurs only at high norm al pressures. R ie d e l shear and deep gouge develop only after enough debris has been generated to completely fill the pores and the partings between the tw o sliding surfaces. Sim ilar observations were m ade by E in s te in et al (1969) in their studies on jo in ted specimens who found that the steep sides form ed are opposed to the direction o f sliding (Fig. 10-71). A ccording to them , these steps are a part o f secondary conjugate shear planes a long which displacem ent occurs after the prim ary shear surface has been created. This phenom enon occurs only at confining pressures up to 6.895 M Pa (1000 lbf/in2) and is absent al higher confining pressures.
EIandin (1972b) investigated the gouge developm ent under different experim ental conditions. In his tests precut specimens were subjected to axial and varying confining pressures and strain rates. He found that the gouge development changes systematically, tha t is, the abundance o f thick, clumped gouge increases while undisturbed original surface and “welded gouge" decreases with increase in the angle which the precut makes with the axial load. This change, he suggested, may be related to the change in the normal pressure across the sliding plane which increases with increase in the angle o f precut. He also found that gouge abundance increases with increasing confining pressure while the rate o f strain (range 10/s to 10 4/s) has no perceptible influence (Fig. 10-72).
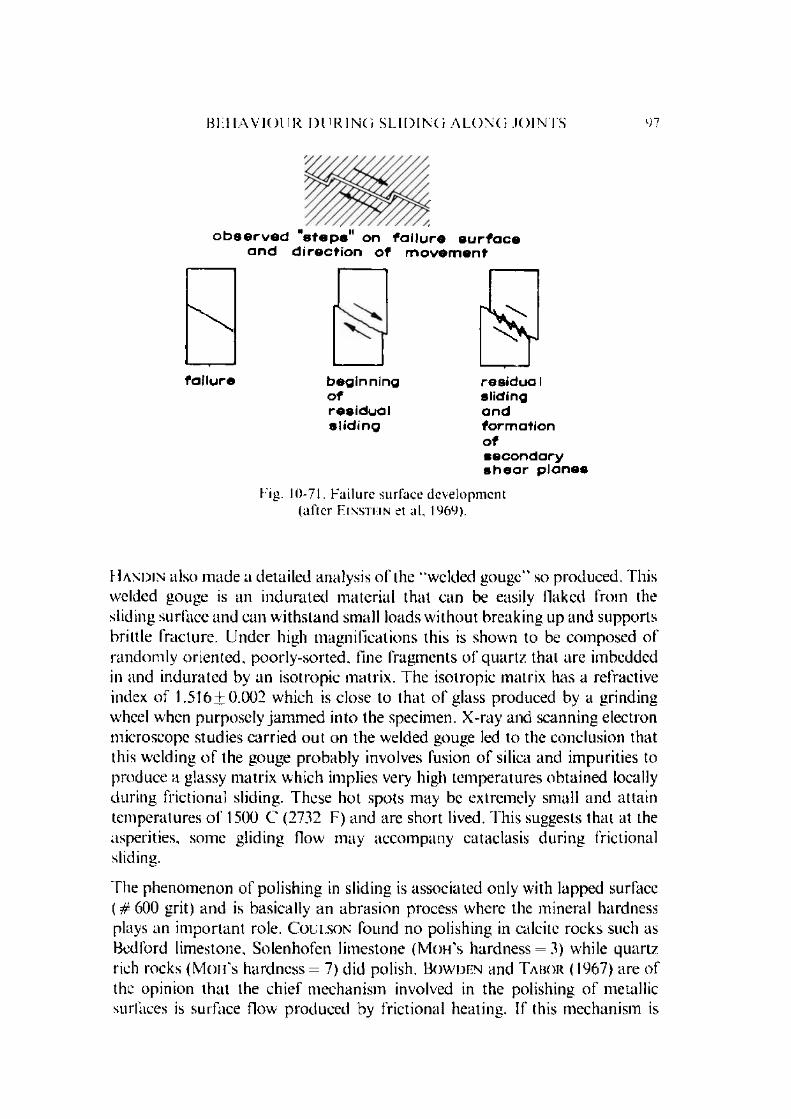
B1 M A V I O l ' R D U R I N G S L I D I N G A L O N G J O I N T S 97
o b s e r v e d " s t e p s " o n f a i l u r e s u r f a c e a n d d i r e c t i o n o f m o v e m e n t
f a i l u r e b e g i n n i n go fr e s i d u a ls l i d i n g
r e s i d u a Is l idinga n df o r m a t i o no fs e c o n d a r y s h e a r p l a n e s
Fig. 10-71. Failure surface development (after E in s t e i n et al, 1969).
I U n d i n also m ade a detailed analysis o f the “welded gouge" so produced. This welded gouge is an indurated m aterial that can he easily flaked from the sliding surface and can w ithstand small loads w ithout breaking up and supports brittle fracture. U nder high m agnifications this is shown to be com posed o f random ly oriented, poorly-sorted, fine fragm ents o f quartz that are imbedded in and indurated by an isotropic m atrix. The isotropic m atrix has a refractive index o f 1 .516+0.002 which is close to that o f glass produced by a grinding wheel when purposely jam m ed into the specimen. X -ray and scanning electron m icroscope studies carried ou t on the welded gouge led to the conclusion that this welding o f the gouge probably involves fusion o f silica and im purities to produce a glassy m atrix which implies very high tem peratures obtained locally during frictional sliding. These hot spots may be extremely small and attain tem peratures o f 1500 C (2732 F) and are short lived. This suggests that at the asperities, some gliding How m ay accom pany cataclasis during frictional sliding.
The phenom enon o f polishing in sliding is associated only with lapped surface ( # 6 0 0 grit) and is basically an abrasion process where the mineral hardness plays an im portan t role. C o u l s o n found no polishing in calcite rocks such as Bedford limestone, Solenhofen lim estone (M on 's hardness = 3) while quartz rich rocks (M on 's hardness = 7) did polish. B o w d e n and T a b o r (1967) are of the opinion tha t the ch ief m echanism involved in the polishing o f metallic surfaces is surface flow produced by frictional heating. If this m echanism is
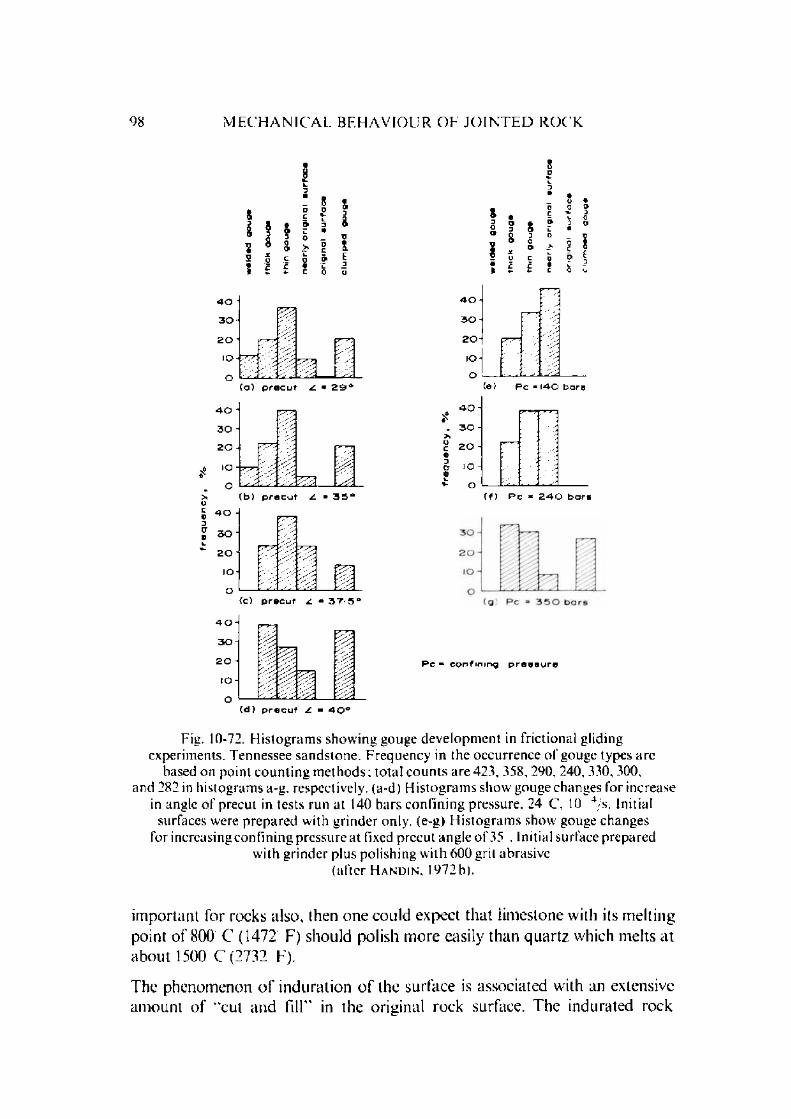
98 MEC H A N I C A L B E H A V I O U R O F J O I N T E D R O C K
4 0
3 0
20
IO
O
4 0
3 0
20
I O
O
403 0
20
IOO
4 0
3 0
20
IOo
r ”
0 H( a ) p r o c u t Z = 2 9 °
( b ) p r e c u t Z * 3 5 c
( c ) p r e c u t Z ■ 3 7 - 5 c
ro:' / y y
4 0 j
(e) P c = 1 4 0 b a r s
4 0
3 0
20
I O
O( f ) P c = 2 4 0 b a r s
P c « c o n f i n i n g p r e s s u r e
( d ) p r e c u t Z ■ 4 0 °
Fig. 10-72. H istogram s showing gouge developm ent in frictional gliding experiments, Tennessee sandstone. Frequency in the occurrence o f gouge types are
based on point coun ting m ethods; total coun ts are 423, 358, 290, 240, 330, 300, and 282 in histograms a-g. respectively, (a-d) H istogram s show gouge changes for increase
in angle o f precut in tests run at 140 bars confining pressure, 24 C. 10 4/s. Initial surfaces were prepared with grinder only, (c-g) Histogram s show gouge changes
for increasing confining pressure a t fixed precut angle o f 35 . Initial surface prepared with grinder plus polishing with 600 grit abrasive
(after H a n d i n , 1972b).
im portant for rocks also, then one could expect that limestone with its m elting point o f 800 C (1472 F) should polish m ore easily than quartz which melts at about 1500 C (2732 F).
The phenom enon o f induration o f the surface is associated with an extensive am ount o f “cut and fill" in the original rock surface. The indurated rock
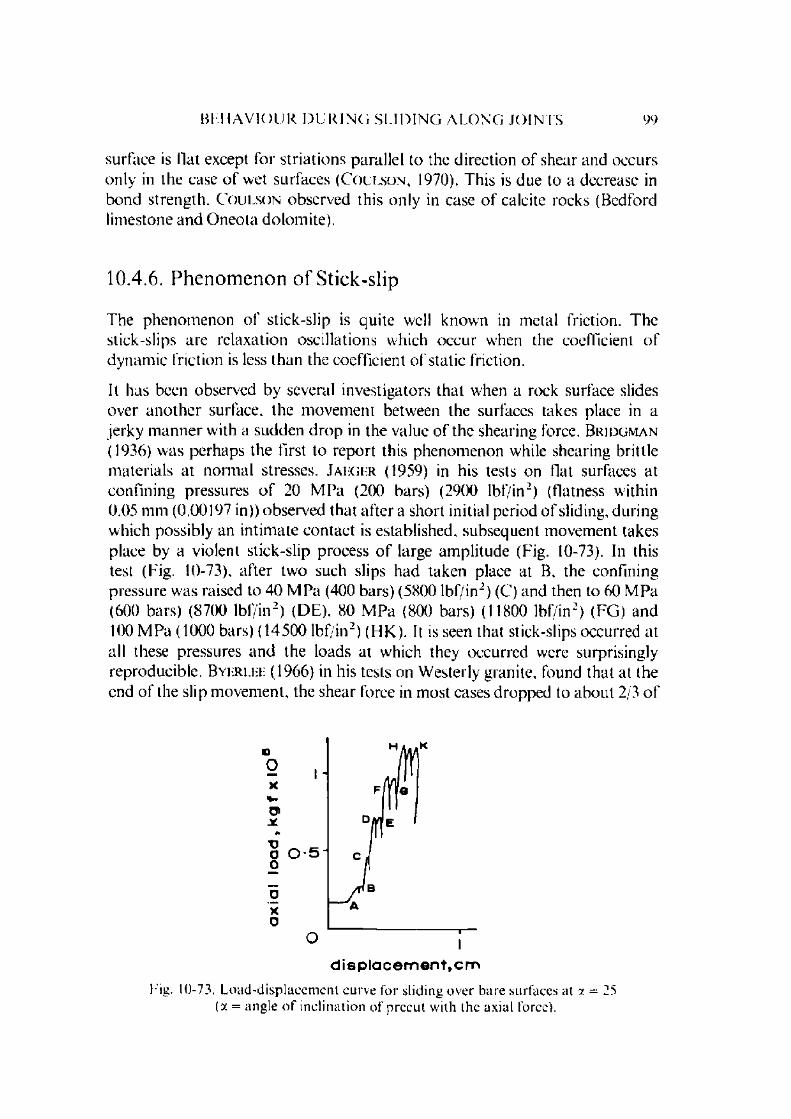
B L H A V I O U R D U R I N G S L I D I N G A L O N G J O I N T S 99
surface is flat except fo r striations parallel to the direction o f shear and occurs only in the case o f wet surfaces ( C o u l s o n , 1970). This is due to a decrease in bond strength. C o u l s o n observed this only in case o f calcite rocks (Bedford lim estone and O neota dolom ite).
10.4.6. P h e n o m e n o n o f Stick-slip
The phenom enon o f stick-slip is quite well known in metal friction. The stick-slips a re relaxation oscillations which occur when the coefficient o f dynam ic friction is less than the coefficient o f static friction.
It has been observed by several investigators that when a rock surface slides over an o th er surface, the m ovem ent between the surfaces takes place in a jerky m anner with a sudden d rop in the value o f the shearing force. B r id g m a n (1936) was perhaps the first to report this phenom enon while shearing brittle m aterials a t norm al stresses. J a e g e r (1959) in his tests on flat surfaces at confining pressures o f 20 M Pa (200 bars) (2900 lbf/in2) (flatness within 0.05 m m (0.00197 in)) observed tha t after a short initial period o f sliding, during which possibly an in tim ate contact is established, subsequent m ovem ent takes place by a violent stick-slip process o f large am plitude (Fig. 10-73). In this test (Fig. 10-73), after two such slips had taken place at B, the confining pressure was raised to 40 M Pa (400 bars) (5800 lbf/in2) (C) and then to 60 M Pa (600 bars) (8700 lbf/in2) (D E), 80 M Pa (800 bars) (11800 lbf/in2) (FG ) and 100 M Pa (1000 bars) (14500 lbf/in2) (H K ). It is seen that stick-slips occurred at all these pressures and the loads at which they occurred were surprisingly reproducible. B y e r le e (1966) in his tests on W esterly granite, found that at the end o f the slip m ovem ent, the shear force in most cases dropped to about 2/3 o f
Fig. 10-73. Load-displacem ent curve for sliding over bare surfaces at y. = 25 (a = angle o f inclination o f precut with the axial force).

100 M E C H A N I C A L B E H A V I O U R O E J O I N T E D R O C K
the shear stress required to initiate m ovem ent. Sim ilar results have been reported by C h r i s t e n s e n et al (1974) on ground surfaces o f W esterly granite using to rsional shear test.
H o s k in s , J a e g e r and R o s e n g r e n (1968) tested blocks o f Red granite having lapped surfaces with roughness o f 0.889 ± 0 .1 2 7 //m (35 ± 5 //in) in the equipm ent (Fig. 10-18c) and reported that after an initial rise in load, a sudden slip occurred and stick-slip proceeded regularly with increasing am plitude (Fig. 10-74). Fig. 10-74a is taken from the m achine recorder and on an enlarged scale it is shown in Fig. 10-74b. The portion o f the oscillations below the dotted line PQ are caused by m otion o f the testing m achine pendulum and the actual am plitude o f the oscillations is the distance between the upper portion and the line PQ. If the highest and lowest values o f the r are calculated and the r — on curves are plotted, straight lines are obtained (Fig. 10-75) with different values o f the intercepts on the r axis giving different cohesive strengths (< ) and different friction values (//). These values so calculated for different rocks are given in T able 13.
T A B L E 13
C oefficient o f friction and cohesion fo r rock surfaces exhibiting stick-slip behaviour
(after H o s k i n s , J a e g e r and R o s e n g r e n , 1968)
R ockSurface roughness
//in (//cm) /<* c <•*(F — F*)/X
lbf/in (N /m )
Red g ran ite 35 ± 5 (89 ± 1 3 ) 0.53 0.31 0.42 40 40 5.1 x 10⁶ (894 x 10°)
Red g ran ite 80 ± 2 0 (203 ± 5 1 ) 0.53 0.48 0.50 50 50 4.7 x 10^ (823 x 10°)
G a b b ro 35 ± 5 (8 9 ± 13) 0.32 0.25 0.28 35 30 3.4 x 10⁶ (596 x 10°)
G a b b ro 50 (127) 0.18 0.15 0.16 40 30 2.9 x 10^ (508 x 10°)
T rachy te
C a r r a r a
30 (76) 0.63 0.54 0.58 60 70 5.0 x 10°(876 x 10°)
m arb le 55 (140) 0.41 0.39 0.40 120 110
// = coefficient o f friction before slip (Fig. 10-75)//* = coefficient o f friction a f te r slip/ / ' = average value o f coefficient o f friction equal to coefficient o f dynam ic frictionc = in tercep t on r axis before-slip curvec* = in tercept on r axis after-slip curveF - F *
= s tillness of the m achine
F = load before slipF* = load af te r slipX = disp lacem ent d u r in g slip

BIT I A V I O l R D U R I N G S L I D I N G A L O N G J O I N T S 101
H Q i"h
(•) (IO (iii) (iv) ( v ) (vi) (vii) (viii)
( a )
Fig. 10-74. (a) Testing m achine recorder load-displacement curves for sm oo th Red granite with surface roughness 35 ± 5 / / in. F lat jack pressures
(i) 500 lbf/in2 ; (ii) 250; (iii) 750; (iv) 125; (v) 250; (vi) 375; (vii) 500; (viii) 625. (b) The oscillations o f Fig. 10-74 (a) (i) on a magnified scale
(after H o s k i n s . J a e g e r and R o s e n g r e n , 1968).
crn , 1 b f / i n 2
Fig. 10-75. Typical shear stress-normal stress relations for surfaces which show stick-slip.A. Red granite 35 // in;
B. G a b h ro 35 /< in (after H o s k i n s , J a e g f r , and R o s e n g r e n , 1968).
T he phenom enon o f stick-slip is not very clear as yet. F Iosk in s , J a e g e r and R o s e n g r e n (1968) observed that these were associated only with surfaces o f high finish and that this behaviour can be inhibited by reworking o f the surfaces. They found that when the surface o f Red granite was reworked from 0.889 ± 0 .1 2 7 //m (3 5 ± 5 //in) to 4.562 + 0.508 /m i (180 + 20 //in), the stick-slip oscillations disappeared. J a e g e r (1959) also observed these oscillations with ground surfaces but there are indications that sim ilar oscillations existed in his tests on plaster filled jo in ts at large displacem ents. J a e g e r and R o s e n g r e n (1969) reported that oscillations occur only when the surface roughness is less than 0.00254 m m (0.0001 in) and that these oscillations are som etim es irregular. B r a c e and B y k r le e (1966a, b) and B y e r le e (1967a) stated tha t
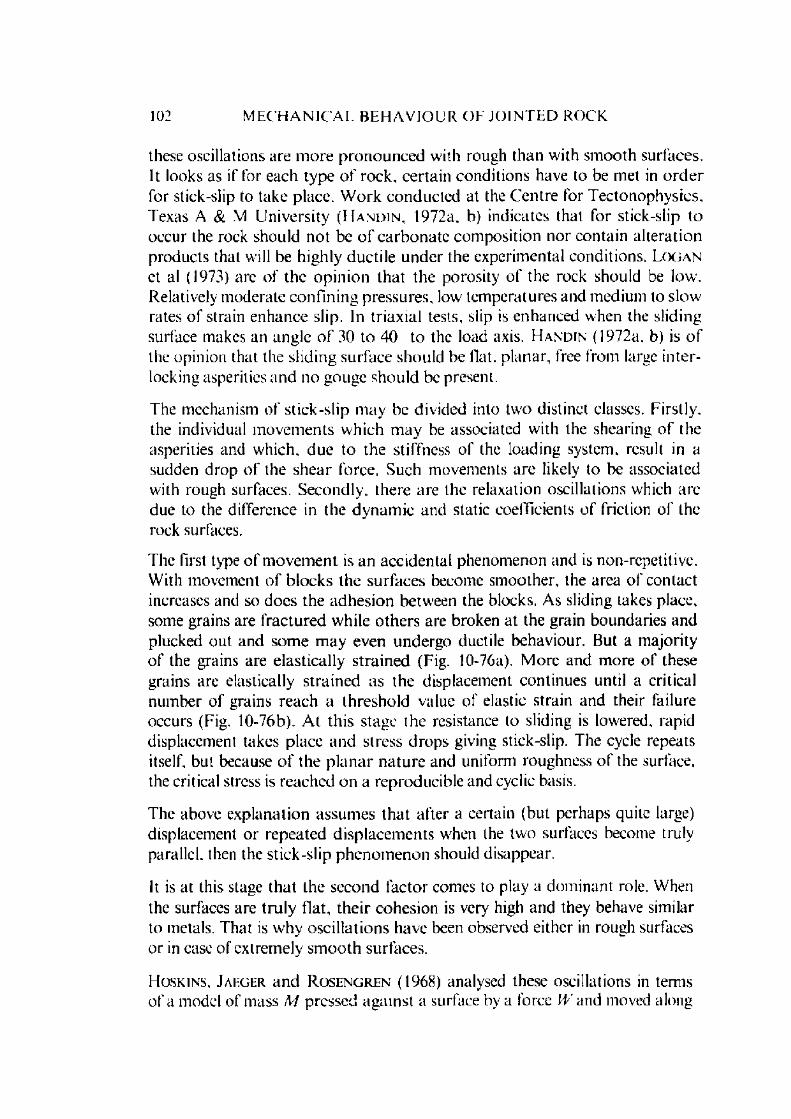
102 M E C H A N I C A L B E H A V I O U R O E J O I N T E D R O C K
these oscillations are m ore p ronounced with rough than with sm ooth surfaces. It looks as if for each type o f rock, certain conditions have to be met in o rd e r for stick-slip to take place. W ork conducted at the C entre for Tectonophysics, Texas A & M U niversity ( H a n d in . 1972a, b) indicates that for stick-slip to occur the rock should no t be o f ca rb o n ate com position nor contain a lteration products that will be highly ductile under the experim ental conditions. L o g a n et al (1973) are o f the op in ion tha t the porosity o f the rock should be low. Relatively m oderate confin ing pressures, low tem peratures and m edium to slow rates o f strain enhance slip. In triax ial tests, slip is enhanced w hen the sliding surface makes an angle o f 30 to 40 to the load axis. H a n d in (1972a, b) is o f the opinion that the slid ing surface should be flat, p lanar, free from large in te rlocking asperities and no gouge should be present.
The mechanism o f stick-slip m ay be divided into two distinct classes. Firstly, the individual m ovem ents w hich m ay be associated with the shearing o f the asperities and which, due to the stiffness o f the loading system, result in a sudden drop o f the shear force. Such m ovements are likely to be associated with rough surfaces. Secondly, there are the relaxation oscillations which are due to the difference in the dynam ic and static coefficients o f friction o f the rock surfaces.
The first type o f m ovem ent is an accidental phenom enon and is non-repetitive. W ith movement o f blocks the surfaces become sm oother, the area o f contact increases and so does the adhesion between the blocks. As sliding takes place, some grains are fractured while o th e rs are broken at the grain boundaries and plucked out and som e m ay even undergo ductile behaviour. But a m ajority o f the grains are elastically stra ined (Fig. 10-76a). M ore and m ore o f these grains are elastically stra ined as the displacement continues until a critical num ber o f grains reach a threshold value o f elastic strain and their failure occurs (Fig. 10-76b). A t this stage the resistance to sliding is lowered, rapid displacement takes place and stress d rops giving stick-slip. The cycle repeats itself, but because o f the p la n a r n a tu re and uniform roughness o f the surface, the critical stress is reached on a reproducible and cyclic basis.
The above explanation assum es tha t after a certain (but perhaps quite large) displacement o r repeated d isp lacem ents when the two surfaces become truly parallel, then the stick-slip phenom enon should disappear.
It is at this stage tha t the second facto r comes to play a dom inant role. When the surfaces are tru ly flat, the ir cohesion is very high and they behave similar to metals. That is w hy oscillations have been observed either in rough surfaces or in case of extrem ely sm ooth surfaces.
H o sk in s , J a h g e r and R o s e n g r e n (1968) analysed these oscillations in terms o f a model o f m ass M pressed against a surface by a force W and moved along

B E H A V I O U R D U R I N G S L I D I N G A L O N G J O I N T S 103
( a ) ( b )
( c )
Fig. 10- 7 ( > . Schematic diagrams o f concept o f surface d e fo rm at io n during stick-slip. Shaded areas indicate elastic s tra in ing o f rock a t sliding surface
(after H a n d i n , 1972b).
the surface by a spring (DM o f stiffness /. w hose one end O is moved with a co n stan t speed V (Fig. 10-77a). The m ass will rem ain at rest relative to the p lane until the force F exerted by the spring reaches the value given by the equation
F = \ i W (10.56)
A t this time it will slip and its m otion will be resisted by the force o f dynam icfriction [i'W. D uring slipping, if V is sm all, its d isplacem ent A'relative to theplane is approxim ately given by
X = (// — n') W [1 — cos nt\j). (10.57)
where n = (/I/M )1/2

104 M E C H A N I C A L B E H A V I O U R O F J O I N T E D R O C K
( a ) ( b ) i c )
Fig. 10-77. (a) S im ple m odel for stick-slip oscillations(b) F o rce-d isp lacem ent curve(c) D isp lacem en t- t im e curve
(after H o s k i n s , J a e g e r and R o s e n g r e n , 1968).
The m ass comes to rest again a t tim e t = njn, approxim ately, and the sp ring begins to com press again. T he d isp lacem ent X a t each slip is given by
X = 2 ( h - li' ) Ij (10.58)
The force F * exerted by the spring when m otion has just ceased is given by
F* = (2 //' — //) W (10.59)
It follows from Eqs. (10.56), (10.58) and (10.59) that
( / r _ /.’*)
and the period o f oscillations is
2 ^ - y T ) W_A V
The force-displacement curve is given in Fig. 10-77b and the displacem enttime curve in Fig. 10-77c.
It shall be seen that the actua l curves so obtained have a close resemblance to the theoretical curve (Fig. 10-78). The oscillations take the form a A C in which gA represents the sm all displacem ent when the load is building up. A C represents the slipping phase an d B C is the effect o f m achine pendulum.
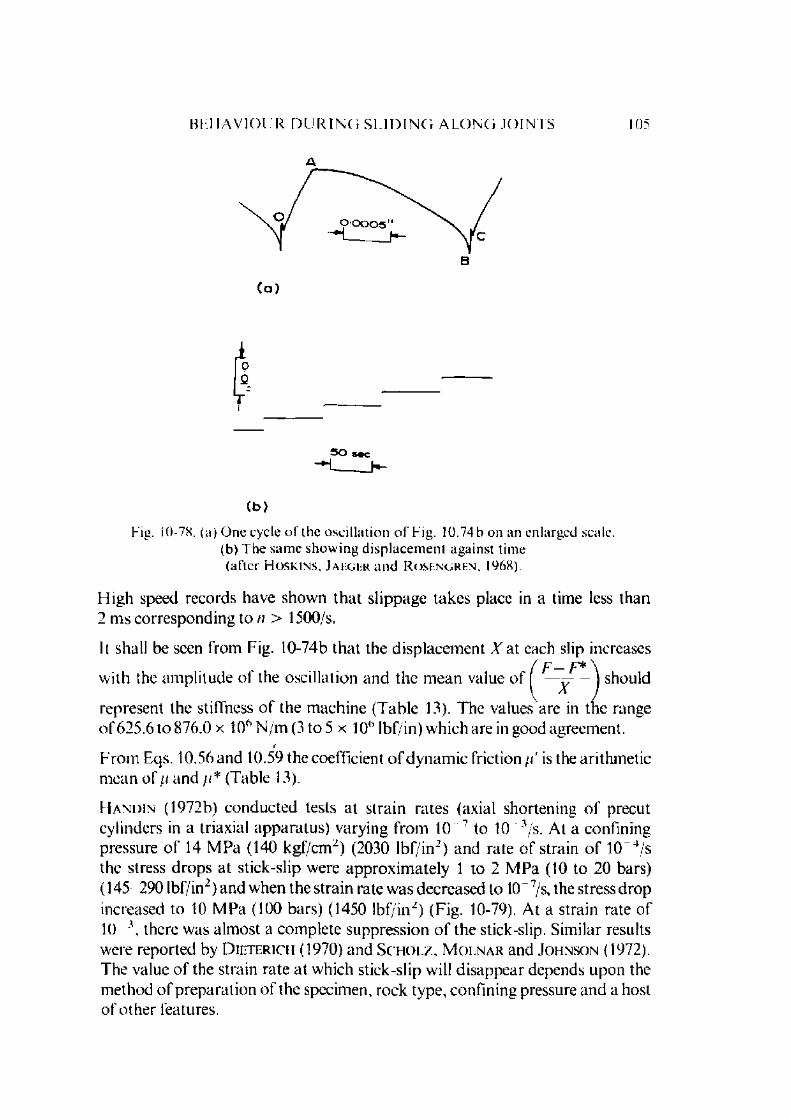
B E H A V I O U R D U R I N G S L I D I N G A L O N G J O I N T S 105
(b )
Fig. 10-78. (a) O ne cycle o f the oscillation o f Fig. 10.74 b on an enlarged scale.(b) The sam e show ing d isp lacem ent against time (after H o s k i n s , J a e g e r an d R o s e n g r e n , 1968).
H igh speed records have shown that slippage takes place in a time less than2 m s corresponding to n > 1500/s.
It shall be seen from Fig. 10-74b tha t the d isplacem ent X at each slip increases/ / r _ f * \
w ith the am plitude of the oscillation and the m ean value o f v ] shouldX
represent the stiffness o f the m achine (T able 13). The values are in the rangeo f 625.6 to 876.0 x 10⁶ N /m (3 to 5 x 10°’lbf/in) w hich are in good agreement.
/From Eqs. 10.56 and 10.59 the coefficient o f dynam ic friction //' is the arithm etic m ean o f // and //* (Table 13).
H a n d i n (1972b) conducted tests at strain rates (axial shortening o f precut cylinders in a triaxial apparatus) varying from 10 7 to 10 3/s. At a confining pressure o f 14 M Pa (140 kgf/cm 2) (2030 lb f/in2) and rate o f strain o f 10 4/s the stress d rops a t stick-slip were approxim ately 1 to 2 M Pa (10 to 20 bars) (145 290 lbf/in2) and when the strain rate w as decreased to 10 7/s, the stress drop increased to 10 M Pa (100 bars) (1450 lbf/in^) (Fig. 10-79). At a strain rate o f 10 \ there was alm ost a com plete suppression o f the stick-slip. Sim ilar results were reported by D i e t e r i c h (1970) and S c h o l z , M o l n a r and J o h n s o n (1972). The value o f the strain rate a t which stick-slip will d isappear depends upon the m ethod o f preparation o f the specimen, rock type, confining pressure and a host o f o ther features.

dif
fere
nti
al
stre
ss,
bar
s106 M E C H A N I C A L B E H A V I O U R O F J O I N T E D R O C K
s h o r t e n i n g , p e rc e n t
Fig. 10-79. Differential stress versus shortening for Tennessee sandstone deformed at a constan t rate o f shortening o f 10 4/s and 10 7/s. Tests were done at 140 bars
confining pressure (P J and room temperature.Specimens conta ined a saw cut at 35 to the load axis
(after H a n d i n , 1972b).

B E H A V I O U R D U R I N G S L I D I N G A L O N G J O I N T S 107
Tests were conducted by B y e r l e e and B r a c e (1968) on the influence o f various factors such as rock type, pressure, strain rate and stiffness o f the system on the phenom enon o f stick-slip. They found that certain rock types (granite, g abbro , g ranodiorite , dunite. etc.) give rise to stick-slip and the stick-slip am plitude increases w ith increase in pressure (Fig. 10-80). A t low pressures the
axial st ra in , percent
Eig. 10-80. Differential stress versus axial strain for San Marcos gabbro .The value at the end of each curve gives the confining pressure in kilobars
(after B y e r l e e and B r a c e , 1968).
rocks give stable sliding and only at interm ediate and high pressures do these give stick-slip. In o ther rocks (e.g. Solenhofen limestone, m arble, granite, rhyolite tuff, Spruce Pine dunite, etc.) no stick-slip occurs even at pressures up to 500 M Pa (5 kb) (72,500 lbf/in2) (Fig. 10-81). They concluded tha t stick-slip is controlled by m ineral type and porosity. Stick-slip does not occur with high porosity rocks like tuff and is also absent in rocks containing calcite, serpentine, etc. The increase o f 3% o f serpentine in two dunites tested by them com pletely changed the frictional characteristics. T he presence o f large am ounts o f m inerals such as mica and chalcocite has little influence and as such they concluded that the role o f alteration is not certain . They also found tha t the stiffness o f the system has influence on the phenom enon o f stick-slip and that very elastic systems shall give rise to a greater d rop in the stick-slip ( R a b i n o w i c z . 1965). The maximum stiffness o f the system used by B y e r l e e and B r a c e (1968) was however o f the order o f 19,618 x 104 N /m (2 0 x 104 kgf/cm) (111.9 x 10⁴ lbf/in)

108 M E C H A N I C A L B E H A V I O U R O E J O I N T E D R O C K
(/>o
jQ0
c2!0)
axial s t ra in , percent
Fig. 10-81. Differential stress versus axial strain for Spruce Pine dunite. The value at the end o f each curve gives the confining pressure in kilobars
(after B yf.rl ee an d B r a c e , 1968).
which was o f the o rder o f the specimen stiffness and the lower range was o f the o rd er o f 1961.8 x 104 N /m (2 x 10⁴ kgf/cm) (11.19 x 10⁴ lbf/in).
Tests conducted by L am a (1975a) on models o f m arble surface obtained in a Brazilian test using plaster-w ater m ixture as a model m aterial showed distinct stick-slip phenom enon on these highly rough surfaces as well as on polished surfaces. The am plitude o f stick-slip is related to the norm al stress and the shear displacem ent rate. Fig. 10-82 shows parts o f the shear-displacement curves at a to ta l displacem ent o f 2 mm at different shear displacement rates and norm al stresses for the same jo in t surface reproduced every time using silicone rubber m ould. The am plitude decreases w ith increase in shear displacem ent rate and increases with norm al stress. The stick-slip am plitude seems to be dependent upon the m achine stiffness and decreases with increase in the shear stiffness o f the machine.
C o u l s o n (1970) tested specimens in the stiffness range from 350.4 x 10⁴ to 6657.6 x 104 N /m (2 x 10⁴ to 38 x 104 lbf/in) (i.e. stiffness systems m uch lower than those used by B y e r le e and B r a c e , 1968) and found decreased stiffness increased the severity o f the stick-slip. The stiffness o f the faults in the earth ’s crust is o f about 4 to 5 o rder o f m agnitude sm aller than the laboratory testing m achines ( W a ls h . 1971) and hence stick-slips occurring in nature shall be much m ore severe.
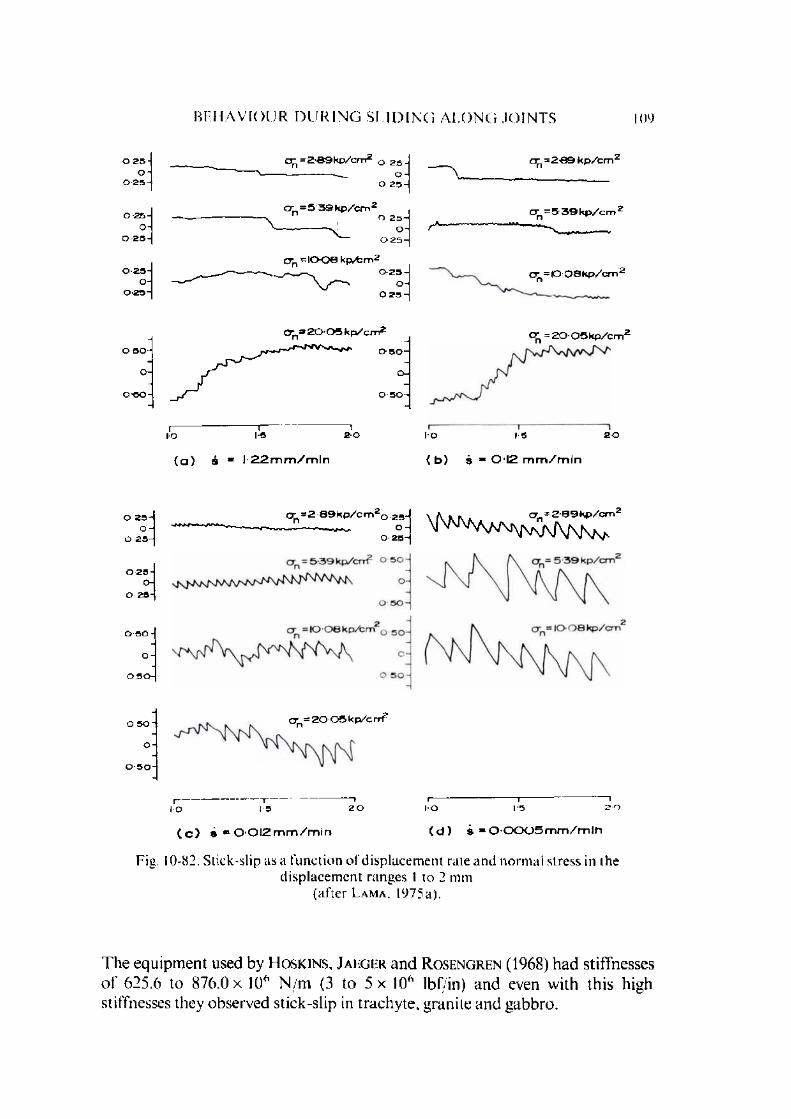
B E H A V I O U R D U R I N G S L I D I N G A L O N G J O I N T S 109
O 2 5 - O -
0 2 5 -
0 - 2 5 - O-
O 2 5 -
O 2 5 - O-
0 - 2 5 -
O 5 0 -
O-
0 - 5 0 -
O 2 5 -O-
0 - 2 5 -
O 2 5 -O-
0 2 5 -
0 5 0 -
O- O 5 0 -
0 5 0 '
o -
0 5 0 -
cr = 2 -8 9 k p / c m 2 n 0 2 5 - O -
0 2 5 -
a = 5 3 9 k p / c m 2" V O 2 5 -
o -0 2 5 -
CTn - I O O 0 kp/fcm20 - 2 5 -
O- 0 2 5 -
= 2 -8 9 k p / c m 2
0 ^ = 5 3 9 k p / c m 2
cr =IO 0 8 k p /c m 2 n
<Tn= 2 0 0 5 k p /c m 20 - 5 0 -
o -
0 5 0 -
|— ------------- 1---------------------- 1IO 1*3 2 0
( a ) s = l ' 2 2 m m / m i n
I O 1-5
( b) s = 0 1 2 m m / m i n
cr = 2 8 9 k p / c m z 0 23o
CT =20 0 5 k p / c r r f n
I O 1 5 2 0
Cc) 8 = 0 '0 l2 m m / m i n
—i— 1-5
—12-0
( d ) s = O 0 0 0 5 m m / m in
10-82. Stick-slip as a function o f displacement rate and normal stress in the displacem ent ranges 1 to 2 mm
(after L a m a . 1975a).
The equipm ent used by H o s k i n s , J a e g e r and R o s e n g r e n (1968) had stiffnesses o f 625.6 to 876.0 x IO6 N /m (3 to 5 x IO6 lbf/in) and even with this high stiffnesses they observed stick-slip in trachyte, granite and gabbro.
M E C H A N I C A L B E H A V I O U R O F J O I N T E D R O C K
The presence o f w ater and pore pressure will reduce the effective stress a n d hence cause reduction in the stress drop. B r a c e and M a r t i n (1968) found th a t violent stress d rop disappears under high pore-pressures at low strain rates. C o u l s o n (1970) also found that stick-slip is m ore com m on for dry specim ens than for wet surfaces.
The influence o f tem perature (30 to 200 C) (86 to 392 F) on stick-slip at no rm al pressures o f 0.073 to 1.958 M Pa (0.75 to 20 kgf/cm 2) (10.65 to 284 lbf/in2) w as studied by D rennon and Handy (1972). They found tha t an increase in tem perature o f the rock undergoing stick-slip caused an increase in stick-tim e, a corresponding increase in the length o f the individual slips and an increase in the am ount o f relaxation o f the shearing load upon slip. On decrease in tem perature, the am ount o f stick-slip and load relaxation decreased (though non- linearly) until sm ooth slip finally occurred. The tem perature at which stick-slip disappears depends upon the norm al load.
T he gouge present in the fault plane influences the stick-slip behaviour. Saw cut granite specimens tested at confining pressures o f 0.75 kb 6.72 kb (10,900 lbf/in2 —92,100 lbf/in~) with gouge thickness o f 0.25 m m - 4.0 mm (0.01 in — 1.6 in) showed that stick-slip was absent a t low confining pressures (0.75 kb) and appears at higher pressures only. The pressure at which this transition takes place increases with increase in gouge thickness ( B y e r le e and Sum m ers, 1976). This influence o f gouge probably explains why certain investigators observed stick-slip with clean surfaces only ( E n g e ld e r , 1973). The interaction with the norm al pressure is im portant. The gouge m aterial which is m ore or less granular undergoes com paction a t higher pressures and then dilates under shear (B y e r le e , 1968 b). If the transition from high pressure com paction to dilatation at com paratively high pressure leads to weakening o f the m aterial, then it is possible that this mechanical instability caused is responsible for stick-slip.
It is also anticipated that stick-slip in rough jo in ts is associated with the fracture o f the asperities. The influence o f time for which as asperity indents in to the opposite surface under both norm al and shear loads will naturally show som e creep depending upon the stress and the creep properties o f the rock. Its penetration increases the contact area and hence requires higher shear force for sliding. This suggests that dynam ic and static frictional values should be velocity dependent and obey some form o f logarithm ic creep law. This is likely to happen only if the asperities remain undam aged under these high stresses. Tests conducted using diam ond asperities on different rock surfaces tend to support it ( S c h o lz and E n g e l d e r , 1976).
Shear stiffness o f the system and the brittle fracture are im portan t contributing factors which should not be ignored.
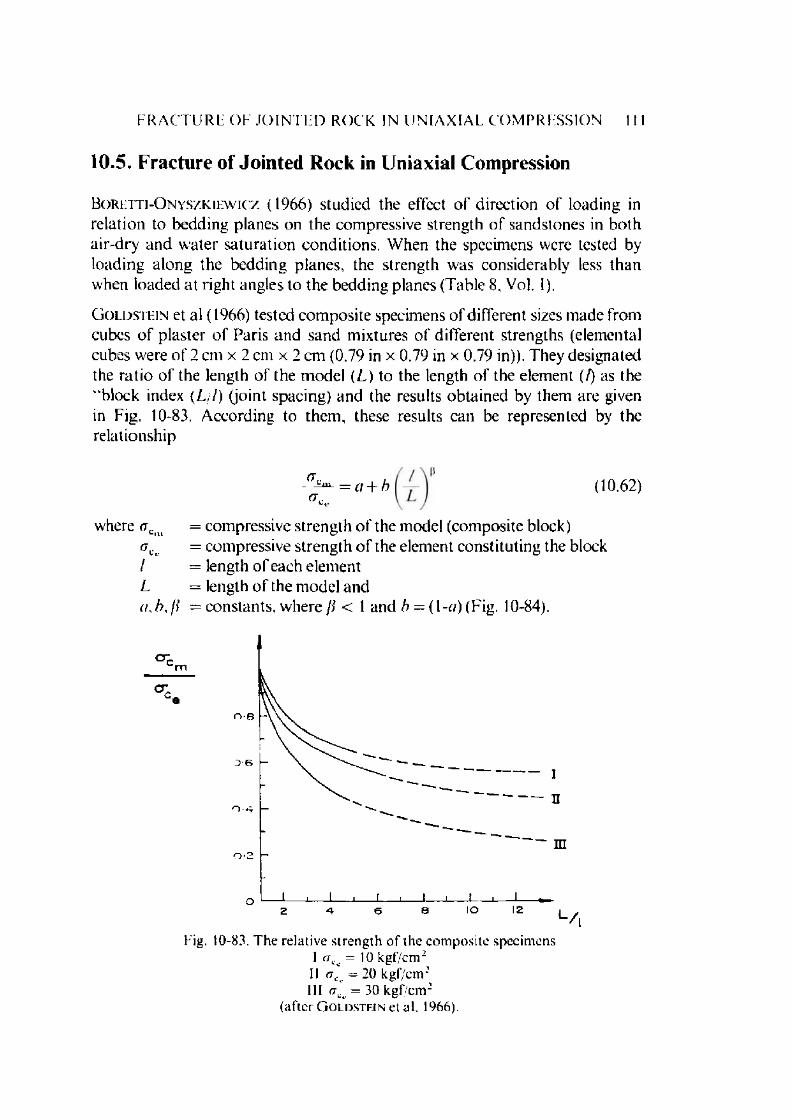
F R A C T U R E OF' J O I N T E D R O C K IN U N I A X I A L C O M P R E S S I O N 111
10.5. Fracture of Jointed Rock in Uniaxial Compression
B o r l t t i - O n y s z k i e w i c z (1966) studied the effect o f direction o f loading in relation to bedding planes on the compressive strength o f sandstones in both air-dry and w ater satu ration conditions. W hen the specimens were tested by loading along the bedding planes, the strength was considerably less than when loaded a t right angles to the bedding planes (Table 8, Vol. 1).
G o l d s t e i n et al (1966) tested com posite specimens o f different sizes m ade from cubes o f plaster o f Paris and sand m ixtures o f different strengths (elemental cubes were o f 2 cm x 2 cm x 2 cm (0.79 in x 0.79 in x 0.79 in)). They designated the ra tio o f the length o f the m odel (L) to the length o f the element (/) as the "block index (L/l) (joint spacing) and the results obtained by them are given in Fig. 10-83. According to them , these results can be represented by the relationship
where oc<-n
(Tc_ku(7..
= a + b 10.62)
/La, />,
com pressive strength o f the model (com posite block ) com pressive strength o f the element constituting the block length o f each elem ent length o f the m odel andconstants, where />* < 1 and h = (1 - /) (Fig. 10-84).
°"c.
c r
Fig. 10-83. The relative strength o f the com posite specimens I crCc = 10 kgf/cm 2

M E C H A N I C A L B E H A V I O U R O E J O I N T E D R O C K
eFig. 10-84. The relative strength o f m ass
(after G o ldstein et al, 1966).
b
o
1 0
L/ i
It shall be seen from Fig. 10-83 that the influence o f increase in the value o f (Ljl) is greater for m odels with higher elemental strength (<rc ) than for m odels with lower elem ental strength. A fter a certain num ber o f elements, the strength alm ost becomes constan t but the num ber o f these elem ents was not determ ined by G o l d s t e i n et al. They, however, m easured the ultrasonic longitudinal wave
velocity and found a sim ilar asym ptotic relationship between and (L //)1 c
(where Vx - ultrasonic longitudinal wave velocity in the model and Vle- ultrasonic longitudinal wave velocity in the element), and found tha t this
ratio becomes alm ost asym ptotic at (L / l ) = 15, which perhaps suggests*Ie
that this value could be taken for the strength relationship (Eq. 10.62). Very similar results have been obtained by C v e t k o v i c (1974).
H ayashi (1966) conducted tests on the uniaxial strength o f jo inted specimens prepared out o f plaster o f Paris (compressive strength 3.652 M Pa (37.3 kgf/cm 2) (529.7 lbf/in2), tensile strength 0.832 M Pa (8.5 kgf/cm 2) (120.7 lbf/in2) (direct pull test)). The jo in ts were produced by inserting a wax paper during casting. He found that the uniaxial com pressive strength decreased with the increase in the num ber o f jo in ts even if the total area o f the interm ittent jo in ts was equal (Fig. 10-85). According to him, the relationship can be expressed in the form o f an equation
where <rCn = uniaxial compressive strength o f a specimen with n num ber of jo in ts
rrCi = uniaxial compressive strength o f a specimen with one jo in t and \' = coefficient o f variation.
(10.63)
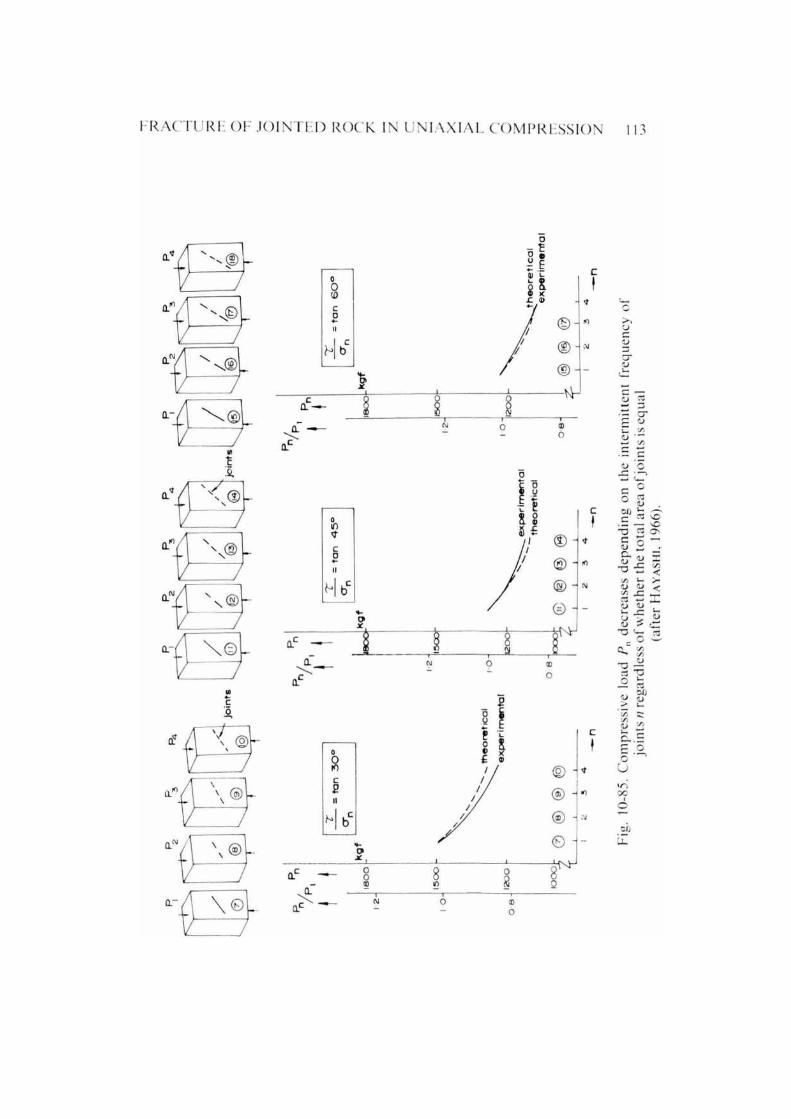
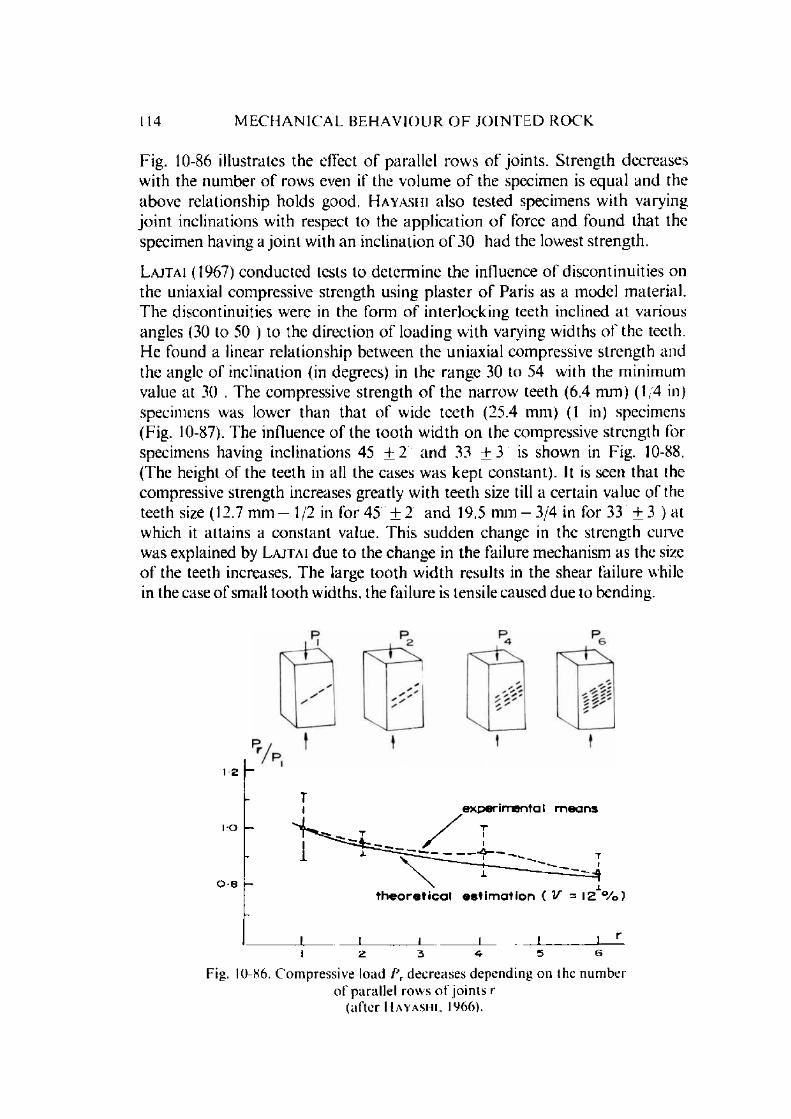
M E C H A N I C A L B E H A V I O U R O F J O I N T E D R O C K
Fig. 10-86 illustrates the effect o f parallel row s o f joints. Strength decreases with the num ber o f rows even if the volum e o f the specimen is equal and the above relationship holds good. H a y a s h i also tested specimens w ith varying jo in t inclinations with respect to the application o f force and found that the specimen having a jo in t with an inclination o f 30 had the lowest strength.
L ajtai (1967) conducted tests to determ ine the influence o f discontinuities on the uniaxial compressive strength using p laster o f Paris as a model m aterial. The discontinuities were in the form o f interlocking teeth inclined a t various angles (30 to 50 ) to the direction o f loading with varying widths o f the teeth. He found a linear relationship between the uniaxial compressive strength and the angle o f inclination (in degrees) in the range 30 to 54 with the minimum value at 30 . The compressive strength o f the narrow teeth (6.4 m m ) (1/4 in) specimens was lower than that o f wide teeth (25.4 mm) (1 in) specimens (Fig. 10-87). The influence o f the tooth w idth on the compressive strength for specimens having inclinations 45 ± 2 and 33 ± 3 is shown in Fig. 10-88. (The height o f the teeth in all the cases was kept constant). It is seen that the compressive strength increases greatly with teeth size till a certain value o f the teeth size (12.7 m m — 1/2 in for 45 ± 2 and 19.5 mm — 3/4 in for 33 ± 3 ) at which it a ttains a constant value. This sudden change in the strength curve was explained by L ajtai due to the change in the failure mechanism as the size o f the teeth increases. The large tooth w idth results in the shear failure while in the case o f small too th w idths, the failure is tensile caused due to bending.
12
Texperimental m eans
i-O
0-8t h e o re t ic a l e s t im a t io n ( V = 12 °/o)
5
r2 3 e
Fig. 10-86. Compressive load PT decreases depending on the number o f parallel rows o f jo in ts r
(after H a y a s h i . 1966).
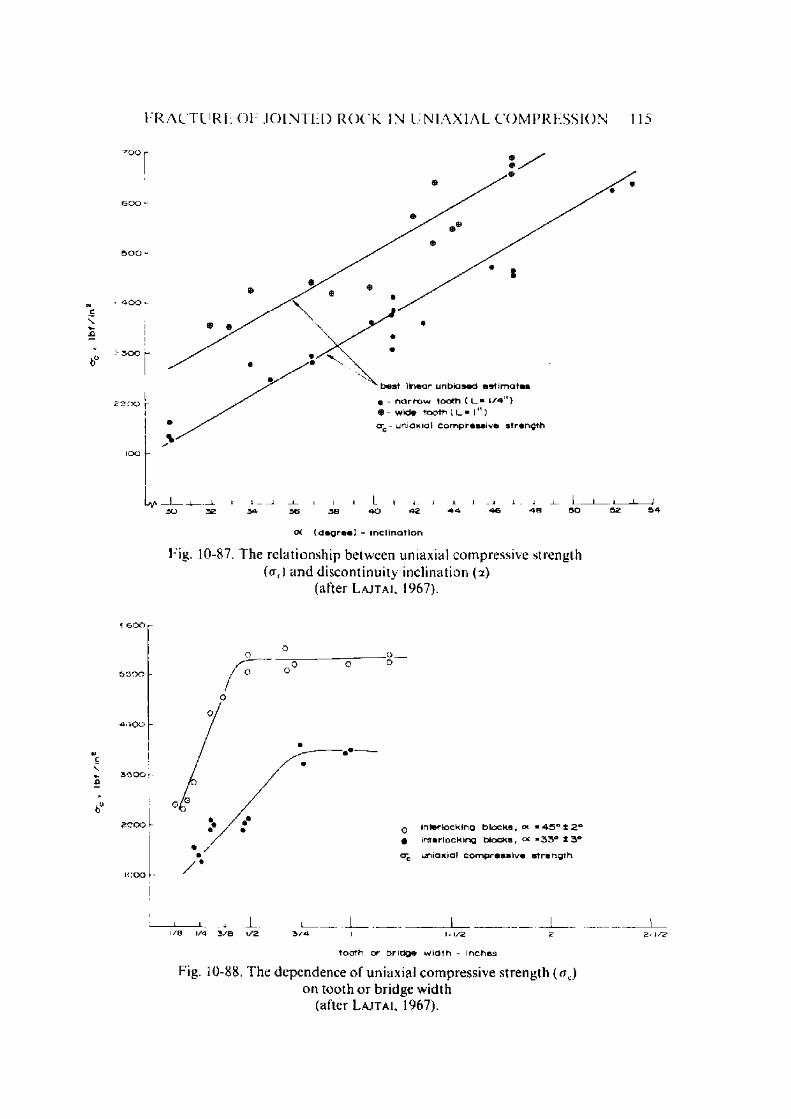
lbf
/in
F R A C T U R E O F J O I N T E D R O C K IN U N I A X I A L C O M P R E S S I O N 115
CK ( d e g r e e ) - i n c l i n a t i o n
Fig. 10-87. The relationship between uniaxial compressive strength ( a r) an d discontinuity inclination (a)
(after L a j t a i , 1967).
in te r lo c k in g b l o c k s , « » 4 .5 0 ± 2 ° in t e r lo c k in g b lo c k s , °< = 3 3 ° ± 3 °
u n ia x ia l c o m p r e s s i v e s t r e n g t h
-1___1___1___I______ I______ I_____________ I_____________ 1_____________ 1__1 / 8 1 / 4 3 / 8 1 / 2 3 / A I 1 - 1 / 2 2 2 - 1 / 2
t o o t h o r b r i d g e w i d t h - i n c h e s
Fig. 10-88. The dependence o f uniaxial compressive strength (<rc) on tooth or bridge width
(after L a j t a i , 1967).
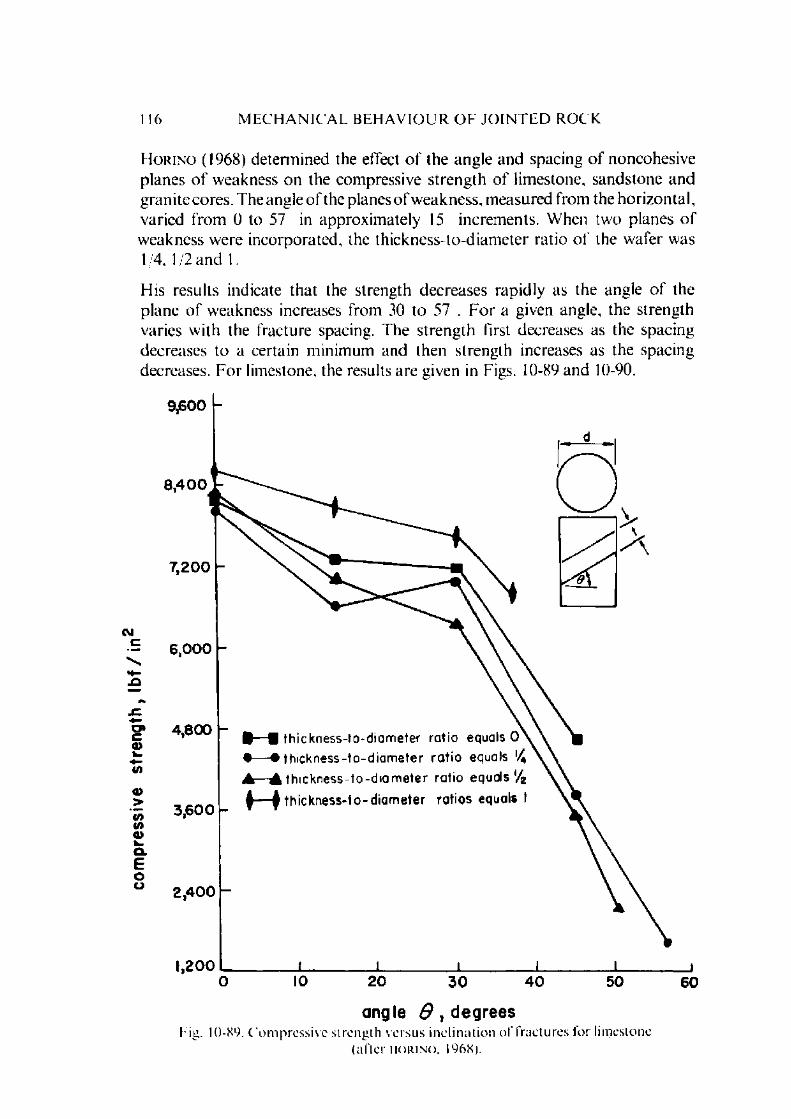
M E C H A N I C A L B E H A V I O U R O F J O I N T E D R O C K
H o r i n o (1 9 6 8 ) determ ined the effect o f the angle and spacing o f noncohesive planes o f weakness on the compressive streng th o f lim estone, sandstone and granite cores. The angle o f the planes o f w eakness, m easured from the horizontal, varied from 0 to 57 in approxim ately 15 increm ents. W hen two planes o f w eakness were incorporated, the th ickness-to-diam eter ratio o f the w afer was 1 /4 .1 /2 and 1.
Elis results indicate that the strength decreases rapidly as the angle o f the plane o f weakness increases from 30 to 57 . F o r a given angle, the strength varies w ith the fracture spacing. The streng th first decreases as the spacing decreases to a certain m inim um and then strength increases as the spacing decreases. F o r limestone, the results a re given in Figs. 10-89 and 10-90.
angle 9 , degreesI ig. 10-89. Compressive strength versus inclination o f fractures for limestone
(after h o r i n o . 1968).
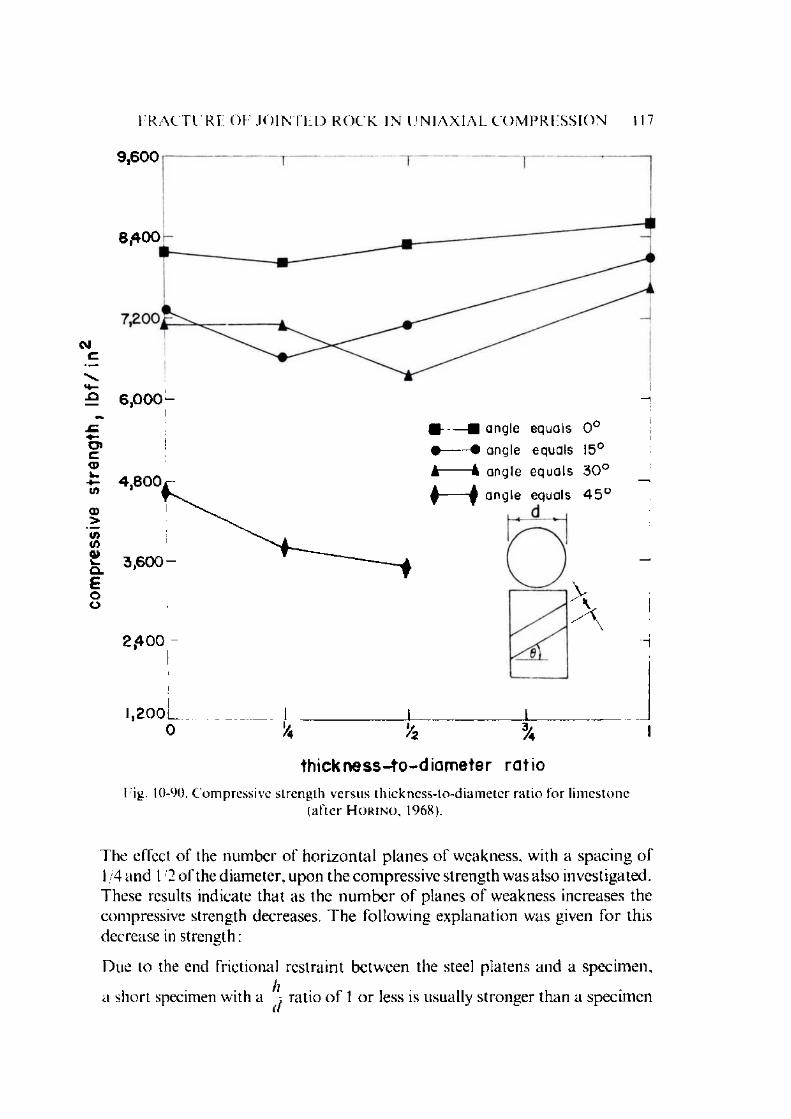
CVJc
CDcCDk_
(/)a>>CO(J)Q)u_CLEoo
______________ I% I
th ickness-to -d iam eter ra tio
Fig. 10-90. Compressive strength versus th ickness-to-diam eter ratio for limestone(a f te r H o r i n o , 1968).
The effect o f the num ber o f horizon tal p lanes o f weakness, with a spacing o f1 /4 and 1 / 2 o f the diam eter, upon the com pressive strength was also investigated. These results indicate that as the num ber o f planes o f weakness increases the compressive strength decreases. T he following explanation was given fo r this decrease in streng th :
Due to the end frictional restrain t betw een the steel platens and a specim en,
a short specimen with a ^ ratio o f 1 o r less is usually stronger than a specimen
8 ,400
F R A C T U R E O F J O I N T E D R O C K I N U N I A X I A L C O M P R E S S I O N 117
9 ,6 0 0
2 ,400
6 ,00 0 -
■ —■ angle
• ------- • anglek--------4 angle
angle
equals 0 °
equals 15°equals 3 0 °
equals 4 5 °
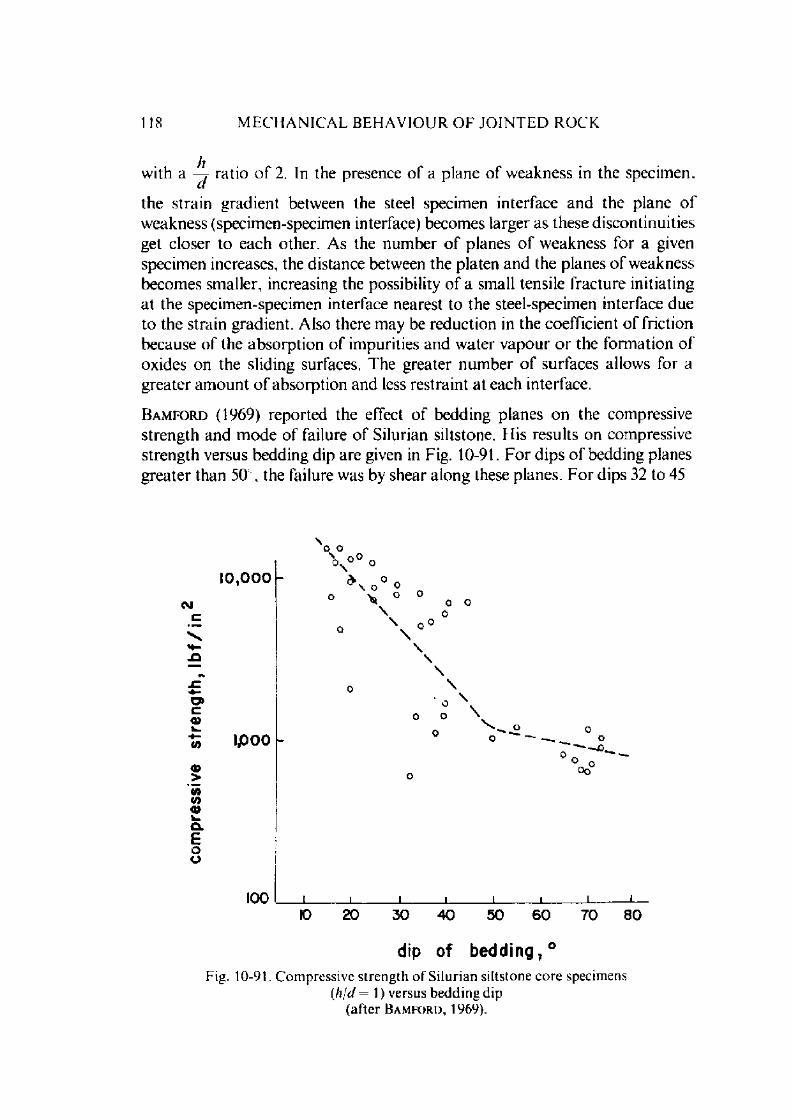
M E C H A N I C A L B E H A V I O U R O F J O I N T E D R O C K
w ith a -j ra tio o f 2. In the presence o f a plane o f w eakness in the specimen,
the strain gradient between the steel specimen interface and the plane o f weakness (specimen-specimen interface) becomes larger as these discontinuities get closer to each other. As the num ber o f planes o f weakness for a given specim en increases, the distance between the platen and the planes o f weakness becom es sm aller, increasing the possibility o f a small tensile fracture initiating at the specimen-specimen interface nearest to the steel-specimen interface due to the strain gradient. Also there m ay be reduction in the coefficient o f friction because o f the absorp tion o f im purities and w ater vapour o r the form ation o f oxides on the sliding surfaces. The greater num ber o f surfaces allows for a greater am ount o f absorption and less restraint at each interface.
Ba m fo r d (1969) reported the effect o f bedding planes on the compressive strength and m ode o f failure o f Silurian siltstone. His results on compressive strength versus bedding dip are given in Fig. 10-91. F or d ips o f bedding planes greater than 50 . the failure was by shear along these planes. F o r dips 32 to 45
CM
CT>C0>k-co
a>>i/i<o0>w.Q.Eoo
10,000
o o\ ° ° o
\ o ° o oO ^ O O \
o o\
\\
\\
\o
o o o
\\
o o—D o Oo
10010
_I__20 30 40 50
J ___60 70 80
dip of bedding,0Fig. 10-91. C o m press ive s t re n g th o f S ilu r ian sil ts tone c o re specimens
(hid = 1) versus b ed d in g dip (a f te r B a m f o r d . 1969).
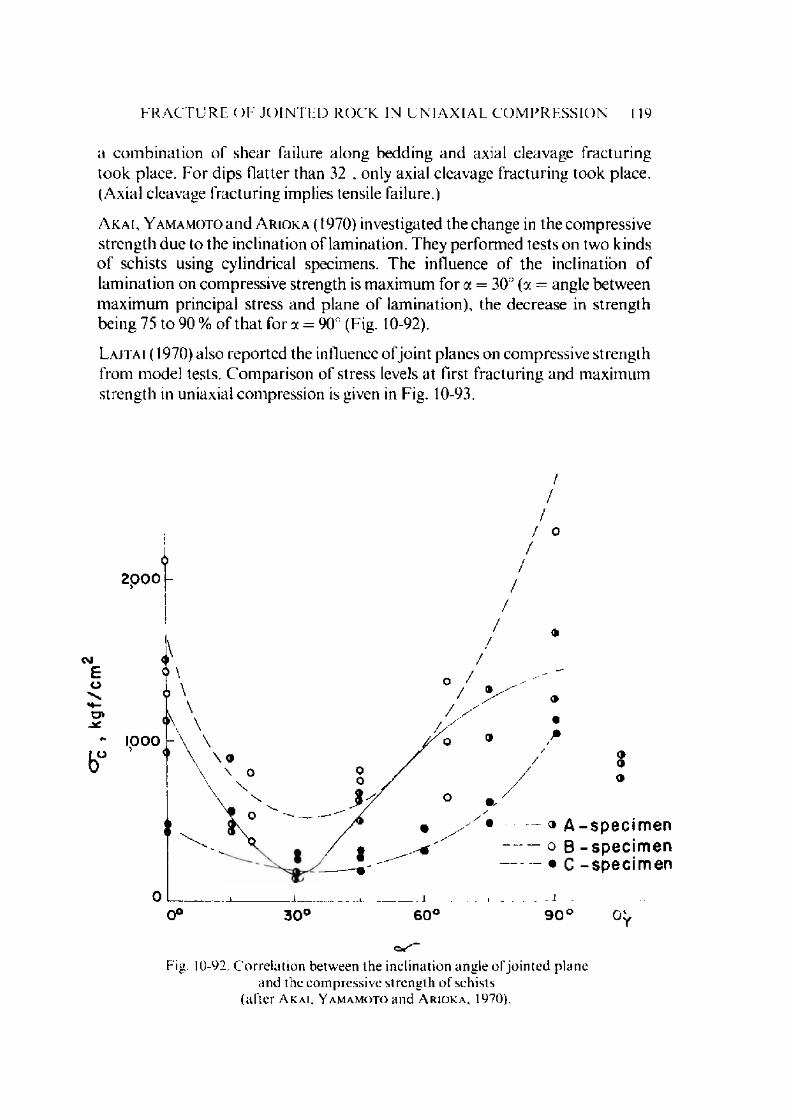
F R A C T U R E O F J O I N T E D R O C K IN U N I A X I A L C O M P R E S S I O N 119
a com bination o f shear failure along bedding and axial cleavage fracturing took place. F o r dips flatter than 32 , only axial cleavage fracturing took place. (Axial cleavage fracturing implies tensile failure.)
A k a i . Y a m am oto and A r io k a (1970) investigated the change in the com pressive strength due to the inclination o f lam ination. They perform ed tests on two kinds o f schists using cylindrical specimens. T he influence o f the inclination o f lam ination on com pressive strength is m axim um for a = 30° (a = angle between m axim um principal stress and plane o f lam ination), the decrease in strength being 75 to 90 % o f tha t for a = 90 (Fig. 10-92).
L a j i a i (1970) also reported the influence o f jo in t planes on com pressive strength from m odel tests. C om parison o f stress levels at first fracturing and m axim um strength in uniaxial com pression is given in Fig. 10-93.
2000 -
//
// o
/
C\J
Eo
b°IOOO \
\ o\ \ o 0\ \
\ \o
h
I0 --------- ^ A
0
0C 30<_. l 6 0 °
* A -spec im en — o B -spec im en
------- • C -spec im en
9 0 ‘ °Y
Fig. 10-92. C orre la tion between the inclination angle o f jo in ted plane and the compressive strength o f schists
(after A k a i , Y a m a m o t o and A r i o k a , 1970).

120 M E C H A N I C A L B E H A V I O U R O F J O I N T E D R O C K
CVJ 5 0 0 r
E3eXoE
3 0 0 '
if) if) a>a>
oQ.O
200 *
100
c o m p r e s s i o n
• median values
—I_______ l _40 5 0
. j _60
l7 02 0 30
angle between maximum principal
s tress and joint plane, degreesFig. 10-93. C o m p ariso n o f stress levels a t first fracturing and maximum
strength in uniaxial compression (after L a j t a i , 1970).
W a lk er (1971) conducted some tests on slabs o f plaster placed parallel to each o ther under uniaxial com pression and found that strength decreases with increase in the num ber o f slabs. He obtained similar asym ptotic curves as G o ld st ein et al (1966), bu t in his case compressive strength became constan t and reached a value o f abou t 50% when the num ber o f slabs placed to each o ther serving as colum ns reached 5 (the overall size o f the test block in each case rem aining the same). W hen the slabs are placed one above the other, the strength reduced slowly and with the num ber o f jo ints equal to 5, its value was about 40% o f the strength o f an unjointed block (Fig. 10-94). M odulus (the stress-strain curves were obtained by m ounting gauges on the specimens) versus jo in ting num ber is shown in Fig. 10-95.
Extensive tests have been conducted by L ama (1974a) on the effect o f density o f both horizontal, vertical and orthogonal jo in ts on compressive strength and deform ation m odulus using m odel m aterials o f different strengths. The different m odel arrangem ents are shown in Fig. 10-96. The influence o f the num ber o f horizontal and vertical jo in ts on both the deform ation m odulus and strength is shown in Figs. 10-97 and 10-98. The drop in both the deform ation

F R A C T U R E O F J O I N T E D R O C K I N U N I A X I A L C O M P R E S S I O N
c\hmm0>
800
600
400
200 h
I_«4
jo in tin g n u m b e r
cH-XI
800
600
400
200 -
jo in tin g n u m b e r
Fig. 10-94. Uniaxial compressive strength versus jointing num ber (after W a l k e r , 1971).
m odulus and strength is small after the num ber o f jo in ts exceed 6 and is in accordance with the result obtained by G o ld st ein et al (1966) and W a lk e r (1971). On percentage basis, the decrease in the strength o f rock with horizontal o r vertical jo in ts is about 30% . but the m odulus values for horizontal jo in ts fall to alm ost 30 to 40% and vertical jo in ts 60 to 70% . The m odulus values
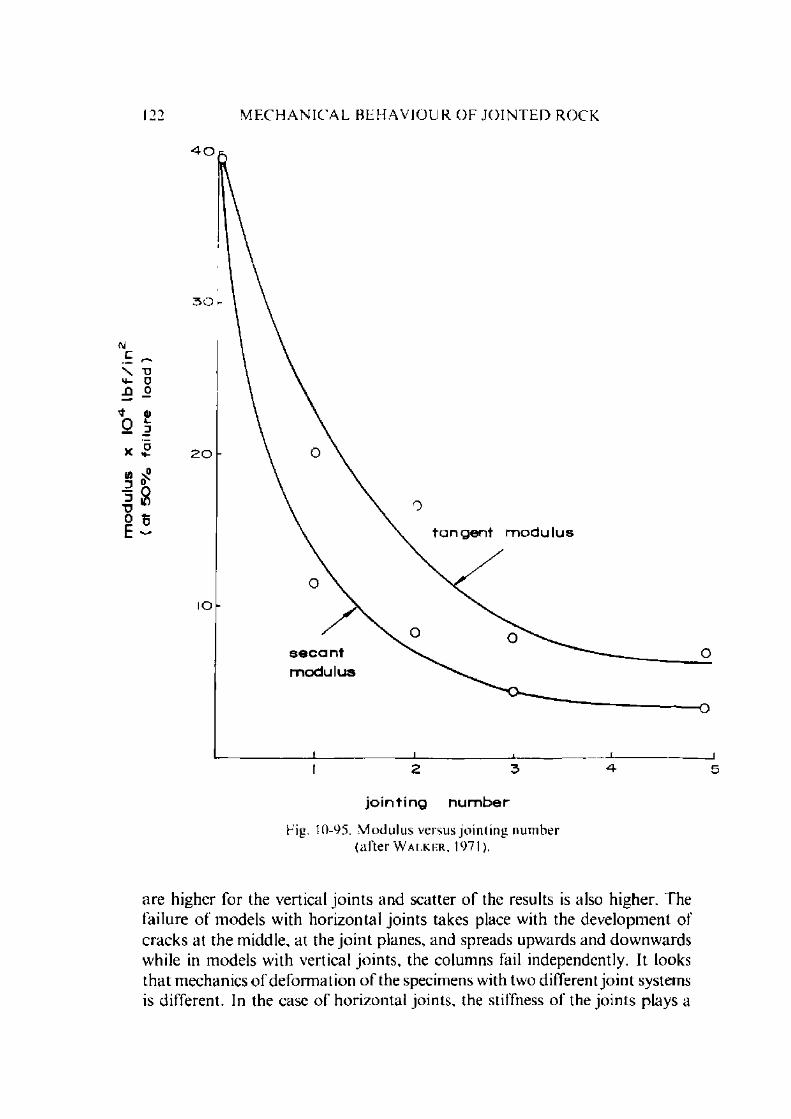
111 M E C H A N I C A L B E H A V I O U R O F J O I N T E D R O C K
c ^N T3 **- O A 0
00) L.D
X S
</)2ZJ
V0E
o°
S
j o i n t i n g n u m b e r
Fig. 10-95. M odu lus versus jo in ting num ber (after W a l k e r . 1 9 7 1 ).
are higher for the vertical jo in ts and scatter o f the results is also higher. The failure o f m odels with horizontal jo in ts takes place with the developm ent of cracks a t the m iddle, at the jo in t planes, and spreads upwards and dow nw ards w'hile in m odels with vertical jo in ts, the colum ns fail independently. It looks tha t m echanics o f deform ation o f the specimens with two different jo in t systems is different. In the case o f horizontal jo ints, the stiffness o f the jo in ts plays a
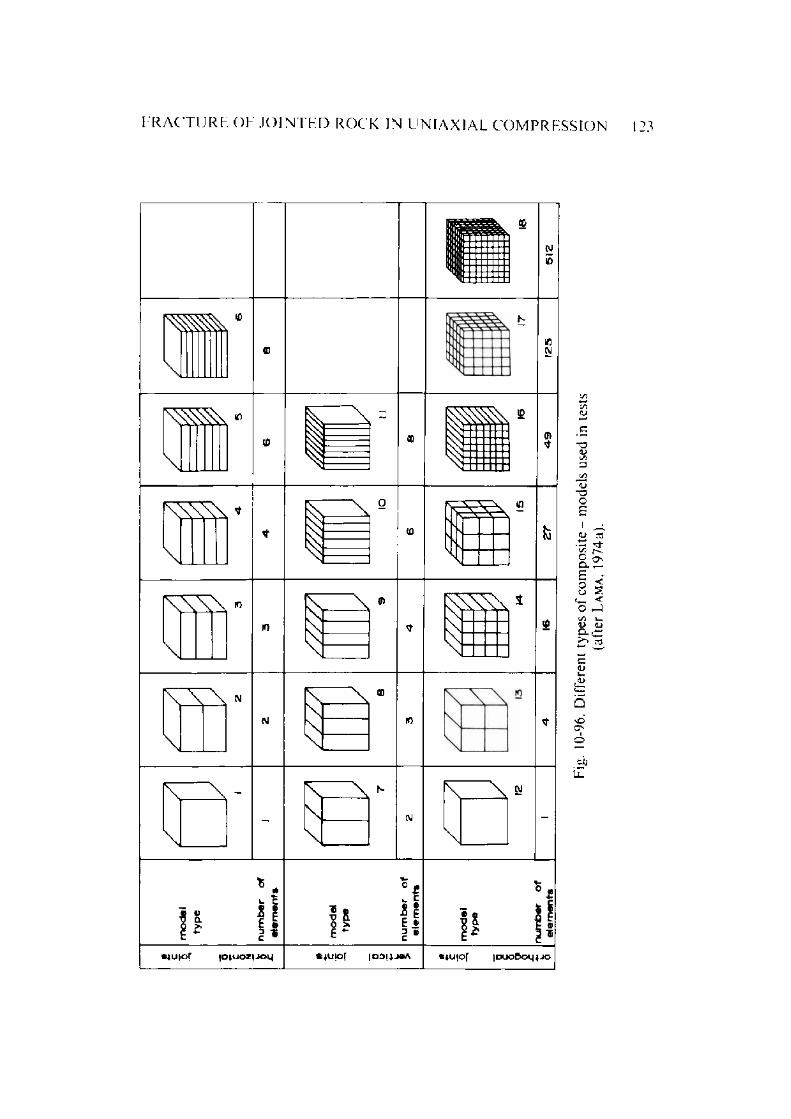
F R A C T U R E O F J O I N T E D R O C K IN U N I A X I A L C O M P R E S S I O N
i5 5 X 10
\\
A ®
« *
t> •»4-k. c
1 1 E ®c *
1T3
u J2
I EE «2* E*
•juiof |D|uoz|Jog S*UIOf IDOHJ0A s*uiof icxjoDoq JO
Fig.
10
-96.
Dif
fere
nt
type
s of
com
posi
te
mod
els
used
in
test
s (a
fter
La
ma
, 19
74a)
.

124 M E C H A N I C A L B E H A V I O U R O F J O I N T E D R O C K
-o -m / h o r i z o n t a l j o i n t s
/ v e r t i c a l j o i n t s
* t
m / v e r t i c a l j o i n t s
m / h o r i z o n t a l j o i n t s
r>3 / v e r t i c a l j o i n t s
jo in t d e n s i t y , n*
Fig. 10-97. Influence o f horizonta l and vertical joints on compressivestrength o f a model
(after L a m a . 1974a).
role, while in the case o f vertical jo in ts it is the decrease o f lateral constra in t that slightly decreases the m odulus value. As the colum ns become slender, the o u te r co lum ns bend outw ards a t the m id-height shedding off some o f their load resulting in slightly over loading o f the central colum ns and hence decreasing the strength o f the m odel. This seems to be the reason why the strength o f the specim ens with vertical jo in ts is slightly lower than with horizontal joints.
W hen m odels with horizontal jo in ts were cyclically loaded, the deform ation m odu lus in the second cycle was alm ost equal to that o f the specimen with vertical jo in ts. This is because o f the closure o f the jo in ts and evening-out o f the asperities.
T he cubes o f different size were assembled to model orthogonal jo in ts and the results obtained are represented in Figs. 10-99 and 10-100. It is seen tha t the strength as well as the deform ation m odulus d rop as the num ber o f elem ents
(ti) (joint density n = j ) increases. Both the m odulus and the strength achieve
m ore o r less a constan t value when the num ber o f elements contained in the m odel reaches about 150. The relationship between strength and jo in t density and m odulus o f deform ation and jo int density for cubic elem ents (orthogonal jo in ts placed at equal intervals in all the three directions) can be represented by

F R A C T U R E O F J O I N T E D R O C K I N U N I A X I A L C O M P R E S S I O N 125
g c o r £ d = A' + L 10.64)
where oc = compressive strength deform ation m odulusstrength (or deform ation) o f the model containing m ore than 150 jo in ts (real strength o r deform ation o f the system) constantlength o f the m odel and length o f the elem ent.
£d = K =
P L /
j o i n t d e n s i t y , n ■
Fig. 10-98. Influence o f h o r iz o n ta l a n d vertical jo in ts on d e fo rm a t io nm o d u lu s o f a m odel ( a f te r L ama , 1974a).
r n s ( h o r i z o n t a l )
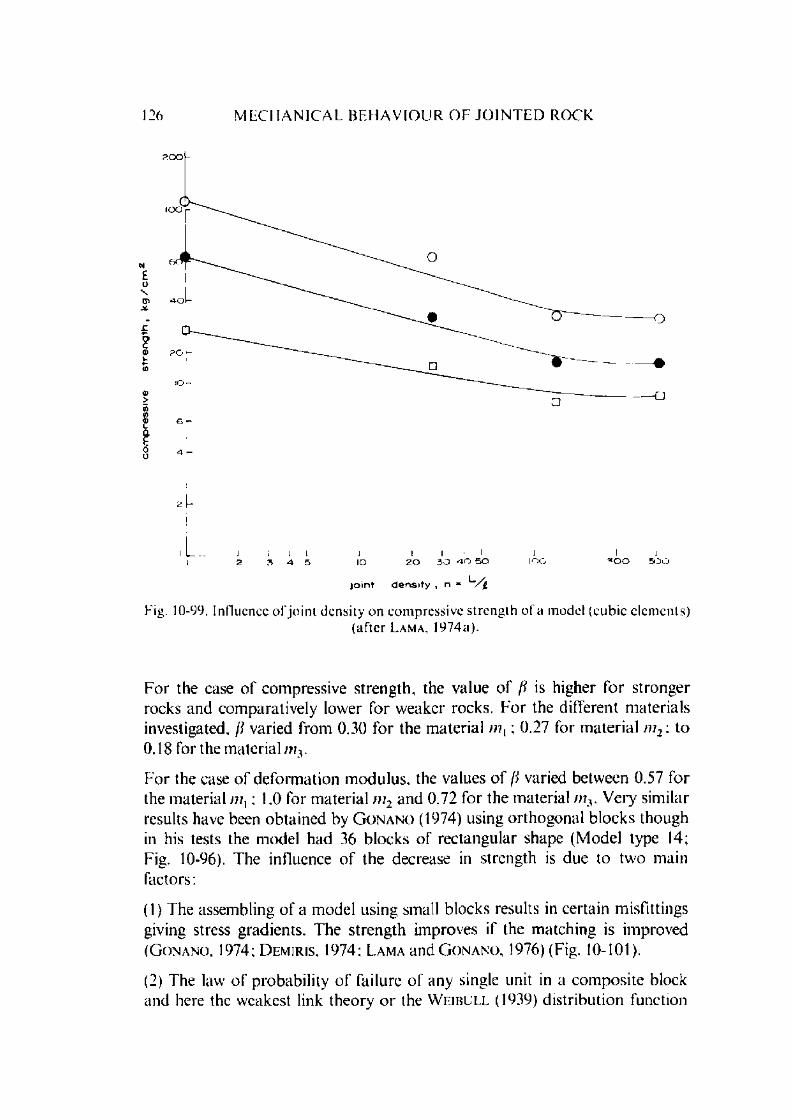
126 M E C H A N I C A L B E H A V I O U R O E J O I N T E D R O C K
i 1 iio
jo in t
2 0 3 0 A O 5 0
d e n s i t y , n =
too1_____ I_
■ * 0 0 5 0 0
Fig. 10-99. Influence o f jo in t density on compressive strength o f a model (cubic elements)(after L a m a . 1974a).
For the case o f compressive strength, the value o f /? is higher fo r stronger rocks and com paratively lower for weaker rocks. F or the different m aterials investigated, ft varied from 0.30 for the m aterial /?/,; 0.27 for m aterial m 2 : to0.18 for the m aterial m3.
For the case o f deform ation m odulus, the values o f [1 varied between 0.57 for the m aterial /?/,; 1.0 for m aterial m 2 and 0.72 for the m aterial w 3. Very sim ilar results have been obtained by G o n a n o (1974) using orthogonal blocks though in his tests the model had 36 blocks o f rectangular shape (M odel type 14; Fig. 10-96). The influence o f the decrease in strength is due to tw'o main fac to rs:
(1) The assembling o f a model using small blocks results in certain misfittings giving stress gradients. The strength improves if the m atching is improved (G o n a n o , 1974; D em iris , 1974; L ama and G o n a n o , 1976) (Fig. 10-101).
(2) The law o f probability o f failure o f any single unit in a com posite block and here the weakest link theory o r the W e ib u l l (1939) d istribution function

F R A C T U R E O F J O I N T E D R O C K I N U N I A X I A L C O M P R E S S I O N 127
jo in t d en s ity , n = ~/o
Fig. 10-100. Influence o f jo in t density on deform ation m odulus of a model(cubic elements)
(a f te r La m a . 1974a).
has been applied by m any investigators to predict the volume effect in com pression ( E v a n s and P o m e r o y , 1958; L u n d b o r g , 1972). There seems to be however certain lim itations in the application o f this theory to a block jointed m odels which have a constan t (more o r less) type o f flaw. The W e i b u l l ’s theory fails if this is applied to a set o f observations made on models with different elem ent-shapes plotted together (Figs. 10-102 and 10-103). The curves are very confusing as if they consist o f two separate parts. It is because the shape o f the elem ents plays an im portant role. It is well known that the strength o f rectangular elem ents is abou t 10 to 15 % higher than cubic elements. Taking this aspect into account, the compressive strength-// curve is draw n by the dotted lines (Fig. 10-102). The influence o f shapes is m ore m arked for higher strength m aterial than for lower strength m aterial. It looks, therefore, that some different m echanism o f failure starts to play w hich is a function o f the element shape.

stre
ss,
lbf/
in128 M E C H A N I C A L B E H A V I O U R O F J O I N T E D R O C K
s tr a in , °/o
Fig. 10-101. Stress-strain curves for block-jointed accurately matched and roughly matched models.
(after L ama and G o n a n o , 1976)
The m ode o f failure in com posite m odels is not sudden as is usually observed in specimens with a single element. In the model consisting o f a num ber o f elements the m ode o f failure is a "progressive failure'! The failure starts with one or two elem ents and proceeds w ith m ore and m ore num ber o f elem ents failing with increase in deform ation (Figs. 10-104 and 10-105). Even a t very large deform ation, exceeding 30% , there are always some blocks to be found which are still intact (Fig. 10-106). This figure is m ore clearly visible in the post-failure curve obtained on models o f elem ents o f size 1 cm x 1.6 cm x 1.6 cm in a limited num ber o f tests (Fig. 10-107). The post-failure curves are Hatter for m odels containing a large num ber o f elements.
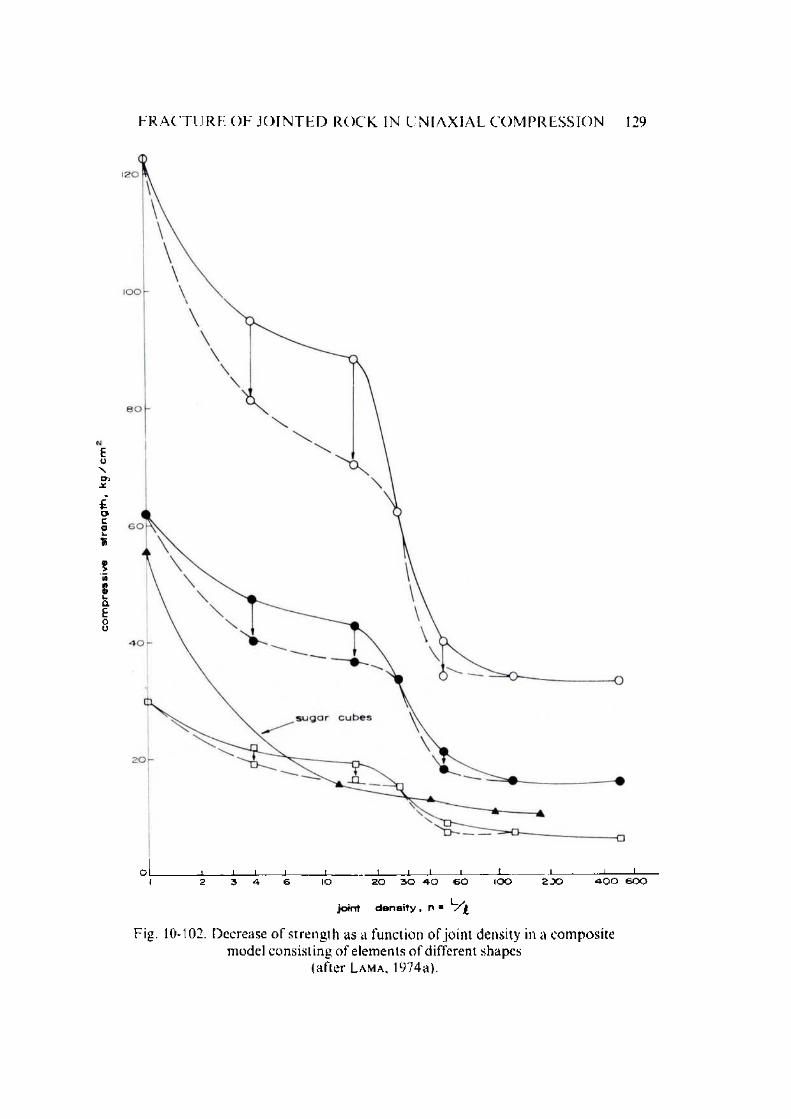
com
pres
sive
st
ren
gth
, k
g/c
m
F R A C T U R E O F J O I N T E D R O C K IN U N I A X I A L C O M P R E S S I O N 129
ol_______I____i__ I___ i_____ 1_______i___ i__ i___ i------- 1----------1---------- 1------1—I 2 3 4 6 IO 2 0 3 0 - 4 0 6 0 IO O 2 J O 4 0 0 6 0 0
joint d en s ity , n =
Fig. 10-102. Decrease o f s trength as a function o f jo in t density in a com posite model consisting o f elements o f different shapes
(after L a m a , 1974a).
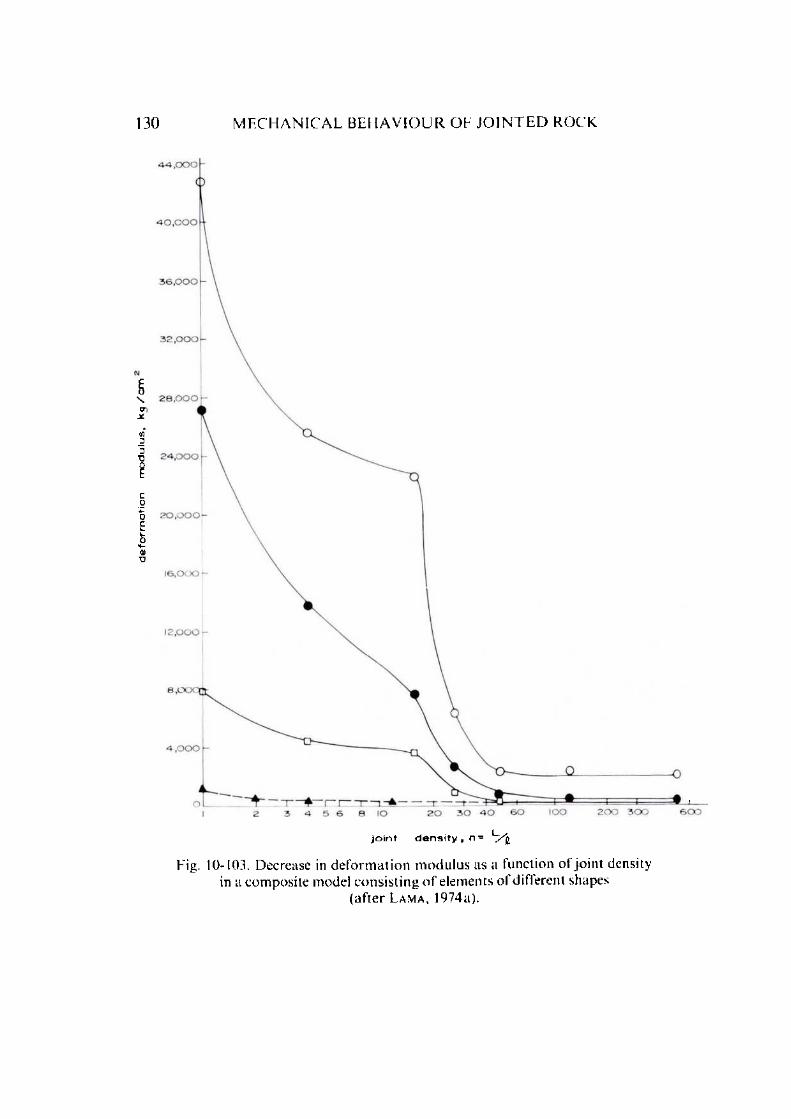
def
orm
atio
n
mod
ulus
, kq
/c
m130 M E C H A N I C A L B E H A V I O U R O F J O I N T E D R O C K
jo in t d e n s ity , n =
Fig. 10-103. Decrease in d e fo rm a tio n m odu lus as a function ot jo in t density in a com posite model consis t ing o f elements ol different shapes
(a fte r L a m a , 1974a).
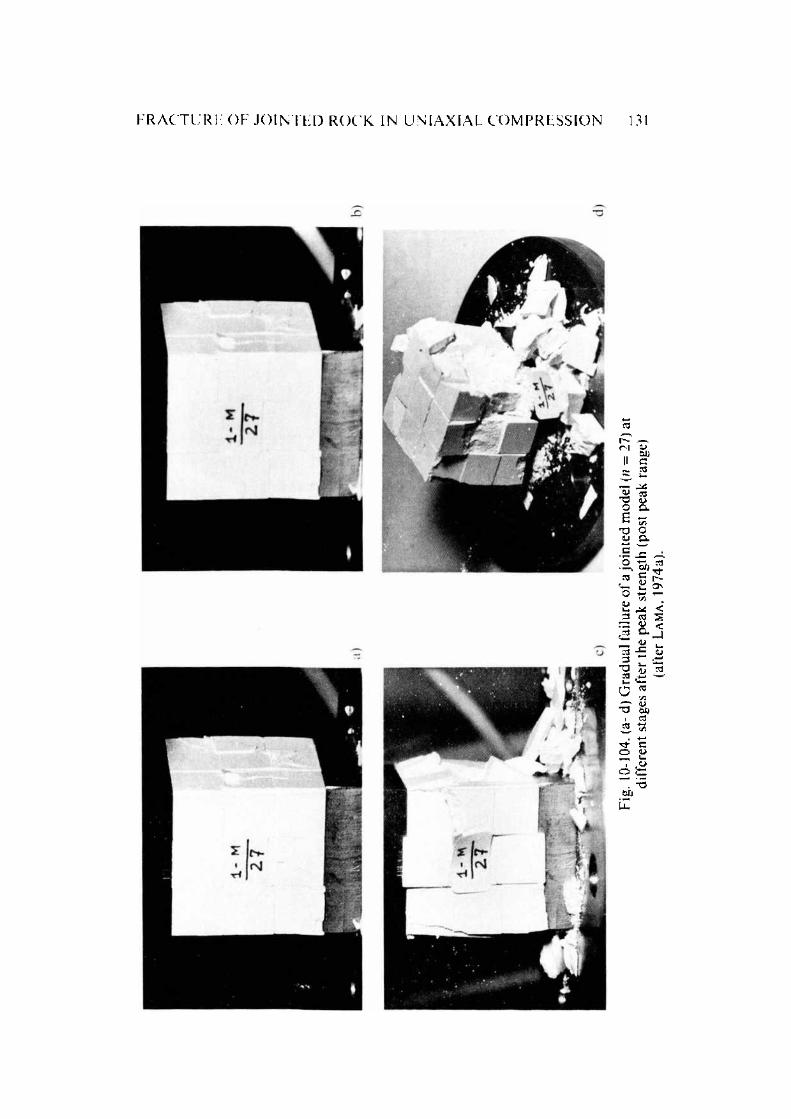
F R A C T U R E O F J O I N T E D R O C K I N U N I A X I A L C O M P R E S S I O N 131
Fig.
10
-104
. (a
d) G
radu
al f
ailu
re
of a
join
ted
mod
el (
n =
27)
at
diff
eren
t st
ages
af
ter
the
peak
st
reng
th
(pos
t pe
ak
rang
e)
(afte
r L
am
a.
1974
a).
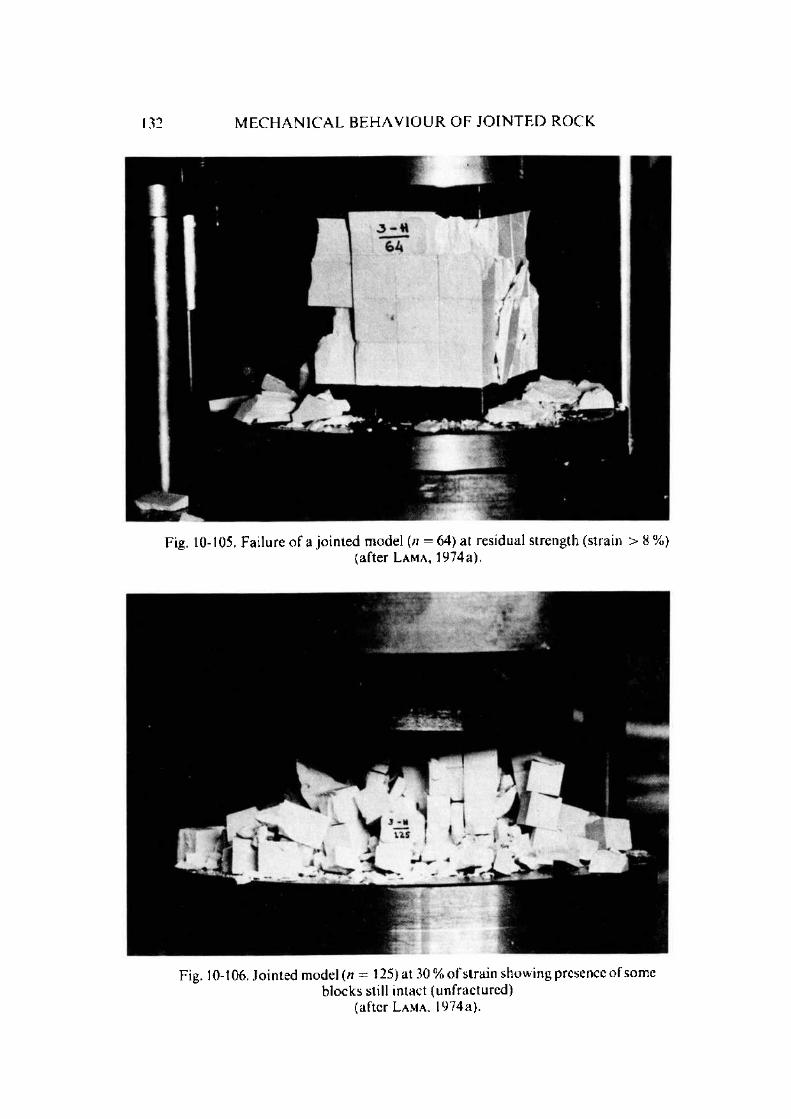
132 M E C H A N I C A L B E H A V I O U R O F J O I N T E D R O C K
Fig. 10-105. Failure o f a jo in ted model (n = 64) at residual strength (strain > 8 %)(after L a m a , 1974a).
Fig. 10-106. Jointed model (n = 125) at 30% o f strain showing presence of some blocks still intact (unfractured)
(after L a m a . 1974a).
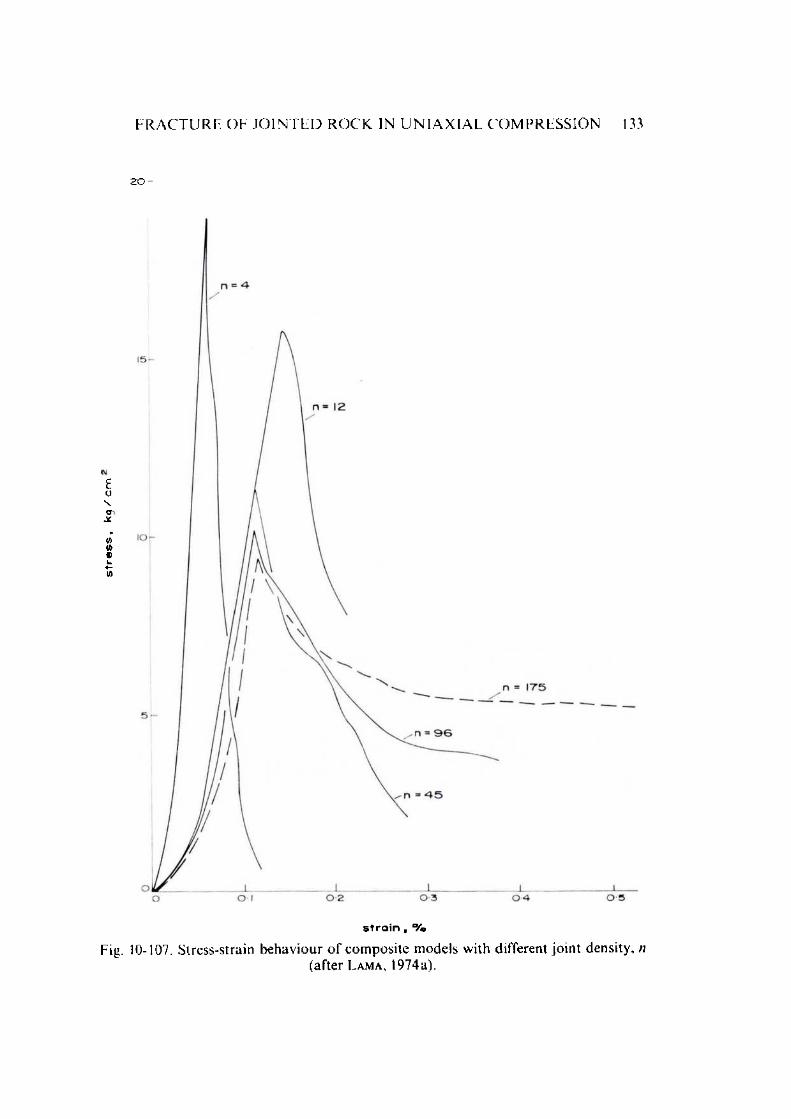
str
es
s,
kq
/cm
F R A C T U R E O F J O I N T E D R O C K I N U N I A X I A L C O M P R E S S I O N 133
20-
s t r a in , °/o
Fig. 10-107. Stress-strain behaviour o f com posite models with different jo in t density, n(after L a m a , 1974a).
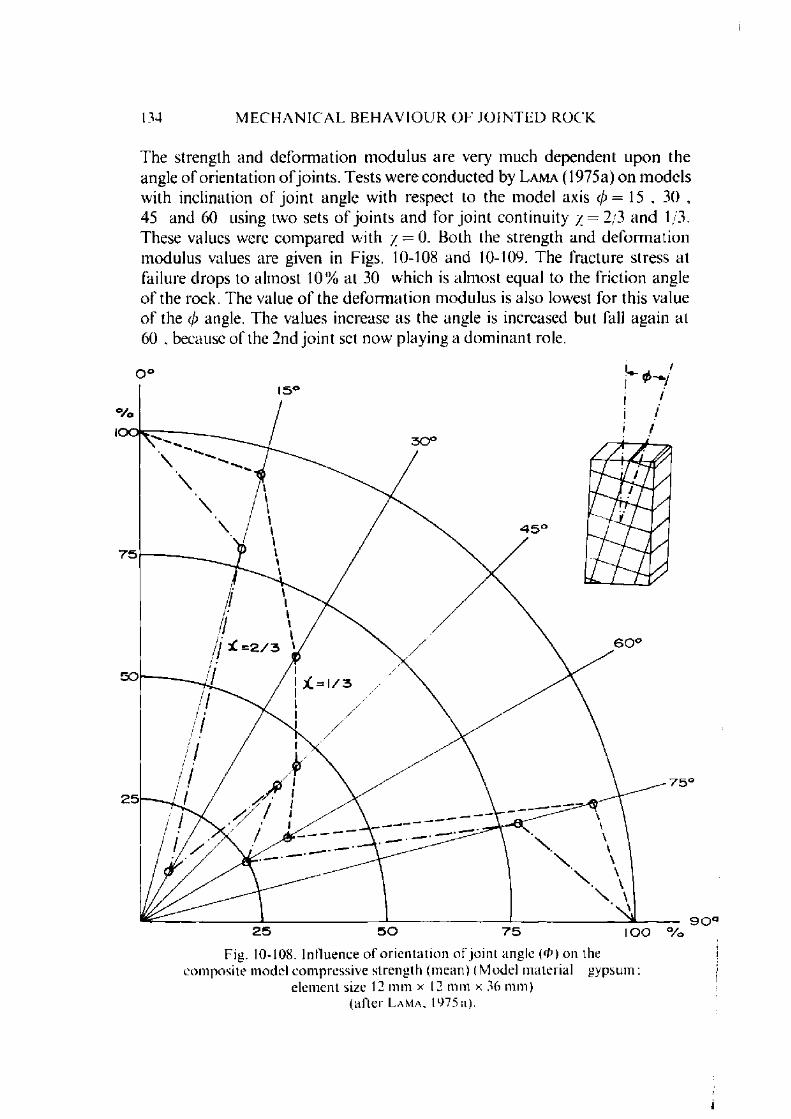
134 M E C H A N I C A L B E H A V I O U R O F J O I N T E D R O C K
The strength and deform ation m odulus are very much dependent upon the angle o f orientation o f jo ints. Tests w ere conducted by L a m a (1975a) on m odels with inclination o f jo in t angle with respect to the model axis (/)= 15 . 30 , 45 and 60 using two sets o f jo in ts and for jo in t continuity / = 2/3 and 1/3. These values were com pared with / = 0. Both the strength and deform ation m odulus values are given in Figs. 10-108 and 10-109. The fracture stress at failure drops to alm ost 10% at 30 which is alm ost equal to the friction angle o f the rock. The value o f the deform ation m odulus is also lowest for this value o f the (j) angle. The values increase as the angle is increased but fall again at 60 , because o f the 2nd jo in t set now playing a dom inant role.
Fig. 10-108. Influence o f orienta tion o f joint angle (0 ) on the com posite model compressive strength (mean) (Model material gypsum :
element size 12 mm x 12 m m x 36 mm)(after L a m a . 1975a).
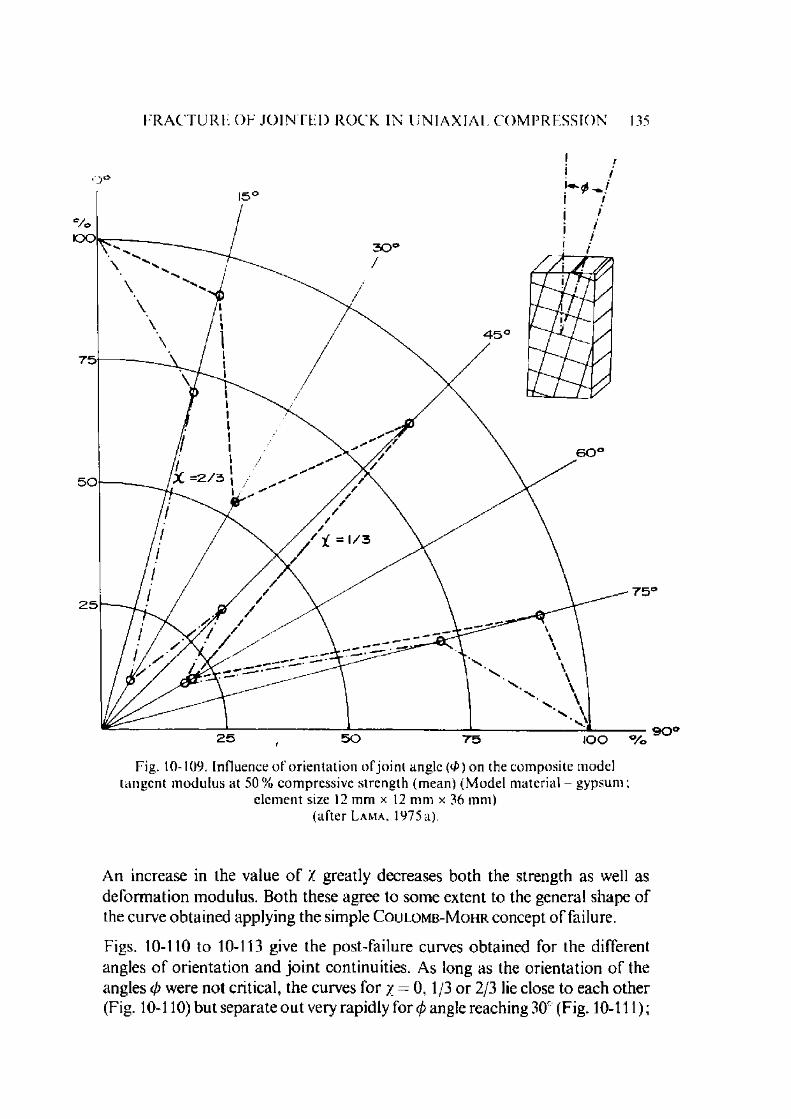
F R A C T U R E O F J O I N T E D R O C K I N U N I A X I A L C O M P R E S S I O N 135
Fig. 10-109. Influence o f orien ta tion o f jo in t angle (<P) on the com posite model tangent m odulus at 50% compressive strength (mean) (M odel material gypsum;
element size 12 m m x 12 m m x 36 mm)(after L a m a , 1975a).
An increase in the value o f X greatly decreases both the strength as well as deform ation modulus. Both these agree to some extent to the general shape o f the curve obtained applying the simple C o u l o m b - M o h r concept o f failure.
Figs. 10-110 to 10-113 give the post-failure curves obtained for the different angles o f orientation and jo in t continuities. As long as the orientation o f the angles cp were not critical, the curves for / = 0, 1 /3 o r 2/3 lie close to each other (Fig. 10-110) but separate ou t very rapidly for c/> angle reaching 30° (Fig. 10-111);

str
es
s,
k5
/cm
2 st
ress
,
kg
/cm
136 M E C H A N I C A L B E H A V I O U R O F J O I N T E D R O C K
20 -
i = o
r *=l/3I \ '/ Xa
/ / > =2/3^ ‘/ / / /
s t r a i n , %
Fig. 10-110. Stress-strain curves for jo in t inclination angle 0 = 15 , with different values o f /
(after L a m a , 1975 a).
ior * =o
s t r a i n , *y0
Fig. 10-111. Stress-strain curves for jo in t inclination angle 0 = 30 . with different values o f /
(after L a m a , 1975a).
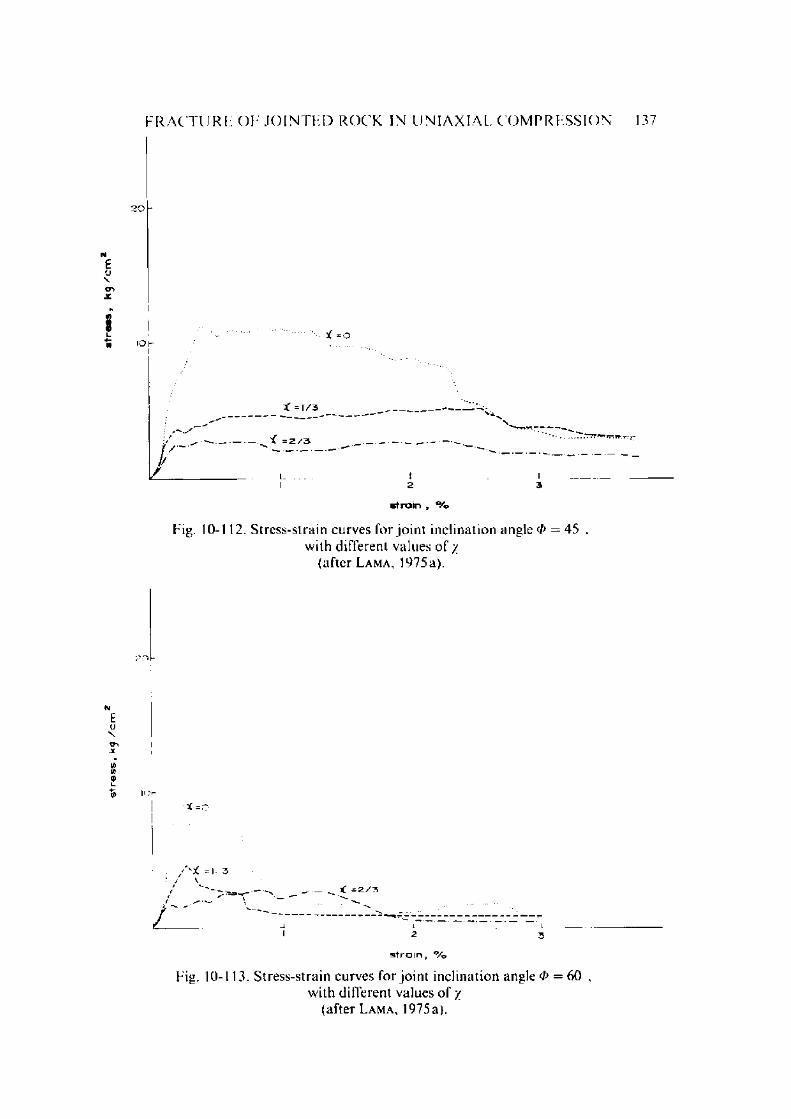
stre
ss,
kg /c
m2
stre
ss,
kj/
cm
F R A C T U R E O F J O I N T E D R O C K I N U N I A X I A L C O M P R E S S I O N 137
20
IOh * = o
] /
X = 1/3
______ = 2 / 3
VL __ I_2
stra in , °/o
Fig. 10-112. Stress-strain curves for jo in t inclination angle (I> = 45 with different values o f /
(after L a m a . 1975a).
i. >-* =o
f ' H =1/3 / \/ __ ______________ tC = 2 /3
L —I____________________ I_2 3strain, °/o
Fig. 10-113. Stress-strain curves for jo in t inclination angle </> = 60 with different values o f /
(after L a m a , 1975a).

138 M E C H A N I C A L B E H A V I O U R O F J O I N T E D R O C K
trying to close up again for 0 = 45 (Fig. 10-112) and down again for 60 (Fig. 10-113). The strain at which the load drops to u ltim ate value is lower for higher value o f / and is dependent upon </>. The results are given in T able 14.
T A B L E 14
Influence o f jo in t continuity and jo in t inclination on stra in values a t u ltim ate streng th
(after L a m a . 1975 a)
Jo in t con tinu ity Jo in t inclination
S tra in a t u lt im ate s trength . %15 30 45 60
X = 0 3.5 2.1 2.8 1.4
/ = 1 / 3 3.5 1.0 0.8 0.65
= 2 / 3 2.6 0.55 0.25 0.65
Fig. 10-114. Fracture o f a jo in ted model with joint inclinations k-j = 15 , k 2 = 75 , / = 1 /3, showing failure along k x jo in t
(after L a m a , 1975 a).

F R A C T U R E O F J O I N T F . D R O C K I N U N I A X I A L C O M P R E S S I O N 139
O~o roo IIn <NT3<U 'c ©o „• —>S3 _,
U—,O<D C/5u~3 OOC3 cSi-U- C
oc• —'■«— _io c
o• ■—i0/j r;tz £
* =
2/3,
with
fa
ilure
al
ong
k2
join
t an
d /
= 2/
3, w
ith
failu
re
by sh
ear
alon
g bo
th
the
with
de
velo
pmen
t of
se
cond
ary
frac
ures
jo
ints
wi
th
dila
tion
due
to ro
tatio
n of
or
igin
atin
g fro
m jo
int
inte
rfac
es
bloc
ks
(aft
er
Lam
a.
1975
a).
(afte
r L
am
a,
1975
a).

140 M E C H A N I C A L B E H A V I O U R O F J O I N T E D R O C K
Fig. 10-117. Failure o f a jo in ted model showing stages o f dilation o f the model and gradual collapse
(after L a m a , 1975 a).

F R A C T U R E O F J O I N T E D R O C K I N U N I A X I A L C O M P R E S S I O N 141
T he m ode o f failure o f oriented orthogonal jo in ted models is dependent upon jo in t orientation (Figs. 10-114 and 10-115). Failure occurs with the extension o f jo in t in its plane for lower values o f 0 and for values increasing to 45 and m ore, the failure occurs w ith developm ent o f crack at the end o f the jo in t but following through the m aterial. In any case the jo in ts play an im portant role. T he dilation occurs along the jo in ts a t stages and the rocks fall apart along these surfaces as shown in Figs. 10-116 and 10-117.
10.6. Fracture of Jointed Rock in Tension
Y o u a s h (1966) conducted direct tension tests on a shale, a gneiss and two sandstones. Cores 5.4 cm by 10 cm (2 1/8 in by 4 1/4 in) were prepared with the layers dipping a t 0 , 1 5 , 30 , 45 , 60 , 75 and 90 to the short cylinder axis. R upture strength increases as the dip increases from 0 to 60 , for which failure occurs along layering. F o r 75 and 90 cores, failure occurs across layering and with a sharp increase in rupture strength. R upture strength in tension versus inclination o f layering for one sandstone is given in Fig. 10-118.
D a y r e (1970) studied the influence o f the lineation and the cleavage on the m axim um bending m om ent during failure o f slaty shales. 11 is results are given in Fig. 10-119.
inclination o f layerin g to short cy lin d er a x is
Fig. 10-118. R up tu re strength in tension versus inclination of layering for sandstone o f Lyons Form ation
(after Y o u a s h , 1966).

142 M E C H A N I C A L B E H A V I O U R O F J O I N T E D R O C K
Fig. 10-119. Bending: A niso tropy o f the m axim um bending m om entM
dur in g failu re . X = j w here M is the m a x im u m ben d in g
m o m e n t a t fa ilu re ; / is the m o m e n t o f inertia o f the bar.M
I () = the value ol o b ta in e d in the case of lo ad in g a lo n g 07. w ith 7 = 90
(af te r D ayre , 1970).
T A B L E 15
C om parison o f to ta l defects in six angular intervals with tensile streng th in B arre g ran ite
(after W i l l a r d and M c W i l l i a m s , 1969)
A"Sula.r Defects sTrength Line-‘° adlnterval MPa (lbf/in2) anSle
0 ± 1 5 213 15.5 (2244) 0
30 ± 1 5 ° 160 14.8 (2145) 30
60 ± 1 5 105 9.5 (1385) 60
90 ± 1 5 76 10.7 (1553) 90
120 ± 1 5 77 11.7 (1695) 120
150 + 15 172 13.7 (1981) 150

F R A C T U R E O F J O I N T E D R O C K I N T E N S I O N 143
W il l a r d and M c W illia m s (1969) developed m icrostructural techniques to investigate relations between rock fabric and m echanical properties. In Table 15 defect frequency orien tation to ta ls are com pared with the tensile strength of Barre granite from Brazilian tests. The tensile strength was calculated from each o f these line-load angles. The frequency o f defects tends to be inversely p roportional to strength, suggesting tha t the direction o f weakest tensile strength is approxim ately norm al to the direction o f m ost defects.
Beren ba u m and Br o d ie (1959) prepared and tested coal specimens for tensile strength by Brazilian test a t various orientations o f the planes o f weakness. The four types o f discs used are illustrated in Fig. 10-120 and are referred to as discs o f type (a), (b), (c) and (d) respectively. Their results are given in Fig. 10-121. On each set o f discs, m easurem ents were m ade a t five different angles to the planes perpendicular to the faces o f the set; these angles were 0°, 25°, 45°, 65°, and 90°. The discs used had a m ean thickness o f0.79 cm (0.31 in). The m ean d iam eter was 2.54 cm (1.00 in). Broadly speaking, the strength is greatest at 0 to the bedding planes and lowest a t 90 but whereas in Barnsley H ard coal the tensile strength decreases m onotonically as the angle with the bedding plane increases, in Cwmtillery coal the lowest value is
i- iii
( a ) c r o s s c l e a t s p a r a l l e l t o f a c e
| t4 I
( b ) m a i n c l e a t s p a r a l l e l t o f a c e
( c ) b e a d i n g p l a n e s p a r a l l e l ( d ) m a i n a n d c r o s s c l e a t s t o f a c e a t 4 5 ° t o f a c e
- b e d d i n g p l a n e s m a i n c l e a t s c r e s s c l e a t s
Fig. 10-120. Disc specimens for test on coal (after B e r e n b a u m and B r o d i e , 1959).

144 M E C H A N I C A L B E H A V I O U R O F J O I N T E D R O C K
found at angles with the bedding plane varying about 55 to 75 (depending on the cleat orientation) and there is evidence that the greatest strength m ay be found a t angles up to 25 with the bedding plane (again depending on cleat orientation).
Fig. 10-121 a. Tensile s trength results for Barnsley H ard coal (after B e r e n b a u m and B r o d i e . 1959).
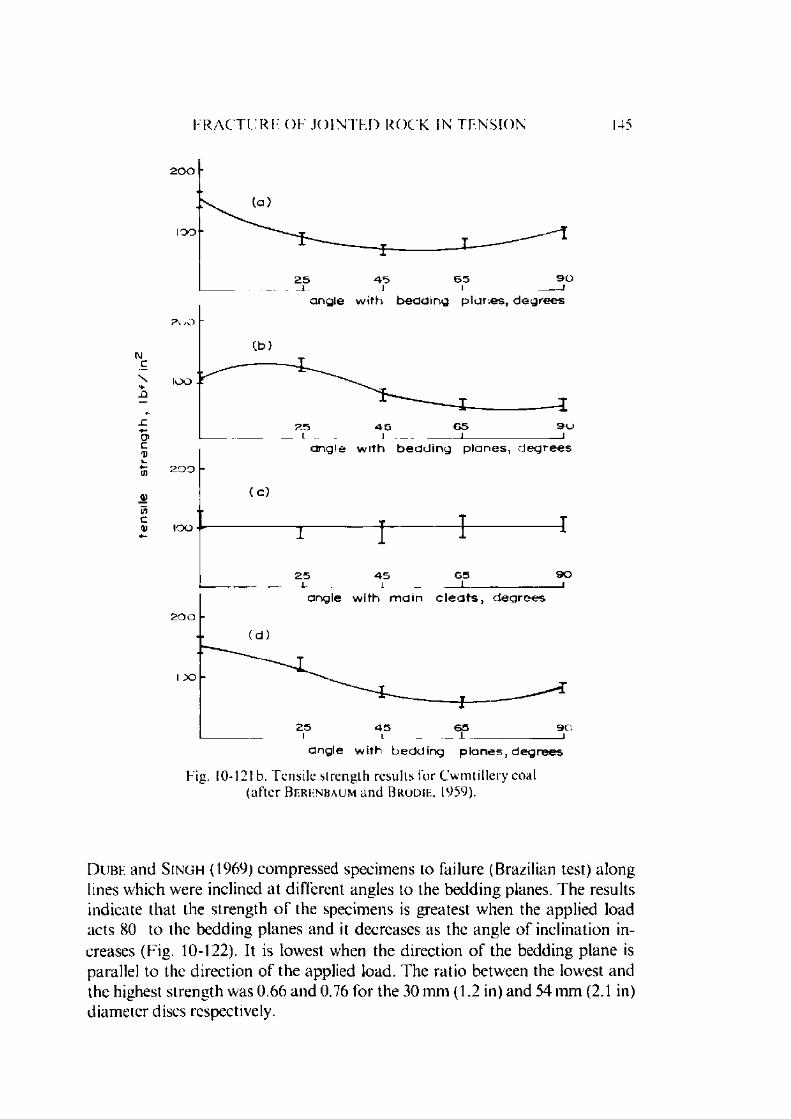
I R A C T U R E O F J O I N T E D R O C K IN T E N S I O N 145
Fig. 10-121 b. Tensile strength results for Cwmtillery coal (after Bi r i n b a u m and B r o d i k , 1959).
D ljbh and S i n g h (1969) com pressed specimens to failure (Brazilian test) along lines which were inclined at different angles to the bedding planes. The results indicate that the strength o f the specimens is greatest when the applied load acts 80 to the bedding planes and it decreases as the angle o f inclination increases (Fig. 10-122). It is lowest when the direction o f the bedding plane is parallel to the direction o f the applied load. The ratio between the lowest and the highest strength was 0.66 and 0.76 for the 30 mm (1.2 in) and 54 mm (2.1 in) d iam eter discs respectively.

146 M E C H A N I C A L B E H A V I O U R O F J O I N T E D R O C K
d i s c d i a . 5 4 m m
O IO 2 0 3 0 4 0 5 0 6 0 7 0 8 0 9 0
a n g l e b e t w e e n a p p l i e d l o a d
a n d b e d d i n g p l a n e , d e g r e e s
Fig. 10-122. Effect o f direction o f loading (with respect to bedding plane) on tensile s trength o f sandstone (after D ub e and S in g h , 1969).
Using the ring test, H obbs (1964) evaluated the effect o f orien tation o f the bedding planes on the tensile strength o f rocks. H e used discs o f 2.54 cm (1 in) external diam eter, 0.64 cm (0.25 in) thick with a 0.32 cm (0.125 in) d iam eter hole. The results are given in Table 16. It is seen that tensile strength is greatest when the tensile stress generated is at 0 to the lam ination (lam inations at right angle to the loaded axis). However, there arc two exceptions. T he K irkby siltstone shows m inim um tensile strength at 75 to the lam inations and m axim um at 30 to the lam inations. Cefn C oed sandstone shows little variation in tensile strength with lam ination orientation. The m ajority o f the discs failed along the loaded diam eter irrespective o f the orientation o f the lam inations. Subsidiary cracks tending to follow the plane o f the lam inations also occurred. Certain specimens loaded at 60 to the lam inations sheared along one o r m ore planes parallel to the direction o f lam inations.
Ba r r o n (1971) has evaluated the effect o f o rien tation o f the bedding planes on the tensile strength o f siltstone using the ring test. All specimens failed directly across the loading diam eter. The results are very similar to those o f H o bbs .
Berenbaum and Br o d ie (1959) studied the variation o f the tensile strength o f Barnsley H ard coal at various angles with the bedding planes by two methods, namely, indentation method (com pression o f square plate along a diameter) and Brazilian test m ethod (Table 17). They are in good agreement.
Similar results have been obtained in direct pull ou t tests on cylindrical specimens o f serpentineous schist (Val M alenco, Italy) and gneiss (Entracque, Val Gesso, Italy) (Fig. 10-123). The m axim um value o f tensile strength and the
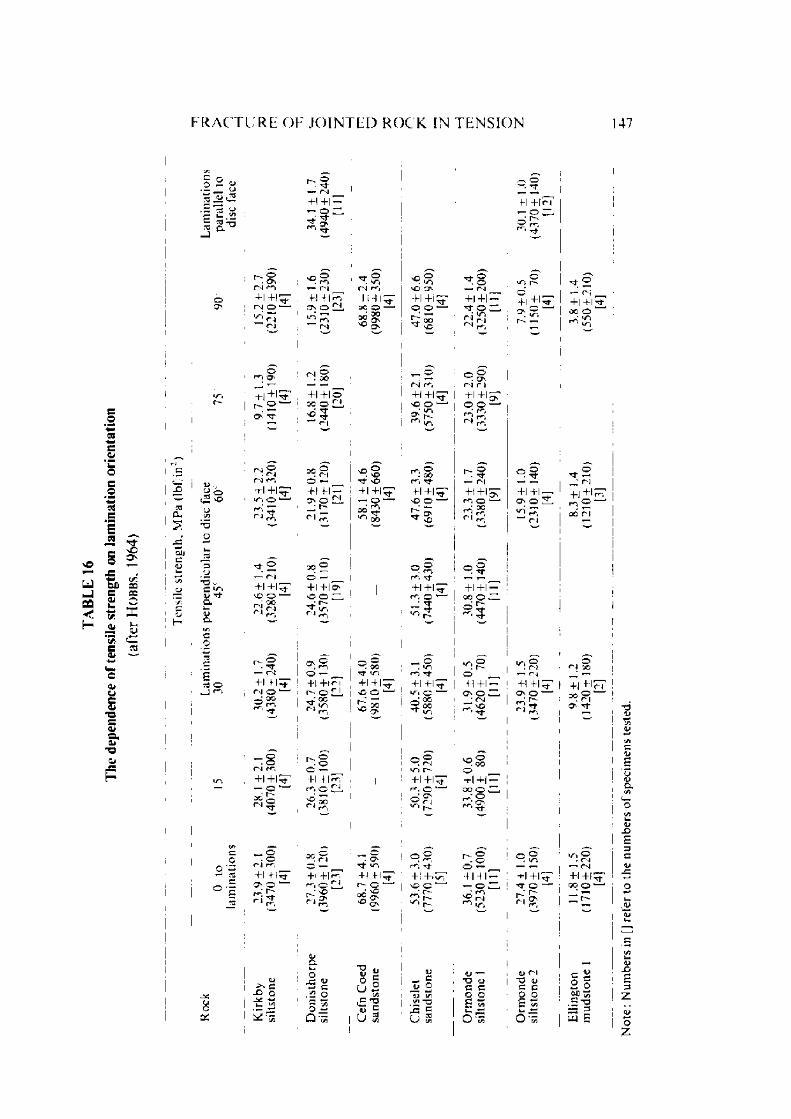
TAB
LE
16
The
depe
nden
ce
of te
nsile
st
reng
th
on la
min
atio
n or
ient
atio
n
(aft
er
Ho
bb
s.
1964
)F R A C T U R E O F J O I N T E D R O C K IN T E N S I O N 147
o oo•
~ oV)COC~
CL
auc<U
H
OJ
so' J(/5
•5o
J33' J
■O L.c >n <U -rtc.
Er3 O
+1+1-
s r
O-l r*->+1 +!^T
vO ©— (N+ + 1 rr"‘O' 2 —iri r*-5
r i
^.in fN pr>;+1 +l t" oc o 1—*Ort 00°£ O' ^ O '
+1 +15ON -3-
ni r*i +1 + 1 >n o 1—1 <*■> ^r i m
rs °. oo
+1 +1© 00 O Li2 3r i
O ~+1 +1- O' O £± • r -ri r*~.
— C'l+1 + 1 vO O —1 oo <N
1 r<-,<N
— n+1 + 1 r-i o 1—1q ooS. r»
oo ^© —1 +1+1 O'■ o o l l
o —_+1 + l r .h-cLLoo
T* x©+ 1 +1^ — o 1—1
. - 3 O . oo rfr in+l +I^FvO © 1— 1r~~SO OO
„ o• or i m+i+ i^O' O •—1
oo
r*l
Q
ri+i+l ~. © Lii- .i 3s
. O ' T f « 0
+I+M r- o 1OP 0 °X O '
O '
<u >■» c -£> O- 2311
c.U.O•5 S.12 o § |
a l</5£ cU *n-/ c/5
vO O '+1 + 1 o © —•s *>^ SC
n r<-, +i +i: SO © *■■ >n r-m in
' : oo cn rf+1 +l^ro © 1—1 r-’ ^
P Sm Tt+1+15;
- 5
. </~) m Tf+1 +1 Tf<n © — 1f—; oo 2 oo
W
_ © • © r~- § © S '
R nn m o u n r -
i i n + 1 + 1 + i + i ^ r + 1 + 1 ^— — © “ r*~, © r*~, © ------
° o ©
r , s
o -
W
C/5
C<u o1) t/5i/> "O
gU C/5
f - O
m r t © —
+ 1 + 1 v n + 1 + 1v£> © 1— 1 — ©
r ‘ « n
r i - <=>• ©—• Cl _
+1 + 1- rr © IL
O ©w . O ' n r j+1+15T © © >—■ r- i *
— ri+1+I5Tr*~, © 1—> • 00r , £:
+i + i - oo © nS 3
+! + i - r i '
'O m
+1 +1- oo © Z
o —XJ OJc co o£ 2
O ’!a
. rf+1 +|rT
i § “
+1 + 1 o ,9
S i +1 +1— o. © ZL
- 8 — n +1 + 1 O ' © •— *r-i £ rsi
rf ^— r ;+1 +1 ~3~ oo © ir,r<5 >r,
r t S — r'1 +| + l5r*~, ^
oo n
n §+1 +><N00 ° “ . ri O ' Tf
'^ r . — ciI— +1 +1 +l+lrf
• r-i O'
4j r i ~0 v c co o£ to •- ~0-7.
oo © 1 “ r-
co<D
a § . s i— 3uj E
Not
e: N
umbe
rs
in []
refe
r to
the
num
bers
of
spec
imen
s te
sted
.

148 MEC H A N I C A L B E H A V I O U R O F J O I N T E D R O C K
T A B L E 17
V ariation o f the tensile streng th o f Barnsley H ard coal with o rien ta tion to the bedding planes
(All spec im ens cu t from the sam e block)
(after B e r e n b a u m an d B r o d i e , 1959)
M ethod
Inden ta tion (0.95 cm (3/8 in) indenter)15 specimens a t each angle
Brazilian20 specimens at each angle
Tensile strength , M P a (lbf/in2)
A ngle between tensile stresses and bedding p lanes
0 25 45 65 90
2.8 ± 0 .1 9 2.3 ± 0 .2 8 1.7 ± 0 .1 0 1.6 ± 0 .1 0 1 .3 ± 0 .1 2 (408 ± 27) (3 2 9 + 41) (2 4 2 ± 14) (226± 14) (191 ± 18)
2.8 ± 0 .1 9 2.9 ± 0 .2 7 1 .9 ± 0 .2 2 1 6 ± 0 . 10 1 .2 ± 0 .1 0 (408 ± 27) (415 ± 39) (279± 32) (226± 14) (168 ± 14)
(Told
Fig. 10-123a. R atio o f the tensile strengths versus otV ' 0 /
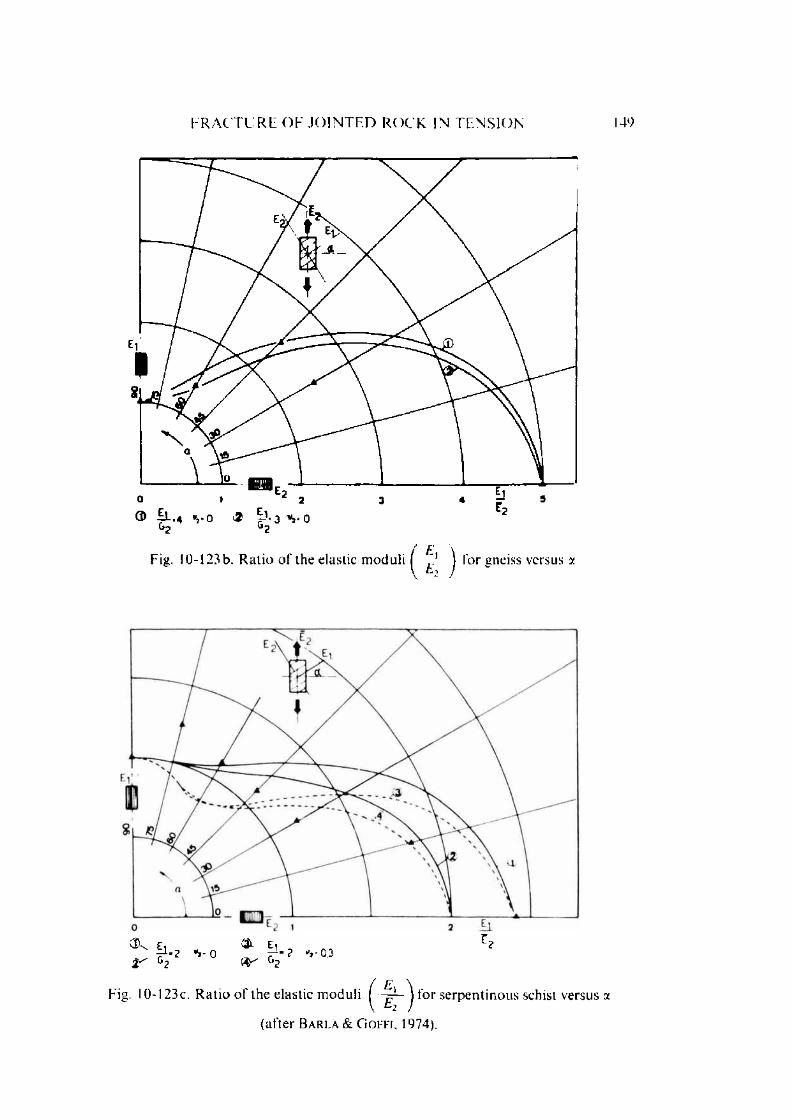
F R A C T U R E O F J O I N T E D R O C K IN T E N S I O N 149
Fig. 10-123 b. R atio o f the elastic m oduli | j '.1 j for gneiss versus y.
Ei Ei 2£1-2 0 r -2 V0.3
Fig. 10-123c. R atio o f the elastic moduli | ^ j for serpentinous schist versus a
(after Ba r l a & G offi . 1974).
150 M E C H A N I C A L B E H A V I O U R O F J O I N T E D R O C K
elastic m odulus occurs when the tensile load is applied parallel to the p lane o f lam inations. The m inim um values for these rocks are obtained when the load is applied perpendicular to the same plane. The anisotropies o f defo rm ab ility and strength seem to coincide with the gneiss but this does not hold fo r the serpentineous schist. The change in elastic m odulus with o rien ta tion does not seem to agree with the tensorial transform ations for elastic constan ts w hich hold true for a transversely isotropic medium.
10.7. Fracture of Jointed Rock in Direct Shear
K rsm a no vic and L a n g o f ( 1 9 6 4 ) conducted tests on stratified and jo in ted limestone in a direct shear m achine and their results are given in Fig. 10-1 2 4 . T here are three typical r — A s lines (obtained at approxim ately the sam e values o f norm al stress a).
The first type occurs in the solid rock where there is cohesion (the line for the first Series “ A "). Its characteristics are very high shear resistance w ith slight deform ations necessary to develop m axim um shear resistance: A s approxim ately0 .1 .to 0.5 mm (0.004 to 0.02 in). The high value o f the relation r t/ r r is also noted, which in the cases tested was always greater than 2.0.
The second typical z — A s d iagram , is observed for stratification surfaces o f different degrees o f roughness (lines for the Series B1 to B3) and fissures o f great roughness (lines o f Series D2 and D3). Their characteristics a re (1) the deform ations necessary to develop shear resistance are considerably greater (2 to 5 m m ) (0.08 to 0.2 in) and (2) the value o f the relation r , / i r ranges between 1.0 and 2.0.
Third r — A s line is characterised by slight o r great deform ations necessary for activation o f shear resistance, but in this case the relation T,/rr is approx imately equal to 1.0 (Series C2 and D3).
L a jta i (1 9 6 9 a , b ) te s te d sev e ra l p l a n e , o p e n a n d c lo s e d , j o i n t s w i th r o c k b r id g e s a n d id e n t i f ie d 3 i n o d e s o f fa i lu re :1. Failure in tension at low norm al stresses.2. Failure in shear at interm ediate norm al stresses.3. U ltim ate failure failure o f crushed m aterial at high norm al stresses.
According to him, the total shear strength o f a plane o f weakness consisting o f discontinuities separated by solid bridges can be considered as a sum o f cohesional strength (fundam ental shear strength (r0), internal friction in the solid bridges (r/>j), and friction angle along the open jo in ts (c/>M). Accordingly, it is possible that along a plane o f weakness frictional resistance is not fully mobilised before first fracturing as the deform ation may be quite large and
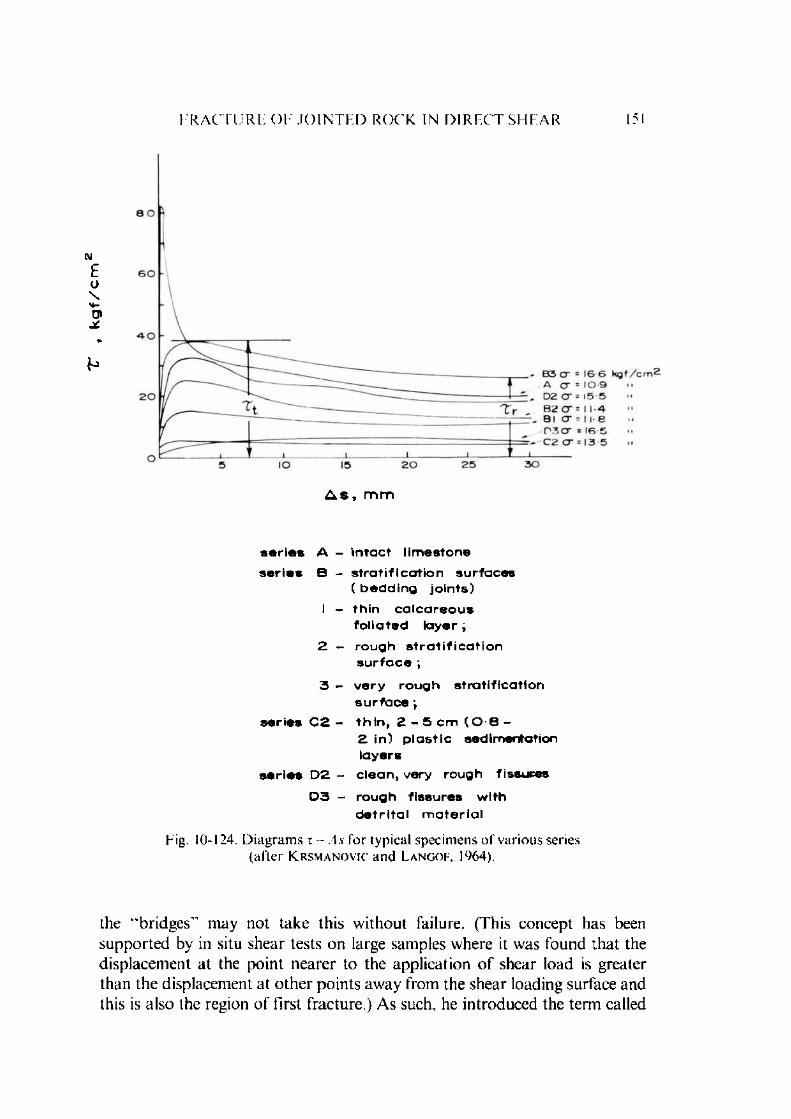
F R A C T U R E O F J O I N T E D ROC K IN D I R E C T S H E A R 151
A s , m m
s e r i e s A - i n t a c t l i m e s t o n e
s e r i e s B - s t r a t i f i c a t i o n s u r f a c e s ( b e d d i n g j o i n t s )
I - t h i n c a l c a r e o u s f o l i a t e d t a y e r ;
2 - r o u g h s t r a t i f i c a t i o ns u r f a c e ;
3 - v e r y r o u g h s t r a t i f i c a t i o ns u r f a c e •,
s e r i e s C 2 - t h i n l 2 - 5 c m ( 0 - 8 -2 i n ) p l a s t i c s e d i m e n t a t i o n l a y e r s
s e r i e s D 2 - c l e a n , v e r y r o u g h f i s & u c e s
D 3 - r o u g h f i s s u r e s w i t h d e t r i t a l m a t e r i a l
Fig. 10-124. D iagram s r — A s for typical specimens o f various series (after K r smanovi c and L a n g o f , 1964).
the “ bridges" may not take this w ithout failure. (This concept has been supported by in situ shear tests on large samples where it was found that the displacem ent at the point nearer to the application o f shear load is greater than the displacem ent at o ther points away from the shear loading surface and this is also the region o f first fracture.) As such, he introduced the term called
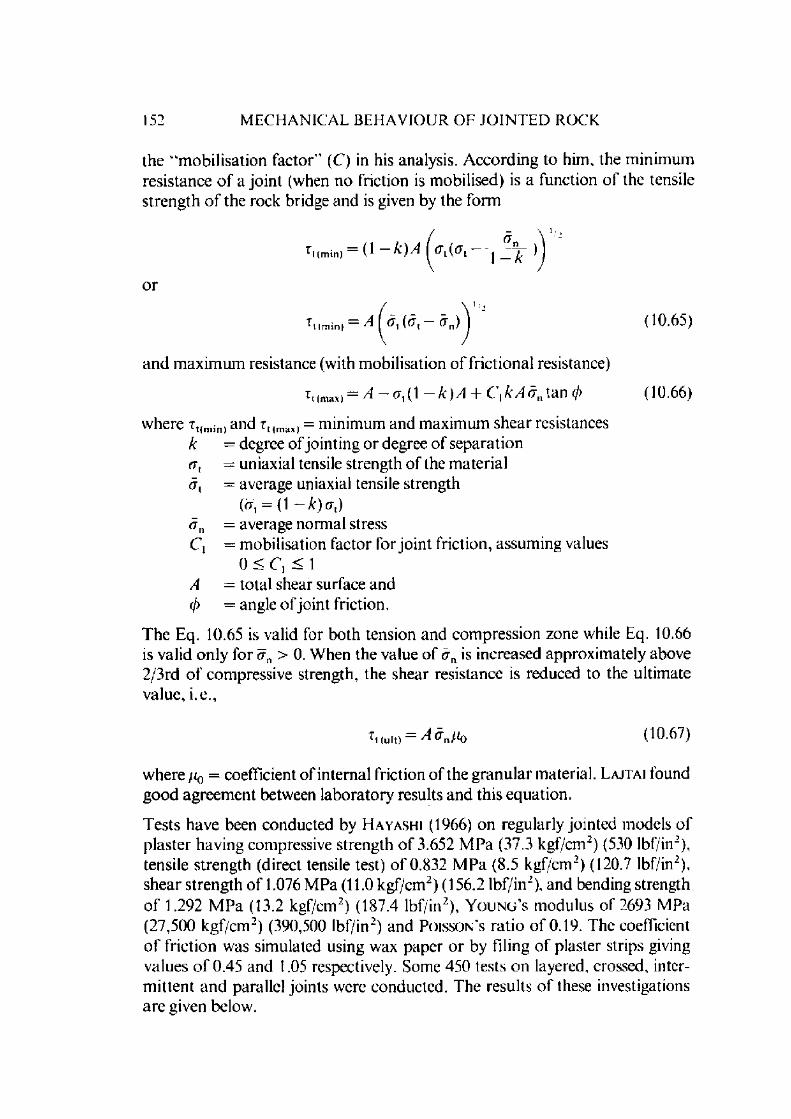
152 M E C H A N I C A L B E H A V I O U R O F J O I N T E D R O C K
the “ m obilisation factor" (C) in his analysis. A ccording to him, the m inim umresistance o f a jo in t (when no friction is m obilised) is a function o f the tensilestrength o f the rock bridge and is given by the form
o r
T,,min, = ^ , ( f f . - f f nA <10-65)
and m axim um resistance (with m obilisation o f frictional resistance)
i t(max)= A — o y(\ — k ) A + C xk A d n tan (/) (10.66)
Tt(min) and i Mmax) = minimum and m axim um shear resistancesk = degree o f jo inting or degree o f separation
= uniaxial tensile strength o f the m aterial— average uniaxial tensile strength
(<xt = (l - k ) o x)
<jn = average norm al stressCi = m obilisation factor for jo in t Iriction, assum ing values
0 < C, < 1A = total shear surface and<t> = angle o f jo in t friction.
The Eq. 10.65 is valid for both tension and com pression zone while Eq. 10.66 is valid only for cfn > 0. W hen the value o f a n is increased approxim ately above 2/3rd o f com pressive strength, the shear resistance is reduced to the ultim ate value, i.e .,
W ) = ^ n / '0 <IO-67>
w here //0 = coefficient o f internal friction o f the g ranu lar m aterial. L ajtai found good agreem ent between laboratory results and this equation.
Tests have been conducted by H ayashi (1966) on regularly jointed models o f plaster having compressive strength o f 3.652 M Pa (37.3 kgf/cm 2) (530 lbf/in2), tensile strength (direct tensile test) o f 0.832 M Pa (8.5 kgf/cm 2) (120.7 lbf/in2), shear strength o f 1.076 M Pa (11.0 kgf/cm 2) (156.2 lbf/in2), and bending strength o f 1.292 M Pa (13.2 kgf/cm2) (187.4 lbf/in2), Y o u n g ’s m odulus o f 2693 M Pa (27,500 kgf/cm 2) (390,500 lbf/in2) and P o isso n ’s ra tio o f 0.19. The coefficient o f friction was simulated using wax paper o r by filing o f plaster strips giving values o f 0.45 and 1.05 respectively. Some 450 tests on layered, crossed, interm ittent and parallel joints were conducted. The results o f these investigations are given below.
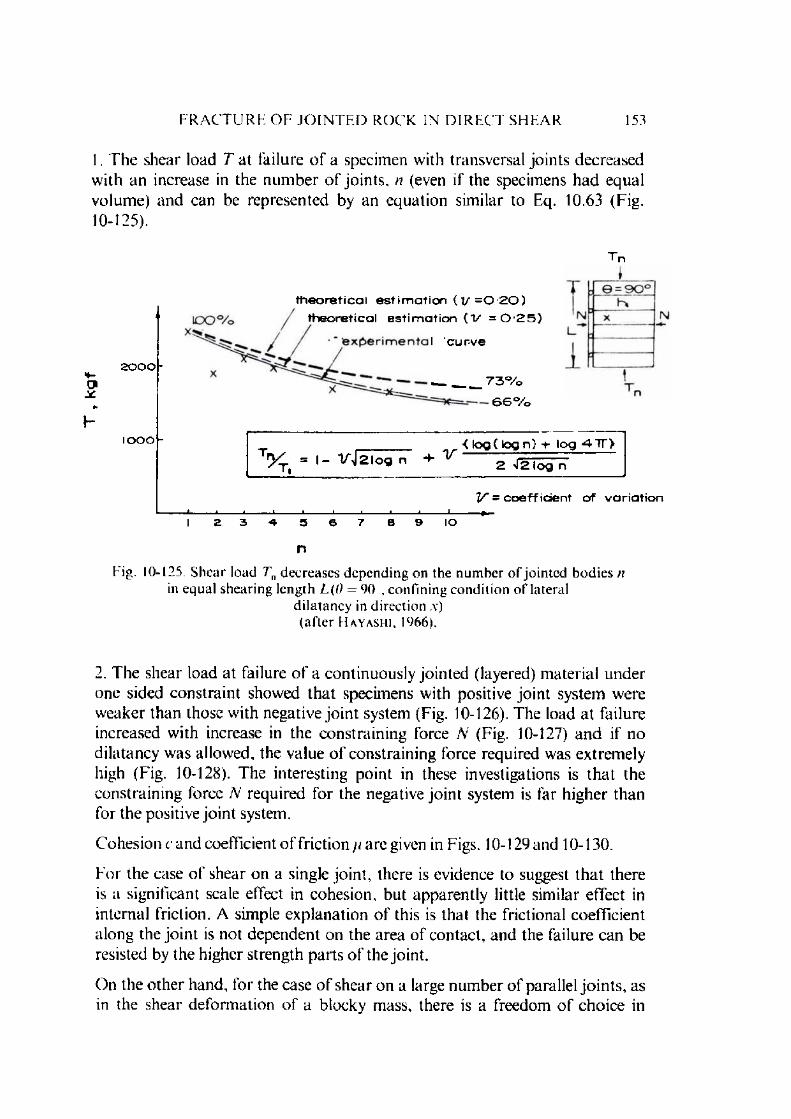
F R A C T U R E O F J O I N T E D R O C K IN D I R E C T S H E A R 153
1. T he shear load T at failure o f a specimen with transversal jo in ts decreased w ith an increase in the num ber o f jo in ts, n (even if the specimens had equal volum e) and can be represented by an equation sim ilar to Eq. 10.63 (Fig. 10-125).
o>*
h
2000
IOOO~ ^ry L = \ - V j 2 l o g n
• iV
< log ( log n ) lo g <4-TT>
2 >J2 l o g n
V = c o e f f i c i e n t o f v a r i a t i o n
IO
nf ig . 10-125. Shear load Tn decreases depending on the num ber o f jo in ted bodies n
in equal shearing length L (0 = 90 , confining condition o f lateral d ila tancy in direction .v)
( a f t e r H a v a s h i , 1966).
2. The shear load at failure o f a continuously jo inted (layered) m aterial under one sided constrain t showed that specimens with positive jo in t system were w eaker than those with negative jo in t system (Fig. 10-126). The load at failure increased with increase in the constrain ing force N (Fig. 10-127) and if no d ilatancy was allowed, the value o f constraining force required was extrem ely high (Fig. 10-128). The interesting point in these investigations is tha t the constraining force N required for the negative jo in t system is far higher than for the positive jo in t system.
C ohesion c and coefficient o f fric tion // are given in Figs. 10-129 and 10-130.
F o r the case o f shear on a single jo in t, there is evidence to suggest th a t there is a significant scale effect in cohesion, but apparently little similar effect in internal friction. A simple explanation o f this is that the frictional coefficient along the jo in t is not dependent on the area o f contact, and the failure can be resisted by the higher strength parts o f the joint.
On the o ther hand, for the case o f shear on a large num ber o f parallel jo in ts , as in the shear deform ation o f a blocky mass, there is a freedom o f choice in
t h e o r e t i c a l e s t i m a t i o n ( V = 0 - 2 0 ) t h e o r e t i c a l e s t i m a t i o n ( V = 0 - 2 5 )
I c u r v e
7 3 %
66%

154 M E C H A N I C A L B E H A V I O U R O F J O I N T E D R O C K
defining the failure surface, and greater deform ation takes place along lower strength joints. Thus the greater the num ber o f jo in ts, the higher the probability o f defining a series o f failure surfaces in lower strength com ponents, and greater the m agnitude o f scale effect.
6 =o°
Eig. 10-126. Anisotropy o f shear load at failure T in confining the lateral d ilatancy in direction x
(after H a y a s h i , 1966).
Fig. 10-127. A nisotropy o f shear load at failure 7 under normal force N(after H a y a s h i , 1966).
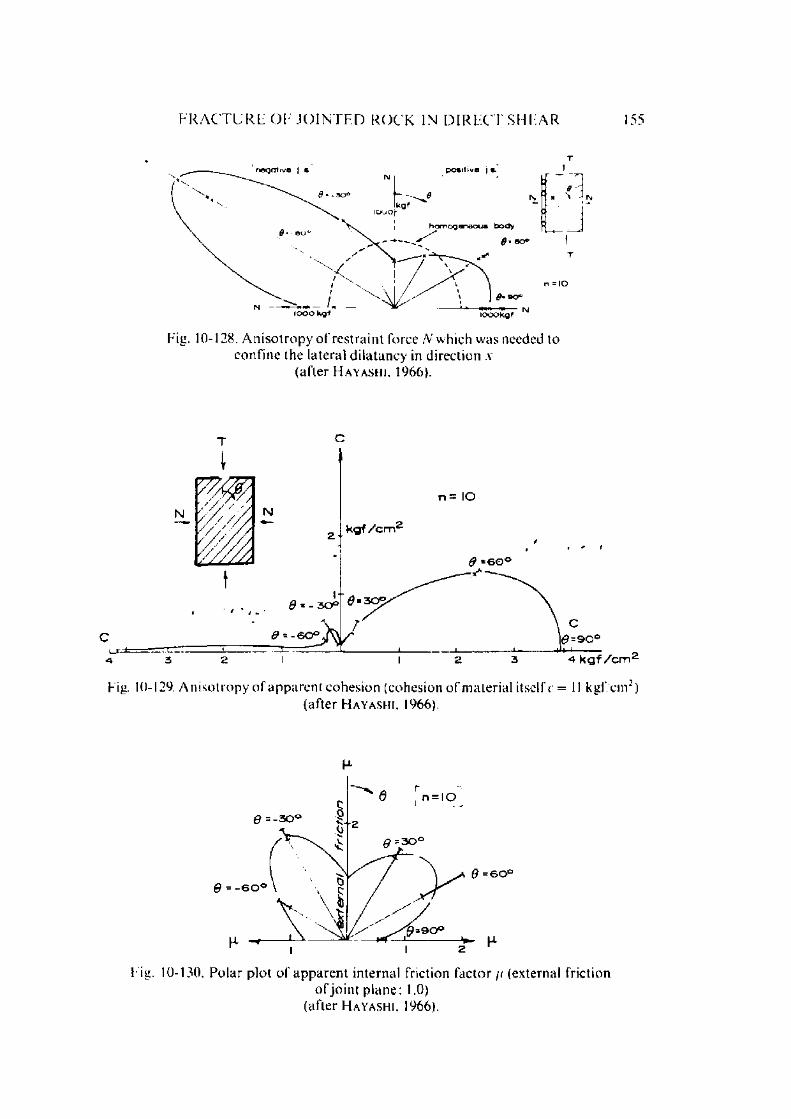
F R A C T U R E O F J O I N T E D ROC K IN D I R E C T S H E A R 155
Fig. 10-128. A niso tropy o f restraint force N which was needed to confine the lateral dilatancy in direction v
(after H a y a s h i , 1966).
T c
Fig. 10-129. A niso tropy o f apparen t cohesion (cohesion o f material itself c = 11 kgf/cm2)(after H a y a s h i . 1966).
Fig. 10-130. Polar plot o f apparen t internal friction factor // (external frictiono f jo in t plane: 1 .0)
(after H a y a s h i . 1966).
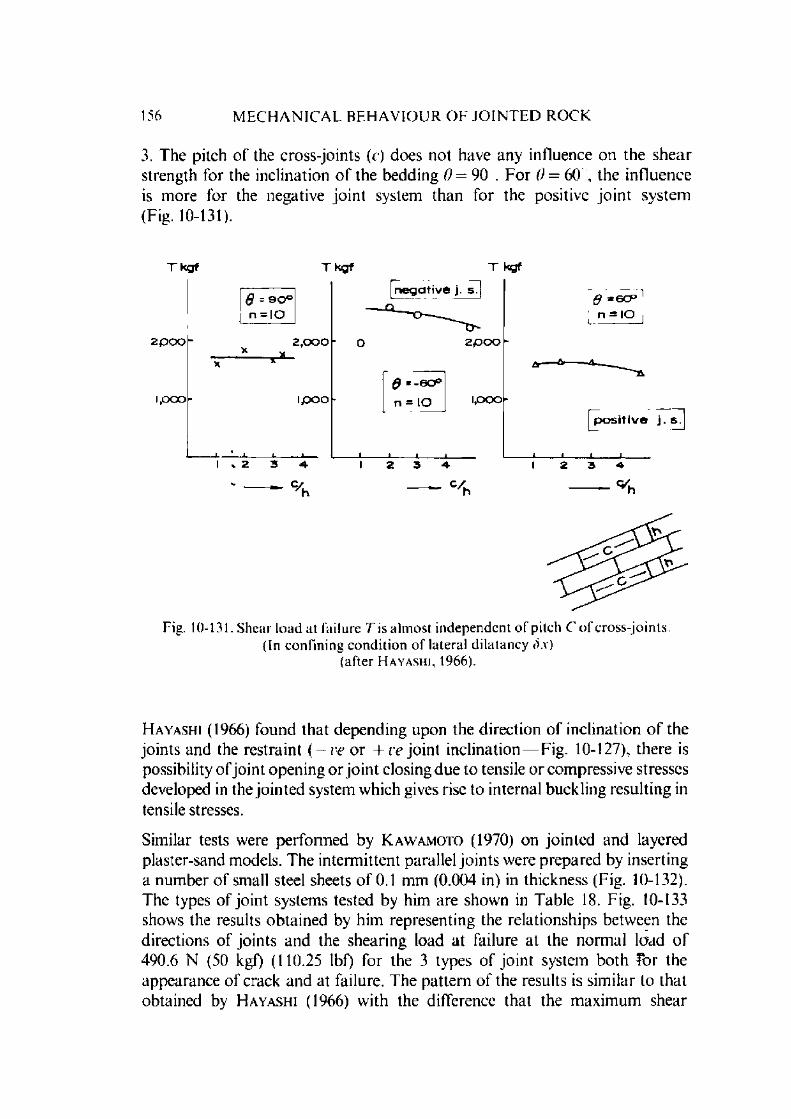
156 M E C H A N I C A L B E H A V I O U R O F J O I N T E D R O C K
3. The pitch o f the cross-joints (c) does not have any influence on the shear strength for the inclination o f the bedding 0 = 90 . F o r 0 = 60 , the influence is m ore for the negative jo in t system than for the positive jo in t system (Fig. 10-131).
T k g f T kgf T kgf
& = 9 0 °[ n e g a t i v e j. s ]
n = IO
2 p O O . 2 , 0 0 0 0 2 P O O -
- —X
6 = - 6 0 ^
1 , 0 0 0 - i p o o j n = IO 1 , 0 0 0 -
1 1 1 _l_ i .. i i2 3 - 4
C/u2 3 4
6 =GCP n = IO
-^ — ex
p o s i t i v e j . s .
_i_____i_____i_____ i_I 2 3 4
Fig. 10-131. Shear load at failure T is almost independent o f pitch C o f cross-joints. (In confining condition o f lateral dilatancy <>.v)
(after H a y a s h i , 1966).
H ayashi (1966) found that depending upon the direction o f inclination o f the jo ints and the restraint ( — ve o r + ve jo in t inclination— Fig. 10-127), there is possibility o f jo in t opening o r jo in t closing due to tensile or com pressive stresses developed in the jo in ted system which gives rise to internal buckling resulting in tensile stresses.
Similar tests were perform ed by K a w a m o to (1970) on jo inted and layered plaster-sand models. The interm ittent parallel jo in ts were prepared by inserting a num ber o f small steel sheets o f 0.1 mm (0.004 in) in thickness (Fig. 10-132). The types o f jo in t systems tested by him are shown in Table 18. Fig. 10-133 shows the results obtained by him representing the relationships between the directions o f joints and the shearing load at failure at the norm al load o f 490.6 N (50 kgf) (110.25 lbf) for the 3 types o f jo in t system both Tor the appearance o f crack and at failure. The pattern o f the results is sim ilar to that obtained by H ayashi (1966) with the difference that the m axim um shear
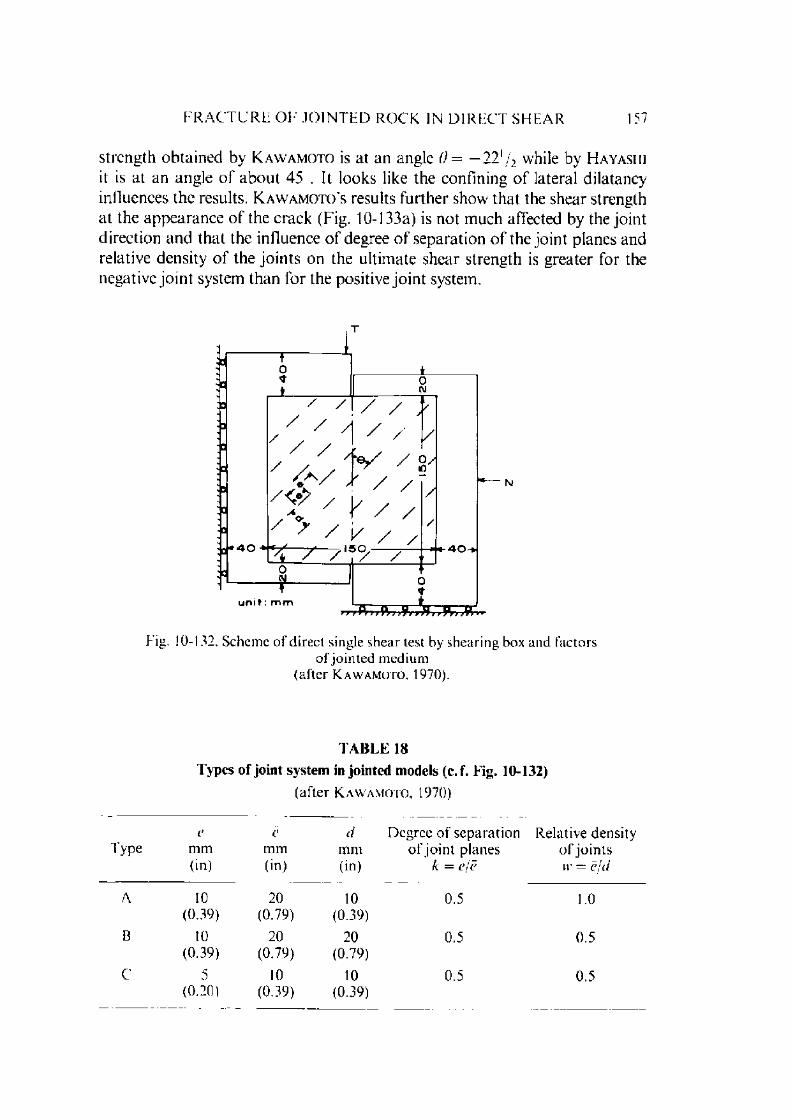
F R A C T U R E O F J O I N T E D R O C K IN D I R E C T S H E A R 157
strength obtained by K a w a m o t o is a t an angle 0 = —22l/2 while by H ayashi it is at an angle o f about 45 . It looks like the confining o f lateral dilatancy influences the results. K a w a m o t o ' s results further show that the shear strength at the appearance o f the crack (Fig. 10-133a) is not much affected by the joint direction and that the influence o f degree o f separation o f the joint planes and relative density o f the jo in ts on the ultim ate shear strength is greater for the negative jo in t system than for the positive jo in t system.
o
~ ro* oN
/
/ < • >
//
V // /
. / y // y / v
OCVJ
---------r~uni t : m m
/
/ //
/
<40-*.
Fig. 10-132. Scheme o f direct single shear test by shearing box and factorso f jo in ted medium
(after K a w a m o t o , 1970).
T A B L E 18
T ypes o f jo in t system in jo in ted m odels (c .f . Fig. 10-132)
(after K a w a m o t o , 1970)
Typee
m m(in)
em m(in)
tim m(in)
D egree o f separa tion o f jo in t p lanes
k = e je
Relative density o f jo in ts w = e jd
A 10 20 10 0.5 1.0(0.39) (0.79) (0.39)
B 10 20 20 0.5 0.5(0.39) (0.79) (0.79)
C 5 10 10 0.5 0.5(0.20 ) (0.39) (0.39)
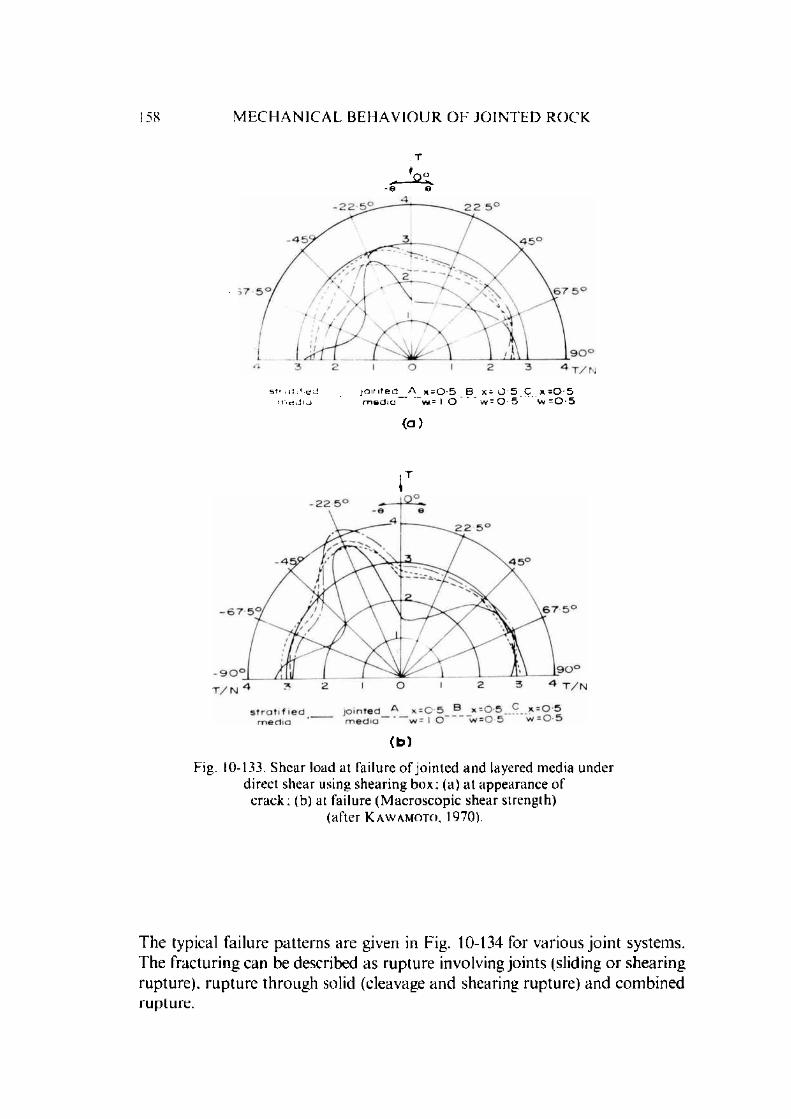
158 M E C H A N I C A L B E H A V I O U R O F J O I N T E D R O C K
1QQ- e e
s t r u t t e d j o i n t e d A x = 0 - 5 B x - 0 5 C x = 0 - 5m e d i a m s i d i a v*= I O w = 0 5 w = 0 - 5
(a)
(b)
Fig. 10-133. Shear load al failure o f jo in ted and layered media under direct shear using shearing box: (a) a t appearance o f
c rack; (b) at failure (M acroscopic shear strength)(a f te r K a w a m o t o , 1970).
The typical failure patterns are given in Fig. 10-134 for various jo in t systems. The fracturing can be described as rup ture involving joints (sliding o r shearing rupture), rupture through solid (cleavage and shearing rupture) and com bined rupture.
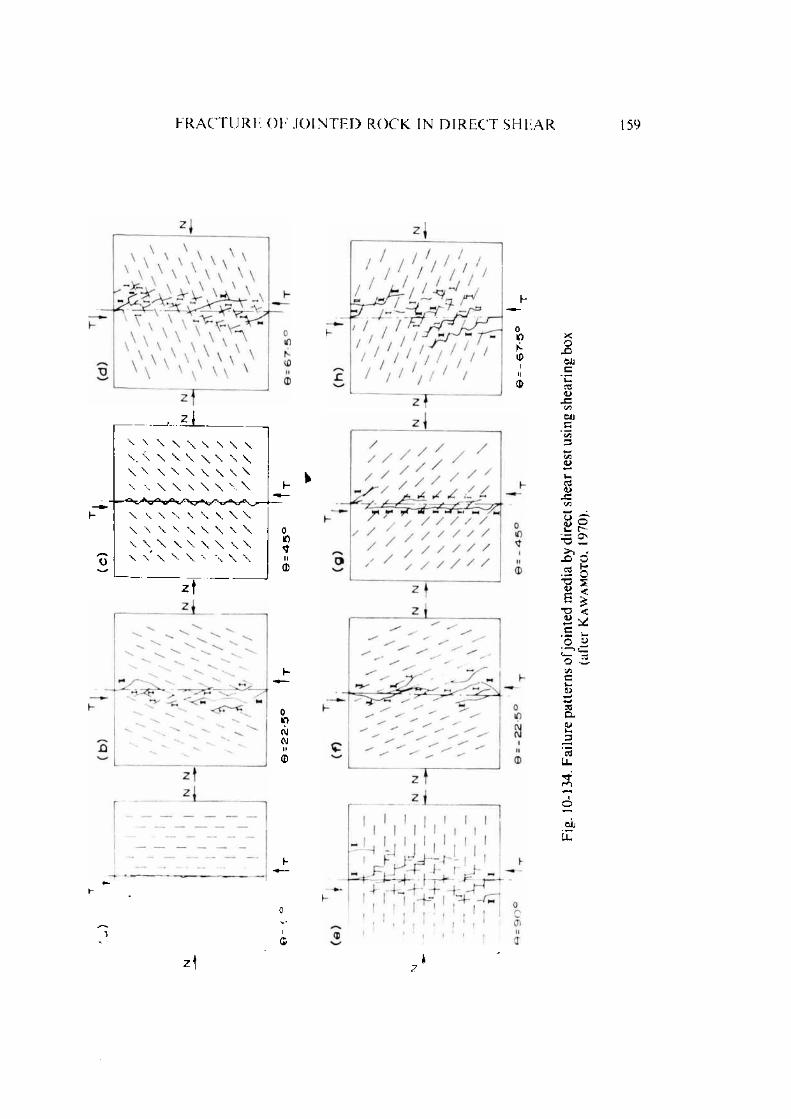
F R A C T U R E O F J O I N T E D R O C K IN D I R E C T S H E A R 159
o
\ \ \ \ \ \ \ \ \\. \ \ \ \ \ \ \ \\ \ \ \ \ \ \ \ \
; \ \ \ \ \ \ \ \
\ \ \ \ \ \ \ W\ \ \ \ \ \ \ \ \\ \ \ \ \ \ \ \ \\ \ V \ N \ \
010II0
010(\JOJ
0(0N10
XQJZ60c73<DCiJc
CS<USZt/5
.o& o
V s
"O<uco
u_oin
<i—U
S3
CLOi—
c3Ll.
m
O /J
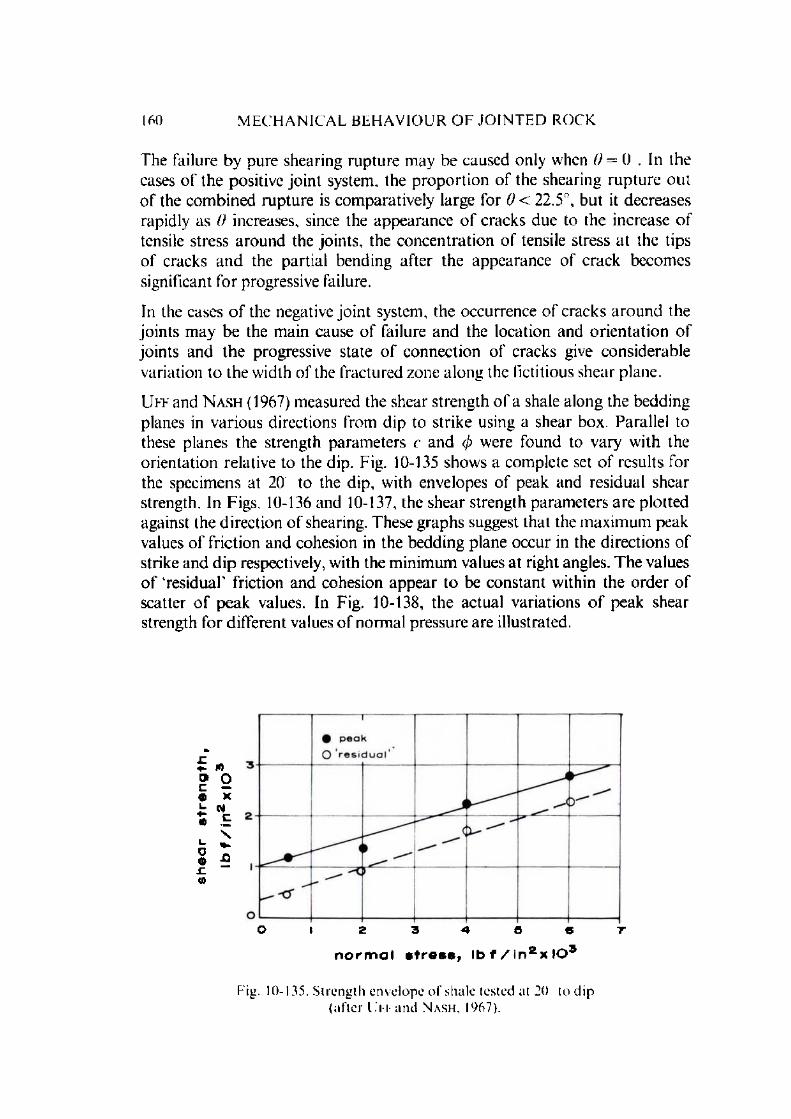
160 M E C H A N I C A L B E H A V I O U R O F J O I N T E D R O C K
The failure by pure shearing rupture may be caused only when 0 = 0 . In the cases o f the positive jo in t system, the p roportion o f the shearing rup tu re out o f the com bined rupture is com paratively large for 0 < 22.5°, but it decreases rapidly as 0 increases, since the appearance o f cracks due to the increase o f tensile stress around the jo ints, the concentration o f tensile stress a t the tips o f cracks an d the partial bending after the appearance o f crack becomes significant fo r progressive failure.
In the cases o f the negative jo in t system, the occurrence o f cracks a round the jo in ts m ay be the m ain cause o f failure and the location and orien ta tion o f jo in ts and the progressive state o f connection o f cracks give considerable variation to the w idth o f the fractured /.one along the fictitious shear plane.
U ff and N ash (1967) measured the shear strength o f a shale along the bedding planes in various directions from dip to strike using a shear box. Parallel to these planes the strength param eters c and 0 were found to vary with the orientation relative to the dip. Fig. 10-135 shows a com plete set o f results for the specimens at 20 to the dip, with envelopes o f peak and residual shear strength. In Figs. 10-136 and 10-137, the shear strength param eters are plotted against the direction o f shearing. These graphs suggest that the m axim um peak values o f friction and cohesion in the bedding plane occur in the directions o f strike and d ip respectively, with the m inim um values at right angles. The values o f ‘residual' friction and cohesion appear to be constant within the order o f scatter o f peak values. In Fig. 10-138, the actual variations o f peak shear strength for different values o f norm al pressure are illustrated.
♦ - 100> Oc
XL. 0J♦-(0 c
\L. *»00) nrU)
O I 2 3 4 8 6 T
normal stress, I b f / i n 2x l0 3
Fig. 10-135. S trength envelope o f shale tested at 20 to dip (after U ff and N a s h , 1967).

F R A C T U R L O F J O I N T E D R O C K IN D I R E C T S H E A R 161
Fig. 10-136. R elationship between 0 and angle to dip (after U iT a n d N a s h , 1967).
a n g l e t o d i p d i r e c t i o n , d e g r e e s
Fig. 10-137. R elationship between c and angle to dip (after UFFand N a s h . 1967).
W a l k e r (1971) conducted direct shear tests on m odels consisting o f cubic blocks oriented a t different angles to the direction o f norm al and shear stresses.I le observed sliding along jo in ts, ro ta tion o f blocks and failure through the blocks depending upon the direction o f orientation o f blocks with respect to the applied stress field. W hen the norm al stress existing on the imposed shear plane is high w ith low value o f the norm al stress on the orthogonal jo in t plane
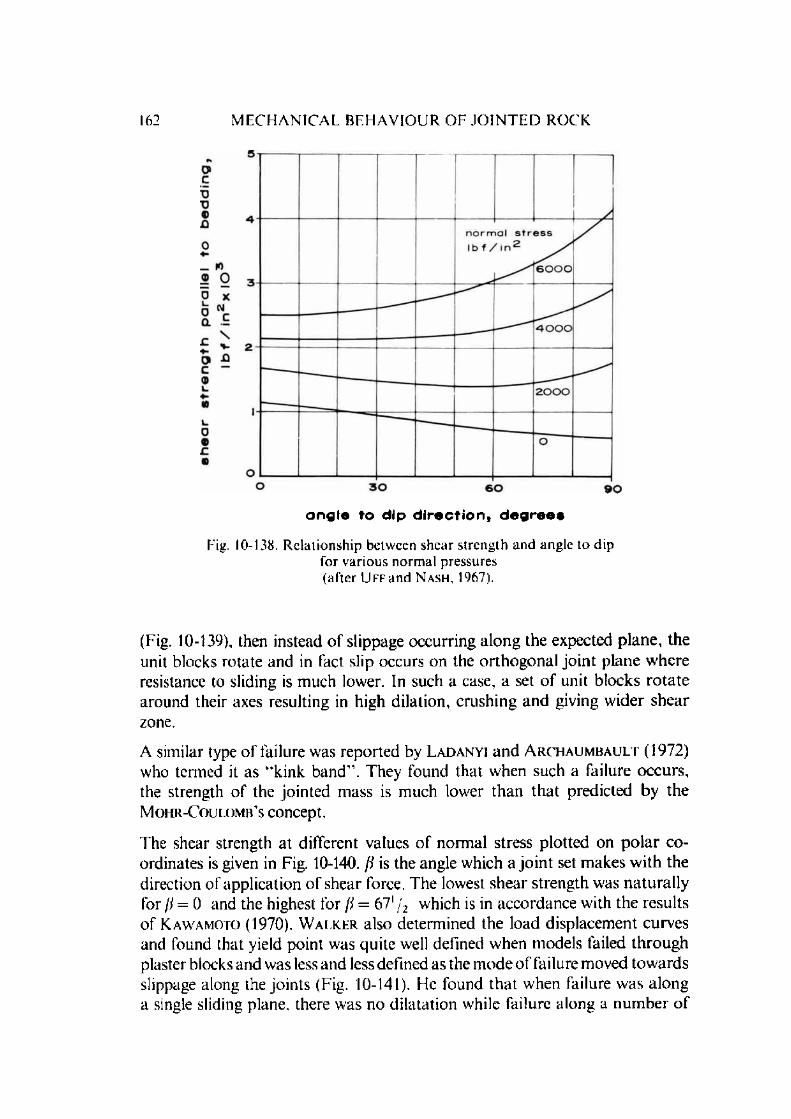
162 M E C H A N I C A L B E H A V I O U R O F J O I N T E D R O C K
ang le to dip d ire c t io n , d eg re es
Fig. 10-138. Relationship between shear strength and angle to dip for various norm al pressures (after UFFand N a s h , 1967).
(Fig. 10-139), then instead o f slippage occurring a long the expected p lane, the unit blocks rotate and in fact slip occurs on the orthogonal jo in t plane w here resistance to sliding is m uch lower. In such a case, a set o f unit blocks ro ta te around their axes resulting in high dilation, crushing and giving w ider shear zone.
A similar type o f failure was reported by L a d a n y i and A r c h a u m b a u l t (1972) who termed it as “ kink band". They found that when such a failure occurs, the strength o f the jo in ted m ass is m uch lower than that predicted by the M o h r - C o u l o m b ’s concept.
The shear strength at different values o f norm al stress plotted on p o la r co ordinates is given in Fig. 10-140. /I is the angle which a jo in t set m akes w ith the direction o f application o f shear force. The lowest shear strength was natu ra lly for /I = 0 and the highest for ft = 671 /2 which is in accordance with the results o f K a w a m o t o (1970). W a l k e r also determ ined the load displacem ent curves and found that yield point was quite w;ell defined w hen m odels failed th rough plaster blocks and was less and less defined as the m ode o f failure moved tow ards slippage along the jo ints (Fig. 10-141). He found th a t when failure was along a single sliding plane, there was no d ilatation while failure along a num ber o f
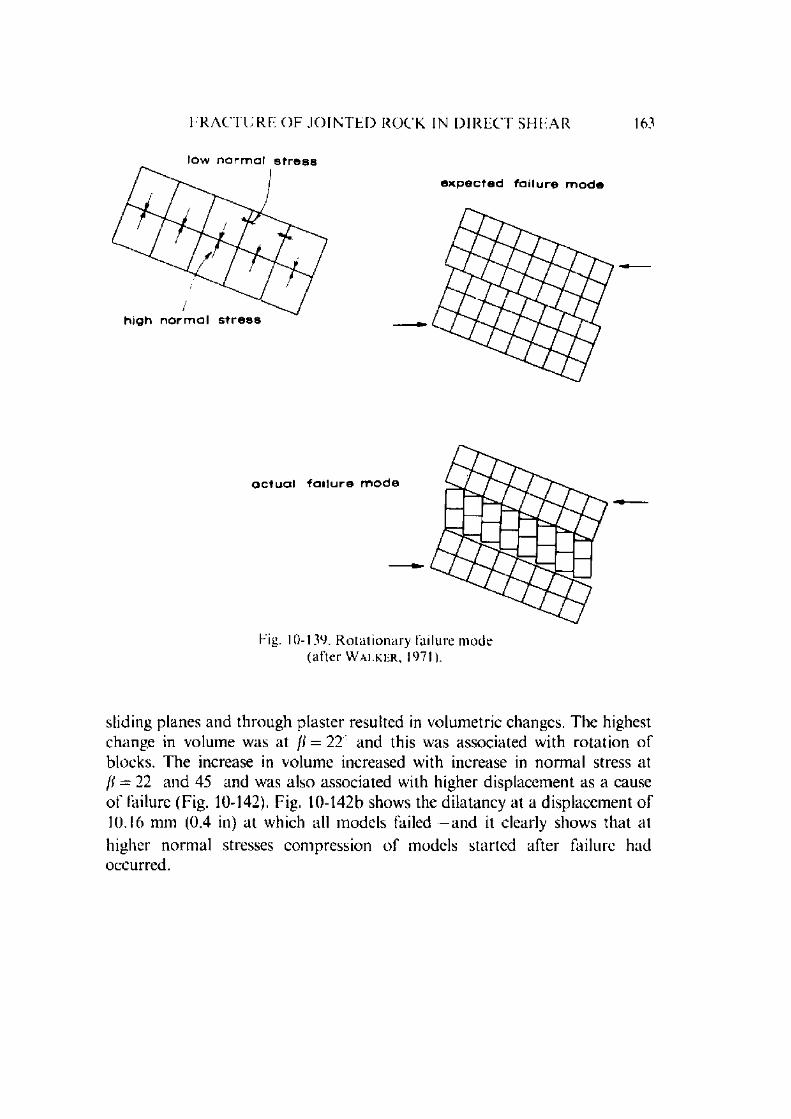
F R A C T U R E O F J O I N T E D R O C K IN D IR E C T S H E A R
l o w n o r m a l s t r e s s
e x p e c t e d f a i l u r e m o d e
163
a c t u a l f a i l u r e m o d e
Fig. 10-139. R ota tionary failure mode (after W a l k e r , 1971).
sliding planes and through plaster resulted in volum etric changes. The highest change in volume was at ji = 22 and this was associated with rotation o f blocks. The increase in volum e increased with increase in norm al stress at
= 22 and 45 and was also associated with higher displacem ent as a cause o f failure (Fig. 10-142). Fig. 10-142b shows the dilatancy at a displacem ent o f 10.16 mm (0.4 in) at which all models failed and it clearly shows that at higher norm al stresses com pression o f models started after failure had occurred.

shea
r s
tre
ng
th,
lbf/
in'
s h e a r s tr e n g th , l b f / i n 2
Fig. 10-140. P o la r d is t r ib u t io n o f sh ea r s t reng th a t d ifferen t n o rm a l stresses(a f te r W a l k e r , 1971).
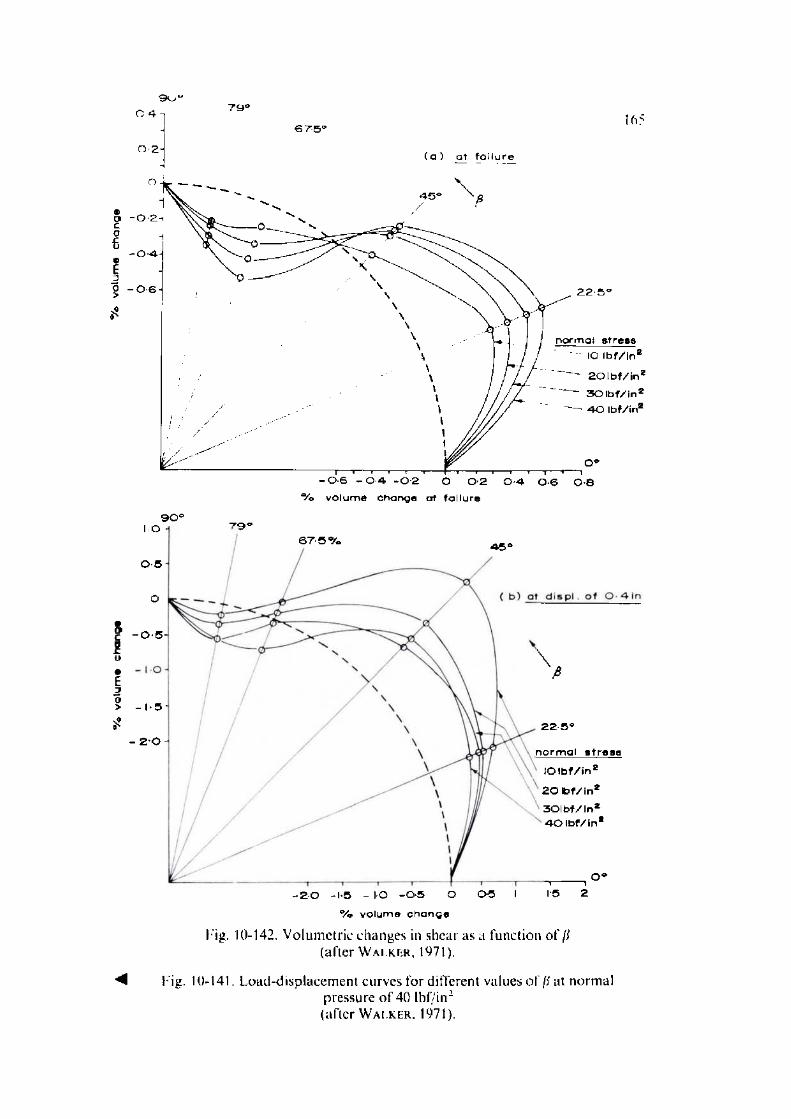
Vo vo
lum
e ch
ange
vo
lum
e ch
ang
e
% v o lu m e change a t fa ilu re
675% 4 5 c
0 - 5 ■
O
- 0 5 -
- 1 -5 -
- 20
- 2 0 -1 -5 - I O - 0 - 5 O 0 -5 I 15 2
°/o vo lu m e c h a n g e
Fig. 10-142. V olum ctric changes in shear as a function o f /i (after W a l k e r , 1971).
2 2 5 °
n o rm a l s tre s s
IO I b f / i n 2
2 0 lb f / in 2
3 0 l b f / in 2 4 -0 lb f / in 2
Fig . 10-141. L o a d -d isp la c e m en t cu rves for d ifferen t va lues of/)' at n o rm a lp re ssu re o f 40 lb f / in2 (a f te r W a l k e r . 1971).
166 M E C H A N I C A L B E H A V I O U R O F J O I N T E D R O C K
10.8. Fracture of Jointed Rock in M ultiaxial Compression
Q uite a num ber o f investigations have been done in the last few years under biaxial and triaxial loading conditions to determ ine the behaviour o f jo in ted rocks. All these studies have been m ade on m odel m aterials because they are easier to cast in any desired shape and the testing can be done in lower capacity equipm ent since the strength o f the model m aterials can be changed as desired. T he results o f these investigations are given below.
10.8.1. Biaxial C o n d i t io n s
M u l l e r and P a c h e r (1965) carried out tests on m odels o f size 70 cm x 70 cm x 30 cm (27.6 in x 27.6 in x 11.8 in) with one set o f jo in ts loaded biaxially
by a pair o f hydraulic jacks. The angle </> between the plane o f the jo in t set and the direction o f the greatest principal stress was varied from 0 to 60 in steps o f 0 , 15 , 30 , 45 , 60 . Tests were also conducted with d iscontinuous jo in ts o f different “degree o f separation" / e = 0, 1/3, 2/3, 1 at different ratios o f the principal stresses /?3//;, = n = 3, 5, 10, x . The results obtained by them are given in Fig. 10-143. The upper half o f the curve refers to the strength for d ifferent values o f n and / c = 1 (First quadran t) and ye < 1 (second quadrant). The lower ha lf refers to the deform ation m easured in the centre o f the lest body. It is clear that the angle </>, as in the case o f uniaxial shear strength, has a great influence on the strength o f the jo in ted mass. The strength falls very rapidly as 0 increases from 0 and reaches a m inim um at (/) = 30 . F or (/> > 60 the presence o f these jo in ts has alm ost no influence and the strength is th a t o f the unjointed mass. At </> = 30 , ( / e = 1, n = x ) the strength o f the jo in ted m ass alm ost falls to 10 to 20% o f the unjointed mass. F or n = 3, the strength rem ains alm ost constant equal to that o f the unjointed mass.
It is also seen that the degree o f jo in ting ( / c) has an im portant influence on the failure strength and that its influence is a function o f the angle (j) and //.
A ccording to them , the experim ental results can be represented by the “ m ethod o f resistance quo tien t" ( J o h n , 1962). The com parison o f the theoretical and experim ental results is given in Fig. 10-144. The difference between the theoretical and experim ental results lies merely in the fact that the maxima for the theoretically calculated results lies at (j) = 28 while for the actual tests it lies between 22 and 30 . They also com pared the results obtained by D o n a t h (1963) which are represented in Fig. 10.144c which support the calculation technique o f “ m ethod o f resistance quotien t".
Results obtained by M u l l e r and P a c h e r (1965) show that for i single set o f jo in ts, the m ode o f failure under biaxial conditions is dependent upon n = (Pi/Pi), i.e. the ratio between the principal stresses, and the orientation

F R A C T U R H O F R O C K IN M U L T I A X I A L C O M P R E S S I O N 167
Fig. 10-143. Test re su lts ; red u c t io n o f s treng th (above) a n d d e fo rm a t io n in the d irec t io n o f p r inc ipa l stresses (below) versus angle 0
(a f te r M u ller a n d P a c h l r , 1965).
tmmt
tttm
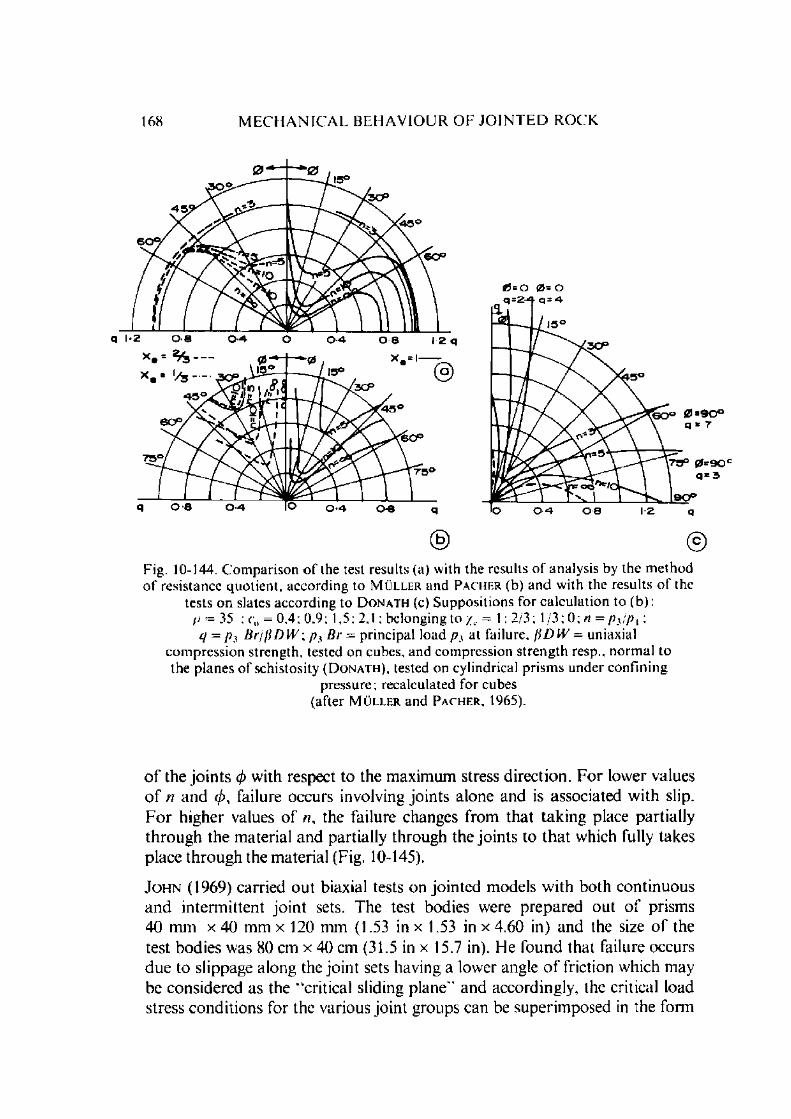
168 M E C H A N I C A L B E H A V I O U R O F J O I N T E D R O C K
® © Fig. 10-144. C om parison o f the test results (a) with the results o f analysis by the m ethod o f resistance quotient, according to M u l l e r and P a c h f .r (b) an d with the results o f the
tests on slates accord ing to D o n a t h (c ) Suppositions for ca lculation to (b): p - 35 : cQ = 0,4; 0.9; 1,5; 2,1; belonging to %e = 1; 2/3; 1/3; 0; n = P i/P i ; q = p3 Br/pDW; p3 Br = principal load ps at failure, f iDW = uniaxial
com pression strength, tested on cubes, and com pression s trength resp., norm al to the planes of schistosity ( D o n a t h ), tested on cylindrical prism s under confining
p r e s s u r e ; r e c a l c u l a t e d f o r c u b e s ( a f t e r M u l l e r a n d P a c h e r , 1965).
o f the jo in ts </> with respect to the maximum stress direction. F or lower values o f n and 0 , failure occurs involving jo in ts alone and is associated w ith slip. F o r higher values o f n , the failure changes from that tak ing place partially through the m aterial and partially through the jo in ts to th a t which fully takes place through the m aterial (Fig. 10-145).
J o h n (1969) carried out biaxial tests on jo in ted models w ith both continuous and interm ittent jo in t sets. The test bodies were prepared out o f prisms 40 m m x 40 mm x 120 mm (1.53 in x 1.53 in x 4.60 in) and the size o f the test bodies was 80 cm x 40 cm (31.5 in x 15.7 in). He found that failure occurs due to slippage along the jo in t sets having a lower angle o f friction which may be considered as the “critical sliding plane" and accordingly, the critical load stress conditions for the various jo in t groups can be superim posed in the form

F R A C T U R E O F R O C K IN M U L T I A X I A L C O M P R E S S I O N 169
m u u ur
r n m t t tpj
Fig. 10 - 145. Param eters which determ ine the gross strength o f the an iso trop ic mass. Types o f fracturing at yc = I (left): + rup tu re involving
jo in ts ;L J c o m b in e d rupture : O rup ture through the solid.Decisive strength param eters (right) : a friction on joints,
h bonding s trength ; < strength o f the rock substance (after M u ller and P a c h e r , 1965).
o f a polar d iagram (Fig. 10-17) obtained from the theoretical relationships (Eqs. 10.34 and 10.35). In the case o f discontinuous jo inted system, the only change required is to introduce the different values o f k (Eq. 10.34), replacing it by
k ' = (1 —%e)T{ + k (10.68)
where k = cohesion o f continuous jo in t (Eq. 10.34)Ze = degree o f continuity o f the jo in t such that (1 - yc) represents the
the degree o f rock bridging. F or a continuous join t / c = 1. t , = shear strength o f the solid rock.
The influence o f the bridging ( / e) is to raise the envelope up (Fig. 10-146). The influence o f the two jo in ts at the points where the locii o f the equilibrium conditions meet (intersection o f the two locii) signifies the concurrence o f jo in t slippage. There is also the occurrence o f “ fresh fracturing" and the net effect is to disturb this region with the equilibrium curve taking a curvature (shown dotted in Fig. 10-147).
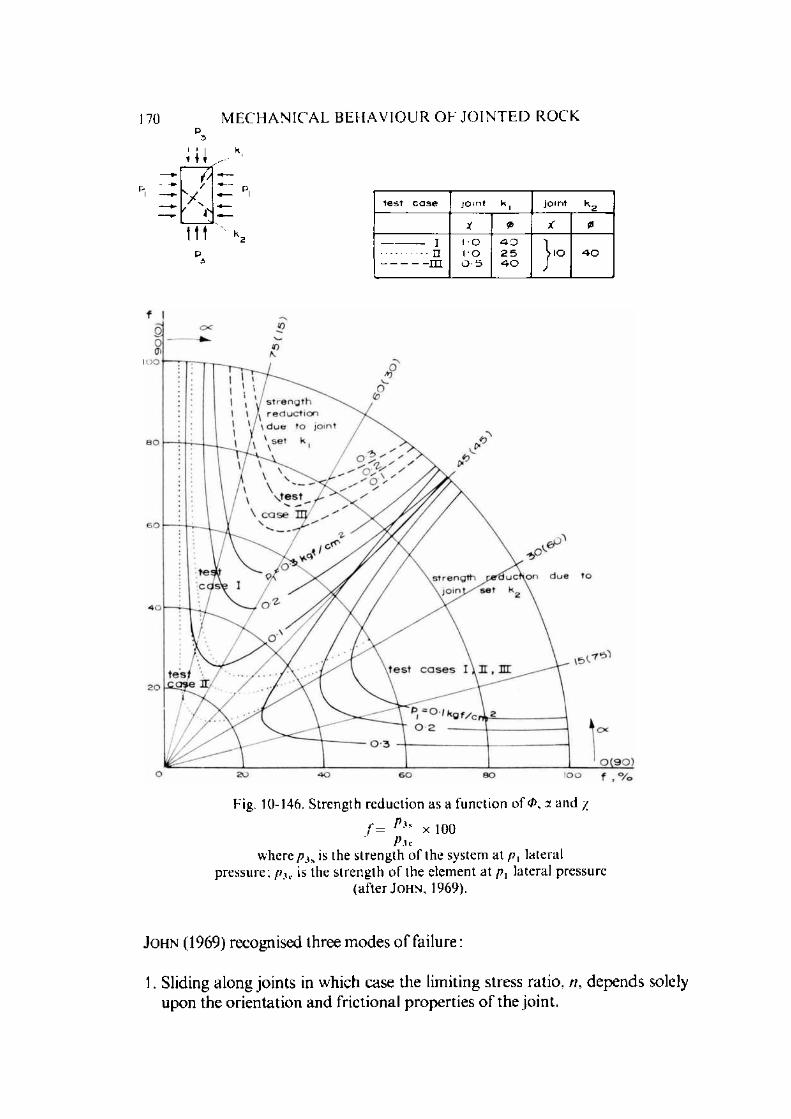
170 M E C H A N I C A L B E H A V IO U R O F J O I N T E D R O C Kp
3
III k ,H i ^ '
Istest case jo int k ( joint k 2
X 0 tC
- I................n---------- m
I O I O 0 5
4 02 54 0 }'°
■40
Fig. 10-146. S trength reduction as a function o f 0 , y. and /
f = P** x 100 Pic
where p is is the strength o f the system at />, lateral pressure; /?3e is the strength o f the element at />, lateral pressure
(after J o h n , 1969).
J o h n (1969) r e c o g n is e d th re e m o d e s o f fa i lu re :
1. S l id in g a l o n g j o i n t s in w h ic h c a s e th e l im i t in g s t re s s r a t io , n , d e p e n d s so le ly u p o n th e o r i e n t a t i o n a n d f r ic t io n a l p r o p e r t i e s o f th e jo in t .

F R A C T U R E O F ROC K IN M U L T I A X I A L C O M P R E S S I O N 171
a I o n g k ( o r k 2
l i g. 10-147. Strength reduction caused by fresh fracturing in a system contain ingfully traversing jo in t sets A', and k 2
(after J o h n , 1969).
2. Shear through the rock m aterial in which case the limiting stress ratio. //, depends upon the shear strength o f an elem ent and the confining pressure.
3. Shear partially through the rock m aterial and partially through the jo int which is a com bination o f the above two modes.
L a da ny i and A r ch a m b a u lt (1972) have found a sim ilar fracture behaviour termed by them as slippage along a shear plane, shear zone including fracturing and shearing along a num ber o f planes and kink bands depending upon the orientation o f the jo in t plane with the principal stress direction and horizontal stress. M ore recent tests at the University o f K arlsruhe by M u l l e r , F eck er and L ama in a servo-controlled biaxial m achine found that at higher values o f /?, large scale dilation occurs while at low values, failure occurs along a limited o r a single shear plane.

172 M E C H A N I C A L B E H A V I O U R O F J O I N T E D R O C K
10.8.2. Triaxia l C ond i t io n s
P r ic e (1958) tes ted P e n n a n t sa n d s to n e by co m p re ssin g it in tw o d ire c tio n s . E ffec t o f c o n fin in g p re ssu re o n rise in s tre n g th o f specim ens c o m p re s se d p a ra lle l to th e b e d d in g p lan e s is m o re p ro n o u n c e d th an w hen c o m p re s se d p e rp e n d ic u la r to th e b e d d in g p lane .
D o n a t h (1963) reported the effect o f confinem ent on the ultim ate strength o f an iso trop ic rock - M artinsburg slate (Fig. 10-148). The effect is pronounced both a t low and high confining pressures. The specimens com pressed perpen dicular to cleavage sustained the greatest differential stress and those com pressed at an angle o f 30 to cleavage showed the lowest strength. At high confining pressures, strength parallel to foliation is nearly equal to that o f 90 o rien tation .
c o n f i n i n g p r e s s u r e
i n c l i n a t i o n o f a n i s o t r o p y t o s p e c i m e n a x i s
Fig. 10-148. U ltim ate strength versus inclination of cleavage, M artinsburg slate(after D o n a t h . 1963).

F R A C T U R E O F R O C K IN M U L T I A X I A L C O M P R E S S I O N 173
The curves o f differential stress vs. anisotropy are shifted upw ards w ith increased confining pressure, the am ount o f shift being proportional to the increase in pressure. The effect o f orientation on increase in differential stress is given in Fig. 10-149.
o r i e n t a t i o n
c o n f i n ing p r e s s u r e , b a r s
Fig. 10-149. Ultimate strength versus confining pressure, M artinsburg slate( a f t e r D o n a t h , 1963).
L a n e and H e c k (1964) tested specimens o f Pikes Peak granite using 5.4 cm (2 1/8 in) diam eter specimens (N X size) and o f length 2 to 21 /2 tim es the diam eter. The specimens were tested after saturating with w ater for 3 days and then air drying just before testing. The rock consists o f large crystals o f o rtho - clase and m icrocline feldspar w ith an abundance o f quartz crystals and lesser am ounts o f biotite and hornblende. T he rock has little lineation o r fabric structure and jo in ts tend to be p lanar with varying degrees o f roughness.
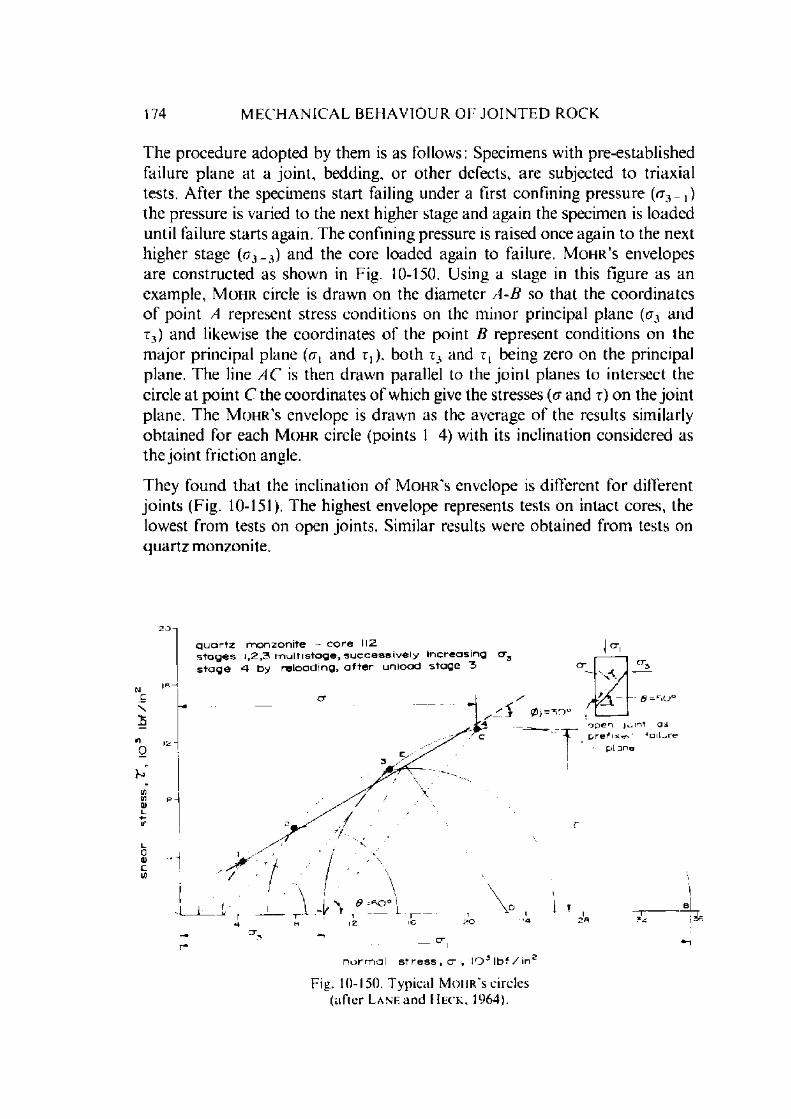
174 M E C H A N I C A L B E H A V I O U R O F J O I N T E D R O C K
The procedure adopted by them is as follows: Specimens with pre-established failure plane at a jo in t, bedding, or o ther defects, are subjected to triaxial tests. A fter the specimens start failing under a first confining pressure (rr3 ^ ,) the pressure is varied to the next higher stage and again the specimen is loaded until failure starts again. The confining pressure is raised once again to the next higher stage (a3_3) and the core loaded again to failure. M o h r ' s envelopes are constructed as shown in Fig. 10-150. Using a stage in this figure as an exam ple, M o h r circle is draw n on the diam eter A -B so that the coord inates o f point A represent stress conditions on the m inor principal plane (<r3 and r 3) and likewise the coordinates o f the point B represent conditions on the m ajor principal plane (rx, and r , ), both r3 and r, being zero on the principal plane. The line A C is then draw n parallel to the jo in t planes to intersect the circle at po in t C the coordinates o f which give the stresses (a and r) on the jo in t plane. The M o h r ' s envelope is draw n as the average o f the results similarly obtained for each M o h r circle (points 1 4) with its inclination considered as the jo in t friction angle.
They found tha t the inclination o f M o h r ' s envelope is different for different jo in ts (Fig. 10-151). The highest envelope represents tests on intact cores, the lowest from tests on open joints. Sim ilar results were obtained from tests on quartz m onzonite.
Fig. 10-150. Typical M o h r ' s circles (after L anf. and H e c k , 1964).

F R A C T U R E O F R O C K IN M U L T I A X I A L C O M P R E S S I O N 175
Fig. 10-151. N orad granite-Coarse grained (after L a n e and H e c k , 1964).
E v a n s and P o m e r o y (1966) reported tha t strength o f coal is dependent upon the direction o f loading at small confining pressures (Fig. 10-152) but at higher confining pressures [above 13.8 M Pa (2000 lbf/in2)] the strength is independent o f o rien ta tion .
Triaxial com pression tests were conducted by Y o u a s h (1966) on a shale, a gneiss, and two sandstones under 0.1, 10.3, 20.7 and 31.0 M Pa (15, 1500. 3000 and 4500 lbf/in2) confining pressures. C ores 5.4 cm by 10.8 cm (2 1/8 in by 4 */4 in) were prepared with the layers dipping at 0 , 15 , 30 . 45 , 60 , 75 and 90 to the short cylinder axis. Plots o f stress difference versus inclination o f layering are concave upw ard with the m axim um stress difference for 0 and 90 cores and the m inim um for 45 and 60 core orientation (Figs. 10.153 to 10-156).

axia
l co
mp
ress
ive
fra
ctu
re
stre
ss
, lb
f/in
2
176 M E C H A N I C A L B E H A V I O U R O h J O I N T E D R O C K
20,000
■— orien tation I jn d 2
10,000Rossington Barnsley
Hards
• bedding and main cleat planes ^• bedding and crass cleat planes / p a ra lle lx main jn a cross cleat planes J s Pe c imen
1 ,0 0 0 ? ,o O J 3 , 0 0 0 4 , 0 0 0 S.O'^O
c o n f i n i n g p r e s s u r e , l b f / i n 2
Fig. 10-152. Variation o f axial compressive fracture stress with confining pressure for different specimen orienta tions
(after E v a n s and P o m l r o y , 1966).
wc\4-_q
b-ib"
8C2.0)
w(00)L
i n c l i n a t i o n o f l a y e r i n g
t o ct3
Fig. 10-153. Stress difference versus inclination o f layering to minimum principal stress <r3 for sandstone o f Lyons Form ation
(after Y o u a s h , 1966).
toa x i s
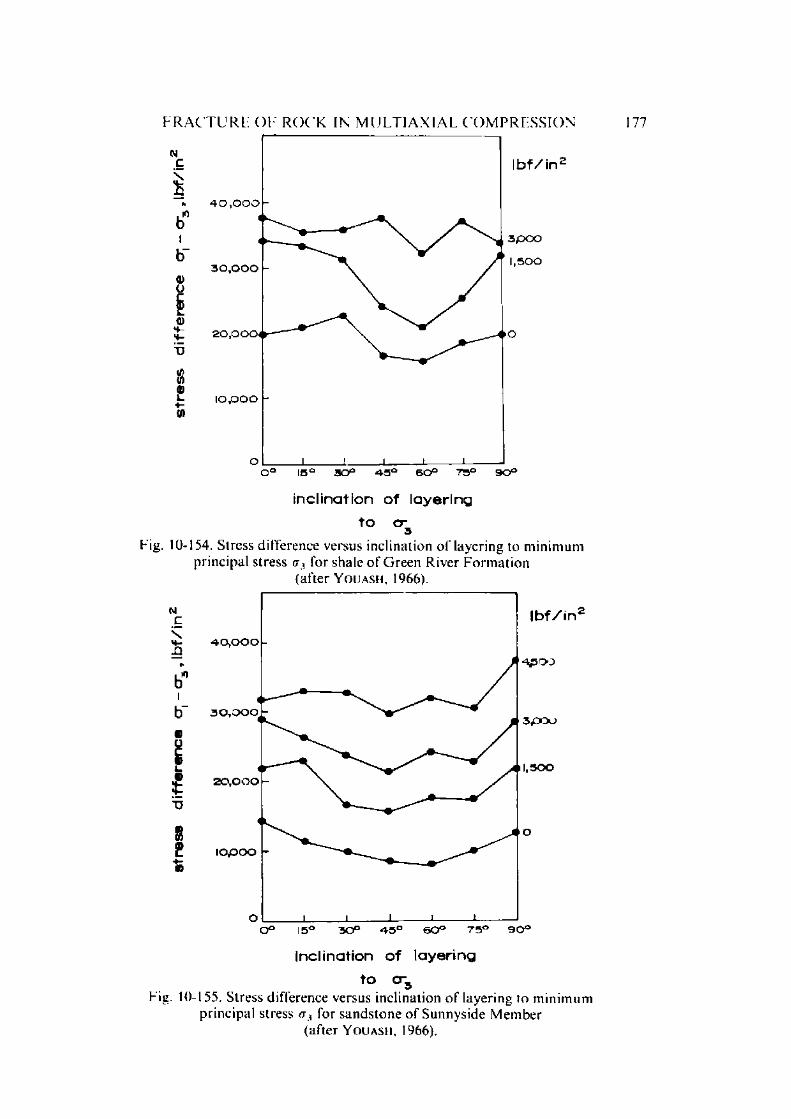
F R A C T U R E O F R O C K IN M U L T I A X I A L C O M P R E S S I O N
inclination o f layering
to cr3
Fig. 10-154. Stress difference versus inclination o f layering to m inim um principal stress <r3 for shale o f Green River F orm ation
(after Y o u a s h , 1966).
inclination o f layering
to cr3Fig. 10-155. Stress difference versus inclination o f layering to m in im um
principal stress <x3 for sandstone o f Sunnyside M em ber (after Y o u a s h , 1966).
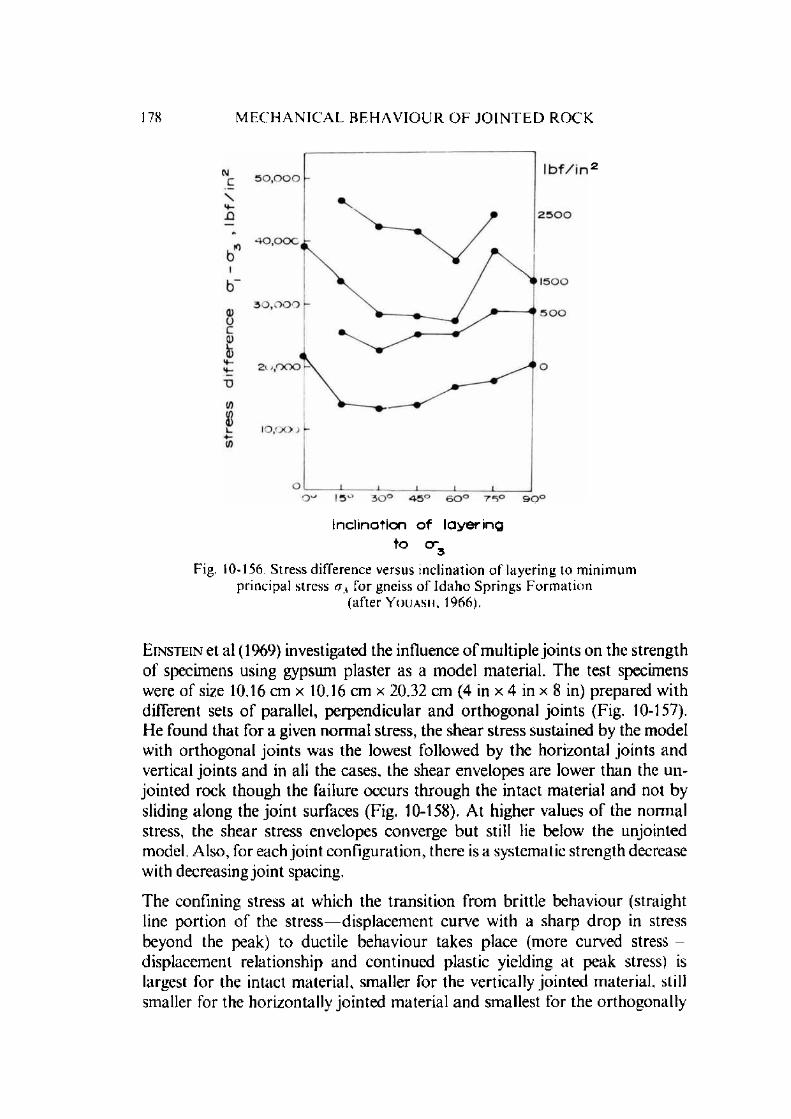
178 M E C H A N I C A L B E H A V I O U R O F J O I N T E D R O C K
inclination o f layering to cr3
Fig. 10-156. Stress difference versus inclination o f layering to minimum principal stress rr3 for gneiss o f Idaho Springs F orm ation
(after Y ou a s h , 1966).
E i n s t e i n et al (1969) investigated the influence o f m ultiple jo in ts on the strength o f specimens using gypsum plaster as a m odel m aterial. The test specimens were o f size 10.16 cm x 10.16 cm x 20.32 cm (4 in x 4 in x 8 in) prepared with different sets o f parallel, perpendicular and orthogonal jo in ts (Fig. 10-157). He found that for a given norm al stress, the shear stress sustained by the model with orthogonal jo in ts was the lowest followed by the horizontal jo in ts and vertical jo in ts and in all the cases, the shear envelopes are lower than the unjointed rock though the failure occurs through the intact m aterial and not by sliding along the jo in t surfaces (Fig. 10-158). At higher values o f the norm al stress, the shear stress envelopes converge but still lie below the unjointed model. Also, for each jo in t configuration, there is a systematic strength decrease with decreasing jo in t spacing.
The confining stress at which the transition from brittle behaviour (straight line portion o f the stress displacem ent curve with a sharp drop in stress beyond the peak) to ductile behaviour takes place (more curved stress displacement relationship and continued plastic yielding at peak stress) is largest for the intact m aterial, sm aller for the vertically jo in ted m aterial, still smaller for the horizontally jo in ted m aterial and smallest for the orthogonally

R A C T U R E O F R O C K IN M U L T I A X IA L C O M P R E S S IO N
vort ica l Joint*:
2 inches I Inch
s p a ci n g
179
h o r i z o n t a l jo in ts :
2 inches I inch
s p a d n g
^2 Inch
orthogona l j o i n t s :
^2 Inch spacing
Fig. 10-157. Jo in t configurations (after E in s t e in et al, 1969).
jo inted m aterial (Fig. 10-159). This transition stress systematically increases w ith increasing jo in t spacing for the vertically and horizontally jointed specimens (Fig. 10-160).
B r o w n and T r o l l o p e (1970) conducted tests in a triaxial cell for the strength o f specimens prepared out o f an assembly o f 2.54 cm (1 in) cubes o f plaster w ith varying degrees o f jo in t orientation and under different confining pressures. They found that at lower confining pressures, the strength o f the jo inted specimens was lower than those o f corresponding unjointed specimens. The lowest values obtained were for the specimens having jo in t inclination 30 /120
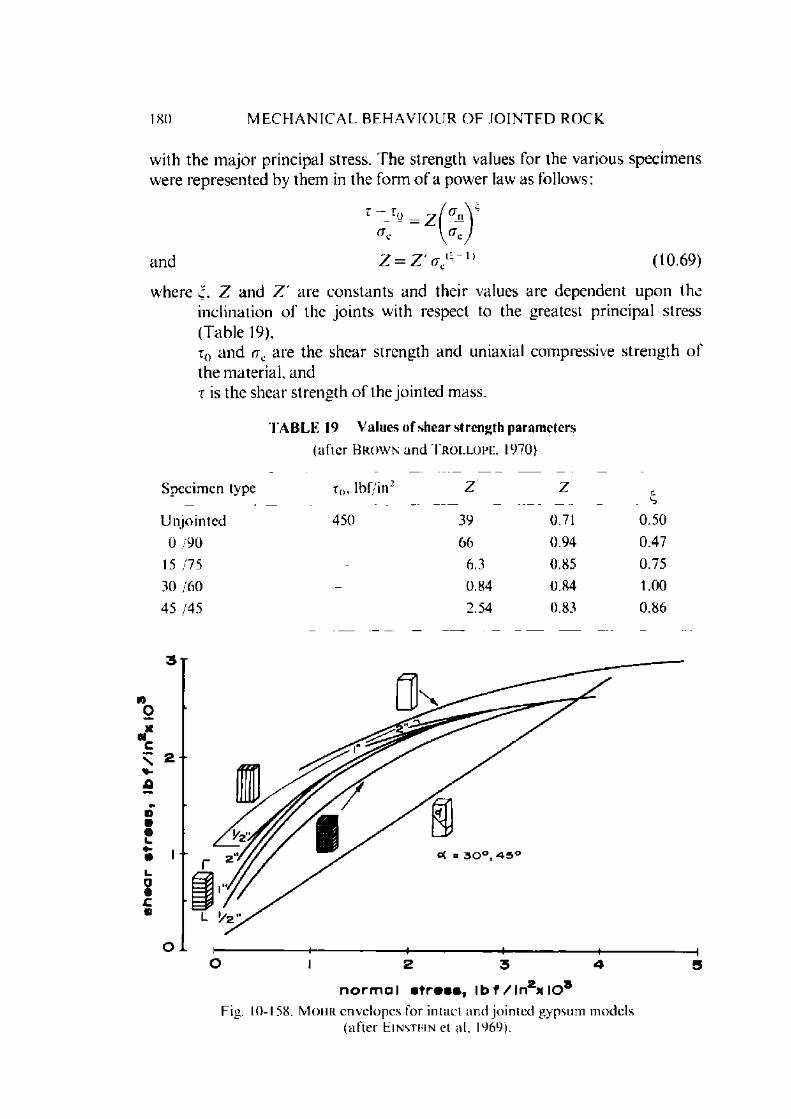
180 M E C H A N I C A L B E H A V I O U R O F J O I N T E D R O C K
with the m ajo r principal stress. The strength values for the various specim enswere represented by them in the form o f a pow er law as follows:
T ~ T0 = Z ( ?n V a , V v
and Z=Z '<rc(*"n (10.69)
where c, Z and Z ' are constan ts and their values are dependent upon the inclination o f the jo in ts with respect to the greatest principal stress (Table 19),r0 and <rc are the shear strength and uniaxial compressive streng th o f the m aterial, andr is the shear strength o f the jo in ted mass.
TABLE 19 V alues o f shear streng th param eters
( a f te r Br o w n a n d T r o l l o p e , 1970)
S p e c im e n type if,, lb f / in 2 Z Z_____ b_
U n jo in t e d 450 39 0.71 0 .50
0 /9 0 66 0.94 0 .47
15 /75 6.3 0.85 0 .75
30 , 60 0.84 0.84 1.00
45 /45 2.54 0.83 0 .8 6
n o r m a l s t ress , I b f / l n 2x l 0 3Fig. 10-158. M o h r envelopes for intact and jointed gypsum models
(after E in s t e in et al. 1969).
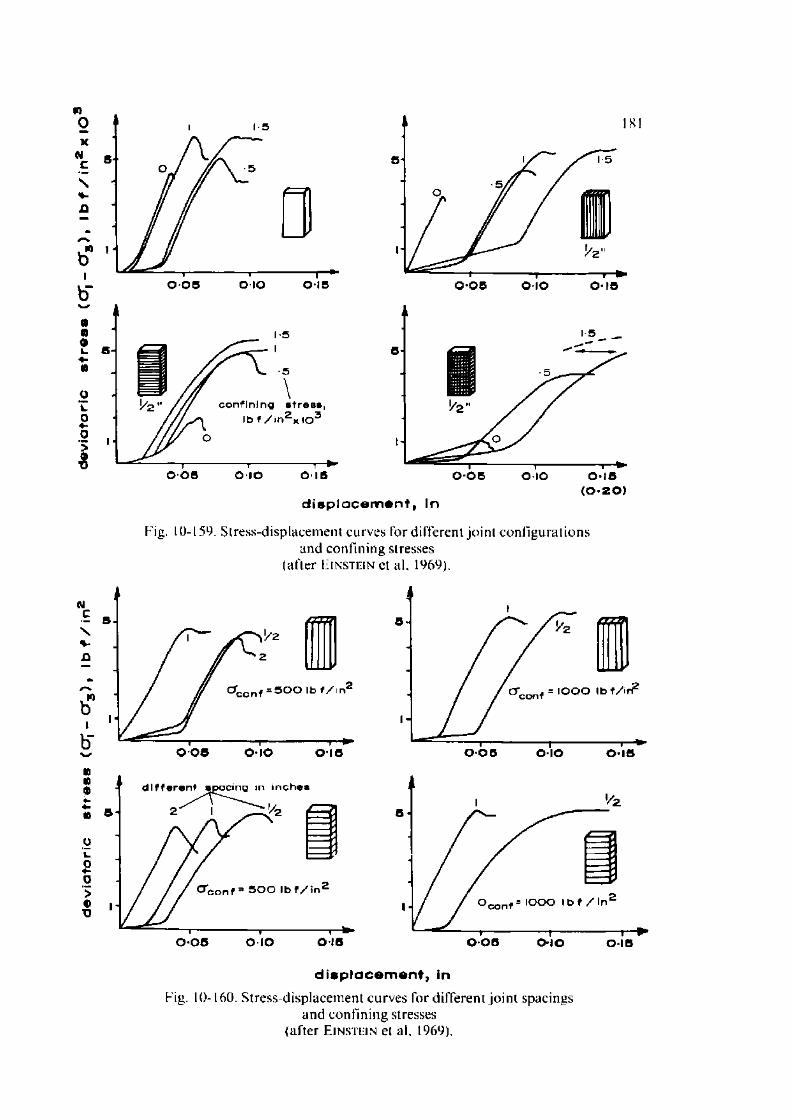
(0 -20)d i s p l a c e m e n t , In
Fig. 10-159. Stress-displacement curves for different jo in t configurationsa n d con f in in g stresses
(a f te r E instein et al. 1969).
d is p la c e m e n t , inFig. 10-160. Stress-displacement curves for different jo in t spacings
and confining stresses (after E instein et al. 1969).

182 M E C H A N I C A L B E H A V I O U R O F J O I N T E D R O C K
U nder sim ilar conditions, the influence o f non-continuous jo in ts using parallelopipedal and hexagonal blocks (Fig. 10-161) was investigated by B r o w n (1970). H e found that the M o h r - C o u l o m b ’s concept with certain m odifications (m aking use o f the curved envelope Eq. 10.69) and the increased strength due to bridging can be used to describe the strength o f specimens w ith d iscontinuous jo in ts . The strength o f the jo inted m odels tested by him was represented by the relationship
T = c / eA.'j + (l - / e )T 0 + c7L, f T „ t a n </>M + (1 - / J Z '0acn ( 10.70)
w here the strength o f the unjointed specimen is given by
T = T0~ \ ~ Z ^ n
where z = shear strength o f the jo in ted rock a t failurec = m obilisation factor = 1A'j = cohesion o f joint; c = degree o f jo in tingr0 = cohesion intercept in power law (Eq. 10.69) i.e. shear strength
o f the material a n = norm al stress </.>M = angle o f jo in t frictionZq = m ultiplier in strength pow er law (Eq. 10.69) and Qn = norm al stress index (Eq. 10.69).
The results calculated from the Eq. 10.70 and those obtained experim entally are shown in Table 20.
T A B L E 20C om parison o f predicted (E q. 10.70) and m easured shear stress
at fa ilure o f jo in ted specim ens
( a f t e r B r o w n . 1970)
Specim en C onfin ing pressure. lbf/in2 (M P a)
Shear stress on fa ilure at peak axial stress, lb f / in 2 (M P a)
C alculatedM easu red from
M o h r ' s circle plot
D egree o f 200 (1.38) 860 (5.93) 610 (4.21)jo in t in g 500 (3.52) 1,310 (9.0) 1,200 (8.27)X = l /2 1,000 (7.03) 1,810 (12.5) 1,810 (12.5)
7 = 1/3 200 (1.38) 1,320 (9.1) 1.300 (8.96)500 (3.52) 1,610 (11.18) 1,620 (11.17)
1.000 (7.03) 2 ,110 (14.6) 2,380 (16.41)2,000 (14.07) 2,760 (19.0) 3,220 (22 .2)

F R A C T U R E O F RO C K IN M U L T I A X I A L C O M P R E S S I O N 183
(c) H 6 0
(d) H 495 (•) H 3 0
Fig. 10-161. Block-jointed specimen geometry (after B r o w n , 1970).
B r o w n (1970) pointed ou t two o ther types o f failure in addition to those recognised by J o h n (1969). Fie found that besides the three types o f failure described in the previous section, at low confining pressures, axial cleavage fractures occur splitting the elem ents constituting the test body. At low pressures he also observed collapse o f the specimens due to block m ovement and opening o f the jo in ts . This type o f failure was term ed by him dilational failure.
M c G i l l and R a n e y (1970) conducted 89 tests on cores (3.2 cm (1.25 in) long and 1.2 cm (0.48 in) in diam eter) o f lam inated dolom itic limestone from the M anlius Form ation at confining pressures o f 0.1, 20, 30, 40, 50, 60 and 80 M Pa (14.5, 2901, 4351, 5801, 7252, 8702 and 11,603 lbf/in2) (1,200, 300, 400, 500, 600 an d 800 bars), and w ith the angle between laminae and maximum principal stress varying from 0 to 90°. In Fig. 10-162, plots o f compressive strength versus lam inae orien tation at different confining pressures are given.
P o m e r o y , H o b b s and M a h m o u d (1971) studied the effect o f w eakness-plane o rien ta tions on the fracture o f Barnsley H ards by triaxial com pression. Barnsley H ards is a fairly hom ogeneous, dull bitum inous coal with a volatile con ten t o f 36 % (dry, ash-free). The bedding planes are well m arked and there are two discernible cleat planes, the three families o f weaknesses lying in m utually perpendicular directions. The cleats in the dom inant direction are know n as the m ain cleats and the less well-defined system as the cross-cleats. C ylinders were cut from the coal at different angles relative to the bedding planes bu t always w ith the cross-cleat plane parallel to the axis o f the cylinder (the d irection o f
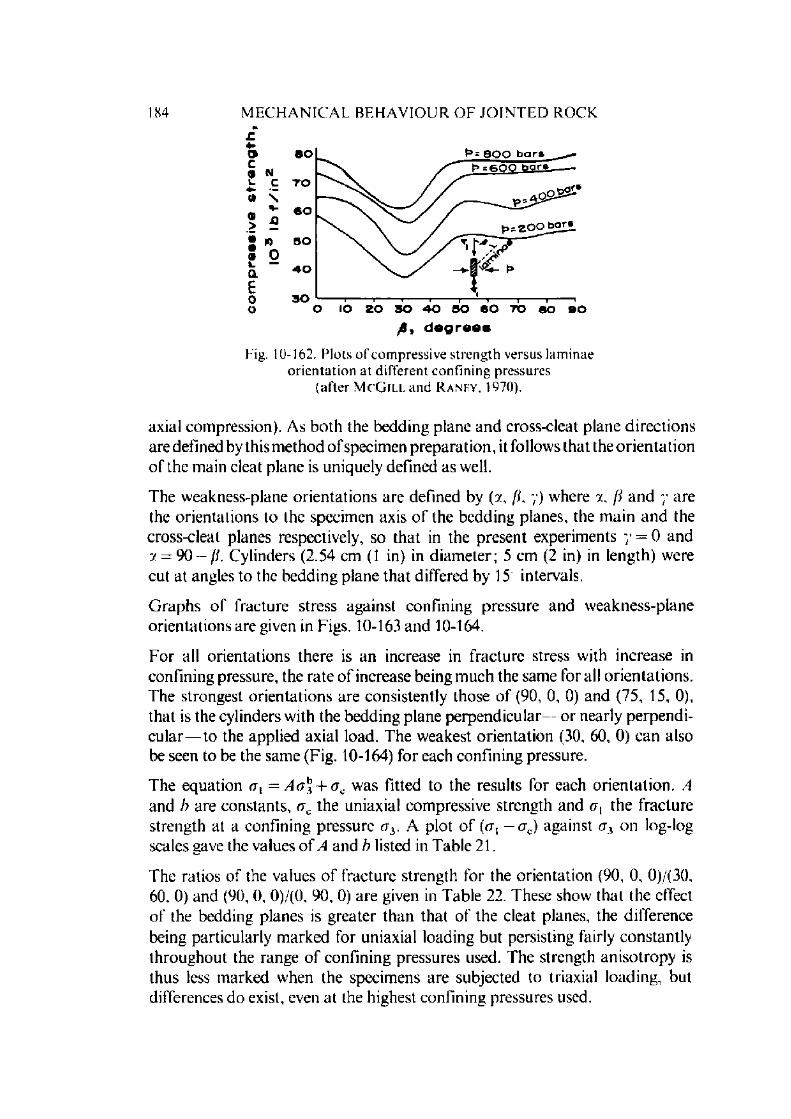
184 M E C H A N I C A L B E H A V IO U R O F J O I N T E D R O C K
£
f i , degrees
F ig . 10-162. P l o t s o f c o m p r e s s i v e s t r e n g t h v e r s u s l a m i n a e o r i e n t a t i o n a t d i f f e r e n t c o n f i n i n g p r e s s u r e s
( a f t e r M c G i l l a n d R a n e y , 1970).
axial compression). As both the bedding plane and cross-cleat plane d irections are defined by this m ethod o f specimen preparation , it follows that the orien tation o f the main cleat plane is uniquely defined as well.
The weakness-plane orientations are defined by (v., /i, y) where 2 , /i and 7 are the orientations to the specimen axis o f the bedding planes, the m ain and the cross-cleat planes respectively, so tha t in the present experiments 7 = 0 and 7 = 9 0 - /i. Cylinders (2.54 cm (1 in) in d iam eter; 5 cm (2 in) in length) were cut at angles to the bedding plane that differed by 15 intervals.
G raphs o f fracture stress against confining pressure and weakness-plane orientations are given in Figs. 10-163 and 10-164.
For all orientations there is an increase in fracture stress with increase in confining pressure, the rate o f increase being m uch the same for all orientations. The strongest orientations are consistently those o f (90, 0, 0) and (75, 15, 0), that is the cylinders with the bedding plane perpendicular- or nearly perpendicular — to the applied axial load. The weakest orientation (30, 60, 0) can also be seen to be the same (Fig. 10-164) for each confining pressure.
The equation rx, = A g3 + <jc was fitted to the results for each orientation. A and b are constants, <rc the uniaxial compressive strength and rr, the fracture strength at a confining pressure rr3. A plot o f (rr, — (tc) against oi on log-log scales gave the values o f A and h listed in Table 21.
The ratios o f the values o f fracture strength for the orientation (90, 0, 0)/(30, 60, 0) and (90, 0, 0)/(0, 90, 0) are given in Table 22. These show that the effect o f the bedding planes is greater than that o f the cleat planes, the difference being particularly m arked for uniaxial loading but persisting fairly constantly throughout the range o f confining pressures used. The strength anisotropy is thus less m arked when the specimens are subjected to triaxial loading, but differences do exist, even at the highest confining pressures used.

axia
l fr
ac
ture
st
ress
, M
Pa
F R A C T U R E O F R O C K IN M U L T I A X I A L C O M P R E S S I O N 185
c o n f i n i n g p r e s s u r e , M P a
Fig. 10-163. Relationships between fracture stress and confining pressure for different weakness-plane orientations
(after P o m e r o y et al. 1971).
T A B L E 21
V alues of A and b to satisfy <rl = A <73b + <jc (after P o m e r o y et al. 1971)
W eakness-p laneo rien ta tion
0, 90, 0 18.4 0.5
15, 75, 0 8.3 0.9
30, 60, 0 6.5 0.4
45, 45, 0 8.0 0.6
60, 30, 0 12.6 0.6
75, 15, 0 16.8 0.6
90, 0, 0 10.0 1.0

186 M E C H A N I C A L B E H A V I O U R O F J O I N T E D R O C K
w e a k n e s s p l a n © o r i e n t a t i o n
Eig. 10-164. Relationships between fracture stress and weakness-plane orientation for different confining pressures
(after P omf.r oy el al. 1971).
T A B L E 22
F rac tu re streng th ratios
(after P o m e r o y et al. 1971)
C o n f in in g F rac tu re strength ratiopressure M P a ( lb f in 2) (90. 0. 0)/(30, 60. 0) (90, 0. 0)/(0, 90, 0)
0.1 (14.5) 5.2 2.5
3.5 (507.6) 3.1 1.4
13.8 (2001.5) 2.1 1.4
20.7 (3002.2) 2.1 1.3

F R A C T U R E O F R O C K IN M U L T I A X I A L C O M P R E S S I O N 187
M o i o y a m a and I I i r s c h f e l d (1971) conducted tests on m odels using orthogonal and 45 oriented blocks with different jo in t densities. The m odel m ateria l had a strength o f about 980 lbf/in2 (7 M Pa). The elements were accurately p repared (varia tion in dimensions for the m ean value ± 0 .1 5 to 0.6% ). Their results are given in Figs. 10-165 and 10-166. Their conclusions are very sim ilar to those draw n by other investigators tha t the strength o f the jo in ted rock m asses m ay be m uch m ore influenced by the jo in t system within the rock mass a t low confining pressures than at high confining pressures. C onfining pressure has greatei influence on the strength o f a m odel with two sets o f jo in ts than with one set o f jo in ts . Joint orientation is m ore im portan t in triaxial conditions than the jo in t
■---------- * — —i i -----------------------------------------1_____________O I 0-2 0 3 o 0 5
jo in t d e n s ity , D j
Fig. 10-165. Effect o f jo in t configuration on the strength o f jointed m odels(A) vertical joints
(B) horizonta l joints(C) multiple orthogonal jo ints
(D ) multiple inclined joints (45 )(E) o rthogonal inclined joints., . . . ^ volume o f element
N ote: Jo in t density D =J volume ot model
(after M o t o y a m a and H ir s c h f e l d , 1971).

188 M E C H A N I C A L B E H A V I O U R O F J O I N T E D R O C K
0»c1)
I o
OB
0'6H--------- cr / c r 3 = 6 67"----------- cr / c r = 5 0 0
I 3
o J ______0 2 O 3 0-4 0 5
jo in t d e n s ity , D j
Fig. 10-166. Effect o f jo in t configuration on the s trength o f jo in ted models.(A) vertical jo in ts
(B) horizonta l jo in ts(C) multiple orthogonal jo in ts
(D) multiple inclined jo ints (45 )(E) orthogonal inclined joints.. . . . _ volume o f element
N ote: Joint density D = ,1 volume of model
(after M o t o y a m a and H ir s c h f e l d , 1971).
density. T he ir influence tends to be less than 20 % at lateral pressures approaching the uniaxial compressive strength o f the m aterial. Even at confining pressures alm ost tw ice the uniaxial strength, the jo in ted m odel has lower strength than m aterial.
D efo rm ation m odulus depends very strongly on jo in t configuration. It decreases in the order for intact, vertical jo in t, horizontal jo in t, orthogonal jo in t, m ultip le inclined jo in t and orthogonal inclined jo in t at all confining pressures. Increase in jo in t spacing increases the m odulus value and so also confining pressure up to a certain limit.
10.9. Summary and Conclusions
The m echanical behaviour o f a rock mass in situ is very complex and in no case can be predicted from tests in the laboratory on smaller intact specimens. The behav iour o f a large m ass is dependent upon the mechanical behaviour o f the rock substance, the presence and absence o f jo in ts, the operating stress field and its orientation with respect to the joints and the join t density.

S U M M A R Y A N D C O N C L U S I O N S 189
The sliding characteristics o f a single jo in t can be predicted quite satisfactorily by using the Eq. 10.18 developed by L a d a n y i and A r c h a m b a u lt (1969) and the relationship gives quite satisfactory results even with a m ultiple jo in ted system. M o h r theory could be successfully applied for practical problem s in a m ulti-jointed system but has lim itations at certain critical values o f jo in t orien ta tion where the zones o f unstability due to the jo in t sets intersect o r overlap. In this zone, the values obtained by this theory shall be m ore optim istic.
The frictional properties o f a jo in t are dependent upon the m aterial p roperty as well as on jo in t roughness, norm al stress, displacem ent history, presence o r absence o f w ater and gouge thickness. Angles o f friction for some rocks are given in T able 23 (see also Table 30- Volume III).
The phenom enon o f stick-slip is dependent upon the norm al stress, surface geom etry, strain rate and the stiffness o f the loading system. The am plitude increases w ith increased norm al stress and decreased loading system stiffness. This could well be the cause o f irregular m ovem ent o f rock mass.
T A B L E 23
A pprox im ate fric tion angles for som e rocks (labo rato ry results)
(after H o ek , 1970)
Rock type In tac t rock (degrees)
Jo in t(degrees)
Residual(degrees)
A ndesite 45 31 35 2 8 -3 0Basalt 48 50 47 *
C halk * 35-41 *
D iorite 53 55 * *
G ra n i te 50 64 * 3 1 -3 5G ra y w ac k e 45 50 * *
L im estone 3 0 -6 0 * 3 1 -3 7M o n zo n i te 48 65 * 2 8 -3 2Porphyry * 40 30 34Q u a rtz i te 64 44 26 34San d s to n e 45 50 27 38 2 5 -3 4Schist 26 70 * *
Shale 45 64 37 27 32S ilts tone 50 43 *
Slate 45 60 * 2 4 -3 4
* D a ta not ava ilab le

190 M E C H A N I C A L B E H A V I O U R O F J O I N T E D R O C K
T he uniaxial compressive strength , shear strength and strength under biaxial and triaxial stresses are dependen t upon a num ber o f factors such as the jo in t density, frictional properties, jo in t continuity , jo in t orien ta tion and the m aterial p roperty . F o r the determ ination o f the properties o f a rock m ass in situ, the sam ple to be tested m ust have at least 150 200 discontinuities.
T he presence o f jo in ts decreases both the strength as well as the deform ation m odulus o f the rock mass and the decrease in strength is m ore rapid for stronger rock m ateria l than for w eaker rock m aterial. The com pressive strength o f a jo in ted rock system may be only 25% o f the rock m aterial and the deform ation m odulus only 5 % o f the in tact rock m odulus.
T he influence o f constrain ing the jo in ted rock mass is to increase its strength and deform ation m odulus very rapidly. The influence is m ore m arked for a m ultip le jo in ted system than for a single jo in t o r a single jo in t set.
R E F E R E N C E S 191
References to Chapter 101 A k a i . K... Y a m a m o t o . K. and A r i o k a , M .: E xperim enta l research on the structura l
a n is o t ro p y o f crystalline schists. Rock Mech. in J a p a n , Vol. 1, 1970. pp. 32 34.2. B a m f o r d , W .E . A niso tropy , and the natura l var iab ili ty o f rock properties. Proc.
Sym p. Rock M ech., Univ. Sydney, 1969, pp. 1 10.
3. B a r l a , G . a n d G o f f i , L.: Direct tensile testing o f an iso trop ic rocks, 3rd C ong . Int. Soc. Rock M ech., Denver, C o lo rad o , Vol. II-A. 1974. pp . 93 98.
4. B a r r o n , K..: Brittle fracture initiation in and u l t im ate failure o f rocks. P a r t III A n iso tro p ic rocks: Experim ental results. Int. J. R ock Mech. Min. Sci., Vol. 8, N o . 6. Nov., 1971. pp. 565 575.
5. B a r t o n , N .R . : A model study o f the behaviour o f steep excavated rock slopes. Ph. D. Thesis, Univ. L ondon , London, 1971a. 520 p.
6. B a r t o n , N .R . : A rela tionship between jo in t ro u g h n ess and jo in t shear strength. P roc. Sym p. Rock Frac ture , Nancy, 1971 b. Paper I 8.
7. B a r t o n , N. R . : Review o f a new shear strength c r i te r io n for rock joints. Eng. Geol., Vol. 7. N o . 4. A pril , 1973a, pp. 287 332.
8 . B a r t o n , N .R . : A review o f the shear strength o f d iscontinuities in rock masses w ith p a r ticu la r reference to slope stability. N orw eg. G eotech . Inst., Oslo, Int. Rep. 54204. A ug., 1973b, 164 p.
9. B e r e n b a u m , R. an d B r o d i e , I.: The tensile s trength o f coal. J. Inst. Fuel. Vol. 32, 1959, pp. 320 327.
10. B j e r r u m , L.: Problem s o f soil mechanics and co n s tru c t io n on soft clays. S ta te o f th e A rt R ep o r t to Session IV, 8th Int. Conf. Soil M ech. Found. Eng., M oscow ,1973.
11. B oc k , I I . : Field studies on jo in ting in hardly tectonically stressed sed im entary rocks. Proc. Sym p. Rock Frac ture , N ancy, 1971. P ap e r 1-12.
12. B o r e t t i - O n y s z k i e w i c z , W . : Joints in the flysch san d s to n es on the ground o f strength exam ina tions . Proc. 1st C ong. Int. Soc. Rock M ech., Lisbon, 1966, Vol. 1, pp. 153 157.
13. B o r r o s o , M .: C em ent grouts and their influence on the shear strength o f fissured rock masses. Proc. 2nd C ong. Int. Soc. Rock M ech.. Belgrade, 1970, Vol. 3, pp. 189 195.
14. B o w d e n , F .P . an d T a b o r , D .: The area o f co n tac t between s ta t io n ary anck between m ov ing surfaces. Proc. Roy. Soc. London , Series A, Vol. 169. 1939, pp. 391 413.
15. B o w d e n , F .P . an d T a b o r , D .: Friction and L ubrica tion . London, M ethuen , 1967.16. B r a c e , W .F . an d B y e r l e e , J .D . : Recent experim ental studies o f brittle f rac tu re o f
rocks. Proc. 8th Symp. Rock Mech., M inneapolis, M in n ., 1966a, pp. 58 81.17. B r a c e , W .F . and By e r l e e , J .D . : Stick-slip as a m echanism for ea r thquakes .
Science, Vol. 153, 1966b. pp. 990 992.18. B r a c e , W. F. an d M a r t i n , R .J . : A test o f the law o f effective stress for crystalline
rocks o f low porosity . Int. J. Rock Mech. Min. Sci.. Vol. 5, No. 5, Sept., 1968, pp. 415 426.
19. Br id g m a n , P .W .: Shearing phenom ena at high p ressure o f possible im portance for geology. J. G eo l. . Vol. 44. 1936, pp. 653-669.
20. B r o m w e l l , L .G . : The friction o f q u a r tz in high v acu u m . Sc. I). Thesis, M .I .T . . C am bridge , 1966.

192 M E C H A N I C A L B E H A V I O U R O F J O I N T E D ROC K
21. B r o w n , E .T . : S trength o f models o f rock with in term ittent joints. J. Soil Mech. F ound . Div., Am. Soc. Civ. Eng.. Vol. 96, No. SM 6, Nov., 1970. pp. 1935 1949.
22. B r o w n , E.T. and T r o l l o p e , D .H . : S trength o f a model o f jo in ted rock. J. Soil Mech. Found. Div., Am. Soc. Civ. Eng., Vol. 96, No. SM 2, M arch , 1970. pp. 685 704.
23. B y e r l e e . J .D . : The frictional characteristics o f Westerly granite. Ph. D. Thesis. M. I.T., Cambridge, 1966.
24. B y e r l e e , J .D . : Theory o f friction based on brittle fracture. J. Appl. Phys.. Vol. 38, N o . 7, June, 1967a. pp. 2928 2934.
25. B y e r l e e , J .D . . Frictional characteristics o f granite under high confining pressure. J. Geophys. Res., Vol. 72, No. 14. July 15, 1967b, pp. 3639 3648.
26. B y e r l e e , J .D . : Brittle-ductile transition in rocks. J. Geophys. Res.. Vol. 73. N o. 14, Ju ly 15. 1968a, pp. 4741 4750.
27. B y e r l e e . J. D . : Deform ational characteristics o f rock powders, Trans. Am. G eophys. U n., Vol. 49, 1968b. p. 314.
28. B y e r l e e , J .D . : The fracture strength an d frictional strength o f W eber sandstone. Int. J. Rock Mech. Min. Sci. & G eom ech. Abstr., Vol. 12. No. 1, Jan.. 1975, pp. 1 4.
29. B y e r l e e , J. D. and B r a c e , W. F . : Stickslip, stable sliding, and earthquakes Effect o f rock type, pressure, strain rate, and stiffness. J. Geophys. Res., Vol. 73, No. 18, Sept. 15, 1968, pp. 6031 6037.
30. B y e r l e e , J. and S u m m e r s , R . : A note on the effect o f fault gouge thickness on fault stability. Int. J. Rock Mech. Min. Sci. & G eom ech. Abstr., Vol. 13. 1976, pp. 35-36.
31. C h a p p e l l , B. A.: Friction characteristic o f graphite coated bedding jo in ts in shale. Int. J. Rock Mech. Min. Sci. & G eom ech. Abstr., Vol. 12, No. 2, Feb., 1975, pp. 33 39.
32. C h r is t e n s e n , R .J . , S w a n s o n , S .R . and B r o w n , W .S.: Torsional shear m easurements o f the frictional properties o f Westerly granite, 3rd Cong. Int. Soc. Rock Mech.. Denver, Colorado , Vol. II-A. 1974. pp. 221 225.
33. C l o o s , H .: Experiment zur inneren Tektonik . Centralbl. Mineral. Geol. u. Pal., 1928, pp. 609 621.
34. C o r t h o u t s , L .T .: Sliding resistance o f brittle surfaces. S. M. Thesis, M .I .T . . C am bridge, 1966, 72 p.
35. C o u l s o n , J. 11.: The effects o f surface roughness on the shear strength o f jo in ts in rock. Ph. D. Thesis, Univ. Illinois, U rb an a , 1970.
36. C v e t k o v i c , M .: Dimensions influence o f tested samples on its uniaxial strength- p o la r strength (in French). 3rd Cong. Int. Soc. Rock Mech.. Denver. C olorado, Vol. II-A. 1974. pp. 126 131.
37. D a y r e , M.: Yield laws o f a slaty shale with a lineation in the slaty cleavage plane. Proc. 2nd Cong. Int. Soc. Rock Mech.. Belgrade. 1970. Vol. 2. pp. 261 266.
38. D e m ir is , C .A .: The influence o f unevenness o f loading surfaces on the strength o f rock cubes, 3rd Cong. Int. Soc. Rock Mech.. Denver, Colorado . Vol. II-A,1974. pp. 132 137.
39. D i e t e r i c h , J .H . : Time dependence in stick-slip sliding. Trans. Am. Geophys. U nion . Vol. 51. No. 4. April. 1970. p. 423.
40. D ie t e r i c h . J .H . : Time dependent friction in rocks. U.S. Geological Survey, Menlo Park , Calif. (Personal com m unication). 1972.
R E F E R E N C E S 193
4 F D o n a t h , F . A . : Strength varia tion and deform ational behaviour in an iso tropic rock. Proc. Int. Conf. State o f Stress in the E ar th 's Crust, Santa M onica, California,1963. pp. 280 297.
42. D o n a t h , F . A . , F r u t h . L. S. and O l s s o n , W . A . : Experimental study o f frictional p roperties o f faults. Proc. 14th Symp. Rock Mech., Univ. Park. Penn., June, 1972, pp. 189 222.
43. D r e n n o n , C.B. and H a n d y , R .L . : Stick-slip o f lightly loaded limestone. Int. J. R ock Mech. Min. Sci., Vol. 9, No. 5, Sept.. 1972. pp. 603 615.
44. D u b e , A .K . and S i n g h , B.: D eterm ination o f tensile s trength o f rocks by disc test m ethod . J. Mines, M etals and Fuels, Vol. 17, No. 9, Sept., 1969, pp. 305 307.
45. D un c a n , N .: Engineering G eology and Rock Mechanics. Vol. 2, London. Leonard Hill, 1969, 270 p.
46. D u n c a n , N. and S h e e r m a n - C h a s e , A.: Rock mechanics in the planning, design, an d construc tion o f civil engineering works. Civ. Eng. Public W orks Rev., Vol. 60, N o . 713, Dec., 1965, pp. 1751 1753,1755 56 and Vol. 61, Nos. 714 716, Jan .-M arch ,1966, pp. 57 59,213 215 ,217 ,327 3 3 0 ,4 3 3 ,6 1 3 ,6 1 5 ,6 1 7 ,7 5 1 753.
47. D u r a n d , E. and C o m e s , G . : L'essai de torsion et la resistance au cisaillement des roches, 3rd Cong. Int. Soc. Rock Mech.. Denver. C o lorado , Vol. II-A, 1974, pp. 226-232.
48. E i n s t e i n , H . H . , B r u h n , R .W . and H i r s c h f e l d , R .C .: M echanics o f jo in ted rock. Experim ental and theoretical studies. M .I .T . , Cam bridge. Dept. Civil Engng., Rep., Aug., 1970. 115 p.
49. E i n s t e i n , H .H ., N e l s o n , R .A ., B r i j h n , R .W . and H ir s c h f e l d , R .C .: Model s tudies o f jo in ted-rock behaviour. Proc. 11th Symp. Rock Mech., Berkeley, C a lifornia , 1969, pp. 83 103.
50. E n g e l d e r , J .T . : Q uartz fault gouge, its generation and effect on the frictional properties o f sandstone, Ph. D. Thesis, Texas A & M University, 1973.
51. E v a n s , I. and P o m e r o y , C .D . : T he strength o f cubes o f coal in uniaxial com pression. Proc. Conf. Mech. Prop. Non-metallic Brittle Materials, L ondon. 1958, pp. 5 28.
52. E v a n s , I. and P o m e r o y , C .D . : The Strength, F rac ture and W orkability o f Coal. L ondon , Pergam on Press, 1966, 277 p.
53. F a i r h u r s t , C . : On the validity o f the 'B razilian ' test for brittle materials. Int. J. Rock Mech. Min. Sci., Vol. 1, No. 4, Oct., 1964. pp. 535 546.
54. F ec k e r , E. : Geologische K artie rung des Gebietes nordwestlich von N eustad t/ W einstrasse sowie Bau und A nw endung eines Profilographen. Diplom-Thesis, Univ. K arlsruhe, Karlsruhe, 1970.
55. F e c k e r , E. and R e n c e r s , N .: M easurem ent o f large scale roughnesses o f rock planes by m eans o f profilograph an d geological compass. Proc. Symp. Rock Fracture, Nancy. 1971, Paper 1-18.
56. G o l d s t e i n , M., G o o s e v , B., P y r o g o v s k y , N., T u l i n o n , R. and T u r o v s k a y a , A.: Investigation o f mechanical properties o f cracked rock. Proc. 1st Cong. Int. Soc. Rock Mech.. Lisbon. 1966. Vol. 1, pp. 521 524.
57. G o n a n o , L .P .: Stress gradient and size effect phenom ena in brittle materials. Ph. D. Thesis, Jam es C ook Univ. o f N orth Q ueensland, Townsville, 1974, 364 p.
58. G o o d m a n , R .E . : The deformability o f jo in ts . Proc. Symp. Determ ination o f the In Situ M odulus o f D eform ation o f Rock. Denver, Colo., 1969. A .S .T .M . Spec. Tech. Pub. 477, 1970, pp. 174 196.

194 M E C H A N I C A L B E H A V I O U R O F J O I N T E D R O C K
59. G o o d m a n . R .E ., H e u z e , F .E . and O h n is h i , Y .: Research on strength, deform abil- ity w ater pressure re lationship for faults in direct shear. Rep. A R P A C o n trac t H 0210020 . Univ. Calif.. Berkeley, 1972.
60. H a n d i n , J.: Friction in rocks. Lecture delivered at Inst. Soil Mech. & Rock Mech.. Univ. K arlsruhe. Karlsruhe. Oct., 1972a.
61. H a n d i n . J. Mechanical properties o f rocks affecting earthquakes. C entre for Tectonophysics. Texas A & M Univ.. C on trac t No. 14-08-0001-12723, 1972b.
62. H a n d i n , J. and S t e a r n s , D .W .: Sliding friction o f rock. Trans. Am. Geophys. U n ion . Vol. 45, No. 1. M arch, 1964, p. 103.
63. H a r d y , W .B . and H a r d y , J .K . : N ote on static friction and on the lubricating p ro perties o f certain chemical substances. Phil. Mag., 6th Series, Vol. 38, No. 233, July, 1919, pp. 32 48.
64. H a y a s h i , M .: Strength and dilatancy o f brittle jo in ted mass The extreme value stochastics and anisotropic failure mechanism. Proc. 1st Cong. Int. Soc. Rock M ech.. Lisbon. 1966, Vol. 1, pp. 295 302.
65. H o b b s , D .W .: The tensile strength o f rocks. Int. J. Rock Mech. Min. Sci., Vol. 1, N o . 3, M ay, 1964, pp. 385-396.
66. H o b b s , D. W . : A study o f the behaviour o f a broken rock under triaxial compression, and its application to mine roadways. Int. J. Rock Mech. Min. Sci.. Vol. 3, N o. 1, M arch . 1966, pp. 11 43.
67. H o b b s , D .W .: The behaviour o f broken rock under triaxial compression. Int. J. R ock M ech. Min. Sci., Vol. 7, No. 2, M arch, 1970, pp. 125 148.
68. H of.k , E.: F rac tu re o f anisotropic rock. J .S . African Inst. Min. Mctall., Vol. 64, N o. 10, M ay, 1964, pp. 501 518.
69. H o e k , E.: Estimating the stability o f excavated slopes in opencast mines. M ining Ind. T rans . Inst. Min. M et., Section A, Vol. 79 (767), 1970, pp. 109-132.
70. H o e k , E. an d B r a y , J. Rock Slope Engineering. L ondon , Inst. Min. Metall., 1974, 309 p.
71. H o e k , E. an d P f.n t z , D .L .: Review o f the role o f rock mechanics research in the design o f opencast mines. Proc. 9th C om m . Min. Metall. Cong., London. 1969, pp. 389 404.
72. H o l m . R.: Electric contacts. U ppasala , Almquist and Wiksells, 1946.
73. H o r i n o , E .G .: Effects o f planes o f weakness on uniaxial compressive strength of m odel mine pillars. U .S.B .M ., R.I. 7155, 1968, 24 p.
74. H o r i n o , F .G . and E l l i c k s o n , M .L .: A m ethod for estimating strength o f rock co n taining planes o f weakness. U .S . B. M. R. I. 7449. 1970, 29 p.
75. H o r n . H . M. and D e e r e , D . U . : Frictional characteristics o f minerals. Geotechnique, Vol. 12, 1962, pp. 319 335.
76. H o s k i n s , E .R ., J a e g e r , J . C . and R o s e n g r e n , K .J . A medium-scale direct friction experiment. Int. J. Rock Mech. Min. Sci., Vol. 5, No. 2, March, 1968. pp. 143 154.
77. J a e g e r , J . C . : T he frictional properties o f joints in rock .’ Geofis. Pura e Appl.. Vol. 43, 1959, pp. 148 158.
78. J a e g e r , J .C . : Friction o f rocks and stability o f rock slopes. Geotechnique, Vol. 21. N o . 2, Ju n e , 1971, pp. 97 134.
79. J a e g e r , J . C . and C o o k , N .G .W . : Fundam entals o f Rock Mechanics. London. M ethuen . 1969a, 513 p.
Rl I E R E N C E S 195
80. J a e g e r , J .C . and C o o k , N .G .W . : Friction in granu la r materials. Proc. Int. Conf. S truct., Solid Mech. and Eng. Design in Civil Eng. M ater., S ou th am p to n . 1969b. pp. 257 — 266.
81. J a e g e r , J .C . and R o s e n g r e n , K .J . : Friction and sliding o f joints. Proc. Aust. Inst. Min. Metall.. No. 229. M arch , 1969, pp. 93 104.
82. J imenf .z S a l a s , J .A . and U r ie l , S . : Some recent rock mechanics testing in Spain. T rans. 8th Cong. Large D am s. Edinburgh, 1964. Vol. 1., pp. 995 -1002.
83. J o h n , K .W .: An ap p ro ach to rock mechanics. J . Soil Mech. Found . Div . Am. Soc. Civ. Eng., Vol. 88, No. SM 4. Aug.. 1962, pp. 1 30.
84. J o h n , K .W .: Festigkeit und V erform barkeit von druckfesten, regelmassig gefiigten D iskontinuen. Inst. Soil Mech. & Rock Mech., Univ. K arlsruhe, K arlsruhe, Heft 37, 1969.
85. K a w a m o t o , T.: M acroscopic shear failure o f jo in ted and layered brittle media. Proc. 2nd Cong. Int. Soc. Rock Mech., Belgrade. 1970, Vol. 2, pp. 215 221.
86. K r a g e l s k ii , I.V .: F riction and Wear. Transla ted from Russian. L o n d o n , Butter- w orths, 1965, 346 p.
87. K r s m a n o v k . D . : Initial and residual shear strength o f hard rocks. G eo techn ique , Vol. 17, 1967, pp. 145 160.
88. K r s m a n o v k , D. and L a n g o e , Z . : Large scale labora tory tests o f the shea r s trength o f rocky material. Rock Mech. Eng. Geol., Supplem entum No. 1, 1964, pp. 20 30.
89. K u t t e r , U .K .: R o tary shear testing o f rock jo in ts , 3rd Cong. Int. Soc. R ock Mech., Denver. Colorado , Vol. II-A, 1974, pp. 254 262.
90. K u z n e c o v , G .N . : G raph ica l m ethod to determ ine the strength o f a non h o m o g e- neous jo in ted rock mass. Rock Mech., Vol. 2, 1970. pp. 75 92.
91. L a d a n y i , B. and A r( h a m b a u l t , G .: S im ulation o f shear behaviour o f a jo in ted rock mass. Proc. 11 th Symp. Rock Mech.. Berkeley, California, 1969. pp. 105 125.
92. L a d a n y i , B. and A rc h a m b a u l t . G .: Evaluation o f shear strength o f a jo in ted rock mass. In French. Proc. 24th Int. Geological Cong., M ontreal, 1972, pp. 249 260.
93. L a j t a i . E .Z .: The influence o f interlocking rock discontinuities on com pressive s trength (model experiments). Rock Mech. Eng. Geol., Vol. 5, 1967, pp. 217 228.
94. L a j t a i . E .Z .: Shear s trength o f weakness planes in rock. Int. J. R ock M ech. Min. Sci., Vol. 6, No. 5, Sept., 1969a, pp. 499 515.
95. L a j t a i , E .Z .: Strength o f discontinuous rocks in direct shear. G eo techn ique . Vol.19, 1969b, pp. 218 233.
96. L a j t a i . E .Z .: Unconfined shear strength o f discontinuous rocks. Proc. 2nd Cong. Int. Soc. Rock Mech., Belgrade, Vol. 2, 1970, pp. 267 272.
97. L a m a . R .D . : M echanical behaviour o f jo in ted rock mass. Inst. Soil Mech. & Rock Mech., Univ. Karlsruhe. Karlsruhe. Rep. K-126, 1972.
98. L a m a . R .D .: The uniaxial compressive strength o f jo in ted rock. Prof. L. Miiller Festschrift, Inst. Soil Mech. & Rock Mech., Univ. Karlsruhe, K arls ruhe , 1974a, pp. 67 77.
99. L a m a . R .D .: U nlersuchung des Rheologischen Verhaltens von gekliiftetem E'cls. S FD 77, Jahresbericht, 1973. Inst. Soil Mech. & Rock Mech., Univ. K arls ruhe , K arlsruhe, 1974b.
100. L a m a . R. D . : The concept o f creep o f jo in ted rocks and the status o f research project A -6. SFB77, Jahresberich t, 1974. Inst. Soil Mech. & Rock Mech., Univ. K arls ruhe , Karlsruhe. 1975 a.

M E C H A N I C A L B E H A V I O U R O F J O I N T E D R O C K
101. L a m a , R .D .: Institute o f Soil M echanics and Rock M echanics, Univ. K arlsruhe. S FB Project A-7, 1975 b (unpublished).
102. L a m a , R .D . and G o n a n o , L . P . : Size effect considerations in the assessment o f m echanical properties o f rock masses. Proc. 2nd Symp. Rock Mech.. D h an b ad , 1976.
103. L a m b l , T. W . and W h i t m a n , R .V .: Soil mechanics. New Y ork , Wiley, 1969, 553 p.104. L a n e , K.S. and H e c k . W .J . : Triaxial testing for strength o f rock jo ints . Proc. 6th
Symp. Rock Mech.. Rolla, Missouri. 1964. pp. 98 108.
105. L i n k . H.: Zur Beurteilung und Bestimm ung d er Gleitsieherheit von Gew icht- und Pfcilerstaumauern. Die Wasserwirtschaft, No. 1. 1967, pp. 35 46.
106. L i t w i n i s z y n , J.: On certain linear and non linear s trata theoretical models. Proc. 4th Int. Conf. Strata C ontro l and Rock Mech., New York. 1964.
107. L o c h e r , H .G .: Some results o f direct shear tests on rock discontinuities. Proc. Int. Symp. Rock Mech.. M adrid , 1968. pp. 171 173.
108. L o g a n , J .M .. I w a s a k i . T.. F r i e d m a n , M. and K l i n g , S. A.: Experim ental investigation of sliding friction in multilithologic specimens. Geol. Soc. Am. Eng. Geol. Case History No. 9, 1973. pp. 55-67.
109. L u n d b o r g , N.: A statistical theory o f the polyaxial compressive s trength o f materials. Int. J. Rock Mech. Min. Sci., Vol. 9, 1972, pp. 617 624.
110. M a t h e w s , K .E .: Excavation design in hard an d fractured rock at the M oun t Isa mine, Australia. M.Sc. Thesis, Univ. Q ueensland , Brisbane, 1970.
111. M a u r e r . W .C .: Shear failure o f rock under axial and hydrostatic pressure. Proc. 1st Cong. Int. Soc. Rock Mech.. Lisbon. 1966, Vol. 1, pp. 337 341.
112. M c G i l l , G .E . and R a n e y , J .A . : Experim ental study o f faulting in an anisotropic, inhom ogeneous dolomitic limestone. Geol. Soc. Am. Bull.. Vol. 81, No. 10, Oct.. 1970, pp. 2949 2958.
113. M e n t e r . J .W .: A study o f boundary lubrican t films by electron diffraction. Proc. Symp. Physics o f Lubrication, M anchester, 1950. Brit. J. Appl. Phys., Supplem ent I. 1951, pp. 52 53.
114. Mocii, K.: Pressure dependence o f rock strength and transition from brittle fracture to ducticle flow. Bull. E ar thquake Res. Inst., Tokyo Univ.. Vol. 44, 1966. pp.215-232.
115. Mocii, K.: Fracture and flow o f rocks. Tectonophysics. Vol. 13. 1972. pp. 541 568.
116. M o r g e n s t e r n , N .R . : T he influence o f g roundw ater on stability. Proc. 1st Int. Conf. Stability in Open Pit Mining. Vancouver. C anada , 1970. pp. 65 81.
1 17. M o t o y a m a , H . and H i r s c h e e l d , R .C .: The effect o f jo in t configurations on the strength and deform ability o f model rocks. Federal Railroad Adm inistration , D epartm ent o f T ransporta t ion , W ashington, D .C ., R eport No. FRA-RT-73-25, 1971.183 p.
I 18. M i l.i i r . L.: Der Felsbau. Bd. I. S tu ttgar t, Ferd inand Enke, 1963. 623 p.
119. M u l l e r , L..: The progressive failure in jo in ted media. Proc. 1st Cong. Int. Soc. Rock Mech., Lisbon, 1966, Vol. 1. pp. 679 686.
120. M u l l e r , L. and H o f m a n n , H . : Selection, com pilation and assessment o f geological d a ta for the slope problem. Proc. Symp. Planning Open Pit Mines, Johannesburg,1970, pp. 153 170.
121. M u l l e r , L. and P a c h e r , F.: M odellversuche zur Kliirung der Bruchgefahr ge- klufteter Medien. Rock Mech. Eng. G eol. , Supplem entum No. 2, 1965. pp. 7 24
R E F E R E N C E S 197
122. M u r r e l l , S .A .F . : The effect o f triaxial stress systems on the strength o f rocks at atmospheric temperatures. Geophvs. J. Roy. Astr. Soc., Vol. 10. 1965. pp. 231 281.
123. N e w l a n d . P. L. and A l l e l y , B .H .: Volume changes in drained triaxial tests on g ranu la r materials. G eotechnique, Vol. 7, N o . 1, March. 1957. pp. 17 34.
124. O b e r t , L.. B r a d y , B.T. and S c h m e c h e l , F .W .: The effect o f norm al stiffness onthe shear resistance o f rock. R ock Mech.. Vol. 8. No. 2. 1976. pp. 57 72.
125. P a t to n , F .D .: Multiple m odes o f shear failure in rock and related materials. Ph.I). Thesis, Univ. Illinois, U rb an a , 1966a, 282 p.
126. P a t t o n , F .D . : Multiple m odes o f shear failure in rock. Proc. 1st Cong. Int. Soc. R ock Mech., Lisbon, 1966b, Vol. 1, pp. 509 513.
127. P o m e r o y , C .D ., H o b b s , D .W . and M a h m o u d , A.: The effect o f weakness-plane orien ta tion on the fracture o f Barnsley H ards by triaxial compression. Int. J. Rock Mech. Min. Sci., Vol. 8, No. 3, M ay. 1971, pp. 227 238.
128. P r i c e , N .J . : A study o f rock properties in conditions o f triaxial stress. Proc. Conf. Mech. Prop. Non-metallic Brittle M aterials, London, 1958. pp. 106 122.
129. R a b i n o w i c z , E.: Friction and W ear o f M aterials. New York. Wiley, 1965.
130. R af., D .: The m easurem ent o f the coefficient o f friction o f some rocks du ringco n tin u o u s rubbing. J. Sci. Inst., Vol. 40, No. 9, Sept.. 1963, pp. 438 440.
131. R a l e i g h , C.B. and P a t e r s o n , M . S . : Experimental deform ation o f serpentinite an d its tectonic implications. J. G eophys. Res., Vol. 70. No. 16, Aug.. 15, 1965, pp. 3965 3985.
132. R l n g e r s , N.: Influence o f surface roughness on the friction properties o f rock planes. Proc. 2nd Cong. Int. Soc. Rock Mech., Belgrade, 1970. Vol. I. pp. 229 234.
133. R i n g e r s . N.: Unebenheit und R eibungsw iderstand von Gesteinstrennflachen. Inst. Soil Mech. & Rock Mech.. Univ. K arlsruhe, Karlsruhe, Heft 47. 1971.
134. R i e d e l , W.: Z ur Mechanik geologischer Brucherscheinungen. Centralbl. Mineral. G eol. u. Pal., 1929. pp. 354 368.
135. R i p l e y , C .F . and L e e , K .L .: Sliding friction tests on sedimentary rock specimens. T rans . 7th Cong. Large D am s, R om e, 1961, Vol. 4. pp. 657 671.
136. R o c h a , M.: Mechanical behav iour o f rock foundations in concrete dam s. T rans. 8th C ong. Large Dams, Ed inburgh , 1964, pp. 785 832.
137. R o s e n g r e n . K .J .: Rock mechanics o f the Black Star Open Cut, M o u n t Isa. Ph. D. Thesis, Australian N a tional University, Canberra , 1968.
13S. R o w i . P .W ., B a r d e n , L. and L e i . I .K .: Energy com ponen ts during the triaxial cell and direct shear tests. G eotechn ique , Vol. 14, No. 3, Sept.. 1964. pp. 247 261.
139. R u i z , M .D . and d e C a m a r g o , F .P . : A large-scale field shear test on rock. Proc. 1st C ong . Int. Soc. Rock Mech.. Lisbon, 1966. Vol. 1. pp. 257 261.
140. R u i z , M . D . , d e C a m a r g o , F . P . . M i d e a , N . F . a n d N i e b l e , C .M .: S o m e c o n s i d e r a t i o n s r e g a r d i n g t h e s h e a r s t r e n g t h o f r o c k m a s s e s . P r o c . I n t . S y m p . R o c k M e c h . , M a d r i d . 1968, p p . 159 169.
141. S c h n e i d e r , I I .J . : S1B-77. .lahresbericht, 1972. Inst. Soil Mech. &. Rock Mech., Univ. K arlsruhe, Karlsruhe.
142. S c h o l z , C. H. and E n g e l d e r , J .T . : The role o f asperity indentation and p loughing in rock friction. Parts I & II. Int. J. Rock Mech. Min. Sci. & G eom ech . Abstr., Vol. 13, 1976, pp. 149 154.155 163.

198 M E C H A N I C A L B E H A V I O U R O F J O I N T E D R O C K
143. S c h o l z , C.. M o l n a r , P. and J o h n s o n , T . : Detailed studies o f frictional s l id ing o f g ran ite and im plications for the ea r th q u ak e mechanism. J . G eophys. Res.. Vol. 77, No. 32, Nov. 10, 1972, pp. 6392 6406.
144. S e r a f i m , J .L . and G u e r r e i r o , M .: S hear s trength o f rock masses a t 3 S p an ish d am sites. Proc. Int. Symp. Rock Mech., M adrid . 1968, pp. 147 157.
145. S k e m p t o n , A. W .: Long term stability o f clay slopes. G eotechnique, Vol. 14. N o. 2,1964, p p . 77 101.
146. S k e m p t o n , A. W. and H u t c h i n s o n , J .: Stability o f natural slopes and e m b a n k m e n t founda tions . Proc. 7th Int. Conf. Soil Mech. Found . Eng.. Mexico, 1969. S ta te o f the A rt volume, pp. 291 340.
147. T e r z a g h i , K. and P e c k , R. B.: Soil m echanics in engineering practice. 2nd ed ition . New Y o rk , Wiley. 1967, 729 p.
148. T r o l l o p e , D .H .: T he mechanics o f d iscon tinua or clastic mechanics in rock p rob lem s. In Rock M echanics in Engineering Practice (Editors K .G . Stagg andO .C . Zienkiewicz), L ondon , Wiley. 1968. pp. 275 320.
149. Tsc 'h e b o t a r i o f f , G . P. and W e l c h , J . D . : Lateral earth pressures and friction between soil minerals. Proc. 2nd Int. C onf. Soil Mech. Found. Eng.. 1948, Vol. 7, pp. 135 138.
150. T u l i n o v , R. and M o l o k o v , L.: Role o f jo in t filling material in shear s trength of rocks. Proc. Symp. Rock Fracture, N ancy, 1971, Paper 11-24.
151. U f e , J. F. and N a s h , J. K .T . L . : A niso tropy o f shale due to folding. Proc. Geotec'n- nical C onf. Shear Strength Properties o f N a tural Soils and Rocks, Oslo, 1967, Vol. 1. pp. 301 303.
152. U .S . Bureau o f Reclam ation. Bond strength between concrete and rock f ro n M onticello d am site, Solano project, California. Concrete Lab. Rep. No. C-761, 1954.
153. W a g n e r , G .: K leintektonische U ntersuchungen im Gebiet des N ordlinger Riescs. G eol. Jb ., Vol. 81, 1964, pp. 519 600.
154. W a l k e r . P. E . : The shearing behaviour o f a block jointed rock model. Ph. D. Thesis, Q ueens Univ., Belfast, 1971.
155. W a l s h , J .B .: Stiffness in faulting and in friction experiments. J. Geophys. Rc>.. Vol. 76, No. 35, Dec.. 10, 1971. pp. 8597 98.
156. W a w e r s i k , W . R . and B r o w n , W . S . : Creep fracture o f rock. Report. Mech. En-Z. D ept. , Univ. U tah , Salt Lake City, July, 1973, 81 p.
157. W e i b u l l , W . : A statistical theory o f the strength o f materials. Ingvetensk. AkaJ. H and l. , Vol. 151, 1939, pp. 5 44.
158. W i l l a r d . R .J. and M c W il l i a m s . J. R.: M icrostructural techniques in the study jf physical properties o f rock. Int. J. Rock Mech. Min. Sci., Vol. 6, No. 1. Jan., 196J, pp. 1- 12.
159. W o h n l i c h . H .M .: K leintektonische Bruch- und Fliessdeformationen in Faltei ju ra . Ph. D. Thesis, Univ. Basel, Basel, Switzerland, 1968.
160. Y e v d o k i m o v , P. D. and S a p e g i n . D .D .: Stability, shear sliding resistance aid de fo rm atio n o f rock foundations. Clearinghouse Federal Sci. and Tech. In., Springfield. Va.. 1967. 145 p.
161. Y o u a s h , Y . Y . : Experimental deform ation o f layered rocks. Proc. 1st Cong. lit. Soc. R ock Mech.. Lisbon, 1966, Vol. 1. pp. 787 795.

U N C I T E D R E F E R E N C E S 199
I Uncited References to Chapter 10
1. A d l e r . L.: Failure in geologic materia l conta in ing planes o f weakness. Trans. A . I .M .E . , Vol. 226. 1963, pp. 88 94.
2. A m m a r i , I .S .Y .: C orre la tion o f jo in t roughness with geology. M .Sc. Thesis, Univ. L ondon . London, 1972.
3. A r c h a r d , J .F . : Elastic defo rm atio n and the laws o f friction. Proc. Roy. Soc. L ondon . Series A . Vol. 243. N o. 1233, 1958. p p . 190-205.
4. B i e n i a w s k i , Z .T .: M echanics o f jointed rock masses. Rep. S. A frican. C .S . I .R . . N o . M E G 998, M arch, 1971. 42 p.'
5. B i e n i a w s k i , Z.T ., D e n k h a u s , I L G . and V o g l e r , U. W .: Failure o f fractured rock. Int. J. Rock Mech. Min. Sci., Vol. 6, N o. 3, M ay, 1969. pp. 323-341.
6 . B j u r s t r o m , S.: Estimating the stability and deform ation behaviour o f a rock mass. In Swedish. Proc. Conf. Rock Mech.. S tockholm , Feb.. 1971, pp. 47 61.
7. B r a y . J .W . : Limiting equilibrium o f fractured and jo inted rocks. Proc. 1st Cong. Int. Soc. Rock Mech., Lisbon. 1966, Vol. 1, pp. 531 535.
8 . B r a y , J .W .: A study of jo in ted and fractured rock. Part I F rac tu re p a t te rn s and their failure characteristics. Part II T heory o f limiting equilibrium. Rock Mech. Eng. Geol., Vol. 5, Nos. 2 - 3 and 4 ,1967 , pp. 117 136 and 197 216.
9. B r a y b o o k e , J .C . : The strength effect and m easurem ent o f d iscontinu ity in rock masses. M. Sc. Thesis, Univ. L ondon , L o n d o n , 1966, 211 p.
10. B r e k k e , T. L. and S e l m e r - O l s e n , R.: Stability problem s in underg round co n struc tions caused by m ontm oril lon ite ca rry ing jo in ts and faults. Eng. G eo l. , Vol. 1,1965, pp. 3-19.
11. B r o w n . E .T .: M odes o f failure in jo in ted rock masses. Proc. 2nd Cong. Int. Soc. R ock Mech., Belgrade, 1970, Vol. 2, pp. 293-298.
12. B r o w n , E .T .: Strength-size effects in rock material. Proc. Symp. R ock Frac ture , N an cy , 1971, Paper 11-11.
13. B r o w n , E.T. and H u d s o n , J .A . : Discussion on “ The operational s trength o f fissured clays by K. Y. Lo". G eotechnique, Vol. 20, No. 3, Sept., 1970. pp. 334-336.
14. B y e r l e e , J .D . : The mechanics o f stick-slip. Tectonophysics, Vol. 9, 1970, pp. 475-486 .
15. B y e r l e e , J .D . : Static and kinetic friction o f granite at high normal stress. Int. .1. R ock Mech. Min. Sci., Vol. 7, No. 6, N ov., 1970, pp. 577 582.
116. B y e r l e e , J .D . and S u m m e r s , R.: Stability sliding preceding stick-slip on fault surfaces in granite at high pressure. Pure & Appl. Geophys., Vol. 113, 1975, pp. 63 -6 8 .
117. C h a p p e l l , B.A .: The mechanics o f blocky material. Ph. D. Thesis, A ustra lian N a tio n a l Univ., C anberra . 1972.
118. C h a p p e l l , B.A.: D eform ational response o f blocky models. Int. J. R ock Mech. M in. Sci. & G eomech. Abstr., Vol. 11, N o. 1, Jan., 1974, pp. 13 19.
119. C h a p p e l l , B .A .: C o m p o n en t characteristics o f jo in ted rock masses. Int. J. Rock M ech. Min. Sci. & G eom ech. Abstr., Vol. 12, No. 4, April, 1975, pp. 87-92.
220. C h e n e v e r t , M .E . and G a t l i n , C . : M echanical anisotropies o f laminated sed im entary rocks. Soc. Pet. Eng. J., Vol. 5, No. 1, M arch, 1965, pp. 67-77.
221. C u n d a l l . P .A .: A com pute r model for simulating progressive, large-scale m ovem ents in blocky rock systems. Proc. Symp. Rock Fracture, Nancy, 1971, P ap er 11-8.
200 M E C H A N I C A L B E H A V I O U R O F J O I N T E D R O C K
22. D e e r e , D .U . and C o u l s o n , J . H . : The effects o f w ater and cement g ro u t on the shear strength o f na tu ra l and artificial jo in ts in G ra n d Coulee granite. Rep.. D ept. Civil Eng., Univ. Illinois, U rbana , 1970. 175 p.
23. D i e t e r i c h , J. H . : T im e-dependent friction in rocks. J. Geophys. Res., Vol. 77, No. 20. Ju ly 10, 1972, pp. 3690 3697.
24. D i e t e r i c h , J. H .: T im e-dependent friction as a possible mechanism for aftershocks. J. G eophys. Res., Vol. 77, N o. 20, July 10, 1972, pp. 3771 3781.
25. D v o r a k , A.: Influence o f separation planes on the shear strength o f rock masses. Proc. G eotechnical Conf. Shear Strength Properties o f N atural Soils an d Rocks. Oslo , 1967, Vol. I, pp. 271 274.
26. E d w a r d s , C. M . and H a l l i n g , J .: Analysis o f plastic interaction o f surface asperities an d its relevance to value o f coefficient o f friction. J. Mech. E n g . Sci.. Vol. 10. N o . 2, April, 1968, pp. 101 110.
27. E n g e l d e r , J .T . : Coefficient o f friction for sandstone sliding on qu ar tz gouge, 3rd C ong . Int. Soc. Rock Mech., Denver, C olorado , Vol. II-A, 1974, pp. 499 504.
28. E n g e l d e r , J .T . , L o g a n , J. M. and H a n d i n , J . : The sliding characteristics o f sa n d s tone on qu ar tz fault gouge. Pure & Appl. G eophys., Vol. 113, 1975, pp. 69 86.
29. E r g u n , I.: M odel studies o f underground openings in jo in ted and fractured rock. M in. Res. Rep. No. 13, Royal School o f Mines, London, Feb.. 1967.
30. E r g u n , L: Stability o f underground openings in jo in ted media. Ph. D. Thesis, Univ. L o n d o n , London, 1970.
31. E r g u n , I.: Stress distribution in jointed media. Proc. 2nd Cong. Int. Soc. Rock M ech., Belgrade, 1970, Vol. 1, pp. 497 507.
32. F a i r h u r s t , C .: Estimation o f the mechanical properties o f rock masses. Rep. Univ. M inneso ta , Minneapolis, 1972.
33. F i g u e r o a , A.: Point-contact friction: A possible index value for the residual shear s treng th o f rocks. M. Sc. Thesis, Univ. London, London, 1971.
34. F r a n k l i n . J., M a n a il o g l o u . J. a n d Sh e r w o o d , D . : Field d e te rm in a t io n o f d irec t s h e a r s t re n g th , 3 rd C ong. Int. Soc. R ock M ech., D enver, C o lo ra d o , Vol. II-A. 1974. p p . 233 -240 .
35. G o o d m a n , R .E . and O h n i s h i , Y.: U ndra ined shear testing o f jo in ted rock. Rock M ech., Vol. 5, 1973, pp. 129-149.
36. G o o d m a n , R .E . , T a y l o r , R .L . and B r e k k e , T .L .: A model for the mechanics of jo in te d rock. J. Soil Mech. F ound Div., Am. Soc. Civ. Eng., Vol. 94, No. SM 3, M ay. 1968, pp. 637 659.
37. H a n s a g l I . : Numerical determ ination o f mechanical properties o f rock and o f rock masses. Int. J. Rock Mech. Min. Sci.. Vol. 2. No. 2. July, 1965, pp. 219-223.
38. H ayashi, M . : O n a mechanism o f stress p ropagation in a cracked rock foundation A p roposed mechanical model for d iscontinuous media. Presented at the Rock M ech. C om m ittee of the Civil Eng. Soc., Nov.. 1962. Abstract-Int. J. Rock Mech. M in. Sci.. Vol. 1. No. 2, M arch, 1964. p. 310.
39. H a y a s h i , M .: Strength characteristics o f discontinuous jo in ty masses. In Japanese. Tech. Rep. No. 65052. Res. Inst. Elec. Power Industry, T okyo, 1965.
40. H a y a s h i , M. and F u j i w a r a , G .: A mechanism o f anisotropic d ila tancy and shear failure o f lam inated jointed rock mass. Tech. Rep. C. E 7006. Central Res. Inst. Elect. Power Industry, Tokyo , 1968.

U N C I T E D R E F E R E N C E S 201
4 1 1 I a y a s h i . M. and H ib in o , S . : Progressive relaxation o f rock m assesduring excavation for underground cavity. Proc. Int. Symp. Rock Mech.. M adrid . 1968. pp. 343 349.
42. H e l f r i c h , U . K . : Strength o f rock and rock masses. Proc. 10th Cong. Int. Bur. Rock Mech.. Leipzig, 1968, pp. 87 93.
43. H e r m a n , L .R . and T a y l o r , M .A .: Characterisa tion o f the structural b eh av io u r o f rock masses, Vols. I & II, U SB M , O F R -6 7 (1 )-75 & O FR -67 (2)-75, 1975.
44. H o w a r d , T. R.. B r e k k e , T. L. and H o u s t o n , W .N .: Labora to ry testing o f fault gouge material. Bull. Assoc. E n g n g G e o l. , Vol. XII. No. 4. 1975. pp. 303 315.
45. I id a , R. and K o b a y a s h i , S. : A mechanical consideration on the stress d is tr ibu tions and the characteristics o f de form ation in rock masses. Proc. 2nd Cong. Int. Soc. Rock Mech.. Belgrade, 1970, Vol. 1. pp. 361 371.
46. J a e g e r , J .C . : Shear fracture o f an iso tropic rocks. Geol. Mag., Vol. 97, 1960, pp. 65-72.
47. J o h n , K. W.: Civil engineering ap p ro ach to evaluate strength and deform ability o f regularly jointed rock. Proc. 11th Symp. Rock Mech.. Berkeley, C alifornia , 1969, pp. 69 80.
48. J o h n , K. W.: Engineering analyses o f three-dimensional stability problem s utilising the reference hemisphere. Proc. 2nd Cong. Int. Soc. Rock Mech., Belgrade, 1970, Vol. 3, pp. 385 391.
49. K a n d a o u r o v , 1.1., M o u l l h r , P. A. and O u v a r o v , L .A .: Stress >tate an d settlements o f jo in ted rock masses. Proc. 2nd Cong. Int. Soc. Rock Mech.. Belgrade,1970, Vol. 1. pp. 341 349.
50. K a n d a o u r o v , I T . , O u v a r o v , L.A . and K a r p o v , N .M .: C onstrain tes d a n s les modeles des massifs rocheux fissures sans poussee h o r iz o n ta l . 3rd Cong. Int. Soc. Rock Mech., Denver, C o lo rado , Vol. II-A, 1974, pp. 156 160.
51. K e n n e y , T .C . : Residual s trength o f fine-grained minerals and mineral mixtures. Norwcg. Geotech. Inst.. Oslo, Pub. N o. 68, 1966.
52. Ko. K .C . and H aas , C .J . : The effective m odulus o f rock as a com posite materia l. Int. J. Rock Mech. Min. Sci., Vol. 9. 1972, pp. 531 541.
53. K o b a y a s h i , S . : F rac ture criteria for an iso tropic rocks. K yoto Univ. Fac. Eng. M em.. Vol. 32, Part 3, 1970, pp. 307 333.
54. K o b a y a s h i , Y., I i z u k a . A. and K u m a g a l , K . : Shear strength o f rocks in situ a long weak planes. Case of schist, m udstone and granite. Q. Rep. Railway Tech. Res. Inst.. Japan . Vol. 7. No. 1. M arch. 1966. pp. 7 8.
55. K olic k o , A. V.: Tensile s trength of a jo in ted rock. (In Foundations o f H ydrau lic S tructures) In Russian. Proc. H ydropro ject Inst.. M oscow, Vol. 33, 1974, pp. 93-104.
56. K r s m a n o v ic , D . : C ontr ibu tion to a s tudy o f the failure problem in rock mass. Proc. G eotechnical Conf. Shear Strength Properties o f N atural Soils and Rocks, Oslo.1967. Vol. I. pp. 275-282.
57. K r s m a n o v ic , D. and M il k , S.: Model experiments on pressure d is tr ib u tio n in som e cases o f a d iscontinuum . Rock Mech. Eng. Geol., Suppl. I. 1964, pp. 72 87.
58. K r s m a n o v i c , D., L a n g o f , Z. and T u f o , M .: Some aspects o f rup ture o f rocky mass. Rock Mech. Eng. Geol. , Suppl. II. 1965, pp. 143-155.
59. K rsm anovic , D.. T u f o , M . and L a n g o f , Z.: Shear s trength o f rock m asses and possibilities o f its reproduction on models. Proc. 1st Cong. Int. Soc. Rock M ech., Lisbon, 1966, Vol. I, pp. 537 542.

202 M E C H A N I C A L B E H A V I O U R O F J O I N T E D R O C K
60. K r u s e , G .H .: Deform ability o f rock structures, C aliforn ia State w ater project. Proc. Symp. D eterm ination o f the In Situ M odulus o f D efo rm ation o f Rock, D enver, Colo., 1969. A .S .T . M. Spec. Tech. Publ. 477, 1970, pp. 58-88.
61. K u j u n d z i c , B. and S t o j a k o v i c , M .: A contribu tion to the experimental investigation o f changes o f mechanical characteristics o f rock massives as a function o f depth. Trans. 8th Cong. Large Dams, Edinburgh, 1964, pp. 1051 1068.
62. K u t t e r , H .K . and F i g u e r o a , A .: Erm ittlung eines einfachen K ennw ortes zur Bestimmung der Reissfestigkeit von Gesteinstrennflachen. Rock Mech., Suppl. 2. 1973, pp. 53-70.
63. K v a p i l , R. and L a u f f e r , K . : Supplement to the problem o f stress d is tr ibu tion in samples under triaxial strain. In G erm an . Bergakademie, Vol. 12, No. 11, 1960. pp. 587 594.
64. L a j t a i , E .Z .: The evolution o f brittle fracture in rock. Dept. Geology, Univ. New Brunswick, Fredericton, 1972.
65. L a j t a i , E .Z .: Failure along planes o f weakness. Can. G eotechnical J., Vol. 112, 1975, pp. 118-125.
66. L a m a , R .D .: The mechanics o f jo in ted rocks. Proc. Symp. Rock Mech.. D h an b ad , 1972 (Inst. Engrs., Calcutta , India, 1973, pp. 60-85).
67. L e o n o v , M .P .: T he relationship between jo inting and deform ability in ledge-ron base o f the K rasnoyork hydro-electric power station. Hydrotechnical C onstruc tion , No. 4, April, 1974, pp. 311 314.
68. M a r t i n , G .R . and M i l l e r , P .J . : Jointed strength characterisation o f weathered rock, 3rd Cong. Int. Soc. Rock Mech., Denver, C o lorado , Vol. II-A, 1974, pp. 263-270.
69. M a s u r e , P.: Behaviour o f rock with two dimensional con tinuous anisotropy. In French. Proc. 2nd Cong. Int. Soc. Rock Mech., Belgrade, 1970, pp. 197 207.
70. M e l l o - M e n d e s , F.: A bout the anisotropy o f uniaxial compressive strength in schistose rocks. Proc. Symp. Rock Fracture, Nancy, 1971, Paper 11-13.
71. M e n c l , V.: F ac to r o f s trength o f rock material in the strength o f rock mass. Proc. 1st Cong. Int. Soc. Rock M ech., Lisbon, 1966. Vol. 1. pp. 289-290.
72. M e t c a l f , J .R . : Angle o f repose and internal friction. Int. J. Rock Mech. Min. Sci., Vol. 3, No. 2, May, 1966, pp. 155-161.
73. M o g i l e v s k a y a , S .E .: Effect o f geological factors on the shearing resistance along joints in rock, 3rd Cong. Int. Soc. Rock Mech.. Denver, C o lo rado , Vol. II-A, 1974, pp. 263-270.
74. M o r l a n d , L .W .: C on tinuum model o f regularly jo in ted mediums. J. Geophys. Res., Vol. 79, No. 2, Jan. 10, 1974, pp. 357-362.
75. M o r l a n d , L .W .: Elastic an iso tropy o f regularly jo in ted media. Rock Mech., Vol. 8, 1976, pp. 35-48.
76. M o n j o ie , A.: Mechanical properties o f the Silurian schists in T ihange (Belgium). Proc. 2nd Cong. Int. Soc. R ock Mech., Belgrade, 1970, Vol. 1, pp. 213-220.
77. M u l l e r , L., C e s a r e , T., F e c k e r , E. and M u l l e r , K . : Kriterien zur Erkennung von Bruchgefahr geklufteter M edien Ein Versuch. Rock Mech., Suppl. 2, 1973. pp. 71-92.
78. M u l l e r , L. and M a l i n a , H . : D istribution o f shear stresses in a progressive failure surface. In G erm an . Rock Mech. Eng. Geol., Vol. 6, 1968, pp. 216-224.
79. M u l l e r , L. : The mechanical properties o f geological bodies. In G erm an . Festschrift Kahler, Sonderheft 28, Klagenfurt. 1971, pp. 177 191.
U N C I T E D R E F E R E N C E S 203
80. M u r r e l l , S .A .F . : A criterion for brittle fracture o f rocks and concrete under triaxial stress, and the effect o f pore pressure on the criterion. Proc. 5th Symp. Rock Mech.. Minneapolis. M inn., 1962, pp. 563 577.
81. N a s c im e n t o , U. and T e ix e ir a , H.: M echanisms o f internal friction in soils and rocks. Proc. Symp. Rock Fracture, Nancy. 1971, Paper 11-3.
82. N elson , R .A . and H ir s c h e e l d , R .C .: Modelling a jo in ted rock mass. M .I .7 . , Cam bridge. Rept. R 68 70, 1968, 218 p.
83. N i k it in , A. A.. S a p e g in , D .D . and U v a ro v , L .A .: Shear resistance o f rock along jo in t planes undei static and impulse loads, 3rd Cong. Int. Soc. Rock Mech., Denver. C o lo rado , Vol. II-A, 1974, pp. 302 310.
84. O lsson , W. A . : Effect o f tem perature, pressure and displacement rate on the frictional characteristics o f a limestone. Int. J. Rock Mech. Min. Sci. & Geom ech. Abstr.. Vol. 11, N o. 7, July, 1974, pp. 267 278.
85. P a u l d i n g , B.W .: Coefficient o f friction o f natura l rock surfaces. J. Soil Mech. Found . Div.. Am. Soc. Civ. Eng., Vol. 96, 1970, pp. 385 -394, Vol. 97, SM 4, April. 1971. p p . 685 686.
86. P e ra m i , R.: Mechanical behaviour under uniaxial stresses of rocks first micro- fissured by heating. Proc. Symp. Rock Fracture, Nancy, 1971, Paper 11-14.
87. P in t o , J .L . : Deform ability o f schistous rocks. Proc. 2nd Cong. Int. Soc. Rock M ech., Belgrade, 1970, Vol. 1, pp. 491 496.
88. P ir o g o v , I. A. : The study o f tectonic rup tures and join ting o f rocks and evaluation them as foundations o f high concretc dam s. Proc. Symp. Rock Frac ture , Nancy,1971, Paper 1-16.
89. P it ea u , D. R . : Characteris ing and ex trapolating rock jo in t properties in engineering practice. Proc. 20th Colloquium on Geomechanics, Salzburg, Austria, Sept., 1971, Paper 1.
90. P itf.a u , D .R . and R ussell , L.: Cum ulative sum s technique A new approach to analysing jo in ts in rock. Proc. 13th Symp. Rock Mech.. U rbana , Illinois, 1971, pp. 1 29.
91. R o c h a . M .: Some problem s on failure o f rock masses. Rock Mech. Eng. Geol., Suppl. 1, 1964, p. 1 .
92. R o g h a , M .: Structural model techniques Some recent developments. Lab. Nac. de Enge. Civil. Lisbon. No. 264, 1965, 49 p.
93. R o s e n b l a d , J. L . : G eomcchanical model s tudy o f the failure modes o f jo in ted rock masses. U .S. C orps Engrs. Dept. Army. Missouri River, O m aha , Tech. Rept. M R D 1 71, 1971, 374 p.
94. R u p p e n e it , K.V . and T arassova , I.V .: Influence o f the cleavage o f a rock mass upon the deform ation modulus. Proc. 2nd Cong. Int. Soc. Rock Mech., Belgrade.1970, Vol. 1. pp. 295-300.
95. Sc h r a d e r , P.: Bruchbildung in M odellsubstanzen durch Deformierungen mit m onoklincr Symmetric. Ph. D. Thesis. R u h r Univ.. Bochum. 1970.
96. S c h w a r t z , A .E .: Failure o f rock in the triaxial shear test. Proc. 6th Svm p. Rock Mech.. Rolla, Missouri. 1964. pp. 109 151.
97. S h eshen y a . N .L .: Basic factors governing the extension o f point shear strength m easurem ents on the whole jointed rock mass. Proc. Symp. Rock Fracture. Nancy,1971, Paper 11-29.
98. S i n g h , B.: C on tinuum characterisation o f jo in ted rock masses. Parts I and II. Int. J. Rock Mech. Min. Sci., Vol. 10, 1973. pp. 311 335, 337 349.
204 M E C H A N I C A L . B E H A V I O U R O F J O I N T E D R O C K
99 . S k i n n e r , A . E . : A note on the influence o f in terpartic le friction on the shearing strength o f a random assembly o f spherical particles. G eo techn ique , Vol. 19. 1969, p p . 1 5 0 - 157.
100. S ow ers , G .F . , W il l i a m s , R .C . and W a l l a c e , T .S . : C om pressib ili ty o f broken rock and the settlem ent o f rockfills. Proc. 6th Int. C onf. Soil Mech. F o u n d . Eng., M ontreal, 1965.
101. S u d a k o v , V.B. et a l.: Shear characteristics o f ho rizon ta l expansion jo in ts in the Toktogul hydro-electric station dam. Sov. Min. Sci., Vol. 10. 1974. pp. 401 403.
102. S w a n s o n . S .R . and B r o w n , W .S.: The mechanical response o f p re frac tu red rock in compression. Rept.. Mech. Eng. Dept., Univ. U tah , Salt Lake City, 1971.
103. T s y t o v i c h , H .A ., U k h o v , S. E. and K o r n i l l o v , A .M . : D e fo rm ation o f fissured rock. Proc. 3rd Budapest Conf. Soil Mech. Found. Eng., Budapest, O c t. , 1968, pp. 227 241.
104. W a n g , C .Y . and M o r r i s o n , H .F . : Electrical resistivity o f gran ite on frictional sliding: application to ea r thquake prediction, G eophys. Res. Letter, Vol. 2. No. 12,1975, pp. 525 528.
105. W it h e r s , J. H . : Sliding resistance along d iscontinuity in rock masses. Ph. D. Thesis, Univ. Illinois, U rb an a , 1964.
106. W it t k e , W . : Influence o f the shear strength o f the jo in ts on the design o f prestressed anchors to stabilise a rock slope. Proc. Geotechnical Conf. Shear S trength Properties o f N atural Soils and Rocks, Oslo. 1967, Vol. I. pp. 311 318.
107. W u, T .H ., D o u g l a s , A .G . and G o u g h n o u r . R .D . : Friction an d cohesion of saturated clays. J. Soil Mech. Found. Div., Am. Soc. Civ. Eng., Vol. 88, SM 3, June, 1962, pp. 1 32.

C H A P T E R 11
Classification of Rock
11.1. Introduction
W ith the developm ents in rock testing techniques and the influence o f the individual param eters on the m echanical response o f a rock, there has been a need to consolidate the da ta acquired together to give som e simple numerical indices reliable enough for a practical rock engineer to determ ine the stability o f his excavations and design a support system. Any am ount o f da ta obtained from testing has no m eaning as long as it is not correlated with each o ther to give a m eaningful p ic tu re o f the rock mass as a whole and related to the type o f excavation w hich is to be placed in it. These facts have been recognised for qu ite som e tim e and attem pts have been m ade by geologists and engineers to synthesise their experience in certain num erical values. A ttem pts have been m ade to classify rocks according to a com bination o f field and laboratory studies w ith the labo ra to ry tests being limited to certain simple index tests. It is here tha t the geologists and engineers try to speak a language understandable to each o ther. There had been a wide gap between the practising rock engineer, the research scientist and the geologist and this gap has been slow ly decreasing. In the last 15 years a num ber o f classification systems have been p u t forw ard and im proved upon. Because o f the large num ber o f param eters involved and the inherent variability in the rock properties a general classification w hich perm its to arrive at a final decision whether a slope or an excavation is stable o r requires to be bolted o r lined is still very difficult. The long term stability o f an unsupported opening, the design o f a support system o r the corrective m easures to be adopted for an existing slope is still a difficult question . Till now no classification system has been put forw ard to take in to account the time-effect. The design o f underground caverns is still largely based upon precedent and the construction o f large cham bers under cond itions not previously encountered is heavily based on extended previous experience coupled with observations during construction to confirm the suitability o f the design. In spite o f the highly developed
206 C L A S S I F I C A T I O N O F R O C K
numerical techniques, experience overweighs several times the calculated results, the basic reasons behind this being that1. the input data to the analysis are very m eagre and are not very reliable when
extended to large dim ensions2. the relative influence o f the various values obtained from tests when co n
sidered altogether is not sufficiently know n3. the structural variations in the rock cannot be sufficiently accurately d e te r
mined from surface observations o r drilling and exploratory work w ith the techniques available presently and
4. the influence o f time on these param eters has still not been sufficiently investigated.
In spite o f these difficulties, m uch has been gained and m ore can be gained if both the geological considerations o f the area and the m echanical response o f the rock mass are considered sim ultaneously both in space and time.
This chapter contains a general appreciation o f the origin o f rocks and the defects in rocks from the point o f view o f rock m echanics. Em phasis is laid on the genetics o f defect-structure in rocks such as folds, faults, jo in ts and rock weathering. Joints, jo in t surveying and errors in jo in t surveys are discussed. The classification o f intact rock and rock m ass is discussed in detail. The classification o f in situ rock from the point o f view o f tunnels and underground excavations is described and its use in determ ining the pressure on the support explained.
This chapter should be read in conjunction with o ther chapters especially C hapter 6 (Volume II), C hapter 8 (Volume III) and C hap ter 10.
11.2. Minerals and Rocks
A rock is a m ineral or an aggregate o f minerals. A m ineral is a natural inorganic substance o f a definite structure and chemical com position. The most im portant elements tha t constitute about 99% o f crust o f the earth extending to upper 16 km (10 miles) are given in Table 24a. These elem ents and others (about 60 o r so) which form the rem aining 1 %, occur in alm ost 1500 com binations called minerals. From the point o f view o f rocks, only 20 o r 30 o f these com binations are im portant (Table 24 b).
A mineral usually occurs in crystals o f characteristic shape representing its atom ic structure. In a mass m ade up o f m any crystals crowded together, the crystal shape may not be evident, though an exam ination o f individual grain will show consistency in the atom ic structure. C ertain m inerals, however, may not develop any definite crystal shape due to very rapid cooling giving am orphous structure (e.g. glasses).

M I N E R A L S A N D R O C K S 207
T A B L E 24a
Im portan t elem ents constitu ting ea rth ’s crust
( a f t e r C l a r k e , 1924)
Elem ent Percent
Oxygen 49.78
Silicon 26.08A lu m in iu m 7.34
1 ron 4.11
C alc ium 3.19
Sod ium 2.33Potass ium 2.28M agnesium 2.24
H ydrogen 0.95
T itan iu m 0.35C h lo rine 0.21
C a rb o n 0.19
P h o sp h o ro u s 0.11
S u lp h u r 0.11
T o ta l 99.29
Som e o f the most im portan t constituents o f rock form ing m inerals are silicates, oxides, carbonates, sulphates, chlorides, phosphates, sulphides and native elements. Silicates are the m ost im portant and occur as metasilicates (H 2S i0 3-pyroxenes, am phiboles, leucites, etc.), orthosilicates (H 2S i0 4-mica, olivine, anorth ite , nepheline, garnet, etc.) o r products o f H 4S i0 30 8 (such as orthoclase and albite). The silicates o f base elements such as Al, Fe, Mg. Ca. N a. K occur as anhydrous or hydrous depending upon the weathering processes to which these have been subjected. The chief anhydrous silicates in igneous rocks consist o f feldspars, feldspathoids, pyroxenes, am phibolites, m ica and olivine which on weathering give rise to hydrated products such as kaolinite, chlorite, serpentine, etc. The m etam orphic rock silicates usually are sillim anite, kyanite, andalucite, scalprolite, epidote, etc.
Oxides are the next m ost im portant constituents o f which quartz (S i0 2) dom inates and exists in various form s such as chalcedony, cristobolite, tri- dym ate as anhydrous and opal as hydrous. A nother group o f oxides is that o f iron such as m agnetite and hem atite as anhydrous and limonite as hydrous.

208 C L A S S I F I C A T I O N O F R O C K
T A B L E 24 b
C h e m ic a l c o m p o s it io n o f ig n e o u s an d s e d im e n ta r y ro c k s
( a f te r G i l l u l y , W a t e r s a n d W o o d f o r d , 1959)
S E D IM E N T A R YC O N S T IT U E N T IG N E O U S R O C K S R O C K S
SiO, 59.14 ° 0 57.95 ° 0TiO“ 1.05 0.57
aiA 15.34 13.39F e , 0 , 3.08 3.47FeO 3.80 2*08M gO 3.49 2.65C aO 5.08 5.89N a 20 3.84 1.13k 2o 3.13 2.86H , 0 1.15 3.23p2o 5 0.30 0.13co, 0.10 5.38so3 0.54BaO 0.06C 0.66
T otal 99.56 99.93
N ote : T he co m p o s i t io n s in the tab le ab o v e are based on 5,159 analyses o f igneous rocks com piled by F. W. C larke , an d on selected analyses o f sed im en ta ry rocks c o m piled by C .K . Leith an d W .F . M ead . T he sed im entary rocks have been w eighted in the properties o f 82 per cent shale , 12 per cent sandstone an d 6 p e r cent lim estone. The com posit ions a rc reported as oxides, which is the conven tiona l system for reporting da ta on the co m p o s i t io n o f rocks and minerals.
N o te : Tables 24 b. 2 5 .2 6 ,2 9 and 3 0 a re rep roduced with perm ission from “ PR I N C I PL E S O F G E O L O G Y , F o u r th Edition , by J a m es G i l l u l y , A a r o n C. W a t e r s and A . O . W o o d f o r d . W . 11. F reem an an d C o m p an y . Copyright c 1975.
C arbonates occur chiefly in sedim entary rocks in the form o f calcite, dolom ite and siderite and as w eathering products in igneous rocks. G ypsum and anhydrite are sulphates and pyrite and pyrrhotite are sulphides. Table 25 gives a summary o f the properties o f these basic mineral constituents.From the engineering point o f view, the products o f w eathering o f the silicates are im portant. U nder the action o f w ater and carbon dioxide, feldspars alter into clay m inerals o r white mica. The presence o f clay at the site o f a rock structure always places the engineer o r the geologist on alert because o f its very complex behaviour and m arked influence on the stability. The clay minerals are essentially hydrous alum inium silicates o r occasionally hydrous magnesium or iron silicates occurring in the form o f flakes and can be divided
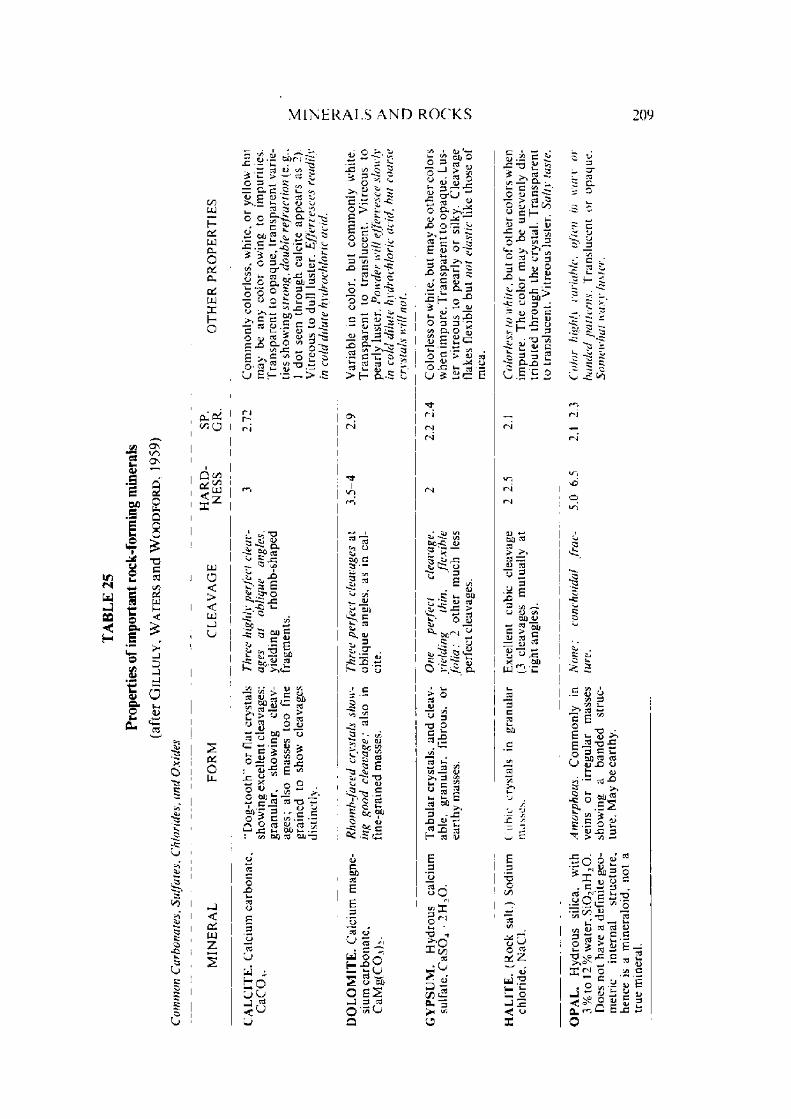
M I N E R A L S A N D R O C K S 209
C/3 ON — : ty~>
D £c
•rif NU—CO<H
*
£ai
8i—* -Ccst:oo .E
•—cC/3o»roa .o
xo£T 3
73C/3a;LU-<>
- J
-Jau<D
CS
o
. 3
to
> c5
C/3UJ
Pc cUJC L
Oa:a.&
HO
C L &C O
Q c/3(V ^ ^ UJ
U J
a<<UJ-JU
oiOLl
- 1<a:UJz
- r~ w> > . 5 -
' J o u o j
. t ; ^ <u «« q u . > — ' co ^
S.C 5 e iC CJ — CO ^C “ O ^
~ 5 C . ?O S -^g -g ^o u § ? « & *
• 2 <> o£ ^ | 3 u cc D. ^,’S» 3 ? o o 5 g ~ “ 5 U c i : 9 3 :w — -o ~T C "zL o u *-* _ * j
• c c c r - O co <u . 3 — —
« 3 2 S?_c CL o «/> 3 " «/» J 3 — O - 5
•3 2 s -a - - E h w - > . 5
S-^ O .* > S « 3
- C>3 c/5
v s £
s O f l C=3 — u, 2 ^ b e . 2 5 ■3 >%<i:
^ ifl £ s u i *-* o u i ' i
£*> rj 5o
co u
u C '*o: ^ ”5- C ° w X O w -
o o u 1= ■ * r c _ 20U> 3o £ 3r-s O co
U x u: t/5 ox)
c
- C
ca
51 t/53 <u ,= 00 •“ COo SO j y
w ut/3• u >C/2 --'co o2 -3s ^ o 2 •r. > -,
^3 " O ~
. ' . I I0 3 “o jj u . . £ r3 O J , - ;
cOU
O W _ j co
< U
u
J S ^
5? 8
C . 3 ? - Co > 2 ^ ,
ou o ■
— 3 "u 3 i a ' '
£ = •■ '
O ? >
o 2 . - 5 -
c <uP TS :xs a.
3 2 2• r " U
J r cO cO ^ -J- > h- C.-S:
o s
r s i
■rf
CO CO. o
O c c
~ c/>
^ OJj-< c
CO
C i . <D
5! §• £ 2 . 2 K. o a
Ou->- CO
53 • - tA t : cu o j u 00 '-2P ? s -T ? £
- C $ u
S & *J°O <L> Sf 3
^ - S ' -
c01)CO
E3G
CO i )
0 3 J;UJ O r>‘ u x y =^ u O b
O■ J 3 CO
O ' Z U
o
t/5 1 U j —1— t/5 o u c
7: - J > sCJ— u —i
c o c
0X0 C L . • -j<J
> » —0 O ~
x > O rzz> . ^ C lls\
EcOJ'—
0 %
co > ,—<
J DC Lt/5 I— 2
1 )c 0 —
c . 3J C 0 - °
— _a>
•—a j•— t/5 X
O 3 3 • “1/5 C L O « it/5_ o E
•~ ■— - 3 tA_ o c > D CO!L» L>O J Z lr co0 £ r~> T— E
Tt
r i
< N
r i
00- c 55 5 •§ £ • 5• 3
E t/5ajs: v-i ou- ~ <u CO.2 — >V ' O^ oc^j U
a: cu ~—
o 3- o c
. . c :
w B W CA — O >. 3 '-51—0 c
COt - u .
J O O/j
3X j j '
CO
h -
C3
Hn• j w
f N
• O t
i:*cU- c/3CO
i iC/5 Cu 3> *«
o
5 . - 3 ^J = • o £J *5 i ? co c ; w j — C L ^t- c « C'O (U 3 -5.
— > CO . 5 O a j t - l/ s
u c h .U- 3 u .U _ • <U
• 5 ^ 2 ^O '-/". 3
^ ^ U 71^ 3 (_> 3" C ( j O
u
* > 0 3 _ ;
^ 2 § J h - 5 J
C
| 1 2 §U . E u o
</-.
<N
(L»0D 3 3 > > > CO — IL> CO O 3
■a IX ) C
3o
cU CO
“ o
XUJ C
- 23
o u
c
!/5 ---- .O t/5 OljJJ 3 o u
cCO
E3
■5o
C/3
cO
t oJ 2< wI
-C L_• 2 H
nC
o
2 i •■C
^ 5 . E U u
tA 3
h
1 E "C "O - • c 1- o> >>3 _ 3 - 3 - 3 O 3 3 C
y o u 3 co^ - u X ) <u
• t «>5 — CO
J Ot ° . £ S
^ C/5 >
k . E o 2
| ° . 2 ^ - I ' OU. c 2
3 " r 3. a o |
(A o 3 3 3 O
° % i I - > CO T3 xC-C^o' w I rl O — j -
. O ry5 _ J u
a . ^ ^
O
o *u . ^2 OO 33 .ir •o1/5 o
co— 1—cO Oc cu_<u
cE —“ CO
I I
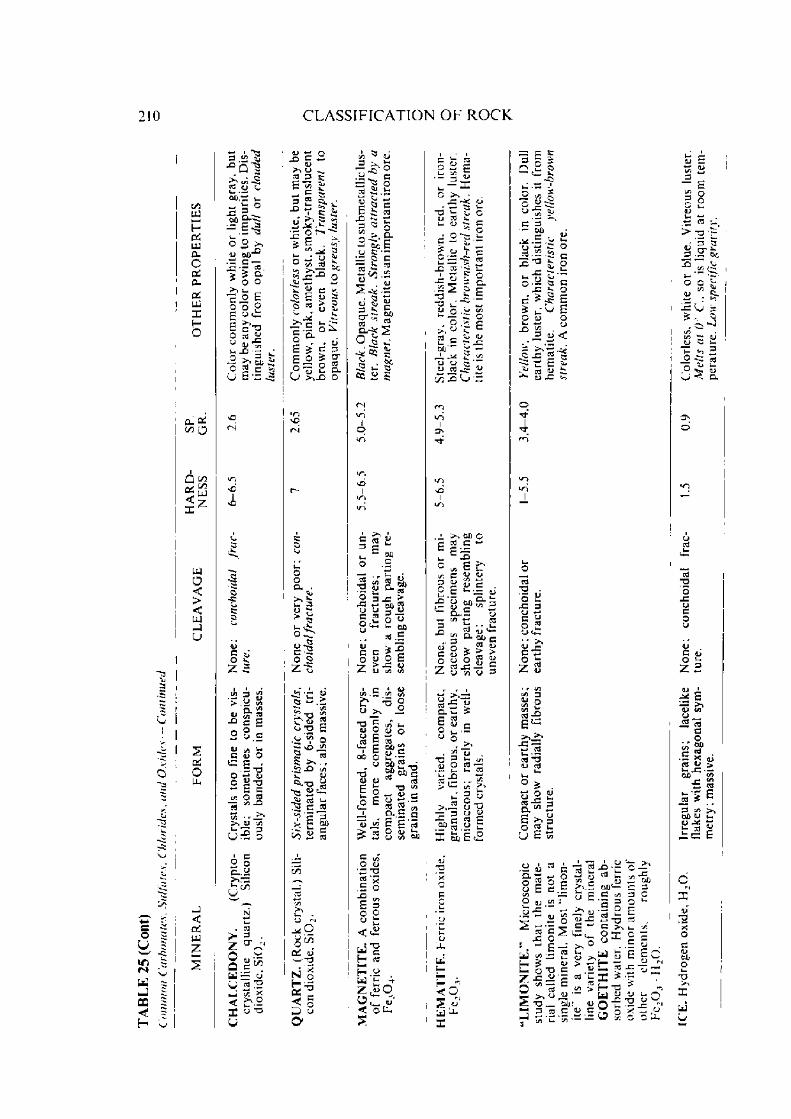
210 C L A S S I F I C A T I O N O F R O C K
c -° 2
U |IT, $
as<H
C/3UJH05 UJ a. C cd o-6 UJ X (- o
cLctc/> O
Q </)25£S< z
UJO<><UJ- iU
2
oUh
—<o'UJZ
3X
i• -
'._ CJ SJ
01).3 u.— 5 °
E - g
O 2 > •CJ 00*°
.3 3 —X ■- r3
^ c~o cI— _
3oo E o 2
E cj i
E & - oo — CJCJ OJ • Su- X • -o
o do 2 CU 3
nC
• is 1/5Q.Su
X c Eo 8 . S
CJ (A t3 CJ o•X
■ l- aoo*-* E cC/5 o g3 C/5 X
t /5 • • J ?>, O C A
2 o CL.y
C/5U
O Quj x0 2j /j ^ < £\21 u-o U
O ! c/5
o'T3
X) c1) > » CJ 3 3 E C/5 _ c -1 3
2 £ £ 3c ■■*.
S - W .-° i« a h§ -n ^ o t | 5 i
^ £ I^ p I—-=.5 c ^ o . »£ £ C 3 E o # J0 = 5 E S .U >,x o
oc - .
u- 3U> 3«- -ir o ^<u -2 c ° 8 z ~5
43 -r w a t/5£k ' i 2 ^ 3 E
'f o- v O «2 co £ cj
«TS4i 3 l- v c 3
S I §>£ a §
o ’ o' J — -a
s i s i —-a
j) 'j 3 ^ ^— Ox ^ 5 o3 > .-v 5 £ £ § i
1 ! I2 - ^ SU 5 - x c, 3— C: r3B On .J£It) CJ
ai S53 s». cI 55!
o | ?•^ 0 3 ^5 • ^
$ 5 i
CJ
t/5uh3D.
CJ01)3
3 X >CJ73,u.
OD 3 .
3_CJO CJ•— u- Olj3 .5
c c s* -p2 > J It . U (/) i/l
i r- 1 OJ</5 .3 c/5 c/5- ^ 8 ° —
•n C . T .oE „
01) g, coo o cj
*dcj CJ
a B13 jd £ B
CJ oCO 01) cjod 2 .S ' 00 ‘
*acjo •
S.g £ o c j
cj
5 </5O CJ •C 3J<3 * .E cc 1/5 £ 3o o
g lH.a . w t 1 z ,o q^ ■_ o'< O u .
2 £ E - i 4:
O >^ • .jr ><: o
9 iE ->x 5 ' s A o u2 S g
. -cT3•oCJ
r i l l o/j i ; —
_1 g CAo o ~ , w J2 —t/5 . c ^ —
, Dlj Ic *
xE
g i s s = u-X) O 0)«= K .S
2 1/5 St/3 Q ,
y O > c o° y 2 z 3-S
CJ CJ
c— CJc . i=
01) ccy qj
J2 cCJ =
1 1 ' C - u .
—CJ■s
E g 3R >-° o
t / CJ3 3 5 L. C/5
TD 3 j O 3■_ 3
33 E x i — t /5C/53
>u
f/53
> •I—CJ
C/5oCJ - a
E — 3 CJ CJX r- 33 01) ^ CJ zz
1—u01) — u— 01) E
UJI—
5 or
c 2 S• wlJ — -'
O ,y, *o'->■£'?
3 Olj C !-*!
x ^ >
5 Xc ^5 _C CJ u. —X ,y>
: >> 5 X
CJu.OcoucoEEoCJ
cj <
u
co JJ C:CJ s z >5
o" t•'t
COT3 .o U
SZ 3
« §
CJ
S-sE ^■573u- • —CO ~oCJ 73 u.u«° is .o o OS.* aEo -H hCJ E V5
. H u se - » ScE S E
« 2 - rn cj
c
2 <l> .S2 :“ 5 „^ 3 -5 :
X 0
U xt l -o
O «^ T3 _ — 3 - 3
>>._ 01)t— t3 E .E ^ 2 E- . • i l l CJ X 2 -a 3 .c w c >, ■_ x
^ O 8 * g I
g > £ $ ? ! 9 . - ■ S i S | “ =
> H “O ^■- iiJ CJ CJ - O. ^ S X -a ^CJ C ® o X — °. 3 x 0 S O O J .
CJ c
t/53 Xc cCJI- —
.3 1,3 '—.> "3« ’| - 5_3 Oc
■°o o ^
S ":§•x O => ^
C/5 CJCJ
>5 “
o .’- J ■
ONd
cOT3‘oXCJ3o
3OZ
CJ '7* ECJ 1/5*CJJ31o
3O
* s?.E x li >
“ - Is ' i E3 ^ aij cj u-
H i
o
acCJ
-a><o
OLO
UJO
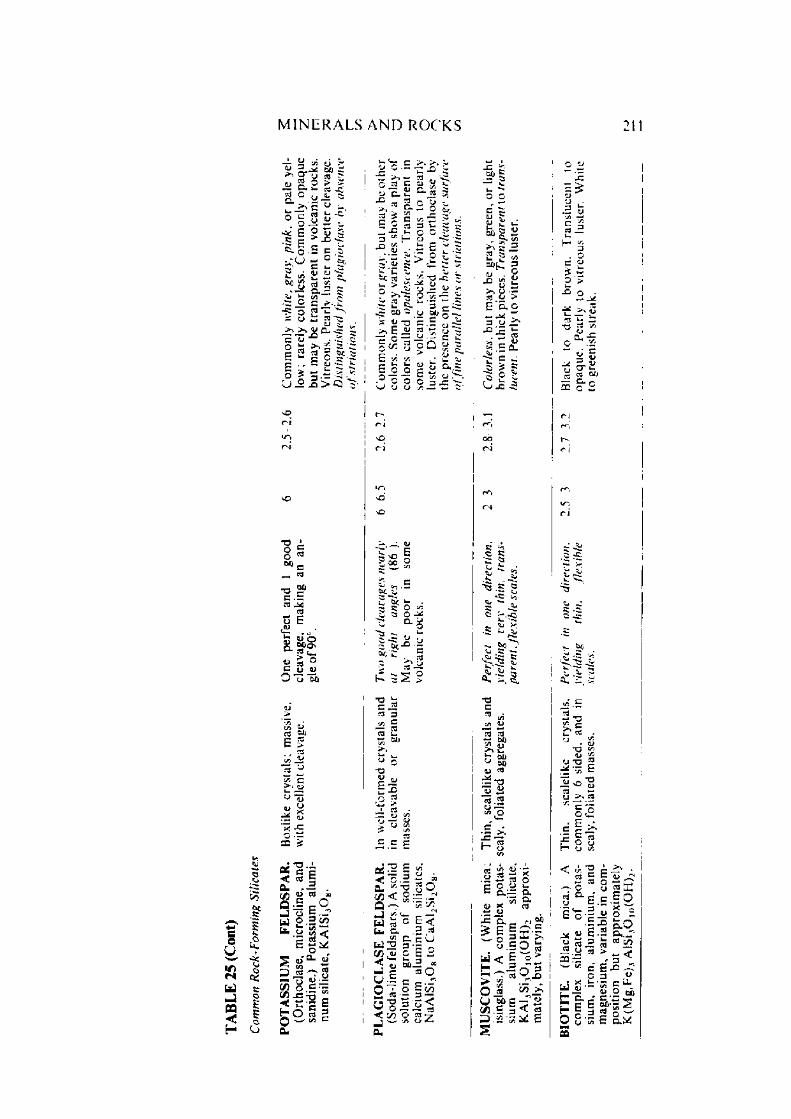
M I N E R A L S A N D ROC KS
OJ =5 >, CT
CO £
^ SiCo
Uir,nm-CO<H
£
©os
03o.S3 O °->* ° §
- i i
<u ><,^-s OXJ
u 01 r-o > £I I—w _ciu JL 5
' 5 CJ03 1— -c'o o
O>
ajX)c c— O 5j
tif, ^**— .2 -? o 2 o >>
coP£o U
u o >* 3 r5C/5 oc > -i- i -w a> £>, SC ' c c
i > 3
SO<n
1 .S03
* > W oO . ^r3 «—« £ ° C y UO U M
c§ W>
{/» c
u w . - u '* —
* c•< 03a . •c/3 «a Je•j oU £ a. o
—: <A- 3 JHc73 oC/3 J S
< C
a.
E_3cd oo
s S * .2 ^ wi <<
a. J,—v c5«.a .S-a - EC 3S c
u O . - — JO -o S’S 3S a a j s g£ s 2 o ng i f : | i a " £ 2 o o ? Q 3 1/5 f - « *2•°..S ~ § : .s ja\g 5 > £ S S£: 03 J5 T3 -c S > 2 u 2 « ».
«* *o ' e .5 ;• *1 = 8.2 g c - n f'l uC ■*> W‘ —£ o o g i a■® O o § g jiU o u w - «
&-§': £ &c 1 oo5 o- a 2
i-s.jj
£
S3 3 ■s. C — 03
^ O TD C ^I s~ O V)V 73 £
flj = | ss .< 0 . 3 — =a, * ■a
J t/5 _ —u A o c< U. O. .2 ,S _. *3 o. c u U 2 3 •- r
C w
— INa c/5
■—Dtl
=
r i £03
U .2 2 ^
CO E
3
2 ®3 _c
< CO O cc-J w t/J CJ
a .
eb « ^ , S- >>2 3
3ou
t £
E 0.03 ij ^*°.S 55u. ~ <V?. .E Cl1 i ? ^ o v!\J _D C
-S i3 c -Si— '<o .s:••:l S
* ^ .8.T3Ccfl tAri -5 oo ^ o >> t_ h oij° OJJflj cCa 2•o<ur3n -£
h- o
c oC O.; aj x
• --E a£ £w oo ,ui < H*■> w "Z. <s>O _2
.EJ.2
S ’S!8 oCJ u.-3 a v! o.03
E~.E3 X >*•SO S3 E ^ >- i o j 00
p — - 3 < 05a ^ E
o3 - _ OS “3 3L-H ^
a ij §-2 J2 2.?J I! c -
i_ 3T3 V)
C /i
v -a_ ^ s ■si E73 • o -o«jL» >%03y. c Oo !—
E »•CIE £
of— o c / i
<* t/3-a
d t E £ ■2
. 3 X)
^ z =y —— yCQ —
U <u ' — f c t p s i lw o (/>5
i f ^ o 2 1c .§ OX ^u o -
aO•s a . - !5
^ •1 1 -j iu■3 O o/)K I sE g.*
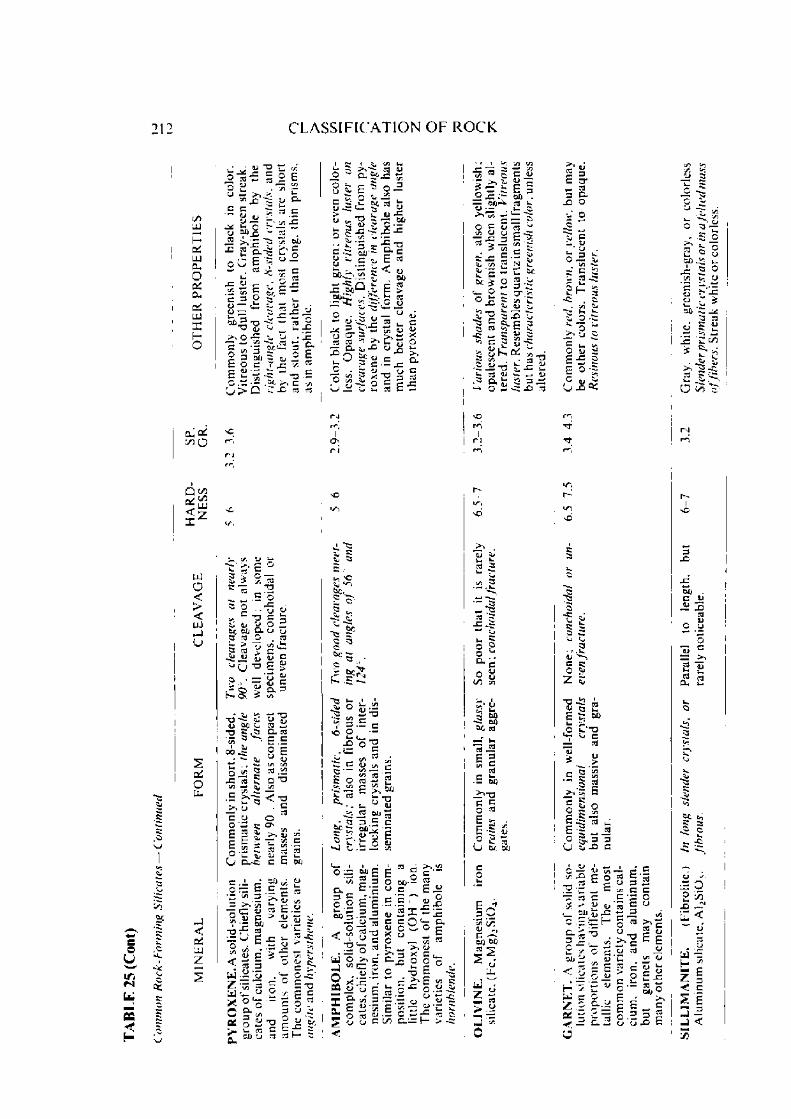
212 C L A S S I F I C A T I O N O F R O C K
ecU
f N
CQ
>3
5
£
(—oSUJ
C u
-
O
uuO<><—
o
-J<x
iJ J 4-* ”2o -c E■a U “O W
C/5
C/5 ■ —
Cj C.
■—— ■ V.—CJ D/j X re3 X0. z5u.
DO
O0 O E ~ 0
1—re 00 x 3
s z. £
OC/5 E & = •3
E 3 •_(U —1 ~ 3 O 00 ~~ XI—DO 3
T 3 ■0CJ - > ~ reu . X
> O X ^ O , P
POE
C/53
C/5
’ 3DXjC
~5o'-55 <u *!. —
3 CuE
E Ol. w - a .E
Q .3 . — > ■ - > p ’✓ 5
u >n C £>
C _ a:C/3 O
Q ooooUJ
;Z
. 5/5 ^Q 5 C —Z 2 Z ~C 13 ."5® I J | e^ cj o o ^ b o d o c x c j '_> a TZ O . 7 3
8 « 2 S *> U y II C73 s >
CJ b o•o
i l £ S & tt - 3
_>> CJc oO w ~C C3 ^p E £3 c/5 -° 'E U c — c
§ 1 h. re£ .53 £° c jC /5 C/5re £ C T3V 5
< -a . p
c j -r -
■g s . s« re reOJ r l - C P 0 0
= •- d 2 * £ o — C .= P re3 £■§ S "_ » ^ c/2 ■— <- f ,
— C O ” - -
8.52 S» — w •a-c rer U c £ u S .c . c — cj ■>* & g ' ■£ ts< re 3 ° £
UJ y G . ' — c .
g 2 s i : i -X 0 *5 - c o
§ ° a o - £“ d o 0 re ret—
. 2 c .
o c o p
g § £
5 S'S ° E"§- 2 3s ■?00OJ .—c j . 5
ofto ^
4 , i / i ure u &0 (— •—1 ~ J — C/5
5 o —6. 1/5
* o
~ «*E- "o ■-■g ^ X
•S o.^^ £ re~ *5 <u
00 rex £o . . -
_ C 2 . iUr e r e ^
7 : c . % ,
f O gf
t E
o
re- 7) U ^
x s Ec-S^r Ci-x -o 3 re o c
I «*
| |So a
I . i s
■l0 S €■? | . s csc o •-
0 ‘S
'— 10 rE
I s'ZZ Sij 3
o< T
V)O-T.
r e
P C/5C/5P
OC/5re
r e ’ rec/5
EC/5> > D/j
r e
u
I—O T D
QJDO re
5 3 3
DOO CJ E'— O CJ
■s>
LU O
o/j di IEE-.E _3
re
O'^ =2 o re d
-creE "
a i t x:- o c~o _
■o
t/,
C/5 __
<D e x' IE “O O Po. Ji 3E "-35O re W Cj o c
s ic •'“ ~
Ereii
X CE g o P I•*> E C/3
c ^ c/5 a. sJS'S
— t/3c o E 3DO -re ~-
S S " d"re ■> —
? C/5
~""C § • ^.2 2 £ c ~DC 3:•_ O
C/5
C S
; 5 ^; re •-
3cr.£C/5_0J ^x; t:E 2(U W ts, ~u ^^ re "O •S Ji -TD S -c 2i ^ re u •- —■ a>
>5 cq U t
K 2re ~
O sC/5 c/i
3 W)re
re — £ g ^ re
X‘T3c =O reE >-. . E | Si! re \J b/ OJj
c o3 vJ
C -—DO 01)I s -4J
reE3X5
— OJ
~ c jq L.
v f-" S
> , 8 S
E f 2P o •£• ,cCj x; ^
■trr,
C Co Z S
T3 •<L>
Ere i_ DXJ
CT3 c re^ > c V i — o re >•» D- E
| I jE c re ^ E -5 ^ j*u ^ 3 ?
C-^ <u vs -9 p o
■o ■■- - £re E§ o 3 ca C Cc •= o« ! ° o re
7i — '~— ,yi'- o ° = D Ij 22 „ 4>
< 1 1 1H '7 'E 0 U c o Z 0 o..aa p • - -=<f — c. w
re =I S2--Sa) re jy-C CA (U
^ fljp i £■§ o oil O p >» p £ - c c.E 3 gO O X P
SIL
LIM
AN
ITE
. (F
ibro
lite.
) hi
long
slend
er
crys
tals,
or
Para
llel
to le
ngth
, bu
t 6-
7 3.2
G
ray,
w
hite
, gr
eeni
sh-g
ray,
or
co
lorl
ess
Alu
min
um
silic
ate,
AL
SiO
s-
fibro
us.
rare
ly
notic
eabl
e.
Slen
der
prism
atic
crys
tals
or in
a felt
ed
mas
sof
fiber
s. S
treak
w
hite
or
colo
rles
s.
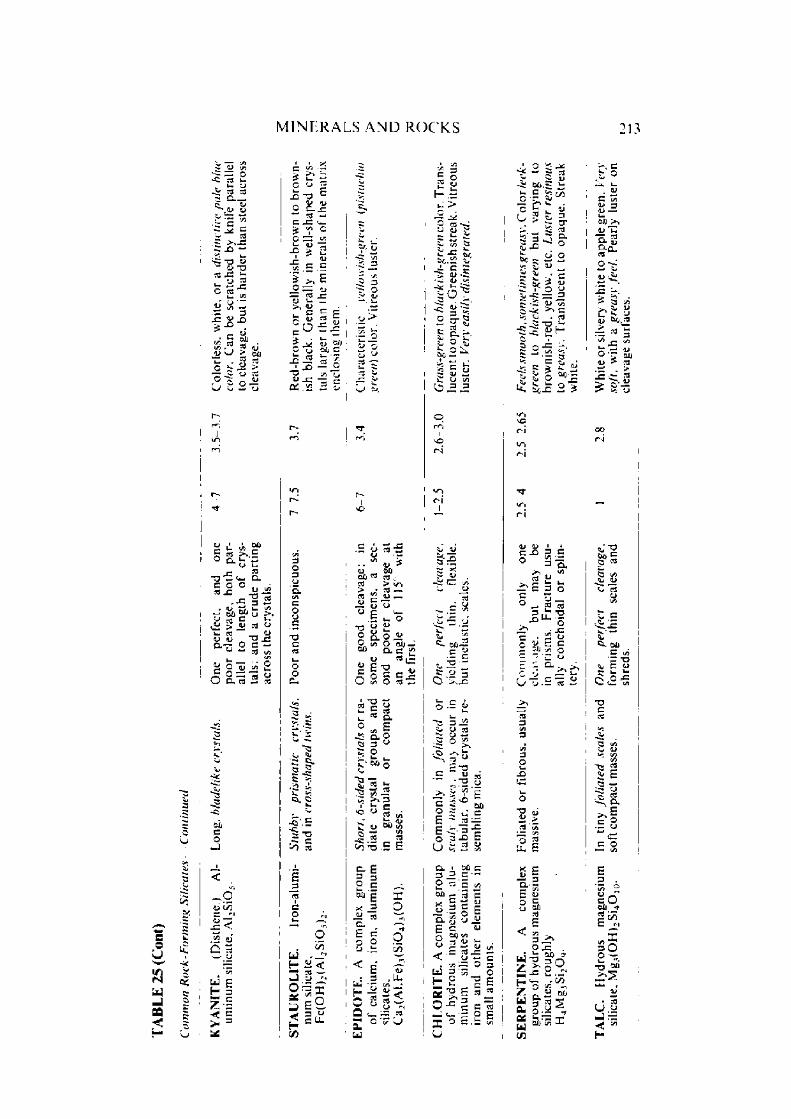
M I N E R A L S A N D ROC K S
soO• r -
U-Jao
2 JU GOlo ^
* *- uCO CO
a a . _S ' <u t2i 0
i - s. s : > > - C ^ x> —
y73
3f X>
B oJU sJ 1—
— 3u 8
0 0
1J 2O co
£ i ~ co > > . £o Q, u s^ U U.
■ o5«- a ^ 2 0 <u
o' 1 S ? &j « > o1— CO _ 1><U (U T3 x;0-7- O C —<
0 w co v>t- 1/1
£ o w « 2n * aO Cu CO «—» CO
00co_ J
<•/}/ “ \
aj 0- E <.2 o r > r * -— b
z | < c- 2 3
i C r.O O -i -o -O J L J *~ cO —C _ C=s ? cC — t/5
j3 § 5-s = 1
If “0 5r — c - Q 0 73 5
“ O -SM'•$■ ^ 00O cj 00 c■— —- L— * 71X5 — "3
0^.2 - t>
3oo
‘5.CAc
73C
oO
C L
2 •«: £ ^•2 ci)V. ^C5. ?
■§■0£> rt
c/5uH — <— CO■ J O r <o s fc
Z f 3 ^ « = □ -’S)
SC y . •2 ^
0 >
■s, u!
0 "q
0 0CO '—-■—73 >y
_ cU 5 c
00 «J CO
0 0 CO C
E u o7 3QO00
&OoO o/. a c
cO iz:e w§•5
COIx
-0c Oco
Uc CO c.0>5
3 <->O•—00 or
~?3 u.1/2 JO
3 >1 3
Vo•—0 C
CO—
'C 0 00cO
co -5 cw C/5
E . 5 00 gX j2 o **C . ’5 c2.1<
XO
o£
aT . L l.
C 3 3 ^ , 2 •_ — «r o 7 0 u
1 1uJ >
■ S^o co - » : 0 0 - ~ u . ^
C/2 >2^ •S *>oc .S£ ^ -!. c 5J•-; <n ^
t o ' ?
o S ’S 2 cr Sr~ ^ ^| S '?W ^ W
o>. 5 -'O ^ l-i5 5 3£. U v)
O = =
vOr-4
*S~)r-i
•;C ~ X
^ d ■✓3C_» _or:0ry)
■yj^ 00^
£ C> *5 ■ —w ——^ 0 —o > ._c
o.i= 2 ■2 5 J£5 /0 3t- o —*•2 o ^
5 -a
7 : >•• o ~ ~ s ofj 2 ~ »_' cc ' JO ^i t s l
U ? 2 i !
a . .o " ;_OJJ
00 c c • —
a .=
s io d1 < =. -yiU 3 H p~ -a
— o (/L» —••_= o c3
•° ICO
I 0U
C CO O £b v)
— 3 «o! S wso-S i:r - 2 ^
I f r *n 5 fc 3CT
OcK -5 <u>1• "O
£!
I 2 ^
^ <u= JC/iC
u .H
55 ^ d be--° t
(U o C - Co
3 Ct/2 • — = o.to u
i ' H a o° CO
U
o•a
3 ,V" "bX I u _ . _
0
(J l l50 n O"3 ■ cr 0
■J c ~O - - CO
E |8 &C3
£3 ^o j c .
w - S S oi ^ E ? -[_ «— - COZ n B 00 W 3 ^ 2£ o . s «5 00-5 3CM/ TA
LC.
Hyd
rous
m
agne
sium
In
tiny
folia
ted
scal
es
and
One
perf
ect
clea
vage
. 1
2.8
Whi
te
or sil
very
w
hite
to
appl
e gr
een.
Ver
y si
licat
e. M
g,(O
H)2
Si4O
10.
soft
com
pact
mas
ses.
fo
rmin
g thi
n sc
ales
an
d so
ft,
with
a.
grea
sy
feel
. Pe
arly
lu
ster
on
shre
ds.
clea
vage
su
rfac
es.

214 C L A S S I F I C A T I O N O F R O C K
c 5c-it:
IT, £
UJ j
5 §< 5 H C
ooUJptCLUClCO'CLO'LU
Ho
Q corvl CO
UJ
UJO<><UJ-1U
£DCoLU
-J<ocUJz
c ^ C 3be
* 11 3 -5 • S ©sj *~
« f
t / 5
.£ OC5 O.s: 3
"O — W r- x ,_,
-> CO S <D
5 *»*-X
o > 0 > w </j i-SI I^ D.
l
•u r - c v-/eO £
— <uS jSS .2c c «
> . ' < /5
« u 2|5 OJJ co > , co c/> ajco "o =3
U - 5 £
cOaEo
>* 3 e 2 o S E - E "SO h;u S
■p »^.SE O o c3 . - ° §CO to ro gi/)— u c 3 < X C O -tw p. i- m c*_ CJ^ ° <*
<u .. <U CO«*■£ S W S S -|H — c E7 & i_*_• u a .J g a ^0 = J | 5cCt w a*
s:§
O
£.0<u aj
7Z O CO <— . «J
c/5 ^ 3 — -* CJ CO— <u— I—2 SS «■> >
o
&5 X"5 xC/5Ls ^36>. W>i O
£ ^ 5 co CO o/jJH
&C =2 3 2 E
C/5
O B£E «0 vau. C/5UCJ cOCA O V)cO O C/5cO^ . st_° > ,
Eu
_C0CJ ~ 3
X C/5 33 O CO
u El_01)
coxCL
■oG
-OCO■j-J
<ZuJ<CJ
3 =:
>2O cnjo s:
o K ~
c
o
1 <E^o =: i:C/5 Qj «
2 §
•2 15 l
TfON
I O 'S ^
S.5 "u ci
.E^ II N1 a ©•— Qj
■| .SS f loj —
3 ^ 1- c to o co « CLc l i : po co .=:
1/5aiiiC, CJJ 00
Z CO c ■C ^ C3 S CO w JU
CJ Oft
*3**•■ b >» s: —
^ ^ co
l SX )^
Li *»>S Si -Si “So o s:r- *3
CL®
5 § .*0 *. ■5 a
5 &
3x> £cOO
, CJco o E . E g §n c 5/5
c E
•2 ^ 3g . 1 sO a w»4> CO XJc: 003 .Sc
CO
. 1 1 N «->
t/j CO. >> c U «NHjs ^
CO G OQ£
UJ :
< S 5 I S.SQuif)
*S• — c / i _ J
s § S>,0^5 • cOc 0 o• - _3
l i i o C — co
^ 2 5
S ^ .2 • c
l b ? O >-
o"|co u . J 2
C - X ) X)
asTt-
O >, -3j - — C w C <U
= 1 ! •o I ^u r V ___g U co
- 3 >3 U U X ^
g-g's 2 a £*5 3 5 U o fp 'J J3 3 C w ■O- CJ «.CO 2 trt
y W33 * C O -O CO c/5 <UZ E a E
oSC
coZ
A TJ E w8.2 ^t r </5 E2 -c
•s • - 00 2 3 0 -
"3 c/5 > C d > 0 0 ± E<2
oOJJ
O . O r)U- ^ . u ^ L lr j <UH Sa 3> 1/5 a.
Dx ^ oO
J* E
<
_ _ 0•5 C T3 5 s: — <u «— b c x Oq aj c/5 c/5^ y '3 ^. • u o u c r 3 - ?
_oo« u u*.*S5
•| •§ io1 2 2
to2 3-8>» (U CO crt CLX CO 1- 'u. 3 X
aa a ..-
tj-
I s
a CL CL O a> cj u _^ o>. 3 X 3
C3
COZ
« ^ co - a
1 * W r-c/i C"O
(U CO
CJ , u•0 T3 ' CL O o E a CLo
u I I
a0 .oU
00. (UUJ Ll
£ u .
o |W C/5
-3 C £ 2 U
•* c$ tO CO v D “ r
— 1/5 CL 0>. cg CO . 3
P M C5 ^ <O t_
• CO u$ 0 22 3Si) ^
l j CJ CJ -C -_35/5 ”c0s : s >*$s l2 ? -• gOO 00 o a x 2 ? cc/s Si o■■§■8 t o
j L c
r i
Xo
3W TDW^ UC r
u ? dCO CL «5 .x -O — TD _
cO 1) X 3 3 C X C■— O ^ ^>■“ £ § m >< cd —*V—. CJ *—'CO X ■“U >>u o J X X > T3'35 5 01/5 O > > 3 !S u CO-3
_LCL CLl- O 3
( _ ) t /5
3Ou I"HUUG o^ U 00J c ^
!Z

M I N E R A L S A N D R O C K S 215
c©UITinU-Jco
H
§•§:§uP "P <->O p —0 C flj*-* "O "O3 c cX S sb: ^ « >- u c- ii -3
o>.2? o- •> 3w ’O- ~ C- S O r - ; j o
i 5c c ^ w.
£ >
£ uj
Z
“52 14/ be s j 6^
T“ ^
CLD.Oo
Z °
C 3&C 5 T3•if -2 ~o • S fc'Sb s: JH> ■“- X r* 3 JH ~ ~
C £ £
c*~,
ON
•O
•S~)CN
c
Z1—> >o •—3-*C/3 >c C/3
‘ 5 •— 300 Tl
"Ou
l_oc2 'J
c7 3 to
° ^C/3 CQ
3<C<u
<d- jo
Hi—. <U3 Q M ,Ac
o «
1 * 2 sr.-* . • T3 o —. u ~ 73 ~ X15i'l-* 2^ 2 «>5 '2‘S
5 'c "c i- « 5
w s: "P 'ox; 3 3
<ucoZ
■g^ia cc
’csu-CJJ-
■stS 2
C/3 C/3P
= 3 .
01)<
c<au>_c/3
x£
.Si =? xSu
. ■ <*> -~c;
-2 O-c =2 ^ j . j j
= & $ °- =q 2
CO «-Z JH
i"S6.3
rs ^—
■§1r-c *-U o,0T a 13 c3 £ E
•3 £ 3CO u .
t«e2 C>> _£ Umu S ■- f ro >
■ X) , X
| B d .: > ,u i:
Jo E.
"O .(U -y)F3 r3 O i- t - 0 / j
O-ach*
uiH5LuH ;.35 oC/3 c
k- 1u ' “/ c3 u_-J . a o
XO •CJ
.2 — 3X 3 "OX
C/5■oi—
73—C o g•5 fli 3Oi— CX —X i-o o 3
'a. o_*: „ UJo o CJ,2 'X u.X 73 3O'_ <U C/3
j2 E 73rs X I—w 3 Ou t/3 C
u 42r3 T3£ '5-Co
§ nZ 2
XJ3
TDajTD '
S—
3 201) C/0 ^->
*oJ 2x *t,■go'£D w v •a
. ’>< u ob e
| ' i < j Z. s U
3
c<
S 3-a>- 73
0 3 c
_ o . —Tj- ClClr3
H O
73a.a.73OZ
-o
>%
csUJ
73u-3
E ~3 - Coo
£ _ Q
r- xj —vr 73 -*
IIIi '& z
216 C L A S S I F I C A T I O N O F R O C K
into kaolinites (single tetrahedral silica sheet and single octahedral alum ina sheet, a com bination repeating itself), m ontm orillonites (alum ina octahedral sheet between two silica tetrahedral sheets), and illites (similar to m ont- m orillonite except that it occurs as an aggregate o f smaller particles).
Kaolinites are subject to m inim al expansion on contact with w ater and have a larger angle o f internal friction than o ther clay m inerals. Sometimes the clay minerals occur in round and flattened tubes such as halloysite which when wet acts like a pile o f rollers and starts to flow.
M ontm orillonite sheets being loosely bound, w ater molecules enter in between these sheets causing swelling, lowering internal friction giving high plasticity and high cracking on drying. As a result heavy dam age may occur to structures placed on these either due to expansion and contraction o r due to creep and flow.
W hen mica occurs in some rocks, these have to be given proper attention since easy cleavage o f rocks containing this mineral m ay result to rapid deterioration after it is exposed to weathering (e.g. mica schist).
Certain hydrous silicates such as serpentine, chlorite, talc, illite require a tten tion. Serpentine may be com petent or soft and greasy having a low friction angle and even when com petent can rapidly deteriorate into soft incom petent material under atm ospheric action. Chlorites are not so hazardous as serpentine, but when present in jo in ts may greatly decrease the frictional values and cause instability. Talc is very soft and is a very poor foundation material.
Among the oxides quartz is the most durable and reliable constituent o f rocks and an increased percentage o f this is an indication o f greater stability o f the structure placed in it.
11.3. Geological Classification of Rocks
From an engineering view point krock ' m eans a com pact sem ihard to hard mass o f a variety o f m inerals, but the geological classification o f rocks is based upon their origin and rocks are divided into three m ajor groups: igneous, sedimentary and m etam orphic. Igneous rocks are formed by the solidification o f molten magma. Sedim entary rocks are derived from the weathering and denudation o f igneous or o ther old rocks which may be either left in place or transported and deposited somew here else and later consolidated and cemented together under depositional loads and percolating mineral waters. M etam orphic rocks are formed from pre-existing igneous and sedim entary rocks under the action o f heat and pressure. These two factors act individually o r together in com bination with time.

G E O L O G I C A L C L A S S IF IC A T IO N O F ROC KS 217
Igneous Rocks
Igneous rocks are classified either depending upon the silica content o r the m ineralogical com position o r the texture. On the basis o f the silica content igneous rocks are subdivided in to the following groups:A cid igneous-silica content > 66%Interm ediate igneous-silica content 52 66%Basic igneous-silica content 4 5 -5 2 %U ltrabasic igneous-silica con ten t < 45%
U sing mineralogical com position as a classifying m ethod, acid igneous rocks con tain quartz in excess o f 10% ; interm ediate igneous rocks contain less than 10%); in basic igneous rocks, quartz is either absent o r is present only as an accessory mineral and in ultrabasic rocks quartz is completely absent. The presence o f ferrom agnesian m inerals im parts colour to the igneous rocks and they tend to be darker as they pass from acid igneous to ultrabasic. Alkali feldspars (e.g. orthoclase, m icrocline and albite-rich plagioclase) are dom inant in the interm ediate igneous rocks while in basic rocks talc-alkali-feldspars (plagioclases) are the im portan t constituents.
Som e igneous rocks have a massive structure i.e. their m inerals are not a rranged in parallel o r distinct layers while others may show definite flow' structure. Depending upon the rate o f cooling, their texture may be glassy (rapid cooling e.g. outer surface o f lava flows), fine grained o r felsitic (rather rapid cooling but not so quickly to prevent crystallisation), granular (coarse grained crystals o f m ore o r less the sam e size) o r porphyritic (large crystals embedded in a fine grained ground mass. Table 26 gives the classification o f igneous rocks depending upon the com position and environm ents effecting texture. Table 27 gives the minerals associated w ith com m on igneous rocks.
D uring volcanic activity, w ith the ejection o f lava, some air bubbles may be trapped giving vesicular texture and which may later be even filled with some o th er minerals. Volcanic ashes and tuffs so ejected m ay get solidified giving volcanic breccia embedded in a m atrix o f rapidly cooled lava giving pyroclastic texture.
Igneous rocks on solidification develop tensile jo in ts as their mechanical constrain ts change depending upon their depth and existing stress field.
Sedimentary Rocks
There are four groups o f sedim entary rocks, namely 1. Breccias and mechanical sedim ents not limestones 2. Lim estones 3. O rganic remains and 4. Evaporites. M any times sedim entary rocks are grouped depending upon the sedim entation environm ents such as:

218 C L A S S I F I C A T I O N O F R O C K
TABLE 26
C lassification of igneous rocks
( a f te r G i i .i .l’l v . W a ter s & W o o d f o r d . 1959)
I * red om i n a n t Mi n e ra 1 s
Textures Feldspar and Feldspar Q uartz Predom inates
(no quartz)
Ferro- magnesian Minerals and Feldspar (no quartz)
F erro - m agnesian M inera ls (no q u a r tz o r feldspar)
Pyroclastic Volcanic tu ff (fragments up to 4 mm. in d iam eter) Volcanic Breccia (fragments m ore than 4 mm . in diameter)
R ocks o f th e textu re an d c o m
posit ion re p re sented by this part o f the table a re ra re or u n know n.
Glassy Obsidian (if massive glass) Pumice (if a glass froth)
Basalt G lass
A phanitic(generallyporphyrit ic-aphanitic)
R hyoliteand Andesite Dacite
Basalt
G ra n ular G ranite Dioritepotassium feldspar predominates) and G ranodiorite (plagioclase feldspar predominates)
G abbro P erido tite (with bo th olivine and pyroxene)
D oleriteor P y roxen ite D iabase (with (if fine gra ined) (pyroxene only)
S erpen tine (with altered olivine an d pyroxene)
D E C R E A S IN G SIL IC A C O N T E N T — >
(a) Continental environments’, i.e. essentially land areas, such as:(i) Fluviatile-deposits laid down by rivers;(ii) Lacustrine-deposits o f fresh-water lakes;(iii) Salt lake-deposits formed by the shrinking and evaporation o f salt-w ater
lakes;(iv) G lacial-m orainic debris, i.e. m aterial deposited by glaciers
andFluvio-glacial deposits which are formed o f m aterial w ashed out o f glaciers, and although originating as a result o f ice action are later transported and deposited by w ater;
(v) A eolian-deposits transported and deposited by wind
(b) Intermediate environments, such as:(i) D eltaic-deposits formed in deltas;
INC
RE
ASI
NG
G
RA
IN
SIZ
E

G E O L O G I C A L C L A S S I F I C A T I O N O F R O C K S
T A B L E 27
M inerals associated with igneous rocks
(after D unc a n . 1969)
Granite the essentia l m inera ls a re q u a r tz an d feldspar. C o m m o n ly , m ica is p resent
e i th e r as m u sco v ite o r biotite. H o rn b le n d e and tou rm aline m ay be present.
T h e sam e m in era lo g ica l co m p o s i t io n applies to the o ther acid, a lka l i- fe ld spar d o m inan t rocks, nam ely : Q uartz porphyry , microgranite, rhyolite, obsid ian and pitchstone.
G ranodiorite the essential m inera ls are q u a r tz and plagioclase feldspar. O r th o c la se fe ldspar, h o rn b le n d e an d biotite, a re co m m o n .T h e sam e m in era lo g ica l co m p o s i t io n applies to the o th e r acid, calc-alkali fe lspar d o m in an t rocks nam ely : M icrogranod iorite and dacite.
S ye n ite the ch ie f co n s t i tu en t is o r th o c lase feldspar, usually fo rm ing well o v er h a lf o f th e rock. P lag ioclase p resent in sm aller am o u n t . H ornb lende , biotite a n d so m et im es augite m ay be present.
T h e sam e c o m p o s i t io n applies to the o th e r in term ediate , a lkali-feldspar d o m in a n t rocks, nam ely: M icrosyenite and trachyte.
D iorite the essen tia l m inera ls a re p lagioclase fe ldspar and hornblende . S o m e biotite, o r th o c la se fe ldspa r a n d q u a r tz a re present frequently.
T h e sam e c o m p o s i t io n applies to the o th e r in term ediate , ca lc-a lka li-fe ldspar d o m in an t rocks, n am ely : M ic ro d io r i te an d andcsite.
Gabbro essen tia l m inera ls are p lagioclase feldspar and augite. H o rn b le n d e an d o livine m ay be presen t. A lkali g ab b ro s m ay co n ta in o r thoclase feldspar.
The same com posit ion applies to the o ther basic rocks, namely: Do/critc and basalt.
D unite o liv ine is the m ain consti tuen t.
P erido tite o liv ine is the m a in const i tuen t , possibly with augite, h o rn b le n d e an d biotite.
P ivrite c o n ta in s so m e fe ldspar w ith olivine, augite and hornblende .
(ii) E stuarine-deposits form ed in estuaries o f rivers;(iii) Shore deposits-form ed along coast lines
(c) M arine environm ents : i. e. essentially deep w ater a reas :(i) C on tinen ta l shelf-deposits;(ii) Shallow w ater-deposits o f the C ontinental shelf;(iii) Deep w ater-deposits form ed in depths o f water less than 6,000 ft
(1830m );(iv) A byssal-deposits form ed in depths o f w ater greater than 6,000 ft
(1830 m).
Because o f the very m ode o f their form ation the shape and size o f grains o f m echanically form ed sedim ents depend upon the original shape o f the m aterial supplied by the o lder rocks (e.g. quartz-angular, feldspars-bounded by cleavage
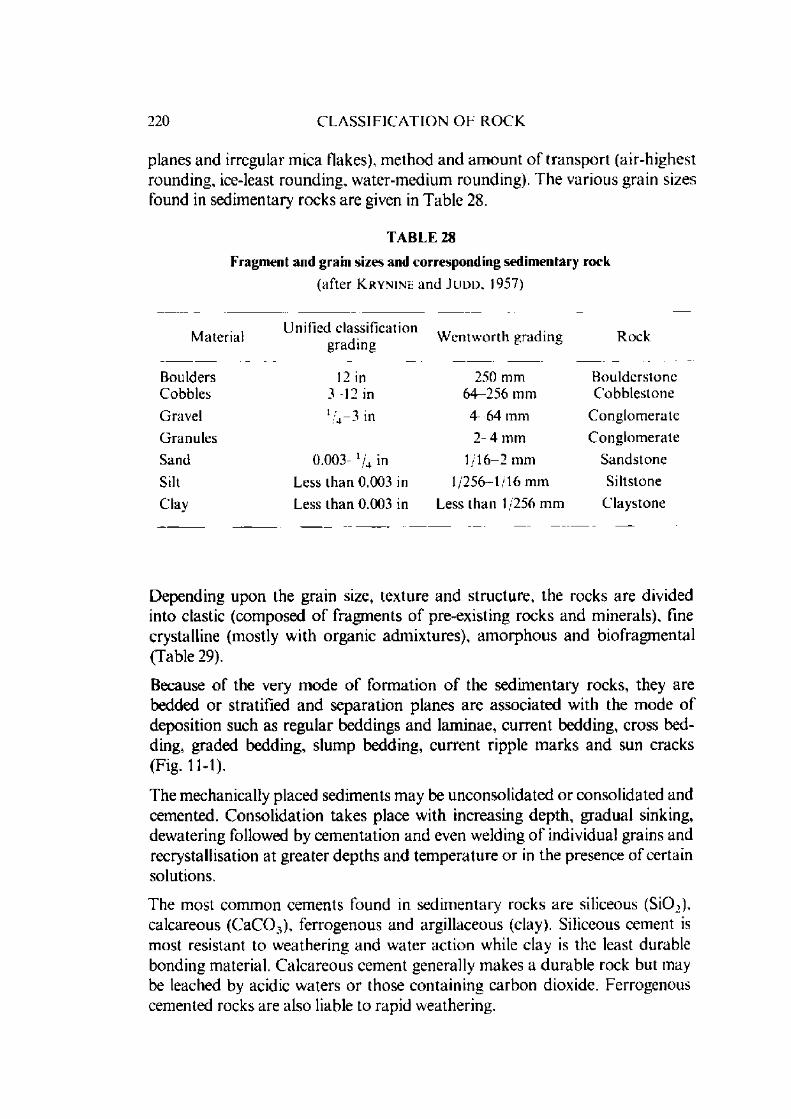
220 C L A S S I F I C A T I O N O F R O C K
planes and irregular m ica flakes), m ethod and am ount o f transport (air-highest rounding, ice-least rounding, water-m edium rounding). The various grain sizes found in sedim entary rocks are given in Table 28.
T A B L E 28
Fragm ent and grain sizes and corresponding sedim entary rock
(after K r y n i n e an d J u d d , 1957)
M aterialU nified classification
g rad ing W en tw o rth g rad ing Rock
Boulders 12 in 250 mm B oulders toneCobbles 3 -1 2 in 64-256 m m C o b b les to n e
G ravel 1/4.—3 in 4 64 m m C o n g lo m e ra te
G ranu les 2 4 m m C o n g lo m e ra te
Sand 0.003- V4 in 1 /16 - 2 m m S an d s to n e
Silt Less than 0.003 in 1/256-1 /16 m m Siltstone
Clay Less th an 0.003 in Less than 1/256 m m C'laystone
Depending upon the grain size, texture and structure, the rocks are divided into clastic (composed o f fragm ents o f pre-existing rocks and minerals), fine crystalline (mostly with organic adm ixtures), am orphous and biofragm ental (Table 29).
Because o f the very m ode o f form ation o f the sedim entary rocks, they are bedded o r stratified and separation planes are associated with the m ode o f deposition such as regular beddings and lam inae, current bedding, cross bedding, graded bedding, slum p bedding, current ripple m arks and sun cracks (Fig. 11-1).
The mechanically placed sediments m ay be unconsolidated or consolidated and cemented. C onsolidation takes place with increasing depth, gradual sinking, dewatering followed by cem entation and even welding o f individual grains and recrystallisation at greater depths and tem perature or in the presence o f certain solutions.
The m ost common cem ents found in sedim entary rocks are siliceous (S i0 2), calcareous (C a C 0 3), ferrogenous and argillaceous (clay). Siliceous cement is most resistant to w eathering and w ater action while clay is the least durable bonding material. Calcareous cement generally makes a durable rock but may be leached by acidic w aters o r those containing carbon dioxide. Ferrogenous cemented rocks are also liable to rapid weathering.

G E O L O G I C A L C L A S S I F I C A T I O N O F R O C K S 221
TA B LE 29
C lassification of sedim entary rocks
(a f te r G il l u l y , W aters & W o o d f o r d , 1959)
Clastic Sedimentary Rocks
Consolidated C h ie f Mineral Original D iam eter o fRock o r Rock U nconsolidated Fragm ents
C o m p o n en ts Debris
Conglomerate Q u artz , and rock Gravel (roundedfragm ents pebbles) M ore than 2 mm.
Breccia Rock fragments R ubble (angularfragments)
Sandstone Sand 2 to ,l6 mm.Q uartz Sandstone Q uartz Quartz-rich sandArkose Q u a r tz and feldspar Feldspar-rich sandG raywacke Q u artz , feldspar. “ Dirty sand ,” with
clay, rock frag clay and rockments, volcanic fragmentsdebris
Shale Clay minerals, M ud. clay and silt Less than ,!h mm.quar tz
Clastic Limestone Calc it e Broken and rounded Variableshells and calcitegrains
O rganic and Chemical Sedimentary Rocks
Consolidated C hie f Mineral Original N ature Chemical C o m p o Rock o r Rock o f Material sition o f d o m in an t
C o m p o n en ts Material
Limestone Calcite Shells; chemical and C aC O ,organic precipitates
Dolomite D olom ite Limestone, o r un C a M g (C 0 3)2consolidatedcalcareous ooze.altered by solutions
P eat and Coal O rgan ic materials Plant fragments C, plus com poundso f C, H, O
Chert O pal, chalcedony Siliceous shells and SiO, and S iO ,n H -,0chemicalprecipitates
Evaporites, or Salt Halite, gypsum. Evaporation Varied, chieflyDeposits anhydrite residues from the N aCl and
ocean or saline lakes C a S 0 42 H 20
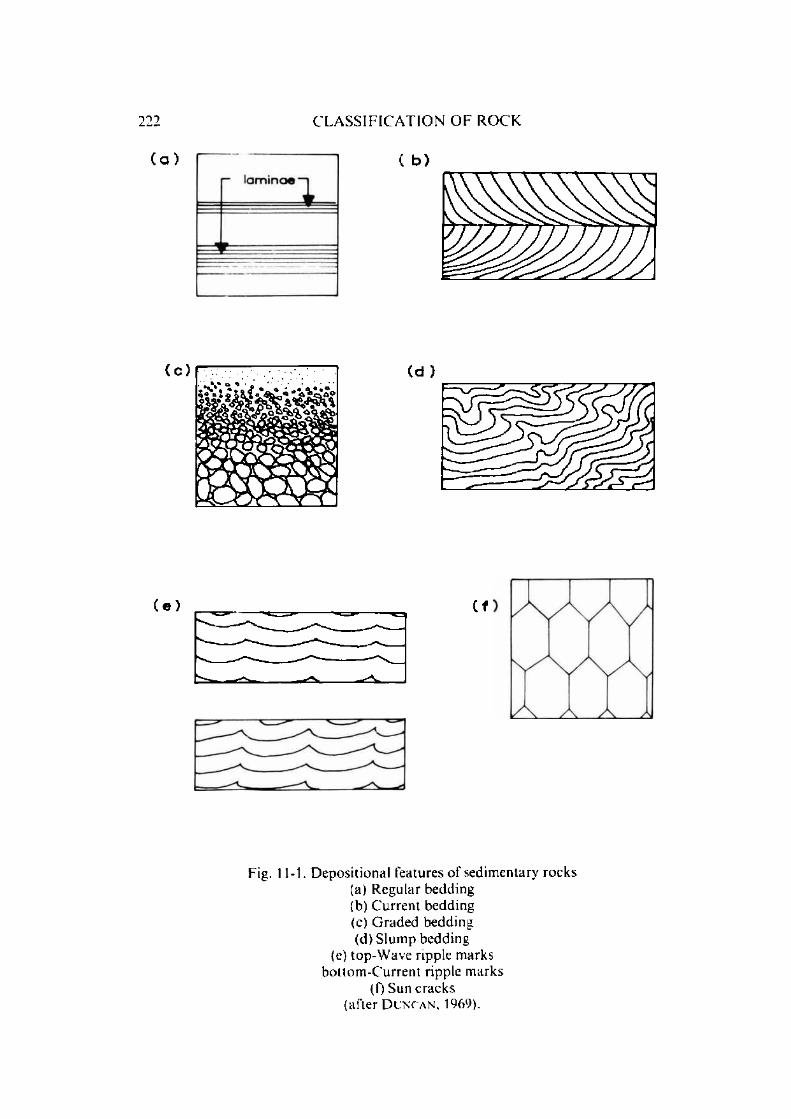
C L A S S I F I C A T I O N O F R O C K
( a ) ( b )
( d )
( e ) ( f
Fig. 11-1. Depositional features o f sedimentary rocks(a) Regular bedding(b) C urren t bedding(c) G rad ed bedding(d) S lum p bedding
(e) top-W ave ripple marks bo ttom -C urren t ripple marks
(0 Sun cracks (after D u n c a n . 1969).

G E O L O G I C A L C L A S S IF IC A T IO N O F R O C K S 223
Sedim entary rocks m ay at a later stage be subjected to tectonic stresses resulting in folding and faulting with m ore than one set o f jo in ts introduced in them .
F rom the engineering point o f view, quartzite, siliceous and calcareous sandstones, arkose, and graywacke are com petent rocks. Conglom erates, unless well cemented, m ay w eather severely when exposed. Shales, claystones, m udstones and siltstones arc o f m ost concern to a rock mechanics engineer. Their strength and durability vary within wide limits. Sitlstones in general disintegrate very quickly on contact with w ater while shales m ay be quite hard and durable. All these when subjected to alternate dry and wet cycles revert to original clays.
Limestones and dolom ites are in general com petent m aterials for structures except when they contain clays. C avernous limestones occurring under a reservoir o r a dam m ay cause excessive leakage. Lim estone is liable to decompose under heat and is not suitable as an aggregate in a ir strips for je t planes. C halk is a weak variety o f limestone and is not suitable for heavy structures. This is also true o f marl.
C halk with saturation m oisture o f about 20% often does not exhibit swelling on absorbing water. N on-calcareous rocks containing m oisture behave as com petent, but rocks containing argillaceous m aterials tend to be incom petent and require proper attention.
A lm ost all sedim entary rocks have a preferred fabric orientation and hence their properties are direction sensitive.
M etamorphic Rocks
There are two groups o f m etam orphic rocks: 1. C ontact m etam orphic, produced by local heating o f country rock adjacent to igneous intrusions. 2. Regionally m etam orphic rocks extending to over great distances and m etam orphosed under the action o f pressure and tem perature. M etam orphic rocks are classified mostly on the basis o f their m ineralogy and texture. Table 30 gives the principal m etam orphic rocks.
The texture produced in these rocks is the result o f heat and pressure acting simultaneously. Hornfelsic texture is produced due to heat in the vicinity of igneous rocks and alters shales into hornfels. U nder the influence o f directed stresses, rocks develop slaty cleavage. Cleavage is also associated with changes in rock fabric and strong folding. U nder the influence o f both heat and pressure, the fluids in pores may m igrate and crystallise on the fracture surfaces with their long axes aligned parallel to the cleavage giving a silky appearance or phyllite texture. Extensive folding and continued directed
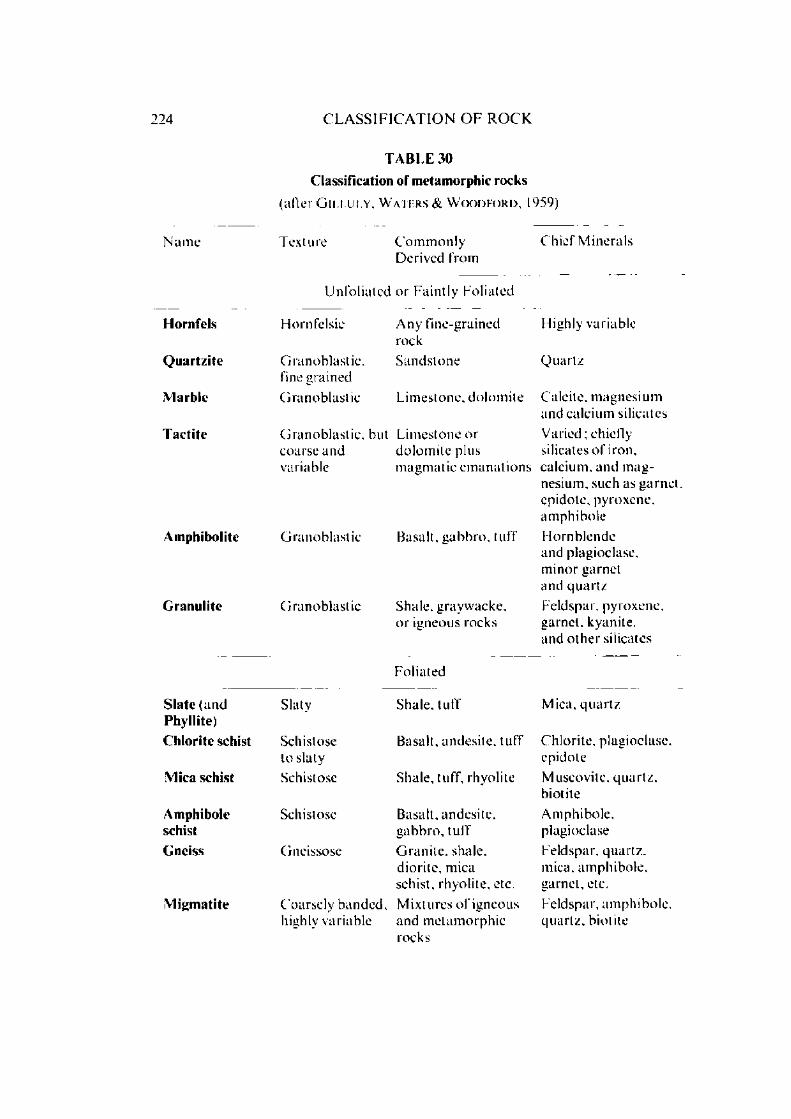
224 C L A S S I F I C A T I O N O F R O C K
T A B L E 30 Classification of m etam orphie rocks
(a f te r G n i .u l y . W a t e r s & W o o d f o r d , 1959)
N am e Texture C om m only Derived from
Chief M inerals
Unfoliated or Faintly Foliated
H ornfels Hornfelsie Any fine-grained rock
I lighly variable
Q u a rtz ite G ran oblast ic. fine grained
Sandstone Q uartz
M arble G ra noblast ic Limestone, do lom ite Calcite, m agnesium and calcium silicates
T ac tite G ranoblastic , but coarse and variable
Limestone or do lom ite plus m agm atic em anations
V aried ; chiefly silicates o f iron, calcium, and m ag nesium, such as garnet, epidote, pyroxene, am phibole
Am phibolite G ranoblastic Basalt, gabbro , tu ff I lorn blende and plagioclase, m inor garnet and quartz
G ranulite G ranoblastic Shale, graywacke, o r igneous rocks
Feldspar, pyroxene, garnet, kyanite. and o ther silicatcs
Foliated
S la te (and Slaty Shale, tuff Mica, quartzPhyllite)C hlorite schist Schistose Basalt, andesite. tu ff Chlorite, plagioclase.
to slaty epidoteM ica schist Schistose Shale, tuff, rhyolite Muscovite, quartz .
biotiteAmphibole Schistose Basalt, andesite. Amphibole,schist gabbro , tu ff plagioclaseGneiss Gneissose G ran ite , shale. Feldspar, quartz .
diorite, mica mica, am phibole.schist, rhyolite, etc. garnet, etc.
M igm atite Coarsely banded. M ixtures o f igneous Feldspar, am phibole.highly variable and m etam orphic quartz , biotite
rocks

D E F E C T S IN R O C K S
stresses as in m ountain building regions m ay further convert the texture into schistose and gneissose. Recrystallisation occurring under hydrosta tic pressures and heat gives rise to granulites (granulite, quartzite and m arble).
11.4. Defects in RocksAll features, starting from ultra m icroscopic to m acroscopic, tha t influence the strength and deform ation properties o f the rocks can be called defects. The influence o f these defects is to decrease the load carrying capacity o f rocks and cause concentration o f stresses in certain directions around an excavation.
D efects in rocks can be grouped into the following categories: 1. F abric defects and 2. Structural defects.
11.4.1. Fabr ic Defects
The com ponent parts o f a m aterial m ay be arranged in som e irregular o r regular order relative to each o ther which defines what is know n as rock fabric.
F abric therefore refers to the spacial data about the grains constitu ting the rock m ass, their orientation, m utual relationship to each o th er o r packing. The m easure o f the fabric is therefore the orientation o f the grain (inclination o f a fixed direction, axis o r plane within the grain) to a fixed d irection outside it. T he c-axis o f quartz grains is a typical example o f the use o f the crystallo- graphic plane with the geographic N orth as the exterior reference axis. A nother way o f describing the orien tation o f the grains is to refer ap p aren t long axes o f the grains with reference to the bedding planes o r the geographic N orth . Obviously, therefore, there are two ways o f analysing the o rien ta tion fabric, the crystallographic o r petrographic fabric referring to internal crystallographic structure and the other relating to the m orphology o f the grain. As such 4 d ifferent types o f fabric structure m ay be recognised (Fig. 11-2).
Preferred m orphological orien tation o f grains in a rock is the result o f several factors such as their m ode o f origin and initial shape (arrangem ent o f pebbles and cobbles in a stream deposit, J o h a n sso n , 1965) and their stra in history. This is a result o f the kinem atic processes which the rock has undergone. The crystallographic fabric is the result o f the stress field at the time o f crystallisation o r recrystallisation o f the m ineral grains and develops under sustained conditions o f stress and tem perature o r both. In general the fabric developm ent o f one kind is coupled w ith the fading o f the other fabric but the traces o f this may be retained indicating thereby whole deform ation history o f the rock recorded in its “ inherited fabric" (T u r n e r and W eiss, 1963).
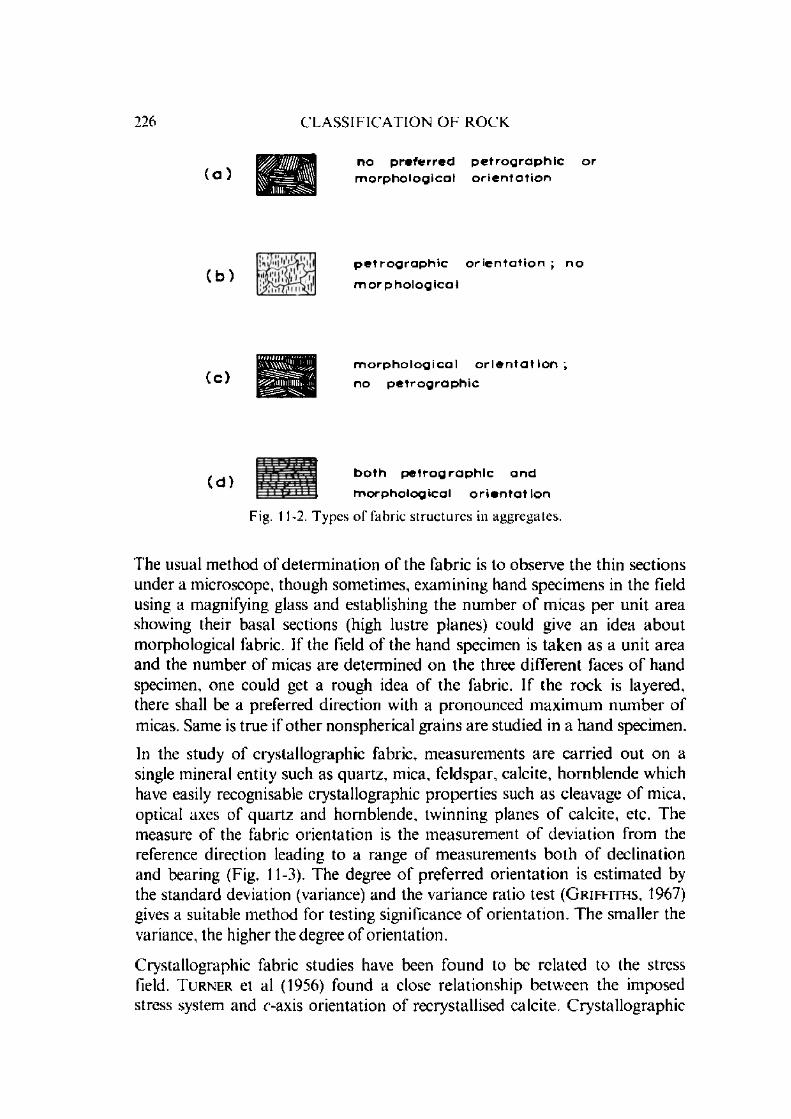
226 C L A S S I F I C A T I O N O F R O C K
n o p r e f e r r e d p e t r o g r a p h i c o r m o r p h o l o g i c a l o r i e n t a t i o n
p e t r o g r a p h i c o r i e n t a t i o n ; n o
m o r p h o l o g i c a I
m o r p h o l o g i c a l o r i e n t a t i o n ;
n o p e t r o g r a p h i c
b o t h p e t r o g r a p h i c a n d
m o r p h o l o g i c a l o r i e n t a t i o n
Fig. 11-2. Types o f fabric s tructures in aggregates.
The usual m ethod o f determ ination o f the fabric is to observe the thin sections under a m icroscope, though sometimes, exam ining hand specim ens in the field using a magnifying glass and establishing the num ber o f m icas per unit area showing their basal sections (high lustre planes) could give an idea abou t m orphological fabric. If the field o f the hand specimen is taken as a unit area and the num ber o f micas are determ ined on the three d ifferent faces o f hand specimen, one could get a rough idea o f the fabric. If the rock is layered, there shall be a preferred direction with a pronounced m axim um num ber o f micas. Same is true if o ther nonsphcrical grains are studied in a hand specimen.
In the study o f crystallographic fabric, m easurem ents are carried ou t on a single m ineral entity such as quartz , mica, feldspar, calcite, hornb lende which have easily recognisable crystallographic properties such as cleavage o f mica, optical axes o f quartz and hornblende, tw inning planes o f calcite, etc. The m easure o f the fabric orientation is the m easurem ent o f deviation from the reference direction leading to a range o f m easurem ents bo th o f declination and bearing (Fig. 11-3). The degree o f preferred orien tation is estim ated by the standard deviation (variance) and the variance ratio test ( G r i f f i t h s , 1967) gives a suitable m ethod for testing significance o f o rien tation . T he sm aller the variance, the higher the degree o f orientation.
Crystallographic fabric studies have been found to be related to the stress field. T u r n e r et al (1956) found a close relationship betw een the imposed stress system and e-axis orientation o f recrystallised calcite. C rystallographic
( a ) AM
( b )
( c )
( d )

D E F E C T S IN R O C K S 227
re fe ren ce d irec t ion
O d e g re e s 1 80°
( a )
- 9 0 ° O + 9 0 °
( c )
f re q u e n c y by number
O d e g re e s 180° - 9 0 ° O + 9 0 °
( b ) ( d )Fig. 11-3. Unim odality produced by ro tation o f reference directions
(a) O rien ta tion o f long ‘a ’ axes; reference direction bedding (b) U-shaped frequency distribution from (a)
(c) O rien ta t io n o f l o n g ‘a ’ axes measured as deviations from bedding; reference direction rotated 90
(d) U nim odal frequency distribution from (c)(a f te r G r iffith s , 1967).
fabric tha t develops in an anisotropic m ineral is dependent upon the stress field in such a way th a t the potential energy o f the external forces and the potential energy o f the system are minimised. The potential energy o f an an isotropic m ineral in an anisotropic field is a function o f the orientation o f the m ineral relative to the stress field and will be m inim um for certain orientations which this m ineral will tend to take. Applying M a c D o n a l d ' s (1957) therm odynam ic predictions, B r a c e (1960) showed that the (1OT1 ] plane for calcite, [10T2] plane for high quartz, and the [0221] plane for low quartz shall be oriented such tha t in a single com ponent o f stress these shall be perpendicular to the stress. In a triaxial nonhom ogeneous stress field the orientation is dependent bo th on the stress difference and the confining pressure which indicates tha t theoretically similar fabric orientations are possible in rocks with same stress difference but different confining pressures. The equilibrium orien ta tion o f ice in different stress fields is given in Fig. 11-4. W ork o f G r i g g s , T u r n e r and H e a r d (1960) showed that in the recrystallisation o f calcite m arble, grains have a strong preferred orientation parallel to the m aximum

228 C L A S S I F I C A T I O N O F R O C K
Fig.
11-
4. P
refe
rred
or
ient
atio
n of
ice
in a
gene
ral
stres
s fi
eld.
H
eavy
ci
rcle
s sh
ow
uppe
r he
mis
pher
e pr
ojec
tions
of
c-a
xes
(afte
r B
ra
ce
, 19
60).

D E F E C T S IN R O C K S 229
principal stress. This is also in accordance w ith the theoretical in terpre ta tions o f K a m b (1959). In uniaxial com pression tests, the c-axis o f calcite is found to be perpendicular to the stress axis and in triaxial extension (w ith cylinders elongated in the direction o f their axes and com pressed radially) c-axis o f the recrystallised grains is perpendicular to the axis o f the cylinder and in the plane o f greatest com pression.
In practice, however, there has been little success in predicting stress from fabric studies. In som e cases it has been possible to correlate the extrem e stress h istory (only the last cycle) to the fabric orientation utilising the c-axis o f quartz ( P r i c e , 1975), but the full objectives have not been realised. It has been often found tha t the orien tation diagram s o f different m inerals in the sam e slide have different symmetries, fo r instance, mica planes are m ore o r less parallel to m ain slip planes (.v-plane) o f schistosity showing m onoclinic sym m etry bu t the quartz grains shapes are inclined to this plane. The explanation very often put forw ard is tha t quartz is very m obile and tha t this different sym m etry o f q u a rtz is due to later orientation o f quartz . Sim ilarly, in m icrofolds, it has been found that several kinds o f deform ations m ay have occurred in the sam e structure . The preferred orien tation o f m inerals can assume the two basic p a tte rn s; m axim a o r girdles. There m ay be m ore than one m axim um in a section but m ore than one girdle is quite com m on. There m ay be maxima enclosed in a girdle pattern (Fig. 11-5).
Some orientation p a tte rn s in term s o f tectonic o r growth s tructu re are given in Fig. 11-6 (D e S i t t e r , 1964). The various features in Fig. 11-6 are explained be low :
I. A concentration o f poles in one m axim wn(m).(a) Presence o f a single set o f .s planes, the pole o f which coincides w ith /;/,
com m only shown by (001) o f mica either because o f grow th in a plane o f least resistance o r for mechanical reasons; com m on for (001) in mica and (0112) o f calcite (1 A).
(b) Presence o f a single set o f .v planes within w hich m coincides w ith d irection o f slip. Very com m on in quartz (0001) (IB).
(c) Presence o f a kb ' axis whose pole coincides w ith /?/, e ither for m echanical reasons or because o f fabric grow th o f prism atic crystals in th a t d irection ; (001) in hornblende, for instance (IC).
II. An arcuate girdle o f concentration in a great circle. The m easured opticaldirections tend to fall within a plane surface.(a) The same case as in I A , but the single set o f .s planes has been folded;
the fold axis is then the axis o f the girdle (001) in m ica and chlorite ,(0112) in calcite, (0001) in quartz (11 A).

230 C L A S S I F I C A T I O N O F R O C K
q u a r tz
Fig. 11-5. Different patterns o f preferred orienta tion (A) Biotite axes m axim um vertical to schistosity plane
G a rn e t schist from S. Valpurga d ’U ltimo (B) Q u a r tz c-axes m axim um parallel to ‘a* axis in granite mylonite. Odenwald
(C) Girdle o f quar tz c-axes in *ac' plane. Quartzite from the eastern Alps (D ) G ird le in ‘ac' plane o f muscovite cleavage. Mica schist from Schim bom
(E) Two small girdles o f quar tz optical axes. G ranu lite from Saxony (F) T w o crossing girdles o f quartz optical axes. G ranu lite from Finland
(after N i g g l i . 1948).
m6-8
(b) Intersection o f several sets o f s planes in a line coinciding with the axis o f the girdle (/? axis); (001) in mica and chlorite, (01T2) in calcite. (0001) in quartz (IIB).
(c) T he same case as in IA o r IB, but the faces o r cleavage parallel to the axes o f the prism atic m inerals, and not the axes themselves.
(d) G row th o f elongated crystals with their longest dim ension (e.g., (X) 1 in hornblende) oriented at random in a plane o f m inim um resistance to grow th, which coincides w ith the plane o f the girdle (IIC).
III. A girdle which is not a great circle, but a small circle o f the sphere o f projection. The m easured optical lines thus tend to lie on the surface o f a cone(HI).(a) The m easured optical direction makes an angle with the crystal face
oriented in .v. This is essentially the same case as IA, except that some optical angles and not the crystal faces, are m easured, as, for instance, the (0001) axis o f calcite, which is oriented in the .v plane according to its (01T2) faces. The diam eter o f the ring is then 52 .
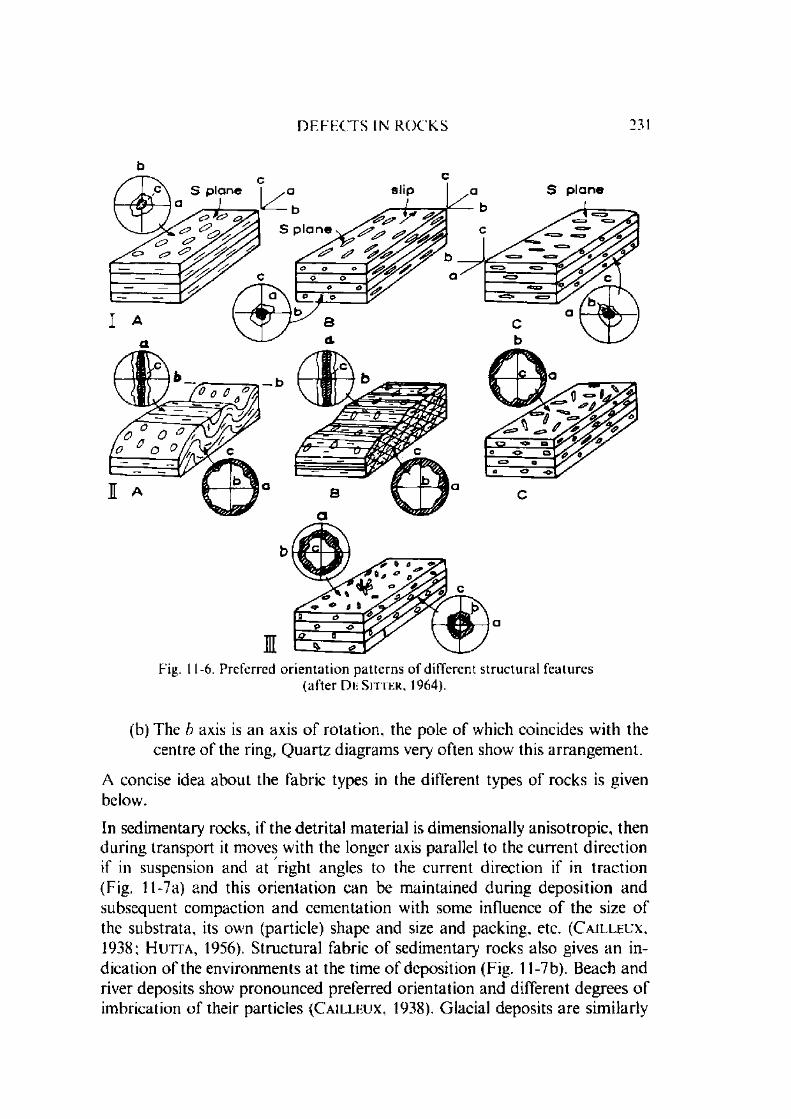
D E F E C T S IN R O C K S 231
S p l a n eS p l a n e
Fig. 11-6. Preferred orien ta tion patterns o f different structural features(a f te r D e S it t e r , 1964).
(b) The b axis is an axis o f ro ta tion , the pole o f which coincides w ith the centre o f the ring, Q uartz diagram s very often show this arrangem ent.
A concise idea about the fabric types in the different types o f rocks is given below'.
In sedim entary rocks, if the detrital m aterial is dim ensionally anisotropic, then during transport it moves w ith the longer axis parallel to the current direction if in suspension and at right angles to the current direction if in trac tion (Fig. 11-7a) and this o rien tation can be m aintained during deposition and subsequent com paction and cem entation with some influence o f the size o f the substrata, its own (particle) shape and size and packing, etc. ( C a i l l e u x , 1938; H u t t a , 1956). S tructural fabric o f sedim entary rocks also gives an indication o f the environm ents a t the time o f deposition (Fig. 11 -7b). Beach and river deposits show' pronounced preferred orientation and different degrees o f im brication o f their particles ( C a i l l e u x , 1938). G lacial deposits are sim ilarly
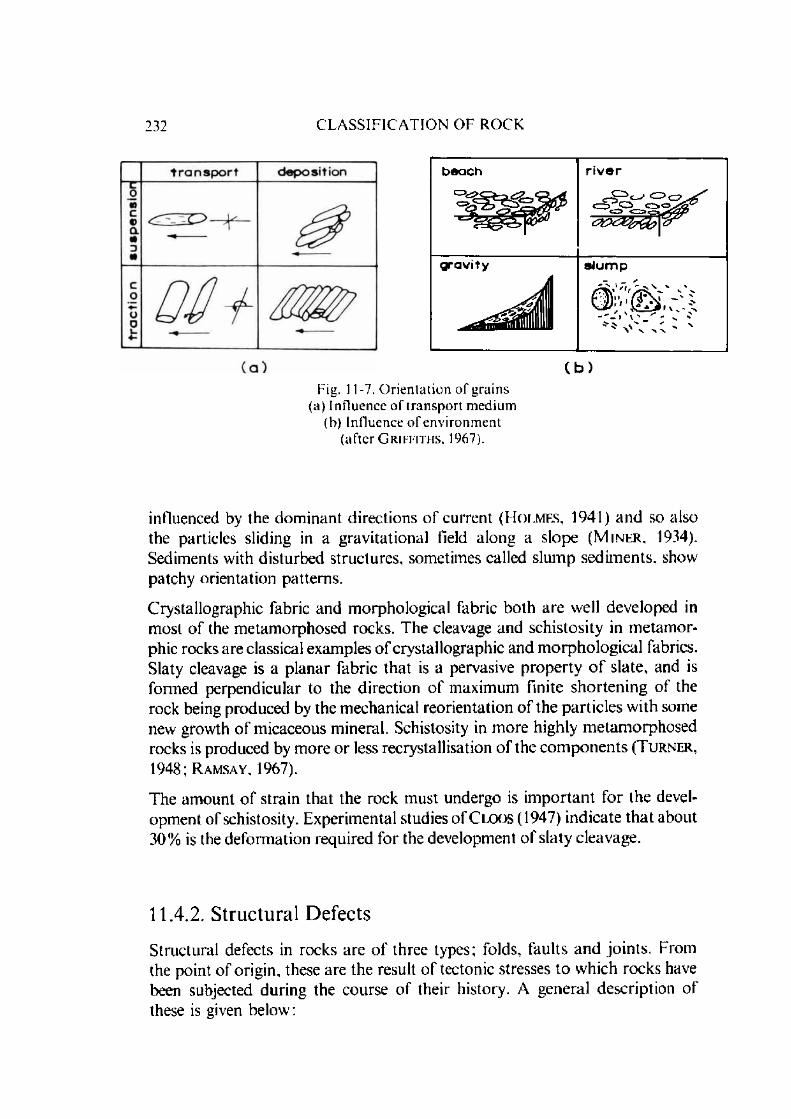
232 C L A S S I F I C A T I O N O F R O C K
Fig. 11-7. O rien ta tion o f grains (a) Influence o f transport m edium
(b) Influence o f environment (after G r if f i t h s , 1967).
influenced by the dom inant directions o f current (H o lm es , 1941) and so also the particles sliding in a gravitational field along a slope ( M in e r , 1934). Sediments with disturbed structures, sometimes called slum p sedim ents, show patchy orientation patterns.
Crystallographic fabric and m orphological fabric both are well developed in most o f the m etam orphosed rocks. The cleavage and schistosity in m etam or- phic rocks are classical examples o f crystallographic and m orphological fabrics. Slaty cleavage is a p lanar fabric that is a pervasive p roperty o f slate, and is formed perpendicular to the direction o f maximum finite shorten ing o f the rock being produced by the m echanical reorientation o f the particles w ith some new growth o f m icaceous m ineral. Schistosity in m ore highly m etam orphosed rocks is produced by m ore o r less recrystallisation o f the com ponents (T u r n e r , 1948; R amsay , 1967).
The am ount o f strain that the rock m ust undergo is im p o rtan t for the developm ent o f schistosity. Experim ental studies o f C l o o s (1947) indicate tha t about 30% is the deform ation required for the developm ent o f slaty cleavage.
11.4.2. S truc tura l Defects
Structural defects in rocks are o f three types; folds, faults and jo in ts . From the point o f origin, these are the result o f tectonic stresses to which rocks have been subjected during the course o f their history. A general description o f these is given below:
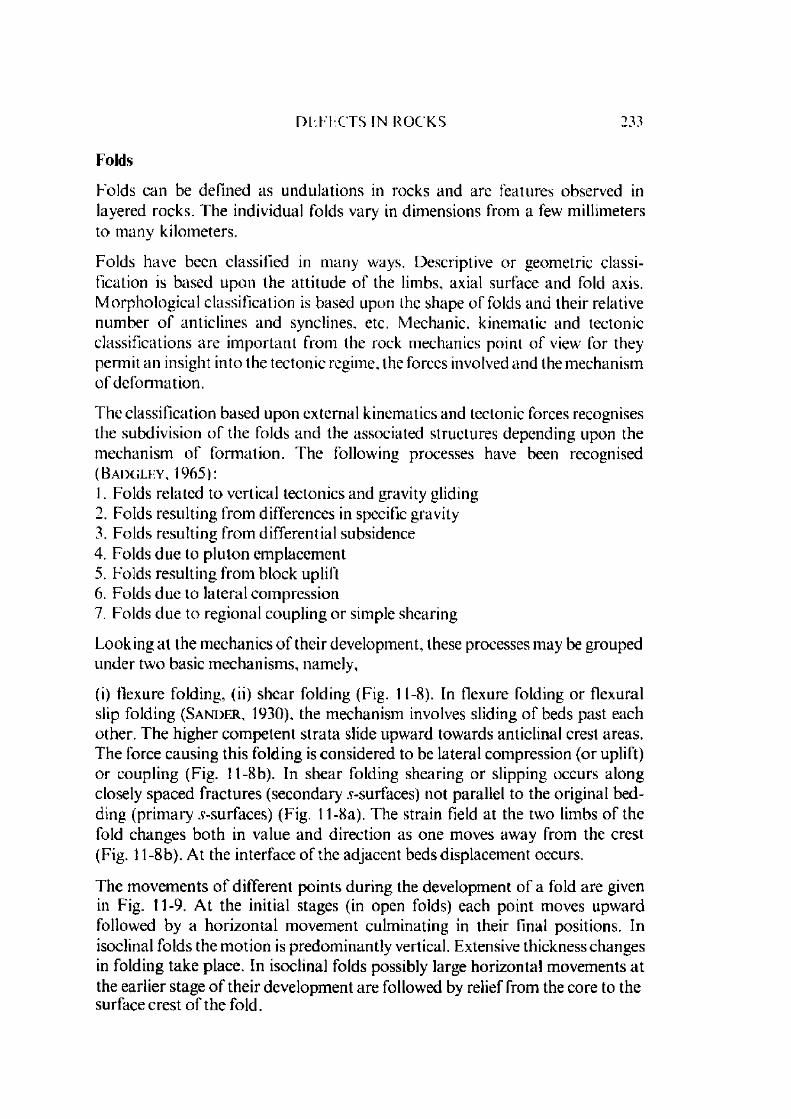
D I M C I S I N R O C K S 233
Folds
Folds can be defined as undulations in rocks and are features observed in layered rocks. The individual folds vary in dim ensions from a few millimeters to m any kilom eters.
Folds have been classified in m any ways. Descriptive or geometric classification is based upon the a ttitude o f the limbs, axial surface and fold axis. M orphological classification is based upon ihe shape o f folds and their relative num ber o f anticlines and synclines, etc. M echanic, kinem atic and tectonic classifications are im portan t from the rock mechanics point o f view for they perm it an insight into the tectonic regime, the forces involved and the mechanism o f deform ation.
The classification based upon external kinematics and tectonic forces recognises the subdivision o f the folds and the associated structures depending upon the m echanism o f form ation. The following processes have been recognised ( B a d g l e y , 1965):1. Folds related to vertical tectonics and gravity gliding2. Folds resulting from differences in specific gravity3. Folds resulting from differential subsidence4. Folds due to p lu ton em placem ent5. Folds resulting from block uplift6. Folds due to lateral com pression7. Folds due to regional coupling o r simple shearing
Looking at the m echanics o f their developm ent, these processes may be grouped under tw o basic m echanism s, namely,
(i) flexure folding, (ii) shear folding (Fig. 11-8). In flexure folding or flexural slip folding ( S a n d e r , 1930), the mechanism involves sliding o f beds past each other. The higher com petent s tra ta slide upw ard tow ards anticlinal crest areas. The force causing this folding is considered to be lateral com pression (or uplift) or coupling (Fig. 11 -8b). In shear folding shearing o r slipping occurs along closely spaced fractures (secondary ^-surfaces) not parallel to the original bedding (prim ary 5-surfaces) (Fig. 1 l-8a). The strain field at the two limbs o f the fold changes both in value and direction as one moves away from the crest (Fig. 11 -8b). At the interface o f the adjacent beds displacement occurs.
The m ovem ents o f different points during the developm ent o f a fold are given in Fig. 11-9. A t the initial stages (in open folds) each point moves upward followed by a horizontal m ovem ent culm inating in their final positions. In isoclinal folds the m otion is predom inantly vertical. Extensive thickness changes in folding take place. In isoclinal folds possibly large horizontal m ovem ents a t the earlier stage o f their developm ent are followed by relief from the core to the surface crest o f the fold.

234 C L A S S I F I C A T I O N O F R O C K
Fig. 11-8. Mechanism o f folding (a) Shear o r slip folding
(b) Flexure folding (flexural slip) mechanism involving concentric shear motion(after B a d g l e y , 1965).
The m ovement history at low displacem ent rates ranging in the order o f 10 14 to 10“ 16 mm /s influences the ‘inherent fabric' o f rock producing a new ‘defor- m ational fabric’ as described earlier and is also responsible for the developm ent o f certain oriented fractures.
As the folding strain under the influence o f horizontal stress progresses further resulting in buckling o f the beds (Fig. 11-10), multiple folds develop and the wave length o f these is dependent upon the com petency o f the bed undergoing folding and the surrounding rocks. Both theoretical and experim ental investigations have been conducted to interpret their wave lengths and shapes (B iot, O d e and R o e v e r , 1961; B i o t , 1964. 1965; C u r r i e , P a t n o d e and T r u m p , 1962; R a m b e r g , 1960, 1961, 1963). The wave length is directly proportional to the thickness o f the com petent layer ( C u r r i e , P a t n o d e and T r u m p , 1962).
A very im portant aspect o f folding from an engineering point o f view is the strains associated with it. F o r instance, during the buckling o f beds the outer

D E F E C T S IN R O C K S 235
Fig. 11-9. (a) Stages in the evolution o f a fold from an original horizontal sheet o f rock to an eventual isoclinal position
(heavy solid line).(b) and (c) The arrow s show the movements from various points
on the original sheet to their final position (after Ba d g l e y , 1965).
layers slip over the inner layers (Fig. 11-11) giving hom ogeneously d istribu ted strain o r inhomogeneously distributed strain with m ore m ovem ent on the layer boundaries than in the centre o f the layers (Fig. 11-11) giving slickenside and sigm oidal tension fissures (Fig. 11-12). These fractures are inclined a t an angle, the inclination o f which changes with respect to the bedding planes as one moves away from the crest (Fig. 11-12). The am ount o f slip is greatest a t the limbs o f the fold and is p roportional to the layer thickness. These structures

236 C L A S S I F I C A T I O N O F R O C K
Fig. 11-10. Varying wavelengths of folds produced by buck ling pegm atite sheets o f variable thickness in a mica schist matrix .
Pennine Alps, Ticino, Switzerland (after R a m s a y , 1967).
s l i c k e n s i d e s on t h r u s t s u r f a c e
Fig. 11-11. Development o f th rusts in a flexural-slip fold (after R a m s a y , 1967).
are best developed in the fold limbs at the boundaries o f the thickest and m ost com petent beds and die away tow ards the hinge o f the structu re . Besides the developm ent o f tensional sigmoidal fissures, tensional jo in ts m ay develop in layer progressively folded at the upper and lower boundaries o f the beds and the depth to which they extend depends upon the position o f the neutral surface
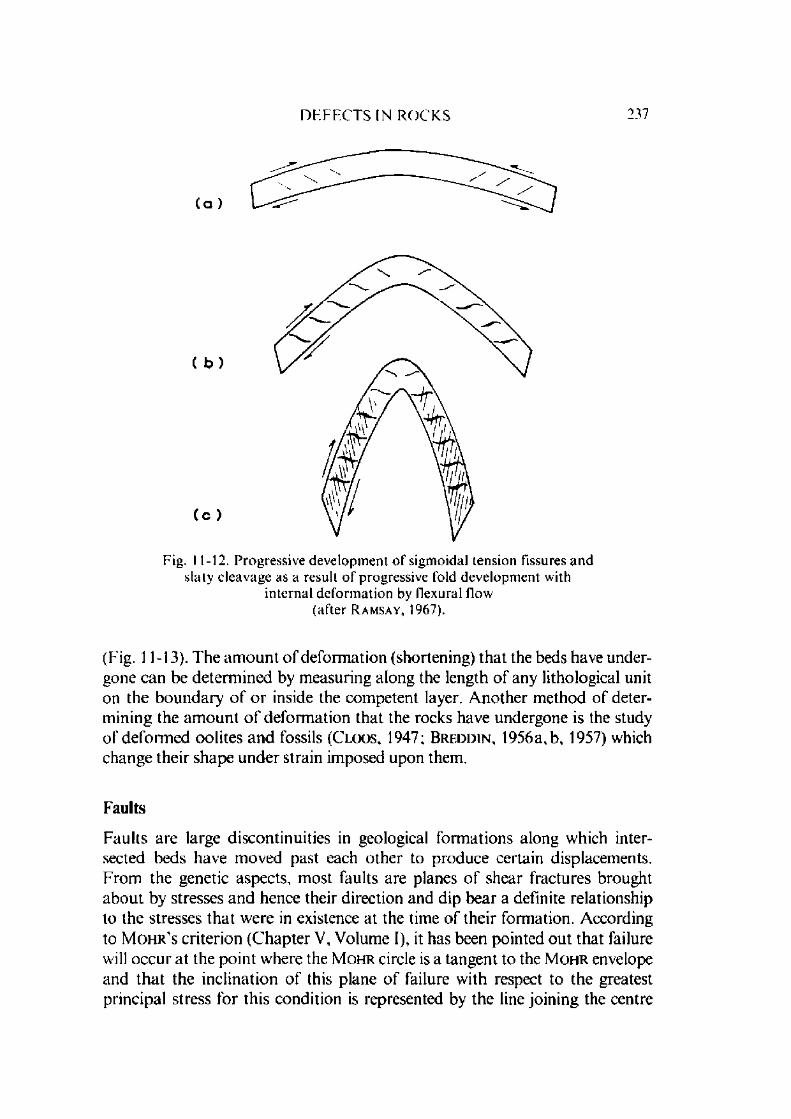
D E F E C T S IN R O C K S 237
( a )
( b )
( c )
Fig. 11-12. Progressive developm ent o f sigmoidal tension fissures and slaty cleavage as a result o f progressive fold developm ent with
internal deform ation by flexural flow (after R a m s a y , 1967).
(Fig. 11-13). T he am ount o f deform ation (shortening) tha t the beds have undergone can be determ ined by m easuring along the length o f any lithological unit on the boundary o f o r inside the com petent layer. A nother m ethod o f determ ining the am oun t o f deform ation that the rocks have undergone is the study o f deform ed oolites and fossils ( C l o o s , 1947; B r k d d i n , 1956a, b, 1957) which change their shape under strain imposed upon them.
Faults
Faults are large discontinuities in geological form ations along which intersected beds have m oved past each o ther to produce certain displacements. From the genetic aspects, m ost faults are planes o f shear fractures brought abou t by stresses and hence their direction and dip bear a definite relationship to the stresses th a t were in existence at the time o f their form ation. According to M o h r ' s criterion (C hap ter V, Volume I), it has been pointed out that failure will occur at the point w here the M o h r circle is a tangent to the M o h r envelope and th a t the inclination o f this plane o f failure with respect to the greatest principal stress for this condition is represented by the line join ing the centre
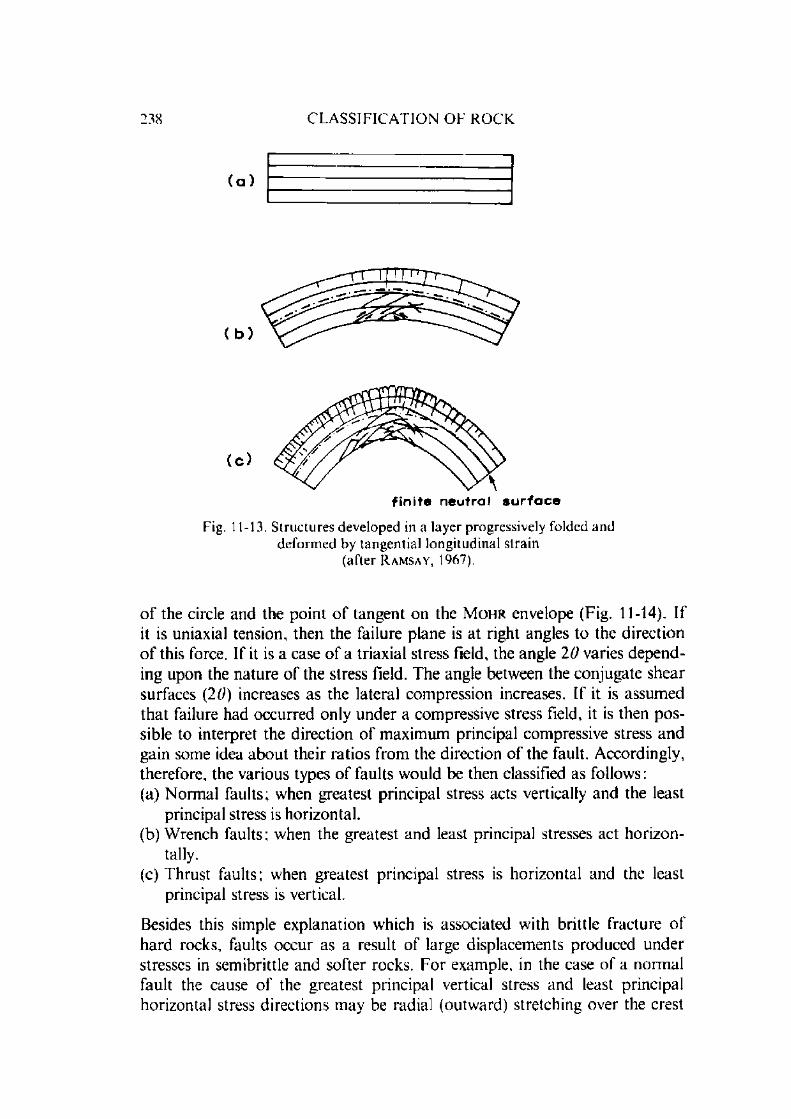
238 C L A S S I F I C A T I O N O F R O C K
( a )
f i n i t e n e u t r a l s u r f a c e
Fig. 11-13. S tructures developed in a layer progressively folded and deform ed by tangential longitudinal strain
(after R a m s a y , 1967).
o f the circle and the point o f tangent on the M o h r envelope (Fig. 11-14). If it is uniaxial tension, then the failure plane is at right angles to the direction o f this force. If it is a case o f a triaxial stress field, the angle 20 varies depending upon the nature o f the stress field. The angle between the conjugate shear surfaces (20) increases as the lateral com pression increases. If it is assum ed th a t failure had occurred only under a compressive stress field, it is then possible to interpret the direction o f m axim um principal compressive stress and gain some idea about their ratios from the direction o f the fault. Accordingly, therefore, the various types o f faults would be then classified as follows:(a) N orm al faults; when greatest principal stress acts vertically and the least
principal stress is horizontal.(b) W rench faults; when the greatest and least principal stresses act horizon
tally.(c) Thrust faults; when greatest principal stress is horizontal and the least
principal stress is vertical.
Besides this simple explanation which is associated with brittle fracture o f hard rocks, faults occur as a result o f large displacem ents produced under stresses in semibrittle and softer rocks. F or example, in the case o f a norm al fault the cause o f the greatest principal vertical stress and least principal horizontal stress directions may be radial (outw ard) stretching over the crest

D E F E C T S IN R O C K S 239
Fig. 11-14. (a) Resolution o f forces acting on failure planes in rocks.The lateral force (<j3) is tensional in the First three examples (1 ,2 ,3 ) but the confining
pressure ( <r3) gradually increases from example 4 th rough to example 6. Note that the shear com ponents ( t ) o f the external forces are additive in examples 2 and 3 but oppose
each o ther in examples 4, 5, 6. The norm al com ponents ( cr) oppose each other in examples 2 and 3 but are additive in examples 4, 5 and 6.
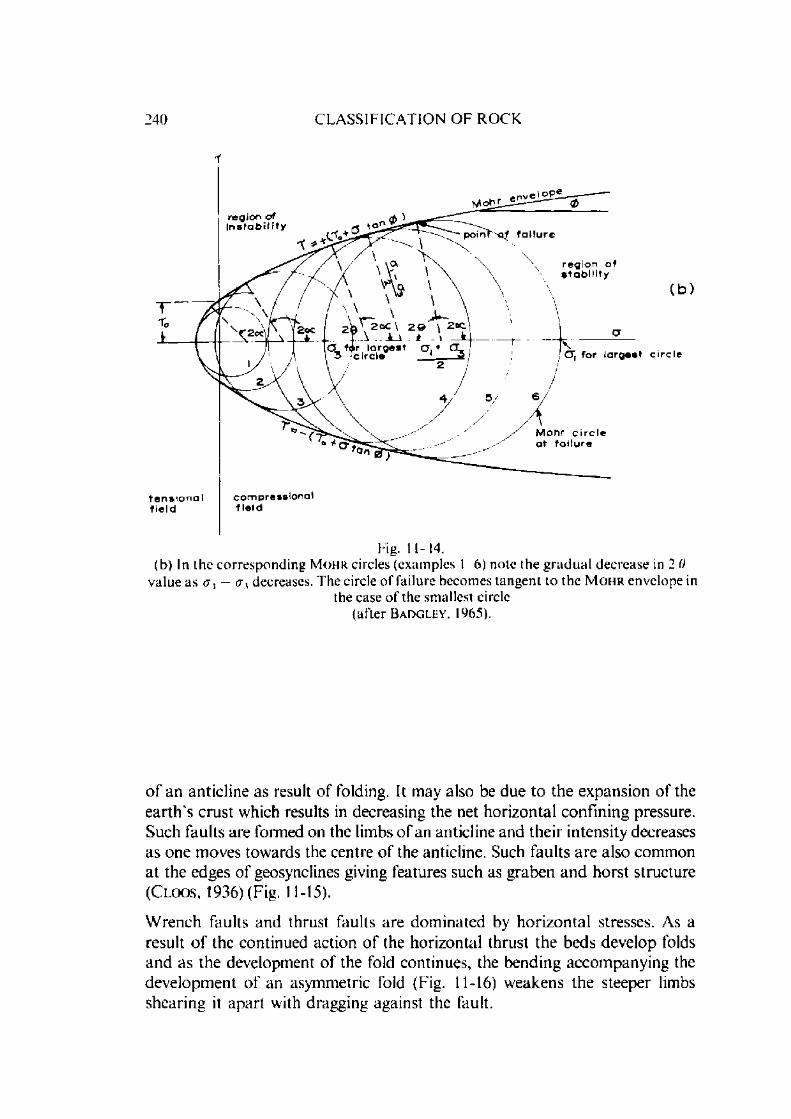
240 C L A S S I F I C A T I O N O F R O C K
i
(b) In the corresponding M o h r circles (examples 1 6) note the g rad u a l decrease in 2 0 value as rrl — <j3 decreases. The circle o f failure becomes tangent to the M o h r envelope in
the case o f the smallest circle (after Ba d g l e y , 1965).
o f an anticline as result o f folding. It may also be due to the expansion o f the ea rth 's c rust which results in decreasing the net horizontal confining pressure. Such faults are formed on the limbs o f an anticline and their intensity decreases as one m oves towards the centre o f the anticline. Such faults a re also common a t the edges o f geosynclines giving features such as graben and horst structure ( C l o o s , 1936) (Fig. 11-15).
W rench faults and thrust faults are dom inated by horizon tal stresses. As a result o f the continued action o f the horizontal thrust the beds develop folds and as the developm ent o f the fold continues, the bending accom panying the developm ent o f an asym m etric fold (Fig. 11-16) w eakens the steeper limbs shearing it apart with dragging against the fault.
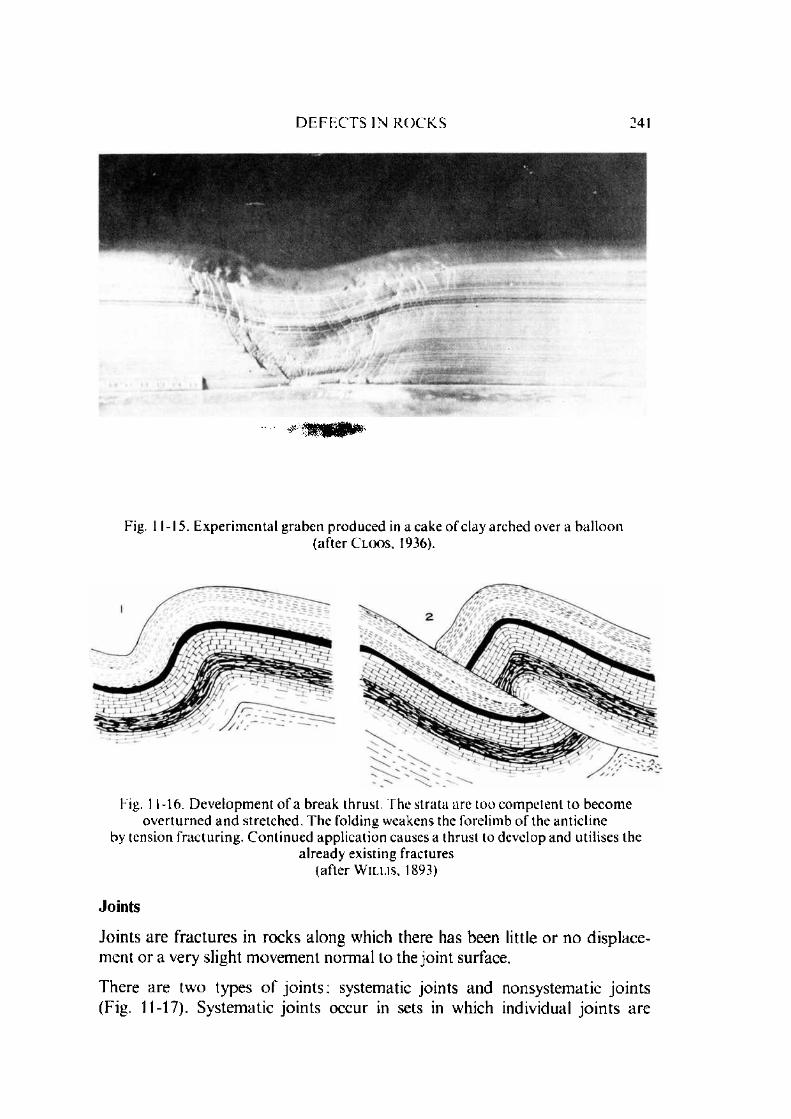
D E F E C T S IN R O C K S 241
Fig. 11-15. Experim ental g raben produced in a cake o f clay arched over a balloon( a f t e r C l m s , 1936).
Fig. 11-16. D evelopm ent o f a break thrust. The strata are too com petent to becom e overtu rned an d stretched. T he folding weakens the forelimb o f the anticline
by tension fracturing. C ontinued application causes a thrust to develop and utilises thealready existing fractures
(after W il l is , 1893)
Joints
Joints are fractures in rocks along which there has been little o r no displacement or a very slight m ovem ent norm al to the join t surface.
There are tw o types o f jo in ts ; systematic jo ints and nonsystem atic jo in ts (Fig. 11-17). System atic jo in ts occur in sets in which individual jo in ts are

242 C L A S S I F I C A T I O N O F R O C K
parallel or sub-parallel to each other. N onsystem atic jo in ts do not have any definite pattern and frequently term inate at systematic joints.
Jo in ts which cut through a num ber o f beds o r rock units and which can be followed several tens o r hundreds o f m etres are term ed m aster jo in ts and those which are an order o f m agnitude sm aller but are still large enough may be called m ajor joints. Still sm aller and relatively unim portant fractures m ay be called m inor jo in ts and those o f only up to a few centim etres (like cleavage in coal) are called m icro-joints. The jo in t set that is m ore developed (i.e. m ore frequent and larger) is called a prim ary set o f jo in ts and the o ther set is called a secondary set o f joints.
Joints are secondary features o f the rock tectonics and as such have a definite relationship with the regional structure. They are generally related to the predom inant structural trend o f the region such as fold axes and thrust faults, basin rims, monoclines, m ountain uplifts o r swell structures. Joints roughly parallel to the fold axis are formed due to tensile stress a t high angle to the beddings (Fig. 11-18). These are called longitudinal joints. C ross jo in ts are roughly perpendicular to fold axes and generally term inate against systematic joints. They have a m ore irregular surface than systematic jo in ts ( F I o d g s o n , 1961). D iagonal jo in ts generally occur in pairs m ore o r less symmetrical to the longitudinal and cross jo in ts with high angle to bedding and are the result o f shear failures.
The genetics o f jo int form ation under a general stress field is explained in Fig. 11-14. Obviously therefore, there may be tensional jo ints o r shear joints. Shear joints are cut across the crystals and are com m only slickensided (Fig. 11-19) o r a narrow cataclastic zone with offsetting on opposite sides o f the fracture (Fig. 11-20). Tensional jo in ts, on the o ther hand, have clean, granular breaks and may have plum ose m arkings (Fig. 11-21).
From Fig. 11-14, it is clear that for 2y = 180 , i.e. contained angle between the fractures to be zero (tensional jo ints) at least one o f the principal stresses need to be zero or tensile. This m eans that tensional jo ints are near-surface features.
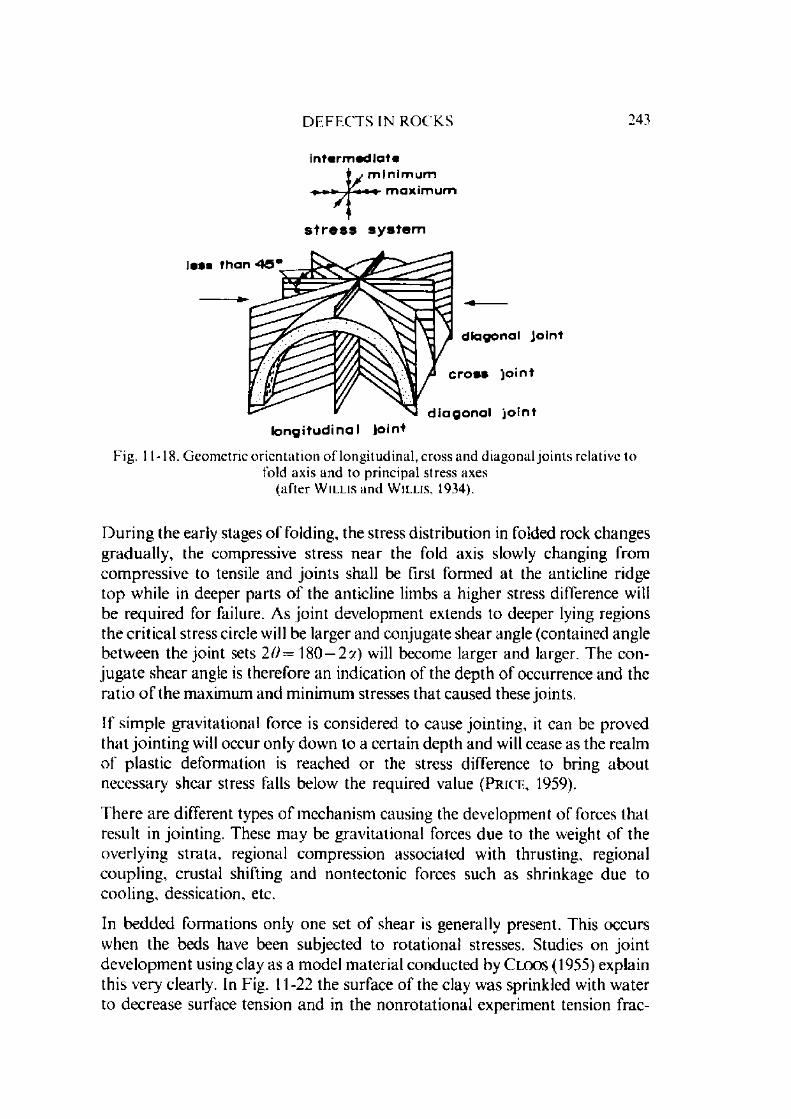
D E F E C T S IN R O C K S 243
i n t e r m e d i a t e
/m I n i m u m
m a x i m u m
s t r e s s s y s t e m
less the
d ia g o n a l jo in t
c ro ss Joint
diagona l Joint
lo n g itu d in a l Joint
Fig. 11-18. Geometric orien ta tion o f longitudinal, cross and diagonal jo in ts relative tofold axis and to principal stress axes
(after W illis and W il l is , 1934).
D uring the early stages o f folding, the stress d istribution in folded rock changes gradually , the compressive stress near the fold axis slowly changing from com pressive to tensile and jo in ts shall be first form ed a t the anticline ridge top while in deeper parts o f the anticline limbs a higher stress difference will be required for failure. As jo in t developm ent extends to deeper lying regions the critical stress circle will be larger and conjugate shear angle (contained angle between the jo in t sets 2 0 = 180-2 :*) will become larger and larger. The conjuga te shear angle is therefore an indication o f the depth o f occurrence and the ra tio o f the maximum and m inim um stresses that caused these joints.
If sim ple gravitational force is considered to cause join ting, it can be proved that jo in tin g will occur only down to a certain depth and will cease as the realm o f p lastic deform ation is reached o r the stress difference to bring abou t necessary shear stress falls below the required value ( P r i c e , 1959).
T here are different types o f m echanism causing the developm ent o f forces tha t result in jointing. These m ay be gravitational forces due to the weight o f the overlying strata, regional com pression associated with thrusting, regional coupling, crustal shifting and nontectonic forces such as shrinkage due to cooling, dessication, etc.
In bedded form ations only one set o f shear is generally present. This occurs when the beds have been subjected to rotational stresses. Studies on jo in t developm ent using clay as a model m aterial conducted by C l o o s (1955) explain this very clearly. In Fig. 11-22 the surface o f the clay was sprinkled with w ater to decrease surface tension and in the nonrotational experim ent tension frac-
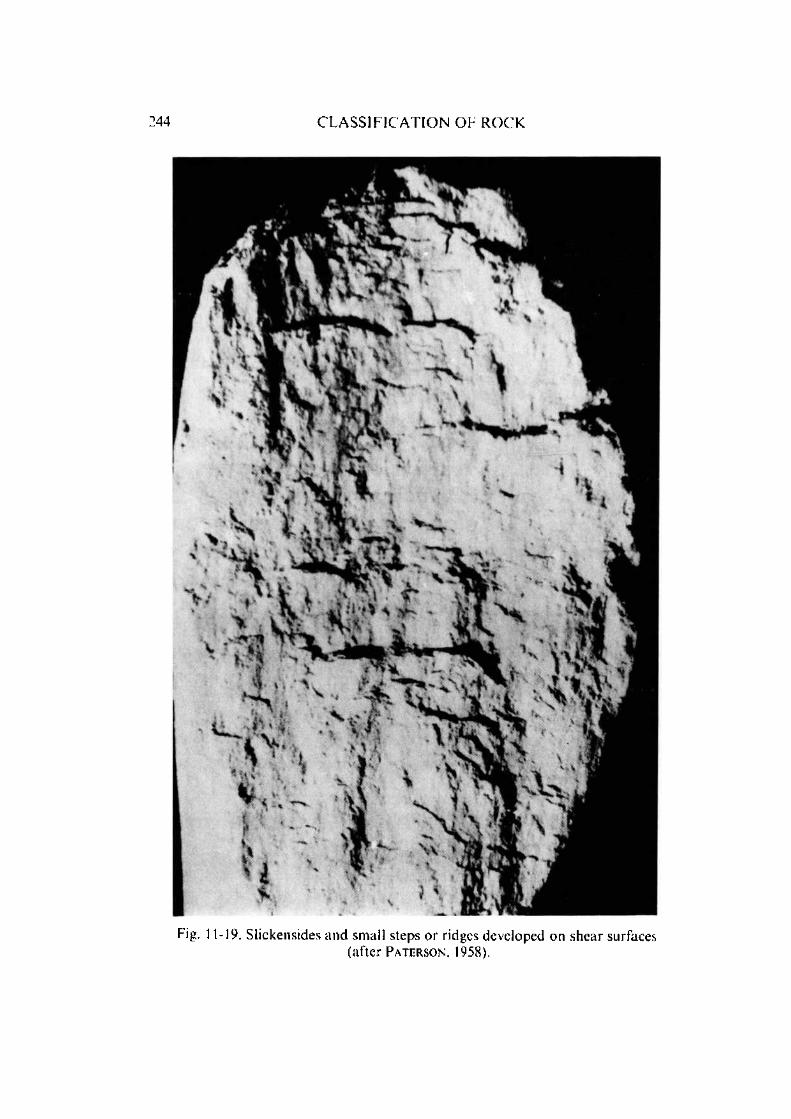
C L A S S I F I C A T I O N O F R O C K
Fig. 11-19. Slickensides and small steps o r ridges developed on shear surfaces(a f te r P a terson , 1958).

D E F E C T S IN R O C K S 245
Fig. 11-20. Fault in St. Peter sandstone. Longitudinal compression (vertical). C onfining pressure o f 5000 bars, interstitial water pressure o f 1000 bars, tem perature of
500°C, shortened 40 percent. N ote the wide zone o f mylonitised quartz . There is very little grain breakage away from the mylonitised zone
(after G r i g g s and H a n d i n , 1960).
tures were formed (Fig. ll-2 2 a). W hen the clay surface was left dry the application o f rotational stress produced conjugate shear fractures m aking 60 intersection angles initially (Fig. 11-22b). As deform ation continued one o f the two sets o f fractures ro ta te to different angles, the conjugate shear angle 20 to m ore than 90 and one o f the fractures develop m ore than the other. The reason for the poor developm ent o f the second set until 20 = 90 is due to the space requirem ents o f individual cleavage m ullions (Fig. 11 -22c) which
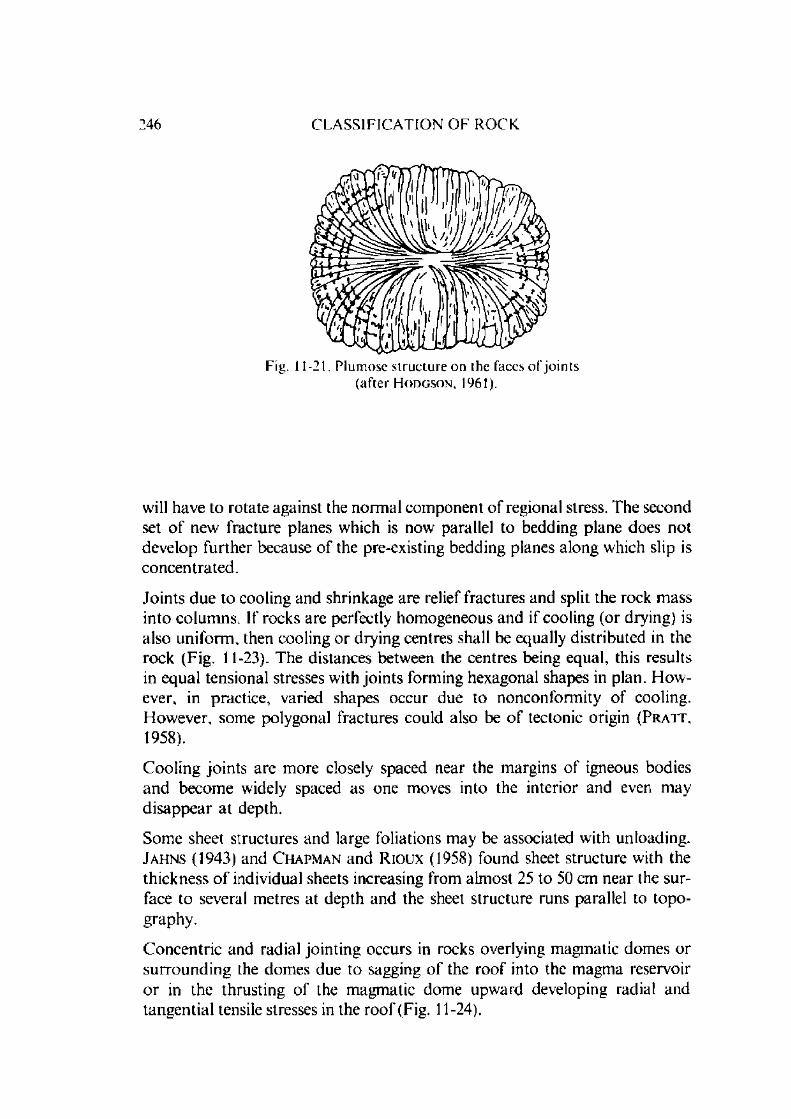
246 C L A S S I F I C A T I O N O F R O C K
Fig. 11-21. Plumose s tructure on the faces o f join ts (after H odgson , 1961).
will have to rotate against the norm al com ponent o f regional stress. The second set o f new fracture planes which is now7 parallel to bedding plane does not develop further because o f the pre-existing bedding planes along which slip is concentrated .
Jo in ts due to cooling and shrinkage are relief fractures and split the rock m ass into colum ns. If rocks are perfectly hom ogeneous and if cooling (or drying) is also uniform , then cooling o r drying centres shall be equally distributed in the rock (Fig. 11-23). The distances between the centres being equal, this results in equal tensional stresses with jo in ts forming hexagonal shapes in plan. H ow ever, in practice, varied shapes occur due to nonconform ity o f cooling. H ow ever, some polygonal fractures could also be o f tectonic origin ( P r a t t , 1958).
C ooling jo in ts are m ore closely spaced near the m argins o f igneous bodies and becom e widely spaced as one moves into the interior and even may d isappear a t depth.
Some sheet structures and large foliations m ay be associated with unloading. J a h n s (1943) and C h a p m a n and R ioux (1958) found sheet structure with the thickness o f individual sheets increasing from alm ost 25 to 50 cm near the surface to several metres at depth and the sheet structure runs parallel to topography.
C oncentric and radial jo in ting occurs in rocks overlying m agm atic dom es or su rround ing the dom es due to sagging o f the roo f into the m agm a reservoir o r in the thrusting o f the m agm atic dom e upward developing radial and tangential tensile stresses in the roo f (Fig. 11-24).
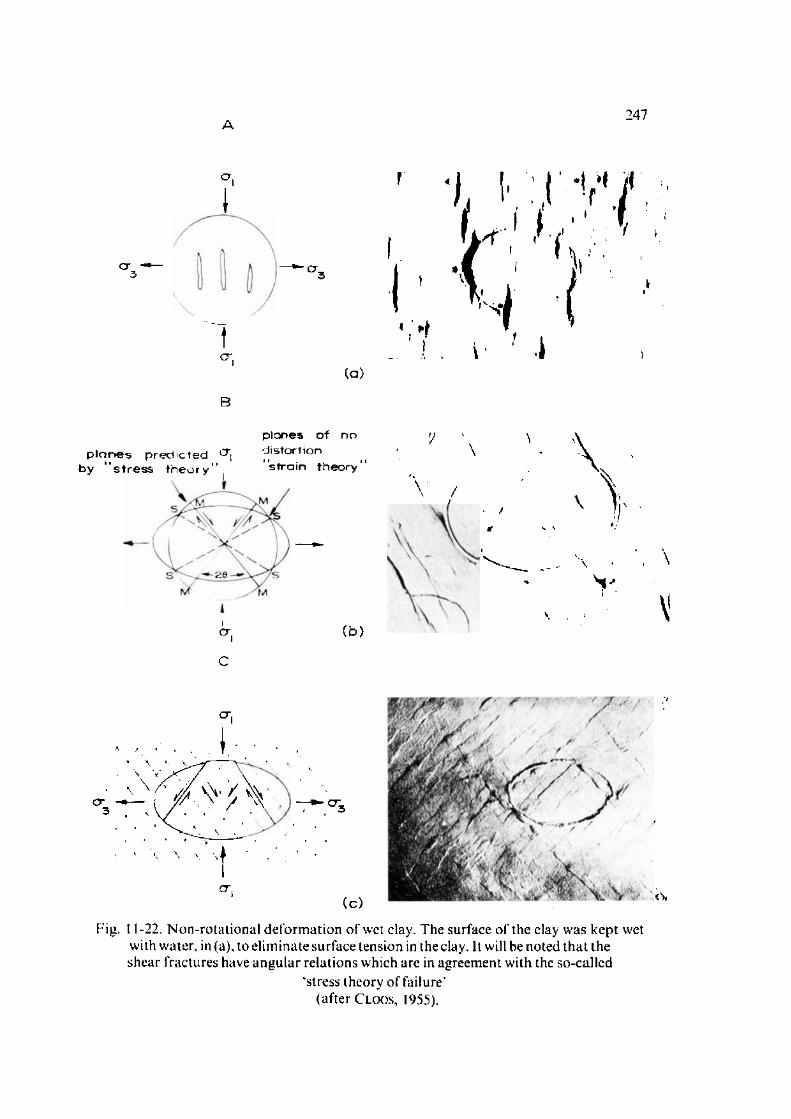
A 247
o .
cr cr
cr.
B
planes p r e d ic t e d by stress th eo ry ”
( a )
p la n e s o f n od is to r t io n
" s t r a in t h e o r y ’
C
Cd )
■I , I- :.t• ! •« . .
■ i > i' ’ V ' ,
• ' t
\
X
\
cr,
\ v
cr3
( c )
Fig. 11-22. N on-ro ta tional deform ation o f wet clay. The surface o f the clay was kept wet with water, in (a), to eliminate surface tension in the clay. It will be noted th a t the shear fractures have angu la r relations which are in agreement with the so-called
‘stress theory o f failure'(a f te r C loos , 1955).

248 C L A S S I F I C A T I O N O F R O C K
Fig. 11-23. Uniform cooling or drying in a hom ogeneous material occurs abou t centres which are equally distributed throughout a material in plan view (all centres are
equidistant). Fractures develop at right angles to the tensional pull between centres, and individual fractures intersect to form symmetrical hexagons abou t each centre
(after B a d g l e y , 1965).
s u r f a c e
( d )
Fig. 11-24. Jointing in the country rock above and around a m agm atic dom e (a) an d (b) R o o f sags into m agm a reservoir giving radial and concentric join ts (c) an d (d) Radial and concentric jo in ts developed due to tension in the roof
as a result o f uplift.

J O I N T S U R V E Y A N D J O I N T A N A L Y S I S 249
11.5. Joint Survey and Joint Analysis
In the analysis o f any rock structure, a sample o f jo in ts at various positions in the rock mass made accessible by drilling, outcrops, trenches, shafts, tunnels, etc. is surveyed to assess the various properties o f interest. The sam ple should be sufficiently large so tha t the inform ation obtained is sufficiently accurate. D epending upon the size o f the region involved, the num ber o f observations m ay run to several thousands (9000 in de Beer's mine. South Africa, R o b e r t s o n , 1970; 24000 in C.S.A. mine. C obar, N .S.W ., A ustralia, Ba r t o n , 1975a, b).
W hile conducting field survey, it is always advisable to divide the exposures into different zones o f equal area (say 3 m x 3 m [10' x 10']). The jo in ts that intersect this face o f limited size are recorded. Sometimes line sam pling technique is adopted in which all the jo in ts which intersect a given line are recorded. Sam pling a line o f given length yields a smaller sample and hence is m ore econom ical to implement where extensive surfaces are available for sam pling.
The various aspects that have to be considered in a jo in t survey are as follows:(a) Jo in t frequency(b) Jo in t length and jo in t continuity(c) Jo in t roughness and(d) Jo in t thickness.
(a) Joint Frequency
Joint frequency or degree o f jo in ting is a term used to indicate the num ber o f intersections o f one particu lar jo in t set encountered in a linear transverse at right angle to the jo in t plane. From the point o f view o f definition, a straight line (tape) o f length / is stretched ou t on the surface on which the jo in t frequency is to be measured (Fig. 11-25) and the num ber o f jo in ts (n) intersecting the line are counted starting from the first jo in t to the last jo in t on the line. The inclination o f these jo in ts (0) with respect to the stretched line is m easured using geological com pass and the frequency ( J n) is given by
j . - m z f - ( i i . i )
The equation 11.1 holds good only if the survey line is placed at right angle to the jo in t plane. In o ther cases the value so obtained will have to be corrected to account for the dip direction. Placing a survey line a t an angle to the jo in t plane results in a greater num ber o f jo in ts which are norm al to the line to be sam pled and those parallel to the line are completely missed. In a general case

250 C L A S S I F I C A T I O N O F R O C K
j o i n t s
2 3 - 4
Fig. 11-25. Joint survey.
if a line has a d ip o f <)/ and a dip direction o f 01 (Fig. 11-26) and is used to survey different sets o f jo in ts and if the jo in t spacing o f any jo in t set is 7S, then
J . =I ■ cos Sj • cos Oj
he frequency is given by J n =Js
(11.3)
In practice, however, the Oj and Sj are not fixed num bers bu t have a certain d istribution and a suitable m ethod is to use the mid o f the class interval selected in correla ting the spacing o r the frequency. F o r exam ple, if the frequency calculated o f any class interval from the above line is given by J n (cj/, Oj) for the class interval defined by the m idpoints Sj and Oj, then the corrected frequency o f this class J n (Sj, Oj) can be given by ( R o b e r t s o n , 1970)
J . = *Ai Qj)_________cos (01 — Oj) x cos [(SI + Sj) — 90] •4)
While com paring jo in t frequencies obtained using different lengths o f survey lines, the frequency should be reduced to a standard length o f say unity o r hundred. M ost research w orkers use unity as the reference length.
M easurem ents have shown that jo in t frequency is dependent upon rock type and stress intensity causing jointing. H a rr is , T aylor and W a l p e r (1960) found tha t for a given rock lithology, jo in t frequency is inversely related to

J O I N T S U R V E Y A N D J O I N T A N A L Y S I S 251
z
Fig. 11-26. T hree dimensional representation o f norm al to joint set andsa m p lin g d irec t ion
(a f te r R o bertso n , 1970).
the bed thickness. F o r example, in two dolom ite beds in the same locality, the one having jo in t frequency o f 0.33 has a bed thickness o f 3.0 m and the o ther having jo in t frequency o f 1.0 has bed thickness o f 0.33 m. A linear relationship between bed thickness and join t interval (inverse o f jo in t frequency) has been reported by Bo g d a n o v (1947), N ovikova (1947) and K irollova (1949) (Fig. 11-27). F o c a r d i et al (1970), however, report a nonlinear relationship. The phenom enon has been explained by P rice (1966) as a result o f friction th a t exists between jo in ted bed under consideration and the adjacen- beds. T he higher the friction between the beds the sm aller the free gap between the developm ent o f required tensile stress and the 1st tensional jo in t and lower the unit tensile stress when distributed to the full thickness o f the bed (Fig. 11-28). The higher the rock strength the lower is the frequency.
In case o f shear jo in ts , the frequency is dependent upon (stress field rock strength) ratio. The higher this ratio the higher the frequency. In case o f jo in ts developed due to folding, the degree o f tectonic deform ation plays an im portan t role. A com parative idea o f the operating stresses could be obtained by com paring the jo in t frequency in different areas o f similar bed thickness having sam e lithology and strength.
Jo in ts a re m apped in the field using the usual geological compass and determ ining the ir angle o f d ip , strike direction and other param eters. There are two m ethods o f p lo tting the jo in ts: 1. Equal area plot and 2. Rose diagram . The

252 C L A S S I F I C A T I O N O F R O C K
2 0
tf)Q>L.4-Q)E
A"O*
(0(00)Ior
I o
A/
• //
/%
B//
//
//
o 2 O
d i s t a n c e b e t w e e n j o i n t s , m e t r e s
Fig. 11-27. Relationship between bed thickness and distance between jo in ts(after P r ic e , 1966).
(a)
(b)iI n T
( C )
Fig. 11-28. (a) Uniform tensile stress <rT acting in a single com peten t unit.(b) Indicates the reduction in tensile stress due to the formation o f a single jo in t coupled
with the development of shear stresses along the bedding planes which preventexcessive opening o f the joint.
(c) Details o f stress intensity in section o f com peten t bed length L and thickness Z(after P r ic e . 1966).

J O I N T S U R V E Y A N D J O I N T A N A L Y S I S 253
m ethod o f representation o f a plane on an equal area plot is given in A ppendix V. The num ber o f concentrations o f poles to jo ints indicate the existence o f the num bers o f jo int sets. For example. Fig. 11-29 indicates two concentra tions o f poles o f jo in ts with intersections plunging at a small angle from the horizontal.
The rose diagram , sometimes called star diagram o r jo in t rose, is a useful representation when the directions o f a large num ber o f jo in ts have been m easured but the dip values are not known (e.g. in aerial photography). The distance from the centre (concentric circles) represents the num ber o f m easurem ents (20, 40, 60, 80, etc.) and radial lines represent the strikes m easured from the N orth in the clockwise direction (Fig. 11-30). In this plot the total num ber o f jo in ts are counted in each 10 degree sector and plotted on a radial line bisecting the sector and lines are draw n connecting the points in the various sectors. Fig. 11-30, for example, represents rose diagram o f two sets o f jo in ts w ith strikes nearly at right angles with one set having a higher frequency than the other. The m ethod has a draw back that it does not give any inform ation
Fig. 11-29. C on toured equal-area plot o f a jo in t system contain ing two jo in t sets. Lower hemisphere
(after W a h l s t r o m . 1973).
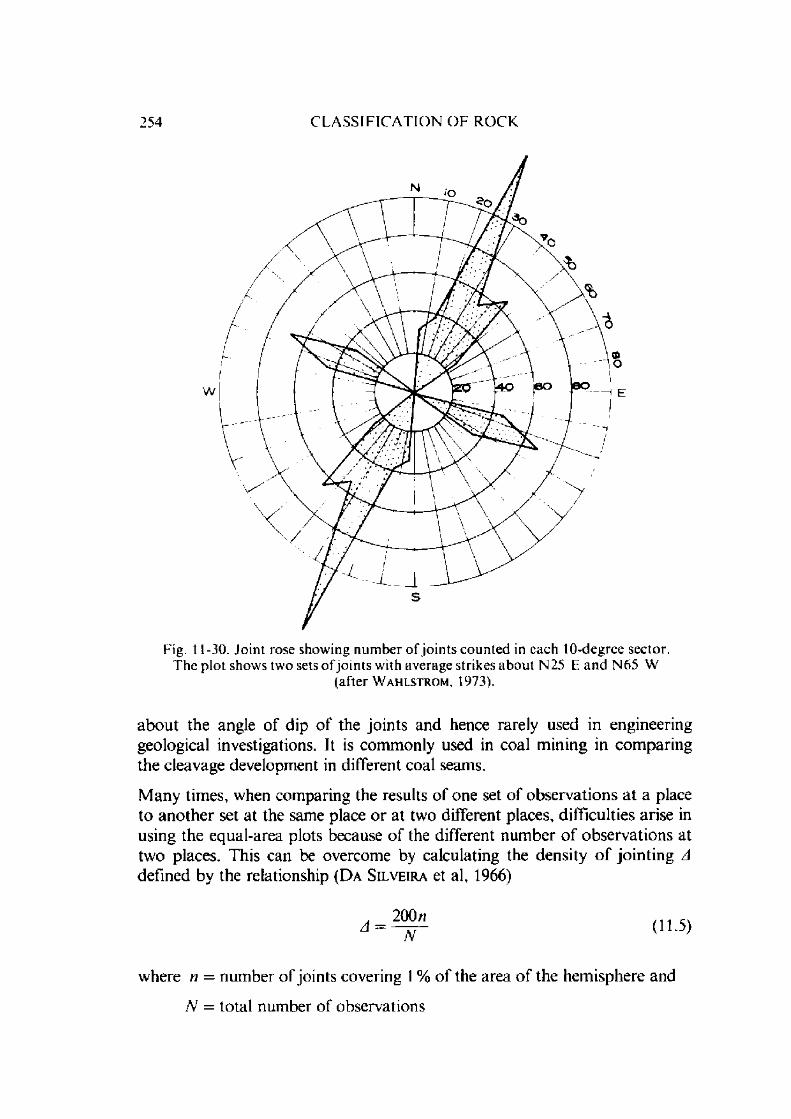
254 C L A S S I F I C A T I O N O F R O C K
Fig. 11-30. Joint rose showing num ber o f joints counted in each 10-degree sector. T he plot shows two sets o f jo in ts with average strikes abou t N25 E an d N 65 W
(a f te r W a h l st r o m , 1973).
ab o u t the angle o f d ip o f the jo in ts and hence rarely used in engineering geological investigations. It is com m only used in coal m ining in com paring the cleavage developm ent in different coal seams.
M any tim es, when com paring the results o f one set o f observations a t a place to an o th er set at the same place o r at two different places, difficulties arise in using the equal-area plots because o f the different num ber o f observations at tw o places. This can be overcom e by calculating the density o f jo in ting A defined by the relationship (D a S i l v e i r a et al, 1966)
where n = num ber o f jo ints covering 1 % o f the area o f the hem isphere and
N = total num ber o f observations

J O I N T S U R V E Y A N D J O I N T A N A L Y S I S 255
in which 200 is a scale factor chosen arbitrarily and found to be useful in practice. T he unit density o f jo in ting A = 1 corresponds to the occurrence o f0 .5% o f the total num ber o f joints.
T he stereoplo ts have been adopted for com puter print out for handling a large am ount o f d a ta ( R o s e n g r e n , 1968), but rectangular plots form ed by a cylindrical equal spaced m eridional projection (Fig. 11-31) ( P i n c u s , 1951,
N
Fig. 11-31. (a) Cylindrical equal-spaced meridional projection (b) The physical interpretation o f the rectangle plot
(c) C om parison o f the stereo and rectangle plots (after P i n c u s , 1951, 1953; R o b e r t s o n , 1970).

256 C L A S S I F I C A T I O N O F R O C K
1953) are m ore useful for com puter construction. This has the advantage o f easy visual inspection but has the disadvantage that some o f the properties o f the geometric relationships between the jo in t planes which can be easily calculated in the equal area plot ( S c h m i d t projections) are lost in this representation.
D eterm ination o f hom ogeneity o f a rock m ass with respect to the jo in ting can be done by establishing jo in t frequency, standard deviation, a ttitude o f jo in ts and coefficients o f variation o f distribution o f jo in ts calculated from observations made at different places in the rock mass. In case o f hom ogeneous rock mass the coefficient o f variation m easures the regularity o f the d istribu tion and in heterogenous rock mass the deviation from homogeneity. A nother m ethod is to determ ine zones o f rock mass where the num ber o f jo in ts o f a given set exceeds a certain value fixed previously o r with respect to the total num ber o f joints o f all sets. The change in the a ttitude o f jo in t is ano ther useful m ethod o f zoning o f rock mass. This is particularly useful in rocks which have well developed planes o f schistosity.
In same zone, m any times, occur m ore than one set o f jo in ts and interpretation o f it is not always easy, particularly when standard deviation is large. The personal judgem ent o f the rock m echanics engineer should take into co n sideration the purpose o f the jo in t study and the stress field a ttitude as well as the most likely direction o f failure. W hen variations in d ip and strike are greater than 30 then jo in ts can definitely be treated as belonging to two different sets. In other cases petrographic exam ination o f the jo in t fillings, if any, jo in t surfaces, if differ m arkedly, or the association o f o ther structures could be an indication o f dividing into m ore than one jo in t set. A nother m ethod o f differentiation o f jo in t group is by determ ining their length d istribution as discussed later (joint length and jo in t continuity).
(b) Joint Length and Joint Continuity (Degree o f Separation)
By treating that the exposed surface cuts the various jo in ts and their trace “ in the form o f some co rd " is visible as a jo in t, the length o f all these visible cords is measured on a selected area o f an exposure section. The average length o f the trace is then given by:
j _ total area o f exposuretotal length o f jo in t traces x num ber o f jo in ts
Usually, the lengths o f jo in ts at different exposures are m easured and plotted on a frequency diagram . The cum ulative percent and length o f jo in ts have been found to have a linear relationship on log-probability scale (Fig. 11-32) as long as all the jo in t traces m easured belong to the same group o r if the average

cum
ulat
ive
per
cent
J O I N T S U R V E Y A N D J O I N T A N A L Y S I S 257
99 99r
9 9 -5
9 0
5 0
IO
0 0 5
photo -in terpretation d ata point fo r join ts In 9 0 0 ,1 0 5 0 ,1 1 5 0 ,1 6 0 0 ,1 8 0 0 tran sp o rt crossc u ts . (n = 3 0 0 ; d ep th s range 2 7 4 - 5 4 8 m )
fie ld observation data point fo r low a n g le joints In W 4 access (n = 8 5 )
p h o to -in te rp re ta t io n d a t a p o in t fo r low anglejo in ts in W 4 access ( n= IO O )
m om ent s u m m a tio n line fo r photo---------m easurem ents o f low a n g le jo in ts in W 4
access ( n= IO O )
_ lower lim it of field observation
f ' lower limit ofdetection onw all photographs
0-8 (O 15cm )
O( l O cm )
I O(lO c m )
20 ( lO O cm )
log l e n g t h , c mFig. 11-32. Frequency distribution o f “jo in t” trace length, C .S . A. mine
(after Ba r t o n , 1975a).
length o f the two groups has the same distribution. In o ther cases the log norm al curves will have tw o different inclinations (Fig. 11-33) indicating thereby two different d istributions o f the two different sites. In such a case they shall be required to be differentiated by replotting the values corresponding to the different sets which on the section show different inclinations to the horizontal or the vertical line. If observations are carried ou t on two planes at right angle to each o ther (e.g. side and roof o f a tunnel), and if the m ean lengths o f the trace determ ined from these two sets o f observations do no t differ appreciably and on plotting them together on the log-log curve they follow a straight line, it can be assum ed that the shape o f the planar d iscontinuity is near to a circle o r a square. If the mean values so determ ined are different, it is an indication that the shape o f the discontinuity is not a circle but a rectangle or an ellipse or any o ther shape with the ratio between the m ajor and m inor axes far greater than unity.
Theoretical solutions to obtain the dim ensions from a variety o f shapes have been form ulated ( U n d e r w o o d , 1969). If the jo in t plane is assumed circular
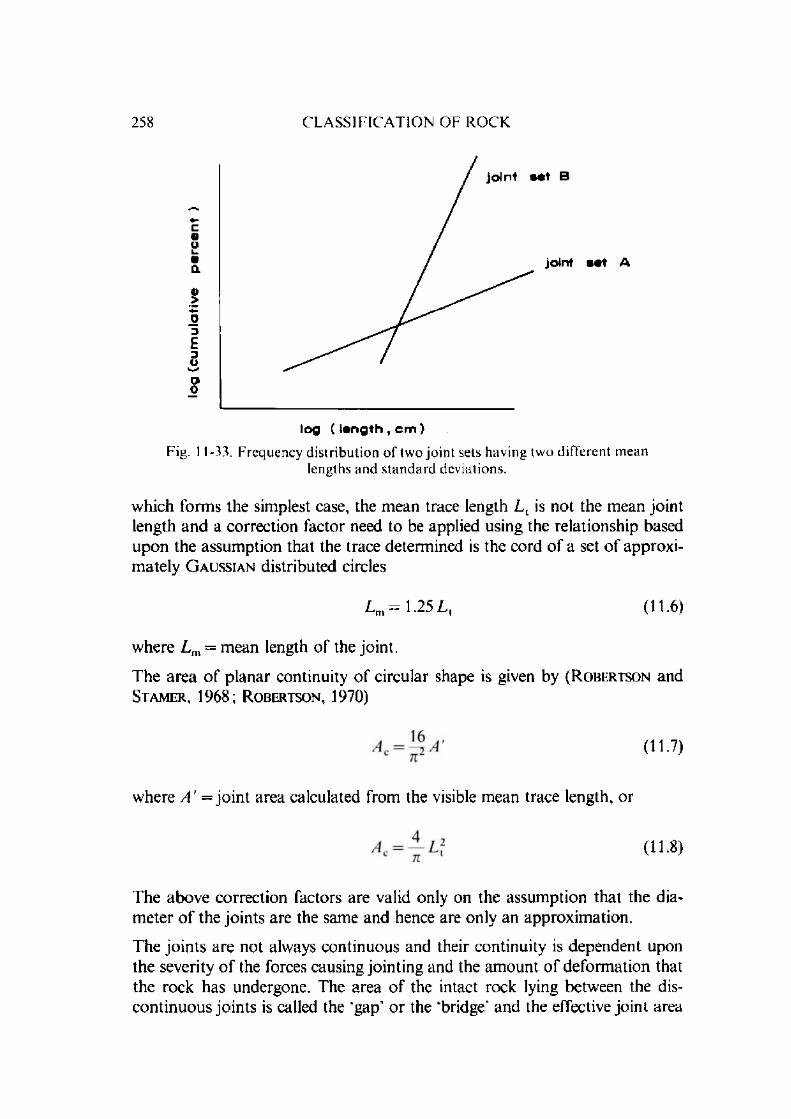
258 C L A S S I F I C A T I O N O F R O C K
E
D
0>>
C©o
/ joint »et B
/ jolmjoint set A
o0
log ( length , cm )
Fig. 11-33. Frequency distribution o f two jo in t sets having two different mean lengths and s tandard deviations.
which form s the simplest case, the m ean trace length L { is not the m ean jo int length and a correction factor need to be applied using the relationship based upon the assum ption that the trace determ ined is the cord o f a set o f approx im ately G a u s s i a n distributed circles
w here L m = m ean length o f the jo in t.
T he area o f p lanar continuity o f circular shape is given by ( R o b e r t s o n and S t a m e r , 1 9 6 8 ; R o b e r t s o n , 1970)
w here A ' = jo in t area calculated from the visible m ean trace length, or
T he above correction factors are valid only on the assum ption that the diam eter o f the jo in ts are the same and hence are only an approxim ation.
The jo in ts are not always continuous and their continuity is dependent upon the severity o f the forces causing jo in ting and the am ount o f deform ation that the rock has undergone. The area o f the intact rock lying between the discon tinuous jo in ts is called the *gap' o r the ‘bridge* and the effective jo in t area
L m = 1 . 2 5 L t ( 11.6 )
(11-7)

J O I N T S U R V E Y A N D J O I N T A N A L Y S I S 259
as a function o f the to tal area is called the jo in t continuity ( P a c h e r , 1959; T e r z a g h i , 1962).
From the data obtained on jo in t spacing J s and jo in t length Lm, the jo in t con tinuity (ye) can be calculated. F or circular jo in ts
F or continuous jo in ts / c = 1 and for discontinuous / e < 1. It is possible that different jo in t sets have different continuity values (Fig. 11-34).
The planar jo in t continuity surface / ep (Ebener K luftflachenanteil P a c h e r , 1959; M u l l e r , 1963) o f a jo int set is given by the product o f m ean jo in t continuity factor ye and jo in t frequency J n ,
and represents the jo in t continuity surface per unit area. In a given rock volume, intersected by three sets o f jo in ts , K 2, A^, the planar continuity factor o f a given plane parallel to a given set is given by the average o f the planar joint continuity surfaces o f the o ther two sets o f joints such as (Fig. 11-34)
for the planes parallel to the set and K 2.
The volumetric continuity factor representing the total area o f the geological separations in a unit volum e o f rock is given by
The planar continuity factor o f the different jo in t sets gives an idea o f the strength o f the rock m ass and perm eability in different d irections. The volumetric joint continuity factor gives an idea o f the dilation possibility, porosity and perm eability o f the rock mass as a whole. A much clearer p icture o f the rock mass influenced by the jo in ts and their continuities em erges when their various values are represented for different jo in t sets against each o ther as in Table 31 which m akes clear the use o f above concepts in the form o f an example.
(11.9)
Zep = Ze X • / „ ’ ( 11 . 10 )
( 11 .11 )
Total p lanar continuity 2 ' / ep = 8.55 m 2/m 3

260 C L A S S I F I C A T I O N O F R O C K
TABLE 31Special quantification o f the jo in t from the
indices o f individual jo in ts
( a f te r P a c h e r , 1959)
Jo in tset
A t t i tu d e
S tr ike d irec- D |P
t ion
Join t frequency J„', m 1
Jo in tcon tinu ity
Ze
P lanar jo in t
con tinu ity o f the set
*cp, m 2/ m 3
Jo in tfriction
coefficient
Jo in tcond ition
R e m a rk s
K, 0 10 4.5 1.0 4.5 1.0 Filledwith coal
K , 35 80 4 1.0 4 0.84 Closed D o m inan t
jo in t setk 3 120 80 0.2 < 0 .2 5 0.05 —
P lanar con tinu ity factor
Zep? ~1~ Xep _ ? = 0.62
j?ep.i _ 0.62
V olum etric continuity factor = ^ *ePi + fep + *epi ^
= 0.72
Average block size = j x — x = 0.27 m 3• ' n l ^ n ' 2 * 'n , 3
R atio o f jo in t frequencies 7n , :J n> = 4 .5 :4 :0 .2
If the values o f 7n in the three directions are equal then the rock m ass can be described as blocky and if the two values are equal and the third greater, then the rock mass can be described as prism atic and if two values are small and the th ird value is high, it has a platy structure.

J O I N T S U R V E Y A N D J O I N T A N A L Y S I S 261
Fig. 11-34. P lanar jo in t continuity, / for the different jo in t sets (after P a c h e r , i959).
It may be pointed out here th a t while considering jo in t continuity as a factor in determ ining the cohesion o f a rock, its proportional effect should no t be taken (as is usually done) until the stress field direction has been ascertained. T e r z a g h i (1962), for exam ple, considers that the effective cohesion c*eff can be given by
Ceff = C ^f~ 0 1 1 2 )
where c = cohesion o f intact rockA g = total area o f gap w ithin the section and
A = to tal area o f section through the rock
There are several reasons th a t can be put forward against this. Firstly the jo in t tips form points o f high stress concentrations and secondly it has been found th a t jo in t propagation does not take place from tip to tip but may give a step like structure (Fig. 11-35). T he direction o f propagation o f the jo in ts depends upon the orientation o f stress field and propagation takes place in such a way th a t it aligns itself in the direction o f m axim um compressive stress ( M u l l e r , 1974 and 1975). The effect o f this shall be to increase the c*eff value. A lso the concept o f jo in t continuity is valid only if jo in t propagation takes place from end to end. In o ther cases, its value will depend upon relative interval between the adjacent jo in t sets o r som e o ther point on the jo in t to which the p ropagating fracture meets depending upon the relative orientation o f the stress field.

262 C L A S S I F I C A T I O N O F R O C K
The volum e o f a unit block ( VVB) referred to as the smallest hom ogeneous rock unit produced as a result o f various jo in t systems is given by
where 7 nM, J n 2 and J n 3 are the frequencies o f three orthogonal jo in t sets.
A num ber o f jo in t spacing classifications have been proposed and the classification by D here (1963) has been widely accepted (Table 32). The thickness o f beds in sedim entary rocks may be described in term s o f the spacing betw een them and a classification is given in Table 33. C lassification o f jo in t spacing and block size suggested by I.S .R .M . (1975) is given in Tables 34 and 35 respectively. There is basically no difference in the various classifications proposed.
( c) and (d) Joint Roughness and Joint Thickness
Jo in t roughness influences both frictional resistance o f jo in t as well as jo in t d ila ta tion . The m icro-asperities influence friction angle and m acro-asperities influence d ilatation. T otal resistance to sliding (w ithout separating the influence o f d ila ta tion) increases as jo in t roughness increases. A m easure o f jo in t roughness is the d ilatation that the two surfaces will have on displacem ent a long their length. V arious techniques for m easuring jo in t roughness are given in C h ap ter 10. F rom rock classification point, asperity height, thickness o f filling, and n a tu re o f the filling m aterial in the jo in ts are im portant. D epending upon the thickness and the asperity height, either the jo in t filling m aterial m ay control the behav iour o f the jo in t com pletely or it m ay not. C lay fillings w ith o ther g ranu lar m aterials are particularly critical because o f the danger o f internal erosion. C lay filling may also result in liquifaction under dynam ic loadings and will have to be properly studied.
W hen jo in ts are very rough (m acro-roughness o r waviness) and roughness varies in different directions, this will result in keying action in one direction and relatively easier m ovem ent in the o ther direction. This is also influenced even in sm ooth jo in ts in rocks with well defined fabric orientation. T he platy form o f grains aligned in any direction will favour slip in this direction and hinder in o ther directions. Studies conducted on phyllites have shown that friction angle for sliding parallel to lineation is 40 and across the lineation 42 (Fig. 11-36). Residual angles o f friction decrease due to fracturing o f the ‘keys' and the broken m aterial falling in between the surfaces acts as rollers except in very soft rocks where the difference in the value is negligible. W hen it is not possible to determ ine the roughness (Section 10.4.), the geologist can define the roughness into five categories. These categories o f roughness which can

J O I N T S U R V E Y A N D J O I N T A N A L Y S I S 263
T A B L E 32 C lassification o f joint spacing
(a fte r D e e r e , 1963)
D esc r ip t io n Spacing o f jo in ts
Very close < 5 cm ( < 2 in)
C lose 5 to 30 cm (2 to 12 in)
M o d e ra te ly close 30 cm to 1 m (1 to 3 ft)
W ide 1 to 3 m (3 to 10 ft)
V ery wide > 3 m ( > 10 ft )
T A B L E 33
C lassification o f bed thickness
(a f te r D e e r e , 1963)
D esc r ip t io n Thickness o f bed
Very thin < 5 cm ( < 2 in)
T h in 5 to 30 cm (2 to 12 in)M ed iu m 30 cm to 1 in ( 1 to 3 ft)
T h ick 1 to 3 m (3 to 10 ft)Very thick > 3 m ( > 10 ft)
T A B L E 34
, C lassification o f joint spacing
(a f te r I .S .R .M ., 1975)
C lassif ica tion Jo in t spacing
E x trem e ly close < 3 cmV ery close 3 to 10 cmC lose 10 to 30 cmM e d iu m 30 to 100 cm
W id e 1 to 3 m
V ery w ide 3 to 10 m
E xtem ely wide > 1 0 m

264 C L A S S I F I C A T IO N O F R O C K
T A B L E 35 C lassification o f block size
(after I .S .R .M ., 1975)
Classification Jo in t volum e, m 3
Massive < 1.0Large b locks 1 to 3
M edium size blocks 3 to 10
Small b locks 10 to 30
Very small b locks > 30
R e m a r k : J.V . > 60 represents c rushed rocks typical o f clay free c ru sh ed zone.
Calculated jo in t continuity / = -j-
Actual jo in t continuity / = ^
be classed easily in the field are given in Fig. 11-37. The waviness o f jo in t can be determ ined by plotting the am plitude against the length m easured by using a straight edge (1 m length) placed on the exposed jo in t roughness can be best described by stating the value in term s o f the angle / (Fig. 11-38).
Aperture
A perture refers to such jo in ts where the intervening space is filled with w ater o r air o r where the filling m aterial has been washed away o r the m aterial has been dissolved by m igrating waters or solutions o r to an opening developed

<Do
0>c
.cCO
imtia I
J O I N T S U R V E Y A N D J O I N T A N A L Y S I S 265
Fig.
n o r m a l f o r c e , Ib f
-36. Frictional behaviour o f phyllite (after D unc a n , 1969).
si ic k en s ld e d' W / / a v V 7
Lc a te g o ry I O = 0 ° )
condition
sm oothvZ?;w//Ay// W 7 W
/ c a te g o r y 3
_ _ S Z .''^ /?7 777 —777 ^ —
( not to s c a le )
Fig. 11-37. Illustration o f relative roughness o f the five categories (after P i t e a u , 1970).
due to shear movement along undulating joints. Knowledge o f apertures is im portant to determ ine loosening and hydraulic conductivity.M easurem ent o f aperture can be m ade by a graduated rule o r a feeler gauge. The surface o f the exposure is cleaned properly to remove extraneous dirt filling the norm ally open jo in ts. In bore holes, rubber packers may be pressed against the walls to obtain the impression and after w ithdrawing the packer, the w idth can be m easured ( F a i r h u r s t and R o e g i e r s , 1972).
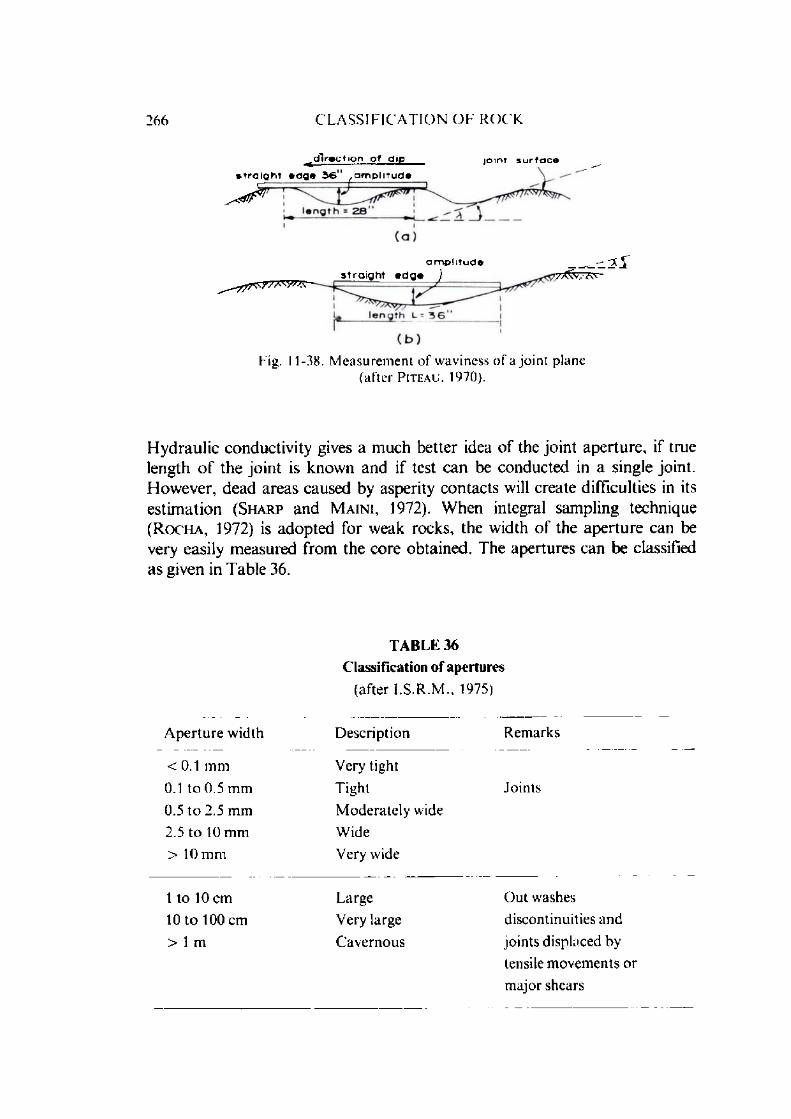
266 C L A S S I F I C A T I O N O F R O C K
^d irect ion o f dip
s tra ig h t edge 3 6 " .a m p litu d ejo in t s u rfa c e
^^7 ^7 7 7 ^7 ^-a m p litu d e
s tra ig h t e d g e )
Fig. 11-38. M easurem ent o f waviness o f a jo in t plane (after P i t e a u . 1970).
H ydraulic conductivity gives a m uch better idea o f the jo in t aperture , if true length o f the jo in t is known and if test can be conducted in a single joint. H ow ever, dead areas caused by asperity contacts will create difficulties in its estim ation (S h a r p and M a in i , 1972). W hen integral sam pling technique ( R o c h a , 1972) is adopted for weak rocks, the width o f the apertu re can be very easily m easured from the core obtained. The apertures can be classified as given in Table 36.
TABLE 36 C lassification o f apertu res
(after I .S .R .M ., 1975)
A p e r tu re width D escrip tion Rem arks
< 0.1 m m
0.1 to 0.5 m m
0.5 to 2.5 m m
2.5 to 10 m m
> 10 m m
Very tight
T ight
M o d era te ly wide
W ide
Very wide
Joints
1 to 10 cm Large O ut washes
10 to 100 cm Very large discontinuities an d
> 1 m C av e rn o u s jo in ts d isplaced by
tensile m ovem en ts o r
m ajor shears

E R R O R S IN J O I N T S U R V E Y S 267
11.6. Errors in Joint Surveys
Some im portant points need to be considered when carrying out a jo in t survey. A s long as plenty o f irregular outcrops o r excavations running at different angles to each other are available for exam ination, the jo int survey d a ta is likely to present a reasonably fair sam ple o f the joints. However, if the ou tc rop is fairly unidirectional o r if the jo in t survey is m ade only from holes drilled in one particu lar direction (say vertical), the jo in t survey is unlikely to provide even an approxim ate data o f the area.
W hen jo in t survey is conducted from the drill records, the angle at which the jo in ts intersect the bore hole is an im portan t factor and appropria te correction has got to be applied as already indicated in the surveying o f ou tc ro p (Section 11.5.). If this correction is not applied and the results are com pared with the results o f the jo in t survey conducted on the outcrop , one is likely to get a po lar diagram (Fig. 11-39) with an erroneous in terpretation that the jo in ts at depth are quite different than on the surface. Such diagram s can be redraw n by using a correction factor
Ngo = ^ ~ (H .14 )vu sin y. v 7
where N 90 = num ber o f jo in ts intersected at 90 for a bore o f length /N , = num ber o f jo in ts intersected at an angle y. for the same bore
length and2 = angle o f inclination between jo in ts and the borehole.
(a) ( b )
Fig. 11-39. Idealised con tou red polar d iagram s o f random jo in ts observed (a) on horizonta l ou tcrop and (b) in a vertical drill hole. Figures indicate relative density
o f poles, i.e. num ber per unit area, on an arb itra ry scale from 0 to 10 (after T e r z a g h i , 1965).

268 C L A S S I F I C A T I O N O F R O C K
H ow ever, when v. is zero (i.e. the jo in ts are parallel to the borehole), no correction can be applied and even a corrected version o f the po lar d iagram will fail to indicate such joints or abundance o f gently dipping jo in ts which only one o r m ore m ight have been intersected in the borehole o f a limited length and could be an im portant jo in t set. As a result a borehole, depending upon its o rien ta tion , will give a blind zone, which is a great circle 90 from the axial po in t o f the hole as defined in the section o f the reference sphere (Fig. 11-40). The w idth o f the blind zone (in term s o f the angle) is dependent upon the length o f the bore and the spacing o f joints.
N
Fig. 11-40. Layout o f a cluster o f three drill holes permitting adequate observation o f all jo in ts , shown in equal-area projection
(after T e r z a g h i , 1965).
T o avoid these errors in surveying it is im portant that a t least one borehole should be available which intersects the jo in ts a t an angle not less than 30 . W hen a num ber o f boreholes have been drilled at different angles, the corrected values o f the poles (N 90) can be m arked on the polar diagram and near the blind zone in any one diagram either the corrected count from one, o r the average o f the corrected counts from the others is substituted. Final interp re ta tion should be based upon a collective diagram constructed from all the boreholes at the place where each num ber inscribed in this diagram is the sum o f the num bers o f poles divided by the num ber o f boreholes. In the blind zone the sum o f the poles from individual plots shall be divided by (/7-1) where // is the num ber o f holes o r individual plots. W here two or m ore blind zones intersect (Points A, B and C in Fig. 11-40) the sum total o f pole points in that com m on blind zone will need to be divided by the num ber (n-m) where m is the num ber o f holes which have blind zones intersecting giving a common blind zone area.
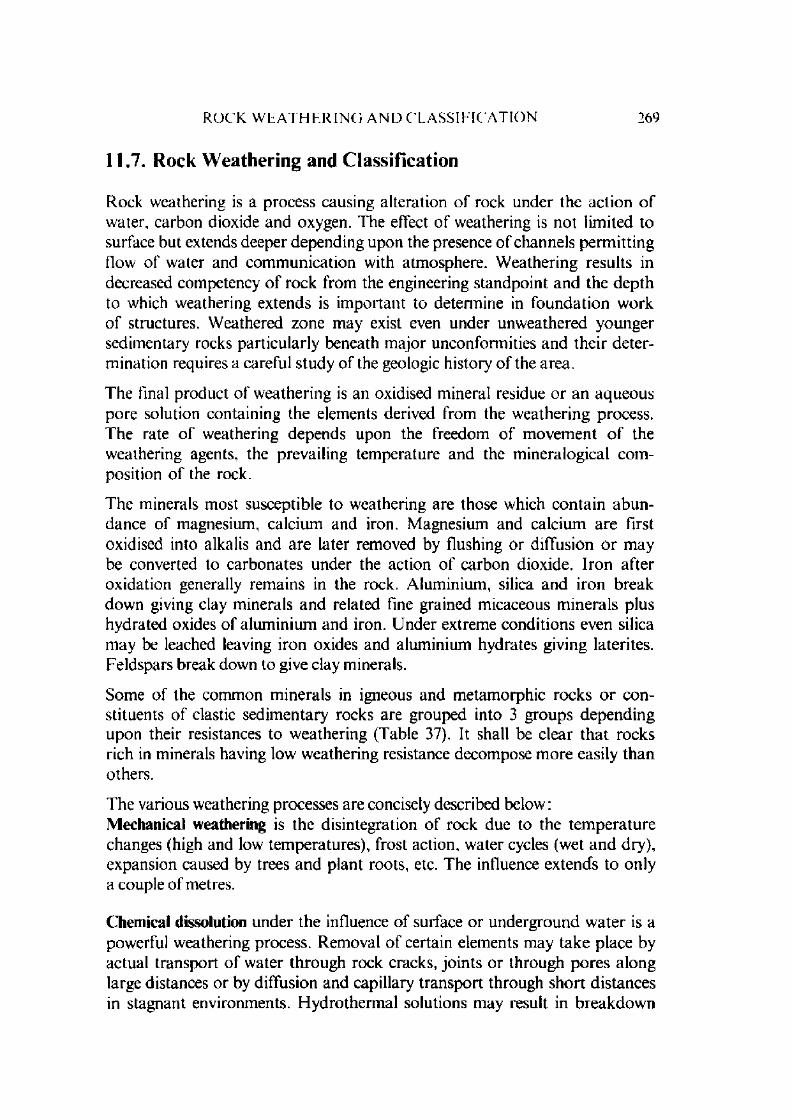
R O C K W E A T H E R I N G A N D C L A S S I F I C A T I O N 269
11.7. Rock Weathering and Classification
Rock weathering is a process causing alteration o f rock under the action o f water, carbon dioxide and oxygen. The effect o f weathering is not lim ited to surface but extends deeper depending upon the presence o f channels perm itting flow o f water and com m unication with atm osphere. W eathering results in decreased com petency o f rock from the engineering standpoint and the depth to which weathering extends is im portant to determ ine in foundation work o f structures. W eathered zone may exist even under unw eathered younger sedim entary rocks particularly beneath m ajor unconform ities and their d e term ination requires a careful study o f the geologic history o f the area.
The final product o f w eathering is an oxidised m ineral residue o r an aqueous pore solution containing the elem ents derived from the w eathering process. The rate o f weathering depends upon the freedom o f m ovem ent o f the weathering agents, the prevailing tem perature and the m ineralogical com position o f the rock.
The minerals most susceptible to weathering are those which con tain ab u n dance o f magnesium, calcium and iron. M agnesium and calcium are first oxidised into alkalis and are later removed by flushing or diffusion o r m ay be converted to carbonates under the action o f carbon dioxide. Iron after oxidation generally rem ains in the rock. A lum inium , silica and iron break down giving clay m inerals and related fine grained micaceous m inerals plus hydrated oxides o f alum inium and iron. U nder extreme conditions even silica m ay be leached leaving iron oxides and alum inium hydrates giving laterites. Feldspars break down to give clay minerals.
Some o f the common m inerals in igneous and m etam orphic rocks o r constituents o f clastic sedim entary rocks are grouped into 3 groups depending upon their resistances to w eathering (Table 37). It shall be clear th a t rocks rich in minerals having low w eathering resistance decom pose m ore easily than others.
The various weathering processes are concisely described below :Mechanical weathering is the disintegration o f rock due to the tem perature changes (high and low tem peratures), frost action, w ater cycles (wet and dry), expansion caused by trees and plant roots, etc. The influence extends to only a couple o f metres.
Chemical dissolution under the influence o f surface o r underground w ater is a powerful weathering process. Rem oval o f certain elements may take place by actual transport o f w ater through rock cracks, jo in ts o r through pores along large distances o r by diffusion and capillary transport through sho rt distances in stagnant environm ents. H ydrotherm al solutions m ay result in breakdow n

270 C L A S S I F I C A T I O N O F R O C K
o f rocks (argillisation) producing clay m ineral aggregates as a result o f leaching o f alkalis and alkaline earths. W ith imperfect leaching, chlorite and m ont- m orillon ite replace pre-existing silicate m inerals which are m ost treacherous in any underground or surface excavations. Pyritisation provides a w arning th a t rock has been subjected to hydrotherm al solutions which m ight have caused o th er chemical breakdow ns and replacem ent by clay m inerals. C hlo- ritisa tion is accom panied by argillic alteration and dolom itisation is an indication th a t there m ay be open spaces and loose aggregates and sand-size crystals th a t possess no cem enting and could How into the excavation. Some o th er processes such as silicification, serialisa tion , sausuritisation, carbonisation do produce strengthening o f the existing rock.
T A B L E 37
R esistance to chem ical w eathering o f common m inerals o f igneous and nietaniorpliic rocks
(a f te r W a h l s t r o m , 1973)
1. Low re s is ta n c e :o liv in e s ta u ro l i tep y ro x e n e iro n - r ic h g a rn e th o r n b l e n d e m eliliteca lc ic p la g io c la s e e p id o teb io t i t e m ic a fe Id spa t h o ids
2. In term ed ia te re s is ta n c e :i n t e r m e d ia t e p lag io c la se s i l l im an ites o d ic p la g io c la s e a n d a lu s i teo r th o c l a s e f e ld s p a r k y a n i tem ic ro c l in e f e ld s p a r c a lc iu m a lu m in iu m g a rn e tm u s c o v i t e m ic a i r o n - p o o r g a rn e t
c l inozo is i te
3. H igh re s is ta n c e :q u a r t z h e m a t i tem a g n e t i t e to u rm a l in e
In w eathering (both mechanical and chemical) the availability o f m oisture is the m ost im portan t single factor. An index ‘W ” o f the availability o f w ater for w eathering is given by W e i n e r t (1968) as a function o f the total annual p recip itation and the potential evaporation during the warmest m onth as follows :
12 EiN = ^ (11.15)
w here E j = potential evaporation in the warmest m onth and Pci = annual precipitation.
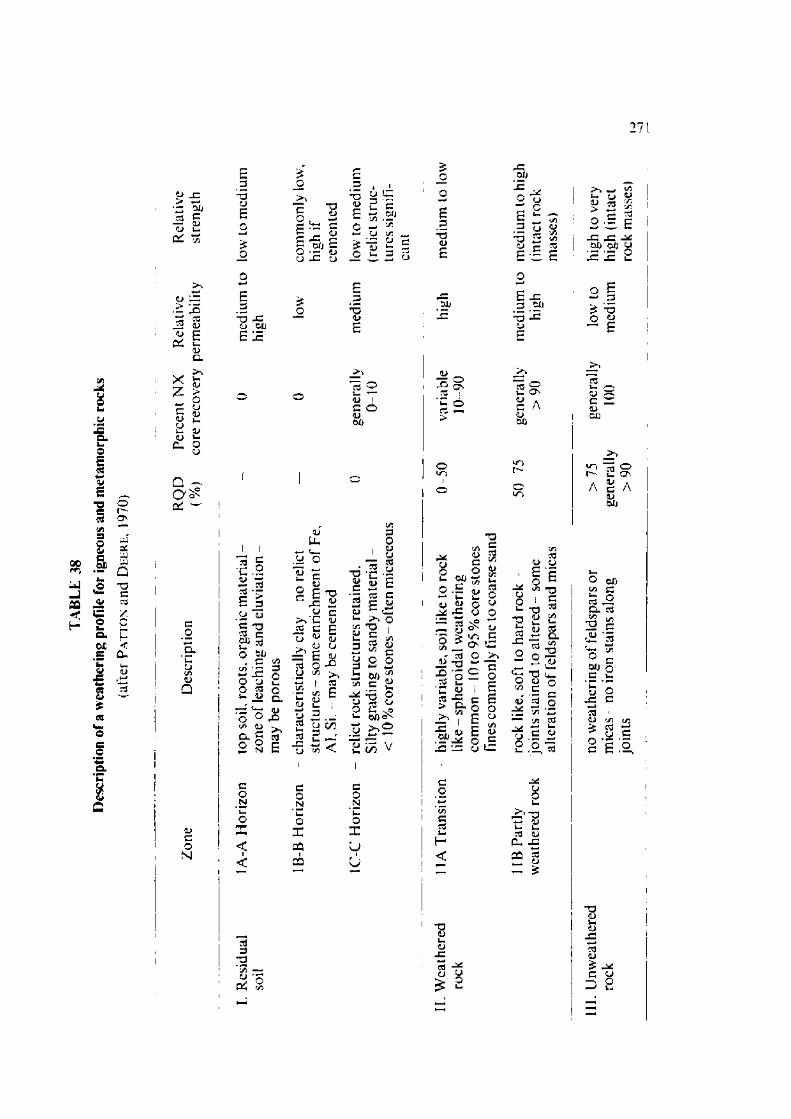
TABL
E 38
Des
crip
tion
of a
wea
ther
ing
prof
ile
for
igne
ous
and
met
amor
phic
ro
cks
(afte
r P
att
on
an
d D
ee
re
, 19
70)
271
oj jr - 0/)
-2 gc j v -
-oCJ % i k s
5 . ? E S 1 c c o — TiC (D w o c/3 ^
i f i § 1 1 § O -C CJ J s w — <->
£2"3
c j
jeo / j
c i j
■— ° C/3-a 2 ^I I r> ^ 3
>»53
o d
>» o —
•£ x qjoj P •“ 1) a
c j
oCj
XZc<Do• ~<d
CL
Q _Q ^ c w
coacCJC/3<D
CJCo
N
J=C J 0 1 j r™ • — C JZ
. 2r -
O
CJ ♦—*. 2r 3
r— >c
0 CJ
•0r 301)u KJ
0 O J)C/3
c /) ■ — 3w _ c OO CJ • _O O
CJ Q .
’ O
c—O
CJX
C/3 CJ > *c . C3c
N £
<uUu
.5 "oc j 7 ^ s- c
§ l ^ o c c juTZ C P
l j u 5^ c ^ = c:« oU V) •_>,
'5 I g■5 & £CJ i_S 5 . -2 y c/)
cofN
' c0
X <1<
C J C/3
cGN
' c0zccc1CC
3-a
TDCJ
r3 53d cc j01)
T3oC’c3
CJ
Poc jocdCJr~cc<U
p-O 0" 5 « 2 5 " y o o- 60 ssv. _c £0 ^ 0 o 2 .ct- Clf)O >>2
< 2i c/5 V
0 XU
1
U
O/j15
JD
CJ C
C OD ~ ^ c O .zs aj w •— o c j o
X ) •
o &
.eOU
C3CJ cN CJ> ‘O c(S
Or s c’ 0 „ 0
•—CJ
x : C
/—
£Q -C/3 O 0r—c 0
CJ £C/3CJ
5 cU3 0
cr3u1H
-aQJu.C J
-C
cZ3 01)
~o -Ccj
U ONS ACJO/j
•or-
C3CJ CJ £ C
^ O15■- -O ^2 — “b c; ^
x •“ s*2w ^ ,CJ
o <L) Q" • a =C J d o
U . E C J
o
X'"0tr 2C3 CJCl jc
5 8 —
ocCJCij
in 1—A
a.C/32
oOUcuZCJJ=
oc
TJCJU«CJXc3CJ
c
rock
m
icas
-no
iron
stai
ns
alon
g ge
nera
lly
100
med
ium
hi
gh
(int
act
join
ts
> 90
rock
m
asse
s)
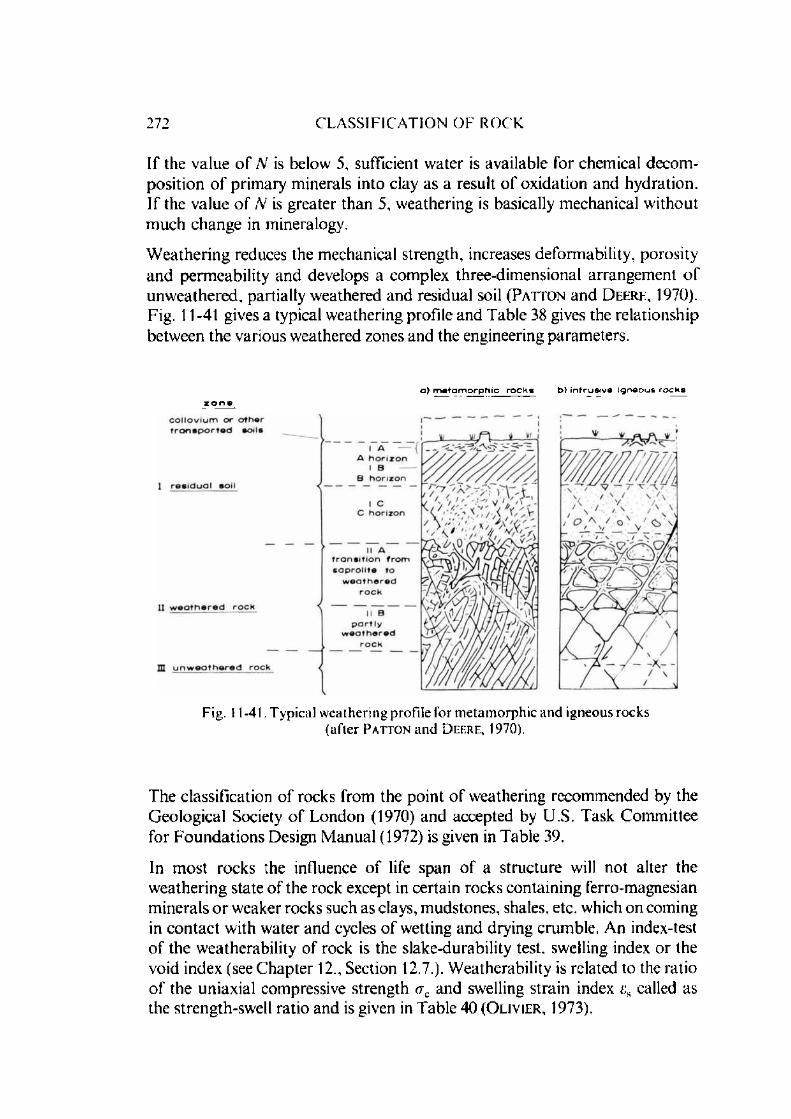
272 C L A S S I F I C A T I O N O F R O C K
If the value o f N is below 5, sufficient w ater is available for chemical decom position o f prim ary m inerals into clay as a result o f oxidation and hydration. If the value o f N is greater than 5, w eathering is basically m echanical w ithout m uch change in mineralogy.
W eathering reduces the m echanical strength, increases defonnability , porosity and penneability and develops a com plex three-dim ensional arrangem ent o f unw eathered, partially w eathered and residual soil ( P a t t o n and D e e r e , 1970). Fig. 11-41 gives a typical w eathering profile and Table 38 gives the relationship between the various w eathered zones and the engineering param eters.
a ) m e t a m o r p h i c r o c K s b ) i n t r u s i v e i g n e o u s r o c k szone
Fig. 11-41. T yp ica l w e a th e r in g p rofile fo r m e ta m o rp h ic a n d igneous rocks (a f te r P a tto n an d D eere , 1970).
The classification o f rocks from the point o f w eathering recom m ended by the G eological Society o f London (1970) and accepted by U.S. Task Com m ittee for F oundations Design M anual (1972) is given in Table 39.
In m ost rocks the influence o f life span o f a structure will not alter the w eathering state o f the rock except in certain rocks contain ing ferro-magnesian m inerals o r w eaker rocks such as clays, m udstones, shales, etc. which on coming in con tac t w ith w ater and cycles o f w etting and drying crum ble. An index-test o f the w;eatherability o f rock is the slake-durability test, swelling index or the void index (see C hapter 12., Section 12.7.). W eatherability is related to the ratio o f the uniaxial compressive strength oc and swelling strain index *:s called as the strength-swell ratio and is given in Table 40 ( O l i v i e r , 1973).
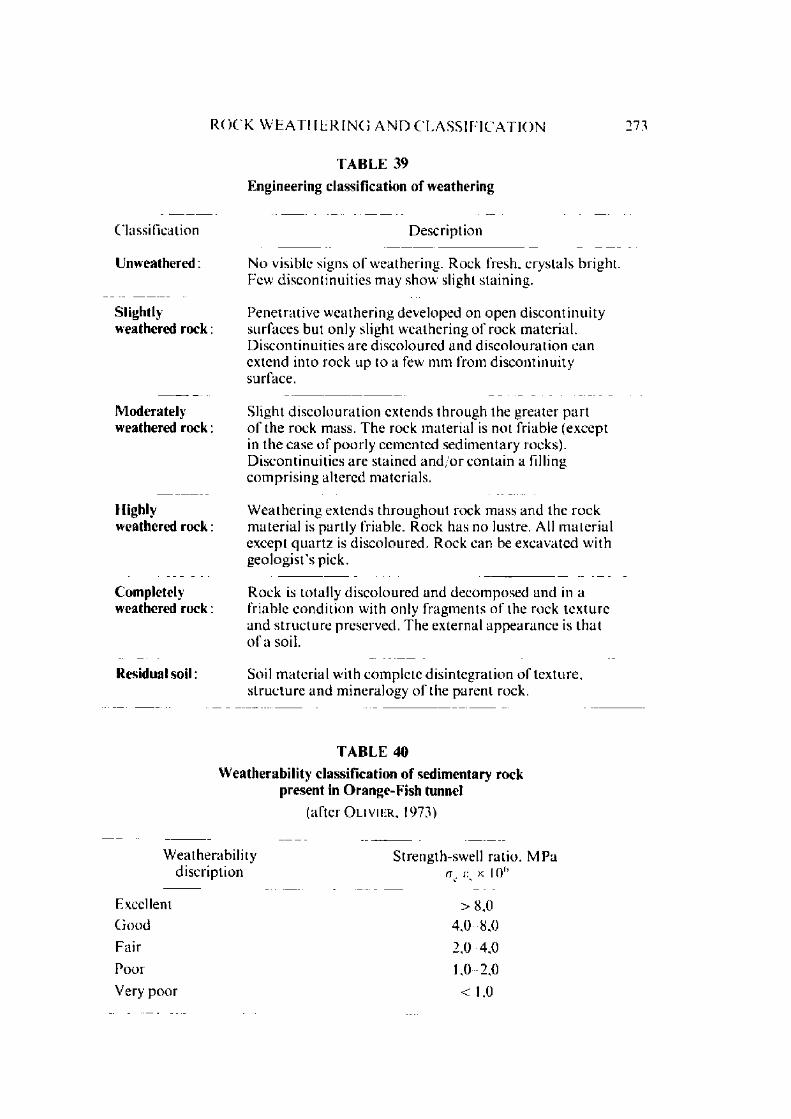
R O C K W E A T H E R I N G A N D C L A S S I F I C A T I O N 273
T A B L E 39
Engineering classification o f w eathering
Classification D escrip tion
U nw eathered : N o visible signs o f weathering. Rock fresh, crysta ls bright. Few d iscon tinu it ies m ay show slight staining.
Slightly Penetra tive w eathering developed on open d isco n tin u ityw eathered ro c k : surfaces bu t only slight w eathering o f rock m ateria l.
D iscon tinu ities are d isco loured and d isco lou ra t ion can ex tend in to rock up to a few m m from discon tinu ity surface.
M oderately Slight d isco lou ra t ion ex tends th ro u g h the g reater p a r tweathered ro c k : o f the rock mass. T he rock m ateria l is not friable (except
in the case o f p o o r ly cem ented sed im entary rocks). D iscon tinu itie s a re s tained a n d /o r con ta in a filling co m p ris in g altered materials.
Highly W ea th e r in g ex tends th ro u g h o u t rock m ass an d the rockweathered ro c k : m ater ia l is partly friable. Rock has no lustre. All m a te r ia l
except q u a r tz is d isco loured . R ock can be excavated w ith geologis t’s pick.
Com pletely R ock is totally d isco loured an d decom posed and in aweathered ro c k : friable cond it ion with only fragm ents o f the rock tex tu re
and s t ru c tu re preserved. T he external ap p ea ran ce is th a t o f a soil.
Residual so il: Soil m ater ia l with com ple te d is in tegration o f tex ture , s t ru c tu re an d m inera logy o f the paren t rock.
T A B L E 40
W eatherab ility classification o f sedim entary rock presen t in O range-F ish tunnel
(after O l i v i h r , 1973)
W eatherability Strength-swell ra tio , M Padiscription <rjc% x 10b
Excellent > 8 , 0G o o d 4,0 8,0
Fair 2,0 4,0
Poor 1,0-2,0
Very po o r < 1,0

274 C L A S S I F I C A T I O N O F R O C K
11.8. Classification of Intact Rock
Classification o f intact rock deals with the m aterial removed from its environm ent and devoid o f discontinuities. It includes any descriptive term inology relating the condition o f its origin and certain visual observatations on its structure, com position, texture, grain size, porosity and sometimes some other index properties such as swelling strain index o r slake durability. It is basically a geologist’s classification and gives a fair idea to the engineer about the type o f material that he has to deal with. The origin o f the rock, for example igneous rock, is an indication to the engineer that it will have small directional anisotropy while m etam orphic rock such as shale, chlorite, schist, have strong directional anisotropy. Similarly, limestone, gypsum and rock salt are associated with solution features such as caves, sink holes, etc. and lava flows with sheets and colum nar jo in ts and certain clays and shales are sensitive to m oisture. It is therefore im portant that the rock engineer does not loose side o f the immense wealth associated with the geological classification while considering the engineering classification o f intact rock.
The index properties along with the compressive strength are the engineering classification o f the rock substance and give an idea about the possible mechanical response o f the rock. These form an im portant part o f the overall classification o f the rock as discussed later.
A fter an extensive study, H a n d in (1966) grouped the m ost com m only experienced rocks into seven lithological groups (Table 41) depending upon their general behaviour. The term lithology connoted in his classification system refers not only to the general rock type (e.g. sandstones, dolom ites, shales) but also the m inor variations in mineralogy, texture and cem enting m aterial. Tests conducted by R u iz (1966) on 26 rock types from Brazil agree well with the lithological classification o f H a n d i n .
T A B L E 41Lithological c lassification o f rock (a f te r H a n d i n , 1966)
Type Rock m ateria l
1 U nfolia ted igneous an d m e tam o rp h ic rocks, q uar tz i te , highly s ilicacemented sands tone :
9 Slate and highly in dura ted shale:
3 D olom ite :
4 M odera te ly well cem ented sands tone :
5 L im estone:
6 Schist, shale, m u d s to n e , and poorly indurated siltstone:
7 Salt and gypsum .

C L A S S I F I C A T I O N O F IN TA C T R O C K 275
T he classification system that is o f greater im portance for an engineer is the one based upon num erical values. The purpose o f it is to provide inform ation on w hether the strength o f the intact m aterial in itself is likely to be a source o f trouble. C o a t e s (1964), C o a t e s and P a r s o n s (1966) have classified rock substance based upon com pressive strength and deform ation param eters determ ined in the laboratory. They divided the rock into weak (less than 5()00 lbf/in2 (35 M Pa)), strong (between 5000and 25000 lbf/in2 (35 to 173 MPa)) and very strong (greater than 25000 lbf/in2 (173 M Pa)) categories. F urther facto rs that they considered in the classification o f rock substance are the prefailure deform ation and failure characteristics. In the prefailure deform ation the rocks m ay be classified as elastic if there is no creep at 50% o f the compressive strength o r viscous if the rocks creep at 50% o f the compressive strength. (In such cases, it is desirable to give the creep rate.) In the failure characteristics if the failure is sudden the rocks are classified as brittle and if the failure is by How, they are termed as plastic (25 % o f total strain before failure is permanent). This classification system is useful when classifying rocks for drilling, grinding and underground blasting purposes o r for fragm entation on a smaller scale and in rocks which are massive in nature w ithout joints. Some o f the rocks classified by them are given in T able 42.
T o include a wider range o f m aterials met with in civil engineering, the strength classification has been extended by a num ber o f au thors ( D e e r e and M i l l e r , 1966; S t a p l e d o n , 1968; G eological Society o f London, 1970; B rcx 'H and F r a n k l i n , 1972; J e n n i n g s et al, 1973; B i e n i a w s k i , 1973). A general com parison o f the various classes with num erical values o f uniaxial compressive strength is given in Fig. 11-42. T he classification scale o f D e e r e and M i l l e r (1960) has been m ore o r less accepted now and this is represented in T able 43. T h is covers alm ost the com plete range o f the rocks met with in m ining and civil engineering. The com pressive strength is determ ined on specimens with the height/diam eter ratio o f at least 2. The division into class o f highest strength is chosen at about 200 M Pa which is alm ost the strength o f very strong rocks such as quartzite, dolerite, gabbro, basalt, diabase, etc. The other classes are scaled down by a dividing factor o f 2. The class B includes m ajority o f coarsegrained igneous (granites, granodiorites) and stronger m etam orphic rocks and som e strong sandstones, lim estones and dolomites. Class C includes m ost o f shales, medium strength sandstones and limestones and m etam orphic rocks having schistose structure such as chlorites, micaceous and talc schists. Class D includes coal and siltstones and m any carbonaceous rocks while E includes low strength rocks such as m udstones, clay shales, rock salts, chalks and weathered rocks.
T he deform ation characteristics o f the rock substance has also been considered in rock classification. It has been shown that stronger rocks in general have a high m odulus. Instead o f using the m odulus value alone, the ra tio o f the

276 C L A S S I F I C A T I O N O F R O C K
TA BLE 42R ock substancc classification (after C o a t e s an d P a r s o n s . 1966)
N a m e <TC,kgf/cm 2
E. k g f /cm 2 x 10 s
c,// /h r
v.p.%
Substaiclassifies
A n d esi te 3.8 2.49.7 0.06
Basalt 5.5 1.5
B las ton ite 1190 4.53 1.75 7.3 S, E, B((8)) ((8)) ((2)) ((9))
(45.0) (32.1) (72)
C h lo r i te 1120 6.09 1.42 4.7 S, E. B((10)) ((10)) ((4)) ((6))(8.0) (8.81) (6.60) (40)
C o n g lo 2220 7.60 1.0 1.8 VS, E, Bm era te ((32)) ((32)) ((3)) ((2))
(22.5) (15.7) (40)
D iab a se 2180 9.48 0.9 0.7 VS, E, B((23)) ((23)) ((4)) ((3))(35.2) (11.5) (33) (90)
F lo u r i te 1020 5.27 0.25 10.8 S, E. B((2)) ((2)) ((2)) ((2))
G ra n i te 1 1720 6.58 0 1.0 S, E, B((7)) ((8)) ((2)) ((2))
(17.4) (10.7)
G ra n i te 2 2760 7.38 0.8 1.8 VS, E, B((5)) ((5)) ((4)) ((10))(4.0) (4.8) (91) (108)
G ra n i te 3 1440 7.16 0.4 4.1 S, E, B((4)) ((4)) ((3)) ((16))
(30.2) (9.8) (82.5) 82)-
G ra n i te 4 3.8 1.1
G ra n i te 5 1400 5.4 1.4 S, E
H alite 156 1.84* 92.8 83.9 W , V, P((4)) ((5)) ((5)) ((5))
(11.0) (19.8) (21.6) (5.48)
H e m a ti te 1940 7.45 < 1 1.4 VS. E, B((9)) ((9)) ((3)) ((3))
(6.57) (11.3) (8.0)
L im es to n e 1 2780 5.89 3.6 1.5 VS. V, B((6)) ((6)) ((2)) ((5))
(13.7) (17.8) (86)
* Based o n final un lo ad in g cycle.
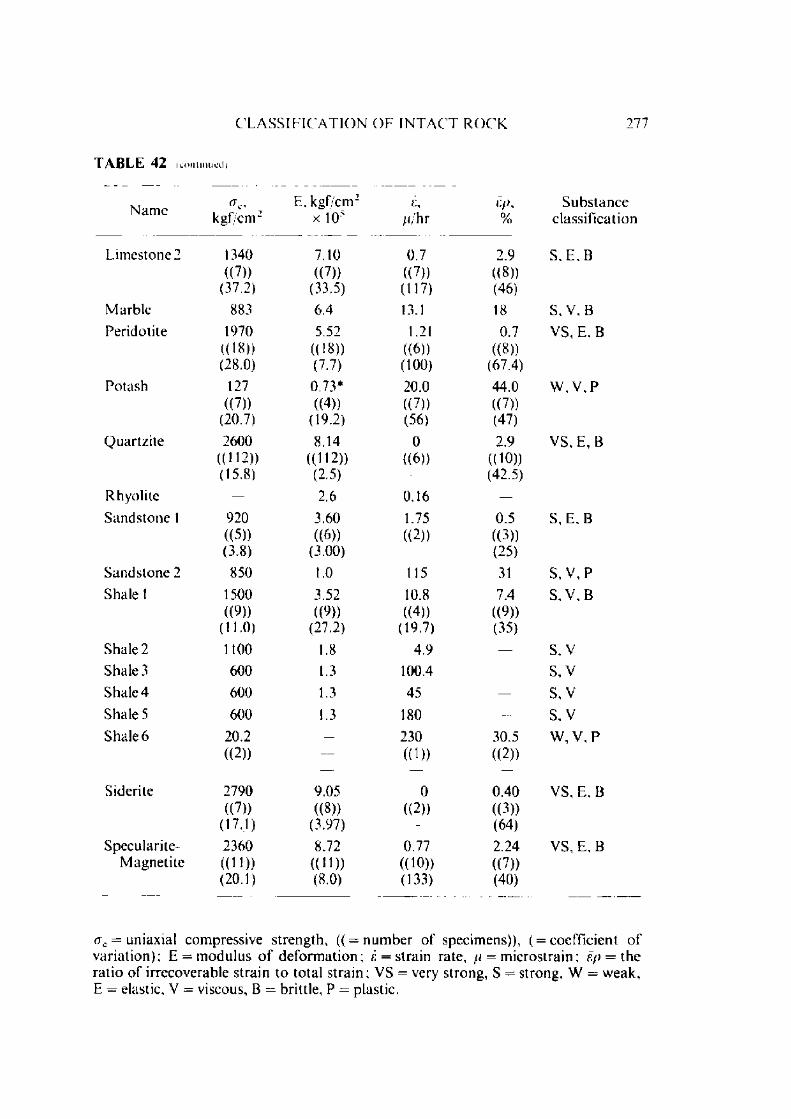
C L A S S I F I C A T I O N O F I N T A C T ROC K 277
T A B L E 42 (continued)
^ <rc, E ,k g f /c m 2 £, r.f>, S u b s ta n cekgf/cm 2 x 10**' / / /h r % c lassif ication
Lim estone 2 1340 7.10 0.7 2.9 S, E, B((7)) ((7)) ((7)) ((8))
(37.2) (33.5) (117) (46)
M arble 883 6.4 13.1 18 S, V, B
Peridotite 1970 5.52 1.21 0.7 VS, E. B((18)) ((18)) ((6)) ((8))(28.0) (7.7) (100) (67.4)
Potash 127 0.73* 20.0 44.0 W , V ,P((7)) ((4)) ((7)) ((7))
(20.7) (19.2) (56) (47)
Q uartz ite 2600 8.14 0 2.9 VS, E. B((112)) ((112)) ((6)) ((10))(15.8) (2.5) (42.5)
R hyolite 2.6 0.16
S ands tone 1 920 3.60 1.75 0.5 S, E, B((5)) ((6)) ((2)) ((3))(3.8) (3.00) (25)
S an d s to n e 2 850 1.0 115 31 S , V , P
Shale 1 1500 3.52 10.8 7.4 S, V, B((9)) ( m ((4)) ((9))
(11.0) (27.2) (19.7) (35)
Shale 2 1100 1.8 4.9 S, V
Shale 3 600 1.3 100.4 S, V
Shale 4 600 1.3 45 S, V
Shale 5 600 1.3 180 — S, V
Shale 6 20.2 230 30.5 W , V , P((2)) ((D) ((2))
Siderite 2790 9.05 0 0.40 VS, E, B((7)) ((8)) ((2)) ((3))
(17.1) (3.97) (64)
Specularite- 2360 8.72 0.77 2.24 VS, E. BM agnetite ( (H )) ((H )) ((10)) ((7))
(20.1) (8.0) (133) (40)
crc = uniaxial com pressive s treng th , ( ( = n u m b er o f specimens)), ( = coefficient o f va r ia t ion ) ; E = m o d u lu s o f d e fo rm a tio n ; e = s tra in rate, // = m icros tra in : Ep = the ra tio o f irrecoverable s tra in to to tal s tra in ; VS = very s trong , S = strong, W = w eak , E = elastic, V = viscous, B = brittle , P = plastic.

278 C L A S S I F I C A T I O N O F ROC K
T A B L E 43
S treng th classification for rock substance
(after D e e r e an d M i l l e r . 1966)
~ . . U niaxial com pressive s treng thD escrip tion ^ pa
A Very high strength > 2 0 0
B High strength 100 200
C M edium strength 50 100
I) Low strength 2 5 - 50
E Very low strength < 2 5
T A B L E 44
C lassification o f in tact rock based upon modulus ra tio
(after D e e r e an d M i l l e r , 1966)
C lass D escrip tion M o d u lu s ra tio
H High m o d u lu s ra tio > 500
M M edium m o d u lu s ra tio 200 500
L Low m o d u lu s ra tio < 2 0 0
N ote: M o d u lu s ra tio is defined as the ra tio o f the tangen t m o d u lu s at 50 percent o f the u l t im a te s trength o f the m ater ia l to the uniaxial com pressive strength .
un iaxia l com p n
0 .0 0 , 7 I* * 1 * » I 3 4 5 6 7 8 IO_i-1 1— » i-t-4 2 0 3 0 4 0 SO 7 0 * 9 °i . . i. i i . 12 0 0 3 0 0 4 0 0 3 0 0 7 0 0
C o a t * *s tron g v e ry * t r o n g ( 1964)
low m ed ium high v e ry highst rength strength • trength • trangth
Millar(1 9 6 6 )
Stap le dovery weak w ea k m ed iu m stron g •tron g v e ry s tron g ( 1 9 66 )
v m r y w eak w eak m o d e ra te lyw eak m o d e ra te ly s tron g stron g
v e rys tron g e x tr e m e ly s tron g
• o l !♦ + " * ■ rock
e x t r e m e lylo w
e tr en g thv e r y lo w strength low stren gth m ed iu m • tren g th h igh s tren gth v e r y high strength
— e x trem e ly —, high
L_ s tr en g th _J
G eo lo g ic a lS o c ie ty(1 9 7 0 )
B ro ch »I In
—. o r o c n iI F ro n k l
—I (1 9 7 2 )
v e ry e o ft rock • o f t roCk hard rock ve ry hard rock ex tr e m e ly ha rd ro ck
Jen n in gs I el al
1 ------1 (1 9 7 3 )
v * r y low stren gh low m ed ium h ighstren gth stren gth stren gth vary h ig h * tr*n g th
B len iow sk i ( 1 9 7 3 )
Fig. 11-42. S trength classifications for rock substance.

C L A S S I F I C A T I O N O F I N T A C T R O C K 279
m odulus and the uniaxial compressive strength called as “ m odulus ra tio " has been used and the classification is given in Table 44.
D escribing the rock together using both the classifications sim ultaneously gives a better idea o f the rock type. Figs. 11-43 to 11-45 give visual classification plots o f different rock types. The uniaxial compressive strength and m odulus values are plotted on a log scale. The zones o f high ( > 500), m edium (200 to 500) and low ( < 200) m odulus ratios are given by diagonal lines. M ost o f the igneous rocks have m edium m odulus ratios and so also is true o f a m ajority o f sedim entary and m etam orphic rocks, though shales tend to have lower m odulus and m arbles higher m odulus ratios.
u n iax ia l c o m p r e e e i v © s t r e n g t h , <rc
Fig. 11-43. Classification for intact rock substance sum m ary plot for igneous rocks (176 specimens, 75% o f points)
£, = tangent m odulus at 50% ultimate strength Class rock as A M . BFL BL, etc.(after D eere and M i l l e r , 1966).
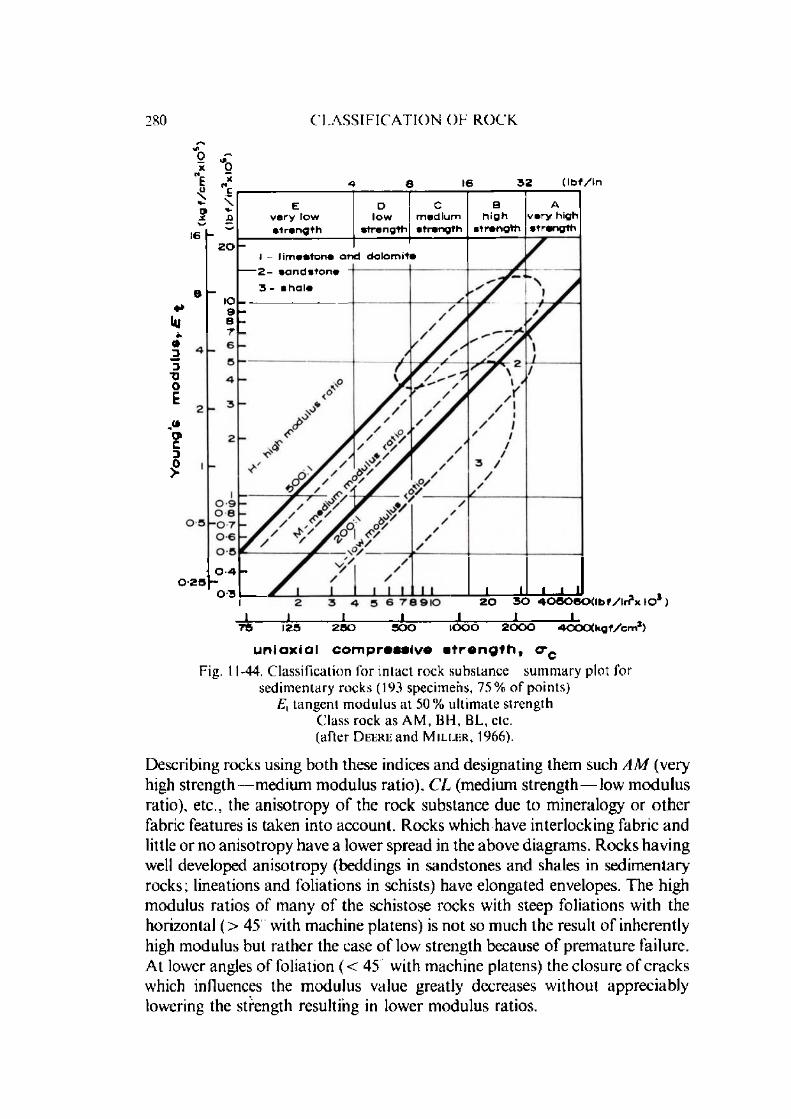
280 C L A S S I F I C A T I O N O F R O C K
0 - 2 30 -4
0 -3
2 5 0
2 0 3 0 4 0 0 0 6 0 ( l b f / l r ? x IO S )
J5 0 0 IO O O 2 0 0 0 A O O C X kg f/cm 2)
( I b f / in
v e ry lows tre n g th streng th
m ed iumstrength s treng th
Av e ry high streng th
I - lim e s to n e and d o lo m ite ' 2 - s a n d s to n e
3 - 8 h a le
u n i a x i a l c o m p r « M i v e s t r e n g t h , <rcFig. 11-44. Classification lor intact rock substance sum m ary plot for
sedimentary rocks (193 specimens, 75% o f points)£, tangent m odulus at 50% ultimate strength
Class rock as A M , BH, BL, etc.(a fte r D eere a n d M il l e r , 1966).
Describing rocks using both these indices and designating them such A M (very high strength medium m odulus ratio), CL (medium s tre n g th - low m odulus ratio), etc., the anisotropy o f the rock substance due to mineralogy or o ther fabric features is taken into account. Rocks which have interlocking fabric and little or no anisotropy have a lower spread in the above diagram s. Rocks having well developed anisotropy (beddings in sandstones and shales in sedim entary rocks; lineations and foliations in schists) have elongated envelopes. The high modulus ratios o f m any o f the schistose rocks with steep foliations with the horizontal (> 45 with m achine platens) is not so much the result o f inherently high m odulus but ra ther the case o f low strength because o f prem ature failure. A t lower angles o f foliation ( < 45 with m achine platens) the closure o f cracks which influences the m odulus value greatly decreases w ithout appreciably lowering the strength resulting in lower m odulus ratios.

C L A S S I F I C A T I O N O F I N T A C T R O C K 281
3 0 <40 5 0 6 0 ( l b f / i n 3xlC^)
7 5 125 2 5 0 5 0 0 IO O O 2 0 0 0 4 0 0 0 ( k g f / c n S )
u n i a x i a l c o m p r e s s i v e s t r e n g t h , a cFig. 11-45. Classification for rock substance sum m ary plot for m etam orphic
rocks (167 specimens, 75 % o f points)Ex = tangent m odulus at 50% ultimate strength
C lass rock as A M , BH, BL, etc.(after D e e r e and M i l l e r , 1966).
0 5
i0 9 0 8
h o -7 0-6 0 5
16 3 2 ( Ib f / in ’ xIO3)
A
high s treng th
Dlow
strenglti
q u a r tz ite-
gneiss
marbleschist
a s te e p fo lia tio n ^b f la t fo lia tio n //
Ev e ry low s tren g th
W hile determ ining com pressive strength o f rock, any o f the m ethods described earlier (C hapter 2, Volume I) m ay be used. From the classification point o f view, the point load test has been found to be sufficient. The point load
pstrength index (C hapter 3, Volum e I) calculated from the relationship / s =
where P is the failure load and D is the distance between the loading platens is related to the com pressive strength oc by the relationship (B ik n ia w sk i , 1975b)
<7C = 2 4 / s (11 .16 )
The m odulus values can be determ ined by the techniques described in C hapter 6 (Volum e II).

282 C L A S S I F I C A T I O N O F R O C K
11.9. Classification of Rock In Situ
The first a ttem pt to classify rock in situ was by T e r z a g h i (1946) whose a p proach was descriptive and not defined by m easurem ents. The first classification system based upon m easurem ents taking into account the com pressive strength o f intact rock, jo in t spacing and in situ w ater has been due to the developm ents by the Salzburg School ( J o h n , 1962; M u l l e r , 1963) on the lines set forth by S t i n i (1922, 1929 and 1951).
Salzburg School Classification
The classification system developed by the Salzburg School takes into consideration the following properties:(a) In tact rock strength.(b) Jo in ts, their orientation, spacing, degree o f jo inting, extent, aperture and
coefficients o f friction.(c) Presence or absence o f water.(d) R elative size o f the tunnel and the open length* (in tunnelling only).
Figs. 11-46 and 11-47 represent the modified version as now com m only used. Fig. 11-46 represents the influence o f the jo in t frequency and jo in t continuity (degree o f separation) while Fig. 11-47 shows the influence o f rock substance and jo in t spacing on overall strength o f the rock mass. The com bined effect o f all the three factors (a, b, c) is shown in Fig. 11-48 in a very qualitative way. One po in t tha t is very clear from this representation is the influence o f the joint fabric which becomes m ore significant as the strength o f rock increases.
s p a c i n g o f j o i n t s
d e g r e es e p a r a t i o n
li t t l e
J
m o d e r a t e l y
o i n t e c
in t e n s i v e l yc r u s l r e d t o m y l o n i t i z e d
Oc o m p e t e n t ( n e a r l y n o t o - 2
j o m t e a )
1 e
•c®E®
*o0l-
0 - 4v e r y d i * c o n t in u o u *
j o i n t sO 6
d i s c o n t i n u o u s _ j o i n t s
c o n t i n u o u s jo i n t s I’O
\ 'O/
11
i n!V
s p a c i n g o f j o i n t * c m IO O O 100 10 i
Fig. 11-46. Partial mobility o f rock mass in relation to spacing of joints and degreeo f separation
I Q uasim onolith : II Jo in ted rock: III C racked rock ; IV Shattered rock (after M u l l f r and H o f m a n n , 1970).
*) Open length means unsupported length, i.e. d istance between the face and the last support unit.
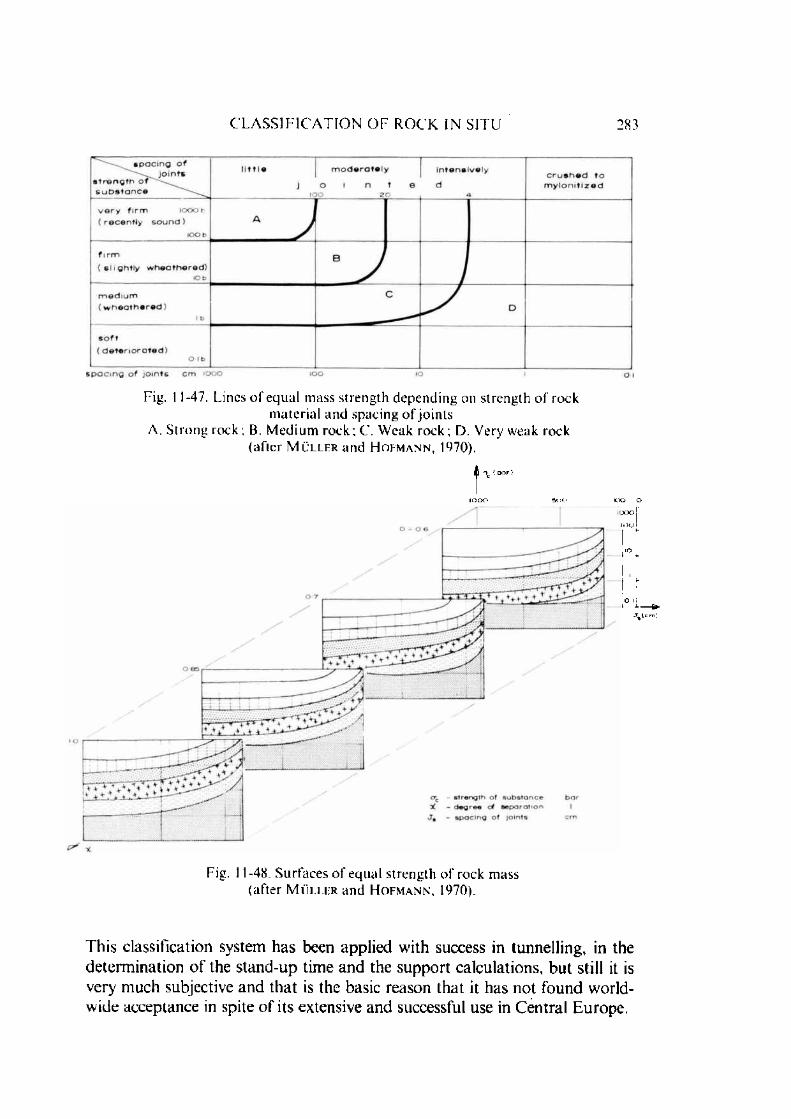
C L A S S I F I C A T I O N O F R O C K IN S I T U 283
Fig. 11-47. Lines o f equal mass strength depending on strength o f rock material and spacing o f jo in ts
A. S trong rock; B. M edium rock; C. W eak rock; D. Very weak rock (after M u l l e r and H o f m a n n . 1970).
^ ac ( b a r )
IOOO 5 0 0 0 0 O
.oojj
J .(c m )
Fig. 11-48. Surfaces o f equal strength o f rock mass (after M u l l e r and H o f m a n n , 1970).
This classification system has been applied with success in tunnelling, in the determ ination o f the stand-up time and the support calculations, but still it is very much subjective and that is the basic reason that it has not found w orldwide acceptance in spite o f its extensive and successful use in C entral Europe.
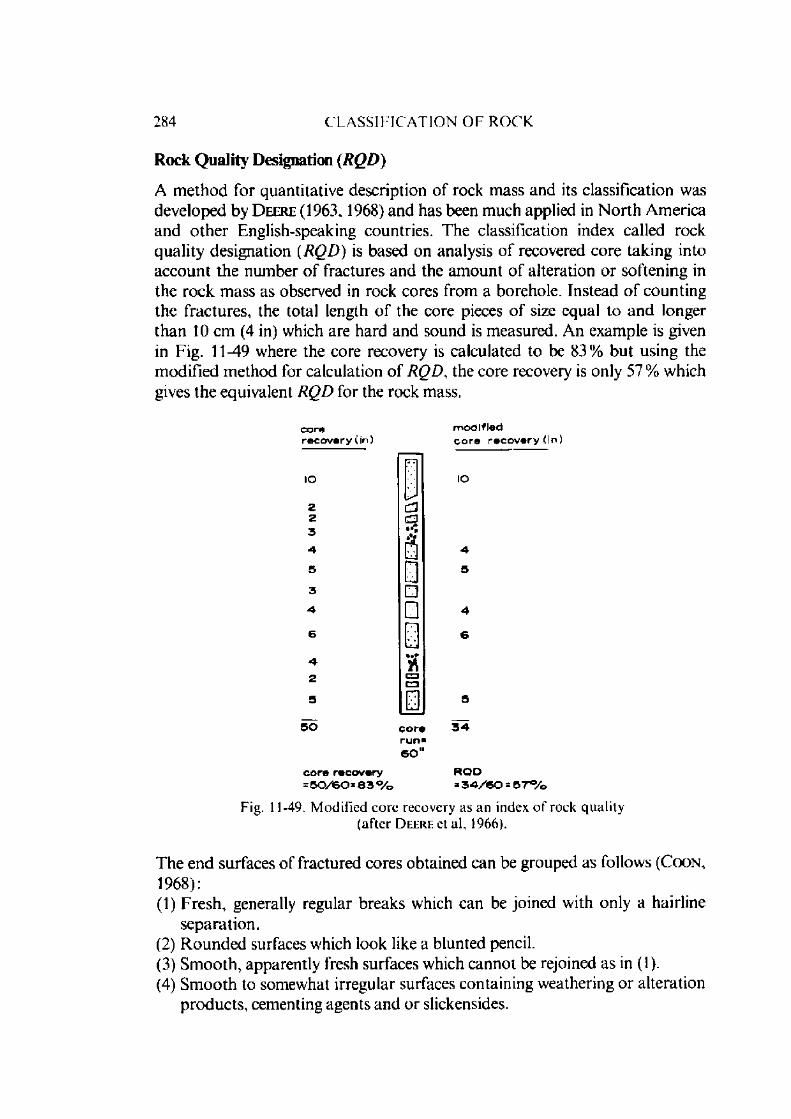
284 C L A S S I F I C A T I O N O F R O C K
Rock Quality Designation (RQD)
A m ethod for quantitative description o f rock m ass and its classification was developed by D eere (1963, 1968) and has been m uch applied in N o rth Am erica and o th er English-speaking countries. The classification index called rock quality designation (R Q D ) is based on analysis o f recovered core taking into account the num ber o f fractures and the am ount o f alteration o r softening in the rock m ass as observed in rock cores from a borehole. Instead o f counting the fractures, the total length o f the core pieces o f size equal to and longer than 10 cm (4 in) which are hard and sound is m easured. An exam ple is given in Fig. 11-49 where the core recovery is calculated to be 83% but using the m odified m ethod for calculation o f R Q D , the core recovery is only 57% which gives the equivalent RQ D for the rock mass.
m o d ifie dc o re re c o v e ry (In )
IO
A5
6
5
3 4
ROD= 3 4 / 6 0 = 5 7 %
Fig. 11-49. M od if ied co re recovery as an index o f rock qua li ty (a f te r D eere e t a l, 1966).
The end surfaces o f fractured cores obtained can be grouped as follows (C o o n , 1968):(1) F resh , generally regular breaks which can be joined with only a hairline
separation.(2) R ounded surfaces which look like a blunted pencil.(3) S m ooth , apparently fresh surfaces which cannot be rejoined as in (1).(4) Sm ooth to somewhat irregular surfaces containing weathering or alteration
p roducts, cementing agents and or slickensides.
corere c o v e ry (in )
IO
2 2 3
A5
3
A6
A2
5
5 0 c o rer u n * 6 0 "
c o re re co very = 5 0 / 6 0 = 8 3 %
(3C3
a□□□
aCZJcn
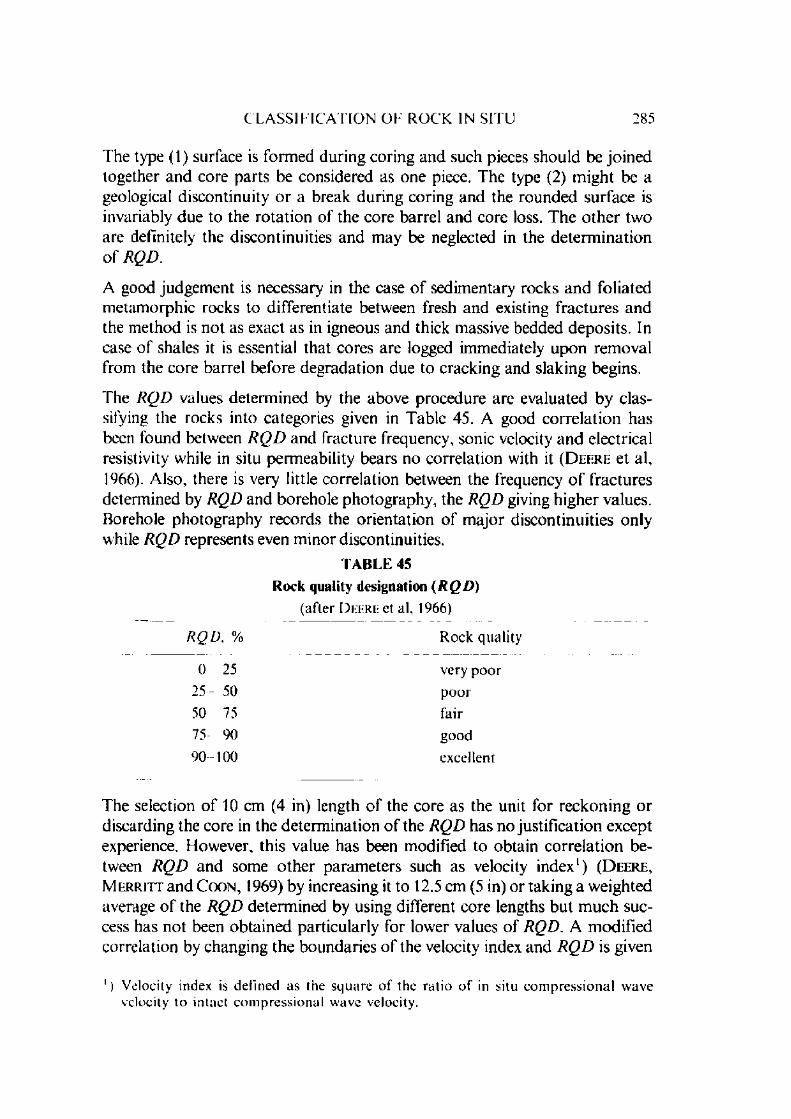
C L A S S I F I C A T I O N O F R O C K IN S I T U 285
The type (1) surface is form ed during coring and such pieces should be jo ined together and core parts be considered as one piece. The type (2) m ight be a geological discontinuity o r a break during coring and the rounded surface is invariably due to the ro ta tion o f the core barrel and core loss. T he o th er two are definitely the discontinuities and may be neglected in the determ ination o f RQD.
A good judgem ent is necessary in the case o f sedim entary rocks and foliated m etam orphic rocks to differentiate between fresh and existing fractures and the m ethod is not as exact as in igneous and thick massive bedded deposits. In case o f shales it is essential that cores are logged immediately upon rem oval from the core barrel before degradation due to cracking and slaking begins.
The RQ D values determ ined by the above procedure are evaluated by classifying the rocks into categories given in Table 45. A good corre la tion has been found between R Q D and fracture frequency, sonic velocity and electrical resistivity while in situ perm eability bears no correlation with it ( D e e r e et al, 1966). Also, there is very little correlation between the frequency o f fractures determ ined by R Q D and borehole photography, the RQ D giving higher values. Borehole photography records the orientation o f m ajor discontinuities only while RQ D represents even m inor discontinuities.
T A B L E 45
Rock quality designation ( R Q D )
(a fter D eere et al, 1966)
R Q D , % Rock quality
0- 25 very p o o r
25 50 p o o r
50 75 fair
7 5 - 90 good90 100 excellent
The selection o f 10 cm (4 in) length o f the core as the unit for reckoning o r discarding the core in the determ ination o f the RQ D has no justification except experience. However, this value has been modified to obtain corre la tion between RQ D and some o ther param eters such as velocity index1) ( D e e r e , M e r r i t t and C o o n , 1969) by increasing it to 12.5 cm (5 in) or taking a weighted average o f the RQ D determ ined by using different core lengths but m uch success has not been obtained particularly for lower values o f RQD. A m odified correlation by changing the boundaries o f the velocity index and R Q D is given
1) Velocity index is defined as the square o f the ratio o f in situ com pressional wave velocity to intact com pressional wave velocity.
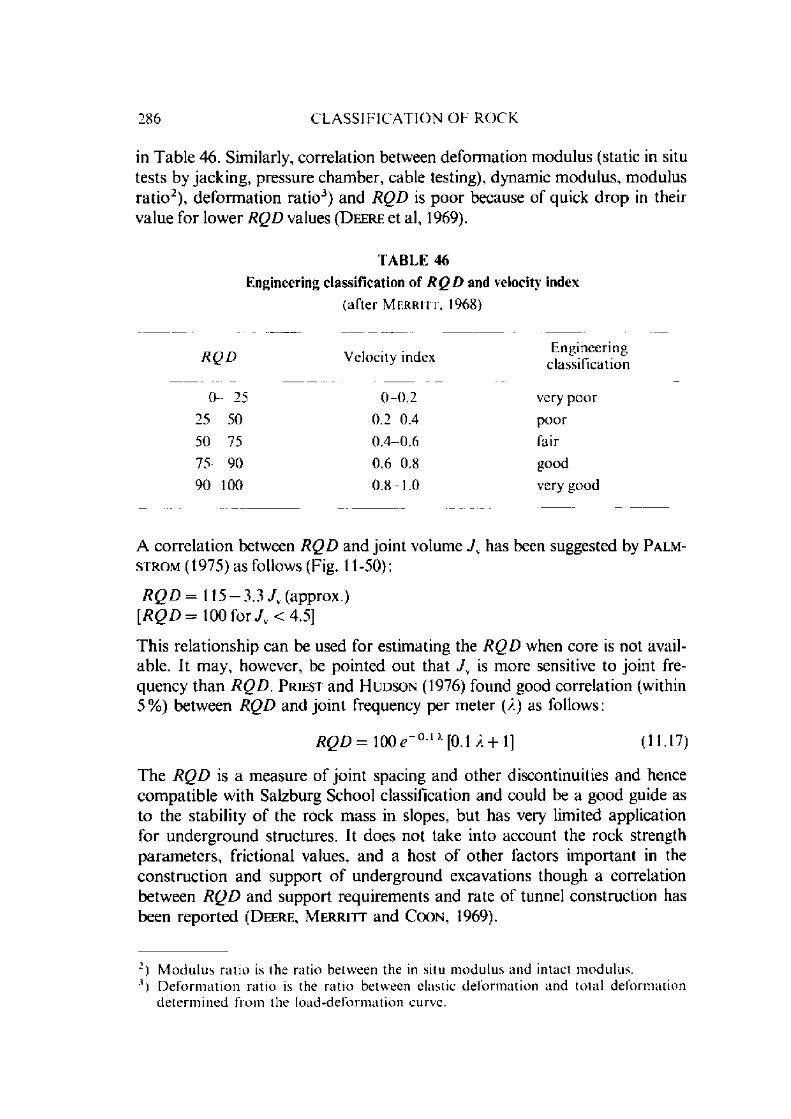
286 C L A S S I F I C A T I O N O F R O C K
in T ab le 46. Similarly, correlation between deform ation m odulus (static in situ tests by jacking , pressure cham ber, cable testing), dynam ic m odulus, m odulus ra tio 2), deform ation ra tio3) and RQ D is poor because o f quick d ro p in their value for lower RQ D values (D eere et al, 1969).
T A B L E 46
Engineering classification of RQ D and velocity index
(a f te r M e r r it t , 1968)
R Q D Velocity indexE ngineering
classification
0 25 0 0.2 very p o o r
25 50 0.2 0.4 p o o r
50 75 0 .4 -0 .6 fair
7 5 - 90 0.6 0.8 good
90 100 0.8 1.0 very good
A co rre la tion between R Q D and jo in t volume J s has been suggested by P a lm - s i r om (1975) as follows (Fig. 11 -50):
R Q D = 115 — 3.3 J v (approx.)[ R Q D = 100 for */v < 4.5]
T his relationship can be used for estim ating the R Q D when core is not available. It m ay, however, be pointed out that ./v is m ore sensitive to jo in t frequency than R Q D . P riest and H u d so n (1976) found good correlation (within 5% ) between RQD and jo in t frequency per m eter (/.) as follows:
R Q D = 1 0 0 1 x [0.1 A + l] (11.17)
T he R Q D is a m easure o f jo in t spacing and o ther discontinuities and hence com patib le w ith Salzburg School classification and could be a good guide as to the stability o f the rock m ass in slopes, but has very limited application for underground structures. It does not take into account the rock strength param eters, frictional values, and a host o f o ther factors im portant in the construction and support o f underground excavations though a correlation between R Q D and support requirem ents and rate o f tunnel construction has been reported ( D eere , M e r r it t and C o o n , 1969).
2) M odu lus ratio is the ratio between the in situ m odulus and intact modulus.3) D e fo rm atio n ratio is the ra tio between elastic deform ation and total deformation
de term ined from the load-deform ation curve.

C L A S S I F I C A T I O N F O R U N D E R G R O U N D E X C A V A T I O N S 287
IOO
9 0
7 5
\
QO 50o:
2 5
= 11 5 - 3 3 J-
joint vo lu m e , / m s
b lo cksize
I arge m ed ium small v e ry smal
Fig. 11-50. A pproxim ate re la tionship between R Q D and joint volume J s (b lock size)(a f te r P almsi ro m , 1975).
11.10. Rock Classification for Underground Excavations
A ny com prehensive rock m ass classification for underground excavations should be objective and provide easy to determ ine indices which can be put together to give some com m on values reliable enough to divide the rock mass into groups o f similar engineering behaviour from the point o f view o f the excavation techniques and support requirem ents. This is only possible if the classification system incorporates all the variables that enter to influence the structure placed in a rock mass. Three comprehensive classification systems developed independently which are based very heavily on the earlier concepts such as the Salzburg School classification and RQD are given here in detail.
11.10.1. South Afr ican G eom echan ics Classification
A ccording to this classification system (B ie n ia w s k i , 1973 and 1975a) rock m ass is divided into a num ber o f regions having similar structural characteristics,
R O D
3 6 KD 2 0 3 0 6 0
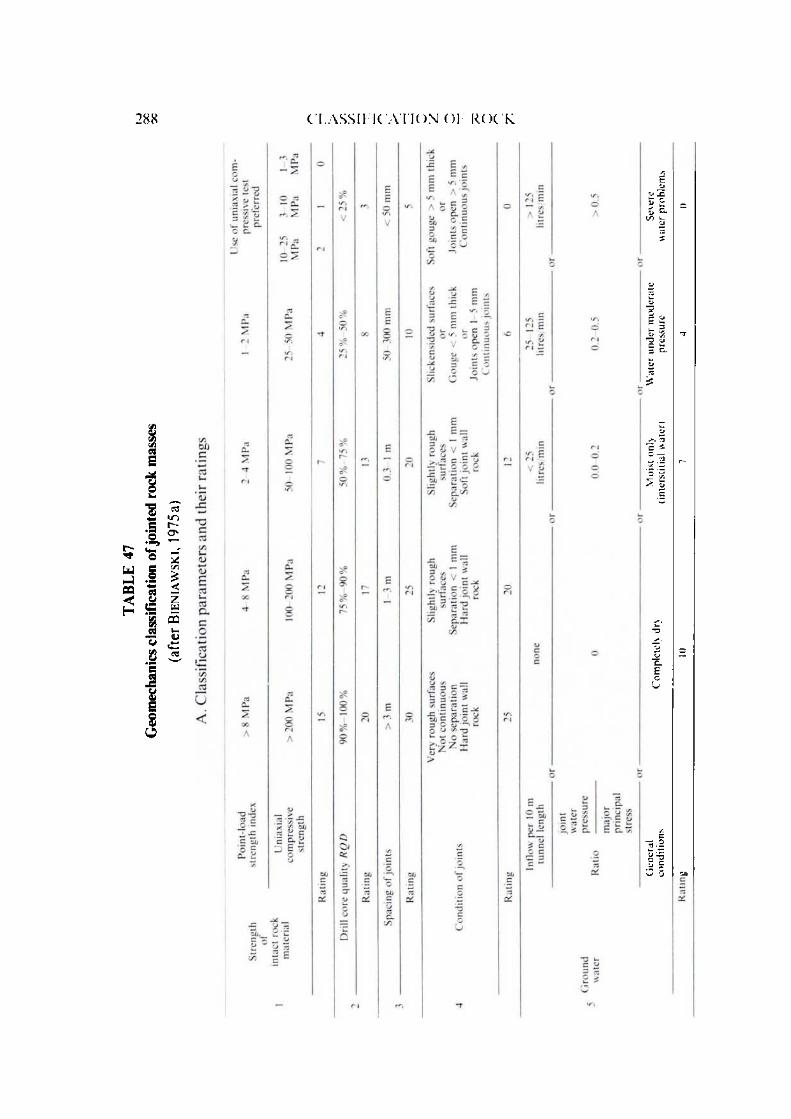
TAB
LE
47
Geo
mec
liani
cs
clas
sifi
catio
n of
join
ted
rock
m
asse
s
(aft
er
Bie
nia
ws
ki,
1975
a)
288 C l A S S II 1C A 1 IO N O l ROC k
Gen
eral
„
. .
. M
oist
on
ly
Wat
er
unde
r m
oder
ate
Seve
re
cond
ition
s om
pete
iyar
y (i
nter
stiti
al w
ater
) pr
essu
re
wat
er
prob
lem
s

. Adj
ustm
ent
for
join
t or
ient
atio
ns
C L A S S I F I C A T I O N F O R U N D E R G R O U N D E X C A V A T I O N S 289

290 C L A S S I F I C A T I O N O F R O C K
e .g . the sam e rock type, the same jo in t spacing, etc. The following param eters o f the regions are established:
1. U niaxial com pressive strength2. R Q D3. W eathering and alteration character4. Spacing o f jo in ts5. Jo in t separation , continuity and filling6. G ro u n d w ater7. D ip and strike o f joints.
The rock m ass has been classified into 5 classes and the relative indices o f the various param eters for these classes are given in Table 47. Since all the param eters are not o f equal im portance, each param eter is assigned a rating, a weighted num erical value, and a sum total o f all the values o f the various p aram eters o f the rock define the rock quality such as very good, good, etc.
It shall be clear from Table 47 that though ratings o f o ther param eters are unaltered for tunnels, foundations and slopes, the rating o f o rien tation o f jo in ts is o f relatively smaller im portance in tunnels, but o f far higher im portance in slopes and foundations (Table 4 7 B). Sim ilarly on longwall faces, the cleavage o rien ta tion to guard against fall o f coal on the working front and the caveability o f ro o f will be dependent upon orien tation o f cleavage and jo in ts in the ro o f w ith respect to the line o f faces and here the rating shall be different and shall be m ore or less in line with that used for tunnels.
T he classification system, however, does not take into account the size o f the opening w ith respect to the jo in t spacing o r o th e r param eters, but has been found to w ork for openings up to 12 m with success. Its application to support design is given in Table 48. The ratings obtained bear a non-linear relationship
w ith the m odulus reduction factor ( /r^'roc—rjLSS— ] (Fig. 11-51) and is very\ -^ ro c k s u b s ta n c e J
m uch sim ilar to that obtained for RQD.
B ie n ia w s k i (1973) has used these classes to determ ine the stand up time in line with the concept put forward by L a u ffe r (1958). The ratings determ ined tend to give lower stand up time than found by actual experience in a few cases w here actual failures have been reported, hence, the values are on the conservative side.
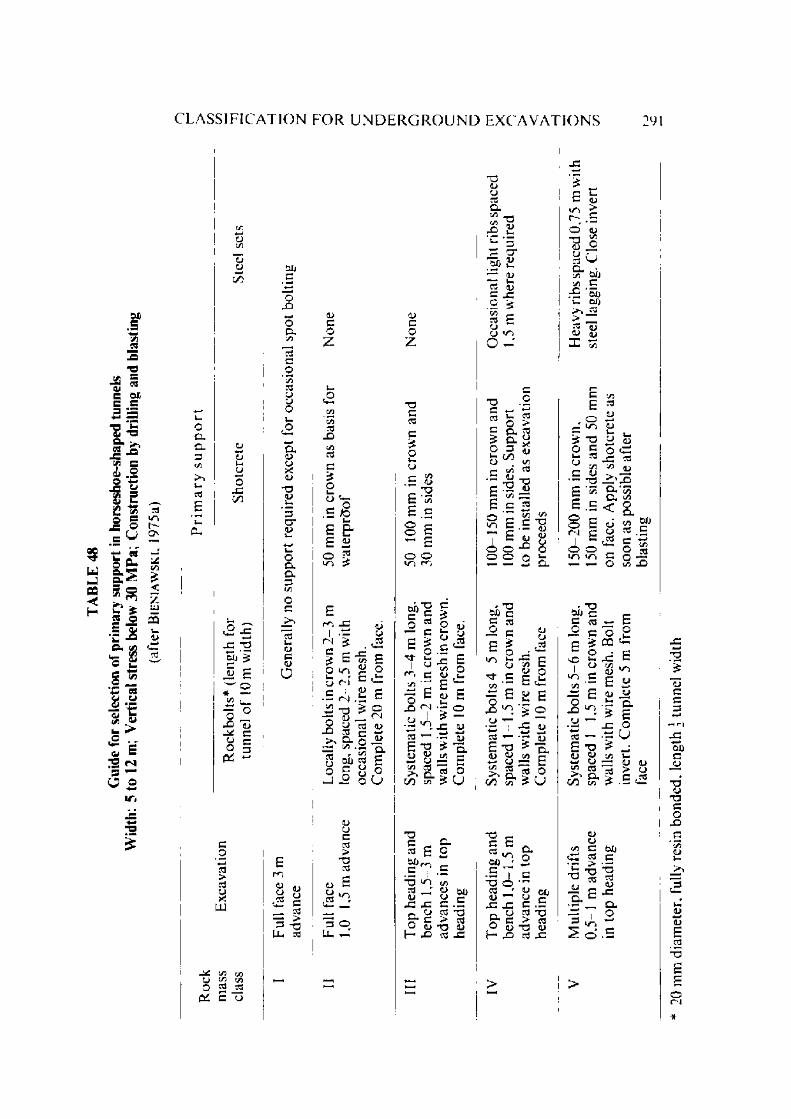
C L A S S I F I C A T I O N F O R U N D E R G R O U N D E X C A V A T I O N S 291
ZLe
*-«c/5
x-o
J £ eCJ3 CJC3 =3 3~~
■?u.
■aCLC5 XC/5 3IOO 4—>
A
I
CJ3i—r . ♦—Xo 3
X O_3 U
731—a.a .3C/5 o>•4L-« cEiZ i sa .
u— i3 u .3 —5/3*—1 C3Jy *■*3o s—5 O
l—>Xai E
rs n*3o c■*-»
v r ,
cS•or -ON
C/52?UJ3
£ c * s
oCZ73
■o
c .CL3c/5
<L>1)c/5
CJ
ov-c j
cr -
C/5
<X x: x ;o 0/j 5
j£ E ^ o * — £ u -
o fX
cCJ c
0^ ~
3o
73c jXUJ
C/5 c/5CJ c/5
O *2O L 3 cj
5JJc
c .C/5
C/573c jc j
c .oc jXQJ
©
CT1>
C -c .
c/5
u<uKj
o
<DCJ
,? 3
_ :3— > , 3 "3 LL ^
Z
•—, o
.C/5C/57 3
X
C/5C^3
3
£Ou ,C J
3c
A Cu
E G .U lr - ■
3O 5■-T) ■5
< N
c
cC/5■♦—IOX_ > >
cjo
*T~! <uCJ
> C3i
E XC/5 3
U-5 dj3
O(ur i
<u c(N ■— 3
T 3(U nCJ 73 oCLCO
3_ o•33
oc.
OXJ 73 E3 CJ
Oo
oO U
<uc jcC3
O e. 8 ^
TD3
3
O• _CJ
C/5<L)
r s3 'c /5<—H
Q .o 3
<—3
c : O• / “ ) r ^ i
01)3
"O 3
73 O l i3 '— CJ
O
CJ3
c£3
•—CJ X E
C/5 o3 <D , L-• — r- —r- 3 r—3 4> 3
fN •—“
X wjOz*o
<u5C/5 CLr -o 3
D .C/315 O
u
■§ e a-73 £ O.5 I • - ■5 ' f * <*?3 _ r <1> CJJ
U CJx x c .3
c j >u " O c ^ 3
O (U T D (L) h- X S3 X
T3OCJ
“ 3 ~ CT' <L>J5/J
CJCJ i/">
^ r O —
T5
§ - ? 3 §.£ CL %p 3 5b ooO . c/5{ - C / 5 3
■S - o ^r - . ^ CJ3 ^ rj3 3O ’c ■A) 3
15t o C/53 -a
• - d
73 CXj c 3 r3
-2 3 £E
to
C/5
oXo
<uCJcX
X r—C/5<D or “3 u_
<D— Eo
X o•—-• r-
a.C/5 3*—
OU
3 T3£ 8C/5 J -
•a c3 33 Cl.^ oCij * ^
• S | 3
IS °* <U oij(U —1 o rr X JZ
^ CJ
CJ3 ~o
rf c ^ ^ O <d 73 <L> h- X 73 X
>
- O
o tu •o go ^^ U 5r sLC/5 3
rS oijO SJ
— >■ __73 r>o o
E -o H <u
CJ
3
E c
•—CJ u.
<uO ' . 1r~C/5 J J>> XC - ‘ c/5Cl V)
< 0a .
<u (/) CS/jCJ 73
33
C/5ooo C/5 X
• T3 CiJ c 3 73
EnClO
C/5
c o y■$. CQ 2 x ECJ C/5 ,_ <u
• E 3 (UE a»
- a.^ E
•« X o U
E *o ^ ^aj 5-> co v—*-» CJ — q j n>5 S 15 > On. -v; r- --5
C/3 vT £ . 3 'X
a>CJ
c 3 5U
■ ^ 1 2■&„ a. X o5 ^ wS o . S
>
20 mm
di
amet
er,
fully
res
in bo
nded
, le
ngth
\
tunn
el w
idth

292 C l . A S S I I 1C A I I O N O l R O C K
0 - 9
o e
0 - 7
0 6
lb 2 b 3 0 4o 5 0 6 0 7 0 8 0 9 0
g 60m e c h a n lc 6 c l a s c i f i c a t i o n r a t i n g
Fig. 11-51. Corre la tion between geomechanics classification ra ting an d m odulusreduction factor
(after B ih n i a w s k i . 1975a).
L o c a lit ie s
B O r a n g e F ish T u n n e l
O D Ie p s lo o t B r id g e
f N e v a d a T es t S ite
■ D w o rs h a k D a m
- ▼ K a r ib a P o w e rh o u s e
11.10.2. Rock S truc ture R a t ing ( R S R )
T he concept o f rock structure rating ( R S R ) has been developed by W ic k h a m and T ihdemann (1972 and 1974) for use in rapid tunnelling and is based upon case history data o f 53 tunnel projects with a total length o f 200 miles (320 km ) in U.S.A. mid-west with diam eters ranging from 8 to 36 ft (2.4 to 10.8 m) an d practical and empirical applications relating to tunnel construction . The R S R concept considers basically the following param eters:Param eter A Rock type, folding and discontinuities Param eter B Joint pattern (spacing) and orientation Param eter C - W ater inflow and jo in t openings.
T he m axim um value assigned to the param eter A is 30 w hich refers to an igneous rock with RQD o f 75 to 90% o r has been appraised by visual inspection as being good. The o ther values are given in Table 49. Slightly faulted o r folded rock refers to the R Q D o f abou t 50 75; m oderately faulted or folded has RQD equal to about 25 50 and intensely faulted o r folded has RQD abou t less than 25.

C L A S S I F I C A T I O N F O R U N D E R G R O U N D E X C A V A T I O N S 293
T A B L E 49
Rock s tru c tu re ra ting , p a ram ete r A (rock type, folding and discontinuities)
(a f te r W i c k h a m an d T i e d e m a n n , 1974)
G eolog ica l s tructureBasicrocktype M assive
Slightly folded o r
faulted
M oderate ly folded o r
faulted
Intensely folded or
faulted
Type I 30 n 15 9
T ype II 27 20 13 8
T ype III 24 18 12 7
T ype IV 19 15 10 6
The param eter B relates the influence o f jo in t pattern, spacing, strike and dip with respect to the excavation 's long axis and direction o f drive. The m axim um value o f this p a ram ete r is 45 which corresponds to the excavation axis at right angle to the d ip w ith the drive direction against dip in a massive rock with d ip o f jo in ts between 50 and 90 . The jo in t spacings here are divided into 6 classes and the dip into 3 classes. T he respective ratings are given in Table 50.
The param eter C takes into consideration the overall quality o f rock structure indicated by the num erical sum o f the param eters A and B , the w ater inflow and the conditions o f jo in t surfaces such as tight or cem ented, slightly w eathered or severely w eathered o r open. The maximum value o f this p a ra m eter is 25 for a tight or cem ented jo in t under no w ater conditions. The flow rate in gallons/m inute per 1000 ft o f excavation length is divided into 4 classes and the sum o f the param eters A and B into two classes. The various ratings are given in T able 51.
The final R S R value for any geological condition is then the sum total o f the param eters (A + B + C). The value shall range from 25 to 100 which reflect the quality o f rock irrespective o f the size o f the excavation or the m ethod o f excavation. The values hold good m ostly for excavations driven with blasting. These values can be im proved by m ultiplying by a factor when an excavation is driven by a m achine. The m ultiplication factor can be determ ined from Fig. 11-52.
W i c k h a m and T i e d e m a n n (1974) have found good correlation between rock loads on steel ribs used as support in tunnels and R S R values. A R S R value o f 19 m eant an extrem ely heavy support and an R S R o f 80 o r m ore m eant alm ost no support requirem ents. It m ay be m entioned that the relationship is not linear. The system has been successfully employed to evaluate support

294 C L A S S I F I C A T I O N O l ROC k
-ooco'•JVUrn
*5a
a.
r-av
sUJ QQ
B UJ *S r\w
2CH
T 3C
<Iu
o a»573
£ aOX ^
■§ b es <*- i- coi_a■MCJ
<Uo<d
XC3
<L>
C/5
"Oooo<u
c.*5
Sij<
C."5
2c
wj_cocL
CJOU
<D><
Vc
oc.
c_Oa.
c<u
cO
?5o
<u>
&QcC.c.
n
U-
cu’S.c.
u<u
OJjc'S.c.
—_
r - -r-.
o
r\
O'
c<N
T3<L>C
‘o
<u</>j2a•—<D>
r~"
sC
_c\o
<N-a<D
<U
U
O' ^r(N
m OOr 1 <N !
r or i
n GOr i CN
ON LTlO'!
OO v Cr i r i
• t CNr J m
o(N c*-,
W— <N0 OcvO ^ '
" O<u Oe _ o
;s -Oo
<u (UC3 S3J—<D <u
T3 ■oO o
s
c*~, ^ I
:cr i
ro
sCr«~,
r i
r*~,r*"i
c i
00r*l
r-rn
OOr*i
sDro
( 1<U>
U
TfA
nO
Not
es:
Flat
0-2
0 :
Dip
ping
20
50 ;
Ver
tical
50
90

C L A S S I F I C A T I O N F O R U N D E R G R O U N D E X C A V A T I O N S 295
T A B L E 51
Rock s tructure rating, param eter C , ground water, joint condition
( a f t e r W i c k h a m a n d T ie d e m a n n , 1974)
Sum o f p aram eters A + B
Anticipated w a te r 13-44 45 75inflow
gallons/min/1000 Jo in t cond ition
good* fair p oor good fair p o o r
N o n e 22 18 12 25 22 18
Slight ( < 2 0 0 gpm) 19 15 9 23 19 14
M o d era te (200 to 1000 gpm ) 15 11 7 21 16 12
H eavy ( > 1000 gpm) 10 8 6 18 14 10
*good tight o r cem ented fair slightly w eathered p o o r severely w eathered o r open
R S R a d ju s t m e n t f a c t o rFig. 11-52. R S R ad justm ent for tunnel boring machine operation
(after W i c k h a m , T ie d e m a n n and S k i n n e r . 1972).
requirem ents o f steel ribs, shotcrete and roo f bolts both in tunnelling and m ining projects and in determ ining rock loads on support system. The correlation between the R S R values and actual ground support is obtained by the use o f a kfcrib-ra tio” ( RR ) which gives a relationship between steel rib support used in tunnel and theoretical rib support determ ined from a com m on datum condition. R ib ra tio (R R ) is determ ined using T e r z a g h i em pirical form ula ( T e r z a g h i , 1946) for m aximum roo f load for loose, cohesionless sand below water table. F o r a tunnel with a semicircular arch
P x = [1.38 ( / ? + / / ) ] x B x yt (11.18a)
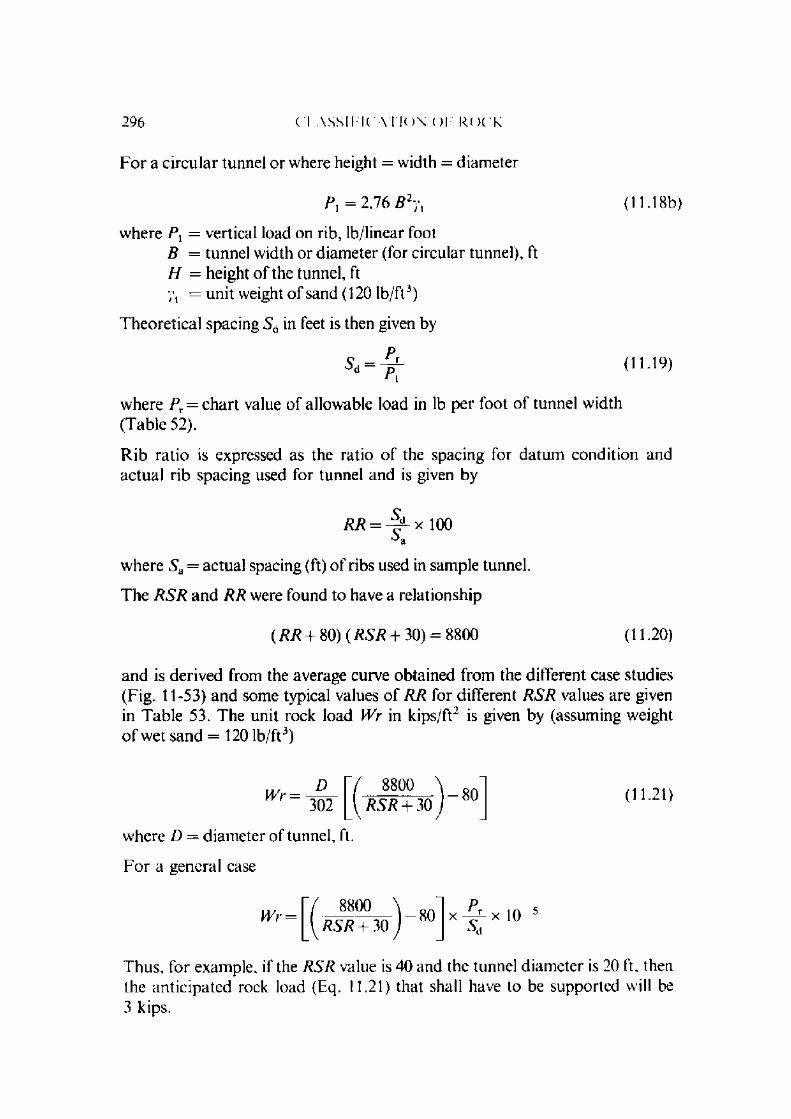
296 C l A S S I I 1C A I I O N O l R O C K
F o r a c ircu lar tunnel or where height = w idth = diam eter
P x = 2.76 B 2y{ (11.18b)
w here P } = vertical load on rib, lb/linear footB = tunnel width o r diam eter (for circular tunnel), ftH = height o f the tunnel, ft7 , = unit weight o f sand (120 lb /ft3)
T heore tical spacing Sd in feet is then given by
Sd = ^ (11.19)
w here Pr = chart value o f allowable load in lb per foot o f tunnel width (T able 52).
R ib ra tio is expressed as the ratio o f the spacing for da tum condition and actual rib spacing used for tunnel and is given by
RR = - | l x 100
w here S a = actual spacing (ft) o f ribs used in sam ple tunnel.
T he R S R and R R were found to have a relationship
( R R + 80) ( R S R + 30) = 8800 (11.20)
and is derived from the average curve obtained from the different case studies (Fig. 11-53) and some typical values o f RR for different R S R values are givenin T ab le 53. The unit rock load Wr in k ips/ft2 is given by (assum ing weighto f wet sand = 120 lb /ft3)
Wr = — 302
7 8800{ R S R 4- 30
1 -8 0 (11.21
w here D = d iam eter o f tunnel, ft.
F o r a general case
Wr = 7 8800 \ R S R + 30
1 -8 0 x x 10 5
T hus, for exam ple, if the R S R value is 40 and the tunnel d iam eter is 20 ft. then the an tic ipated rock load (Eq. 11.21) that shall have to be supported will be3 kips.

TABL
E 52
Con
tinuo
us
ribs.
Cap
acity
in
lb ft
of tu
nnel
wid
th
Min
imum
fib
re
stre
ss
2400
0 lb
in2
(aft
er
Pr
oc
tor
an
d W
hit
e.
1946
)C L A S S I F I C A T I O N F O R U N D E R G R O U N D E X C A V A T I O N S 297
it, o r i » i• f X X '/"i X n - O' x C ? 7 ^ T C I'Cr'coon'T'OTfrr'Or^O'O'O^iO' — -r
00 ; C=9 G
5 ^
■t'*'. — — 5> — C " C l I— T , £ v is x ic r', — c " , n x n v, —r v, o c: o~ 1—nC O r~ o> — <■ ■ v ic x o 'c — -r o — •
y. O'
a *_o — “ oa 1;- "5O C.■S5
X cScrl'TO X 'tci7. J ^ i- tC X ^ -P o ^ x T' '',m n x C x t r i c c O' — x c v,■j n ^ r- x O' n " , it, Tt it, x C O r i rr o r i v,
'/•i r i n C x o o ^ 5 5 5 ? ^ n x 5 n ° S °— O f~~ so vO " , o o >o r-i r~- r— \C — v, <r, r~- c — r-i" , Ti'C'Civ x>0f|,t | r " * i n r '3 '0 — ri'n — ", c
r- rt- " " -f 5 - n x x — ", 5 ? n o x r,r-- i-- v, i/~, r- r- r i t r i - " , t in r i x O " , v, oc " . 'O 'c r 'x o '- 't 'o 'o x w i 'c x o — ri t ri -r x
K ? n P 2 - — R oo S ~ x " R x ~i 2 ", 5c r i o— - C O " . ‘n - -t r- x - x v, x r i £ r i x v,\o i-' x O' o r i in >o co in nC O' o m f 'l '/'i x " , >/•, o>
5 5 5 o 2 — 'A " , o 5 n o n " , r- P r-- r - xt >n ^ T) ■£ o " — sc — n o " . r- v, t r- r i m — x r-v, 'o r - x o ' — " , 'C x i^ 0 '< 3 ( '0 - " . t ' E o t c o
rf V. -T r i oX r i 2 S r-- *5 § r~- "■ r i s
o — r- r" — X— ", O O r- o n —", X r i r i o- o O' Vl X T* " , r~- ■rr r 1Vl sC sC O' >/i r- X O' o —-r r- O' l-~ O' O r- o r-i rr V,
" " ,Vi X vi v©
r- rf ", \© " , o 'O rt O' C O — § v , ^ v i §o c i r i v> cc oo — r- " vi vi r i t~~ o •'T r i " , r f O' r- O'o v, vo r- oo O' — r i vi oc ~ x o r— x *— " , vi s© x r i
— §0°2irirl¥^>no^aSo^aoSooM oo§§° r- -c O' " , -o x O oo c r- — v. C O f~- C o — oc v> v, — o T c i r i O'
. C O " x — r -o - r iT T 'C x o - r r— ------------n r i
x t- — o O' O' " , C r i ’■f — r i x " , - x o - sc vi H be — O —^ ■£! r ' Tt \o ^ o » o h - jq O' n oo O' " , oo
„ •C'CO --, r i v, v, -«-r v, r f v, vi r~~ x v, so x vi " >o O' — r i r t vc O'
— o'Ti — ^ 5 7, — x i~i'?‘2 o '^ r ';?V i o> — OC — i ' l C ' l< ' i ' t ' O ^ - ,+ 0 ' ' ' i r - - ' C ^ O ' C r i i A i f i n > C
O O O O O O O O O O O O O O O O O O O O O O O- x ", o t r- >c — ", t'' O'- - O r i 'jf, — ", o 'a r i 3 r-O' r-i >c " , '/-> r- r f — o r~- v, O' C — ", O' " , r- o rt oc c oc" , " , Ti vC »t I/-! r t >c >0 f ' O' in h O' o T h- X O r i " , Vi r-
O O O O O O O O O O O O r^ —r ir i 'O " . X T fs c r-'O r- rf " C r I O O " , O' r- -C v» 'n r i - t " , £ r -T , ' O ' t ' C C X O
>A x " n 2 o o S 2 v, v, o r-~ r-- o O' x vi — ■/-,!/-> rf i/-, oc ri'f-^-'Cr-~i/-ii'~inr~-r'~0' —
J O O VI O O f •o o " o o o o o o o o o o t o o o o o o o o o o o o
7Z
n i gjS j s j-C Jc c 00 00 ss J J M 1 1
00
Ll. Ll.
& * il u: u: ^ u: % % * * * ? * * * ? ?: O O O ; O H
Vl Vi X X 00 — — — X — ——, X X X X X X X X X X X
i t T f i n v i i i r i i 2 i 2 2 2 2 S x 3 o x t o x o o j o o o c o x o c x c o x £ 2 - X Z - - ^ X ^ S ! C ! C ]
U. I> > >;J . C/3 3-
rt V, v, rt Tf « « lo tj- x loV7c*c‘x 00 X oo X OC _x _ x x — — x x x x x „ _ _ — x x x x x x x x x x x x p

rock
st
ruct
ure
ra
ting
(R
SR
)298 C l \S S I I l ( \ l l ( ) \ <)l ROC k
T A B L E 53
R SR values and rib ratios
(a f te r W i c k h a m a n d T i e d e m a n n , 1974 )
R S R 27 30 35 40 45 50 55 60 65 70 77
R R 74 67 55 46 37 30 24 18 13 8 9
r i b r a t i o ( R R )
Fig. 11-53. C orre la tion o f R S R and R R (after W ic k h a m and T ie d e m a n n , 1974).
It shall be pointed out that since m ost o f the case history data pertain to steel rib support, the correlation prim arily relates to steel support. Flowever, when rock bolts and shotcrete are used, the following relationships have been suggested.
R ock bo lting :
Spacing, in ft, S = / (11.22)V m
where Bs = allowable tensile load o f the bolt, kipsWr = rock load determ ined from R S R considerations, k ips/ft2
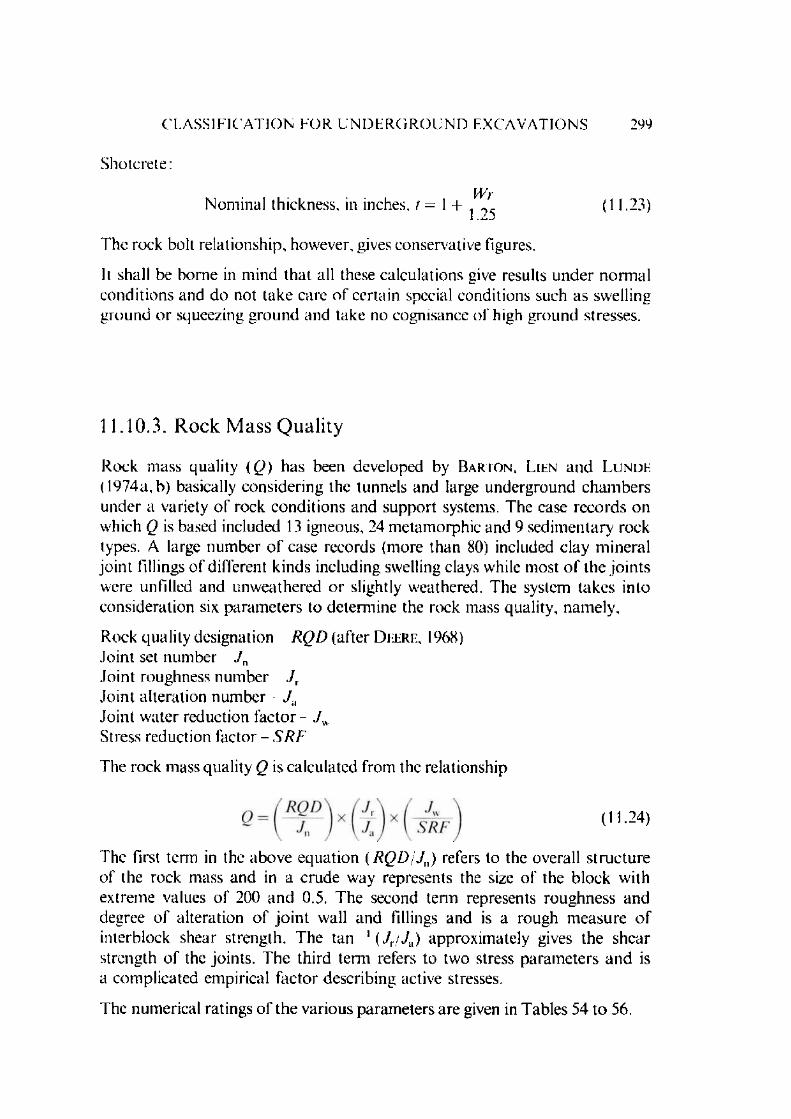
C L A S S I F I C A T I O N F O R U N D E R G R O U N D E X C A V A T I O N S 299
Shotcrete:
N om inal thickness, in inches, 1 = 1 + (11.23)
The rock bolt relationship, however, gives conservative figures.
It shall be borne in m ind that all these calculations give results under norm al conditions and do not take care o f certain special conditions such as swelling ground o r squeezing ground and take no cognisance o f high ground stresses.
Rock mass quality (Q ) has been developed by B a r t o n , L ihn and L u n d e ( 1974a. b) basically considering the tunnels and large underground cham bers under a variety o f rock conditions and support systems. The case records on which Q is based included 13 igneous, 24 m etam orphic and 9 sedim entary rock types. A large num ber o f case records (m ore than 80) included clay m ineral jo in t fillings o f different kinds including swelling clays while m ost o f the jo in ts were unfilled and unw eathered or slightly weathered. The system takes into consideration six param eters to determ ine the rock mass quality, nam ely.
R o c k q u a l i t y d e s ig n a t io n RQD ( a f t e r D e e r e , 1968)Joint set num ber J n Joint roughness num ber J r Jo int alteration num ber J.x Jo int w ater reduction factor J w Stress reduction factor S R F
The rock mass quality Q is calculated from the relationship
The first term in the above equation ( R Q D jJ u) refers to the overall s tructu re o f the rock mass and in a crude way represents the size o f the block w ith extrem e values o f 200 and 0.5. The second term represents roughness and degree o f alteration o f jo in t wall and fillings and is a rough m easure o f interblock shear strength. The tan 1 (Jr/J.d) approxim ately gives the shear strength o f the jo ints. T he third term refers to two stress param eters and is a com plicated em pirical factor describing active stresses.
11.10.3. Rock M ass Qual i ty
(11.24)
The num erical ratings o f the various param eters are given in Tables 54 to 56.

300 C l \S S I I IC \ I l < ) \ o i R O C K
T A B L E 54
Descriptions and ratings for the param eters RQD, J n and Jr(a fter B a r t o n , L ien an d Lu n d e . 1974a)
1. Rock quality designation ( RQD )A. Very po o r 0 - 25 N o te :B. P o o r 25 50 (i) W h e re is rep o r tedC\ Fair 50 75 o r m e a s u re d as ^ 10D. G o o d 75 90 (in c lu d in g 0) a nom ina lE. Excellent 90 100 value o f 10 is used to eva lua te
Q in Eq. (11.24)(ii) R Q D in te rva ls o f 5, i.e.
1 0 0 ,9 5 ,9 0 etc. are s u file ien 11 y acc u ra t e
2 .Joint set number Un)A. Massive, no o r few jo in ts 0 .5-1 .0B. O ne jo in t set 2C. O ne jo in t set plus random 3D.E.
T w o jo in t setsT w o jo in t sets plus ran d o m
46
P. T hree jo in t sets 9G.H.
T h ree jo in t sets plus ran d o m F o u ro rm o re jo in t sets, ran d o m .
12 N o te :(i) F o r in te rsec t ions use
h cav ily jo in ted ,“ su g a rc u b c '\e tc . 15 ( 3 .0 x 7 , , )J. C rushed rock, earth like 20 (ii) F o r p o r ta ls use
(2 .0 x J n)3. Jo in t roughness number
(a) Rock wall co n tac t and(b) Rock wall con tac t before
10 cm s shear
Ur)
A. D iscon tinuous jo in ts 4 N o te :B. R ough o r irregular, undu la t ing 3 (i) A d d 1.0 if th e m eanC. S m oo th , undu la t ing 7 sp ac in g o f the relevantD. Slickensidcd. undu la ting 1.5 jo in t set is g rea te r thanE. R ough o r irregular, p lan a r 1.5 3 mF. S m ooth , p lan a r 1.0 (ii) J t = 0.5 c a n be used forG . Slickensidcd, p lan a r
(c) N o rock wall contac t when sheared
0.5 p lan a rs l ic k en s id ed jo in ts h av in g l ineations, p ro v id ed th e lineat ions
H. Z one co n ta in in g clay m inera ls thick en o u g h to prevent rock wall contac t 1.0
a re fa v o u rab ly o r ien ta te d
(nom inal)J. Sandy, gravelly o r crushed zone
thick eno u g h to prevent rock 1.0wall con tac t (nom inal)
T A B L E 55 ►
Descriptions and ra tings for the p a ram ete rs / . a n d 7 W
(after B a r t o n , L ie n an d L u n d e , 1974a)
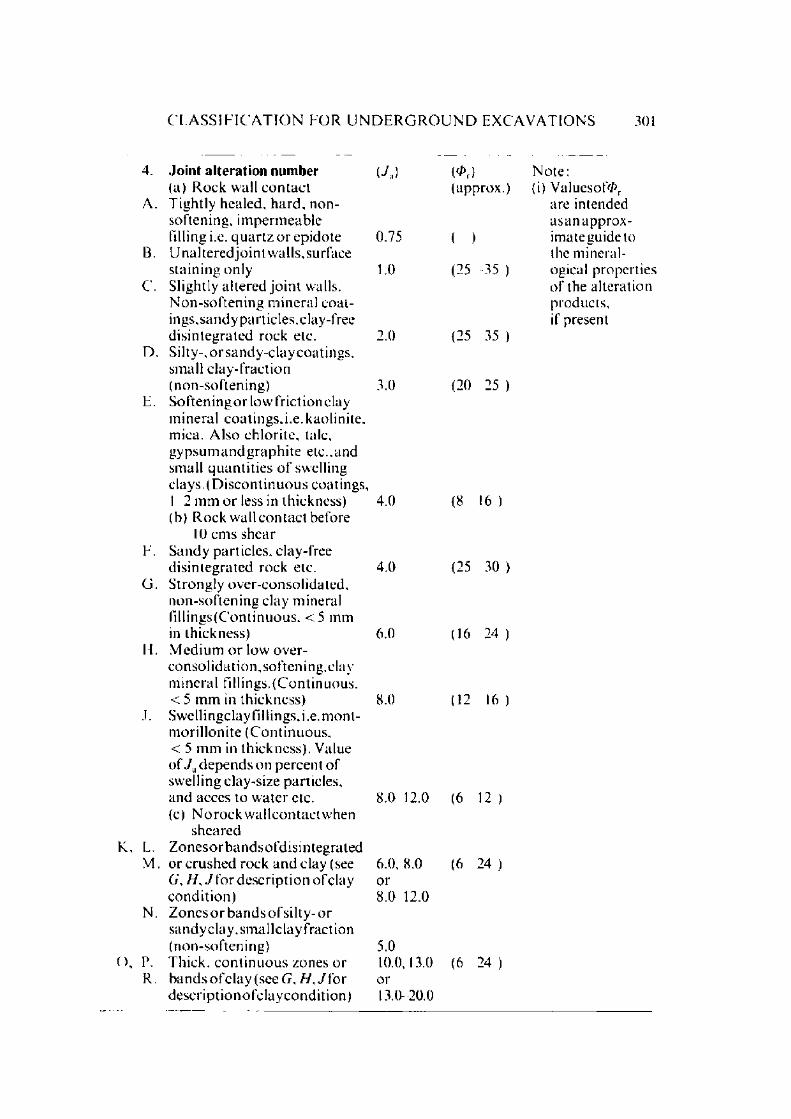
C L A S S I F I C A T I O N F O R U N D E R G R O U N D E X C A V A T I O N S 301
4. J o i n t a l t e r a t i o n n u m b e r ( / , ) ( 0 r)(a) R o ck wall c o n ta c t (approx .)
A. T igh tly hea led , h a r d , non- so ften ing . im p erm eab lefilling i.e. q u a r tz o r ep ido te 0.75 ( )
B . U n a 11 ered j o i n t w a 11 s , s u r faces ta in in g o n ly 1.0 (25 35 )
C. Slightly a l te red jo in t walls.N o n -so f te n in g m in e ra l c o a l ings, san d y partic les , clay-freed is in teg ra ted rock etc. 2.0 (25 35 )
D. S i l ty - ,o rsan d y -c lay co a t in g s , sm all c lay -frac t ion(n o n -so f ten in g ) 3.0 (20 25 )
E. S o ften in g o r low fr ic tion clay m inera l co a tin g s , i .e . kaolinite , m ica. A lso ch lo r i te , talc, gypsum an d g ra p h ite etc., an d small q u a n t i t ie s o f swelling clays. (D is c o n t in u o u s coatings,1 2 m m o r less in th ickness) 4.0 (8 1 6 )(b) R o ck wall c o n ta c t before
10 c m s sh ea rF. S an d y partic les , clay-free
d is in teg ra ted rock etc. 4.0 (25 30 )G . S trong ly o v e r -co n so lid a ted ,
n o n -so f te n in g c lay m ineral f i l l in g s (C o n t in u o u s , < 5 m min th ickness) 6.0 (16 2 4 )
II. M e d iu m o r low o v e r co n so l id a t io n , so f ten ing ,c lay m inera l f i l l in g s .(C o n tin u o u s ,< 5 m m in th ickness) 8.0 (12 1 6 )
J. S w ell ingclayfil l ings .i .e .m ont-m o ri l lo n i te (C o n t in u o u s ,< 5 m m in th ickness) . Value o f / , d e p e n d s on percen t o f swelling clay-size partic les,an d acces to w a te r etc. 8.0 12.0 (6 1 2 )(c ) N o ro c k wal 1 c o n tac t when
shea redK, L. Z o n e s o r b a n d s o fd is in te g ra te d
M. o r c ru sh e d rock a n d c lay (see 6.0, 8.0 (6 2 4 )G. / / , J fo r d e sc r ip t io n o f clay orco n d i t io n ) 8.0 12.0
N. Z o n es o r b a n d s o f s i l ty -o rs a n d y c 1 a y , s m a 11 c 1 a y fr a c t i o n (n o n -so f ten in g ) 5.0
O , P. T h ick , c o n t in u o u s zones o r 10.0,13.0 (6 2 4 )R b a n d s o f c i a y (see G, H , J for or
d e sc r ip t io n o fc la y c o n d i t io n ) 13.0 20.0
N o te :(i) Valuesot>/\
are intended as an a p p ro x imate guide to the mineral- ogical p roperties o f the a lte ra tion products , if present
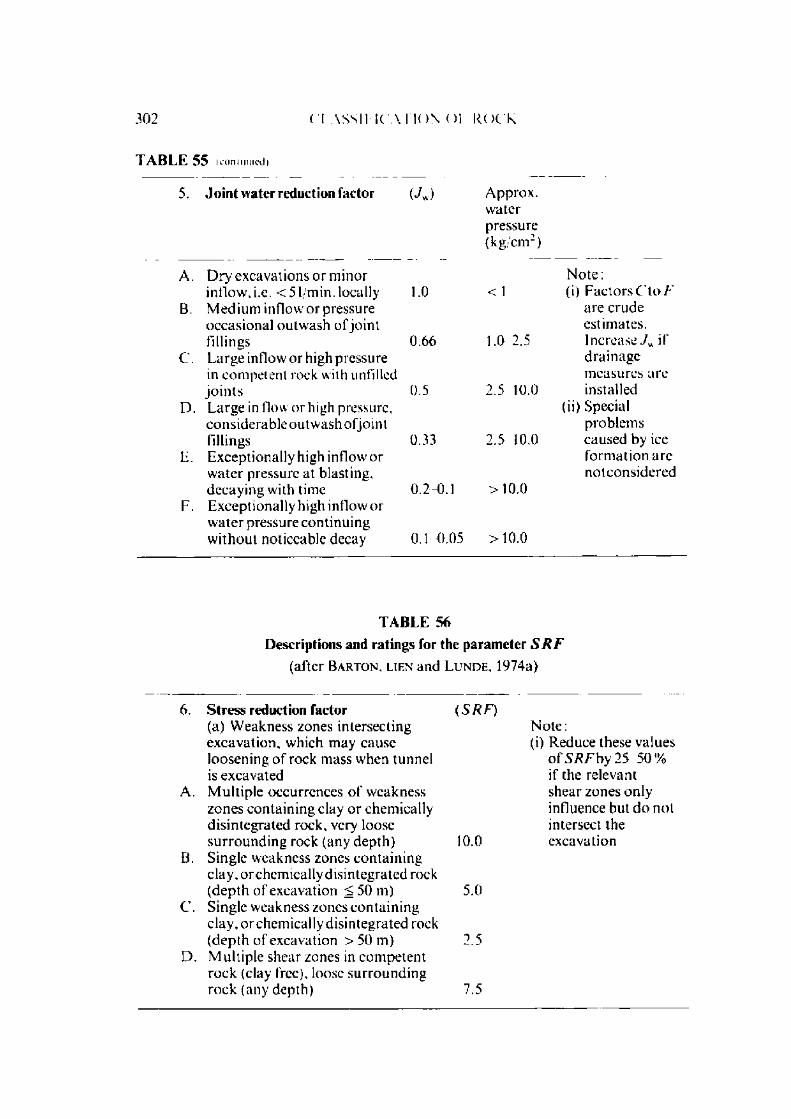
302 C l XSSI I K A I I O N <)l R O C K
T A B L E 55 ( cont i nued)
5. Jo in t water reduction factor (■/w) A pprox .w aterpressure(kg /cm 2)
A. D ry excavations o r m inor N o te :inflow, i.e. < 5 1/min. locally 1.0 < 1 (i) F a c to r s C t o F
B. M ed iu m inflow o r pressure arc c rudeoccas ional ou tw ash o f jo in t estim ates.fillings 0.66 1.0 2.5 I n c r e a s e i f
C. L arge inflow o r high pressure d ra in ag ein com petent rock with unfilled m easures arejo in ts 0.5 2.5 10.0 installed
D. L arge in How or high pressure, (ii) Specialconsiderab le o u tw ash ol jo in t p rob lem sfillings 0.33 2 .5-10.0 caused by ice
E. Exceptionally high inflow or fo rm a tio n arew a te r pressure at blasting, n o tco n s id e reddecay ing with time 0.2-0.1 > 1 0 .0
F. Exceptionally high inflow orw a te r pressure con tinu ingw ith o u t noticeable decay 0.1-0.05 > 1 0 .0
T A B L E 56
Descriptions and ra tings for the param eter S R F(after B a r t o n , lie n and L u n d e , 1974a)
6. S tress reduction factor(a) W eakness zones intersecting excavation , which m ay causc loosening o f rock mass when tunnel is excavated
(S R F )N o te :(i) Reduce these values
o f S R F by 25 5 0 % if the relevant
A. M ultip le occurrences o f w eakness zo n es con ta in ing clay o r chemically d is in tegra ted rock, very loose
shear zones only influence but d o not intersect the
s u r ro u n d in g rock (any dep th ) 10.0 excavationB. Single w eakness zones co n ta in in g
c lay , o r chemically d is in tegra ted rock (d ep th o f excavation ^ 50 m) 5.0
C. Single w eakness zones co n ta in in g clay, o r chemically d is in tegra ted rock (d ep th o f excavation > 50 m) 2.5
D. M ultip le shear zones in co m p eten t rock (clay free), loose su rro u n d in g rock (any depth) 7.5

C L A S S I F I C A T I O N F O R U N D E R G R O U N D E X C A V A T I O N S 303
T A B L E 56 (continued)
E. Single shear zones in co m p e ten t rock (clay free) (dep th o f excavation ^ 50m) 5.0
F. Single shear zones in co m p e ten t rock (clay free) (depth o f excavation > 50 m) 2.5
G. Loose open jo in ts , heavily jo in ted o r “ sugar cu b e" etc. (any dep th )(b) C o m p e ten t rock , rock stress
p rob lem s
5.0
H. Low stress, (ii) F o r s tronglynear surface > 200 > 13 2.5 an iso tro p ic stress
J. M ed ium stress 200--10 13 0.66 1.0 field (if m easu red ):K. High stress,
very tight s truc tu re (U sually favourab le to stability, m ay he un favourab le to wall
when 10, reduce a c an d rx, to 0.8 <rc an d 0.8 a x\when rjj /<r3 > 10, reduce <rc a n d (t, l o 0 . 6 a c an d 0.6 <r, where: ac= u n c o n
stability) 10 5 0 .66 0.33 0.5 2.0 fined co m p ress io nL. Mild rock burst strength ,
(massive rock) 5 -2 .5 0.33--0.16 5-10 (r, = tensile s treng thM. Heavy rock
burst(po in t load),(ji an d a 3 = m a jo r
(massive rock) < 2 .5 < 0 .1 6 10 20 an d m in o r p rinc ipa l(c) Squeezing ro ck ; plastic How o f stressesincom peten t rock u n d e r the influence (iii) Few case reco rd so f high rock pressures available w here
N. M ild squeezing rock pressure 5-10 dep th o f c ro w nO. H eavy squeezing rock p ressure
(d) Swelling rock : chem ical swelling activity d ep en d in g on presence o f w ater
10 20 below su rface is less th an sp an w id th . Suggest S R F increase from
P. Mild swelling ro ck pressure 5-10 2.5 to 5 fo r suchR. Heavy swelling rock pressure 10 15 cases (see H )
In the use o f the tables for estim ating rock mass quality Q , the following points should be kept in view:
1. W hen bore core is unavailable. RQD can be estim ated from the num ber o f jo in ts per unit volume, in which the num ber o f jo in ts per m etre fo r each joint set are added. A simple relation can be used to convert this num ber to R Q D for the case o f clay-free rock masses,
R Q D = 1 1 5 -3 .3 ./, (approx.) (11.25)
where Js = total num ber o f jo in ts per m 3 ( R Q D = 1 0 0 fo r /v< 4 .5 )
304 C l \ S S I I K A I I O N O l R O C K
2. The param eter Jn representing the num ber o f jo in t sets will often be affected by foliation, schistosity, slatey cleavage o r bedding, etc. If strongly developed these parallel “jo in ts" should obviously be counted as a com plete jo in t set. However, if there are few “jo in ts" visible, o r only occasional breaks in bore core due to these features, then it will be m ore appropria te to count them as “ random jo in ts" when evaluating J n in Table 54.
3. T he param eters ,/r and ./, should be relevant to the weakest significant jo in t set o r clay filled discontinuity in a given zone. I lowever, if the jo in t set or d iscontinuity with the m inim um value o f ( J J J a) is favourably oriented for stability , then a second, less favourably oriented jo in t set o r discontinuity may som etim es be o f m ore significance, and its higher value o f ( J J J J should be used when evaluating Q.
4. W hen a rock mass contains clay, the factor S R F appropria te to loosening loads should be evaluated (Table 56; 6a). In such cases the strength o f the intact rock is o f little interest. However, when jo in ting is m inim al and clay is com pletely absent, the strength o f the intact rock m ay become the weakest link, and the stability will then depend on the ra tio (rock stress/rock strength) (Table 56, 6b). A strongly anisotropic stress field is unfavourable to stability and is roughly accounted for as in N ote (ii). Table 56.
5. In general the com pressive and tensile strengths (oc and a {) o f the intact rock should be evaluated in the direction that is unfavourable for stability. This is especially im portant in the case o f strongly anisotropic rocks. In addition, the test specimens should be saturated if this condition is appropria te to present o r future in situ conditions. A very conservative estim ate o f strength should be made for those rocks that deteriorate when exposed to m oist or satu rated conditions.
W hen the rock mass quality varies m arkedly from place to place it is desirable to m ap and classify these zones separately. The system does no t take into account special features such as swelling and softening clay zones o r large unstable wedges which require individual treatm ent.
Em pirical relationships between rock mass quality Q and ro o f and wall support pressures have been determ ined and are given as follows:
F o r a m edium with two sets o f jo in ts
W r = 2.° Q °-33J r
(11.26)
F o r a m edium with three sets o f jo in ts
(11.27)
where W r — support pressure in ro o f o r walls, kgf/cm 2.

S U M M A R Y 305
The relationship (11.26) is represented in Fig. 11-54 with different values o f Jv. The shaded portion is the estim ate o f the expected range in practice from case records.
R Q D J r J wr o c k m a s s q u a l i t y Q • ( — -— ) x ( —) x ( - — )
Jn SRF
Fig. 11-54. Empirical method for estimating the support pressure. Plotted po in ts refer to ease records describing measured o r designed roo f support pressures
(after B a r t o n , L if.n and L u n d e , 1974a).
W hile calculating rock pressure, the higher value o f Q than obtained shall be used. The modified value m ay be 5 Q for the Q value > 10 (good rocks), 2.5 Q for 0.1 < Q < 10 (interm ediate rocks) and 1.0 Q for Q < 0.1 (poor rocks).
The rock mass quality system has been found to be very useful particu larly for predicting the self supporting excavations and support requirem ents using shot- crete and bolting.
11.11. Summary
W hile classifying rock m asses from an engineering point o f view', the origin o f the rocks and their geological history are very im portant aspects and should no t be overlooked. An immense am ount o f inform ation about the possible shape o f structural defects, the influence o f weathering and even possibly the nature o f stress field can be obtained from the general geology o f the region.

306 C l XSSI I 1C A I I O N O l ROC k
The surveying o f jo in ts from the bore holes and outcrops is an im portan t aspect o f any engineering geological study and precautions should be taken in their interpretation. It is not always true that the jo in t set having a larger frequency is also m ore dom inant. It shall depend upon the type o f structure slope o r a tunnel and proper appreciation is essential.
The rock classification systems described are based upon em pirical in terp reta tion o f the successful case histories and hence tend to perpetuate the conservatism and overdesigning o f the support system. Their com parison w ith actual failure cases shall be the m ost im portant step forward. N evertheless, these help in arriving at quick decisions.
The South African geom echanics classification is m ore universal than the o ther tw o and shall be preferred in the study o f rock slopes. The R S R classification shall be better used with steel rib support in medium strength rocks while the Rock M ass Q uality classification shall be m ore appropria te for hard highly jo in ted rocks. All classifications give conservative results fo r softer rocks.
R E F E R E N C E S 307
References to Chapter 11
1. B a d g l e y . P .C .: S tructura l and Tectonic Principles. New York. H a rp e r & Row,1965. 521 p.
2. Ba r t o n . C .M .: An analysis o f rock structure and fabric in the C .S . A. mine. C obar . N .S . W., C .S . 1. R .O . . A ustralia, Div. Appl. Geomech., Tech. Paper. 1975a.
3. Ba r t o n , C. M.: G eom echanics o f high rise filled stopes: Rock fabric quantifica tion in relation to engineering design at C .S . A. mine. C obar. C .S . I .R .O . . A ustralia, Div. Appl. G eom ech.. A M IRA Project Report 4. 1975b.
4. Ba r t o n . N., L ie n , R. and L u n d e , J.: Engineering classification of rock masses for the design o f tunnel support. Rock Mech., Vol. 6, No. 4. Dec.. 1974a, pp. 189 236.
5 Ba r t o n , N., L ien , R. and L u n d e , J.: Analysis o f rock mass quality an d support practice in tunnelling, and a guide for estim ating support requirements. N orw egian G eotech. Inst., Int. Rep. 54206, 1974b, 74 p.
6. B ie n ia w s k i , Z . T . : Engineeringclassification ofjo in ted rock masses. Trans. S. African Instn. Civ. Engrs., Vol. 15, No. 12, Dec., 1973, pp. 335 344.
7. B ie n ia w s k i , Z .T .: C ase studies: Prediction o f rock mass behaviour by the geom echanics classification. Proc. 2nd A ust.-N .Z . Conf. Geomech., Brisbane, 1975a, p p . 36 41.
8. B ie n ia w s k i , Z . T . : T he point-load test in geotechnical practice. Eng. G eol. , Vol. 9, 1975b, pp. 1 1 1 .
9. B io t , M. A .: T heory o f viscous buckling o f multilayered fluids undergoing finite s train. Phys. o f Fluids, Vol. 7, 1964. pp. 855-859.
10. B io t , M. A .: T heory o f viscous buckling and gravity instability o f multilayers with large deform ation . Geol. Soc. Am. Bull., Vol. 76, 1965, pp. 371 378.
11. B i o t , M .A ., O d e . H. and R o e v e r . W .L .: Experimental verification o f the folding o f stratified viscoelastic media. Geol. Soc. Am. Bull., Vol. 72, 1961, pp. 1621 1630.
12. Bo g d a n o v , A. A.: T he intensity o f cleavage as related to the thickness o f the bed (In Russian). Sov. Geol., Vol. 16, 1947.
13. Br a c e , W. F.: O rien ta tion o f anisotropic minerals in a stress field: Discussion. Geol. Soc. Am. Mem. 79, 1960. pp. 9 20.
14. Br e d d i n , H .: Die tektonische Deform ation der Fossilien im Rheinischen Schiefer- gebirge. Deut. Geol. Ges. Z.. Vol. 196, 1956a, pp. 227 305.
15. Br e d d i n , H .: Die tcktonische Geste insdeform ation im Karbongiirtcl W estdeutsch-lands und Siidlimburgs. Deut. Geol. Ges. Z., Vol. 107. 1956b, pp. 232 260.
16. Br e d d i n , H.: Tektonische Fossil- und Geste insdeform ation im G ebiet vonSt. G o a rh au sen . D echeniana , Vol. 110, 1957, pp. 289 350.
17. Br o c h , E. and F r a n k l i n , J .A .: The point-load strength test. Int. J. Rock Mech. Min. Sci., Vol. 9. 1972. pp. 669-697.
18. C a il l e u x , A . : La d isposition individuelle des galets dans les form ations detritiques. Rev. G eo g rap h . Phys. Geol. D ynam ique, Vol. 11,1938, pp. 171 198.
19. C h a p m a n , C .A . and R ioux , R .L . : Statistical study o f topography, sheeting andjo in ting in granite. Acadia N ational Park, Maine. Am. J. Sci., Vol. 256, 1958.pp. I l f 127?
20. C l a r k e , F. W.: T he d a ta o f geochemistry. U.S. Geol. Survey Bull. 770, 1924.
308 Cl \S S I I l( A I I O N <>| R O C K
21. C l (X)S, E.: Boudinage. Trans. Am. Geophys. Union, Vol. 28, 1947, pp. 626-632.22. C l o o s , E.: Experimental analysis o f fracture patterns. Geol. Soc. Am . Bull.. Vol. 66,
1955. pp. 241 256.23. C l o o s , H . : E infiihrung in die Geologic. Berlin, Borntraeger, 1936, pp. 258 272.24. C o a t e s , D .E .: Classification o f rocks for rock mechanics. Int. J. Rock Mech. Min.
Sci., Vol. 1. No. 3, May, 1964, pp. 421 429.25. C o a t e s , D . F . and P a r s o n s , R . C . : Experimental criteria for classification o f rock
substances. Int. J. Rock Mech. Min. Sci.. Vol. 3, No. 3, July, 1966, pp. 181 189.26. C o o n , R .F . : C orre la tion o f engineering behaviour with the classification o f in situ
rock. Ph. I). Thesis, Univ. Illinois, U rbana . 1968. 236 p.27. C u r r i e , J.B ., P a t n o d e , H .W . and T r u m p . R .P .: Development o f folds in
sedimentary strata. Geol. Soc. Am. Bull.. Vol. 73, No. 6, June, 1962. pp. 655 673.28. D aS il v e ir a , A .E . , R o d r i g u e s , F .P .. G r o s s m a n n , N .F . and M e n d e s , F. d e M .:
Quantita tive characterisation o f the geometric param eters o f jo in ting in rock masses. Proc. 1st Cong. Int. Soc. Rock Mech., Lisbon. 1966, Vol. 1. pp. 225-233.
29. D e e r e , D . U . : Technical description o f rock cores for engineering purposes. Rock Mech. Eng. G eol. , Vol. 1, 1963, pp. 18 22.
30. D e e r e , D . U.: Geological considerations. C h ap te r in Rock M echanics in Engineering Practice (Editors K .G . S ta g g a n d O .C . Zienkiewicz), London, Wiley, 1968, pp. 1 20.
31. D e e r e , D . U., H e n d r o n . A .J ., P a t t o n , F . D . and C o r d i n g , E .J .: Design o f surface and near-surface construction in rock. Proc. 8th Symp. Rock Mech., M inneapolis, M inn., 1966, pp. 237 302.
32. D e e r e , D .U .. M e r r i t t , A. 11, and C o o n , R .F .: Engineering classification o f in situ rock. U .S. A ir Force Systems C o m m and . Air Force W eapons Lab., K irtland Air Force Base. New Mexico, Tech. Rep. AFW L-TR-67-144. Jan., 1969, 269 p.
33. D e e r e , D . U . and M il l e r . R .P .: Engineering classification and index properties for intact rock. U .S . Air Force Systems C om m and , Air Force W eapons Lab., K irtland Air F orce Base, New Mexico, Tech. Rep. A F W L -T R -65-116, 1966.
34. D e S i t t e r , L. U .: S tructural Geology. New York, M cGraw-Hill, 1964, 551 p.35. D u n c a n , N .: Engineering geology and rock mechanics, Vols. I and II. L ondon.
Leonard Hill. 1969.36. F a i r h u r s t , C. and R o e g ie r s , J .C . : Estimation o f rock permeability by hydraulic
fracturing A suggestion. Discussion in Proc. Symp. Percolation th rough Fissured Rock, S tu ttgar t, Germ any, 1972, Paper D-2.
37. F()( a r d i . P., G a n d o l f i , S. and M i r i o , M . : Frequency o f jo in ts in turbidite s an d stone 2nd Cong. Int. Soc. Rock Mech., Belgrade. Vol. I, 1970, Pap. 1-16.
38. Geological Society o f L ondon: Engineering G ro u p W orking Party. The logging o f rock cores for engineering purposes. Q .J . Eng. Geol., Vol. 3, No. 1. 1970. pp. 1 24.
39. G i l l u l y . J.. W a t e r s . A .C . and W o o d f o r d , A .O .: Principles o f Geology, W . H . Freeman & C o ., San Francisco. 1959.
40. G r i f f i t h s , J .C . : Scientific M ethod in Analysis o f Sediments. New Y ork, M cG raw - Hill, 1967,508 p.
41. G r i g g s . D. an d H a n d i n . J.: Observations on fracture and a hypothesis o f e a r th quakes. Geol. Soc. Am. Mem. 79. 1960, pp. 347 364.
42. G r ig g s , D .T . , T u r n e r , F .J . and H e a r d , H .C . : D eform ation o f rocks at 500° to 800^ C . Geol. Soc. Am. M em . 79, 1960. pp. 39 104.
43. H a n d i n , J.: S trength and ductility. Section in H andbook o f Physical C onstan ts (S. P. C lark, Editor), Geol. Soc. Am. Mem. 97. 1966. pp. 223 289.

R E F E R E N C E S
44. H a r r i s , J. F.. T a y l o r , G . L. and W a l p e r , J. L . : Relation o f deform ational fractures in sedimentary rocks to regional and local structures. Bull. Am. Assoc. Pet. Geol.. Vol. 44, 1960, pp. 1853 1960.
45. H o d g s o n , R .A .: Regional study o f jo in ting in C om b Ridge-Navajo m ountain area , Arizona and U tah. Bull. Am. Assoc. Pet. Geol., Vol. 45. No. 1. Jan., 1961, p p . 1 38.
46. H o l m e s , C .D . : Till fabric. Geol. Soc. Am. Bull., Vol. 52, 1941, pp. 1299-1354.47. H u n a , J .J . : Relation o f d im ensional orienta tion o f quar tz grains to directional
permeability in sandstones. M .S . Thesis, Dept. Mineralogy, Penn. State Univ., Univ. Park. Penn.. 1956. 97 p.
48. I. S. R. M . : Description o f rock masses, jo in ts and discontinuities. 2nd draft, August, 1975.
49. J a h n s , R. A.: Sheet s tructure in granites; its origin and use as a measure o f glacial erosion in New England. J. Geol.. Vol. 51. 1943. pp. 71 98.
50. J e n n in g s , J .E . , B r in k . A .B .A . and W illiams, A .A .B . : Revised guide to soil profiling. Trans. S. African Instn. Civil Engrs., Vol. 15, No. 1, Jan.. 1973, pp. 3 12.
51. J o h a n s s o n , C .E . : S tructural studies o f sedimentary desposits. Geologiska For- cningens i Stockholm Forhand lingar , Vol. 87, 1965, pp. 3—61.
52. J o h n , K . W . : An approach to rock mechanics. J. Soil Mech. Found. Div., Am. Soc. Civ. Eng., Vol. 88, SM-4, Aug., 1962, pp. 1 30.
53. K a m il W .B .: Theory o f preferred crystal orientations developed by crystallisation u n d er stress. J. Geol., Vol. 67, 1959, pp. 153 170.
54. K ir o i l o v a , I. V.: Some problem s o f the mechanics o f folding (In Russian). Trans. G eofian , Vol. 6, 1949.
55. K r y n i n e , D .P . and J u d d , W .R . : Principles o f Engineering Geology and G e o technics. New York, M cG raw -H ill , 1957. 730 p.
56. L a u f f e r , H.: Gebirgsklassifizierung fur den Stollenbau. Geol.- u. Bauwesen, Vol.24, 1958, pp . 46 51.
57. M a c D o n a l d . G .J .F . : T herm odynam ics o f solids under non-hydrostatic stress with geological applications. Am. J. Sci., Vol. 225, 1957, pp. 266 281.
58. M e r r i t t , A .H .: Engineering classification for in situ rock. Ph. D . Thesis, Univ. Illinois, U rb an a , 1968.
59. M in e r . N . A . : Talus slopes o f the G aspe Peninsula. Science, Vol. 79, 1934, pp. 229 230.
60. M u l l e r , K .E .H . : Z ur Definition des Durchtrennungsgrades. Rock Mech., Supl. 3. 1974, pp. 17 29.
61. M u l l e r , K .E .H . : Zur Definition des Durchtrennungsgrades. SFB. Jahresbericht 1974. Inst. Boden- u. Felsmech., Univ. Karlsruhe. Karlsruhe, 1975.
62. M u l l e r . L.: D er Felsbau. S tu ttgar t. Ferd inand Enke-Verlag, 1963, 624 p.63. M u l l e r . L. and H o i m a n n , H . : Selection, compilation and assessment o f geological
d a ta for the slope problem. Proc. Symp. Planning Open Pit Mines, Johannesburg , 1970. pp. 153 170.
64. N i g g l i , P . : Gestein- und M inerallagerstatten. Basel. Berkhauser Verlag, 1948.65. N o v i k o v a , A .C .: The intensity o f cleavage as related to the thickness o f the bed.
(In Russian). Sov. Geol.. Vol. 16. 1947.66. O l i v i e r . H .G . : Note on the swelling properties and o ther related geomechanical
pa ram ete rs o f K aroo s tra ta as encountered in the Orange-Fish tunnel. Report, Oviston L aboratories , 1973, 7 p.
310 C l ASS! I 1C A I I O N O l ROC k
67. P a c h e r . F.: Kennziffern des Flachengefiiges. Geol- u. Bauwesen. Vol. 24, 1959, pp. 224- 227.
68. P a l m s t r o m , A.: Karakterisering av oppsreknigsgrad og fjellmassers kvalitet. Int. Rep., Ing. A. B. Berdal, Mariesvei 20, 1322 Hovik. Oslo. 1975, 26 p.
69. P a t e r s o n , M .S .: Experim ental deform ation and faulting in W om beyan marble . Geol. Soc. Am. Bull.. Vol. 69, 1958, pp. 465 476.
70. P a t t o n , F . D . and D e e r e , D . U . : Geological factors controlling slope stability in open pit mines. Proc. 1st Int. Conf. Stability in O pen Pit Mining. V ancouver. Canada , 1970. pp. 23 47.
71. P i n c u s , H .J .: Q uantita tive com parative analysis o f fractures in gneisses and over- lying sediment rocks o f N o rth e rn New Jersey. Geol. Soc. Am. Bull.. Vol. 62. 1951. pp. 81 130.
72. P in c u s . H .J .: The analysis o f aggregates o f orientation da ta in the earth sciences. J. Geol., Vol. 61, 1953, pp. 482 509.
73. P it e a u , D .R . : Geological factors significant to the stability o f slope cu t in rock. Proc. Symp. Planning Open Pit Mines. Johannesburg , 1970, pp. 33 53.
74. P r a t t , W .E .: Large-scale polygonal jointing. Bull. Am. Assoc. Pet. Geol., Vol. 42,1958, p p . 2249 2251.
75. P r ic e , G. P . : Q uartz c-axis fabric analysis by the photom etric m ethod. Ph. D. Thesis, Univ. Sydney, Sydney. 1975.
76. P r ic e , N. J . : M echanics o f jo in ting in rocks. Geol. Mag., Vol. 96. No. 2, M arch-A pril .1959, p p . 149 167.
77. P r ic e , N .J .: Fault and jo in t developm ent in brittle and semi-brittle rock. Oxford, Pergamon, 1966, 176 p.
78. P r ie s t , S .D . and H u d s o n , J. A .: D iscontinuity spacings in rock. Int. J. Rock Mech. Min. Sci. & G eomech. Abstr., Vol. 13, 1976, pp. 135-148.
79. P r o c t o r , R.V. and W h i t e , T .L . : Rock Tunnelling with Steel Supports . Y oungstown. Ohio, Com m ercial Shearing & Stamping Co., 1946, 278 p.
80. R a m b e r g , H .: Relationships between length o f arc and thickness o f p tygm atically folded veins. Am. J. Sci., Vol. 258, 1960, pp. 36 46.
81. R a m b e r g . H.: C ontac t strain and folding instability o f a multi-layered body under compression. Geol. Rund., Vol. 51, 1961, pp. 405 439.
82. R a m b e r g , FI.: Fluid dynam ics o f viscous buckling applicable to folding o f layered rocks. Bull. Am. Assoc. Pet. Geol., Vol. 47, 1963, pp. 484-515.
83. R a m s a y , J .G . : Folding and fracturing o f rocks. New York. M cG raw -H ill. 1967, 568 p.
84. R o b e r t s o n , A. M.: The in terpretation o f geological factors for use in slope theory. Proc. Symp. Planning Open Pit Mines. Johannesburg , 1970. pp. 55 71.
85. R o b e r t s o n , A .M . and S t a m e r , R.: The interpretation o f jo in t survey data . Report on the stability o f side slopes o f the big holes o f the de Beer's mine, Kimberley, South Africa. 1968.
86. R o c h a , M.: Discussion in Proc. Symp. Percolation through Fissured Rock. Stuttgart, G erm any , 1972, pp. 1 1 1 5 .
87. R o s e n g r e n , K .J . : Rock mechanics o f the Black Star open cut. M ount Isa. Ph. D. Thesis, Aust. N at. Univ., C anberra , 1968.
88. R u iz , M .D .: Some technological characteristics o f twenty-six Brazilian rock types. Proc. 1 st Cong. Int. Soc. Rock Mech., Lisbon, 1966, Vol. 1, pp. 115 119.
89. S a n d e r , B.: Gefiigekunde d e r Gesteine. Berlin, Springer, 1930.

R E F E R E N C E S 311
90. S h a r p , J .C . and M a i m , Y .N .T . : F undam enta l considerations on the hydraulic characteristics o f jo in ts in rock. Proc. Symp. Percolation through Fissured Rock. S tu ttgar t, G erm any . 1972. Paper T 1 4 .
91. S t a p l e d o n , D .H . : Discussion o f paper “ Classification o f rock substances” byD. F. C o a t e s . Int. J. Rock Mech. Min. Sci., Vol. 5, No. 4. July. 1968, pp. 371 373.
92. St in i , J . : Technische Geologie. Stuttgart. Enke Verlag. 1922.93. St in i , J .: Technische Gesteinskunde. Wien, Springer Verlag, 1929.94. S t i n i . . ! . : Tunnelbaugeologie. Wien, Springer Verlag, 1951.95. T f.r z a c . h i . K .: Rock defects and loads on tunnel supports. In Rock Tunnelling
with Steel S upports by R.V. P r o c t o r and T .L . W h i t e . Youngstown, Ohio, C om m ercial Shearing and S tam ping Co.. 1946. pp. 15 199.
96 . T e r z a g h i , K . : Stability o f steep slopes on hard unweathcred rock. Geotechnique, Vol. 12, 1962, pp. 2 5 1 - 2 7 0 .
97. T e r z a g h i , R . D . : Sources o f er ro r in joint surveys. Geotechnique, Vol. 15, 1965, pp. 287 304.
98. T u r n e r . E . G . : Review o f curren t hypotheses and tectonic significance o f schistosity in m etam orph ic rocks. Trans. Am. Geophys. U nion , Vol. 29, 1948. pp. 558 564.
99. T u r n e r , F .J . , G r i g g s , D .T ., C l a r k , R .H . and D i x o n . R .H .: Deform ation of Yule marble. Part 7. Geol. Soc. Am. Bull., Vol. 67, 1956, pp. 1259 1294.
100. T u r n e r , F .J . and W l i ss , L .E .: S tructural Analysis o f M etam orphic Tectonites. New Y ork , M cG raw -H ill, 1963, 545 p.
101. U n d e r w o o d , E .E .: Q uantitative Stereology. Reading, M assachusetts, Addison Wesley, 1969, 274 p.
102. U .S. Task C om m ittee for Foundations Design M anual, Am. Soc. Civ. Eng. Subsurface investigation for design and construction o f foundations o f buildings: Part II. J. Soil Mech. Found. Div., Am. Soc. Civ. Eng., Vol. 98 , SM6, June. 1972, p p . 5 5 7 578 .
103. W a h l s t r o m , E. E.: Tunnelling in rock. A m sterdam . Elsevier, 1973, 250 p.104. W e i n e r t , H .H . : Engineering petrology for roads in South Africa. Eng. Geol.,
Vol. 2, 1968, pp. 363-395.105. W i c k h a m , G .E . and T i e d e m a n n , H .R . : Research in ground support and its
evaluation for coord ina tion with system analysis in rapid excavation. U .S .B .M . C o n trac t R eport H-0210038, A R P A Program, 1972.
106. W i c k h a m , G .E . and T i e d e m a n n , H .R . : G ro u n d support prediction model (RSR concept). U.S. B. M. C on trac t R eport H-020075, A R P A Program, 1974.
107. W i c k h a m , G .E ., T i e d e m a n n , H .R . and S k i n n e r , E .H .: Support determinations based on geologic predictions. Proc. N orth American Rapid Excavation Tunnelling Conf., Chicago, 1972, Vol. I, pp. 43 64.
108. W i l l i s , B . : M echanics o f A ppalachian structure. U.S. Geol. Survey, 13th Annual R eport , Part II, 1893.
109 . W i l l i s , B. and W i l l i s , R . : Geologic Structures. M cGraw-Hill, 1934 , 5 4 4 p.

312 C l XSSI 11C \ I It ) \ < >1 R( K k
Uncited References to Chapter 11
1. A i s e n s t e in , B .: Some observations on deconsolidation o f limey rocks on steep slopes. Proc. 6th Int. Conf. Soil Mech. Found. Eng., M ontreal, 1965, Vol. 2, p p . 439 441.
2. A n o n : Proposal for rock classification. Proc. 10th Cong. Int. Bur. Rock M ech., Leipzig, 1968, pp. 787 788.
3. A u f m u t h , R. E . : Site engineering indexing o f rock. Field Testing and Instrum ention o f Rock , A .S .T . M., Spec. Tech. Pub. 554, 1970.
4. A u f m u t h , R .E .: A systematic determ ination o f the engineering criteria for rock. Bull. Assoc. Eng. Geol., Vol. 11, N o. 3, 1974, pp. 235 245.
5. B a r t o n , C .M .: Simplified procedures for the vector sum m ation and statistical analysis o f spherically d istributed point clusters. C .S . I .R .O . , Australia, Div. Appl. G eom ech ., Tech. Rep. No. 20, 1974.
6. B a l t o s s e r , R .W . and L a w r e n c e , H .W .: Application o f well logging techniques in metallic mineral mining. Geophysics, Vol. 35, No. 1, Feb., 1970, pp. 143 152.
7. Bo n i f a c e , A.: Stereographic aid for oriented borehole core. Trans. S. African Instn. Civil Engrs., Vol. 16, No. 6, June, 1974, pp. 199-202.
8. B o r e i t i - O n y s z k i e w i c z , W . : Joints in the flysch sandstones on the ground o f strength exam inations. Proc. 1st Cong. Inst. Soc. Rock Mech., Lisbon, 1966, Vol. 1, pp. 153 157.
9. B r (X)k e r , P .I . : Avoiding unnecessary drilling. Proc. Aust. Inst. Min. MetalL, N o . 253, M arch, 1975, pp. 21 23.
10. C e c i l , O .S . : C orrela tion o f rock bolts, shotcrete support and rock quality p a r a m eters in Scandinavian tunnels. Ph. D. Thesis, Univ. Illinois, U rbana , 1970.
11. C h a p m a n , R .W .: Criteria for the m ode o f emplacement o f the alkaline stock at M o u n t M onadrak , Vermont. Geol. Soc. Am. Bull., Vol. 65, 1954, pp. 97 114.
12. C h a t t e r j i , G .C . : Thoughts on studies concerning microrelief. Proc. Ind. Soc. Eng. G eo l. , Oct., 1968.
13. C l a r , E.: Z ur D ars te l lungder Kluftigkeit von Felsaufschliissen. G eo l. -u . Bauwesen, Vol. 7, No. 1, 1939.
14. C l o o s , II .: Experimente zur inneren Tektonik . Centralbl. Minerol. Geol. u. Pal., 1928, pp. 609-621.
15. C l o o s , FI.: Z ur experimentellen Tektonik I. M ethodik und Beispiele. Die N a tu r - w issenschaften, Vol. 18, No. 34, 1930, pp. 741 747.
16. C lo o s , H .: Hebung, Spaltung, Vulkanismus. Geol. Rund. Vol. 30, 1939.
17. C o o n , R .F . and M e r r i t t , A .H .: Predicting in situ m odulus o f deform ation using rock quality indexes. Proc. Symp. D eterm ination o f the In-situ M odulus o f D eform ation o f Rock, Denver, Colo., 1969, A .S .T .M . Spec. Tech. Publ. 477, 1970, pp. 154-173.
18. C o t t i s s , G .I . , D o w e l l , R .W . and F r a n k l i n , J .A .: A rock classification system applied in civil engineering. Parts I and II. Civil Eng. Public W orks Rev.. June and July, 1971.
19. C u m m in g , J. D . : D iam ond Drilling H andbook . T oron to , Smith & Sons, 1956.
20. D e n i s s o v , N .J ., P a u s h k i n , G .A . and Z a y t z e v , A .S.: Applying the inform ation received in the process o f drilling for the estimation o f the state o f rocks. Proc. Ist C ong. Int. Soc. Rock Mech.. Lisbon. 1966. Vol. 1, pp. 199 203.

U N C I T E D R E F E R E N C E S 313
21. D i e t e r i c h , J .H . : Origin o f cleavage in folded rocks. Am. J. Sci., Vol. 267, N o. 2, Feb.. 1969, pp. 155 165.
22. D ieteric h . J .H . : C o m p u te r experiments on mechanics o f finite am pli tude folds. C an . J. Earth Sci., Vol. 7, No. 2, April, 1970, pp. 467 476.
23. D i e t e r i c h , J. H, and C a r t e r , N. L . : Stress-history o f folding. Am. J. Sci., Vol. 267. No. 2, Feb., 1969, pp. 129 154.
24. D i x o n , H. W .: D ecom position products o f rock substances Proposed engineering geological classification. Proc. Symp. Rock Mech., Univ. Sydney, 1969. pp. 39-44.
25. E r z h a n o v , Z.S. and E g o r o v , A .K .: The m athem atical theory o f the fo rm a tion o f folds in the earth 's crust. Proc. 2nd Cong. Int. Soc. Rock Mech.. Belgrade, 1970, Vol. 1, pp. 457-462.
26. E u r e n i u s , J. and F a g e r s t r o m , II.: Sam pling and testing o f soft rock with weak layers. Geotechnique, Vol. 19, No. 1, 1969, pp. 116-132.
27. F o ok .es . P .G . and D e n n e s s , B.: Observational studies on fissure p a t te rn s in C retaceous sediments o f S o u th East England. G eotechnique, Vol. 19, N o. 4, 1969, pp. 453-477.
28. F o o k e s , P .G . and H i g g i n b o t t o m , I .E .: The classification and description o f n e a r shore ca rbonate sediments for engineering purposes. Geotechnique, Vol. 25, N o . 2, June, 1975, pp. 406 411.
29. F o o k e s , P .G . and P a r r i s h , D .G .: O bservations on small scale s tructu ra l d isco n tinuities in the L ondon clay and their re lationship to regional geology. Q .J . Eng. G eol. , Vol. 1, No. 4, 1969, pp. 217-240.
30. F r a n k l i n , J .A .: O bservations and tests for engineering description and m ap p in g o f rocks. Proc. 2nd Cong. Int. Soc. Rock Mech., Belgrade, 1970, Vol. 1, pp. 11 16.
31. F r a n k l i n , J .A .. B r o c k . E. and W a l t o n , G .: Logging the mechanical ch a rac te r o f rock. Trans. Inst. Min. M etall., Section A, Vol. 80, 1971, pp. A 1-A 9.
32. F o i j r m a i n t r a u x , D.: Q uantification o f discontinuities o f rock and rock masses M ethods and applications. Rock Mech., Vol. 7, No. 2. June, 1975, pp. 83 100.
33. G a m b l e , J . C . : Durability plasticity classification o f shales and other argillaceous rocks. Ph. D. Thesis. Univ. Illinois, U rbana , 1971.
34. Geol. Soc. Am .: A pplication o f geology to engineering practice. Berkey Volum e, New Y ork, Geol. Soc. Am ., 1950, 327 p.
35. G o e t z e , C.: Sheared iherzolites from the poin t o f view o f rock mechanics. G eo logy (G .S . Am.), Vol. 3, No. 4, April, 1975, pp. 172-173.
36. G r a m b e r g , J.: Bruchbildung, Bewegungen und Spannungen um eine A b b au streck e bei einseitigem Abbau. G ebirgsdruck und G rubenausbau , ( In fo rm ationstagung), 13 14 Nov., 1969.
37. G r a m b e r g , J.: The axial cleavage fracture. Eng. Geol., Vol. 1, 1965, pp. 31-72.38. H a g e r m a n , T .H .: Rock bodies and particular zones in rock. The geological
s truc tu re as a factor in rock stability. Proc. 1st Cong. Int. Soc. Rock Mech., L isbon, 1966, Vol. 1, pp. 159-162.
39. H a g e r m a n , T .H .: Different types o f rock masses from rock mechanics p o in t o f view. Rock Mech. Eng. G eol. . Vol. 4, 1966, pp. 183-198.
40. H a m e l , J.V . and A d a m s , R.: Discussion on “ Some field examples o f topp ling failure b y De F r e it a s , M .H . and W a t t e r s , R .J . ” Geotechnique, Vol. 24. N o . 4, Dec., 1974. pp. 691 693.
41. H a n s a g i , I.: Mining way o f defining the mechanical properties o f rock and o f the classification o f rock. Proc. 1st Cong. Int. Soc. Rock Mech., Lisbon, 1966, Vol. 1,

314 C I AS SI I 1C \ I K ) \ ( )l R ( )( k
42. H a n sa gi . I.: A m ethod o f determ ining the degree o f fissuration o f rock. Int. J. Rock Mech. Min. Sci. & Geomech. Abstr.. Vol. 11, No. 10. Oct., 1974. pp. 379 388.
43. H e n d r o n , A. J., C o r d i n g , E. J. and A iyer , A. K . : Analytical and graphical m ethods for the analysis o f slopes in rock masses. U .S. Arm y Eng. W aterways Exp. Stn.. C orps of Engrs, N .C .G . Tech. Rep., July, 1971. 162 p.
44. H o e pp e n e r , R.: Vorlaufige Mitteilung iiber ein genetisches System tektonischer Gefugetypen. N. Jb. Geol. Pclaont. 1959, pp. 363 367.
45. H o e pp e n e r , R.: Physical tectonic representation o f offine deform ation and o f stress conditions by m eans o f equal area spherical projection. Rock Mech., Vol. 2, N o. 1. 1964, pp. 22 44.
46. H o e ppe n e r , R.. K a l t h o f f , E. and S c h r a d e r , P.: F rac tu ring o f rocks during hom ogeneous deform ations. In G erm an . Geol. R und., Vol. 59,1969, pp. 179 193.
47. H o l l in g s w o r t h , J . : A review o f the work on overbreak in stopes at the C .S .A . mine. Cobar, N .S .W . Parts 1 and 2. C .S . I .R .O . , Australia. Div. Appl. G eom ech., Report No. 20, 1974.
48. H ubaijx , A . : Scheme for a quick description o f rocks. J. Int. Assoc. M ath . Geology, Vol. 3, 1971, pp. 317 322.
49. H u g h e s , M .D .: D iam ond drilling for rock mechanics investigations. Proc. Symp. Rock Mech., Univ. Sydney, 1969, pp. 135 139.
50. I id a , R., O k a m o t o , R. and Y asuf., T . : Geological rock classification o f dam foundation, Rock M echanics in Japan , Vol. 1, 1970, pp. 161 163.
51. Il ie v , I .G . : An a ttem pt to estimate the degree o f weathering of intrusive rocks from their physico-mechanical properties. Proc. 1st Cong. Int. Soc. Rock Mech., Lisbon,1966, Vol. 1, pp. 109 114.
52. In g les , O .G . and L afeber , D.: The investigation and development o f crack and joint systems in g ranu la r masses. C .S . I .R .O . , Australia, Div. Appl. Geomech.. Res. Rep. No. 97, 1967.
53. In g les , O .G . and L afeber , D .: The influence o f volume defects on the strength and strength isotropy o f stabilised clays. Eng. Geol.. Vol. 1, No. 4, June, 1966, pp. 305-310."
54. J aarsveld , A .P . v o n .: Site exploration in tunnelling projects. Rep. S. African C .S .I .R . , No. M E G 1008, 1971.
55. J effers, J .P . : C ore barrel designed for m axim um core recovery and drilling performance. Proc. D iam ond Drilling Symp., Adelaide, 1966.
56. J o h n , M.: Properties and classification o f rocks with reference to tunnelling.C .S .I .R . , South Africa. M E G 1020, 1971.
57. Jo h n , M .: Tunnelling in rock. Rep. S. African C .S. I. R., No. M E G 1037, 1971.58. J o v a n . S. and Bo z in o v ic , D.: On a geotechnical classification o f terrain. Proc.
1st Cong. Int. Soc. Rock Mech., Lisbon. 1966. Vol. 1. pp. 121 -124.59. K a l t h o ff , E.: Bruchbildung in M odellsubstanzen bei D eform ationen mit axialer
und rhom bischer Symmetric. Ph. D. Thesis, R uhr Univ.. Bochum, 1970.60. K irkby , M .J . : Landslides and weathering rates. Proc. Conf. Stability and C onser
vation, N aples, Geol. Appl. Idrogol, Vol. 8, 1973, pp. 171 183.61. K rebs, E.: Optical surveying with the borehole periscope. Min. Mag., Vol. 116,
No. 6, June, 1967, pp. 390 399.62. L a k s h m a n a n , J. and A l l a r d , P.: Seismic logging: a m eans to investigate rock
fissuration. Proc. Symp. Rock Fracture, Nancy, 1971, Paper 1-20.
pp. 179 183.
U N C I T E D R E F E R E N C E S 315
63. L a n k . K .S .: Stability o f reservoir slopes. Proc. 8th Symp. Rock Mech.. Minneapolis. Minn.. 1966. pp. 321 336.
64. Lo m b a r d i . G . : T he influence o f rock characteristics on the stability o f rock cavities. Tunnels and Tunnelling, Vol. 2, 1970. pp. 19 to 22 and 104 109.
65. M a h t a b , M . A . . B o l s t a d . D. D.. A l l d r e d g e , J R. and S h a n l e y , R .J . : Analysis o f fracture orienta tions for input to structural models o f d iscontinuous rock. U . S . B . M . , R. I. 7669, 1972, 76 p.
66. M a t u l a , M . : Engineering geologic investigations o f rock heterogeneity. Proc.11th Symp. Rock Mech.. Berkeley, California. 1969, pp. 25 42.
67. M c M a h a n , B .K .: Indices related to the mechanical properties o f jo in ted rock. Proc. 9th Symp. Rock Mech., C o lo rado School o f Mines, 1967, pp. 117 128.
68. M o g i l e v s k a y a , S .E .: M orphology o f jo in t surfaces in rock and its im portance for engineering geological exam ination o f dam foundations. 2nd Int. Cong. Int. Assoc. Engng Geol., Sao Paulo, Vol. II, 1974, pap. VI 17.1.
69. M i l l e r , R .P .: Engineering classification and index properties for intact rock. Ph. D. Thesis, Univ. Illinois. U rbana, 1965.
70. M u l l e r , L.: O ntersuchungen tiber statische Kluftmessungen. Geol.- u. Bauwesen, Vol. 1, No. 3. 1933, pp. 26 82.
71. M u l l e r , L..: Der K luftkorper, Geol.- u. Bauwesen, Vol. 18, No. I. 1950.72. M u l l e r , L.: Baugeologie der Festgesteine, Felsbaumechanik. G ru n d b a u Taschen-
buch. Band I. 1970.73. M u l l e r . L..: G eom echanische Auswirkungen von Abtragungsvorgiingen. Geol.
R und ., Band 59, No. I, 1969, pp. 163 178.74. M u l l e r , L.: Gestein und Gebirgseigenschaften in Abhangigkeit von bctrachtetem
G ro B en b ere ich : Deut. Geol. Ges. Z.. Vol. 119, 1967. pp. 65 70.75. M u l l e r , L.: The presentation o f geologic planes in structura l drawings. Geol.- u.
Bauwesen, Vol. 20. No. 1, 1963.76. O b e r t i , Ci. and F u m a g a l l i , E.: Investigations o f tunnel and penstock linings in
an iso tro p ic media. Proc. 6th Int. Conf. Soil Mech. F ound . Eng., M ontreal, 1965, Vol. 2. pp. 405 409.
77. O r r , C .N . : The geological description o f in situ rock mass as input da ta for engineering design. Rep. S. African C .S . I .R . . No. M EG/344. ME 1274. 1974. 133 p.
78. O v e r b e y , W .K ., K o m a r , C .A . and P a s in i , J.: Predicting probable roo f fall areas in advance o f m ining by geological analysis. U .S .B .M . Tech. Prog. Rep. (T R P ) 70, 1973. 17 p.
79. P itf.a u , D. R.: Classification and ex trapolating rock jo in t properties in engineering practice. Rock Mech., Suppl. No. 2, 1973, pp. 5 31.
80. P r o c t o r , R .J . : M apping geological conditions in tunnels. Bull. Assoc. Eng. Geol., Vol. 8. 1971. pp. 1 43.
81. R a n k il o r . P. P . : A suggested system oflogg ing rock cores for engineering purposes. Bull. Assoc. Eng. Geol., Vol. 11, No. 3, pp. 247 258.
82. R ic h a r d s , L .R .: Classification and weathering o f near-surface join ted rock. M. Sc. Thesis, Univ. London. London, 1972, 165 p.
83. R o b e r t s o n , A. M . : The in terpretation o f geological factors for use in slope theory. Proc. Sym p. Planning O pen Pit Mines. Johannesburg , 1970. pp. 55 71.
84. R o s e n g r e n , K .J .: D iam ond drilling for structura l purposes at M ount Isa. Proc. Symp. Aust. D iam ond Drilling Assoc., Surfers Paradise, 1969.

316 C l AS S I I K ' A T I O N O l R O C K
85. R o t h , E.: Gefiigeanalytische U ntersuchungen im M arlsburgpluton. Ph. D. Thesis. Univ. K arlsruhe, Karlsruhe, 1969.
86. S a v i c h . A . I . and K e r e s e l id z e , S .B . : Establishment o f param eters for the zone to be s tr ipped in the foundation o f arch dam . Hydrotechnical C onstruction, Vol. 6. June , 1974. pp. 512-518.
87. S h a n l e y , R.J. and M a h t a b , M . A . F r a c t a n : A com pu ter code for analysis o f clusters defined on the unit hemisphere. U .S. B. M . I.C . 8671, 1975. 49 p.
88. S c o t t , S . H . . L ee , F .T ., C a r r o l l . R . D . and R o b i n s o n , C . S . : The re lationship o f geophysical m easurem ents to engineering and construction param eters in the S tra igh t Creek Tunnel pilot bore, C olorado. Int. J. Rock Mech. Min. Sci., Vol. 5, N o . 1, Jan . , 1968, pp. 1 30.
89. S h e a , I I .J . : Proposal f o r a particle size grade scale based on 10. Geology ( G . S. Am.). Vol. 1, N o . 1. 1973, pp. 3 8.
90. H i l l s , E .S .: Elements o f Structural Geology. 2nd edition. C hapm an & Hall, 1972, 500 p.
91. S h o r t , N .M . : Borehole TV camera gives geologists inside story. Min. Eng., Vol. 15, No. 1. Jan . . 1963, pp. 41 47.
92. S l y , D .G . : A new cu tte r liner system for soft sediments cores. Eng. Geol.. Vol. 1. N o . 4, 1966, pp. 343 344.
93. S p e a r s , D. A. and T a y l o r , R. K . : The influence o f wheathering on the com posit ion an d engineering properties o f in situ coal m easure rocks. Int. J. Rock Mech. Min. Sci., Vol. 9, 1972, pp. 729 756.
94. S p e n c e r , E .W .: In troduction o f the S tructure o f the Earth. New York, M cG raw - Hill, 1969,597 p.
95. S t o n e , R .O . and D u y u n d j i , J.: A study o f microrelief its mapping, classification and quantifica tion by m eans o f a Fourier analysis. Eng. Geol., Vol. 1. No. 2, Dec., 1965.
96. T a y l o r , L .C .: G eom etric analysis o f geological separation for slope stability investigations. Bull. Assoc. Eng. Geol., Vol. 7, Nos. 1 and 2, 1970. pp. 67 85.
97. V o i g h t , B.: On the functional classification o f rocks for engineering purposes. Proc. Int. Symp. Rock Mech., M adrid. 1968, pp. 131 135.
98. v o n T h u n , J .L . and T a r b o x , G .S .: D eform ation moduli determ ined by jo int-shear index an d shear catalog. Proc. Symp. Rock F rac tu re , Nancy, 1971, Paper 11-23.
99. W a l s h . J .D . and H o l l i n g s w o r t h , J.: Sam pling and prepara tion o f n a tu ra l soils for quan ti ta t ive three-dimensional fabric analysis. C .S . I .R .O . , Austra lia , Div. A ppl. G eom ech., Tech. Rep. No. 7. 1968.
100. W a t k i n s , M. D . : Term inology for describing the spacing o f discontinuities o f roc< masses. Q. J. Eng. Geol., Vol. 3, 1970, pp. 193 195.
101. W e n t w o r t h , C. K . : A scale o f grade and class terms for clastic sediments, J. G e o l . Vol. 30, 1922.
102. Y o u n g , J. D . : D iam ond drilling core orienta tion. B. H. P. Tech. Bull., N o. 24.103. Z e m a n e k , J., C a l d w e l l , R .L . and G l e n n , E .L .: The borehole televiewer. A ncv
logging concept for fracture location and o th er types o f borehole inspection. .. Pet. Tech .. Vol. 21. 1969. pp. 762 774.
104. Z e m a n e k . J., G l e n n , E., N o r t o n , L. J. and C a l d w e l l , R. L . : Fo rm ation evaluation by inspection with borehole televiewer. Geophysics, Vol. 35, N o . 2, April, 1970, pp. 254 269.

C H A P T E R 12
M iscellaneous Properties of Rock
12.1. Introduction
This chap ter deals with the general physical properties such as grain density, bulk density, porosity, w ater content, void index, permeability, swelling and slake-durability index properties and grain size. A special em phasis has been laid on the determ ination o f perm eability o f rock masses in situ and co n ductiv ity o f jo in ts and the various factors that influence these param eters.
12.2. Density
D ensity is defined as m ass per unit volume. If the weight (force), and no t the m ass, o f a unit volum e is m easured, a unit weight is obtained. The density is related to its unit weight as follows:
•* unit weight / n i xD ensity = ------- =— -r— - f —-------------------------------------------v— (12.1)acceleration due to gravity
In practical work it has been com m on practice to use weight units as force units: in o ther w ords, the unit o f force has been that force which, w hen ap plied to unit mass, produces an acceleration £ (acceleration due to gravity), ra ther than unit acceleration. This has several disadvantages. To obviate these, density is used which is independent o f g.
The m ass o f a unit volum e o f rock in its natural state is different from the m ass o f the sam e volume o f rock containing only o f its solid phase. Because o f this, two term s “ bulk density" or simply “density" and “grain density" a re in com m on use.

318 M I S C E L L A N E O U S P R O P E R T I E S O F R O C K
12.2.1. G ra in Density
G ra in density />g is the m ass o f a unit volum e o f the grains (i.e. solid phase or m ineral skeleton) o f a rock.
w here m g = mass o f grains and V% — volume o f grains.
T he grain density o f a rock is wholly dependent on the grain densities o f the m inerals form ing it, and is calculated by the form ula
p %= z p-y, ( 1 2 .3 )i= 1
w here n = num ber o f m inerals form ing the rock />i = grain density o f each m ineral andV j = volume o f each m inera l.
T he grain density is com m only determ ined by either o f the two m ethods: Pycnom etric m ethod and Buoyancy m ethod. In both cases, the rock is pow dered in an agate o r jasper m ortar and sieved through a 0.22 mm (0.01 in) mesh sieve (B e lik o v et al, 1967).
Pycnometric method
A pycnom eter with a capacity o f 20 to 100 cm 3 (usually 50 cm 3) (1 to 6 in3 (usually 3 in3)) is selected and after p roper cleaning and drying its mass d e term ined while empty. Then after filling to the m ark with distilled water, its mass is determ ined. The difference in masses between the filled and the em pty pycnom eter gives its capacity. A fter pouring a sample (15 to 20 g) (250 to 300 grains) o f powdered rock into the pycnom eter with the aid o f a funnel, it is dried in an oven at a tem perature o f 105 C (221 F) for a period o f 24 hours (to a constan t mass) and then cooled in a desiccator. Its total mass is d e term ined from which the mass o f the sam ple is calculated. The pycnom eter is then filled to one-third with distilled w ater and heated on sand bath for 30 to 60 m inutes to remove air from the rock sample. A fter heating, the pycnom eter is cooled to room tem perature, distilled water is filled up to the m ark, and the m ass o f the filled pycnom eter is determ ined. The grain density o f the rock is calculated from the following e q u a tio n :
D E N S I T Y 319
where />g = grain density/?/y = mass o f the grains in the sample pw = density o f w ater/??, = mass o f the pycnom eter w hen filled with water and m 2 = mass o f the pycnom eter with the sample, filled to the m ark
with water.
If the rock contains w ater-soluble minerals, inert chemicals, e .g ., carbon te tra chloride, naphtha, toluene, etc. are used. Vacuum saturation m ay be used instead o f heating in an apparatus capable o f a vacuum less than 800 Pa (17 lbf/ft2).
A t least 3 tests are perform ed and this m ethod gives an accuracy o f ± 20 kg /m 3 (1 lb /ft3).
Buoyancy method
This m ethod is m ore accurate than the previous m ethod but is also m ore laborious. A pycnom eter o f abou t 50 cm 3 (3 in3) is used. After de term ining its mass, it is filled to one-th ird o f its capacity with the powdered sam ple. The m ass o f the pycnom eter w ith the pow der is determ ined in a ir and the mass o f the sam ple is calculated.
Then the pycnom eter with the sample is half filled with liquid (usually carbon tetrachloride; density = 1600 kg/m 3 (99.9 lb /ft3)) and deaerated in a vacuum cham ber until no m ore a ir bubbles are released from the sample. T he pycnom eter is then removed from the vacuum cham ber, filled with liquid to its neck, stoppered and left to stand for 24 hours until the suspended particles have settled and the liquid has acquired the room tem perature. It is then filled to the top with the liquid and its mass determ ined in the same liquid after suspending it in a beaker containing the liquid from the balance beam . It is essential that no air bubbles adhere to the immersed pycnom eter o r to the dipped section o f the wire.
The pycnom eter is then em ptied and washed with the same liquid; then filled with ano ther portion o f liquid and its mass determ ined while suspending it in to the liquid-filled beaker. Care should be taken to see that the liquid level in the beaker is the same as before.
The grain density o f the rock is calculated from the following re la tionship :
w here = mass o f grains in air/>, = density o f the liquid and /?/yi = mass o f grains in liquid.

320 M I S C E L L A N E O U S P R O P E R T I E S O F R O C K
This method is recom m ended for rocks having a porosity less than 3% . The accuracy is ± 1 kg/m 3 (0.05 lb /ft3). The accuracy increases with increase in the density o f the liquid used. A ny liquid can be used keeping in view that it has a good wetting property. C arbon tetrachloride which has a density o f 1600 kg /m 3 (99.9 lb /ft3) is a com m on weighing m edium because o f its high density and good wetting property. It is however im portan t that the weighing liquid should have low volumetric expansion with tem perature otherwise an accurate tem perature control o f the surroundings shall be needed.
W hen working with rocks o f lower densities, the accuracy can be enhanced by reducing the density determ ined from Equation 12.5 to the density o f w ater at4 C and by applying the correction to the buoyancy in air. The following relationship can be ap p lied :
mg- m g,
where p* = density reduced to the density o f w ater at 4 C p i = density o f w ater a t 4 C and / = density o f air at a given tem perature.
The values o f the correction factor (p* - X) at various tem peratures are given in Table 57.
TABLE 57VALUES OF ( p i - X) AT VARIOUS TEMPERATURES
(a f te r B e l ik o v et a l , 1967)
T em p e ra ture C pi -*■
T em pera- tu re C p i - a
T em p e ra ture C pi - a
T e m p e ra ture C p l - / •
10 0.99853 18 0.99742 26 0.99561 34 0.99319
11 0.99843 19 0.99723 27 0.99534 35 0.99266
12 0.99832 20 0.99703 28 0.99506 36 0.99250
13 0.99820 21 0.99682 29 0.99477 37 0.99214
14 0.99807 22 0.99660 30 0.99447 38 0.99177
15 0.99793 23 0.99636 31 0.99415 39 0.99141
16 0.99777 24 0.99612 32 0.99384 40 0.99104
17 0.99760 25 0.99587 33 0.99352
Since the volume o f the sample taken is small, it is im portant that the sample represents all the m ineral constituents that are present in the rock. It is recommended that a sufficiently large sample of rock be crushed and ground

D E N S I T Y 321
so that the whole o f it passes through the 0.22 mm (0.01 in) sieve and then a required quantity o f the same be taken by using the well known m ethods o f coning and quartering and other sam pling techniques used for powder m aterials.
It is also advisable to determ ine the density o f the liquid used unless it is o f high purity and an accurate value has been provided by the supplier. The density o f the liquid can be determ ined, first, by determ ining the mass o f an inert solid in air, ma, then in water, w w, and finally in the liquid o f interest.
The density o f the liquid is calculated from the following equation:
The bulk density (m any times simply called “density") is defined as the mass o f a unit volume o f a rock. It depends upon the m ineralogical com position, porosity and am ount o f w ater present in the pores. If bulk volume o f the specimen is Vb (i.e. pore volume Vp-f grain volum e Kg) and bulk specimen m ass is m h (mass o f grains m %-1-mass o f w ater in the pores mw), then
bulk density o r density o f rock p =
_ mB + mw ( P 8'vP+ v ;
If the rock is com pletely dry, then dry density o f rock is obtained.
If the rock is saturated with w ater, then saturated density o f rock ps is calculated from the equation
Usually, the dry density o f rock is determ ined and quoted as one o f the rock param eters unless otherw ise specified.
The bulk density can be determ ined by either o f the two m ethods:1. M ethod o f m easurem ents2. Buoyancy m ethod.
(12.7)
12.2.2. Bulk Density
P s =
/?/g -}- density o f w aterK '
( 12 . 1 0 )

322 M I S C E L L A N E O U S P R O P E R T I E S O F R O C K
Method of measurements
W hen rocks can he cut into regular-shaped (cylindrical o r prism atic) specimens, the volume o f the specimen can be found by m easuring its dim ensions. F or cylindrical specimens, the diam eters are m easured bo th a t the two ends and at the middle twice a t right angles to each o ther, and the heights are m easured at 4 points (ends o f two diam eters right angle to each o th e r draw n on flat ends). The average values so obtained can be used for calculating the volume. Similarly, for prism atic specimens, the m easurem ents are done both at the ends and at the centre. An accurate value o f the volum e o f a cubic specimen can be obtained by m easuring the lengths o f the 12 edges o f the cube and finding the m ean value. The m easurem ents are m ade w ith an accuracy o f0.05 mm (0.002 in).
A fter drying the specimen to constant m ass at a tem perature o f 105 C (221 F) (usually 24 hours) and allowing it to cool in a desiccator for 30 m inutes, the mass o f the specimen is determ ined.
The differences in values obtained should not exceed 20 kg /m 3 (1 lb /ft3) but in some cases large variations may be noticed when the specim ens con tain large pores o r caverns, joints, ore im pregnations and o ther inclusions o f heavy minerals. By choosing appropria te size specimens, errors can be reduced.
Buoyancy method
After cleaning the adhering particles from the surface o f a specim en with a brush, it is dried to a constant mass. The mass o f the specimen is then determined in air and then saturated with w ater o r naph tha (if the rock contains w ater-soluble minerals) in a vacuum o f less than 800 Pa (17 lb f/ft2) fo r a period o f at least one hour, with periodic agitation to remove trapped air. A fter saturation, the specimen is surface dried with a m oist c lo th and its m ass determined first in air, and then hydrostatically in a beaker filled with the saturating fluid.
The dry density o f rock is calculated from the following re lationship :
where pd = dry density o f rockw a = mass o f the dry specimen in airp x = density o f liquidw sa = mass o f the saturated-surface-dry specimen in a ir and/?7sl = mass o f the saturated specimen when immersed in the liquid.
Densities o f some im portant rocks and m inerals are given in T ab le 58. Rocks containing heavy m inerals posess high densities. Igneous an m etam orphic
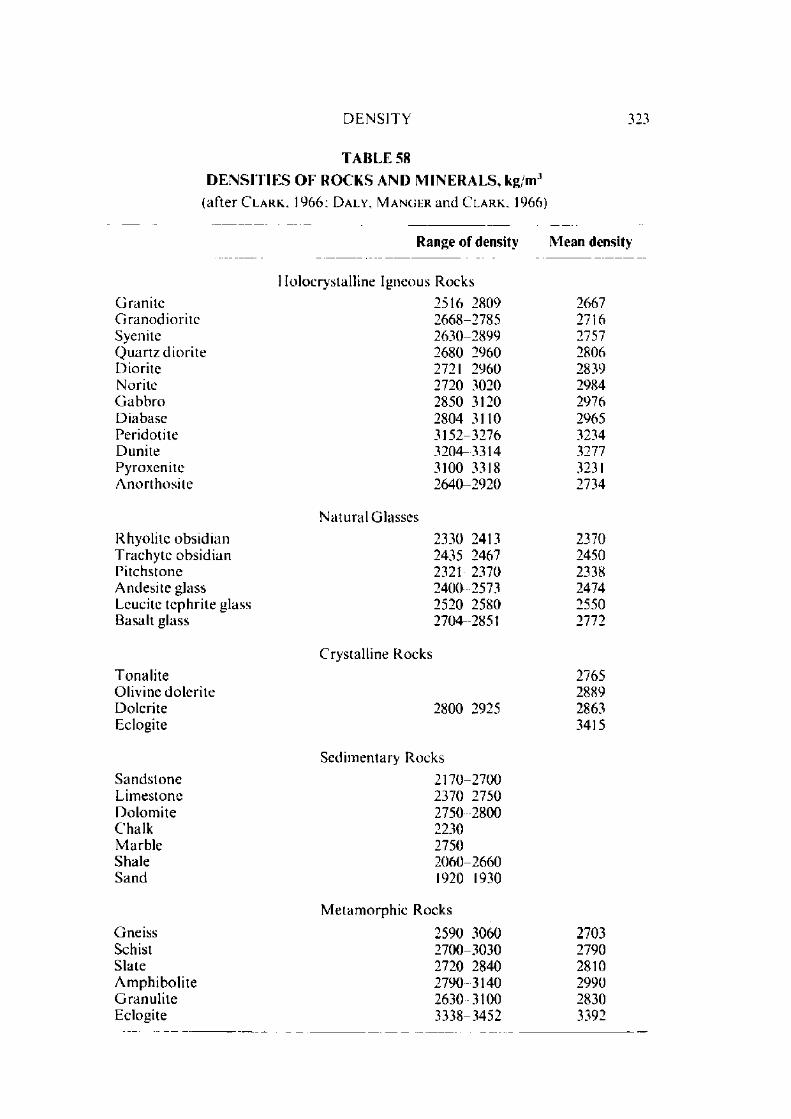
D E N S I T Y 323
T A B L E 58
D E N S IT I E S O F R O C K S A N D M IN E R A L S , k g /m 3
(a f te r C l a r k , 1966; D a l y , M a n g e r an d C l a r k , 1966)
Range of density M ean density
H olocrysta ll ine Igneous Rocks
G ra n i te 2516-2809 2667G ra n o d io r i te 2668 2785 2716Syenite 2630-2899 2757Q u ar tz d io r i te 2680 2960 2806D iorite 2721 2960 2839N orite 2720 3020 2984G a b b ro 2850 3120 2976D iabase 2804 3110 2965Peridoti te 3152 3276 3234D unite 3204 3314 3277Pyroxenite 3100 3318 3231A n o r th o s i te 2640 2920 2734
N a tu ra l G lasses
R hyolile ob s id ian 2330 2413 2370T rach y te o b s id ian 2435 2467 2450Pitchstone 2321 2370 2338A ndesite glass 2400 2573 2474Leucite tep h r i te glass 2520 2580 2550Basalt glass 2704 2851 2772
Crystalline Rocks
T o n a li te 2765O livine d o le r i te 2889D olerite 2800 2925 2863Eclogite 3415
Sed im entary R ocks
S an d s to n e 2170-2700L im estone 2370-2750D o lo m ite 2750 2800C halk 2230M arb le 2750Shale 2060 2660Sand 1920 1930
M etam o rp h ic Rocks
G ne iss 2590 3060 2703Schist 2700 3030 2790Slate 2720 2840 2810A m p h ib o l i te 2790 3140 2990G ra n u l i te 2630 3100 2830Eclogite 3338 3452 3392

324 M I S C E L L A N E O U S P R O P E R T I E S O F R O C K
T A B L E 58 (continued)
Range of density M ean density
H ortono lite duniteM o n o m in era l ic A ggregates
3760Pyroxenite 3250-3310 3280Diopside 3240H ornblendite 3120-3220 3170Serpentine 2440 2650 2550Talc 2790Chlorite 2790H em atite 4100M agnetite 4600S oapstone 2840G rossu lar ite 3490G arn e t 3930A nhydrite 2820-2930 2887Rocksalt 2100 2180 2140Polyhalite 2760
rocks (excepting glasses) have high densities. F or example, the density o f certain types o f gabbro exceeds 3000 kg/m 3. G ranites have densities o f 26(X) to 2800 kg/m 3 while certain very porous sandstones m ay have densities quite small even falling down to 2100. The density o f natural glasses is lower than that o f the corresponding rocks because o f the air trapped in them.
The density o f rocks depends upon porosity, jo in ts and o ther open spaces present. For the same rock type, the density increases as the depth increases due to decreased frequency o f open cracks or closure o f the cracks, etc. under pressure o f overlying rocks. W eathering o f rocks near their outcrops decreases the density firstly due to fracturing, secondly due to increase in volume o f certain minerals as they com e in contact with w ater (m ontm orilIonites, anhydrites) and thirdly due to decom position under the influence o f atm ospheric action (alteration o f feldspars into clay minerals under the action o f w ater and carbon dioxide).
Since most o f the com m on rock-form ing m inerals have densities in the range 2650 to 2800 kg/m 3 (166 to 175 lb /ft3), it could be argued tha t the presence o f pore space in a rock would affect to a large extent the density o f the rock. Since the presence o f pores affects the mechanical properties o f rocks, there is a possibility that relationships exist between density and m echanical properties o f rocks.
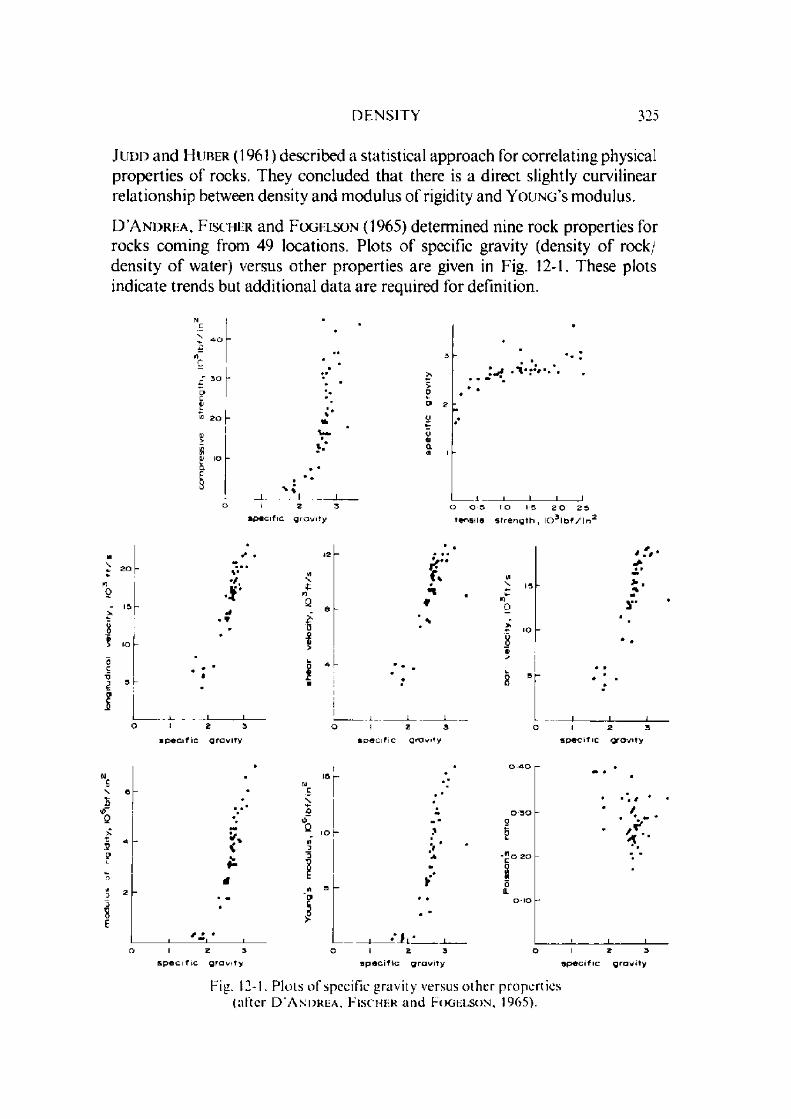
D E N S I T Y 325
J u d d and H u b e r (1961) described a statistical approach for correlating physical properties o f rocks. They concluded that there is a direct slightly curvilinear relationship between density and m odulus o f rigidity and Y o u n g ’s m odulus.
D ’A n d r h a , F i s c h e r and F o g e l s o n (1965) determ ined nine rock properties for rocks com ing from 49 locations. Plots o f specific gravity (density o f rock/ density o f water) versus o ther properties are given in Fig. 12-1. These plots indicate trends but additional data are required for definition.
O'c1’
0) IOa
i .
0 1 2 3s p e c i f i c g r a v i t y
0>o£oa>a
V:v«
O 0 5 I O 1 3 2 0 2 3
t e n s i l e s t r e n g t h , I 0 3 l b f / i n 2
0ctj2bc2
•S’a . *
0 1 2 3
s p e c i f i c g r a v i t y
£Q
tn
*
I 2 3
s p e c i f i c g r a v i t y
rr IO 8 4>
> > . n
r
0 1 2 3
s p e c i f i c g r a v i t y
\
/ • •I 2 3
s p e c i f i c g r a v i t y
ZiiI 2 3
s p e c i f i c g r a v i t y
-"020ooa
I 2 3
s p e c i f i c g r a v i t y
Fig. 12-1. Plots o f specific gravity versus o ther properties (after D ’A n d r e a . F is c h e r and F o g e l s o n , 1965).
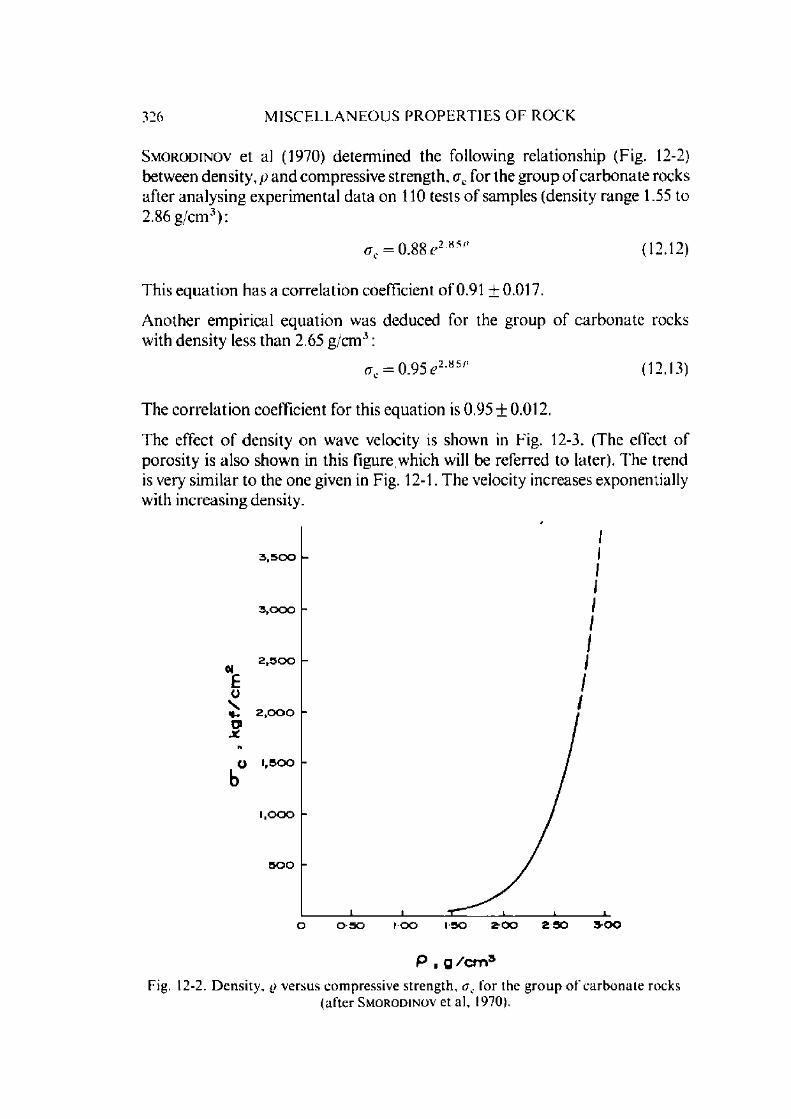
326 M I S C E L L A N E O U S P R O P E R T I E S O F R O C K
S m o r o d i n o v et al (1970) determ ined the following relationship (Fig. 12-2) between density, p and compressive strength, ac for the group o f carbonate rocks after analysing experim ental data on 110 tests o f samples (density range 1.55 to 2.86 g /cm 3):
<xc = 0.88 e2 85,) (12.12)
This equation has a correlation coefficient o f 0.91 ±0.017.
A nother em pirical equation was deduced for the group o f carbonate rocks with density less than 2.65 g/cm 3 :
G ^ O W e 2 *5'1 (12.13)
The correla tion coefficient for this equation is 0.95 ±0.012.
The effect o f density on wave velocity is shown in Fig. 12-3. (The effect o fporosity is also shown in this figure which will be referred to later). The trendis very sim ilar to the one given in Fig. 12-1. The velocity increases exponentially with increasing density.
P • g /c m 3Fig. 12-2. D ensity , q versus compressive strength. <xc for the g ro u p o f carbonate rocks
(after S m o r o d i n o v et al, 1970).

T O P O R O S I T Y 327
2 0ISO 2 00 2 5 0 3 00 3 5 0
6 0 -
4 0
x d en s ity o p o ro s ity
d e n s ity , g / c m B
I____________ I_____________I____________ I_____________I5 15 2 5 3 5 4 5
p o ro s ity , V*Fig. 1 2 - 3 . Effect o f density and porosity on wave velocity
(after R a m a n a and V f . n k a t a n a r a y a n a , 1 9 7 1 ) .
12.3. Porosity
The porosity o f a rock is defined as the ratio o f the volume o f internal open spaces (also referred to as pores, interstices o r voids) to the bulk volum e of the rock.
Porosity, n = Pore volume, Vp Bulk volum e, Vh
V— i--------?-----=------ 12------------------------ (12 14)Volum e o f grains, Vg+ Pore volume, Vp
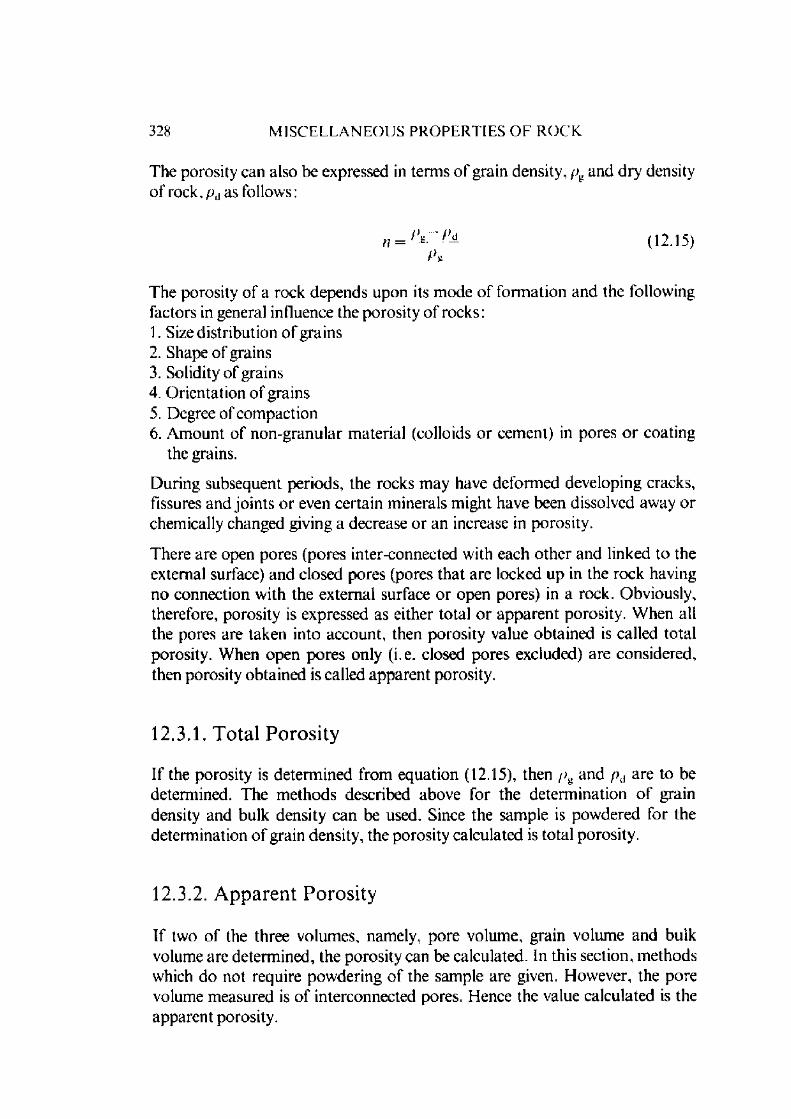
328 M I S C E L L A N E O U S P R O P E R T I E S O F R O C K
The porosity can also be expressed in term s o f grain density, /^ and dry density o f rock, />d as follow s:
„ = (12.15)Pe
The porosity o f a rock depends upon its m ode o f form ation and the following factors in general influence the porosity o f rocks:1. Size distribution o f grains2. Shape o f grains3. Solidity o f grains4. O rientation o f grains5. Degree o f com paction6. A m ount o f non-granular m aterial (colloids o r cem ent) in pores o r coating
the grains.
D uring subsequent periods, the rocks m ay have deform ed developing cracks, fissures and jo in ts o r even certain minerals might have been dissolved away or chemically changed giving a decrease o r an increase in porosity.
There are open pores (pores inter-connected with each o ther and linked to the external surface) and closed pores (pores that are locked up in the rock having no connection with the external surface o r open pores) in a rock. Obviously, therefore, porosity is expressed as either total or apparen t porosity. W hen all the pores are taken into account, then porosity value obtained is called total porosity. W hen open pores only (i.e. closed pores excluded) are considered, then porosity obtained is called apparent porosity.
12.3.1. Tota l Porosi ty
If the porosity is determ ined from equation (12.15), then /jg and pd are to be determined. The m ethods described above for the determ ination o f grain density and bulk density can be used. Since the sample is powdered for the determ ination o f grain density, the porosity calculated is total porosity.
12.3.2. A p p a ren t Porosi ty
If two o f the three volumes, namely, pore volume, grain volume and bulk volume are determ ined, the porosity can be calculated. In this section, m ethods which do not require pow dering o f the sample are given. However, the pore volume measured is o f interconnected pores. Hence the value calculated is the apparent porosity.

P O R O S I T Y 329
(a) Pore volumeT he pore volume can be determ ined by two m ethods, namely, (/') Gravim etric m ethod and (//) Volumetric method.
(/) Gravimetric method: The pore volume o f a rock specimen may be determ ined from the difference between the masses o f saturated-surface-dry and oven-dry specimen. The specimen is oven-dried to determ ine the mass o f grains, m r It is then saturated with water under vacuum, surface-dried with a moist c lo th and its mass, m wsal determ ined. The pore volume, Vp is calculated as
V p = ( 12. 16)/ w
w h e r e = density o f water.
T he volume obtained by this m ethod is only that o f the open pores connected to the surface.
(ii) Volumetric method: T w o p o ro s im e te rs a re given below . W a sh b u r n -B u n t in g porosimeter: T h is p o ro s im e te r m ak e s use o f a m od ified T o e p l e r p u m p (used in h ig h -v acu u m tech n iq u es) in o rd e r to p ro d u c e the b a ro m e tr ic v acu u m a n d rem o v e a ir from a d rie d specim en .
T he porosim eter consists o f two containers A and B (Fig. 12-4) attached to each other through a ground jo in t lubricated with grease. The bottom part A has a volume o f 50 cm 3 (3 in3) and is attached from the bottom to a 500 cm 3 (30 in3) levelling bulb contain ing m ercury resting on a movable support (not shown in figure). The stem o f the container B is graduated in 0.05 cm 3 (0.0025 in3) divisions from zero at the stopcock to 3.5 cm 3 (0.2 in3) near the bo ttom . The procedure requires the following steps:
1. Fill levelling bulb with m ercury and adjust height until meniscus is in bottom part o f A.
2. P lace specim en in A w'ith a sh o rt p iece o f p ia n o w ire lo o p ed o v e r it to p re v e n t the specim en fro m flo a tin g u p w a rd s w hen the m erc u ry is in tro d u c ed .
3. A ttach B to A and fasten securely with rubber bands between lugs.4. Elevate the bulb until the meniscus stands above the level o f the stopcock.5. C lose stopcock. The only a ir in the cham ber is now that which occupied
the pores o f the specimen at atm ospheric pressure.6. Lower the bulb until the meniscus stands as in 1, and hold in that position
for tw'o o r three m inutes to perm it the reduced pressure in the cham ber to draw air out o f the specimen.
7. Elevate bulb until the menisci in bottle and graduated stem are on a common level. The a ir in the graduated stem is then at atm ospheric pressure. Read the graduated stem at the meniscus level.
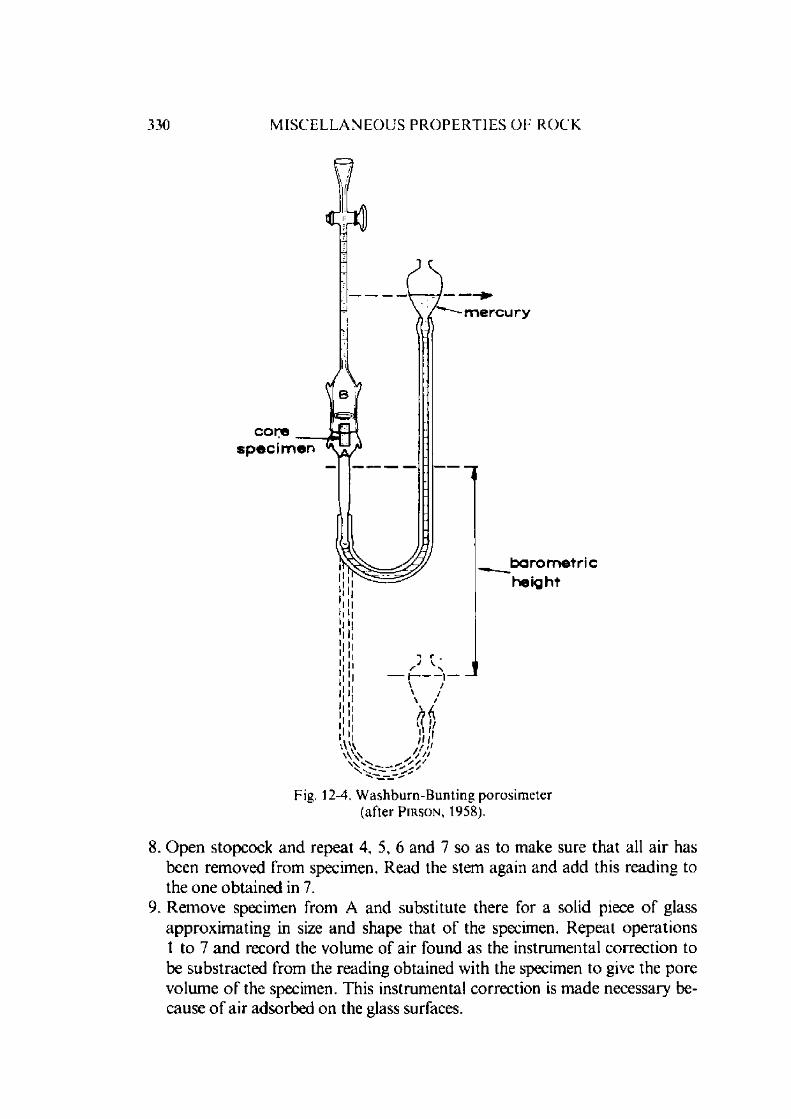
330 M I S C E L L A N E O U S P R O P E R T I E S O F R O C K
Fig. 12-4. W ashburn-B unting porosimeter (after P i r s o n , 1958).
8. O pen stopcock and repeat 4, 5, 6 and 7 so as to make sure that all a ir has been rem oved from specimen. Read the stem again and add this reading to the one obtained in 7.
9. Rem ove specimen from A and substitute there for a solid piece o f glass approx im ating in size and shape that o f the specimen. Repeat operations 1 to 7 and record the volum e o f air found as the instrum ental correction to be substracted from the reading obtained with the specimen to give the pore volum e o f the specimen. This instrum ental correction is m ade necessary because o f a ir adsorbed on the glass surfaces.

P O R O S I T Y 331
The volume determ ined needs correction for any tem perature change during the test and the value m ay be reduced to the norm al tem perature and pressure if the prevailing conditions were different. The pore volume obtained is only o f pores open to the surface.
R i t t e r and D r a k e mercury porosimeter: This porosim eter can be used for the determ ination o f the apparen t porosity o f solid samples as well as the d e te rm ination o f the pore size distribution in them. The size o f the sam ple handled is usually very small and therefore it gives only the micro- o r sem i-m icro porosities.
T he appara tu s is designed to m easure small changes in the volume o f a m ass o f m ercury in which the porous m aterial under study is immersed when the m ercury is subjected to varying external pressures. The volume changes are m easured electrically in a glass d ilatom eter placed in a therm ostated high- pressure bom b subjected to fluid pressures up to 69 M Pa (10,000 lbf/in2).
The dila tom eter is o f the usual one-piece type. Samples varying from 1 to 20 g are norm ally charged, and the capillary tubing has a cross-sectional a rea o f abou t 0.04 cm 3/cm. Larger or sm aller capillary tubing may be used for very porous o r slightly porous m aterial.
The d ila tom eter is provided with a device for observing the height o f m ercury in the capillary w hen enclosed in an opaque m etal bomb. A metal wire is strung taut along the inside o f the capillary tubing and m ade one arm o f a resistance bridge. The length o f the exposed wire is then equal to the length o f capillary not filled with m ercury. Since the m ercury column will act as a co n d u cto r o f effectively zero resistance, shorting out m ore o r less o f the wire as the m ercury is raised o r lowered, the resistance o f the wire-mercury conductor is a m easure o f the m ercury height. I f the tubing is o f uniform diam eter and the w ire o f uniform resistance, then the change in resistance o f the wire-mercury conducto r will be a direct m easure o f the change in volume o f the mercury.
Fig. 12-5 is a diagram o f the dilatom eter ( R i t t e r and D r a k e , 1945). The wire is looped over a bridge fused across the junction o f capillary to bulb, and passes up th rough the capillary and out through side holes in the tubing. The ends are separately anchored between cushioned nuts threaded on an insulating screw. A no ther nut provided w ith locknut is threaded on the inner end o f the screw, so that when this nut is tightened the screw' is backed out o f the tube and the wire thereby stretched tau t. The sm ooth glass bridge allows the tension to equalise over both branches and obviates separate tightening. R i t t e r and D r a k e (1945) used No. 32 platinum wire. Platinum is used because it is the only com m on m etal w ith an air-stable surface not attacked by mercury, and this size is a com prom ise between sturdiness and flexibility.

332 M I S C E L L A N E O U S P R O P E R T I E S O F R O C K
n
1 0 - 3 2 b a k e l i t e s c r e w g r o u n d e d p la t in u m c o n d u c t o r
i n s u l a t e d p l a t in u m c o n d u c t o r
lu c i te c u s h io n in g w a s h e r
lock n u t s t r e t c h i n g n u tt h r u s t c o l la r - lucite
•4— h e a v y wall p y r e x - 4 m m I.D. r \ 3 2 B B S g a u g e p l a t i n u m w i r e
h o le s
c a l i b r a t e d b o r e
/v.
2 o r 4 m m I.D. h e a v y w all g l a s s tu b in g
i n te r n a l g l a s s b r id g e
c a t a l y s t b u lb 12 m m O. D. p y r e x
Fig. 12-5. M ercury d ilatom eter (after R i t t e r and D r a k l . 1945).
The d ila tom eter is calibrated directly in cubic centim eters per ohm by taking coo rd ina ted readings o f resistance and weight o f m ercury buretted from a stopcock sealed tem porarily to the bottom o f the d ila tom eter, while the latter is held a t 0°C in an ice bath. F o r convenience, only those d ilatom eters exh ibiting a constan t cm '/o h m conversion factor are re ta ined for use. D ilatom eter, for example, had an average conversion fac tor o f 0.608 cm 3/ohm w ith an average deviation over its useful length o f 0.002 cm 3/ohm .
The d ila tom eter is filled with sample through its open bo ttom , sealed off. and placed in the filling pistol as shown in Fig. 12-6. T he pistol is evacuated at ab o u t 0.13 Pa (10“ 3 m m o f mercury) for 30 m inutes, during which time

P O R O S I T Y 333
the m ercury is poured back and forth several times between the reservoir and the barrel o f the pistol. Finally, the pistol is up-ended with the d ila tom eter head dow n, isolated from the vacuum line, and the vacuum broken by rem oving the stopcock plug. A tm ospheric pressure forces m ercury th rough the dilatom eter head and fills the entire vessel with mercury.
/►to v a c u u m l i n e
Fig. 12-6. Filling pistol for dilatometer (after R i t t e r and D r a k e , 1945).
In operation , the filled d ilatom eter is placed in a high-pressure bom b w ith one end o f the resistance w ire grounded and the o ther brought through an insulated lead in the bom b head. Pressures up to 13.79 M Pa (2000 lbf/in2) are supplied from a full cylinder o f nitrogen and read on a dial gauge ( ^ 7 0 kPa or 10 lbf/in2) calib rated against a dead weight gauge. Pressures from 13.79 to 68.95 M Pa* (2000 to 10,000 Ibf in2) are generated by forcing oil into the bom b with a hand-operated fuel-injection pum p and read directly on the dead weight gauge. T he initial 13.79 M Pa (2000 lbf/in2) o f gas pressure provides a cushion at the top o f the bom b which prevents oil from the pum p from spilling over in to the top o f the dilatom eter at the higher pressures and consequent fouling o f the capillary tube.
Pressuring is stopped from time to time and coordinated readings o f pressure and resistance are m ade. W ith some m aterials there is a m easurable rate o f penetration and tim e is allowed for the resistance to rise to its equilibrium value. W hen the pressure is rapidly applied there is a noticeable rise in tem perature and tim e is allowed for the system to cool and the resistance to fall to its equilibrium value. C orrections to the observed gauge pressure are m ade by add ing atm ospheric pressure plus the average m ercury height in the d ila to meter.
*) Presently eq u ip m en t for porosity determ ination using m ercury up lo 60000 lb f in 2 (414 M Pa) is com m ercia lly available (C arlo-Erba, Italy).
334 M I S C E L L A N E O U S P R O P E R T I E S O F R O C K
The compressibility o f m ercury and the change o f resistance with pressure o f platinum are both negligible in this pressure range.
The m ethod is a handy tool in the determ ination o f the pore size distribution o f the rock specimens if the porosity is determ ined at different confining pressures. W ash bu rn and Bu n t in g (1922) pointed out that surface tension opposes the entrance into a small pore o f any liquid having an angle o f contact greater than 90 . This can be overcom e by the application o f external pressure. The pressure required to force a liquid into a pore o f given size is given by
where p = pressure r = pore radius a = surface tension and0 = contact angle.
Eq. 12.17 assumes circular cross-section o f the pores. If the pores have any other cross-section, the constant will have ano ther value instead o f 2. The effect will be to change the radii calculated by a certain constant factor.
This Eq. 12.17 shows that a non-w etting fluid will not enter pores a t all and that when pressure is raised to any finite value, the fluid will penetrate and fill all the pores having radii greater than that calculated from the Eq. 12.17. As the pressure is increased the am ount o f liquid absorbed increases at a rate proportional to the differential pore volume due to pores o f size corresponding to the instantaneous pressure. Thus a given pore size distribution gives rise to a unique pressuring curve. T able 59 gives the pore radius with pressure for several values o f contact angle.
If the total volume o f all pores having radii between r and r + dr is
where D(r) is the distribution function for pore size, from Eq. 12.17. assum ing constant a and 0,
p • r — — 2n cos 0 (12.17)
d V = D (r)dr (12.18)
p d r + rdp = 0 (12.19)
Elim inating r and dr from Eqs. (12.17), (12.18) and (12.19) gives
= —D(r) dp ( 12.20)

P O R O S I T Y 335
T A B L E 59
V aria t ion o f pore radius with pressure for several values o f contact angle
( a f t e r R i t t e r a n d D r a k e , 1945)
P r e s s u r el b f / i n 2
P o r e r a d i u s f o r c o n t a c t a n g l e s o f
140A
112A
180A
25 42.680 20,840 55.680
100 10.670 5,210 13,920200 5,330 2.600 6,960
300 3,560 1,740 4.640
400 2.670 1,300 3,480
500 2,135 1.040 2.780
700 1.520 744 1,990
1,000 1,067 521 1,392
1,500 712 347 928
2,000 533 260 696
3,000 356 174 464
4,000 267 130 348
5,000 214 104 278
6,000 178 87 239
7,000 152 74 199
8,000 133 65 174
9,000 119 58 15510,000 107 52 139
The volum e m easured by the dilatom eter is the volum e o f all pores having radii greater than /\ i.e., the total pore volume, V0, decreased by the volume, V. o r pores sm aller than r. Thus the pressuring curves plot V^— V as a func
tion o f p. The slope o f the pressuring curve, is then an
experim entally determ inable quantity and Eq. 12.20 m ay now be rewritten in the form
D (/• )= £ (12.21)
in which all the term s on the right are known o r determ inable.

336 M I S C E L L A N E O U S P R O P E R T I E S O F R O C K
Values o f the derivative in Eq. 12.20 required to evaluate D(r) are readily obtained by graphical differentiation. F or a num ber o f values o f p, the pressuring curve is differentiated to obtain d ( V 0— V ) ld p , r is calculated from Eq. 12.17, and D(r) is calculated from Eq. 12.20. Plotting D(r) against r gives the distribution curve. Pressuring curves and distribution curves for two porous m aterials are given in Figs. 12-7 and 12-8. By differentiating and applying Eq. 12.20, Fig. 12-8 is obtained which gives the pore d istribution function o f these m aterials.
ab so lu te preesur#, l b f / i n 2
Fig. 12-7. Pressuring curves for d ia tom aceous earth and fritted glass (after R i t t e r and D r a k l , 1945).
It may be pointed out that both in the gravimetric as well as volum etric m ethods, the porosity m easured depends upon the m ethod o f m easurem ent. The variations m ay be attribu ted mainly to two factors which influence the results oppositely. C ertain liquids m ay be adsorbed by the surface o f the rock giving decrease in volume o r increase in weight giving values higher than true densities. A lternatively, slow o r incomplete penetration o f the pores by the fluid or incomplete release o f contained gas will lead to low apparent density. In this case a density drift m ay be observed with time. W hen m ercury is used as a displacement fluid, then depending upon its angle o f contact with the rock, the smallest pore that can be penetrated may be o f the order o f 50 A (1) (Table 59) at high pressures o f the order o f 68.95 M Pa (10,000 lbf/in2). A t such high pressures the correction due to the compressibility o f the m aterials becomes essential to apply. T he erro r due to com pressibility in certain rocks such as coal, may be very high.
' 11 A = Angstrom = 10 8 cm
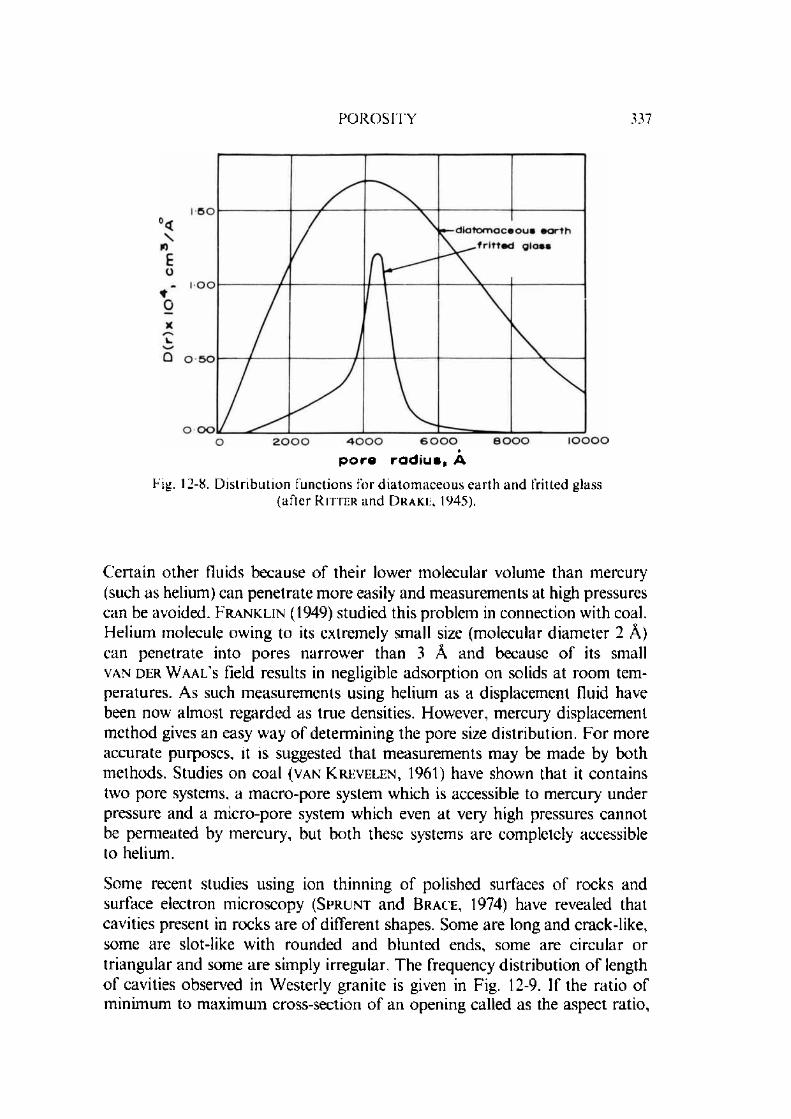
P O R O S I T Y
p o r e r a d i u s , A
Fig. 12-8. D istribution functions for d ia tom aceous earth and fritted glass (after R i t t e r and D r a k e , 1945).
C ertain o ther fluids because o f their lower m olecular volume than m ercury (such as helium) can penetrate m ore easily and m easurem ents at high pressures can be avoided. F r a n k l in (1949) studied this problem in connection with coal. Helium molecule owing to its extremely small size (molecular diam eter 2 A) can penetrate into pores narrow er than 3 A and because o f its small van d e r W a a l 's field results in negligible adsorption on solids at room temperatures. As such m easurem ents using helium as a displacement tluid have been now alm ost regarded as true densities. However, m ercury displacement m ethod gives an easy way o f determ ining the pore size distribution. F or m ore accurate purposes, it is suggested that m easurem ents m ay be m ade by both m ethods. Studies on coal (van K r ev elen , 1961) have shown that it contains two pore systems, a m acro-pore system which is accessible to m ercury under pressure and a m icro-pore system which even at very high pressures cannot be perm eated by m ercury, but both these systems are completely accessible to helium.
Some recent studies using ion thinning o f polished surfaces o f rocks and surface electron m icroscopy (S p r u n t and Br a c e , 1974) have revealed that cavities present in rocks are o f different shapes. Some are long and crack-like, some are slot-like with rounded and blunted ends, some are circular or triangular and some are simply irregular. The frequency distribution o f length o f cavities observed in W esterly granite is given in Fig. 12-9. If the ratio o f m inim um to maximum cross-section o f an opening called as the aspect ratio,

338 M I S C E L L A N E O U S P R O P E R T I E S O F R O C K
a, be p lo tted against the num ber o f cavities (total observations = 80 in this case), the d istribution is shown in Fig. 12-10. The low aspect ra tio cavities ( a < 10 ') in unstressed samples have blunt, circular or square term inations. T he long narrow , sharp ended cracks typical o f brittle fracture were rarely observed in the rocks (granites, diabase, gabbro) examined by them. T he num ber o f these low aspect ratio cavities sharing a com m on point o f intersection varied from 2 to 6 depending upon the rock. The high aspect ratio cavities (a > 10 ’) appear scattered or are joined by low aspect ratio cavities and are found concentrated in certain m ineral grains while the o ther m ineral grains m ay be free o f these (microcline in W esterly granite o r plagioclase in San M arcos gabbro).
c a v ity length , >um
Fig. 12-9. Frequency distribution o f cavity length in stressed and unstressed W esterly granite. The samples contained 80 random ly selected cavities,
(after S p r u n t and B r a c e , 1974).
In m echanically stressed rocks, the low aspect ratio cavities tend to increase and there seems to be a strong preferred orientation and the bridges formed between them tend to break under mechanical and therm al stresses. The length o f the low aspect ratio cavities is about 1 /10th the grain size. Some closely placed low aspect ratio cavities have length equal to the grain size.
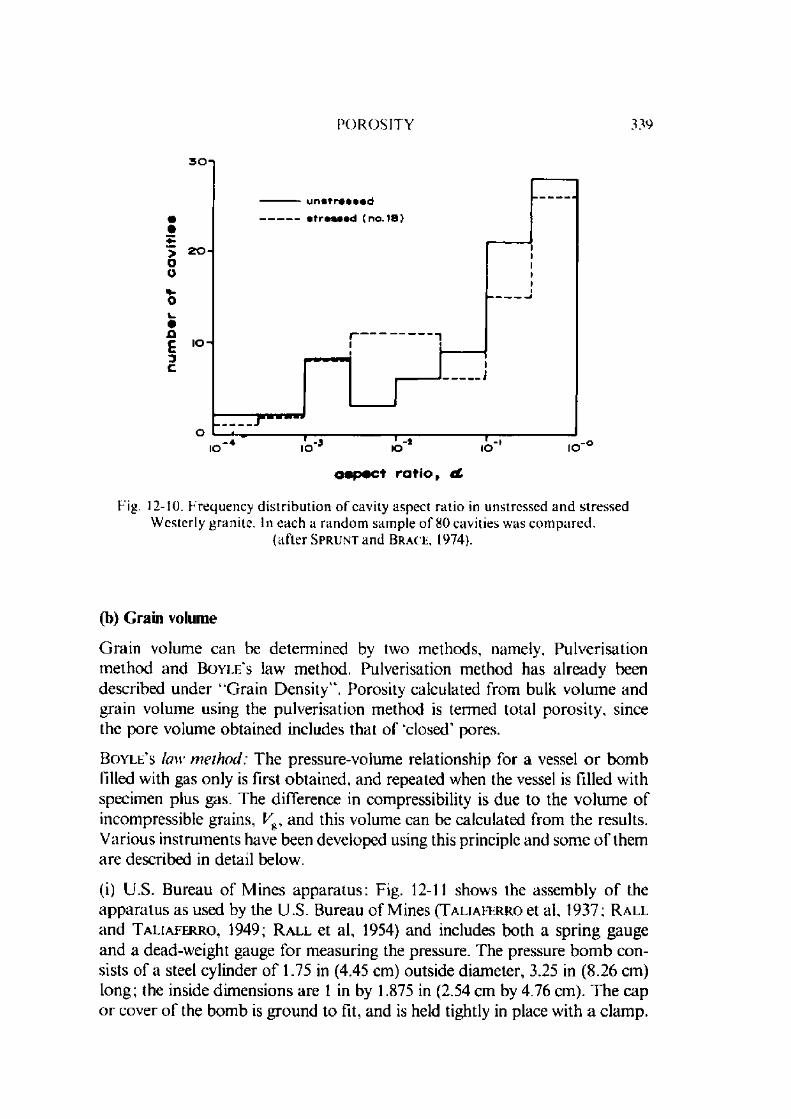
P O R O S I T Y 339
aspect ra t io , cCFig. 12-10. F requency d is tribution o f cavity aspect ratio in unstressed and stressed
Westerly granite. In each a random sample o f 80 cavities was com pared , (after S p r u n t and B r a c k , 1974).
(b) Grain volume
G rain volume can be determ ined by two m ethods, namely. Pulverisation m ethod and Bo y l e ’s law m ethod. Pulverisation m ethod has already been described under “G rain D ensity". Porosity calculated from bulk volum e and grain volum e using the pulverisation m ethod is termed total porosity , since the pore volum e obtained includes that o f ‘closed' pores.
Bo y l e ' s law method: The pressure-volum e relationship for a vessel o r bom b filled w ith gas only is first obtained, and repeated when the vessel is filled with specimen plus gas. The difference in compressibility is due to the volum e o f incompressible grains, Kg, and this volume can be calculated from the results. V arious instrum ents have been developed using this principle and som e o f them are described in detail below.
(i) U .S. Bureau o f M ines apparatus: Fig. 12-11 shows the assem bly o f the apparatus as used by the U.S. Bureau o f M ines (T a lia fer ro et al. 1937; R a ll and T a l ia fe r r o . 1949; R a l l et al, 1954) and includes both a spring gauge and a dead-weight gauge for m easuring the pressure. The pressure bom b consists o f a steel cylinder o f 1.75 in (4.45 cm) outside diam eter, 3.25 in (8.26 cm) long; the inside dim ensions are 1 in by 1.875 in (2.54 cm by 4.76 cm). T he cap o r cover o f the bom b is ground to fit, and is held tightly in place with a clam p.
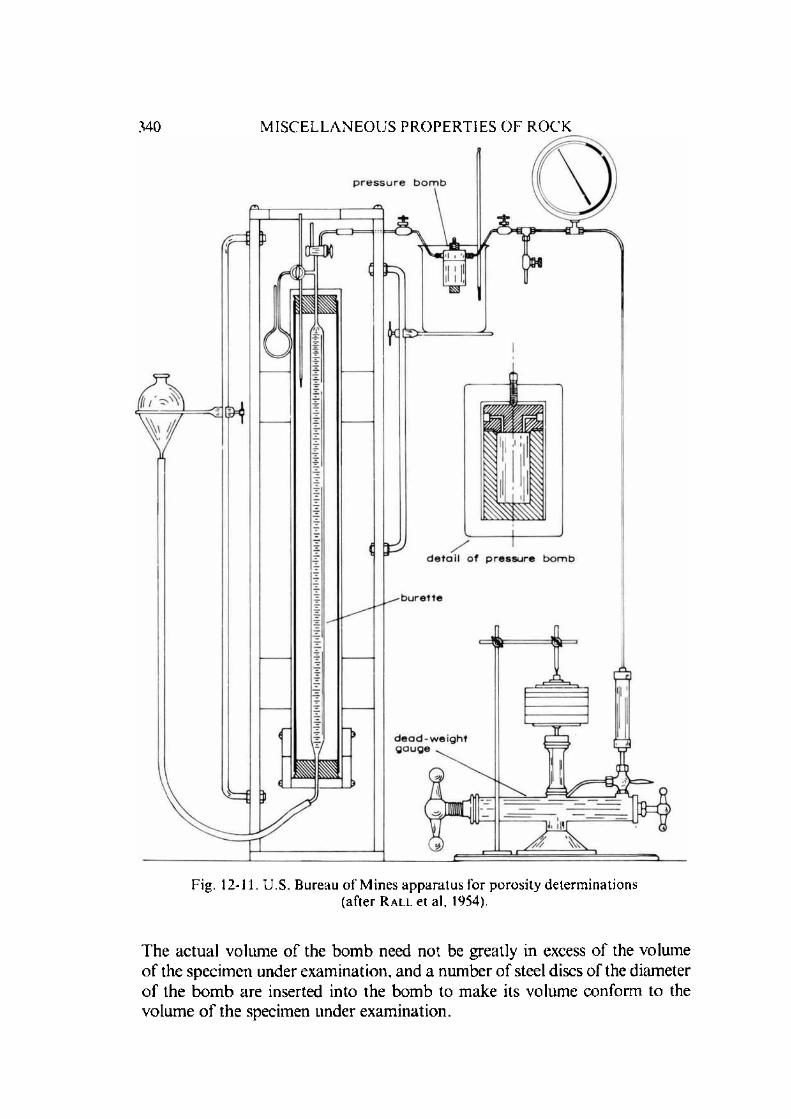
340 M I S C E L L A N E O U S P R O P E R T I E S O F R O C K
Fig. 12-11. U.S. Bureau o f Mines appa ra tus for porosity determ inations(after R a l l et al, 1954).
The actual volum e o f the bom b need not be greatly in excess o f the volume o f the specim en under exam ination, and a num ber o f steel discs o f the diam eter o f the bom b are inserted into the bom b to m ake its volume conform to the volum e o f the specimen under exam ination.

P O R O S I T Y 341
D ifferent gases and pressures m ay be used in the determ ination; however, it was found convenient for laboratory purposes to use a ir at pressures o f 75 to 100 lbf/in2 (517 to 690 kPa). A fter the compressed gas in the bom b has com e to the tem perature o f the bath and the pressure determ ined accurately, it is released into the water-jacketed burette where its volume is m easured a t the tem perature o f the bath surrounding the burette and at atm ospheric pressure.
The d a ta required for the determ ination o f the volume o f the bom b ( V l ), along with the actual observations and calculations for such a determ ination using compressed air, are as follows:
Pressure in the bom b (/;,) = 100.0 lbf/in2, gauge Tem perature o f the air in the bom b ( T x) = 66.5 F Barom etric pressure (p2) = 14.375 lbf/in2Volume o f air after expansion (burette m easurem ent) ( Vb) = 92.02 cm 3 Tem perature o f air in burette ( T 2) = 73.9 FThe burette volume m easured at 73.9 F is converted to a volume a t 66.5 F.
T he absolute pressure o f the a ir in the bom b is 100.0+ 14.375 = 114.375 lbf/in2. A ir does not follow exactly the pressure-volum e relationship expressed by B o y l e ’s law for an ideal gas (/?, Vx = p 2 V2) and with a decrease in pressure is m ore expansible than an ideal gas. Accordingly, a correction factor is applied to the equation o f B o y l e ’s law to give:
where n = the percent deviation.
F or the pressure and tem perature o f the air in this particu lar determ ination , the value o f n is 0.23, and the value o f the term :
The value 7.9748 may be considered as the num ber o f atm ospheres o f com pressed a ir contained in the bom b before expansion. A fter expansion, one atm osphere o f a ir remains in the bom b; and, therefore, the volume m easured by the burette is equivalent to only 6.9748 atm ospheres o f air. In o ther w ords,
92.02 x = 90.74 cm 3
or
P' becomes 1.0023 x 1 ^ = 7.9748P-, 14.375
after the air in the bom b has expanded into the burette, the air in the bom b

342 M I S C E L L A N E O U S P R O P E R T I E S O F R O C K
is at a tm ospheric pressure, and the total volum e o f air after expansion ( V2) is equal to the volume measured in the burette plus the volume rem aining in the bom b.
The simplified equation for determ ining the volume o f the bom b ( V x) then becom es:
which is the volume o f the em pty bom b.
The sam e laboratory procedure and calculations as described above are followed w hen the specimen is placed in the bom b. F or the specimen referred to in this discussion, the volume o f space in the bom b occupied by compressed a ir w ith the specimen contained in it was 4.918 cm 3. Therefore, the volume of the grains in the specimen is the difference between 13.009 and 4.918, or 8.091 cm 3.
(ii) K o b e porosim eter: This porosim eter (Fig. 12-12) has been recommended by the In ternational Society for Rock M echanics (1972) and has the following features:
Fig. 12-12. Schematic d iagram o f a K o b e porosimeter (after I .S .R .M .. 1972).
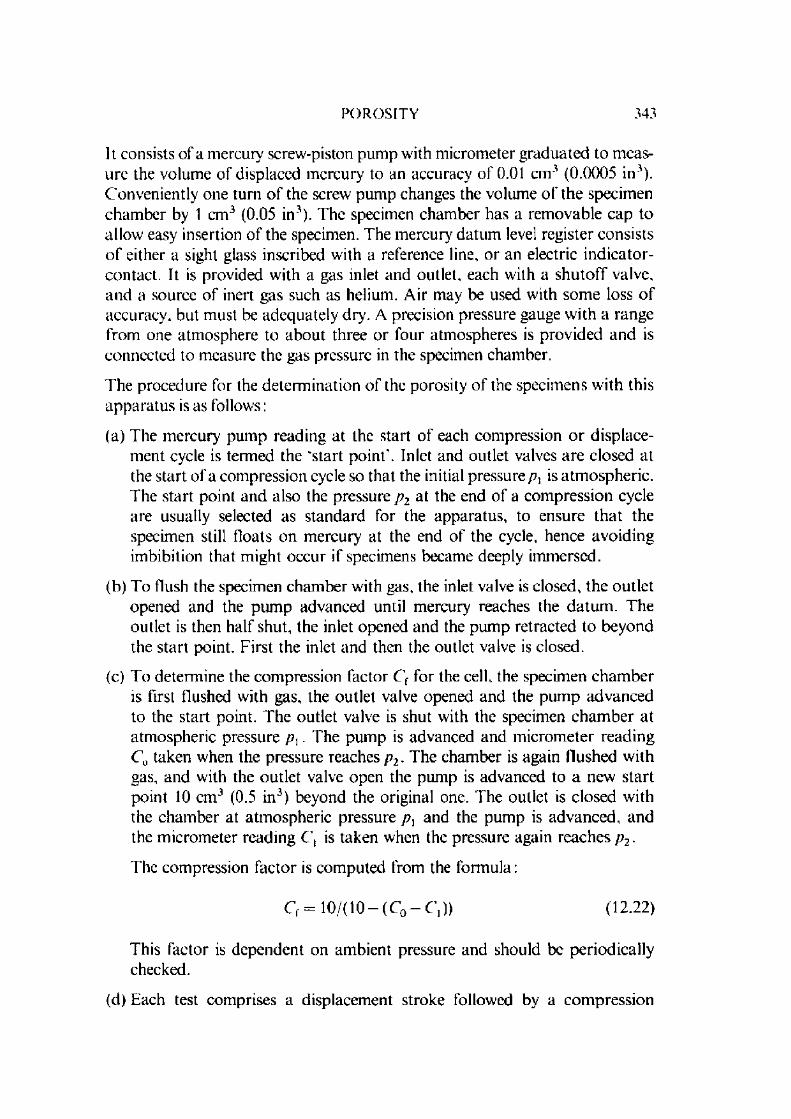
P O R O S I T Y 343
It consists of a mercury screw-piston pum p with m icrom eter g raduated to m easure the volume o f displaced m ercury to an accuracy o f 0.01 cm 3 (0.0005 in3). Conveniently one turn o f the screw pum p changes the volume o f the specim en cham ber by 1 cm 3 (0.05 in3). The specimen cham ber has a rem ovable cap to allow easy insertion o f the specimen. The m ercury datum level register consists o f either a sight glass inscribed with a reference line, o r an electric indicator- contact. It is provided with a gas inlet and outlet, each with a sh u to ff valve, and a source o f inert gas such as helium. A ir may be used with som e loss o f accuracy, but m ust be adequately dry. A precision pressure gauge w ith a range from one atm osphere to about three or four atm ospheres is provided and is connected to m easure the gas pressure in the specimen cham ber.
The procedure for the determ ination o f the porosity o f the specimens w ith this apparatus is as follows:
(a) The m ercury pum p reading at the start o f each com pression o r displacement cycle is termed the ‘start point'. Inlet and outlet valves are closed at the start o f a com pression cycle so that the initial pressure /?, is a tm ospheric. The start point and also the pressure p 2 at the end o f a com pression cycle are usually selected as standard for the apparatus, to ensure th a t the specimen still floats on m ercury at the end o f the cycle, hence avoiding im bibition that m ight occur if specimens became deeply immersed.
(b) T o Hush the specimen cham ber with gas, the inlet valve is closed, the outlet opened and the pum p advanced until m ercury reaches the da tum . The outlet is then half shut, the inlet opened and the pum p retracted to beyond the s tart point. First the inlet and then the outlet valve is closed.
(c) T o determ ine the com pression factor Cf for the cell, the specimen cham ber is first Hushed with gas, the outlet valve opened and the pum p advanced to the start point. The outlet valve is shut with the specimen cham ber at atm ospheric pressure /?,. The pum p is advanced and m icrom eter reading CQ taken when the pressure reaches p2. The cham ber is again Hushed with gas, and with the outlet valve open the pum p is advanced to a new start point 10 cm 3 (0.5 in3) beyond the original one. The outlet is closed w ith the cham ber at atm ospheric pressure p x and the pum p is advanced, and the m icrom eter reading C, is taken when the pressure again reaches p 2.
The compression factor is com puted from the form ula:
Cf = 10/(1 0 - (C0 -C ,) ) ( 12.2 2 )
This factor is dependent on am bient pressure and should be periodically checked.
(d) Each test com prises a displacem ent stroke followed by a com pression

344 M I S C E L L A N E O U S P R O P E R T I E S O F R O C K
stroke w ith the specimen cham ber empty (a blank run), then a displacem ent stroke followed by a com pression stroke with the specimen in the cham ber. The procedure is as follows:
(e) W ith the inlet valve shut and the outlet open, the pum p is advanced until the m ercury reaches the datum . The m icrom eter reading is recorded.
(0 T he cham ber is flushed with gas, the pum p advanced to the start point and the valves closed with the cham ber a t atm ospheric pressure /?,. The pum p is advanced and a m icrom eter reading R 2 recorded when the pressure reaches p 2 •
(g) The specimen is inserted in the cham ber. The cham ber is Hushed w ith gas and step (e) repeated, recording the displacem ent stroke m icrom eter reading R 3 a t which m ercury reaches the datum .
(h) Step (f) is repeated, recording the com pression stroke m icrom eter reading R4 when the pressure again reaches p 2.
The calculations are as follows:
G ra in volum e is calculated from the relationship :
W ith this test, bulk volum e Vb can also be determ ined and is given by:
R a m a n a and V e n k a t a n a r a y a n a (1971, 1974) have developed a porosim eter fo r rocks o f porosity in excess o f 3% . The porosim eter is simple to operate and gives approxim ate values since the error for low porosity rocks is high and secondly the use o f atm ospheric pressure limits to the large diam eter pores being taken into account.
(c) Bulk volume
A lthough the bulk volume m ay be com puted from m easurem ents (by vernier o r m icrom eter) o f the dim ensions o f a regularly shaped prism or cylinder, the usual procedure utilises the observation o f the volume o f liquid displaced by the specimen. This procedure is particularly desirable, as the bulk volum e o f irregularly-shaped specimens can be determ ined as rapidly as that o f regularly- shaped specimens.
T he liquid displaced by a specimen can be observed either volum etrically or gravim etrically. In either procedure it is necessary to prevent liquid penetration
(1 2 .2 3 )
vh = R3-R (1 2 .2 4 )

P O R O S I T Y 345
into the pore space o f the rock. This can be accomplished (1) by coating the rock with paraffin or a sim ilar substance, (2) by saturating the rock w ith the liquid into which it is to be immersed, o r (3) by using mercury, w hich by virtue o f its surface tension and w etting characteristics does not tend to enter the small pore spaces o f m ost in tergranular m aterials at o r near a tm ospheric pressure.
G ravim etric determ ination o f bulk volum e can be accomplished by observing the loss in mass o f the specimen when immersed in a liquid or by observing the change in m ass o f a pycnom eter when filled with m ercury and w hen filled with m ercury and the specimen. The details are summarised in the exam ples.
Exam ple 1. C oated specimen immersed in water.M ass o f dry specimen in a ir = AM ass o f dry specimen coated with paraffin = BM ass o f coated specimen imm ersed in w ater at 40 F = CM ass o f paraffin = B — A
B - AVolume o f paraffin = jr density ol paraltin
M ass o f w ater displaced = B — CB — CVolume o f water displaced
density o f w ater
Volume o f w ater displaced — Volume o f paraffin =I B - C \ ( B - A^density o f w ater ) [ density o f paraffin )
= Bulk volume o f specimen
Exam ple 2. W ater-saturated specimen immersed in water.M ass o f d ry specimen in a ir = A M ass o f saturated surface-dry specimen in air = B M ass o f saturated specimen in w ater at 40 F = C M ass o f w ater displaced = B — C
g _£Volume o f w ater displaced = -.
density of w ater
= Bulk volume o f specimen
This m ethod is not suitable to friable, swelling or slaking rocks.
Example 3. Dry specimen immersed in m ercury pycnometer.M ass o f dry specimen in a ir = AM ass o f pycnom eter filled w ith m ercury at 20 C = BM ass o f pycnom eter filled with m ercury and specimen at 20 C = CM ass o f specimen + M ass o f pycnom eter filled with m ercury = A + B

346 M I S C E L L A N E O U S P R O P E R T I E S O F R O C K
M ass o f mercury displaced = A + B — CA
Volume o f mercury displaceddensity o f mercury
= Bulk volum e o f specimen
D eterm ination o f bulk volum e volum etrically utilises a variety o f specially constructed pycnom eters or volumeters. In the case o f an electric pycnom eter the specimen is immersed in the core cylinder, which causes a rise in the level o f the connecting U tube. The change in the level is sensed by the m icrom eter screw. The resulting change in level is read directly in volume from the m icrom eter scale. Either dry o r saturated specimens may be used in the device.
The R u s s e l volum eter shown in Fig. 12-13 also provides for direct reading o f the bulk volume. A saturated specimen is placed in the specimen bottle after a zero reading is established with fluid in the volumeter. The resulting increase in volume is the bulk volume. Only saturated o r coated specimens may be used in the device.
bulb
flu id level
- gr a d ua ted s tem
specim en
zero point
g ro u n d -g la s s
b o tt le
joi nt
Fig. 12-13. R u s s i - l l volum eter (after A m y x et al, 1960).
12.3.3. Effect o f Porosi ty on M echanical P ropert ies o f Rocks
All strength properties o f rocks fall with increase in porosity ( P r i c e . 1960; K o w a l s k i , 1966; S m o r o d i n o v et al, 1970; R z h e v s k y and N o v i k , 1971; D u b e and S i n g h , 1972). The reasons are:
1. Stress concentration caused on the boundary o f the pores reduces the strength.
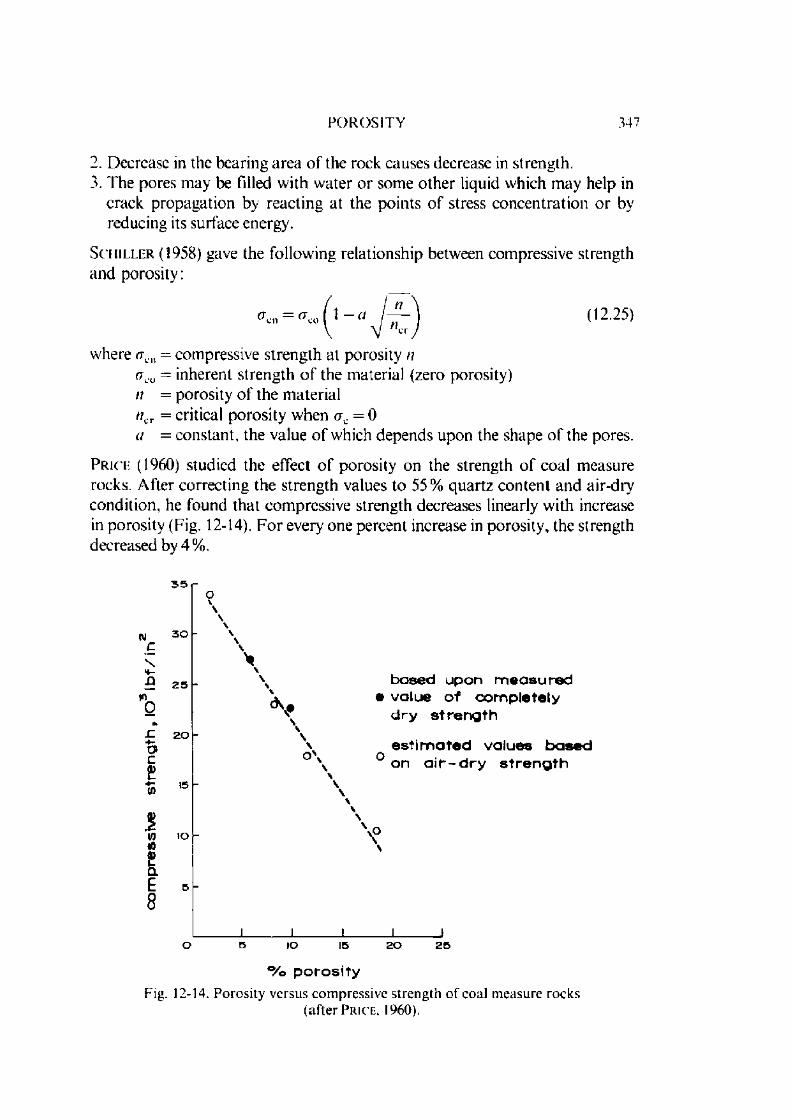
P O R O S I T Y
2. Decrease in the bearing area o f the rock causes decrease in strength.3. The pores may be filled with w ater or some other liquid which m ay help in
crack propagation by reacting at the points o f stress concentration o r by reducing its surface energy.
S c h i l l e r (1958) g a v e th e fo l lo w in g r e la t io n s h ip b e tw e e n c o m p re s s iv e s t r e n g th a n d p o r o s i ty :
1 — aI
" c r12.25)
where <xcn = compressive strength at porosity n(tco = inherent strength o f the m aterial (zero porosity)n = porosity o f the m aterial/?cr = critical porosity when <rc = 0a = constant, the value o f which depends upon the shape o f the pores.
P r i c e (1960) studied the effect o f porosity on the strength o f coal measure rocks. A fter correcting the strength values to 55% quartz content and air-dry condition, he found that compressive strength decreases linearly with increase in porosity (Fig. 12-14). F o r every one percent increase in porosity, the strength decreased by 4% .
35
30CN4-5 25
toO
c2!c/j
o(/>0)uaE8
20
15
IO
O\
\o \
based upon m easured value o f com pletely d ry s tren g th
e s tim a te d values based on a i r - d r y s tre n g th
\ o\
\
_LIO 15 20 25
°/o p o ro s ityFig. 12-14. P oros i ty versus com press ive s t ren g th o f coal m easu re rocks
(a f te r P rice , 1960).

348 M I S C E L L A N E O U S P R O P E R T I E S O F R O C K
K o w a l s k i (1966) reported the dependence o f compressive strength oc on porosity n as follows:
where d and c are constants. The values o f these constants depend (among others) on the kind o f rock, its w ater saturation and on the direction o f load in com parison w'ith the direction o f bedding o r o ther structural elements. For lim estones and m arbles, he gave the values o f cl and c when the rocks were com pressed perpendicular to bedding and parallel to bedding in air-dry condition and with w ater saturation (Table 60).
(12.26)
T A B L E 60
The values of constants d and c(a fte r K o w a l s k i , 1966)
Test C o nd ition d c
A ir-d ry , com press ion I t o bedd ing
A ir-d ry , com press ion to bedd ing
W a te r -sa tu ra t io n , com press ion 1 to bedding
W a te r -sa tu ra t io n , com press ion to bedding
261.1
177.2
127.5
0.358
0.260
0.444
0.041
3 ,5 0 0
3 , 0 0 0
2 , 5 0 0 ^
\
2,000 - \
\
0 5 IO 15 2 0 2 5 3 0 3 5 >40
n , °/o
Fig. 12-15. Porosity, n versus compressive strength. <rc for ca rbonate rocks (after S m o r o d i n o v et al, 1970).
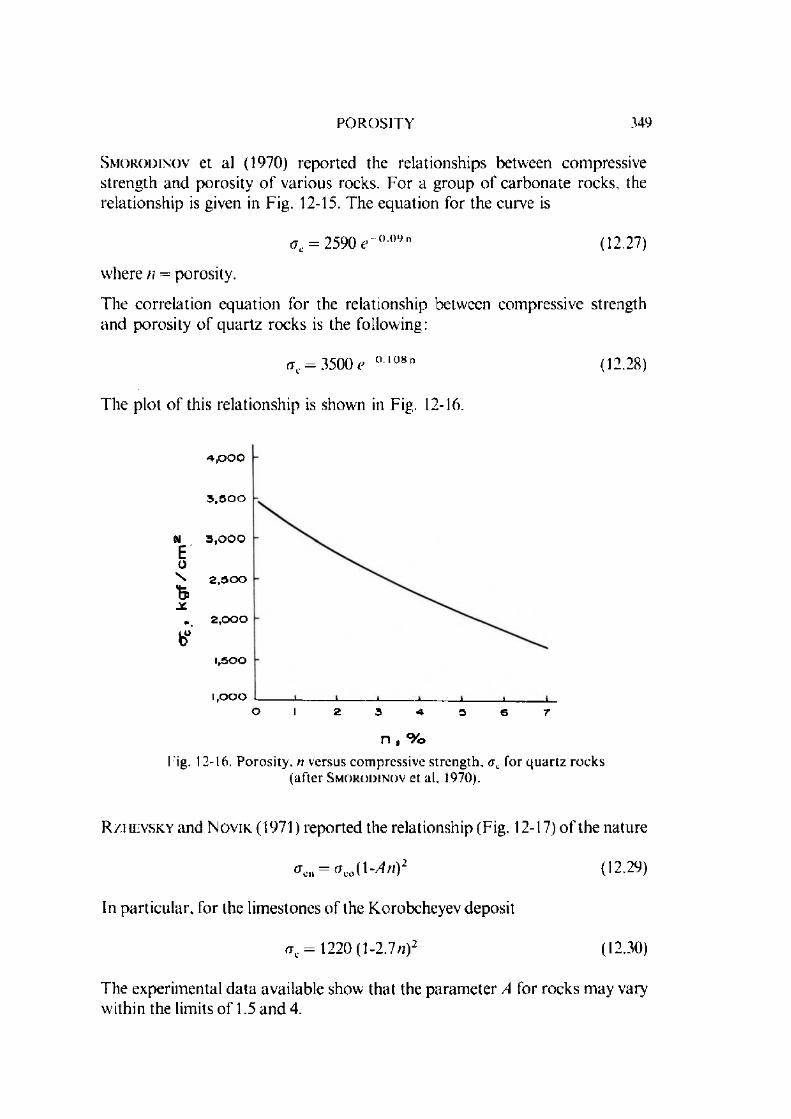
P O R O S I T Y 349
S m o r o d i n o v et al (1970) reported the relationships between compressive strength and porosity o f various rocks. F or a group o f carbonate rocks, the relationship is given in Fig. 12-15. The equation for the curve is
<tc = 2590 c' 0 09n (12.27)
where n = porosity.
T he correlation equation for the relationship between com pressive strengthand porosity o f quartz rocks is the following:
<rc = 3500 e _0108n (12.28)
The plot o f this relationship is shown in Fig. 12-16.
4 , 0 0 0
3 , 5 0 0
N 3 , 0 0 0E0
\ 2 , 3 0 0
%* 2,000
bu1 ,5 0 0
1,000O I 2 3 - 4 3 6 7
n , °/oI ig. 12-16. Porosity, n versus comprcssive strength. ae for quar tz rocks
(after S m o r o d i n o v et al, 1970).
R z h e v s k y and N o v i k (1971) reported the relationship (Fig. 12-17) o f the nature
a ,n = (7,0( \ -A n )2 (12.29)
In particular, for the limestones o f the Korobcheyev deposit
(Te = 1220 (1 -2.7/?)2 (12.30)
The experim ental da ta available show that the param eter A for rocks m ay vary within the limits o f 1.5 and 4.

350 M I S C E L L A N E O U S P R O P E R T I E S O F R O C K
n , °/o
Fig. 12-17. Porosity, n versus compressive strength, ac fo r carbonates 1 and 2 - limiting curves
(after R z h e v s k y and N o v i k , 1971).
D u b e and S in g h (1972) reported the effect o f porosity on tensile strength (Brazilian test) o f dry and saturated sandstone (Fig. 12-18). In both cases, tensile strength decreased as the porosity o f sandstone increased.
R a m a n a and V en k a t a n a r a y a n a (1971) reported the effect o f porosity on wave velocity (Fig. 12-3). The wave velocity decreases exponentially w ith increasing porosity.
NE
p o r o s i t y , °/o
Fig. 12-18. Effect o f porosity on tensile strength o f sandstone (after D u b e and S i n g h , 1972).
W A T E R C O N T E N T 351
F o r sim ilar rocks, density and porosity are related. In the case o f Palaeozoic sandstones o f A rkansas, B r a n n e r (1937) showed that the densities o f 82 sam ples varied between 2.1 and 2.7 g/cm 3, and the porosities between 0 and 22.5% . The distribution o f his plotted points is found to be substantially linear and the empirical relationship between the two is
n = 1 0 4 - 4 0 p (1 2 .3 1 )
w here n = porosity, %p = density, g/cm 3.
D a v is (1954) a l s o f o u n d a l i n e a r r e l a t io n s h ip in te s t in g 370 s a m p le s f r o m o t h e r lo c a l i t ie s , w h ic h in d ic a te s t h e e q u a t i o n :
n = 106 — 40 p (12.32)
Som e o ther authors have obtained slightly different relationships though the natu re o f the relationship still rem ains linear.
A nalysis o f da ta com piled by D aly et al (1966) on sedim entary rocks (sandstone. limestone, dolom ite, chalk, m arble, shale, claystone, slate, sand , clay, gravel, alluvium and soils) gave the following equation with a corre la tion coefficient o f —0.9648.
n = 146.14 — 53.92 p (12.33)
W hen only sandstone was considered, the correlation coefficient im proved slightly to —0.9674 with the following relationship
n = 157.93 -5 9 .3 9 p (12.34)
A nalysis o f da ta reported by R am ana and V en k a ta n a r a y a n a (1971) gave the following equation w ith a correlation coefficient o f -0 .9 4 6 8 .
n = 9 6 .4 9 — 32 .29 p (1 2 .3 5 )
12.4. Water Content
The w ater content o f a rock is the quantity o f water in the rock pores expressed as a percentage o f the m ass o f a perfectly dry rock specimen.
In o rder to determ ine the natural w ater content, the sample is paraffinised im m ediately after separation from the place o f sampling.

352 M I S C E L L A N E O U S P R O P E R T I E S O F R O C K
The natural water content is calculated as the difference in the masses o f the original and the dried samples, referred to the dry m ass and expressed in percent.
The determ inations are m ade as follows: The paraffin is peeled o ff and two small portions o f rock are taken from the centre o f the sample. The masses o f the portions are determ ined immediately after extraction. The samples are then dried to constant mass at 105 C (221 F) and masses determ ined again.
The calculations are m ade using the relationship
w = m * ~ m X 100 (12 .36)m
where \v = water content, %m s = mass o f the m oist rock and m = dry mass.
Saturation m oisture can be calculated by drying, placing the specimen in a vacuum cham ber and then introducing w ater into the vacuum cham ber in which the specimen is placed. The time period for which a specimen is allowed to remain in water is very critical. Certain rocks m ay get saturated in a couple o f hours while others m ay need 5 o r m ore days. U nder such conditions, it is preferable to apply w ater under pressure 15 M Pa (2200 lbf/in2) (150 atm ospheres) for 24 hours and then determ ine the m ass o f the m oist rock. The complete saturation m oisture content can be calculated using the Eq. 12.36 as above.
A definite relationship exists between the saturation m oisture content and bulk density o f the rock. F o r crystalline rocks, it is m ore o r less linear.
12.5. Void Index
Void index is defined as the mass o f w ater contained in a rock sample after a one hour period o f im m ersion, as a percentage o f its initial desiccator-dry- mass (I.S .R .M ., 1972). It is nothing but a m easure o f porosity o f the rock and is extensively used as the prim ary characteristic o f rock material in engineering. Void index should only be determ ined for rocks tha t do not appreciably disintegrate when immersed in water.
The method suggested by International Society for Rock M echanics (1972) is given below:
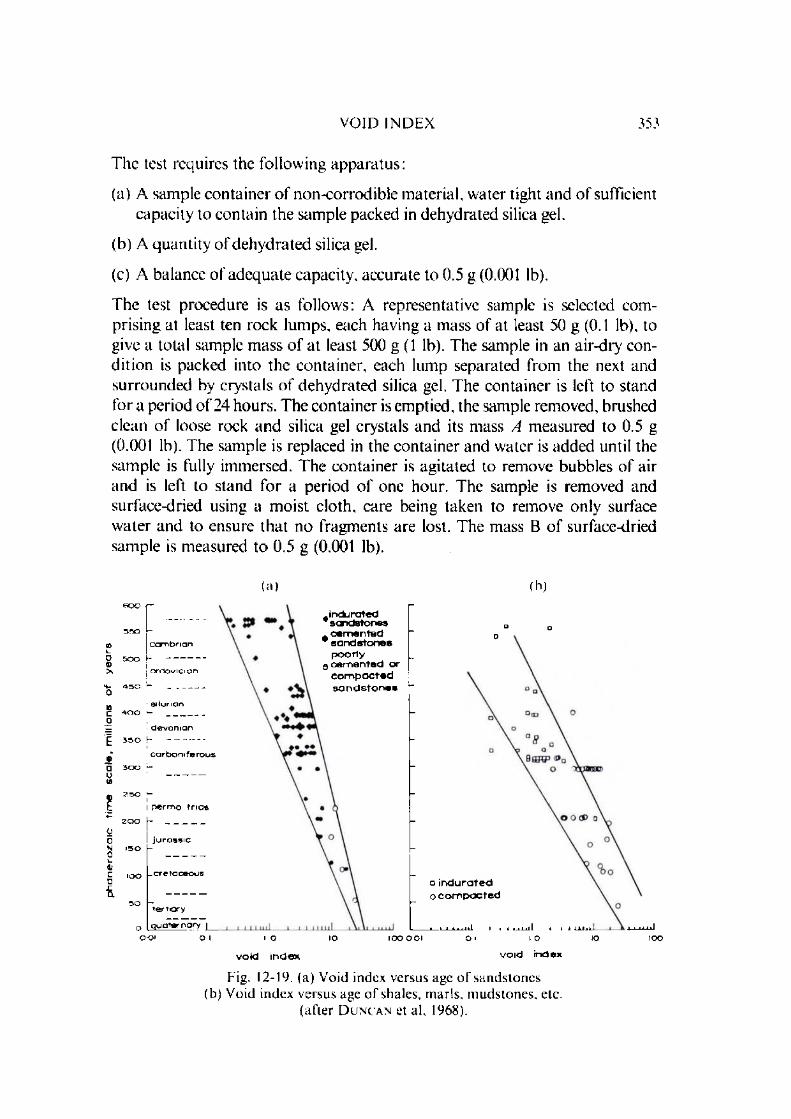
V O I D I N D E X 353
The test requires the following apparatus:
(a) A sample container o f non-corrodible m aterial, water tight and o f sufficient capacity to contain the sample packed in dehydrated silica gel.
(b) A quantity o f dehydrated silica gel.
(c) A balance o f adequate capacity, accurate to 0.5 g (0.001 lb).
The test procedure is as follows: A representative sample is selected com prising at least ten rock lum ps, each having a mass o f at least 50 g (0.1 lb), to give a total sample m ass o f at least 500 g (1 lb). The sample in an air-dry condition is packed into the container, each lump separated from the next and surrounded by crystals o f dehydrated silica gel. The container is left to stand for a period o f 24 hours. The container is em ptied, the sample removed, brushed clean o f loose rock and silica gel crystals and its mass A measured to 0.5 g (0.001 lb). The sample is replaced in the container and w ater is added until the sam ple is fully immersed. The container is agitated to remove bubbles o f air and is left to stand for a period o f one hour. The sample is removed and surface-dried using a m oist cloth, care being taken to remove only surface w ater and to ensure that no fragments are lost. The mass B o f surface-dried sam ple is m easured to 0.5 g (0.001 lb).
C a m b r i a n
o r d o v i c i a n
j S ilu rian400 1- _______
: d e v o n ia n350 (- -------
' c a r b o n i f e r o u s s o o f-
permo trias200 h
j u r a s s i c
- c r e t a c e o u s
t e r t i a r y
q u a t e r n a r y |Q Qi O I
.indurated sandstones cem ented sandstones poorly
q cem ented or co m p a c te d s a n d s to n es
a in d u ra te d o co m p a c te d
void index void index
Fig. 12-19. (a) Void index versus age o f sandstones (b) Void index versus age o f shales, marls, mudstones, etc.
(after D u n c a n et al, 1968).

354 M I S C E L L A N E O U S P R O P E R T I E S O F R O C K
T he void index, /N, is calculated from the relationship
I, = B~ X 100% (12.37)A
T he results o f the void index test should be reported to the nearest 1 % and the report should specify that the void index has been determ ined as the w ater con ten t afte r desiccator drying followed by a one-hour period o f immersion.
void index , %Fig. 12-20. Void index versus compressive and tensile strengths o f granite
(after S e r a f i m and L o p e s , 1962).

VOID IN D E X 355
Void index is also som etim es called the index o f alteration and depends upon the type and age o f rock m aterial. F o r sandstones, shales, m arls, m udstones, etc., the relationships between void index and age o f rock are given in Fig. 12-19 ( D unc an et al, 1968). There seems to be a rem arkable correlation between them.
S erafim and Lo pes (1962) correlated the void index values o f g ranite w ith the compressive strength m easured in uniaxial and triaxial tests. T here is also correlation between void index and tensile strength. Fig. 12-20 gives the results.
There is also a straight-line correlation between the laboratory-determ ined seismic velocity and the void index. Results o f D u n c a n et al (1968) are given in Fig. 12-21.
+ shale • sandstone
mestone O granite a basalt
o o
void index
Fig. 12-21. L ab ora to ry determined seismic velocity versus void index (after D u n c a n et al, 1968).

356 M IS C E L L A N E O U S PRO PE RT IES O F ROCK
12.6. Permeability
Rocks are permeable to the passage o f fluids by virtue o f their porosities. Certain rocks (e.g. volcanic glasses) may, however, be porous w ithout being permeable, as in the case o f sealed pores. Perm eability, therefore, is an expression o f the freedom o f fluid m otion within or through a porous body. The porosity o f a rock influences the perm eability, but there may not be any quantitative relationship between them, for two rocks (e.g. clay and gravel) m ay have equal porosities but different perm eabilities. However, for sandstones, carbonates and limestones, straight-line relationships (Fig. 12-22) were reported between perm eability and porosity ( R z h e v s k y and N o v i k , 1971). For oil sands, permeability and grain d iam eter bear a parabolic relationship ( N u t t i n g , 1930).
n, %
Fig. 12-22. Corre la tion graph showing dependence o f the coefficient o f permeability, k on porosity, n o f rocks: 1 -sandstones; 2 carbonate deposits; 3 Devonian chalky
limestone (the zones o f scatter o f points are hatched)(after R z h e v s k y and N o v i k , 1971).
The following three units are com m only used for perm eability:
Darcy: Through a rock o f 1 darcy, a fluid o f 1 centipoise viscosity (water has1 centipoise viscosity at 6 8 F (20 Q ) moves at the rate o f 1 cm per second under a pressure gradient o f 1 atm osphere per cm (1034 cm o f w ater at the same tem perature). This unit is used by petroleum engineers.
Velocity o f flow: Through a rock o f unit perm eability, water o f 1 centipoise viscosity moves 1 cm per second at 1 (K) % gradient. N ote that this rate o f flow
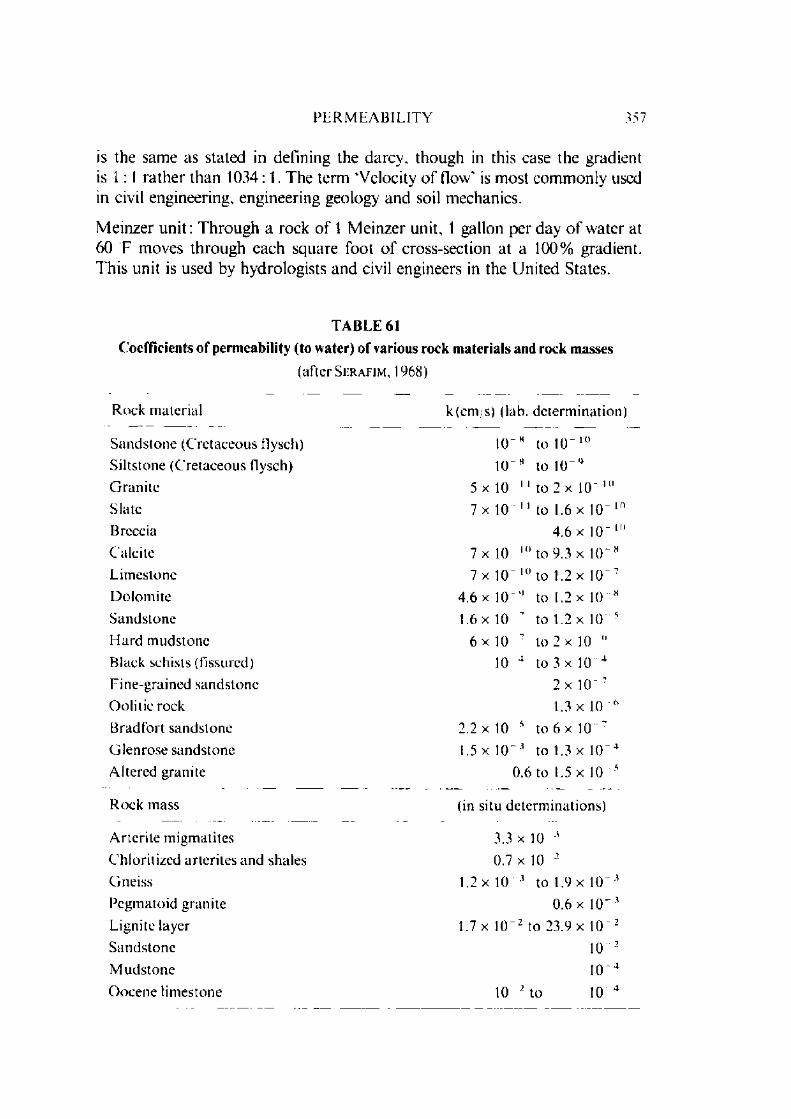
P E R M E A B IL ITY 357
is the same as stated in defining the darcy, though in this case the gradient is 1 : 1 rather than 1034: 1. The term ‘Velocity o f flow' is m ost com m only used in civil engineering, engineering geology and soil mechanics.
M einzer unit: Through a rock o f 1 M einzer unit, 1 gallon per day o f w ater at 60 F moves through each square foot o f cross-section at a 1 0 0 % gradient. This unit is used by hydrologists and civil engineers in the United States.
T A B LE 61Coefficients o f permeability (to water) o f various rock materials and rock masses
( a f t e r S e r a f i m , 1968)
Rock material k(cm/s) (lab. determination)
Sandstone (Cretaceous flysch) 10 to 10 10Siltstone (Cretaceous flysch) 10 8 to 10“ 41Granite 5 x 10 11 to 2 x 10 10Slate 7 x 10 11 to 1.6 x 10 10Breccia 4.6 x 10 10Calcite 7 x 10 10 to 9.3 x 10" 8Limestone 7 x 10 10 to 1.2 x 10 "'Dolom ite 4.6 x 10 to 1.2 x 10 " 8Sandstone 1.6 x 10 7 to 1.2 x 10 51 lard mudstone 6 x 10 7 to 2 x 10" 6Black schists (fissured) 10 4 to 3 x 10 4Fine-grained sandstone 2 x 10""Oolitic rock 1.3 x 10 hBradfort sandstone 2.2 x 10 5 to 6 x 10Glen rose sandstone 1.5 x 10 3 to 1.3 x 10 4Altered granite 0.6 to 1.5 x 10 ■
Rock mass (in situ determinations)
Arterite migmatites 3.3 x 10" 3Chloritized arterites and shales 0.7 x 10 2Gneiss 1.2 x 10 3 to 1.9 x 10" 3Pegmatoid granite 0.6 x 10" 3Lignite layer 1.7 x 10 2 to 23.9 x 1 0 " 2Sandstone 10 2M udstone 10"4Oocene limestone 10 2 to 10"4
358 M IS C E L L A N E O U S PRO PE RT IES O F ROCK
A rock having a perm eability o f 1 darcy, has perm eability o f 18.2 M einzer units and 9.7 x 10 4 cm/s.
C ertain au th o rs use Lugeon as the m easure o f the in situ perm eability o f rock. This is derived after the nam e o f the French engineer who devised the pum p-in test using a single bore hole to determ ine the groutability o f rock. A rock mass is considered to accept grout if it has perm eability o f 1 Lugeon which represents How o f 1 litre o f w ater per m inute through a bore hole o f 1 m etre length a t a pressure o f 10 kgf/cm 2 (0.98 M Pa).
The range o f variation o f perm eabilities o f rocks is very large. M u s k a t (1949) reported perm eabilities o f com m ercial oil- o r gas-bearing sandstones from 5 to 5000 millidarcys (1 m illidarcy = 0.001 darcy). Permeabilities to w ater o f various rock m aterials and rock masses com piled by S e r a i im (1968) are given in T able 61. Permeability determ ined in situ may be 1,000 to 10,000 times higher than th a t obtained from tests in the laboratory. The m ethod used for determ ination o f perm eability will depend upon the rock type. Some o f the most com m only used m ethods are given below.
12.6.1. L a b o ra to ry Tests for D e te rm ina t ion o f Permeabil i ty o f Rock Specimens
Penneability is m easured by a variety o f m ethods. In all these m ethods, some fluid is passed under pressure through a rock specimen held fast in a metal ring by a rubber gasket. The pressure is m easured at the entrance to and the exit from the specimen; the run length is recorded and the quantity o f seeping fluid is detennined (its viscosity is known). The penneability is calculated using the following relationship:
k = , A r 1 - (12.38)4 (P -P o )
where k = perm eability, darcy// = viscosity o f the fluid at the tem perature o f the experim ent, centi-
poiseq = quantity o f the fluid seeping through the specimen in one second.
cnrVs/ = length o f the specimen, cmA = cross-sectional area o f the specimen perpendicular to direction o f
flow, cm 2= absolute pressure at the point o f entrance to the specimen, atm os
phere andp0 = absolute pressure at the point o f exit from the specimen, atm os
phere.
P ER MEA BILITY 359
Specimen preparation
The preparation o f the specimen for perm eability test is a very im portant phase o f the test. D epending upon the test procedure adopted, the sample is cut to required dim ensions using a flushing Liquid (usually w ater). Before cutting o f the sample, the sam ple should be saturated with the fluid to prevent m udding o f the forces due to capillary effects. Failure to saturate the sample results in blocking o f the pores with the m ud and causes serious reduction o f permeability. In case it is not possible to cut the sample, the specimen may be m oulded as is the usual practice in soil mechanics. The samples containing oil should be treated to rem ove all traces o f oil as far as possible. T his is best done by fitting the sample in a 10 to 15 cm (4 to 6 in) long tube and inserting the tube into the Soxlet extraction apparatus using carbon tetrachloride or benzol as a solvent with the sample end downwards. It may be pointed out th a t depending upon the sam ple size and its porosity, a considerable time is usually required to free it from contained oil.
Determination of air permeability
Cylindrical specimens, 2 cm (1 in) in d iam eter and 2 to 3 cm (1 in) long, are usually used for perm eability m easurem ents. T o calculate perm eability o f a cylinder, the dim ensions o f length and cross-section may be m easured directly by calipering o r by m easuring the length and com puting the cross-sectional area by dividing the bulk volum e by the length. These m easurem ents are taken before the specimen is used for its perm eability measurem ent. If the specimen is to be m ounted in plastic o r pitch, it m ust be m easured before m ounting. However, if a m ounted core is cut o r sectioned to clean its ends, the length must be rem easured after cutting.
The clean specimen is placed in an appropria te holder in the perm eam eter so that any bypassing o f air around the sides o f the specimen or the m ounting is elim inated (Fig. 12-23). P ry clean air is passed through the core and the rate o f tlow o f the a ir determ ined from the pressure difference across a calibrated orifice o r o ther suitable flow-rate m easuring device. The differential pressure across the specimen m ay be adjusted to give appropriate o r convenient rates o f flow. The inlet air pressure and the a ir flow rates are recorded. F rom these m easurem ents and the specimen dim ensions, the dry-air perm eability may be calculated from the equation (12.39) using appropriate viscosity value for the a ir at the tem perature o f the test.
If q is the rate o f flow o f outlet air, referred to mean pressure in the
system i.e. the a ir perm eability is given by
b — 2%Po!>1 M2 391(P -f-P o ) d ( • }
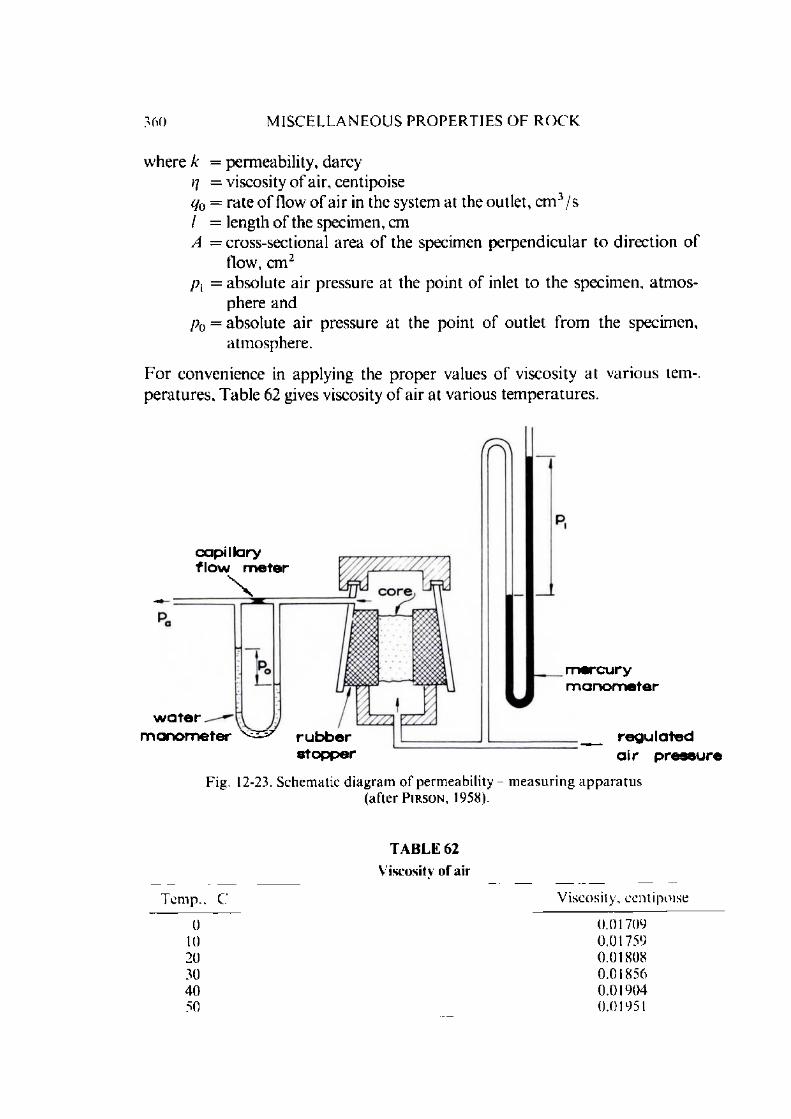
M I S C E L L A N E O U S PR OPERTIES O F ROCK
w here k = perm eability, darcy// = viscosity o f air, centipoiseqo = rate o f flow o f a ir in the system at the outlet, cm 3/s / = length o f the specimen, cmA = cross-sectional area o f the specimen perpendicular to direction o f
How, cm 2
p x = absolute air pressure at the point o f inlet to the specim en, a tm osphere and
p0 = absolute a ir pressure a t the point o f outlet from the specimen, atm osphere.
F o r convenience in applying the proper values o f viscosity a t various tem peratures, Table 62 gives viscosity o f a ir at various tem peratures.
capillary f lo w m eter
X
w a te r m a n o m e te r ru b b e r
stopper
m ercu rym a n o m e te r
reg u la te d a ir pressure
Fig. 12-23. Schematic d iagram o f permeability m easur ing ap p a ra tu s( a f t e r P i r s o n , 1958) .
TABLE 62
Viscosity o f air
Temp.. C Viscosity, centipoise
0 0.0170910 0.0175920 0.0180830 0.0185640 0.0190450 0.01951

PER MEA BILITY
W hen perm eability is required in a radial direction (perm eability is a highly directional property), cylindrical cores with a central hole are used w ith the end faces sealed and the cylindrical walls open. C om putation o f radial perm eability is then obtained from the following equation:
where k = perm eability, darcy)] = v iscosity o f air, centipoise% = rate o f flow o f outlet air, cm 3/sr0 = ou ter radius o f specimen, cm/‘i = inside radius o f hole, a n/ = axial length o f core, cmp x = absolute pressure at the inlet, atm osphere andp0 = absolu te pressure at the outlet, atm osphere.
Determination o f liquid permeability
Liquid perm eability determ inations are infrequently m ade in petro leum industry to determ ine the oil flow characteristics o f the rocks essential in well design. D ue to the tim e required to fully saturate the specimen and establish steady state flow, and the difficulty o f finding a liquid which is com pletely inert with respect to the rock, the m ethod requires careful planning. W ater perm eability de term inations are com m only m ade by civil engineers, engineering geologists and hydrologists as a routine test in all m inor and m ajor w orks.
Basically, the tw o perm eability tests i.e. longitudinal and radial, are used. Cylindrical specim ens o f d iam eter 60 mm (2.5 in) and length varying up to 150 mm (6.0 in) are used. Pressure gradients up to 1 in 1000 are used in the laboratory , w hereas gradients o f only 1 in 10 are usual in situ to ob ta in m easurable rate o f percolation.
Longitudinal percolation test: Some laboratories use the apparatus derived from conventional soil-testing equipm ent (Fig. 12-24), where the rock specim en is encapsulated in an epoxy resin, with the object o f preventing leakage along the external cylindrical face o f the specimen. U nder practical conditions this is not always possible, and in addition it is difficult to remove the epoxy coating when the specimen is required for further tests.
The apparatus show n in Fig. 12-25 was developed by the Paris L ab o ra to ry where the specimen is protected with a plastic coating and im m ersed into w ater under pressure. The radial com ponent o f the w ater pressure being
(12.40)
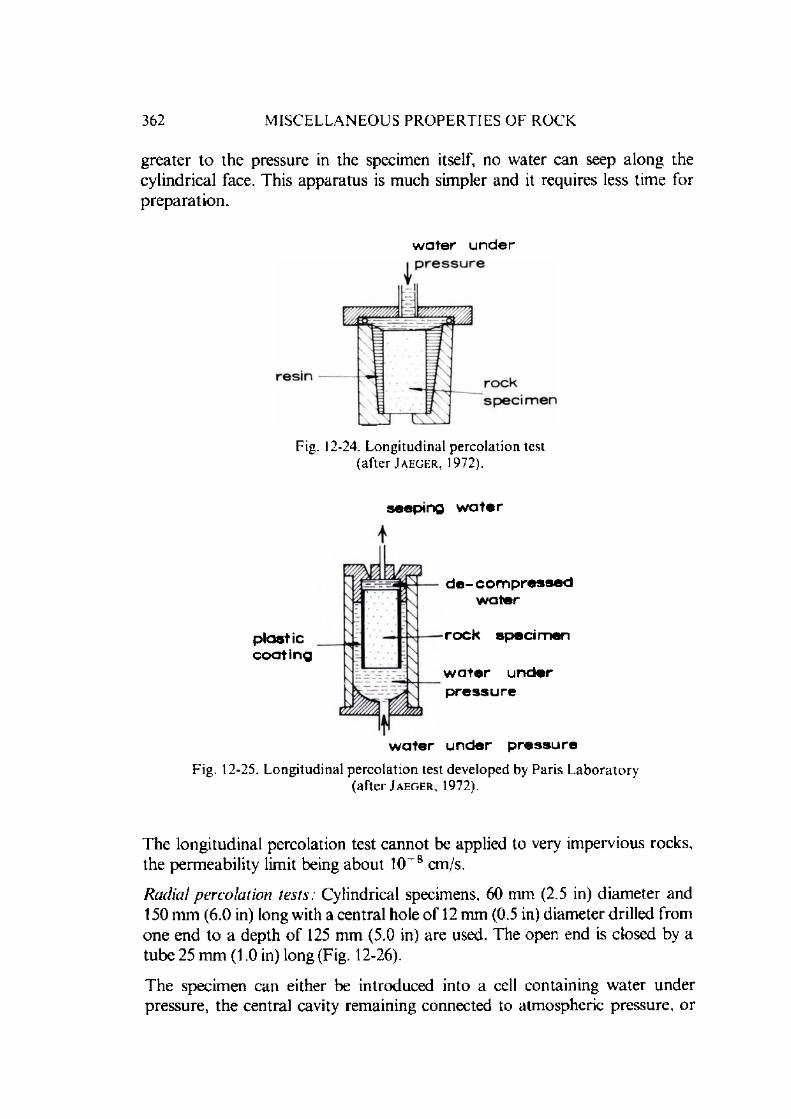
362 M IS C E L L A N E O U S PR OPERTIES OF ROCK
g reater to the pressure in the specimen itself, no w ater can seep along the cylindrical face. This apparatus is m uch simpler and it requires less tim e for p reparation .
w a t e r u n d e r
Fig. 12-24. Longitudinal percolation test (after J aeger, 1972).
seeping w a te r
plasticco a tin g
d e - com pressed w ater
ro ck specim en
w a te r under p ress u re
w a te r under pressure
Fig. 12-25. Longitudinal percolation test developed by Paris L abora to ry(after J a e g e r , 1972).
The longitudinal percolation test cannot be applied to very im pervious rocks, the perm eability limit being about 10 8 cm/s.
Radial percolation tests: Cylindrical specimens, 60 mm (2.5 in) d iam eter and 150 m m (6.0 in) long with a central hole o f 12 mm (0.5 in) diam eter drilled from one end to a depth o f 125 mm (5.0 in) are used. The open end is closed by a tube 25 m m (1.0 in) long (Fig. 12-26).
The specim en can either be introduced into a cell containing w ater under pressure, the central cavity rem aining connected to atm ospheric pressure, or

P E R M EABILITY 363
t
T
160
Fig. 12-26. S tandard rockspecimen prepared for radial percolation tests (dim ensions in mm) (Paris Laboratory)
(after J aec.f.r , 1972).
w ater can be injected under pressure inside the specimen. The w ater will percolate across the rock and the flow being radial over alm ost the whole height o f the specimen, this test is called ‘radial percolation test'. W hen w ater pressure is applied to the exterior side o f the cylinder, the How is convergent and when w ater is under pressure inside the specimen, the flow is divergent.
I f p is the percolation pressure and / is the length o f inside hole (disregarding the ends), the How rate q across a coaxial cylinder o f radius r is:
tak ing the viscosity o f w ater as 1 centipoise. Rew riting equation (12.41)
A fter integration over the whole length o f the path taken by the w ater (between rx and r0) this equation becomes
q = k l n r ! (dp I dr) (12.41)
(12.42)
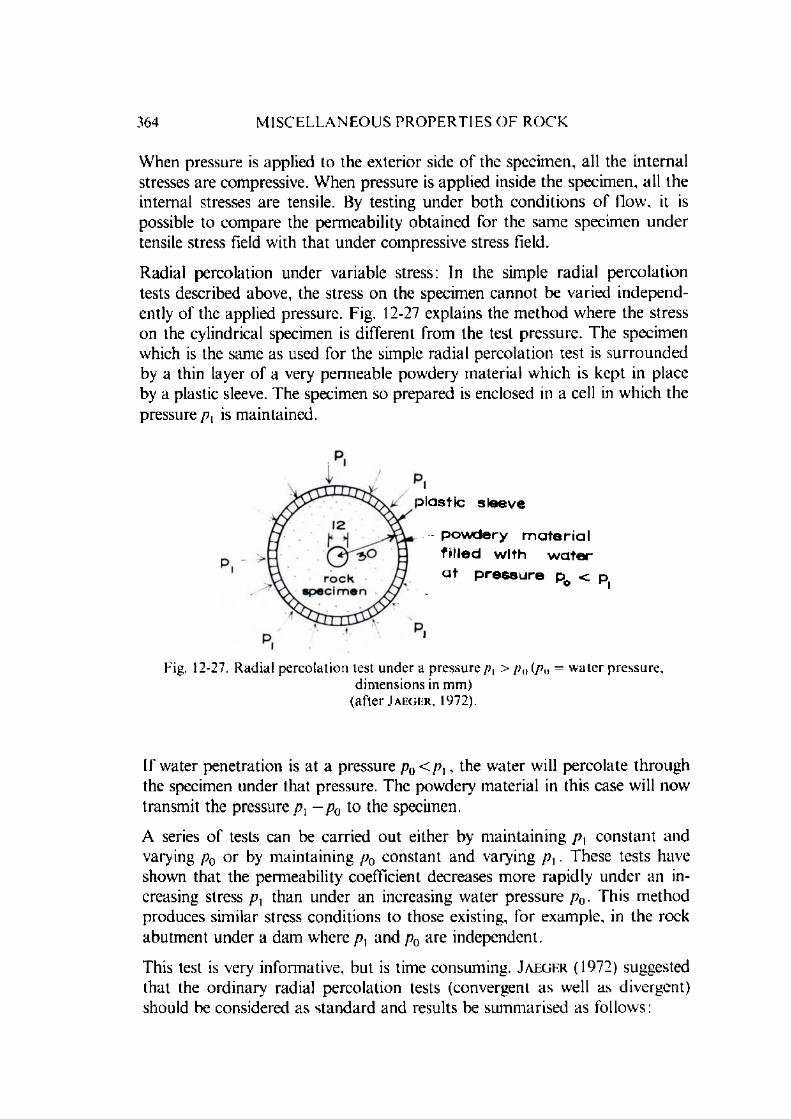
364 M I S C E L L A N E O U S PRO PE RT IES OF ROCK
W hen pressure is applied to the exterior side o f the specimen, all the internal stresses are compressive. W hen pressure is applied inside the specim en, all the internal stresses are tensile. By testing under both conditions o f How, it is possible to com pare the perm eability obtained for the sam e specim en under tensile stress field with that under compressive stress field.
Radial percolation under variable stress: In the simple radial percolation tests described above, the stress on the specimen cannot be varied independently o f the applied pressure. Fig. 12-27 explains the m ethod w here the stress on the cylindrical specimen is different from the test pressure. The specim en which is the same as used for the simple radial percolation test is surrounded by a thin layer o f a very perm eable powdery m aterial w hich is kept in place by a plastic sleeve. The specimen so prepared is enclosed in a cell in which the pressure /?, is m aintained.
il a s t i c s l e e v e
p o w d e r y m a t e r i a l f i l l e d w i th w a t e r a t p r e s s u r e p < n
O r' |
I
Fig. 12-27. Radial percolation lest under a pressure />, > /?„ ( p Q = w ate r pressure,dimensions in mm)
( a f t e r J a e g e r , 1972).
If water penetration is at a pressure P o < P \, the w ater will percolate through the specimen under that pressure. The powdery m aterial in this case will now transm it the pressure /?, —p0 to the specimen.
A series o f tests can be carried out either by m ain tain ing /?, constan t and varying p0 o r by m aintaining p0 constant and varying /?,. These tests have shown that the perm eability coefficient decreases m ore rapidly under an increasing stress p x than under an increasing w ater pressure p0 . This m ethod produces sim ilar stress conditions to those existing, for exam ple, in the rock abutm ent under a dam where /?, and p0 are independent.
This test is very inform ative, but is time consum ing. J a e g e r (1972) suggested that the ordinary radial percolation tests (convergent as well as divergent) should be considered as standard and results be sum m arised as follows:
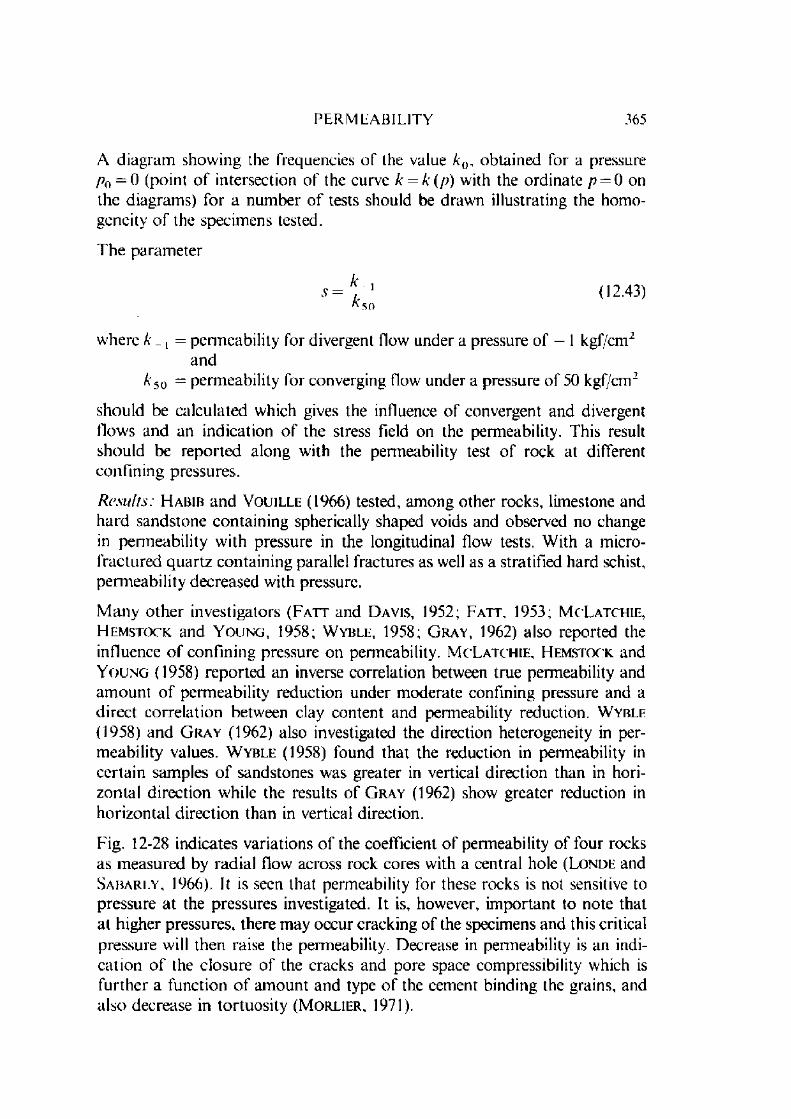
PE R M E A B IL ITY 365
A diagram showing the frequencies o f the value A0, obtained for a pressure /7o = 0 (po in t o f intersection o f the curve k = k {p ) with the ordinate p = 0 on the diagram s) for a num ber o f tests should be draw n illustrating the hom ogeneity o f the specim ens tested.
T he param eter
S = k ' (12.43)*50
w here A , = perm eability for divergent How under a pressure o f — 1 kgf/cm 2 and
A' 50 = perm eability for converging How under a pressure o f 50 kgf/cm 2
should be calculated which gives the influence o f convergent and divergent Hows and an indication o f the stress field on the permeability. This result should be reported along with the perm eability test o f rock at different confin ing pressures.
Results: H a b i b an d V o u i l l e (1966) tested, am ong other rocks, limestone and h ard sandstone con tain ing spherically shaped voids and observed no change in perm eability w ith pressure in the longitudinal flow tests. W ith a m icrofractured q u artz contain ing parallel fractures as well as a stratified hard schist, perm eability decreased with pressure.
M any o th er investigators ( F a t t and D a v i s , 1952; F a t t , 1953; M c L a t c h i e , H e m s t o c k and Y o u n g , 1958; W y b l e , 1958; G r a y , 1962) also reported the influence o f confin ing pressure on permeability. M c L a t c h i e , H e m s to c k and Y o u n g (1958) reported an inverse correlation between true perm eability and am ount o f perm eability reduction under m oderate confining pressure and a d irect correla tion between clay content and perm eability reduction. W y b l e (1958) and G r a y (1962) also investigated the direction heterogeneity in perm eability values. W y b l e (1958) found that the reduction in perm eability in certain sam ples o f sandstones was greater in vertical direction than in horizon tal d irection w'hile the results o f G r a y (1962) show greater reduction in horizontal d irection than in vertical direction.
Fig. 12-28 indicates variations o f the coefficient o f perm eability o f four rocks as m easured by rad ial (low across rock cores with a central hole ( L o n d e and S a b a r l y , 1966). It is seen tha t perm eability for these rocks is not sensitive to pressure at the pressures investigated. It is, however, im portan t to note that at higher pressures, there m ay occur cracking o f the specimens and this critical pressure will then raise the permeability. Decrease in perm eability is an indication o f the c losure o f the cracks and pore space compressibility which is fu rther a function o f am ount and type o f the cement binding the grains, and also decrease in to rtuosity ( M o r l i e r , 1971).

366 M I S C E L L A N E O U S PRO PE RT IES O F ROCK
(0\Eo*
The decrease in the perm eability is also dependent upon the shape and o rien tation o f the pores and cracks with respect to the m ajor stress direction. W hen rock contains spherical connected openings, the perm eability obtained from cores drilled in different directions are independent both o f the pressure and the direction.
Rocks show perm eability hysteresis (Figs. 12-29 and 12-30) which has been reported by m any investigators ( K n u t s o n and B o h o r , 1962; J a e g e r , 1972; S a r d a , L e T i r a n t and B a r o n , 1974). This seems to be an indication o f the internal changes namely grain rupture and pore collapse that take place in the specimen. If the pores are spherical, there is much less likelihood o f these changes taking place when the specimen is subjected to a hydrostatic pressure in a bom b. An idea o f the shape and orientation o f the pores can be obtained by determ ining the change in directional perm eability if oriented cores are subjected to different hydrostatic pressures and their permeabilities determ ined afterwards.
Change in stress field from + ve to —re results in opening out o f the cracks at right angles and hence a sudden increase in perm eability (Fig. 12-30).
The influence o f tem perature on the perm eability has been studied by A f i n o -
g e n o v (1969) on certain rocks and found a decrease in perm eability with rise in tem perature. The decrease in value is ra ther small and he associates it with the decreasing m odulus o f elasticity o f the rocks with rise in tem perature.
IO ’ 6 -o o lit ic 1 im es to n e
I O - ^
IO "8 --—Hi2^»s
IO -9 -■
1-' 1 ..... 1
a ran lte (sound )
"7 — ( f i ssur ed)-5 O +-IO 4-20 + 3 0 +-40 -*-50
p , b a r
Fig. 12-28. Results o f radial percolation test (after L o n d f . and S a b a r l y , 1966).
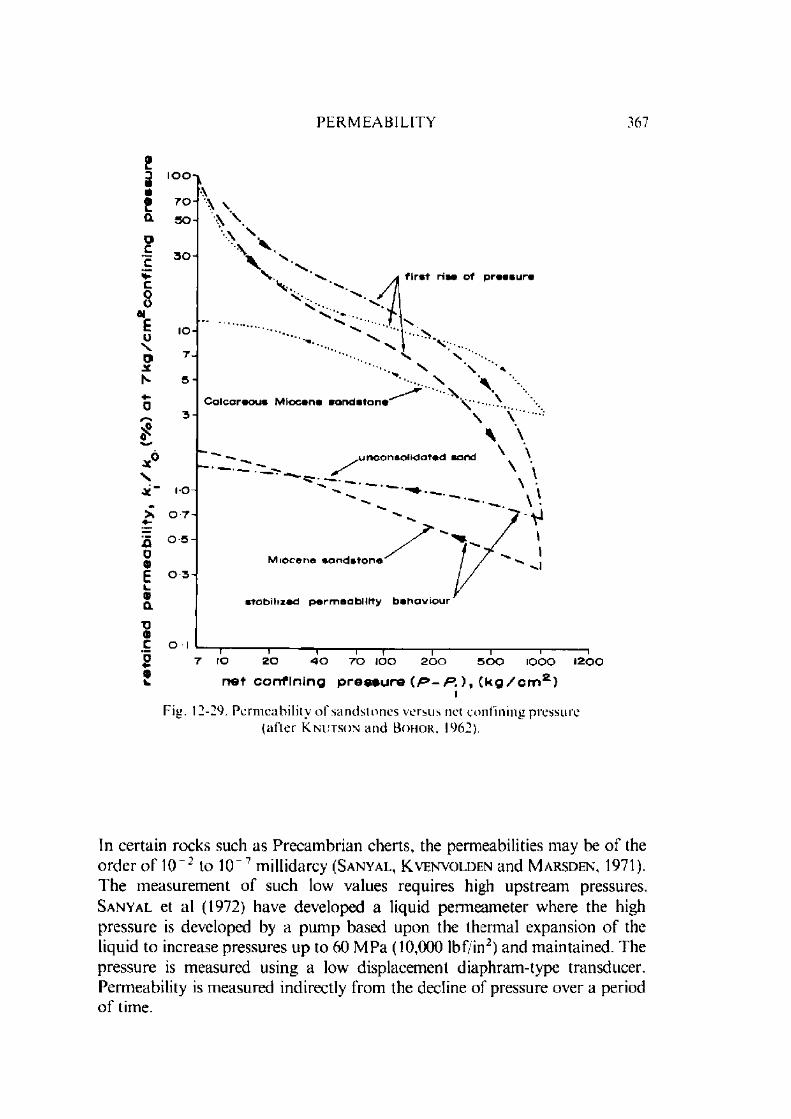
P E R M E A B IL ITY 367
s
IFig. 12-29. Perm eability o f sandstones versus net confining pressure
(after K n u t s o n and Bo h o r , 1962).
In certain rocks such as Precam brian cherts, the permeabilities may be o f the o rder o f 10 2 to 10 m illidarcy ( S a n y a l , K v e n v o l d e n and M a r s d e n , 1971). The m easurem ent o f such low values requires high upstream pressures. S a n y a l et al (1972) have developed a liquid perm eam eter where the high pressure is developed by a pum p based upon the therm al expansion o f the liquid to increase pressures up to 60 M Pa (10,000 lbf/in2) and m aintained. The pressure is m easured using a low displacem ent diaphram -type transducer. Perm eability is m easured indirectly from the decline o f pressure over a period o f time.

368 M I S C E L L A N E O U S PR OPERTIES O F ROCK
^ _______I__ ________ ___ > . pore p re s s u re , k g f / c m 2tensile co m p ress ivestresses stresses
Fig. 12-30. Radial percolation tests. Results for fissured rock (gneiss) and rock with spherical voids (sandstone)
(after J a e g e r , 1972).
12.6.2. Permeabili ty o f Rock Masses In Situ
Laboratory tests on cores do not indicate hydraulic properties o f large fractures. joints, etc. found in rock mass unless the specimens are large enough that they represent fairly well the structure o f tha t rock mass and are subjected to the same stress field in which they lie in situ. If the structural units are large, the required size o f the specimen m ay be form idably large. An alternative method o f m easuring the perm eability o f a large num ber o f small samples obtained from the rock mass in different orientations may well provide an

PE R M E A B IL ITY 369
acceptably repeatable value o f the perm eability, but the average may not necessarily represent the field perm eability as can be readily shown with reference to a hypothetical structure (Fig. 12-31) with vertical and horizontal
Wjo in ts . A sample with a w idth of 1 and length exceeding L can never provide
a continuous flow path and the m easured co n d u ctiv ity 0 will be zero.
1----1 i-----1
1 1
1 1
l1
1
1----------- 1
r ■ 1 _
_ir i L
1-----1
1 1
i I
i_______i
1L _
1J
L W
Fig. 12-31. A hypothetical s tructure showing that any sample o f the size show n in the do tted outlines canno t truly represent the whole material. However
placed, the sam ple will have a zero longitudinal conductivity.
In the in situ m easurem ents for perm eability, two situations m ay occur. Firstly, the ground is fully saturated and secondly the ground is unsaturated and satu ration condition m ust be imposed artificially as part o f the m easuring technique. The two cases are discussed as under.
Saturated ground
W hen the ground is fully saturated, pum ping tests are m ade to determ ine the perm eability o f strata located below the w ater table. The m ost com m only used m ethod is the T h i e m ’s (1906) m ethod and is described below.
(a) T h i e m 's method: Fig. 12-32 (a) is a vertical section through a stratum located between two relatively impervious strata. A bore hole is drilled to the bo ttom o f the layer, and w ater is pum ped from the bore hole at a constant rate until the w ater level in the bore hole becomes almost stationary. Once this state has been established, the perm eability k is calculated from the following eq u a tio n :
k = Q2 n H ( h 2 — h x) r
12.44)
A differentiation is usually m ade between permeability o f a porous m edium and the capacity to permit fluid How o f an opening usually referred to as conductivity.

370 M I S C E L L A N E O U S PR OPE RT IES O F ROCK
where k = perm eability o f the layer, cm/s Q = quantity o f w ater pum ped, cm 3/s H = thickness o f the bed, cm//, and h2 = piezom etric levels in the adjacent holes, cm and r, and r2 = distance to the adjacent holes from the pum p hole, cm.
( a ) ( b )
Fig. 12-32. D iagram illustrating flow o f w ater toward bore hole du rin g pum ping test (a) if piezometric level lies above pervious layer;
(b) if free w ater surface lies within pervious layer (after T h r z a g h i and P e c k , 1948).
If the free-water surface is located below the top o f the stratum the perm eability o f which is to be m easured, as shown in Fig. 12-32 (b), the perm eability is calculated from the following eq u a tio n :
k = — , 9 In - 2- (12.45)n ( h \ - h \ ) r
A pum ping test requires the drilling o f one test bore, com m only 10 o r 12 in (25 or 30 cm) in diam eter, and at least 8 observation bores located on two straight lines through the centre o f the test bore. One o f these lines is located approxim ately in the direction o f the ground-w ater flow, and the o th er line at right angles to it. In this way anisotropy in perm eability in different directions can be determ ined.
(b) K ir k h a m ’s method: T h ie m ’s m ethod is useful only when pum ping rates are high so that a certain level difference due to draw-down can be easily and accurately measured which m any times require large diam eter holes. In cases where the holes are drilled only for perm eability studies and are to be abandoned later, it is very expensive to drill deep holes o f large diam eter. K ir k h a m ' s (1945) m ethod is useful under such conditions. In this m ethod a short length o f perforated tube with a closely fitted rivet is driven in to the ground. W hen the tube has reached the required depth, the rivet is ham m ered down using an internal plunger to the exact m easured desired depth (Fig. 12-33).
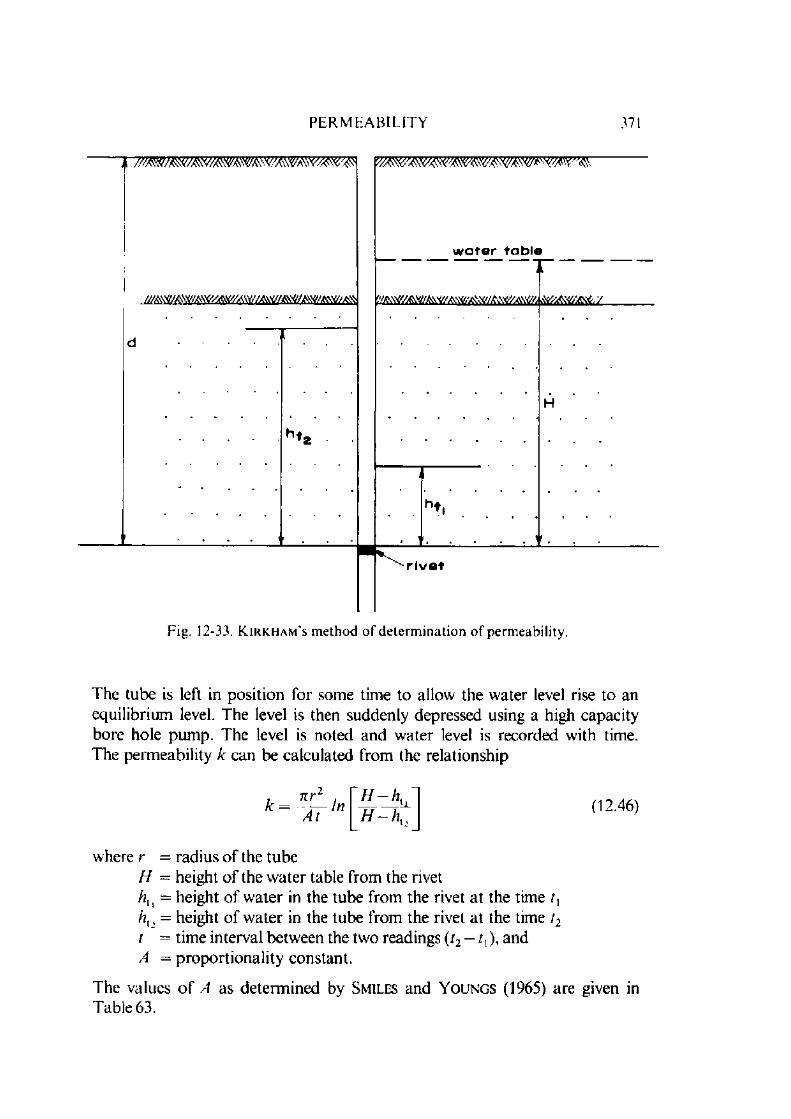
P E R M E A B IL IT Y 371
Fig. 12-33. K i r k h a m ’s m e t h o d o f d e t e r m i n a t i o n o f p e r m e a b i l i t y .
The tube is left in position for some time to allow the water level rise to an equilibrium level. The level is then suddenly depressed using a high capacity bore hole pum p. The level is noted and w ater level is recorded with time. The perm eability k can be calculated from the relationship
k = ~ l n A t
H - h u H - h „
where r = radius o f the tubeH = height o f the w ater table from the riveth{[ = height o f w ater in the tube from the rivet at the time t xhl2 = height o f w ater in the tube from the rivet at the time t2t = time interval between the two readings (t2 - tx), and A = p roportionality constant.
(12.46)
The values o f A as determ ined by S m i le s and Y o u n g s (1965) are given in Table 63.
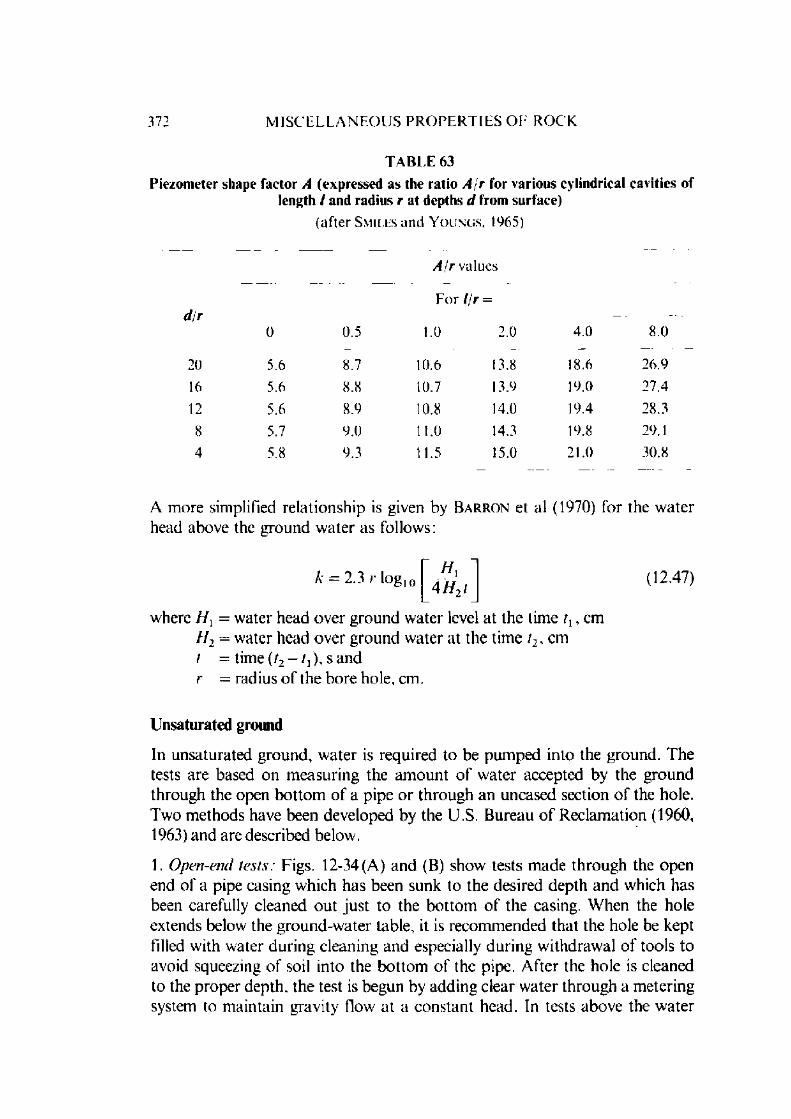
372 M I S C E L L A N E O U S PRO PE RT IES O F ROCK
T A B L E 63
Piezometer shape factor A (expressed as the ratio A / r for various cylindrical cavities of length / and radius r at depths d from surface)
(a fter S m i l e s an d Y o u n g s , 1965)
A j r Vcilues
,/ rF o r / Ir =
u r0 0.5 1.0 2.0 4.0 8.0
20 5.6 8.7 10.6 13.8 18.6 26.9
16 5.6 8.8 10.7 13.9 19.0 21A
12 5.6 8.9 10.8 14.0 19.4 28.3
8 5.7 9.0 11.0 14.3 19.8 29.1
4 5.8 9.3 11.5 15.0 21.0 30.8
A m o re s im p lif ied r e la t io n s h ip is g iv en b y Ba r r o n e t al (1970) fo r th e w a te r h e a d a b o v e th e g ro u n d w a te r a s fo llo w s :
k = 2.3 r log] o W,4 / / , /
12.47)
where / / , = water head over ground water level at the time / , , cm / / 2 = water head over ground water at the time /2, cm t = time ( / 2 —*iK s and r = radius o f the bore hole, cm.
Unsaturated ground
In unsaturated ground, w ater is required to be pum ped into the ground. The tests are based on m easuring the am ount o f w ater accepted by the ground through the open bottom o f a pipe o r through an uncased section o f the hole. Two m ethods have been developed by the U.S. Bureau o f Reclam ation (1960, 1963) and are described below.
1. Open-end tests: Figs. 12-34(A) and (B) show tests m ade through the open end o f a pipe casing which has been sunk to the desired depth and which has been carefully cleaned out just to the bottom o f the casing. W hen the hole extends below the ground-w ater table, it is recommended that the hole be kept filled with water during cleaning and especially during w ithdraw al o f tools to avoid squeezing o f soil into the bottom o f the pipe. A fter the hole is cleaned to the proper depth, the test is begun by adding clear w ater through a m etering system to m aintain gravity How at a constant head. In tests above the w ater
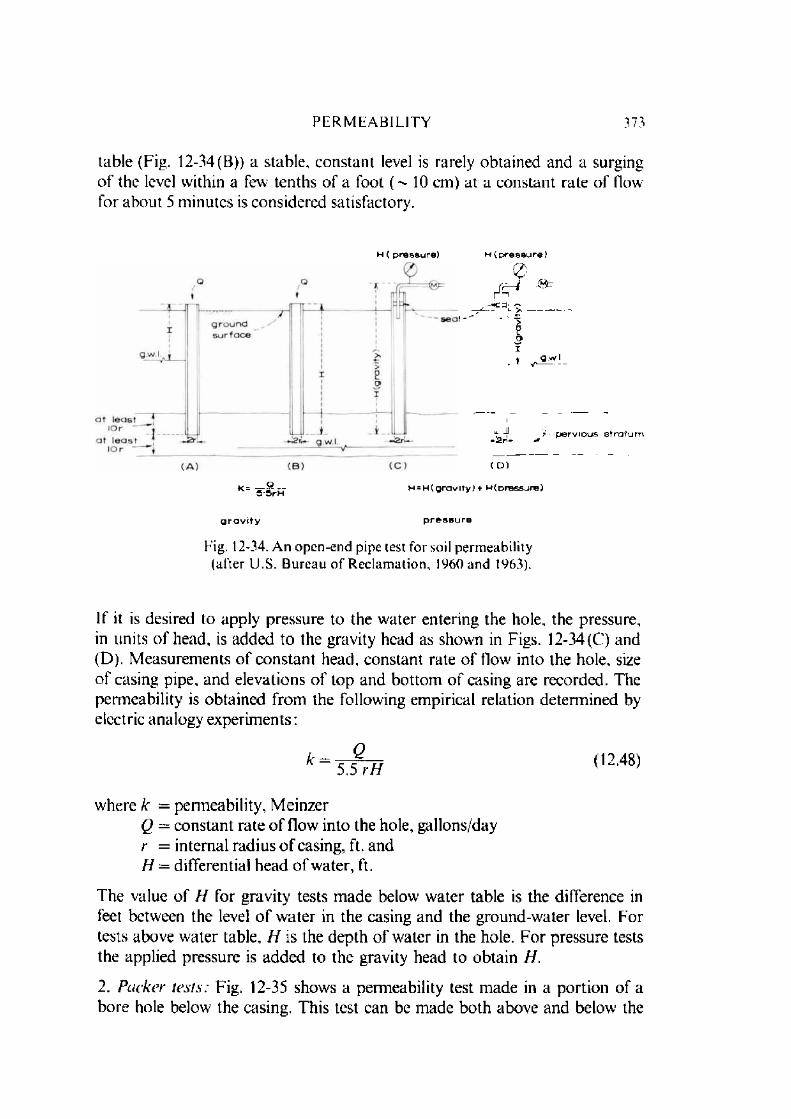
P E R MEABILITY 373
table (Fig. 12-34(B)) a stable, constant level is rarely obtained and a surging o f the level within a few' tenths o f a foot ( — 10 cm) at a constant rate o f flow for about 5 m inutes is considered satisfactory.
H ( p r e s s u r e ) H ( p r e s s u r e )
g.w.i
lJ-l2n- r p e r v i o u s s t r a t u m
( D )
H = H ( g r a v i t y ) + H ( o r e s s j r e )
g ra v ity p r e s s u r e
Fig. 12-34. A n open-end pipe test for soil permeability (after U.S. Bureau o f Reclamation, 1960 and 1963).
If it is desired to apply pressure to the w ater entering the hole, the pressure, in units o f head, is added to the gravity head as shown in Figs. 12-34 (C) and (D). M easurem ents o f constan t head, constant rate o f How into the hole, size o f casing pipe, and elevations o f top and bottom o f casing are recorded. The perm eability is obtained from the following empirical relation determ ined by electric analogy experim ents:
k - 5 T F H 1 ,2 481
where k = perm eability, M einzerQ = constant rate o f flow into the hole, gallons/day r = internal radius o f casing, ft. and H = differential head o f w ater, ft.
The value o f H for gravity tests m ade below w ater table is the difference in feet between the level o f w ater in the casing and the ground-w ater level. For tests above w ater table, H is the depth o f water in the hole. F or pressure tests the applied pressure is added to the gravity head to obtain // .
2. Packer tests: Fig. 12-35 shows a perm eability test m ade in a portion o f a bore hole below the casing. This test can be made both above and below the
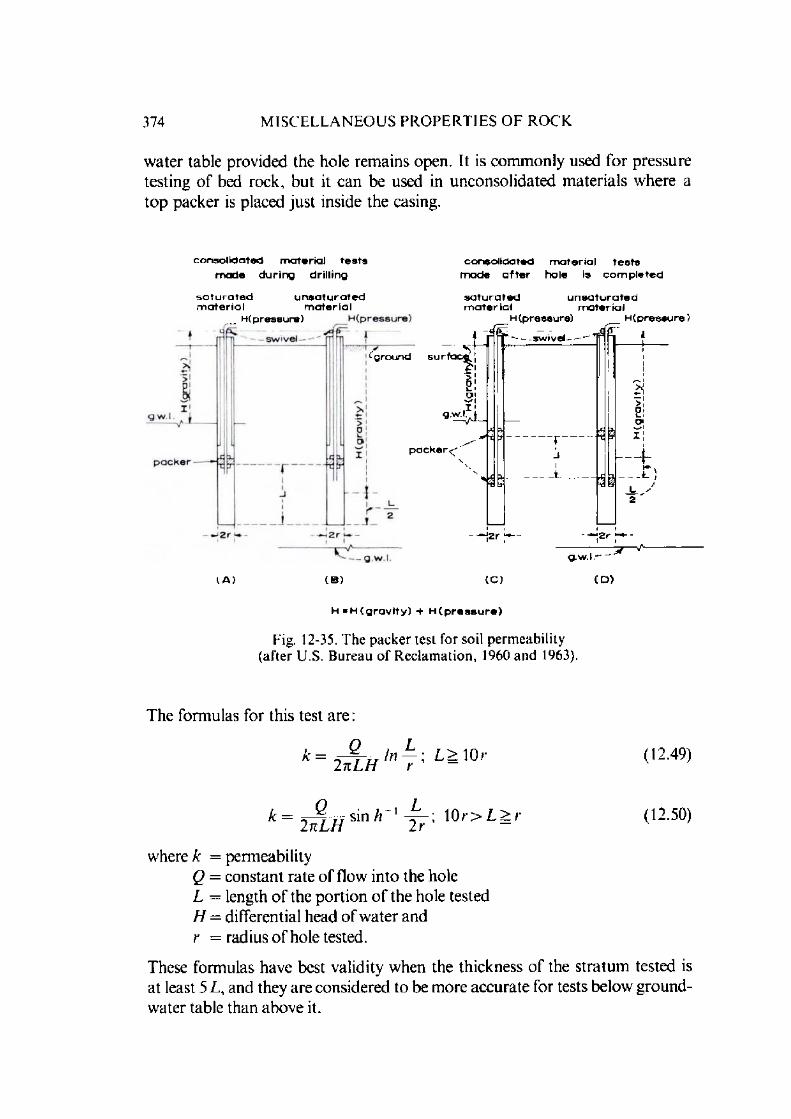
374 M I S C E L L A N E O U S PR OPERTIES OF ROCK
w ater table provided the hole rem ains open. It is com m only used for pressure testing o f bed rock, but it can be used in unconsolidated m aterials where a top packer is placed just inside the casing.
c onsolidated m aterial tests m ade d u r in g drill ing
s a t u r a t e dm a te r ia l
u n s a t u r a t e dm a te r ia l
H (pressure)
consolidated m a te ria l tests m a d e a f t e r hole is c o m p le t e d
s a t u r a t e d u n s a t u r a t e dm a t e r ia l m a te ria l
H (p ressure) __ H (p re s s u r e )
(g ro u n d s u r fa o
g.w.l
p a c k e r^ -
4
1%>!0 1L. 'O'.1 '
( A ) ( 8 )
- - - s w i v e l - -
ouO.X
I--4 - — C]2
( C )
g.w.l.
2r r
(D)
H ® H ( g r a v l t y ) -f H ( p r e s s u r e )
Fig. 12-35. The packer test for soil permeability (after U.S. Bureau o f Reclamation, 1960 and 1963).
The formulas for this test are:
k = , 0 - I J l n — ; L > \ O r (12.49)2 n L H r ~
k = 77 sin /( 1 - — ; 10r> L > r (12.50)z n L H 2 r
where k = permeabilityQ = constant rate o f flow into the hole L = length o f the portion o f the hole tested H = differential head o f w ater and r = radius o f hole tested.
These form ulas have best validity when the thickness o f the stratum tested is at least 5 L, and they are considered to be m ore accurate for tests below groundwater table than above it.
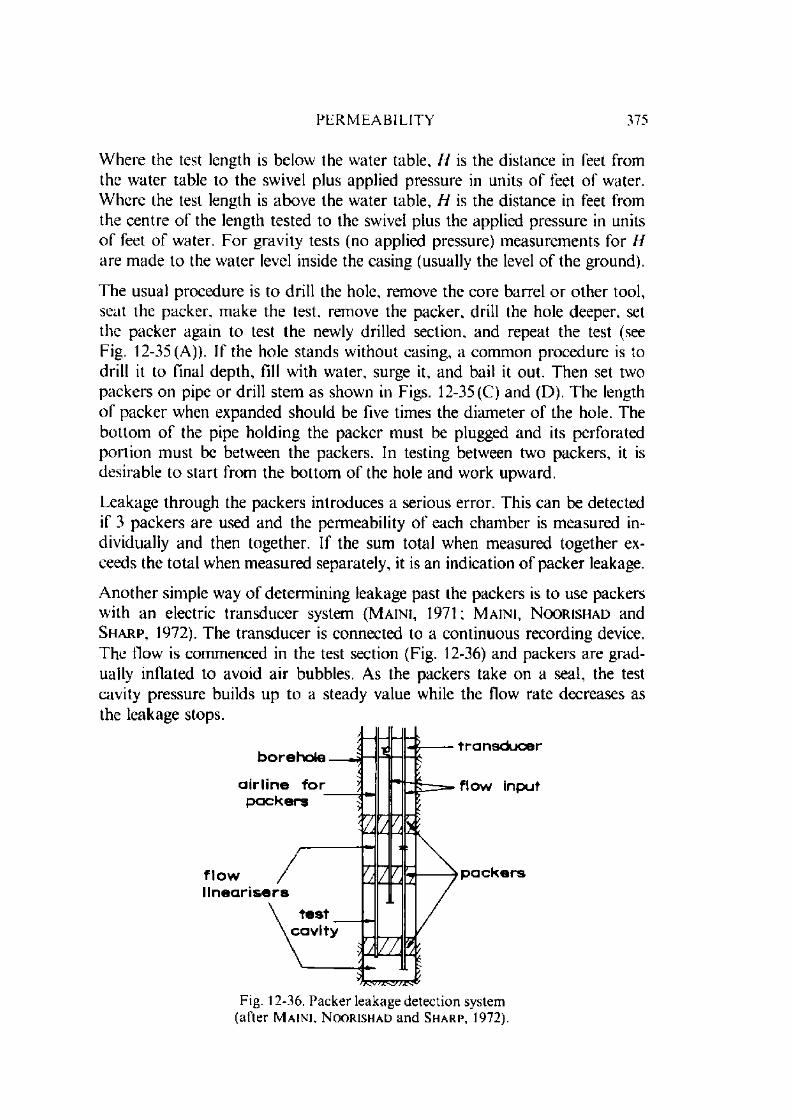
P ER MEA BILITY 375
W here the test length is below the water table. H is the distance in feet from the w ater table to the swivel plus applied pressure in units o f feet o f water. W here the test length is above the water table, H is the distance in feet from the centre o f the length tested to the swivel plus the applied pressure in units o f feet o f water. F or gravity tests (no applied pressure) m easurem ents for H are m ade to the w ater level inside the casing (usually the level o f the ground).
The usual procedure is to drill the hole, remove the core barrel o r o ther tool, seat the packer, m ake the test, remove the packer, drill the hole deeper, set the packer again to test the newly drilled section, and repeat the test (see Fig. 12-35(A)). If the hole stands w ithout casing, a com m on procedure is to drill it to final depth, fill with water, surge it, and bail it out. Then set two packers on pipe o r drill stem as shown in Figs. 12-35(C) and (D). The length o f packer when expanded should be five times the diam eter o f the hole. The bottom o f the pipe holding the packer m ust be plugged and its perforated portion m ust be between the packers. In testing between two packers, it is desirable to start from the bottom o f the hole and work upward.
Leakage through the packers introduces a serious error. This can be detected if 3 packers are used and the perm eability o f each cham ber is m easured individually and then together. If the sum total when m easured together exceeds the to tal when m easured separately, it is an indication o f packer leakage.
A nother simple way o f determ ining leakage past the packers is to use packers with an electric transducer system ( M a i n i , 1971; M a i n i , N o o r i s h a d and S h a r p , 1972). The transducer is connected to a continuous recording device. The flow is commenced in the test section (Fig. 12-36) and packers are gradually inflated to avoid a ir bubbles. As the packers take on a seal, the test cavity pressure builds up to a steady value while the flow rate decreases as the leakage stops.
Fig. 12-36. Packer leakage detection system (after M a i n i , N c k j r i s h a d and S h a r p , 1972).

376 M I S C E L L A N E O U S PR OPERTIES OF ROCK
Rem arks: Pum ping tests are time consum ing and costly and generally are limited to a few on a project. Hence, it is difficult if not impossible to (a) de termine permeability o f m ore than one part o f a complex rock mass, (b) indicate uniform ity o f any part o f the mass or (c) establish averages which can be used w ith confidence.
Packer tests are com m on and can be m ade in holes o f usual d iam ond-drilling size, the packers can be set to test any interval o f open hole, and can be reset repeatedly.
G enerally, water pressure, at the section under test, can be between 1.1 and 2.5 times the hydrostatic head without danger o f opening fractures. W here perm eability is high, it is an advantage to test at a low pressure difference to limit pipe friction and the likelihood o f turbulence. W here it is low, a higher pressure difference provides a m easurable inflow with less time.
Conductivity of joints
Packer test can be employed for determ ining conductivity o f individual joints. This test is also called L u g e o n test. O ne Lugeon unit corresponds to a flow o f 1 litre per m inute per m etre length o f the bore hole at a pressure o f 10 kgf/cm 2. The test for a jo in t conductivity is shown in Fig. 12-37. The quantity o f water q that would filtrate per unit o f time from A to B along the jo in t a a \ considered o f uniform opening e, is given by:
a = Pl (1251)cl 12 r, [ n d_
'o
where the symbols have the m eaning indicated in the Fig. 12-37, r0 is the radius o f the bore hole, and // is the viscosity o f w ater and />, and p 2 are the pressures at the jo in t level.
The flow is usually measured for various pressures. The standard pressure o f m easurem ent is 10 kgf/cm 2. It m ay, however, be pointed out that deform ation o f the rock mass takes place under the application o f pressure. If the pressure exceeds the internal stress o f the rock mass, the jo in ts may open and the results obtained will be grossly misleading. L o n d e and S a b a r l y (1966) have shown that if the pressure o f 10 kgf/cm 2 extends over a circular area o f 2 m in radius it will deform a rock o f a m odulus o f elasticity o f 2 0 0 ,0 0 0 kgf/cm 2 by about0.3 mm. This may result in conductivity even 100 Lugeon units in a rock mass that had the jo ints completely closed before the test started.
The conductivity is very sensitive to changes in aperture and it has been reported that Hows show proportionality to the 3rd power o f the jo in t aperture

P ER MEA BILITY 377
a
\
\\
\
\ \\
\ \
^ - r
\ \
' \P 2
- V f
\ p >,
‘ ...........
\
d
Fig. 12-37. Conductivity test in a joint(after S e r a f i m and d e l C a m p o , 1965).
( S n o w , 1972). This m ay permit a rough estim ate o f the joint opening also under a given stress system and even an idea about the stress field if tests are conducted at different pressures.
The determ ination o f jo in t param eters is not easy. A ttem pts have been made to m easure join t openings and define these in terms o f their width, fillings, etc. by bore hole cam era surveys ( B a n k s , 1972) but it is very difficult to assign an average value.
There are certain o ther objections to the test. It is very difficult in practice to incorporate in the test section only a single join t except in special cases such as determ ination o f the conductivity o f a fault. The relationship (12.51) does not take into account the influence o f natural flow and also assumes that the flow is lam inar. In cases o f jo in ts with wider openings, the How is bound to be turbulent which shall m ean higher pressure losses. Louis and M a i n i (1970) have m ade a theoretical analysis o f the various factors.
It m ay be unnecessary to determ ine the conductivity o f each jo in t to calculate the conductivity o f a set o f joints. The conductivity o f each set o f jo in ts can be determ ined if the orien tation and position o f a jo in t system has been correctly studied.

378 M IS C E L L A N E O U S PR OPERTIES OF ROCK
If a rock body contains 3 jo in t sets (A , , k 2 and A3), the optim um hole direction for testing set A', is parallel to the o ther two sets k 2 and k 3.
It is preferable to carry out the test at various pressures and plot the How rate against pressure o r gradient. The usual curve obtained is given in Fig. 12-38. T he various effects (1. Lam inar How, 2. Turbulence effect, 3. T urbulence offset by fissure expansion, 4. Predom inance o f Fissure expansion) can be easily detected from the curve. In very deform able rocks, the effects 2 and 3 m ay be absent. Such a curve also gives an idea o f the maximum pressure to be applied in fu rther tests and the deform ability o f the joints.
Fig. 12-38. Typical results o f field water test.I . L am inar How : 2. Turbulence effect; 3. Turbulcnce offset by fissure
expansion: 4. Predom inance o f fissure expansion effects.(after Louis and M a i n i , 1970).
W hen the flow is turbulent, the lam inar coefficient o f conductivity k is related to the turbu len t coefficient o f conductivity k ' through the relationship
k ' = A ] f k (12.52)
w here A = constant o f each jo in t. B a n k s (1972) found that the value o f A could be taken as ] / l cm/s.
T he changes in conductivity o f jo in ts with norm al stress and shear displacem ent are very much likely and their influence is determ ined by the nature o f
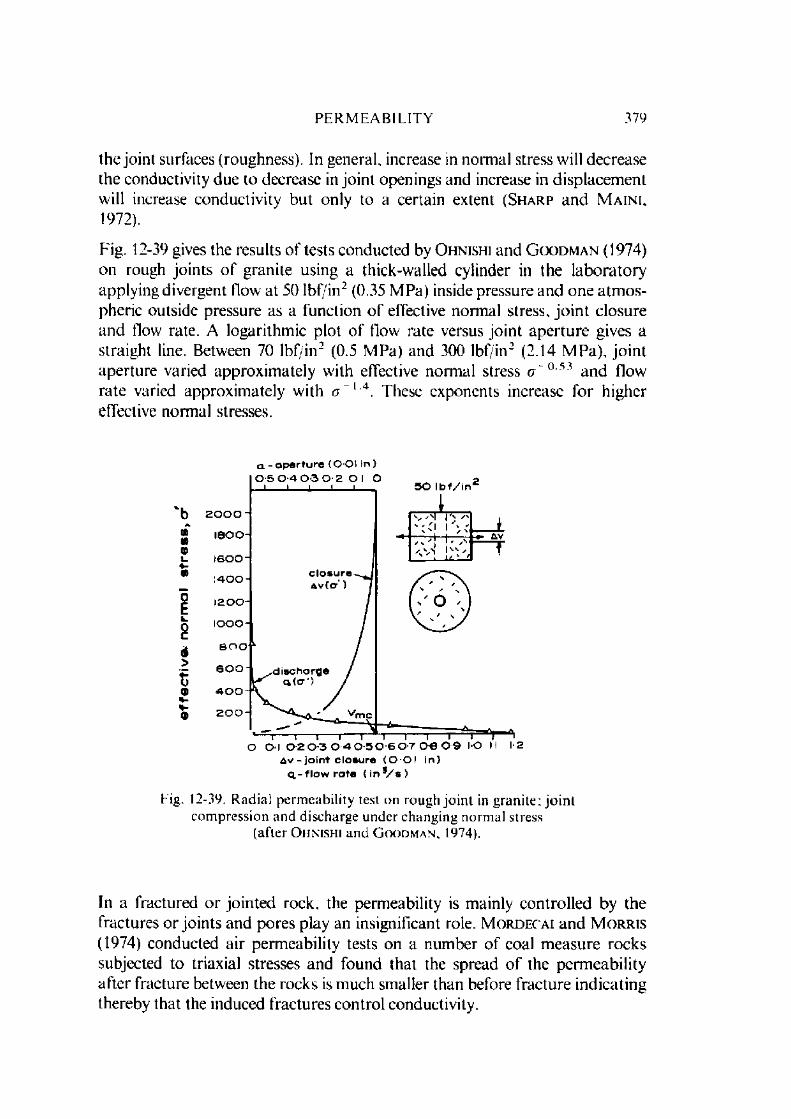
PE RM EABILITY 379
the join t surfaces (roughness). In general, increase in norm al stress will decrease the conductivity due to decrease in jo in t openings and increase in d isplacem ent will increase conductivity but only to a certain extent (S h a r p and M a in i , 1972).
Fig. 12-39 gives the results o f tests conducted by O h n ish i and G(X)d m a n (1974) on rough jo in ts o f granite using a thick-walled cylinder in the labora to ry applying divergent flow at 50 lbf/in2 (0.35 M Pa) inside pressure and one a tm ospheric outside pressure as a function o f effective norm al stress, jo in t closure and tlow rate. A logarithm ic plot o f flow rate versus jo in t apertu re gives a straight line. Between 70 lbf/in2 (0.5 M Pa) and 300 lbf/in2 (2.14 M Pa), jo in t aperture varied approxim ately with effective norm al stress a 0,53 and flow rate varied approxim ately with a 1 4. These exponents increase for higher effective norm al stresses.
a - a p e r t u r e ( O O I In )
A v - jo in t c lo s u re ( O O I i n ) q . - f l o w ra t e ( i n 5/ s )
Fig. 12-39. Radial permeability test on rough jo in t in granite; jo in t compression and discharge under changing normal stress
(after O h n i s h i and G o o d m a n , 1974).
In a fractured o r jo in ted rock, the perm eability is mainly controlled by the fractures or jo in ts and pores play an insignificant role. M o rd eca i and M o r r is (1974) conducted air perm eability tests on a num ber o f coal m easure rocks subjected to triaxial stresses and found that the spread o f the perm eability after fracture between the rocks is m uch smaller than before fracture indicating thereby that the induced fractures control conductivity.

380 M IS C E L L A N E O U S PROPE RT IES O F ROCK
However, it is not always essential that fractured rocks will have greater conductivity than porous rocks. The relative influences m ay be different. M i c h e l (1972) showed that for a porous rock, such as Lias claystone, the ground w ater flow was greater than the so-called fissured limestones and sandstones.
The permeability o f the jo in ts or rocks should theoretically be independent o f the type o f fluid used if the viscosity o f the fluid has been taken into consideration. D i B i a g i o and M y r v o l l (1972), however, reported that the results were erratic in their tests a t two underground power stations in Norway.
Certain new' m ethods are being developed using tracer technique. O ne o f the m ethods is the dilution test wherein the region o f the bore hole under investigation is isolated using packers and a certain quantity o f salt solution is introduced. The concentration o f the salt solution changes as the natural w ater flow through the region washes away some o f the solution. The rate o f dilution is governed by the hydraulic gradient, conductivity o f the jo in t and size of the bore hole ( H a l e v y et al, 1966; M a i n i , 1968, 1971). The rate o f dilution is a function o f the seepage velocity and if the dilution rate is m easured with time, it is possible to calculate o r have a check on the perm eability measured by other methods. By m easuring concentration at different sites, it is possible to calculate the flow velocity in different directions.
In another technique, radioactive tracers such as Chrom ium -51, Iodine-131, are pumped in with the w ater in one bore hole and the time is noted for their arrival at different locations. This gives a fairly accurate idea o f the seepage velocities in different directions ( W u r z e l and W a r d , 1965). However, it may not be possible sometimes to m easure the time o f tracer arrival due to disappearance o f the tracer. This can be overcom e if large diam eter bore hole is used ( W u r z e l , 1972). It m ay be pointed ou t that when radioactive tracers are used, their half-life decay time is an im portant consideration.
12.7. Swelling and Slake-Durability Index Properties
A num ber o f rocks particularly those containing clays are prone to swelling, cracking and disintegration when exposed to short term weathering processes of wetting and drying. Besides, supports placed in excavations m ade in such rocks experience cycles o f increased and decreased pressures depending upon the wetting and drying cycles. Special tests are required to estim ate this aspect o f mechanical behaviour. These tests are called index tests and can be used for classifying and com paring one rock with another. The swelling strain index should not, for example, be taken as the actual swelling strain that the rock would develop in situ, even if the test is carried out under similar loading and water content conditions. I lowever it definitely gives an approxim ate idea o f
S W E L L I N G A N D S L A K E - D U R A B I L I T Y IN D E X 381
its behaviour. These tests basically sim ulate natural wetting and drying processes.
These tests are com m only required for classification or characterisation o f the softer rock m aterials. They may also be used, however, for characterisation o f harder rocks w here the rock condition, its advanced state o f weathering for exam ple, indicates tha t they are appropriate.
Rocks that disintegrate during the tests m ay be further characterised using soil classification tests such as determ ination o f the liquid and plastic limits, the grain size distribution, o r the content and type o f clay m inerals present.
T he m ethods as suggested by the International Society for Rock M echanics (I.S .R .M .) C om m ittee on L aboratory Tests (1972) are given as under:
1. Swelling pressure index under conditions o f zero volume change.2. Swelling strain index for a radially confined specimen with axial pressure.3. Swelling strain developed in an unconfined specimen.4. Slake-durability index.
W here possible, undisturbed rock specimens should be tested, as rock fabric h as an im portant influence on the properties to be measured. W here this is not possible, for example the sample is too weak or dam aged, the swelling tests may be carried out on rem oulded specimens. Rem oulding should be according to standard procedures for soil com paction, and the procedure followed should be reported along with the results.
12.7.1. Swelling Pressure Index under C ond i t ions o f Zero Volum e C h an g e
This test is intended to m easure the pressure necessary to constrain an undistributed rock specimen at constant volume when it is immersed in water.U sually, the apparatus may be adapted from that used for soil consolidationtesting, and consists essentially o f the following (Fig. 12-40):
(a) A metal ring for rigid radial restraint o f the specimen, polished and lubricated to reduce side friction and o f depth at least sufficient to accom m odate the specimen.
(b) Porous plates to allow w ater access at top and bottom o f the specimen, the top p late o f such a d iam eter as to slide freely in the ring. Filter papers m ay be inserted between specimen and plates.
(c) A cell to contain the specimen assembly, capable o f being filled with w ater to a level above the top porous plate. The principal features o f the cell and specimen assembly are illustrated in Fig. 12-40.
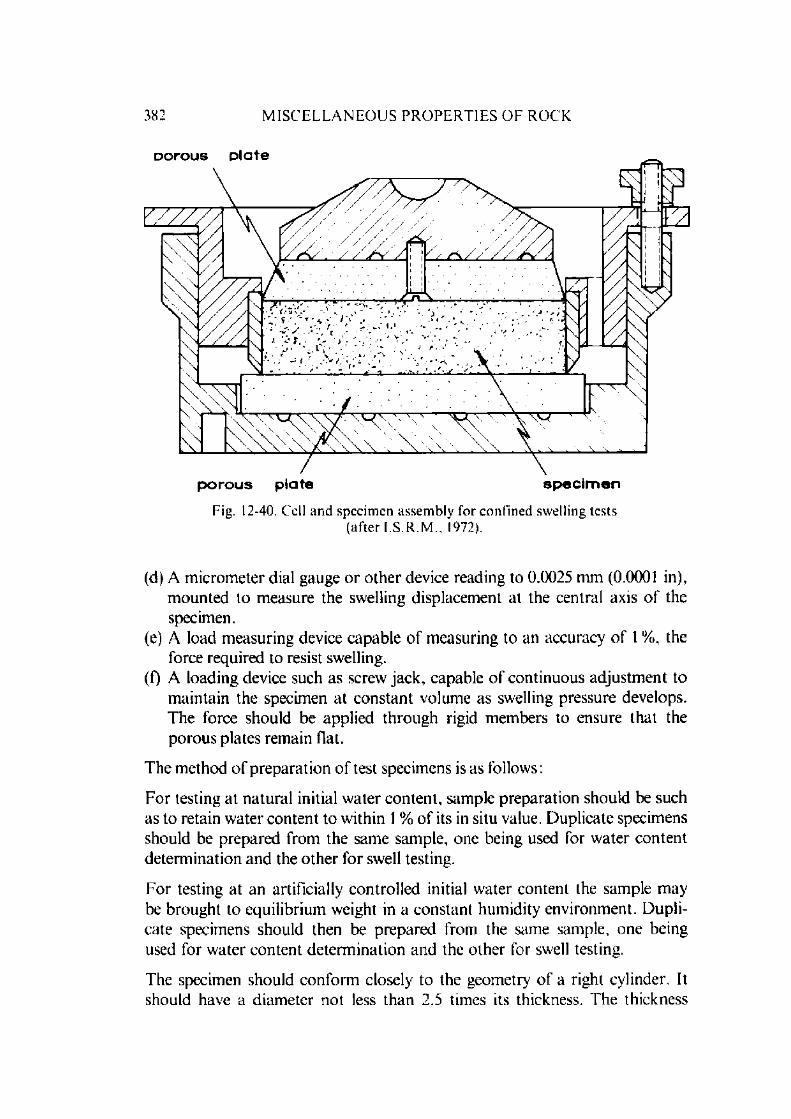
382 M I S C E L L A N E O U S PR OPERTIES OF ROCK
D o r o u s Dlate
porous p late sp e c im en
Fig. 12-40. Cell and specimen assembly for confined swelling tests (after I .S .R .M ., 1972).
(d) A m icrom eter dial gauge o r o ther device reading to 0.0025 mm (0.0(M)1 in), m ounted to m easure the swelling displacem ent at the central axis o f the specimen.
(e) A load m easuring device capable o f m easuring to an accuracy of' 1 %, the force required to resist swelling.
(0 A loading device such as screw jack , capable o f continuous adjustm ent to m aintain the specimen at constant volume as swelling pressure develops. The force should be applied through rigid members to ensure tha t the porous plates rem ain fiat.
The m ethod o f preparation o f test specimens is as follows:
For testing at natural initial w ater content, sample preparation should be such as to retain w ater content to within 1 % o f its in situ value. Duplicate specimens should be prepared from the same sample, one being used for w ater content determ ination and the o ther for swell testing.
For testing at an artificially controlled initial w ater content the sample may be brought to equilibrium weight in a constant hum idity environm ent. D uplicate specimens should then be prepared from the same sample, one being used for w ater content determ ination and the o ther for swell testing.
The specimen should conform closely to the geometry o f a right cylinder. It should have a diam eter not less than 2.5 times its thickness. The thickness

S W E L L I N G A N D S L A K E - D U R A B I L I T Y I N D E X 383
should exceed 15 mm o r ten times the m axim um grain diam eter, whichever is greater. The specimen should be a close fit in the ring.
The inclination o f bedding o r foliation with respect to the specimen axis should be recorded.
The procedure for conducting the test is as follows:
The apparatus is assembled and a small axial force is applied to the specimen.
T he cell is then Hooded with w ater to cover the top porous plate, and the swelling force is recorded as a function o f time elapsed.
The applied force is regularly adjusted to m aintain zero specimen swell throughout the test with an accuracy o f ±0.01 mm (0.004 in).
Swelling force should continue to be recorded until it reaches a constant level o r passes a peak.
The swelling pressure index is given b y :
FSwelling pressure index = -^ (12.53)
where F = m axim um axial swelling force recorded during the test and A = cross-sectional area o f the specimen.
The results should be reported for at least three specimens per sample. The following inform ation should be included in the report for each specimen:
1. The swelling pressure index2. T he initial water content o f the specimen: whether this corresponds to the
na tu ra l w ater content, and if so the m ethod o f storage prior to testing.3. T he d iam eter and thickness o f the specimen, together with the inclination of
bedding o r foliation w ith respect to the specimen axis.
12.7.2. Swelling S tra in Index for a Radial ly Conf ined Specimen with Axial Pressure
This test is intended to m easure the axial swelling strain developed against a constant axial pressure, when a radially confined, undisturbed rock specimen is im m ersed in water.
The ap p ara tu s is essentially the sam e as tha t described under 12.7.1. The metal ring should be o f depth at least sufficient to accom m odate the specimen when fully swollen. A loading device such as dead weight, or weight and lever system, capable o f applying a sustained pressure o f 5 kPa (70 lbf/in2) to the specimen

384 M I S C E L L A N E O U S PROPERTIES OF ROCK
is required. This pressure is m aintained within 1 % throughout the swelling o f the specimen.
The m ethod o f preparation o f test specimens is the same as described under 12.7.1. and that the specimen should have a diam eter not less than ten tim es its thickness.
The procedure for conducting the test is as follows:
The initial thickness and diam eter o f the specimen are recorded to w ithin0 .1% .
The apparatus is assembled and the specimen loaded axially to an axial pressure o f 3 kPa (40 lbf/in2).
The cell is then Hooded with w ater to cover the top porous plate, and the swelling displacement recorded as a function o f time elapsed.
Swelling displacement should be continuously recorded until it reaches a constant level o r passes a peak.
The swelling strain index is given by:
Swelling strain index = - ^ - x 100% (12.54)
where cl = maximum swelling displacem ent recorded during the test and L = initial thickness o f the specimen.
Reporting o f results is the same as given under 12.7.1.
12.7.3. Swelling Strain Developed in an U nconf ined Spec im en
This test is intended to m easure the swelling strain developed when an unconfined, undisturbed rock specimen is immersed in water. The test should only be applied to specimens that do not change their geometry appreciably on slaking; less durable rocks are better tested using a confined swelling test.
The apparatus consists essentially o f the following:
(a) A cell to contain the specimen assembly, capable o f being filled with w ater to a level above the top o f the specimen.
The principal features o f the cell and specimen assembly are illustrated in Fig. 12-41.
(b) A m icrom eter dial gauge o r o ther device reading to 0.0025 mm (0.0001 in) m ounted to m easure the swelling displacem ent on the central axis o f the
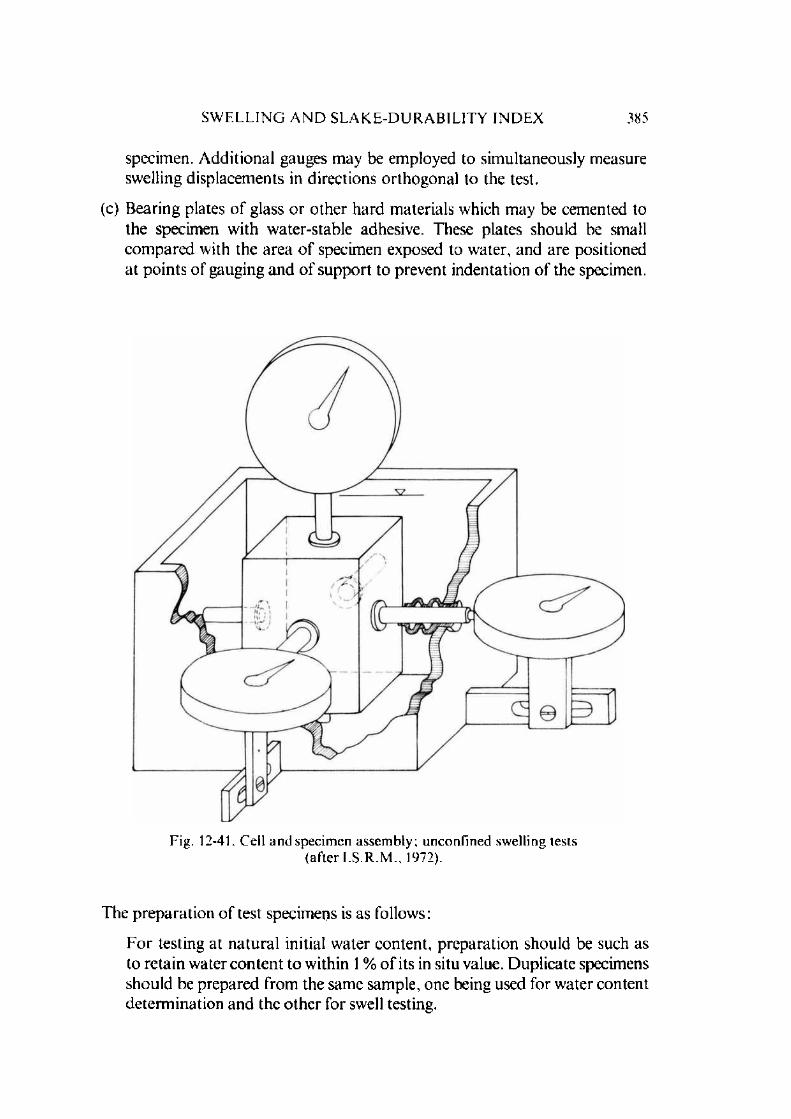
S W E L L I N G A N D S L A K E - D U R A B I L I T Y I N D E X 385
specimen. A dditional gauges may be employed to sim ultaneously m easure swelling displacem ents in directions orthogonal to the test.
(c) Bearing plates o f glass o r o ther hard m aterials which may be cemented to the specimen with w ater-stable adhesive. These plates should be small com pared with the area o f specimen exposed to water, and are positioned at poin ts o f gauging and o f support to prevent indentation o f the specimen.
Fig. 12-41. Cell and specimen assembly; unconfined swelling tests (after I .S .R .M ., 1972).
The preparation o f test specimens is as follows:
F or testing at na tu ra l initial w ater content, p reparation should be such as to retain water content to within 1 % o f its in situ value. D uplicate specimens should be prepared from the same sample, one being used for w ater content determ ination and the o ther for swell testing.
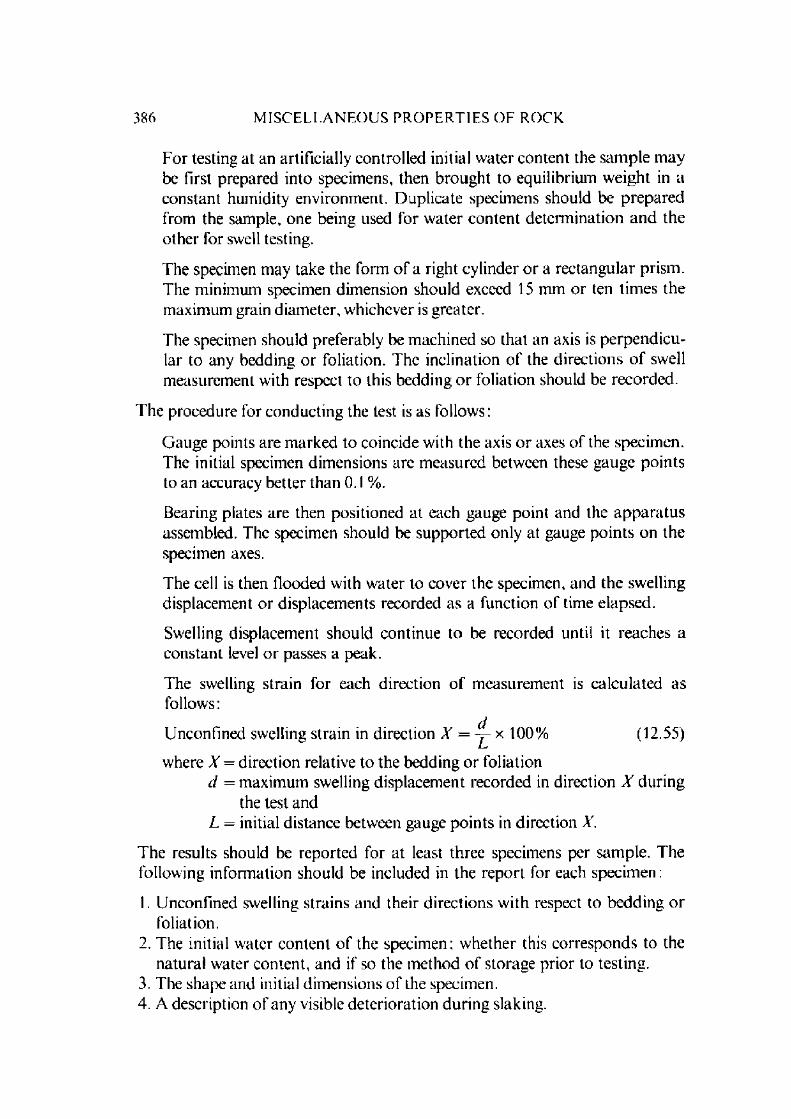
386 M I S C E L L A N E O U S PRO PE RT IES OF ROCK
For testing at an artificially controlled initial w ater content the sam ple m ay be first prepared into specimens, then brought to equilibrium w eight in a constant humidity environm ent. Duplicate specimens should be p repared from the sample, one being used for w ater content determ ination and the other for swell testing.
The specimen m ay take the form o f a right cylinder o r a rectangular prism . The m inimum specimen dim ension should exceed 15 mm or ten tim es the m axim um grain diam eter, whichever is greater.
The specimen should preferably be m achined so that an axis is perpend icular to any bedding o r foliation. The inclination o f the directions o f swell m easurem ent with respect to this bedding o r foliation should be recorded.
The procedure for conducting the test is as follows:
G auge points are m arked to coincide with the axis o r axes o f the specimen. The initial specimen dim ensions are m easured between these gauge points to an accuracy better than 0.1 %.
Bearing plates are then positioned at each gauge point and the ap p ara tu s assembled. The specimen should be supported only at gauge po in ts on the specimen axes.
The cell is then Hooded with w ater to cover the specimen, and the swelling displacement o r displacem ents recorded as a function o f time elapsed.
Swelling displacement should continue to be recorded until it reaches a constant level o r passes a peak.
The swelling strain for each direction o f m easurem ent is calculated as follows:
Unconfined swelling strain in direction X = ^ x 100% (12.55)
where X = direction relative to the bedding o r foliation(I = m axim um swelling displacem ent recorded in direction X during
the test andL = initial distance between gauge points in direction X.
The results should be reported for at least three specimens per sam ple. T he following inform ation should be included in the report for each specim en:
1. Unconfined swelling strains and their directions w ith respect to bedding o r foliation.
2. The initial w ater content o f the specimen; w hether this corresponds to the natural water content, and if so the m ethod o f storage prior to testing.
3. The shape and initial dim ensions o f the specimen.4. A description o f any visible deterioration during slaking.

S W E L L I N G A N D S L A K E - D U R A B I L I T Y I N D E X 387
0-1
K0 _ sandstone
1 E
- V _ shales, m udstones
- \\
and clays
- \ + —
• 1+ \
O O I—
\ #—
X<D — —T3 — \ _C \c \0w — 1 —
0> \c \ +*
>CO \ • \ +
O O O I— • \ V —
_ \ *
—• \ • + \ —
• \\ !
•
•O OOOI
O a 8 12 16 20u n ia x ia l c o m p re s s iv e s t r e n g th , I b f / i n 2 x l 0 3
Fig. 12-42. Relationship between uniaxial compressive strength and swelling strain index( a f t e r D u n c a n , 1969) .

swel
ling
stra
in388 M I S C E L L A N E O U S PR OPERTIES OF ROCK
In the swelling index tests, peak values are usually obtained within 5 -10 m inutes, but for certain rocks, collapse m ay take m uch longer time even up to a year or so. As such tests should be carried out for longer periods if any rock is suspected o f weakness or if it contains certain clayey constituents in the form o f pockets and when the porosity o f rock is small and pore size is also small.
Swelling also depends upon the degree o f cem entation. If the cem entation bond is strong, swelling is small and the time required to achieve peak will be large. If the bond is weak, considerable swelling occurs and the peak is arrived quickly.
The swelling characteristic o f a rock is the function o f its m oisture content, grain size, nature o f the bond between the grains and the chemical properties o f the grain material. The size o f the pores governs the capillary suction pressures developed and perhaps also the osm otic suction and gravitational suction. The extent o f cem entation governs the ability o f the individual grains to reorient themselves under the influence o f stresses developed. If the bond is strong, expansion will be negligible. A weak bond will show swelling and therefore swelling could be regarded as a m easure o f the bond strength and strength o f the rock. Tests conducted on sandstones, clays, m udstones and
void index
Fig. 12-43. Swelling strain versus void index (after D u n c a n et al, 1968).
S W E L L I N G A N D S L A K E - D U R A B I L I T Y IN D E X
shales show some form o f relationship between the compressive strength and swelling strain index (Fig. 12-42). Sandstones with uniaxial compressive strength greater than 6000 lbf/in2 (40 M Pa) (400 kgf/cm 2) rarely show any significant swelling. Swelling pressure index under zero volume change is dependent upon the swelling strain and Y o u n g ' s m odulus o f the rock.
D uncan et al (1968) tested 61 different rock types including sandstones, m udstones, limestones and granites. Swelling was mostly observable in the case o f clays, shales, m arls and sandstones (11 out o f 13 cases), alm ost 40% o f granites showed swelling (5 ou t o f 12 cases) and about 50% o f sandstones (11 out o f 23 cases) while none o f the limestones (zero out o f 13 cases) showed swelling. The void index o f the limestones investigated was in the range o f 0.2 to 4.3% . The non-dilatational effect in limestones seem to be due to the solubility of calcite.
The relationship between swelling strain and void index for various rocks is given in Fig. 12-43. It is predom inantly linear. Similarly linear relationship exists between bulk density and swelling strain index.
12.7.4. S lake-D urab i l i ty Index
This test is intended to assess the resistance offered by a rock sample to weakening and disintegration when subjected to two standard cycles o f drying and wetting.
The apparatus consists essentially o f the following:
(a) A test drum com prising a 2 mm standard m esh*11 cylinder o f unobstructed length 100 mm and diam eter 140 m m , w ith solid fixed base capable o f withstanding a tem perature o f 105 C. It has a solid removable lid and is sufficiently strong to retain its shape during use. N either the exterior o f the mesh nor the in terior o f the drum should be obstructed, for example by reinforcing m em bers.
(b) A trough, to contain the test drum supported with axis horizontal in a m anner allowing free ro ta tion , capable o f being filled with a slaking fluid such as w ater to a level 20 m m below the drum axis. The drum is m ounted to allow 40 mm unobstructed clearance between the trough and the base of the mesh. The principal features o f the trough and drum assembly are illustrated in Fig. 12-44.
(c) A m otor drive capable o f rotating the drum at a speed o f 20 rpm, the speed to be held constan t to within 5 per cent for a period o f 10 minutes.
(1) International S tan d ard s O rganisation. R565. W oven Wire C loth and PerforatedPlates in Test Sieves, 1967.
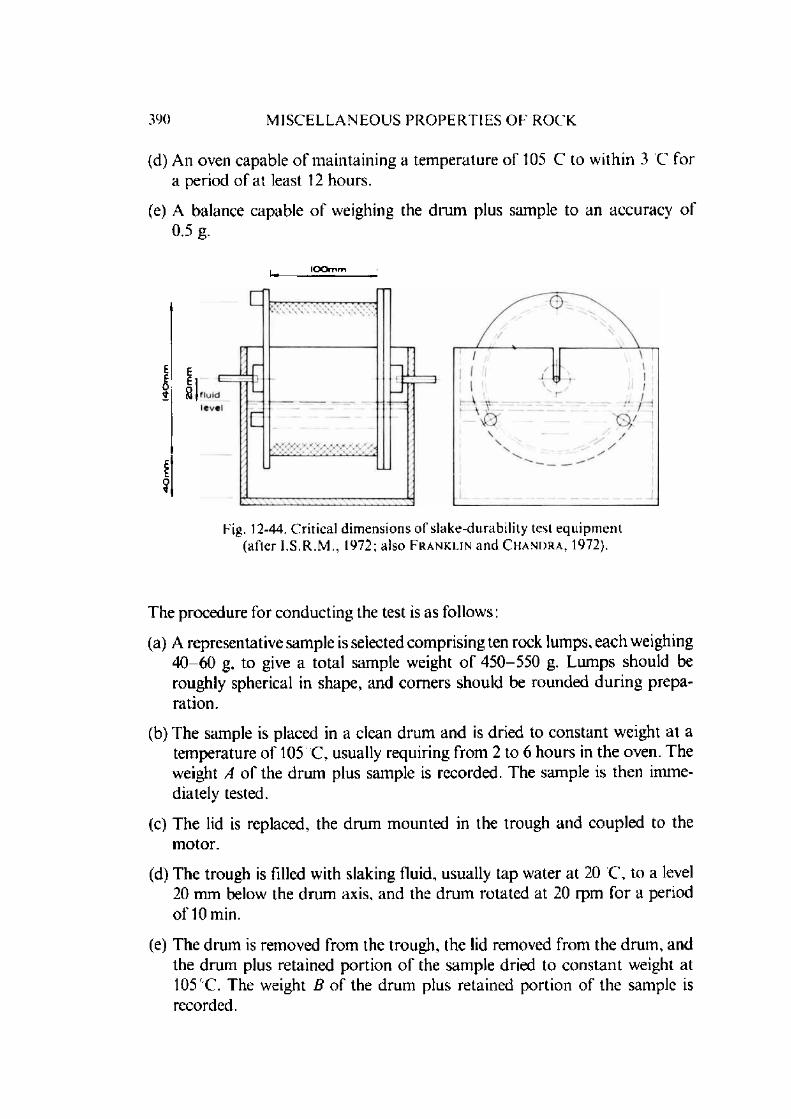
390 M I S C E L L A N E O U S PRO PE RT IES OF ROCK
(d) An oven capable o f m aintaining a tem perature o f 105 C to w ithin 3 C for a period o f at least 12 hours.
(e) A balance capable o f weighing the drum plus sample to an accuracy o f0.5 g.
l O O m m
11
Fig. 12-44. Critical dimensions o f s lake-durability test equ ipm ent (after I .S .R .M ., 1972; also F r a n k l i n and C h a n d r a , 1972).
The procedure for conducting the test is as follows:
(a) A representative sample is selected com prising ten rock lumps, each weighing 40- 60 g, to give a total sample weight o f 450- 550 g. Lum ps should be roughly spherical in shape, and corners should be rounded during preparation.
(b) The sample is placed in a clean drum and is dried to constant weight a t a tem perature o f 105 C, usually requiring from 2 to 6 hours in the oven. The weight A o f the drum plus sample is recorded. The sample is then immediately tested.
(c) The lid is replaced, the drum m ounted in the trough and coupled to the m otor.
(d) The trough is filled with slaking fluid, usually tap water at 20 C , to a level 2 0 mm below the drum axis, and the drum rotated at 2 0 rpm for a period o f lOmin.
(e) The drum is removed from the trough, the lid removed from the drum , and the da im plus retained portion o f the sam ple dried to constant weight at 105 C. The weight B o f the drum plus retained portion o f the sample is recorded.

S W E L L I N G A N D S L A K E - D U R A B I L I T Y IN D E X 391
(0 Steps (c) (e) are repeated and the weight C o f the drum plus retained portion of the sample is recorded.
(g) The drum is brushed clean and its weight D is recorded.
The calculation for slake durability index (second cycle) is done as follows:
Slake durability index, /d, = ~ ^ x 100% (12.56)
The following inform ation should be included in the report for each sample te s ted :
1. The slake durability index (second cycle) to the nearest 0.1 per cent.2. The nature and tem perature o f the slaking flu id : usually tap w ater at 20 C,
but for example distilled water, natural ground water, sea water, a diluteacid o r a dispersing agent m ay be specified.
3. The appearance o f fragm ents retained in the drum .4. The appearance o f m aterial passing through the drum .
o shale II sam plesA siltstone 5 samples• m udstone 3 sam plesA "clay shale" I sam ple
o£0 >cX0
slaking durab ility , °/o retained
Fig. 12-45. Influence o f the num ber o f slaking cycles on slake-durability(after G a m b l e , 1971).
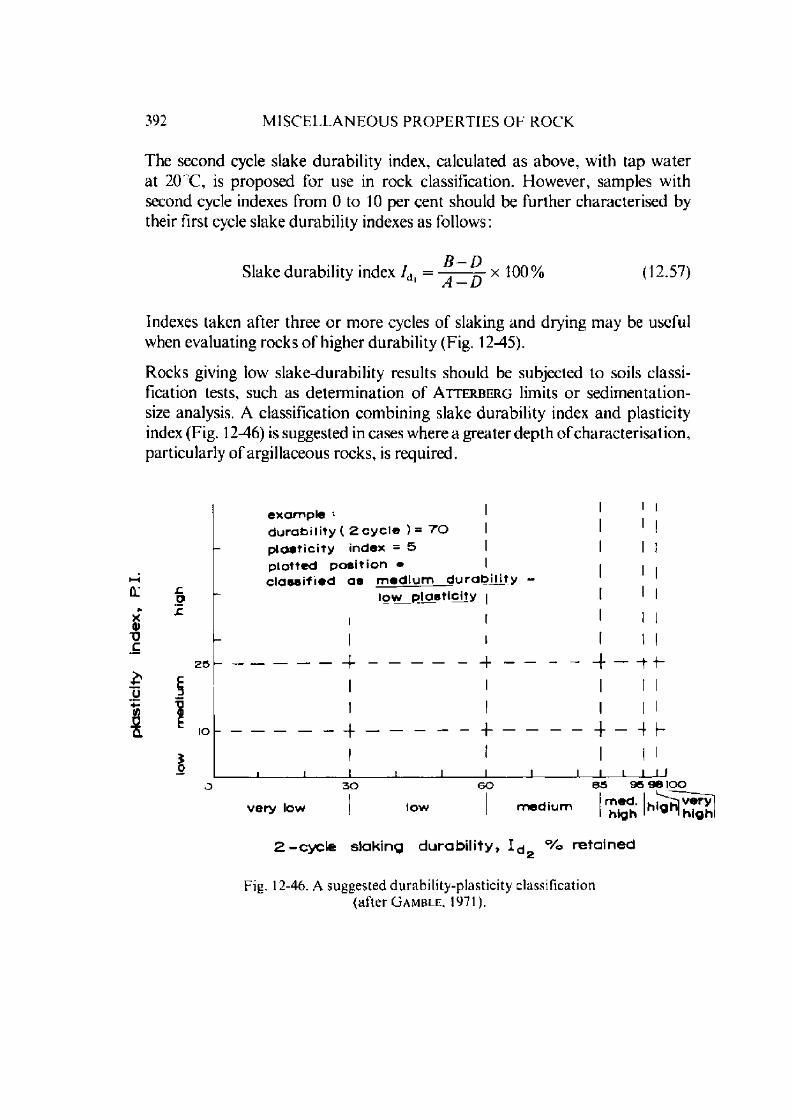
plas
ticity
in
dex,
R
I.392 MISCELL A N E O U S PROPERTIES O F ROCK
The second cycle slake durability index, calculated as above, w ith tap w ater at 20 C, is proposed for use in rock classification. However, samples with second cycle indexes from 0 to 10 per cent should be further characterised by their first cycle slake durability indexes as follows:
Slake durability index /d = ^ x 100% (12.57)/\. — D
Indexes taken after three o r m ore cycles o f slaking and drying m ay be useful when evaluating rocks o f higher durability (Fig. 12-45).
Rocks giving low slake-durability results should be subjected to soils classification tests, such as determ ination o f A t t e r b e r g limits or sedim entation- size analysis. A classification com bining slake durability index and plasticity index (Fig. 12-46) is suggested in cases where a greater depth o f characterisation, particularly o f argillaceous rocks, is required.
i I 1 iexample '• 1durability ( 2 cycle )= TO Iplasticity index = 5 I I I I
plotted position • I | I |classified as medium durability -
S " low plasticity i 1 I I
I I I I I---------------------- ( . --------------------4 --------------------- f - - t t -
| I I I N
2 5
IO ------------------------------------------------------------- + ---------------------------------------------------------- + -----------------------------------------------4 - 4 F
*0 J ___ I___ I___ I—L3 0 6 0 8 5 9 5 9 B IO OI I I - | ^ —
very low low ! medium
2. -cyc le slaking d u ra b ility , I dz °/o retained
Fig. 12-46. A suggested durability-plasticity classification (after G a m b l e , 1971).
G R A I N SIZE 393
12.8. Grain Size
The size o f grains in a heterogeneous aggregate such as rock, may be expressed in different ways, and the form chosen will depend upon the state o f aggregation o f the rock and the m ethod and purpose o f the determ ination. The m ethod o f size analysis may be :
1. Visual2. M echanical3. Both visual and m echanical.
Visual analysis is m ost com m on for rocks. M echanical m ethods such as sieving are com m only used for soils and can be found in several books on Soil M echanics and M ineral Processing and shall not be discussed here. Visual analysis is done w ith the aid o f a m icroscope, a cam era or both. Simple inspection with a m icroscope equipped with a m icrom eter eyepiece gives an idea about the m axim um and m inim um size o f the grains, the degree o f rounding and a large num ber o f m icrom eter m easurem ents gives an approxim ation o f the average grain diam eter. By photographing the surface (or the slide) o f the rock, and projecting the negative on to a ruled screen with a total m agnification o f abou t 2 0 ,0 0 0 diam eters, the average diam eter o f the individual grains can be easily read with a millimetre scale and size-frequency distribution can be made.
The averaging o f the grain size is not an easy solution. The accuracy depends upon the shape o f the grains and it is im portant to choose an expression which rightly conveys the grain size. W hen the shape is spherical or nearly spherical, the m ean diam eter can be taken as the average diam eter o f the grain. When the grains are prism atic and elongated, the best value for the average diam eter o f a grain is the harm onic mean which is given by:
i 3 Ibt . . . _n.dav = , (12.58)av /b + lt + bt v 7
where c/av = average diam eter / = lengthh = b readth and / = thickness.
C ertain o ther average values are also sometimes referred, such as, arithm etical mean, length m ean, average volume, surface m ean, weight m ean (Table 64). The arithm etical m ean is the one m ost com m only employed, but it does not have m uch significance for heterogeneous m aterials and a small proportion o f large grains has small significance on its value. The length m ean represents the surface observed and the total surface o r volume o f the particle has no significance upon it. The average volume can be considered as that diam eter

394 M IS C E L L A N E O U S PR OPERTIES O F ROCK
oa .cur.0laCJ
E
oJ =
c5ac
3UJ5
H
N J •-- 2
* 4 U
o•*—o
•ao
#N’ 3 ?
OC-»
£C9Q .
o<u
- Cc/5
c'O •*—> 033Q .
Eoo
- occ<5C lc
r -~■ 'fr
h -Ui<U
a
coC
o
6u n
( N
CO
S3O
o
o
‘ p
co=
- e
’£■ 3
os’53-Sit«
C l.
i i
' £ u C 'o > >W o
• 2 = 5r\ r3
C3•— o
“C3 3 O
2 X
o3
*T3
o *4)
C3O
U
r - r - r - © © © © © © © © © © © m u n ^ C ^ m u n u n © © © © ©
M OO 1^ , T— 'sC n - 1/^ ( N VO r ' - T tun o no r f r - rn —' un t J-
— ----------------- ---- M r , - M
nO — ( N u n o u n t*~i u n u n ot N — — ■^t T— r - — r -
— c*", v O s C ON o m u ^
r i r n r f r o c n
u n r N —- ^ f r - r i c ^ O N — O N © r i r - - ^ - — u n — o f N ^ n i r i \ o —— T) oo ^ ^ ^ 'O M M
Tf r - n — v c ' o v o o ’t r i ’t ' n ^ o oM -st- T i o - X CO ON OO h - n M
r^ i ^ O ^ M <N — OO 'O \D r n O r n m - — r f i n i o r ^ i — — — r-
25
75 » /n
r 1 u nr -
u no i
u np -
u nn
u nr - u n u n u n u n u n
r 4 n r n r n - f u n u n v d o o O n' o
nr -
r -r -
noc
mr -r -
r-4
rj
r iGOr i
O
H
c_ o; s
>
5jyr3o
C/5
< u
ccS
o u n O u n u n p u n p u n o O p p © ©r i r 4 r<~, r n ^ t ^ t u n u n v d o o o © '—
u n O u n u n o u n p p u k c i : © ©
r i r i r n r*"i.
u n u n v d 0 0 ON2
o•—CJ
' g
u n
O 'u n
II
>
•5OOr f ’
m r i r - — t— ri Un —
k l
Cc3(U
&/.»CQ-»
c/5CO
C
GOc nu n
>
*5c*~,
n
OU"o
r™C
•/->
ON• in
- a
o o
2 lrl3 0 ( N
C/5C
•—O
r ir -
* 5
o o
u n
P H— o o . u n r- •
| ®
% FbH IH
<D
XL0 / j
‘ 5
>
no o r ju n o o© !nr r , \
couo
<—c
rnnCv C
>
* 5
m
u n
< No ou n
mr -r -
^3 , -
t-J |W ii
II nC II
s : ! s: n !w
< u <u ii
E ll
~CQ 0C3<D
>
d> 0Jr " 1 )
OX u
o uI— > 3< < c / )
G R A I N SIZE 395
whose corresponding volum e divided into the total volume equals the total num ber o f grains. It gives results larger than the arithm etical or length mean, but the large grains o f a m ixture, where small grains greatly predom inate, do not affect the average. T he surface m ean is based upon the to tal surface o f the particle and is thought to give the best value for non-metallic minerals. The weight mean is based upon the volume o f the particle and gives the highest value than other means. It is o f im portance in the study o f pulverised coal and ore-dressing problems.
The m easurem ent o f the thickness o f the particle poses a difficult problem. The m ethod requires the preparation o f the rock surface and photographing it in reflected light and then repolishing by taking away slices o f a given thickness accurately m easured. The average values o f /, />, t (for different particles) can then be accurately calculated. In general, however, b and t may be taken as equal and the form ula daw = ] / l x b may be used.
For random ly distributed grains, for example igneous rocks, it may suffice to m ake only sections for cores drilled in any one direction and m easuring the diam eter always in one direction with respect to the m icroscopic field.
F o r sedim entary rocks where the difference between the values in the two directions is large (elongated grains) it is required to make thin sections both in the horizontal and vertical directions o f the bedding planes and calculating the average values as above.
The particle size record is usually done in some form as shown in Table 64. The results are then plotted in the form o f a histogram o r in the form o f a distribution curve with v-axis representing the cum ulative frequency (% ) the .v-axis representing the size giving the socalled cum ulative frequency distribution curve (Fig. 12-47). The curves are plotted on a semi-logarithmic scale. This has the advantage o f saving space and requires less com putation while it can be easily read out.
M any times it is m ore useful to plot the frequency (% ) grain diam eter giving the so-called frequency distribution curves o f the m athem atical statistics. Num erical data cannot be taken from the curves but they facilitate the visualisation o f the type o f sample represented and reveal its characteristics. Some types o f curves and their characteristic interpretations are given in Fig. 12-48. The high peak o f the frequency curve is called the mode. It represents the size o f grains tha t is m ost abundant. The relative height o f the mode and the way in which the frequencies are grouped on each side o f it are characteristic o f the m aterial.
Lack o f symmetry ab o u t the m ode is called skewness and a close bunching of frequencies at the m ode (high narrow peak) is called kurtosis. A frequency distribution curve can be characterised by these two. In a norm al curve.
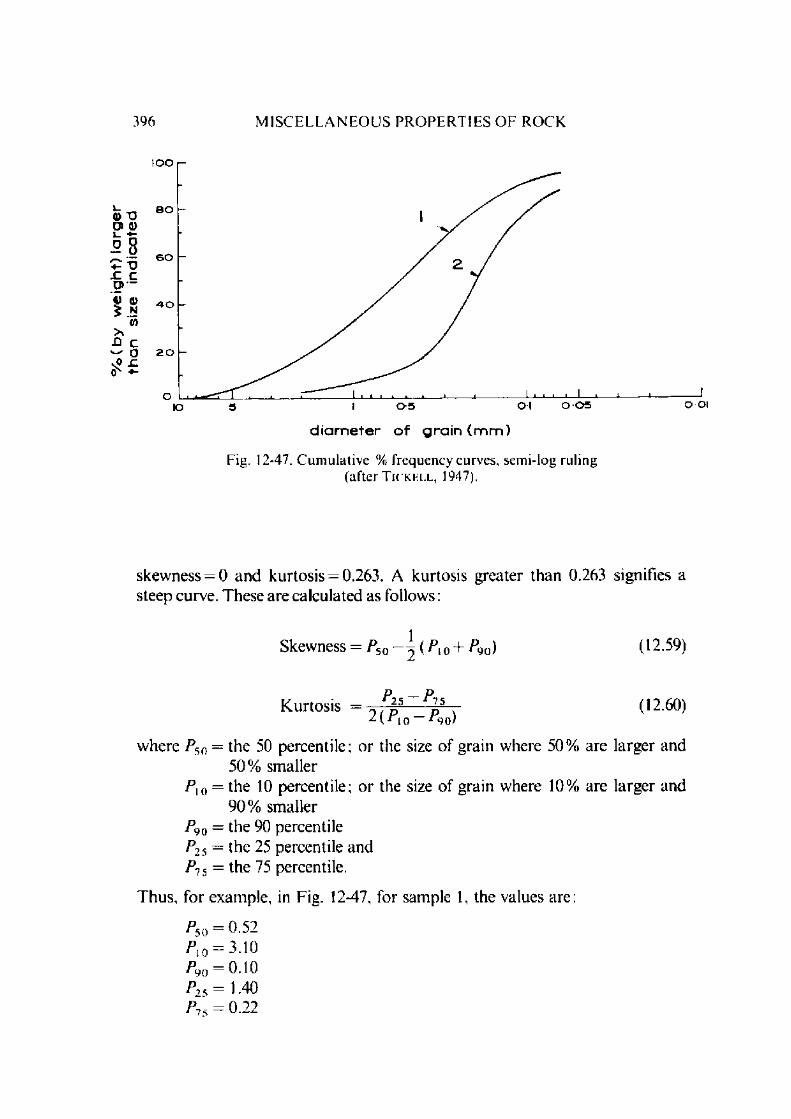
396 M IS C E L L A N E O U S PRO PERTIES O F ROCK
d ia m e te r o f grain (m m )
Fig. 12-47. C um ula tive % frequency curves, semi-log ruling (after T i c k e l l , 1947).
skewness = 0 and kurtosis = 0.263. A kurtosis greater than 0.263 signifies a steep curve. These are calculated as follows:
Skewness = P50- ^ ( P UI+ Pgo) (12.59)
K urtosis = ^ r (12.60)^ I M O * 9 0 /
w here P50 = the 50 percentile; o r the size o f grain where 50% are larger and 50% smaller
P\o = the 10 percentile; o r the size o f grain where 1 0 % are larger and 90% smaller
P90 = the 90 percentile P25 = the 25 percentile and P15 = the 75 percentile.
T hus, for exam ple, in Fig. 12-47, for sample 1, the values are:
^50 — 0.52 ^ io = 3.10 P90 = 0.10 P25= 1.40 P7S = 0.22
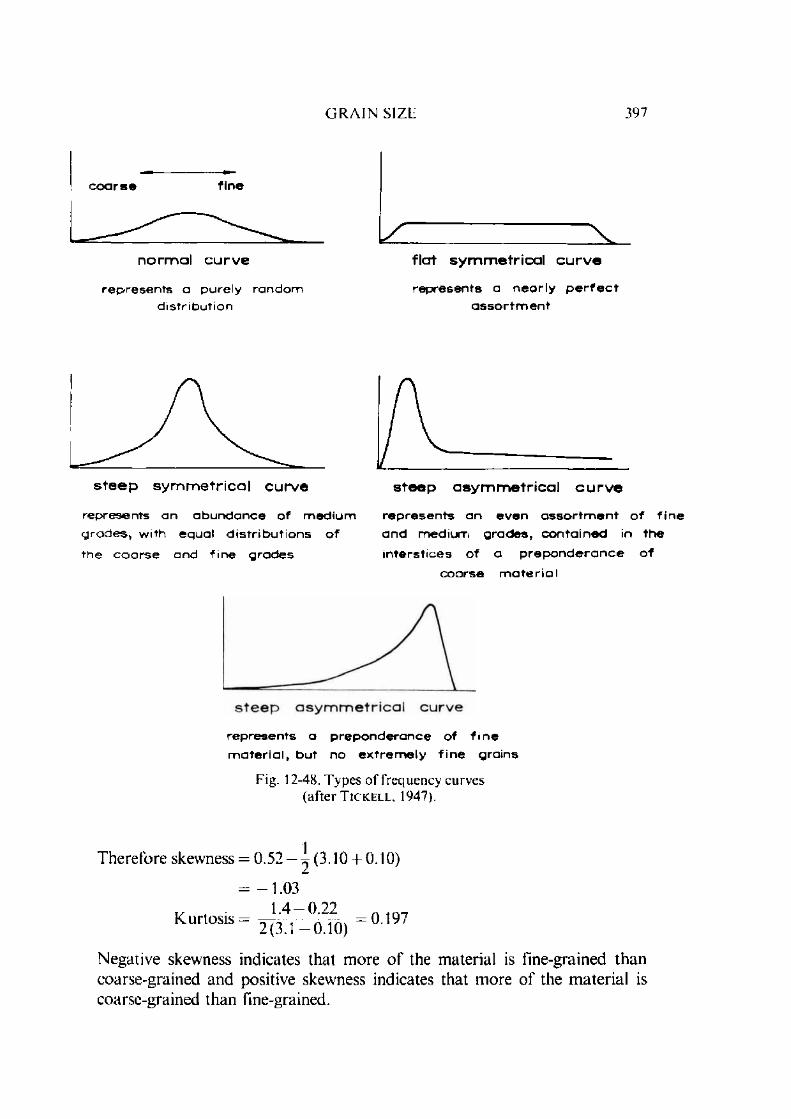
G R A I N SIZE 397
c o a r s e f i n e
norm al cu rve
r e p r e s e n t s a p u r e l y r a n d o m d i s t r i b u t i o n
Iz :fla t sym m etrica l c u rv e
r e p r e s e n t s a n e a r l y p e r f e c t a s s o r t m e n t
r e p r e s e n t s a n a b u n d a n c e o f m e d i u m g r a d e s , w i t h e g u a l d i s t r i b u t i o n s o f
t h e c o a r s e a n d f i n e g r a d e s
r e p r e s e n t s a n e v e n a s s o r t m e n t o f f i n e a n d m e d i u m g r a d e s , c o n t a i n e d in t h e
i n t e r s t i c e s o f a p r e p o n d e r a n c e o f
c o a r s e m a t e r i a l
r e p r e s e n t s a p r e p o n d e r a n c e o f f i n e m a t e r i a l , b u t n o e x t r e m e l y f i n e g r a i n s
Fig. 12-48. Types o f frequency curves (after T i c k e l l , 1947).
Therefore skewness = 0.52 — (3.10 + 0.10)
= -1 .0 3 1 .4 -0 .2 2
2 (3 .1 -0 .1 0 )0.197
N egative skewness indicates that m ore o f the m aterial is fine-grained than coarse-grained and positive skewness indicates that m ore o f the m ateria l is coarse-grained than fine-grained.

398 M IS C E L L A N E O U S PR OPE RT IES O F ROCK
In the last few years, photographic techniques have been highly developed and are coupled with autom atic com puting system. These usually go under the nam e o f “ image analysers” and are being used in medicine, biology and m etallurgy on increasing scale ( F i s h e r and N a z a r e t h , 1968). Its use in rock m icroscopy to date has been extremely small. The system works on counting the con trast spots on the slide o r photograph o f the object and program m ed to evaluate the num ber o r counts, area o f the dark spots (particles), projected length o r longest chord, to tal or mean perim eter, mean linear intercept and form fac to r etc. The scanning equipm ent can be connected to the m icroscope o r used w ith an epidiascope o r 16 o r 35 mm cine film record, the only cond ition being tha t there should be a good contrast available between the background and the grains under study. C ertain techniques like etching, fluorescent dye, use o f certain filters for coloured particles etc. may be used to enhance con trast.

R E F E R E N C E S 399
References to Chapter 12
1. A f i n o g e n o v , Yu. A . : H ow the liquid permeability o f rocks is affected by pressure an d temperature. Sov. Min. Sci., No. 6. 1969, pp. 638 645.
2. A m y x . J . W . , B a s s , D .M . and W h i t i n g , R .L .: Petroleum Reservoir Engineering. New York, M cG raw-H ill, 1960, 610 p.
3. B a n k s , D .C .: In situ m easurem ents o f permeability in basalt. Proc. Symp. Percolation through Fissured Rock, Stuttgart, G erm any, 1972, Paper T l - A .
4. B a r r o n . K.. H e d l e y , D .G .F . and C o a t e s . D .F . : Field instrum entation for rock slopes. Proc. 1st Int. Conf. Stability in O pen Pit Mining, Vancouver, C an ad a , 1970, pp. 143 168.
5. B e l i k o v , B . P . , Z a l e s s k i i . B. V., R o z a n o v , Y u. A . , S a n i n a , E . A . a n d T i m c h e n k o , I. P . : M e t h o d s o f s t u d y i n g t h e p h y s i c o m e c h a n i c a l p r o p e r t i e s o f r o c k s . I n P h y s i c a l a n d M e c h a n i c a l P r o p e r t i e s o f R o c k s b y B. V. Z a l e s s k i ( E d i t o r ) . T r a n s l a t e d f r o m R u s s i a n . J e r u s a l e m , I s r a e l P r o g r a m f o r S c i e n t i f i c T r a n s l a t i o n s , 1967, p p . 1 58.
6. B r a n n e r , G .C . : Sandstone porosities in Palaeozoic region in A rkansas . B ul l . Am. Assoc. Petr. G e o L Vol. 31, 1937, pp. 67 79.
7. C l a r k , S. P.: Therm al conductivity. In H andbook o f Physical C o n s ta n ts by S. P. C la rk (Editor). Geol. Soc. Am. Mem. 97. 1966, pp. 459 482.
8. D a l y . R . A . , M a n g e r , G . E . a n d C l a r k , S . P . : D e n s i t y o f r o c k s . I n H a n d b o o k o f P h y s i c a l C o n s t a n t s b y S. P. C l a r k ( E d i t o r ) . G e o l . S o c . A m . M e m . 97, 1966, pp. 19-26.
9. D ' A n d r e a . D . V . , F i s c h e r , R .L . and F o g e l s o n , D . E . : Prediction o f com pressive s trength from other rock properties. U .S. B. M., R. I. 6702, 1965, 23 p.
10. D a v i s , D . H . : Estimating porosity o f sedimentary rocks from bulk density. J. Geol., Vol. 62, 1954, pp. 102-107.
11. Di B i a g i o , E. and M y r v o l l , F.: In situ tests for predicting the air an d water permeability o f rock masses adjacent to underground openings. Proc. Symp. Percola tion through Fissured Rock, S tuttgart, G erm any, 1972, Paper T l - B .
12. D ube, A .K . and S in g h , B.: Effect o f humidity on tensile strength o f sandstone. J. Mines, Metals and Fuels, Vol. 20, No. 1, Jan., 1972, pp. 8 10.
13. D u n c a n , N . : Engineering geology and rock mechanics. Vol. I. L ondon , Leonard Hill. 1969, 252 p.
14. D u n c a n , N., D u n n e , M .H . and P e t t y , S.: Swelling characteristics o f rock. W a te r Power, Vol. 20, 1968, pp. 185 192.
15. F a t t , I.: The effect o f overburden pressure on relative permeability. J. Pet. Tech., Vol. 5, No. 10, Oct., 1953, pp. 15-16.
16. F a t t , I. and D a v i s , D . H . : Reduction in permeability with overburden pressure. T rans . A . I . M . E . , Vol. 195, 1952, p. 329.
17. F i s h e r , C. and N a z a r e t h . L .J . : Classified treatments for the app lica tion o f the q u an tim et to stereological problems. The Microscope, Vol. 16, 1968, pp. 95 104.
18. F r a n k l i n , J .A . and C h a n d r a , R.: The slake-durability test. Int. J. Rock Mech. M in. Sci., Vol. 9. 1972. pp. 325 341.
19. F r a n k l i n , R .E . : A study o f the fine structure o f carbonaceous solids by m easu re m ents o f true and ap p a ren t densities. Trans. F araday Soc., Vol. 45. 1949. pp. 274-286.
20. G a m b l e , J .C . : Durability-plasticity classification o f shales and o ther argillaceous rocks. Ph. D. Thesis, Univ. Illinois, U rbana . Illinois. 1971.
400 M I S C E L L A N E O U S PR OPERTIES OF ROCK
21. G r a y , D . H . : The effect o f stress on the directional properties o f reservoir rocks. M . S . Thesis, Univ. Calif., Berkeley, Calif., 1962.
22. H a b i b . P. and V o u i l l e , G . : Sur la d isparition de l'echelle aux hautes pressions. C . R . Acad. Sci. Paris, Vol. 262B, 1966. pp. 715-717.
23. H a l e v y , E., M o s e r , H . , Z e l l h o f 'e r , O. and Z u b e r , A . : Borehole dilution techniques: A critical review. Proc. Symp. Isotopes in Hydrology, Vienna, 1966, pp. 531 563.
24 I .S .R .M . Com m ittee on Laboratory Tests: Suggested methods for de term in ing water content, porosity, density, absorp tion and related properties and swelling and slake-durability index properties. D ocum ent No. 2. Nov., 1972. 36 p.
25. J a e g e r , C.: Rock M echanics and Engineering. Cambridge. University Press. 1972. 417 p.
26. J u d d , W . R. and H u b e r , C.: C orre la tion o f rock properties by statistical m ethods. Proc. Int. Symp. Min. Res., Rolla, Missouri. 1961, Vol. 2, pp. 621 648.
27. K i r k h a m . D.: Proposed m ethod for field m easurement o f permeability o f soil below the water table. Soil Sci. Soc. Am. Proc., Vol. 10, 1945. pp. 58 68.
28. K n u t s o n , C . F . and Bo h o r , B . F . : Reservoir rock behaviour under m o d era te c o n fining pressure. Proc. 5th Symp. Rock Mech., Minneapolis, Minn., 1962, pp. 627 658.
29. K o w a l s k i . W .C .: The interdependence between the strength and voids ratio o f limestones and marls in connection with their water saturating and an iso tropy . Proc. 1st Cong. Int. Soc. Rock. Mech., Lisbon, 1966, Vol. 1, pp. 143 144.
30. L o n d e , P. and S a b a r l y , F . : Permeability distribution in arch dam founda tions as a function o f the stress field. Proc. 1st Cong. Int. Soc. Rock Mech.. L isbon. 1966, Vol. 2, pp. 517 521.
31. L o u i s , C. and M a i n i , Y .N .T . : D eterm ination o f in situ hydraulic param eters in jointed rock. Proc. 2nd Cong. Int. Soc. Rock Mech., Belgrade, 1970, Vol. 1, pp. 235 245.
32. M a i n i , Y .N .T . : In situ hydraulic param eters in jointed rock —Their m easurem ent and interpretation. Ph. D. Thesis, Univ. London. London, 1971, 325 p.
33. M a i n i , Y .N .T . : The use o f radioisotopes in rock mechanics. D .I .C . Thesis, Univ. London, London, 1968, 25 p.
34. M a i n i , Y .N .T . , N o o r i s h a d , J. and S h a r p . J .: Theoretical and field considerations on the determ ination o f in situ hydraulic param eters in fractured rock. Proc. Symp. Percolation through Fissured Rock, S tuttgart, G erm any. 1972, Paper T l -E .
35. M c L atc h i e , A.S.. H e m s t o c k , R .A .a n d Y o u n g , J .W .: The effective compressibility o f reservoir rock and its effects on permeability. J. Pet. Tech.. Vol. 10. 1958, pp. 49 51.
36. M i c h e l , G .: Knowledge o f the g roundw ater conductivity o f Mesozoic rock o f East-W cstphalia from experience in well sinkings. Proc. Symp. Percola tion through Fissured Rock. S tu ttgar t, G erm any . 1972, Paper T3-F.
37. M or dec a i , M. and M o r r i s , L. H . : The effects o f stress on the flow o f gas through coal measure strata. M i n . Engr., No. 164. July, 1974. pp. 435 443.
38. M o r l i e r , P.: Evolution o f petrophysical param eters o f cracked rock with pressure. Proc. Symp. Rock Fracture, Nancy, 1971. Paper 11-15.
39. M u s k a t , M . : Physical Principles o f Oil Production. New York. M cG raw -H ill , 1949, 922 p.
40. N u t t i n g , P .G .: Physical analysis o f oil sands. Bull. Am. Assoc. Pet. G eol. , Vol. 14, 1930. p p . 1337 1349.

R E F E R E N C E S 401
41. O h n i s h i , Y. and G o o d m a n , R. E . : Results o f labora to ry tests on water pressure and How in joints. Proc. 3rd Cong. Int. Soc. Rock Mech., Denver. 1974. Vol. II. Part A. pp. 660 666.
42 . P i r s o n , S .J .: Oil Reservoir Engineering. 2nd edition. New York, McGraw-Hill, 1958, 735 p.
43. P r i c e , N . J . : T he compressive strength o f coal m easure rocks. Coll. Eng., Vol. 37, 1960. pp. 283-292.
44. R a l l , C . G . , H a m o n t r e , H . C . and T a l i a f e r r o . D .B .: D eterm ination o f porosity by a Bureau o f M ines m ethod : A list o f porosities o f oil sands. U . S . B . M . , R . I . 5025, 1954, 24 p.
45 . R a l l , C .G . and T a l i a f e r r o , D .B .: A Bureau o f M ines method for determining porosity: A list o f porosities o f oil sands. U . S . B. M., R . I. 4 5 4 8 . 1949. 28 p.
46. R a m a n a , Y. V. and V e n k a t a n a r a y a n a . B.: An air porosim eter for the porosity o f rocks. Int..I. Rock Mech. Min. Sci., V o l . 8, N o . 1, Jan .. 1971. pp. 2953.
47. R a m a n a . Y. V. and V e n k a t a n a r a y a n a , B .: Calibra tion o f air porosim eter Nature o f the curve. Int. J. Rock Mech. Min. Sci. and Geomech. Abstr., Vol. 11, No. 7, July. 1974. pp. 279 280.
48. R i t t e r , H .L . and D r a k e , L .C .: Pore-size distribution in porous materials. Ind. Eng. Chem. Anal. Ed., Vol. 17, No. 12, Dec., 1945, pp. 782 786.
49. R z h e v s k y , V. and N o v i k , G .: The Physics o f Rocks. Moscow, M IR Publishers, 1971,320 p.
50. S a n y a l , S . K . , K v e n v o l d e n , K .A . and M a r s d e n , S .S . Jr .: Permeabilities of Precam brian Onverw acht cherts and other low permeability rocks. Nature, Vol. 232, No. 5309, July 30, 1971, pp. 325 327.
51. S a n y a l , S . K . , P i r n i e , R . M . I ll , C h e n , G . O . and M a r s d e n , S .S . Jr .: A novel liquid perm eam eter for m easuring very low permeability. Soc. Pet. Eng. J., Vol. 12, No. 3, June, 1972, pp. 206 210.
52. S a r d a , J .P . , L eT i r a n t . P. and B a r o n , G. : Influence o f external stresses and fluid pressure on the How in fissured rocks. Proc. 3rd Cong. Int. Soc. Rock Mech.. Denver, 1974, Vol. II. Part A, pp. 667 673.
53. S c h i l l e r , K .K .: Porosity and strength o f brittle solids (with particular reference to gypsum). Proc. Conf. Mech. Prop. Non-metallic Brittle Materials, London, 1958, pp. 35 45.
54. S e r a f i m , J .L . : Influence o f interstitial water on the behaviour o f rock masses. In Rock M echanics in Engineering Practice by K .G . S t a g g and O .C . Z i e n k i e w i c z (Editors). London. Wiley, 1968. pp. 55 97.
55. S e r a f i m , J .L . and d e l C a m p o , A.: Interstitial pressures on rock foundations of dam s. J. Soil Mech. F ound . Div.. Am. Soc. Civ. Eng., Vol. 91, No. SM5, Sept.. 1965, pp. 65 85.
56. S e r a f i m , J .L . and L o p e s , J .J . B.: In situ shear tests and triaxial tests o f foundation rocks o f concrete dam s. Lab. Nacional de Engenharia Civil.. Tech. Paper No. 190. 1962. 7 p.
57. S h a r p , J .C . and M a i n l Y .N .T . : Fundm ental considerations on the hydraulic characteristics o f jo in ts in rock. Proc. Symp. Percolation through Fissured Rock, S tuttgart, G erm any , 1972. Paper T l -F .
58. S miles , D .E . and Y o u n g s , E .G .: Hydraulic conductivity determ inations by several field m ethods in a sand tank. Soil Sci., Vol. 99. 1965, pp. 83 87.

402 M I S C E L L A N E O U S PRO PE RT IES O F ROCK
59. S m o r o d i n o v , M . I . , M o t o v i l o v , E . A . a n d V o l k o v , V . A . : D e t e r m i n a t i o n s o f c o r r e l a t i o n r e l a t i o n s h i p s b e t w e e n s t r e n g t h a n d s o m e p h y s i c a l c h a r a c t e r i s t i c s o f r o c k s . P r o c . 2 n d C o n g . I n t . S o c . R o c k . M e c h . , B e l g r a d e , 1970, V o l . 2, p p . 35 37.
60. S n o w . D .T . : F undam en ta ls and in situ determ ination o f permeability (General R ep o rt o f Them e 1). Proc. Symp. Percolation through Fissured Rock. S tuttgart, G e rm an y , 1972, Paper G l .
61. S p r u n t , E . S . and B r a c e , W .F .: Direct observation o f microcavities in crystallinerocks. Int. J. Rock Mech. Min. Sci. and Geomech. Abstr., Vol. 11, No. 4. April,1974, pp. 139 150.
62 . T a l i a f e r r o , D . B . . J o h n s o n , T . W . a n d D e w e e s , E .J . : A m e t h o d o f d e t e r m i n i n g p o r o s i t y : A list o f p o r o s i t i e s o f o i l s a n d s , U . S . B. M . , R . I . 33 5 2 , 1937 , 2 4 p.
63. T e r z a g h i , K . and P e c k , R .B .: Soil M echanics in Engineering Practice. New York. Wiley, 1948, 566 p.
64. T h i e m , G . : Hydrologische M ethoden. Leipzig, G cbhart , 1906, 56 p.65. T i c k e l l , F .G . : The Exam ination o f Fragm ental Rocks. Stanford, University Press,
1947, 154 p.66. U .S . Bureau o f R ec lam a tio n : Design o f small dams. 1960.67. U .S . Bureau o f R eclam ation: Earth manual. Denver. 1963, 783 p.68. v a n K revf .l e n , D .W . C oal: Typology, Chemistry, Physics and Constitution.
A m ste rd am , Elsevier, 1961, 514 p.69. W a s h b u r n , E. W . and B u n t i n g , E .N .: The determ ination o f the porosity o f highly
vitrified bodies. J. Am. Cer. Soc., Vol. 5, 1922, pp. 527 537.70. W u r z e l , P.: R adioisotopes in underground water investigations in Rhodesia.
T rans . Geol. Soc. S. Africa, Vol. 75, 1972, pp. 5 10.71. W u r z e l , P. and W a r d , P .R .B . : A simplified m ethod o f groundw ater direction
m easurem ent in single borehole. J. Hydrology, Vol. 3, 1965. pp. 97 105.7 2. W y b l e , D .O .: Effect o f applied pressure on the conductivity, porosity and per
meability o f sandstones. Trans. A IM E , Vol. 213 . 1958, pp. 4 3 0 - 4 3 2 .
Uncited References to Chapter 12
U N C I T E D R E F E R E N C E S 403
1. A finogenov , Yu. A . and K asyano v , M .V .: Influence o f heteroaxial com press ion o f rock specimens on their porosity and permeability. Sov. Min. Sci.. Vol. 9, No. 3. M ay-June, 1973, pp. 326-328.
2. A lekseyev, A .D . Brfkhunets , A .G . and Z h u r a v le v , V. I . : Use o f N M R to study the hydrodynam ic properties o f rocks. Sov. Min. Sci.. No. 2, M arch-A pril , 1970, pp. 136-138.
3. A r n o ld , M .: L abora to ry determ ination o f the coefficient o f e lec troosm otic permeability o f a soil. G eotechnique, Vol. 23, No. 4. Dec., 1973, pp. 581 588.
4. Be r n a ix , J.: New labora to ry m ethods o f studying the mechanical p roperties o f rocks. Int. J. Rock Mech. Min. Sci., Vol. 6, No. 1. Jan ., 1969, pp. 43-90 .
5. B ishop, A. W. and A l -D h a h ir . Z. A.: Some com parisons between lab o ra to ry tests, in situ tests and full scale perform ance, with special reference to perm eability and coefficient o f consolidation . Proc. Conf. In-situ Invest. Soils and Rocks, L ondon ,1969, p p . 251 264.
6. Bo u w er , H.: P lanning and interpreting soil permeability m easurem ents . J. Irrigation, Drainage Div., Am. Soc. Civ. Eng., Vol. 95, IR 3, Sept.. 1969. pp. 391 402.
7. Br a d le y , J .S ., D u s c h a tk o , R .W . and H in c h . 11.11.: Pocket perm eam eter : H a n d held device for rapid m easurem ent o f permeability. Bull. Am. Assoc. Pet. Geol., Vol. 56, No. 3, M arch , 1972, pp. 568 571.
8. D ic k , R .C .: Insitu m easurem ent o f rock permeability: Influence o f ca lib ra t ion erro rs on test results. Bull. Assoc. Engng Geol., Vol. XII. No. 3, 1975, pp. 193-211.
9. C a l d w e l l . J .A . : Fluid flow in rock masses. In Stability o f Rock Slopes. S. A fr ican Instn. Civ. Engrs., Johannesburg , 1973, C hap te r 7, pp. 7.1 7.85.
10. C hernyshev , S .N .: Estimation o f the permeability o f the jo in ty rocks in massif. Proc. Symp. Percola tion th rough Fissured Rock, S tuttgart, G erm any . 1972. Paper T l -G .
11. C o lo n n a , J., Brissaud , F. and M il l e t , J .L . : Evolution o f capillarity an d relative permeability hysteresis -L a b o ra to ry test shows the effects o f alternate d isp lacem ents of w ater and gas on hydrodynam ic characteristics o f rock. Soc. Pel. Eng. J., Vol. 12, No. 1, 1972, pp. 28 -38.
12. C ro o k . J. M. and H o w e l l , F . T . : Three new simple tests for m easuring and es tim ating the permeability o f the permo-triassic sandstones o f northwest England. G e o te ch nique, Vol. 20, N o. 4, 1970, pp. 446 451.
13. C r o o k , J .M . . H o w e l l , F .T . , W o o d h ead , F .A . and W o r th in g to n , P .F . : Perm eation properties o f Bunter sandstones from the Cheshire and Fylde basins. G eotechnique, Vol. 23, N o. 2, June, 1973. pp. 262 265.
14. G ibson , R .E . : An extension o f the theory o f constan t head in situ perm eability test. Geotechnique, Vol. 20, No. 2, June, 1970. pp. 193-197.
15. G odse, V.B. and Sin g h , M .: G ro u n d w ate r movement studies in radioactive waste s to rage site, T rom bay . B haba A tom ic Res. Centre, Bombay, India, R ep o r t No. BARC-478. 1970, 14 p.
16. G riffith s , J .C . : Scientific M ethod in Analysis o f Sediments. New Y ork , M cG raw - Hill, 1967, 508 pp.
404 M IS C E L L A N E O U S PR OPERTIES OF ROCK
17. H a r p e r , T. R . : Some observations o f the influence o f geological env ironm en t upon groundwater. Proc. Symp. Percolation th rough Fissured Rock, S tu ttgar t, G erm any , 1972, Paper T4-D.
18. H a r p e r , T . R . : A technique o f field permeability testing employing a single packer suspended by wire line. Proc. 3rd Cong. Int. Soc. Rock Mech., D enver. 1974, Vol. 2, Part B, pp. 705 712.
19. H o l l a b a u g h , G .R . and S l o t b o o m , R .A .: A vertical perm eability study C ontribu tion o f cross-flow and m ethod for averaging vertical permeabilities. Soc. Pet. Eng. J., Vol. 12, N o. 3, 1972, pp. 199-205.
20. H o w e l l , F.T .. P a y n e , C .J . and T h o m p s o n , P .J . : A perm eam eter for investigating the passage o f water th rough unfissured samples o f Permo-Triassic sandstone. Civil Eng. Public W orks Rev., Vol. 67, No. 788. M arch, 1972, pp. 261 262.
21. H o w e l l , F.T . and W o o d h e a d , F .A .: A null m ethod for the es tim ation o f the permeability o f irregular specimens o f permeable strata. G eotechn ique , Vol. 22, No. 2, June, 1972, pp. 352 356.
22. H u b e r t , M .K .: The T heory o f G ro u n d w ate r M otion and Related Papers. New York, H afner Publ. Co., 1969, 311 p.
23. H u p p l e r , J .D . : W ater Hood relative permeabilities in com posite cores. J. Pet. Tech., May, 1969. pp. 539- 540.
24. I .A .E .A . : G uidebook on Nuclear Techniques in Hydrology. Vienna, Int. A tom ic Energy Agency, 1969, 214 p.
25. J o u a n n a , P.: Labora to ry tests on the permeability o f micaschist sam ples under applied stresses. Proc. Symp. Percolation through Fissured Rock , S tu ttgar t, G erm any, 1972, Paper T2-F.
26. K l e m e n t e v , I.: Lever-type ap p a ra tu s for electrically measuring volum e change. Geotechnique, Vol. 24, No. 4. Dec., 1974, pp. 670 671.
27. K l o c k , G .O ., Bo e r s m a , L. and D e B a c k e r , L .W .: Pore size d is tr ibu tions as m easured by mercury intrusion and their use in predicting permeability. Soil Sci. Soc. Am. Proc.. Vol. 33, No. 1, 1969, pp. 12-15.
28. K o w a l s k i . W .C .: The interdependence between strength, softening, swelling and shrinkage o f Cretaceous marl. Proc. Int. Cong. Int. Assoc. Eng. Geol. , Paris, 1970, pp. 457-464.
29. L a n c a s t e r - Jo n e s , P .F .F . : The in terpretation o f Leugeon water-test, Q. J . Engng. Geol., Vol. 9, 1975, pp. 151-154.
30. L o n d e , P . : Rock mechanics and dam foundation design. Int. C om m ission on Large D ams, C om m ittee on International Relations, 1973.
31. M u n d i , E. K. and W a l l a c e , J. R . : On the permeability of some fractured crystalline rocks. Bull. Assoc. Eng. Geol., Vol. 10, No. 4, 1973, pp. 299 312.
32. M u s k a i , M .: The How o f hom ogeneous fluids th rough porous media. N ew York. McGraw-Hill, 1937.
33. M l r a y a m a , S. and Y a g i , N .: Swelling o f m udstone due to sucking o f water. Rock Mech. in Japan , Vol. 1, 1970, pp. 65 67.
34. N ini, H.: Engineering geological classification and m easurem ent o f the broken bed rock in Finland, 2nd Int. Cong. Int. Assoc. Engng. Geol., Sao Paulo, Vol. 1, 1974. pap. 1V-6.1.
35. O w e n s , W. W. and A r c h e r , D. L . : The effect o f rock wettability on oil w a te r relative permeability relationships. J. Pet. Tech., Vol. 23. July, 1971. pp. 873 878.

U N C I T E D R E F E R E N C E S 405
36. P a s c a l , H.: C oncerning several m ethods o f the in situ determ ination o f permeability in p o rous media. In French. Rev. Inst. Franc. Petr., Vol. 24. No. 3. 1969, pp. 275 289.
37. P r y o r , W .A .: Reservoir inhomogeneities o f some recent sand bodies M easurement o f permeability, porosity and texture. Soc. Petr. Eng. J.. Vol. 12. No. 3. 1972, p p . 229-245.
38. R i e k e , H .H . Ill and C h i l i n g a r i a n , G. V.: C om paction o f Argillaceous Sediments. Am sterdam . Elsevier. 1974. 424 p.
39. R a y m o n d , G .P . and A z z o u z , M .M .: Permeability determ ination for predicting rates o f consolidation. Proc. Conf. In-situ Invest. Soils and Rocks. London, 1969. pp. 285 293.
40. R im y , J .P . : The m easurem ent o f small permeabilities in the laboratory. G eo technique, Vol. 23. No. 3, Sept.. 1973, pp. 454- 458.
41. St h n e i d e r , F .N . and O w e n s , W . W . : Sandstone and ca rbonate two and three phase relative permeability characteristics. Soc. Petr. Eng. J., Vol. 10, No. 1, 1970. pp. 75 84.
42. Sn o w , D .T .: Rock fracture spacings, openings & porosities. J. Soil Mech. & Found. Div. A SCE, SM-1, Jan. 1968, pp. 73 91.
43. S o m e r t o n , W .H ., M a s o n h e i m e r , R. and S i n g h a l , A.: Study o f pore and matrix an iso tropy o f porous rocks, 2nd Cong. Int. Soc. o f Rock Mech., Belgrade. Vol. 1.1970, Pap ' 1-21.
44. S o m e r t o n , W. H., S o y l e m z o g e n , I. M. and D u d l e y , R .C .: Effect o f stress on the perm eability o f coal. U .S . B. M. Openfile Report 45 74, 56 p.
45. W a r d l a w , N .C . : Pore geometry o f ca rbonate rocks as revealed by pore casts and capillary pressure. Am. Assoc. Petrol. Geol., Vol. 60, 1976, pp. 245 257.
46. W a r r e n , N .: Theoretical calculation o f compressibility o f porous media. J. G eophys. Res., Vol. 78, No. 2, Jan. 10. 1973, pp. 352 362.
47. W e i n b r a n d t , R .M . & F a t t , I.: Scanning electron microscope study o f the pore s truc tu re o f sandstone, 11th Symp. Rock Mech., Berkeley, 1968, pp. 629 641.


A P P E N D I X V
Stereographic Projections
Principle of Stereographic Projections
The strike o f any structural plane is m easured in term s o f 360 compass-rose setting the 0 due N orth and graduating clockwise. The dip is measured with respect to the horizontal plane and its azim uth is given with respect to the N orth-South line. Thus, for example, the location o f a plane in space can be truely defined by stating that its direction o f strike say 300 and dip 50 South- West (Fig. la ) . If a sphere is draw n around the point O lying in this plane, such that the point O (Fig. 1 b) lies at the centre o f this sphere, the plane shall cut the sphere boundaries along a great circle. Thus the great circle is defined as the intersection o f a sphere by any plane passing through the centre o f the sphere. The spherical projection o f the lower ha lf o f this great circle on a two dim ensional horizontal plane (equatorial plane) passing through O is called the stereographic projection o f this plane (Fig. 2a). It can be obtained by joining all points o f the great circle to the zenith P o f the sphere cutting the equatorial plane (Fig. 2b).
The stereogram is an arc o f a circle. If a series o f planes is projected striking N-S, and dipping E (or W ), at various angles we get a net o f meridional (great circle) curves. Similarly, the projections o f the small circles0 * can also be obtained giving circular arcs. If N and S are taken as centres and a series o f small circles is draw n with increasing radius, we shall get their projections in a sim ilar way as a series o f arcs. These stereogram s o f the great and small circles together give a stereographic net called the ‘W u l f f net' (Fig. 3) which represents the stereogram s for every 10 increase in the dip angle.
(1) A small circle is the intersection o f a sphere by any plane not passing through the centre o f the sphere.
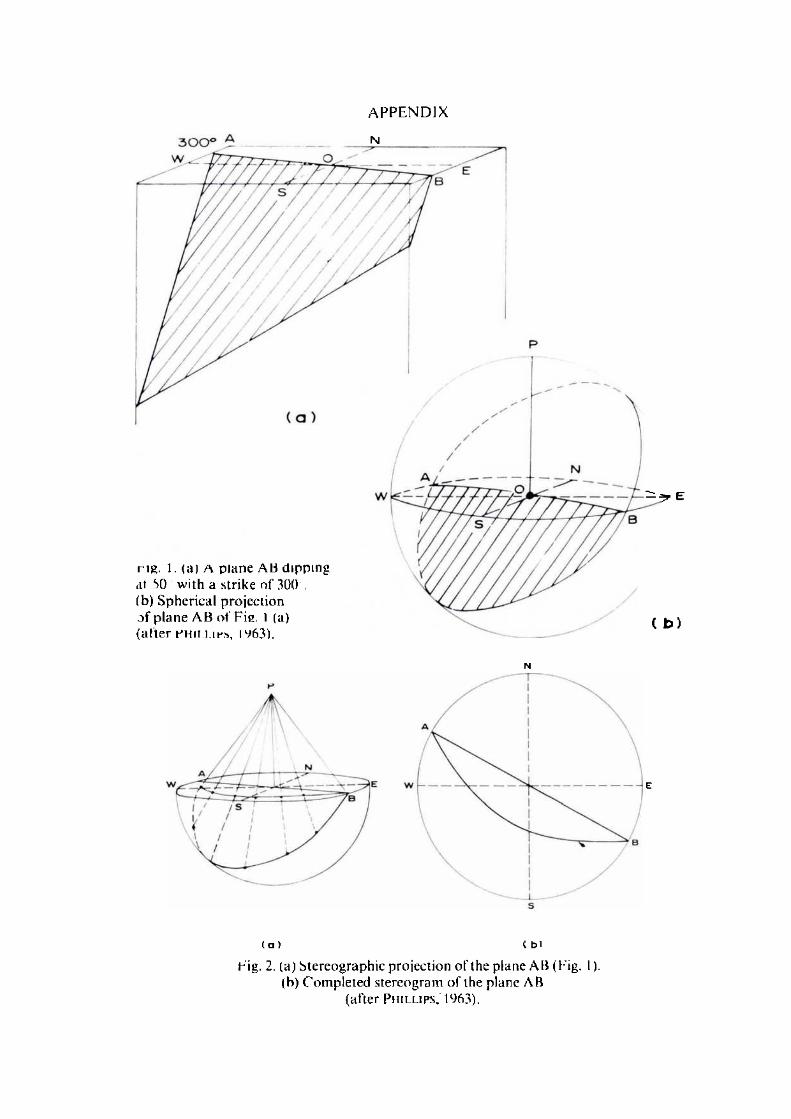
N
A P P E N D I X
rig. I. (a) A plane A H dipping at SO with a strike of 300 .(b) Spherical projection of p lane AB o f Fie. 1 (a)(after c h il l i™, 1963).
- - r E
( b )
( a ) ( b>Fig. 2. (a) S tereographic projection o f the plane AB (Fig. 1).
(h) Com pleted stereogram o f the plane AB (after P h i l l i p s , 1963).

NO
S T E R E O G R A P H I C PROJECTIONS 409
sF ig . 3 . A ‘W u l f f ’ s t e r e o g r a p h i c ne t .
Tracing the Stereographic Projection of a Joint Plane
It is not essential to go th rough the com plicated draw ing for tracing the stereographic projection o f any plane o r a jo in t, but the W u l f f net can be easily used for the purpose. A sheet o f tracing paper on which the stereogram is required to be draw n, is placed over such a net. The N-S and E-W lines on this paper are draw n and the strike direction m arked. A circle o f d iam eter equal to tha t o f the W u l f f net is also draw n over it. The tracing pap er is then so ro tated tha t the strike direction corresponds w ith the N-S line o f the W u l f f net with the centres o f two circles always coinciding with each o ther. The stereogram is then traced ou t running along the line o f corresponding dip.
The true dip is m easured from the outerm ost circle (primitive) which represents a plane w ith angle o f d ip = 0 (Hat) and the N-S line represents a plane w ith an angle o f d ip = 90 . Thus fo r the plane with strike o f 300 and dip o f 50 , the d istance e-J (Fig. 4) represents the true dip which is measured by d ro p p in g a right angle from the centre o f the stereographic net to the projection o f the plane and m easuring this point o f intersection from the primitive.
To determ ine apparent d ip in any other direction, w hat is required is to draw the azim uth line in the direction its value is required to be determ ined and
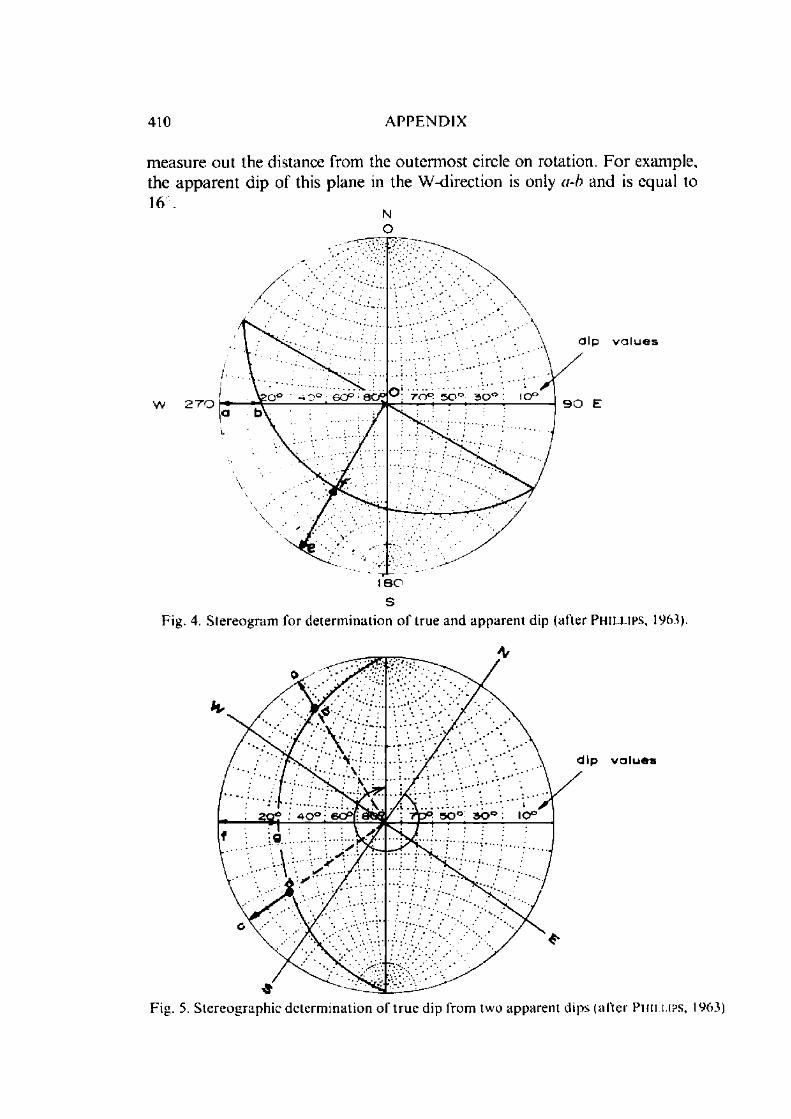
410 A P P E N D I X
m easure ou t the distance from the outerm ost circle on rotation. F o r example, the ap paren t dip o f this plane in the W -direction is only ci-b and is equal to 16° .
NO
sFig. 4. S tereogram for determ ination o f true and apparen t dip (after P h i l l i p s , 1963).
Fig. 5. S tereographic determ ination o f t rue dip from two apparent dips (after Pmi u p s , 1963)

S T E R E O G R A P H I C PROJECTIONS 411
Similarly, if the apparen t dip values o f any jo in t plane are known in any two directions, these points can be m arked out on the W u l f f net (Fig. 5) (ab and cd). The net may then be rotated over ano ther net so that the 2 po in ts lie on one o f the great circles m arked on the underlying net and running from N o rth to South. This then gives the projection o f the jo in t plane and the azim uth m easured from the N orth in the clockwise direction gives the strike direction. I f a fault plane is represented, then the hade o f the fault is given by m easuring from the centre o f the net (og in Fig. 5).
Intersection of Two Joints
W hen m ore than one jo in t plane is present in a rock mass, the determ ination o f the line o f intersection o f these becomes very im portant. This problem is o f fundam ental basis in the analysis o f the slope stability in jointed rocks ( J o h n , 1968; M a r k l a n d , 1972 and H o e k and B r a y , 1974).
The projections o f the two jo in t planes are plotted as usual independently (Fig. 6 ). The point o f intersection (p) o f the two stereogram s gives the pro jection o f the line o f intersection o f the two planes. The distance p q represents the plunge. Thus, when one jo in t plane with a strike o f N 110° E and dip o f 20 S and another with a strike o f N 75° E and dip o f at 60° S are p lo tted , they intersect along a line bearing 247 and plunge o f 14 (Fig. 6 a).
It' the two jo in t sets are dipping in the exactly opposite directions as in Fig. 6 b, the bearing o f the line o f intersection is given by the equato r p g and this line o f intersection has zero plunge.
Preferred Orientation of Discontinuities
In actual practice, one is hardly concerned with an individual s truc tu ra l d iscontinuity. A large num ber o f scattered observations are taken and have to be presented and these invariably do not group into one, two o r th ree sets o f discontinuities. It is invariably required to determ ining the m ost p robable orientation o f the various discontinuities present in the field observations.
Here it becomes usually impossible to draw each o f the various discontinuities m easured as it w ould m ake the diagram extremely crowded. A m ore simple way o f representing the individual plane o f discontinuity is to represent it by a single poin t called the pole to the plane. The pole to the plane is the point at which the surface o f the sphere is pierced by the radial line placed norm al to the plane (Fig. 7). Thus the pole to the plane bC O D in Fig. 7 is represented by P. The distance from the centre O represents the dip o f the plane O P = ab.
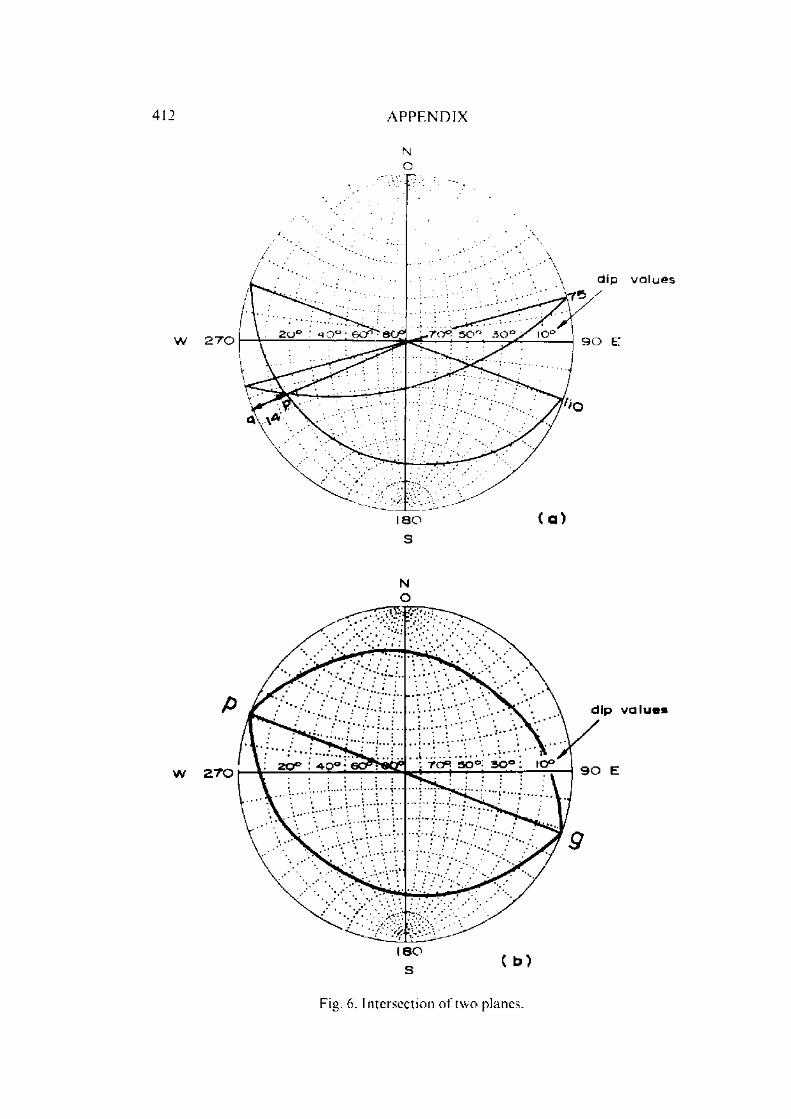
4 1 2 A P P E N D I X
NO
180 ( a )s
N
O
v a l u e s
v a l u e s
Fig. 6. Intersection o f two planes.

S T E R E O G R A P H I C P R ()JECTIONS 413
NO
S
Fig. 7. Pole ‘P ’ o f a plane b C O D .
In practice, the poles are not plotted on the W u l f f net because o f the disadvantage associated with it that it is an unequal area-net. U sually the L a m b e r t equal area projection called as the S c h m i d t net (Fig. 8 ) or the po lar equal area net (FTg. 9) is used. In this case a family o f small circles is centred abou t the extremity o f the axis norm al to the plane o f projection and the great circles pass through this axis.
In any tectonic study o f an area, the poles o f the planes observed are plotted on an equal area net (Fig. 10). This plot shows a clear concentration o f the poles near the prim itive in the N -E and S-W quadran ts, but a m ore clear and numerical picture is obtained by using a contouring technique com m only used in structural geology ( M u l l e r , 1933,1963; B i l l i n g s , 1942).
The equal area projection o f the poles is placed over a squared paper (Fig. 11) and scanned by m oving a thin transparent plastic scale with a 1 cm diam eter hole cut at the ends in such a way tha t the centre o f the scale coincides w ith the centre o f the po lar diagram . The num ber o f poles falling in the circular hole are counted and m arked with a certain num ber say 5. The c ircu lar hole may be either centred on the crosslines (Fig. 11) o r at the junctions o f the m ajo r and m inor circles. F or centres lying on the prim itive, the same Figure is w ritten at both the ends (e.g. num ber 2 at the N orth and South). A fter the d iagram has been scanned, con tours are draw n and the area shaded showing the d ifferent density o f the pole concentrations (Fig. 12).
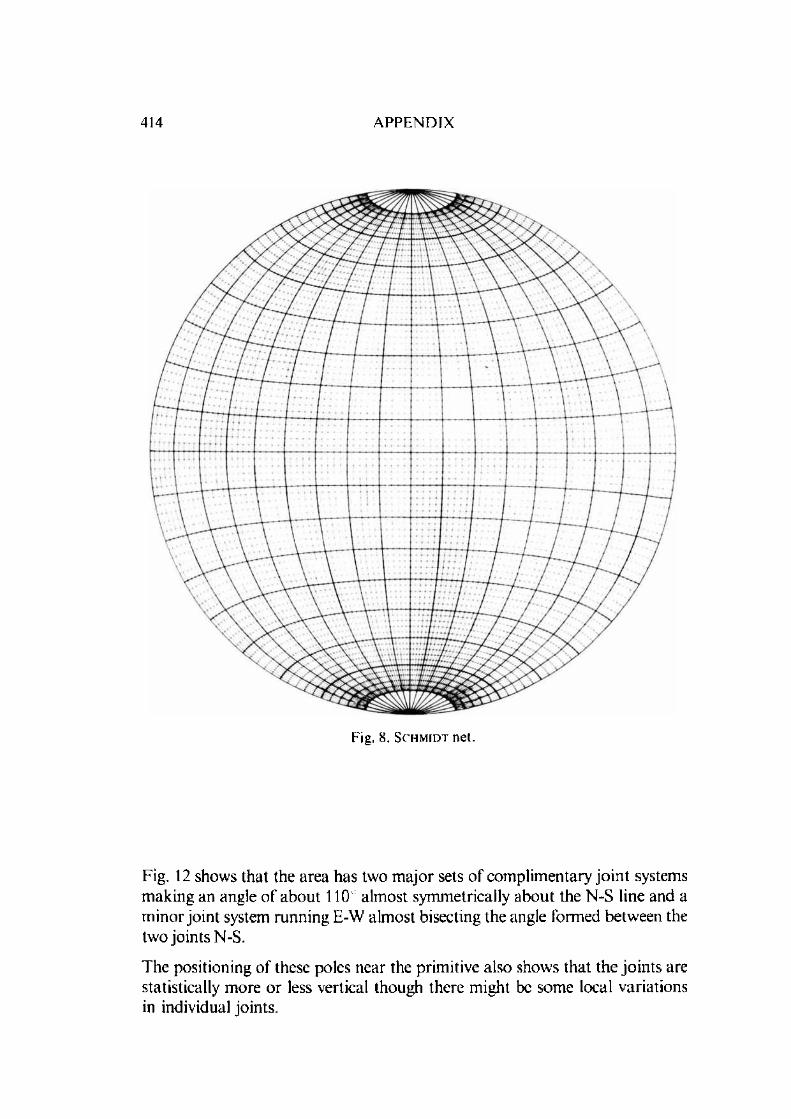
414 A P P E N D I X
Fig. 8. Sc h m i d t n e t .
Fig. 12 shows that the area has two m ajor sets o f com plim entary jo in t systems m aking an angle o f about 110 alm ost symmetrically about the N-S line and a m inor jo in t system running E-W alm ost bisecting the angle formed between the two jo ints N-S.
The positioning o f these poles near the prim itive also shows that the jo in ts are statistically m ore o r less vertical though there m ight be som e local variations in individual joints.
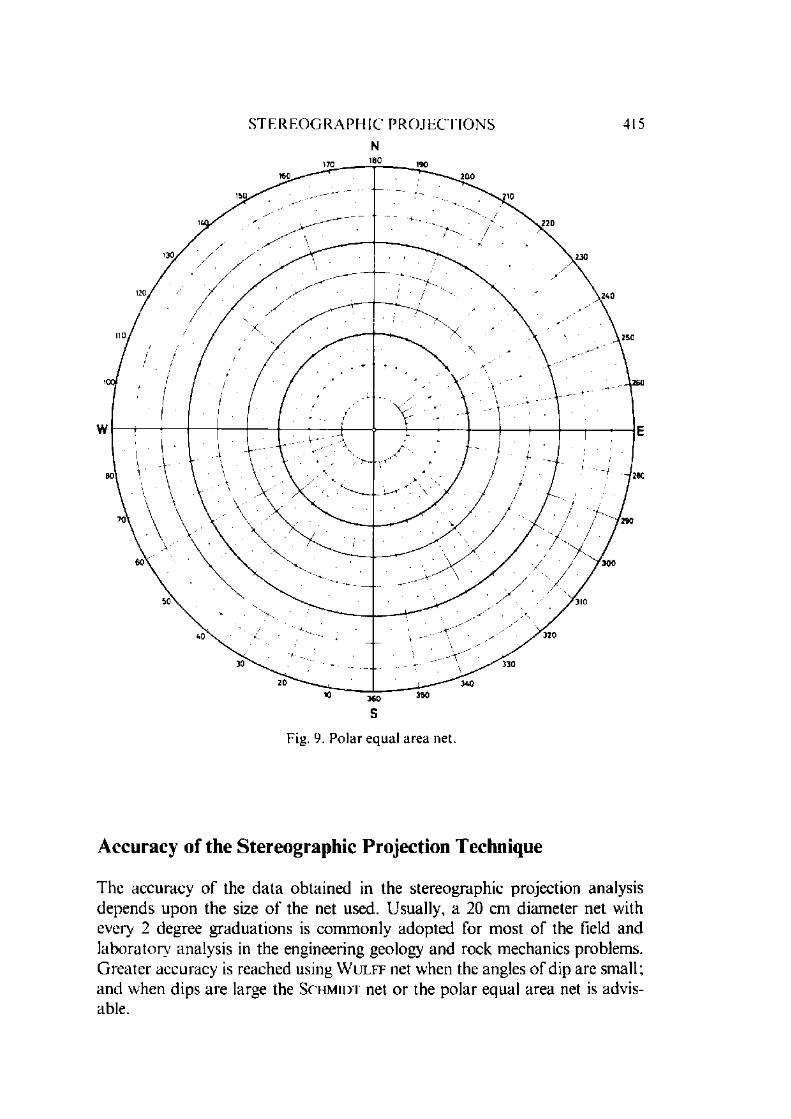
ST E R EOG R A PHIC P R ( )J ECT IONS 4 1 5
N
Fig. 9. Polar equal area net.
Accuracy of the Stereographic Projection Technique
The accuracy o f the d a ta obtained in the stereographic projection analysis depends upon the size o f the net used. Usually, a 20 cm diam eter net with every 2 degree graduations is com m only adopted for m ost o f the field and laborato ry analysis in the engineering geology and rock mechanics problems. G reater accuracy is reached using W u l f f net when the angles o f dip are small; and when dips are large the S c h m i d t net o r the polar equal area net is advisable.
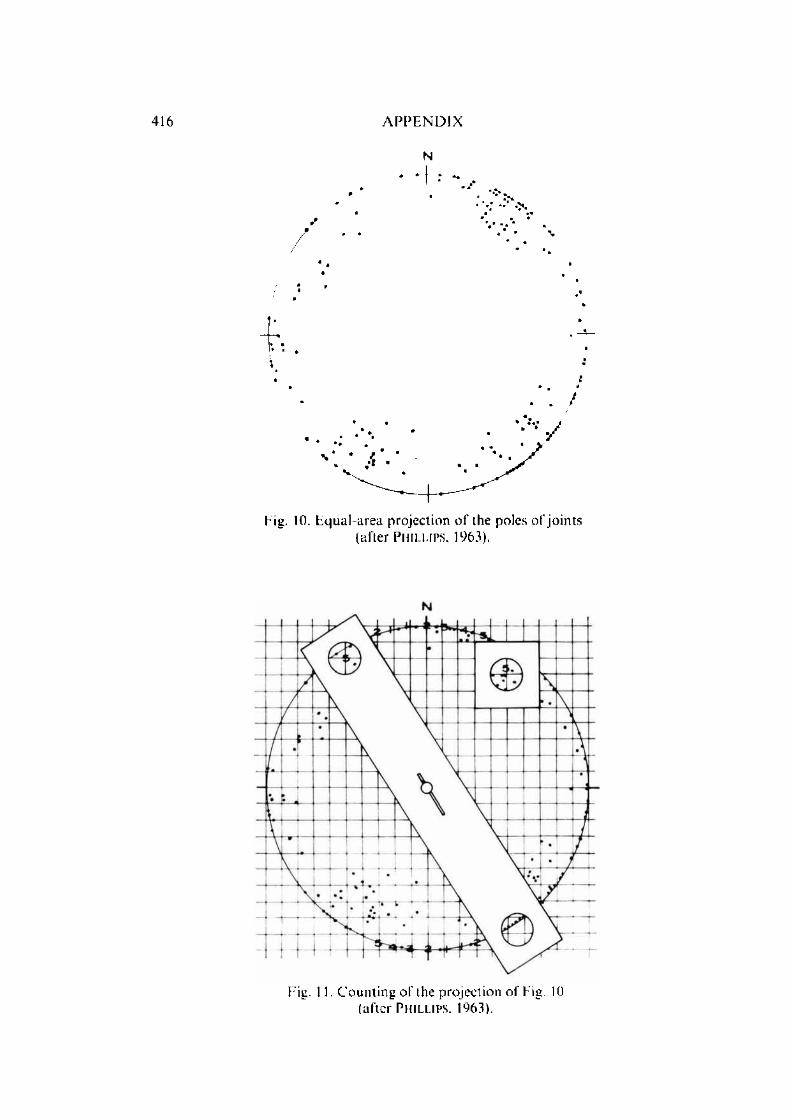
416 A P P E N D I X
N
Fig. 10. Equal-area projection o f the poles o f jo in ts (after P h i l l i p s , 1963).
Fig. 11. C ounting o f the projection o f Fig. 10 (after P h i l l i p s , 1963).

STEREOGRAPHIC PROJECTIONS 417
N
Fig. 12. T he projection o f Fig. 10 con toured and shaded (after P h i l l i p s , 1963).
When two planes intersect at lower angles, the e rro r in the graphical construction is enhanced and it is advisable that in such cases, a larger num ber o f observations be m ade.
There are m any o ther applications o f the stereographic projections than ou tlined here. P h il l ip s (1963) has discussed the technique and its applications in a very lucid way. Some o ther standard works may be referred to for m ore details.

418 A P P E N D I X
References to Appendix V
1. B i l l i n g s , M .P . : S tructural Geology. Englewood Cliffs, N .J . , Prentice-Hall. 1942.2. H o e k , E. and B r a y , J.: Rock Slope Engineering. L ondon , Inst. Min. M etall., 1974,
309 p.3. J o h n , K .W .: Graphical stability analysis o f slopes in jointed rock. J . Soil Mech.
F o und . Div., Am. Soc. Civ. Eng., Vol. 94, 1968, pp. 497 526. (Discussion and closure. Vol. 95. 1969, pp. 1541 1545).
4. M a r k l a n d , J .T . : A useful technique for estimating the stability o f rock slopes when the rigid type sliding failure is expected. Imp. Coll. Rock Mech. Res. Rep. N o. 19. M ay, 1972, 10 p.
5. M u l l e r . L.: U ntersuchungen iiber statistische Kluftmessung. Geol.- u. Bauwesen, Jahrg . 5, 1933, pp. 185 255.
6. M u l l e r , L.: Der Felsbau. Bd. I. S tu ttgart, Ferd inand Enke, 1963, 623 p.7. P h i l l i p s , F .C .: The Use o f Stereographic Projection in Structural Geology. 2nd
edition. London , Edward A rnold, 1963, 86 p.
A P P E N D I X VI
Definition of Some Rock Mechanics Terms
(extracted from the docum ent on Term inology as prepared by the Com m ission on “Term inology, Symbols and G raphic R epresentation" o f the
In ternational Society for Rock M echanics (Final D raft: July 1975)
ENGLISH FR E N C H G E R M A N
To facilita te search , the corresponding defin itions o f term s in E ng lish , French a nd G erm an have been assigned a n u m b e r
as given in the Index below .

420 A P P E N D I X
ENGLISH
IN D E X a
angle— of internal friction 2— of repose 3— of shear resistance 2
anisotropy 87attenuation 53
B
bending 18biaxial
— compression 20— state of stress 23
buckling 111bulk modulus 93burst: rock — 108
rcircle:
Mohr — of strain 11Mohr — of stress 11
coeffic ient of friction 1cohesion 72compression:
biaxial — 20triaxial — 21unconfined — 19uniaxial — 19
compressive stress 50content: moisture — 157contraction 25creep 74
Ddamping 54decay t im e 56deform ation 27
inelastic — 67modulus of — 89
degree of saturation 158
deviator— of strain 4— of stress 4
dilatancy 75dilatation 26dip 125discontinuity surface 116
disking 106dispersion 57displacem ent 29distortion 28ductility 76
E
elasticity 77modulus of — 88
element: finite 17ellipsoid:
strain 6stress — 5
energy: elastic strain 7envelope: Mohr — 12equation: constitutive - 73extension 30
F
fabric 131
failure 101— criterium 102progressive — 103
fatigue 79fault 118
— breccia 150- gouge 151— set 145— system 146
faults: conjugate 149field:
strain 8stress — 8
filling 142fin ite e lem ent 17fold 152foliation 135footw all 138force:
body 39external — 40normal — 41seepage 165shear - 42surface 43
fracture 119brittle 104
pattern 105

R O C K M E C I - lA N IC S T IR M S 421
frequency: natural - 58 unloading 92friction: Young's 88
angle of internal — 2 M ohrcoefficient of 1 circle os strain 11
circle of stress 11G envelope 12
gradient: hydraulic - 155 moisture content 157
Hmylonite 144
hanging wall 137 0
hardness 81 outcrop 127head 44 overburden 129heterogeneity 84 load 45hom ogeneity 83hydraulic gradient 155 physteresis 85
J percolation 160permeability 153
joint (s) 117 plane of weakness 107conjugate - 149 plasticity 94
diagram 148 Poisson's ratio 100pattern 147 porosity 163set 145 pressure: hydrostatic 48system 146
RK rate:
strain 13karst 140 stress 13
ratio: Poisson's 100L relaxation: stress 96
residuallandslide 141 strain 37(38)limit: stress 49
elastic 78 retardation 97fatigue 80 rise t im e 55
lineation 134 rock 69load: overburden 45 anchor 205
M bolt 206burst 108
mass: rock - 14 intact - 70
microseism 59 mass 14
model: mathematical 10 mechanics 9rupture 121
modulus:bulk 93
of deformation 89 sof elasticity 88
secant 90 saturation: degree of 158tangent - 91 schistosity 133

422 A P P E N D I X
seism ic ve locityshaftshear:
angle of — resistance intrinsic — strength peak — strenght— plane pure —residual — strength simple —— strain— stress— wave
shock w a v e size e f fe c t slickensidesliding spalling stability state o f stress:
biaxial - primary secondary — triaxial uniaxial
stiffnessstrain:
deviator of — elastic — energy— ellipsoid— fieldlinear (normal) - Mohr circle of — permanent plane principal - residual - shear —— tensor volumetric -
strengthintrinsic shear peak shear residual shear
stresscompressive deviator of
60 - ellipsoid 5176 — field 8
Mohr circle of 112 plane - 31
72 principal 32114 — relaxation 9671 residual 4933 shear - 51
115 tensile — 5234 tensor 1636 yield — 6851 strike 12662 structure 132
63 subsidence 139
113143109
surface:discontinuitypiezometric
116162
110 swelling 198
15 Ttensile stress 52
23 tensor:46 strain — 1647 stress — 1624 texture 13022 therm al spalling 248
thickness 12482 thixotropy
time:98
4 decay — 567 rise — 556 trench 1708 triaxial
2135 — compression11 — state of stress 2438 U31
1932 unconfined compression
37 (38) uniaxial1936 — compression
16 — state of stress 22
2611272
114 V11566 velocity: seismic — 6050 viscoelasticity 95
4 volum etric strain 26

R O C K M E C H A N I C S T E R M S 423
w ave:longitudinal shear — shock — surface — transverse -
w ave fro n t w eathering
W
61626364 6265 99
yield stress Young's modulus
6888

42 4 A P P E N D IX
ENGLISH
I N D E X
1 — co e ff ic ien t of fric tion
2 — angle of internal fr ic t ion , angle of shear resistance
3 — angle of repose
4 d ev ia tor of s tress/s tra in
5 — stress ellipsoid
6 strain ellipsoid
7 — elastic strain energy
8 s tress/s tra in field
9 — rock m echan ics
10 — m a th e m a tic a l m odel
A constant proportionality factor, jj relating normal stress and the corresponding critical shear stress at which sliding starts between two surfaces:!: = jj . a
The angle, o between the axis of normal stress and the tangent to the Mohr envelope at a point representing a given failure stress condition for solid material.
The maximum angle with respect to the horizontal plane that the surface of a pile of a loose material will assume
The stress/strain tensor obtained by subtracting the mean of the normal stress/strain components of a stress/strain tensor from each normal stress/strain component
The representation of the state of stress in the form of an ellipsoid whose semi-axes are proportional to the magnitudes of the principal stresses and lie in the principal directions. The coordinates of a point P on this ellipsoid are proportional to the magnitudes of the respective components of the stress across the plane normal to the direction OP, where O is the centre of the ellipsoid
The representation of the strain in the form of an ellipsoid into which a sphere of unit radius deforms and whose axes are the principal axes of strain
Potential energy stored in a strained solid and equal to the work done in deforming the solid from its unstrained state less any energy dissipated by inelastic deformation
The ensemble of stress/strain states defined at all points of an elastic solid
Theoretical and applied science of the mechanical behaviour of rock
The representation of a physical system by m athematical expressions from which the behaviour of the system can be deduced with known accuracy

R O C K M E C H A N I C S T E R M S 425
11 - mohr circle of stress/strain A graphical representation of the components ofstress/strain acting across the various planes at a given point, drawn with reference to axes of normal stress
/strain and shear stress strain
12 M ohr envelope
13 - strain/stress rate
14 rock mass
15 - stability
16 stress/strain tensor
17 finite e lem ent
18 — bending
The envelope of a sequence of Mohr circles representing stress conditions at failure for a given material
Rate of change of strain/stress with time
Rock as it occurs in-situ, including its structural discontinuities
The condition of a structure or a mass of material when it is able to support the applied stress for a long time without suffering any significant deformation or movement that is not reversed by the release of stress
The second order tensor whose diagonal elements consist of the normal stress/strain components with respect to a given set of coordinate axes and whose off diagonal elements consist of the corresponding shear stress/strain components
One of the regular geometrical shapes into which a figure is subdivided for the purpose of numerical stressanalysis
Process of deformation normal to the axis of an elongated structural member when a moment is applied normal to its long axis
19 — uniaxial compression,unconfined compression
Compression caused by the application of normal stress in a single direction
20 biaxial compression Compression caused by the application of normal stresses in three perpendicular directions
21 triaxial compression
22 uniaxial s tate of stress
23 — biaxial s tate of stress
Compression caused by the application of normal stresses in three perpendicular directions
State of stress in which two of the three principal stresses are zero
State of stress in which one of the three principal stresses are zero
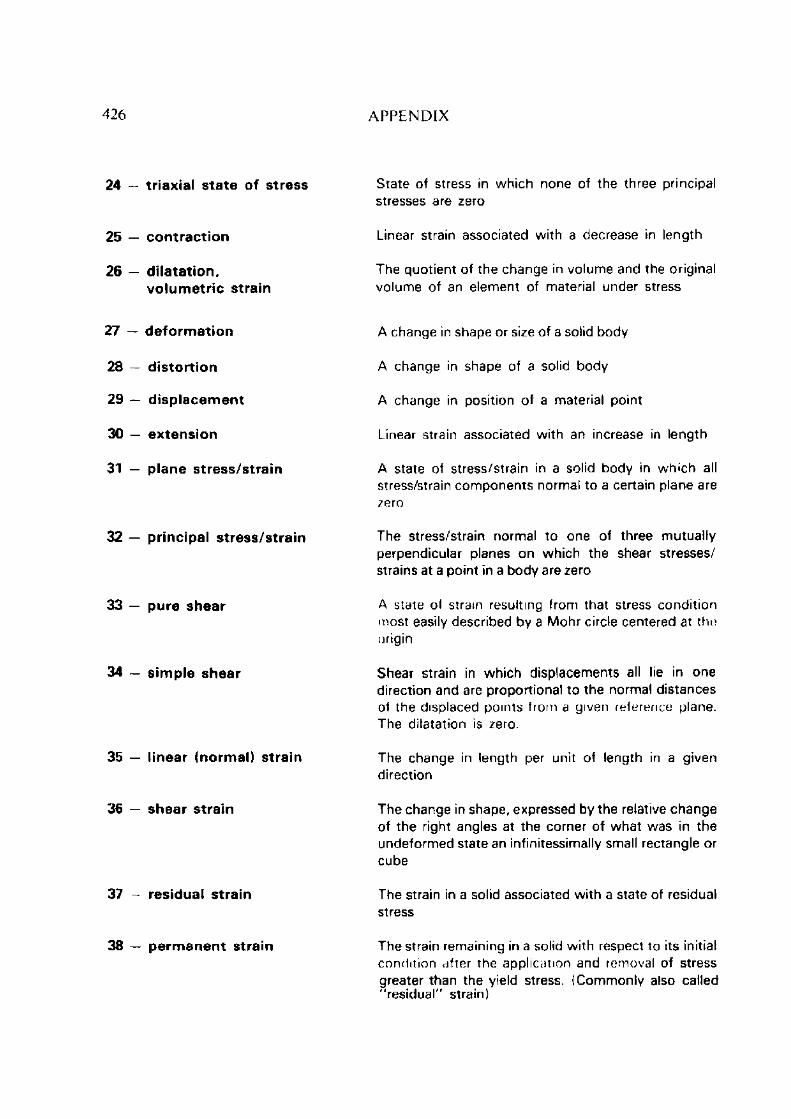
4 2 6 A P P E N D I X
24 — triaxial s ta te of stress
25 — contrac tion
26 — dila ta tion ,vo lu m etr ic strain
27 — d e fo rm atio n
28 — distortion
29 — d isp lacem ent
30 — extension
31 — plane stress/stra in
32 — principal stress/s tra in
33 — pure shear
34 — sim ple shear
35 — linear (norm al) strain
36 — shear strain
37 - residual strain
38 — p e rm a n e n t strain
State of stress in which none of the three principal stresses are zero
Linear strain associated with a decrease in length
The quotient of the change in volume and the original volume of an element of material under stress
A change in shape or size of a solid body
A change in shape of a solid body
A change in position of a material point
Linear strain associated with an increase in length
A state of stress/strain in a solid body in which all stress/strain components normal to a certain plane arezero
The stress/strain normal to one of three mutually perpendicular planes on which the shear stresses/ strains at a point in a body are zero
A state of strain resulting from that stress condition most easily described by a Mohr circle centered at the origin
Shear strain in which displacements all lie in one direction and are proportional to the normal distancesof the displaced points from a given reference plane. The dilatation is zero.
The change in length per unit of length in a given direction
The change in shape, expressed by the relative change of the right angles at the corner of what was in the undeformed state an infinitessimally small rectangle or cube
The strain in a solid associated with a state of residual stress
The strain remaining in a solid with respect to its initial cond it ion after the app lica tion and removal of stress greater than the yield stress. (Commonly also called "residual" strain)
R O C K M H C H A N I C S T E R M S 427
39 — body force
40 — external force
41 — normal force
42 — shear force
43 — surface force
44 — head
45 — overburden load
46 — prim ary state of stress
47 — secondary state of stress
48 - hydrostatic pressure
49 — residual stress
50 — com pressive stress
51 — shear stress
A force such as gravity whose effect is distributed throughout a material body by direct action on each elementary part of the body independent of the others
A force that acts across external surface elements of a material body
A force directed normal to the surface element across which it acts
A force directed parallel to the surface element across which it acts
Any force that acts across an internal or external surface element in a material body, not necessarily in a direction lying in the surface
Pressure at a point in a liquid expressed in terms of the vertical distance of the point below the surface of the liquid
The load on a horizontal surface underground due tothe column of material located vertically above it
The stress in a geological formation before it is disturbed by man-made works
The resulting state of stress in the rock around man-made excavations or structures
A state of stress in which all the principal stresses are equal (and there is no shear stress)
Stress remaining in a solid under zero external stress after some process that causes the dimensions of the various parts of the solid to be incompatible under zero stress, e.g. (i) deformation under the action of external stress when some parts of the body suffer permanent strain; (ii) heating or cooling of a body in which the thermal expansion coefficient is not uniform throughout the body
Normal stress tending to shorten the body in the direction in which it acts
Stress directed parallel to the surface element across which it acts

52 — tensile stress
53 — a tten u a t io n
54 — dam ping
55 — rise t im e
56 — decay t im e
57 — dispersion
58 — natural freq uen cy
59 — m icroseism
60 — seism ic ve loc ity
61 — longitud inal w a v e
62 — transverse w a v e ,shear w a v e
63 — shock w a v e
64 — surface w a v e
65 — w a v e fro n t
428 A P P E N D I X
Normal stress tending to lengthen the body in the direction in which it acts
Reduction in the amplitude of a wave with the distance of propagation from its source
Reduction in the amplitude of vibration of a body or system due to dissipation of energy internally or by ra diation
The interval of time required for the leading edge of a pulse to rise from some specified small fraction to some specified larger fraction of the maximum value
The interval of time required for a pulse to decay from its maximum value to some specified fraction of that value
The phenomenon of varying speed of transmission of waves, depending on their frequency
The frequency at which a body or system vibrates when unconstrained by external forces
Seismic pulses of short duration and low amplitude often occurring previous to failure of a material or structure
The velocity of seismic waves in geological formations
A wave in which the displacement at each point of the medium is normal to the wave front
A wave in which the displacement at each point of the medium is parallel to the wave front
A wave of finite amplitude characterized by a shock front, a surface across which pressure, density andinternal energy rise almost discontinuously, and which travels with a speed greater than the normal speed of sound
A wave confined to a thin layer at the surface of a bo dy
(a) A continuous surface over which the phase of a wave that progresses in three dimensions is constant(b) A continuous line along which the phase of a surface wave is constant

R O C K M E C H A N I C S T E R M S
66 — stress
67 — inelastic deform ation
68 — yield stress
69 — rock
70 — intact rock
71 — shear plane
72 — cohesion
73 — constitutive equation
74 — creep
75 — dilatancy
76 — ductility
77 — elasticity
78 — elastic lim it
79 — fatigue
80 — fatigue limit
81 — hardness
82 — stiffness
83 — hom ogeneity
Force acting across a given surface element, divided by the area of the element
The portion of deformation under stress that is not annulled by removal of stress
The stress beyond which the induced deformation is not fully annulled after complete destressing
Any naturally formed aggregate of mineral matter occurring in large masses or fragments
Material of the rock mass, typically represented by whole drill core not affected by the gross structural discontinuities
A plane along which failure of material occurs by shearing
Shear resistance at zero normal stress. (An equivalent term in rock mechanics is intrinsic shear strength)
Force-deformation function for a particular material
Time dependent deformation
Property of volume increase under loading
Condition in which material can sustain permanent deformation without losing its ability to resist load
Property of material which returns to its original form or condition after the applied force is removed
Point on s tress/s tra in curve at which transition from elastic to inelastic behaviour takes place
Decrease of strength by repetitive loading
Point on stress/strain curve below which no fatigue can be obtained regardless pf number of loading cycles
Resistance of a material to indentation or scratching
Force-displacement ratio
Having the same properties at all points

A P P E N D I X
84 — hete ro g en e ity
85 — hysteresis
86 — isotropy
87 — an iso tropy
88 — m odulus of e lastic ity .You ng 's m odulus
89 — m odulus of d e fo rm atio n
90 — secant m odulus
91 — ta n g e n t m odulus
92 — unloading m odulus
93 — bulk m odulus,incom pressib ility
94 — plastic ity
95 — viscoelastic ity
96 — stress relaxation
97 — retardation
98 — th ixo tro p y
99 — w e a th e r in g
Having different properties at different points
Incomplete in recovery of strain during unloading cycle due to energy consumption
Having same properties in all directions
Having diferent properties in different directions
The ratio of stress to corresponding strain below theproportional limit of a material
The ratio of stress to corresponding strain during loading of a rock mass including elastic and inelastic behaviour
Slope of the line connecting the origin and a given point on the stress/strain curve
Slope of the tangent to the stress/strain curve at a given stress value (generally taken at a stress equal to half the compressive strength)
Slope of the tangent to the unloading stress-strain curve at a given stress value
Ratio of hydrostatic pressure to the volumetric strain which it produces
Property of a material to continue to deform indefinitely while sustaining a constant stress
Property of materials which strain under stress partly elastically and partly viscously, i.e. whose strain is partly dependent on time and magnitude of stress
Stress release due to creep
Delay in deformation
The property of liquefying on being shaken and of reforming on standing
The process of disintegration and decomposition as a consequence of exposure to the atmosphere, to chemical action and to the action of frost, water and heat
ROC K M E C H A N I C S T l R M S 431
100 — Poisson's ratio
101 — failure
102 — failure criterion
103 — progressive failure
104 — brittle fracture
105 — frac tu re pattern
106 — disking
107 — plane of weakness
108 — rock burst
109 — sliding
110 — spalling
111 — buckling
112 — strength
113 — size e ffec t
114 — peak shear strength
The ratio of the shortening in the transverse direction to the elongation in the direction of an applied force in a body under tension below the porportional limit
Failure in rocks means exceeding of maximum strength of the rock or exceeding the stress or strain requirement of a specific design
Theoretically or empirically derived stress or strain relationschip characterizing the occurrence of failure in the rock
Formation and development of localized fractures which, after additional stress increase eventually form a continuous rupture surface and thus lead to failure after steady deterioration of the rock
Sudden failure with complete loss of cohesion across a plane
Spatial arrangement of a group of fracture surfaces
Breakage of a hard rock core into disks during diamond drilling caused by high field stresses
Surface or narrow zone with a (shear or tensile) strength lower than that of the surrounding material
Sudden explosive-like release of energy due to the failure of a brittle rock of high strength
Relative displacement of tw o bodies along a surface, without loss of contact between the bodies
(a) Longitudinal splitting in uniaxial compression(b) Breaking off of plate-like pieces from a free rock surface
Instability of a column or a plate under sufficient high load due to sudden deflection of the structure
Maximum stress which a material can resist without failing for any given type of loading
Influence of specimen size on its strength or other mechanical parameters
Maximum shear strength along a failure surface
10

432 A P P E N D I X
115 — residual shear s trength
116 — d isco n tin u ity surface
117 — jo in t
Shear strength along a failure surface after a large displacement
Any surface across which some property for a rock mass is discontinuous. This includes fracture surfaces, weakness planes, and bedding planes but the term should not be restricted only to mechanical continuity
A break of geological origin in the continuity of a body of rock occurring either single, or more frequently in a set or system, but not attended by a visible movement parallel to the surface of discontinuity
118 - fau lt
119 — frac tu re
A fracture or fracture zone along which there has been displacement of the two sides relative to one another parallel to the fracture. (This displacement may be a few centimeters or many kilometers)
The general term for any mechanical discontinuity in the rock; it therefore is the collective term for joints, faults, cracks, etc.
120 — fissure A gapped fracture
121 — rupture I'hat stage in the development of a fracture where instability occurs. It is not recommended that the term rupture be used in rock mechanics as a synonym for fracture
122 — crack A small fracture, i.e. small with respect to the scale of the feature in which it occurs
123 — bedding Applies to rocks resulting from consolidation of sediments and exhibiting surfaces of separation (bedding planes) between layers of the same or different materials, e.g., shale, siltstone, sandstone, limestone, etc.
124 — th ickness
125 — dip
The perpendicular distance between bounding surfaces such as bedding or foliation planes of a rock
The angle at which a stratum or other planar feature is inclined from the horizontal
126 — strike The direction or azimuth of a horizontal line in the plane of an inclined stratum, joint, fault, cleavage plane or other planar feature within a rock mas
R O C K M E C H A N I C ' S I 1 R M S 433
127 — outcrop
128 — bedrock
129 — overburden
130 — texture
131 — fabric
132 — structure
133 — schistosity
134 — lineation
135 — foliation
136 — cleavage
137 — hanging w all
The exposure of the bedrock at the surface of the ground
The more or less continuous body of rock which underlies the overburden soils
The loose soil, sand, silt or clay that overlies bedrock. In some usages it refers to all material overlying the point of interest (e.g., a tunnel crown), also the total cover of soil and rock overlying an underground excavation
The arrangement in space of the components of a rock body and of the boundaries between these components
The orientation in space of the elements composing the rock substance
One of the larger features of a rock mass, like bedding, foliation, jointing, cleavage or brecciation; also th sum total of such features as contrasted with texture. Also, in a broader sense, it refers to the structural features of an area such as anticlines or synclines
The variety of foliation that occurs in the coarser- grained metamorphic rocks and is generally the result
of the parallel arrangement of platy and ellipsoidal mineral grains within the rock substance
The parallel orientation of structural features that are lines rather than planes; some examples are parallel orientation of the long dimensions of minerals; long axes of pebbles; striae on slickensides; and cleavage-bedding plane intersections
The somewhat laminated structure resulting from segregation of different minerals into layers parallel to the schistosity
The tendency to cleave or split along definite parallel planes, which may be highly inclined to the bedding. It is a secondary structure and is ordinarily accompanied by at least some recrystallization of the rock
The mass of rock above a discontinuity surface
138 — fo o tw a ll T h e m a s s of rock b e n e a t h a d i s c o n t i n u i t y s u r f a c e
43 4 A P P E N D I X
139 — subsidence
140 — karst
The downward displacement of the overburden (rock and/or soiO lying above an underground excavation or adjoining a surface excavation. Also the sinking of a part of the earth's crust
A geologic setting where cavities are developed in massive limestone beds by solution by flowing water. Caves and even underground river channels are produced into which surface runoff drains and often result in the land above being dry and relatively barren
141 — landslide
142 — filling
143 — slickenside
The perceptible downward sliding or movement of a mass of earth, rock or mixture of both
Generally the material occupying the space between fracture surfaces, in joints, faults, and other rock discontinuities. The filling material may be clay, gouge, various natural cementing agents or alteration products of the adjacent rock
The polished and striated surface that results from friction along a fault plane or other movement surfaces in a rock mass
144 — m ylon ite A microscopic breccia with flow structure formed in fault zones
145 — jo in t / fa u l t set A group of more or less parallel joints/faults
146 — jo in t / fa u i t system Consists of two or more joint/fault sets or any groupof joints/faults with a characteristic pattern, e.g., radiating, concentric, etc.
147 — jo in t pattern A group of joints which form a characteristic geometrical relationship, and which can vary considerable from one location to another within the same geologic formation
148 — jo in t d iagram A diagram constructed by accurately plotting thestrike and dip of joints to illustrate the geometrical relationship of the joints within a specified area of geologic investigation
1^9 — co n ju g a te jo in ts /fa u lts Two sets of joints/faults that formed under the samestress conditions (usually shear pairs)

ROC K M E C H A N I C S T E R M S 435
150 — fault breccia The assemblage of brocken rock fragments frequentlyfound along faults. The fragments may vary in size from inches to feet
151 — fault gouge A clay-like material occurring between the walls of afault as a result of the movement along the fault surfaces
152 — fold A bend in the strata or other planar structure withinthe rock mass
153 — perm eability The capacity of a rock to conduct liquid or gas. It ismeasured as the proportionality constant, k, between flow velocity, v, and hydraulic gradient, i; v = k.i
155 — hydraulic gradient The change of pressure head per unit of distance at agiven point and in a given direction
157 — moisture content The percentage by weight of w ater contained in thepore space of a rock or soil with respect to the weight of the solid material
158 — degree of saturation The extent or degree to which the voids in rockcontain fluid (water, gas or oil). Usually expressed in percent related to total void or pore space
160 — percolation Movement, under hydrostatic pressure, of waterthrough the smaller interstices of rock or soil, excluding movement through large openings such as ca ves and solution channels
163 — porosity The ratio of the aggregate volume of voids or interstices in a rock or soil to its total volume

I N D E X1 — co e ff ic ien t de f ro t te m e n t
4 3 6
2 — angle de f ro t te m e n t in tern e
3 — angle de ta lus naturel
4 — d £viateur du tenseur desc o n tra in te s /d 6 fo rm a tio n s
5 — ellipsoide des contra in tes
6 — ellipsoide des d e fo rm a tio n s
7 — energie de d e fo rm atio neiastique
8 — ch am p de co n tra in tes //d e fo rm a t io n s
9 — m 6can iqu e des roches
10 — m odule m a th £ m a tiq u e
11 — cercle de M o h r desco n tra in te s /d e fo rm a tio n s
FR EN C H
Rapport de la contrainte normale et de la contrainte tangentielle au contact de deux surfaces lorsqu'elles commencent (ou continuent) £ glisser I'une sur I'autre.
Angle de I'axe des contraintes normales et de la tangente a la courbe intrins^que en un point de cette courbe.Angle maximal de la surface libre d'un talus de ma- teriau meuble par rapport au plan horizontal.
Tenseur S obtenu en retranchant d'un tenseur 0 de valeurs principales 02, <*3 un tenseur isotrope de valeurs principales egales d '/3 (O-j -1-02 - + 03). (Meme definition applicable en deformation.)
Representation du tenseur des contraintes en un point d'un solide par un ellipsoide lieu de I'extremite du vecteur contrainte et dont les axes coincident en direction et proportion avec les contraintes principales.
Representation du tenseur des deformations en un point d'un solide par un ellipsoide resultant de la d e formation d'une sphere c e n tre sur le point consider.
Energie potentielle contenue dans un solide deforme, egale au travail de deformation du solide £ partir de I'etat non deforme diminue de I'energie dissipee par deformation non eiastique.
Ensemble des etats de contrainte/deformation en tout point d'un solide.
Science theorique et appliquee du comportement mecanique des roches.
Representation d'un phenomene par des expressions mathematiques d'ou I'on peut deduire d'une facon plus ou moins approchee le comportement d'un systeme.
Dans un plan rapporte aux axes n (contrainte normale) Z (contrainte tangentielle) le cercle de Mohr est centre sur I'axe 0 et passe par les points represen- tatifs des deux contraintes principales extremes 0] et03. C'est le lieu de I'extremite des vecteurs (d ,T ) representatifs des contraintes agissant sur les facettes contenant le vecteur de la contrainte intermediate. (Meme definition applicable en deformation.)
A P P E N D I X
ROC K M E C H A N I C S T E R M S 437
12 — courbe intrins£que
13 — vitesse de contra in te //d e fo rm atio n
14 — massif rocheux
15 — stability
16 — tenseur des defo rm atio ns //contra in tes
17 — e lem ent fini
18 — flexion
19 — compression uniaxiale
20 — compression biaxiale
21 — com pression triaxiale
22 — 6tat de contra inte uniaxial
23 — 6tat de contra inte biaxial
24 — 6tat de contra inte triaxial
25 — contraction
26 — dilatation cubique
Enveloppe de cercles de M ohr qui reprfesentent I'fetat de contrainte & la rupture pour un matferiau donnfe.
Vitesse de variation d'une contrainte/deformation.
Roche comme elle se pr&sente in situ y compris ses discontinues structuraies.
£tat d'une structure ou d'un massif qui reste apte £ resister aux solicitations qu'elle subit.
Tenseur du deuxteme ordre reprfesentant res- pectivement I'ensemble des dilatations et des dis- torsions autour d'un point, ou I'ensemble des contraintes s'exergant sur les diffferentes facettes autour d'un point
Element de la decomposition d'une structure en parties discretes pour I'analyse numerique de son comportement.
Reaction d'une structure allongee & un moment flechissant.
Compression causee par ('application d'une contrainte normale selon une seule direction.
Compression causee par ('application de contraintes normales selon deux directions perpendiculaires.
Compression causee par I'application de contraintes normales selon trois directions perpendiculaires.
£tat de contrainte dans lequel deux des trois contraintes principales sont nulles.
£tat de contrainte dans lequel une des trois contraintes principales est nulle.
£tat de contrainte dans lequel aucune des trois contraintes principales n'est nulle.
Diminution relative de la distance entre deux points d'un solide.
Variation relative du volume d'un element de m ature.
43 8 A P P E N D I X
27 — d e fo rm a tio n Modification des distances mutuelles des differentspoints d'un corps.
28 — distorsion Voir 36
29 — d £ p la c e m e n t Changement de position d'un point materiel.
30 — extension Augmentation relative de la distance entre deux pointsd'un solide.
31 — c o n tra in te /d £ fo rm a t io n plan
32 — c o n tra in te /d £ fo rm a t io n principale
33 — c isa il lem ent pur
34 — c isa il lem ent simple
£tat de contrainte/deformation dans un corps solide tel que la contrainte/deformation normale £ un certain plan soit nulle en tout point.
Contrainte/deformation normale & I'un des trois plans mutuellement perpendiculaires sur lequel les con- traintes/deformations de cisaillement en un point d'un corps sont nulles.
Deformation de cisaillement ou les deplacements de tous les points sont paralieies et proportionnels & la distance & un plan de reference.
£tat de contrainte dans lequel I'une des contraintes principals est nulle, les deux autres egaies et de signe contraire.
35 — d ila ta tion Iin6aire Variation relative de la distance entre deux points d'un solide.
36 — distorsion Variation de Tangle forme par deux segments issus d'un meme point qui etaient perpendiculaires entre eux avant deformation.
37 — d 6 fo rm a tio n residuelle
38 — d e fo rm a tio n p e rm a n e n te
39 — fo rce de vo lum e
40 — fo rce ext£rieure
Deformation qui persiste au temps apr£s disparition de la sollicitation.
Limite vers laquelle tend la deformation residuelle au bout d'un temps infini.
Force dont I'intensitfe est proportionelle au volume de I'element auquel elle s'applique. Exemple: la gravite.
Force resultant du contact d'un solide avec le milieu exterieur.
41 — e f fo r t norm al Effort dirige perpendiculairement & I'element desurface sur lequel il agit.
ROC K MEC H A N I C S T E R M S 439
42 — effo rt de cisaillem ent
43 — force de surface
44 — charge hydraulique
45 — charge de couverture
46 — 6tat de contra inte naturel
47 — 6tat de contra in te induit
48 — pression hydrostatique
49 — contra inte residuelle
50 — contra inte de compression
51 — contra in te de cisaillem ent
52 — contra in te de traction
53 — attenuation
54 — am ortissem ent
55 - tem ps de m ont6e
56 — tem ps de descente
57 dispersion
Effort dirige parall&lement £ I'element de surface sur lequel il agit.
Force dont I'intensite est proportionnelle 3 la superficie de ('element auquel elle s'applique.
Pression statique ou dynamique en un point d'un flui-de.
Charge verticale ou poids des matferiaux susjacents.
E=tat de contrainte dans un massif avant travaux.
Etat de contrainte dans un massif apr6s travaux.
£tat de contrainte dans lequel toutes les contraintes principals sont egales.
£tat de contrainte existant dans un corps non soumis 3 des sollicitations. Cet fetat de contrainte rfesulte du passe rhfcologique du materiau.
Contrainte normale tendant a raccourcir un solide dans la direction suivant laquelle elle agit.
Contrainte paraltele £ I'6l6ment de surface sur lequel elle agit.
Contrainte normale tendant & allonger un solide dans la direction suivant laquelle elle agit.
Reduction d'amplitude d'une onde en fonction de la distance & la source.
Reduction d'amplitude d'une onde en fonction du temps, due £ la non elasticity du milieu.
Intervalle de temps n6cessaire pour que I'amplitude d'une onde en un point passe d'une valeur con- ventionnelle petite £ une autre valeur conventionnelle proche de I'amplitude maximale
Intervalle de temps nfecessaire pour que I'amplitude d'une onde en un point passe d'une valeur conventionnelle proche de I'amplitude maximale £ une autre valeur conventionnelle petite.
Phenom6ne de variation de la vitesse de transmission des ondes en fonction de leur frequence.
440 A P P E N D I X
58 freq u en ce propre
59 — m icro b ru it
60 — c6l6rit6 sism ique
61 — onde longitud inale
62 — o nde transversale.onde de c isa illem ent
63 — onde de choc
64 — onde de surface
65 — fro n t d 'onde
66 — v ec teu r con tra in te
67 — d 6 fo rm a t io n non 6lastique
68 — seuil de plastic ity
69 — roche
70 — m atr ice rocheuse
71 — surface de c isa il lem ent
72 — cohesion
Frequence 3 laquelle un corps ou un syst^me oscille quand il n'est pas soumis £ une solicitation vibratoire.
Impulsion sismique de courte durfee et de petite amplitude qui se produit souvent avant que la roche casse.
Celerity des ondes sismiques dans les formations geologiques.
Onde telle que la direction du deplacement des par- ticules en tout point du milieu soit normale au front d'onde.
Onde telle que la direction du dfeplacement des par- ticules en tout point du milieu soit parall^le au front d'onde.
Onde ayant une amplitude finite, caracterisfee par une surface (ou volume de trfes faible fepaisseur) de part et d'autre de laquelle un ph£nom6ne physique subit une brusque variation.Onde se propageant dans une couche de tr&s faible epaisseur & la surface d'un corps.
Surface (ou ligne) continue sur laquelle la phase d'une onde de volume ou de surface est constante.
Force de contact s'exergant sur une facette, rapport6e £ I'aire de cette facette.
Voir 38
Valeur de la solicitation cl partir de laquelle ap- paraissent des deformations permanentes.
Tout agrfegat de mature minferale formfe naturellement et se prfesentant en grande masse ou en fragments.
Mat6riau situfe entre les discontinues (matferiau des blocs). La matrice varie avec I'fechelle et la maille des discontinues consid6r6es.
Surface de rupture d'une roche soumise £ des efforts de cisaillement.
Resistance au cisaillement sous contrainte normale nulle.
73 — loi de c o m p o r te m e n t Relation so llic ita tion -defo rm ation d 'un matferiau donn6.

R O C K M E C H A N I C S T E R M S
74 — fluage
75 — dilatance
76 — ductility
77 — elasticity
78 — lim ite d'elastiticit£
79 — fatigue
80 — lim ite de fatigue
81 — duret&
82 — raideur
83 — hom og6n6it6
84 — het£rog£n6it£
85 — hyst6r6sis
86 — isotropie
a) Sens usuel: Deformation retard&e d'un solide sous I'action d'une force ou d'une contrainte constante.b) Sens strict: Deformation retardfee non recouvrable au dechargement.
Propri6te qu'ont certains corps d'augmenter de volume sous I'action d'un 6tat de contrainte de cisail- fement simple.
Aptitude d'un materiau £ subir sans fractures de grandes deformations.
Propriety d'un corps qui reprend la forme et les dimensions qu'il avait avant une solicitation, lorsqu'on supprime cette solicitation.
Valeur maximale de la solicitation pour laquelle n'apparaissent pas de deformations permanentes.
Variation des p ro p rie ty mecaniques sous I'effet de charges r6p£t6es.
Niveau de contrainte au-dessous duquel le pheno- m&ne de fatigue n'apparait pas quel que soit le nombre de cycles de chargement.
Resistance d'un solide £ la penetration, c'est-d-dire £ une deformation de sa surface.
Propriete d'un solide caractferisant la grandeur de la deformation qu'il subit pour un accroissement de contrainte donnfe. Plus cette deformation est faible, plus !e corps est raide.
Qualite d'un corps qui poss£de les memes proprietes en tout point.
Qualite d'un corps qui ne poss£de pas les memes proprietes en tout point.
Apparition d'un retard dans revolution d'un phenom£ne physique par rapport £ un autre. Exemple: hysteresis des cycles de charge.
Qualite d'un corps dont les proprietes physiques sont identiques dans toutes les directions.
442 A P P E N D I X
87 — h 6 t6 ro tro p ie Quality d'un corps dont les proprifetes sont differentessuivant les directions.
88 — m o d u le d 'Yourig C'est le module E qui, pour un solide isotrope ou non,elastique lineaire, soumis £ une contrainte uniaxiale, apparait dans la relation o jj— E . £jj entre la contrainte principaie non nulle et la dilatation linfeaire dans la direction de cette contrainte.
89 — m o d u le de d e fo rm atio n Rapport entre contrainte appliquee et deformationcorrespondante lors du chargement d'un massif rocheux.
90 — m o d u le d '6 lastic it£ secant Pente de la droite reliant I'origine £ un point donne dela courbe contrainte-deformation
91 — m o d u le d '6 lastic it6 ta n g e n t Pente de la tangente a la courbe contrainte-deformation en un de ses points.
92 — m o d u le de d 6 c h a rg e m e n t Pente de la tangente & la tranche de la courbe con-trainte-deformation qui correspond au dechargement.
93 — co e ff ic ien t ded ila ta tion cubique
94 plastic ity
Rapport entre la pression hydrostatique et la dilatation cubique resultante
Aptitude o'un corps cj subir des deformations per- manentes.
95 — visco6lastic it6 Propriete d'un corps dont les caracteristiques elas- tiques varient en fonction de la vitesse d'application des sollicitations
96 — re laxation Liberation de contrainte en fonction du temps dans un solide auquel on a impose une deformation maintenueensuite constante.
97 — retard
98 — th ixo tro p ie
Voir 74
Propriete d un corps tres visquex qui se liquefie lor- qu'on I'agite, puis retrouve sa viscosite initiate apr6s un certain temps de repos.
99 — a l t e r a t i o n Modification (generalement degradation) des proprie- tes mecaniques d'une roche sous I'effect d'agents exteneurs: air, eau de percolation, choc thermique.
R O C K M E C H A N I C S T E R M S 443
100 — coeff ic ient de Poisson
101 — rupture
102 — crit^re de rupture
103 — rupture progressive
104 — rupture fragile
Pour un solide isotrope lineaire soumis & une con- trainte uniaxiale, le coefficient de Poisson est I'oppose du rapport de la dilatation lineaire, dans n'importe quelle direction perpendiculaire £ la contrainte princ ip a l non nulle, £ la dilatation lineaire dans la direction de cette contrainte.
Depassement de la resistance maximale de la roche.
Relation theorique ou empirique entre contrainte et deformation qui caracterise la rupture d'une roche.
Rupture d'un bloc rocheux resultant de la formation et du developpement de surfaces de rupture localises.
Rupture acompagnee d'une diminution brusque et importante de la resistance.
105 — s tructure de la fracturation Disposition spatiale des systemes de fractures.
106 — disquage
107 - surface de m oindre resistance
108 — coup de terrain
109 - g lissem ent
110 - £caillage
Separation d'une carotte de roche dure en disques, provoquee par de fortes contraintes naturelles.
Surface ou zone peu epaisse dont la resistance est inferieure & celle du materiau qui I'entoure.
Rupture par liberation soudaine d'fenergie eiastique dans une roche fragile.
Mouvement relatif de deux corps sans perte de contact.
(a) Separation en Elements longitudinaux en com pression simple.(b) Formation d'6lements en plaquettes & la surface li- bre d'un massif.
111 - f la m b e m e n t Deformation Iat6rale instable des structures allong£es lorsqu'elles sont comprim6es perpendiculairement £ leur plus petite dimension.
112 - resistance Contrainte maximale qu'un materiau peut supporter sans se rompre. (La resistance depend du critere de rupture.)
113 — e f fe t d'6chelle Influence des dimensions de I'echantillon sur la resistance ou sur d'autres parametres mecaniques.
4 44 A P P E N D I X
114 — resistance m a x im a le auc isa il lem ent, resistance au pic
115 — resistance de c isa il lem entrgsiduelle
116 — surface de d iscontinu ity
117 — diaclase
Resistance maximale au cisaillement d'une surface de rupture.
Resistance au cisaillement d'une surface de rupture apr£s un grand dfeplacement
Surface ou zone mince & I'int&rieur d'un milieu continu ou entre deux milieux continus diffferents, en gfenferal assimilable & un plan sur une certaine 6tendue.
Fracture sans rejet, transversale £ la stratification ou £ la schistosite.
118 - fa ille
119 — frac tu re
120 — fissure
121 — rupture
122 — p etit fissure
123 — s tra tif ica tion
124 — 6paisseur de couche
125 — pendage
126 — direction
Surface de discontinuity avec d6placement tangentiel des deux Idvres, appel§ rejet, souvent soulignfe par des stries, avec ou sans interposition d'une zone broyfce. (Une fracture, un joint de stratification, un ensemble de fissures peuvent jouer le role d'une faille.)
Surface de non adherence de grande etendue par- tageant le volume consid6re en parties distinctes. Exemples: diaclase, joint de stratification ouvert au voisinage du sol.
Surface de non adherence, d'fetendue limitfee, ne trav e rs a l pas le volume considere. Exemples: fissures de retrait £ la surface du beton ou de I'argile.
£tat instable auquel peut conduire I'extension de la fracturation
Voir 120
Disposition d'une roche sfedimentaire en bancs paralieies, de composition identique ou differenciee, separes par des joints de stratification.
Distance normale entre fractures de la meme famille.
Angle d'un plan de fracture ou d'un joint de stratification avec le plan horizontal.
Azimuth d'une horizontale d'un plan de fracture ou d'un joint de stratification.
127 — a f f le u re m e n t Exposition d'une roche & la surface du terrain naturel.
128 — "b e d ro c k " Massi f r o c h e u x s o u s j a c e n t a u sol de c o u v e r t u r e .

R O C K M E C H A N I C S T E R M S 445
129 — couverture Sol meuble situe au-dessus de ia roche solide. Ce mot est aussi employe pour designer tout le massif situe au-dessus du point corisidere par exemple la couverture de sol et roche sus-jacente & une excavation souterraine.
130 — tex tu re
131 ----------
132 — structure
Disposition et dimensions relatives des Elements composant une matrice rocheuse.
(il n'v a pas de terme correspondant en franpais.)
Maniere dont sont disposes les blocs ou couches constituant un massif rocheux.
133 — schistosity
134 — Lineation
135 — foliation
136 — clivage
137 — c o m p a rt im e n t sup6rieur
138 — c o m p a rt im e n t inf6rieur
139 — subsidence
140 — karst
141 — g lissem ent de terrain
Disposition de nombreuses roches metamorphiques en feuillets paraliyies de meme nature, qui favorise leur separation suivant des joints tr&s rapprochfes.
Orientation aes caracteristques structurales sous forme de lignes plutot que plans paralteles.
Orientation des caracteristiques structuraies sous forme de plans parall&les £ la schistosity.
Aptitude d un cristal £ se sfeparer facilement suivant certaines directions de plan du reseau cristallin. Designe aussi I'op&ration de separation en deux parties ou en feuillets minces d'un cristal et par extension la separation d'un matferiau schisteux, no- tamment des schistes ardoisiers.
Masse de rocher situfee au-dessus d'une surface de discontinuity.
Masse de rocher situfee au-dessous d'une surface de discontinuity.
Affaissement de surface du soit a la realisation de ca- vites souterraines, soit a des phynom£nes hydrauli- ques ou g£ologiques.
Cavites qui se developpent par dissolution dans des bancs de calcaire massif.
Mouvement perceptible vers le bas d'une masse de terre ou de roche.
142 — remplissage Materieu meuble en general remplissant I'fepaisseur d'une surface de separation ou d'une fracture.
446 A P P E N D I X
143 — surface Iiss6e
144 — m ylo n ite
145 — fa m il le de fractures
146 — systfeme de fractures
147 — reseau de fractures
148 — d ia g ra m m e de frac tu res
149 — frac tu res conjugu6es
150 — br&che de faille
151 — argile de faille
152 - pli
153 — p erm eab il i ty
155 — grad ien t hydrau lique
157 — te n e u r en eau
158 — degr6 de saturation
160 — perco lation
163 — porosit^
Surface des Apontes d'une faille ou d'une autre fracture lissee par le cisaillement.
Br6che de faille £ structure fine et laminae.
Groupe de fractures plus ou moins parall^les.
Ensemble de deux ou plusieurs families de fractures.
Disposition geometrique caracteristique de fractures.
Diagramme sur lequel ont ete report6es, suivant une certaine convention, les mesures des param^tres caractfcrisant I'orientation de fractures existant dansune certaine zone du massif.
Deux families de fractures (failles) formfces par la meme solicitation tectonique (aeneralement directions conjuguees de cisaillement).
Conglomerat forme de fragments anguleux resultant du broyage des eponts d'une faille.
Materiau argileux souvent present entre les epontes d'une faille et cr£6 par le deplacement relatif de ces epontes.
Courbure d'un element du massif originellement plan (strate par exemple).
Aptitude d'une roche d se laisser traverser par des flui- des.
Variation de la charge hydraulique par unite de distance en un point donne et dans une direction donnee.
Pourcentage en poids de I'eau contenue dans les vides d'une roche ou d'un sol, rapport^ au poids du m ateriau solide.
Degre de remplissage des vides d'une roche par un fluide, generalement exprime en pourcentage par rapport au volume total des vides.
fcoulement d'eau interstitielle dans les vides d'un sol ou d'une roche.
Rapport entre le volume des vides d'une roche ou d'un sol et son volume total.

ROC K M E C H A N I C S T E R M S 447
G E R M A NIN D E X1 Reibungsbeiwert
2 — R eibungswinkel
Ein konstanter Proportionalitatsfaktor u, der das Ver haltnis zw ischen N o rm alspannung und der Schubspannung bestimmt, bei der der Gleitvorgang zwischen zwei Oberflachen beginnt:"C = jj . o
Der Winkel 0 zwischen der Normalspannungsachse und der Tangente an die Mohr'sche Hullkurve an einem Punkt, der einen gegebenen Bruch- spannungszustand fur festes Material darstellt
3 S ch u ttw in ke l Der groptmbgliche W inkel, bezogen auf diewaagerechte Ebene, den die Oberflache einerSchuttung von losem Material annehmen wird
4 S p an nu ng s /D ehn ung s /d ev ia to r Der Spannungs/Dehnungs/tensor, der erhalten wirddurch S ubtraktion des M itte ls der Nor-m a lsp an n u n g s /D eh n u n g s /ko m p o n en ten eines S p a n n u n g s /D eh n u n g s /ten so rs von jeder Nor-malspannungs/Dehnungs/komponente
5 — Spannungsellipsoid Die Darstellung des Spannungszustandes in Formeines Ellipsoids, dessen Halbachsen proportional zu den Gropen der Hauptspannungen sind und in den Hauptrichtungen liegen. Die Koordinaten eines Punktes P auf dieser Ellipsoid sind proportionaLzu den G rbpen der en tsp rech en d en S p annungskom - ponenten, die auf derjenigen Ebene wirken, die senkrecht zur Richtung OP steht, wobei 0 der Mit- telpunkt des Ellipsoids ist
6 — V erfo rm un gs /D ehn un gs /e ll ipso id Die Darstellung der Dehnung in Form eines Ellipsoids,zu dem eine Kugel mit Einheitsradius verformt wird und dessen Achsen die Hauptdeformationsachsen sind
7 — elastische Formanderungsenergie Potentielle Energie, die in einem verformten Fest-korper gespeichert ist und die, unter Abzug der durch inelastische V e rfo rm u n g verb rau ch ten Energie, derjenigen Arbeit gleich ist, die zur Verformung des Festkbrpers aus seinem unverformten Zustand benotigt wird
8 — S pan n u n g s /D eh n u n g s /fe ld Die Summe der Spannungs/Dehnungs/zustande, diefur samtliche Punkte eines elastichen Korpers definiert sind
448 A P P E N D I X
9 — Felsm echan ik Die theoretische und angewandte Wissenschaft des mechanischen Verhaltens von Fels
10 — m ath e m a tis c h e s M od e ll
11 — M o h rs c h e r S p an n u n g s / /D e h n u n g s /k re is
12 — M o h rs c h e H ii l lkurve
Die Darstellung eines physikalischen Systems durch mathematische Ausdrucke, aus denen das Verhalten des Systems mit einem bekannten Genauigkeitsgrad abgeleitet werden kann
Eine graphische Darstellung der Span-nungs/Dehnungs/komponenten die an einem gege- benen Punkt auf den verschiedenen Ebenen wirken, wobei die Bezugsachsen Normal-bzw. Scher/span- nung/dehnung sind
Die Umhullende einer Reihe von Mohrscher Kreise, die fur ein gegebenes M aterial die Span-n u n g s/D ehnungs/zustande im A ugenblick des Bruches darstellen
13 — V e r fo rm u n g s /B e la s tu n g s //g e s c h w in d ig k e it
14 — Gebirge,Fels
Anderung der Dehnung/Spannung mit der Zeit
Das in situ vorliegende Gestein einschliepiich seiner Trennflachen
15 — S tands icherhe it Der Zustand eines Bauwerkes oder einer Ma- terialmasse, bei dem dies (e) die uber emen langen Zeitraum hinweg wirkenden Spannungen tragen kann, ohne bedeutsam e Verform ungen oder Ver- schiebungen zu erfahren, welche bei Entspannung nicht ruckgangig gemacht werden
16 — D e h n u n g s /S p a n n u n g s /te n s o r Der Tensor zweiter Ordnung, dessen diagonaleElemente aus den Normal-Dehnungs/Spannungs/ /komponenten hinsichtlich eines gegebenen Koor- dinatensystems und dessen nicht-diagonale Elemente aus den entsprechenden S cher-D ehnungs/ /Spannungs/komponenten bestehen
17 — Finites E lem en t Eine der regelmafBigen geometrischen Formen, in dieeine Figur zum Zwecke der numerischen Span- nungsanalyse aufgegliedert ist
18 - B iegung Verformungsvorgang normal zur Langsachse eineslanggestreckten Bauteils, wenn ein Moment senkrecht zu dessen Langsachse angreift
ROC K M E C H A N I C S T E R M S 4-w
19 einachsige Kom pression, seitlich unbehinderte Kom pression
Zusammendruckung durch eine Normalspannung in einer einzigen Richtung
20 zw eiachsige Kom pression Zusammendruckung durch Normalspannungen zwei zueinander rechtwinkligen Richtungen
in
21 dreiachsige Kom pression Zusammendruckung durch Normalspannungen in dreizueinander rechtwinkligen Richtungen
22 einachsiger Spannungszustand Spannungszustand, bei dem zwei der drei Hauptspannungen gleich null sind
23 zw eiachsiger Spannungszustand Spannungszustand, bei dem eine der drei Hauptspannungen gleich null ist
24 dreiachsiger Spannungszustand Spannungszustand bei dem keine der drei Hauptspannungen gleich null ist
25 K ontraktion
26 — D ilatation ,relative Vo lum enanderung
27 V erform ung
28 — Verzerrung
29 Verschiebung
30 Streckung
31 — ebener Spannungs/ D ehnungs/zustand
32 H au p t/sp an n u n g /d eh n u n g
Lineare Dehnung, die mit einer Langenabnahme einhergeht
Der Quotient aus Volumenanderung und ur- sprunglichem V o lum en eines unter Spannung stehenden Matbrialteilchens
Eines Form oder GrofSenanderung eines Festkorpers
Eine Formanderung eines Festkorpers
Ein Ortswechsel eines Materialpunktes
Lineare Dehnung, die mit einer Langenzunahme einhergeht
Ein Spannungs/Dehnungs/zustand in einem Fest- korper, bei dem alle S p a n n u n g s /D e h n u n g s / /komponenten, die senkrecht zu einer gewissen Ebene stehen, gleich null sind
Die Spannung/Dehnung, die senkrecht zu einer der drei gegeneinander senkrecht stehenden Ebenen ver- lau ft, auf w e lch en die S c h er/sp an n u n g en / /dehnungen an einem Punkt in einem Korper gleich null sind
450 A P P E N D I X
33 — reine Scherung
34 — e in fache Scherung
35 — lineare (norm ale) D ehnung
36 — S cherdehnung ,S ch erver fo rm un g
37 — R estdehnung
38 — b le ibende D ehnung
Ein Dehnungszustand, der von jenem Span- nungszustand herruhrt, der durch einen Mohrschen Kreis beschrieben wird, der am Nullpunkt seinen Mittelpunkt hat
Scherverformung, bei der die Verschiebungen alle in einer Richtung liegen und proportional zu den Nor- malabstanden der verschobenen Punkte von einer gegebenen Bezugsebene sind. D ie V o lum en- veranderung ist gleich null
Die Langenanderung pro Langeneinheit in einer gegebenen Richtung
Die Formanderung, die durch die relative Anderung der rechten Winkel am Eckpunkt derjenigen Form ausgedriickt wird, die im unverformten Zustand ein unendlich kleines Rechteck oder ein unendlich kleiner Kubus war
Die Dehnung in einem Festkorper, die mit Rest- spannungen einhergeht
Die Dehnung, die in einem Festkorper im Vergleich zu seinem Anfangszustand verbleibt, nach dem eine Spannung, die die FliePgrenze uberstiegen hat, angelegt und wieder beseitigt wurde (allgemein auch mit "Restdehnung" bezeichnet)
39 — M a s s e n k ra ft
40 — a u p e re Kraft
41 — N o rm a lk ra f t
42 — S ch erkra ft
43 — O b erf lach en kra ft
Eine Kraft, wie z.B. die Schwerkraft, deren Wirkung uber Materialkorper verteilt ist, und zwar durch direkte Wirkung auf jedes Elementarteilchen des Korpers, unabhangig von den anderen
Eine Kraft, die an auperen Oberflachenteilchen eines Materialkorpers angreift
Eine Kraft, die in senkrechter Richtung auf einem Oberflachenteilchen angreift
Eine Kraft, die in paralleler Richtung an einem Oberflachenteilchen angreift
Jede Kraft, die an einem inneren oder auperen Ober- berflachenteilchen eines Materialkorpers angreift, ohne unbedingt in einer in der Oberflache gelegenen Richtung zu liegen

ROC K M E C H A N I C S T E R M S 451
44 — D ruckhohe Druck an einem Punkte in einer Flussigkeit, der durchdem vertikalen Abstand zwischen dem Punkt und der Flussigkeitsoberflache ausgedruckt wird
45 — U berlagerungsdruck Die Last, die auf einer unterirdischen horizontalenFlache infolge der daruber lagernden Materialsaule ruht
46 — prim arer Spannungszustand Spannung in einer geologischen Formation, bevordiese durch kunstliche Einwirkungen gestort wird
47 — sekundarer Spannungszustand Der Spannungszustand im Gestein, der sich durchkunstliche Ausbruche und Bauten ergibt
48 — hydrostatischer Druck Ein Spannungszustand, bei dem alle Haupt-spannungen gleich sind (und keine Scherspannungen existieren)
49 Restspannung Diejenige Spannung, welche in einem Festkorper trotz auperer Entspannung nach einem Vorgang verbleibt, der die Dimensionen der verschiedenen Ma terialteilchen bei Entlastung nicht mehr ineinan- derpassen lapt. Z.B. (i) Verformung unter Einwirkung auperer Spannungen, bei der einzelne Teile des Korpers bleibende Verformungen erfahren. (ii) Er- hitzung oder Abkuhlung eines Korpers, in dem der Warmeausdehnungskoeffizient innerhalb des Korpers nicht gleichmapig ist
50 — Druckspannung Normalspannung, die den Korper in derjenigen Richtung zu verkurzen sucht, in welcher sie wirkt
51 — Scherspannung Spannung, die in paralleler Richtung an einem Ober flachenteil angreift
52 - Zugspannung Normalspannung, die den Korper in derjenigenRichtung zu verlangern sucht, in welcher sie wirkt
53 — A m p litu d e n a b n a h m e Verringerung der Amplitude einer W elle mit derenEntfernung von der Quelle
54 D am p fu n g Verm inderung der S c h w in g u n g sam p litu d e eines Korpers oder Systems infolge interner oder durch Ausstrahlung verursachter Energieverzehrung

A P P E N D I X
55 — A nstiegsze it Der Zeitraum, den die fuhrende Front einer Wellebenotigt, um von einem bestimmten spezifischen kleinen Bruchteil bis auf einen bestimmten gro^eren spezifischen Bruchteil des Hochstwertes der Am plitude anzusteigen
56 — A u ssch w in g ze it
57 -
58 -
Dispersion
naturliche Frequenz
59 — M ik ro s e is m ik
60 seism ische G eschw ind igke it
61 — L o ng itu d in a lw e lle
62 — Transversa lw elle , S ch e rw e lle
63 — S to p w e l le
64 — O b erf lach en w e lle
65 — W e lle n fro n t
Der Zeitraum, der erforderlich ist, damit bei einer Welle deren Amplitude von ihrem Hochstwert auf einen bestimmten spezifischen Bruchteil abfallt
Das Phanomen wechselnder Wellengeschwindigkeit in Abhangigkeit derer Frequenz
Die Frequenz, bei der ein Korper oder ein System schwingt, wenn er keinem Zwang durch au^ere Krafte unterliegt
Seismische Storungen von kurzer Dauer und geringer Amplitude, die oft vor dem Bruch eines Materials oder eines Bauwerkes eintreten
Die G eschw indigkeit von Erdbebenw ellen in geologischen Formationen
Eine Welle, bei der die Verschiebung an jedem Punkte des Mediums senkrecht zur Wellenfront ist
Eine Welle, bei der die Verschiebung an jedem Punkt des Mediums parallel zur Wellenfront ist
Eine Welle mit endlicher Amplitude, die durch eine Stopfront gekennzeichnet ist, das ist eine Oberflache, uber die hinweg Druck, Dichte und innere Energie fast diskontinuierlich ansteigen, und die mit einer Geschwindigkeit wandert, die grower als die normale Schallgeschwindigkeit ist
Eine Welle, die auf eine dunne Schicht an der Oberflache eines Korpers beschrankt ist
(1) Eine durchgehende Oberflache, entlang der die Phase einer in drei Dimensionen fortschreitenden Welle konstant ist
(2) Eine durchgehende Linie, entlang welcher die Phase einer Oberflachenwelle konstant ist

ROC K M E C H A N I C S T E R M S 453
66 — Spannung
67 — inelastische Verform ung
68 — FliePgrenze
69 - Fels
70 — Festgestein
71 — Scherflache
72 - Kohasion
73 — Stoffg le ichung,Stoffgesetz
74 Kriechen
75 — D ilatanz
76 — Duktilitat
77 — Elastizitat
78 Elastizitatsgrenze
Eine uber eine gegebene Oberflache, und zwar pro Flacheneinheit wirkende Kraft
Derjenige Anteil an der unter Spannung erfolgten Verformung, der durch die Beseitigung der Spannung nicht ruckgangig gemacht wird
Diejenige Spannung, bei deren Uberschreiten die bewirkte Verformung auch nach volliger Entlastung nicht ganz ruckgangig gemacht wird
Jede naturlich gebildete Anhaufung von Mineralsub- stanz, die in gropen Massen oder Bruchstiicken vorkommt
Der Gesteinsmasse entstammendes Material, w ofiir ein ganzer Bohrkern der keine groperen Trennflachen aufzeigt, typisch ware
Eine Ebene, entlang welcher im Material ein Scher- bruch auftritt
Scherfestigkeit bei einer Normalspannung, die gleich Null ist (ein gleichwertiger Ausdruck in der Fels- mechanik ist intrinsische Scherfestigkeit)
Kraft Verformungsbeziehung fur ein bestimmtes Ma terial
Zeitabhangige Verformung
Eigenschaft der Vo lum envergro Perung unter Scherbeanspruchung
Derjenige Zustand, bei dem Material eine bleibende Verformung erfahrt, ohne dabei seine Tragfahigkeit zu verlieren
Eigenschaft eines Materials, das in seine urspriingliche Form oder Zustand nach der Entlastung zuruckkehrt
Derjenige Punkt auf der Spannungs-Dehnungskurve, an dem der Ubergang vom elastichen zum inelas- tischen Verhalten stattfindet
79 — E rm udung
80 — D au erfes t ig ke it
81 — Harte
82 — S te if ig k e it
83 — H o m o g e n ita t
84 — H e te ro g en ita t
85 — Hysteres ie
86 — Isotropie
87 — A n iso tro p ie
88 E las tiz ita tsm odu l. Young M od u l
89 V e rfo rm u n g s m o d u l
90 S ekan ten m o d u l
91 T an g en ten m o d u l
92 — Entlas tungsm odul
454 \P!M N O I X
Abnahme der Festigkeit durch wiederholte Belastung
Diejenige Spannung, unterhalb der keine Ermudung auftritt, und zwar unabhangig von der Anzahl der Belastungen
Widerstand eines Materials gegen Einbeulung oder gegen Kratzen
Verhaltnis von Kraft zu Verschiebung
Mit den gleichen Eigenschaften an alien Punkten ausgestattet
Mit verschiedenen Eigenschaften an verschiedenen Punkten ausgestattet
Unvollstandige Aufhebung der Dehnung wahrend der Entlastung infolge Energieverbrauchs
Mit den gleichen Eigenschaften in samtlichen Richtungen ausgestattet
Mit verschiedenen Eigenschaften in verschiedenen Richtungen ausgestattet
Das Verhaltnis von Spannung zur entsprechenden Dehnung unterhalb der Proportionalitatsgrenze eines Materials
Das Verhaltn is Spannung zu entsprechender Dehnung (Form'anderung) wahrend der Belastung einer Gesteinsmasse, und zwar einschliepiich des elastischen und des inelastischen Verhaltens
Neigung der Linie, die den Ursprung mit einem gege- benen Punkt auf der Spannungs-Dehnungskurve verbindet
Neigung der an die Spannungs-Dehnungkurve an einem gegebenen S pannungsw ert angelegten Tangente (im algemeinen bei einer Spannung, die gleich der halben Druckfestigkeit ist)
Neigung der Tangente an den Entlastungszweig der Spannungs-Dehnungskurve bei einem gegebenen Spannungswert

R O C K M E C H A N I C S T E R M S 455
93 Kom pressionsmodul Verhaltnis von hydrostatischem Druck zu relativer Volumenanderung, welche er hervorruft
94 — Plastizitat Die Eigenschaft eines Materials, sich unbegrenzt unter einer konstanten Spannung zu verformen
95 — Viskoelastizit'at
96 — Spannungsrelaxation
97 — Retardation
98 — Thixotropie
99 — Verw itterung
100 PoissonscheQuerdehnungszahl
101 — Bruch
102 Bruchkriterium
103 — Progressiver Bruch
Die Eigenschaft eines Materials, sich unter Spannung teils elastisch, teils viskos (d.h. dessen Dehnung ist teilweise von der Zeit und der GrofSe der Spannung abhangig) zu verformen
Entspannung infolge von Kriechen
Verzogerung der Verformung
Die Eigenschaft sich aufgrund von Erschutterungen zu verflussigen und durch Stehen sich wieder zu ver- festigen
Der Vorgang des Zerfallens und der Zersetzung infolge der Aussetzung an die Atmosphare, durch chemische Einwirkung und die Einwirkung von Frost, Wasser und Hitze
Verhaltnis zwischen Kurzung in der Querrichtung eines Korpers zu dessen Verlangerung in der Langsrichtung bei Zugbeanspruchung und zwar unterhalb der Proportionalitatsgrenze
Bruch im Fels bedeutet das Uberschreiten der maximalen Festigkeit des Felses oder das Uberschreiten der fur eine bestimmte konstruktive M ap- nahme vorgeschriebenen A n fo rd eru n g an die Spannung (Druckanderung) oder Verformung
Die theoretisch oder empirisch abgeleitete Span- nungs-bsw. Dehnungsverh'altnisse, die das Eintreten des Bruches im Fels kennzeichnen
Bildung und W e ite re n tw ic k lu n g tirtlic h e r Ge- steinsrisse, die nach weiterer Spannungssteigerung schliepiich eine durchlaufende Bruchflache bilden und so durch laufende Entfestigung zum Bruch fiihren
104 — Sprodbruch Plotzlicher Bruch mit volligem Kohasionsverlust entlang einer Flache
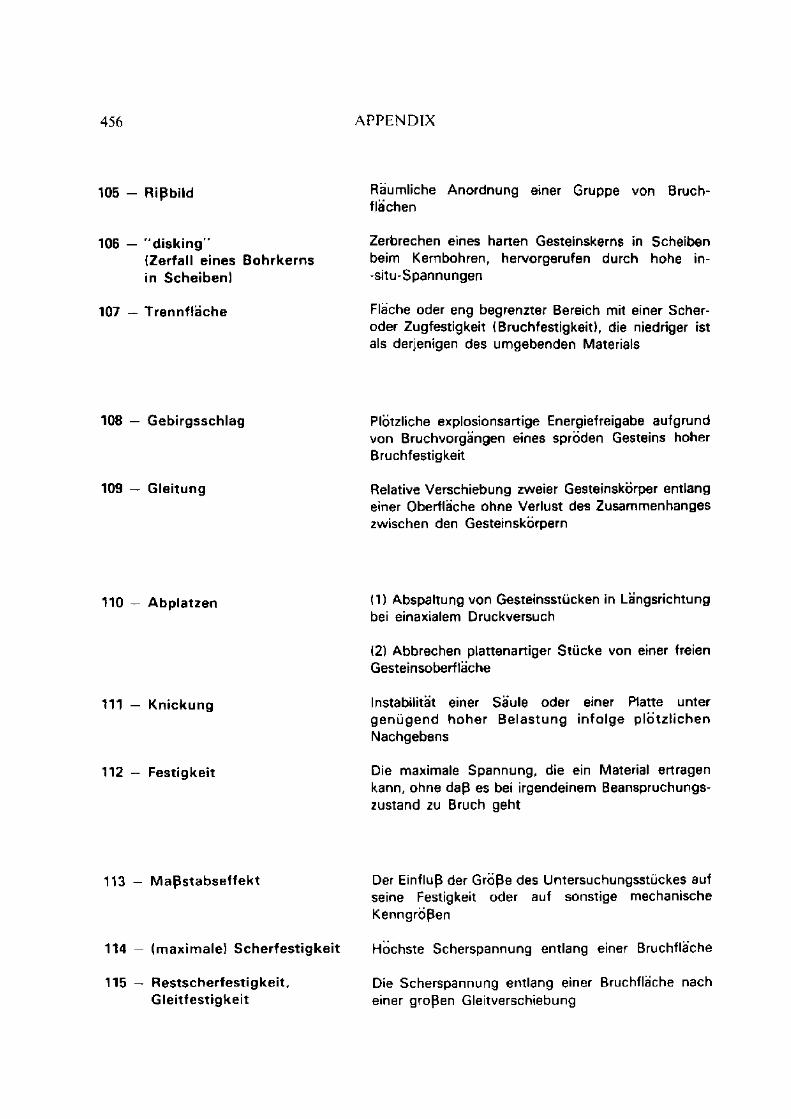
456 A P P E N D I X
105 - Ripbild Raumliche Anordnung einer Gruppe von Bruch- flachen
106 — "d isk in g ”(Zerfall eines Bohrkerns in Scheiben)
Zerbrechen eines harten Gesteinskerns in Scheiben beim Kernbohren, hervorgerufen durch hohe in- -situ-Spannungen
107 — Trennflache Flache oder eng begrenzter Bereich mit einer Scher- oder Zugfestigkeit (Bruchfestigkeit), die niedriger ist als derjenigen des umgebenden Materials
108 — Gebirgsschlag Plotzliche explosionsartige Energiefreigabe aufgrundvon Bruchvorgangen eines sproden Gesteins hoher Bruchfestigkeit
109 — G leitung Relative Verschiebung zweier Gesteinskorper entlangeiner Oberflache ohne Verlust des Zusammenhanges zwischen den Gesteinskorpern
110 — Abplatzen (1) Abspaltung von Gesteinsstiicken in Langsrichtung bei einaxialem Druckversuch
(2) Abbrechen plattenartiger Stucke von einer freien Gesteinsoberflache
111 — Knickung
112 — Festigkeit
Instabilitat einer Saule oder einer Platte unter genugend hoher Belastung infolge plotzlichen Nachgebens
Die maximale Spannung, die ein Material ertragen kann, ohne dap es bei irgendeinem Beanspruchungs- zustand zu Bruch geht
113 — M aP stab seffek t Der Einflup der Grbpe des Untersuchungsstuckes auf seine Festigkeit oder auf sonstige mechanische Kenngrbpen
114 (m axim ale) S ch erfestigke it Hochste Scherspannung entlang einer Bruchflache
115 R estscherfestigkeit. G leitfestigkeit
Die Scherspannung entlang einer Bruchflache nach einer gropen Gleitverschiebung

R O C K M E C H A N I C S T E R M S 457
116 D isko n tinu ita ts flache Jede Oberflache, uber die hinweg irgendeine Ge-steinseigenschaft sich diskontinuierlich (unstetig) andert. Das schliept Klufte, Storungen und Schichtflachen ein, jedoch sollte der Ausdruck nicht nur auf die D isko n tin u ita t m echanischer Eigenschaften beschrankt werden
117 - K luft
118 — Storung
119 Ruptur
120 Spalte
121 Bruch (im engeren Sinne)
122 - Rip
123 Schichtung
124 — M a c h tig k e it
125 - Fallen
126 — Streichen
Ein geologisch bedingtes Unterbrechen des Zusam m enhanges eines Gesteinsktirpers, wobei dieser Bruch einzeln vorkommen kann oder, was h'aufiger ist, in Scharen oder in einem Bruchsystem; parallel zur Bruchfl'ache sind keine sichtbaren Rela- tivbewegungen eingetreten
Ein Bruch oder eine Bruchzone, entlang welcher es eine Gleitverschiebung der beiden gegeniiberliegen- den und zum Bruch parallel verlaufenden Seiten gege- ben hat. Diese Gleitverschiebung kann wenige Zentimeter oder viele Kilometer betragen)
Der algemeine Ausdruck fur jegliche mechanische Diskontinuitat im Gestein; deshalb stellt es den Sammelbegriff fur Klufte, Storungen, Risse usw. dar
Eine klaffende Ruptur
Dasjenige Stadium in der Entwicklung eines Bruches, wo Instability eintritt.
Eine kleine Ruptur, d.h. klein im Hinblick auf seine vergleichbare Umgebung
Tritt in Gesteinen auf, die durch Verfestigung von Se- dim enten entstanden sind und Trennfl'dchen (Schichtflachen) zwischen den Ablagerungsschichten gleichen oder verschiedenen Materials aufweisen, z.B. Tonstein, Schluffstein, Sandstein, Kalkstein usw.
Der senkrechte Abstand zwischen Grenzflachen wie z.B. Schichtflachen eines Gesteins
Der Winkel, unter dem eine Schicht oder irgendein anderes Planargefiige zur Waagerechten geneigt ist
Richtung bzw. Azimut einer horizontalen Linie in der Flache einer geneigten Schicht, Kluft, Storung oder eines sonstigen Planargefuges im Fels
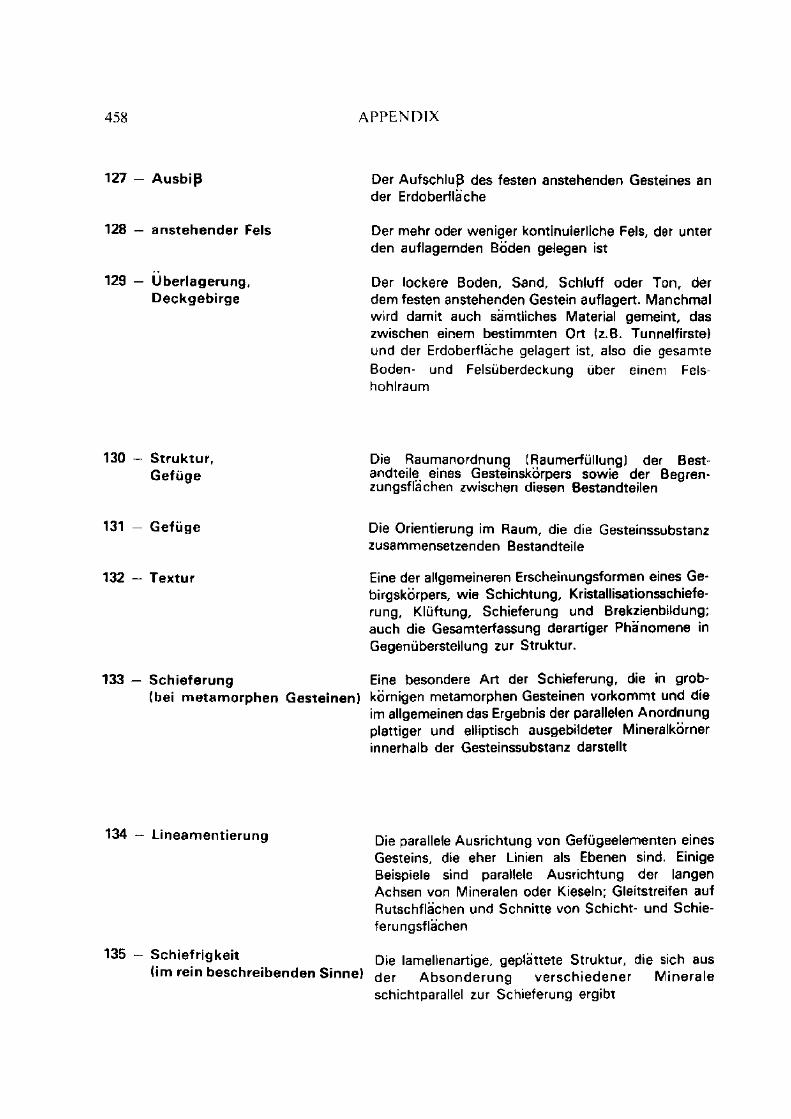
458 A P P E N D I X
127 — Ausbip
128 — anstehender Fels
129 — Uberlagerung, Deckgebirge
Der Aufschlup des festen anstehenden Gesteines an der Erdoberflache
Der mehr oder weniger kontinuierliche Fels, der unter den auflagernden Boden gelegen ist
Der lockere Boden, Sand, Schluff oder Ton, der dem festen anstehenden Gestein auflagert. Manchmal wird damit auch samtliches Material gemeint, das zwischen einem bestimmten Ort (z.B. Tunnelfirste)und der Erdoberflache gelagert ist, also die gesamte Boden- und Felsuberdeckung uber einem Fels- hohlraum
130 - S truktur,G efiige
Die Raumanordnung (Raumerfullung) der Best- andteile eines Gesteinskorpers sowie der Begren- zungsflachen zwischen diesen Bestandteilen
131 — Gefuge
132 — Textur
133 — Schieferung
Die Orientierung im Raum, die die Gesteinssubstanz zusammensetzenden Bestandteile
Eine der allgemeineren Erscheinungsformen eines Ge- birgskorpers, wie Schichtung, Kristallisationsschiefe- rung, Kluftung, Schieferung und Brekzienbildung; auch die Gesamterfassung derartiger Phanomene in Gegenuberstellung zur Struktur.
Eine besondere Art der Schieferung, die in grob- (bei m etam orphen G esteinen) kornigen metamorphen Gesteinen vorkommt und die
im allgemeinen das Ergebnis der parallelen Anordnung plattiger und elliptisch ausgebildeter Mineralkorner innerhalb der Gesteinssubstanz darstellt
134 — Lineamentierung
135 — Schiefrigkeit(im rein beschreibenden Sinne)
Die parallele Ausrichtung von Gefiigeelementen eines Gesteins, die eher Linien als Ebenen sind. Einige Beispiele sind parallele Ausrichtung der langen Achsen von Mineralen oder Kieseln; Gleitstreifen auf Rutschflachen und Schnitte von Schicht- und Schie- ferungsflachen
Die lamellenartige, geplattete Struktur, die sich aus der Absonderung verschiedener M inerale schichtparallel zur Schieferung ergibt
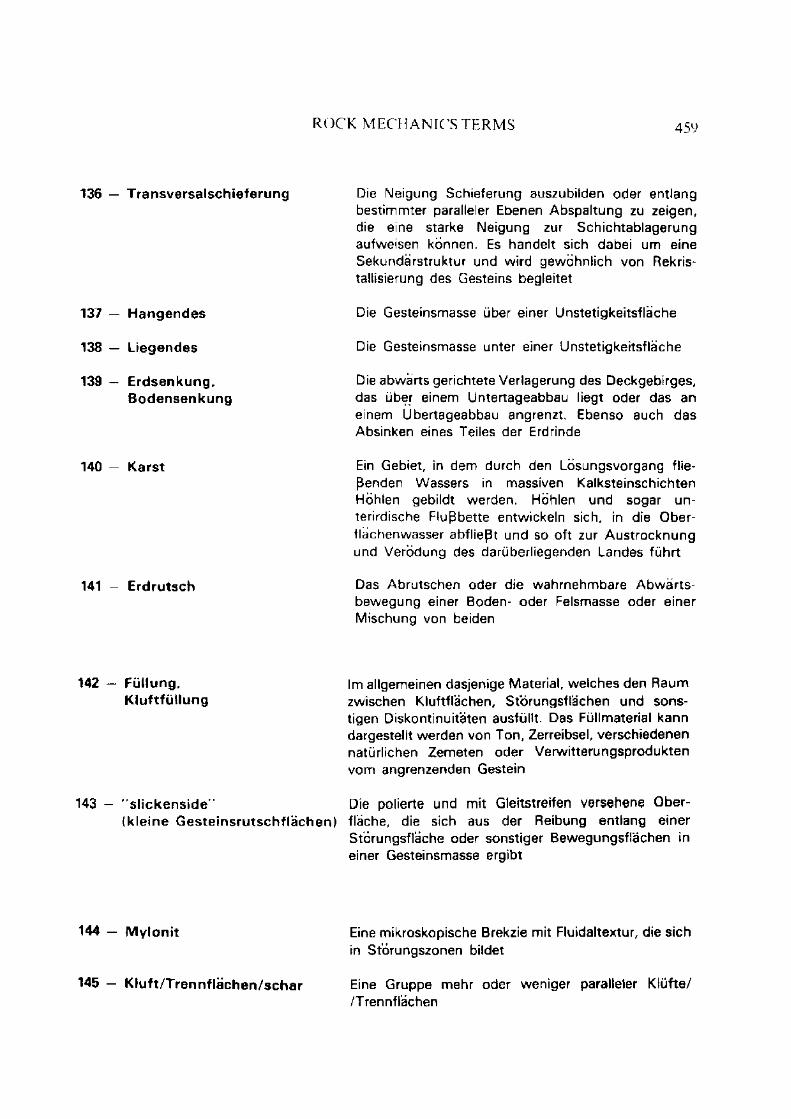
R O C K M E C H A N I C S T E R M S 459
136 — Transversalschieferung
137 — Hangendes
138 — Liegendes
139 — Erdsenkung,Bodensenkung
Die Neigung Schieferung auszubilden oder entlang bestimmter paralleler Ebenen Abspaltung zu zeigen, die eine starke Neigung zur Schichtablagerung aufweisen konnen. Es handelt sich dabei um eine Sekundarstruktur und wird gewohnlich von Rekris- tallisierung des Gesteins begleitet
Die Gesteinsmasse uber einer Unstetigkeitsflache
Die Gesteinsmasse unter einer Unstetigkeitsflache
Die abwarts gerichtete Verlagerung des Deckgebirges, das uber einem Untertageabbau liegt oder das an einem Ubertageabbau angrenzt. Ebenso auch das Absinken eines Teiles der Erdrinde
140 - Karst
141 Erdrutsch
Ein Gebiet, in dem durch den Losungsvorgang flie- Penden Wassers in massiven Kalksteinschichten Hohlen gebildt werden. Hohlen und sogar un- terirdische Flupbette entwickeln sich, in die Ober- flachenwasser abfliept und so oft zur Austrocknung und Verodung des daruberliegenden Landes fuhrt
Das Abrutschen oder die wahrnehmbare Abwarts- bewegung einer Boden- oder Felsmasse oder einer Mischung von beiden
142 Fiillung,K luftfii l lung
Im allgemeinen dasjenige Material, welches den Raum zwischen Kluftflachen, Storungsfl'achen und sons- tigen Diskontinuitaten ausfullt. Das Fullmaterial kann dargestellt werden von Ton, Zerreibsel, verschiedenen natiirlichen Zemeten oder Verwitterungsprodukten vom angrenzenden Gestein
143 — ' slickenside"(kleine Gesteinsrutschflachen)
Die polierte und mit Gleitstreifen versehene Ober- flache, die sich aus der Reibung entlang einer Storungsffache oder sonstiger Bewegungsflachen in einer Gesteinsmasse ergibt
144 — M y lo n it Eine mikroskopische Brekzie mit Fluidaltextur, die sichin Storungszonen bildet
145 — K lu ft /T ren n flach en /sch ar Eine Gruppe mehr oder weniger paralleler Klufte//Trennflachen
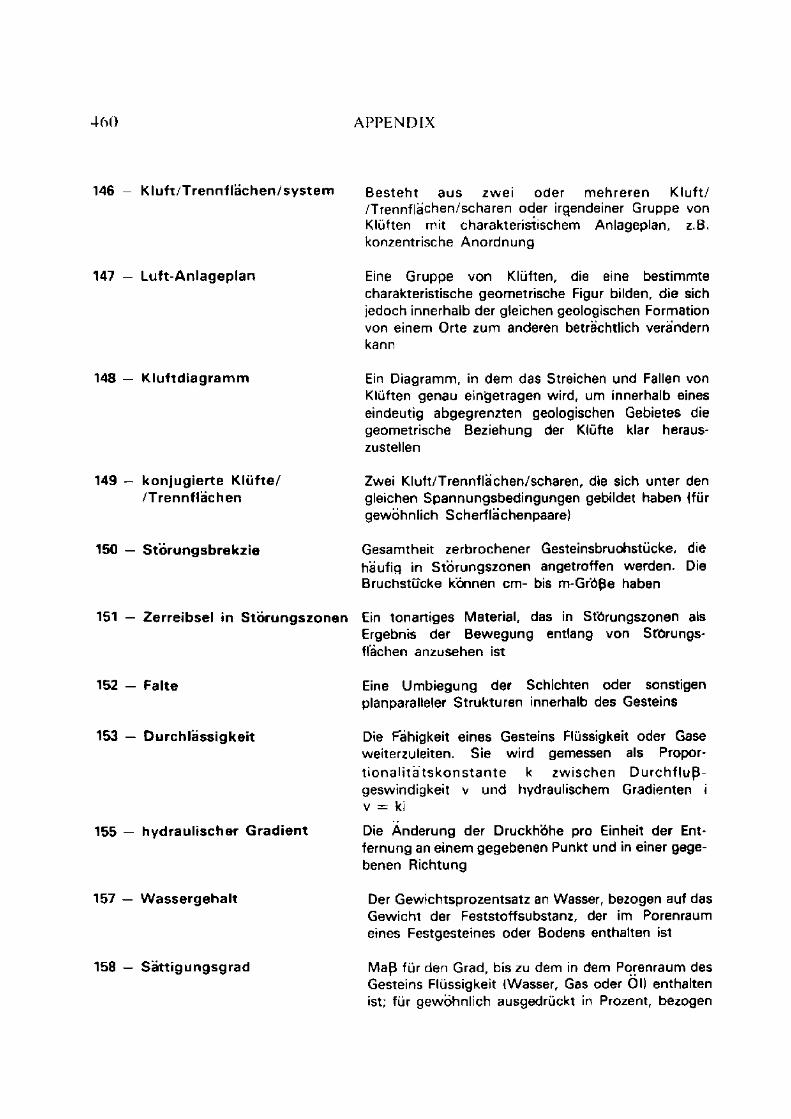
4 6 0 A P P E N D I X
146 K lu ft/T re n n fla c h e n /s y s te m Besteht aus zw ei oder m ehreren K lu ft//Trennfla’chen/scharen oder irgendeiner Gruppe von Kluften mit charakteristischem Anlageplan, z.B. konzentrische Anordnung
Eine Gruppe von Kluften, die eine bestimmte charakteristische geometrische Figur bilden, die sich jedoch innerhalb der gleichen geologischen Formation von einem Orte zum anderen betrachtlich verandern kann
Ein Diagramm, in dem das Streichen und Fallen von Kluften genau eingetragen wird, um innerhalb eines eindeutig abgegrenzten geologischen Gebietes die geometrische Beziehung der Klufte klar heraus- zustellen
Zwei Kluft/Trennflachen/scharen, die sich unter den gleichen Spannungsbedingungen gebildet haben (fur gewohnlich Scherflachenpaare)
Gesamtheit zerbrochener Gesteinsbruohstucke, die haufiq in Storungszonen angetroffen werden. Die Bruchstucke konnen cm- bis m-Grtipe haben
151 — Zerreibsel in Storungszonen Ein tonartiges Material, das in Storungszonen alsErgebnis der Bewegung entlang von StOrungs- flachen anzusehen ist
152 — Falte Eine Umbiegung der Schichten oder sonstigenplanparalleler Strukturen innerhalb des Gesteins
153 — D urch lassigke it Die Fahigkeit eines Gesteins Flussigkeit oder Gaseweiterzuleiten. Sie wird gemessen als Proportiona lity tsko n s tan te k zw ischen D urch flup geswindigkeit v und hydraulischem Gradienten i v = ki
155 — hydraulischer G rad ien t Die Anderung der Druckhohe pro Einheit der Ent-fernung an einem gegebenen Punkt und in einer gege- benen Richtung
157 — W assergeha lt Der Gewichtsprozentsatz an Wasser, bezogen auf dasGewicht der Feststoffsubstanz, der im Porenraum eines Festgesteines oder Bodens enthalten ist
147 Luft A n lagep lan
148 — K lu ftd iag ram m
149 — ko n ju g ie rte K lu f te / /T renn flach en
150 — Storungsbrekzie
158 — Satt igungsgrad M ap fur den Grad, bis zu dem in dem Porenraum des Gesteins Flussigkeit (Wasser, Gas oder Ol) enthalten ist; fur gewohnlich ausgedruckt in Prozent, bezogen

ROC K M E C H A N I C S T H R M S 4(> 1
160 — D urchstrom ung
163 Porositat
auf den Gesamthohlraum oder auf den Gesamt- porenraum
Die unter hydrosta tischem D ruck e rfo lgende Bewegung des Wassers durch die kleineren Zwis- chenraume von Festgestein oder Boden, nicht jedoch die Bew egung von W asser durch w eite Offnungen wie Hohlen und Losungskanale
Das Verhaltnis des Gesamtvolumens an Poren- oder Zwischenraumen in einem Festgestein oder Boden zum Gesamtvolumen

A P P E N D I X VII
Imperial, Metric and SI Units
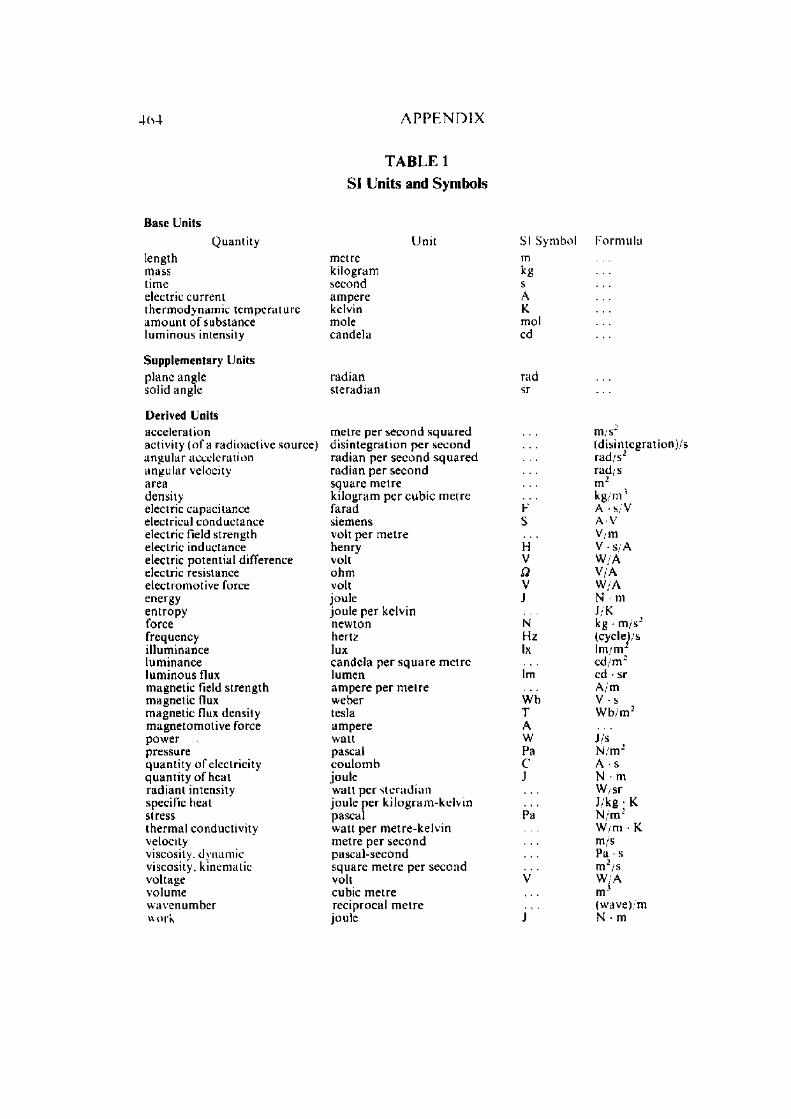
4h4 A P P E N D I X
T A B L E 1
SI U nits and Sym bols
Base UnitsQuantity Unit SI S
length metre mmass kilogram kgtime second selectric current ampere Atherm odynamic temperature kelvin Kam ount o f substance mole molluminous intensity candela cd
Supplementary Unitsplane angle radian radsolid angle steradian sr
Derived Unitsacceleration metre per second squaredactivity (of a radioactive source) disintegration per secondangular acceleration radian per second squaredangular velocity radian per secondarea square metredensity kilogram per cubic metreelectric capacitance farad Felectrical conductance siemens Selectric field strength volt per metreelectric inductance henry Helectric potential difference volt Velectric resistance ohm Qelectromotive force volt Venergy joule Jentropy joule per kelvinforce newton N ’frequency hertz Hzilluminance lux Ixluminance candela per square metreluminous flux lumen lmmagnetic field strength ampere per metremagnetic flux weber Wbmagnetic flux density tesla Tmagnetomotive force ampere Apower watt Wpressure pascal Paquantity o f electricity coulom b Cquantity o f heat joule Jradiant intensity watt per ste radianspecific heat joule per kilogram-kelvinstress pascal Pathermal conductivity watt per metre-kelvinvelocity metre per secondviscosity, dynamic pa seal-secondviscosity, kinematic square metre per secondvoltage volt Vvolume cubic metrewaven umber reciprocal m etrework joule J
Form ula
m/s2(disin tegration)^rad /s2rad/s
2mk g /m 'A s V A V V/m V • s/A W/A V/A W/A N • m J/Kkg • m /s2(cycle)slm /me d /m 2cd • srA/mV sW b / n r
i/sN /m 2 A • s N • m W/sr J/kg K N /m 2 W /m K m/s Pa • s m 2/s W/A m*(wave)/m N • m
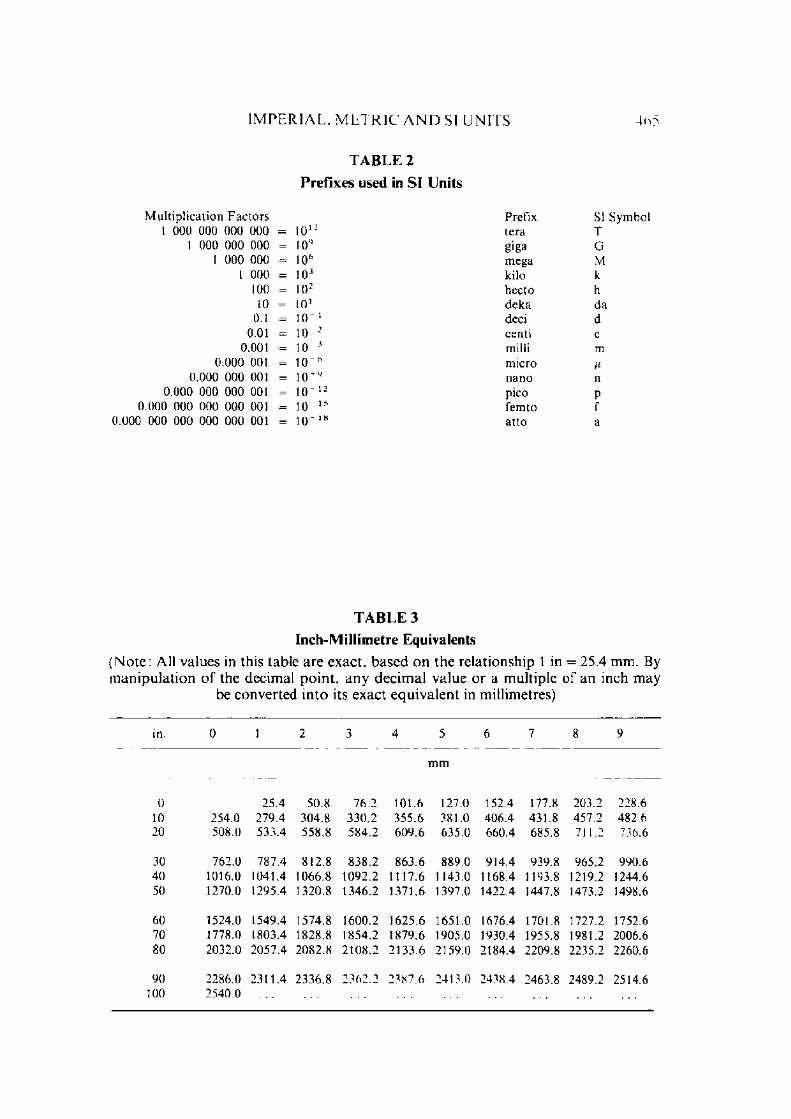
I M P E R I A L . M E T R I C A N D SI U N I T S
T A B L E 2
P re fix e s used in S I U nits
Multiplication Factors Prefix SI1 000 000 000 000 = 1012 tera T
1 000 000 000 = 10l> giga G1 000 000 = 106 mega M
1 000 = 10-' kilo k100 = 102 hecto h10 = 10* deka da
0.1 = 10 1 deci d0.01 = 10 2 centi c
0.001 = 10 3 milli m0.000 001 = 10 '6 micro V
0.000 000 001 = 10 '9 nano n0.000 000 000 001 = 10 12 pico P
0.000 000 000 000 001 = 10 15 fern to f0.000 000 000 000 000 001 = 10 ,H atto a
T A B L E 3
In ch -M illim e tre E quivalents
(N o te : All values in this table a re exac t, b ased o n the re la tionship 1 in = 25.4 m m . By m an ip u la t io n o f the decim al p o in t , a n y d ec im a l value o r a m ultip le o f an inch m ay
be converted in to its exact eq u iv a le n t in millimetres)
in. 0 1 2 3 4 5 6 7 8 9
mm
0 25.4 50.8 76.2 101.6 127.0 152.4 177.8 203.2 228.610 254.0 279.4 304.8 330.2 355.6 381.0 406.4 431.8 457.2 482.620 508.0 533.4 558.8 584.2 609.6 635.0 660.4 685.8 711.2 736.6
30 762.0 787.4 812.8 838.2 863.6 889.0 914.4 939.8 965.2 990.640 1016.0 1041.4 1066.8 1092.2 1117.6 1143.0 1168.4 1193.8 1219.2 1244.650 1270.0 1295.4 1320.8 1346.2 1371.6 1397.0 1422.4 1447.8 1473.2 1498.6
60 1524.0 1549.4 1574.8 1600.2 1625.6 1651.0 1676.4 1701.8 1727.2 1752.670 1778.0 1803.4 1828.8 1854.2 1879.6 1905.0 1930.4 1955.8 1981.2 2006.680 2032.0 2057.4 2082.8 2108.2 2133.6 2159.0 2184.4 2209.8 2235.2 2260.6
90 2286.0 2311.4 2336.8 2362.2 2387.6 2413.0 2438.4 2463.8 2489.2 2514.6100 2540.0
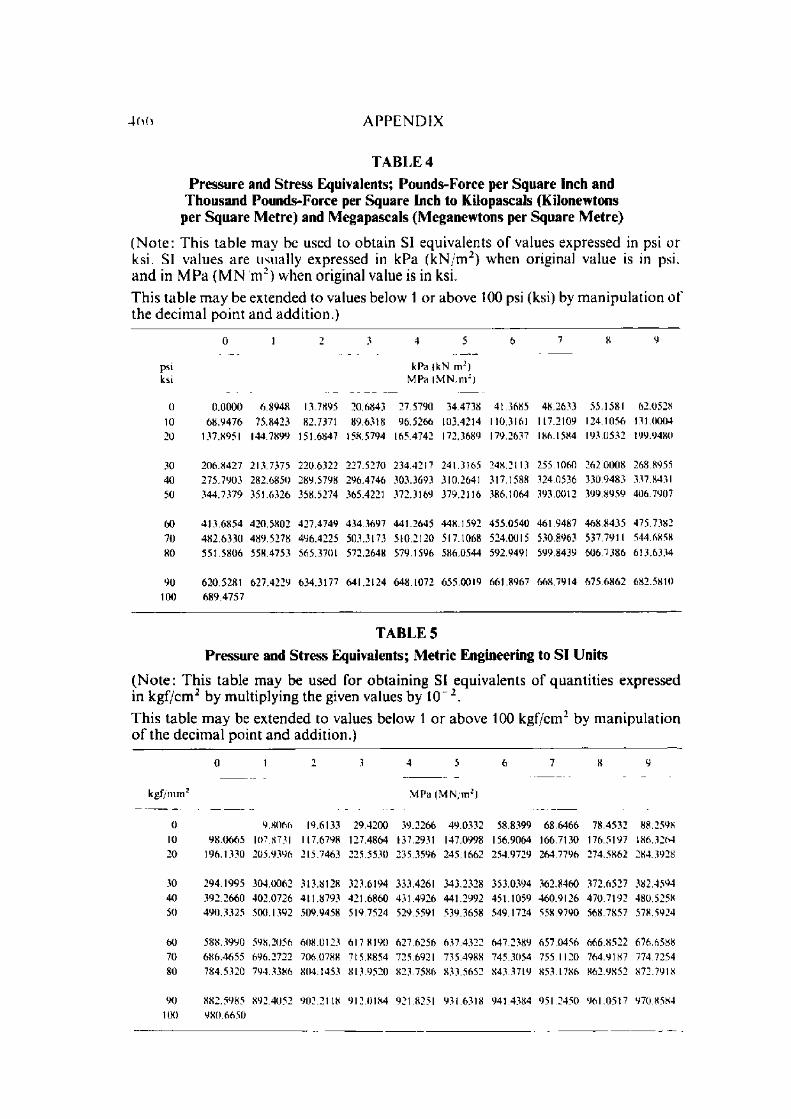
4(>(> A P P E N D I X
T A B L E 4
P ressu re and S tress Equivalents; Pounds-Force per S quare Inch and T housand P ounds-Force per S quare Inch to K ilopascals (K ilonew tons
per S q u are M etre ) and M egapascals (M eganew tons per S quare M etre )
(N o te : T h is tab le m ay be used to ob ta in SI equivalen ts o f values expressed in psi o r ksi. SI va lues a re usually expressed in kPa ( k N / m 2) w hen original value is in psi. a n d in M P a (M N n r ) w hen original value is in ksi.
T h is tab le m ay be ex tended to values below 1 o r above 100 psi (ksi) by m an ip u la t io n o f the dec im a l p o in t and add ition .)
psiksi
0 1 2 3 4 5 6 7 8 9
kPa (kN m2) MPa (M N n r)
0 0.0000 6.8948 13.7895 20.6843 27.5790 34.4738 41.3685 48.2633 55.1581 62.052810 68.9476 75.8423 82.7371 89.6318 96.5266 103.4214 110.316! 117.2109 124.1056 131.000420 137.8951 144.7899 151.6847 158.5794 165.4742 172.3689 179.2637 186.1584 193.0532 199.9480
30 206.8427 213.7375 220.6322 227.5270 234.4217 241.3165 248.2113 255.1060 262.0008 268.895540 275.7903 282.6850 289.5798 296.4746 303.3693 310.2641 317.1588 324.0536 330.9483 337.843150 344.7379 351.6326 358.5274 365.4221 372.3169 379.2116 386.1064 393.0012 399.8959 406.7907
60 413.6854 420.5802 427.4749 434.3697 441.2645 448.1592 455.0540 461.9487 468.8435 475.738270 482.6330 489.5278 496.4225 503.3173 510.2120 517.1068 524.0015 530.8963 537.7911 544.685880 551.5806 558.4753 565.3701 572.2648 579.1596 586.0544 592.9491 599.8439 606.7386 613.6334
90 620.5281 627.4229 634.3177 641.2124 648.1072 655.0019 661.8967 668.7914 675.6862 682.5810tOO 689.4757
T A B L E 5
P ressu re and S tress Equivalents; M etric Engineering to SI U nits
(N o te : T h is tab le m ay be used for o b ta in ing SI equivalen ts o f q u an ti t ie s expressed in k g f /c m 2 by m ultip ly ing the given values by 10~2.
T h is tab le m ay be ex tended to values below 1 o r above 100 kgf/cm 2 by m a n ip u la t io n o f th e dec im a l po in t a n d add ition .)
0 1 2 3 4 5 6 7 8 9
f/nun2 MPa (M N m2)
0 9.8066 19.6133 29.4200 39.2266 49.0332 58.8399 68.6466 78.4532 88.259810 98.0665 107.8731 117.6798 127.4864 137.2931 147.0998 156.9064 166.7130 176.5197 186.326420 196.1330 205.9396 215.7463 225.5530 235.3596 245.1662 254.9729 264.7796 274.5862 284.3928
30 294.1995 304.0062 313.8128 323.6194 333.4261 343.2328 353.0394 362.8460 372.6527 382.459440 392.2660 402.0726 411.8793 421.6860 431.4926 441.2992 451.1059 460.9126 470.7192 480.525850 490.3325 500.1392 509.9458 519.7524 529.5591 539.3658 549.1724 558.9790 568.7857 578.5924
60 588.3990 598.2056 608.0123 617.8190 627.6256 637.4322 647.2389 657.0456 666.8522 676.658870 686.4655 696.2722 706.0788 715.8854 725.6921 735.4988 745.3054 755.1120 764.9187 774.725480 784.5320 794.3386 804.1453 813.9520 823.7586 833.5652 843.3719 853.1786 862.9852 872.7918
90100
882.5985980.6650
892.4052 902.2118 912.0184 921.8251 931.6318 941.4384 951.2450 961.0517 970.8584

IM P E R IA L . M E T R IC A N D SI U N IT S
T A B L E 6 Selected C onvertion F acto rs
To convert from to multiply bya tm osphere (760 mm Hg) pascal (Pa) 1.013 25 x 105board foot m etre3 (nr3) 2.359 737 x 10“ 3Btu (In ternational Table) joule (J) 1.055 056 x 103Btu (In ternational Table) hour watt (W) 2.930711 x 10 1Btu (In ternationa l Table) • in./s • ft2 • F watt metre-kclvin (W in • K) 5.192 204 x 102(A, thermal conductivity) calorie (Internationa! Table) joule (J) 4.186 800*centipoise pascal-second (Pa • s) 1.000 000* x 10 3centistokes metre2/second (m 2/s) 1.000 000* x 1 0 " 6circular mil metre2 (m 2) 5.067 075 x 10“ 10degree Fahrenheit degree Celsius / t = (/ r. — 32)/l .8foot metre (m) 3.048 000* x 10 1foot2 metre2 (m 2) 9.290 304* x 10 2foot3 metre3 (m 3) 2.831 685 x 10 2foo t- po u n d -force joule (J) 1.355818foo t- po u nd - force/ minute watt (W) 2.259697 x 10 2foot/second2 metre/second2 (m /s2) 3.048 000* x 10 1gallon (U.S. liquid) metre3 (m 3) 3.785 412 x 1 0 3horsepower (electric) watt (W) 7.460 000* x 102inch metre (m) 2.540000* x 10 2inch2 metre2 (m 2) 6.451 600* x 10 4inch3 metre3 (m 3) 1.638 706 x 1 0 sinch o f mercury (60 F) pascal (Pa) 3.376 85 x 103inch o f water (60 F) pascal (Pa) 2.488 4 x 10²kilogram-force/centi metre2 pascal (Pa) 9.806 650* x 104kip (1000 lbf) newton (N) 4.448 222 x 103kip inch2 (ksi) pascal (Pa) 6.894 757 x 106ounce (U.S. fluid) metre3 (m 3) 2.957 353 x 10" sounce-force (avoirdupois) newton (N) 2.780 139 x 10 1ounce-mass (avoirdupois) kilogram (kg) 2.834952 x 1 0 2ou nee-mass/ft2 kilogram /metre2 (kg/ m 2) 0.305 152ounce-m ass /yard2 kilogram/metre2 (kg /m 2) 3.390 575 x 1 0 “ 2ounce (avoirdupois)/gallon (U.S. liquid) k i logra m / met re3 ( k g m 3) 7.489 152pint (U.S. liquid) metre3 (m 3) 4.731 765 x 10 4pound-force (lbf avoirdupois) newton (N) 4.448 222pound-m ass (lbm avoirdupois) kilogram (kg) 4.535 924 x 1 0 »pound-force inch2 (psi) pascal (Pa) 6.894 757 x 103pound-mass/ inch3 kilogram/metre3 (kg m 3) 2.767 990 x 1()4pound-m ass /foo t3 kilogram /m etre3 (kg /m 3) 1.601 846 x 10quart (U.S. liquid) metre3 (m 3) 9.463 529 x 10 4ton (short, 2000 lbm) kilogram (kg) 9.071 847 x 102torr (m m Hg) pascal (Pa) 1.333 22 x 102watt-hour joule (J) 3.600 000* x 103yard metre (m) 9.144 000* x 10 1yard2 metre2 (m 2) 8.361 274 x 10“ 1yard3 metre3 (m 3) 7.645 549 x 10 1
* Exact

A P P E N D I X
A B O U T T H E A U T H O R S
R. D. L am a was born in India on A pril 1, 1940 and received the Degree of Bachelor o f Science (with merit) from the Punjab University in 1957 and the D egree o f Bachelor o f Science in M ining Engineering in 1961 from the B anaras H indu University standing First C lass First throughout. H e worked for one year in the Research D epartm ent o f the Bengal Coal Co. and then left for h igher studies to Poland on a G overnm ent o f India Scholarship. D uring the period 1962-66 he w orked in the Academy o f M ining and M etallurgy, Cracow , Poland and obtained the Degree o f D octor o f Technical Science in 1966 with a thesis on rock bursts and mechanical behaviour o f coal seam s in-situ.
In 1967 he jo ined B anaras H indu University as a Reader in Coal M ining where he had been engaged in the teaching o f Rock M echanics, and G round M ovem ent to the post-graduate and under-graduate students. In 1971, he w orked fo r six m onths with the Institute o f U nderground M ining, A kadem ia G orn iczo-H utn icza, C racow , on the problem s associated with the prediction o f crack ing and crack density around tunnels. From Decem ber 1971 to D ecem ber 1974, he worked with Professor L. M uller Salzburg under the p rogram m e SFB-77 o f the G erm an Science Foundation in the Institute o f Soil M echanics and Rock M echanics, University o f K arlsruhe, W est G erm any, on certain aspects o f jo inted rock masses including developm ent o f servo- con tro lled testing facility for studies on jo in ted rock systems. In January 1975, he jo ined the Division o f A pplied G eom echanics, C SIR O , A ustralia, first as a Senior Research Scientist and since July 1976 as Principal Research Scientist w here he is w orking on various problem s o f underground coal mine designs, excavations placed in jo inted rocks, ou tbursts o f gas and coal etc.
Dr. Lam a w as awarded B anaras H indu U niversity G old M edal, N and Lai G o ld M edal o f the B anaras H indu U niversity and R oberton M edal o f the M ining, G eological and M etallurgical Institute o f India for his outstanding academ ic record. He is a m em ber o f the In ternational Society for Rock M echanics, C anadian Institute o f M ining and M etallurgy, Association o f the M ining Engineers and Technicians Poland, the A ustralian Geom echanics Society and Fellow o f the Institu tion o f Engineers (India).Dr. Lam a has published m ore than 50 papers in various journals in the field o f rock m echanics and its applications to m ining.
A B O U T T H E A U T H O R S
V. S. Vutukuri was born in India on Septem ber 22, 1937. In I960 he received the Degree o f Bachelor o f Science in M ining Engineering from B anaras H indu University. He received the Degree o f M aster o f Science in M ining E ngineering from University o f W isconsin in 1965. Between 1960 and 1964 he held the post o f Lecturer in M ining Engineering at Banaras H indu University. H e then went to University o f W isconsin on study leave for postg raduate studies on a W isconsin Alumni Research Foundation Fellowship. A fter com pleting the requirem ents for M. S. Degree, he jo ined the staff o f W hite Pine C opper C om pany and was engaged with them for 6 m onths, in rock m echanics and rock breaking research. In 1966, he returned to Banaras H indu University. He was prom oted to R eader in 1966. In 1970 he emigrated to A ustra lia and joined the University o f New South W ales, Broken Hill Division as Lecturer in M ining Engineering. In 1978 he has been prom oted to Senior Lecturer. In 1975. while on sabbatical leave, he was Research Associate in the D epartm en t o f M ining Engineering o f University o f Newcastle upon Tyne for 5 m onths, Visiting Research Associate in the D epartm ent o f M ineral Engineering o f Pennsylvania State University for 2 m onths and Visiting Professor in the College o f Engineering, G uindy, M adras for 6 m onths. His special interests a re in rock m echanics and rock fragm entation.
He is a M em ber o f the M ining, G eological and M etallurgical Institu te o f India, a M em ber o f the A m erican Institute o f M ining, M etallurgical and Petroleum Engineers, a M em ber o f the In ternational Society for R ock M echanics and an Associate M em ber o f the A ustralasian Institute o f M ining and M etallurgy.
M r. V utukuri has m ore than 30 publications to his credit.

470 A U T H O R I N D E X
Author Index
A fin o g e n o v , Y u .A .A k a i , K. Allely. B .H . A m y x , J. W.
3661194346
A rc h a m b a u l t , G . 13, 15 to 18,41, 162. 171,189 119A rio k a . M.
B adgley , P .C . B am fo rd . W. E. B anks , D .C . B ard en , L.B arla , G .B aro n , G . B a rro n , K. B a r to n , C . M. B a r to n , N . R.
Bass, D. M. Belikov, B. P. B e re n b au m , R. B ieniaw ski, Z .T .
Billings, M. P.Biot, M. A.B je rru m , L.Bock, H.B o g d an o v , A. A.B o h o r , B .F .Borctt i-Onyszkiewicz,W .B o rro so , M. B o w d en , F. P. Brace, W . F.
/, B .T . B ran n e r , G .C . B ray , J.B redd in . H. B r id g m an , P .W . B rink , A. B. A.
Broeh, E.
233 to 235. 240, 248 118377,378 14, 15149 366146,372 249 ,25740. 59. 7 4 ,8 1 ,8 2 ,87 to 9 1 ,9 3 , 299, 300, 302,305see A m ya, J . W . 346318 ,320143 to 146, 1482 7 5 ,2 7 8 ,2 8 1 .2 8 7 to 288,291 ^92413234 84 2251366,367
863, 52, 9735, 101.107, 108. 110, 227. 228, 337 to 33971 35125,41123799see Jennings, J .E .275 .278275. 278
Brodie, I. Bromwell, L .G . Brown, E .T . Brown. W .S .
Bruhn. R. W.
Bunting, E. N. Byerlee, J .D .
Cailleux, A. C h a n d ra , R. C h a p m a n , C. A C happell , B. A. C h en , G .O . C hris tensen , R. C la rk , R .H . C lark . S. P.
C larke , F .W . Cloos, E.C loos. 11. C oates , D. F.
C om es, G . C o o k , N .G . W. C o o n , R. F. C o rd ing , E .J .
C o r th o u ts , L .T C ou lson . J. II.
C urrie . J. B. Cvetkovic, M.
143 to 146, 148 73197, 180. 182, 18376, also see christensen,R . J . - 36. 1004, 6. 9. 11. 23. a lso seeEinstein. H. H. 54.96.97, 178 to 1813344, 19, 2 8 ,3 5 ,3 6 ,4 0 ,5 5 , 59, 69, 73. 76, 93, 99.101. 107. 108,110
231 390 246 56, 59see Sanya I, S. K. 367
1.36. 100 see T u rn e r , F. J. -2 2 5 323, also see D aly ,R. A. 351 207, 2082 3 1 ,2 3 7 ,2 4 3 ,2 4 795, 240, 241275, 276, 278, a lso see B arron . K. 3723620 to 2 2 ,2 5 ,2 8 ,3 6 ,6 1 ,6 7284 .286see Deere, D . U.284 ,285 10, 12, 1334, 56, 63 ,6 7 , 75, 86. 90,94 to 97, 99. 108. 110 234 111
Daly, R. A. 323,351 D 'A n d rea , D. V. 325 D a Silveira, A. F. 254Davis. D. H. D ayre . M. de Camarizo. F .P .
351 ,365 141, 142
see Ruiz, M. D. 39, 42, 92
38.
A U T H O R I N D E X 471
D eere, D. U. 28, 54 to 56, 71 to 74, G o n an o , L. P. 126. 1282 6 2 ,2 6 3 ,2 7 1 ,2 7 2 ,2 7 5 , G o o d m an . R. E. 46, 76. 8 0 .8 1 .9 3 .3 7 9
del C a m p o . A.
278 to 281, 284 to 286. 299 Goosev, B. see G oldste in , M .
111,112. 120. 121377 G ray , D .H . 365
Deiniris , C . A. 126 Griffiths, J .C . 225,227,231D e Sitter, L .U . 229.231 Griggs, D .T . 227, 245, also seeD ew ees, E. J. see T alia ferro , D. B. Turner, F .J . 225
Di Biagio, E.339 G ross m ann.380 N .F . see D a Silveira, A. K
D ieter ich , J. H. 34, 76, 105 254D ixon . R. 11. D o n a th . F. A.
sec T u rn e r . F. J. 225 4 0 .4 2 .6 7 ,7 6 , 166, 168,
G uerreiro , M. 92
172, 173 H abib. P. 365D rak e , L .C . 331 to 333 ,335 to 337 II a levy, E. 380D re n n o n . C. B. 6 3 ,7 0 , 110 H am ontre , H .C . see Rail, C .G .D u b e , A. K. 145, 146 ,346 ,350 339,340D u n c a n , N. 75 ,219 , 222, 265,353.
355, 387 to 389H andin , J. 35, 57, 58, 67. 76, 85,
96 to 98, 102. 103. 10iD u n n e , M. 11. see D u n c an , N. 353, 106. 245. 274
355, 388, 389 Handy, R .L . 63, 70. 1 10D u ra n d , E. 36 H ardy, J .K .
1 lardy, W. B.7373
Einstein , H. H. 4 .6 , 9, 1 1 ,2 3 ,5 4 ,9 6 ,9 7 . Harris, J. F. 250178 to 181 Hayashi, M. 112to 114, 152 to 156
Elliekson, M. L. 23 H eard. H .C . 2^7Engelder, J .T . 110 Heck, W..I. 35,42, 173 to 175Evans, I. 127, 175, 176 Hedley, D .G .F .
Hemstock, R. A.see Barron, K. 372 365
F a irh u rs t , C. 16,265 H endron , A. J. see Deere, D. U.F a tt , I. 365 284,285F ecker , E. 2 ,4 3 to 4 5 ,4 8 , 171 Heuze, F. E. 46. 76, 80, 81Fischer, R. L. 325 Hirschfeld. R .C . 4, 6. 9, 11,23, 187, 18
F isher, C. 398 also see Einstein, H. 196.97. 178 to 181
1 o c a r d i . P. 251 Hobbs, D .W . 3 5 ,4 0 ,4 2 ,6 8 ,6 9 . 146Fogelson , D . E. 325 147. 183, also seeF ran k lin , J. A. 275, 278, 390 Pomeroy, C. D.F ran k lin , R. E. 337 185,186
F r ied m an , M. see L ogan . J. M. 102 I lodgson, R. A. 242, 246
F ru th . L. S. 40. 42, 67, 76 Hoek, E. H ofm ann , 11.
23 ,25 ,30 , 189.411 17, 282. 283
G am ble . J .C . 391,392 Holm. R. 52
G andolH . S. see Focard i, P. 251 Holmes, C. D. 232
Geological H orino, F .G . 23,116. 117Society H orn, H .M . 28, 54 to 56, 71 to 74o f London 272, 275, 278 Hoskins, E. R. 34. 35, 56, 59. 94,Gill lily, J. 20 8 ,2 09 .218 ,221 , 224 100 to 102, 104. 105,Goffi, L. 149 H uber, C. 325Goldstein , M. 111.112, 120, 121 H udson. J. A. 286
472 A U T H O R I N D E X
Hutchinson. J. 84 Lambe, T. W.H utta 1 1 231 Lane. K.S.
Langof, Z.I.S.R.M . 262 to 264, 266, 342, Lauffer, H.
352, 382, 385, 390 Lee. K .L.I.S.R.M. Lee, I. K.
C om m ittee on LeTirant, P.
Laboratory Lien, R.Tests 381 Link. H.Iwasaki, T. see Logan. J. M. 102 Litwiniszyn. J.Jaeger, C. 362 to 364, 366, 368 Locher. H .G .Jaeger, J .C . 20 to 23, 25, 26, 28.34, Logan. J. M.
3 5 ,4 0 to 42, 56,57, Londe, P.59 to 62, 64. 66, 67, 73, Lopes M B .75. 76. 94, 99 to 102.104, 105, 109. also see Louis, C’.Hoskins, E .R . 35 Lundborg. N.
Jahns, R. A. 246 Lunde, J.Jennings. J. E. 275,278Jiminez Salas, M acD onald .J. A. 92 G . J .F .Johansson , C. E. 225 M ah m o u d , A.John , K. W. 27, 166, 168, 170. 171,
183,282,411 Maini, Y. N .T.Johnson, T. W. 105, also see Taliaferro, M anger, G .E .
D.B . 339Judd, W .R . 220,325 ' M arkland , J.T .
M arsden, S. S.Kam h, W.B. 229 (Jr.)
K aw am oto , T. 156 to 159. 162Kirkham , D. 370,371 M artin , R. J.
Kirollova, I. V. 251 M athews, K. E.
Kling, S. A. see Logan, J. M. 102 M aurer, W .C.
K nutson , C. F. 366, 367 M cGill, G .E .
Kowalski, W.C. 346, 348 M cLatchie, A.*
Kragelskii, I. V. 3,46, 51 McWilliams,J .R .
Krsmanovic, D. 30 ,32 ,41 ,62 ,93 ,150 ,151 Mendes, F.Krynine, D. P. 220 de M.Kutter. U .K . 36Kuznecov, G. N. 25 M enter, J .W .Kvenvoiden, Merritt, A. H.K. A. 367 Michel, G.
M idea, N. F.Ladanyi, B. 13, 15 to 18,41. 162,
171,189 Miller, R .P .Lajtai, E.Z. 41, 114, 115, 119,120,
150, 152 Miner, N. A.
Lama, R. D. 3, 30, 40, 42, 64, 66, 67, M irto, M.
76 to 79, 108, 109, 120, Mogi, K.123 to 140. 171 M olnar, P.
7335.42. 173 to 17541.93. 150. 15129054. 9014. 15366299. 300, 302, 30537 230, 31102365. 366, 376 354,355377,378127299, 300, 302. 305
227183, also see Pom eroy . C D . 185. 186266, 375, 377 to 380 323, also see Daly. R .A .— 351 411
367, also see Sanya 1.S .K . 3671106040. 67, 68 183,184365
142, 143
see Da Silveira, A. F. 25473 286 380See Ruiz, M. D. 38,39, 42275,278 to 281 232see Focard i, P. 25119105

A U T H O R I N D E X 473
M olokov, L. 81 to 83 Phillips, F. C. 408 ,410 .416 ,417M ordecai. M. 379 Pine us, H .J. 255M orgenstern . Pirnie. R .M . Ill see Sanyal, S. K . 367N .R . 76 Pirson. S..I. 330,360Morlier, P. 365 Pi tea u, D. R. 265, 266Morris, L .H . 379 Pomeroy, C. D. 127. 175, 176. 183, 185.Moser. H. see Halervy, E. 380 186M otovilov, E.A . see Sm orodinov, Pratt, W .E. 246
M. I. 326. 346.348. Price, G. P. 229349
M otoyam a, 11.Price. N .J . 172, 243, 251.252,346.
187, 188 347Muller. K .E .H . 261 Priest. S. D. 286Muller. L. 2. 17, 166 to 169, 171, Proctor, R. V. 297
259. 282, 283,413Murrell, S .A.F.
Pyrogovsky, N. see Goldstein , M. I l l35, 42 112, 120, 121
M uskat. M. 358Myrvoll, F. 380 Rabinowicz, E. 107
Rae, D. 55Nash, J .K .T .L . 160 to 162 Raleigh, C\ B. 67N azare th , L . j . 398 Rail, C .G . 339,340Nelson, R. A. see Einstein, H. U. Ram ana, Y. V. 327,344,350.351
Newland. P. L.54 ,96 ,97 . 178 to 181 Ram berg, H. 2344 Ramsay, J .G . 232, 236 to 238
Nieble, C. M. see Ruiz, M . D. 38, 39, 42 Raney, J. A. 183.184
Niggli, P. 230 Rengers, N. 29, 30, 40, 43 to 49, 90
N oorishad , J. 375 Riedel, W. 95
Novik, G. 346, 349, 350, 356 Rioux, R. I.. 246
N ovikova, A .C . 251 Ripley, C. F. 54, 90
N utting, P .O . 356 Ritter. H .L . 331 to 333, 335 to 337Robertson, A. M .249 to 251,255,258
( )bert, L. 71 Rocha, M. 40. 266
Ode, H. 234 Rodrigues, F. P. see Da Silveira, A. F.( )linishi, Y. 46. 76, 8 0 ,8 1 .3 7 9 254
Olivier, 11.G. 272, 273 Roegiers, J .C . 265
Olsson, W. A. 40, 42. 67, 76 Roever, W. L. Rosengren, K J .
23423, 26, 34, 42, 56, 57,
Paeher, F. 166 to 169, 259 to 261 59, 64, 66, 75, 76. 94. 100 to 102,104, 105,
Palm strom , A. 286,287 109, 255, also seeParsons, R .C . 275,276 Hoskins, E .R . 35Paterson. M .S. 67, 244 Rowe. P. W. 14, 15Patnode, H. W. 234 Rozanov, Yu. A. see Belikov, B. P.Patton, F .D . 4 to 8, 33, 3 4 ,4 1 ,6 2 , 70, 318,320
7 1 ,7 5 ,9 2 ,9 4 , 271,272, Ruiz, M .D . 38, 39, 42, 92, 274also see Deere, D. U. Rzhevsky, V. 346,349, 350, 356284, 285
Peck, R .B. 84,370 Sabarly, F. 365,366, 376Pentz, D .L . 30 Sander, B. 233Petty, S. see D u ncan , N. 353,
355, 388, 389Sanina, E.A. see Belikov, B. P.
318,320

4 7 4 A U T H O R I N D E X
Sanyal, S. K. Sapegin . D. I). S ard a , J .P . Schiller, K. K. Schm echel, F. W. Schneider, H .J . Scholz, C. H. Serafim , J. L.
S harp , J .C . Sheerm an-C'hasc A.Singh, B.S kem pt on. A. W. Skinner, E. I I. Smiles, D. E. S m orod inov , M.I.Snow , D .T . S p ru n t , E .S. S tam er, R. S tap ledon . D. U. S tearns, I). W. Stini, J. Sum m ers , R. S w anson , S. R.
T a b o r , D. T a lia fe rro , D. B.
T ay lor, G . L. T erzagh i, K. Terzaghi, R. D. T hiem , G. Tickell, K G . T iedem an n, H.R.T im ch en k o , I. P.
T ro llope , D. H. T ru m p . R. P.Tsc he hot a rioff, G .P .T u linov , R.
T u rn e r , F .G . T u rn e r , F .J .
367303663477140. 64. 65 105. I 1092, 354. 355, 357,358 .377266, 375. 379
7 5
145. 146.346.35084295371. 372
326, 346. 348. 349 377337 to 339 258275, 27867 282110see C hristensen. R .J .36. 100
3, 52, 97339. also see Rail, C. G. - 3 3 9 , 340
2 5 0
84 ,259 ,261 .282 ,295 .370267, 268 369394. 396, 397
292 to 295, 298 see Belikov, B. P.318. 320 2 .1 7 9 .1 8 0234
54, 71, 7281 to 83. also see G o lds te in , M. 111.1 1 2 , 1 2 0 . 1 2 1
232225 to 227
T urovskaya, A.
Uff, J. F.U nderw ood,E .E.Uriel. S.U.S. Bureau o f Reclamation U.S. Task C om m ittee for F oundations Design Manual
Van Krevelen. D .W .V enkatanara- yana , B.Volkov, V. A.
Vouille, G.
W agner, G. W ahlstrom . E. E W alker. P.E. W alper. J.L . W alsh , J.B. W ard , P. R. B. W ashburn , E. W W aters, A .C. Wawersik, W .R Weibull, W. W einert, H .H . Weiss. L.E. Welch..I. D. W hite . T .L . W hiting, R. L. W hitm an , R. V. W ickham , G .E . W illard. R.J. Williams, A .A .B .
Willis, B.Willis, R. W ohnlich , H. M W oodfo rd . A .O W urzel. P. W yble, D. ().
see G oldste in , M. 1 1 1 . 1 1 2 . 1 2 0 . 1 2 1
160 to 162
25792
34,372 to 374
272
337
327,344.350.351 sec Sm orodinov , M .I
326, 346, 348, 349 365
->.253 ,254 . 270
120 to 122, 161 to 165 250108 380
. 334208.209. 218.221, 224
. 76126 270 22554, 71. 72 297see Amyse, J . W. 34673292 to 295, 298 142.143
sec Jennings, J. E.275,278 241. 243 243 i
. 2 0 8 ,2 0 9 ,2 1 8 ,2 2 1 ,2 2 4 380 365
A U T H O R I N D E X 475
Y a m a m o to . K. 1 19Y evdokim ov,P .D . 30Y ouash , Y. Y. 141. 175 to 178Y oung , J. W. 365Y oungs, E .G . 371.372
Zalesskii. B. V. see Belikov, B.P.318,320
Zell hol er. (). see Ha levy, E. 380Z uber , A. see 1 la lew . E. 380
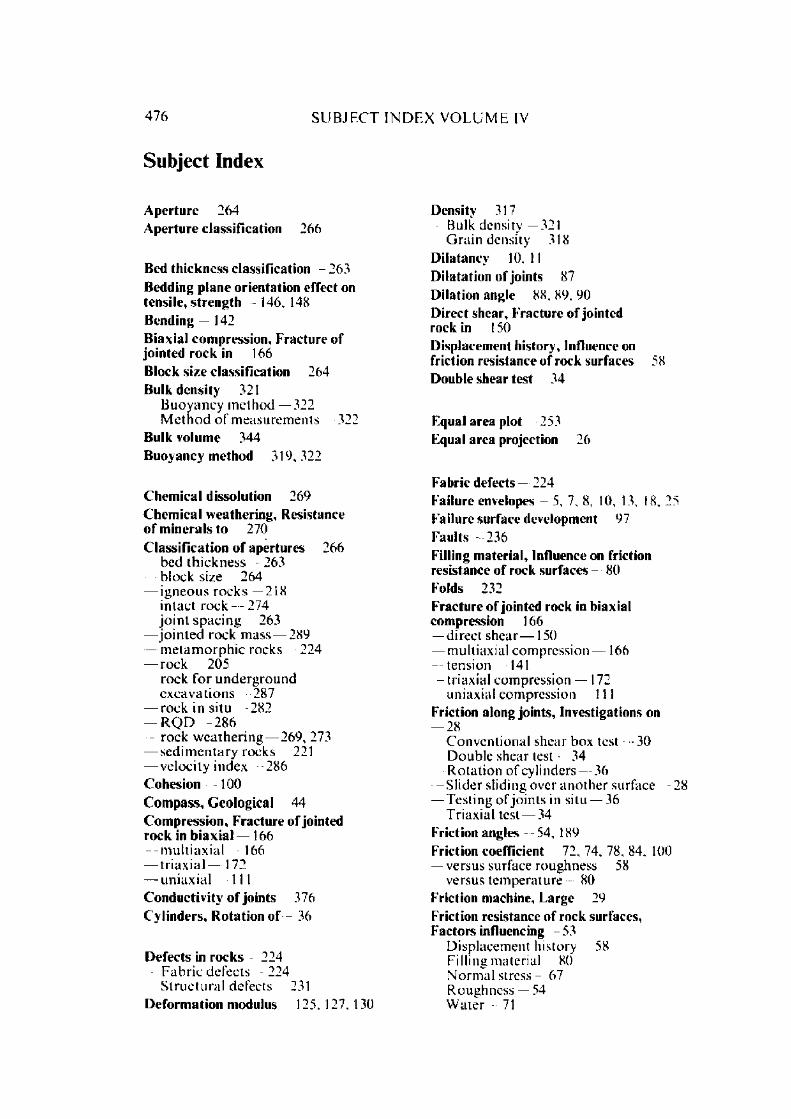
47 6 s u b j e c t i n d e ;x V O L U M E IV
Subject Index
A perture 264 A perture classification 266
Bed th ickness classification 263Bedding plane orientation effect on tensile, streng th 146,148 Bending 142B iaxial com pression, F racture of jointed rock in 166 Block size classification 264 Bulk density 321
Buoyancy m ethod -322 M eth o d o f m easurem ents 322
Bulk volume 344 Buoyancy m ethod 319, 322
Chem ical dissolution 269 Chem ical w eathering, Resistance o f m inerals to 270 C lassification o f apertures 266
bed th ickness 263 block size 264 igneous rocks -218 in tact rock 274 jo in t spac ing 263 jo in te d rock mass 289 m e tam o rp h ic rocks 224 rock 205 rock fo r underground excavations 287 rock in situ 282 R Q D 286rock w eathering 269, 273 sed im en tary rocks 221 velocity index 286
Cohesion 100C om pass, Geological 44 Com pression, F racture of jointed rock in b iax ial -166
m u l t ia x ia l- 166 triaxial 172 uniaxial 111
C onductivity o f joints 376 C ylinders, R otation of 36
D efects in rocks 224 F ab ric defects 224S t rue t u ra 1 de fects 231
D eform ation modulus 125. 127, 130
Density 317Bulk density 321 G ra in density 318
D ilatancy 10,11 D ilatation o f joints 87 Dilation angle 88, 89. 90 D irect shear. F racture of jointed rock in 150Displacement history, Influence on friction resistance of rock surfaces 58 Double shear test 34
Equal area plot 253 Equal area projection 26
Fabric defects 224Failure envelopes 5, 7, 8, 10, 13, 18, 25 Failure surface development 97 Faults 236Filling m aterial. Influence on friction resistance of rock surfaces 80 Folds 232Fracture of jointed rock in biaxial compression 166
direct sh ea r— 150 multiaxial compression 166 tension 141
-triaxial compression 172 uniaxial compression - 111
Friction along joints. Investigations on28Conventional shear box test 30 Double shear test 34 R ota tion o f cylinders —36 Slider sliding over ano ther surface 28 Testing o f jo in ts in situ 36Triaxial test — 34
Friction angles 54,189 Friction coefficient 72, 74, 78, 84. 100
versus surface roughness 58 versus tem perature 80
Friction machine, Large 29 Friction resistance of rock surfaces,Factors influencing 53
Displacement history 58 Filling material 80 Norm al stress 67 Roughness — 54 W ater 71

S U B J E C T I N D E X V O L U M E IV 47 7
Geological classification of rocks 216Igneous rocks 217 M et a morp h ic rocks 223 Sedimentary rocks 217
Geological compass 44 Grain density 318
Buoyancy method -319 Pycnomctric method 318
Grain s i /e 393 Grain volume 339
Boyle's law method 339
Igneous rocks 217Chemical composi t ion 208 Classification 218 Minera ls associated with 219
In situ testing of joints 36Intact rock classification 274
Modu lus ratio 278 Strength 278
J o in t a n a ly s i s 249Joint, Behaviour during sliding along 28 Joint continuity 138, 256 Joint frequency 249 Joint length 256 Joint orientation. Double 24
Mul t ip le- 24 Single 19
Joint plane, Stereographic projection of 409
Joint rose 254 Joint roughness 262 Joint spacing classification 263 Joint surface roughness
Descript ion 46 Recording 43
Joint surfaces. Physical process of sliding between 93Joint survey 249
Errors in 267Joint, Theory of sliding along a 3 Joint thickness 262 Jointed rock, Fracture in biaxial compression 166
direct shear 150 multiaxial compression 166 tension 141triaxial compress ion -17 2 uniaxial compress ion 111
Jointed rock, Mechanical behaviour of 1
Joints 240Conduct ivi ty o f 376 Di latat ion o f 87 Friction a long 28 Scale effect in 91 Testing in situ 36
Joints, Mutual area of contact of surfaces along 50
Adhesion method 52 Electrical resistance method 52 Light deflection method 53
Rirkham's method 370Kobe porosimeter 324Lamination orientation effect ontensile strength 147Lithological classification of rock 274Loading sequence in testing of jointproperties 41
Mechanical behaviour of jointed rock I Mechanical weathering 268 Metamorphic rocks 223
Classification 224 Microscope, S tereo depth m easurem ent
43Minerals 206
Associated with igneous rocks 219 Properties o f rock-forming minerals 209
Modulus 122Multiaxial compression. Fracture of jointed rock in 166
Normal stress. Influence on friction resistance of rock surfaces 67
Open-end test 372
P acker test 373 Permeability 356
Relat ionship with poros ity 356 Permeability coefficients 357 Permeability of rock masses in situ 368
Ki rkham's method 370 —Open-end test 372
Packer test 373 Thiem's method 369
Pore volume 329Gravimetr ic method 329 Volumetric method 329
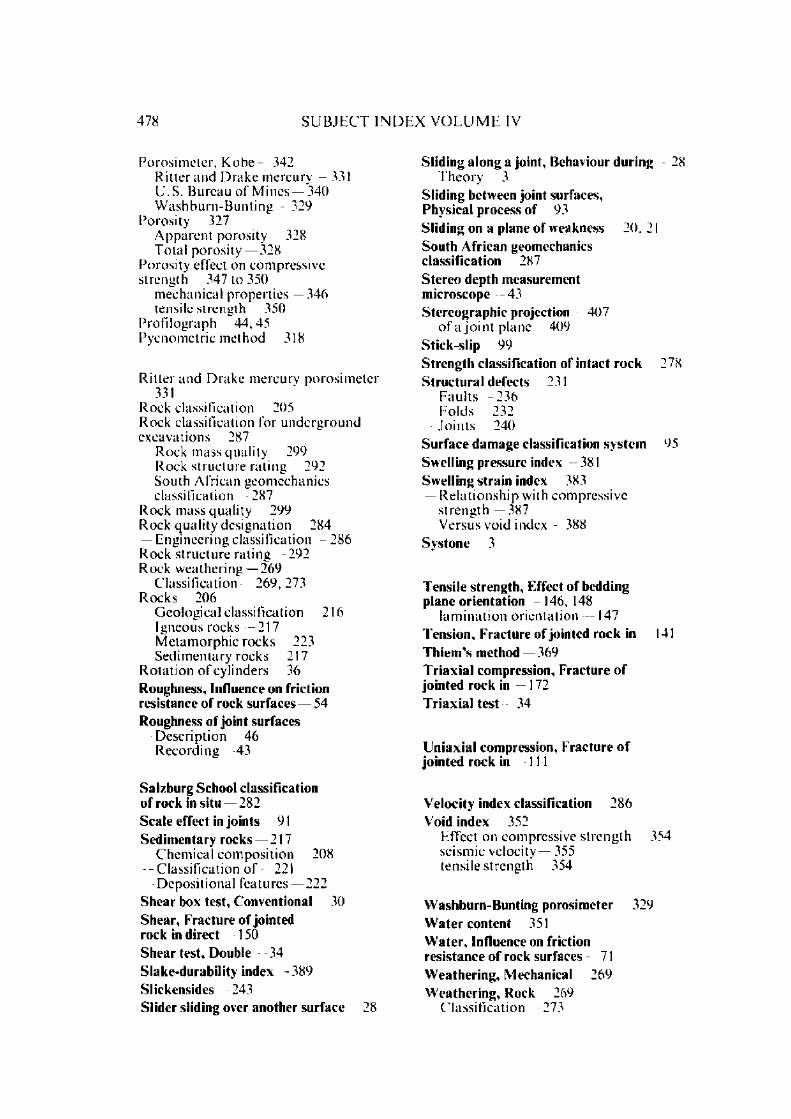
478 S U B J E C T I N D E X V O L U M E IV
Porosimeter, Kobe 342Ritter and Drake mercury 331 U.S. Bureau o f Mines — 340 Washburn-Bunt ing 329
Porosity 327Apparent porosity 328 Total porosity —328
Porosity effect on compressive strength 347 to 350
mechanical propert ies- 346 tensile strength 350
Profi lograph 44.45 Pycnometric method 318
Ritter and Drake mercury poros imeter 331
Rock classification 205Rock classification for undergroundexcavations 287
Rock mass quali ty 299 Rock s tructure rating 292 South African geomechanics classification 287
Rock mass quali ty 299 Rock quali ty designat ion 284
Engineering classification 286 Rock st ructure rating -292 Rock weathering 269
-Classification- 269,273 Rocks 206
Geological classification 216 Igneous rocks 217 Metamorphic rocks 223 Sedimentary rocks 217
Rotat ion of cylinders 36 Roughness, Influence on friction resistance o f rock surfaces 54 Roughness of joint surfaces
Description 46 Recording 43
Salzburg School classification of rock in situ - 2 8 2 Seale effect in joints 91 Sedimentary rocks 217
Chemical composi t ion 208 -Classification o f 221
Deposi tional features 222 Shear box test. Conventional 30 Shear, Fracture of jointed rock in direct 150 Shear test. Double 34 Slakc-durability index 389 Slickensides 243Slider sliding over another surface 28
Sliding along a joint. Behaviour during 28 Theory 3
Sliding between joint surfaces.Physical process of 93 Sliding on a plane of weakness 20. 21 South African geomeehanies classification 287 S tereo depth measurement microscope 43 Stereographic projection 407
o f a jo in t plane 409 Stick-slip 99Strength classification of intact rock 278 S tructural defects 231
Faul ts 236 Folds 232 Joints 240
Surface damage classification system 95 Swelling pressure index 381 Swelling strain index 383
Rela t ionship with compressive s trength 387 Versus void index 388
Systone 3
Tensile strength. Effect of bedding plane orientation 146.148
l aminat ion orientation 147 Tension, Fracture of jointed rock in 141 Thiem ’s method 369 Triaxia l compression. Fracture of jointed rock in 172 Triax ia l test 34
Uniaxial compression, Fracture of jointed rock in 111
Velocity index classification 286 Void index 352
Effect on compressive s t rength 354 seismic velocity 355 tensile strength 354
Washburn-Bunting porosimeter 329 W ate r content 351 W ate r , Influence on friction resistance o f rock surfaces 71 Weathering, Mechanical 269 Weathering, Rock 269
Classification 273

A U T H O R I N D E X V O L U M E S I-IV 479
Author Index for Volumes I-IV
Absi. E. Ill 87 Armbruster , J. (see Agearwal , Y. P.Adachi . K. (see Mesri. G. 11 II 170)
357,379,390,419) Arthur . J . R . F . II 137A dams , F. I). II 99. 162. 163, 321, A . S . T .M . I 36,183:11 3,
338 . 346. 353, 372, 389. tv ) 2^3412 . 4 4 9 ; I I I 211 Atchison, T.C. II 352,387.391
Addinal l . E. 1 108 to 110. 118. 119: Atkinson, J. 11 11 — 139Adler. L. 1 96:11 48.49,51 Attewell. P.B. II 118, 131,224,262,Afanascv, B.G. III 278,311 448:111 282,285Afinogenov, Yu. A. IV - 3 6 6
Auberger, M. Avedissian,
II 224
A fro uz, A. III 250, 251.260 Y .M . II 343,379,380,420,Aggarwal , Y. P. II 170 439. 443. 444
Ahlvin. R .G . III 27 to 31 Avila, F .P . II 326. 327, 351, 352Ahrens , T. J. 11 266 A v ram ova-Ainsworth . L). L. II 71. 326, 359,452 Tacheva, E. II 384:111 126,
128,129Aisenstein. B. II 329Akai, K. IV 119Alas, M .C . 111 85 Bacon, L. 11 300
Albrecht , H. III 245, 369 Badgley, P.C. IV 232 to 234, 239, 248Aldrich, M.J . I - 208,209 Baidyuk, B. V. I 180to 182; IIIAlekseev, A. D. I 33. 43. 44. 49 235.308
Alexander, E.G. III 353, 357 Balia, A. 1 15,16
Alexandrov, K. II133.
121. 123. 125. 131. , 135
Balmer, G . G . 1 234; II — 320, 325. 350. 355. 357, 366, 373,
Allely. B.H.374,401,402,413,432,
IV 4 433. 436. 442Amyx, J .W . IV 346 Bam ford. W. E. II 119,327,360,400,Anderson. F. A. (see Wallace, G. B. 4 4 8 ; IV 118
II -320 ,348 ,436; Bancila, I. II 419;1II 349;III 47); III 46.74. (also see Priscu, R.81,:S2 Ill 355)
Anderson, O. L. I I - 199,200. 202,204, Bancroft, D. II 224,265,266,338,206..209,21 0,213 ,214, 339, 344 to 348, 354.233 364. 388. 389,401,403,
Anderson, W. F. III 83 404 ,433,447 ,449,451Andrade. E. N. Banks, D. C. IV 377,378da C\ III 239 Barber, E. S. III 35Andric, M. III 341 Barden, L. IV 14.15A nonym ous 111 176 Barioli, E. III 339Antonides , L. E. III 210 Barla .G. II 123, 133; IV 149Aoki . K. III 341 Barnard. P. R. I - 2 5 8 . 2 6 2
A ram buru. J. A. II 135 Baron, G. II 2 7 3 ; IV 366
Arch am b au l t .G . IV 13. 15 to 18.41. Barron, K. (see Cochrane, T. S.16~> 171 1XQ 11 405 ) ; 111 137. 138.
' 140. 141. 143.209, 263;Arguelles, FI. III 359 IV 146,372Arioka, M. IV 119 Barroso. M. III 148
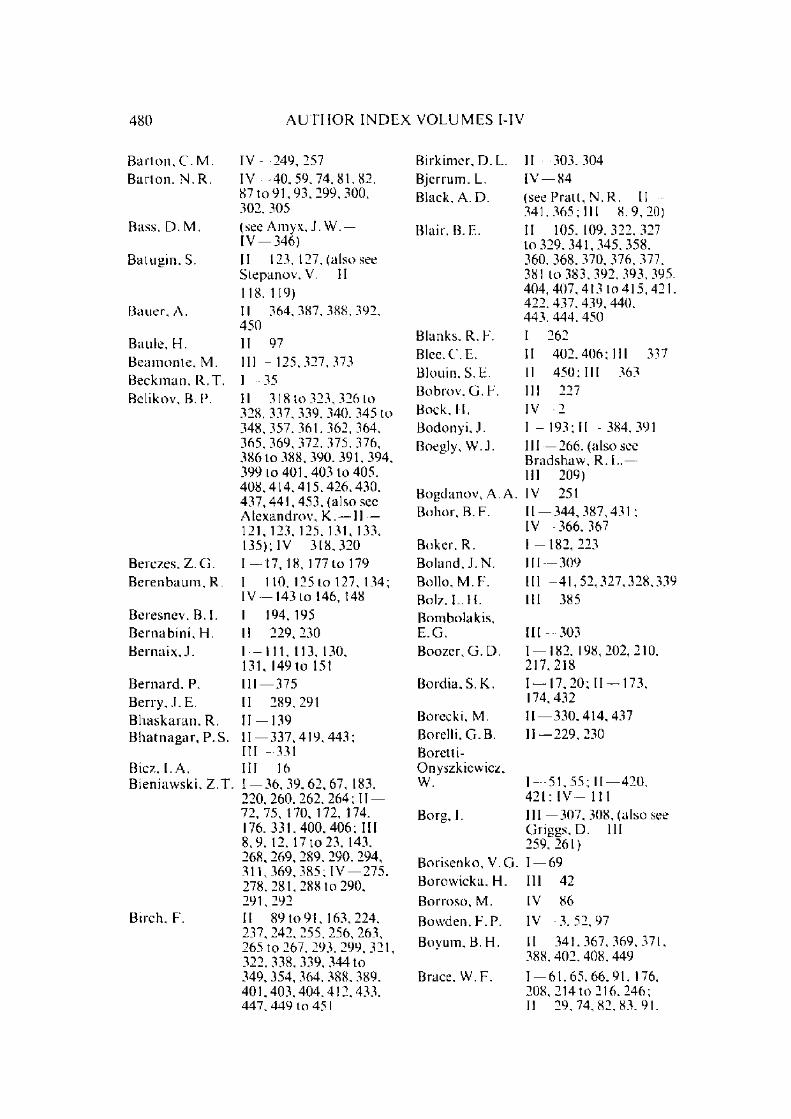
4 80 A U T H O R I N D E X V O L U M E S I-IV
Barton. C. M. IV 249.257Bar ton. N. R. I V — 40. 59 ,74 .81.82.
87 to 91,93, 299,300, 302,305
Bass. L).M. (see Amyx, J. W. IV -346)
Batugin, S. II 123,127, (also see Stepanov, V. II 118.119)
Bauer , A. II 364.387,388,392. 450
Baule, H. 11— 97Beamonte . M. III 125,327,373Beckman, R .T . 1— 35Belikov, B.P. II 318 to 323, 326 to
328, 337, 339, 340. 345 to 348,357 .361 .362,364 . 365, 369, 372. 375, 376. 386 to 388, 390. 391,394, 399 to 401. 403 to 405. 4 08 .41 4.415 ,426 .430. 437,441. 453. (also see Alexandrov, K. II 121. 123, 125, 131, 133, 135); IV 318,320
Berczes, Z. G. I —17, 18, 177 to 179Be re n bau in. R. I 110,125 to 127, 134;
IV 143 to 146,148Beresnev, B. 1 1 194,195Bernabini , H. 11 229,230Bernaix, J. I 1 1 1 .113.130.
131, 149 to 151Bernard . P. III - 375Berry 1 F II - 2 8 9 , 291B haskaran. R. II 139Bha tnaga r , P. S. II -3 3 7 ,4 1 9 ,4 4 3 ;
III 331Bicz. I. A. III 16Bieniawski, Z . T . I - 3 6 ,3 9 ,6 2 , 6 7 , 183,
220, 260. 262, 264; II - 72, 75, 170, 172, 174. 176,331.400. 406; III 8 ,9 . 12, 17 to 23. 143. 268.269.289. 290. 294. 311,369, 385; IV — 275, 278,281, 288 to 290,291 292
Birch, F. I I — 89 to 91, 163,224, 237, 242, 255, 256, 263, 265 to 267, 293.299,321. 322,338,339, 344 to 349, 354. 364, 388. 389. 401.403 ,404.412 .433. 447. 449 to 451
Birkimer, D. L. I I - 303,304Bjerrum. L. IV — 84Black. A. D. (see Pra tt , N. R. II
341.365:111 - 8 . 9 , 2 0 )Blair, B.E. II 105. 109.322.327
to 329 ,341,345,358 ,360. 368. 370, 376, 377. 381 to 383,392, 393, 395. 404, 407. 413 to 415, 421. 422. 437. 439. 440.443. 444. 450
Blanks. R .F . I 262B l c c X . E . II 402.406; III 337Blouin. S. E. II 450; III -363Bobrov, G. F. III 227Bock, H. IV - 2Bodonyi, J. I 193; II 384,391Boegly. W.J. 111 266. (also see
Bradshaw, R. L.— III 209)
Bogdanov, A. A. IV 251Bohor, B. F. I I - 344,387,431;
IV 366.367Boker. R. I 182,223Boland, J. N. III 309Bollo, M .F . 111 41,52,327,328,339Bolz, L.H. III 385Bombolakis.E .G . III 303Boozer, G. I). 1— 182, 198,202,210.
217, 218Bordia, S. K. I 17,20; II 173,
174.432Borecki, M. II - 3 3 0 , 4 1 4 ,4 3 7Borelli, G. B. 11— 229, 230Boretti-Onyszkiewicz,W. I 51,55; II 420,
421: IV 111Borg, I. III 307, 308, (also see
Griggs, D. Ill 259, 261)
Borisenko, V. G. 1— 69Borowicka. H. III 42Borroso, M. IV— 86
Bowden, F. P. IV 3 .52 ,9 7
Boyum. B. H. II 341,367,369,371, 388,402, 408, 449
Brace. W.F . I 61 .65 .66 .9 1 . 176. 208, 214 to 216. 246;II 2 9 .7 4 .8 2 ,8 3 .9 1 .

A U T H O R I N D E X V O L U M E S I-IV 481
Bradley. W. B. Bradshaw, R. L. Brady. B.T.
Bragg, W. L. Brandon, T. R.
k a n nor. G . C . i ra t ton , J. L.
Jravo, G.3ray,J.Sreddin. 11 . i redthauer .
Sreyer-Kassel, I '
Bridgman. P. W
$righenti, G. *rink, A .B .A .
iri to, S. i roberg, K. B. i roch, E.3rock, G. Srodie, I.
Cromwell, L. G. 3rook, N.3looker, E. W. iroul, J. i rown, E. L. k o w n , E.T.
Brown, J. H.
104 to 106. 108, 117, 143. 160 to 163, 170, 174, 180,224, 263,339,343,361 , 385, 391.407,III 294,303.384;IV 35. 101. 107, 108.110, 227, 228, 337 to 339, (also see Prat t . H. R.II 341.365; III
8. 9. 20)I I I— 385III 209, 254. 266. 267I 23,66. 180; II 99;IV 7111— 97II 320,322,324,325, 329, 330, 337. 351,358,364, 366, 370, 377, 405, 415 to 418. 434. 435,437 ,438 ,443,452IV 351II - 3 3 7 , 3 8 0 , 3 8 1 , 4 2 0 ,439.442III 341IV - 2 5 , 4 1 1 IV 237
III 307,308
II 321,323,338,346.354, 449II 170; III 294;IV 99I 61(see Jennings, J .E.IV 275,278)III 359III 384IV 275,278I 262I 1 10, 125 to 127, 134; IV 143 to 146, 148 IV — 73I 76II — 87I 164,167,168, 170II 320,359I 6 5 ,6 7 .9 9 , 101, 108.119,257. 259.261; II 62; III 143; IV 170. 180. 182, 183I 29 .30
Brown. J. W
Brown, W. S.
Bruce. W.E. Bruckshaw, J. M. Brugman, B.J. Bruhn. R. W.
Buben, J.
Bueky, P.B. Budiansky, B. Bukovansky, M.
Bunting, D. Bunting, E. N. Bur, T. R.
Burdin, N.T. Burcin. L.
Burmister, D. M Burshtein, L.S. Busehing, H. W. Butcher. B.M. Butler, M E.
(see Clark. G. B.II 343 ,348.36 3,408 , 430, also see Deklotz.E.J. II 92 ,351)I 198, 199; II 173,176. (also see Pratt .H .R . II 341,365;III 8. 9, 20; C hr is ten sen. R..I. - I V - 36,100). Ill 232 to 234, 244. 246. 248. 250. 252. 2 6 0 ,270 t o 272; IV 76I — 76II 224I I I — 73IV 4 , 6 , 9 , 11.23, (also see Einstein, II. 11.IV 5 4 . 9 6 .9 7 , 1 7 8 to 181)(seeSibek ,V. II 340,367)III 187II 102III 168 ,331 ,333 ,349, 357,359I — 33IV — 334II 243 ,245 ,262 ,263,285. 287. 288. also see Thill. R .E . II 136III - 2 8 1II - 240 , (also see Rinehart . J. S. II267,268 ,341 .363.364 . 36 7 .3 87 .3 95 .400 .4 02 , 435,441 ,445)III 35 to 37I 55II 141III 235(see Ward. W. I I.II 139)
Byerlee, J. D. I 197; II - 1 7 4 . 1 7 6 ;IV 1 9 ,2 8 ,3 5 .36 .4 0 . 5 5 .5 9 .6 9 .7 3 ,7 6 .9 3 .9 9 , 101. 107, 108. 110
Cailleux, A. Cain, P. J. Calder, P. N.
Carati , L.
IV — 231III 2 8 1 .2 8 2 .2 8 6 ,2 8 7II 36 4. 387 ,3 88 ,392 , 450(sec Scalabrini, M.III 337)

482 A U T H O R I N D E X V O L U M E S I-IV
Carey, S. W. Ill 219 Clark . H. II 163Car ter , N .L . 111— 235 Clark , R .H . (seeTurner. E.J.Car ter , O.K. (see Cochrane, T. S. Ill 307; IV 225)
II 405) Clark , S. P. II 150, 152, 154. 358;C a ru g o , G. (see Scalabrini, M. IV — 323, (also see D a ly
Ill 337) R. A. 351)
Caudle , R. I). II 352,361,38 5,424 Clarke. E. W. IV 207.208
C h ab a i , A .J . II 165 to 169 CIoos. E. IV 232,237,243,247
C h ak ra v a r ty , S. 111 256. 308 Cloos. 11. IV 95.240.241
Cham ber la in . C M J G III 345P .G . I 93,13 6; II 270.
271 ,274,275,290, 292Coates , D .E . II 328.329.337.339.
346, 360. 368. 383. 388.C h a n , S. S. M. 11 407 to 410 401,403 .407 .423.44 0.
C h a n d r a , R. IV -3 9 0 442; III 45, 143: IV 275. 276, 278. (also see
C h an d ra s - Barron, K. IV 372)I I A A CT 4 1 / \hekh ara . K. I 125 to 127. 138 Cochrane. T.S. II 405.410
C h an g , C. Y. 11— 82 Cogan, .1. III 331C haou i , A. 111 18 Coker , E .G . II 321,338,346,353,C h a p m a n , C. A. IV 246 372,389,412,449C h a p m a n n , E.J. III 337 Colback, P. S. B. I 51 to 53, 57 ,58, 110.C h a p m a n , Ci. P. I 262 137Chappel l . B. A. IV 56,59 Colic. B. III 129,130, (also seeCh a r lam b a k is , S. (see Brown. E. L. Kujundzic, B. Ill
II -320,359) 59, Radosvljevic, Z.
Char les. R..1. III 304 Ill 329)
C h e n . G . O . (see Sanyal. S. K. IV -367)
Comes, G. III 83,85. 112. 113, 169, 367. (also see Mary.M. Ill 373,375);
C'henevert , M. E. II 127. 131,232,234, IV 36378 C ondon , J. L. 11— 391
Chercasov, 1.1. III 139 Cook, N . G . W. I 2 7 ,2 8 ,4 3 ,2 1 9 ,2 2 1 ,Cherry , J .T . II 170 222, 247, 258,262, 265;C h esh an k o v a , K. — 11 — 384 II 99,170:111 8.12.Ch i rk ov, S. E. II -3 1 8 ,319 ,3 23 ,333 ,
385.426. 441. (also see Yagodkin, G. 1. II
13.22, 52,87, 102, 292. 304; IV 20 to 22, 25, 2 8 ,3 6 ,6 1 ,6 7
322,323,333,415, Coo per , A. F. 11— 450424 to 426) Coo per . H E. III 363
Chris tensen, N. I II 125II 90,451: III 132,Cording, E.J.
Chr is tensen. R. J , IV 36. 100 343, 347, 349, 353. 355,C h u d ek , M. II —330,414,437 357. 365. (also seeC h u g h . Y. P. III - 2 1 0 . 2 4 7 .2 4 8 .2 8 0 . Deere, D . U . - III
281,288 124 to 126; IV 284.Chu p r ik o v , I. K . (see Grishin, M. M. 285)
Ill 41) Cornish . R .H . III 235C h u ra k o v , A . I . (see Grishin, M. M. Corns , C. R. II 326,327,379,452
Ill 41) C or t hou t s . L.T. IV 10.12,13C lark , G . B . II 236.343.348.352,
III 239 ,299 ,301,302361, 363,385 ,408,424 , Cottrell . A.M.430: III 4 3 , (alsosee Coulson. .1.11. IV 34 ,56 ,63 ,67 ,75.Lehnhoff, T. F. II 86, 90, 94 to 97, 99.325) 108.110
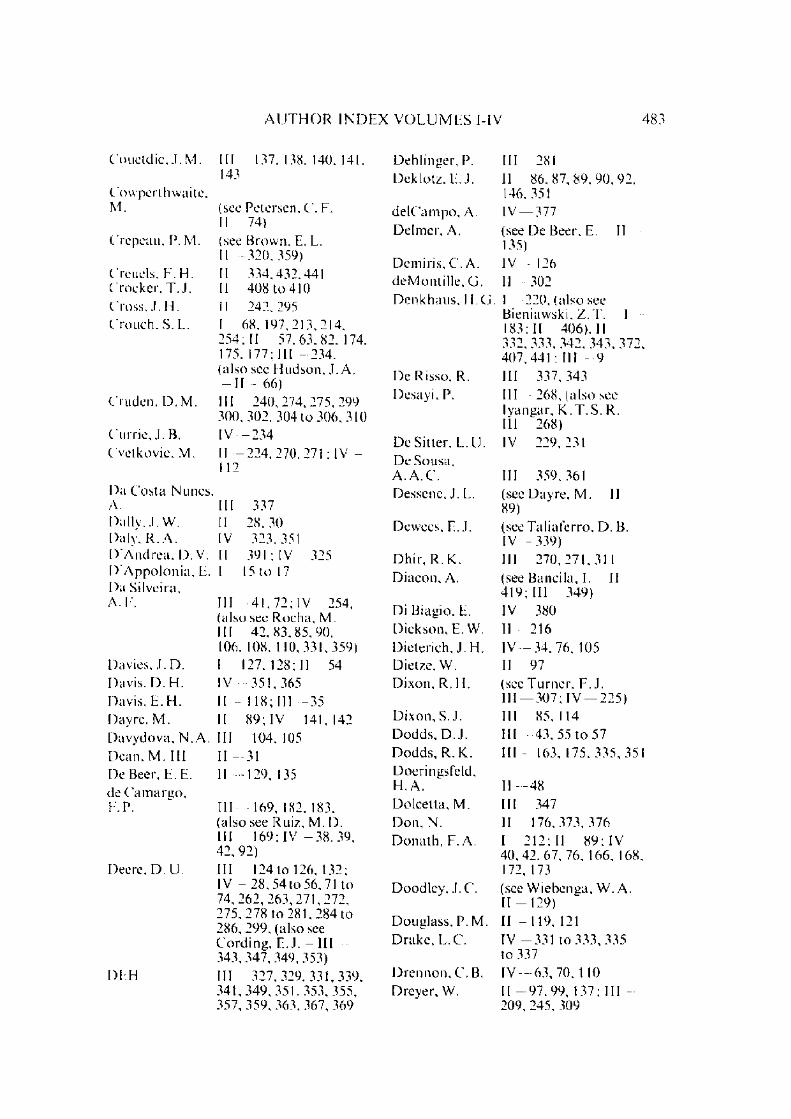
A U T H O R I N D E X V O L U M E S I-IV 483
Couetdic. J. M.
Cow per th waite, M.
Crepeau. P. M.
Creuels, F. II. Crocker, T. J. Cross. J. H. Crouch. S. L.
Cruden, D. M.
Currie, J. B. Cvetkovic. M.
P a Cos ta Nunes. A.Dally,.I. W.Daly, R. A.D ’Andrea . I). V.I VAppolonia , H. P a Silveira,A. F.
Davies, J. D. Davis, D. H. Davis, E. H. Dayre. M. Davydova, N. A. Dean, M. Ill De Beer, E. E. de Cam arg o ,F. P.
Deere, D. U.
1)1 II
III 137. 138. 140. 141, 143
(see Petersen, C. F.II 74)(see Brown. E. L.II 320,359)II 334,432.441II 408 to 410II 242.295I 68. 197.213,214,254; II 57 ,63,82, 174. 175.177:111 234.(also see Hudson. J. A.
11— 66)III 240.274,275,299 300, 302, 304 to 306, 310IV - 234II -224, 270, 271; IV1 1 2
III 33711 28.30IV 323,351II 391; IV 325I 15 to 17
III 41 ,72 ; IV 254. (also see Rocha. M.III 42 .83.85 .90 .106, 108, 110,331,359)I 127, 128; II -54IV 351,365II 118; III 35II 89; IV 141.142III 104,105II 31II 129,135
III 169, 182, 183,(also see Ruiz, M. D.Ill 169; IV 38,39,42, 92)III 124 to 126, 132;IV 28, 54 to 56, 71 to 74, 262,263,271,272, 275, 278 to 281. 284 to286, 299, (also see Cording, E.J. Ill 343, 347,349, 353)III 327 ,329,331,339 , 341,349, 351, 353, 355,357, 359, 363, 367, 369
Dehlinger. P. Deklotz, E.J.
delCampo, A. Delmer , A.
Demiris, C. A. de Monti lie, G. Denkhaus . H G
De Risso, R. Desayi, P.
De Sitter, L .U. De Sousa,A. A.C. Dessene, .1.1..
Dewees, E. J.
Dhir, R .K. Diacon, A.
Di Biagio, E. Dickson, E. W. Dieterich, J. H. Dietze, W. Dixon, R .H .
Dixon, S. J. Dodds , D.J. Dodds , R .K . Doeriimsfeld,H. A.Dolcetta, M. Don, N.Don a th , F. A.
Doodley, J .C.
Douglass, P. M. Drake, L.C.
Drennon , C. B. Dreyer, W.
III 281II 8 6 , 8 7 ,8 9 , 9 0 ,9 2 ,146, 351IV — 377(see De Beer, E. II 135)IV 126II 302I 220 , (also see Bieniawski, Z . T . — I 183; II 406), II332, 333, 342, 343, 372, 407,441; III 9III 337,343III 268, (also see Iyangar, K . T. S. R.III 268)IV 229,231
III 359,361(sec Dayre. M. II 89)(seeTal iafer ro , D. B.IV 339)III 270,271,311(see B a n d la, I. II 419; 111 349)IV 380II -2 16IV 34, 76, 105 11— 97(secTurner , F .J .III 307; IV — 225)III 85 ,114III 43, 55 to 57III 163, 175, 335, 351
II — 48III 347II 176,373,376I — 212; 11 — 89; IV — 40 ,42 ,67 , 76. 166, 168, 172,173(see Wiebenga, W. A.II — 129)II -119, 121IV 331 to 333, 335 to 337IV 6 3 ,7 0 ,1 1 0II 97,99, 137; III 209,245, 309

484 A U T H O R I N D E X V O L U M E S I-IV
Drozd, K. Ill 333.359 Engelder, J .TDrude, P. II 323,346 Erickson. G. /Dryselius. G. III — 87, 100 Eristov, V. S.Dube, A. K. I 1 1 0 ,1 1 1 ,114.115:
IV 145. 146,346,350Evans, I.
Duchrow, G. (see Spackeler, G. II 328,329,411)
Duckworth .W .M . 1 — 46 Evans, R. H.
Duffaut , P. III 112,113,367, Evdokimov,(also see Mary, M. P.D.Ill 373,375)
Dulaney, E. N. III 384 Everell, M . D
Duncan, J. M. II 82, 144 Everling, G.
Duncan, N. IV 75,219,222,265,353, 355, 387 to 389 Ewoldsen, H.
Dunne, M. H. (see Duncan, N. IV353,355,388,389) Fa i , J .
Dunoyer de Fairhurs t , C.Segonzac, Ph. II - 2 5 6Durand , E. IV— 36Durb aum , H. (see Martini , H . .1.
Ill 87)Duvall. W. I. 1 37, 47, 50, 66, 80,
8 8 , 8 9 ,9 1 , 9 7 ,9 8 ; II4, 119, 123, 127, 135, 137, 215,217 ,225,285 ; Farmer . I .W
III 210,227,249, Fait , I.(also see Atchison, T. C. Faust, L. Y.
II 352,387,391, Favreau, R. FObert , L. II 342, 347,355 ,361,373 ,385, Fayed, L. A.
391,413,424,449) F . -D .-W ang
Dvorak, A. II 232,329,341,353, 365 ,366 ,3 87 ,419 ,4 42 ;III 355,373
Feather , J. N.
Fecker, E. Feda, J.
Edm on d, J. M. II 173,175 Fenz, R.Egorov, K. E. III — 39 Fergus, J. H.Ehrgott , J .Q . 1 — 183 Fernandes,Einstein. II. H. IV 4 ,6 ,9 . 11,23,54, L . H . G .
96,97, 178 to 181 Fernandez-Ellickson, M. L. I V - 23 Bollo, M.Ellsworth. W. L. (see Robinson, R. Ferratini , G.
II 170) Filon, L.N.CEmery, C. L. II 424 Fischer, R. L.Empson, F. M. III 266, (also see Fisher, C.Bradshaw, R. 1..
Ill 209) Fishman, Yu
Enener, J R. III 98, 103, (also see Worotnicki, G. Ill
Flegont, G.
87,98, 100) Focardi , P.
IV 110II 351,435III 264,265I — 36,39, 70, 72.77,79, 98, 191,219, 225,226:II 82,215, 331; III 20, 184, 185; IV - 127,175, 176III 209 ,241,292
II 135:111 41,169,179,180 II 328,385I 141, 147. 148. 157:II 97,432:111 164III 333,373
II 32 4 ,339 ,3 55I 27, 28, 67, 68. 89, 90, 93, 99, 100. 109, 136,213, 254, 257, 259, 260, 261, 263: II 37. 38. 62. 63, 82, 344, 364, 391, 430: IV 16, 265, (also sec Hudson, J. A.II 66)III -2 8 1 ,2 8 5IV 365II 355II 363,388II 384,385I 57,59I 202, 205: (also see H a nd in . J . II -8 6 to 89, 96, 98, 170, 171)IV 2 ,43 to 45 ,4 8 , 171 I — 51I 448:111 355,369I 57, 59 to 61
III 359,361
III 61III 363I 14 to 17, 177 to 179IV 325IV 398III 172(see Priseu, R. Ill 355)IV -251

A U T H O R I N D E X V O L U M E S I-IV 48 5
Fodor . I. Fogelson, D. E Foote , P. For t in, J. P.
Foster, C .R . Fournier , G. Fox. P.P. Franklin . J. A.
Frankl in, R. E. Fr iedman, M.
Froula, N .H . F ruth , L.S.
Frye, J. F. Fujii, T. Fuj imura , F. Fujiwara, Y.
Fukushima, H. Fumagal li , E. Fung , P. K. Furujo , I.
Gaddy , F. L. Gall ico, A. Gamble , J. C.
Gandolfi , S.
Gangal , M.Gardner ,G . H . F .
G a rd ne r , L. W.
II 410,411 Gariepy, S. (see Hawkes , I. IIIV 325 361. 385,424)
III 184 to 186 Garofa lo , F. III 274
II 240, (also see Garre t t , B. K. II 396Rinehar t , J. S. II Gass man II 349,355267, 268 ,341 ,363 ,364, Gatl in , C. II 127.131367, 387. 395, 400, 402, 435 ,441 .445) Gay, N.C. II 407,424
III 27 Geertsma, J. II 248.250.251
III — 169 II 337; III 41
Geological Society o f London IV 272,275,278
I 183, 185; IV 275, G eoprobe278,390 Inst rument III 83 ,85IV 337 Georgescu, M. (see B a n d la, I III 4 5 ,4 6 ,2 0 2 ,2 0 5 ; II 419; III 349)62,71 to 73, 174, 178, Georei , F. III — 8(also see Hardin , J.II 63, 64, 86 to 89, 96, 98, 170, 171; 268, I.
Ger rard , C. M. II 118, 120; III 34 to 36
Ill 307,308 ; Gerstle, K .H . II 141,331; III 267Logan, .! . M. IV 102) Geyer. R.L. II 321,342,347,349,II 74 357, 394, 405
I 212; IV 40,42, Gibala, R. 11 12967, 76 Gibson, R. E. I I - 139; III 1501— 97 Gicot , H. II 419; III 40III 353 Giesel, W. (see Martini , H.J.III 359 Ill 87)
(see Ki tahara , Y. Gilg, B. III 188, 189, 191, 371II 439,452 ; Gill, D. E. (see Everell, M. D.Hayashi , M. Ill 11 328,385)375) Gilluly, J. IV 208,209,218,III 365 221,224II 358,450; III 335 G im m , W. A. R. III 8, 337, (also seeII 56 Spackeler, G. IIIII 158, 159, 178, 179. 328,329.411)373 Giri jyval labhan,
C.V. I 15,17Ciiroud, J. P. III 32 to 34
1 — 38 Gloyna, E. F. III 209,262III 131,363 Goe t /e , C. III 310IV 391, 392, (also see Goetz, W. 11. (see Busching, H. W.Hendson, A. J. Ill II 141)85) Goffi , L. II 123,133; III(see Foeardi , P. IV 66; IV 149251) Gold, L.W. III 293I - 27 to 27 Goldsmith, W. II 137,327,341,372,
383, 403, 423, 436, 44911 — 224,230,23 1 ,247 , Golds tein, M. IV 111, 112,120,121263, 264, 268, 269, 285, Gole, C. V. III 363289,291 G o n a n o , L. P. 11 — 64, 67 to 69; IIIII 248 ,249,28 4,289 , 20, 23, 143, 144; IV290 126,128

486 A U T H O R I N D E X V O L U M E S l -IV
Goncalves, E. (see Brito, S. Ill 359)
Guerrc iro, M
Goodier , J. N. I 257:11 198,206; G u p ta , I. N.III 25 Gustkiewicz.
G o o d m a n . R. E. II 417:111 85,96. Gyenge. M.104. 113, 333, 373; IV46, 76, 80 ,8 1 .9 3 .3 7 9
Goosev, B. (see Golds tein, M. Haas, C. J.IV III, 112,120, 121) I la bet ha. E.
Goranson . R. W. III 257 Habib, P.Grady. D. E. II 169 Hackct t, P.G r a m berg, J. I 17, 18, 177 to 179;
II 65 ,377Hager, R.V.
Grant , N.J . III 274Graul ich, J. M. (see De Beer, E. E.
II 129)Gray, D .H . IV 365 1 laimson, B.CCiray, K. E. II 116Green, S. J. I 45 ,46:11 62.
71 to 74, 174,178 Halevy, E.Greenwald , M.P III 8 , 9 , 1 6 , 1 9 Hamontre , 11Gregory, A. R. II 22 4,230 ,2 31 ,247
to 249, 263,264, 268, I landin, J. W.269, 284, 285, 289 to 291
Gresz.czuk, L. B. II 107Griffith, A. A. I 242 to 244, 246Griffiths, J .C. IV 226,227,232Griggs, D.T. I 182. 198,201,217.
218; II 8 0 ,8 8 ,9 3 ; III 209 ,235,23 9 ,241 ,
248, 251,252, 257 to 259, 261,268 ,274,30 7 ,308; IV 227,245, (also sec Turner , E.J. 1 landy, R. L.
Ill 207; IV 226) I lanks, T.C.
Grishin, M. M. 111— 41 Hansagi. I.
Grobhelaar , C. II 17, 18, 39 t o 41 Hardy, I I .R.
Grokholski i ,A.A. (see Kar ta shov, Yu M.
I -24 to 26, 37,38)G romova , N. V. 1 93 ,94Grossman n. Hardy, J .K .N .F . (see Rocha, M. Ill
83 ,85 ,90, 106, 108, 110; Hardy, M. P.
Da Silveira, A. F. Hardy, W.B.IV 254) Harp. M. E.
Grosvenor, N. E I 26, 32, 33, 89 ,90Grover , H. J. III 281 Harris. J .F .
Grujic, N. III 371 Hartm ann , 11
G T C N E III 329 ,331,333,339, 11 ar t man n, I.
341, 349, 353. 357, 361. Harvey, J. M.363,367 1 lashin. /..
III 41 ,44, 148, 169;IV 92 11 — 170II 4 , 4 4 .4 5III 45 ,143
II 107III 369II 273: IV 365I 108 to 110, 118.119I 182,198,200,202, 205:11 -80, 82. 86 to 89. 9 2 ,9 3 ,9 7 ; III 307, (also see 1 landin . J.86 to 89. 96, 98. 170.171)II 176, 178. 179,344. 364,391,430; III 281, 283,284IV 380(sec Rail, C .G .IV 339.340)I 182, 183, 198,200 to 202, 205, 210,211,216 to 218, 223 to 225, 228,230,11 63,64,80,82,86 to 89,92,93,9 6 t p 98, 170, 171; III 259,307; IV 35 ,57 ,58, 67, 7 6 , 8 5 ,9 6 to 98, 102, 103, 105, 106, 245,274, (alsosee Borg, I. Ill 307, 308)
IV -63, 70, 1 10III 297II 388,450I 104,134:11 422,440; III 209 ,210,224,225, 227, 239, 243, 249,280,281,288, 294, (also see Chugh, Y. P.III - 2 1 0 )IV 73I 99.100IV 73(see Busching, H. W.II 141)IV 250II 361 ,383,423III 8 .9 , 16, 19III 250,251 .260II 107

A U T H O R I N D E X V O L U M E S I-IV 487
Hast . N. I 22 to 24, 26; III 35 Hobbs, B. E.Hausm an , A. II - 335,336 Hobbs, D. W.Hawkes , I. I 27 ,91 ,92 , 108,110
to 114.133,135, 137, 138; II 19,361,385, 424
Hayashi , M. III 375; IV 112 to 114, 152 to 156
Heard, H.C. I 177,182, 198,201. 216, 225,228.230; II 77, 78.80, 82,86, 88 ,93;III - 2 3 5 , 262, 307, 308;IV — 227; (also see Schock, R .N . II
Hodgson, K.
170; Griggs, D. Ill Hodgson, R. A
Heck, W.J.261,307) Hoek. E.I 188; 11 90,146; IV 35,42, 173 to 175,(seealso Deklotz, E. J.
Hofer, K .H .11 — 86,87, 89,92, 146)
Medley. D . G . F . III - 2 0 9 , 263, (see also Barrow, K. IV 372)
Hemstock, R. A. IV— 365Hendron, A. J. III 85, 132, (also see Hoffmann, H.
Cording, E.J . Ill 343, 347, 349, 353, 355, Hofmann, H.
357,365, Deere, D .U . Hofrichter, P.III 124 to 126; IV Hogg, A. D.284,285) Hojem, J. P. M.
Henkel , D .J . II 365,435; III 150,351
Herel, J. 11 -3 8 8Hcrget, G. 11— 329 ,394,442,453 Holland, C .T .
Hermes, J. M. II 334,432,441 Holm, R.Heroesewojo, R. III — 226 Holmes, C. D.
Hetenyi, M. II - 7 , 13, 36 Holt, R. J.
Heuze, F. E. I I — 417; III 96, 104, Hondros , G.105, 113; IV 46,76, Hooper , J. A.80, 81 Horibe, T.
Hicks, W .G . II -2 89 ,291Higgs, D.V. I 223; III 307,
(a lsosee Borg, I. Ill 307,308)
Horino, F. G.
Hill, R. II 110 Horn, II. M.Hiller, K .H . I 218 Hoshino. K.Hinde, P. B. I 262 Hoskins, E. R.Hiramatsu , Y. I 117, 118, 125,129,
130,133, 134Hirschfeld, R.C. IV— 4 , 6 , 9 , 1 1 , 2 3 , 187,
188, (also see Einstein, Hoskins, H.H . H . — IV— 96,97, 178 to 181)
Hoskins, J. R.
Hjclmstad, K. E. 11 - 243,245 ,262 Houpert , R.
III — 309I 6 ,3 3 ,6 9 ,7 1 ,7 9 ,1 1 6 . 118.119,121,134, 189, 230 to 233; II 14.330, 331 .371,377 ,383.39 5 to 397, 415, 417, 423, 437,443; III 209,244, 245; IV— 35,40,42,68, 69, 146, 147, 183, (also Pomeroy, C .D . IV 185,186)1 — 43; III 12, 13,(also see Cook, N .G . W.
Ill - 2 2 )IV— 242,246I — 5 ,6 ,9 1 , 183, 185;III 9, 305; IV -2 3, 25,30, 189,411II 321,328,403,411, 423; III 209.227,245,265.(also see Spackeler, G.
II -328,329,411, Georgi , F. Ill — 8)11 — 82IV 17,282,283I 164,167,168,170II 343,379,419.438I -2 1 9 ,2 2 1 ,2 2 2 ,2 4 7 , 258, 262, 265; III -12, 13, (also see Cook,N .G . W. Ill 22)I 30 to 32, 35; II 334IV 52IV 232III 351I 105; I I — 51III - 2 3 2I 49 ,80 ,136,13 7 ,167; II 70, 117I — 41 to 43. 66; II356, 372, 389,413; IV 23, 116, 117IV 28, 54 to 56, 71 to 74II 86; III - 3 1 0I 116, 117, 134,135, 227,229; III -375;IV — 34, 35, 56, 59, 94, 100 to 102,104.105,109I I— 220I 41 to 43; II 356, 372, 389,413I -45
488 A U T H O R I N D E X V O L U M E S I-IV
H ouska , J. H o w a r th , I I .C . Huber , C. Huck, P. J. Hud so n . .1. A.
I lughes , B. P.11ughes, D. S.
H u l t J .H u sak , A. Hutch inson, J. Hut ta , J. J.
Ide, J. M.
Iida, K. Iida, R.
Iida, Y.
Iliev, I.Ci. Ilivitskii, A. A. I lni t skaya, E. I. Imrie, A. S.
Inglis. C. E. Interfels In te rnat ional Bureau for Rock Mechan ics Ishii, F.I .S .R.M.
I .S .R.M. C o m m i t t ee on L ab ora to ry Tests
Ito. I.Iwasaki , T.
Iyengar, K .T . S. r T
II 394III — 8 ,9 , 16, 19IV 325II 328,344,363 .430I 6 5 , 6 7 ,6 8 , 9 9 to 101, 108,119 to 121, 254, 257 258.261 ; II 62.63.66: IV 2861— 262II 80,242,263,267, 295 t o 298: III 307III — 87, 100I 56IV 84IV 231
II 232,293 ,295 ,296, 338,342,344. 346 to 349 ,354,355 ,389,400 , 412II -321 ,327,361 ,410III 371, (also see Ishii, F .— III — 181,182,327)(see Iida, K. II 321,327,361,410)II 3951 — 69I 162,163,171II 41 3,431 ,432,437 , 441I 243III 78
I 69III 181,182,327III 4. 5, 145. 151. 152. 165: IV 262 to 264,266, 342, 352, 382, 385, 390
I 4 . 1 0 ,3 8 ,4 4 ,49 ,5 7 , 80,81: IV 381II 390,416.417(see Logan, J. M.IV 102)
III 268
Jaeger, C. II 228:111 63 ,125:IV 362 to 364, 366. 368
Jaeger, J .C. I 102, 116, 117, 123to 125, 134. 135.224:II 91:111 52,87.102,304: IV 20 to 23, 25, 26, 28, 34, 35, 40 to 42, 56, 57, 59 to 62, 64, 66, 67, 73, 75, 76, 94.99 to 102, 104. 105, 109 (also sec Hoskins , E. R.
IV 35)Jahns , II. II 368:111 8 ,9 ,1 2 ,
16, 20, 369Jahns, R. A. IV 246James, L. S. 11 370Jamieson. J .C. II 220.lanod, A. III 83, 85JapaneseNationalCommit tee onLarge Dams III 341. 345, 353,
355.,361 ,363Jayaraman , N.I. I 104,134Jenkins, J. D. I 23:111 140,144Jennings, J. E. IV 275,278Jiminez-Salas,J. A. III 4 1 ,3 3 9 ,3 4 1 ,3 5 1 ;
IV 92Johansson, C. E. IV 225Jo hn , K .W . III 363: IV 27,166,
168 , 170, 171, 183, 282,41 1
John, M. 11 73John, S. W. III 162, 188Johnson , A .M . II 361Johnson , C. F. II 224Johnson , T. W. IV 105, (also see
Tal iaferro. D. B.IV 339)
Johnson, W. S. (see Kruse, G. 11. II352 ,353:111 337)
Jones, A. H. IIS.J.
74, (also sec Green. II 74)
Jones, H. J. II 267, 295. 296, 298Jones, K.. S. III 349Jones. R. III 210Jory. L.T. II
441413.431 .432.437,
Judd, W .R . II 328.336, 342,365,413., 4 3 3 ,4 3 6 ,4 4 2 ; III125 3 S V IV 220.325

Jumikis, A. R.
Kaarsberg, E.A Kalia, H .N .
K amb, W. B. Kanagawa, T. Kartashov, Yu. M.Katz , S. Kawabuchi . K. Kawai , T. K awam oto , I'.K a warn ura, M.
Kazakov, B. N.
Kendorski , F. S. Kenty. J. D. Kcrkhof, F. Khachikian,C j . C j .
Khattab, A. F. Khorshid, M.
Khrapkov, A. A
Kidybinski, A. Kicndl, (). G. Kim, C. M.Kim, K.Kim, R. Y.
Kim, Y. C. Kimishima. H. King, M.S.
Kinstler. F. L.
Kirkham, I).Ki roll ova, I V . Kishimoto, S.
Ki tahara, Y. Kitsiinezaki, C.
A U T H O R I N D E X V O L U M E S I-IV 4<S9
II 439
II 123,127 (see Clark . G. B.II 343.348,363,408, 430)IV 229III 259
I 24 to 26, 37, 38II 266III 125,327II 321, 359, 390,420IV 156 to 159,162 (see Ki t aha ra , Y.II 439,452)(see Paraskevov, R. D.II 336,394,399)II — 395I 153III 385
II 118II 384,385 (see Lama, R. D.III 65 ,66)II 116, (see also Panov, S. I. II 342;III 347)
II 330; III 227I 262III 281 ,283,284II — 178(see Hardy, H. R.III 209,210,225,243,249,288, 294)I — 115III 154,168,373II 86, 119, 127, 145, 146,276 to 280. (also see Somerton, W. H.II 324)(see Maddo x, J. M.
III 353)IV 370,371IV 251(see Ishii . F. Ill 181,182,327)II 439.452III 365
Kjaernsli. B. Kling, S. A. Kluth, D..I. KniII, J. L.
Knoll . P.
Knopoff , L. Knutson, C. F.
Ko, II. Y.Ko, K.C. Kobayashi, A. S. Kobayashi , R. Kobilka, G.
Kobi lka , .1. G. Koide, 11.Koide, N.Koi lman. M. I.
Kolev, K. L.
K om oda , H.
Koning, H. Kotte, J. J. Kowalski. W.C. Kragelskii. I V. Kranz, R.Krech, W. W. Krokosky, E. M. Krsmanovic , D.
Kruse, G. II.
Krynine, D. P. Kubetsky, V. L..
I 50(see L o g a n , .I. M. 102)II 364I 119to 122: III 349, (sec also I lenkel.D.J. II 36 5,435 ;III 351)III 265. (also see Georgi , F. Ill 8)
li 355II 344. 387.431 ; IV 366,367II 141,331; III 267II 107III 385I 46 to 48; II 70 ,117 (see Fenz, R. Ill355,369)(see Fenz, R. II 448)II 86III 310II 31 8,319 ,323 ,3 33 , 3 3 9 ,361 ,3 85 ,390 ,3 94 , 426.441(see Paraskevov, R. D.
II 3 3 6 , 3 9 4 , 3 9 9 )
(see I layashi. M.III 375)III 36I 17. 18, 177 to 179 1— 61
II 176I 93 1— 56I — 149,150; III 55, 153, 155, 169, 175, 178II 352. 353; III 337, 347
III 264, 265, (also see Tsytovich, N. A.I l f 39 .53 ,56)
Kujundzic, B. Ill 5 8 , 5 9 ,7 3 , 7 5 ,8 3 .85, 129. 1 3 0 , 3 2 9 , 3 3 3 ,
371Kulhawy, F. H.
Kum azawa, M. Kut tcr , H. K.Kuznecov, G. N.
II 8 4 , 8 6 ,9 0 , 9 2 ,9 4 . 144 to 146. 148II 110III 164

490 A U T H O R I N D E X V O L U M E S I- IV
Kuznetsov,Y . U . F . I l l — 256Kuznetsov,Yu. F. 11— 273,274Kvenvolden,K. A.
Ladanyi. B. II 176 ,328,373,376 ;III 139, 140, 143, 194, 274; IV 13, 15to 18, 41, 162, 171,189
Lafeber, D. II 137Laherrere, J. II -256Lajtai, E. Z. IV 41,114,115,119,
120,150, 152Lama, R. D. I 2 1 , 2 2 ,2 6 ,2 7 ,3 3 ,
36; II 1 1 ,1 8 ,4 2 ,62 to 65,to 69, 74, 75 ,105,107, 117, 143, 330; III — 8 to 10, 12 to 17, 20 to 23, 65 ,66, 144, 192, 240, 289 to 291, 307; IV 3, 30, 40, 42, 64, 66, 67,76 to 79, 108, 109, 120, 123 to 140, 171
Lamb, E. H. 11 — 14Lambe, T. W. IV - 7 3Lane, K.S. IV 35,42, 173 to 175Lane, R .G .T . II 406; III 125,
345,347, 349Langer. M. III - 2 0 9 , 227, 245,266,
267Langof. Z. I 150, IV 41,93,
150,151Larocque, Ci ! II -3 63 ,388Lauffer, H. II 123, 129, 133; III
75 ,79 ,345; IV 290Lawn, B. R. III 386Learmonth , A. P. 11 — 396Leasia, J. D. (see Green, S. J.
II — 74)LeC'omte, P. 11 -2 1 6 ,2 1 7 ,2 2 4 ,3 4 4 ;
I I I — 209,250,251,253, 261
Lee, K.L. IV - 5 4 , 90Lee, I .K. IV— 14,15Leeman, E. R. II 17,18, 39 to 41,
364,405le Francois, P. (see Brown. E. L.
11 - 3 2 0 , 359)Lehnhoff, T. F. II — 325
Lekhnitskii, S. G. II 113,119, 129Lepper, H. A. II 137Le Tirant . P. IV 366Levy, J. 11 329Lewis, W. E. II 207, 208,211,221.
222 ,226,292, 294Libermann,Y .M . III 227Lien, R. IV 2 9 9 ,3 00 ,3 02 ,305Limaye, R.G. (see Parasar thy, A.
II 402 .406.43 5)Lin, W. II 281,287,288Link, H. III 125,327,329,337.
339., 3 47 .3 51 ,357 ,3 61 .369 ; IV 37
Lissner, H R. II -22 to 24, 27, 36Litwiniszyn, J. IV 2Livenskii, V. S. II -273,274Livingston, C. W. II 327Lloyd. D .G . (see Henkel . D. J.
II 365,43 5 ; III 351)LN E C II 116; III 9 ,60
to 63Locher, H .G . III 1 6 9 , 3 2 9 ; IV
30, 31Lodus, E.V. III 251,275 ,276Logan, J. M. I 183,21 0 ,211 ; IV
102, (also see Handin ,J . - II -63 ,64)
Logani, K. II 170Logters, G. 11 127; III - 1 8 8 ,
190,191Lokin .P. (see Radosavljevic, Z.
Ill 329)Lomenick,T. F. III - 254Lomnitz, C. III 209,230. 241,242,
246., 2 50 ,2 56Londe, P. IV 365,366, 376Loonen, H. E. III 221Lopes I I B . I I - -81,82, 117; III
145. 146, 175; IV 354,355
Lotti, C. III 125,327,373Louis, C. IV - 3 7 7 , 3 7 8Louma. B. III - 3 3 3 , 3 5 9Love, A. E. H. II 100Lozinska-Stepien, H. II 118,129, 135,378,
392., 393Lundborg, N. I - 24, 26 ,39,40 , 111,
113 . 157, 158, 169: II361 ; IV 127

A U T H O R I N D E X V O L U M E S I-IV 491
I.unde, J. Lyakhov, G. M. Lysne. P.C.
MacDonald .G . J . F .Mackenzie, I. D. Maddox, J. M. Magouirk, J. N. Mahanta , P.C. M abend ra, A. R. M ah m o u d , A.
Mahrer , K . D . Maini. Y . N .T . Makovec, F. F.
Maldar i, J. A. Mal ina, H. Manev, G. Manger, G . E .
Manghnani ,M i l .Mann , P.E.
Marinier, P.
Mariot ti , M.
Mark land, J .T . Marmorshteyn, L.M.Marsden, S. S. (Jr.)
Marsland, A.
Martin, R. J. Martini, II. J. Mar tinov, E. D. Martos , F.
Mary, M. Masure. P. Mather , R. P.
Mathews, k . E.
IV -299 ,300 ,3 02 ,305II 166(see Schuler, K. W.II 438)
IV - 2 2 7III 333 II! 353I 216 ,225 ,2 28 ,230
II — 224III 359IV 183, (also see Pomeroy, C. D. IV 185, 186)II 169IV 266, 375, 377 to 380 (see Fenz, R. II 448:111 355,369)1 — 262III 55III 126, 128, 129IV 3 2 3 , (also see Daly, R. A. IV 351)
II 259(see Wiebenga, W. A.II 129)(see Arguelles, 11III 359)( seeChaou i . A. Ill 18)IV 411
II 175
IV 367, (also Sanyal, S .K IV 367)(see Ward, W .H .II 139)I 208; IV 110III — 87I 194,195II 393,394 ,397 to 399,445 to 447, 453III 373,375II 119,133(see M addox , J. M.III 353)IV 60
Matsushima, S. II 361; III 209.224,242,293
Maurer, W.C. I 154 to 156, 171;IV 40, 67, 68
Mauret te , C. II 80, 263, 295, 297.298 ; III 307
Maxwell. L.H. III 246Mayer. A. III - 3 4 1 . 3 4 6Mazant i. B. B. I
2286, 102, 103. 147, 225,
Mazur-Dzhurilovskii.Yu. D. (sec Kartashov , Yu. M.
-2 4 to 26, 37, 38)McClain. W.C. III 254, 267McClintock,F. A. I 246McClure, G. M. III 281McGarry , F. J. II -263McGill, G .E . IV 183,184McHenry, D. I 262McKinlay, I). Ci. 111 83McKitt rick, D. P. I I - 351,406, 435McLamore , R.T. II 87, 88,92McLatchie, A. S. IV 365McLean, D. 11 175McQueen, R. G. II 164McWilliams,J .R. 11 76; IV 142,143Mehtab, M. A. I I - 395Meidal, P. III 351Meikle, P .G. I 30, 31Mckler, Y.B. II 175Mclckidzc. I.G. I 69Mellor, M. I 27 ,91 ,92, 108, 110
to 114. 133, 135 to 137;II 19. (also seeHawkes, I. II 361.385, 424)
Melnikov, E. A. I 20, 24Menard, L. III 83, 85Mencl, V. III 176, 177Mcndes,F. de M. (sec Da Silveira, A. F.
IV 254)Menter, J. W. IV 73Mcnzel, W. II 321,328,403,411,
423: III 246 , (alsosee Georgi, F. Ill 8)
Menzies. B.K. II 1*37Mermin. P. Ill 83,85
492 A U T H O R I N D E X V O L U M E S I-IV
M cr r i am , R. Merrill , R .H . Merr i t t . A. I I . Mesri , G.
Meyer, A. A.
Meye r ho IT. G. G Mieh alo pou los , A. P.Michel , G. Michelson, A. A. Midea , N. F.
Milic, S.Miller, F. E. Miller. R .P .
Miller, W.B. Milovic, D . M . Miner , N. A. Mir to , M.
Misra , A. K.
Mis tcrek. D. L. Mitani , T. Mitchel l , P. B. M oc h ida , Y.
M ogi . K .
Mogi levskaya, S M o h an ty , B. B. M o k h ash i , S. L. M o k h n ac h ev , M .P .M olcha nenko, V.S.
Moiler, W.
M ol na r . P. M olokov , L.
I 115III 187IV 286II 129,357,379,390, 419; (also see Hcndror , A.J . III 85)II 402.406; III 41, 337, (also see Fox, P. P.
II 337). I II 35 ,37,38 , 139
II 359,379.417,450IV 380III 209, 240, 246 (seeRuiz , M l). Ill 169; IV 38 ,39,42)III 55II 48II 326 ,343,349,357, 372, 373, 375,381,390, 405,410 ,413,434, 442, 451: IV 275,278 to 281I 182; III 257,307III 39 ,40IV 232(see Focardi, P. IV 251)III 230,240,253,298, 301III 69 to 71II 321 ,359 ,390 ,420II 396,420,443II - 3 2 1 , 3 4 4 , 4 1 0 , 4 2 0 , 439,444 .452I 33 to 35, 39 ,176,192 196,220 t o 223,247; II 84 ,90 .9 1 ,93 ,9 5 ,96 , 101IV 19
. I I I 127,128III — 293III 363
I 93 ,94
(see Alekseev, A. D.I 33 ,43,44 ,49)(see Brito, S. Ill 359)IV 105IV 81 to 83
Monjoie, A. Ill 363M onk man, F .C. III 274M onto to . M. III 211Mordecai , M. IV 379Morgan, T. A. III 187Morgans ,W. T. A. I 9 8 ; IV 225Morgenstern,N .R . II 413; IV 76Mori ta, M. 11 321.361Moi lier, P. 11 273; IV 365Morocco,Direction deL'Hydraul iq ue III 169, 171Morris, L. H. IV 379Morr ison,R . G . K . II 336, 337, 377, 400.
403 ,405,417,434 , 451Moruzi, Ci. A. 11 371.400.401Moser, 11. (see Ha levy, E. IV
380)Motoviliv, E. A. (seeSmorodinov, M.I .
1 61; IV 326,346,348, 349)
M otoyama, H. IV 187.188Mott , N.F. III 298, 299, 383Moyc, I ) .G. II 351,359M I S SystemsCorpora t ion III 234Muir, W .G . II 410Muller, E. I I - 97Muller. K . E .H . IV 261Muller, L. III 9 ,188 ,327 ,331,
333, 335,337,339,341.343. 345, 349, 353, 355,357, 361,363,367,369.371:; IV 2, 17, 166 to169, 171, 259.282, 283.
Mul t ipurpose41.1
Dam TestingG r o u p Japan III 345Murphy, V. J. III 351Murrell , S. A. E. I 182,189,213,215,
245 ; I I — 331; III231. 236, 240. 253, 256.298, 301,308, IV 35,
M u n i. W. J. II 169. (also seePetersen, C. F. II 74)
Muskat , M. IV 358Muskhelishvili ,N.I . Ill 52
A U T H O R I N D E X V O L U M E S I-IV 493
M> rvoll, F.My ling. J. I.
Nakaara i , K. N akam ura , S.T. Nash, J. K.T. L. Navalon, N.
Na /a re lh , L.J. Neff, T. L.
Nelson Nelson, J. S.
Nelson. R. A.
Neshitt , R .H.
Newland, P. L. Newmark, N. M Nieholls, H. R. Nickolin, V.I. Nicolson, J .T . Nieble, C. M.
Niggli. P. Nishihara, M.
Nishimatsu, Y.
Noel, G. Nonveiller, E. Noorishad, J. Nose, M.Novik, G.
Novikova, A. C. Nur, A.Nutting, P. G. N y e . J .F .
Ohert , L.
IV 380II 321 ,342,347,349 ,357,394, 405
III 259III 221.227IV 160 to 162III 41, (also see Amuel les , H. Ill 359; Bollo, M .F .III 52)IV 398I 183, (also see Deklotz, E.J. II 86,87, 89,92, 146)II 362,363 (sec Kruse, G. H.II 352,353:111 337)(see Eienstein, H. H.IV 54,96 ,97 , 178 to 181)II 326 to 328, 356, 379, 434,452IV 4I 15 to 17II 231,364,411I — 69II 99; III 211(see Ruiz, M I). Ill 169; IV 38,39,42)IV 230II 101, 104,423.440;III 209,224II 12 5,131,321 ,448;III 226III 85III 75IV 375III 169,171,345I I — 235,236, 240, 246,252.253.257. 269,283, 293, 300; IV 346, 349,350,356IV 251II 121,282IV 35611 160
I 37. 47, 50, 80, 88, 8991 .97 .9 8 , 182 to 184.
188; II 4. 123. 127, 135137 ,2 15 ,2 17 ,225 ,2 84 ,3 4 2 .3 4 7 ,3 5 5 ,3 6 1 .3 7 3 ,3 8 5 .3 91 .4 13 ,424 . 449;III 2 1 0 .2 2 7 ,2 4 9 ;IV 71
Obert i, G. II 371; III 75,335.355
O'Brien , J .K . I 223O'Brien, T. 11— 422O'Connel l , R..I. II 102Ode, H. IV 234Odemark, N. Ill 35Ogura , K. (seeOh ya, S. Ill
1 1 2 )Ohnishi , Y. IV 4 6 , 7 6 , 8 0 . 8 1 , 3 7 9Ohya, S. I l l - 1 1 2Oka, Y. I 117 ,118 ,125 ,129,
130, 133, 134 O k a m o to , R. Ill 347,371Oksenkrug, E. Ill 254.255Oliveira, E. R. A. Ill 107, (also see
Rocha, M. Ill 83, 85,90, 106, 108, 110)
Olivier, H .G . IV 272,273Olsen, D. A. I - 31, 32Olsen, O. III - 3 3 9Olsson, W. A. IV 40,42, 67,Onodera , T. F. III 125, 343Orliac, M. (sec Chaoui . A.
Orow an, E.18)III 305
Ortiz, C. A. III - 2 8 6Ou, C. II 139, 141Outerbridge,W.F . II 224OyoCorpora t ion III 8 5 , 9 2 ,9 3
Pacher, F.
Pahl, A. Palmer, L. A. Palmstrom, A. Pa nek, L..A. Panenkov, A. S.
Panov, S. I.Pa rasa rt hv, A.
IV 166to 169.259 to 261III 369III 35IV 286,287III 87 ,114(see Tsytovich, N. A.Ill 3 9 ,5 3 ,5 6 )II 116,342; III 347II 402 ,406.435

494 A U T H O R I N D E X V O L U M E S I - 1V
Paraskevov,R . D .Parker , J. Parsons , R. C.
Pas ieka. A. R. Patel, M R.
Paterson, M .S .
Paterson, N. R. P a tn o d e , H . W. Pat t i son, L. J.
Pat ton , F .D .
Paul , B. Paulding, B. W.
Pavl ishcheva,T.V.Peck, R.B. Pells, P . J . N . Peng, S.Peng, S. D.
Peng, S. S.
P enman ,A . D M . Pcntz. D. L. Perkins , R .D .
Perr in , J R . Perry, C .C . Perry, R .M . Peselnick, L. Petersen, C. F Petkof, P. B.
Pel lex. D. J.
Petty, S.
II 336,394 ,399,43211— 431,445 II 328,329,337,339, 346, 360,368, 383, 388,401,40 3,40 7,423 ,440, 4 4 2 : IV 275,276 II 371,400,401 (see Lehnhoff, T. F.II 325)II 88,93, 173, 175:IV 67,244II 248IV 234(see Handin , J . — II 63, 64)IV 4 to 8, 33 ,34,41,62, 7 0 ,7 1 ,7 5 ,9 2 ,9 4 ,271, 272, (also see Deere,D .U . Ill 124 to 126; IV 284,285)I — 27 to 29; II 107I 262:11 — 105,170, 174, 180; III 294, (also sec Brace, W. F. Ill 294)
III 259 ,260,310IV 84,370II 416II 73 ,75 ,76,224 ,361I 15 to 17, 19,21,24, 25, 80III -281,282,286,287,289
II - 3 9 6 , 4 2 0 ,4 4 3IV 30I 46:11 62, 71 to 74,174. 178. (also see Green. S.J. II 74)1— 6III 22 to 24, 27, 36II 436II 224,37211 — 74(see Atchison, T .C .II 352,387,391)
(see Skempton. A.W.II 138)
(see Duncan, N. IV 353,355,388,389)
Phelines, R .F . Phillips, D .W .
Phillips, F .C. Phukan, A .L .T . Pickett, G. Pigot, C. H. Pincus, H. J. Pinto, J. L.
Pirnie, R .M . Ill
Pirson, S.J. Piteau, D .R . Podnieks, E. R.
Pomeroy, C. D.
Popovic, M.
Popovic, R. Pospelov, V. B.
Potts, E .L.J . Poulos, H .G . Prandtl , L. Pratt , I I. R.
Pratt , W.E. Price, D. G. Price, G. P. Price, N.J.
Priest, S. D. Prigozhin, E. S. Priscu. R. Proctor, R . V. Proskuryakov, N.M.Protodvakonov M .M . '
II 337:111 -355II 70; III 209,228. 229, 240. 246. 256. 257. 268IV 40 8,410,416,417II 413I 15,16III 333IV 255II 115, 116. 119. 133, 135(see Sanyal, S. K.
IV 367)IV 330,360IV - 2 6 5 , 2 6 6II 73 ,7 5 ,7 6 ,270 ,2 71 . 274, 275 ,290 ,292; III 281,282,286, 287, 289I 2 9 . 3 0 .3 6 . 3 9 .7 0 . 7 2 .77 ,79,98, 191,219,225. 226; II 82 ,215,331, 334,335:111 -20,139, 209,246: IV 127. 175. 176, 183, 185, 186III 153, 155, 169, 175, 178II —224, 270, 271 (seeGrishin . M .M .III 41)III 209,268III 35III 13911— 33 7,341 ,365,380 , 381 ,420 ,439 .442 ; III 8 ,9 , 11,20IV 246I 119 to 122IV -2 29I 3 3 ,5 0 .5 1 ,6 1 . 182;II 14 ,397.415.417.423.443 t o 445; III209, 224 to 226. 246. 250. 268; IV 172,243,251. 252. 346, 347IV 286III 85III 355IV 297
II 273.274
I 8, 37. 69, 73 to 76,

A U T H O R I N D E X V O L U M E S I-IV 495
Pushkarev, V. I. Pyrogovsky, N.
Rabinowicz, E. Rad, P. F. Radosavljevic, Z.
Radulescu, I).
Rae, D. Raleigh, C. B. Rail, C .G . Ramana , Y. V.
R am ananan to - andro . R. Ramberg, 11. Ramez, M . R . H . Ramsay, J. G. Raney, J. A.Rappopor t ,R.M.Rayleigh, Lord Rebaudi , A. Regula, W. Rcichmuth, D R .Rengers, N.
Renzhiglov,N.E.Rcuss, A. Reynolds, T. D. Rice, J. R.Rice, L.O.Rice, M .H .Rice, O. L. Richards, T. C.
80, 99, 102, 104. 110.131, 132, 142 to 144. 146,147, 149, 154, 159, 160. 161,162, 163;II 10; III 158,159, 184III 278,311 (see Golds tein, M.IV 111, 112, 120,121)
IV 107II 363
III 129,130,329,(also see Kujundzic, B.
Ill 59)(see B a n d la, I. II 4 1 9 ; III 349)IV— 55II 93; IV 67IV 339,340II 235,236 ,241,242 , 24 6 ,252 ,2 54 ,258 to 261.271,272, 286,318,342,365, 369,404,450, 453;
Richter, E.
Ricketts, T .E.
Riedel, W. Riedcr, U. G. Rieki III. H .H . Riley, D .K . Riley, W.F . Rinehart , J.S.
Ringheim, A. S. Rioux, R.L. Ripley, C. F. Ripperger, E.A. Rising, R. R. Ritter, ILL.
Roberts, A. Roberts, G. I.
IV 327,344,350,351 Robertson, A. M
11 125 Rober tson, E.C.IV 234I 219 Rober tson, W. EIV 231, 236 to 238 Robinson, L. FI.IV 183,184
Robinson, R.III 38 <ocha. M.II 97II 371; III 35511 389
I 1 2 4 . 1 2 5 ; II 358 Rodrigues, F. P.IV90
29, 30, 40, 43 to 49,
Roegicrs, J. C.III 259, 260,310 Roesler. F .C.II 108 Roever, W. L.III 209.262 Rogatkina,II 85 Zh.^E.III 125 Rollins, R. R.II 164III 339,351. 371 Romero, S. U.II 321,373 Rosenblad, J. L.
Ill —8, 17, (also see G imm, W. A. R.Ill 8 ,337)II -1 3 7 ,3 2 7 ,3 4 1 .3 7 2 ,3 8 3 ,403 ,4 23 ,436 , 449 IV— 95III 329I 115II 104 to 106, 108II - 2 8 ,3 0I 27; II 224,240,267, 268, 300 to 303, 3 4 1 ,3 6 3 ,3 64 ,367 ,3 87 ,3 9 5 ,4 0 0 ,4 02 ,435 ,4 41 , 445II 438,439IV 246IV 54,90III 251II 351,435 IV— 331 to 333, 335 to 3371— 25(see Andric, M. Ill 341)IV - 2 4 9 to 251, 255,258I 224; III 209.240. 250 ,251 ,256 ,257II 451I 182,201 to 204, 210, 217; III 210II -170II 129; III 2 , 4 1 ,4 2 , 58 ,61 ,63, 72, 83 ,85,90,106, 108, 110. 116 to 120, 136, 164, 169, 170, 1 74 ,327 ,331,359 ,369 , 373; IV 40 ,266II 121,131, 1 33 , (see Da Silveira, A. F.IV -2 5 4 )IV - 2 6 5III 138IV - 2 3 4
II 137(see Clark, G. B II 3 4 3 ,348 ,3 63 ,408 ,4 30)III 160, 161, 169II 436
496 A U T H O R I N D E X V O L U M E S I-IV
Rosengren, K .J . IV 2 3 , 2 6 ,3 4 ,4 2 ,5 6 , 57, 59, 64, 66, 75, 76, 94,100 to 102, 104, 105, 109255, (also see Hoskins, E .R . IV 35)
Rosetz, G . P. (see G im m , W. AIII 8, 337)
Rouff , A. L. III 235Rouse , G . C . III 48Rowe. P. W. IV 14, 15Rowland s . D. 1 3Roy, A. II 328R o zanov , Yu. A. (see Belikov. B.P
II 319,321 ,322,326 to 328, 339, 347, 357, 361 ,364,386 ,387,39 0. 391. 394,400.401.405.408,414 ,415 ,426, 437, 441; IV 318,320)
Ruiz, M . D . I 51,54; II 325,327, 339, 343. 349 to 353,356,35 7,359 ,360,36 4, 365,374 ,381.405,407. 413,420; III 122, 169, 182, 183; IV 38,39, 4 2 ,9 2 ,2 7 4
R u m m e l , F. I 108, 119. 260; II173,276; III 209,253, 293
Rupp enei t . K. V. Ill 227 R u s c h . H . I 262; II 73 to 75;
III 273.289Rut ter , E .H . Ill 235,236Ryab in in , Yu. N. I 194,195R yshora , T. V. (see Alexandrov. K.
II 121.123,125,131, 133, 135)
Rzhevsky, V. II - 2 3 5 , 2 3 6 ,2 4 0 , 2 4 6 ,252, 253, 257. 269, 283. 293.300; IV 346,349.350,356
Saada, A.S. II 139.141Sabar ly , F. IV 365.366,376Sack, R. A. I 246Sal arenko . E. Ill 254,255Sah ah , S. D. (see Parasar thy,
A. II 402,406.435) Saint -Leu, C. Ill 288Sala mon,M . D . G . I 253,256:111 19,
23. 35S a l a s , .I. A. J. II 356
Salustowicz, A. I 44 .45,51:11 104,117.142:111 227
Samal ikova, M. II 359 Samuels, S. G. see Ward, W .H . 139Sande, A. I 50Sander, B. IV— 233Sangha.C ' .M. Ill - 2 7 0 , 2 7 1 ,3 1 1 S an in a ,E .A . (see Belikov, B. P. II
319, 321, 322, 326 to 328339 ,347 ,357,361 .364 ,386 ,387 ,390,391 .394 ,400 ,401 ,4 05,408 ,414,415.426, 437.441; IV318, 320)
Sanyal, S. K. IV - 3 6 7Sanz Saracho,J .M . Ill 41, (also see
Arguelles, H. Ill 359. Bollo. M .F .III 52)
Sapegin, D. D. II 116, 135; III169,179. 180,341,367;IV 30, (also see Panov, S.I. II 342; 111 347)
Sarda , J .P. IV 366Sarmento , G. 11
333328,41 9,44 2; III
Saucier, K. L. 1 183; II 90,145,146-Savage, J .C. 11 170:111 293Sbar, M L. (see Aggarwal , Y. P.
II 170)Scalabrini. M. III -337Schardin, 11. III 385Schiller, K .K . IV 347Schmechel, E. W. IV -71Schmidt, H. II 104. 117. 142Schneider, H. J. IV 40, 64, 65Schneider, T. R. II 370; III 337Sell nil ter. N..I. II 370; III 337,361S eh o ck .R .N . II 170Scholz, C. H. II 170.174. 176. 179,
180: III 293,304;IV 105. 110, (also seeBrace, W .F . Ill 294)
Sehreiber, E. II 199.200. 202,204,206,233
209 ,210 ,213,214,
Schreiner, W. III 246Schuler, K . W. II 438

A U T H O R I N D E X V O L U M E S I-IV 497
Schuster , R. L.
Schwartz, A. E.
Scott , J. B.
Scott . J . J . Seaborne , N. F. Seeber, G.
Seely, F. B. Seguin. M. Seifert, K. E. Seldenra th , TIi .R.
Selim, A. A. Sellers, J B.
Semenov, A. 11. Serafim, J. L.
Serata, S. Serdengecti , S.
Shaba nova, L A .
S h ah ,S . R.
S h an n o n and Wilson, Inc.Sharp . J .C . Sheerman- C’hase, A. Shichi, R.
S hidomoto, Y. Shield. R.T. Shih. T.-S. Shih. Tso-Min.
(see Skempton, A. W.II 138)
I 182, 190,203,206. 207,218 : II 82 .84.86. 89. 90. 93, 364, 387, 392, 431(see Kruse, G. H. II 352. 353; III 337)I 6 ; II 431.445II 257II 123, 129, 133, 137;III 6 8 ,7 5 ,7 9 ,8 0 , 121, 345I 101,103III 87I 198
I 17,18,177.11 65,377, (also see Kotte, J .J .
I 178.179)I 76II 339,361,383.403, 41 1 ; III 165 to 167II — 170II 81 ,82 ,117 ,1 19 ,121; III 41 ,44 ,72,145, 146, 148, 169, 175, 3 27 ,329 ,331,337 , 339;IV 92 ,354,355,357 .358, 377, (also see Rocha M. Ill 42,331,359)III 251I 182, 198,202,210, (also see Boozer, G. D.
I 210)
(sec Alexandrov, K.II 121. 123, 125, 131. 133, 135)II 337.41 9,443 ; III 331
III 40 ,48, 125,335IV 266,375,379
IV 75(see Iida, K. II 321,327,361.410)
111 83 ,85 ,359III 143I 98II 348
Shi ill oz ura. I). II 263Shiryaev, R. A. (see Sapegin, I). D.
Ill 341,367)Shook, W.B. I 25, 107; II 219Sibek,V. II 340.367,441Siggins, A. F. (see Lama, R. D.
Ill 65 ,66)Silva, J .N . da II 129Silveira, A. III 54 ,58.123Si mane, J. (see Sibek, V. II
340, 367)Simmons, G. II 121.224.265,320,
322,339, 340, 344, 345, 347 400
Simpson, D. R. I 57, 59 to 61Sinclair, S. R. II 87Singh, B. 1 98, 110. I l l , 114,
115; IV 145. 146,346, 350
Singh. D. P. II 360,383,388,391,422; III 243 ,249,29 3, 294,311
Singh, M. M. II 3 2 8 ,3 4 4 ,3 6 3 ,4 3 0Singh, R. D. II 331,332Sinha, K. N. I 98Sinou, P. II 337,370,392Sirieys, P. III 288Sirois. L. L. (see Everell. M. D.
11 — 328, 385)Skempton, A.W. II 138; IV 84, (also
sec Henkel, I). J. II365,435; III 351)
Skinner, E. H. IV 295Skinner, W. J. 1 39Skorikova, M. F. II 125,127,131Slebir, E. J. 111 4 6 , 7 4 , 7 6 , 7 7 , 8 1 ,
82, (also see Wallace, G.B. II 320,348. 436; III 47)
Smiles. D. E. IV 371.372Smith, J .O. I 101,103Smolka, J. I I I — 361S mo rod i no v.M.I. I 61; IV 326.346.
348, 349Snow, D.T. IV 377Snowa M o u n tain Author i ty III 337Soejima, T. III 359Soga. N. II 199.200.202,204,
206, 2 0 9 .2 1 0 .2 1 3 ,2 1 4 . :

498 A U T H O R I N D E X V O L U M E S I-IV
Somerton, W. H. II 324 Sosoka.J . (seeGrigizs, D. Ill
259,261)Sowers, G. F. I 6, 102, 103, 147, 225,
228Spackeler, G. II 328,329,411Spaeth, W. I 63,258Spathis, A. III 98. 103, (also see
Worotnicki , G. Ill 87,98, 100)
Spencer, J.W. II 282Sprunt , E. S. IV 337 to 339Stagg, K.G. I 127.128:11 54;
III 3 5 .4 5 ,6 3 ,6 4 ,7 2Stamer, R. IV 258Stapled on, D. II. IV - 275,278Stassen.P. II -335 ,336Stavrogin, A. N. III 251,275,276Stearns, D.W. IV 67Stears, J. H. III 87,100Stcart, F. A. I 35Steckley. R. C. II 263,287,288Stefanko, R. (see Chugh, Y. P.
I l l - 210, Ha rd y , H.R III 209,210,225,
243,249, 288, 294)Stein brenner, W. III 35Stemler, (). A. (see Deklotz, E. J.
II 92 ,351)Stepanov, V. II 118, 119, 123, 127Stephens. D. R. (see Schock, R. N.
II 170)Stevens, A. L. (seeSchuler, K.W.
II 438)Stewart, J.W. II 318Stini, J. IV -28 2Stock,J . A. III — 87Stojakovic, M. III 83 ,85 ,3 29 ,333Stowe, R. L. I I — 7 1 ,7 2 ,8 9 to 91,
145, 146,325,326,357. 359,375.451.452
Strauch, 11. II 216Street, N. I 57 ,59Stucky, A. III 42Summers , R. IV 110Sundara RajaIyengar. K.T. I 125 to 127, 138Sutherland, R. B. II 212,232Swain, M.V. III 386Swanson. S. R. I 198,199:11 173,
176, (see Christensen, R.J . IV 36,100)
Swolfs, U.S. (see Handin. J. II63, 64)
Sykes, L. R. (see Aggarwal , Y. P.II 170)
Syn-Dzao-Min II 63
Tabor , D. IV 3 ,5 2 .9 7T ak a h ash i .H . Ill 365Takano, M. Ill 83 ,85 ,158 ,159,
178, 179,373 Taliaferro, D. B. IV 339, (also see Rail,
C .G . IV 339,340) Talobre, J. A. Ill 40,41, 87, (also
see Fox, P.P. II 337 Tamada, B. I -151 ,152,171T andanand , S. 11 207, 208, 2 1 1,221,
722 2^7 292 294Tano , J. Ill — 341Tarvvdas , R. K. (see Andric, M. Ill
341)Taylor, G. L. IV 250Teder, R.l . (see Y a g o d k in ,G . I .
II 319 ,322,323,333 , 415, 424,425 ,426)
Tendou, H. (see Ish i i ,H. Ill181,182,327)
Teodorescu, A. (see Priscu, R. Ill355)
Terada, M. II — 390.416.417Ternovsky, I .N. (seeTsytovich, N. A.
III 39 ,53 ,56)Terry, N.B. II 214,257; III 225Ter-Stepanian.G. I l l — 310Terzaghi, K. I 217; III 139,143;
IV- 84,259,261.282, 295,370
Terzaghi, R .D . IV - 2 6 7 , 2 6 8Thenn DeBarros, S. Ill 37T h iem ,G . IV 369Thill. R.E. I 6 ,7 :11 136.170,
224. 262.263,270 .271,274 .275 ,285 ,287.28 8 . 290.292; III 273
Thirumala i , K. II 327,363 T ho ma, K. (seeGeorgi, F. Ill )Th om ps on, E. Ill 251Thomsen. L. Ill 294 to 297
A U T H O R I N D E X V O L U M E S I-IV
Tickell, F .G .Tiedemann,I I .R.T imchenko, I. P.
Timoshenko , S.
Timur , A E. Tincelin, E.
Tocher , D. Toews, N. A. Tokes, T. Tokh tuyev, G. V Tranter , C. J. Tremmel, E.T riandafilidis, G .E .Trol lope, D .H . T rumbachev,V. F.Tru m p , R. P.Tschebotarioff ,G .P .Tschernjak , I. L. Tsuji, M.
Tsytovich, N. A. Tufo, M. Tul inov, R.
Turner , F. G.Turner , F. J.
Turner , P. W. Turovskaya, A.
Ueshita, K.Uff, J .F .Uhrig, L. F. Ukhov , S. B.
Ulate, C. A.
IV 394, 396, 397
IV 292 to 295, 298II 408 ,426 to 430, (also see Belikov, B. P.II — 319; IV 318,320)I 257; II 198,206;III 25III 327II 302,337 ,370 ,371, 392II - 2 5 6 , 2 6 3 , 2 6 4III 209,263II 410,411
. 1 — 69III 68 ,70II 123
II 35 9,379 ,417,450 IV— 2. 179, 180
I -20, 24IV 234
IV 54, 71 ,72II 432( se e O h y a ,S . - Ill 112)III 3 9 ,5 3 ,5 6 ,1 2 2 ,3 6 7I 150IV 81 to 83, (also see Golds tein. M. IVIII, 112, 120,121)232I 182. 198,201,262;II — 80; III 235,257, 307,308; IV— 225 to 227, (also see Griggs, D.III 259,261 ,307)I 258,262(see Golds te in , M.IV 111, 112. 120,121)
III 3 5 ,3 7 ,3 8 I V - 160 to 162II — 256III 122,264,367,(also see Tsytovich,N. A. — III 39 ,53,56) (see Serafim, J. L.Il l 331)
Ulery, H .H . Ullao, A. Ullrich, C. R.
U m ana , J. E.
Underwood ,E.E.Unde rwood,L.B.
Uriel, S.
U.S. Bureau o f Reclamation
U.S. Task Commit tee for Foundat ions Desiun Manual
III 28 to 31II 452; III 361 ( s e eM es r i ,G . 11 357,379,390,419)(see Serafim, J L.III 331)
IV— 257
II 329,439; HI341,357III 41 .33 9.34 1,351 ;IV 92
II -232,233,321,349,373,413 ,433,434 ,436, 451; III 40 ,49, 125, 335,351; IV 34, 372 to 374
IV -2 7 2
Van, T. K.Van der Vlis, A.C.
Van I leerdcn, W.L.Van Krevelen.D.W.Von Melle, F. A. Vashchilin, V. A. Vasiliu, M. F. Vaz, L.
Venkatanara-yana, B.
Vesic, A. S. Vickers, B. L. Viswanatha.C.S.
Voblikov, V. S.
Ill 96 ,104,113
II 372 ,378,392,418, 419
III 17 to 19,22,24
IV - 3 3 7II — 256III 256III 343II 328,419,442 ; III 333
II 235,236,241,242, 246,252, 254,258, 259,260,261 ,271,272 , 286; IV— 327,344,350,351, also see R am an a , Y. V.
II 318,342.365,369,404,450,453III 35I 6 , 7
III 268, (also see Iyengar, K..T. S. R.Il l — 268)1 — 69

500 A U T H O R I N D E X V O L U M E S I-IV
Vogler, U. W.
Vogtli
Voight, B. Voight, W.
Volkov. V. A.
von Ka rma 11. T
Voort , H.
Voropinov, J.
Vouille, G. Vutukuri , V. S.
Wachtman, J. 1 Wack, B.
Wada, T.
Wagner, G. Wagner, H. Wahls t rom, E. Walker, P.E.
Wallace, G.B.
Wallays, M.
Walper, J. L. Walsh, J .B.
Walsh, J .M . Wang, C.
Wang. Y..I.
Want land, I). Ward, P. R. B. Ward, S. H.
Ward, W. II.
I 220, (also sec Bieniawski, Z .T.I 183:11 406), II331:111 143,369(s eeG assm an II 349,355)II 119,121:111 124II 108,323,346,401, 412(see Smorodinov, M.I .
I 61: IV 326,346, 348, 349)
h. I 175,181,189,190. 223:11 S I . 82:111 21 0
II 127:111 188.190,191I 144. 145, 171; III 309IV— 365I 115,121,122
5 III 246(see Day re, M. II89)(sec Iida, K. II 321, 327, 361,410)IV 2III 19
E. IV - 2 5 3 ,2 5 4 ,2 7 0IV 120 to 122, 161 to 16511 — 320,348,436: III46 to 48, 74, 76 ,77 ,8 1 ,82 (see De Beer, E. II 129,135)IV -2 5 0I 246:11 99,100,103, 117, 143, 163,263:IV 108II — 164II 281,287,288: III 188(sec Hardy, H .R .III 209,210.225,243.249,288. 294)III 333,337IV 380(see Somerton, W. 11.II 324)11 139
Wardle, L.J. Warren, N. Washb urn , E. W Waters, A. C.
Watstein, D. Wawersik. W .R .
Way, G.
Weatherby, R.B Webb, D. L. Weber
Weber, P.Wei bull, W. Weinert . H. 11. Weir-Jones, I. Weiss, L.E. Welch, J. D. Wenk, H. Wesson. R. L.
West, L.J. Westergaard ,II.M.Weyermann , W. White, S.White, T. L. Whi ting, R. L.
Whi tm an , R. V. Whi tney, C.S. Wickh am, G. E. Widm ann , R. Wiebenga, W. A. Wiederhorn, S .M.Wiid, B.L.
Wild. P. A. Wilhelm, N. Wilkins, J . Willard, R.J.
II 118:111 34 to 36II 99 ,163 ,1 64IV 334IV— 208,209,218,221 224II 74I 63 to 66, 213,214,263:11 56,82:111232 to 234, 244. 246. 248,250,252,260,271 to 273, 276, 277,310: I V ~ 76(see I Icndron. A. J.III 85)II 355III 347( seeG assm an II 349, 355)II 302IV 126IV - 2 7 011— 367,368IV— 224IV 5 4 ,7 1 ,7 2II 281,287,288 (see Rob inson , R.II 170)I I - 4 3 6
I I I — 68III - 3 2 9III 307,308IV 297(sec Amya, J. W.IV 346)IV 73I 253,262IV 292 to 295. 298II 123II 129
III 304,385I 51 to 53, 57, 58:111 261,269,27 0II 351,406,435II 41
II 76 .262: IV 142. 143. (also sec Thill. R.E. II 136)
A U T H O R I N D E X V O L U M E S I - 1V 501
WilliamWilliams.A .A .B .
Wil liamson.E. D.Willis. B. Willis, R. Willough hy, D RWilson, A. II. Windes, S. L.
Winkel, B. V. Wiseman, G. Wohnl ich , H. M W ood , L. E.
Woo d. R .H . Wood ford , A. ()
Wool lard , G. P Worotnicki , G. Wright , F. D. Wright , P. J. F. Wu, F .T. Wuerker . R. G.
Wurzel, P. Wyhle, D .O . Wyllic, M.R. .I .
W v ss , M .
11 362, 363
(see Jennings, J. E.IV 275,278)
II 99 ,162,16 3IV 241,243IV 243
II — 137II 334,387,430,445I 37. 47, 50 80, 88, 8 9 , 9 1 ,9 7 , 9 8 ; II 215, 217 ,284 ,320.323 ,324 . 339,340, 342. 343, 345,347, 349, 368, 388, 389. 404. 447, 449. 451, (also sec Cher t , L. II342,347 ,355 ,361,37 3,385,391 ,413 ,424, 449)III 267II 329IV 2II 343,379,380,420, 4 39 ,44 3,444III 209,292IV 208 ,209,218,221, 224II 259III 87,98, 100. 103III 187I — 134III 294 to 297I 5 ,8 9 ,1 6 6 ; II 70, 319, 324, 339 to 341.343 to 345, 347, 350, 351,355, 356, 365 to 368, 370, 374, 375, 389, 392, 394, 4 01 ,403 ,404,411 ,412 . 433. 436. 442. 447. 449. 450
IV 380IV 365II 224,230 .231,247 to 249, 263, 264, 268.269.284. 285, 289 to 291III 297
Yagodkin, G. I
Yamaguchi, U.
Yam am oto , K. Y amano , T. Yarovaya, L. I.
Yasue, T. Yevdokimov, P. D.Yokobor i , T. Youash, Y. Y.
Young, J. W. Youngs, L. G. Yu, Y.S.Yugeta. H.
Zahary, G. Zalcsskii, B. V
Zaruba, Q. Zellhofcr, O.
Zerneke, K. L.
Zhuravlev, V. I.
Zienkiewicz,O . C .
Zisman, M. D.
Znanski , J.
Zoback, M. I). Zuber, A.
I 8 ; II 319,322,323, 333, 415,424 to 426II 321,360.361.452, 453IV 119II 318,396(see Alekseev, A. D.I 33, 4 3 .4 4 .4 9 )III 371
IV 30III 274II 220,232,23 4,242 to 245,252, 253,255, 258,325 ,358,359.377. 390.418 .438,452 ; IV 141. 175 to 178IV 365IV 371,372 I 91 ,110 ,134 (see Ishii, I. Ill 181.182,327)
I 194see Belikov, B. P. II319, 321,322, 326 to 328,339,347 ,357.361 .364.386,387 ,390,391 .394.400,401 ,405 .408,41 4,415,426, 437, 441; IV 318, 320)I 50; III -357(see H a levy, E. IV 380)(see Kruse, G. H.II 352,353; III 337) (see Alekseev, A. D.I 33, 43 ,44. 49)
III 3 5 ,6 3 ,6 4II 104,232,338,346 to 349. 354, 355, 373.389, 400.312I 21,31; II 65,334, 432,437.441II 174,176(see H a levy, E. IV 380)


S U B J E C T I N D E X V O L U M E S I-IV
Subject Index for Volumes I-IV
Acoustic energy coupling II 209 Anisotropy of static elastic constants II 105,113, 115 Anisotropy of wave velocities 11 254.256, 257, 260 to 262, 277 to 279
Effect o f poros ity 11 259Aperture IV 264 Aperture classification IV 266
Bearing capacity III 136 Theories I i f 141
Bed thickness classification IV 263 Bedding plane orientation effect on modulus of elasticity II 116
tensile st rength IV 146,148 Bending IV 142 Bending test I 95
Cylindrical specimen I 95 Discs I 101,102 heed back signal generat ion I -100 Force-displacement curve I 100 Prismat ic specimen I 95, 98, 99
Bending test for creep III 228 modulus o f elasticity II 116
Biaxial compression. Fracture of jointed rock in IV 166Biaxial stress, Strength under I 175, 230 Bingham model III 226 Block s i /e classification IV 264 Borehole dilatometers III 83
Calcula t ions III 94I .NEC dilatometcr III 90 O Y O e la s to m e te r 200 III 91 Yaehiyo tube deformeter III 91
Borehole jacks 111 95C . S . I . R . O . pressiometer III 98 G o o d m a n ' s jack III 95 In terpretat ion o f results III 102
Borehole penetrometers III 100 Borehole tests III 83
Borehole di latometers III 83 Borehole jacks III 95 Borehole penetrometers 111 100Test ing procedure III 101
Brazilian test I 105 Effect on results Diamete r I 111 Environment I 114.115 Minera logy I 115
Porosity I 115 Rate o f loading I 114 Relative humidity I 114 Specimen geometry I 110 Thickness I 111 Volume I 111 Fracture mode I 108, 109 Stress dist ribution across loaded diameter I 105
Brazilian test for static elastic constants II 51Brazilian test under confining pressureI - 2 2 4Briquette tensile specimens I 5 Brittle-ductile transition 11 80Brittle fracture mechanism II 176 Bulk density IV 321
Buoyancy method IV 322 Method o f measurements IV 322
Bulk volume IV 344 Buoyancy method IV 319, 322 Burger’s model III 222
Cable jacking method 111 63Centrifugal tension 1 131Chemical dissolution IV 269 Chemical nature of pore fluids
Effect on triaxial s trength I 210 Chcmical weathering, Resistance of minerals to IV 270 Circumferential strain incasing system II 42Classification of apertures IV 266
bed thickness IV 263 block size IV 264 igneous rocks IV -218 intact rock IV 274 joint spacing IV 263 jo in ted rock mass IV 289 metamorphic rocks IV 224 rock IV 205rock for undei i iround excavationsIV 287rock in situ IV 282 R Q D IV - 2 8 6rock weathering IV 269. 273 sedimentary rocks IV 221 velocity index IV -286
Clip-on gauges 11 40C O D detector II 42

504 S U B J E C T I N D E X V O L U M E S I-IV
Coefficient o f friction I 29-Effect on compress ive s trength I 31
Cohesion IV 100 Effect o f size I - 1 wa ter con tent I 151
Comparison o f results Shear s t rength I 167 Tensi le s t rength I 133
Com pass, Geological IV— 44 Compressibility II 148, 150, 152,154, 160
Effect o f di rec tion II 161 pressure II 161,162
CompressionD e fo rm a t iona l behaviour in I - 6 1 Fai lure mechanism in I — 28 F ra c tu re o f jo in ted rock in biaxialIV- 166mul tiaxial IV 166triaxial IV- 172uniaxial IV — 111M o d e o f failure in I 26o f cyl inders d iametra lly I 123discs d iametra l ly I -105ir regular specimen for tensile strengthI I 32spheres d iametra l ly I — 125square plates a long a d iameter I 125squar e plates for static elasticcons tan ts II -54Post- fai lure behaviour in I 61Stress d is t r ibut ion under I 14Stress d i s t r ibut ion under triaxial I 177test for creep 111 — 231test for stat ic elastic constants II 43
Compressive strength I 13— Effect o f d ep th II 98
env iron ment I 50 friction between platens an d end surfaces I — 29 gra in size I 6height- to-diameter ratio I —32liquids I 57minera logy I 61mois ture 1 — 50p H I 57poros i ty I 61ra te o f l o a d i n g I 44shape I 32size I 38specimen d iameter I 41 specimen geometry I 32
—strain rate I 44 ,45 te m pera tu re I 61 vac uum pressure I 56 volume I 41 indi rect m e th o d s for 1 68testing i r regular specimens for I 68
Compressive strength, In situ uniaxialIII - 8
Displacement measur ing systemIII — 12Loading system III 12 Results III 16 Specimen prepara t ion III 9
Compressometer, Leeman and Grobbelaar 11 39, 40Conductivity of joints IV — 376 Confining pressure
Effect on creep 111 -251 initial tangent modulus II 84 initial tangent Poisson's ratio II 145 longitudinal wave velocity II 269,277 to 279, 298modulus o f elasticity II 116. 280 Poisson’s ratio II -2 8 0 shear wave velocity II — 277 to 279, 298 strain at failure II 95 stress-strain curves II 81. 95 triaxial strength I 189
Constricted oblique, shear,Method of I 164 Contraction (total) indicator, Cantilever-type 11 37Coulomb’s criterion of failure 1 238Coulomb-Navier criterion of failure I 238 C rack propagation II 174 C rack propagation velocity 111 383Cracks, Effect on stress-strain curve II 99 Creep curve III - 237 Creep, Factors influencing III 246
-Confining pressure III 251 Cyclic loading III 256 Humidity I I I — 257 Mois ture III -257 Stress level III 248Stress nature III 246 Structural factors III 261
-Temperature III —253 Creep in rocks and minerals III 240 Creep of fractured rock III - 2 8 8 Creep of rock in situ 111 262Creep tests III 227
Bending test III 228 Compress ion test III 231 Tension test III 231Tors ion test III 230
Creep theories III 297Dislocation theory III 298
-Exhaus t ion hypothesis III 300 General mechanism o f creep III 307
S U B J E C T I N D E X V O L U M E S I - 1V 505
Strain hardening theory III 298 St ructura l theory o f brittle creep 111 303
( 'reep, Transverse 111 292Cross-anisotropic parameters II 118 ( ’.S. I .R .O . pressiometer I I I— 98 Cube compressed simultaneously between two pairs o f its faces I 231 Cyclic loading effect on creep III 256 Cyclic tests
Effect on porosi ty II 180 Cylinders, Rotation o f IV 36
Defects in rocks IV 224 Fab r i c defects IV 224 Structura l defects IV 231
Deformability o f rock mass I I I - 115 Deformability tests in situ III 25
Borehole tests III 83 Plate bearing test III 25 Pressure tunnel test III 68
Deformation measurement II 5 Dial indicators II 10 Electrical gauges II 14 Electrical resistance strain gauges II 20Linear variable differential t ransformers II 14 to 16, 18, 19 Mechanical gauges II 9
O p t i c a l gauges II 10 Deformation (strain) modulusIV 125, 127, 130
Effect o f h/d ratio II 63 size II 63
Dcformational behaviour in compressionI 61
Dcformational properties, definitionsII 57Density IV 317
Bulk density IV 321 Effect on longitudinal wave velocity II 242, 244 to 246 m odu lus o f elasticity II -243 Po isson’s ratio II 244 t ransverse wave velocity II - 2 4 5 G ra in densi ty IV 318
DepthEffect on compressive strength II 98
Dial indicators II 10 Diameter
Effect on Brazilian test results I 111 post-failure stiffness II 66
Diameter of hole. Effect on ring test results I 119Diametral compression of cylinders I 123
d isc s I 105— spheres I 125
Dilatancy II 170; IV 10,11 Dilatation of joints IV 87Dilation angle IV 88 to 90 Dilatometers, Borehole III 83 —Calculat ions III — 94
L N E C di latometer III 90 O Y O ela s to m e te r 200 III 91 Yachiyo tube defo rmete r III 91
Direct method for tensile s trength I 87 Direct shear. Fracture o f jointed rock in IV 150Direct test of irregular specimens for tensile I 131 Disc, Bending of I 101 Dislocation theory 111 298Displacement history, Influence of friction resistance of rock surfaces IV -58Displacement measuring system III 12 Double shear test I 146; IV 34— with compress ion I 154 Dynamic elastic constants II - 195,233,241—Com par ison between resonance
and ultrasonic pulse m e thods II 223 Compar i son with static elastic constants II 231 ,233 ,2 35 ,280 In situ test II 226 Laboratory methods II 196 Resonance method II 196 Ul trasonic pulse metho d II -218
Dynamic modulus of elasticity —Com par ison with static m od ulus
o f elasticity I 234 Dynamic modulus of elasticity (in situ) — Compari son with in situ static
modulus o f defo rmat ion II - 2 3 8 — Compari son with in situ static
modulus o f elasticity II 239 Dynamic properties II 240
Effect o f or ientation 11 258Dynamic tensile strength 11 299
Com par ison with static tensile strength II -303
Elastic constants II 120Calculat ion II 43 Definit ions II 1Dynamic II 195,233,241

506 S U B J E C T I N D E X V O L U M E S I-IV
Static II 1,233 Effect o f temperature II 294
Elastic material. Perfectly III 212 Elastic waves 11 -195
Velocity II 236 Elasticity in rocks III 210 Elastoplastic material. Perfectly III 214 Electrical gauges 11 14Electrical resistance strain gauges 11 20
Adequacy o f bonding II 30Construct ion II —20 Factors influencing behaviour II 26 Fat igue performance improvementII — 28Limitations II 37 Principle II 20Selection II 23Surface prepara tion o f specimens for mount ing II 30
Electromagnetic apparatus II — 215 Electrostatic apparatus II 217 Environment effect on compressive strength I — 50
tensile strength (Brazilian test) I 115 tensile strength (r ing test) I 121
Equal area plot IV 253 Equal area projection IV 26 Equipment for triaxial testing I 181 Exhaustion hypothesis 111 300Extensometers using electrical gauges II 37
-Cantilever-type total contract ion indicator II 37 Clip-on gauges II 40
- L e e m a n and Grobbe laa r compressometer II 39, 40
F abric defects IV 224 Failure behaviour
-Classification in compress ion I 62 Failure criteria I 236
C oulomb 's I 238 Coulomb-Navic r I 238 Grif fi th’s I -2 4 2 M o h r ’s I 241
Failure envelopes IV 5, 7, 8, 10. 13, 18, 25 Failure in discs under bending I 102 Failure mechanism in compression I 28 Failure mode in compression I 26 Failure modes I 26, 230 Failure strain
Effect o f confining pressure II 95
Failure surface I 236 Failure surface development IV 97 Fatigue III -279 Faults IV 236Filling material. Influence on friction resistance o f rock surfaces IV 80 Firmo-viscous material III 219 Flexagauge 11 46Flexural vibration II 198
Cylindrical rods II 199 Rectangular bars II 199
Flexure test III 187 Folds IV 232Force-displacement curve
Effect o f testing machine stiffness on I 62 in bending tests I 99
Fracture of jointed rock in biaxial compression IV 166
direct shear IV 150 multiaxial compression IV 166 tension IV 141 triaxial compress ion IV 172 uniaxial compress ion IV 111
Fracture mode in Brazilian test I 108 ring test I 118
Fracture strainEffect o f strain rate II 304
Friction along joints.Investigations on IV 28
Convent ional shear box test IV 30 Double shear test IV 34 Rota t ion o f cylinders IV —36 Slider sl iding over another surfaceIV 28Test ing o f jo in ts in situ IV 36 Triaxial test IV - 3 4
Friction angles IV 54, 189 Friction between platens and end surfaces
Effect on compressive st rength I - 29 Friction coefficient IV 72, 74, 78, 84, 100
versus surface roughness IV -5 8 versus temperature IV 58
Friction machine. Large IV 29 Friction resistance of rock surfaces,Factors influencing IV 53
Displacement history IV 58 Filling mater ial IV 80 Norm al stress IV 67 Roughness IV 54 W a te r IV 71
Geological classification of rocksIV 216

S U B J E C T I N D E X V O L U M E S I-IV 507
Igneous rocks IV 217 Metam orph ic rocks IV 223 Sedimentary rocks IV 217
Geological compass IV 44 Geometry o f specimen
Effect on compressive strength I 32 post-failure stiffness in comression I 62 stress-strain curves II 62 tensile strength (Brazilian test) I 110 tensile strength (r ing test) I 119
(Joffi’s method 111 66Goodman's jack III 95 Grain density IV 318
Buoyancy method IV 319 Pycnometr ic method IV 318
G rain size IV 393Effect on compressive s trength I 61
Grain volume IV 339Boyle's law method IV 339
Griffith’s criterion o f failure I 242
I leight-to-diameter ratioEffect on compressive s trength I 32 defo rmat ion (strain) modulus II 63 post-failure stiffness II 66 stress-strain curves II 65, 67 to 69 triaxial s trength I 196
Hollow cylinders subject tocombined compress ion and tension under conf ining pressure I 230 external hydros tat ic pressure and axial force I 230
I lollow cylinders under compression I 225I lookean material III 212 llugoniot II 164 Humidity
Effect on creep 111 25711\ (I ran lie extension of irregular ring for tensile strength I 132 Hydraulic extension test I 103
(triaxial) I 305 Hydraulic pressure chamber test III 71
Igneous rocks IV 217Chemical composi t ion IV 208 Classification IV -218 Minerals associated with IV 219
Impact strength indexEst imation o f compress ive st rength I 79
Impact strength test I 77 In situ creep of rock 111 262
In situ mechanical properties III 325 In situ shear strength of rock.Factors influencing III 168 In situ shear strength tests III 144
Inclined load test III 145 Parallel load test III 161 Torsion test III 164
In situ tensile strength of rock III 183 Flexural test III 187 Pull test III 184
In situ test for dynamic elastic constants II 226 In situ testing of joints IV 36 In situ tests 111 2
for deformabi li ty III 25 Types III 2 ,5
In situ testing 111 1In situ triaxial tests III 188 In situ uniaxial compressive strength III 8
Displacement measur ing system III 12 Loading system III 12 Results III 16
-Specimen prepara t ion III 9 Inclined load test III 145
Calculat ion and report ing o f results III 156 Preparat ion o f test block III 147 Test equipment III 146Test proced u re 111 150Test with water satura tion III 159 Variations III 158
Indentation failure modes III 139 Indentation test I 125 Indirect methods for compressive strength I 68
tensile strength I 95 Inductive axial-strain measurement device II 41Intact rock classification IV 274
Modulus ratio IV 278 Strength IV 278
Intermediate principal stressEffect on stress-strain curves II 95 triaxial strength I -2 21
Irregular ringHydraul ic extension test I 191
Irregular specimen preparation I 4 Irregular specimen testing for
compressive strength I 68 shear strength (single shear with compress ion between bevelled dies)I 24
508 S U B J E C T I N D E X V O L U M E S I - 1V
tensile s t rength I 131 di rect test I -131 com press ion test I 132
Jacks, Borehole III 95C . S . I . R . O . pressiometer III 98 G o o d m a n ' s jack III 95In terpre ta t ion o f results III 102
Joint analysis IV 249 Joint, Behaviour during sliding along, IV 28Joint continuity IV 138, 256Joint frequency IV 249Joint length IV 256 Joint orientation. Double IV 24
Multiple IV 24 Single IV 19
Joint plane, Stereographic projection o f IV 409 Joint rose IV 254 Joint roughness IV 262 Joint spacing classification IV 263 Joint surface roughness
Descr ip t ion IV 46 Record ing IV 43
Joint surfaces. Physical process o f sliding between IV 93 Joint survey IV —249
Errors in IV 267 Joint, Theory o f sliding along a IV 3 Joint thickness IV 262 Jointed rock. Fracture in biaxial compression IV 166
direct shear IV 150 mul tiaxia l compress ion IV 166 tens ion IV 141 triaxial compress ion IV 172 uniaxial compress ion IV 111
Jointed rock. Mechanical behaviour o f IV 1 Joints IV 240
Cond uct iv i ty o f IV 376 Di la t a t ion o f IV 87 Fr ict ion a long IV 28 Scale effect in IV 91 Test ing in situ IV 36
Joints, Mutual area of contact of surfaces along IV 50
Ad hesion m e thod IV -5 2 Electrical resistance method IV -52 Light deflect ion method IV —53
Kelvin material III 219 Kelvin model. Generalised III 221
Kirkham’s method IV 370 Kobe porosimeter IV 324
Laboratory mechanical propertiesII 318 to 453Laboratory methods for dynamic elastic constants II 196 Lamb’s roller extensometer II 14Lamination orientation effect on tensile strength IV 147Large scale in situ tests III 2
Types III 2Leeman and Crobbclaar compressometer II 39, 40 Linear variable differential transformer 11 14 to 16, 18, 19
Lateral ex tensometer II 18, 41 Liquids
-Effect on compressive s t rength I 57 Lithological classification o f rock IV 274 Lissajous patterns II 210 LNEC dilatometer III 90 Load-deflection curves
Effect of rate o f loading 11 70Loading duration
Effect on st ress-strain curves II 75 tensile st rength (direct test) I 93
Loading pathEffect on triaxial s t rength I 197
Loading rateEffect on compress ive s t rength I 44 load-deflection curves 11 70stress-strain curves II 66, 71, 72,74, 75, 79tensile s trength (Brazi lian test) I 114 tensile s trength (direct test) I 93
Loading sequence in testing of joint properties IV 41 Loading system for in situ uniaxial compressive strength test II 12 Longitudinal vibration 11 197Longitudinal wave velocity II 240,257,283
Anisot ropy II 254, 260 to 262Effect o f conf ining pressure 11 269,277 to 279, 298densi ty II 242, 244 to 246mineral content II 242porosity II 247 to 251, 253, 254pressure II 264 to 268, 281. 282, 290.2 91 ,296 ,297rock type 11 237strain II 272stress II 263. 269 to 272, 274

S U B J E C T I N D E X V O L U M E S I-IV 509
temperature II 282, 292. 293, 295,297,298, 300texture II 237thermal cycling II 296water content II 282, 284, 287, 288.290 to 292wetting II 2 8 5 ,2 8 6 .2 8 8
Martens single mirror extensometerII 13Maxwell material III 216 Mechanical behaviour o f jointed rock IV 1Mechanical gauges II 9 Mechanical properties, laboratoryII 318 to 453Mechanical weathering IV 268 Mechanism of failure in compression I 28 Metamorphic rocks IV 223
Classification IV 224 Microfracturing III 292 Microscope, Stereo depth measurement IV 43 Mineral content
Effect on longitudinal wave velocity II 242
MineralogyEffect on compressive s t rength I 61tensile s t rength (Brazil ian test) I 115
Minerals IV 206Associated wi th igneous rocks IV 219 Proper ties o f rock- forming minerals IV 209
Mode of failure in compression I 26 Modulus IV 122 Modulus anisotropy II 105 Modulus of deformation (in situ static)
Com par i son with in situ dynamic modulus o f elasticity I 238
Modulus of elasticity Anisot ropy II 115 Bending test II 46 Calculat ion f rom flexural resonant frequency II 206 Compar ison between static and dynamic values 11 234Representat ion o f three types II 59 Effect o f conf ining pressureII 116,280bedding plane or ien ta t ion II 116 density II 243 effective no rm a l stress II 83 porosity II 252 specific gravity II 109
stress II 99,270 temperature II 294
.Modulus of elasticity (in situ static) Com par ison with in situ dynam ic modulus o f elasticity II 239
Modulus o f rigidityEffect o f temperature 11 294
Modulus of rupture Effect o f span I 98 specimen diameter I 98 thickness I 98,99
Mohr's criterion of failure I 241 Mohr's representation of uniaxial tensile and compressive strengths, shear strength from I 166 Moisture effect on compressive strength I 50
creep III - 2 5 7 Multiaxial compression. Fracture of jointed rock in IV 166
Newtonian material I I I 215 N. M. E. R. I. tensile specimen I 6 Node positions 11 233Normal stress. Influence on friction resistance of rock surfaces IV 67 Number of specimens to be tested I 7 Open-end test IV 372 Orientation
Effect on dynamic propert ies 11 258Optical gauges II 10 Oscillator (composite) II 213
Quar tz t ransducer II 214 O VO elastometer 200 111 91
Packer test IV 373 Parallel load test III 161 Penetrometers, Borehole III 100 Permeability IV 356
Relat ionship with porosi ty IV 356 Permeability coefficients IV 357 Permeability o f rock masses in situ IV 368
K irkham' s method IV 370 Open-end test IV 373 Packer test IV 373 Thiem 's method IV 369
pH effect on compressive strength I 57 Piezoelectric apparatus II 211 Plastic material. Perfectly III 213 Plasticity in rocks III 210
510 S U B J E C T I N D E X V O L U M E S I-IV
Plate bearing test III 25Interpretat ion III 48 Testing in trenches or open pits III 48 Test ing technique III 40 Theoret ical basis III 25
Plate bearing test modifications III 58 Cable jacking method III* 63 Compress ion in narrow slits III 58 Goffi 's method III 66
Platen conditionEffect on stress-strain curves11 64. 67 to 69
Point loading method I 124 Poisson’s number II 142
Effect o f stress II -142 Poisson’s ratio II 117
Anisot ropy II 115Compar i son between static and dynamic values 11 234Effect o f confining pressure II 280 density II 244 stress' ll 143,268 temperature II 294
Poisson’s ratio (initial tangent)Effect o f confining pressure II 145
Poisson’s ratio parameters (triaxial)II 146, 148 Polyaxial test I 219
Results I 221 Pore fluids effect on triaxial strength I 210 Pore pressure effect on triaxial strength I 201 Pore volume IV 329
Gravimetr ic method IV 329 Volumetric method IV 329
PoresEffect on stress-strain curves II 99
Porosimeter, Kobe IV 342Ritter and Drake mercury IV 331 U.S. Bureau o f Mines IV 340 Washburn-Bunt ing IV 329
Porosity II 106; IV -327 Apparent porosity IV 328 Effect o f cyclic tests II 180 Total porosity IV 328
Porosity effect on anisotropy II 259 compressive s trength I 61; IV 347 to 350increment o f compressive strength I47longitudinal wave velocity II 247 to 251,253,254mechanical properties IV 346 modulus o f elasticity II 252
tensile st rength IV 350 tensile strength (Brazilian test) I 115
Post-failure behaviour in bending I 99 compress ion I 61 triaxial compress ion I 212
Post-failure modulus II 60 Post-failure stiffness
Effect of h d ratio II 66 specimen diameter II 66
Post-failure stiffness in compression as function of specimen geometry I 67 Preparation of specimen I 1,3
Briquette tensile I 5 Cylindrical I 4 Hol low cylindrical I 5 Irregular I 4 N . M . E . R . I . tensile I 6 Prismat ic I 3 Regular I 3 Ring I 5 Special-shape I 5 Sphere I 6
PressureEffect on compressibil i ty II 161, 162 longi tudinal wave velocity II 264 to 268. 281. 282, 290, 291. 296, 297 shea r wave velocity II 265. 281. 282 stress-strain curve 11 80
Pressure tunnel test III 68 Analysis o f results III 78 Hydraulic pressure ch amber test 111 71'Radial j acking test III 75 Theoret ical basis III 68
Profilograph IV 44,45 Protodyakonov strength coefficient
Est imation o f compressive s trengthI 73
Protodyakonov test I 73 Pull test III 184
M. R E. device III 185Russian device III 184
Punch test I 147 Punching under confining pressure I 224 Pycnometric method IV 318
Radial jacking test III 75 Rate o f loading
Effect on compressive s trength I 44 load-deflection curves 11 70shear st rength (torsion test) I 145 stress-strain curves II 66 ,71. 72, 74.75. 79

S U B J E C T I N D E X V O L U M E S I - 1V
tensile s trength (Brazilian test) I 114 tensile s trength (direct test) I 93 tensile s trength (r ing test) I 121
Regular specimen preparation I 3 Relationship between compressive strength and impact strength index I 79 Relative humidity
Effect on tensile strength ( Brazilian test) I 115
Resonance method I! 196 Flexural vibration II 197 Identification o f vibrat ing mode 11 209Longi tudinal vibrat ion II 197 Measurements at high temperatureII 211Measur ing system II 207 Practical l imitations II 218 Some othe r methods o f employing resonance II 211 Torsional v ibrat ion II 199 Vibra ting mode identification II 209
Resonance systemA utom ated f requency scan o f U.S. Bureau o f Mines II 208 based on elect romagnet ic effect II 215o f U.S. Bureau o f Mines II 207
Rheological models III —212 Complex behaviour III 221 for different rock types III 227
Ring test I 116 Effect on results D iamete r o f hole I 119 Environment I -121 Rate o f loading I 121 Specimen geometry I 119
Ritter and Drake mercury porosimeter IV 331 Rock classification IV 205 Rock classification for underground excavations IV 287
Rock mass quali ty IV 299 Rock s tructure rating IV 292 South African geomechanics classification IV 287
Rock fabricEffect on stress-strain curve II 105
Rock mass quality IV 299Rock quality designation IV 284
Engineering classification IV 286Rock structure rating IV 292Rock type
Effect on longitudinal wave velocity II 237
Rock weathering IV 269 Classification IV 269, 273
Rocks IV 206Geological classification IV 216 Igneous rocks IV 217 Metamorphic rocks IV 223 Sedimentary rocks IV 217
Rotation of cylinders IV 36 Roughness, Influence on friction resistance o f rock surface IV 54 Roughness of joint surfaces
Description IV 46 Recording IV 43
Sal/burg School classification of rock in situ IV 282 Sampling I 1 Scale effect in joints IV 91 Sedimentary rocks IV 217
Chemical composi t ion IV 208 Classification o f IV 221 Deposi tional features IV 222
Seismic wave propagation 11 228Shape effect on
compressive s trength I 32 stress-strain curve I 67 triaxial strength I 196
Shear box test. Conventional IV 30 Shear, Fracture of jointed rock in direct IV 150Shear strength 1 141
Const ricted obl ique shear test I 164Double shear test I - 144Double shear with compress ion I 154Effect of hydros tat ic pressure I 155normal stress I 154. 155rate o f loading (torsion test) I 145specimen size I 162time I -151water content I 153From Mohr ' s representationof tensile and compressivestrengths 1 166Punch test I 147Single shear test I —144Single shear with compress ionI 148,154Single shear with compress ion between bevelled dies I 158 Testing irregularly shaped specimens I 163 Tors ion test I 208 Triaxial test I - 2 3 1 ,2 4 3
Shear strength of rock in situ.Factors influencing III 168
512 S U B J E C T I N D E X V O L U M E S I-IV
Shear strength tests of rock in situ III 144Inclined load test III 145 Parallel load test III 161 Tors ion test III 164
Shear test. Double IV 34 Shear wave velocity
Anisot ropy II 260, 261 Effect o f confining pressureII -277 to 279, 298 pressure II - 2 6 5 , 2 8 1 . 2 8 2 temperature II 282,298
Shock I lugoniot 11 164Single shear test I 144
with compression I 148, 154 Effect o f a on I, Tr I 150 with compression between bevelled dies I 158
S i /e effect on cohesion I 163 compressive strength I 38 deformation (strain) modulus II 63 shear strength I 162 stress-strain curve I 67
S i/e of grainsEffect on compressive s trength I 61
Skin-to-skin drilling III 11 Slake-durability index IV 389 Sliekensides IV 243 Slider sliding over another surface IV 28 Sliding along a joint. Behaviour during IV 28
Theory IV 3 Sliding between joint surfaces.Physical process of IV 93Sliding on a plane of weakness IV 20, 2 1Slit cutting machine III 61South African geomechanicsclassification IV 287Span
Effect on modulus o f rupture I 98 Specific gravity
Effect on modulus o f elasticity II 109 Specimen diameter
Effect on compressive st rength I 41 post-failure stiffness II 66
Specimen geometryEffect on compressive s trength I 32 post-failure stiffness in compression I 67 stress-strain curves II 62 tensile s trength (Brazilian test) I 110 tensile strength (ring test) I 119
Specimen preparation I 1.2 Briquette tensile I 5
Cylindrical I 3 Hollow cylindrical I 5 Irregular I 4 N . M . E . R . l . tensile I 6 Prismatic I 3 Regular I 3 Ring I 5 Special-shapc I 5 Sphere I 6
Specimen preparation for in situ uniaxial compressive strength testIII 9. 10 Sphere
Diametral compress ion I 125 Preparat ion I 6
Square plateCompress ion a long a d iameter I 125
St. Venant material III 214 Static elastic constants II 1. 233
Anisotropy, II 105. 113, 115 Brazilian test II 51 Com par ison with dynamic elastic constants II 231, 233, 235, 280 Compress ion o f square plates 11 54
-Compression (simple) test II 43 Tension (direct) test II 43 Triaxial test 11 74
Static modulus of deformation (in situ) Com par ison with in situ dynamic modulus o f elasticity II 238
Static modulus of elasticityCom par ison with dynamic modulus o f elasticity II 234
Static modulus of elasticity (in situ) —Com parison with in situ dynamic
modulus o f elasticity II -239 Static tensile strength
Com par ison with dynamic tensile strength II 303
Stereo depth measurement microscopeIV 43Stereographic projection IV 407
o f a jo int plane IV 409 Stick-slip IV 99 Stiff testing machines I 253
Concept I 253 Development I - 262
Stiffness of a testing machine I 256 Strain
Effect on longitudinal wave velocity II 272
Strain gauge cement summary 11 24Strain gauge conductors, properties 11 22Strain gauge, waterproofing II 33

S U B J E C T I N D E X V O L U M E S I-IV 513
Strain hardening theory Hi 298 Strain indicator drift II 30 Strain measurement 1 180Strain modulus
I fleet o f h d ratio II 63 specimen size II 63
Strain rateEffect on compressive st rength I 44 fracture strain II 304 stress-strain curves II 76 to 78 triaxial s trength I 210
Strain-sensitive alloys, effective temperature ranges II 23 Strength classification of intakt rockIV -278Strength under biaxial stress I 175, 230
triaxial stress I 210 Stress
Effect on longitudinal wave velocity II 263, 269 to 272. 274 modulus o f elasticity 11 99, 270Poisson's num ber II 142 Poisson's ratio II 143. 268 stress-strain curves II 97 volume change II 73. 178, 179
Stress distributionacross loaded diameter for Brazilian test I 105 along loaded diameter for ring I 116 at end o f elliptical hole I 242 in thick-walled cylinder I 225, 230 under compress ion I 14 under triaxial compression I 177
Stress-deformation curve for shear test I 148Stress level
1 ffect on creep 111 248Stress nature
I ffect on creep 111 246Stress-strain curve in triaxial compression I 212Stress-strain curves I 62. 65
Brittle-ductile transit ion II 80 Effect o fc o n fm in u pressure II 81. 95 cracks II 99geometry o f specimen II 62 h/d ratio II 65, 67 to 69 intermediate principal stress II 95 loading du ra t ion II 75platen condi t ion II 64, 67 to 69pores II 99 pressure II 80rate o f loading II 66. 71. 72. 74, 75, 79 repeated loading II 272 rock fabric II 105
specimen geometry II 62 specimen size and shape 62 strain rate II 76 to 78 stress II 97 t emperature II 80
Stress-strain parameters (triaxial)II 8 6 .9 0 ,9 2 .9 4 Stress-strain properties II 120 Structural defects IV 231
Faul ts IV 236 Folds IV 232 Joints IV 240
S tructural factorsE ffect on creep 111 261
Structural theory of brittle creep III 303 Surface damage classification svstcmIV 95Surface tension of liquids
Effect on compressive s trength I 57 Swelling pressure index IV 381 Swelling strain index IV 383
Relat ionship with compressive st rength IV 387 Versus void index IV 388
Systone IV 3
Tangent modulus (initial)Effect of confining pressure II 84
Tangent Poisson’s ratio (initial)Effect o f confining pressure II 145
TemperatureEffect on compressive s trength I 61 creep III 253 elastic constants II 294 longitudinal wave velocityII 282, 292, 293, 295, 297, 298. 300 modulus o f elasticity II 294 modulus o f rigidity II 294 Poisson's ratio II 294 shear wave velocity 11 — 282, 298 stress-strain curves II 80 triaxial strength I 198 wave velocity 11 282, 292
Tensile specimen preparation I 6 Tensile strength 1 87
Bending test I 95Brazilian test I 105 Centri fugal tension I 131 Chamfered collar method I 92 Compress ion o f square plates a long a d iameter I 125Diametral compress ion of discs I 105 spheres I 125 Direct method I 87

514 S U B J E C T I N D E X V O L U M E S I-IV
Effect o f A 1C 13 solut ions (Brazilian test) I 115 bedding plane orientat ion IV 146. 148 contact area and nature o f platens (Brazilian test) I 108 diameter (bending test) I 98 diameter (Brazilian test) I 111 diameter o f hole ( ring test) I 119 eccentricity o f hole (r ing test) I 121 environment (Brazil ian tesl) I 115 environment (r ing test) I 121 fluids (ring test) I 121 humidity (Brazilian test) I 115 laminat ion or ienta t ion IV 147 loading dura t ion (direct test) I 93 mineralogy (Brazil ian lest) I 115 porosity ( Brazilian test) I 115 rate o f loading (Brazil ian test) I 114 rate o f loading (direct test) I 93 rate o f loading (r ing test) I 121 relative humidity (Brazil ian test) I 115 span (bending test) I 98 specimen geometry (Brazilian test)I 110specimen geometry (ring test) I 119 thickness (bending test) I 98 thickness (Brazilian test) I 111 volume (Brazilian test) I 111I lydraulic extension test 1 103Indentat ion test I 125 Indirect methods I 95 Irregular specimen testing I 131 compress ion test I 132 direel test I 131 hydraulic extension test I 132 Point loading m e thod I 124 Ring test 1 116
Tensile strength, dynamic 11 299Com par ison with static tensile s trength II 303
Tensile strength of rock in situ III 183 Flexural test III 187 Pull test III 184
Tensile strength, staticCompar ison with dynamic tensile s trength II 303
Tension, Fracture of jointed rock in IV 141Tension test for creep III 231Tension (direct) test for static elastic constants 11 43Test site selection III 4Testing equipment for triaxial strengthI 181Testing machine
Concept o f stiff I 253 High-speed compress ive I 45
Servo-controlled I 258 Stiff I 253 Stiffness o f I 256 Thermally-controlled stiff I 263
Testing machine stiffness I 253 Effect on force-displacement curve I 62
Testing techniques for triaxial strength I 175Tests for static elastic constants 11 43
Bending II 46 Brazilian II 51 Compress ion (simple) I I — 43 Compress ion of square plates II 54 Requirements II 3 Tension, direct II 43 Triaxial test o f solid and hollow cylinders II 54
TextureEffect on longitudinal wave velocityII 237
Thermal cyclingEffect on longitudinal wave velocity II 296
ThicknessEffect on tensile strength (Brazilian test) I 111
Thiem’s method IV 369 Time
Effect on volumetric strain (crcep test) II 179
Time-dependent properties III 209 rime-dependent strength 111 267
Creep rate method III - 274 Di latancy method III 268 Micro-seismic method III 272 Relaxation method III 277 Strain rate method III 270Transient creep method III 268
Time-strain curve III 231 Torsion test I 142; III 164
Deformat ion diagrams at different rates o f loading I 145 Equipment for creep 111 230Fai lure in I 142
Torsion under compression I 223 Torsional vibration II 199 Transverse creep III 292Transverse wave velocity
Effect o f density II 245Triaxial compression
Fracture o f jointed rock in IV 172 Post-failure behaviour in 1 212Strain distribution under I 177

S U B J E C T I N D E X V O L U M E S I-IV 515
Stress dist ribution under I 177 Various methods for I 176
Triax ia l PoissoiTs ratio parametersII 146.148 Triax ia l strength
Effect o f chemical na tu re o f pore fluids I 210 conf ining pressure I 189 h d ratio I 196intermediate principal stress I 221 loading path I 197 pore pressure I 201 shape I 196 strain rate I 210 temperature I 198 Testing equipment I 181 Testing techniques I 175 U.S. B. M. appa ra tus I 183
Triax ia l stress. Strength under I 175 T riax ia l stress-strain param eters11 86, 90, 92, 94T riax ia l test I 165, 176; IV 34Triax ia l test for static elastic constantsII 54Triax ia l tests in situ III 188
Uniaxial compression. Fractureof jointed rock in IV 111I niaxial compressive strength in situ III 8
L o a d i n g a n d displacement measur ing system III 12 Results III 16 Specimen prepara t ion III 9
U .S . B. R. plate loading system III 47 Ultrasonic pulse method II 218
Limita tions II 223 Measur ing system 11 220 to 222Variat ions II - 2 1 9
Vacuum pressureEffect on compress ive s trength I 56
Velocity index classification IV 286 Vibrating mode identification 11 209
Viscoelastic material III 216 Viscosity coefficients of rocks 111 260V iscous material. Perfectly III 215 Void index IV 352
Effect on compressive strength IV 354 seismic velocity IV 355 tensile strength IV 354
Voigt material III 219V olume change as a function of stressII 73 ,178 ,179Volume effect on
compressive strength I 41 tensile strength (Brazilian test) I 111
Volumetric strain (creep test)-E f fec t o f time 11 179
Washburn-Bunting porosimeter IV 329 W ater content IV 351
Effect on longitudinal wave velocity II 282. 284. 287. 288. 290 to 292
W ater, Influence on friction resistance of rock surface IV 71 Waterproofing strain gauges II 33Wave velocity II 236,240,241
Anisot ropy II 254, 256, 257, 260 to 262, 277 to 279 Effect o f temperature II 282, 292
Weathering, Mechanical IV 269 Weathering, Rock IV 269
Classification IV 273 Wetting
Effect on longitudinal wave velocity II - 2 8 5 , 286, 288
Wheatstone bridge principle II 33
Yachiyo tube deformeter III 91 Yielding failure I I I 137
Zero drift determination 11 27Zero shift as a function of gauge current and time II 28

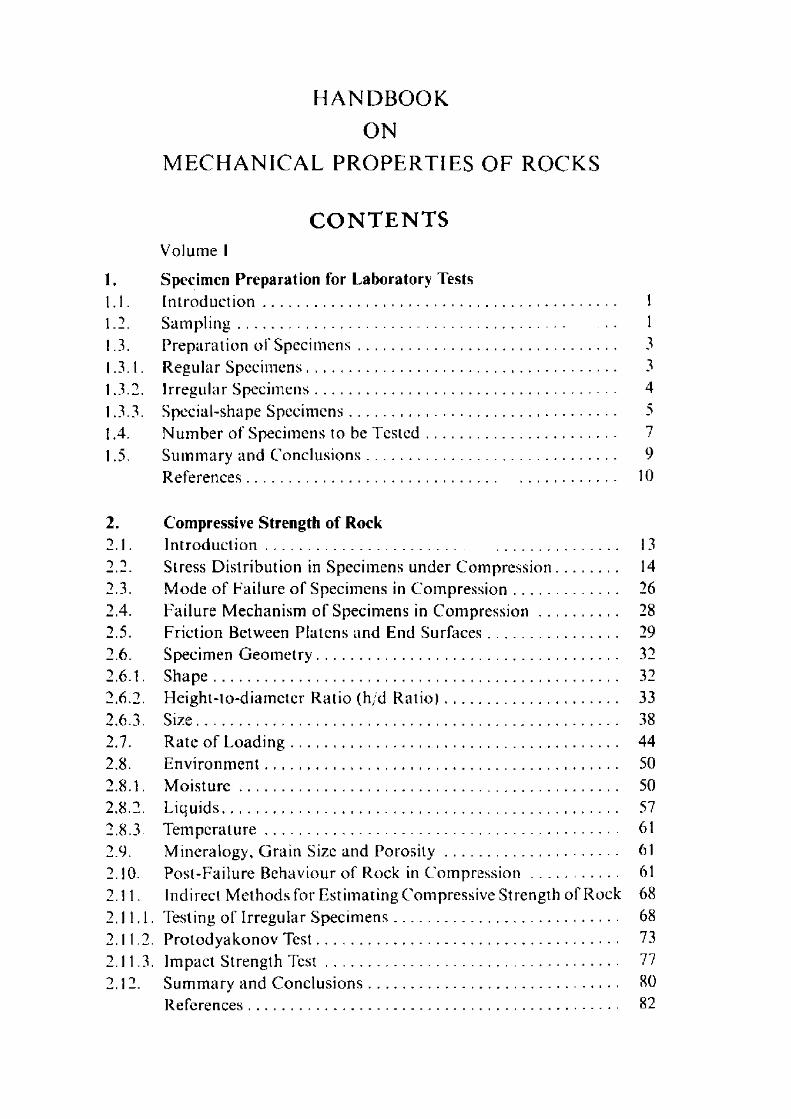
H A N D B O O K
O N
M E C H A N I C A L P R O P E R T I E S O F R O C K S
C O N T E N T S
Volume 1
1. Specim en Preparation for Laboratory Tests1.1. I n t r o d u c t i o n ........................................................1.2. S a m p l i n g ...............................................................1.3. P repara t ion o f S p e c i m e n s ................................1.3.1. Regular S p e c im e n s .............................................1.3.2. Ir regular S p e c im e n s ................................................................................... 41.3.3. Special-shape S p e c i m e n s ......................................................................... 51.4. N u m b e r o f Specimens to be T e s t e d .................................................... 71.5. S um m ary and C o n c l u s i o n s .................................................................... 9
R efe ren c es .................................................................................................... 10
2. C om pressive Strength o f Roek2.1. I n t r o d u c t i o n ..................................................... ................................. 132.2. Stress Dis tr ibution in Specimens under C o m p r e s s io n ................. 142.3. M o d e o f Fa ilure o f Specimens in C o m p r e s s i o n .............................. 262.4. Fa ilure M echan ism o f Specimens in C o m p r e s s i o n ...................... 282.5. Fr ict ion Between Platens and End S u r f a c e s ..................................... 292.6. Specimen G e o m e t r y ................................................................................... 322.6.1. S h a p e ............................................................................................................... 322.6.2. Height- to-d iameter R a t io (h/d R a t i o ) ................................................ 332.6.3. S ize .................................................................................................................... 382.7. Rate o f L o a d i n g .......................................................................................... 442.8. E n v i r o n m e n t ................................................................................................. 502.8.1. M o i s t u r e ........................................................................................................ 502.8.2. L iq u id s ............................................................................................................. 572.8.3. T e m p e r a t u r e ................................................................................................. 612.9. Mineralogy, G ra in Size and P o r o s i t y ................................................ 612.10. Pos t-Failure Behaviour o f Rock in C o m p r e s s i o n ......................... 612.11. Indirect M ethods for Es t imat ing Compress ive Strength o f Rock 682.11.1. Testing o f Irregular S p e c i m e n s .............................................................. 682.11.2. P ro to d y ak o n o v T e s t ................................................................................... 732.11.3. Impact Strength T e s t ................................................................................. 772.12. S u m m ary and C o n c l u s i o n s ..................................................................... 80
R efe ren ces ..................................................................................................... 82
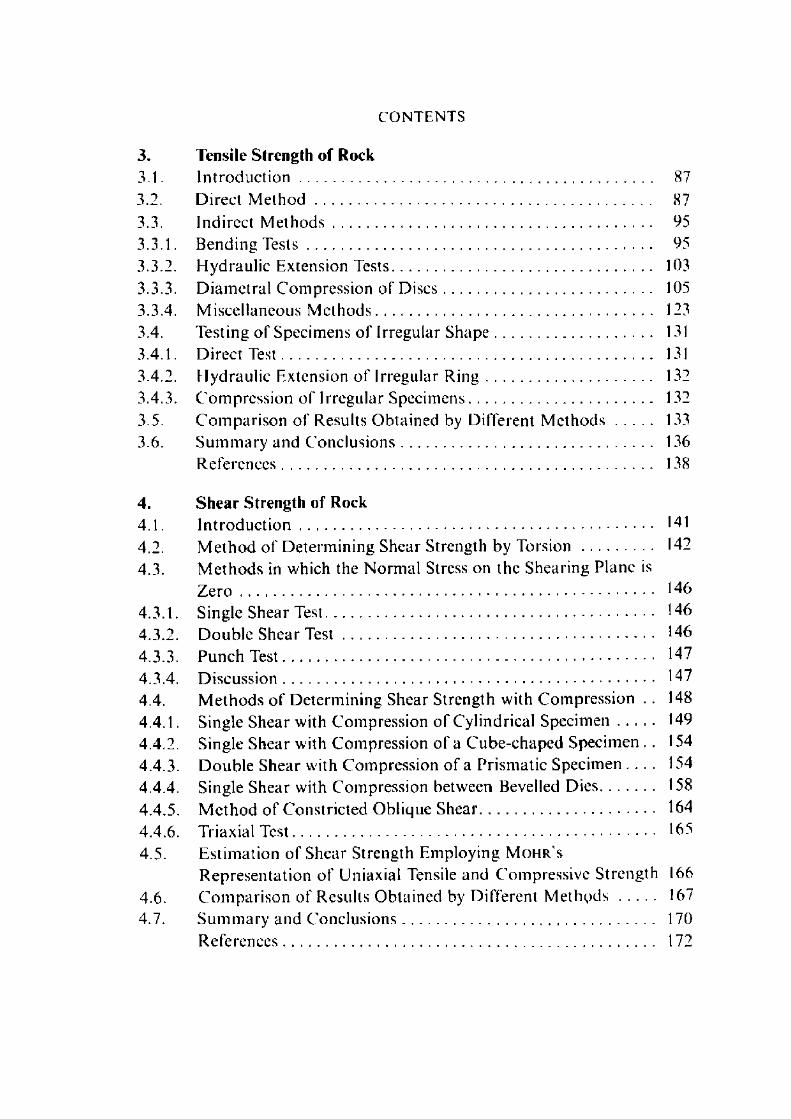
C O N T E N T S
3. Tensile Strength o f Rock3.1. I n t r o d u c t i o n ................................................................................................ 873.2. D irec t M e t h o d ........................................................................................... 873.3. Indirect M e t h o d s ...................................................................................... 953.3.1. Bending T e s t s ............................................................................................. 953.3.2. Hydrau l ic Extension Tests ...................................................................... 1033.3.3. D iam et ra l Com press ion o f D i s c s ........................................................ 1053.3.4. Miscellaneous M e t h o d s ........................................................................... 1233.4. Testing o f Specimens o f Irregular S h a p e .......................................... 1313.4.1. Direct T e s t .................................................................................................... 1313.4.2. Hydrau l ic Extension o f Irregular R i n g ............................................ 1323.4.3. C om press ion o f Irregular S pec im ens ................................................. 1323.5. C o m p a r i so n o f Results Obta ined by Different M e t h o d s ........... 1333.6. S u m m a r y and C o n c l u s i o n s ................................................................... 136
R e f e r e n c e s ..................................................................................................... 138
4 . Shear Strength o f Rock4.1. I n t r o d u c t i o n ................................................................................................ 1414.2. M e th o d o f Determin ing Shear Strength by Torsion ..................... 1424.3. M e th o d s in which the N orm al Stress on the Shearing Plane is
Z e r o ................................................................................................................. 1464.3.1. Single Shear Tes t ......................................................................................... 1464.3.2. D oub le Shear T e s t ..................................................................................... 1464.3.3. P u n ch T e s t ..................................................................................................... 1474.3.4. D i s c u s s i o n ..................................................................................................... 1474.4. M e th o d s o f De term in ing Shear Strength with C om press ion . . 1484.4.1. Single Shear with Compress ion o f Cylindrical S p e c i m e n ............ 1494.4.2. Single Shear with Compress ion o f a C ube-chaped Specimen . . 1544.4.3. D o u b le Shear with Compress ion o f a Pr ismatic Specimen . . . . 1544.4.4. Single Shear with Compress ion between Bevelled D ies ................. 1584.4.5. M e th o d o f Const r ic ted Oblique S h e a r .................................................. 1644.4.6. Triaxial T e s t .................................................................................................. 1654.5. Es t im at ion o f Shear Strength Employing M o h r ' s
Represen ta t ion o f Uniaxial Tensile and Compress ive S trength 1664.6. C o m p a r i s o n o f Results Ob ta ined by Different M e t h p d s ............ 1674.7. S u m m a r y an d C o n c l u s i o n s .................................................................... 170
R e f e r e n c e s ..................................................................................................... 172

175
175176177180181189216219221
283223224224225230
230
231231233236238241242247248
253253256262266268270
274
C O N T E N T S
Strength of Rock Under Triaxial and Biaxial StressesI n t r o d u c t i o n ................................................................................................Testing T e c h n iq u e s .....................................................................................Convent iona l Triaxial T e s t ....................................................................Stress Dis tr ibution in Specimens under Triaxial C o m p re ss io n .M easurem ent o f S t r a i n ...........................................................................Testing E q u i p m e n t .....................................................................................R e s u l t s ............................................................................................................M odes o f Failure o f R o c k s ....................................................................Polyaxial T e s t ..............................................................................................R e s u l t s ............................................................................................................Miscellaneous T e s t s ..................................................................................Torsion o f Solid Cyl inders under C o m p r e s s i o n ............................Punching under Confining P ressu re ....................................................Brazil ian Test under Confining P r e s s u r e ...........................................Hollow Cylinders under C o m p re ss io n ...............................................St rength o f Rock under Biaxial S t ress ...............................................Hollow Cyl inder Subjected to External Hydros ta t ic Pressurean d Axial F o r c e .........................................................................................C u b e C om pressed Simul taneously between Two Pairs o f ItsF a c e s ..............................................................................................................R e s u l t s ............................................................................................................De term ina t ion o f Shear Strength from Triaxial T e s t s .................Fa i lure C r i t e r i a ............................................................................................C o u lo m b -N av ie r C r i t e r i o n ....................................................................M o h r ' s C r i t e r i o n .......................................................................................G riffith ' s C r i t e r io n ..................................................................................S um m ary and C o n c l u s i o n s ....................................................................R e fe ren c es .....................................................................................................
AppendixStiff Testing M a c h i n e s .............................................................................Concep t o f Stiff Testing M a c h i n e s ......................................................Stiffness o f a Testing M a c h i n e .............................................................Development o f Stiff M achines for Testing o f R o c k s .................R e fe ren ces .....................................................................................................A b o u t the A u t h o r s .....................................................................................Au thor Index ..............................................................................................Subject I n d e x ..............................................................................................
H A N D B O O K
O N
M E C H A N I C A L P R O P E R T I E S O F R O C K S
C O N T E N T SVolum e 11
6. Static Elastic Constants of Rocks6.1. In troduction ............................................................................................ 16.2. Definit ions of Term s ............................................................................. 16.3. Tes t R e q u i r e m e n t s ................................................................................ 36.4. M easurem ent of Deformation .......................................................... 56.4.1. Mechanical G a u g e s ................................................................................ 96.4.2. Opt ical G a u g e s ....................................................................................... 106.4.3. Electrical G a u g e s ................................................................................... 146.4 .3 .1 . L inear variable differential t r a n s f o r m e r s ...................................... 146.4.3 .2. Electrical resistance strain g a u g e s ..................................................... 206.4.4. Extensometers Using Electrical G a u g e s ......................................... 376.5. Calcula tion of Elastic Constants from T e s t s ................................. 436.5.1. Simple Compress ion and Direct T e n s i o n ...................................... 436.5.2. Bending .................................................................................................... 466.5.3. Brazil ian Test .......................................................................................... 516.5.4. Compress ion of Square Plates .......................................................... 546.5.5. Tr iaxia l Test (Solid and Hollow C y l i n d e r s ) ................................. 546.6. Deformation of Rock ............................................................................ 576.7. Fac tors Influencing Stress-Strain Curves for R o c k s .................. 626.7.1. Specimen Geometry .............................................................................. 626.7.2. Platen C o n d i t i o n s ................................................................................... 646.7.3. Rate of L o a d i n g ...................................................................................... 666.7.4. Tem pera ture , Pressure and Britt le-Ductile T r a n s i t i o n ............. 806.7.5. Stress Level ............................................................................................. 976.7.6. Inf luence of Pores and C r a c k s .......................................................... 996.7.7. Rock Fabr ic and Modulus — A n i s o t r o p y .................................... 1056.8. Poisson’s Ratio of R o c k s .................................................................... 1176.9. Compressibil i ty of R o c k ...................................................................... 1486.10. Shock Hugonio t of R o c k s .................................................................... 1646.11. Dilatancy in R o c k s ................................................................................ 1706.12. Summ ary and C o n c l u s i o n s ................................................................. 180
References to C hap ter 6 ..................................................................... 182Uncited References to Chap ter 6 .................................................... 192
C O N T E N T S
7. D ynam ic E lastic C onstants o f Rocks7.1. In troduction ............................................................................................ 1957.2. Elastic W a v e s ......................................................................................... 1957.3. Methods of Determin ing Dynamic Elastic Constants in L a
bora tory 1967.3.1. Resonance M e t h o d ............................................................................... 1967.3.1.1. Longi tudinal vibration ........................................................................ 1977.3.1.2. Flexural v i b r a t i o n .................................................................................. 1987.3.1.3. Torsional v i b r a t i o n ............................................................................... 1997.3.1.4. Calculation of modulus of elasticity from flexural resonant
frequency .................................................................................................. 2067.3.1.5. Measuring system .................................................................................. 2077.3.1.6. Identification of the vibrating m o d e ............................................... 2107.3.1.7. Measurem ents at high t e m p e r a t u r e s ............................................... 2117.3.1.8. Some o ther methods of employing r e s o n a n c e ........................... 2117.3.1.9. Practical limitations ............................................................................. 2187.3.2. Ult rasonic Pulse M ethod ................................................................... 2187.3.2.1. Measur ing system .................................................................................. 2201 3 .2 .2 . Limita tions .............................................................................................. 2237.3.3. C om par ison between Resonance and Ultrasonic Pulse M e
thods ............................................................................................................ 2237.4. In Situ T e s t .............................................................................................. 2267.5. C om par ison of Static and Dynamic Elastic C o n s t a n t s ............. 2317.6. Parameters Affecting Propagat ion Velocity of Waves in Rocks 2367.6.1. Rock T y p e .............. .................................................................................. 2377.6.2. Tex ture ..................................................................................................... 2377.6.3. Density ...................................................................................................... 2427.6.4. P o r o s i t y ...................................................................................................... 2477.6.5. Aniso tropy .............................................................................................. 2547.6.6. S t r e s s ........................................................................................................... 2637.6.7. W ater Content ....................................................................................... 2827.6.8. Tem p era tu re ........................................................................................... 2927.7. Dynamic Tensile Strength of Rock ............................................... 2997.8. Sum m ary and C o n c l u s i o n s ................................................................ 305
References to Chap te r 7 ...................................................................... 308Uncited References to Chap te r 7 ..................................................... 311
A pp en d ix IIL aboratory M echanical Properties o f R o c k s .............................. 315References to A ppend ix I I ................................................................. 455

H A N D B O O K
O N
M E C H A N I C A L P R O P E R T I E S O F R O C K S
C O N T E N T SVolume III
8. In Situ Testing of Rock8.1. I n t r o d u c t i o n ................................................................................................. 18.2. Types o f Large Scale in Situ T e s t s ...................................................... 28.3. Selection o f Test S i t e ................................................................................. 48.4. Uniaxial Compress ive S t reng th o f Rock in Situ ........................... 88.4.1. Specimen P r e p a r a t i o n .............................................................................. 98.4.2. Load ing and D isp lacement M e a s u r in g S y s te m .............................. 128.4.3. Results o f in Situ C om press ive S treng th T e s t s ............................... 168.5. In Situ Tests for D efo rm ab i l i ty o f R o c k .......................................... 258.5.1. Plate Bearing T e s t ....................................................................................... 258.5.1.1. Theoretical Basis .......................................................................................... 258.5.1.2. Test ing T e c h n iq u e ....................................................................................... 408.5.1.3. Test ing in Trenches or O p e n P i t s ........................................................ 488.5.1.4. In te rpreta tion o f Plate Bear ing T e s t ................................................... 488.5.2. Modif icat ions o f Plate B ear ing T e s t .................................................... 588.5.2.1. Compress ion in N a r ro w Sli ts .................................................................. 588.5.2.2. Cab le Jacking M e t h o d .............................................................................. 638.5.2.3. Goff i 's M e t h o d ............................................................................................ 668.6. Pressure Tunnel T e s t ................................................................................ 688.6.1. Theoretical Bas is .......................................................................................... 688.6.2. Hydraul ic Pressure C h a m b e r T e s t ...................................................... 718.6.3. Radial Jacking T e s t ................................................................................... 758.6.4. Analysis o f Results f rom Pressure Tunne l T e s t s .............................. 788.7. Borehole T e s t s ............................................................................................... 838.7.1. Borehole D i l a to m e te r s .............................................................................. 838.7.1.1. L N E C D i la to m e te r ..................................................................................... 908.7.1.2. Y a c h iy o T u b e D e f o r m e t e r ....................................................................... 918.7.1.3. O Y O Elastometer 200 .............................................................................. 918.7.1.4. Calcula t ion o f M o du lus o f Rock f rom D i la tom eter Tests . . . . 948.7.2. Borehole J a c k s ............................................................................................ 958.7.2.1. G o o d m a n ’s J a c k .......................................................................................... 958.7.2.2. C .S .I .R .O . P ress iom ete r ............................................................................ 988.7.3. Borehole P e n e t ro m e te r s ............................................................................ 1008.7.4. Testing Procedure in U s ing Borehole Deform at ion Ins t rum ents 101
102115136144145146147150156158159161164168183184187188192197208
209210212
212
213214215216219221
221
222227237240246
C O N T E N T S
In te rpreta tion o f Results f rom Borehole J a c k s .........Deformabil i ty o f Rock M ass ..........................................Bear ing Capacity o f R o c k .................................................Shear Strength o f Rock in S i t u ........................................Inclined Load T e s t ................................................................1. Test E q u ip m e n t ..................................................................2. Prepara t ion o f Test B l o c k ............................................3. Test P r o c e d u r e ..................................................................4. Calcu la tions and R e p o r t in g o f Result s .....................Varia tions o f Inclined L o a d T e s t ...................................Shear Test with W ate r S a tu ra t i o n ................................Parallel Load Test ................................................................To rs ion Test ...........................................................................Fac to rs Influencing Shea r S t reng th o f Rock in SituTensile Strength o f Rock in Situ ...................................Pull T e s t ....................................................................................Flexural T e s t ...........................................................................Tr iaxial Tests in S i t u ...........................................................S u m m ary and C o n c l u s i o n s ...............................................References to C h ap te r 8 ......................................................Uncited References to C h a p t e r 8 ...................................
Time-Dependent Properties of RocksI n t r o d u c t i o n .........................................................................Elasticity and Plasticity in R o c k s ................................Rheological Models - Simple B e h a v io u r ...................Perfectly Elastic or H o o k e a n Mate r ia l .....................Perfectly Plastic M a t e r i a l ..................................................Perfectly Elastoplastic o r St. V enan t Materia l . . . .Perfectly Viscous o r N e w t o n ia n M a t e r i a l ................Viscoelastic o r Maxwell M a t e r i a l .................................Fi rmo-viscous o r Kelvin o r Voigt M a t e r i a l ............Rheological Models - C o m p le x B e h a v io u r ..............Genera lised Kelvin M o d e l ...............................................Burger 's M o d e l ....................................................................C reep Test E q u i p m e n t ......................................................Time-Stra in C u r v e ..............................................................Creep in Rocks and M i n e r a l s ........................................Fac tors Influencing C r e e p ...............................................

C O N T E N T S
9.8.1. N a tu re o f S t r e s s ...........................................................................................2469.8.2. Level o f S t r e s s ............................................................................................... 2489.8.3. Confining P r e s s u r e ......................................................................................2519.8.4. T e m p e r a t u r e ................................................................................................. 2539.8.5. Cyclic L o a d i n g .............................................................................................2569.8.6. Moisture and H u m i d i t y .............................................................................2579.8.7. Structural F a c t o r s ........................................................................................ 2619.9. Creep o f Rock In S i t u ...............................................................................2629.10. T ime-Dependent Strength o f R ock .....................................................2669.11. Rock F a t ig u e ..................................................................................................2799.12. Creep o f Frac tured R o c k .......................................................................... 2889.13. Transverse Creep and M i c r o f r a c t u r i n g ..............................................2929.14. Theor ies o f Rock C r e e p .............................................................................2979.14.1. Strain Harden ing o r Dis locat ion T h e o r y ........................................... 2989.14.2. Exhaustion H y p o t h e s i s .............................................................................3009.14.3. St ructural Theory o f Brittle C r e e p ....................................................... 3039.14.4. Genera l Mechanism o f C r e e p .................................................................3079.15. Sum m ary and C o n c l u s i o n s ...................................................................... 310
References to C h ap te r 9 ........................................................................... 312Uncited References to C h ap te r 9 ........................................................ 320
Appendix IIIIn Situ Mechanical Properties o f R o c k .............................................325References to Appendix I I I .....................................................................376
Appendix IVCrack Propagat ion Velocity in R o c k ................................................. 383References to Appendix I V .....................................................................388A u th o r In d e x ................................................................................................. 389Subject In d e x ................................................................................................ 396
Tab les of C on ten tsV o lum e I .................................................................................................... 4 0 0V olum e II .................................................................................................... 403V olum e IV .................................................................................................. 405


The Science of Rock Mechanics
P A R T 1S T R E N G T H P R O P E R T I E S OF R O C K S
Series on Rock and Soil Mechanics
Vol. 1 (1971/74) No. 2
By Prof. Dr W. Dreyer, Techn ica l U n ive rs ity C laustha l, G erm any
1972, re p r in ted 1973, 500 pages, 200 re fe rences , 86 tab les, 137 f igures, p r ice : US $ 30 00 hard co ve r
In te rn a t io n a l S tandard B o o k N um ber: 0-87849-002-7.L ib ra ry o f C ong ress C a ta log Card N u m b e r : 78-149276.
The p re se n t vo lum e is the f irs t — in i tse lf c o m p le te - part of the m ono- g raphy "T h e S c ie nce o f Rock M e c h a n ic s " . It co m p r ise s p r im a r i ly the re la t io n s h ip be tw een s ta te of stress, s t re n g th o f rocks and the ir d e te r m in ing tex tu ra l data. As the d e s c r ip t io n o f the m echan ica l b eha v io r of rocks u n d e r c o m p re ss ive load is e x tre m e ly in co m p le te w ith o u t adequa te c o n s id e ra t io n of the p e t ro g ra p h ic p a ra m e te rs such as m inera l c o m p o s it ion , m in e ra l in te r lo ck ing , g ra n u la t io n , g ra in dens ity and poros ity , the a u th o r has trea ted the m ine ra l c o n te n t o f all inves tiga ted rock sam p les q u a n t i ta t iv e ly and fo rm u la te d them m a th e m a t ica l ly .
The o p e ra t io n of ca ve rns in salt d e p o s i ts for the purpose o f s to rag e re qu ires in t im a te k n o w le d g e of s tab i l i ty and c o nve rg e nce behav io r o f an u n d e rg ro u n d system. The so lu t ion to th is h igh ly co m p lex rock m echan ics p ro b le m is d iscussed in a sp ec ia l chapter.
"O r ig in a l i ty in its true and goo d sense o f the w o rd is the g rea t advan tage of th is book . Here, a p ro fe s s o r has not w r i t te n a seventh book out o f s ix o thers , bu t a resea rche r has p resen ted h is f ie ld of in te res t and e spe c ia l ly the resu lts of his ow n s tud ies , e x te n d ing o ve r a lm os t tw o decades, a m o ng th e m m a n y to be p u b l is h e d fo r the f i rs t t im e . "
TRANS TECH PUBLICATIONSTrans Tech House CH-4711 Aedermannsdorf Switzerland

Series on Rock and Soil M echan icsVol. 2 (1974/77) No. 3
PROCEEDINGS FIRST CONFERENCE ON ACOUSTIC EMISSION/MICROSEISMIC ACTIVITY IN GEOLOGIC STRUCTURES AND MATERIALS
By H. Reginald Hardy, jr., and Frederick W. Leighton
1977, 490 pages, 235 f ig u re s , 480 re fe rences, US D o lla r 40.00 (sFr. 100.00)
T he ra t io n a le fo r o rg a n iz in g th is c o n fe re n c e deve loped f ro m the fee l ing s o f the c o n fe re n c e c o -c h a i rm e n tha t the t im e had c o m e to b r in g to g e th e r the ideas a n d e x p e r ie n c e s o f v a r io u s w o rk e rs invo lved in the a p p l ic a t io n o f acous t ic
e m is s io n /m ic r o s e is m ic a c t iv i ty in the g e o m e c h a n ic s area. It was c le a r that
th e re w e re a c o n s id e ra b le n u m b e r o f persons , th ro u g h o u t the w o r ld , w ho
w e re a c t iv e ly e n g a g e d in bas ic and a p p l ie d research in th is area in c lu d ing ,
a m o n g s t o th e rs , th o s e in v o lv e d in such w id e ly va ry ing in te res ts as the fo l lo
w in g :
Ro ck Burst M e c h a n ic s
Un der grou nd G a s S to r a g e
R es e rv o ir Stability
Stability of Earth Filled Dams
E a r th qu ak e M e c h a n ic s
Hydrofracturing R e s e a r c h
- S l o p e Stability Monitoring
- Fu nda m en tal Behavior
of G e o l o g i c Materials
- Strata Control in Coal
and Hardrock Mines
- Comminution
T h e p ro c e e d in g s in c lu d e an in t ro d u c to ry sec t ion p re se n t in g an h is to r ica l
re v ie w o f th e s u b je c t , the fu l l tex t o f all pape rs p resen ted at the con fe rence ,
g e n e ra l c o n c lu d in g rem arks , a m as te r b ib l io g ra p h y , and a list o f the c o n fe
re n c e p a r t ic ip a n ts a nd th e i r a f f i l ia t io n s . The p ro c e e d in g s rep resen t the most
c o m p re h e n s iv e rev iew o f th e s u b je c t p u b l is h e d to date. In all a to ta l o f 25
p a p e rs a re in c lu d e d . T h ese dea l w ith a w id e range o f labora to ry , f ie ld and
a n a ly t ic a l a s p e c ts o f a c o u s t ic e m is s io n /m ic ro s e is m ic ac t iv i ty in the areas o f
mining, petroleum, a nd civil engineering, and in g e o l o g y and geophy si cs.
TRANS TECH PUBLICATIONSTrans Tech House CH-4711 Aedermannsdorf Switzerland

SOI L MECHANI CS FOR O F F - R O A D V E H I C L E E N G I N E E R I N G
B y L e s l ie L. Karafiath, G ru m m a n A erosp a ce C o rp o ra t io n , B e thpage , New
Y o rk , a n d E dw ar d A. Nowatzki, U n ive rs i ty o f A r izona , Tuscon . A r izona
S e ries on R o ck and Soil M echan icsVo l. 2 (1974 /77) No. 5
1978, 520 p a g e s , 204 f igs , US D o l la r 54.00 (sFr. 135.00)
T h e a b i l i t y to m o v e ve h ic le s over n a tu ra l te r ra in is o f p a ra m o u n t im p o r ta n c e to
a w id e v a r ie ty o f d is c ip l in e s , fo r exam p le , a u to m o t ive , m il i ta ry , m echan ica l, a e ro s p a c e , c o n s t ru c t io n and a g r ic u l tu ra l e n g in e e r in g . W o rke rs in these d is c i p l in e s w o u ld have to eva lua te an e n o rm o u s q u a n t i ty o f soil m e ch a n ics p u b l i c a t io n s to e x t r a c t th e in fo rm a t io n tha t is usefu l fo r them . R e c o g n iz in g th is d i f f i
c u l t y , th e a u th o r s a t te m p t to assess the va lue o f p ub l ish e d so il m e c h a n ic s and o th e r re f la te d l i te ra tu re f ro m the v ie w p o in t o f o f f - ro a d lo c o m o t io n and to
p re s e n t a b a la n c e d d is c u s s io n o f the m os t im p o r ta n t ideas.
B e c a u s e th e f ie ld o f o f f - ro a d ve h ic le e n g in e e r in g is e x p a n d in g so rap id ly , th is
b o o k is n o t th e f in a l w o rd on the to p ic . It is, how ever, the f irs t to b r in g to g e th e r
in o n e p la c e th e resu lts o f e f fo r ts in a w id e va r ie ty o f d is c ip l in e s a n d to p re s e n t
th e la te s t te c h n ic a l ly s o u n d c o n c e p ts on the sub jec t. In shor t, it p rov ides a
ra t io n a l b a s is fo r the a na lys is o f o f f - ro a d lo c o m o t io n p ro b le m s and, as such,
is a “ m u s t " f o r w o rk e rs in th e f ie ld o f ve h ic le m o b i l i ty . B ecause o f th is d e p a r
tu r e f r o m s o m e o f th e m o re c o n v e n t io n a l m e th o d s o f s o i l -s t ru c tu re ana lys is it
is a ls o re c o m m e n d e d fo r w o rk e rs in the f ie ld o f so il m e chan ics .
TRANS TECH PUBLICATIONSTrans Tech House CH-4711 Aedermannsdorf Switzerland
Series on Rock iV Soil Mechanics Vol. 2 ( 1974 77) No. 4
THE PRESSUREMETER ANDFOUNDATIONENGINEERINGby F. B A G U E L IN , J. F. JE Z E Q U E L , I). H. SH IE L D S, France a n d C a n a d a
January 1978, 624 pages. 314 tigs, US Dollar 52.00 (or sFr. 130.00) cloth
PREFACE
T h e design and construct ion of founda tions require a thorough know ledge of the behav iour of soils and rocks in the field. Since even e labora te l a b o ratory tests on large subsurface samples can at best only approx im ate the field condit ions, in-situ tests are often preferable. The p ressu rem ete r is p robab ly the most versati le in-situ test ing device available at presen t for invest igat ing static and cyclic s trength and defo rmation propert ies of soils and rocks.
Based on the au thors ' compar isons between the results of s tandard ized p ressuremeter tests and both static and s tandard penetrat ion tests u n d e r different site condit ions, the meri ts and l imitat ions of the various m e thods of field invest igat ions can readily be assessed. At the same time the e x t e n sive exper ience gained by these reliable, pract ical and semi-empir ical me thods of using pressuremeter da ta becomes available to other types of field invest igat ions to their mutual benefit. These approaches require m a tu re engineering judgm ent and sound experience based on pe r fo rm ance o b servations on structures during and after cons truct ion. In this way p re s s u re meter tests can lead to safe and economica l solut ions to many geotcchnical problems, as shown in this warmly r ecom m ended book.
G. G. M e y e r h o f
TRANS TECH PUBLICATIONSTrans Tech House CH-4711 Aedermannsdorf Switzerland

F O U N D A T I O N I N S T R U M E N T A T I O NBy Dr. T h o m a s H. Hanna. P ro fe sso r o f C iv i l and S truc tu ra l E ng in e e r in g . U n iv e rs i ty o f S he ff ie ld , Eng land
1973. 372 pages, 251 f igures , 520 re fe rences , p r ice : US $ 35.00 hard cover
Series on Rock and Soil MechanicsVol. 1 (1971/74) No. 3
Contents
1. Introduction 6 . Data from Instrumented2. Load Measurement Foundations3. Pore Water Pressure 7. The Recording and Processing
Measurement of Field Data4. Earth Pressure Measurement 8. Instrumentation of Laboratory5. Measurement of Ground Sca le Foundations
Movements 9. Appendix
The book rep resen ts a f ine he lp and a w e lc o m e treasury of m e thods and dev ices fo r every c iv i l and s t ru c tu ra l e n g in e e r c o nce rn e d w ith the des ign and c o n s t ru c t io n of c iv i l e n g in e e r in g w orks , s ince the g ro u n d a lw ays a ffec ts the s tab i l i ty and p e r fo rm a n c e of these s tructures. It can be re co m m e nd e d w a rm ly to s tu d e n ts and c iv i l eng ine e rs in the f ie ld of des ign , c o n s t ru c t io n and research
A pp lied M echan ics Reviews
This most in te res t in g b oo k in c lu de s a very la rge num ber of re fe rences and a list of in s tru m e n t supp lie rs . It w i l l p ro b a b ly beco m e one of the m ost w ide ly used too ls fo r so il and fo u n d a t io n e n g in e e rs w ho unde rs tand the need for p e r fo rm a n ce e va lua t ion ."
C anad ian G eo techn ica l J o u rna l
"T he book can o bv io u s ly be re c o m m e n d e d to all peop le dea ling w ith founda t io ns , earth and rock f i l l dam s, tunne ls , and soil m echan ics in g e n e ra l."
W ater P ow er
TRANS TECH PUBLICATIONSTrans Tech House CH-4711 Aedermannsdorf Switzerland

In preparation
ROCK MECHANICSBy Alf reds R. Jumikis, P ro fe sso r o f C iv i l E n g in e e r in g , R u tge rs U n ive rs ity
T h e S ta te U n iv e rs i ty o f N ew Jersey
A b o u t 300 pages , 105 f ig u re s , 17 tab les.
E x p e c te d p u b l ic a t io n date: F e b ru a ry /A p r i l 1979
Series on Rock and Soil M echan icsVol. 3 (1978/79) No. 5
In th is v o lu m e , th e a u th o r p resen ts an in t ro d u c to ry se gm en t to the re la tive ly n e w c iv i l e n g in e e r in g d is c ip l in e kn o w n as e n g in e e r in g ro ck m echan ics .
T h is s u b je c t is p re s e n te d here f ro m the v ie w p o in t o f a c iv i l e n g in e e r to c iv i l
e n g in e e rs .
T he c o n te n t o f th is b o o k dea ls w ith rock as an e n g in e e r in g c o n s t ru c t io n
m a te r ia l b y m e a n s o f w h ic h , u p o n w h ic h , and w i th in w h ic h c iv i l eng in e e rs bu i ld
s t r u c tu re s in ro c k . T h is d is c ip l in e th u s p e r ta in s to h y d ra u l ic s tru c tu re s e n g i
n e e r in g ; to h ig h w a y , ra i lw ay, cana l, fo u n d a t io n , and tu n n e l e ng in e e r ing ;
as w e l l as to e a r th w o rk s of, and s u b s t ru c tu re s in, ro ck o f all k in d s in any way
a s s o c ia te d w i th e n g in e e r in g .
The m a in p u rp o s e o f th is b o o k is to assist in te res ted readers in u nd e rs tan d in g
so m e o f th e bas ic ro ck m e c h a n ic s p r in c ip le s as they app ly to rock e n g in e e r
ing. H e n ce , the b o o k is deve lo p ed bas ica l ly as a g u ide in e n g in e e r in g rock
m e c h a n ic s .
In e ssen ce , th is u n iq u e v o lu m e e m p h a s iz e s u n d e rs ta n d in g . It g ives a p rac tica l
o r ie n ta t io n to bas ic ro c k m e c h a n ic s ; p ro v id e s a b a c k g ro u n d as w e ll as an
o u t lo o k th a t m o t iv a te s to fu r th e r s tudy ; and w i l l a l lo w the reader to p ro f i t f ro m
h is la te r s tu d ie s o f m o re c o m p re h e n s iv e and c o m p le x p u b l ic a t io n s on e n g i
n e e r in g ro c k m e c h a n ic s than w h a t is p re se n ted in th is text.
P l e a s e a s k for further information.
TRANS TECH PUBLICATIONSTrans Tech House CH-4711 Aedermannsdorf Switzerland