Investment Opportunities for Livestock in the North Eastern ...
72
ReSAKSS Working Paper No. 12 October 2008 Investment Opportunities for Livestock in the North Eastern Province of Kenya: A Synthesis of Existing Knowledge Manitra Rakotoarisoa Stella Massawe Andrew Mude Robert Ouma Ade Freeman Godfrey Bahiigwa Joseph Karugia
-
Upload
khangminh22 -
Category
Documents
-
view
0 -
download
0
Transcript of Investment Opportunities for Livestock in the North Eastern ...

ReSAKSS Working Paper No. 12
October 2008
Investment Opportunities for Livestock in the North Eastern Province of Kenya: A
Synthesis of Existing Knowledge
Manitra Rakotoarisoa Stella Massawe Andrew Mude Robert Ouma Ade Freeman
Godfrey Bahiigwa Joseph Karugia

Regional Strategic Analysis and Knowledge Support System
(ReSAKSS)
ReSAKSS Working Paper No. 12
October 2008
Investment Opportunities for Livestock in the North Eastern Province of Kenya: A Synthesis of Existing Knowledge
Manitra Rakotoarisoa
Stella Massawe
Andrew Mude Robert Ouma Ade Freeman
Godfrey Bahiigwa Joseph Karugia

ii
About ReSAKSS The Regional Strategic Analysis and Knowledge Support System (ReSAKSS) is an Africa-wide network that provides analysis, data, and tools to promote evidence-based decisionmaking, improve awareness of the role of agriculture for development in Africa, fill knowledge gaps, promote dialogue and facilitate the benchmarking and review processes associated with the AU/NEPAD’s Comprehensive Africa Agriculture Development Program (CAADP) and other regional agricultural development initiatives in Africa. About the Working Paper series The goal of the ReSAKSS Working Paper series is to provide timely access to preliminary research and data analysis results that relate directly to strengthening ongoing discussions and critical commentaries on the future direction of African agriculture and rural development. The series undergoes a standard peer-review process involving at least one reviewer from within the ReSAKSS network of partners and at least one external reviewer. It is expected that most of the working papers eventually will be published in some other form and that their content may be revised further. For more information, contact: Coordinator Regional Strategic Analysis and Knowledge Support System, East and Central Africa (ReSAKSS-ECA) International Livestock Research Institute (ILRI) P.O. Box 30709 Nairobi, Kenya Telephone: +254 (20) 422 3000 Facsimile: +254 (20) 422 3001 Email: [email protected] Website: www.eca.resakss.org

iii
The authors Manitra Rakotoarisoa is a former researcher with the International Livestock Research Institute (ILRI) and currently working with the UN Food and Agricuture Orgnaization (FAO). Andrew Mude, Robert Ouma and Ade Freeman are researchers with ILRI. Stella Massawe and Joseph Karugia are researchers with ReSAKSS-ECA and Godfrey Bahingwa is the Director of the Plan for Modernisation of Agriculture (PMA), Uganda and a former Coordinator of ReSAKSS-ECA. Acknowledgements Funding for this work was provided by the United States Agency for International Development (USAID), the UK Department for International Development (DFID), and the Swedish International Development Cooperation Agency (SIDA) through their support to the Regional Strategic Analysis and Knowledge Support System (ReSAKSS). The International Livestock Research Institute (ILRI) also contributed towards funding this work. Manitra Rakotoarisoa, Stella Massawe, Andrew Mude, Robert Ouma, Ade Freeman, Godfrey Bahiigwa, and Joseph Karugia, October 2008. Investment Opportunities for Livestock in the North Eastern Province of Kenya: A Synthesis of Existing Knowledge. ReSAKSS Working Paper No. 12, IFPRI. Key words: Livestock investment options, North Eastern Province, Kenya, livelihoods, public and private sectors, and Kenya Vision 2030
Except where otherwise noted, this work is licensed under a Creative Commons Attribution 3.0 License.
iv
TABLE OF CONTENTS
1. INTRODUCTION ................................................................................................................................................ 1
2. THE NORTH EASTERN PROVINCE OF KENYA: DESCRIPTION AND CHALLENGES .................... 1
2.1 CONSTRAINTS TO LIVELIHOOD IN NORTH EASTERN PROVINCE ........................................................................ 2 2.2 THE LIVESTOCK PRODUCTION SYSTEM IN THE NEP .......................................................................................... 8 2.3 ONGOING AND RECENTLY COMPLETED PROJECTS/PLANS FOR THE NEP ........................................................... 9
3. CURRENT STATE OF THE LIVESTOCK SECTOR IN NORTH EASTERN PROVINCE .................... 11
3.1 IMPORTANCE OF LIVESTOCK PRODUCTION TO NEP ....................................................................................... 12 3.2 TRENDS IN LIVESTOCK PRODUCTION .............................................................................................................. 14 3.3 LIVESTOCK AND LIVESTOCK PRODUCT SALE AND PRICES AND FARMERS’ EARNINGS ..................................... 14 3.4 EXTERNAL TRADE IN LIVESTOCK AND LIVESTOCK PRODUCTS ........................................................................ 17 3.5 SOME FIGURES ON THE LIVESTOCK VALUE-CHAIN FOR THE NEP ................................................................... 19
4 INVESTMENT AND GROWTH OPPORTUNITIES FOR THE NEP ........................................................ 21
4.1 FIRST SCENARIO: BUSINESS-AS-USUAL (STATUS QUO) .................................................................................. 21 4.1.1 Description of the status quo ..................................................................................................................... 21 4.1.2 Trends in livestock sector without any new investment ............................................................................. 21 4.1.3 Consequences of the status quo ................................................................................................................. 22
4.2 SECOND SCENARIO: PROCESSING TOWARDS DOMESTIC DEMAND-LED GROWTH (IMPORT SUBSTITUTION) ..... 23 4.2.1 Drivers: Domestic market opportunities .............................................................................................. 23 4.2.2 Proposed investment strategies for the domestic demand-led investment ........................................... 26 4.2.3 Consequences of the domestic demand led-investment ........................................................................ 28
4.3 THIRD SCENARIO: IMPROVING THE EXPORT OF LIVE ANIMALS ....................................................................... 31 4.3.1 Introduction ......................................................................................................................................... 31 4.3.2 The drivers of demand in the live animals export market .................................................................... 32 4.3.3 Investment opportunities in the export of live animals ........................................................................ 35 4.3.4 Potential impacts of a resurgent live animals export market ............................................................... 39
4.4 FOURTH SCENARIO: EXPORT OF PROCESSED LIVESTOCK PRODUCTS ............................................................... 41 4.4.1 The drivers ........................................................................................................................................... 41 4.4.2 Requisite investments ........................................................................................................................... 44 4.4.3 Potential impact on the NEP economy ................................................................................................ 45
5 SOME IMPLICATIONS OF THE VISION ON THE ROLE OF THE PUBLIC AND PRIVATE SECTORS .................................................................................................................................................................. 47
5.1 CREATING AN ENVIRONMENT FAVOURABLE TO INVESTMENT: THE ROLE OF THE PUBLIC SECTOR ................. 48 5.2 THE ROLES OF PRIVATE FIRMS AND STAKEHOLDERS: MULTIPLIERS OF GROWTH ............................................ 49
5.2.1 Investment within the livestock sector .................................................................................................. 50 5.2.2 Investment outside but related to livestock sector ................................................................................ 50
6 CONCLUSIONS ................................................................................................................................................. 50
7 REFERENCES ................................................................................................................................................... 52

v
List of Figures Figure 1. Location of the North Eastern Province, Kenya. ............................................................. 2 Figure 2. Rural poverty in the North Eastern Province. ................................................................. 4 Figure 3. Proportion of people below standard food consumption level by Province. ................... 5 Figure 4. Primary and secondary school enrolment in Kenya. ....................................................... 5 Figure 5. Proportion of agricultural land in different categories by province. ............................... 6 Figure 6. Location of the North Eastern Province and agro-climatic zones of Kenya. .................. 6 Figure 7. Development domains (agricultural potential, market access and population density) in
the North Eastern Province. .................................................................................................... 7 Figure 8. Relative importance of livestock to NEP. ..................................................................... 13 Figure 9. Livestock trade routes from neighbouring countries. .................................................... 24 Figure 10. Number of animals slaughtered in Nairobi (1996–2000). ........................................... 25 Figure 11. Meat consumption estimates for Kenya up to 2030. ................................................... 25 Figure 12. Trends in beef deficit for Kenya (2004–2014). ........................................................... 26 Figure 13. Additional cattle required to meet beef demand in Nairobi and Mombasa each year. 30 Figure 14. Total meat consumption trends and meat deficit in the MENA region (1961–2002). 33 Figure 15. Export of live animals from eastern Africa (1961–2005). .......................................... 36 Figure 16. Export of live animals from Kenya (1961–2005). ....................................................... 37 List of Tables Table 1. North eastern Kenya in the Kenyan context 3 Table 2. Livestock populations in NEP 12 Table 3. Summary of economic activities in NEP 12 Table 4. Trends in livestock production for NEP 14 Table 5. Recorded sales of live animals (average prices and earnings to farmers), 2006 15 Table 6. National trends; value of sales of livestock and livestock products (in millions Kshs) 16 Table 7. Local livestock product sales and earnings to farmers in NEP, 2006 17 Table 8. Trade, values in million US$, and products 18 Table 9. Export/import dependency for livestock products 19 Table 10. Value addition from live animal marketing for the NEP (Kshs) 19 Table 11. Value addition from livestock product marketing for the NEP (Kshs) 20 Table 12. Livestock production and revenue in the NEP, 2003 22 Table 13. Livestock product balance sheet for the NEP 2003 23 Table 14. Sources of cattle, goats, and camels in Nairobi, Mombasa and Malindi 30 Table 15. Per capita income of major live animal importing countries 34 Table 16. Per capita meat consumption in some major meat importing countries in the MENA
region 34 Table 17. Live animal imports and human population of the Middle East 35 Table 18. Export values of meat products from Kenya (US$ ’000) 42 Table 19. Value of meat imports in MENA (US$ ’000) 42 Table 20. EU tariffs on live animals and products 43 Table 21. Quota allocation by EU for beef, 2000 43 Table 22. Requirements and impacts of the four investment scenarios 48
vi
List of Boxes Box 1: Examples of the development initiatives operating in the North Eastern Province .......... 11 Box 2: Consequences on income, employment, and food security if the NEP can supply at least
50% of the beef and mutton imported to Kenya ................................................................... 29 Box 3: Changes in been imports in Egypt and Saudi Arabia, 2001 and 2006 .............................. 33 Box 4 : Consequences of promoting live animal export to the three major markets in the MENA
region .................................................................................................................................... 40 Box 5: Consequences of promoting meat export to the three major markets in the MENA region
............................................................................................................................................... 46
List of Appendices Appendix 1: Input data into analysis of the impact of livestock production on income and
employment-input substitution scenario ............................................................................... 57 Appendix 2: Value addition from live animal marketing for the NEP domestic market ............. 58 Appendix 3: Occurrence of Droughts and Floods in Kenya ......................................................... 61 Appendix 4: Ruminant livestock populations and annual milk production in Kenya .................. 61 Appendix 5: Exchange rate (USD vs. Kshs) ................................................................................. 62

vii
List of Abbreviations and Acronyms ASAL: Arid and semi-arid land
AU/IBAR: African Union/Inter-African Bureau for Animal Resources
CAP: Common Agriculture Policy, EU
CIDA: Canadian International Development Agency
COMESA: Common Market for Eastern and Southern Africa
EMACK: Education for Marginalized Children in Kenya
EU: European Union
EUREPGAP: European Retailers Protocol on Good Agricultural Practices
FAO: Food and Agriculture Organization of the United Nations
FOB Free on Board
GMP: Good Manufacturing Practices
GoK: Government of Kenya
HACCP: Hazard Critical Control Points
KAPP: Kenya Agricultural Productivity Project
KMC: Kenya Meat Commission
LIME: Livestock Marketing Enterprise
NEP: North Eastern Province
NEPDP: North Eastern Province Pastoral Development Programme
NGO: Non-governmental organization
NOHA: Nomadic Heritage Aid
M&E: Monitoring and evaluation
MENA: Middle East and North Africa
OIE: World Organisation for Animal Health
PACE: Pan African Programme for the Control of Epizootics
PDO: Pastoralist Development Organization
PPC: Pastoralist production companies
PYGI: Pastoralist Young Girls’ Initiative
RSLTC: Red Sea Livestock Trade Commission
SADC: Southern African Development Community
SPS: Sanitary and Phytosanitary
SRA: Strategy for Revitalization of Agriculture
UAE: United Arab Emirates
USAID: United States Agency for International Development
WOKIKE: Womankind Kenya
WTO: World Trade Organization

viii
Abstract Pastoralism is the dominant livelihood activity in the North Eastern Province (NEP) of Kenya. It is supplemented only by a limited amount of agriculture along the rivers. The province faces various developmental challenges including chronic poverty and food insecurity, low human capital and poor health standards, high vulnerability to climate change, poor infrastructure, insecurity and low crop and livestock productivity. This study synthesises existing knowledge and provides recommendations on livestock investments to increase incomes, create employment and reduce food insecurity in the province. It examines investment opportunities in livestock and presents scenarios that meet the objectives of Kenya’s 2030 vision. Four scenarios are analysed. The first scenario consists of the business-as-usual case: a vision of the state of the livestock sector, and its contribution to NEP and national economy, if the current trajectory is maintained. The second scenario outlines a strategy that focuses on catering to domestic demand for livestock products. The third scenario focuses on feeding foreign demand for live animals, while the fourth scenario investigates the possibilities of a livestock sector driven by exports of processed livestock products. Also in these investment scenarios, the broad-based growth contribution to the economy is discussed. The analysis indicates that all three alternative scenarios have far better impacts on pastoralists’ income and employment than the ‘business-as-usual’ scenario. The second scenario is found to have the largest favourable impact. Besides creating jobs and income opportunities, it provides alternatives to meet the growing livestock product consumption spurred by population increase, rising incomes and urbanization in Kenya. However, there are several requirements for this scenario to work and yield the desired impact. The need for creating a favourable investment climate is discussed and specific roles of the public and private sectors are explained.

1
1. Introduction The North Eastern Province (NEP) is one of Kenya’s leading livestock production areas. Under the Strategy for Revitalization of Agriculture (SRA) set out by the Government of Kenya (GoK), the livestock sector, especially in the NEP, is expected to play a major role in promoting sectoral and economy-wide growth by the year 2030. This growth will benefit both local and national economies and especially the welfare of poor people living in the province. Such a vision, however, requires clear investment options that help design government policies and clarify decisionmaking. The objective of this report is to examine investment opportunities for livestock in the NEP of Kenya and present investment policy scenarios that meet the 2030 vision (i.e. to increase farmer’s income, create employment, and reduce malnutrition and food insecurity). The GoK and numerous non-governmental organizations (NGOs) have already initiated many projects aimed at stimulating the NEP economy by accelerating the development and productivity of the livestock sector. Several studies (Agriconsortium 2003; Perry et al. 2005; AU/IBAR and NEPDP 2006) on the comparative advantage of the region have resulted in various recommendations for creating an enabling environment best suited to optimizing the welfare effect of these projects. This report builds on these studies but places particular emphasis on clarifying tangible investment opportunities arising from the livestock sector. The report highlights those investment opportunities that are most likely to increase farmer’s income, create employment and reduce poverty and food insecurity in the province. The next section, describes the NEP and its challenges within the national context. Section 2 also describes the ongoing development projects and initiatives to address some of the main challenges facing the province. Section 3 explains the importance of the livestock sector in NEP and presents the current situation and trends in livestock production, marketing and trade. Section 4 presents and analyses four investment scenarios in NEP’s livestock sector and their likely impacts on farmers’ income, employment and food security. These scenarios are (i) business-as-usual; (ii) domestic demand-led growth; (iii) live animal export-led growth; and (iv) livestock product export-led growth. Section 5 explains the role of the public and private sectors in attracting investments and generating growth within and outside the livestock sector and Section 6 concludes the report.
2. The North Eastern Province of Kenya: Description and Challenges
The North Eastern Province (NEP) is one of the eight administrative provinces of Kenya and is located in the arid communal rangeland of Kenya. The province has a total area of 126,902 km² and is divided into four administrative districts, namely: Garissa, Ijara, Wajir and Mandera. Garissa town is the provincial capital. The province is bordered by the Eastern Province to the west, Coast Province to the south, Ethiopia to the north and Somalia to the east (Figure 1). Pastoralism is the dominant livelihood activity in the province, supplemented by a limited amount of agriculture along the rivers. Most of the pastoralists are nomadic and shift with their livestock in search for water and pasture. Commonly reared types of livestock are cattle, goats, sheep, camels and chickens.
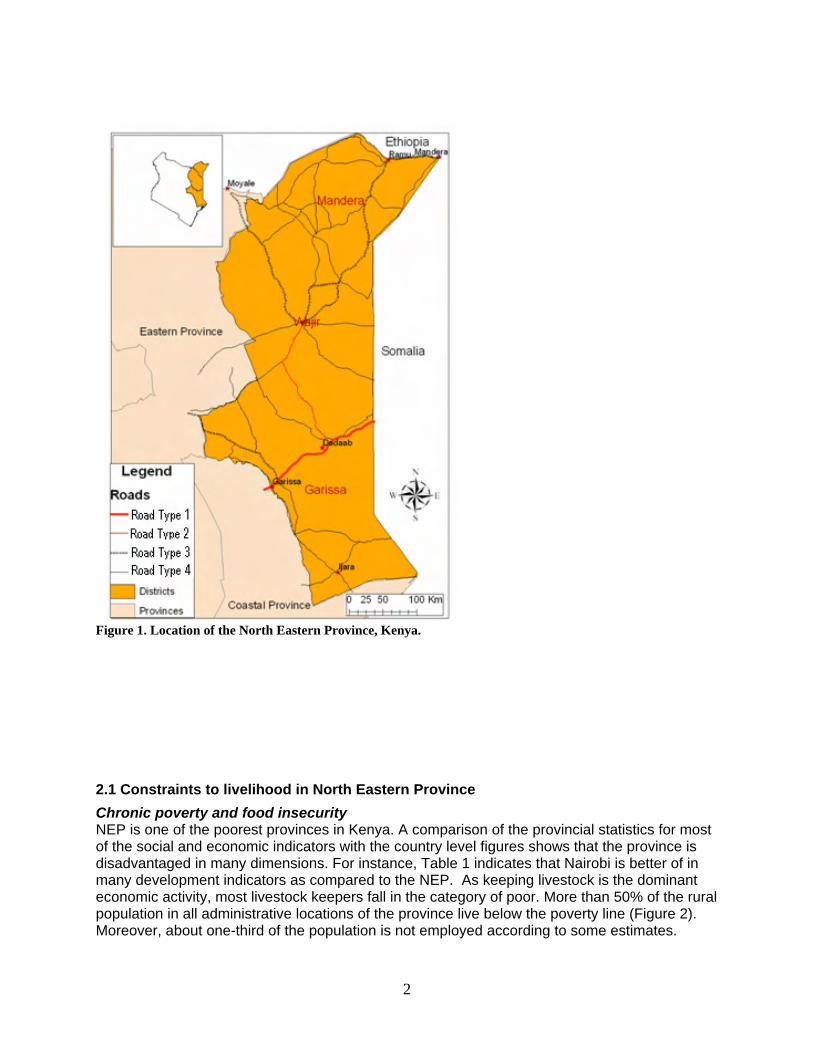
2
Figure 1. Location of the North Eastern Province, Kenya.
2.1 Constraints to livelihood in North Eastern Province
Chronic poverty and food insecurity NEP is one of the poorest provinces in Kenya. A comparison of the provincial statistics for most of the social and economic indicators with the country level figures shows that the province is disadvantaged in many dimensions. For instance, Table 1 indicates that Nairobi is better of in many development indicators as compared to the NEP. As keeping livestock is the dominant economic activity, most livestock keepers fall in the category of poor. More than 50% of the rural population in all administrative locations of the province live below the poverty line (Figure 2). Moreover, about one-third of the population is not employed according to some estimates.

3
Table 1. North eastern Kenya in the Kenyan context
Kenya Nairobi NEP Poverty and demography Human Development Index, 2001 (HDI value) 1 0.539 0.783 0.413 Poverty rate (% of individuals below poverty line) 2 53 44 64 Estimated population (1999 census) 28,686,607 2,143,254 962,143 Population density (persons per sq. km) (1999 census) 49 3,079 8 Health Life expectancy at birth (years) 54.7 61.6 52.4 People without access to health care (%)1 51 45 89 Number of hospitals in 20053 562 71 13 Number of health centres in 20053 691 61 14 Proportion delivered in health service (%)4 77.2 7.1 Education and other services Access to safe water (%)4 53.6 66 49 Total (male and female) literacy rates (2006)5 61.5 87.1 8.0 Male literacy rates (2006)5 64.2 87.1 12.3 Female literacy rates (2006)5 58.9 86.9 4.3 Total numeracy rates (2006)5 64.6 86.6 9.1 Male numeracy rates (2006)5 67.9 89.3 13.7 Female numeracy rates (2006)5 61.4 84.1 5.0
Food security Children underweight (%)1 26.4 16.3 35.8 Employment Wage employment in 20053 1,807,712 453,415 16,626 Earning from labour (Kshs million) in 20053 596875.1 181,360.3 5,462.6
1 Human Development Report 2001. 2 CBS (2005). 3 CBS (2006). 4 Kenya Demographic and Health Survey 2003. 5 Ministry of States for Planning, National Development and Vision 2030, 2008 (based on the Kenya National Adult Literacy Survey, 2006) and Kilele, 2007

4
Figure 2. Rural poverty in the North Eastern Province.
Source: Map made by ILRI based on data from CBS (2005). As of 2003, NEP was home to about 1.2 million people. It’s intercensal growth rate between 1989 and 1999 was the highest in the country at 9.5% as opposed to an average of 2.9% for Kenya (CBS, 2001). Agricultural, especially crop, production in the province is very limited due to the harsh climatic conditions (GoK 1997; GoK 2002a; GoK 2002b; GoK 2002c). This implies that the province is vulnerable to food insecurity as the growth in food supply lags behind the growth in food demand. The Kenya Integrated Household Budget Survey—2005/06 (KNBS 2007a) reported that the NEP has the highest ‘food poverty’ in the country with about 66% of the total population consuming less than the standard 2250 kilocalories per day (Figure 3). The same survey also indicated that about one-third of the food supply in the province comes from gifts including food relief (KNBS 2007a).

5
0
10
20
30
40
50
60
70
Na
iro
bi
Ce
ntr
al
Nya
nza
Rift
Va
lley
Ea
ste
rn
We
ste
rn
Co
ast
No
rth
Ea
ste
rn
Province
Pro
po
rtio
n o
f th
e p
eo
ple
wit
h
be
low
sta
nd
ard
fo
od
c
on
su
mp
tio
n l
ev
els
Figure 3. Proportion of people below standard food consumption level by Province.
Source: KNBS (2007b). Low human capital and poor health standards The NEP is also plagued with a critical shortage of human capital and extremely low investment in the education of upcoming generations. The literacy rate in the province is lower than the country average (Table 1). According to the findings of the 2006 Kenya National Adult Literacy Survey, the national average literacy level is at 61.5 while that of NEP is only 8.0 (Kilele, 2007) In addition, the province has the lowest primary and secondary school enrolment in the country (Figure 4).
0
20
40
60
80
100
Nai
robi
Cen
tral
Coa
st
Rift
Val
ley
Nya
nza
NE
Wes
tern
Eas
tern
Province
Per
cen
tag
e
Primary Secondary
Figure 4. Primary and secondary school enrolment in Kenya.
Source: CBS (2001).

6
The NEP also had the highest infant mortality rate (91 per 1000) and highest under-five infant mortality rate (163 per 1000) in 2003. The data presented in Table 1 indicate that all health indexes for the NEP are poor. High vulnerability to climate change and low agricultural potential All the land in NEP falls under the low agricultural potential category1 (Figure 5). The majority of the province falls under the arid agro-climactic zone (Figure 6), which is characterized by harsh climatic conditions, especially erratic rainfall patterns. The province frequently experiences floods and famines caused by droughts (Appendix 3). Moreover, recent studies show that NEP will be adversely affected by the impact of climate change: weather patterns will exhibit greater variability and more frequency of extreme weather events.
0.0
20.0
40.0
60.0
80.0
100.0
CE
NT
RA
L
CO
AS
T
EA
ST
ER
N
NA
IRO
BI
NE
NY
AN
ZA
RF
WE
ST
ER
N
Province
Per
cen
tag
e o
f th
e ag
ricu
ltu
ral
lan
d
high potential medium low
Figure 5. Proportion of agricultural land in different categories by province.
Figure 6. Location of the North Eastern Province and agro-climatic zones of Kenya.
1 Based on data from CBS (2006), these categories are defined as: high potential areas have annual rainfall of 857.5 mm (over 980 mm in the Coast Province); medium potential areas are those with annual rainfall of 735–857.5 mm (735–980 mm in Coast Province and 612.5–857.5 mm in Eastern Province); and low potential areas are those with annual rainfall of 612.5 mm or less.

7
Poor infrastructure Road networks and infrastructure in NEP are among the most underdeveloped in Kenya. The road network covers a very small fraction of the region; where roads exist, they are largely dry-weather roads that are mostly impassable during rainy seasons. Road types 1 and 2 (tarmac and murram/gravel road respectively) cover only the area around Garissa and Wajir while the rest of the province has poor quality roads (Figure 7). This dramatically increases transport and other transactions costs and is a major limitation to the marketing of agricultural products and other goods. The development domains for NEP, based on a combination of three criteria— agricultural potential, market access and population density—are presented in Figure 7. The classes in the development domain map portray these three criteria. For example, class LLL indicates that there is low agricultural potential, low market access (measured by the lack of quality roads) and low population density. Each of these domains is expected to have similar comparative advantages for different agricultural or rural development options. The LLL domain is the most dominant in the NEP indicating that the area is highly constrained as far as opportunities for rural development are concerned.
Figure 7. Development domains (agricultural potential, market access and population density) in the North Eastern Province.
8
Insecurity Socio-economic activities in the NEP are severely affected by insecurity. This situation, which has been endemic to the area, has its roots in a combination of factors including conflicts over natural resources (e.g. fighting for pasture, water and land); cattle rustling; and intertribal and clan clashes because of the fragile cohabitation of different groups living in the province that have often different family or tribal ties with people in the surrounding countries and others (Akiwumi 2002). The situation is exacerbated by instability in bordering countries (Ethiopia and Somalia). Low livestock productivity The NEP suffers from low livestock productivity due to limitations of feed resources and low access to technology. The livestock sector in the province is also constrained by several livestock diseases affecting animal health and livestock productivity. The major diseases include Rift Valley fever (outbreaks in 1997–98 and more recently in 2006–07); rinderpest that led to the closure of livestock markets in 2003; trypanosomosis due to the fact that the area is highly infested by tsetse flies; helminthiasis; Brucellosis; and camel diseases such as laaba and lahaw-gaal (camel fever).
2.2 The livestock production system in the NEP
The majority of the population of the NEP practice nomadic pastoralism. They maintain herds of camels, cattle, sheep and goats. Indigenous cattle breeds such as boran and the small East African Zebu are the main breeds kept in the province. Dairy (improved) breeds constitute less than 1% percent of the cattle population (Appendix 4). Indigenous breeds are resistant to most diseases e.g. tick borne diseases and others. Orma boran breed is resistant to Trypanosomosis. The indigenous breeds are also drought tolerant, able to walk long distance and are able to feed on rough pasture. However, their milk production capacity is very low hence they are mainly kept for sale as beef cattle while milk production is mainly for local consumption. Animals are fed through natural grazing using open grazing livestock management practice, supplementary feeding is uncommon in the province. The population practice seasonal migration to access pasture, settling near to water sources and good pasture for a few weeks before moving on. Distress migration is practised in times of hardship. Because of the prolonged drought many pastoralists have been forced to migrate long distances with herds in search of pasture (Rioba, Sheikh and Stevens, 2000). The most common livestock reproduction method is through natural breeding. In most cases management of diseases is by natural ways. Government/ public extension including veterinary service has for a long time been inadequate in the NEP as it is the case in many Arid and Semi Arid areas of Kenya. Reports indicate that despite the fact that more than 75% of Kenya’s livestock are in the ASAL areas, they are served by fewer than 10% of livestock service staff. This is mostly because the ASAL areas are considered a hardship post and few veterinary staff want to work there (Young, Kajume and Wanyama, 2003). Due to inadequate or lack of animal health services in ASAL/Pastoral areas, various private service delivery initiatives, including community-based animal health service delivery systems facilitated by various NGOs, have emerged as an alternative option (Okwiri, Kajume and Odondi, 2001; Riviere-Cinnamond and Eregae, 2003). Even with a combination of private and public extension providers, extension delivery in the pastoral areas is still challenging because of conditions such as insecurity, poor infrastructure, low cash economy, high cost of service delivery, vastness of the areas, and lack of veterinary personnel among others (Okwiri, Kajume and Odondi, 2001).
9
2.3 Ongoing and recently completed projects/plans for the NEP
Several projects aimed at tackling the major development challenges of the NEP and catalysing economic growth have been initiated over the years. The major projects that have large scope are discussed below. a) North Eastern Province Pastoral Development Programme The North Eastern Province Pastoral Development Programme (NEPDP) is a three-year programme funded by the United States Agency for International Development (USAID), and developed and executed by the African Union/Inter-African Bureau for Animal Resources (AU/IBAR) in collaboration with the GoK and private sector partners. The project is worth about US$ 2 million and aims to increase the incomes of pastoralists in Kenya’s NEP by focusing on constraints to livestock trade. The programme officially started in February 2005 and was scheduled to run until February 2008. The programme’s focus is to support development and strengthening of local and national level livestock trade commissions, provide animal health services that are required for domestic movement and international export of livestock, and provide limited support to infrastructural development (water points and their management) to enhance quality of livestock for trade. Trade associations will be strengthened in business services and trade capabilities. This programme will complement ongoing USAID support for increasing livestock trade in the Horn of Africa, funded and implemented by USAID/Kenya. More information on this project is available at http://tcbdb.wto.org/trta project.asp and http://www.usaidkenya.org/ke. b) The ASAL Based Livestock and Rural Livelihoods Support Project The project area consists of 22 districts covering the arid and semi-arid lands (ASALs). Garissa, Mandera and Wajir districts of NEP are part of this project. The overall objective is to contribute to poverty reduction at the national and household levels, consistent with the government’s policies of mainstreaming ASAL areas in the economic framework of the country. The specific objective of the project is to improve sustainable rural livelihoods and food security through improved livestock productivity, marketing and support for drought management and food security initiatives in the ASAL. The project is financed by the African Development Bank (some of the money being a loan and the rest a grant) and GoK, including contributions from the pastoralists in NE Kenya. Total project costs are estimated at US$ 38 million (KSh 2.8 billion). The project is being implemented over a six-year period beginning July 2004. For more information see http://www.livestock.go.ke. c) Livestock Marketing Enterprise The Livestock Marketing Enterprise (LIME) is a CIDA (Canadian International Development Agency)-funded project developed by CARE and the community, designed to address the challenges faced by pastoralists from the north-eastern part of Kenya through livestock marketing. LIME intervention emphasizes improved access to markets facilitated by improved credit provision. The project integrates pastoralists into the competitive livestock market through forward market contracts resulting in increased incomes. It has facilitated the establishment of pastoralist production companies (PPCs) around the watering holes it helped to rehabilitate across Garissa District. CARE has signed forward market contracts with Makram, one of the country’s largest livestock buyers. In coordination with the Ministry of Livestock and Fisheries Development, LIME ensures that cattle are screened, vaccinated, weighed, branded, and tagged, all on a fee-for-service basis. LIME then pays the farmers a fixed guaranteed price for

10
their cattle based on their weight, within 7 days. LIME hires local herdsmen to trek the cattle for 3 weeks down to the conditioning ranch at Galana in the Coast Province; this ranch is leased from the Agricultural Development Company. The price paid to LIME by Makram includes a premium that covers costs for trekking and ranch fees, and any profits generated are re-invested in more cattle for the next consignment. For further details on LIME visit http://www.care.ca/CEP/CEPportfolio e.shtm. d) The Kenya Agricultural Productivity Project The Kenya Agricultural Productivity Project (KAPP) is a GoK multi-sectoral and multi-institutional project funded by the World Bank. The total cost of the project is US$ 80.27 million and its operations started in June 2004; the project is scheduled to close in December 2008. It aims to support the agriculture research system, improve institutional and financial mechanisms that help farmers to access technology and to increase productivity. The project contributes to the SRA whose objective is ‘to provide a policy and institutional environment that is conducive to increasing agricultural productivity, promoting investments, encouraging private sector involvement in agricultural enterprises and agribusiness’ (MoA and MoLFD 2004). KAPP intends to contribute to the revitalization of agriculture through four project components: (i) policy and institutional reforms; (ii) extension system reform; (iii) research system reform; and (iv) farmer/client empowerment. KAAP pilot activities are ongoing with intervention in 20 districts across Kenya, out of which two (Wajir and Garissa) are in NEP. For more information visit http://web.worldbank.org and www.kari.org/KAPP/. e) Pan-African Programme for the Control of Epizootics The Pan-African Programme for the Control of Epizootics (PACE) is a project that conducts disease surveillance, and disease control and vaccination. The start date of PACE was 31st October 1999 and completion date was the 31st October, 2004.The main aim of PACE was surveillance of epizootic diseases in Africa to accurately determine their prevalence and impact on livestock production. The 5-year PACE programme covered 32 sub-Saharan countries. It is a € 72 million (Approximately $ 77 million) programme that is coordinated by AU/IBAR. The programme includes national operations planned and implemented in each country, and sub-regional and regional support and coordination components. The main activities of PACE in the NEP were on surveillance and control of rinderpest. The Community-based Animal Health and Participatory Epidemiology (CAPE) project – funded by DFID was an integral part of PACE. The MoU was signed in December 2000 between DFID and OAU-IBAR for a period of 4 years, till October 2004. The project was funded to the tune of £ 5.4 million (approximately $ 7 million).The unit promoted policy and institutional change to enable community-based animal health delivery systems, and promote the wider use of participatory approaches and methods in veterinary institutions. A range of awareness-raising, training and field experience activities were supported by the unit up to mid-2004. The unit was absorbed into the new Institutional and Policy Support Team in AU/IBAR in late 2004. In addition to these major projects, there are several other projects/initiatives carried out by various NGOs and local groups that aim to improve people’s socio-economic conditions in the province. Some examples of these projects and initiatives are provided in Box 1.
11
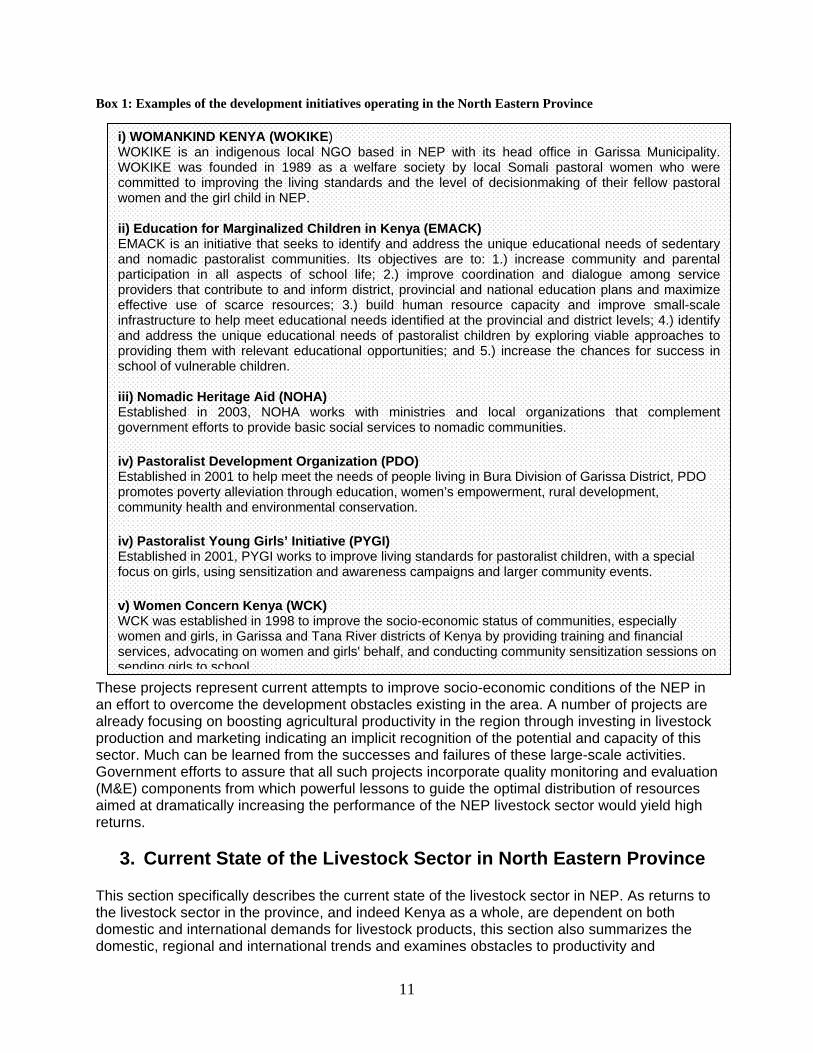
Box 1: Examples of the development initiatives operating in the North Eastern Province
These projects represent current attempts to improve socio-economic conditions of the NEP in an effort to overcome the development obstacles existing in the area. A number of projects are already focusing on boosting agricultural productivity in the region through investing in livestock production and marketing indicating an implicit recognition of the potential and capacity of this sector. Much can be learned from the successes and failures of these large-scale activities. Government efforts to assure that all such projects incorporate quality monitoring and evaluation (M&E) components from which powerful lessons to guide the optimal distribution of resources aimed at dramatically increasing the performance of the NEP livestock sector would yield high returns.
3. Current State of the Livestock Sector in North Eastern Province This section specifically describes the current state of the livestock sector in NEP. As returns to the livestock sector in the province, and indeed Kenya as a whole, are dependent on both domestic and international demands for livestock products, this section also summarizes the domestic, regional and international trends and examines obstacles to productivity and
i) WOMANKIND KENYA (WOKIKE) WOKIKE is an indigenous local NGO based in NEP with its head office in Garissa Municipality. WOKIKE was founded in 1989 as a welfare society by local Somali pastoral women who were committed to improving the living standards and the level of decisionmaking of their fellow pastoral women and the girl child in NEP. ii) Education for Marginalized Children in Kenya (EMACK) EMACK is an initiative that seeks to identify and address the unique educational needs of sedentary and nomadic pastoralist communities. Its objectives are to: 1.) increase community and parental participation in all aspects of school life; 2.) improve coordination and dialogue among service providers that contribute to and inform district, provincial and national education plans and maximize effective use of scarce resources; 3.) build human resource capacity and improve small-scale infrastructure to help meet educational needs identified at the provincial and district levels; 4.) identify and address the unique educational needs of pastoralist children by exploring viable approaches to providing them with relevant educational opportunities; and 5.) increase the chances for success in school of vulnerable children. iii) Nomadic Heritage Aid (NOHA) Established in 2003, NOHA works with ministries and local organizations that complement government efforts to provide basic social services to nomadic communities.
iv) Pastoralist Development Organization (PDO) Established in 2001 to help meet the needs of people living in Bura Division of Garissa District, PDO promotes poverty alleviation through education, women’s empowerment, rural development, community health and environmental conservation.
iv) Pastoralist Young Girls’ Initiative (PYGI) Established in 2001, PYGI works to improve living standards for pastoralist children, with a special focus on girls, using sensitization and awareness campaigns and larger community events.
v) Women Concern Kenya (WCK) WCK was established in 1998 to improve the socio-economic status of communities, especially women and girls, in Garissa and Tana River districts of Kenya by providing training and financial services, advocating on women and girls' behalf, and conducting community sensitization sessions on sending girls to school
12
production growth which would need to be addressed to optimize and fuel growth of the livestock sector.
3.1 Importance of livestock production to NEP
The ecological zone in which the NEP lies is highly suitable for pastoral production. One important advantage of the province is its location near the livestock markets in the Middle East and North Africa (MENA). Furthermore, the NEP serves as a route for livestock movement from Somalia and Ethiopia to Nairobi and other markets that serve as a potential source of income for local people through value addition. Due to the arid and semi-arid terrain over most of NEP, pastoral/nomadic livestock keeping is the more viable and therefore primary social and economic activity in the area. The numbers of livestock kept in the province are shown in Table 2.
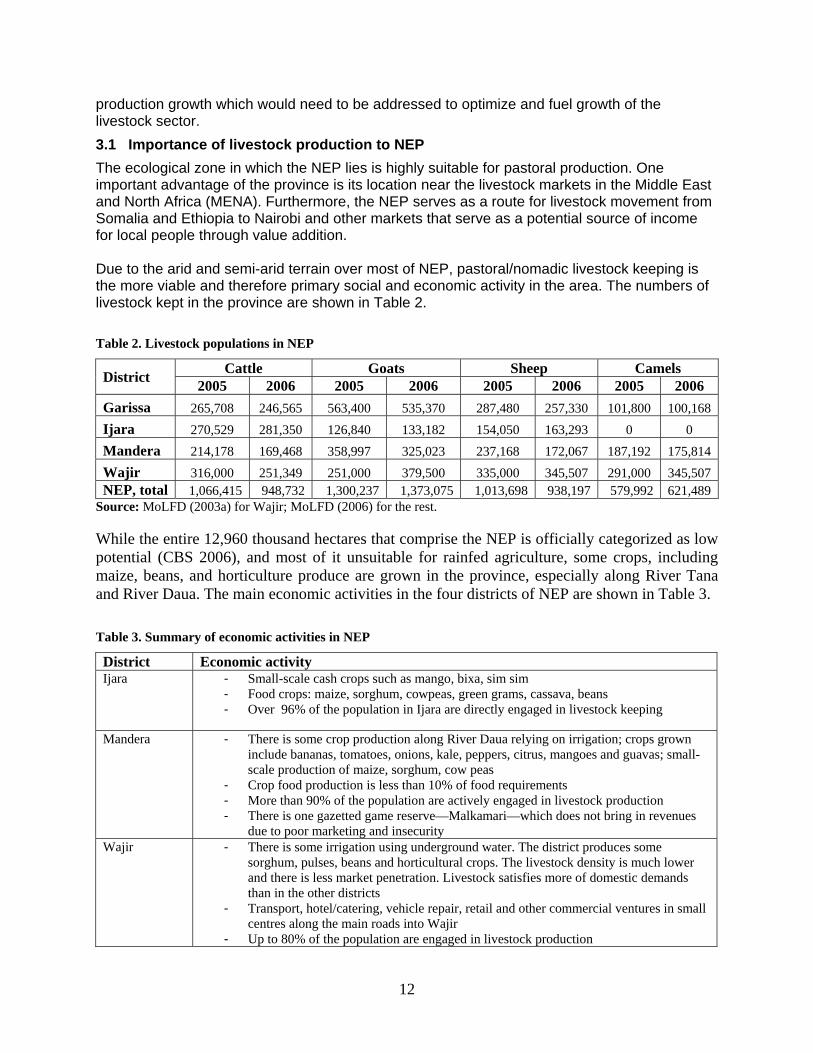
Table 2. Livestock populations in NEP
District Cattle Goats Sheep Camels
2005 2006 2005 2006 2005 2006 2005 2006
Garissa 265,708 246,565 563,400 535,370 287,480 257,330 101,800 100,168
Ijara 270,529 281,350 126,840 133,182 154,050 163,293 0 0
Mandera 214,178 169,468 358,997 325,023 237,168 172,067 187,192 175,814
Wajir 316,000 251,349 251,000 379,500 335,000 345,507 291,000 345,507 NEP, total 1,066,415 948,732 1,300,237 1,373,075 1,013,698 938,197 579,992 621,489
Source: MoLFD (2003a) for Wajir; MoLFD (2006) for the rest. While the entire 12,960 thousand hectares that comprise the NEP is officially categorized as low potential (CBS 2006), and most of it unsuitable for rainfed agriculture, some crops, including maize, beans, and horticulture produce are grown in the province, especially along River Tana and River Daua. The main economic activities in the four districts of NEP are shown in Table 3.
Table 3. Summary of economic activities in NEP
District Economic activity Ijara - Small-scale cash crops such as mango, bixa, sim sim
- Food crops: maize, sorghum, cowpeas, green grams, cassava, beans - Over 96% of the population in Ijara are directly engaged in livestock keeping
Mandera - There is some crop production along River Daua relying on irrigation; crops grown include bananas, tomatoes, onions, kale, peppers, citrus, mangoes and guavas; small-scale production of maize, sorghum, cow peas
- Crop food production is less than 10% of food requirements - More than 90% of the population are actively engaged in livestock production - There is one gazetted game reserve—Malkamari—which does not bring in revenues
due to poor marketing and insecurity Wajir - There is some irrigation using underground water. The district produces some
sorghum, pulses, beans and horticultural crops. The livestock density is much lower and there is less market penetration. Livestock satisfies more of domestic demands than in the other districts
- Transport, hotel/catering, vehicle repair, retail and other commercial ventures in small centres along the main roads into Wajir
- Up to 80% of the population are engaged in livestock production

13
Garissa - Has greatest potential for crop production of the four districts (irrigation potential estimated at 28,000 ha compared to the current 1200 ha—main crops are bananas, tomatoes, oilseeds
- 385,000 ha of forest along River Tana (meets 98% of domestic wood fuel needs) - Sand harvesting—mainly for construction within Garissa - Some fishing on River Tana - Tannery in Garissa, and services industry (vehicle repair, retail and catering in the
town) - 75% of the population are engaged in livestock keeping
Source: GoK (1997). Despite this evidence of other important activities in the province, pastoral/nomadic livestock production of mainly goats, sheep, camels and cattle remains the mainstay of the local economy. While the livestock populations in NEP represent only a small fraction of the national livestock populations (Figure 8), the relative importance of this sector to the NEP economy is clearer when the livestock numbers are weighted against the population2 (Figure 8); for example, the per capita cattle kept in NEP is about 1 animal against a national per capita of 0.3. Arguably, productivity of livestock is much lower in NEP (pastoral systems) than in, say, the Rift Valley Province (ranching systems). However, because of its even lower potential in crop production relative to livestock production—it would benefit both NEP and the national economy if the province specialized in livestock production, where it has comparative advantages.
0
2
4
6
8
10
12
14
Othercattle
Goats Hair sheep Camels
NEP
Total national herd
0.0
0.2
0.4
0.6
0.8
1.0
1.2
1.4
1.6
Catt le Goats Sheep Camel
Per capita livestock (NEP)
Per capita livestock(Nat ional)
Livestock numbers, NEP and national Per capita livestock (national and NEP)
Figure 8. Relative importance of livestock to NEP.
Source: MoLFD (2006).
2 NEP population is only 3.4% of the total Kenyan population.

14
3.2 Trends in livestock production
The livestock population in NEP has stagnated over the past 7 years, with significant variations during drought and flood years (Table 4)3. Drought is the most severe risk faced by pastoralists in Northern Kenya. Droughts have been occurring regularly since the 1970’s (Mude et al., 2007). In the year 2000 Kenya suffered its worst drought in 37 years. In 2006 there was another occurrence of drought and later floods in Garissa and Mandera districts (Appendix 3). Apart from affecting an increasingly larger number of people in the province, droughts have also had a clear effect on livestock production. This might explain why cattle and sheep numbers declined in these years. Floods that occurred in years 2001, 2005 and 2006 could explain the decline in production in subsequent years. Floods are usually associated with increased incidence of water-borne livestock diseases and increased mortalities.
Table 4. Trends in livestock production for NEP
Species 2000 2001 2002 2003 2004 2005 2006 Cattle 868,000 945,687 1,018,010 1,056,280 1,066,415 948,732 Sheep 1,268,250 1,233,994 557,743 596,662 1,013,698 938,197 Goats 782,888 882,931 1,300,237 1,373,075 Camels 501,500 502,929 520,116 546,232 579,992 621,489
Source: MoLFD (2006). There are two types of livestock movements that happen across the porous borders of northern Kenya. The first, involving movement of animals into Ethiopia and Somali in search of water and pasture intensifies during severe drought [MoLFD 2003b]. This type of migratory movement does not usually result in imports and is more correctly seen as a traditional coping mechanism. The second movement, estimated by AU/IBAR and NEPDP (2006) to represent 25–30% of the animals that are sold in Kenya, involves the trekking of animals destined for terminal markets in Kenya. These animals are subsequently trucked from livestock markets in Northern Kenya for slaughter. As observed by Knips (2004), livestock production data in a country like Kenya, that is a net importer, tend to be overrated. The inflows of livestock into Kenya are the result of stronger demand and higher prices in the country (AU/IBAR and NEPDP 2006). A survey by Agriconsortium (2003) found Nairobi prices for live animals and meat to be the highest in the Horn of Africa. In addition, the breakdown of the state in Somalia and the bad relations between Eritrea (which has a port) and Ethiopia has made Kenya a more attractive destination for re-export of live animals. With better infrastructure connecting Northern Kenya to the coastline, the country has potential to emerge as a re-export centre.
3.3 Livestock and livestock product sale and prices and farmers’ earnings
Based on recorded sales of live animals (Table 5), cattle provide most of the livestock income in NEP (over Kshs 1 billion); while shoats and camels generate Kshs 290 million and Kshs 260 million respectively. Nationally, approximately Kshs 13 billion and Kshs 2.5 billion was
3 These figures need to be interpreted with caution because no national livestock census has been carried out since the 1960s, and livestock population data are largely estimates, or single non-representative surveys from disparate sources whose findings often clash.

15
generated from sale of cattle and shoats, for slaughter in 2005 (Table 5). See Appendix 5 for dollar equivalents of these figures.
Table 5. Recorded sales of live animals (average prices and earnings to farmers), 2006
Species
Cattle Sheep & goats Camels
No.
Price (in
Kshs) Value
(in Kshs) No.
Price (in
Kshs) Value
(in Kshs) No.
Price (in
Kshs) Value
(in Kshs)
Garissa 51,323 7,850 402,885,550 36,883 1,460 53,849,180 139 12,560 1,745,840
Ijara 21,407 8,500 181,959,500 28,992 1,403 40,681,850 0 0 0
Wajir 29,598 7,950 235,304,100 66,169 1,342 88,765,714
15,783
8,187 129,210,1
60
Mandera 29,580 7,500 221,985,000 93,522 1,162 108,630,200
10,108
12,000 128,496,0
00 NEP, total
131,908
1,042,134,150 225,566 291,926,944
26,030
259,452,000
Source: MoLFD (2003a) for Wajir; MoLFD (2006) for the rest. The national trends in value of sales for cattle and shoats have been upward since 1999 (Table 6). This is largely due to increases in prices over the same period rather than improvements in productivity since the national slaughter went down over the same period. For example, the numbers of cattle and calves for slaughter went down from 2.5 million head in 1999 to 1.7 million head in 2003. Livestock is sold from NEP largely as live animals rather than slaughtered carcasses. These live animals are trekked from within the four districts (and some from neighbouring countries such as Somalia (see Agriconsortium 2003; AU/IBAR and NEPDP 2006) to local markets in northern Kenya. The main livestock markets that receive animals from NEP are at Garissa and Isiolo. However, there are many smaller livestock markets in the area. Middlemen buy livestock from these markets and transport them by either trekking or trucking to the terminal markets, mainly in Nairobi and Mombasa (Agriconsortium 2003; AU/IBAR and NEPDP 2006). Some animals are also transported to other towns. After years of such trade, elaborate trekking and trucking routes have been developed for live animals (AU/IBAR and NEPDP 2006). Significant proportions are kept in intermediate ranches, especially in the Rift Valley and at the Coast for fattening before sale or export.
16
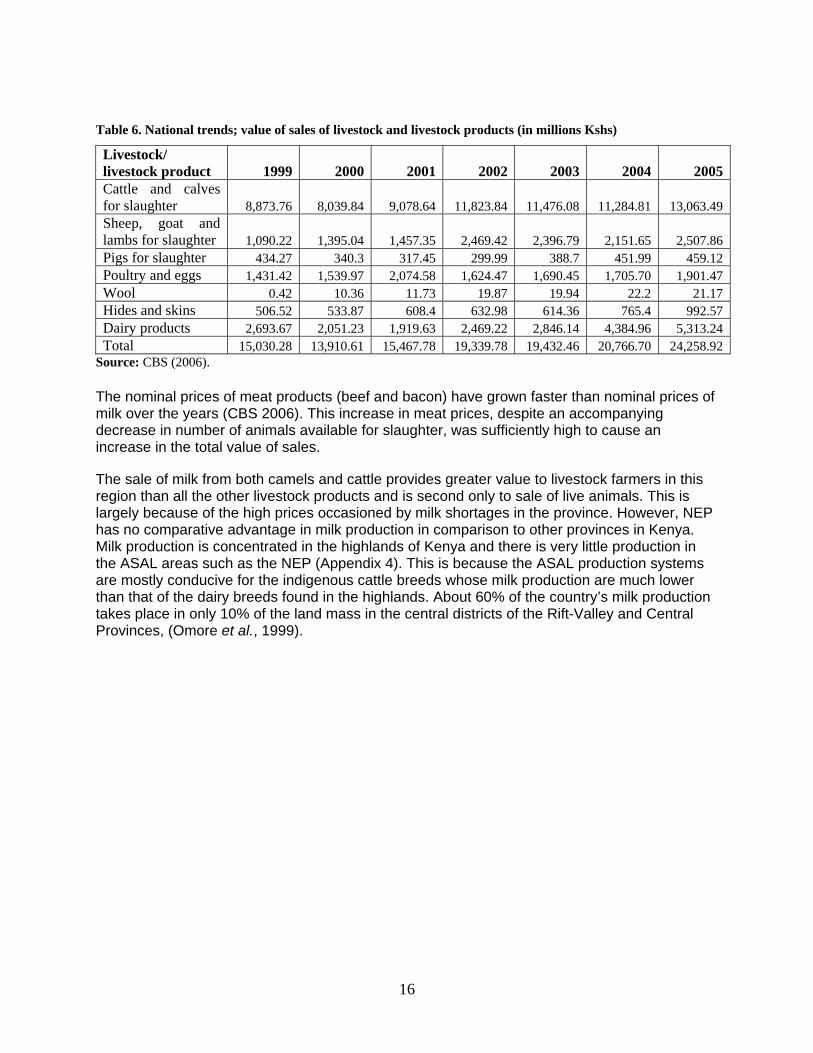
Table 6. National trends; value of sales of livestock and livestock products (in millions Kshs)
Livestock/ livestock product 1999 2000 2001 2002 2003 2004 2005Cattle and calves for slaughter 8,873.76 8,039.84 9,078.64 11,823.84 11,476.08 11,284.81 13,063.49 Sheep, goat and lambs for slaughter 1,090.22 1,395.04 1,457.35 2,469.42 2,396.79 2,151.65 2,507.86 Pigs for slaughter 434.27 340.3 317.45 299.99 388.7 451.99 459.12 Poultry and eggs 1,431.42 1,539.97 2,074.58 1,624.47 1,690.45 1,705.70 1,901.47 Wool 0.42 10.36 11.73 19.87 19.94 22.2 21.17 Hides and skins 506.52 533.87 608.4 632.98 614.36 765.4 992.57 Dairy products 2,693.67 2,051.23 1,919.63 2,469.22 2,846.14 4,384.96 5,313.24 Total 15,030.28 13,910.61 15,467.78 19,339.78 19,432.46 20,766.70 24,258.92
Source: CBS (2006). The nominal prices of meat products (beef and bacon) have grown faster than nominal prices of milk over the years (CBS 2006). This increase in meat prices, despite an accompanying decrease in number of animals available for slaughter, was sufficiently high to cause an increase in the total value of sales. The sale of milk from both camels and cattle provides greater value to livestock farmers in this region than all the other livestock products and is second only to sale of live animals. This is largely because of the high prices occasioned by milk shortages in the province. However, NEP has no comparative advantage in milk production in comparison to other provinces in Kenya. Milk production is concentrated in the highlands of Kenya and there is very little production in the ASAL areas such as the NEP (Appendix 4). This is because the ASAL production systems are mostly conducive for the indigenous cattle breeds whose milk production are much lower than that of the dairy breeds found in the highlands. About 60% of the country’s milk production takes place in only 10% of the land mass in the central districts of the Rift-Valley and Central Provinces, (Omore et al., 1999).

17
The quantities, prices and values of relative livestock product sales in NEP, highlighting the importance to livelihoods in the region, are shown in Table 7. Pastoralists look at livestock as assets and not necessarily as sources of food.
Table 7. Local livestock product sales and earnings to farmers in NEP, 2006
Product Garissa Ijara Wajir Mandera Province (Total)
Milk (cattle) Litres 1,145,000 5,140,900 5,002,160 4,000,000 15,288,060 Price (Kshs) 50 30 35 40 Value 57,250,000 154,227,000 175,075,600 160,000,000 402,552,600 Milk (camel) Litres 4,680,000 Nil 20,758,000 9,000,000 34,438,000 Price 45 Nil 30 40 Value 210,600,000 Nil 622,740,000 360,000,000 119,340,000 Meats (beef) Kg 479,800 3,480 209,290 265,346 957,916 Price 150 120 120 120 Value 71,790,000 417,600 25,114,800 31,841,520 129,163,920 Sheep and goats Kg 345,440 279,252 300,240 359,000 1,283,932 Price 170 140 160 140 Value 58,724,800 39,095,280 48,038,400 50,260,000 196,118,480 Camel meat Kg 171,632 18,750 301,180 430,020 621,582 Price 150 180 140 120 Value 25,744,800 3,375,000 42,165,200 51,602,400 122,887,400 Poultry meat kg 171,632 653 7,232 8,500 188,017 Price 150 150 120 200 Value 25,744,800 97,950 867,840 1,700,000 28,410,590 Hides (cattle) Pieces 4472 241 1,674 2965 9,352 Price 60 50 52 50 Value 268,320 12,050 87,048 148,250 515,668 Camel (hides) Pieces 14,808 125 2,007 2150 19,090 Price 90 50 75 70 Value 1,332,720 11,440 150,525 150,500 1,645,185 Skins (shoats) Pieces 127,037 31921 30,024 5278 194,860 Price 52 46 40 40 Value 6,605,924 1,470,643 1,200,960 211,135 9,488,662
Source: MoLFD (2006).
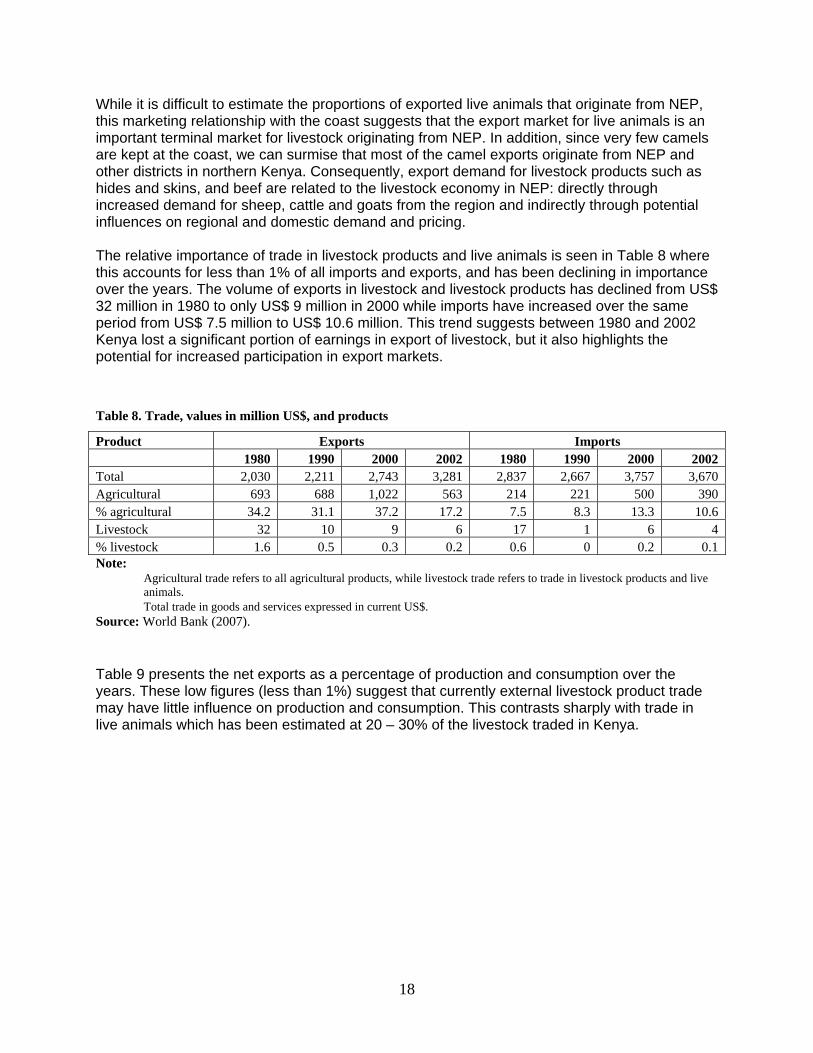
3.4 External trade in livestock and livestock products
The livestock industry in NEP is very closely connected with that of Coast Province. Most of Kenya’s live animal exports are by sea through the coast. According to AU-IBAR and NEPDP (2006) a considerable proportion of cattle traded at the coast come from NEP, trekked or trucked from Garissa through Tana River District. These animals are either slaughtered or fattened at various ranches along the coast for export.
18
While it is difficult to estimate the proportions of exported live animals that originate from NEP, this marketing relationship with the coast suggests that the export market for live animals is an important terminal market for livestock originating from NEP. In addition, since very few camels are kept at the coast, we can surmise that most of the camel exports originate from NEP and other districts in northern Kenya. Consequently, export demand for livestock products such as hides and skins, and beef are related to the livestock economy in NEP: directly through increased demand for sheep, cattle and goats from the region and indirectly through potential influences on regional and domestic demand and pricing. The relative importance of trade in livestock products and live animals is seen in Table 8 where this accounts for less than 1% of all imports and exports, and has been declining in importance over the years. The volume of exports in livestock and livestock products has declined from US$ 32 million in 1980 to only US$ 9 million in 2000 while imports have increased over the same period from US$ 7.5 million to US$ 10.6 million. This trend suggests between 1980 and 2002 Kenya lost a significant portion of earnings in export of livestock, but it also highlights the potential for increased participation in export markets.
Table 8. Trade, values in million US$, and products
Product Exports Imports 1980 1990 2000 2002 1980 1990 2000 2002 Total 2,030 2,211 2,743 3,281 2,837 2,667 3,757 3,670 Agricultural 693 688 1,022 563 214 221 500 390 % agricultural 34.2 31.1 37.2 17.2 7.5 8.3 13.3 10.6 Livestock 32 10 9 6 17 1 6 4 % livestock 1.6 0.5 0.3 0.2 0.6 0 0.2 0.1 Note:
Agricultural trade refers to all agricultural products, while livestock trade refers to trade in livestock products and live animals.
Total trade in goods and services expressed in current US$. Source: World Bank (2007). Table 9 presents the net exports as a percentage of production and consumption over the years. These low figures (less than 1%) suggest that currently external livestock product trade may have little influence on production and consumption. This contrasts sharply with trade in live animals which has been estimated at 20 – 30% of the livestock traded in Kenya.
19
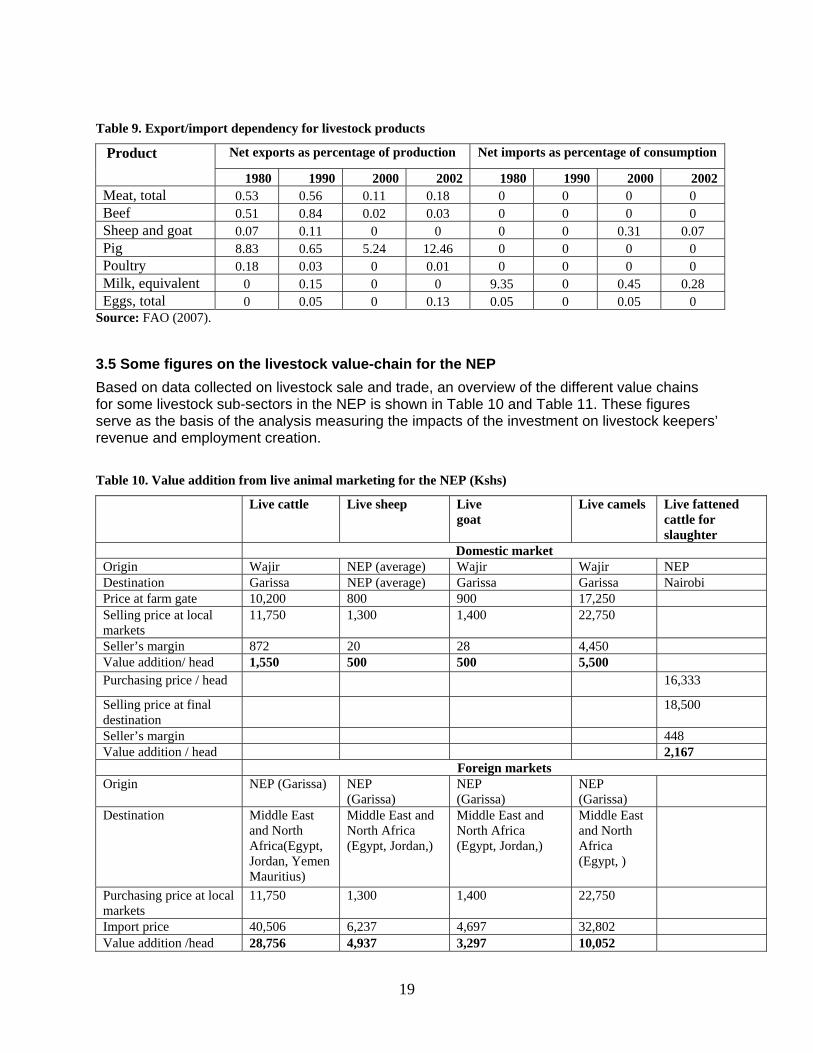
Table 9. Export/import dependency for livestock products
Product Net exports as percentage of production Net imports as percentage of consumption
1980 1990 2000 2002 1980 1990 2000 2002 Meat, total 0.53 0.56 0.11 0.18 0 0 0 0 Beef 0.51 0.84 0.02 0.03 0 0 0 0 Sheep and goat 0.07 0.11 0 0 0 0 0.31 0.07 Pig 8.83 0.65 5.24 12.46 0 0 0 0 Poultry 0.18 0.03 0 0.01 0 0 0 0 Milk, equivalent 0 0.15 0 0 9.35 0 0.45 0.28 Eggs, total 0 0.05 0 0.13 0.05 0 0.05 0
Source: FAO (2007).
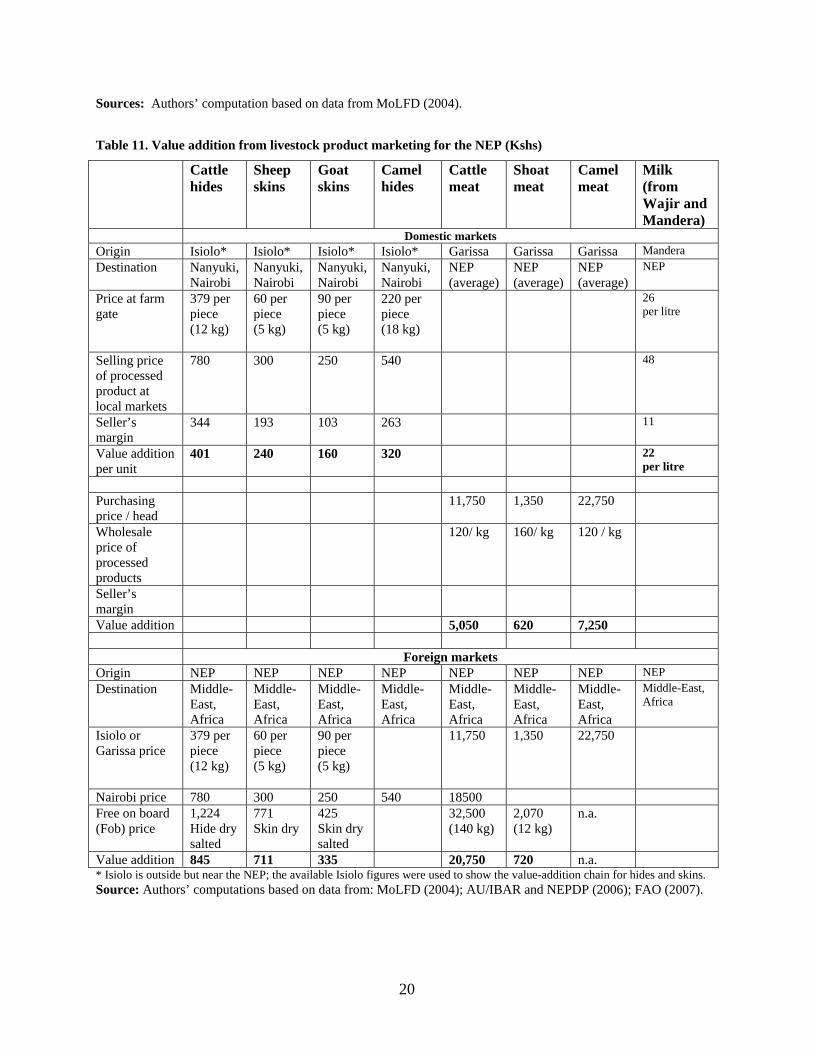
3.5 Some figures on the livestock value-chain for the NEP
Based on data collected on livestock sale and trade, an overview of the different value chains for some livestock sub-sectors in the NEP is shown in Table 10 and Table 11. These figures serve as the basis of the analysis measuring the impacts of the investment on livestock keepers’ revenue and employment creation.
Table 10. Value addition from live animal marketing for the NEP (Kshs)
Live cattle Live sheep Live goat
Live camels Live fattened cattle for slaughter
Domestic market Origin Wajir NEP (average) Wajir Wajir NEP Destination Garissa NEP (average) Garissa Garissa Nairobi Price at farm gate 10,200 800 900 17,250
Selling price at local markets
11,750 1,300 1,400 22,750
Seller’s margin 872 20 28 4,450
Value addition/ head 1,550 500 500 5,500
Purchasing price / head 16,333
Selling price at final destination
18,500
Seller’s margin 448 Value addition / head 2,167 Foreign markets Origin NEP (Garissa) NEP
(Garissa) NEP (Garissa)
NEP (Garissa)
Destination Middle East and North Africa(Egypt, Jordan, Yemen Mauritius)
Middle East and North Africa (Egypt, Jordan,)
Middle East and North Africa (Egypt, Jordan,)
Middle East and North Africa (Egypt, )
Purchasing price at local markets
11,750 1,300 1,400 22,750
Import price 40,506 6,237 4,697 32,802
Value addition /head 28,756 4,937 3,297 10,052
20
Sources: Authors’ computation based on data from MoLFD (2004).
Table 11. Value addition from livestock product marketing for the NEP (Kshs)
Cattle hides
Sheep skins
Goat skins
Camel hides
Cattle meat
Shoat meat
Camel meat
Milk (from Wajir and Mandera)
Domestic markets Origin Isiolo* Isiolo* Isiolo* Isiolo* Garissa Garissa Garissa Mandera
Destination Nanyuki, Nairobi
Nanyuki, Nairobi
Nanyuki, Nairobi
Nanyuki, Nairobi
NEP (average)
NEP (average)
NEP (average)
NEP
Price at farm gate
379 per piece (12 kg)
60 per piece (5 kg)
90 per piece (5 kg)
220 per piece (18 kg)
26 per litre
Selling price of processed product at local markets
780 300 250 540 48
Seller’s margin
344 193 103 263 11
Value addition per unit
401 240 160 320 22 per litre
Purchasing price / head
11,750 1,350 22,750
Wholesale price of processed products
120/ kg
160/ kg 120 / kg
Seller’s margin
Value addition 5,050 620 7,250
Foreign markets Origin NEP NEP NEP NEP NEP NEP NEP NEP
Destination Middle-East, Africa
Middle-East, Africa
Middle-East, Africa
Middle-East, Africa
Middle-East, Africa
Middle-East, Africa
Middle-East, Africa
Middle-East, Africa
Isiolo or Garissa price
379 per piece (12 kg)
60 per piece (5 kg)
90 per piece (5 kg)
11,750 1,350 22,750
Nairobi price 780 300 250 540 18500
Free on board (Fob) price
1,224 Hide dry salted
771 Skin dry
425 Skin dry salted
32,500 (140 kg)
2,070 (12 kg)
n.a.
Value addition 845 711 335 20,750 720 n.a. * Isiolo is outside but near the NEP; the available Isiolo figures were used to show the value-addition chain for hides and skins. Source: Authors’ computations based on data from: MoLFD (2004); AU/IBAR and NEPDP (2006); FAO (2007).
21
These tables show that in the domestic market for live animals, live camels yield the highest value added per head, followed by live cattle per head. However, cattle meat yields the highest value added per animal in the international markets.
4. Investment and Growth Opportunities for the NEP This section is motivated by the spirit of Vision 2030 of the GoK: projecting a clear image of a future in which Kenya has made optimal use of its resources and the opportunities presented by the national, regional and global economy to lift itself into a robust and vibrant middle-income economy with welfare benefits sufficiently distributed across the citizenry. While such a visioning exercise must by definition present an optimistic picture, it is only useful if one can chart a realistic path to arrive at the envisioned future. From the current situation in the livestock sector already laid out in Section 3, this report projects into the future, uncovering the opportunities and estimating the potential returns to different investment scenarios. The first scenario consists of the business-as-usual case: a vision of the state of the livestock sector, and its contribution to the NEP and national economy, if we maintain the current trajectory. The second scenario outlines a strategy that focuses on catering to domestic demand for livestock products especially for meet which leads to the demand of more live animals. The third scenario focuses on feeding foreign demand for live animals, while the fourth scenario investigates the possibilities of a livestock sector driven by exports of processed livestock products. Analysis in each scenario will assess the likely impact on three key indicators of success: increase in livestock income and production, employment generation, and state of food security. While not mutually exclusive, each investment scenario has a unique configuration of challenges and opportunities that demand a specific set of policies to generate optimal returns. For all scenarios, the focus in mainly on live animal and meat production where NEP has a comparative advantage.
4.1 First scenario: Business-as-usual (status quo)
4.1.1 Description of the status quo A visioning exercise presents one with a desired end which explicitly recognizes that its achievement is only possible if resources and efforts have been applied in a creative and proactive manner. In that sense, business-as-usual presents the counterfactual: a picture of the future if the necessary innovative steps to dramatically increase the productivity and profitability of the livestock sector are ignored. In this scenario, the main assumption is that, for the livestock sector, there is no vision to add new investment or to create and target new market opportunities. In other words, the livestock sector is left to grow at its current rate. 4.1.2 Trends in livestock sector without any new investment Currently the NEP produces and sells (i) live animals (mainly cattle, shoats and camel) for the domestic market (including Nairobi and Mombasa); (ii) hides and skins for the domestic and international markets; (iii) meat (beef, shoat and camel meat) for the local market; and (iv) milk for the local market. Live animals, mostly cattle and shoats, are shipped from the NEP to large markets such as Nairobi and Mombasa. It is, however, difficult to specify the actual number of livestock originating from and moved out of the province because the NEP is often used as an export route of live animals from neighbouring countries (Ethiopia and Somalia). Figures for livestock population and revenue from livestock production (Table 12) indicate that cattle production is

22
the largest revenue-generator in the NEP although it has the lowest growth rate (MoLFD 2004; AU/IBAR and NEPDP 2006). According to the same data sources, total revenue from livestock in the province amounted at least to about KSh 2 billion and the net value addition was about KSh 600 million. Such figures indicate the importance of livestock in the economy of NEP under current trends.
Table 12. Livestock production and revenue in the NEP, 2003
Livestock population (2003)
Growth rate of livestock population (%)2002–03
Number of animals sold in the local market
Meat produced for local market (kg)
Hides and skins (kg)
Average price per animal (KShs)
Revenue from livestock sales (Kshs)
Cattle 1,056,280 3.8 156,856 247,160 16,854 8,488 1,329,405,250
Sheep 596,662 7.0 86,639 274,716 (shoats) 232,506 1,303 100,540,139
Goats 882,931 12.8 121,168 n.a. 354,179 1,378 159,596,150 Camels 546,232 5.0 28,709 2,080,000 15,084 13,758 352,890,450 Chicken 137,782 8.2 0 n.a. 0 Donkeys 49,142 66.1 5,157 n.a. 4,667 20,557,500
Source: MoLFD (2004); AU/IBAR and NEPDP (2006).
4.1.3 Consequences of the status quo Impact on livestock keepers’ income. The analysis focuses mainly on the domestic market where most NEP livestock are currently destined. With the annual increases in livestock population (Table 12), revenue for livestock keepers from total livestock sales would increase by about Kshs 115.5 million per year. This is under the assumption that average prices per head of animal remain constant. Such figures imply that livestock production and income may continue to grow even without new investment. But the concern is whether production under the status quo meets actual demands in both the domestic and international markets. Impact on employment creation. With the actual growth in livestock population shown in Table 12 and using the value addition per animal sold in the local market shown in Table 11, the increase in total value addition from livestock sale in the NEP will be about Kshs 29.1 million. The minimum wage in the agriculture sector is about Kshs 30,000 per year. Assuming that all the value addition goes to job creation, total value addition will create only about 1000 jobs per year. For instance, with a population of about 1.2 million, and an employment rate of about 65% in the NEP for 2003, the growth in the livestock sector could increase employment only by about 0.12% per year in the province which is only a tiny contribution towards reducing unemployment in Kenya. Impact on food security. The NEP has the highest population growth rate in the entire country. The latest census indicates that the population growth was about 9.5% between 1989 and 1999 compared with 3% for Kenya. Such a high growth rate is well above the growth rate of the livestock population (Table 13).
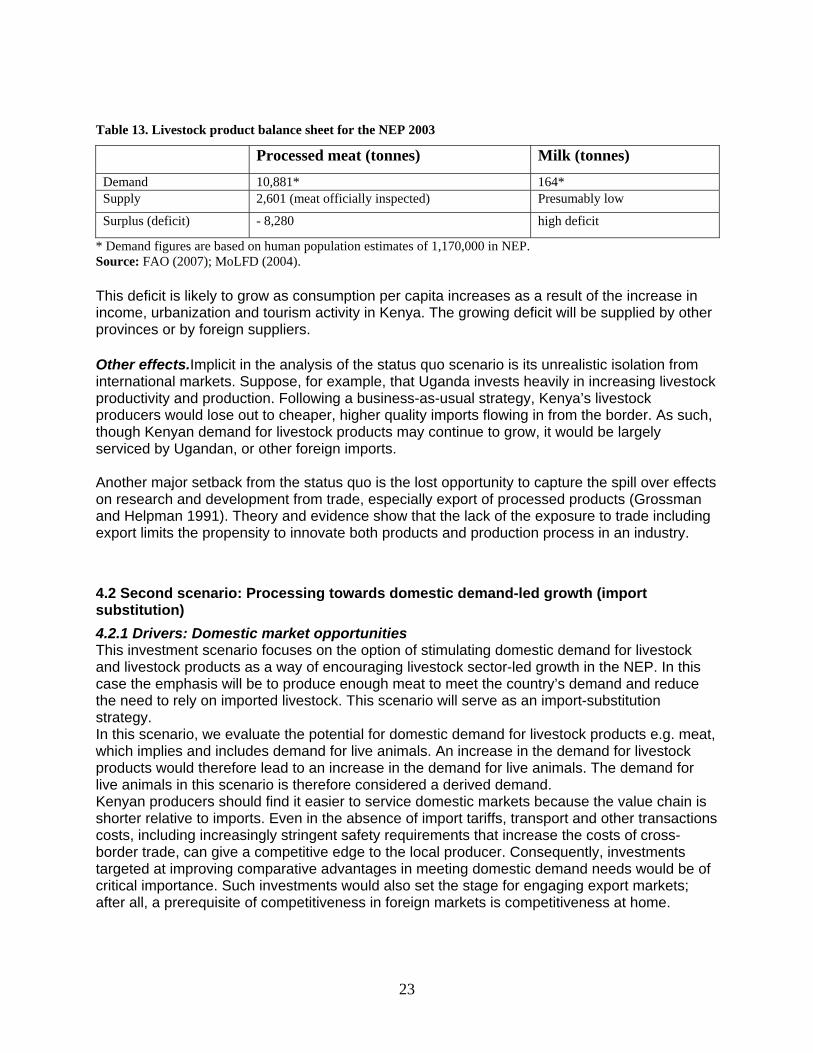
23
Table 13. Livestock product balance sheet for the NEP 2003
Processed meat (tonnes) Milk (tonnes)
Demand 10,881* 164* Supply 2,601 (meat officially inspected) Presumably low
Surplus (deficit) - 8,280 high deficit
* Demand figures are based on human population estimates of 1,170,000 in NEP. Source: FAO (2007); MoLFD (2004). This deficit is likely to grow as consumption per capita increases as a result of the increase in income, urbanization and tourism activity in Kenya. The growing deficit will be supplied by other provinces or by foreign suppliers. Other effects.Implicit in the analysis of the status quo scenario is its unrealistic isolation from international markets. Suppose, for example, that Uganda invests heavily in increasing livestock productivity and production. Following a business-as-usual strategy, Kenya’s livestock producers would lose out to cheaper, higher quality imports flowing in from the border. As such, though Kenyan demand for livestock products may continue to grow, it would be largely serviced by Ugandan, or other foreign imports. Another major setback from the status quo is the lost opportunity to capture the spill over effects on research and development from trade, especially export of processed products (Grossman and Helpman 1991). Theory and evidence show that the lack of the exposure to trade including export limits the propensity to innovate both products and production process in an industry.
4.2 Second scenario: Processing towards domestic demand-led growth (import substitution)
4.2.1 Drivers: Domestic market opportunities This investment scenario focuses on the option of stimulating domestic demand for livestock and livestock products as a way of encouraging livestock sector-led growth in the NEP. In this case the emphasis will be to produce enough meat to meet the country’s demand and reduce the need to rely on imported livestock. This scenario will serve as an import-substitution strategy. In this scenario, we evaluate the potential for domestic demand for livestock products e.g. meat, which implies and includes demand for live animals. An increase in the demand for livestock products would therefore lead to an increase in the demand for live animals. The demand for live animals in this scenario is therefore considered a derived demand. Kenyan producers should find it easier to service domestic markets because the value chain is shorter relative to imports. Even in the absence of import tariffs, transport and other transactions costs, including increasingly stringent safety requirements that increase the costs of cross-border trade, can give a competitive edge to the local producer. Consequently, investments targeted at improving comparative advantages in meeting domestic demand needs would be of critical importance. Such investments would also set the stage for engaging export markets; after all, a prerequisite of competitiveness in foreign markets is competitiveness at home.
24
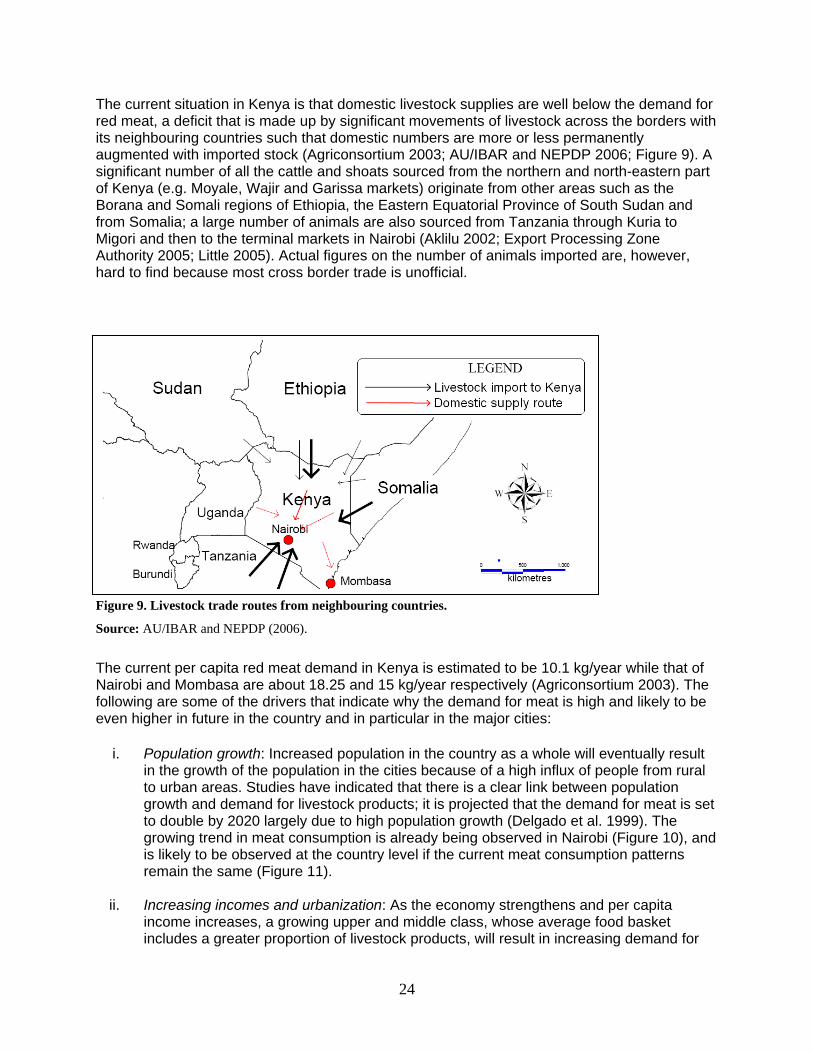
The current situation in Kenya is that domestic livestock supplies are well below the demand for red meat, a deficit that is made up by significant movements of livestock across the borders with its neighbouring countries such that domestic numbers are more or less permanently augmented with imported stock (Agriconsortium 2003; AU/IBAR and NEPDP 2006; Figure 9). A significant number of all the cattle and shoats sourced from the northern and north-eastern part of Kenya (e.g. Moyale, Wajir and Garissa markets) originate from other areas such as the Borana and Somali regions of Ethiopia, the Eastern Equatorial Province of South Sudan and from Somalia; a large number of animals are also sourced from Tanzania through Kuria to Migori and then to the terminal markets in Nairobi (Aklilu 2002; Export Processing Zone Authority 2005; Little 2005). Actual figures on the number of animals imported are, however, hard to find because most cross border trade is unofficial.
Figure 9. Livestock trade routes from neighbouring countries.
Source: AU/IBAR and NEPDP (2006).
The current per capita red meat demand in Kenya is estimated to be 10.1 kg/year while that of Nairobi and Mombasa are about 18.25 and 15 kg/year respectively (Agriconsortium 2003). The following are some of the drivers that indicate why the demand for meat is high and likely to be even higher in future in the country and in particular in the major cities:
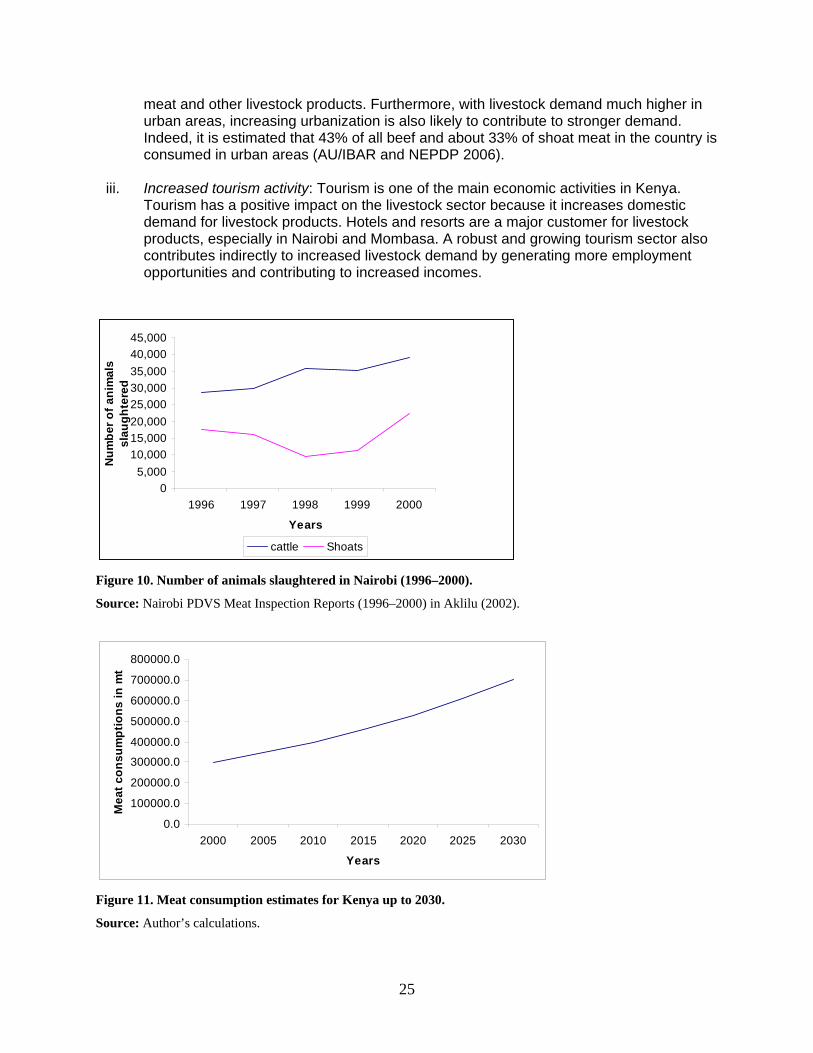
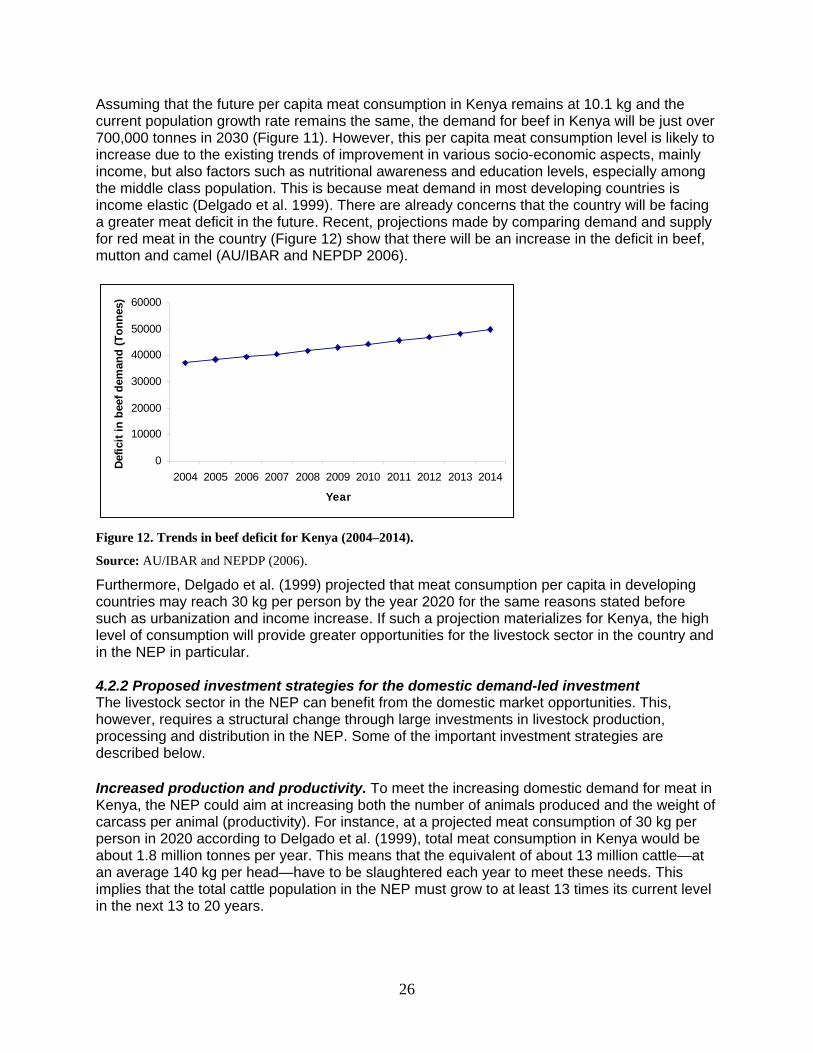
i. Population growth: Increased population in the country as a whole will eventually result in the growth of the population in the cities because of a high influx of people from rural to urban areas. Studies have indicated that there is a clear link between population growth and demand for livestock products; it is projected that the demand for meat is set to double by 2020 largely due to high population growth (Delgado et al. 1999). The growing trend in meat consumption is already being observed in Nairobi (Figure 10), and is likely to be observed at the country level if the current meat consumption patterns remain the same (Figure 11).
ii. Increasing incomes and urbanization: As the economy strengthens and per capita
income increases, a growing upper and middle class, whose average food basket includes a greater proportion of livestock products, will result in increasing demand for
25
meat and other livestock products. Furthermore, with livestock demand much higher in urban areas, increasing urbanization is also likely to contribute to stronger demand. Indeed, it is estimated that 43% of all beef and about 33% of shoat meat in the country is consumed in urban areas (AU/IBAR and NEPDP 2006).
iii. Increased tourism activity: Tourism is one of the main economic activities in Kenya.
Tourism has a positive impact on the livestock sector because it increases domestic demand for livestock products. Hotels and resorts are a major customer for livestock products, especially in Nairobi and Mombasa. A robust and growing tourism sector also contributes indirectly to increased livestock demand by generating more employment opportunities and contributing to increased incomes.
0
5,000
10,000
15,000
20,000
25,000
30,000
35,000
40,000
45,000
1996 1997 1998 1999 2000
Years
Nu
mb
er
of
an
ima
ls
sla
ug
hte
red
cattle Shoats
Figure 10. Number of animals slaughtered in Nairobi (1996–2000).
Source: Nairobi PDVS Meat Inspection Reports (1996–2000) in Aklilu (2002).
0.0
100000.0
200000.0
300000.0
400000.0
500000.0
600000.0
700000.0
800000.0
2000 2005 2010 2015 2020 2025 2030
Years
Me
at
co
ns
um
pti
on
s i
n m
t
Figure 11. Meat consumption estimates for Kenya up to 2030.
Source: Author’s calculations.
26
Assuming that the future per capita meat consumption in Kenya remains at 10.1 kg and the current population growth rate remains the same, the demand for beef in Kenya will be just over 700,000 tonnes in 2030 (Figure 11). However, this per capita meat consumption level is likely to increase due to the existing trends of improvement in various socio-economic aspects, mainly income, but also factors such as nutritional awareness and education levels, especially among the middle class population. This is because meat demand in most developing countries is income elastic (Delgado et al. 1999). There are already concerns that the country will be facing a greater meat deficit in the future. Recent, projections made by comparing demand and supply for red meat in the country (Figure 12) show that there will be an increase in the deficit in beef, mutton and camel (AU/IBAR and NEPDP 2006).
0
10000
20000
30000
40000
50000
60000
2004 2005 2006 2007 2008 2009 2010 2011 2012 2013 2014
Year
Def
icit
in
bee
f d
eman
d (
To
nn
es)
Figure 12. Trends in beef deficit for Kenya (2004–2014).
Source: AU/IBAR and NEPDP (2006).
Furthermore, Delgado et al. (1999) projected that meat consumption per capita in developing countries may reach 30 kg per person by the year 2020 for the same reasons stated before such as urbanization and income increase. If such a projection materializes for Kenya, the high level of consumption will provide greater opportunities for the livestock sector in the country and in the NEP in particular. 4.2.2 Proposed investment strategies for the domestic demand-led investment The livestock sector in the NEP can benefit from the domestic market opportunities. This, however, requires a structural change through large investments in livestock production, processing and distribution in the NEP. Some of the important investment strategies are described below. Increased production and productivity. To meet the increasing domestic demand for meat in Kenya, the NEP could aim at increasing both the number of animals produced and the weight of carcass per animal (productivity). For instance, at a projected meat consumption of 30 kg per person in 2020 according to Delgado et al. (1999), total meat consumption in Kenya would be about 1.8 million tonnes per year. This means that the equivalent of about 13 million cattle—at an average 140 kg per head—have to be slaughtered each year to meet these needs. This implies that the total cattle population in the NEP must grow to at least 13 times its current level in the next 13 to 20 years.
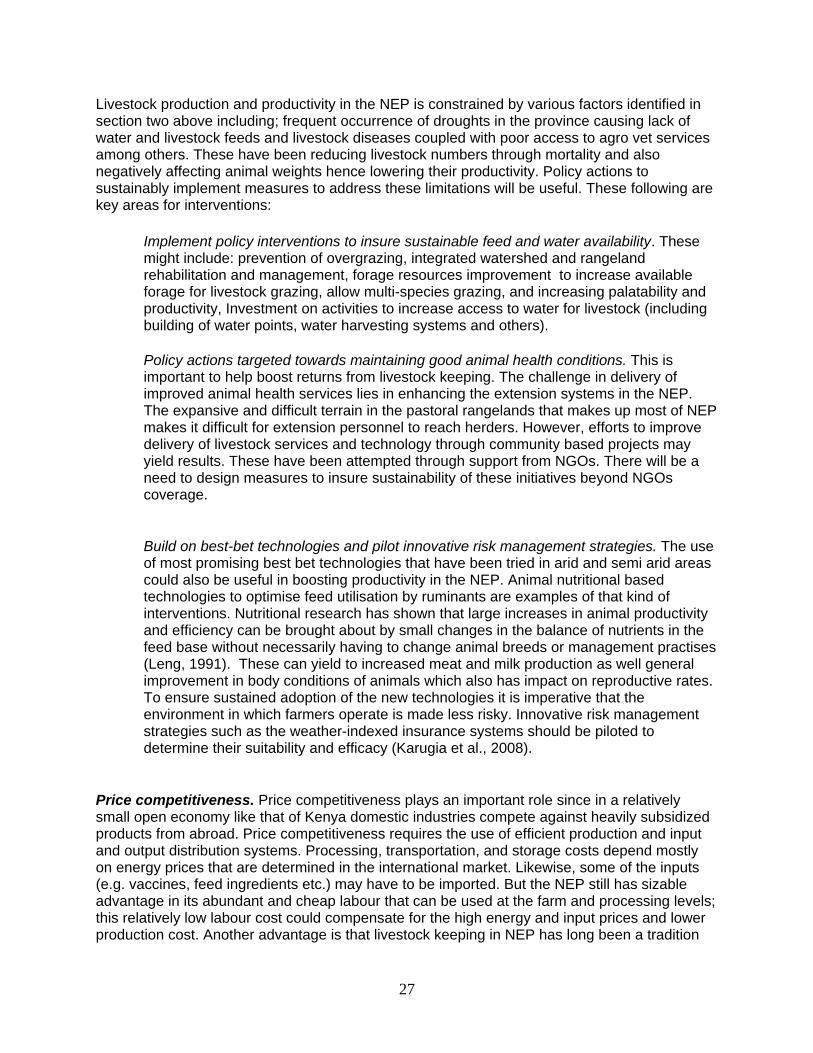
27
Livestock production and productivity in the NEP is constrained by various factors identified in section two above including; frequent occurrence of droughts in the province causing lack of water and livestock feeds and livestock diseases coupled with poor access to agro vet services among others. These have been reducing livestock numbers through mortality and also negatively affecting animal weights hence lowering their productivity. Policy actions to sustainably implement measures to address these limitations will be useful. These following are key areas for interventions:
Implement policy interventions to insure sustainable feed and water availability. These might include: prevention of overgrazing, integrated watershed and rangeland rehabilitation and management, forage resources improvement to increase available forage for livestock grazing, allow multi-species grazing, and increasing palatability and productivity, Investment on activities to increase access to water for livestock (including building of water points, water harvesting systems and others).
Policy actions targeted towards maintaining good animal health conditions. This is
important to help boost returns from livestock keeping. The challenge in delivery of improved animal health services lies in enhancing the extension systems in the NEP. The expansive and difficult terrain in the pastoral rangelands that makes up most of NEP makes it difficult for extension personnel to reach herders. However, efforts to improve delivery of livestock services and technology through community based projects may yield results. These have been attempted through support from NGOs. There will be a need to design measures to insure sustainability of these initiatives beyond NGOs coverage.
Build on best-bet technologies and pilot innovative risk management strategies. The use of most promising best bet technologies that have been tried in arid and semi arid areas could also be useful in boosting productivity in the NEP. Animal nutritional based technologies to optimise feed utilisation by ruminants are examples of that kind of interventions. Nutritional research has shown that large increases in animal productivity and efficiency can be brought about by small changes in the balance of nutrients in the feed base without necessarily having to change animal breeds or management practises (Leng, 1991). These can yield to increased meat and milk production as well general improvement in body conditions of animals which also has impact on reproductive rates. To ensure sustained adoption of the new technologies it is imperative that the environment in which farmers operate is made less risky. Innovative risk management strategies such as the weather-indexed insurance systems should be piloted to determine their suitability and efficacy (Karugia et al., 2008).
Price competitiveness. Price competitiveness plays an important role since in a relatively small open economy like that of Kenya domestic industries compete against heavily subsidized products from abroad. Price competitiveness requires the use of efficient production and input and output distribution systems. Processing, transportation, and storage costs depend mostly on energy prices that are determined in the international market. Likewise, some of the inputs (e.g. vaccines, feed ingredients etc.) may have to be imported. But the NEP still has sizable advantage in its abundant and cheap labour that can be used at the farm and processing levels; this relatively low labour cost could compensate for the high energy and input prices and lower production cost. Another advantage is that livestock keeping in NEP has long been a tradition
28
embedded in the pastoralists’ way of life. Rural communities in the province have therefore valuable livestock keeping experience which could raise efficiency and help increase price competitiveness. Product quality and differentiation. Providing high product quality that matches the quality of imported products is critical for successful investment in domestic market opportunities. An important element of strategy is to emphasize the originality of the product and promote and use local brands that attract local consumers and tourism. This is to differentiate the livestock products out of the NEP from other products already in the market. The differentiation could be based on specific criteria such as flavour (taste and aroma), the production process, and packaging (presentation of the final product). The key is to search for original ingredients or processing practices that could be of use for such a differentiation. This comment also applies to trade in live animals discussed in Section 4.5. The NEP has the advantage of having livestock mostly fed on grass (natural) instead of grains (often processed or stored using some chemical products) could be a source of product differentiation on taste and other food quality and safety attributes that applies to both live animals and processed products. A differentiation in taste and health attributes between, say, dry (beef, lamb or goat) salami from the NEP and dry salamis from other parts of Kenya could find a niche market among local consumers and tourists. Efficient distribution and marketing. Improving the state of infrastructure and communication in the NEP and in Kenya as whole is a requirement for successful investment in the livestock sector. Better roads and communication will help reduce transportation and transaction costs and contribute to price competitiveness of local livestock products and live animals. Moreover, the NEP could take advantage of the increased number of supermarkets (supermarket revolution), especially in large towns across Kenya. The province could adopt the successful approach used in small-scale dairy in the Kenya highlands that involves forging links between farmers’ cooperative, processors and distributors (Ngigi 2005). This includes ‘contract farming’ or the ‘vertical integration’ approach which provide many advantages such as ensuring stable income sources for stakeholders, better communication along the chains and better control of the final product quality. Advertising livestock products from the NEP seems appropriate to increase sales because of competition from other parts of Kenya and abroad. Such an advertising campaign would promote a new image of the NEP as a trusted source of high quality and original livestock products for the domestic market. 4.2.3 Consequences of the domestic demand led-investment The domestic demand-led investment scenario will have positive consequences on income, employment, and food security in the NEP. The main foods consumed in NEP are meat, milk, maize and rice; meat and milk are obtained from the animals while maize and rice are brought in from outside the province by traders. Increased income would provide the means to purchase these foods from traders, thus improving food security. An example of a situation where investment can be made to enable the province supply at least 50% of the beef and mutton deficit that Kenya faces each year is provided in Box 2.

29
Furthermore, as illustrated in Figure 13, which uses population projections to show potential future demand for meat in Kenya’s two largest cities, the demand is likely to rise significantly to 2030. Currently these two cities plus Malindi obtain most of their livestock from the three districts in NEP presented in italics in Table 14 among other sources. If the livestock sector is promoted NEP’share of this market could increase significantly.
Box 2: Consequences on income, employment, and food security if the NEP can supply at least 50% of the beef and mutton imported to Kenya
According to recent projections of meat deficit by AU/IBAR and NEPDP (2006), we can deduce that in 2007, Kenya’s per capita beef import is about 1.1 kg while that of mutton is 0.4 kg. These projections indicate that there is an increasing trend for deficit in these products (Table 5 in AU/IBAR and NEPDP 2006). Since there is also an increasing trend in the country’s population growth, it is obvious that there will be an increase in the number of cattle and sheep that will be required to meet the country’s demand each year. Based on this background information, we calculated the impact on employment and income in the NEP assuming that the proposed investment in the NEP under this scenario will enable the province to supply at least 50% of the required animals each year. We used average value additions of KSh 4400 for cattle and KSh 500 for sheep. The table below provides the results of this analysis.
Employment opportunities created by 2030
Percentage increase in employment in NEP
Annual increase in the farmers’ income in the NEP (KSh)
Beef 282,974 2.1 2,534,589,608 Mutton 145,045 0.3 312,402,041 Total 428,019 2.4 2,846,991,649
This information in the table indicates that if livestock production in the NEP can be promoted such that the province supplies at least 50% of cattle and sheep that are in deficit (imported) in Kenya, the province will accrue the following benefits: i) more than 400,000 jobs will be created, most of which could directly benefit the province; ii) unemployment in the province will be reduced by about 2.4% each year; and iii) farmers’ incomes in the province will increase by more than KSh 2 billion each year. The import substitution strategy is likely to have direct and positive impacts on food security. With the larger incomes for producers, there will be a more effective demand for food products and commodities such as maize, rice and sugar that are not traditionally produced in the province. It is assumed that suppliers (traders and transporters) will respond to this demand. In NEP, lorries that transport live animals for processing in Nairobi, often backhaul commodities including the above food stuff for sale in the province. This movement is likely to intensify under this scenario, improving the availability of food.
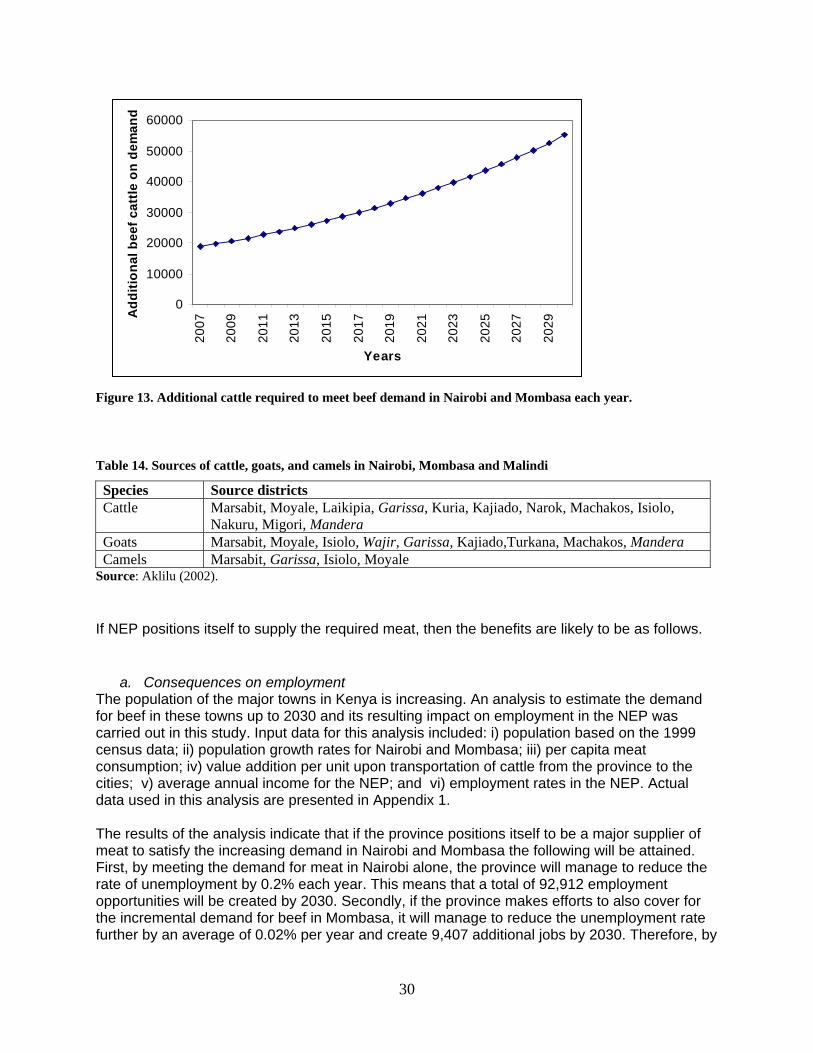
30
0
10000
20000
30000
40000
50000
60000
20
07
20
09
20
11
20
13
20
15
20
17
20
19
20
21
20
23
20
25
20
27
20
29
Years
Ad
dit
ion
al
be
ef
ca
ttle
on
de
ma
nd
Figure 13. Additional cattle required to meet beef demand in Nairobi and Mombasa each year.
Table 14. Sources of cattle, goats, and camels in Nairobi, Mombasa and Malindi
Species Source districts Cattle Marsabit, Moyale, Laikipia, Garissa, Kuria, Kajiado, Narok, Machakos, Isiolo,
Nakuru, Migori, Mandera Goats Marsabit, Moyale, Isiolo, Wajir, Garissa, Kajiado,Turkana, Machakos, Mandera Camels Marsabit, Garissa, Isiolo, Moyale
Source: Aklilu (2002). If NEP positions itself to supply the required meat, then the benefits are likely to be as follows.
a. Consequences on employment The population of the major towns in Kenya is increasing. An analysis to estimate the demand for beef in these towns up to 2030 and its resulting impact on employment in the NEP was carried out in this study. Input data for this analysis included: i) population based on the 1999 census data; ii) population growth rates for Nairobi and Mombasa; iii) per capita meat consumption; iv) value addition per unit upon transportation of cattle from the province to the cities; v) average annual income for the NEP; and vi) employment rates in the NEP. Actual data used in this analysis are presented in Appendix 1. The results of the analysis indicate that if the province positions itself to be a major supplier of meat to satisfy the increasing demand in Nairobi and Mombasa the following will be attained. First, by meeting the demand for meat in Nairobi alone, the province will manage to reduce the rate of unemployment by 0.2% each year. This means that a total of 92,912 employment opportunities will be created by 2030. Secondly, if the province makes efforts to also cover for the incremental demand for beef in Mombasa, it will manage to reduce the unemployment rate further by an average of 0.02% per year and create 9,407 additional jobs by 2030. Therefore, by
31
responding to the additional meat demand in the two cities alone the NEP will in total generate about 100,000 new jobs by 2030. These figures assume that all value additions from increased production go to job creation. Employment generated outside the livestock sector based on the value additions from this investment scenario could enhance the direct employment effects. According to a study by Omore et al. (2004) on dairy marketing and processing, such indirect employment effects of livestock based investment could be high.
b. Consequences on food security and livestock keepers’ income The aim of this investment scenario itself is to satisfy domestic consumption. This means that this strategy is key to increasing livestock product, especially meat availability in the province and in Kenya as a whole. For Mombasa and Nairobi, the projections from this study show, for instance, that close to a million additional cattle will be required to meet the increased meat demand in markets by 2030 (Figure 13). Income will also increase each year as the increase in number of animals demanded is directly related to more sales to the farmers and consequently more income at the farm gate (Appendix 2).
c. Other consequences This livestock-based investment that specifically targets domestic market opportunities has beneficial multiplier effects along the processing chains and even outside the livestock sector. For instance, the local feed industry could grow and could prompt the growth of production of feed ingredients (e.g. crops providing proteins and starches for feed). Likewise, advertising and a successful bid to provide high quality livestock products may boost the image of NEP in building a good reputation as a source of high quality agricultural products. All the direct and indirect effects would certainly contribute to significant economic growth in the province and in the country as a whole. But the major positive effect of the domestic-led demand investment is that it prepares the ground for the livestock sector in the NEP to face competition in the international market. Although the requirements in product quantity and especially quality in foreign and domestic markets may differ, the investment strategies defined above remain valid for an export-oriented investment. The limitation of the import substitution scenario is that an inward-looking investment strategy often leaves the government with the temptation to increase protection in favour of the domestic industry. Such protection could be beneficial in the short term but will always fail in the long run as the well-known cases of many import-substitution industries in developing countries in the 1980s proved. Protection can fail in a developing country because it is not sustainable. For instance, the consumer price of beef could rise (relative to imported beef) as a result of the protection. This could compromise efforts to increase access to meat and other livestock products, especially for poor consumers. Protection also could misallocate resources by draining out inputs from other sectors (including more efficient sectors) to the protected livestock sector. Also, protection often involves domestic price support that cannot be sustained over a long period because of lack of financial resources.
4.3 Third Scenario: Improving the export of live animals
4.3.1 Introduction As the domestic livestock industry becomes increasingly productive and produces more and more output, a limited local market will eventually diminish the production and revenue

possibilities as prices in the domestic market drop to deal with the ever-increasing supply. To further extend the growth frontier of the NEP livestock sector, competitively engaging in foreign markets will be key. One such option—improving the export of live animals—offers the promise of sustainable income to farmers (because of relatively good prices in potential destination markets), but should also improve earnings and employment opportunities along the live animals export value chain (for trekkers, transporters, shipping agencies and veterinarians). Analysts (see Agriconsortium 2003) have pointed to long-term trends from the consumption of live animals towards fresh (chilled and frozen) meats in traditional markets such as the Middle East. However, this paper argues that since the export market for live animals is still expected to remain an important, albeit declining part of the trade in livestock/livestock products for the foreseeable future, policy makers ought to use it as a springboard towards future development of and participation in the more sophisticated processed meat markets. 4.3.2 The drivers of demand in the live animals export market Due to various factors, chiefly tradition, proximity, and market access, the MENA region and to a lesser extent other African countries provide the realistic potential markets for a burgeoning industry in the export of live animals from Kenya (Aklilu 2002; Agriconsortium 2003; AU/IBAR and NEPDP 2006). The MENA region is one of the leading consumers of meat globally. This region comprises the Middle East countries (Bahrain, Kuwait, Oman, Qatar, Saudi Arabia, the United Arab Emirates [UAE], Iran, Iraq, Syria, Yemen and Egypt)4 and other countries such as Tunisia, Morocco, Israel, Jordan, Turkey and Lebanon. The increasing trend in total meat consumption and meat deficit (Figure 14) shows that the region will continue to be a major market of meat and its products in the future. This region has a high purchasing power due to high incomes in most of the countries, hence a high tendency to buy income elastic goods such as meat. The high purchasing power (mainly resulting from oil sales) can be seen by inspecting per capita incomes in this region (Table 15), which average at US$ 8910 comparing with US$ 594 for South Asia and US$ 601 for sub-Saharan Africa (World Bank, 2004). Furthermore, factors such as rapidly growing populations, rising real incomes, and changing diets as consumers reduce their intake of grains and add more livestock products will accelerate the growth of demand for meat products (Kurtzig 1999). Growth in the food service and hospitality industry largely driven by a flourishing tourism industry is also a factor for increasing meat consumption (McAlister 2005). For example in 2006, Egypt had a per capita beef consumption of 8.7 kg while that of Saudi Arabia was 4 kg. Compared with the figures for 2001, the Egypt figures reflected a 118% increase in per capita consumption (USMEF 2007). 4 No t refer to these 11 countries unless otherwise indicated.

33
Figure 14. Total meat consumption trends and meat deficit in the MENA region (1961–2002).
In spite of the demand, most of the MENA region is characterized by desert environments with low productive capacity for livestock and lack of animal feeds, and cannot engage in appreciable livestock production activities over the long term; thus the need to import. The region is considered a net food-importer of livestock products (meat and dairy products) which constitute a large share of the imported products (IFPRI 1985; Dutilly-Diane, 2006; USMEF, 2007). Beef imports to Egypt and Saudi Arabia increased by close to 100% between 2001 and 2006 (Box 3).
Box 3: Changes in been imports in Egypt and Saudi Arabia, 2001 and 2006
Egypt Saudi Arabia Per capita beef consumption (2006)
8.7 kg +118%* 4 kg
Total beef imports (2006) 207,837 tonnes
+98%* 72,147 tonnes +99%*
Total beef variety meet imports (2006)
85,289 tonnes +224%* 2,827 tonnes +120%*
* = Vs. 2001. Source: USMEF (2007). According to a recent United States Department of Agriculture projection, Egypt will still be among the largest beef importers in 2017: the country will import about 332,000 tonnes (731.9 million pounds) growing from the current figures of about 250,000 tonnes (551.1 million pounds) (Herlihy 2008). Saudi Arabia imports more live sheep and goats than any other nation in the world; in both 1998 and 1999 the country imported an estimated six million head (FAS-USDA 2003). Most of these animals are imported because Saudi Arabia has a marked preference for fresh chilled meat, and does not have a large enough domestic herd to fulfil domestic consumption. In most MENA countries meat demand mainly constitutes of poultry and lamb consumption although beef is also consumed to some extent (Table 16).

34
Table 15. Per capita income of major live animal importing countries
Country Gross national income per capita (in US$) Bahrain 14,370 Egypt 1,250 Iran, Islamic Rep of 2,330 Jordan 2,260 Kuwait 24,040 Oman 9,070 Qatar Saudi Arabia 10,170 Syrian Arab Republic 1,270 United Arab Emirates 23,770 Yemen 570 Average (Middle East) 8,910 South America 594 Sub-Saharan Africa 601
Source: World Bank (2007).
Table 16. Per capita meat consumption in some major meat importing countries in the MENA region
Importing countries Meat consumption per capita (kg/year) Poultry Sheep and Mutton Beef and veal
United Arab Emirates 70.5 ( 2004 estimates) 14 ( 2005 estimates) 19.4 ( 2004 estimates) Saudi Arabia 34.3 ( 2004 estimates) 6 ( 2004 estimates) 4 ( 1999 estimates) Egypt 8.9 ( 1999 estimates) No data 3.7 ( 2004 estimates)
Source: compiled from the following sources: Photius Coutsoukis and Information Technology Associates (2006). FAS-USDA (2000). FAS-USDA (2006). USAID (2006). With a current population of over 230 million people, set to increase to 300 million by 2020, the Middle East region provides a lucrative market for live animals for the foreseeable future (Table 17). In addition, the populations in the Middle East are mixed with immigrants from Asia, Africa and Europe accounting for large segments: Saudi Arabia is 71% native, UAE is 20% native, Oman is 66% native while both Kuwait and Qatar are only 33% native (Agriconsortium 2003). This mixed population creates a steady market for meat. As the centre of the Islamic pilgrimage, and due to its large population, Saudi Arabia is the largest market for livestock and meat in the region.5
5 Due to some limited intra-regional re-exporting, the import figures may be somewhat lower than presented here.
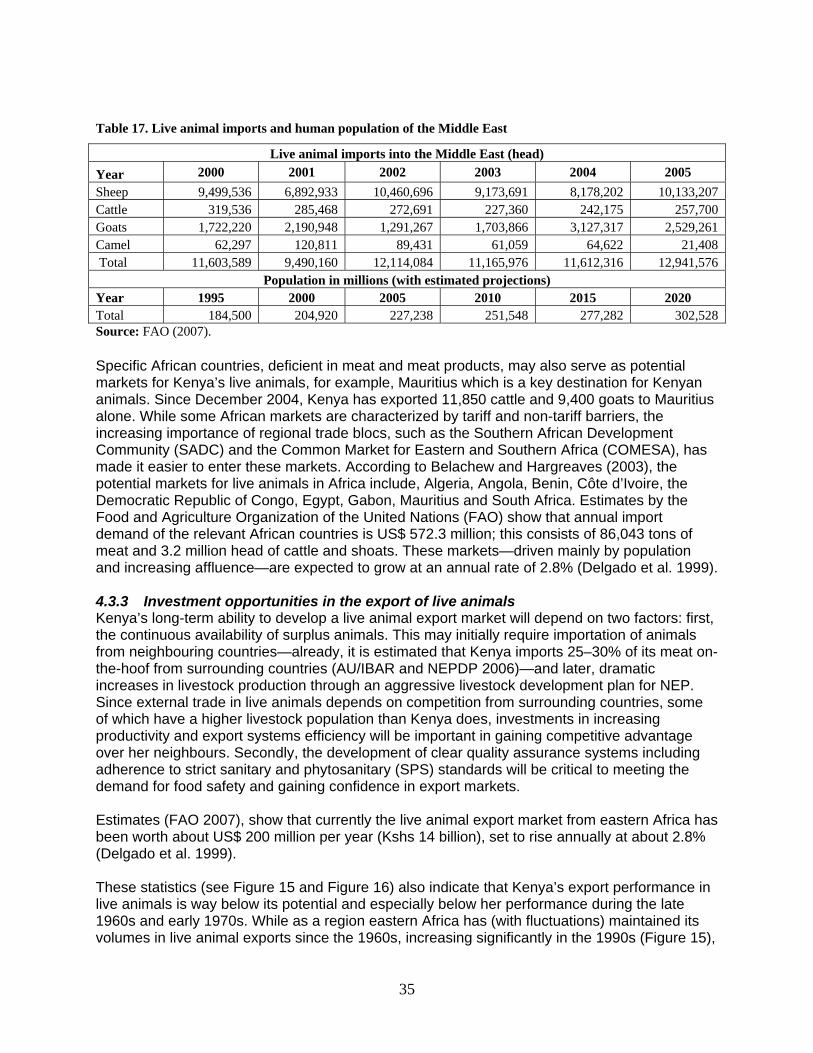
35
Table 17. Live animal imports and human population of the Middle East
Live animal imports into the Middle East (head)
Year 2000 2001 2002 2003 2004 2005
Sheep 9,499,536 6,892,933 10,460,696 9,173,691 8,178,202 10,133,207 Cattle 319,536 285,468 272,691 227,360 242,175 257,700 Goats 1,722,220 2,190,948 1,291,267 1,703,866 3,127,317 2,529,261 Camel 62,297 120,811 89,431 61,059 64,622 21,408 Total 11,603,589 9,490,160 12,114,084 11,165,976 11,612,316 12,941,576
Population in millions (with estimated projections) Year 1995 2000 2005 2010 2015 2020 Total 184,500 204,920 227,238 251,548 277,282 302,528 Source: FAO (2007). Specific African countries, deficient in meat and meat products, may also serve as potential markets for Kenya’s live animals, for example, Mauritius which is a key destination for Kenyan animals. Since December 2004, Kenya has exported 11,850 cattle and 9,400 goats to Mauritius alone. While some African markets are characterized by tariff and non-tariff barriers, the increasing importance of regional trade blocs, such as the Southern African Development Community (SADC) and the Common Market for Eastern and Southern Africa (COMESA), has made it easier to enter these markets. According to Belachew and Hargreaves (2003), the potential markets for live animals in Africa include, Algeria, Angola, Benin, Côte d’Ivoire, the Democratic Republic of Congo, Egypt, Gabon, Mauritius and South Africa. Estimates by the Food and Agriculture Organization of the United Nations (FAO) show that annual import demand of the relevant African countries is US$ 572.3 million; this consists of 86,043 tons of meat and 3.2 million head of cattle and shoats. These markets—driven mainly by population and increasing affluence—are expected to grow at an annual rate of 2.8% (Delgado et al. 1999). 4.3.3 Investment opportunities in the export of live animals Kenya’s long-term ability to develop a live animal export market will depend on two factors: first, the continuous availability of surplus animals. This may initially require importation of animals from neighbouring countries—already, it is estimated that Kenya imports 25–30% of its meat on-the-hoof from surrounding countries (AU/IBAR and NEPDP 2006)—and later, dramatic increases in livestock production through an aggressive livestock development plan for NEP. Since external trade in live animals depends on competition from surrounding countries, some of which have a higher livestock population than Kenya does, investments in increasing productivity and export systems efficiency will be important in gaining competitive advantage over her neighbours. Secondly, the development of clear quality assurance systems including adherence to strict sanitary and phytosanitary (SPS) standards will be critical to meeting the demand for food safety and gaining confidence in export markets. Estimates (FAO 2007), show that currently the live animal export market from eastern Africa has been worth about US$ 200 million per year (Kshs 14 billion), set to rise annually at about 2.8% (Delgado et al. 1999). These statistics (see Figure 15 and Figure 16) also indicate that Kenya’s export performance in live animals is way below its potential and especially below her performance during the late 1960s and early 1970s. While as a region eastern Africa has (with fluctuations) maintained its volumes in live animal exports since the 1960s, increasing significantly in the 1990s (Figure 15),

36
Kenya’s exports have declined over the same period. For example, Kenya’s sheep exports declined from an all time high of 72,000 sheep in 1966 to less than 500 in 2000 while sheep exports from eastern Africa increased from about 500,000 in 1961 to 2.7 million head in 1999 (Figure 15 and Figure 16).
Export of live animals from Eastern Africa
0
500000
1000000
1500000
2000000
2500000
3000000
1961
1963
1965
1967
1969
1971
1973
1975
1977
1979
1981
1983
1985
1987
1989
1991
1993
1995
1997
1999
2001
2003
Camels
Cattle
Goats
Sheep
Figure 15. Export of live animals from eastern Africa (1961–2005).
Source: FAO (2007).
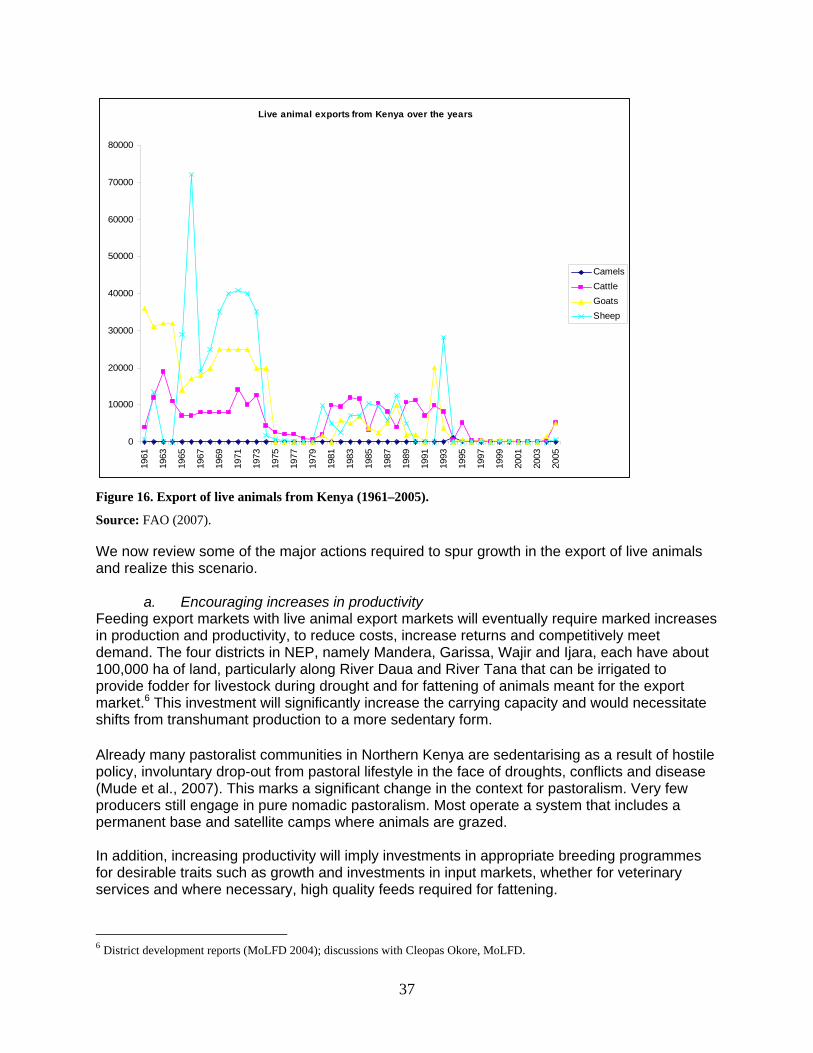
37
Live animal exports from Kenya over the years
0
10000
20000
30000
40000
50000
60000
70000
8000019
61
1963
1965
1967
1969
1971
1973
1975
1977
1979
1981
1983
1985
1987
1989
1991
1993
1995
1997
1999
2001
2003
2005
Camels
Cattle
Goats
Sheep
Figure 16. Export of live animals from Kenya (1961–2005).
Source: FAO (2007). We now review some of the major actions required to spur growth in the export of live animals and realize this scenario.
a. Encouraging increases in productivity Feeding export markets with live animal export markets will eventually require marked increases in production and productivity, to reduce costs, increase returns and competitively meet demand. The four districts in NEP, namely Mandera, Garissa, Wajir and Ijara, each have about 100,000 ha of land, particularly along River Daua and River Tana that can be irrigated to provide fodder for livestock during drought and for fattening of animals meant for the export market.6 This investment will significantly increase the carrying capacity and would necessitate shifts from transhumant production to a more sedentary form. Already many pastoralist communities in Northern Kenya are sedentarising as a result of hostile policy, involuntary drop-out from pastoral lifestyle in the face of droughts, conflicts and disease (Mude et al., 2007). This marks a significant change in the context for pastoralism. Very few producers still engage in pure nomadic pastoralism. Most operate a system that includes a permanent base and satellite camps where animals are grazed. In addition, increasing productivity will imply investments in appropriate breeding programmes for desirable traits such as growth and investments in input markets, whether for veterinary services and where necessary, high quality feeds required for fattening.
6 District development reports (MoLFD 2004); discussions with Cleopas Okore, MoLFD.

38
b. Investments in livestock infrastructure Live animals lose weight during transportation (trekking and trucking). Appropriate investments in the development of road and rail infrastructure connecting NEP to Mombasa and fattening ranches in the Coast and Rift Valley provinces would be necessary to improve longer-term export competitiveness. In addition, over the long term good physical, communication, financial and institutional infrastructure would be necessary to improve innovations and swift supply responses to market stimuli.
c. Dealing with the disease and human health challenges Despite robust demand, access to external live animal markets, especially those in the Middle East, remain unpredictable because of stringent health requirements resulting in frequent import bans or rejections at the port of delivery. For instance, in 2003 all livestock and beef exports from East Africa (except the Sudan) to Saudi Arabia were banned largely due to concerns about disease contamination and safety (this ban has since been lifted). Setting up mechanisms to assure potential importers that Kenya’s animals are disease free could include three broad strategies to improve confidence in the quality of exports:
i. Establishment of disease free zones, which involves defining and managing geographically isolated or fenced areas free from some or all of the diseases of trade importance.
ii. Establishment of export zones, which involves animals being brought into holding areas, observed for disease symptoms, then released into a quarantine area, before being certified and exported.
iii. Introduction of a system for examination and certification of livestock for export. (Also referred to as EXCELEX.) This approach involves examination of export animals near their point of sale with a second inspection near a laboratory facility.
d. Meeting the marketing challenges A private sector approach is a necessary ingredient to the development of a live animals export market. A review of the characteristics of the Middle East markets shows that there is a lot of scope for entrepreneurship. According to Belachew and Hargreaves (2003), the Middle East live animals market is characterized by:
Buyer’s markets that are dominated by influential personalities7 Personal friendships and close follow-up A high demand for quality products at competitive prices; the c.i.f. prices at Saudi
Arabian ports are often 300–400% higher than those in Kenya High preference for credit sales even though risky Less preference of letter of credit or advance payment as a modes of transaction Preference to Black Head Ogaden and Adal breeds of sheep Preference for 8–12 kg sheep
In addition, developing standards for eventual quality branding and to reap the benefits of advertising (marketing) could become the key to a competitive edge over the long term.
7 For example, Kenya’s larger live animal exports were managed by a single livestock trader (a Mr Hirji). While there were other less known players, Mr. Hirji used his knowledge of the Middle East and contacts there to broker large exports of live animals

39
To address these challenges, engagement in bilateral trade agreements with countries in the Middle East and involvement in regional projects aimed at developing the export market are key strategies. An example is the Red Sea Livestock Trade Commission (RSLTC), established under the AU to encourage exports of live animals to countries in the Middle East through provision of support to private sector regional inspection agencies (with laboratories), marketing (including establishing a Red Sea Brand for African meat) and facilitating international cooperation. 4.3.4 Potential impacts of a resurgent live animals export market Encouraging live animal exports is likely to significantly benefit NEP in terms of increased income to farmers, employment generation and food security. More broadly, there are likely to be spillover effects from the development of infrastructure, technology transfer as market value chains become more sophisticated, and from favourable effects on the country’s balance of trade. The magnitude of these effects will depend to a considerable extent, on what proportions of livestock exported are directly sourced from the NEP. This scenario is promising as there is a readily available market in the MENA region as indicated in section 4.3.2. Most MENA countries (especially those in the Middle East) have been traditional markets for live animal exports from the Horn of Africa. They are easily accessible from various ports along the coast of eastern Africa including Mombasa and Lamu. As a strategy to promote the NEP, Kenya can focus on exporting a combination of sheep, goats, and cattle from this province to Saudi Arabia and the UAE. In addition, Kenya can also target the Egypt beef import market due to the existing higher demand for this product in Egypt. The country has expressed interest in increasing her beef imports from other African countries (People’s Daily online 2006). Both Kenya and Egypt are members of the Common Market for eastern and Southern Africa (COMESA) trade bloc which provides easier access to markets. Given Kenya’s currently unfavourable balance of trade with Egypt, provisions of this trade agreement could be invoked to facilitate this export. However, as Kenya implements this scenario it will be faced with several challenges, one of them being competing with other countries that are major suppliers of live animals to the MENA region. These include Australia, Brazil, Ireland, New Zealand and others. Kenya should therefore aim to meet a certain percentage of the demand in the importing countries. Such an investment can have the effects outlined below.
a. Effects on income and employment For example if Kenya focuses on production for export to cater for at least 5% of the required livestock imports in the MENA countries (all sourced from the NEP), the country would manage to increase income, employment opportunities and food security which can directly benefit the NEP. Results of an analysis on the potential impacts of investing in exporting shoats and beef to the MENA region using a case of three major potential markets, Egypt, Saudi Arabia and the UAE, is presented in Box 4.
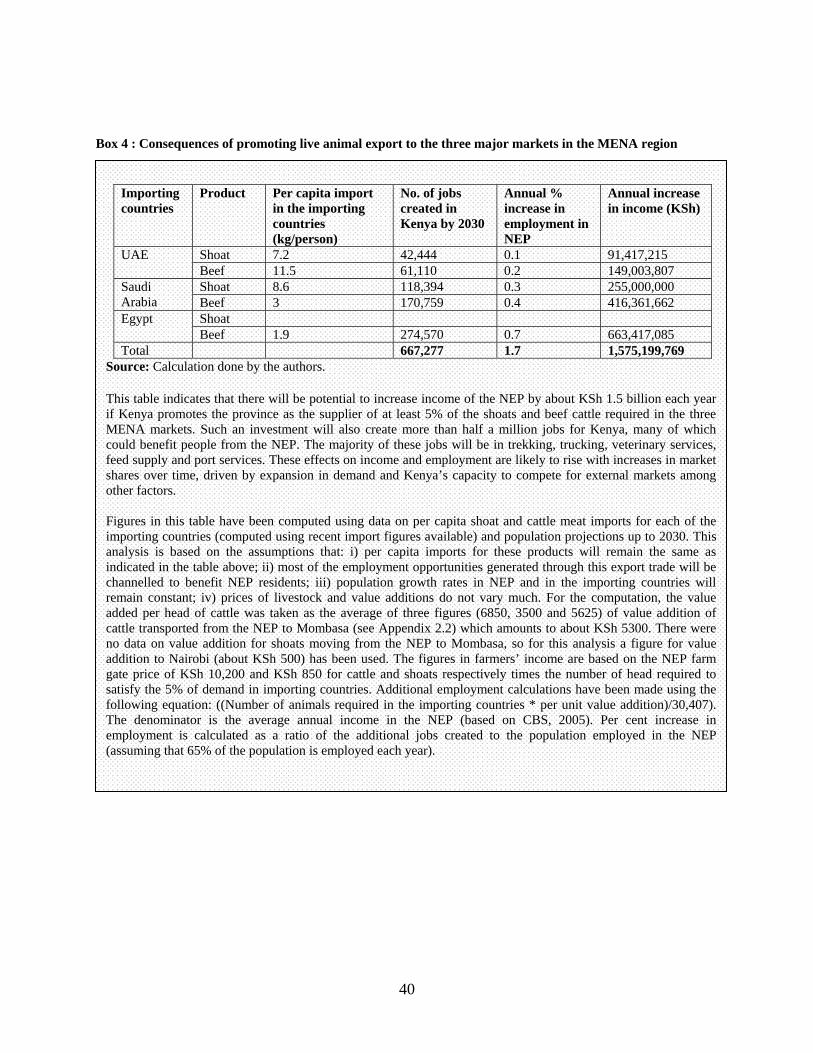
40
Box 4 : Consequences of promoting live animal export to the three major markets in the MENA region
Importing countries
Product Per capita import in the importing countries (kg/person)
No. of jobs created in Kenya by 2030
Annual % increase in employment in NEP
Annual increase in income (KSh)
UAE Shoat 7.2 42,444 0.1 91,417,215 Beef 11.5 61,110 0.2 149,003,807
Saudi Arabia
Shoat 8.6 118,394 0.3 255,000,000 Beef 3 170,759 0.4 416,361,662
Egypt Shoat Beef 1.9 274,570 0.7 663,417,085
Total 667,277 1.7 1,575,199,769 Source: Calculation done by the authors. This table indicates that there will be potential to increase income of the NEP by about KSh 1.5 billion each year if Kenya promotes the province as the supplier of at least 5% of the shoats and beef cattle required in the three MENA markets. Such an investment will also create more than half a million jobs for Kenya, many of which could benefit people from the NEP. The majority of these jobs will be in trekking, trucking, veterinary services, feed supply and port services. These effects on income and employment are likely to rise with increases in market shares over time, driven by expansion in demand and Kenya’s capacity to compete for external markets among other factors. Figures in this table have been computed using data on per capita shoat and cattle meat imports for each of the importing countries (computed using recent import figures available) and population projections up to 2030. This analysis is based on the assumptions that: i) per capita imports for these products will remain the same as indicated in the table above; ii) most of the employment opportunities generated through this export trade will be channelled to benefit NEP residents; iii) population growth rates in NEP and in the importing countries will remain constant; iv) prices of livestock and value additions do not vary much. For the computation, the value added per head of cattle was taken as the average of three figures (6850, 3500 and 5625) of value addition of cattle transported from the NEP to Mombasa (see Appendix 2.2) which amounts to about KSh 5300. There were no data on value addition for shoats moving from the NEP to Mombasa, so for this analysis a figure for value addition to Nairobi (about KSh 500) has been used. The figures in farmers’ income are based on the NEP farm gate price of KSh 10,200 and KSh 850 for cattle and shoats respectively times the number of head required to satisfy the 5% of demand in importing countries. Additional employment calculations have been made using the following equation: ((Number of animals required in the importing countries * per unit value addition)/30,407). The denominator is the average annual income in the NEP (based on CBS, 2005). Per cent increase in employment is calculated as a ratio of the additional jobs created to the population employed in the NEP (assuming that 65% of the population is employed each year).

41
b. Effects on food security and nutrition
Increased farmer incomes and employment generation along the live animals export value chain will have significant effects on food security and nutrition in NEP. The basic diet in NEP is meat and rice; unfortunately rice has to be brought in from other districts, usually by NGOs, the government and private traders. District development reports (GoK 1997; GoK 2002a; GoK 2002b; GoK 2002c) showed that the food availability in NEP is very low because the arid conditions do not allow sustained local food production. Available statistics indicate that severe droughts occur every 8 years while mild droughts occur on a 4-year cycle (GoK 1997). Due to high poverty levels in the province the population does not have sufficient purchasing power to attract huge investments in commercial food supply; increasing incomes are likely to encourage private sector food supply in the region.
c. Spillovers: technology transfer and foreign exchange Investments in modern livestock handling facilities and procedures are likely to lead to technology transfer as the country learns and develops modern methods of disease control and quality assurance. Furthermore, the development of livestock infrastructure—including important supply roads and holding facilities—is likely to open up the region for trade in other products such as bixa and sim sim that can be grown in the region. Exports have the additional advantage of improving the balance of trade and providing valuable foreign exchange.
4.4 Fourth scenario: Export of processed livestock products
4.4.1 The drivers After decades of inactivity following the collapse of the Kenya Meat Commission (KMC) in the early 1990s, Kenya’s exports of meats and other livestock products is slowly growing and gaining momentum. Before its demise the KMC abattoirs, which were fully integrated and of high international standard, exported an average of 3000 tonnes of chilled beef and 11,000 tonnes of canned beef annually (AU/IBAR and NEPDP 2006). With KMC out of the market, only 2 of the 65 slaughterhouses in Kenya as of 2004 were export standard: Farmer’s Choice, which deals exclusively with pigs, and Hurlingham which is fully integrated (Export Processing Zones Authority 2005). Nevertheless, AU/IBAR and NEPDP (2006) showed a steady upward trend in revenues from the export of livestock products that indicates the industry’s potential (Table 18). The consistent growth of exports (Table 18) does not quite capture the full potential of the industry. Currently, Kenya’s share of the total value of African exports is a paltry 4% (AU/IBAR and NEPDP 2006), significantly less than it was during the KMC heydays. Meanwhile, demand for livestock products in key foreign markets is steadily increasing and projections into the foreseeable future are strongly positive (Delgado et al., 1999). The total value of imports from the MENA countries (currently sub-Saharan Africa’s largest market) increased from US$ 1.5 billion in 2002 to US$ 2 billion in 2004 (Table 19).
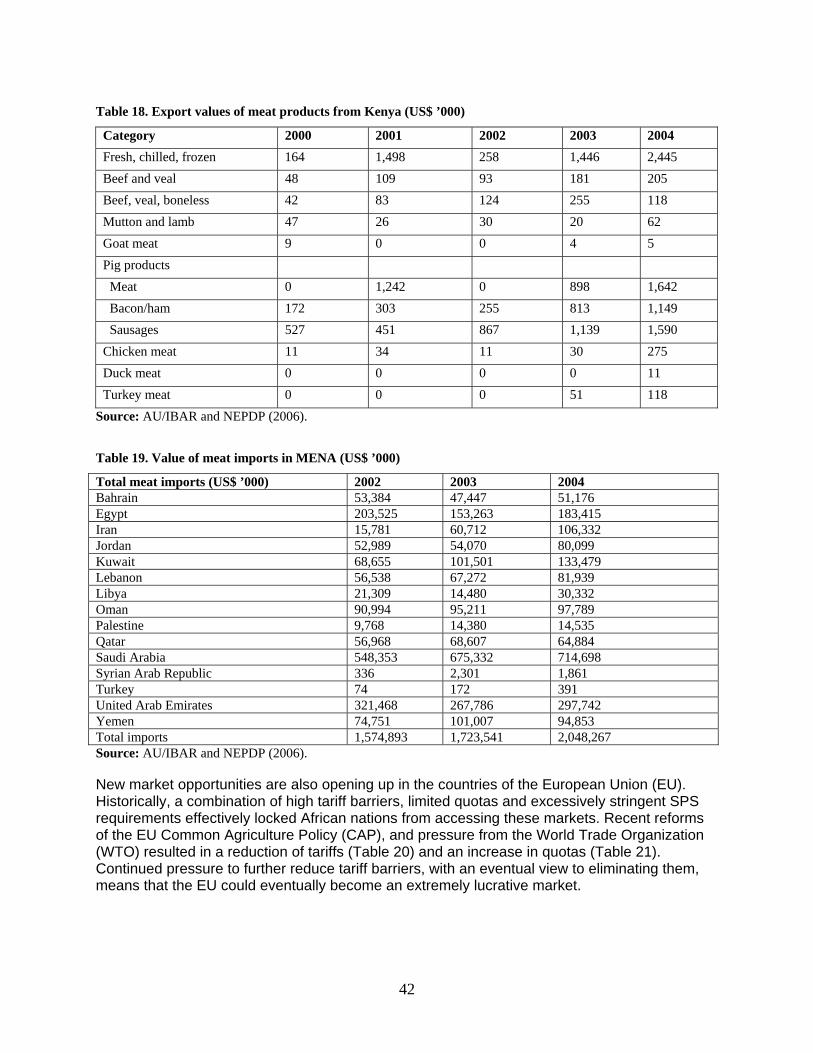
42
Table 18. Export values of meat products from Kenya (US$ ’000)
Category 2000 2001 2002 2003 2004
Fresh, chilled, frozen 164 1,498 258 1,446 2,445
Beef and veal 48 109 93 181 205
Beef, veal, boneless 42 83 124 255 118
Mutton and lamb 47 26 30 20 62
Goat meat 9 0 0 4 5
Pig products
Meat 0 1,242 0 898 1,642
Bacon/ham 172 303 255 813 1,149
Sausages 527 451 867 1,139 1,590
Chicken meat 11 34 11 30 275
Duck meat 0 0 0 0 11
Turkey meat 0 0 0 51 118
Source: AU/IBAR and NEPDP (2006).
Table 19. Value of meat imports in MENA (US$ ’000)
Total meat imports (US$ ’000) 2002 2003 2004 Bahrain 53,384 47,447 51,176 Egypt 203,525 153,263 183,415 Iran 15,781 60,712 106,332 Jordan 52,989 54,070 80,099 Kuwait 68,655 101,501 133,479 Lebanon 56,538 67,272 81,939 Libya 21,309 14,480 30,332 Oman 90,994 95,211 97,789 Palestine 9,768 14,380 14,535 Qatar 56,968 68,607 64,884 Saudi Arabia 548,353 675,332 714,698 Syrian Arab Republic 336 2,301 1,861 Turkey 74 172 391 United Arab Emirates 321,468 267,786 297,742 Yemen 74,751 101,007 94,853 Total imports 1,574,893 1,723,541 2,048,267 Source: AU/IBAR and NEPDP (2006). New market opportunities are also opening up in the countries of the European Union (EU). Historically, a combination of high tariff barriers, limited quotas and excessively stringent SPS requirements effectively locked African nations from accessing these markets. Recent reforms of the EU Common Agriculture Policy (CAP), and pressure from the World Trade Organization (WTO) resulted in a reduction of tariffs (Table 20) and an increase in quotas (Table 21). Continued pressure to further reduce tariff barriers, with an eventual view to eliminating them, means that the EU could eventually become an extremely lucrative market.
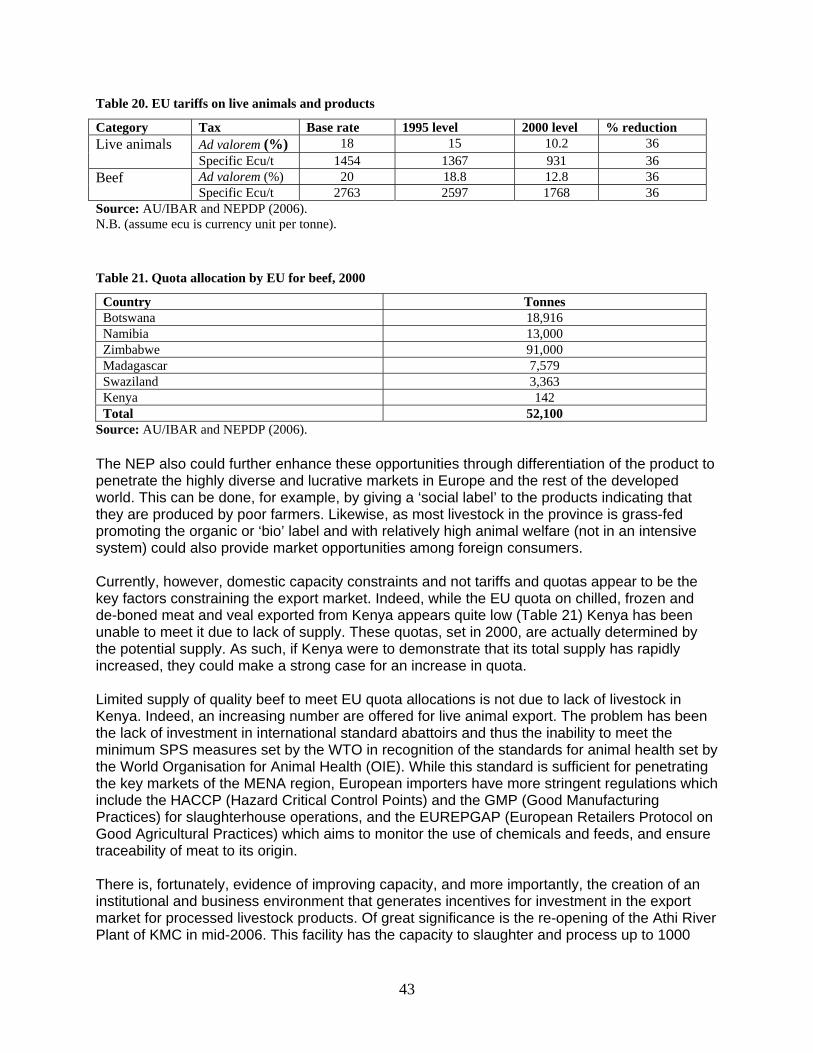
43
Table 20. EU tariffs on live animals and products
Category Tax Base rate 1995 level 2000 level % reduction Live animals Ad valorem (%) 18 15 10.2 36
Specific Ecu/t 1454 1367 931 36 Beef Ad valorem (%) 20 18.8 12.8 36
Specific Ecu/t 2763 2597 1768 36 Source: AU/IBAR and NEPDP (2006). N.B. (assume ecu is currency unit per tonne).
Table 21. Quota allocation by EU for beef, 2000
Country Tonnes Botswana 18,916 Namibia 13,000 Zimbabwe 91,000 Madagascar 7,579 Swaziland 3,363 Kenya 142 Total 52,100
Source: AU/IBAR and NEPDP (2006). The NEP also could further enhance these opportunities through differentiation of the product to penetrate the highly diverse and lucrative markets in Europe and the rest of the developed world. This can be done, for example, by giving a ‘social label’ to the products indicating that they are produced by poor farmers. Likewise, as most livestock in the province is grass-fed promoting the organic or ‘bio’ label and with relatively high animal welfare (not in an intensive system) could also provide market opportunities among foreign consumers. Currently, however, domestic capacity constraints and not tariffs and quotas appear to be the key factors constraining the export market. Indeed, while the EU quota on chilled, frozen and de-boned meat and veal exported from Kenya appears quite low (Table 21) Kenya has been unable to meet it due to lack of supply. These quotas, set in 2000, are actually determined by the potential supply. As such, if Kenya were to demonstrate that its total supply has rapidly increased, they could make a strong case for an increase in quota. Limited supply of quality beef to meet EU quota allocations is not due to lack of livestock in Kenya. Indeed, an increasing number are offered for live animal export. The problem has been the lack of investment in international standard abattoirs and thus the inability to meet the minimum SPS measures set by the WTO in recognition of the standards for animal health set by the World Organisation for Animal Health (OIE). While this standard is sufficient for penetrating the key markets of the MENA region, European importers have more stringent regulations which include the HACCP (Hazard Critical Control Points) and the GMP (Good Manufacturing Practices) for slaughterhouse operations, and the EUREPGAP (European Retailers Protocol on Good Agricultural Practices) which aims to monitor the use of chemicals and feeds, and ensure traceability of meat to its origin. There is, fortunately, evidence of improving capacity, and more importantly, the creation of an institutional and business environment that generates incentives for investment in the export market for processed livestock products. Of great significance is the re-opening of the Athi River Plant of KMC in mid-2006. This facility has the capacity to slaughter and process up to 1000

44
cattle a day with plans to expand the plant already underway. A new plant in Mombasa has also been opened, proof of the great demand that exists. A majority (about 60%) of the products are earmarked for the export market, while the remaining 40% will be for local consumption (speech by President Mwai Kibaki at KMC re-opening (GoK 2007). The success of KMC is likely to attract new entrants into the market and the increased competitiveness boosts both production and productivity, setting the stage for Kenya to aggressively engage foreign markets and dramatically expand its share of the export of processed goods. Another significant incentive likely to increase the returns to investments in international standard abattoirs is the fact that Nakumatt, Kenya’s dominant supermarket chain, which is rapidly expanding through the country and the region, has recently committed to meeting the International Standards Organization (ISO) regulations for all products it carries. As such, domestic suppliers for processed livestock products now have to meet these standards. Since domestic providers have a competitive advantage in proximity and transactions costs, investing in meeting the standards—an investment that would also reap returns in accessing international markets—would be profitable. 4.4.2 Requisite investments The previous discussion concentrated on the national experience with and capacity and potential for the export of processed livestock productions. This report, however, focuses on Kenya’s NEP and as such, this section is primarily concerned with the potential for catalysing export processing capacity in the province. The national experience is clearly important as it provides precedent and is prerequisite for stimulating the industry in NEP, which currently has no export processing capacity. Only live animals, trucked or trekked to their terminal destination in the relevant domestic market, leave the region for sale and subsequent slaughter. Poor infrastructure leading to prohibitive transports costs and the high perishability of livestock products dictate that all non-live animal sales of livestock from NEP occur locally within the province. For this reason, animals meant for the domestic market are first transported live to abattoirs in Nairobi and Mombasa before slaughter. It would, however, generate more value for NEP if livestock was slaughtered and processed in NEP before distribution in the domestic market. Therefore, while improved transport systems is a necessary condition for directly engaging the export market for processed livestock products, this is not sufficient. What must be determined is whether it is possible for NEP (and if so how to create it) to have a comparative advantage to justify the requisite huge investments in industrial abattoirs that satisfy the strict international standards set for processed livestock products of all kinds. Many of the investments—in physical infrastructure, in creating a conducive regulatory environment, and in building the capacity to meet stiff export standards—that are being or should be initiated to simulate the national export industry will also naturally contribute to increasing the returns to similar investments in the NEP. Improved port handling facilities and capacities, transport refrigeration, the creation of credible institutions to enforce standards, and the availability of healthy quality livestock are some of the key areas of investment to boost national exports. For NEP, transport infrastructure, especially the route to the Mombasa port is the most critical factor. Without this, NEP will suffer a comparative disadvantage as locating abattoirs in Nairobi, or the Coast Province would be much more cost-effective. Nevertheless, NEP does have elements of comparative advantage that would justify the investments necessary to create a vibrant export processing economy. First, much of the land is unsuitable for rainfed agricultural production but well suited for pastoral and agropastoral production (Rass 2006; Rodriguez, 2008). Furthermore, relative to other areas in Kenya, land in the NEP is cheap and abundant

45
with most of it still held as common rangelands8. Meanwhile, in Nairobi and Coast provinces, land prices are constantly on the rise due to high demand for commercial, agricultural and residential land. As such, with transport infrastructure in place, the NEP will present the opportunities for large-scale industrial abattoirs to locate their operations right next to their supply, where the prices for livestock will be relatively cheap and livestock can be easily monitored for diseases and pre-screened for quality, and where the land, an otherwise significant portion of production costs, will be relatively inexpensive. Good transport infrastructure to increase market access, cheap and abundant land, and low population density, is also perfectly suited for large-scale industrial production of livestock. Indeed, the invasive species Prosopis juliflora that thrives in the arid and semi-arid environment of NEP, and which has been shown to yield quality feeds would contribute further to reduced costs. Moreover, environmental and human health concerns, such as exposure to the putrid fumes produced by abattoirs and large industrial animal farms, and the fetid wastes they generate, are a much greater and more costly concern in areas with high population densities. One disadvantage that the NEP currently has is the scarcity of water. Nevertheless, the presence of two rivers, Daua and Tana, whose irrigation potential has not been tapped, could help solve the problem. Furthermore, the relative cost of sinking large boreholes, shown to be a good and consistent source of water in many areas of the region, would be a relatively small expense for an outfit such as a full-scale abattoir or industrial livestock farm. 4.4.3 Potential impact on the NEP economy
a. Effects on income and employment The development of a fully fledged export industry for processed livestock products would doubtless have the greatest impact on the economy and welfare of NEP and its people. Because much of the value added will take place in the NEP, a greater share of industry sales will accrue to the region. A burgeoning export industry will also mean significantly increased employment opportunities. Increasing returns to livestock keeping will provide greater incentives for more people to join this already important source of employment and livelihood. Abattoirs and industrial livestock farms will naturally require considerable labour inputs. Indeed, the revival of KMC is expected to eventually generate about 400 jobs directly, and over 40,000 indirectly (speech by President Mwai Kibaki at KMC re-opening) (GoK 2007). Given that this represents an estimate of the initial employment effect before Kenya asserts itself as a trusted producer of safe, high quality livestock products, the future employment impact is likely to be much higher. Indirect jobs will come from the providers of input services (such as feeds, fodder, veterinary services, extension services etc.) for which there will be markedly increased demand. Increased demand for transportation services, port handling services, regulatory services and the like would also generate potentially large positive externalities throughout the national economy. The multiplier effect, whereby more incomes in people’s pockets gets circulated through the economy via increased demands in consumer goods and services, would likely add to this. When KMC was still vibrant in the 1970s and 1980s, it played a critical role in strengthening the national food security system by assuring the livelihoods of pastoral communities as a buyer of last resort. The development of abattoirs and large-scale industrial plants in NEP is likely to play the same role. Moreover, located right at the doorstep of pastoral communities, and with access to improved early warning mechanisms, they should be more effective in protecting pastoralists
8 Although increasingly, land is being allocated for private purposes
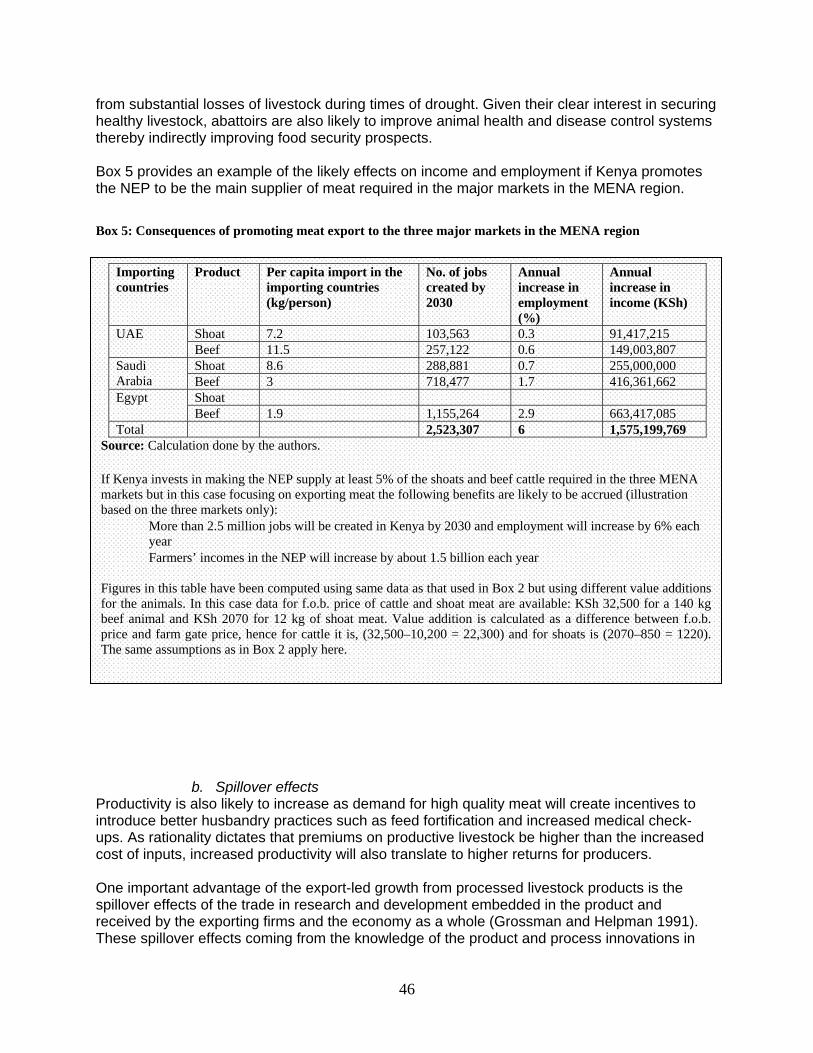
46
from substantial losses of livestock during times of drought. Given their clear interest in securing healthy livestock, abattoirs are also likely to improve animal health and disease control systems thereby indirectly improving food security prospects. Box 5 provides an example of the likely effects on income and employment if Kenya promotes the NEP to be the main supplier of meat required in the major markets in the MENA region.
Box 5: Consequences of promoting meat export to the three major markets in the MENA region
b. Spillover effects Productivity is also likely to increase as demand for high quality meat will create incentives to introduce better husbandry practices such as feed fortification and increased medical check-ups. As rationality dictates that premiums on productive livestock be higher than the increased cost of inputs, increased productivity will also translate to higher returns for producers. One important advantage of the export-led growth from processed livestock products is the spillover effects of the trade in research and development embedded in the product and received by the exporting firms and the economy as a whole (Grossman and Helpman 1991). These spillover effects coming from the knowledge of the product and process innovations in
Importing countries
Product Per capita import in the importing countries (kg/person)
No. of jobs created by 2030
Annual increase in employment (%)
Annual increase in income (KSh)
UAE Shoat 7.2 103,563 0.3 91,417,215 Beef 11.5 257,122 0.6 149,003,807
Saudi Arabia
Shoat 8.6 288,881 0.7 255,000,000 Beef 3 718,477 1.7 416,361,662
Egypt Shoat Beef 1.9 1,155,264 2.9 663,417,085
Total 2,523,307 6 1,575,199,769 Source: Calculation done by the authors. If Kenya invests in making the NEP supply at least 5% of the shoats and beef cattle required in the three MENA markets but in this case focusing on exporting meat the following benefits are likely to be accrued (illustration based on the three markets only):
More than 2.5 million jobs will be created in Kenya by 2030 and employment will increase by 6% each year
Farmers’ incomes in the NEP will increase by about 1.5 billion each year Figures in this table have been computed using same data as that used in Box 2 but using different value additions for the animals. In this case data for f.o.b. price of cattle and shoat meat are available: KSh 32,500 for a 140 kg beef animal and KSh 2070 for 12 kg of shoat meat. Value addition is calculated as a difference between f.o.b. price and farm gate price, hence for cattle it is, (32,500–10,200 = 22,300) and for shoats is (2070–850 = 1220). The same assumptions as in Box 2 apply here.

47
the international markets would contribute to rising research capacity and transferring technology in the NEP and Kenya.
5. Some Implications of the Vision on the Role of the Public and
Private Sectors
The focus in this section is on how to attract the sizable investments that are needed in the scenarios described in Section 4 above with an emphasis on the role of private and public sectors to make these investments profitable for all stakeholders including livestock keepers. Both the attraction of investors and the implementation of investment plans require an environment that guarantees high returns from these investments. The requirements for and impacts of the four scenarios are compared in Table 22. Each plus sign (+) represents an increased level of requirement or impact. For example, the business with (+) represents a lower requirement threshold for basic infrastructure than the domestic demand led growth scenario with (+++). While the last three relevant scenarios have far better outcomes than the business-as-usual, they also require significant efforts to create a favourable investment climate. Most of these requirements could be carried out by public sectors. Private firms and agents (including livestock keepers) would then bring in investment that would have significant impacts on economic growth and development. This analysis, although qualitative, offers a good comparison of the relative costs and benefits of adapting either scenario.
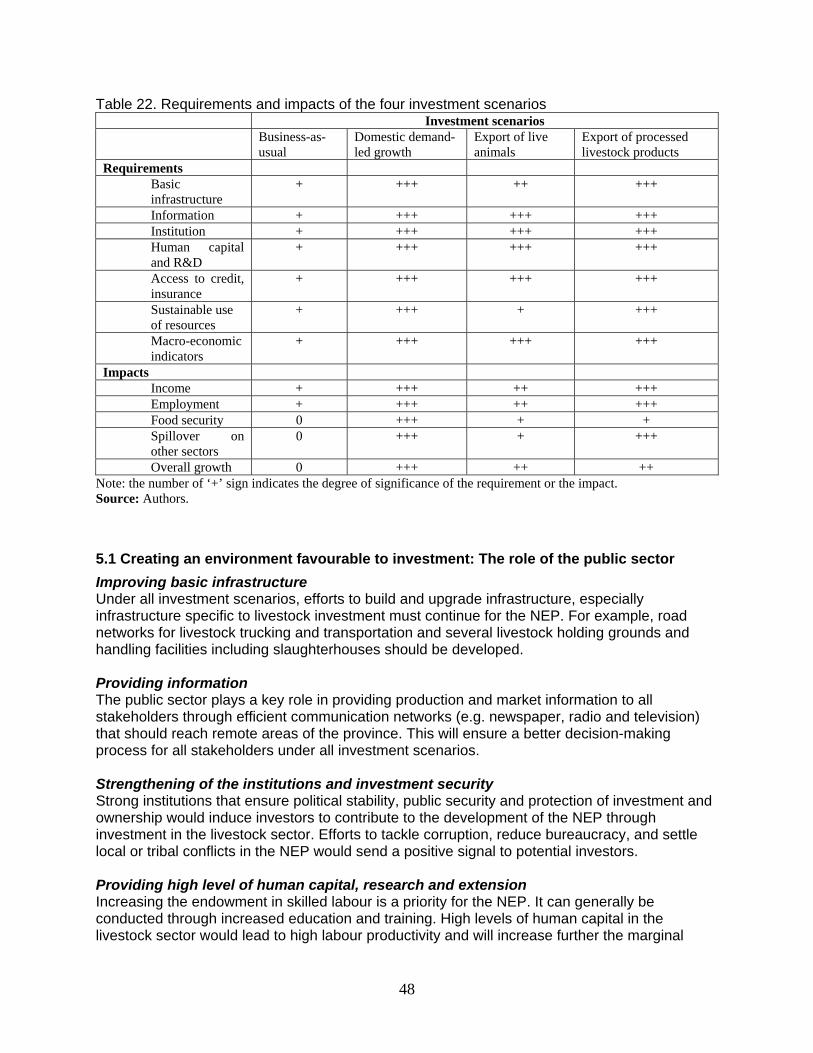
48
Table 22. Requirements and impacts of the four investment scenarios Investment scenarios Business-as-
usual Domestic demand-led growth
Export of live animals
Export of processed livestock products
Requirements Basic infrastructure
+ +++ ++ +++
Information + +++ +++ +++ Institution + +++ +++ +++ Human capital and R&D
+ +++ +++ +++
Access to credit, insurance
+ +++ +++ +++
Sustainable use of resources
+ +++ + +++
Macro-economic indicators
+ +++ +++ +++
Impacts Income + +++ ++ +++ Employment + +++ ++ +++ Food security 0 +++ + + Spillover on other sectors
0 +++ + +++
Overall growth 0 +++ ++ ++ Note: the number of ‘+’ sign indicates the degree of significance of the requirement or the impact. Source: Authors.
5.1 Creating an environment favourable to investment: The role of the public sector
Improving basic infrastructure Under all investment scenarios, efforts to build and upgrade infrastructure, especially infrastructure specific to livestock investment must continue for the NEP. For example, road networks for livestock trucking and transportation and several livestock holding grounds and handling facilities including slaughterhouses should be developed. Providing information The public sector plays a key role in providing production and market information to all stakeholders through efficient communication networks (e.g. newspaper, radio and television) that should reach remote areas of the province. This will ensure a better decision-making process for all stakeholders under all investment scenarios. Strengthening of the institutions and investment security Strong institutions that ensure political stability, public security and protection of investment and ownership would induce investors to contribute to the development of the NEP through investment in the livestock sector. Efforts to tackle corruption, reduce bureaucracy, and settle local or tribal conflicts in the NEP would send a positive signal to potential investors. Providing high level of human capital, research and extension Increasing the endowment in skilled labour is a priority for the NEP. It can generally be conducted through increased education and training. High levels of human capital in the livestock sector would lead to high labour productivity and will increase further the marginal
49
value product of capital invested. For the livestock sector in particular, improvement of extension programmes for farmers is also important, especially to develop strong and efficient veterinary services for the NEP. Livestock-based investment requires a better allocation of resources to livestock research and an increased cooperation with international research centres. Various areas of research include animal health, environment and marketing, and product innovation. Available technology and innovation produced from past and future research should be made available to stakeholders through rigorous extension programmes. Facilitating access to credit and insurance markets One major constraint that smallholders face is access to financial assets and securing production insurance for risky activities like livestock production and marketing. The public sector could facilitate implementations of financial tools such as micro-credit and rural banks, and of risk management tools such insurance or futures markets. Providing optimal policy for the use of natural resources The expansion of the livestock sector will put constraints on the uses of land, water and feed resources. The expansion will also create challenges in handling soil, water, air and noise pollution, and other environmental degradation including the loss of biodiversity. Investors (including smallholders) will be keen to be shown clear policies on the access to these resources and handling of these challenges. Measures such as pricing resource uses, and creating pollution permits that can be bought and traded should be considered. Improving the overall macro-economic indicators and reducing financial risks Keeping inflation low in Kenya and in the NEP would reduce the risk of having high interest rates and especially high production costs. To keep input costs low, measures should be taken to increase input sources for a more competitive input supply and to reduce or eliminate tariffs on imported inputs. More openness in the markets of goods and services will also attract investors. Moreover, government also has to reduce financial risks by reducing exchange rate volatility and by ensuring that it meets its financial obligations (debt payment) to attract investors (especially those aiming to export live animals and livestock products).
5.2 The roles of private firms and stakeholders: Multipliers of growth
Investors work through private firms to carry out their investment plans once the local and national governments set the stage for a conducive investment climate. For a livestock-based investment in the NEP, private firms would be the drivers of the investment in providing the flow of financial, human (expertise) and physical (equipment) capital to the livestock sector and other related sectors in the province. It is from these investments through private firms that the economic growth of the province will take root. Partnership between the public sector and private firms and livestock keepers is key to successful investment. The public sector alone should no longer be in charge of making investments. Indeed, evidence shows that the failure of the import-substitution industries in many developing countries was linked to having little or no involvement of private firms in domestic industries (Balassa and Bauwens 1988). For the livestock sector in the NEP, investors can intervene through sub-sectors (meat, dairy, and hides and skins) and at one or many levels of the production–processing–marketing chain

50
in the livestock sector. Likewise, sectors other than livestock, contributing to the investment in livestock would be also of high interest for investors. All these sectors contribute to growth opportunities by creating jobs and income, transferring expertise to the local labour force and allowing these workers to contribute to national revenue. 5.2.1 Investment within the livestock sector Under vertical integration. Investors could buy land or cooperate with individual farmers or cooperatives of farmers and adopt the vertical integration structure in which the investors control the whole chain (from production of live animals to, say, exports of livestock products) in the livestock sector (Perry et al. 2005). This structure fits more the investment scenarios aiming at domestic and export markets for processed products. At one or two levels of the livestock chain only. Some investors may find interest in, for instance, processing animals for the domestic market only, while others find interest in both processing and exporting. The growth opportunities under the investment within the livestock sector have been discussed earlier under the three alternative scenarios. These investments provide jobs and incomes, and improve the state of food security that enables people to be productive. 5.2.2 Investment outside but related to livestock sector Input and equipment supplies.Private firms growing crops, and producing other ingredients for livestock feed would be needed under all the three relevant investment scenarios. Likewise small farm equipment and packaging would also be demanded and provide investment opportunities. In transportation and storage facilities. Firms specializing in ground, water and air transport would find sizable opportunity in transporting live animals or processed livestock products under the three alternative investment scenarios. Likewise firms specializing in providing storage facilities with conditioned temperature and freezers for livestock products are in need. Construction of infrastructure and waste management. The building of infrastructure such as roads, and storage and handling facilities constitutes an attractive opportunity for building contractors, especially since the current state of infrastructure in the province is poor. Moreover, investment in waste management, for instance recycling manure or waste from abattoirs into fertilizers would be attractive. Although most of the spending for basic infrastructure may come from public funds, the work will be conducted mostly by private firms that have the expertise in such work and create job and income opportunities for locals.
6. Conclusions
The NEP of Kenya faces several challenges, especially those of reducing poverty and providing food security. The development of the region is part of the 2030 Vision from the Government of Kenya to combat poverty through investment and fostering economic growth. The NEP, a livestock area, possesses unique advantage that could be turned into capacity to contribute to poverty reduction. This report presents different investment scenarios through livestock to help increase the incomes of livestock keepers, create employment and reduce food insecurity and malnutrition. Also in these investment scenarios, the broad-based growth to the economy and the roles of public and private sectors are discussed.

51
This report shows that, with investment options that are well thought out, the NEP through livestock could be turned into one of Kenya’s economic powerhouses. Against the background of the status quo or ‘business-as-usual’, three relevant and mutually inclusive investment scenarios in the livestock sector were presented: domestic-demand led investment, live animal exports, and export of processed products. The analysis indicates that these three relevant scenarios all have far better impacts on farmers’ income and employment than the ‘business-as-usual’ scenario. The ‘domestic demand-led investment’ scenario, besides creating jobs and income opportunities, provides alternatives to meet the growing livestock product consumption spurred by population increase, income increase and urbanization in Kenya. Likewise, exports of live animals targeting several market outlets including those in the Middle East constitute a valuable option to boost farmers’ income and create employment. Export of processed products, meat, and hides and skins, to regional markets in Africa would also provide significant benefits in terms of employment and income for the province and the country, especially because of its longer value chains. This report also explains the specific roles of the public sector in providing a favourable investment climate to attract and protect investments. These investments through private sectors would then turn into tangible opportunities, both within and outside the livestock sector, that would foster strong economic growth and create wealth for the NEP and for Kenya as a whole.

52
References
Agriconsortium. 2003. Livestock and livestock products production and marketing system in Kenya. Draft Report. Agrisystems Limited, Stone, Aylesbury, United Kingdom. Prepared for the European Union, 1 July 2003.
Akiwumi JAM. 2002. Report on the Judicial Commission appointed to enquire into tribal clashes in Kenya. Part IV: North Eastern. Daily Nation Special Report, 22 October 2002, Nairobi, Kenya.
Aklilu, Y (2002). An Audit of the livestock marketing status of Kenya, Ethiopia, and Sudan, Volume I. Community-Based Animal Health and Participatory Epidemiology Unit, Pan African Programme for the Control of Epizootics (CAPE/PACE Programme), Organization of African Unity/Inter-African Bureau for Animal Resources (AU/IBAR), Nairobi, Kenya.
AU/IBAR (African Union/Inter-African Bureau for Animal Resources) and NEPDP (North Eastern Province Pastoral Development Programme). 2006. Kenya livestock sector study: An analysis of pastoralist livestock products market value chains and potential external markets for live animals and meat. AU/IBAR (Organization of African Unity/Inter-African Bureau for Animal Resources), Nairobi, Kenya.
Balassa B and L. Bauwens 1988. Inter-industry specialization in manufactured goods. Weltwirtschaftliches Archiv 124:1–13.
Belachew H and S.K. Hargreaves 2003. Consultancy report on livestock export zones. FAO Project GCP/RAF/365/EC. FAO (Food and Agriculture Organization of the United Nations), Rome, Italy.
CBS (Central Bureau of Statistics). 2001. 1999 Population and Housing Census: Population distribution by administrative areas and urban centres. Volume 1. CBS, Ministry of Finance and Planning. Government Printer, Nairobi, Kenya.
CBS (Central Bureau of Statistics). 2005. Geographic dimensions of the well-being in Kenya. Who and where are the poor? A constituency profile, Volume II. CBS, Ministry of Planning and National Development. Regal Press, Nairobi, Kenya.
CBS (Central Bureau of Statistics). 2006. Statistical abstract, 2006. CBS, Ministry of Planning and National Development. Government Printer, Nairobi, Kenya.
Coutsoukis P and Information Technology Associates. 2006. Per capita consumption of meat and poultry, by country. (Available from http://www.allcountries.org/uscensus/1370 per capita consumption of meat and.html)
Delgado C., M. Rosegrant , H. Steinfeld, S, Ehui and C. Courbois, 1999. Livestock to 2020: The next food revolution. Food, Agriculture and the Environment Discussion Paper 28. IFPRI (International Food Policy Research Institute), Washington, DC, USA/FAO (Food and Agriculture Organization of the United Nations), Rome, Italy/ILRI (International Livestock Research Institute), Nairobi, Kenya.

53
Dutilly-Diane, C., 2006. Review of the literature on Pastoral Economics and Marketing:North Africa, Report prepared for the World Initiative for Sustainable Pastoralism, IUCN EARO, electronically accessed at http://data.iucn.org/wisp/documents_english/north_africa_reports.pdf , Accessed on November, 2007
Export Processing Zones Authority. 2005. Meat production in Kenya. Export Processing Zones Authority, Nairobi, Kenya. (Available from www.epzakenya.com) (Accessed on 20 March 2007)
FAS-USDA (Foreign Agricultural Service, United States Department of Agriculture). 2000. Per capita poultry meat consumption, commodity and marketing programs. Dairy, Livestock and Poultry Division. Available from
http://www.fas.usda.gov/dlp2/circular/2000/00-10lp/poultpcc.pdf) (Accessed March 2007)
FAS- USDA (Foreign Agricultural Service, United States Department of Agriculture). 2003. Sheep and goats. (Available from http://ffas.usda.gov/dlp2/circular/1998/98-10LP/sheep3.htm, last updated 16 December 2003) (Accessed March 2007)FAS-USDA (Foreign Agricultural Service, United States Department of Agriculture). 2006. Livestock and poultry world markets and trade, March 2006, (Available from http://www.fas.usda.gov/dlp/circular/2006/06-03LP/bpppcc.pdf) (Accessed March 2007)
FAO (Food and Agricultural Organization of the United Nations). 2007. FAO statistical databases. FAO, Rome, Italy. (Available from http://www.apps.org/default.htm)
FewsNET. 2003. Closure of Garissa (Kenya) cattle market: Food security implications in the Garissa marketshed in Kenya and Somalia. FewsNET/USAID (United States Agency for International Development) and , Nairobi, Kenya Arid Land Resources Management Project ALRMP GOK, Garissa, Kenya (Available at www.fews.net/resources) (Accessed on 4 March 2007)
GoK (Government of Kenya). 1997. Wajir District development plans (1997–2001). Office of Vice President and Ministry of Planning and National Development. Government Printer, Nairobi, Kenya.
GoK (Government of Kenya). 2002a. Ijara District development plans (2002-2008). Office of Vice President and Ministry of Planning and National Development, Government Printer, Nairobi, Kenya.
GoK (Government of Kenya). 2002b. Garissa District development plans (2002-2008). Office of Vice President and Ministry of Planning and National Development, Government Printer, Nairobi, Kenya.
GoK (Government of Kenya). 2002c. Mandera District development plans (2002-2008). Office of Vice President and Ministry of Planning and National Development. Government Printer, Nairobi, Kenya.
GoK (Government of Kenya). 2007. Kenya Meat Commission reopens after 15 years. Office of Public Communications. (Available from http://www.communication.go.ke/media) (Accessed March 2007)

54
Grossman G.M and E. Helpman, 1991. Innovation and growth in the global economy. The MIT Press, Cambridge, Massachusetts, USA.
Sarma J.S and P. Yeung 1985. Livestock products in the Third World: past trends and projections to 1990 and 2000. IFPRI Research Report 49. IFPRI (International Food Policy Research Institute), Washington DC, USA. (Abstract for chapter five available from http://www.ifpri.org/pubs/abstract/49/rr49ch05.pdf) (Accessed March 2007)
Karugia, J.T., M.M. Waithaka, A.H. Freeman, R. Prabhu, B. Shiferaw, S. Gbegbelegbe, S. Massawe, J. Wanjiku, M. Kyotalimye, 2008. Responding to the food price crisis in Eastern and Southern Africa: Policy options for national and regional action Draft ASARECA, ReSAKSS and CGIAR Alliance report. Nairobi, August
Kilele A.K.M., 2007. Adult literacy in Kenya, Presentation on the results of the Kenya National Adult and Literacy Survey (KNALS) 2006, Presented by the director of Kenya National Bureau of Statistics, Nairobi, Kenya electronically accessed at http://www.cbs.go.ke/downloads/pdf/KNALS2007.pdf , Accessed on March, 2008
KNBS (Kenya National Bureau of Statistics). 2007a. Kenya Integrated Household Budget Survey (KIHBS)—2005/06. KNBS, Ministry of Planning and National Development. Regal Press, Nairobi, Kenya.
KNBS (Kenya National Bureau of Statistics). 2007b. Basic report on well-being in Kenya. Based on the Integrated Household Budget Survey, 2005/06. KNBS, Ministry of Planning and National Development. Regal Press, Nairobi, Kenya.
Knips V. 2004. Review of the livestock sector in the Horn of Africa (IGAD countries). Livestock Information. Sector Analysis and Policy Branch (AGAL), FAO (Food and Agriculture Organization of the United Nations), Rome, Italy.
Kurtzig M. 1999. World agriculture and trade, imports rising in Middle East and North Africa. Agricultural Outlook June–July 1999. Economic Research Service, USDA (United States Department of Agriculture), USA.
Leng, R.A. 1991. Factors affecting the utilization of ‘poor-quality’ forages by ruminants particularly under tropical conditions. Nutrition Research Reviews 3
Little PD. 2005. Unofficial trade when states are weak: The case of cross-border commerce in the Horn of Africa. Research Paper No. 2005/13. Expert Group on Development Issues (EGDI) and United Nations University, World Institute of Development Economics Research (UNU-WIDER). (Available from www.wider.unu.edu/publications/rps/rps2005/rp2005-13.pdf) (Accessed on 2 March 2007)
McAlister G. 2005. Middle East, Situation analysis for Saudi Arabia and the United Arab Emirates, Market briefs Meat and livestock market information, April 2005, Meat and Livestock Australia market information. (Available from www.mla.com.au) (Accessed April 2008)
Ministry of States Planning, National Development and Vision 2030, 2008. Millenium Development Goals: Status report for Kenya-2007, July 2008, Republic of Kenya, Nairobi, Kenya
55
MoA and MoLFD (Ministry of Agriculture and Ministry of Livestock and Fisheries Development). 2004. Strategy for Revitalizing Agriculture 2004–2014. MoA and MoLFD, Nairobi, Kenya,
MoLFD (Ministry of Livestock and Fisheries Development). 2003a. District livestock production report: Wajir. MoLFD, Nairobi, Kenya. Unpublished.
MoLFD(Ministry of Livestock and Fisheries Development). 2003. NEP Provincial Annual Livestock Report for 2003. North Eastern Province. MoLFD, Nairobi, Kenya.
MoLFD (Ministry of Livestock and Fisheries Development). 2004. Annual Report for the year 2003. MoLFD, District Livestock Production Office, Wajir, North Eastern Province, unpublished.
MoLFD (Ministry of Livestock and Fisheries Development). 2006. District livestock production reports: Mandera, Garissa and Ijara. MoLFD, Nairobi, Kenya, unpublished.
Mude, A., R. Ouma, J. V. d. Steeg, J. Kariuki, D. Opiyo and A. Tipilda (2007). Anticipating, adapting to and coping with climate risks in Kenya: Operational recommendations for KACCAL. Nairobi, International Livestock Research Institute.
Ngigi M. 2005. The case of smallholder dairying in Eastern Africa. Environment and Production
Technology Division Discussion Paper 131. IFPRI (International Food Policy Research Institute), Washington, DC, USA.
Okwiri,., J.K.Kajume and R.K.Odondi, 2001. An assessment of the Economic Viability of Private Animal
Health Service Delivery in Pastoral Areas of Kenya, Community-based Animal Health and Participartory Epidemiology Unit (CAPE),Pan African Programme for the Control of Epizootics (PACE) and Organization of African Unit/ Interafrican Bureau for Animal Resources (OAU/IBAR), Nairobi, Kenya, electronically accessed at http://www/cape-ibar.org , Accessed on May, 2007
Omore A.O., H.Muriuki, M. Kenyanjui, M.Owango, and S. Staal, S. 1999. The Kenyan Dairy Sub-
Sector: A Rapid Appraisal: Research Report of the MoA/KARI/ILRI Smallholder Dairy (Research & Development) Project. International Livestock Research Institute. Nairobi (Kenya).51pp. http://www.smallholderdairy.org/publications.htm
Omore A, J. Mulindo, S.M. Islam, G. Nurah, M.I. Khan, S.J Staal and B.T. Dugdill. 2004. Employment generation through small-scale dairy marketing and processing. Experiences from Kenya, Bangladesh and Ghana. A joint study by ILRI (International Livestock Research Institute) and FAO (Food and Agriculture Organization of the United Nations). FAO Animal Production and Health Paper 158. FAO, Rome, Italy. (Available from http://www.fao.org/catalog/bullettin/07 04.htm)
Oxfam International (2006). Making the case: A national drought contingency fund for Kenya, Oxfam Briefing Paper, 89
People’s Daily online. 2006. Egypt interested in importing Tanzanian beef: Minister. (Available from http://english.people.com.cn/200602/10/eng20060210 241591.html) (Accessed March 2007)

56
Perry B, A. Nin Pratt, K. Stones, C. Stevens. 2005 An appropriate level of risk: Balancing the need for safe livestock products with fair market access for the poor. Pro-Poor Livestock Initiative Working Paper 23. ILRI (International Livestock Research Institute), Nairobi, Kenya, and FAO (Food and Agriculture Organization of the United Nations), Rome, Italy.
Rass, N. (2006). Policies and Strategies to Address the Vulnerability of Pastoralists in Sub-Saharan Africa. W. P. N. 37. Rome, FAO Pro-Poor Livestock Policy Initiative.
Rioba, J., N.M Sheikh and D. Stevens, 2000. Report of Nutrition Survey in North and West Wajir District North Eastern Province Kenya, October, 2000, Prepared for the Ministry of Health, electronically accessed at http://www.univ-lille1.fr/pfeda/Ethiop/Docs01/0105scf1.pdf , Accessed on May, 2007
Riviere-Cinnamond, A. and M. Eregae, 2003. Community-Based Animal Health Workers (CAHWS) in Pastoralist Areas of Kenya: A study on Selection Process, Impact and Sustainability-West Pokot, Wajir and Marsabit, Electonically accessed at ftp://ftp.fao.org/docrep/fao/010/ag277e/ag277e.pdf Accessed on September, 2007
Rodriguez, L. (2008). A global perspective on the total economic valuation of pastoralism: global synthesis report based on six country valuations. Nairobi, World Initiative for Sustainable Pastoralism (WISP).
USAID (United States Agency for International Development). 2006. Iraq private sector growth and employment generation. Small ruminant animals in Iraq. Project report. USAID Iraq IZDIHAR project.
USMEF (United States Meat Export Federation). 2007. International markets. UMSEF Strategic Market
Profile. (Available from http://www.usmef.org/TradeLibrary/MiddleEast ProfileBeef.asp) (Accessed on 2007)
World Bank. 2004 World Development Indicators (WDI), 2001 on CD ROM. The World Bank, Washington, DC, USA.
World Bank. 2007. World Development Indicators, 2007 on CD ROM. The World Bank, Washington, DC, USA.
Young, J., J. Kajume and J. Wanyama, 2003. Animal Health Care in Kenya: The road to Community-based Animal Health Service Delivery, Overseas Development Institute, London, United Kingngdom
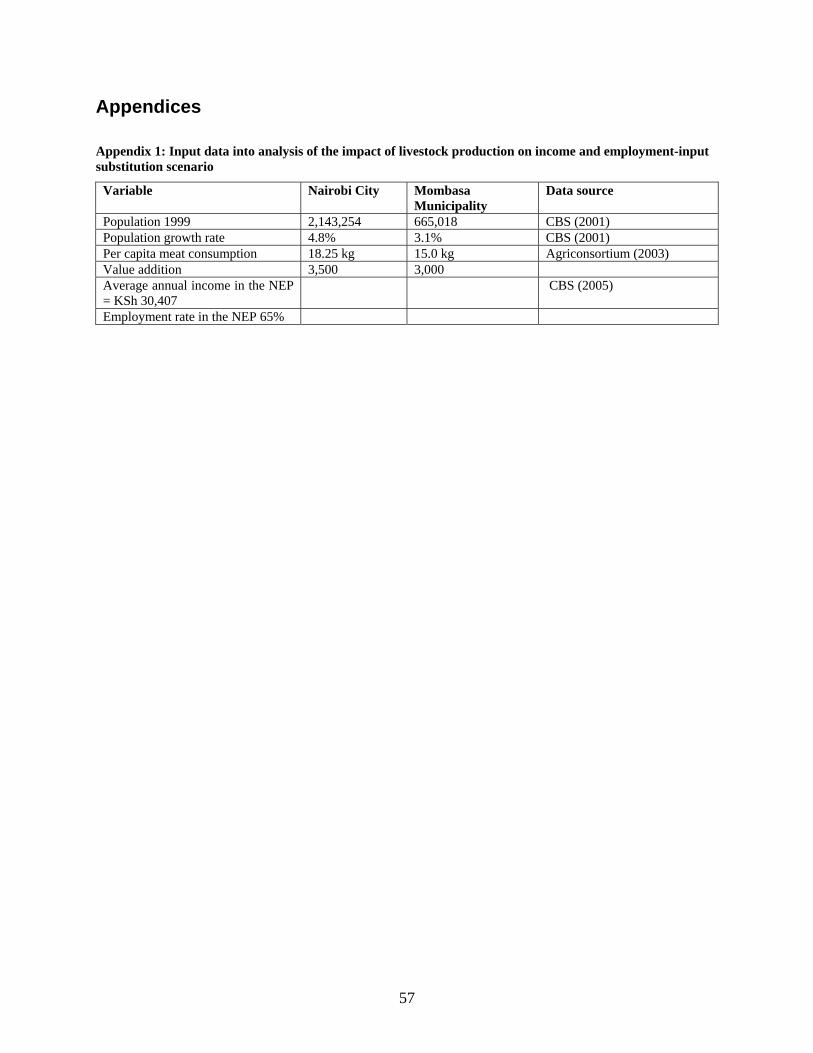
57
Appendices
Appendix 1: Input data into analysis of the impact of livestock production on income and employment-input substitution scenario
Variable Nairobi City Mombasa Municipality
Data source
Population 1999 2,143,254 665,018 CBS (2001) Population growth rate 4.8% 3.1% CBS (2001) Per capita meat consumption 18.25 kg 15.0 kg Agriconsortium (2003) Value addition 3,500 3,000 Average annual income in the NEP = KSh 30,407
CBS (2005)
Employment rate in the NEP 65%

58
Appendix 2: Value addition from live animal marketing for the NEP domestic market
Appendix 2.1. Local market (within the province) Live
cattle* Live sheep
Live goat*
Live camels*
Live cattle*
Live camels*
Live camels
Origin Wajir NEP (average)
Wajir Wajir Wajir Wajir Mandera
Destination Garissa NEP (average)
Garissa Garissa Isiolo Isiolo Garissa
Price at farm gate (KSh)
10,200 800 900 17,250 12,000 17,000 12,000
Selling price at local markets (KSh)
11,750 1,300 1,300 22,750 14,666 21,500 18,000
Seller’s margin (KSh)
672 20 28 4,450 2,052 706 2,747
Value addition (KSh)
1,750 500 400 5,500 2,666 4,500 6,000
*Trekking. ** Trucking. *** Trucking and trekking. Source: AU/IBAR and NEPDP (2006).
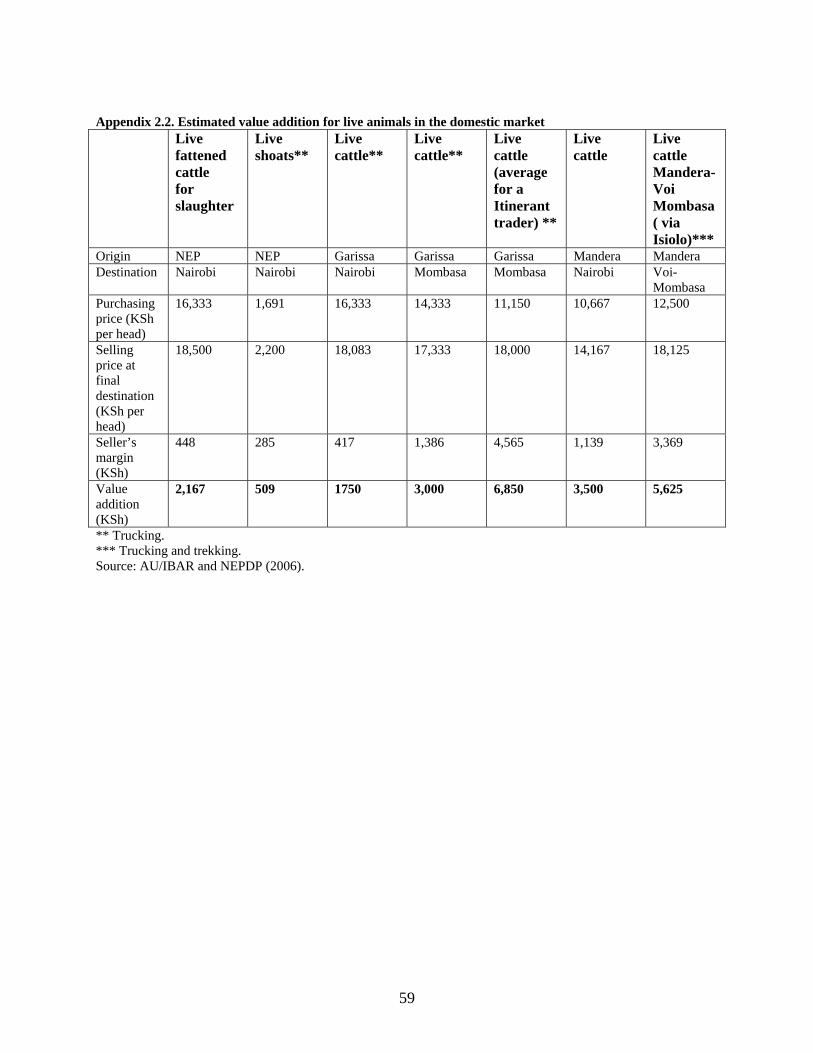
59
Appendix 2.2. Estimated value addition for live animals in the domestic market Live
fattened cattle for slaughter
Live shoats**
Live cattle**
Live cattle**
Live cattle (average for a Itinerant trader) **
Live cattle
Live cattle Mandera-Voi Mombasa ( via Isiolo)***
Origin NEP NEP Garissa Garissa Garissa Mandera Mandera Destination Nairobi Nairobi Nairobi Mombasa Mombasa Nairobi Voi-
Mombasa Purchasing price (KSh per head)
16,333 1,691 16,333 14,333 11,150 10,667 12,500
Selling price at final destination (KSh per head)
18,500 2,200 18,083 17,333 18,000 14,167 18,125
Seller’s margin (KSh)
448 285 417 1,386 4,565 1,139 3,369
Value addition (KSh)
2,167 509 1750 3,000 6,850 3,500 5,625
** Trucking. *** Trucking and trekking. Source: AU/IBAR and NEPDP (2006).

60
Appendix 2.3. Value addition from livestock product marketing for the NEP
Cattle hides
Sheep skins
Goat skins
Camel hides
Beef meat
Shoat meat
Camel meat
Milk (from Wajir and Mandera)
Domestic markets Origin Isiolo* Isiolo* Isiolo* Isiolo* Garissa Garissa Garissa Mandera
Destination Nanyuki, Nairobi
Nanyuki, Nairobi
Nanyuki, Nairobi
Nanyuki, Nairobi
NEP NEP NEP NEP
Price at farm gate (KSh)
379 per piece (25 per kg)
60 per piece
90 per piece
220 per piece (10 per kg)
26 per litre
Selling price at local markets (KSh)
780 300 250 540 11,750 1,350 22,750 48
Seller’s margin (KSh)
344 193 103 263 11
Value addition (KSh)
401 133 13 43 22
Purchasing price (KSh per head)
11,750 1,350 22,750
Wholesale price at final destination (KSh)
16,800 per head (140 kg)
1,920 per head (12 kg)
30,000 per head (250 kg)
Seller’s margin (KSh)
Value addition (KSh)
5,050 620 7250
* Isiolo is outside but near the NEP.
Source: AU/IBAR and NEPDP (2006).

61
Appendix 3: Occurrence of Droughts and Floods in Kenya
Year Type of Disaster Area of coverage No. of people affected
2006 Drought Widespread 3.5 Million 1999/2000 Drought Widespread 4.4 Million 1995/96 Drought Widespread 1.4 Million 1991/92 Drought Arid/Semi Arid Zones 1.5 Million 1983/84 Drought Widespread 200,000 1980 Drought Widespread 40,000 1977 Drought Widespread 20,000 1975 Drought Widespread 16,000 1971 Drought Widespread 1997/98 Floods 2001 Floods
2006 (December) Floods
Isiolo, Garissa, Turkana, Lodwar, Moyale, Wajir, Mandera and Kisumu. Estimated 723,00
Source: Modified from Oxfam International, 2006
Appendix 4: Ruminant livestock populations and annual milk production in Kenya
Province
Indigenous cattle
Dairy cattle
Small Ruminants
Milk Prod. Milk per Capita
Milk per Km2
Pop (‘000)
% Pop (‘000)
% Pop. (‘000)
% ('000 MT) MT
Central 78 <1 810 27 690 4 699 165 52.8
Coast 1,074 11 45 1 1,308 8 100 40 1.2
Eastern 1,498 15 273 9 3,010 17 325 63 2.1
North Eastern 809 8 <1 <1 1,268 7 47 93 <1
Nyanza 2,089 21 149 5 1,612 9 230 48 18.4
Rift Valley 3,358 34 1,666 55 9,258 53 1,571 231 8.6
Western 925 10 102 3 328 2 126 36 15.2
Total 9,831 100 3,045 100 17,474 100 3,098 106b 5.3 aSource: MoA Annual Reports and Peeler and Omore (1997). Figures exclude milk production from camels, which is significant in parts of Eastern and North Eastern provinces. bThe overall milk per capita takes into consideration the population of Nairobi N.B The Table is from Omore et all, 2009
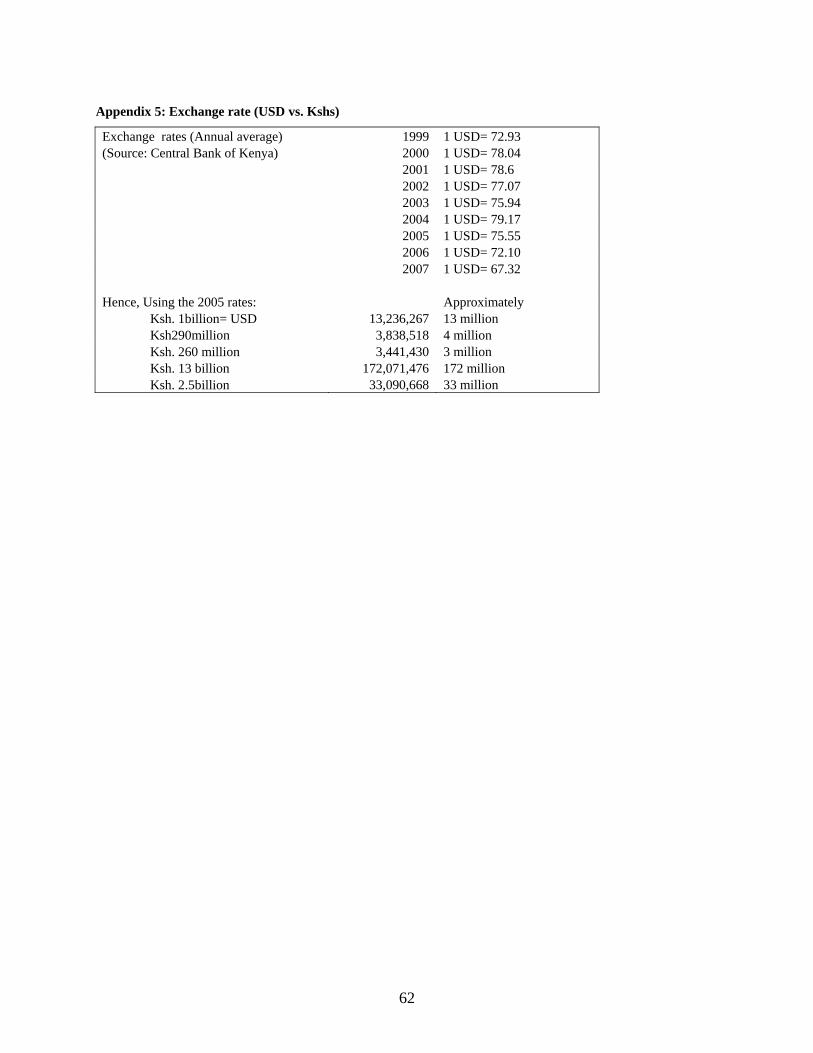
62
Appendix 5: Exchange rate (USD vs. Kshs)
Exchange rates (Annual average) 1999 1 USD= 72.93 (Source: Central Bank of Kenya) 2000 1 USD= 78.04 2001 1 USD= 78.6 2002 1 USD= 77.07 2003 1 USD= 75.94 2004 1 USD= 79.17 2005 1 USD= 75.55 2006 1 USD= 72.10 2007 1 USD= 67.32 Hence, Using the 2005 rates: Approximately
Ksh. 1billion= USD 13,236,267 13 million Ksh290million 3,838,518 4 million Ksh. 260 million 3,441,430 3 million Ksh. 13 billion 172,071,476 172 million Ksh. 2.5billion 33,090,668 33 million

63
For more information, contact:
Coordinator Regional Strategic Analysis and Knowledge Support System, East and Central Africa
(ReSAKSS-ECA) International Livestock Research Institute (ILRI)
P.O. Box 30709 Nairobi, Kenya
Telephone: +254 (20) 422 3000 Facsimile: +254 (20) 422 3001 Email: [email protected] Website: www.eca.resakss.org
WWW.RESAKSS.ORG