
Skúsenosť s prechodom od LMS Moodle ku cloudovému LMS iSmart
Upload
khangminh22Category
view
1download
0
Investment Decision CriteriaCH
AP
TE
R 11
Chapter Outline
360
Objective 1. Understand how to identify the sources and types of profitable investment opportunities.
Objective 3. Use the profitability index, internal rate of return, and payback criteria to evaluate investment opportunities.
Objective 4. Understand current business practice with respect to the use of capital-budgeting criteria.
Objective 2. Evaluate investment opportunities using the net present value and describe why it is the best measure to use.
11.1 An Overview of Capital
Budgeting (pgs. 362–364)
11.2 Net Present Value
(pgs. 364–372)
11.3 Other Investment Criteria
(pgs. 372–387)
11.4 A Glance at Actual Capital-
Budgeting Practices
(pgs. 387–389)
Part 1 Introduction to Financial Management (Chapters 1, 2, 3, 4)
Part 2 Valuation of Financial Assets (Chapters 5, 6, 7, 8, 9, 10)
Part 3 Capital Budgeting (Chapters 11, 12, 13, 14)
Part 4 Capital Structure and Dividend Policy (Chapters 15, 16)
Part 5 Liquidity Management and Special Topics in Finance (Chapters 17, 18, 19, 20)
M11_TITM2189_13_GE_C11.indd 360 18/05/17 12:46 PM

Real Estate InvestingSuppose that you and your roommates rent a condo near campus and, at the end of your senior year, your landlord offers to sell you the condo for $90,000. If you bought the condo, you would make some minor repairs and sell it right away. Your fa-ther has agreed to loan you the money for the pur-chase and repairs. How would you decide whether to take your landlord up on the offer?
You estimate that it will cost $2,000 and take about three weeks to get the condo repainted and ready for sale. Given the demand for student housing in the area, you think that you will be able to sell it in a few days for $100,000, which represents a profit of $8,000. By completing this analysis, you’ve just determined the net present value of this project, which is the $8,000 increase in your wealth that results from the purchase and sale of the condo.
This scenario is not unlike many investment problems in the world of corporate finance. A firm’s manager who is considering a new investment, such as the launch of a new product, first analyzes the costs involved. Next, the man-ager forecasts the future cash inflows expected throughout the life of the product. Our condo investment example assumed that there is only three weeks from purchase to sale, so we ignored the time value of money, which in most cases plays an important role. Hence, in the final step, the future cash flows of the investment must be discounted back to the present and then compared to the initial cash outlay to determine whether the investment is likely to cre-ate value for the investor. This will be the case if the present value of the cash inflows exceeds the initial cash outlay.
With the exception of the necessity of adjusting future cash flows for the time value of money, the analysis carried out by the manager is exactly what you would have done in analyzing the condo investment. Very simply, a good investment is one that is worth more than it costs to make. This observation is a good one to file away and come back to over and over as we go through the rest of this chapter. Throughout the chapter, we will be talking about the analysis of investment opportunities; the commonsense approach we will use is to compare the benefits we derive from the investment with the costs we incur in making it.
Capital budgeting is the term we use to refer to the process used to evaluate a firm’s long-term investment opportunities. As part of this process, managers rely on four of the basic principles of finance:
• First, we value an investment opportunity by evaluating its expected cash flows, following P Principle 3: Cash Flows Are the Source of Value.
• Second, we discount all cash flows back to the present, taking into account P Principle 1: Money Has a Time Value.
This chapter applies what we have learned from valuing stocks and bonds to the valuation of investments in production plants, new equipment, real estate, and any other asset that is likely to generate future profits. Our discussion of valuing investment opportunities relies on the first three basic principles of finance, along with the fi-nal principle: P Principle 1: Money Has a Time Value—the cash inflows and outflows from an investment opportunity are generally spread out over a number of years; thus, we need the time-value-of-money tools to make these cash flows that occur in different time periods comparable; P Principle 2: There Is a Risk-Return
Tradeoff—different investment opportunities have different levels of risk, and as a result, the risk-return tradeoff becomes important when determining the rate to use to discount future cash flows; P Principle 3: Cash Flows Are the Source of Value—when evaluating investment opportunities, we will rely on the cash flows generated by the investment rather than accounting profits; and P Principle 5: Individuals Respond to Incentives—managers respond to incen-tives, and when their investment incentives are not properly aligned with those of the firm’s stockholders, they may not make the invest-ments that are consistent with increasing shareholder value.
Principles P 1, P 2, P 3, and P 5 Applied
361
M11_TITM2189_13_GE_C11.indd 361 19/07/17 2:13 PM
362 PART 3 | Capital Budgeting
• Next, we incorporate risk into the analysis by adjusting the discount rate used to calculate the present value of the project’s future cash flows, bearing in mind P Principle 2: There Is a Risk-Return Tradeoff. The term risk means that more things can happen than will happen, so the reward for assuming more risk is not a sure thing but simply a higher expected return.
• Finally, we must take into account P Principle 5: Individuals Respond to Incentives. Managers respond to incentives, and when their incentives are not properly aligned with those of the firm’s stockholders, they may not make investment decisions that are consistent with increasing shareholder value.
We begin this chapter with a look at the criteria managers use to determine if an investment opportunity—such as the condo investment or the product introduction—is a good investment. Our primary focus is on net present value, a measure of the value created by the investment. However, we also review other popular mea-sures used in practice.
Over your career, you will be faced with in-vestment opportunities that require some type of evaluation and analysis. Whether the deci-sion is to purchase a piece of property that you hope to develop and resell or to start and run a business, capital-budgeting analysis will
help you make the right decision. In the introduction, we described a very simple real estate in-vestment opportunity. More typically, such an investment would require a substantial investment to improve the property, with renovations carried out over an extended period of time (perhaps
as much as a year). Having completed the renovation, you might consider at least two al-ternatives: You could sell the property to someone else to rent and manage, or you could keep the property and manage the rentals yourself. The tools we develop in this chapter will
help you evaluate the initial property investment as well as decide whether or not to keep and manage the property.
Your Turn: See Study Question 11–1.
Regardless of Your Major…
“Making Personal Investment Decisions”
11.1 An Overview of Capital BudgetingIn 1955, the Walt Disney Company (DIS) was largely a movie studio, but that all changed when the company decided to invest $17.5 million to build Disneyland in Anaheim, Califor-nia. The decision to build the theme park was a major capital-budgeting decision for Disney and was so successful that the company later decided to open theme parks in Orlando, Tokyo, Paris, and Hong Kong. In retrospect, how important was this investment? Today, parks and resorts account for over 30 percent of Disney’s revenue. There are three important lessons from the Disney theme park story:
Lesson 1: Capital-budgeting decisions are critical in defining a company’s business. Had Disney not embarked on its theme park strategy, it would be a very different company today.
Lesson 2: Very large investments frequently consist of many smaller investment decisions that define a business strategy. Disney did not launch its theme parks in 1955 with a plan to invest $3.5 billion some 50 years later to build the Hong Kong site. Rather, the $3.5 billion investment in the Hong Kong Disneyland was the result of a series of smaller investments that led to the eventual decision to expand the franchise in Asia.
M11_TITM2189_13_GE_C11.indd 362 18/05/17 12:47 PM
CHAPTER 11 | Investment Decision Criteria 363
Lesson 3: Successful investment choices lead to the development of managerial expertise and capabilities that influence the firm’s choice of future in-vestments. Disney’s early success with its theme park in California provided its managers with the expertise and confidence to replicate the theme park in Orlando and then internationally. This storehouse of talent and experience gives Disney a competitive edge on would-be competitors who might seek to enter the theme park business.
The Typical Capital-Budgeting ProcessAlthough the capital-budgeting process can be long and complicated at many major corporations, we can sum up the typical capital-budgeting process at any firm in terms of two basic phases:
Phase 1: The firm’s management identifies promising investment opportunities. These opportunities generally arise from ideas generated by the management and employees of the firm. Employees who work closely with the firm’s cus-tomers (generally, the marketing department) or who run the firm’s operations (the production management department) are often the idea generators.
Phase 2: Once an investment opportunity has been identified, its value-creating potential—what some refer to as its value proposition—is thoroughly evaluated. In very simple terms, a project’s value proposition answers the following question: “How do we plan to make money?” It is at this stage that financial analysts enter the picture.
The logic of the two-phase process is very simple: Identify promising investment opportunities, and select those that offer an opportunity to create value for the firm’s common stockholders.
What Are the Sources of Good Investment Projects?Finding good investment projects can be a daunting task, particularly when the firm faces substantial competition from other firms that are also looking for similar investment oppor-tunities. Recall from your introductory economics class that firms tend to be more profitable when they operate in markets that have less competition. So the search for good investments is largely a search for opportunities where the firm can exploit some competitive advantage over its competitors. For example, the firm may have a proprietary production process that uses fewer inputs and results in a lower cost of production.
As a general rule, good investments are most likely to be found in markets that are less competitive. These are markets where barriers to new entrants are sufficiently high that they keep out would-be competitors. For example, the strong brand reputation of the Frito-Lay products that results from an ongoing barrage of advertising makes it difficult for competing brands to enter the salty snack food category and, at the same time, makes it easier for Frito-Lay to introduce new products.
Types of Capital Investment ProjectsCapital investment projects can be classified into one of three broad categories:
1. Revenue-enhancing investments
2. Cost-reducing investments
3. Mandatory investments that are a result of government mandates
Let’s consider each of these briefly.
Revenue-Enhancing InvestmentsInvestments that lead to higher revenues often involve the expansion of existing businesses, such as Apple’s (APPL) decision to add the smaller Nano to its iPod products. Alternatively, when Apple originally decided to begin selling its iPod line of MP3 players, it created an entirely new line of business.
M11_TITM2189_13_GE_C11.indd 363 18/05/17 12:47 PM
364 PART 3 | Capital Budgeting
11.2 Net Present ValueIn the introduction to this chapter, we described a simple investment opportunity involving the purchase and sale of a condo. The $8,000 difference between the $100,000 cash inflow from the sale of the condo and the $92,000 investment outlay (the $90,000 cost of buying the condo from your landlord plus $2,000 in painting and repair expenses) is the incremental ef-fect of the investment on your personal wealth. Because both the inflow from the sale and the outflows related to buying and fixing up the condo were only three weeks apart, we ignored the time value of money and compared the inflows directly to the outflows. We determined that the investment is a sound undertaking because it can be sold for more than it cost.
The analysis of most investments requires us to also consider the time value of money. In other words, instead of simply calculating the profits of the investment, we must calculate the investment’s net present value. The net present value (NPV) is the difference between
Larger firms have research and development (R&D) departments that search for ways to improve existing products and create new ones. These ideas may come from within the R&D department or be based on ideas from executives, sales personnel, or customers. The most common new investment projects might involve taking an existing product and selling it to a new market. That was the case when Kimberly-Clark (KMB), the manufacturer of Huggies, made its disposable diapers more waterproof and began marketing them as disposable swim pants called Little Swimmers. Similarly, the Sara Lee Corporation’s (SLE) hosiery unit appealed to more customers when it introduced Sheer Energy pantyhose for support and Just My Size pantyhose aimed at larger-size customers.
Cost-Reducing InvestmentsThe majority of a firm’s capital expenditure proposals are aimed at reducing the cost of doing business. For example, Walmart (WMT) did not locate a regional distribution center in San Marcos, Texas, to expand firm revenues; the region was already populated with Walmart stores. Instead, the primary benefit of the distribution center came from lowering the cost of supporting stores within the region.
Other types of cost-reducing investments arise when equipment either wears out or becomes obsolete due to the development of new and improved equipment. For example, Intel’s (INTC) semiconductor manufacturing plants (called “fabs”) utilize equipment called handlers that move microprocessors from one processing station to another and test their functionality. Because the technology involved in the manufacture of these processors is always evolving, the handlers also change and evolve. This means that Intel is continually evaluating the replacement of existing equipment.
Mandated InvestmentsCompanies frequently find that they must make capital investments to meet safety and envi-ronmental regulations. These investments are not revenue-producing or cost-reducing but are required for the company to continue doing business. An example is the scrubbers that are installed on the smokestacks of coal-fired power plants. The scrubbers reduce airborne emis-sions in order to meet government pollution guidelines.
Not all investments have sufficient potential for value creation to be undertaken, and we need some analytical tools or criteria to help us ferret out the most promising investments. In the pages that follow, we consider the most commonly used criteria for determining the desirability of alter-native investment proposals. These include net present value (NPV), a closely related metric called the equivalent annual cost (EAC), the profitability index (PI), the internal rate of return (IRR), the modified internal rate of return (MIRR), the payback period, and the discounted payback period.
Before you move on to 11.2
Concept Check | 11.11. What does the term capital budgeting mean?
2. Describe the two-phase process typically involved in carrying out a capital-budgeting analysis.
3. What makes a capital-budgeting project a good one?
4. What are the three basic types of capital investment projects?
M11_TITM2189_13_GE_C11.indd 364 18/05/17 12:47 PM
CHAPTER 11 | Investment Decision Criteria 365
1 Note that projects that have a zero NPV earn the required rate of return used to discount the project cash flows and technically are acceptable investments. However, given that we are estimating future cash flows, it is not uncommon for firms to require an “NPV cushion” or a positive NPV. They accomplish this by adding a premium to the discount rate. We discuss this idea further in Chapter 14, where we discuss the determination of the required rate of return or cost of capital.
Net PresentValue (NPV)
=Cash Flow
for Year 0 (CF0)+
Cash Flowfor Year 1 (CF1)
a1 +DiscountRate (k)
b1 +
Cash Flowfor Year 2 (CF2)
a1 +DiscountRate (k)
b2 + g +
Cash Flowfor Year n (CFn)
a1 +DiscountRate (k)
bn (11–1)
Cost of making the investment = Initial cash flow (this is typically a cash outflow, taking on a negative value)
Present value of the investment’s cash inflows = Present value of the project’s future cash inflows
¯˚˚˚˚˚˚˚˚˚˚˚˚˚˚˘˚˚˚˚˚˚˚˚˚˚˚˚˚˚˙
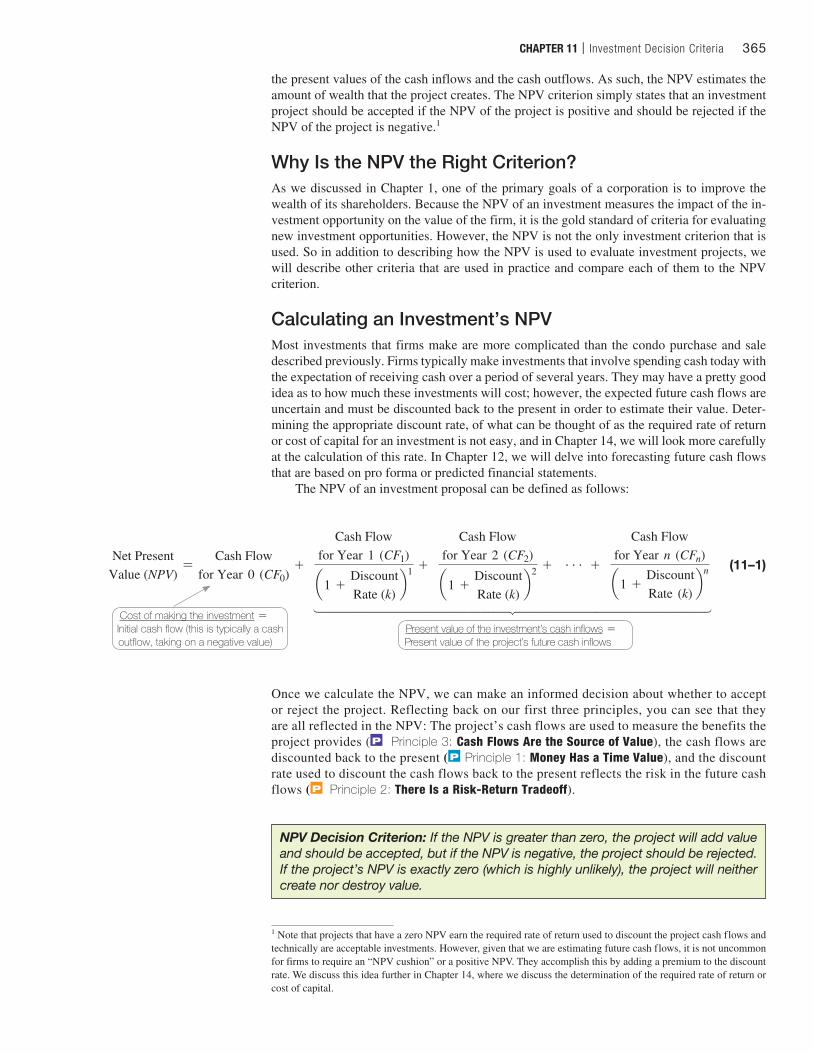
the present values of the cash inflows and the cash outflows. As such, the NPV estimates the amount of wealth that the project creates. The NPV criterion simply states that an investment project should be accepted if the NPV of the project is positive and should be rejected if the NPV of the project is negative.1
Why Is the NPV the Right Criterion?As we discussed in Chapter 1, one of the primary goals of a corporation is to improve the wealth of its shareholders. Because the NPV of an investment measures the impact of the in-vestment opportunity on the value of the firm, it is the gold standard of criteria for evaluating new investment opportunities. However, the NPV is not the only investment criterion that is used. So in addition to describing how the NPV is used to evaluate investment projects, we will describe other criteria that are used in practice and compare each of them to the NPV criterion.
Calculating an Investment’s NPVMost investments that firms make are more complicated than the condo purchase and sale described previously. Firms typically make investments that involve spending cash today with the expectation of receiving cash over a period of several years. They may have a pretty good idea as to how much these investments will cost; however, the expected future cash flows are uncertain and must be discounted back to the present in order to estimate their value. Deter-mining the appropriate discount rate, of what can be thought of as the required rate of return or cost of capital for an investment is not easy, and in Chapter 14, we will look more carefully at the calculation of this rate. In Chapter 12, we will delve into forecasting future cash flows that are based on pro forma or predicted financial statements.
The NPV of an investment proposal can be defined as follows:
Once we calculate the NPV, we can make an informed decision about whether to accept or reject the project. Reflecting back on our first three principles, you can see that they are all reflected in the NPV: The project’s cash flows are used to measure the benefits the project provides ( P Principle 3: Cash Flows Are the Source of Value), the cash flows are discounted back to the present ( P Principle 1: Money Has a Time Value), and the discount rate used to discount the cash flows back to the present reflects the risk in the future cash flows ( P Principle 2: There Is a Risk-Return Tradeoff).
NPV Decision Criterion: If the NPV is greater than zero, the project will add value and should be accepted, but if the NPV is negative, the project should be rejected. If the project’s NPV is exactly zero (which is highly unlikely), the project will neither create nor destroy value.
M11_TITM2189_13_GE_C11.indd 365 18/05/17 12:47 PM
366 PART 3 | Capital Budgeting
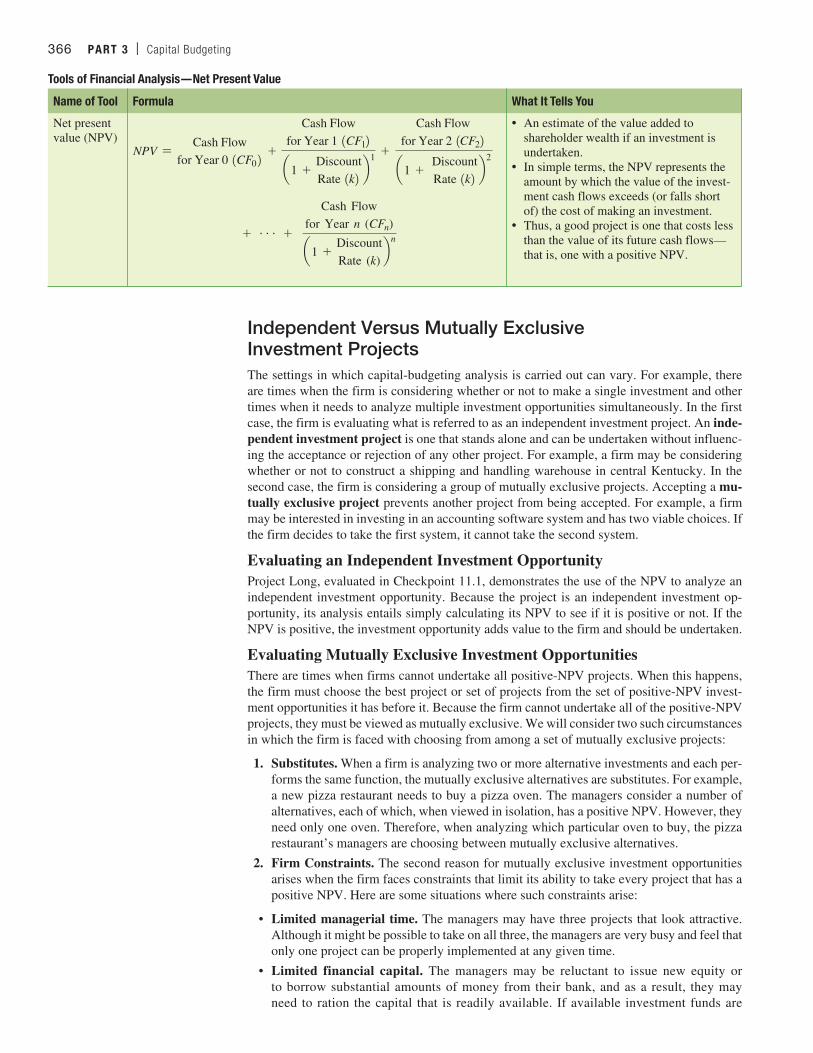
Tools of Financial Analysis—Net Present Value
Name of Tool Formula What It Tells You
Net present value (NPV)
NPV =Cash Flow
for Year 0 1CF02 +
Cash Flowfor Year 1 1CF12
a1 +DiscountRate 1k2 b
1 +
Cash Flowfor Year 2 1CF22
a1 + DiscountRate 1k2 b
2
+ g +
Cash Flowfor Year n (CFn)
a1 +DiscountRate (k)
bn
• An estimate of the value added to shareholder wealth if an investment is undertaken.
• In simple terms, the NPV represents the amount by which the value of the invest-ment cash flows exceeds (or falls short of) the cost of making an investment.
• Thus, a good project is one that costs less than the value of its future cash flows—that is, one with a positive NPV.
Independent Versus Mutually Exclusive Investment ProjectsThe settings in which capital-budgeting analysis is carried out can vary. For example, there are times when the firm is considering whether or not to make a single investment and other times when it needs to analyze multiple investment opportunities simultaneously. In the first case, the firm is evaluating what is referred to as an independent investment project. An inde-pendent investment project is one that stands alone and can be undertaken without influenc-ing the acceptance or rejection of any other project. For example, a firm may be considering whether or not to construct a shipping and handling warehouse in central Kentucky. In the second case, the firm is considering a group of mutually exclusive projects. Accepting a mu-tually exclusive project prevents another project from being accepted. For example, a firm may be interested in investing in an accounting software system and has two viable choices. If the firm decides to take the first system, it cannot take the second system.
Evaluating an Independent Investment OpportunityProject Long, evaluated in Checkpoint 11.1, demonstrates the use of the NPV to analyze an independent investment opportunity. Because the project is an independent investment op-portunity, its analysis entails simply calculating its NPV to see if it is positive or not. If the NPV is positive, the investment opportunity adds value to the firm and should be undertaken.
Evaluating Mutually Exclusive Investment OpportunitiesThere are times when firms cannot undertake all positive-NPV projects. When this happens, the firm must choose the best project or set of projects from the set of positive-NPV invest-ment opportunities it has before it. Because the firm cannot undertake all of the positive-NPV projects, they must be viewed as mutually exclusive. We will consider two such circumstances in which the firm is faced with choosing from among a set of mutually exclusive projects:
1. Substitutes. When a firm is analyzing two or more alternative investments and each per-forms the same function, the mutually exclusive alternatives are substitutes. For example, a new pizza restaurant needs to buy a pizza oven. The managers consider a number of alternatives, each of which, when viewed in isolation, has a positive NPV. However, they need only one oven. Therefore, when analyzing which particular oven to buy, the pizza restaurant’s managers are choosing between mutually exclusive alternatives.
2. Firm Constraints. The second reason for mutually exclusive investment opportunities arises when the firm faces constraints that limit its ability to take every project that has a positive NPV. Here are some situations where such constraints arise:
• Limited managerial time. The managers may have three projects that look attractive. Although it might be possible to take on all three, the managers are very busy and feel that only one project can be properly implemented at any given time.
• Limited financial capital. The managers may be reluctant to issue new equity or to borrow substantial amounts of money from their bank, and as a result, they may need to ration the capital that is readily available. If available investment funds are
M11_TITM2189_13_GE_C11.indd 366 18/05/17 12:47 PM
CHAPTER 11 | Investment Decision Criteria 367
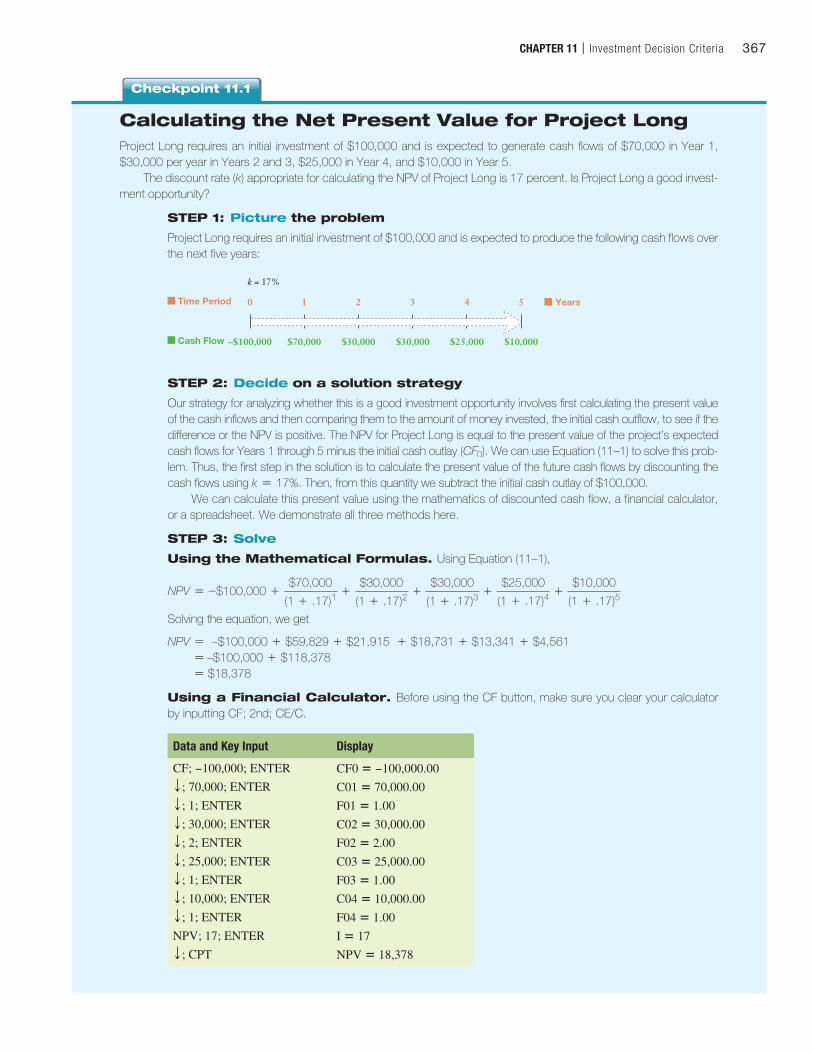
Calculating the Net Present Value for Project LongProject Long requires an initial investment of $100,000 and is expected to generate cash flows of $70,000 in Year 1, $30,000 per year in Years 2 and 3, $25,000 in Year 4, and $10,000 in Year 5.
The discount rate (k) appropriate for calculating the NPV of Project Long is 17 percent. Is Project Long a good invest-ment opportunity?
STEP 1: Picture the problem
Project Long requires an initial investment of $100,000 and is expected to produce the following cash flows over the next five years:
–$100,000 $70,000 $30,000 $30,000 $25,000 $10,000
0 1 2 3
k = 17%
4 5Time Period
Cash Flow
Years
STEP 2: Decide on a solution strategy
Our strategy for analyzing whether this is a good investment opportunity involves first calculating the present value of the cash inflows and then comparing them to the amount of money invested, the initial cash outflow, to see if the difference or the NPV is positive. The NPV for Project Long is equal to the present value of the project’s expected cash flows for Years 1 through 5 minus the initial cash outlay (CF0). We can use Equation (11–1) to solve this prob-lem. Thus, the first step in the solution is to calculate the present value of the future cash flows by discounting the cash flows using k = 17%. Then, from this quantity we subtract the initial cash outlay of $100,000.
We can calculate this present value using the mathematics of discounted cash flow, a financial calculator, or a spreadsheet. We demonstrate all three methods here.
STEP 3: Solve
Using the Mathematical Formulas. Using Equation (11–1),
NPV = -$100,000 +$70,000
(1 + .17)1+
$30,000
(1 + .17)2+
$30,000
(1 + .17)3+
$25,000
(1 + .17)4+
$10,000
(1 + .17)5
Solving the equation, we get
NPV = –$100,000 + $59,829 + $21,915 + $18,731 + $13,341 + $4,561 = –$100,000 + $118,378 = $18,378
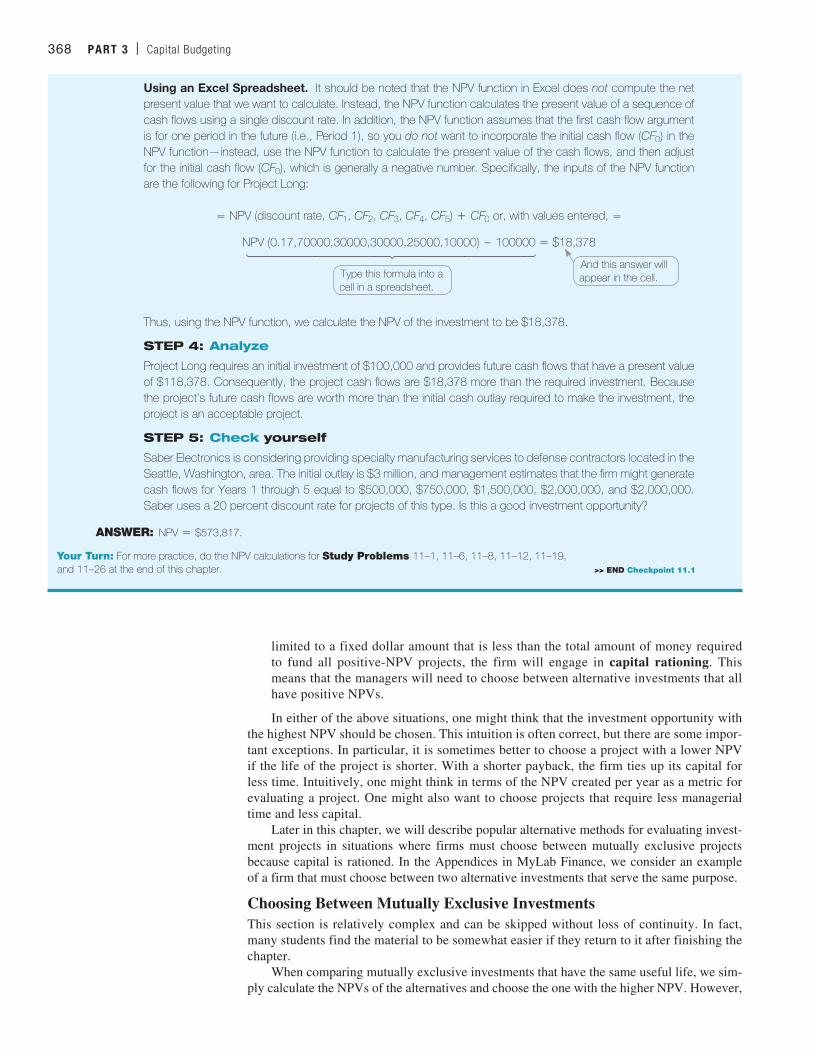
Using a Financial Calculator. Before using the CF button, make sure you clear your calculator by inputting CF; 2nd; CE/C.
Data and Key Input Display
CF; −100,000; ENTER
T ; 70,000; ENTER
T ; 1; ENTER
T ; 30,000; ENTER
T ; 2; ENTER
T ; 25,000; ENTER
T ; 1; ENTER
T ; 10,000; ENTER
T ; 1; ENTER
NPV; 17; ENTER
T ; CPT
CF0 5 −100,000.00
C01 5 70,000.00
F01 5 1.00
C02 5 30,000.00
F02 5 2.00
C03 5 25,000.00
F03 5 1.00
C04 5 10,000.00
F04 5 1.00
I 5 17
NPV 5 18,378
Checkpoint 11.1
M11_TITM2189_13_GE_C11.indd 367 18/05/17 12:47 PM
368 PART 3 | Capital Budgeting
Using an Excel Spreadsheet. It should be noted that the NPV function in Excel does not compute the net present value that we want to calculate. Instead, the NPV function calculates the present value of a sequence of cash flows using a single discount rate. In addition, the NPV function assumes that the first cash flow argument is for one period in the future (i.e., Period 1), so you do not want to incorporate the initial cash flow (CF0) in the NPV function—instead, use the NPV function to calculate the present value of the cash flows, and then adjust for the initial cash flow (CF0), which is generally a negative number. Specifically, the inputs of the NPV function are the following for Project Long:
= NPV (discount rate, CF1, CF2, CF3, CF4, CF5) + CF0 or, with values entered, =
NPV (0.17,70000,30000,30000,25000,10000) - 100000 = $18,378
Thus, using the NPV function, we calculate the NPV of the investment to be $18,378.
STEP 4: Analyze
Project Long requires an initial investment of $100,000 and provides future cash flows that have a present value of $118,378. Consequently, the project cash flows are $18,378 more than the required investment. Because the project’s future cash flows are worth more than the initial cash outlay required to make the investment, the project is an acceptable project.
STEP 5: Check yourself
Saber Electronics is considering providing specialty manufacturing services to defense contractors located in the Seattle, Washington, area. The initial outlay is $3 million, and management estimates that the firm might generate cash flows for Years 1 through 5 equal to $500,000, $750,000, $1,500,000, $2,000,000, and $2,000,000. Saber uses a 20 percent discount rate for projects of this type. Is this a good investment opportunity?
ANSWER: NPV = $573,817.
Type this formula into a cell in a spreadsheet.
¯˚˚˚˚˘˚˚˚˚˙And this answer will appear in the cell.
Your Turn: For more practice, do the NPV calculations for Study Problems 11–1, 11–6, 11–8, 11–12, 11–19, and 11–26 at the end of this chapter. >> END Checkpoint 11.1
limited to a fixed dollar amount that is less than the total amount of money required to fund all positive-NPV projects, the firm will engage in capital rationing. This means that the managers will need to choose between alternative investments that all have positive NPVs.
In either of the above situations, one might think that the investment opportunity with the highest NPV should be chosen. This intuition is often correct, but there are some impor-tant exceptions. In particular, it is sometimes better to choose a project with a lower NPV if the life of the project is shorter. With a shorter payback, the firm ties up its capital for less time. Intuitively, one might think in terms of the NPV created per year as a metric for evaluating a project. One might also want to choose projects that require less managerial time and less capital.
Later in this chapter, we will describe popular alternative methods for evaluating invest-ment projects in situations where firms must choose between mutually exclusive projects because capital is rationed. In the Appendices in MyLab Finance, we consider an example of a firm that must choose between two alternative investments that serve the same purpose.
Choosing Between Mutually Exclusive InvestmentsThis section is relatively complex and can be skipped without loss of continuity. In fact, many students find the material to be somewhat easier if they return to it after finishing the chapter.
When comparing mutually exclusive investments that have the same useful life, we sim-ply calculate the NPVs of the alternatives and choose the one with the higher NPV. However,
M11_TITM2189_13_GE_C11.indd 368 24/06/17 1:05 PM
CHAPTER 11 | Investment Decision Criteria 369
it is often the case that mutually exclusive investments have different useful lives. For exam-ple, one alternative might last for 10 years, while the other lasts only 6 years. This often occurs when the firm is considering the replacement of a piece of equipment where the alternatives have different initial costs to purchase, different useful lives, and different annual costs of operations. The decision the firm must make is which alternative is most cost-effective.
Before we can decide which alternative to select, we must determine whether we will need this piece of equipment forever. That is, at the end of its useful life, will we buy another one? If not, we can simply compare alternatives with different lives by calculating the NPV of each alternative and choosing the piece of equipment with the higher NPV. However, if we expect this new piece of equipment to be replaced over and over again with a similar piece of equipment with the same NPV for each replication of the investment, then we must calculate the equivalent annual cost (EAC). The EAC is sometimes referred to as the equivalent annual annuity (EAA). The EAC capital-budgeting technique provides an estimate of the annual cost of owning and operating the investment over its lifetime. We can then compare the EACs of two or more alternatives and select the most cost-effective alternative. The power of the EAC is that it incorporates the time value of money, the initial cash outlay, and the productive life of the investment all in a single number that can be compared across alternative investments.
The EAC of the equipment can be calculated as follows:
• First, we calculate the sum of the present values of the project’s costs, including the project’s initial cost and the costs the firm will incur to operate the equipment over its projected lifespan. Remember, in this case the revenues are the same for both of the alter-natives we are considering, so the free cash flows for the alternative investments are all negative (thus the name equivalent annual cost).
• Next, we convert the present value of the costs into its annual equivalent, which is the EAC of the investment.
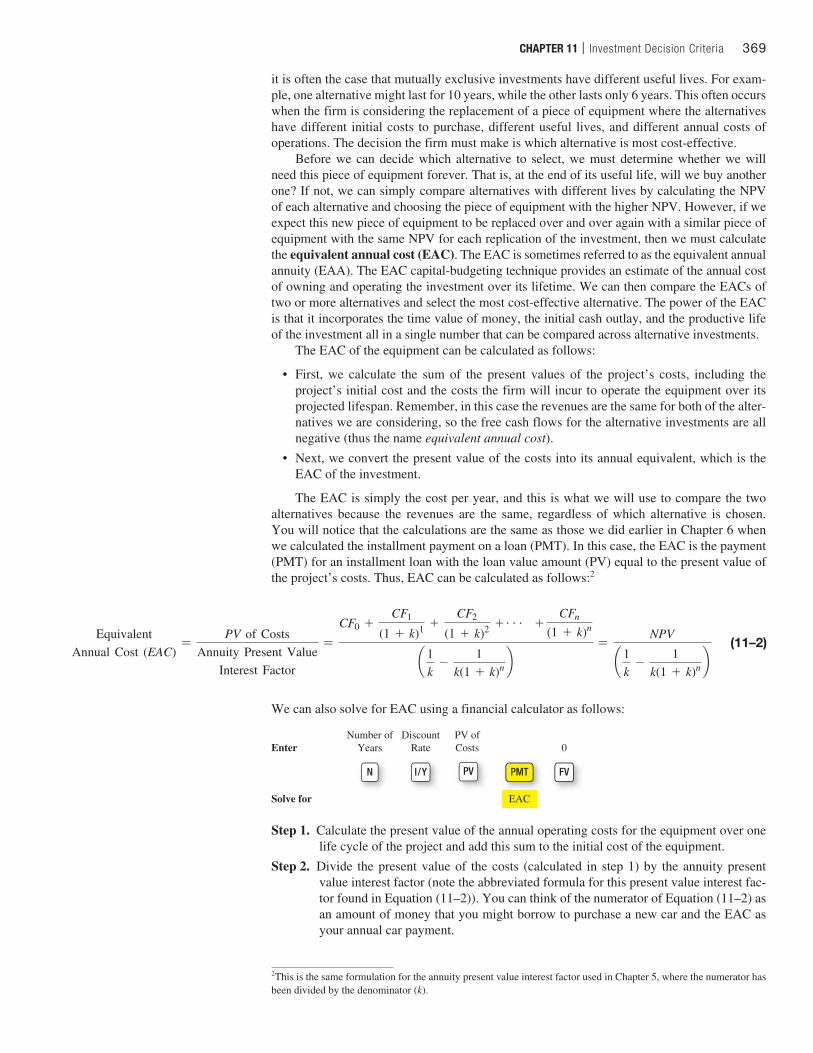
The EAC is simply the cost per year, and this is what we will use to compare the two alternatives because the revenues are the same, regardless of which alternative is chosen. You will notice that the calculations are the same as those we did earlier in Chapter 6 when we calculated the installment payment on a loan (PMT). In this case, the EAC is the payment (PMT) for an installment loan with the loan value amount (PV) equal to the present value of the project’s costs. Thus, EAC can be calculated as follows:2
Equivalent
Annual Cost (EAC)=
PV of CostsAnnuity Present Value
Interest Factor
=CF0 +
CF1
(1 + k)1 +CF2
(1 + k)2 + g + CFn
(1 + k)n
a 1k
-1
k(1 + k)n b=
NPV
a 1k
-1
k(1 + k)n b (11–2)
2This is the same formulation for the annuity present value interest factor used in Chapter 5, where the numerator has been divided by the denominator (k).
We can also solve for EAC using a financial calculator as follows:
EnterNumber of
YearsDiscount
Rate
EAC
0PV ofCosts
N I/Y PV PMT FV
Solve for
Step 1. Calculate the present value of the annual operating costs for the equipment over one life cycle of the project and add this sum to the initial cost of the equipment.
Step 2. Divide the present value of the costs (calculated in step 1) by the annuity present value interest factor (note the abbreviated formula for this present value interest fac-tor found in Equation (11–2)). You can think of the numerator of Equation (11–2) as an amount of money that you might borrow to purchase a new car and the EAC as your annual car payment.
M11_TITM2189_13_GE_C11.indd 369 18/05/17 12:47 PM
370 PART 3 | Capital Budgeting
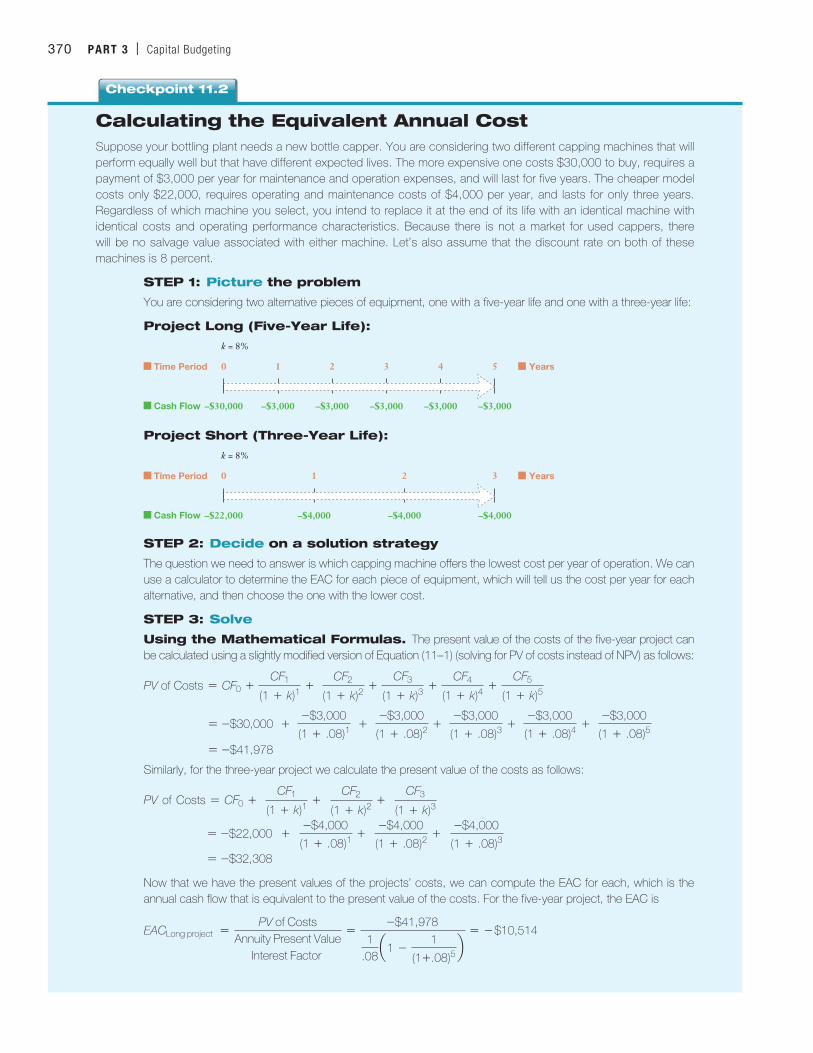
Calculating the Equivalent Annual CostSuppose your bottling plant needs a new bottle capper. You are considering two different capping machines that will perform equally well but that have different expected lives. The more expensive one costs $30,000 to buy, requires a payment of $3,000 per year for maintenance and operation expenses, and will last for five years. The cheaper model costs only $22,000, requires operating and maintenance costs of $4,000 per year, and lasts for only three years. Regardless of which machine you select, you intend to replace it at the end of its life with an identical machine with identical costs and operating performance characteristics. Because there is not a market for used cappers, there will be no salvage value associated with either machine. Let’s also assume that the discount rate on both of these machines is 8 percent.
STEP 1: Picture the problem
You are considering two alternative pieces of equipment, one with a five-year life and one with a three-year life:
Project Long (Five-Year Life):
–$30,000 –$3,000 –$3,000 –$3,000 –$3,000 –$3,000
0 1 2 3
k = 8%
4 5Time Period
Cash Flow
Years
Project Short (Three-Year Life):
–$22,000 –$4,000 –$4,000 –$4,000
0 1 2
k = 8%
3Time Period
Cash Flow
Years
STEP 2: Decide on a solution strategy
The question we need to answer is which capping machine offers the lowest cost per year of operation. We can use a calculator to determine the EAC for each piece of equipment, which will tell us the cost per year for each alternative, and then choose the one with the lower cost.
STEP 3: Solve
Using the Mathematical Formulas. The present value of the costs of the five-year project can be calculated using a slightly modified version of Equation (11–1) (solving for PV of costs instead of NPV) as follows:
PV of Costs = CF0 +CF1
(1 + k)1+
CF2
(1 + k)2+
CF3
(1 + k)3+
CF4
(1 + k)4+
CF5
(1 + k)5
= -$30,000 + -$3,000
(1 + .08)1 +
-$3,000
(1 + .08)2+
-$3,000
(1 + .08)3+
-$3,000
(1 + .08)4+
-$3,000
(1 + .08)5
= -$41,978
Similarly, for the three-year project we calculate the present value of the costs as follows:
PV of Costs = CF0 + CF1
(1 + k)1+
CF2
(1 + k)2+
CF3
(1 + k)3
= -$22,000 + -$4,000
(1 + .08)1+
-$4,000
(1 + .08)2+
-$4,000
(1 + .08)3
= -$32,308
Now that we have the present values of the projects’ costs, we can compute the EAC for each, which is the annual cash flow that is equivalent to the present value of the costs. For the five-year project, the EAC is
EACLong project =PV of Costs
Annuity Present ValueInterest Factor
=-$41,978
1.08
a1 -1
(1+ .08)5b
= - $10,514
Checkpoint 11.2
M11_TITM2189_13_GE_C11.indd 370 18/05/17 12:47 PM
CHAPTER 11 | Investment Decision Criteria 371
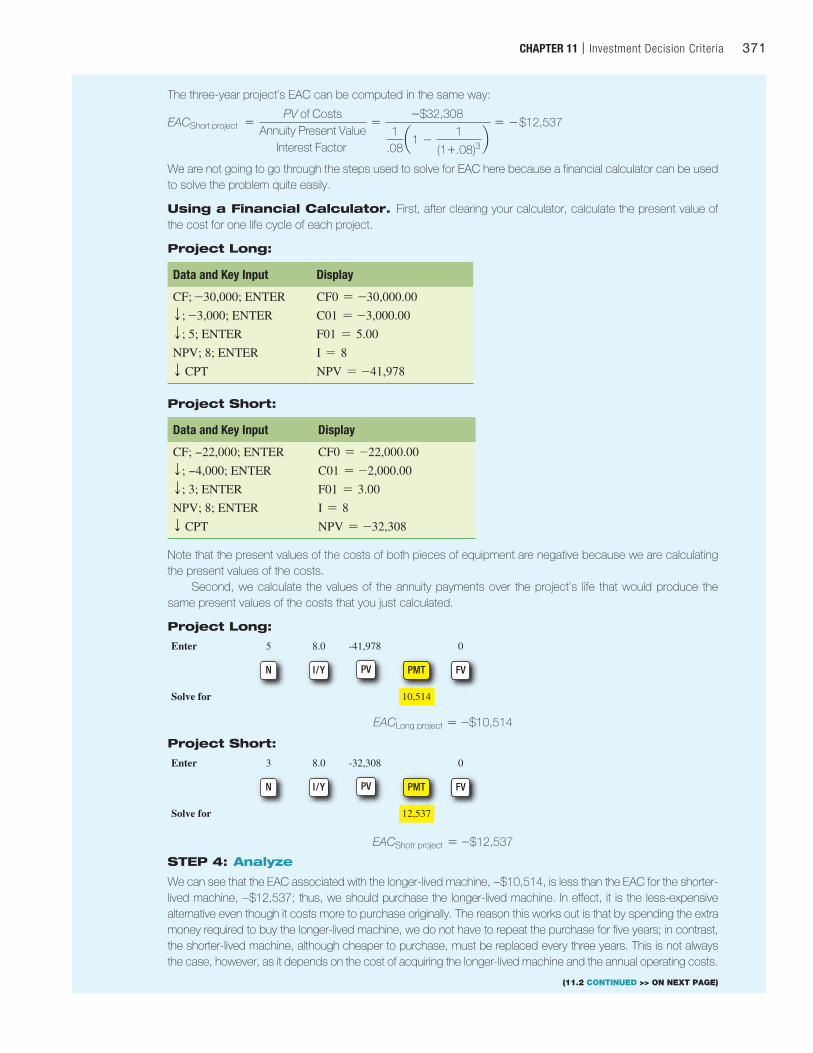
The three-year project’s EAC can be computed in the same way:
EACShort project =PV of Costs
Annuity Present ValueInterest Factor
=-$32,308
1.08
a1 -1
(1+ .08)3b
= - $12,537
We are not going to go through the steps used to solve for EAC here because a financial calculator can be used to solve the problem quite easily.
Using a Financial Calculator. First, after clearing your calculator, calculate the present value of the cost for one life cycle of each project.
Project Long:
Data and Key Input Display
CF; -30,000; ENTER
T ; -3,000; ENTER
T ; 5; ENTER
NPV; 8; ENTER
T CPT
CF0 = -30,000.00
C01 = -3,000.00
F01 = 5.00
I = 8
NPV = -41,978
Project Short:
Data and Key Input Display
CF; −22,000; ENTER
T ; −4,000; ENTER
T ; 3; ENTER
NPV; 8; ENTER
T CPT
CF0 = -22,000.00
C01 = -2,000.00
F01 = 3.00
I = 8
NPV = -32,308
Note that the present values of the costs of both pieces of equipment are negative because we are calculating the present values of the costs.
Second, we calculate the values of the annuity payments over the project’s life that would produce the same present values of the costs that you just calculated.
Project Long:
Enter 5 8.0
10,514
0-41,978
N I/Y PV PMT FV
Solve for
EACLong project = -$10,514
Project Short:
Enter 3 8.0
12,537
0-32,308
N I/Y PV PMT FV
Solve for
EACShotr project = -$12,537
STEP 4: Analyze
We can see that the EAC associated with the longer-lived machine, −$10,514, is less than the EAC for the shorter-lived machine, −$12,537; thus, we should purchase the longer-lived machine. In effect, it is the less-expensive alternative even though it costs more to purchase originally. The reason this works out is that by spending the extra money required to buy the longer-lived machine, we do not have to repeat the purchase for five years; in contrast, the shorter-lived machine, although cheaper to purchase, must be replaced every three years. This is not always the case, however, as it depends on the cost of acquiring the longer-lived machine and the annual operating costs.
(11.2 CONTINUED >> ON NEXT PAGE)
M11_TITM2189_13_GE_C11.indd 371 18/05/17 12:47 PM
372 PART 3 | Capital Budgeting
Tools of Financial Analysis—Equivalent Annual Cost (or Equivalent Annual Annuity)
Name of Tool Formula What It Tells You
Equivalent annual cost (EAC) or equivalent annual annuity (EAA)
EAC =PV of All Cash FlowsAnnuity Present Value
Interest Factor
=
CF0 +CF1
11 + k21 +CF2
11 + k22 + g +CFn
11 + k2n
a1k
-1
k11 + k2n b
=NPV
a1k
-1
k11 + k2n b
• An estimate of the annualized present value of a project’s cash flows.
• Where all project cash flows are negative, then the lower the EAC is, the less costly the project is to operate per year.
• For a normal project with positive future cash flows, the EAC is the annualized NPV of the project. This metric is sometimes used to compare projects that have different initial costs and different useful lives.
Before you move on to 11.3
Concept Check | 11.21. Describe what the NPV tells the analyst about a new investment opportunity.
2. What is the equivalent annual cost (EAC) measure, and when should it be used?
3. What is capital rationing?
11.3 Other Investment CriteriaAlthough the NPV investment criterion makes the most sense in theory, in practice financial managers use a number of criteria to evaluate investment opportunities. Criteria that we explore in this section include the profitability index, internal rate of return, modified internal rate of return, and payback period.
Profitability IndexThe profitability index (PI) is a cost-benefit ratio equal to the present value of an invest-ment’s future cash flows divided by its initial cost:3
ProfitabilityIndex 1PI2 = a Present Value of
Future Cash Flowsb , a Initial Cash
Outlayb
3While the initial outlay is a negative value because it is an outflow, we do not give it a negative sign in calculating the PI. Instead, the initial outlay is entered as a positive value, since we are interested only in the ratio of benefits to costs.
The EAC decision criterion is generally applied to mutually exclusive projects where the only difference is in the length of life and the costs. Thus, with the EAC we ignore cash inflows because they are identical. However, if the mutually exclusive projects produce different cash inflows, we can still use this technique, but rather than calculating the present value of each project’s costs (which would have a negative value), we calculate each project’s NPV (which should have a positive value) and select the project with the highest EAC.
STEP 5: Check yourself
What is the EAC for a machine that costs $50,000, requires an annual payment of $6,000 for maintenance and operation, and lasts for six years? You may assume that the discount rate is 9 percent and that there will be no salvage value associated with the machine. In addition, you intend to replace this machine at the end of its life with an identical machine with identical costs.
ANSWER: EAC = -$17,146.
Your Turn: For more practice, do related Study Problem 11–4 at the end of this chapter. >> END Checkpoint 11.2
M11_TITM2189_13_GE_C11.indd 372 18/05/17 12:47 PM
CHAPTER 11 | Investment Decision Criteria 373
ProfitabilityIndex 1PI2 =
Cash Flowfor Year 1 1CF12
a1 +DiscountRate 1k2 b
1 +
Cash Flowfor Year 2 1CF
22
a1 +DiscountRate 1k2 b
2 + g +
Cash Flowfor Year n 1CFn2a1 +
DiscountRate 1k2 b
n
Initial Cash Outlay 1-CF02
(11–3)
A PI greater than 1 indicates that the present value of the investment’s future cash flows ex-ceeds the cost of making the investment, so the investment should be accepted. For the condo investment we discussed in the introduction, the PI is equal to 1.087 = $100,000/$92,000.
Note that when computing the PI, we use a positive value for the initial cash outlay (CF0). This is done so that the PI is a positive ratio. Technically, because the initial outlay for most investments is a cash outflow, the sign on this number is negative.
The PI is closely related to the NPV because it uses the same inputs: the present value of the project’s future cash flows and the initial cash outlay. The PI is a ratio of these two quanti-ties, and the NPV is the difference between them:
ProfitabilityIndex 1PI2 =
Present Value ofFuture Cash Flows
,Initial Cash
Outlayand
Net PresentValue (NPV)
=Present Value of
Future Cash Flows-
Initial CashOutlay
NPV Decision Criterion: When the PI is greater than 1, the NPV will be positive, so the project should be accepted. When the PI is less than 1, the NPV will be negative, which indicates a bad investment, so the project should be rejected.
or
The PI of an investment is always greater than 1 for all positive-NPV projects and is always less than 1 for all negative-NPV projects. Thus, for independent projects, the NPV criterion and the PI criterion are exactly the same. However, for mutually exclusive projects that have different costs, the criteria may provide different rankings. For example, suppose that Project 1 costs $200,000 and has future cash flows with a present value of $250,000 and that Project 2 costs $500,000 and has future cash flows with a present value of $600,000. Project 2 has the higher NPV: $100,000 versus $50,000 for Project 1. But Project 1 has the higher PI: 1.25 versus 1.20 for Project 2.
Firms with easy access to capital prefer the NPV criterion because it measures the amount of wealth created by the investment. However, if the firm’s management have a limited amount of capital and cannot undertake all of its positive-NPV investments, the PI offers a useful way to rank investment opportunities to determine which ones to accept. The PI is useful in this setting because, unlike the NPV, it measures the amount of wealth created per dollar invested.
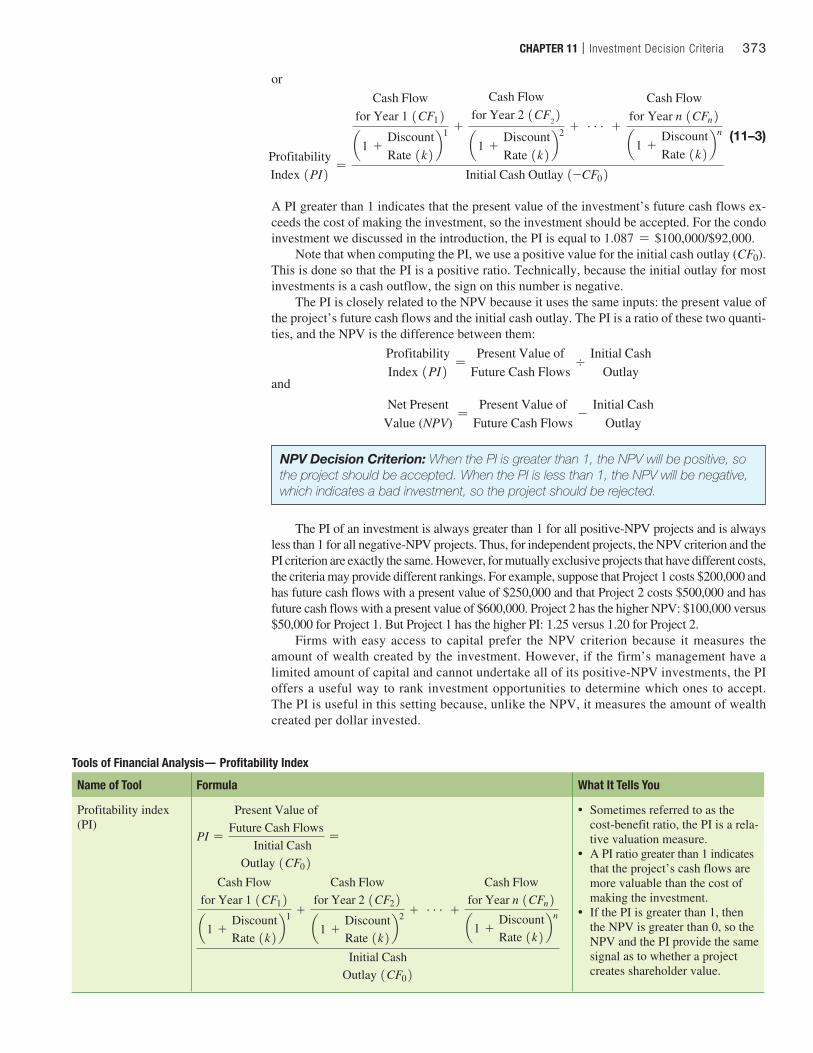
Tools of Financial Analysis— Profitability Index
Name of Tool Formula What It Tells You
Profitability index (PI)
PI =
Present Value ofFuture Cash Flows
Initial CashOutlay 1CF02
=
Cash Flowfor Year 1 1CF12
a1 +DiscountRate 1k2 b
1 +
Cash Flowfor Year 2 1CF22
a1 +DiscountRate 1k2 b
2 + g +
Cash Flowfor Year n 1CFn2
a1 +DiscountRate 1k2 b
n
Initial CashOutlay 1CF02
• Sometimes referred to as the cost-benefit ratio, the PI is a rela-tive valuation measure.
• A PI ratio greater than 1 indicates that the project’s cash flows are more valuable than the cost of making the investment.
• If the PI is greater than 1, then the NPV is greater than 0, so the NPV and the PI provide the same signal as to whether a project creates shareholder value.
M11_TITM2189_13_GE_C11.indd 373 18/05/17 12:47 PM
374 PART 3 | Capital Budgeting
Internal Rate of ReturnThe internal rate of return (IRR) of an investment is analogous to the yield to maturity (YTM) on a bond, which we defined in Chapter 9. Specifically, the IRR is the discount rate that results in a zero NPV for the project. For example, if you invest $100 today in a project expected to return $120 in one year, the IRR for the investment is 20 percent. We can show that this is correct by discounting the $120 cash flow one year at 20 percent, which results in a present value equal to the initial cash outlay of $100 (CF0 = -100). The result, then, is an NPV of zero.
Net PresentValue
=Cash Flow
for Year 0 1CF02+
Cash Flowfor Year 1 1CF12
a1 +Internal Rate
of Return 1IRR2 b1 = 0
0 = -$100 +$120
11 + IRR2
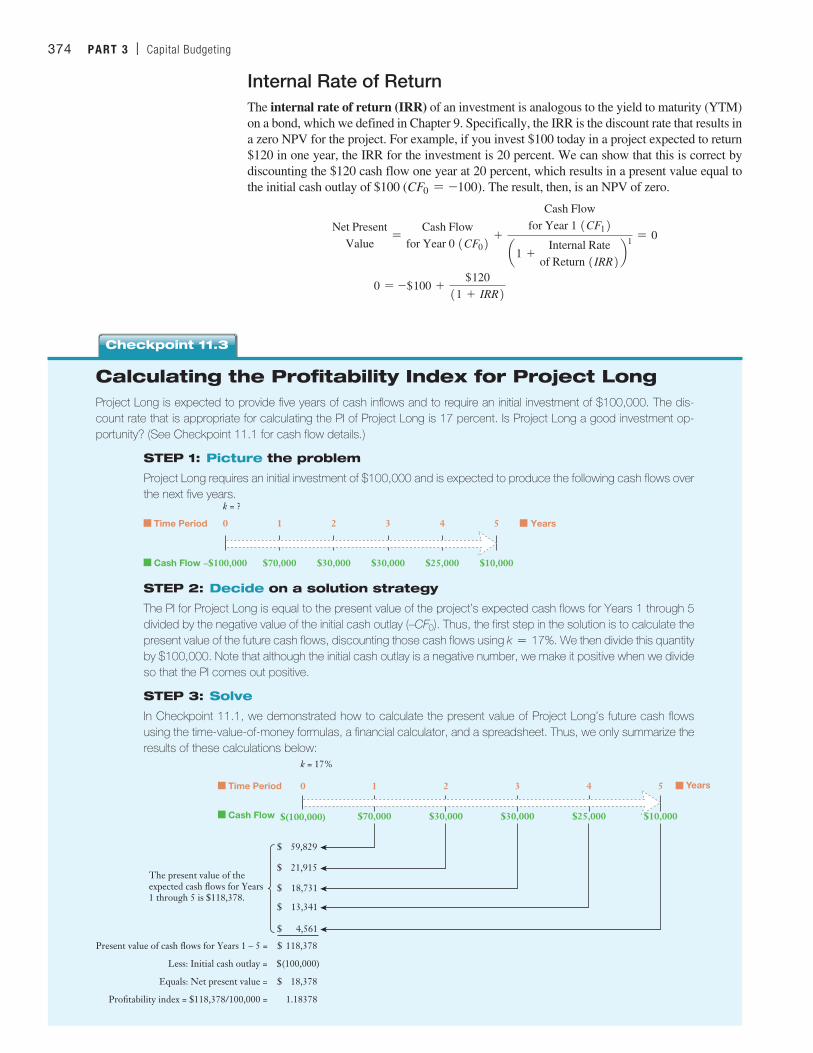
Calculating the Profitability Index for Project LongProject Long is expected to provide five years of cash inflows and to require an initial investment of $100,000. The dis-count rate that is appropriate for calculating the PI of Project Long is 17 percent. Is Project Long a good investment op-portunity? (See Checkpoint 11.1 for cash flow details.)
STEP 1: Picture the problem
Project Long requires an initial investment of $100,000 and is expected to produce the following cash flows over the next five years.
–$100,000 $70,000 $30,000 $30,000 $25,000 $10,000
0 1 2 3 4 5Time Period
Cash Flow
Years
k = ?
STEP 2: Decide on a solution strategy
The PI for Project Long is equal to the present value of the project’s expected cash flows for Years 1 through 5 divided by the negative value of the initial cash outlay (–CF0). Thus, the first step in the solution is to calculate the present value of the future cash flows, discounting those cash flows using k = 17%. We then divide this quantity by $100,000. Note that although the initial cash outlay is a negative number, we make it positive when we divide so that the PI comes out positive.
STEP 3: Solve
In Checkpoint 11.1, we demonstrated how to calculate the present value of Project Long’s future cash flows using the time-value-of-money formulas, a financial calculator, and a spreadsheet. Thus, we only summarize the results of these calculations below:
Time Period
Cash Flow $(100,000) $25,000$30,000
0 1 3 Years4
$30,000$70,000
2
$10,000
5
$ 59,829
$ 21,915
$ 18,731
$ 13,341
$ 4,561
Present value of cash flows for Years 1 – 5 = $ 118,378
Less: Initial cash outlay = $(100,000)
Equals: Net present value = $ 18,378
Profitability index = $118,378/100,000 = 1.18378
The present value of the expected cash flows for Years 1 through 5 is $118,378.
k = 17%
Checkpoint 11.3
M11_TITM2189_13_GE_C11.indd 374 18/05/17 12:47 PM
CHAPTER 11 | Investment Decision Criteria 375
For investments that offer more than one year of expected cash flows, the calculation is a bit more tedious. Mathematically, we solve for the internal rate of return for a multiple-period investment by solving for IRR, which is the unknown discount rate in the following equation that makes the present value of the investment cash flows (the initial outlay and future cash flows) equal to zero. In other words, using the IRR as the discount rate makes the NPV equal to zero:
Net PresentValue
=Cash Flow
for Year 0 1CF02 +
Cash Flowfor Year 1 1CF12
a1 +Internal Rate
of Return 1IRR2 b1 +
Cash Flowfor Year 2 1CF22
a1 +Internal Rate
of Return 1IRR2 b2
+ g +
Cash Flowfor Year n 1CFn2
a1 +Internal Rate
of Return 1IRR2 bn = 0 (11–4)
Solving for IRR when there are multiple future periods can be done in several ways, which we demonstrate in Checkpoint 11.4.
IRR Decision Criterion: Accept the project if the IRR is greater than the required rate of return or discount rate used to calculate the net present value of the project, and reject it otherwise.
STEP 4: Analyze
Project Long requires an initial investment of $100,000 and provides future cash flows that have a present value of $118,378. Consequently, the project’s future cash flows are worth 1.18378 times the initial investment. Be-cause the project’s future cash flows are worth more than the initial cash outlay required to create the investment, this is an acceptable project.
STEP 5: Check yourself
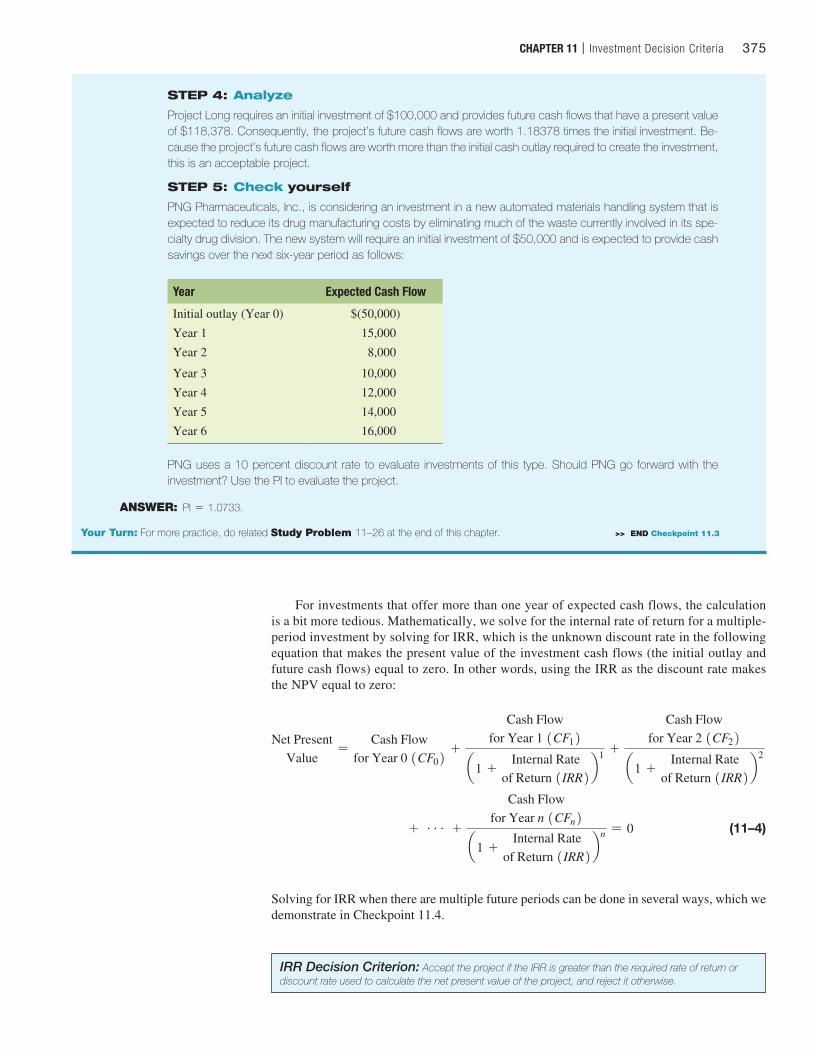
PNG Pharmaceuticals, Inc., is considering an investment in a new automated materials handling system that is expected to reduce its drug manufacturing costs by eliminating much of the waste currently involved in its spe-cialty drug division. The new system will require an initial investment of $50,000 and is expected to provide cash savings over the next six-year period as follows:
Year Expected Cash Flow
Initial outlay (Year 0) $(50,000)
Year 1 15,000
Year 2 8,000
Year 3 10,000
Year 4 12,000
Year 5 14,000
Year 6 16,000
PNG uses a 10 percent discount rate to evaluate investments of this type. Should PNG go forward with the investment? Use the PI to evaluate the project.
ANSWER: PI = 1.0733.
Your Turn: For more practice, do related Study Problem 11–26 at the end of this chapter. >> END Checkpoint 11.3
M11_TITM2189_13_GE_C11.indd 375 18/05/17 12:47 PM
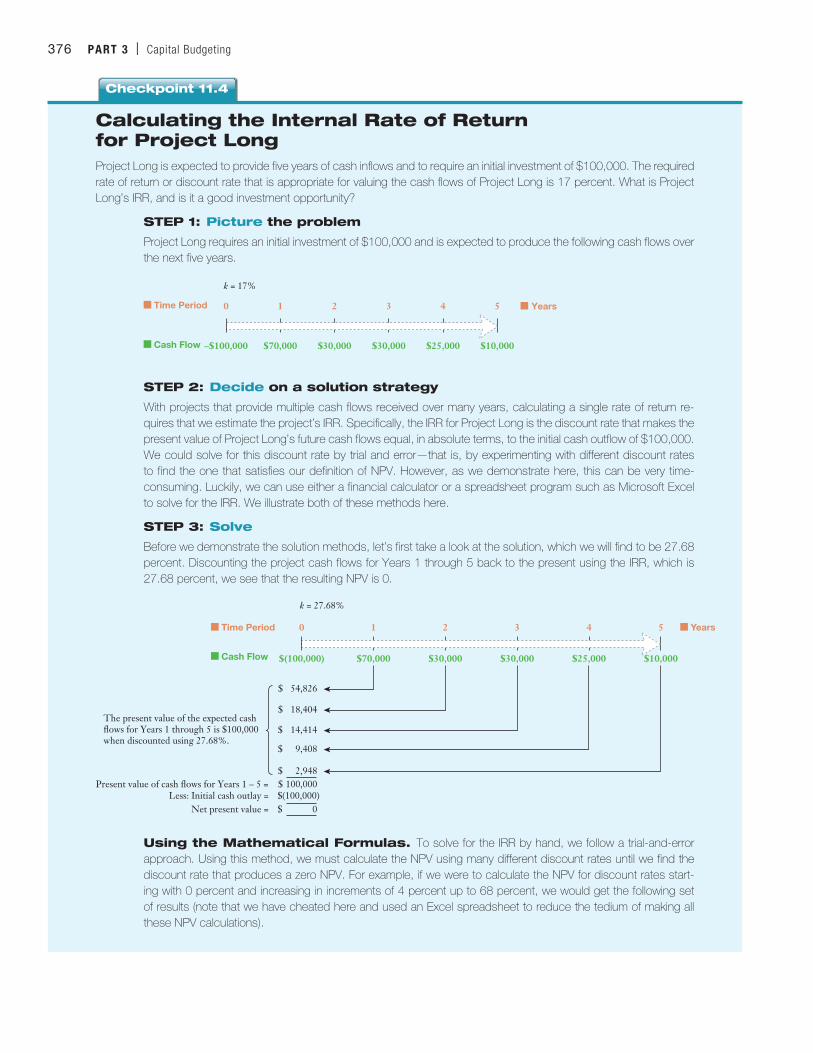
Calculating the Internal Rate of Return for Project LongProject Long is expected to provide five years of cash inflows and to require an initial investment of $100,000. The required rate of return or discount rate that is appropriate for valuing the cash flows of Project Long is 17 percent. What is Project Long’s IRR, and is it a good investment opportunity?
STEP 1: Picture the problem
Project Long requires an initial investment of $100,000 and is expected to produce the following cash flows over the next five years.
–$100,000 $70,000 $30,000 $30,000 $25,000 $10,000
0 1 2 3
k = 17%
4 5Time Period
Cash Flow
Years
STEP 2: Decide on a solution strategy
With projects that provide multiple cash flows received over many years, calculating a single rate of return re-quires that we estimate the project’s IRR. Specifically, the IRR for Project Long is the discount rate that makes the present value of Project Long’s future cash flows equal, in absolute terms, to the initial cash outflow of $100,000. We could solve for this discount rate by trial and error—that is, by experimenting with different discount rates to find the one that satisfies our definition of NPV. However, as we demonstrate here, this can be very time-consuming. Luckily, we can use either a financial calculator or a spreadsheet program such as Microsoft Excel to solve for the IRR. We illustrate both of these methods here.
STEP 3: Solve
Before we demonstrate the solution methods, let’s first take a look at the solution, which we will find to be 27.68 percent. Discounting the project cash flows for Years 1 through 5 back to the present using the IRR, which is 27.68 percent, we see that the resulting NPV is 0.
Time Period
Cash Flow $(100,000) $25,000$30,000
0 1 3 Years4
$30,000$70,000
2
$10,000
5
$ 54,826
$ 18,404
$ 14,414
$ 9,408
$ 2,948Present value of cash flows for Years 1 – 5 = $ 100,000
Less: Initial cash outlay = $(100,000)Net present value = $ 0
The present value of the expected cash flows for Years 1 through 5 is $100,000 when discounted using 27.68%.
k = 27.68%
Using the Mathematical Formulas. To solve for the IRR by hand, we follow a trial-and-error approach. Using this method, we must calculate the NPV using many different discount rates until we find the discount rate that produces a zero NPV. For example, if we were to calculate the NPV for discount rates start-ing with 0 percent and increasing in increments of 4 percent up to 68 percent, we would get the following set of results (note that we have cheated here and used an Excel spreadsheet to reduce the tedium of making all these NPV calculations).
Checkpoint 11.4
376 PART 3 | Capital Budgeting
M11_TITM2189_13_GE_C11.indd 376 18/05/17 12:47 PM
CHAPTER 11 | Investment Decision Criteria 377
Discount rate
NPV profile for Project Long
$(60,000)
$(40,000)
$(20,000)
$0
$20,000
$40,000
$60,000
$80,000
0% 10% 20% 30% 40% 50% 60% 70% 80%
Net
pre
sent
val
ue
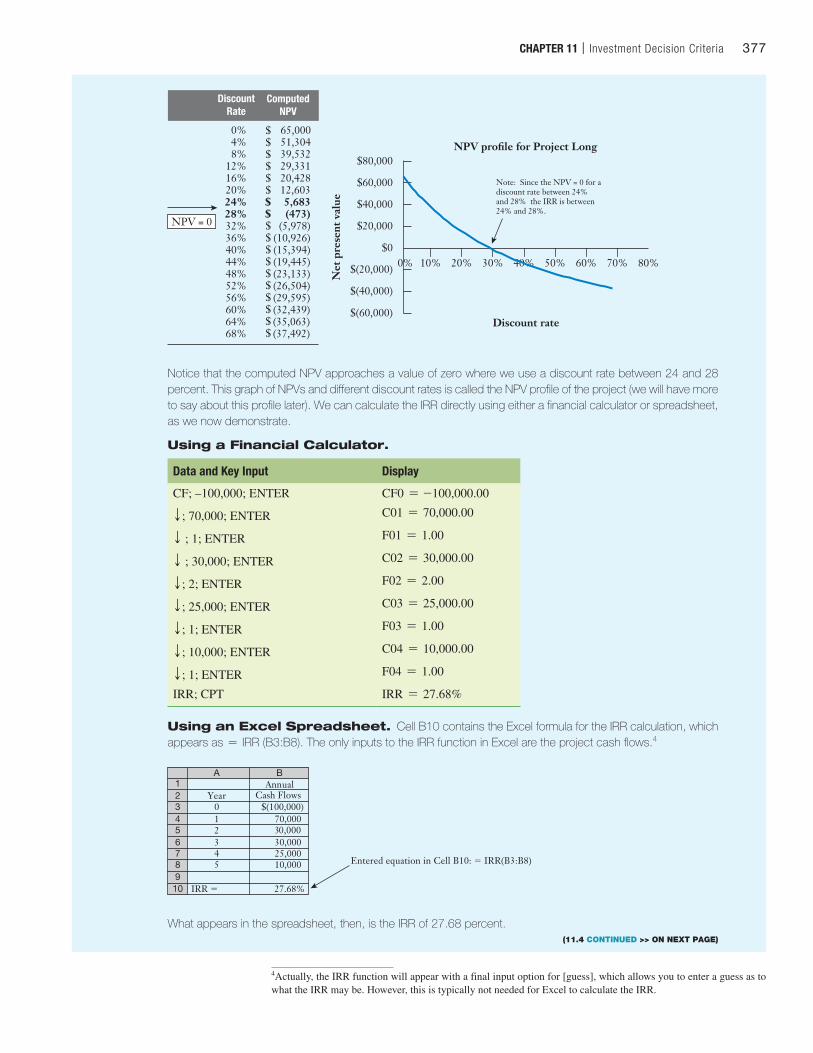
0% 65,000 4% 51,304 8% 39,532 12% 29,331 16% 20,428 20% 12,603 24% 5,683 28% (473) 32% (5,978) 36% (10,926) 40% (15,394) 44% (19,445) 48% (23,133) 52% (26,504) 56% (29,595) 60% (32,439) 64% (35,063) 68% (37,492)
DiscountRate
NPV = 0
$$$$$$$$$$$$$$$$$$
ComputedNPV
Note: Since the NPV = 0 for a discount rate between 24%and 28% the IRR is between 24% and 28%.
Notice that the computed NPV approaches a value of zero where we use a discount rate between 24 and 28 percent. This graph of NPVs and different discount rates is called the NPV profile of the project (we will have more to say about this profile later). We can calculate the IRR directly using either a financial calculator or spreadsheet, as we now demonstrate.
Using a Financial Calculator.
Data and Key Input Display
CF; –100,000; ENTER CF0 = -100,000.00
T ; 70,000; ENTER C01 = 70,000.00
T ; 1; ENTER F01 = 1.00
T ; 30,000; ENTER C02 = 30,000.00
T ; 2; ENTER F02 = 2.00
T ; 25,000; ENTER C03 = 25,000.00
T ; 1; ENTER F03 = 1.00
T ; 10,000; ENTER C04 = 10,000.00
T ; 1; ENTER F04 = 1.00
IRR; CPT IRR = 27.68%
Using an Excel Spreadsheet. Cell B10 contains the Excel formula for the IRR calculation, which appears as = IRR (B3:B8). The only inputs to the IRR function in Excel are the project cash flows.4
A BAnnual
Year Cash Flows 0 $(100,000)1 70,0002 30,0003 30,0004 25,0005 10,000
123456789
10 IRR 5 27.68%
Entered equation in Cell B10: 5 IRR(B3:B8)
What appears in the spreadsheet, then, is the IRR of 27.68 percent.
4Actually, the IRR function will appear with a final input option for [guess], which allows you to enter a guess as to what the IRR may be. However, this is typically not needed for Excel to calculate the IRR.
(11.4 CONTINUED >> ON NEXT PAGE)
M11_TITM2189_13_GE_C11.indd 377 18/05/17 12:47 PM
378 PART 3 | Capital Budgeting
Complications with the IRR: Multiple Rates of ReturnAn investment project will always have only one NPV. However, in some situations an invest-ment project can have more than one IRR. We can trace the reasons for this to the calculations involved in determining the IRR. In Equation (11–4), we defined the IRR as the discount rate that results in an NPV calculation of zero:
NPV = CF0 +CF1
11 + IRR21 +CF2
11 + IRR22 +CF3
11 + IRR23 + g+ CFn
11 + IRR2n = 0 (11–4)
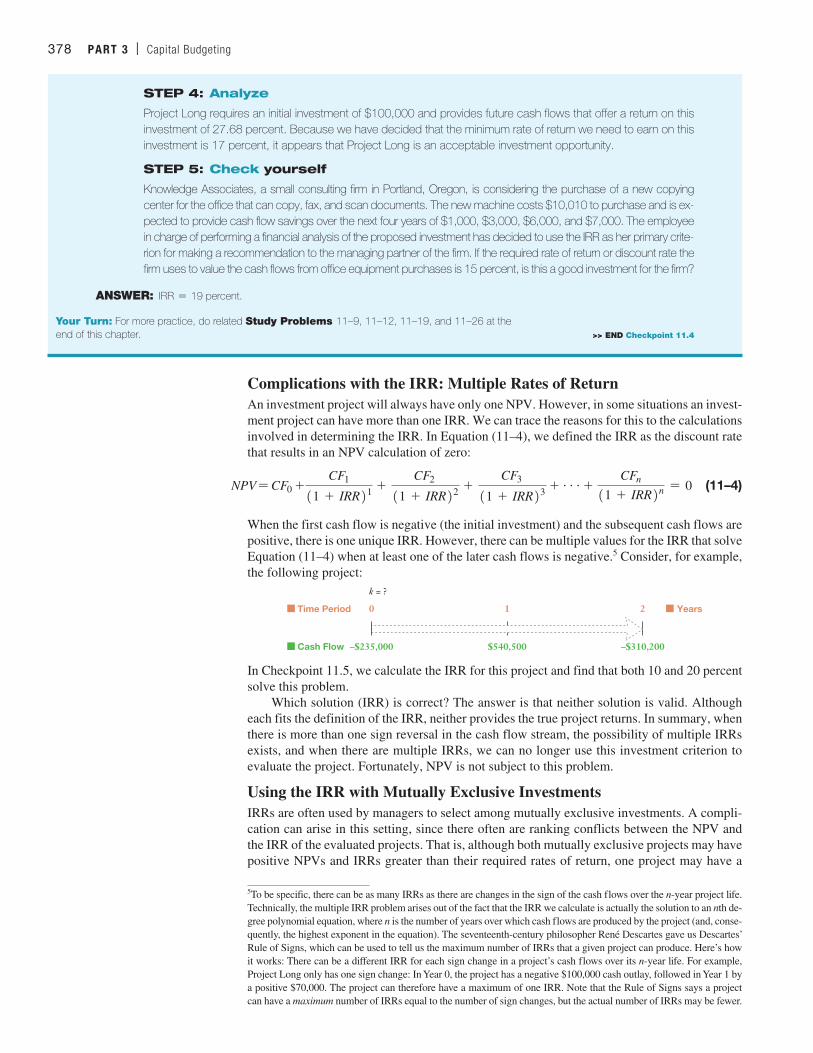
When the first cash flow is negative (the initial investment) and the subsequent cash flows are positive, there is one unique IRR. However, there can be multiple values for the IRR that solve Equation (11–4) when at least one of the later cash flows is negative.5 Consider, for example, the following project:
–$235,000 $540,500 –$310,200
0 1 2Time Period
Cash Flow
Years
k = ?
In Checkpoint 11.5, we calculate the IRR for this project and find that both 10 and 20 percent solve this problem.
Which solution (IRR) is correct? The answer is that neither solution is valid. Although each fits the definition of the IRR, neither provides the true project returns. In summary, when there is more than one sign reversal in the cash flow stream, the possibility of multiple IRRs exists, and when there are multiple IRRs, we can no longer use this investment criterion to evaluate the project. Fortunately, NPV is not subject to this problem.
Using the IRR with Mutually Exclusive InvestmentsIRRs are often used by managers to select among mutually exclusive investments. A compli-cation can arise in this setting, since there often are ranking conflicts between the NPV and the IRR of the evaluated projects. That is, although both mutually exclusive projects may have positive NPVs and IRRs greater than their required rates of return, one project may have a
5To be specific, there can be as many IRRs as there are changes in the sign of the cash flows over the n-year project life. Technically, the multiple IRR problem arises out of the fact that the IRR we calculate is actually the solution to an nth de-gree polynomial equation, where n is the number of years over which cash flows are produced by the project (and, conse-quently, the highest exponent in the equation). The seventeenth-century philosopher René Descartes gave us Descartes’ Rule of Signs, which can be used to tell us the maximum number of IRRs that a given project can produce. Here’s how it works: There can be a different IRR for each sign change in a project’s cash flows over its n-year life. For example, Project Long only has one sign change: In Year 0, the project has a negative $100,000 cash outlay, followed in Year 1 by a positive $70,000. The project can therefore have a maximum of one IRR. Note that the Rule of Signs says a project can have a maximum number of IRRs equal to the number of sign changes, but the actual number of IRRs may be fewer.
STEP 4: Analyze
Project Long requires an initial investment of $100,000 and provides future cash flows that offer a return on this investment of 27.68 percent. Because we have decided that the minimum rate of return we need to earn on this investment is 17 percent, it appears that Project Long is an acceptable investment opportunity.
STEP 5: Check yourself
Knowledge Associates, a small consulting firm in Portland, Oregon, is considering the purchase of a new copying center for the office that can copy, fax, and scan documents. The new machine costs $10,010 to purchase and is ex-pected to provide cash flow savings over the next four years of $1,000, $3,000, $6,000, and $7,000. The employee in charge of performing a financial analysis of the proposed investment has decided to use the IRR as her primary crite-rion for making a recommendation to the managing partner of the firm. If the required rate of return or discount rate the firm uses to value the cash flows from office equipment purchases is 15 percent, is this a good investment for the firm?
ANSWER: IRR = 19 percent.
Your Turn: For more practice, do related Study Problems 11–9, 11–12, 11–19, and 11–26 at the end of this chapter. >> END Checkpoint 11.4
M11_TITM2189_13_GE_C11.indd 378 18/05/17 12:47 PM
CHAPTER 11 | Investment Decision Criteria 379
higher NPV, whereas the other has a higher IRR. When this is the case, which criterion should we go with, the higher NPV or the higher IRR?
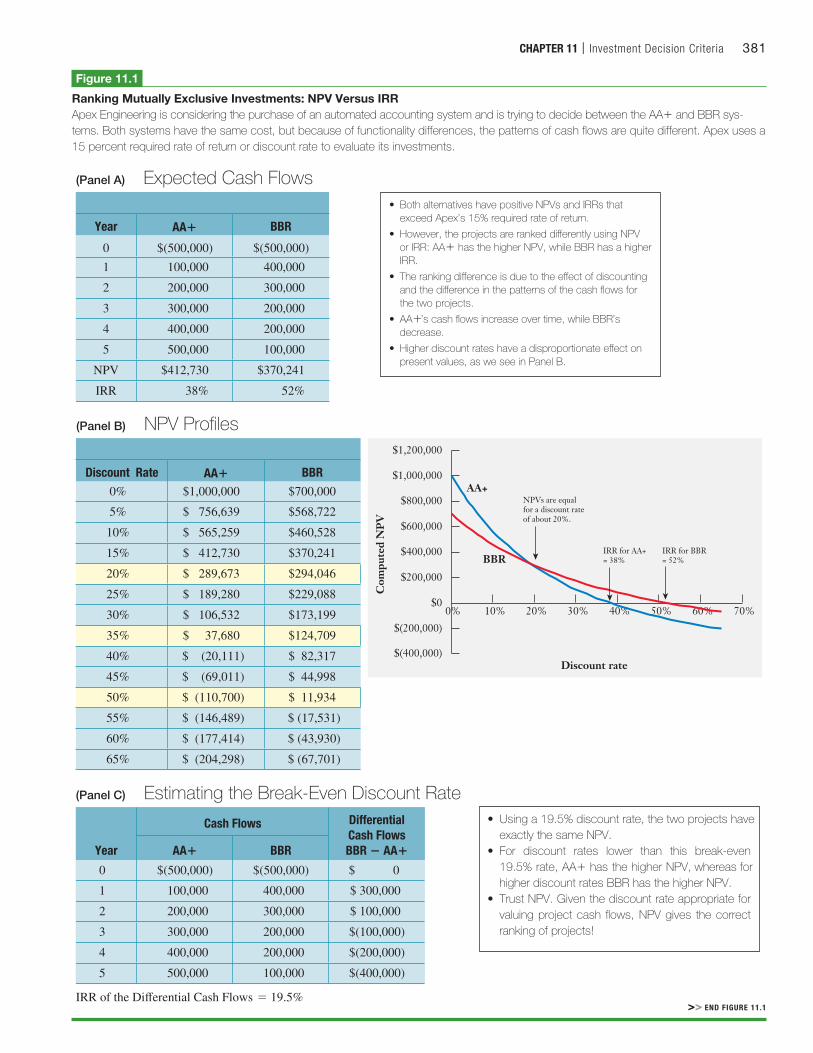
For example, Apex Engineering is considering the purchase of an automated accounting system. Two software systems are being considered that will perform the same functions, Automated Accounting Plus (AA+ ) and Business Basics Reporting (BBR). The cash flows from the AA+ system grow over time because this system offers the user the opportunity to expand functionality. The cash flows for the BBR system, on the other hand, decline over time as the initial cost savings are captured in the early years of implementation. The expected cash flows of the two systems are found in Panel A of Figure 11.1.
Note that both accounting systems provide positive NPVs using the firm’s 15 percent discount rate or required rate of return. This suggests that one of the two systems should in-deed be purchased. However, the AA+ system, which offers an NPV of $412,730 compared to $370,241 for the BBR alternative, has the lower IRR (38 percent compared to 52 percent). Why do the two criteria provide different answers? It is because the larger cash flows come earlier for the BBR system. The BBR system earns a very high return—but over a shorter period of time. The fact that the BBR system uses the firm’s capital over a shorter time period may be relevant if there are constraints on the firm’s ability to raise capital (that is, if capital is being rationed). However, if the firm has unlimited access to external capital markets, the project with the higher NPV should be chosen.
To examine this more closely, we will look at each project’s NPV profile, a graph of its NPV using required rates of return ranging from 0 percent to 65 percent. As shown in Panel B of Figure 11.1, for discount rates below 19.5 percent, the AA+ system offers higher NPVs, and for higher discount rates, the BBR system has higher NPVs. This implies that if the appropriate required rate of return for the projects is less than 19.5 percent and the firm is not capital-constrained, the AA+ system should be taken. However, if the firm is capital-constrained and is likely to have opportunities with IRRs greater than 19.5 percent in the near future, it may want to take the BBR system, which allows it to recover its capital sooner.
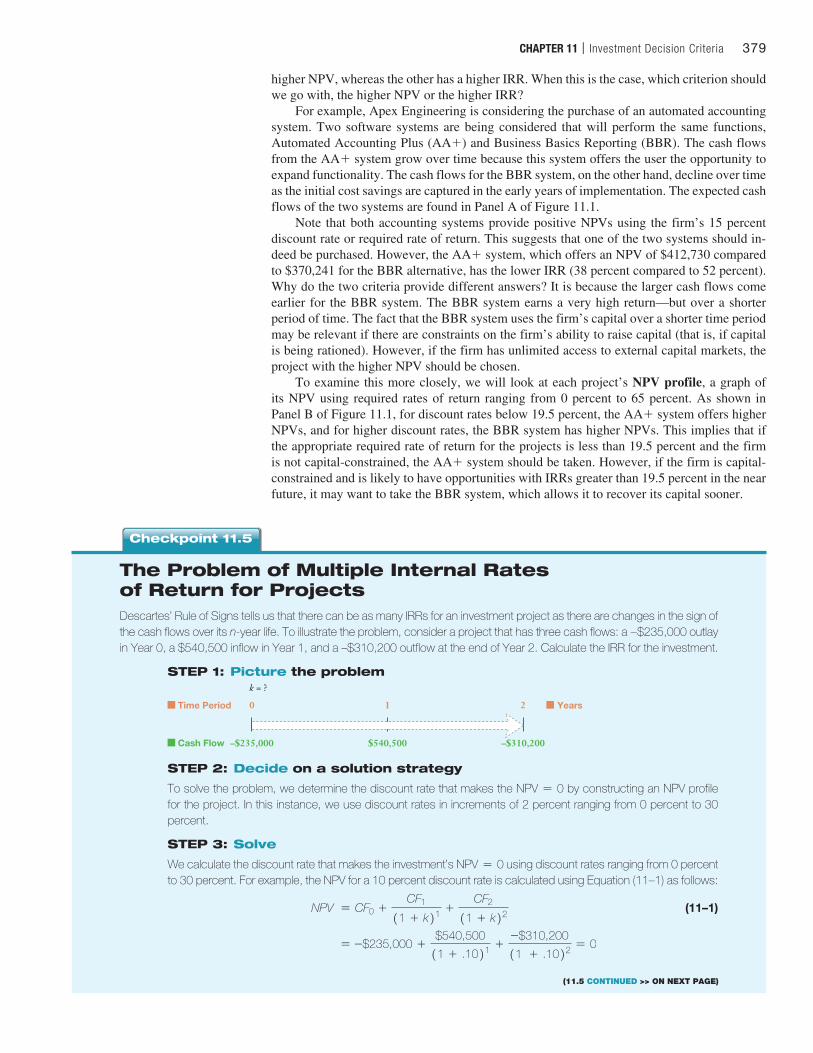
The Problem of Multiple Internal Rates of Return for ProjectsDescartes’ Rule of Signs tells us that there can be as many IRRs for an investment project as there are changes in the sign of the cash flows over its n-year life. To illustrate the problem, consider a project that has three cash flows: a −$235,000 outlay in Year 0, a $540,500 inflow in Year 1, and a –$310,200 outflow at the end of Year 2. Calculate the IRR for the investment.
STEP 1: Picture the problem
–$235,000 $540,500 –$310,200
0 1 2Time Period
Cash Flow
Years
k = ?
STEP 2: Decide on a solution strategy
To solve the problem, we determine the discount rate that makes the NPV = 0 by constructing an NPV profile for the project. In this instance, we use discount rates in increments of 2 percent ranging from 0 percent to 30 percent.
STEP 3: Solve
We calculate the discount rate that makes the investment’s NPV = 0 using discount rates ranging from 0 percent to 30 percent. For example, the NPV for a 10 percent discount rate is calculated using Equation (11–1) as follows:
NPV = CF0 +CF1
11 + k21 +CF2
11 + k22 (11–1)
= -$235,000 +$540,500
11 + .1021 +-$310,200
11 + .1022 = 0
Checkpoint 11.5
(11.5 CONTINUED >> ON NEXT PAGE)
M11_TITM2189_13_GE_C11.indd 379 18/05/17 12:47 PM
380 PART 3 | Capital Budgeting
(5,000)
(4,000)
(3,000)
(2,000)
(1,000)
0
$1,000
0% 5% 10% 15% 20% 25% 30% 35%
Net
pre
sent
val
ueRequired rate of return
IRR = 10%
Net PresentValue
Discount Rate
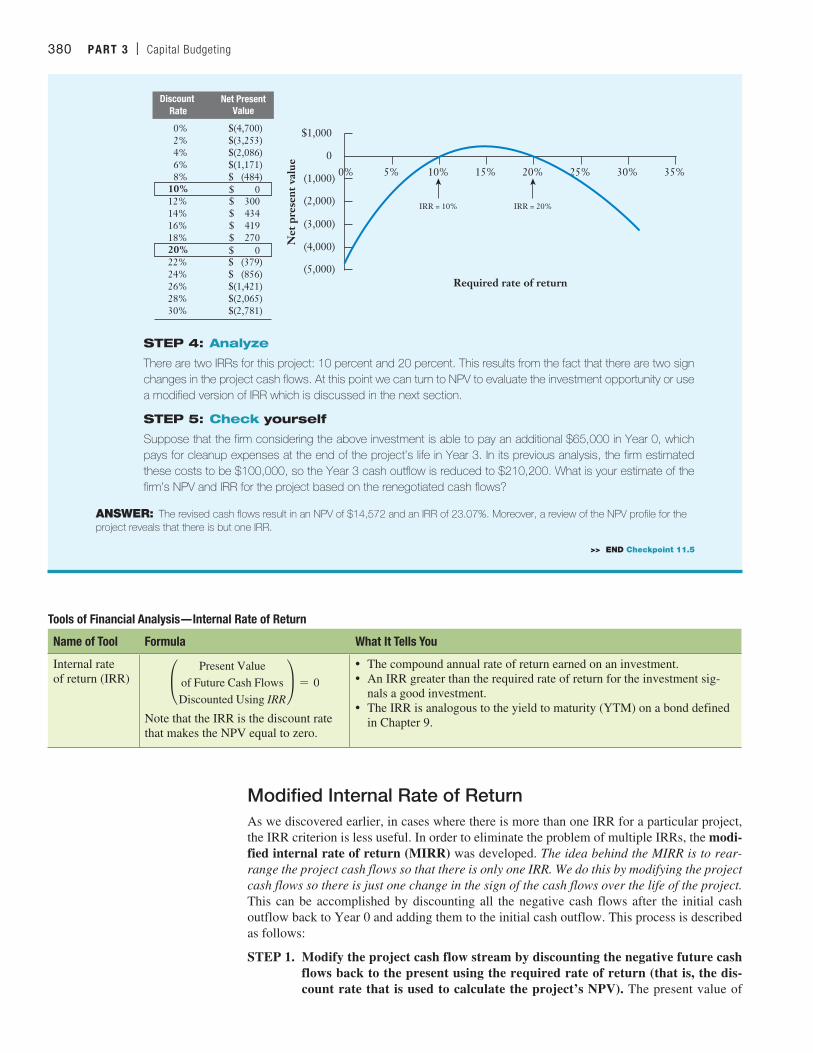
0% $(4,700)2% $(3,253)4% $(2,086)6% $(1,171)8% $ (484)
$ 0
$ 0
10%12% $ 30014% $ 43416% $ 41918% $ 27020%22% $ (379)24% $ (856)26% $(1,421)28% $(2,065)30% $(2,781)
IRR = 20%
STEP 4: Analyze
There are two IRRs for this project: 10 percent and 20 percent. This results from the fact that there are two sign changes in the project cash flows. At this point we can turn to NPV to evaluate the investment opportunity or use a modified version of IRR which is discussed in the next section.
STEP 5: Check yourself
Suppose that the firm considering the above investment is able to pay an additional $65,000 in Year 0, which pays for cleanup expenses at the end of the project’s life in Year 3. In its previous analysis, the firm estimated these costs to be $100,000, so the Year 3 cash outflow is reduced to $210,200. What is your estimate of the firm’s NPV and IRR for the project based on the renegotiated cash flows?
ANSWER: The revised cash flows result in an NPV of $14,572 and an IRR of 23.07%. Moreover, a review of the NPV profile for the project reveals that there is but one IRR.
>> END Checkpoint 11.5
Tools of Financial Analysis—Internal Rate of Return
Name of Tool Formula What It Tells You
Internal rate of return (IRR) °
Present Valueof Future Cash FlowsDiscounted Using IRR
¢ = 0
Note that the IRR is the discount rate that makes the NPV equal to zero.
• The compound annual rate of return earned on an investment.• An IRR greater than the required rate of return for the investment sig-
nals a good investment.• The IRR is analogous to the yield to maturity (YTM) on a bond defined
in Chapter 9.
Modified Internal Rate of ReturnAs we discovered earlier, in cases where there is more than one IRR for a particular project, the IRR criterion is less useful. In order to eliminate the problem of multiple IRRs, the modi-fied internal rate of return (MIRR) was developed. The idea behind the MIRR is to rear-range the project cash flows so that there is only one IRR. We do this by modifying the project cash flows so there is just one change in the sign of the cash flows over the life of the project. This can be accomplished by discounting all the negative cash flows after the initial cash outflow back to Year 0 and adding them to the initial cash outflow. This process is described as follows:
STEP 1. Modify the project cash flow stream by discounting the negative future cash flows back to the present using the required rate of return (that is, the dis-count rate that is used to calculate the project’s NPV). The present value of
M11_TITM2189_13_GE_C11.indd 380 18/05/17 12:47 PM
CHAPTER 11 | Investment Decision Criteria 381
(Panel A) Expected Cash Flows• Both alternatives have positive NPVs and IRRs that
exceed Apex’s 15% required rate of return.
• However, the projects are ranked di�erently using NPV or IRR: AA has the higher NPV, while BBR has a higher IRR.
• The ranking di�erence is due to the e�ect of discounting and the di�erence in the patterns of the cash flows for the two projects.
• AA ’s cash flows increase over time, while BBR’s decrease.
• Higher discount rates have a disproportionate e�ect on present values, as we see in Panel B.
• Using a 19.5% discount rate, the two projects have exactly the same NPV.
• For discount rates lower than this break-even 19.5% rate, AA has the higher NPV, whereas forhigher discount rates BBR has the higher NPV.
• Trust NPV. Given the discount rate appropriate for valuing project cash flows, NPV gives the correct ranking of projects!
Year AA BBR
0 $(500,000) $(500,000)
1 100,000 400,000
2 200,000 300,000
3 300,000 200,000
4 400,000 200,000
5 500,000 100,000
NPV $412,730 $370,241
IRR 38% 52%
Year AA BBR
Di�erentialCash FlowsBBR AA
0 $(500,000) $(500,000) $ 0
1 100,000 400,000 $ 300,000
2 200,000 300,000 $ 100,000
3 300,000 200,000 $(100,000)
4 400,000 200,000 $(200,000)
5 500,000 100,000 $(400,000)
Discount Rate AA BBR0% $1,000,000 $700,000
5% $ 756,639 $568,722
10% $ 565,259 $460,528
15% $ 412,730 $370,241
20% $ 289,673 $294,046
25% $ 189,280 $229,088
30% $ 106,532 $173,199
35% $ 37,680 $124,709
40% $ (20,111) $ 82,317
45% $ (69,011) $ 44,998
50% $ (110,700) $ 11,934
55% $ (146,489) $ (17,531)
60% $ (177,414) $ (43,930)
65% $ (204,298) $ (67,701)
Cash Flows
(Panel B) NPV Profiles
(Panel C) Estimating the Break-Even Discount Rate
IRR of the Di�erential Cash Flows 19.5%
0% 10% 20% 30% 40% 50% 60% 70%
$(400,000)
$(200,000)
$0
$200,000
$400,000
$600,000
$800,000
$1,000,000
$1,200,000
Discount rate
Com
pute
d N
PV
AA+
BBRIRR for BBR = 52%
NPVs are equal for a discount rateof about 20%.
IRR for AA+= 38%
>> END FIGURE 11.1
Figure 11.1
Ranking Mutually Exclusive Investments: NPV Versus IRRApex Engineering is considering the purchase of an automated accounting system and is trying to decide between the AA+ and BBR sys-tems. Both systems have the same cost, but because of functionality differences, the patterns of cash flows are quite different. Apex uses a 15 percent required rate of return or discount rate to evaluate its investments.
M11_TITM2189_13_GE_C11.indd 381 18/05/17 12:47 PM
382 PART 3 | Capital Budgeting
these future negative cash flows is then added to the initial outlay to form a modi-fied project cash flow stream in which all the cash outflows have been moved back to Year 0.
STEP 2. Calculate the MIRR as the IRR of the modified cash flow stream. We add the “modified” to IRR because the MIRR is based on a modified set of cash flows.
Let’s reconsider Checkpoint 11.5, where there were two sign changes. Checkpoint 11.6 illustrates how we can eliminate the sign changes by discounting the negative cash flow in Year 2 back to the present and combining it with the Year 0 initial cash outlay. The IRR of the modified cash flows, or MIRR, of 12.07 percent exceeds the 12 percent required rate of return or discount rate used to value the project cash flows, which indicates the project is a good one.
To close our discussion of the MIRR, here are some summary points and caveats con-cerning its use:
• There is more than one way to compute the MIRR, and each method can potentially result in a different value for the MIRR. In our example, we discounted the project’s negative cash flows back to the present using the project’s required rate of return and then computed the MIRR from the modified cash flows. An alternative is to discount the negative future cash flows to the present using the risk-free rate, which has the effect of increasing the present value of the negative cash flows and thus lowering the IRR of the entire cash flow stream. Some analysts prefer this approach because it reduces the level of the MIRR and thereby provides a more conservative criterion when the cost of capital is high and the cash flows are very uncertain.
• The NPV is our capital-budgeting method of choice. Unlike the IRR criterion, the NPV approach is always straightforward and provides an estimate of the dollar value created by investing in the project. This is true whether or not a unique estimate of the IRR can be calculated.
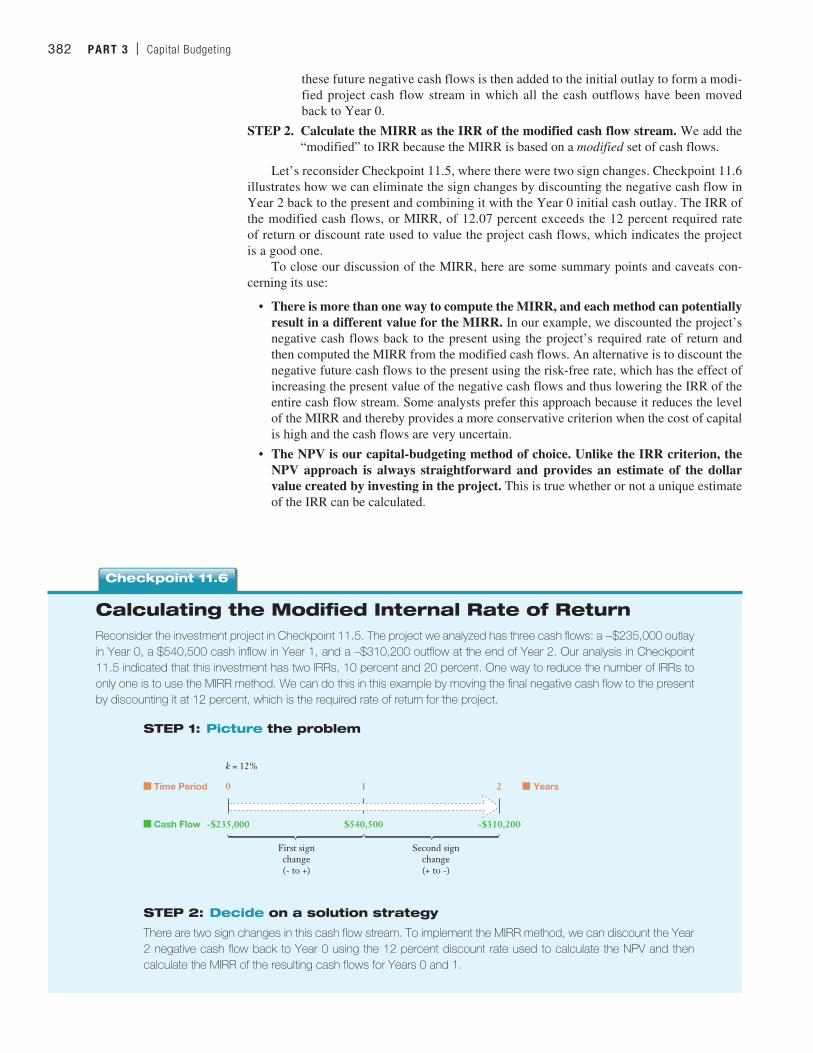
Calculating the Modified Internal Rate of ReturnReconsider the investment project in Checkpoint 11.5. The project we analyzed has three cash flows: a −$235,000 outlay in Year 0, a $540,500 cash inflow in Year 1, and a –$310,200 outflow at the end of Year 2. Our analysis in Checkpoint 11.5 indicated that this investment has two IRRs, 10 percent and 20 percent. One way to reduce the number of IRRs to only one is to use the MIRR method. We can do this in this example by moving the final negative cash flow to the present by discounting it at 12 percent, which is the required rate of return for the project.
STEP 1: Picture the problem
-$235,000 $540,500 -$310,200
0 1
k = 12%
2Time Period
Cash Flow
Years
First signchange(- to +)
Second sign change(+ to -)
STEP 2: Decide on a solution strategy
There are two sign changes in this cash flow stream. To implement the MIRR method, we can discount the Year 2 negative cash flow back to Year 0 using the 12 percent discount rate used to calculate the NPV and then calculate the MIRR of the resulting cash flows for Years 0 and 1.
Checkpoint 11.6
M11_TITM2189_13_GE_C11.indd 382 18/05/17 12:47 PM
CHAPTER 11 | Investment Decision Criteria 383
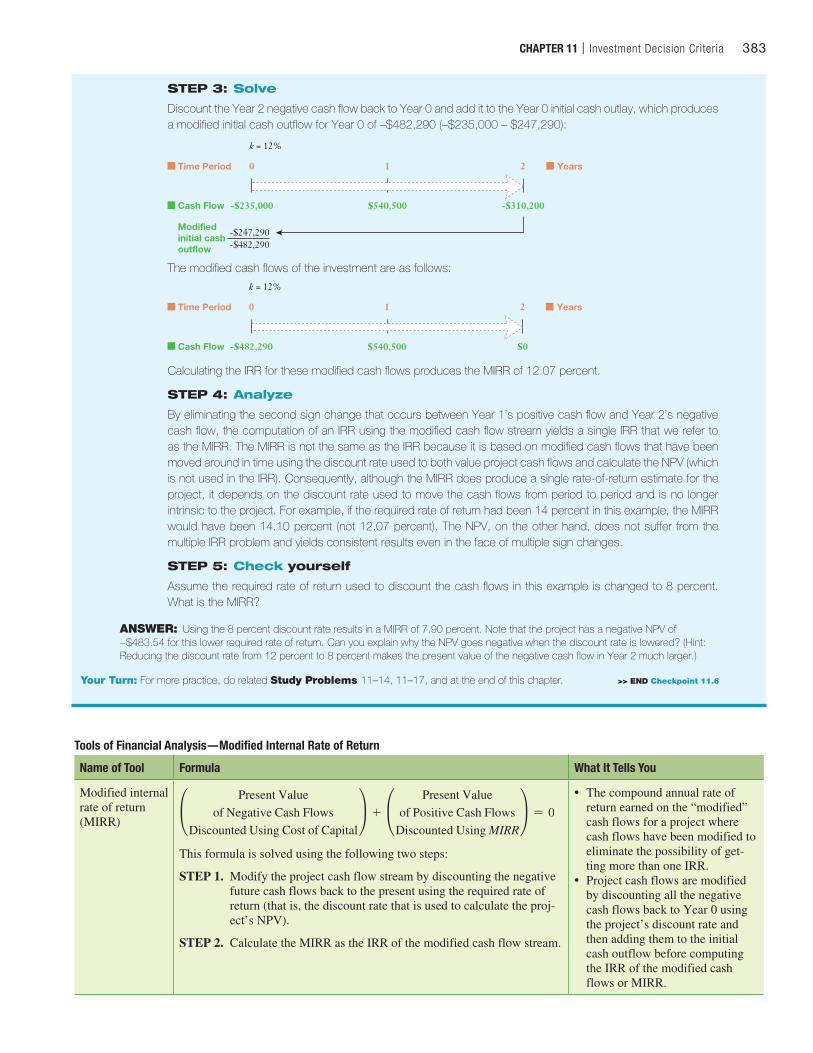
STEP 3: Solve
Discount the Year 2 negative cash flow back to Year 0 and add it to the Year 0 initial cash outlay, which produces a modified initial cash outflow for Year 0 of –$482,290 (–$235,000 – $247,290):
-$235,000 $540,500 -$310,200
0 1 2Time Period
Cash Flow
Modifiedinitial cashoutflow
Years
-$247,290-$482,290
k = 12%
The modified cash flows of the investment are as follows:
-$482,290 $540,500 $0
1
k = 12%
2Time Period
Cash Flow
Years0
Calculating the IRR for these modified cash flows produces the MIRR of 12.07 percent.
STEP 4: Analyze
By eliminating the second sign change that occurs between Year 1’s positive cash flow and Year 2’s negative cash flow, the computation of an IRR using the modified cash flow stream yields a single IRR that we refer to as the MIRR. The MIRR is not the same as the IRR because it is based on modified cash flows that have been moved around in time using the discount rate used to both value project cash flows and calculate the NPV (which is not used in the IRR). Consequently, although the MIRR does produce a single rate-of-return estimate for the project, it depends on the discount rate used to move the cash flows from period to period and is no longer intrinsic to the project. For example, if the required rate of return had been 14 percent in this example, the MIRR would have been 14.10 percent (not 12.07 percent). The NPV, on the other hand, does not suffer from the multiple IRR problem and yields consistent results even in the face of multiple sign changes.
STEP 5: Check yourself
Assume the required rate of return used to discount the cash flows in this example is changed to 8 percent. What is the MIRR?
ANSWER: Using the 8 percent discount rate results in a MIRR of 7.90 percent. Note that the project has a negative NPV of −$483.54 for this lower required rate of return. Can you explain why the NPV goes negative when the discount rate is lowered? (Hint: Reducing the discount rate from 12 percent to 8 percent makes the present value of the negative cash flow in Year 2 much larger.)
Your Turn: For more practice, do related Study Problems 11–14, 11–17, and at the end of this chapter. >> END Checkpoint 11.6
Tools of Financial Analysis—Modified Internal Rate of Return
Name of Tool Formula What It Tells You
Modified internal rate of return (MIRR)
°Present Value
of Negative Cash FlowsDiscounted Using Cost of Capital
¢ + °Present Value
of Positive Cash FlowsDiscounted Using MIRR
¢ = 0
This formula is solved using the following two steps:
STEP 1. Modify the project cash flow stream by discounting the negative future cash flows back to the present using the required rate of return (that is, the discount rate that is used to calculate the proj-ect’s NPV).
STEP 2. Calculate the MIRR as the IRR of the modified cash flow stream.
• The compound annual rate of return earned on the “modified” cash flows for a project where cash flows have been modified to eliminate the possibility of get-ting more than one IRR.
• Project cash flows are modified by discounting all the negative cash flows back to Year 0 using the project’s discount rate and then adding them to the initial cash outflow before computing the IRR of the modified cash flows or MIRR.
M11_TITM2189_13_GE_C11.indd 383 18/05/17 12:47 PM
384 PART 3 | Capital Budgeting
Payback PeriodThe payback period for an investment opportunity is the number of years needed to recover the initial cash outlay required to make the investment. For example, suppose Exec Corpora-tion was deciding whether to spend $8 million for a new software system that would allow it to monitor the daily production from its thousands of operating oil and gas wells. If the new automated system was to reduce the costs of monitoring production by $4 million a year, the payback period for the investment would be only two years. Similarly, if the savings were only $2 million per year, the payback period would be four years. If the savings were not the
We do not have to do a lot of calculations to figure out that education pays. For example, the average earnings differential of $21,530 between the holder of a bachelor’s degree and that of a high school diploma ($55,432 – $33,902), spread over a 45-year working life and discounted using a 5 percent discount rate, pro-duces a present value at the end of college of $382,676 and has a present value of $314,828 today (assuming you are in college for four years). If the present value of the benefits of a college education is $314,828, what does it cost? Assuming that the cost of attend-ing college is $15,000 for a public college and $35,000 for a pri-vate college, the present values of the costs of attending college are ($53,189) and ($124,108), respectively. There’s one more important cost of attending college that we must consider, and that’s lost earn-ings while in college. If we assume that the student would be earning $20,000 per year for all four years he or she was not in college (this is approximately the minimum wage), the present value of four years of lost income is ($70,919). Adding up the costs of college (tuition and lost income), the present value cost of a public college degree is $124,108 while that of a private college degree is $195,027. Com-paring these costs with the present value of future benefits yields an NPV of $190,720 for obtaining a bachelor’s degree from a public col-lege. Similarly, the NPV is $119,801 for obtaining a bachelor’s degree from a private college.
Professional degree
Bachelor’s degree
High schooldiploma
No diploma$0
$10,000
$20,000
$30,000
$40,000
$50,000
$60,000
$70,000
$80,000
$90,000
$100,000
Average Earnings by Education Level, 2012Source: U.S. Department of Labor, Bureau of Labor Statistics, Employ-ment Projection (2012).
Finance for Life Higher Education as an Investment in Yourself
Your decision to pursue a college education, and specifically a busi-ness degree, can be viewed as an investment decision. After all, to go to college you must delay entering the workforce for four to six years (or sometimes longer), and you are likely to spend between $10,000 and $40,000 per year, depending on whether you attend a public or private college or university.* Financially speaking, is it worth it? We should hasten to point out that having a college education can (and should) enrich your life in ways that are not reflected in the amount of money you earn. However, for our purposes, let’s concen-trate on the financial implications of getting a college degree.
According to the U.S. Department of Labor’s Bureau of Labor Statistics, in 2012 the average annual earnings for workers ranged from only $24,492 per year for workers with no high school diploma to $90,120 for those with professional degrees. Simply having a high school diploma increased earnings by over $9,000 a year, and a bachelor’s degree almost doubled earnings for high school grads.
The salaries reported in the diagram above are for all degrees and across the complete spectrum of years of experience (new hires to those close to retirement). What about business degrees and starting salaries in particular? For undergraduate business majors in the class of 2012, the average starting salary was $53,900. This would suggest that down the road, after some experience, having a business degree would produce much higher average earnings than the $53,900 reported starting salary for all majors.
Your Turn: See Study Question 11–11.
*This is the average cost of attending a public four-year college. The average cost of attending a private college was $35,074 in 2012–2013. Source: http://nces.ed.gov/fastfacts/display.asp?id = 76, accessed February 11, 2016.
M11_TITM2189_13_GE_C11.indd 384 18/05/17 12:47 PM
same each year, the company would simply cumulate them over time until they reached the total investment outlay of $8 million. In this case, the payback period is often not an even number of years. For example, if the savings for the first three years of the investment were $4 million, $3 million, and $2 million, the payback period would equal 2.5 years. The company would recover $7 million of the investment during the first two years and the remaining $1 million from half of the third year’s savings—thus, a 2.5-year payback.
Payback Period Decision Criterion: Accept the project if the payback period is less than a prespecified maximum number of years.
The payback criterion measures how quickly the project will return its original invest-ment, which is a very useful piece of information to have when evaluating a risky investment. Specifically, the longer the firm has to wait to recover its investment, the more things that can happen that might reduce or eliminate the benefits of making the investment. However, using the payback period as the sole criterion for evaluating whether to undertake an investment has three fundamental limitations:
Limitation 1. The payback period calculation ignores the time value of money, treating, for example, cash flows three years from now the same as cash flows in one year.
Limitation 2. The payback period method ignores cash flows that are generated by the project beyond the end of the payback period.
Limitation 3. There is no clear-cut way to define the cutoff criterion for the payback period that is tied to the value-creation potential of the investment.
To illustrate these limitations of the payback period method, consider the cash flows for Project Long and Project Short found in Table 11.1. Both projects require an initial cash out-lay of $100,000, and we assume that the payback criterion being used to evaluate the projects is three years. Note that although both projects have the same payback period of two years, which is shorter than the cutoff criteria of three years, we would clearly prefer Project Long to Project Short for the following reasons:
1. Regardless of what happens after the payback period, Project Long returns the initial investment earlier within the payback period (i.e., $70,000 in Year 1 as compared to only $50,000 for Project Short).
2. Project Long generates $65,000 in cash flows during Years 3 through 5, whereas Project Short provides no cash flows after the payback period.
Discounted Payback PeriodTo deal with the criticism that the payback period method ignores the time value of money, some firms use the discounted payback period approach. The discounted payback period approach is similar to that of the traditional payback period except that it uses discounted cash flows (using the same discount rate used in calculating the NPV) to calculate the payback pe-riod. Thus, the discounted payback period is defined as the number of years needed to recover the initial cash outlay from the discounted cash flows.
If we assume that the discount rate for Projects Long and Short is 17 percent, the dis-counted cash flows calculated for these projects are as shown in Table 11.2. After two years, Project Long still needs $18,256 in present value dollars to achieve payback. Therefore, pay-back occurs when approximately 97 percent of Year 3’s discounted cash flow is received (i.e., $18,256/$18,731). Thus, Project Long has a discounted payback period of 2.97 years. Project Short, on the other hand, never achieves discounted payback, as the cumulative present value of its cash flows falls $20,739 short of the initial investment at the end of its life in Year 2. Clearly, the discounted payback period method is an improvement over the straight payback period method.
Discounted Payback Period Decision Criterion: Accept the project if its discounted payback period is less than the prespecified number of years.
CHAPTER 11 | Investment Decision Criteria 385
M11_TITM2189_13_GE_C11.indd 385 18/05/17 12:47 PM
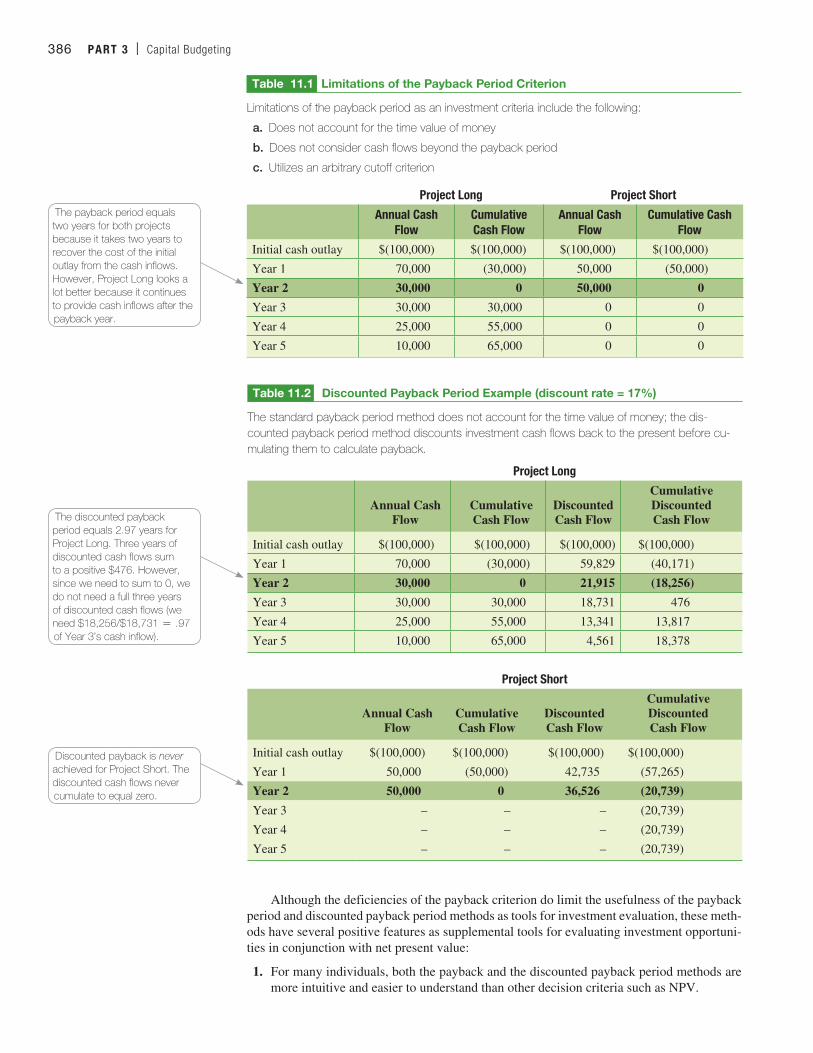
386 PART 3 | Capital Budgeting
Table 11.1 Limitations of the Payback Period Criterion
Limitations of the payback period as an investment criteria include the following:
a. Does not account for the time value of money
b. Does not consider cash flows beyond the payback period
c. Utilizes an arbitrary cutoff criterion
Project Long Project Short
Annual Cash Flow
Cumulative Cash Flow
Annual Cash Flow
Cumulative Cash Flow
Initial cash outlay $(100,000) $(100,000) $(100,000) $(100,000)
Year 1 70,000 (30,000) 50,000 (50,000)
Year 2 30,000 0 50,000 0
Year 3 30,000 30,000 0 0
Year 4 25,000 55,000 0 0
Year 5 10,000 65,000 0 0
The payback period equals two years for both projects because it takes two years to recover the cost of the initial outlay from the cash inflows. However, Project Long looks a lot better because it continues to provide cash inflows after the payback year.
The discounted payback period equals 2.97 years for Project Long. Three years of discounted cash flows sum to a positive $476. However, since we need to sum to 0, we do not need a full three years of discounted cash flows (we need $18,256/$18,731 = .97 of Year 3’s cash inflow).
Discounted payback is never achieved for Project Short. The discounted cash flows never cumulate to equal zero.
Table 11.2 Discounted Payback Period Example (discount rate = 17%)
The standard payback period method does not account for the time value of money; the dis-counted payback period method discounts investment cash flows back to the present before cu-mulating them to calculate payback.
Project Long
Annual Cash Flow
Cumulative Cash Flow
Discounted Cash Flow
Cumulative Discounted Cash Flow
Initial cash outlay $(100,000) $(100,000) $(100,000) $(100,000)
Year 1 70,000 (30,000) 59,829 (40,171)
Year 2 30,000 0 21,915 (18,256)
Year 3 30,000 30,000 18,731 476
Year 4 25,000 55,000 13,341 13,817
Year 5 10,000 65,000 4,561 18,378
Project Short
Annual Cash Flow
Cumulative Cash Flow
Discounted Cash Flow
Cumulative Discounted Cash Flow
Initial cash outlay $(100,000) $(100,000) $(100,000) $(100,000)
Year 1 50,000 (50,000) 42,735 (57,265)
Year 2 50,000 0 36,526 (20,739)
Year 3 – – – (20,739)
Year 4 – – – (20,739)
Year 5 – – – (20,739)
Although the deficiencies of the payback criterion do limit the usefulness of the payback period and discounted payback period methods as tools for investment evaluation, these meth-ods have several positive features as supplemental tools for evaluating investment opportuni-ties in conjunction with net present value:
1. For many individuals, both the payback and the discounted payback period methods are more intuitive and easier to understand than other decision criteria such as NPV.
M11_TITM2189_13_GE_C11.indd 386 18/05/17 12:47 PM
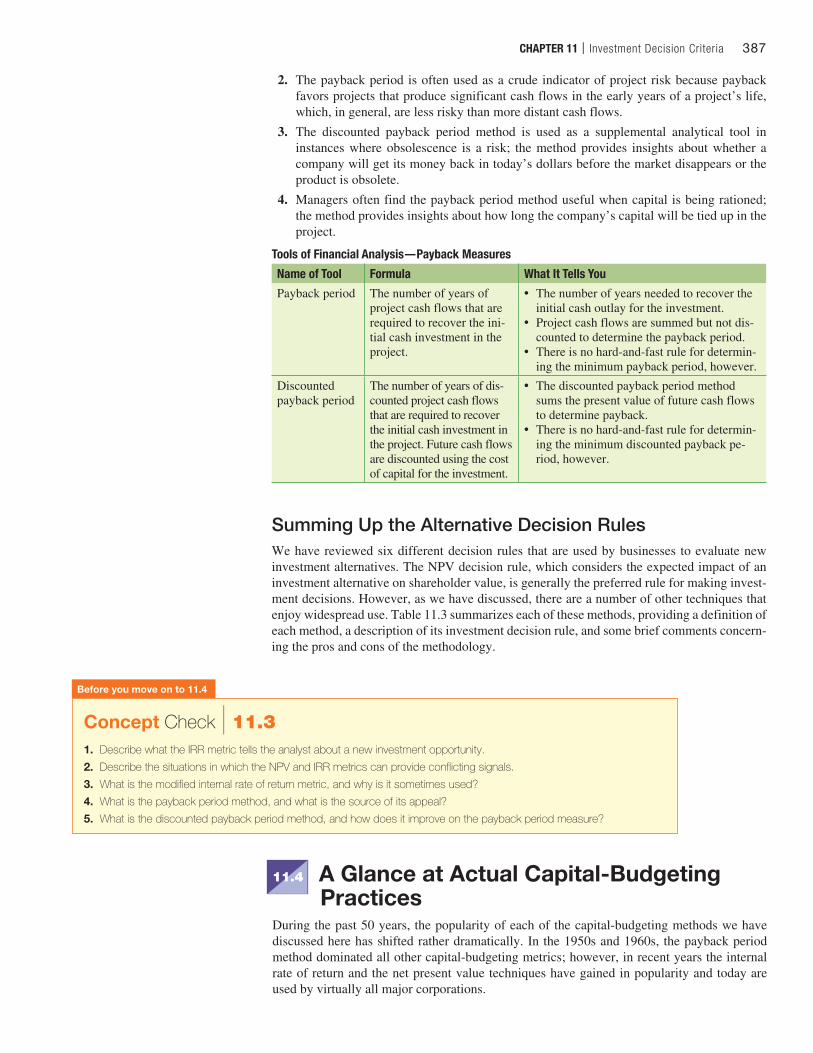
CHAPTER 11 | Investment Decision Criteria 387
2. The payback period is often used as a crude indicator of project risk because payback favors projects that produce significant cash flows in the early years of a project’s life, which, in general, are less risky than more distant cash flows.
3. The discounted payback period method is used as a supplemental analytical tool in instances where obsolescence is a risk; the method provides insights about whether a company will get its money back in today’s dollars before the market disappears or the product is obsolete.
4. Managers often find the payback period method useful when capital is being rationed; the method provides insights about how long the company’s capital will be tied up in the project.
Tools of Financial Analysis—Payback Measures
Name of Tool Formula What It Tells You
Payback period The number of years of project cash flows that are required to recover the ini-tial cash investment in the project.
• The number of years needed to recover the initial cash outlay for the investment.
• Project cash flows are summed but not dis-counted to determine the payback period.
• There is no hard-and-fast rule for determin-ing the minimum payback period, however.
Discounted payback period
The number of years of dis-counted project cash flows that are required to recover the initial cash investment in the project. Future cash flows are discounted using the cost of capital for the investment.
• The discounted payback period method sums the present value of future cash flows to determine payback.
• There is no hard-and-fast rule for determin-ing the minimum discounted payback pe-riod, however.
Summing Up the Alternative Decision RulesWe have reviewed six different decision rules that are used by businesses to evaluate new investment alternatives. The NPV decision rule, which considers the expected impact of an investment alternative on shareholder value, is generally the preferred rule for making invest-ment decisions. However, as we have discussed, there are a number of other techniques that enjoy widespread use. Table 11.3 summarizes each of these methods, providing a definition of each method, a description of its investment decision rule, and some brief comments concern-ing the pros and cons of the methodology.
Before you move on to 11.4
Concept Check | 11.31. Describe what the IRR metric tells the analyst about a new investment opportunity.
2. Describe the situations in which the NPV and IRR metrics can provide conflicting signals.
3. What is the modified internal rate of return metric, and why is it sometimes used?
4. What is the payback period method, and what is the source of its appeal?
5. What is the discounted payback period method, and how does it improve on the payback period measure?
11.4 A Glance at Actual Capital-Budgeting Practices
During the past 50 years, the popularity of each of the capital-budgeting methods we have discussed here has shifted rather dramatically. In the 1950s and 1960s, the payback period method dominated all other capital-budgeting metrics; however, in recent years the internal rate of return and the net present value techniques have gained in popularity and today are used by virtually all major corporations.
M11_TITM2189_13_GE_C11.indd 387 18/05/17 12:47 PM
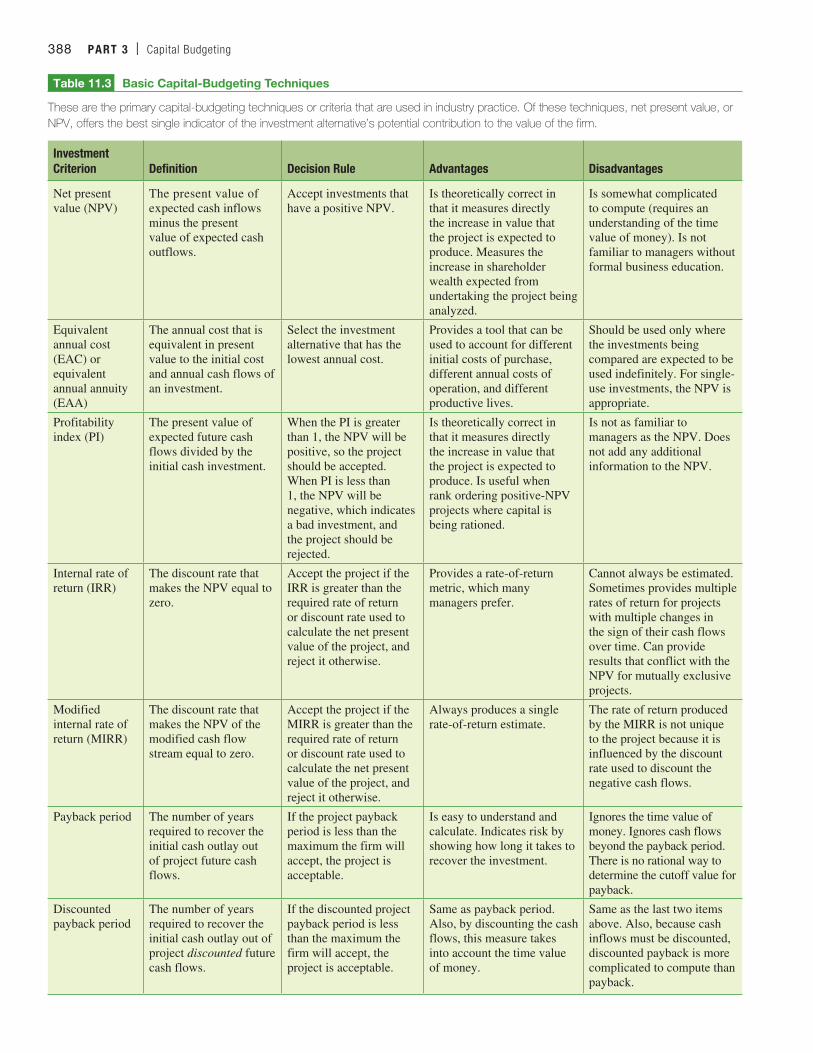
388 PART 3 | Capital Budgeting
Table 11.3 Basic Capital-Budgeting Techniques
These are the primary capital-budgeting techniques or criteria that are used in industry practice. Of these techniques, net present value, or NPV, offers the best single indicator of the investment alternative’s potential contribution to the value of the firm.
Investment Criterion
Definition
Decision Rule
Advantages
Disadvantages
Net present value (NPV)
The present value of expected cash inflows minus the present value of expected cash outflows.
Accept investments that have a positive NPV.
Is theoretically correct in that it measures directly the increase in value that the project is expected to produce. Measures the increase in shareholder wealth expected from undertaking the project being analyzed.
Is somewhat complicated to compute (requires an understanding of the time value of money). Is not familiar to managers without formal business education.
Equivalent annual cost (EAC) or equivalent annual annuity (EAA)
The annual cost that is equivalent in present value to the initial cost and annual cash flows of an investment.
Select the investment alternative that has the lowest annual cost.
Provides a tool that can be used to account for different initial costs of purchase, different annual costs of operation, and different productive lives.
Should be used only where the investments being compared are expected to be used indefinitely. For single-use investments, the NPV is appropriate.
Profitability index (PI)
The present value of expected future cash flows divided by the initial cash investment.
When the PI is greater than 1, the NPV will be positive, so the project should be accepted. When PI is less than 1, the NPV will be negative, which indicates a bad investment, and the project should be rejected.
Is theoretically correct in that it measures directly the increase in value that the project is expected to produce. Is useful when rank ordering positive-NPV projects where capital is being rationed.
Is not as familiar to managers as the NPV. Does not add any additional information to the NPV.
Internal rate of return (IRR)
The discount rate that makes the NPV equal to zero.
Accept the project if the IRR is greater than the required rate of return or discount rate used to calculate the net present value of the project, and reject it otherwise.
Provides a rate-of-return metric, which many managers prefer.
Cannot always be estimated. Sometimes provides multiple rates of return for projects with multiple changes in the sign of their cash flows over time. Can provide results that conflict with the NPV for mutually exclusive projects.
Modified internal rate of return (MIRR)
The discount rate that makes the NPV of the modified cash flow stream equal to zero.
Accept the project if the MIRR is greater than the required rate of return or discount rate used to calculate the net present value of the project, and reject it otherwise.
Always produces a single rate-of-return estimate.
The rate of return produced by the MIRR is not unique to the project because it is influenced by the discount rate used to discount the negative cash flows.
Payback period The number of years required to recover the initial cash outlay out of project future cash flows.
If the project payback period is less than the maximum the firm will accept, the project is acceptable.
Is easy to understand and calculate. Indicates risk by showing how long it takes to recover the investment.
Ignores the time value of money. Ignores cash flows beyond the payback period. There is no rational way to determine the cutoff value for payback.
Discounted payback period
The number of years required to recover the initial cash outlay out of project discounted future cash flows.
If the discounted project payback period is less than the maximum the firm will accept, the project is acceptable.
Same as payback period. Also, by discounting the cash flows, this measure takes into account the time value of money.
Same as the last two items above. Also, because cash inflows must be discounted, discounted payback is more complicated to compute than payback.
M11_TITM2189_13_GE_C11.indd 388 18/05/17 12:47 PM
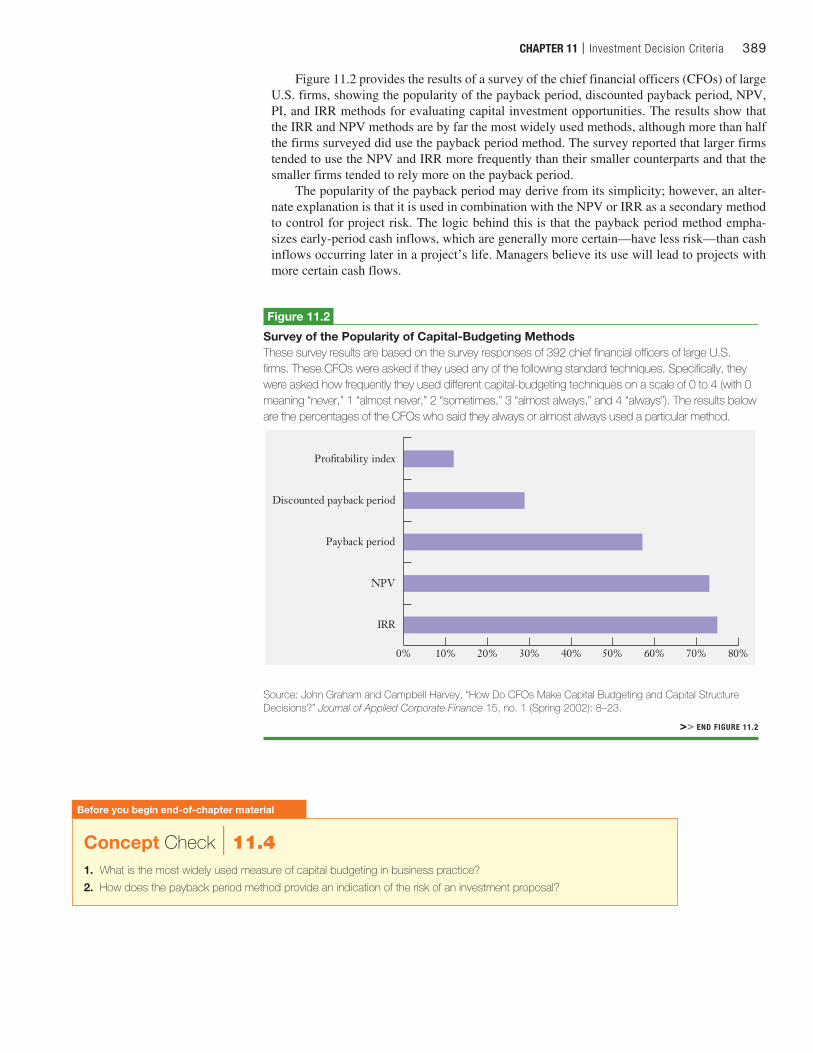
CHAPTER 11 | Investment Decision Criteria 389
Figure 11.2 provides the results of a survey of the chief financial officers (CFOs) of large U.S. firms, showing the popularity of the payback period, discounted payback period, NPV, PI, and IRR methods for evaluating capital investment opportunities. The results show that the IRR and NPV methods are by far the most widely used methods, although more than half the firms surveyed did use the payback period method. The survey reported that larger firms tended to use the NPV and IRR more frequently than their smaller counterparts and that the smaller firms tended to rely more on the payback period.
The popularity of the payback period may derive from its simplicity; however, an alter-nate explanation is that it is used in combination with the NPV or IRR as a secondary method to control for project risk. The logic behind this is that the payback period method empha-sizes early-period cash inflows, which are generally more certain—have less risk—than cash inflows occurring later in a project’s life. Managers believe its use will lead to projects with more certain cash flows.
0% 10% 20% 30% 40% 50% 60% 70% 80%
IRR
NPV
Payback period
Discounted payback period
Profitability index
Figure 11.2
Survey of the Popularity of Capital-Budgeting MethodsThese survey results are based on the survey responses of 392 chief financial officers of large U.S. firms. These CFOs were asked if they used any of the following standard techniques. Specifically, they were asked how frequently they used different capital-budgeting techniques on a scale of 0 to 4 (with 0 meaning “never,” 1 “almost never,” 2 “sometimes,” 3 “almost always,” and 4 “always”). The results below are the percentages of the CFOs who said they always or almost always used a particular method.
Source: John Graham and Campbell Harvey, “How Do CFOs Make Capital Budgeting and Capital Structure Decisions?” Journal of Applied Corporate Finance 15, no. 1 (Spring 2002): 8–23.
>> END FIGURE 11.2
Before you begin end-of-chapter material
Concept Check | 11.41. What is the most widely used measure of capital budgeting in business practice?
2. How does the payback period method provide an indication of the risk of an investment proposal?
M11_TITM2189_13_GE_C11.indd 389 18/05/17 12:47 PM
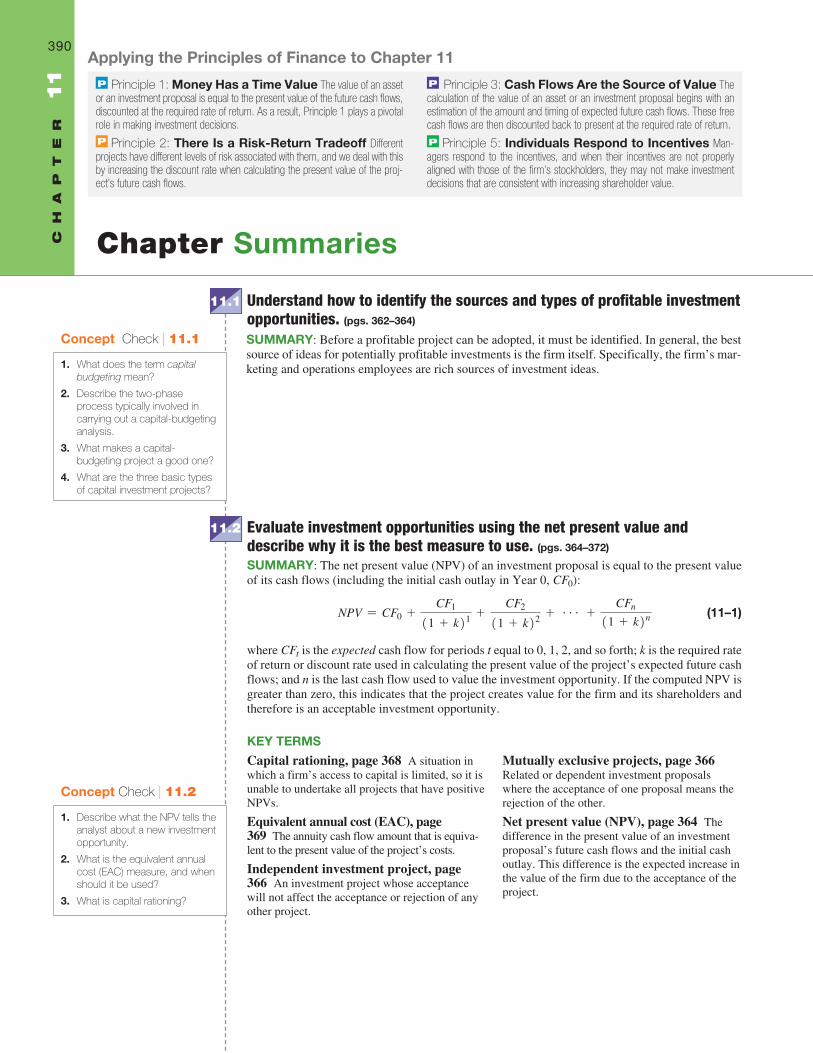
Chapter Summaries
11.1 Understand how to identify the sources and types of profitable investment opportunities. (pgs. 362–364)
SUMMARY: Before a profitable project can be adopted, it must be identified. In general, the best source of ideas for potentially profitable investments is the firm itself. Specifically, the firm’s mar-keting and operations employees are rich sources of investment ideas.
CH
AP
TE
R 11 P Principle 1: Money Has a Time Value The value of an asset
or an investment proposal is equal to the present value of the future cash flows, discounted at the required rate of return. As a result, Principle 1 plays a pivotal role in making investment decisions.P Principle 2: There Is a Risk-Return Tradeoff Different projects have different levels of risk associated with them, and we deal with this by increasing the discount rate when calculating the present value of the proj-ect’s future cash flows.
P Principle 3: Cash Flows Are the Source of Value The calculation of the value of an asset or an investment proposal begins with an estimation of the amount and timing of expected future cash flows. These free cash flows are then discounted back to present at the required rate of return.P Principle 5: Individuals Respond to Incentives Man-agers respond to the incentives, and when their incentives are not properly aligned with those of the firm’s stockholders, they may not make investment decisions that are consistent with increasing shareholder value.
Applying the Principles of Finance to Chapter 11
Concept Check | 11.1
1. What does the term capital budgeting mean?
2. Describe the two-phase process typically involved in carrying out a capital-budgeting analysis.
3. What makes a capital-budgeting project a good one?
4. What are the three basic types of capital investment projects?
11.2 Evaluate investment opportunities using the net present value and describe why it is the best measure to use. (pgs. 364–372)
SUMMARY: The net present value (NPV) of an investment proposal is equal to the present value of its cash flows (including the initial cash outlay in Year 0, CF0):
NPV = CF0 +CF1
11 + k21 +CF2
11 + k22 + g +CFn
11 + k2n (11–1)
where CFt is the expected cash flow for periods t equal to 0, 1, 2, and so forth; k is the required rate of return or discount rate used in calculating the present value of the project’s expected future cash flows; and n is the last cash flow used to value the investment opportunity. If the computed NPV is greater than zero, this indicates that the project creates value for the firm and its shareholders and therefore is an acceptable investment opportunity.
KEY TERMSCapital rationing, page 368 A situation in which a firm’s access to capital is limited, so it is unable to undertake all projects that have positive NPVs.
Equivalent annual cost (EAC), page 369 The annuity cash flow amount that is equiva-lent to the present value of the project’s costs.
Independent investment project, page 366 An investment project whose acceptance will not affect the acceptance or rejection of any other project.
Mutually exclusive projects, page 366 Related or dependent investment proposals where the acceptance of one proposal means the rejection of the other.
Net present value (NPV), page 364 The difference in the present value of an investment proposal’s future cash flows and the initial cash outlay. This difference is the expected increase in the value of the firm due to the acceptance of the project.
390
Concept Check | 11.2
1. Describe what the NPV tells the analyst about a new investment opportunity.
2. What is the equivalent annual cost (EAC) measure, and when should it be used?
3. What is capital rationing?
M11_TITM2189_13_GE_C11.indd 390 18/05/17 12:47 PM
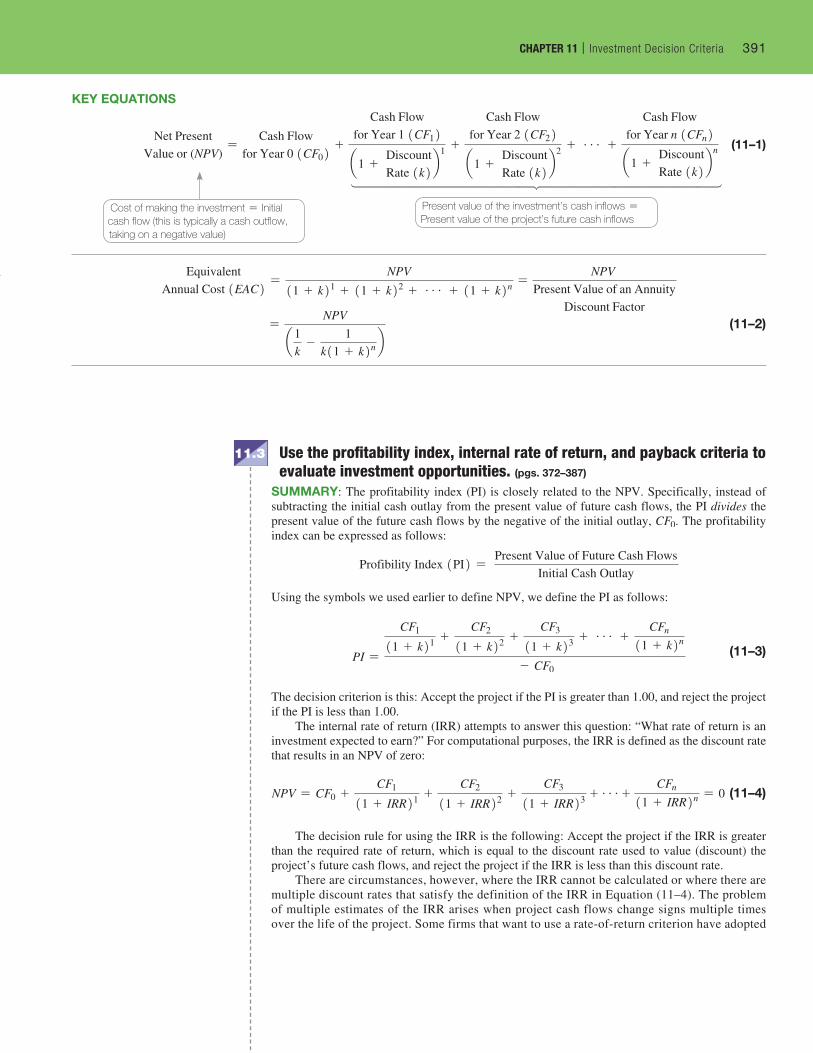
CHAPTER 11 | Investment Decision Criteria 391
KEY EQUATIONS
Net Present
Value or (NPV)=
Cash Flowfor Year 0 1CF02 +
Cash Flowfor Year 1 1CF12
a1 + DiscountRate 1k2 b
1 +
Cash Flowfor Year 2 1CF22
a1 + DiscountRate 1k2 b
2 + g +
Cash Flowfor Year n 1CFn2
a1 + DiscountRate 1k2 b
n (11–1)
¯˚˚˚˚˚˚˚˚˚˚˚˚˚˚˘˚˚˚˚˚˚˚˚˚˚˚˚˚˚˙
Equivalent
Annual Cost 1EAC2 =NPV
11 + k21 + 11 + k22 + g + 11 + k2n =NPV
Present Value of an AnnuityDiscount Factor
=NPV
a1k
-1
k11 + k2n b (11–2)
Cost of making the investment = Initial cash flow (this is typically a cash outflow, taking on a negative value)
Present value of the investment’s cash inflows =Present value of the project’s future cash inflows
SUMMARY: The profitability index (PI) is closely related to the NPV. Specifically, instead of subtracting the initial cash outlay from the present value of future cash flows, the PI divides the present value of the future cash flows by the negative of the initial outlay, CF0. The profitability index can be expressed as follows:
Profibility Index 1PI2 = Present Value of Future Cash Flows
Initial Cash Outlay
Using the symbols we used earlier to define NPV, we define the PI as follows:
PI =
CF1
11 + k21 + CF2
11 + k22 + CF3
11 + k23 + g +CFn
11 + k2n
- CF0 (11–3)
The decision criterion is this: Accept the project if the PI is greater than 1.00, and reject the project if the PI is less than 1.00.
The internal rate of return (IRR) attempts to answer this question: “What rate of return is an investment expected to earn?” For computational purposes, the IRR is defined as the discount rate that results in an NPV of zero:
NPV = CF0 +CF1
11 + IRR21 +CF2
11 + IRR22 +CF3
11 + IRR23 + g+ CFn
11 + IRR2n = 0 (11–4)
The decision rule for using the IRR is the following: Accept the project if the IRR is greater than the required rate of return, which is equal to the discount rate used to value (discount) the project’s future cash flows, and reject the project if the IRR is less than this discount rate.
There are circumstances, however, where the IRR cannot be calculated or where there are multiple discount rates that satisfy the definition of the IRR in Equation (11–4). The problem of multiple estimates of the IRR arises when project cash flows change signs multiple times over the life of the project. Some firms that want to use a rate-of-return criterion have adopted
CHAPTER 11 | Investment Decision Criteria 391
11.3 Use the profitability index, internal rate of return, and payback criteria to evaluate investment opportunities. (pgs. 372–387)
M11_TITM2189_13_GE_C11.indd 391 18/05/17 12:47 PM
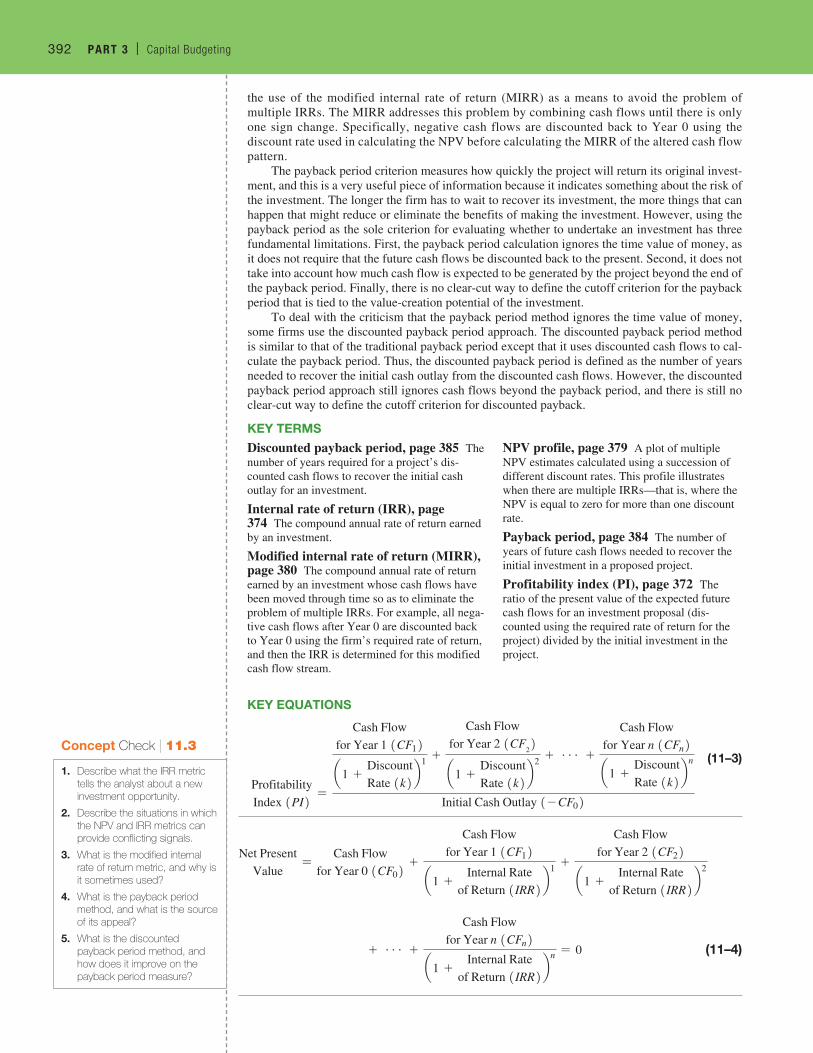
392 PART 3 | Capital Budgeting392 PART 3 | Capital Budgeting
the use of the modified internal rate of return (MIRR) as a means to avoid the problem of multiple IRRs. The MIRR addresses this problem by combining cash flows until there is only one sign change. Specifically, negative cash flows are discounted back to Year 0 using the discount rate used in calculating the NPV before calculating the MIRR of the altered cash flow pattern.
The payback period criterion measures how quickly the project will return its original invest-ment, and this is a very useful piece of information because it indicates something about the risk of the investment. The longer the firm has to wait to recover its investment, the more things that can happen that might reduce or eliminate the benefits of making the investment. However, using the payback period as the sole criterion for evaluating whether to undertake an investment has three fundamental limitations. First, the payback period calculation ignores the time value of money, as it does not require that the future cash flows be discounted back to the present. Second, it does not take into account how much cash flow is expected to be generated by the project beyond the end of the payback period. Finally, there is no clear-cut way to define the cutoff criterion for the payback period that is tied to the value-creation potential of the investment.
To deal with the criticism that the payback period method ignores the time value of money, some firms use the discounted payback period approach. The discounted payback period method is similar to that of the traditional payback period except that it uses discounted cash flows to cal-culate the payback period. Thus, the discounted payback period is defined as the number of years needed to recover the initial cash outlay from the discounted cash flows. However, the discounted payback period approach still ignores cash flows beyond the payback period, and there is still no clear-cut way to define the cutoff criterion for discounted payback.
KEY TERMSDiscounted payback period, page 385 The number of years required for a project’s dis-counted cash flows to recover the initial cash outlay for an investment.
Internal rate of return (IRR), page 374 The compound annual rate of return earned by an investment.
Modified internal rate of return (MIRR), page 380 The compound annual rate of return earned by an investment whose cash flows have been moved through time so as to eliminate the problem of multiple IRRs. For example, all nega-tive cash flows after Year 0 are discounted back to Year 0 using the firm’s required rate of return, and then the IRR is determined for this modified cash flow stream.
NPV profile, page 379 A plot of multiple NPV estimates calculated using a succession of different discount rates. This profile illustrates when there are multiple IRRs—that is, where the NPV is equal to zero for more than one discount rate.
Payback period, page 384 The number of years of future cash flows needed to recover the initial investment in a proposed project.
Profitability index (PI), page 372 The ratio of the present value of the expected future cash flows for an investment proposal (dis-counted using the required rate of return for the project) divided by the initial investment in the project.
KEY EQUATIONS
ProfitabilityIndex 1PI2 =
Cash Flowfor Year 1 1CF12
a1 +DiscountRate 1k2 b
1 +
Cash Flowfor Year 2 1CF
22
a1 +DiscountRate 1k2 b
2 + g +
Cash Flowfor Year n 1CFn2
a1 +DiscountRate 1k2 b
n
Initial Cash Outlay 1- CF02
(11–3)
Net PresentValue
=Cash Flow
for Year 0 1CF02 +
Cash Flowfor Year 1 1CF12
a1 +Internal Rate
of Return 1IRR2 b1 +
Cash Flowfor Year 2 1CF22
a1 +Internal Rate
of Return 1IRR2 b2
+ g +
Cash Flowfor Year n 1CFn2
a1 +Internal Rate
of Return 1IRR2 bn = 0 (11–4)
Concept Check | 11.3
1. Describe what the IRR metric tells the analyst about a new investment opportunity.
2. Describe the situations in which the NPV and IRR metrics can provide conflicting signals.
3. What is the modified internal rate of return metric, and why is it sometimes used?
4. What is the payback period method, and what is the source of its appeal?
5. What is the discounted payback period method, and how does it improve on the payback period measure?
M11_TITM2189_13_GE_C11.indd 392 18/05/17 12:47 PM
CHAPTER 11 | Investment Decision Criteria 393
SUMMARY: Recent survey evidence from large U.S. firms on the popularity of the standard methods for evaluating capital investment opportunities showed that the IRR and NPV are by far the most widely used. However, more than half the firms surveyed use the payback period method. Larger firms use the NPV and IRR more frequently than their smaller counterparts, and smaller firms tend to rely more on the payback period. Finally, most firms use multiple invest-ment criteria and often use the payback period as a secondary measure to reflect project risk considerations.
11.4 Understand current business practice with respect to the use of capital-budgeting criteria. (pgs. 387–389)
11–1. In Regardless of Your Major: Making Personal Investment Decisions on page 362, what were the types of personal decisions discussed that can be addressed using capital-budgeting analyses?
11–2. Why might it be difficult for firms to find good investment ideas?
11–3. Distinguish between revenue enhancement investments, cost-reduction investments, and mandated investments.
11–4. How is the presence or absence of product market competition that a firm faces related to the NPV of the firm’s investment opportunities? What are the types of barriers to competition (market entry) that tend to preserve positive NPVs?
11–5. Why is the NPV generally considered to be the preferred method for evaluating new capital investment proposals? Describe the meaning of the NPV to a close relative who has no business background in terms they would understand.
11–6. What does it mean to say that two or more investment projects are mutually exclusive?
11–7. What are the limitations of the payback period as an investment decision criterion? What are its advantages? Why do you think it is used so frequently?
11–8. Briefly compare and contrast the NPV, PI, and IRR criteria. What are the advantages and disadvantages of using each of these methods?
11–9. If a project’s payback period is less than the maximum payback period that the firm will accept, does this mean that the project’s NPV will also be positive?
11–10. What is the rationale for using the MIRR as opposed to the IRR decision criterion? Describe the fundamental shortcoming of the MIRR method.
11–11. In Finance for Life: Higher Education as an Investment in Yourself on page 384, the decision to get a college education was discussed in the context of an investment de-cision. Discuss the analogy in more detail by identifying the initial cash outlay(s) and the future benefits of your investment in higher education.
11–12. Discuss the merits and shortcomings of using the payback period for capital budget-ing decisions.
11–13. What are the most widely used methods for evaluating capital expenditure projects in practice?
11–14. Some analysts argue that the payback period criterion is actually a measure of project risk. What is the logic behind this belief?
Study Questions
Concept Check | 11.4
1. What is the most widely used measure of capital budgeting in business practice?
2. How does the payback period method provide an indication of the risk of an investment proposal?
CHAPTER 11 | Investment Decision Criteria 393
M11_TITM2189_13_GE_C11.indd 393 18/05/17 12:47 PM
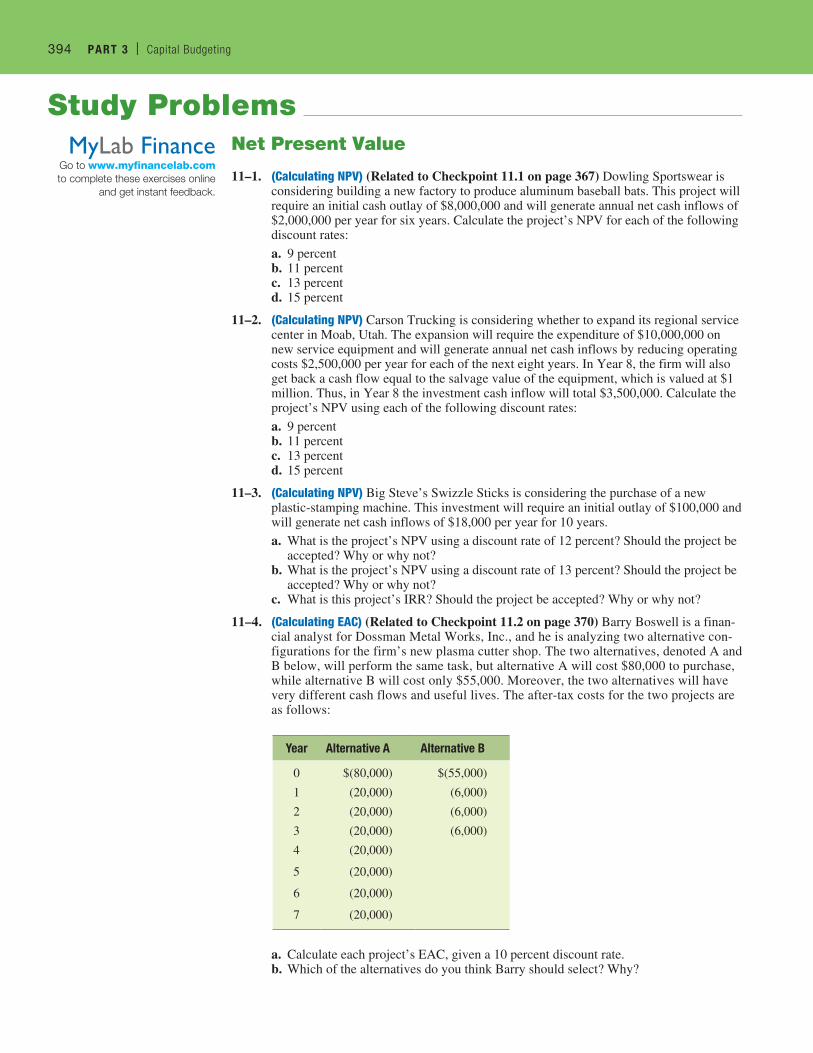
394 PART 3 | Capital Budgeting394 PART 3 | Capital Budgeting
Net Present Value
11–1. (Calculating NPV) (Related to Checkpoint 11.1 on page 367) Dowling Sportswear is considering building a new factory to produce aluminum baseball bats. This project will require an initial cash outlay of $8,000,000 and will generate annual net cash inflows of $2,000,000 per year for six years. Calculate the project’s NPV for each of the following discount rates:a. 9 percentb. 11 percentc. 13 percentd. 15 percent
11–2. (Calculating NPV) Carson Trucking is considering whether to expand its regional service center in Moab, Utah. The expansion will require the expenditure of $10,000,000 on new service equipment and will generate annual net cash inflows by reducing operating costs $2,500,000 per year for each of the next eight years. In Year 8, the firm will also get back a cash flow equal to the salvage value of the equipment, which is valued at $1 million. Thus, in Year 8 the investment cash inflow will total $3,500,000. Calculate the project’s NPV using each of the following discount rates:a. 9 percentb. 11 percentc. 13 percentd. 15 percent
11–3. (Calculating NPV) Big Steve’s Swizzle Sticks is considering the purchase of a new plastic-stamping machine. This investment will require an initial outlay of $100,000 and will generate net cash inflows of $18,000 per year for 10 years.a. What is the project’s NPV using a discount rate of 12 percent? Should the project be
accepted? Why or why not?b. What is the project’s NPV using a discount rate of 13 percent? Should the project be
accepted? Why or why not?c. What is this project’s IRR? Should the project be accepted? Why or why not?
11–4. (Calculating EAC) (Related to Checkpoint 11.2 on page 370) Barry Boswell is a finan-cial analyst for Dossman Metal Works, Inc., and he is analyzing two alternative con-figurations for the firm’s new plasma cutter shop. The two alternatives, denoted A and B below, will perform the same task, but alternative A will cost $80,000 to purchase, while alternative B will cost only $55,000. Moreover, the two alternatives will have very different cash flows and useful lives. The after-tax costs for the two projects are as follows:
Year Alternative A Alternative B
0 $(80,000) $(55,000)
1 (20,000) (6,000)
2 (20,000) (6,000)
3 (20,000) (6,000)
4 (20,000)
5 (20,000)
6 (20,000)
7 (20,000)
a. Calculate each project’s EAC, given a 10 percent discount rate.b. Which of the alternatives do you think Barry should select? Why?
Study Problems
Go to www.myfinancelab.com to complete these exercises online
and get instant feedback.
MyLab Finance
M11_TITM2189_13_GE_C11.indd 394 24/06/17 1:06 PM
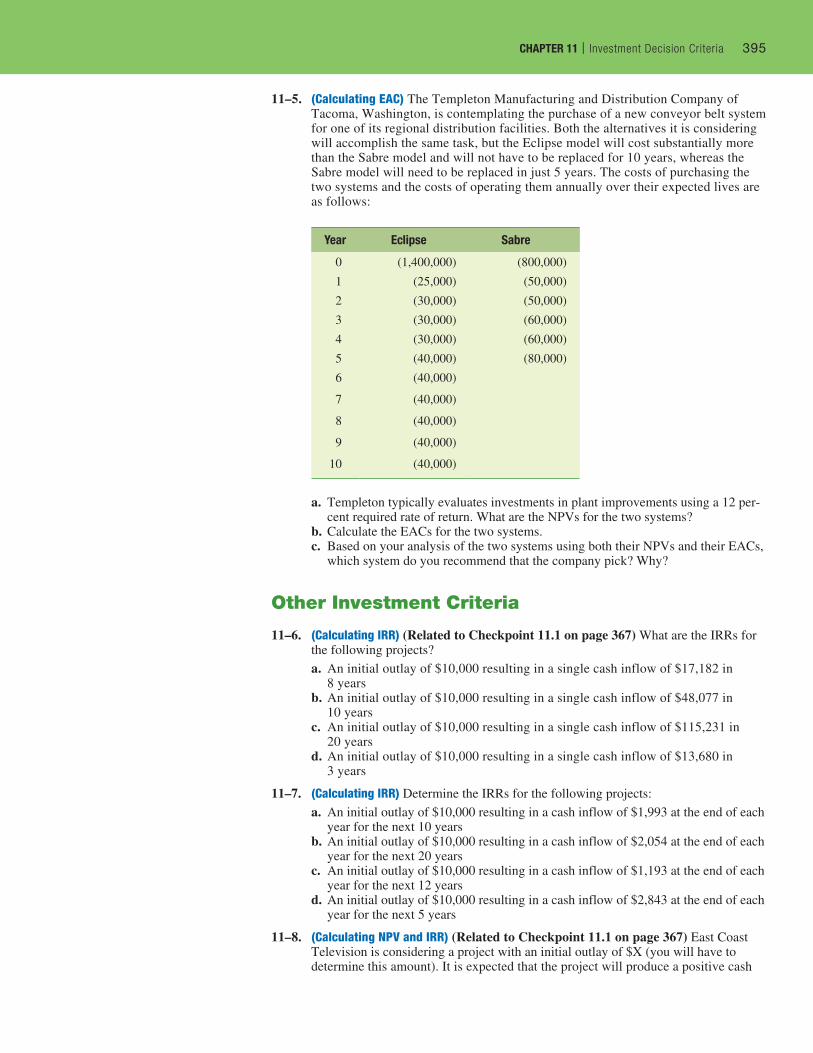
CHAPTER 11 | Investment Decision Criteria 395
11–5. (Calculating EAC) The Templeton Manufacturing and Distribution Company of Tacoma, Washington, is contemplating the purchase of a new conveyor belt system for one of its regional distribution facilities. Both the alternatives it is considering will accomplish the same task, but the Eclipse model will cost substantially more than the Sabre model and will not have to be replaced for 10 years, whereas the Sabre model will need to be replaced in just 5 years. The costs of purchasing the two systems and the costs of operating them annually over their expected lives are as follows:
Year Eclipse Sabre
0 (1,400,000) (800,000)
1 (25,000) (50,000)
2 (30,000) (50,000)
3 (30,000) (60,000)
4 (30,000) (60,000)
5 (40,000) (80,000)
6 (40,000)
7 (40,000)
8 (40,000)
9 (40,000)
10 (40,000)
a. Templeton typically evaluates investments in plant improvements using a 12 per-cent required rate of return. What are the NPVs for the two systems?
b. Calculate the EACs for the two systems.c. Based on your analysis of the two systems using both their NPVs and their EACs,
which system do you recommend that the company pick? Why?
Other Investment Criteria
11–6. (Calculating IRR) (Related to Checkpoint 11.1 on page 367) What are the IRRs for the following projects?a. An initial outlay of $10,000 resulting in a single cash inflow of $17,182 in
8 yearsb. An initial outlay of $10,000 resulting in a single cash inflow of $48,077 in
10 yearsc. An initial outlay of $10,000 resulting in a single cash inflow of $115,231 in
20 yearsd. An initial outlay of $10,000 resulting in a single cash inflow of $13,680 in
3 years
11–7. (Calculating IRR) Determine the IRRs for the following projects:a. An initial outlay of $10,000 resulting in a cash inflow of $1,993 at the end of each
year for the next 10 yearsb. An initial outlay of $10,000 resulting in a cash inflow of $2,054 at the end of each
year for the next 20 yearsc. An initial outlay of $10,000 resulting in a cash inflow of $1,193 at the end of each
year for the next 12 yearsd. An initial outlay of $10,000 resulting in a cash inflow of $2,843 at the end of each
year for the next 5 years
11–8. (Calculating NPV and IRR) (Related to Checkpoint 11.1 on page 367) East Coast Television is considering a project with an initial outlay of $X (you will have to determine this amount). It is expected that the project will produce a positive cash
CHAPTER 11 | Investment Decision Criteria 395
M11_TITM2189_13_GE_C11.indd 395 18/05/17 12:47 PM
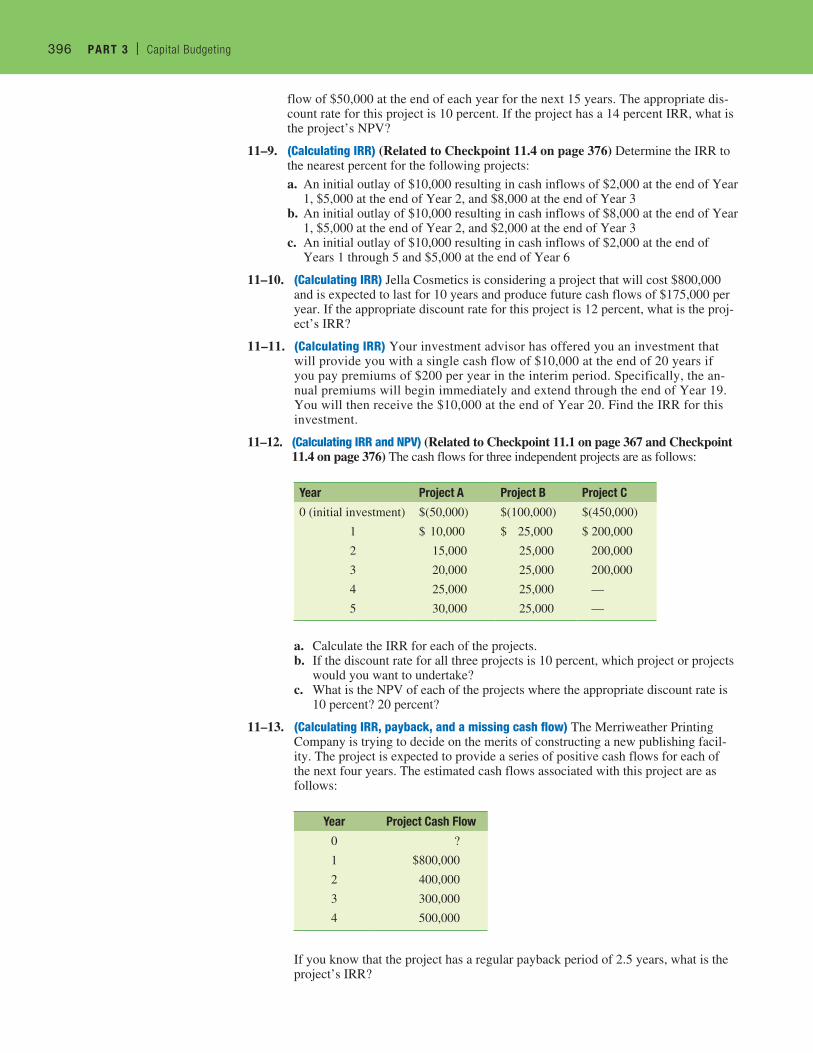
396 PART 3 | Capital Budgeting396 PART 3 | Capital Budgeting
flow of $50,000 at the end of each year for the next 15 years. The appropriate dis-count rate for this project is 10 percent. If the project has a 14 percent IRR, what is the project’s NPV?
11–9. (Calculating IRR) (Related to Checkpoint 11.4 on page 376) Determine the IRR to the nearest percent for the following projects:a. An initial outlay of $10,000 resulting in cash inflows of $2,000 at the end of Year
1, $5,000 at the end of Year 2, and $8,000 at the end of Year 3b. An initial outlay of $10,000 resulting in cash inflows of $8,000 at the end of Year
1, $5,000 at the end of Year 2, and $2,000 at the end of Year 3c. An initial outlay of $10,000 resulting in cash inflows of $2,000 at the end of
Years 1 through 5 and $5,000 at the end of Year 6
11–10. (Calculating IRR) Jella Cosmetics is considering a project that will cost $800,000 and is expected to last for 10 years and produce future cash flows of $175,000 per year. If the appropriate discount rate for this project is 12 percent, what is the proj-ect’s IRR?
11–11. (Calculating IRR) Your investment advisor has offered you an investment that will provide you with a single cash flow of $10,000 at the end of 20 years if you pay premiums of $200 per year in the interim period. Specifically, the an-nual premiums will begin immediately and extend through the end of Year 19. You will then receive the $10,000 at the end of Year 20. Find the IRR for this investment.
11–12. (Calculating IRR and NPV) (Related to Checkpoint 11.1 on page 367 and Checkpoint 11.4 on page 376) The cash flows for three independent projects are as follows:
Year Project A Project B Project C
0 (initial investment) $(50,000) $(100,000) $(450,000)
1 $ 10,000 $ 25,000 $ 200,000
2 15,000 25,000 200,000
3 20,000 25,000 200,000
4 25,000 25,000 —
5 30,000 25,000 —
a. Calculate the IRR for each of the projects.b. If the discount rate for all three projects is 10 percent, which project or projects
would you want to undertake?c. What is the NPV of each of the projects where the appropriate discount rate is
10 percent? 20 percent?
11–13. (Calculating IRR, payback, and a missing cash flow) The Merriweather Printing Company is trying to decide on the merits of constructing a new publishing facil-ity. The project is expected to provide a series of positive cash flows for each of the next four years. The estimated cash flows associated with this project are as follows:
Year Project Cash Flow
0 ?
1 $800,000
2 400,000
3 300,000
4 500,000
If you know that the project has a regular payback period of 2.5 years, what is the project’s IRR?
M11_TITM2189_13_GE_C11.indd 396 23/05/17 11:03 AM
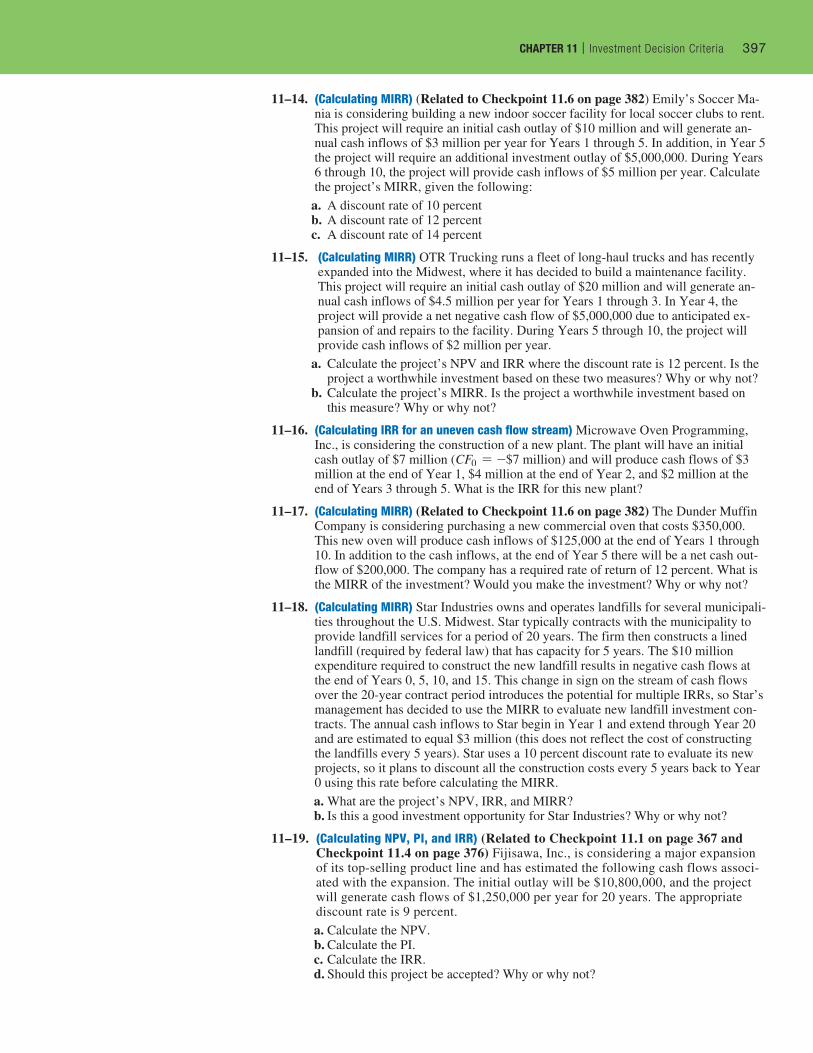
CHAPTER 11 | Investment Decision Criteria 397
11–14. (Calculating MIRR) (Related to Checkpoint 11.6 on page 382) Emily’s Soccer Ma-nia is considering building a new indoor soccer facility for local soccer clubs to rent. This project will require an initial cash outlay of $10 million and will generate an-nual cash inflows of $3 million per year for Years 1 through 5. In addition, in Year 5 the project will require an additional investment outlay of $5,000,000. During Years 6 through 10, the project will provide cash inflows of $5 million per year. Calculate the project’s MIRR, given the following:a. A discount rate of 10 percentb. A discount rate of 12 percentc. A discount rate of 14 percent
11–15. (Calculating MIRR) OTR Trucking runs a fleet of long-haul trucks and has recently expanded into the Midwest, where it has decided to build a maintenance facility. This project will require an initial cash outlay of $20 million and will generate an-nual cash inflows of $4.5 million per year for Years 1 through 3. In Year 4, the project will provide a net negative cash flow of $5,000,000 due to anticipated ex-pansion of and repairs to the facility. During Years 5 through 10, the project will provide cash inflows of $2 million per year.
a. Calculate the project’s NPV and IRR where the discount rate is 12 percent. Is the project a worthwhile investment based on these two measures? Why or why not?
b. Calculate the project’s MIRR. Is the project a worthwhile investment based on this measure? Why or why not?
11–16. (Calculating IRR for an uneven cash flow stream) Microwave Oven Programming, Inc., is considering the construction of a new plant. The plant will have an initial cash outlay of $7 million (CF0 = -$7 million) and will produce cash flows of $3 million at the end of Year 1, $4 million at the end of Year 2, and $2 million at the end of Years 3 through 5. What is the IRR for this new plant?
11–17. (Calculating MIRR) (Related to Checkpoint 11.6 on page 382) The Dunder Muffin Company is considering purchasing a new commercial oven that costs $350,000. This new oven will produce cash inflows of $125,000 at the end of Years 1 through 10. In addition to the cash inflows, at the end of Year 5 there will be a net cash out-flow of $200,000. The company has a required rate of return of 12 percent. What is the MIRR of the investment? Would you make the investment? Why or why not?
11–18. (Calculating MIRR) Star Industries owns and operates landfills for several municipali-ties throughout the U.S. Midwest. Star typically contracts with the municipality to provide landfill services for a period of 20 years. The firm then constructs a lined landfill (required by federal law) that has capacity for 5 years. The $10 million expenditure required to construct the new landfill results in negative cash flows at the end of Years 0, 5, 10, and 15. This change in sign on the stream of cash flows over the 20-year contract period introduces the potential for multiple IRRs, so Star’s management has decided to use the MIRR to evaluate new landfill investment con-tracts. The annual cash inflows to Star begin in Year 1 and extend through Year 20 and are estimated to equal $3 million (this does not reflect the cost of constructing the landfills every 5 years). Star uses a 10 percent discount rate to evaluate its new projects, so it plans to discount all the construction costs every 5 years back to Year 0 using this rate before calculating the MIRR.a. What are the project’s NPV, IRR, and MIRR?b. Is this a good investment opportunity for Star Industries? Why or why not?
11–19. (Calculating NPV, PI, and IRR) (Related to Checkpoint 11.1 on page 367 and Checkpoint 11.4 on page 376) Fijisawa, Inc., is considering a major expansion of its top-selling product line and has estimated the following cash flows associ-ated with the expansion. The initial outlay will be $10,800,000, and the project will generate cash flows of $1,250,000 per year for 20 years. The appropriate discount rate is 9 percent.a. Calculate the NPV.b. Calculate the PI.c. Calculate the IRR.d. Should this project be accepted? Why or why not?
CHAPTER 11 | Investment Decision Criteria 397
M11_TITM2189_13_GE_C11.indd 397 18/05/17 12:47 PM

398 PART 3 | Capital Budgeting398 PART 3 | Capital Budgeting
11–20. (Calculating the discounted payback period) Gio’s Restaurants is considering a proj-ect with the following expected cash flows:
Year Project Cash Flow
0 $(150 million)
1 90 million
2 70 million
3 90 million
4 100 million
If the project’s appropriate discount is 12 percent, what is the project’s discounted payback period?
11–21. (Calculating the discounted payback period) The Callaway Cattle Company is considering the construction of a new feed-handling system for its feed-lot in Abilene, Kansas. The new system will provide annual labor savings and reduced waste totaling $200,000, and the initial investment will be only $500,000. Callaway’s management has used a simple payback period method for evaluating new investments in the past but plans to calculate the discounted payback period to analyze the investment. Where the appropriate discount rate for this type of project is 10 percent, what is the project’s discounted pay-back period?
11–22. (Calculating the payback and discounted payback periods) The Bar-None Manufac-turing Company manufactures fence panels used in cattle feedlots throughout the Midwest. Bar-None’s management is considering three investment projects for next year but doesn’t want to make any investment that requires more than three years to recover the firm’s initial investment. The cash flows for the three projects (A, B, and C) are as follows:
Year Project A Project B Project C
0 $(1,000) $(10,000) $(5,000)
1 600 5,000 1,000
2 300 3,000 1,000
3 200 3,000 2,000
4 100 3,000 2,000
5 500 3,000 2,000
a. Given Bar-None’s three-year payback period, which of the projects will qualify for acceptance?
b. Rank the three projects using their payback periods. Which project looks the best using this criterion? Do you agree with this ranking? Why or why not?
c. If Bar-None uses a 10 percent discount rate to analyze projects, what is the dis-counted payback period for each of the three projects? If the firm still maintains its three-year payback policy for the discounted payback, which projects should the firm undertake?
11–23. (Calculating the payback period and NPV) Plato Energy is an oil-and-gas explora-tion and development company located in Farmington, New Mexico. The company drills shallow wells in hopes of finding significant oil and gas deposits. The firm is considering two different drilling opportunities that have very different production potentials. One is in the Barnett Shale region of central Texas, and the other is on the Gulf Coast. The Barnett Shale project requires a much larger initial investment but provides cash flows (if successful) over a much longer period of time than the Gulf Coast opportunity. In addition, the longer life of the Barnett Shale project results in additional expenditures in Year 3 of the project to enhance production
M11_TITM2189_13_GE_C11.indd 398 18/05/17 12:47 PM
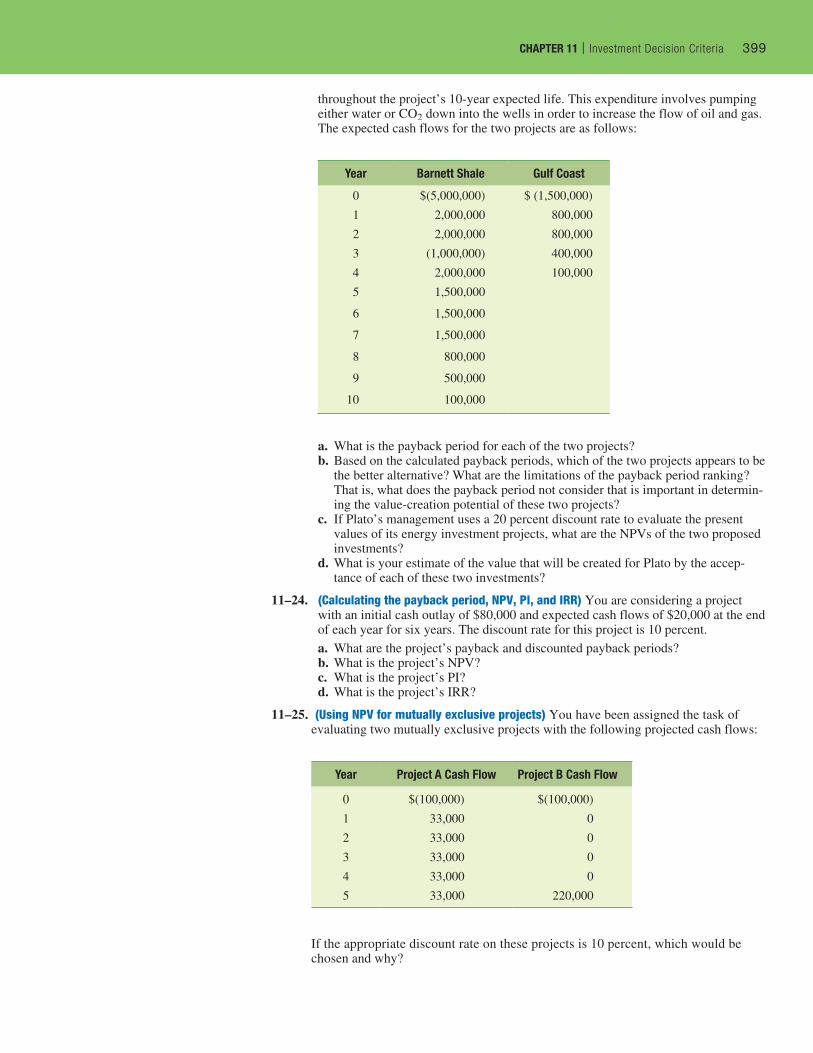
CHAPTER 11 | Investment Decision Criteria 399
throughout the project’s 10-year expected life. This expenditure involves pumping either water or CO2 down into the wells in order to increase the flow of oil and gas. The expected cash flows for the two projects are as follows:
Year Barnett Shale Gulf Coast
0 $(5,000,000) $ (1,500,000)
1 2,000,000 800,000
2 2,000,000 800,000
3 (1,000,000) 400,000
4 2,000,000 100,000
5 1,500,000
6 1,500,000
7 1,500,000
8 800,000
9 500,000
10 100,000
a. What is the payback period for each of the two projects?b. Based on the calculated payback periods, which of the two projects appears to be
the better alternative? What are the limitations of the payback period ranking? That is, what does the payback period not consider that is important in determin-ing the value-creation potential of these two projects?
c. If Plato’s management uses a 20 percent discount rate to evaluate the present values of its energy investment projects, what are the NPVs of the two proposed investments?
d. What is your estimate of the value that will be created for Plato by the accep-tance of each of these two investments?
11–24. (Calculating the payback period, NPV, PI, and IRR) You are considering a project with an initial cash outlay of $80,000 and expected cash flows of $20,000 at the end of each year for six years. The discount rate for this project is 10 percent.a. What are the project’s payback and discounted payback periods?b. What is the project’s NPV?c. What is the project’s PI?d. What is the project’s IRR?
11–25. (Using NPV for mutually exclusive projects) You have been assigned the task of evaluating two mutually exclusive projects with the following projected cash flows:
Year Project A Cash Flow Project B Cash Flow
0 $(100,000) $(100,000)
1 33,000 0
2 33,000 0
3 33,000 0
4 33,000 0
5 33,000 220,000
If the appropriate discount rate on these projects is 10 percent, which would be chosen and why?
CHAPTER 11 | Investment Decision Criteria 399
M11_TITM2189_13_GE_C11.indd 399 18/05/17 12:47 PM
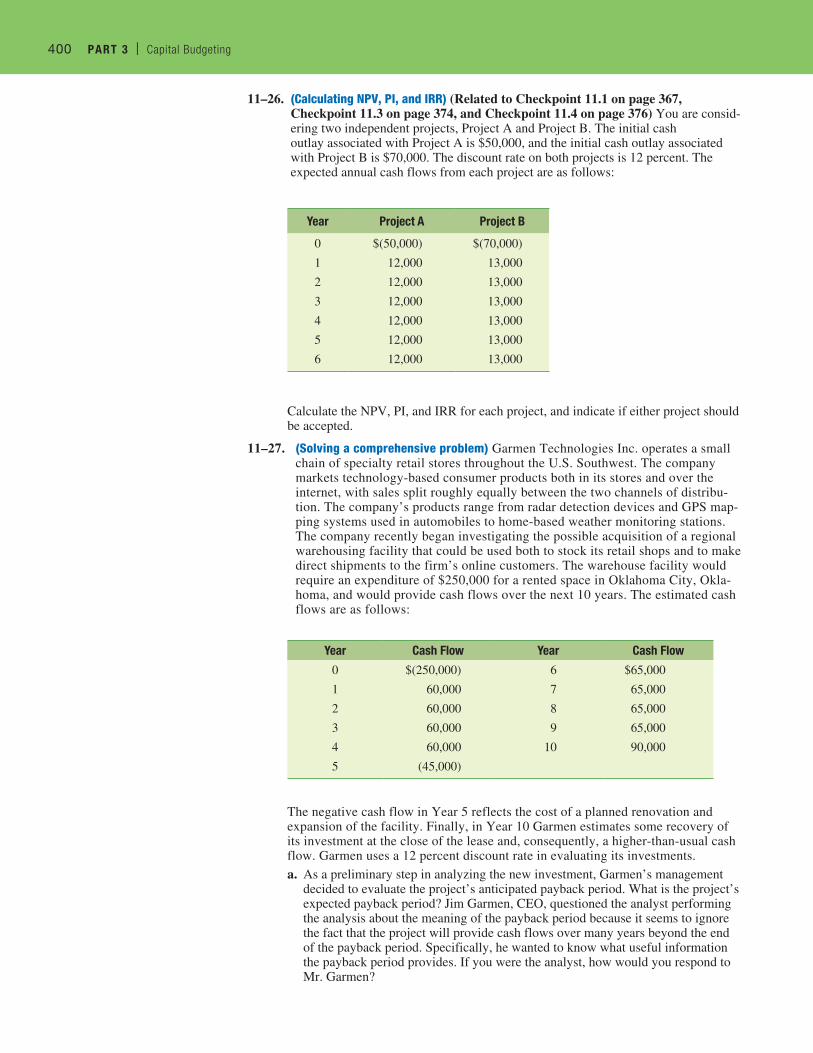
400 PART 3 | Capital Budgeting400 PART 3 | Capital Budgeting
11–26. (Calculating NPV, PI, and IRR) (Related to Checkpoint 11.1 on page 367, Checkpoint 11.3 on page 374, and Checkpoint 11.4 on page 376) You are consid-ering two independent projects, Project A and Project B. The initial cash outlay associated with Project A is $50,000, and the initial cash outlay associated with Project B is $70,000. The discount rate on both projects is 12 percent. The expected annual cash flows from each project are as follows:
Year Project A Project B
0 $(50,000) $(70,000)
1 12,000 13,000
2 12,000 13,000
3 12,000 13,000
4 12,000 13,000
5 12,000 13,000
6 12,000 13,000
Calculate the NPV, PI, and IRR for each project, and indicate if either project should be accepted.
11–27. (Solving a comprehensive problem) Garmen Technologies Inc. operates a small chain of specialty retail stores throughout the U.S. Southwest. The company markets technology-based consumer products both in its stores and over the internet, with sales split roughly equally between the two channels of distribu-tion. The company’s products range from radar detection devices and GPS map-ping systems used in automobiles to home-based weather monitoring stations. The company recently began investigating the possible acquisition of a regional warehousing facility that could be used both to stock its retail shops and to make direct shipments to the firm’s online customers. The warehouse facility would require an expenditure of $250,000 for a rented space in Oklahoma City, Okla-homa, and would provide cash flows over the next 10 years. The estimated cash flows are as follows:
Year Cash Flow Year Cash Flow
0 $(250,000) 6 $65,000
1 60,000 7 65,000
2 60,000 8 65,000
3 60,000 9 65,000
4 60,000 10 90,000
5 (45,000)
The negative cash flow in Year 5 reflects the cost of a planned renovation and expansion of the facility. Finally, in Year 10 Garmen estimates some recovery of its investment at the close of the lease and, consequently, a higher-than-usual cash flow. Garmen uses a 12 percent discount rate in evaluating its investments.a. As a preliminary step in analyzing the new investment, Garmen’s management
decided to evaluate the project’s anticipated payback period. What is the project’s expected payback period? Jim Garmen, CEO, questioned the analyst performing the analysis about the meaning of the payback period because it seems to ignore the fact that the project will provide cash flows over many years beyond the end of the payback period. Specifically, he wanted to know what useful information the payback period provides. If you were the analyst, how would you respond to Mr. Garmen?
M11_TITM2189_13_GE_C11.indd 400 18/05/17 12:47 PM
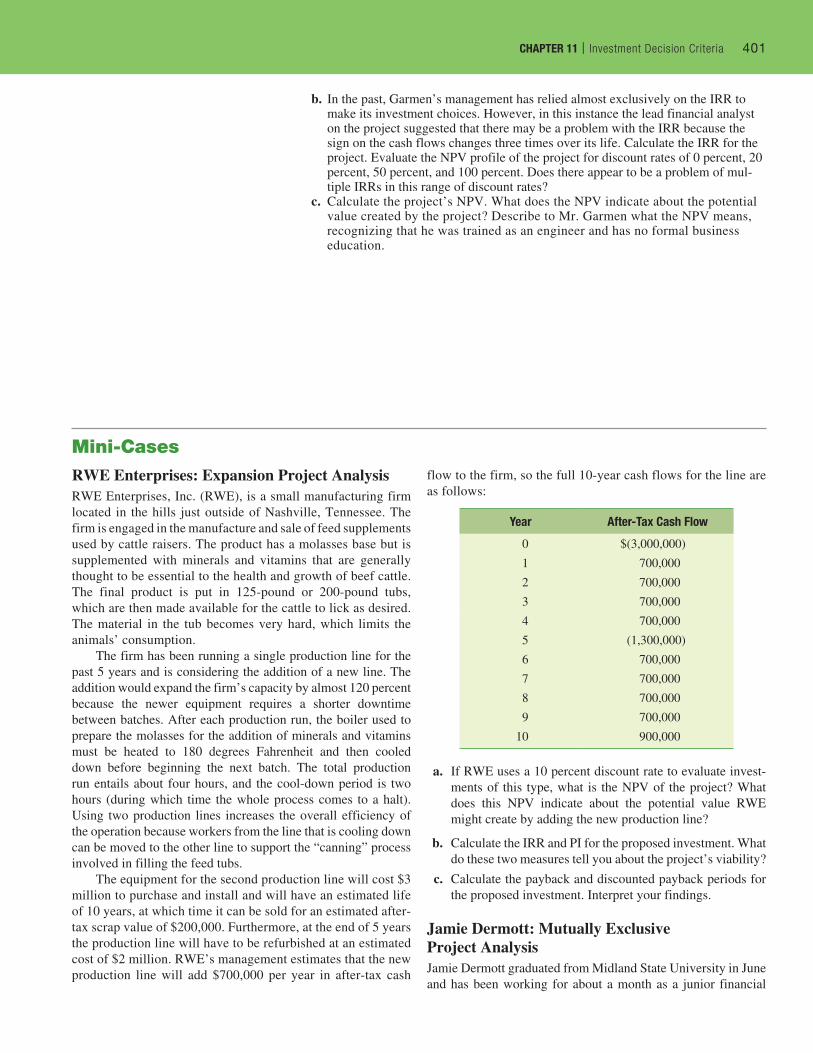
CHAPTER 11 | Investment Decision Criteria 401
b. In the past, Garmen’s management has relied almost exclusively on the IRR to make its investment choices. However, in this instance the lead financial analyst on the project suggested that there may be a problem with the IRR because the sign on the cash flows changes three times over its life. Calculate the IRR for the project. Evaluate the NPV profile of the project for discount rates of 0 percent, 20 percent, 50 percent, and 100 percent. Does there appear to be a problem of mul-tiple IRRs in this range of discount rates?
c. Calculate the project’s NPV. What does the NPV indicate about the potential value created by the project? Describe to Mr. Garmen what the NPV means, recognizing that he was trained as an engineer and has no formal business education.
Mini-CasesRWE Enterprises: Expansion Project AnalysisRWE Enterprises, Inc. (RWE), is a small manufacturing firm located in the hills just outside of Nashville, Tennessee. The firm is engaged in the manufacture and sale of feed supplements used by cattle raisers. The product has a molasses base but is supplemented with minerals and vitamins that are generally thought to be essential to the health and growth of beef cattle. The final product is put in 125-pound or 200-pound tubs, which are then made available for the cattle to lick as desired. The material in the tub becomes very hard, which limits the animals’ consumption.
The firm has been running a single production line for the past 5 years and is considering the addition of a new line. The addition would expand the firm’s capacity by almost 120 percent because the newer equipment requires a shorter downtime between batches. After each production run, the boiler used to prepare the molasses for the addition of minerals and vitamins must be heated to 180 degrees Fahrenheit and then cooled down before beginning the next batch. The total production run entails about four hours, and the cool-down period is two hours (during which time the whole process comes to a halt). Using two production lines increases the overall efficiency of the operation because workers from the line that is cooling down can be moved to the other line to support the “canning” process involved in filling the feed tubs.
The equipment for the second production line will cost $3 million to purchase and install and will have an estimated life of 10 years, at which time it can be sold for an estimated after-tax scrap value of $200,000. Furthermore, at the end of 5 years the production line will have to be refurbished at an estimated cost of $2 million. RWE’s management estimates that the new production line will add $700,000 per year in after-tax cash
flow to the firm, so the full 10-year cash flows for the line are as follows:
Year After-Tax Cash Flow
0 $(3,000,000)
1 700,000
2 700,000
3 700,000
4 700,000
5 (1,300,000)
6 700,000
7 700,000
8 700,000
9 700,000
10 900,000
a. If RWE uses a 10 percent discount rate to evaluate invest-ments of this type, what is the NPV of the project? What does this NPV indicate about the potential value RWE might create by adding the new production line?
b. Calculate the IRR and PI for the proposed investment. What do these two measures tell you about the project’s viability?
c. Calculate the payback and discounted payback periods for the proposed investment. Interpret your findings.
Jamie Dermott: Mutually Exclusive Project AnalysisJamie Dermott graduated from Midland State University in June and has been working for about a month as a junior financial
CHAPTER 11 | Investment Decision Criteria 401
M11_TITM2189_13_GE_C11.indd 401 18/05/17 12:47 PM
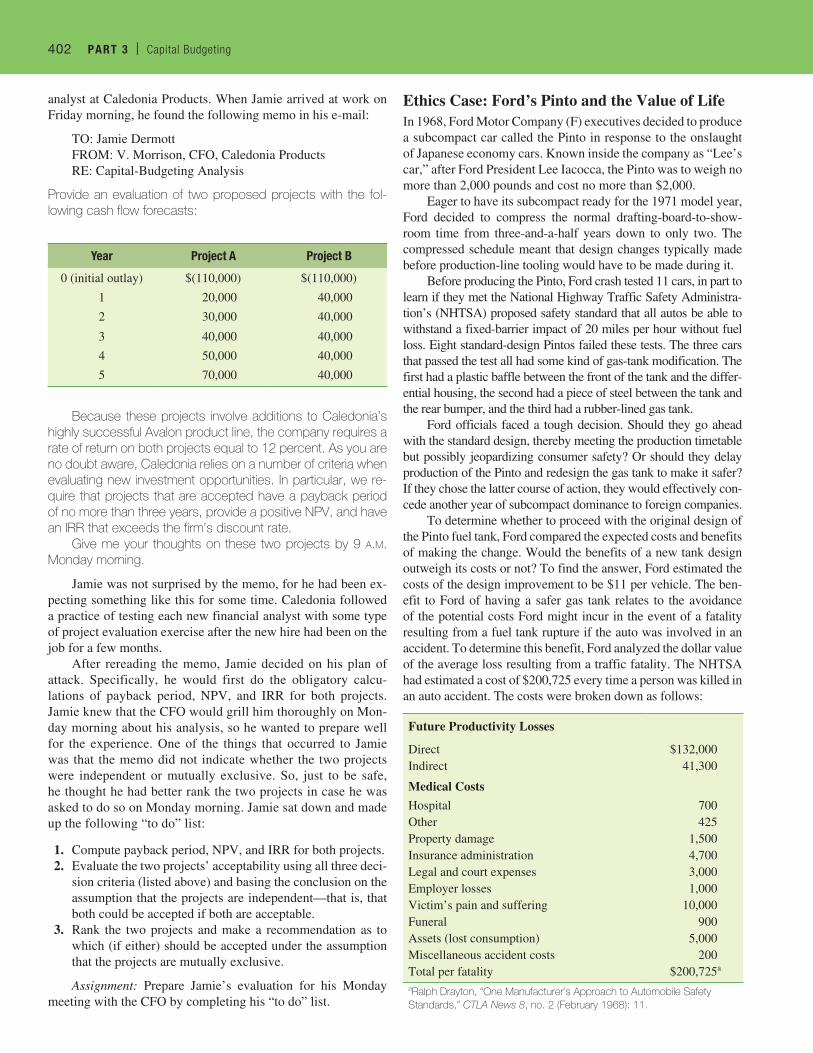
402 PART 3 | Capital Budgeting402 PART 3 | Capital Budgeting
analyst at Caledonia Products. When Jamie arrived at work on Friday morning, he found the following memo in his e-mail:
TO: Jamie Dermott FROM: V. Morrison, CFO, Caledonia Products RE: Capital-Budgeting Analysis
Provide an evaluation of two proposed projects with the fol-lowing cash flow forecasts:
Year Project A Project B
0 (initial outlay) $(110,000) $(110,000)
1 20,000 40,000
2 30,000 40,000
3 40,000 40,000
4 50,000 40,000
5 70,000 40,000
Because these projects involve additions to Caledonia’s highly successful Avalon product line, the company requires a rate of return on both projects equal to 12 percent. As you are no doubt aware, Caledonia relies on a number of criteria when evaluating new investment opportunities. In particular, we re-quire that projects that are accepted have a payback period of no more than three years, provide a positive NPV, and have an IRR that exceeds the firm’s discount rate.
Give me your thoughts on these two projects by 9 a.m. Monday morning.
Jamie was not surprised by the memo, for he had been ex-pecting something like this for some time. Caledonia followed a practice of testing each new financial analyst with some type of project evaluation exercise after the new hire had been on the job for a few months.
After rereading the memo, Jamie decided on his plan of attack. Specifically, he would first do the obligatory calcu-lations of payback period, NPV, and IRR for both projects. Jamie knew that the CFO would grill him thoroughly on Mon-day morning about his analysis, so he wanted to prepare well for the experience. One of the things that occurred to Jamie was that the memo did not indicate whether the two projects were independent or mutually exclusive. So, just to be safe, he thought he had better rank the two projects in case he was asked to do so on Monday morning. Jamie sat down and made up the following “to do” list:
1. Compute payback period, NPV, and IRR for both projects. 2. Evaluate the two projects’ acceptability using all three deci-
sion criteria (listed above) and basing the conclusion on the assumption that the projects are independent—that is, that both could be accepted if both are acceptable.
3. Rank the two projects and make a recommendation as to which (if either) should be accepted under the assumption that the projects are mutually exclusive.
Assignment: Prepare Jamie’s evaluation for his Monday meeting with the CFO by completing his “to do” list.
Ethics Case: Ford’s Pinto and the Value of LifeIn 1968, Ford Motor Company (F) executives decided to produce a subcompact car called the Pinto in response to the onslaught of Japanese economy cars. Known inside the company as “Lee’s car,” after Ford President Lee Iacocca, the Pinto was to weigh no more than 2,000 pounds and cost no more than $2,000.
Eager to have its subcompact ready for the 1971 model year, Ford decided to compress the normal drafting-board-to-show-room time from three-and-a-half years down to only two. The compressed schedule meant that design changes typically made before production-line tooling would have to be made during it.
Before producing the Pinto, Ford crash tested 11 cars, in part to learn if they met the National Highway Traffic Safety Administra-tion’s (NHTSA) proposed safety standard that all autos be able to withstand a fixed-barrier impact of 20 miles per hour without fuel loss. Eight standard-design Pintos failed these tests. The three cars that passed the test all had some kind of gas-tank modification. The first had a plastic baffle between the front of the tank and the differ-ential housing, the second had a piece of steel between the tank and the rear bumper, and the third had a rubber-lined gas tank.
Ford officials faced a tough decision. Should they go ahead with the standard design, thereby meeting the production timetable but possibly jeopardizing consumer safety? Or should they delay production of the Pinto and redesign the gas tank to make it safer? If they chose the latter course of action, they would effectively con-cede another year of subcompact dominance to foreign companies.
To determine whether to proceed with the original design of the Pinto fuel tank, Ford compared the expected costs and benefits of making the change. Would the benefits of a new tank design outweigh its costs or not? To find the answer, Ford estimated the costs of the design improvement to be $11 per vehicle. The ben-efit to Ford of having a safer gas tank relates to the avoidance of the potential costs Ford might incur in the event of a fatality resulting from a fuel tank rupture if the auto was involved in an accident. To determine this benefit, Ford analyzed the dollar value of the average loss resulting from a traffic fatality. The NHTSA had estimated a cost of $200,725 every time a person was killed in an auto accident. The costs were broken down as follows:
Future Productivity Losses
Direct $132,000Indirect 41,300
Medical Costs
Hospital 700Other 425Property damage 1,500Insurance administration 4,700Legal and court expenses 3,000Employer losses 1,000Victim’s pain and suffering 10,000Funeral 900Assets (lost consumption) 5,000Miscellaneous accident costs 200Total per fatality $200,725a
aRalph Drayton, “One Manufacturer’s Approach to Automobile Safety Standards,” CTLA News 8, no. 2 (February 1968): 11.
M11_TITM2189_13_GE_C11.indd 402 18/05/17 12:47 PM
CHAPTER 11 | Investment Decision Criteria 403
Because the $137.5 million cost of the safety improvement outweighed the $49.5 million benefit of the redesign, Ford decided to push ahead with the original design.
Questions
1. Do you think Ford analyzed the problem of redesigning the Pinto fuel tank in a reasonable way?
2. Should questions involving the risk of loss of human life be answered using a cost-benefit analysis? After all, don’t life insurance companies do this all the time in pricing life insurance policies to older versus younger customers?
Source: This case is based on William Shaw and Vincent Barry, “Ford’s Pinto,” Moral Issues in Business, 9th ed. (New York: Wadsworth, 2004), 84–86. © by Wadsworth, Inc.
Ford analysts used NHTSA’s estimates and other statistical studies in their cost-benefit analysis, which yielded the follow-ing estimates:
Benefits Losses avoided by redesigning the fuel tank in the Pinto
Savings: 180 burn deaths; 180 serious burn injuries; and 2,100 burned vehicles
Unit cost: $200,000 per death; $67,000 per injury; and $700 per vehicle
Total benefit: (180 * $200,000) + (180 * $67,000) +(2,100 * $700) = $49.5 million
Costs Losses incurred by the redesign of the fuel tank in the Pinto
Sales: 11 million cars; 1.5 million light trucks
Unit cost: $11 per car and $11 per truck
Total cost: 12.5 million * $11 = $137.5 milliona
aMark Dowie, “Pinto Madness,” Mother Jones, September–October 1977, 20. See also Russell Mokhiber, Corporate Crime and Violence (San Fran-cisco: Sierra Club Books, 1988), 373–382, and Francis T. Cullen, William J. Maakestad, and Gary Cavender, Corporate Crime Under Attack: The Ford Pinto Case and Beyond (Cincinnati: Anderson Publishing, 1987).
CHAPTER 11 | Investment Decision Criteria 403
M11_TITM2189_13_GE_C11.indd 403 18/05/17 12:47 PM
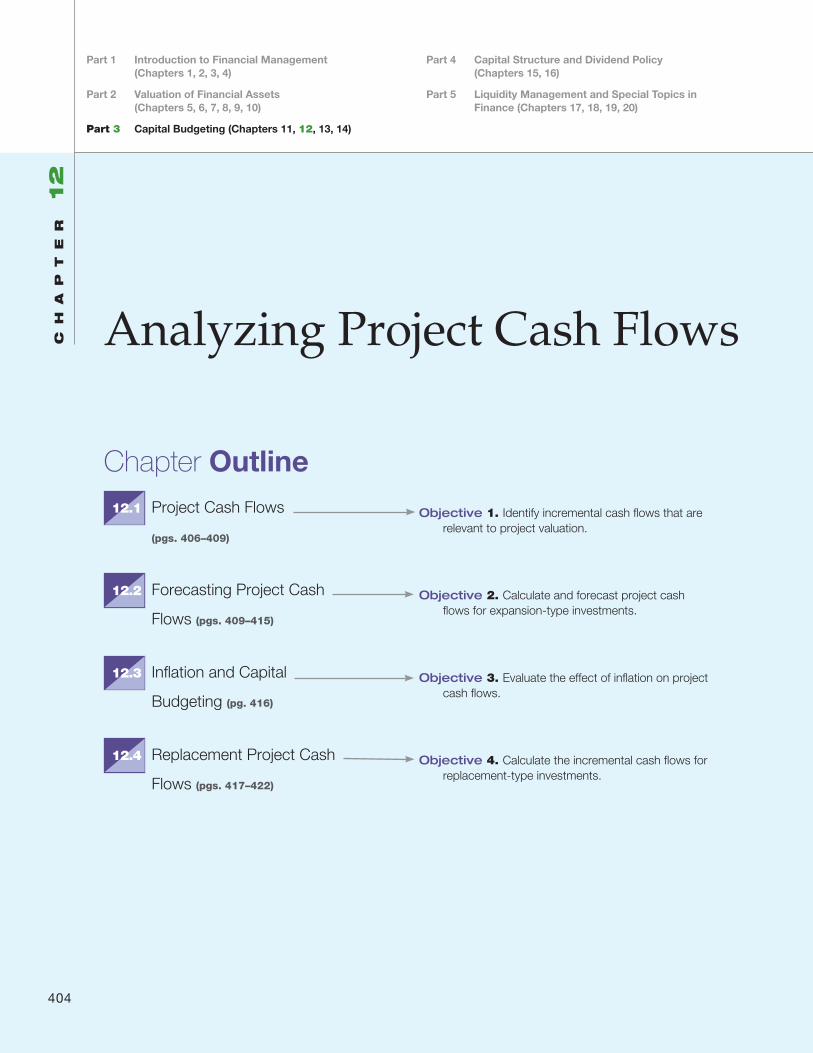
Analyzing Project Cash FlowsCH
AP
TE
R 12
Chapter Outline
404
Objective 1. Identify incremental cash flows that are relevant to project valuation.
Objective 3. Evaluate the effect of inflation on project cash flows.
Objective 4. Calculate the incremental cash flows for replacement-type investments.
Objective 2. Calculate and forecast project cash flows for expansion-type investments.
12.1 Project Cash Flows
(pgs. 406–409)
12.2 Forecasting Project Cash
Flows (pgs. 409–415)
12.3 Inflation and Capital
Budgeting (pg. 416)
12.4 Replacement Project Cash
Flows (pgs. 417–422)
Part 1 Introduction to Financial Management (Chapters 1, 2, 3, 4)
Part 2 Valuation of Financial Assets (Chapters 5, 6, 7, 8, 9, 10)
Part 3 Capital Budgeting (Chapters 11, 12, 13, 14)
Part 4 Capital Structure and Dividend Policy (Chapters 15, 16)
Part 5 Liquidity Management and Special Topics in Finance (Chapters 17, 18, 19, 20)
M12_TITM2189_13_GE_C12.indd 404 19/05/17 8:12 AM

Forecasting Sales of Hybrid AutomobilesIn 2001, when Toyota introduced the first-generation model of its gas- and electric-powered hybrid car, the Prius, it seemed more like a science experiment than real competition for auto industry market share. Toyota’s decision to introduce the Prius and enter the hybrid car market was particularly difficult to evaluate because the cash flows were so difficult to forecast. Revenues from the Prius would depend largely on how many buyers the newly designed hybrids drew away from traditionally powered cars—a number that would be strongly influenced by the future price of gasoline. Moreover, some of the hybrid sales would come from customers who would have otherwise bought another Toyota model. These are difficult issues for any firm to face; however, they are issues a financial manager must address to make an informed decision about the introduction of an innovative new product.
In this chapter, we calculate investment cash flows and discuss methods that can be used to develop cash flow forecasts. Calculating the appropriate cash flows in a valuation exercise is not always obvious, and we offer some guidelines that are designed to avoid some of the more common mistakes. In particular, we will stress P Principle 3: Cash Flows Are the Source of Value. In addition, we will be reminded that managers
are often incentivized to do things that are not in the best interest of the firm’s shareholders, which is P Principle 5: Individuals Respond to Incentives. Specifically, when managers forecast cash flows for a project in their department, they may be tempted to paint a rosy picture for the project in the hopes of winning the funding from headquarters.
Principles P 3 and P 5 Applied
405
M12_TITM2189_13_GE_C12.indd 405 19/05/17 8:12 AM
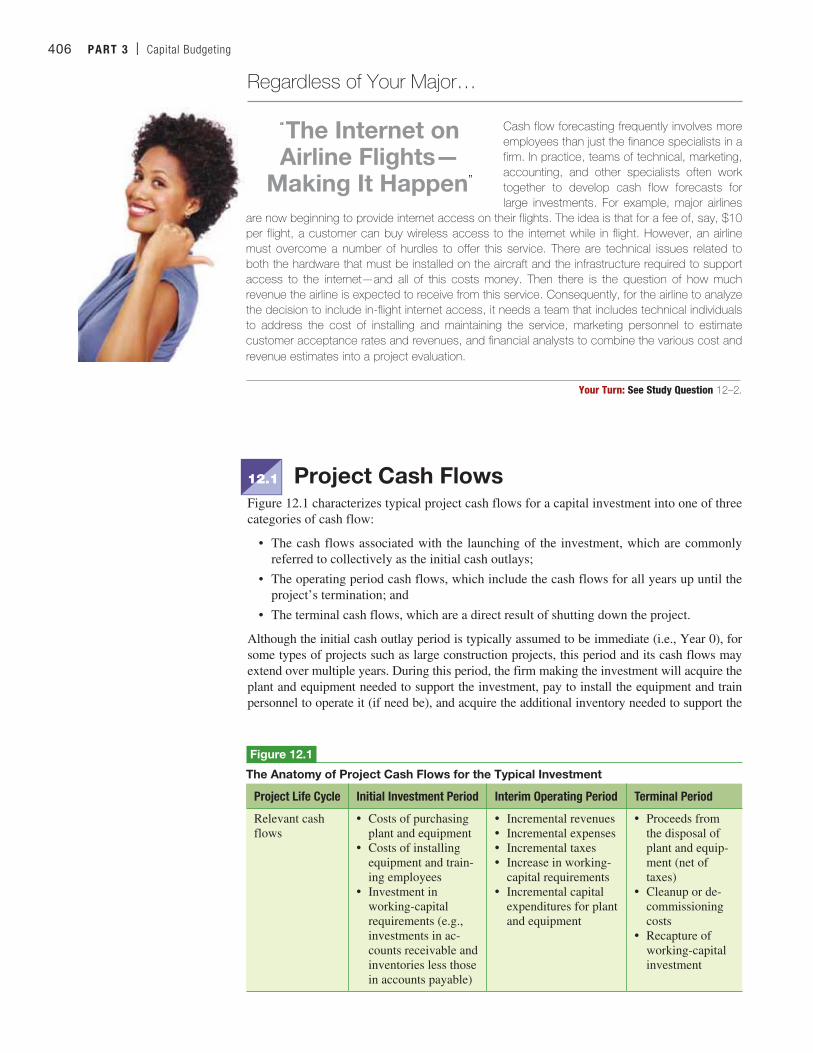
406 PART 3 | Capital Budgeting
Cash flow forecasting frequently involves more employees than just the finance specialists in a firm. In practice, teams of technical, marketing, accounting, and other specialists often work together to develop cash flow forecasts for large investments. For example, major airlines
are now beginning to provide internet access on their flights. The idea is that for a fee of, say, $10 per flight, a customer can buy wireless access to the internet while in flight. However, an airline must overcome a number of hurdles to offer this service. There are technical issues related to both the hardware that must be installed on the aircraft and the infrastructure required to support access to the internet—and all of this costs money. Then there is the question of how much revenue the airline is expected to receive from this service. Consequently, for the airline to analyze the decision to include in-flight internet access, it needs a team that includes technical individuals to address the cost of installing and maintaining the service, marketing personnel to estimate customer acceptance rates and revenues, and financial analysts to combine the various cost and revenue estimates into a project evaluation.
Your Turn: See Study Question 12–2.
Regardless of Your Major…
“ The Internet on Airline Flights—
Making It Happen”
12.1 Project Cash FlowsFigure 12.1 characterizes typical project cash flows for a capital investment into one of three categories of cash flow:
• The cash flows associated with the launching of the investment, which are commonly referred to collectively as the initial cash outlays;
• The operating period cash flows, which include the cash flows for all years up until the project’s termination; and
• The terminal cash flows, which are a direct result of shutting down the project.
Although the initial cash outlay period is typically assumed to be immediate (i.e., Year 0), for some types of projects such as large construction projects, this period and its cash flows may extend over multiple years. During this period, the firm making the investment will acquire the plant and equipment needed to support the investment, pay to install the equipment and train personnel to operate it (if need be), and acquire the additional inventory needed to support the
Figure 12.1
The Anatomy of Project Cash Flows for the Typical Investment
Project Life Cycle Initial Investment Period Interim Operating Period Terminal Period
Relevant cash flows
• Costs of purchasing plant and equipment
• Costs of installing equipment and train-ing employees
• Investment in working-capital requirements (e.g., investments in ac-counts receivable and inventories less those in accounts payable)
• Incremental revenues• Incremental expenses• Incremental taxes• Increase in working-
capital requirements• Incremental capital
expenditures for plant and equipment
• Proceeds from the disposal of plant and equip-ment (net of taxes)
• Cleanup or de-commissioning costs
• Recapture of working-capital investment
M12_TITM2189_13_GE_C12.indd 406 19/05/17 8:12 AM
CHAPTER 12 | Analyzing Project Cash Flows 407
operation of the investment for the coming year. In addition to inventories, the firm may need to finance added accounts receivable if it sells some of its output on credit. Finally, at least some part of this added investment in current assets is financed by the firm’s suppliers in the form of trade credit, so we deduct any increase in accounts payable from the added investments in receivables and inventory. During the interim operating period, we account for the cash flow consequences of incremental revenues and expenses as well as any need for additional plant and equipment or working capital. Finally, in the final or terminal year of the investment’s life, the firm incurs both cash inflows (from the sale of plant and equipment and from working capital that is used up without replenishment) and cash outflows (related to decommissioning the investment). In some cases, the latter is very sizable. For example, shutting down a crude-oil refinery would include the costs of cleaning up any environmental hazards on the plant site.
Incremental Cash Flows Are What MattersWhen a firm takes on a new investment, it does so anticipating that the investment will increase the firm’s future cash flows. So when we are evaluating whether to undertake the investment, as we learned from P Principle 3: Cash Flows Are the Source of Value, we consider what we will refer to as the incremental cash flow associated with the investment—that is, the additional cash flow a firm receives from taking on a new project.
To understand this concept of incremental cash flows, suppose that you recently opened a small convenience store. The store is a big success, and you are offered the opportunity to rent space in a strip mall six blocks away to open a second convenience store. To evaluate this opportunity, you begin by calculating the costs of the initial investment and the cash flows from the investment in exactly the same way you did when you evaluated the initial site. However, before calculating the net present value (NPV) of this new opportunity, you start to think about how adding a second location will affect your sales in the initial location. To what extent will you generate business by simply stealing business from your initial location? Cash flows that are generated by stealing customers from your initial location are clearly worth less to you than cash flows generated by stealing customers from your competitors.
This example serves to emphasize that the proper way to look at the cash flows from the second convenience store involves calculating the incremental cash flows generated by the new store. That is, the cash flows for the second store should be calculated by comparing the total cash flows from the two stores to the total cash flows without the second store. More generally, we define incremental project cash flows as follows:
Incremental Project
Cash Flows= aFirm Cash Flows
with the Projectb - a Firm Cash Flows
without the Projectb (12–1)
Thus, to find the incremental cash flow for a project, we take the difference between the firm’s cash flows if the new investment is and is not undertaken. This may sound simple enough, but there are a number of circumstances in which estimating this incremental cash flow can be very challenging, requiring the analyst to carefully consider each potential source of cash flow.
Guidelines for Forecasting Incremental Cash FlowsIn this section, we focus on some simple guidelines for proper identification of incremental cash flows for a project. As we will see, this is not always easy to do, so it is helpful to have a set of basic guidelines to help us avoid some common mistakes.
Sunk Costs Are Not Incremental Cash FlowsSunk costs are those costs that have already been incurred or are going to be incurred, regard-less of whether or not the investment is undertaken. An example would be the cost of a market research study or a pilot program. These costs are not incremental cash flows resulting from the acceptance of the investment because they will be incurred in any case. For example, in the convenience store example just discussed, suppose last year you spent $1,000 getting an appraisal of the prospective site for the second store. This expenditure is not relevant to the decision we have to make today because you have already spent that money. The cost of the appraisal is a sunk cost because the money has already been spent and cannot be recovered whether or not you build the second convenience store.
M12_TITM2189_13_GE_C12.indd 407 19/05/17 8:12 AM
408 PART 3 | Capital Budgeting
Overhead Costs Are Generally Not Incremental Cash FlowsOverhead expenses such as the cost of heat, light, and rent often occur whether we accept or reject a particular project. In these instances, overhead expenses are not a relevant consider-ation when evaluating project cash flows.
To illustrate, consider the decision as to whether the university bookstore should open a sub shop in an underutilized portion of the bookstore. The bookstore manager estimates that the sub shop will take up one-tenth of the bookstore’s floor space. If the store’s monthly heat and light bill is $10,000, should the manager allocate $1,000 of this cost to the sub shop proposal? Assuming the space will be heated and lighted whether or not it is converted into a sub shop, the answer is no.
Look for Synergistic EffectsOftentimes the acceptance of a new project will have an effect on the cash flows of the firm’s other projects or investments. These effects can be either positive or negative, and if these syn-ergistic effects can be anticipated, their costs and benefits are relevant to the project analysis.
Don’t Overlook Positive SynergiesIn 2000, General Motors’ (GM) Pontiac division introduced the Aztek, a boldly designed sport-utility vehicle aimed at young buyers. The idea was to sell Azteks, of course, but also to help lure younger customers back into Pontiac’s showrooms. Thus, in evaluating the Aztek, if Pontiac’s analysts focused only on the expected revenues from new Aztek sales, they would have missed the incremental cash flow from new customers who came in to see the Aztek but instead purchased another Pontiac automobile.
Another example of a synergistic effect is that of Harley-Davidson’s introduction of the Buell Blast and the Lightning Low XB95—two smaller, lighter motorcycles targeted at younger riders and female riders not yet ready for heavier and more expensive Harley-Davidson bikes. The com-pany had two goals in mind when it introduced the Buell Blast and Lightning Low bikes. First, it was trying to expand its customer base into a new market made up of Generation Xers. Second, it wanted to expand the market for existing products by introducing more people to motorcycling. That is, the Buell Blast and Lightning Low models were offered not only to produce their own sales but also to ultimately increase the sales of Harley’s heavier cruiser and touring bikes.
Beware of Cash Flows Diverted from Existing ProductsAn important type of negative synergistic effect comes in the form of revenue cannibalization. This occurs when the offering of a new product draws sales away from an existing product. This is a very real concern, for example, when a firm such as Frito-Lay considers offering a new flavor of Dorito® chips. A supermarket allocates limited shelf space to Frito-Lay’s snack products, so if a new flavor is offered, it must take space away from existing products. If the new flavor is expected to produce $10 million per year in cash flows, perhaps as much as $6 million of this cash flow may be at the expense of existing flavors of Doritos®. Conse-quently, we take the resulting $4 million dollars, our incremental cash flow, as the relevant cash flow in evaluating whether or not to introduce the new flavor.
Account for Opportunity CostsIn calculating the cash flows of an investment, it is important to account for what economists refer to as opportunity cost, the cost of passing up the next best choice when making a deci-sion. To illustrate, consider the convenience store example we introduced earlier. Remember that we were considering whether to open a second location just a few blocks from our first, very successful store. Let’s now assume that you have purchased the building in which the second store is to be located and it has space for two businesses. One of the spaces is occupied by a tanning salon, and you are considering opening a second convenience store in the unoc-cupied space. Because you already own the building and the space needed for the convenience store is currently unused, should you charge the second convenience store business for use of the open space? The answer is no if you have no other foreseeable use for the space. However, what if a local restaurant owner approaches you with a proposal to rent the space for $2,000 a month? If you open the second convenience store, you will then forego the $2,000 per month in rent, and this becomes a very relevant incremental expense because it represents an oppor-tunity cost of putting in the convenience store.
M12_TITM2189_13_GE_C12.indd 408 19/05/17 8:12 AM
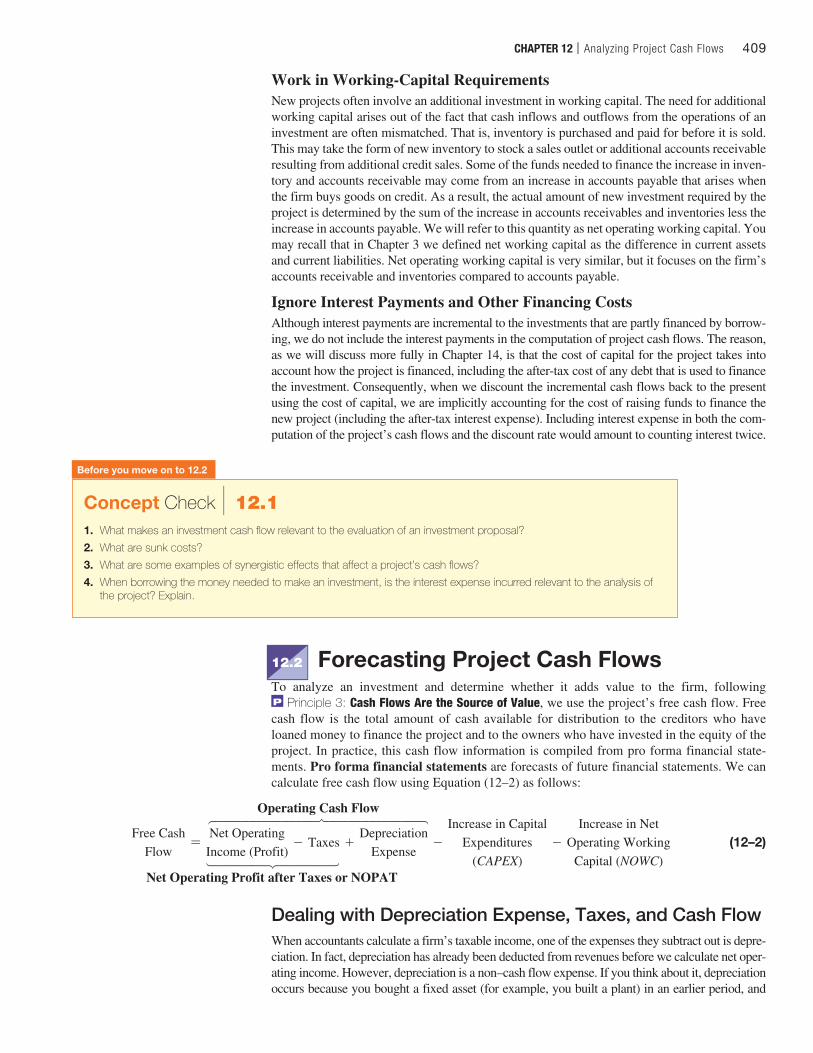
CHAPTER 12 | Analyzing Project Cash Flows 409
Work in Working-Capital RequirementsNew projects often involve an additional investment in working capital. The need for additional working capital arises out of the fact that cash inflows and outflows from the operations of an investment are often mismatched. That is, inventory is purchased and paid for before it is sold. This may take the form of new inventory to stock a sales outlet or additional accounts receivable resulting from additional credit sales. Some of the funds needed to finance the increase in inven-tory and accounts receivable may come from an increase in accounts payable that arises when the firm buys goods on credit. As a result, the actual amount of new investment required by the project is determined by the sum of the increase in accounts receivables and inventories less the increase in accounts payable. We will refer to this quantity as net operating working capital. You may recall that in Chapter 3 we defined net working capital as the difference in current assets and current liabilities. Net operating working capital is very similar, but it focuses on the firm’s accounts receivable and inventories compared to accounts payable.
Ignore Interest Payments and Other Financing CostsAlthough interest payments are incremental to the investments that are partly financed by borrow-ing, we do not include the interest payments in the computation of project cash flows. The reason, as we will discuss more fully in Chapter 14, is that the cost of capital for the project takes into account how the project is financed, including the after-tax cost of any debt that is used to finance the investment. Consequently, when we discount the incremental cash flows back to the present using the cost of capital, we are implicitly accounting for the cost of raising funds to finance the new project (including the after-tax interest expense). Including interest expense in both the com-putation of the project’s cash flows and the discount rate would amount to counting interest twice.
Before you move on to 12.2
Concept Check | 12.11. What makes an investment cash flow relevant to the evaluation of an investment proposal?
2. What are sunk costs?
3. What are some examples of synergistic effects that affect a project’s cash flows?
4. When borrowing the money needed to make an investment, is the interest expense incurred relevant to the analysis of the project? Explain.
12.2 Forecasting Project Cash FlowsTo analyze an investment and determine whether it adds value to the firm, following P Principle 3: Cash Flows Are the Source of Value, we use the project’s free cash flow. Free cash flow is the total amount of cash available for distribution to the creditors who have loaned money to finance the project and to the owners who have invested in the equity of the project. In practice, this cash flow information is compiled from pro forma financial state-ments. Pro forma financial statements are forecasts of future financial statements. We can calculate free cash flow using Equation (12–2) as follows:
Free CashFlow
=Net Operating
Income (Profit)- Taxes +
DepreciationExpense
-Increase in Capital
Expenditures(CAPEX)
-Increase in Net
Operating WorkingCapital (NOWC)
(12–2)
Operating Cash Flow¸˚˚˚˚˚˚˚˚˚˚˚˚˝˚˚˚˚˚˚˚˚˚˚˚˛
¯˚˚˚˚˘˚˚˚˚˙Net Operating Profit after Taxes or NOPAT
Dealing with Depreciation Expense, Taxes, and Cash FlowWhen accountants calculate a firm’s taxable income, one of the expenses they subtract out is depre-ciation. In fact, depreciation has already been deducted from revenues before we calculate net oper-ating income. However, depreciation is a non–cash flow expense. If you think about it, depreciation occurs because you bought a fixed asset (for example, you built a plant) in an earlier period, and
M12_TITM2189_13_GE_C12.indd 409 19/05/17 8:12 AM
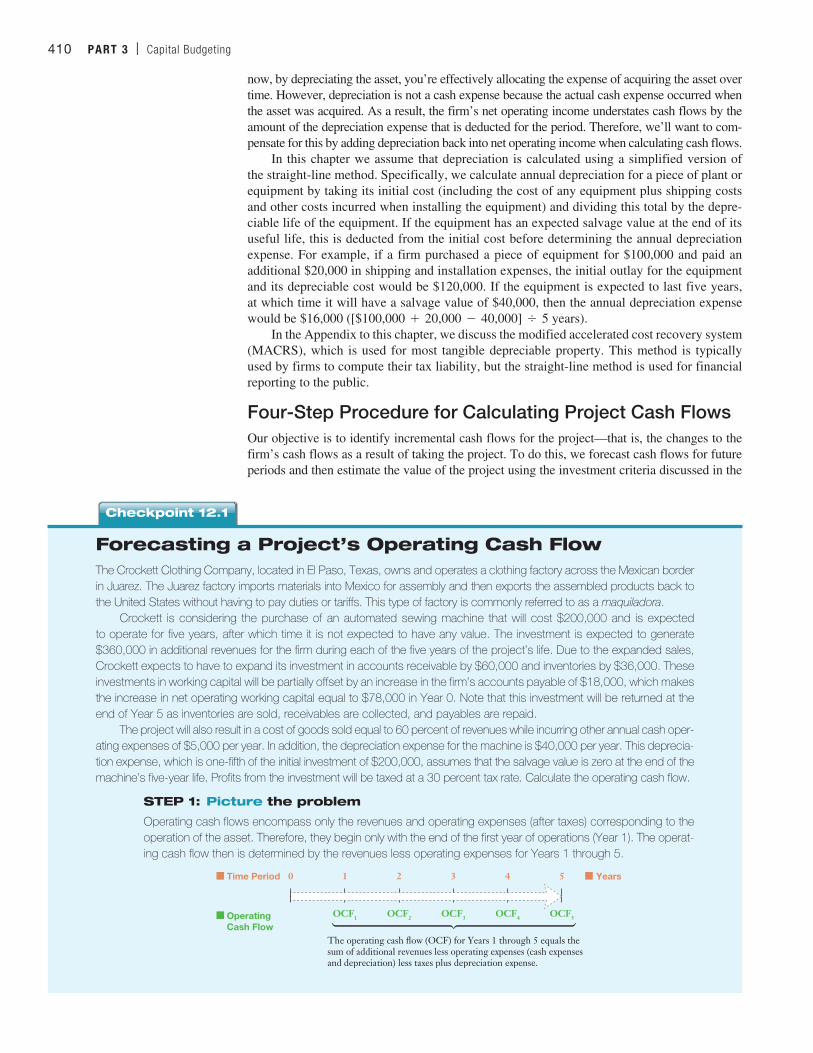
410 PART 3 | Capital Budgeting
now, by depreciating the asset, you’re effectively allocating the expense of acquiring the asset over time. However, depreciation is not a cash expense because the actual cash expense occurred when the asset was acquired. As a result, the firm’s net operating income understates cash flows by the amount of the depreciation expense that is deducted for the period. Therefore, we’ll want to com-pensate for this by adding depreciation back into net operating income when calculating cash flows.
In this chapter we assume that depreciation is calculated using a simplified version of the straight-line method. Specifically, we calculate annual depreciation for a piece of plant or equipment by taking its initial cost (including the cost of any equipment plus shipping costs and other costs incurred when installing the equipment) and dividing this total by the depre-ciable life of the equipment. If the equipment has an expected salvage value at the end of its useful life, this is deducted from the initial cost before determining the annual depreciation expense. For example, if a firm purchased a piece of equipment for $100,000 and paid an additional $20,000 in shipping and installation expenses, the initial outlay for the equipment and its depreciable cost would be $120,000. If the equipment is expected to last five years, at which time it will have a salvage value of $40,000, then the annual depreciation expense would be $16,000 ([$100,000 + 20,000 - 40,000] , 5 years).
In the Appendix to this chapter, we discuss the modified accelerated cost recovery system (MACRS), which is used for most tangible depreciable property. This method is typically used by firms to compute their tax liability, but the straight-line method is used for financial reporting to the public.
Four-Step Procedure for Calculating Project Cash FlowsOur objective is to identify incremental cash flows for the project—that is, the changes to the firm’s cash flows as a result of taking the project. To do this, we forecast cash flows for future periods and then estimate the value of the project using the investment criteria discussed in the
Forecasting a Project’s Operating Cash FlowThe Crockett Clothing Company, located in El Paso, Texas, owns and operates a clothing factory across the Mexican border in Juarez. The Juarez factory imports materials into Mexico for assembly and then exports the assembled products back to the United States without having to pay duties or tariffs. This type of factory is commonly referred to as a maquiladora.
Crockett is considering the purchase of an automated sewing machine that will cost $200,000 and is expected to operate for five years, after which time it is not expected to have any value. The investment is expected to generate $360,000 in additional revenues for the firm during each of the five years of the project’s life. Due to the expanded sales, Crockett expects to have to expand its investment in accounts receivable by $60,000 and inventories by $36,000. These investments in working capital will be partially offset by an increase in the firm’s accounts payable of $18,000, which makes the increase in net operating working capital equal to $78,000 in Year 0. Note that this investment will be returned at the end of Year 5 as inventories are sold, receivables are collected, and payables are repaid.
The project will also result in a cost of goods sold equal to 60 percent of revenues while incurring other annual cash oper-ating expenses of $5,000 per year. In addition, the depreciation expense for the machine is $40,000 per year. This deprecia-tion expense, which is one-fifth of the initial investment of $200,000, assumes that the salvage value is zero at the end of the machine’s five-year life. Profits from the investment will be taxed at a 30 percent tax rate. Calculate the operating cash flow.
STEP 1: Picture the problem
Operating cash flows encompass only the revenues and operating expenses (after taxes) corresponding to the operation of the asset. Therefore, they begin only with the end of the first year of operations (Year 1). The operat-ing cash flow then is determined by the revenues less operating expenses for Years 1 through 5.
OCF1 OCF2 OCF3 OCF4 OCF5
0 1 2 3 4 5Time Period
Operating Cash Flow
Years
The operating cash flow (OCF) for Years 1 through 5 equals thesum of additional revenues less operating expenses (cash expenses and depreciation) less taxes plus depreciation expense.
Checkpoint 12.1
M12_TITM2189_13_GE_C12.indd 410 19/05/17 8:12 AM
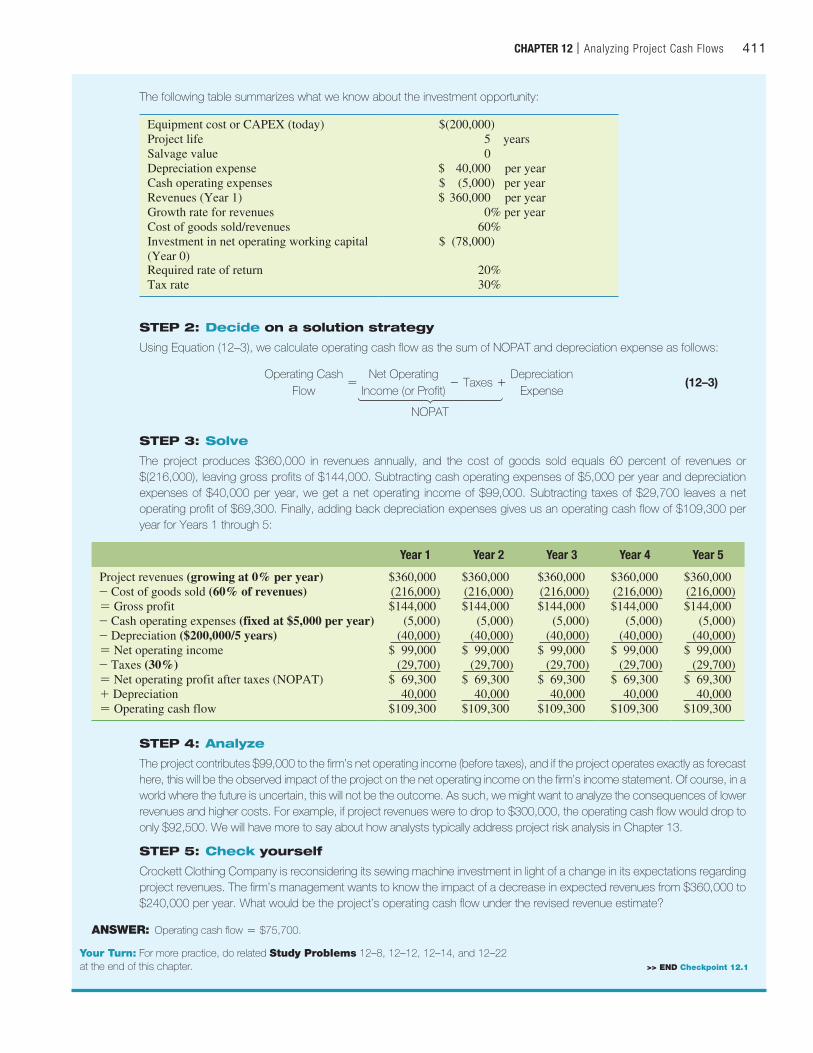
CHAPTER 12 | Analyzing Project Cash Flows 411
The following table summarizes what we know about the investment opportunity:
Equipment cost or CAPEX (today) $(200,000)Project life 5 yearsSalvage value 0Depreciation expense $ 40,000 per yearCash operating expenses $ (5,000) per yearRevenues (Year 1) $ 360,000 per yearGrowth rate for revenues 0% per yearCost of goods sold/revenues 60%Investment in net operating working capital (Year 0)
$ (78,000)
Required rate of return 20%Tax rate 30%
STEP 2: Decide on a solution strategy
Using Equation (12–3), we calculate operating cash flow as the sum of NOPAT and depreciation expense as follows:
Operating Cash
Flow=
Net OperatingIncome (or Profit)
- Taxes +Depreciation
Expense (12–3)
STEP 3: Solve
The project produces $360,000 in revenues annually, and the cost of goods sold equals 60 percent of revenues or $(216,000), leaving gross profits of $144,000. Subtracting cash operating expenses of $5,000 per year and depreciation expenses of $40,000 per year, we get a net operating income of $99,000. Subtracting taxes of $29,700 leaves a net operating profit of $69,300. Finally, adding back depreciation expenses gives us an operating cash flow of $109,300 per year for Years 1 through 5:
Year 1 Year 2 Year 3 Year 4 Year 5
Project revenues (growing at 0% per year) $360,000 $360,000 $360,000 $360,000 $360,000- Cost of goods sold (60% of revenues) (216,000) (216,000) (216,000) (216,000) (216,000)= Gross profit $144,000 $144,000 $144,000 $144,000 $144,000- Cash operating expenses (fixed at $5,000 per year) (5,000) (5,000) (5,000) (5,000) (5,000)- Depreciation ($200,000/5 years) (40,000) (40,000) (40,000) (40,000) (40,000)= Net operating income $ 99,000 $ 99,000 $ 99,000 $ 99,000 $ 99,000- Taxes (30%) (29,700) (29,700) (29,700) (29,700) (29,700)= Net operating profit after taxes (NOPAT) $ 69,300 $ 69,300 $ 69,300 $ 69,300 $ 69,300+ Depreciation 40,000 40,000 40,000 40,000 40,000= Operating cash flow $109,300 $109,300 $109,300 $109,300 $109,300
STEP 4: Analyze
The project contributes $99,000 to the firm’s net operating income (before taxes), and if the project operates exactly as forecast here, this will be the observed impact of the project on the net operating income on the firm’s income statement. Of course, in a world where the future is uncertain, this will not be the outcome. As such, we might want to analyze the consequences of lower revenues and higher costs. For example, if project revenues were to drop to $300,000, the operating cash flow would drop to only $92,500. We will have more to say about how analysts typically address project risk analysis in Chapter 13.
STEP 5: Check yourself
Crockett Clothing Company is reconsidering its sewing machine investment in light of a change in its expectations regarding project revenues. The firm’s management wants to know the impact of a decrease in expected revenues from $360,000 to $240,000 per year. What would be the project’s operating cash flow under the revised revenue estimate?
ANSWER: Operating cash flow = $75,700.
¯˚˚˚˚˚˘˚˚˚˚˚˙NOPAT
Your Turn: For more practice, do related Study Problems 12–8, 12–12, 12–14, and 12–22 at the end of this chapter. >> END Checkpoint 12.1
M12_TITM2189_13_GE_C12.indd 411 19/05/17 8:12 AM
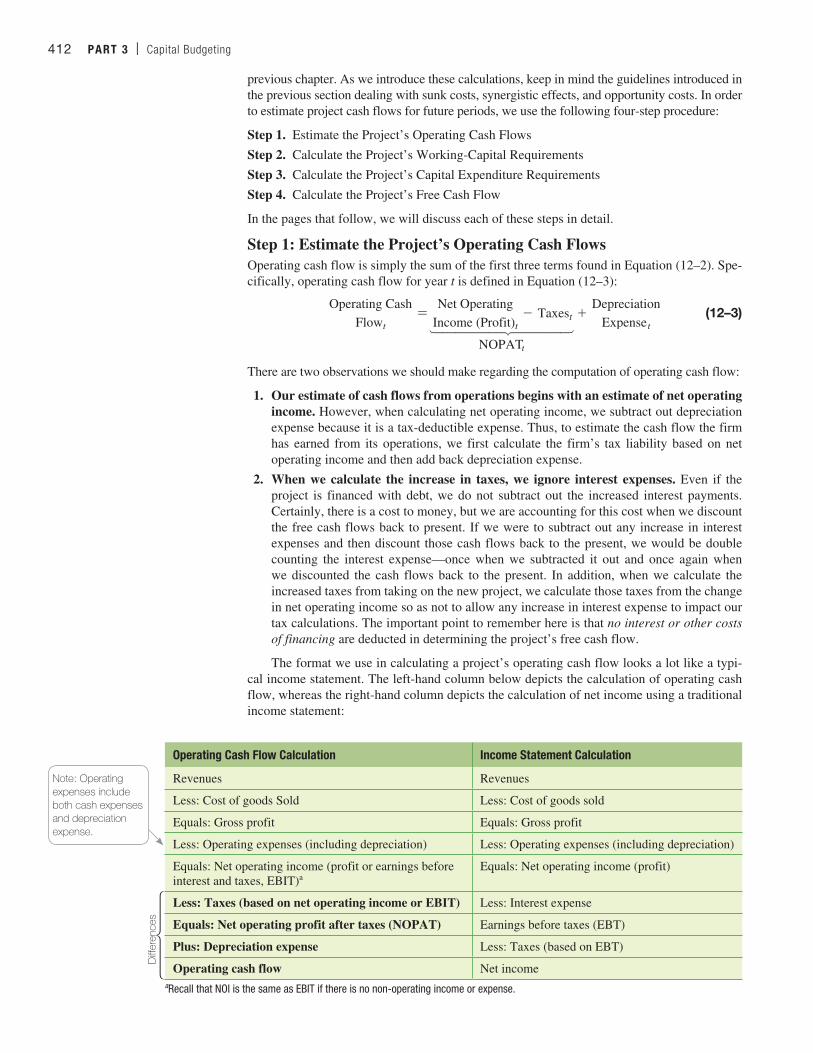
412 PART 3 | Capital Budgeting
previous chapter. As we introduce these calculations, keep in mind the guidelines introduced in the previous section dealing with sunk costs, synergistic effects, and opportunity costs. In order to estimate project cash flows for future periods, we use the following four-step procedure:
Step 1. Estimate the Project’s Operating Cash Flows
Step 2. Calculate the Project’s Working-Capital Requirements
Step 3. Calculate the Project’s Capital Expenditure Requirements
Step 4. Calculate the Project’s Free Cash Flow
In the pages that follow, we will discuss each of these steps in detail.
Step 1: Estimate the Project’s Operating Cash FlowsOperating cash flow is simply the sum of the first three terms found in Equation (12–2). Spe-cifically, operating cash flow for year t is defined in Equation (12–3):
Operating Cash
Flowt=
Net OperatingIncome (Profit)t
- Taxest +Depreciation
Expenset (12–3)
There are two observations we should make regarding the computation of operating cash flow:
1. Our estimate of cash flows from operations begins with an estimate of net operating income. However, when calculating net operating income, we subtract out depreciation expense because it is a tax-deductible expense. Thus, to estimate the cash flow the firm has earned from its operations, we first calculate the firm’s tax liability based on net operating income and then add back depreciation expense.
2. When we calculate the increase in taxes, we ignore interest expenses. Even if the project is financed with debt, we do not subtract out the increased interest payments. Certainly, there is a cost to money, but we are accounting for this cost when we discount the free cash flows back to present. If we were to subtract out any increase in interest expenses and then discount those cash flows back to the present, we would be double counting the interest expense—once when we subtracted it out and once again when we discounted the cash flows back to the present. In addition, when we calculate the increased taxes from taking on the new project, we calculate those taxes from the change in net operating income so as not to allow any increase in interest expense to impact our tax calculations. The important point to remember here is that no interest or other costs of financing are deducted in determining the project’s free cash flow.
The format we use in calculating a project’s operating cash flow looks a lot like a typi-cal income statement. The left-hand column below depicts the calculation of operating cash flow, whereas the right-hand column depicts the calculation of net income using a traditional income statement:
¯˚˚˚˚˚˘˚˚˚˚˙NOPATt
Operating Cash Flow Calculation Income Statement Calculation
Revenues Revenues
Less: Cost of goods Sold Less: Cost of goods sold
Equals: Gross profit Equals: Gross profit
Less: Operating expenses (including depreciation) Less: Operating expenses (including depreciation)
Equals: Net operating income (profit or earnings before interest and taxes, EBIT)a
Equals: Net operating income (profit)
Less: Taxes (based on net operating income or EBIT) Less: Interest expense
Equals: Net operating profit after taxes (NOPAT) Earnings before taxes (EBT)
Plus: Depreciation expense Less: Taxes (based on EBT)
Operating cash flow Net incomeaRecall that NOI is the same as EBIT if there is no non-operating income or expense.
Note: Operating expenses include both cash expenses and depreciation expense.
Diff
eren
ces
¸˚
˝˚
˛
M12_TITM2189_13_GE_C12.indd 412 19/05/17 8:12 AM
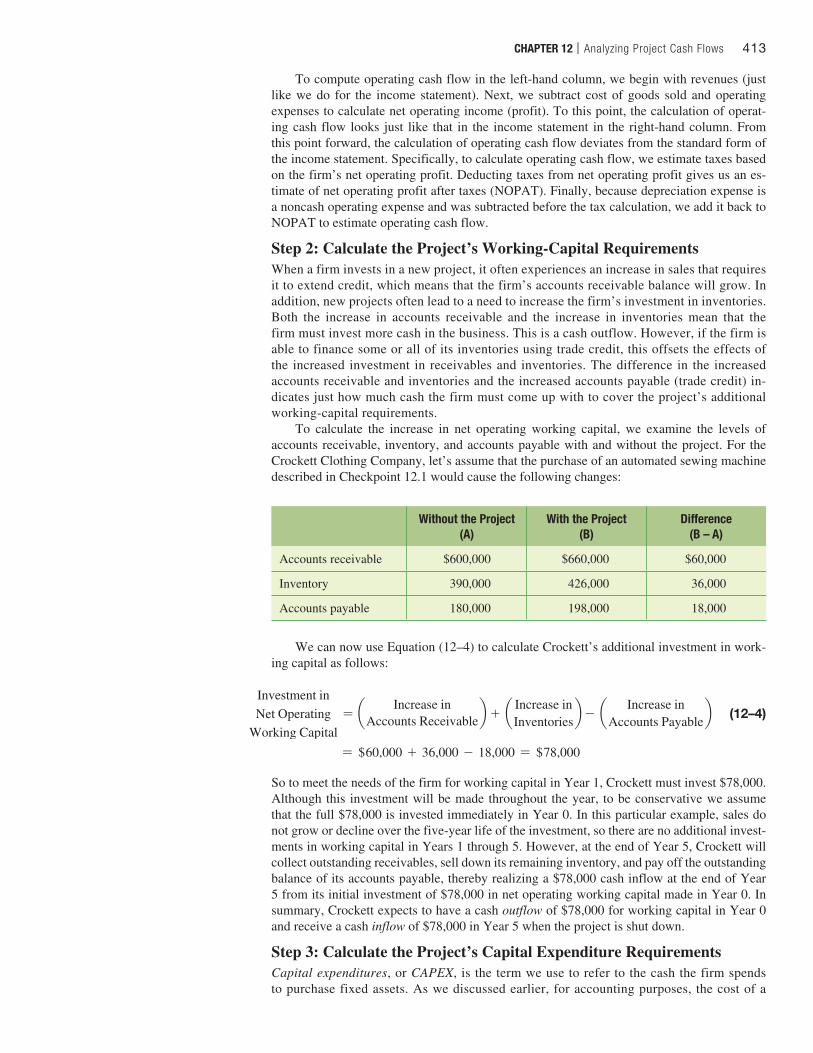
CHAPTER 12 | Analyzing Project Cash Flows 413
To compute operating cash flow in the left-hand column, we begin with revenues (just like we do for the income statement). Next, we subtract cost of goods sold and operating expenses to calculate net operating income (profit). To this point, the calculation of operat-ing cash flow looks just like that in the income statement in the right-hand column. From this point forward, the calculation of operating cash flow deviates from the standard form of the income statement. Specifically, to calculate operating cash flow, we estimate taxes based on the firm’s net operating profit. Deducting taxes from net operating profit gives us an es-timate of net operating profit after taxes (NOPAT). Finally, because depreciation expense is a noncash operating expense and was subtracted before the tax calculation, we add it back to NOPAT to estimate operating cash flow.
Step 2: Calculate the Project’s Working-Capital RequirementsWhen a firm invests in a new project, it often experiences an increase in sales that requires it to extend credit, which means that the firm’s accounts receivable balance will grow. In addition, new projects often lead to a need to increase the firm’s investment in inventories. Both the increase in accounts receivable and the increase in inventories mean that the firm must invest more cash in the business. This is a cash outflow. However, if the firm is able to finance some or all of its inventories using trade credit, this offsets the effects of the increased investment in receivables and inventories. The difference in the increased accounts receivable and inventories and the increased accounts payable (trade credit) in-dicates just how much cash the firm must come up with to cover the project’s additional working-capital requirements.
To calculate the increase in net operating working capital, we examine the levels of accounts receivable, inventory, and accounts payable with and without the project. For the Crockett Clothing Company, let’s assume that the purchase of an automated sewing machine described in Checkpoint 12.1 would cause the following changes:
Without the Project (A)
With the Project (B)
Difference (B – A)
Accounts receivable $600,000 $660,000 $60,000
Inventory 390,000 426,000 36,000
Accounts payable 180,000 198,000 18,000
We can now use Equation (12–4) to calculate Crockett’s additional investment in work-ing capital as follows:
Investment inNet Operating
Working Capital= a Increase in
Accounts Receivableb + a Increase inInventories
b - a Increase inAccounts Payable
b (12–4)
= $60,000 + 36,000 - 18,000 = $78,000
So to meet the needs of the firm for working capital in Year 1, Crockett must invest $78,000. Although this investment will be made throughout the year, to be conservative we assume that the full $78,000 is invested immediately in Year 0. In this particular example, sales do not grow or decline over the five-year life of the investment, so there are no additional invest-ments in working capital in Years 1 through 5. However, at the end of Year 5, Crockett will collect outstanding receivables, sell down its remaining inventory, and pay off the outstanding balance of its accounts payable, thereby realizing a $78,000 cash inflow at the end of Year 5 from its initial investment of $78,000 in net operating working capital made in Year 0. In summary, Crockett expects to have a cash outflow of $78,000 for working capital in Year 0 and receive a cash inflow of $78,000 in Year 5 when the project is shut down.
Step 3: Calculate the Project’s Capital Expenditure RequirementsCapital expenditures, or CAPEX, is the term we use to refer to the cash the firm spends to purchase fixed assets. As we discussed earlier, for accounting purposes, the cost of a
M12_TITM2189_13_GE_C12.indd 413 19/05/17 8:12 AM
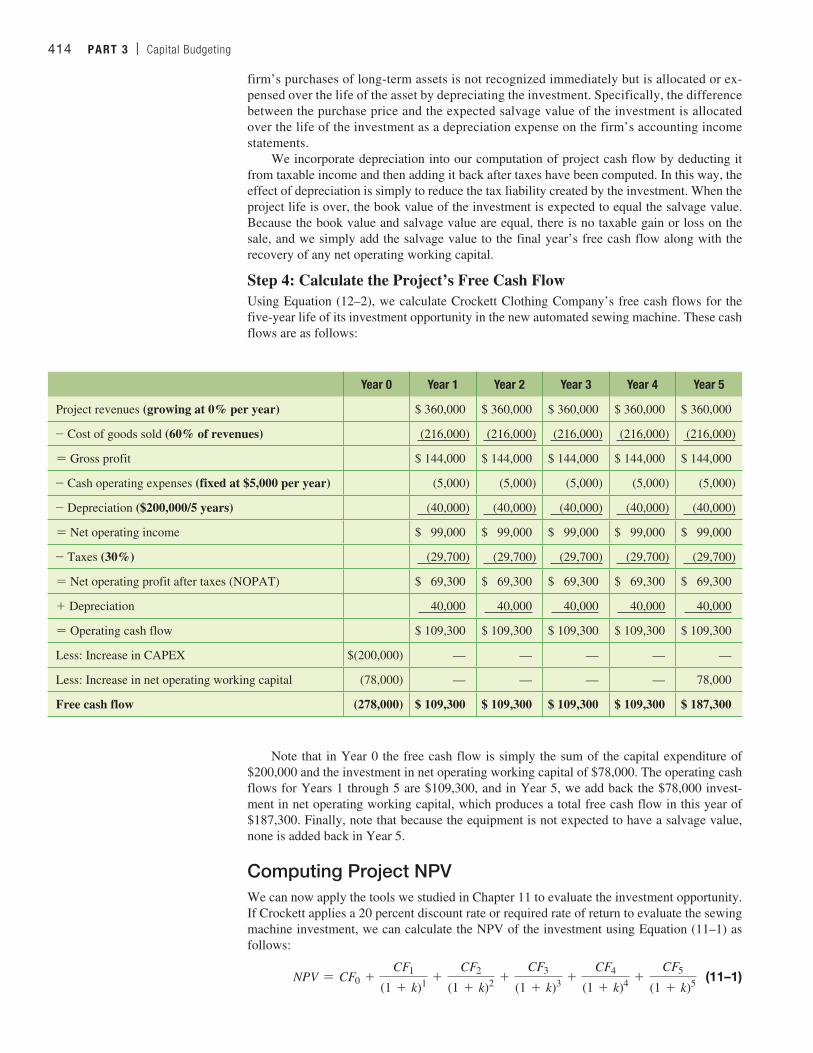
414 PART 3 | Capital Budgeting
firm’s purchases of long-term assets is not recognized immediately but is allocated or ex-pensed over the life of the asset by depreciating the investment. Specifically, the difference between the purchase price and the expected salvage value of the investment is allocated over the life of the investment as a depreciation expense on the firm’s accounting income statements.
We incorporate depreciation into our computation of project cash flow by deducting it from taxable income and then adding it back after taxes have been computed. In this way, the effect of depreciation is simply to reduce the tax liability created by the investment. When the project life is over, the book value of the investment is expected to equal the salvage value. Because the book value and salvage value are equal, there is no taxable gain or loss on the sale, and we simply add the salvage value to the final year’s free cash flow along with the recovery of any net operating working capital.
Step 4: Calculate the Project’s Free Cash FlowUsing Equation (12–2), we calculate Crockett Clothing Company’s free cash flows for the five-year life of its investment opportunity in the new automated sewing machine. These cash flows are as follows:
Year 0 Year 1 Year 2 Year 3 Year 4 Year 5
Project revenues (growing at 0% per year) $ 360,000 $ 360,000 $ 360,000 $ 360,000 $ 360,000
- Cost of goods sold (60% of revenues) (216,000) (216,000) (216,000) (216,000) (216,000)
= Gross profit $ 144,000 $ 144,000 $ 144,000 $ 144,000 $ 144,000
- Cash operating expenses (fixed at $5,000 per year) (5,000) (5,000) (5,000) (5,000) (5,000)
- Depreciation ($200,000/5 years) (40,000) (40,000) (40,000) (40,000) (40,000)
= Net operating income $ 99,000 $ 99,000 $ 99,000 $ 99,000 $ 99,000
- Taxes (30%) (29,700) (29,700) (29,700) (29,700) (29,700)
= Net operating profit after taxes (NOPAT) $ 69,300 $ 69,300 $ 69,300 $ 69,300 $ 69,300
+ Depreciation 40,000 40,000 40,000 40,000 40,000
= Operating cash flow $ 109,300 $ 109,300 $ 109,300 $ 109,300 $ 109,300
Less: Increase in CAPEX $(200,000) — — — — —
Less: Increase in net operating working capital (78,000) — — — — 78,000
Free cash flow (278,000) $ 109,300 $ 109,300 $ 109,300 $ 109,300 $ 187,300
Note that in Year 0 the free cash flow is simply the sum of the capital expenditure of $200,000 and the investment in net operating working capital of $78,000. The operating cash flows for Years 1 through 5 are $109,300, and in Year 5, we add back the $78,000 invest-ment in net operating working capital, which produces a total free cash flow in this year of $187,300. Finally, note that because the equipment is not expected to have a salvage value, none is added back in Year 5.
Computing Project NPVWe can now apply the tools we studied in Chapter 11 to evaluate the investment opportunity. If Crockett applies a 20 percent discount rate or required rate of return to evaluate the sewing machine investment, we can calculate the NPV of the investment using Equation (11–1) as follows:
NPV = CF0 +CF1
(1 + k)1 +CF2
(1 + k)2 +CF3
(1 + k)3 +CF4
(1 + k)4 +CF5
(1 + k)5 (11–1)
M12_TITM2189_13_GE_C12.indd 414 19/05/17 8:12 AM
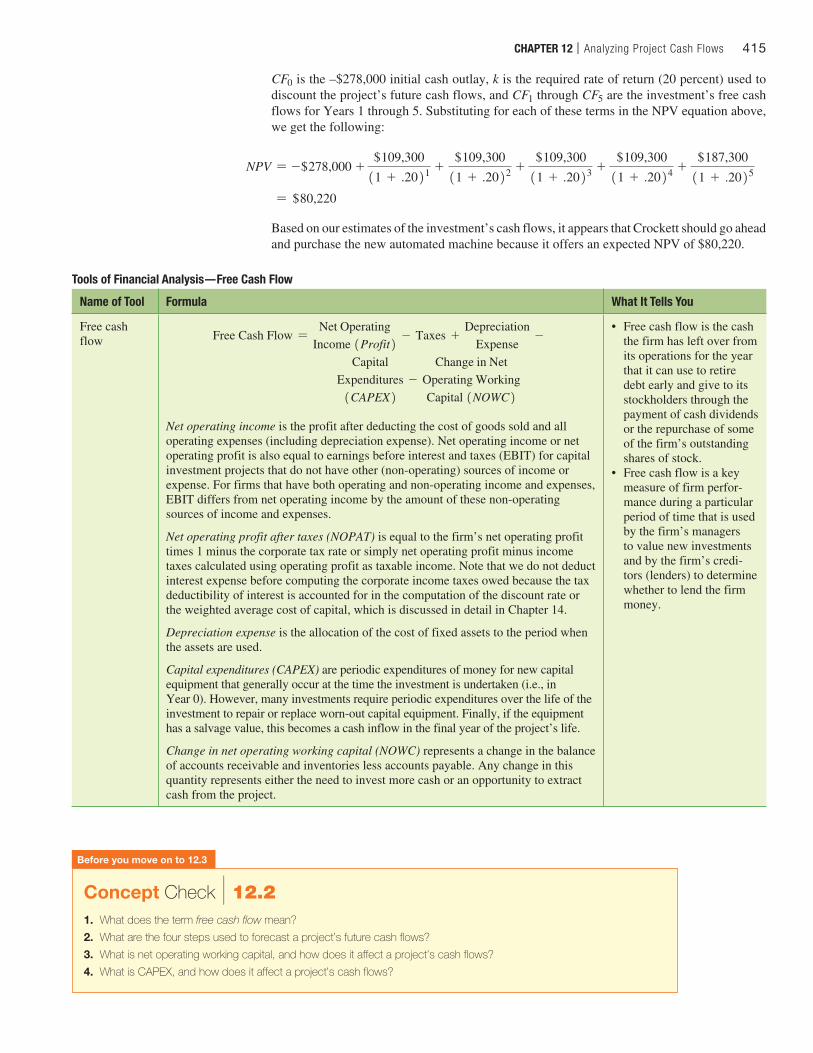
CHAPTER 12 | Analyzing Project Cash Flows 415
CF0 is the –$278,000 initial cash outlay, k is the required rate of return (20 percent) used to discount the project’s future cash flows, and CF1 through CF5 are the investment’s free cash flows for Years 1 through 5. Substituting for each of these terms in the NPV equation above, we get the following:
Tools of Financial Analysis—Free Cash Flow
Name of Tool Formula What It Tells You
Free cash flow Free Cash Flow =
Net OperatingIncome 1Profit2 - Taxes +
DepreciationExpense
-
CapitalExpenditures1CAPEX2
-Change in Net
Operating WorkingCapital 1NOWC2
Net operating income is the profit after deducting the cost of goods sold and all operating expenses (including depreciation expense). Net operating income or net operating profit is also equal to earnings before interest and taxes (EBIT) for capital investment projects that do not have other (non-operating) sources of income or expense. For firms that have both operating and non-operating income and expenses, EBIT differs from net operating income by the amount of these non-operating sources of income and expenses.
Net operating profit after taxes (NOPAT) is equal to the firm’s net operating profit times 1 minus the corporate tax rate or simply net operating profit minus income taxes calculated using operating profit as taxable income. Note that we do not deduct interest expense before computing the corporate income taxes owed because the tax deductibility of interest is accounted for in the computation of the discount rate or the weighted average cost of capital, which is discussed in detail in Chapter 14.
Depreciation expense is the allocation of the cost of fixed assets to the period when the assets are used.
Capital expenditures (CAPEX) are periodic expenditures of money for new capital equipment that generally occur at the time the investment is undertaken (i.e., in Year 0). However, many investments require periodic expenditures over the life of the investment to repair or replace worn-out capital equipment. Finally, if the equipment has a salvage value, this becomes a cash inflow in the final year of the project’s life.
Change in net operating working capital (NOWC) represents a change in the balance of accounts receivable and inventories less accounts payable. Any change in this quantity represents either the need to invest more cash or an opportunity to extract cash from the project.
• Free cash flow is the cash the firm has left over from its operations for the year that it can use to retire debt early and give to its stockholders through the payment of cash dividends or the repurchase of some of the firm’s outstanding shares of stock.
• Free cash flow is a key measure of firm perfor-mance during a particular period of time that is used by the firm’s managers to value new investments and by the firm’s credi-tors (lenders) to determine whether to lend the firm money.
NPV = -$278,000 + $109,300
11 + .2021 + $109,300
11 + .2022 + $109,300
11 + .2023 + $109,300
11 + .2024 + $187,300
11 + .2025
= $80,220
Based on our estimates of the investment’s cash flows, it appears that Crockett should go ahead and purchase the new automated machine because it offers an expected NPV of $80,220.
Concept Check | 12.21. What does the term free cash flow mean?
2. What are the four steps used to forecast a project’s future cash flows?
3. What is net operating working capital, and how does it affect a project’s cash flows?
4. What is CAPEX, and how does it affect a project’s cash flows?
Before you move on to 12.3
M12_TITM2189_13_GE_C12.indd 415 19/05/17 8:12 AM
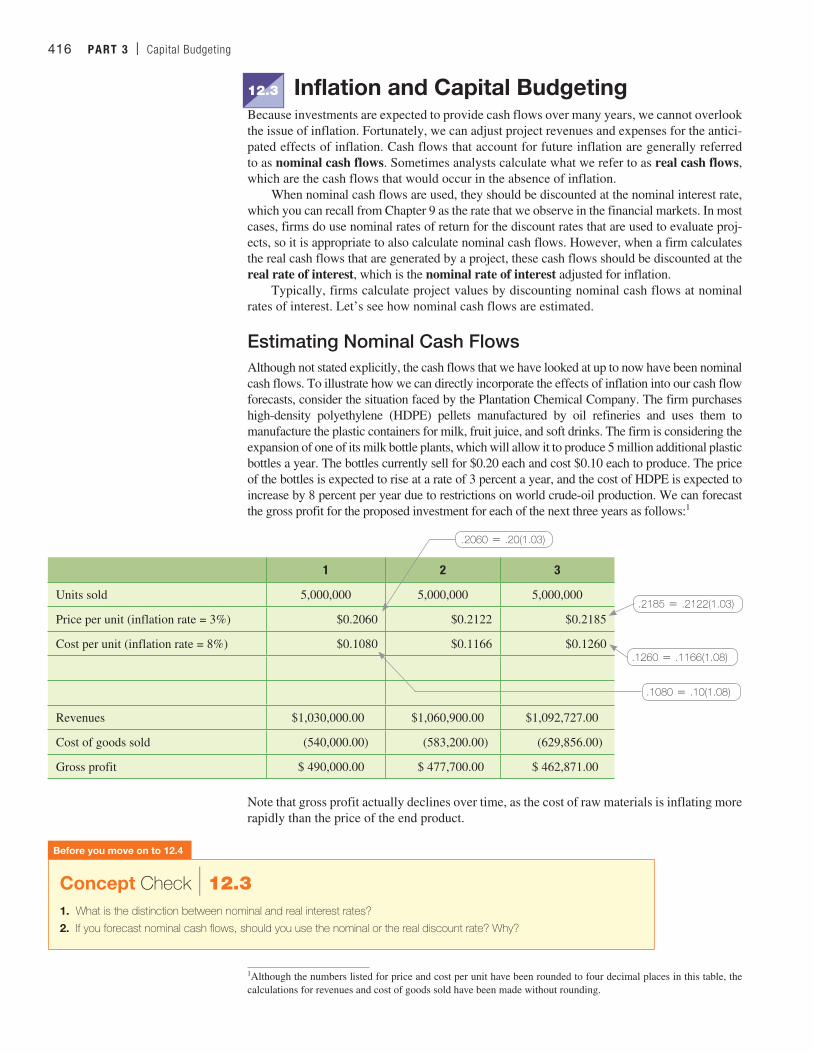
416 PART 3 | Capital Budgeting
12.3 Inflation and Capital BudgetingBecause investments are expected to provide cash flows over many years, we cannot overlook the issue of inflation. Fortunately, we can adjust project revenues and expenses for the antici-pated effects of inflation. Cash flows that account for future inflation are generally referred to as nominal cash flows. Sometimes analysts calculate what we refer to as real cash flows, which are the cash flows that would occur in the absence of inflation.
When nominal cash flows are used, they should be discounted at the nominal interest rate, which you can recall from Chapter 9 as the rate that we observe in the financial markets. In most cases, firms do use nominal rates of return for the discount rates that are used to evaluate proj-ects, so it is appropriate to also calculate nominal cash flows. However, when a firm calculates the real cash flows that are generated by a project, these cash flows should be discounted at the real rate of interest, which is the nominal rate of interest adjusted for inflation.
Typically, firms calculate project values by discounting nominal cash flows at nominal rates of interest. Let’s see how nominal cash flows are estimated.
Estimating Nominal Cash FlowsAlthough not stated explicitly, the cash flows that we have looked at up to now have been nominal cash flows. To illustrate how we can directly incorporate the effects of inflation into our cash flow forecasts, consider the situation faced by the Plantation Chemical Company. The firm purchases high-density polyethylene (HDPE) pellets manufactured by oil refineries and uses them to manufacture the plastic containers for milk, fruit juice, and soft drinks. The firm is considering the expansion of one of its milk bottle plants, which will allow it to produce 5 million additional plastic bottles a year. The bottles currently sell for $0.20 each and cost $0.10 each to produce. The price of the bottles is expected to rise at a rate of 3 percent a year, and the cost of HDPE is expected to increase by 8 percent per year due to restrictions on world crude-oil production. We can forecast the gross profit for the proposed investment for each of the next three years as follows:1
1Although the numbers listed for price and cost per unit have been rounded to four decimal places in this table, the calculations for revenues and cost of goods sold have been made without rounding.
Concept Check | 12.31. What is the distinction between nominal and real interest rates?
2. If you forecast nominal cash flows, should you use the nominal or the real discount rate? Why?
Before you move on to 12.4
1 2 3
Units sold 5,000,000 5,000,000 5,000,000
Price per unit (inflation rate = 3%) $0.2060 $0.2122 $0.2185
Cost per unit (inflation rate = 8%) $0.1080 $0.1166 $0.1260
Revenues $1,030,000.00 $1,060,900.00 $1,092,727.00
Cost of goods sold (540,000.00) (583,200.00) (629,856.00)
Gross profit $ 490,000.00 $ 477,700.00 $ 462,871.00
.2185 = .2122(1.03)
.2060 = .20(1.03)
.1260 = .1166(1.08)
.1080 = .10(1.08)
Note that gross profit actually declines over time, as the cost of raw materials is inflating more rapidly than the price of the end product.
M12_TITM2189_13_GE_C12.indd 416 19/05/17 8:12 AM
CHAPTER 12 | Analyzing Project Cash Flows 417
12.4 Replacement Project Cash FlowsTo this point, we have been evaluating project cash flows for an expansion project that increases the scope of the firm’s operations but does not replace any existing assets or operations. In this section, we consider a replacement investment, an acquisition of a new productive asset that replaces an older, less productive asset. A distinctive feature of many replacement investments is that the principal source of investment cash flows is cost savings, not new revenues, because the firm already operates an existing asset to generate revenues.
The objective of our analysis of investment cash flows is the same for a replacement project as it was for the expansion projects considered earlier. Specifically, project or invest-ment free cash flow is still defined by Equation (12–3). However, with a replacement project, we must explicitly compare what the firm’s cash flows would be without making a change to what they would be with the replacement assets. To perform this analysis, it is helpful to categorize investment cash flows as an initial outlay of CF0 and future cash flows as CF1, CF2, CF3, and so forth.
Category 1: Initial Outlay, CF0For an expansion project, the initial cash outlay typically includes the immediate cash outflow (CAPEX) necessary to purchase fixed assets and put them in operating order plus the cost of any increased investment in net operating working capital (NOWC) required by the project. However, when the investment proposal involves the replacement of an existing asset, the computation of the initial cash outlay is a bit more complicated because disposing of the exist-ing asset can involve immediate expenses. If the old asset is sold for more than the book value of the asset, this gives rise to a taxable gain on the sale. On the other hand, if the old asset is sold for less than its book value, then a tax-deductible loss occurs.
When an existing asset is sold, there are three possible tax scenarios:
• The old asset is sold for a price above the depreciated value. Here the difference between the selling price of the old machine and its depreciated book value is a tax-able gain, taxed at the marginal corporate tax rate and subtracted from the CAPEX. For example, assume that the old machine was originally purchased for $350,000, has a depreciated book value of $100,000 today, and could be sold for $150,000 and that the firm’s marginal corporate tax rate is 30 percent. The taxes due from the gain would then be ($150,000 - $100,000) * (.30), or $15,000.
• The old asset is sold for its depreciated value. In this case, no taxes result, as there is neither a gain nor a loss from the asset’s sale.
• The old asset is sold for less than its depreciated value. In this case, the difference be-tween the depreciated book value and the salvage value of the asset is a taxable-deductible loss and may be used to offset capital gains. Thus, it results in tax savings, and we add it to the CAPEX. For example, if the depreciated book value of the asset is $100,000 and it is sold for $70,000, we have a $30,000 loss. Assuming the firm’s marginal corporate tax rate is 30 percent, the cash inflow from tax savings is ($100,000 - $70,000) * (.30), or $9,000.
Category 2: Annual Cash FlowsAnnual cash flows for a replacement decision differ from those for a simple asset acquisition because we must now consider the differential operating cash flow of the new versus the old (replaced) asset.
Changes in Depreciation and TaxesOnce again, we are interested only in any change in taxes that the change in depreciation might bring about—after all, depreciation is not a cash flow expense, but because it is tax-deductible, it impacts taxes, which are a cash flow item. We want to look at the incremental change in taxes—that is, what the taxes would be if the asset was replaced versus what they would be if the asset was not replaced.
M12_TITM2189_13_GE_C12.indd 417 19/05/17 8:12 AM
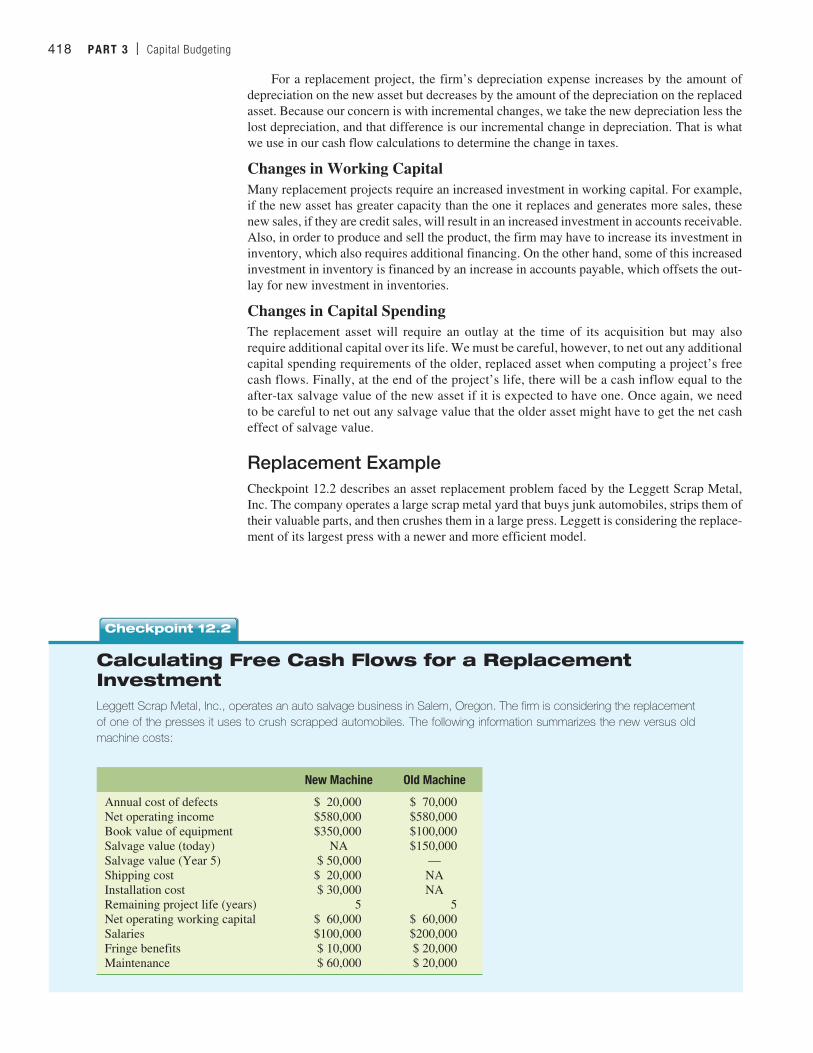
418 PART 3 | Capital Budgeting
For a replacement project, the firm’s depreciation expense increases by the amount of depreciation on the new asset but decreases by the amount of the depreciation on the replaced asset. Because our concern is with incremental changes, we take the new depreciation less the lost depreciation, and that difference is our incremental change in depreciation. That is what we use in our cash flow calculations to determine the change in taxes.
Changes in Working CapitalMany replacement projects require an increased investment in working capital. For example, if the new asset has greater capacity than the one it replaces and generates more sales, these new sales, if they are credit sales, will result in an increased investment in accounts receivable. Also, in order to produce and sell the product, the firm may have to increase its investment in inventory, which also requires additional financing. On the other hand, some of this increased investment in inventory is financed by an increase in accounts payable, which offsets the out-lay for new investment in inventories.
Changes in Capital SpendingThe replacement asset will require an outlay at the time of its acquisition but may also require additional capital over its life. We must be careful, however, to net out any additional capital spending requirements of the older, replaced asset when computing a project’s free cash flows. Finally, at the end of the project’s life, there will be a cash inflow equal to the after-tax salvage value of the new asset if it is expected to have one. Once again, we need to be careful to net out any salvage value that the older asset might have to get the net cash effect of salvage value.
Replacement ExampleCheckpoint 12.2 describes an asset replacement problem faced by the Leggett Scrap Metal, Inc. The company operates a large scrap metal yard that buys junk automobiles, strips them of their valuable parts, and then crushes them in a large press. Leggett is considering the replace-ment of its largest press with a newer and more efficient model.
Calculating Free Cash Flows for a Replacement InvestmentLeggett Scrap Metal, Inc., operates an auto salvage business in Salem, Oregon. The firm is considering the replacement of one of the presses it uses to crush scrapped automobiles. The following information summarizes the new versus old machine costs:
New Machine Old Machine
Annual cost of defects $ 20,000 $ 70,000Net operating income $580,000 $580,000Book value of equipment $350,000 $100,000Salvage value (today) NA $150,000Salvage value (Year 5) $ 50,000 —Shipping cost $ 20,000 NAInstallation cost $ 30,000 NARemaining project life (years) 5 5Net operating working capital $ 60,000 $ 60,000Salaries $100,000 $200,000Fringe benefits $ 10,000 $ 20,000Maintenance $ 60,000 $ 20,000
Checkpoint 12.2
M12_TITM2189_13_GE_C12.indd 418 19/05/17 8:12 AM
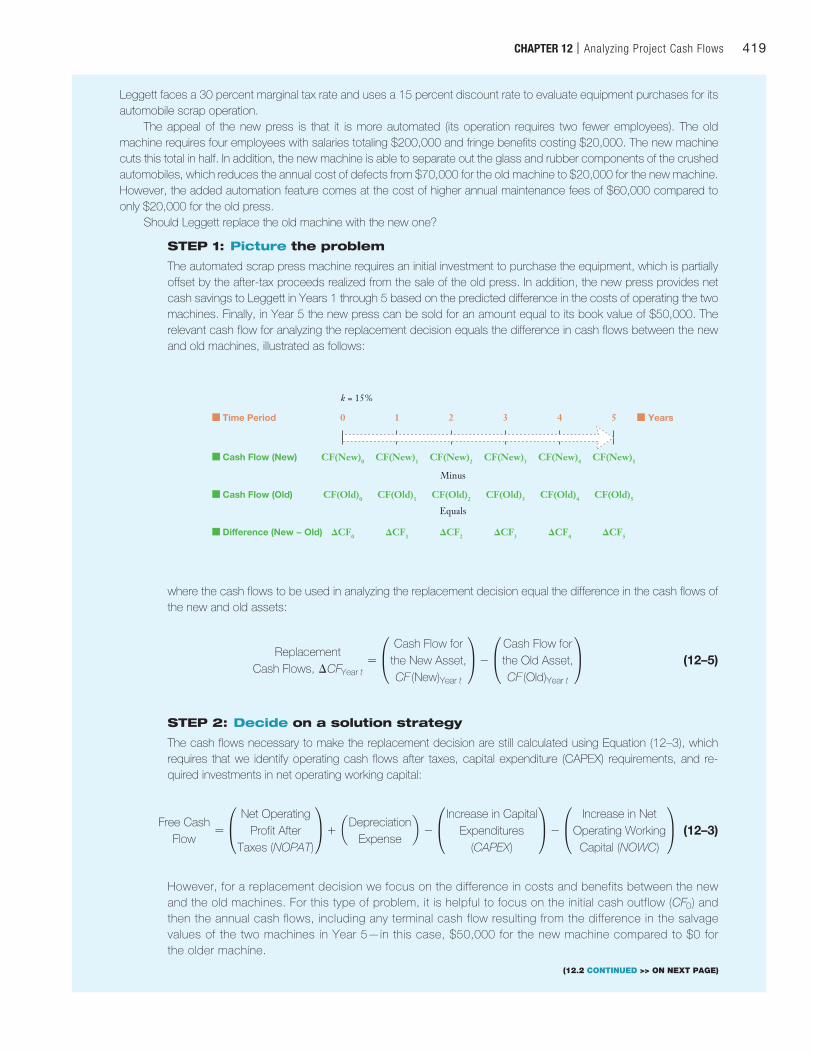
CHAPTER 12 | Analyzing Project Cash Flows 419
Leggett faces a 30 percent marginal tax rate and uses a 15 percent discount rate to evaluate equipment purchases for its automobile scrap operation.
The appeal of the new press is that it is more automated (its operation requires two fewer employees). The old machine requires four employees with salaries totaling $200,000 and fringe benefits costing $20,000. The new machine cuts this total in half. In addition, the new machine is able to separate out the glass and rubber components of the crushed automobiles, which reduces the annual cost of defects from $70,000 for the old machine to $20,000 for the new machine. However, the added automation feature comes at the cost of higher annual maintenance fees of $60,000 compared to only $20,000 for the old press.
Should Leggett replace the old machine with the new one?
STEP 1: Picture the problem
The automated scrap press machine requires an initial investment to purchase the equipment, which is partially offset by the after-tax proceeds realized from the sale of the old press. In addition, the new press provides net cash savings to Leggett in Years 1 through 5 based on the predicted difference in the costs of operating the two machines. Finally, in Year 5 the new press can be sold for an amount equal to its book value of $50,000. The relevant cash flow for analyzing the replacement decision equals the difference in cash flows between the new and old machines, illustrated as follows:
CF(New)0 CF(New)1 CF(New)2
Minus
Equals
CF(New)3 CF(New)4 CF(New)5
0 1 2 3 4 5Time Period
Cash Flow (New)
CF(Old)0 CF(Old)1 CF(Old)2 CF(Old)3 CF(Old)4 CF(Old)5Cash Flow (Old)
DCF0 DCF1 DCF2 DCF3 DCF4 DCF5Di�erence (New − Old)
Years
k = 15%
where the cash flows to be used in analyzing the replacement decision equal the difference in the cash flows of the new and old assets:
ReplacementCash Flows, ∆CFYear t
= °Cash Flow for
the New Asset,CF (New)Year t
¢ - °Cash Flow forthe Old Asset,CF (Old)Year t
¢ (12–5)
STEP 2: Decide on a solution strategy
The cash flows necessary to make the replacement decision are still calculated using Equation (12–3), which requires that we identify operating cash flows after taxes, capital expenditure (CAPEX) requirements, and re-quired investments in net operating working capital:
Free CashFlow
= °Net Operating
Profit AfterTaxes (NOPAT)
¢ + aDepreciationExpense
b - °Increase in Capital
Expenditures(CAPEX)
¢ - °Increase in Net
Operating WorkingCapital (NOWC)
¢ (12–3)
However, for a replacement decision we focus on the difference in costs and benefits between the new and the old machines. For this type of problem, it is helpful to focus on the initial cash outflow (CF0) and then the annual cash flows, including any terminal cash flow resulting from the difference in the salvage values of the two machines in Year 5—in this case, $50,000 for the new machine compared to $0 for the older machine.
(12.2 CONTINUED >> ON NEXT PAGE)
M12_TITM2189_13_GE_C12.indd 419 19/05/17 8:12 AM
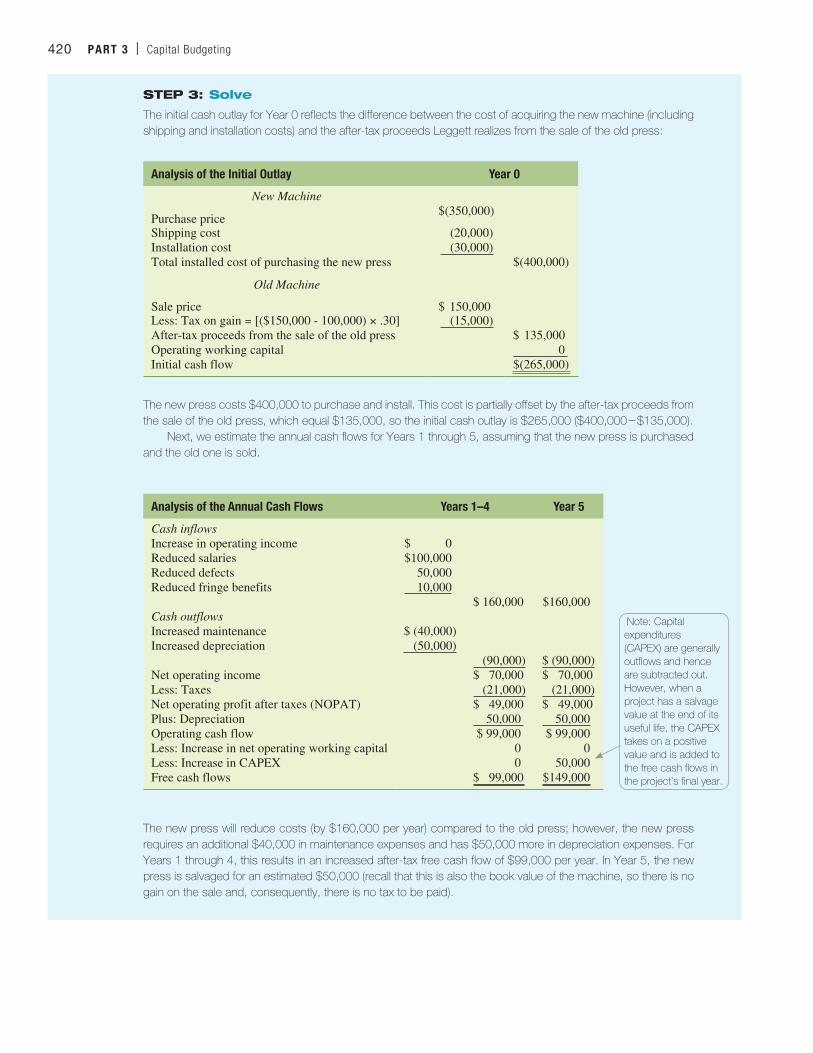
420 PART 3 | Capital Budgeting
STEP 3: Solve
The initial cash outlay for Year 0 reflects the difference between the cost of acquiring the new machine (including shipping and installation costs) and the after-tax proceeds Leggett realizes from the sale of the old press:
Analysis of the Initial Outlay Year 0
New Machine
Purchase price$(350,000)
Shipping cost (20,000)Installation cost (30,000)Total installed cost of purchasing the new press $(400,000)
Old Machine
Sale price $ 150,000Less: Tax on gain = [($150,000 - 100,000) × .30] (15,000)After-tax proceeds from the sale of the old press $ 135,000Operating working capital 0 Initial cash flow $(265,000)
The new press costs $400,000 to purchase and install. This cost is partially offset by the after-tax proceeds from the sale of the old press, which equal $135,000, so the initial cash outlay is $265,000 ($400,0002$135,000).
Next, we estimate the annual cash flows for Years 1 through 5, assuming that the new press is purchased and the old one is sold.
Analysis of the Annual Cash Flows Years 1–4 Year 5
Cash inflowsIncrease in operating income $ 0Reduced salaries $100,000Reduced defects 50,000Reduced fringe benefits 10,000
$ 160,000 $160,000Cash outflowsIncreased maintenance $ (40,000)Increased depreciation (50,000)
(90,000) $ (90,000)Net operating income $ 70,000 $ 70,000Less: Taxes (21,000) (21,000)Net operating profit after taxes (NOPAT) $ 49,000 $ 49,000Plus: Depreciation 50,000 50,000Operating cash flow $ 99,000 $ 99,000Less: Increase in net operating working capital 0 0Less: Increase in CAPEX 0 50,000Free cash flows $ 99,000 $149,000
The new press will reduce costs (by $160,000 per year) compared to the old press; however, the new press requires an additional $40,000 in maintenance expenses and has $50,000 more in depreciation expenses. For Years 1 through 4, this results in an increased after-tax free cash flow of $99,000 per year. In Year 5, the new press is salvaged for an estimated $50,000 (recall that this is also the book value of the machine, so there is no gain on the sale and, consequently, there is no tax to be paid).
Note: Capital expenditures (CAPEX) are generally outflows and hence are subtracted out. However, when a project has a salvage value at the end of its useful life, the CAPEX takes on a positive value and is added to the free cash flows in the project’s final year.
M12_TITM2189_13_GE_C12.indd 420 19/05/17 8:12 AM
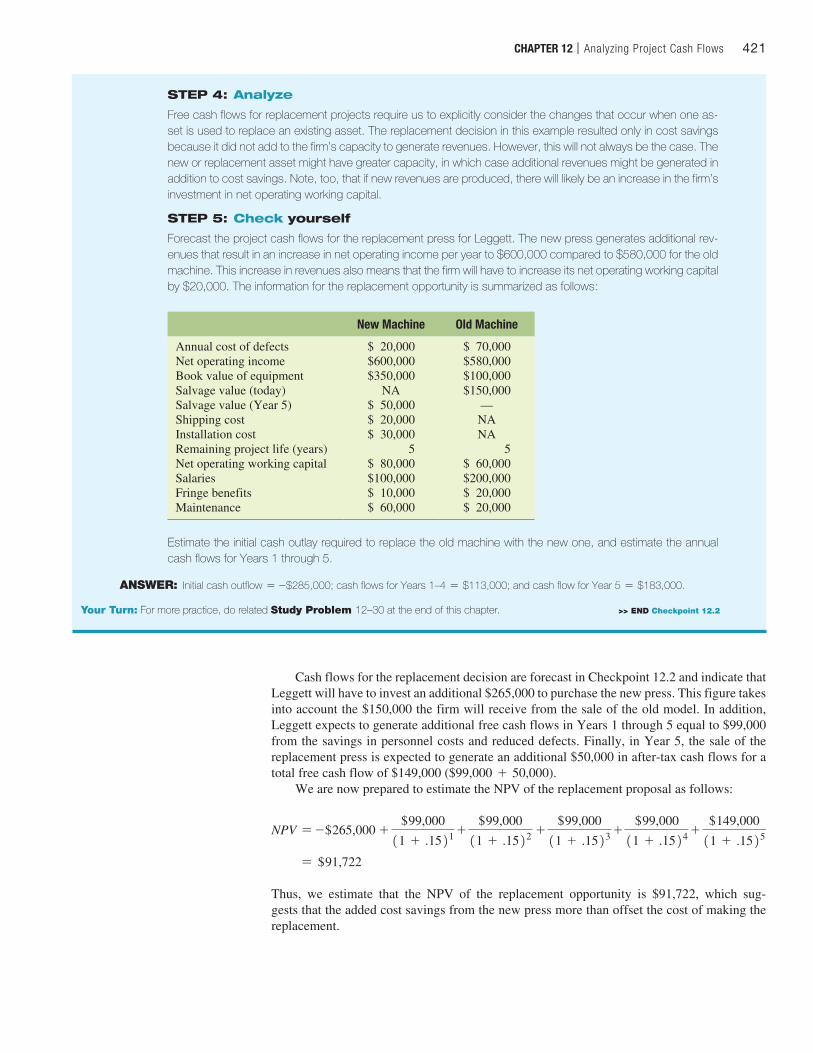
CHAPTER 12 | Analyzing Project Cash Flows 421
Cash flows for the replacement decision are forecast in Checkpoint 12.2 and indicate that Leggett will have to invest an additional $265,000 to purchase the new press. This figure takes into account the $150,000 the firm will receive from the sale of the old model. In addition, Leggett expects to generate additional free cash flows in Years 1 through 5 equal to $99,000 from the savings in personnel costs and reduced defects. Finally, in Year 5, the sale of the replacement press is expected to generate an additional $50,000 in after-tax cash flows for a total free cash flow of $149,000 ($99,000 + 50,000).
We are now prepared to estimate the NPV of the replacement proposal as follows:
NPV = -$265,000 + $99,000
11 + .1521 + $99,000
11 + .1522 + $99,000
11 + .1523 + $99,000
11 + .1524 + $149,000
11 + .1525
= $91,722
Thus, we estimate that the NPV of the replacement opportunity is $91,722, which sug-gests that the added cost savings from the new press more than offset the cost of making the replacement.
STEP 4: Analyze
Free cash flows for replacement projects require us to explicitly consider the changes that occur when one as-set is used to replace an existing asset. The replacement decision in this example resulted only in cost savings because it did not add to the firm’s capacity to generate revenues. However, this will not always be the case. The new or replacement asset might have greater capacity, in which case additional revenues might be generated in addition to cost savings. Note, too, that if new revenues are produced, there will likely be an increase in the firm’s investment in net operating working capital.
STEP 5: Check yourself
Forecast the project cash flows for the replacement press for Leggett. The new press generates additional rev-enues that result in an increase in net operating income per year to $600,000 compared to $580,000 for the old machine. This increase in revenues also means that the firm will have to increase its net operating working capital by $20,000. The information for the replacement opportunity is summarized as follows:
New Machine Old Machine
Annual cost of defects $ 20,000 $ 70,000Net operating income $600,000 $580,000Book value of equipment $350,000 $100,000Salvage value (today) NA $150,000Salvage value (Year 5) $ 50,000 —Shipping cost $ 20,000 NAInstallation cost $ 30,000 NARemaining project life (years) 5 5Net operating working capital $ 80,000 $ 60,000Salaries $100,000 $200,000Fringe benefits $ 10,000 $ 20,000Maintenance $ 60,000 $ 20,000
Estimate the initial cash outlay required to replace the old machine with the new one, and estimate the annual cash flows for Years 1 through 5.
ANSWER: Initial cash outflow = -$285,000; cash flows for Years 1–4 = $113,000; and cash flow for Year 5 = $183,000.
Your Turn: For more practice, do related Study Problem 12–30 at the end of this chapter. >> END Checkpoint 12.2
M12_TITM2189_13_GE_C12.indd 421 19/05/17 8:12 AM
422 PART 3 | Capital Budgeting
Concept Check | 12.41. What is a replacement investment?
2. What is the relevant depreciation expense when you are analyzing a replacement decision?
Before you begin end-of-chapter material
Finance in a Flat World Entering New Markets
When measuring free cash flow, it is important to think globally. We should consider threats from foreign competition as well as opportunities to sell internationally. To illustrate the threat from for-eign competition, we need only look at how the U.S. auto industry has evolved over the past 40 years. When foreign carmakers first started making inroads into the U.S. market during the 1970s, no one would have thought that firms like Toyota, Honda, and Nissan could challenge the likes of Ford and GM. On the other hand, the opportunities that come from selling in foreign markets can be huge. For example, more than half of the revenues from Hollywood movies now come from abroad.
Your Turn: See Study Question 12–14.
There are also other intangible benefits from investing in countries such as Germany and Japan, where cutting-edge tech-nology is making its way into the marketplace. Such investments provide a chance to observe the introduction of overseas innova-tions on a first-hand basis. This allows firms such as IBM, GE, and 3Com to react more quickly to any technological advances and product innovations that might come out of countries such as Germany or Japan.
Finally, if a product is well received at home, international markets can be viewed as an opportunity to expand. For example, McDonald’s was much more of a hit at home than anyone ever expected 40 years ago. Once it conquered the United States, it moved abroad—but it hasn’t always been a smooth move. McDonald’s faces cultural challenges whenever it opens in a new country. However, what McDonald’s learns in the first store that it opens in a new country can be used to modify the firm’s plans for opening subsequent stores in that country. McDonald’s also learns what works in different countries and maintains the flexibility to adapt to different tastes. As a result, you’ll find McLaks, a sandwich made of grilled salmon and dill sauce in Norway, Koroke Burgers (mashed potato, cabbage, and katsu sauce, all in a sandwich) and green-tea-flavored milkshakes in Japan, and McHuevos (regular hamburgers topped with a poached egg) in Uruguay. In effect, taking a product that has been successful in the United States to a new country requires flexibility, and the success of the venture is much less predictable.
Australia
USA
Mexico
Brazil
Argentina
North AfricaMorocco
Spain
NorwayEngland
Finland
Germany
Russia
South Africa
Malaysia
Turkey China
Thailand
France
SwedenDenmark
Italy
Philippines
JapanSouth Korea
M12_TITM2189_13_GE_C12.indd 422 19/05/17 8:12 AM
Chapter Summaries
12.1 Identify incremental cash flows that are relevant to project valuation. (pgs. 406–409)
SUMMARY: The cash flows that are relevant to the valuation of an investment project are those that are incremental to the firm. Although this seems straightforward, identifying incremental cash flows can be very challenging; therefore, we offered the following guidelines and words of caution:
• Sunk costs are not incremental cash flows. Sunk costs are one particular category of ex-penditures that frequently give rise to difficulty when evaluating an investment opportunity; they are expenditures that have already been made and cannot be undone if the project is not undertaken. By definition, such costs are not incremental to the decision to undertake a new investment.
• Overhead costs are generally not incremental cash flows. Overhead costs include such things as the utilities required to heat and cool a business. If the utility bills of the firm will not change if the new investment is undertaken, then the allocated costs of utilities should not be included in the analysis of the investment proposal.
• Beware of cash flows diverted from existing products. Oftentimes a new product will get some portion of its revenues from reduced demand for another product produced by the same firm. For example, you might purchase lime-flavored Dorito® chips rather than nacho cheese Doritos®. When this happens, the analyst must be careful not to count the cannibalized sales taken away from an existing product as incremental sales.
• Account for opportunity costs. Sometimes there are important cash flow consequences of undertaking an investment that do not actually happen but that are foregone as a result of the investment. For example, if you rent out a part of your floor space, you obviously cannot use it in your business. Similarly, if you decide to use the space yourself, you forego the rent that would otherwise be received. The latter is an opportunity cost of using the space.
• Work in working-capital requirements. If an investment requires that the firm increase its investment in working capital (e.g., accounts receivable and inventories net of any corre-sponding increase in funding provided in the form of accounts payable), this investment is no different than capital expenditures and results in a cash outflow.
• Ignore interest payments and other financing costs. Interest expense associated with the debt used to finance an investment is not included as part of incremental cash flows. Rather, it is considered as part of the firm’s cost of capital.
KEY TERMSIncremental cash flow, page 407 The change in a firm’s cash flows that is a direct consequence of its having undertaken a particular project.
Sunk costs, page 407 Costs that have already been incurred.
KEY EQUATION
Incremental Project
Cash Flows= aFirm Cash Flows
with the Projectb - a Firm Cash Flows
without the Projectb (12–1)
P Principle 3: Cash Flows Are the Source of Value The process of deciding whether or not to accept an investment proposal begins with an estimation of the amount and timing of the relevant future free cash flows. These cash flows are discounted back to the present at the project’s required rate of return to determine the present value of the investment proposal.
P Principle 5: Individuals Respond to Incentives When managers forecast cash flows for a project in their own department, they may be tempted to paint a rosy picture for the project in the hopes of winning the funding from headquarters.
C
HA
PT
ER
12
423Applying the Principles of Finance to Chapter 12
Concept Check | 12.1
1. What makes an investment cash flow relevant to the evaluation of an investment proposal?
2. What are sunk costs?
3. What are some examples of synergistic effects that affect a project’s cash flows?
4. When borrowing the money needed to make an investment, is the interest expense incurred relevant to the analysis of the project? Explain.
M12_TITM2189_13_GE_C12.indd 423 19/05/17 8:12 AM
424 PART 3 | Capital Budgeting424 PART 3 | Capital Budgeting
Free CashFlow
=Net OperatingIncome (Profit)
- Taxes +Depreciation
Expense-
Increase in CapitalExpenditures
(CAPEX)-
Increase in NetOperating Working
Capital (NOWC) (12–2)
Operating Cash Flow¸˚˚˚˚˚˚˚˚˚˚˚˝˚˚˚˚˚˚˚˚˚˚˛
¯˚˚˚˚˘˚˚˚˚˙Net Operating Profit after Taxes or NOPAT
12.2 Calculate and forecast project cash flows for expansion-type investments. (pgs. 409–415)
SUMMARY: An expansion project expands or increases the scope of the firm’s operations, including the addition of both revenues and costs, but does not replace any existing assets or operations. Project cash flows equal to the sum of operating cash flows less capital expenditures and any change needed in the firm’s investment in working capital:
Concept Check | 12.2
1. What does the term free cash flow mean?
2. What are the four steps used to forecast a project’s future cash flows?
3. What is net operating working capital, and how does it affect a project’s cash flows?
4. What is CAPEX, and how does it affect a project’s cash flows?
Estimating a project’s free cash flow involves a four-step process:
Step 1. Measure the effect of the proposed investment on the firm’s operating cash flows—that is, its cash flows from operations. This includes the estimated incremental revenues and operating expenses resulting from the project’s acceptance.
Step 2. Calculate the project’s requirements for working capital and the resulting cash flows. Here we consider the incremental investment that the project may require in accounts receivable and inventories less any increase in accounts payable or trade credit.
Step 3. Calculate the project’s cash requirements for capital expenditures. Capital expen-ditures include expenditures for property, plant, and equipment that are expected to last for longer than one year. The biggest capital expenditure for most investments occurs when the investment is made. However, additional capital expenditures may have to be made periodically over the life of the project as older equipment wears out or new capac-ity needs to be added to meet the needs of growth over time.
Step 4. Combine the project’s operating cash flow with any investments made in net oper-ating working capital and capital expenditures to calculate the project’s free cash flow. In the initial year, the free cash flow will generally include only the required investment outlays for capital equipment and working capital. In subsequent years, both operating revenues and expenses determine the project’s cash flows, and in the final year of the project, additional cash inflows from salvage value and the return of working capi-tal may be present.
KEY TERMPro forma financial statements, page 409 A forecast of financial statements for a future period.
KEY EQUATIONS
Operating CashFlowt
=Net Operating
Income (Profit)t- Taxest +
DepreciationExpenset
(12–3)
Investment inNet Operating
Working Capital= a Increase in
Accounts Receivableb + a Increase in
Inventoriesb - a Increase in
Accounts Payableb (12–4)
¯˚˚˚˚˚˘˚˚˚˚˚˙NOPAT
Free CashFlow
=Net OperatingIncome (Profit)
- Taxes +Depreciation
Expense-
Increase in CapitalExpenditures
(CAPEX)-
Increase in NetOperating Working
Capital (NOWC) (12–2)
Operating Cash Flow¸˚˚˚˚˚˚˚˚˚˚˚˚˝˚˚˚˚˚˚˚˚˚˚˚˛
¯˚˚˚˚˘˚˚˚˚˙Net Operating Profit after Taxes or NOPAT
12.3 Evaluate the effect of inflation on project cash flows. (pg. 416)
SUMMARY: Inflation can have a very significant effect on project cash flows and, consequently, the value of an investment opportunity. The consequences of inflation can be felt in both revenues and costs, and the effect is often quite different. Inflation may cause project cash flows to increase
M12_TITM2189_13_GE_C12.indd 424 19/05/17 8:12 AM
CHAPTER 12 | Analyzing Project Cash Flows 425CHAPTER 12 | Analyzing Project Cash Flows 425
Concept Check | 12.3
1. What is the distinction between nominal and real interest rates?
2. If you forecast nominal cash flows, should you use the nominal or the real discount rate? Why?
(revenues rise faster than costs) or to fall (costs rise faster than revenues). The important thing is that the analysts carefully consider the potential effects of inflationary expectations and incorpo-rate them into the cash flow forecast. These inflation-adjusted cash flows are referred to as nominal cash flows (as contrasted with real cash flows, which do not incorporate the effects of inflation). Because we forecast nominal cash flows, we should use nominal rates of interest as the basis for determining the discount rate for the project.
KEY TERMSNominal cash flows, page 416 Cash flows that account for the effects of inflation.
Nominal rate of interest, page 416 The rate of interest that is observed in financial markets and that incorporates consideration for inflation.
Real cash flows, page 416 Cash flows that would occur in the absence of any inflation.
Real rate of interest, page 416 The rate of interest that would occur in the absence of any inflation.
SUMMARY: A replacement project is one in which an existing asset is taken out of service and another is added in its place. Thus, a distinctive feature of many replacement investments is that the principal source of investment cash flows is cost savings, not new revenues. Because the firm already operates an existing asset to generate revenues, the primary benefit of acquiring the new asset comes from the cost savings it offers.
The cash flows for a replacement project are calculated using Equation (12–1) just like those for an expansion project. The only difference is that with a replacement project, we are continually asking how cash flows generated by the new asset differ from those generated by the older asset. For this reason, computing project cash flows for replacement asset investments is a bit more com-plicated. However, the principles are exactly the same.
KEY TERMSExpansion project, page 417 An investment proposal that increases the scope of the firm’s op-erations, including the addition of both revenues and costs, but does not replace any existing assets or operations.
Replacement investment, page 417 An in-vestment proposal that is a substitute for an existing investment.
12.4 Calculate the incremental cash flows for replacement-type investments. (pgs. 417–422)
Concept Check | 12.4
1. What is a replacement investment?
2. What is the relevant depreciation expense when you are analyzing a replacement decision?
12–1. As you saw in the introduction, the Toyota Prius took some of its sales away from other Toyota products. Toyota has also licensed its hybrid technology to Ford Motor Company, which allowed Ford to introduce a Ford Fusion hybrid in 2010 that traveled 39 miles per gallon (mpg), almost doubling the city efficiency of the non-hybrid Fusion. Obviously, this new Ford product will compete directly with Toyota’s hybrids. Why do you think Toyota licensed its technology to Ford?
12–2. In Regardless of Your Major: The Internet on Airline Flights—Making It Happen on page 406, we described an investment proposal involving the sale of internet services on airlines. How would you approach the problem of calculating the cash flows for such a venture? What costs would you include in the initial cash outlay, the annual operating cash flows, capital expenditures, and working capital?
12–3. A business is currently considering the project cash flows for the acquisition of a new subsidiary. The business is operated from a head-office in London. The CEO wants to include a flow for absorption of some head-office costs, but the CFO says this is not correct. Whom do you agree with? Explain why.
12–4. A food manufacturing business is looking to commission six new production lines that will double the output capacity of the business. Why should the project cash flows include an incremental cash flow for working capital?
Study Questions
M12_TITM2189_13_GE_C12.indd 425 24/06/17 1:21 PM
426 PART 3 | Capital Budgeting426 PART 3 | Capital Budgeting
12–5. When a firm finances a new investment, it often borrows part of the money, so the interest and principal payments this creates are incremental to the project’s acceptance. Why are these expenditures not included in the project’s cash flow computation?
12–6. Discuss how free cash flow differs from a firm’s operating cash flow.
12–7. If depreciation is not a cash flow item, why does it affect the level of cash flows from a project?
12–8. Describe net operating working capital, and explain how changes in this quantity affect an investment proposal’s cash flows.
12–9. What are sunk costs, and how should they be considered when evaluating an invest-ment’s cash flows?
12–10. Consider how an IT business can help its clients to construct the cash flow benefits of the implementation of its accounting software. The main advantage will be that the software will save time. Consider this from two different perspectives: (a) a business with only marginal growth, and (b) a business with exponential growth.
12–11. What are opportunity costs, and how should they affect an investment’s cash flows? Give an example.
12–12. A multinational company is looking to open a new operating division. Revenue and cost cash flows have been identified, and the only remaining decision is whether to base the division in a higher wage and lower inflation country or a lower wage and higher infla-tion country. Consider the questions that would need to be addressed to derive the opti-mal result for the worldwide business.
12–13. When McDonald’s moved into India, it faced a particularly difficult task. The major religion in India is the Hindu religion, and Hindus don’t eat beef—in fact, most of the 1 billion people living in India are vegetarians. Still, McDonald’s ventured into India and has been enormously successful. Why do you think the restaurant has been so successful, and what kinds of products do you think it sells in India?
12–14. In Finance in a Flat World: Entering New Markets on page 422, we described the importance of thinking globally when making investments. Pick a new product that you have just learned about that is being sold domestically, and describe how the product might benefit from international markets.
12–15. A food manufacturing company has found that products that do not meet the qual-ity standards of supermarkets and are currently going to waste can be reprocessed at a minimum cost and turned into animal feed. Suggest the cash flows that should be considered in assessing the viability of such a project.
12–16. Throughout the examples in this chapter, we have assumed that the initial invest-ment in working capital is later recaptured when the project ends. Is this a realistic assumption? Do firms always recover 100 percent of their investment in accounts receivable and inventories?
Forecasting Project Cash Flows
12–1. (Identifying incremental revenues from new products) Morten Food Products, Inc., is a regional manufacturer of salty food snacks. The firm competes directly with the national brands including Frito-Lay—but only in the southeastern part of the United States. Next year Morten expects total revenues of $300 million from its various chip products. Moreover, a new line of baked chips is expected to produce revenue of $60 million. However, the firm’s analysts estimate that about 60 percent of this revenue will come from existing customers who switch their purchases from one of the firm’s existing products to the new, healthier baked chips.
a. What level of incremental sales should the company analyst attribute to the new line of baked chips?
Study Problems
Go to www.myfinancelab.com to complete these exercises online
and get instant feedback.
MyLab Finance
M12_TITM2189_13_GE_C12.indd 426 24/06/17 1:25 PM
CHAPTER 12 | Analyzing Project Cash Flows 427CHAPTER 12 | Analyzing Project Cash Flows 427
b. Assume that some of Morten’s existing customers are actively looking for a healthier snack alternative and will move to another company’s baked chip of-fering if Morten does not introduce the new product. How would the loss of chip revenue due to the defection of Morten customers to other brands affect your analysis of incremental sales? Discuss (no computations required).
12–2. (Determining relevant cash flows) Landcruisers Plus (LP) has operated an online retail store selling off-road truck parts. As the name implies, the firm specializes in parts for the venerable Toyota FJ40, which is known throughout the world for its durability and off-road prowess. The fact that Toyota stopped building and export-ing the FJ40 to the U.S. market in 1982 meant that FJ40 owners depended more and more on remanufactured parts to keep their beloved off-road vehicles running. More and more FJ40 owners are replacing the original inline six-cylinder engines with a modern American-built engine. The engine replacement requires mating the new en-gine with the Toyota drive train. LP’s owners had been offering engine adaptor kits for some time but have recently decided to begin building their own units. To make the adaptor kits, the firm would need to invest in a variety of machine tools costing a total of $700,000.
LP’s management estimates that the company will be able to borrow $400,000 from its bank and pay 8 percent interest. The remaining funds would have to be supplied by LP’s owners. The firm estimates that it will be able to sell 1,000 units a year for $1,300 each. The units would cost $1,000 each in cash expenses to produce (this does not include depreciation expense of $70,000 per year or interest expense of $32,000). After all expenses, the firm expects earnings before interest and taxes of $198,000. The firm pays taxes equal to 30 percent, which results in net income of $138,600 per year over the 10-year expected life of the equipment.a. What is the annual free cash flow LP should expect to receive from the invest-
ment in Year 1, assuming that it does not require any other investments in either capital equipment or working capital and that the equipment is depreciated over a 10-year life to a zero salvage and book value? How should the financing cost as-sociated with the $400,000 loan be incorporated into the analysis of cash flow?
b. If the firm’s required rate of return for its investments is 10 percent and the invest-ment has a 10-year expected life, what is the anticipated NPV of the investment?
12–3. (Identifying incremental earnings from advertising synergies) Fastfoot shoes currently sells £1 million worth of products to a major sports warehouse retailer delivering an operating profit of 35 percent for Fastfoot. The retailer has offered a promotional deal to Fastfoot that would see projected (but not guaranteed) additional sales of £300,000 for Fastfoot. To achieve this, the retailer wants to reduce Fastfoot’s margin. Fastfoot has calculated that their operating profit on their entire sales to the retailer will fall to 30 percent. Fastfoot pays corporation tax at 22 percent. Is the deal worth doing from a cash flow perspective? What are the two main risks faced by Fastfoot?
12–4. (Identifying incremental earnings from lowering product prices) Apple’s (AAPL) iPad jump-started the touchscreen computer market, driving it to levels few analysts had ever dreamed possible. Moreover, the popularity of the iPad pushed Apple’s competitors to offer similar touchscreen computers. Hewlett Packard (HPE) offered its Slate product, and others soon followed suit. One such manufacturer was Soko Industries. The Soko product, the sPad, had a number of appealing features and initially sold for $600. However, the relative obscurity of the company did not help product sales. In fact, disappointing sales led Soko Industries’ management to con-sider taking a 25 percent price break on the computer, which cost $400 to manufac-ture and sell.a. If Soko goes through with the price adjustment and it leads to total sales of 400,000
sPads, what are the incremental revenues attributable to the new pricing strategy?b. Now suppose that for each new sPad it sells, the firm also sells an average of $100
worth of applications on which the firm has 75 percent operating profit margins (i.e., the firm earns $75 in additional operating profits for each $100 in application sales). What is the incremental impact on firm operating profits of the new lower-price strategy under these conditions?
12–5. (Identifying incremental costs for products involving pilot studies) Look back at your answer to Study Problem 12–3. Before accepting the deal with the retailer, Fastfoot
M12_TITM2189_13_GE_C12.indd 427 24/06/17 1:29 PM
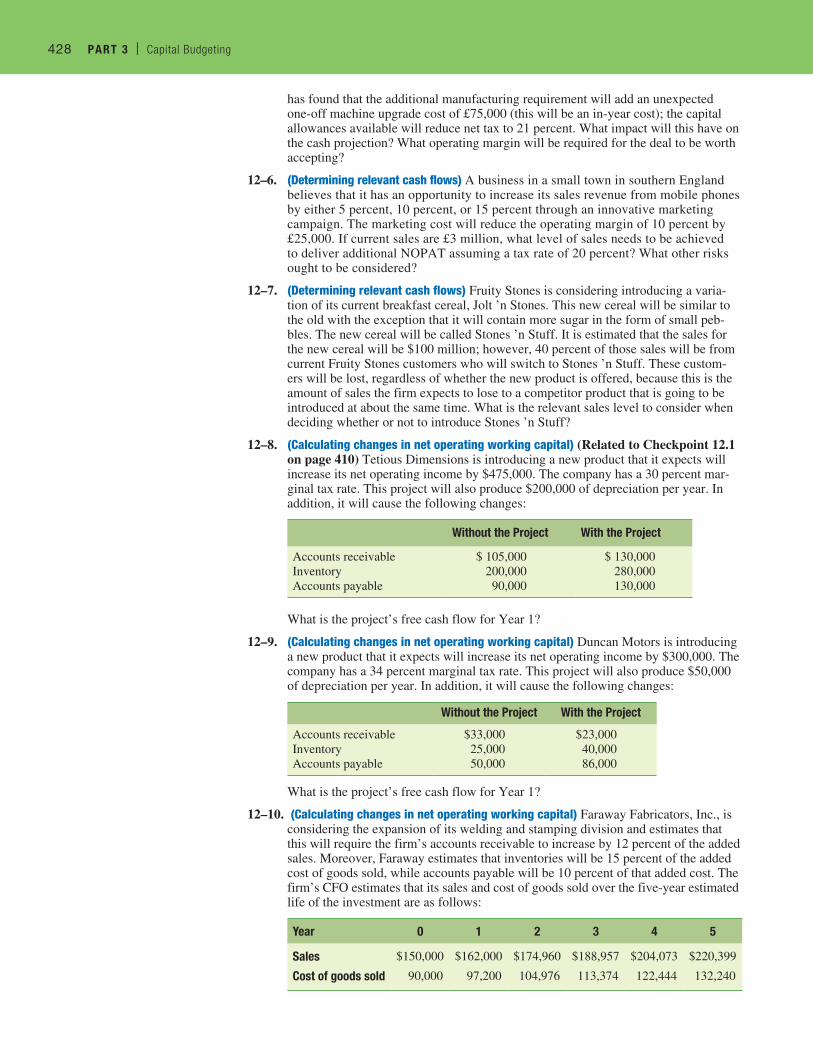
428 PART 3 | Capital Budgeting428 PART 3 | Capital Budgeting
has found that the additional manufacturing requirement will add an unexpected one-off machine upgrade cost of £75,000 (this will be an in-year cost); the capital allowances available will reduce net tax to 21 percent. What impact will this have on the cash projection? What operating margin will be required for the deal to be worth accepting?
12–6. (Determining relevant cash flows) A business in a small town in southern England believes that it has an opportunity to increase its sales revenue from mobile phones by either 5 percent, 10 percent, or 15 percent through an innovative marketing campaign. The marketing cost will reduce the operating margin of 10 percent by £25,000. If current sales are £3 million, what level of sales needs to be achieved to deliver additional NOPAT assuming a tax rate of 20 percent? What other risks ought to be considered?
12–7. (Determining relevant cash flows) Fruity Stones is considering introducing a varia-tion of its current breakfast cereal, Jolt ’n Stones. This new cereal will be similar to the old with the exception that it will contain more sugar in the form of small peb-bles. The new cereal will be called Stones ’n Stuff. It is estimated that the sales for the new cereal will be $100 million; however, 40 percent of those sales will be from current Fruity Stones customers who will switch to Stones ’n Stuff. These custom-ers will be lost, regardless of whether the new product is offered, because this is the amount of sales the firm expects to lose to a competitor product that is going to be introduced at about the same time. What is the relevant sales level to consider when deciding whether or not to introduce Stones ’n Stuff?
12–8. (Calculating changes in net operating working capital) (Related to Checkpoint 12.1 on page 410) Tetious Dimensions is introducing a new product that it expects will increase its net operating income by $475,000. The company has a 30 percent mar-ginal tax rate. This project will also produce $200,000 of depreciation per year. In addition, it will cause the following changes:
Without the Project With the Project
Accounts receivableInventoryAccounts payable
$ 105,000 200,000 90,000
$ 130,000 280,000 130,000
What is the project’s free cash flow for Year 1?
12–9. (Calculating changes in net operating working capital) Duncan Motors is introducing a new product that it expects will increase its net operating income by $300,000. The company has a 34 percent marginal tax rate. This project will also produce $50,000 of depreciation per year. In addition, it will cause the following changes:
Without the Project With the Project
Accounts receivableInventoryAccounts payable
$33,00025,00050,000
$23,00040,00086,000
What is the project’s free cash flow for Year 1?
12–10. (Calculating changes in net operating working capital) Faraway Fabricators, Inc., is considering the expansion of its welding and stamping division and estimates that this will require the firm’s accounts receivable to increase by 12 percent of the added sales. Moreover, Faraway estimates that inventories will be 15 percent of the added cost of goods sold, while accounts payable will be 10 percent of that added cost. The firm’s CFO estimates that its sales and cost of goods sold over the five-year estimated life of the investment are as follows:
Year 0 1 2 3 4 5
Sales $150,000 $162,000 $174,960 $188,957 $204,073 $220,399
Cost of goods sold 90,000 97,200 104,976 113,374 122,444 132,240
M12_TITM2189_13_GE_C12.indd 428 24/06/17 1:32 PM
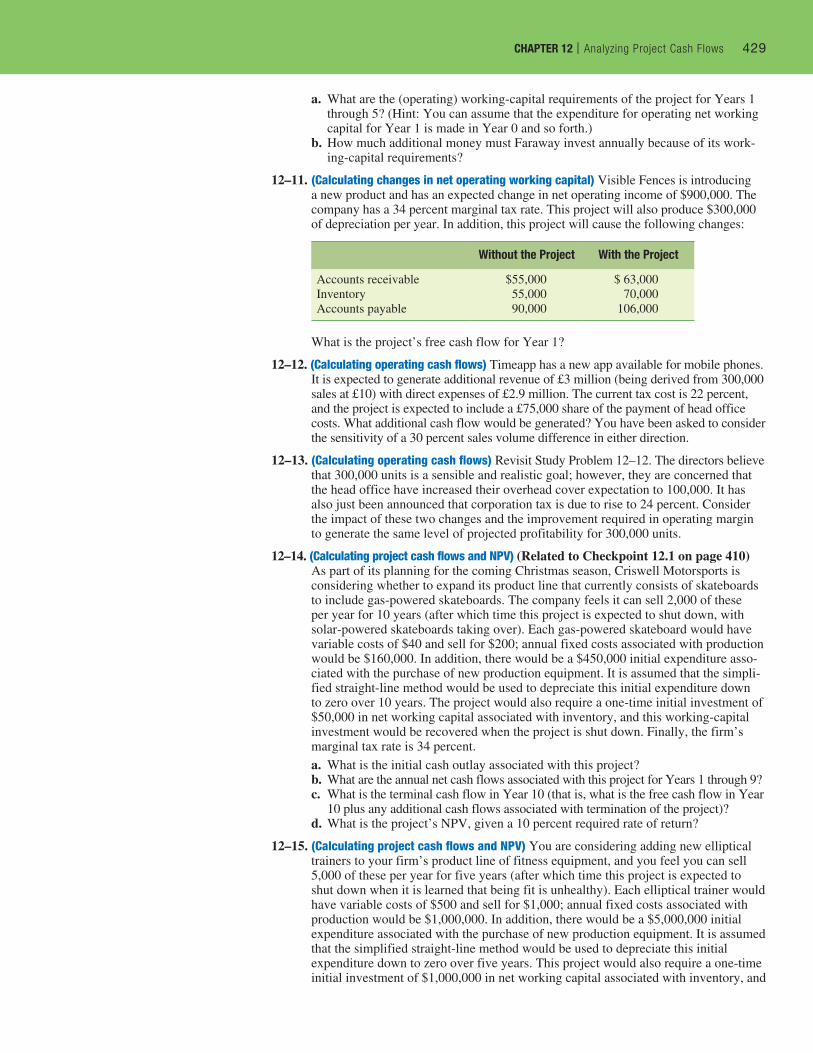
CHAPTER 12 | Analyzing Project Cash Flows 429CHAPTER 12 | Analyzing Project Cash Flows 429
a. What are the (operating) working-capital requirements of the project for Years 1 through 5? (Hint: You can assume that the expenditure for operating net working capital for Year 1 is made in Year 0 and so forth.)
b. How much additional money must Faraway invest annually because of its work-ing-capital requirements?
12–11. (Calculating changes in net operating working capital) Visible Fences is introducing a new product and has an expected change in net operating income of $900,000. The company has a 34 percent marginal tax rate. This project will also produce $300,000 of depreciation per year. In addition, this project will cause the following changes:
Without the Project With the Project
Accounts receivableInventoryAccounts payable
$55,00055,00090,000
$ 63,00070,000
106,000
What is the project’s free cash flow for Year 1?
12–12. (Calculating operating cash flows) Timeapp has a new app available for mobile phones. It is expected to generate additional revenue of £3 million (being derived from 300,000 sales at £10) with direct expenses of £2.9 million. The current tax cost is 22 percent, and the project is expected to include a £75,000 share of the payment of head office costs. What additional cash flow would be generated? You have been asked to consider the sensitivity of a 30 percent sales volume difference in either direction.
12–13. (Calculating operating cash flows) Revisit Study Problem 12–12. The directors believe that 300,000 units is a sensible and realistic goal; however, they are concerned that the head office have increased their overhead cover expectation to 100,000. It has also just been announced that corporation tax is due to rise to 24 percent. Consider the impact of these two changes and the improvement required in operating margin to generate the same level of projected profitability for 300,000 units.
12–14. (Calculating project cash flows and NPV) (Related to Checkpoint 12.1 on page 410) As part of its planning for the coming Christmas season, Criswell Motorsports is considering whether to expand its product line that currently consists of skateboards to include gas-powered skateboards. The company feels it can sell 2,000 of these per year for 10 years (after which time this project is expected to shut down, with solar-powered skateboards taking over). Each gas-powered skateboard would have variable costs of $40 and sell for $200; annual fixed costs associated with production would be $160,000. In addition, there would be a $450,000 initial expenditure asso-ciated with the purchase of new production equipment. It is assumed that the simpli-fied straight-line method would be used to depreciate this initial expenditure down to zero over 10 years. The project would also require a one-time initial investment of $50,000 in net working capital associated with inventory, and this working-capital investment would be recovered when the project is shut down. Finally, the firm’s marginal tax rate is 34 percent.a. What is the initial cash outlay associated with this project?b. What are the annual net cash flows associated with this project for Years 1 through 9?c. What is the terminal cash flow in Year 10 (that is, what is the free cash flow in Year
10 plus any additional cash flows associated with termination of the project)?d. What is the project’s NPV, given a 10 percent required rate of return?
12–15. (Calculating project cash flows and NPV) You are considering adding new elliptical trainers to your firm’s product line of fitness equipment, and you feel you can sell 5,000 of these per year for five years (after which time this project is expected to shut down when it is learned that being fit is unhealthy). Each elliptical trainer would have variable costs of $500 and sell for $1,000; annual fixed costs associated with production would be $1,000,000. In addition, there would be a $5,000,000 initial expenditure associated with the purchase of new production equipment. It is assumed that the simplified straight-line method would be used to depreciate this initial expenditure down to zero over five years. This project would also require a one-time initial investment of $1,000,000 in net working capital associated with inventory, and
M12_TITM2189_13_GE_C12.indd 429 24/06/17 1:36 PM
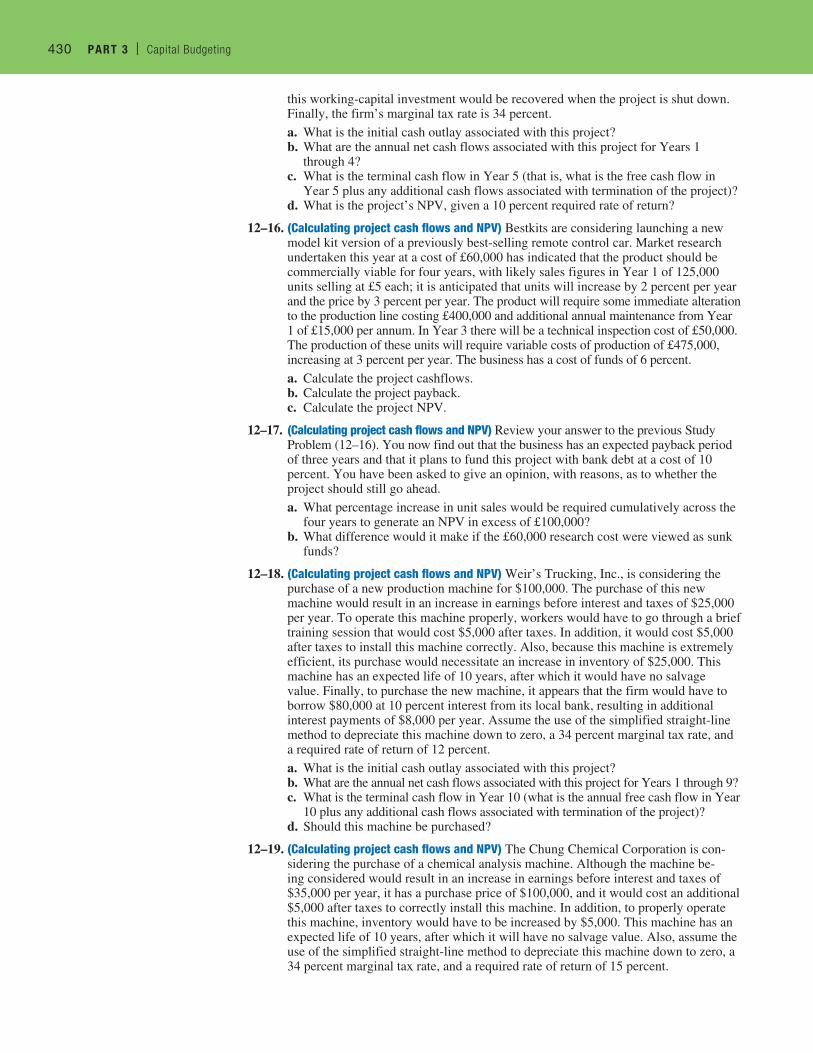
430 PART 3 | Capital Budgeting430 PART 3 | Capital Budgeting
this working-capital investment would be recovered when the project is shut down. Finally, the firm’s marginal tax rate is 34 percent.a. What is the initial cash outlay associated with this project?b. What are the annual net cash flows associated with this project for Years 1
through 4?c. What is the terminal cash flow in Year 5 (that is, what is the free cash flow in
Year 5 plus any additional cash flows associated with termination of the project)?d. What is the project’s NPV, given a 10 percent required rate of return?
12–16. (Calculating project cash flows and NPV) Bestkits are considering launching a new model kit version of a previously best-selling remote control car. Market research undertaken this year at a cost of £60,000 has indicated that the product should be commercially viable for four years, with likely sales figures in Year 1 of 125,000 units selling at £5 each; it is anticipated that units will increase by 2 percent per year and the price by 3 percent per year. The product will require some immediate alteration to the production line costing £400,000 and additional annual maintenance from Year 1 of £15,000 per annum. In Year 3 there will be a technical inspection cost of £50,000. The production of these units will require variable costs of production of £475,000, increasing at 3 percent per year. The business has a cost of funds of 6 percent.a. Calculate the project cashflows.b. Calculate the project payback.c. Calculate the project NPV.
12–17. (Calculating project cash flows and NPV) Review your answer to the previous Study Problem (12–16). You now find out that the business has an expected payback period of three years and that it plans to fund this project with bank debt at a cost of 10 percent. You have been asked to give an opinion, with reasons, as to whether the project should still go ahead.a. What percentage increase in unit sales would be required cumulatively across the
four years to generate an NPV in excess of £100,000?b. What difference would it make if the £60,000 research cost were viewed as sunk
funds?
12–18. (Calculating project cash flows and NPV) Weir’s Trucking, Inc., is considering the purchase of a new production machine for $100,000. The purchase of this new machine would result in an increase in earnings before interest and taxes of $25,000 per year. To operate this machine properly, workers would have to go through a brief training session that would cost $5,000 after taxes. In addition, it would cost $5,000 after taxes to install this machine correctly. Also, because this machine is extremely efficient, its purchase would necessitate an increase in inventory of $25,000. This machine has an expected life of 10 years, after which it would have no salvage value. Finally, to purchase the new machine, it appears that the firm would have to borrow $80,000 at 10 percent interest from its local bank, resulting in additional interest payments of $8,000 per year. Assume the use of the simplified straight-line method to depreciate this machine down to zero, a 34 percent marginal tax rate, and a required rate of return of 12 percent.a. What is the initial cash outlay associated with this project?b. What are the annual net cash flows associated with this project for Years 1 through 9?c. What is the terminal cash flow in Year 10 (what is the annual free cash flow in Year
10 plus any additional cash flows associated with termination of the project)?d. Should this machine be purchased?
12–19. (Calculating project cash flows and NPV) The Chung Chemical Corporation is con-sidering the purchase of a chemical analysis machine. Although the machine be-ing considered would result in an increase in earnings before interest and taxes of $35,000 per year, it has a purchase price of $100,000, and it would cost an additional $5,000 after taxes to correctly install this machine. In addition, to properly operate this machine, inventory would have to be increased by $5,000. This machine has an expected life of 10 years, after which it will have no salvage value. Also, assume the use of the simplified straight-line method to depreciate this machine down to zero, a 34 percent marginal tax rate, and a required rate of return of 15 percent.
M12_TITM2189_13_GE_C12.indd 430 24/06/17 1:43 PM
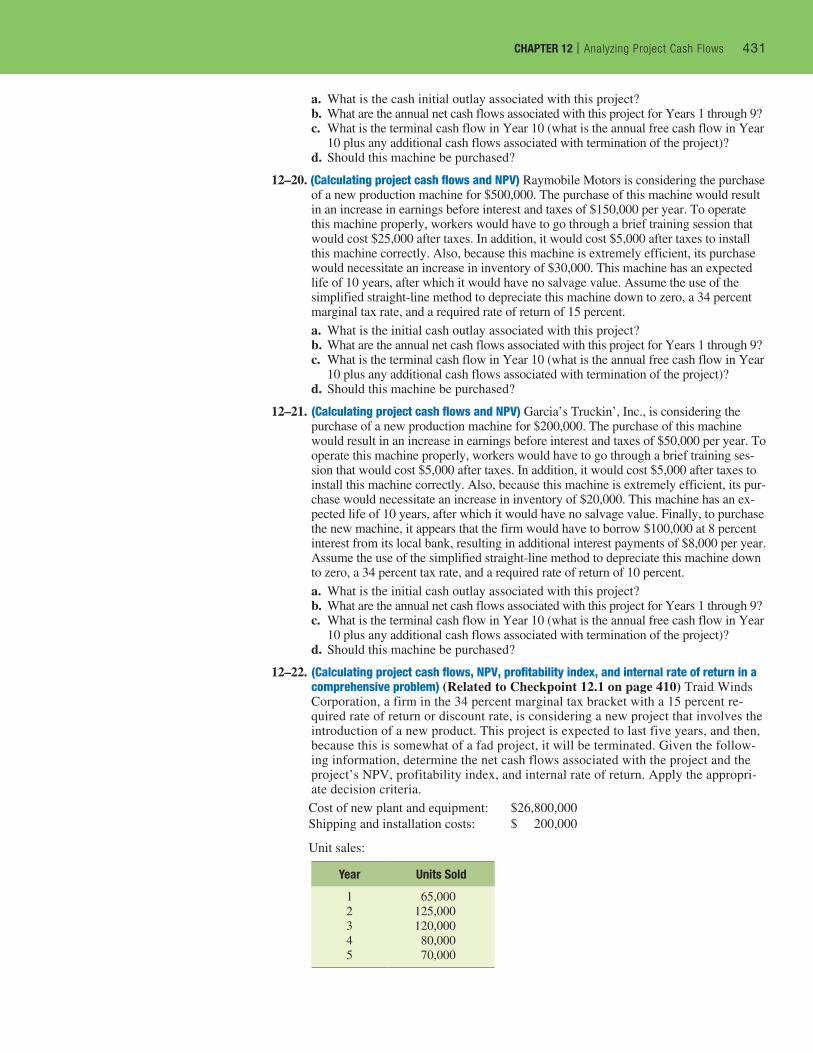
CHAPTER 12 | Analyzing Project Cash Flows 431CHAPTER 12 | Analyzing Project Cash Flows 431
a. What is the cash initial outlay associated with this project?b. What are the annual net cash flows associated with this project for Years 1 through 9?c. What is the terminal cash flow in Year 10 (what is the annual free cash flow in Year
10 plus any additional cash flows associated with termination of the project)?d. Should this machine be purchased?
12–20. (Calculating project cash flows and NPV) Raymobile Motors is considering the purchase of a new production machine for $500,000. The purchase of this machine would result in an increase in earnings before interest and taxes of $150,000 per year. To operate this machine properly, workers would have to go through a brief training session that would cost $25,000 after taxes. In addition, it would cost $5,000 after taxes to install this machine correctly. Also, because this machine is extremely efficient, its purchase would necessitate an increase in inventory of $30,000. This machine has an expected life of 10 years, after which it would have no salvage value. Assume the use of the simplified straight-line method to depreciate this machine down to zero, a 34 percent marginal tax rate, and a required rate of return of 15 percent.a. What is the initial cash outlay associated with this project?b. What are the annual net cash flows associated with this project for Years 1 through 9?c. What is the terminal cash flow in Year 10 (what is the annual free cash flow in Year
10 plus any additional cash flows associated with termination of the project)?d. Should this machine be purchased?
12–21. (Calculating project cash flows and NPV) Garcia’s Truckin’, Inc., is considering the purchase of a new production machine for $200,000. The purchase of this machine would result in an increase in earnings before interest and taxes of $50,000 per year. To operate this machine properly, workers would have to go through a brief training ses-sion that would cost $5,000 after taxes. In addition, it would cost $5,000 after taxes to install this machine correctly. Also, because this machine is extremely efficient, its pur-chase would necessitate an increase in inventory of $20,000. This machine has an ex-pected life of 10 years, after which it would have no salvage value. Finally, to purchase the new machine, it appears that the firm would have to borrow $100,000 at 8 percent interest from its local bank, resulting in additional interest payments of $8,000 per year. Assume the use of the simplified straight-line method to depreciate this machine down to zero, a 34 percent tax rate, and a required rate of return of 10 percent.a. What is the initial cash outlay associated with this project?b. What are the annual net cash flows associated with this project for Years 1 through 9?c. What is the terminal cash flow in Year 10 (what is the annual free cash flow in Year
10 plus any additional cash flows associated with termination of the project)?d. Should this machine be purchased?
12–22. (Calculating project cash flows, NPV, profitability index, and internal rate of return in a comprehensive problem) (Related to Checkpoint 12.1 on page 410) Traid Winds Corporation, a firm in the 34 percent marginal tax bracket with a 15 percent re-quired rate of return or discount rate, is considering a new project that involves the introduction of a new product. This project is expected to last five years, and then, because this is somewhat of a fad project, it will be terminated. Given the follow-ing information, determine the net cash flows associated with the project and the project’s NPV, profitability index, and internal rate of return. Apply the appropri-ate decision criteria.Cost of new plant and equipment: $26,800,000Shipping and installation costs: $ 200,000
Unit sales:
Year Units Sold
12345
65,000125,000120,00080,00070,000
M12_TITM2189_13_GE_C12.indd 431 19/05/17 8:12 AM
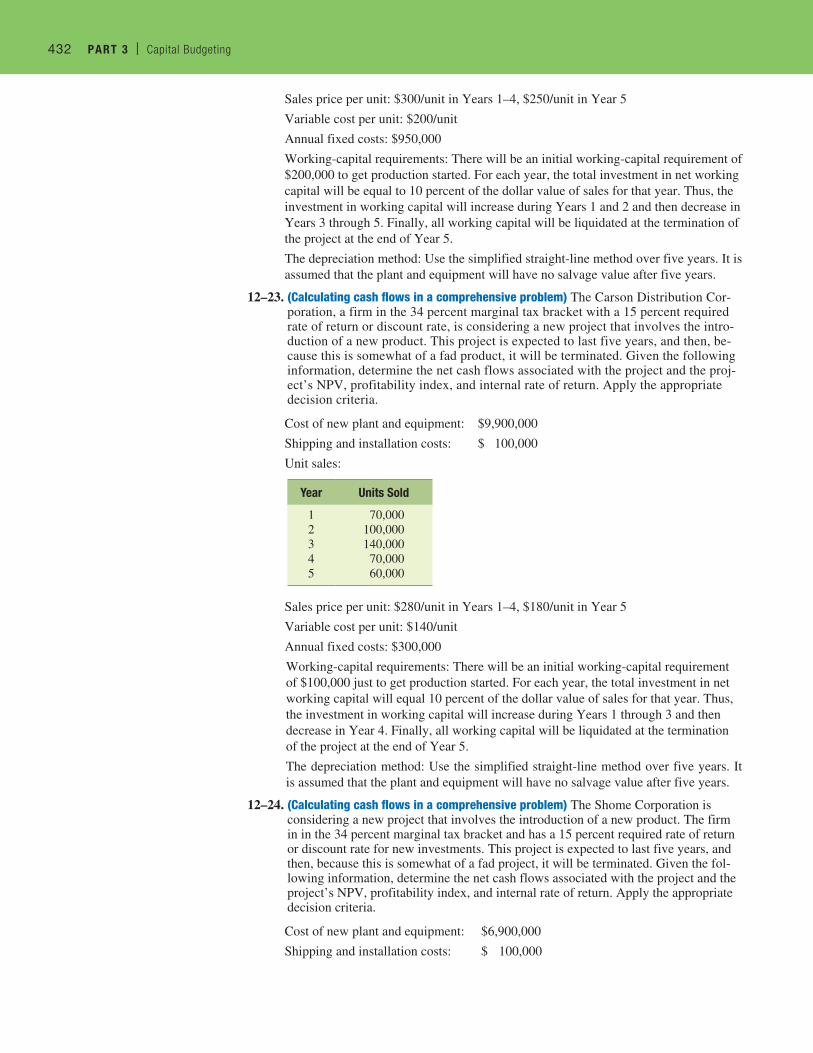
432 PART 3 | Capital Budgeting432 PART 3 | Capital Budgeting
Sales price per unit: $300/unit in Years 1–4, $250/unit in Year 5
Variable cost per unit: $200/unit
Annual fixed costs: $950,000
Working-capital requirements: There will be an initial working-capital requirement of $200,000 to get production started. For each year, the total investment in net working capital will be equal to 10 percent of the dollar value of sales for that year. Thus, the investment in working capital will increase during Years 1 and 2 and then decrease in Years 3 through 5. Finally, all working capital will be liquidated at the termination of the project at the end of Year 5.
The depreciation method: Use the simplified straight-line method over five years. It is assumed that the plant and equipment will have no salvage value after five years.
12–23. (Calculating cash flows in a comprehensive problem) The Carson Distribution Cor-poration, a firm in the 34 percent marginal tax bracket with a 15 percent required rate of return or discount rate, is considering a new project that involves the intro-duction of a new product. This project is expected to last five years, and then, be-cause this is somewhat of a fad product, it will be terminated. Given the following information, determine the net cash flows associated with the project and the proj-ect’s NPV, profitability index, and internal rate of return. Apply the appropriate decision criteria.
Cost of new plant and equipment: $9,900,000
Shipping and installation costs: $ 100,000
Unit sales:
Year Units Sold
12345
70,000100,000140,00070,00060,000
Sales price per unit: $280/unit in Years 1–4, $180/unit in Year 5
Variable cost per unit: $140/unit
Annual fixed costs: $300,000
Working-capital requirements: There will be an initial working-capital requirement of $100,000 just to get production started. For each year, the total investment in net working capital will equal 10 percent of the dollar value of sales for that year. Thus, the investment in working capital will increase during Years 1 through 3 and then decrease in Year 4. Finally, all working capital will be liquidated at the termination of the project at the end of Year 5.
The depreciation method: Use the simplified straight-line method over five years. It is assumed that the plant and equipment will have no salvage value after five years.
12–24. (Calculating cash flows in a comprehensive problem) The Shome Corporation is considering a new project that involves the introduction of a new product. The firm in in the 34 percent marginal tax bracket and has a 15 percent required rate of return or discount rate for new investments. This project is expected to last five years, and then, because this is somewhat of a fad project, it will be terminated. Given the fol-lowing information, determine the net cash flows associated with the project and the project’s NPV, profitability index, and internal rate of return. Apply the appropriate decision criteria.
Cost of new plant and equipment: $6,900,000
Shipping and installation costs: $ 100,000
M12_TITM2189_13_GE_C12.indd 432 19/05/17 8:12 AM
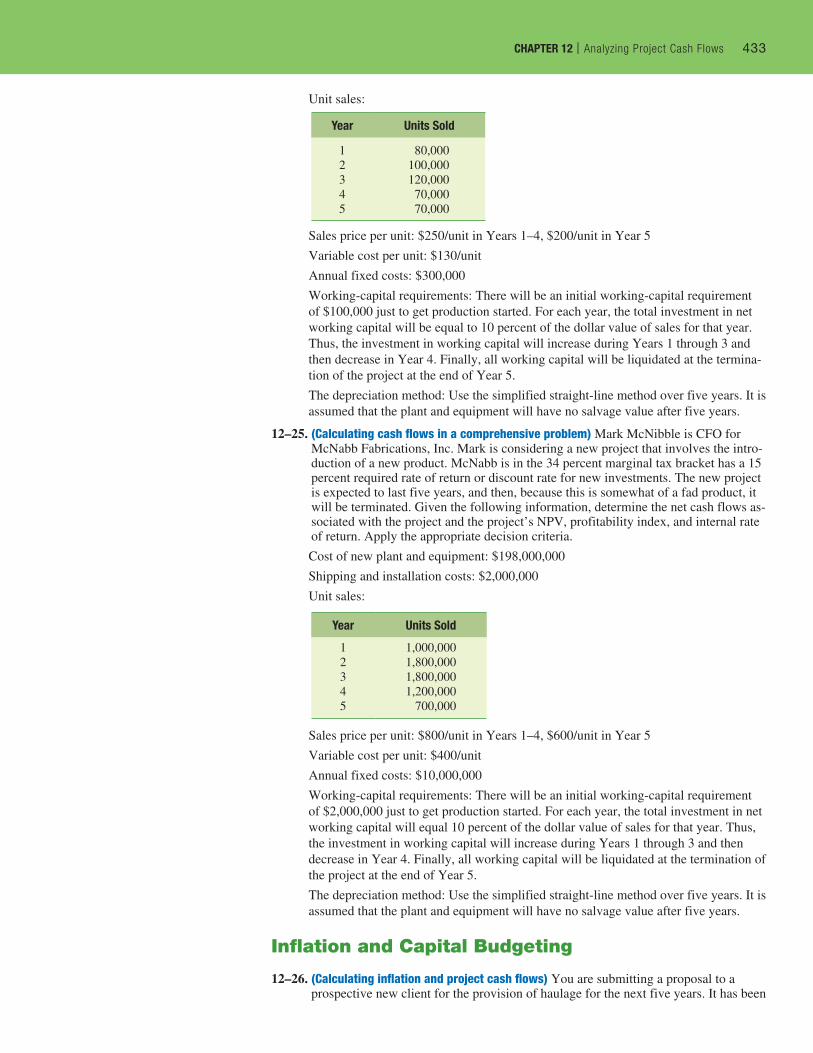
CHAPTER 12 | Analyzing Project Cash Flows 433CHAPTER 12 | Analyzing Project Cash Flows 433
Unit sales:
Year Units Sold
12345
80,000100,000120,00070,00070,000
Sales price per unit: $250/unit in Years 1–4, $200/unit in Year 5
Variable cost per unit: $130/unit
Annual fixed costs: $300,000
Working-capital requirements: There will be an initial working-capital requirement of $100,000 just to get production started. For each year, the total investment in net working capital will be equal to 10 percent of the dollar value of sales for that year. Thus, the investment in working capital will increase during Years 1 through 3 and then decrease in Year 4. Finally, all working capital will be liquidated at the termina-tion of the project at the end of Year 5.
The depreciation method: Use the simplified straight-line method over five years. It is assumed that the plant and equipment will have no salvage value after five years.
12–25. (Calculating cash flows in a comprehensive problem) Mark McNibble is CFO for McNabb Fabrications, Inc. Mark is considering a new project that involves the intro-duction of a new product. McNabb is in the 34 percent marginal tax bracket has a 15 percent required rate of return or discount rate for new investments. The new project is expected to last five years, and then, because this is somewhat of a fad product, it will be terminated. Given the following information, determine the net cash flows as-sociated with the project and the project’s NPV, profitability index, and internal rate of return. Apply the appropriate decision criteria.
Cost of new plant and equipment: $198,000,000
Shipping and installation costs: $2,000,000
Unit sales:
Year Units Sold
12345
1,000,0001,800,0001,800,0001,200,000
700,000
Sales price per unit: $800/unit in Years 1–4, $600/unit in Year 5
Variable cost per unit: $400/unit
Annual fixed costs: $10,000,000
Working-capital requirements: There will be an initial working-capital requirement of $2,000,000 just to get production started. For each year, the total investment in net working capital will equal 10 percent of the dollar value of sales for that year. Thus, the investment in working capital will increase during Years 1 through 3 and then decrease in Year 4. Finally, all working capital will be liquidated at the termination of the project at the end of Year 5.
The depreciation method: Use the simplified straight-line method over five years. It is assumed that the plant and equipment will have no salvage value after five years.
Inflation and Capital Budgeting
12–26. (Calculating inflation and project cash flows) You are submitting a proposal to a prospective new client for the provision of haulage for the next five years. It has been
M12_TITM2189_13_GE_C12.indd 433 29/05/17 12:35 PM
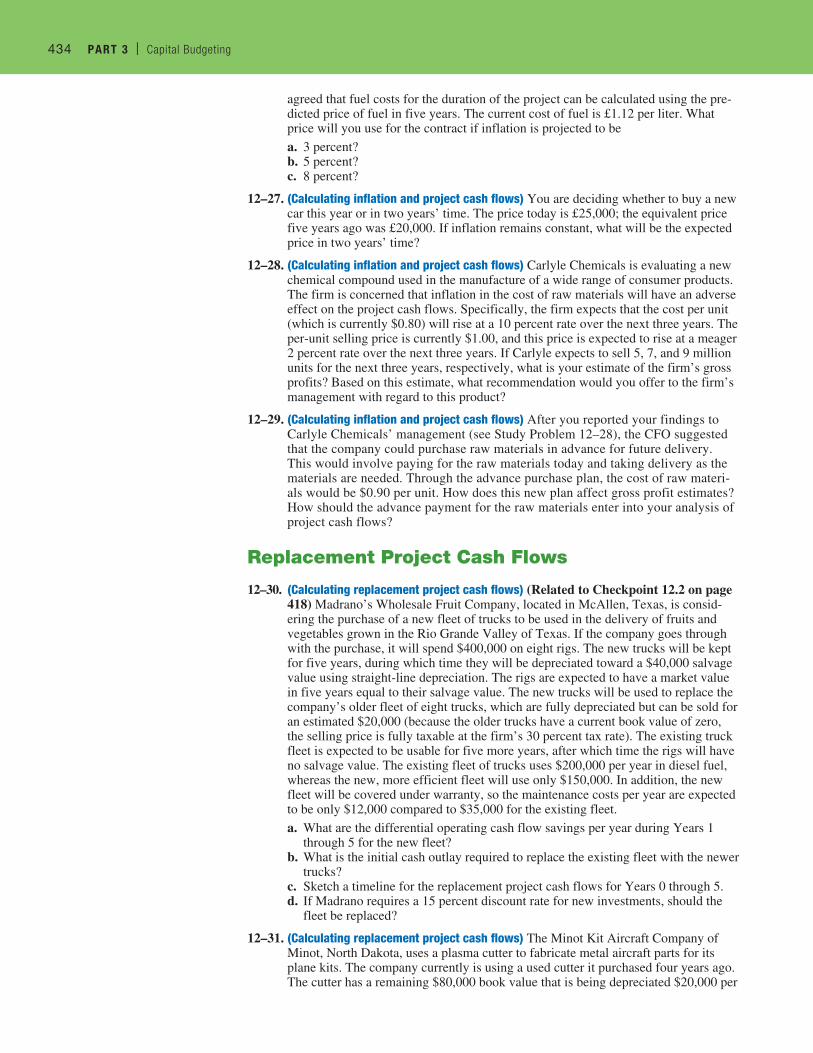
434 PART 3 | Capital Budgeting434 PART 3 | Capital Budgeting
agreed that fuel costs for the duration of the project can be calculated using the pre-dicted price of fuel in five years. The current cost of fuel is £1.12 per liter. What price will you use for the contract if inflation is projected to bea. 3 percent?b. 5 percent?c. 8 percent?
12–27. (Calculating inflation and project cash flows) You are deciding whether to buy a new car this year or in two years’ time. The price today is £25,000; the equivalent price five years ago was £20,000. If inflation remains constant, what will be the expected price in two years’ time?
12–28. (Calculating inflation and project cash flows) Carlyle Chemicals is evaluating a new chemical compound used in the manufacture of a wide range of consumer products. The firm is concerned that inflation in the cost of raw materials will have an adverse effect on the project cash flows. Specifically, the firm expects that the cost per unit (which is currently $0.80) will rise at a 10 percent rate over the next three years. The per-unit selling price is currently $1.00, and this price is expected to rise at a meager 2 percent rate over the next three years. If Carlyle expects to sell 5, 7, and 9 million units for the next three years, respectively, what is your estimate of the firm’s gross profits? Based on this estimate, what recommendation would you offer to the firm’s management with regard to this product?
12–29. (Calculating inflation and project cash flows) After you reported your findings to Carlyle Chemicals’ management (see Study Problem 12–28), the CFO suggested that the company could purchase raw materials in advance for future delivery. This would involve paying for the raw materials today and taking delivery as the materials are needed. Through the advance purchase plan, the cost of raw materi-als would be $0.90 per unit. How does this new plan affect gross profit estimates? How should the advance payment for the raw materials enter into your analysis of project cash flows?
Replacement Project Cash Flows
12–30. (Calculating replacement project cash flows) (Related to Checkpoint 12.2 on page 418) Madrano’s Wholesale Fruit Company, located in McAllen, Texas, is consid-ering the purchase of a new fleet of trucks to be used in the delivery of fruits and vegetables grown in the Rio Grande Valley of Texas. If the company goes through with the purchase, it will spend $400,000 on eight rigs. The new trucks will be kept for five years, during which time they will be depreciated toward a $40,000 salvage value using straight-line depreciation. The rigs are expected to have a market value in five years equal to their salvage value. The new trucks will be used to replace the company’s older fleet of eight trucks, which are fully depreciated but can be sold for an estimated $20,000 (because the older trucks have a current book value of zero, the selling price is fully taxable at the firm’s 30 percent tax rate). The existing truck fleet is expected to be usable for five more years, after which time the rigs will have no salvage value. The existing fleet of trucks uses $200,000 per year in diesel fuel, whereas the new, more efficient fleet will use only $150,000. In addition, the new fleet will be covered under warranty, so the maintenance costs per year are expected to be only $12,000 compared to $35,000 for the existing fleet.a. What are the differential operating cash flow savings per year during Years 1
through 5 for the new fleet?b. What is the initial cash outlay required to replace the existing fleet with the newer
trucks?c. Sketch a timeline for the replacement project cash flows for Years 0 through 5.d. If Madrano requires a 15 percent discount rate for new investments, should the
fleet be replaced?
12–31. (Calculating replacement project cash flows) The Minot Kit Aircraft Company of Minot, North Dakota, uses a plasma cutter to fabricate metal aircraft parts for its plane kits. The company currently is using a used cutter it purchased four years ago. The cutter has a remaining $80,000 book value that is being depreciated $20,000 per
M12_TITM2189_13_GE_C12.indd 434 24/06/17 1:47 PM
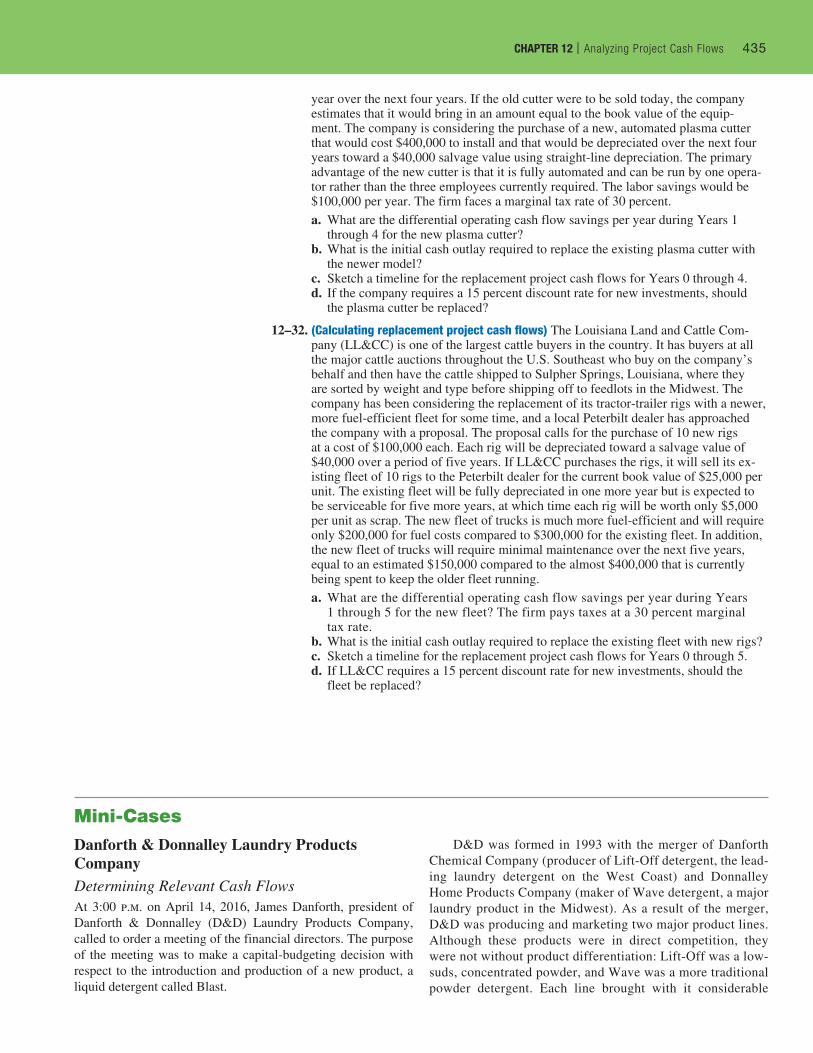
CHAPTER 12 | Analyzing Project Cash Flows 435CHAPTER 12 | Analyzing Project Cash Flows 435
year over the next four years. If the old cutter were to be sold today, the company estimates that it would bring in an amount equal to the book value of the equip-ment. The company is considering the purchase of a new, automated plasma cutter that would cost $400,000 to install and that would be depreciated over the next four years toward a $40,000 salvage value using straight-line depreciation. The primary advantage of the new cutter is that it is fully automated and can be run by one opera-tor rather than the three employees currently required. The labor savings would be $100,000 per year. The firm faces a marginal tax rate of 30 percent.a. What are the differential operating cash flow savings per year during Years 1
through 4 for the new plasma cutter?b. What is the initial cash outlay required to replace the existing plasma cutter with
the newer model?c. Sketch a timeline for the replacement project cash flows for Years 0 through 4.d. If the company requires a 15 percent discount rate for new investments, should
the plasma cutter be replaced?
12–32. (Calculating replacement project cash flows) The Louisiana Land and Cattle Com-pany (LL&CC) is one of the largest cattle buyers in the country. It has buyers at all the major cattle auctions throughout the U.S. Southeast who buy on the company’s behalf and then have the cattle shipped to Sulpher Springs, Louisiana, where they are sorted by weight and type before shipping off to feedlots in the Midwest. The company has been considering the replacement of its tractor-trailer rigs with a newer, more fuel-efficient fleet for some time, and a local Peterbilt dealer has approached the company with a proposal. The proposal calls for the purchase of 10 new rigs at a cost of $100,000 each. Each rig will be depreciated toward a salvage value of $40,000 over a period of five years. If LL&CC purchases the rigs, it will sell its ex-isting fleet of 10 rigs to the Peterbilt dealer for the current book value of $25,000 per unit. The existing fleet will be fully depreciated in one more year but is expected to be serviceable for five more years, at which time each rig will be worth only $5,000 per unit as scrap. The new fleet of trucks is much more fuel-efficient and will require only $200,000 for fuel costs compared to $300,000 for the existing fleet. In addition, the new fleet of trucks will require minimal maintenance over the next five years, equal to an estimated $150,000 compared to the almost $400,000 that is currently being spent to keep the older fleet running.a. What are the differential operating cash flow savings per year during Years
1 through 5 for the new fleet? The firm pays taxes at a 30 percent marginal tax rate.
b. What is the initial cash outlay required to replace the existing fleet with new rigs?c. Sketch a timeline for the replacement project cash flows for Years 0 through 5.d. If LL&CC requires a 15 percent discount rate for new investments, should the
fleet be replaced?
Mini-CasesDanforth & Donnalley Laundry Products CompanyDetermining Relevant Cash FlowsAt 3:00 p.m. on April 14, 2016, James Danforth, president of Danforth & Donnalley (D&D) Laundry Products Company, called to order a meeting of the financial directors. The purpose of the meeting was to make a capital-budgeting decision with respect to the introduction and production of a new product, a liquid detergent called Blast.
D&D was formed in 1993 with the merger of Danforth Chemical Company (producer of Lift-Off detergent, the lead-ing laundry detergent on the West Coast) and Donnalley Home Products Company (maker of Wave detergent, a major laundry product in the Midwest). As a result of the merger, D&D was producing and marketing two major product lines. Although these products were in direct competition, they were not without product differentiation: Lift-Off was a low-suds, concentrated powder, and Wave was a more traditional powder detergent. Each line brought with it considerable
M12_TITM2189_13_GE_C12.indd 435 19/05/17 8:12 AM
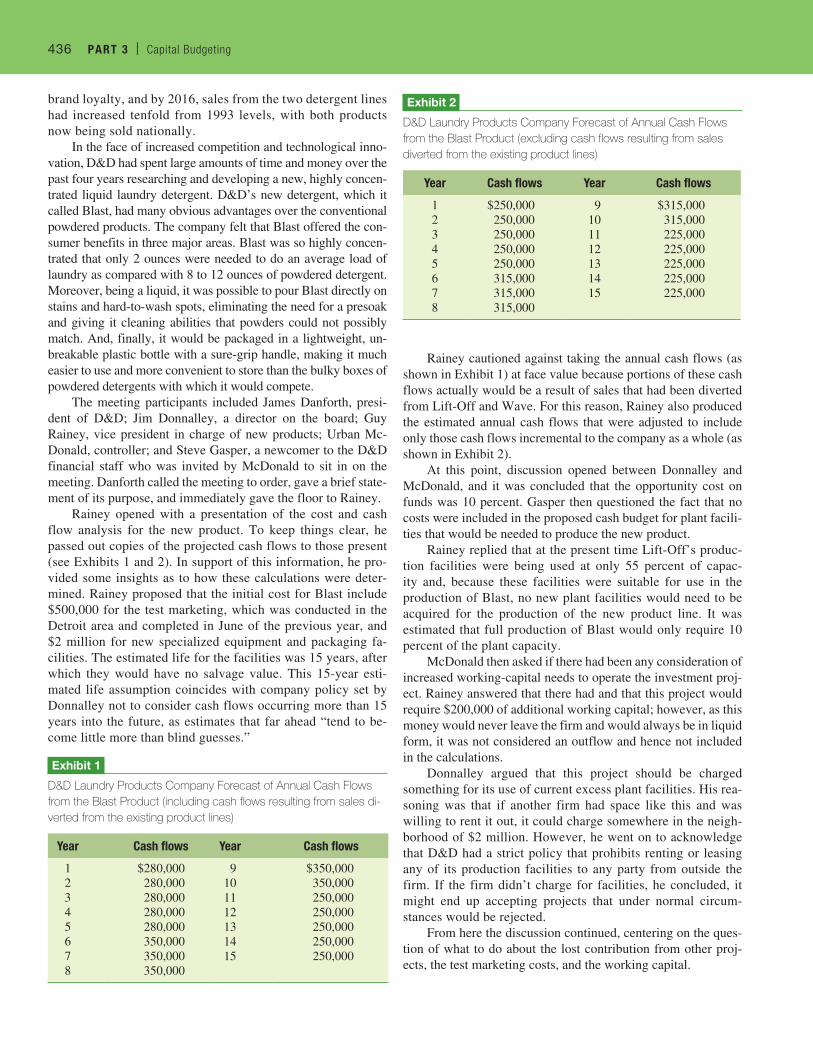
436 PART 3 | Capital Budgeting436 PART 3 | Capital Budgeting
brand loyalty, and by 2016, sales from the two detergent lines had increased tenfold from 1993 levels, with both products now being sold nationally.
In the face of increased competition and technological inno-vation, D&D had spent large amounts of time and money over the past four years researching and developing a new, highly concen-trated liquid laundry detergent. D&D’s new detergent, which it called Blast, had many obvious advantages over the conventional powdered products. The company felt that Blast offered the con-sumer benefits in three major areas. Blast was so highly concen-trated that only 2 ounces were needed to do an average load of laundry as compared with 8 to 12 ounces of powdered detergent. Moreover, being a liquid, it was possible to pour Blast directly on stains and hard-to-wash spots, eliminating the need for a presoak and giving it cleaning abilities that powders could not possibly match. And, finally, it would be packaged in a lightweight, un-breakable plastic bottle with a sure-grip handle, making it much easier to use and more convenient to store than the bulky boxes of powdered detergents with which it would compete.
The meeting participants included James Danforth, presi-dent of D&D; Jim Donnalley, a director on the board; Guy Rainey, vice president in charge of new products; Urban Mc-Donald, controller; and Steve Gasper, a newcomer to the D&D financial staff who was invited by McDonald to sit in on the meeting. Danforth called the meeting to order, gave a brief state-ment of its purpose, and immediately gave the floor to Rainey.
Rainey opened with a presentation of the cost and cash flow analysis for the new product. To keep things clear, he passed out copies of the projected cash flows to those present (see Exhibits 1 and 2). In support of this information, he pro-vided some insights as to how these calculations were deter-mined. Rainey proposed that the initial cost for Blast include $500,000 for the test marketing, which was conducted in the Detroit area and completed in June of the previous year, and $2 million for new specialized equipment and packaging fa-cilities. The estimated life for the facilities was 15 years, after which they would have no salvage value. This 15-year esti-mated life assumption coincides with company policy set by Donnalley not to consider cash flows occurring more than 15 years into the future, as estimates that far ahead “tend to be-come little more than blind guesses.”
Exhibit 1
D&D Laundry Products Company Forecast of Annual Cash Flows from the Blast Product (including cash flows resulting from sales di-verted from the existing product lines)
Year Cash flows Year Cash flows
12345678
$280,000280,000280,000280,000280,000350,000350,000350,000
9101112131415
$350,000350,000250,000250,000250,000250,000250,000
Exhibit 2
D&D Laundry Products Company Forecast of Annual Cash Flows from the Blast Product (excluding cash flows resulting from sales diverted from the existing product lines)
Year Cash flows Year Cash flows
12345678
$250,000250,000250,000250,000250,000315,000315,000315,000
9101112131415
$315,000315,000225,000225,000225,000225,000225,000
Rainey cautioned against taking the annual cash flows (as shown in Exhibit 1) at face value because portions of these cash flows actually would be a result of sales that had been diverted from Lift-Off and Wave. For this reason, Rainey also produced the estimated annual cash flows that were adjusted to include only those cash flows incremental to the company as a whole (as shown in Exhibit 2).
At this point, discussion opened between Donnalley and McDonald, and it was concluded that the opportunity cost on funds was 10 percent. Gasper then questioned the fact that no costs were included in the proposed cash budget for plant facili-ties that would be needed to produce the new product.
Rainey replied that at the present time Lift-Off’s produc-tion facilities were being used at only 55 percent of capac-ity and, because these facilities were suitable for use in the production of Blast, no new plant facilities would need to be acquired for the production of the new product line. It was estimated that full production of Blast would only require 10 percent of the plant capacity.
McDonald then asked if there had been any consideration of increased working-capital needs to operate the investment proj-ect. Rainey answered that there had and that this project would require $200,000 of additional working capital; however, as this money would never leave the firm and would always be in liquid form, it was not considered an outflow and hence not included in the calculations.
Donnalley argued that this project should be charged something for its use of current excess plant facilities. His rea-soning was that if another firm had space like this and was willing to rent it out, it could charge somewhere in the neigh-borhood of $2 million. However, he went on to acknowledge that D&D had a strict policy that prohibits renting or leasing any of its production facilities to any party from outside the firm. If the firm didn’t charge for facilities, he concluded, it might end up accepting projects that under normal circum-stances would be rejected.
From here the discussion continued, centering on the ques-tion of what to do about the lost contribution from other proj-ects, the test marketing costs, and the working capital.
M12_TITM2189_13_GE_C12.indd 436 19/05/17 8:12 AM
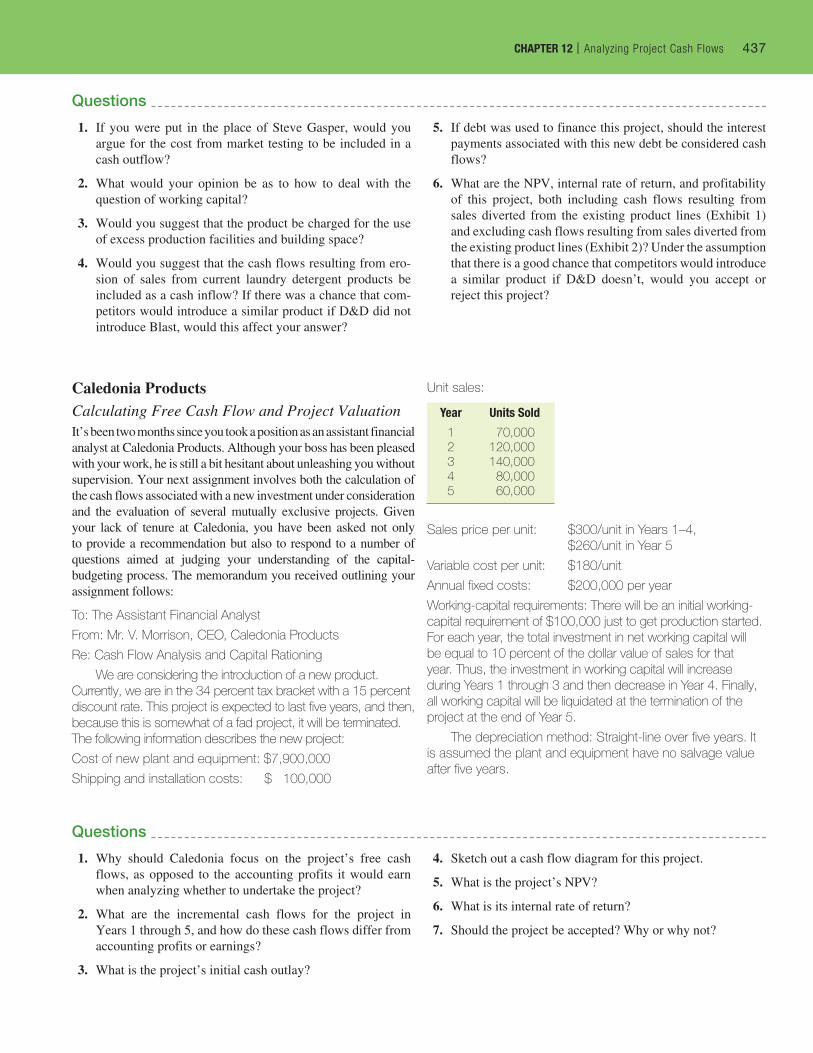
CHAPTER 12 | Analyzing Project Cash Flows 437CHAPTER 12 | Analyzing Project Cash Flows 437
Questions
1. If you were put in the place of Steve Gasper, would you argue for the cost from market testing to be included in a cash outflow?
2. What would your opinion be as to how to deal with the question of working capital?
3. Would you suggest that the product be charged for the use of excess production facilities and building space?
4. Would you suggest that the cash flows resulting from ero-sion of sales from current laundry detergent products be included as a cash inflow? If there was a chance that com-petitors would introduce a similar product if D&D did not introduce Blast, would this affect your answer?
5. If debt was used to finance this project, should the interest payments associated with this new debt be considered cash flows?
6. What are the NPV, internal rate of return, and profitability of this project, both including cash flows resulting from sales diverted from the existing product lines (Exhibit 1) and excluding cash flows resulting from sales diverted from the existing product lines (Exhibit 2)? Under the assumption that there is a good chance that competitors would introduce a similar product if D&D doesn’t, would you accept or reject this project?
Caledonia ProductsCalculating Free Cash Flow and Project ValuationIt’s been two months since you took a position as an assistant financial analyst at Caledonia Products. Although your boss has been pleased with your work, he is still a bit hesitant about unleashing you without supervision. Your next assignment involves both the calculation of the cash flows associated with a new investment under consideration and the evaluation of several mutually exclusive projects. Given your lack of tenure at Caledonia, you have been asked not only to provide a recommendation but also to respond to a number of questions aimed at judging your understanding of the capital-budgeting process. The memorandum you received outlining your assignment follows:
To: The Assistant Financial Analyst
From: Mr. V. Morrison, CEO, Caledonia Products
Re: Cash Flow Analysis and Capital Rationing
We are considering the introduction of a new product. Currently, we are in the 34 percent tax bracket with a 15 percent discount rate. This project is expected to last five years, and then, because this is somewhat of a fad project, it will be terminated. The following information describes the new project:
Cost of new plant and equipment: $7,900,000
Shipping and installation costs: $ 100,000
Unit sales:
Year Units Sold
12345
70,000120,000140,000
80,00060,000
Sales price per unit: $300/unit in Years 1–4, $260/unit in Year 5
Variable cost per unit: $180/unit
Annual fixed costs: $200,000 per year
Working-capital requirements: There will be an initial working-capital requirement of $100,000 just to get production started. For each year, the total investment in net working capital will be equal to 10 percent of the dollar value of sales for that year. Thus, the investment in working capital will increase during Years 1 through 3 and then decrease in Year 4. Finally, all working capital will be liquidated at the termination of the project at the end of Year 5.
The depreciation method: Straight-line over five years. It is assumed the plant and equipment have no salvage value after five years.
Questions
1. Why should Caledonia focus on the project’s free cash flows, as opposed to the accounting profits it would earn when analyzing whether to undertake the project?
2. What are the incremental cash flows for the project in Years 1 through 5, and how do these cash flows differ from accounting profits or earnings?
3. What is the project’s initial cash outlay?
4. Sketch out a cash flow diagram for this project.
5. What is the project’s NPV?
6. What is its internal rate of return?
7. Should the project be accepted? Why or why not?
M12_TITM2189_13_GE_C12.indd 437 19/05/17 8:12 AM
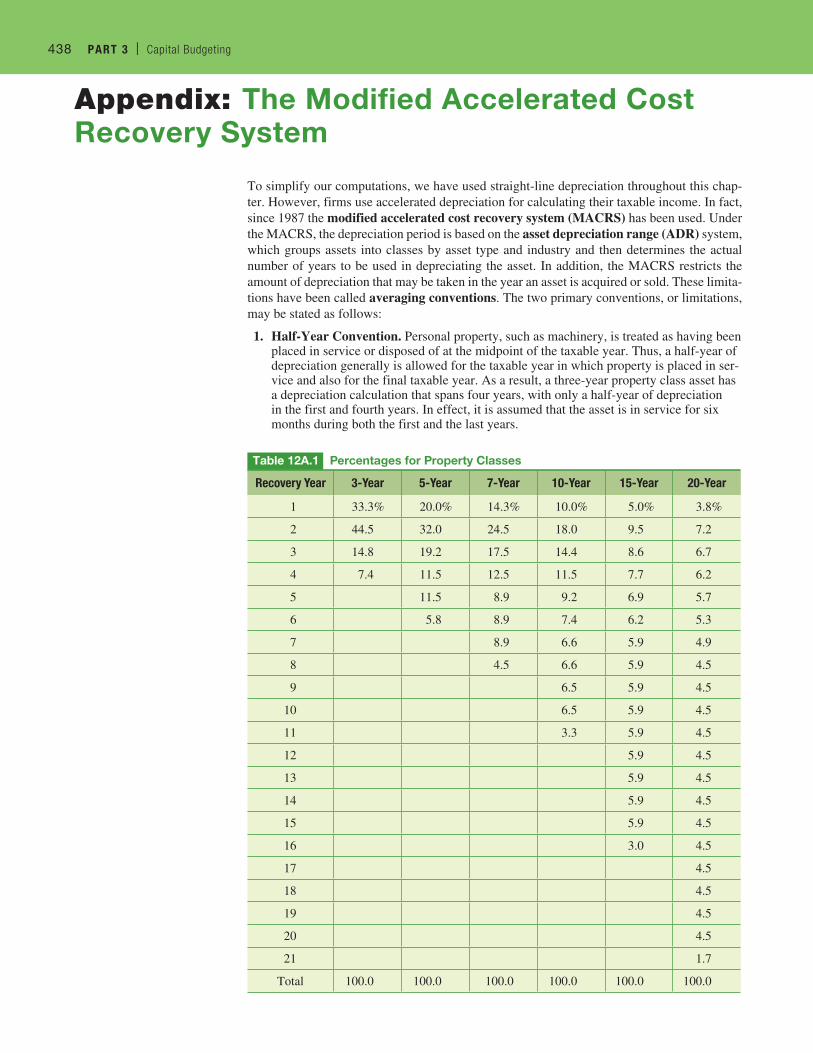
438 PART 3 | Capital Budgeting438 PART 3 | Capital Budgeting
To simplify our computations, we have used straight-line depreciation throughout this chap-ter. However, firms use accelerated depreciation for calculating their taxable income. In fact, since 1987 the modified accelerated cost recovery system (MACRS) has been used. Under the MACRS, the depreciation period is based on the asset depreciation range (ADR) system, which groups assets into classes by asset type and industry and then determines the actual number of years to be used in depreciating the asset. In addition, the MACRS restricts the amount of depreciation that may be taken in the year an asset is acquired or sold. These limita-tions have been called averaging conventions. The two primary conventions, or limitations, may be stated as follows:
1. Half-Year Convention. Personal property, such as machinery, is treated as having been placed in service or disposed of at the midpoint of the taxable year. Thus, a half-year of depreciation generally is allowed for the taxable year in which property is placed in ser-vice and also for the final taxable year. As a result, a three-year property class asset has a depreciation calculation that spans four years, with only a half-year of depreciation in the first and fourth years. In effect, it is assumed that the asset is in service for six months during both the first and the last years.
Appendix: The Modified Accelerated Cost Recovery System
Table 12A.1 Percentages for Property Classes
Recovery Year 3-Year 5-Year 7-Year 10-Year 15-Year 20-Year
1 33.3% 20.0% 14.3% 10.0% 5.0% 3.8%
2 44.5 32.0 24.5 18.0 9.5 7.2
3 14.8 19.2 17.5 14.4 8.6 6.7
4 7.4 11.5 12.5 11.5 7.7 6.2
5 11.5 8.9 9.2 6.9 5.7
6 5.8 8.9 7.4 6.2 5.3
7 8.9 6.6 5.9 4.9
8 4.5 6.6 5.9 4.5
9 6.5 5.9 4.5
10 6.5 5.9 4.5
11 3.3 5.9 4.5
12 5.9 4.5
13 5.9 4.5
14 5.9 4.5
15 5.9 4.5
16 3.0 4.5
17 4.5
18 4.5
19 4.5
20 4.5
21 1.7
Total 100.0 100.0 100.0 100.0 100.0 100.0
M12_TITM2189_13_GE_C12.indd 438 19/05/17 8:12 AM
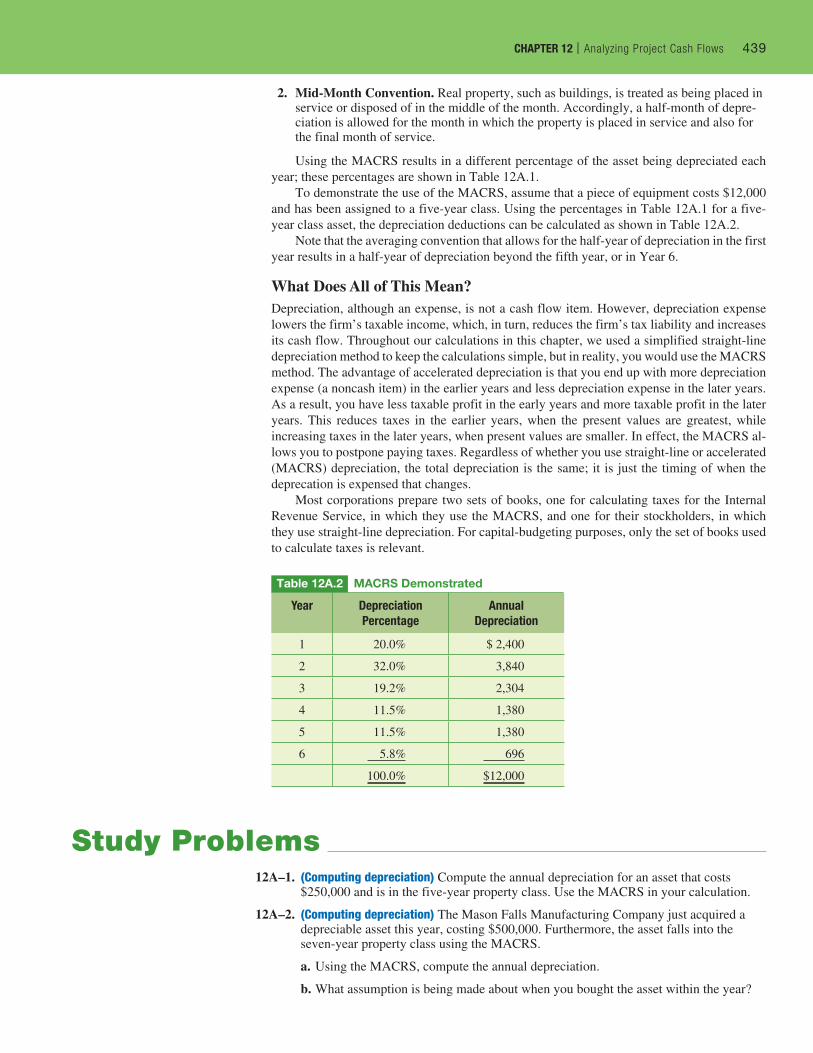
CHAPTER 12 | Analyzing Project Cash Flows 439CHAPTER 12 | Analyzing Project Cash Flows 439
2. Mid-Month Convention. Real property, such as buildings, is treated as being placed in service or disposed of in the middle of the month. Accordingly, a half-month of depre-ciation is allowed for the month in which the property is placed in service and also for the final month of service.
Using the MACRS results in a different percentage of the asset being depreciated each year; these percentages are shown in Table 12A.1.
To demonstrate the use of the MACRS, assume that a piece of equipment costs $12,000 and has been assigned to a five-year class. Using the percentages in Table 12A.1 for a five-year class asset, the depreciation deductions can be calculated as shown in Table 12A.2.
Note that the averaging convention that allows for the half-year of depreciation in the first year results in a half-year of depreciation beyond the fifth year, or in Year 6.
What Does All of This Mean?Depreciation, although an expense, is not a cash flow item. However, depreciation expense lowers the firm’s taxable income, which, in turn, reduces the firm’s tax liability and increases its cash flow. Throughout our calculations in this chapter, we used a simplified straight-line depreciation method to keep the calculations simple, but in reality, you would use the MACRS method. The advantage of accelerated depreciation is that you end up with more depreciation expense (a noncash item) in the earlier years and less depreciation expense in the later years. As a result, you have less taxable profit in the early years and more taxable profit in the later years. This reduces taxes in the earlier years, when the present values are greatest, while increasing taxes in the later years, when present values are smaller. In effect, the MACRS al-lows you to postpone paying taxes. Regardless of whether you use straight-line or accelerated (MACRS) depreciation, the total depreciation is the same; it is just the timing of when the deprecation is expensed that changes.
Most corporations prepare two sets of books, one for calculating taxes for the Internal Revenue Service, in which they use the MACRS, and one for their stockholders, in which they use straight-line depreciation. For capital-budgeting purposes, only the set of books used to calculate taxes is relevant.
Table 12A.2 MACRS Demonstrated
Year Depreciation Percentage
Annual Depreciation
1 20.0% $ 2,400
2 32.0% 3,840
3 19.2% 2,304
4 11.5% 1,380
5 11.5% 1,380
6 5.8% 696
100.0% $12,000
12A–1. (Computing depreciation) Compute the annual depreciation for an asset that costs $250,000 and is in the five-year property class. Use the MACRS in your calculation.
12A–2. (Computing depreciation) The Mason Falls Manufacturing Company just acquired a depreciable asset this year, costing $500,000. Furthermore, the asset falls into the seven-year property class using the MACRS.
a. Using the MACRS, compute the annual depreciation.
b. What assumption is being made about when you bought the asset within the year?
Study Problems
M12_TITM2189_13_GE_C12.indd 439 19/05/17 8:12 AM
Copyright © 2022 FDOKUMEN