Investigation of structural failure mechanisms of LiCoO2 at ...
245
THÈSE PRÉSENTÉE POUR OBTENIR LE GRADE DE DOCTEUR DE L’UNIVERSITÉ DE BORDEAUX ÉCOLE DOCTORALE DES SCIENCES CHIMIQUES SPÉCIALITÉ : PHYSICO-CHIMIE DE LA MATIERE CONDENSEE Par Marie DUFFIET Investigation of structural failure mechanisms of LiCoO 2 at high voltage and material optimization through aluminum doping Sous la direction de : Dany CARLIER-LARREGARAY Soutenue le 12 juin 2019 Membres du jury : M. DEDRYVERE, Rémi Professeur, UPPA/IPREM Président Mme CASAS-CABANAS, Montserrat Directeur de recherche, CIC Energigune Rapporteur M. BOUCHER, Florent Directeur de recherche, CNRS/IMN Rapporteur M. MAGLIONE, Mario Directeur de recherche, CNRS/ICMCB Examinateur M. CABELGUEN, Pierre-Etienne Docteur, UMICORE Examinateur Mme CARLIER-LARREGARAY, Dany Professeur, Université de Bordeaux Directrice de thèse M. DELMAS, Claude Directeur de recherche, CNRS/ICMCB Co-encadrant Mme MONTESDEOCA SANTANA, Docteur, UMICORE Membre Invité Amada
-
Upload
khangminh22 -
Category
Documents
-
view
3 -
download
0
Transcript of Investigation of structural failure mechanisms of LiCoO2 at ...
THÈSE PRÉSENTÉE
POUR OBTENIR LE GRADE DE
DOCTEUR DE
L’UNIVERSITÉ DE BORDEAUX
ÉCOLE DOCTORALE DES SCIENCES CHIMIQUES
SPÉCIALITÉ : PHYSICO-CHIMIE DE LA MATIERE CONDENSEE
Par Marie DUFFIET
Investigation of structural failure mechanisms of LiCoO2 at
high voltage and material optimization through
aluminum doping
Sous la direction de : Dany CARLIER-LARREGARAY
Soutenue le 12 juin 2019
Membres du jury :
M. DEDRYVERE, Rémi Professeur, UPPA/IPREM Président Mme CASAS-CABANAS, Montserrat Directeur de recherche, CIC Energigune Rapporteur M. BOUCHER, Florent Directeur de recherche, CNRS/IMN Rapporteur M. MAGLIONE, Mario Directeur de recherche, CNRS/ICMCB Examinateur M. CABELGUEN, Pierre-Etienne Docteur, UMICORE Examinateur Mme CARLIER-LARREGARAY, Dany Professeur, Université de Bordeaux Directrice de thèse M. DELMAS, Claude Directeur de recherche, CNRS/ICMCB Co-encadrant Mme MONTESDEOCA SANTANA, Docteur, UMICORE Membre Invité Amada

2
3
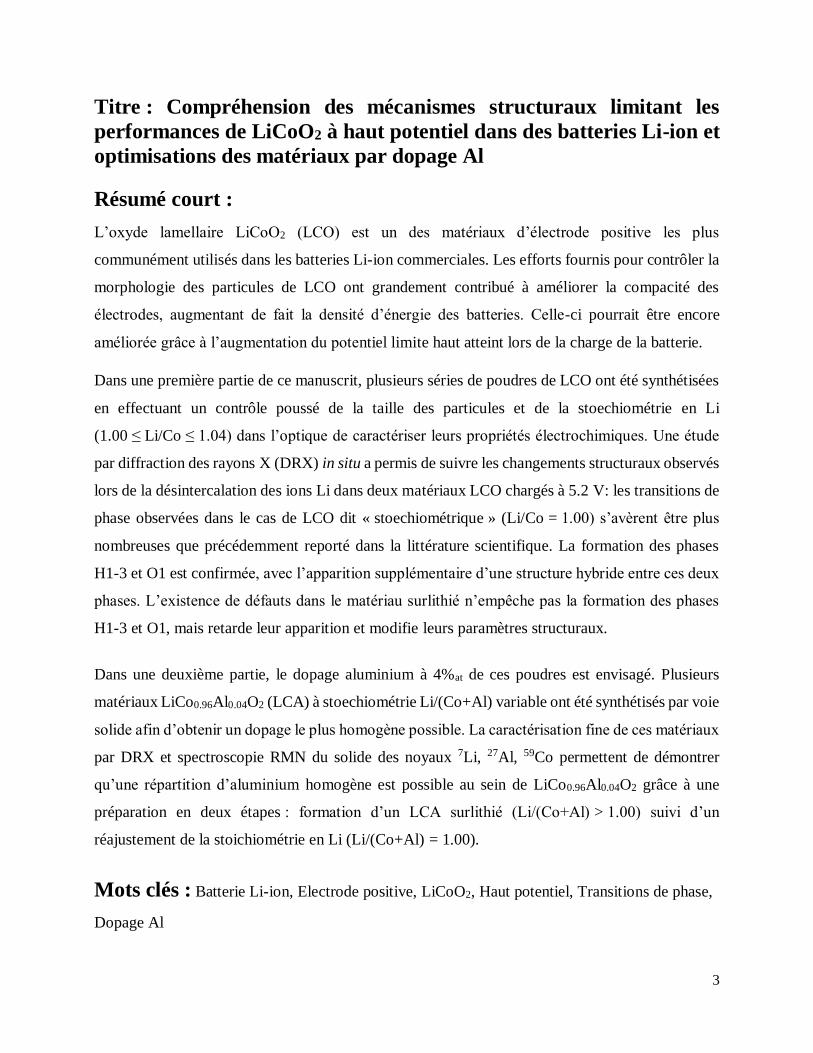
Titre : Compréhension des mécanismes structuraux limitant les
performances de LiCoO2 à haut potentiel dans des batteries Li-ion et
optimisations des matériaux par dopage Al
Résumé court :
L’oxyde lamellaire LiCoO2 (LCO) est un des matériaux d’électrode positive les plus
communément utilisés dans les batteries Li-ion commerciales. Les efforts fournis pour contrôler la
morphologie des particules de LCO ont grandement contribué à améliorer la compacité des
électrodes, augmentant de fait la densité d’énergie des batteries. Celle-ci pourrait être encore
améliorée grâce à l’augmentation du potentiel limite haut atteint lors de la charge de la batterie.
Dans une première partie de ce manuscrit, plusieurs séries de poudres de LCO ont été synthétisées
en effectuant un contrôle poussé de la taille des particules et de la stoechiométrie en Li
(1.00 ≤ Li/Co ≤ 1.04) dans l’optique de caractériser leurs propriétés électrochimiques. Une étude
par diffraction des rayons X (DRX) in situ a permis de suivre les changements structuraux observés
lors de la désintercalation des ions Li dans deux matériaux LCO chargés à 5.2 V: les transitions de
phase observées dans le cas de LCO dit « stoechiométrique » (Li/Co = 1.00) s’avèrent être plus
nombreuses que précédemment reporté dans la littérature scientifique. La formation des phases
H1-3 et O1 est confirmée, avec l’apparition supplémentaire d’une structure hybride entre ces deux
phases. L’existence de défauts dans le matériau surlithié n’empêche pas la formation des phases
H1-3 et O1, mais retarde leur apparition et modifie leurs paramètres structuraux.
Dans une deuxième partie, le dopage aluminium à 4%at de ces poudres est envisagé. Plusieurs
matériaux LiCo0.96Al0.04O2 (LCA) à stoechiométrie Li/(Co+Al) variable ont été synthétisés par voie
solide afin d’obtenir un dopage le plus homogène possible. La caractérisation fine de ces matériaux
par DRX et spectroscopie RMN du solide des noyaux 7Li, 27Al, 59Co permettent de démontrer
qu’une répartition d’aluminium homogène est possible au sein de LiCo0.96Al0.04O2 grâce à une
préparation en deux étapes : formation d’un LCA surlithié (Li/(Co+Al) > 1.00) suivi d’un
réajustement de la stoichiométrie en Li (Li/(Co+Al) = 1.00).
Mots clés : Batterie Li-ion, Electrode positive, LiCoO2, Haut potentiel, Transitions de phase,
Dopage Al

4
5
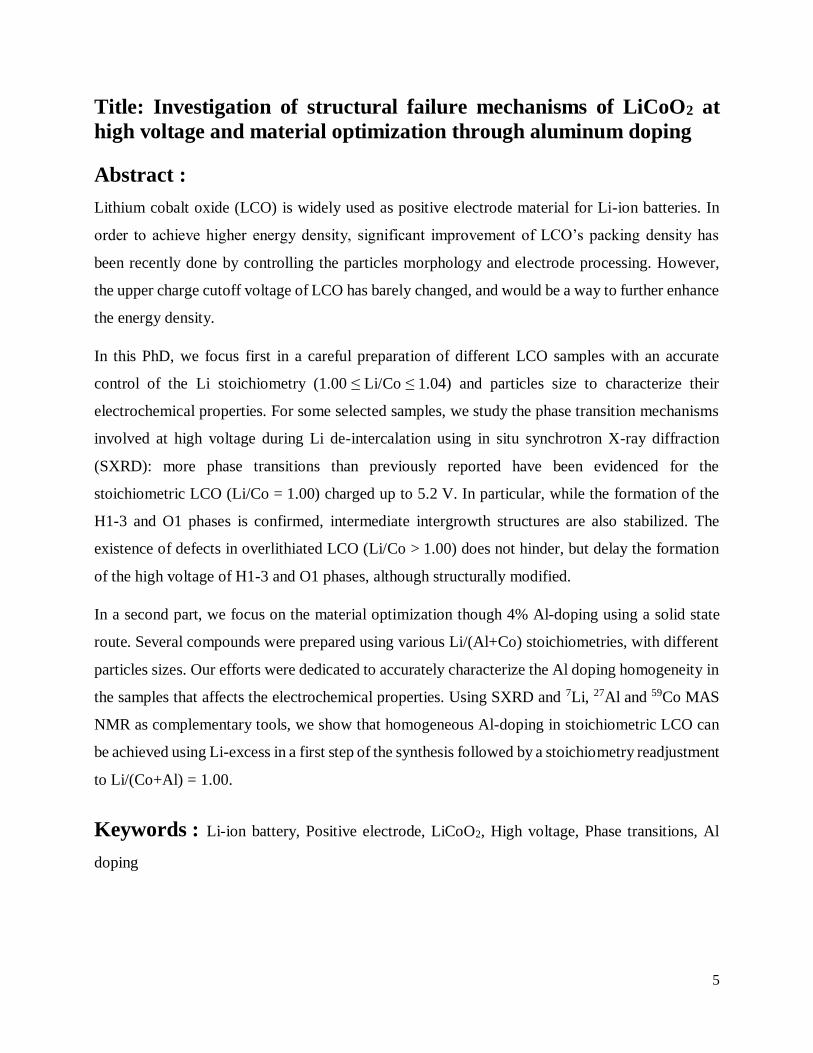
Title: Investigation of structural failure mechanisms of LiCoO2 at
high voltage and material optimization through aluminum doping
Abstract :
Lithium cobalt oxide (LCO) is widely used as positive electrode material for Li-ion batteries. In
order to achieve higher energy density, significant improvement of LCO’s packing density has
been recently done by controlling the particles morphology and electrode processing. However,
the upper charge cutoff voltage of LCO has barely changed, and would be a way to further enhance
the energy density.
In this PhD, we focus first in a careful preparation of different LCO samples with an accurate
control of the Li stoichiometry (1.00 ≤ Li/Co ≤ 1.04) and particles size to characterize their
electrochemical properties. For some selected samples, we study the phase transition mechanisms
involved at high voltage during Li de-intercalation using in situ synchrotron X-ray diffraction
(SXRD): more phase transitions than previously reported have been evidenced for the
stoichiometric LCO (Li/Co = 1.00) charged up to 5.2 V. In particular, while the formation of the
H1-3 and O1 phases is confirmed, intermediate intergrowth structures are also stabilized. The
existence of defects in overlithiated LCO (Li/Co > 1.00) does not hinder, but delay the formation
of the high voltage of H1-3 and O1 phases, although structurally modified.
In a second part, we focus on the material optimization though 4% Al-doping using a solid state
route. Several compounds were prepared using various Li/(Al+Co) stoichiometries, with different
particles sizes. Our efforts were dedicated to accurately characterize the Al doping homogeneity in
the samples that affects the electrochemical properties. Using SXRD and 7Li, 27Al and 59Co MAS
NMR as complementary tools, we show that homogeneous Al-doping in stoichiometric LCO can
be achieved using Li-excess in a first step of the synthesis followed by a stoichiometry readjustment
to Li/(Co+Al) = 1.00.
Keywords : Li-ion battery, Positive electrode, LiCoO2, High voltage, Phase transitions, Al
doping

6
7
Institut de Chimie de la Matière Condensée de Bordeaux
ICMCB/CNRS – UMR 5026
87, Avenue du Dr Schweitzer, 33608 PESSAC
8
Table of contents.
Résumé étendu (en français) ................................................................................................ 12
General introduction ............................................................................................................ 24
Bibliography (general introduction).................................................................................... 28
Part A. Evaluation of the influence of initial ratio Li/Co and particle size on
the electrochemical performance of LiCoO2. Selection of samples ............... 31
A.1 Introduction. Bibliographic context.............................................................................. 34
A.1.1 Working principle of a Li-ion battery and electrochemical variables ......................... 34
A.1.2 LiCoO2 as positive electrode for Li-ion batteries: structure, synthesis and
electrochemical behavior .................................................................................................... 38
A.1.2.1 Structure and synthesis of LiCoO2 ...................................................................... 38
A.1.2.3 Overstoichiometry in LiCoO2 and consequences on the electrochemical
performance of LCO-based Li-ion batteries .................................................................... 42
A.2 Synthesis and general characterization of LiCoO2 powders. ....................................... 47
A.2.1 Description of syntheses ........................................................................................... 47
A.2.2 Experimental section for general characterization ..................................................... 49
A.2.3 Results and discussion: Chemical and structural properties ....................................... 50
A.2.3.1. ICP results ......................................................................................................... 50
A.2.3.2. Size and morphology of LCO powders .............................................................. 51
A.2.3.3 XRD and SXRD ................................................................................................. 55
A.2.3.3 7Li MAS NMR results ........................................................................................ 58
A.2.3.4 General conclusions on prepared LCO and methods used for characterization .... 61
A.3 Influence of Li/Co ratio and particle size on the electrochemical performance of
LCO//Li half cells ................................................................................................................. 62
A.3.1 Experimental details: electrochemistry ...................................................................... 63
A.3.2 Influence of Li/Co ratio on the overall electrochemical performance of LCO//Li cells
........................................................................................................................................... 64
9
A.3.2.1 Reversibily of Li intercalation during the 1st cycle. Charge/discharge capacities
and Coulombic efficiency. .............................................................................................. 64
A.3.2.2 Cycles 1 to 25: short-term cycleability of LCO ................................................... 67
A.3.2.3 Evidence of structural changes............................................................................ 70
A.4 Conclusion Part A ......................................................................................................... 73
A.5 Bibliography Part A ...................................................................................................... 75
Part B. Investigation of high voltage phase transitions occurring during the Li-
de-intercalation of LCO-based electrodes ......................................................... 86
B.1 Introduction. Bibliographic context .............................................................................. 86
B.1.1 Description of surface-related issues identified during the cycling of LCO at high
voltage ............................................................................................................................... 87
B.1.2 Identification of the phase transitions occurring at high voltage for the LixCoO2 system
........................................................................................................................................... 90
B.1.2.1 Background on the end member CoO2: structure, stability .................................. 90
B.1.2.2 Background on the H1-3 phase: structure, stability, composition ........................ 94
B.1.2.3 The O3 – H1-3 and H1-3 – O1 transitions ........................................................... 98
B.2 Preliminary study: in situ XRD investigation of the phase transitions occurring at
high voltage for stoichiometric and 4%-overlithiated LCO ............................................. 103
B.2.1 Experimental section ............................................................................................... 103
B.2.2 Results and discussion ............................................................................................. 104
B.2.3 Trends and hypotheses from the preliminary study. First conclusions. ..................... 108
B.3 Synchrotron in situ and ex situ X-ray diffraction for the reinvestigation of the phase
transitions occurring in the LixCoO2 system. Influence of the initial Li/Co stoichiometry.
............................................................................................................................................ 109
B.3.1 Experimental section ............................................................................................... 109
B.3.2 Re-investigated: the O3 – O’3 transition .................................................................. 114
B.3.3 The O3 – H1-3 transition ......................................................................................... 124
B.3.4 The H1-3 – O1 transition ......................................................................................... 130
10
B.4. On the chemical and structural properties of H1-3-Li~0.167CoO2.............................. 134
B.4.1 Structural properties ................................................................................................ 134
B.4.4 Stability of the H1-3 phase ...................................................................................... 141
B.5. General conclusions on Part B ................................................................................... 145
B.6 Bibliography Part B..................................................................................................... 147
Part C: Optimization of LCO – towards the preparation of high energy
density Al-doped LiCoO2 powders by solid state route ................................... 159
C.1 Introduction ................................................................................................................. 159
C.2. Experimental section: general considerations and adopted approaches .................. 162
C.2.1 Syntheses of Al-doped LCO powders ...................................................................... 162
C.2.2 General characterization of powders: experimental details and technical background
......................................................................................................................................... 163
C.3 Approach n°1: preparation of LiCo0.96Al0.04O2 powders from solid state reaction of
Li2CO3 and [(Co3O4)0.32(Al2O3)0.02] in stoichiometric proportions ................................... 166
C.3.1 Description of synthesis .......................................................................................... 166
C.3.2 General characterization .......................................................................................... 168
C.3.2.1 On the heat treatment of Co3O4 and Al2O3: what is the chemical nature of both
Co/Al precursors? ......................................................................................................... 168
C.3.2.2 Characterization of resulting LCA powders ...................................................... 172
C.3.3 Homogeneity of Al-doping within P1- and P2-LCA ................................................ 177
C.3.3.1 Results .............................................................................................................. 177
C.3.3.2 Discussion ........................................................................................................ 187
C.3.4 Consequences on the 1st cycle curves of LCA//Li cells ............................................ 188
C.3.5 Conclusions on the preparation of LCA from the solid state reaction of stoichiometric
amounts of Li2CO3 and Co/Al-based oxide(s) ................................................................... 191
11
C.4. Approach n°2: preparation of LiCo0.96Al0.04O2 powders from solid state reaction of
Li2CO3 and [(Co3O4)0.32(Al2O3)0.02] in non-stoichiometric proportions ............................ 192
C.4.1. LCA Samples without control of particle size (Group A) ........................................ 192
C.4.1.1. Description of synthesis ................................................................................... 192
C.4.1.2. Results ............................................................................................................. 194
C.4.1.2.1. General characterization ............................................................................ 194
C.4.1.2.2. Homogeneity of Al-doping as a function of initial (Li/M)1 ........................ 200
C.4.2 LCA Samples with controlled particle size (Group B) ............................................. 208
C.4.2.1. Description of synthesis ................................................................................... 208
C.4.2.2. Results ............................................................................................................. 210
C.4.2.2.1. General characterization ............................................................................ 210
C.4.2.2.2. Homogeneity of Al-doping for 40µm-sized LCA....................................... 214
C.4.3 Electrochemistry of LCA samples prepared with Approach n°2 .............................. 218
C.4.4 Discussion. On the beneficial effect of excess Li2CO3 for the synthesis of
homogeneous 4% Al-doped LCO ..................................................................................... 222
C.5 General conclusions for Part C ................................................................................... 231
C.6 Bibliography Part C .................................................................................................... 233
General conclusion ............................................................................................................. 241
Appendix ............................................................................................................................ 243
12
Résumé étendu en français
L’oxyde lamellaire O3-LiCoO2 (groupe d’espace R-3m) est un des matériaux d’électrode
positive les plus communément utilisés dans les batteries Li-ion commerciales. Le cyclage de ces
batteries se fait généralement entre 3.0 et 4.4 V vs graphite (4.3 V vs Li+/Li), au cours duquel
x(Li+) = 0.62 peuvent être désinsérés réversiblement du matériau initial, correspondant à une
capacité spécifique de 174 mAh/g.
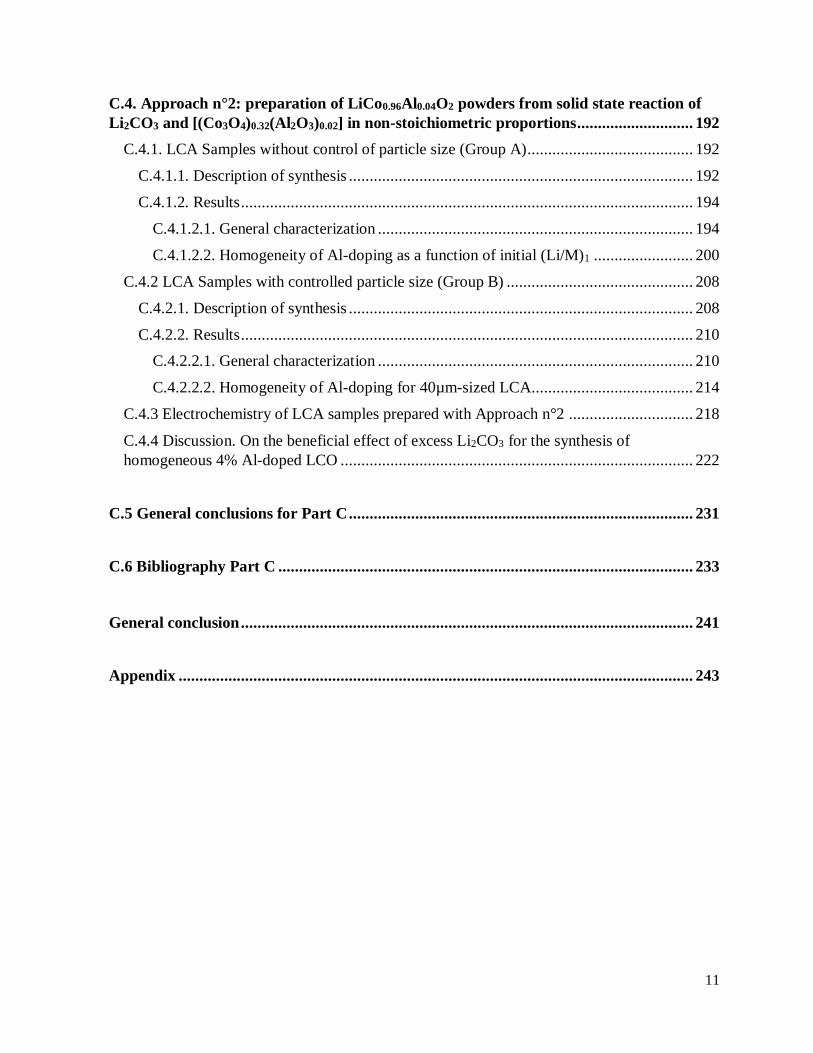
Un excès en lithium lors de la synthèse a permis de révéler l’existence de composés analogues
dits surlithiés1, notés O3-Li1+tCo1-tO2-t, au sein desquels les Li+ en excès substituent certains Co3+
présents dans les feuillets (voir Figure 1). Bien que possédant la même structure de type O3 que
LiCoO2, il a été démontré que l’existence de défauts locaux induits par l’excès de Li+ dans les
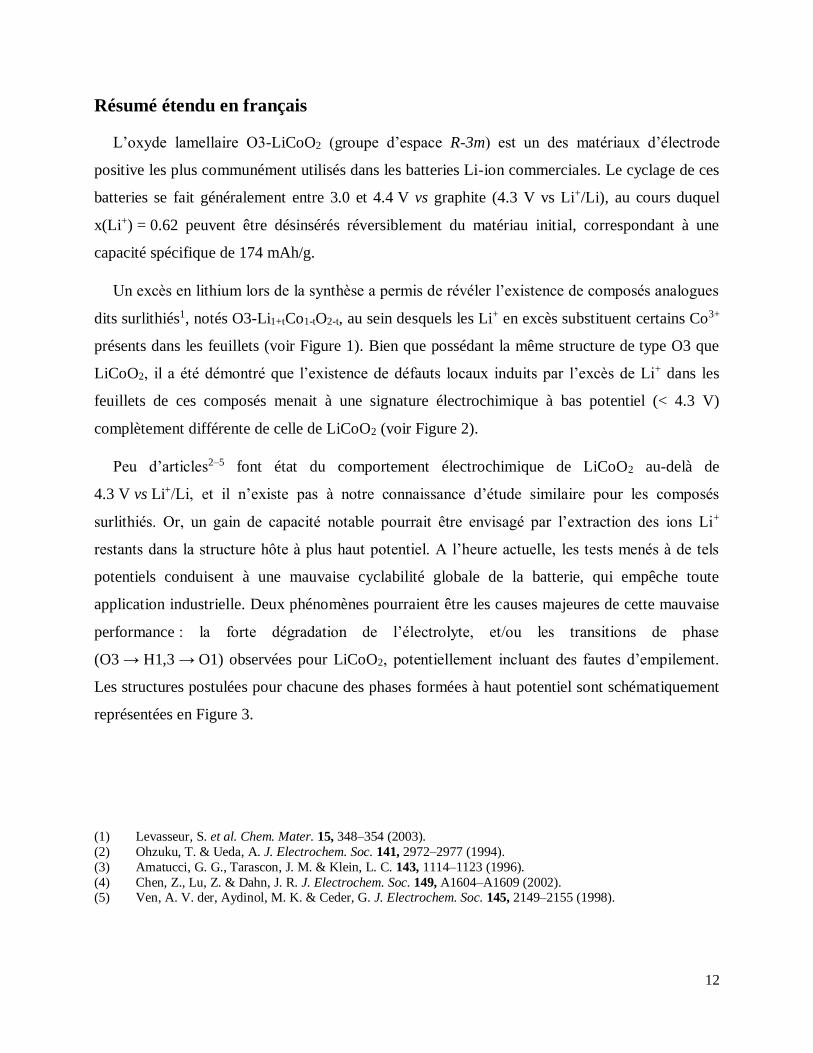
feuillets de ces composés menait à une signature électrochimique à bas potentiel (< 4.3 V)
complètement différente de celle de LiCoO2 (voir Figure 2).
Peu d’articles2–5 font état du comportement électrochimique de LiCoO2 au-delà de
4.3 V vs Li+/Li, et il n’existe pas à notre connaissance d’étude similaire pour les composés
surlithiés. Or, un gain de capacité notable pourrait être envisagé par l’extraction des ions Li+
restants dans la structure hôte à plus haut potentiel. A l’heure actuelle, les tests menés à de tels
potentiels conduisent à une mauvaise cyclabilité globale de la batterie, qui empêche toute
application industrielle. Deux phénomènes pourraient être les causes majeures de cette mauvaise
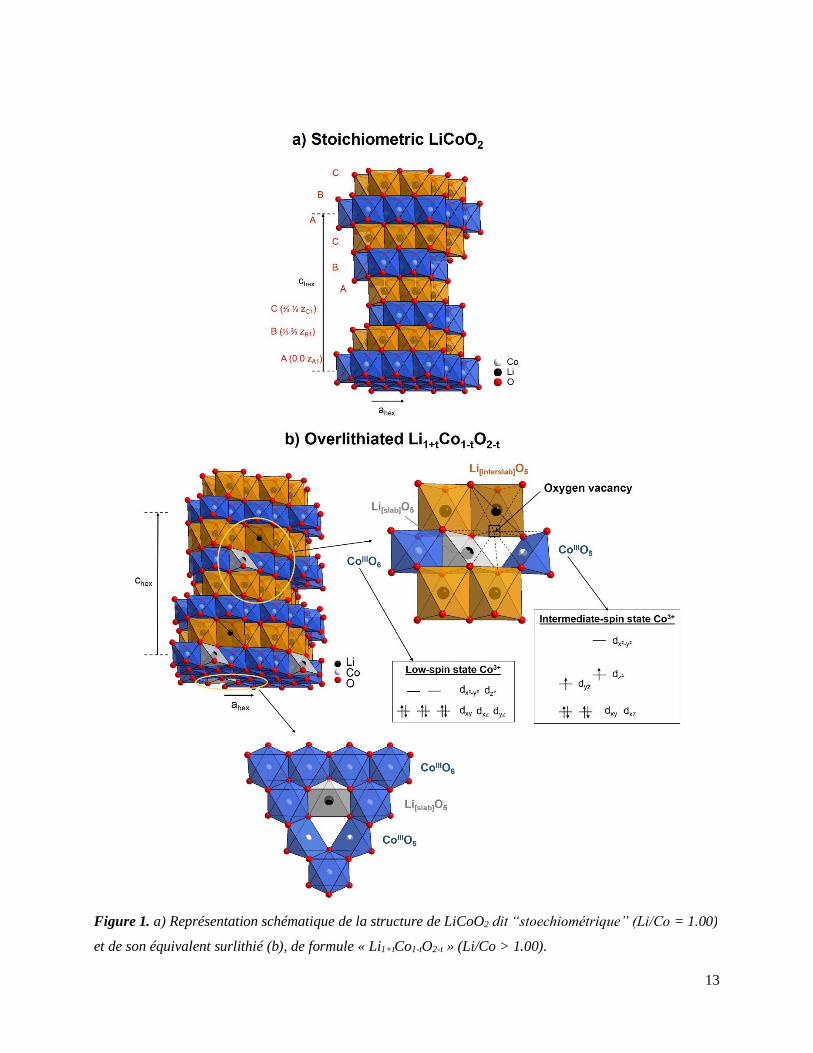
performance : la forte dégradation de l’électrolyte, et/ou les transitions de phase
(O3 → H1,3 → O1) observées pour LiCoO2, potentiellement incluant des fautes d’empilement.
Les structures postulées pour chacune des phases formées à haut potentiel sont schématiquement
représentées en Figure 3.
(1) Levasseur, S. et al. Chem. Mater. 15, 348–354 (2003).
(2) Ohzuku, T. & Ueda, A. J. Electrochem. Soc. 141, 2972–2977 (1994).
(3) Amatucci, G. G., Tarascon, J. M. & Klein, L. C. 143, 1114–1123 (1996).
(4) Chen, Z., Lu, Z. & Dahn, J. R. J. Electrochem. Soc. 149, A1604–A1609 (2002). (5) Ven, A. V. der, Aydinol, M. K. & Ceder, G. J. Electrochem. Soc. 145, 2149–2155 (1998).
13
Figure 1. a) Représentation schématique de la structure de LiCoO2 dit “stoechiométrique” (Li/Co = 1.00)
et de son équivalent surlithié (b), de formule « Li1+tCo1-tO2-t » (Li/Co > 1.00).
14
Figure 2. Courbe galvanostatique enregistrée lors de la première charge de batteries LiCoO2//Li avec des
ratios Li/Co différents (resultat obtenu par Stéphane Levasseur1).
Figure 3. Représentation schématique des empilements de feuillets CoO2 dans des structures de type O3,
H1-3 et O1. Les lettres A, B, et C sont associées aux 3 sites possiblement occupés par les atomes d’oxygène,
de coordonnées (fixées arbitrairement): (A(0, 0, zA), B(⅓, ⅔, zB) and C(⅔, ⅓, zC).
15
Un premier élément de progression est donc la compréhension des mécanismes de formation des
phases H1,3 et O1 à haut potentiel selon la stœchiométrie de la phase initiale.
Dans une première partie de ce manuscrit, plusieurs séries de poudres de LCO ont été
synthétisées en effectuant un contrôle poussé de la taille des particules et de la stoechiométrie en
Li (1.00 ≤ Li/Co ≤ 1.04) dans l’optique de caractériser leurs propriétés électrochimiques. Le
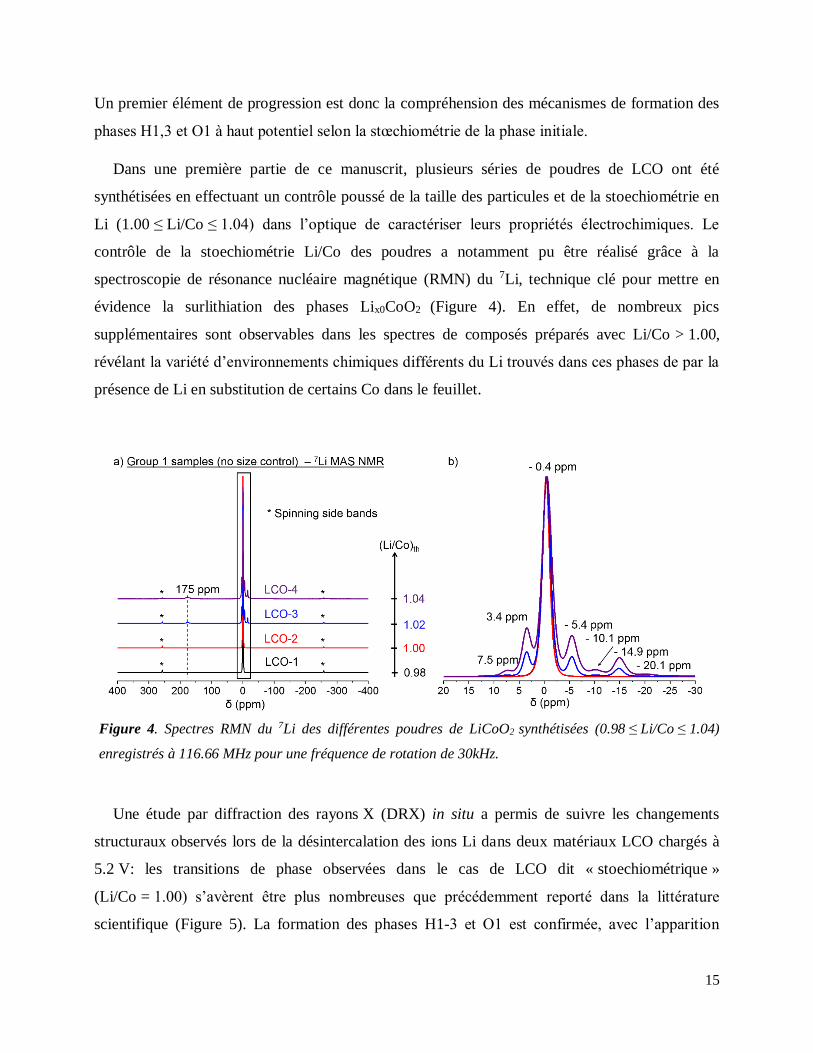
contrôle de la stoechiométrie Li/Co des poudres a notamment pu être réalisé grâce à la
spectroscopie de résonance nucléaire magnétique (RMN) du 7Li, technique clé pour mettre en
évidence la surlithiation des phases Lix0CoO2 (Figure 4). En effet, de nombreux pics
supplémentaires sont observables dans les spectres de composés préparés avec Li/Co > 1.00,
révélant la variété d’environnements chimiques différents du Li trouvés dans ces phases de par la
présence de Li en substitution de certains Co dans le feuillet.
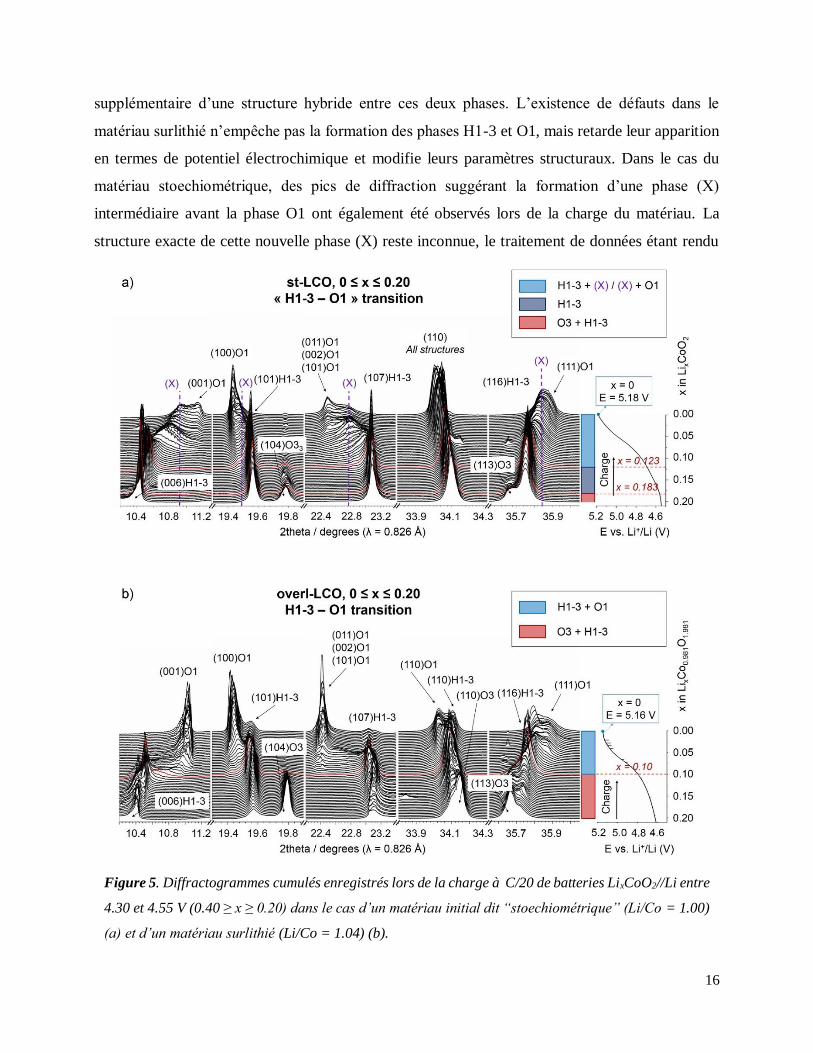
Une étude par diffraction des rayons X (DRX) in situ a permis de suivre les changements
structuraux observés lors de la désintercalation des ions Li dans deux matériaux LCO chargés à
5.2 V: les transitions de phase observées dans le cas de LCO dit « stoechiométrique »
(Li/Co = 1.00) s’avèrent être plus nombreuses que précédemment reporté dans la littérature
scientifique (Figure 5). La formation des phases H1-3 et O1 est confirmée, avec l’apparition
Figure 4. Spectres RMN du 7Li des différentes poudres de LiCoO2 synthétisées (0.98 ≤ Li/Co ≤ 1.04)
enregistrés à 116.66 MHz pour une fréquence de rotation de 30kHz.
16
supplémentaire d’une structure hybride entre ces deux phases. L’existence de défauts dans le
matériau surlithié n’empêche pas la formation des phases H1-3 et O1, mais retarde leur apparition
en termes de potentiel électrochimique et modifie leurs paramètres structuraux. Dans le cas du
matériau stoechiométrique, des pics de diffraction suggérant la formation d’une phase (X)
intermédiaire avant la phase O1 ont également été observés lors de la charge du matériau. La
structure exacte de cette nouvelle phase (X) reste inconnue, le traitement de données étant rendu
Figure 5. Diffractogrammes cumulés enregistrés lors de la charge à C/20 de batteries LixCoO2//Li entre
4.30 et 4.55 V (0.40 ≥ x ≥ 0.20) dans le cas d’un matériau initial dit “stoechiométrique” (Li/Co = 1.00)
(a) et d’un matériau surlithié (Li/Co = 1.04) (b).
17
particulièrement difficile par la présence de fautes d’empilement. Il est néanmoins raisonnable de
penser que la phase (X) possède une structure très analogue aux phases H1-3 et O1, alternant entre
un empilement AB-AB dit de type « O1 » et la séquence plus complexe de type « H1-3 ».
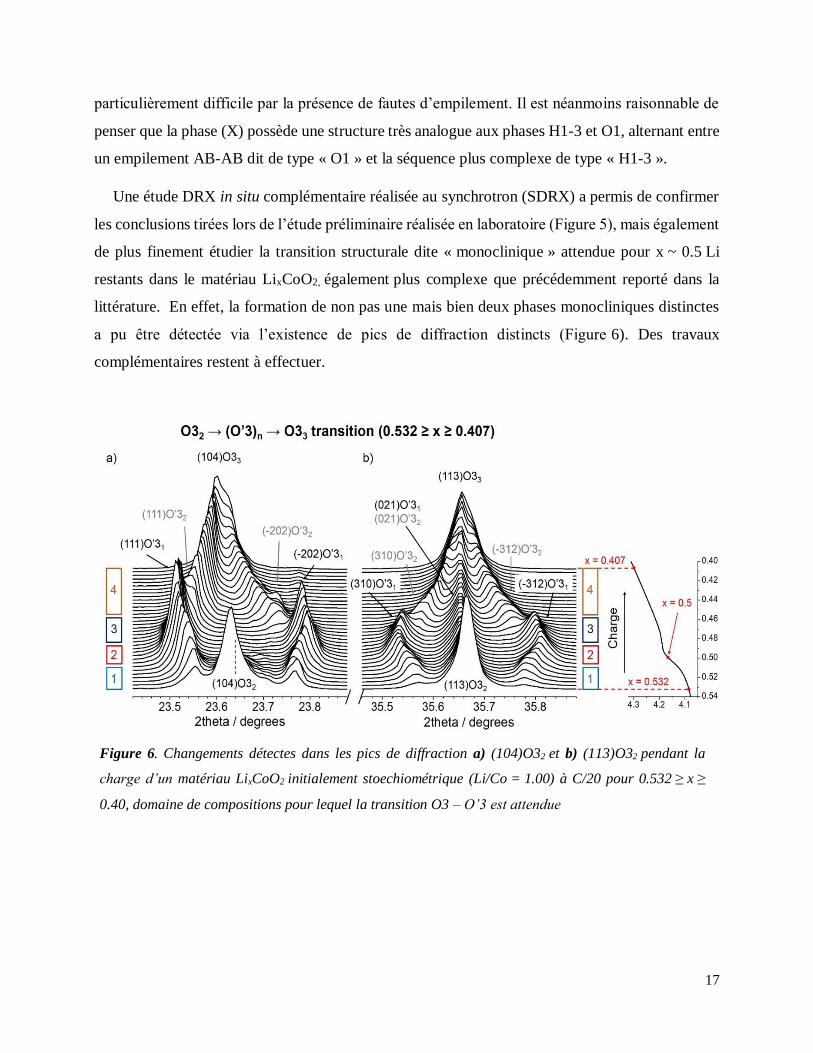
Une étude DRX in situ complémentaire réalisée au synchrotron (SDRX) a permis de confirmer
les conclusions tirées lors de l’étude préliminaire réalisée en laboratoire (Figure 5), mais également
de plus finement étudier la transition structurale dite « monoclinique » attendue pour x ~ 0.5 Li
restants dans le matériau LixCoO2, également plus complexe que précédemment reporté dans la
littérature. En effet, la formation de non pas une mais bien deux phases monocliniques distinctes
a pu être détectée via l’existence de pics de diffraction distincts (Figure 6). Des travaux
complémentaires restent à effectuer.
Figure 6. Changements détectes dans les pics de diffraction a) (104)O32 et b) (113)O32 pendant la
charge d’un matériau LixCoO2 initialement stoechiométrique (Li/Co = 1.00) à C/20 pour 0.532 ≥ x ≥
0.40, domaine de compositions pour lequel la transition O3 – O’3 est attendue
18
Dans une deuxième partie, le dopage aluminium à 4%at de ces poudres a été envisagé. En effet,
la majeure partie des articles concernant LCO et publiés ces dernières années est dédiée à
l’optimisation de ce matériau via i) la substitution de certains Co3+ par de nouveaux dopants6-8, ii)
l’utilisation de « coatings » pour recouvrir les particules de LCO9 ou iii) les deux approches
simultanément, dans le but d’améliorer ses performances à haut potentiel. Bien que le cyclage des
phases LiCoxAl1-xO2 conduisent systématiquement à une perte de capacité en cyclage10,11, des
effets bénéfiques ont été observés sur la structure du matériau, avec notamment des variations de
volume fortement réduites12,13 ainsi que l’absence de phase spinelle LiCo2O4 en surface des
particules14.
Bien que les premières études des phases LiCoxAl1-xO2 remontent aux années 1990, peu
d’articles se sont concentrés sur des phases avec un taux d’aluminium inférieur à 10 %at. Les ions
Al3+ étant électrochimiquement inactifs, le pourcentage d’Al3+ dans le matériau se doit en effet
d’être faible pour que les phases LiCoxAl1-xO2 restent viables industriellement parlant grâce à des
capacités théoriques proches de celle du matériau LCO non dopé. Par ailleurs, la stoechiométrie de
départ Li/(Co+Al) n’est que très rarement controlée alors même que les études de Levasseur et. al15
ont démontré la perte de capacité induite par la présence de Li en excès au sein du matériau.
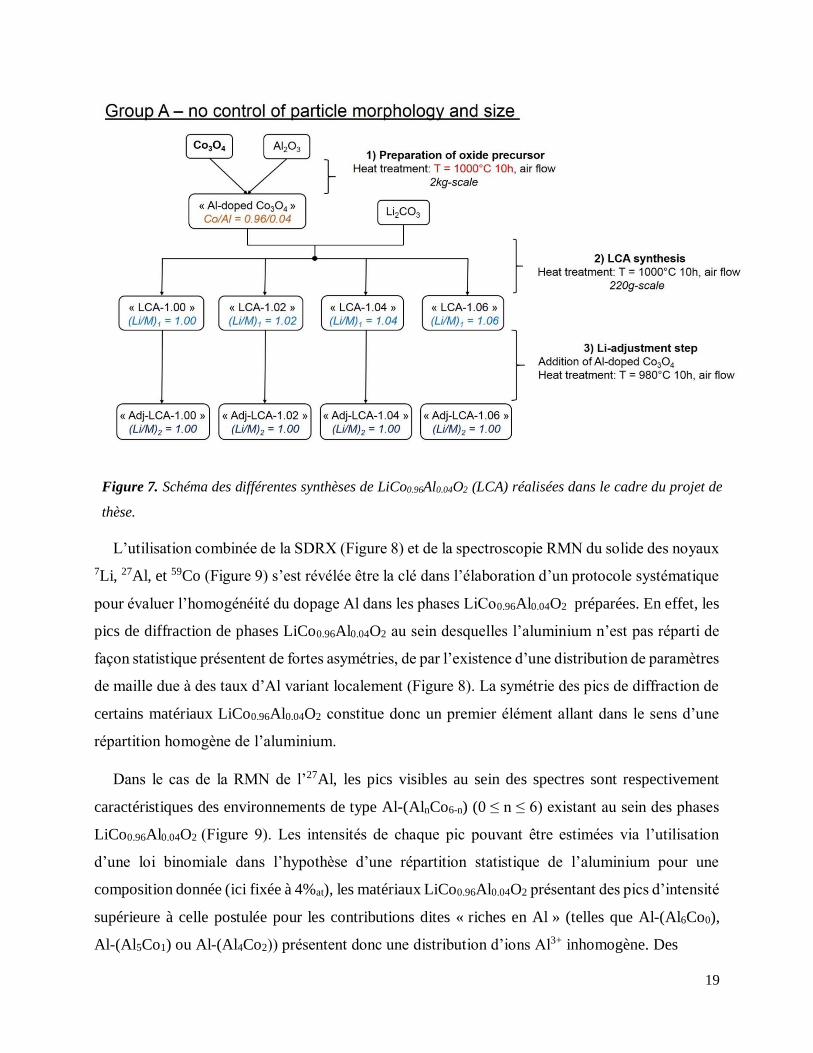
Plusieurs matériaux LiCo0.96Al0.04O2 (LCA) à stoechiométrie Li/(Co+Al) variable ont donc été
synthétisés dans le cadre de cette thèse. La préparation de ces matériaux a été exclusivement
réalisée via une approche voie solide, déjà largement utilisée pour la production industrielle de
LCO (Figure 7), mais jamais considérée dans la littérature scientifique. Cette approche se devait
de répondre à plusieurs exigences : i) une stoechiométrie initiale Li/(Co+Al) ≤ 1.00 pour toutes les
phases LiCo0.96Al0.04O2 préparées – sans pour autant éliminer l’utilisation de Li2CO3 en excès à
certaines étapes de la synthèse (Figure 7) et ii) une répartition homogène de l’aluminium au sein
du matériau.
(6) S. A. Needham, G. X. Wang, H. K. Liu, V. A. Drozd, and R. S. Liu, J. Power Sources, 174, 828–831 (2007).
(7) M. Zou, M. Yoshio, S. Gopukumar, and J. Yamaki, Chem. Mater., 17, 1284–1286 (2005).
(8) P. Prahasini, M. Sivakumar, R. Subadevi, and F. M. Wang, Adv. Mater. Res., 584, 345–349 (2012). (9) Y. J. Kim, J. Cho, T.-J. Kim, and B. Park, J. Electrochem. Soc., 150, A1723–A1725 (2003).
(10) G. Ceder et al., Nature, 392, 694 (1998).
(11) W.-S. Yoon, K.-K. Lee, and K.-B. Kim, J. Electrochem. Soc., 147, 2023–2028 (2000).
(12) Y.-I. Jang et al., J. Electrochem. Soc., 146, 862–868 (1999).
(13) S.-T. Myung, N. Kumagai, S. Komaba, and H.-T. Chung, Solid State Ion., 139, 47–56 (2001).
(14) H. Wang, Y.-I. Jang, B. Huang, D. R. Sadoway, and Y.-M. Chiang, J. Electrochem. Soc., 146, 473–480 (1999).
(15) S. Levasseur, M. Menetrier, E. Suard, and C. Delmas, Solid State Ion., 128, 11–24 (2000).
19
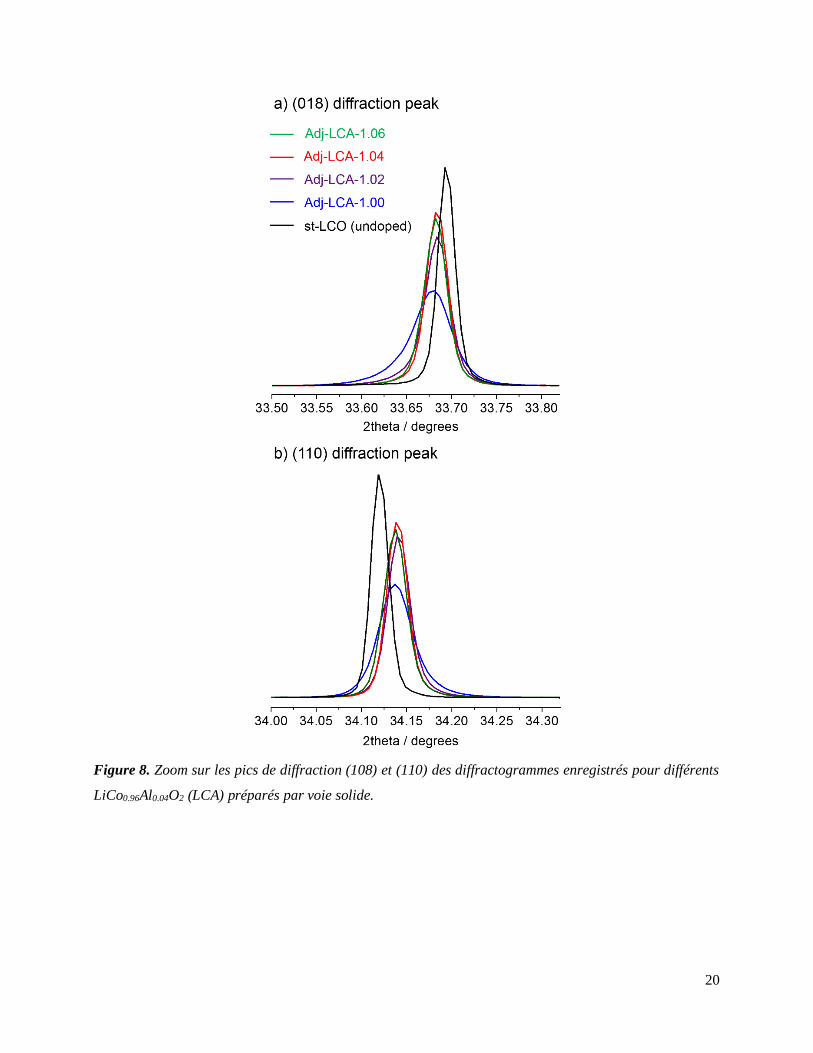
L’utilisation combinée de la SDRX (Figure 8) et de la spectroscopie RMN du solide des noyaux
7Li, 27Al, et 59Co (Figure 9) s’est révélée être la clé dans l’élaboration d’un protocole systématique
pour évaluer l’homogénéité du dopage Al dans les phases LiCo0.96Al0.04O2 préparées. En effet, les
pics de diffraction de phases LiCo0.96Al0.04O2 au sein desquelles l’aluminium n’est pas réparti de
façon statistique présentent de fortes asymétries, de par l’existence d’une distribution de paramètres
de maille due à des taux d’Al variant localement (Figure 8). La symétrie des pics de diffraction de
certains matériaux LiCo0.96Al0.04O2 constitue donc un premier élément allant dans le sens d’une
répartition homogène de l’aluminium.
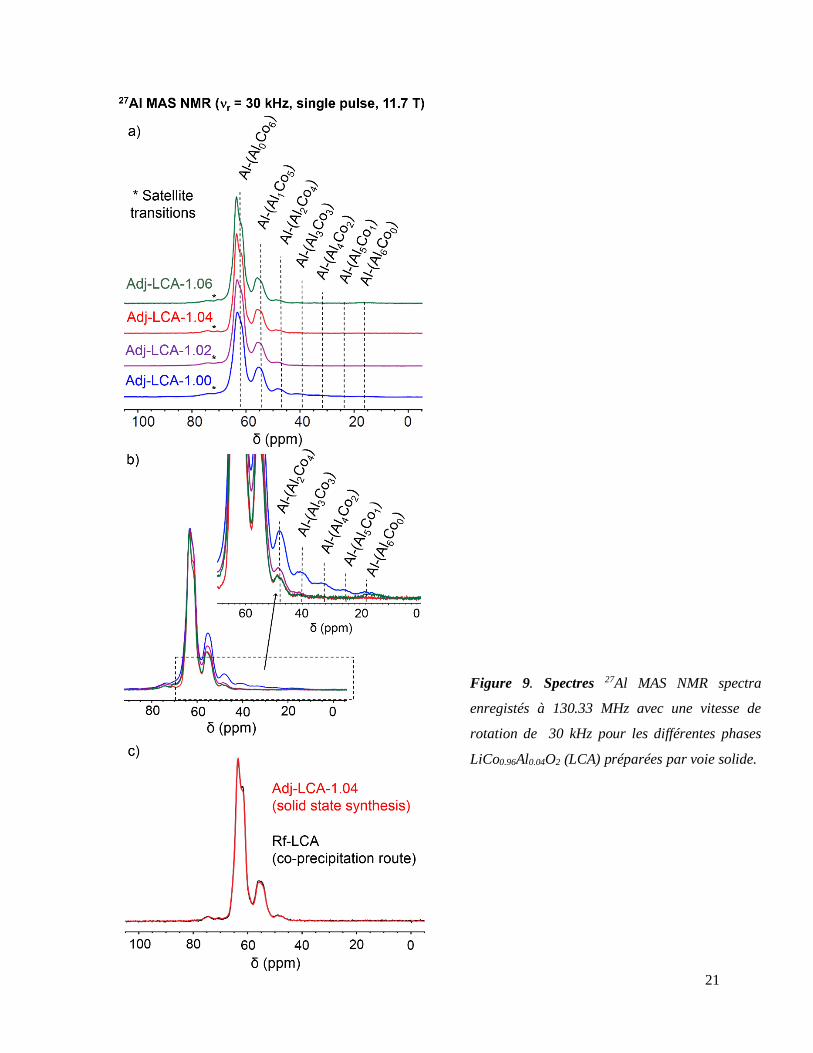
Dans le cas de la RMN de l’27Al, les pics visibles au sein des spectres sont respectivement
caractéristiques des environnements de type Al-(AlnCo6-n) (0 ≤ n ≤ 6) existant au sein des phases
LiCo0.96Al0.04O2 (Figure 9). Les intensités de chaque pic pouvant être estimées via l’utilisation
d’une loi binomiale dans l’hypothèse d’une répartition statistique de l’aluminium pour une
composition donnée (ici fixée à 4%at), les matériaux LiCo0.96Al0.04O2 présentant des pics d’intensité
supérieure à celle postulée pour les contributions dites « riches en Al » (telles que Al-(Al6Co0),
Al-(Al5Co1) ou Al-(Al4Co2)) présentent donc une distribution d’ions Al3+ inhomogène. Des
Figure 7. Schéma des différentes synthèses de LiCo0.96Al0.04O2 (LCA) réalisées dans le cadre du projet de
thèse.
20
spectres RMN superposables au spectre théorique peuvent donc être considérés caractéristiques de
Figure 8. Zoom sur les pics de diffraction (108) et (110) des diffractogrammes enregistrés pour différents
LiCo0.96Al0.04O2 (LCA) préparés par voie solide.
21
spectres RMN superposables au spectre théorique peuvent donc être considérés caractéristiques de
Figure 9. Spectres 27Al MAS NMR spectra
enregistés à 130.33 MHz avec une vitesse de
rotation de 30 kHz pour les différentes phases
LiCo0.96Al0.04O2 (LCA) préparées par voie solide.
22
spectres RMN superposables au spectre théorique peuvent donc être considérés caractéristiques de
matériaux LiCo0.96Al0.04O2 homogènes.
Le protocole précédent a ainsi permis de mettre en évidence que la synthèse d’un matériau
LiCo0.96Al0.04O2 dopé homogènement et de stoechiométrie initiale Li/(Co+Al) = 1.00 est possible
par voie solide. Sa préparation a été réalisée en deux étapes : formation d’un LCA surlithié
(Li/(Co+Al) > 1.00) suivi d’un réajustement de la stoichiométrie en Li (Li/(Co+Al) = 1.00). Ses
performances électrochimiques ainsi que les mécanismes réactionnels impliqués restent néanmoins
à évaluer.

23
24
General introduction
With a theoretical specific capacity as high as 274 mAh/g, LiCoO2 (LCO) was identified as a
promising positive electrode materials for non aqueous secondary batteries by Goodenough1 in
1980. Its ability to reversibly de-intercalate and re-intercalate lithium with a graphite electrode over
hundreds of cycles – coupled with an excellent rate capability and easy synthesis – quickly led to
its first commercialization in full Li-ion batteries (LiBs) by Sony2 in 1991, meant for the portable
electronics market. Since then, LCO-based LiBs have been consistently implemented in
smartphones (commercialized by Apple, Samsung…) and laptops (Lenovo, Acer, Dell, HP,
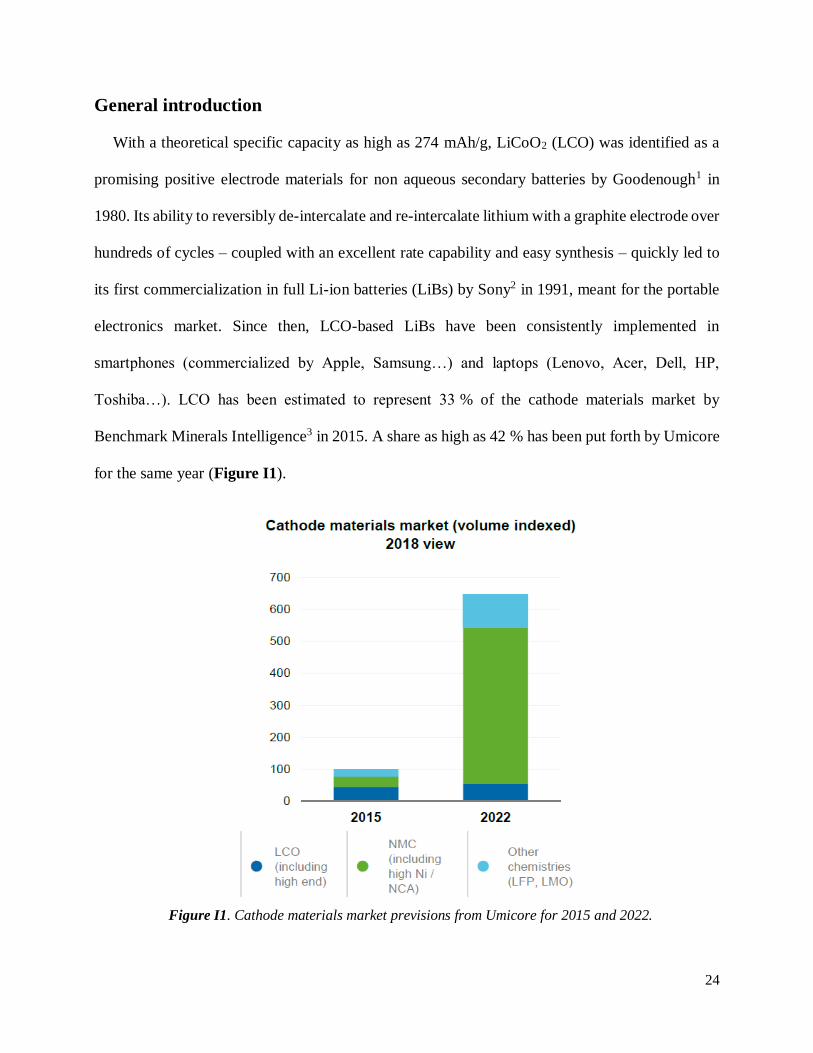
Toshiba…). LCO has been estimated to represent 33 % of the cathode materials market by
Benchmark Minerals Intelligence3 in 2015. A share as high as 42 % has been put forth by Umicore
for the same year (Figure I1).
Figure I1. Cathode materials market previsions from Umicore for 2015 and 2022.
25
In terms of volume, the demand for cathode materials is expected to be multiplied by 6.5 by
2022, with the main part being lithium nickel manganese cobalt oxides (NMC) and lithium nickel
cobalt aluminum oxides (NCA) dedicated to electrical vehicles (EV). The high cost of cobalt,
coupled with an elevated working voltage, make LCO an unsuitable candidate as positive electrode
for such applications. On the other hand, LCO is expected to remain the material of choice for
portative applications in the near future thanks to its excellent volumetric energy density,
explaining its consistent stable share of the cathode market in 2022 (Figure I1).
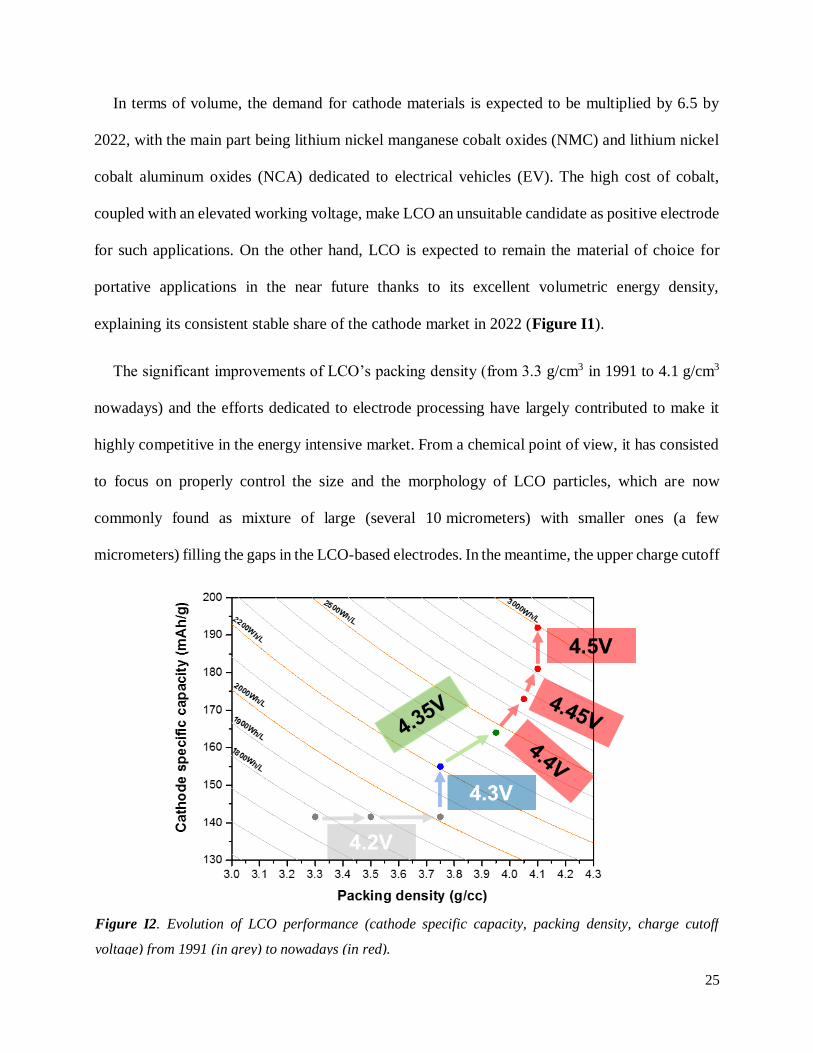
The significant improvements of LCO’s packing density (from 3.3 g/cm3 in 1991 to 4.1 g/cm3
nowadays) and the efforts dedicated to electrode processing have largely contributed to make it
highly competitive in the energy intensive market. From a chemical point of view, it has consisted
to focus on properly control the size and the morphology of LCO particles, which are now
commonly found as mixture of large (several 10 micrometers) with smaller ones (a few
micrometers) filling the gaps in the LCO-based electrodes. In the meantime, the upper charge cutoff
Figure I2. Evolution of LCO performance (cathode specific capacity, packing density, charge cutoff
voltage) from 1991 (in grey) to nowadays (in red).
26
voltage of LCO has barely changed, as depicted in Figure I2. Increasing the charge voltage higher
than 4.3 V vs. Li+/Li would enable the extraction of more Li+ ions and reach charge capacities
higher than 174 mAh/g, a value still far from the theoretical one. However, poor structural stability
and interface issues have prevented any use of LCO at voltage higher than 4.5 V vs. Li+/Li so far.
Since the 2000’s, most of the LCO-dedicated research has been directed towards material
optimization through the use of coatings and dopings (such as aluminum doping) to overcome these
issues, without really trying to gain more fundamental knowledge of these structural instabilities.
This project aims to contribute to the previously discussed aspects, by: i) identifying the
formation mechanisms of high voltage LixCoO2 phases during Li removal, ii) gaining more
fundamental knowledge of their structures, iii) evaluating the possible influence of the initial Li/Co
ratio on their formation and iv) synthesizing industrially-viable optimized Al-doped LCO.
This manuscript is divided into 3 parts in the following.
Part A is meant to lay the foundations for a more systematic investigation of the influence of the
initial Li/Co ratio in LCO on the phase transitions occurring at high voltage. This part is dedicated
to the careful synthesis and characterization of samples series with well controlled Li/Co ratios,
also meeting the industrial expectations regarding the high packing density expected for LCO-
based electrodes (therefore with a specific control on the size and morphology of the powders).
Part B is dedicated to the characterization of LixCoO2 phases formed during the high voltage
cycling of LCO. In particular, a comparative in situ X-ray diffraction (XRD) study of the phase
transitions experienced by LCO materials with various initial Li/Co ratios (Li/Co = 1.00 or 1.05)
will be provided.
27
Part C gathers all results regarding the development of a solid state synthesis of homogeneous Al-
doped LCO. 1–6
28
Bibliography (general introduction)
(1) Mizushima, K.; Jones, P. C.; Wiseman, P. J.; Goodenough, J. B. LixCoO2 (0 < x < 1): A New
Cathode Material for Batteries of High Energy Density. Mater. Res. Bull. 1980, 15 (6), 783–
789.
(2) Yamahira, T.; Kato, H.; Anzai, M. Nonaqueous Electrolyte Secondary Battery.
US5053297A, October 1, 1991.
(3) The Lithum Ion Supply Chain. Benchmark 2016, 44–61.
https://www.benchmarkminerals.com.
And more generally based on:
(4) Nitta, N.; Wu, F.; Lee, J. T.; Yushin, G. Li-Ion Battery Materials: Present and Future. Mater.
Today 2015, 18 (5), 252–264.
(5) Olivetti, E. A.; Ceder, G.; Gaustad, G. G.; Fu, X. Lithium-Ion Battery Supply Chain
Considerations: Analysis of Potential Bottlenecks in Critical Metals. Joule 2017, 1 (2), 229–
243.
(6) Wang, L.; Chen, B.; Ma, J.; Cui, G.; Chen, L. Reviving Lithium Cobalt Oxide-Based
Lithium Secondary Batteries-toward a Higher Energy Density. Chem. Soc. Rev. 2018, 47
(17), 6505–6602. https://doi.org/10.1039/C8CS00322J.
(7) Fergus, J. W. Recent Developments in Cathode Materials for Lithium Ion Batteries. J.
Power Sources 2010, 195 (4), 939–954. https://doi.org/10.1016/j.jpowsour.2009.08.089.

29

30
31
Part A. Evaluation of the influence of initial ratio
Li/Co and particle size on the electrochemical
performance of LiCoO2. Selection of samples

32
33
Part A. Evaluation of the influence of initial ratio Li/Co and particle size on
the electrochemical performance of LiCoO2. Selection of samples ............... 31
A.1 Introduction. Bibliographic context.............................................................................. 34
A.1.1 Working principle of a Li-ion battery and electrochemical variables ......................... 34
A.1.2 LiCoO2 as positive electrode for Li-ion batteries: structure, synthesis and
electrochemical behavior .................................................................................................... 38
A.1.2.1 Structure and synthesis of LiCoO2 ...................................................................... 38
A.1.2.3 Overstoichiometry in LiCoO2 and consequences on the electrochemical
performance of LCO-based Li-ion batteries .................................................................... 42
A.2 Synthesis and general characterization of LiCoO2 powders. ....................................... 47
A.2.1 Description of syntheses ........................................................................................... 47
A.2.2 Experimental section for general characterization ..................................................... 49
A.2.3 Results and discussion: Chemical and structural properties ....................................... 50
A.2.3.1. ICP results ......................................................................................................... 50
A.2.3.2. Size and morphology of LCO powders .............................................................. 51
A.2.3.3 XRD and SXRD ................................................................................................. 55
A.2.3.3 7Li MAS NMR results ........................................................................................ 58
A.2.3.4 General conclusions on prepared LCO and methods used for characterization .... 61
A.3 Influence of Li/Co ratio and particle size on the electrochemical performance of
LCO//Li half cells ................................................................................................................. 62
A.3.1 Experimental details: electrochemistry ...................................................................... 63
A.3.2 Influence of Li/Co ratio on the overall electrochemical performance of LCO//Li cells
........................................................................................................................................... 64
A.3.2.1 Reversibily of Li intercalation during the 1st cycle. Charge/discharge capacities
and Coulombic efficiency. .............................................................................................. 64
A.3.2.2 Cycles 1 to 25: short-term cycleability of LCO ................................................... 67
A.3.2.3 Evidence of structural changes............................................................................ 70
A.4 Conclusion Part A ......................................................................................................... 73
A.5 Bibliography Part A ...................................................................................................... 75
34
Part A. Evaluation of the influence of initial ratio Li/Co
and particle size on the electrochemical performance of
LiCoO2. Selection of samples
A.1 Introduction. Bibliographic context.
A.1.1 Working principle of a Li-ion battery and electrochemical variables
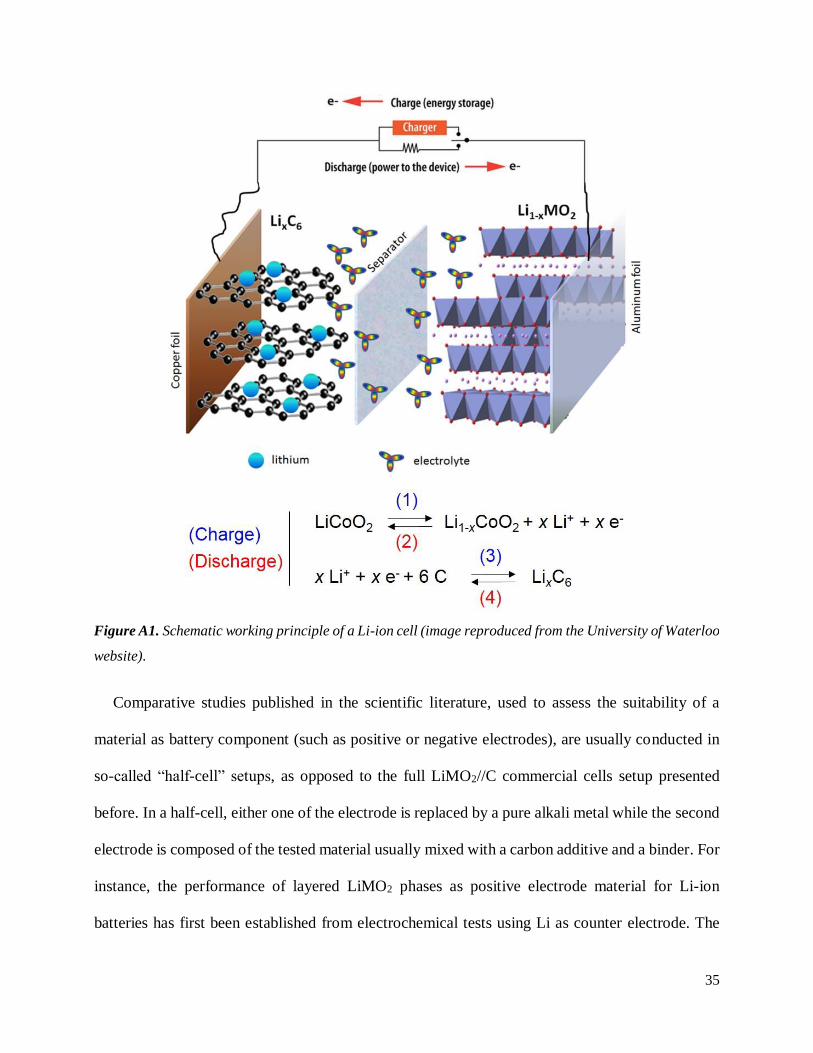
Commercial batteries are made of several packed Li-ion cells, whose schematic representation
is given in Figure A1. The negative electrode, made of graphite (or mesophase carbon microbeads,
MCMB), is classically casted onto a copper current collector. The positive electrode material (here
LiMO2 with M = transition metal) is embedded with a conductive carbon additive (carbon black,
Super P…) and a polymeric binder (such as polyvinylidene fluoride PVDF) on top of an aluminum
current collector. Separators soaked in electrolyte are found between both electrodes. During the
charge of the cell, Li ions are de-intercalated from the positive electrode LiMO2 and re-intercalated
between the sheets of graphite, as denoted by equations (1) and (3) in Figure A1, while the inverse
motion is expected during the discharge (equations (2) and (4)). As the electrolyte only allows the
motion of Li ions between the electrodes, all generated electrons circulate in the outer circuit.
When M = Co, conventional beliefs are that the charge compensation in Li1-xCoO2 is achieved
through the oxidation of Co3+ into Co4+ during the charge of LiCoO2//C cells (and through the
reduction of Co4+ into Co3+ during the discharge), which has been supported by Co K-edge X-ray
absorption1 (XAS), 7Li magic angle spinning nuclear resonance2 (7Li MAS NMR) and magnetic
susceptibility measurements3. However, other processes involving i) partial oxidation4–6 of both
O2- and Co3+ or even ii) the sole oxidation7,8 of O2- have also been experimentally observed. Still
today, this matter seems to be debated9.
35
Comparative studies published in the scientific literature, used to assess the suitability of a
material as battery component (such as positive or negative electrodes), are usually conducted in
so-called “half-cell” setups, as opposed to the full LiMO2//C commercial cells setup presented
before. In a half-cell, either one of the electrode is replaced by a pure alkali metal while the second
electrode is composed of the tested material usually mixed with a carbon additive and a binder. For
instance, the performance of layered LiMO2 phases as positive electrode material for Li-ion
batteries has first been established from electrochemical tests using Li as counter electrode. The
Figure A1. Schematic working principle of a Li-ion cell (image reproduced from the University of Waterloo
website).
36
comparison of each material’s performance may be done through the recording of galvanostatic
curves and the use of electrochemical variables, such as the capacity Q or the lithium content x in
the active material at a specific time. They may be calculated as follow:
Besides, a maximum theoretical capacity C may also be estimated from the same formula for any
electroactive material, considering the highest possible Δx. For LiMO2 phases, this corresponds to
Δx = 1. In the hypothesis of no side reactions in the battery, the theoretical capacity is reached after
charging the material for a specific time t decided by the operator through the cycling rate input
C/t. For instance, charging a LiMO2//Li half cell at a C/20 rate means that the theoretical capacity
C is reached after 20 hours.
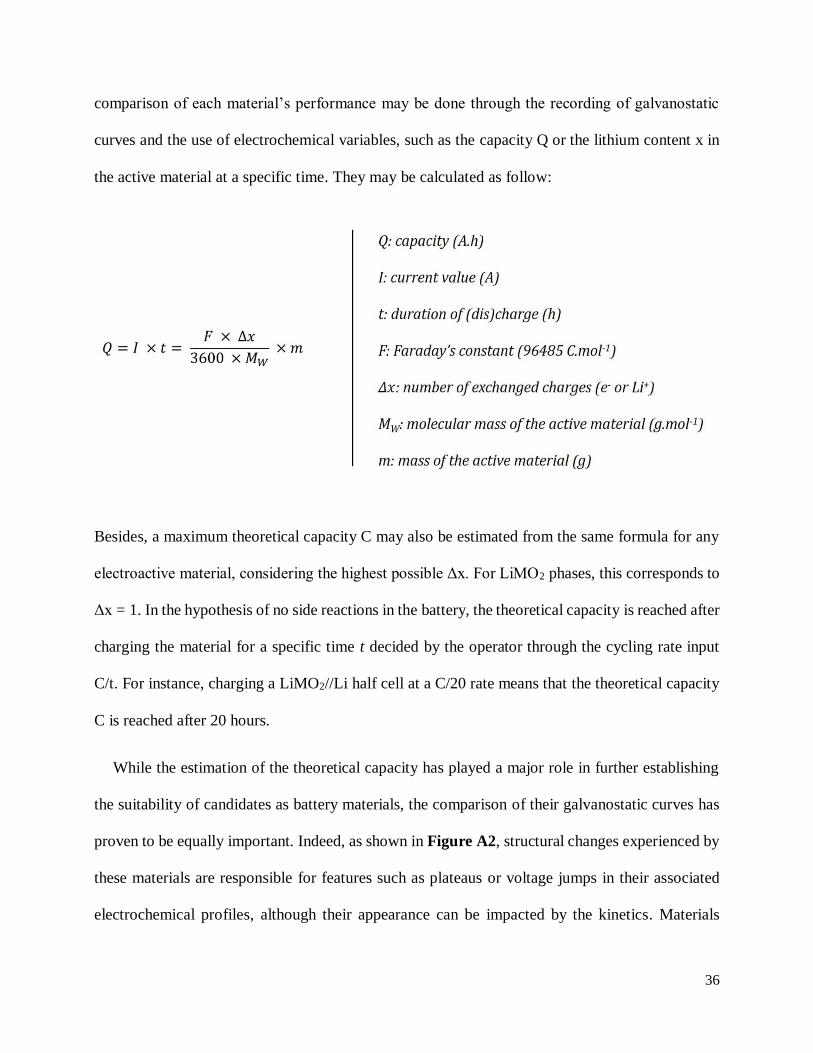
While the estimation of the theoretical capacity has played a major role in further establishing
the suitability of candidates as battery materials, the comparison of their galvanostatic curves has
proven to be equally important. Indeed, as shown in Figure A2, structural changes experienced by
these materials are responsible for features such as plateaus or voltage jumps in their associated
electrochemical profiles, although their appearance can be impacted by the kinetics. Materials
37
experiencing many structural changes are usually not favored, as their corresponding change of
volume may be detrimental for the battery life time. Abrupt voltage jumps (in red in Figure A2)
reveals the existence of single phases with a peculiar composition with a well-defined structure.
Plateaus are characteristic of biphasic domains, i.e. highlighting the simultaneous existence of two
phases with distinct compositions and/or structures. A constant evolution of the voltage vs. x
content corresponds to a solid solution behavior where the structure of the material is preserved
but the x content varies. Such considerations will be widely applied throughout this manuscript.
Figure A2. Schematic representation of a galvanostatic curve and identification of possible behaviors.
38
A.1.2 LiCoO2 as positive electrode for Li-ion batteries: structure, synthesis and
electrochemical behavior
A.1.2.1 Structure and synthesis of LiCoO2
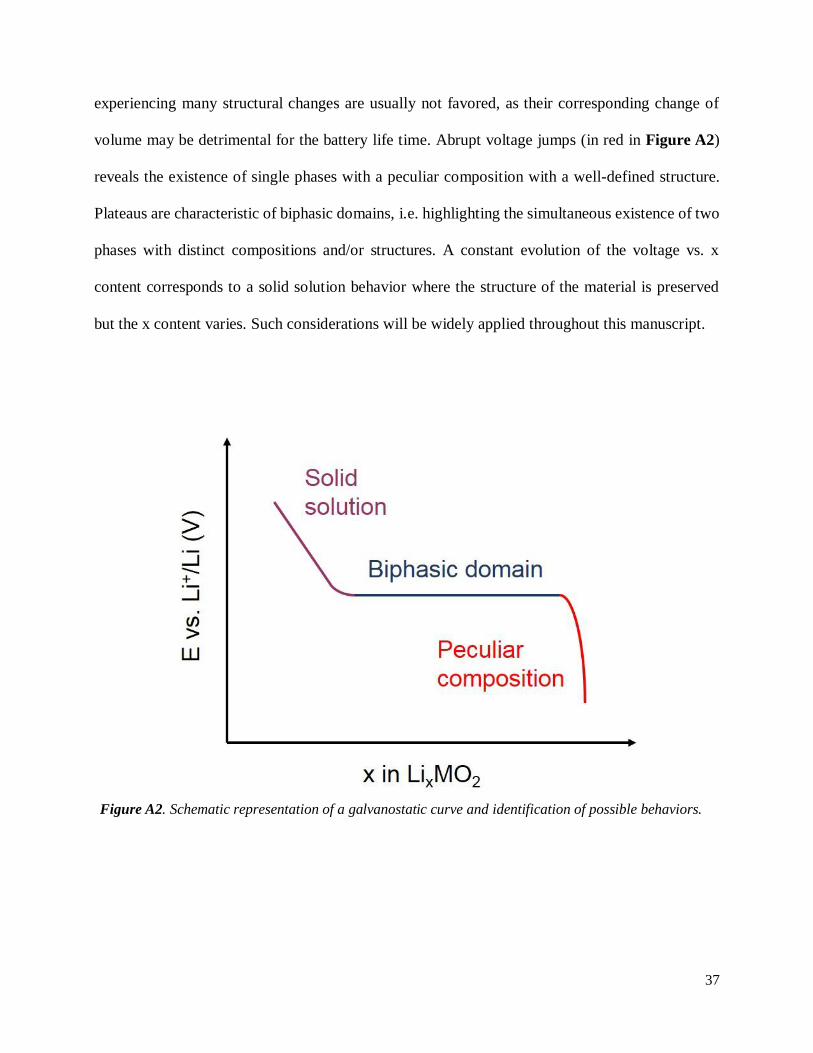
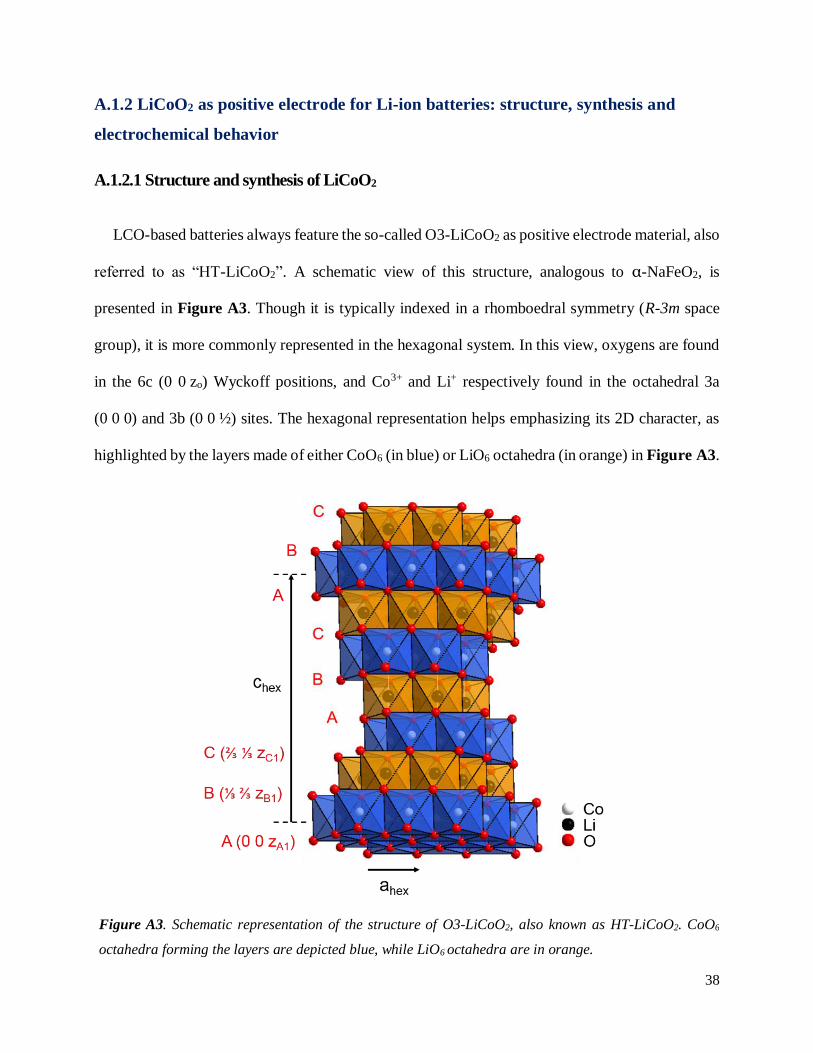
LCO-based batteries always feature the so-called O3-LiCoO2 as positive electrode material, also
referred to as “HT-LiCoO2”. A schematic view of this structure, analogous to α-NaFeO2, is
presented in Figure A3. Though it is typically indexed in a rhomboedral symmetry (R-3m space
group), it is more commonly represented in the hexagonal system. In this view, oxygens are found
in the 6c (0 0 zo) Wyckoff positions, and Co3+ and Li+ respectively found in the octahedral 3a
(0 0 0) and 3b (0 0 ½) sites. The hexagonal representation helps emphasizing its 2D character, as
highlighted by the layers made of either CoO6 (in blue) or LiO6 octahedra (in orange) in Figure A3.
Figure A3. Schematic representation of the structure of O3-LiCoO2, also known as HT-LiCoO2. CoO6
octahedra forming the layers are depicted blue, while LiO6 octahedra are in orange.
39
Note that CoO2 and LiO2 layers share edges with each other, and 3 layers of each are found in one
unit cell. This crystallographic form is labelled as “O3-LiCoO2” in a nomenclature developed by
Delmas et al.10, as Li is found in Octahedral sites and 3 layers of CoO2 define the unit cell. This
label will be widely used throughout this manuscript. The layers are more commonly described by
the oxygen stacking itself, here found as ABCABC type. The existence of such oxygen stacking
implies that CoO6 and LiO6 units share edges.
Other structures have been reported for LiCoO2 depending on the synthetic route adopted to
prepare it, including metastable layered forms, such as the O2- and O4-polytypes11–13 and a spinel
form14 usually denoted as “LT-LiCoO2”. Still, a wide variety of synthetic paths have proven to
successfully lead to O3-LCO. Solid state reactions, typically between either Co3O4 or CoCO3 and
Li2CO3 powders, are among the most common methods used in the literature. The “HT” and “LT”
notations were adopted following observations of the obtained LiCoO2 phase from this route, as a
function of the heat treatment temperature14,15: LT-form for T < 400 °C and HT structure for
T > 400 °C. The exact mechanisms involved during the solid state reaction of Co3O4 and Li2CO3
were surprisingly only recently investigated by Wicker and Walker16. Through thermal and
diffraction measurements, they evidenced several crucial steps, all taking place in the 700 – 990 K
temperature range: i) aggregation of Li2CO3 particles (700 – 900 K), ii) melting of Li2CO3
(900 – 975 K), iii) liberation of CO2 and diffusion of Li into Co3O4 at the liquid-solid interface,
with intermediate formation of Li2CoO4 spinel quickly converting into layered LiCoO2. Unlike a
previous report from Timoshevskii et al.17 and Ktalkherman et al.18, they did not observe any Li2O
formed from the decomposition of Li2CO3.
Due to the high temperature (~ 900 – 1000 °C) required for the successful synthesis of O3-LCO
from a solid state route15,19,20, in good agreement with Wicker and Walker’s work16, solution
40
techniques were rapidly considered in order to prepare it at moderate temperatures. The
development of methods in liquid media was also strongly motivated by the necessity to control
the particle size and morphology of the LCO powders, which are crucial to their electrochemical
performance in LiBs. Various sol-gel-type syntheses starting with Li and Co nitrates21,22 or
acetates23,24 as reagents followed by a heat treatment at moderate temperature (T = 550 – 600 °C)
were reported to form O3-LiCoO2 with submicronic particle size. Attempts to fire the gel at lower
temperatures (T ≤ 400 °C) though seems to lead to mixtures25 of layered and spinel LCO, or pure
spinel LCO if short firing times are used22 (1 hour). Amatucci et al.26 prepared layered LCO by
ionic-exchange reaction between LiOH and CoOOH at T = 100 °C, though remaining organic
impurities were detected in the final powder. As a matter of fact, the successful preparation of
O3-LCO at such a low temperature is one more reason to discard the “LT” and “HT” notations.
Performed at intermediate temperatures compared to sol-gel based- or solid state reactions
(T = 650 – 750 °C), molten salt syntheses were also largely reported27,28. Micron-sized particles
are typically formed from this route (1 to 15 µm).
All of the above-mentioned syntheses are here and there used in the literature. Solid state
syntheses are however still favored for the industrial production of LCO, as it is not only easy to
implement at a rather low cost. Additionally, large particle size may be achieved if one uses Li2CO3
as Li precursor. Indeed, as lithium carbonate melts at T = 723 °C and LCO partially dissolves29 in
melted Li2CO3, a beneficial flux role occurs and significantly drives the crystalline growth. Larger
particle sizes were systematically reported for final LCO powders prepared in such conditions by
Antolini et al.30, Lundblad et al.15 and Levasseur et al.31. A proportionality between the amount of
excess Li2CO3 and the average particle size was also demonstrated, as the more excess Li2CO3, the
larger the particle size. LCO powders prepared in stoichiometric conditions have been showed to
41
have particles whose average diameter is around 1-2 µm, while those prepared with a 10 % Li
excess featured 20 µm sized particles. Even if the use of Li2CO3 excess has proven to be very useful
to prepare LCO powders with large particle size, it was initially motivated to compensate Li losses
during the firing of the precursors. Many groups still report to do so in the experimental sections
of their articles. However, they often leave aside the possibility of chemical changes and new
stoichiometries LiaCobOc (a ≠ 1, b≠ 1 and c ≠ 2) for the resulting LCO phase, known since the late
1990’s, as described in the following paragraph.
42
A.1.2.3 Overstoichiometry in LiCoO2 and consequences on the electrochemical performance
of LCO-based Li-ion batteries
The first evidence of lithium overstoichiometry in LiCoO2 is found in an article from 1997 by
Carewska et al.32. They showed that some Li could enter the structure, changing the Co valence in
parallel. Additional data confirming the existence of overlithiated LiCoO2 compounds
(Li/Co > 1.00) was later gathered by other groups, and complementary studies were carried out to
not only determine which site was occupied by the Li and in which proportions, but also to discuss
the charge compensation mechanisms implied by its presence. The presence of paramagnetic cobalt
in LCO prepared with an Li2CO3 excess was rapidly evidenced by Ganguly et al.33 and
Peeters et al.34 – the former believing it was Co2+ – by the means of nuclear magnetic resonance
(NMR) of 6Li, 7Li, and 59Co nuclei. Additional peaks were found in the 7Li NMR spectra of
overlithiated LCO, while a single peak is normally expected in the NMR spectrum of
stoichiometric LCO, arising from the diamagnetic-only environments of Li (being either low spin
LS-Co3+ or impurities like Li2CO3 or LiOH). Several other groups later agreed on the existence of
Co2+ in nonstoichiometric LCO, accompanied by oxygen deficiency35–39. Levasseur et al.35 also
suggested that the stoichiometry for Co was below 1.00.
Further work from Imanishi et al.40 and Levasseur et al.41 eventually reported another charge
compensation mechanism, in which the existence of paramagnetic Co2+ in nonstoichiometric LCO
was no longer considered. Indeed, the former found that all cobalt was in the +III oxidation state39,
and that the electronic neutrality was still maintained thanks to oxygen vacancies. By varying the
initial Li/Co ratios used during the preparation of LCO, they also demonstrated that passed
Li/Co = 1.15, no more Li could be accepted within the structure – the rest remaining within Li2CO3.
In the meantime, Levasseur et al.31,41 also came to the conclusion that all Co remains at the +III
43
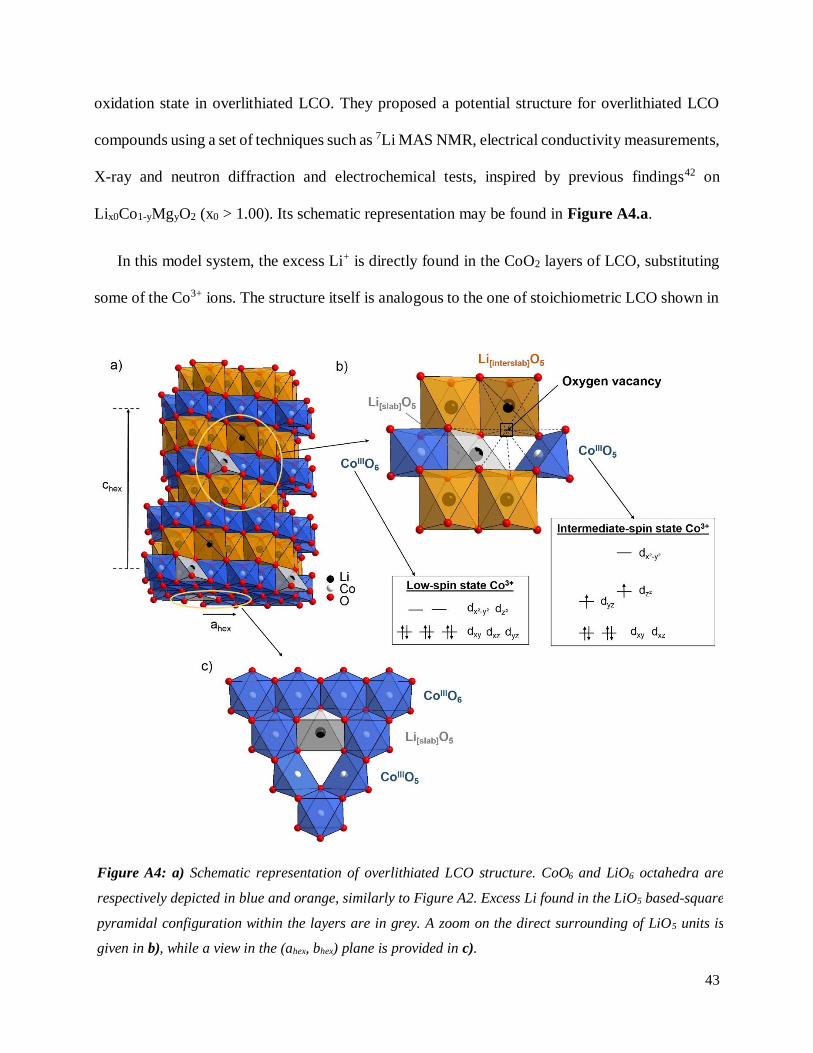
oxidation state in overlithiated LCO. They proposed a potential structure for overlithiated LCO
compounds using a set of techniques such as 7Li MAS NMR, electrical conductivity measurements,
X-ray and neutron diffraction and electrochemical tests, inspired by previous findings42 on
Lix0Co1-yMgyO2 (x0 > 1.00). Its schematic representation may be found in Figure A4.a.
In this model system, the excess Li+ is directly found in the CoO2 layers of LCO, substituting
some of the Co3+ ions. The structure itself is analogous to the one of stoichiometric LCO shown in
Figure A4: a) Schematic representation of overlithiated LCO structure. CoO6 and LiO6 octahedra are
respectively depicted in blue and orange, similarly to Figure A2. Excess Li found in the LiO5 based-square
pyramidal configuration within the layers are in grey. A zoom on the direct surrounding of LiO5 units is
given in b), while a view in the (ahex, bhex) plane is provided in c).
44
Figure A3 (space group R-3m), which is why it is also represented in the hexagonal network. No
Co2+ or Co4+ are found within the structure, and no Co has been found migrating in the interlayer
space. Following observations from Imanishi40, the presence of one oxygen vacancy in the
proximity of each excess Li is assumed to maintain the electronic neutrality (Figure A4.b).
Therefore, Li inside the layers is surrounded by only 5 oxygens. As properly shown in Figure A4.c,
two close-by Co3+ are consequently found in square-based pyramidal sites (noted CoO5),
contrasting with the octahedral CoO6 found within the rest of the layers. These Co3+ adopt an
intermediate spin (IS) state distribution41, depicted in Figure A4.b. Because of the existence of
unpaired electrons in IS-Co3+, their magnetic properties differ from those of LS-Co3+, the former
being paramagnetic while the latter are diamagnetic. Further work from Carlier et al.43 confirmed
the existence of IS-Co3+ and proposed the electronic configuration shown in Figure A4.b. Such
assumption therefore corroborates the findings of Ganguly et al.33 and Peeters et al.34. Due to the
hyperfine interaction, adjacent Li can thus exhibit the negative or positive shifted additional
signals previously reported in the 7Li NMR spectra (out of the narrow chemical shifts range of 7Li),
depending on its environment. As a matter of fact, since Rietveld refinements carried out on X-ray
and neutron diffraction patterns of overlithiated LCO are of no help to evidence the presence of Li
in the Co site, 7Li MAS NMR is considered to be the method of choice to properly establish the
real stoichiometry of LCO powders. Assuming the model previously described, chemical formulas
can be extrapolated41 for overlithiated LCO compounds, usually denoted as
“[Li]interslab[Co1-tLit]slabO2-t” or “Li1+tCo1-tO2-t”.
45
All the previously mentioned authors concurrently demonstrated that Li overstoichiometry has
significant effects on the performance of LCO in LiBs. In particular, Imanishi et al.40 and Levasseur
et al.35 reported that the discharge capacity of overlithiated LCO cycled up to 4.3 V was lower than
those of stoichiometric LCO. Additionally, they showed that stoichiometric and overlithiated LCO
did not experience the same phase transitions going along with the Li-removal and re-intercalation
from their structure during the charge and the discharge of LCO-based cells cycled up to 4.4 V, as
proven by noticeable differences in the associated electrochemical curves. Though structural
changes are more rigorously discussed with diffraction data, they induce the presence of voltage
jumps or plateaus in their electrochemical curves, which constitutes a good starting point to discuss
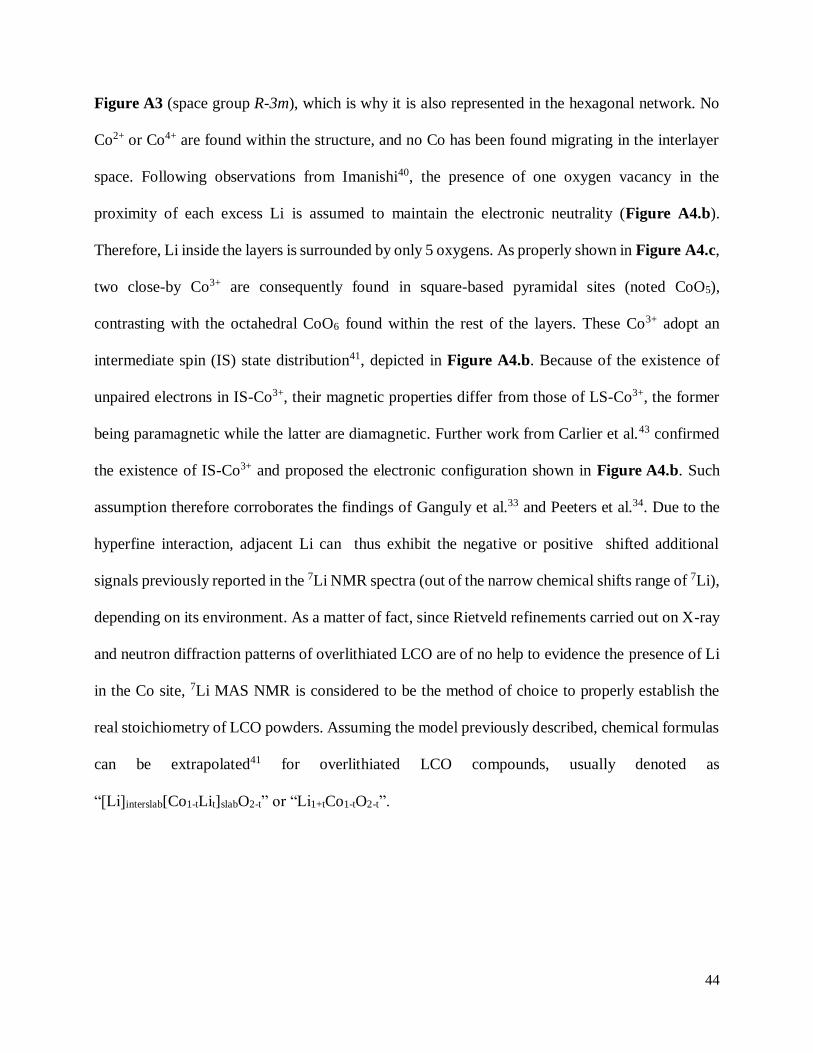
them. Figure A5 shows 1st charge curves obtained from the electrochemical testing of LCO
powders with various initial Li/Co stoichiometries in Li//LCO cells. These systematic
electrochemical studies, associated to other characterization techniques, have helped gaining more
knowledge on the nature of the structural changes itself experienced by both stoichiometric and
overlithiated LCO.
Figure A5. 1st cycle curves of LiCoO2 synthesized with Li/Co = 1.00, 1.05 or 1.10, from Levasseur et al.35.
46
Regarding stoichiometric LCO, the plateau observed at the beginning of the charge of
stoichiometric LCO for E = 3.95 V has proven2,44,45 to be characteristic of the co-existence of two
O3 phases with respective Li contents of ~ 0.75 and ~ 1.00. As it induces a change of electronic
properties (from insulating to conductive), such change is usually referred to as “insulator-metal
transition”. The voltage jump at E = 4.12 V was assigned to the ordering of Li in the interlayer
space46–49. As the monoclinic system is used to describe the unit cell of Li0.5CoO2, it is now
commonly denominated as monoclinic transition. Both features are absent of the cycling curves of
overlithiated LCO. Diffraction data confirmed that both the insulator-metal and the monoclinic
transition are inhibited by the presence of Li inside the CoO2 layers of overlithiated LCO.
Therefore, these changes may be used as a probe for Li stoichiometry in LCO.
In the attempts to de-intercalate more Li from LiCoO2 to access more capacity, additional
voltage jumps have more recently been detected50,51 in the galvanostatic curves of LiCoO2//Li cells
charged at higher voltages than 4.4 V. They have been shown to correspond to the O3 – H1-3 and
H1-3 – O1 transitions, which will be more deeply explained later in this manuscript. The influence
of the initial Li/Co stoichiometry on these transitions has not been established yet, let alone the
evolution of charge and discharge capacities at increased cutoff voltages for stoichiometric and
overlithiated LCO. In the following, powders of LCO with well controlled initial Li/Co ratios are
synthesized and finely characterized to further investigate their electrochemical properties when
cycled at high voltage.
47
A.2 Synthesis and general characterization of LiCoO2 powders.
A.2.1 Description of syntheses
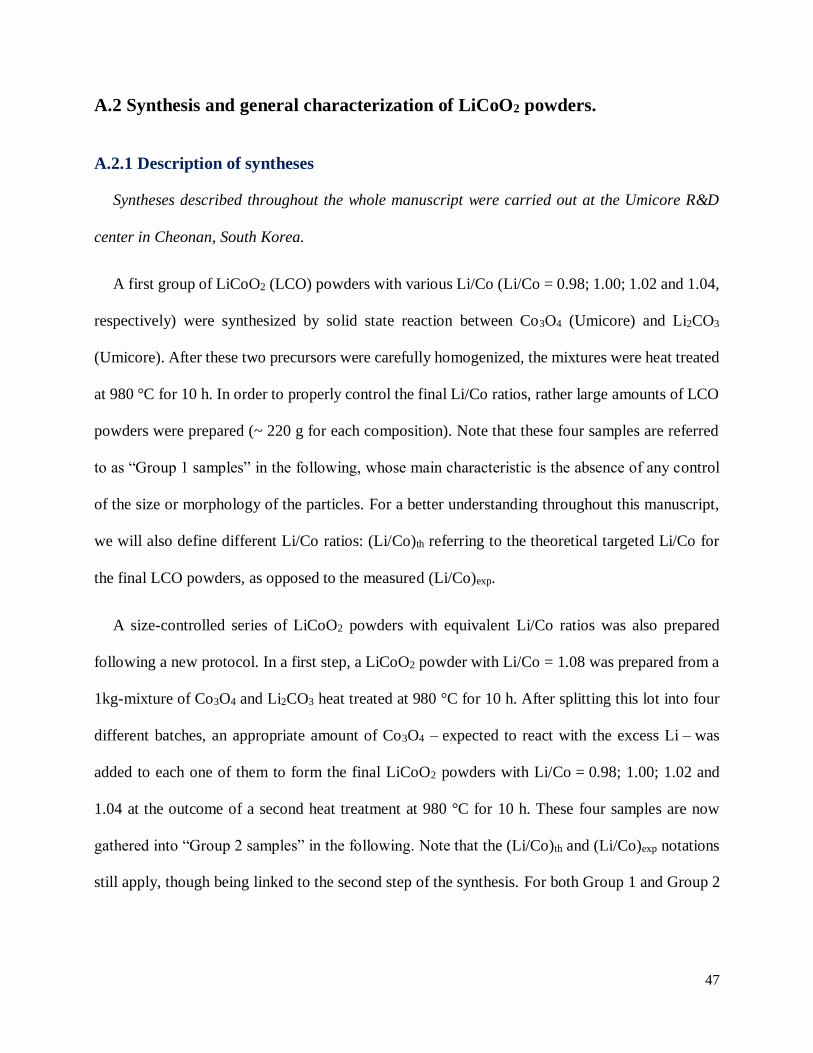
Syntheses described throughout the whole manuscript were carried out at the Umicore R&D
center in Cheonan, South Korea.
A first group of LiCoO2 (LCO) powders with various Li/Co (Li/Co = 0.98; 1.00; 1.02 and 1.04,
respectively) were synthesized by solid state reaction between Co3O4 (Umicore) and Li2CO3
(Umicore). After these two precursors were carefully homogenized, the mixtures were heat treated
at 980 °C for 10 h. In order to properly control the final Li/Co ratios, rather large amounts of LCO
powders were prepared (~ 220 g for each composition). Note that these four samples are referred
to as “Group 1 samples” in the following, whose main characteristic is the absence of any control
of the size or morphology of the particles. For a better understanding throughout this manuscript,
we will also define different Li/Co ratios: (Li/Co)th referring to the theoretical targeted Li/Co for
the final LCO powders, as opposed to the measured (Li/Co)exp.
A size-controlled series of LiCoO2 powders with equivalent Li/Co ratios was also prepared
following a new protocol. In a first step, a LiCoO2 powder with Li/Co = 1.08 was prepared from a
1kg-mixture of Co3O4 and Li2CO3 heat treated at 980 °C for 10 h. After splitting this lot into four
different batches, an appropriate amount of Co3O4 – expected to react with the excess Li – was
added to each one of them to form the final LiCoO2 powders with Li/Co = 0.98; 1.00; 1.02 and
1.04 at the outcome of a second heat treatment at 980 °C for 10 h. These four samples are now
gathered into “Group 2 samples” in the following. Note that the (Li/Co)th and (Li/Co)exp notations
still apply, though being linked to the second step of the synthesis. For both Group 1 and Group 2
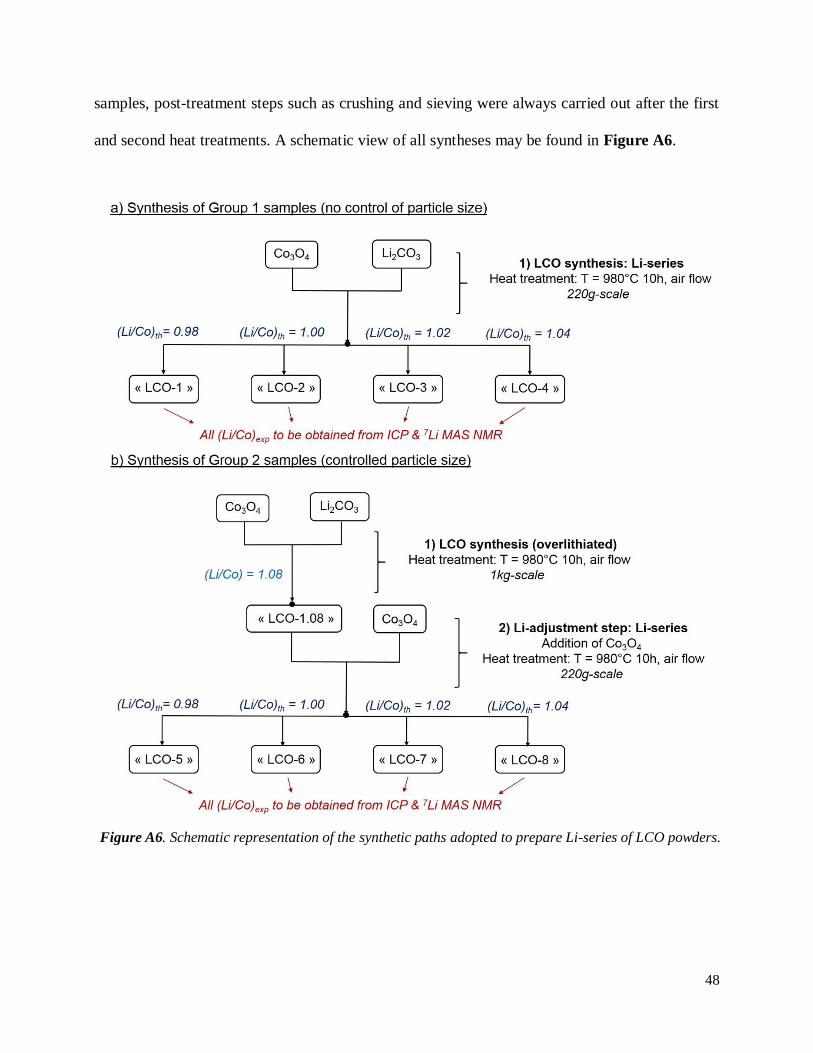
48
samples, post-treatment steps such as crushing and sieving were always carried out after the first
and second heat treatments. A schematic view of all syntheses may be found in Figure A6.
Figure A6. Schematic representation of the synthetic paths adopted to prepare Li-series of LCO powders.
49
A.2.2 Experimental section for general characterization
Scanning electron micrographs (SEM) were taken using a Hitachi Model S-4500 microscope
after metallizing the powders with gold.
Inductively coupled plasma (ICP) measurements were carried out on Agilent ICP-720ES
equipment after sample digestion using hot plate heating in concentrated HCl solution.
Powder X-ray diffraction (XRD) patterns were collected on a PANalitycal X'pert PRO MPD
diffractometer in Bragg-Brentano θ-θ geometry equipped with a Fe filter, a spinner and X'Celerator
multi-strip detector. Each measurement was made within an angular range of 2θ = 10 - 120° and
lasted for 15 hours with 0.016° intervals. The Co-Kα radiation was generated at 35 kV and 30 mA
(λ(Kα1) = 1.789 Å; λ(Kα2) = 1.793 Å). Additional high angular resolution synchrotron powder
X-ray diffraction (SXRD) was carried out on the BL04-MSPD beamline of the ALBA synchrotron
in collaboration with François Fauth (Cerdanyola del Vallès, Spain). All powders were packed in
0.5 mm diameter capillaries. The patterns were recorded in Debye-Scherrer geometry with a
wavelength of λ = 0.825 Å. The typical 2ϴ angular range was 0 - 70 ° with 0.006° angular step and
3-minute-long accumulation time.
7Li MAS NMR spectra were recorded on a Bruker 300 Advance spectrometer at 116 MHz
(7.05 T magnet), with a standard 2.5 mm Bruker MAS probe. A Hahn echo sequence [t/2-1-t-2]
synchronized with one period of rotor rotation was used for a 30 kHz spinning frequency. The 90°
pulse duration was equal to t/2 = 2.0 s was determined using a LiCl 1 M solution. A recycle time
of D0 = 40 s was used for stoichiometric LCO, whereas a shorter D0 = 2s was enough for
overlithiated LCO samples, to avoid T1 saturation effects.
50
A.2.3 Results and discussion: Chemical and structural properties
A.2.3.1. ICP results
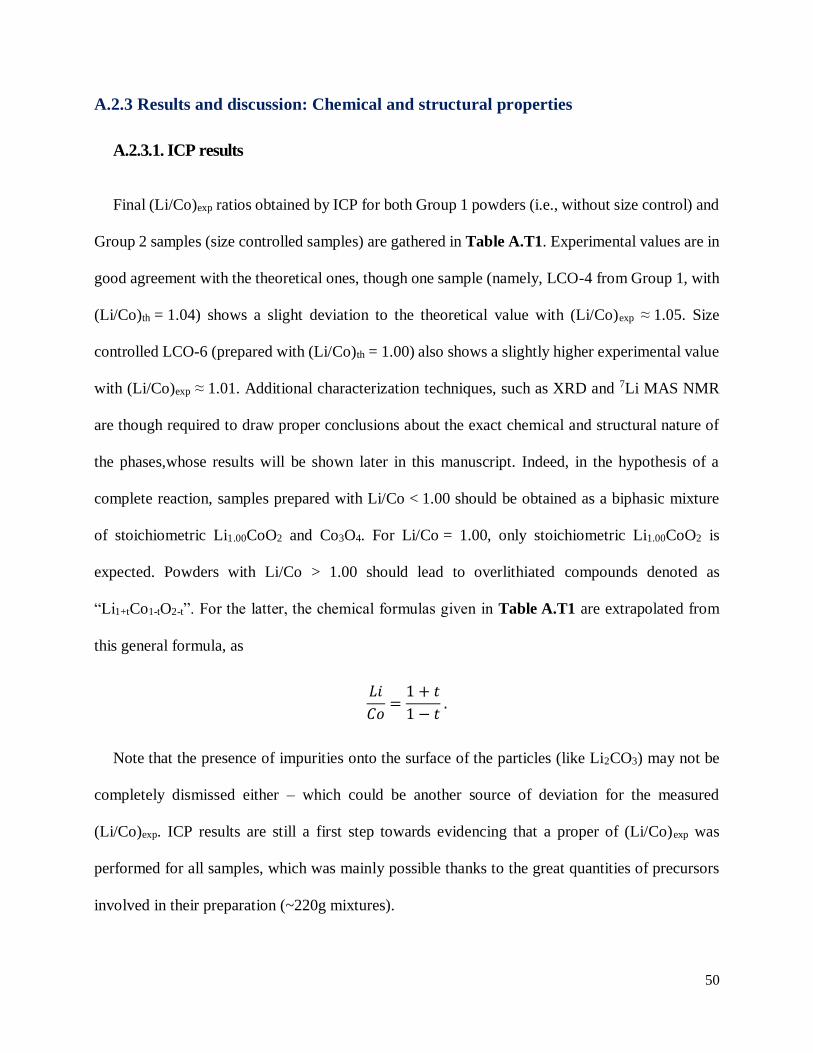
Final (Li/Co)exp ratios obtained by ICP for both Group 1 powders (i.e., without size control) and
Group 2 samples (size controlled samples) are gathered in Table A.T1. Experimental values are in
good agreement with the theoretical ones, though one sample (namely, LCO-4 from Group 1, with
(Li/Co)th = 1.04) shows a slight deviation to the theoretical value with (Li/Co)exp ≈ 1.05. Size
controlled LCO-6 (prepared with (Li/Co)th = 1.00) also shows a slightly higher experimental value
with (Li/Co)exp ≈ 1.01. Additional characterization techniques, such as XRD and 7Li MAS NMR
are though required to draw proper conclusions about the exact chemical and structural nature of
the phases,whose results will be shown later in this manuscript. Indeed, in the hypothesis of a
complete reaction, samples prepared with Li/Co < 1.00 should be obtained as a biphasic mixture
of stoichiometric Li1.00CoO2 and Co3O4. For Li/Co = 1.00, only stoichiometric Li1.00CoO2 is
expected. Powders with Li/Co > 1.00 should lead to overlithiated compounds denoted as
“Li1+tCo1-tO2-t”. For the latter, the chemical formulas given in Table A.T1 are extrapolated from
this general formula, as
𝐿𝑖
𝐶𝑜=
1 + 𝑡
1 − 𝑡 .
Note that the presence of impurities onto the surface of the particles (like Li2CO3) may not be
completely dismissed either – which could be another source of deviation for the measured
(Li/Co)exp. ICP results are still a first step towards evidencing that a proper of (Li/Co)exp was
performed for all samples, which was mainly possible thanks to the great quantities of precursors
involved in their preparation (~220g mixtures).
51
Sample reference (Li/Co)th
(Li/Co)exp
/ ICP
Expected composition
Group 1
No size
control
LCO-1 0.98 0.979 Li1.00CoO2 + εCo3O4
LCO-2 1.00 1.000 Li1.00CoO2
LCO-3 1.02 1.015 ~ Li1.008Co0.992O1.992
LCO-4 1.04 1.052 ~ Li1.025Co0.975O1.975
Group 2
Size
control
LCO-5 0.98 0.986 Li1.00CoO2 + εCo3O4
LCO-6 1.00 1.007 Li1.00CoO2 or Li1+εCo1-εO2-ε
LCO-7 1.02 1.017 ~ Li1.008Co0.992O1.992
LCO-8 1.04 1.039 ~ Li1.019Co0.981O1.981
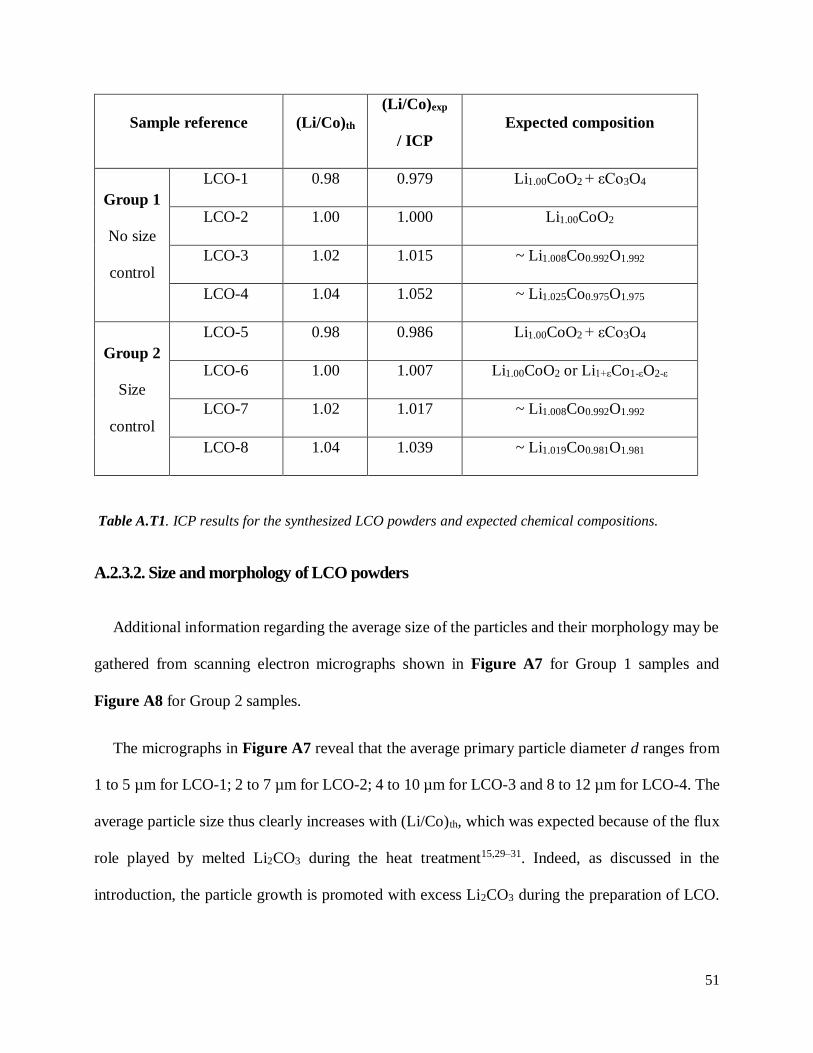
Table A.T1. ICP results for the synthesized LCO powders and expected chemical compositions.
A.2.3.2. Size and morphology of LCO powders
Additional information regarding the average size of the particles and their morphology may be
gathered from scanning electron micrographs shown in Figure A7 for Group 1 samples and
Figure A8 for Group 2 samples.
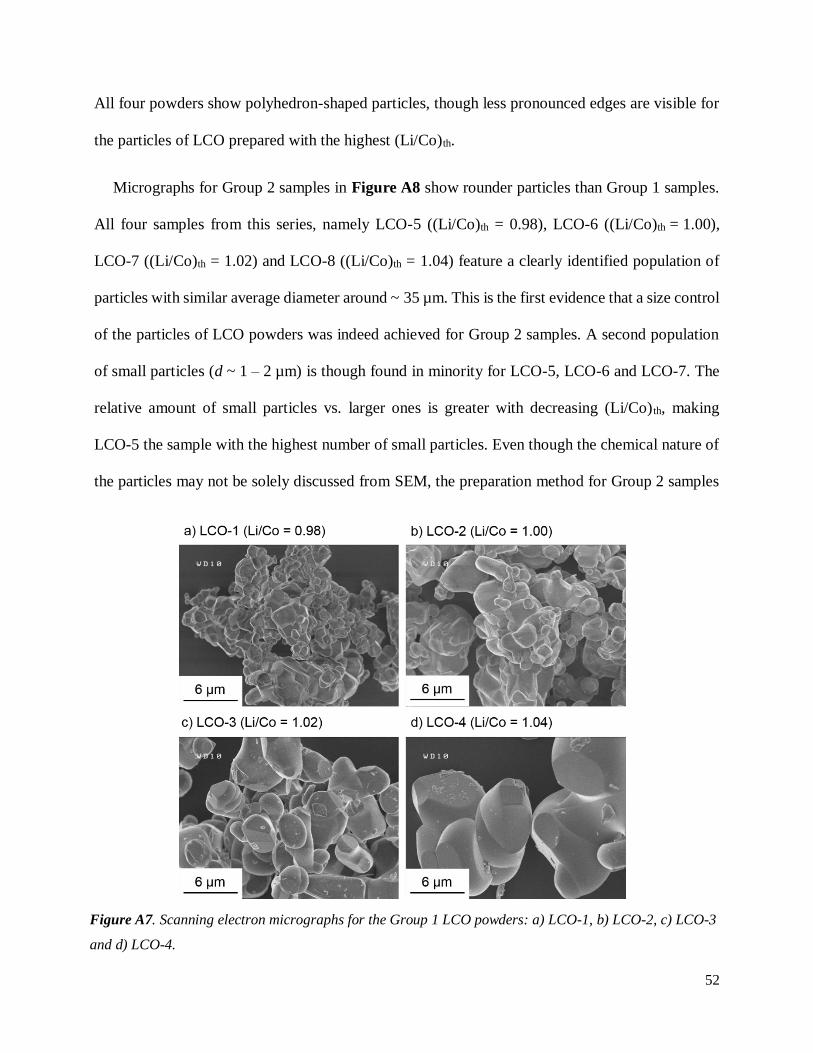
The micrographs in Figure A7 reveal that the average primary particle diameter d ranges from
1 to 5 µm for LCO-1; 2 to 7 µm for LCO-2; 4 to 10 µm for LCO-3 and 8 to 12 µm for LCO-4. The
average particle size thus clearly increases with (Li/Co)th, which was expected because of the flux
role played by melted Li2CO3 during the heat treatment15,29–31. Indeed, as discussed in the
introduction, the particle growth is promoted with excess Li2CO3 during the preparation of LCO.
52
All four powders show polyhedron-shaped particles, though less pronounced edges are visible for
the particles of LCO prepared with the highest (Li/Co)th.
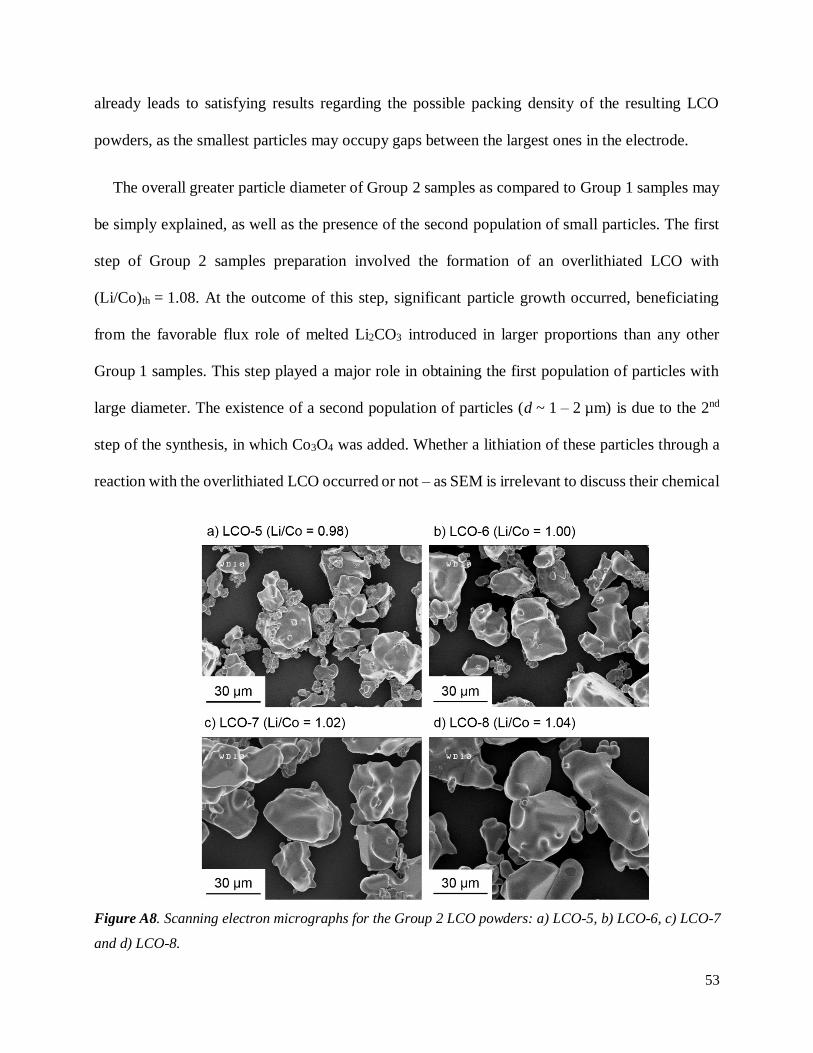
Micrographs for Group 2 samples in Figure A8 show rounder particles than Group 1 samples.
All four samples from this series, namely LCO-5 ((Li/Co)th = 0.98), LCO-6 ((Li/Co)th = 1.00),
LCO-7 ((Li/Co)th = 1.02) and LCO-8 ((Li/Co)th = 1.04) feature a clearly identified population of
particles with similar average diameter around ~ 35 µm. This is the first evidence that a size control
of the particles of LCO powders was indeed achieved for Group 2 samples. A second population
of small particles (d ~ 1 – 2 µm) is though found in minority for LCO-5, LCO-6 and LCO-7. The
relative amount of small particles vs. larger ones is greater with decreasing (Li/Co) th, making
LCO-5 the sample with the highest number of small particles. Even though the chemical nature of
the particles may not be solely discussed from SEM, the preparation method for Group 2 samples
Figure A7. Scanning electron micrographs for the Group 1 LCO powders: a) LCO-1, b) LCO-2, c) LCO-3
and d) LCO-4.
53
already leads to satisfying results regarding the possible packing density of the resulting LCO
powders, as the smallest particles may occupy gaps between the largest ones in the electrode.
The overall greater particle diameter of Group 2 samples as compared to Group 1 samples may
be simply explained, as well as the presence of the second population of small particles. The first
step of Group 2 samples preparation involved the formation of an overlithiated LCO with
(Li/Co)th = 1.08. At the outcome of this step, significant particle growth occurred, beneficiating
from the favorable flux role of melted Li2CO3 introduced in larger proportions than any other
Group 1 samples. This step played a major role in obtaining the first population of particles with
large diameter. The existence of a second population of particles (d ~ 1 – 2 µm) is due to the 2nd
step of the synthesis, in which Co3O4 was added. Whether a lithiation of these particles through a
reaction with the overlithiated LCO occurred or not – as SEM is irrelevant to discuss their chemical
Figure A8. Scanning electron micrographs for the Group 2 LCO powders: a) LCO-5, b) LCO-6, c) LCO-7
and d) LCO-8.
54
nature at this point – they could not beneficiate of the favorable effect of melted Li2CO3, already
reacted in the 1st step.
55
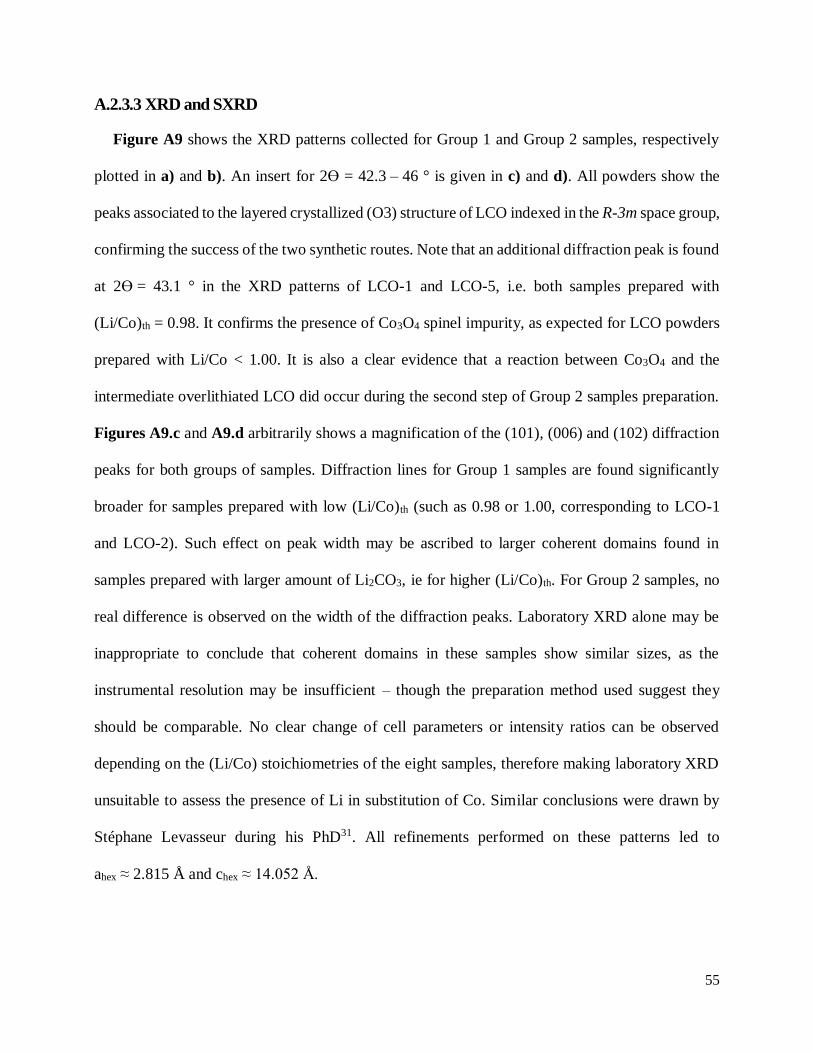
A.2.3.3 XRD and SXRD
Figure A9 shows the XRD patterns collected for Group 1 and Group 2 samples, respectively
plotted in a) and b). An insert for 2ϴ = 42.3 – 46 ° is given in c) and d). All powders show the
peaks associated to the layered crystallized (O3) structure of LCO indexed in the R-3m space group,
confirming the success of the two synthetic routes. Note that an additional diffraction peak is found
at 2ϴ = 43.1 ° in the XRD patterns of LCO-1 and LCO-5, i.e. both samples prepared with
(Li/Co)th = 0.98. It confirms the presence of Co3O4 spinel impurity, as expected for LCO powders
prepared with Li/Co < 1.00. It is also a clear evidence that a reaction between Co3O4 and the
intermediate overlithiated LCO did occur during the second step of Group 2 samples preparation.
Figures A9.c and A9.d arbitrarily shows a magnification of the (101), (006) and (102) diffraction
peaks for both groups of samples. Diffraction lines for Group 1 samples are found significantly
broader for samples prepared with low (Li/Co)th (such as 0.98 or 1.00, corresponding to LCO-1
and LCO-2). Such effect on peak width may be ascribed to larger coherent domains found in
samples prepared with larger amount of Li2CO3, ie for higher (Li/Co)th. For Group 2 samples, no
real difference is observed on the width of the diffraction peaks. Laboratory XRD alone may be
inappropriate to conclude that coherent domains in these samples show similar sizes, as the
instrumental resolution may be insufficient – though the preparation method used suggest they
should be comparable. No clear change of cell parameters or intensity ratios can be observed
depending on the (Li/Co) stoichiometries of the eight samples, therefore making laboratory XRD
unsuitable to assess the presence of Li in substitution of Co. Similar conclusions were drawn by
Stéphane Levasseur during his PhD31. All refinements performed on these patterns led to
ahex ≈ 2.815 Å and chex ≈ 14.052 Å.
56
Note that neutron diffraction was already carried out on overlithiated LCO powders31. The
presence of Li in the Co site could not be detected either. However, we could not find any patterns
of overlithiated LCO (stated as if) recorded with high energy sources in the literature, ie featuring
synchrotron radiation, which is known to lead to significant angular resolution increase. We
recorded diffraction patterns at ALBA synchrotron for three of these samples, namely LCO-5
((Li/Co)th = 0.98), LCO-7 ((Li/Co)th = 1.02) and LCO-8 ((Li/Co)th = 1.04). They are plotted in
Figure A9. X-ray diffraction (XRD) data recorded for a) Group 1 and b) Group 2 LCO powders. These
patterns were collected using a laboratory diffractometer equipped with a cobalt source
(λ(CoKα1) = 1.789 Å, λ(CoKα2) = 1.793 Å). Miller indexes are specified for all the peaks visible for 2ϴ < 80°.
Zooms on their (101), (006) and (102) diffraction peaks are respectively presented in c) and d).
57
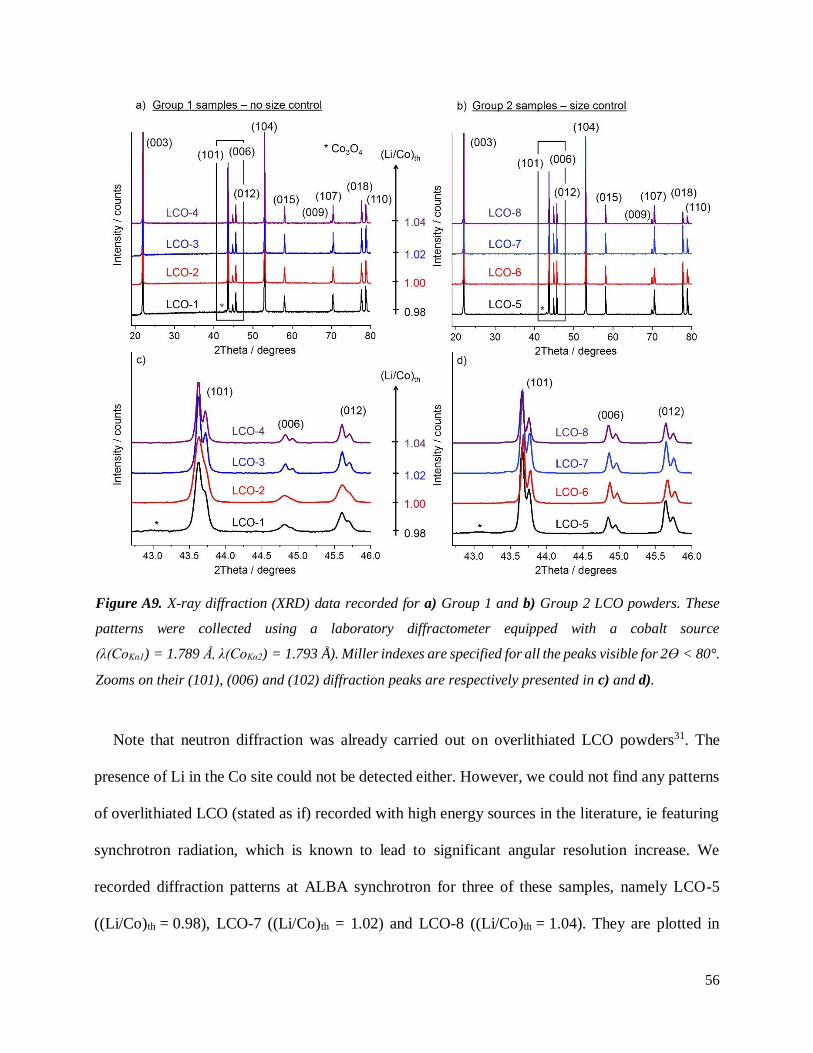
Figure A10.a. These patterns confirm the high crystallinity obtained for these LCO powders, as
thin diffraction lines are clearly visible on the insert provided in Figure A10.b. Note that the lines
exhibited by our LCO powders were even thinner than the ones of the standards used for
calibration due to the technical limitations regarding the MYTHEN detector used – which caused
the impossibility to perform Rietveld refinements. No clear difference of peak shape or cell
parameters was again observed after Le Bail refinement, though the intensity ratio between the
(101), (006) and (102) lines seems to be changed depending on the (Li/Co)th stoichiometry. XRD
patterns were simulated for these three stoichiometries in an attempt to link the change of intensity
ratio to the presence of Li in the Co site. As no significant difference was observed, the various
intensity ratios observed for these peaks most likely arise from preferential orientations in the
capillaries.
Figure A10. a) Synchrotron X-ray diffraction (SXRD) patterns recorded for LCO-5, LCO-7 and LCO-8. A
zoom on the (101), (006) and (102) diffraction peaks is given in b).
58
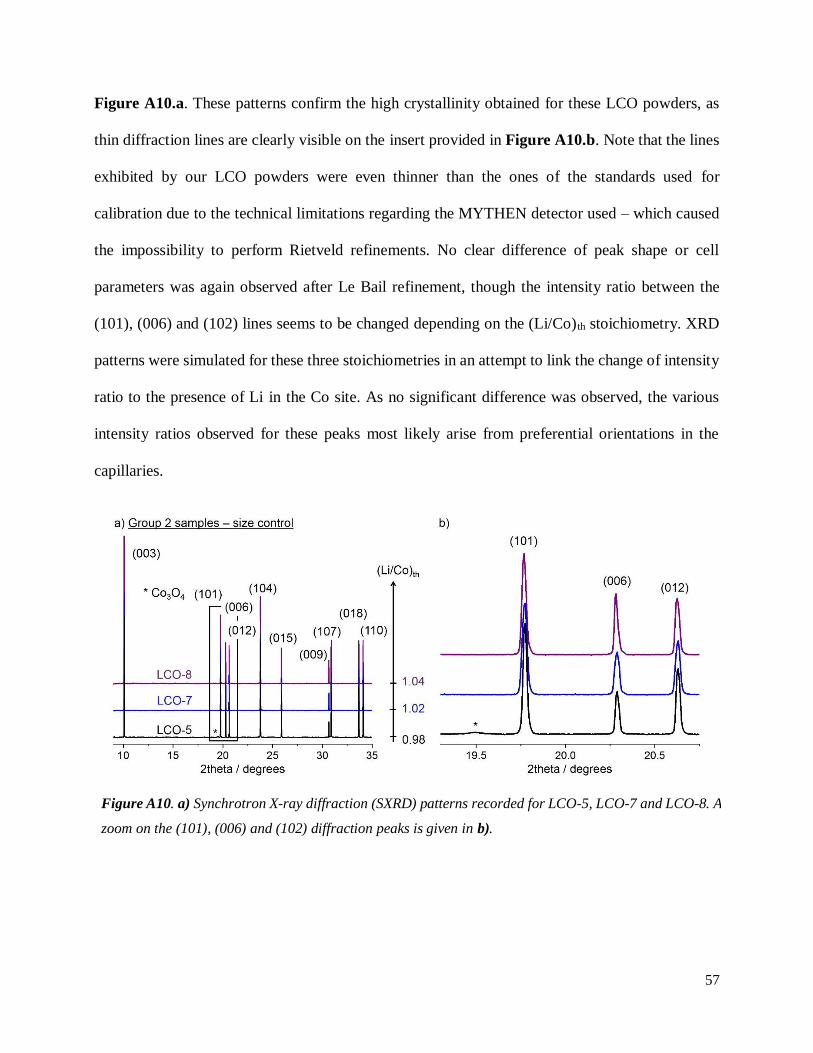
A.2.3.3 7Li MAS NMR results
Figure A11.a and Figure A11.b show a compilation of 7Li MAS NMR global spectra recorded
for Group 1 samples. Those of Group 2 samples are provided in Figure A11.c and Figure A11.d.
Apart from the spinning side bands, a single signal centered at -0.4 ppm is observed in the 7Li
NMR spectra of three samples: LCO-1 and LCO-2 (Group 1, Figure A11.b) and LCO-5 (Group 2,
Figures A11.c and A11.d). This was already reported44 as very typical signature for stoichiometric
LCO. Indeed, as Li is present in a single diamagnetic environment in stoichiometric LCO since all
cobalt ions are in low spin state (LS-Co3+: t2g6 eg0), only one contribution around 0 ppm is expected.
The chemical composition speculated in Table A.T1 for LCO-1, LCO-2 and LCO-5 were thus
correct. All three samples are indeed Li1.00CoO2, with remaining traces of Co3O4 for the two
samples prepared with (Li/Co)th = 0.98 (LCO-1 and LCO-5). A good agreement between ICP
results and 7Li NMR is found.
Six additional signals are observed in the [-30; 20ppm] chemical shift range for the five other
samples (respectively found at 7.5; 3.4; -5.4; -10.1, -14.9 and -20.1 ppm) : LCO-3 & LCO-4 for
Group 1 samples (Figure 15 b) and LCO-6, LCO-7 & LCO-8 for Group 2 samples (Figure A11.d).
Additionally, all systematically show a set of signals with weak intensities around 175 ppm. All
are characteristic features exhibited by overlithiated LCO. Indeed, intermediate spin state
paramagnetic (IS-Co3+, dxz2 dxy
2 dyz1 dz²
1 dx²-y²0) cobalt ions are formed due to the presence of Li in
the Co site associated with an O vacancy41. Due to the hyperfine interaction, adjacent Li can exhibit
negative or positive shifted signals (out of the narrow chemical shifts range of 7Li), depending on
its environment. The spectrum of every overlithiated LCO does exhibit, therefore, in addition to
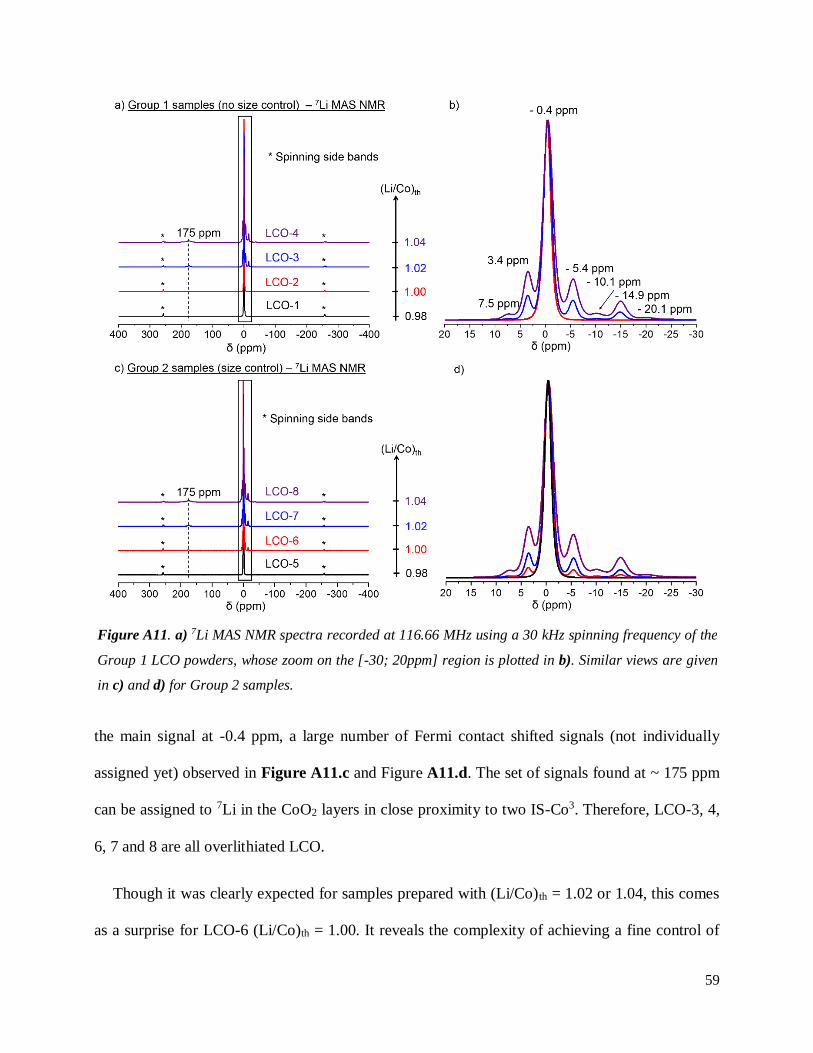
59
the main signal at -0.4 ppm, a large number of Fermi contact shifted signals (not individually
assigned yet) observed in Figure A11.c and Figure A11.d. The set of signals found at ~ 175 ppm
can be assigned to 7Li in the CoO2 layers in close proximity to two IS-Co3. Therefore, LCO-3, 4,
6, 7 and 8 are all overlithiated LCO.
Though it was clearly expected for samples prepared with (Li/Co)th = 1.02 or 1.04, this comes
as a surprise for LCO-6 (Li/Co)th = 1.00. It reveals the complexity of achieving a fine control of
Figure A11. a) 7Li MAS NMR spectra recorded at 116.66 MHz using a 30 kHz spinning frequency of the
Group 1 LCO powders, whose zoom on the [-30; 20ppm] region is plotted in b). Similar views are given
in c) and d) for Group 2 samples.
60
the Li stoichiometry in LCO – even though the powders were prepared in large quantities to
minimize a possible deviation to (Li/Co)th due to mass errors of introduced. As a matter of fact,
this result supports the assumptions regarding the chemical composition of LCO-6 stated in
Table A.T1, arising from the measured (Li/Co)exp ratio (1.007). A good agreement between ICP
and 7Li NMR is confirmed again.
Note that the intensity of all additional signals are directly linked to the amount of excess Li
found inside the CoO2 layers of LCO. The more intense the signals are, the higher the overlithiation
rate is. Though proper quantitative analysis was not performed as it requires to integrate all
signals – including spinning side bands and a proper T2 relaxation time determination for all signals
since a Hahn echo sequence is used here – samples may be ranked according to Li excess content.
For Group 1 samples, LCO-4 is more overlithiated than LCO-3, as logically expected from their
theoretical (Li/Co)th and measured (Li/Co)exp ratios. Following the same reasoning, LCO-8 shows
the highest overlithiation rate among Group 2 samples, while LCO-6 shows the lowest. Few excess
Li are most likely found in LCO-6, judging by the very weak intensities of the additional signals.
61
A.2.3.4 General conclusions on prepared LCO and methods used for characterization
No matter the synthetic path taken, LCO powders with very fine control of Li/Co ratios were
successfully obtained. Though the synthesis for Group 1 samples was already widely known and
used, the new preparation method developed to get control on the size of the particles of Group 2
samples is thereof validated too. These samples also meet the industrial requirements, as the
combination of large and small particles is known to help achieving great packing densities.
Only one sample showed a slight deviation to the expected Li stoichiometry, namely LCO-6
with (Li/Co)th = 1.00. Though techniques such as XRD or ICP are mandatory to discuss the layered
structure and the chemical nature of the obtained phases, 7Li MAS NMR again proved itself to be
the key technique to assess the proper Li stoichiometry of the LCO powders. Indeed, as excess Li
in the structure of LCO may not be detected by the means of XRD (even with the use of a highly
energetic radiation generated by synchrotron), additional characteristic signature peaks arise in
their NMR spectra.
62
A.3 Influence of Li/Co ratio and particle size on the electrochemical
performance of LCO//Li half cells
The following aim to give more insight on the electrochemical behavior of our LCO powders
when cycled in LCO//Li half cells.
Although Stéphane Levasseur carried out an equivalent investigation during his PhD31, the
involved amounts of excess Li were significantly greater than ours, with initial Li/Co ratio of either
1.05 or 1.10. He also mainly focused on LCO//Li cells cycled in conventional voltage range, i.e.
between 3.0 and 4.3 V, meaning that no information about the electrochemical behavior of LCO
powders (including overlithiated ones) was obtained in the high voltage window. Additionally, no
size control of the particles was achieved. Powders with higher specific surface areas are expected
to suffer substantially more from electrolyte degradation, which can reflect in the electrochemical
profiles. Note that the particle size itself also influences the Li intercalation processes, as Li
diffusion in larger particles is more challenging. Decomposition products forming the solid
electrolyte interphase on LCO (SEI) may also lead to greater polarization in the cycling curves due
to a poor resulting electronic conductivity (see Part B). Depending on the chemical nature of the
SEI, the Li conductivity may also be impacted. All these parameters are thereof expected to
influence the cycling curves obtained for the LCO//Li cells. As a matter of fact, we indeed observed
more polarization in the cycling curves of Group 2 samples than those of Group 1 samples.
Therefore, the discussion will feature both series of LCO powders depending on the topic in the
following. Electrochemical variables such as charge and discharge capacities will be discussed for
Group 2 samples – as they show similar specific surface areas and may have similar reactivity
towards the electrolyte, making the Li/Co ratio the main changing parameter from one test to
another. Note that since the sample prepared with (Li/Co)th = 1.00 (LCO-6) was dismissed for this
63
study as it is not a real stoichiometric LCO. Sample LCO-5 ((Li/Co)th = 0.98) was used as
replacement – since it was proven to be mainly composed of stoichiometric LCO. Group 1 samples
will preferentially be used to discuss the lineshape of the cycling curves at high voltage, linked to
structural instabilities, as they showed less polarization and more pronounced changes.
A.3.1 Experimental details: electrochemistry
All electrochemical tests for this part were carried out in coin cells. Note that 3 to 4 coin cells
were assembled for each test to ensure a good reproducibility. Special efforts on the formulation
of the electrodes were also made in order to meet the industrial requirements for the active material
loading (10mg/cm²), playing on the viscosity of the prepared slurries and the thickness of the films.
LCO:C:PVDF electrodes (90:5:5 %wt) with the above-mentioned LCO active materials were
prepared from a slurry using N-methyl-pyrrolidone (NMP) as solvent casted onto
30µm-thick-aluminum circles. Typical active material loading and diameter for an electrode used
for tests was 10mg/cm² and 15mm. The electrodes were dried overnight under vacuum at
T = 120 °C and stored in an argon-filled glovebox and the coin cells were assembled using pure
lithium as counter-electrode and 1 M LiPF6 in EC:DEC:DMC as electrolyte. All cells were cycled
at C/20 between 3.0 V and X (X = 4.5; 4.6; 4.7; 4.8 V).
Note that these conditions are far from ideal to ensure a proper cycle life of the LCO//Li cells,
especially with such high cutoff voltages. Additional efforts would be required to optimize it
through the use of more stable electrolytes, counter-electrodes and even current collectors – though
achieving long cycling life was not the purpose of the study. As all technical requirements were
kept equivalent from one material to another, proper conclusions regarding a comparison of the
short-term electrochemical performance of each LCO powder (i.e., 1st to 25th cycle) may still be
drawn.
64
A.3.2 Influence of Li/Co ratio on the overall electrochemical performance of
LCO//Li cells
A.3.2.1 Reversibily of Li intercalation during the 1st cycle. Charge/discharge capacities and
Coulombic efficiency.
Figure A12 shows the 1st cycle curves of the three Group 2 samples selected for electrochemical
testing, respectively i) stoichiometric LCO-5, plotted in Figure A12.a, ii) 2% overlithiated LCO-7
plotted in Figure A12.b and 4% overlithiated LCO-8 plotted in Figure A12.c. The four profiles
visible on each one of these figures correspond to the 1st cycle curves for various cutting voltages,
ranging from 4.5 to 4.8 V. All curves are plotted as a function of both remaining Li in the LCO
phase (x in LixCo1-tO2-t) and the capacity (Q) in mAh/g for easier view. The initial value for x0 is
therefore slightly different depending on the initial (Li/Co)exp of the tested LCO, and so were the
molar masses used to calculate Q. At first considerations, some electrochemical features are shared
no matter the initial Li stoichiometry of the active LCO material. The higher the cutoff voltage, the
higher the charge capacity logically is, as more Li is de-intercalated. This may be more easily seen
on Figure A12.d, which gives the evolution of charge and discharge capacities (respectively CQ
and DQ) as a function of the cutoff voltage. Unlike Figure A12.a, Figure A12.b and Figure A12.c,
Figure A12.d is based on the results obtained for several coin cells for each test, one experiment
being defined by both the active material and the cutoff voltage. Greater polarizations are also
observed in the electrochemical window above 4.2 V with an increase of the charge cutoff voltage.
This may be due to the presence of insulating SEI at the surface of the particles, whose growth may
be driven by greater electrolyte decomposition. Indeed, the electrolyte used for this study is
expected to be unstable for E > 4.5 V. In any case, the formation of decomposition products is
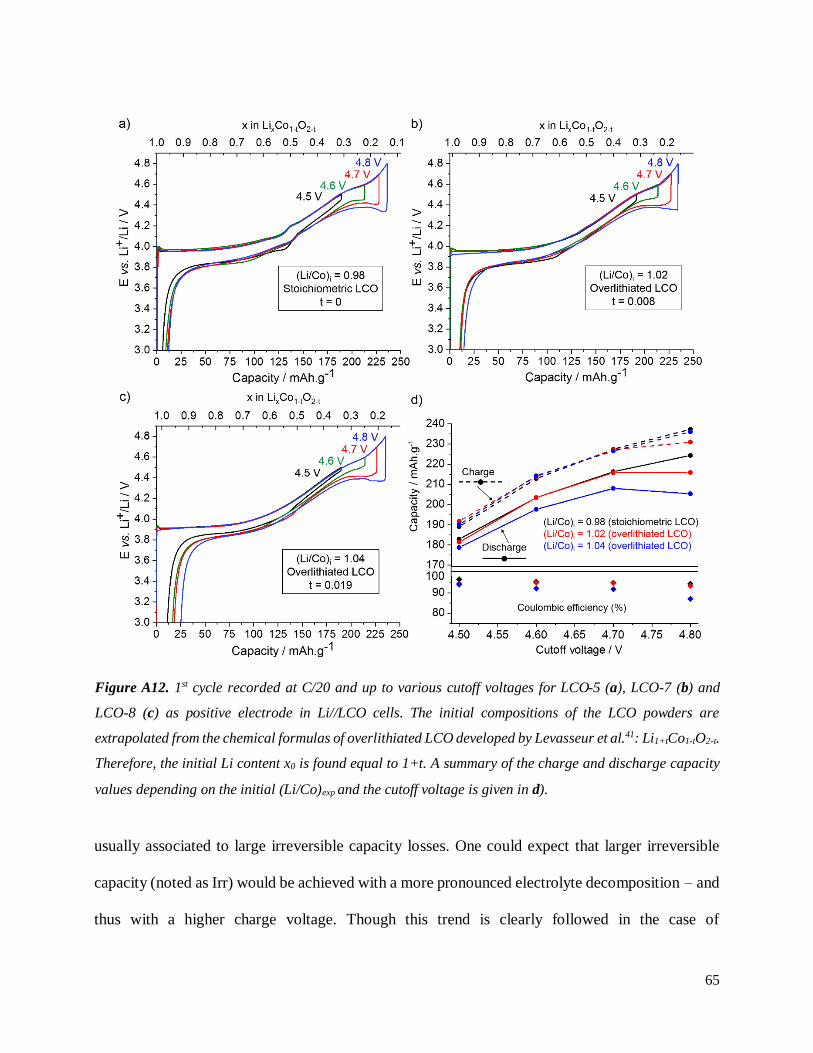
65
usually associated to large irreversible capacity losses. One could expect that larger irreversible
capacity (noted as Irr) would be achieved with a more pronounced electrolyte decomposition – and
thus with a higher charge voltage. Though this trend is clearly followed in the case of
Figure A12. 1st cycle recorded at C/20 and up to various cutoff voltages for LCO-5 (a), LCO-7 (b) and
LCO-8 (c) as positive electrode in Li//LCO cells. The initial compositions of the LCO powders are
extrapolated from the chemical formulas of overlithiated LCO developed by Levasseur et al.41: Li1+tCo1-tO2-t.
Therefore, the initial Li content x0 is found equal to 1+t. A summary of the charge and discharge capacity
values depending on the initial (Li/Co)exp and the cutoff voltage is given in d).
66
4%-overlithiated LCO-8 (Figure A12.c), as the highest capacity losses are found for Ecutoff = 4.8 V
and the lowest for Ecutoff = 4.5 V, quite similar irreversible capacity is achieved no matter the cutoff
voltage for LCO with Li/Co getting closer to 1.00. Note that such information may be more simply
discussed in Figure A12.d through the calculated Coulombic efficiency (CE), which can be
expressed as
𝐶𝐸 = 𝐷𝑄
𝐶𝑄× 100 =
𝐶𝑄 − 𝐼𝑟𝑟
𝐶𝑄× 100 .
While the coulombic efficiency achieved for the 1st cycle of LCO-8 up to 4.5 V was ~ 94 %, it
drops at 84 % with a cutoff voltage of 4.8 V. For stoichiometric LCO-5, it only goes from 96.5 %
to 93.5 % with similar voltage range. The cause for the observed polarization at high voltage may
thereof linked to other factors, in which the initial (Li/Co)exp may play a role – in addition to the
particle size itself. Note that for a same final voltage, the sample with the greater Li excess (LCO-8)
always show less discharge capacity – and thus more Irr – than LCO-7 and LCO-5. For instance,
the 1st cycle between 3.0 and 4.8 V leads to ~ 84 % Coulombic efficiency for LCO-8, while much
better CE of ~ 94 and ~ 95% are respectively obtained for LCO-7 and LCO-5. Therefore, while it
is true that the influence of Li excess (in greater amounts) on the electrochemical performances of
LCO is not new, it seems that even percentages as small as 4% of Li excess also have a measurable
effects on electrochemical variables such as the discharge capacity and the irreversible capacity
losses. Differences between LCO-8 and LCO-5 or LCO-7 are though more pronounced as
compared to those between LCO-5 and LCO-7, almost undetectable.
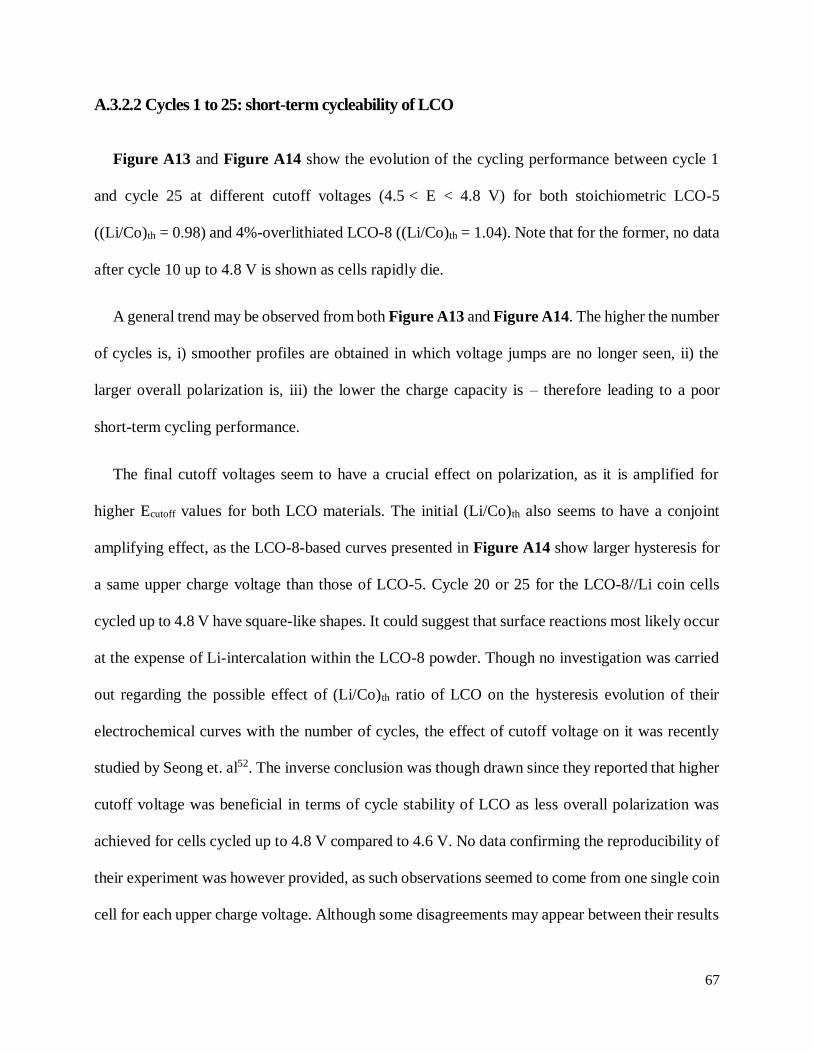
67
A.3.2.2 Cycles 1 to 25: short-term cycleability of LCO
Figure A13 and Figure A14 show the evolution of the cycling performance between cycle 1
and cycle 25 at different cutoff voltages (4.5 < E < 4.8 V) for both stoichiometric LCO-5
((Li/Co)th = 0.98) and 4%-overlithiated LCO-8 ((Li/Co)th = 1.04). Note that for the former, no data
after cycle 10 up to 4.8 V is shown as cells rapidly die.
A general trend may be observed from both Figure A13 and Figure A14. The higher the number
of cycles is, i) smoother profiles are obtained in which voltage jumps are no longer seen, ii) the
larger overall polarization is, iii) the lower the charge capacity is – therefore leading to a poor
short-term cycling performance.
The final cutoff voltages seem to have a crucial effect on polarization, as it is amplified for
higher Ecutoff values for both LCO materials. The initial (Li/Co)th also seems to have a conjoint
amplifying effect, as the LCO-8-based curves presented in Figure A14 show larger hysteresis for
a same upper charge voltage than those of LCO-5. Cycle 20 or 25 for the LCO-8//Li coin cells
cycled up to 4.8 V have square-like shapes. It could suggest that surface reactions most likely occur
at the expense of Li-intercalation within the LCO-8 powder. Though no investigation was carried
out regarding the possible effect of (Li/Co)th ratio of LCO on the hysteresis evolution of their
electrochemical curves with the number of cycles, the effect of cutoff voltage on it was recently
studied by Seong et. al52. The inverse conclusion was though drawn since they reported that higher
cutoff voltage was beneficial in terms of cycle stability of LCO as less overall polarization was
achieved for cells cycled up to 4.8 V compared to 4.6 V. No data confirming the reproducibility of
their experiment was however provided, as such observations seemed to come from one single coin
cell for each upper charge voltage. Although some disagreements may appear between their results
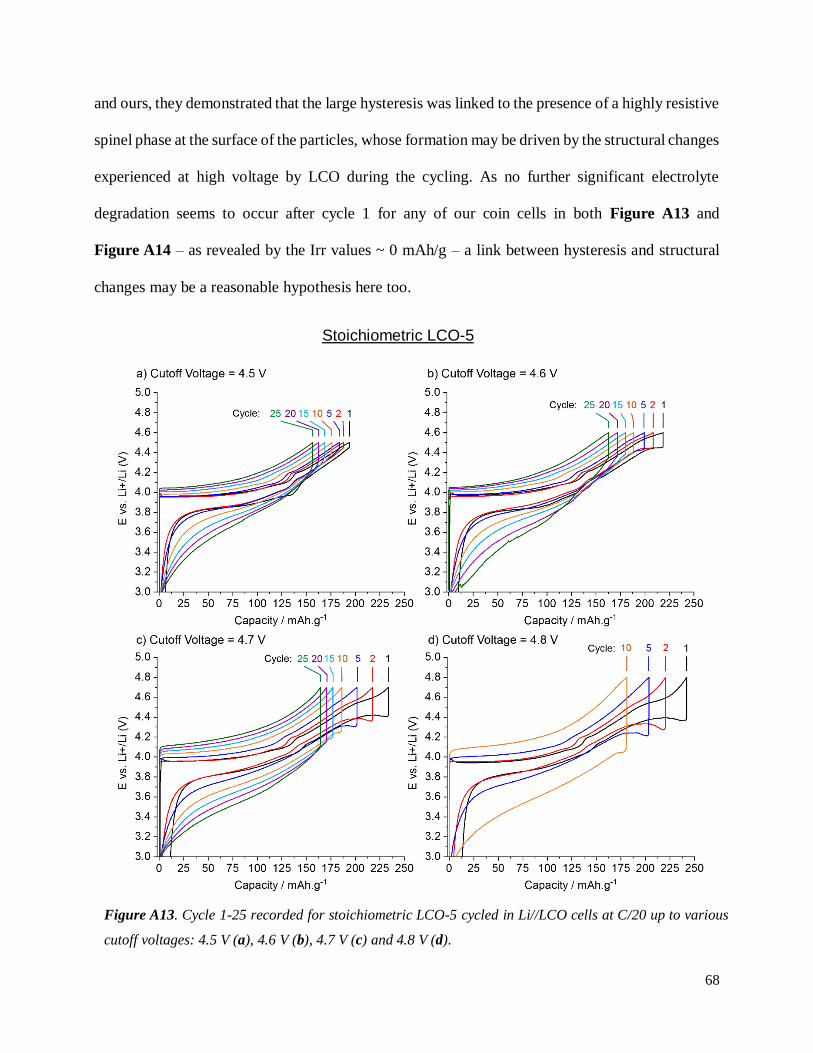
68
and ours, they demonstrated that the large hysteresis was linked to the presence of a highly resistive
spinel phase at the surface of the particles, whose formation may be driven by the structural changes
experienced at high voltage by LCO during the cycling. As no further significant electrolyte
degradation seems to occur after cycle 1 for any of our coin cells in both Figure A13 and
Figure A14 – as revealed by the Irr values ~ 0 mAh/g – a link between hysteresis and structural
changes may be a reasonable hypothesis here too.
Figure A13. Cycle 1-25 recorded for stoichiometric LCO-5 cycled in Li//LCO cells at C/20 up to various
cutoff voltages: 4.5 V (a), 4.6 V (b), 4.7 V (c) and 4.8 V (d).
Stoichiometric LCO-5
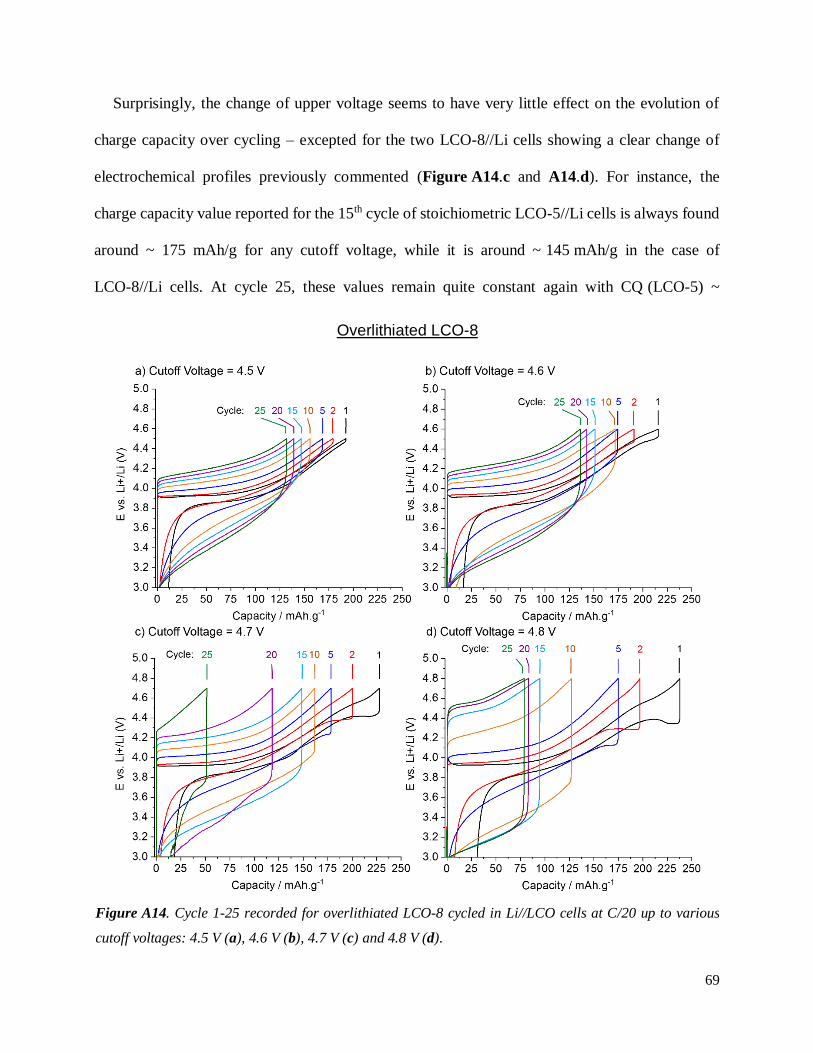
69
Surprisingly, the change of upper voltage seems to have very little effect on the evolution of
charge capacity over cycling – excepted for the two LCO-8//Li cells showing a clear change of
electrochemical profiles previously commented (Figure A14.c and A14.d). For instance, the
charge capacity value reported for the 15th cycle of stoichiometric LCO-5//Li cells is always found
around ~ 175 mAh/g for any cutoff voltage, while it is around ~ 145 mAh/g in the case of
LCO-8//Li cells. At cycle 25, these values remain quite constant again with CQ (LCO-5) ~
Figure A14. Cycle 1-25 recorded for overlithiated LCO-8 cycled in Li//LCO cells at C/20 up to various
cutoff voltages: 4.5 V (a), 4.6 V (b), 4.7 V (c) and 4.8 V (d).
Overlithiated LCO-8
70
160 mAh/g and CQ (LCO-8) ~ 130 mAh/g. the difference between the values reported for
stoichiometric or overlithiated LCO may still reveal an additional effect of initial Li/Co on the
cycle stability of LCO.
A.3.2.3 Evidence of structural changes
Another important consideration to be made regards the overall shape of the profile obtained for
LCO-based electrodes with different initial Li/Co. Though Figure A12.a, Figure A12.b and
Figure A12.c certainly showed some of the features about to be discussed, the comparison of 1st
cycle curves was more thoroughly performed for Group 1 samples, whose polarization at high
voltage was significantly decreased. Electrochemical profiles are gathered in Figure A15.a, and
the associated dQ/dV curves are shown in Figure A15.b. Note that a zoom on both the 1st cycle
and derivative curves in the high voltage window (4.35 < E < 4.7 V) are respectively provided in
Figure A15.c and Figure A15.d.
Both LCO-1 ((Li/Co)th = 0.98) and LCO-2 ((Li/Co)th = 1.00) samples show very typical features
expected for stoichiometric LCO-based cells at low voltage: i) the voltage plateau located at 3.95 V
corresponding to the insulator – metal transition occurring as first Li+ ions are removed2,44, and ii)
the voltage jump corresponding to the O3 ↔ O’3 monoclinic transition resulting from the
formation of a Li-vacancy ordering44,46,48,49 at x = 0.5. The latter may be more explicitly visualized
in the dQ/dV curve with the emergence of two well-defined peaks at E ~ 4.06 V and E ~ 4.18 V
respectively corresponding to the O3 – O’3 and O’3 – O3 transitions. Overlithiated samples LCO-3
((Li/Co)th = 1.02) and LCO-4 ((Li/Co)th = 1.04) do not show any voltage jump for x = 0.5 – and
thus no associated peak in their derivative profiles, which is again expected as local defects induced
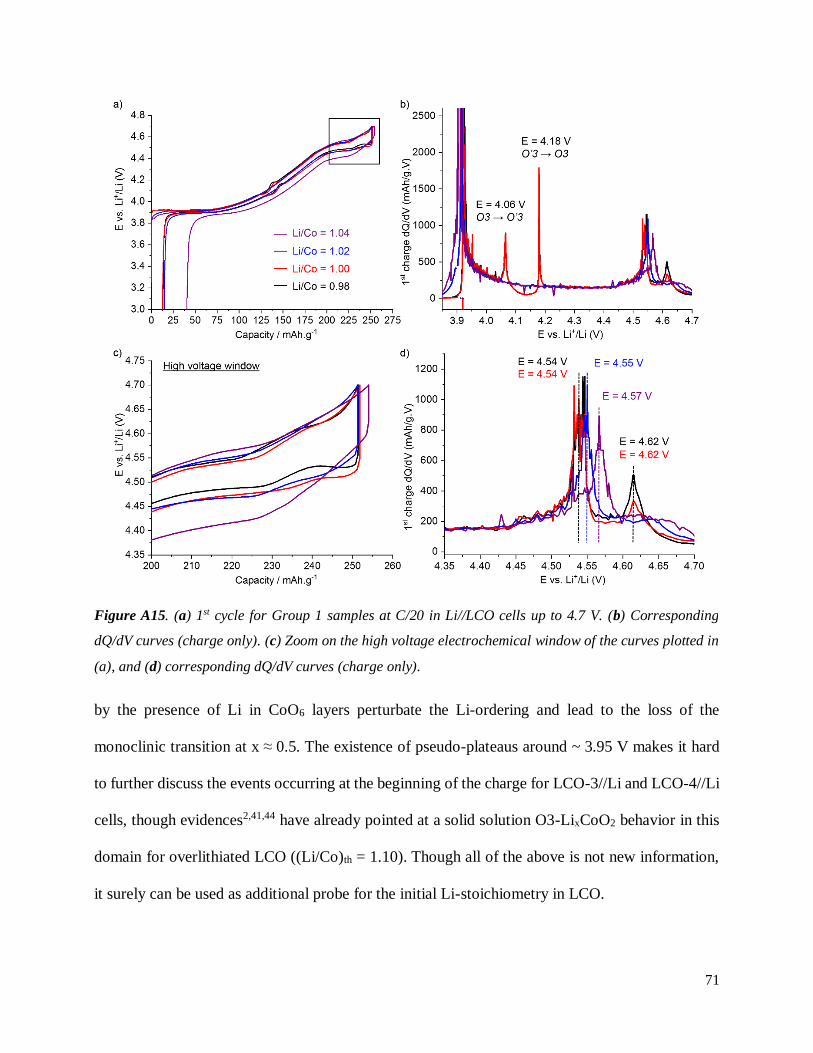
71
by the presence of Li in CoO6 layers perturbate the Li-ordering and lead to the loss of the
monoclinic transition at x ≈ 0.5. The existence of pseudo-plateaus around ~ 3.95 V makes it hard
to further discuss the events occurring at the beginning of the charge for LCO-3//Li and LCO-4//Li
cells, though evidences2,41,44 have already pointed at a solid solution O3-LixCoO2 behavior in this
domain for overlithiated LCO ((Li/Co)th = 1.10). Though all of the above is not new information,
it surely can be used as additional probe for the initial Li-stoichiometry in LCO.
Figure A15. (a) 1st cycle for Group 1 samples at C/20 in Li//LCO cells up to 4.7 V. (b) Corresponding
dQ/dV curves (charge only). (c) Zoom on the high voltage electrochemical window of the curves plotted in
(a), and (d) corresponding dQ/dV curves (charge only).
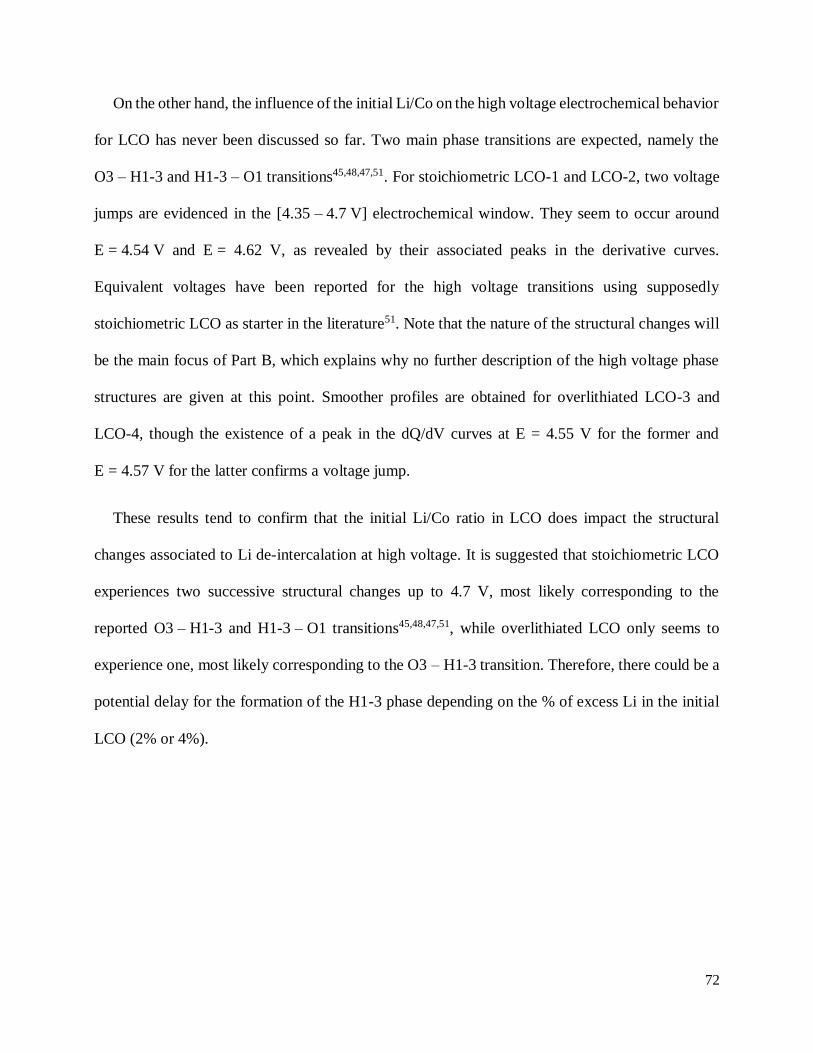
72
On the other hand, the influence of the initial Li/Co on the high voltage electrochemical behavior
for LCO has never been discussed so far. Two main phase transitions are expected, namely the
O3 – H1-3 and H1-3 – O1 transitions45,48,47,51. For stoichiometric LCO-1 and LCO-2, two voltage
jumps are evidenced in the [4.35 – 4.7 V] electrochemical window. They seem to occur around
E = 4.54 V and E = 4.62 V, as revealed by their associated peaks in the derivative curves.
Equivalent voltages have been reported for the high voltage transitions using supposedly
stoichiometric LCO as starter in the literature51. Note that the nature of the structural changes will
be the main focus of Part B, which explains why no further description of the high voltage phase
structures are given at this point. Smoother profiles are obtained for overlithiated LCO-3 and
LCO-4, though the existence of a peak in the dQ/dV curves at E = 4.55 V for the former and
E = 4.57 V for the latter confirms a voltage jump.
These results tend to confirm that the initial Li/Co ratio in LCO does impact the structural
changes associated to Li de-intercalation at high voltage. It is suggested that stoichiometric LCO
experiences two successive structural changes up to 4.7 V, most likely corresponding to the
reported O3 – H1-3 and H1-3 – O1 transitions45,48,47,51, while overlithiated LCO only seems to
experience one, most likely corresponding to the O3 – H1-3 transition. Therefore, there could be a
potential delay for the formation of the H1-3 phase depending on the % of excess Li in the initial
LCO (2% or 4%).
73
A.4 Conclusion Part A
Series of LCO powders with well controlled Li/Co initial stoichiometries were successfully
prepared using two different solid state routes. Only one sample shows a slight deviation to the
expected Li/Co)th stoichiometry: LCO-6 ((Li/Co)th = 1.00) as traces of surlithiation were detected
and therefore mean that it is not stoichiometric. However, no article had reported the preparation
of LCO powders with such a narrow range of Li stoichiometries so far (0.98 < Li/Co < 1.04). While
the first preparation method is not new as it consists of the heat treatment of mixtures of Co3O4 and
Li2CO3, already known from the literature, we validated a second synthetic path. The formation of
an overlithiated LCO in the first step and the use of Co3O4 in the second step yields to a proper
control of particle sizes in the final LCO powders, which could not be achieved following the
classical solid state route due to the flux role from melted Li2CO3. The resulting Group 2 samples
indeed show two populations of particles whose sizes are respectively ~ 35 µm and ~ 1 µm no
matter the final Li/Co ratio targeted for LCO. With a varying Li/Co ratio, these populations are
found in different relative amounts within the LCO powders. To this end, Group 2 LCO samples
follow the industrial requirements needed to achieve proper packing density.
The validation of both procedures was possible thanks to the combination of characterization
techniques such as ICP, XRD, SEM and 7Li MAS NMR. The latter has shown itself to be key when
it comes to discussing the proper Li stoichiometries of LCO powders. Indeed, the presence of
excess Li within the structure of LCO to form overlithiated phases can only be certified through
their NMR spectra, as no difference is observed in the XRD patterns of the series of LCO.
Electrochemical tests confirmed previous findings that the initial Li/Co ratio in LCO does
influence the electrochemical variables such as capacity values. Overlithiated LCO always show
74
lower discharge capacity than their stoichiometric analogues during the 1st cycle. This effect is
amplified for larger initial Li/Co. However, no matter the initial Li stoichiometry of the tested LCO
powders, poor cycle life is achieved as curves with large hysteresis are quickly obtained after a few
cycles. This could be related to structural instabilities experienced in the high voltage
electrochemical window. The mechanisms for phase transitions seems to be influenced by the
initial Li/Co ratio of LCO. While two voltage jumps can be clearly seen at the end of the 1st cycle
up to 4.7 V for stoichiometric LCO, only one is visible for overlithiated LCO. A proper
investigation of the phase transition mechanisms depending on the initial Li/Co of LCO may
therefore be carried out based on these results. As they showed the most pronounced differences,
samples LCO-5 (Li/Co)th = 0.98) and LCO-8 (Li/Co)th = 1.04) will now be used as reference
samples for Part B.
75
A.5 Bibliography Part A
(1) Nakai, I.; Takahashi, K.; Shiraishi, Y.; Nakagome, T.; Izumi, F.; Ishii, Y.; Nishikawa, F.;
Konishi, T. X-Ray Absorption Fine Structure and Neutron Diffraction Analyses of de-
Intercalation Behavior in the LiCoO2 and LiNiO2 Systems. J. Power Sources 1997, 68 (2),
536–539. https://doi.org/10.1016/S0378-7753(97)02598-6.
(2) Ménétrier, M.; Saadoune, I.; Levasseur, S.; Delmas, C. The Insulator-Metal Transition upon
Lithium Deintercalation from LiCoO2: Electronic Properties and 7Li NMR Study. J. Mater.
Chem. 1999, 9 (5), 1135–1140. https://doi.org/10.1039/A900016J.
(3) Kellerman, D. G.; Galakhov, V. R.; Semenova, A. S.; Blinovskov, Y. N.; Leonidova, O. N.
Semiconductor-Metal Transition in Defect Lithium Cobaltite. Phys. Solid State 2006, 48 (3),
548–556. https://doi.org/10.1134/S106378340603022X.
(4) Dahéron, L.; Dedryvère, R.; Martinez, H.; Ménétrier, M.; Denage, C.; Delmas, C.; Gonbeau,
D. Electron Transfer Mechanisms upon Lithium Deintercalation from LiCoO2 to CoO2
Investigated by XPS. Chem. Mater. 2008, 20 (2), 583–590.
https://doi.org/10.1021/cm702546s.
(5) Chen, C.-H.; Hwang, B.-J.; Chen, C.-Y.; Hu, S.-K.; Chen, J.-M.; Sheu, H.-S.; Lee, J.-F. Soft
X-Ray Absorption Spectroscopy Studies on the Chemically Delithiated Commercial LiCoO2
Cathode Material. J. Power Sources 2007, 174 (2), 938–943.
https://doi.org/10.1016/j.jpowsour.2007.06.083.
(6) Yoon, W.-S.; Kim, K.-B.; Kim, M.-G.; Lee, M.-K.; Shin, H.-J.; Lee, J.-M.; Lee, J.-S.; Yo,
C.-H. Oxygen Contribution on Li-Ion Intercalation−Deintercalation in LiCoO2 Investigated
76
by O K-Edge and Co L-Edge X-Ray Absorption Spectroscopy. J. Phys. Chem. B 2002, 106
(10), 2526–2532. https://doi.org/10.1021/jp013735e.
(7) Graetz, J.; Hightower, A.; Ahn, C. C.; Yazami, R.; Rez, P.; Fultz, B. Electronic Structure of
Chemically-Delithiated LiCoO2 Studied by Electron Energy-Loss Spectrometry. J. Phys.
Chem. B 2002, 106 (6), 1286–1289. https://doi.org/10.1021/jp0133283.
(8) Montoro, L. A.; Abbate, M.; Rosolen, J. M. Changes in the Electronic Structure of
Chemically Deintercalated LiCoO2. Electrochem. Solid-State Lett. 2000, 3 (9), 410–412.
https://doi.org/10.1149/1.1391162.
(9) Niemöller, A.; Jakes, P.; Eichel, R.-A.; Granwehr, J. In Operando EPR Investigation of
Redox Mechanisms in LiCoO2. Chem. Phys. Lett. 2019, 716, 231–236.
https://doi.org/10.1016/j.cplett.2018.12.022.
(10) Delmas, C.; Fouassier, C.; Hagenmuller, P. Structural Classification and Properties of the
Layered Oxides. Phys. BC 1980, 99 (1), 81–85. https://doi.org/10.1016/0378-
4363(80)90214-4.
(11) Mendiboure, A.; Delmas, C.; Hagenmuller, P. New Layered Structure Obtained by
Electrochemical Deintercalation of the Metastable LiCoO2 (O2) Variety. Mater. Res. Bull.
1984, 19 (10), 1383–1392. https://doi.org/10.1016/0025-5408(84)90204-6.
(12) Komaba, S.; Yabuuchi, N.; Kawamoto, Y. A New Polymorph of Layered LiCoO2. Chem.
Lett. 2009, 38 (10), 954–955. https://doi.org/10.1246/cl.2009.954.
(13) Berthelot, R.; Carlier, D.; Pollet, M.; Doumerc, J.-P.; Delmas, C. Synthesis and
Investigations on an O4-LiCoO2 Polytype. Electrochem. Solid-State Lett. 2009, 12 (11),
A207–A210. https://doi.org/10.1149/1.3204643.
77
(14) Gummow, R.; Thackeray, M.; David, W.; Hull, S. Structure and Electrochemistry of Lithium
Cobalt Oxide Synthesised at 400°C. Mater. Res. Bull. 1992, 27 (3), 327–337.
https://doi.org/10.1016/0025-5408(92)90062-5.
(15) Lundblad, A.; Bergman, B. Synthesis of LiCoO2 Starting from Carbonate Precursors II.
Influence of Calcination Conditions and Leaching. Solid State Ion. 1997, 96 (3–4), 183–193.
https://doi.org/10.1016/S0167-2738(97)00017-9.
(16) Wicker, S. A.; Walker, E. H. Revisited: Decomposition or Melting? Formation Mechanism
Investigation of LiCoO2 via In-Situ Time-Resolved X-Ray Diffraction. Inorg. Chem. 2013,
52 (4), 1772–1779. https://doi.org/10.1021/ic301516a.
(17) Timoshevskii, A. N.; Ktalkherman, M. G.; Emel’kin, V. A.; Pozdnyakov, B. A.; Zamyatin,
A. P. High-Temperature Decomposition of Lithium Carbonate at Atmospheric Pressure.
High Temp. 2008, 46 (3), 414–421. https://doi.org/10.1134/S0018151X0803019X.
(18) Ktalkherman, M. G.; Emelkin, V. A.; Pozdnyakov, B. A. Production of Lithium Oxide by
Decompostion Lithium Carbonate in the Flow of a Heat Carrier. Theor. Found. Chem. Eng.
2009, 43 (1), 88–93. https://doi.org/10.1134/S0040579509010114.
(19) Lundblad, A.; Bergman, B. Synthesis of LiCoO2 Starting from Carbonate Precursors I. The
Reaction Mechanisms. Solid State Ion. 1997, 96 (3–4), 173–181.
https://doi.org/10.1016/S0167-2738(97)00016-7.
(20) Antolini, E.; Ferretti, M. Synthesis and Thermal Stability of LiCoO2. J. Solid State Chem.
1995, 117 (1), 1–7. https://doi.org/10.1006/jssc.1995.1238.
(21) Sun, Y.-K.; Oh, I.-H.; Hong, S.-A. Synthesis of Ultrafine LiCoO2 Powders by the Sol-Gel
Method. J. Mater. Sci. 1996, 31 (14), 3617–3621. https://doi.org/10.1007/BF00352769.
78
(22) Oh, I.-H.; Hong, S.-A.; Sun, Y.-K. Low-Temperature Preparation of Ultrafine LiCoO2
Powders by the Sol–Gel Method. J. Mater. Sci. 1997, 32 (12), 3177–3182.
https://doi.org/10.1023/A:1018650717723.
(23) Yoon, W.-S.; Kim, K.-B. Synthesis of LiCoO2 Using Acrylic Acid and Its Electrochemical
Properties for Li Secondary Batteries. J. Power Sources 1999, 81–82, 517–523.
https://doi.org/10.1016/S0378-7753(98)00226-2.
(24) Peng, Z. S.; Wan, C. R.; Jiang, C. Y. Synthesis by Sol–Gel Process and Characterization of
LiCoO2 Cathode Materials. J. Power Sources 1998, 72 (2), 215–220.
https://doi.org/10.1016/S0378-7753(97)02689-X.
(25) Kang, S. G.; Kang, S. Y.; Ryu, K. S.; Chang, S. H. Electrochemical and Structural Properties
of HT-LiCoO2 and LT-LiCoO2 Prepared by the Citrate Sol-Gel Method. Solid State Ion.
1999, 120 (1), 155–161. https://doi.org/10.1016/S0167-2738(98)00559-1.
(26) Amatucci, G. G.; Tarascon, J. M.; Larcher, D.; Klein, L. C. Synthesis of Electrochemically
Active LiCoO2 and LiNiO2 at 100 °C. Solid State Ion. 1996, 84 (3–4), 169–180.
https://doi.org/10.1016/0167-2738(96)00031-8.
(27) Han, C.-H.; Hong, Y.-S.; Park, C. M.; Kim, K. Synthesis and Electrochemical Properties of
Lithium Cobalt Oxides Prepared by Molten-Salt Synthesis Using the Eutectic Mixture of
LiCl–Li2CO3. J. Power Sources 2001, 92 (1), 95–101. https://doi.org/10.1016/S0378-
7753(00)00505-X.
(28) Tang, W.; Kanoh, H.; Ooi, K. Preparation of Lithium Cobalt Oxide by LiCl Flux Method
for Lithium Rechargeable Batteries. Electrochem. Solid-State Lett. 1998, 1 (3), 145–146.
https://doi.org/10.1149/1.1390665.
79
(29) Giorgi, L.; Carewska, M.; Patriarca, M.; Scaccia, S.; Simonetti, E.; Di Bartolomeo, A.
Development and Characterization of Novel Cathode Materials for Molten Carbonate Fuel
Cell. J. Power Sources 1994, 49 (1–3), 227–243.
(30) Antolini, E.; Giorgi, L.; Carewska, M. Formation of Li-and Mg-Doped LiCoO2 Powders: A
BET Analysis. J. Mater. Sci. Lett. 1999, 18 (4), 325–327.
(31) Levasseur, S. Contribution à l’étude Des Phases Lix(Co, M)O2 En Tant Que Matériaux
d’électrode Positive Des Batteries Li-Ion. Effets Combinés de La Surstoechiométrie En
Lithium et de La Substitution (M= Ni, Mg), Université Sciences et Technologies-Bordeaux
I, 2001.
(32) Carewska, M.; Scaccia, S.; Croce, F.; Arumugam, S.; Wang, Y.; Greenbaum, S. Electrical
Conductivity and 6,7Li NMR Studies of Li1 + YCoO2. Solid State Ion. 1997, 93 (3), 227–237.
https://doi.org/10.1016/S0167-2738(96)00545-0.
(33) Ganguly, P.; Venkatraman, T. N.; Rajamohanan, P. R.; Ganapathy, S. Evidence for Multiple
M Sites in AMO2 Compounds: 59Co Solid State NMR Studies on LiCoO2. J. Phys. Chem.
B 1997, 101 (51), 11099–11105. https://doi.org/10.1021/jp9729775.
(34) Peeters, M. P. J.; van Bommel, M. J.; Neilen-ten Wolde, P. M. C.; van Hal, H. A. M.; Keur,
W. C.; Kentgens, A. P. M. A 6Li, 7Li and 59Co MAS NMR Study of Rock Salt Type LixCoO2
(0.48 ≤ x ≤ 1.05). Solid State Ion. 1998, 112 (1–2), 41–52. https://doi.org/10.1016/S0167-
2738(98)00213-6.
(35) Levasseur, S.; Menetrier, M.; Suard, E.; Delmas, C. Evidence for Structural Defects in Non-
Stoichiometric HT-LiCoO2: Electrochemical, Electronic Properties and 7Li NMR Studies.
Solid State Ion. 2000, 128 (1–4), 11–24.
(36) Gorshkov, V. S.; Kellerman, D. G.; Karelina, V. V. Magnetic susceptibility study of defect
formation in the LiCoO2 complex oxide. Zhurnal Fiz. Khimii 1999, 73 (6), 1041–1045.
80
(37) Karelina, V. V.; Kellerman, D. G.; Gorshkov, V. S.; Leonidov, I. A.; Patrakeev, M. V.
Nonstoichiometry and electric properties of LiCoO2. Zhurnal Fiz. Khimii 2001, 75 (3), 568–
572.
(38) Galakhov, V. R.; Karelina, V. V.; Kellerman, D. G.; Gorshkov, V. S.; Ovechkina, N. A.;
Neumann, M. Electronic Structure, x-Ray Spectra, and Magnetic Properties of the LiCoO2−δ
and NaxCoO2 Nonstoichiometric Oxides. Phys. Solid State 2002, 44 (2), 266–273.
https://doi.org/10.1134/1.1451011.
(39) Imanishi, N.; Fujii, M.; Hirano, A.; Takeda, Y. Synthesis and Characterization of
Nonstoichiometric LiCoO2. J. Power Sources 2001, 97–98, 287–289.
https://doi.org/10.1016/S0378-7753(01)00740-6.
(40) Imanishi, N.; Yamade, M.; Ichikawa, T.; Hirano, A.; Takeda, Y. Characterization and
Electrode Behavior of LixCoO2 (x>1). Ionics 2002, 8 (1–2), 100–107.
https://doi.org/10.1007/BF02377759.
(41) Levasseur, S.; Ménétrier, M.; Shao-Horn, Y.; Gautier, L.; Audemer, A.; Demazeau, G.;
Largeteau, A.; Delmas, C. Oxygen Vacancies and Intermediate Spin Trivalent Cobalt Ions
in Lithium-Overstoichiometric LiCoO2. Chem. Mater. 2003, 15 (1), 348–354.
https://doi.org/10.1021/cm021279g.
(42) Levasseur, S.; Ménétrier, M.; Delmas, C. On the Dual Effect of Mg Doping in LiCoO2 and
Li1+δCoO2: Structural, Electronic Properties, and 7Li MAS NMR Studies. Chem. Mater.
2002, 14 (8), 3584–3590. https://doi.org/10.1021/cm021107j.
(43) Carlier, D.; Cheng, J.-H.; Pan, C.-J.; Ménétrier, M.; Delmas, C.; Hwang, B.-J. DFT+U
Calculations and XAS Study: Further Confirmation of the Presence of CoO5 Square-Based
Pyramids with IS-Co3+ in Li-Overstoichiometric LiCoO2
http://pubs.acs.org/doi/suppl/10.1021/jp409850q.
81
(44) Ménétrier, M.; Carlier, D.; Blangero, M.; Delmas, C. On “Really” Stoichiometric LiCoO2.
Electrochem. Solid-State Lett. 2008, 11 (11), A179–A182.
https://doi.org/10.1149/1.2968953.
(45) Van der Ven, A.; Aydinol, M. K.; Ceder, G.; Kresse, G.; Hafner, J. First-Principles
Investigation of Phase Stability in LixCoO2. Phys. Rev. B 1998, 58 (6), 2975–2987.
https://doi.org/10.1103/PhysRevB.58.2975.
(46) Reimers, J. N.; Dahn, J. R. Electrochemical and In Situ X‐Ray Diffraction Studies of Lithium
Intercalation in LixCoO2. J. Electrochem. Soc. 1992, 139 (8), 2091–2097.
https://doi.org/10.1149/1.2221184.
(47) Amatucci, G. G.; Tarascon, J. M.; Klein, L. C. CoO2, The End Member of the LixCoO2 Solid
Solution. J. Electrochem. Soc. 1996, 143 (3), 1114–1123.
https://doi.org/10.1149/1.1836594.
(48) Ohzuku, T.; Ueda, A. Solid‐State Redox Reactions of LiCoO2 (R3̅m) for 4 Volt Secondary
Lithium Cells. J. Electrochem. Soc. 1994, 141 (11), 2972–2977.
https://doi.org/10.1149/1.2059267.
(49) Shao-Horn, Y.; Levasseur, S.; Weill, F.; Delmas, C. Probing Lithium and Vacancy Ordering
in O3 Layered LixCoO2 ( x ≈ 0.5 ) An Electron Diffraction Study. J. Electrochem. Soc. 2003,
150 (3), A366–A373. https://doi.org/10.1149/1.1553787.
(50) Chen, Z.; Lu, Z.; Dahn, J. R. Staging Phase Transitions in LixCoO2. J. Electrochem. Soc.
2002, 149 (12), A1604–A1609. https://doi.org/10.1149/1.1519850.
(51) Xia, H.; Lu, L.; Meng, Y. S.; Ceder, G. Phase Transitions and High-Voltage Electrochemical
Behavior of LiCoO2 Thin Films Grown by Pulsed Laser Deposition. J. Electrochem. Soc.
2007, 154 (4), A337–A342. https://doi.org/10.1149/1.2509021.
82
(52) Seong, W. M.; Yoon, K.; Lee, M. H.; Jung, S.-K.; Kang, K. Unveiling the Intrinsic Cycle
Reversibility of a LiCoO2 Electrode at 4.8-V Cutoff Voltage through Subtractive Surface
Modification for Lithium-Ion Batteries. Nano Lett. 2018.
https://doi.org/10.1021/acs.nanolett.8b02902.
83
Part B. Investigation of high voltage phase transitions
occurring during the Li-de-intercalation of
LCO-based electrodes

84
85
Part B. Investigation of high voltage phase transitions occurring during the Li-
de-intercalation of LCO-based electrodes ......................................................... 86
B.1 Introduction. Bibliographic context .............................................................................. 86
B.1.1 Description of surface-related issues identified during the cycling of LCO at high
voltage ............................................................................................................................... 87
B.1.2 Identification of the phase transitions occurring at high voltage for the LixCoO2 system
........................................................................................................................................... 90
B.1.2.1 Background on the end member CoO2: structure, stability .................................. 90
B.1.2.2 Background on the H1-3 phase: structure, stability, composition ........................ 94
B.1.2.3 The O3 – H1-3 and H1-3 – O1 transitions ........................................................... 98
B.2 Preliminary study: in situ XRD investigation of the phase transitions occurring at
high voltage for stoichiometric and 4%-overlithiated LCO ............................................. 103
B.2.1 Experimental section ............................................................................................... 103
B.2.2 Results and discussion ............................................................................................. 104
B.2.3 Trends and hypotheses from the preliminary study. First conclusions. ..................... 108
B.3 Synchrotron in situ and ex situ X-ray diffraction for the reinvestigation of the phase
transitions occurring in the LixCoO2 system. Influence of the initial Li/Co stoichiometry.
............................................................................................................................................ 109
B.3.1 Experimental section ............................................................................................... 109
B.3.2 Re-investigated: the O3 – O’3 transition .................................................................. 114
B.3.3 The O3 – H1-3 transition ......................................................................................... 124
B.3.4 The H1-3 – O1 transition ......................................................................................... 130
B.4. On the chemical and structural properties of H1-3-Li~0.167CoO2.............................. 134
B.4.1 Structural properties ................................................................................................ 134
B.4.4 Stability of the H1-3 phase ...................................................................................... 141
B.5. General conclusions on Part B ................................................................................... 145
B.6 Bibliography Part B..................................................................................................... 147
86
Part B. Investigation of high voltage phase transitions
occurring during the Li-de-intercalation of LCO-based
electrodes
B.1 Introduction. Bibliographic context
We showed in Part A that even if more charge and discharge capacities (CQ and DQ) are
indeed achieved after one cycle of LCO//Li cells with increasing cutoff voltages, the gain of
capacity is far from being kept in the next cycles. Poor cycle life is systematically achieved, and
increasing polarization is easily observed in good agreement with previous findings1,2.
Polarization issues appearing over cycling may come from various sources, though they
usually reflect the deterioration of either the electronic and ionic conductivities, or its mechanical
properties on the whole electrode scale. However, polarization is quite often directly linked to the
degradation of the active material itself as it is found in larger proportions than any other
components of the electrode (i.e, binder and conductive filler). Historically, it may include i) the
formation of a resistive layer on its particles from the parasitic reaction with the electrolyte (SEI),
ii) blocked Li-diffusion pathways either due to the formation of the film previously mentioned, or
because of major structural re-arrangements overcome by the host structure accompanying the
Li-intercalation processes, iii) insufficient percolation between the particles of all components of
the electrode due to either volume changes or cracking of the active material particles, as shown in
Figure B1.
Following these guidelines, only a few groups have indeed investigated both the surface
and the bulk properties of cycled LCO in an attempt to explain the rapid decrease of performance
of LCO-based cells at high voltage. The major part of the recent literature dedicated to the use of
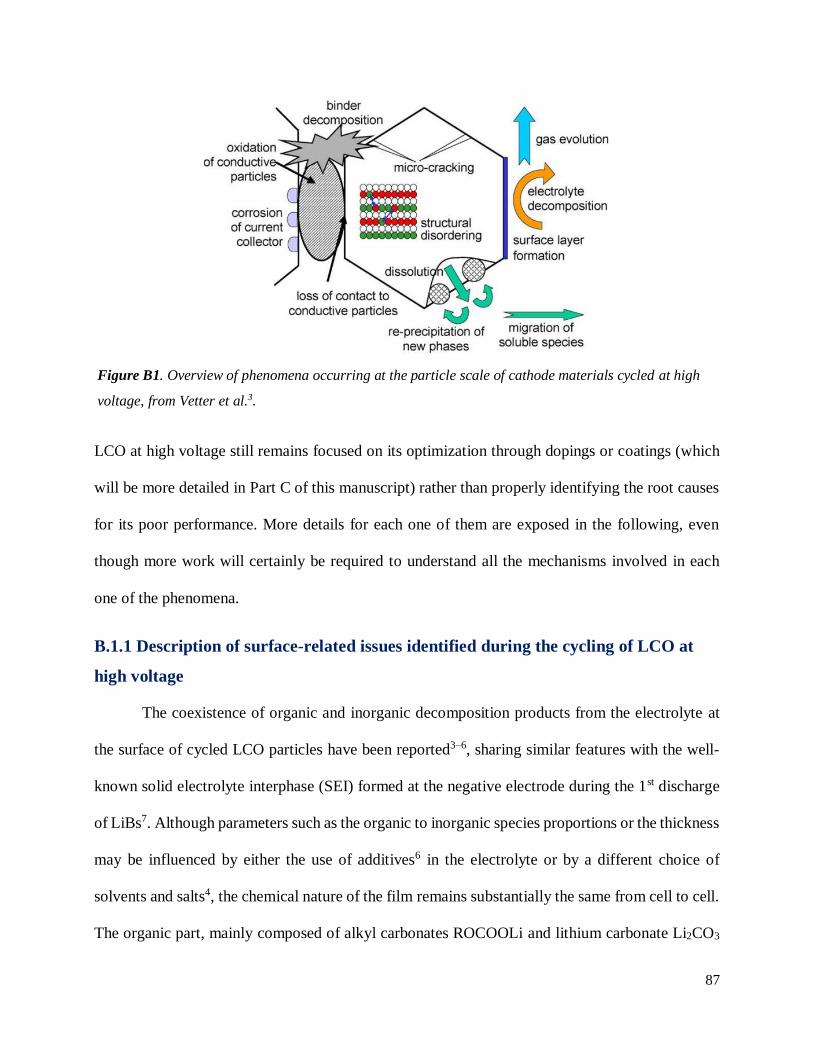
87
LCO at high voltage still remains focused on its optimization through dopings or coatings (which
will be more detailed in Part C of this manuscript) rather than properly identifying the root causes
for its poor performance. More details for each one of them are exposed in the following, even
though more work will certainly be required to understand all the mechanisms involved in each
one of the phenomena.
B.1.1 Description of surface-related issues identified during the cycling of LCO at
high voltage
The coexistence of organic and inorganic decomposition products from the electrolyte at
the surface of cycled LCO particles have been reported3–6, sharing similar features with the well-
known solid electrolyte interphase (SEI) formed at the negative electrode during the 1st discharge
of LiBs7. Although parameters such as the organic to inorganic species proportions or the thickness
may be influenced by either the use of additives6 in the electrolyte or by a different choice of
solvents and salts4, the chemical nature of the film remains substantially the same from cell to cell.
The organic part, mainly composed of alkyl carbonates ROCOOLi and lithium carbonate Li2CO3
Figure B1. Overview of phenomena occurring at the particle scale of cathode materials cycled at high
voltage, from Vetter et al.3.
88
resulting from the degradation of solvents, confers a porous character to the film. The
decomposition products from the LiPF6 salt leads to highly resistive8 lithium fluoride LiF and
oxyfluorophosphate LiPOxFy. As decomposition products such as alkyl carbonates are known to
further react, a more complex overall scheme was proposed by Aurbach et al.3,9. They stated that
LCO acts as a catalyst in the decomposition of alkyl carbonates. As a consequence, i) carbon
dioxide is emitted, ii) Co3+ are reduced in Co2+, thereof forming the Co3O4 spinel discussed later
and iii) Li2O is formed, which simultaneously reacts with HF (usually resulting from the reaction
of LiPF6 with remaining traces of water in the electrolyte) to turn into some more LiF and water.
Takahashi et al.10 later claimed that the oxidation of ethylene carbonate (EC), commonly found as
solvent in electrolytes, was responsible for Co-dissolution already observed by several other
groups11–13. As these reactions are all autocatalytic, no stable capacity can be achieved. Besides,
the combination of both the porosity and the poor electronic conductivity of the cathodic SEI has
proven to favor the creation of “dead zones” within the electrode and considerably promote particle
isolation3.
The additional presence of Co3O4 and LiCo2O4 spinels at the surface of cycled LCO has
also been uncovered by various group. Wang et al.14 and Gabrisch et al.15,16 conducted transmission
electron microscopy (TEM) investigations on LCO-based electrodes respectively cycled 50 times
at 4.35 V and 334 times at 4.2 V. They both observed spinel LiCo2O4 (Fd3m space group) on top
of the cycled LCO particles. Not only did Gabrisch et al. see this cubic phase at the surface of LCO,
some crystals were found spreading out throughout LCO crystals. Similar observations were
reported for LCO particles cycled at higher voltages in much shorter terms. Yazami et al.17
evidenced the existence of spinel for LCO submitted to a short cycling (several hours) in which
only one charge was performed up to 4.7 V. Yano et al.18 recently observed the spinel on top of
89
LCO particles cycled up to 4.7 V and submitted to a prolonged floating. They however suggested
that the cubic phase was a mixture of both LiCo2O4 and Co3O4. They proposed that at high voltage,
the creation of tetravalent CoO2 units was promoted, which could be easily oxidized into Co3O4.
In any case, as both spinels exhibit a rather low Li conductivity, they are believed to strongly
participate to both the large overall polarization observed over cycling and the capacity fade of
LCO.
Observations through TEM investigations also revealed that large amounts of defects such
as dislocations (resulting in internal strains) are systematically found in particles of LCO cycled at
moderate voltage (E < 4.35 V) and high voltage (E = 4.7 V). However, as the former experiment
usually implies hundreds of cycles while much shorter cycling is applied to the latter, accelerated
particle aging seems to be promoted again at high voltage. Besides, Yano et al.18 observed severe
cracking of LCO particles, going along with a high density of stacking faults. Pits were also clearly
distinguished. Since stacking faults are the result of irreversible CoO2 plane gliding, which is the
main mechanism considered for the formation of the H1-3 and O1 phases (see Part B.1.2.3), it is
believed that the repeated structural changes at high voltage are responsible for the severe damages
undergone by LCO particles. Gabrisch et al. additionally proposed that dislocations already present
in the starting LCO could be initiation sites for CoO2 gliding19.
One should note that a cyclic pattern may be identified between all elements previously
discussed due to the creation of “fresh” surface through cracks and pits most likely arising from
high voltage phase transitions repeating themselves over cycling. Indeed, continuous electrolyte
degradation is probably achieved, which promotes continuous formation of both direct SEI
products and spinels, gassing, and water.
90
B.1.2 Identification of the phase transitions occurring at high voltage for the
LixCoO2 system
Because of the relation between the phase transitions and all reasons given above leading
to the poor electrochemical performance of LCO//Li cells at high voltage, most research groups
focus on how to prevent their formation through LCO optimization using coatings and dopings,
rather than gaining fundamental knowledge on both H1-3 and O1 phases. Few groups have
proposed a description of their respective structures and their real chemical compositions. The
following is meant to not only give more insights on the available information, but also to identify
the missing components.
B.1.2.1 Background on the end member CoO2: structure, stability
A summary of all contemplated structures for CoO2 and their cell parameters reported by the
authors mentioned in the following is given in Table B.T1.
Amatucci et al.20 first claimed that they achieved complete Li-removal from LixCoO2 when
charging a LCO//Li cell up to E = 5.2 V. They identified the structure of CoO2 to be analogous to
the one of CdI2, and refined its XRD pattern in the P3m1 space group with cell parameters
a = 2.82 Å and c = 4.293 Å. A schematic representation of the CoO2 structure is given in
Figure B2, in which the CoO2 layers are highlighted in blue. An AB-AB sequence is found for the
closed packed oxygen planes in CoO2, differing from the ABC-ABC sequence of O3-LCO. In the
nomenclature developed by Delmas et al.21, CoO2 is an O1-type phase. Amatucci et al. also reported
that i) the poor stability of CoO2 versus air, decomposing into CoOOH and ii) the Li reinsertion
inside O1-CoO2 was possible and directly led back to an O3-LixCoO2 compound behaving as a
solid solution in the whole 0 < x < 0.95 range.
91
Further work from other groups have been dedicated to establish whether or not the P3m1
space group was crystallographically appropriated to describe the O1-structure. Seguin et al.22
recorded an in situ XRD pattern of the CoO2 end member obtained after full electrochemical Li
de-intercalation from LiCoO2, and eventually indexed it in the Cm space group. They highlighted
how challenging the refinement of CoO2 XRD patterns could be due to broad and complex
diffraction lines, raising the question of structural disorder for the first time. Three different
crystallographic sites were extrapolated for Co while no precise oxygen positions could be
determined. A follow up work23 from the same group eventually led to the indexation of CoO2
XRD pattern in the P-3m1 space group, which has later been confirmed by work from Yang et al.24,
Motohashi et al.25 and De Vaulx et al.26 and is now widely adopted. The Wyckoff positions and
occupancies of Co and O are given in Table B.T2.
Although the question of the symmetry for the O1-structure seems to be settled, the
fluctuations of cell parameters a and c existing from one article to another are never discussed. For
instance, Yang et al.24 have obtained a CoO2 phase with a = 2.828 Å and c = 4.237 Å (no
uncertainties given), while De Vaulx26 reported a = 2.8068(1) Å and c = 4.313(4) Å for their phase.
It is true that these variations of cell parameters are weak, somehow justifying that they are not
debated as they could be uncertainties from refinement, rarely given. However, experimental
considerations such as the possibility of remaining Li inside the O1-structure (directly linked to the
CoO2 end member) could also explain the variations of cell parameters. As a matter of fact, the
“CoO2” stoichiometry itself is rather assumed than experimentally demonstrated in the literature.
One cannot forget that the favored preparation of supposedly CoO2 from Li de-intercalation of
LixCoO2 in a battery implies severe electrolyte degradation, which considerably complicates the
determination of the real Li stoichiometry x of their phases.
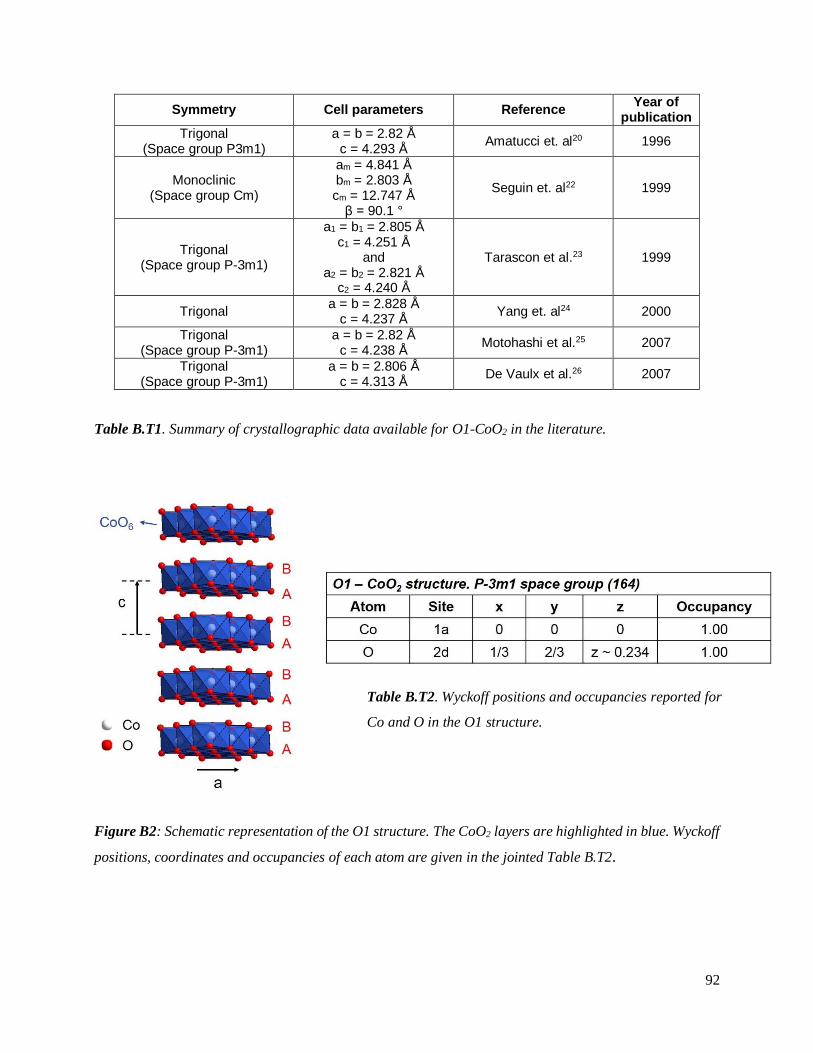
92
Symmetry Cell parameters Reference Year of
publication
Trigonal (Space group P3m1)
a = b = 2.82 Å c = 4.293 Å
Amatucci et. al20 1996
Monoclinic (Space group Cm)
am = 4.841 Å bm = 2.803 Å cm = 12.747 Å
β = 90.1 °
Seguin et. al22 1999
Trigonal (Space group P-3m1)
a1 = b1 = 2.805 Å c1 = 4.251 Å
and a2 = b2 = 2.821 Å
c2 = 4.240 Å
Tarascon et al.23 1999
Trigonal a = b = 2.828 Å
c = 4.237 Å Yang et. al24 2000
Trigonal (Space group P-3m1)
a = b = 2.82 Å c = 4.238 Å
Motohashi et al.25 2007
Trigonal (Space group P-3m1)
a = b = 2.806 Å c = 4.313 Å
De Vaulx et al.26 2007
Table B.T1. Summary of crystallographic data available for O1-CoO2 in the literature.
Figure B2: Schematic representation of the O1 structure. The CoO2 layers are highlighted in blue. Wyckoff
positions, coordinates and occupancies of each atom are given in the jointed Table B.T2.
Table B.T2. Wyckoff positions and occupancies reported for
Co and O in the O1 structure.
93
This may have contributed to the general confusion consisting of further establishing the formation
of the CoO2 end member through biases. For instance, many groups state that CoO2 is formed as
soon as lines indexed in the P-3m1 space group appear in the corresponding XRD patterns, without
considering that LiεCoO2 (ε → 0) phases could share the same symmetry. Another bias resides in
determining the formation of “CoO2” through the final cutoff voltage of their batteries itself.
Indeed, as an O1-type structure seems to be formed for E > 4.62 V, a common shortcut is to claim
the formation of CoO2 for any cutoff voltage E > 4.62 V. Besides, applying a common voltage
setpoint to LCO materials with various initial Li/Co ratios most likely leads to the formation of de-
intercalated LixCoO2 phases with various x values as well. These points will be discussed based on
our in situ XRD studies in the following.
94
B.1.2.2 Background on the H1-3 phase: structure, stability, composition
A summary of all contemplated structures for H1-3 and their cell parameters reported by the
authors mentioned in the following is given in Table B.T3.
The first experimental evidence of the H1-3 phase existence was given by Ohzuku and
Ueda27 in 1994. They observed new diffraction lines in three ex situ XRD patterns of LixCoO2
electrodes with x = 0.22; 0.21 and 0.19 (corresponding to the XRD patterns shown for Q = 216;
219 and 225 mAh/g, respectively). The new phase (later referred to as H1-3), indexed in the
monoclinic symmetry, was though never obtained as a single phase for these three compositions.
Remaining hexagonal phase was detected. No proper Li stoichiometry was proposed for the H1-3
phase. Amatucci et al.20 later confirmed that both a monoclinic with an approximate ~Li0.21CoO2
composition and a hexagonal phase analogous to O3-LCO co-existed in the same x range from in
situ XRD experiments. The cell parameters reported by these authors for the monoclinic phase
were also very comparable to those of Ohzuku and Ueda (see Table B.T4). However, they reported
the existence of a single monoclinic phase at the peculiar Li0.148CoO2 composition, whose cell
parameters differed from those of monoclinic Li0.21CoO2.
Following these two experimental works, Van der Ven et al.28–30 carried out theoretical
calculations and proposed that the new phase observed in the previously mentioned x range was an
intergrowth compound whose structure was an Hybrid of the O1- and O3- structures (leading to
the “H1-3” notation). Following previous findings on the existence of graphite intercalation stage
compounds31, they also identified it as a “stage II” compound. A schematic representation of the
H1-3 structure following Van der Ven’s predictions is given in Figure B3. Unlike the experimental
findings mentioned above, a rhomboedral symmetry is considered here (R-3m space group).
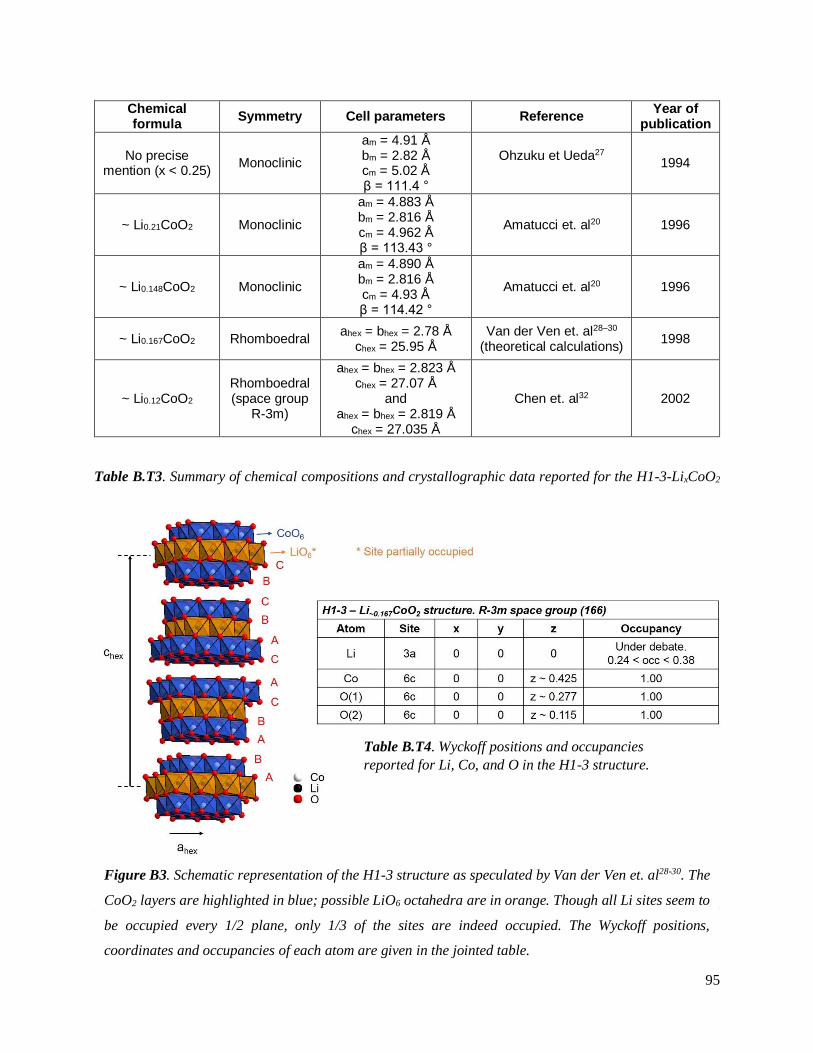
95
Table B.T3. Summary of chemical compositions and crystallographic data reported for the H1-3-LixCoO2
phase.
Figure B3. Schematic representation of the H1-3 structure as speculated by Van der Ven et. al. The CoO2
layers are highlighted in blue; possible LiO6 octahedra are in orange. Though all Li sites seem to be
Chemical formula
Symmetry Cell parameters Reference Year of
publication
No precise mention (x < 0.25)
Monoclinic
am = 4.91 Å bm = 2.82 Å cm = 5.02 Å β = 111.4 °
Ohzuku et Ueda27
1994
~ Li0.21CoO2 Monoclinic
am = 4.883 Å bm = 2.816 Å cm = 4.962 Å β = 113.43 °
Amatucci et. al20 1996
~ Li0.148CoO2 Monoclinic
am = 4.890 Å bm = 2.816 Å cm = 4.93 Å β = 114.42 °
Amatucci et. al20 1996
~ Li0.167CoO2 Rhomboedral ahex = bhex = 2.78 Å
chex = 25.95 Å Van der Ven et. al28–30
(theoretical calculations) 1998
~ Li0.12CoO2 Rhomboedral (space group
R-3m)
ahex = bhex = 2.823 Å chex = 27.07 Å
and ahex = bhex = 2.819 Å
chex = 27.035 Å
Chen et. al32 2002
Table B.T4. Wyckoff positions and occupancies
reported for Li, Co, and O in the H1-3 structure.
Figure B3. Schematic representation of the H1-3 structure as speculated by Van der Ven et. al28-30. The
CoO2 layers are highlighted in blue; possible LiO6 octahedra are in orange. Though all Li sites seem to
be occupied every 1/2 plane, only 1/3 of the sites are indeed occupied. The Wyckoff positions,
coordinates and occupancies of each atom are given in the jointed table.
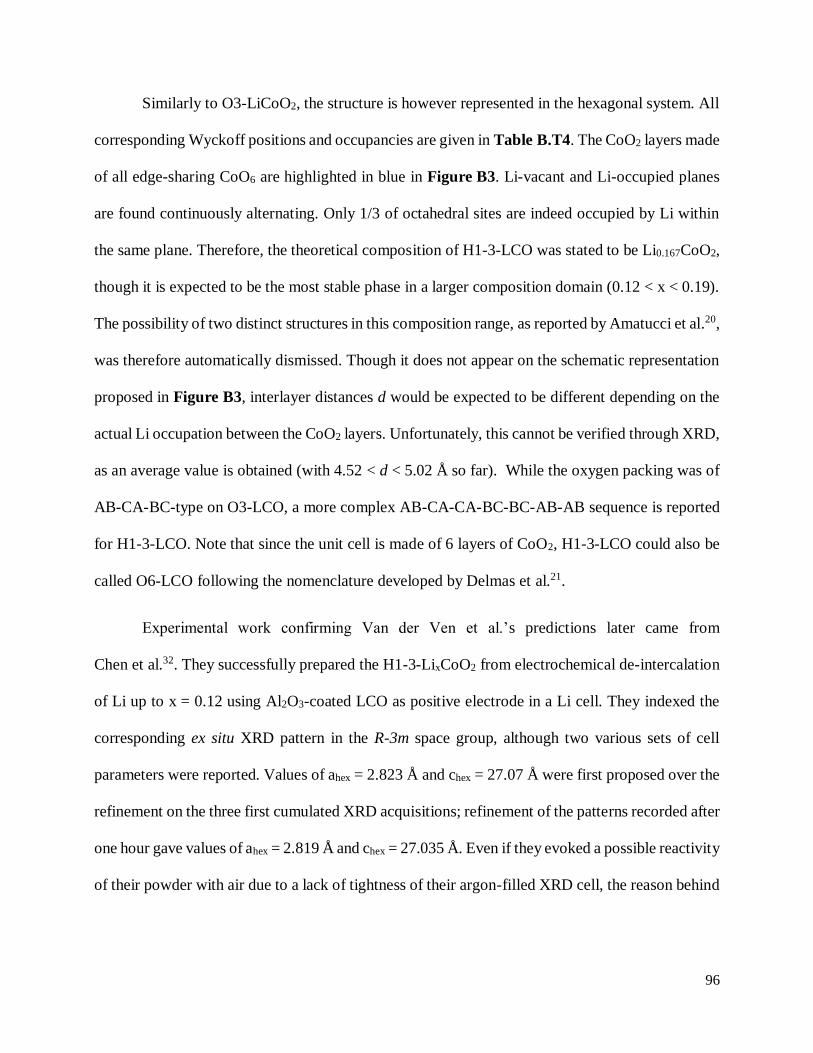
96
Similarly to O3-LiCoO2, the structure is however represented in the hexagonal system. All
corresponding Wyckoff positions and occupancies are given in Table B.T4. The CoO2 layers made
of all edge-sharing CoO6 are highlighted in blue in Figure B3. Li-vacant and Li-occupied planes
are found continuously alternating. Only 1/3 of octahedral sites are indeed occupied by Li within
the same plane. Therefore, the theoretical composition of H1-3-LCO was stated to be Li0.167CoO2,
though it is expected to be the most stable phase in a larger composition domain (0.12 < x < 0.19).
The possibility of two distinct structures in this composition range, as reported by Amatucci et al.20,
was therefore automatically dismissed. Though it does not appear on the schematic representation
proposed in Figure B3, interlayer distances d would be expected to be different depending on the
actual Li occupation between the CoO2 layers. Unfortunately, this cannot be verified through XRD,
as an average value is obtained (with 4.52 < d < 5.02 Å so far). While the oxygen packing was of
AB-CA-BC-type on O3-LCO, a more complex AB-CA-CA-BC-BC-AB-AB sequence is reported
for H1-3-LCO. Note that since the unit cell is made of 6 layers of CoO2, H1-3-LCO could also be
called O6-LCO following the nomenclature developed by Delmas et al.21.
Experimental work confirming Van der Ven et al.’s predictions later came from
Chen et al.32. They successfully prepared the H1-3-LixCoO2 from electrochemical de-intercalation
of Li up to x = 0.12 using Al2O3-coated LCO as positive electrode in a Li cell. They indexed the
corresponding ex situ XRD pattern in the R-3m space group, although two various sets of cell
parameters were reported. Values of ahex = 2.823 Å and chex = 27.07 Å were first proposed over the
refinement on the three first cumulated XRD acquisitions; refinement of the patterns recorded after
one hour gave values of ahex = 2.819 Å and chex = 27.035 Å. Even if they evoked a possible reactivity
of their powder with air due to a lack of tightness of their argon-filled XRD cell, the reason behind
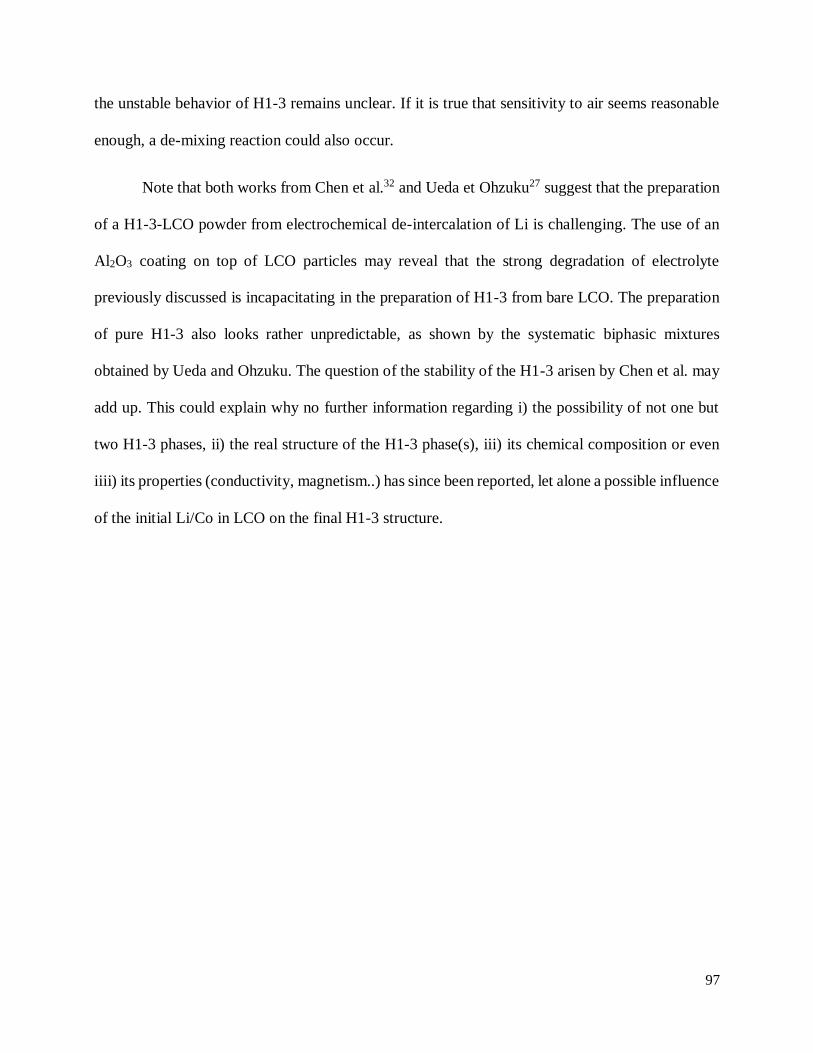
97
the unstable behavior of H1-3 remains unclear. If it is true that sensitivity to air seems reasonable
enough, a de-mixing reaction could also occur.
Note that both works from Chen et al.32 and Ueda et Ohzuku27 suggest that the preparation
of a H1-3-LCO powder from electrochemical de-intercalation of Li is challenging. The use of an
Al2O3 coating on top of LCO particles may reveal that the strong degradation of electrolyte
previously discussed is incapacitating in the preparation of H1-3 from bare LCO. The preparation
of pure H1-3 also looks rather unpredictable, as shown by the systematic biphasic mixtures
obtained by Ueda and Ohzuku. The question of the stability of the H1-3 arisen by Chen et al. may
add up. This could explain why no further information regarding i) the possibility of not one but
two H1-3 phases, ii) the real structure of the H1-3 phase(s), iii) its chemical composition or even
iiii) its properties (conductivity, magnetism..) has since been reported, let alone a possible influence
of the initial Li/Co in LCO on the final H1-3 structure.
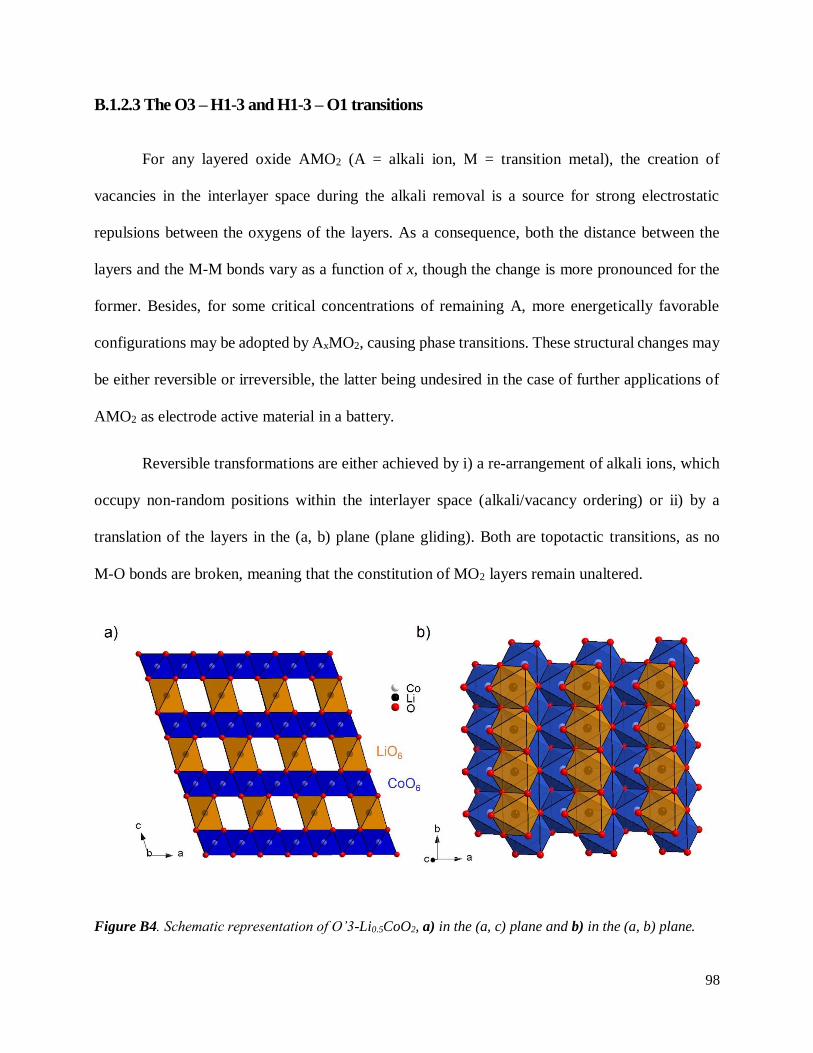
98
B.1.2.3 The O3 – H1-3 and H1-3 – O1 transitions
For any layered oxide AMO2 (A = alkali ion, M = transition metal), the creation of
vacancies in the interlayer space during the alkali removal is a source for strong electrostatic
repulsions between the oxygens of the layers. As a consequence, both the distance between the
layers and the M-M bonds vary as a function of x, though the change is more pronounced for the
former. Besides, for some critical concentrations of remaining A, more energetically favorable
configurations may be adopted by AxMO2, causing phase transitions. These structural changes may
be either reversible or irreversible, the latter being undesired in the case of further applications of
AMO2 as electrode active material in a battery.
Reversible transformations are either achieved by i) a re-arrangement of alkali ions, which
occupy non-random positions within the interlayer space (alkali/vacancy ordering) or ii) by a
translation of the layers in the (a, b) plane (plane gliding). Both are topotactic transitions, as no
M-O bonds are broken, meaning that the constitution of MO2 layers remain unaltered.
Figure B4. Schematic representation of O’3-Li0.5CoO2, a) in the (a, c) plane and b) in the (a, b) plane.
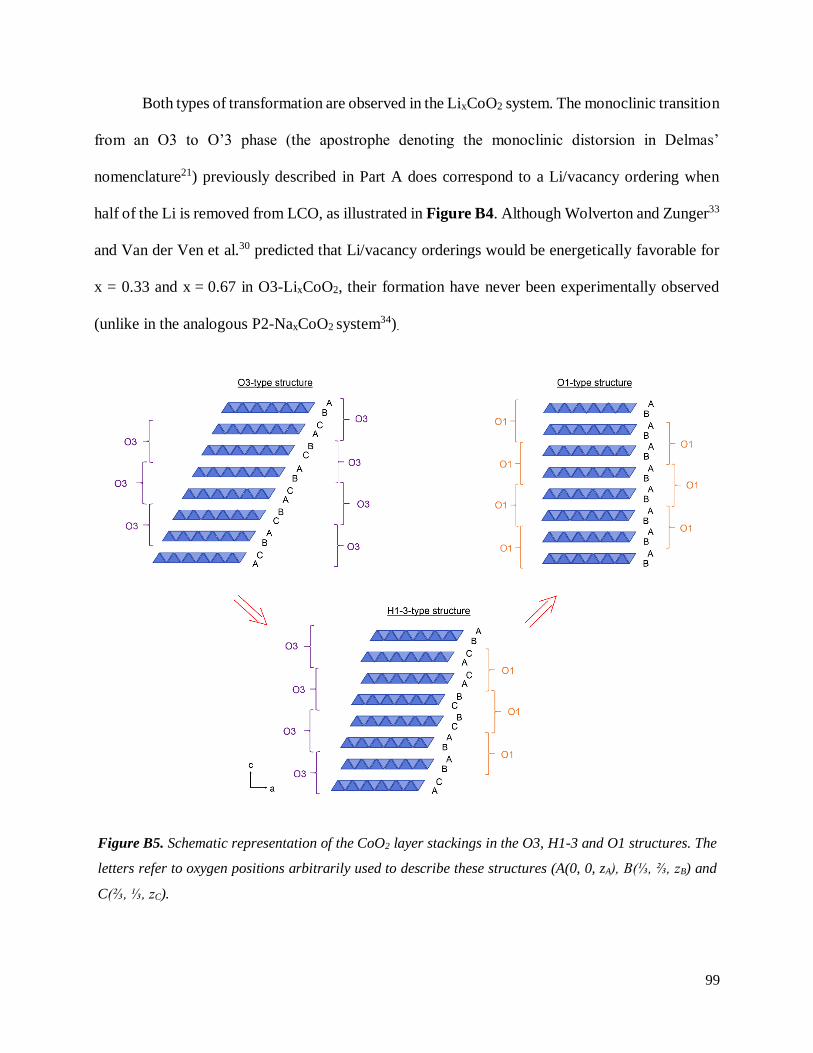
99
Both types of transformation are observed in the LixCoO2 system. The monoclinic transition
from an O3 to O’3 phase (the apostrophe denoting the monoclinic distorsion in Delmas’
nomenclature21) previously described in Part A does correspond to a Li/vacancy ordering when
half of the Li is removed from LCO, as illustrated in Figure B4. Although Wolverton and Zunger33
and Van der Ven et al.30 predicted that Li/vacancy orderings would be energetically favorable for
x = 0.33 and x = 0.67 in O3-LixCoO2, their formation have never been experimentally observed
(unlike in the analogous P2-NaxCoO2 system34).
Figure B5. Schematic representation of the CoO2 layer stackings in the O3, H1-3 and O1 structures. The
letters refer to oxygen positions arbitrarily used to describe these structures (A(0, 0, zA), B(⅓, ⅔, zB) and
C(⅔, ⅓, zC).
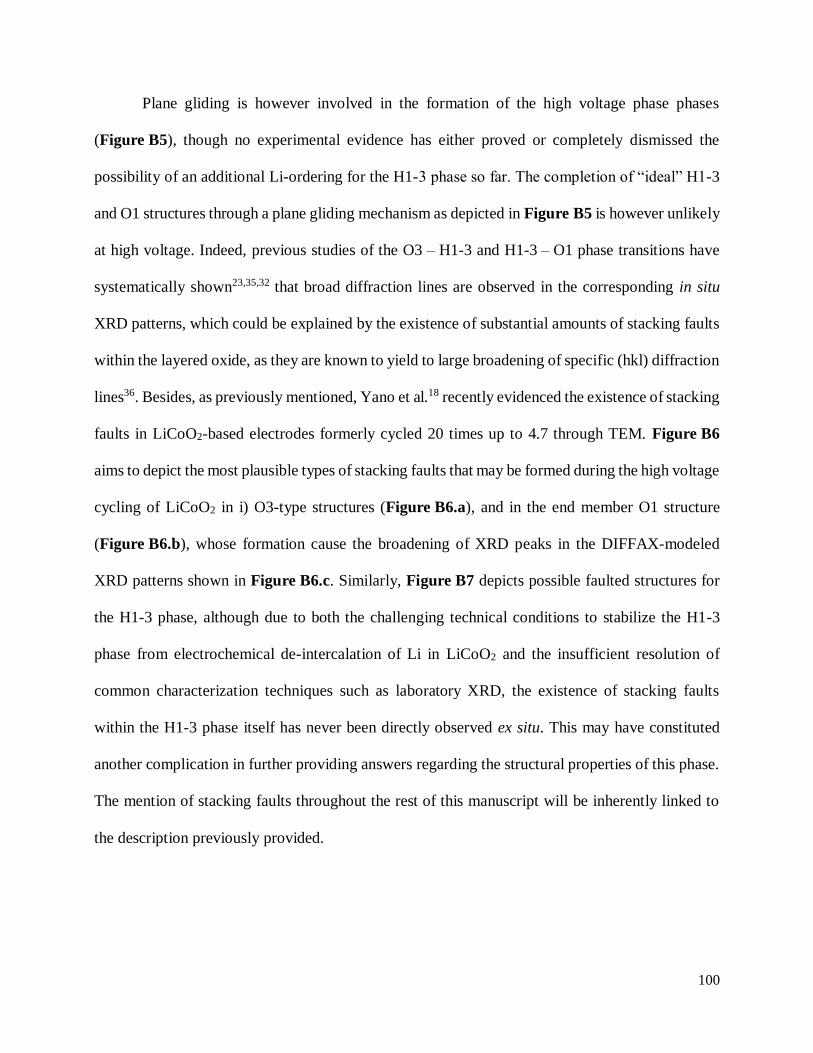
100
Plane gliding is however involved in the formation of the high voltage phase phases
(Figure B5), though no experimental evidence has either proved or completely dismissed the
possibility of an additional Li-ordering for the H1-3 phase so far. The completion of “ideal” H1-3
and O1 structures through a plane gliding mechanism as depicted in Figure B5 is however unlikely
at high voltage. Indeed, previous studies of the O3 – H1-3 and H1-3 – O1 phase transitions have
systematically shown23,35,32 that broad diffraction lines are observed in the corresponding in situ
XRD patterns, which could be explained by the existence of substantial amounts of stacking faults
within the layered oxide, as they are known to yield to large broadening of specific (hkl) diffraction
lines36. Besides, as previously mentioned, Yano et al.18 recently evidenced the existence of stacking
faults in LiCoO2-based electrodes formerly cycled 20 times up to 4.7 through TEM. Figure B6
aims to depict the most plausible types of stacking faults that may be formed during the high voltage
cycling of LiCoO2 in i) O3-type structures (Figure B6.a), and in the end member O1 structure
(Figure B6.b), whose formation cause the broadening of XRD peaks in the DIFFAX-modeled
XRD patterns shown in Figure B6.c. Similarly, Figure B7 depicts possible faulted structures for
the H1-3 phase, although due to both the challenging technical conditions to stabilize the H1-3
phase from electrochemical de-intercalation of Li in LiCoO2 and the insufficient resolution of
common characterization techniques such as laboratory XRD, the existence of stacking faults
within the H1-3 phase itself has never been directly observed ex situ. This may have constituted
another complication in further providing answers regarding the structural properties of this phase.
The mention of stacking faults throughout the rest of this manuscript will be inherently linked to
the description previously provided.
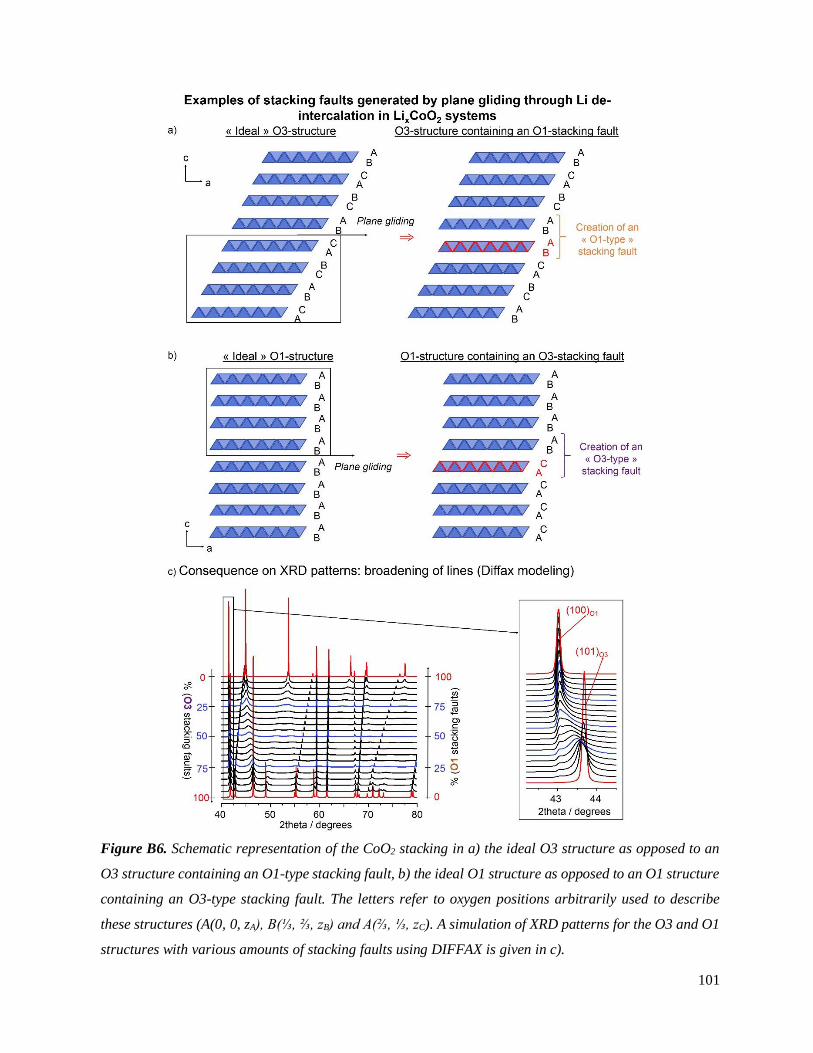
101
In the following, we re-investigated the structural changes experienced by LCO during its 1st full
Figure B6. Schematic representation of the CoO2 stacking in a) the ideal O3 structure as opposed to an
O3 structure containing an O1-type stacking fault, b) the ideal O1 structure as opposed to an O1 structure
containing an O3-type stacking fault. The letters refer to oxygen positions arbitrarily used to describe
these structures (A(0, 0, zA), B(⅓, ⅔, zB) and A(⅔, ⅓, zC). A simulation of XRD patterns for the O3 and O1
structures with various amounts of stacking faults using DIFFAX is given in c).
102
In the following, we re-investigated the structural changes experienced by LCO during its
1st full charge in a Li cell, taking into consideration a possible influence of the initial Li/Co ratio
(Li/Co = 1.00 or 1.05) through in situ and ex situ X-ray diffraction measurements.
Figure B7. Schematic representation of the CoO2 stacking in the ideal H1-3 structure, as opposed to an
H1-3 structure containing either an O1-type stacking fault or an O3-type stacking fault. The letters refer
to oxygen positions arbitrarily used to describe these structures (A(0, 0, zA), B(⅓, ⅔, zB) and A(⅔, ⅓, zC).
103
B.2 Preliminary study: in situ XRD investigation of the phase transitions
occurring at high voltage for stoichiometric and 4%-overlithiated LCO
In a preliminary study, laboratory in situ XRD was carried out to follow the structural
changes occurring at high voltage during the charge of both stoichiometric and overlithiated LCO.
This work was published37 in 2018 and is presented in the following.
B.2.1 Experimental section
Note that three LCO powders were selected for this investigation: i) LCO-5
((Li/Co)th = 0.98) and LCO-8 ((Li/Co)th = 1.04) were used in order to evaluate the influence of the
initial Li/Co ratio on the high voltage phase transitions. A comparison of data collected for both
stoichiometric LCO (LCO-5 with (Li/Co)th = 0.98 and d ~ 35 µm; LCO-2 with (Li/Co)th = 1.00
and ~ 1-2 µm) was used to evaluate the influence of the initial particle size on the same transitions.
As no such effect was observed, data is presented in Appendix.
As the selection of samples is significantly narrower than in Part A, the stoichiometric LCO
(LCO-5) will be now designated by “st-LCO”. 4%-overlithiated LCO-8 will be denoted as
“overl-LCO”.
LCO:C:PVDF electrodes (90:5:5 %wt) with either st-LCO or overl-LCO as active materials
were prepared from a slurry using N-methyl-pyrrolidone (NMP) as solvent casted onto 6.5µm-
thick-aluminum circles for the in situ XRD experiments. Typical active material loading and
diameter for an electrode used during in situ XRD experiments were respectively 15 mg/cm² and
20 mm. The electrodes were dried overnight under vacuum at T = 120 °C and stored in an argon-
filled glovebox, the homemade in situ cells were assembled using pure lithium as counter-electrode
and 1 M LiPF6 in EC:DEC:DMC as electrolyte. More details can be found in Appendix.
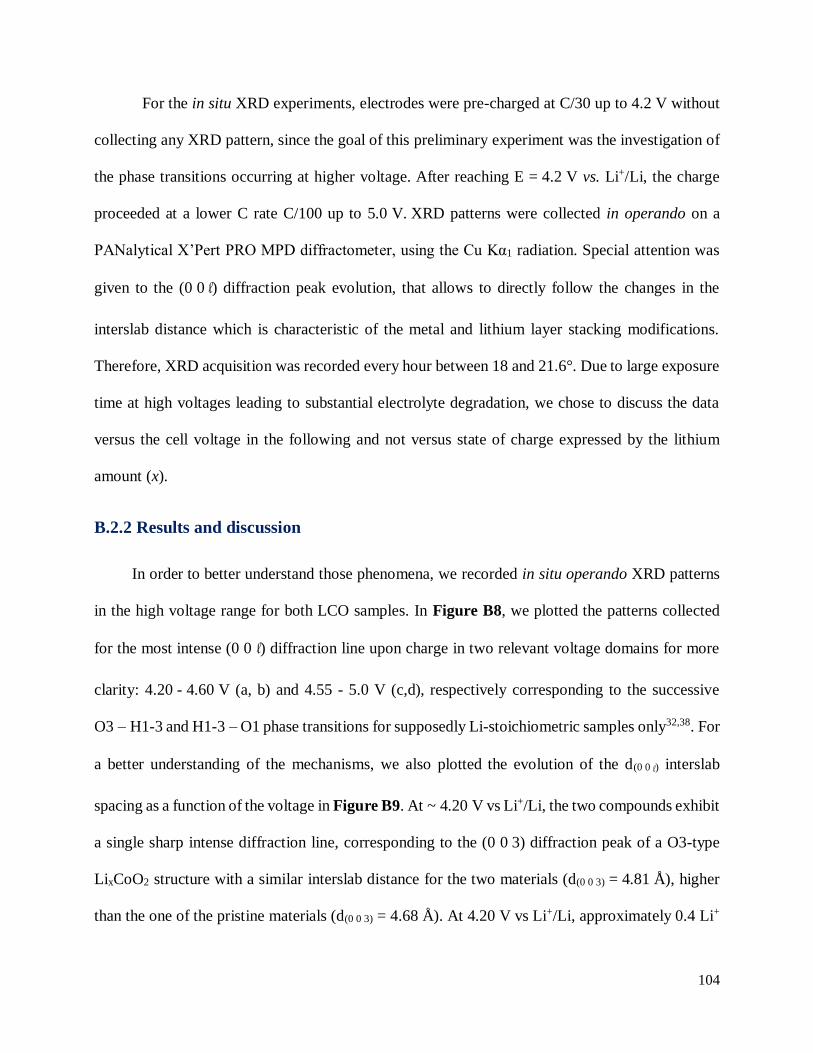
104
For the in situ XRD experiments, electrodes were pre-charged at C/30 up to 4.2 V without
collecting any XRD pattern, since the goal of this preliminary experiment was the investigation of
the phase transitions occurring at higher voltage. After reaching E = 4.2 V vs. Li+/Li, the charge
proceeded at a lower C rate C/100 up to 5.0 V. XRD patterns were collected in operando on a
PANalytical X’Pert PRO MPD diffractometer, using the Cu Kα1 radiation. Special attention was
given to the (0 0 l) diffraction peak evolution, that allows to directly follow the changes in the
interslab distance which is characteristic of the metal and lithium layer stacking modifications.
Therefore, XRD acquisition was recorded every hour between 18 and 21.6°. Due to large exposure
time at high voltages leading to substantial electrolyte degradation, we chose to discuss the data
versus the cell voltage in the following and not versus state of charge expressed by the lithium
amount (x).
B.2.2 Results and discussion
In order to better understand those phenomena, we recorded in situ operando XRD patterns
in the high voltage range for both LCO samples. In Figure B8, we plotted the patterns collected
for the most intense (0 0 l) diffraction line upon charge in two relevant voltage domains for more
clarity: 4.20 - 4.60 V (a, b) and 4.55 - 5.0 V (c,d), respectively corresponding to the successive
O3 – H1-3 and H1-3 – O1 phase transitions for supposedly Li-stoichiometric samples only32,38. For
a better understanding of the mechanisms, we also plotted the evolution of the d(0 0 l) interslab
spacing as a function of the voltage in Figure B9. At ~ 4.20 V vs Li+/Li, the two compounds exhibit
a single sharp intense diffraction line, corresponding to the (0 0 3) diffraction peak of a O3-type
LixCoO2 structure with a similar interslab distance for the two materials (d(0 0 3) = 4.81 Å), higher
than the one of the pristine materials (d(0 0 3) = 4.68 Å). At 4.20 V vs Li+/Li, approximately 0.4 Li+
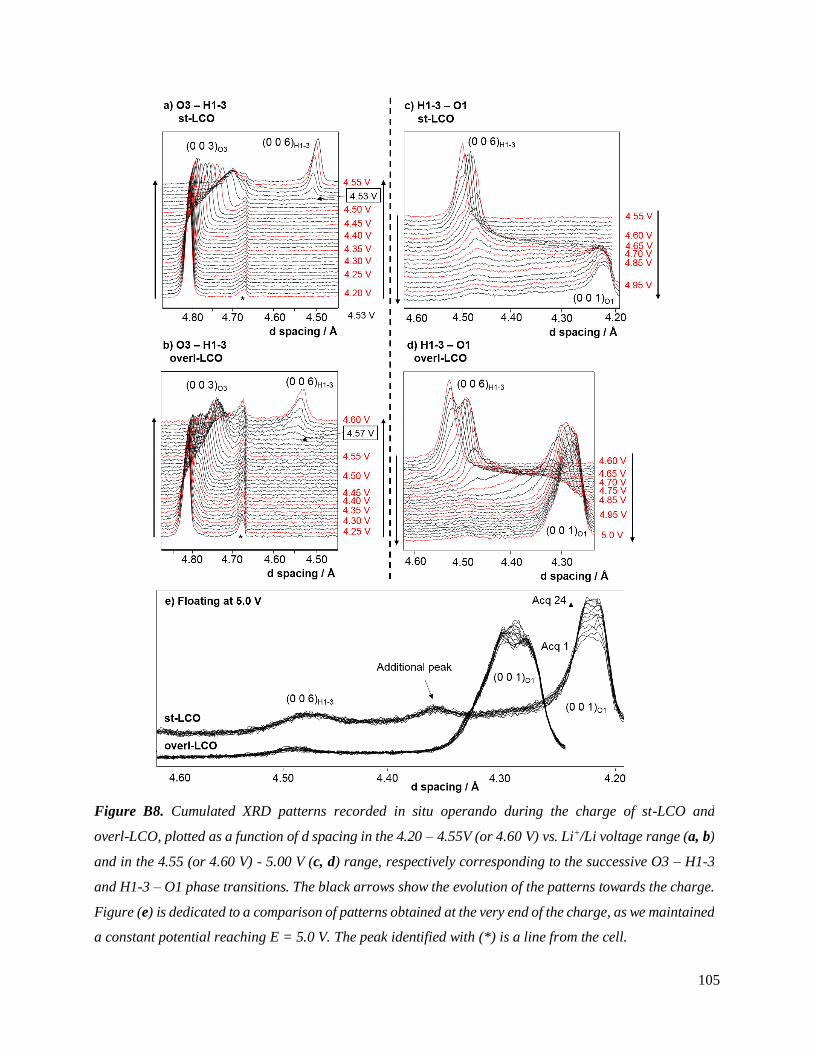
105
ions are remaining in both LCO compounds. A schematic representation of the O3 structure is ions
Figure B8. Cumulated XRD patterns recorded in situ operando during the charge of st-LCO and
overl-LCO, plotted as a function of d spacing in the 4.20 – 4.55V (or 4.60 V) vs. Li+/Li voltage range (a, b)
and in the 4.55 (or 4.60 V) - 5.00 V (c, d) range, respectively corresponding to the successive O3 – H1-3
and H1-3 – O1 phase transitions. The black arrows show the evolution of the patterns towards the charge.
Figure (e) is dedicated to a comparison of patterns obtained at the very end of the charge, as we maintained
a constant potential reaching E = 5.0 V. The peak identified with (*) is a line from the cell.
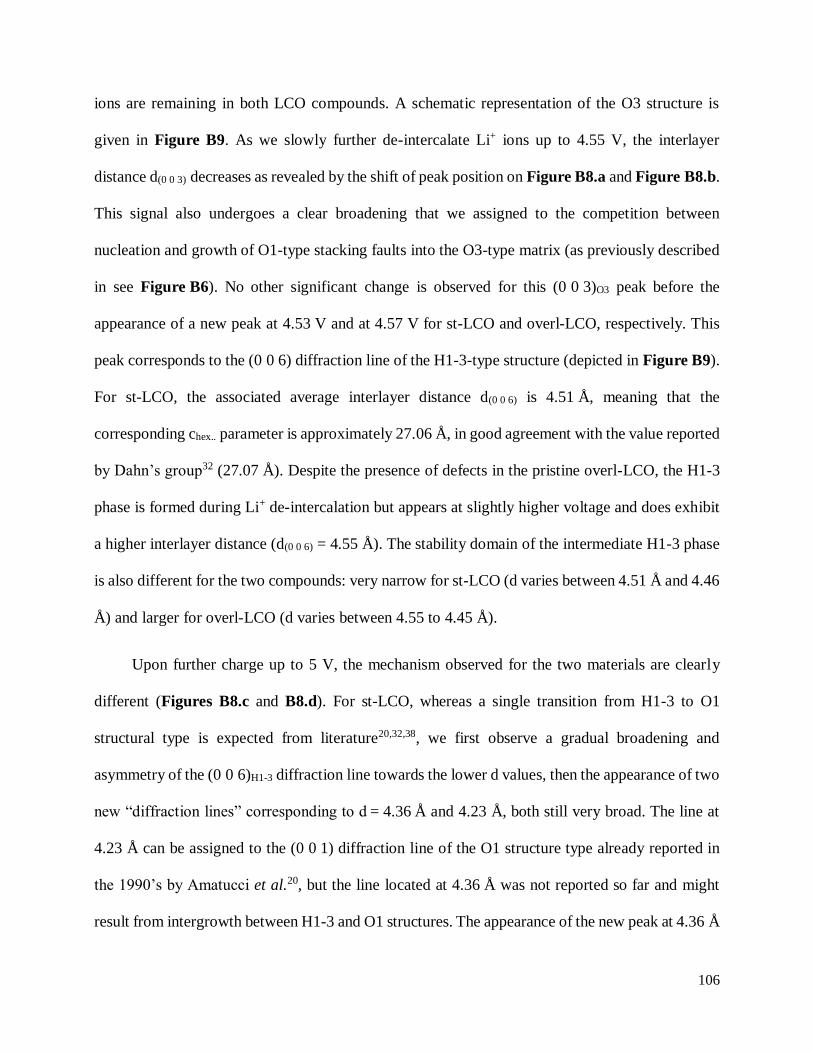
106
ions are remaining in both LCO compounds. A schematic representation of the O3 structure is
given in Figure B9. As we slowly further de-intercalate Li+ ions up to 4.55 V, the interlayer
distance d(0 0 3) decreases as revealed by the shift of peak position on Figure B8.a and Figure B8.b.
This signal also undergoes a clear broadening that we assigned to the competition between
nucleation and growth of O1-type stacking faults into the O3-type matrix (as previously described
in see Figure B6). No other significant change is observed for this (0 0 3)O3 peak before the
appearance of a new peak at 4.53 V and at 4.57 V for st-LCO and overl-LCO, respectively. This
peak corresponds to the (0 0 6) diffraction line of the H1-3-type structure (depicted in Figure B9).
For st-LCO, the associated average interlayer distance d(0 0 6) is 4.51 Å, meaning that the
corresponding chex.. parameter is approximately 27.06 Å, in good agreement with the value reported
by Dahn’s group32 (27.07 Å). Despite the presence of defects in the pristine overl-LCO, the H1-3
phase is formed during Li+ de-intercalation but appears at slightly higher voltage and does exhibit
a higher interlayer distance (d(0 0 6) = 4.55 Å). The stability domain of the intermediate H1-3 phase
is also different for the two compounds: very narrow for st-LCO (d varies between 4.51 Å and 4.46
Å) and larger for overl-LCO (d varies between 4.55 to 4.45 Å).
Upon further charge up to 5 V, the mechanism observed for the two materials are clearly
different (Figures B8.c and B8.d). For st-LCO, whereas a single transition from H1-3 to O1
structural type is expected from literature20,32,38, we first observe a gradual broadening and
asymmetry of the (0 0 6)H1-3 diffraction line towards the lower d values, then the appearance of two
new “diffraction lines” corresponding to d = 4.36 Å and 4.23 Å, both still very broad. The line at
4.23 Å can be assigned to the (0 0 1) diffraction line of the O1 structure type already reported in
the 1990’s by Amatucci et al.20, but the line located at 4.36 Å was not reported so far and might
result from intergrowth between H1-3 and O1 structures. The appearance of the new peak at 4.36 Å
107
is better seen on the XRD pattern, after we applied a potentiostatic step at E = 5.0 V for several
hours following the charge of the compound and recorded a few more patterns (Figure B8.e). Since
it is located for intermediate d-values between H1-3 and O1 phases, we propose that the intergrowth
between these structures is not completely random, thus forming an intermediate stacking. Its
formation could be a way to minimize the internal constraints due to the strong d-interslab space
diminution from H1-3 to O1 for the system. Note that even after a long floating at 5 V, the
diffraction lines for the three phases (H1-3, intermediate and O1) are still observed (Figure B8.e).
Figure B9. Plot of the average interlayer distance d(0 0 l) for each phase formed during the charge of st-
LCO and overl-LCO as function of E vs. Li+/Li. The values for d(0 0 l) are reported for each XRD pattern
shown in Figure B8. For better understanding, structures for all phases are schematically depicted in small
boxes, on the right of the figure. The blue octahedra are CoO6 units, while the yellow ones are possible
LiO6. Letters in red represent the oxygen stacking, each letter corresponding to an oxygen position as
followed: A (0 0 zA); B (⅓ ⅔ zB); C (⅔ ⅓ zC).
108
In any case, from their peak broadening, those structures may contain a high number of stacking
faults resulting in overall structural disorder (see previous figures: Figure B6 and Figure B7). For
overl-LCO, the mechanism is different, no intermediate peak is observed: the H1-3 structure
gradually transform into an O1 structure with the formation of several intermediate stacking faulted
structures, with a continuous process.
In addition, it can be noticed that the final O1 structures obtained from both st-LCO and
overl-LCO show significant differences regarding their respective interslab spacing. Indeed, a
lower value for st-LCO (d001 = 4.23 Å) sample is obtained, as compared to overl-LCO
(d001 = 4.31 Å) sample. This could be related to the presence of vacancies in the Co1-tO2-t slabs, or
to some more remaining Li in overl-LCO as compared to its analogue obtained from st-LCO.
B.2.3 Trends and hypotheses from the preliminary study. First conclusions.
Following the conclusions on the effect of the initial Li/Co stoichiometry on Li+
de-intercalation process at low voltage (below 4.4 V) for LCO materials evidenced by several
groups, we showed that the initial Li/Co stoichiometry also affect the mechanisms involved at high
voltage. The successive structural transitions from O3 to H1-3 and O1 phase are observed for both
samples, but these phases appear at higher voltage and does exhibit different cell parameters for an
overlithiated compound. Note that less volume changes are obtained for the overlithiated
compound despite a higher irreversible capacity, that may therefore be due to some structural
reorganization, stronger electrolyte oxidation and cobalt dissolution. We also showed that for the
stoichiometric LCO, the de-intercalation process occurring at high voltage is more complex than
already reported, with the formation of an intermediate phase between H1-3 and O1.
109
B.3 Synchrotron in situ and ex situ X-ray diffraction for the reinvestigation of
the phase transitions occurring in the LixCoO2 system. Influence of the initial
Li/Co stoichiometry.
B.3.1 Experimental section
Following the preliminary in situ XRD investigation presented in part B.2, a
complementary study was carried out at ALBA synchrotron at the BL04-MSPD beamline
(Cerdanyola del Vallès, Spain) in collaboration with François Fauth using the same starting LCO
(st-LCO and overl-LCO).
Φ15 mm electrodes of st-LCO and overl-LCO were prepared following the same
experimental protocol presented in Part B.2. The typical active material loading per electrode
was ~ 17 – 18 mg (12 mg/cm²) for an approximate thickness of ~ 50 µm after calendering
(p = 10 tons/electrode).
The battery setup used for this investigation was significantly changed. While in situ XRD
in part B.2 was performed using a homemade cell, all in situ synchrotron powder X-ray diffraction
(in situ SXRD) was carried out in regular CR2032 coin cells with Φ3 mm hole drilled beforehand,
on top of which kapton windows were glued. To ensure a proper pressure inside the coin cells, an
additional spring was systematically added as compared to conventional assembling of CR2032
coin cells. Coin cells were assembled using Li as counter electrode and LiPF6 in EC:DEC:DMC as
electrolyte.
High angular resolution in situ synchrotron powder X-ray patterns were collected for up to
4 coin cells simultaneously charging / discharging, as the holder was translated according to a
110
sequential positioning (see Appendix). The patterns were recorded in transmission mode with a
wavelength of λ = 0.825957 Å (refined after performing Rietveld refinement on both Si and
mixture of CaF2 + Na2Ca3Al2F14 used as standards) and 30-second-accumulation time. The typical
2ϴ angular range for an acquisition was 2 - 43 ° with 0.006° angular step using a MYTHEN 6K
detector39. Note while this detector allows fast acquisitions suitable for operando studies, it does
not provide the best angular resolution. After recording the nth XRD pattern, the (n+1)th pattern for
the same coin cell was collected 260 seconds later, which takes into account accumulation times
for other SXRD patterns recorded for the 3 other coin cells and the time for sample change from
positions 1, 2, 3 or 4. A constant rocking of ± 15 ° of the whole setup within the Eulerian cradle
was applied to reduce the effect of the preferred orientation of crystallites, though not entirely
suppressed. Although various experiments were carried out during our synchrotron session
(including various C rates), only the results obtained at the outcome of the charge of st-LCO and
overl-LCO at C/20 are shown within Part B.3, corresponding to a total of ~ 275 SXRD patterns
each (3 patterns every Δx = 0.01 Li). An overview of cumulated SXRD patterns collected during
the charge of st-LCO and the corresponding charge curve is provided in Figure B10. However,
chosen zooms will be mainly shown throughout this part of the manuscript due to the many
additional diffraction lines corresponding to other battery components probed by the beam (Li,
kapton, PVDF, aluminum…) which often overlaps with essential peaks ascribed to the LCO active
material (see Figure B11). As stated in Figure B10, three successive electrochemical windows
will be commented upon in the following: a low voltage window (3.9 < V < 4.3; 0.4 < x ≤ 1.00,
part B.3.2) for st-LCO only, and a high voltage window divided into two separate parts for both
st-LCO and overl-LCO: High voltage 1 (4.3 < V < ~4.55; 0.2 < x ≤ 0.4, part B.3.3) and High
voltage 2 (~4.55 < V < 5.2; 0.0 < x ≤ 0.2, part B.3.4).
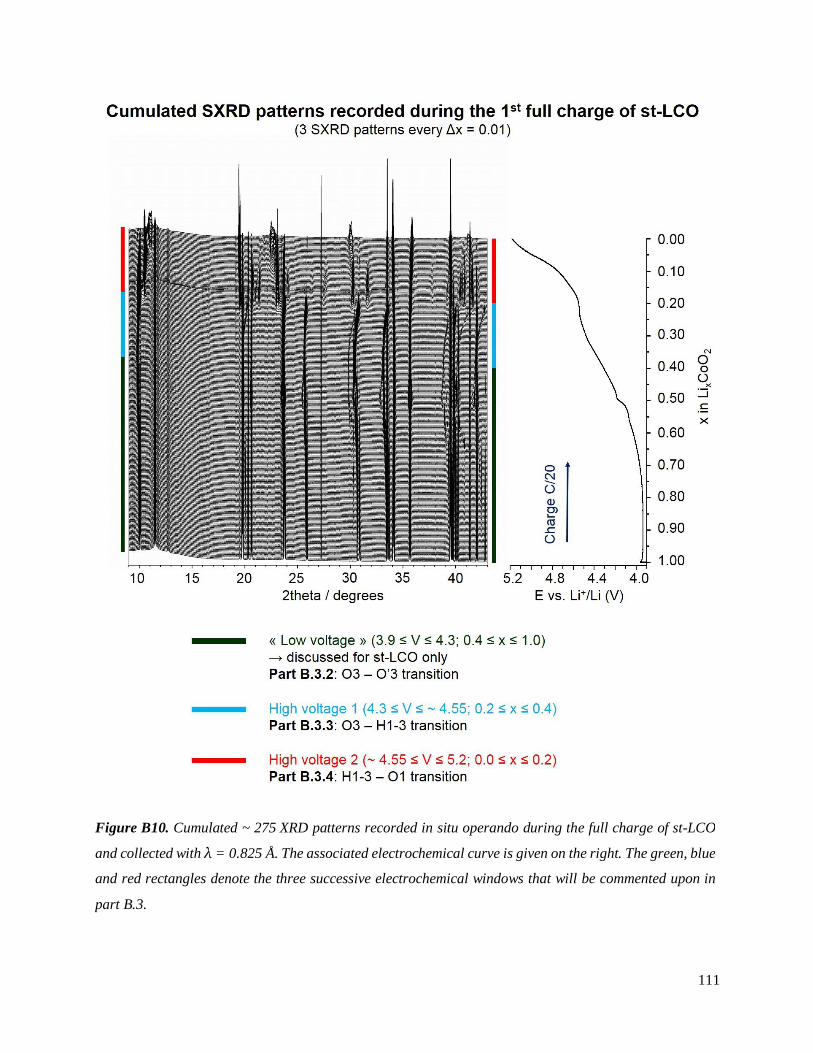
111
Figure B10. Cumulated ~ 275 XRD patterns recorded in situ operando during the full charge of st-LCO
and collected with λ = 0.825 Å. The associated electrochemical curve is given on the right. The green, blue
and red rectangles denote the three successive electrochemical windows that will be commented upon in
part B.3.
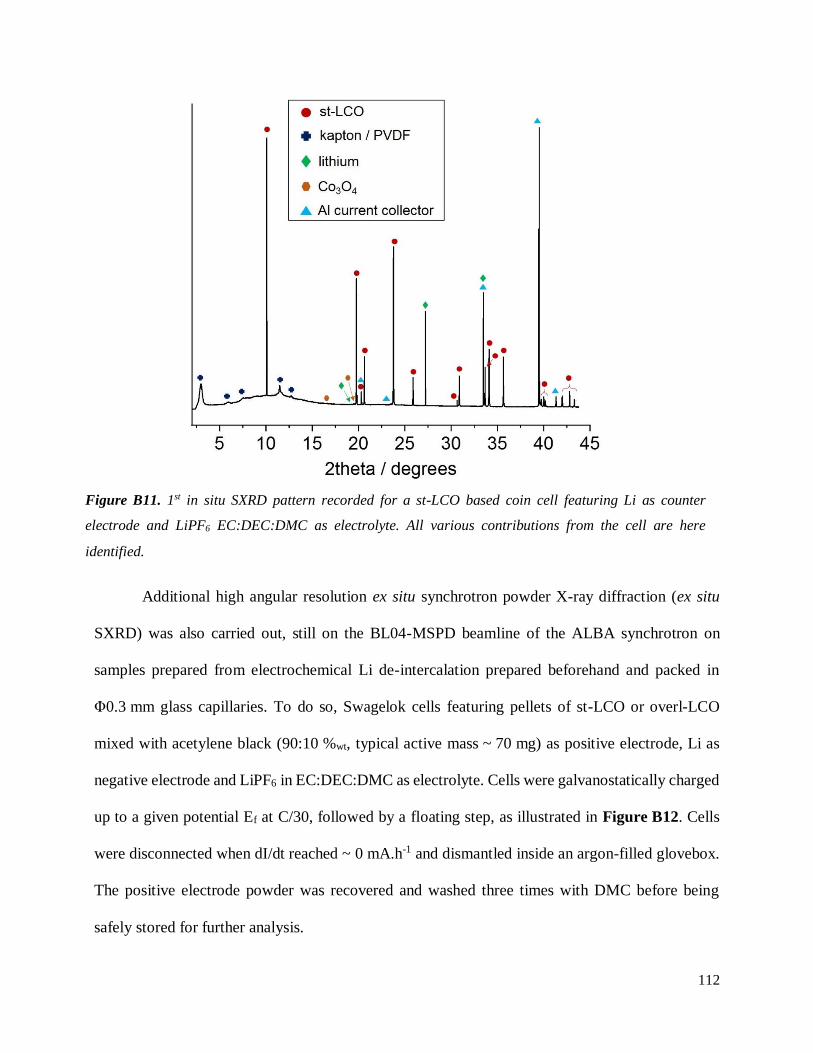
112
Additional high angular resolution ex situ synchrotron powder X-ray diffraction (ex situ
SXRD) was also carried out, still on the BL04-MSPD beamline of the ALBA synchrotron on
samples prepared from electrochemical Li de-intercalation prepared beforehand and packed in
Φ0.3 mm glass capillaries. To do so, Swagelok cells featuring pellets of st-LCO or overl-LCO
mixed with acetylene black (90:10 %wt, typical active mass ~ 70 mg) as positive electrode, Li as
negative electrode and LiPF6 in EC:DEC:DMC as electrolyte. Cells were galvanostatically charged
up to a given potential Ef at C/30, followed by a floating step, as illustrated in Figure B12. Cells
were disconnected when dI/dt reached ~ 0 mA.h-1 and dismantled inside an argon-filled glovebox.
The positive electrode powder was recovered and washed three times with DMC before being
safely stored for further analysis.
Figure B11. 1st in situ SXRD pattern recorded for a st-LCO based coin cell featuring Li as counter
electrode and LiPF6 EC:DEC:DMC as electrolyte. All various contributions from the cell are here
identified.
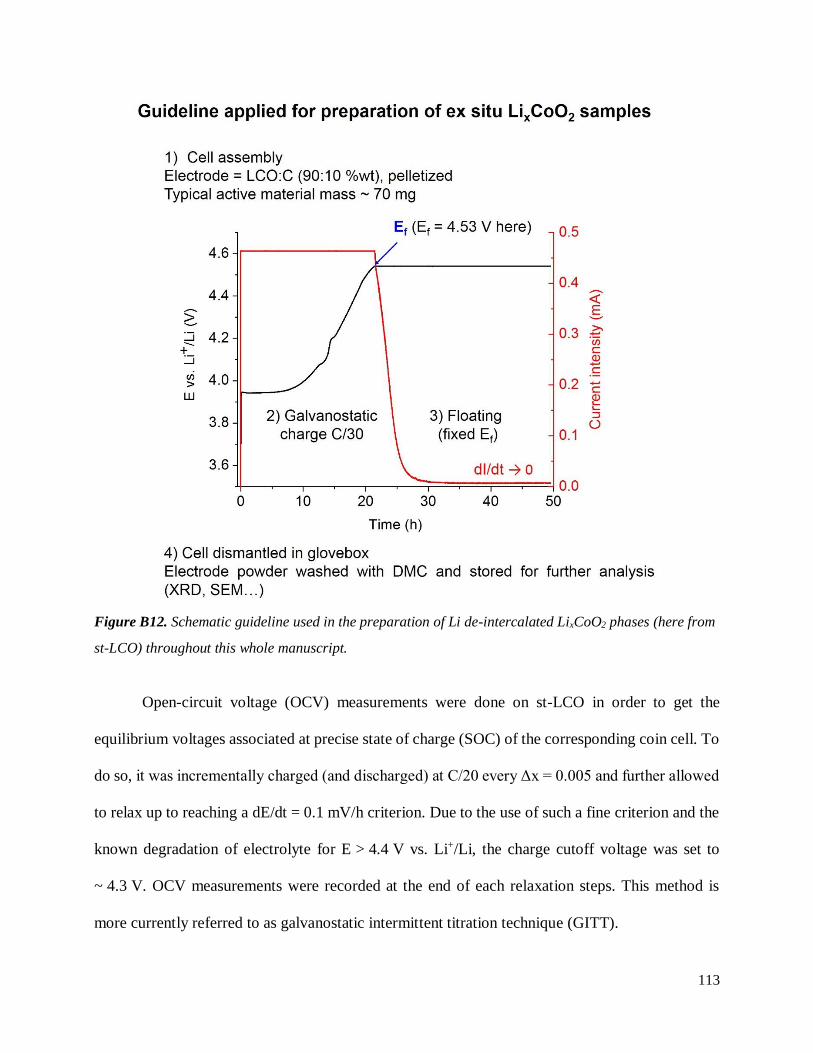
113
Open-circuit voltage (OCV) measurements were done on st-LCO in order to get the
equilibrium voltages associated at precise state of charge (SOC) of the corresponding coin cell. To
do so, it was incrementally charged (and discharged) at C/20 every Δx = 0.005 and further allowed
to relax up to reaching a dE/dt = 0.1 mV/h criterion. Due to the use of such a fine criterion and the
known degradation of electrolyte for E > 4.4 V vs. Li+/Li, the charge cutoff voltage was set to
~ 4.3 V. OCV measurements were recorded at the end of each relaxation steps. This method is
more currently referred to as galvanostatic intermittent titration technique (GITT).
Figure B12. Schematic guideline used in the preparation of Li de-intercalated LixCoO2 phases (here from
st-LCO) throughout this whole manuscript.
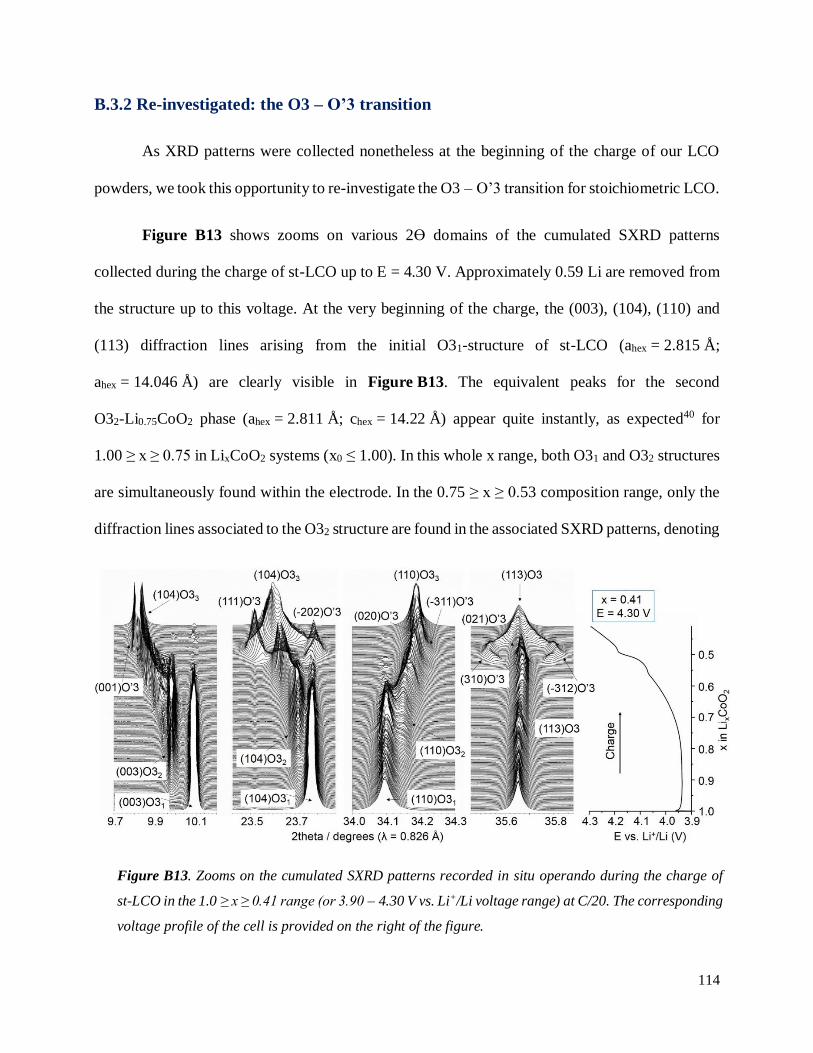
114
B.3.2 Re-investigated: the O3 – O’3 transition
As XRD patterns were collected nonetheless at the beginning of the charge of our LCO
powders, we took this opportunity to re-investigate the O3 – O’3 transition for stoichiometric LCO.
Figure B13 shows zooms on various 2ϴ domains of the cumulated SXRD patterns
collected during the charge of st-LCO up to E = 4.30 V. Approximately 0.59 Li are removed from
the structure up to this voltage. At the very beginning of the charge, the (003), (104), (110) and
(113) diffraction lines arising from the initial O31-structure of st-LCO (ahex = 2.815 Å;
ahex = 14.046 Å) are clearly visible in Figure B13. The equivalent peaks for the second
O32-Li0.75CoO2 phase (ahex = 2.811 Å; chex = 14.22 Å) appear quite instantly, as expected40 for
1.00 ≥ x ≥ 0.75 in LixCoO2 systems (x0 ≤ 1.00). In this whole x range, both O31 and O32 structures
are simultaneously found within the electrode. In the 0.75 ≥ x ≥ 0.53 composition range, only the
diffraction lines associated to the O32 structure are found in the associated SXRD patterns, denoting
Figure B13. Zooms on the cumulated SXRD patterns recorded in situ operando during the charge of
st-LCO in the 1.0 ≥ x ≥ 0.41 range (or 3.90 – 4.30 V vs. Li+/Li voltage range) at C/20. The corresponding
voltage profile of the cell is provided on the right of the figure.
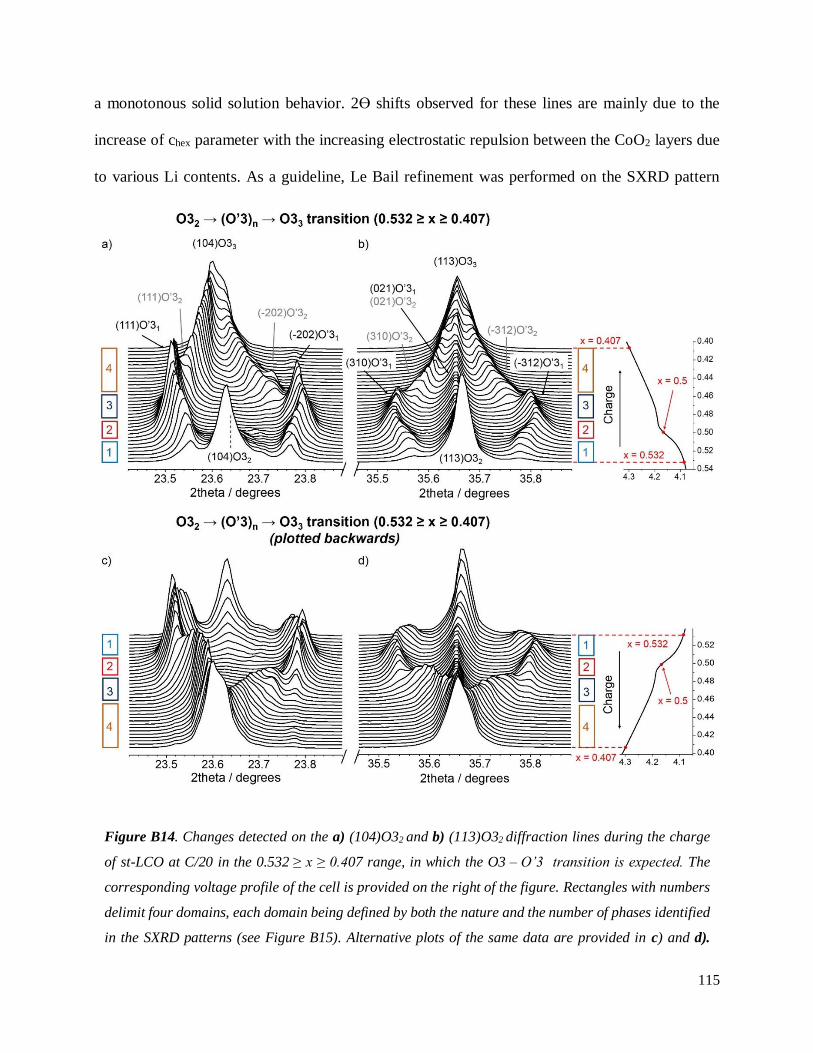
115
a monotonous solid solution behavior. 2ϴ shifts observed for these lines are mainly due to the
increase of chex parameter with the increasing electrostatic repulsion between the CoO2 layers due
to various Li contents. As a guideline, Le Bail refinement was performed on the SXRD pattern
Figure B14. Changes detected on the a) (104)O32 and b) (113)O32 diffraction lines during the charge
of st-LCO at C/20 in the 0.532 ≥ x ≥ 0.407 range, in which the O3 – O’3 transition is expected. The
corresponding voltage profile of the cell is provided on the right of the figure. Rectangles with numbers
delimit four domains, each domain being defined by both the nature and the number of phases identified
in the SXRD patterns (see Figure B15). Alternative plots of the same data are provided in c) and d).
(backwards).
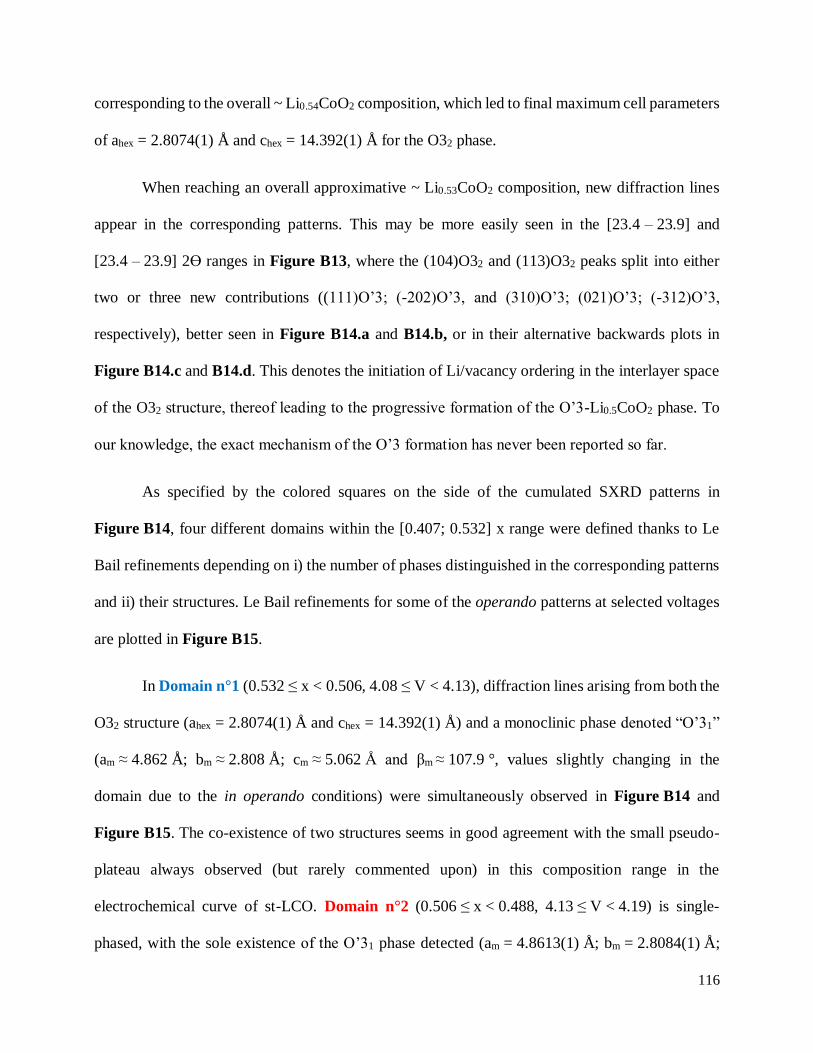
116
corresponding to the overall ~ Li0.54CoO2 composition, which led to final maximum cell parameters
of ahex = 2.8074(1) Å and chex = 14.392(1) Å for the O32 phase.
When reaching an overall approximative ~ Li0.53CoO2 composition, new diffraction lines
appear in the corresponding patterns. This may be more easily seen in the [23.4 – 23.9] and
[23.4 – 23.9] 2ϴ ranges in Figure B13, where the (104)O32 and (113)O32 peaks split into either
two or three new contributions ((111)O’3; (-202)O’3, and (310)O’3; (021)O’3; (-312)O’3,
respectively), better seen in Figure B14.a and B14.b, or in their alternative backwards plots in
Figure B14.c and B14.d. This denotes the initiation of Li/vacancy ordering in the interlayer space
of the O32 structure, thereof leading to the progressive formation of the O’3-Li0.5CoO2 phase. To
our knowledge, the exact mechanism of the O’3 formation has never been reported so far.
As specified by the colored squares on the side of the cumulated SXRD patterns in
Figure B14, four different domains within the [0.407; 0.532] x range were defined thanks to Le
Bail refinements depending on i) the number of phases distinguished in the corresponding patterns
and ii) their structures. Le Bail refinements for some of the operando patterns at selected voltages
are plotted in Figure B15.
In Domain n°1 (0.532 ≤ x < 0.506, 4.08 ≤ V < 4.13), diffraction lines arising from both the
O32 structure (ahex = 2.8074(1) Å and chex = 14.392(1) Å) and a monoclinic phase denoted “O’31”
(am ≈ 4.862 Å; bm ≈ 2.808 Å; cm ≈ 5.062 Å and βm ≈ 107.9 °, values slightly changing in the
domain due to the in operando conditions) were simultaneously observed in Figure B14 and
Figure B15. The co-existence of two structures seems in good agreement with the small pseudo-
plateau always observed (but rarely commented upon) in this composition range in the
electrochemical curve of st-LCO. Domain n°2 (0.506 ≤ x < 0.488, 4.13 ≤ V < 4.19) is single-
phased, with the sole existence of the O’31 phase detected (am = 4.8613(1) Å; bm = 2.8084(1) Å;
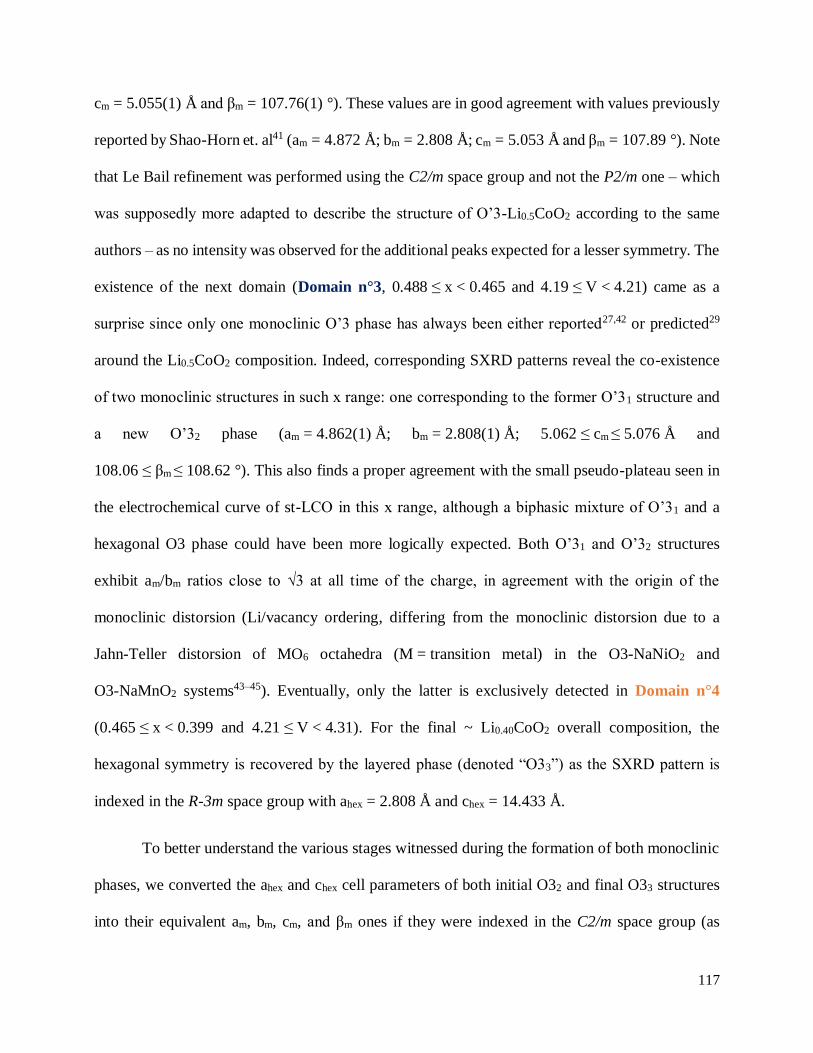
117
cm = 5.055(1) Å and βm = 107.76(1) °). These values are in good agreement with values previously
reported by Shao-Horn et. al41 (am = 4.872 Å; bm = 2.808 Å; cm = 5.053 Å and βm = 107.89 °). Note
that Le Bail refinement was performed using the C2/m space group and not the P2/m one – which
was supposedly more adapted to describe the structure of O’3-Li0.5CoO2 according to the same
authors – as no intensity was observed for the additional peaks expected for a lesser symmetry. The
existence of the next domain (Domain n°3, 0.488 ≤ x < 0.465 and 4.19 ≤ V < 4.21) came as a
surprise since only one monoclinic O’3 phase has always been either reported27,42 or predicted29
around the Li0.5CoO2 composition. Indeed, corresponding SXRD patterns reveal the co-existence
of two monoclinic structures in such x range: one corresponding to the former O’31 structure and
a new O’32 phase (am = 4.862(1) Å; bm = 2.808(1) Å; 5.062 ≤ cm ≤ 5.076 Å and
108.06 ≤ βm ≤ 108.62 °). This also finds a proper agreement with the small pseudo-plateau seen in
the electrochemical curve of st-LCO in this x range, although a biphasic mixture of O’31 and a
hexagonal O3 phase could have been more logically expected. Both O’31 and O’32 structures
exhibit am/bm ratios close to √3 at all time of the charge, in agreement with the origin of the
monoclinic distorsion (Li/vacancy ordering, differing from the monoclinic distorsion due to a
Jahn-Teller distorsion of MO6 octahedra (M = transition metal) in the O3-NaNiO2 and
O3-NaMnO2 systems43–45). Eventually, only the latter is exclusively detected in Domain n°4
(0.465 ≤ x < 0.399 and 4.21 ≤ V < 4.31). For the final ~ Li0.40CoO2 overall composition, the
hexagonal symmetry is recovered by the layered phase (denoted “O33”) as the SXRD pattern is
indexed in the R-3m space group with ahex = 2.808 Å and chex = 14.433 Å.
To better understand the various stages witnessed during the formation of both monoclinic
phases, we converted the ahex and chex cell parameters of both initial O32 and final O33 structures
into their equivalent am, bm, cm, and βm ones if they were indexed in the C2/m space group (as
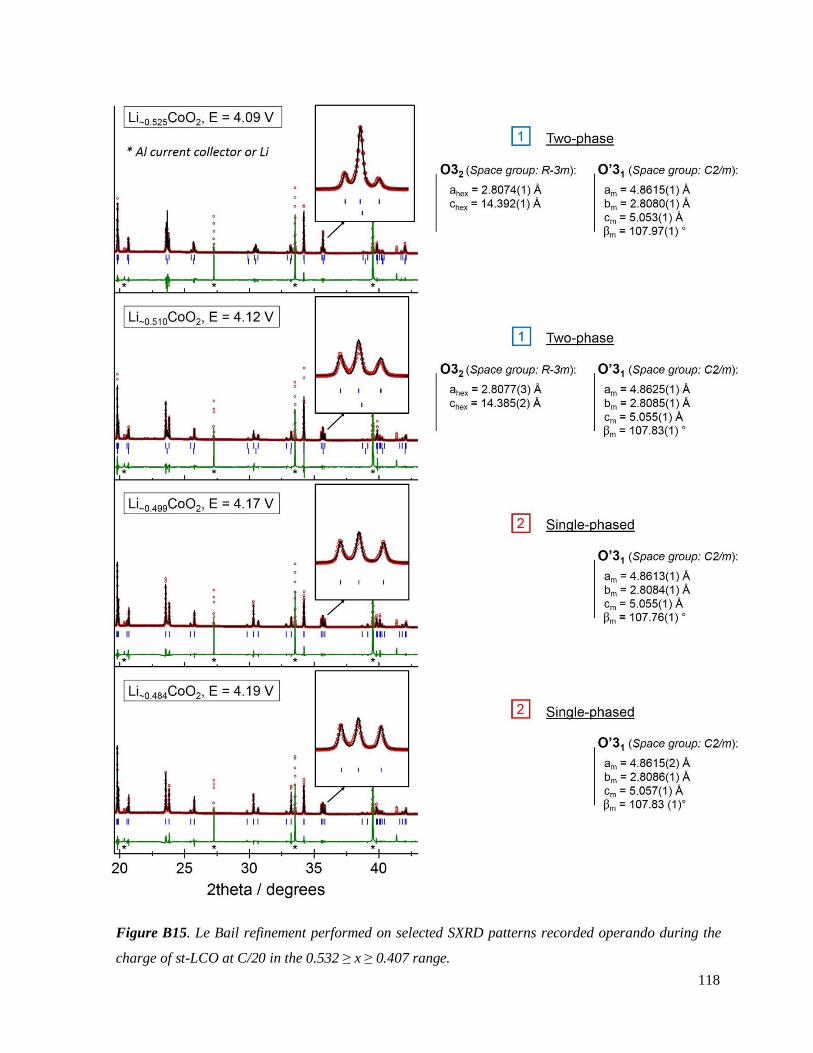
118
schematically depicted in Figure B16). The results are presented in Table B.T5. As quite different
Figure B15. Le Bail refinement performed on selected SXRD patterns recorded operando during the
charge of st-LCO at C/20 in the 0.532 ≥ x ≥ 0.407 range.
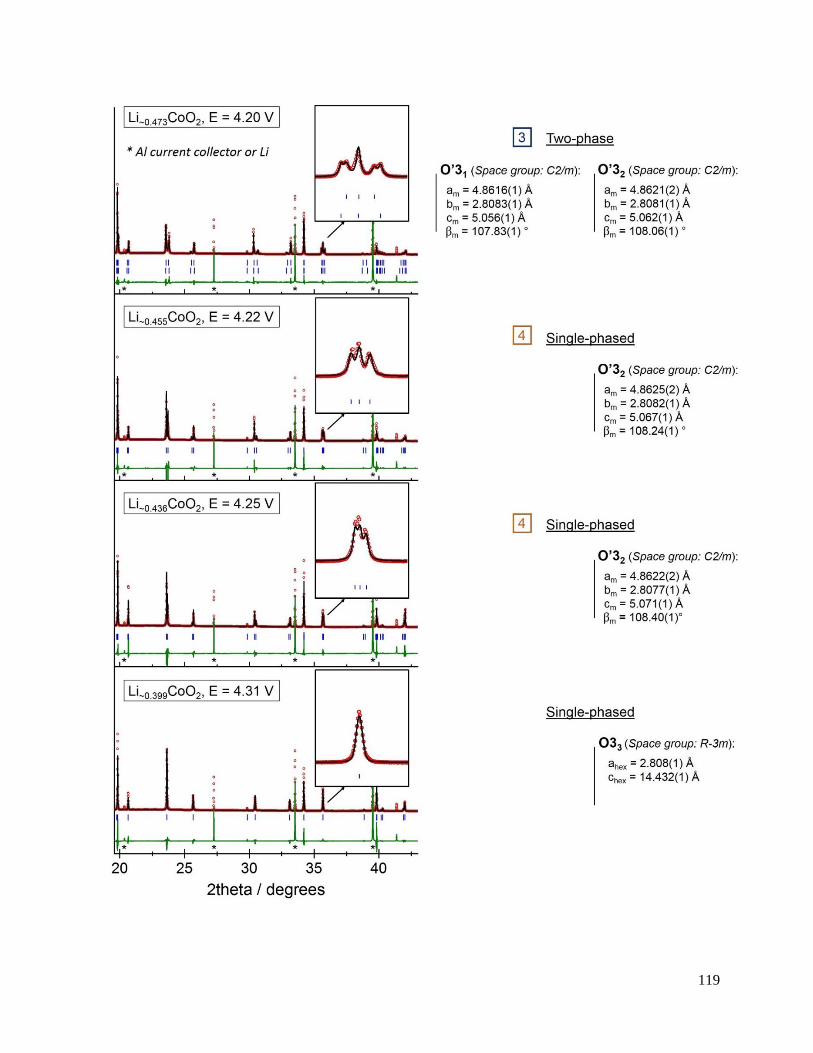
119
βm and cm values are reported for the O32 and the first-appearing O’31 (108.68 ° vs. 107.97 °;
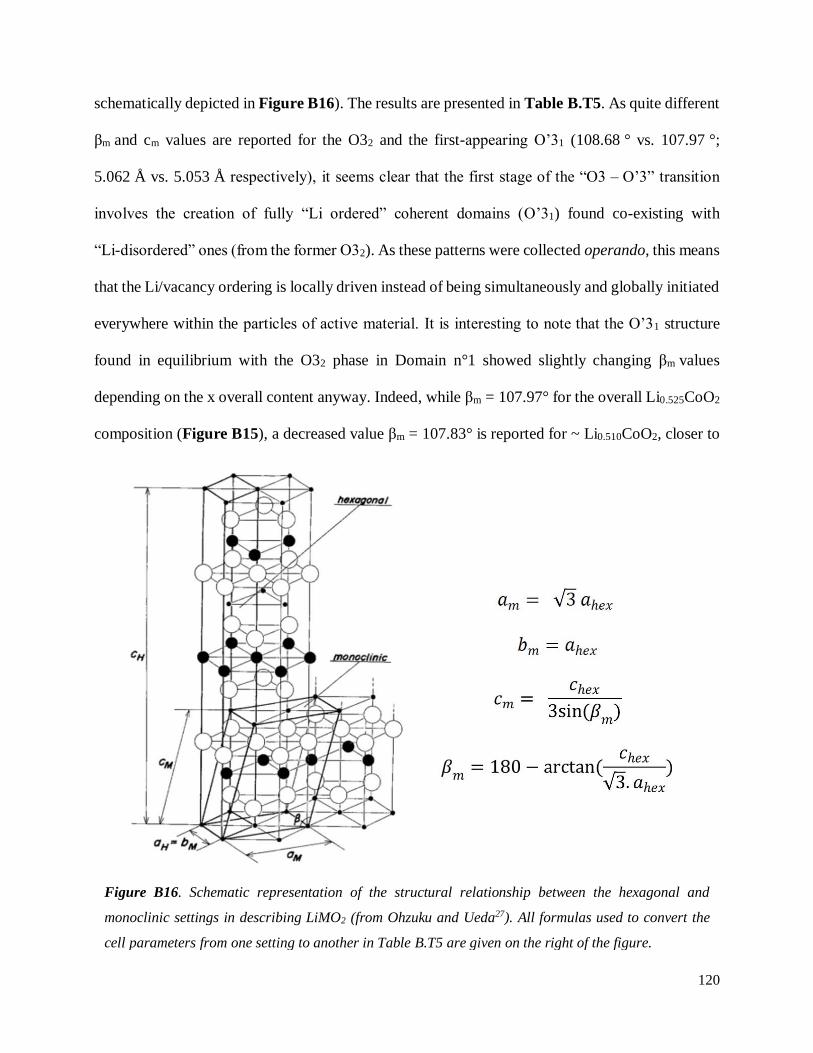
120
schematically depicted in Figure B16). The results are presented in Table B.T5. As quite different
βm and cm values are reported for the O32 and the first-appearing O’31 (108.68 ° vs. 107.97 °;
5.062 Å vs. 5.053 Å respectively), it seems clear that the first stage of the “O3 – O’3” transition
involves the creation of fully “Li ordered” coherent domains (O’31) found co-existing with
“Li-disordered” ones (from the former O32). As these patterns were collected operando, this means
that the Li/vacancy ordering is locally driven instead of being simultaneously and globally initiated
everywhere within the particles of active material. It is interesting to note that the O’31 structure
found in equilibrium with the O32 phase in Domain n°1 showed slightly changing βm values
depending on the x overall content anyway. Indeed, while βm = 107.97° for the overall Li0.525CoO2
composition (Figure B15), a decreased value βm = 107.83° is reported for ~ Li0.510CoO2, closer to
Figure B16. Schematic representation of the structural relationship between the hexagonal and
monoclinic settings in describing LiMO2 (from Ohzuku and Ueda27). All formulas used to convert the
cell parameters from one setting to another in Table B.T5 are given on the right of the figure.
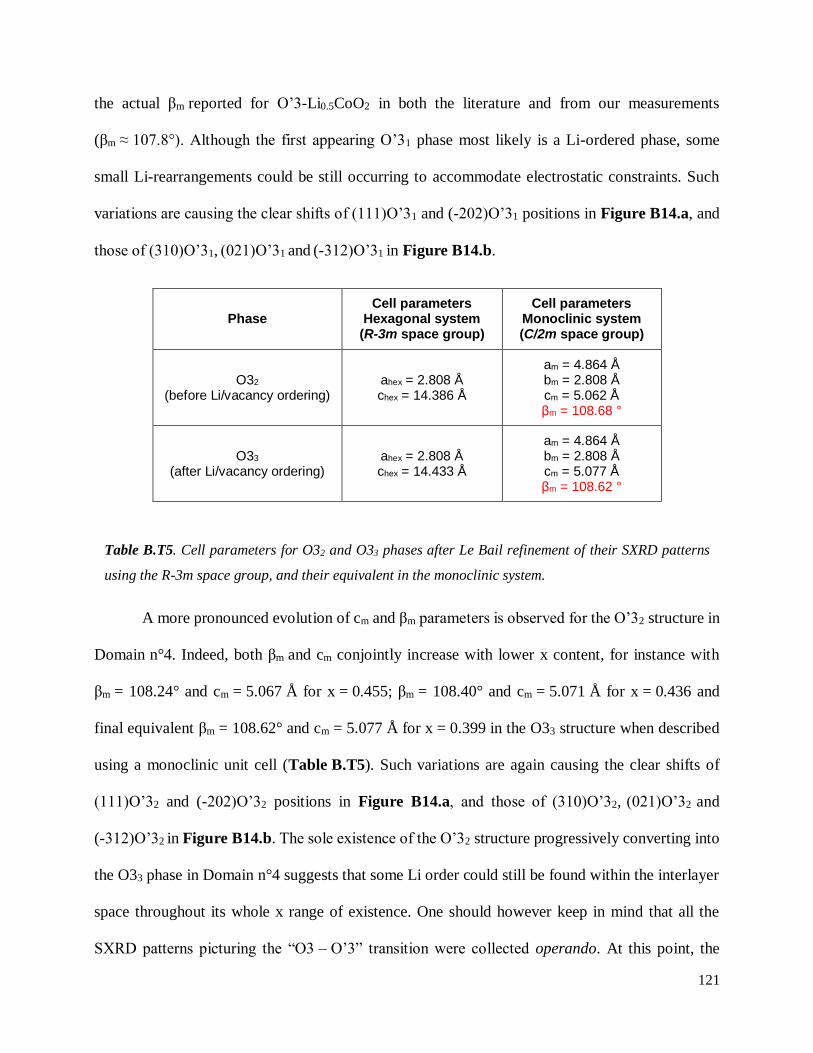
121
the actual βm reported for O’3-Li0.5CoO2 in both the literature and from our measurements
(βm ≈ 107.8°). Although the first appearing O’31 phase most likely is a Li-ordered phase, some
small Li-rearrangements could be still occurring to accommodate electrostatic constraints. Such
variations are causing the clear shifts of (111)O’31 and (-202)O’31 positions in Figure B14.a, and
those of (310)O’31, (021)O’31 and (-312)O’31 in Figure B14.b.
Phase Cell parameters
Hexagonal system (R-3m space group)
Cell parameters Monoclinic system (C/2m space group)
O32
(before Li/vacancy ordering) ahex = 2.808 Å chex = 14.386 Å
am = 4.864 Å bm = 2.808 Å cm = 5.062 Å βm = 108.68 °
O33
(after Li/vacancy ordering) ahex = 2.808 Å chex = 14.433 Å
am = 4.864 Å bm = 2.808 Å cm = 5.077 Å βm = 108.62 °
A more pronounced evolution of cm and βm parameters is observed for the O’32 structure in
Domain n°4. Indeed, both βm and cm conjointly increase with lower x content, for instance with
βm = 108.24° and cm = 5.067 Å for x = 0.455; βm = 108.40° and cm = 5.071 Å for x = 0.436 and
final equivalent βm = 108.62° and cm = 5.077 Å for x = 0.399 in the O33 structure when described
using a monoclinic unit cell (Table B.T5). Such variations are again causing the clear shifts of
(111)O’32 and (-202)O’32 positions in Figure B14.a, and those of (310)O’32, (021)O’32 and
(-312)O’32 in Figure B14.b. The sole existence of the O’32 structure progressively converting into
the O33 phase in Domain n°4 suggests that some Li order could still be found within the interlayer
space throughout its whole x range of existence. One should however keep in mind that all the
SXRD patterns picturing the “O3 – O’3” transition were collected operando. At this point, the
Table B.T5. Cell parameters for O32 and O33 phases after Le Bail refinement of their SXRD patterns
using the R-3m space group, and their equivalent in the monoclinic system.
122
existence of a second monoclinic O’32 phase, as well as biphasic domains could also be only
observed under dynamical conditions.
Figure B17.a shows the GITT curve recorded for a st-LCO-based coin cell. Results for the
open-circuit voltage (OCV) measurements have been gathered in Figure B17.b, in which a
summary of the potential existing low voltage structures for LixCoO2 are highlighted (according to
the in situ operando SXRD experiment). The aim of this experiment was to check if voltage
plateaus could be clearly seen on both sides of the voltage jump around x = 0.5. As revealed in
Figure B17.a, two distinct plateaus are indeed observable in equilibrium conditions around ~
4.06 V (0.55 ≤ x ≤ 0.53) and ~ 4.18 V (0.47 ≤ x ≤ 0.49). According to the previous findings, they
could respectively correspond to the two-phase “O32 + O3’1” and “O’31 + O’32” domains.
However, additional ex situ SXRD patterns would be necessary to properly identify the co-existing
structures at equilibrium, which may differ from the ones formed operando. In particular, the most
thermodynamically stable structures around ~ 4.18 V may be the O3’1 and O33 forms, with the
O’32 structure only observed in operando due to the kinetics associated to the Li removal. Ex situ
SXRD measurements may still be challenging due to the narrowness of the compositions domains
for these plateaus. Similarly, complementary in situ and ex situ data during the discharge would be
mandatory to conclude on the reversibility of these phase transitions.
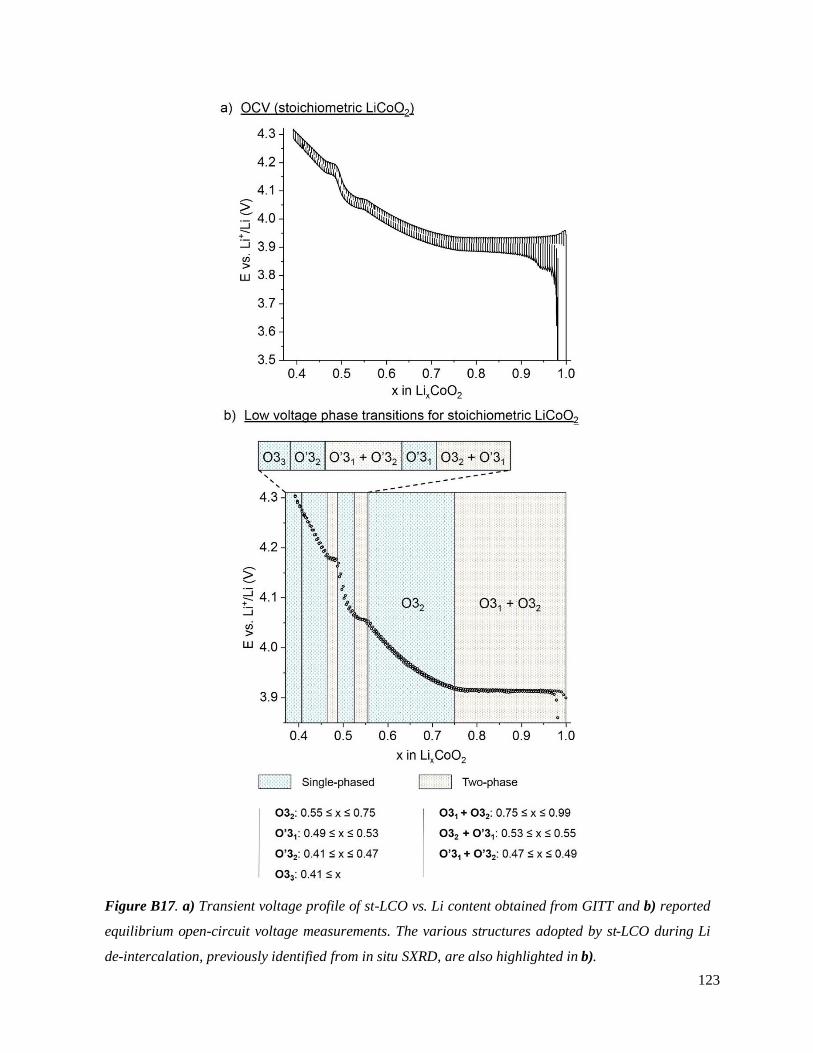
123
Figure B17. a) Transient voltage profile of st-LCO vs. Li content obtained from GITT and b) reported
equilibrium open-circuit voltage measurements. The various structures adopted by st-LCO during Li
de-intercalation, previously identified from in situ SXRD, are also highlighted in b).
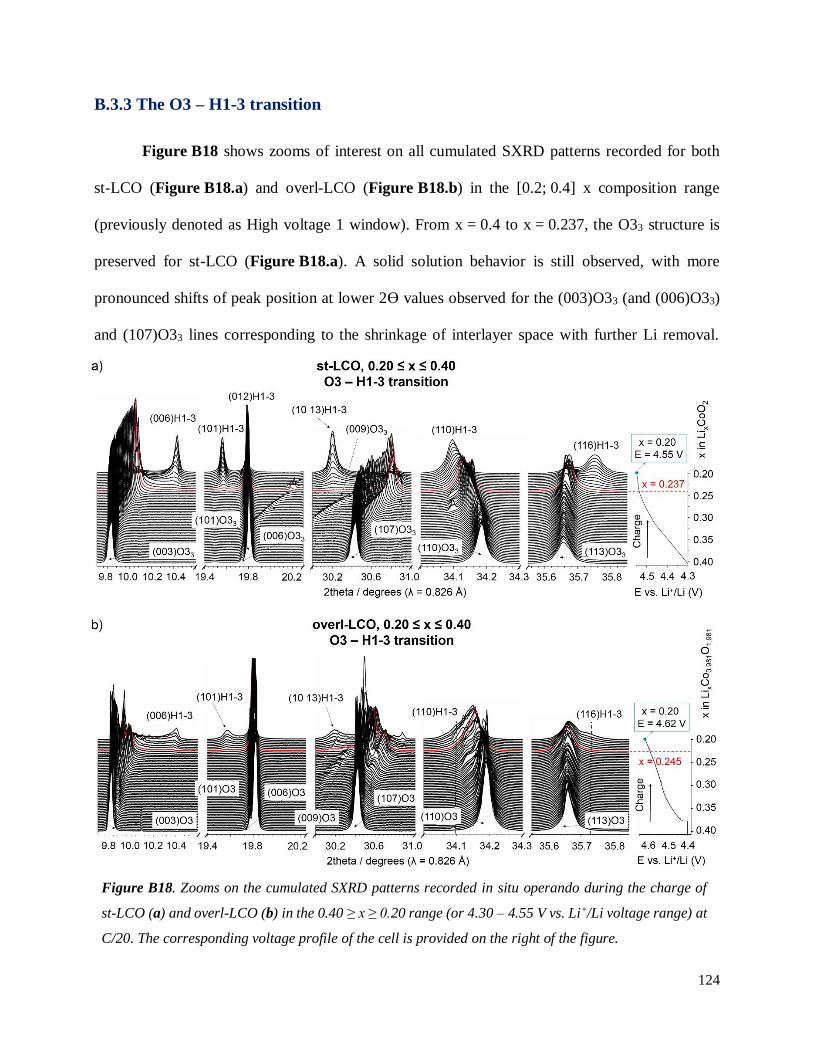
124
B.3.3 The O3 – H1-3 transition
Figure B18 shows zooms of interest on all cumulated SXRD patterns recorded for both
st-LCO (Figure B18.a) and overl-LCO (Figure B18.b) in the [0.2; 0.4] x composition range
(previously denoted as High voltage 1 window). From x = 0.4 to x = 0.237, the O33 structure is
preserved for st-LCO (Figure B18.a). A solid solution behavior is still observed, with more
pronounced shifts of peak position at lower 2ϴ values observed for the (003)O33 (and (006)O33)
and (107)O33 lines corresponding to the shrinkage of interlayer space with further Li removal.
Figure B18. Zooms on the cumulated SXRD patterns recorded in situ operando during the charge of
st-LCO (a) and overl-LCO (b) in the 0.40 ≥ x ≥ 0.20 range (or 4.30 – 4.55 V vs. Li+/Li voltage range) at
C/20. The corresponding voltage profile of the cell is provided on the right of the figure.
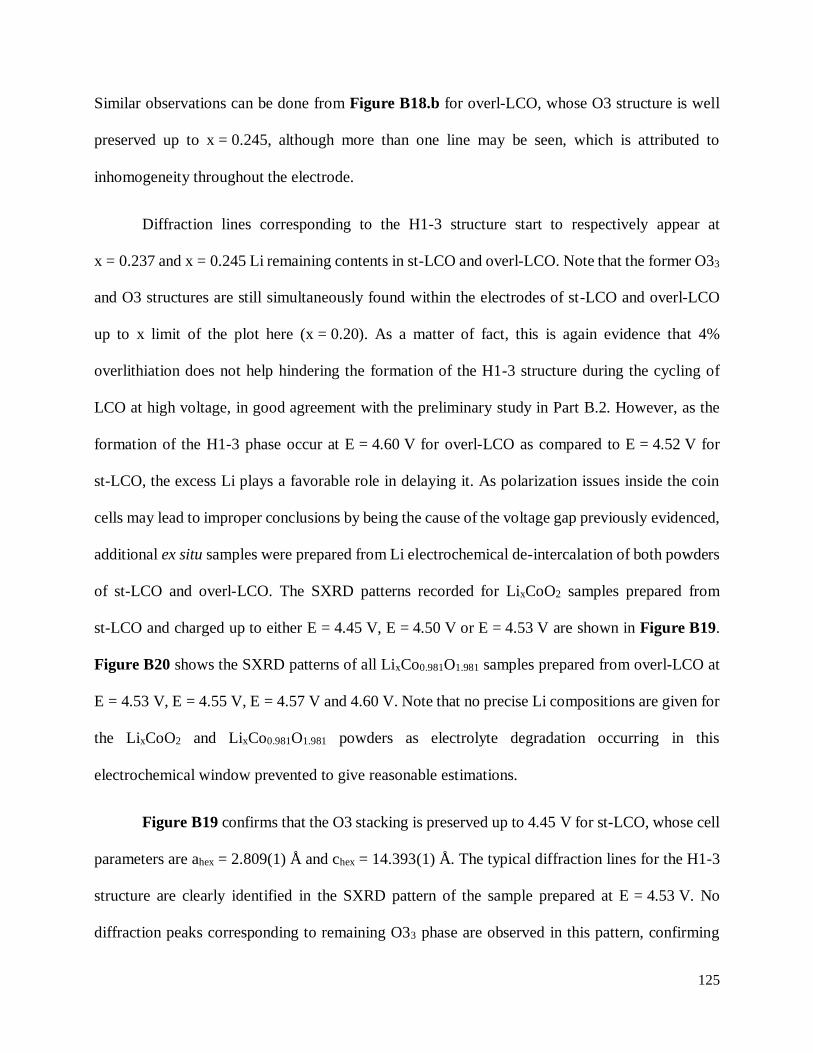
125
Similar observations can be done from Figure B18.b for overl-LCO, whose O3 structure is well
preserved up to x = 0.245, although more than one line may be seen, which is attributed to
inhomogeneity throughout the electrode.
Diffraction lines corresponding to the H1-3 structure start to respectively appear at
x = 0.237 and x = 0.245 Li remaining contents in st-LCO and overl-LCO. Note that the former O33
and O3 structures are still simultaneously found within the electrodes of st-LCO and overl-LCO
up to x limit of the plot here (x = 0.20). As a matter of fact, this is again evidence that 4%
overlithiation does not help hindering the formation of the H1-3 structure during the cycling of
LCO at high voltage, in good agreement with the preliminary study in Part B.2. However, as the
formation of the H1-3 phase occur at E = 4.60 V for overl-LCO as compared to E = 4.52 V for
st-LCO, the excess Li plays a favorable role in delaying it. As polarization issues inside the coin
cells may lead to improper conclusions by being the cause of the voltage gap previously evidenced,
additional ex situ samples were prepared from Li electrochemical de-intercalation of both powders
of st-LCO and overl-LCO. The SXRD patterns recorded for LixCoO2 samples prepared from
st-LCO and charged up to either E = 4.45 V, E = 4.50 V or E = 4.53 V are shown in Figure B19.
Figure B20 shows the SXRD patterns of all LixCo0.981O1.981 samples prepared from overl-LCO at
E = 4.53 V, E = 4.55 V, E = 4.57 V and 4.60 V. Note that no precise Li compositions are given for
the LixCoO2 and LixCo0.981O1.981 powders as electrolyte degradation occurring in this
electrochemical window prevented to give reasonable estimations.
Figure B19 confirms that the O3 stacking is preserved up to 4.45 V for st-LCO, whose cell
parameters are ahex = 2.809(1) Å and chex = 14.393(1) Å. The typical diffraction lines for the H1-3
structure are clearly identified in the SXRD pattern of the sample prepared at E = 4.53 V. No
diffraction peaks corresponding to remaining O33 phase are observed in this pattern, confirming
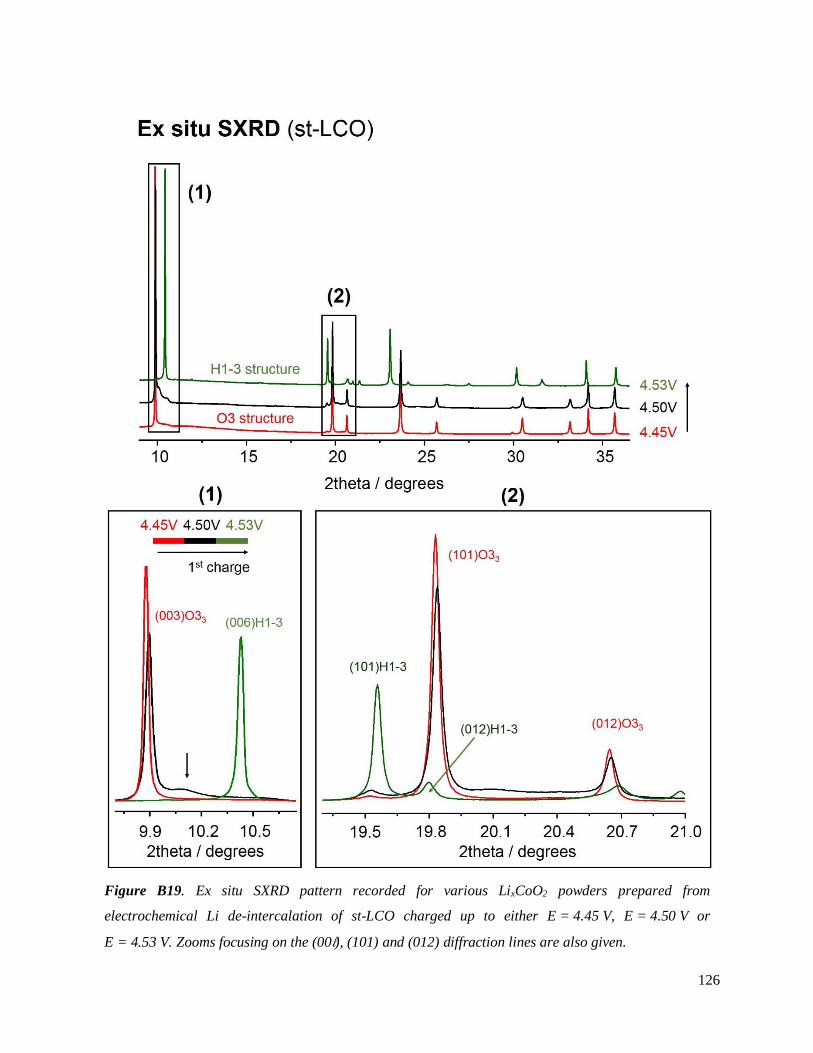
126
that we successfully prepared a pure powder of the H1-3 phase. This will however be widely that
Figure B19. Ex situ SXRD pattern recorded for various LixCoO2 powders prepared from
electrochemical Li de-intercalation of st-LCO charged up to either E = 4.45 V, E = 4.50 V or
E = 4.53 V. Zooms focusing on the (00l), (101) and (012) diffraction lines are also given.
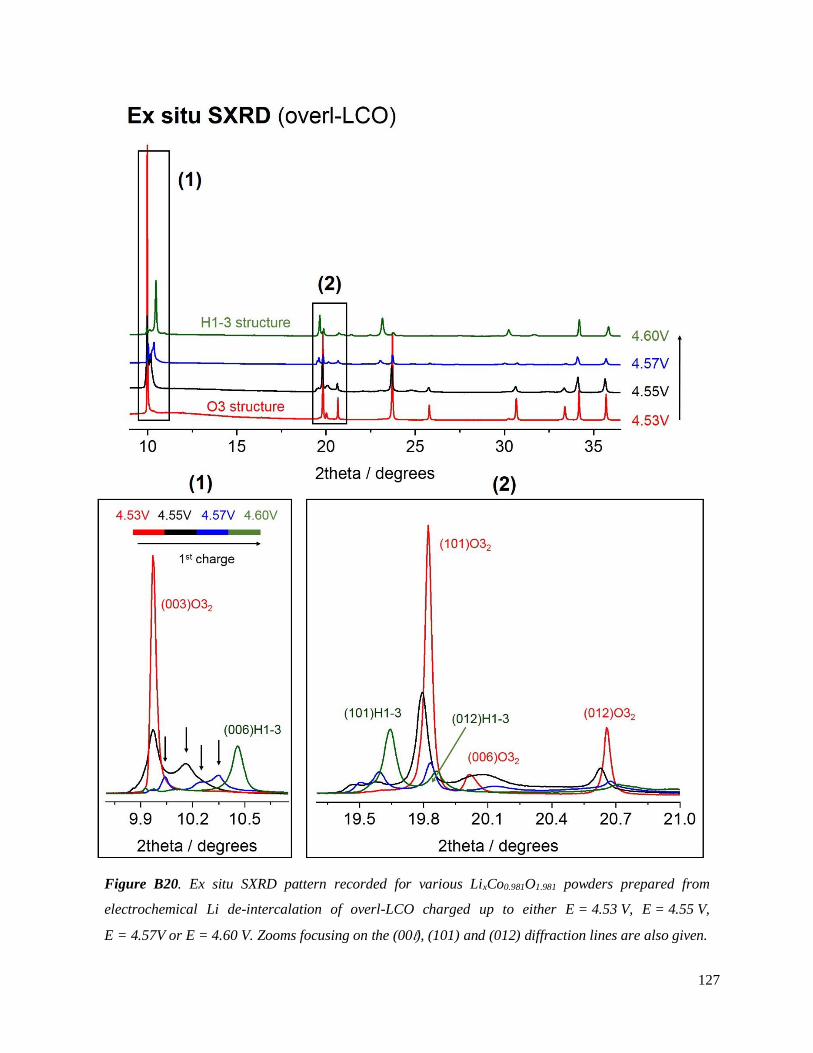
127
we successfully prepared a pure powder of the H1-3 phase. This will however be widely discussed
Figure B20. Ex situ SXRD pattern recorded for various LixCo0.981O1.981 powders prepared from
electrochemical Li de-intercalation of overl-LCO charged up to either E = 4.53 V, E = 4.55 V,
E = 4.57V or E = 4.60 V. Zooms focusing on the (00l), (101) and (012) diffraction lines are also given.
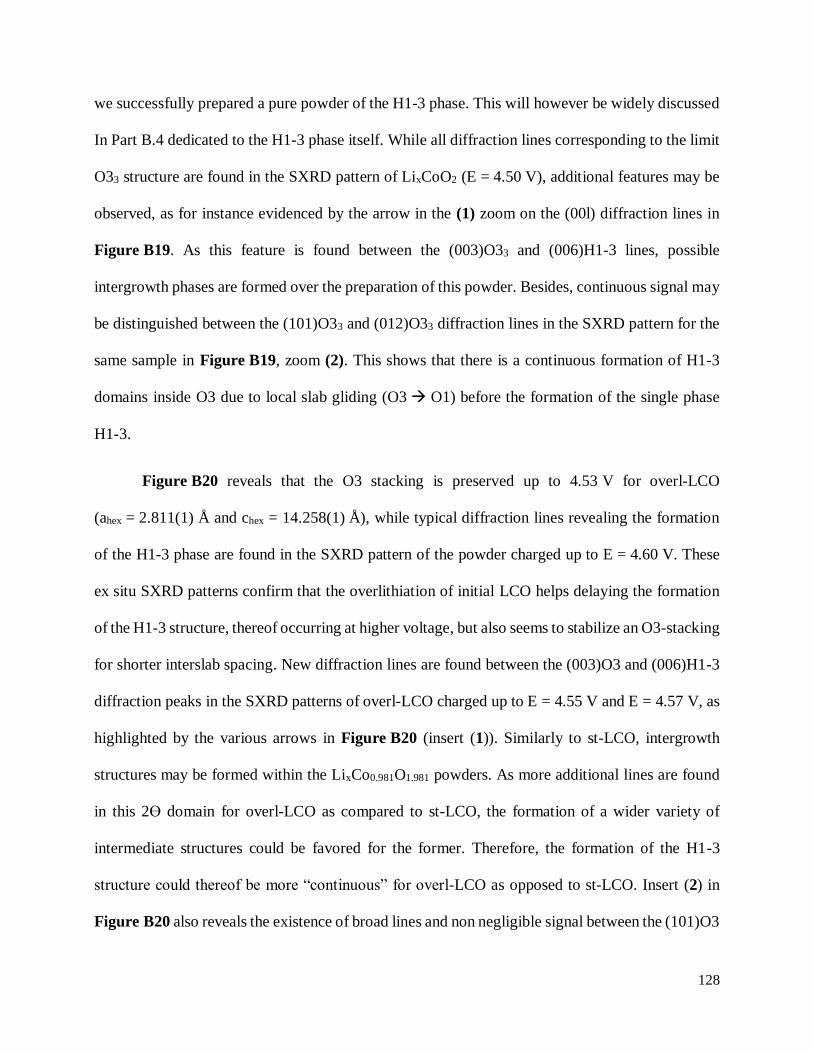
128
we successfully prepared a pure powder of the H1-3 phase. This will however be widely discussed
In Part B.4 dedicated to the H1-3 phase itself. While all diffraction lines corresponding to the limit
O33 structure are found in the SXRD pattern of LixCoO2 (E = 4.50 V), additional features may be
observed, as for instance evidenced by the arrow in the (1) zoom on the (00l) diffraction lines in
Figure B19. As this feature is found between the (003)O33 and (006)H1-3 lines, possible
intergrowth phases are formed over the preparation of this powder. Besides, continuous signal may
be distinguished between the (101)O33 and (012)O33 diffraction lines in the SXRD pattern for the
same sample in Figure B19, zoom (2). This shows that there is a continuous formation of H1-3
domains inside O3 due to local slab gliding (O3 O1) before the formation of the single phase
H1-3.
Figure B20 reveals that the O3 stacking is preserved up to 4.53 V for overl-LCO
(ahex = 2.811(1) Å and chex = 14.258(1) Å), while typical diffraction lines revealing the formation
of the H1-3 phase are found in the SXRD pattern of the powder charged up to E = 4.60 V. These
ex situ SXRD patterns confirm that the overlithiation of initial LCO helps delaying the formation
of the H1-3 structure, thereof occurring at higher voltage, but also seems to stabilize an O3-stacking
for shorter interslab spacing. New diffraction lines are found between the (003)O3 and (006)H1-3
diffraction peaks in the SXRD patterns of overl-LCO charged up to E = 4.55 V and E = 4.57 V, as
highlighted by the various arrows in Figure B20 (insert (1)). Similarly to st-LCO, intergrowth
structures may be formed within the LixCo0.981O1.981 powders. As more additional lines are found
in this 2ϴ domain for overl-LCO as compared to st-LCO, the formation of a wider variety of
intermediate structures could be favored for the former. Therefore, the formation of the H1-3
structure could thereof be more “continuous” for overl-LCO as opposed to st-LCO. Insert (2) in
Figure B20 also reveals the existence of broad lines and non negligible signal between the (101)O3
129
and (012)O3 lines exhibited by overl-LCO charged up to E = 4.55 V and E = 4.57 V, again
suggesting that their corresponding O3 structures may contain a high density of O1 stacking faults.
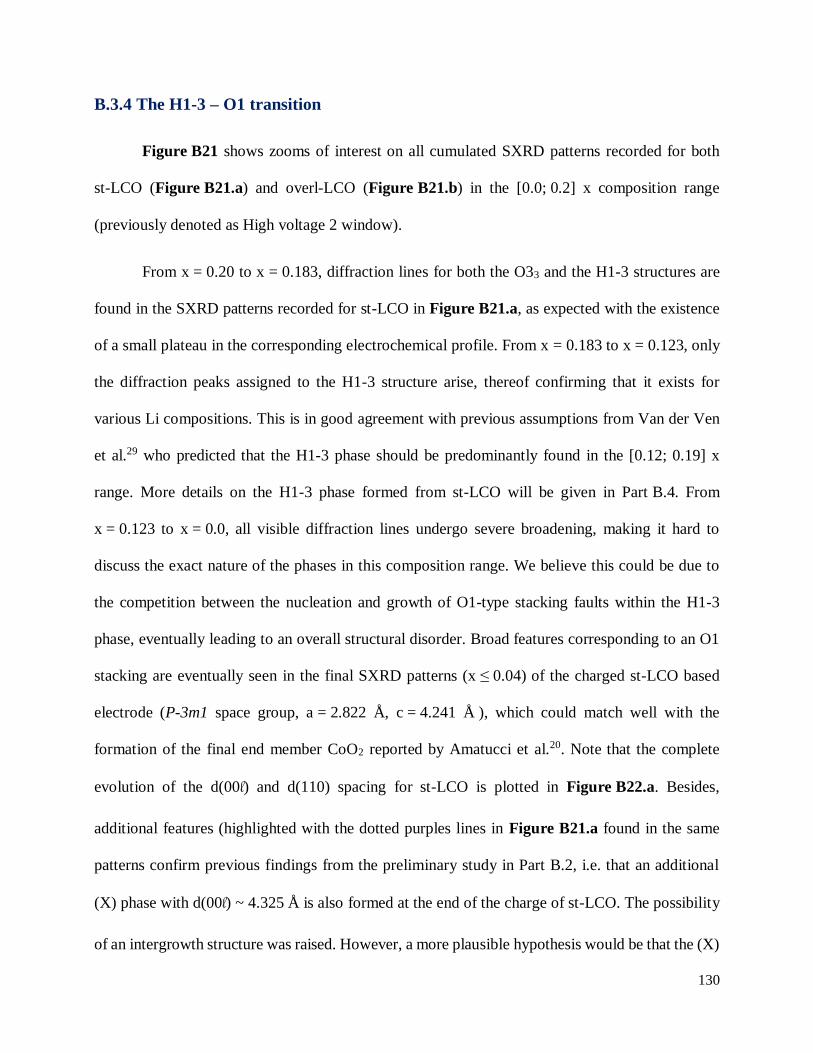
130
B.3.4 The H1-3 – O1 transition
Figure B21 shows zooms of interest on all cumulated SXRD patterns recorded for both
st-LCO (Figure B21.a) and overl-LCO (Figure B21.b) in the [0.0; 0.2] x composition range
(previously denoted as High voltage 2 window).
From x = 0.20 to x = 0.183, diffraction lines for both the O33 and the H1-3 structures are
found in the SXRD patterns recorded for st-LCO in Figure B21.a, as expected with the existence
of a small plateau in the corresponding electrochemical profile. From x = 0.183 to x = 0.123, only
the diffraction peaks assigned to the H1-3 structure arise, thereof confirming that it exists for
various Li compositions. This is in good agreement with previous assumptions from Van der Ven
et al.29 who predicted that the H1-3 phase should be predominantly found in the [0.12; 0.19] x
range. More details on the H1-3 phase formed from st-LCO will be given in Part B.4. From
x = 0.123 to x = 0.0, all visible diffraction lines undergo severe broadening, making it hard to
discuss the exact nature of the phases in this composition range. We believe this could be due to
the competition between the nucleation and growth of O1-type stacking faults within the H1-3
phase, eventually leading to an overall structural disorder. Broad features corresponding to an O1
stacking are eventually seen in the final SXRD patterns (x ≤ 0.04) of the charged st-LCO based
electrode (P-3m1 space group, a = 2.822 Å, c = 4.241 Å ), which could match well with the
formation of the final end member CoO2 reported by Amatucci et al.20. Note that the complete
evolution of the d(00l) and d(110) spacing for st-LCO is plotted in Figure B22.a. Besides,
additional features (highlighted with the dotted purples lines in Figure B21.a found in the same
patterns confirm previous findings from the preliminary study in Part B.2, i.e. that an additional
(X) phase with d(00l) ~ 4.325 Å is also formed at the end of the charge of st-LCO. The possibility
of an intergrowth structure was raised. However, a more plausible hypothesis would be that the (X)
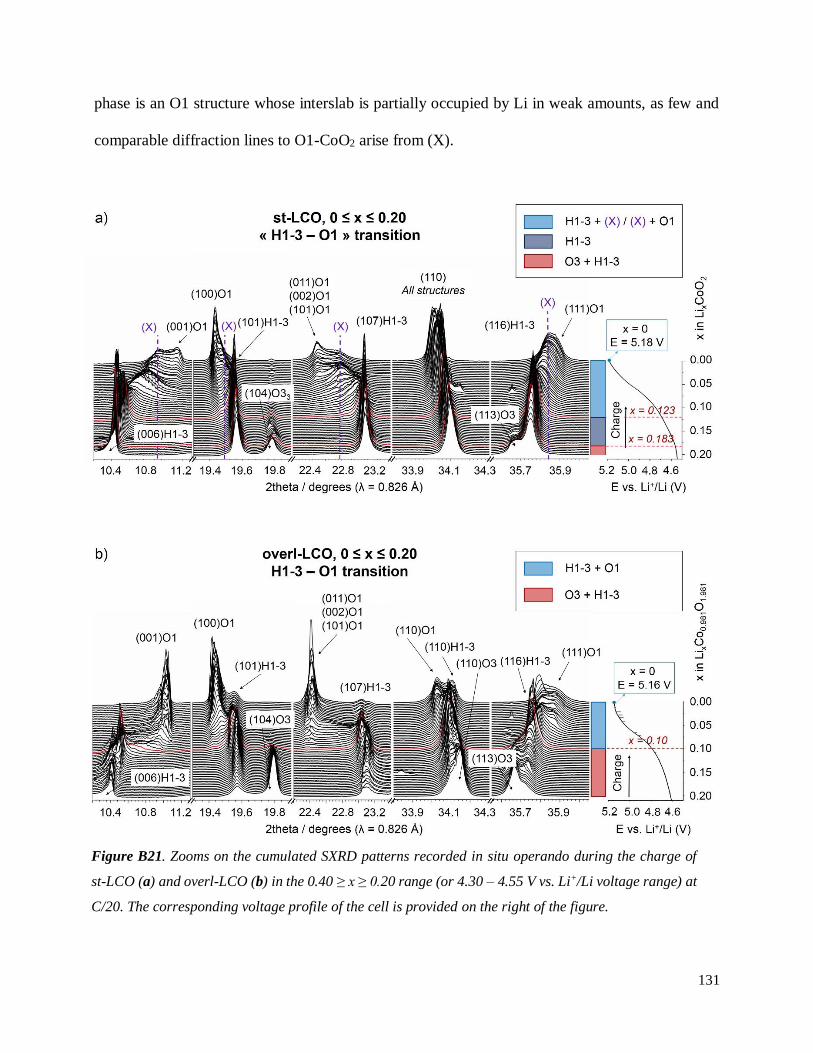
131
phase is an O1 structure whose interslab is partially occupied by Li in weak amounts, as few and
comparable diffraction lines to O1-CoO2 arise from (X).
Figure B21. Zooms on the cumulated SXRD patterns recorded in situ operando during the charge of
st-LCO (a) and overl-LCO (b) in the 0.40 ≥ x ≥ 0.20 range (or 4.30 – 4.55 V vs. Li+/Li voltage range) at
C/20. The corresponding voltage profile of the cell is provided on the right of the figure.
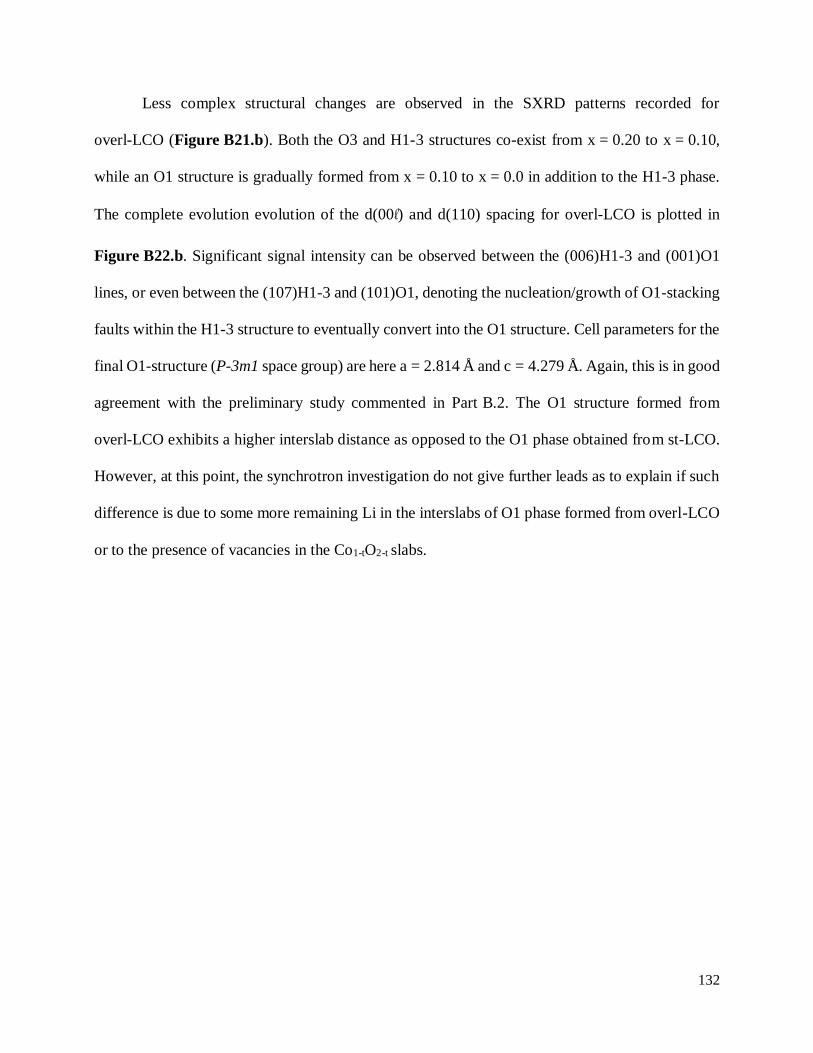
132
Less complex structural changes are observed in the SXRD patterns recorded for
overl-LCO (Figure B21.b). Both the O3 and H1-3 structures co-exist from x = 0.20 to x = 0.10,
while an O1 structure is gradually formed from x = 0.10 to x = 0.0 in addition to the H1-3 phase.
The complete evolution evolution of the d(00l) and d(110) spacing for overl-LCO is plotted in
Figure B22.b. Significant signal intensity can be observed between the (006)H1-3 and (001)O1
lines, or even between the (107)H1-3 and (101)O1, denoting the nucleation/growth of O1-stacking
faults within the H1-3 structure to eventually convert into the O1 structure. Cell parameters for the
final O1-structure (P-3m1 space group) are here a = 2.814 Å and c = 4.279 Å. Again, this is in good
agreement with the preliminary study commented in Part B.2. The O1 structure formed from
overl-LCO exhibits a higher interslab distance as opposed to the O1 phase obtained from st-LCO.
However, at this point, the synchrotron investigation do not give further leads as to explain if such
difference is due to some more remaining Li in the interslabs of O1 phase formed from overl-LCO
or to the presence of vacancies in the Co1-tO2-t slabs.
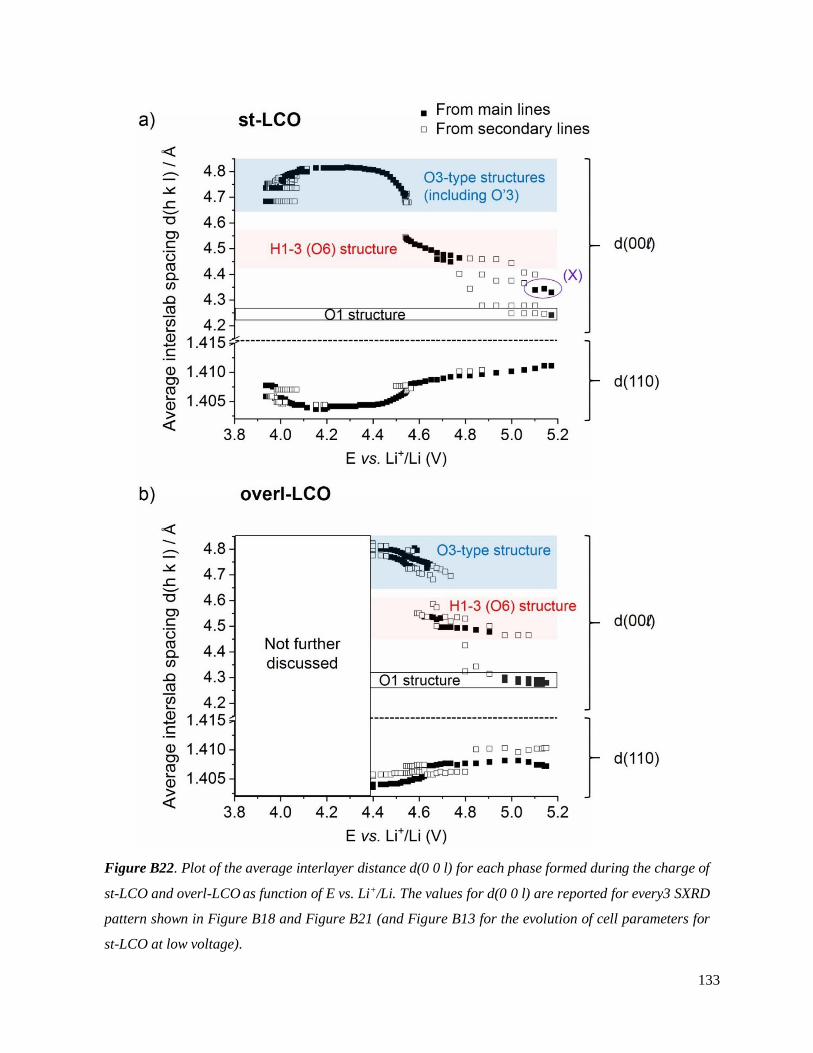
133
Figure B22. Plot of the average interlayer distance d(0 0 l) for each phase formed during the charge of
st-LCO and overl-LCO as function of E vs. Li+/Li. The values for d(0 0 l) are reported for every3 SXRD
pattern shown in Figure B18 and Figure B21 (and Figure B13 for the evolution of cell parameters for
st-LCO at low voltage).
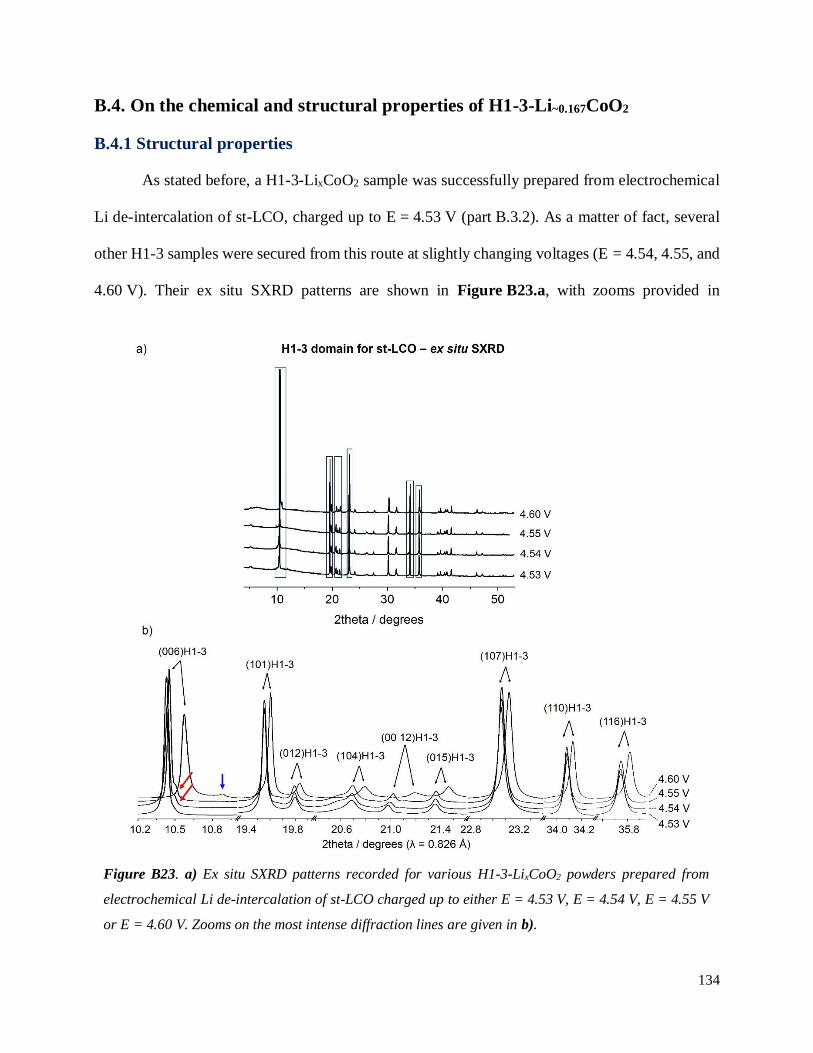
134
B.4. On the chemical and structural properties of H1-3-Li~0.167CoO2
B.4.1 Structural properties
As stated before, a H1-3-LixCoO2 sample was successfully prepared from electrochemical
Li de-intercalation of st-LCO, charged up to E = 4.53 V (part B.3.2). As a matter of fact, several
other H1-3 samples were secured from this route at slightly changing voltages (E = 4.54, 4.55, and
4.60 V). Their ex situ SXRD patterns are shown in Figure B23.a, with zooms provided in
Figure B23. a) Ex situ SXRD patterns recorded for various H1-3-LixCoO2 powders prepared from
electrochemical Li de-intercalation of st-LCO charged up to either E = 4.53 V, E = 4.54 V, E = 4.55 V
or E = 4.60 V. Zooms on the most intense diffraction lines are given in b).
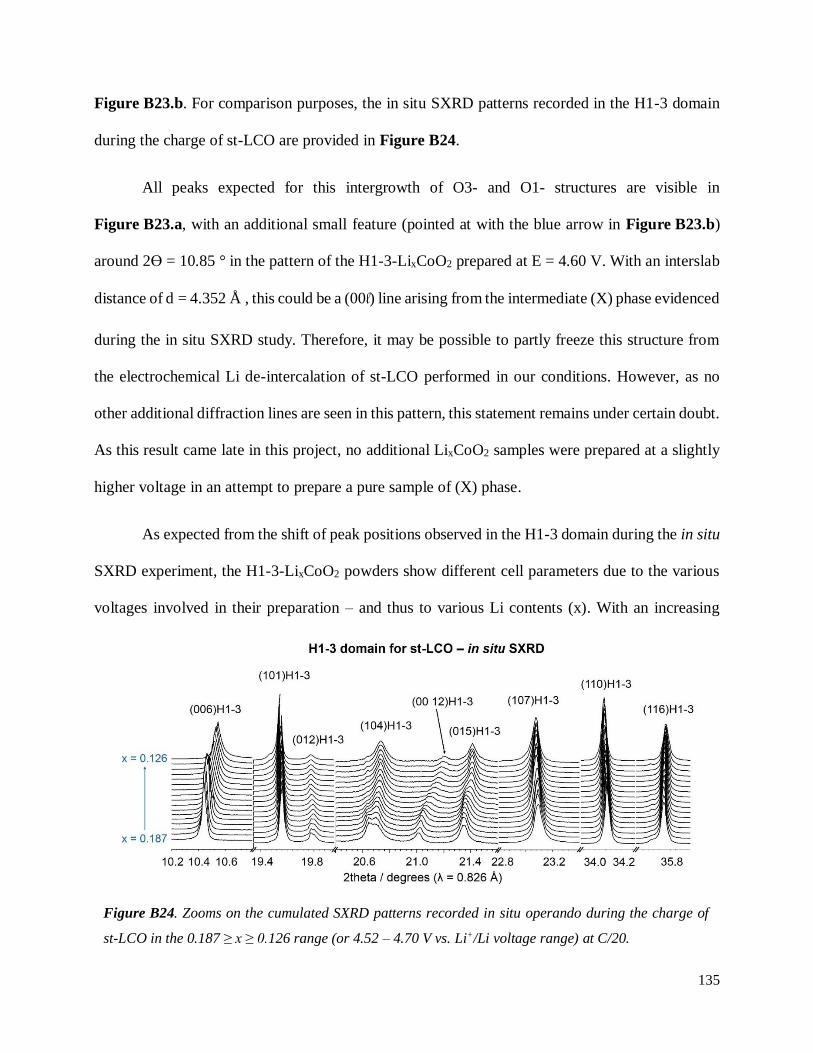
135
Figure B23.b. For comparison purposes, the in situ SXRD patterns recorded in the H1-3 domain
during the charge of st-LCO are provided in Figure B24.
All peaks expected for this intergrowth of O3- and O1- structures are visible in
Figure B23.a, with an additional small feature (pointed at with the blue arrow in Figure B23.b)
around 2ϴ = 10.85 ° in the pattern of the H1-3-LixCoO2 prepared at E = 4.60 V. With an interslab
distance of d = 4.352 Å , this could be a (00l) line arising from the intermediate (X) phase evidenced
during the in situ SXRD study. Therefore, it may be possible to partly freeze this structure from
the electrochemical Li de-intercalation of st-LCO performed in our conditions. However, as no
other additional diffraction lines are seen in this pattern, this statement remains under certain doubt.
As this result came late in this project, no additional LixCoO2 samples were prepared at a slightly
higher voltage in an attempt to prepare a pure sample of (X) phase.
As expected from the shift of peak positions observed in the H1-3 domain during the in situ
SXRD experiment, the H1-3-LixCoO2 powders show different cell parameters due to the various
voltages involved in their preparation – and thus to various Li contents (x). With an increasing
Figure B24. Zooms on the cumulated SXRD patterns recorded in situ operando during the charge of
st-LCO in the 0.187 ≥ x ≥ 0.126 range (or 4.52 – 4.70 V vs. Li+/Li voltage range) at C/20.
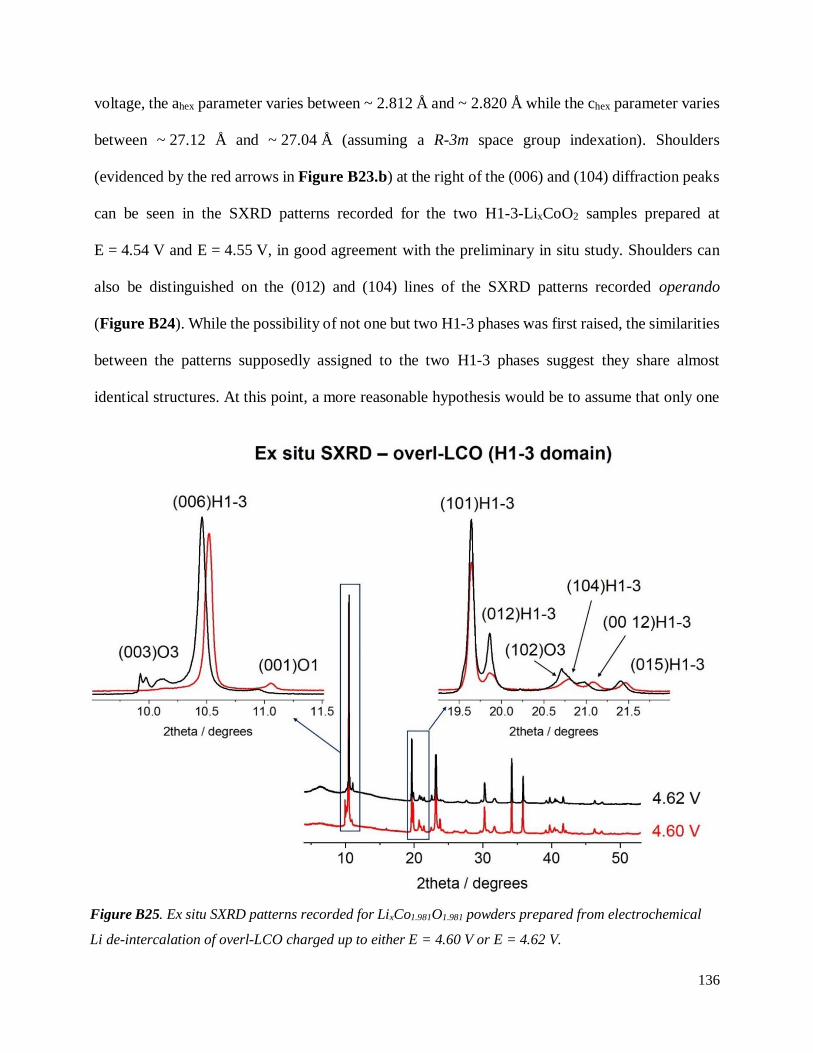
136
voltage, the ahex parameter varies between ~ 2.812 Å and ~ 2.820 Å while the chex parameter varies
between ~ 27.12 Å and ~ 27.04 Å (assuming a R-3m space group indexation). Shoulders
(evidenced by the red arrows in Figure B23.b) at the right of the (006) and (104) diffraction peaks
can be seen in the SXRD patterns recorded for the two H1-3-LixCoO2 samples prepared at
E = 4.54 V and E = 4.55 V, in good agreement with the preliminary in situ study. Shoulders can
also be distinguished on the (012) and (104) lines of the SXRD patterns recorded operando
(Figure B24). While the possibility of not one but two H1-3 phases was first raised, the similarities
between the patterns supposedly assigned to the two H1-3 phases suggest they share almost
identical structures. At this point, a more reasonable hypothesis would be to assume that only one
Figure B25. Ex situ SXRD patterns recorded for LixCo1.981O1.981 powders prepared from electrochemical
Li de-intercalation of overl-LCO charged up to either E = 4.60 V or E = 4.62 V.
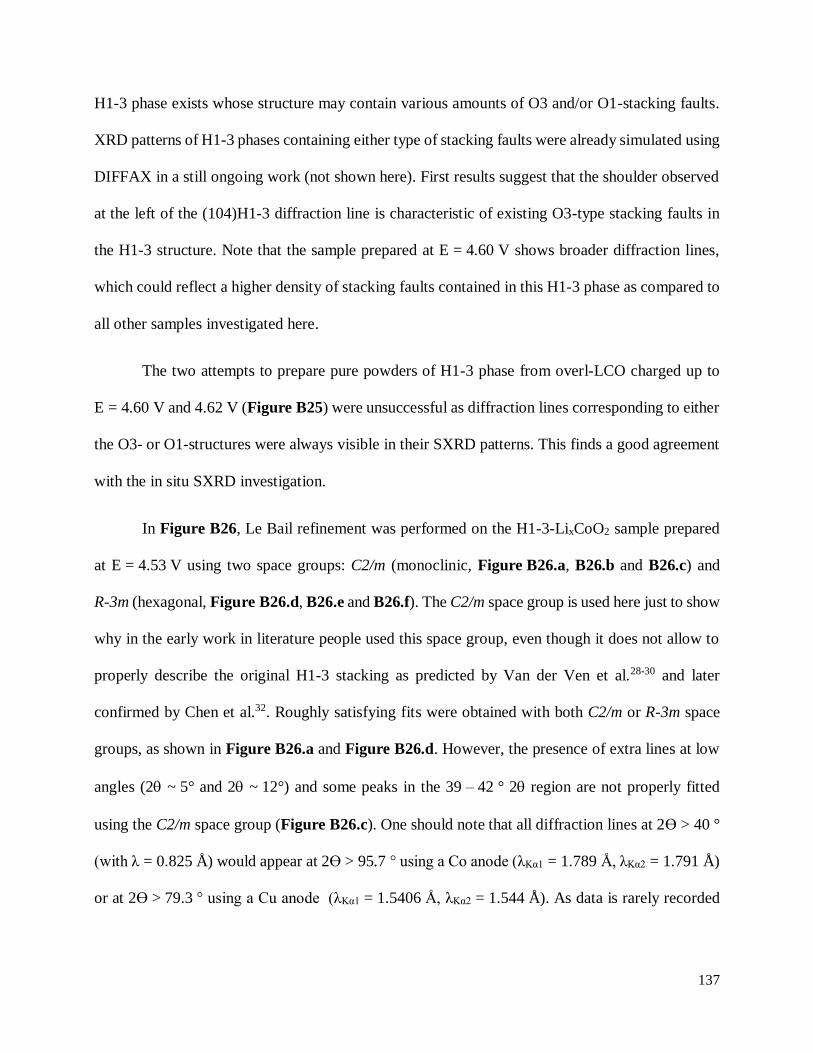
137
H1-3 phase exists whose structure may contain various amounts of O3 and/or O1-stacking faults.
XRD patterns of H1-3 phases containing either type of stacking faults were already simulated using
DIFFAX in a still ongoing work (not shown here). First results suggest that the shoulder observed
at the left of the (104)H1-3 diffraction line is characteristic of existing O3-type stacking faults in
the H1-3 structure. Note that the sample prepared at E = 4.60 V shows broader diffraction lines,
which could reflect a higher density of stacking faults contained in this H1-3 phase as compared to
all other samples investigated here.
The two attempts to prepare pure powders of H1-3 phase from overl-LCO charged up to
E = 4.60 V and 4.62 V (Figure B25) were unsuccessful as diffraction lines corresponding to either
the O3- or O1-structures were always visible in their SXRD patterns. This finds a good agreement
with the in situ SXRD investigation.
In Figure B26, Le Bail refinement was performed on the H1-3-LixCoO2 sample prepared
at E = 4.53 V using two space groups: C2/m (monoclinic, Figure B26.a, B26.b and B26.c) and
R-3m (hexagonal, Figure B26.d, B26.e and B26.f). The C2/m space group is used here just to show
why in the early work in literature people used this space group, even though it does not allow to
properly describe the original H1-3 stacking as predicted by Van der Ven et al.28-30 and later
confirmed by Chen et al.32. Roughly satisfying fits were obtained with both C2/m or R-3m space
groups, as shown in Figure B26.a and Figure B26.d. However, the presence of extra lines at low
angles (2 ~ 5° and 2 ~ 12°) and some peaks in the 39 – 42 ° 2 region are not properly fitted
using the C2/m space group (Figure B26.c). One should note that all diffraction lines at 2ϴ > 40 °
(with λ = 0.825 Å) would appear at 2ϴ > 95.7 ° using a Co anode (λKα1 = 1.789 Å, λKα2 = 1.791 Å)
or at 2ϴ > 79.3 ° using a Cu anode (λKα1 = 1.5406 Å, λKα2 = 1.544 Å). As data is rarely recorded
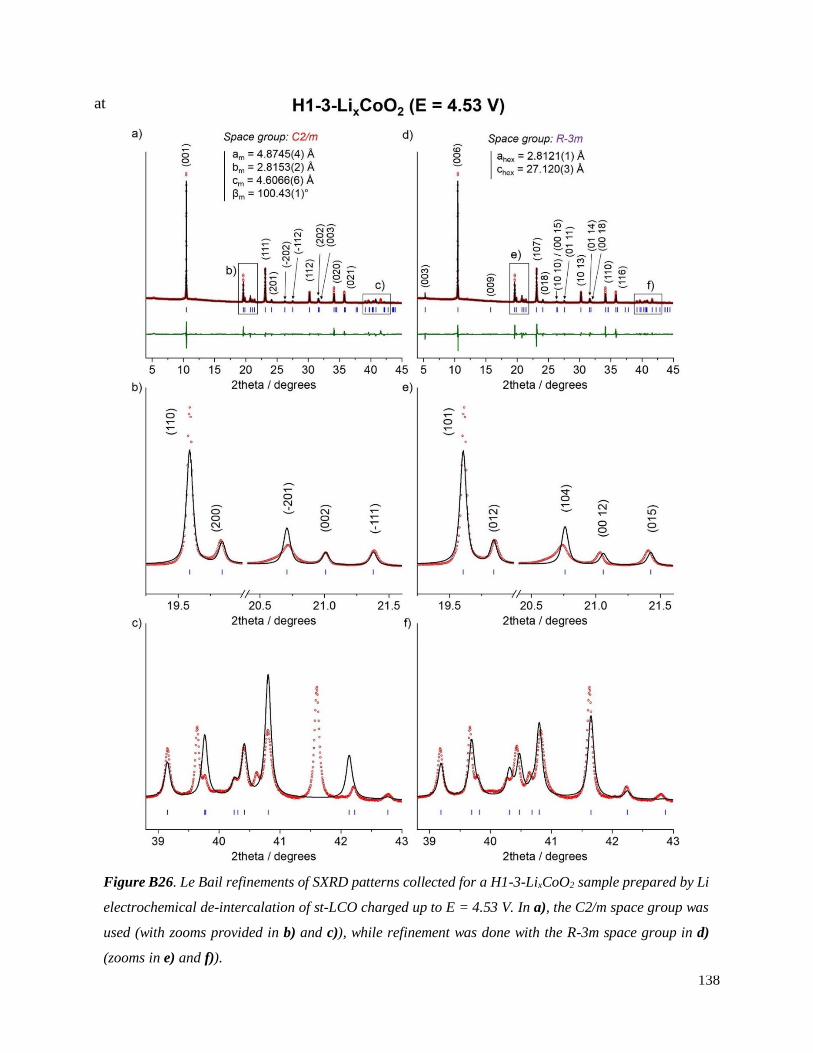
138
at higher angle and with peaks strongly overlapping, this could explain why the C2/m space group
Figure B26. Le Bail refinements of SXRD patterns collected for a H1-3-LixCoO2 sample prepared by Li
electrochemical de-intercalation of st-LCO charged up to E = 4.53 V. In a), the C2/m space group was
used (with zooms provided in b) and c)), while refinement was done with the R-3m space group in d)
(zooms in e) and f)).
139
higher angle and with peaks strongly overlapping, this could explain why the C2/m space group
was used in the early study in literature.
As shown in both Figure B26.d and B26.e, all peaks are fitted using the R-3m space group
to fit the SXRD pattern of the H1-3 phase. Cell parameters are ahex = 2.8121(1) Å and
ahex = 27.1210(3) Å. However, deviations of peak positions may be identified in the zoom provided
in Figure B26.e. The impossibility to accurately fit the peak positions only appeared during the Le
Bail refinement of all H1-3-LixCoO2 powders as opposed to other materials (including st-LCO and
overl-LCO, whose patterns were recorded at the same time), which raises the question of a possible
effect of stacking faults creating local constraints. The hypothesis of an angular dependence of the
zero setpoint due to the non negligible X-ray absorption of the Co contained in the samples at
λ = 0.825 Å was also excluded for the same reasons. At this point, it still seems reasonable to affirm
that refinement of XRD pattern of the H1-3 structure should be performed using the R-3m space
group. Unfortunately, attempts to record complementary electron diffraction patterns to both
confirm the indexation according to a hexagonal unit cell (R-3m space group) and the existence
were fruitless. The additional use of softwares such as DIFFAX or FAULTS will still be required.
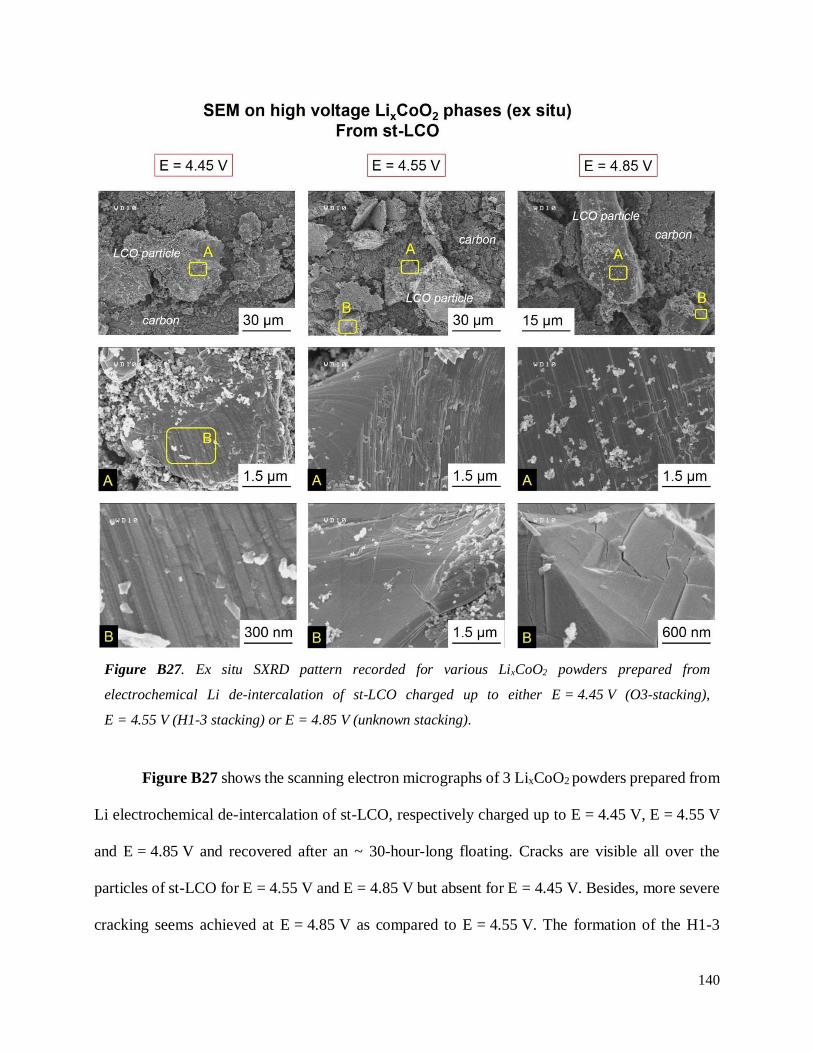
140
Figure B27 shows the scanning electron micrographs of 3 LixCoO2 powders prepared from
Li electrochemical de-intercalation of st-LCO, respectively charged up to E = 4.45 V, E = 4.55 V
and E = 4.85 V and recovered after an ~ 30-hour-long floating. Cracks are visible all over the
particles of st-LCO for E = 4.55 V and E = 4.85 V but absent for E = 4.45 V. Besides, more severe
cracking seems achieved at E = 4.85 V as compared to E = 4.55 V. The formation of the H1-3
Figure B27. Ex situ SXRD pattern recorded for various LixCoO2 powders prepared from
electrochemical Li de-intercalation of st-LCO charged up to either E = 4.45 V (O3-stacking),
E = 4.55 V (H1-3 stacking) or E = 4.85 V (unknown stacking).
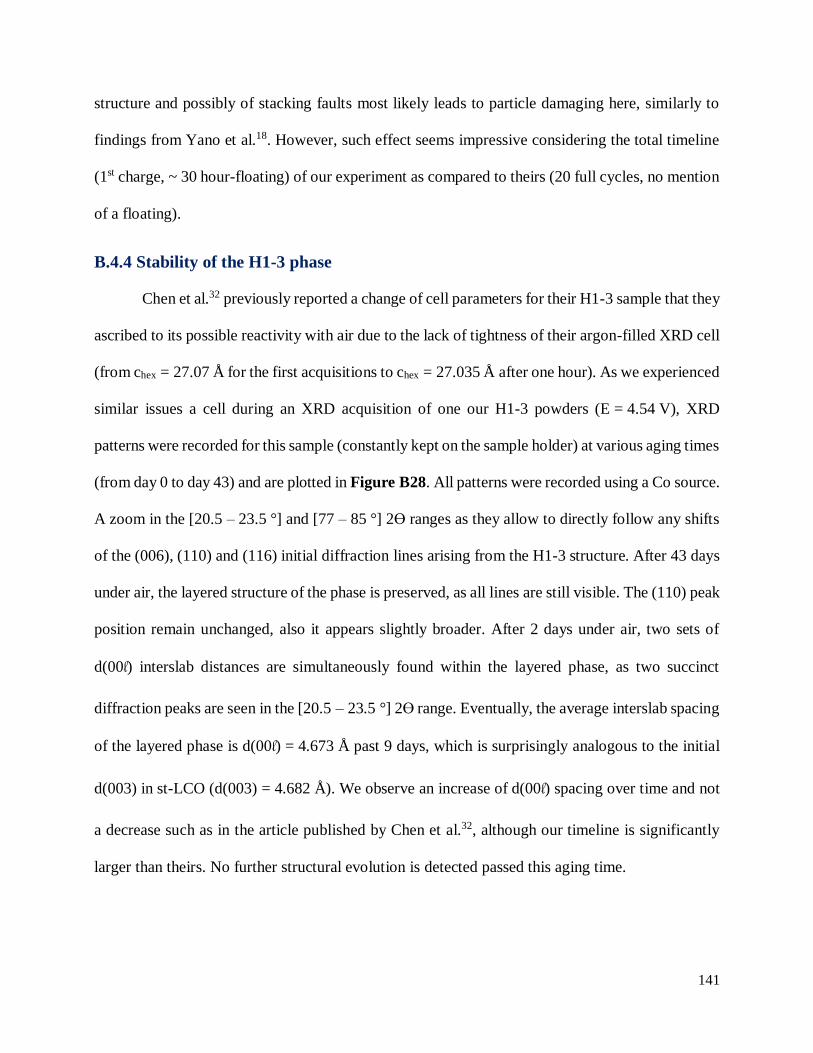
141
structure and possibly of stacking faults most likely leads to particle damaging here, similarly to
findings from Yano et al.18. However, such effect seems impressive considering the total timeline
(1st charge, ~ 30 hour-floating) of our experiment as compared to theirs (20 full cycles, no mention
of a floating).
B.4.4 Stability of the H1-3 phase
Chen et al.32 previously reported a change of cell parameters for their H1-3 sample that they
ascribed to its possible reactivity with air due to the lack of tightness of their argon-filled XRD cell
(from chex = 27.07 Å for the first acquisitions to chex = 27.035 Å after one hour). As we experienced
similar issues a cell during an XRD acquisition of one our H1-3 powders (E = 4.54 V), XRD
patterns were recorded for this sample (constantly kept on the sample holder) at various aging times
(from day 0 to day 43) and are plotted in Figure B28. All patterns were recorded using a Co source.
A zoom in the [20.5 – 23.5 °] and [77 – 85 °] 2ϴ ranges as they allow to directly follow any shifts
of the (006), (110) and (116) initial diffraction lines arising from the H1-3 structure. After 43 days
under air, the layered structure of the phase is preserved, as all lines are still visible. The (110) peak
position remain unchanged, also it appears slightly broader. After 2 days under air, two sets of
d(00l) interslab distances are simultaneously found within the layered phase, as two succinct
diffraction peaks are seen in the [20.5 – 23.5 °] 2ϴ range. Eventually, the average interslab spacing
of the layered phase is d(00l) = 4.673 Å past 9 days, which is surprisingly analogous to the initial
d(003) in st-LCO (d(003) = 4.682 Å). We observe an increase of d(00l) spacing over time and not
a decrease such as in the article published by Chen et al.32, although our timeline is significantly
larger than theirs. No further structural evolution is detected passed this aging time.
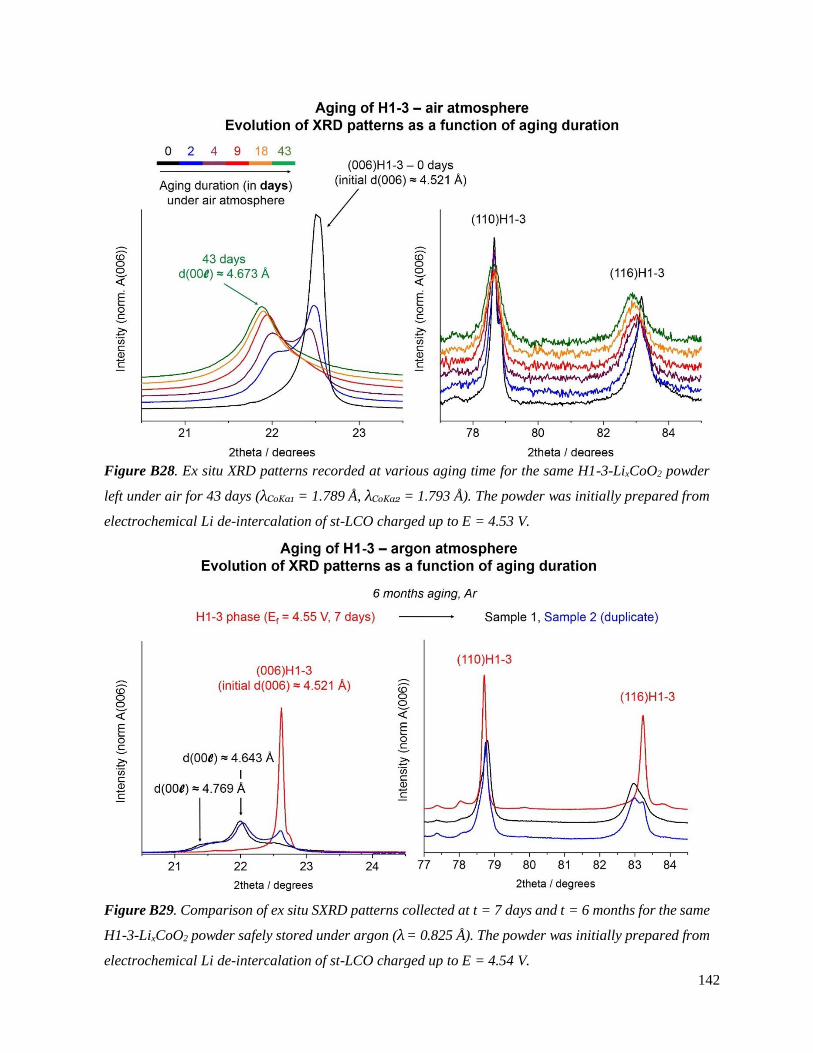
142
We observed a similar evolution in the SXRD patterns of a H1-3 sample prepared from
Figure B29. Comparison of ex situ SXRD patterns collected at t = 7 days and t = 6 months for the same
H1-3-LixCoO2 powder safely stored under argon (λ = 0.825 Å). The powder was initially prepared from
electrochemical Li de-intercalation of st-LCO charged up to E = 4.54 V.
Figure B28. Ex situ XRD patterns recorded at various aging time for the same H1-3-LixCoO2 powder
left under air for 43 days (λCoKα1 = 1.789 Å, λCoKα2 = 1.793 Å). The powder was initially prepared from
electrochemical Li de-intercalation of st-LCO charged up to E = 4.53 V.
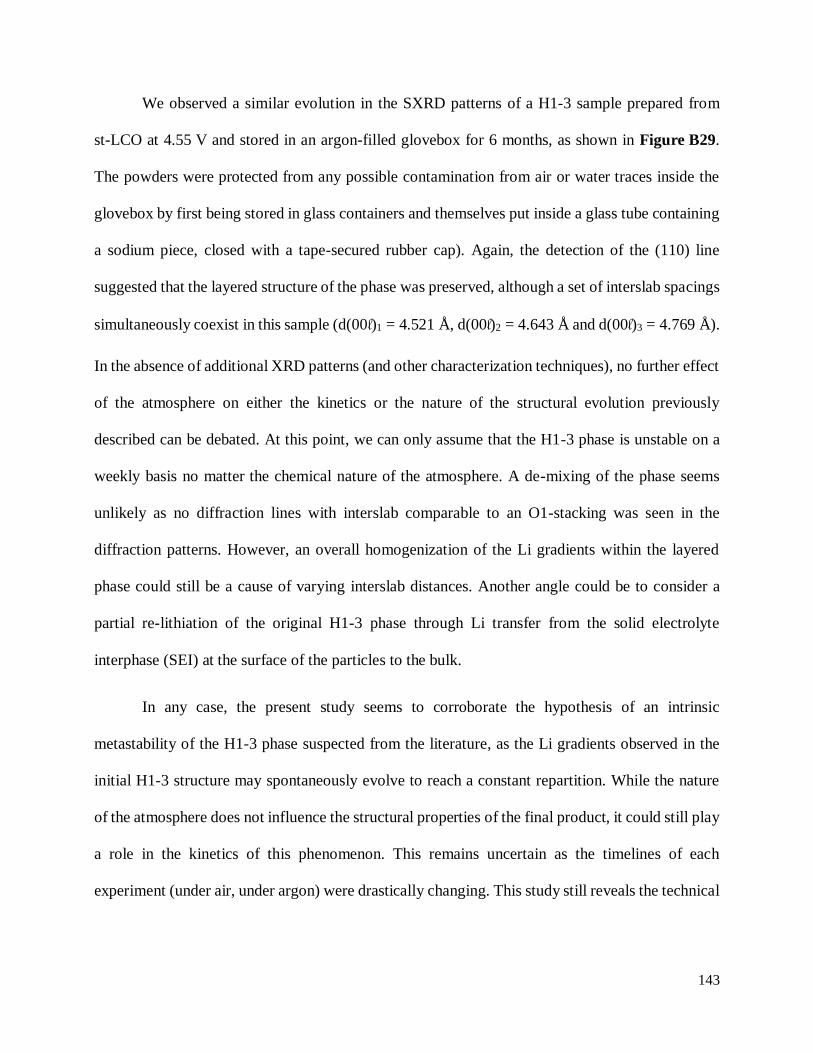
143
We observed a similar evolution in the SXRD patterns of a H1-3 sample prepared from
st-LCO at 4.55 V and stored in an argon-filled glovebox for 6 months, as shown in Figure B29.
The powders were protected from any possible contamination from air or water traces inside the
glovebox by first being stored in glass containers and themselves put inside a glass tube containing
a sodium piece, closed with a tape-secured rubber cap). Again, the detection of the (110) line
suggested that the layered structure of the phase was preserved, although a set of interslab spacings
simultaneously coexist in this sample (d(00l)1 = 4.521 Å, d(00l)2 = 4.643 Å and d(00l)3 = 4.769 Å).
In the absence of additional XRD patterns (and other characterization techniques), no further effect
of the atmosphere on either the kinetics or the nature of the structural evolution previously
described can be debated. At this point, we can only assume that the H1-3 phase is unstable on a
weekly basis no matter the chemical nature of the atmosphere. A de-mixing of the phase seems
unlikely as no diffraction lines with interslab comparable to an O1-stacking was seen in the
diffraction patterns. However, an overall homogenization of the Li gradients within the layered
phase could still be a cause of varying interslab distances. Another angle could be to consider a
partial re-lithiation of the original H1-3 phase through Li transfer from the solid electrolyte
interphase (SEI) at the surface of the particles to the bulk.
In any case, the present study seems to corroborate the hypothesis of an intrinsic
metastability of the H1-3 phase suspected from the literature, as the Li gradients observed in the
initial H1-3 structure may spontaneously evolve to reach a constant repartition. While the nature
of the atmosphere does not influence the structural properties of the final product, it could still play
a role in the kinetics of this phenomenon. This remains uncertain as the timelines of each
experiment (under air, under argon) were drastically changing. This study still reveals the technical

144
difficulties inherent to the handling of H1-3 powders, which was still suspected due to the lack of
knowledge available in the literature.
145
B.5. General conclusions on Part B
In situ X-ray diffraction measurements have revealed that st-LCO (initial Li/Co = 1.00)
experiences more phase transitions than previously reported, both at low and high voltage during
its 1st full charge in a half cell setup. In the 0.55 < x < 0.40 range, the coexistence of two monoclinic
phases was detected operando for the LixCoO2 system, although their existence at equilibrium
remains unknown. The complementary preparation of LixCoO2 powders from electrochemical Li
de-intercalation of st-LCO in this x range is now currently performed within the frame of a Sean
Hinkle Master’s project. While the formation of the high voltage H1-3 (R-3m space group) and O1
(P-3m1 space group) structures was confirmed, diffraction lines arising from a possible intergrowth
(X) structure were additionally detected. The existence of defects generated by the initial presence
of excess Li inside the CoO2 layers of overl-LCO (initial Li/Co = 1.05) does not hinder but delays
the formation of the H1-3 and O1 phases, though their cell parameters slightly differ. Besides, the
intermediate (X) structure is not formed.
This new intergrowth structure has been additionally detected in the in situ SXRD patterns
recorded during the charge of st-LCO at C/10 and C/2 (not shown in this manuscript). Data
treatment of the SXRD patterns first suggests that the average interslab spacing in the (X) phase
varies with the C rate. Further work will be required to confirm it.
The successful preparation of pure powders of H1-3-LixCoO2 from electrochemical
de-intercalation of Li from st-LCO has helped confirming the indexation of its structure using an
hexagonal unit cell. However, no information regarding the sites occupied by Li and their
occupancy could be gathered. Deeper analysis of the diffraction data still remains challenging to
this day due to the existence of stacking faults in all the high voltage phases. DIFFAX modelling
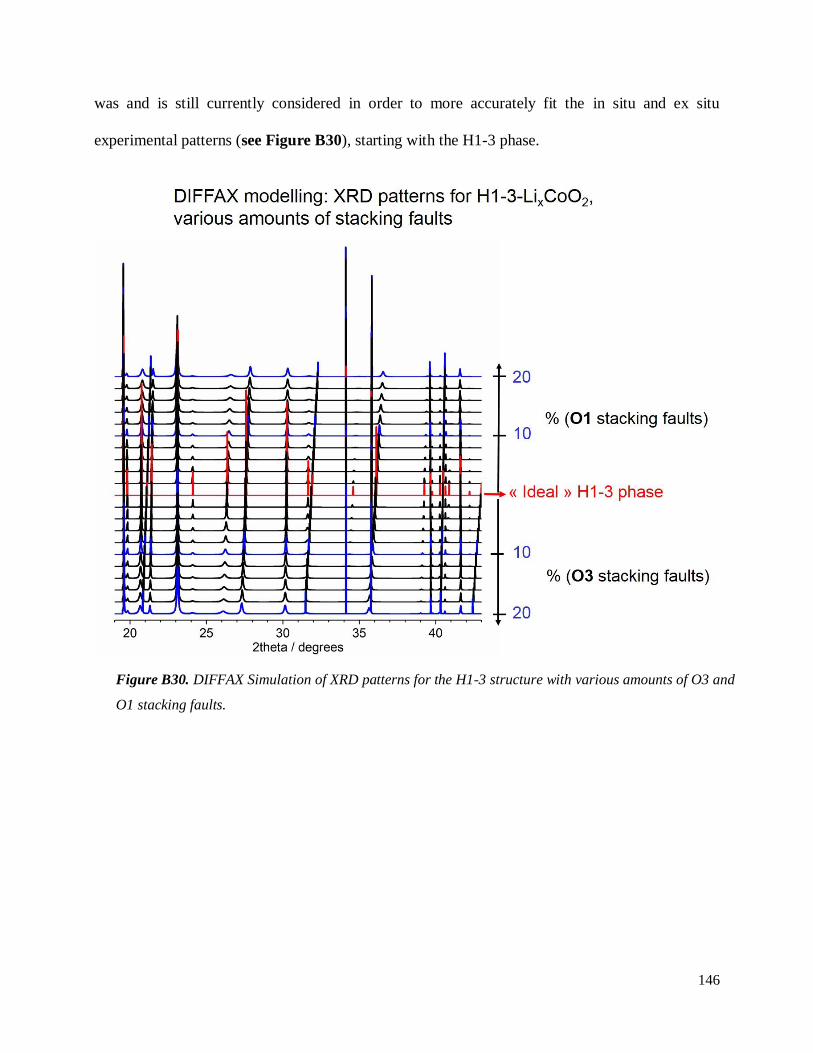
146
was and is still currently considered in order to more accurately fit the in situ and ex situ
experimental patterns (see Figure B30), starting with the H1-3 phase.
Figure B30. DIFFAX Simulation of XRD patterns for the H1-3 structure with various amounts of O3 and
O1 stacking faults.
147
B.6 Bibliography Part B
(1) Seong, W. M.; Yoon, K.; Lee, M. H.; Jung, S.-K.; Kang, K. Unveiling the Intrinsic Cycle
Reversibility of a LiCoO2 Electrode at 4.8-V Cutoff Voltage through Subtractive Surface
Modification for Lithium-Ion Batteries. Nano Lett. 2018.
https://doi.org/10.1021/acs.nanolett.8b02902.
(2) Liu, L.; Chen, L.; Huang, X.; Yang, X.-Q.; Yoon, W.-S.; Lee, H. S.; McBreen, J.
Electrochemical and In Situ Synchrotron XRD Studies on Al2O3-Coated LiCoO2 Cathode
Material. J. Electrochem. Soc. 2004, 151 (9), A1344–A1351.
https://doi.org/10.1149/1.1772781.
(3) Aurbach, D.; Markovsky, B.; Rodkin, A.; Cojocaru, M.; Levi, E.; Kim, H.-J. An Analysis of
Rechargeable Lithium-Ion Batteries after Prolonged Cycling. Electrochimica Acta 2002, 47
(12), 1899–1911. https://doi.org/10.1016/S0013-4686(02)00013-0.
(4) Würsig, A.; Buqa, H.; Holzapfel, M.; Krumeich, F.; Novák, P. Film Formation at Positive
Electrodes in Lithium-Ion Batteries. Electrochem. Solid-State Lett. 2005, 8 (1), A34–A37.
https://doi.org/10.1149/1.1836114.
(5) Dahéron, L.; Dedryvère, R.; Martinez, H.; Ménétrier, M.; Denage, C.; Delmas, C.; Gonbeau,
D. Electron Transfer Mechanisms upon Lithium Deintercalation from LiCoO2 to CoO2
Investigated by XPS. Chem. Mater. 2008, 20 (2), 583–590.
https://doi.org/10.1021/cm702546s.
(6) Park, Y.; Shin, S. H.; Hwang, H.; Lee, S. M.; Kim, S. P.; Choi, H. C.; Jung, Y. M.
Investigation of Solid Electrolyte Interface (SEI) Film on LiCoO2 Cathode in Fluoroethylene
Carbonate (FEC)-Containing Electrolyte by 2D Correlation X-Ray Photoelectron
148
Spectroscopy (XPS). J. Mol. Struct. 2014, 1069, 157–163.
https://doi.org/10.1016/j.molstruc.2014.01.041.
(7) Verma, P.; Maire, P.; Novák, P. A Review of the Features and Analyses of the Solid
Electrolyte Interphase in Li-Ion Batteries. Electrochimica Acta 2010, 55 (22), 6332–6341.
https://doi.org/10.1016/j.electacta.2010.05.072.
(8) Zaban, A.; Zinigrad, E.; Aurbach, D. Impedance Spectroscopy of Li Electrodes. 4. A General
Simple Model of the Li−Solution Interphase in Polar Aprotic Systems. J. Phys. Chem. 1996,
100 (8), 3089–3101. https://doi.org/10.1021/jp9514279.
(9) Markevich, E.; Salitra, G.; Aurbach, D. Influence of the PVdF Binder on the Stability of
LiCoO2 Electrodes. Electrochem. Commun. 2005, 7 (12), 1298–1304.
https://doi.org/10.1016/j.elecom.2005.09.010.
(10) Takahashi, Y.; Tode, S.; Kinoshita, A.; Fujimoto, H.; Nakane, I.; Fujitani, S. Development
of Lithium-Ion Batteries with a LiCoO2 Cathode Toward High Capacity by Elevating
Charging Potential. J. Electrochem. Soc. 2008, 155 (7), A537–A541.
https://doi.org/10.1149/1.2916685.
(11) Amatucci, G. G.; Tarascon, J. M.; Klein, L. C. Cobalt Dissolution in LiCoO2-Based Non-
Aqueous Rechargeable Batteries. Solid State Ion. 1996, 83 (1–2), 167–173.
https://doi.org/10.1016/0167-2738(95)00231-6.
(12) Jeon, S.-W.; Lim, J.-K.; Lim, S.-H.; Lee, S.-M. As-Deposited LiCoO2 Thin Film Cathodes
Prepared by Rf Magnetron Sputtering. Electrochimica Acta 2005, 51 (2), 268–273.
https://doi.org/10.1016/j.electacta.2005.04.035.
(13) Kim, Y. J.; Cho, J.; Kim, T.-J.; Park, B. Suppression of Cobalt Dissolution from the LiCoO2
Cathodes with Various Metal-Oxide Coatings. J. Electrochem. Soc. 2003, 150 (12), A1723–
A1725. https://doi.org/10.1149/1.1627347.
149
(14) Wang, H.; Jang, Y.-I.; Huang, B.; Sadoway, D. R.; Chiang, Y.-M. TEM Study of
Electrochemical Cycling‐Induced Damage and Disorder in LiCoO2 Cathodes for
Rechargeable Lithium Batteries. J. Electrochem. Soc. 1999, 146 (2), 473–480.
https://doi.org/10.1149/1.1391631.
(15) Gabrisch, H.; Yazami, R.; Fultz, B. Hexagonal to Cubic Spinel Transformation in Lithiated
Cobalt Oxide TEM Investigation. J. Electrochem. Soc. 2004, 151 (6), A891–A897.
https://doi.org/10.1149/1.1738677.
(16) Gabrisch, H.; Yazami, R.; Fultz, B. A Transmission Electron Microscopy Study of Cycled
LiCoO2. J. Power Sources 2003, 119–121, 674–679. https://doi.org/10.1016/S0378-
7753(03)00234-9.
(17) Yazami, R.; Ozawa, Y.; Gabrisch, H.; Fultz, B. Mechanism of Electrochemical Performance
Decay in LiCoO2 Aged at High Voltage. Electrochimica Acta 2004, 50 (2–3), 385–390.
https://doi.org/10.1016/j.electacta.2004.03.048.
(18) Yano, A.; Shikano, M.; Ueda, A.; Sakaebe, H.; Ogumi, Z. LiCoO2 Degradation Behavior in
the High-Voltage Phase Transition Region and Improved Reversibility with Surface
Coating. J. Electrochem. Soc. 2017, 164 (1), A6116–A6122.
https://doi.org/10.1149/2.0181701jes.
(19) Gabrisch, H.; Yazami, R.; Fultz, B. The Character of Dislocations in LiCoO2. Electrochem.
Solid-State Lett. 2002, 5 (6), A111–A114. https://doi.org/10.1149/1.1472257.
(20) Amatucci, G. G.; Tarascon, J. M.; Klein, L. C. CoO2, The End Member of the LixCoO2 Solid
Solution. J. Electrochem. Soc. 1996, 143 (3), 1114–1123.
https://doi.org/10.1149/1.1836594.
150
(21) Delmas, C.; Fouassier, C.; Hagenmuller, P. Structural Classification and Properties of the
Layered Oxides. Phys. BC 1980, 99 (1), 81–85. https://doi.org/10.1016/0378-
4363(80)90214-4.
(22) Seguin, L.; Amatucci, G.; Anne, M.; Chabre, Y.; Strobel, P.; Tarascon, J. M.; Vaughan, G.
Structural Study of NiO2 and CoO2 as End Members of the Lithiated Compounds by in Situ
High Resolution X-Ray Powder Diffraction. J. Power Sources 1999, 81–82, 604–606.
https://doi.org/10.1016/S0378-7753(99)00110-X.
(23) Tarascon, J. M.; Vaughan, G.; Chabre, Y.; Seguin, L.; Anne, M.; Strobel, P.; Amatucci, G.
In Situ Structural and Electrochemical Study of Ni1−xCoxO2 Metastable Oxides Prepared by
Soft Chemistry. J. Solid State Chem. 1999, 147 (1), 410–420.
https://doi.org/10.1006/jssc.1999.8465.
(24) Yang, X. Q.; Sun, X.; McBreen, J. New Phases and Phase Transitions Observed in Li1−xCoO2
during Charge: In Situ Synchrotron X-Ray Diffraction Studies. Electrochem. Commun.
2000, 2 (2), 100–103. https://doi.org/10.1016/S1388-2481(99)00155-1.
(25) Motohashi, T.; Katsumata, Y.; Ono, T.; Kanno, R.; Karppinen, M.; Yamauchi, H. Synthesis
and Properties of CoO2 , the x = 0 End Member of the LixCoO2 and NaxCoO2 Systems. Chem.
Mater. 2007, 19 (21), 5063–5066. https://doi.org/10.1021/cm0702464.
(26) De Vaulx, C.; Julien, M.-H.; Berthier, C.; Hebert, S.; Pralong, V.; Maignan, A. Electronic
Correlations in CoO2, the Parent Compound of Triangular Cobaltates. Phys. Rev. Lett. 2007,
98 (24). https://doi.org/10.1103/PhysRevLett.98.246402.
(27) Ohzuku, T.; Ueda, A. Solid‐State Redox Reactions of LiCoO2 (R3̅m) for 4 Volt Secondary
Lithium Cells. J. Electrochem. Soc. 1994, 141 (11), 2972–2977.
https://doi.org/10.1149/1.2059267.
151
(28) Van der Ven, A.; Aydinol, M. K.; Ceder, G.; Kresse, G.; Hafner, J. First-Principles
Investigation of Phase Stability in LixCoO2. Phys. Rev. B 1998, 58 (6), 2975–2987.
https://doi.org/10.1103/PhysRevB.58.2975.
(29) Van der Ven, A.; Aydinol, M. K.; Ceder, G. First-Principles Evidence for Stage Ordering in
LixCoO2. J. Electrochem. Soc. 1998, 145 (6), 2149–2155.
(30) Van der Ven, A. First Principles Investigation of the Thermodynamic and Kinetic Properties
of Lithium Transition Metal Oxides. Thesis, Massachusetts Institute of Technology, 2000.
(31) Guerard, D.; Herold, A. Intercalation of Lithium into Graphite and Other Carbons. Carbon
1975, 13 (4), 337–345. https://doi.org/10.1016/0008-6223(75)90040-8.
(32) Chen, Z.; Lu, Z.; Dahn, J. R. Staging Phase Transitions in LixCoO2. J. Electrochem. Soc.
2002, 149 (12), A1604–A1609. https://doi.org/10.1149/1.1519850.
(33) Wolverton, C.; Zunger, A. First-Principles Prediction of Vacancy Order-Disorder and
Intercalation Battery Voltages in LixCoO2. Phys. Rev. Lett. 1998, 81 (3), 606.
(34) Berthelot, R. Contribution à l’étude électrochimique du système P2-NaxCoO2 : synthèse et
caractérisation de nouveaux oxydes lamellaires ordonnés (A/A’)CoO2 (A, A’ = Li, Na, Ag).
phdthesis, Université Sciences et Technologies - Bordeaux I, 2010.
(35) Sun, X.; Yang, X. Q.; McBreen, J.; Gao, Y.; Yakovleva, M. V.; Xing, X. K.; Daroux, M. L.
New Phases and Phase Transitions Observed in Over-Charged States of LiCoO2-Based
Cathode Materials. J. Power Sources 2001, 97–98, 274–276. https://doi.org/10.1016/S0378-
7753(01)00512-2.
(36) Casas-Cabanas, M.; Rodríguez-Carvajal, J.; Canales-Vázquez, J.; Laligant, Y.; Lacorre, P.;
Palacín, M. R. Microstructural Characterisation of Battery Materials Using Powder
Diffraction Data: DIFFaX, FAULTS and SH-FullProf Approaches. J. Power Sources 2007,
174 (2), 414–420. https://doi.org/10.1016/j.jpowsour.2007.06.216.
152
(37) Duffiet, M.; Blangero, M.; Cabelguen, P.-E.; Delmas, C.; Carlier, D. Influence of the Initial
Li/Co Ratio in LiCoO2 on the High-Voltage Phase-Transitions Mechanisms. J. Phys. Chem.
Lett. 2018, 5334–5338. https://doi.org/10.1021/acs.jpclett.8b02252.
(38) Xia, H.; Lu, L.; Meng, Y. S.; Ceder, G. Phase Transitions and High-Voltage Electrochemical
Behavior of LiCoO2 Thin Films Grown by Pulsed Laser Deposition. J. Electrochem. Soc.
2007, 154 (4), A337–A342. https://doi.org/10.1149/1.2509021.
(39) Fauth, F.; Peral, I.; Popescu, C.; Knapp, M. The New Material Science Powder Diffraction
Beamline at ALBA Synchrotron. Powder Diffr. 2013, 28 (S2), S360–S370.
https://doi.org/10.1017/S0885715613000900.
(40) Ménétrier, M.; Carlier, D.; Blangero, M.; Delmas, C. On “Really” Stoichiometric LiCoO2.
Electrochem. Solid-State Lett. 2008, 11 (11), A179–A182.
https://doi.org/10.1149/1.2968953.
(41) Shao-Horn, Y.; Levasseur, S.; Weill, F.; Delmas, C. Probing Lithium and Vacancy Ordering
in O3 Layered LixCoO2 ( x ≈ 0.5 ) An Electron Diffraction Study. J. Electrochem. Soc. 2003,
150 (3), A366–A373. https://doi.org/10.1149/1.1553787.
(42) Reimers, J. N.; Dahn, J. R. Electrochemical and In Situ X‐Ray Diffraction Studies of Lithium
Intercalation in LixCoO2. J. Electrochem. Soc. 1992, 139 (8), 2091–2097.
https://doi.org/10.1149/1.2221184.
(43) Dyer, L. D.; Borie, B. S.; Smith, G. P. Alkali Metal-Nickel Oxides of the Type MNiO2. J.
Am. Chem. Soc. 1954, 76 (6), 1499–1503. https://doi.org/10.1021/ja01635a012.
(44) Chappel, E.; Núñez-Regueiro, M. D.; Chouteau, G.; Isnard, O.; Darie, C. Study of the
Ferrodistorsive Orbital Ordering in NaNiO2 by Neutron Diffraction and Submillimeter Wave
ESR. Eur. Phys. J. B - Condens. Matter Complex Syst. 2000, 17 (4), 615–622.
https://doi.org/10.1007/s100510070099.
153
(45) Ma, X.; Chen, H.; Ceder, G. Electrochemical Properties of Monoclinic NaMnO2. J.
Electrochem. Soc. 2011, 158 (12), A1307–A1312. https://doi.org/10.1149/2.035112jes.

154
155
Part C. Optimization of LCO – towards the
preparation of high energy density Al-doped
LiCoO2 powders by solid state route
156
Part C: Optimization of LCO – towards the preparation of high energy
density Al-doped LiCoO2 powders by solid state route ................................... 159
C.1 Introduction ................................................................................................................. 159
C.2. Experimental section: general considerations and adopted approaches .................. 162
C.2.1 Syntheses of Al-doped LCO powders ...................................................................... 162
C.2.2 General characterization of powders: experimental details and technical background
......................................................................................................................................... 163
C.3 Approach n°1: preparation of LiCo0.96Al0.04O2 powders from solid state reaction of
Li2CO3 and [(Co3O4)0.32(Al2O3)0.02] in stoichiometric proportions ................................... 166
C.3.1 Description of synthesis .......................................................................................... 166
C.3.2 General characterization .......................................................................................... 168
C.3.2.1 On the heat treatment of Co3O4 and Al2O3: what is the chemical nature of both
Co/Al precursors? ......................................................................................................... 168
C.3.2.2 Characterization of resulting LCA powders ...................................................... 172
C.3.3 Homogeneity of Al-doping within P1- and P2-LCA ................................................ 177
C.3.3.1 Results .............................................................................................................. 177
C.3.3.2 Discussion ........................................................................................................ 187
C.3.4 Consequences on the 1st cycle curves of LCA//Li cells ............................................ 188
C.3.5 Conclusions on the preparation of LCA from the solid state reaction of stoichiometric
amounts of Li2CO3 and Co/Al-based oxide(s) ................................................................... 191
C.4. Approach n°2: preparation of LiCo0.96Al0.04O2 powders from solid state reaction of
Li2CO3 and [(Co3O4)0.32(Al2O3)0.02] in non-stoichiometric proportions ............................ 192
C.4.1. LCA Samples without control of particle size (Group A) ........................................ 192
C.4.1.1. Description of synthesis ................................................................................... 192
C.4.1.2. Results ............................................................................................................. 194
C.4.1.2.1. General characterization ............................................................................ 194
C.4.1.2.2. Homogeneity of Al-doping as a function of initial (Li/M)1 ........................ 200
C.4.2 LCA Samples with controlled particle size (Group B) ............................................. 208
C.4.2.1. Description of synthesis ................................................................................... 208
C.4.2.2. Results ............................................................................................................. 210
157
C.4.2.2.1. General characterization ............................................................................ 210
C.4.2.2.2. Homogeneity of Al-doping for 40µm-sized LCA....................................... 214
C.4.3 Electrochemistry of LCA samples prepared with Approach n°2 .............................. 218
C.4.4 Discussion. On the beneficial effect of excess Li2CO3 for the synthesis of
homogeneous 4% Al-doped LCO ..................................................................................... 222
C.5 General conclusions for Part C ................................................................................... 231
C.6 Bibliography Part C .................................................................................................... 233

158
159
Part C. Optimization of LCO – towards the preparation
of high energy density Al-doped LiCoO2 powders by
solid state route
C.1 Introduction
As revealed in Parts A and B, attempts to reversibly de-intercalate more Li from LCO result
in poor cycling performances due to strong degradation of the conventional carbonate-based
electrolytes1,2, structural instabilities3–7 and cobalt dissolution8 observed at high voltage
(V > 4.3 vs. Li+/Li). While Part B of this manuscript was fully consecrated to gaining more
fundamental knowledge about the phase transitions occurring at high voltage for the LixCoO2
systems (x0 ≥ 1.00), Part C is meant to align with the current LCO-related literature which is almost
exclusively dedicated to material optimization through coatings and dopings to address the above-
mentioned issues – which (supposedly) includes preventing the O3 – H1-3 – O1 transitions for the
latter. Indeed, the substitution of some Co3+ ions with various dopants9–12 M (M = Mg, Ti, Zr, Cr…)
or more recently co-dopants13–15 (M, M’) like (Mn, Mg), (Mg, Ti) or (La, Al), has been reported to
be an effective strategy to improve the cycle life of LCO at high voltage.
Aluminum ions as dopants were among the first considered, by the means of theoretical
calculations from Ceder’s group16, followed by experimental work from Jang et al.17 and other
groups18–20. The choice for aluminum was motivated by i) the low cost and non-toxicity of
aluminum, ii) a similar radius for Al3+ compared to Co3+ (0.535 Å vs. 0.545 Å) facilitating the
substitution of the latter and preserving the initial structure leading to the full solid solution
LiCo1-yAlyO2. Al-doped LCO has been reported to experience: i) less volume changes17,18, ii) a
decreased cobalt dissolution18, and iii) the suppression of spinel disorder onto the surface of the
160
particles as compared to LCO21, even though accelerate capacity fading was also demonstrated16,22.
The effect of Al doping on the phase transitions observed for LCO at high voltage is though still
unclear.
The first step towards a gain of more fundamental knowledge on the real effect(s) of Al
doping in LCO would however require a proper control of the initial Li/M stoichiometry
(M = Co + Al) – which is (similarly to previous observations on undoped LCO) either missing or
such as Li is introduced in excess (Li/M > 1.00). A parasitic effect of Li excess in Al-doped LCO
with non-controlled Li stoichiometry may have – so far – led to incorrect conclusions.
Another major issue regards the homogeneity of the Al doping in LCO powders. One could
guess that the effects reported for Al doping, especially regarding its electrochemical
properties, are strongly dependent on the distribution of Al within LCO, intrinsically linked to its
synthesis. Evidencing the Al distribution for a very low Al content in LCO is intuitively more
challenging than in the case of larger amounts of Al, as the detection of the dopant may be
impossible due to the low resolution of conventional characterization techniques. In most (if not
all) articles17,21,22,18,23 currently considered as pioneering works on Al-doped LCO, the amount of
Al y in LiCo1-yAlyO2 is quite significant (y ≥ 0.10), which could explain why the question of finding
appropriate techniques to evidence the distribution of Al in Al-doped LCO (y < 0.10) has never
really been brought up (though it has temporarily been dealt with24 for Al-coated LCO). Besides,
as precious as these contributions were in gaining knowledge about the potential effect of the
substitution of Co3+ with Al3+ on the electrochemical performance of model LiCo1-yAlyO2 systems
(y ≥ 0.10), these phases are not viable for further applications in commercial Li-ion cells due to the
electrochemical inactivity of Al itself, which severely cuts off the capacity of the battery.
161
In addition, even with high Al content, a proper Co3+/Al3+ mixing is expected and assumed
as they are often synthesized in liquid media, featuring co-precipitation routes17,18,22,23,25,26. In any
case, doped LCO prepared through solvent-friendly routes – no matter how effective they may be
in achieving homogeneous doping – show higher time and financial costs, and usually lower
particle sizes as compared to solid state routes, which may be interesting to further develop even
though achieving a proper Al distribution may be more challenging. Thus, developing proper tools
to judge on the distribution of Al within LCO is of great importance to: i) establish the relation
between homogeneity of the doping and the electrochemical properties of the material in a Li cell,
ii) gain more fundamental knowledge about the role of Al on the structural stability of LCO upon
cycling, iii) lay the foundations to help designing a standardized synthesis for Al-doped LCO
closer to the current processes used by battery materials manufacturers, i.e. solid routes.
The following aims to discuss the possibility of formation of homogeneous Al-doped LCO
samples (or “LCA”) from solid state reactions between the oxide precursors (Co3O4, Al2O3) and
lithium carbonate with well-controlled Li and Al stoichiometries. Although the incorporation of Al
through interdiffusion of Co3+ and Al3+ in the layered structure of LCO was recently discussed to
try to optimize the synthesis of Al2O3-coated LCO24,27, no article has reported similar attempts to
prepare Al-doped LCO to our knowledge. In the meantime, this study also aims to more generally
propose a protocol to discuss the homogeneity of Al-distribution in Li-stoichiometric LiCo1-yAlyO2
with a low Al content.
162
C.2. Experimental section: general considerations and adopted approaches
C.2.1 Syntheses of Al-doped LCO powders
Although solid state reactions are rather easy to implement thanks to a limited number of
steps, a significant number of parameters could still be tuned while trying to design a standard
synthesis of Al-doped LCO (or “LCA”). An exhaustive list includes the chemical nature of the
precursors, their relative proportions, the temperature and atmosphere for their heat treatment,
etc…
Three compositions were initially targeted when we first started the preparation of LCA
powders from solid state reaction of Li2CO3, Co3O4 and Al2O3: LiCo0.99Al0.01O2, LiCo0.98Al0.02O2
and LiCo0.96Al0.04O2. However, most of the optimization work has eventually been pursued for the
latter. The influence of the heat treatment temperature and the relative proportions of precursors on
the final distribution of Al within the LCA powders was also considered, though the effect of the
former proved to be quite negligible. Therefore, in the following, we present all results related to
the preparation of LiCo0.96Al0.04O2 from the solid state reaction between Li2CO3, Co3O4 and Al2O3,
in which Li2CO3 was either introduced in stoichiometric proportions (Approach n°1, section C.3)
or in excess (Approach n°2, section C.4) with the metal oxide precursors. All syntheses were
carried out in the Umicore R&D center in Cheonan, South Korea. Precise descriptions of each
approach are given at the beginning of their respective sections.
163
C.2.2 General characterization of powders: experimental details and technical
background
All characterization was performed under the same experimental conditions in section C.3
(Approach n°1) or section C.4 (Approach n°2).
Scanning electron micrographs were taken using a Hitachi Model S-4500 microscope after
metallizing the powders with gold.
Inductively Coupled Plasma (ICP) measurements were carried out on Agilent ICP-720ES
equipment after sample dissolution using hotplate heating in concentrated HCl solution.
Powder X-ray diffraction (XRD) patterns were collected on a PANalitycal X'pert PRO
MPD diffractometer in Bragg-Brentano θ-θ geometry equipped with a Fe filter, a spinner and
X'Celerator multi-strip detector. Each measurement was made within an angular range of 2θ =
10 - 120° and lasted for 15 hours, at 0.016° intervals. The Co-Kα radiation was generated at 35 kV
and 30 mA (λ(Kα1) = 1.789 Å; λ(Kα2) = 1.793 Å).
Additional high angular resolution synchrotron powder X-ray diffraction (SXRD) was
carried out on the BL04-MSPD beamline of the ALBA synchrotron (Cerdanyola del Vallès, Spain).
All powders were packed in 0.5 mm diameter capillaries. The typical 2ϴ angular range was 0 - 70 °
with 0.006° angular step and 3-minute-long accumulation time. The patterns were recorded in
Debye-Scherrer geometry with a wavelength of λ ≈ 0.825 Å.
Data treatment for SXRD: As all data was collected over 4 different synchrotron sessions
with slightly different wavelengths, all SXRD patterns have been converted and mainly plotted for
the same λ = 0.826 Å all over Part C, which corresponds to the refined value of λ obtained from Le
Bail refinement with FullProf28 of the two standard samples (Si and Na2Ca3Al2F14 + CaF2,
164
respectively) during session n°1. A few figures have been converted and plotted for λCo = 1.790 Å
when a comparison with XRD data was necessary. Besides, zero offsets obtained from Le Bail
refinement of all SXRD patterns have been input in the corresponding plots, meaning that any
change of peak position in the SXRD patterns may directly be assigned to different cell parameters
from one sample to another. All provided zooms on specific diffraction peak are normalized to the
total peak area, unless it says otherwise in the caption.
7Li MAS NMR spectra were recorded on a Bruker 300 Advance spectrometer at
116.66 MHz (7.05 T magnet), with a standard 2.5 mm Bruker MAS probe. A Hahn echo sequence
[t/2-1-t-2] synchronized with one period of rotor rotation was used for a 30 kHz spinning
frequency. The 90° pulse duration was equal to t/2 = 2.0 s and determined using a LiCl 1 M
solution. A recycle time of D0 = 40s was used for st-LCO and LCA samples, whereas a shorter
D0 = 2s was enough for the overl-LCO sample, to avoid T1 saturation effects.
Single pulse 27Al MAS NMR spectra were recorded on a Bruker 500 MHz spectrometer at
130.33 MHz (11.7 T magnet) using a standard Bruker 2.5 mm MAS probe with a 30 kHz typical
spinning frequency. The spectral width was set to 0.5 MHz and the recycle time to D0 = 5 s, long
enough to avoid T1 saturation effects. As 27Al is a strong quadrupolar nucleus with I = 5/2, a short
pulse length of 1.1 s corresponding to a /12 pulse determined using an aqueous 1 M Al(NO3)3
solution was employed. In these conditions, all of the -½ → +½ central transitions are equally
excited regardless of the magnitude of the nuclear quadrupole coupling constants and one can
extract quantitative data. The external reference was a 1 M Al(NO3)3 aqueous solution. For the
samples containing only 4% of Al, overnight experiments (10240 scans) were carried out to ensure
a good signal/noise ratio. No baseline subtraction was done in the figures presented here.
165
59Co MAS NMR spectra were recorded on a Bruker 500 MHz spectrometer at 120.35 MHz
(11.7 T magnet) using a standard Bruker 2.5 mm MAS probe with a 30 kHz typical spinning
frequency. The spectral width was set to 0.5 MHz and the recycle time to D0 = 1 s. A combination
of single pulse and rotor-synchronized Hahn echo sequences was used. The single pulse sequence
using a short pulse length of 1.1 s corresponding to a /16 pulse was used to extract quantitative
data. However, it requires a first-order phasing process with a sin x/x baseline correction due to the
dead time of the spectrometer here, not easily determined due to large overlapping signals. The
Hahn echo sequence [t/2-1-t-2] with t/2 = 2.5 s was therefore used to facilitate the phasing of
all the signals and to ensure the observation of possible very wide signals which are lost during the
receiver dead time. The external reference was a 1M K3Co(CN)6 aqueous solution.
Electrochemical tests were performed in coin cells, using pure lithium as counter-electrode
and 1 M LiPF6 in EC:DEC:DMC as electrolyte. LCA:C:PVDF electrodes (90:5:5 %wt) were
prepared from a slurry using N-methyl-pyrrolidone (NMP) as solvent casted onto a 30 µm-thick-
aluminum foil. After evaporating the NMP for 2 hours at T = 80 °C, Φ15 mm electrodes were cut
in the obtained film with typical active material loading of 10 mg/cm². The electrodes were then
dried overnight under vacuum at T = 120 °C and stored in an argon-filled glovebox, whose cell
assembling was carried out.
166
C.3 Approach n°1: preparation of LiCo0.96Al0.04O2 powders from solid state
reaction of Li2CO3 and [(Co3O4)0.32(Al2O3)0.02] in stoichiometric proportions
C.3.1 Description of synthesis
A schematic figure summarizing all steps of the synthesis can also be found in Figure C1.
Precursors: A 2 kg-blend containing Co3O4 (Umicore) and Al2O3 (Umicore) in a Co/Al
ratio of 0.96/0.04 was initially prepared as starter. After homogenizing the mixture, it was split into
two batches. The first batch (now called Precursor 1) was directly used to prepare P1-LCA. Note
that a heat treatment of Precursor 1 at moderate temperature (600 °C) did not lead to any reaction
between Co3O4 and Al2O3 (in good agreement with previous studies29–31). In the meantime, a heat
treatment at 1000 °C for 10 hours under air flow was applied to the second batch. The fired mixture,
now referred to as Precursor 2, was accordingly used to prepare P2-LCA.
LCA samples: Two LiCo0.96Al0.04O2 (LCA) powders samples called “P1-LCA” and
“P2-LCA” were both prepared by solid state synthesis of homogenized mixtures of Li2CO3
(Umicore) and a Co- and Al- based oxide precursors (P1 or P2, respectively). The mixtures to form
the final LCA samples (first intimately blended) were prepared in rather large amounts (220 g) in
the ratio Li/(Co+Al) = 0.99. Both were simultaneously heat treated in the same furnace for 12 h
under air flow at T = 980 °C, followed by a second annealing at T = 980 °C for 10 h under air. A
final post-treatment step using a grinder was mandatory to pulverize the synthesized powder
blocks. Additionally, the as-prepared powders were sieved.
For comparison purposes, both non Al-doped stoichiometric (st-LCO, Li/Co = 0.99) and
overlithiated LiCoO2 (overl-LCO, Li/Co = 1.05) from Part B are used as reference samples in the
following. Additionally, a 4%-Al doped LCO called “Rf-LCA” was prepared by a citrate co-
precipitation route, following the experimental protocol detailed in a previous article from
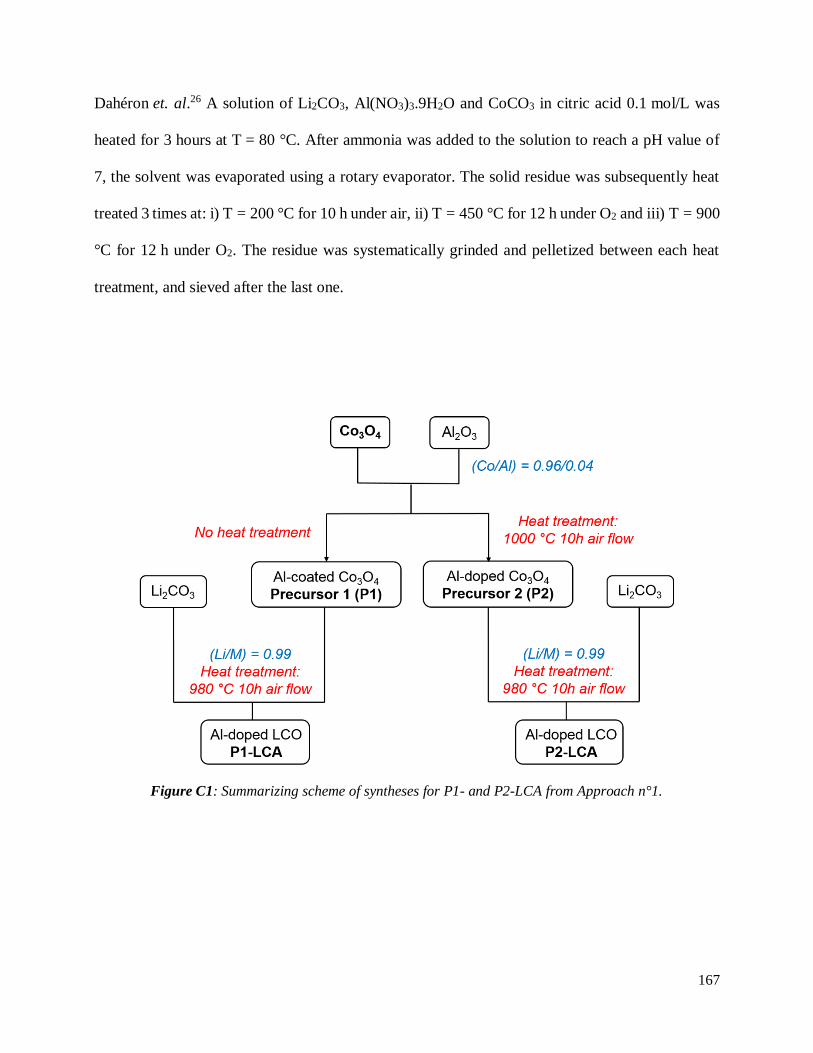
167
Dahéron et. al.26 A solution of Li2CO3, Al(NO3)3.9H2O and CoCO3 in citric acid 0.1 mol/L was
heated for 3 hours at T = 80 °C. After ammonia was added to the solution to reach a pH value of
7, the solvent was evaporated using a rotary evaporator. The solid residue was subsequently heat
treated 3 times at: i) T = 200 °C for 10 h under air, ii) T = 450 °C for 12 h under O2 and iii) T = 900
°C for 12 h under O2. The residue was systematically grinded and pelletized between each heat
treatment, and sieved after the last one.
Figure C1: Summarizing scheme of syntheses for P1- and P2-LCA from Approach n°1.
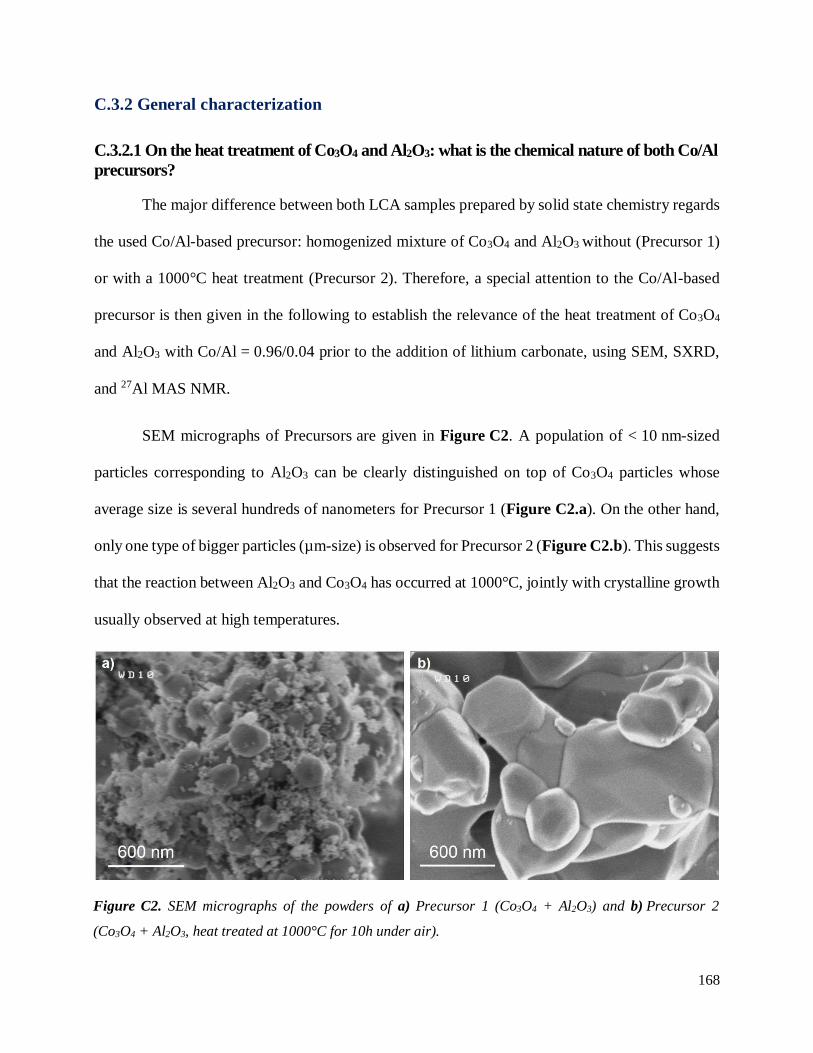
168
C.3.2 General characterization
C.3.2.1 On the heat treatment of Co3O4 and Al2O3: what is the chemical nature of both Co/Al
precursors?
The major difference between both LCA samples prepared by solid state chemistry regards
the used Co/Al-based precursor: homogenized mixture of Co3O4 and Al2O3 without (Precursor 1)
or with a 1000°C heat treatment (Precursor 2). Therefore, a special attention to the Co/Al-based
precursor is then given in the following to establish the relevance of the heat treatment of Co3O4
and Al2O3 with Co/Al = 0.96/0.04 prior to the addition of lithium carbonate, using SEM, SXRD,
and 27Al MAS NMR.
SEM micrographs of Precursors are given in Figure C2. A population of < 10 nm-sized
particles corresponding to Al2O3 can be clearly distinguished on top of Co3O4 particles whose
average size is several hundreds of nanometers for Precursor 1 (Figure C2.a). On the other hand,
only one type of bigger particles (µm-size) is observed for Precursor 2 (Figure C2.b). This suggests
that the reaction between Al2O3 and Co3O4 has occurred at 1000°C, jointly with crystalline growth
usually observed at high temperatures.
Figure C2. SEM micrographs of the powders of a) Precursor 1 (Co3O4 + Al2O3) and b) Precursor 2
(Co3O4 + Al2O3, heat treated at 1000°C for 10h under air).
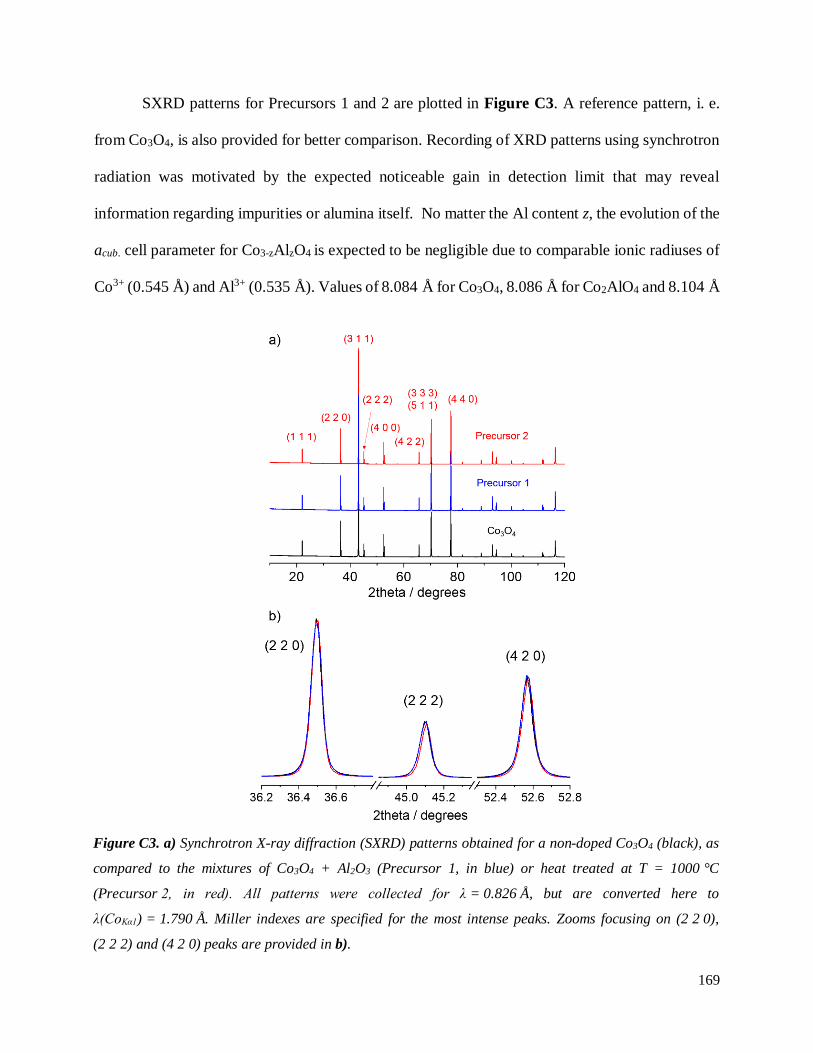
169
SXRD patterns for Precursors 1 and 2 are plotted in Figure C3. A reference pattern, i. e.
from Co3O4, is also provided for better comparison. Recording of XRD patterns using synchrotron
radiation was motivated by the expected noticeable gain in detection limit that may reveal
information regarding impurities or alumina itself. No matter the Al content z, the evolution of the
acub. cell parameter for Co3-zAlzO4 is expected to be negligible due to comparable ionic radiuses of
Co3+ (0.545 Å) and Al3+ (0.535 Å). Values of 8.084 Å for Co3O4, 8.086 Å for Co2AlO4 and 8.104 Å
Figure C3. a) Synchrotron X-ray diffraction (SXRD) patterns obtained for a non-doped Co3O4 (black), as
compared to the mixtures of Co3O4 + Al2O3 (Precursor 1, in blue) or heat treated at T = 1000 °C
(Precursor 2, in red). All patterns were collected for λ = 0.826 Å, but are converted here to
λ(CoKα1) = 1.790 Å. Miller indexes are specified for the most intense peaks. Zooms focusing on (2 2 0),
(2 2 2) and (4 2 0) peaks are provided in b).
170
for CoAl2O4 are typically reported for acub.30. Thus, not surprisingly the diffraction peaks for Co3O4,
Precursor 1 and Precursor 2 are found at identical 2ϴ positions. All peaks can be indexed in the
Fd3m space group with a cell parameter acub equal to 8.084(2) Å. In particular, no signal ascribed
to the presence of crystalline alumina could be detected for either Precursor 1 or Precursor 2 in
Figure C3 – even though alumina is clearly seen in Figure C2 for the former. The Al2O3 present
in P1 does, must be really disordered with very small particles size (< 10 nm). After such heat
treatment, used to form Precursor 2, the formation of mix-Co3-zAlzO4 phase is expected29,30,32,33.
The diffraction peaks of Precursor 1 are found to be slightly broader than those of Precursor 2
(T = 1000 °C). No additional information regarding the Al distribution itself within the precursors
could be gathered from SXRD.
Figure C4 shows the 27Al MAS NMR spectra recorded for the different precursors used
for the LCA materials synthesis. The Al2O3 exhibits a spectrum typical of the γ-form of Al2O3 with
two broad signals localized around 65 and 9 ppm, assigned respectively to Al in tetrahedral and
octahedral environments34–36. The strong asymmetrical broadening of the signals toward lower
shifts originates from distributions of quadrupolar couplings typically observed in disordered
compounds. The Co3O4 mixed with Al2O3 (Precursor 1) still logically exhibits the same 27Al MAS
NMR signature as γ-Al2O3, therefore un-reacted. On the contrary, as no signal is observed in the
same recording conditions after a heat treatment of these precursors at 1000 °C for 10h
(Precursor 2), we conclude that Al2O3 did react with Co3O4 in good agreement with the SEM
observations and with the literature (a minimum temperature of 800 °C was reported29–31 for the
reaction of Co3O4 and γ-Al2O3 to form Co3-zAlzO4). The absence of signal for Al in doped Co3O4
is most likely due to strong hyperfine coupling with paramagnetic cobalt species either leading to
very fast relaxation times or to such a broadening that they cannot be resolved in our conditions.
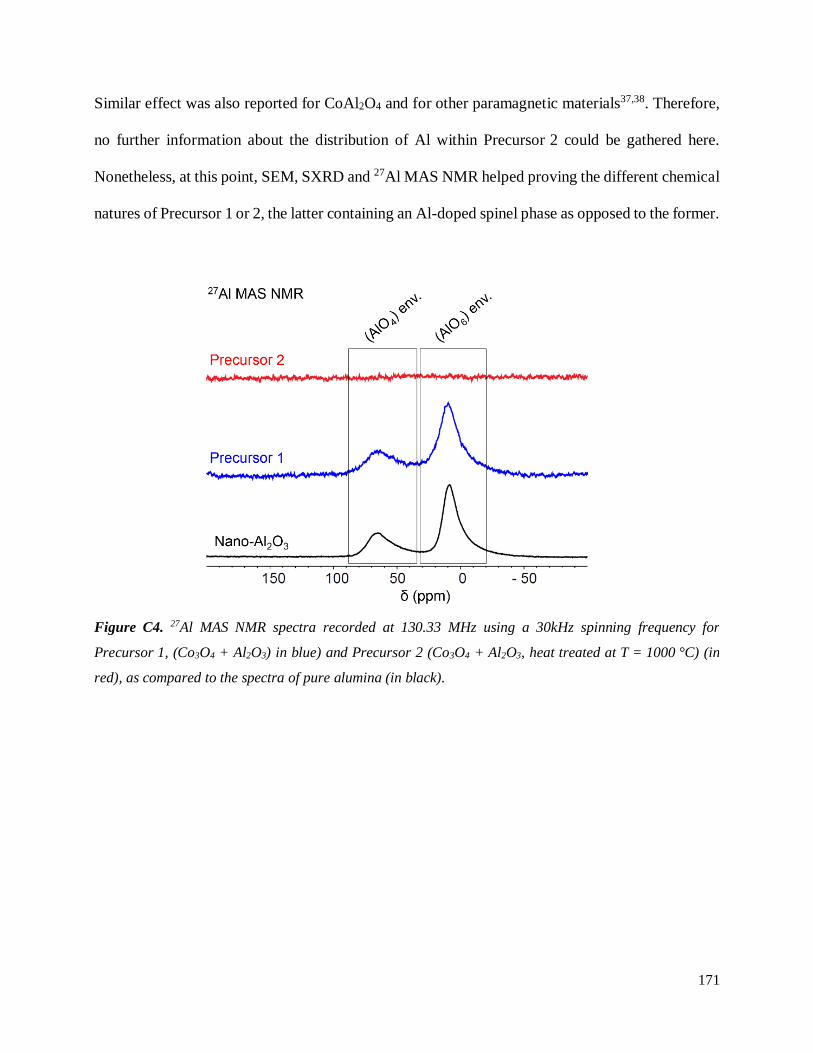
171
Similar effect was also reported for CoAl2O4 and for other paramagnetic materials37,38. Therefore,
no further information about the distribution of Al within Precursor 2 could be gathered here.
Nonetheless, at this point, SEM, SXRD and 27Al MAS NMR helped proving the different chemical
natures of Precursor 1 or 2, the latter containing an Al-doped spinel phase as opposed to the former.
Figure C4. 27Al MAS NMR spectra recorded at 130.33 MHz using a 30kHz spinning frequency for
Precursor 1, (Co3O4 + Al2O3) in blue) and Precursor 2 (Co3O4 + Al2O3, heat treated at T = 1000 °C) (in
red), as compared to the spectra of pure alumina (in black).
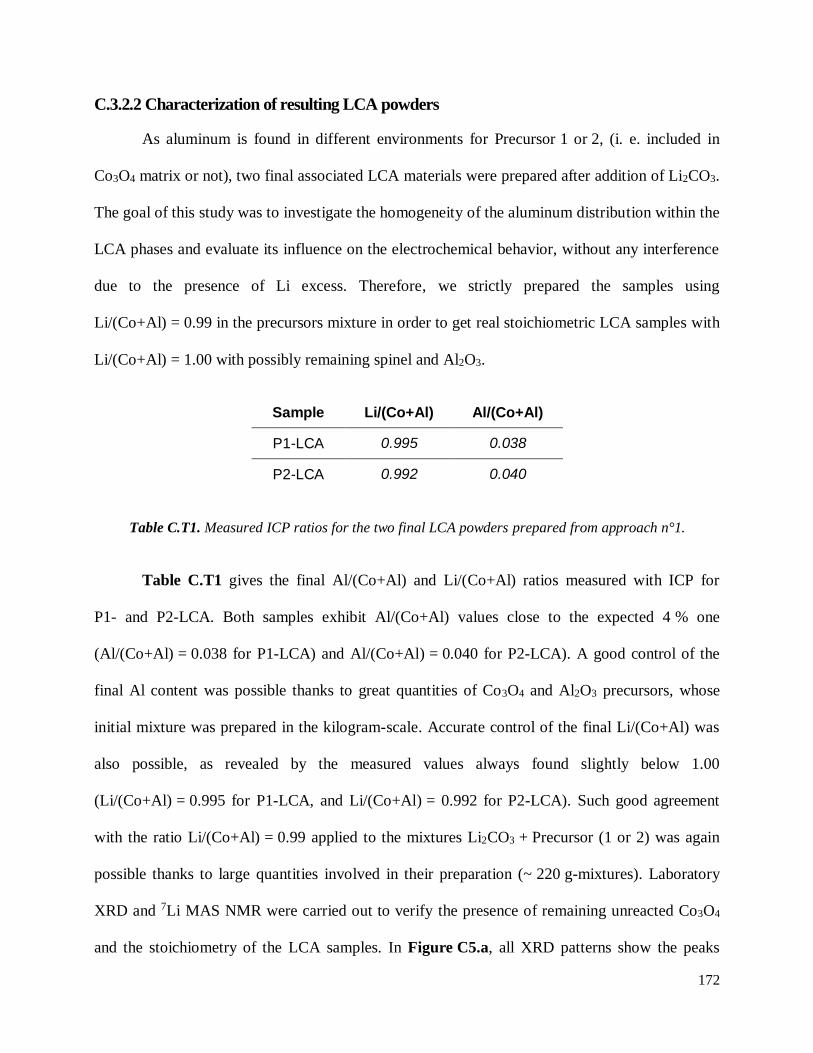
172
C.3.2.2 Characterization of resulting LCA powders
As aluminum is found in different environments for Precursor 1 or 2, (i. e. included in
Co3O4 matrix or not), two final associated LCA materials were prepared after addition of Li2CO3.
The goal of this study was to investigate the homogeneity of the aluminum distribution within the
LCA phases and evaluate its influence on the electrochemical behavior, without any interference
due to the presence of Li excess. Therefore, we strictly prepared the samples using
Li/(Co+Al) = 0.99 in the precursors mixture in order to get real stoichiometric LCA samples with
Li/(Co+Al) = 1.00 with possibly remaining spinel and Al2O3.
Sample Li/(Co+Al) Al/(Co+Al)
P1-LCA 0.995 0.038
P2-LCA 0.992 0.040
Table C.T1 gives the final Al/(Co+Al) and Li/(Co+Al) ratios measured with ICP for
P1- and P2-LCA. Both samples exhibit Al/(Co+Al) values close to the expected 4 % one
(Al/(Co+Al) = 0.038 for P1-LCA) and Al/(Co+Al) = 0.040 for P2-LCA). A good control of the
final Al content was possible thanks to great quantities of Co3O4 and Al2O3 precursors, whose
initial mixture was prepared in the kilogram-scale. Accurate control of the final Li/(Co+Al) was
also possible, as revealed by the measured values always found slightly below 1.00
(Li/(Co+Al) = 0.995 for P1-LCA, and Li/(Co+Al) = 0.992 for P2-LCA). Such good agreement
with the ratio Li/(Co+Al) = 0.99 applied to the mixtures Li2CO3 + Precursor (1 or 2) was again
possible thanks to large quantities involved in their preparation (~ 220 g-mixtures). Laboratory
XRD and 7Li MAS NMR were carried out to verify the presence of remaining unreacted Co3O4
and the stoichiometry of the LCA samples. In Figure C5.a, all XRD patterns show the peaks
Table C.T1. Measured ICP ratios for the two final LCA powders prepared from approach n°1.
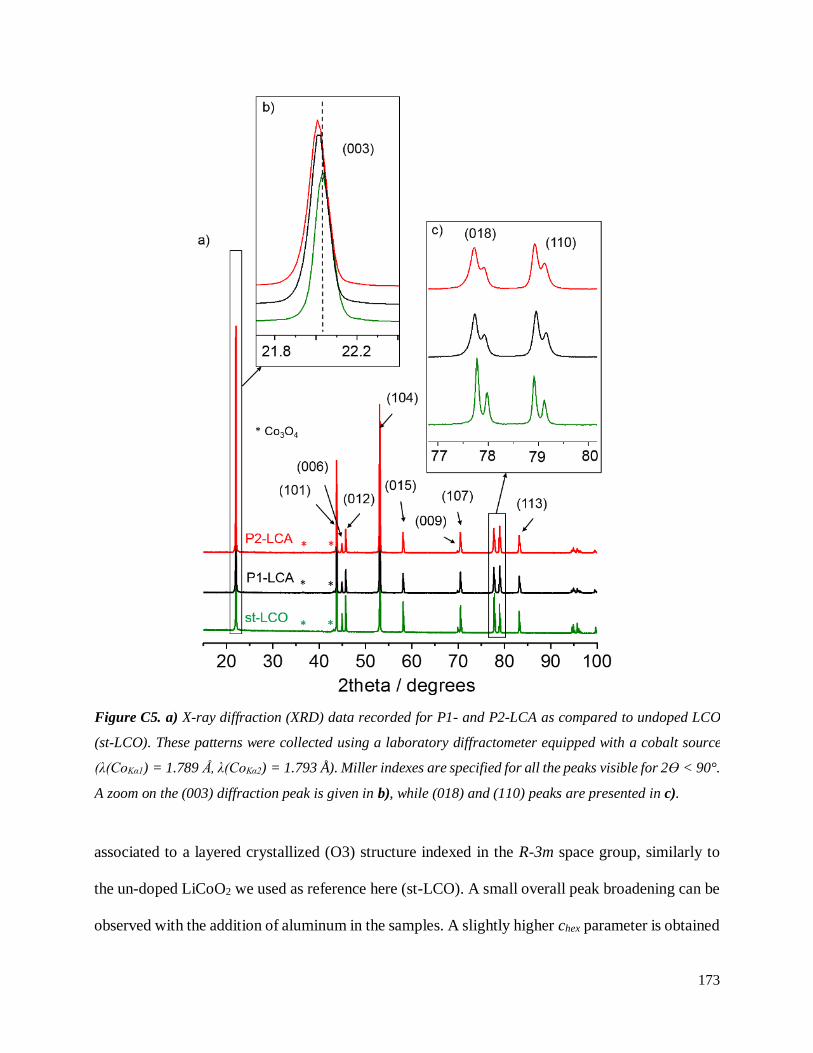
173
associated to a layered crystallized (O3) structure indexed in the R-3m space group, similarly to
the un-doped LiCoO2 we used as reference here (st-LCO). A small overall peak broadening can be
observed with the addition of aluminum in the samples. A slightly higher chex parameter is obtained
Figure C5. a) X-ray diffraction (XRD) data recorded for P1- and P2-LCA as compared to undoped LCO
(st-LCO). These patterns were collected using a laboratory diffractometer equipped with a cobalt source
(λ(CoKα1) = 1.789 Å, λ(CoKα2) = 1.793 Å). Miller indexes are specified for all the peaks visible for 2ϴ < 90°.
A zoom on the (003) diffraction peak is given in b), while (018) and (110) peaks are presented in c).
174
from refinement of the XRD patterns for 4 % Al-doped P1-LCA and P2-LCA (respectively
14.063(7) and 14.065(8) Å) compared to their non-doped analogue st-LCO (14.047(1) Å). Such
change (0.13%) is clearly highlighted in Figure C5.b with the shift observed for the (003) peak.
The evolution of the ahex parameter follows the reverse trend, as both LCA samples show a
decreased value of 2.814(1) Å as opposed to 2.815(2) Å for st-LCO. The change trend of the cell
parameters are here in good agreement with the observations already reported in the literature for
LCA with larger aluminum content17,18,23,39. Two additional weak peaks are observed at
2ϴ° = 36.5 ° and 2ϴ = 43.1 ° in all XRD patterns. These peaks correspond to the (220) and (311)
peaks arising from remaining traces of spinel (Fd3m space group) cobalt-based oxide precursors,
as expected from the use of the Li/(Co+Al) = 0.99 ratio in the precursors mixture.
Figure C6 shows the recorded 7Li MAS NMR spectra for P1- and P2-LCA. Both are
plotted and compared to that of undoped LiCoO2 materials prepared with and without an excess of
lithium carbonate designed as st-LCO (stoichiometric, Li/Co = 1.00) and overl-LCO (overlithiated,
Li/Co = 1.05). As already reported, and widely commented upon in Part A, 7Li MAS NMR is the
key technique to probe the Li/Co stoichiometry in those materials40,41; in st-LCO, Li is present in
a single diamagnetic environment as all cobalt ions are in low spin state (LS-Co3+), leading to a
single signal located at -0.4 ppm. On the other hand, several signals are observed for overl-LCO.
Indeed, intermediate spin state paramagnetic (IS-Co3+) cobalt ions are formed due to the presence
of Li in the Co site associated with an O vacancy40. Due to the Fermi contact interaction, adjacent
Li can exhibit negative or positive shifted signals (out of the narrow chemical shifts range of 7Li),
depending on its environment. Therefore, the spectrum of overl-LCO does exhibit a large number
of more shifted signals in addition to the main signal at -0.4 ppm (Figure C6). Since the 7Li MAS
NMR spectra of the two 4% Al-doped LCA samples do not exhibit those extra signals, this confirms
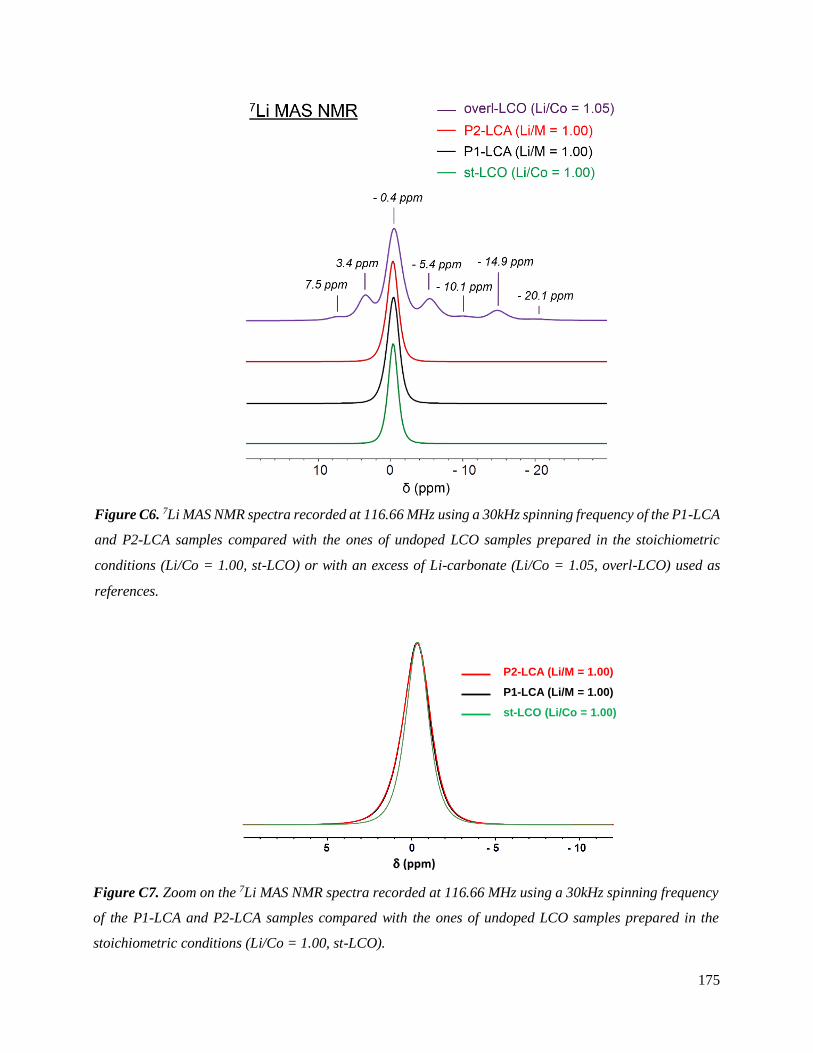
175
that these materials are really Li-stoichiometric and do not contain any paramagnetic species. These
Figure C6. 7Li MAS NMR spectra recorded at 116.66 MHz using a 30kHz spinning frequency of the P1-LCA
and P2-LCA samples compared with the ones of undoped LCO samples prepared in the stoichiometric
conditions (Li/Co = 1.00, st-LCO) or with an excess of Li-carbonate (Li/Co = 1.05, overl-LCO) used as
references.
st-LCO (Li/Co = 1.00)
P1-LCA (Li/M = 1.00)
P2-LCA (Li/M = 1.00)
d (ppm)
Figure C7. Zoom on the 7Li MAS NMR spectra recorded at 116.66 MHz using a 30kHz spinning frequency
of the P1-LCA and P2-LCA samples compared with the ones of undoped LCO samples prepared in the
stoichiometric conditions (Li/Co = 1.00, st-LCO).
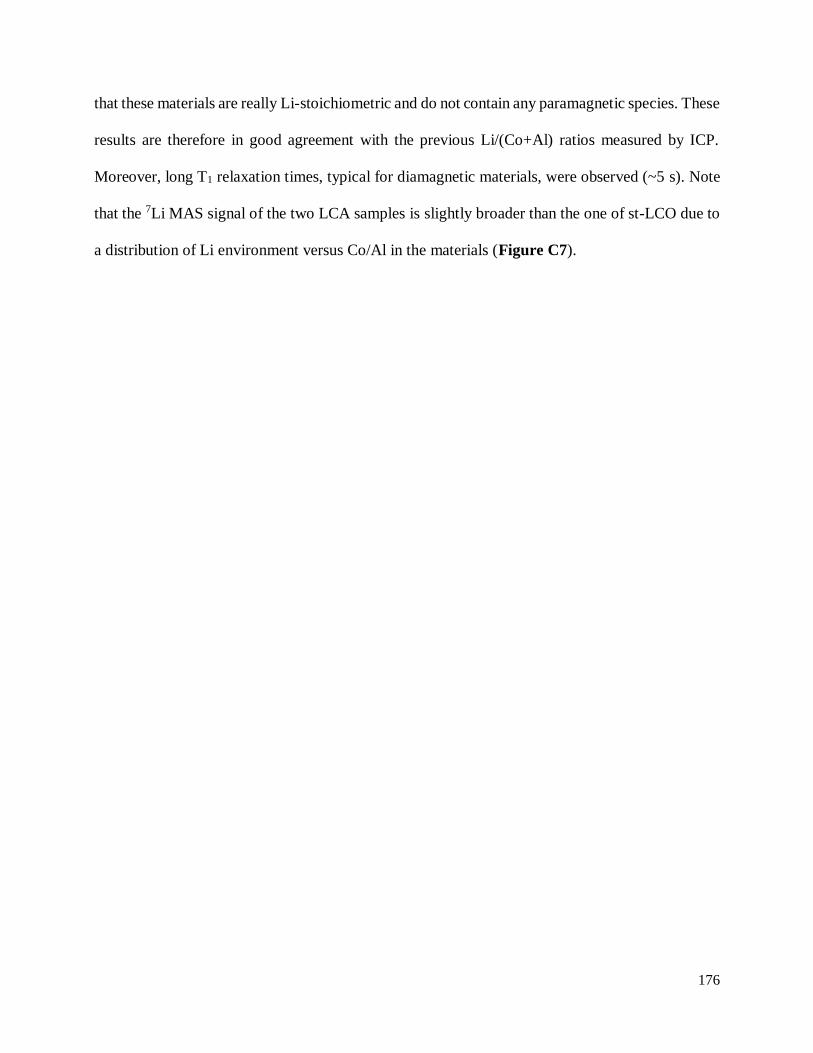
176
that these materials are really Li-stoichiometric and do not contain any paramagnetic species. These
results are therefore in good agreement with the previous Li/(Co+Al) ratios measured by ICP.
Moreover, long T1 relaxation times, typical for diamagnetic materials, were observed (~5 s). Note
that the 7Li MAS signal of the two LCA samples is slightly broader than the one of st-LCO due to
a distribution of Li environment versus Co/Al in the materials (Figure C7).
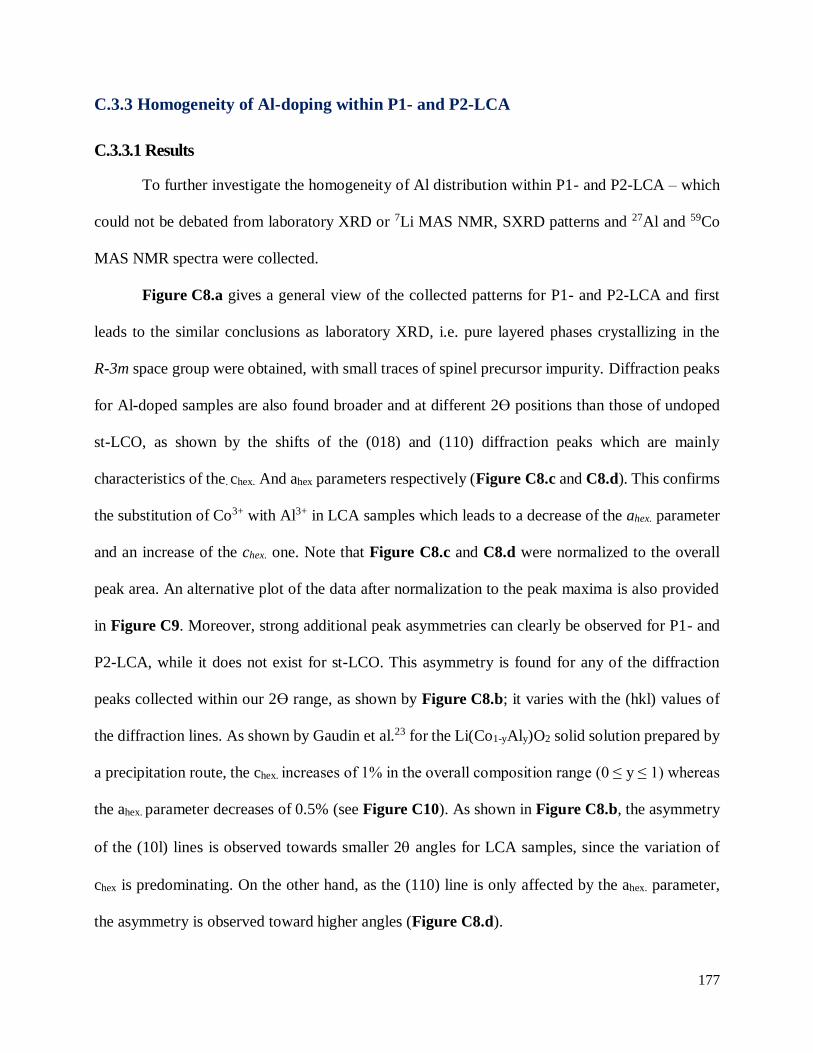
177
C.3.3 Homogeneity of Al-doping within P1- and P2-LCA
C.3.3.1 Results
To further investigate the homogeneity of Al distribution within P1- and P2-LCA – which
could not be debated from laboratory XRD or 7Li MAS NMR, SXRD patterns and 27Al and 59Co
MAS NMR spectra were collected.
Figure C8.a gives a general view of the collected patterns for P1- and P2-LCA and first
leads to the similar conclusions as laboratory XRD, i.e. pure layered phases crystallizing in the
R-3m space group were obtained, with small traces of spinel precursor impurity. Diffraction peaks
for Al-doped samples are also found broader and at different 2ϴ positions than those of undoped
st-LCO, as shown by the shifts of the (018) and (110) diffraction peaks which are mainly
characteristics of the. chex. And ahex parameters respectively (Figure C8.c and C8.d). This confirms
the substitution of Co3+ with Al3+ in LCA samples which leads to a decrease of the ahex. parameter
and an increase of the chex. one. Note that Figure C8.c and C8.d were normalized to the overall
peak area. An alternative plot of the data after normalization to the peak maxima is also provided
in Figure C9. Moreover, strong additional peak asymmetries can clearly be observed for P1- and
P2-LCA, while it does not exist for st-LCO. This asymmetry is found for any of the diffraction
peaks collected within our 2ϴ range, as shown by Figure C8.b; it varies with the (hkl) values of
the diffraction lines. As shown by Gaudin et al.23 for the Li(Co1-yAly)O2 solid solution prepared by
a precipitation route, the chex. increases of 1% in the overall composition range (0 ≤ y ≤ 1) whereas
the ahex. parameter decreases of 0.5% (see Figure C10). As shown in Figure C8.b, the asymmetry
of the (10l) lines is observed towards smaller 2 angles for LCA samples, since the variation of
chex is predominating. On the other hand, as the (110) line is only affected by the ahex. parameter,
the asymmetry is observed toward higher angles (Figure C8.d).
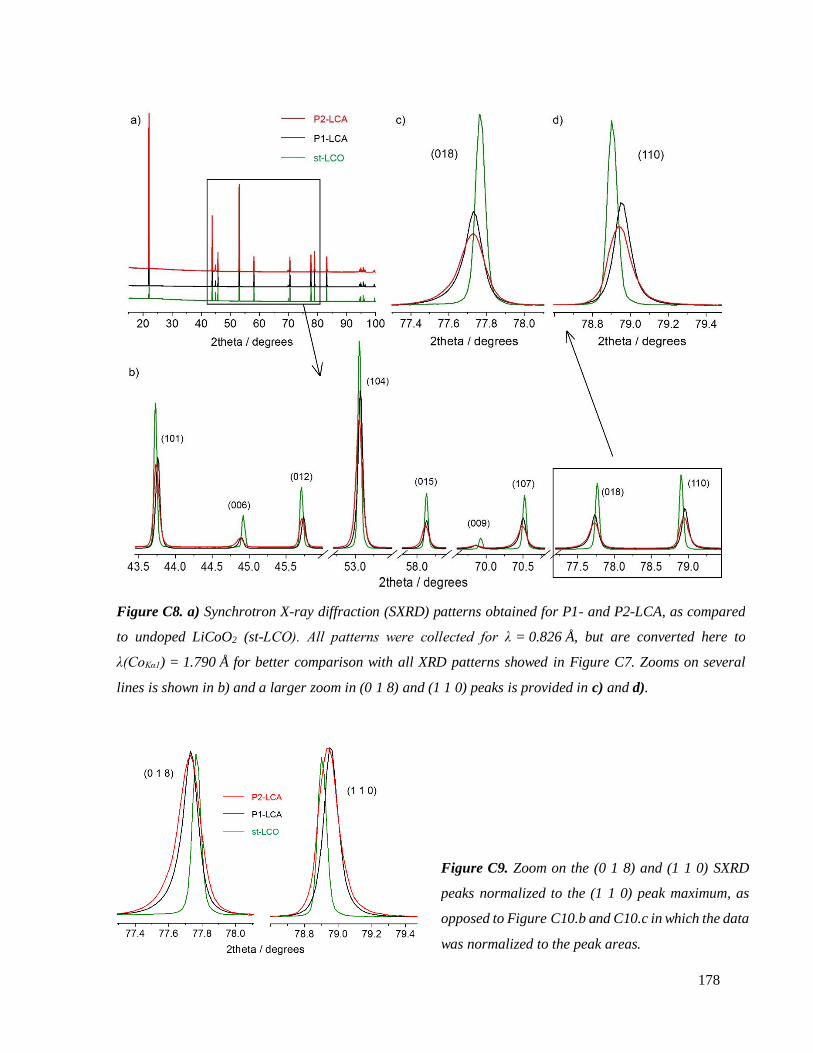
178
Figure C8. a) Synchrotron X-ray diffraction (SXRD) patterns obtained for P1- and P2-LCA, as compared
to undoped LiCoO2 (st-LCO). All patterns were collected for λ = 0.826 Å, but are converted here to
λ(CoKα1) = 1.790 Å for better comparison with all XRD patterns showed in Figure C7. Zooms on several
lines is shown in b) and a larger zoom in (0 1 8) and (1 1 0) peaks is provided in c) and d).
Figure C9. Zoom on the (0 1 8) and (1 1 0) SXRD
peaks normalized to the (1 1 0) peak maximum, as
opposed to Figure C10.b and C10.c in which the data
was normalized to the peak areas.
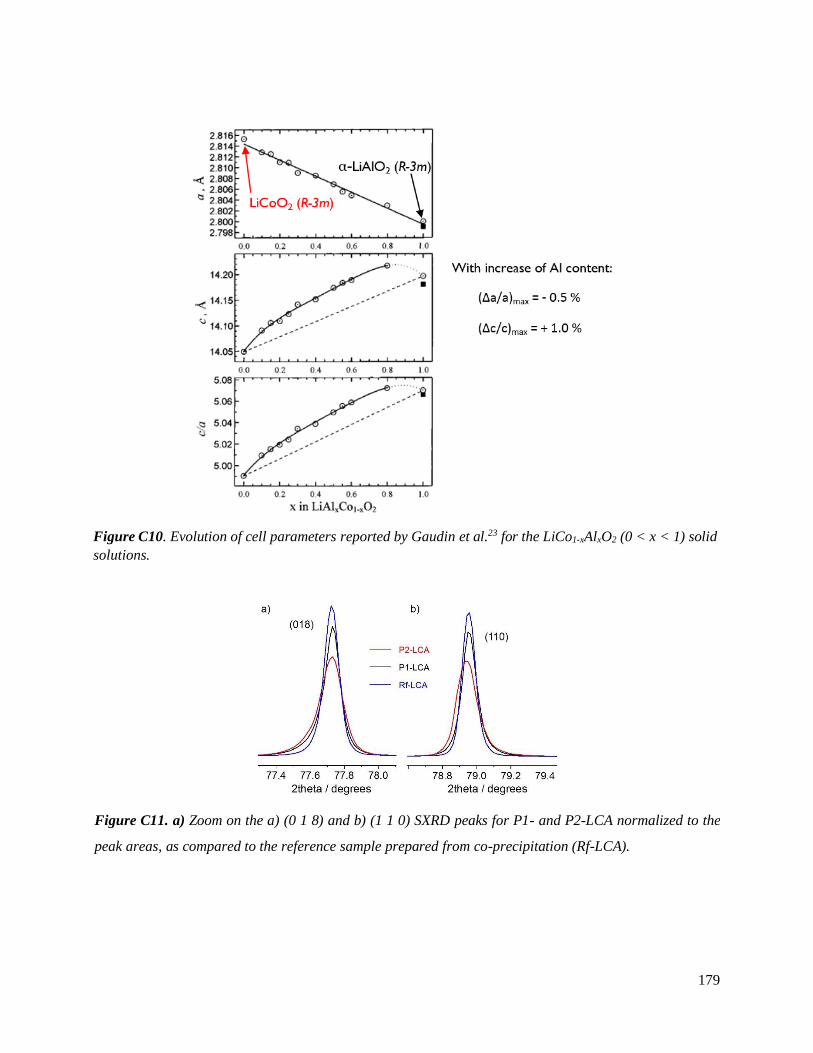
179
Figure C11. a) Zoom on the a) (0 1 8) and b) (1 1 0) SXRD peaks for P1- and P2-LCA normalized to the
peak areas, as compared to the reference sample prepared from co-precipitation (Rf-LCA).
Figure C10. Evolution of cell parameters reported by Gaudin et al.23 for the LiCo1-xAlxO2 (0 < x < 1) solid
solutions.
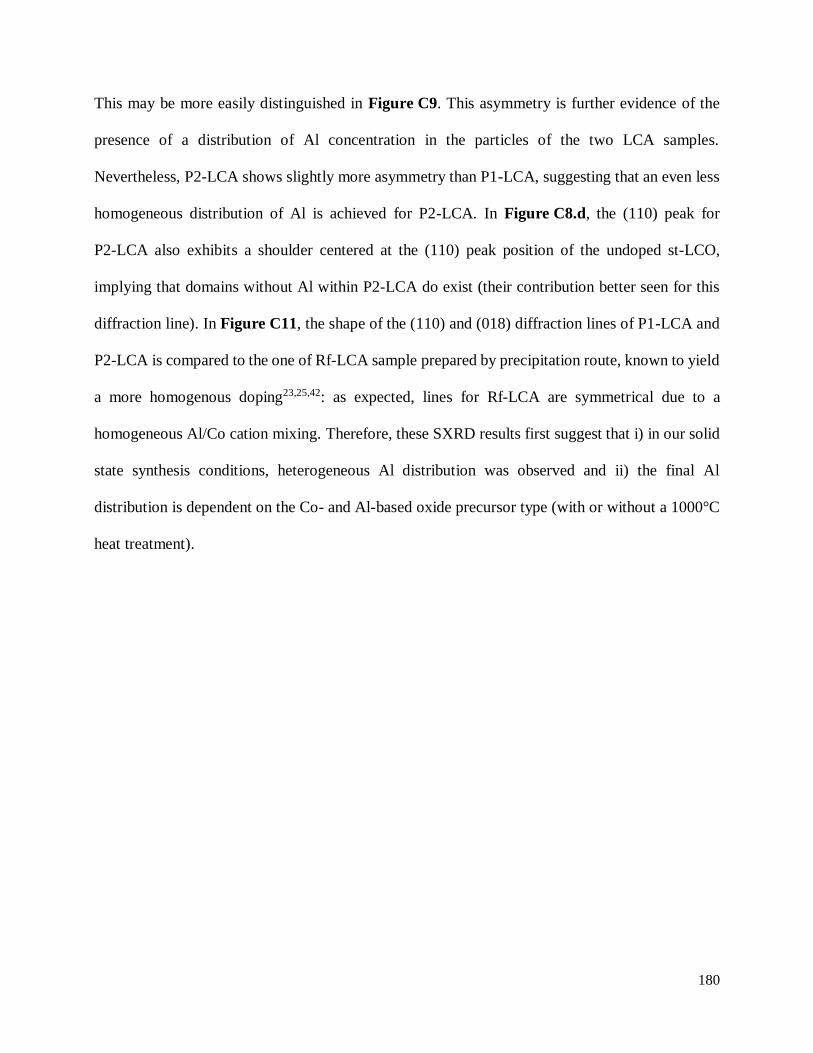
180
This may be more easily distinguished in Figure C9. This asymmetry is further evidence of the
presence of a distribution of Al concentration in the particles of the two LCA samples.
Nevertheless, P2-LCA shows slightly more asymmetry than P1-LCA, suggesting that an even less
homogeneous distribution of Al is achieved for P2-LCA. In Figure C8.d, the (110) peak for
P2-LCA also exhibits a shoulder centered at the (110) peak position of the undoped st-LCO,
implying that domains without Al within P2-LCA do exist (their contribution better seen for this
diffraction line). In Figure C11, the shape of the (110) and (018) diffraction lines of P1-LCA and
P2-LCA is compared to the one of Rf-LCA sample prepared by precipitation route, known to yield
a more homogenous doping23,25,42: as expected, lines for Rf-LCA are symmetrical due to a
homogeneous Al/Co cation mixing. Therefore, these SXRD results first suggest that i) in our solid
state synthesis conditions, heterogeneous Al distribution was observed and ii) the final Al
distribution is dependent on the Co- and Al-based oxide precursor type (with or without a 1000°C
heat treatment).
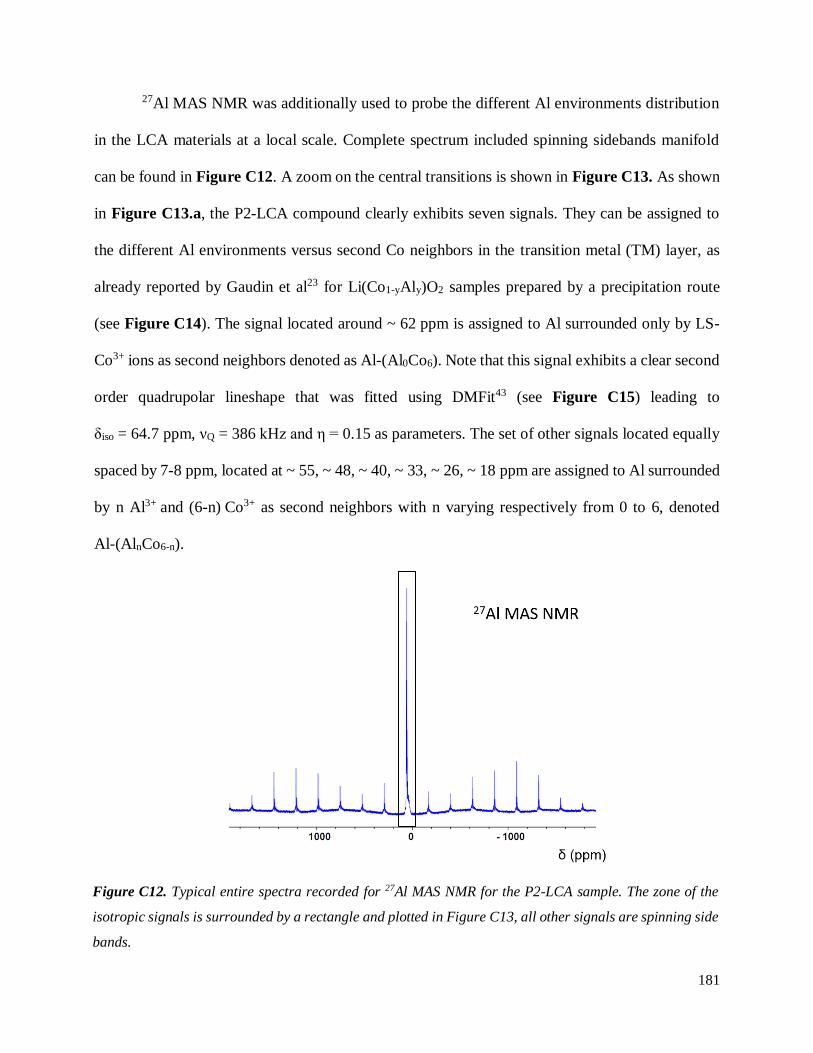
181
27Al MAS NMR was additionally used to probe the different Al environments distribution
in the LCA materials at a local scale. Complete spectrum included spinning sidebands manifold
can be found in Figure C12. A zoom on the central transitions is shown in Figure C13. As shown
in Figure C13.a, the P2-LCA compound clearly exhibits seven signals. They can be assigned to
the different Al environments versus second Co neighbors in the transition metal (TM) layer, as
already reported by Gaudin et al23 for Li(Co1-yAly)O2 samples prepared by a precipitation route
(see Figure C14). The signal located around ~ 62 ppm is assigned to Al surrounded only by LS-
Co3+ ions as second neighbors denoted as Al-(Al0Co6). Note that this signal exhibits a clear second
order quadrupolar lineshape that was fitted using DMFit43 (see Figure C15) leading to
δiso = 64.7 ppm, νQ = 386 kHz and η = 0.15 as parameters. The set of other signals located equally
spaced by 7-8 ppm, located at ~ 55, ~ 48, ~ 40, ~ 33, ~ 26, ~ 18 ppm are assigned to Al surrounded
by n Al3+ and (6-n) Co3+ as second neighbors with n varying respectively from 0 to 6, denoted
Al-(AlnCo6-n).
Figure C12. Typical entire spectra recorded for 27Al MAS NMR for the P2-LCA sample. The zone of the
isotropic signals is surrounded by a rectangle and plotted in Figure C13, all other signals are spinning side
bands.
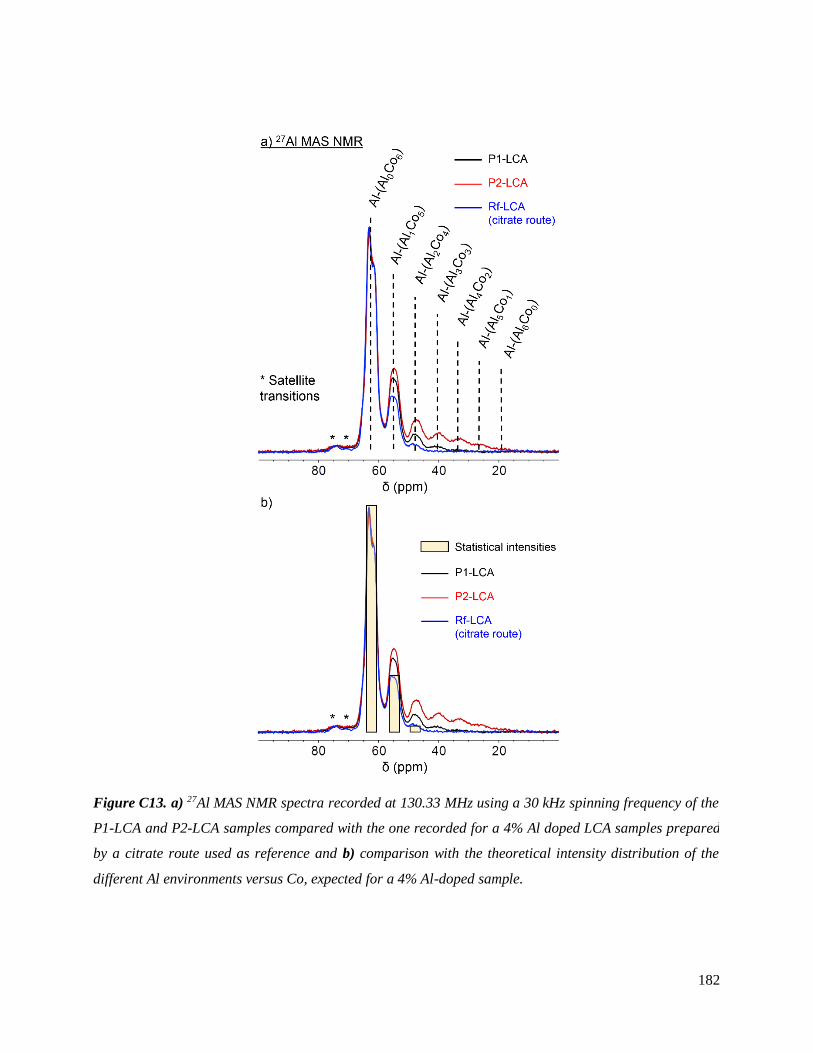
182
Figure C13. a) 27Al MAS NMR spectra recorded at 130.33 MHz using a 30 kHz spinning frequency of the
P1-LCA and P2-LCA samples compared with the one recorded for a 4% Al doped LCA samples prepared
by a citrate route used as reference and b) comparison with the theoretical intensity distribution of the
different Al environments versus Co, expected for a 4% Al-doped sample.
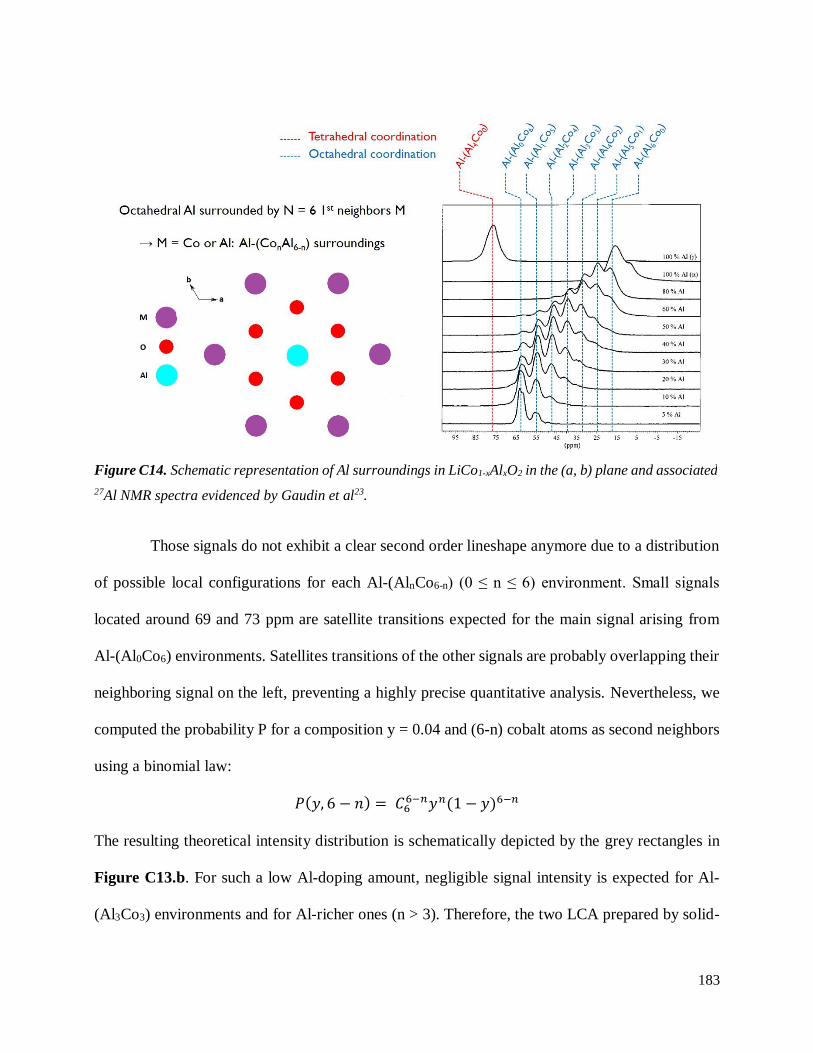
183
Those signals do not exhibit a clear second order lineshape anymore due to a distribution
of possible local configurations for each Al-(AlnCo6-n) (0 ≤ n ≤ 6) environment. Small signals
located around 69 and 73 ppm are satellite transitions expected for the main signal arising from
Al-(Al0Co6) environments. Satellites transitions of the other signals are probably overlapping their
neighboring signal on the left, preventing a highly precise quantitative analysis. Nevertheless, we
computed the probability P for a composition y = 0.04 and (6-n) cobalt atoms as second neighbors
using a binomial law:
𝑃(𝑦, 6 − 𝑛) = 𝐶66−𝑛𝑦𝑛(1 − 𝑦)6−𝑛
The resulting theoretical intensity distribution is schematically depicted by the grey rectangles in
Figure C13.b. For such a low Al-doping amount, negligible signal intensity is expected for Al-
(Al3Co3) environments and for Al-richer ones (n > 3). Therefore, the two LCA prepared by solid-
Figure C14. Schematic representation of Al surroundings in LiCo1-xAlxO2 in the (a, b) plane and associated
27Al NMR spectra evidenced by Gaudin et al23.
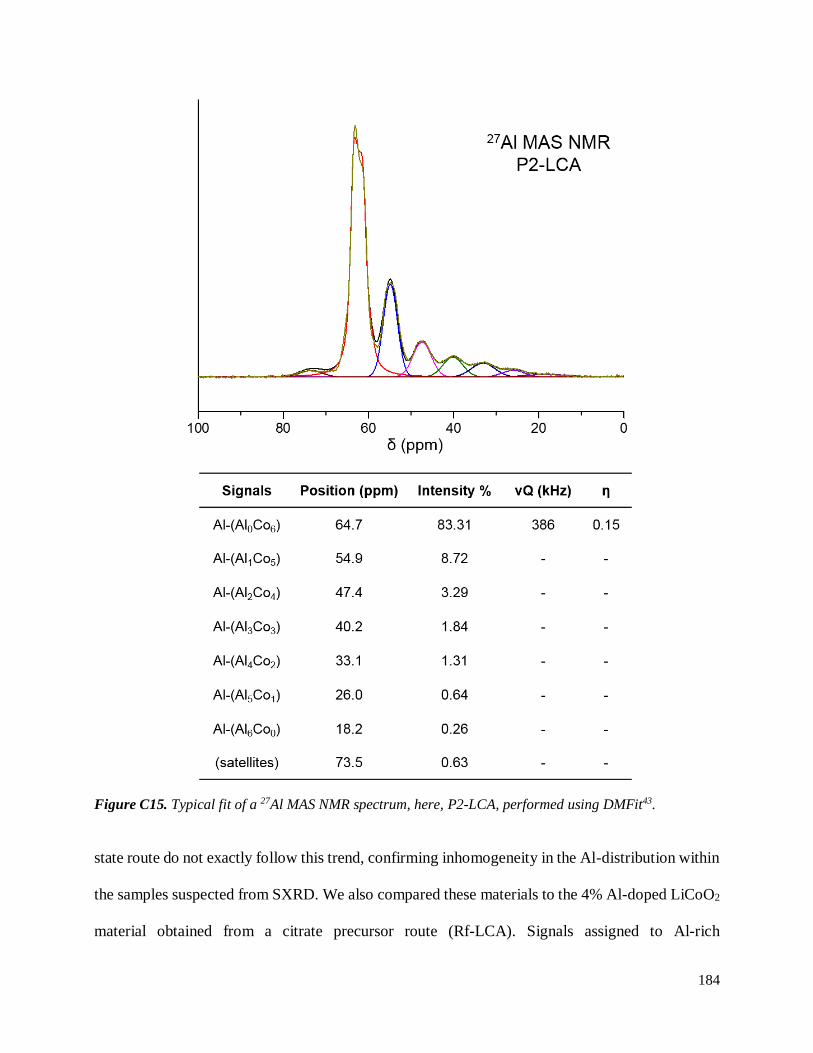
184
state route do not exactly follow this trend, confirming inhomogeneity in the Al-distribution within
the samples suspected from SXRD. We also compared these materials to the 4% Al-doped LiCoO2
material obtained from a citrate precursor route (Rf-LCA). Signals assigned to Al-rich
Figure C15. Typical fit of a 27Al MAS NMR spectrum, here, P2-LCA, performed using DMFit43.
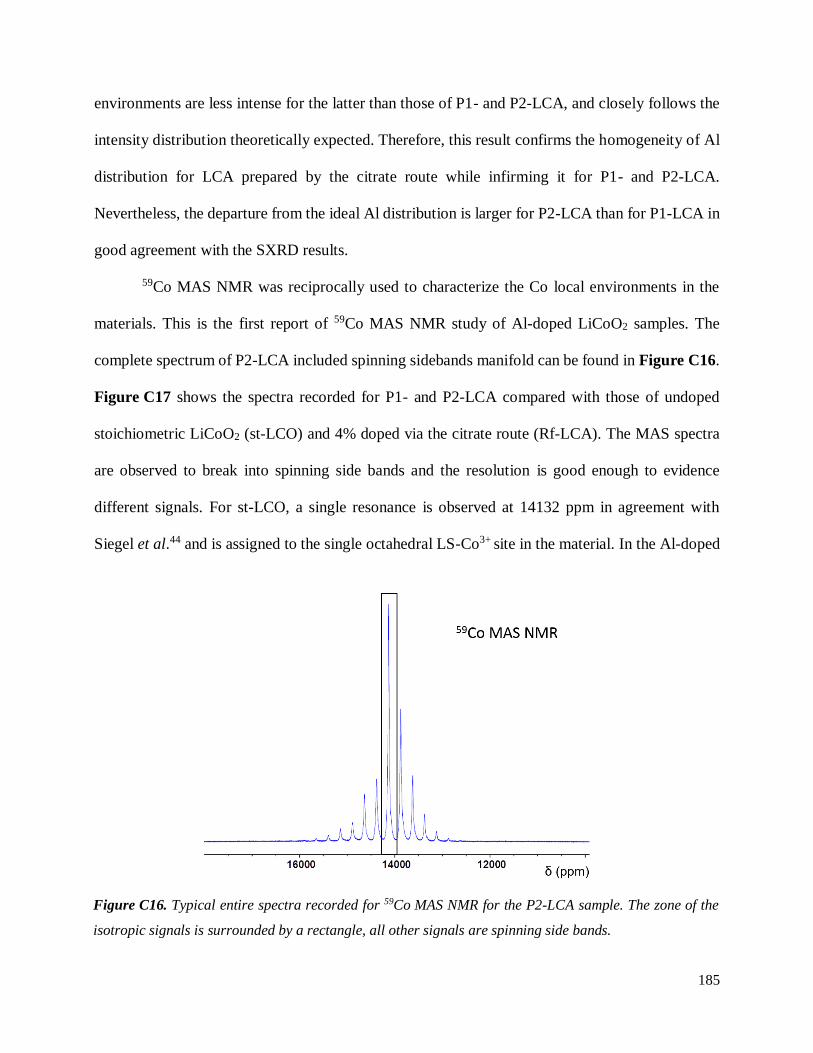
185
environments are less intense for the latter than those of P1- and P2-LCA, and closely follows the
intensity distribution theoretically expected. Therefore, this result confirms the homogeneity of Al
distribution for LCA prepared by the citrate route while infirming it for P1- and P2-LCA.
Nevertheless, the departure from the ideal Al distribution is larger for P2-LCA than for P1-LCA in
good agreement with the SXRD results.
59Co MAS NMR was reciprocally used to characterize the Co local environments in the
materials. This is the first report of 59Co MAS NMR study of Al-doped LiCoO2 samples. The
complete spectrum of P2-LCA included spinning sidebands manifold can be found in Figure C16.
Figure C17 shows the spectra recorded for P1- and P2-LCA compared with those of undoped
stoichiometric LiCoO2 (st-LCO) and 4% doped via the citrate route (Rf-LCA). The MAS spectra
are observed to break into spinning side bands and the resolution is good enough to evidence
different signals. For st-LCO, a single resonance is observed at 14132 ppm in agreement with
Siegel et al.44 and is assigned to the single octahedral LS-Co3+ site in the material. In the Al-doped
Figure C16. Typical entire spectra recorded for 59Co MAS NMR for the P2-LCA sample. The zone of the
isotropic signals is surrounded by a rectangle, all other signals are spinning side bands.
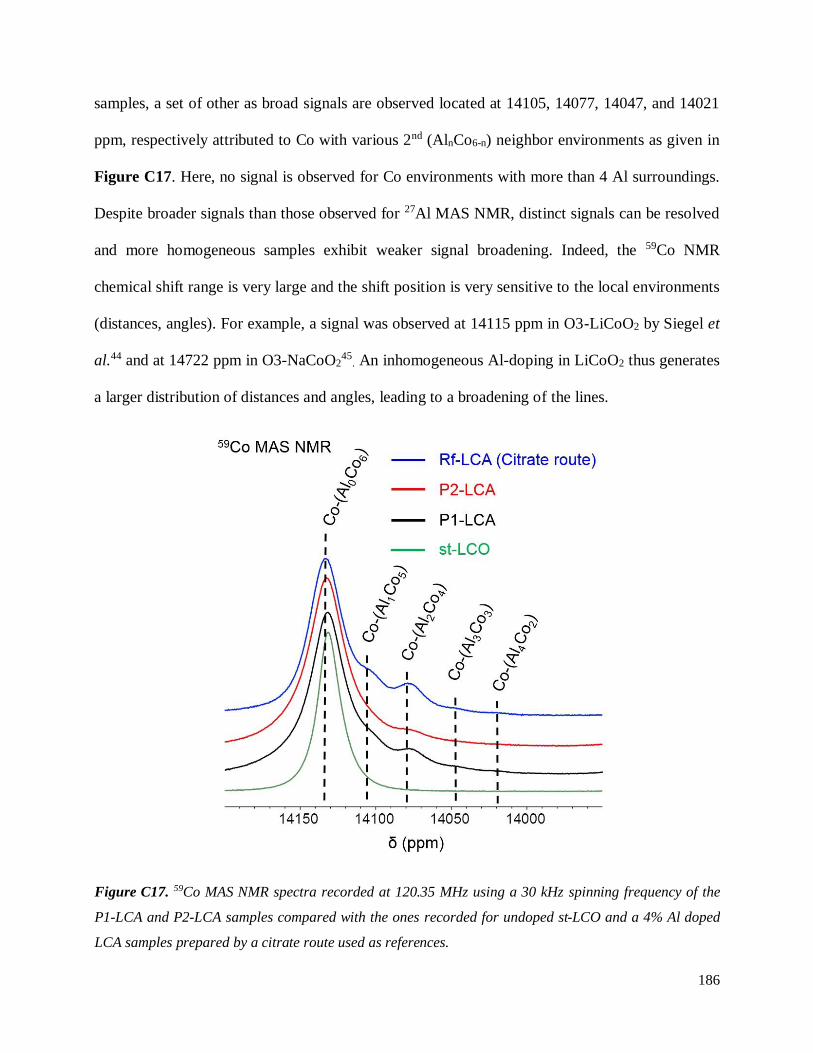
186
samples, a set of other as broad signals are observed located at 14105, 14077, 14047, and 14021
ppm, respectively attributed to Co with various 2nd (AlnCo6-n) neighbor environments as given in
Figure C17. Here, no signal is observed for Co environments with more than 4 Al surroundings.
Despite broader signals than those observed for 27Al MAS NMR, distinct signals can be resolved
and more homogeneous samples exhibit weaker signal broadening. Indeed, the 59Co NMR
chemical shift range is very large and the shift position is very sensitive to the local environments
(distances, angles). For example, a signal was observed at 14115 ppm in O3-LiCoO2 by Siegel et
al.44 and at 14722 ppm in O3-NaCoO245
. An inhomogeneous Al-doping in LiCoO2 thus generates
a larger distribution of distances and angles, leading to a broadening of the lines.
Figure C17. 59Co MAS NMR spectra recorded at 120.35 MHz using a 30 kHz spinning frequency of the
P1-LCA and P2-LCA samples compared with the ones recorded for undoped st-LCO and a 4% Al doped
LCA samples prepared by a citrate route used as references.
187
C.3.3.2 Discussion
SXRD, 27Al and 59Co MAS NMR all lead to the same conclusions. Our solid state synthesis
route, even performed at relatively high temperature (980°C) with either a Al2O3 precursor mixed
with Co3O4 (Precursor 1) or with a pre-heat treatment of this precursor at 1000°C (Precursor 2), do
not allow to prepare materials as homogeneous as the one prepared by the citrate route. A small
gradient in composition is remaining in the P1- and P2-LCA samples. Nevertheless, the Al-doping
of LCO was effective, since no signal of remaining Al2O3 is observed by 27Al MAS NMR. While
we initially thought that a pre-heat treatment of the Al and Co precursor might help to get
homogeneous LCA samples, the opposite effect is though observed, P2-LCA sample shows even
more inhomogeneity of Al distribution than P1-LCA. These differences may arise from several
causes. The formation of segregated cobalt aluminate domains for Precursor 2 most likely leads to
further heterogeneous Al distribution in the final P2-LCA phase, though we could not collect data
to verify it. A preferential reaction between Li2CO3 and γ-Al2O3 may also be a little more favorable
for the final Al distribution within P1-LCA. The particle size may also have played a role, as
homogenization processes may be harder in the bigger particles of Precursor 2 as opposed to
Precursor 1 during the formation of the associated LCA. Even though no clear conclusions on the
precursors can be drawn, differences of Al distribution were still evidenced in both resulting LCA
prepared from solid state synthesis thanks to the remarkable resolutions of SXRD and 27Al MAS
NMR.
188
C.3.4 Consequences on the 1st cycle curves of LCA//Li cells
In the case of LCA powders, it seems reasonable to expect differences in the
electrochemical profiles depending on the homogeneity of the Al distribution within the samples.
Figure C18.a shows the 1st cycle between 3.0 and 5.0 V for coin cells with either st-LCO, P1-LCA,
P2-LCA and Rf-LCA as positive electrodes. Typical features characteristic of stoichiometric
LiCoO2 (st-LCO) are clearly seen: i) the voltage jump corresponding to the O3 ↔ O’3 monoclinic
transition resulting from the formation of a Li-vacancy ordering at x = 0.5, (Figure C18.b and
Figure C18.c); ii) the formation of the H1-3 phase around x ≈ 0.17, also revealed by a clear change
of slope. The homogeneously Al-doped material Rf-LCA shows none of the above, as revealed by
the overall sloppy profile of the electrochemical curve. In particular, the O3 ↔ O’3 monoclinic
transition does not occur (Figure C18.c). Note that in the case of LCO, even a very little excess of
Li found in the Co layers hinders the Li-vacancy ordering at x = 0.540,41. The occurrence of this
transition is thus extremely sensible to the local perturbations within LCO-type materials. Since
we controlled the initial Li/(Co+Al) ratios in this study, only the presence of homogeneously
distributed Al3+ in substitution of some Co3+ can explain the absence of the O3 ↔ O’3 monoclinic
transition. As a matter of fact, this could then be considered a first indirect tool to probe the dopants
repartition within the doped LCO, when an accurate control of the Li/(Co+Al) = 1.00 is achieved.
For both P1 and P2-LCA, this O3 ↔ O’3 monoclinic transition occurs – as clearly evidenced by
the small change of slope in the near x = 0.5 region (Figure C18.b) and in the derivative dx/dV
curve (Figure C18.c). One can assume the coexistence of un-doped and Al doped domains due to
the inhomogeneous distribution of Al ions to explain this behavior. This supports the previous
conclusions obtained from SXRD and MAS NMR, i.e. that non homogeneous Al-doping was
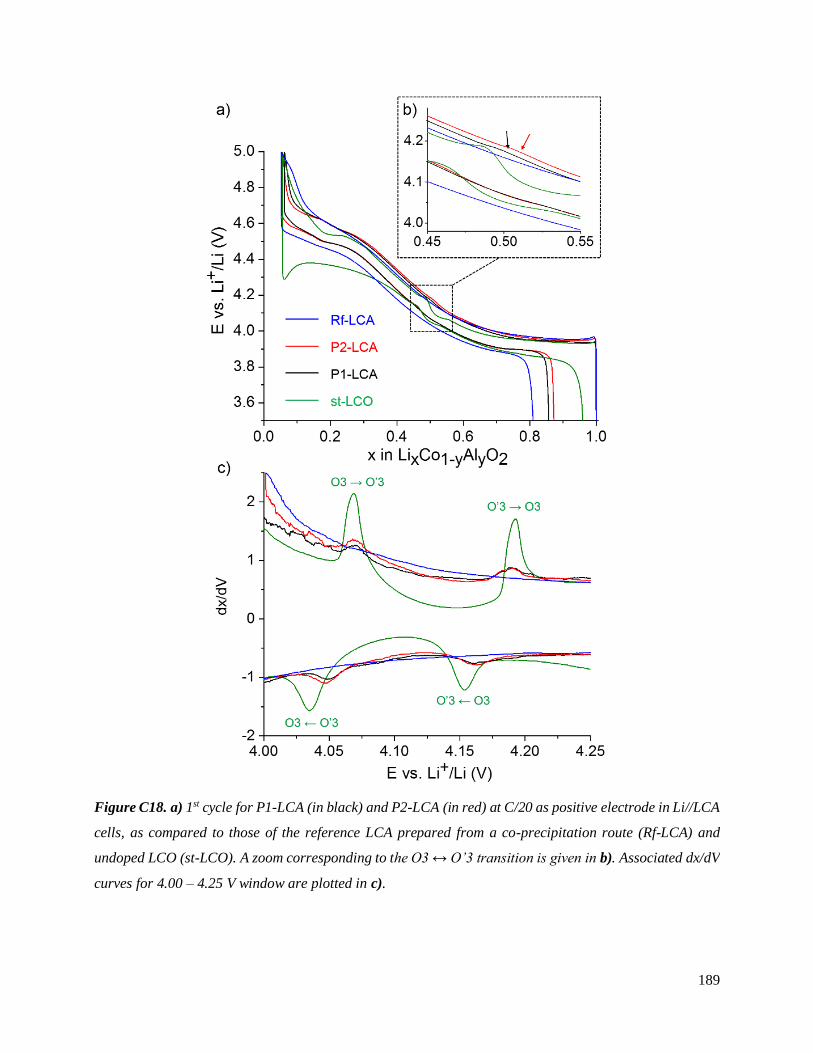
189
achieved by our solid state synthesis of LCA. It is though impossible to discriminate between P1
Figure C18. a) 1st cycle for P1-LCA (in black) and P2-LCA (in red) at C/20 as positive electrode in Li//LCA
cells, as compared to those of the reference LCA prepared from a co-precipitation route (Rf-LCA) and
undoped LCO (st-LCO). A zoom corresponding to the O3 ↔ O’3 transition is given in b). Associated dx/dV
curves for 4.00 – 4.25 V window are plotted in c).
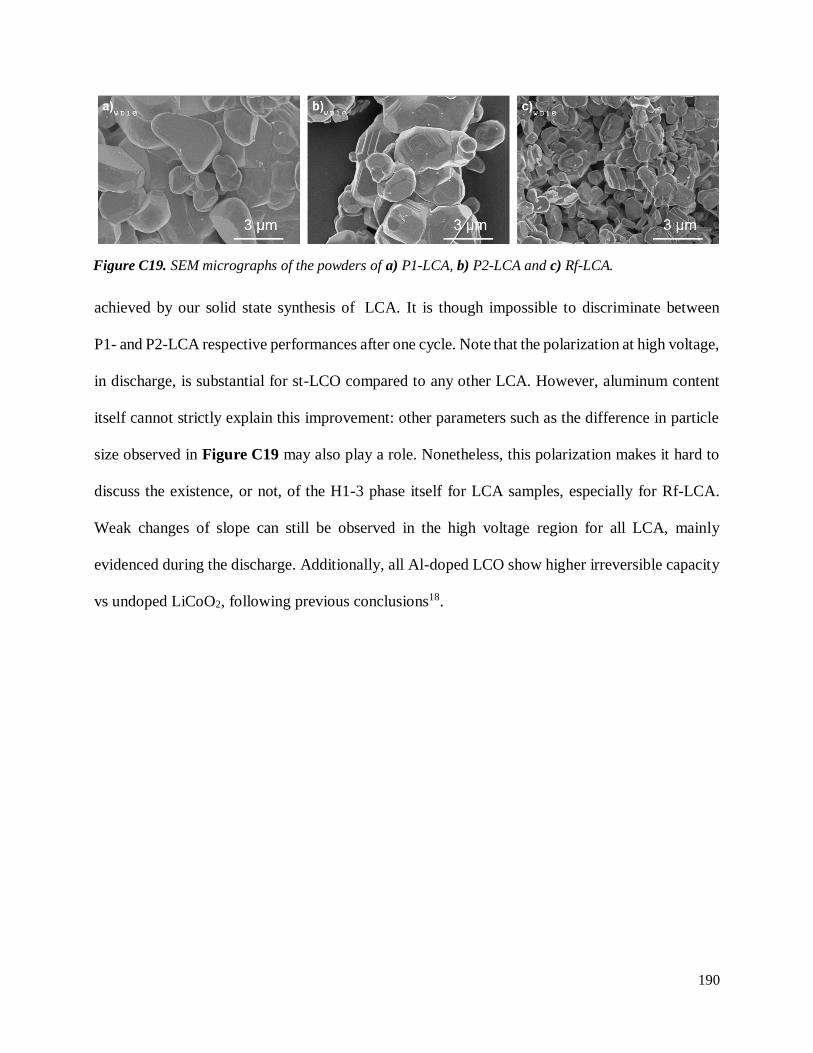
190
achieved by our solid state synthesis of LCA. It is though impossible to discriminate between
P1- and P2-LCA respective performances after one cycle. Note that the polarization at high voltage,
in discharge, is substantial for st-LCO compared to any other LCA. However, aluminum content
itself cannot strictly explain this improvement: other parameters such as the difference in particle
size observed in Figure C19 may also play a role. Nonetheless, this polarization makes it hard to
discuss the existence, or not, of the H1-3 phase itself for LCA samples, especially for Rf-LCA.
Weak changes of slope can still be observed in the high voltage region for all LCA, mainly
evidenced during the discharge. Additionally, all Al-doped LCO show higher irreversible capacity
vs undoped LiCoO2, following previous conclusions18.
Figure C19. SEM micrographs of the powders of a) P1-LCA, b) P2-LCA and c) Rf-LCA.
191
C.3.5 Conclusions on the preparation of LCA from the solid state reaction of
stoichiometric amounts of Li2CO3 and Co/Al-based oxide(s)
In this first section of Part C, we succeeded in preparing Al-doped LCO (LCA) powders
with low Al content (4%) and well controlled Li/(Co+Al) stoichiometries (≤ 1.00) from solid state
reaction of (Co3O4, Al2O3) and Li2CO3 in stoichiometric proportions. We established a reliable
protocol to characterize the Al distribution within these LCA powders at different scales through
the combined use of synchrotron XRD with 27Al and 59Co MAS NMR. Although both samples
investigated in this section showed poor homogeneity of Al doping, this is still a first encouraging
step towards the preparation of LCA powders from a solid state route.
Doping the Co3O4 spinel precursor by reacting it with Al2O3 may be avoided, as it most
likely leads to an inhomogeneous mixture of Co3O4 and Co3-zAlzO4 as precursor, eventually
reflecting in the final LiCo0.96Al0.04O2 powder. Using Li2CO3 with an unreacted mixture of Co3O4
and Al2O3 in stoichiometric proportions instead does not lead to a homogeneous Al doping for the
resulting LCA powder either – though the distribution of Al appears to be slightly more
homogeneous in this case.
The comparison of the electrochemical performance of both LCA powders with a reference
LCA sample prepared from co-precipitation route confirmed the inhomogeneity of Al doping, as
typical features (such as the O3 ↔ O’3 transition) obtained for un-doped LCO were still
distinguished for the former. Nonetheless, higher irreversible capacity was achieved at the outcome
of the 1st cycle for all LCA as compared to undoped LCO, confirming previous findings from
Myung et al.18. As we carefully controlled the Li/(Co+Al) stoichiometries of all LCA powders
through 7Li MAS NMR, the possible contribution of Li excess to the increase of capacity losses at
cycle n°1 is discarded.
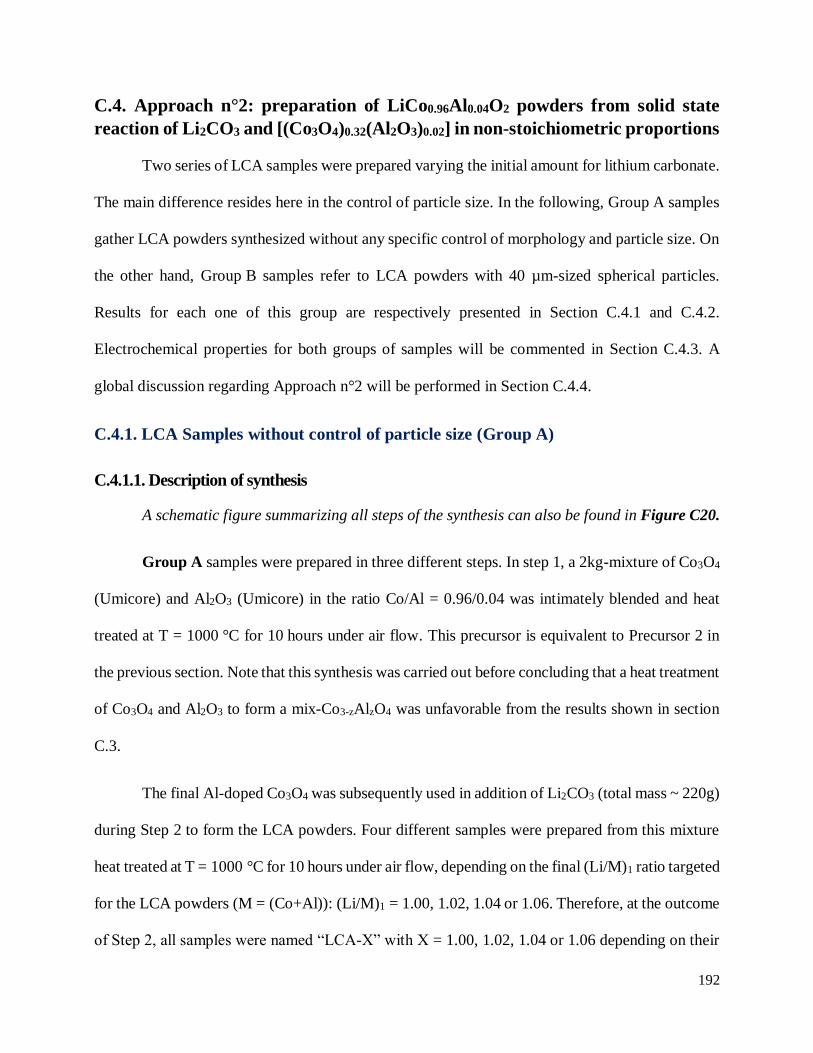
192
C.4. Approach n°2: preparation of LiCo0.96Al0.04O2 powders from solid state
reaction of Li2CO3 and [(Co3O4)0.32(Al2O3)0.02] in non-stoichiometric proportions
Two series of LCA samples were prepared varying the initial amount for lithium carbonate.
The main difference resides here in the control of particle size. In the following, Group A samples
gather LCA powders synthesized without any specific control of morphology and particle size. On
the other hand, Group B samples refer to LCA powders with 40 µm-sized spherical particles.
Results for each one of this group are respectively presented in Section C.4.1 and C.4.2.
Electrochemical properties for both groups of samples will be commented in Section C.4.3. A
global discussion regarding Approach n°2 will be performed in Section C.4.4.
C.4.1. LCA Samples without control of particle size (Group A)
C.4.1.1. Description of synthesis
A schematic figure summarizing all steps of the synthesis can also be found in Figure C20.
Group A samples were prepared in three different steps. In step 1, a 2kg-mixture of Co3O4
(Umicore) and Al2O3 (Umicore) in the ratio Co/Al = 0.96/0.04 was intimately blended and heat
treated at T = 1000 °C for 10 hours under air flow. This precursor is equivalent to Precursor 2 in
the previous section. Note that this synthesis was carried out before concluding that a heat treatment
of Co3O4 and Al2O3 to form a mix-Co3-zAlzO4 was unfavorable from the results shown in section
C.3.
The final Al-doped Co3O4 was subsequently used in addition of Li2CO3 (total mass ~ 220g)
during Step 2 to form the LCA powders. Four different samples were prepared from this mixture
heat treated at T = 1000 °C for 10 hours under air flow, depending on the final (Li/M)1 ratio targeted
for the LCA powders (M = (Co+Al)): (Li/M)1 = 1.00, 1.02, 1.04 or 1.06. Therefore, at the outcome
of Step 2, all samples were named “LCA-X” with X = 1.00, 1.02, 1.04 or 1.06 depending on their
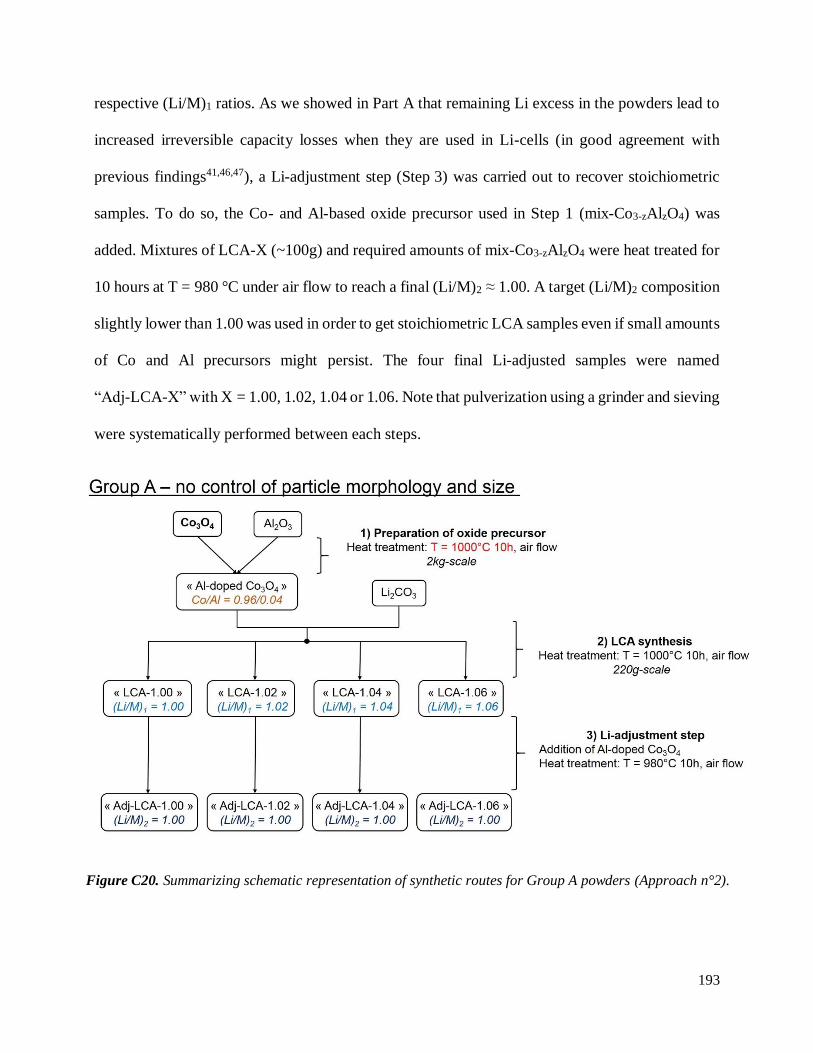
193
respective (Li/M)1 ratios. As we showed in Part A that remaining Li excess in the powders lead to
increased irreversible capacity losses when they are used in Li-cells (in good agreement with
previous findings41,46,47), a Li-adjustment step (Step 3) was carried out to recover stoichiometric
samples. To do so, the Co- and Al-based oxide precursor used in Step 1 (mix-Co3-zAlzO4) was
added. Mixtures of LCA-X (~100g) and required amounts of mix-Co3-zAlzO4 were heat treated for
10 hours at T = 980 °C under air flow to reach a final (Li/M)2 ≈ 1.00. A target (Li/M)2 composition
slightly lower than 1.00 was used in order to get stoichiometric LCA samples even if small amounts
of Co and Al precursors might persist. The four final Li-adjusted samples were named
“Adj-LCA-X” with X = 1.00, 1.02, 1.04 or 1.06. Note that pulverization using a grinder and sieving
were systematically performed between each steps.
Figure C20. Summarizing schematic representation of synthetic routes for Group A powders (Approach n°2).
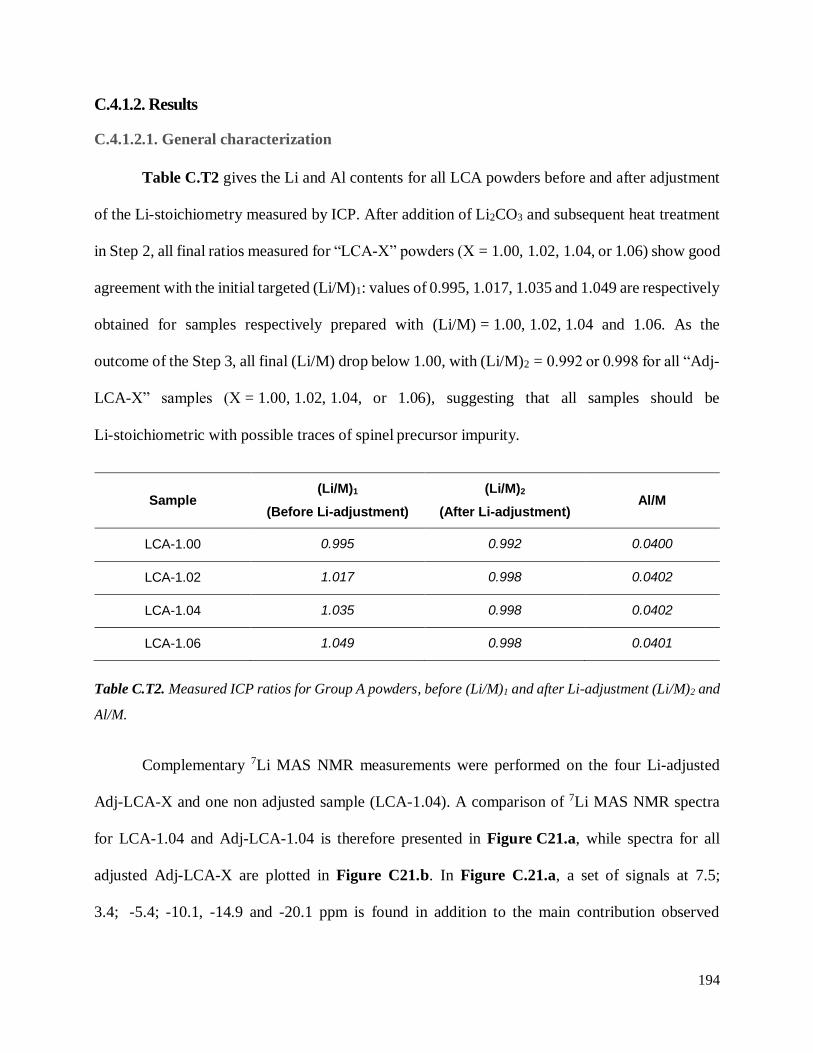
194
C.4.1.2. Results
C.4.1.2.1. General characterization
Table C.T2 gives the Li and Al contents for all LCA powders before and after adjustment
of the Li-stoichiometry measured by ICP. After addition of Li2CO3 and subsequent heat treatment
in Step 2, all final ratios measured for “LCA-X” powders (X = 1.00, 1.02, 1.04, or 1.06) show good
agreement with the initial targeted (Li/M)1: values of 0.995, 1.017, 1.035 and 1.049 are respectively
obtained for samples respectively prepared with (Li/M) = 1.00, 1.02, 1.04 and 1.06. As the
outcome of the Step 3, all final (Li/M) drop below 1.00, with (Li/M)2 = 0.992 or 0.998 for all “Adj-
LCA-X” samples (X = 1.00, 1.02, 1.04, or 1.06), suggesting that all samples should be
Li-stoichiometric with possible traces of spinel precursor impurity.
Sample (Li/M)1
(Before Li-adjustment)
(Li/M)2
(After Li-adjustment) Al/M
LCA-1.00 0.995 0.992 0.0400
LCA-1.02 1.017 0.998 0.0402
LCA-1.04 1.035 0.998 0.0402
LCA-1.06 1.049 0.998 0.0401
Complementary 7Li MAS NMR measurements were performed on the four Li-adjusted
Adj-LCA-X and one non adjusted sample (LCA-1.04). A comparison of 7Li MAS NMR spectra
for LCA-1.04 and Adj-LCA-1.04 is therefore presented in Figure C21.a, while spectra for all
adjusted Adj-LCA-X are plotted in Figure C21.b. In Figure C.21.a, a set of signals at 7.5;
3.4; -5.4; -10.1, -14.9 and -20.1 ppm is found in addition to the main contribution observed
at - 0.4 ppm
Table C.T2. Measured ICP ratios for Group A powders, before (Li/M)1 and after Li-adjustment (Li/M)2 and
Al/M.
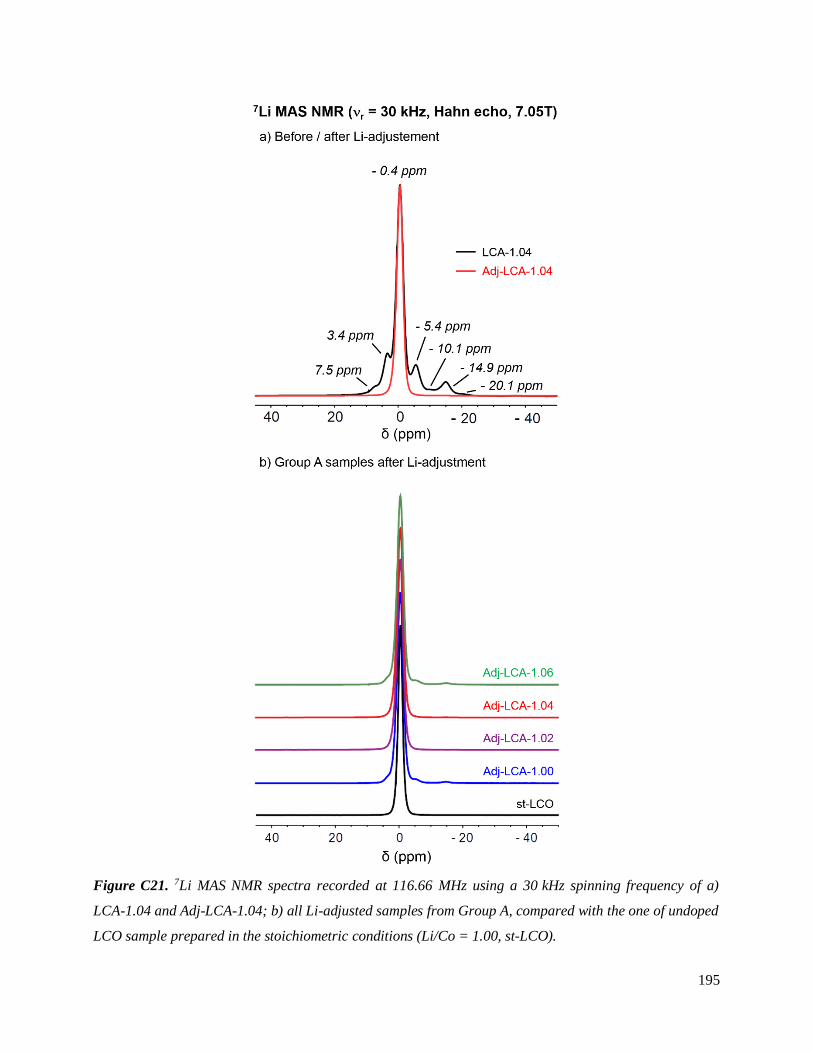
195
for LCA-1.04, revealing the presence of paramagnetic IS-Co3+ due to remaining Li excess in the
Figure C21. 7Li MAS NMR spectra recorded at 116.66 MHz using a 30 kHz spinning frequency of a)
LCA-1.04 and Adj-LCA-1.04; b) all Li-adjusted samples from Group A, compared with the one of undoped
LCO sample prepared in the stoichiometric conditions (Li/Co = 1.00, st-LCO).
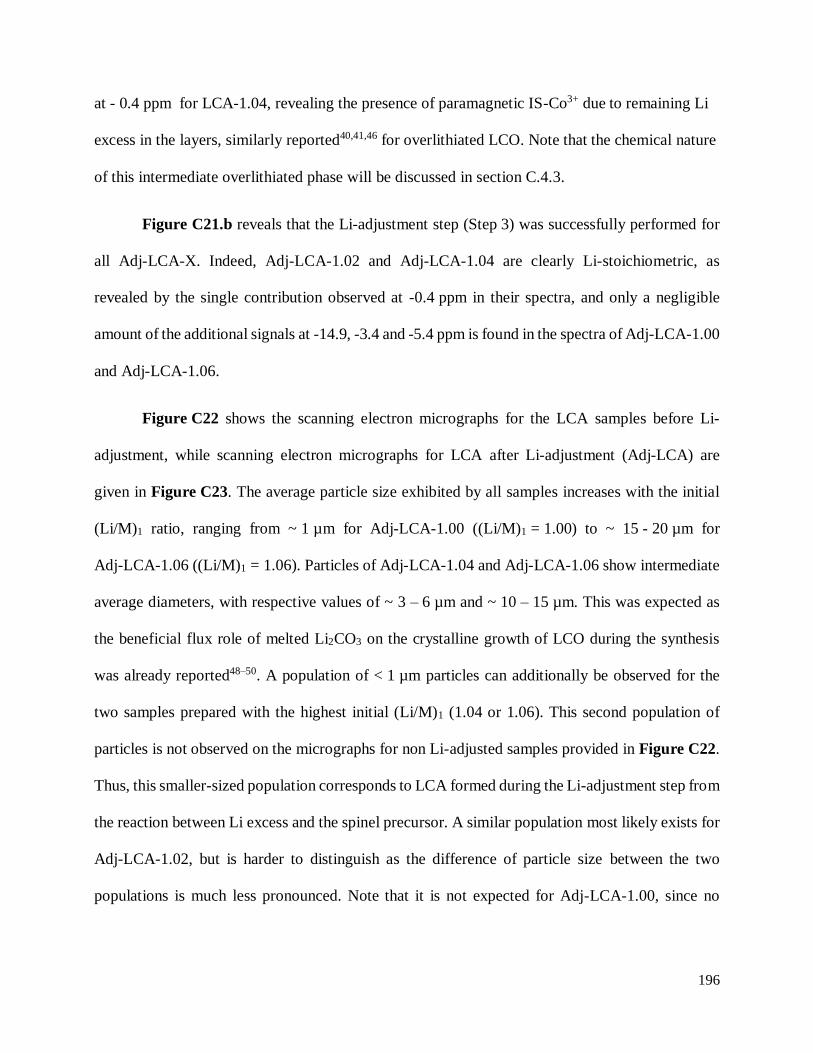
196
at - 0.4 ppm for LCA-1.04, revealing the presence of paramagnetic IS-Co3+ due to remaining Li
excess in the layers, similarly reported40,41,46 for overlithiated LCO. Note that the chemical nature
of this intermediate overlithiated phase will be discussed in section C.4.3.
Figure C21.b reveals that the Li-adjustment step (Step 3) was successfully performed for
all Adj-LCA-X. Indeed, Adj-LCA-1.02 and Adj-LCA-1.04 are clearly Li-stoichiometric, as
revealed by the single contribution observed at -0.4 ppm in their spectra, and only a negligible
amount of the additional signals at -14.9, -3.4 and -5.4 ppm is found in the spectra of Adj-LCA-1.00
and Adj-LCA-1.06.
Figure C22 shows the scanning electron micrographs for the LCA samples before Li-
adjustment, while scanning electron micrographs for LCA after Li-adjustment (Adj-LCA) are
given in Figure C23. The average particle size exhibited by all samples increases with the initial
(Li/M)1 ratio, ranging from ~ 1 µm for Adj-LCA-1.00 ((Li/M)1 = 1.00) to ~ 15 - 20 µm for
Adj-LCA-1.06 ((Li/M)1 = 1.06). Particles of Adj-LCA-1.04 and Adj-LCA-1.06 show intermediate
average diameters, with respective values of ~ 3 – 6 µm and ~ 10 – 15 µm. This was expected as
the beneficial flux role of melted Li2CO3 on the crystalline growth of LCO during the synthesis
was already reported48–50. A population of < 1 µm particles can additionally be observed for the
two samples prepared with the highest initial (Li/M)1 (1.04 or 1.06). This second population of
particles is not observed on the micrographs for non Li-adjusted samples provided in Figure C22.
Thus, this smaller-sized population corresponds to LCA formed during the Li-adjustment step from
the reaction between Li excess and the spinel precursor. A similar population most likely exists for
Adj-LCA-1.02, but is harder to distinguish as the difference of particle size between the two
populations is much less pronounced. Note that it is not expected for Adj-LCA-1.00, since no
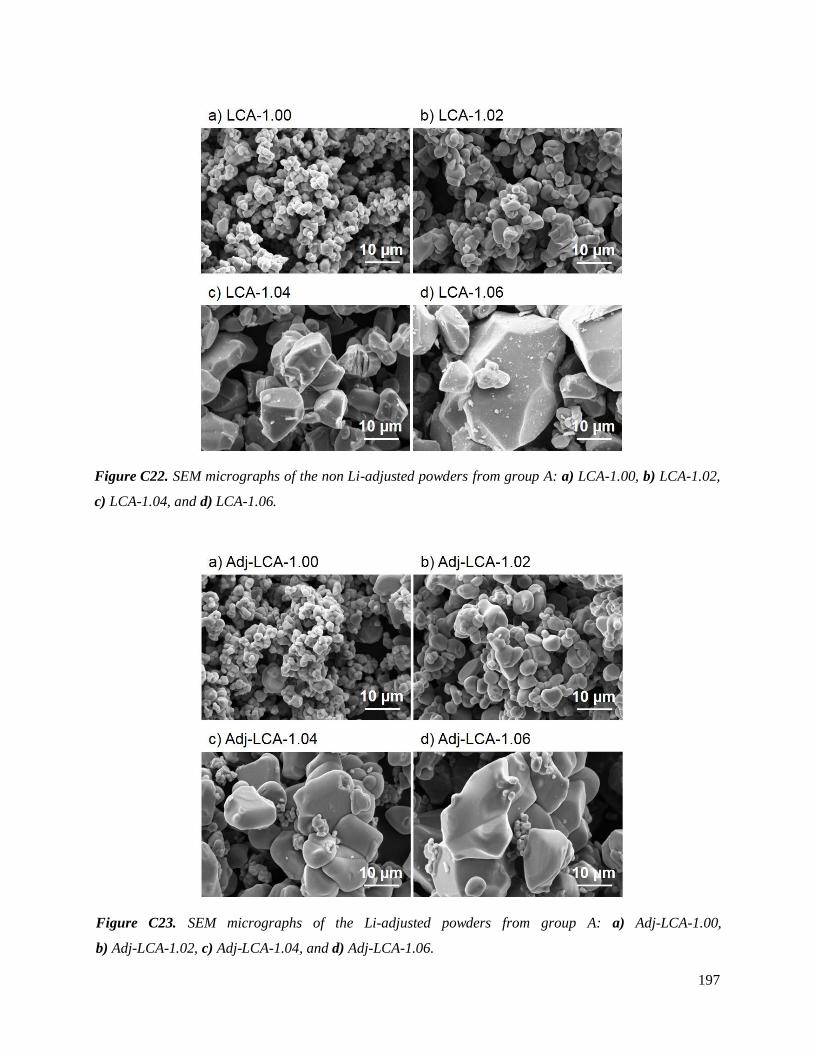
197
mix-Co3-zAlzO4 was added during the final “Li-adjustment” step, as (Li/M)1 was already below
Figure C23. SEM micrographs of the Li-adjusted powders from group A: a) Adj-LCA-1.00,
b) Adj-LCA-1.02, c) Adj-LCA-1.04, and d) Adj-LCA-1.06.
Figure C22. SEM micrographs of the non Li-adjusted powders from group A: a) LCA-1.00, b) LCA-1.02,
c) LCA-1.04, and d) LCA-1.06.
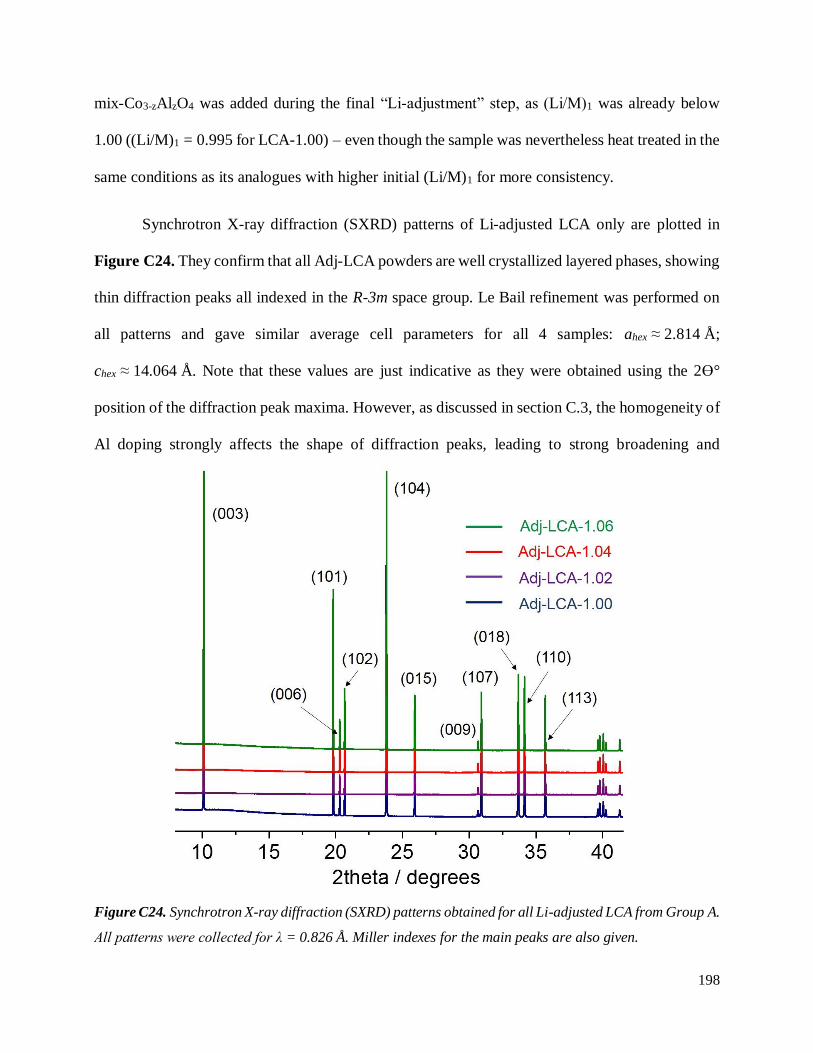
198
mix-Co3-zAlzO4 was added during the final “Li-adjustment” step, as (Li/M)1 was already below
1.00 ((Li/M)1 = 0.995 for LCA-1.00) – even though the sample was nevertheless heat treated in the
same conditions as its analogues with higher initial (Li/M)1 for more consistency.
Synchrotron X-ray diffraction (SXRD) patterns of Li-adjusted LCA only are plotted in
Figure C24. They confirm that all Adj-LCA powders are well crystallized layered phases, showing
thin diffraction peaks all indexed in the R-3m space group. Le Bail refinement was performed on
all patterns and gave similar average cell parameters for all 4 samples: ahex ≈ 2.814 Å;
chex ≈ 14.064 Å. Note that these values are just indicative as they were obtained using the 2ϴ°
position of the diffraction peak maxima. However, as discussed in section C.3, the homogeneity of
Al doping strongly affects the shape of diffraction peaks, leading to strong broadening and
Figure C24. Synchrotron X-ray diffraction (SXRD) patterns obtained for all Li-adjusted LCA from Group A.
All patterns were collected for λ = 0.826 Å. Miller indexes for the main peaks are also given.
199
asymmetry in the case of an inhomogeneous Al distribution within Al-doped LCO. Additionally,
no diffraction peaks of a spinel impurity are found in these patterns despite the (Li/M)2 in good
agreement with 7Li MAS NMR studies, meaning that the samples are either really stoichiometric
or contain a negligible amount of Li excess.
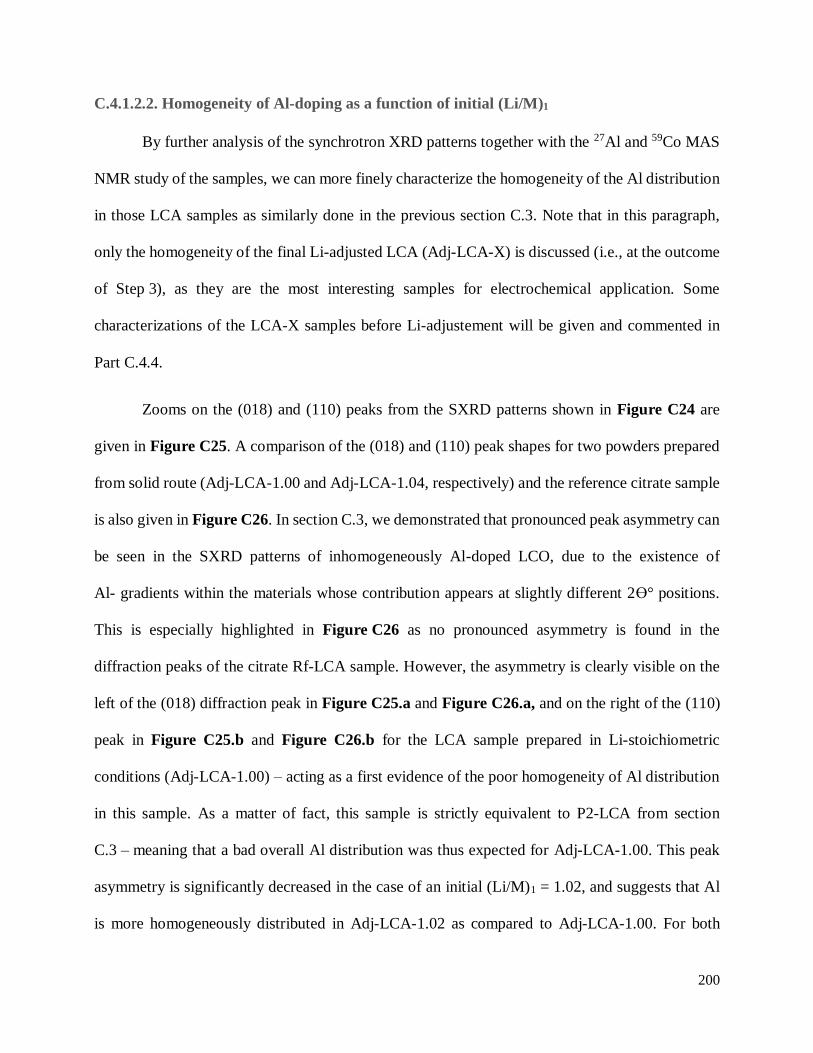
200
C.4.1.2.2. Homogeneity of Al-doping as a function of initial (Li/M)1
By further analysis of the synchrotron XRD patterns together with the 27Al and 59Co MAS
NMR study of the samples, we can more finely characterize the homogeneity of the Al distribution
in those LCA samples as similarly done in the previous section C.3. Note that in this paragraph,
only the homogeneity of the final Li-adjusted LCA (Adj-LCA-X) is discussed (i.e., at the outcome
of Step 3), as they are the most interesting samples for electrochemical application. Some
characterizations of the LCA-X samples before Li-adjustement will be given and commented in
Part C.4.4.
Zooms on the (018) and (110) peaks from the SXRD patterns shown in Figure C24 are
given in Figure C25. A comparison of the (018) and (110) peak shapes for two powders prepared
from solid route (Adj-LCA-1.00 and Adj-LCA-1.04, respectively) and the reference citrate sample
is also given in Figure C26. In section C.3, we demonstrated that pronounced peak asymmetry can
be seen in the SXRD patterns of inhomogeneously Al-doped LCO, due to the existence of
Al- gradients within the materials whose contribution appears at slightly different 2ϴ° positions.
This is especially highlighted in Figure C26 as no pronounced asymmetry is found in the
diffraction peaks of the citrate Rf-LCA sample. However, the asymmetry is clearly visible on the
left of the (018) diffraction peak in Figure C25.a and Figure C26.a, and on the right of the (110)
peak in Figure C25.b and Figure C26.b for the LCA sample prepared in Li-stoichiometric
conditions (Adj-LCA-1.00) – acting as a first evidence of the poor homogeneity of Al distribution
in this sample. As a matter of fact, this sample is strictly equivalent to P2-LCA from section
C.3 – meaning that a bad overall Al distribution was thus expected for Adj-LCA-1.00. This peak
asymmetry is significantly decreased in the case of an initial (Li/M)1 = 1.02, and suggests that Al
is more homogeneously distributed in Adj-LCA-1.02 as compared to Adj-LCA-1.00. For both
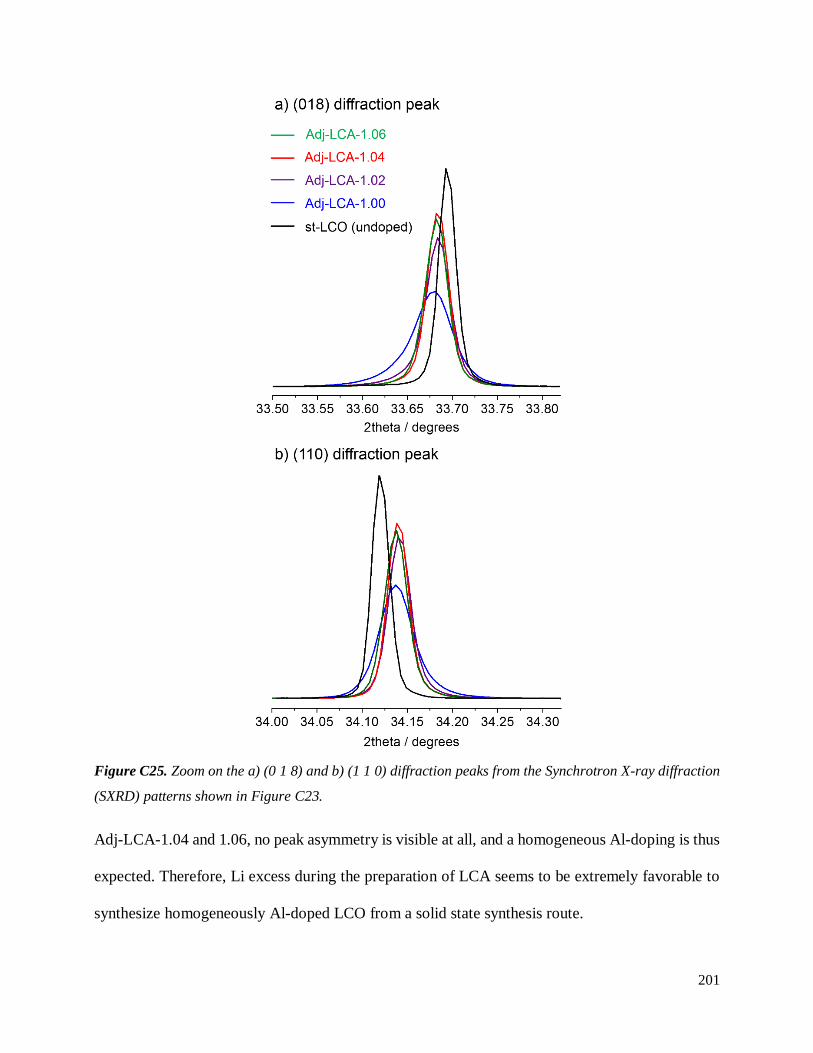
201
Adj-LCA-1.04 and 1.06, no peak asymmetry is visible at all, and a homogeneous Al-doping is thus
expected. Therefore, Li excess during the preparation of LCA seems to be extremely favorable to
synthesize homogeneously Al-doped LCO from a solid state synthesis route.
Figure C25. Zoom on the a) (0 1 8) and b) (1 1 0) diffraction peaks from the Synchrotron X-ray diffraction
(SXRD) patterns shown in Figure C23.
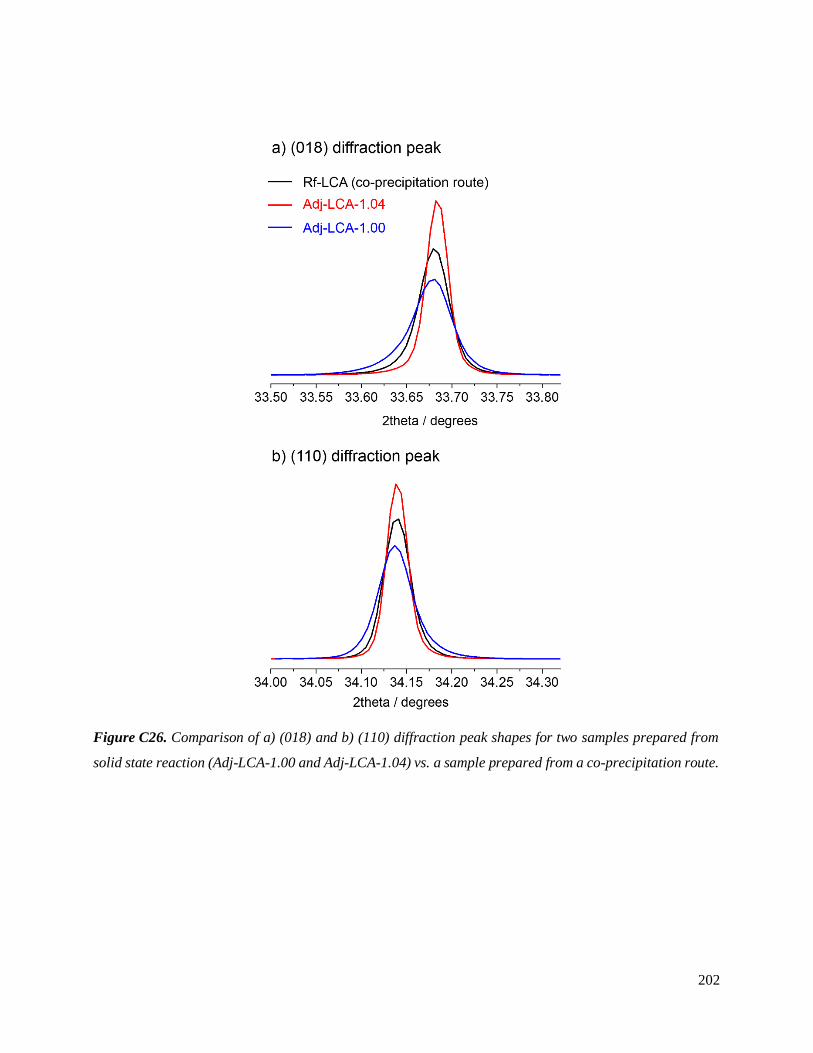
202
Figure C26. Comparison of a) (018) and b) (110) diffraction peak shapes for two samples prepared from
solid state reaction (Adj-LCA-1.00 and Adj-LCA-1.04) vs. a sample prepared from a co-precipitation route.
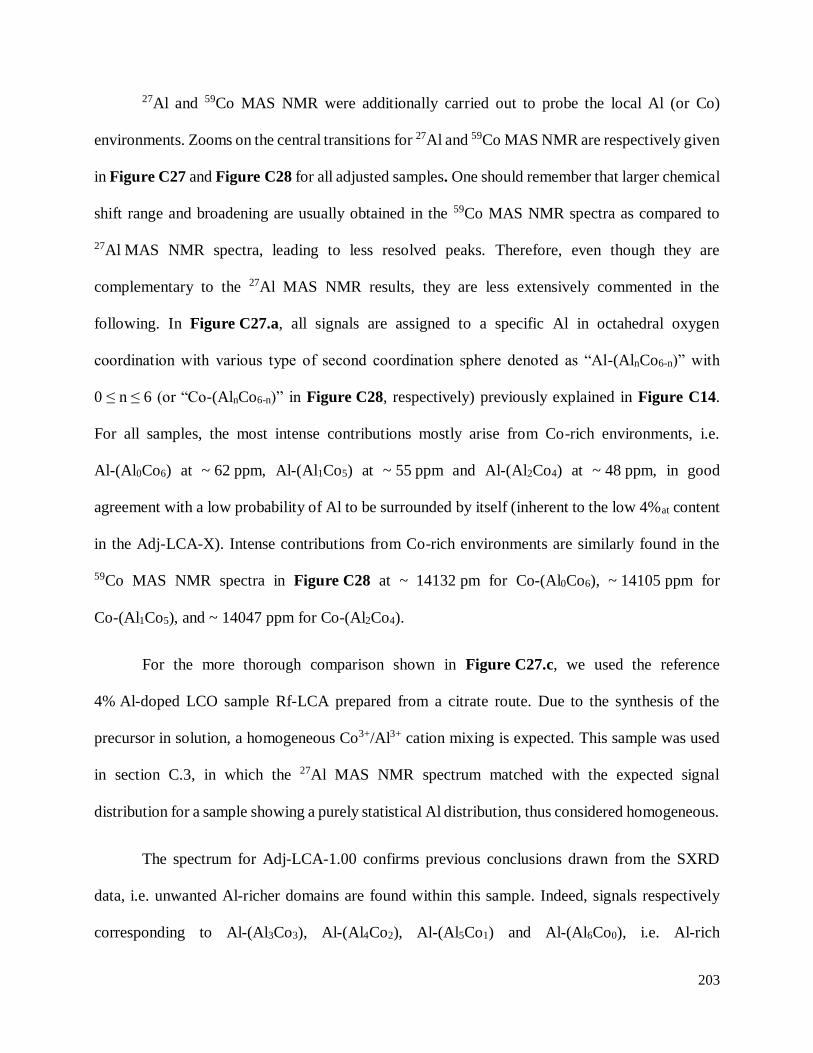
203
27Al and 59Co MAS NMR were additionally carried out to probe the local Al (or Co)
environments. Zooms on the central transitions for 27Al and 59Co MAS NMR are respectively given
in Figure C27 and Figure C28 for all adjusted samples. One should remember that larger chemical
shift range and broadening are usually obtained in the 59Co MAS NMR spectra as compared to
27Al MAS NMR spectra, leading to less resolved peaks. Therefore, even though they are
complementary to the 27Al MAS NMR results, they are less extensively commented in the
following. In Figure C27.a, all signals are assigned to a specific Al in octahedral oxygen
coordination with various type of second coordination sphere denoted as “Al-(AlnCo6-n)” with
0 ≤ n ≤ 6 (or “Co-(AlnCo6-n)” in Figure C28, respectively) previously explained in Figure C14.
For all samples, the most intense contributions mostly arise from Co-rich environments, i.e.
Al-(Al0Co6) at ~ 62 ppm, Al-(Al1Co5) at ~ 55 ppm and Al-(Al2Co4) at ~ 48 ppm, in good
agreement with a low probability of Al to be surrounded by itself (inherent to the low 4%at content
in the Adj-LCA-X). Intense contributions from Co-rich environments are similarly found in the
59Co MAS NMR spectra in Figure C28 at ~ 14132 pm for Co-(Al0Co6), ~ 14105 ppm for
Co-(Al1Co5), and ~ 14047 ppm for Co-(Al2Co4).
For the more thorough comparison shown in Figure C27.c, we used the reference
4% Al-doped LCO sample Rf-LCA prepared from a citrate route. Due to the synthesis of the
precursor in solution, a homogeneous Co3+/Al3+ cation mixing is expected. This sample was used
in section C.3, in which the 27Al MAS NMR spectrum matched with the expected signal
distribution for a sample showing a purely statistical Al distribution, thus considered homogeneous.
The spectrum for Adj-LCA-1.00 confirms previous conclusions drawn from the SXRD
data, i.e. unwanted Al-richer domains are found within this sample. Indeed, signals respectively
corresponding to Al-(Al3Co3), Al-(Al4Co2), Al-(Al5Co1) and Al-(Al6Co0), i.e. Al-rich
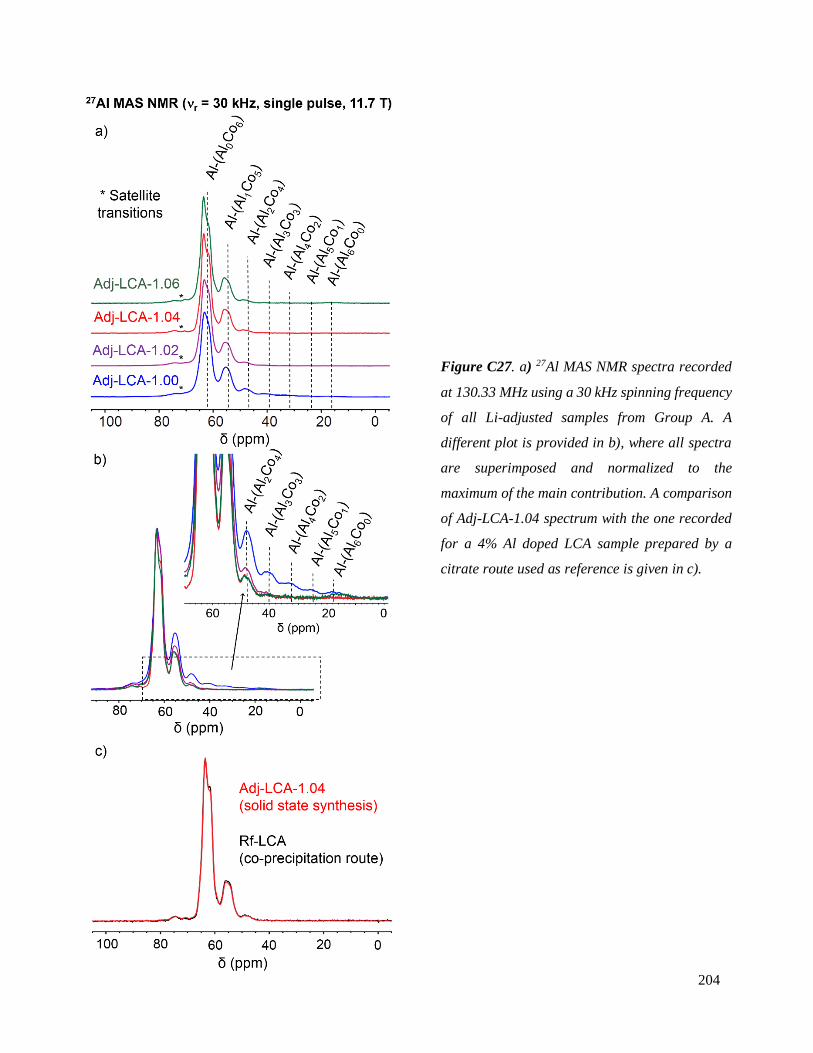
204
surroundings, appear at ~ 40 ppm, ~ 33 ppm, ~ 26 ppm and ~ 18 ppm in the zoom provided in
Figure C27. a) 27Al MAS NMR spectra recorded
at 130.33 MHz using a 30 kHz spinning frequency
of all Li-adjusted samples from Group A. A
different plot is provided in b), where all spectra
are superimposed and normalized to the
maximum of the main contribution. A comparison
of Adj-LCA-1.04 spectrum with the one recorded
for a 4% Al doped LCA sample prepared by a
citrate route used as reference is given in c).
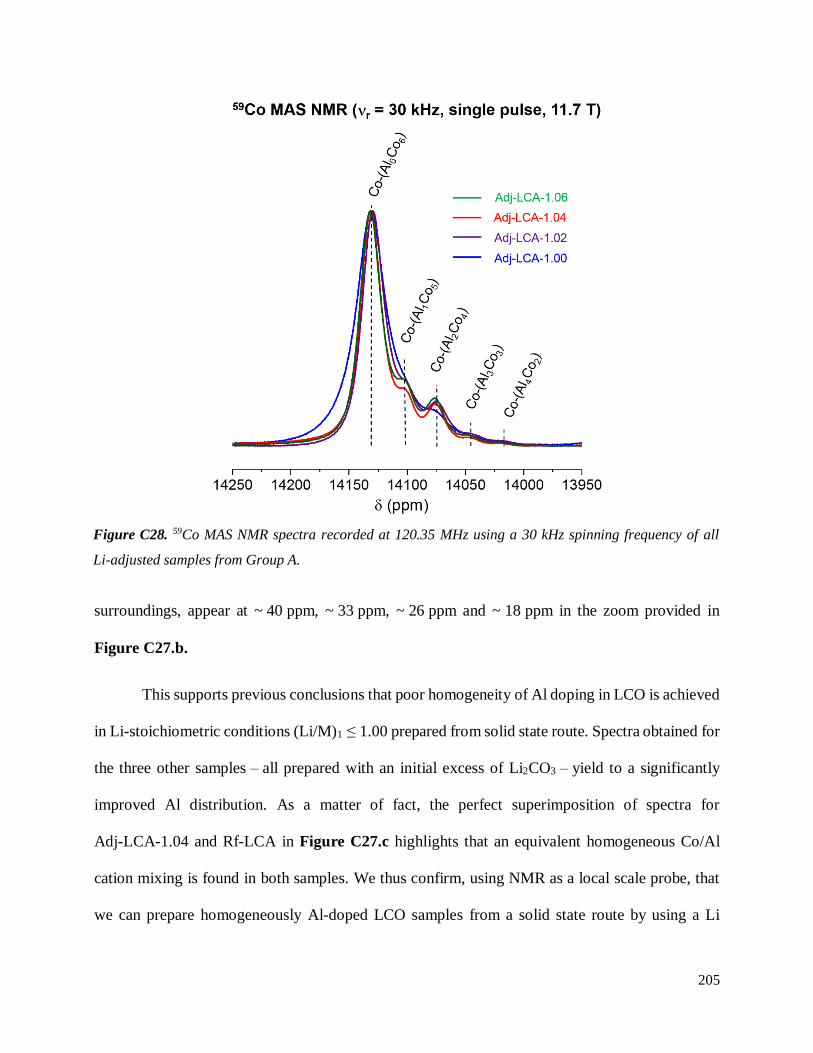
205
surroundings, appear at ~ 40 ppm, ~ 33 ppm, ~ 26 ppm and ~ 18 ppm in the zoom provided in
Figure C27.b.
This supports previous conclusions that poor homogeneity of Al doping in LCO is achieved
in Li-stoichiometric conditions (Li/M)1 ≤ 1.00 prepared from solid state route. Spectra obtained for
the three other samples – all prepared with an initial excess of Li2CO3 – yield to a significantly
improved Al distribution. As a matter of fact, the perfect superimposition of spectra for
Adj-LCA-1.04 and Rf-LCA in Figure C27.c highlights that an equivalent homogeneous Co/Al
cation mixing is found in both samples. We thus confirm, using NMR as a local scale probe, that
we can prepare homogeneously Al-doped LCO samples from a solid state route by using a Li
Figure C28. 59Co MAS NMR spectra recorded at 120.35 MHz using a 30 kHz spinning frequency of all
Li-adjusted samples from Group A.
206
excess in a first step of the synthesis and readjust the stoichiometry to Li/M = 1.00 in a second step.
Besides, the exact amount of excess Li2CO3 required to achieve homogeneous doping does not
seem to take a random value. Indeed, the spectra of Adj-LCA-1.02 and Adj-LCA-1.06 are not
identical to the one of Adj-LCA-1.04. No signals corresponding to Al-rich contributions (n ≥ 3)
are found in the spectrum of Adj-LCA-1.02 (Figure C27.b), but the intensity ratio for the existing
ones does not exactly follow the predictions for a really homogeneous Al doping either:
contributions arising from Al-(Al1Co5), Al-(Al2Co4) and Al-(Al3Co3) environments are slightly
enhanced at the expense of the Al-(Al0Co6) signal. On the other hand, a small contribution from an
Al-(Al6Co0) surrounding is visible at ~ 18 ppm in the spectrum of Adj-LCA-1.06 (Figure C27).
It seems clear that the use of an excess of Li2CO3 in the preparation of LCA by solid route
is the key to achieve homogeneous Al-doping. In order to prepare materials with a high energy
density, we thus aim to prepare homogeneous LCA with large particle size (d ~ 40 µm) using the
same synthesis approach as group A, but starting a new large-particle-Co/Al oxide precursor as
described below.

207
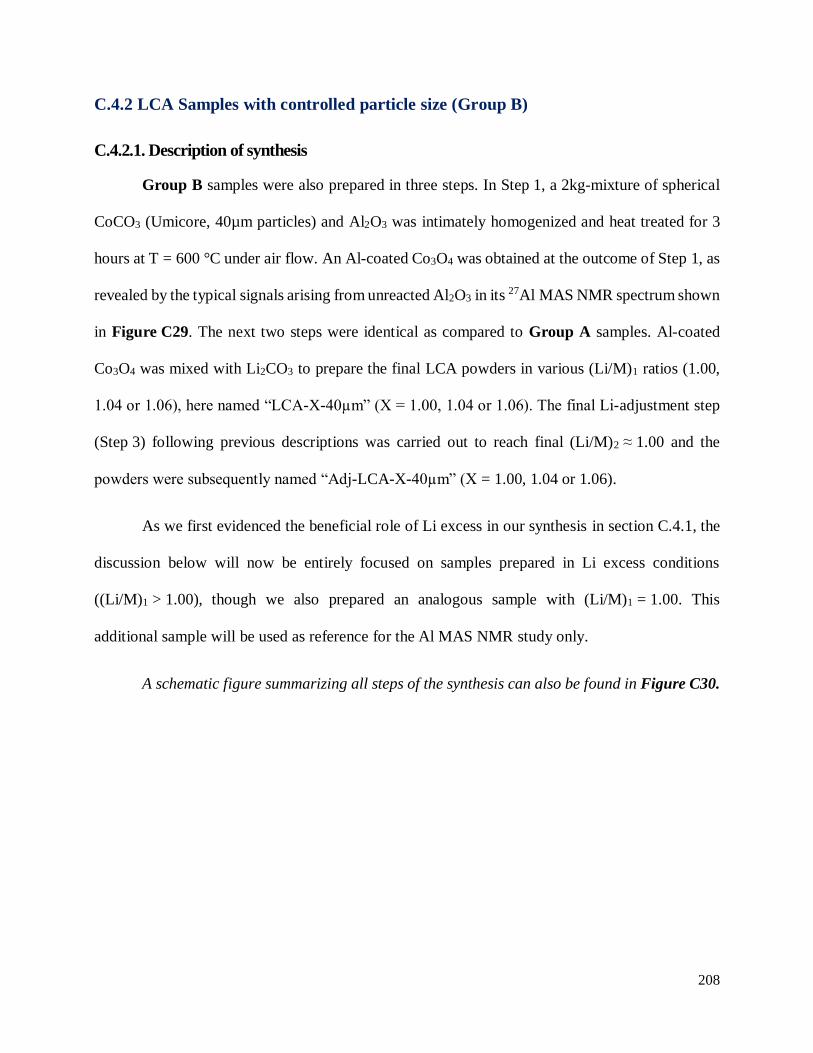
208
C.4.2 LCA Samples with controlled particle size (Group B)
C.4.2.1. Description of synthesis
Group B samples were also prepared in three steps. In Step 1, a 2kg-mixture of spherical
CoCO3 (Umicore, 40µm particles) and Al2O3 was intimately homogenized and heat treated for 3
hours at T = 600 °C under air flow. An Al-coated Co3O4 was obtained at the outcome of Step 1, as
revealed by the typical signals arising from unreacted Al2O3 in its 27Al MAS NMR spectrum shown
in Figure C29. The next two steps were identical as compared to Group A samples. Al-coated
Co3O4 was mixed with Li2CO3 to prepare the final LCA powders in various (Li/M)1 ratios (1.00,
1.04 or 1.06), here named “LCA-X-40µm” (X = 1.00, 1.04 or 1.06). The final Li-adjustment step
(Step 3) following previous descriptions was carried out to reach final (Li/M)2 ≈ 1.00 and the
powders were subsequently named “Adj-LCA-X-40µm” (X = 1.00, 1.04 or 1.06).
As we first evidenced the beneficial role of Li excess in our synthesis in section C.4.1, the
discussion below will now be entirely focused on samples prepared in Li excess conditions
((Li/M)1 > 1.00), though we also prepared an analogous sample with (Li/M)1 = 1.00. This
additional sample will be used as reference for the Al MAS NMR study only.
A schematic figure summarizing all steps of the synthesis can also be found in Figure C30.
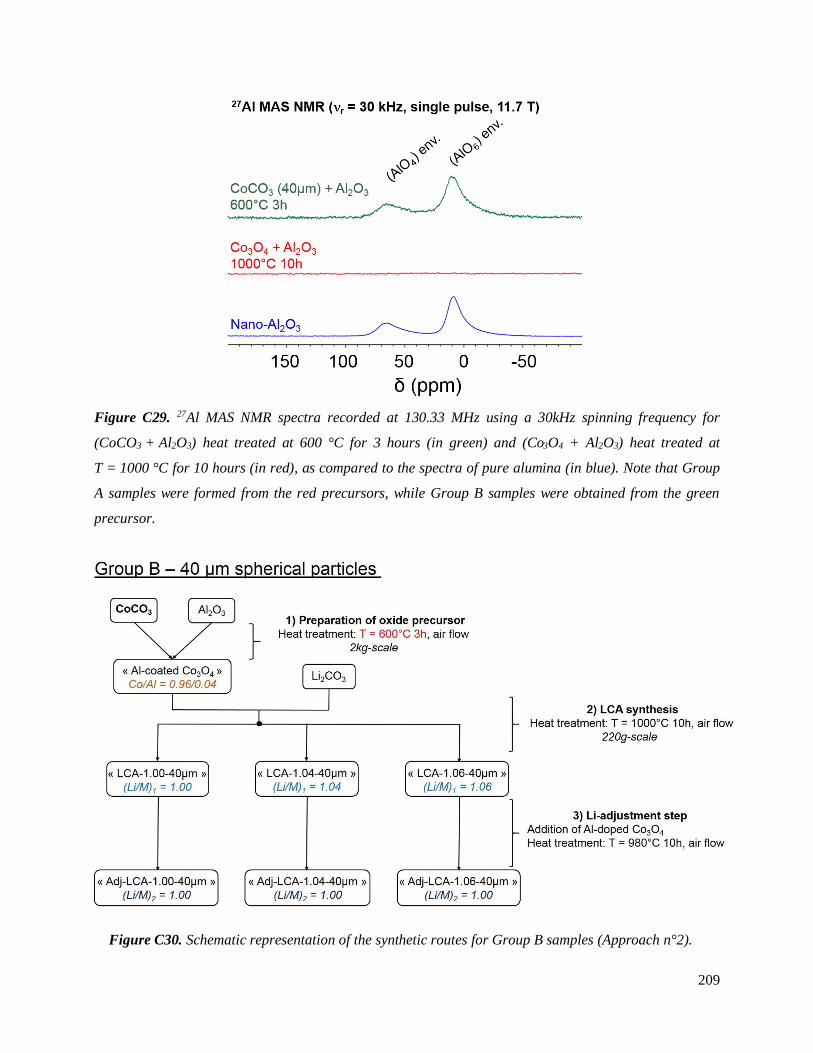
209
Figure C30. Schematic representation of the synthetic routes for Group B samples (Approach n°2).
Figure C29. 27Al MAS NMR spectra recorded at 130.33 MHz using a 30kHz spinning frequency for
(CoCO3 + Al2O3) heat treated at 600 °C for 3 hours (in green) and (Co3O4 + Al2O3) heat treated at
T = 1000 °C for 10 hours (in red), as compared to the spectra of pure alumina (in blue). Note that Group
A samples were formed from the red precursors, while Group B samples were obtained from the green
precursor.
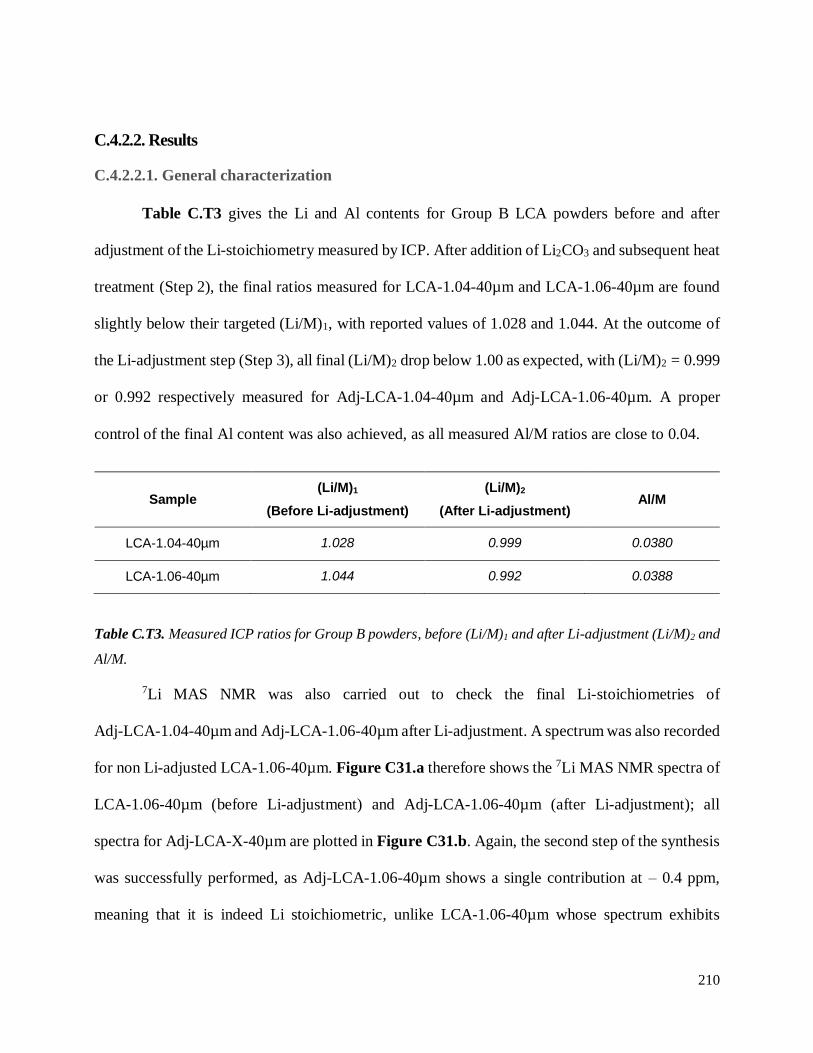
210
C.4.2.2. Results
C.4.2.2.1. General characterization
Table C.T3 gives the Li and Al contents for Group B LCA powders before and after
adjustment of the Li-stoichiometry measured by ICP. After addition of Li2CO3 and subsequent heat
treatment (Step 2), the final ratios measured for LCA-1.04-40µm and LCA-1.06-40µm are found
slightly below their targeted (Li/M)1, with reported values of 1.028 and 1.044. At the outcome of
the Li-adjustment step (Step 3), all final (Li/M)2 drop below 1.00 as expected, with (Li/M)2 = 0.999
or 0.992 respectively measured for Adj-LCA-1.04-40µm and Adj-LCA-1.06-40µm. A proper
control of the final Al content was also achieved, as all measured Al/M ratios are close to 0.04.
Sample (Li/M)1
(Before Li-adjustment)
(Li/M)2
(After Li-adjustment) Al/M
LCA-1.04-40µm 1.028 0.999 0.0380
LCA-1.06-40µm 1.044 0.992 0.0388
7Li MAS NMR was also carried out to check the final Li-stoichiometries of
Adj-LCA-1.04-40µm and Adj-LCA-1.06-40µm after Li-adjustment. A spectrum was also recorded
for non Li-adjusted LCA-1.06-40µm. Figure C31.a therefore shows the 7Li MAS NMR spectra of
LCA-1.06-40µm (before Li-adjustment) and Adj-LCA-1.06-40µm (after Li-adjustment); all
spectra for Adj-LCA-X-40µm are plotted in Figure C31.b. Again, the second step of the synthesis
was successfully performed, as Adj-LCA-1.06-40µm shows a single contribution at – 0.4 ppm,
meaning that it is indeed Li stoichiometric, unlike LCA-1.06-40µm whose spectrum exhibits
Table C.T3. Measured ICP ratios for Group B powders, before (Li/M)1 and after Li-adjustment (Li/M)2 and
Al/M.
211
additional signals typically distinguished for overlithiated samples (Figure C31.a). Some of these
contributions are also found in the spectrum of Adj-LCA-1.04-40µm at ~ 4, - 5 and - 15 ppm
(Figure C31.b). The intensity of these contributions are though negligible, especially as compared
to the real overlithiated phase presented in Figure C31.a (Adj-LCA-1.06-40µm), making it clear
that Li excess is found as traces in the final Adj-LCA-1.04-40µm sample.
Figure C32 shows the SEM images obtained for the two samples we prepared with
(Li/M)1 = 1.04 and 1.06 exhibiting well controlled size and spherical morphology after Li-
adjustment (namely “Adj-LCA-1.04-40µm” and “Adj-LCA-1.06-40µm”) as compared to the
homogeneous Adj-LCA-1.04 from section C.4.1. The typical average particle size for these
powders is ~ 40 µm, though a second population of small particles is again observed due to the
addition of mix-Co3-zAlzO4 during the second step of the synthesis. The spherical character and
similar sizes of the particles from one sample to another were well preserved despite the flux role
of Li2CO3.
Figure C31. 7Li MAS NMR spectra recorded at 116.66 MHz using a 30 kHz spinning frequency of
a) LCA-1.06-40µm and Adj-LCA-1.06-40µm; b) Li-adjusted samples from Group B: Adj-LCA-1.04-40µm
and Adj-LCA-1.06-40µm.
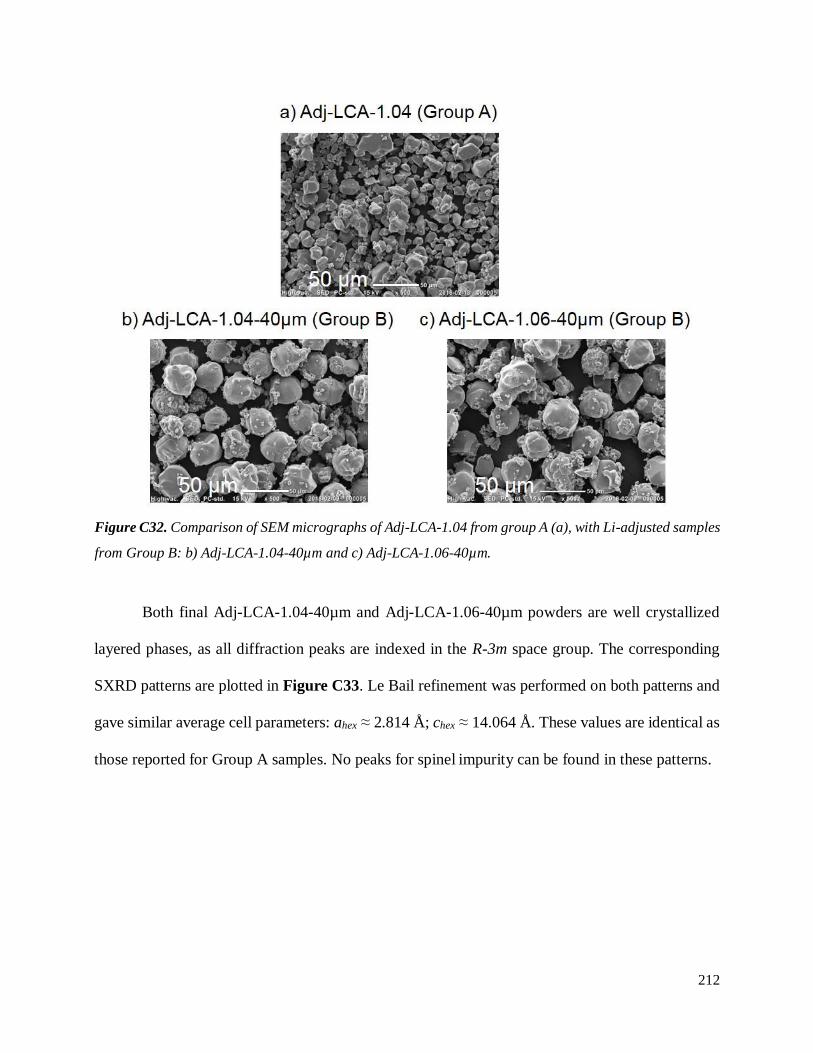
212
Both final Adj-LCA-1.04-40µm and Adj-LCA-1.06-40µm powders are well crystallized
layered phases, as all diffraction peaks are indexed in the R-3m space group. The corresponding
SXRD patterns are plotted in Figure C33. Le Bail refinement was performed on both patterns and
gave similar average cell parameters: ahex ≈ 2.814 Å; chex ≈ 14.064 Å. These values are identical as
those reported for Group A samples. No peaks for spinel impurity can be found in these patterns.
Figure C32. Comparison of SEM micrographs of Adj-LCA-1.04 from group A (a), with Li-adjusted samples
from Group B: b) Adj-LCA-1.04-40µm and c) Adj-LCA-1.06-40µm.
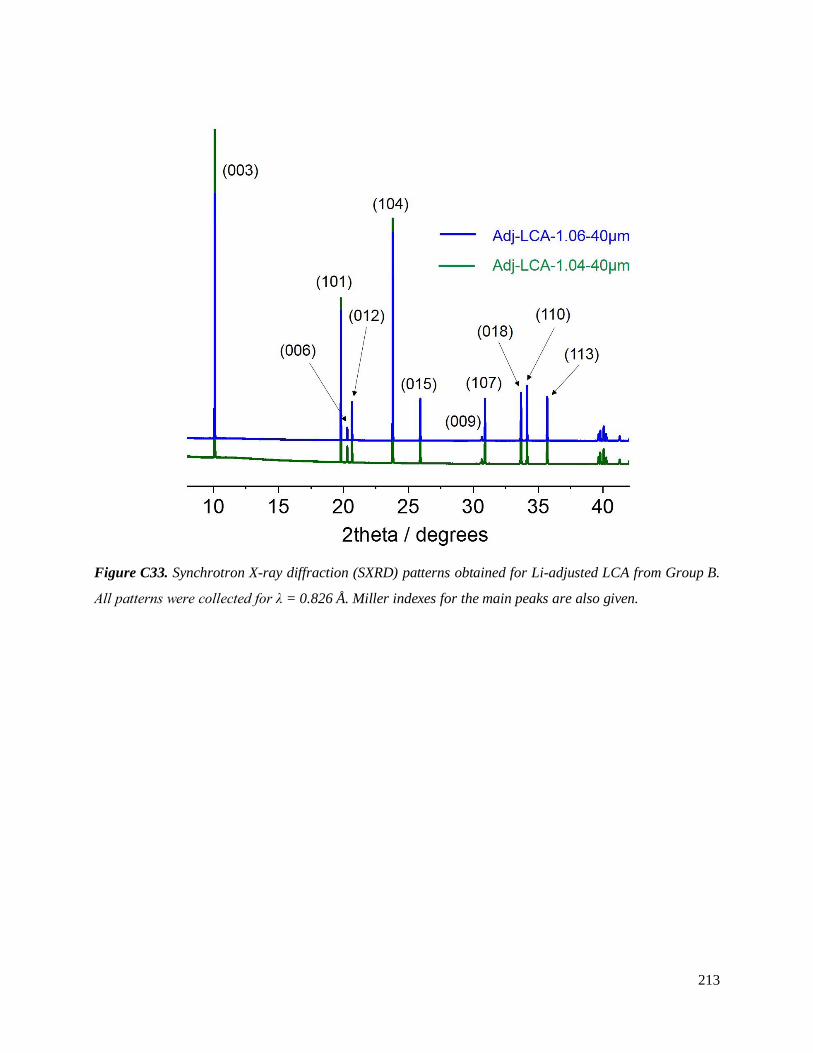
213
Figure C33. Synchrotron X-ray diffraction (SXRD) patterns obtained for Li-adjusted LCA from Group B.
All patterns were collected for λ = 0.826 Å. Miller indexes for the main peaks are also given.
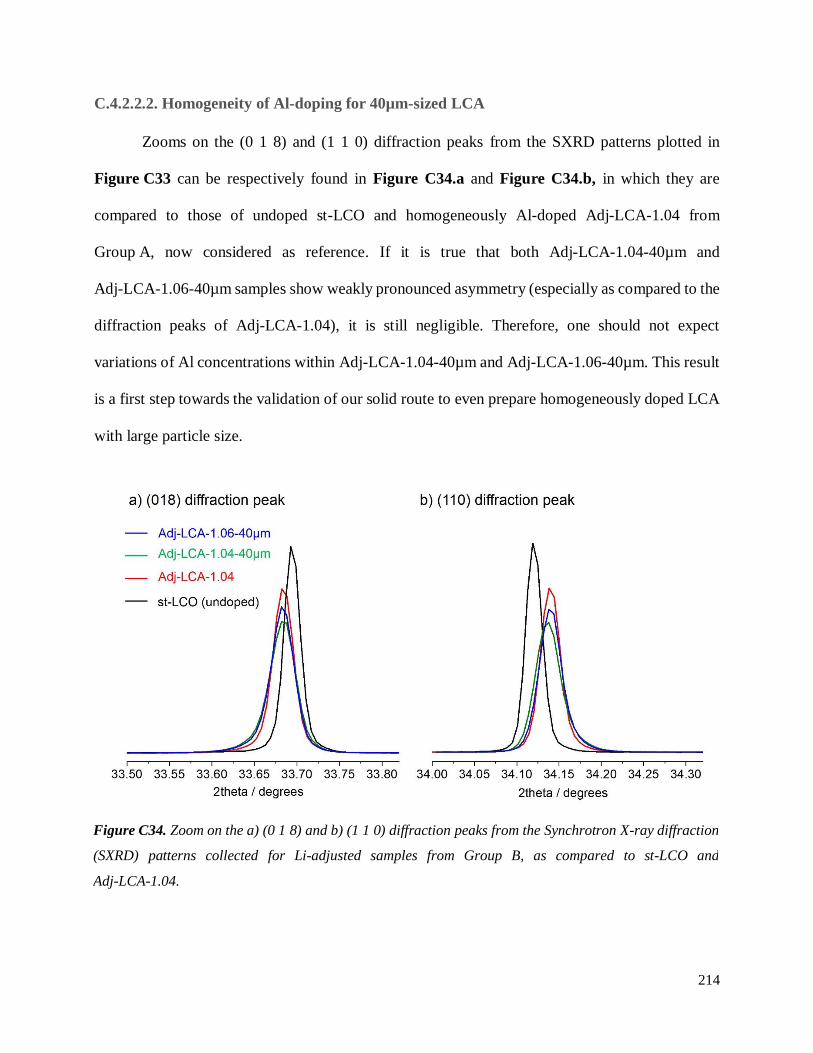
214
C.4.2.2.2. Homogeneity of Al-doping for 40µm-sized LCA
Zooms on the (0 1 8) and (1 1 0) diffraction peaks from the SXRD patterns plotted in
Figure C33 can be respectively found in Figure C34.a and Figure C34.b, in which they are
compared to those of undoped st-LCO and homogeneously Al-doped Adj-LCA-1.04 from
Group A, now considered as reference. If it is true that both Adj-LCA-1.04-40µm and
Adj-LCA-1.06-40µm samples show weakly pronounced asymmetry (especially as compared to the
diffraction peaks of Adj-LCA-1.04), it is still negligible. Therefore, one should not expect
variations of Al concentrations within Adj-LCA-1.04-40µm and Adj-LCA-1.06-40µm. This result
is a first step towards the validation of our solid route to even prepare homogeneously doped LCA
with large particle size.
Figure C34. Zoom on the a) (0 1 8) and b) (1 1 0) diffraction peaks from the Synchrotron X-ray diffraction
(SXRD) patterns collected for Li-adjusted samples from Group B, as compared to st-LCO and
Adj-LCA-1.04.
215
27Al and 59Co MAS NMR spectra were subsequently recorded and zooms on the central
transitions are given in Figure C35.a for 27Al NMR, and in Figure C35.b for 59Co NMR. Spectra
for Adj-LCA-1.04-40µm and Adj-LCA-1.06-40µm are there compared to those of the most
homogeneously doped powder from Group A samples (i.e. Adj-LCA-1.04). As mentioned earlier,
since we also prepared a 40µm-sized LCA powder with stoichiometric amounts of precursors (Adj-
LCA-1.00-40µm), a comparison of its 27Al and 59Co NMR spectra with those of Adj-LCA-1.06-
40µm is additionally provided in Figure C36.a and C36.b.
In Figure C35.a, the two powders prepared with Li excess, Adj-LCA-1.04-40µm and
Adj-LCA-1.06-40 µm respectively, show rather similar spectra with three main contributions at ~
62, 55 and 48 ppm, arising from Al-(Al0Co6), Al-(Al1Co5) and Al-(Al2Co4) – though obtained in
slightly different intensity ratios. Intense contributions from Co-rich environments are similarly
found in their 59Co MAS NMR spectra in Figure C35.b at ~ 14132 pm for Co-(Al0Co6),
~ 14105 ppm for Co-(Al1Co5), and ~ 14047 ppm for Co-(Al2Co4). No intensity is detected for
Al-rich contributions, confirming that the preparation with Li excess was determinant to achieve
proper Al distribution within the powders. Even though the spectra of these two samples do not
perfectly superimpose to our homogeneously doped sample from Group A, our attempts to
synthesize LCA with significantly large particle size from simple solid state reaction was
successful. The most homogeneous Al distribution for Group B samples seems to be obtained for
Adj-LCA-1.06-40µm, meaning that trying to apply the process using a precursor with higher
particle size requires to add some more Li2CO3. Indeed, the most homogeneous sample from Group
A was obtained for (Li/M)1 = 1.04, while making it to (Li/M)1 = 1.06 here was necessary to
approach similar Al distributions for Group B samples.
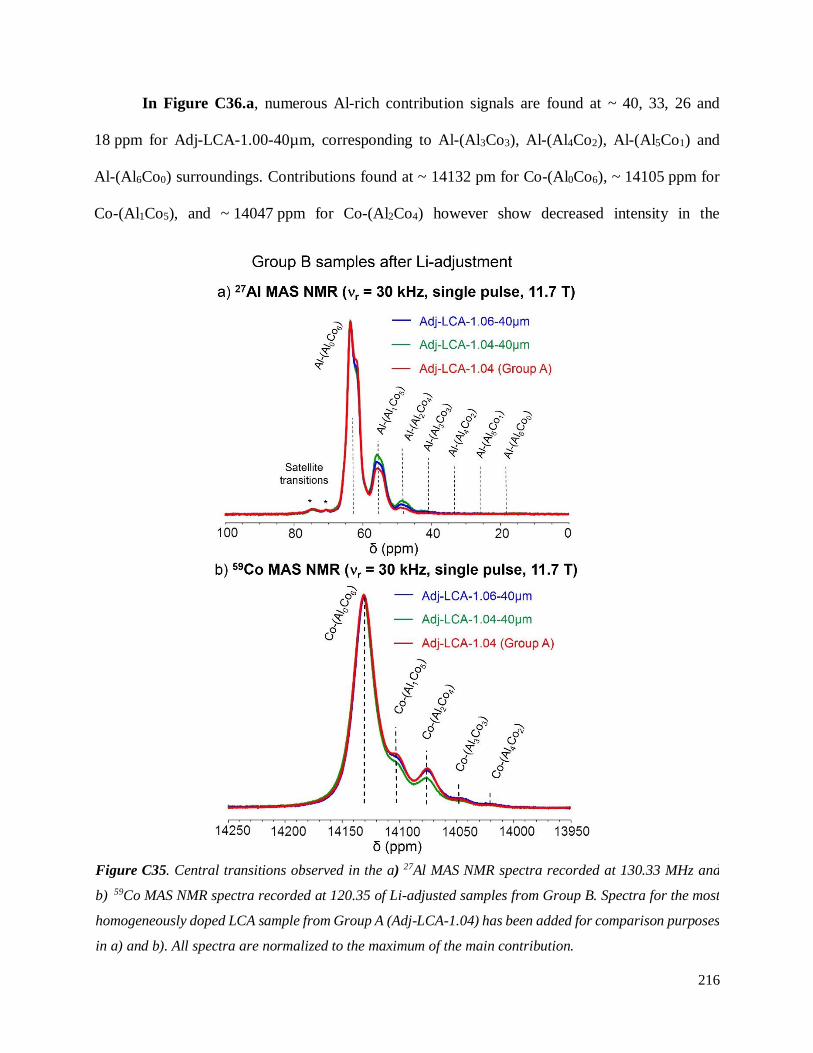
216
In Figure C36.a, numerous Al-rich contribution signals are found at ~ 40, 33, 26 and
18 ppm for Adj-LCA-1.00-40µm, corresponding to Al-(Al3Co3), Al-(Al4Co2), Al-(Al5Co1) and
Al-(Al6Co0) surroundings. Contributions found at ~ 14132 pm for Co-(Al0Co6), ~ 14105 ppm for
Co-(Al1Co5), and ~ 14047 ppm for Co-(Al2Co4) however show decreased intensity in the
Figure C35. Central transitions observed in the a) 27Al MAS NMR spectra recorded at 130.33 MHz and
b) 59Co MAS NMR spectra recorded at 120.35 of Li-adjusted samples from Group B. Spectra for the most
homogeneously doped LCA sample from Group A (Adj-LCA-1.04) has been added for comparison purposes
in a) and b). All spectra are normalized to the maximum of the main contribution.
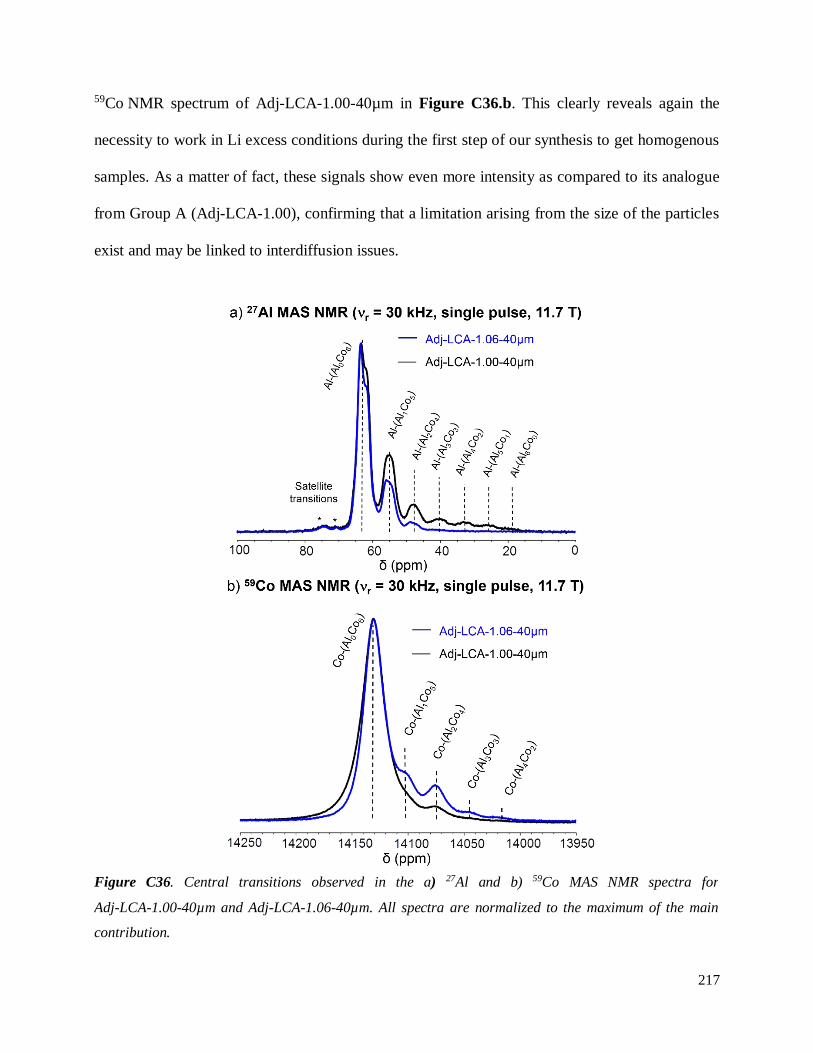
217
59Co NMR spectrum of Adj-LCA-1.00-40µm in Figure C36.b. This clearly reveals again the
necessity to work in Li excess conditions during the first step of our synthesis to get homogenous
samples. As a matter of fact, these signals show even more intensity as compared to its analogue
from Group A (Adj-LCA-1.00), confirming that a limitation arising from the size of the particles
exist and may be linked to interdiffusion issues.
Figure C36. Central transitions observed in the a) 27Al and b) 59Co MAS NMR spectra for
Adj-LCA-1.00-40µm and Adj-LCA-1.06-40µm. All spectra are normalized to the maximum of the main
contribution.
218
C.4.3 Electrochemistry of LCA samples prepared with Approach n°2
Li-adjusted samples from Group A and B were cycled in coin cells at C/20 up to 5.0 V. The
1st cycle curves obtained Group A LixCo0.96Al0.04O2 systems as compared to undoped st-LCO are
plotted in Figure C37.a in which a zoom on the [0.45; 0.55] x range is also provided. The
corresponding derivative dx/dV curve for the zoom is plotted in Figure C37.b. The 1st cycle curves
obtained for Group B LixCo0.96Al0.04O2 systems are also given in Figure C38. All Adj-LCA-X and
Adj-LCA-X-40µm show more irreversible capacity losses (Qirr) as compared to undoped st-LCO,
in good agreement with previous works16,18,51; Qirr seems to be quite comparable no matter the
homogeneity of Al doping. As expected, the 1st cycle curves show significant differences from one
sample to another. The electrochemical profile of the sample we identified as the least
homogeneously doped, namely Adj-LCA-1.00 and Adj-LCA-1.00-40µm (Figures C37.a and C38,
respectively), exhibits characteristics typically reported for undoped LCO, such as i) a plateau at
E = 3.95 V at the beginning of the charge and ii) a weak voltage jump around x = 0.5, denoting the
O3 ↔ O3’ transition, in good agreement with the first study in section C.3. This series of events is
just one more evidence to highlight the poor homogeneity of Al doping achieved for Adj-LCA-1.00
and Adj-LCA-1.00-40µm, and ultimately confirms that Li-stoichiometric conditions for the
preparation of homogeneously Al-doped LCO by solid state route are not recommended. Although
these samples are not homogeneously doped, the presence of Al has again a beneficial effect on
the polarization observed at high voltage (V > 4.5) compared to st-LCO (Figure C37.a). As a
matter of fact, this beneficial effect is observed for all Adj-LCA-X powders, which suggest that it
may be independent of the Al distribution within the powders. The change of slope due to the
Li/vacancies ordering at x = 0.5 is not detected for all other samples Adj-LCA-X (X = 1.02, 1.04
or 1.06) and Adj-LCA-1.06-40µm. All show pseudo-plateaus during the removal of the first Li at
an expected16 slightly higher voltage than st-LCO (E = 3.98 V). Adj-LCA-1.02 and Adj-LCA-1.04
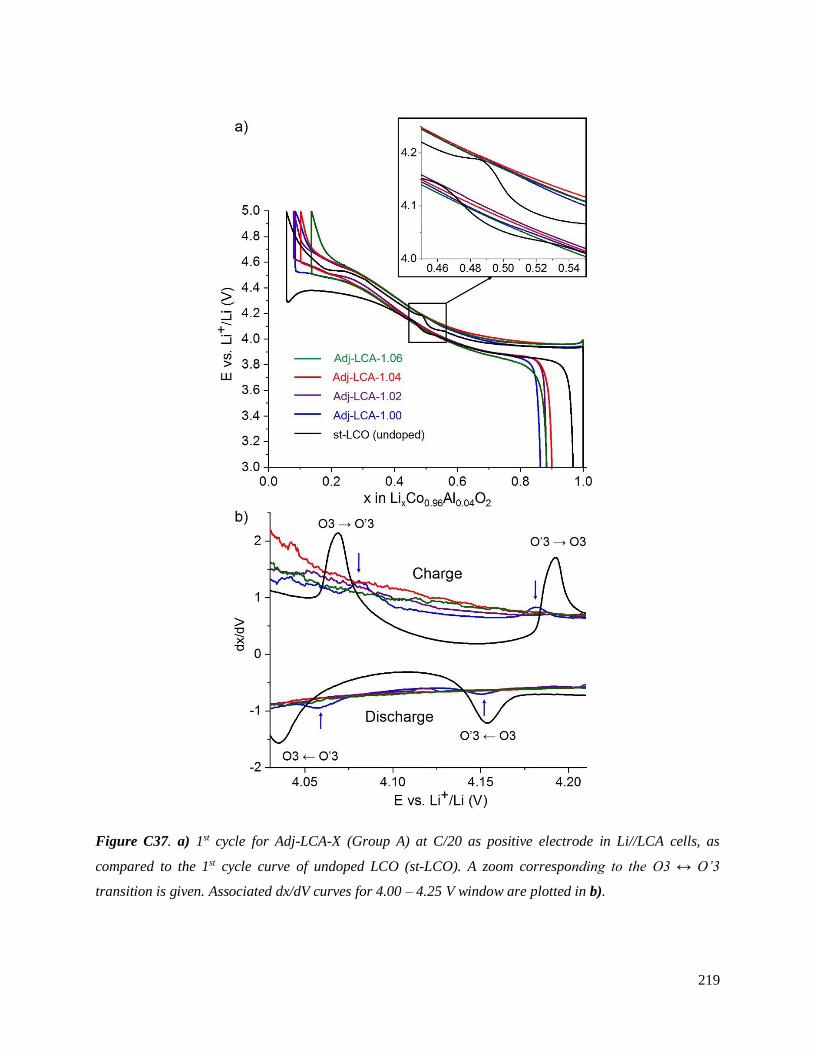
219
sh ow a comparable 1st cycle, no matter the small differences observed at the local scale for their
Figure C37. a) 1st cycle for Adj-LCA-X (Group A) at C/20 as positive electrode in Li//LCA cells, as
compared to the 1st cycle curve of undoped LCO (st-LCO). A zoom corresponding to the O3 ↔ O’3
transition is given. Associated dx/dV curves for 4.00 – 4.25 V window are plotted in b).
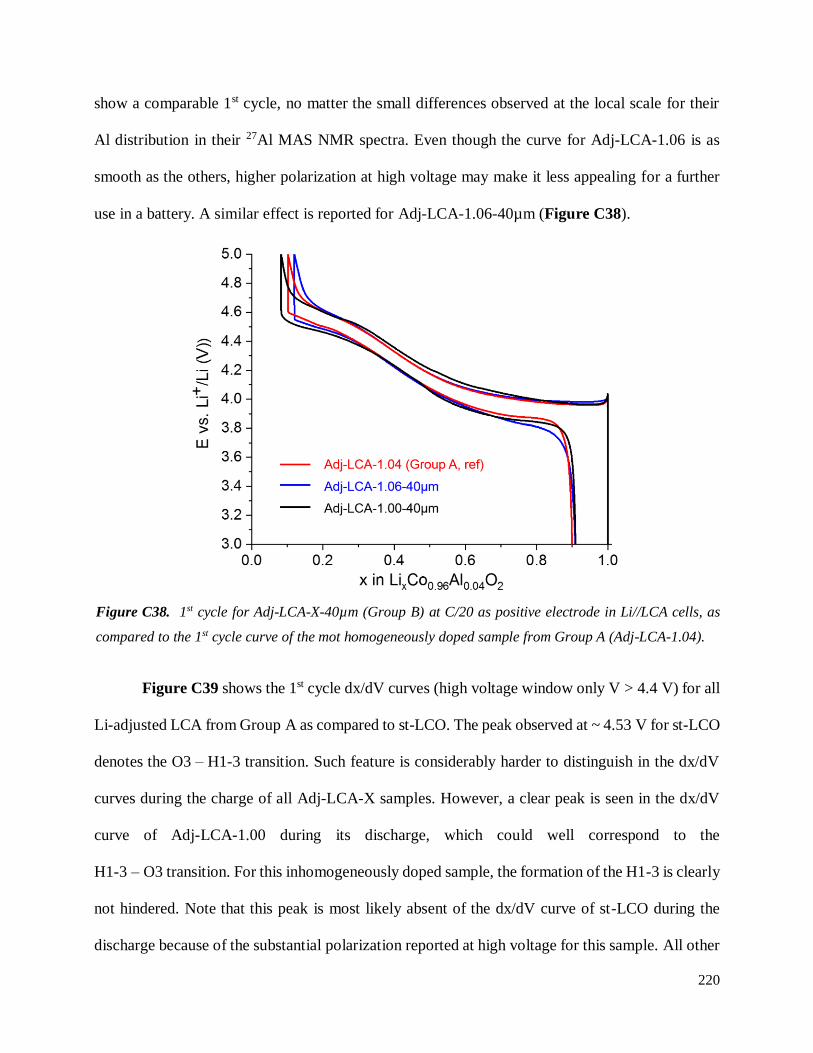
220
show a comparable 1st cycle, no matter the small differences observed at the local scale for their
Al distribution in their 27Al MAS NMR spectra. Even though the curve for Adj-LCA-1.06 is as
smooth as the others, higher polarization at high voltage may make it less appealing for a further
use in a battery. A similar effect is reported for Adj-LCA-1.06-40µm (Figure C38).
Figure C39 shows the 1st cycle dx/dV curves (high voltage window only V > 4.4 V) for all
Li-adjusted LCA from Group A as compared to st-LCO. The peak observed at ~ 4.53 V for st-LCO
denotes the O3 – H1-3 transition. Such feature is considerably harder to distinguish in the dx/dV
curves during the charge of all Adj-LCA-X samples. However, a clear peak is seen in the dx/dV
curve of Adj-LCA-1.00 during its discharge, which could well correspond to the
H1-3 – O3 transition. For this inhomogeneously doped sample, the formation of the H1-3 is clearly
not hindered. Note that this peak is most likely absent of the dx/dV curve of st-LCO during the
discharge because of the substantial polarization reported at high voltage for this sample. All other
Figure C38. 1st cycle for Adj-LCA-X-40µm (Group B) at C/20 as positive electrode in Li//LCA cells, as
compared to the 1st cycle curve of the mot homogeneously doped sample from Group A (Adj-LCA-1.04).
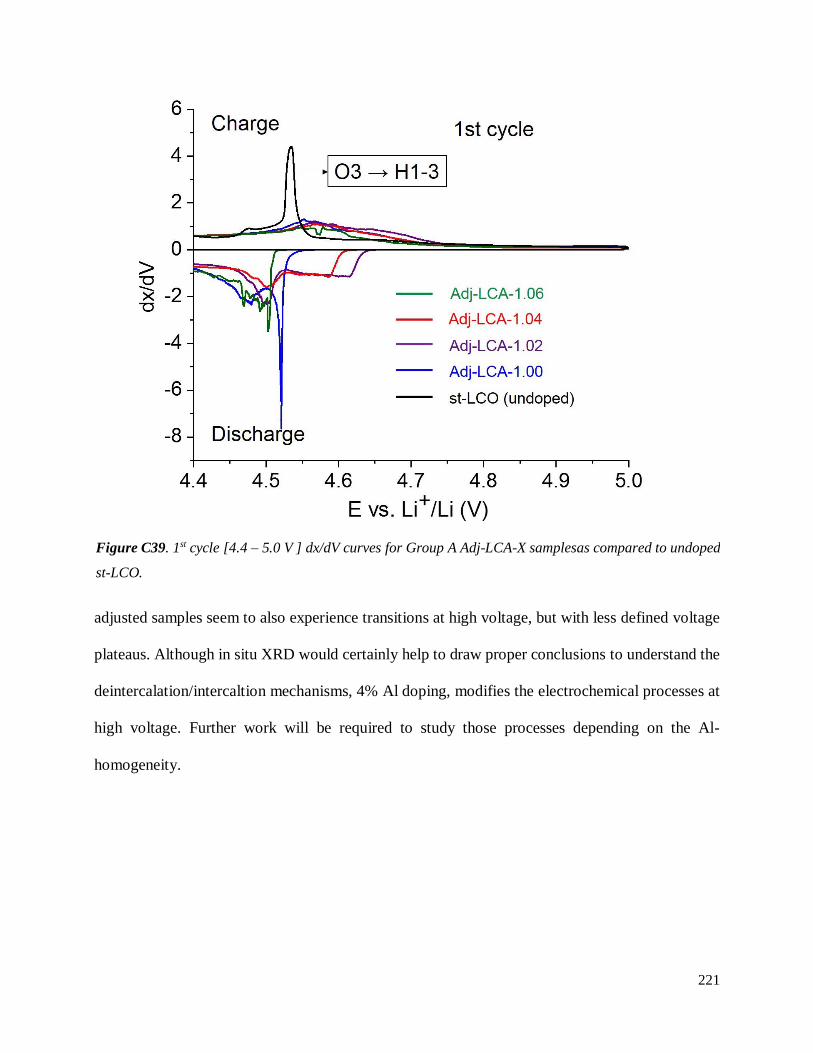
221
adjusted samples seem to also experience transitions at high voltage, but with less defined voltage
plateaus. Although in situ XRD would certainly help to draw proper conclusions to understand the
deintercalation/intercaltion mechanisms, 4% Al doping, modifies the electrochemical processes at
high voltage. Further work will be required to study those processes depending on the Al-
homogeneity.
Figure C39. 1st cycle [4.4 – 5.0 V ] dx/dV curves for Group A Adj-LCA-X samplesas compared to undoped
st-LCO.
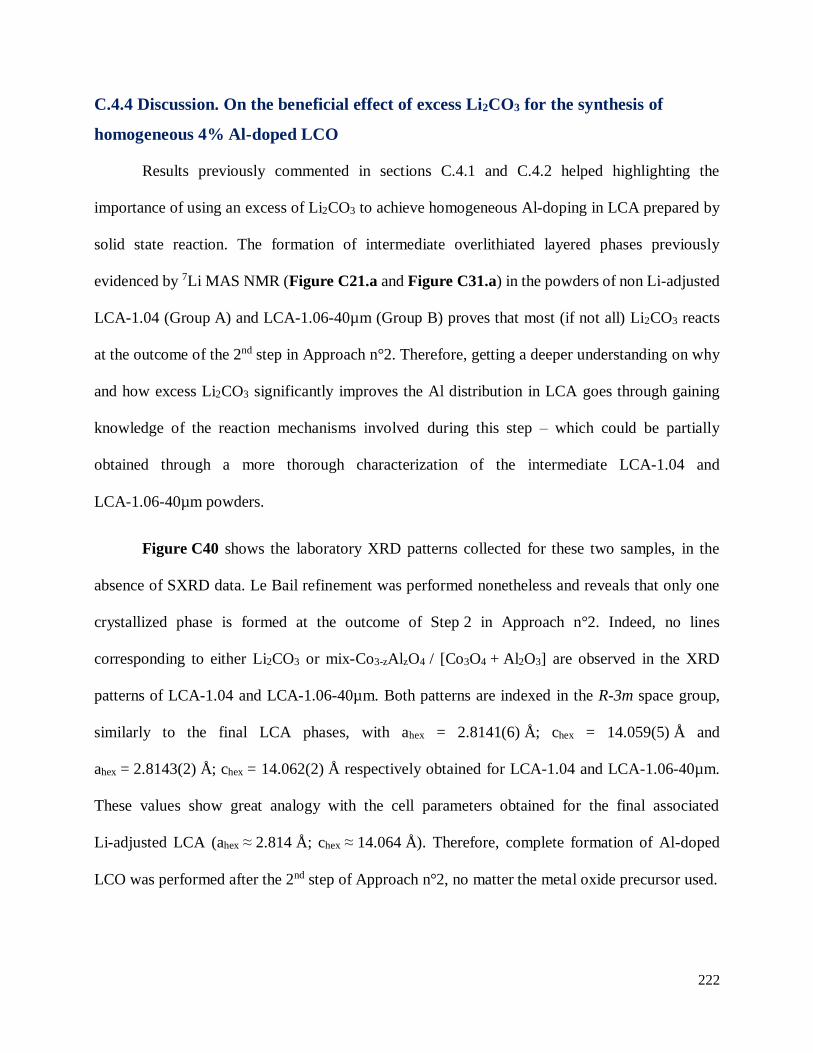
222
C.4.4 Discussion. On the beneficial effect of excess Li2CO3 for the synthesis of
homogeneous 4% Al-doped LCO
Results previously commented in sections C.4.1 and C.4.2 helped highlighting the
importance of using an excess of Li2CO3 to achieve homogeneous Al-doping in LCA prepared by
solid state reaction. The formation of intermediate overlithiated layered phases previously
evidenced by 7Li MAS NMR (Figure C21.a and Figure C31.a) in the powders of non Li-adjusted
LCA-1.04 (Group A) and LCA-1.06-40µm (Group B) proves that most (if not all) Li2CO3 reacts
at the outcome of the 2nd step in Approach n°2. Therefore, getting a deeper understanding on why
and how excess Li2CO3 significantly improves the Al distribution in LCA goes through gaining
knowledge of the reaction mechanisms involved during this step – which could be partially
obtained through a more thorough characterization of the intermediate LCA-1.04 and
LCA-1.06-40µm powders.
Figure C40 shows the laboratory XRD patterns collected for these two samples, in the
absence of SXRD data. Le Bail refinement was performed nonetheless and reveals that only one
crystallized phase is formed at the outcome of Step 2 in Approach n°2. Indeed, no lines
corresponding to either Li2CO3 or mix-Co3-zAlzO4 / [Co3O4 + Al2O3] are observed in the XRD
patterns of LCA-1.04 and LCA-1.06-40µm. Both patterns are indexed in the R-3m space group,
similarly to the final LCA phases, with ahex = 2.8141(6) Å; chex = 14.059(5) Å and
ahex = 2.8143(2) Å; chex = 14.062(2) Å respectively obtained for LCA-1.04 and LCA-1.06-40µm.
These values show great analogy with the cell parameters obtained for the final associated
Li-adjusted LCA (ahex ≈ 2.814 Å; chex ≈ 14.064 Å). Therefore, complete formation of Al-doped
LCO was performed after the 2nd step of Approach n°2, no matter the metal oxide precursor used.
223
Complementary 27Al MAS NMR spectra for LCA-1.04 and LCA-1.06-40µm are
respectively plotted in Figures C41.a and C41.b, as compared to the spectra of their final Li-
adjusted analogues (Adj-LCA-1.04 and Adj-LCA-1.06-40µm). One could note that the spectra of
LCA-1.04 and LCA-1.06-40µm are strictly equivalent, in addition to their XRD patterns, thereof
suggesting that the chemical nature of the intermediate layered product formed after the 2nd step of
the synthesis is equivalent no matter the initial Co/Al precursor used. This may be surprising as a
mix-Co3-zAlzO4 was used in the preparation of LCA-1.04, while an unreacted mixture of Co3O4
and Al2O3 was employed for LCA-1.06-40µm. While the use of the latter seemed to positively
influence the Al distribution in LCA prepared with (Li/M)1 ≤ 1.00 (section C.3.2.1, Approach
n°1), the choice of one type of oxide precursor over the other seems no longer relevant in the
preparation of homogeneous LCA with (Li/M)1 ≥ 1.00 (Approach n°2). Besides, Al NMR spectra
for LCA-1.04 and LCA-1.06-40µm do confirm the formation of an intermediate overlithiated LCA
before the Li-adjustment step. Indeed, a new broad highly shifted signal located at ~ 205 ppm is
Figure C40. XRD patterns collected for the intermediate LCA-1.04 (Group A) and LCA-1.06-40µm
(Group B). Cell parameters were obtained from Le Bail refinements (also shown here). The Miller indexes
for the mains peaks are also provided.
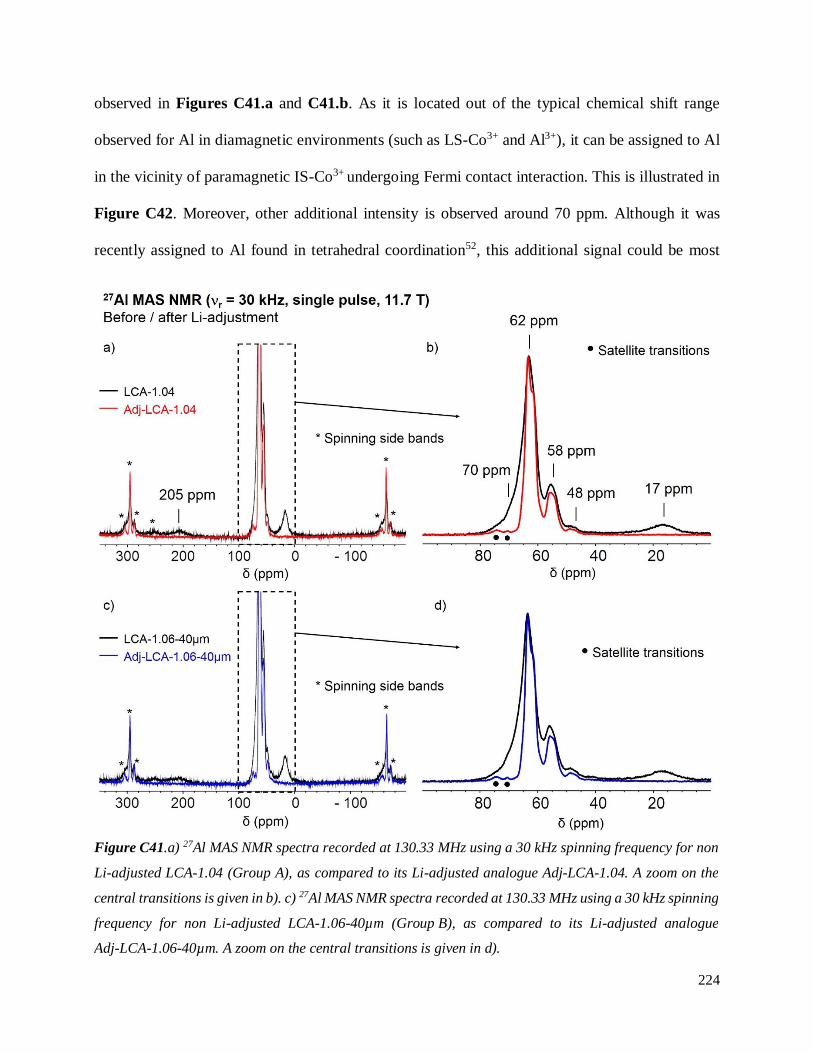
224
observed in Figures C41.a and C41.b. As it is located out of the typical chemical shift range
observed for Al in diamagnetic environments (such as LS-Co3+ and Al3+), it can be assigned to Al
in the vicinity of paramagnetic IS-Co3+ undergoing Fermi contact interaction. This is illustrated in
Figure C42. Moreover, other additional intensity is observed around 70 ppm. Although it was
recently assigned to Al found in tetrahedral coordination52, this additional signal could be most
Figure C41.a) 27Al MAS NMR spectra recorded at 130.33 MHz using a 30 kHz spinning frequency for non
Li-adjusted LCA-1.04 (Group A), as compared to its Li-adjusted analogue Adj-LCA-1.04. A zoom on the
central transitions is given in b). c) 27Al MAS NMR spectra recorded at 130.33 MHz using a 30 kHz spinning
frequency for non Li-adjusted LCA-1.06-40µm (Group B), as compared to its Li-adjusted analogue
Adj-LCA-1.06-40µm. A zoom on the central transitions is given in d).
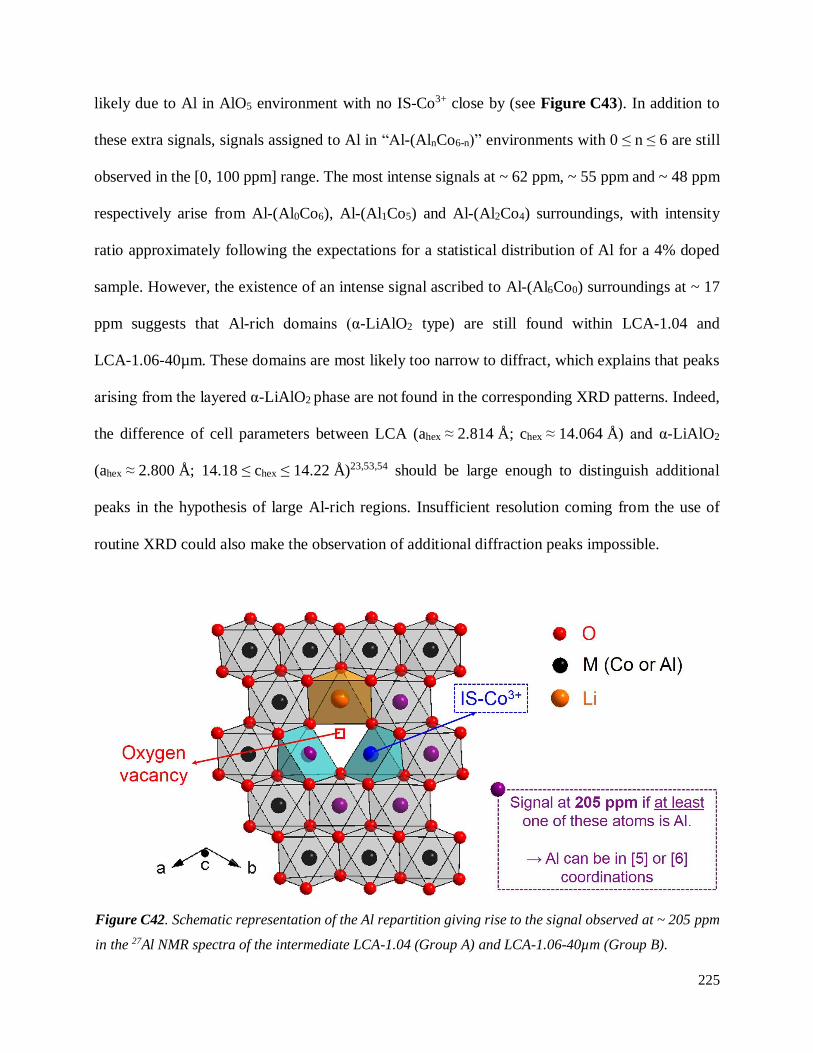
225
likely due to Al in AlO5 environment with no IS-Co3+ close by (see Figure C43). In addition to
these extra signals, signals assigned to Al in “Al-(AlnCo6-n)” environments with 0 ≤ n ≤ 6 are still
observed in the [0, 100 ppm] range. The most intense signals at ~ 62 ppm, ~ 55 ppm and ~ 48 ppm
respectively arise from Al-(Al0Co6), Al-(Al1Co5) and Al-(Al2Co4) surroundings, with intensity
ratio approximately following the expectations for a statistical distribution of Al for a 4% doped
sample. However, the existence of an intense signal ascribed to Al-(Al6Co0) surroundings at ~ 17
ppm suggests that Al-rich domains (α-LiAlO2 type) are still found within LCA-1.04 and
LCA-1.06-40µm. These domains are most likely too narrow to diffract, which explains that peaks
arising from the layered α-LiAlO2 phase are not found in the corresponding XRD patterns. Indeed,
the difference of cell parameters between LCA (ahex ≈ 2.814 Å; chex ≈ 14.064 Å) and α-LiAlO2
(ahex ≈ 2.800 Å; 14.18 ≤ chex ≤ 14.22 Å)23,53,54 should be large enough to distinguish additional
peaks in the hypothesis of large Al-rich regions. Insufficient resolution coming from the use of
routine XRD could also make the observation of additional diffraction peaks impossible.
Figure C42. Schematic representation of the Al repartition giving rise to the signal observed at ~ 205 ppm
in the 27Al NMR spectra of the intermediate LCA-1.04 (Group A) and LCA-1.06-40µm (Group B).
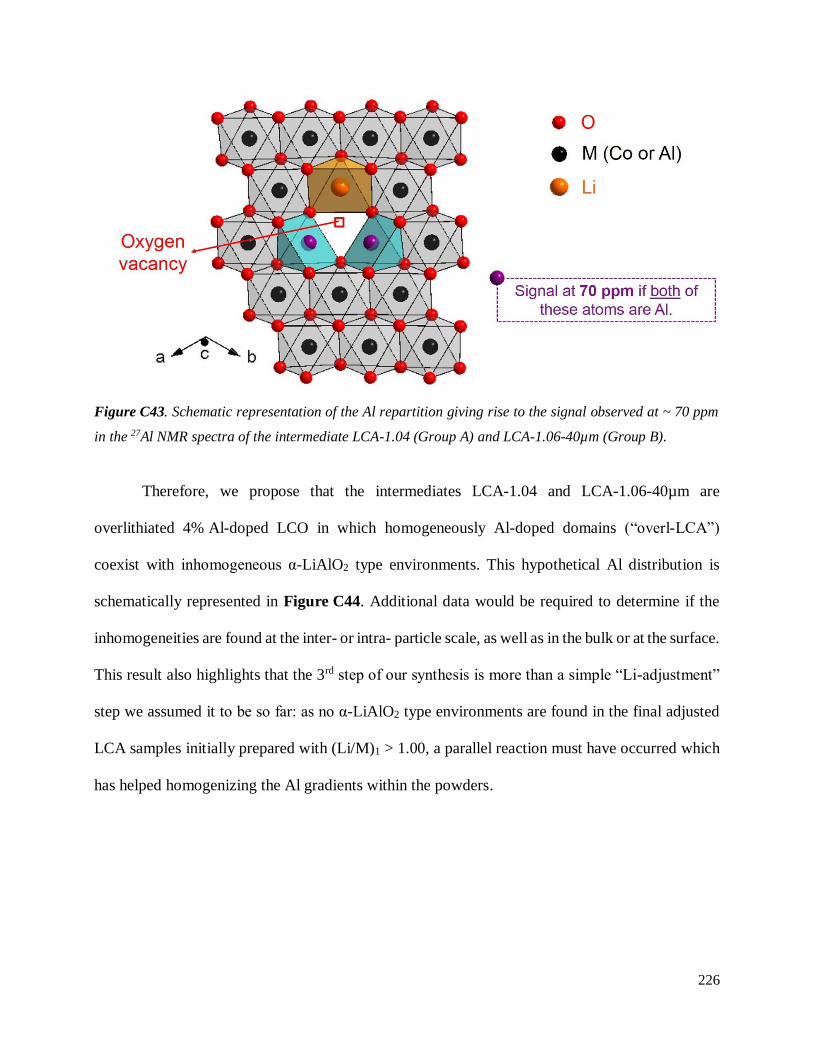
226
Therefore, we propose that the intermediates LCA-1.04 and LCA-1.06-40µm are
overlithiated 4% Al-doped LCO in which homogeneously Al-doped domains (“overl-LCA”)
coexist with inhomogeneous α-LiAlO2 type environments. This hypothetical Al distribution is
schematically represented in Figure C44. Additional data would be required to determine if the
inhomogeneities are found at the inter- or intra- particle scale, as well as in the bulk or at the surface.
This result also highlights that the 3rd step of our synthesis is more than a simple “Li-adjustment”
step we assumed it to be so far: as no α-LiAlO2 type environments are found in the final adjusted
LCA samples initially prepared with (Li/M)1 > 1.00, a parallel reaction must have occurred which
has helped homogenizing the Al gradients within the powders.
Figure C43. Schematic representation of the Al repartition giving rise to the signal observed at ~ 70 ppm
in the 27Al NMR spectra of the intermediate LCA-1.04 (Group A) and LCA-1.06-40µm (Group B).
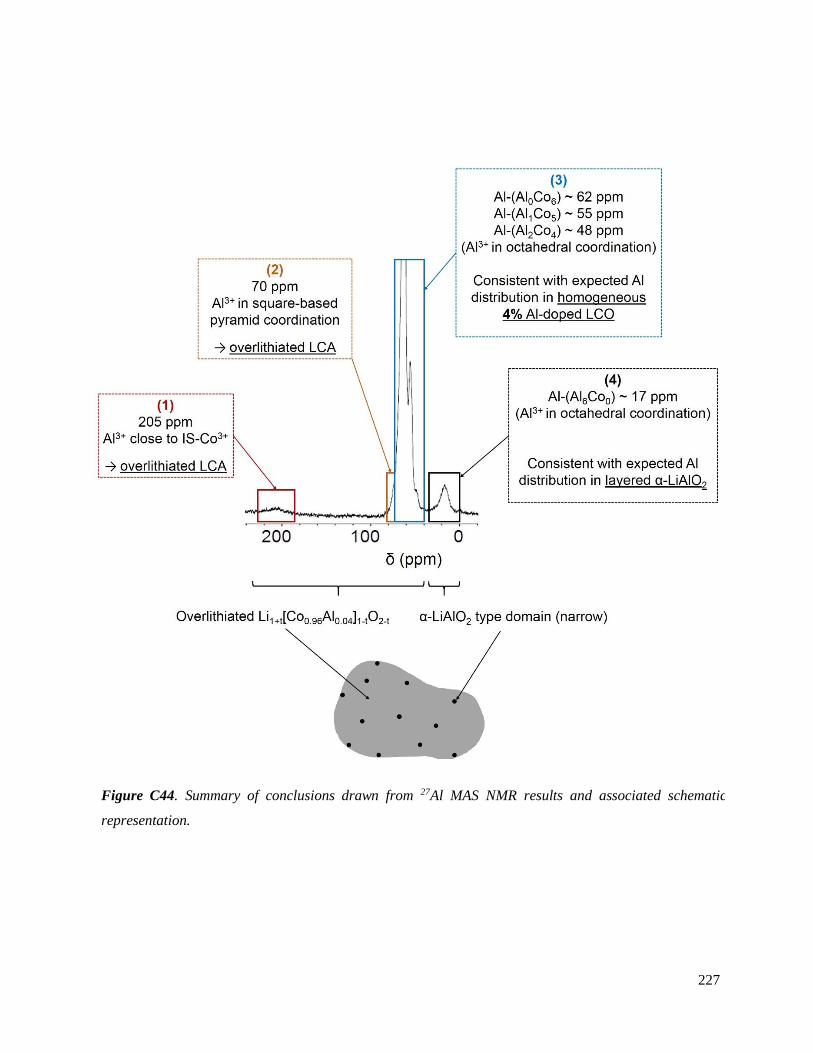
227
Figure C44. Summary of conclusions drawn from 27Al MAS NMR results and associated schematic
representation.
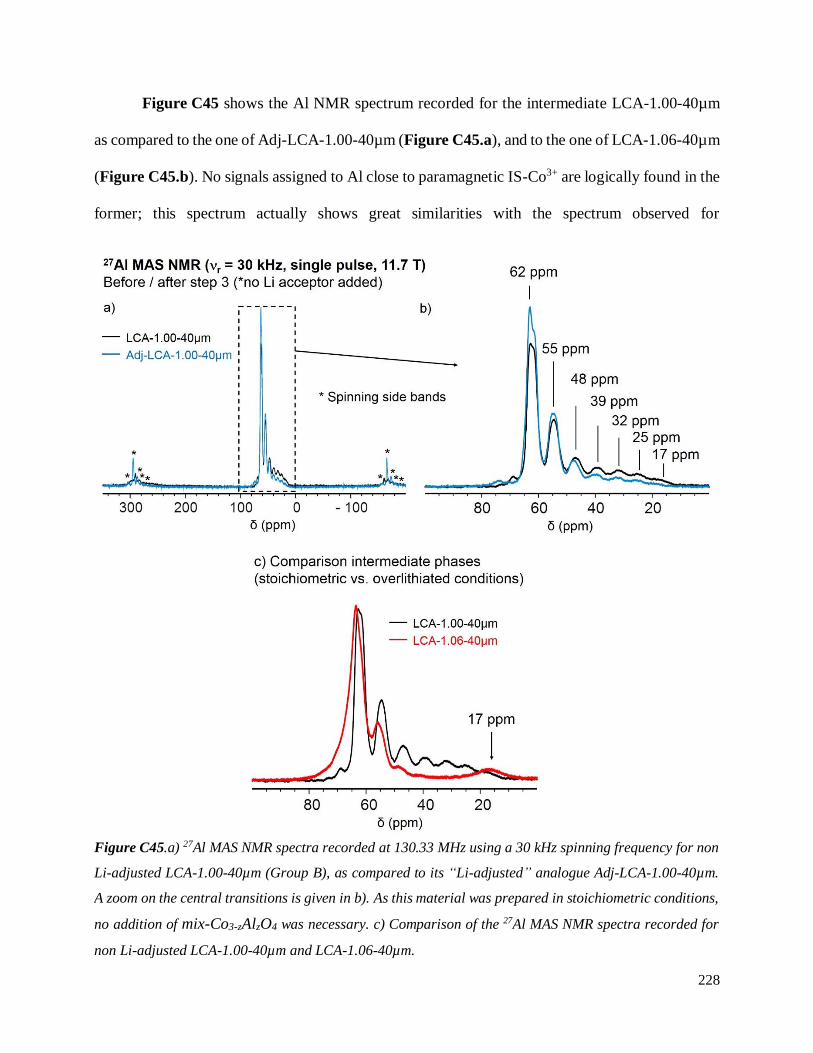
228
Figure C45 shows the Al NMR spectrum recorded for the intermediate LCA-1.00-40µm
as compared to the one of Adj-LCA-1.00-40µm (Figure C45.a), and to the one of LCA-1.06-40µm
(Figure C45.b). No signals assigned to Al close to paramagnetic IS-Co3+ are logically found in the
former; this spectrum actually shows great similarities with the spectrum observed for
Figure C45.a) 27Al MAS NMR spectra recorded at 130.33 MHz using a 30 kHz spinning frequency for non
Li-adjusted LCA-1.00-40µm (Group B), as compared to its “Li-adjusted” analogue Adj-LCA-1.00-40µm.
A zoom on the central transitions is given in b). As this material was prepared in stoichiometric conditions,
no addition of mix-Co3-zAlzO4 was necessary. c) Comparison of the 27Al MAS NMR spectra recorded for
non Li-adjusted LCA-1.00-40µm and LCA-1.06-40µm.
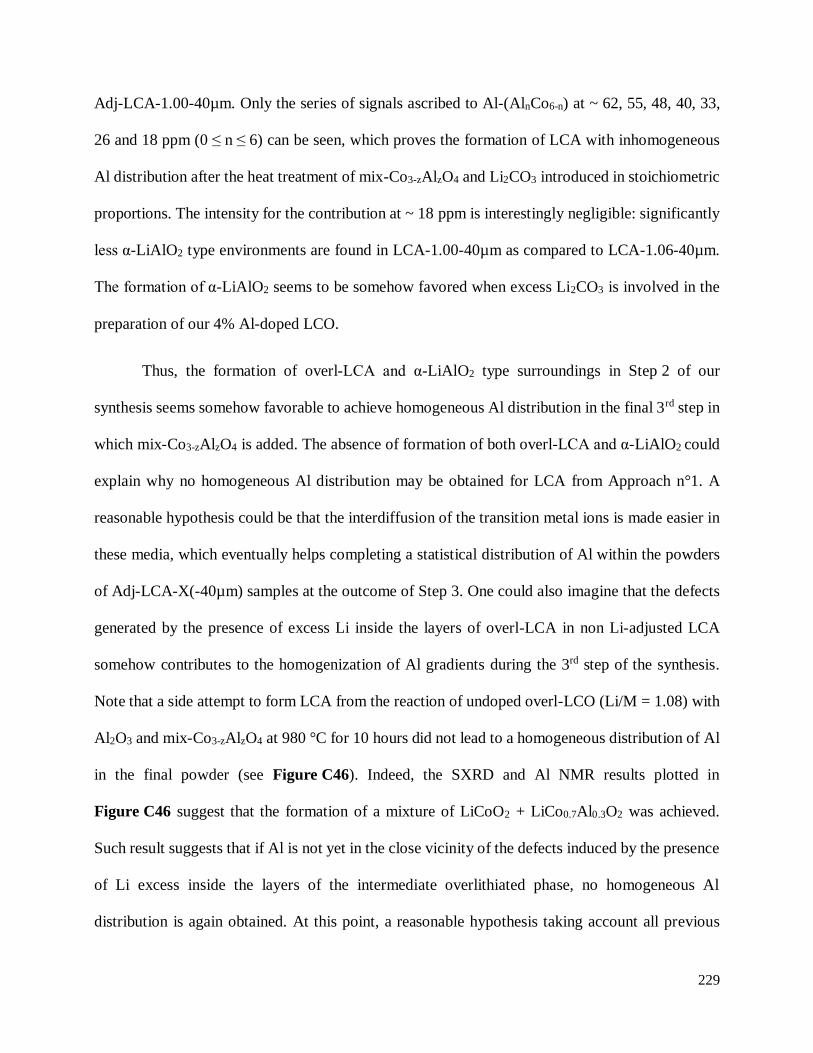
229
Adj-LCA-1.00-40µm. Only the series of signals ascribed to Al-(AlnCo6-n) at ~ 62, 55, 48, 40, 33,
26 and 18 ppm (0 ≤ n ≤ 6) can be seen, which proves the formation of LCA with inhomogeneous
Al distribution after the heat treatment of mix-Co3-zAlzO4 and Li2CO3 introduced in stoichiometric
proportions. The intensity for the contribution at ~ 18 ppm is interestingly negligible: significantly
less α-LiAlO2 type environments are found in LCA-1.00-40µm as compared to LCA-1.06-40µm.
The formation of α-LiAlO2 seems to be somehow favored when excess Li2CO3 is involved in the
preparation of our 4% Al-doped LCO.
Thus, the formation of overl-LCA and α-LiAlO2 type surroundings in Step 2 of our
synthesis seems somehow favorable to achieve homogeneous Al distribution in the final 3rd step in
which mix-Co3-zAlzO4 is added. The absence of formation of both overl-LCA and α-LiAlO2 could
explain why no homogeneous Al distribution may be obtained for LCA from Approach n°1. A
reasonable hypothesis could be that the interdiffusion of the transition metal ions is made easier in
these media, which eventually helps completing a statistical distribution of Al within the powders
of Adj-LCA-X(-40µm) samples at the outcome of Step 3. One could also imagine that the defects
generated by the presence of excess Li inside the layers of overl-LCA in non Li-adjusted LCA
somehow contributes to the homogenization of Al gradients during the 3rd step of the synthesis.
Note that a side attempt to form LCA from the reaction of undoped overl-LCO (Li/M = 1.08) with
Al2O3 and mix-Co3-zAlzO4 at 980 °C for 10 hours did not lead to a homogeneous distribution of Al
in the final powder (see Figure C46). Indeed, the SXRD and Al NMR results plotted in
Figure C46 suggest that the formation of a mixture of LiCoO2 + LiCo0.7Al0.3O2 was achieved.
Such result suggests that if Al is not yet in the close vicinity of the defects induced by the presence
of Li excess inside the layers of the intermediate overlithiated phase, no homogeneous Al
distribution is again obtained. At this point, a reasonable hypothesis taking account all previous
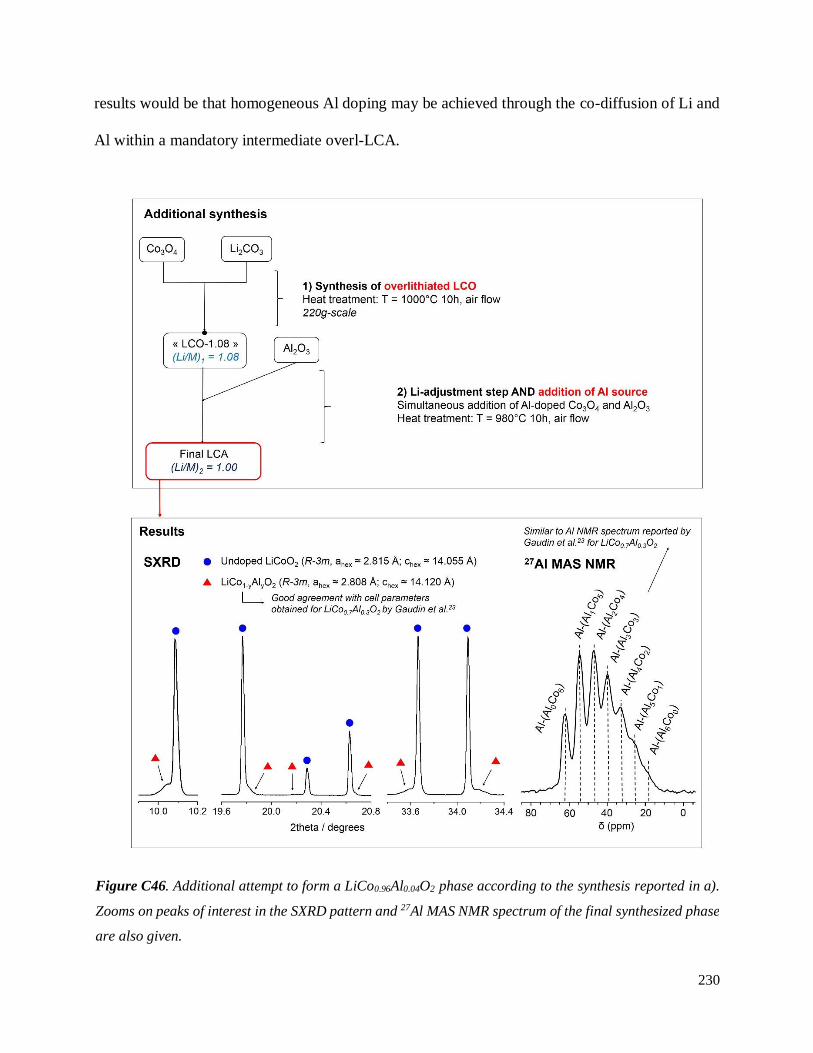
230
results would be that homogeneous Al doping may be achieved through the co-diffusion of Li and
Al within a mandatory intermediate overl-LCA.
Figure C46. Additional attempt to form a LiCo0.96Al0.04O2 phase according to the synthesis reported in a).
Zooms on peaks of interest in the SXRD pattern and 27Al MAS NMR spectrum of the final synthesized phase
are also given.
231
C.5 General conclusions for Part C
In Part C, we successfully prepared various 4% Al-doped LCO (LCA) powders with well
controlled Li and Al stoichiometries by solid state reaction of Li2CO3 and oxide precursors (Co3O4
and Al2O3) introduced either in stoichiometric proportions (Approach n°1, (Li/M)1 ≤ 1.00) or non
stoichiometric proportions (Approach n°2, (Li/M)1 > 1.00).
Although the powders obtained from Approach n°1 were indeed LCA materials,
inhomogeneous Al doping was systematically evidenced by the means of synchrotron X-ray
diffraction and 27Al / 59Co MAS NMR. The chemical nature of the metal oxide precursor
(mix-Co3-zAlzO4 or an unreacted mixture of Co3O4 and Al2O3) proved to have an effect on the final
Al distribution in the LCA powders prepared in such conditions, though its impact was relatively
weak.
Aluminum was more homogeneously distributed in LCA powders prepared with an excess
of Li2CO3 (Approach n°2). For the first time, a LCA powder prepared by solid state route with
(Li/M)1 = 1.04 (in the absence of any specific control of particle morphology or size) showed a
comparable Al distribution to a LCA sample obtained from a co-precipitation route. The viability
of this approach was also confirmed for the preparation of LCA powders with large particles
(~ 40 µm), which is a clear requirement to achieve proper packing density in the LCA-based
electrodes. Introducing slightly more Li2CO3 was however mandatory to achieve homogeneous
doping in this case ((Li/M)1 = 1.06). Although we only showed results for 4% Al-doped LCO
powders throughout this part, Approach n°2 was also validated for the preparation of homogeneous
10% Al-doped LCO by Adam Bertrand during his Master’s degree internship. A logical follow-up
would be to implement Approach n°2 to other dopants and/or co-dopants, such as Mg, Ti, etc.
232
The inhomogeneity of Al doping in LCA powders prepared according to Approach n°1 was
also evidenced through electrochemical testing in Li cells. Indeed, the changes of slope associated
to the monoclinic transition typically expected for stoichiometric LCO was still observed in the 1st
cycle curves for these LCA samples when it should not. Electrochemical profiles for all samples
prepared with the second approach were smoother and somehow all comparable, which prevented
us to establish a finer relation between the homogeneity of Al doping for LCA powders prepared
with Approach n°2 ((Li/M)1 > 1.00) and possible structural changes when cycled in Li cells. In any
case, the dx/dV profiles at high voltage for each one of the LCA tested suggested that the formation
of the H1-3 phase could be not completely hindered with 4% Al doping. A more systematic study,
comparable to the one performed in Part B, would be required to draw proper conclusions to this
end and link the electrochemical properties at high voltage to the Al-distribution in the samples.
At this point of the project, we believe that the addition of excess Li2CO3 drives the
formation of an intermediate phase mainly composed of overlithiated Li1+t[Co0.96Al0.04]1-tO2-t with
very α-LiAlO2 domains at the local scale. The homogenization of Al distribution during the heat
treatment of this intermediate could possibly be performed through a favorable co-diffusion of Li
and Al in both these media, which could explain why the synthesis of homogeneous LCA from the
reaction between overlithiated Li1+tCo0.961-tO2-t and Al2O3 is unsuccessful. The defects generated
by the presence of excess Li inside the layers of overl-LCA most likely play a key role in the co-
diffusion process, as no homogeneously doped LCA powders can be synthesized when Li2CO3 is
introduced in stoichiometric proportions. It may be related to the good affinity of Al3+ in [5]
environments found around the Li excess in the transition metal (TM) plane. Efforts will be
required to properly understand the exact mechanisms of reaction involved in the successful
preparation of LCA by Approach n°2.
233
C.6 Bibliography Part C
(1) Zhuang, Q.; Xu, J.; Fan, X.; Wei, G.; Dong, Q.; Jiang, Y.; Huang, L.; Sun, S. LiCoO2
Electrode/Electrolyte Interface of Li-Ion Batteries Investigated by Electrochemical
Impedance Spectroscopy. Sci. China Ser. B Chem. 2007, 50 (6), 776–783.
https://doi.org/10.1007/s11426-007-0088-7.
(2) Würsig, A.; Buqa, H.; Holzapfel, M.; Krumeich, F.; Novák, P. Film Formation at Positive
Electrodes in Lithium-Ion Batteries. Electrochem. Solid-State Lett. 2005, 8 (1), A34–A37.
https://doi.org/10.1149/1.1836114.
(3) Ohzuku, T.; Ueda, A. Solid‐State Redox Reactions of LiCoO2 (R3̅m) for 4 Volt Secondary
Lithium Cells. J. Electrochem. Soc. 1994, 141 (11), 2972–2977.
https://doi.org/10.1149/1.2059267.
(4) Amatucci, G. G.; Tarascon, J. M.; Klein, L. C. CoO2, The End Member of the LixCoO2 Solid
Solution. J. Electrochem. Soc. 1996, 143 (3), 1114–1123.
https://doi.org/10.1149/1.1836594.
(5) Chen, Z.; Lu, Z.; Dahn, J. R. Staging Phase Transitions in LixCoO2. J. Electrochem. Soc.
2002, 149 (12), A1604–A1609. https://doi.org/10.1149/1.1519850.
(6) Xia, H.; Lu, L.; Meng, Y. S.; Ceder, G. Phase Transitions and High-Voltage Electrochemical
Behavior of LiCoO2 Thin Films Grown by Pulsed Laser Deposition. J. Electrochem. Soc.
2007, 154 (4), A337–A342. https://doi.org/10.1149/1.2509021.
(7) Duffiet, M.; Blangero, M.; Cabelguen, P.-E.; Delmas, C.; Carlier, D. Influence of the Initial
Li/Co Ratio in LiCoO2 on the High-Voltage Phase-Transitions Mechanisms. J. Phys. Chem.
Lett. 2018, 5334–5338. https://doi.org/10.1021/acs.jpclett.8b02252.
234
(8) Amatucci, G. G.; Tarascon, J. M.; Klein, L. C. Cobalt Dissolution in LiCoO2-Based Non-
Aqueous Rechargeable Batteries. Solid State Ion. 1996, 83 (1–2), 167–173.
https://doi.org/10.1016/0167-2738(95)00231-6.
(9) Needham, S. A.; Wang, G. X.; Liu, H. K.; Drozd, V. A.; Liu, R. S. Synthesis and
Electrochemical Performance of Doped LiCoO2 Materials. J. Power Sources 2007, 174 (2),
828–831. https://doi.org/10.1016/j.jpowsour.2007.06.228.
(10) Zou, M.; Yoshio, M.; Gopukumar, S.; Yamaki, J. Performance of LiM0.05Co0.95O2 Cathode
Materials in Lithium Rechargeable Cells When Cycled up to 4.5 V. Chem. Mater. 2005, 17
(6), 1284–1286. https://doi.org/10.1021/cm048734o.
(11) Yu, J.; Han, Z.; Hu, X.; Zhan, H.; Zhou, Y.; Liu, X. The Investigation of Ti-Modified
LiCoO2 Materials for Lithium Ion Battery. J. Power Sources 2014, 262, 136–139.
https://doi.org/10.1016/j.jpowsour.2014.03.073.
(12) Prahasini, P.; Sivakumar, M.; Subadevi, R.; Wang, F. M. Synthesis and Characterization of
Cu Doped LiCoO2 Cathode Material for Lithium Batteries Using Microwave Assisted Sol-
Gel Synthesis. Adv. Mater. Res. 2012, 584, 345–349.
https://doi.org/10.4028/www.scientific.net/AMR.584.345.
(13) Liu, A.; Li, J.; Shunmugasundaram, R.; Dahn, J. R. Synthesis of Mg and Mn Doped LiCoO2
and Effects on High Voltage Cycling. J. Electrochem. Soc. 2017, 164 (7), A1655–A1664.
https://doi.org/10.1149/2.1381707jes.
(14) Liu, Q.; Su, X.; Lei, D.; Qin, Y.; Wen, J.; Guo, F.; Wu, Y. A.; Rong, Y.; Kou, R.; Xiao, X.;
et al. Approaching the Capacity Limit of Lithium Cobalt Oxide in Lithium Ion Batteries via
Lanthanum and Aluminium Doping. Nat. Energy 2018. https://doi.org/10.1038/s41560-018-
0180-6.
235
(15) Zhang, M.; Tan, M.; Zhao, H.; Liu, S.; Shu, X.; Hu, Y.; Liu, J.; Ran, Q.; Li, H.; Liu, X.
Enhanced High-Voltage Cycling Stability and Rate Capability of Magnesium and Titanium
Co-Doped Lithium Cobalt Oxides for Lithium-Ion Batteries. Appl. Surf. Sci. 2018, 458, 111–
118. https://doi.org/10.1016/j.apsusc.2018.07.091.
(16) Ceder, G.; Chiang, Y.-M.; Sadoway, D. R.; Aydinol, M. K.; Jang, Y.-I.; Huang, B.
Identification of Cathode Materials for Lithium Batteries Guided by First-Principles
Calculations. Nature 1998, 392 (6677), 694.
(17) Jang, Y.-I.; Huang, B.; Wang, H.; Sadoway, D. R.; Ceder, G.; Chiang, Y.-M.; Liu, H.;
Tamura, H. LiAlyCo1−yO2 ( R3̄m ) Intercalation Cathode for Rechargeable Lithium Batteries.
J. Electrochem. Soc. 1999, 146 (3), 862–868. https://doi.org/10.1149/1.1391693.
(18) Myung, S.-T.; Kumagai, N.; Komaba, S.; Chung, H.-T. Effects of Al Doping on the
Microstructure of LiCoO2 Cathode Materials. Solid State Ion. 2001, 139 (1–2), 47–56.
https://doi.org/10.1016/S0167-2738(00)00828-6.
(19) Lee, Y.; Woo, A. J.; Han, K.-S.; Ryu, K. S.; Sohn, D.; Kim, D.; Lee, H. Solid-State NMR
Studies of Al-Doped and Al2O3-Coated LiCoO2. Electrochimica Acta 2004, 50 (2–3), 491–
494. https://doi.org/10.1016/j.electacta.2004.02.063.
(20) Xu, H.-T.; Zhang, H.; Liu, L.; Feng, Y.; Wang, Y. Fabricating Hexagonal Al-Doped LiCoO2
Nanomeshes Based on Crystal-Mismatch Strategy for Ultrafast Lithium Storage. ACS Appl.
Mater. Interfaces 2015, 7 (37), 20979–20986. https://doi.org/10.1021/acsami.5b06844.
(21) Wang, H.; Jang, Y.-I.; Huang, B.; Sadoway, D. R.; Chiang, Y.-M. Electron Microscopic
Characterization of Electrochemically Cycled LiCoO2 and Li(Al,Co)O2 Battery Cathodes.
J. Power Sources 1999, 81–82, 594–598. https://doi.org/10.1016/S0378-7753(99)00108-1.
236
(22) Yoon, W.-S.; Lee, K.-K.; Kim, K.-B. Structural and Electrochemical Properties of
LiAlyCo1-yO2 Cathode for Li Rechargeable Batteries. J. Electrochem. Soc. 2000, 147 (6),
2023–2028.
(23) Gaudin, E.; Taulelle, F.; Stoyanova, R.; Zhecheva, E.; Alcántara, R.; Lavela, P.; Tirado, J.
L. Cobalt(III) Effect on 27Al NMR Chemical Shifts in LiAlxCo1-xO2. J. Phys. Chem. B 2001,
105 (34), 8081–8087. https://doi.org/10.1021/jp0105948.
(24) Han, B.; Paulauskas, T.; Key, B.; Peebles, C.; Park, J. S.; Klie, R. F.; Vaughey, J. T.; Dogan,
F. Understanding the Role of Temperature and Cathode Composition on Interface and Bulk:
Optimizing Aluminum Oxide Coatings for Li-Ion Cathodes. ACS Appl. Mater. Interfaces
2017, 9 (17), 14769–14778. https://doi.org/10.1021/acsami.7b00595.
(25) Alcántara, R.; Lavela, P.; Relaño, P. L.; Tirado, J. L.; Zhecheva, E.; Stoyanova, R. X-Ray
Diffraction, EPR, and 6Li and 27Al MAS NMR Study of LiAlO2−LiCoO2 Solid Solutions.
Inorg. Chem. 1998, 37 (2), 264–269. https://doi.org/10.1021/ic9707220.
(26) Dahéron, L.; Dedryvère, R.; Martinez, H.; Flahaut, D.; Ménétrier, M.; Delmas, C.; Gonbeau,
D. Possible Explanation for the Efficiency of Al-Based Coatings on LiCoO2 : Surface
Properties of LiCo1-xAlxO2 Solid Solution. Chem. Mater. 2009, 21 (23), 5607–5616.
https://doi.org/10.1021/cm901972e.
(27) Zhao, Y.; Li, J.; Dahn, J. R. Interdiffusion of Cations from Metal Oxide Surface Coatings
into LiCoO2 During Sintering. Chem. Mater. 2017, 29 (12), 5239–5248.
https://doi.org/10.1021/acs.chemmater.7b01219.
(28) Rodriguez-Carvajal, J. FULLPROF: A Program for Rietveld Refinement and Pattern
Matching Analysis. Physica B.(1993), 192, 55.
237
(29) Garcia Casado, P.; Rasines, I. The Series of Spinels Co3−sAlsO4 (0 < s < 2): Study of
Co2AlO4. J. Solid State Chem. 1984, 52 (2), 187–190. https://doi.org/10.1016/0022-
4596(84)90190-7.
(30) Zayat, M.; Levy, D. Blue CoAl2O4 Particles Prepared by the Sol−Gel and Citrate−Gel
Methods. Chem. Mater. 2000, 12 (9), 2763–2769. https://doi.org/10.1021/cm001061z.
(31) Lee, G.-Y.; Ryu, K.-H.; Kim, H.-G.; Kim, Y.-Y. The Preparation of Blue CoAl2O4 Powders
by the Malonate Method: The Effect of the Amount of Malonic Acid Used, the Formation
Pathway of CoAl2O4 Crystallites and the Characteristics of the Prepared Powders. Bull.
Korean Chem. Soc. 2009, 30 (2), 373–377.
(32) Bolt, P. H.; Habraken, F. H.; Geus, J. W. Formation of Nickel, Cobalt, Copper, and Iron
Aluminates From α- and γ-Alumina-Supported Oxides: A Comparative Study. J. Solid State
Chem. 1998, 135 (1), 59–69.
(33) Azurdia, J.; Marchal, J.; Laine, R. M. Synthesis and Characterization of Mixed-Metal Oxide
Nanopowders Along the CoOx-Al2O3 Tie Line Using Liquid-Feed Flame Spray Pyrolysis.
J. Am. Ceram. Soc. 2006, 0 (0), https://doi.org/10.1111/j.1551-2916.2006.01155.x.
(34) Smith, M. E. Application Of 27Al NMR Techniques to Structure Determination in Solids.
Appl. Magn. Reson. 1993, 4 (1–2), 1–64. https://doi.org/10.1007/BF03162555.
(35) O’Dell, L. A.; Savin, S. L. P.; Chadwick, A. V.; Smith, M. E. A 27Al MAS NMR Study of a
Sol–Gel Produced Alumina: Identification of the NMR Parameters of the θ-Al2O3 Transition
Alumina Phase. Solid State Nucl. Magn. Reson. 2007, 31 (4), 169–173.
https://doi.org/10.1016/j.ssnmr.2007.05.002.
(36) Samain, L.; Jaworski, A.; Edén, M.; Ladd, D. M.; Seo, D.-K.; Javier Garcia-Garcia, F.;
Häussermann, U. Structural Analysis of Highly Porous γ-Al2O3. J. Solid State Chem. 2014,
217, 1–8. https://doi.org/10.1016/j.jssc.2014.05.004.
238
(37) Gaudon, M.; Apheceixborde, A.; Ménétrier, M.; Le Nestour, A.; Demourgues, A. Synthesis
Temperature Effect on the Structural Features and Optical Absorption of Zn1−xCoxAl2O4
Oxides. Inorg. Chem. 2009, 48 (19), 9085–9091. https://doi.org/10.1021/ic900482v.
(38) Kim, J.; Ilott, A. J.; Middlemiss, D. S.; Chernova, N. A.; Pinney, N.; Morgan, D.; Grey, C.
P. 2H and 27Al Solid-State NMR Study of the Local Environments in Al-Doped 2-Line
Ferrihydrite, Goethite, and Lepidocrocite. Chem. Mater. 2015, 27 (11), 3966–3978.
https://doi.org/10.1021/acs.chemmater.5b00856.
(39) Takahashi, Y.; Kijima, N.; Akimoto, J. Single-Crystal Synthesis and Structure Refinement
of the LiCoO2–LiAlO2 Solid-Solution Compounds: LiAl0.32Co0.68O2 and LiAl0.71Co0.29O2. J.
Solid State Chem. 2005, 178 (12), 3667–3671. https://doi.org/10.1016/j.jssc.2005.09.016.
(40) Levasseur, S.; Ménétrier, M.; Shao-Horn, Y.; Gautier, L.; Audemer, A.; Demazeau, G.;
Largeteau, A.; Delmas, C. Oxygen Vacancies and Intermediate Spin Trivalent Cobalt Ions
in Lithium-Overstoichiometric LiCoO2. Chem. Mater. 2003, 15 (1), 348–354.
https://doi.org/10.1021/cm021279g.
(41) Levasseur, S.; Menetrier, M.; Suard, E.; Delmas, C. Evidence for Structural Defects in Non-
Stoichiometric HT-LiCoO2: Electrochemical, Electronic Properties and 7Li NMR Studies.
Solid State Ion. 2000, 128 (1–4), 11–24.
(42) Zhecheva, E.; Stoyanova, R.; Gorova, M.; Alcántara, R.; Morales, J.; Tirado, J. L.
Lithium−Cobalt Citrate Precursors in the Preparation of Intercalation Electrode Materials.
Chem. Mater. 1996, 8 (7), 1429–1440. https://doi.org/10.1021/cm960009t.
(43) Modelling one‐ and two‐dimensional solid‐state NMR spectra - Massiot - 2002 - Magnetic
Resonance in Chemistry - Wiley Online Library
https://onlinelibrary.wiley.com/doi/abs/10.1002/mrc.984.
239
(44) Siegel, R.; Hirschinger, J.; Carlier, D.; Matar, S.; Ménétrier, M.; Delmas, C. 59Co and 6,7Li
MAS NMR in Polytypes O2 and O3 of LiCoO2. J. Phys. Chem. B 2001, 105 (19), 4166–
4174. https://doi.org/10.1021/jp003832s.
(45) Siegel, R.; Hirschinger, J.; Carlier, D.; Ménétrier, M.; Delmas, C. 59Co, 23Na NMR and
Electric Field Gradient Calculations in the Layered Cobalt Oxides NaCoO2 and HCoO2.
Solid State Nucl. Magn. Reson. 2003, 23 (4), 243–262. https://doi.org/10.1016/S0926-
2040(03)00017-1.
(46) Levasseur, S. Contribution à l’étude Des Phases Lix(Co,M)O2 En Tant Que Matériaux
d’électrode Positive Des Batteries Li-Ion. Effets Combinés de La Surstoechiométrie En
Lithium et de La Substitution (M= Ni, Mg), Université Sciences et Technologies-Bordeaux
I, 2001.
(47) Imanishi, N.; Yamade, M.; Ichikawa, T.; Hirano, A.; Takeda, Y. Characterization and
Electrode Behavior of LixCoO2 (x>1). Ionics 2002, 8 (1–2), 100–107.
https://doi.org/10.1007/BF02377759.
(48) Antolini, E.; Giorgi, L.; Carewska, M. Formation of Li-and Mg-Doped LiCoO2 Powders: A
BET Analysis. J. Mater. Sci. Lett. 1999, 18 (4), 325–327.
(49) Giorgi, L.; Carewska, M.; Patriarca, M.; Scaccia, S.; Simonetti, E.; Di Bartolomeo, A.
Development and Characterization of Novel Cathode Materials for Molten Carbonate Fuel
Cell. J. Power Sources 1994, 49 (1–3), 227–243.
(50) Wicker, S. A.; Walker, E. H. Revisited: Decomposition or Melting? Formation Mechanism
Investigation of LiCoO2 via In-Situ Time-Resolved X-Ray Diffraction. Inorg. Chem. 2013,
52 (4), 1772–1779. https://doi.org/10.1021/ic301516a.
(51) Perkinsa, J. D.; Bahna, C. S.; Parillaa, P. A.; McGrawb, J. M.; Fuc, M. L.; Duncana, M.;
Yua, H.; Ginleya, D. S. LiCoO2 and LiCo1−xAlxO2 Thin Film Cathodes Grown by Pulsed
240
Laser Ablation. J. Power Sources 1999, 81–82, 675–679. https://doi.org/10.1016/S0378-
7753(99)00266-9.
(52) Faenza, N. V.; Pereira, N.; Halat, D. M.; Vinckeviciute, J.; Bruce, L.; Radin, M. D.;
Mukherjee, P.; Badway, F.; Halajko, A.; Cosandey, F.; et al. Phase Evolution and
Degradation Modes of R3̅m LixNi1–y–zCoyAlzO2 Electrodes Cycled Near Complete
Delithiation. Chem. Mater. 2018, 30 (21), 7545–7574.
https://doi.org/10.1021/acs.chemmater.8b02720.
(53) Poeppelmeier, K. R.; Chiang, C. K.; Kipp, D. O. Synthesis of High Surface Area Lithium
Aluminate (α-LiAlO2). Inorg. Chem. 1988, 27 (25), 4523–4524.
https://doi.org/10.1021/ic00298a002.
(54) Marezio, M.; Remeika, J. P. High‐Pressure Synthesis and Crystal Structure of α‐LiAlO2. J.
Chem. Phys. 1966, 44 (8), 3143–3144. https://doi.org/10.1063/1.1727203.
241
General conclusion
While LiCoO2 remains one of the most used positive electrode materials in Li-ion batteries,
fundamental knowledge regarding the phase transitions it experiences during the Li removal at
high voltage was and is still missing. This project was dedicated to further understand the
mechanisms of formation of such high voltage phases, and evaluate a possible influence of either
the initial Li/Co stoichiometry in the pristine LCO powders or Al doping to hinder their completion.
In the first part of this manuscript, series of LiCoO2 samples with well controlled initial
Li/Co stoichiometries (1.00 ≤ Li/Co ≤ 1.04) and particle sizes were successfully synthesized from
a solid state route, following the current industrial requirements. While their structures were
evidenced by X-ray diffraction (XRD), 7Li MAS NMR was key to detect the local defects in
overlithiated LCO, generated by the use of an excess of Li2CO3 during their synthesis.
Electrochemical testing confirmed the poor cycle stability of all LCO powders at high voltage, no
matter their initial Li content. However, smoother 1st cycle profiles were systematically obtained
for overlithiated LCO as compared to its stoichiometric analogue, first suggesting the existence of
defects could impact the formation of the high voltage phases.
The in situ XRD data collected during the 1st charge of a stoichiometric LCO (st-LCO,
initial Li/Co = 1.00) and an overlithiated LCO (overl-LCO, Li/Co = 1.05), and presented in a
second part, revealed that the expected H1-3 and O1 structures were formed nonetheless at high
voltage for both compounds, though with stacking faults, and delayed in the case of overl-LCO.
Besides, the formation of an additional intergrowth structure at high voltage and a more complex
O3 – O’3 – O3 phase transition at low voltage were evidenced in the case of st-LCO. Ex situ XRD
performed on H1-3-LixCoO2 powders prepared from Li electrochemical de-intercalation from both
st-LCO and overl-LCO revealed that the initial Li/Co has no influence of its structure itself.
242
Although the use of Al doping was first motivated by a possible beneficial effect on the
structural stability of LCO over cycling, the question of homogeneity of doping quickly arose. The
investigation of phase transitions overcome by 4% Al-doped LCO (LCA) during the removal of Li
at high voltage was subsequently delayed in order to first ensure that a homogeneous distribution
of Al was found within the various pristine powders synthesized by solid state reaction of Co3O4,
Li2CO3 and Al2O3. Thanks to SXRD and 27Al MAS NMR, we showed that the use of an excess of
Li2CO3 to first form an overlithiated LCA seems key to obtain final Li-adjusted LCA powders with
satisfactory homogeneity of doping. As a matter of a fact, this is the first time the synthesis of
homogeneously Al-doped LCO from a solid state route is reported. Al gradients were always
achieved in samples prepared with precursors introduced in stoichiometric conditions. The viability
of the process to prepare LCA powders with higher Al content was recently confirmed by Adam
Bertrand during his master’s thesis. Further work would now require to establish i) a possible
influence of the dopant on the formation of the high voltage phases and ii) the effect of the
homogeneity of doping, doping amount and Li stoichiometry in LCA on their electrochemical
properties, which may be done in a new PhD student (Fatima El-Rami) in a new launched project.
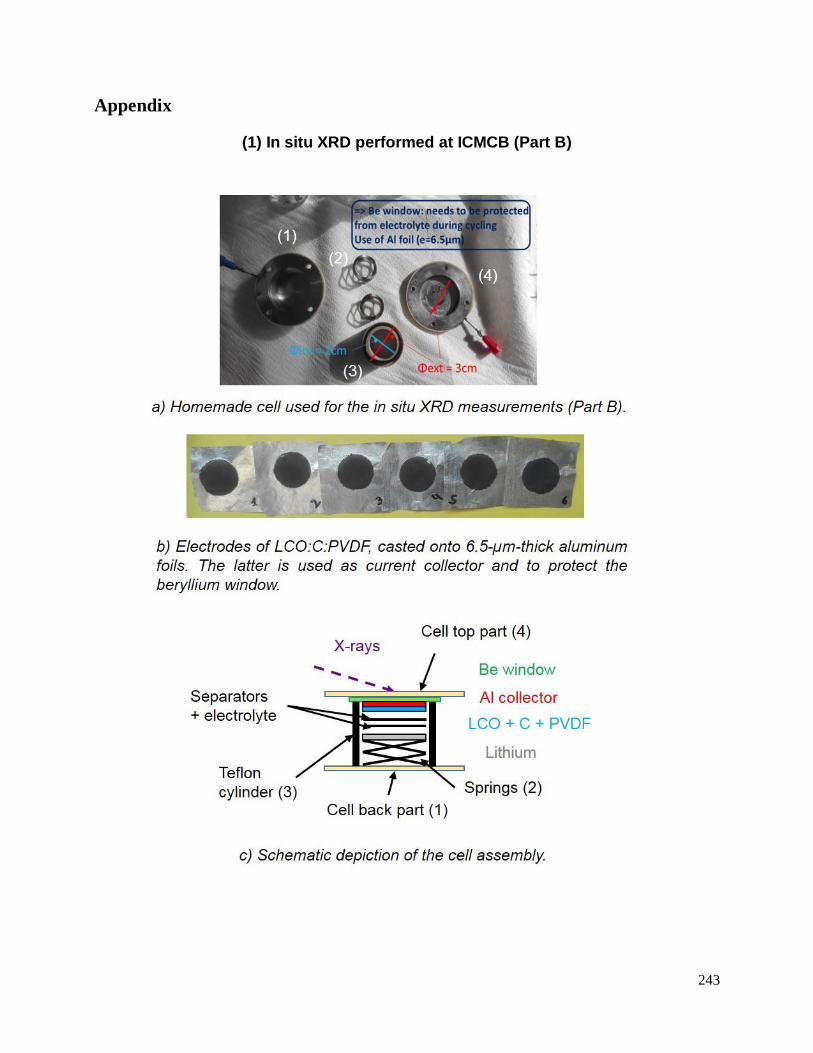
243
Appendix
(1) In situ XRD performed at ICMCB (Part B)
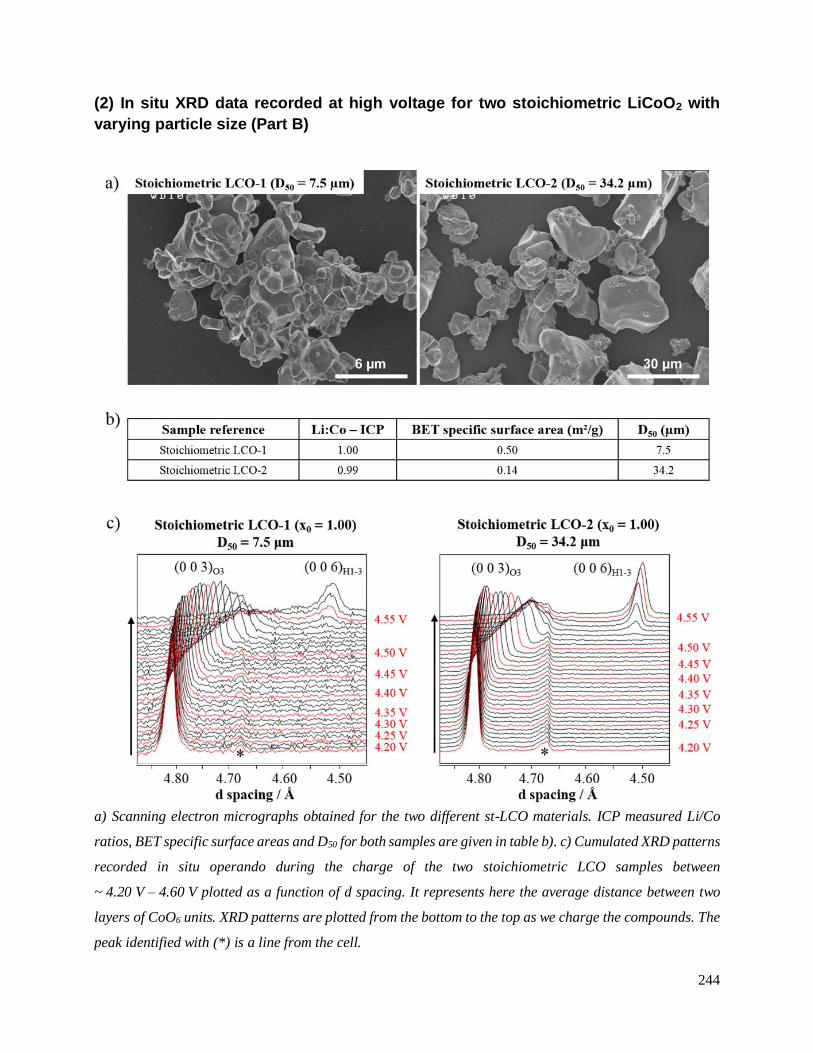
244
(2) In situ XRD data recorded at high voltage for two stoichiometric LiCoO2 with
varying particle size (Part B)
a) Scanning electron micrographs obtained for the two different st-LCO materials. ICP measured Li/Co
ratios, BET specific surface areas and D50 for both samples are given in table b). c) Cumulated XRD patterns
recorded in situ operando during the charge of the two stoichiometric LCO samples between
~ 4.20 V – 4.60 V plotted as a function of d spacing. It represents here the average distance between two
layers of CoO6 units. XRD patterns are plotted from the bottom to the top as we charge the compounds. The
peak identified with (*) is a line from the cell.
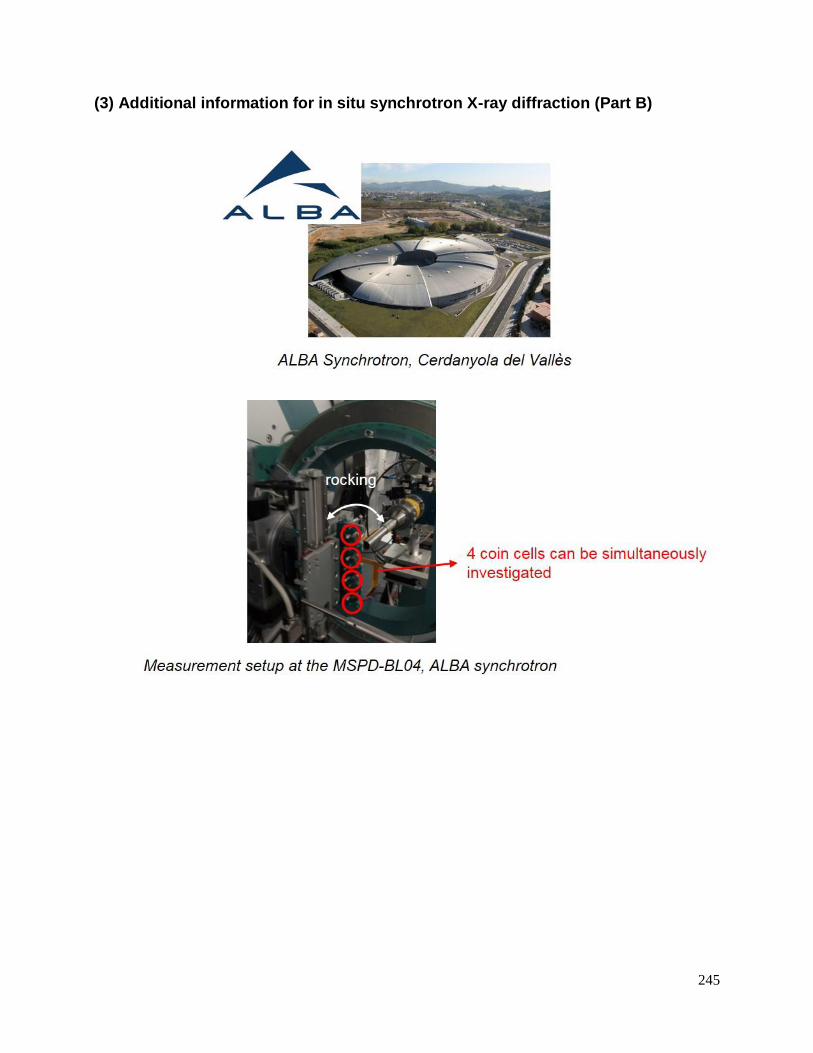
245
(3) Additional information for in situ synchrotron X-ray diffraction (Part B)