Investigating Cooling Performance and Energy Utilization of ...
218
Investigating Cooling Performance and Energy Utilization of Refrigerated Shipping Container Packed with Fresh Fruit using Computational Fluid Dynamics Modelling by Samuel Tenaw Getahun Dissertation presented for the degree of Doctor of Philosophy in the Faculty of Engineering at the University of Stellenbosch Supervisors: Prof. Umezuruike Linus Opara Prof. Chris J. Meyer March 2017
-
Upload
khangminh22 -
Category
Documents
-
view
2 -
download
0
Transcript of Investigating Cooling Performance and Energy Utilization of ...

Investigating Cooling Performance and Energy Utilization of Refrigerated Shipping Container
Packed with Fresh Fruit using Computational Fluid Dynamics Modelling
by
Samuel Tenaw Getahun
Dissertation presented for the degree of Doctor of Philosophy in the Faculty of Engineering at the University of Stellenbosch
Supervisors:
Prof. Umezuruike Linus Opara
Prof. Chris J. Meyer
March 2017
i
Declaration
By submitting this thesis electronically, I declare that the entirety of the work
contained therein is my own, original work, that I am the sole author thereof (save to
the extent explicitly otherwise stated), that reproduction and publication thereof by
Stellenbosch University will not infringe any third party rights and that I have not
previously in its entirety or in part submitted it for obtaining any qualification.
Date: March 2017
Copyright ©2017 Stellenbosch University All rights reserved
Stellenbosch University https://scholar.sun.ac.za
ii
Abstract
This dissertation addresses a number of topics that arise from the use of a
refrigerated shipping containers (reefers) during transportation of fresh produce. The
work contributes to (i) development of a computational fluid dynamics (CFD) model
of a reefer packed with fresh produce, (ii) simultaneous estimation of produce quality
and energy consumption to maintain product value and minimize wastage in the cold
chain system. The work presented herein is concerned primarily with three topics: the
airflow distribution in reefers (empty and packed), cooling operation of apple fruit, and
energy use with respect to packaging designs and fan operation. Additionally, a chapter
is presented that focuses on the impact of environmental conditions on the performance
of fruit packed reefer during transportation.
First, a numerical and experimental investigation of airflow and temperature
distribution inside two types of empty reefers (T-bar floor and flat floor) used for fresh
fruit handling was conducted to establish the fundamental characteristics of transport
phenomena. Then, a CFD model of a fully loaded reefer was developed using porous
medium approach. Fruit stacked pallets were modelled as porous media, in which
volume average transport equations were employed, to avoid complex geometries
inside packed pallet and minimize computational cost. Wind tunnel tests were used to
obtain the pressure drop characteristics of palletized stack of apple fruit and the viscous
and inertia coefficients in Darcy-Forchheimer equation. The detailed structure of the
T-bar floor of the reefer and resistance-to-airflow of wooden pallets that were
previously overlooked, were incorporated in the model. Airflow, pulp temperature and,
energy consumption data obtained from a fully loaded, full-scale reefer were used to
validate the model. The validated model was used to further investigate airflow
Stellenbosch University https://scholar.sun.ac.za
iii
distribution and fruit cooling performance of packaging designs used for handling
apples and vertical airflow resistance or addition of bottom vent-holes.
Energy consumption of reefers packed with apple fruit during shipping was
examined experimentally and numerically using the validated model. The energy
consumption of reefers packed with different apple packaging designs was evaluated
with respect to seven-eighth cooling time, which confirmed the influence of ventilation
area on energy use and the trade-off between the energy savings that can be achieved
by employing packaging designs with low and high fruit packing density. In addition,
the effect of evaporator fan on energy consumption was studied by simulating fruit
packed reefers operating at low, medium, high and variable evaporator fan speeds. The
study demonstrated significance of optimal fan speed operation on energy use of
reefers packed with stacked load of fresh produce.
Finally, the impact of climate on cooling performance and energy consumption
of reefer during shipping was studied. The study showed an increase in fruit
temperature and energy consumption due to heat conduction through the walls when
the reefer operate in high temperature region. Overall, the CFD model developed
predicted airflow, heat transfer and energy use with satisfactory accuracy. The model
and research approach can be applied to a wide range of horticultural products and cold
chains with slight modification.
Stellenbosch University https://scholar.sun.ac.za
iv
Opsomming
In hierdie tesis word verskeie onderwerpe i.v.m. die gebruik van verkoelde
skeepshouers gedurende die vervoer van vars produkte, behandel. Die navorsing dra
by tot (i) ontwikkeling van ’n berekeningsvloeidinamika (BVD) model van ’n
skeepshouer gepak met vars produkte, (ii) gelyktydige skatting van produk gehalte en
energieverbruik om sodoende die waarde van die produk te behou en vermorsing van
energie in die koue-ketting sisteem te verminder. Daar word veral op drie onderwerpe
gefokus: die lugvloeiverspreiding in die skeepshouers (leeg en volgepak), die
verkoeling van die appels, en die gebruik van energie deur die verkoelings- en
waaierontwerpe. Daar is ook ’n hoofstuk wat fokus oor die impak van
omgewingstoestande op die prestasie van vrugte verpak in die skeepshouer tydens
vervoer.
Daar is eerstens ’n numeriese en eksperimentele ondersoek gedoen na lugvloei
en temperatuurverspreiding binne die twee tipes leë skeepshouers (T-vorm vloer en
plat vloer) om die fundamentele kenmerke van die vervoerverskynsels te verstaan. Toe
is ’n BVD model van ’n volle gelaaide skeepshouer met die gebruik van die poreuse
medium benadering ontwikkel. Vrugte-verpakte houtpalette is gemodelleer as poreuse
media, waarin gemiddelde volume vervoer vegelykings gebruik is om komplekse
geometrie binne-in die gepakte houtpalet te vermy en om berekende koste tot die
minimum te beperk. Windtonnel toetse is gebruik om die val-in-druk kenmerke van die
gepakte appels en die taaiheids- en traagheidskoëffisiente van die Darcy-Forchheimer
vergelyking te verkry. Die gedetailleerde struktuur van die T-vorm vloer van die
skeepshouer en die weerstand tot lugvloei van houtpalette wat voorheen misgekyk is,
word ook in die model geïnkorporeer. Die lugvloei, temperatuur van die vleisgedeelte
Stellenbosch University https://scholar.sun.ac.za
v
van die vrugte, en die data oor energie-verbruik wat verkry is vanaf ’n volgelaaide,
volskaal skeepshouer is gebruik om die model te valideer. Die gevalideerde model is
gebruik om lugvloeiverspreiding en vrugte-verkoeling van verpakkingsontwerpe wat
gebruik word vir die hantering van appels en die vertikale lugvloei weerstand of die
byvoeging van ventilasie gaatjies verder te ondersoek.
Die energieverbruik van skeepshouers gepak met appels is gedurende
verskeping eksperimenteel en numeries met die gebruik van die gevalideerde model
ondersoek. Die energieverbruik van skeepshouers met verskillende tipes
appelverpakking is vir sewe-agstes verkoeling evalueer, wat die invloed van ventilasie
area op energieverbruik en die kompromie met energiebesparing bevestig het, en
verkry word deur die gebruik van verpakkingsontwerpe met lae-en hoë vrugte
verpakkingsdigtheid. Verder is die effek van ’n verdampingswaaier op die
energieverbruik bestudeer deur vrugteverpakte skeepshouers met waaiers wat teen lae-
, middel- en hoë spoede loop, te simuleer. Die studie het die belangrikheid van optimale
waaierspoed operasie op die energieverbruik van skeepshouers volgepak met vars
produkte getoon.
Laastens is die impak van klimaat op die verkoelingsdoeltreffendheid en die
energieverbruik van skeepshouers tydens verskeping bestudeer. Daar is bevind dat die
temperatuur van die vrugte asook die energieverbruik van die skeepshouer in streke
met hoë temperature weens die geleiding van hitte deur die mure, verhoog. Oor die
algemeen het die BVD model die lugvloei, hitte-oordrag en energieverbruik akkuraat
voorspel. Hierdie model en navorsingsbenadering kan op ’n wye reeks tuinbou
produkte en koue kettings, met klein aanpassings, toegepas word.
Stellenbosch University https://scholar.sun.ac.za

vi
Acknowledgements
Firstly, I would like to acknowledge the support and guidance of my
supervisors: Prof U.L. Opara and Prof C.J. Meyer. Their knowledge and advice was
shared without reservation and was invaluable throughout the PhD experience. The
supervisor-student relationship was relaxed and open; it would be difficult to find a
better group to work with. Chris you are a great source of interesting conversation and
academic guidance. Opara thank you for the financial support and, you have been a
decisive influence in my life for the last few years and, certainly, the foremost influence
in my academic career.
I would like to extend a special thanks to Dr. Alemayehu Ambaw and Dr.
Mulugeta Delele who gave me constructive comments and uninterrupted support
throughout my study. I would also like to acknowledge all my friends at SARChI
Postharvest Technology Research Lab for their support and friendship, I am grateful
for that.
Financial assistance from the National Research Foundation (NRF), South
African Postharvest Innovation Programme (PHI) and Hortgroscience is gratefully
acknowledged. I would also like to thank the following people for their technical,
administrative and logistical support: Mr. Cobus Zietsman and Ms. Welma Liebenberg
from Department of Mechanical Engineering, Ms. Nazneen Ebrahim at SARChI
Postharvest, Mr. Henk Griessel from Tru-Cape and, Mr. Con Louw from Ceres Fruit
Growers.
Finally, I wish to express my gratitude to my family, my friends and my parents
for their help and encouragement. Especially my wife Yenatfanta and daughter Rediet
for their endless support, understanding, and love.
Stellenbosch University https://scholar.sun.ac.za
vii
Contents
Abstract ......................................................................................................................... ii
Opsomming .................................................................................................................. iv
Acknowledgements ...................................................................................................... vi
Contents ...................................................................................................................... vii
List of Figures ............................................................................................................. xii
List of Tables ........................................................................................................... xxiii
1. General introduction ................................................................................................. 1
1.1. Background and motivation .......................................................................... 1
1.2. Research objective and scope ....................................................................... 5
1.3. Thesis outline ................................................................................................ 6
2. Literature review on refrigerated shipping container modeling and energy use ....... 7
2.1. Introduction ................................................................................................... 7
2.2. Reefers .......................................................................................................... 8
2.2.1. Types of reefers ..................................................................................... 8
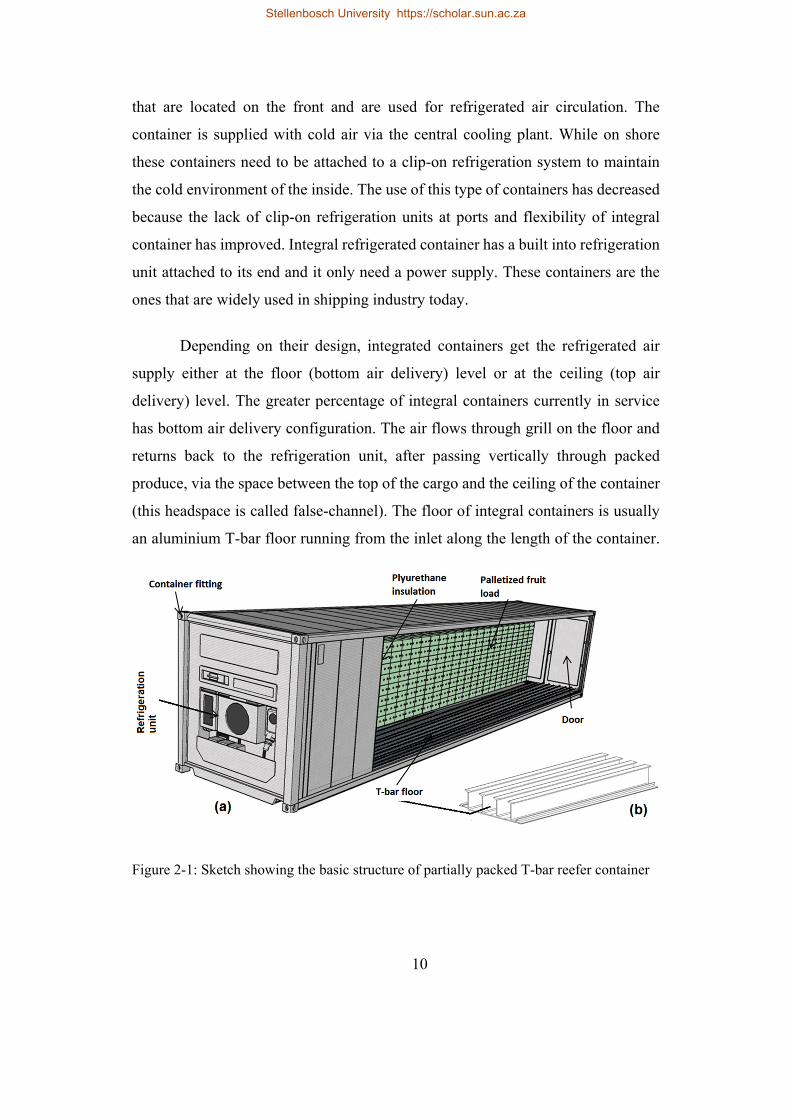
2.2.2. Working principle and packaging/stuffing of reefer ........................... 11
2.3. Modelling airflow and heat transfer in reefer ............................................. 12
2.3.1. Resistance network modelling ............................................................ 13
2.3.2. Computational fluid dynamics (CFD) modelling ............................... 15
2.4. Factors that affect energy consumption in cold chain systems and
quantification of energy in reefer container ................................................ 29
2.4.1. Insulation ............................................................................................. 30
Stellenbosch University https://scholar.sun.ac.za

viii
2.4.2. Infiltration ........................................................................................... 31
2.4.3. Product property .................................................................................. 31
2.4.4. Packaging design and alignment ......................................................... 33
2.4.5. Fans ..................................................................................................... 35
2.4.6. Defrost load ......................................................................................... 36
2.4.7. Forklift loads ....................................................................................... 37
2.5. Quantification of energy consumption: Experimental, analytical and
mathematical approaches ............................................................................ 37
2.5.1. Experimental and analytical approaches ............................................. 37
2.5.2. Mathematical approaches .................................................................... 43
2.6. Conclusion .................................................................................................. 47
3. Experimental and numerical investigation of airflow and heat transfer inside empty
reefer ....................................................................................................................... 50
3.1. Introduction ................................................................................................. 51
3.2. Materials and methods ................................................................................ 53
3.2.1. Reefer .................................................................................................. 53
3.2.2. Measurements ..................................................................................... 56
3.2.3. Airflow ................................................................................................ 56
3.2.4. Temperature ........................................................................................ 56
3.3. Model formulation ...................................................................................... 57
3.3.1. Assumptions ........................................................................................ 57
3.3.2. Governing equations ........................................................................... 58
3.3.3. Geometry, boundary and initial conditions ......................................... 59
3.3.4. Mesh generation, sensitivity analysis and simulation ......................... 63
3.4. Result and discussion .................................................................................. 64
Stellenbosch University https://scholar.sun.ac.za
ix
3.4.1. Inlet air flow ........................................................................................ 64
3.4.2. Air velocity distribution inside the reefer ........................................... 65
3.4.3. Temperature distribution inside the reefer .......................................... 68
3.4.4. Airflow characteristics under high evaporator fan speed .................... 69
3.4.5. Airflow characteristics under low evaporator fan speed ..................... 74
3.5. Conclusion .................................................................................................. 78
4. Airflow and heat transfer inside refrigerated shipping container packed with stacked
load of apples: Numerical model development and validation ............................... 80
4.1. Introduction ................................................................................................. 81
4.2. Materials and methods ................................................................................ 83
4.2.1. Fruit and packaging box ...................................................................... 83
4.2.2. Reefer .................................................................................................. 84
4.2.3. Measurements ..................................................................................... 85
4.2.4. Pressure drop characteristics ............................................................... 85
4.2.5. Airflow ................................................................................................ 86
4.2.6. Temperature ........................................................................................ 87
4.2.7. Model equations .................................................................................. 88
4.2.8. Geometry, boundary and initial conditions ......................................... 92
4.2.9. Simulation procedure .......................................................................... 93
4.3. Result and discussion .................................................................................. 94
4.3.1. Pallet pressure drop characterization .................................................. 94
4.3.2. Model validations ................................................................................ 96
4.4. Conclusion ................................................................................................ 103
5. Numerical evaluation of airflow, heat transfer, and effects of vertical flow inside
apple packed refrigerated shipping container fruit packed inside commonly used
packaging designs ................................................................................................. 104
Stellenbosch University https://scholar.sun.ac.za
x
5.1. Introduction ............................................................................................... 105
5.2. Materials and methods .............................................................................. 107
5.2.1. Packaging boxes ................................................................................ 107
5.2.2. Wind-tunnel experiment .................................................................... 112
5.3. Mathematical modelling ........................................................................... 112
5.3.1. Governing equations ......................................................................... 112
5.3.2. Model parameters .............................................................................. 113
5.3.3. Boundary and initial condition .......................................................... 113
5.3.4. Simulation setups .............................................................................. 113
5.3.5. Simulations ........................................................................................ 114
5.4. Result and discussion ................................................................................ 115
5.4.1. Characterizing the airflow resistances .............................................. 115
5.4.2. Analysis of the airflow distribution inside the reefer ........................ 117
5.4.3. Analysis of the temperature distribution and the cooling rate .......... 123
5.4.4. Influence of the vertical airflow resistance ....................................... 127
5.4.5. Cooling rate and temperature profile ................................................ 130
5.5. Conclusion ................................................................................................ 136
6. Numerical and experimental study of energy consumption in apple packed
reefers .................................................................................................................... 137
6.1. Introduction ............................................................................................... 138
6.2. Materials and methods .............................................................................. 140
6.2.1. Reefer ................................................................................................ 140
6.2.2. Packaging boxes ................................................................................ 141
6.2.3. Experimental study ............................................................................ 143
6.2.4. Set-up and measurements .................................................................. 143
6.2.5. Model ................................................................................................ 145
Stellenbosch University https://scholar.sun.ac.za
xi
6.2.6. Simulation ......................................................................................... 148
6.3. Result and discussion ................................................................................ 149
6.3.1. Total and component-specific electricity usage of the refrigeration
system ............................................................................................... 149
6.3.2. Ventilated packaging design ............................................................. 155
6.3.3. Vertical airflow resistance ................................................................. 157
6.3.4. Evaporator fan speed ......................................................................... 159
6.4. Conclusion ................................................................................................ 161
7. Effects of climatic conditions on cooling characteristics and energy consumption of
apple packed reefer during marine transport ......................................................... 163
7.1. Introduction ............................................................................................... 163
7.2. Materials and methods .............................................................................. 165
7.2.1. Reefer and fruit load .......................................................................... 165
7.2.2. Numerical model and assumptions ................................................... 167
7.2.3. Numerical simulation ........................................................................ 168
7.2.4. Initial and boundary conditions ......................................................... 168
7.3. Result and discussion ................................................................................ 171
7.3.1. Fruit cooling characteristic and temperature profile ......................... 171
7.3.2. Heat load and environmental effect .................................................. 174
7.3.3. Energy consumption .......................................................................... 175
7.4. Conclusion ................................................................................................ 177
8. General summary and conclusions ....................................................................... 178
8.1. Summary and conclusions ........................................................................ 178
8.2. Future prospects ........................................................................................ 181
References .............................................................................................................. 182
Stellenbosch University https://scholar.sun.ac.za
xii
List of Figures
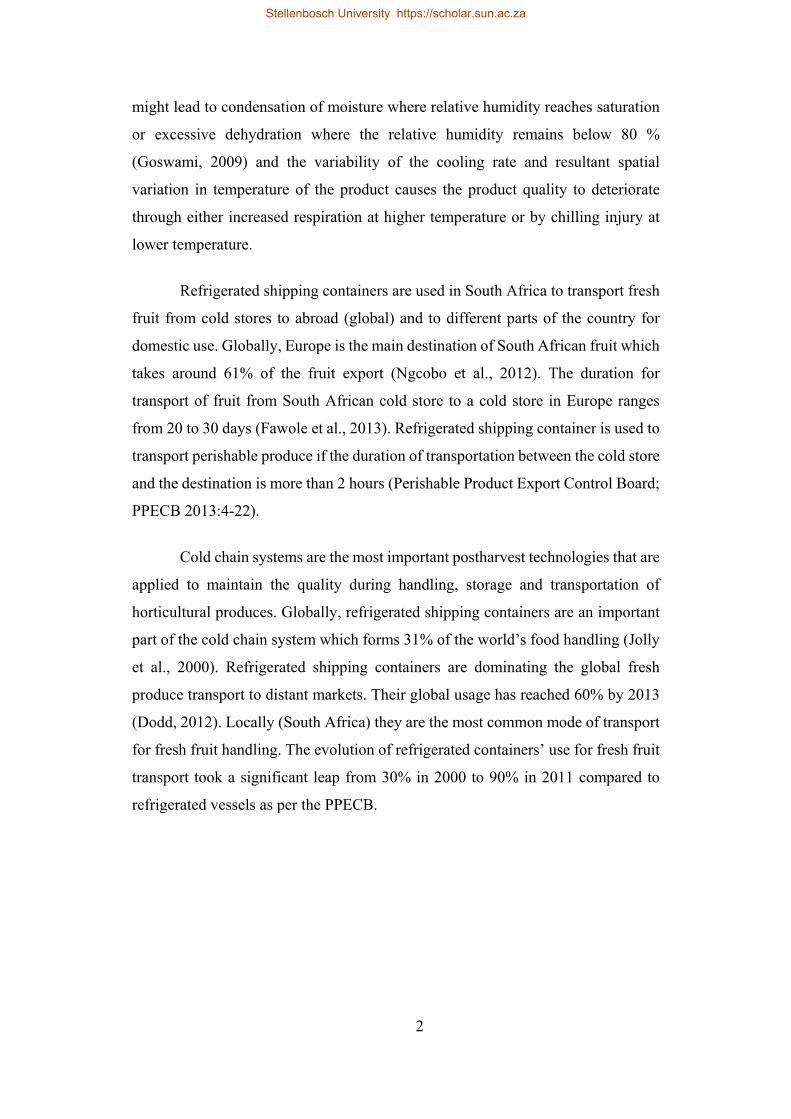
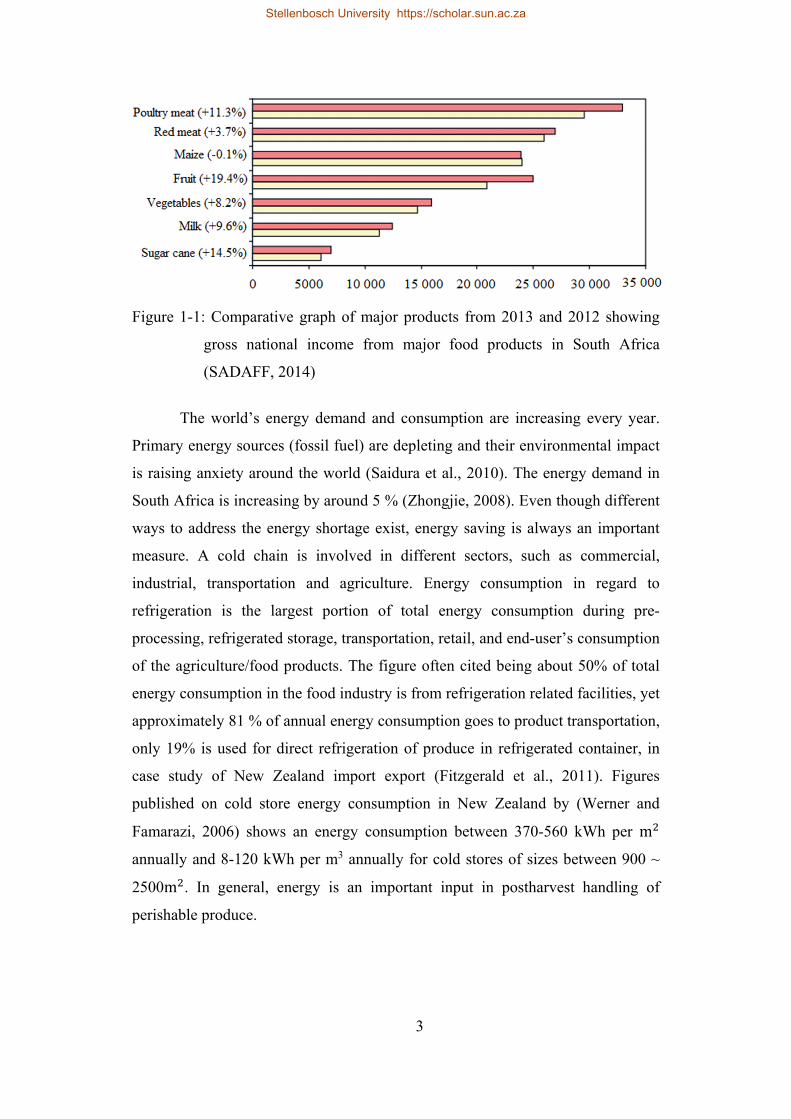
Figure 1-1: Comparative graph of major products from 2013 and 2012 showing
gross national income from major food products in South Africa
(SADAFF, 2014) ......................................................................................... 3
Figure 2-1: Sketch showing the basic structure of partially packed T-bar reefer
container .................................................................................................... 10
Figure 2-2: Influence of the load on the airflow pattern. (a) Streamlines in
unloaded configuration, Laser–Doppler measurements (1100 points).
(b) Streamlines in unloaded configuration, RSM model. (c)
Streamlines in loaded configuration, RSM model. (d) Air velocity
scale (Moureh et al., 2002). ...................................................................... 27
Figure 2-3: Respiration process .................................................................................. 32
Figure 2-4: Effect of vent area on airflow characteristics: (a) air velocity vector,
3% vent area (left), 11% vent area (right); (b) pressure drop, 3% vent
area (left), 11% vent area (right); (c) turbulence kinetic energy, 3%
vent area (left), 11% vent area (right); for superficial velocity of
0.5 m s−1 (Delele et al., 2013b) ................................................................ 34
Figure 2-5: Geometry of the boxes evaluated: standard and Supervent corrugated
fibreboard containers (CFC) and the Ecopack reusable plastic
container (RPC) (Defraeye et al., 2014) ................................................... 45
Stellenbosch University https://scholar.sun.ac.za
xiii
Figure 2-6: Energy required for maintaining the airflow through one layer of
CFCs and two layers of RPC containers modelled until the seven-
eighth cooling time is reached (Defraeye et al., 2014) ............................. 46
Figure 3-1: Schematic showing the Carrier Transicold bottom-air delivery T-bar
reefer (Models 69NT-40-541-306, 314 & 328) (a), closer view of the
T-bar floor structure (b) and the cross sectional view showing the
dimensions of the T-bar (c). ...................................................................... 54
Figure 3-2: Schematics showing the position of the velocity and temperature
sensors inside the T-bar reefer (a) and the candlestick sensors (b). A
total of ninety-nine measurement points were used. ................................. 57
Figure 3-3: Schematics of the model geometry corresponding to a reefer at high
evaporator performance. The model explicitly incorporated the
detailed structure of the reefer floor .......................................................... 60
Figure 3-4: Velocity decay of the air jet from the cooling unit into the T-bar floor
container at high evaporator performance. Numerical and
experimental results .................................................................................. 65
Figure 3-5: The experimental (symbols) and simulated (solid curves) magnitudes
of air velocities as a function of vertical and axial locations inside the
T-bar floor reefer. The locations are 1m from the inlet face (a), 3 m
(b), 6 m (c), 8 m (d), 9 m (e) and 11 m (f) ................................................ 67
Figure 3-6: Air velocity magnitude on a line one meter above the floor at 0.5 of
the width (a) and two third of the width (b) .............................................. 68
Figure 3-7: The measured and simulated characteristics of the air cooling inside
a T-bar floor reefer under high evaporator performance operation (at
Stellenbosch University https://scholar.sun.ac.za
xiv
air exchange rate of ≈ 80 h-1) were compared. Temperature was
measured were averaged over the volume of the reefer............................ 69
Figure 3-8: Simulated airflow pattern on a section plane bisecting the reefers.
Simulation results corresponds to, a) T-bar floor model and, b) Flat
floor model reefers operating at high evaporator performance (c)
airflow pattern for empty slot ventilated enclosure (Moureh et al,
2002) at Inlet velocity=11.5 m s-1 (comparable to high evaporator
performance) ............................................................................................. 70
Figure 3-9: Contours of magnitudes of vertical air velocity on section plan
bisecting the T-bar floor reefer (a) and flat floor reefer (b). Simulation
corresponds to the reefers working at high evaporator performance
with an air flow rate of 5400 m3 h-1 (air exchange rate of ≈ 80 h-1) .......... 72
Figure 3-10: Jet flow characteristics of T-bar floor and flat floor models at high
evaporator performance numerical study (a) and, static pressure
distribution in the domain (b) ................................................................... 73
Figure 3-11: Simulated airflow pattern on a section plane bisecting the reefers.
Simulation results corresponds to, (a) T-bar floor model, (b) Flat floor
model reefers operating at low evaporator performance. ......................... 75
Figure 3-12: Contours of magnitudes of vertical air velocity on section plan
bisecting the T-bar floor reefer (a) and flat floor reefer (b). Simulation
corresponds to the reefers working at low evaporator performance
with an air flow rate of 2500 m3 h-1 (air exchange rate of ≈ 36 h-1) .......... 76
Stellenbosch University https://scholar.sun.ac.za
xv
Figure 3-13: Jet flow characteristics of T-bar floor and flat floor models (a) and,
Static pressure distribution (1 m above the floor) along the length of
the reefer (b) at low evaporator performance numerical study ................. 77
Figure 4-1: Components of the palletized Econo-D box analysed in this study.
(a) a bag of apple fruit each containing approximately 1.5 kg top red
apples, (b) corrugated fibre carton (Econo-D) to contain eight bags of
fruit, (c) pallet formed from 8 layers of boxes with 8 boxes per layer
and, (d) standard wooden pallet on which stacking was formed. ............. 84
Figure 4-2: Schematic showing partially packed bottom-air delivery T-bar reefer
(a) and, closer view of the T-bar floor structure ....................................... 85
Figure 4-3: Schematics showing setup of the wind tunnel experiment to measure
the vertical direction (y-direction) pressure drop characteristic of
palletized fruit stack. Measurements were taken across half a pallet:
(a) top half of a pallet (without wooden pallet) and (b) bottom half of
a pallet with wooden pallet (WWP). (c) Isometric view of the bottoms
half of a pallet. .......................................................................................... 86
Figure 4-4: Schematics of the position of pulp temperature sensors (red circle)
and air velocity sensors (blue circle). (a) Showing the positions of the
temperature and air velocity sensors as seen from top, (b) position of
temperature and air velocity sensors as seen from side of a pallet, (c)
position of airflow sensors in the overhead space and, (d) a snapshot
(door side) of a fully packed reefer wired with the sensors. ..................... 88
Figure 4-5: Pallet arrangement and porous media zonal representation of packed
pallets inside a fully loaded reefer. Top view (a), dimensions of the
Stellenbosch University https://scholar.sun.ac.za
xvi
stack shown on isomeric view of the porous pallet zones and, front
view of the porous zones from the door side of the reefer (c). ................. 93
Figure 4-6: Experimental pressure drop versus superficial air velocity plot for air
flow horizontally and vertically through half a pallet (see Figure 4.3).
The vertical airflow for the bottom half included the flow resistance
of the wooden pallet. ................................................................................. 95
Figure 4-7 Measured and simulated air velocities in the free region between the
two rows inside reefer (a) and in the region above the pallet (in the
region between stack and the reefer ceiling) (b). ...................................... 97
Figure 4-8 Simulated profile of airflow inside a fully loaded reefer. Colour
contours show magnitude of air velocity and arrows (vector) show the
local airflow direction on vertical plane bisecting pallets in row 1 (a),
the air gap between the two rows (b) and pallets in row 2 (c). ................. 98
Figure 4-9 Measured (dashed line) and simulated (solid lines) evolution of pulp
temperatures (pallet averages) inside a fully loaded reefer. Pallets(p)
in row one (R1) p1 to p4 (a), p5 to 9(b) and (c) p9 to p11and, Pallets(p)
in row two (R2) p1 to p3 (d) p4 to p6(e) and p7 to p9(f). The reefer
was loaded with 15 tons of fruit (twenty pallets each holding 768 kg
apple fruit). The reefer was operating at cooling flow rate of 5400 m3
h-1 ............................................................................................................ 100
Figure 4-10: Average cooling rate of fruit in row 1 (blue) and row 2 (red). The
dashed line curves show the measured (experimental) fruit
temperature evolution and the solid line curves show the numerical
predictions. The horizontal lines show half cooling times (dashed
lines) and 7/8th cooling time (solid line) ................................................. 101
Stellenbosch University https://scholar.sun.ac.za
xvii
Figure 4-11 Simulated profile of produce temperature at 24 hour on vertical plane
(YZ-plane) bisecting row 1 (a) and row 2 (2) inside reefer. ................... 102
Figure 4-12: Experimental (red) and numerical (blue) average pallet temperatures
at 24 hours of cooling. (a) Pallets in row 1 and, (b) pallets in row 2.
Vertical lines in Figure 4.12 show standard deviations calculated
based on temperatures at bottom, middle and top of a pallet. ................. 102
Figure 5-1: Schematics of the three package designs examined in this study.
Isometric view of Econo D (a), double layer display carton box (Mk9)
(b) and Telescopic packaging box (Mk6) (c). The right column depicts
the bottom side of the Econo D (d), Mk9 (e) and Mk6 (f) boxes. Sizes
shown correspond to the external dimensions. ....................................... 109
Figure 5-2: Stacking of the packaging boxes in to a pallet. The top row shows the
palletized Econo-D (a) Mk9 (b) and Mk6 (c) packaging designs. The
bottom row shows the corresponding box arrangement of an
individual layer forming the pallet. Notice that pallet of the Mk6
packaging box is stacked in a staggered manner in the top half to
ensure stability ........................................................................................ 111
Figure 5-3: Experimentally obtained pressure loss vs. flow rate profiles of
palletized Mk6 and Mk9 boxes. Pressure loss profiles for horizontal
airflow perpendicular to the width (Mk6-L and Mk9-L) and,
perpendicular to the length (Mk6-W and Mk9-W). The profiles of the
pressure loss along the vertical direction were obtained for the bottom
half of the pallet (Mk6-V-B and Mk9-V-B) and for the top half of the
pallet (Mk6-V-T and Mk9-V-T). The bottom half incorporated the
airflow resistance due the wooden pallets. ............................................. 117
Stellenbosch University https://scholar.sun.ac.za
xviii
Figure 5-4: Vertical airflow velocity profiles in the pallets configured in row 1
and row 2 inside a reefer with the Mk 6 (a)(b), Mk9 (c)(d) and, Econo-
D (e)(f). The simulations correspond to a reefer working at an inlet
airflow and temperature of 5400m3 h-1 and -1 . .................................... 119
Figure 5-5: Average horizontal airflow magnitudes through row1 and row2 inside
a reefer along the Z-axis. Pallets in row 1 and row 2 were configured
with horizontal airflow (Z-direction) across the width and length of
the pallets, respectively. The simulations correspond to a reefer
working at an inlet airflow and temperature of 5400m3 h-1 and -1 . .... 121
Figure 5-6: Temperature contour in time on a horizontal (ZX) plan bisecting the
reefer with the Mk6 (a), Mk9 (b) and Econo-D (c) packaging boxes. .... 124
Figure 5-7: Temperature contour at 72 h on vertical (YZ) planes bisecting row
1(left) and row 2 (right) of the reefer with the Mk6 (a), Mk9 (b) and
Econo-D (c) packaging boxes. ................................................................ 126
Figure 5-8: The produce temperature history (average) in row 1 (broken lines)
and row 2 (solid lines) inside reefer with Mk6 (Blue), Mk9 (green)
and Econo-D (red) boxes. The half cooling time and the 7/8th cooling
time are marked with horizontal broken and solid lines, respectively. ... 127
Figure 5-9: Average vertical airflow distribution as vertical airflow resistance in
the pallets vary from the base model (100%) (Apple fruit packed in
Econo-D) packaging box. Pallet row 1 (a) and, pallets row 2 (b) .......... 128
Figure 5-10: Average horizontal airflow magnitude in Ec-25, Ec-50, Ec-75
models. The horizontal airflow magnitude was calculated from
averaged magnitudes at bottom, middle and top layers of the pallets
Stellenbosch University https://scholar.sun.ac.za
xix
in the respective row in the three models. These were compared with
that of the result found for the base model in pallet row 1 (a) and pallet
row 2 (b) .................................................................................................. 130
Figure 5-11: Average cooling rate of the produce in pallet row 1(broken curves)
and pallet row 2 (full curves) of the reefers palletised with the normal
Econo-D box (black curve), Econo-D with vertical airflow resistance
reduced by 25% (blue curve-Ec-25), 50% (green curve-Ec-50) and
75% (red curve-Ec-75). The broken and full horizontal lines mark the
half cooling time and the 7/8th cooling time, respectively. .................... 132
Figure 5-12: Simulated results showing the effect of the vertical airflow
resistance on the cooling rate inside reefer. The spatial and temporal
temperature evolution of apple fruit in a packed reefer as the vertical
airflow resistance was set 25 % (Ec-25), 50% (Ec-50) and 75 % (Ec-
75) of the base model (No bottom vent packaging design-Econo-D
box). Representative pallets (p) from row 1(R1) a) p2 & p5 b) p8 &
p11 and, from row 2(R2) c) p1& p4 and d) p6& p8 ............................... 134
Figure 5-13: Simulated temperature contours on vertical plans (Z-Y planes)
bisecting pallets in row 1(left) and row 2 (right). The contours
correspond the instantaneous temperature distribution inside the
reefer after cooling the load for 72 hours from initial temperature of
9.5 with cooling air supply at -1 (5400 m3 h-1). (a) Base model
(b) Ec-25 (c)Ec-50 and, Ec-75 (d) .......................................................... 135
Figure 6-1: Schematics of the three package designs examined in this study.
Isometric view of Econo D (a), double layer display carton box (Mk9)
(b) and Telescopic packaging box (Mk6) (c). The right column depicts
Stellenbosch University https://scholar.sun.ac.za

xx
the bottom side of the Econo D (d), Mk9 (e) and Mk6 (f) boxes. Sizes
shown correspond to the external dimensions. ....................................... 142
Figure 6-2: Simplified diagram of refrigeration system of a reefer and
measurement points for power use of (a) total reefer, (b) compressor,
(d) condenser motor and (d)evaporator motors ...................................... 144
Figure 6-3: Configuration of fan motor and evaporator coils (ASHRAE, 2010). .... 146
Figure 6-4: Representation of airflow path inside a fully packed reefer (a) and,
components of the refrigeration unit of a reefer (b) ................................ 147
Figure 6-5: Measured power consumption of reefer operating in “Normal”
control mode (a) and, QUEST control mode (b) during the 72 h
cooling period. Reefer loaded with 15.36 tonnes apple fruit (in Econo-
D box) at 9.5 ⁰C initial produce temperature. Cooling air at 5400 m3
h-1 and -1 ⁰C was supplied. ..................................................................... 150
Figure 6-6: Cumulative heat load of the reefer packed with apple fruit in Econo-
D packaging boxes (a) and, heat load due evaporator fan, respiration
and, conduction from the environment (b). ............................................ 153
Figure 6-7: Measured and predicted energy consumption of the reefer packed
with apple fruit in Econo-D box design during the 72 hours cooling
operation. ................................................................................................ 154
Figure 6-8: Energy consumption of reefers loaded with apple fruits inside Econo-
D packaging box, Mk6 and, Mk9 packaging boxes in a reefer
operating in “Normal” control mode. (a) Transient power use by each
reefer, (b) cumulative energy consumption of each reefer and, (c)
energy consumption per tonne of apple fruit. Solid lines show the
Stellenbosch University https://scholar.sun.ac.za
xxi
power consumption of the reefers and, broken lines show the SECT
of fruit in each reefer. .............................................................................. 156
Figure 6-9: Reefers operating at high, medium and low fan speeds. (a)
Refrigeration heat load and, (b) average temperature evolution during
high, medium, low and variable speed fan. Variable speed used high
speed - 8100 m3 h-1 (0-40 hours), medium speed - 5400 m3 h-1 (40-55
hours) and, low speed - 2700 m3 h-1 (55-72 hours) ................................. 160
Figure 6-10: Energy consumption associated with evaporator fan of the reefers
operating at high, medium, low and variable fan speeds. High speed -
8100 m3 h-1 (0-40 hours), medium speed - 5400 m3 h-1 (40-55 hours)
and, low speed - 2700 m3 h-1 (55-72 hours) ............................................ 161
Figure 7-1: (a) Reefer container ship on route, (b) apple export route from South
Africa to
Europe and, (c) annual average wind speed map (https://www.windfi
nder.com/weather-maps/forecast/#3/5.79/-18.54) .................................. 166
Figure 7-2: Effects of climatic conditions on fruit temperature inside a reefer. (a)
Reefers in different climatic conditions (20, 40, 0 and 7.2 m s-1
wind speed) and adiabatic condition. (b) Fruit temperature evolution
in a reefer during nine days of marine transportation through
successive climatic conditions (20, 40 and 0 and 7.2 m s-1 wind
speed) ...................................................................................................... 172
Figure 7-3: Effects of heat conduction through the walls of the reefer on fruit load
adjacent the side walls of the reefer. Temperature profile on a plane
bisecting the reefer horizontally at the middle (5.8 m from cooling
unit) of the reefer after 3 days in (a) 20, (b) 40 and, (c) 0 ambient
Stellenbosch University https://scholar.sun.ac.za
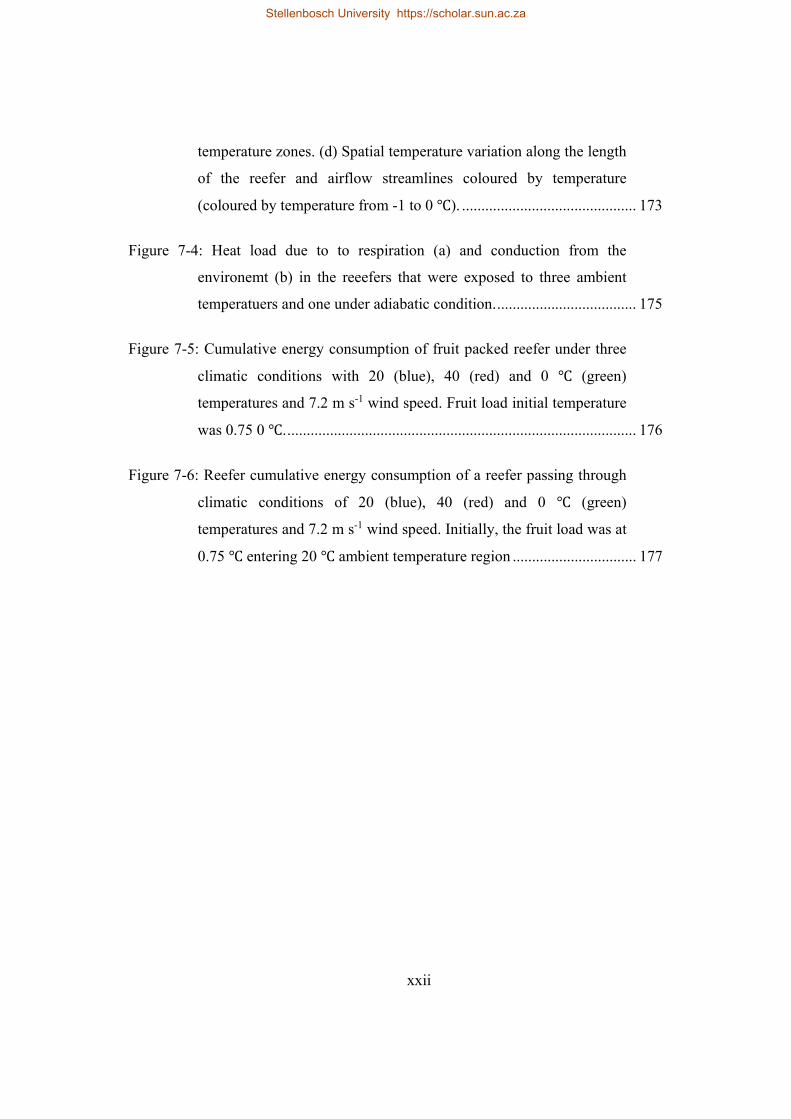
xxii
temperature zones. (d) Spatial temperature variation along the length
of the reefer and airflow streamlines coloured by temperature
(coloured by temperature from -1 to 0 ). ............................................. 173
Figure 7-4: Heat load due to to respiration (a) and conduction from the
environemt (b) in the reeefers that were exposed to three ambient
temperatuers and one under adiabatic condition. .................................... 175
Figure 7-5: Cumulative energy consumption of fruit packed reefer under three
climatic conditions with 20 (blue), 40 (red) and 0 (green)
temperatures and 7.2 m s-1 wind speed. Fruit load initial temperature
was 0.75 0 . .......................................................................................... 176
Figure 7-6: Reefer cumulative energy consumption of a reefer passing through
climatic conditions of 20 (blue), 40 (red) and 0 (green)
temperatures and 7.2 m s-1 wind speed. Initially, the fruit load was at
0.75 entering 20 ambient temperature region ................................ 177
Stellenbosch University https://scholar.sun.ac.za
xxiii
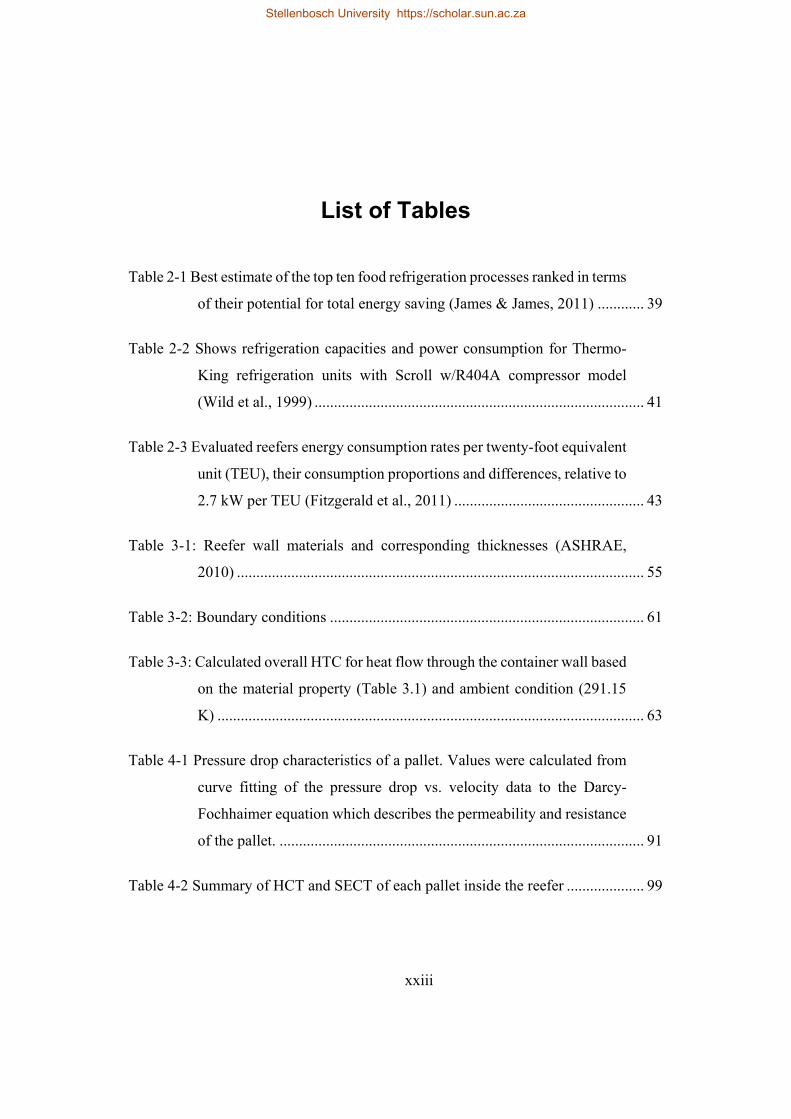
List of Tables
Table 2-1 Best estimate of the top ten food refrigeration processes ranked in terms
of their potential for total energy saving (James & James, 2011) ............ 39
Table 2-2 Shows refrigeration capacities and power consumption for Thermo-
King refrigeration units with Scroll w/R404A compressor model
(Wild et al., 1999) ..................................................................................... 41
Table 2-3 Evaluated reefers energy consumption rates per twenty-foot equivalent
unit (TEU), their consumption proportions and differences, relative to
2.7 kW per TEU (Fitzgerald et al., 2011) ................................................. 43
Table 3-1: Reefer wall materials and corresponding thicknesses (ASHRAE,
2010) ......................................................................................................... 55
Table 3-2: Boundary conditions ................................................................................. 61
Table 3-3: Calculated overall HTC for heat flow through the container wall based
on the material property (Table 3.1) and ambient condition (291.15
K) .............................................................................................................. 63
Table 4-1 Pressure drop characteristics of a pallet. Values were calculated from
curve fitting of the pressure drop vs. velocity data to the Darcy-
Fochhaimer equation which describes the permeability and resistance
of the pallet. .............................................................................................. 91
Table 4-2 Summary of HCT and SECT of each pallet inside the reefer .................... 99
Stellenbosch University https://scholar.sun.ac.za
xxiv
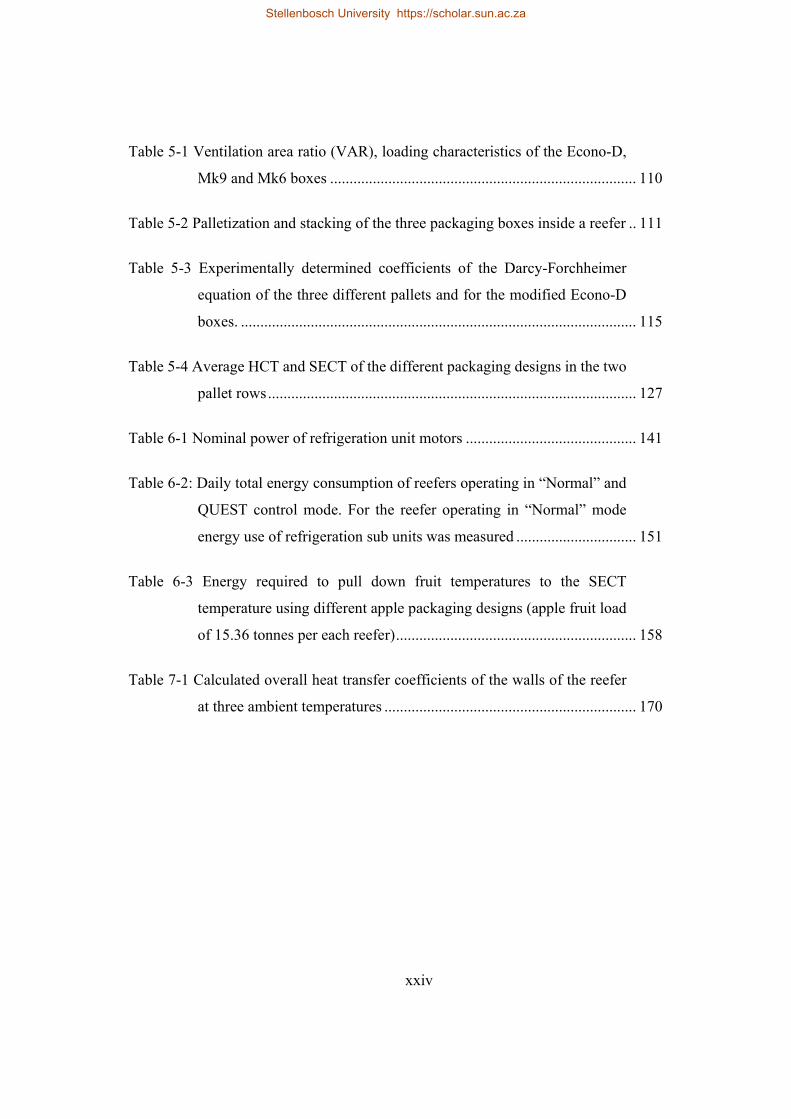
Table 5-1 Ventilation area ratio (VAR), loading characteristics of the Econo-D,
Mk9 and Mk6 boxes ............................................................................... 110
Table 5-2 Palletization and stacking of the three packaging boxes inside a reefer .. 111
Table 5-3 Experimentally determined coefficients of the Darcy-Forchheimer
equation of the three different pallets and for the modified Econo-D
boxes. ...................................................................................................... 115
Table 5-4 Average HCT and SECT of the different packaging designs in the two
pallet rows ............................................................................................... 127
Table 6-1 Nominal power of refrigeration unit motors ............................................ 141
Table 6-2: Daily total energy consumption of reefers operating in “Normal” and
QUEST control mode. For the reefer operating in “Normal” mode
energy use of refrigeration sub units was measured ............................... 151
Table 6-3 Energy required to pull down fruit temperatures to the SECT
temperature using different apple packaging designs (apple fruit load
of 15.36 tonnes per each reefer) .............................................................. 158
Table 7-1 Calculated overall heat transfer coefficients of the walls of the reefer
at three ambient temperatures ................................................................. 170
Stellenbosch University https://scholar.sun.ac.za
1
Chapter1
1. General introduction
1.1. Background and motivation
The primary agricultural sector of South Africa contributes 3 % to the
country’s gross domestic product (GDP), and the entire chain of agricultural sector
contributes about 12 % (South African Department of Agriculture, Forestry and
Fishery (SADAFF), 2014). Perishable produce of the country is an important
section of the agricultural sector and brings foreign exchange from its export. Figure
1.1 shows recent gross income from different agricultural products (2012 to 2013).
The maximum income increment was exhibited by fresh fruits (19.4 %). Some of
the perishable produce is consumed locally. It is part of daily nutrition in the
country. The local consumption of fruits has increased by 11.4 % from 2012 to
2013; however, the price of fruit has increased by 8.9 % (SADAFF, 2014). There
could be a number of factors for price increase, such as production cost,
transportation cost, and rising energy price.
Fresh horticultural and agricultural products are living organisms that carry
on many biological processes essential to maintain life. Energy that is needed for
these life processes comes from the accumulated food reserves through a process
called respiration. The final result of respiration activity is product deterioration and
senescence, and hence achieving as low a respiration rate as possible is desirable to
prolong the shelf life of biological materials (Brosnan, 2001). For this the product
needs to be cooled to low temperature, however, during extensive transport period
packed fruits are subject to heat and mass transfer with the environment. In addition,
uniform cooling in bulk within shipping container is difficult to attain, owing to
existence of an uneven distribution of the airflow which results in considerable
temperature and humidity differences within the product. Non-uniform humidity
Stellenbosch University https://scholar.sun.ac.za
2
might lead to condensation of moisture where relative humidity reaches saturation
or excessive dehydration where the relative humidity remains below 80 %
(Goswami, 2009) and the variability of the cooling rate and resultant spatial
variation in temperature of the product causes the product quality to deteriorate
through either increased respiration at higher temperature or by chilling injury at
lower temperature.
Refrigerated shipping containers are used in South Africa to transport fresh
fruit from cold stores to abroad (global) and to different parts of the country for
domestic use. Globally, Europe is the main destination of South African fruit which
takes around 61% of the fruit export (Ngcobo et al., 2012). The duration for
transport of fruit from South African cold store to a cold store in Europe ranges
from 20 to 30 days (Fawole et al., 2013). Refrigerated shipping container is used to
transport perishable produce if the duration of transportation between the cold store
and the destination is more than 2 hours (Perishable Product Export Control Board;
PPECB 2013:4-22).
Cold chain systems are the most important postharvest technologies that are
applied to maintain the quality during handling, storage and transportation of
horticultural produces. Globally, refrigerated shipping containers are an important
part of the cold chain system which forms 31% of the world’s food handling (Jolly
et al., 2000). Refrigerated shipping containers are dominating the global fresh
produce transport to distant markets. Their global usage has reached 60% by 2013
(Dodd, 2012). Locally (South Africa) they are the most common mode of transport
for fresh fruit handling. The evolution of refrigerated containers’ use for fresh fruit
transport took a significant leap from 30% in 2000 to 90% in 2011 compared to
refrigerated vessels as per the PPECB.
Stellenbosch University https://scholar.sun.ac.za
3
Figure 1-1: Comparative graph of major products from 2013 and 2012 showing
gross national income from major food products in South Africa
(SADAFF, 2014)
The world’s energy demand and consumption are increasing every year.
Primary energy sources (fossil fuel) are depleting and their environmental impact
is raising anxiety around the world (Saidura et al., 2010). The energy demand in
South Africa is increasing by around 5 % (Zhongjie, 2008). Even though different
ways to address the energy shortage exist, energy saving is always an important
measure. A cold chain is involved in different sectors, such as commercial,
industrial, transportation and agriculture. Energy consumption in regard to
refrigeration is the largest portion of total energy consumption during pre-
processing, refrigerated storage, transportation, retail, and end-user’s consumption
of the agriculture/food products. The figure often cited being about 50% of total
energy consumption in the food industry is from refrigeration related facilities, yet
approximately 81 % of annual energy consumption goes to product transportation,
only 19% is used for direct refrigeration of produce in refrigerated container, in
case study of New Zealand import export (Fitzgerald et al., 2011). Figures
published on cold store energy consumption in New Zealand by (Werner and
Famarazi, 2006) shows an energy consumption between 370-560 kWh per m
annually and 8-120 kWh per m3 annually for cold stores of sizes between 900 ~
2500m . In general, energy is an important input in postharvest handling of
perishable produce.
Stellenbosch University https://scholar.sun.ac.za
4
In order minimize unnecessary energy waste in refrigerated shipping
container system, it needs to be designed to be energy efficient and provide high
cooling capacity to ensure rapid pull down to carriage temperature and to maintain
produce quality. Improper operation and design cause a significant waste of energy.
This avoidable waste of energy results in unnecessary economic loss. Energy use
in a shipping container is affected by the amount of heat the refrigeration equipment
must remove, packaging designs, and the efficiency of the equipment. The main
sources of heat in a shipping container, which are similar to cold chain facility for
long-term storage, are transmission through walls, evaporator coil fans, air leakage,
and respiration of the packed produce (Thomson, 2001).
Study and optimization of shipping container system requires extensive
experimentation which may need considerable amount of capital. However,
numerical modelling offers an economic alternative to physical experiments,
although it is imperative that the reliability of the model be established through
validation against experimental data. (Zou et al., 2006a,b) has developed a
computational fluid dynamics (CFD) modelling system of the airflow patterns and
heat transfer inside ventilated packages. If information on packaging system,
cooling conditions, produce properties is used as model input data, the results
obtained can predict the effects of these factors on the airflow patterns and cooling
rate.
CFD is a simulation tool for the modelling of fluid flow problems based on
the solution of the governing flow equations. Early applications of CFD were
devoted to crucial industrial problems in aeronautic or nuclear applications. In
1970-1980’s, the power of digital computers became sufficient to perform
calculations within acceptable time frames and CFD was applied to a wider range
of problems. CFD is becoming an extensively used design tool, thanks to the ever-
growing power of affordable personal computers (Smale, et al, 2006). CFD can be
successfully applied to numerous problems, not only for modelling the fluid flow
but also for modelling transfer of heat, mass (transpiration or dissolution), phase
change (freezing, melting or boiling), chemical reactions (combustion or rusting),
Stellenbosch University https://scholar.sun.ac.za
5
mechanical movements (impellers, pistons, fans or rudders) and stress or
deformation of related structures (Xia, 2002).
Nowadays, cooling operation management in many refrigerated shipping
containers and cold stores is difficult to consider as rational, which is always a
practical problem for reducing the cost of energy and improving the homogeneity
of temperature though out the packed produce. CFD knowledge is a useful tool to
have a profound understanding of the process with great benefits with small cost.
Validated mathematical model that take into account the physical, chemical and
biological processes is viable alternative. Validated mathematical models can
answer ‘what if’ questions in a relatively cheaper way. CFD modelling technique
is the primary method of choice for modelling transport processes during
postharvest handling of horticultural products.
1.2. Research objective and scope
The main aim of this research is to develop and validate a CFD model
applicable to a refrigerated shipping container of fresh fruit that is capable of
predicting the total energy consumption of the system and then apply the validated
model for improving the operation and thermal design of shipping containers.
Specific objectives
Development of CFD model of shipping container, taking into account
produce properties, operational parameters and container and package
design parameters
Conducting model validation experiments on power consumption of
commercial shipping container
Studying the effect of different operational and design parameters on energy
consumption of shipping containers
Stellenbosch University https://scholar.sun.ac.za
6
1.3. Thesis outline
Chapter 2 provides background knowledge necessary to support the
remainder of the work presented in this literature study.
Chapter 3 Numerical model of an empty refrigerated container development
and model validation using experimental work to predict airflow and heat transfer
process in the domain. The validated model was also used to study two evaporator
performance levels/container air recirculation rates and to evaluate the effect of the
T-bar floor design on the overall airflow characteristics.
Chapter 4 addresses the model development and validation of a zonal porous
medium computational fluid dynamic (CFD) model of airflow and produce cooling
inside a fully loaded refrigerated shipping container (reefer). Wind tunnel test was
used to obtain the pressure drop characteristics of palletized stack of apple fruit to
determine coefficients in Darcy-Forchheimer equation for porous media
calculation.
Chapter 5 provides numerical evaluation of the effects of apple packaging
box designs and pallet stacking configuration on the airflow distribution and fruit
cooling uniformity in a produce packed reefer using a validated model.
Experimental and numerical study of energy consumption in reefer loaded
with stacks of apple fruit is discussed in Chapter 6. The effect of ventilated
packaging designs on energy consumption inside a reefer are evaluated. In addition,
the effect of evaporator fan on energy consumption was studied by simulating fruit
packed reefers operating at low, medium, high and variable evaporator fan speeds
were investigated.
Chapter 7 addresses the study on the impact of environmental conditions on
fruit packed reefers as they are shipped and has to pass thorough different ambient
temperature regions over long and extended period. Finally, chapter 8 offers
concluding remarks and future prospects.
Stellenbosch University https://scholar.sun.ac.za
7
Chapter2
2. Literature review on refrigerated shipping
container modeling and energy use
2.1. Introduction
Refrigerated shipping containers are one of the four segments of the cold
chain; cooling and storage; refrigerated transport; distribution centre and
refrigerated display in super markets. The term reefer has become an established
term to refer refrigerated shipping containers and we will use this term in rest of
this study. Heat transfer during produce cooling in a reefer principally takes place
by the convective heat transfer mechanism. Cooling air from the evaporator fans is
supplied into the container where it will be forced to flow in from the bottom (for
bottom delivery system reefers) then between the pallets, through packed produce,
and between the pallet and the ceiling, respectively before it reaches the outlet.
Energy consumption in reefers depends on its status, operational conditions and
design parameters. In order to understand and quantify the energy consumption, it
is imperative to understand the governing phenomena, airflow and heat transfer.
Researchers have been developing mathematical models to predict airflow
and heat transfer modelling for the last 30 years (Smale et al., 2006). Previous
reviews on mathematical modelling approaches in postharvest applications
discussed the growth in use and acceptance of CFD for modelling transport
phenomena in cold chain systems (Ambaw et al., 2013; Dehghannya et al., 2010;
Defraeye et al., 2015c; James et al., 2006; Norton and Sun 2006; Redding et al.,
2016; Smale et al., 2006; Wang and Sun 2003; Xia et al., 2002; Zhao et al., 2016).
However, it is still difficult to develop an explicit model of huge domains, such as
a packed reefer or packed cold store, therefore smart approximations are still
Stellenbosch University https://scholar.sun.ac.za
8
necessary. Mathematical modelling of airflow and heat transfer in refrigerated
transport systems (reefers and trailers) has been conducted by several researchers
(Defraeye et al., 2015a; Menia et al., 2002; Moureh et al., 2002; Moureh and Flick,
2004; Moureh and Flick, 2005; Moureh et al., 2009a, b; Rodríguez-Bermejo et al.,
2007; Smale, 2004) to improve the airflow pattern in order to achieve an efficient
cooling operation.
The aim of this chapter is to review airflow and heat transfer modelling
approaches, such as Resistance network and Computational Fluid Dynamics (CFD)
that are applicable for reefer modelling. Detail review on porous media modelling
approach in postharvest handling of packed produce and previous studies conducts.
In addition, reefer energy consumption quantification and factors that affect energy
consumption in will be discussed reviewed based on previously conducted studies
(experimental, analytical and numerical methods).
2.2. Reefers
Refrigerated transport is an important part of the cold chain system,
particularly in South Africa where integration of supply chain needs improvement
(Dodd, 2012). Reefers used for temperature controlled transport are basically
similar in construction however they have differences in the type of insulation,
structure for conditioned air circulation, and refrigeration system.
2.2.1. Types of reefers
Reefer containers are usually 2.44 m wide (8ft), 2.44 to 2.89 m high (8 to
9.5 ft) and 6 or 12.19 m long (20 or 40 ft) (ASHRAE, 2009). A reefer has hinged
doors in one end for cargo loading and other access to the interior. They usually
have polyurethane insulation at 7.62 cm thickness (3 in.) in walls and floors, and
10.16 cm (4 in.) in ceilings. As shown in Figure 2.1, containers have standardized
corner fittings to secure them to vessels, railway cars, and highway vehicles. There
are four container floor types (T-bar, Castellated Plate, Perforated and Flat floor
Stellenbosch University https://scholar.sun.ac.za
9
with pallet base for airflow) from which to choose from (Smale, 2004). Each of the
floor designs provide different advantages and have different limitations.
T-Bar floor: - The grid running along the length of the reefer commonly
known as a T-bar floor, taking its name from the T-shaped cross-section of
aluminium extrusions that forms the floor. Difficult to walk on, to load pallets using
machines with wheels (this can be solved by using plywood on the floor for wheels
which can be removed after loading), can be damaged by forklift and difficult to
keep clean are the limitations of T-bar floor. The floors have lots of different
advantages regarding the refrigeration process. Its floor design helps air flow by
allowing the cold air to travel around the container from the refrigeration unit
underneath the pallets by channelling the flow. In addition, pallets form an
additional space between container floor and cargo; also form an air flow channel.
This provides the cooling process with a system to increase efficiency in terms of
effectiveness. In a flat floor container pallet bases create space that facilitate airflow
(Smale, 2004).
Perforated floor: - It gives less obstruction to airflow and better distribution
in containers than castellated floors, but they are difficult to clean unless they are
removable (Smale, 2004).
Castellated floors: - This floor type is a floor with a rectangular grooving
running from inlet side to the door side. It has holes for vertical airflow distribution.
It is known for its strength and to its easy to clean structure. The airflow is
obstructed due to reduction in free area (Smale, 2004).
In marine transport there are three types of reefer based on their
configuration. They are conventional reefer vessels, porthole containers and
integral refrigerated. Conventional reefer vessels carry their cargo in large
refrigerated holds. Usually porthole container is not referred as refrigerated
container because it has no integral refrigeration unit. The lack of a refrigeration
unit allows such containers to have a larger internal volume. It has sealable holes
Stellenbosch University https://scholar.sun.ac.za
10
that are located on the front and are used for refrigerated air circulation. The
container is supplied with cold air via the central cooling plant. While on shore
these containers need to be attached to a clip-on refrigeration system to maintain
the cold environment of the inside. The use of this type of containers has decreased
because the lack of clip-on refrigeration units at ports and flexibility of integral
container has improved. Integral refrigerated container has a built into refrigeration
unit attached to its end and it only need a power supply. These containers are the
ones that are widely used in shipping industry today.
Depending on their design, integrated containers get the refrigerated air
supply either at the floor (bottom air delivery) level or at the ceiling (top air
delivery) level. The greater percentage of integral containers currently in service
has bottom air delivery configuration. The air flows through grill on the floor and
returns back to the refrigeration unit, after passing vertically through packed
produce, via the space between the top of the cargo and the ceiling of the container
(this headspace is called false-channel). The floor of integral containers is usually
an aluminium T-bar floor running from the inlet along the length of the container.
Figure 2-1: Sketch showing the basic structure of partially packed T-bar reefer container
Stellenbosch University https://scholar.sun.ac.za
11
2.2.2. Working principle and packaging/stuffing of reefer
Cold air is constantly circulated through the cargo space to dissipate heat.
Cold air is blown at relatively high velocities through a small inlet section located
adjacent to or near the ceiling the refrigeration unit through the grids in the ducted
floor and then drawn off again below the container ceiling on the same side as the
inlet. The circulating fans then force the air through the air cooler, which also acts
as an evaporator in the cold circuit, and back through the gratings into the cargo.
Ethylene and CO2 produced from respiration of the produce in the container are
regularly removed by ventilating via the fresh air exchange vents (considering the
air outside is ethylene free). Air pressure caused by the fan across the vents will
allow fresh air in through one vent and ethylene containing air through the other
vent. Fresh air exchange rates vary widely depending on the source of the
information, for example, suggested rates for apples in a 40' container ranged from
264 m3 h-1 (Smale, 2004) to just 10 m3 h-1 (Irving, 1997). However excessive fresh
air exchange increases the heat and moisture load on the container unnecessarily
which will eventually affect the efficiency of the container as infiltration would.
Stuffing or arranging load into a reefer container depends on the product
airflow requirements. With any arrangement patterns, pallets must cover the entire
T-bar floor to ensure proper distribution of refrigerated air. However, not all
palletized cargo or, irregular shaped goods, can be stuffed in this way. In that case,
when the load does not cover the entire T-floor, it is important to put cover where
no cargo is stuffed in order to avoid short-circuiting of the circulating air (PPECB,
2013; Moureh and Flick, 2004). The height of the cargo must not exceed the red
cargo load line, which shows maximum allowed cargo height, so that ample free
space is left above the stow to ensure proper air circulation around the load (PPECB,
2013).
Inside a reefer container the airflow is influenced by the type of packaging
and the method of arrangement used. The type of load also affects the cooling
airflow rate and energy consumed. In the case of pre-cooled frozen load transport
Stellenbosch University https://scholar.sun.ac.za
12
(<-10 °C) small fluctuation in temperature does not affect the load significantly
therefore the reefer’s compressor can be switched on and off to regulate internal
temperature (frozen mode operation) (Wild, 2009). Since no heat has to be
dissipated from the loads themselves the cooling air flows merely to remove the
heat which penetrates the insulation from outside (ASHRAE, 2009). Frozen type of
load will consume less energy than chilled produce load (Fitzgerald et al., 2011).
When the reefer is loaded with chilled produce, normally the fans operate at full
speed since the temperature has to be kept very close to set point to maintain quality
of the respiring load (chilled mode operation) (ASHRAE, 2009). However, the
recent development and implementation of QUEST I&II (QUality and Energy in
Storage and Transport,) programs, that have a protocol designed to reduce the
energy consumption of the unit by avoiding inefficient part‐load compressor
operation andoptimizing evaporator fan speedwithheat load, showed the
mechanismthatavoidsfullspeedfanoperation Lukasse et al., 2011 .
2.3. Modelling airflow and heat transfer in reefer
Modelling of transport phenomena in reefer can be studied by considering
the airflow or the temperature of the product. Complete models combine both and
deal with the temporal features of transportation: fluctuating ambient conditions,
packaging orientation, product removal/loading, etc. All long-distance transport
systems, such as, trailers and reefer can be considered mobile refrigerated units and
share most of the processes and mechanisms that occur in cold store facilities.
Therefore, some of the modelling approaches applied for cold stores can be
considered relevant to transport systems with little change being required to the
inherent model. The common denominators for cold stores and reefer are climatic
changes, effect of environmental condition on heat transfer with external wall, sun
radiation and infiltration of air from the environment.
Modelling packed agricultural produce has evolved significantly in last few
decades (Ambaw et al., 2013). However, due to computational power limitation,
complicated property of produce and geometrical complexity of packed produce,
Stellenbosch University https://scholar.sun.ac.za

13
development of an efficient model that is capable of simulating the real
phenomenon remains a challenge. This problem particularly prominent in large
domains such as reefers, trailers and, cold stores. The significant improvement in
computing technology made higher level of detailed modelling and simulation
possible. In addition, researchers have been trying different techniques that can
alleviate the problem. One method to minimize computational cost is employing
porous media modelling approach (Alvarez and Flick, 2007; Ambaw et al., 2013;
Delele et al., 2012; Hoang et al., 2015; Moureh et al., 2009a, b; Tapsoba et al.,
2006). In this section the techniques applied in modelling reefer so far will be
discussed.
2.3.1. Resistance network modelling
Resistance network models have been used by civil engineers in the design
of water distribution system in which pipe network (hydraulic network) analysis is
conducted using Hardy-Cross method (Cross, 1936). Before CFD application for
airflow prediction inside a reefer, Van der Ree et al. (1974) developed a simple
channel network model and solved using a finite element program called BERTEM
but there was no validation of the model and the results were only used for
qualitative observations. The airflow model did not include momentum and
moisture loss also was not taken into account. The model was based on vertical air
velocities in the crevices between the stacks of boxes which were calculated from
the crevice sizes and the overall air circulation rate assuming equal pressure fields
above and below the stack and laminar flow throughout. Similarly, Meffert and van
Beek (1983) developed a resistance network model to predict airflow in the cargo
space of transport equipment using electric analogy for laminar flow. The pressure
drop is calculated by, equation 2.1.
∆P Qβ 2.1
Stellenbosch University https://scholar.sun.ac.za
14
Where, Q is fluid volumetric flow (m3 s-1) and β is laminar resistance
(Pa s m-3).
As computational power increase, the algorithms improved. Wood and
Rayes (1981) discussed two basic approaches which solve mass and energy
equations; the first approach known as solving the node equations treats the
pressure at convergent/divergent points as unknowns and solves the mass balances
at each point. The second approach, known as solving the loop equations, treats
flow rates as the unknowns in energy equations around primary loops and again
solves mass balances at convergent/divergent points. The solution for the node
equations was when small error in pressure caused large error in flow rates for low
resistance pipes. The authors found the loop equations were more likely to
converge.
The resistance network model developed by Wang and Touble (1988) to
predict mass and heat transfer resulted in a significant error but showed some level
of agreement with experimental results. Later Wang (1990) used CFD code
Phoenics and k- turbulence model to predict airflow, temperature and moisture
transport. The modelling was conducted in two steps to shorten computational time;
airflow modelling (steady state) followed by heat and mass transfer modelling
(unsteady state) by neglecting buoyance force due to natural convection. The model
was validated only on temperature measurements. Air velocity was not measured
therefore the validity model cannot be confirmed. Menia et al. (2002) developed a
simplified resistance network model to predict airflow inside a scaled model of top
air-delivery refrigerated vehicle loaded with pallets. The vehicle was divided into
four quarters as shown in Figure 2-2.
Stellenbosch University https://scholar.sun.ac.za
15
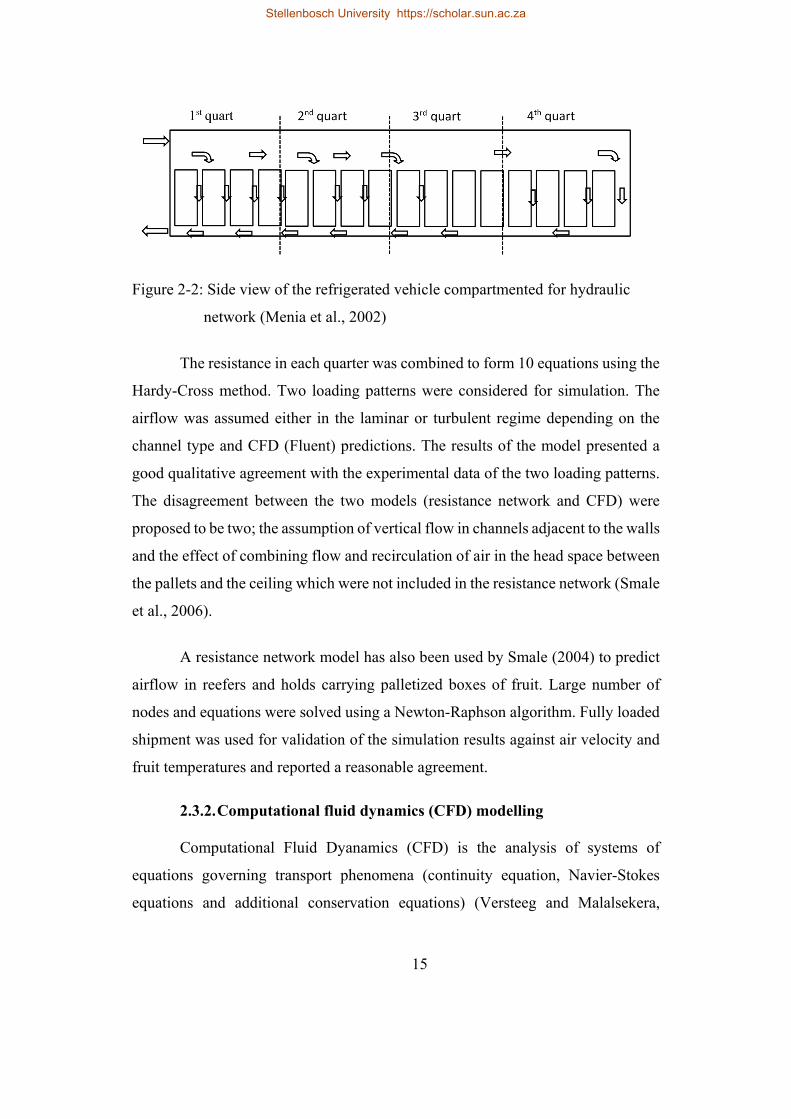
Figure 2-2: Side view of the refrigerated vehicle compartmented for hydraulic
network (Menia et al., 2002)
The resistance in each quarter was combined to form 10 equations using the
Hardy-Cross method. Two loading patterns were considered for simulation. The
airflow was assumed either in the laminar or turbulent regime depending on the
channel type and CFD (Fluent) predictions. The results of the model presented a
good qualitative agreement with the experimental data of the two loading patterns.
The disagreement between the two models (resistance network and CFD) were
proposed to be two; the assumption of vertical flow in channels adjacent to the walls
and the effect of combining flow and recirculation of air in the head space between
the pallets and the ceiling which were not included in the resistance network (Smale
et al., 2006).
A resistance network model has also been used by Smale (2004) to predict
airflow in reefers and holds carrying palletized boxes of fruit. Large number of
nodes and equations were solved using a Newton-Raphson algorithm. Fully loaded
shipment was used for validation of the simulation results against air velocity and
fruit temperatures and reported a reasonable agreement.
2.3.2. Computational fluid dynamics (CFD) modelling
Computational Fluid Dyanamics (CFD) is the analysis of systems of
equations governing transport phenomena (continuity equation, Navier-Stokes
equations and additional conservation equations) (Versteeg and Malalsekera,
Stellenbosch University https://scholar.sun.ac.za
16
1995). In CFD modelling the real geometry of the system is discretized and Navier-
Stokes equation for mass, momentum and energy are solved using the appropriate
numerical methods such as finite difference, finite element and finite volume. The
application of CFD by food engineers began in the 1990s, which has become a
common practice in the postharvest research areas. There are numerous commercial
CFD codes that are supported on different platforms, to name a few common ones
Fluent, CFX, Phoenics, Star-CD. Xia and Sun (2002) listed more commercial codes
and discussed the common commercial codes in detail.
Numerical modelling techniques have been applied to study, optimize and
design processes that are related to horticultural produce cooling, storage and
handling (Alvarez et al., 2003; Defraeye et al., 2015b; Delele et al., 2009a, b; Delele
et al., 2012; Ferrua and Singh, 2007; Hoang et al., 2003; Hoang et al., 2015; Tanner
et al., 2002a, b; Verboven et al., 2006; Xie, et al., 2006; Xu and Burfoot, 1999; Zou
et al., 2006a, b). The studies showed the applicability of mathematical models in
predicting airflow, heat and mass transfer and were used to study the effects of
different operational and design parameters in cold chain systems. However,
application of numerical method such as CFD in postharvest handling systems has
challenges due to the geometrical complexity and size of the produce packed
systems (cold store, reefer, display cabinet) that requires high computational power
to solve transport phenomena equations.
Researchers used different techniques to employ CFD in their study. For
example, Xie, et al. (2006) in their study of the effects of design parameters on flow
and temperature fields of a cold store considered the product load as a solid domain.
The authors employed a k- turbulence model with wall functions to model a 2D
CFD model and a relatively coarse mesh. The application of coarse mesh minimized
computational power requirement but limited the accuracy of the model, whereas
the simplification of the actual 3D to 2D caused loss in connectivity of air spaces
and flow condition. However, the error encountered was not significant in
predicting temperature field in that particular study (Ambaw et al., 2013) and
Stellenbosch University https://scholar.sun.ac.za
17
similar result was found in temperature profile studies in a stack using 2D models
(Xie, et al., 2006; Alvarez and Flick, 2007; Dehghannya et al., 2011). In other
studies, researchers used scaling (Defraeye et al., 2015b; Lovatt et al., 1993;
Moureh et al., 2002; Yu and Hoff, 1999) symmetry (Moureh and Flick, 2004) and
a porous media approach (Bakker-Arkema et al., 1969; Hoang et al., 2000; Mirade
et al., 2005; Verboven et al., 2004; Moureh et al., 2009a, b; Delele et al., 2013a, b;
Ambaw et al., 2014) to apply CFD for complex and enormous cold chain systems.
Recently CFD porous media modelling approach has become a common
technique in postharvest applications due to its advantage in addressing the
computational power limitation and capability of representing the dynamic flow
effects on a macroscopic level, adequately (Ambaw et al., 2013; Hoang et al., 2015).
Porous media modelling concept
Fruits in cold stores or reefer are packed in bulk with boxes and stacked in
a pallet. These bulk packed fruits can be treated as porous media (Bakker-Arkema
et al., 1969). The porous media approximation is a common technique in
postharvest applications due to its advantage in addressing the computational power
limitation and adequately represents the dynamic flow effects on a macroscopic
level since it relates particle size, shape, alignment with airflow and void fraction
to the pressure drop over the modelled object (Zou et al., 2006a, b; Norton and Sun,
2006; Verboven et al., 2006). This assumption has become common approach in
recent years in modelling of cold store and reefer stacked with fruits (Hoang et al.,
2000; Mirade et al., 2005; Verboven et al., 2004; Moureh et al., 2009a, b; Delele et
al., 2013a, b;Ambaw et al., 2014).
Airflow in porous media
Darcy experimentally concluded that fluid flow rate was proportional to the
pressure loss and the cross-sectional area and inversely proportional to the length
of the flow path. The famous Darcy's Law is written as follows:
Stellenbosch University https://scholar.sun.ac.za
18
ΔPμκu 2.2
Where μ (kgm s ) is the dynamic viscosity of the fluid and κ (m ) the
permeability of the porous medium, u is the superficial velocity. Nearly all
engineering calculations for porous media flow problems have originated from
Darcy's Law and/or purely empirical determinations. Later Dupuit (1863) has
proved empirically, that Darcy's Law is limited to very low velocity and becomes
invalid when inertial forces become effective. Since then, several related theories
and approaches have been developed to approximate the flow of fluid through
porous media. Darcy-Forchheimer equation, which includes a quadratic term,
describes flow in high velocity scenarios (equation 2.3).
Δ | | 2.3
The original Ergun (1952) equation which was developed for a packed bed
of uniformly sized spheres has been modified for application of agricultural
products on beds. The model can be considered as purely empirical since the
coefficients of linear and quadratic velocity terms are directly estimated, without
considering the physical characteristics such as porosity and particle size (Verboven
et al., 2004). Chau et al. (1985) used a modified Ergun equation by incorporating
porosity, particle diameter and fluid properties for bulk orange. They fitted two
remaining empirical parameters to the measured pressure drops however, the values
of this parameters change for different fruit size and stacking patterns.
Resistance of airflow has been described mathematically in the form of the
Ergun equation, which is the special case of the Darcy-Forchheimer-Brinkman
equation (2.4) (van der Sman, 2002; Verboven et al., 2006);
Stellenbosch University https://scholar.sun.ac.za
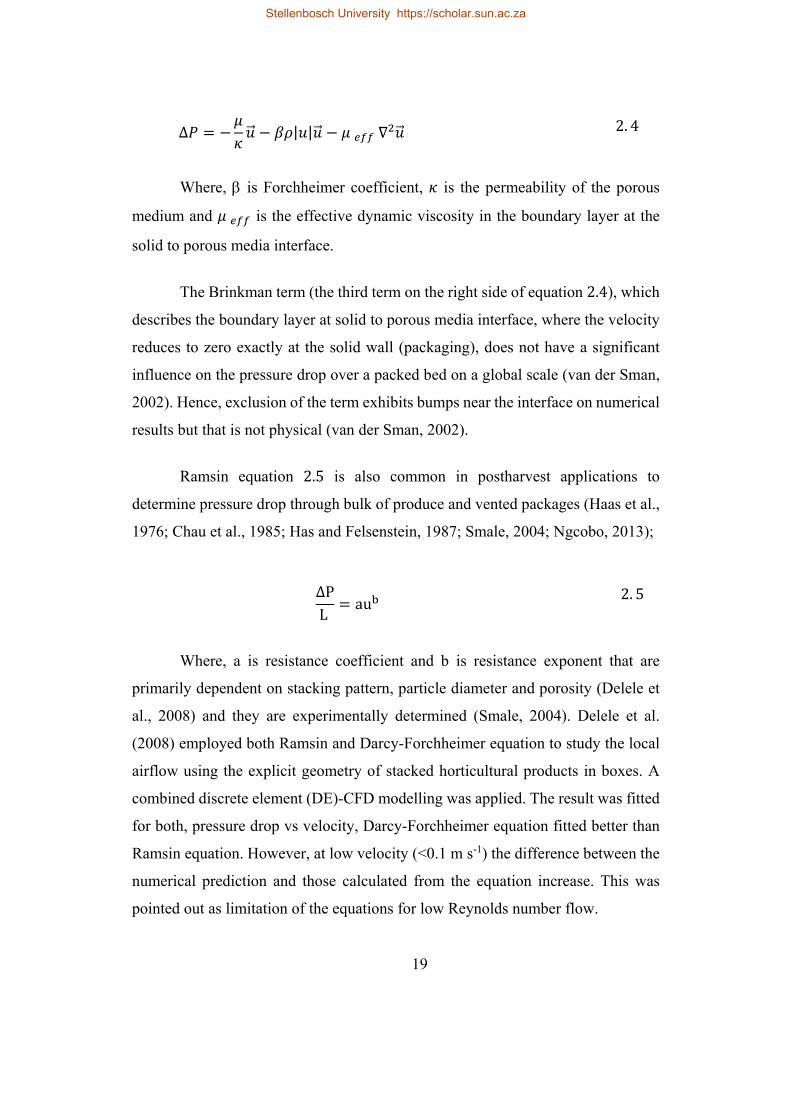
19
Δ | | 2. 4
Where, is Forchheimer coefficient, is the permeability of the porous
medium and is the effective dynamic viscosity in the boundary layer at the
solid to porous media interface.
The Brinkman term (the third term on the right side of equation 2.4), which
describes the boundary layer at solid to porous media interface, where the velocity
reduces to zero exactly at the solid wall (packaging), does not have a significant
influence on the pressure drop over a packed bed on a global scale (van der Sman,
2002). Hence, exclusion of the term exhibits bumps near the interface on numerical
results but that is not physical (van der Sman, 2002).
Ramsin equation 2.5 is also common in postharvest applications to
determine pressure drop through bulk of produce and vented packages (Haas et al.,
1976; Chau et al., 1985; Has and Felsenstein, 1987; Smale, 2004; Ngcobo, 2013);
ΔPL
au 2. 5
Where, a is resistance coefficient and b is resistance exponent that are
primarily dependent on stacking pattern, particle diameter and porosity (Delele et
al., 2008) and they are experimentally determined (Smale, 2004). Delele et al.
(2008) employed both Ramsin and Darcy-Forchheimer equation to study the local
airflow using the explicit geometry of stacked horticultural products in boxes. A
combined discrete element (DE)-CFD modelling was applied. The result was fitted
for both, pressure drop vs velocity, Darcy-Forchheimer equation fitted better than
Ramsin equation. However, at low velocity (<0.1 m s-1) the difference between the
numerical prediction and those calculated from the equation increase. This was
pointed out as limitation of the equations for low Reynolds number flow.
Stellenbosch University https://scholar.sun.ac.za
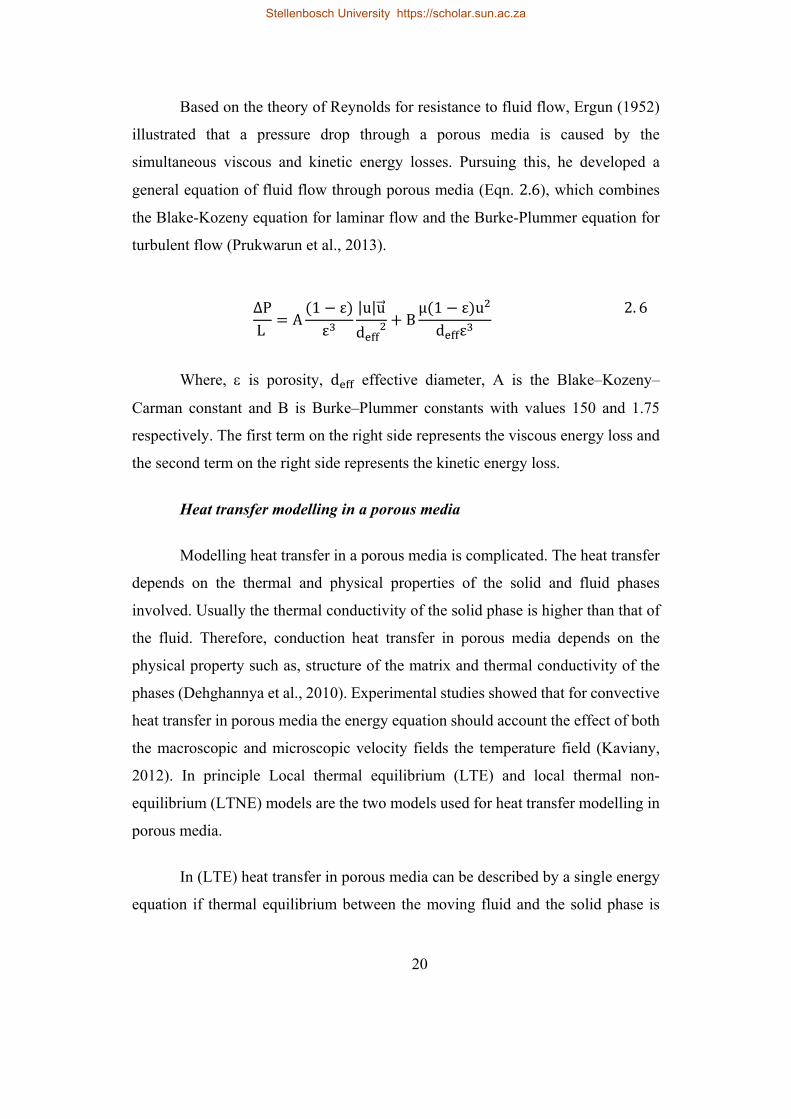
20
Based on the theory of Reynolds for resistance to fluid flow, Ergun (1952)
illustrated that a pressure drop through a porous media is caused by the
simultaneous viscous and kinetic energy losses. Pursuing this, he developed a
general equation of fluid flow through porous media (Eqn. 2.6), which combines
the Blake-Kozeny equation for laminar flow and the Burke-Plummer equation for
turbulent flow (Prukwarun et al., 2013).
ΔPL
A1 εε
|u|u
dBμ 1 ε ud ε
2. 6
Where, is porosity, d effective diameter, A is the Blake–Kozeny–
Carman constant and B is Burke–Plummer constants with values 150 and 1.75
respectively. The first term on the right side represents the viscous energy loss and
the second term on the right side represents the kinetic energy loss.
Heat transfer modelling in a porous media
Modelling heat transfer in a porous media is complicated. The heat transfer
depends on the thermal and physical properties of the solid and fluid phases
involved. Usually the thermal conductivity of the solid phase is higher than that of
the fluid. Therefore, conduction heat transfer in porous media depends on the
physical property such as, structure of the matrix and thermal conductivity of the
phases (Dehghannya et al., 2010). Experimental studies showed that for convective
heat transfer in porous media the energy equation should account the effect of both
the macroscopic and microscopic velocity fields the temperature field (Kaviany,
2012). In principle Local thermal equilibrium (LTE) and local thermal non-
equilibrium (LTNE) models are the two models used for heat transfer modelling in
porous media.
In (LTE) heat transfer in porous media can be described by a single energy
equation if thermal equilibrium between the moving fluid and the solid phase is
Stellenbosch University https://scholar.sun.ac.za
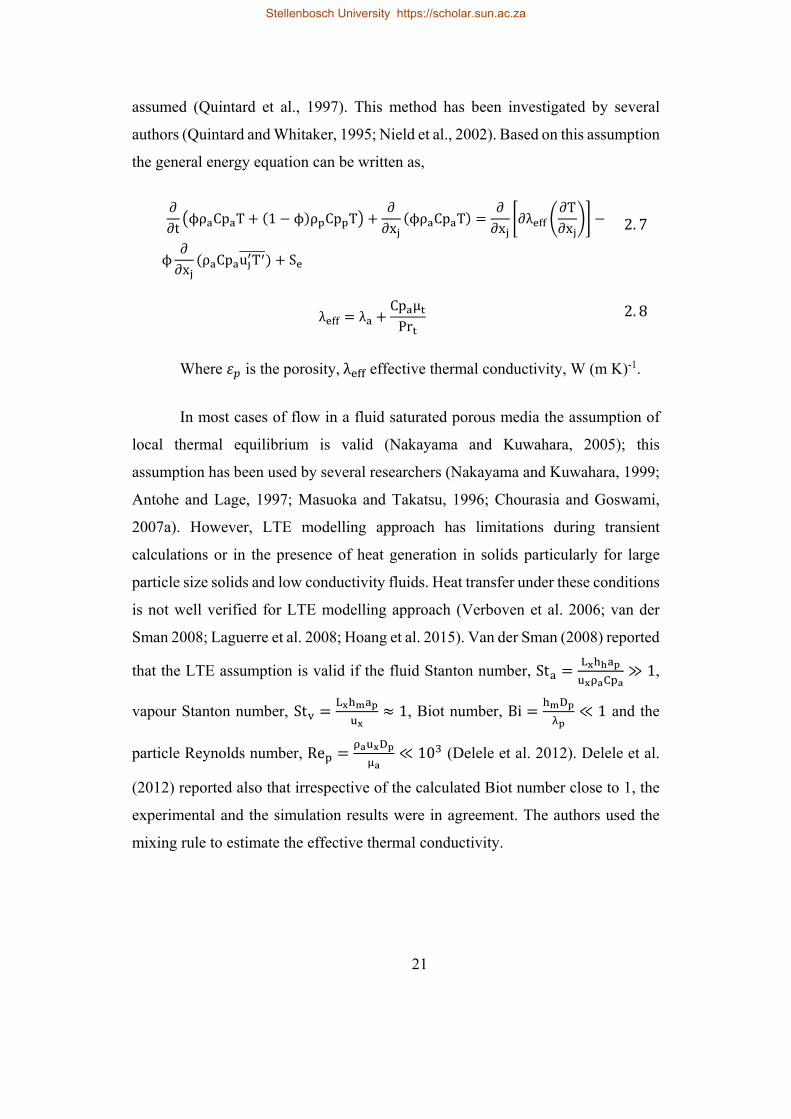
21
assumed (Quintard et al., 1997). This method has been investigated by several
authors (Quintard and Whitaker, 1995; Nield et al., 2002). Based on this assumption
the general energy equation can be written as,
∂∂t
ϕρ Cp T 1 ϕ ρ Cp T∂∂x
ϕρ Cp T∂∂x
∂λ∂T∂x
ϕ∂∂x
ρ Cp u T S
2. 7
λ λCp μPr
2. 8
Where is the porosity,λ effective thermal conductivity, W (m K)-1.
In most cases of flow in a fluid saturated porous media the assumption of
local thermal equilibrium is valid (Nakayama and Kuwahara, 2005); this
assumption has been used by several researchers (Nakayama and Kuwahara, 1999;
Antohe and Lage, 1997; Masuoka and Takatsu, 1996; Chourasia and Goswami,
2007a). However, LTE modelling approach has limitations during transient
calculations or in the presence of heat generation in solids particularly for large
particle size solids and low conductivity fluids. Heat transfer under these conditions
is not well verified for LTE modelling approach (Verboven et al. 2006; van der
Sman 2008; Laguerre et al. 2008; Hoang et al. 2015). Van der Sman (2008) reported
that the LTE assumption is valid if the fluid Stanton number, St ≫ 1,
vapour Stanton number, St 1, Biot number, Bi ≪ 1 and the
particle Reynolds number, Re ≪ 10 (Delele et al. 2012). Delele et al.
(2012) reported also that irrespective of the calculated Biot number close to 1, the
experimental and the simulation results were in agreement. The authors used the
mixing rule to estimate the effective thermal conductivity.
Stellenbosch University https://scholar.sun.ac.za
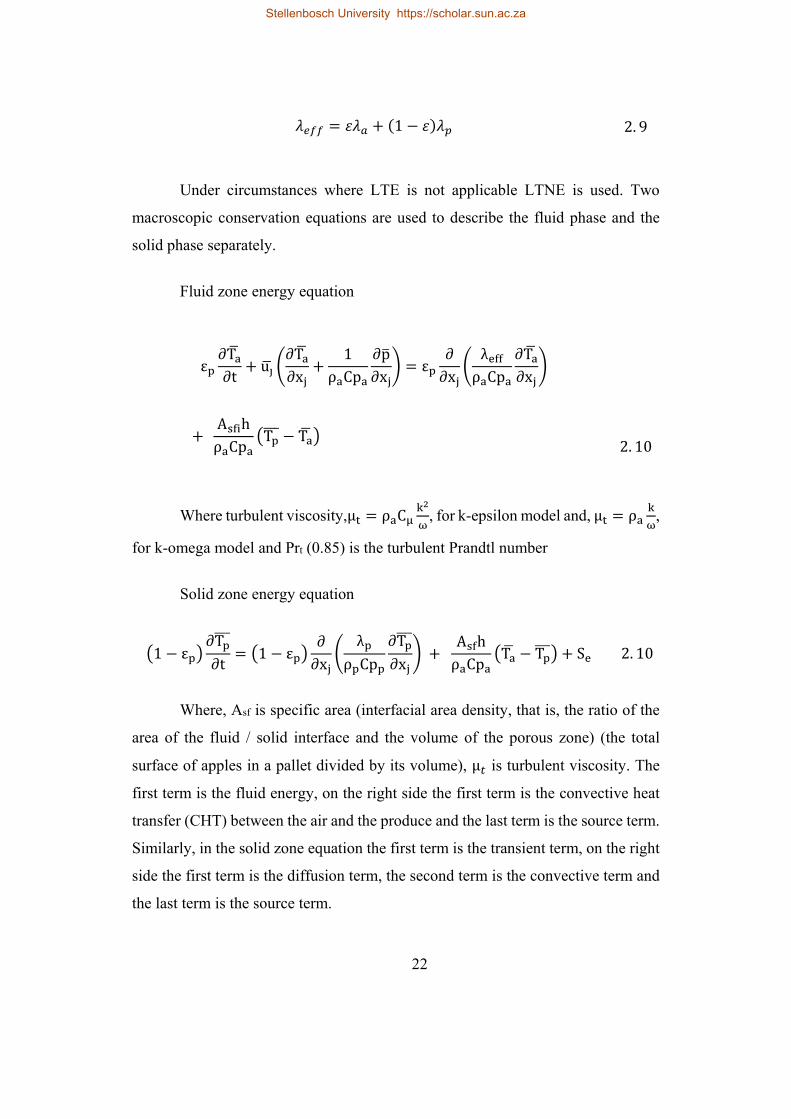
22
1 2. 9
Under circumstances where LTE is not applicable LTNE is used. Two
macroscopic conservation equations are used to describe the fluid phase and the
solid phase separately.
Fluid zone energy equation
ε∂T∂t
u∂T∂x
1ρ Cp
∂p∂x
ε∂∂x
λρ Cp
∂T∂x
A hρ Cp
T T 2. 10
Where turbulent viscosity,μ ρ C , for k-epsilon model and, μ ρ ,
for k-omega model and Prt (0.85) is the turbulent Prandtl number
Solid zone energy equation
1 ε∂T∂t
1 ε∂∂x
λρ Cp
∂T∂x
A hρ Cp
T T S 2. 10
Where, Asf is specific area (interfacial area density, that is, the ratio of the
area of the fluid / solid interface and the volume of the porous zone) (the total
surface of apples in a pallet divided by its volume), μ is turbulent viscosity. The
first term is the fluid energy, on the right side the first term is the convective heat
transfer (CHT) between the air and the produce and the last term is the source term.
Similarly, in the solid zone equation the first term is the transient term, on the right
side the first term is the diffusion term, the second term is the convective term and
the last term is the source term.
Stellenbosch University https://scholar.sun.ac.za
23
Heat transfer resistance between the cooling air and a single apple in a box
are the carry bag and the convective heat transfer resistance between the cooling air
and the carry bag. However, if we consider the average fruit temperature for our
calculation which is located at 3/4th of the radius of the apple, then the resistance of
fruit will be included (Van der Sman, 2003). Hoang et al., (2015) indicated that for
a fruit with a Biot number (Bi) 0.1 < Bi < 10, the internal resistance can be
calculated as R/4 . In addition, the equivalent convective heat transfer coefficient
(CHTC) can be calculated by,
11 R4
2. 11
The turbulent flow CHTC ( for a disordered pack of spheres is
correlated by:
2 1.1 . / 2. 12
For a single apple located in the middle of other apples in a carry bag in a
packaging box is the plastic, stationary air in the bag which acts as an insulator and
the convective heat transfer. Therefore Eqn. (2.11) for the CHTC can be modified
as,
1
1 R4 2. 13
Application of the porous modelling approach in postharvest systems
In CFD modelling explicit geometry representation of is always a priority
rather than as a porous medium for better accuracy. Delele et al. (2008) developed
a validated numerical methodology that takes into account product geometry, box
Stellenbosch University https://scholar.sun.ac.za
24
design and randomness of stacking explicitly by combined discrete element (DE)
and CFD for modelling airflow through a stack of packed fruits. The methodology
showed the capability of the approach to give detailed flow characteristics to the
level of individual pores. However, this methodology will be expensive and highly
complicated when a system as big as packed reefer is the subject. Therefore, porous
media approach has been applied widely applied in large cold chain systems.
Zou et al. (2006a) studied airflow and heat transfer in bulk and layered
packaging systems by porous medium approach. The model was developed with
volume-averaging method and the model was validated by experimental results
(Zou et al., 2006b). Chourasia and Goswami (2007) developed a 3D model to
predict the airflow, heat and mass transfer in a single bag of potato by assuming a
porous medium using Darcy-Forchheimer momentum equation. For both transient
and steady state cooling the rate of moisture loss, velocity vector and temperature
contour were presented and the results were compare with experimental data.
Alvarez and Flick (2007) modelled forced-air cooling of stacked food products
represented by PVC spheres as a macro-porous medium using Darcy-Forchheimer
momentum equation to predict the average superficial velocity. The model
considered the turbulence dissipation and generation in the porous medium which
was not included by other modellers (Xu and Burfoot, 1999; Hoang et al., 2003;
Moureh and Flick, 2004; Moureh and Flick, 2005 Nahor et al., 2005a, b; Chourasia
and Goswami, 2007a,b; Delele et al., 2009a,b).
Several studies were conducted in enclosures/mobile refrigerated transport
systems such as trailers and reefers; empty and packed. The porous media approach
was employed to study airflow in citrus packed shipping containers (Talbot et al.,
1990). The model used the Darcy-Forchheimer and Ergun equations for the flow
resistance calculations by using finite element commercial codes. Air velocity in
the free space for different packaging scenarios was not considered (Dehghannya
et al., 2010). Moureh et al. (2009b) developed a 3D model in reefer with and without
air-duct system, loaded with two rows of slotted pallet, using the RSM turbulence
Stellenbosch University https://scholar.sun.ac.za
25
model to predict the airflow pattern. To calculate the pressure loss in the pallets the
Ergun equation was used. The same scaled model as Moureh et al. (2004) was used
for experimentation. Moureh et al. (2009a, b) investigated the airflow pattern in a
reefer using a 1:3.3 scaled model and RSM turbulence CFD model. Airflow was
predicted in container loaded with two rows of ventilated pallets filled with
spherical objects which were considered as porous medium. Pressure loss
coefficient was determined in a wind tunnel experiment. To avoid the problem of
large computational capacity requirement during meshing the small gaps between
the pallets were replaced by fictitious porous medium that gave aerodynamically
equivalent airflow resistance (the size of the gap was increased from 0.02m to
0.06m) (Tapsoba et al., 2007). Darcy’s equation governed airflow to pressure
gradient relationship. The porous medium approach was proposed because the air
velocity measurement showed that laminar flow was dominant in the small gaps
between the pallets. Similarly, Moureh and Flick (2009a) developed a model to
study airflow characteristics in an enclosure partially filled with slotted porous
boxes. In the model the air gap between boxes was replaced with a fictitious porous
media that imposes equivalent resistance to the actual flow in the region (Tapsoba
et al., 2007). It was reported that the model prediction was in reasonable agreement
with experimental result.
Recently, Hoang et al. (2015) modelled a small cold store with four apple
pallets (composed of 8 layers of wooden bins) and compared two modelling
approaches. In the first approach, each pallet was modelled as one porous medium
and in the other approach; each layer of a pallet was modelled as solid block
representing the bin (8 solid blocks in a pallet). In the solid block approach, the
spherical shape of the fruits was considered by doubling area of the top side of the
block area. It was reported that both models showed good agreement with
experimental results of temperature evolution with air flow pattern prediction
agreed well qualitatively. It was noted that the porous medium approach gives a
fairly good result with nearly four times less than the number of elements.
Therefore, from the above discussions it can be drawn that modelling pallets as a
Stellenbosch University https://scholar.sun.ac.za
26
porous medium is practicable and the quality of the result can also be enhanced by
increasing the number of elements to some extent.
Porous media modelling has limitations. The continuous medium
assumption break-up during cooling operation, particularly in forced air precooling
process where the packaging to product diameter under 10 is the main problem
(Eisfeld and Schnitzlein, 2001; Verboven et al., 2006; Dehghannya et al., 2010). In
addition, when LTNE model is applied for a packed produce determination of the
model parameters involves complicated calculation. Estimation of these parameters
has not been successful (Ferrua et al., 2007; Dehghannya et al., 2010). The other
drawback is lack of capturing detailed spatial and temporal temperature
heterogeneity such as among the individual fruits (Defraeye et al., 2015b).
Alternative modelling approaches
A number of other models besides resistance network and CFD have been
developed in the past to predict airflow and heat transfer in cold stores and reefer.
In this compendium the models that have been employed in postharvest application,
such as Lattice scheme modelling and Scaled modelling, have been considered.
a) Lattice scheme model
Lattice scheme model, in which packets of fluid was represented by qausi-
particles, was used to model convection-diffusion phenomena in vented transport
packaging for produce (Van der Sman, 1999). The mass and energy transfer laws
where obeyed by movement and collision of this packets of particles under lattice
laws. Van der Sman (1999) used three Lattice-Boltzman based models and
validated against experimental results. This model has advantage over finite
element and finite difference methods on relatively easy boundary condition
implementation and possibility of modelling complex processes in a single
framework (Smale, 2004).
Stellenbosch University https://scholar.sun.ac.za
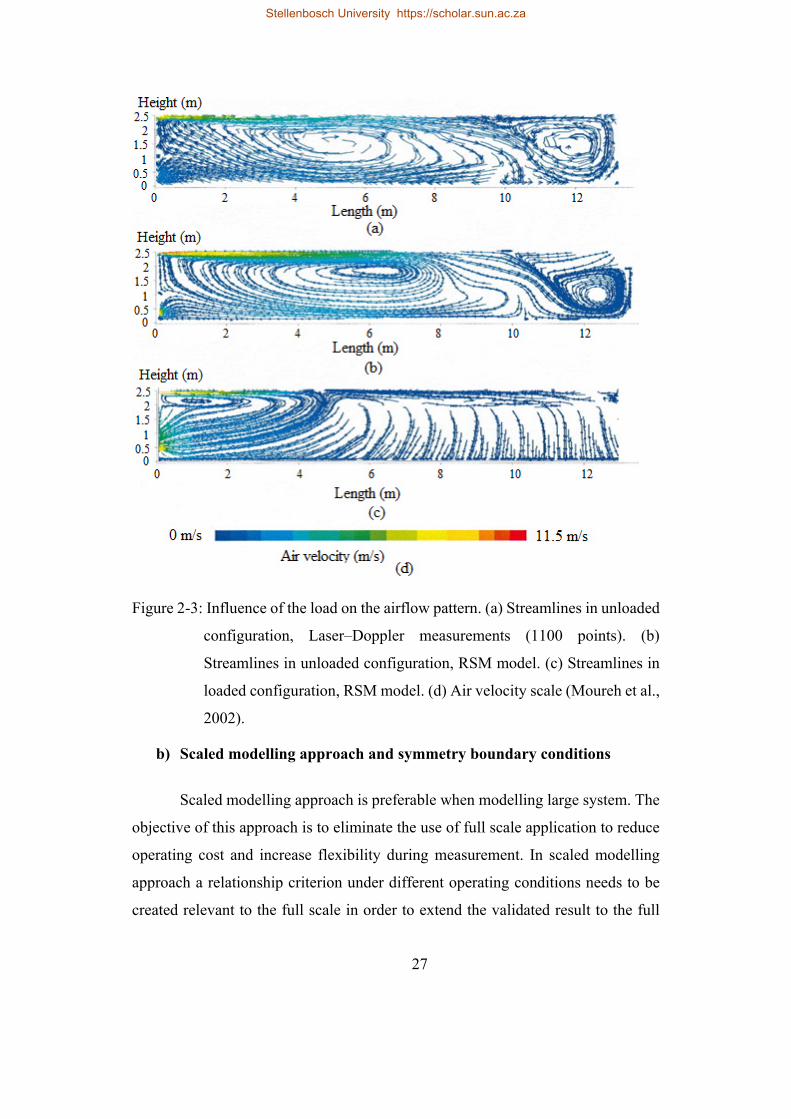
27
Figure 2-3: Influence of the load on the airflow pattern. (a) Streamlines in unloaded
configuration, Laser–Doppler measurements (1100 points). (b)
Streamlines in unloaded configuration, RSM model. (c) Streamlines in
loaded configuration, RSM model. (d) Air velocity scale (Moureh et al.,
2002).
b) Scaled modelling approach and symmetry boundary conditions
Scaled modelling approach is preferable when modelling large system. The
objective of this approach is to eliminate the use of full scale application to reduce
operating cost and increase flexibility during measurement. In scaled modelling
approach a relationship criterion under different operating conditions needs to be
created relevant to the full scale in order to extend the validated result to the full
Stellenbosch University https://scholar.sun.ac.za
28
scale system. Scaled modelling technique has been used by scientist to study airflow
and species transport. Lovatt et al. (1993) used scaled model of chiller to show
airflow trends and effect of turning vanes. A water filled model with an electrode
to produce hydrogen bubbles for flow visualization was used. The Reynolds
number was used as a similarity criterion. The model was developed for qualitative
use and no validation was conducted. 1:6 and 1:3 scaled models were used to study
similarity criterion for celling slot ventilated agricultural enclosures with
intermediate airflow (Yu and Hoff, 1999). The study compared inlet jet momentum
ratio and Reynolds number as a potential similarity criteria and showed that the
Reynolds number is the best similarity criterion. Moureh et al. (2002) used scaled
model (1:3) in modelling airflow in reefers. The model was constructed with glass
at the front wall in order to have optical access to measure the airflow inside using
Laser Doppler anemometer (Figure 2-3). The model was validated but no similarity
criterion was stated.
In other studies, researchers used model scaling and symmetry boundary
conditions for enormous and complicated 3D domains for simplification of CFD
model. Defraeye et al. (2015b) developed a model composed of eight fruit packed
boxes in vertical layers to the study fruit cooling in a low velocity vertical flow that
emulate ambient cooling scenario in a reefer. The study contributed a fundamental
insight of the airflow and cooling phenomena in reefers and gives the potential
modelling approach for a full scale packed reefer. The following simplifications
were made, only vertical flow was considered; air gaps and symmetry boundary
was used in all sides. It was reported that cooling was faster than the practical study
and show logical cooling pattern from the bottom layer to the top layer. However,
in the experimental study of citrus cooling from an ambient condition it was
reported that the cooling rates of different pallets lacks logical pattern Defraeye et
al. (2015a). Moureh and Flick (2004) also shown that the temperature profile in
packed enclosure (top air-delivery system) does not follow a reasonable cooling
pattern in a pallet (from bottom to top) and among pallets along the flow direction.
Stellenbosch University https://scholar.sun.ac.za

29
Other researchers apply symmetry boundary conditions to simplify a model
and reduce the computational requirement (Ambaw et al., 2014; Defraeye et al.,
2013; Delele et al., 2008; Ferrua and Singh, 2009a; Kwon et al., 2015; Moureh and
Flick, 2004). Moureh and Flick (2004) applied geometrical symmetry boundary
condition in a palletized enclosure and modelled half the domain (one row of
pallets). Although this simplification has advantages, due to the nature of airflow
in the confined enclosure that involves flow recirculation, turbulent shear flows and
expanding jet flow application of symmetry boundary in such systems can lead to
numerical errors.
2.4. Factors that affect energy consumption in cold chain systems and quantification of energy in reefer container
Energy use in reefer containers and cold storage facilities is affected by
several factors. The main sources of heat in cold chain facilities for long-term
storage are transmission through walls, evaporator fans, lights, air leakage, and
respiration of the stored product (Thompson, 2001). In the case of reefer the main
factors that affect energy consumption are the amount of heat the refrigeration
equipment must remove from the load, outside ambient air temperature and
humidity, exposure to sun radiation during transport, external wall paint of the
container refrigerant type, and the efficiency of the equipment (age of the
container), evaporator fan motor, air leakage (infiltration), heat generated due to
respiration of loaded produce (Fitzgerald et al. 2011; Jolly et al, 2000; Wild et al.,
1999; Wild et al., 2008).
Energy consumption in a reefer system can be affected by different
operational and design parameters. The dominant factors involved in postharvest
handling of perishable produce are container design, thermal insulation, fan
operation, operational malfunction, fruit packaging design, produce property,
defrost load and, packaging design and alignment. Most of these factors are
Stellenbosch University https://scholar.sun.ac.za
30
common between reefer and cold storage (Thompson et al., 2010) and most of the
literature found was on cold storage.
2.4.1. Insulation
Thermal insulation is necessary for proper control of storage conditions by
reducing heat exchange with the environment. An inferior quality, old or damaged
and, thinner insulation leads to high heat transfer and requires a larger compressor
with more power consumption to make meet the additional cooling load. This in
turn increases both energy wastage and recurring expenses. Therefore, optimum
insulation quality and thickness is critical to improve energy-efficiency and
maintain quality of stored produce. Heat gain from the environment varies
depending on the type of the reefer. According to ISO 668-1995 (E) measurement,
total maximum heat leakage rate at 20 is given as 42 W K-1 for TAL Starcool
reefer (Maersk, 2016). Tridib (2009) reported the cold storage must be insulated in
such a way that heat in-leak should not increase beyond 6 – 8 Wm , however is
not so in practice.
Recently experimental study on reducing the heat transfer across the
insulated walls of refrigerated truck trailers was conducted by Ahmed et al. (2010).
The authors adapted well proved phase change material (PCM) from its successful
practical result in building walls and structural insulated panel (SIP) by (Zhang et
al., 2005) and (Medina et al., 2008), respectively. Integration of PCMs in regular
building walls resulted in 11–20 % peak heat transfer rate reduction with a PCM
concentration of 10 %. Peak heat transfer reduction of 37 and 62 % was found in
SIPs with 10 and 20 % PCM, respectively. Ahmed et al. (2010) used two test truck
trailer simulators (small scale model) with equal dimension of1.22 1.22
1.22m, to evaluate effect of PCM. The result showed the incorporation of the PCM
caused an average reduction of 29.1 % in peak heat transfer and an average of 16.3
% in total heat transfer rate.
Stellenbosch University https://scholar.sun.ac.za
31
2.4.2. Infiltration
Infiltration create additional refrigeration heat load due to inefficient
sealing, density difference between the inside and outside air, opening and closing
of doors during loading. Gosney (1975) modelled infiltration in a cold store using
analytical method and was able to predict the infiltration for two experiments within
experimental error. This model over predicted the infiltration for the other
experiments and was worst for the 0.43 m wide door. Foster et al. (2003) showed
in their CFD model that the Gosney (1975) model was the best of the analytical
models and was able to predict the infiltration for two of the experiments within
experimental error. Cold storage facilities apply air curtains (Foster et al., 2007),
make entry to the store to be through doors that are automatically opened for
15 seconds per opening and (Stoecker, 1998), air curtain devices (Gonçalves et al.,
2012). Stoecker (1998) created analytical equations to predict heat load due to
natural convection through openings and in a 3-D CFD model. The maximum air
leakage and heat leakage in reefers (Starcool-SCI 40 Maersk) were reported to be
0.25 m3 h-1 at 500 Pa and maximum 40 W K-1, respectively (Maersk, 2012).
Where, Q is infiltration coefficient (0.692 √m/s), Ad is area of door (m2),
H is height of door, ρ and ρ are density of air inside and outside, respectively.
2.4.3. Product property
High rate of respiration and moisture loss during postharvest handling of
horticultural produces have an adverse effect on its quality and storability. The
quality of fruits at the time of storage and during the long-term storage also has
direct bearing on the electrical power consumption. The maturity, initial
temperature, damage to the skin of fruits in the form of cutting, bruising, and
Q C A √Hρ ρρ
/ 21 ρ /ρ /
/ ρ ρ2
2. 14
Stellenbosch University https://scholar.sun.ac.za
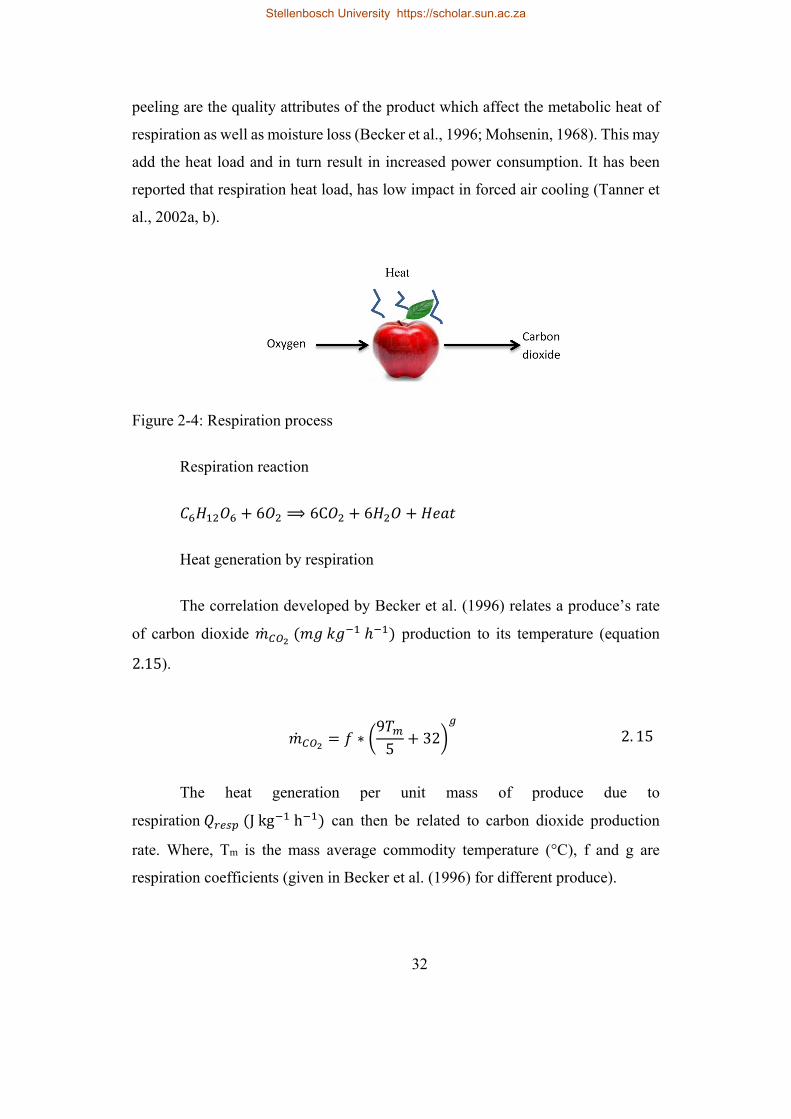
32
peeling are the quality attributes of the product which affect the metabolic heat of
respiration as well as moisture loss (Becker et al., 1996; Mohsenin, 1968). This may
add the heat load and in turn result in increased power consumption. It has been
reported that respiration heat load, has low impact in forced air cooling (Tanner et
al., 2002a, b).
Figure 2-4: Respiration process
Respiration reaction
6 ⟹ 6C 6
Heat generation by respiration
The correlation developed by Becker et al. (1996) relates a produce’s rate
of carbon dioxide production to its temperature (equation
2.15).
∗95
32 2. 15
The heat generation per unit mass of produce due to
respiration Jkg h can then be related to carbon dioxide production
rate. Where, Tm is the mass average commodity temperature (°C), f and g are
respiration coefficients (given in Becker et al. (1996) for different produce).
Stellenbosch University https://scholar.sun.ac.za
33
10.7 ∗95
32 2. 16
2.4.4. Packaging design and alignment
One of the basic elements of importance in postharvest storage is the
product and how it is stacked and packed (Ambaw et al., 2013). The main function
of packaging materials is maintaining the quality of fruits during postharvest
handling and storage by providing mechanical protection against injuries,
minimizing produce moisture loss and retarding microbial growth (Opara, 2011).
The major factors that should be taken into consideration when designing are, type
of produce, pallet construction, cooling method used, and transport methods. The
sagging carton obstructs ventilation across the surface of the box and is likely to
cause mechanical damage to the produce in the package under it. Packaging boxes
should be designed to allow for adequate air flow, which together with cooling
requirements are produce dependent. Vents alignment with adjacent cartons on the
pallet are one of the main factors that affect the air flow through the bulk (Castro et
al., 2005, Castro et al., 2004; Delele et al., 2013a,b; Tridib, 2009). Alvarez and Flick
(1999) demonstrated that heterogeneity of the forced-air process is not only
generated by an increase in the air temperature as it flows through the produce
pallet, but also by the heterogeneity of the airflow behaviour within the palletized
structure. The preassure drop as a result of fruit load, packaging design and
alignment during cooling of products affects the product quality (Thomson, 2001)
and the energy consumption (Defraeye et al., 2014). It is clear that there is a
significant impact of the produce containers and their vent design on the efficiency
and homogeneity of the forced-air cooling process which in turn affect energy
consumption of the system.
Stellenbosch University https://scholar.sun.ac.za
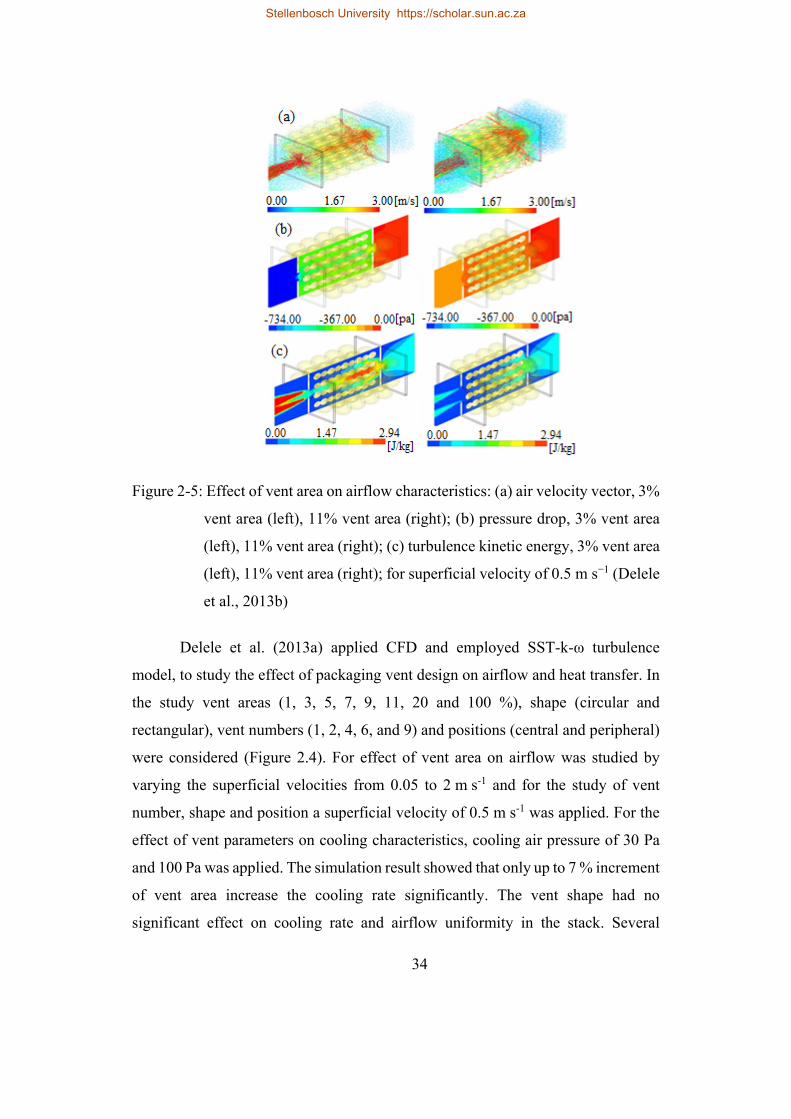
34
Figure 2-5: Effect of vent area on airflow characteristics: (a) air velocity vector, 3%
vent area (left), 11% vent area (right); (b) pressure drop, 3% vent area
(left), 11% vent area (right); (c) turbulence kinetic energy, 3% vent area
(left), 11% vent area (right); for superficial velocity of 0.5 m s−1 (Delele
et al., 2013b)
Delele et al. (2013a) applied CFD and employed SST-k-ω turbulence
model, to study the effect of packaging vent design on airflow and heat transfer. In
the study vent areas (1, 3, 5, 7, 9, 11, 20 and 100 %), shape (circular and
rectangular), vent numbers (1, 2, 4, 6, and 9) and positions (central and peripheral)
were considered (Figure 2.4). For effect of vent area on airflow was studied by
varying the superficial velocities from 0.05 to 2 m s-1 and for the study of vent
number, shape and position a superficial velocity of 0.5 m s-1 was applied. For the
effect of vent parameters on cooling characteristics, cooling air pressure of 30 Pa
and 100 Pa was applied. The simulation result showed that only up to 7 % increment
of vent area increase the cooling rate significantly. The vent shape had no
significant effect on cooling rate and airflow uniformity in the stack. Several
Stellenbosch University https://scholar.sun.ac.za
35
researchers have recommended different packaging vent area ratios (Baird et al.,
1988; Castro et al., 2005). Pathare et al. (2012) also reported recommended vent
areas which vary with the type of the material such as, for corrugated fireboard 4-
27 %, for plastic containers 25 %, for clamshells 13 % and for polyethylene bags
0.5-2.5 %.
2.4.5. Fans
One of the high heat load source is from fixed load from the evaporator fans.
Fans liberate the heat throughout the day due to their continuous operation. And in
addition there is lack of seasonal control (Ambaw et al., 2016). There is a general
lack of “sophistication” in the control regimes used for items such as suction
pressure, defrost frequency and evaporator fans. The fan control regimes used in
most of cold stores is relatively crude, either with 24/7 fan operation or some form
of on/off control. Fan power consumption follows a “cubic relationship” with flow
rate. This means if one slows the fan to give 80% flow it only uses 50% power.
According to British Frozen Food Federation (2009, if one reduces flow further to
50%, the power usage falls to 12.5%. Thompson et al. (2010) reported that the
evaporator fans in cold stores operates at maximum refrigeration design but mostly
less than the maximum capacity is required to achieve the set point. The potential
energy saving opportunities indicated were using variable speed fans, increasing
vent area of boxes, using less lighting or efficient lamps. Hence optimizing fan
operation will not only save fan power consumption but also save the compressor
power needed to remove heat generated by the fan motor. The heat load from the
evaporator fan motor can be calculated using Eqn. (2.17) (Evans et al., 2014).
ƞ
2. 17
Where, is number of motors, ƞ is motor efficiency and, is motor
power.
Stellenbosch University https://scholar.sun.ac.za
36
2.4.6. Defrost load
During operation of a reefer, a layer of ice will form on the evaporator coils
when the unit has a temperature SET lower than 0 °C. Therefore, during this period,
the evaporator fans will turn off and heat will be produced by electrical elements
and defrosting will take place. In modern reefers fans are turned off automatically
in order to prevent heat from fan motor entering the cargo, however the heat
produced by the elements needs to be removed by the refrigeration system.
The effects of defrost load, operating conditions (cooling mode, set point
(0 °C and 6 °C), defrosting system and load level) and outer ambient temperature
on performance of multi-compartment reefer containers has was studied by
Rodríguez-Bermejo et al. (2007). The multi-compartment was modelled using a
CFD to study the thermal characteristic of reefer containers. The result showed the
significant effect of solar radiation on the indoor temperature. The authors also
showed the current control strategies for off/on control refrigeration is poor for
maintaining industry set point (±0.5 °C) and modulated cooling allows better
temperature homogeneity. They recommended further research on cooling mode
strategies to minimize energy consumption.
In experimental investigation in display cabinets Ke-zhi Yu et al (2009)
compared a vertical display cabinet with central air supply (VDCCAS) with
conventional vertical display cabinet (CVDC). It has been indicated that
temperature fluctuation, which is caused by frosting and defrosting, was creating
heterogeneity and affecting the energy consumption. The result also showed that
VDCCAS can decrease the frost magnitude easier than the CVDC since it has better
control of the air curtain velocity, hence decrease the product temperature rise in
the defrost cycle from 3 to 2 . The study showed, by optimizing air curtain
velocity the temperature fluctuation can be decreased and the energy consumption
by the compressor will decrease.
Stellenbosch University https://scholar.sun.ac.za
37
2.4.7. Forklift loads
Forklift is used to load pallets into container after the reefer has been cooled
to the desired pulp temperature. Forklifts generate heat that increase refrigeration
heat load in cold chain facilities (Evans et al., 2014). An estimation of the heat load
due to a forklift operating within a space can be obtained from the information on
the motor and assuming 80% efficiency for battery powered and 33% for internal
combustion powered forklifts (ASHRAE. 2009).
Q MRxtmx24 2. 18
Where, Q is capacity (W), MR is Motor Rating (W), t is time in use per day
(hr.), and m is motor efficiency (80% battery & 33% internal combustion).
2.5. Quantification of energy consumption: Experimental, analytical and mathematical approaches
2.5.1. Experimental and analytical approaches
Numerous papers are written on reefer, cold storage facilities and cooling
systems performance (energy utilization) and mostly they are based on the
information available at the facility’s documentation (Castro et al., 2005; Evans,
2007; Fitzgerald et al., 2011; Goswami, 2009; Thompson et al., 2010; Wang &
Muller, 2000; Wild et al., 1999; Wild et al., 2008). Evans (2007) and Goswami
(2009) studied efficient design, operation, maintenance and management of cold
storage and indicated the rise in the electrical consumption in cold chain facilities
and described the possible causes as higher volume of product being cooled than
before, product is entering storage hotter, infiltration, insulation being wet or
missing and problems of malfunctioning refrigeration equipment. According to
energy mapping conducted (based on data feed from facilities) in ten food
refrigeration processes in UK, following retail display and kitchen refrigeration,
energy consumption of refrigerated transport system was the highest (James &
Stellenbosch University https://scholar.sun.ac.za
38
James, 2011). The potential energy savings of each unit has been estimated based
on the knowledge and technology at the time of the study (Table 2.1). To this end,
20-25 % energy saving per year was estimated for reefer. The authors concluded
that the Coefficient of Performance (COP) of transport refrigeration systems was
low, ranging from 0.5 to 1.75 and that up to 40 % of diesel consumed during
transportation is used by the refrigeration system. The study gave estimation of the
energy consumption but did not provide a quantified analysis of the major factors
that contribute for the energy waste because of the lack of experimental data.
In another study Tassou et al. (2009) reviewed the current approaches in
road food transport refrigeration. They provided estimates of the environmental
impact and covered advances in the development of alternative technologies to
vapour compression refrigeration systems which has a potential to reduce energy
consumption. Similarly, Fitzgerald et al. (2011) estimated the fuel consumption for
refrigeration to be 19 % of fuel related to its journey. However, the conclusions had
to be based on theoretical and derived data due to the lack of any experimentally
measured data on fuel consumption by refrigeration systems in commercial use.
Thompson et al. (2010) and Castro et al. (2005) studied the energy utilization in
forced air coolers for fruits in storage by applying energy coefficient (EC) and
energy added ratio (EAR), respectively.
ECMC T T
Ec 2. 19
EARE EE
2. 20
Stellenbosch University https://scholar.sun.ac.za
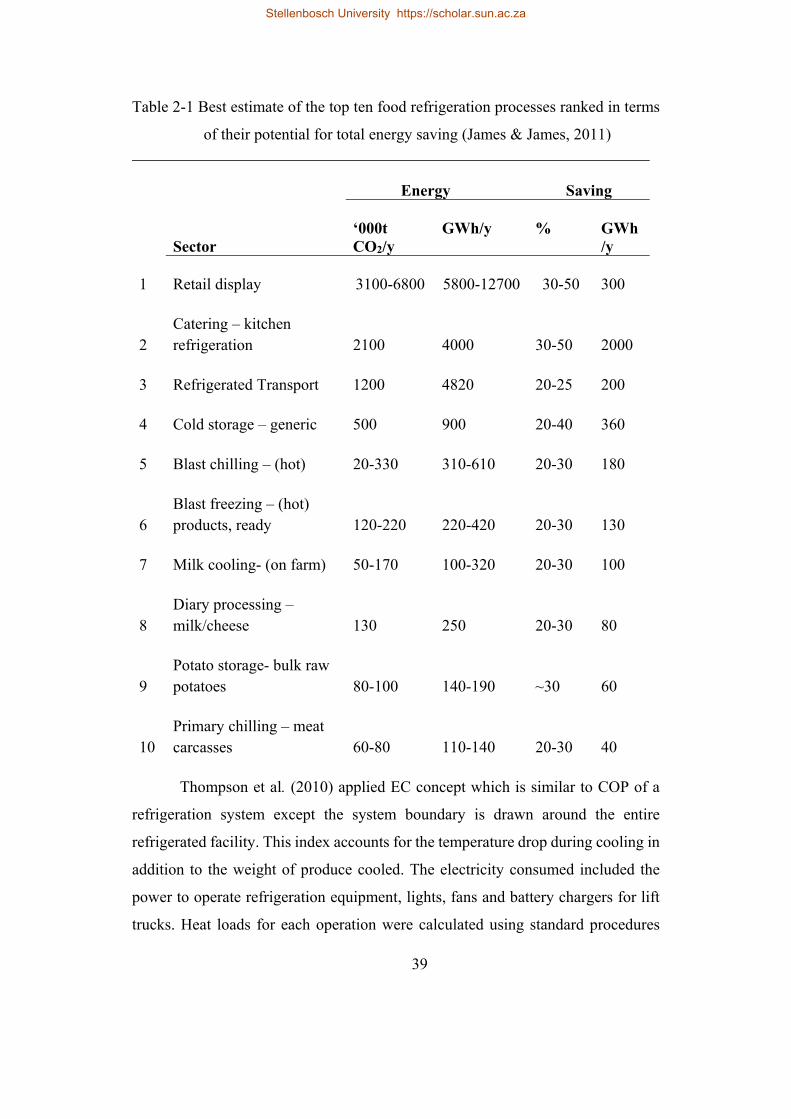
39
Table 2-1 Best estimate of the top ten food refrigeration processes ranked in terms
of their potential for total energy saving (James & James, 2011)
Sector
Energy Saving
‘000t CO2/y
GWh/y % GWh/y
1 Retail display 3100-6800 5800-12700 30-50 300
2 Catering – kitchen refrigeration 2100 4000 30-50 2000
3 Refrigerated Transport 1200 4820 20-25 200
4 Cold storage – generic 500 900 20-40 360
5 Blast chilling – (hot) 20-330 310-610 20-30 180
6 Blast freezing – (hot) products, ready 120-220 220-420 20-30 130
7 Milk cooling- (on farm) 50-170 100-320 20-30 100
8 Diary processing – milk/cheese 130 250 20-30 80
9 Potato storage- bulk raw potatoes 80-100 140-190 ~30 60
10 Primary chilling – meat carcasses 60-80 110-140 20-30 40
Thompson et al. (2010) applied EC concept which is similar to COP of a
refrigeration system except the system boundary is drawn around the entire
refrigerated facility. This index accounts for the temperature drop during cooling in
addition to the weight of produce cooled. The electricity consumed included the
power to operate refrigeration equipment, lights, fans and battery chargers for lift
trucks. Heat loads for each operation were calculated using standard procedures
Stellenbosch University https://scholar.sun.ac.za
40
(ASHRAE, 2009). For product load, the thermal energy load and respiration heat
of the fruits will be combined. Transmission load corresponds to the heat transferred
through walls, roof, and floor; internal equipment heat load is calculated by adding
the loads coming from fans, lights, and fan motor heat production. EAR, considers
respiration energy ( ) (kJ), produce field heat ( ) (kJ) and ventilation energy
( ) (kJ), which are independent of the mechanical characteristics of the cooling
system, however, it was used to evaluate the effect of packaging container opening
and airflow rate on the cooling performance.
Thompson et al. (2010) showed that only 36 % of the total electrical energy
was used for fruit cooling purpose and 45 % of total was used to remove the heat
generated fans, lights and lift trucks. The authors indicated energy saving can be
achieved using variable speed fans (evaporator operates at maximum refrigeration
design but mostly less than the maximum capacity is required to achieve the set
point), increasing vent area of boxes, using less lighting or efficient lamps. In this
study the electricity use data was used smartly to grab on a suffice indicative
scientific evidence on the potential energy saving options based on the relationship
of the amount of heat load from the system and energy needed to remove that heat
load. In this study the airflow pattern, produce temperature heterogeneity and
factors that affect the cooling operation such as packaging strategy and design were
not considered in the calculation. Castro et al. (2005) reported energy saving
options during forced air cooling with respect to packaging design, as ventilation
area increased to 8 % the EAR decreased but a small change was observed as
opening area increased to 100%. Similarly, Delele et al. (2013) also reported up to
7 % increment of vent area increase the cooling rate significantly. The authors
recommended an opening area between 8 and 16 % for energy use optimization.
After analysis of experimental and statistical data available on 2300 TEUs
(Twenty-foot equivalent units), Wild et al. (1999) presented individual reefer power
consumption 4 kW per TEU for 20 ft. reefer and 7 kW per TEU for 40 ft. reefer.
The result shows a significant range of uncertainty. Since TEU was used for
Stellenbosch University https://scholar.sun.ac.za
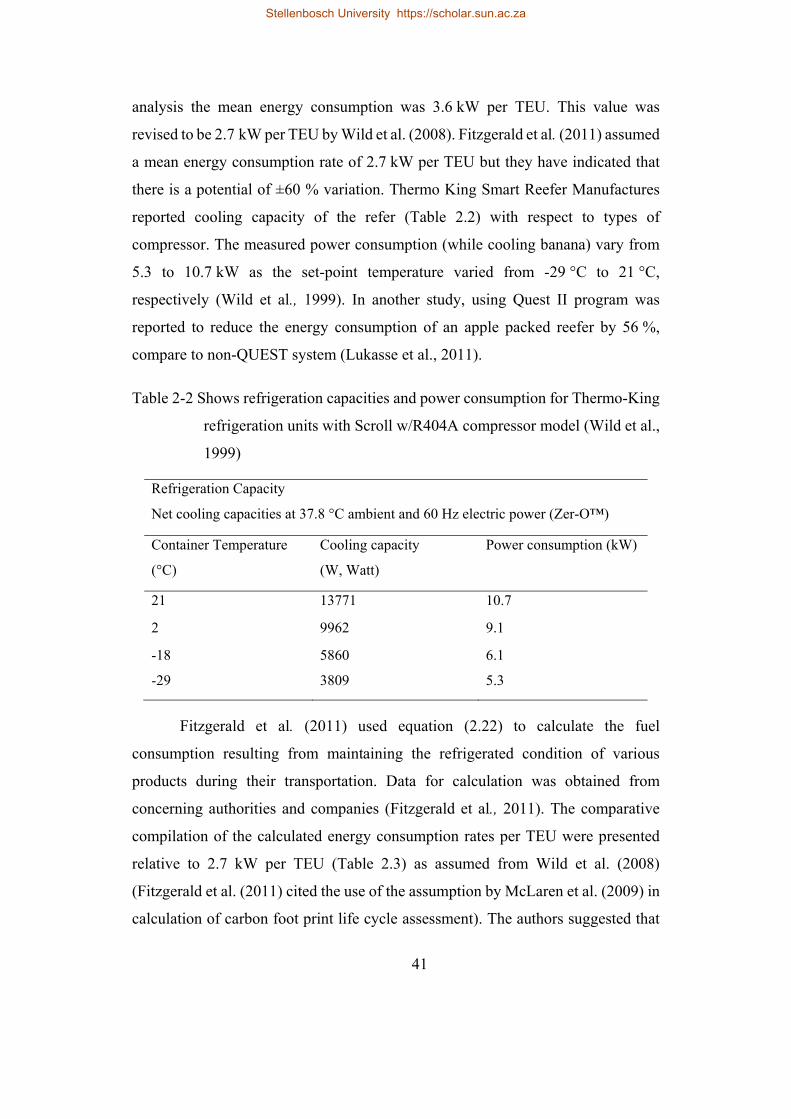
41
analysis the mean energy consumption was 3.6 kW per TEU. This value was
revised to be 2.7 kW per TEU by Wild et al. (2008). Fitzgerald et al. (2011) assumed
a mean energy consumption rate of 2.7 kW per TEU but they have indicated that
there is a potential of ±60 % variation. Thermo King Smart Reefer Manufactures
reported cooling capacity of the refer (Table 2.2) with respect to types of
compressor. The measured power consumption (while cooling banana) vary from
5.3 to 10.7 kW as the set-point temperature varied from -29 °C to 21 °C,
respectively (Wild et al., 1999). In another study, using Quest II program was
reported to reduce the energy consumption of an apple packed reefer by 56 %,
compare to non-QUEST system (Lukasse et al., 2011).
Table 2-2 Shows refrigeration capacities and power consumption for Thermo-King
refrigeration units with Scroll w/R404A compressor model (Wild et al.,
1999)
Refrigeration Capacity
Net cooling capacities at 37.8 °C ambient and 60 Hz electric power (Zer-O™)
Container Temperature
(°C)
Cooling capacity
(W, Watt)
Power consumption (kW)
21 13771 10.7
2 9962 9.1
-18 5860 6.1
-29 3809 5.3
Fitzgerald et al. (2011) used equation (2.22) to calculate the fuel
consumption resulting from maintaining the refrigerated condition of various
products during their transportation. Data for calculation was obtained from
concerning authorities and companies (Fitzgerald et al., 2011). The comparative
compilation of the calculated energy consumption rates per TEU were presented
relative to 2.7 kW per TEU (Table 2.3) as assumed from Wild et al. (2008)
(Fitzgerald et al. (2011) cited the use of the assumption by McLaren et al. (2009) in
calculation of carbon foot print life cycle assessment). The authors suggested that
Stellenbosch University https://scholar.sun.ac.za
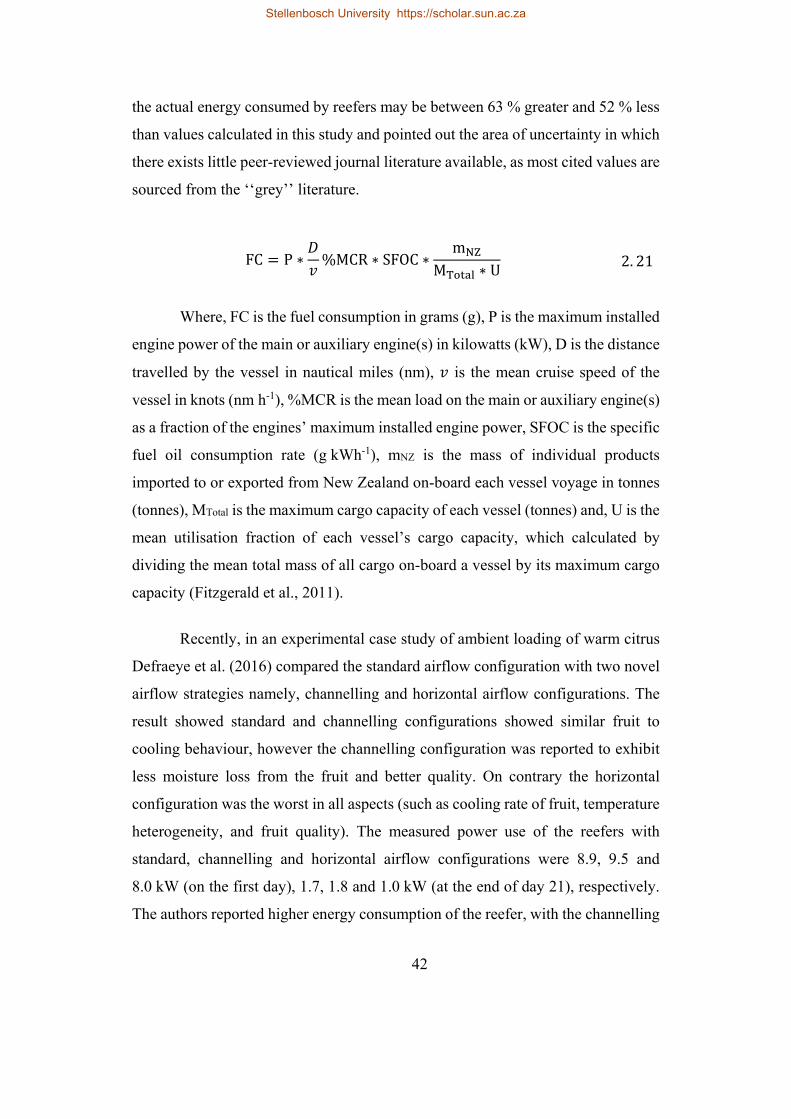
42
the actual energy consumed by reefers may be between 63 % greater and 52 % less
than values calculated in this study and pointed out the area of uncertainty in which
there exists little peer-reviewed journal literature available, as most cited values are
sourced from the ‘‘grey’’ literature.
FC P ∗ %MCR ∗ SFOC ∗m
M ∗ U 2. 21
Where, FC is the fuel consumption in grams (g), P is the maximum installed
engine power of the main or auxiliary engine(s) in kilowatts (kW), D is the distance
travelled by the vessel in nautical miles (nm), is the mean cruise speed of the
vessel in knots (nm h-1), %MCR is the mean load on the main or auxiliary engine(s)
as a fraction of the engines’ maximum installed engine power, SFOC is the specific
fuel oil consumption rate (g kWh-1), mNZ is the mass of individual products
imported to or exported from New Zealand on-board each vessel voyage in tonnes
(tonnes), MTotal is the maximum cargo capacity of each vessel (tonnes) and, U is the
mean utilisation fraction of each vessel’s cargo capacity, which calculated by
dividing the mean total mass of all cargo on-board a vessel by its maximum cargo
capacity (Fitzgerald et al., 2011).
Recently, in an experimental case study of ambient loading of warm citrus
Defraeye et al. (2016) compared the standard airflow configuration with two novel
airflow strategies namely, channelling and horizontal airflow configurations. The
result showed standard and channelling configurations showed similar fruit to
cooling behaviour, however the channelling configuration was reported to exhibit
less moisture loss from the fruit and better quality. On contrary the horizontal
configuration was the worst in all aspects (such as cooling rate of fruit, temperature
heterogeneity, and fruit quality). The measured power use of the reefers with
standard, channelling and horizontal airflow configurations were 8.9, 9.5 and
8.0 kW (on the first day), 1.7, 1.8 and 1.0 kW (at the end of day 21), respectively.
The authors reported higher energy consumption of the reefer, with the channelling
Stellenbosch University https://scholar.sun.ac.za
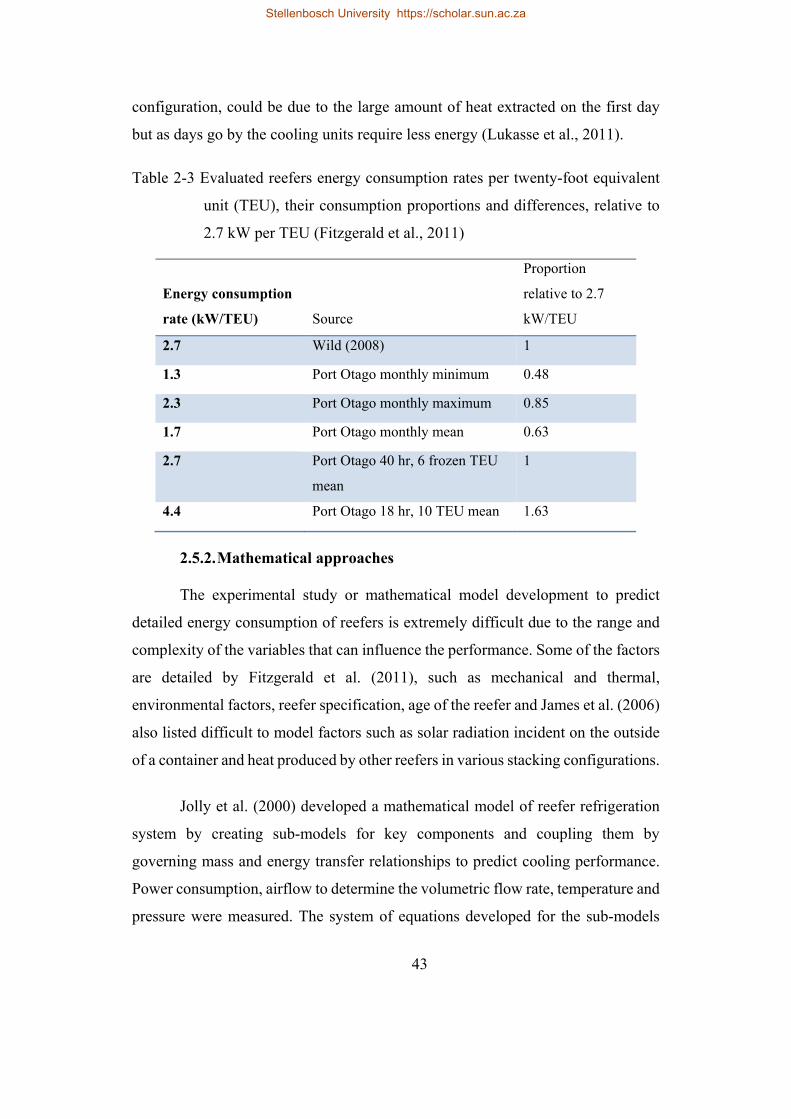
43
configuration, could be due to the large amount of heat extracted on the first day
but as days go by the cooling units require less energy (Lukasse et al., 2011).
Table 2-3 Evaluated reefers energy consumption rates per twenty-foot equivalent
unit (TEU), their consumption proportions and differences, relative to
2.7 kW per TEU (Fitzgerald et al., 2011)
Energy consumption
rate (kW/TEU) Source
Proportion
relative to 2.7
kW/TEU
2.7 Wild (2008) 1
1.3 Port Otago monthly minimum 0.48
2.3 Port Otago monthly maximum 0.85
1.7 Port Otago monthly mean 0.63
2.7 Port Otago 40 hr, 6 frozen TEU
mean
1
4.4 Port Otago 18 hr, 10 TEU mean 1.63
2.5.2. Mathematical approaches
The experimental study or mathematical model development to predict
detailed energy consumption of reefers is extremely difficult due to the range and
complexity of the variables that can influence the performance. Some of the factors
are detailed by Fitzgerald et al. (2011), such as mechanical and thermal,
environmental factors, reefer specification, age of the reefer and James et al. (2006)
also listed difficult to model factors such as solar radiation incident on the outside
of a container and heat produced by other reefers in various stacking configurations.
Jolly et al. (2000) developed a mathematical model of reefer refrigeration
system by creating sub-models for key components and coupling them by
governing mass and energy transfer relationships to predict cooling performance.
Power consumption, airflow to determine the volumetric flow rate, temperature and
pressure were measured. The system of equations developed for the sub-models
Stellenbosch University https://scholar.sun.ac.za

44
were combined to form integrated system of algorism and solved by Newton-
Raphson method. Simulation conducted by varying the internal set temperature
while keeping ambient temperature constant (38 °C). The predicted compressor
power ranged from 8.63 to 4.42 kW for temperature variation from -18 to 13.4 °C.
Deviation of the model predictions from experimental result ranges from -7.8 to
+0.16 % and the study did not consider defrost cycle duty, the pressure drop in the
load and, heat generation in the reefer. In addition, the steady state simulation made
does not represent the dynamic nature of cooling operation, however it has revealed
the complexity of modelling energy consumption due to the nature of the process.
Defraeye et al. (2014) evaluated the performance of three different designs
of orange packaging containers namely, Standard, Supervent and Ecopack (Figure
2.5) during precooling operation. In the study CFD was used with simplifications
on the model to decrease computational cost and Reynolds-averaged Navier-Stokes
(RANS) in combination with SST k-turbulence model was employed in
combination with wall functions. They found sufficient agreement with the
experimental which indicates enough accuracy of the model.
The power required for the forced airflow was calculated using equations
(2.22) and (2.23) (Defraeye et al., 2014):
∆ 2. 22
∆ 2. 23
Where, is the power required to force air through the computational
model, ∆ is the pressure drop is the sum of Forchheimer’s inertia term and Darcy’s
viscous term, is the flow rate through the computational domain (m3 s - 1),
and, are pressure loss coefficients.
Stellenbosch University https://scholar.sun.ac.za
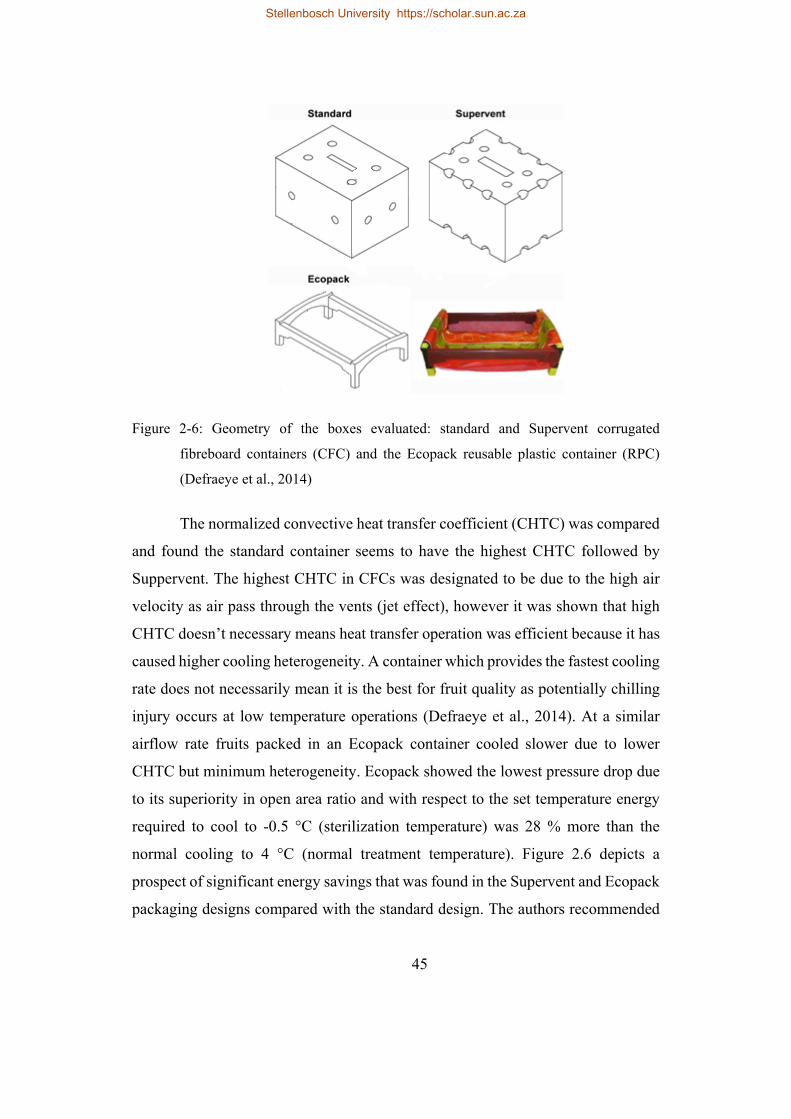
45
Figure 2-6: Geometry of the boxes evaluated: standard and Supervent corrugated
fibreboard containers (CFC) and the Ecopack reusable plastic container (RPC)
(Defraeye et al., 2014)
The normalized convective heat transfer coefficient (CHTC) was compared
and found the standard container seems to have the highest CHTC followed by
Suppervent. The highest CHTC in CFCs was designated to be due to the high air
velocity as air pass through the vents (jet effect), however it was shown that high
CHTC doesn’t necessary means heat transfer operation was efficient because it has
caused higher cooling heterogeneity. A container which provides the fastest cooling
rate does not necessarily mean it is the best for fruit quality as potentially chilling
injury occurs at low temperature operations (Defraeye et al., 2014). At a similar
airflow rate fruits packed in an Ecopack container cooled slower due to lower
CHTC but minimum heterogeneity. Ecopack showed the lowest pressure drop due
to its superiority in open area ratio and with respect to the set temperature energy
required to cool to -0.5 °C (sterilization temperature) was 28 % more than the
normal cooling to 4 °C (normal treatment temperature). Figure 2.6 depicts a
prospect of significant energy savings that was found in the Supervent and Ecopack
packaging designs compared with the standard design. The authors recommended
Stellenbosch University https://scholar.sun.ac.za
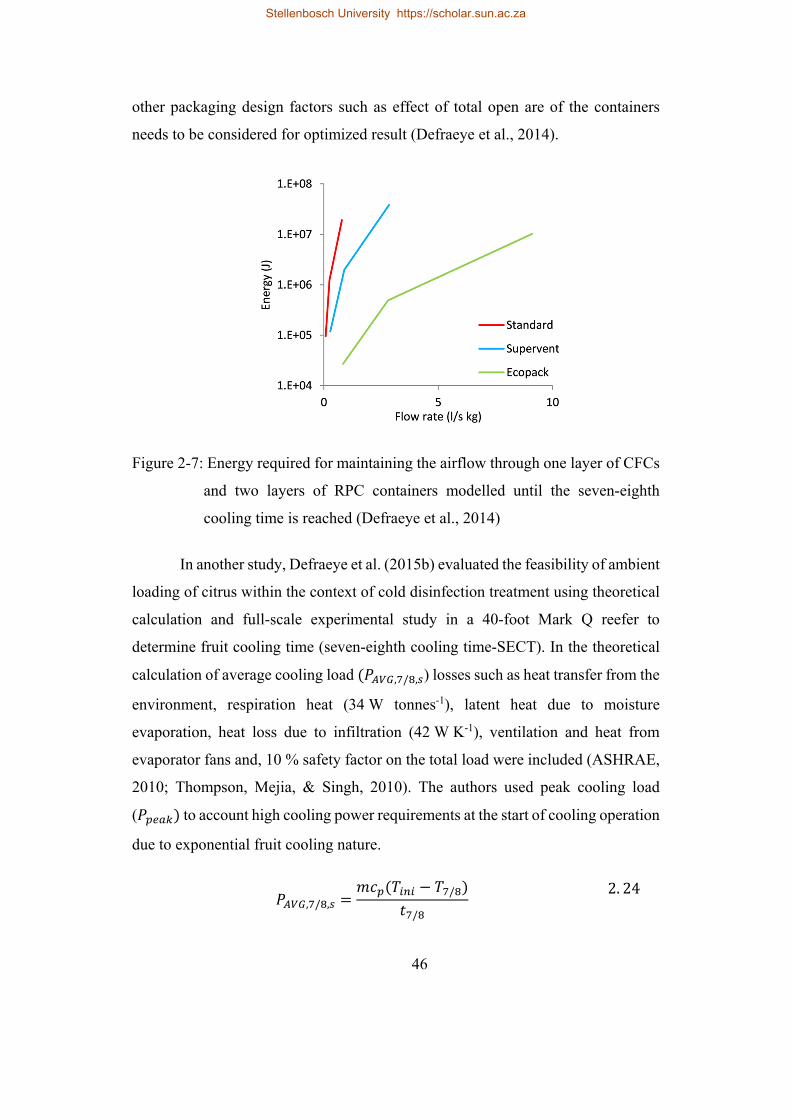
46
other packaging design factors such as effect of total open are of the containers
needs to be considered for optimized result (Defraeye et al., 2014).
Figure 2-7: Energy required for maintaining the airflow through one layer of CFCs
and two layers of RPC containers modelled until the seven-eighth
cooling time is reached (Defraeye et al., 2014)
In another study, Defraeye et al. (2015b) evaluated the feasibility of ambient
loading of citrus within the context of cold disinfection treatment using theoretical
calculation and full-scale experimental study in a 40-foot Mark Q reefer to
determine fruit cooling time (seven-eighth cooling time-SECT). In the theoretical
calculation of average cooling load , / , ) losses such as heat transfer from the
environment, respiration heat (34 W tonnes-1), latent heat due to moisture
evaporation, heat loss due to infiltration (42 W K-1), ventilation and heat from
evaporator fans and, 10 % safety factor on the total load were included (ASHRAE,
2010; Thompson, Mejia, & Singh, 2010). The authors used peak cooling load
( to account high cooling power requirements at the start of cooling operation
due to exponential fruit cooling nature.
, / ,/
/
2. 24
Stellenbosch University https://scholar.sun.ac.za
47
ln 8
/
2. 25
Where, m is the total mass of oranges in the reefer, cp is the specific heat
capacity of the oranges (3850 J kg-1K-1), Tini is the initial temperature of the oranges
(20 ), T7/8 is the resulting SECT (1.2 ) and Tair is the set temperature of the
cooling air (-1.5 ). Although experimental result of fruit cooling took 5 days, the
theoretical calculation showed the reefer has cooling power (≈10.7 kW) to cool the
fruit in less than 5 days. The step-down fruit cooling operation applied for the
experimental study (to avoid fruit chilling injury) was suggested for this variation
as fruit could not be cooled down quick enough.
2.6. Conclusion
The basic airflow and heat transfer modelling approaches have been covered
in this review. Several airflow models have been used in modelling reefer and cold
stores. However, in recent years CFD is the dominant modelling tool due to its
flexibility and efficiency in its accuracy compared with the others. Basically there
are two major modelling approaches in a packed container airflow and heat transfer
modelling (Resistance network and CFD), even though there have been a number
of other models (Lattice Model, Scaled model). The resistance network modelling
was used by several researchers for modelling airflow and heat transfer before CFD
became popular and computational power of computers was limited.
Turbulence modelling is complicated and selecting an appropriate
turbulence model that is capable of predicting the transport phenomena accurately
demands experience and evaluation. A number of turbulence models (such as RSM,
K- models and, K- model) have been used to predict airflow pattern in reefer.
RSMs’ prediction was found to be closer to experimental results than K-model
for flows in an enclosed environment such as reefer. However, recently K- model
appears to be efficient and requires less computational time compared to RSM
Stellenbosch University https://scholar.sun.ac.za
48
model in postharvest applications. It is interesting to compare the two turbulence
models for reefer modelling to study there efficiency, accuracy and in particular
prediction capacity of flow separation and attachment in an enclosed environment
which is a common problem.
A fully packed reefer has a complicated geometry that makes it very
difficult during grid generation if explicit representation is the choice. This is due
to the design of packaging boxes that have multi-vents with thin wall and the shape
and orientation of tightly packed fruits in packaging boxes. In order to capture the
airflow connectivity in the packed pallet correctly it is recommended to have fine
grids around the multi-vents with a maximum of 20% growth rate of elements to
the neighbouring portion of the container. However, the fine grids will lead to
economically unmanageable mesh due to the high size ratio of the packaging boxes
and the rest of the domain. Therefore, treating produce packed pallets as a porous
medium is the most effective way to model the domain and this modelling approach
offers comparatively accurate simulation of fluid flow and heat transfer phenomena
in reefer with relatively less computational capacity requirement than the other
modelling approaches.
In postharvest handling of perishable products, it is not only maintaining the
quality of loaded produce but also the amount of energy used for cooling is
important. Different approaches have been used to study energy consumption. Most
of the studies conducted to quantify energy consumption are based on the data
provided by cold chain facilities and port authorities. The focus of the studies was
focused on the average total energy consumed by reefer container transport (not the
amount of energy utilized for cooling operation in particular). The information on
energy consumption of reefers is useful in maritime carbon-foot printing studies
and it adds to the scarce data available. However, in order to find a way to save
energy in perishable produce transport, it is essential to quantify the amount of
energy utilized for refrigeration operation. The energy consumption estimated for
refrigeration operation ranges from 19% to 40% which brings issues of uncertainty
Stellenbosch University https://scholar.sun.ac.za
49
due to lack of experimental data. The data will give some idea or can be used as
guide line but it is difficult to make use of it for meaningful energy saving.
There are a number of factors in postharvest handling such as packaging
design, packaging orientation and product property that have direct effect on energy
consumption. Therefore, consideration of these important factors, which are critical
for both conservation of produce quality and refrigeration energy consumption, in
reefer energy quantification study is imperative.
Stellenbosch University https://scholar.sun.ac.za
50
Chapter3
3. Experimental and numerical investigation of
airflow and heat transfer inside empty
reefer*
Abstract
During transportation of fruits and vegetables, factors such as temperature,
air exchange, humidity levels, and packaging design and stacking arrangements in
the reefer are extremely important to maintain this cold chain. In this study, the
airflow and temperature distribution inside two types of refrigerated shipping
containers were investigated. CFD model of airflow and heat transfer were
developed and experimentally validated. Measurements of airflow velocities and
temperatures were taken from 222 sample positions inside a full-size reefer. The
validated model was then implemented to study the effect of container designs and
operational conditions on airflow pattern and distribution. High and low evaporator
fan speed scenarios of two different reefer designs (T-bar floor and flat floor) were
investigated and these showed that the airflow distribution in the two container
designs were markedly different. The reefer with T-bar floor design exhibited a
noticeable reduction of air recirculation zone and enhanced vertical air movement
* Samuel Getahun, Alemayehu Ambaw, Mulugeta Delele, Chris J. Meyer, Umezuruike Linus Opara. 2016. Experimental and numerical investigation of airflow and heat transfer inside empty reefer. International Journal of Refrigeration (Submitted).
Stellenbosch University https://scholar.sun.ac.za
51
compared to the reefer with flat floor design. The temperature profile in the two
reefer designs at high and low evaporator fan speed conditions were spatially
uniform due to turbulent mixing of air across the length and the width of the
container. Good agreement was found between measured and predicted values of
air velocities and temperatures. The root-mean-square errors was between the
experimental and the numerical results for vertical ariflow was 1.60. Although
presence of produce load can change the flow field in a reefer significantly, the flow
characteristics of the air from the inlet into the reefer, its distribution along the
length and vertically will still be influenced by the operating and design parameters.
The airflow simulation results provide fundamental insights on the effects of these
design and operational parameters on the airflow distribution in a reefer.
3.1. Introduction
Refrigerated shipping containers (reefers) are used for long distance
transport of fresh fruit from a cold store to a port or vice versa and from a cold store
to a supermarket. It is crucial to control the temperature, air flow and moisture
inside the reefers to avoid produce quality loss. Control of the environmental
condition inside postharvest handling systems such as cold stores, reefers, display
cabinets depends on many factors including the thermal insulation of the container
(Laguerre et al., 2008), temperature fluctuation (Ambaw et al., 2016), rate of
respiration of produce and the air circulation which depends on the design of the
reefer (Fitzgerald et al., 2011) and the design and stacking of the packaging boxes
(Tanner et al., 2002ab; Tanner and Amos, 2003; Delele et al., 2013ab; Defraeye et
al., 2013; Berry et al., 2016).
Reefer usually come in 6.0 m or 12.20 m long (ASHRAE, 2009), with
7.62 cm thick polyurethane insulation in the walls and the floor, and 10.16 cm in
the ceiling. Reefers may have different floor design structures (T-bar, castellated
plate, perforated and flat with pallet base for airflow), and each floor design has its
own advantages and disadvantages (Smale, 2004; Vigneault et al., 2009). The floor
design may affect air exchange inside the reefer and in turn the cooling rate, the
Stellenbosch University https://scholar.sun.ac.za
52
temperature and humidity distributions. Understanding the effect of floor designs
on the airflow and cooling characteristics of reefers is therefore very important.
Experimental study of large cooling containers like reefers is time
consuming, expensive and can only provide limited information on the flow field
(Foster et al., 2002). Application of computational fluid dynamics (CFD) model to
study operational and design parameters has become popular in recent decades.
Frequently, the actual cooling system is reduced to a realistically simple but
accurate model to sufficiently capture important characteristics of the airflow with
existing computational capability (Finn and Brennan, 2003). In another study,
Smale (2004) compared flat floor and perforated floor reefers by applying
resistance network model, however, the static pressure predictions corresponding
to the perforated floor reefer showed discrepancies in the under floor region
attributed to poor prediction of kinetic energy along measurement difficulties.
Moureh et al. (2009 c) employed a 3D CFD model to characterize and show the
effect of air duct system on the uniformity of airflow field in refrigerated trailers.
The authors reported that the air duct system improved the ventilation homogeneity
significantly. In another study, Xie et al. (2006) showed by use of a CFD model that
the corner curves in a cool store room improves uniformity of airflow by reducing
incidence of eddy formations.
Previous studies on reefer and slot-ventilated enclosures (refrigerated
trailers/vehicles) generally assumed fixed working conditions (Moureh and Flick,
2002; Moureh et al., 2009 a, b; Tapsoba et al., 2009). However, reefers are
frequently operated at normal or economic mode. Under normal mode, the
evaporator fans operate at high speed (at air exchange rate of ≈ 79 h-1) and under
economic mode the evaporator fans operate at low speed (at air exchange rate of ≈
36 h-1). Hence, it is appropriate to study the airflow and heat transfers inside reefers
at different operation modes. Furthermore, structure of the floor of the reefer is
aerodynamically important and can profoundly affect the airflow distribution inside
the reefer (Vigneault et al., 2009). Hence, a more complete knowledge of airflow,
Stellenbosch University https://scholar.sun.ac.za
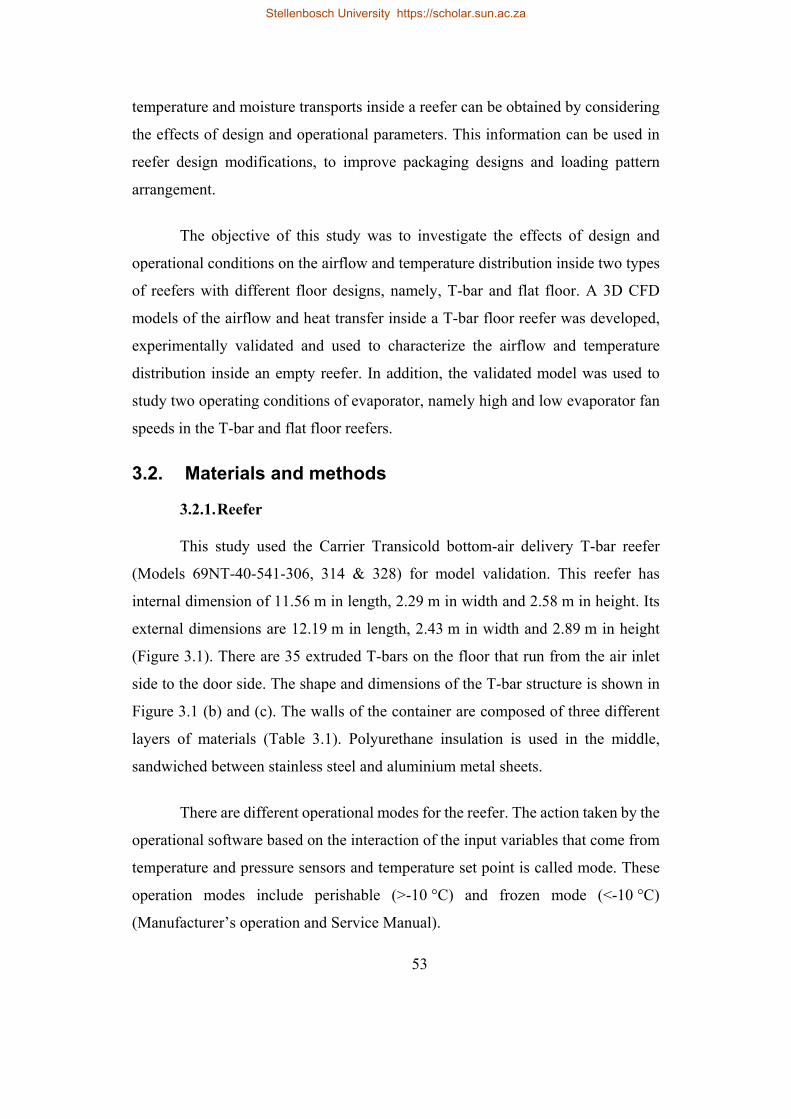
53
temperature and moisture transports inside a reefer can be obtained by considering
the effects of design and operational parameters. This information can be used in
reefer design modifications, to improve packaging designs and loading pattern
arrangement.
The objective of this study was to investigate the effects of design and
operational conditions on the airflow and temperature distribution inside two types
of reefers with different floor designs, namely, T-bar and flat floor. A 3D CFD
models of the airflow and heat transfer inside a T-bar floor reefer was developed,
experimentally validated and used to characterize the airflow and temperature
distribution inside an empty reefer. In addition, the validated model was used to
study two operating conditions of evaporator, namely high and low evaporator fan
speeds in the T-bar and flat floor reefers.
3.2. Materials and methods
3.2.1. Reefer
This study used the Carrier Transicold bottom-air delivery T-bar reefer
(Models 69NT-40-541-306, 314 & 328) for model validation. This reefer has
internal dimension of 11.56 m in length, 2.29 m in width and 2.58 m in height. Its
external dimensions are 12.19 m in length, 2.43 m in width and 2.89 m in height
(Figure 3.1). There are 35 extruded T-bars on the floor that run from the air inlet
side to the door side. The shape and dimensions of the T-bar structure is shown in
Figure 3.1 (b) and (c). The walls of the container are composed of three different
layers of materials (Table 3.1). Polyurethane insulation is used in the middle,
sandwiched between stainless steel and aluminium metal sheets.
There are different operational modes for the reefer. The action taken by the
operational software based on the interaction of the input variables that come from
temperature and pressure sensors and temperature set point is called mode. These
operation modes include perishable (>-10 °C) and frozen mode (<-10 °C)
(Manufacturer’s operation and Service Manual).
Stellenbosch University https://scholar.sun.ac.za
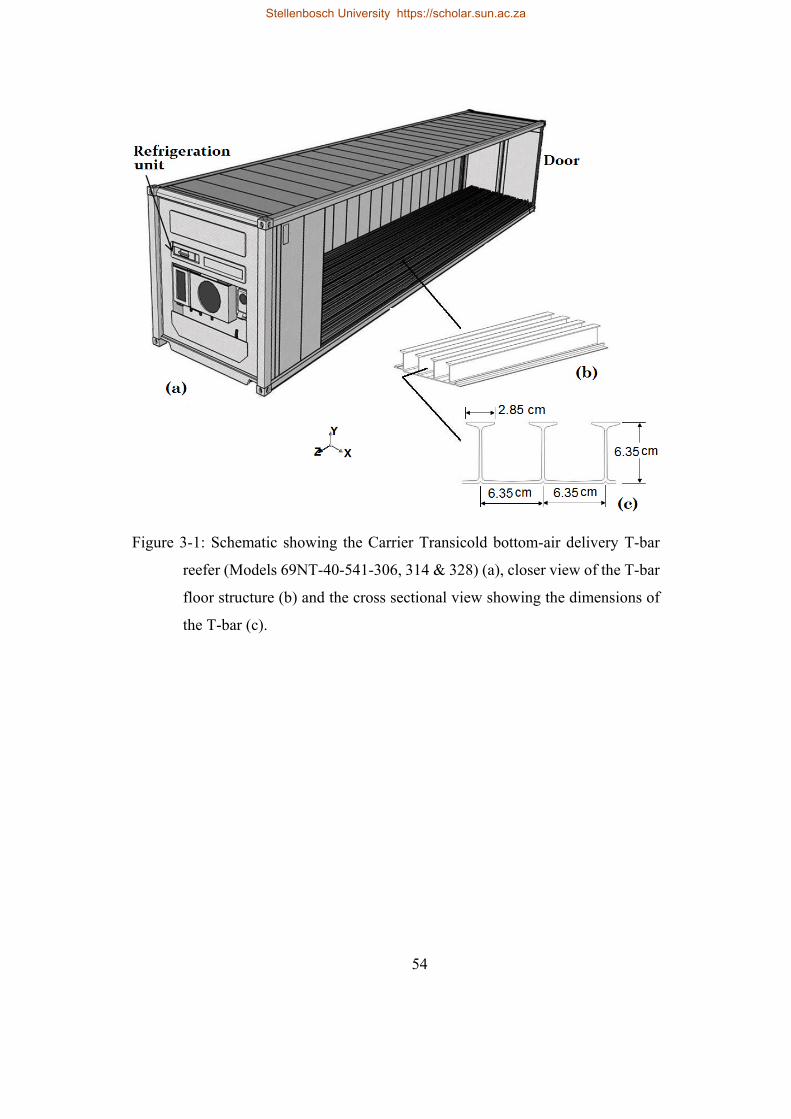
54
Figure 3-1: Schematic showing the Carrier Transicold bottom-air delivery T-bar
reefer (Models 69NT-40-541-306, 314 & 328) (a), closer view of the T-bar
floor structure (b) and the cross sectional view showing the dimensions of
the T-bar (c).
Stellenbosch University https://scholar.sun.ac.za
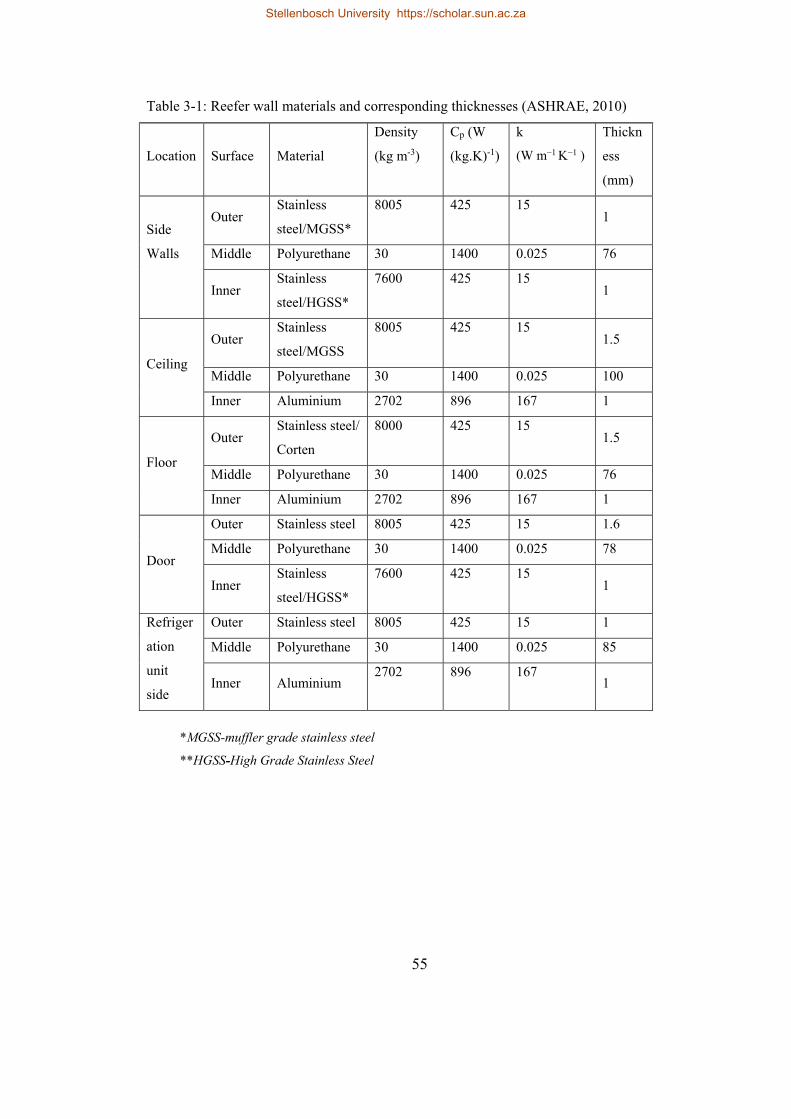
55
Table 3-1: Reefer wall materials and corresponding thicknesses (ASHRAE, 2010)
Location Surface Material
Density
(kg m-3)
Cp (W
(kg.K)-1)
k
(W m−1 K−1 )
Thickn
ess
(mm)
Side
Walls
Outer Stainless
steel/MGSS*
8005 425 15 1
Middle Polyurethane 30 1400 0.025 76
Inner Stainless
steel/HGSS*
7600 425 15 1
Ceiling
Outer Stainless
steel/MGSS
8005 425 15 1.5
Middle Polyurethane 30 1400 0.025 100
Inner Aluminium 2702 896 167 1
Floor
Outer Stainless steel/
Corten
8000 425 15 1.5
Middle Polyurethane 30 1400 0.025 76
Inner Aluminium 2702 896 167 1
Door
Outer Stainless steel 8005 425 15 1.6
Middle Polyurethane 30 1400 0.025 78
Inner Stainless
steel/HGSS*
7600 425 15 1
Refriger
ation
unit
side
Outer Stainless steel 8005 425 15 1
Middle Polyurethane 30 1400 0.025 85
Inner Aluminium 2702 896 167
1
*MGSS-muffler grade stainless steel
**HGSS-High Grade Stainless Steel
Stellenbosch University https://scholar.sun.ac.za
56
3.2.2. Measurements
3.2.3. Airflow
Airflow measurements were conducted using TVS 1100 data logger with
candle stick sensors with accuracy ± 2% and measuring range 0-20 m s-1 as
calibrated by the supplier (Advanced Thermal Solutions Inc, Norwood, USA).
Cooling air enters the refrigerated container with average inlet velocity of 8.5 m s -
1 and volumetric flow rate of 5416 m3 h-1. There were 198 measurement points in
total on the three levels on grid positions as shown in Figure 3.2a. The sensors were
arranged in three levels vertically (near the T-bar floor, 1 m above the floor and 2 m
above the floor) and axially a row of sensors were positioned at 1 m distance from
each other starting from the refrigeration unit as shown in Figure 3.2a. In addition,
12 measurement points each were used at the inlet and outlet regions.
3.2.4. Temperature
Temperature was monitored using T-type thermocouples with a 34970A
data acquisition unit (± 0.1 °C; Agilent Technologies, Santa Clara CA 95051, USA)
(Figure 3.2). Measurements were taken from ninety-nine grid positions as shown in
Figure 3.2a. The sensors were arranged in three levels vertically (near the T-bar
floor, 1 m above the floor and 2 m above the floor) and axially sensors were
positioned at 1 m distance from each other starting from the refrigeration unit as
shown in Figure 3.2a. The candle stick sensors were positioned at a spot by
attaching them on thin bars using scotch tape to support the sensors against the air
flow. Thin bars were used to minimize interference. Temperature data was logged
every 30 seconds for 1h. In addition, air velocities at the inlet and outlet sections of
the refrigeration unit were measured by placing sensors at 12 grid points at the inlet
and outlet cross sections.
Initially, the air inside the reefer was kept at 18 °C. During the experiment
the reefer was set to operate at high evaporator fan speed and the make-up air inlet
was totally closed to minimize environmental effect. The set point for the cooling
Stellenbosch University https://scholar.sun.ac.za
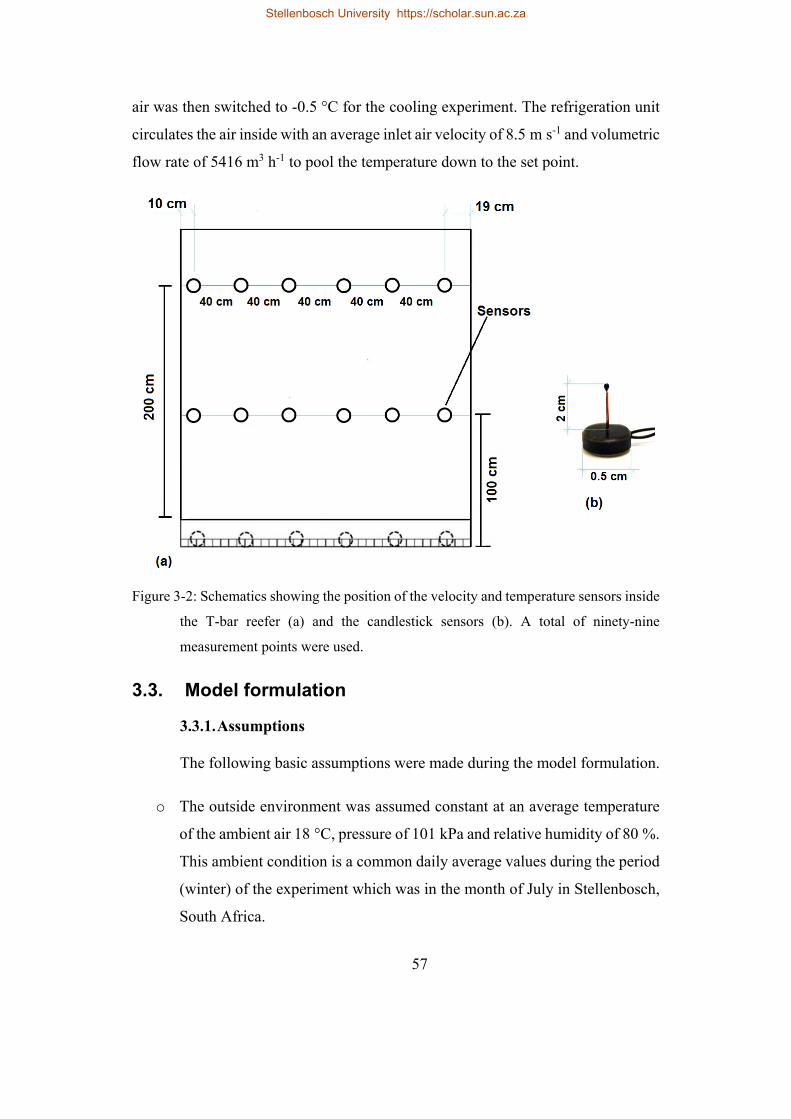
57
air was then switched to -0.5 °C for the cooling experiment. The refrigeration unit
circulates the air inside with an average inlet air velocity of 8.5 m s-1 and volumetric
flow rate of 5416 m3 h-1 to pool the temperature down to the set point.
Figure 3-2: Schematics showing the position of the velocity and temperature sensors inside
the T-bar reefer (a) and the candlestick sensors (b). A total of ninety-nine
measurement points were used.
3.3. Model formulation
3.3.1. Assumptions
The following basic assumptions were made during the model formulation.
o The outside environment was assumed constant at an average temperature
of the ambient air 18 °C, pressure of 101 kPa and relative humidity of 80 %.
This ambient condition is a common daily average values during the period
(winter) of the experiment which was in the month of July in Stellenbosch,
South Africa.
Stellenbosch University https://scholar.sun.ac.za
58
o The cooling unit was accounted for in the model by using the measured
conditions (temperature and air velocity) at the inlet and outlet of the cooling
unit to specify the inlet and outlet boundary conditions of the CFD model.
o Thermal radiation exchange between the exterior surface and the
surroundings was neglected since the outer surfaces of the walls of the reefer
were painted white and the reefer was not exposed to direct sunlight.
o The physical properties of air were assumed constant for the temperature
and pressure ranges of the experiment.
o The RANS k-shear stress (k-SST) model was used to model turbulence
in the domain. This turbulent model perform best in postharvest CFD
applications (Zhang et al., 2007b; Ambaw et al., 2013; Delele et al., 2013b).
o Heat conduction through the walls, floor, door and ceiling was calculated
based on an average outside air temperature of 18 °C. The insulation on all
boundaries was calculated based on the type of material and its thickness.
o Since the air circulation fans were positioned upstream of the evaporator
coil (a blow-through configuration), the fan heat was assumed totally
removed directly by the evaporator coil.
o Heat loads due to lighting and other activities were not considered in the
model since in practice, the reefers are not opened during the experiment,
and there are no lights, and activities within the reefers are minimal.
3.3.2. Governing equations
The airflow and heat transfer in the domain are governed by the mass,
momentum and energy conservation equations given by Eqn. (3.1), Eqn. (3.2) and
Eqn. (3.3), respectively (Versteeg and Malalsekera, 1995). Density of air was
assumed constant at the cooling air temperature (≈ 272.65 K).
3.1
Stellenbosch University https://scholar.sun.ac.za
59
∂∂t
. ⊕ .μ μρ
1ρ
p 3.2
Where, u is the vector of the velocity (m s-1), t is time(s), µ is the dynamic
viscosity of air (kg m-1s-1), µt is the turbulent eddy viscosity (kg m-1s-1), p is pressure
(Pa) and SU (m s-1) is momentum source term.
, . . 3.3
where Cpa (J kg-1K-1) is the heat capacity of air, , ρa (kg m-3) is the density of
air, Ta (K) is the air temperature, ka(W m−1K−1 ) is the thermal conductivity of air,
kt (W m−1K−1) is the turbulent thermal conductivity and S (W m-3) is the energy
source term, S 0. The turbulent thermal conductivity, through the empirical
turbulent Prandl number (Pr), is a function of the turbulent viscosity (kt=
). To
calculate this turbulent viscosity, the shear stress transport (SST) k-ω turbulence
model was chosen based on Zhang et al. (2007ab), Delele et al., (2008)
and Defraeye et al., (2013), that showed this model to be superior in comparison to
the k-ε or k-ω turbulence models. The relevant model parameters and their values
are summarized in Table 3.2.
3.3.3. Geometry, boundary and initial conditions
Figure 3.3 illustrates the model geometry and the boundary conditions for a
reefer at high evaporator fan speed. The model explicitly incorporated the detailed
structure of the floor structures. The model contains a fluid domain bounded by the
reefer walls, door, ceiling, floor, inlet air baffle plate and the side wall of the
refrigeration unit.
The inlet of the fluid domain in the computation was specified from
measured velocity and temperature values at exit of the evaporator fan. The exit of
Stellenbosch University https://scholar.sun.ac.za
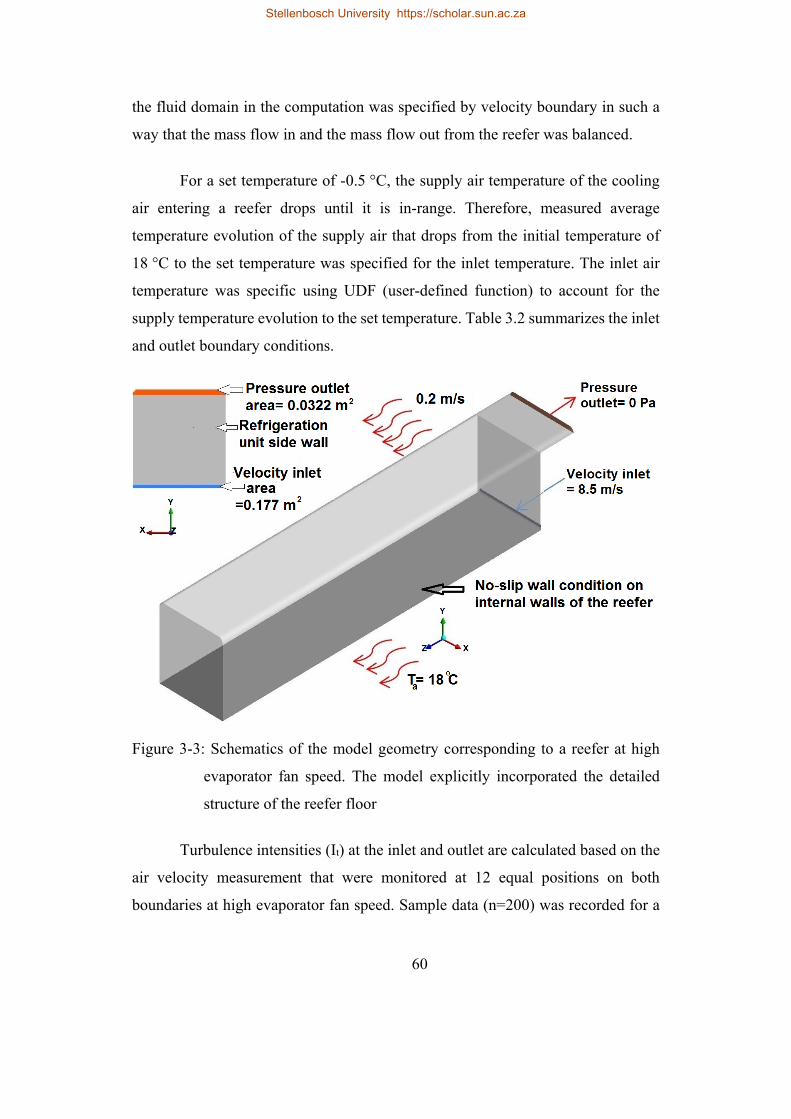
60
the fluid domain in the computation was specified by velocity boundary in such a
way that the mass flow in and the mass flow out from the reefer was balanced.
For a set temperature of -0.5 °C, the supply air temperature of the cooling
air entering a reefer drops until it is in-range. Therefore, measured average
temperature evolution of the supply air that drops from the initial temperature of
18 °C to the set temperature was specified for the inlet temperature. The inlet air
temperature was specific using UDF (user-defined function) to account for the
supply temperature evolution to the set temperature. Table 3.2 summarizes the inlet
and outlet boundary conditions.
Figure 3-3: Schematics of the model geometry corresponding to a reefer at high
evaporator fan speed. The model explicitly incorporated the detailed
structure of the reefer floor
Turbulence intensities (It) at the inlet and outlet are calculated based on the
air velocity measurement that were monitored at 12 equal positions on both
boundaries at high evaporator fan speed. Sample data (n=200) was recorded for a
Stellenbosch University https://scholar.sun.ac.za
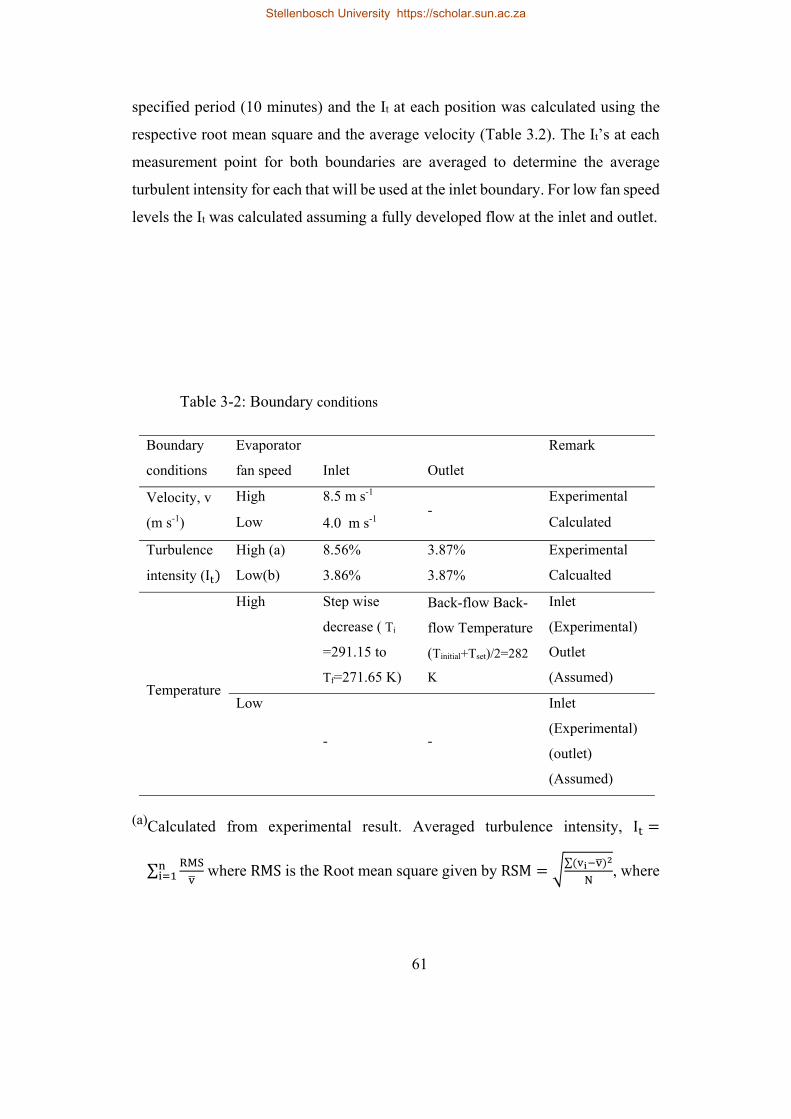
61
specified period (10 minutes) and the It at each position was calculated using the
respective root mean square and the average velocity (Table 3.2). The It’s at each
measurement point for both boundaries are averaged to determine the average
turbulent intensity for each that will be used at the inlet boundary. For low fan speed
levels the It was calculated assuming a fully developed flow at the inlet and outlet.
Table 3-2: Boundary conditions
(a)Calculated from experimental result. Averaged turbulence intensity, I
∑ where RMS is the Root mean square given by RSM∑
, where
Boundary
conditions
Evaporator
fan speed Inlet Outlet
Remark
Velocity, v
(m s-1)
High 8.5 m s-1 -
Experimental
Low 4.0 m s-1 Calculated
Turbulence
intensity (I
High (a) 8.56% 3.87% Experimental
Low(b) 3.86% 3.87% Calcualted
Temperature
High Step wise
decrease ( Ti
=291.15 to
Tf=271.65 K)
Back-flow Back-
flow Temperature
(Tinitial+Tset)/2=282
K
Inlet
(Experimental)
Outlet
(Assumed)
Low
- -
Inlet
(Experimental)
(outlet)
(Assumed)
Stellenbosch University https://scholar.sun.ac.za
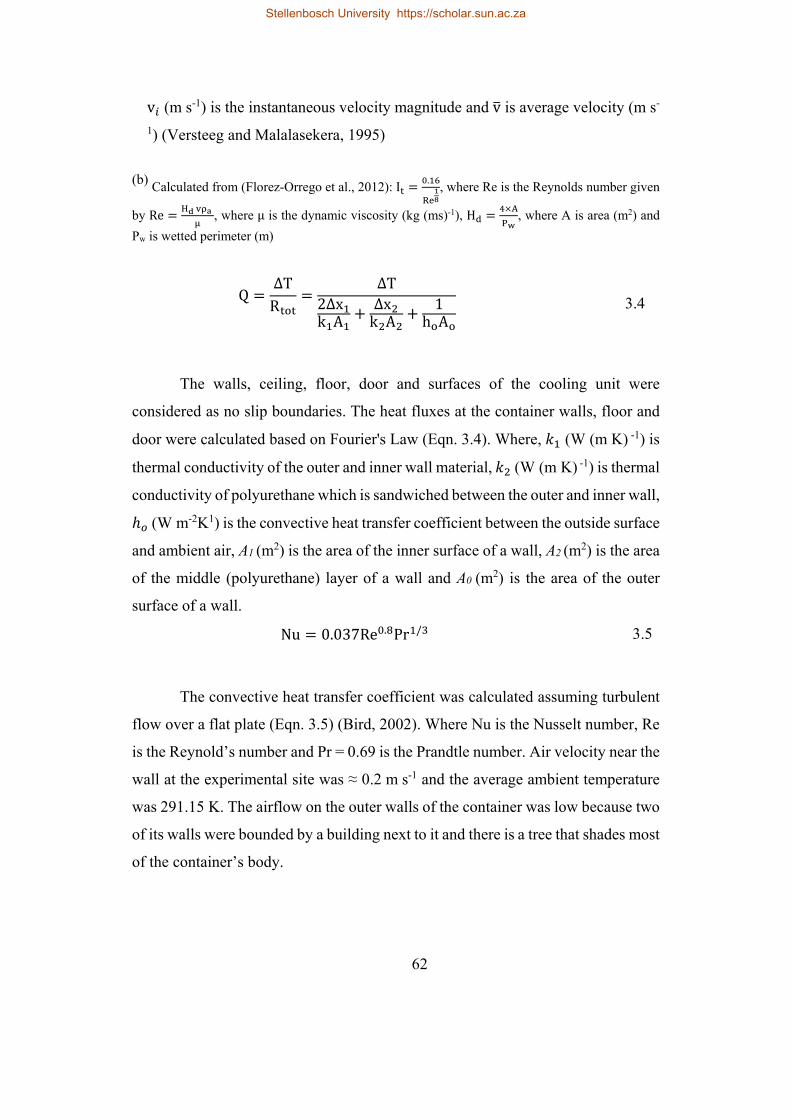
62
v (m s-1) is the instantaneous velocity magnitude and v is average velocity (m s-
1) (Versteeg and Malalasekera, 1995)
(b) Calculated from (Florez-Orrego et al., 2012): I.
, where Re is the Reynolds number given
by Re , where μ is the dynamic viscosity (kg (ms)-1), H , where A is area (m2) and
Pw is wetted perimeter (m)
Q∆TR
∆T2∆xk A
∆xk A
1h A
3.4
The walls, ceiling, floor, door and surfaces of the cooling unit were
considered as no slip boundaries. The heat fluxes at the container walls, floor and
door were calculated based on Fourier's Law (Eqn. 3.4). Where, (W (m K) -1) is
thermal conductivity of the outer and inner wall material, (W (m K) -1) is thermal
conductivity of polyurethane which is sandwiched between the outer and inner wall,
(W m-2K1) is the convective heat transfer coefficient between the outside surface
and ambient air, A1 (m2) is the area of the inner surface of a wall, A2 (m2) is the area
of the middle (polyurethane) layer of a wall and A0 (m2) is the area of the outer
surface of a wall.
Nu 0.037Re . Pr / 3.5
The convective heat transfer coefficient was calculated assuming turbulent
flow over a flat plate (Eqn. 3.5) (Bird, 2002). Where Nu is the Nusselt number, Re
is the Reynold’s number and Pr = 0.69 is the Prandtle number. Air velocity near the
wall at the experimental site was ≈ 0.2 m s-1 and the average ambient temperature
was 291.15 K. The airflow on the outer walls of the container was low because two
of its walls were bounded by a building next to it and there is a tree that shades most
of the container’s body.
Stellenbosch University https://scholar.sun.ac.za
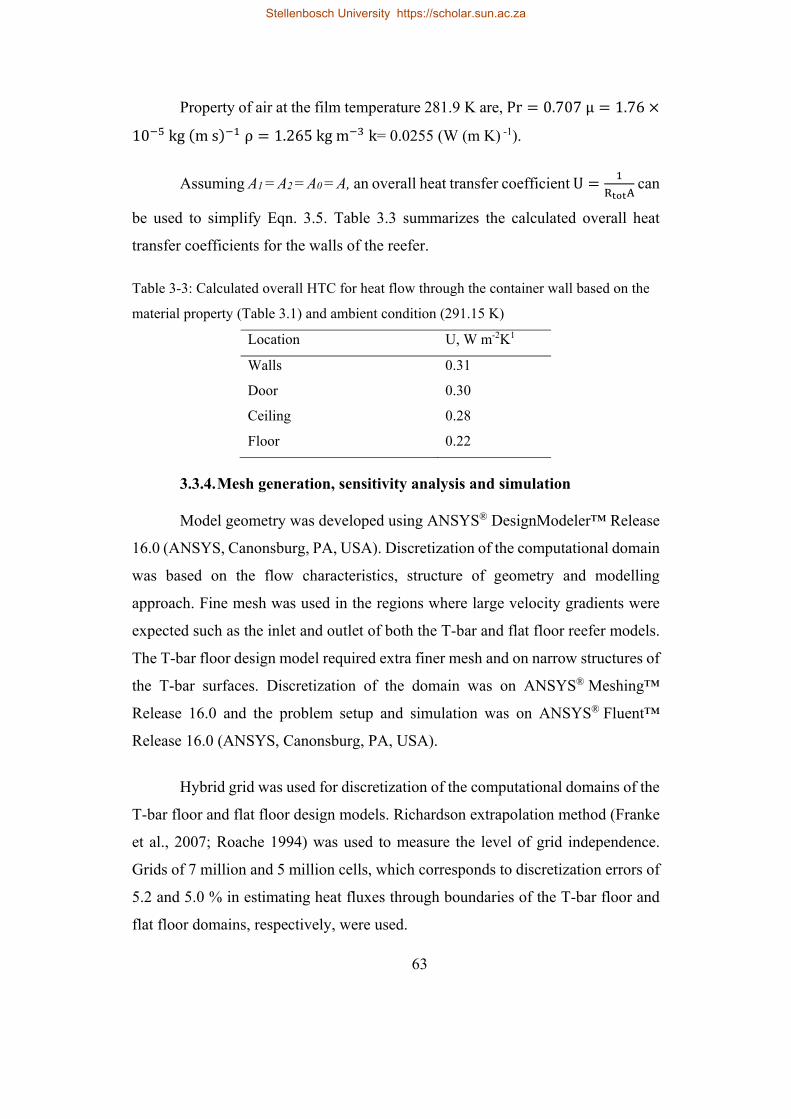
63
Property of air at the film temperature 281.9 K are, Pr 0.707 μ 1.76
10 kg ms ρ 1.265kgm k= 0.0255 (W (m K) -1).
Assuming A1 = A2 = A0 = A, an overall heat transfer coefficient U can
be used to simplify Eqn. 3.5. Table 3.3 summarizes the calculated overall heat
transfer coefficients for the walls of the reefer.
Table 3-3: Calculated overall HTC for heat flow through the container wall based on the
material property (Table 3.1) and ambient condition (291.15 K)
Location U, W m-2K1
Walls 0.31
Door 0.30
Ceiling 0.28
Floor 0.22
3.3.4. Mesh generation, sensitivity analysis and simulation
Model geometry was developed using ANSYS® DesignModeler™ Release
16.0 (ANSYS, Canonsburg, PA, USA). Discretization of the computational domain
was based on the flow characteristics, structure of geometry and modelling
approach. Fine mesh was used in the regions where large velocity gradients were
expected such as the inlet and outlet of both the T-bar and flat floor reefer models.
The T-bar floor design model required extra finer mesh and on narrow structures of
the T-bar surfaces. Discretization of the domain was on ANSYS® Meshing™
Release 16.0 and the problem setup and simulation was on ANSYS® Fluent™
Release 16.0 (ANSYS, Canonsburg, PA, USA).
Hybrid grid was used for discretization of the computational domains of the
T-bar floor and flat floor design models. Richardson extrapolation method (Franke
et al., 2007; Roache 1994) was used to measure the level of grid independence.
Grids of 7 million and 5 million cells, which corresponds to discretization errors of
5.2 and 5.0 % in estimating heat fluxes through boundaries of the T-bar floor and
flat floor domains, respectively, were used.
Stellenbosch University https://scholar.sun.ac.za
64
First, the airflow inside the container was solved assuming a steady state
condition. Then, the steady state airflow condition was used as an initial condition
to the subsequent transient heat transfer calculation. The transient heat transfer was
conducted merely for model validation purpose. SIMPLE discretization scheme
was used for pressure-velocity coupling and second order upwind discretization
was used for momentum, specific dissipation rate and energy calculations. The
transient simulations were run for 24 hours with a time step of 1 s using a computer
with 12 core Intel Xeon processor (3.30 GHz) and 40GB Ram.
3.4. Result and discussion
Model validation was conducted using the T-bar floor design reefer
operating at high evaporator fan speed condition (5416 m3 h-1). Furthermore, the
validated model was used to evaluate high and low evaporator fan speeds (section
3.2 and section 3.3 respectively) in T-bar and flat floor design reefer models.
3.4.1. Inlet air flow
The cooling air enters the container horizontally (perpendicular to the inlet
face) with high velocity (≈ 8.5 m s-1) as a jet. The jet decays along axial direction
because it interacts with the surrounding air and solid surfaces and losses
momentum. This characteristic is commonly expressed by a ratio of the local
velocity component (uw) in the jet direction to the inlet velocity magnitude (U) as
shown in Figure 3.4 for the T-bar floor reefer. The model captured the pattern of
the jet decay accurately but with a significant over predictions between 2 m and
8 m. This region was a primary air recirculation region where air velocity
measurements were highly uncertain. The error bar shows the standard deviation of
duplicated tests that ranges between 0 to 0.28 m s-1. Both the experiment and
simulation estimated the jet decay (flow separation) from the floor ≈9 m (3 L/4),
assuming jet flow separation from the wall when uw/U gets below 0.1 (Yu and Hoff,
1999).
Stellenbosch University https://scholar.sun.ac.za
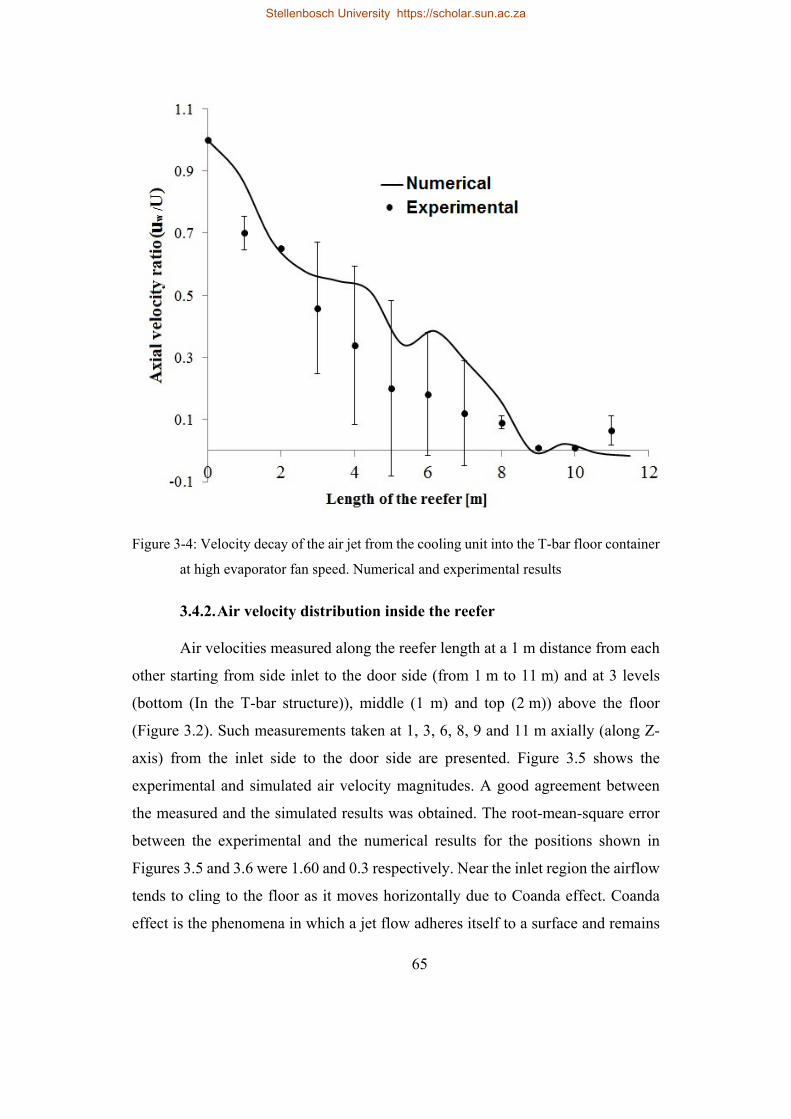
65
Figure 3-4: Velocity decay of the air jet from the cooling unit into the T-bar floor container
at high evaporator fan speed. Numerical and experimental results
3.4.2. Air velocity distribution inside the reefer
Air velocities measured along the reefer length at a 1 m distance from each
other starting from side inlet to the door side (from 1 m to 11 m) and at 3 levels
(bottom (In the T-bar structure)), middle (1 m) and top (2 m)) above the floor
(Figure 3.2). Such measurements taken at 1, 3, 6, 8, 9 and 11 m axially (along Z-
axis) from the inlet side to the door side are presented. Figure 3.5 shows the
experimental and simulated air velocity magnitudes. A good agreement between
the measured and the simulated results was obtained. The root-mean-square error
between the experimental and the numerical results for the positions shown in
Figures 3.5 and 3.6 were 1.60 and 0.3 respectively. Near the inlet region the airflow
tends to cling to the floor as it moves horizontally due to Coanda effect. Coanda
effect is the phenomena in which a jet flow adheres itself to a surface and remains
Stellenbosch University https://scholar.sun.ac.za
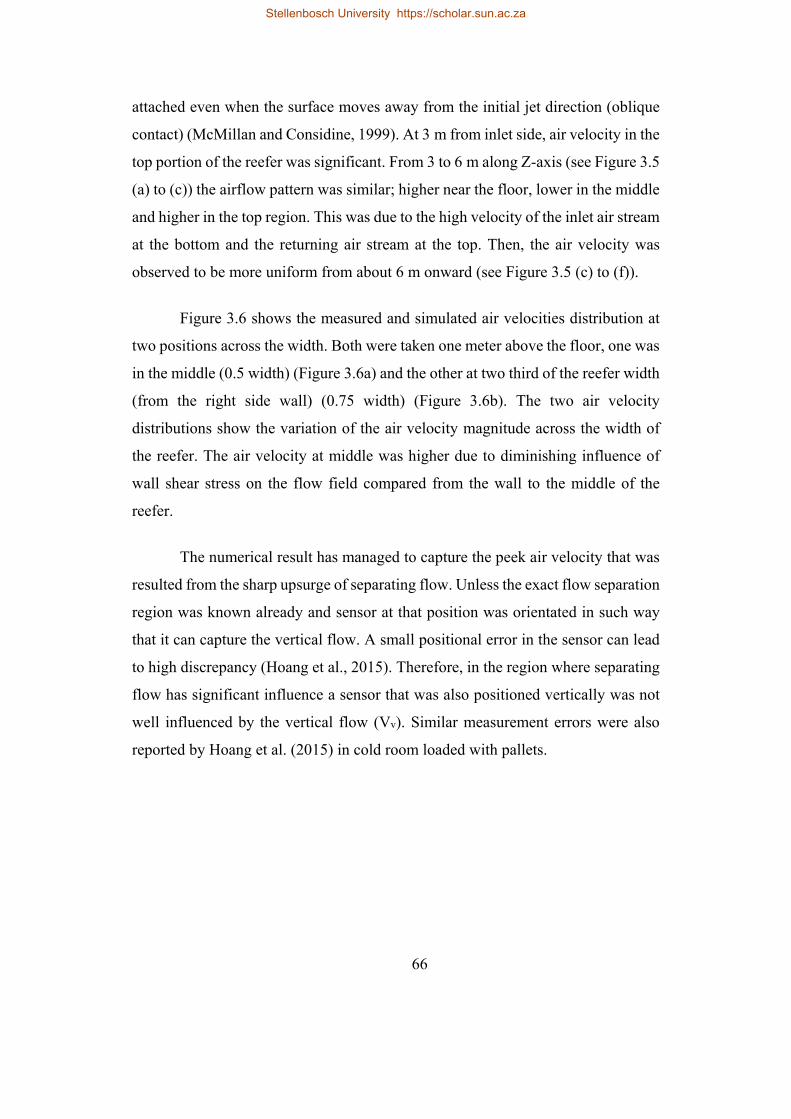
66
attached even when the surface moves away from the initial jet direction (oblique
contact) (McMillan and Considine, 1999). At 3 m from inlet side, air velocity in the
top portion of the reefer was significant. From 3 to 6 m along Z-axis (see Figure 3.5
(a) to (c)) the airflow pattern was similar; higher near the floor, lower in the middle
and higher in the top region. This was due to the high velocity of the inlet air stream
at the bottom and the returning air stream at the top. Then, the air velocity was
observed to be more uniform from about 6 m onward (see Figure 3.5 (c) to (f)).
Figure 3.6 shows the measured and simulated air velocities distribution at
two positions across the width. Both were taken one meter above the floor, one was
in the middle (0.5 width) (Figure 3.6a) and the other at two third of the reefer width
(from the right side wall) (0.75 width) (Figure 3.6b). The two air velocity
distributions show the variation of the air velocity magnitude across the width of
the reefer. The air velocity at middle was higher due to diminishing influence of
wall shear stress on the flow field compared from the wall to the middle of the
reefer.
The numerical result has managed to capture the peek air velocity that was
resulted from the sharp upsurge of separating flow. Unless the exact flow separation
region was known already and sensor at that position was orientated in such way
that it can capture the vertical flow. A small positional error in the sensor can lead
to high discrepancy (Hoang et al., 2015). Therefore, in the region where separating
flow has significant influence a sensor that was also positioned vertically was not
well influenced by the vertical flow (Vv). Similar measurement errors were also
reported by Hoang et al. (2015) in cold room loaded with pallets.
Stellenbosch University https://scholar.sun.ac.za
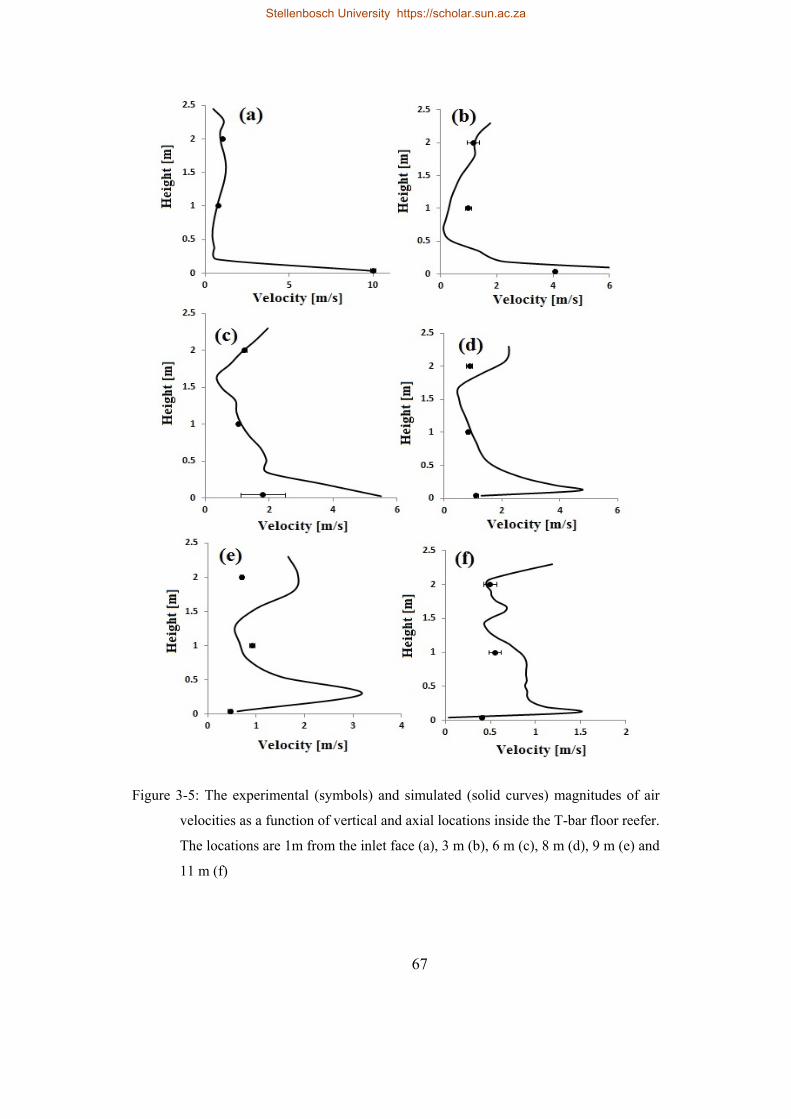
67
Figure 3-5: The experimental (symbols) and simulated (solid curves) magnitudes of air
velocities as a function of vertical and axial locations inside the T-bar floor reefer.
The locations are 1m from the inlet face (a), 3 m (b), 6 m (c), 8 m (d), 9 m (e) and
11 m (f)
Stellenbosch University https://scholar.sun.ac.za
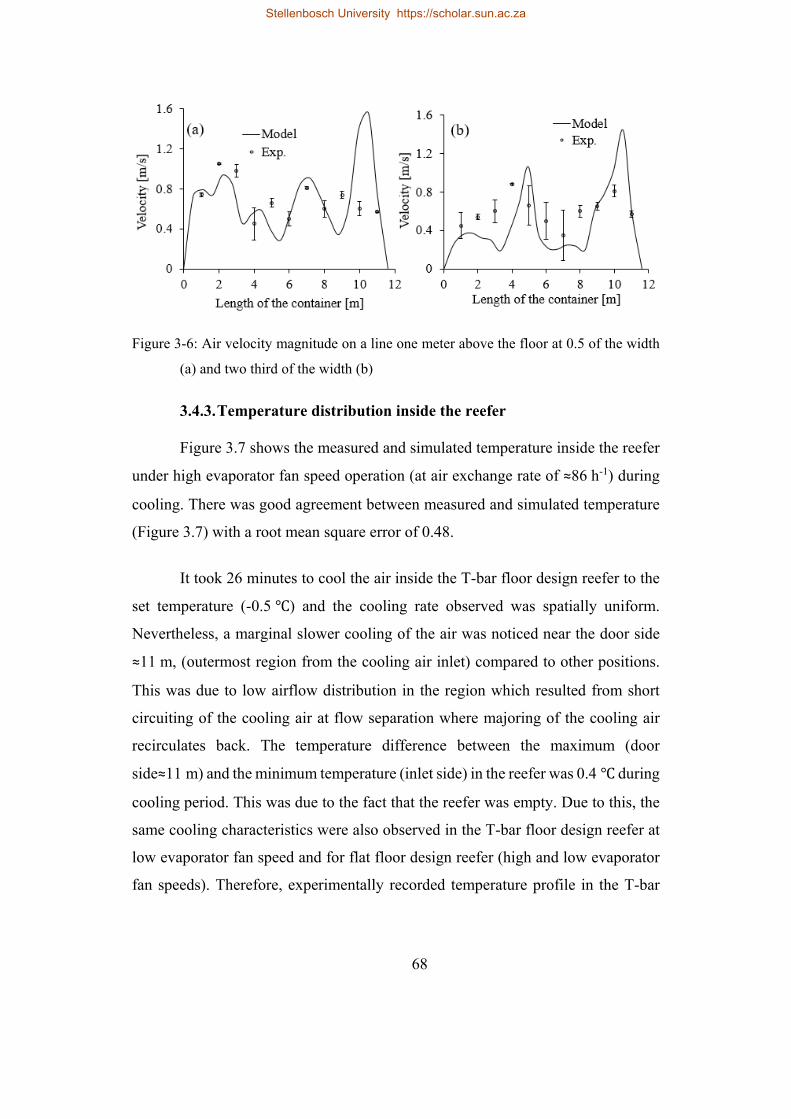
68
Figure 3-6: Air velocity magnitude on a line one meter above the floor at 0.5 of the width
(a) and two third of the width (b)
3.4.3. Temperature distribution inside the reefer
Figure 3.7 shows the measured and simulated temperature inside the reefer
under high evaporator fan speed operation (at air exchange rate of ≈86 h-1) during
cooling. There was good agreement between measured and simulated temperature
(Figure 3.7) with a root mean square error of 0.48.
It took 26 minutes to cool the air inside the T-bar floor design reefer to the
set temperature (-0.5 ) and the cooling rate observed was spatially uniform.
Nevertheless, a marginal slower cooling of the air was noticed near the door side
≈11 m, (outermost region from the cooling air inlet) compared to other positions.
This was due to low airflow distribution in the region which resulted from short
circuiting of the cooling air at flow separation where majoring of the cooling air
recirculates back. The temperature difference between the maximum (door
side≈11 m) and the minimum temperature (inlet side) in the reefer was 0.4 during
cooling period. This was due to the fact that the reefer was empty. Due to this, the
same cooling characteristics were also observed in the T-bar floor design reefer at
low evaporator fan speed and for flat floor design reefer (high and low evaporator
fan speeds). Therefore, experimentally recorded temperature profile in the T-bar
Stellenbosch University https://scholar.sun.ac.za
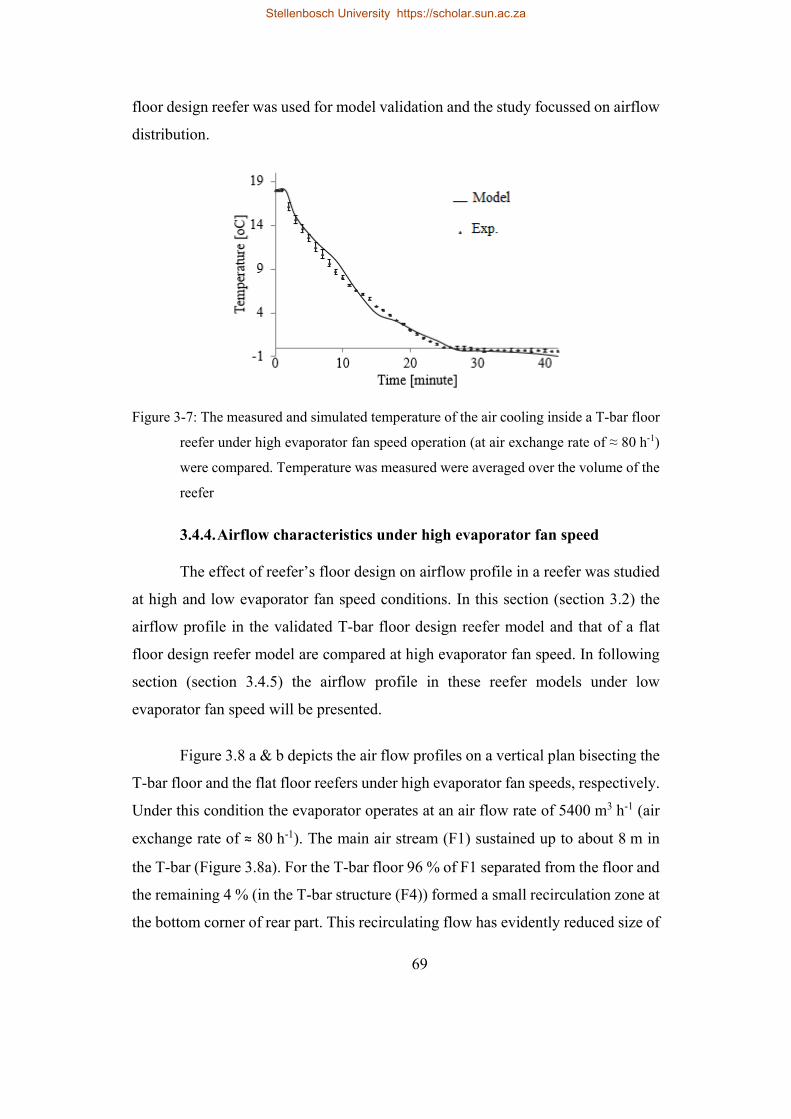
69
floor design reefer was used for model validation and the study focussed on airflow
distribution.
Figure 3-7: The measured and simulated temperature of the air cooling inside a T-bar floor
reefer under high evaporator fan speed operation (at air exchange rate of ≈ 80 h-1)
were compared. Temperature was measured were averaged over the volume of the
reefer
3.4.4. Airflow characteristics under high evaporator fan speed
The effect of reefer’s floor design on airflow profile in a reefer was studied
at high and low evaporator fan speed conditions. In this section (section 3.2) the
airflow profile in the validated T-bar floor design reefer model and that of a flat
floor design reefer model are compared at high evaporator fan speed. In following
section (section 3.4.5) the airflow profile in these reefer models under low
evaporator fan speed will be presented.
Figure 3.8 a & b depicts the air flow profiles on a vertical plan bisecting the
T-bar floor and the flat floor reefers under high evaporator fan speeds, respectively.
Under this condition the evaporator operates at an air flow rate of 5400 m3 h-1 (air
exchange rate of ≈ 80 h-1). The main air stream (F1) sustained up to about 8 m in
the T-bar (Figure 3.8a). For the T-bar floor 96 % of F1 separated from the floor and
the remaining 4 % (in the T-bar structure (F4)) formed a small recirculation zone at
the bottom corner of rear part. This recirculating flow has evidently reduced size of
Stellenbosch University https://scholar.sun.ac.za
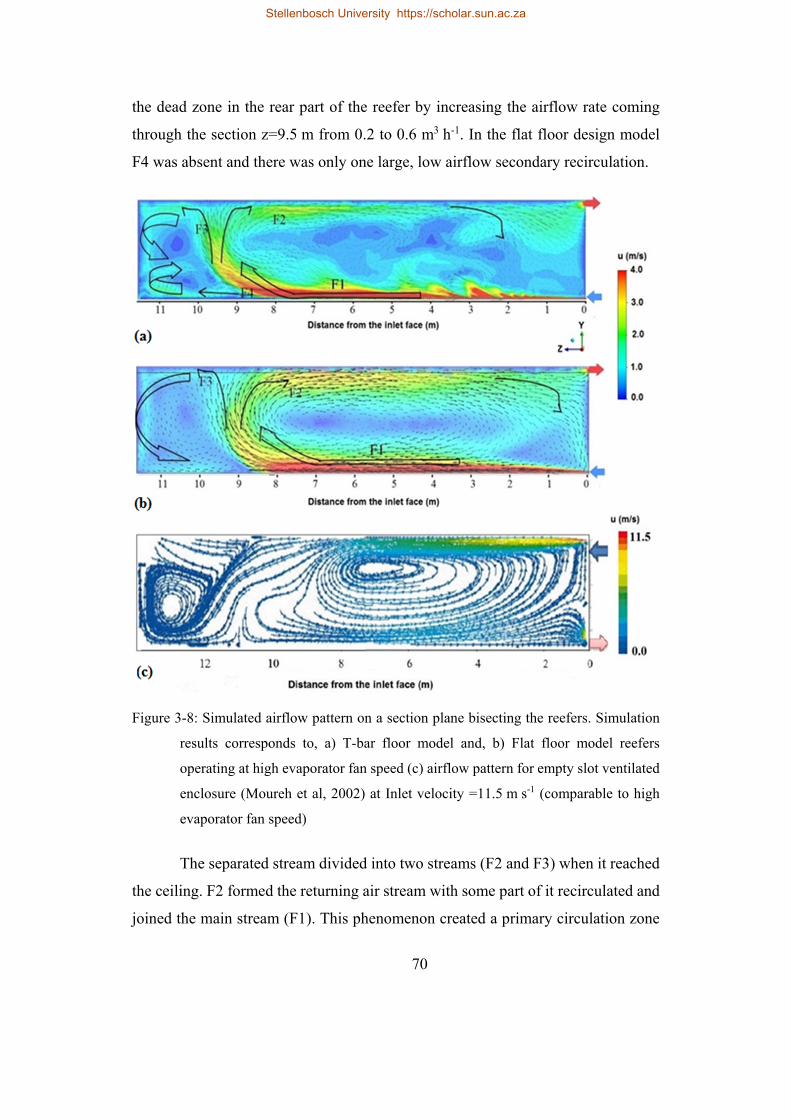
70
the dead zone in the rear part of the reefer by increasing the airflow rate coming
through the section z=9.5 m from 0.2 to 0.6 m3 h-1. In the flat floor design model
F4 was absent and there was only one large, low airflow secondary recirculation.
Figure 3-8: Simulated airflow pattern on a section plane bisecting the reefers. Simulation
results corresponds to, a) T-bar floor model and, b) Flat floor model reefers
operating at high evaporator fan speed (c) airflow pattern for empty slot ventilated
enclosure (Moureh et al, 2002) at Inlet velocity =11.5 m s-1 (comparable to high
evaporator fan speed)
The separated stream divided into two streams (F2 and F3) when it reached
the ceiling. F2 formed the returning air stream with some part of it recirculated and
joined the main stream (F1). This phenomenon created a primary circulation zone
Stellenbosch University https://scholar.sun.ac.za
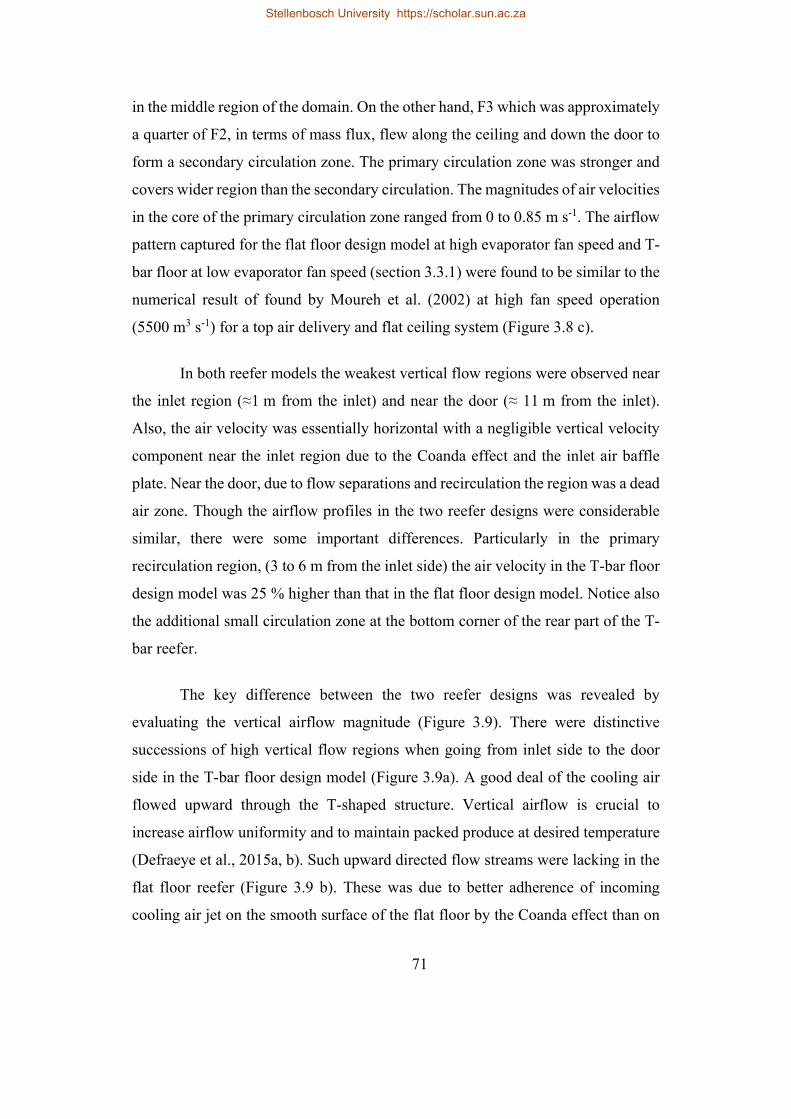
71
in the middle region of the domain. On the other hand, F3 which was approximately
a quarter of F2, in terms of mass flux, flew along the ceiling and down the door to
form a secondary circulation zone. The primary circulation zone was stronger and
covers wider region than the secondary circulation. The magnitudes of air velocities
in the core of the primary circulation zone ranged from 0 to 0.85 m s-1. The airflow
pattern captured for the flat floor design model at high evaporator fan speed and T-
bar floor at low evaporator fan speed (section 3.3.1) were found to be similar to the
numerical result of found by Moureh et al. (2002) at high fan speed operation
(5500 m3 s-1) for a top air delivery and flat ceiling system (Figure 3.8 c).
In both reefer models the weakest vertical flow regions were observed near
the inlet region (≈1 m from the inlet) and near the door (≈ 11 m from the inlet).
Also, the air velocity was essentially horizontal with a negligible vertical velocity
component near the inlet region due to the Coanda effect and the inlet air baffle
plate. Near the door, due to flow separations and recirculation the region was a dead
air zone. Though the airflow profiles in the two reefer designs were considerable
similar, there were some important differences. Particularly in the primary
recirculation region, (3 to 6 m from the inlet side) the air velocity in the T-bar floor
design model was 25 % higher than that in the flat floor design model. Notice also
the additional small circulation zone at the bottom corner of the rear part of the T-
bar reefer.
The key difference between the two reefer designs was revealed by
evaluating the vertical airflow magnitude (Figure 3.9). There were distinctive
successions of high vertical flow regions when going from inlet side to the door
side in the T-bar floor design model (Figure 3.9a). A good deal of the cooling air
flowed upward through the T-shaped structure. Vertical airflow is crucial to
increase airflow uniformity and to maintain packed produce at desired temperature
(Defraeye et al., 2015a, b). Such upward directed flow streams were lacking in the
flat floor reefer (Figure 3.9 b). These was due to better adherence of incoming
cooling air jet on the smooth surface of the flat floor by the Coanda effect than on
Stellenbosch University https://scholar.sun.ac.za

72
the T-bar floor (Tapsoba et al., 2007) which resulted the cooling air jet to flow
axially towards the rear without appreciable vertical motion. This has impact on the
cooling air distribution and cooling operation, particularly in fruit loaded reefer
where cooling air mainly flows thought the packed produce from bottom to top
(Defraeye et al., 2015 a,b).
Figure 3-9: Contours of magnitudes of vertical air velocity on section plan bisecting the T-
bar floor reefer (a) and flat floor reefer (b). Simulation corresponds to the reefers
working at high evaporator fan speed with an air flow rate of 5400 m3 h-1 (air
exchange rate of ≈ 80 h-1)
Figure 3.10a compares the jet flow characteristics of the cold air entering
the reefers at high evaporator fan speed. The jet velocity of the T-bar floor design
model was higher velocity up to 5.7 m. Afterwards the jet velocity in the flat floor
was greater than that in the T-bar floor design model. This was due to strong
primary recirculation zone in the flat floor reefer which influenced the jet flow
characteristics significantly. The effect of the recirculation zone was limited in the
T-bar model due to the relatively weak recirculation caused by the floor structure.
Stellenbosch University https://scholar.sun.ac.za
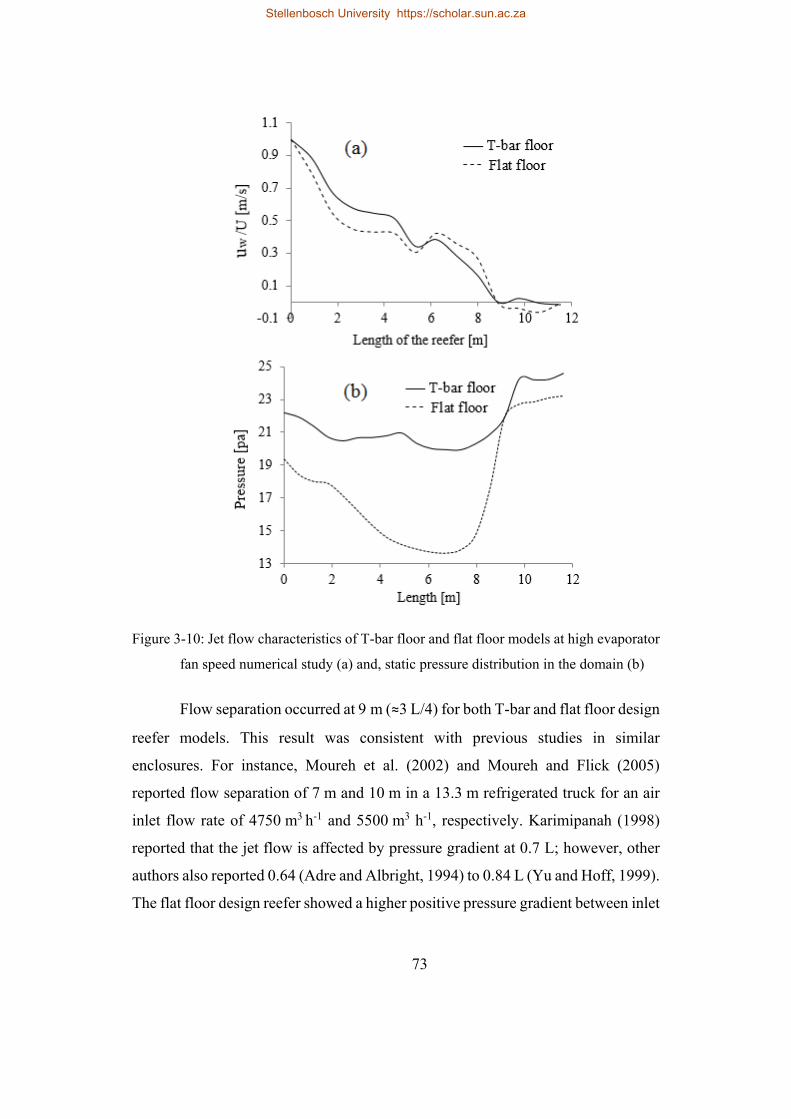
73
Figure 3-10: Jet flow characteristics of T-bar floor and flat floor models at high evaporator
fan speed numerical study (a) and, static pressure distribution in the domain (b)
Flow separation occurred at 9 m (≈3 L/4) for both T-bar and flat floor design
reefer models. This result was consistent with previous studies in similar
enclosures. For instance, Moureh et al. (2002) and Moureh and Flick (2005)
reported flow separation of 7 m and 10 m in a 13.3 m refrigerated truck for an air
inlet flow rate of 4750 m3 h-1 and 5500 m3 h-1, respectively. Karimipanah (1998)
reported that the jet flow is affected by pressure gradient at 0.7 L; however, other
authors also reported 0.64 (Adre and Albright, 1994) to 0.84 L (Yu and Hoff, 1999).
The flat floor design reefer showed a higher positive pressure gradient between inlet
Stellenbosch University https://scholar.sun.ac.za
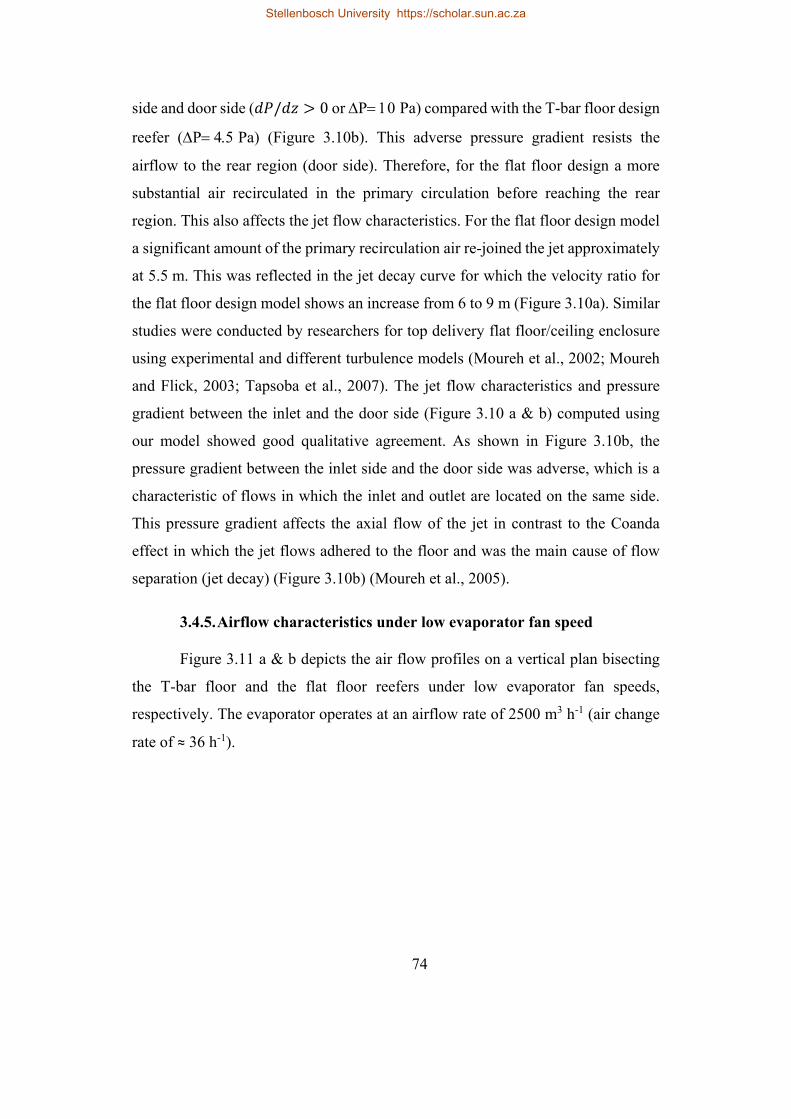
74
side and door side ( / 0 or PPa) compared with the T-bar floor design
reefer (PPa) (Figure 3.10b). This adverse pressure gradient resists the
airflow to the rear region (door side). Therefore, for the flat floor design a more
substantial air recirculated in the primary circulation before reaching the rear
region. This also affects the jet flow characteristics. For the flat floor design model
a significant amount of the primary recirculation air re-joined the jet approximately
at 5.5 m. This was reflected in the jet decay curve for which the velocity ratio for
the flat floor design model shows an increase from 6 to 9 m (Figure 3.10a). Similar
studies were conducted by researchers for top delivery flat floor/ceiling enclosure
using experimental and different turbulence models (Moureh et al., 2002; Moureh
and Flick, 2003; Tapsoba et al., 2007). The jet flow characteristics and pressure
gradient between the inlet and the door side (Figure 3.10 a & b) computed using
our model showed good qualitative agreement. As shown in Figure 3.10b, the
pressure gradient between the inlet side and the door side was adverse, which is a
characteristic of flows in which the inlet and outlet are located on the same side.
This pressure gradient affects the axial flow of the jet in contrast to the Coanda
effect in which the jet flows adhered to the floor and was the main cause of flow
separation (jet decay) (Figure 3.10b) (Moureh et al., 2005).
3.4.5. Airflow characteristics under low evaporator fan speed
Figure 3.11 a & b depicts the air flow profiles on a vertical plan bisecting
the T-bar floor and the flat floor reefers under low evaporator fan speeds,
respectively. The evaporator operates at an airflow rate of 2500 m3 h-1 (air change
rate of ≈ 36 h-1).
Stellenbosch University https://scholar.sun.ac.za
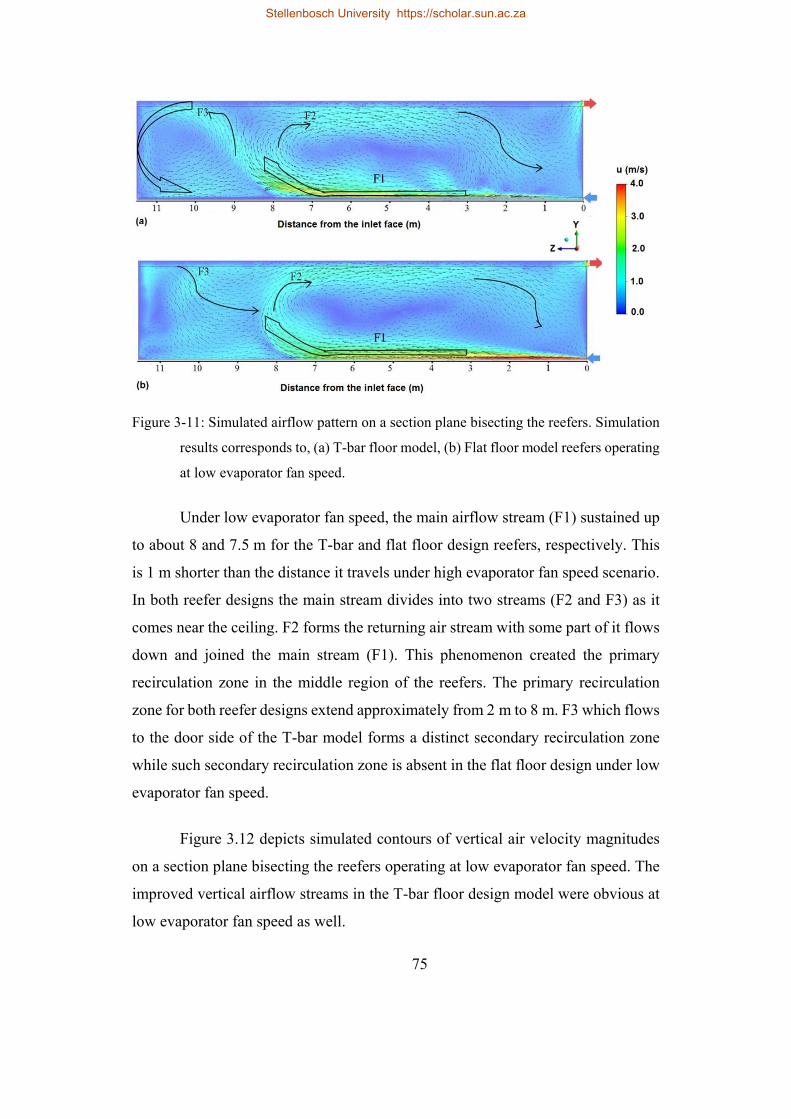
75
Figure 3-11: Simulated airflow pattern on a section plane bisecting the reefers. Simulation
results corresponds to, (a) T-bar floor model, (b) Flat floor model reefers operating
at low evaporator fan speed.
Under low evaporator fan speed, the main airflow stream (F1) sustained up
to about 8 and 7.5 m for the T-bar and flat floor design reefers, respectively. This
is 1 m shorter than the distance it travels under high evaporator fan speed scenario.
In both reefer designs the main stream divides into two streams (F2 and F3) as it
comes near the ceiling. F2 forms the returning air stream with some part of it flows
down and joined the main stream (F1). This phenomenon created the primary
recirculation zone in the middle region of the reefers. The primary recirculation
zone for both reefer designs extend approximately from 2 m to 8 m. F3 which flows
to the door side of the T-bar model forms a distinct secondary recirculation zone
while such secondary recirculation zone is absent in the flat floor design under low
evaporator fan speed.
Figure 3.12 depicts simulated contours of vertical air velocity magnitudes
on a section plane bisecting the reefers operating at low evaporator fan speed. The
improved vertical airflow streams in the T-bar floor design model were obvious at
low evaporator fan speed as well.
Stellenbosch University https://scholar.sun.ac.za
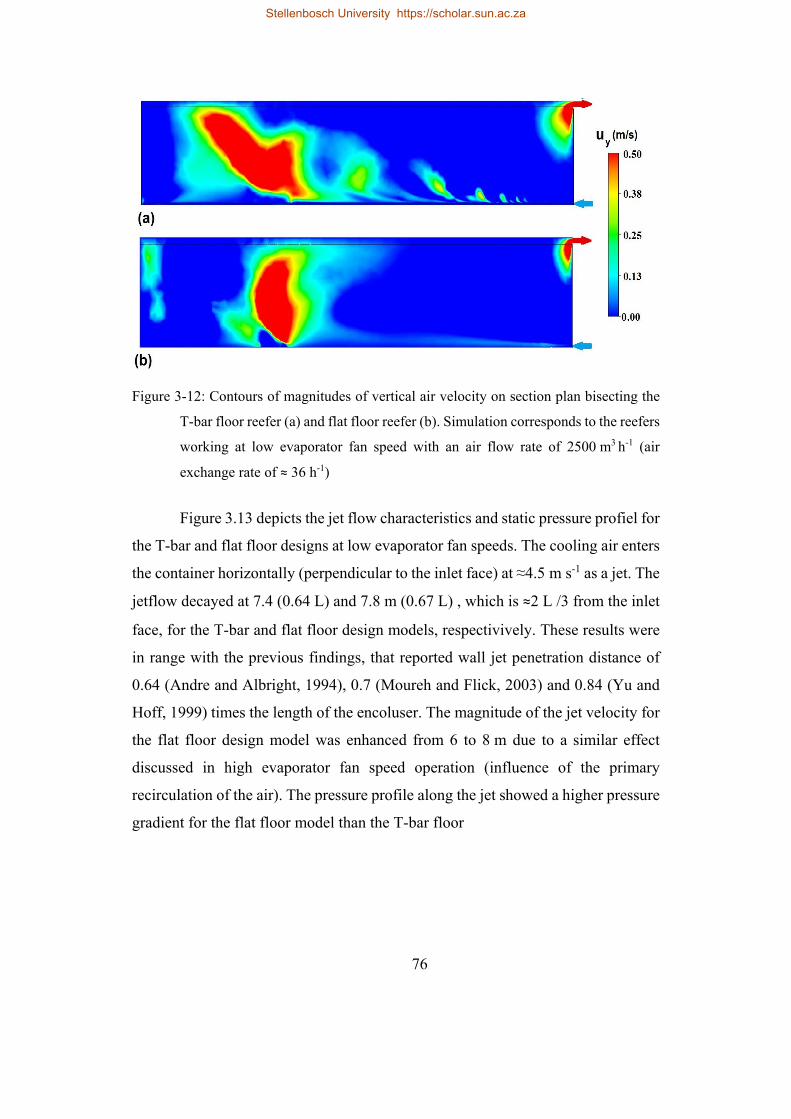
76
Figure 3-12: Contours of magnitudes of vertical air velocity on section plan bisecting the
T-bar floor reefer (a) and flat floor reefer (b). Simulation corresponds to the reefers
working at low evaporator fan speed with an air flow rate of 2500 m3 h-1 (air
exchange rate of ≈ 36 h-1)
Figure 3.13 depicts the jet flow characteristics and static pressure profiel for
the T-bar and flat floor designs at low evaporator fan speeds. The cooling air enters
the container horizontally (perpendicular to the inlet face) at ≈4.5 m s-1 as a jet. The
jetflow decayed at 7.4 (0.64 L) and 7.8 m (0.67 L) , which is ≈2 L /3 from the inlet
face, for the T-bar and flat floor design models, respectivively. These results were
in range with the previous findings, that reported wall jet penetration distance of
0.64 (Andre and Albright, 1994), 0.7 (Moureh and Flick, 2003) and 0.84 (Yu and
Hoff, 1999) times the length of the encoluser. The magnitude of the jet velocity for
the flat floor design model was enhanced from 6 to 8 m due to a similar effect
discussed in high evaporator fan speed operation (influence of the primary
recirculation of the air). The pressure profile along the jet showed a higher pressure
gradient for the flat floor model than the T-bar floor
Stellenbosch University https://scholar.sun.ac.za
77
Figure 3-13: Jet flow characteristics of T-bar floor and flat floor models (a) and, Static
pressure distribution (1 m above the floor) along the length of the reefer (b) at low
evaporator fan speed numerical study
model (Figure 3.13 b), which was also the case at high evporator fan speed
operation (Figure 3.10 b). The static pressure profiles along the length in the two
models drop to their respective minimum in the primary recirculation region (2 to
8 m). However, for the T-bar floor model it was not as sever due to its vertical flow
distribution characteristics that reduces the size and strength of the primary air
Stellenbosch University https://scholar.sun.ac.za
78
recirculation (low pressure region). This ability of the T-bar floor structure to
reduce pressure gradient between the inlet and the rear region indicates energy
saving oportunity.
3.5. Conclusion
The study demonstrated the importance of reefer floor design on the airflow
distribution at high and low evaporator fan speed conditions. By incorporating the
floor structures explicitly in the CFD model, the difference between two reefer floor
designs were visualized and quantified. The T-bar floor structure is characterized
by an increased proportion of vertical airflow inside the reefer compared with the
flat floor structure. This is important during long distance shipping of fresh produce
where cooling air has to flow from the bottom of a pallet to the packed produce in
a fully loaded reefer.
The T-bar floor design reefer recorded 42 % and 51 % less pressure gradient
between the inlet side and door side compared to flat floor design reefer at low and
high evaporator fan speeds, respectively. This reduction in the adversity of the
pressure gradient in turn reduced dead zone in the rear part of the T-bar floor design
reefer by increasing the airflow rate coming through the section z=9.5 m from 0.2
to 0.6 m3 h-1. Presence of produce load can change the flow field in a reefer
significantly. However, operational (fan speed) and design (floor structure)
parameters will still influence flow characteristics of the incoming air, air
distribution along the length (to the rear part) of the container and vertically (into
the load). The airflow simulation results in this study provide fundamental insights
on the effects of these design and operational parameters and remains relevant in
study of packed reefers.
The transient temperature profile in both reefer designs was spatially
uniform since they are empty and due to turbulent mixing of air. The time to cool
the air inside the T-bar and flat floor design reefers to the set temperature was
similar at high and low evaporator fan speed conditions.
Stellenbosch University https://scholar.sun.ac.za
79
The CFD model developed can be applied to study other parameters such
as, airflow distribution, energy consumption and, ambient environmental
conditions that affect cooling operation heat transfer inside a reefer packed with
fresh produce during long shipping periods.
Stellenbosch University https://scholar.sun.ac.za
80
Chapter4
4. Airflow and heat transfer inside refrigerated
shipping container packed with stacked
load of apples: Numerical model
development and validation†
Abstract
This paper developed and validated a porous medium computational fluid
dynamics (CFD) model of airflow and produce cooling inside a fully loaded
refrigerated shipping container (reefer). Wind tunnel tests were used to obtain the
pressure drop characteristics of a palletized stack of apple fruit. One-phase porous
medium CFD model of the air flow and heat transfer was defined using the Darcy-
Forchheimer equation. The detailed structure of the T-bar floor of the reefer and the
resistance to airflow of wooden pallets were included in the model. Heat generation
due to produce respiration and convective heat transfer with the surrounding
environment were incorporated in the CFD model. Airflow and temperature data
obtained from a fully loaded, full-scale reefer were used to validate the model. The
model successfully reproduced the airflow and temperature profiles inside the
reefer. High and low cooling regions were properly identified. The airflow path
† Samuel Getahun, Alemayehu Ambaw, Mulugeta Delele, Chris J. Meyer, Umezuruike Linus Opara. 2016. Airflow and heat transfer inside refrigerated shipping container packed with stacked load of apples: Part I – Numerical model development and validation. Journal of Food Engineering (Submitted).
Stellenbosch University https://scholar.sun.ac.za
81
inside the reefer was visualized using vector and contour plots. Model predictions
were acceptably accurate with an average error of 26% and 18% in predicting
airflow and temperature, respectively. The absence of vent holes on the bottom face
of the packaging box caused non-uniform airflow leading to a highly heterogeneous
cooling, demonstrating the importance of packaging design that takes into account
the particulars of airflow paths inside reefers. A subsequent paper, Part II, will
implement the validated model presented here to further investigate packaging
boxes with respect to vertical airflow to optimize the cooling process in reefers.
4.1. Introduction
Refrigerated shipping container (reefer) is one of the key segments of the
fresh produce cold chain in addition to pre-cooling, storage, handling at distribution
centres and refrigerated display. Uniform distribution of air inside reefers is very
important to insure uniform cooling of the produce (Tanner and Amos, 2003).
Temperature, if not properly controlled, rises due to heat production by the
commodity and other heat sources such as fan motors, heat infiltration from outside,
solar radiation, etc. In addition, chilling injury and/or hot spots due to non-uniform
cooling lead to produce quality loss (Tanner and Amos, 2003; Jedermann et al.,
2013). Hence, it is very important to control temperature inside reefer to preserve
quality and reduce loss (Vigneault et al., 2009).
Controlling reefer internal temperature depends upon many factors
including external climatic conditions, the thermal insulation of the reefer, the
product’s rate of respiration and the air circulation which depends on reefer designs,
package designs and package arrangements inside the reefer (Defraeye et al., 2016).
These factors interact in a complex manner that understanding the effects of design
and operational parameters experimentally alone is time consuming and inadequate.
In the last few decades, experimentally validated numerical models has been
successfully used to acquire important information on airflow and temperature
distributions inside cold storage systems (Smale et al., 2006; Dehghannya et al.,
2010).
Stellenbosch University https://scholar.sun.ac.za
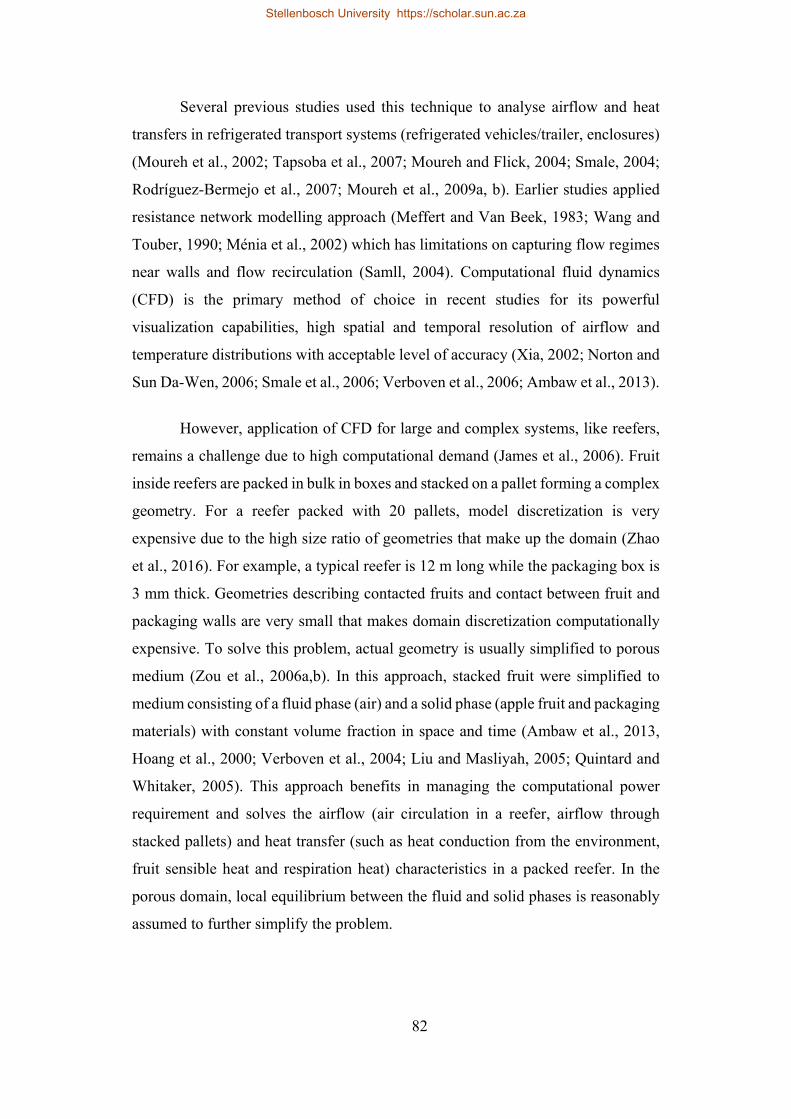
82
Several previous studies used this technique to analyse airflow and heat
transfers in refrigerated transport systems (refrigerated vehicles/trailer, enclosures)
(Moureh et al., 2002; Tapsoba et al., 2007; Moureh and Flick, 2004; Smale, 2004;
Rodríguez-Bermejo et al., 2007; Moureh et al., 2009a, b). Earlier studies applied
resistance network modelling approach (Meffert and Van Beek, 1983; Wang and
Touber, 1990; Ménia et al., 2002) which has limitations on capturing flow regimes
near walls and flow recirculation (Samll, 2004). Computational fluid dynamics
(CFD) is the primary method of choice in recent studies for its powerful
visualization capabilities, high spatial and temporal resolution of airflow and
temperature distributions with acceptable level of accuracy (Xia, 2002; Norton and
Sun Da-Wen, 2006; Smale et al., 2006; Verboven et al., 2006; Ambaw et al., 2013).
However, application of CFD for large and complex systems, like reefers,
remains a challenge due to high computational demand (James et al., 2006). Fruit
inside reefers are packed in bulk in boxes and stacked on a pallet forming a complex
geometry. For a reefer packed with 20 pallets, model discretization is very
expensive due to the high size ratio of geometries that make up the domain (Zhao
et al., 2016). For example, a typical reefer is 12 m long while the packaging box is
3 mm thick. Geometries describing contacted fruits and contact between fruit and
packaging walls are very small that makes domain discretization computationally
expensive. To solve this problem, actual geometry is usually simplified to porous
medium (Zou et al., 2006a,b). In this approach, stacked fruit were simplified to
medium consisting of a fluid phase (air) and a solid phase (apple fruit and packaging
materials) with constant volume fraction in space and time (Ambaw et al., 2013,
Hoang et al., 2000; Verboven et al., 2004; Liu and Masliyah, 2005; Quintard and
Whitaker, 2005). This approach benefits in managing the computational power
requirement and solves the airflow (air circulation in a reefer, airflow through
stacked pallets) and heat transfer (such as heat conduction from the environment,
fruit sensible heat and respiration heat) characteristics in a packed reefer. In the
porous domain, local equilibrium between the fluid and solid phases is reasonably
assumed to further simplify the problem.
Stellenbosch University https://scholar.sun.ac.za
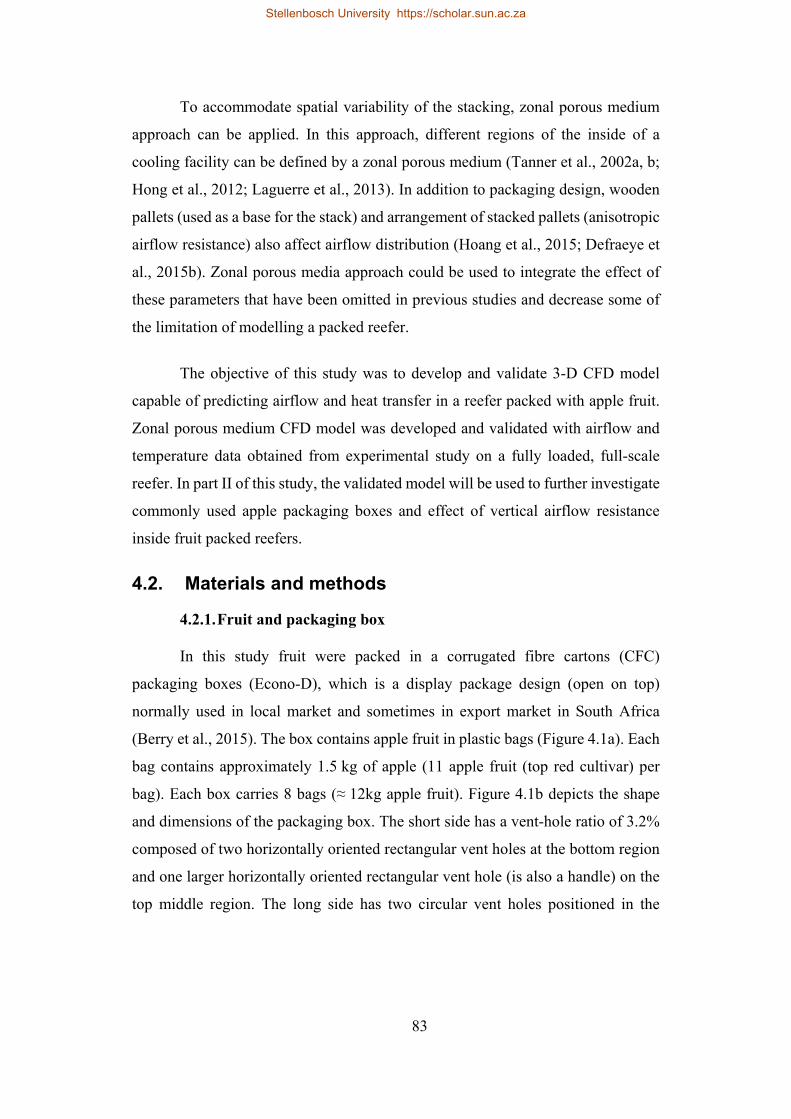
83
To accommodate spatial variability of the stacking, zonal porous medium
approach can be applied. In this approach, different regions of the inside of a
cooling facility can be defined by a zonal porous medium (Tanner et al., 2002a, b;
Hong et al., 2012; Laguerre et al., 2013). In addition to packaging design, wooden
pallets (used as a base for the stack) and arrangement of stacked pallets (anisotropic
airflow resistance) also affect airflow distribution (Hoang et al., 2015; Defraeye et
al., 2015b). Zonal porous media approach could be used to integrate the effect of
these parameters that have been omitted in previous studies and decrease some of
the limitation of modelling a packed reefer.
The objective of this study was to develop and validate 3-D CFD model
capable of predicting airflow and heat transfer in a reefer packed with apple fruit.
Zonal porous medium CFD model was developed and validated with airflow and
temperature data obtained from experimental study on a fully loaded, full-scale
reefer. In part II of this study, the validated model will be used to further investigate
commonly used apple packaging boxes and effect of vertical airflow resistance
inside fruit packed reefers.
4.2. Materials and methods
4.2.1. Fruit and packaging box
In this study fruit were packed in a corrugated fibre cartons (CFC)
packaging boxes (Econo-D), which is a display package design (open on top)
normally used in local market and sometimes in export market in South Africa
(Berry et al., 2015). The box contains apple fruit in plastic bags (Figure 4.1a). Each
bag contains approximately 1.5 kg of apple (11 apple fruit (top red cultivar) per
bag). Each box carries 8 bags (≈ 12kg apple fruit). Figure 4.1b depicts the shape
and dimensions of the packaging box. The short side has a vent-hole ratio of 3.2%
composed of two horizontally oriented rectangular vent holes at the bottom region
and one larger horizontally oriented rectangular vent hole (is also a handle) on the
top middle region. The long side has two circular vent holes positioned in the
Stellenbosch University https://scholar.sun.ac.za
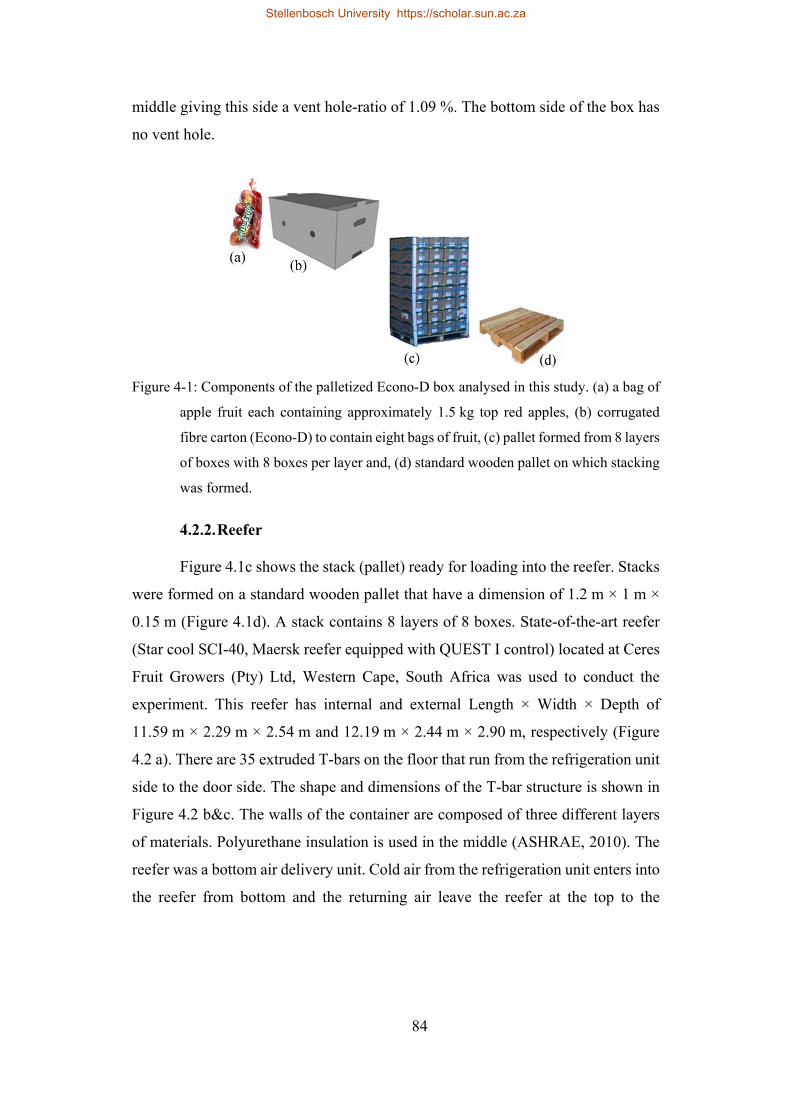
84
middle giving this side a vent hole-ratio of 1.09 %. The bottom side of the box has
no vent hole.
Figure 4-1: Components of the palletized Econo-D box analysed in this study. (a) a bag of
apple fruit each containing approximately 1.5 kg top red apples, (b) corrugated
fibre carton (Econo-D) to contain eight bags of fruit, (c) pallet formed from 8 layers
of boxes with 8 boxes per layer and, (d) standard wooden pallet on which stacking
was formed.
4.2.2. Reefer
Figure 4.1c shows the stack (pallet) ready for loading into the reefer. Stacks
were formed on a standard wooden pallet that have a dimension of 1.2 m × 1 m ×
0.15 m (Figure 4.1d). A stack contains 8 layers of 8 boxes. State-of-the-art reefer
(Star cool SCI-40, Maersk reefer equipped with QUEST I control) located at Ceres
Fruit Growers (Pty) Ltd, Western Cape, South Africa was used to conduct the
experiment. This reefer has internal and external Length × Width × Depth of
11.59 m × 2.29 m × 2.54 m and 12.19 m × 2.44 m × 2.90 m, respectively (Figure
4.2 a). There are 35 extruded T-bars on the floor that run from the refrigeration unit
side to the door side. The shape and dimensions of the T-bar structure is shown in
Figure 4.2 b&c. The walls of the container are composed of three different layers
of materials. Polyurethane insulation is used in the middle (ASHRAE, 2010). The
reefer was a bottom air delivery unit. Cold air from the refrigeration unit enters into
the reefer from bottom and the returning air leave the reefer at the top to the
Stellenbosch University https://scholar.sun.ac.za
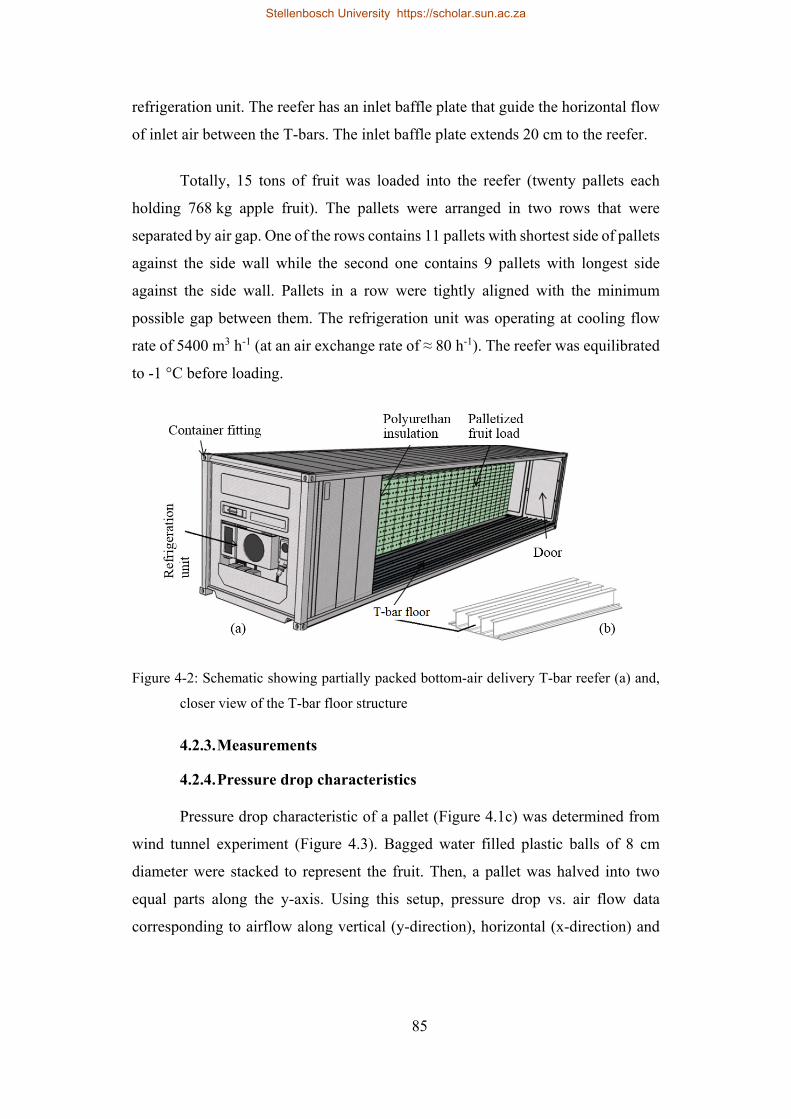
85
refrigeration unit. The reefer has an inlet baffle plate that guide the horizontal flow
of inlet air between the T-bars. The inlet baffle plate extends 20 cm to the reefer.
Totally, 15 tons of fruit was loaded into the reefer (twenty pallets each
holding 768 kg apple fruit). The pallets were arranged in two rows that were
separated by air gap. One of the rows contains 11 pallets with shortest side of pallets
against the side wall while the second one contains 9 pallets with longest side
against the side wall. Pallets in a row were tightly aligned with the minimum
possible gap between them. The refrigeration unit was operating at cooling flow
rate of 5400 m3 h-1 (at an air exchange rate of ≈ 80 h-1). The reefer was equilibrated
to -1 °C before loading.
Figure 4-2: Schematic showing partially packed bottom-air delivery T-bar reefer (a) and,
closer view of the T-bar floor structure
4.2.3. Measurements
4.2.4. Pressure drop characteristics
Pressure drop characteristic of a pallet (Figure 4.1c) was determined from
wind tunnel experiment (Figure 4.3). Bagged water filled plastic balls of 8 cm
diameter were stacked to represent the fruit. Then, a pallet was halved into two
equal parts along the y-axis. Using this setup, pressure drop vs. air flow data
corresponding to airflow along vertical (y-direction), horizontal (x-direction) and
Stellenbosch University https://scholar.sun.ac.za
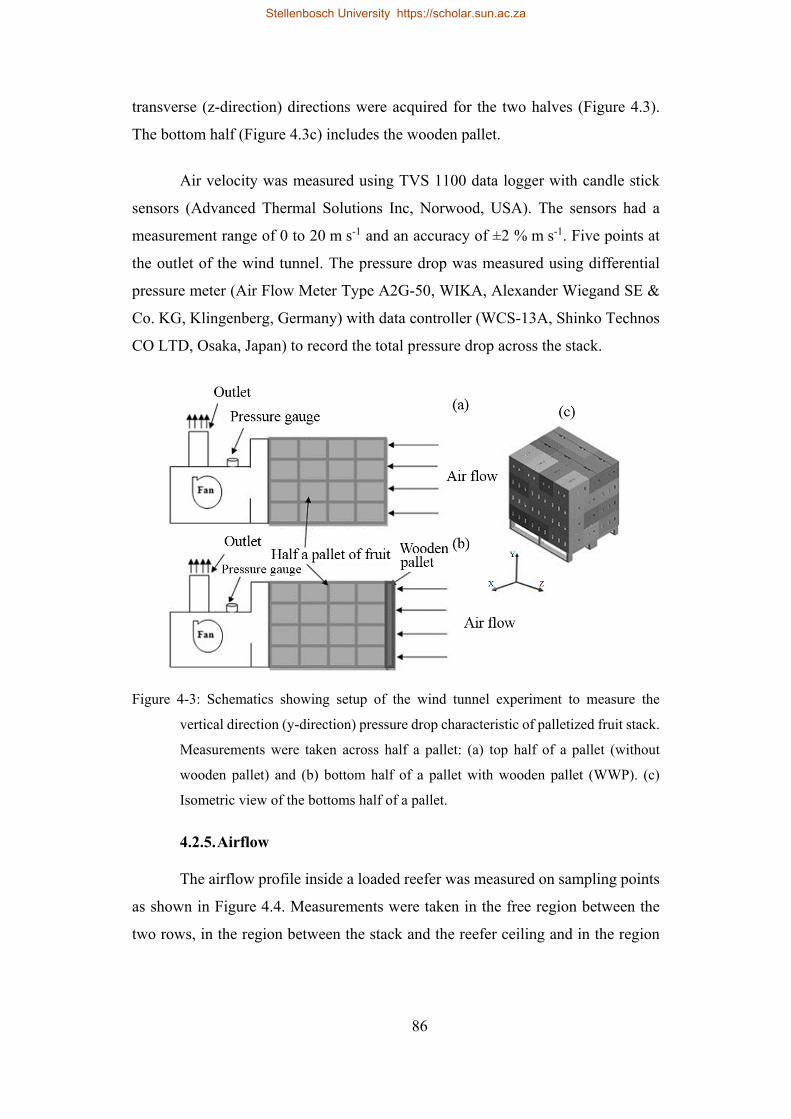
86
transverse (z-direction) directions were acquired for the two halves (Figure 4.3).
The bottom half (Figure 4.3c) includes the wooden pallet.
Air velocity was measured using TVS 1100 data logger with candle stick
sensors (Advanced Thermal Solutions Inc, Norwood, USA). The sensors had a
measurement range of 0 to 20 m s-1 and an accuracy of ±2 % m s-1. Five points at
the outlet of the wind tunnel. The pressure drop was measured using differential
pressure meter (Air Flow Meter Type A2G-50, WIKA, Alexander Wiegand SE &
Co. KG, Klingenberg, Germany) with data controller (WCS-13A, Shinko Technos
CO LTD, Osaka, Japan) to record the total pressure drop across the stack.
Figure 4-3: Schematics showing setup of the wind tunnel experiment to measure the
vertical direction (y-direction) pressure drop characteristic of palletized fruit stack.
Measurements were taken across half a pallet: (a) top half of a pallet (without
wooden pallet) and (b) bottom half of a pallet with wooden pallet (WWP). (c)
Isometric view of the bottoms half of a pallet.
4.2.5. Airflow
The airflow profile inside a loaded reefer was measured on sampling points
as shown in Figure 4.4. Measurements were taken in the free region between the
two rows, in the region between the stack and the reefer ceiling and in the region
Stellenbosch University https://scholar.sun.ac.za
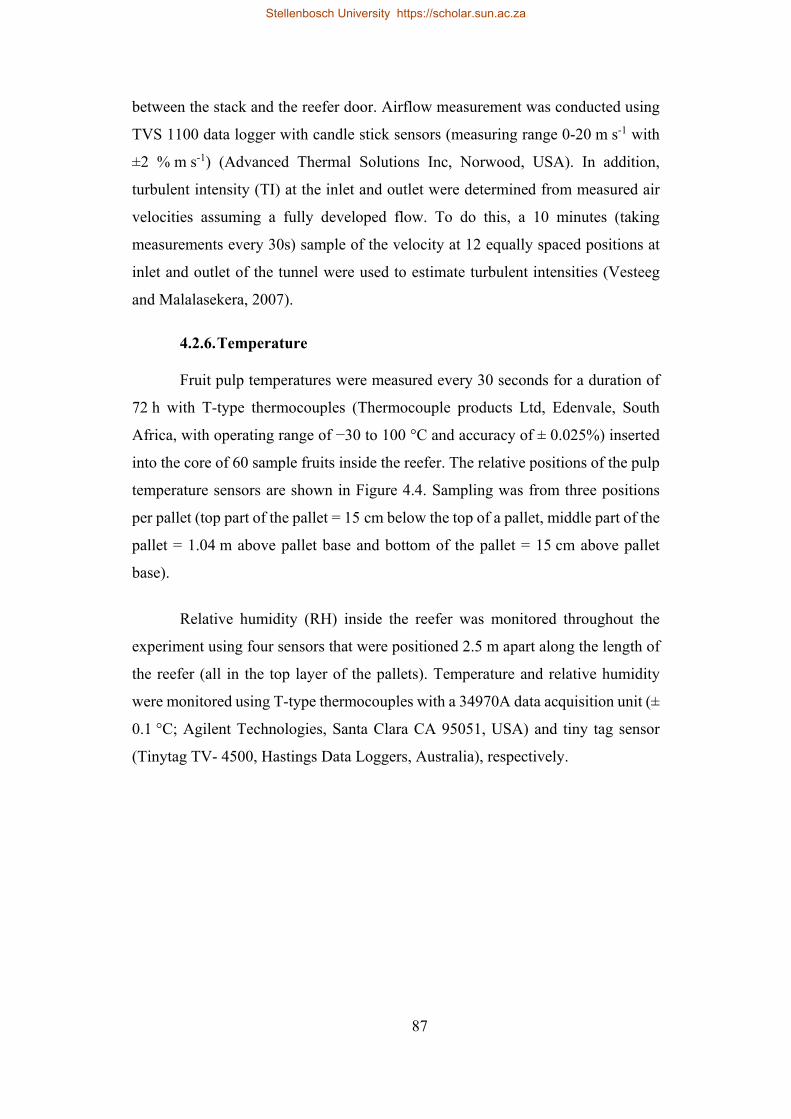
87
between the stack and the reefer door. Airflow measurement was conducted using
TVS 1100 data logger with candle stick sensors (measuring range 0-20 m s-1 with
±2 % m s-1) (Advanced Thermal Solutions Inc, Norwood, USA). In addition,
turbulent intensity (TI) at the inlet and outlet were determined from measured air
velocities assuming a fully developed flow. To do this, a 10 minutes (taking
measurements every 30s) sample of the velocity at 12 equally spaced positions at
inlet and outlet of the tunnel were used to estimate turbulent intensities (Vesteeg
and Malalasekera, 2007).
4.2.6. Temperature
Fruit pulp temperatures were measured every 30 seconds for a duration of
72 h with T-type thermocouples (Thermocouple products Ltd, Edenvale, South
Africa, with operating range of −30 to 100 °C and accuracy of ± 0.025%) inserted
into the core of 60 sample fruits inside the reefer. The relative positions of the pulp
temperature sensors are shown in Figure 4.4. Sampling was from three positions
per pallet (top part of the pallet = 15 cm below the top of a pallet, middle part of the
pallet = 1.04 m above pallet base and bottom of the pallet = 15 cm above pallet
base).
Relative humidity (RH) inside the reefer was monitored throughout the
experiment using four sensors that were positioned 2.5 m apart along the length of
the reefer (all in the top layer of the pallets). Temperature and relative humidity
were monitored using T-type thermocouples with a 34970A data acquisition unit (±
0.1 °C; Agilent Technologies, Santa Clara CA 95051, USA) and tiny tag sensor
(Tinytag TV- 4500, Hastings Data Loggers, Australia), respectively.
Stellenbosch University https://scholar.sun.ac.za
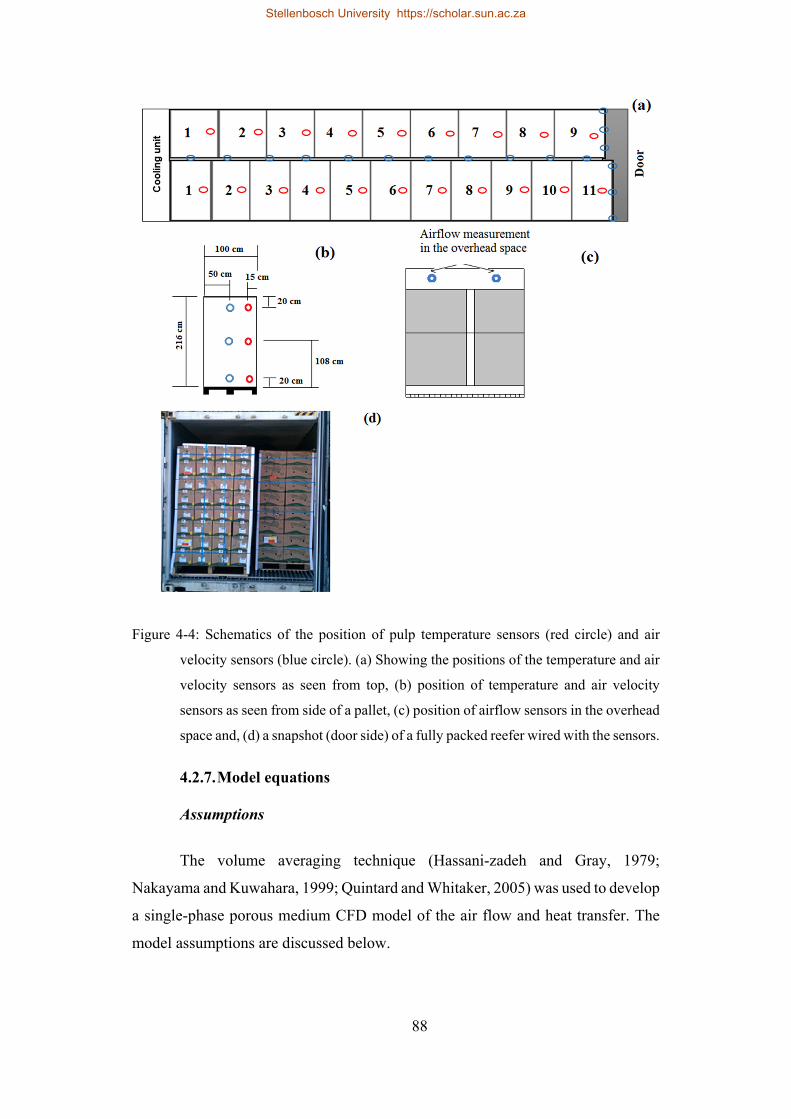
88
Figure 4-4: Schematics of the position of pulp temperature sensors (red circle) and air
velocity sensors (blue circle). (a) Showing the positions of the temperature and air
velocity sensors as seen from top, (b) position of temperature and air velocity
sensors as seen from side of a pallet, (c) position of airflow sensors in the overhead
space and, (d) a snapshot (door side) of a fully packed reefer wired with the sensors.
4.2.7. Model equations
Assumptions
The volume averaging technique (Hassani-zadeh and Gray, 1979;
Nakayama and Kuwahara, 1999; Quintard and Whitaker, 2005) was used to develop
a single-phase porous medium CFD model of the air flow and heat transfer. The
model assumptions are discussed below.
Stellenbosch University https://scholar.sun.ac.za
89
The region occupied by the stack pallets inside the reefer were modeled as
four porous zones (two per row, one on top of the other accounting the top
and bottom halves of a pallet). Splitting the top and bottom part of the pallet
was necessary to different stacking configuration used in the two halves to
ensure stability. The bottom half incorporated the vertical airflow resistance
effect of the wooden pallet.
The flow resistance characteristics of the four porous zones were estimated
from a wind tunnel experiment that provides the pressure drop vs. velocity
data of the two halves of a pallet.
Porosity and resistance characteristics of the porous domains were assumed
constant in space and time.
The physical properties of air and apple fruit were assumed constant within
the temperature range of the application. Density and thermal conductivity
of apple were taken as 898 kg m-3 and 3829 J kg-1 K-1 (Lisowa et al., 2002).
Evaporation/condensation of moisture inside the reefer was assumed
negligible in the model.
Heat generation due to produce respiration was calculated as a function of
temperature only. In actual case, the heat generation is a function of
temperature and gas conditions inside the reefer (O2 and CO2 concentration)
(Hertog et al., 1998; Ho et al., 2013).
Heat conduction through the walls, floor, door and ceiling was calculated
based on an average outside air temperature of 10 °C. The composite walls
(insulation) of the reefer were taken into account in the calculation of overall
heat transfer coefficient at the boundaries based on properties major
construction material (ASHRAE, 2010).
Since the air circulation fans were positioned upstream of the evaporator
coil (a blow-through configuration), the fan heat was assumed totally
removed directly by the evaporator coil.
Stellenbosch University https://scholar.sun.ac.za

90
Governing equations
The airflow inside the reefer was modelled using three-dimensional
Reynolds-averaged Navier Stokes (RANS) equations for incompressible fluid
(Eqn. 4.1) and Eqn. (4.2).
∙ 0 4.1
∂∂t
∙ ∙μρ
1ρ
p 4.2
μV βρ|V |V 4.3
Where, V is the air velocity (m s-1), t is time(s), µ is the dynamic viscosity
of air (kg m-1s-1), μ (= μ + μ t ) is the effective viscosity (sum the dynamic viscosity
and turbulent viscosity) (kg m-1s-1), p is pressure (Pa) and MV (m s-2) is the
momentum source term. Inside the porous domain, MV, accounts for the pressure
loss as given in the Darcy-Forchheimer equation (Eqn. (4.3)) (van der Sman, 2002;
Verboven et al., 2006), i stands for direction in the Cartesian coordinate system (x,
y or z). β(m-1), 1/ m are the viscous and inertial resistance coefficients,
respectively. These coefficients were determined using a dedicated wind tunnel
experiment from the resulting pressure drop as a function of airflow. The calculated
viscous and inertial resistance coefficients are summarized in Table 4.1.
Stellenbosch University https://scholar.sun.ac.za
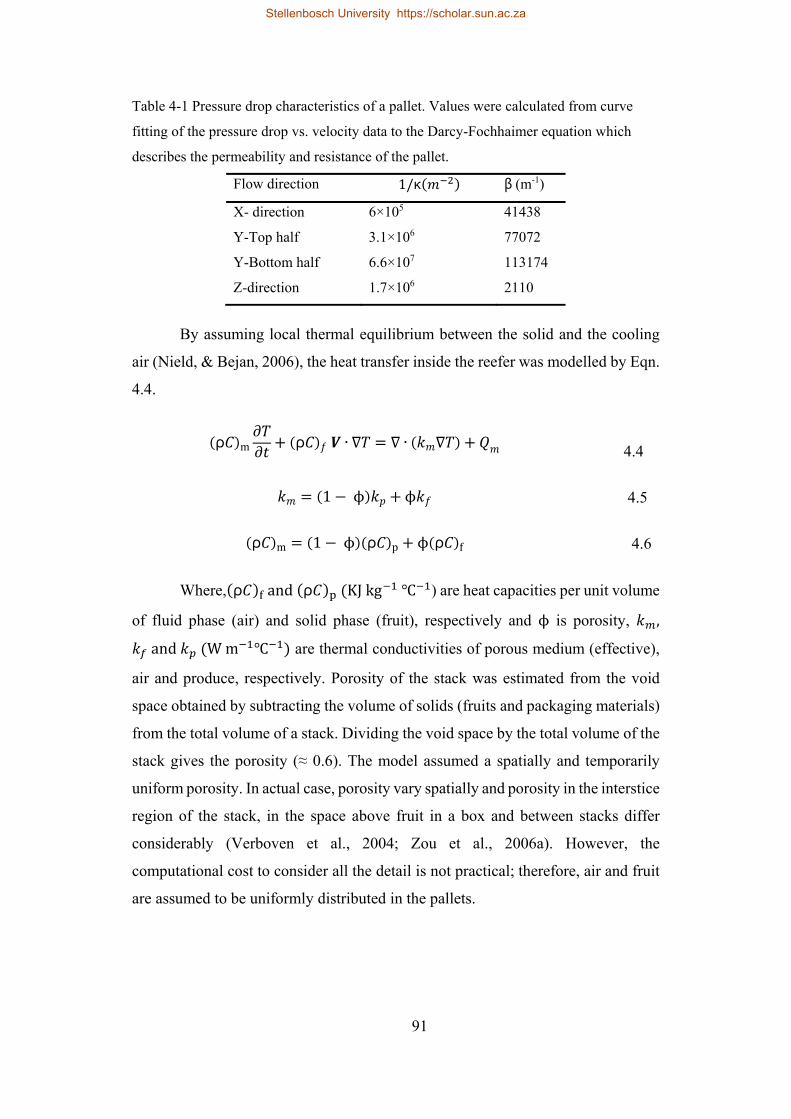
91
Table 4-1 Pressure drop characteristics of a pallet. Values were calculated from curve
fitting of the pressure drop vs. velocity data to the Darcy-Fochhaimer equation which
describes the permeability and resistance of the pallet.
Flow direction 1/κ β(m-1)
X- direction 6×10⁵ 41438
Y-Top half 3.1×10⁶ 77072
Y-Bottom half 6.6×10⁷ 113174
Z-direction 1.7×10⁶ 2110
By assuming local thermal equilibrium between the solid and the cooling
air (Nield, & Bejan, 2006), the heat transfer inside the reefer was modelled by Eqn.
4.4.
ρ m ρ ∙ ∙ 4.4
1 ϕ ϕ 4.5
ρ m 1 ϕ ρ p ϕ ρ f 4.6
Where, ρ and ρ KJkg ) are heat capacities per unit volume
of fluid phase (air) and solid phase (fruit), respectively and ϕ is porosity, ,
and Wm are thermal conductivities of porous medium (effective),
air and produce, respectively. Porosity of the stack was estimated from the void
space obtained by subtracting the volume of solids (fruits and packaging materials)
from the total volume of a stack. Dividing the void space by the total volume of the
stack gives the porosity (≈ 0.6). The model assumed a spatially and temporarily
uniform porosity. In actual case, porosity vary spatially and porosity in the interstice
region of the stack, in the space above fruit in a box and between stacks differ
considerably (Verboven et al., 2004; Zou et al., 2006a). However, the
computational cost to consider all the detail is not practical; therefore, air and fruit
are assumed to be uniformly distributed in the pallets.
Stellenbosch University https://scholar.sun.ac.za
92
The heat generation per unit volume of produce (Qm) due to respirationwas
calculated using equation 4.7 (Becker et al., 1996) at the produce temperature T
(°C).
Q 10.7f9T5
32 4.7
Where, f and g are produce respiration coefficients for apple fruit
(5.6871×10⁻⁴ and 2.5977, respectively).
4.2.8. Geometry, boundary and initial conditions
Figure 4.5 depicts the model geometry and the boundary conditions. The
pallets arranged in two rows form the porous domains and the free region around
and above the rows form the fluid domain. Accordingly, fluid-porous interface
(between the porous domain and fluid domain) was explicitly defined as a
conservative interface flux boundary for the momentum and scalar transports. The
cooling unit was modelled by specifying temperature, pressure, velocity and
turbulence intensity at exit and outlet of the cooling unit. In all the models, the
internal walls of the reefer were set to a no slip walls. The heat exchange with the
environment has been incorporated as heat fluxes on the walls, ceiling, floor and
the door as given by Eqn. (4.8).
Where, qw is the heat flux (W m-2), U (Wm ) is equivalent heat
transfer coefficient of composite wall (including polyurethane insulation)
calculated from the thermo-physical properties of wall, ceiling, floor and door
(Table 3.1). The calculated equivalent heat transfer coefficient of the composite
wall, ceiling, floor and the door were 0.28, 0.22, 0.20 and 0.28 W m ,
respectively. Ambient temperature (T∞) is assumed to be constant (10 °C), and Tw
is wall temperature.
q U T T 4.8
Stellenbosch University https://scholar.sun.ac.za
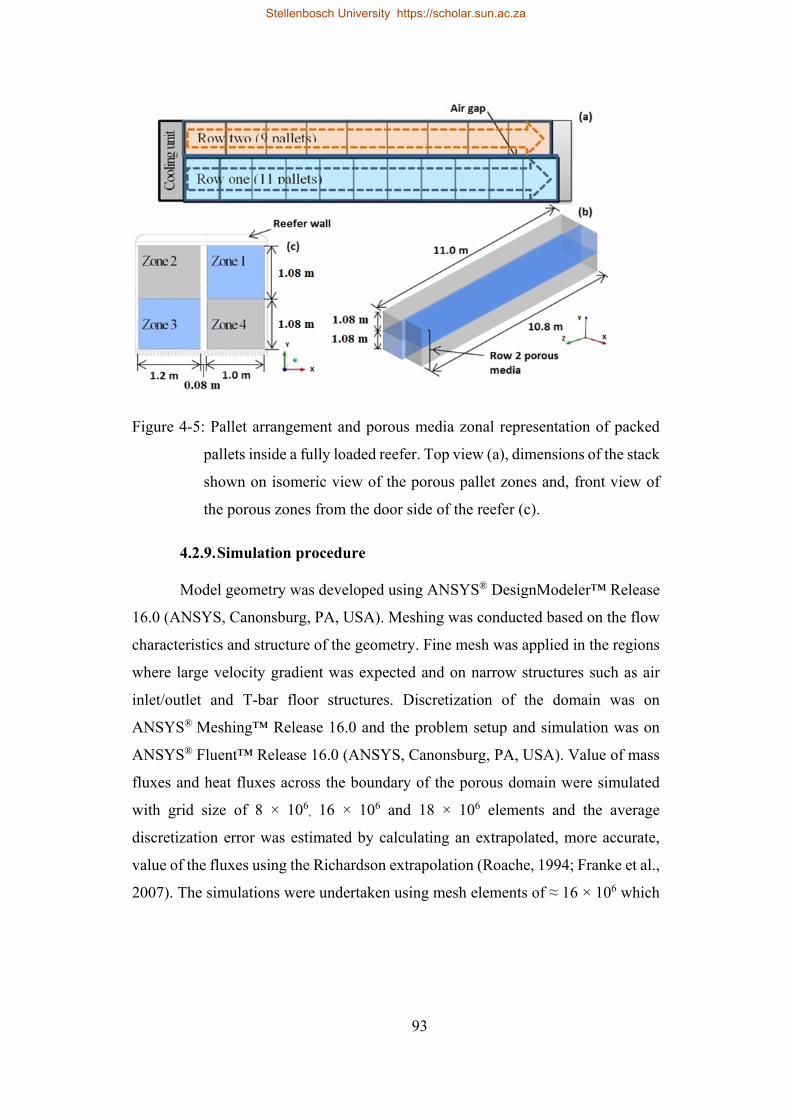
93
Figure 4-5: Pallet arrangement and porous media zonal representation of packed
pallets inside a fully loaded reefer. Top view (a), dimensions of the stack
shown on isomeric view of the porous pallet zones and, front view of
the porous zones from the door side of the reefer (c).
4.2.9. Simulation procedure
Model geometry was developed using ANSYS® DesignModeler™ Release
16.0 (ANSYS, Canonsburg, PA, USA). Meshing was conducted based on the flow
characteristics and structure of the geometry. Fine mesh was applied in the regions
where large velocity gradient was expected and on narrow structures such as air
inlet/outlet and T-bar floor structures. Discretization of the domain was on
ANSYS® Meshing™ Release 16.0 and the problem setup and simulation was on
ANSYS® Fluent™ Release 16.0 (ANSYS, Canonsburg, PA, USA). Value of mass
fluxes and heat fluxes across the boundary of the porous domain were simulated
with grid size of 8 × 10⁶, 16 × 106 and 18 × 106 elements and the average
discretization error was estimated by calculating an extrapolated, more accurate,
value of the fluxes using the Richardson extrapolation (Roache, 1994; Franke et al.,
2007). The simulations were undertaken using mesh elements of ≈ 16 × 106 which
Stellenbosch University https://scholar.sun.ac.za
94
has an average discretization error of 2 and 5 % in estimating mass fluxes and heat
fluxes, respectively.
Steady state airflow simulation was first conducted and the result was used
as initial condition to perform the transient heat transfer calculation. Turbulence
was calculated using k-ω SST model. SIMPLE discretization scheme was used for
pressure-velocity coupling and Second Order Upwind discretization was used for
momentum, specific dissipation rate and energy calculations. A number of time step
sizes (360 s, 180 s, 72 s, 36 s) were assessed. Based on accuracy and computational
time, time step size of 180 s with maximum 20 iterations per time step, was used.
Dell Precision computer (dual Intel Xeon [email protected] GHz with 40 GB Ram)
was used.
Error calculation and cooling uniformity
Numerical and experimental results were compared to evaluate the accuracy
of the model. Average errors obtained in air velocity and fruit temperature were
calculated using equation 4.9 and 4.10:
E1n
|V| |V||V|
100 4.9
E1n
|T| |T||T|
100 4. 10
4.3. Result and discussion
4.3.1. Pallet pressure drop characterization
Figure 4.6 summarizes the experimental airflow vs. pressure drop data for
airflow horizontally (across the length and width) and vertically along the Y-axis
through the bottom-half and top-half of a pallet. Clearly, the airflow resistance in
the vertical direction was the highest and across the width was the list. The only
path accessible for vertical airflow could be crevices between side by side boxes.
Stellenbosch University https://scholar.sun.ac.za
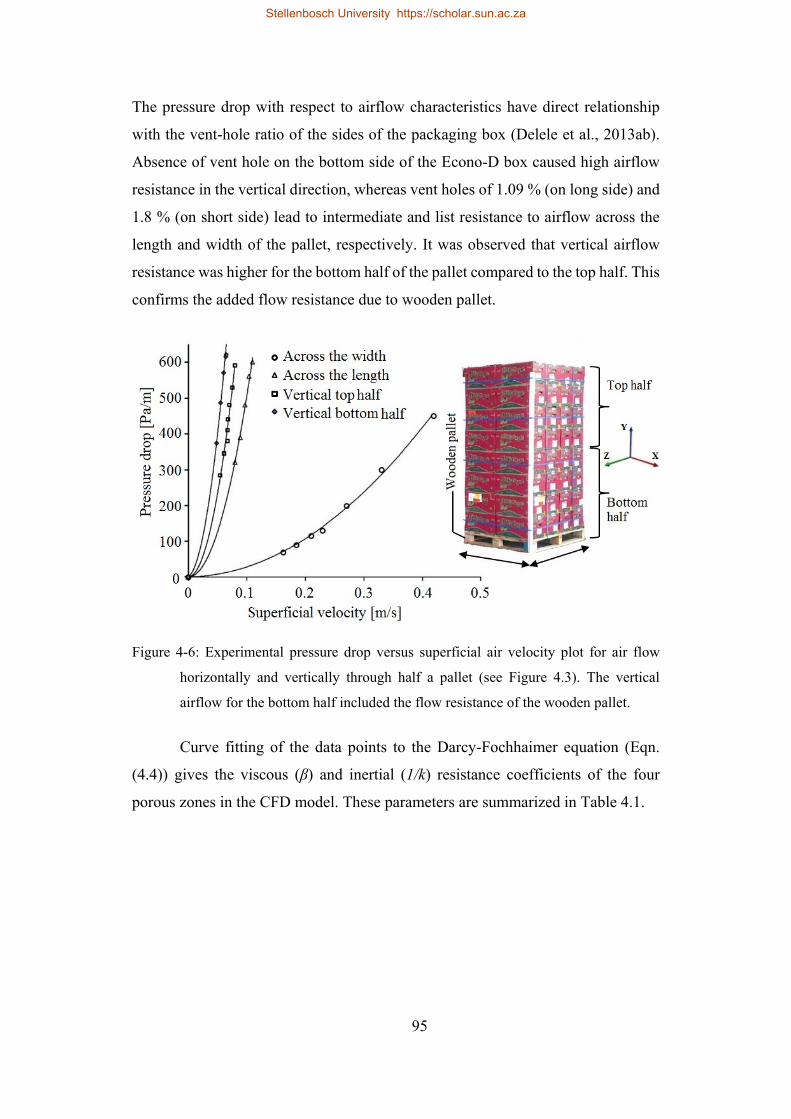
95
The pressure drop with respect to airflow characteristics have direct relationship
with the vent-hole ratio of the sides of the packaging box (Delele et al., 2013ab).
Absence of vent hole on the bottom side of the Econo-D box caused high airflow
resistance in the vertical direction, whereas vent holes of 1.09 % (on long side) and
1.8 % (on short side) lead to intermediate and list resistance to airflow across the
length and width of the pallet, respectively. It was observed that vertical airflow
resistance was higher for the bottom half of the pallet compared to the top half. This
confirms the added flow resistance due to wooden pallet.
Figure 4-6: Experimental pressure drop versus superficial air velocity plot for air flow
horizontally and vertically through half a pallet (see Figure 4.3). The vertical
airflow for the bottom half included the flow resistance of the wooden pallet.
Curve fitting of the data points to the Darcy-Fochhaimer equation (Eqn.
(4.4)) gives the viscous (β) and inertial (1/k) resistance coefficients of the four
porous zones in the CFD model. These parameters are summarized in Table 4.1.
Stellenbosch University https://scholar.sun.ac.za
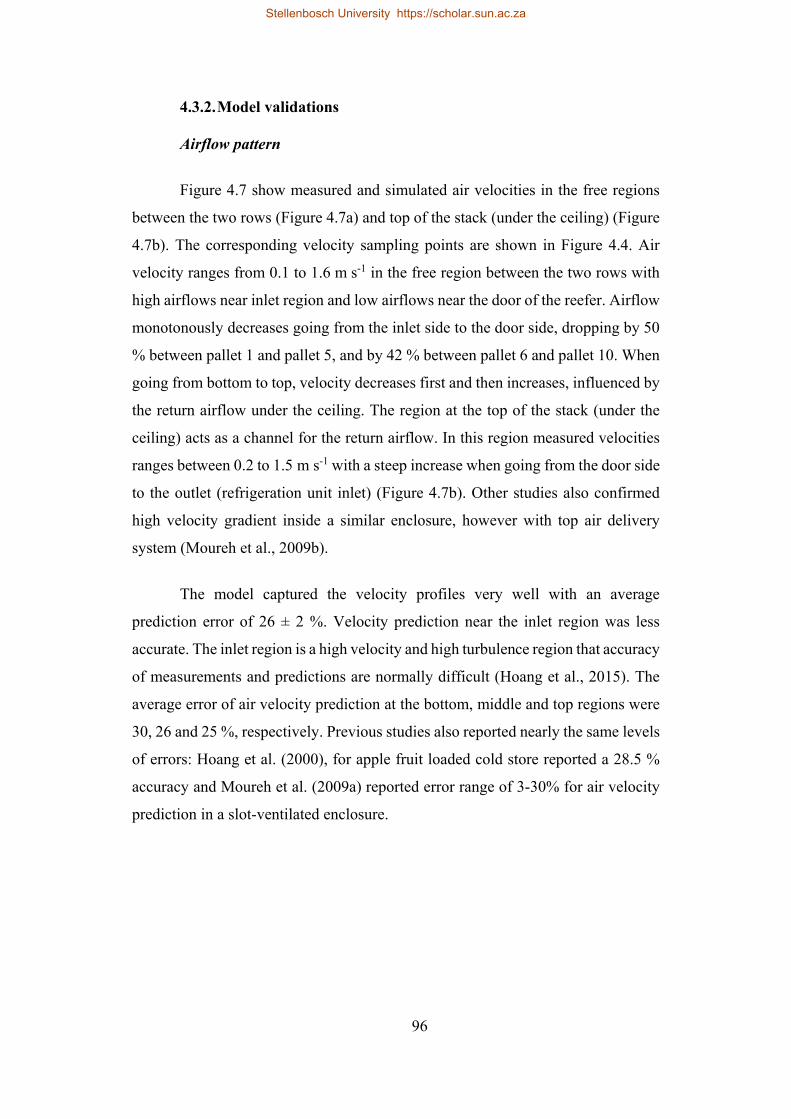
96
4.3.2. Model validations
Airflow pattern
Figure 4.7 show measured and simulated air velocities in the free regions
between the two rows (Figure 4.7a) and top of the stack (under the ceiling) (Figure
4.7b). The corresponding velocity sampling points are shown in Figure 4.4. Air
velocity ranges from 0.1 to 1.6 m s-1 in the free region between the two rows with
high airflows near inlet region and low airflows near the door of the reefer. Airflow
monotonously decreases going from the inlet side to the door side, dropping by 50
% between pallet 1 and pallet 5, and by 42 % between pallet 6 and pallet 10. When
going from bottom to top, velocity decreases first and then increases, influenced by
the return airflow under the ceiling. The region at the top of the stack (under the
ceiling) acts as a channel for the return airflow. In this region measured velocities
ranges between 0.2 to 1.5 m s-1 with a steep increase when going from the door side
to the outlet (refrigeration unit inlet) (Figure 4.7b). Other studies also confirmed
high velocity gradient inside a similar enclosure, however with top air delivery
system (Moureh et al., 2009b).
The model captured the velocity profiles very well with an average
prediction error of 26 ± 2 %. Velocity prediction near the inlet region was less
accurate. The inlet region is a high velocity and high turbulence region that accuracy
of measurements and predictions are normally difficult (Hoang et al., 2015). The
average error of air velocity prediction at the bottom, middle and top regions were
30, 26 and 25 %, respectively. Previous studies also reported nearly the same levels
of errors: Hoang et al. (2000), for apple fruit loaded cold store reported a 28.5 %
accuracy and Moureh et al. (2009a) reported error range of 3-30% for air velocity
prediction in a slot-ventilated enclosure.
Stellenbosch University https://scholar.sun.ac.za
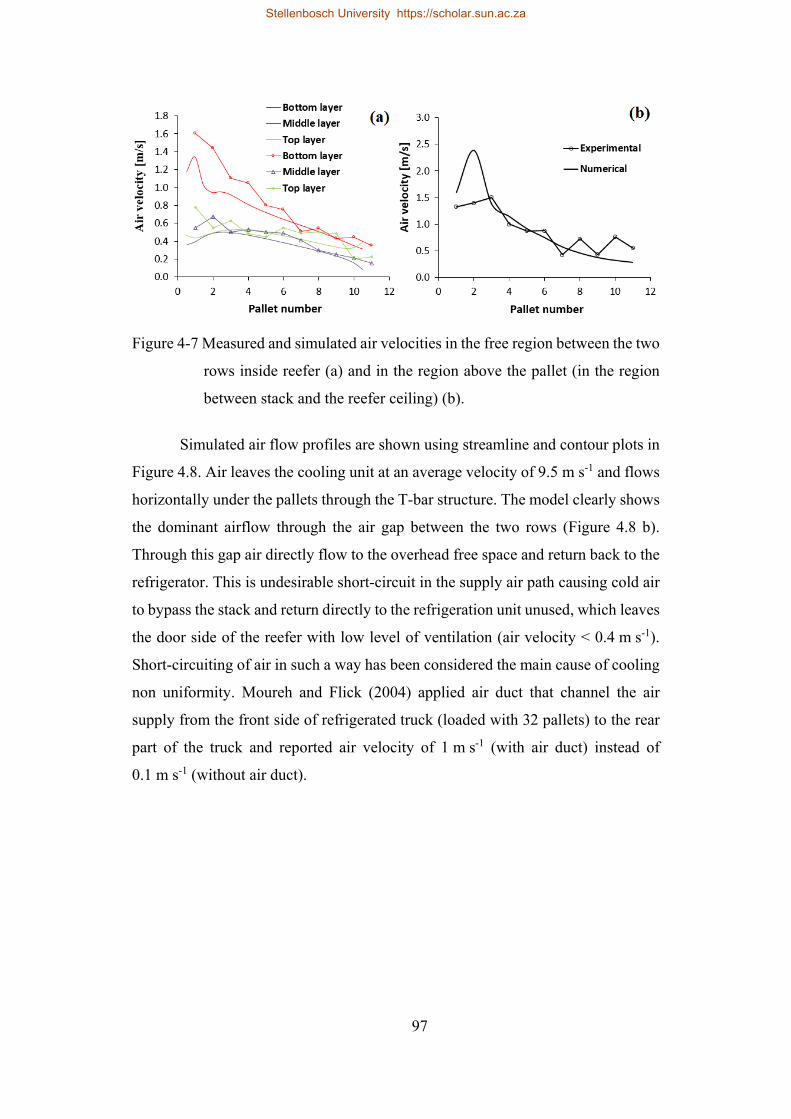
97
Figure 4-7 Measured and simulated air velocities in the free region between the two
rows inside reefer (a) and in the region above the pallet (in the region
between stack and the reefer ceiling) (b).
Simulated air flow profiles are shown using streamline and contour plots in
Figure 4.8. Air leaves the cooling unit at an average velocity of 9.5 m s-1 and flows
horizontally under the pallets through the T-bar structure. The model clearly shows
the dominant airflow through the air gap between the two rows (Figure 4.8 b).
Through this gap air directly flow to the overhead free space and return back to the
refrigerator. This is undesirable short-circuit in the supply air path causing cold air
to bypass the stack and return directly to the refrigeration unit unused, which leaves
the door side of the reefer with low level of ventilation (air velocity < 0.4 m s-1).
Short-circuiting of air in such a way has been considered the main cause of cooling
non uniformity. Moureh and Flick (2004) applied air duct that channel the air
supply from the front side of refrigerated truck (loaded with 32 pallets) to the rear
part of the truck and reported air velocity of 1 m s-1 (with air duct) instead of
0.1 m s-1 (without air duct).
Stellenbosch University https://scholar.sun.ac.za
98
Figure 4-8 Simulated profile of airflow inside a fully loaded reefer. Colour contours
show magnitude of air velocity and arrows (vector) show the local
airflow direction on vertical plane bisecting pallets in row 1 (a), the air
gap between the two rows (b) and pallets in row 2 (c).
Fruit cooling characteristics
Figure 4.9 shows the simulated and measured time history of average pulp
temperatures inside the reefer. The reefer was initially equilibrated to cooling air
temperature (-1 °C) before loading. By the time loading was finished
(simultaneously sensors were installed), average pulp temperature inside the reefer
was 9.5 . The cooling rate clearly differ between pallets. The front of the reefer
(pallet 1 and pallet 2) of both rows cool the slowest, particularly the top half of the
pallets due to the warm returning air through these pallets. Pallets in middle of the
reefer (pallet 3 to 7) cools faster than the pallets in the front and the rear region
since this region was with better level of vertical airflow (Figure 4.8b). The rear
part of the reefer, particularly pallet 10 (row 1) and pallet 8 (row 2) cooled slowest.
On the other hand, pallet 11 (row 1) and 9 (row 2) which share one more boundary
with the pure air zone than the other pallets cooled faster than the adjacent pallets
(Figure 4.9 c & f). Similarly, in the experimental study of citrus ambient loading in
a reefer, Defraeye et al. (2016) reported that the bottom of first pallet reached the
SECT almost half a day after the last pallet (door side). Overall, simulated produce
Stellenbosch University https://scholar.sun.ac.za
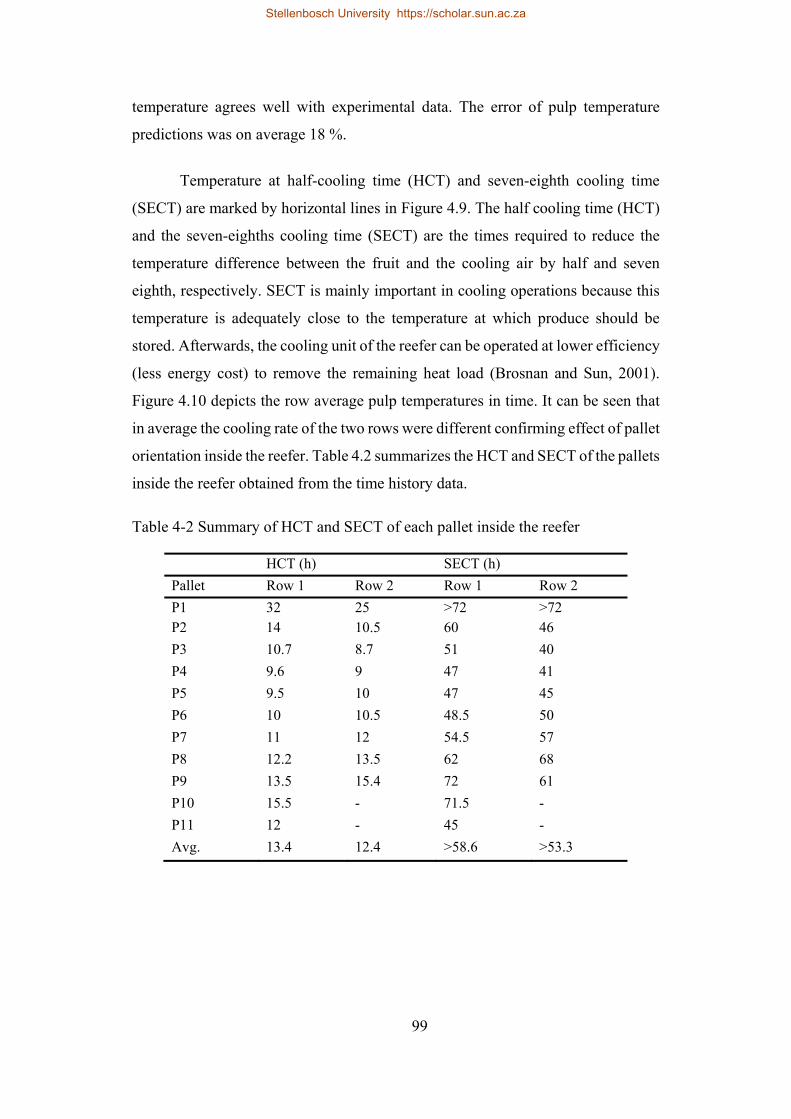
99
temperature agrees well with experimental data. The error of pulp temperature
predictions was on average 18 %.
Temperature at half-cooling time (HCT) and seven-eighth cooling time
(SECT) are marked by horizontal lines in Figure 4.9. The half cooling time (HCT)
and the seven-eighths cooling time (SECT) are the times required to reduce the
temperature difference between the fruit and the cooling air by half and seven
eighth, respectively. SECT is mainly important in cooling operations because this
temperature is adequately close to the temperature at which produce should be
stored. Afterwards, the cooling unit of the reefer can be operated at lower efficiency
(less energy cost) to remove the remaining heat load (Brosnan and Sun, 2001).
Figure 4.10 depicts the row average pulp temperatures in time. It can be seen that
in average the cooling rate of the two rows were different confirming effect of pallet
orientation inside the reefer. Table 4.2 summarizes the HCT and SECT of the pallets
inside the reefer obtained from the time history data.
Table 4-2 Summary of HCT and SECT of each pallet inside the reefer
HCT (h) SECT (h)
Pallet Row 1 Row 2 Row 1 Row 2
P1 32 25 >72 >72 P2 14 10.5 60 46
P3 10.7 8.7 51 40
P4 9.6 9 47 41
P5 9.5 10 47 45
P6 10 10.5 48.5 50
P7 11 12 54.5 57
P8 12.2 13.5 62 68
P9 13.5 15.4 72 61
P10 15.5 - 71.5 -
P11 12 - 45 -
Avg. 13.4 12.4 >58.6 >53.3
Stellenbosch University https://scholar.sun.ac.za
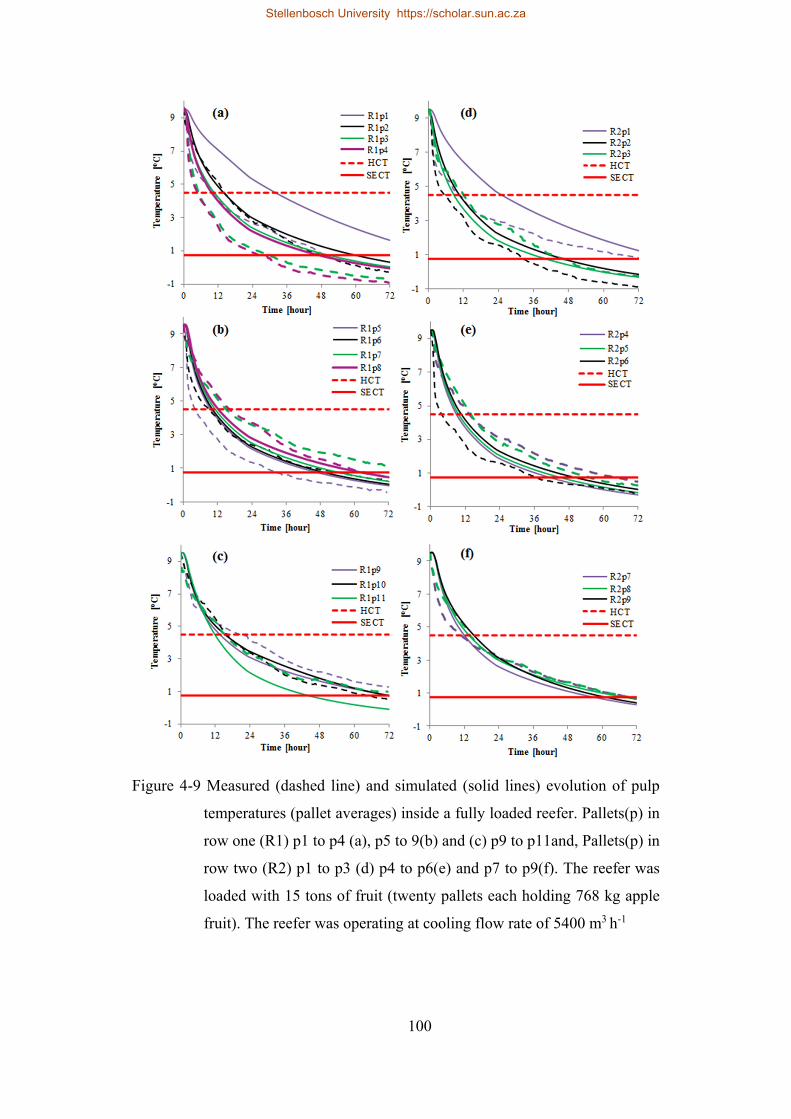
100
Figure 4-9 Measured (dashed line) and simulated (solid lines) evolution of pulp
temperatures (pallet averages) inside a fully loaded reefer. Pallets(p) in
row one (R1) p1 to p4 (a), p5 to 9(b) and (c) p9 to p11and, Pallets(p) in
row two (R2) p1 to p3 (d) p4 to p6(e) and p7 to p9(f). The reefer was
loaded with 15 tons of fruit (twenty pallets each holding 768 kg apple
fruit). The reefer was operating at cooling flow rate of 5400 m3 h-1
Stellenbosch University https://scholar.sun.ac.za
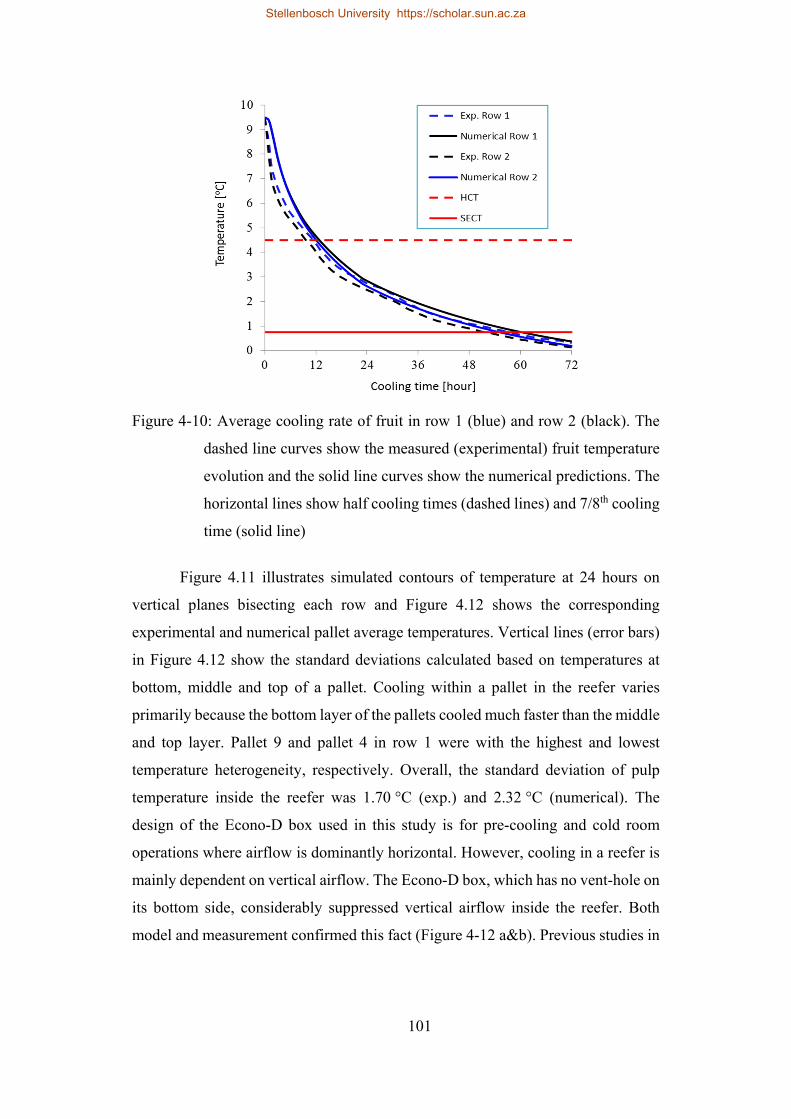
101
Figure 4-10: Average cooling rate of fruit in row 1 (blue) and row 2 (black). The
dashed line curves show the measured (experimental) fruit temperature
evolution and the solid line curves show the numerical predictions. The
horizontal lines show half cooling times (dashed lines) and 7/8th cooling
time (solid line)
Figure 4.11 illustrates simulated contours of temperature at 24 hours on
vertical planes bisecting each row and Figure 4.12 shows the corresponding
experimental and numerical pallet average temperatures. Vertical lines (error bars)
in Figure 4.12 show the standard deviations calculated based on temperatures at
bottom, middle and top of a pallet. Cooling within a pallet in the reefer varies
primarily because the bottom layer of the pallets cooled much faster than the middle
and top layer. Pallet 9 and pallet 4 in row 1 were with the highest and lowest
temperature heterogeneity, respectively. Overall, the standard deviation of pulp
temperature inside the reefer was 1.70 °C (exp.) and 2.32 °C (numerical). The
design of the Econo-D box used in this study is for pre-cooling and cold room
operations where airflow is dominantly horizontal. However, cooling in a reefer is
mainly dependent on vertical airflow. The Econo-D box, which has no vent-hole on
its bottom side, considerably suppressed vertical airflow inside the reefer. Both
model and measurement confirmed this fact (Figure 4-12 a&b). Previous studies in
Stellenbosch University https://scholar.sun.ac.za
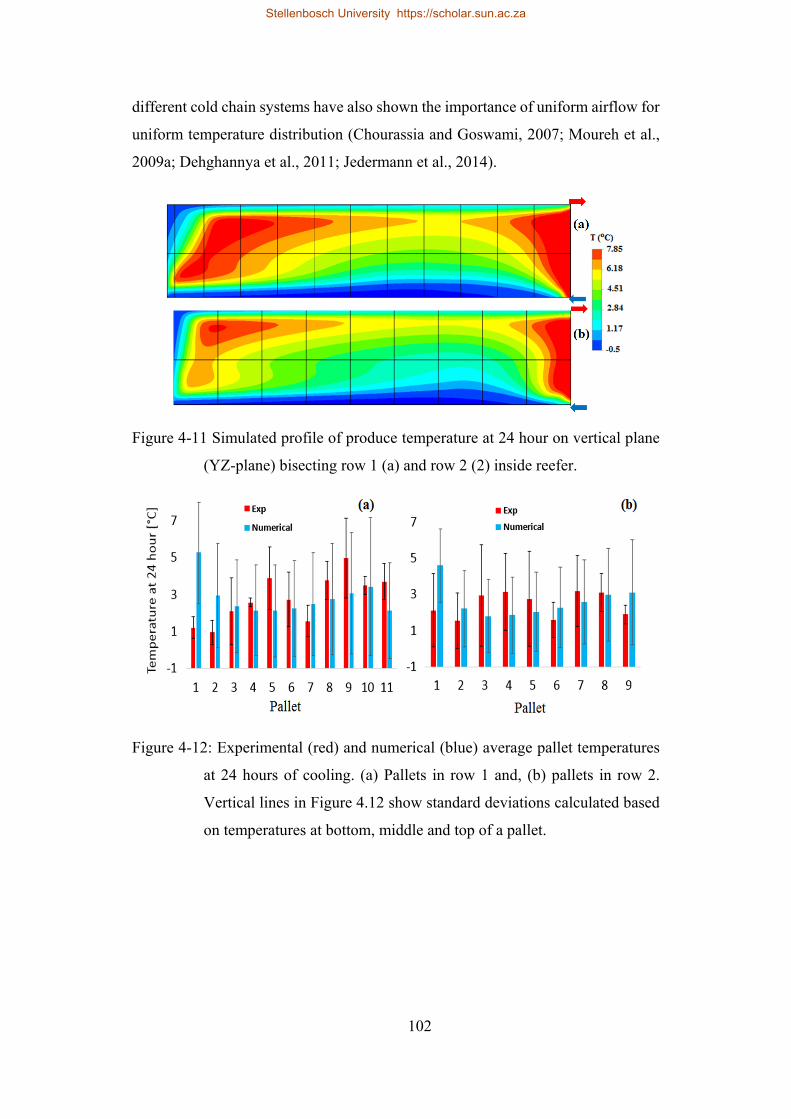
102
different cold chain systems have also shown the importance of uniform airflow for
uniform temperature distribution (Chourassia and Goswami, 2007; Moureh et al.,
2009a; Dehghannya et al., 2011; Jedermann et al., 2014).
Figure 4-11 Simulated profile of produce temperature at 24 hour on vertical plane
(YZ-plane) bisecting row 1 (a) and row 2 (2) inside reefer.
Figure 4-12: Experimental (red) and numerical (blue) average pallet temperatures
at 24 hours of cooling. (a) Pallets in row 1 and, (b) pallets in row 2.
Vertical lines in Figure 4.12 show standard deviations calculated based
on temperatures at bottom, middle and top of a pallet.
Stellenbosch University https://scholar.sun.ac.za
103
4.4. Conclusion
In this study, wind tunnel experiment was used to characterize airflow
resistances of stacked fruit on a standard pallet. The acquired pressure drop vs.
velocity data were used to develop zonal porous media CFD model of airflow and
heat transfers inside a fully loaded reefer. Airflow resistance of wooden pallet and
the detail structure of T-bar floor were included in the model.
The simulation successfully reproduced the airflow and temperature profiles
inside the reefer, high and low airflow and cooling regions were identified. The
airflow and temperature distribution inside the reefer were visualized and quantified
using vector and contour plots. The model was validated against air velocity and
temperature experimental data from a full scale reefer packed with apple.
Considering the complexity of the system, a reasonable agreement between the
experimental and predicted air velocity and fruit temperature evolution was
obtained.
The simulation showed high cooling non-uniformity inside the reefer as
confirmed by experimental data. The design of the packaging box used in this study
may contribute considerably to the observed cooling non-uniformity because it has
no vent holes in its bottom side to help vertical airflow inside the reefer. To assess
this, detailed investigation of apple packaging boxes with respect to vertical
ventilation (vertical airflow resistance) parameters has been conducted in Part II of
this research.
Stellenbosch University https://scholar.sun.ac.za
104
Chapter5
5. Numerical evaluation of airflow, heat
transfer, and effects of vertical flow inside
apple packed refrigerated shipping
container fruit packed inside commonly
used packaging designs‡
Abstract
In the previous Chapter, a 3-D computational fluid dynamics (CFD) model
of airflow and heat transfer inside a refrigerated shipping container (reefer) packed
with apple was developed using porous media approach and validated. In this work,
the performances of commonly used package boxes used in refrigerated apple
containers were investigate. First, the study computes the aerodynamic and
thermodynamic characteristics of three package designs. This confirmed the effect
of vertical airflow on the rate and uniformity of cooling inside the reefer. Then, the
effects of vertical flow resistance on the rate and uniformity of cooling was further
investigated. Adding vent-holes on the bottom face of the package reduces the
vertical airflow resistance, which leads to significant reduction in fruit cooling time.
‡ Samuel Getahun, Alemayehu Ambaw, Mulugeta Delele, Chris J. Meyer, Umezuruike Linus Opara. 2016. Airflow and heat transfer inside refrigerated shipping container packed with stacked load of apples: Part II – Evaluation of apple packaging designs and vertical flow resistance. Journal of Food Engineering (Submitted).
Stellenbosch University https://scholar.sun.ac.za
105
Adding a 3.5% vent area in the bottom side of a package reduced the seven-eighth
(7/8th) cooling time by 27 % (from 55 to 40 h) compared to a package with no vent-
hole at its bottom. The study demonstrated the significance of vent-holes on the
bottom face of packaging boxes and quantified the energy saving achievable
through package design in refrigerated transport systems.
5.1. Introduction
Achieving uniform and rapid cooling during postharvest handling of
produce remains a challenge. Several studies showed that non uniform cooling
during forced-air cooling, cold storages and refrigerated transportation is caused by
a heterogeneous airflow distribution within the fruit stack (Alvarez and Flick, 1999;
Delele et al., 2013b; Zou et al., 2006 a,b). The airflow distribution depends on the
operation of the cooling system and on how the produce is packed and stacked
inside the cooling system (Ambaw et al., 2013; Opara, 2011; Ngcobo et al., 2012;
Delele et al., 2013b). The main function of packaging is maintaining the quality of
fruits during postharvest handling and storage by providing mechanical protection
against injuries, minimizing produce moisture loss and retarding microbial growth
(Opara, 2011; Ngcobo et al., 2012). However, packaging boxes are also the major
cause of airflow resistance (Delele et al., 2013b).
Vent-holes are provided on packaging boxes to allow cold air to flow within
and around the packed produce and warm air to evacuate. The size, shape and
location of vent-holes should be in consideration of the mechanical integrity of the
box (Pathare et al., 2012) and of the stack formed from the produce-loaded boxes.
Hence, optimizing package design has been an area of interest for many researchers.
Researchers recommended different optimal packaging designs for horizontal
cooling operations (Castro et al., 2004a,b; Castro and Vigneault, 2005; Castro et
al., 2005; Hui et al., 2008). Delele et al. (2013b) studied the effect of vent design
parameters (vent area ratio, vent shape and number, vent position) on airflow
uniformity and cooling rate. The authors showed vent area increment from 7% to
11% only decreased 7/8th cooling time by only 5.44% during forced horizontal air
Stellenbosch University https://scholar.sun.ac.za
106
cooling processes. Castro et al. (2004a, b) also reported increasing vent area above
8% did not show a significant increase in produce cooling rate. In addition to the
basic design of the packaging box, wooden pallets used during palletization block
available vent areas at the bottom of the pallet. Misalignment of vent-holes during
pallet stacking, pallet loading and vent hole obstruction by internal packaging
accessories like plastic liners, trays and carry bags, can significantly reduce the
cooling air circulation and uniformity of cooling. (Castro et al., 2005; Castro and
Vigneault, 2005; Chourasia and Goswami, 2009; Vigneault, 2009). These previous
studies mainly focussed on analysing the package designs with respect to horizontal
airflow, which is the primary direction of airflow in cold storage rooms and pre
cooling systems. The effect of package design with respect to the reefer
configurations has not been properly addressed.
Fresh fruit export market uses different design of packaging that have
different geometrical configurations and sizes. Display and Telescopic type
corrugated fibreboard packaging boxes are the frequently used box types for apple
fruit (Berry et al., 2015). In refrigerated shipping container (reefer) with bottom air
delivery system the cooling air primarily flows from bottom to the top through
packed produce. For this reason, vertical airflow is crucial for the proper handling
of the produce inside reefers. Defraeye et al. (2015a, b) reported that airflow
resistance contributed by fruit packing boxes becomes worse in a reefer due to the
absence of appropriate box designs for vertical airflow in the system and the
blockage of the vents. Hui et al. (2008) studied the effect of pallet configuration and
bracing patterns on airflow distribution in refrigerated semi-trailers and the results
obtained from 20 field tests varied greatly within each category. Although no firm
conclusion was drawn, the authors reported that arranging pallets in a pinwheel
pattern tends to assist air circulation better than an offset pattern. The
aforementioned packaging boxes, if are not designed, stacked and palletized in
consideration of reefers, can significantly limit the rate and uniformity of the
cooling. Hence, it is important to study the suitability of these packaging boxes in
reefer containers.
Stellenbosch University https://scholar.sun.ac.za
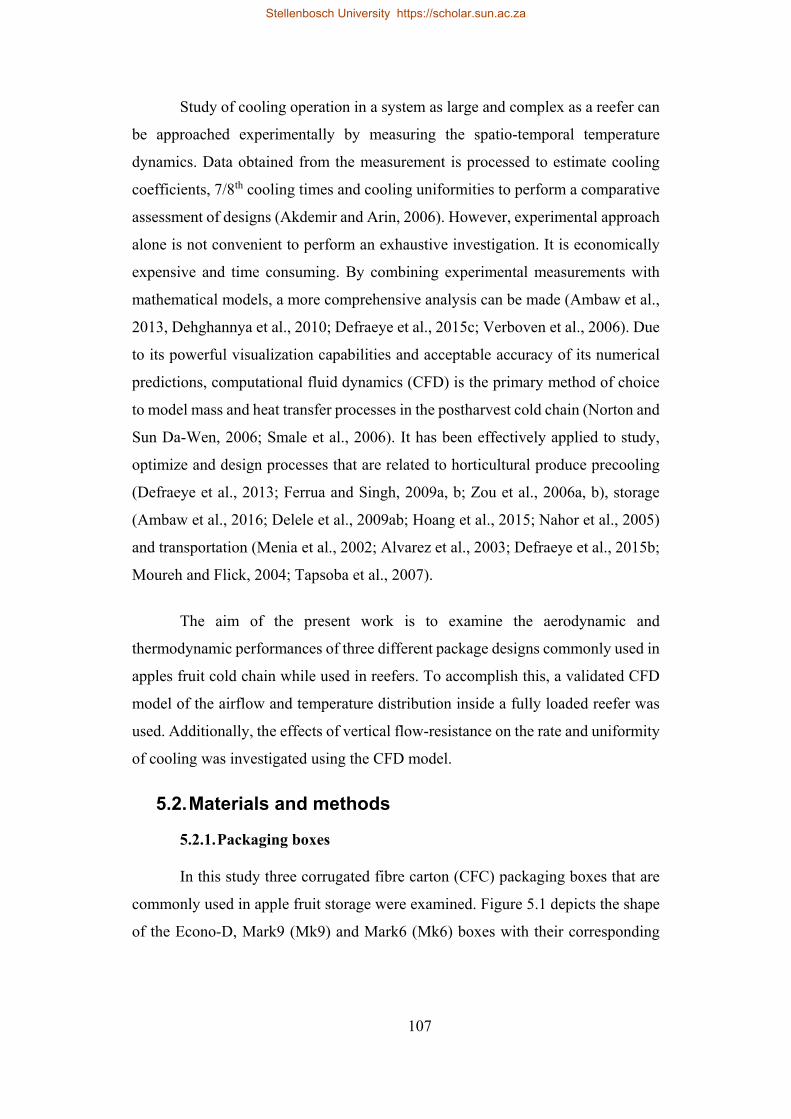
107
Study of cooling operation in a system as large and complex as a reefer can
be approached experimentally by measuring the spatio-temporal temperature
dynamics. Data obtained from the measurement is processed to estimate cooling
coefficients, 7/8th cooling times and cooling uniformities to perform a comparative
assessment of designs (Akdemir and Arin, 2006). However, experimental approach
alone is not convenient to perform an exhaustive investigation. It is economically
expensive and time consuming. By combining experimental measurements with
mathematical models, a more comprehensive analysis can be made (Ambaw et al.,
2013, Dehghannya et al., 2010; Defraeye et al., 2015c; Verboven et al., 2006). Due
to its powerful visualization capabilities and acceptable accuracy of its numerical
predictions, computational fluid dynamics (CFD) is the primary method of choice
to model mass and heat transfer processes in the postharvest cold chain (Norton and
Sun Da-Wen, 2006; Smale et al., 2006). It has been effectively applied to study,
optimize and design processes that are related to horticultural produce precooling
(Defraeye et al., 2013; Ferrua and Singh, 2009a, b; Zou et al., 2006a, b), storage
(Ambaw et al., 2016; Delele et al., 2009ab; Hoang et al., 2015; Nahor et al., 2005)
and transportation (Menia et al., 2002; Alvarez et al., 2003; Defraeye et al., 2015b;
Moureh and Flick, 2004; Tapsoba et al., 2007).
The aim of the present work is to examine the aerodynamic and
thermodynamic performances of three different package designs commonly used in
apples fruit cold chain while used in reefers. To accomplish this, a validated CFD
model of the airflow and temperature distribution inside a fully loaded reefer was
used. Additionally, the effects of vertical flow-resistance on the rate and uniformity
of cooling was investigated using the CFD model.
5.2. Materials and methods
5.2.1. Packaging boxes
In this study three corrugated fibre carton (CFC) packaging boxes that are
commonly used in apple fruit storage were examined. Figure 5.1 depicts the shape
of the Econo-D, Mark9 (Mk9) and Mark6 (Mk6) boxes with their corresponding
Stellenbosch University https://scholar.sun.ac.za
108
bottom surface ventilation area. The Econo-D box has an outer (L × H × W)
dimension of 49.0 cm × 26.0 cm × 29.0 cm and is 3 mm thick (Figure 5.1a). The
short side has two horizontally oriented rectangular vent holes at the bottom region
and one larger horizontally oriented rectangular vent hole (is also the handle) on the
top middle region. Notice that the bottom vent hole is not accessible as an airflow
path because during stacking this vent hole would be blocked. The long side has
two circular vent holes positioned in the middle. The Econo-D contains 8 clusters
of apple fruit in plastic bag. Each bag contains approximately 1.5 kg of apple.
Hence, Econo-D carries a total of 12 kg apple fruit.
The Mk9 has outer (L×H×W) dimensions of 60.0 cm ×13.2 cm × 38.8 cm
and is 3 mm thick (Figure 5.1b). This box has one vent at the bottom of the short
sides and two rectangular holes at the bottom of the long sides. However, these
holes are meant for socketing during stacking and hence would not be fully
accessible as a flow path. The box also has a rectangular cut out at the top rime of
the long side. Mk9 contains 7 bags of apple clusters, each 1.5 kg. Hence, a total of
10.5 kg of apple are contained in Mk9 packaging box.
Stellenbosch University https://scholar.sun.ac.za
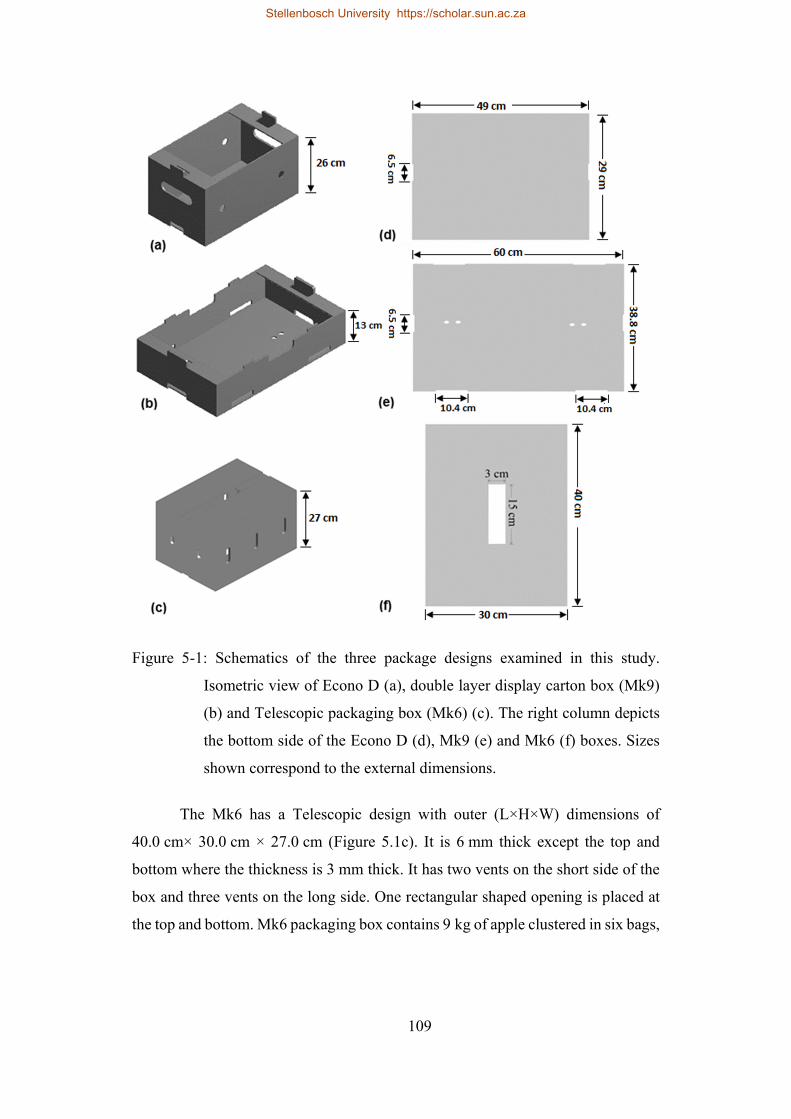
109
Figure 5-1: Schematics of the three package designs examined in this study.
Isometric view of Econo D (a), double layer display carton box (Mk9)
(b) and Telescopic packaging box (Mk6) (c). The right column depicts
the bottom side of the Econo D (d), Mk9 (e) and Mk6 (f) boxes. Sizes
shown correspond to the external dimensions.
The Mk6 has a Telescopic design with outer (L×H×W) dimensions of
40.0 cm× 30.0 cm × 27.0 cm (Figure 5.1c). It is 6 mm thick except the top and
bottom where the thickness is 3 mm thick. It has two vents on the short side of the
box and three vents on the long side. One rectangular shaped opening is placed at
the top and bottom. Mk6 packaging box contains 9 kg of apple clustered in six bags,
Stellenbosch University https://scholar.sun.ac.za
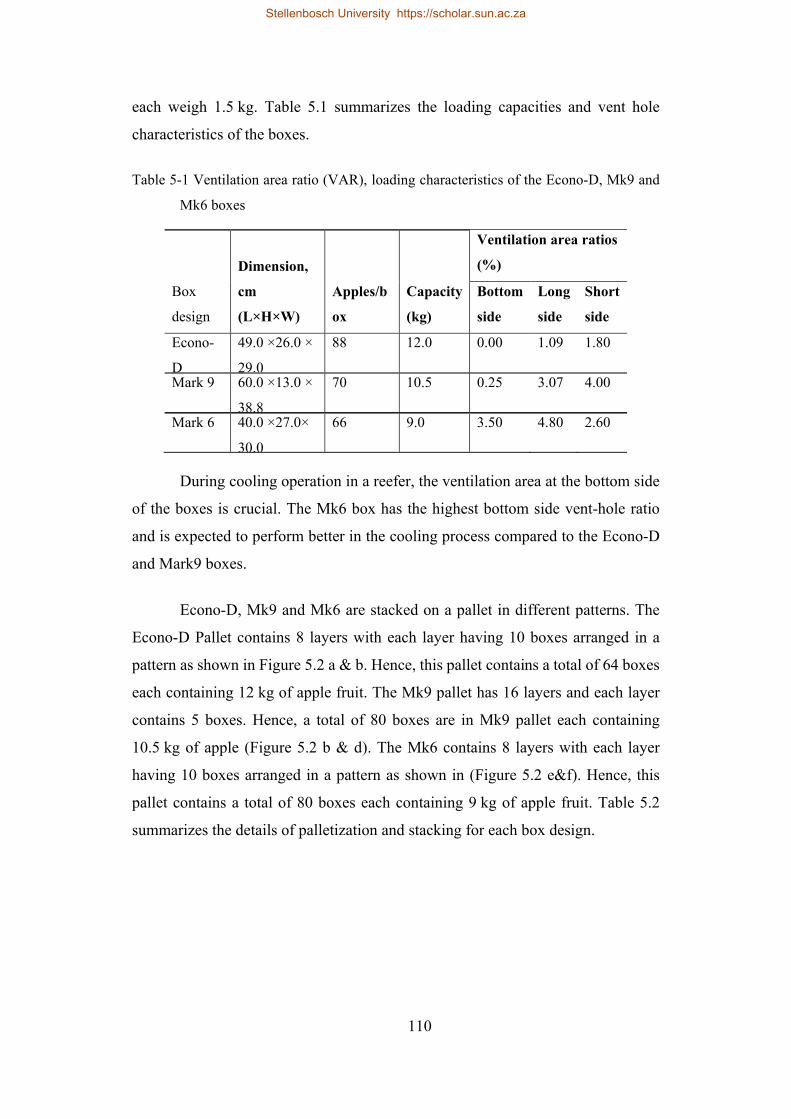
110
each weigh 1.5 kg. Table 5.1 summarizes the loading capacities and vent hole
characteristics of the boxes.
Table 5-1 Ventilation area ratio (VAR), loading characteristics of the Econo-D, Mk9 and
Mk6 boxes
Box
design
Dimension,
cm
(L×H×W)
Apples/b
ox
Capacity
(kg)
Ventilation area ratios
(%)
Bottom
side
Long
side
Short
side
Econo-
D
49.0 ×26.0 ×
29.0
88 12.0 0.00 1.09 1.80
Mark 9 60.0 ×13.0 ×
38.8
70 10.5 0.25 3.07 4.00
Mark 6 40.0 ×27.0×
30.0
66 9.0 3.50 4.80 2.60
During cooling operation in a reefer, the ventilation area at the bottom side
of the boxes is crucial. The Mk6 box has the highest bottom side vent-hole ratio
and is expected to perform better in the cooling process compared to the Econo-D
and Mark9 boxes.
Econo-D, Mk9 and Mk6 are stacked on a pallet in different patterns. The
Econo-D Pallet contains 8 layers with each layer having 10 boxes arranged in a
pattern as shown in Figure 5.2 a & b. Hence, this pallet contains a total of 64 boxes
each containing 12 kg of apple fruit. The Mk9 pallet has 16 layers and each layer
contains 5 boxes. Hence, a total of 80 boxes are in Mk9 pallet each containing
10.5 kg of apple (Figure 5.2 b & d). The Mk6 contains 8 layers with each layer
having 10 boxes arranged in a pattern as shown in (Figure 5.2 e&f). Hence, this
pallet contains a total of 80 boxes each containing 9 kg of apple fruit. Table 5.2
summarizes the details of palletization and stacking for each box design.
Stellenbosch University https://scholar.sun.ac.za
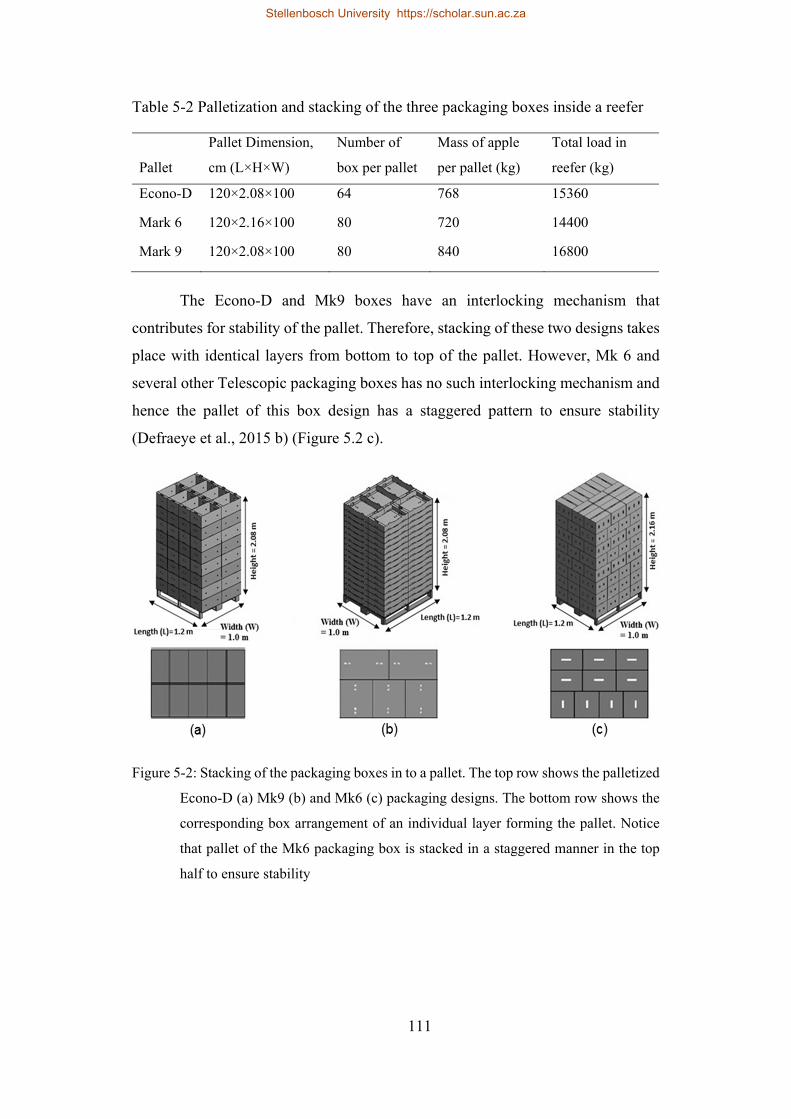
111
Table 5-2 Palletization and stacking of the three packaging boxes inside a reefer
Pallet
Pallet Dimension,
cm (L×H×W)
Number of
box per pallet
Mass of apple
per pallet (kg)
Total load in
reefer (kg)
Econo-D 120×2.08×100 64 768 15360
Mark 6 120×2.16×100 80 720 14400
Mark 9 120×2.08×100 80 840 16800
The Econo-D and Mk9 boxes have an interlocking mechanism that
contributes for stability of the pallet. Therefore, stacking of these two designs takes
place with identical layers from bottom to top of the pallet. However, Mk 6 and
several other Telescopic packaging boxes has no such interlocking mechanism and
hence the pallet of this box design has a staggered pattern to ensure stability
(Defraeye et al., 2015 b) (Figure 5.2 c).
Figure 5-2: Stacking of the packaging boxes in to a pallet. The top row shows the palletized
Econo-D (a) Mk9 (b) and Mk6 (c) packaging designs. The bottom row shows the
corresponding box arrangement of an individual layer forming the pallet. Notice
that pallet of the Mk6 packaging box is stacked in a staggered manner in the top
half to ensure stability
Stellenbosch University https://scholar.sun.ac.za
112
Three reefers that were loaded with 20 pallets of apple packed using Mk 6,
Mk9 and Econo-D packaging boxes are considered in this study. The arrangement
of the pallets inside the reefers was in two rows. Row 1 contains 11 pallets while
row 2 contains nine. The two rows have different pallet orientation.
5.2.2. Wind-tunnel experiment
Characterization of the airflow resistances of pallets of the three package
designs were by use of a wind tunnel experiment. The test was conducted for the
bottom and top half of the pallets. The bottom half of a pallet stacked with Mk6 and
Mk9 consist a wooden pallet in addition to 4 and 8 layer of boxes, respectively. To
represent apple fruit water filled plastic balls with a diameter of 8 cm were used.
The airflow resistance in each flow direction (X-direction (across the length=1.2 m
(L)), Y- direction (vertical= 1.08 m (V)), (Z- direction (across the width=1 m (W).
For the vertical flow direction, the test was conducted with and without the wooden
pallet to represent bottom half (V-B) and the top half (V-T) of a pallet using the
experimental set up described in the previous chapter.
5.3. Mathematical modelling
5.3.1. Governing equations
The current study is built on our previous chapter which describes the
porous medium formulation. In the approach, the palletized fruit inside the reefer
consisting of the packaging boxes, stacked apples and air gaps between apples form
a continuous and homogeneous porous medium. This method avoids the small
details of the stack geometry such that the airflow, temperature and gas distributions
were solved using a volume-averaged Reynolds Averaged Navier-Stokes equation.
The present study extends the investigation by addressing the performance
of two additional fruit packaging boxes, commonly used in apple storage. The
developed and validated model employed for a further investigation of vent areas
(on the bottom side of a box) on airflow, temperature distribution and cooling
performances of reefers.
Stellenbosch University https://scholar.sun.ac.za
113
5.3.2. Model parameters
The model parameters of the porous domain were calculated taking into
account the proportion of fruit, package materials and the air entrained inside the
apple packages. This was accomplished by using average material properties based
on the volume proportion of each part in the porous domain. Resistance of airflow
through the pallets was obtained from a measured pressure drop vs. airflow data in
a wind tunnel experiment. The resistance values were then used to characterize the
porous medium in the CFD model. Table 5.3 summarizes the resistance terms.
5.3.3. Boundary and initial condition
The reefer was in thermal contact with the ambient air with the door, walls,
ceiling and floor as its boundaries. Inside these boundaries we have the porous
domain consisting of all fruit loaded boxes and the remaining region which is the
free air stream is defined as fluid domain. The cooling unit was represented by
specifying temperature and velocity boundary condition at exit from the cooling
system. In all the models, the internal walls of the reefer were set to a no slip walls
and the heat exchange with the environment has been incorporated.
5.3.4. Simulation setups
The domains of each model were discretized using tetrahedral elements. For
every model, the level of grid independence was evaluated using Richardson
extrapolation method (Ambaw et al., 2016; Franke et al., 2007; Roache 1994). The
transport equations were numerically solved using the finite volume method in
ANSYS-Fluent-16 (ANSYS, Canonsburg, PA, USA). Turbulence was calculated
using k-ω SST model. SIMPLE discretization scheme was used for pressure-
velocity coupling and second order upwind discretization was used for momentum,
specific dissipation rate and energy calculations. Time step size of 180 s with
maximum 20 iterations per time step, was used. For each porous medium model, a
steady state calculation was performed to obtain a converged solution of the airflow.
The steady state solutions were used as the initial value for the subsequent transient
heat transfer calculation. Under the selected optimum solver format, a single full
Stellenbosch University https://scholar.sun.ac.za
114
simulation took 40 to 60 h on a 64-bit, Dell Precision T3600, Intel Xeon CPU E5-
1660 0 @3.30 GHz 3.30 GHz and 40GB Ram, Windows 7 PC.
5.3.5. Simulations
First, to investigate the airflow and temperature distributions inside a reefer
containing apple fruit stacked with commonly used apple packaging boxes, namely
Mk6 and Mk9 were simulated. For these simulations previously the validated model
in which fruit was packed in Econo-D packaging box was used. Then, three separate
simulations were conducted to assess the effect of bottom vent area variation on the
airflow distribution and cooling uniformity, keeping all other factors constant. For
this task, the validated porous medium CFD model corresponding to the Econo-D
pallet was taken as a base model (VAR on the bottom side is zero) and its vertical
airflow resistance was virtually reduced by 25 % (Ec-25), 50 % (Ec-50) and 75 %
(Ec-75).
Stellenbosch University https://scholar.sun.ac.za
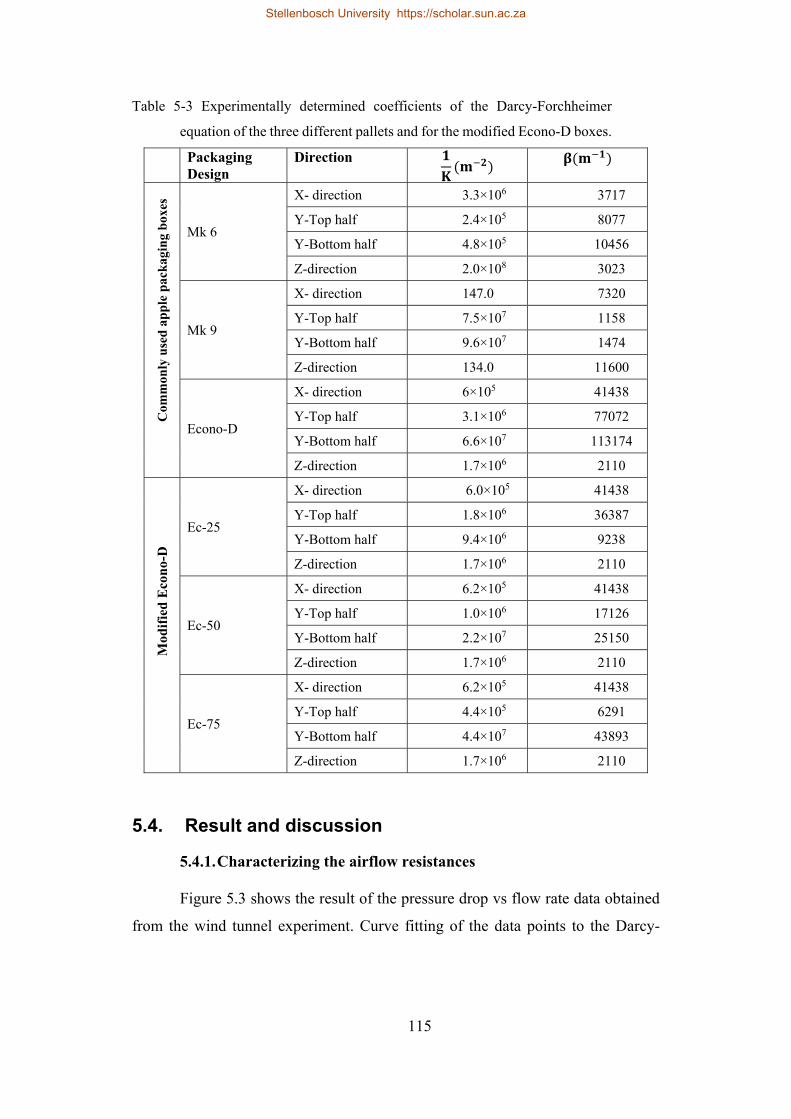
115
Table 5-3 Experimentally determined coefficients of the Darcy-Forchheimer
equation of the three different pallets and for the modified Econo-D boxes.
Packaging Design
Direction
C
omm
only
use
d a
pp
le p
ack
agin
g b
oxes
Mk 6
X- direction 3.3×10⁶ 3717
Y-Top half 2.4×10⁵ 8077
Y-Bottom half 4.8×10⁵ 10456
Z-direction 2.0×10⁸ 3023
Mk 9
X- direction 147.0 7320
Y-Top half 7.5×10⁷ 1158
Y-Bottom half 9.6×10⁷ 1474
Z-direction 134.0 11600
Econo-D
X- direction 6×10⁵ 41438
Y-Top half 3.1×10⁶ 77072
Y-Bottom half 6.6×10⁷ 113174
Z-direction 1.7×10⁶ 2110
Mod
ifie
d E
con
o-D
Ec-25
X- direction 6.0×10⁵ 41438
Y-Top half 1.8×10⁶ 36387
Y-Bottom half 9.4×10⁶ 9238
Z-direction 1.7×10⁶ 2110
Ec-50
X- direction 6.2×10⁵ 41438
Y-Top half 1.0×10⁶ 17126
Y-Bottom half 2.2×10⁷ 25150
Z-direction 1.7×10⁶ 2110
Ec-75
X- direction 6.2×10⁵ 41438
Y-Top half 4.4×10⁵ 6291
Y-Bottom half 4.4×10⁷ 43893
Z-direction 1.7×10⁶ 2110
5.4. Result and discussion
5.4.1. Characterizing the airflow resistances
Figure 5.3 shows the result of the pressure drop vs flow rate data obtained
from the wind tunnel experiment. Curve fitting of the data points to the Darcy-
Stellenbosch University https://scholar.sun.ac.za
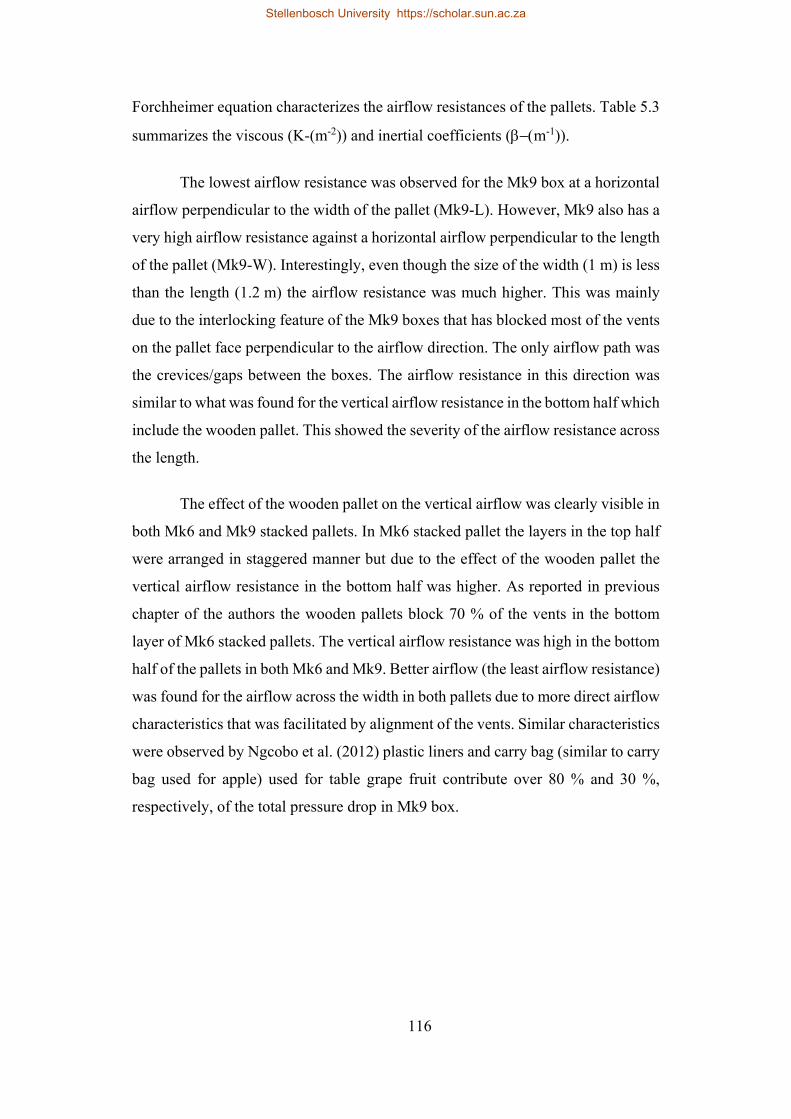
116
Forchheimer equation characterizes the airflow resistances of the pallets. Table 5.3
summarizes the viscous (K-(m-2)) and inertial coefficients (m-1)).
The lowest airflow resistance was observed for the Mk9 box at a horizontal
airflow perpendicular to the width of the pallet (Mk9-L). However, Mk9 also has a
very high airflow resistance against a horizontal airflow perpendicular to the length
of the pallet (Mk9-W). Interestingly, even though the size of the width (1 m) is less
than the length (1.2 m) the airflow resistance was much higher. This was mainly
due to the interlocking feature of the Mk9 boxes that has blocked most of the vents
on the pallet face perpendicular to the airflow direction. The only airflow path was
the crevices/gaps between the boxes. The airflow resistance in this direction was
similar to what was found for the vertical airflow resistance in the bottom half which
include the wooden pallet. This showed the severity of the airflow resistance across
the length.
The effect of the wooden pallet on the vertical airflow was clearly visible in
both Mk6 and Mk9 stacked pallets. In Mk6 stacked pallet the layers in the top half
were arranged in staggered manner but due to the effect of the wooden pallet the
vertical airflow resistance in the bottom half was higher. As reported in previous
chapter of the authors the wooden pallets block 70 % of the vents in the bottom
layer of Mk6 stacked pallets. The vertical airflow resistance was high in the bottom
half of the pallets in both Mk6 and Mk9. Better airflow (the least airflow resistance)
was found for the airflow across the width in both pallets due to more direct airflow
characteristics that was facilitated by alignment of the vents. Similar characteristics
were observed by Ngcobo et al. (2012) plastic liners and carry bag (similar to carry
bag used for apple) used for table grape fruit contribute over 80 % and 30 %,
respectively, of the total pressure drop in Mk9 box.
Stellenbosch University https://scholar.sun.ac.za
117
Figure 5-3: Experimentally obtained pressure loss vs. flow rate profiles of palletized Mk6
and Mk9 boxes. Pressure loss profiles for horizontal airflow perpendicular to the
width (Mk6-L and Mk9-L) and, perpendicular to the length (Mk6-W and Mk9-W).
The profiles of the pressure loss along the vertical direction were obtained for the
bottom half of the pallet (Mk6-V-B and Mk9-V-B) and for the top half of the pallet
(Mk6-V-T and Mk9-V-T). The bottom half incorporated the airflow resistance due
the wooden pallets. Results for Econo-D (Figure 4-6).
To assess the effect of bottom vent area variation whilst keeping other
factors constant one packaging box design (Econo-D) was chosen. For this study
pallet stacked with the Econo-D box design was evaluated by varying it’s the
vertical flow resistance by 25 % (Ec-25), 50 % (Ec-50) and 75 % (Ec-75). Its 75 %
flow resistance variation per unit length was almost the same as that of the flow
resistance per unit length calculated for the Mk 6 box design which has 3. 5 %
bottom vent area (Figure5.1). Therefore, two vertical flow resistances (Econo-D
and Mk 6) were set as references for the worst case and the best-case scenarios to
make sure the evaluation represents the reality, fairly.
5.4.2. Analysis of the airflow distribution inside the reefer
Profile of vertical airflow inside the reefer
Stellenbosch University https://scholar.sun.ac.za
118
The range of the vertical air velocity magnitude varies from one load to the
other depending on the packaging design used for the fruit and the amount of fruit
loaded. The amount of air reaching the fruit in the stacked load depends on the
airflow resistances, which in turn dependents on the packaging design, amount of
fruit, pallet stacking, and pallet orientation. Figure 5.4 depicts the magnitude of the
vertical component of the air velocity (Vv) across each pallet of the row 1 and row
2 inside the reefer. The magnitude of the vertical airflow ranges from 0-0.026 m s-
1 to 0-0.037 m s-1 in pallet row 1 and row 2, respectively. Notice that the airflow
distribution in the reefer with Mk6 was more uniform and relatively higher in
magnitude than the other box designs (Figure 5a&b). This box design is the one
with the highest vent area ratio at the bottom side compared to the others. The result
in part confirms the importance of vent holes on the bottom side of fruit packaging
box.
Stellenbosch University https://scholar.sun.ac.za
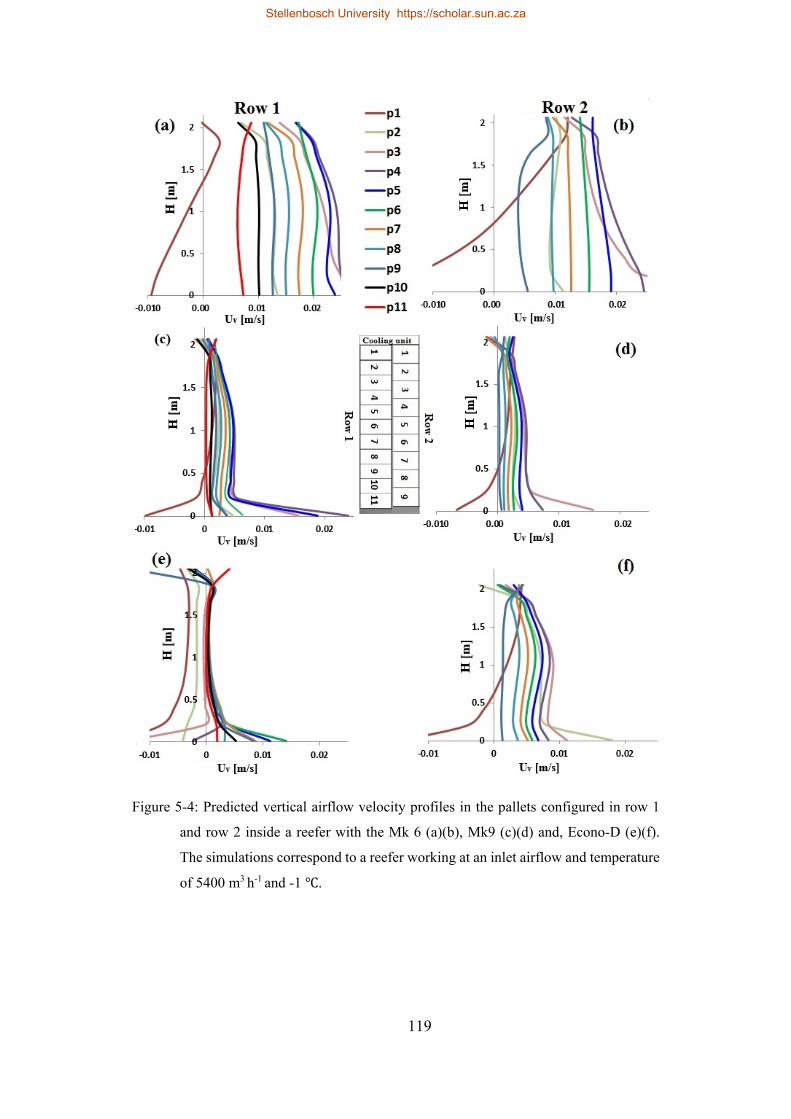
119
Figure 5-4: Predicted vertical airflow velocity profiles in the pallets configured in row 1
and row 2 inside a reefer with the Mk 6 (a)(b), Mk9 (c)(d) and, Econo-D (e)(f).
The simulations correspond to a reefer working at an inlet airflow and temperature
of 5400 m3 h-1 and -1 .
Stellenbosch University https://scholar.sun.ac.za
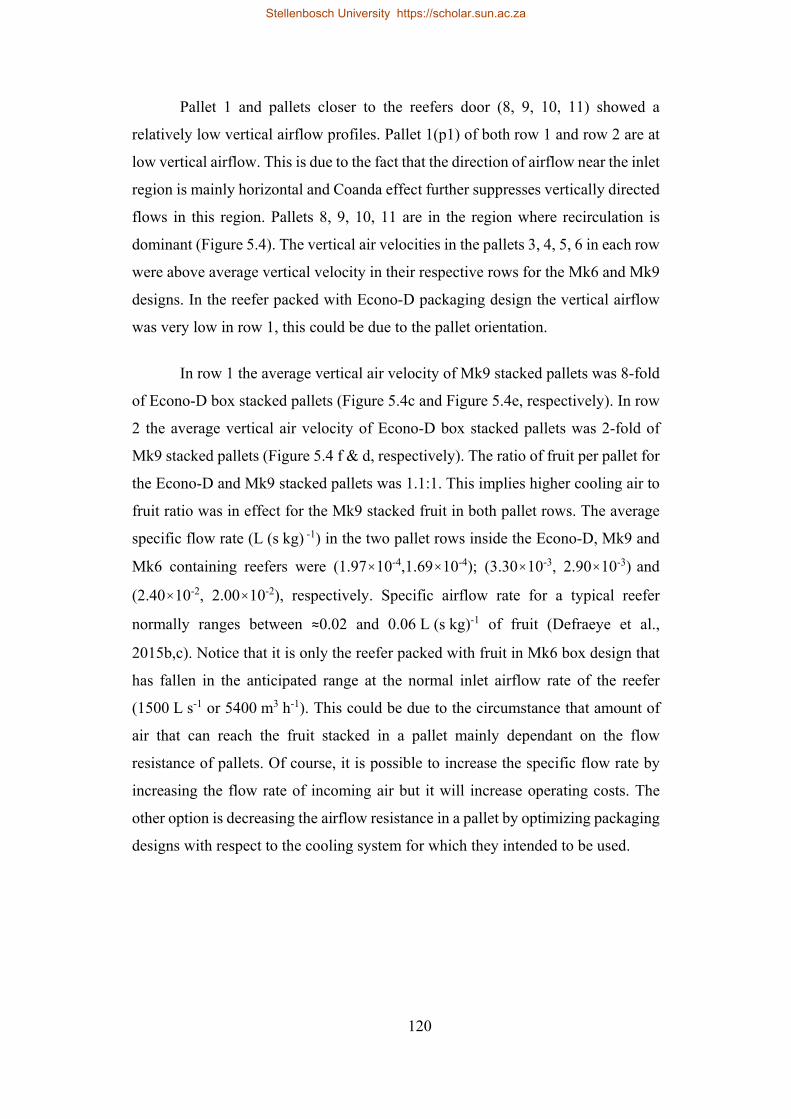
120
Pallet 1 and pallets closer to the reefers door (8, 9, 10, 11) showed a
relatively low vertical airflow profiles. Pallet 1(p1) of both row 1 and row 2 are at
low vertical airflow. This is due to the fact that the direction of airflow near the inlet
region is mainly horizontal and Coanda effect further suppresses vertically directed
flows in this region. Pallets 8, 9, 10, 11 are in the region where recirculation is
dominant (Figure 5.4). The vertical air velocities in the pallets 3, 4, 5, 6 in each row
were above average vertical velocity in their respective rows for the Mk6 and Mk9
designs. In the reefer packed with Econo-D packaging design the vertical airflow
was very low in row 1, this could be due to the pallet orientation.
In row 1 the average vertical air velocity of Mk9 stacked pallets was 8-fold
of Econo-D box stacked pallets (Figure 5.4c and Figure 5.4e, respectively). In row
2 the average vertical air velocity of Econo-D box stacked pallets was 2-fold of
Mk9 stacked pallets (Figure 5.4 f & d, respectively). The ratio of fruit per pallet for
the Econo-D and Mk9 stacked pallets was 1.1:1. This implies higher cooling air to
fruit ratio was in effect for the Mk9 stacked fruit in both pallet rows. The average
specific flow rate (L (s kg) -1) in the two pallet rows inside the Econo-D, Mk9 and
Mk6 containing reefers were (1.97×10-4,1.69×10-4); (3.30×10⁻³, 2.90×10⁻³) and
(2.40×10⁻², 2.00×10⁻²), respectively. Specific airflow rate for a typical reefer
normally ranges between ≈0.02 and 0.06 L (s kg)-1 of fruit (Defraeye et al.,
2015b,c). Notice that it is only the reefer packed with fruit in Mk6 box design that
has fallen in the anticipated range at the normal inlet airflow rate of the reefer
(1500 L s-1 or 5400 m3 h-1). This could be due to the circumstance that amount of
air that can reach the fruit stacked in a pallet mainly dependant on the flow
resistance of pallets. Of course, it is possible to increase the specific flow rate by
increasing the flow rate of incoming air but it will increase operating costs. The
other option is decreasing the airflow resistance in a pallet by optimizing packaging
designs with respect to the cooling system for which they intended to be used.
Stellenbosch University https://scholar.sun.ac.za
121
Profile of horizontal airflow inside the reefer
Figure 5.5 shows the result of the horizontal airflow analysis inside the
reefers corresponding to the three box designs. There is a clear difference in the
airflow distribution between the box designs. Since the pallet orientations are
different in the two rows inside a reefer, the horizontal airflow profiles of the two
rows were also noticeably different. Hence, airflow profile inside a reefer varies in
all spatial direction. The horizontal air velocity magnitude increase from zero to
reach a maximum and decrease to reach a relatively steady air velocity after the first
four meters for all the reefers. The fluctuation in the first four meters was a result
of the recirculating flow of the incoming air in the region and has an opposite flow
direction. The horizontal airflow velocity in the reefers ranges between 0 and
0.019 m s-1.
Figure 5-5: Average horizontal airflow magnitudes through row1 and row2 inside
a reefer along the Z-axis. Pallets in row 1 and row 2 were configured
with horizontal airflow (Z-direction) across the width and length of the
pallets, respectively. The simulations correspond to a reefer working at
an inlet airflow and temperature of 5400 m3 h-1 and -1 .
Stellenbosch University https://scholar.sun.ac.za
122
For the pallets in row 1 and row 2 horizontal airflow was across the width
and the length of pallets, respectively. Airflow in a reefer is a complex three
dimensional flow (Defraeye et al. 2015b), the airflow characteristics in one
direction is not only a result of an airflow resistance in the given direction but also
the airflow characteristics in the other directions. This was reflected in the reefer
with Mk6 packaging design. The horizontal airflow in row 1 (flow across the width
or X-direction) was much lower than row 2 (flow across the length or Z-direction)
despite the higher airflow resistance across the length (similar to row 2
configuration) than across the width (similar to row 1 configuration) (Figure 5.3).
It was also found that average vertical airflow in row 1 was 15 % higher than in row
2. From this it can be concluded that the horizontal and vertical airflow in the two
pallet rows were inversely related. This was consistent with all the rows of Econo-
D, Mk9 and Mk6 stacked fruit pallets. The average horizontal air velocity was
higher in row 2 than in row 1 for Mk6 and Mk9 packed reefers. And in the Econo-
D packed reefer horizontal air velocity was higher in row 1 than in row 2. In
contrast, vertical air velocity was higher in row 1 than in row 2 for Mk6 and Mk9,
whereas it was higher in row 2 for Econo-D packed reefer.
Mk9 stacked reefers the magnitude of horizontal airflow velocity was higher
in row 2 than in row 1. This was consistent with the airflow resistance
characteristics of the Mk9 pallet for flows across the width and the length (Figure
5.3). For Econo-D higher horizontal airflow was found in pallet row 1(across the
width), in which the lowest airflow resistance was recorded across the Econo-D
pallet width.
Horizontal airflow magnitude comparison with respect to pallet orientation
(row 1 and row 2) showed the airflow characteristics depend on the packaging
design and how the pallet is configured in a reefer. It was also shown that the display
type packaging boxes (Mk9 and Econo-D) have higher horizontal airflow (row 1
and 2 for Mk9; row 1 for Econo-D) compared with Telescopic Mk6 packaging
design, particularly after the recirculating flow was settled down (from 5 m to
Stellenbosch University https://scholar.sun.ac.za
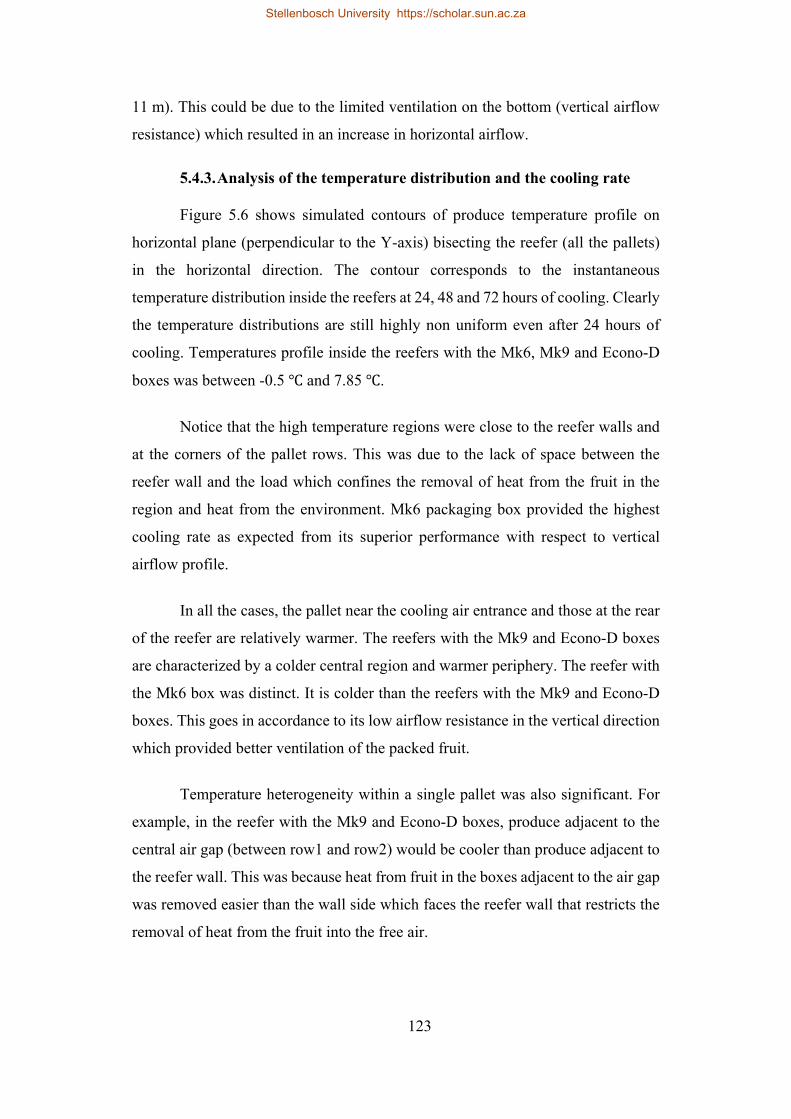
123
11 m). This could be due to the limited ventilation on the bottom (vertical airflow
resistance) which resulted in an increase in horizontal airflow.
5.4.3. Analysis of the temperature distribution and the cooling rate
Figure 5.6 shows simulated contours of produce temperature profile on
horizontal plane (perpendicular to the Y-axis) bisecting the reefer (all the pallets)
in the horizontal direction. The contour corresponds to the instantaneous
temperature distribution inside the reefers at 24, 48 and 72 hours of cooling. Clearly
the temperature distributions are still highly non uniform even after 24 hours of
cooling. Temperatures profile inside the reefers with the Mk6, Mk9 and Econo-D
boxes was between -0.5 and 7.85 .
Notice that the high temperature regions were close to the reefer walls and
at the corners of the pallet rows. This was due to the lack of space between the
reefer wall and the load which confines the removal of heat from the fruit in the
region and heat from the environment. Mk6 packaging box provided the highest
cooling rate as expected from its superior performance with respect to vertical
airflow profile.
In all the cases, the pallet near the cooling air entrance and those at the rear
of the reefer are relatively warmer. The reefers with the Mk9 and Econo-D boxes
are characterized by a colder central region and warmer periphery. The reefer with
the Mk6 box was distinct. It is colder than the reefers with the Mk9 and Econo-D
boxes. This goes in accordance to its low airflow resistance in the vertical direction
which provided better ventilation of the packed fruit.
Temperature heterogeneity within a single pallet was also significant. For
example, in the reefer with the Mk9 and Econo-D boxes, produce adjacent to the
central air gap (between row1 and row2) would be cooler than produce adjacent to
the reefer wall. This was because heat from fruit in the boxes adjacent to the air gap
was removed easier than the wall side which faces the reefer wall that restricts the
removal of heat from the fruit into the free air.
Stellenbosch University https://scholar.sun.ac.za
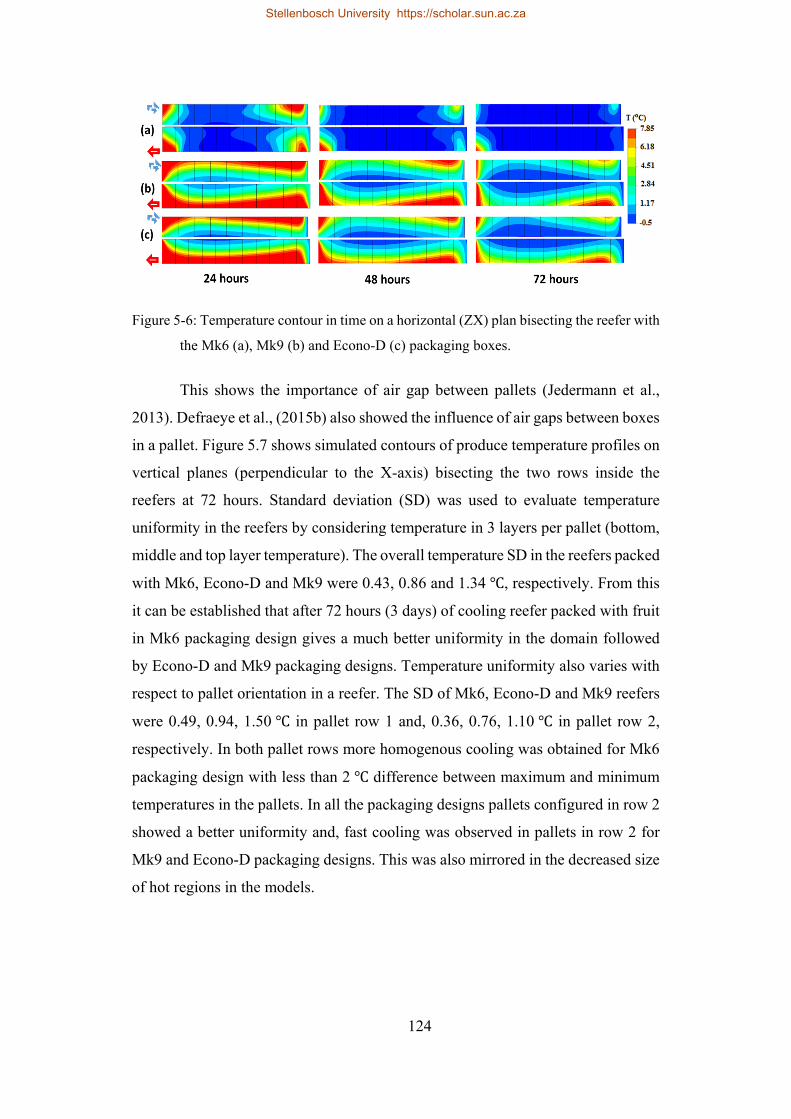
124
Figure 5-6: Temperature contour in time on a horizontal (ZX) plan bisecting the reefer with
the Mk6 (a), Mk9 (b) and Econo-D (c) packaging boxes.
This shows the importance of air gap between pallets (Jedermann et al.,
2013). Defraeye et al., (2015b) also showed the influence of air gaps between boxes
in a pallet. Figure 5.7 shows simulated contours of produce temperature profiles on
vertical planes (perpendicular to the X-axis) bisecting the two rows inside the
reefers at 72 hours. Standard deviation (SD) was used to evaluate temperature
uniformity in the reefers by considering temperature in 3 layers per pallet (bottom,
middle and top layer temperature). The overall temperature SD in the reefers packed
with Mk6, Econo-D and Mk9 were 0.43, 0.86 and 1.34 , respectively. From this
it can be established that after 72 hours (3 days) of cooling reefer packed with fruit
in Mk6 packaging design gives a much better uniformity in the domain followed
by Econo-D and Mk9 packaging designs. Temperature uniformity also varies with
respect to pallet orientation in a reefer. The SD of Mk6, Econo-D and Mk9 reefers
were 0.49, 0.94, 1.50 in pallet row 1 and, 0.36, 0.76, 1.10 in pallet row 2,
respectively. In both pallet rows more homogenous cooling was obtained for Mk6
packaging design with less than 2 difference between maximum and minimum
temperatures in the pallets. In all the packaging designs pallets configured in row 2
showed a better uniformity and, fast cooling was observed in pallets in row 2 for
Mk9 and Econo-D packaging designs. This was also mirrored in the decreased size
of hot regions in the models.
Stellenbosch University https://scholar.sun.ac.za
125
Produce in p2 to p6 of row 1 and p2 to p5 in row 2 were relatively colder
than that of the other pallets (Figure 5.7). This goes in accordance to the cooling air
distribution inside the reefer as discussed in the airflow distribution (sec 3.2.1). The
magnitudes of vertical airflow in these pallets were above average (Figure 5.4).
Although the vertical airflow of the supply cooling air is critical, the returning air
also played a minor role in the cooling operation. This can be clearly observed in
the Mk9 and Econo-D packed reefers’ temperature profiles. The top of the pallets
(parallel to the return air flow region) and the top half of last pallet that reached the
desired temperature (Figure 5.7 b&c).
Figure 5.8 depicted the average temperature history in row 1 and row 2 of
the three reefers. Thermal heterogeneity of fruit is not only generated due to
insufficient flow rate of the cooling air, but also by a non-uniform distribution of
cooling air within the palletized structure (Alvarez and Flick, 1999). As shown in
Figure 5-4 vertical air velocity is almost three times higher near the bottom of the
pallets than the in the middle particularly, in the reefers packed with Econo-D and
Mk9 packaging designs. Although higher velocity that seem to be more beneficial
for fast cooling, local higher cooling rates are actually not desired since they
introduce higher cooling heterogeneity of fruit within a container (Defraeye et al.,
2014). The HCT and SECT differ between rows inside a reefer and between
package designs. Table 5.4 summarizes the HCT and SECT per reefer. There was
a 2, 6 and 9-hour difference between the SECT of row1 and row2 inside the reefer
containing the Econo-D, Mk6 and Mk9 boxes, respectively. The cooling rate was
more uniform inside the reefer packed with the Mk6 box. This box has the highest
vent area ratio on its bottom face which resulted better vertical airflow in the pallets
as compared to Mk9 and Econo-D packed pallets (section 3.2.1). In addition, the
total fruit mass in Mk6 containing reefer was lower than Econo-D and Mk9
containing reefers by 6.6 % and 16.67 %, respectively. Hence, Mk6 is characterized
by its fast cooling performance and worst space utilization. However, fruit
industries are more interested on maximizing the amount of fruit loaded in a reefer
by employing large packaging boxes to minimize the space used by the packaging
Stellenbosch University https://scholar.sun.ac.za
126
boxes. The larger the packaging boxes the better is the space utilization. However,
large weight (>18 kg) is inconvenient for manual labour (Berry et al., 2015). Mk9
and Econo-D packaging box designs carry 10.5 and 12 kg per box, respectively,
which is manageable but the cooling performance of these boxes were not good. By
carefully providing vent-holes in the bottom sides of these two boxes it is possible
to improve their cooling performance. Further assessment of this aspect is made by
virtually modifying the Econo-D box. The result of this modification is discussed
in the section below.
Figure 5-7: Temperature contour at 72 h on vertical (YZ) planes bisecting row 1(left) and
row 2 (right) of the reefer with the Mk6 (a), Mk9 (b) and Econo-D (c) packaging
boxes.
Stellenbosch University https://scholar.sun.ac.za
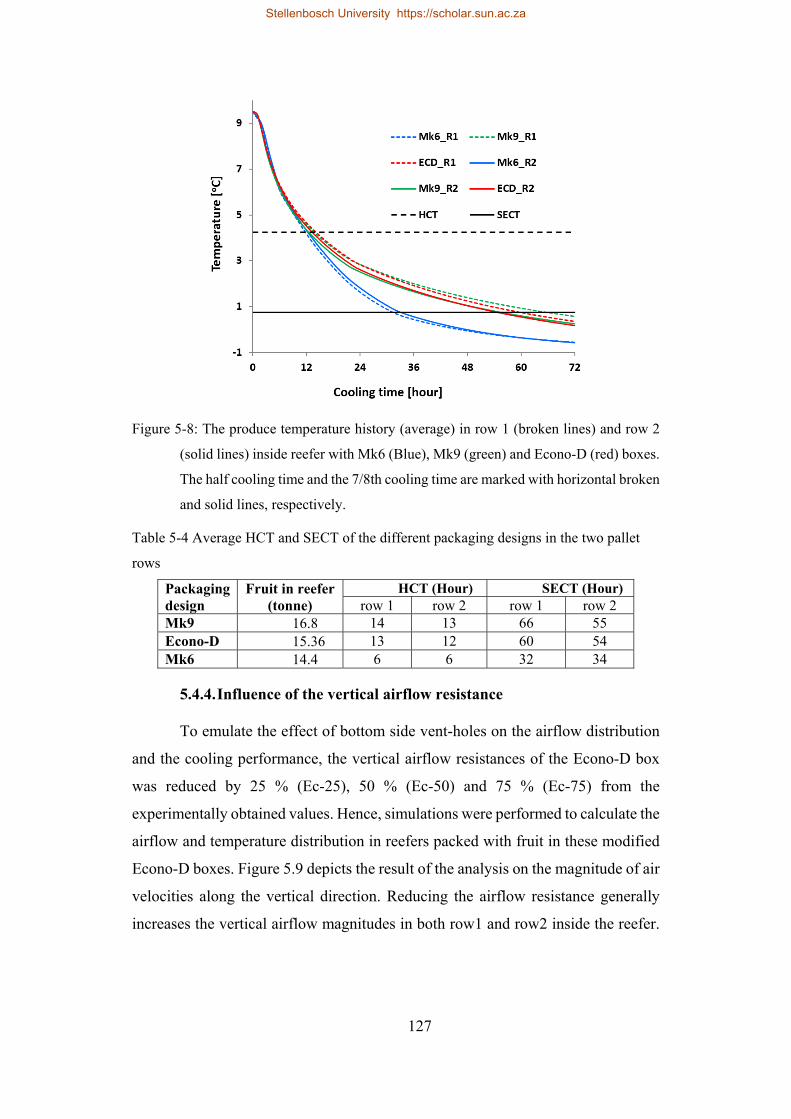
127
Figure 5-8: The produce temperature history (average) in row 1 (broken lines) and row 2
(solid lines) inside reefer with Mk6 (Blue), Mk9 (green) and Econo-D (red) boxes.
The half cooling time and the 7/8th cooling time are marked with horizontal broken
and solid lines, respectively.
Table 5-4 Average HCT and SECT of the different packaging designs in the two pallet
rows
Packaging design
Fruit in reefer (tonne)
HCT (Hour) SECT (Hour) row 1 row 2 row 1 row 2
Mk9 16.8 14 13 66 55 Econo-D 15.36 13 12 60 54 Mk6 14.4 6 6 32 34
5.4.4. Influence of the vertical airflow resistance
To emulate the effect of bottom side vent-holes on the airflow distribution
and the cooling performance, the vertical airflow resistances of the Econo-D box
was reduced by 25 % (Ec-25), 50 % (Ec-50) and 75 % (Ec-75) from the
experimentally obtained values. Hence, simulations were performed to calculate the
airflow and temperature distribution in reefers packed with fruit in these modified
Econo-D boxes. Figure 5.9 depicts the result of the analysis on the magnitude of air
velocities along the vertical direction. Reducing the airflow resistance generally
increases the vertical airflow magnitudes in both row1 and row2 inside the reefer.
Stellenbosch University https://scholar.sun.ac.za
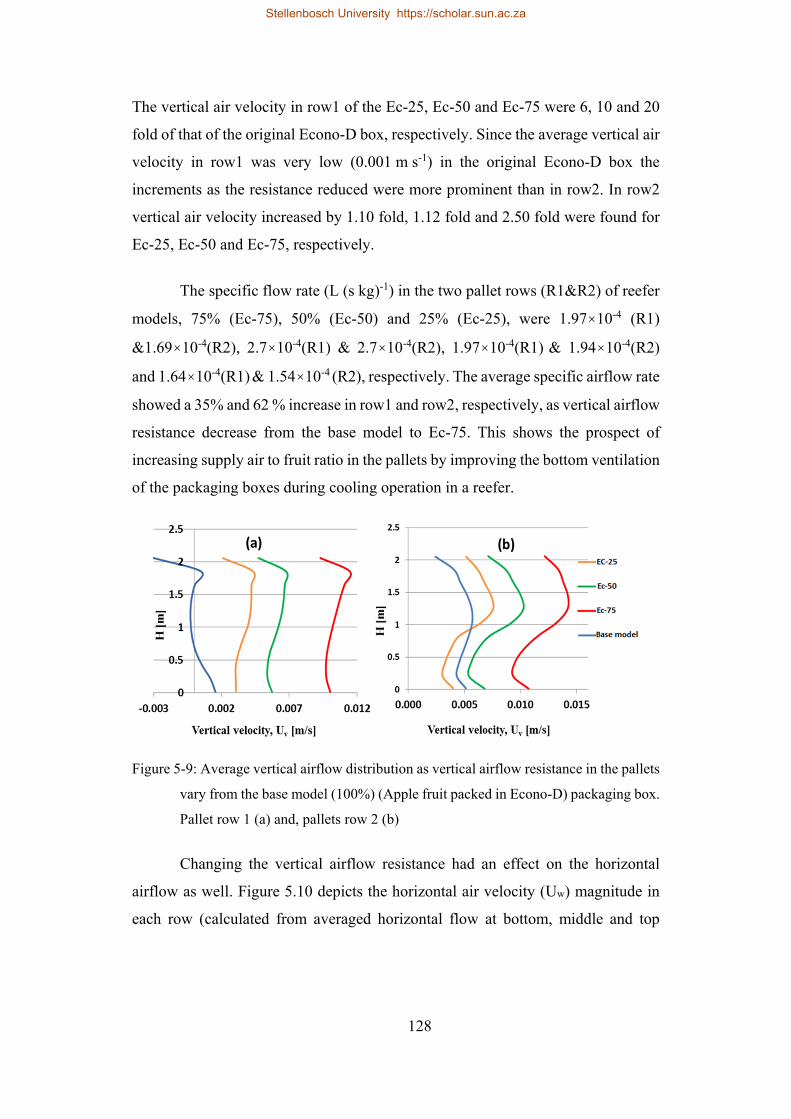
128
The vertical air velocity in row1 of the Ec-25, Ec-50 and Ec-75 were 6, 10 and 20
fold of that of the original Econo-D box, respectively. Since the average vertical air
velocity in row1 was very low (0.001 m s-1) in the original Econo-D box the
increments as the resistance reduced were more prominent than in row2. In row2
vertical air velocity increased by 1.10 fold, 1.12 fold and 2.50 fold were found for
Ec-25, Ec-50 and Ec-75, respectively.
The specific flow rate (L (s kg)-1) in the two pallet rows (R1&R2) of reefer
models, 75% (Ec-75), 50% (Ec-50) and 25% (Ec-25), were 1.97×10⁻⁴ (R1)
&1.69×10⁻⁴(R2), 2.7×10⁻⁴(R1) & 2.7×10⁻⁴(R2), 1.97×10⁻⁴(R1) & 1.94×10⁻⁴(R2)
and 1.64×10⁻⁴(R1) & 1.54×10⁻⁴ (R2), respectively. The average specific airflow rate
showed a 35% and 62 % increase in row1 and row2, respectively, as vertical airflow
resistance decrease from the base model to Ec-75. This shows the prospect of
increasing supply air to fruit ratio in the pallets by improving the bottom ventilation
of the packaging boxes during cooling operation in a reefer.
Figure 5-9: Average vertical airflow distribution as vertical airflow resistance in the pallets
vary from the base model (100%) (Apple fruit packed in Econo-D) packaging box.
Pallet row 1 (a) and, pallets row 2 (b)
Changing the vertical airflow resistance had an effect on the horizontal
airflow as well. Figure 5.10 depicts the horizontal air velocity (Uw) magnitude in
each row (calculated from averaged horizontal flow at bottom, middle and top
Stellenbosch University https://scholar.sun.ac.za
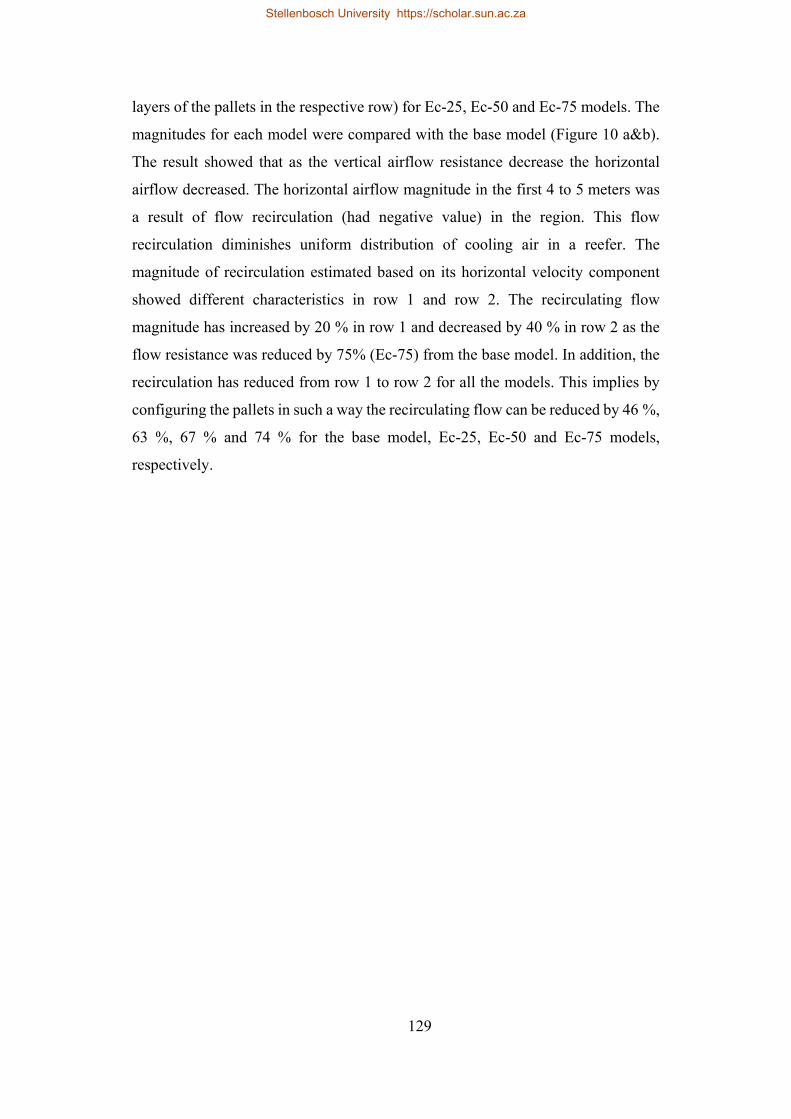
129
layers of the pallets in the respective row) for Ec-25, Ec-50 and Ec-75 models. The
magnitudes for each model were compared with the base model (Figure 10 a&b).
The result showed that as the vertical airflow resistance decrease the horizontal
airflow decreased. The horizontal airflow magnitude in the first 4 to 5 meters was
a result of flow recirculation (had negative value) in the region. This flow
recirculation diminishes uniform distribution of cooling air in a reefer. The
magnitude of recirculation estimated based on its horizontal velocity component
showed different characteristics in row 1 and row 2. The recirculating flow
magnitude has increased by 20 % in row 1 and decreased by 40 % in row 2 as the
flow resistance was reduced by 75% (Ec-75) from the base model. In addition, the
recirculation has reduced from row 1 to row 2 for all the models. This implies by
configuring the pallets in such a way the recirculating flow can be reduced by 46 %,
63 %, 67 % and 74 % for the base model, Ec-25, Ec-50 and Ec-75 models,
respectively.
Stellenbosch University https://scholar.sun.ac.za
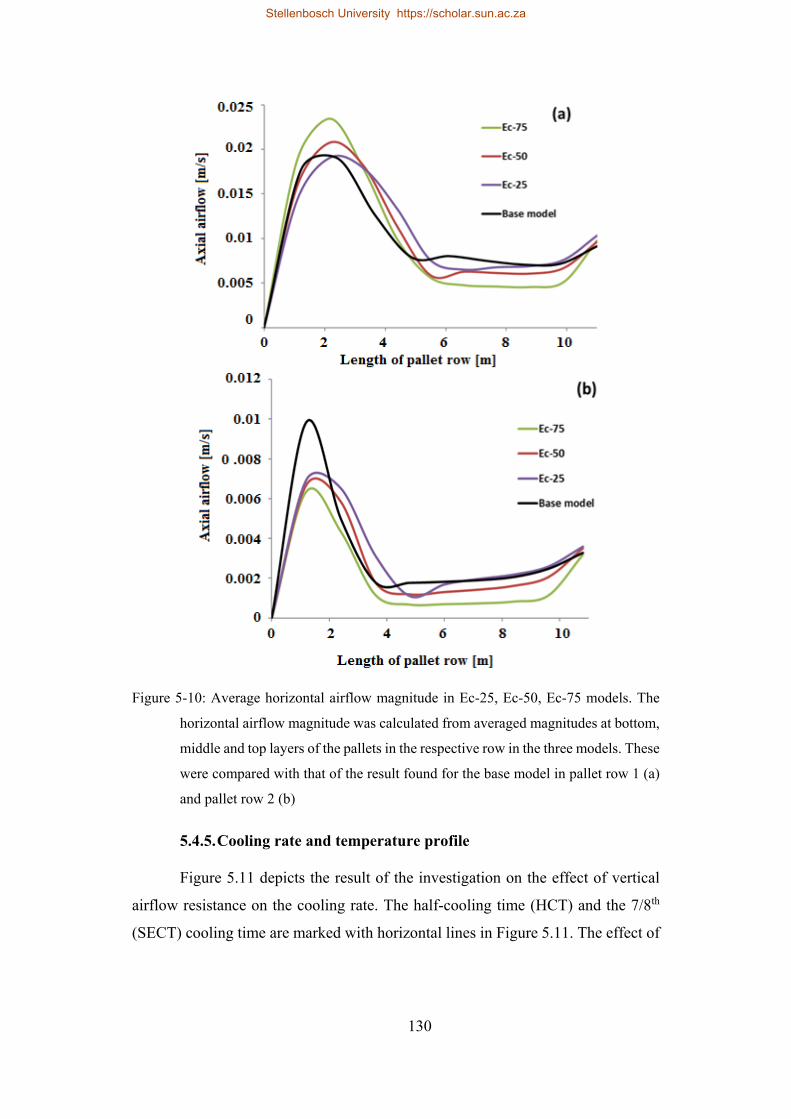
130
Figure 5-10: Average horizontal airflow magnitude in Ec-25, Ec-50, Ec-75 models. The
horizontal airflow magnitude was calculated from averaged magnitudes at bottom,
middle and top layers of the pallets in the respective row in the three models. These
were compared with that of the result found for the base model in pallet row 1 (a)
and pallet row 2 (b)
5.4.5. Cooling rate and temperature profile
Figure 5.11 depicts the result of the investigation on the effect of vertical
airflow resistance on the cooling rate. The half-cooling time (HCT) and the 7/8th
(SECT) cooling time are marked with horizontal lines in Figure 5.11. The effect of
Stellenbosch University https://scholar.sun.ac.za
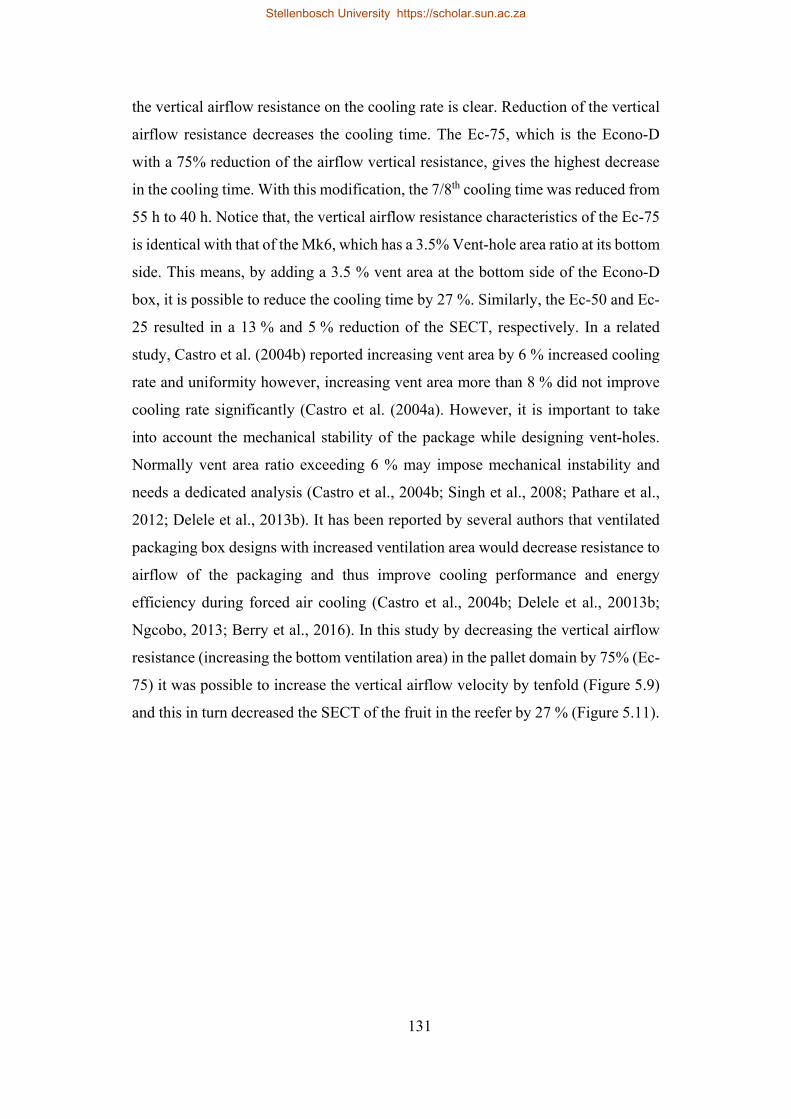
131
the vertical airflow resistance on the cooling rate is clear. Reduction of the vertical
airflow resistance decreases the cooling time. The Ec-75, which is the Econo-D
with a 75% reduction of the airflow vertical resistance, gives the highest decrease
in the cooling time. With this modification, the 7/8th cooling time was reduced from
55 h to 40 h. Notice that, the vertical airflow resistance characteristics of the Ec-75
is identical with that of the Mk6, which has a 3.5% Vent-hole area ratio at its bottom
side. This means, by adding a 3.5 % vent area at the bottom side of the Econo-D
box, it is possible to reduce the cooling time by 27 %. Similarly, the Ec-50 and Ec-
25 resulted in a 13 % and 5 % reduction of the SECT, respectively. In a related
study, Castro et al. (2004b) reported increasing vent area by 6 % increased cooling
rate and uniformity however, increasing vent area more than 8 % did not improve
cooling rate significantly (Castro et al. (2004a). However, it is important to take
into account the mechanical stability of the package while designing vent-holes.
Normally vent area ratio exceeding 6 % may impose mechanical instability and
needs a dedicated analysis (Castro et al., 2004b; Singh et al., 2008; Pathare et al.,
2012; Delele et al., 2013b). It has been reported by several authors that ventilated
packaging box designs with increased ventilation area would decrease resistance to
airflow of the packaging and thus improve cooling performance and energy
efficiency during forced air cooling (Castro et al., 2004b; Delele et al., 20013b;
Ngcobo, 2013; Berry et al., 2016). In this study by decreasing the vertical airflow
resistance (increasing the bottom ventilation area) in the pallet domain by 75% (Ec-
75) it was possible to increase the vertical airflow velocity by tenfold (Figure 5.9)
and this in turn decreased the SECT of the fruit in the reefer by 27 % (Figure 5.11).
Stellenbosch University https://scholar.sun.ac.za
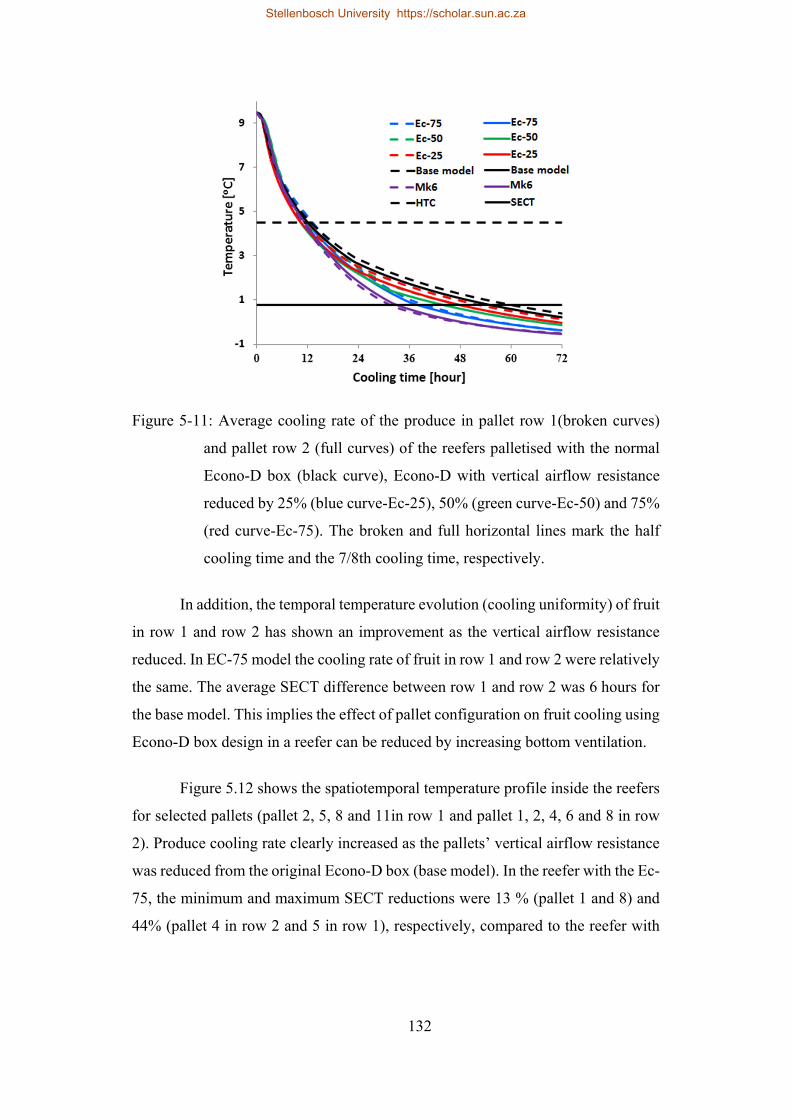
132
Figure 5-11: Average cooling rate of the produce in pallet row 1(broken curves)
and pallet row 2 (full curves) of the reefers palletised with the normal
Econo-D box (black curve), Econo-D with vertical airflow resistance
reduced by 25% (blue curve-Ec-25), 50% (green curve-Ec-50) and 75%
(red curve-Ec-75). The broken and full horizontal lines mark the half
cooling time and the 7/8th cooling time, respectively.
In addition, the temporal temperature evolution (cooling uniformity) of fruit
in row 1 and row 2 has shown an improvement as the vertical airflow resistance
reduced. In EC-75 model the cooling rate of fruit in row 1 and row 2 were relatively
the same. The average SECT difference between row 1 and row 2 was 6 hours for
the base model. This implies the effect of pallet configuration on fruit cooling using
Econo-D box design in a reefer can be reduced by increasing bottom ventilation.
Figure 5.12 shows the spatiotemporal temperature profile inside the reefers
for selected pallets (pallet 2, 5, 8 and 11in row 1 and pallet 1, 2, 4, 6 and 8 in row
2). Produce cooling rate clearly increased as the pallets’ vertical airflow resistance
was reduced from the original Econo-D box (base model). In the reefer with the Ec-
75, the minimum and maximum SECT reductions were 13 % (pallet 1 and 8) and
44% (pallet 4 in row 2 and 5 in row 1), respectively, compared to the reefer with
Stellenbosch University https://scholar.sun.ac.za
133
the base model. Generally, pallet 1 and pallet 8 cools gradually for all the cases
(Figure 5.12c). In pallet 1 the vertical airflow was found to be very small due to two
reasons; 1st incoming air has a jet property which flows in the axial direction
(majority of the cooling air bypass the region) and, 2nd the vertical flow was limited
due to the baffle plate at the inlet (on which the first pallets are partial placed on)
which facilitates the forward flow of the cooling air and deters vertical airflow.
Experimental study of the base model scenario reported in the previous paper also
showed that the cooling rate of fruit the first pallets was actually slower than some
of the pallets in the middle of the reefer. In general, the spatiotemporal temperature
profile showed cooling rate improvement in the pallets located in the middle of the
domain (from pallet 3 to pallet 6 in row 2) as the vertical airflow resistance reduced
from the base model.
Stellenbosch University https://scholar.sun.ac.za
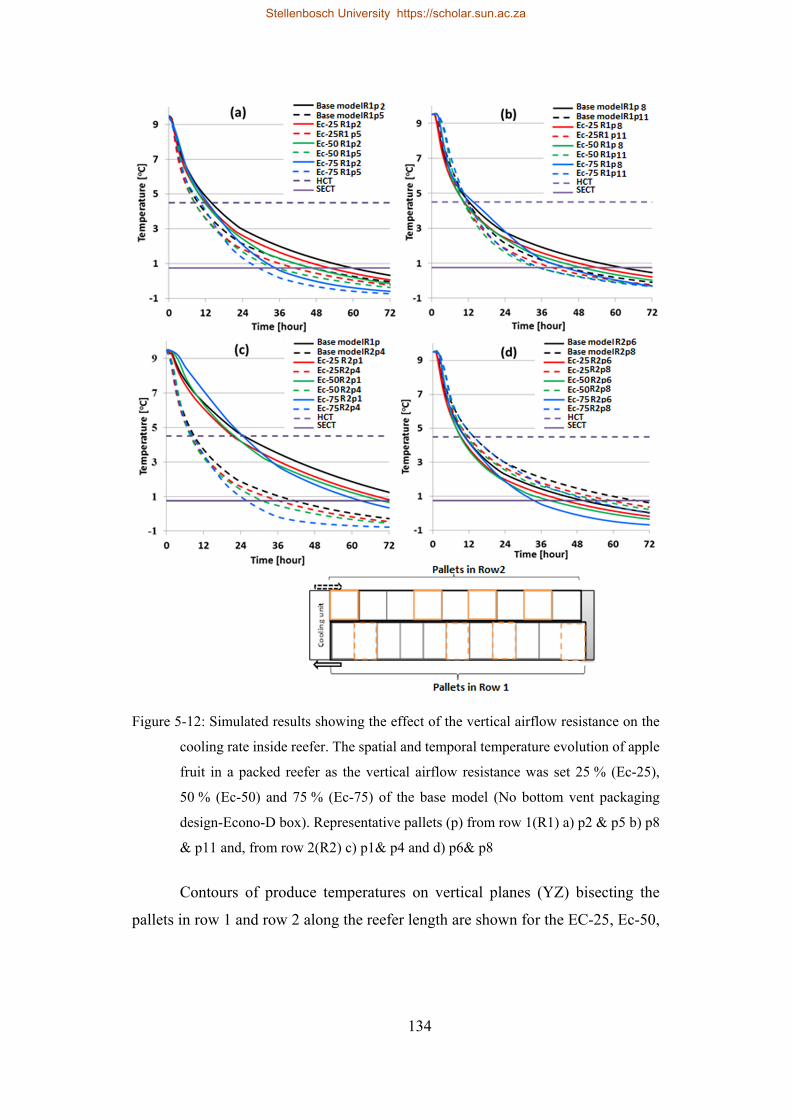
134
Figure 5-12: Simulated results showing the effect of the vertical airflow resistance on the
cooling rate inside reefer. The spatial and temporal temperature evolution of apple
fruit in a packed reefer as the vertical airflow resistance was set 25 % (Ec-25),
50 % (Ec-50) and 75 % (Ec-75) of the base model (No bottom vent packaging
design-Econo-D box). Representative pallets (p) from row 1(R1) a) p2 & p5 b) p8
& p11 and, from row 2(R2) c) p1& p4 and d) p6& p8
Contours of produce temperatures on vertical planes (YZ) bisecting the
pallets in row 1 and row 2 along the reefer length are shown for the EC-25, Ec-50,
Stellenbosch University https://scholar.sun.ac.za

135
Ec-75 and the Econo-D (base model)) (Figure 5.13). The uniformity of fruit
temperature has shown improvement as the vertical airflow resistance decreased
from the base model (Figure 5.13a) to Ec-75 (Figure 5.13d). More uniform
temperature profile was obtained inside the Ec-75 reefer. This model represents
higher ventilation area ratio on the bottom of Econo-D packaging box which
resulted better vertical airflow in the pallets (section 3.4.1). The overall temperature
SD of the reefers at 72 hours were 0.86, 0.78, 0.71 and 0.61 for the base model,
Ec-25, Ec-50 and, Ec-75, respectively. It is interesting to point out that by adding
vent hole area amounting to 3.5 % on the bottom side of the Econo-D box it is
possible to achieve a performance comparable to that obtained with the Mk6 box
which accommodates 6.6 % less fruit. This was mainly due to the stacking structure
of the two boxes on pallets. The Econo-D box due to their interlocking designs all
the layers are set on a pallet in the same pattern, where as in Mk6 boxes for stability
of the pallets the layers were staggered which caused misalignment of vents for
vertical airflow. This implies the interlocking packing designs can perform a lot
better in reefers than the Telescopic boxes if their ventilation on the bottom is
optimized.
Figure 5-13: Simulated temperature contours on vertical plans (Z-Y planes) bisecting
pallets in row 1(left) and row 2 (right). The contours correspond the instantaneous
Stellenbosch University https://scholar.sun.ac.za
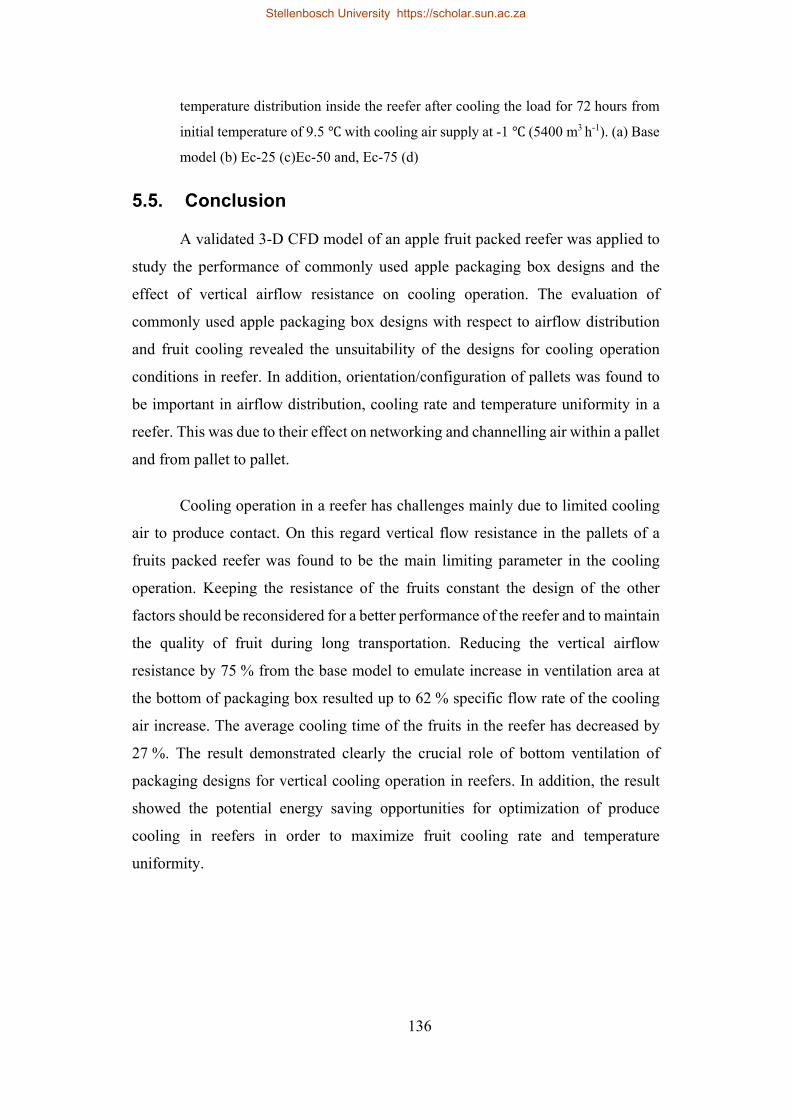
136
temperature distribution inside the reefer after cooling the load for 72 hours from
initial temperature of 9.5 with cooling air supply at -1 (5400 m3 h-1). (a) Base
model (b) Ec-25 (c)Ec-50 and, Ec-75 (d)
5.5. Conclusion
A validated 3-D CFD model of an apple fruit packed reefer was applied to
study the performance of commonly used apple packaging box designs and the
effect of vertical airflow resistance on cooling operation. The evaluation of
commonly used apple packaging box designs with respect to airflow distribution
and fruit cooling revealed the unsuitability of the designs for cooling operation
conditions in reefer. In addition, orientation/configuration of pallets was found to
be important in airflow distribution, cooling rate and temperature uniformity in a
reefer. This was due to their effect on networking and channelling air within a pallet
and from pallet to pallet.
Cooling operation in a reefer has challenges mainly due to limited cooling
air to produce contact. On this regard vertical flow resistance in the pallets of a
fruits packed reefer was found to be the main limiting parameter in the cooling
operation. Keeping the resistance of the fruits constant the design of the other
factors should be reconsidered for a better performance of the reefer and to maintain
the quality of fruit during long transportation. Reducing the vertical airflow
resistance by 75 % from the base model to emulate increase in ventilation area at
the bottom of packaging box resulted up to 62 % specific flow rate of the cooling
air increase. The average cooling time of the fruits in the reefer has decreased by
27 %. The result demonstrated clearly the crucial role of bottom ventilation of
packaging designs for vertical cooling operation in reefers. In addition, the result
showed the potential energy saving opportunities for optimization of produce
cooling in reefers in order to maximize fruit cooling rate and temperature
uniformity.
Stellenbosch University https://scholar.sun.ac.za
137
Chapter6
6. Numerical and experimental study of
energy consumption in apple packed
reefers
Abstract
A validated computational fluid dynamics (CFD) model of a fully loaded
refrigerated shipping container (reefer) was used to investigate the energy
consumption of apple packed reefers during shipping. The total energy
consumption of a reefer packed with apple fruit and components of the refrigeration
system were measured. Comparison of the measured and numerically calculated
total energy consumption showed less than 10 % error. The performance of apple
packaging designs in a reefer was evaluated with respect to energy consumption.
These confirmed the influence of ventilation area, particularity on the bottom side,
on energy use. Adding vent-holes (3.5 % vent area) on the bottom face of the
Econo-D packaging box reduced vertical airflow resistance, which in turn reduced
the reefer total power consumption by 12 % compared to with no bottom vent-holes
a package. The effect of evaporator fan on energy consumption was studied by
simulating fruit packed reefers operating at low, medium, high and variable
evaporator fan speeds. The results demonstrated the potential of variable speed fan
operation to reduce energy consumption.
Stellenbosch University https://scholar.sun.ac.za
138
6.1. Introduction
The world market for refrigerated containers has been estimated to grow by
10 % annually. The estimated number of 20 ft (6 m) reefers in 2000 was around 20
million (Jolly et al., 2000). Reefers are used to transport different varieties of goods
that are temperature sensitive and perishable. Beside their benefits, reefers have a
high-energy consumption following retail display and kitchen refrigeration (James
S.J. & James C., 2010). Numerous papers have been written on energy utilization
of reefers, cold storage facilities and cooling systems and mostly they are based on
the information available at the facility’s documentation (Ambaw et al., 2016;
Castro et al., 2005; Evans, 2007; Wild et al., 2008; Fitzgerald et al., 2011; Goswami,
2009; Thompson et al., 2010; Wild et al., 1999; Wang & Muller, 2000). The
electrical consumption is rising in cold chain facilities (Evans, 2007; Goswami,
2009), possibly due to higher volume of product being cooled than before. Energy
efficiency of a cooling system is determined by design, operation and management
of the cooling process. Efficiency would be lower if product is entering storage
hotter,air infiltrate into the inside environment, doors open more often and,
insulation is not sufficient (Ahmed et al., 2010; Billiard and Gautherin, 1993;
Defraeye et al., 2015c; Gosney, 1975; Thompson et al., 2010).
Factors that affect energy consumption in the cold chain can be categorised
into operational and design parameters for convenience. Operational parameters
include fruit packaging design, produce property, fork lift heat load, stacking and
pallets configuration. Design parameters include thermal infiltration, insulation,
evaporator fan operation (such as QUEST (QUality and Energy in Storage and
Transport) and non-QUEST or “Normal”) and efficiency of refrigeration system
(Defraeye et al., 2016; Lukasse et al., 2011). QUEST is a program based a fixed
protocol designed to reduce the energy consumption of the unit, when operating in
the interval -1 to 30 by avoiding inefficient part‐load compressor
operation and optimizing evaporator fan speed with heat load, without
impairingproducequality Lukasse et al., 2011 . The main function of packaging
materials is maintaining the quality of fruits during postharvest handling and
Stellenbosch University https://scholar.sun.ac.za
139
storage by providing mechanical protection against injuries, minimizing produce
moisture loss and retarding microbial growth (Opara, 2011), however they are the
main operational parameter that affects energy consumption (Defraeye et al., 2014;
Thompson et al., 2010). Fruit packaging boxes are usually designed with
consideration of one cooling method (cooling with horizontal airflow), however
during transportation cooling is mainly by using vertical airflow (from bottom to
top in reefers or from top to bottom in trailers/refrigerated trucks) (ASHRAE, 2010;
Defraeye et al., 2015a, b; Moureh et al., 2009a, b). In addition, alignment of vents
with adjacent cartons on a pallet (Castro et al., 2005; Castro et al., 2004; Delele et
al., 2013a,b; Goswami, 2009) and pallet configuration (Defraeye et al., 2015c;
Thompson et al., 2010) affect the airflow through a stack. Thermal heterogeneity
of fruit is not only generated due to insufficient flow rate of the cooling air, but also
by a non-uniform distribution of cooling air within the palletized structure (Alvarez
and Flick, 1999). The uniformity of cooling air flow is greatly affected by the
packaging design which consequently affects energy consumption of the system.
Evaporator fan is designed to deliver cooling air to meet the design
maximum refrigeration load. However, most of the time, evaporators operate in
conditions requiring much less than maximum refrigeration capacity (Thompson et
al., 2010). In addition, since most cold chain facilities do not change operational set
points between summer and winter time due to lack of seasonal control in cold chain
systems (Ambaw et al. 2016), unnecessary energy is wasted, for example by
continuously running fans (East et al., 2013). Thompson et al. (2010) also noted
that peak airflow rates are not needed during the entire cooling period (Thompson
et al., 2010). The large heat release from evaporator fans throughout the day, due
to their continuous operation, and the fruit respiration heat load further increase the
total required refrigeration load of the refrigerated container. Produce respiration
heat load is less relevant for forced air cooling, due to the large cooling capacity.
However, during long-term storage it can have an important effect on power
consumption (Tanner et al., 2002a, b). Fan power consumption is proportional to
the cube of the flow rate. This means of the airflow rate of the fan is reduced to
Stellenbosch University https://scholar.sun.ac.za
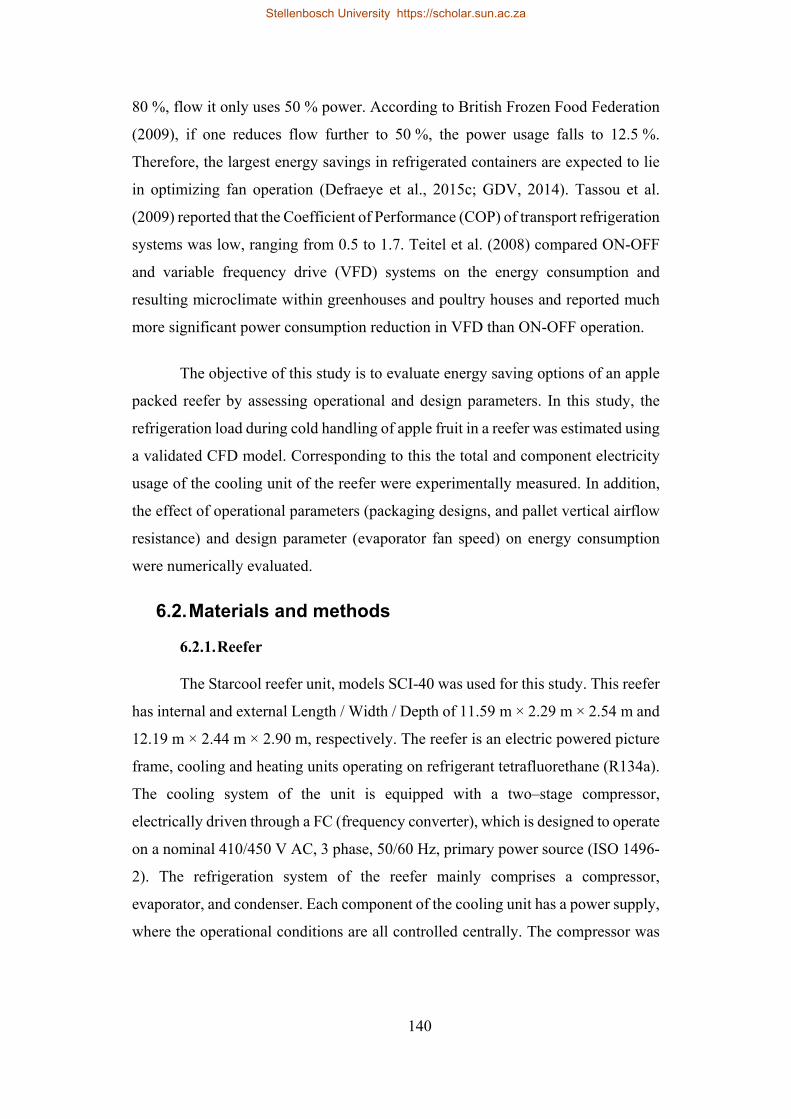
140
80 %, flow it only uses 50 % power. According to British Frozen Food Federation
(2009), if one reduces flow further to 50 %, the power usage falls to 12.5 %.
Therefore, the largest energy savings in refrigerated containers are expected to lie
in optimizing fan operation (Defraeye et al., 2015c; GDV, 2014). Tassou et al.
(2009) reported that the Coefficient of Performance (COP) of transport refrigeration
systems was low, ranging from 0.5 to 1.7. Teitel et al. (2008) compared ON-OFF
and variable frequency drive (VFD) systems on the energy consumption and
resulting microclimate within greenhouses and poultry houses and reported much
more significant power consumption reduction in VFD than ON-OFF operation.
The objective of this study is to evaluate energy saving options of an apple
packed reefer by assessing operational and design parameters. In this study, the
refrigeration load during cold handling of apple fruit in a reefer was estimated using
a validated CFD model. Corresponding to this the total and component electricity
usage of the cooling unit of the reefer were experimentally measured. In addition,
the effect of operational parameters (packaging designs, and pallet vertical airflow
resistance) and design parameter (evaporator fan speed) on energy consumption
were numerically evaluated.
6.2. Materials and methods
6.2.1. Reefer
The Starcool reefer unit, models SCI-40 was used for this study. This reefer
has internal and external Length / Width / Depth of 11.59 m × 2.29 m × 2.54 m and
12.19 m × 2.44 m × 2.90 m, respectively. The reefer is an electric powered picture
frame, cooling and heating units operating on refrigerant tetrafluorethane (R134a).
The cooling system of the unit is equipped with a two–stage compressor,
electrically driven through a FC (frequency converter), which is designed to operate
on a nominal 410/450 V AC, 3 phase, 50/60 Hz, primary power source (ISO 1496-
2). The refrigeration system of the reefer mainly comprises a compressor,
evaporator, and condenser. Each component of the cooling unit has a power supply,
where the operational conditions are all controlled centrally. The compressor was
Stellenbosch University https://scholar.sun.ac.za
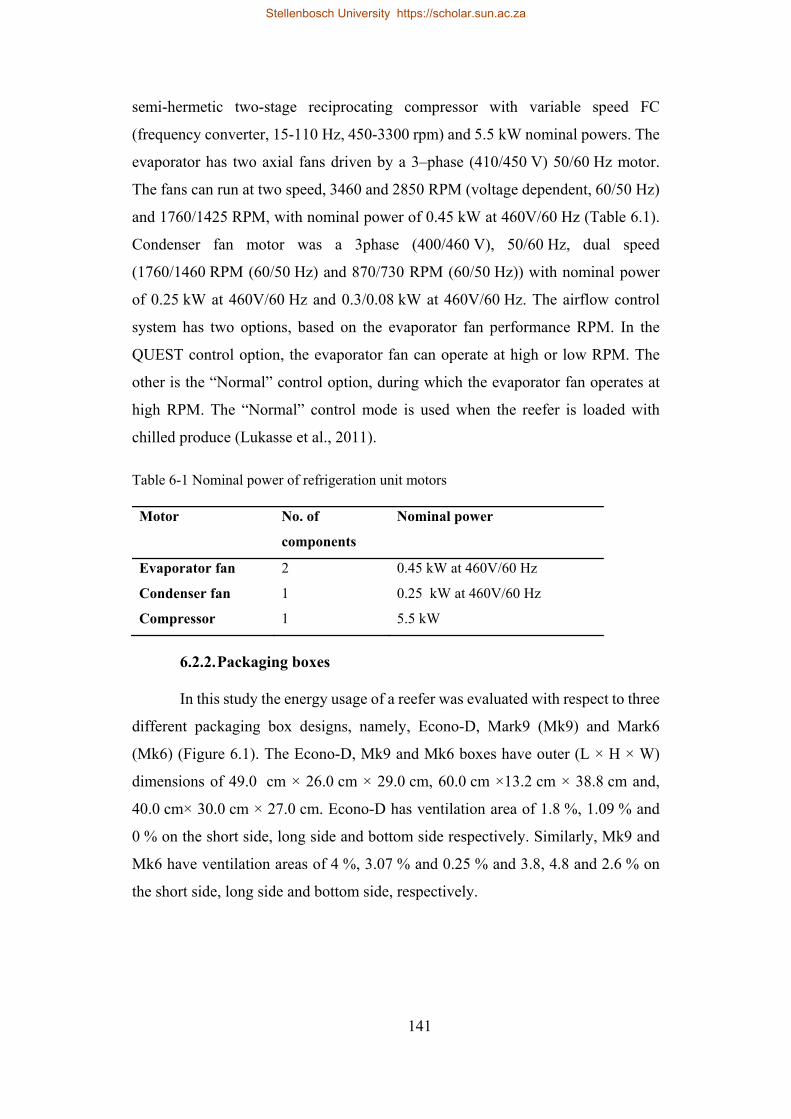
141
semi-hermetic two-stage reciprocating compressor with variable speed FC
(frequency converter, 15-110 Hz, 450-3300 rpm) and 5.5 kW nominal powers. The
evaporator has two axial fans driven by a 3–phase (410/450 V) 50/60 Hz motor.
The fans can run at two speed, 3460 and 2850 RPM (voltage dependent, 60/50 Hz)
and 1760/1425 RPM, with nominal power of 0.45 kW at 460V/60 Hz (Table 6.1).
Condenser fan motor was a 3phase (400/460 V), 50/60 Hz, dual speed
(1760/1460 RPM (60/50 Hz) and 870/730 RPM (60/50 Hz)) with nominal power
of 0.25 kW at 460V/60 Hz and 0.3/0.08 kW at 460V/60 Hz. The airflow control
system has two options, based on the evaporator fan performance RPM. In the
QUEST control option, the evaporator fan can operate at high or low RPM. The
other is the “Normal” control option, during which the evaporator fan operates at
high RPM. The “Normal” control mode is used when the reefer is loaded with
chilled produce (Lukasse et al., 2011).
Table 6-1 Nominal power of refrigeration unit motors
6.2.2. Packaging boxes
In this study the energy usage of a reefer was evaluated with respect to three
different packaging box designs, namely, Econo-D, Mark9 (Mk9) and Mark6
(Mk6) (Figure 6.1). The Econo-D, Mk9 and Mk6 boxes have outer (L × H × W)
dimensions of 49.0 cm × 26.0 cm × 29.0 cm, 60.0 cm ×13.2 cm × 38.8 cm and,
40.0 cm× 30.0 cm × 27.0 cm. Econo-D has ventilation area of 1.8 %, 1.09 % and
0 % on the short side, long side and bottom side respectively. Similarly, Mk9 and
Mk6 have ventilation areas of 4 %, 3.07 % and 0.25 % and 3.8, 4.8 and 2.6 % on
the short side, long side and bottom side, respectively.
Motor No. of
components
Nominal power
Evaporator fan 2 0.45 kW at 460V/60 Hz
Condenser fan 1 0.25 kW at 460V/60 Hz
Compressor 1 5.5 kW
Stellenbosch University https://scholar.sun.ac.za
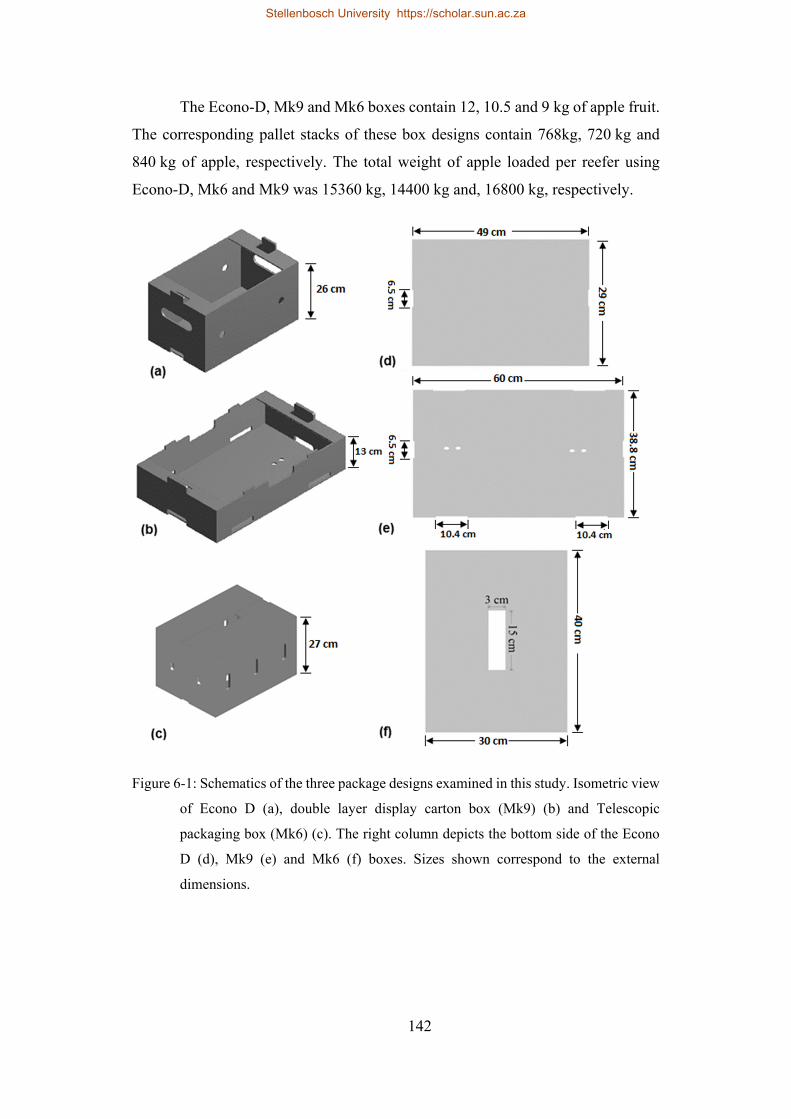
142
The Econo-D, Mk9 and Mk6 boxes contain 12, 10.5 and 9 kg of apple fruit.
The corresponding pallet stacks of these box designs contain 768kg, 720 kg and
840 kg of apple, respectively. The total weight of apple loaded per reefer using
Econo-D, Mk6 and Mk9 was 15360 kg, 14400 kg and, 16800 kg, respectively.
Figure 6-1: Schematics of the three package designs examined in this study. Isometric view
of Econo D (a), double layer display carton box (Mk9) (b) and Telescopic
packaging box (Mk6) (c). The right column depicts the bottom side of the Econo
D (d), Mk9 (e) and Mk6 (f) boxes. Sizes shown correspond to the external
dimensions.
Stellenbosch University https://scholar.sun.ac.za
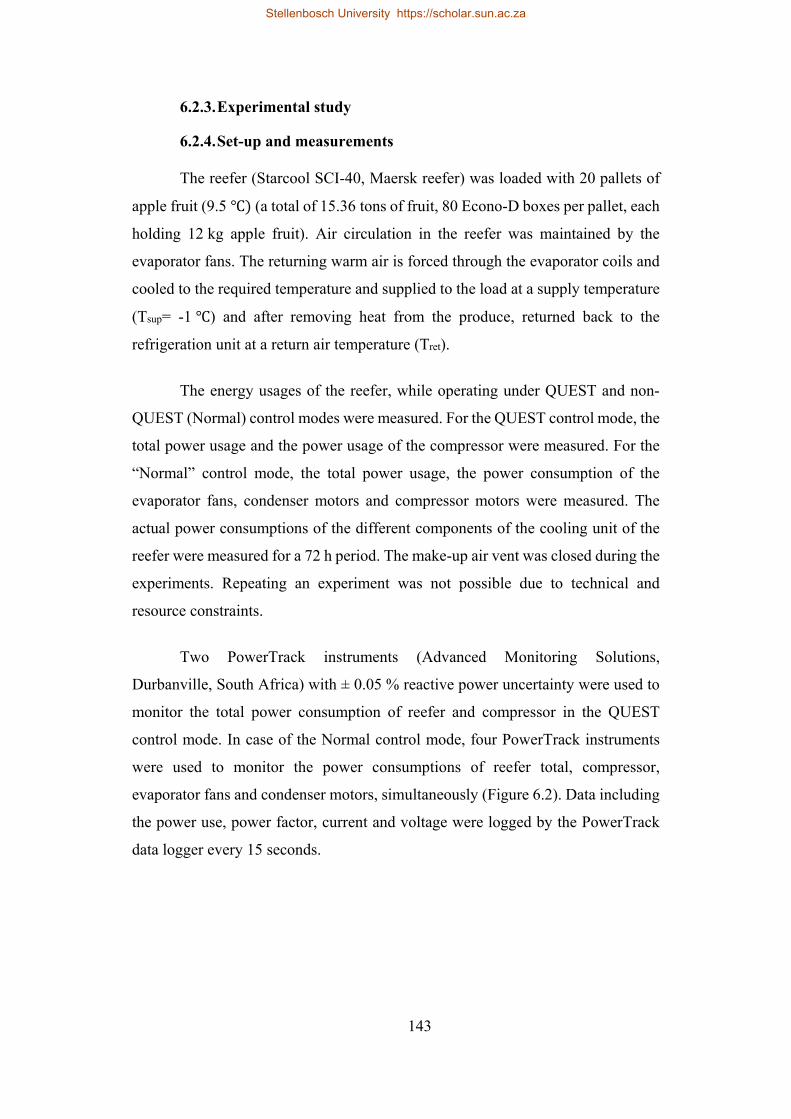
143
6.2.3. Experimental study
6.2.4. Set-up and measurements
The reefer (Starcool SCI-40, Maersk reefer) was loaded with 20 pallets of
apple fruit (9.5 (a total of 15.36 tons of fruit, 80 Econo-D boxes per pallet, each
holding 12 kg apple fruit). Air circulation in the reefer was maintained by the
evaporator fans. The returning warm air is forced through the evaporator coils and
cooled to the required temperature and supplied to the load at a supply temperature
(Tsup= -1 ) and after removing heat from the produce, returned back to the
refrigeration unit at a return air temperature (Tret).
The energy usages of the reefer, while operating under QUEST and non-
QUEST (Normal) control modes were measured. For the QUEST control mode, the
total power usage and the power usage of the compressor were measured. For the
“Normal” control mode, the total power usage, the power consumption of the
evaporator fans, condenser motors and compressor motors were measured. The
actual power consumptions of the different components of the cooling unit of the
reefer were measured for a 72 h period. The make-up air vent was closed during the
experiments. Repeating an experiment was not possible due to technical and
resource constraints.
Two PowerTrack instruments (Advanced Monitoring Solutions,
Durbanville, South Africa) with ± 0.05 % reactive power uncertainty were used to
monitor the total power consumption of reefer and compressor in the QUEST
control mode. In case of the Normal control mode, four PowerTrack instruments
were used to monitor the power consumptions of reefer total, compressor,
evaporator fans and condenser motors, simultaneously (Figure 6.2). Data including
the power use, power factor, current and voltage were logged by the PowerTrack
data logger every 15 seconds.
Stellenbosch University https://scholar.sun.ac.za
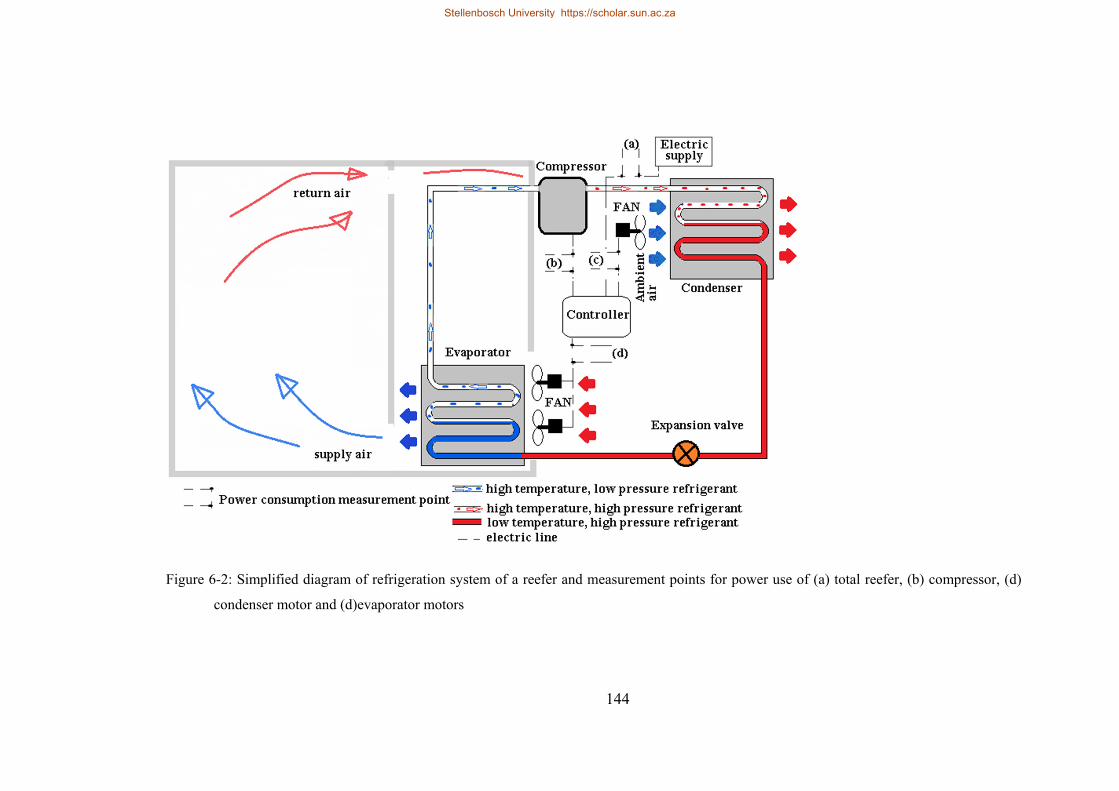
144
Figure 6-2: Simplified diagram of refrigeration system of a reefer and measurement points for power use of (a) total reefer, (b) compressor, (d)
condenser motor and (d)evaporator motors
Stellenbosch University https://scholar.sun.ac.za
Stellenbosch University https://scholar.sun.ac.za
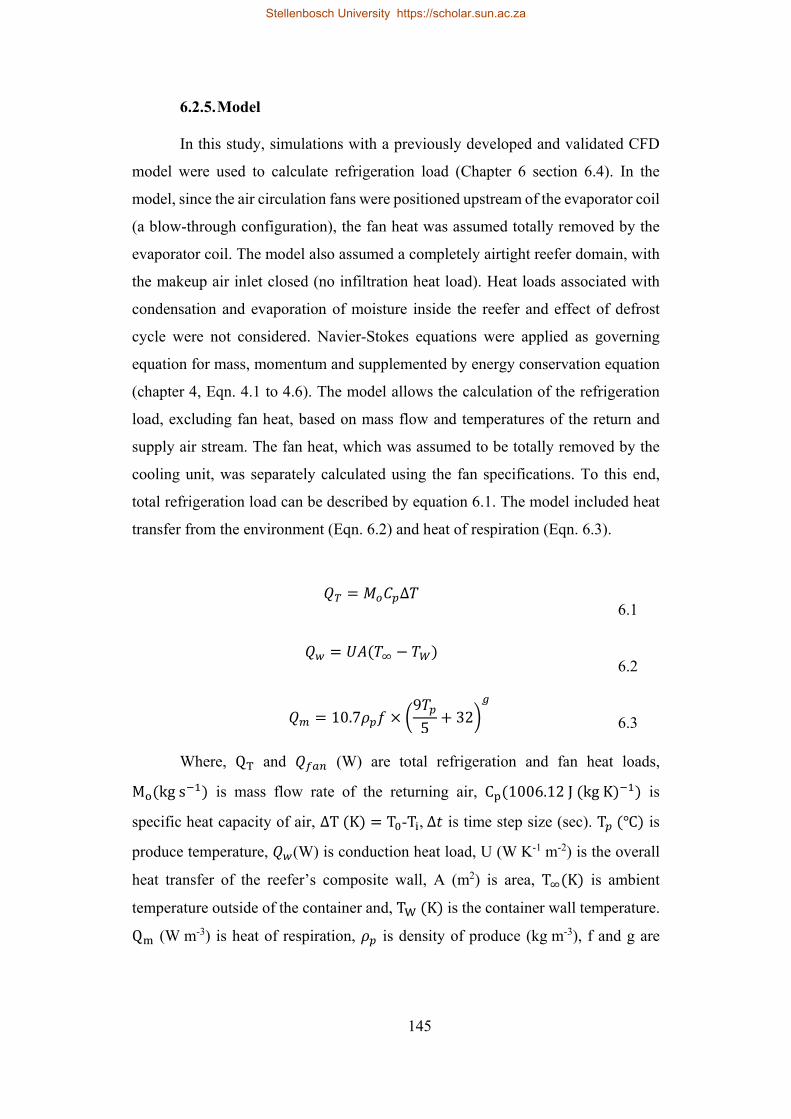
145
6.2.5. Model
In this study, simulations with a previously developed and validated CFD
model were used to calculate refrigeration load (Chapter 6 section 6.4). In the
model, since the air circulation fans were positioned upstream of the evaporator coil
(a blow-through configuration), the fan heat was assumed totally removed by the
evaporator coil. The model also assumed a completely airtight reefer domain, with
the makeup air inlet closed (no infiltration heat load). Heat loads associated with
condensation and evaporation of moisture inside the reefer and effect of defrost
cycle were not considered. Navier-Stokes equations were applied as governing
equation for mass, momentum and supplemented by energy conservation equation
(chapter 4, Eqn. 4.1 to 4.6). The model allows the calculation of the refrigeration
load, excluding fan heat, based on mass flow and temperatures of the return and
supply air stream. The fan heat, which was assumed to be totally removed by the
cooling unit, was separately calculated using the fan specifications. To this end,
total refrigeration load can be described by equation 6.1. The model included heat
transfer from the environment (Eqn. 6.2) and heat of respiration (Eqn. 6.3).
∆ 6.1
6.2
10.795
32 6.3
Where, Q and (W) are total refrigeration and fan heat loads,
M kgs is mass flow rate of the returning air, C 1006.12J kgK is
specific heat capacity of air, ∆T K T -T ,∆ is time step size (sec). T is
produce temperature, (W) is conduction heat load, U (W K-1 m-2) is the overall
heat transfer of the reefer’s composite wall, A (m2) is area, T K is ambient
temperature outside of the container and, T K is the container wall temperature.
Q (W m-3) is heat of respiration, is density of produce (kg m-3), f and g are
Stellenbosch University https://scholar.sun.ac.za
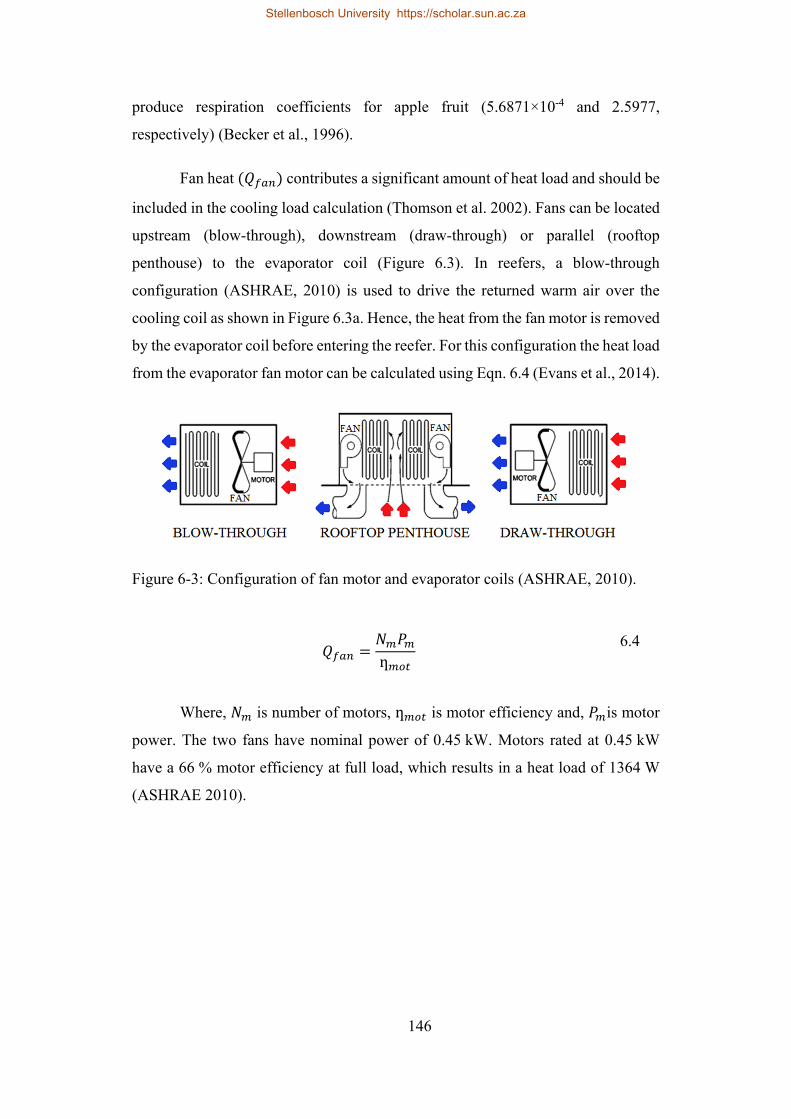
146
produce respiration coefficients for apple fruit (5.6871×10⁻⁴ and 2.5977,
respectively) (Becker et al., 1996).
Fan heat contributes a significant amount of heat load and should be
included in the cooling load calculation (Thomson et al. 2002). Fans can be located
upstream (blow-through), downstream (draw-through) or parallel (rooftop
penthouse) to the evaporator coil (Figure 6.3). In reefers, a blow-through
configuration (ASHRAE, 2010) is used to drive the returned warm air over the
cooling coil as shown in Figure 6.3a. Hence, the heat from the fan motor is removed
by the evaporator coil before entering the reefer. For this configuration the heat load
from the evaporator fan motor can be calculated using Eqn. 6.4 (Evans et al., 2014).
Figure 6-3: Configuration of fan motor and evaporator coils (ASHRAE, 2010).
ƞ
6.4
Where, is number of motors, ƞ is motor efficiency and, is motor
power. The two fans have nominal power of 0.45 kW. Motors rated at 0.45 kW
have a 66 % motor efficiency at full load, which results in a heat load of 1364 W
(ASHRAE 2010).
Stellenbosch University https://scholar.sun.ac.za
147
Figure 6-4: Representation of airflow path inside a fully packed reefer (a) and, components
of the refrigeration unit of a reefer (b)
The refrigeration system of a reefer consist compressor, evaporator and
condenser (Figure 6.4b). Total electric power consumption (E is the sum of all
the loads by refrigeration system components (Eqn. 6.5). The total and component
poser usages were measured in this study. The CFD model provides the
corresponding total refrigeration load (QT) and its components, which are otherwise
difficult to quantify experimentally. Then, by using these, the coefficient of
performance (COP) of the reefer was estimated to quantify the efficiency of the
refrigeration system. COP is a dimensionless number defined as the ratio of the
amount of cooling provided to the work required. There are different theoretical
approaches to calculate coefficient of performance (COP) of an ideal vapour-
compression machine operating on the reverse Carnot cycle (Evans et al., 2009). In
this study, the COP of the refrigeration system calculated using equation 6.6. It is
Stellenbosch University https://scholar.sun.ac.za
148
the ratio of the total refrigeration load ( ) and the total power consumed by
the reefer ( .
6.5
6.6
6.2.6. Simulation
The airflow and heat transfer inside the reefer was simulated using ANSYS-
Fluent-16 (ANSYS, Canonsburg, PA, USA). Turbulence was calculated using k-ω
SST model. The fruit (15.36 tonnes) was initially at ≈ 9.5 and under 10
ambient temperature condition and while stationary (wind speed = 0.2 ms-1). First,
cooling under “Normal” control mode fruit packed with Econo-D, Mk6 and Mk9,
packaging design was simulated and compared experimental result. Second, to
study the effect of vertical airflow resistance the pressure drop of pallet stacked
with Econo-D packaging design was virtually reduced by 25 % (Ec-25), 50 % (Ec-
50) and 75 % (Ec-75). Then, in order to evaluate the effect of variable speed fan on
the energy consumptions, simulations under high (8100 m3 h-1), medium
(5400 m3 h-1) and low (2700 m3 h-1) evaporator fans speeds were conducted. In all
the simulations the cooling air temperature was -1 and duration of simulation
was 72 h. Total refrigeration heat load, based on the supply and return air
temperature, was calculated. In addition, the time history of field heat removed from
the fruit, the respiration heat load and heat conducted from the environment during
the cooling process were individually computed. The simulation results at the three
cooling airflow rates (fan speeds) were used to investigate the effect of variable
speed fan on energy consumption.
Stellenbosch University https://scholar.sun.ac.za
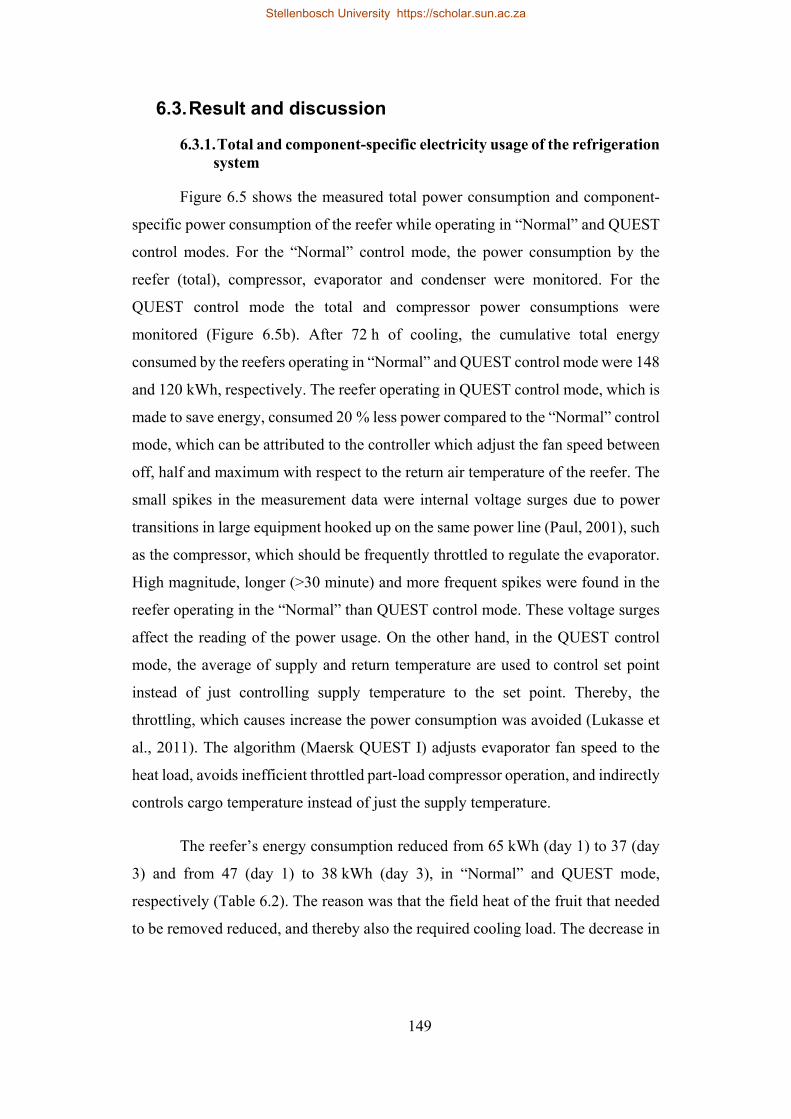
149
6.3. Result and discussion
6.3.1. Total and component-specific electricity usage of the refrigeration system
Figure 6.5 shows the measured total power consumption and component-
specific power consumption of the reefer while operating in “Normal” and QUEST
control modes. For the “Normal” control mode, the power consumption by the
reefer (total), compressor, evaporator and condenser were monitored. For the
QUEST control mode the total and compressor power consumptions were
monitored (Figure 6.5b). After 72 h of cooling, the cumulative total energy
consumed by the reefers operating in “Normal” and QUEST control mode were 148
and 120 kWh, respectively. The reefer operating in QUEST control mode, which is
made to save energy, consumed 20 % less power compared to the “Normal” control
mode, which can be attributed to the controller which adjust the fan speed between
off, half and maximum with respect to the return air temperature of the reefer. The
small spikes in the measurement data were internal voltage surges due to power
transitions in large equipment hooked up on the same power line (Paul, 2001), such
as the compressor, which should be frequently throttled to regulate the evaporator.
High magnitude, longer (>30 minute) and more frequent spikes were found in the
reefer operating in the “Normal” than QUEST control mode. These voltage surges
affect the reading of the power usage. On the other hand, in the QUEST control
mode, the average of supply and return temperature are used to control set point
instead of just controlling supply temperature to the set point. Thereby, the
throttling, which causes increase the power consumption was avoided (Lukasse et
al., 2011). The algorithm (Maersk QUEST I) adjusts evaporator fan speed to the
heat load, avoids inefficient throttled part-load compressor operation, and indirectly
controls cargo temperature instead of just the supply temperature.
The reefer’s energy consumption reduced from 65 kWh (day 1) to 37 (day
3) and from 47 (day 1) to 38 kWh (day 3), in “Normal” and QUEST mode,
respectively (Table 6.2). The reason was that the field heat of the fruit that needed
to be removed reduced, and thereby also the required cooling load. The decrease in
Stellenbosch University https://scholar.sun.ac.za
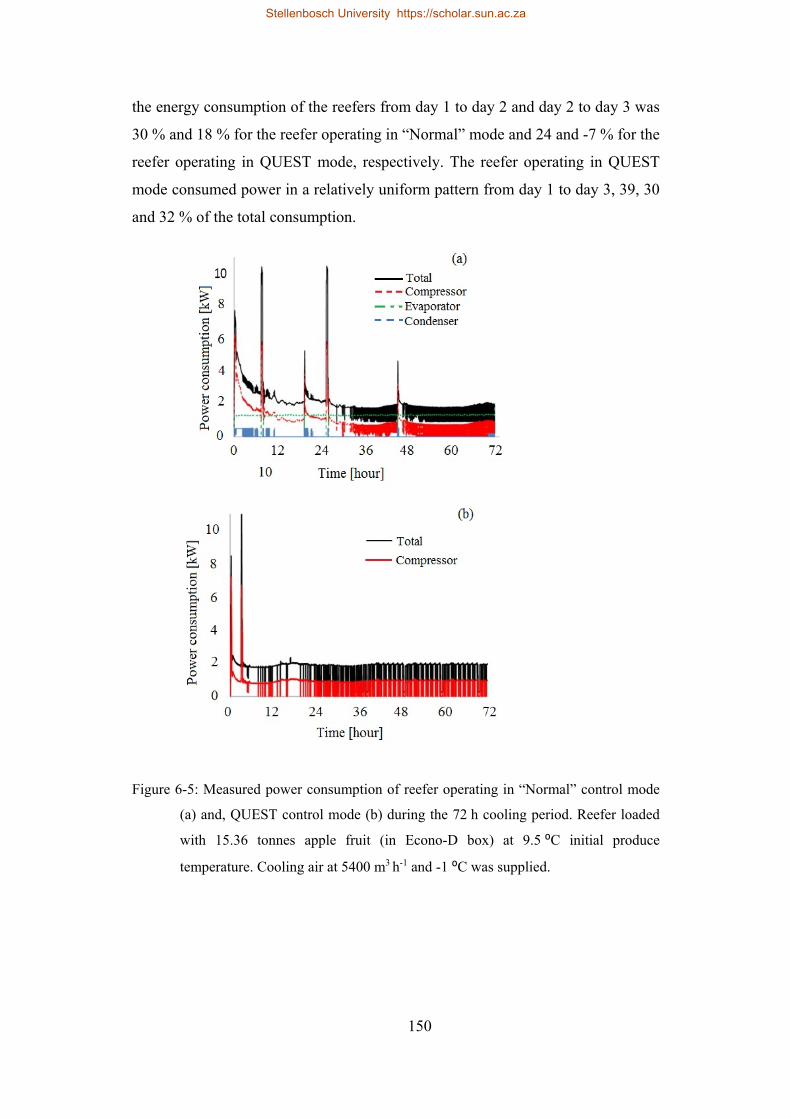
150
the energy consumption of the reefers from day 1 to day 2 and day 2 to day 3 was
30 % and 18 % for the reefer operating in “Normal” mode and 24 and -7 % for the
reefer operating in QUEST mode, respectively. The reefer operating in QUEST
mode consumed power in a relatively uniform pattern from day 1 to day 3, 39, 30
and 32 % of the total consumption.
Figure 6-5: Measured power consumption of reefer operating in “Normal” control mode
(a) and, QUEST control mode (b) during the 72 h cooling period. Reefer loaded
with 15.36 tonnes apple fruit (in Econo-D box) at 9.5 ⁰C initial produce
temperature. Cooling air at 5400 m3 h-1 and -1 ⁰C was supplied.
Stellenbosch University https://scholar.sun.ac.za
151
Table 6-2: Daily total energy consumption of reefers operating in “Normal” and
QUEST control mode. For the reefer operating in “Normal” mode energy
use of refrigeration sub units was measured
Total- Normal(kWh)
Compressor-
Normal (kWh)
Evaporator- Normal (kWh)
Condenser- Normal (kWh)
Total- QUEST
(kWh)
Compressor-
QUEST (kWh)
Day 1 65 38 20 2.3
47 22
Day 2 46 21 20 0.1
35 14
Day 3 37 13 20 0.2
38 16
Total 148 72 61 3 120 52
% 49 41 2
43
Power factor (ranges between −1 to 1) is the ratio of the actual electrical
power dissipated by an AC circuit to the product of the RMS (root mean square)
values of current and voltage. An electric load with a low power factor draws more
current than a load with a high power factor for the same amount of useful power
transferred. The power factor of the compressor, evaporator and condenser were,
0.97, 0.67 and 0.66 respectively and the corresponding share of these component
towards the total energy consumption of the reefer were 49, 41 and 2 %,
respectively (Table 6.2). Energy consumed by the three components makes up ≈ 92
% (136 kWh) of the total, while the remaining ≈ 8 % (12 kWh) can be assumed to
be used by, the control systems of the refrigeration unit, display control board and
wasted due to inefficiency of the system.
The power usage of the compressor decreased from 6 kW to 0.8 kW in
24 hours. On the other hand, the power consumption of the two evaporator fans was
relatively constant for the “Normal” control mode (1.26 kW) for the entire cooling
period. The high power consumption by the compressor during the first 24 hours
was due to the high initial heat of the produce. During this period the compressor
should work at high capacity. The condenser of the refrigeration system operates in
on/off mode and its power consumption was 2 %. For the Quest mode, the power
Stellenbosch University https://scholar.sun.ac.za
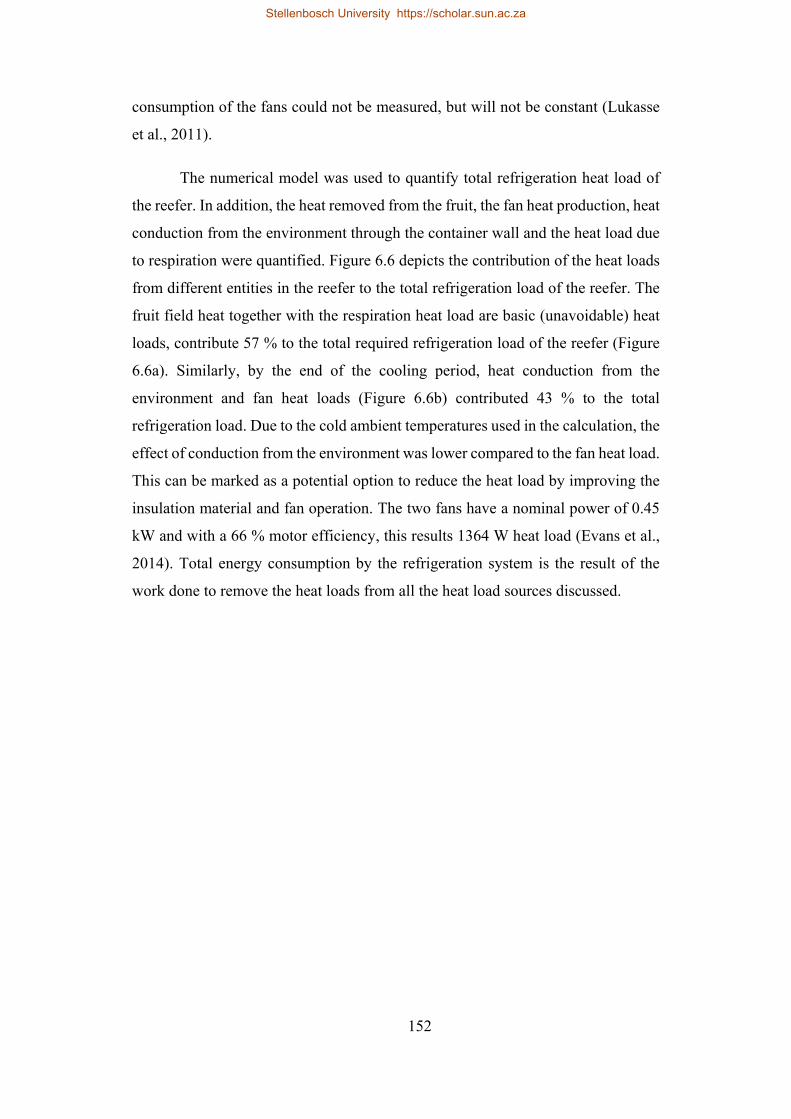
152
consumption of the fans could not be measured, but will not be constant (Lukasse
et al., 2011).
The numerical model was used to quantify total refrigeration heat load of
the reefer. In addition, the heat removed from the fruit, the fan heat production, heat
conduction from the environment through the container wall and the heat load due
to respiration were quantified. Figure 6.6 depicts the contribution of the heat loads
from different entities in the reefer to the total refrigeration load of the reefer. The
fruit field heat together with the respiration heat load are basic (unavoidable) heat
loads, contribute 57 % to the total required refrigeration load of the reefer (Figure
6.6a). Similarly, by the end of the cooling period, heat conduction from the
environment and fan heat loads (Figure 6.6b) contributed 43 % to the total
refrigeration load. Due to the cold ambient temperatures used in the calculation, the
effect of conduction from the environment was lower compared to the fan heat load.
This can be marked as a potential option to reduce the heat load by improving the
insulation material and fan operation. The two fans have a nominal power of 0.45
kW and with a 66 % motor efficiency, this results 1364 W heat load (Evans et al.,
2014). Total energy consumption by the refrigeration system is the result of the
work done to remove the heat loads from all the heat load sources discussed.
Stellenbosch University https://scholar.sun.ac.za
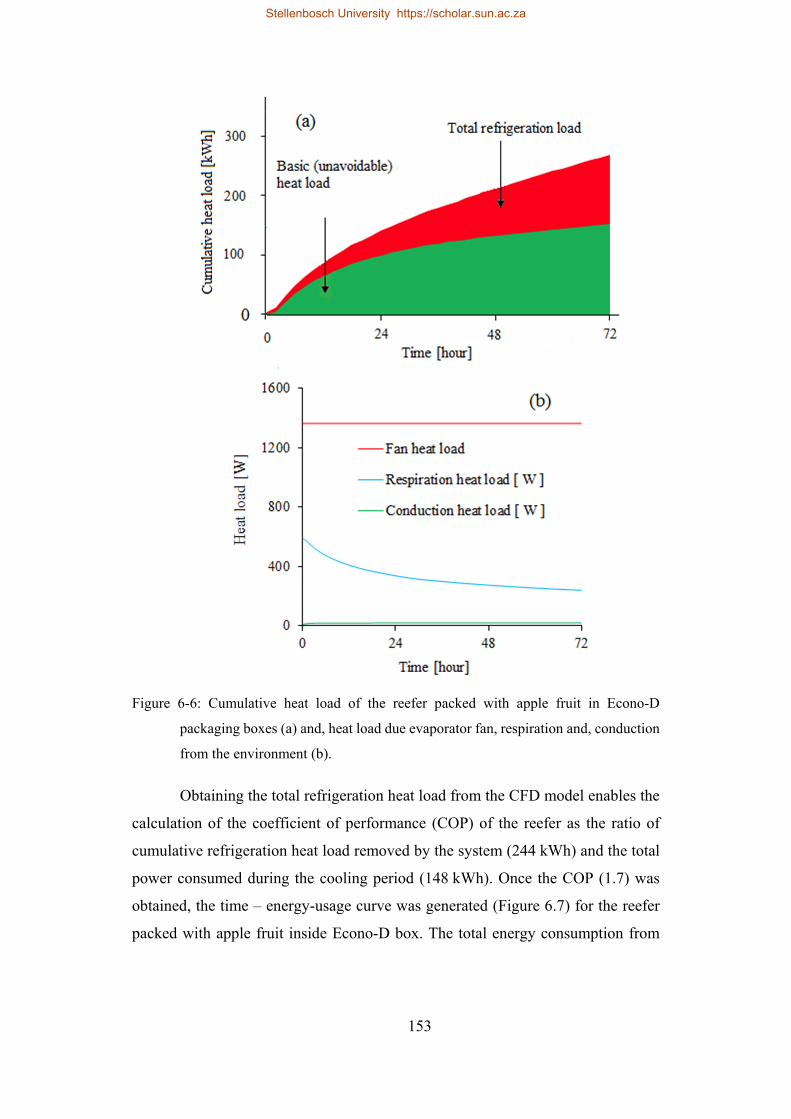
153
Figure 6-6: Cumulative heat load of the reefer packed with apple fruit in Econo-D
packaging boxes (a) and, heat load due evaporator fan, respiration and, conduction
from the environment (b).
Obtaining the total refrigeration heat load from the CFD model enables the
calculation of the coefficient of performance (COP) of the reefer as the ratio of
cumulative refrigeration heat load removed by the system (244 kWh) and the total
power consumed during the cooling period (148 kWh). Once the COP (1.7) was
obtained, the time – energy-usage curve was generated (Figure 6.7) for the reefer
packed with apple fruit inside Econo-D box. The total energy consumption from
Stellenbosch University https://scholar.sun.ac.za

154
the numerical study of the packed reefer resulted 135 kWh and was 8 % less than
the measured value (148 kWh). The performance of refrigeration system varies
depending on the temperature difference between the supply and the return air
(Tassou et al., 2009). Therefore, the difference between the numerical and measured
energy consumption results could be due to the constant supply air temperature
equal to the set temperature in the model. In the actual reefer it took 2 and ½ hours
for the supply air to reach the set temperature and this temperature was fluctuating
(±0.5 ) during the entire cooling operation. In addition, the model did not predict
the voltage surge in the system which increased the power consumption in the
system as described in the previous section (section 3.1). In general, the model
predicted the total power consumption of the reefer quite accurately during the
three-day cooling experiment.
Figure 6-7: Measured and predicted energy consumption of the reefer packed with apple
fruit in Econo-D box design during the 72 hours cooling operation.
Stellenbosch University https://scholar.sun.ac.za
155
6.3.2. Ventilated packaging design
Electric energy consumption of the reefers packed with Mk6 and Mk9
packaging designs were estimated from the total refrigeration load (QTot) and
coefficient of performance (COP). COP (1.7) calculated in the previous section was
used. The total power consumption (calculated from simulation result of
refrigeration load) of reefers packed with apple in Econo-D, Mk6 and Mk9
packaging design during the 72 hour cooling period showed a considerable
difference (Figure 6.8a). The reefer packed with Mk6 packaging design (3.5 %
bottom ventilation area) consumed the highest power during the initial stages but
achieved faster fruit cooling than with the other packaging designs (SECT ≈ 34 h).
This was due to its high ventilation area that facilitated high fruit cooling rate but
imposed high refrigeration load in a short period. The reefer packed with Mk9 box
design contains the highest amount of fruit load (16.8 tonnes) and has lower fruit
cooling rate (SECT≈ 62 h). This resulted in a lower power (low refrigeration load)
in the first 34 h compared to the reefer packed with Mk6 box, however took 28 h
more to reach SECT (Figure 6.8a). Similarly, the reefer packed with fruit inside
Econo-D (SECT≈ 58 h) packaging resulted slightly lower energy consumption per
unit time during these period followed by a relatively constant (1.26 kW) power
consumption in the remaining cooling period.
Stellenbosch University https://scholar.sun.ac.za
156
Figure 6-8: Energy consumption of reefers loaded with apple fruits inside Econo-D
packaging box, Mk6 and, Mk9 packaging boxes in a reefer operating in “Normal”
control mode. (a) Transient power use by each reefer, (b) cumulative energy
consumption of each reefer and, (c) energy consumption per tonne of apple fruit.
Solid lines show the power consumption of the reefers and, broken lines show the
SECT of fruit in each reefer.
In principle, the boxes are designed to pack and transport fruit safely,
however, particular attention must be paid to the design of these boxes. When
designing ventilated packaging, their use in a reefer should be considered in order
to ensure adequate ventilation to the fruit load (Defraeye et al., 2015; 2016). The
maximum energy was consumed by the reefer for the Mk9 packaging design which
used 139 kWh to cool 16.8 tonnes of apple to the SECT in (62 hours) (Figure 6.8b).
Stellenbosch University https://scholar.sun.ac.za
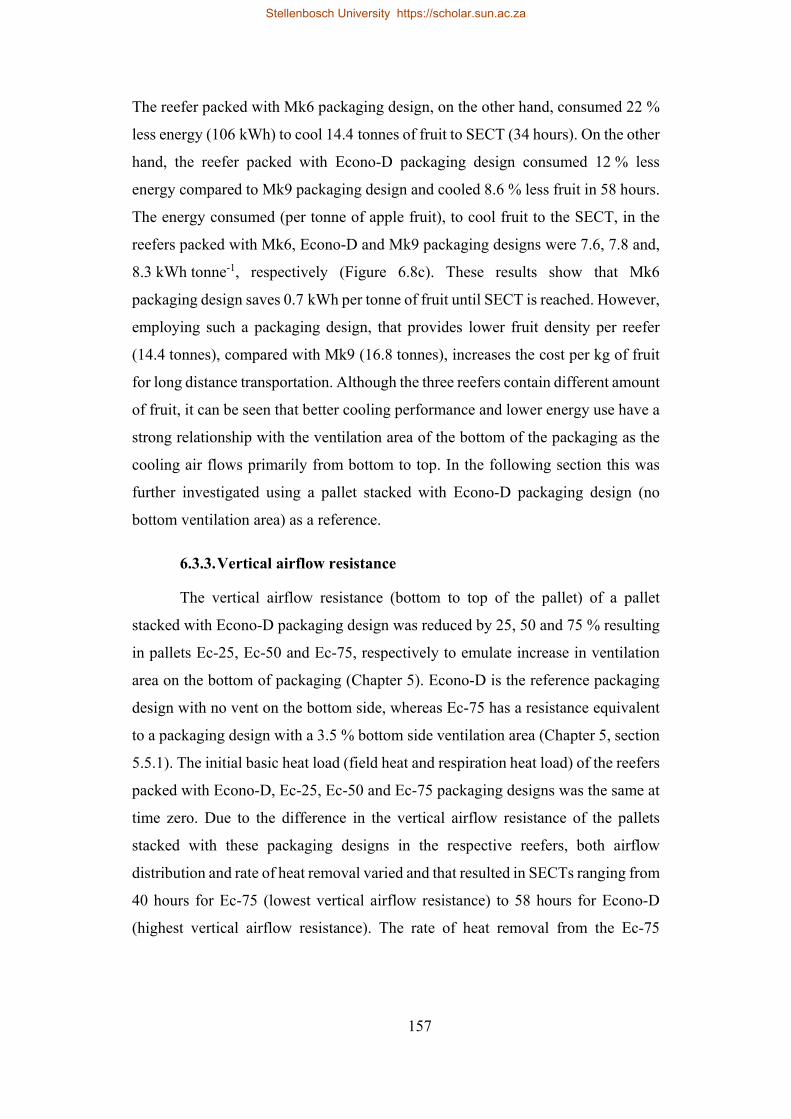
157
The reefer packed with Mk6 packaging design, on the other hand, consumed 22 %
less energy (106 kWh) to cool 14.4 tonnes of fruit to SECT (34 hours). On the other
hand, the reefer packed with Econo-D packaging design consumed 12 % less
energy compared to Mk9 packaging design and cooled 8.6 % less fruit in 58 hours.
The energy consumed (per tonne of apple fruit), to cool fruit to the SECT, in the
reefers packed with Mk6, Econo-D and Mk9 packaging designs were 7.6, 7.8 and,
8.3 kWh tonne-1, respectively (Figure 6.8c). These results show that Mk6
packaging design saves 0.7 kWh per tonne of fruit until SECT is reached. However,
employing such a packaging design, that provides lower fruit density per reefer
(14.4 tonnes), compared with Mk9 (16.8 tonnes), increases the cost per kg of fruit
for long distance transportation. Although the three reefers contain different amount
of fruit, it can be seen that better cooling performance and lower energy use have a
strong relationship with the ventilation area of the bottom of the packaging as the
cooling air flows primarily from bottom to top. In the following section this was
further investigated using a pallet stacked with Econo-D packaging design (no
bottom ventilation area) as a reference.
6.3.3. Vertical airflow resistance
The vertical airflow resistance (bottom to top of the pallet) of a pallet
stacked with Econo-D packaging design was reduced by 25, 50 and 75 % resulting
in pallets Ec-25, Ec-50 and Ec-75, respectively to emulate increase in ventilation
area on the bottom of packaging (Chapter 5). Econo-D is the reference packaging
design with no vent on the bottom side, whereas Ec-75 has a resistance equivalent
to a packaging design with a 3.5 % bottom side ventilation area (Chapter 5, section
5.5.1). The initial basic heat load (field heat and respiration heat load) of the reefers
packed with Econo-D, Ec-25, Ec-50 and Ec-75 packaging designs was the same at
time zero. Due to the difference in the vertical airflow resistance of the pallets
stacked with these packaging designs in the respective reefers, both airflow
distribution and rate of heat removal varied and that resulted in SECTs ranging from
40 hours for Ec-75 (lowest vertical airflow resistance) to 58 hours for Econo-D
(highest vertical airflow resistance). The rate of heat removal from the Ec-75
Stellenbosch University https://scholar.sun.ac.za
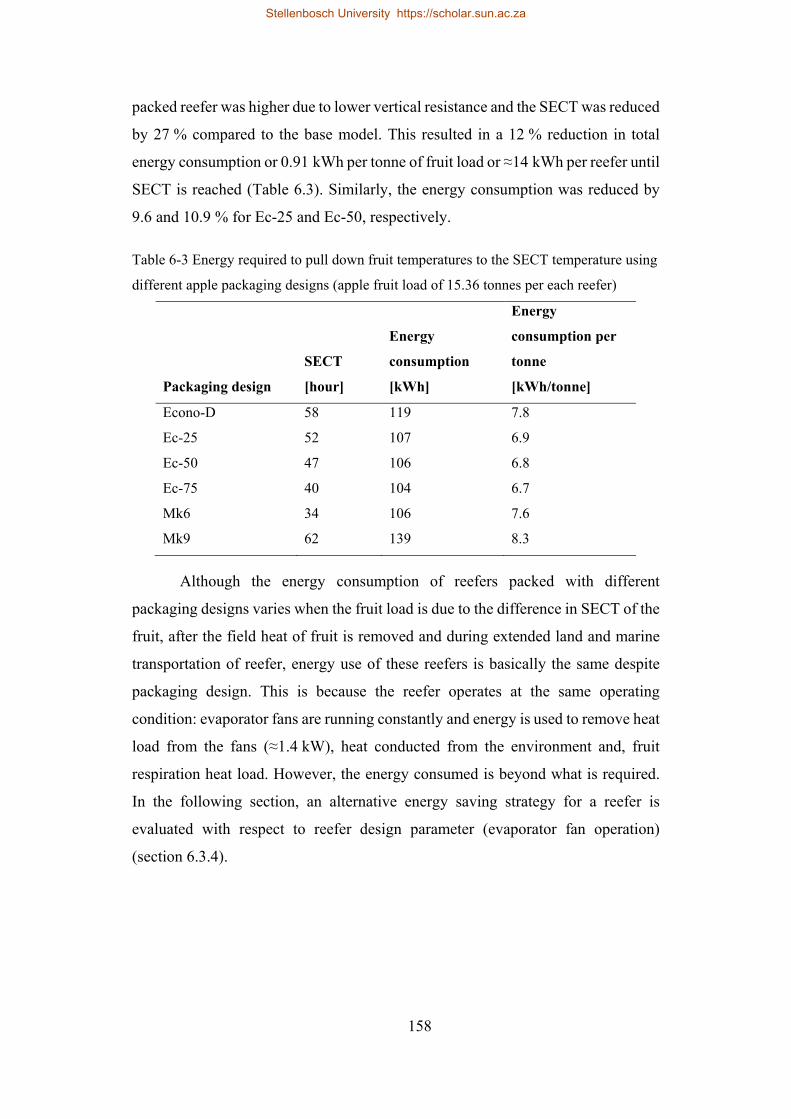
158
packed reefer was higher due to lower vertical resistance and the SECT was reduced
by 27 % compared to the base model. This resulted in a 12 % reduction in total
energy consumption or 0.91 kWh per tonne of fruit load or ≈14 kWh per reefer until
SECT is reached (Table 6.3). Similarly, the energy consumption was reduced by
9.6 and 10.9 % for Ec-25 and Ec-50, respectively.
Table 6-3 Energy required to pull down fruit temperatures to the SECT temperature using
different apple packaging designs (apple fruit load of 15.36 tonnes per each reefer)
Packaging design
SECT
[hour]
Energy
consumption
[kWh]
Energy
consumption per
tonne
[kWh/tonne]
Econo-D 58 119 7.8
Ec-25 52 107 6.9
Ec-50 47 106 6.8
Ec-75 40 104 6.7
Mk6 34 106 7.6
Mk9 62 139 8.3
Although the energy consumption of reefers packed with different
packaging designs varies when the fruit load is due to the difference in SECT of the
fruit, after the field heat of fruit is removed and during extended land and marine
transportation of reefer, energy use of these reefers is basically the same despite
packaging design. This is because the reefer operates at the same operating
condition: evaporator fans are running constantly and energy is used to remove heat
load from the fans (≈1.4 kW), heat conducted from the environment and, fruit
respiration heat load. However, the energy consumed is beyond what is required.
In the following section, an alternative energy saving strategy for a reefer is
evaluated with respect to reefer design parameter (evaporator fan operation)
(section 6.3.4).
Stellenbosch University https://scholar.sun.ac.za
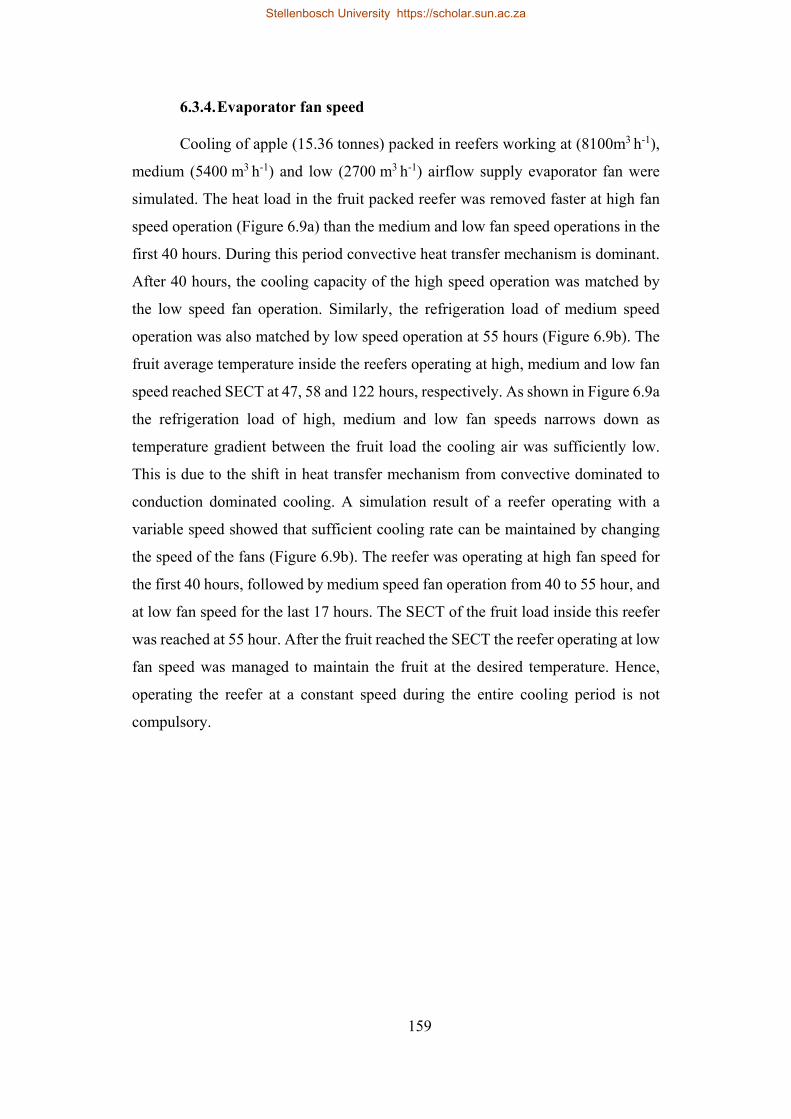
159
6.3.4. Evaporator fan speed
Cooling of apple (15.36 tonnes) packed in reefers working at (8100m3 h-1),
medium (5400 m3 h-1) and low (2700 m3 h-1) airflow supply evaporator fan were
simulated. The heat load in the fruit packed reefer was removed faster at high fan
speed operation (Figure 6.9a) than the medium and low fan speed operations in the
first 40 hours. During this period convective heat transfer mechanism is dominant.
After 40 hours, the cooling capacity of the high speed operation was matched by
the low speed fan operation. Similarly, the refrigeration load of medium speed
operation was also matched by low speed operation at 55 hours (Figure 6.9b). The
fruit average temperature inside the reefers operating at high, medium and low fan
speed reached SECT at 47, 58 and 122 hours, respectively. As shown in Figure 6.9a
the refrigeration load of high, medium and low fan speeds narrows down as
temperature gradient between the fruit load the cooling air was sufficiently low.
This is due to the shift in heat transfer mechanism from convective dominated to
conduction dominated cooling. A simulation result of a reefer operating with a
variable speed showed that sufficient cooling rate can be maintained by changing
the speed of the fans (Figure 6.9b). The reefer was operating at high fan speed for
the first 40 hours, followed by medium speed fan operation from 40 to 55 hour, and
at low fan speed for the last 17 hours. The SECT of the fruit load inside this reefer
was reached at 55 hour. After the fruit reached the SECT the reefer operating at low
fan speed was managed to maintain the fruit at the desired temperature. Hence,
operating the reefer at a constant speed during the entire cooling period is not
compulsory.
Stellenbosch University https://scholar.sun.ac.za
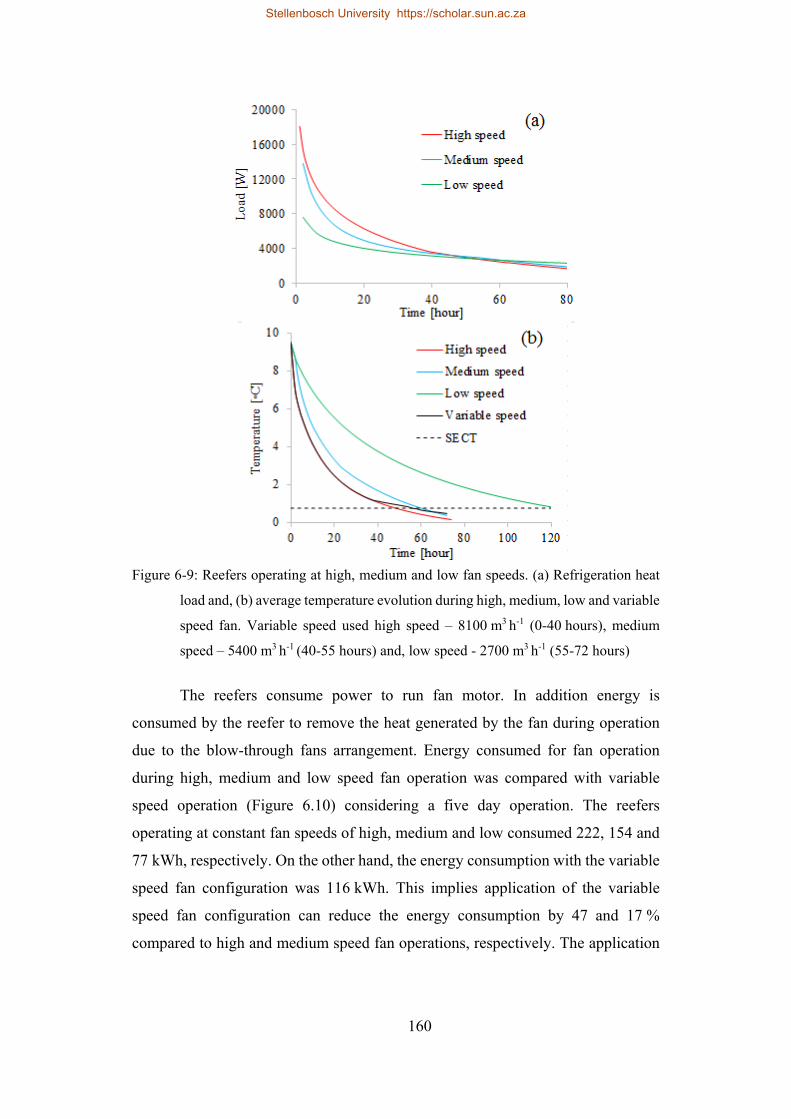
160
Figure 6-9: Reefers operating at high, medium and low fan speeds. (a) Refrigeration heat
load and, (b) average temperature evolution during high, medium, low and variable
speed fan. Variable speed used high speed – 8100 m3 h-1 (0-40 hours), medium
speed – 5400 m3 h-1 (40-55 hours) and, low speed - 2700 m3 h-1 (55-72 hours)
The reefers consume power to run fan motor. In addition energy is
consumed by the reefer to remove the heat generated by the fan during operation
due to the blow-through fans arrangement. Energy consumed for fan operation
during high, medium and low speed fan operation was compared with variable
speed operation (Figure 6.10) considering a five day operation. The reefers
operating at constant fan speeds of high, medium and low consumed 222, 154 and
77 kWh, respectively. On the other hand, the energy consumption with the variable
speed fan configuration was 116 kWh. This implies application of the variable
speed fan configuration can reduce the energy consumption by 47 and 17 %
compared to high and medium speed fan operations, respectively. The application
Stellenbosch University https://scholar.sun.ac.za
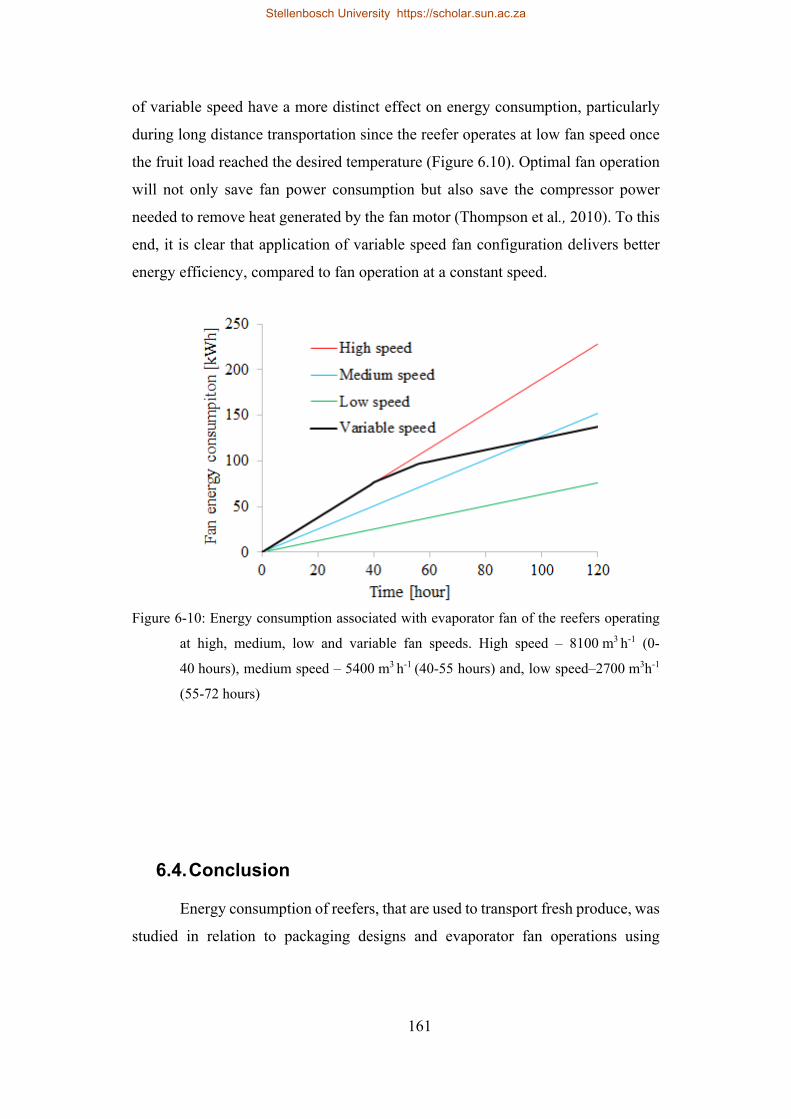
161
of variable speed have a more distinct effect on energy consumption, particularly
during long distance transportation since the reefer operates at low fan speed once
the fruit load reached the desired temperature (Figure 6.10). Optimal fan operation
will not only save fan power consumption but also save the compressor power
needed to remove heat generated by the fan motor (Thompson et al., 2010). To this
end, it is clear that application of variable speed fan configuration delivers better
energy efficiency, compared to fan operation at a constant speed.
Figure 6-10: Energy consumption associated with evaporator fan of the reefers operating
at high, medium, low and variable fan speeds. High speed – 8100 m3 h-1 (0-
40 hours), medium speed – 5400 m3 h-1 (40-55 hours) and, low speed–2700 m3h-1
(55-72 hours)
6.4. Conclusion
Energy consumption of reefers, that are used to transport fresh produce, was
studied in relation to packaging designs and evaporator fan operations using
Stellenbosch University https://scholar.sun.ac.za
162
numerical method and experimental measurement. In the experimental study, the
total electrical power consumption and the power use of major refrigeration system
components were monitored. The numerical study successfully unveiled the effect
of packaging designs on the total energy consumption of reefers, particularly by
reducing the cooling period. The maximum energy consumption (139 kWh) was
recorded by the reefer packed with Mk9 packaging design to cool 16.8 tonnes of
apple to SECT in 62 hours, whereas the reefer packed with Mk6 packaging design
consumed 21.73 % less energy to cool 14.4 tonnes of fruit to the SECT in 34 hours.
On the other hand, evaluation of the vertical airflow resistance of the pallets stacked
with Econo-D, Ec-25, Ec-50 and, Ec-75 packaging designs, that contain the same
amount of fruit, a 12 % reduction in reefer total energy consumption. Similarly, the
energy consumption was reduced by 9.6 and 10.9 % for Ec-25 and Ec-50,
respectively. This was mainly due to a 27 % reduction in the SECT from due to
better ventilation of Ec-75 (≈ 3.5 % bottom ventilation area) compared to Econo-D
(no bottom vent hole).
Simulation results of reefers operating at high, medium, low and variable
speed evaporator fan operation demonstrated the potential energy saving that can
be achieved by using variable speed fan operation, particularly over extended
transportation period. Application of the variable speed fan configuration reduced
the energy consumption by 47 and 17 % compared to high and low speed fan
operations after 120 hours, respectively. Operating the fan at with respect to the
refrigeration load not only save energy but could also reduce CO2 emission as
electric energy for the reefers is generated by diesel combustion on board vessels
using engines.
Stellenbosch University https://scholar.sun.ac.za
163
Chapter7
7. Effects of climatic conditions on cooling
characteristics and energy consumption of
apple packed reefer during marine transport
Abstract
During long marine transportation periods fruit packed reefers are exposed
to a wide range of climatic conditions that can compromise the quality of fruit load
and affect reefer energy utilization. In this study, a validated computational fluid
dynamics (CFD) model of a fully loaded refrigerated shipping container (reefer)
was used to evaluate the impact of climate (0, 20 and 40 ambient temperatures
and 7.2 m s-1 wind speed) on fruit cooling and energy consumption. The numerical
study successfully unveiled the effect of climatic conditions on fruit cooling,
temperature distribution and energy consumption of reefers. Heat transfer through
the walls increased temperature of the fruits near the side walls by 4 , particularity
under 40 environment. The maximum energy (159 kWh) was used by the reefer
operating in 40 region climatic condition. The reefer under adiabatic condition
and 0 region consumed the minimum energy (109 KWh). In addition, the reefer
passing through climatic zones with 20, 40 and 0 ambient temperatures and
7.2 m s-1 wind speed consumed 397 kWh energy in 9-day. The reefer consumed
42 % of the total energy in 40 ambient temperature region.
7.1. Introduction
Refrigerated shipping containers (reefers) carry out a highly demanding
routine to transport different varieties of goods that have a desired temperature
Stellenbosch University https://scholar.sun.ac.za
164
ranging from -30 to +20 under a wide range of climatic conditions with an
ambient temperature range of -40 to +50 °C. Efficient temperature control in the
reefer is critical, particularly for temperature sensitive perishable produce load in a
chilled mode. Poor thermal insulation and air infiltration into a reefer and cold
storage contribute to poor control of storage conditions and energy loss (Foster et
al., 2003; Gosney, 1975).
Cold storage must be insulated in such a way that heat in-leak should not
increase beyond 6 – 8 W/m2 (Tridib, 2009). Ahmed et al. (2010) studied the heat
transfer across the insulated walls of refrigerated truck trailers experimentally. The
authors adapted well proved phase change material (PCM) from its successful
practical result in building walls and structural insulated panel(SIP) by (Zhang et
al., 2005; Medina et al., 2008). Integration of PCMs in regular building walls
resulted in 11–20 % peak heat transfer rate reduction with a PCM concentration of
10 %. A lower capital investment with an inferior quality and thinner insulation
leads to a larger heat in-leak. A larger compressor with more power consumption is
required to make up for the additional cooling load. It is therefore obvious that when
the energy cost has already increased and set to increase further, the quality and
thickness of insulation has to improve further. It is however not so in practice.
The primary factor for heat transfer from the environment is the airflow and
ambient temperature around reefer on open space, such as on shipping vessels
during marine transport. Airflow during marine transportation has a forced nature
and the convective heat transfer coefficient on the exterior of a reefer is seriously
influenced. Several experimental and numerical studies have shown that flow over
a flat plate, similar to that of walls of a reefer, is affected by, temperature, humidity
and wind speed (Xiao et al., 2011). James et al. (2006) emphasised the far less
coverage of refrigerated transport compared to other refrigeration processes with
respect to modelling. The authors also recommended further study of heat transfer
between the container walls and the outside air and heat transfer to the produce load
from the container walls.
Stellenbosch University https://scholar.sun.ac.za
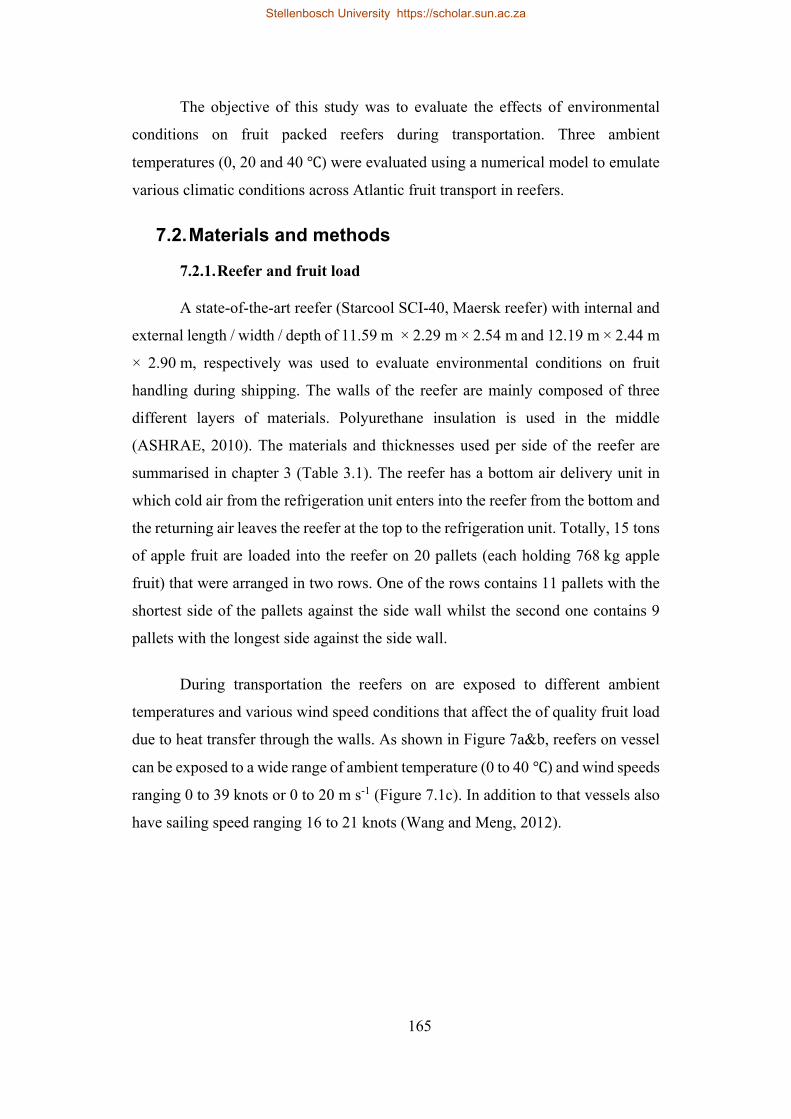
165
The objective of this study was to evaluate the effects of environmental
conditions on fruit packed reefers during transportation. Three ambient
temperatures (0, 20 and 40 ) were evaluated using a numerical model to emulate
various climatic conditions across Atlantic fruit transport in reefers.
7.2. Materials and methods
7.2.1. Reefer and fruit load
A state-of-the-art reefer (Starcool SCI-40, Maersk reefer) with internal and
external length / width / depth of 11.59 m × 2.29 m × 2.54 m and 12.19 m × 2.44 m
× 2.90 m, respectively was used to evaluate environmental conditions on fruit
handling during shipping. The walls of the reefer are mainly composed of three
different layers of materials. Polyurethane insulation is used in the middle
(ASHRAE, 2010). The materials and thicknesses used per side of the reefer are
summarised in chapter 3 (Table 3.1). The reefer has a bottom air delivery unit in
which cold air from the refrigeration unit enters into the reefer from the bottom and
the returning air leaves the reefer at the top to the refrigeration unit. Totally, 15 tons
of apple fruit are loaded into the reefer on 20 pallets (each holding 768 kg apple
fruit) that were arranged in two rows. One of the rows contains 11 pallets with the
shortest side of the pallets against the side wall whilst the second one contains 9
pallets with the longest side against the side wall.
During transportation the reefers on are exposed to different ambient
temperatures and various wind speed conditions that affect the of quality fruit load
due to heat transfer through the walls. As shown in Figure 7a&b, reefers on vessel
can be exposed to a wide range of ambient temperature (0 to 40 ) and wind speeds
ranging 0 to 39 knots or 0 to 20 m s-1 (Figure 7.1c). In addition to that vessels also
have sailing speed ranging 16 to 21 knots (Wang and Meng, 2012).
Stellenbosch University https://scholar.sun.ac.za
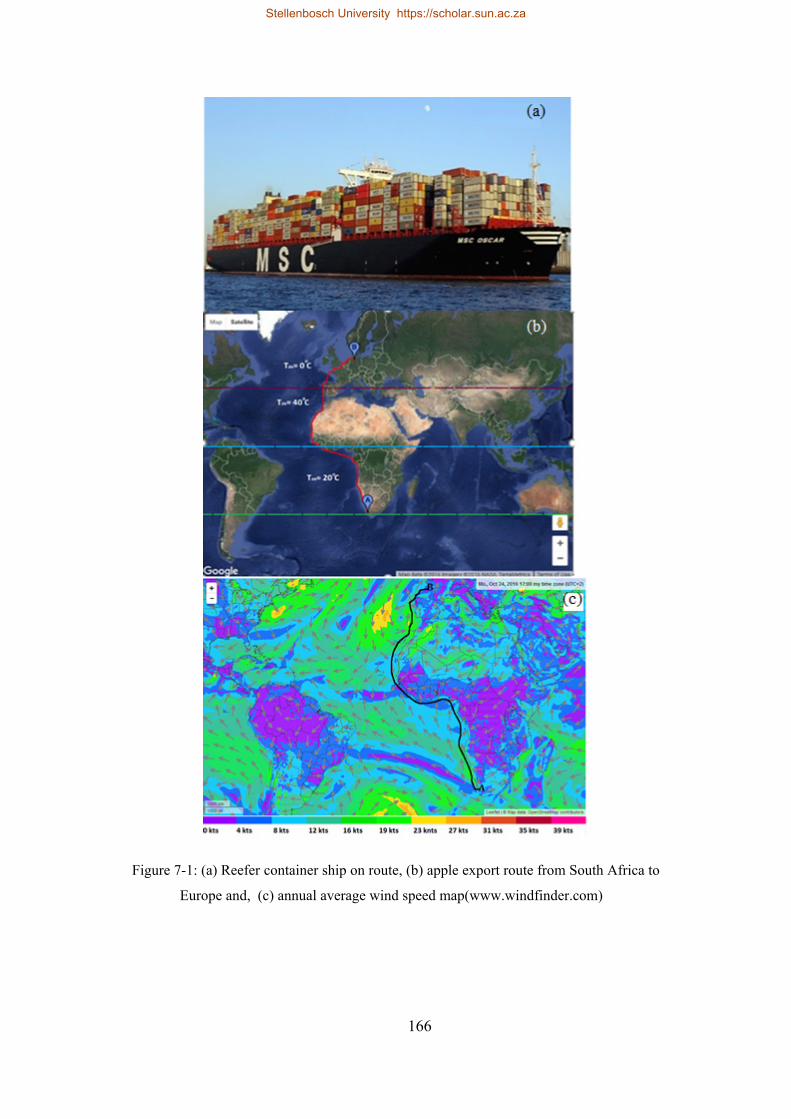
166
Figure 7-1: (a) Reefer container ship on route, (b) apple export route from South Africa to
Europe and, (c) annual average wind speed map(www.windfinder.com)
Stellenbosch University https://scholar.sun.ac.za
167
7.2.2. Numerical model and assumptions
For this study a previously validated numerical model of apple packed reefer
was used to study the effect of ambient conditions. Placement of the stacked pallets
against the side walls provides support during transportation and limits the removal
of heat conducted from the environment. The pallets were modelled as two rows of
porous domains and there is a free air region below and above the pallet rows that
make up the rest of the domain. Fluid-porous interface (between the porous domain
and fluid domain) was explicitly defined as a conservative interface flux boundary
for the momentum and scalar transports. The cooling unit was modelled by
specifying temperature, pressure, and velocity and turbulence intensity at inlet. The
refrigeration unit was operating at cooling flow rate of 5400 m3 h-1 (at an air
exchange rate of ≈ 80 h-1). The environmental conditions were represented by the
ambient temperature and setting the overall convective heat transfer coefficient of
the wall, ceiling, floor and door. Navier-Stokes equations were applied as governing
equation for mass, momentum and supplemented by energy conservation equation
(Eqn. 4.1 to 4.6). The heat generation per unit volume of produce due to
respirationwas calculated using equation 4.7 at the produce temperature.
Some assumptions were made to simplify the model. (1) heat load due to
moisture evaporation from the fruit load was assumed negligible as the fruits are
packed in bagged in plastic and packed in packaging boxes, (2) wind speed used to
calculate convective heat transfer coefficient on the outside was assumed to be
constant during reefer transportation and, (3) the release of heat due to condensation
of water on the surface and defrost cycle of the reefer was not considered. In
addition, the following basic assumptions were made during the model formulation.
o A constant ambient air temperature was assumed for the outside
environment, pressure of 101 kPa and relative humidity of 80 %.
o Thermal radiation exchange between the exterior surface and the
surroundings was neglected since the outer surfaces of the walls of the reefer
were painted white (low emissivity).
Stellenbosch University https://scholar.sun.ac.za

168
o The physical properties of air were assumed constant for the given ambient
temperature.
o Since the air circulation fans were positioned upstream of the evaporator
coil (a blow-through configuration), the fan heat was assumed totally
removed directly by the evaporator coil (Figure 6.3a).
7.2.3. Numerical simulation
Discretization of the domain was on ANSYS® Meshing™ Release 16.0 and
the problem setup and simulation was on ANSYS® Fluent™ Release 16.0 (ANSYS,
Canonsburg, PA, USA). Airflow simulation was conducted at steady state and the
result was used as initial condition for the transient heat transfer calculation.
Turbulence was calculated using k-ω SST model. SIMPLE discretization scheme
was used for pressure-velocity coupling and Second Order Upwind discretization
was used for momentum, specific dissipation rate and energy calculations. A time
step size of 180 s with maximum 20 iterations per time step, was used. Dell
Precision computer (dual Intel Xeon [email protected] GHz with 40 GB Ram) was
used. Cooling operation inside four reefers loaded with precooled fruit loads
(≈0.75 ) were simulated. Three of them were under climatic conditions (20, 40
and 0 ambient temperature and 14-knot (7.2 m s-1) wind speed) and an adiabatic
condition (no interaction with the environment). In addition, a loaded reefer
traveling (9 days) through 20, 40 and 0 ambient temperature regions in the given
sequence was simulated.
7.2.4. Initial and boundary conditions
In all the models, the internal walls of the reefer were set to a no slip
conditions. Initially the average fruit temperature in the domain was assumed to be
at 0.75 .Convective heat transfer coefficient of the composite walls of the reefer
were calculated based on the physical properties of air at the film temperature for
ambient temperatures of 0, 20 and 40 under consideration. The heat fluxes at the
container walls, floor and door were calculated using Fourier's Law (Eqn. 7.1).
Stellenbosch University https://scholar.sun.ac.za
169
∆ 7.1
1
2∆ ∆ 1 7.2
Where, (W m-1 K-1) is thermal conductivity of the outer and inner wall
material, (W m-1°C-1) is thermal conductivity of polyurethane which is
sandwiched between the outer and inner wall, (W m-2 K-1) is the convective heat
transfer coefficient between the outside surface and ambient air, A1 (m2) is the area
of the inner surface of a wall, A2 (m2) is the area of the middle (polyurethane) layer
of a wall and A0 (m2) is the area of the outer surface of a wall. U (W K-1 m-2) is the
overall heat transfer coefficient of composite wall, A (m2), T K is ambient
temperature and, T K wall temperature. Q (J m-3) is heat of respiration. The
convective heat transfer coefficient, ho (W K-1 m-2) was calculated assuming
turbulent flow over a flat plate (Eqn. 7.3) (Bird, 2002).
Nu 0.037Re . Pr / 7.3
Where Nu is the Nusselt number, Re is the Reynold’s number and Pr is the
Prandtle number. Air velocity near the wall was taken as 7.2 m s-1 (14 knots), which
is the average annual wind speed in Atlantic Ocean (Reference). For the three
ambient conditions, properties of air ( , ,Cp, at the film temperatures
272.9, 282.9 and, 292.9 K were used to calculate overall heat transfer coefficient of
the composite side wall, ceiling, floor and the door. Assuming A1 = A2 = A0 = A, an
overall heat transfer coefficient U can be used to simplify Eqn. 7.2. The heat
exchange with the environment has been incorporated as heat fluxes on the walls,
ceiling, floor and door and the corresponding heat transfer coefficients are given in
Table 7.1.
Stellenbosch University https://scholar.sun.ac.za
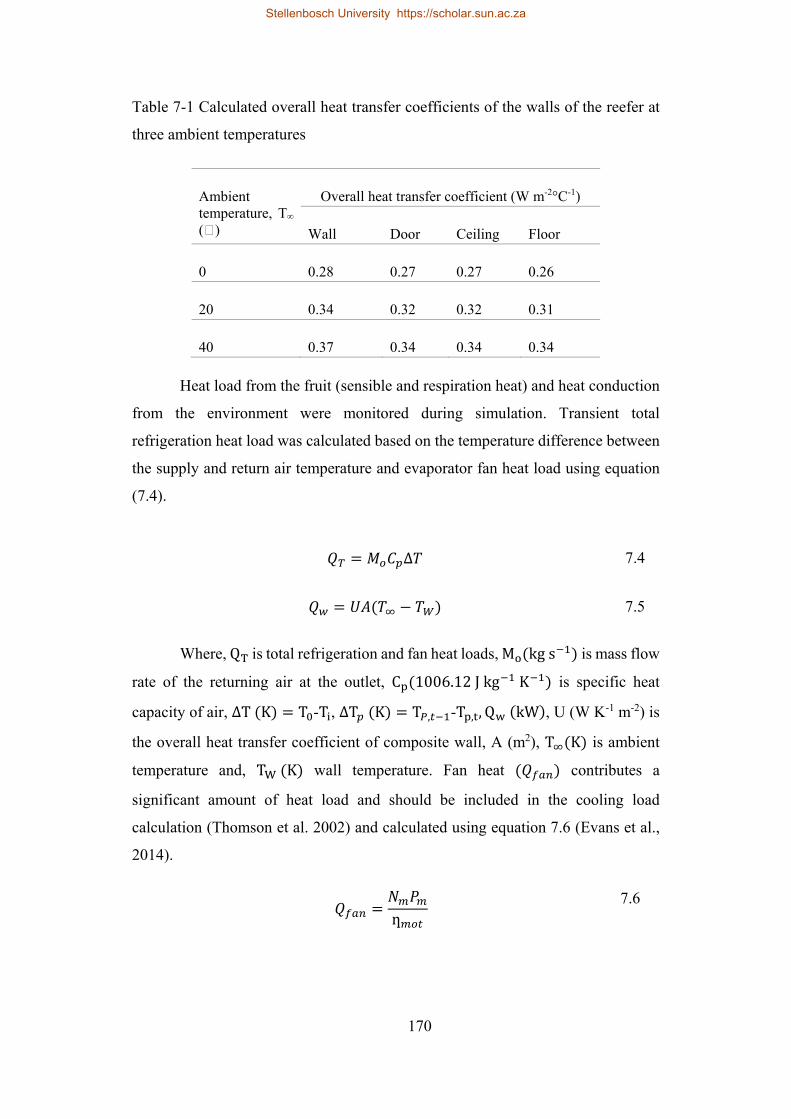
170
Table 7-1 Calculated overall heat transfer coefficients of the walls of the reefer at
three ambient temperatures
Ambient temperature, T∞ ( )
Overall heat transfer coefficient (W m-2°C-1)
Wall Door Ceiling Floor
0 0.28 0.27 0.27 0.26
20 0.34 0.32 0.32 0.31
40 0.37 0.34 0.34 0.34
Heat load from the fruit (sensible and respiration heat) and heat conduction
from the environment were monitored during simulation. Transient total
refrigeration heat load was calculated based on the temperature difference between
the supply and return air temperature and evaporator fan heat load using equation
(7.4).
∆ 7.4
7.5
Where, Q is total refrigeration and fan heat loads, M kgs is mass flow
rate of the returning air at the outlet, C 1006.12Jkg K is specific heat
capacity of air, ∆T K T -T , ∆T K T , -T , , Q kW , U (W K-1 m-2) is
the overall heat transfer coefficient of composite wall, A (m2), T K is ambient
temperature and, T K wall temperature. Fan heat contributes a
significant amount of heat load and should be included in the cooling load
calculation (Thomson et al. 2002) and calculated using equation 7.6 (Evans et al.,
2014).
ƞ
7.6
Stellenbosch University https://scholar.sun.ac.za
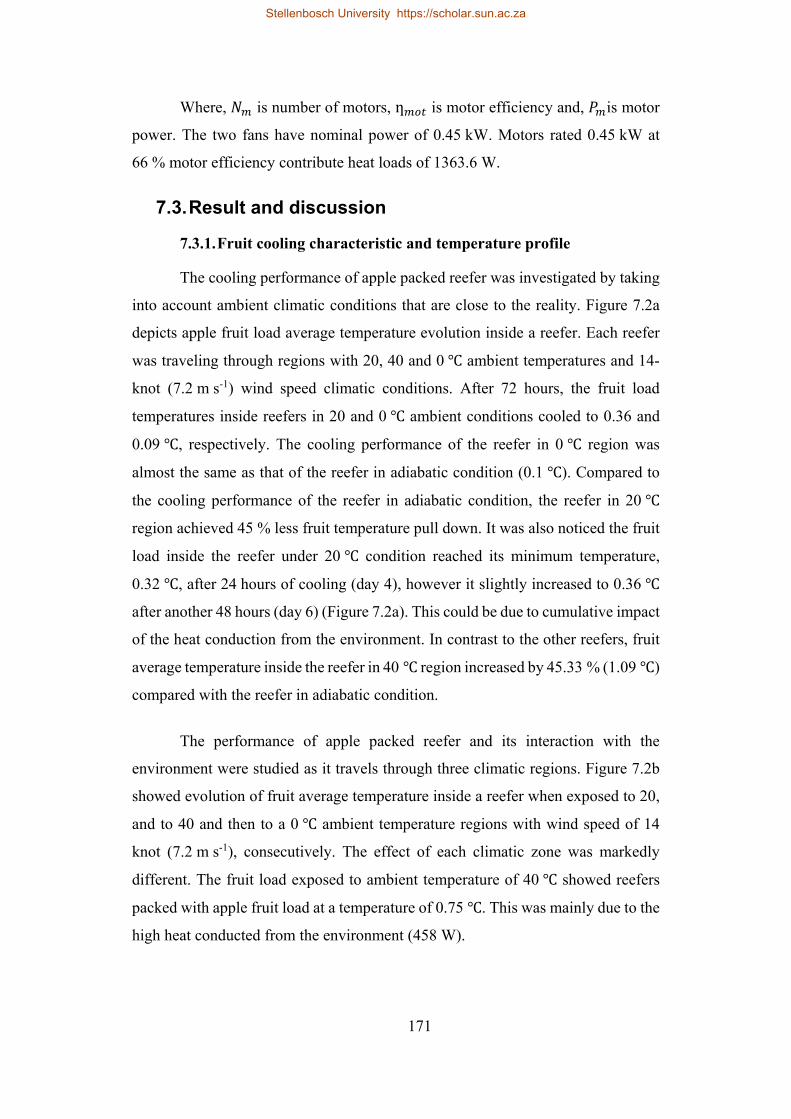
171
Where, is number of motors, ƞ is motor efficiency and, is motor
power. The two fans have nominal power of 0.45 kW. Motors rated 0.45 kW at
66 % motor efficiency contribute heat loads of 1363.6 W.
7.3. Result and discussion
7.3.1. Fruit cooling characteristic and temperature profile
The cooling performance of apple packed reefer was investigated by taking
into account ambient climatic conditions that are close to the reality. Figure 7.2a
depicts apple fruit load average temperature evolution inside a reefer. Each reefer
was traveling through regions with 20, 40 and 0 ambient temperatures and 14-
knot (7.2 m s-1) wind speed climatic conditions. After 72 hours, the fruit load
temperatures inside reefers in 20 and 0 ambient conditions cooled to 0.36 and
0.09 , respectively. The cooling performance of the reefer in 0 region was
almost the same as that of the reefer in adiabatic condition (0.1 ). Compared to
the cooling performance of the reefer in adiabatic condition, the reefer in 20
region achieved 45 % less fruit temperature pull down. It was also noticed the fruit
load inside the reefer under 20 condition reached its minimum temperature,
0.32 , after 24 hours of cooling (day 4), however it slightly increased to 0.36
after another 48 hours (day 6) (Figure 7.2a). This could be due to cumulative impact
of the heat conduction from the environment. In contrast to the other reefers, fruit
average temperature inside the reefer in 40 region increased by 45.33 % (1.09 )
compared with the reefer in adiabatic condition.
The performance of apple packed reefer and its interaction with the
environment were studied as it travels through three climatic regions. Figure 7.2b
showed evolution of fruit average temperature inside a reefer when exposed to 20,
and to 40 and then to a 0 ambient temperature regions with wind speed of 14
knot (7.2 m s-1), consecutively. The effect of each climatic zone was markedly
different. The fruit load exposed to ambient temperature of 40 showed reefers
packed with apple fruit load at a temperature of 0.75 . This was mainly due to the
high heat conducted from the environment (458 W).
Stellenbosch University https://scholar.sun.ac.za
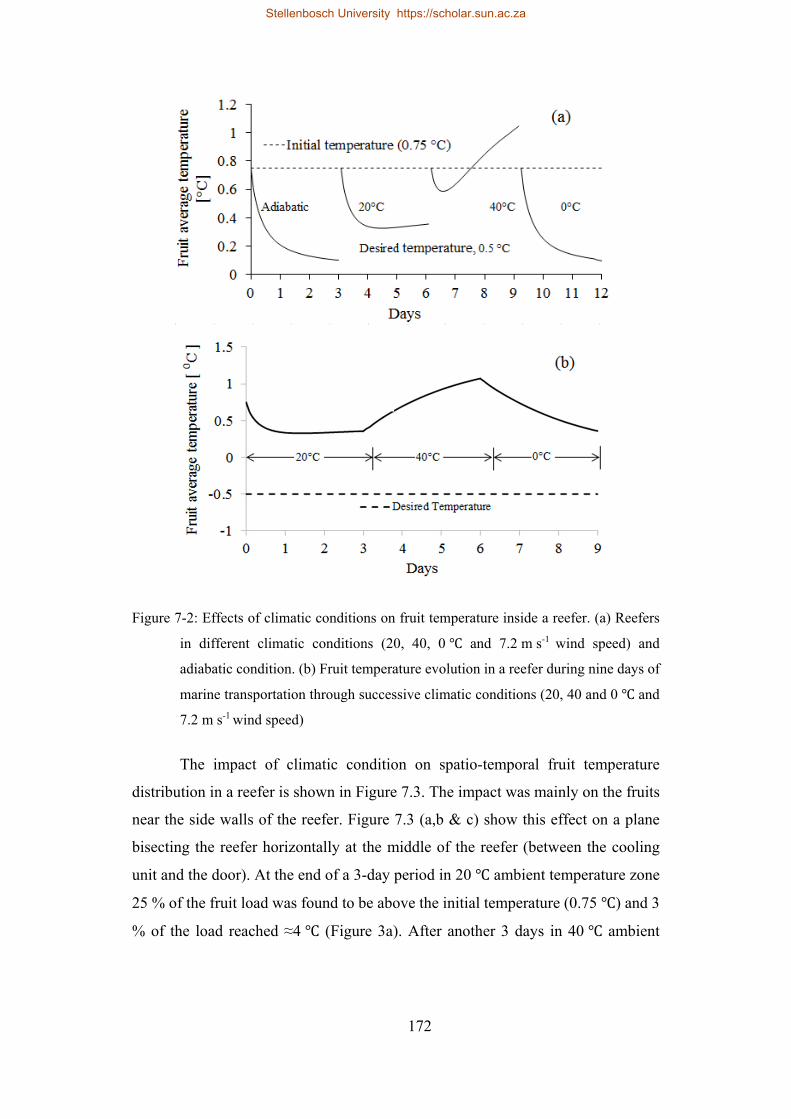
172
Figure 7-2: Effects of climatic conditions on fruit temperature inside a reefer. (a) Reefers
in different climatic conditions (20, 40, 0 and 7.2 m s-1 wind speed) and
adiabatic condition. (b) Fruit temperature evolution in a reefer during nine days of
marine transportation through successive climatic conditions (20, 40 and 0 and
7.2 m s-1 wind speed)
The impact of climatic condition on spatio-temporal fruit temperature
distribution in a reefer is shown in Figure 7.3. The impact was mainly on the fruits
near the side walls of the reefer. Figure 7.3 (a,b & c) show this effect on a plane
bisecting the reefer horizontally at the middle of the reefer (between the cooling
unit and the door). At the end of a 3-day period in 20 ambient temperature zone
25 % of the fruit load was found to be above the initial temperature (0.75 ) and 3
% of the load reached ≈4 (Figure 3a). After another 3 days in 40 ambient
Stellenbosch University https://scholar.sun.ac.za
173
temperature zone, the amount of fruit above 0.75 increased to 42 %, and 11 %
of the fruit load was greater than or equal to 4 . However, in the final 3 days in
0 ambient temperature region the size of warm regions in the fruit load near the
side walls diminished, less than 3 % of the load was ≈4 .
Figure 7-3: Effects of heat conduction through the walls of the reefer on fruit load adjacent
the side walls of the reefer. Temperature profile on a plane bisecting the reefer
horizontally at the middle (5.8 m from cooling unit) of the reefer after 3 days in (a)
20, (b) 40 and, (c) 0 ambient temperature zones. (d) Spatial temperature
variation along the length of the reefer and airflow streamlines coloured by
temperature (coloured by temperature from -1 to 0 ).
The temperature profile of the fruit load showed spatial variation across the
width and the length of the reefer. Across the width of the refer, fruit loads in the
pallet row 1 (left side) were more affected than in the pallets on the right side due
to the arrangement of the pallets. The pallets in row 1 were arranged with the longest
Stellenbosch University https://scholar.sun.ac.za
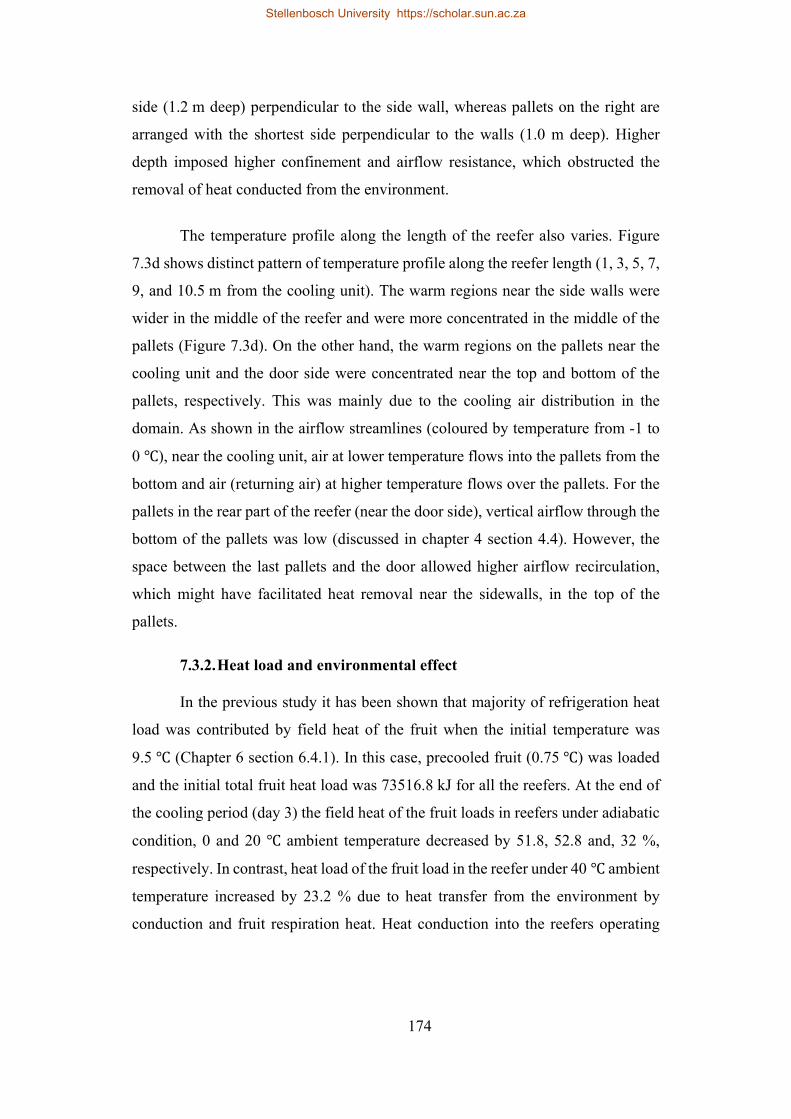
174
side (1.2 m deep) perpendicular to the side wall, whereas pallets on the right are
arranged with the shortest side perpendicular to the walls (1.0 m deep). Higher
depth imposed higher confinement and airflow resistance, which obstructed the
removal of heat conducted from the environment.
The temperature profile along the length of the reefer also varies. Figure
7.3d shows distinct pattern of temperature profile along the reefer length (1, 3, 5, 7,
9, and 10.5 m from the cooling unit). The warm regions near the side walls were
wider in the middle of the reefer and were more concentrated in the middle of the
pallets (Figure 7.3d). On the other hand, the warm regions on the pallets near the
cooling unit and the door side were concentrated near the top and bottom of the
pallets, respectively. This was mainly due to the cooling air distribution in the
domain. As shown in the airflow streamlines (coloured by temperature from -1 to
0 ), near the cooling unit, air at lower temperature flows into the pallets from the
bottom and air (returning air) at higher temperature flows over the pallets. For the
pallets in the rear part of the reefer (near the door side), vertical airflow through the
bottom of the pallets was low (discussed in chapter 4 section 4.4). However, the
space between the last pallets and the door allowed higher airflow recirculation,
which might have facilitated heat removal near the sidewalls, in the top of the
pallets.
7.3.2. Heat load and environmental effect
In the previous study it has been shown that majority of refrigeration heat
load was contributed by field heat of the fruit when the initial temperature was
9.5 (Chapter 6 section 6.4.1). In this case, precooled fruit (0.75 ) was loaded
and the initial total fruit heat load was 73516.8 kJ for all the reefers. At the end of
the cooling period (day 3) the field heat of the fruit loads in reefers under adiabatic
condition, 0 and 20 ambient temperature decreased by 51.8, 52.8 and, 32 %,
respectively. In contrast, heat load of the fruit load in the reefer under 40 ambient
temperature increased by 23.2 % due to heat transfer from the environment by
conduction and fruit respiration heat. Heat conduction into the reefers operating
Stellenbosch University https://scholar.sun.ac.za
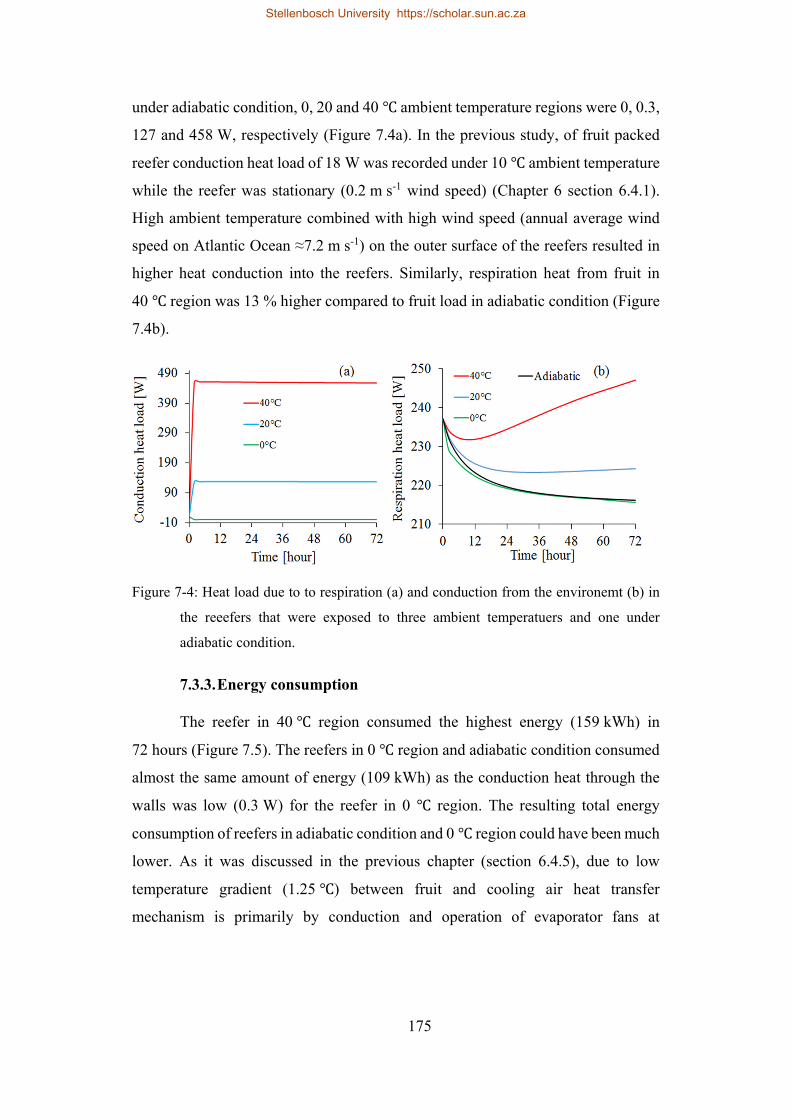
175
under adiabatic condition, 0, 20 and 40 ambient temperature regions were 0, 0.3,
127 and 458 W, respectively (Figure 7.4a). In the previous study, of fruit packed
reefer conduction heat load of 18 W was recorded under 10 ambient temperature
while the reefer was stationary (0.2 m s-1 wind speed) (Chapter 6 section 6.4.1).
High ambient temperature combined with high wind speed (annual average wind
speed on Atlantic Ocean ≈7.2 m s-1) on the outer surface of the reefers resulted in
higher heat conduction into the reefers. Similarly, respiration heat from fruit in
40 region was 13 % higher compared to fruit load in adiabatic condition (Figure
7.4b).
Figure 7-4: Heat load due to to respiration (a) and conduction from the environemt (b) in
the reeefers that were exposed to three ambient temperatuers and one under
adiabatic condition.
7.3.3. Energy consumption
The reefer in 40 region consumed the highest energy (159 kWh) in
72 hours (Figure 7.5). The reefers in 0 region and adiabatic condition consumed
almost the same amount of energy (109 kWh) as the conduction heat through the
walls was low (0.3 W) for the reefer in 0 region. The resulting total energy
consumption of reefers in adiabatic condition and 0 region could have been much
lower. As it was discussed in the previous chapter (section 6.4.5), due to low
temperature gradient (1.25 ) between fruit and cooling air heat transfer
mechanism is primarily by conduction and operation of evaporator fans at
Stellenbosch University https://scholar.sun.ac.za
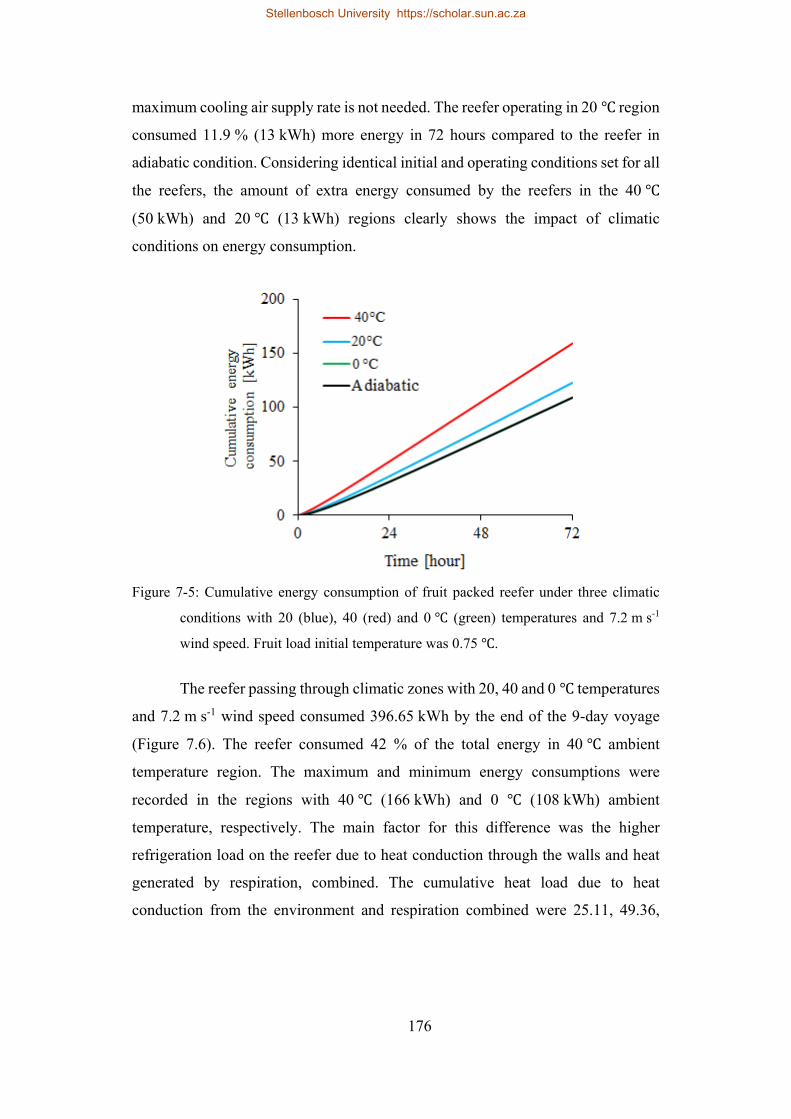
176
maximum cooling air supply rate is not needed. The reefer operating in 20 region
consumed 11.9 % (13 kWh) more energy in 72 hours compared to the reefer in
adiabatic condition. Considering identical initial and operating conditions set for all
the reefers, the amount of extra energy consumed by the reefers in the 40
(50 kWh) and 20 (13 kWh) regions clearly shows the impact of climatic
conditions on energy consumption.
Figure 7-5: Cumulative energy consumption of fruit packed reefer under three climatic
conditions with 20 (blue), 40 (red) and 0 (green) temperatures and 7.2 m s-1
wind speed. Fruit load initial temperature was 0.75 .
The reefer passing through climatic zones with 20, 40 and 0 temperatures
and 7.2 m s-1 wind speed consumed 396.65 kWh by the end of the 9-day voyage
(Figure 7.6). The reefer consumed 42 % of the total energy in 40 ambient
temperature region. The maximum and minimum energy consumptions were
recorded in the regions with 40 (166 kWh) and 0 (108 kWh) ambient
temperature, respectively. The main factor for this difference was the higher
refrigeration load on the reefer due to heat conduction through the walls and heat
generated by respiration, combined. The cumulative heat load due to heat
conduction from the environment and respiration combined were 25.11, 49.36,
Stellenbosch University https://scholar.sun.ac.za
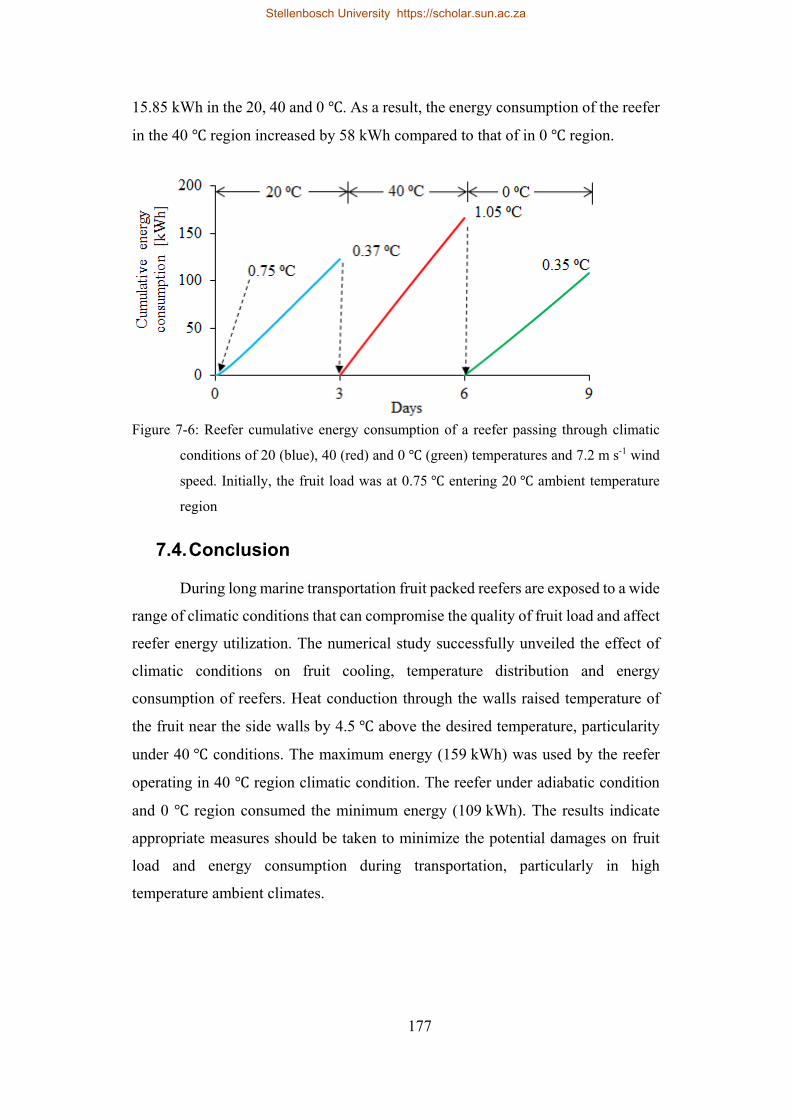
177
15.85 kWh in the 20, 40 and 0 . As a result, the energy consumption of the reefer
in the 40 region increased by 58 kWh compared to that of in 0 region.
Figure 7-6: Reefer cumulative energy consumption of a reefer passing through climatic
conditions of 20 (blue), 40 (red) and 0 (green) temperatures and 7.2 m s-1 wind
speed. Initially, the fruit load was at 0.75 entering 20 ambient temperature
region
7.4. Conclusion
During long marine transportation fruit packed reefers are exposed to a wide
range of climatic conditions that can compromise the quality of fruit load and affect
reefer energy utilization. The numerical study successfully unveiled the effect of
climatic conditions on fruit cooling, temperature distribution and energy
consumption of reefers. Heat conduction through the walls raised temperature of
the fruit near the side walls by 4.5 above the desired temperature, particularity
under 40 conditions. The maximum energy (159 kWh) was used by the reefer
operating in 40 region climatic condition. The reefer under adiabatic condition
and 0 region consumed the minimum energy (109 kWh). The results indicate
appropriate measures should be taken to minimize the potential damages on fruit
load and energy consumption during transportation, particularly in high
temperature ambient climates.
Stellenbosch University https://scholar.sun.ac.za
178
Chapter8
8. General summary and conclusions
8.1. Summary and conclusions
Cold chain systems are the most important postharvest technologies that are
applied to maintain the quality during handling, storage and transportation of
horticultural produces. Refrigerated shipping containers (reefers) are important part
of this cold chain system to deliver fresh fruit that meets standard quality parameters
in the global (export) and local market (domestic use). On the other hand, energy
use for product refrigeration is raising anxiety as the primary energy sources are
depleting and their impact on environment. The main aim of this study is to develop
and validate a computational fluid dynamic (CFD) model applicable to reefers that
is capable of predicting the total energy consumption of the system and then apply
the validated model for improving the operation and design of reefers.
The effect of reefer design and operational conditions on the airflow
distribution was studied using CFD modelling and reported in chapter 3. In this
study, the airflow and temperature distribution inside T-bar and flat floor type
reefers, operating at high and low evaporator performances, were investigated. The
CFD model was validated with experimental study conducted in a full-scale reefer,
and good agreement was found between measured and predicted values of air
velocities and temperatures. Airflow distribution in the two container designs was
markedly different. The reefer with T-bar floor design exhibited a noticeable
reduction of air recirculation zone and enhanced vertical air movement compared
to the reefer with flat floor design.
One of the controlling parameters for fruit quality is temperature and poor
management of temperature in the reefer results in deterioration of fruit postharvest
Stellenbosch University https://scholar.sun.ac.za
179
quality and loss. Uniform distribution of air inside reefers is very important to
ensure uniform cooling of the produce. A CFD model that is capable of predicting
airflow and produce cooling inside a fully loaded reefer was developed using
porous medium approach (Chapter 4). The model included the detailed structure of
the reefer, aerodynamic characteristics of packed produce and stacked pallets. The
model was validated by data obtained from a reefer fully loaded with stacks of apple
fruit, and the model successfully reproduced the airflow and temperature profiles
with an acceptable accuracy. Non-uniform airflow distribution leading to a highly
heterogeneous cooling was found primarily due to the absence of vent-hole on the
bottom face of the apple packaging box. The results demonstrated the importance
of packaging design that takes into account the of airflow path inside reefers.
Further to investigate the effects of packaging designs, the performance of
packaging designs, which are commonly used for handling apple fruit (Econo-D,
Mark 6 (Mk6) and Mark 9 (Mk9)), and effect of vertical airflow resistance was
studied using the validated model (Chapter 5). First, the study computes the
aerodynamic and thermodynamic characteristics of three package designs. The
packaging design that has higher bottom-ventilation area (Mk6) showed better
cooling airflow distribution and faster fruit cooling compared to the other packaging
designs, however, it offers less fruit load per reefer. On the other hand, the study of
vertical airflow resistance for the same packaging design (Econo-D) confirmed the
effect of vertical airflow on the rate and uniformity of cooling inside the reefer.
Adding vent-holes (3.5 % vent area) on the bottom face of the package reduced
vertical airflow resistance, and reduced the seven-eighth cooling time by 27 %
compared to a package with no bottom vent-holes.
Refrigerated transport systems are one of the highest energy consuming
food refrigeration systems. In Chapter 6 the energy consumption reefers were also
studied with respect to operational and design parameters during apple cooling. The
performance of apple packaging designs in a reefer with respect to energy
consumption confirmed the influence of ventilation area, particularity on the bottom
side, and the trade-off between the energy savings that can be achieved by
Stellenbosch University https://scholar.sun.ac.za
180
employing packaging designs with low (Mk6) and high (Mk9) fruit packing
density. To this end, adding vent-holes (3.5 % vent area) on the bottom face of the
Econo-D packaging box reduced the reefer total energy consumption by 12 %
compared to packaging designs with no bottom vent-holes. The effect of evaporator
fan operation on energy consumption was studied by simulating reefers operating
at low, medium, high and variable fan speeds. The simulation result confirmed fans
operating at constant speed were performing over or under with respect to the
refrigeration load, which caused high energy consumption or slow cooling. On the
other hand, a simulation result of a reefer with the variable speed fan configuration
matched the refrigeration load throughout the cooling period. Energy consumption
obtained for a reefer operating with the variable speed fan configuration was 47 and
17 % less compared to reefers operating at high and low fan speed, respectively,
during a 120-hour operation. The results established application of variable speed
fan operation can reduce energy consumption of reefers without compromising the
cooling operation.
Lastly, (chapter 7) is presented regarding the impact of ambient conditions
during transportation of apple fruit. The heat conduction through the walls of the
reefer can damage fruit quality during freight shipping. Reefers loaded with
precooled apple (0.75 ) operating in three climatic conditions (0, 20 and 40
ambient temperatures and 7.2 m s-1 wind speed) were studied using a validated
model. In addition, a reefer on crossing through three climatic conditions 20, 40 and
0 ambient temperatures (7.2 m s-1 wind speed), consecutively, was studied. Heat
conduction through the side walls of the reefer increased the temperature of fruit
load (≈11 % of the total load) to 4 near the side walls inside the reefer
operatinginthe40 zone.The maximum (159 kWh) and minimum (109 KWh)
energy were used by the reefers operating in 40, and 0 zones. The reefer crossing
the three climatic zones consumed 42 % of the total energy (397 kWh) in the 40
ambient temperature region during 9-days journey (3 days in each zone). It is
recommended there is space between the walls of the reefer and the pallets so that
heat from the environment can be removed easily.
Stellenbosch University https://scholar.sun.ac.za
181
8.2. Future prospects
The study presented in this dissertation has touched on and contributed to
various topics that affect the performance of reefers during fresh fruit handling. The
results could be used to study quality parameters of perishable products at different
stages during extended transportation period and in various climatic conditions.
This could be done by relating the spatio-temporal data of produce temperature with
the physical (such as weight loss), biological (such as enzymatic activities) and,
chemical (such as total soluble solid) activities of the perishable produce.
During long distance fruit transportation, from countries such as South
Africa to Europe, the shipment has to pass through various climatic conditions;
from the very cold (near the poles) to hot regions (equator). Despite the availability
of integrated refrigeration systems, the incidence of cold chain breaks happen and
inadequate fruit handling environment may occur and the possible scenarios should
be known to make informed decisions to minimize losses and subsequent claims
associated with fruit quality and energy use. Some of the breaks take place primarily
due to a power failure at ports as the reefers are in line to be loaded onto a vessel,
when refrigeration systems are switched off as a strategy to save electricity
consumption and when refrigeration systems malfunction. More comprehensive
research on cooling mode strategies is important to minimize energy consumption
without compromising the quality of produce.
Stellenbosch University https://scholar.sun.ac.za
182
References
Adre, N., & Albright, L. D., 1994. Criterion for establishing similar air flow patterns
(isothermal) in slotted-inlet ventilated enclosures. Transactions of the
ASAE, 37(1), 235-250.
Akdemir, S., & Arin, S., 2006. Spatial variability of ambient temperature, relative
humidity and air velocity in a cold store. Journal of Central European
Agriculture, 7(1), 101-110.
Alvare, G., Bournet, P. E., & Flick, D., 2003. Two-dimensional simulation of
turbulent flow and heat transfer through stacked spheres. International
Journal of Heat and Mass Transfer, 46(13), 2459-2469.
Ambaw, A., Delele, M. A., Defraeye, T., Ho, Q. T., Opara, L. U., Nicolai, B. M.,
& Verboven, P., and 2013.The use of CFD to characterize and design post-
harvest storage facilities: Past, present future. Computers and Electronics in
Agriculture, 93, 184-194.
Ambaw, A., Bessemans, N., Gruyters, W., Gwanpua, S.G., Schenk, A., De Roeck,
A., Delele, M.A., Verboven, P. and Nicolai, B.M., 2016. Analysis of the
spatiotemporal temperature fluctuations inside an apple cool store in
response to energy use concerns. International Journal of Refrigeration, 66,
156-168.
ASHRAE., 2010. ASHRAE handbook OF refrigeration: Systems and applications
(SI ed.). (Atlanta).
Becker, B. R., Misra, A., & Fricke, B. A., 1996. Bulk refrigeration of fruits and
vegetables Part I: theoretical considerations of heat and mass transfer.
HVAC&R Research, 2(2), 122-134.
Berry, T., Delele, M. A., Griessel, H., & Opara, U. L., 2015. Geometric design
characterisation of ventilated multi-scale packaging used in the South
African pome fruit industry. Agricultural Mechanization in Asia, Africa,
and Latin America, 46(3), 34-42.
Stellenbosch University https://scholar.sun.ac.za
183
Berry, T.M., Defraeye, T., Nicolai, B.M. and Opara, U.L., 2016. Multiparameter
analysis of cooling efficiency of ventilated fruit cartons using CFD: impact
of vent hole design and internal packaging. Food and Bioprocess
Technology, 1-13.
Bird, R. B., 2002. Transport phenomena. Applied Mechanics Reviews, 55(1), R1-
R4.
Brosnan, T., & Sun, D. W., 2001. Precooling techniques and applications for
horticultural products—a review. International Journal of Refrigeration,
24(2), 154-170.
Castro (de), L. R., Vigneault, C., & Cortez, L. A., 2004a. Container opening design
for horticultural produce cooling efficiency. Journal of Food, Agriculture
and Environment, 2, 135-140.
Castro (de), L. R., & Vigneault, C., 2004b. Effect of container opening area on air
distribution during precooling of horticultural produce. Transactions of the
ASAE, 47(6), 2033.
Castro (de), L. R., & Vigneault, C., 2005. Effect of container openings and airflow
rate on energy required for forced-air cooling of horticultural produce.
Canadian Biosystems Engineering, 47, 1-9.
Chourasia, M. K., & Goswami, T. K., 2007. Steady state CFD modelling of airflow,
heat transfer and moisture loss in a commercial potato cold store.
International Journal of Refrigeration, 30(4), 672-689.
Chourasia, M. K., & Goswami, T. K., 2009. Efficient design, operation,
maintenance and management of cold storage compressor. eJournal of
Biological Sciences, 1(1), 2076-9954.
Defraeye, T., Verboven, P., & Nicolai, B., 2013. CFD modelling of flow and scalar
exchange of spherical food products: Turbulence and boundary-layer
modelling. Journal of Food Engineering, 114(4), 495-504.
Defraeye, T., Lambrecht, R., Delele, M.A., Tsige, A.A., Opara, U.L., Cronjé, P.,
Verboven, P. and Nicolai, B., 2014. Forced-convective cooling of citrus
fruit: cooling conditions and energy consumption in relation to package
design. Journal of Food Engineering, 121,118-127.
Stellenbosch University https://scholar.sun.ac.za
184
Defraeye, T., Cronje, P., Verboven, P., Opara, U. L., & Nicolai, B., 2015a.
Exploring ambient loading of citrus fruit into reefer containers for cooling
during marine transport using computational fluid dynamics. Postharvest
Biology and Technology, 108, 91-101.
Defraeye, T., Verboven, P., Opara, U. L., Nicolai, B., & Cronjé, P., 2015b.
Feasibility of ambient loading of citrus fruit into refrigerated containers for
cooling during marine transport. Biosystems Engineering, 134, 20-30.
Defraeye, T., Cronje, P., Berry, T., Opara, U. L., East, A., Hertog, M., Verboven,
P., & Nicolai, B., 2015c. Towards integrated performance evaluation of
future packaging for fresh produce in the cold chain. Trends in Food Science
& Technology, 44(2), 201-225.
Defraeye, T., Nicolai, B., Kirkman, W., Moore, S., van Niekerk, S., Verboven, P.
and Cronjé, P., 2016. Integral performance evaluation of the fresh-produce
cold chain: A case study for ambient loading of citrus in refrigerated
containers. Postharvest Biology and Technology, 112,.1-13.
Dehghannya, J., Ngadi, M., & Vigneault, C., 2010. Mathematical modeling
procedures for airflow, heat and mass transfer during forced convection
cooling of produce: a review. Food Engineering Reviews, 2(4), 227-243.
Dehghannya, J., Ngadi, M., Vigneault, C., 2011. Mathematical modeling of airflow
and heat transfer during forced convection cooling of produce considering
various package vent areas. Food Control 22 (8), 1393–1399.
Dehghannya, J., Ngadi, M., & Vigneault, C., 2011. Mathematical modelling of
airflow and heat transfer during forced convection cooling of produce
considering various package vent areas. Food Control, 22(8), 1393-1399.
Delele, M. A., Tijskens, E., Atalay, Y. T., Ho, Q. T., Ramon, H., Nicolai, B. M., &
Verboven, P., 2008. Combined discrete element and CFD modelling of
airflow through random stacking of horticultural products in vented boxes.
Journal of Food Engineering, 89(1), 33-41.
Delele, M.A., Schenk, A., Tijskens, E., Ramon, H., Nicolai, B.M., Verboven, P.,
2009a. Optimization of the humidification of cold stores by pressurized
Stellenbosch University https://scholar.sun.ac.za
185
water atomizers based on a multiscale CFD model. Journal of Food
Engineering, 91, 228–239.
Delele, M.A., Schenk, A., Ramon, H., Nicolai, B.M., Verboven, P., 2009b.
Evaluation of a chicory root cold store humidification system using
computational fluid dynamics. Journal of Food Engineering 94, 110–121.
Delele, M. A., Ngcobo, M. E. K., Getahun, S. T., Chen, L., Mellmann, J., & Opara,
U. L., 2013a. Studying airflow and heat transfer characteristics of a
horticultural produce packaging system using a 3-D CFD model. Part I:
Model development and validation. Postharvest Biology and Technology,
86, 536-545.
Delele, M. A., Ngcobo, M. E. K., Getahun, S. T., Chen, L., Mellmann, J., & Opara,
U. L., 2013b. Studying airflow and heat transfer characteristics of a
horticultural produce packaging system using a 3-D CFD model. Part II:
Effect of package design. Postharvest Biology and Technology, 86, 546-
555.
Evans, J.A., Foster, A.M., Huet, J.M., Reinholdt, L., Fikiin, K., Zilio, C., Houska,
M., Landfeld, A., Bond, C., Scheurs, M. and van Sambeeck, T.W.M., 2014.
Specific energy consumption values for various refrigerated food cold
stores. Energy and Buildings, 74, 141-151.
Ferrua, M. J., & Singh, R. P., 2009a. Modeling the forced-air cooling process of
fresh strawberry packages, Part I: Numerical model. International Journal
of Refrigeration, 32(2), 335-348.
Ferrua, M. J., & Singh, R. P., 2009b. Modeling the forced-air cooling process of
fresh strawberry packages, Part II: Experimental validation of the flow
model. International Journal of Refrigeration, 32(2), 349-358.
Finn, D. P., & Brennan, S. L., 2003. Sensitivity analysis using CFD of air
distribution in transport refrigeration containers. In Proc. 21st IIR
International Congress of Refrigeration, Washington DC, 17-22 August
2003.
Stellenbosch University https://scholar.sun.ac.za

186
Fitzgerald, W. B., Howitt, O. J., Smith, I. J., & Hume, A., 2011. Energy use of
integral refrigerated containers in maritime transportation. Energy Policy,
39(4), 1885-1896.
Flórez-Orrego, D., Arias, W., López, D., & Velásquez, H., 2012. Experimental and
CFD study of a single phase cone-shaped helical coiled heat exchanger: an
empirical correlation. In Proceedings of ECOS 2012-The 25th International
Conference on Efficiency, Cost, Optimization, Simulation and
Environmental Impact of Energy Systems, 375-394.
Franke, J., Hellsten, A., Schlünzen, H., Carissimo, B., 2007. Best practice guideline
for the CFD simulation of flows in the urban environment. COST Action
732: Quality assurance and improvement of microscale meteorological
models, Hamburg, Germany.
Foster, A. M., Barrett, R., James, S. J., & Swain, M. J. 2002. Measurement and
prediction of air movement through doorways in refrigerated rooms.
International Journal of Refrigeration, 25(8), 1102-1109.
Foster, A.M., Swain, M.J., Barrett, R., D’Agaro, P., Ketteringham, L.P. and James,
S.J., 2007. Three-dimensional effects of an air curtain used to restrict cold
room infiltration. Applied Mathematical Modelling, 31(6),1109-1123.
Gonçalves, J.C., Costa, J.J., Figueiredo, A.R. and Lopes, A.M.G., 2012. CFD
modelling of aerodynamic sealing by vertical and horizontal air curtains.
Energy and Buildings, 52, 153-160.
Hassanizadeh, M. and Gray, W.G., 1979. General conservation equations for multi-
phasesystems: 1. Averaging procedure. Advances in Water Resources, 2,
131-144.
Hertog, M.L.A.T.M., Peppelenbos, H.W., Evelo, R.G. and Tijskens, L.M.M., 1998.
A dynamic and generic model of gas exchange of respiring produce: the
effects of oxygen, carbon dioxide and temperature. Postharvest Biology and
Technology, 14(3), 335-349.
Ho, Q.T., Verboven, P., Verlinden, B.E., Schenk, A. and Nicolai, B.M., 2013.
Controlled atmosphere storage may lead to local ATP deficiency in apple.
Postharvest Biology and Technology, 78,103-112.
Stellenbosch University https://scholar.sun.ac.za
187
Hoang, M.L., Verboven, P., De Baerdemaeker, J., Nicolai, B.M., 2000.Analysis of
the air flow in a cold store by means of computational fluid dynamics.
International Journal of Refrigeration 23, 127–140.
Hoang, M. H., Laguerre, O., Moureh, J., & Flick, D., 2012. Heat transfer modelling
in a ventilated cavity loaded with food product: Application to a refrigerated
vehicle. Journal of Food Engineering, 113(3), 389-398.
Hoang, H. M., Duret, S., Flick, D., & Laguerre, O., 2015. Preliminary study of
airflow and heat transfer in a cold room filled with apple pallets:
Comparison between two modelling approaches and experimental results.
Applied Thermal Engineering, 76, 367-381.
Hui, K. C., Vigneault, C., Sotocinal, S. A., de Castro, L. R., & Raghavan, G. V.,
2008. Effects of loading and air bag bracing patterns on correlated relative
air distribution inside refrigerated semi-trailers transporting fresh
horticultural produce. Canadian Biosystems Engineering, 50(3), 27-35.
ISO 1496-2 Series 1 Freight containers – specification and testing, Part 2:thermal
containers, 3rd ed., 1988.
Jedermann, R., Geyer, M., Praeger, U., & Lang, W., 2013. Sea transport of bananas
in containers–Parameter identification for a temperature model. Journal of
Food Engineering, 115(3), 330-338.
Jedermann, R., Praeger, U., Geyer, M., & Lang, W., 2014. Remote quality
monitoring in the banana chain. Philosophical Transactions of the Royal
Society of London A: Mathematical, Physical and Engineering Sciences,
372(2017), 20130303.
James, S.J., James, C. and Evans, J.A., 2006. Modelling of food transportation
systems–a review. International Journal of Refrigeration, 29(6), 947-957.
James, S.J. and James, C., 2010. The food cold-chain and climate change. Food
Research International, 43(7), 1944-1956.
Karimipanah, M. T., 1998. Deflection of wall-jets in ventilated enclosures
described by pressure distribution. Building and Environment, 34(3), 329-
333.
Stellenbosch University https://scholar.sun.ac.za
188
Laguerre, O., Aissa, M.B. and Flick, D., 2008. Methodology of temperature
prediction in an insulated container equipped with PCM. International
Journal of Refrigeration, 31(6), 1063-1072.
Laguerre, O., Hoang, M. H., & Flick, D., 2012. Heat transfer modelling in a
refrigerated display cabinet: the influence of operating conditions. Journal
of Food Engineering, 108(2), 353-364.
Laguerre, O., Hoang, H. M., & Flick, D., 2013. Experimental investigation and
modelling in the food cold chain: Thermal and quality evolution. Trends in
Food Science & Technology, 29(2), 87-97.
Lisowa, H., Wujec, M., & Lis, T., 2002. Influence of temperature and variety on
the thermal properties of apples. International Agrophysics, 16(1), 43-52.
Liu, S. and Masliyah, J.H., 2005. Dispersion in porous media. Handbook of porous
media, 110.
Lukasse, L.J.S., Baerentz, M.B., Kramer-Cuppen, J.E.D., 2011. Quest II: Reduction
of CO2 emissions of reefer containers, in: 23rd IIR International Congress
of Refrigeration. Prague, 3203-3210.
McMillan, G.K. and Considine, D.M., 1999. Process/industrial instruments and controls handbook (Vol. 7). McGraw Hill.
Maersk, 2014.URL www.mcicontainers.com/Pages/default.aspx, Accessed
(11.10.2016)
Ménia Z, N., Moureh, J., & Flick, D., 2002. Modélisation simplifiée des coulements
d'air dans un véhicule frigorifique. International Journal of Refrigeration,
25(5), 660-672.
Moureh, J., Menia, N., & Flick, D., 2002. Numerical and experimental study of
airflow in a typical refrigerated truck configuration loaded with pallets.
Computers and Electronics in Agriculture, 34(1), 25-42.
Moureh, J., & Flick, D., 2004. Airflow pattern and temperature distribution in a
typical refrigerated truck configuration loaded with pallets. International
Journal of Refrigeration, 27(5), 464-474.
Stellenbosch University https://scholar.sun.ac.za
189
Moureh, J., Tapsoba, S., Derens, E., Flick, D., 2009a. Airflow in a slot-ventilated
enclosure partially filled with porous boxes: Part I – measurements and
simulations in the clear region. Computers & Fluids 38, 194–205.
Moureh, J., Tapsoba, S., Derens, E., Flick, D., 2009b. Airflow in a slot-ventilated
enclosure partially filled with porous boxes: Part II – measurements and
simulations within porous boxes. Computers & Fluids 38, 206–220.
Nakayama, A., & Kuwahara, F., 1999. A macroscopic turbulence model for flow
in a porous medium. Journal of Fluids Engineering, 121(2), 427-433.
Ngcobo, M. E., Delele, M. A., Opara, U. L., Zietsman, C. J., & Meyer, C. J., 2012.
Resistance to airflow and cooling patterns through multi-scale packaging of
table grapes. International Journal of Refrigeration, 35(2), 445-452.
Nield, D.A. and Bejan, A., 2006. Convection in porous media. Springer Science &
Business Media.
Norton, T. and Sun, D.W., 2006. Computational fluid dynamics (CFD)–an effective
and efficient design and analysis tool for the food industry: a review. Trends
in Food Science & Technology, 17(11), .600-620.
Opara, U. L., 2011. From hand holes to vent holes: what's next in innovative
horticultural packaging? (Inaugural Lecture, Faculty of AfriSciences),
South Africa: Stellenbosch University, 1-24.
Pathare, P. B., Opara, U. L., Vigneault, C., Delele, M. A., & Al-Said, F. A. J., 2012.
Design of packaging vents for cooling fresh horticultural produce. Food and
Bioprocess Technology, 5(6), 2031-2045.
Paul, D., 2001. Low-voltage power system surge overvoltage protection. IEEE
Transactions on Industry Applications, 37(1), 223-229.
Quintard, M. and Whitaker, S., 2005. Coupled, nonlinear mass transfer and
heterogeneous reaction in porous media. In: Kambiz, Vafai (Ed.). Handbook
of porous media, Taylor & Francis Group, LLC, 3-37, second ed.
Redding, G.P., Yang, A., Shim, Y.M., Olatunji, J. and East, A., 2016. A review of
the use and design of produce simulators for horticultural forced-air cooling
studies. Journal of Food Engineering, 190, 80-93.
Stellenbosch University https://scholar.sun.ac.za
190
Roache, P. J., 1994. Perspective: a method for uniform reporting of grid refinement
studies. Journal of Fluids Engineering, 116(3), 405-413.
South African Department of Agriculture, Forestry and Fishery annual report, 2014
Singh, J., Olsen, E., Singh, S.P., Manley, J. and Wallace, F., 2008. The effect of
ventilation and hand holes on loss of compression strength in corrugated
boxes. Journal of Applied Packaging Research, 2(4), 227-238.
Rodríguez-Bermejo, J., Barreiro, P., Robla, J. I., & Ruiz-García, L., 2007. Thermal
study of a transport container. Journal of Food Engineering, 80(2), 517-
527.
Smale, N. J., 2004. Mathematical modelling of airflow in shipping systems: model
development and testing. PhD thesis. Massey University, Palmerston North,
New Zealand.
Smale, N.J., Moureh, J. and Cortella, G., 2006. A review of numerical models of
airflow in refrigerated food applications. International Journal of
Refrigeration, 29(6), 911-930.
Tanner, D. J., Cleland, A. C., Opara, L. U., & Robertson, T. R., 2002a. A
generalised mathematical modelling methodology for design of
horticultural food packages exposed to refrigerated conditions: Part 1,
Formulation. International Journal of Refrigeration, 25(1), 33-42.
Tanner, D. J., Cleland, A. C., & Opara, L. U., 2002b. A generalised mathematical
modelling methodology for the design of horticultural food packages
exposed to refrigerated conditions Part 2. Heat transfer modelling and
testing. International Journal of Refrigeration, 25(1), 43-53.
Tanner, D. J., & Amos, N. D., 2003. Heat and mass transfer -temperature variability
during shipment of fresh produce. Acta Horticulturae 599, 193–204.
Tapsoba, M., Moureh, J. and Flick, D., 2006. Airflow patterns in an enclosure
loaded with slotted pallets. International Journal of Refrigeration, 29(6),
899-910.
Stellenbosch University https://scholar.sun.ac.za
191
Tapsoba, M., Moureh, J., & Flick, D., 2007. Airflow patterns in a slot-ventilated
enclosure partially loaded with empty slotted boxes. International Journal
of Heat and Fluid Flow, 28(5), 963-977.
Tassou, S.A., De-Lille, G. and Ge, Y.T., 2009. Food transport refrigeration–
Approaches to reduce energy consumption and environmental impacts of
road transport. Applied Thermal Engineering, 29(8), 1467-1477.
Thompson, J.F., Mejia, D.C. and Singh, R.P., 2010. Energy use of commercial
forced-air coolers for fruit. Applied Engineering in Agriculture, 26(5), 919-
924.
Verboven, P., Hoang, M.L., Baelmans, M., and B.M. Nicolai., 2004. Airflow
through beds of apples and chicory roots. Biosystems Engineering 88: 117–
125.
Verboven, P., Flick, D., Nicolai, B.M., Alvarez, G., 2006. Modelling transport
phenomena in refrigerated food bulks, packages and stacks: basics and
advances. International Journal of Refrigeration, 29 (6), 985–997.
Versteeg, H.K. and Malalasekera, W., 2007. An introduction to computational fluid
dynamics: the finite volume method, second ed., Pearson Education, New
York.
Van der Sman, R. G. M., 2002. Prediction of airflow through a vented box by the
Darcy–Forchheimer equation. Journal of Food Engineering, 55(1), 49-57.
Vigneault, C., Thompson, J., Wu, S., Hui, K. P. C., & LeBlanc, D. L., 2009.
Transportation of fresh horticultural produce. In N. Benkeblia (Ed.),
Postharvest Technologies for Horticultural Crops (2), 1–24, Kerale, India:
Research Signpost
Wang, H. and Touber, S., 1990. Distributed dynamic modelling of a refrigerated
room. International Journal of Refrigeration, 13(4), 214-222.
Wang, D. G., & Muller, P. K., 2000. Improving cooling efficiency by increasing
fan power usage. Microelectronics Journal, 31(9-10), 765–771
Wild, Y., Kraus, A.N.D.R.E.A.S. and Horn, R., 1999. Transport of refrigerated
containers in cargo holds. In Proceedings of the 20th International Congress
of Refrigeration, Sydney, Australia.
Stellenbosch University https://scholar.sun.ac.za
192
Wild, Y., 2008. Proceedings of the Carbon Footprint Workshop. Environmental
aspects of the transport of reefer containers, 3rd Reefer Logistic Conference.
Antwerp, 26 June.
Xia, B., & Sun, D. W., 2002. Applications of computational fluid dynamics (CFD)
in the food industry: a review. Computers and electronics in agriculture,
34(1), 5-24.
Xie, J., Qu, X. H., Shi, J. Y., & Sun, D. W., 2006. Effects of design parameters on
flow and temperature fields of a cold store by CFD simulation. Journal of
Food Engineering, 77(2), 355-363.
Yu, H., & Hoff, S. J., 1999. Airflow pattern similarity criteria for ceiling slot-
ventilated agricultural enclosures under isothermal conditions. Transactions
of the ASAE, 42(2), 459.
Zhang, Z., Zhang, W., Zhai, Z. J., & Chen, Q. Y., 2007a. Evaluation of various
turbulence models in predicting airflow and turbulence in enclosed
environments by CFD: Part 1—Summary of prevalent turbulence models.
Hvac&R Research, 13(6), 853-870.
Zhang, Z., Zhang, W., Zhai, Z. J., & Chen, Q. Y., 2007b. Evaluation of various
turbulence models in predicting airflow and turbulence in enclosed
environments by CFD: Part 2—Comparison with experimental data from
literature. HVAC&R Research, 13(6), 871-886.
Zhao, F.Y., Liu, D. and Tang, G.F., 2008. Multiple steady fluid flows in a slot-
ventilated enclosure. International Journal of Heat and Fluid Flow, 29(5),
1295-1308.
Zhao, C.J., Han, J.W., Yang, X.T., Qian, J.P. and Fan, B.L., 2016. A review of
computational fluid dynamics for forced-air cooling process. Applied
Energy, 168, 314-331.
Zou, Q.,Opara, L.U.,& McKibbin, R., 2006a. A CFD modelling system for airflow
and heat transfer in ventilated packaging for fresh foods I: initial analysis
and development of mathematical models. Journal of Food Engineering,
77(4), 1037–1047.
Stellenbosch University https://scholar.sun.ac.za
193
Zou, Q.,Opara, L.U.,& McKibbin, R., 2006b.A CFD modelling system for airflow
and heat transfer in ventilated packaging for fresh foods II: computational
solution, software development and model testing. Journal of Food
Engineering, 77(4), 1048–1058.
Stellenbosch University https://scholar.sun.ac.za