
Inventory Optimization Based on Purchasing Activities Analysis
77
Inventory Optimization Based on Purchasing Activities Analysis Mengying Fu Bachelor’s Thesis May 2015 Degree Programme in Logistic Engineering Technology, communication and transport
-
Upload
khangminh22 -
Category
Documents
-
view
1 -
download
0
Transcript of Inventory Optimization Based on Purchasing Activities Analysis

Inventory Optimization
Based on Purchasing Activities Analysis
Mengying Fu
Bachelor’s Thesis May 2015
Degree Programme in Logistic Engineering Technology, communication and transport

DESCRIPTION
Author(s) Fu Mengying
Type of publication Bachelor’s Thesis
Date 08052015
Pages 75
Language English
Confidential Permission for web publication ( X )
Title Inventory Optimization – Based on Purchasing Activities Analysis Degree Programme Degree Programme in Logistic Engineering Tutor(s) Aarresola Eero
Assigned by
Abstract Inventory optimization is a popular topic among companies, especially in SMEs. Based on the traditional inventory management methods, some other operations management concepts were considered to improve the inventory performance more comprehensively. On the basis of a case analysis for Company X, some attempts were made to achieve the goal of optimizing inventory from purchasing activities, purchasing strategy and supply chain points of view. Regarding the imbalanced inventory structure and imperfect inventory management system of Company X, some new improvement solutions including inventory replenishment method, overall purchasing strategy and JIT-QM Joint strategy were proposed in order to solve the current existing problems and promote the long-term development of the company. The recommended solutions described in the thesis were presented based on relevant literatures and theoretical calculations, thus the practicality of them needs to be tested empirically to demonstrate a broader support. Nevertheless, the new ideas and methods suggested in the thesis will enhance the vision of purchasing executives during the decision-making process, aiming at minimizing the inventory costs and maximizing the services.
Keywords Inventory Management, Purchasing, Just-in-Time Management, Quality Management
Miscellaneous

1
Contents
1. Introduction ................................................................................ 4
1.1 Objectives of the Thesis ................................................................ 4
1.2 Research Methods ....................................................................... 5
1.3 Case Company ........................................................................... 6
2. Operations Management ............................................................ 7
2.1 Inventory Management ................................................................. 7
2.1.1 Target of Inventory Management ......................................................... 7
2.1.2 Inventory Key Concepts ....................................................................... 9
2.1.3 Inventory Costs .................................................................................. 15
2.1.4 Inventory Performance Assessment .................................................. 17
2.2 Purchasing Function .................................................................. 18
2.2.1 Strategic Process ............................................................................... 19
2.2.2 Operational Process .......................................................................... 20
2.2.3 Purchasing Performance Assessment ............................................... 21
2.3 Quality Management .................................................................. 22
2.3.1 Introduction to QM ............................................................................. 23
2.3.2 Inventory and QM .............................................................................. 26
2.3.3 Purchasing and QM ........................................................................... 27
2.4 Just-in-Time Management ........................................................... 28
2.4.1 JIT Purchasing ................................................................................... 29
2.4.2 Economic Order Quantity ................................................................... 32
2.4.3 QM and JIT ........................................................................................ 35
3. Case Company Analysis .......................................................... 38
3.1 Introduction .............................................................................. 38
3.1.1 Research Method............................................................................... 38
3.1.2 A Case Study as a Research Strategy ............................................... 39
3.1.3 Data Collection................................................................................... 40
3.2 Current Situation of Company X ................................................... 41

2
3.2.1 Imbalanced Inventory Structure ......................................................... 41
3.2.2 Complicated Classification System .................................................... 42
3.3 Purchasing Performance Assessment ........................................... 42
4. Performance Improvement ....................................................... 45
4.1 Inventory Performance Improvement ..................................................... 45
4.1.1 Standard Item Reclassification .......................................................... 45
4.1.2 Non-active Inventory Management .................................................... 47
4.2 Purchasing Performance Improvement .................................................. 50
4.2.1 Inventory Replenishment ................................................................... 50
4.2.2 Purchasing Strategy ........................................................................... 54
4.2.3 JIT- QM Joint Strategy ....................................................................... 58
5. Conclusion and Summary ........................................................ 66
6. Discussion ................................................................................ 67
References ................................................................................... 70
Appendices .................................................................................. 74
Appendix 1. Terminology ............................................................................ 74
Appendix 2. Survey about purchasing performance of Company X ............ 75

3
FIGURES
FIGURE 1. Strategic Purchasing Process ...................................................... 19
FIGURE 2. Operational Purchasing Process .................................................. 20
FIGURE 3. Competitive Advantage of Quality Management .......................... 22
FIGURE 4. The Plan-Do-Check-Act Cycle ..................................................... 23
FIGURE 5. Reorder Point ............................................................................... 33
FIGURE 6. Towards a reduction of the economic order quantity ................... 35
FIGURE 7. Model of relationship among QM, JIT purchasing and business
performance ................................................................................................... 37
FIGURE 8. ABC Classification of standard items ........................................... 46
FIGURE 9. XYZ Classification of standard items ........................................... 46
FIGURE 10. AB-XY Classification of standard items ...................................... 47
FIGURE 11. Obsolete inventory cause and effect diagram ............................ 48
FIGURE 12. Combination of Kraljic's purchasing product portfolio-approach
and AB-XY Analysis ....................................................................................... 55
FIGURE 13. JIT-QM Joint strategy ................................................................. 59
FIGURE 14. Quality improvement of supply chain ......................................... 60
FIGURE 15. Supply chain quality management system ................................. 63
TABLES
TABLE 1. Comparison between JIT purchasing and traditional purchasing ... 31
TABLE 2. Purchasing performance evaluation ............................................... 43
TABLE 3. Safety stock & Reorder level reductions ........................................ 52

4
1. Introduction
According to the Economic situation and outlook 4/2014, offered by The
Federation of Finnish Technology Industries, the growth of the world economy
has failed to achieve the level predicted for this year. One of the crucial factors
is the slowdown in economic growth in the large developed countries, such as
the European countries and Japan. For example, the Finnish technology and
mechanical industry, which sets a warning example of the poor cost
competitiveness in terms of the labor costs and productivity, also experienced
a significant decrease. (Economic situation and outlook, 2014.)
When it comes to the Finnish manufacturing market, the Small and Medium
Scale Industrial Enterprises (SMEs) play an important role. To improve
competitiveness and achieve cost efficiency, a company should not only try to
meet its customers’ needs and learn the competitors’ actions, but also
improve the internal performance by improving its operational processes, such
as inventory control, purchasing and manufacturing, etc. Especially since
inventory constitutes a vital portion of the current assets of SMEs, inventory
management is closely related to the utilization of capacity and the realization
of profit. Therefore, efficient inventory management is meaningful for Small
and Medium Scale manufacturing organizations as well as for a country’s
economic growth.
1.1 Objectives of the Thesis
The thesis was implemented based on a case company X. The research and
analysis were focused especially on assessing the current inventory and
purchasing performance. Based on a comparison between the optimum
(theoretically) results and the current one, an attempt was made to find
corresponding solutions to deal with the company’s existing problems and
improve the future performance.

5
More specifically, the primary goal was to assess the performance of non-
active stocks and to discover the factors causing them. The thesis mainly
focused on the field of waste reduction by applying the JIT Management and
Quality Management principles. Secondly, to achieve cost efficiency, the
company itself implemented some strategy modifications regarding the
purchasing process. In this case, further comparison between the modified
purchasing strategy and theoretical recommendation was implemented, in
order to assist the future decision-making process of the purchasing team and
ensure the company’s long-term competitiveness.
From a scholar point of view, despite a good combination of theoretical study
and practical knowledge during the research and analysis process, the
practicality of certain theories was verified as well. For instance, assessment
was made whether the JIT principle was applicable for finished products in a
non-manufacturing environment. Moreover, this work also reflected on
whether the Economic Order Quantity (EOQ) calculating method was the most
efficient way to find out the optimum order quantity.
1.2 Research Methods
The research was based on the case company X. All the data were collected
from the company’s database, interviews of the personnel from the related
departments and the company’s website.
By implementing an ABC analysis and an XYZ analysis, detailed information
about product sales and transactions could be found. In addition, according to
the expectations of the company, appropriate approaches needed to be found
in order to eliminate the stocks with 0 turnovers and prevent the related
problems from happening in the future. In terms of the inventory system, the
overall structure could be thus optimized by adjusting the percentage
distribution of active and non-active products. Meanwhile, the most suitable
purchasing strategies were expected to be designed as well regarding
different groups of items, in order to reduce inventory cost and improve

6
efficiency. The main academic approaches include inventory management,
JIT Management and Quality Management.
Concerning the research and analysis methods, a combination of qualitative
and quantitative methods was applied. For example, to determine the optimal
ordering level, some calculations were performed with a series of numerical
data. However, only supported by quantitative data, the study results might be
unconvincing enough. Since the acquisition and analysis of different types of
data took place in a separate phase, and since each type of information was
used to measure different but complementary aspects of the same object,
both of them were important for the interpretation of the results. (Joan Miquel
& Marti 2011.) As a result, a qualitative approach was applied at the same
time so as to be able to explain the dynamics between the actors and other
relevant factors (Fenson & Edin 2008, 22).
1.3 Case Company
For decades, Company X has been a remarkable manufacturer and importer
of oil and water hydraulics components and systems. Over decades, global
OEM customers as well as the industrial customers of Company X have
experienced high quality, cleanliness and delivery reliability provided by the
case company.
According to the purchasing manager of Company X, “Although the domestic
sales situation is not that optimistic at the moment, the current financial status
is still doing good. The good result is attributable to the global exporting sales
to a large extent.” (Purchasing Manager of Company X, 2014.) However,
according to the Managing Director of Company X, “in terms of current stock
situation, a large amount of non-active stock has been stored in the
warehouse for so many years.” Especially from a long-term point view, if the
amount of non-active stock continues to increase, the business profit will
finally be affected negatively. In order to spare more development space for
crucial products, which need to be handled with more care, the stock with no
sales should be reduced or eliminated to as great an extent as possible.

7
2. Operations Management
Operations management is the area relating to the efficiency and
effectiveness of the operations supporting the development of a company’s
strategic goals. The four primary functional areas of a firm are marketing,
finance, operations and human resources. Operations are the technical core
of an organization. They interact with the other areas and suppliers in order to
produce products and provide services for customers. They are focused on
the planning, scheduling, and control of manufacturing, or services. (Russell &
Taylor 2009, 4.)
Operations management mainly includes two critical aspects –
competitiveness and performance. In order to improve competitiveness in the
market, a company should try to meet the needs of the customers to the
maximum extent, while learning good actions from its competitors. In terms of
the overall performance improvement, companies normally focus on certain
operational processes such as purchasing, inventory management or
production. While maintaining or improving the quality of a process, cost
efficiency is also expected to be achieved. When analyzing the relations
between competitiveness and performance, an outstanding performance will
obviously contribute to a firm’s competitiveness, and, in turn, strong
competitiveness will motivate the company to achieve better performance in
the future. In this thesis, the current performance of two important logistics
operations processes - purchasing and inventory management processes -
were deeply analyzed in order to make possible strategy adjustments
regarding the improvement of the future performance and hence the overall
business competitiveness.
2.1 Inventory Management
2.1.1 Target of Inventory Management
As part of the most significant assets of a company, stock gives a buffer
between supply and demand. It allows for variation and uncertainty in both

8
supply and demand, and makes operations continue smoothly (Waters 2003,
8). Organizations usually hold different types of stock, such as raw materials,
purchased parts, work in progress, finished goods and so on. There is a
variation of stock holding strategies between different types of company.
However, the importance of keeping the right stocks at the right time is
indubitable. On the one hand, stocks allow the company’s internal operations
to be more effective. Externally, stocks affect lead times and the availability of
materials, thereby affecting customer’ satisfaction and the perceived value of
the products (ibid., 10). In the end, they also play a strategic role affecting the
operating costs and hence the financial performance of the whole business in
the long term. On the other hand, keeping stocks can be either encouraging or
risky, depending on the inventory management method, or in other words how
to manage the stocks that must be held in the most effective way.
Inventory Management manages the product flow along a supply chain, and it
also helps to determine how much products to order and when to replenish.
Meanwhile, Inventory Management plays an important role in cost reduction.
Especially in the current global business environment with more rapid product
updating, the cost of inventory has increased partly as a result of quicker
product obsolescence. (Russell & Taylor 2009, 527.) So, the question of how
to lower the inventory cost while maintaining the required service level of
products has become a popular topic among different types of organizations.
In order to achieve the target that materials or items are available when they
are required while the holding costs are minimized, efficient cooperation in the
decision-making between different levels of an organization is highly
recommended. In general, there are three types of objectives for inventory
management. They are classified as follows.
Strategic decisions are the most important, because they have long-term
effects, use many resources and are the most risky. They set the overall
directions for the operations.
Tactical decisions are concerned with implementing the strategies over
the medium term. They look at more detail, involve fewer resources and
some risk.

9
Operational decisions are concerned with implementing the tactics over
the short term. They are the most detailed, and involve few resources and
little risk.
(Waters 2003, 37.)
After setting the higher strategies regarding the overall direction, the tactical
and operational decisions show how the detailed inventory management
strategy is implemented. Decisions for inventory management come from all
levels, forming part of the overall logistics strategy and the lower tactical and
operational decisions. (ibid., 37.) Nowadays in a modern organization, most of
the decisions are discussed between different departments instead of simply
passing them down through a strict hierarchy. Furthermore, usually the most
suitable person who makes a decision is the one most closely involved with
the issue.
2.1.2 Inventory Key Concepts
Demand Analysis Demand can be regarded as the initial point of the whole supply chain, so the
analysis of demand is crucial. The purchasing decisions regarding “when to
order” and “how much to order” rely on an effective demand analysis to a
large extent. Therefore it would be necessary to understand some basic
terminologies relating to the analysis of demand.
Demand: the number of units to be supplied from stock in a given period.
(Waters 2003, 69)
Independent demand: refers to random demand, which is independent of all
other products. It does not have a consistent pattern and may have high or
low volumes. (Emmett & Granville 2007, 36.)
Lead time: the full time period from when the decision is made to order until
the product is available for issue. (ibid., 94.)
Cycle time: the time between two consecutive replenishments. It depends on
the order quantity, with larger orders leading to longer cycle times. (Waters
2003, 69.)
Order quantity: the fixed order size that has been always used. (ibid., 69.)

10
Reorder point (ROP): the level of inventory that triggers an action to
replenish certain inventory stock. In other words, when it is time to place an
order, the stock on hand must just cover the demand until this order arrives.
The level is normally calculated as the forecast usage during the
replenishment lead time plus the safety stock. (ibid., 69.)
Service level: a target for the proportion of demand that is met directly from
stock. It can be measured by the percentage values such as the percentage of
orders completely satisfied from stock, the percentage of demands that are
delivered from stock, and the percentage of demands that are delivered on
time, etc. (ibid., 171.)
Back-orders: they occur when a customer orders an item that is out of stock,
and then wait to receive the item from the latter delivery from suppliers. (ibid.,
121.)
Stock Analysis Safety stock: the stock kept beyond expected needs, adding a margin of
safety. It is served as an insurance against stockout when there is uncertainty
in demand and supply. The level of safety stock can be defined by using either
the demand of the period or mathematical formula.
Active stock: an assortment of assets that will be used or sold within a
certain period (normally a year).
Non-active stock: some non-moving stocks on hand, and when these have
no foreseeable future use, they are declared as obsolete stock (Emmett &
Granville 2007, 162). The non-active stock may be caused by the backlog of
obsolete stocks for many years, and there is no market demand for the
product.
Overstock: the result of poor management of stock demand or of materials
flow in process management.
Understock: the items whose quantity is under safety stock. The lesser
quantity means the weaker service level.

11
Demand Forecasting When dealing with independent demand, forecasting is an important step for
the best estimation and prediction of possible changes in the future
replenishment. Forecasting also aims to minimize the inaccuracy based on the
previous forecasts. Demand forecasting can be either easy or hard,
depending on the type of products, stability of demand and the length of the
time period.
Time Series Methods: These methods involve looking at the pattern of the
past demand and extending this into the future, in other words, predicting the
future based on the past data. (Emmett & Granville 2007, 51.)
Accuracy of forecast: refers to the actual demand versus demand
forecasted in a period. (ibid., 186.)
ABC Analysis Background of ABC Analysis Since there are many individual items needing to be managed in a
complicated inventory system, it is highly important to make a reasonable time
distribution for items with different values. In order to count the accuracy of the
inventory in a cost-effective manner, one of the useful methods is ABC
Classification / Analysis, which is based on the product consumption during a
particular time period (normally one year). The analysis is based on Pareto’s
80 – 20 rule, which presents that 20% of the population owns 80% of the
wealth. This observation was first made by the Italian economist Vilfredo
Pareto, and more widely speaking, the rule illustrates a high incidence in one
set of variables and equates to a smaller incidence in a corresponding set of
variables. (Emmett & Granville 2007, 41.) As applied to the inventory field, a
typical relation between the percentage of items and the percentage of the
sales or usage values can be in the following pattern:
A Product – about 20% of the items account for about 80% of profit, sales or
usage.
B Product – about 30% of the items account for about 15% of profit, sales or
usage.

12
C Product – about 50% of the items account for about 5% of profit, sales or
usage.
However, the percentage values can be varied depending on different
industries. The above distribution is not the absolute pattern.
Handling different classes of product According to some suggested guidelines for handling A, B and C classes of
items, there are different management procedures based on different levels of
consumption values.
Class A items
Theoretically, Class A items represent a group of products with high
consumption values. This group requires very strict control, no or very low
safety stock, frequent ordering (weekly), weekly control statements, as many
sources as possible for each item, accurate forecasts, minimization of waste
obsolete and surplus and maximum efforts to reduce lead time. (Rama 2009.)
Class B items
Comparing to Class A products, “B” items require moderate control, lower
safety stock, delivery once in three months, monthly control reports, two or
more reliable sources for each item, estimation based on past data and
quarterly control over surplus and obsolete items. (ibid.)
Class C items
C items have the lowest consumption values comparing to the first two
groups. When dealing with this class of products, loose control, high safety
stock, bulk ordering once in 6 months, quarterly control reports, two reliable
sources for each item, and a rough estimation for planning are needed. In
addition, an annual review over surplus and obsolete materials is sufficient,
and minimal clerical efforts should be made on. (ibid.)
Advantages and disadvantages of an ABC inventory analysis Even though the ABC Analysis can help to ensure considerable reduction of
storage expenses and at the same time preserve costly items if applied with

13
care, it is still significant to understand the advantages and disadvantages of
the analysis method.
Better Control of High-Priority Inventory
ABC inventory analysis places tighter and more frequent controls on high-
priority inventory. Class A inventory includes critical items with the highest
value to the company, so it is crucial to constantly monitor the demand for it
and ensure that stock levels match the corresponding demand. (Advantages
and Disadvantages of ABC Analysis Inventory N.d.) On the contrary, Class C
products can be managed with basic and simple records. In addition,
inventory quantities can be larger with very few periodic reviews. In short,
ABC Analysis assists a company to understand which items need to be
focused on, and which are not so important and require less care.
More Efficient Cycle Counts
When applying the ABC inventory analysis method, the resources can be
allocated more efficiently during cycle counts, meaning the process of
counting only certain items on scheduled dates. The frequency of the cycle
counts and the items selected to include depend on how often the inventory
fluctuates. If the inventory is classified by class, Class A inventory could be
handled with regular cycle counts. If necessary, Class B products could be
counted as infrequently as twice per year and Class C products only once per
year. (ibid.) In this way, both time and labor costs can be considerably
reduced.
Nevertheless, the ABC Analysis suffers from the following drawbacks at the
same time.
Risk of Undersupply and Oversupply
Since an ABC analysis is performed based on dollar values rather than on the
number of items, some companies may only concentrate on high-value
products, this means that there is a risk of running out of low-value items
which are, nevertheless, essential in terms of the overall business. The

14
opposite situation exits too – an excess Class B and C items may pile up in
the inventory if they are regularly reordered without a review. Sometimes
those stocks can even be in danger of obsolescence or damage, causing a
great deal of extra costs.
Requires Substantial Resources
The ABC analysis method requires more resources for maintenance than
traditional costing systems. When cycle counts are performed, Class A must
be routinely analyzed to determine if the inventory still consists of high-priority
items. If an inventory piece is no longer used or demanded as frequently, it is
moved to another inventory classification. (ibid.) In this case, a good system of
codification should be adopted for the success of the analysis, and it would be
even better if the company’s inventory system allowed for accurate and timely
information updating.
XYZ Analysis The XYZ classification is a modification of ABC analysis, based on the
structure of selling in pieces. Both ABC and XYZ analysis are following 80/20
rule, which means that about 20% of things produce about 80% of results.
Apart from the assumed criterion according to the sales in value (ABC
analysis), to achieve better segmentation of products, one should divide them
also according to the sales quantity (Bulinski, Waszkiewicz, & Buraczewski
2013, 93). The XYZ classification divides products into three groups:
Group X – the products of high selling rate
Group Y – the products of average selling rate
Group Z – the products of low selling rate (sold occasionally)
Carrying out the ABC/XYZ analysis enables to arrange the products according
to selected criterion. A combination of total sales value and demand size
analysis gives more accurate evaluation of a company’s inventory
performance. Meanwhile, when implementing both ABC and XYZ analysis, a
more comprehensive examination enables to identify the specific products that

15
fail to bring the expected financial profits and allow for making some
corresponding corrections. (Bulinski et al. 2013, 95.)
2.1.3 Inventory Costs
Value of Stocks The treatment of the inventory in a company’s financial account is normally
different than in some other areas. It is important to have an accurate value for
stocks and understand how inventory costs affect the profit and loss account,
cash flow and the return on capital employed. There are mainly four methods
of setting the stock values.
Actual cost method assumes that the actual cost of each item can be
tracked.
First-In, First-Out (FIFO) assumes that the first goods that are purchased
will be the first ones to be dispatched irrespective of the timing of the sale.
Last-In, First-Out (LIFO) assumes that the items that have been recently
purchased will be the ones that are sold first, regardless of when the
actual sales take place.
Average cost method finds the average unit cost of all purchased over
some time, and assigns this value to all remaining stock.
(Emmett & Granville 2007, 105; Waters 2003, 49.)
Types of Cost Keeping stocks produces costs. Simply reducing the amount of stocks is not
the best way to minimize the inventory costs, since sometimes even low
stocks can lead to shortage that affect operations and cause extra cost. In this
case, a detailed analysis of specific type of inventory costs is needed.
Generally, the inventory costs can be classified into four categories.
Unit cost is the price charged by suppliers for one unit of the item, or the
cost to the organization of purchasing one unit.
Carrying costs are the costs of holding one unit of an item in stock for one
period of time. The most obvious carrying cost is the money tied up –

16
which is either borrowed or could be put to other use. Some other types
of carrying costs include storage cost, damage/loss cost, handling cost,
administration cost, insurance and so on.
Ordering costs are the ones associated with replenishing the stock of
inventory being held. This type of cost may include allowance for drawing-
up an order, correspondence and telephone costs, supervision, use of
equipment and follow-up, etc. Sometimes costs such as quality control,
transport, delivery, sorting and movement of received goods are also
included.
Shortage costs usually occur when customer demand cannot be met
because of inefficient inventory. This kind of shortage can result in
customer dissatisfaction and even permanent loss of sales.
(Waters 2003, 52-53; Russell & Taylor 2009, 530-531.)
Financial Impact of Inventory Obviously the inventory has a direct impact on the financial performance of a
firm. Firstly, as current asset, the inventory directly influences the revenue,
cost and profit. Both the revenue and cost will occur in the profit and loss
statement when the sales and purchasing costs of the items occur in the same
period. But when item is purchased in one time period and then is used in a
later period, the adjustment has to be made to the profit in order to allow for
the increase of stock levels. (Emmett & Granville 2007, 107.) Moreover, the
inventory, as one type of capital employed, can affect the performance of cash
flow and even the operation of the supply chain. And, in turn, the inventory
management also has a direct impact on capital employed and therefore
capital/asset turnover. Last but not least, there are some further impacts that
are not as obvious. For example, the warehouse operating costs, extra
transport costs, extra salaries or allowances and the disposal costs caused by
damaged and obsolete items, etc. may also become obstacles to inventory
level optimization and costs reduction.

17
2.1.4 Inventory Performance Assessment
When company’s replenishment process is based on forecasts, the forecast
accuracy and the purchasing frequency determine the stock levels. To reduce
the stock levels while achieving customer service targets, an accurate
inventory performance evaluation is expected to be made regularly.
Inventory Turnover In order to monitor the inventory performance over a certain period (normally
one year), one effective measure to decide whether existing inventory levels
are reasonable or not is to calculate the Stock turnover. The ratio can be
calculated as
, and it demonstrates the number of
times the company sells its inventory during a certain period. Alternatively,
when organizations often find their stock turnover indirectly from accounts, the
Stock turnover is usually defined according to the following formula:
(Waters 2003, 53 – 54.)
Whether a current ratio is good or bad depends on the type of business.
Generally, a higher inventory turnover is considered a positive indicator of
operating efficiency, since inventory that remains in place produces no
revenue but increases inventory carrying costs. However, a higher inventory
turnover ratio does not always indicate better performance. A more specific
and deep analysis should be implemented with some other trends within the
financial statements. (Bierley, Jr., 2008)
Models for Implementing Inventory Controls The basic steps for implementing inventory controls could be done as follows:
a) List all the items sold in the last 12 months at cost.
b) List the current stock value of each item at cost.

18
c) Arrange the information in descending order of value. Make the ABC
analysis.
d) Review the stock level of A, B and C class items respectively.
e) Evaluate the stock turnover regarding each class of item.
f) Identify the items with no usage.
g) Review the inventory parameters such as reorder point, safety stock and
EOQ, etc.
h) Compare current situation with the stockholding targets.
i) Strategy adjustment in order to make improvements.
In order to make a realistic assessment, it is important to have the ability to
measure and understand the variances between targets and achievements.
And according to Waters (2007, 183), it is good to remember that there is little
point in planning if you do not intend to measure, and there is little point in
measuring if there is not a target with which to compare results.
2.2 Purchasing Function
As a buying process, the purchasing function is directly link to the inventory
level control and cost management. The purchasing function plays a
significant role in the whole supply chain, starting from the supplier selection
to follow-up and evaluation. Even though the purchasing seems separated
from some operations such as materials requirements planning, inventory
management, incoming inspection and quality control, etc., in order to
maximize the company’s efficiency, purchasing operations are implemented
interrelated with those activities. Especially in terms of the current global
business environment, in which there are more competitions as well as
cooperation, the purchasing function of an organization becomes increasingly
critical towards the excellent performance of the organization and the whole
supply chain.
19
2.2.1 Strategic Process
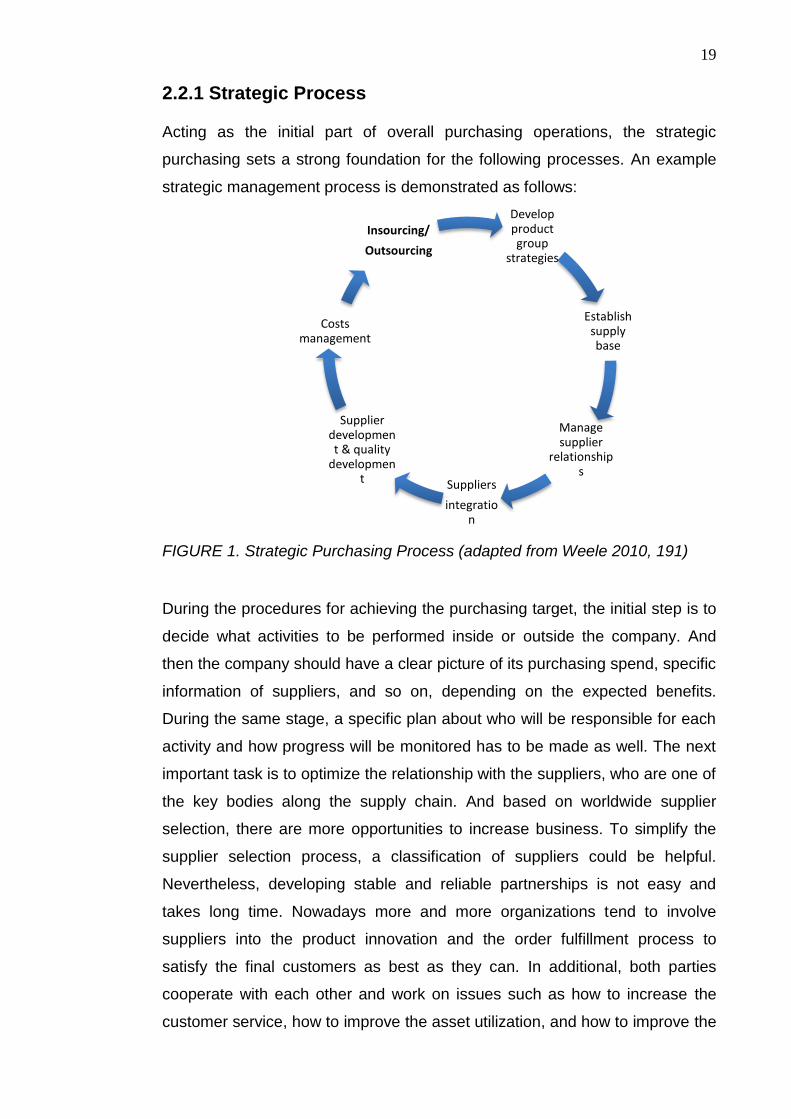
Acting as the initial part of overall purchasing operations, the strategic
purchasing sets a strong foundation for the following processes. An example
strategic management process is demonstrated as follows:
FIGURE 1. Strategic Purchasing Process (adapted from Weele 2010, 191)
During the procedures for achieving the purchasing target, the initial step is to
decide what activities to be performed inside or outside the company. And
then the company should have a clear picture of its purchasing spend, specific
information of suppliers, and so on, depending on the expected benefits.
During the same stage, a specific plan about who will be responsible for each
activity and how progress will be monitored has to be made as well. The next
important task is to optimize the relationship with the suppliers, who are one of
the key bodies along the supply chain. And based on worldwide supplier
selection, there are more opportunities to increase business. To simplify the
supplier selection process, a classification of suppliers could be helpful.
Nevertheless, developing stable and reliable partnerships is not easy and
takes long time. Nowadays more and more organizations tend to involve
suppliers into the product innovation and the order fulfillment process to
satisfy the final customers as best as they can. In additional, both parties
cooperate with each other and work on issues such as how to increase the
customer service, how to improve the asset utilization, and how to improve the
Develop product group
strategies
Establish supply base
Manage supplier
relationships
Suppliers
integration
Supplier development & quality
development
Costs management
Insourcing/
Outsourcing

20
communication flexibility by applying modern ICT, etc. In the final stage, the
buying company shares the benefits gained from all supplier improvement
activities that are generated from its suppliers, rather than taking it all itself
(Weele 2010, 192). This process also encourages both parties to work jointly
with end customer to realize cost savings. However, the implementation of the
strategic purchasing process still depends on the types of business, the
products and the suppliers. (ibid., 190 – 192.)
2.2.2 Operational Process
On the basis of the strategic planning process, how to conduct the operation
process is also significant for a company’s sustainable performance. An
example of operational process is demonstrated as follows:
FIGURE 2. Operational Purchasing Process (adapted from Weele 2010, 193)
In terms of a multinational company, or a company dealing with international
import and export, it is important to have standard rules and guidelines about
how to develop every business unit, in order to avoid some possible
misunderstandings or even conflicts when doing business with international
partners. In addition, the information sharing and effective communication can
also promote the collaboration between different stakeholders concerned.
When it comes to the global sourcing process, sources of supply in low-cost
Develop organizatio
n & teaming
strategies
Deploy globalizati
on
Develop and
implement IT system
HR training & development
Develop purchasing & supply chain measuremen
ts
Establish globally integrated
purchasing & supply chain
strategies

21
countries become increasingly attractive especially for the small and medium-
sized companies. In this case, a basic understanding for the culture of the
countries the company does business with is highly recommended, so as to
avoid misunderstandings or some other possible risks. And to be able to
produce effective purchasing management information and communicate
timely, the investments in advanced IT systems and related facilities are
necessary as well. Those systems should include specific procurement
solutions aimed at simplifying order to pay transactions through electronic
ordering and payment (Weele 2010, 194). From the view of human resource
management, proper recruitment, training and remuneration policy also
contribute to the purchasing efficiency and effectiveness. (ibid., 193 – 194.)
2.2.3 Purchasing Performance Assessment
After implementing both strategic and operational processes, another major
concern for many companies is to measure and evaluate the purchasing
performance in a certain period. The factors which may affect the strategic
purchasing performance include “should cost” analysis, number of new
suppliers contracted, and cost savings. For the operational purchasing
function, which is handled by relatively lower positions of an organization,
some parameters such as number of orders, order backlog, lead time,
inventory reduction, and so on, may influence the measurement. (Weele 2010,
302-303.)
The key areas will be considered when making the evaluation consists of four
main dimensions – purchasing cost, purchasing product/quality, purchasing
logistics (handling process, supplier performance, and inventory level control)
and purchasing organizations. All the aspects reflect the purchasing
effectiveness related to the objectives and purchasing efficiency connected to
the resources that are required to meet the purchasing goals. (ibid., 307-308.)
A regular reporting of actual versus planned results enables a company to
verify whether its expectations have been realized. Based on the purchasing
performance during the previous periods, the purchasing team may improve
decision-making performance and prevent the previous variances happening

22
in the future. The performance assessment may also lead to better
communication and mutual understandings between purchasing department
and other departments. From a buyer’s point of view, a proper performance
evaluation system can meet his or her personal and motivational needs as
well as constructive goal setting. (ibid., 304.)
2.3 Quality Management
According to the definition of quality given by IBM Company, “Quality is the
degree in which customer requirements are met.” Nowadays, in terms of a
certain type of industry that is involved into a complete supply chain, the
quality management represents the involvement and commitment of
everyone, in continuously improving work processes, to satisfy the
requirements and expectations of all internal and external customers (Emmett
& Granville 2007, 198.)
In order to make sure that the customer’s requirement will be met and at the
same time minimize the inventory carrying costs, the quality management is
playing a crucial role in optimizing inventory and improving quality of
purchasing activities. Within an organization, the quality management is the
responsibility of every employee. The organization structure and the level of
training to the employees are closely linked to the quality improvement
process.
FIGURE 3. Competitive Advantage of Quality Management
Carrying Cost Minimization
Inventory Quality Management
Increase Inventory Turnover Reduce Cycle Time
Purchasing Quality Management
Increase Productivity Optimize Organization

23
2.3.1 Introduction to QM
Basic Concept of QM Deming Cycle (PDCA Cycle) To assure every transaction between customer and supplier can be made
smoothly, the quality management requires intensive and effective
cooperation between different departments inside the organization and with
outside suppliers and customers. Generally, customer and supplier should
make agreement regarding following aspects:
the basic requirements of the transaction
the way in which the requirements are to be realized
how to check that the requirements are fulfilled
the measures to be taken when the requirements are not met
(Weele 2010, 238.)
Combining with Deming Cycle (PDCA Cycle), the basic elements of the quality
management are demonstrated below:
FIGURE 4. The Plan-Do-Check-Act Cycle (adapted from Weele 2010, 239)
Plan
Requirement
Do
Realisation
Check
Verification
Act
Feedback

24
The Seven Wastes Mainly there are seven types of wastes needing to be minimized or eliminated
through the quality management.
Overproduction is the excess finished goods stocks resulting from
production, especially found in make-to-stock scenarios.
Waiting is the time spent on queuing for a machine to finish its cycle.
Transporting is the moving of WIP (work-in-progress) around for finishing.
The costs resulted from transport add no value to the finished product.
Inappropriate processing is the waste resulted from over
specifying/engineering.
Unnecessary inventory is the stock over the required minimum.
Unnecessary motion is the movement that does not contribute in getting
products to customers.
Defects are the faults that are required to be corrected.
(Emmett & Granville 2007, 200.)
Quality Tools The performance of quality in a company can be measured by using quality
tools, especially through statistical process control. Currently there are seven
well-known tools for identifying quality problems and improving the
competition of the organization.
The process flowchart is a diagram of the steps in a job, operation or
process. The development of the flowchart can make the process more
understandable and enable us to identify problems concerned.
A check sheet is a list of causes of quality problems with the number of
defects resulting from each cause used to develop a bar chart called a
histogram.
The Pareto analysis is a diagram for tallying the number of defects
resulting from different causes to identify quality problems. Theoretically
the identification of the Pareto chart is that 20% of problems produce 80%
of defects.
Histogram shows the frequency of data related to quality problems. A flat
and wide curve means to stable, rather than vice versa.

25
Scatter Diagram shows the relationship between two variables in a
process, and it identifies a pattern that may cause a quality problem.
Statistical Process Control Chart is the one with statistical upper and
lower limits. If the process stays between these limits over time, it is in
control and a problem does not exist.
Cause-and-Effect Diagram also called a “fishbone” or Ishikawa diagram,
which is used to identify the causes of a quality problem so as to correct
it.
(Russell & Taylor 2009, 60-63.)
Benefits of QM The main goal of the quality management is to improve the quality level of
products and optimize the overall function of an organization.
The major benefit of the quality management is to achieve productivity and
process efficiency by identifying and eliminating problems occurred during the
working process. Improving quality by reducing defects will increase good
output and reduce input, and therefore will improve the overall productivity.
From a long-term point of view, the quality management also helps with
predicting and preventing unproductive activities.
One of the other biggest benefits of the quality management is the cost
savings that will be achieved in the long run. The quality management aims at
reducing or eliminating unnecessary and unproductive tasks such as non-
confirmation and repetitive work. Moreover, the improved profit per product or
service can be achieved through elimination of unnecessary steps and
wasteful expenditure.
Better organization within a business is another benefit of the quality
management. By analyzing available business data from different aspects, the
optimized communication and the efficient information sharing between
departments will be promoted. In addition, the employees will be more positive
because of the more motivated and well-cooperated working environment.
An additional advantage of the quality management relates to customer
satisfaction. For instance, the waiting time can be reduced by changing the

26
method of appointment scheduling or client handling, and the product reaches
the customer faster due to the change of the delivery processes. In this case,
customer loyalty can be maintained. (Idea: Nayab 2011.)
2.3.2 Inventory and QM
Effect on inventory turnover
The impact of the quality management on inventory turnover can be
demonstrated by examining the functional elements of aggregate inventory.
When there are some quality problems occur in the purchasing or
manufacturing process, large amounts of safety stock inventory are required,
in order to compensate the absence of constant work flow. In terms of the
variance of lead-time, since lead-time varies more because of manufacturing
or purchasing process problems, more safety stock is required to guarantee
the meeting of customer needs. At the same time, the quality management
also allows the use of smaller lots, which reduces cycle stock and safety stock
buffers. Thus, the quality management leads to a relatively lower inventory
level. (Flynn, Sakakibara, & Schroeder 1995, 1329.) In terms of the scrapped
and obsolete items that are often the least costly component of poor quality,
the quality management can also prevent recurrence of problems by
improving buying or production process.
Effect on cycle time
Since the quality management practices reduce the amount of items requiring
rework, cycle times are shortened accordingly, allowing improved schedule
attainment and relatively faster response to market demands. In addition,
based on the quality criteria, the cooperation with quality certified suppliers
can reduce or eliminate preprocessing cycle time delays for incoming
inspection. During the processing and the post-processing stages, the
effective quality management practices also reduce or eliminate time delays
for rework and process inspection of in-process and finished goods. In short,
cycle times will be reduced if there is less time wastage resulting from rework
of defective items. (ibid.,1328-1329.) As we say that “time is money”, some
impressive cost savings can be achieved correspondingly.
27
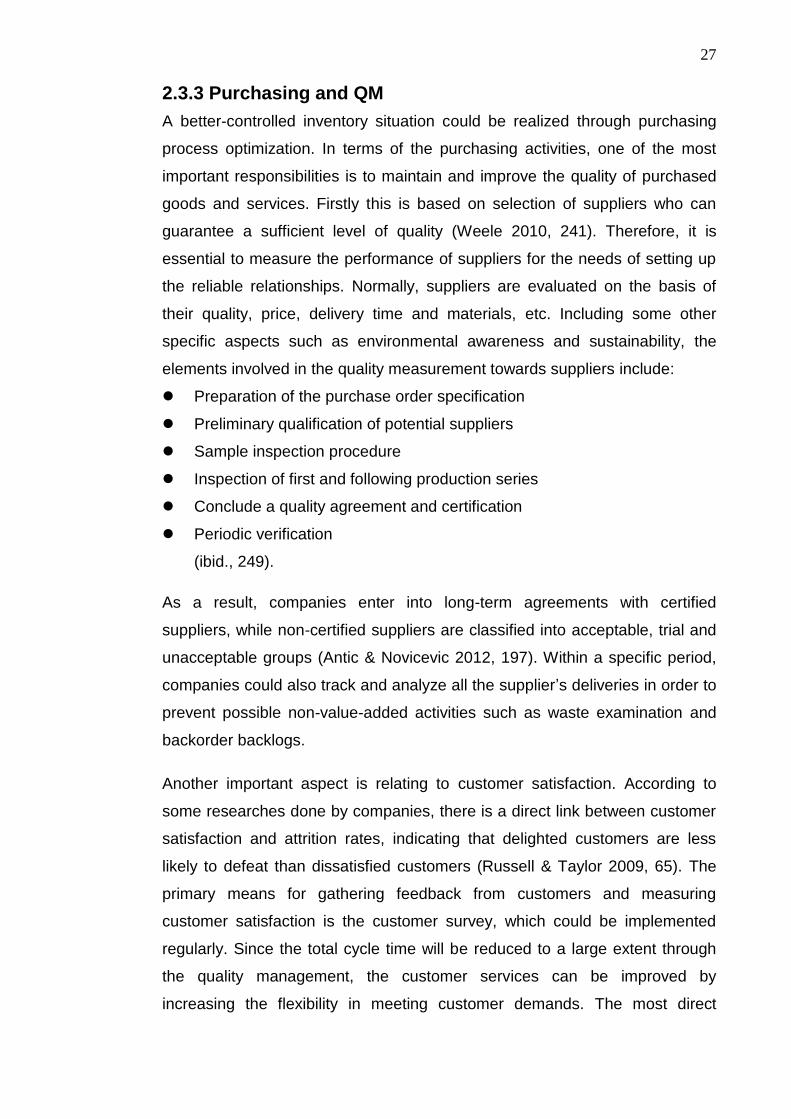
2.3.3 Purchasing and QM
A better-controlled inventory situation could be realized through purchasing
process optimization. In terms of the purchasing activities, one of the most
important responsibilities is to maintain and improve the quality of purchased
goods and services. Firstly this is based on selection of suppliers who can
guarantee a sufficient level of quality (Weele 2010, 241). Therefore, it is
essential to measure the performance of suppliers for the needs of setting up
the reliable relationships. Normally, suppliers are evaluated on the basis of
their quality, price, delivery time and materials, etc. Including some other
specific aspects such as environmental awareness and sustainability, the
elements involved in the quality measurement towards suppliers include:
Preparation of the purchase order specification
Preliminary qualification of potential suppliers
Sample inspection procedure
Inspection of first and following production series
Conclude a quality agreement and certification
Periodic verification
(ibid., 249).
As a result, companies enter into long-term agreements with certified
suppliers, while non-certified suppliers are classified into acceptable, trial and
unacceptable groups (Antic & Novicevic 2012, 197). Within a specific period,
companies could also track and analyze all the supplier’s deliveries in order to
prevent possible non-value-added activities such as waste examination and
backorder backlogs.
Another important aspect is relating to customer satisfaction. According to
some researches done by companies, there is a direct link between customer
satisfaction and attrition rates, indicating that delighted customers are less
likely to defeat than dissatisfied customers (Russell & Taylor 2009, 65). The
primary means for gathering feedback from customers and measuring
customer satisfaction is the customer survey, which could be implemented
regularly. Since the total cycle time will be reduced to a large extent through
the quality management, the customer services can be improved by
increasing the flexibility in meeting customer demands. The most direct

28
advantage for customer is that the waiting times are reduced to a large
degree.
Meanwhile, the roles of employees and purchasing organization are also
significant when implementing the quality management practices. The quality
management practices are designed to better assess both customer’s needs
and organization’s effectiveness, in order to develop a match between them
(Flynn, Sakakibara, & Schroeder 1995, 1327). In terms of the employee
development, the job training is one of the major aspects. For example, the
training in implementing quality tools such as statistical process control,
enabling employees to diagnose and correct day-to-day problems related to
their jobs. This provides employees with greater responsibility for improving
product quality and greater satisfaction for doing their part to achieve quality.
(Russell & Taylor 2009, 67.) When employees are directly involved into the
quality management process, the participation in identifying and solving
relevant problems will promote employees’ morale, improve job skills and
finally increase productivity. In terms of the overall business structure, Process
improvement teams, also called quality improvement teams (QIT) are
recommended to be built. The teams focus on business processes rather than
separate company functions. (ibid., 69.) In other words, cross-functional or
even cross-business processes will be constituted. Especially regarding the
working process of the purchasing department, which plays a role as an
information center or a transit point, the effective communication and
cooperation with other functions or departments should be proceed with the
goal of promoting the more efficient overall process and the better product or
service. A key tool for helping the teams understand and analyze the process
works is a process flowchart, which assists the personnel to focus on the
quality problems might exist (ibid., 69).
2.4 Just-in-Time Management
According to Weele (2010, 260), the principle of the Just-in-Time management
(JIT) means that all materials and products become available at the very
moment when they are needed in the production process, not sooner and not

29
later, but exactly on time and in exactly the right quantity. Accordingly, the
Just-in-Time inventory is intended to avoid situations where inventory exceeds
demand and burdens the business to manage the extra inventory. Originally
manufacturers use the JIT Management method aiming at using materials for
production at levels that meet the demand of customer without excess, since
excess inventory causes unnecessary storage and management costs.
However, nowadays the JIT principles are also applicable in a non-
manufacturing environment.
2.4.1 JIT Purchasing
Definition of JIT Purchasing The JIT purchasing is an integral part of the entire JIT manufacturing concept
(Chung & Bakar 2001, 1). On the basis of eliminating waste and the
cooperative effort of everyone in the organization, the essence of the JIT
purchasing is to purchase the right amount of materials at the right time for
consumption, and at the same time to ensure the high quality of all the
materials in order to enable the smooth operation of the system. Theoretically
a successful JIT program involves total quality surveillance, JIT manufacturing
techniques, and an involvement of people (ibid., 2). Similar to the quality
management practices, JIT is also a team-based approach. All parties
involved in the internal and external processes have the rights and
responsibility to participate in achieving the goals of JIT. Another remarkable
feature of the JIT purchasing is that the program attempts to tighten the record
keeping, and to carry minimum stocks by receiving frequent deliveries in
smaller quantity, aiming at eliminating waste as much as possible. Due to
such characteristic of the JIT purchasing, this kind of practice could be applied
in the firms closer to the buyer’s plant, making frequent deliveries and are
considered long-term partnerships with the buying company. (ibid., 2.)
JIT does not exist in isolation and it is usually combined with other inventory
control and warehouse management methods, such as Material Resource
Planning (MRP), Economy Order Quantity (EOQ), Enterprise Resource
Planning (ERP), etc. Instead of replacing those traditional methods, JIT helps
emphasize their proper executions. (ibid., 3.)

30
Potential Benefits and Risks In terms of both manufacturing and service-orientated firms, the JIT
purchasing concept can provide advantages mainly from the following
aspects:
Costs – minimized inventory carrying costs and scrap costs because of
the elimination of non-moving or slow-moving inventories
Quality – fast detection and correction of unsatisfactory quality, and
ultimately higher quality purchased parts
Administrative efficiency – improved communication resulting in a more
reliable suppliers partnership
Productivity – reduced rework; reduced inspection; reduced parts-related
delays
Customer satisfaction – improved customer delivery reliability; better
product quality
(Chung & Bakar 2001, 3-5.)
However, the Just-in-time purchasing and inventory system is not without
risks. By nature of what it is, companies using JIT are trying to make a
balance between having too much and too little inventory. If company
purchases fail to adjust quickly to increased demand or if suppliers have
distribution problems, the business risks may upset customers with stock outs.
On the contrary, if purchasers over compensate and buy extra inventory to
avoid stock outs, the company could experience higher inventory costs and
the potential risk for bearing more wastes. Another disadvantage is the costly
technology infrastructure required for building the information-sharing channel
between buyers and suppliers. Since such kind of coordination is needed for
building the reliable partnership, meaning that buyers can put major trust in
suppliers by directly monitoring inventory levels to initiate rapid response to
low stock levels. Sometimes it is hard to make agreement to build the
communication/distribution channel between two parties, alternatively some
organizations may lack of budget planning concerning this issue.
Except the issues mentioned above, comparing to the traditional purchasing
approach, the JIT purchasing also has tremendous impact on quality aspect.
The specific comparison between the traditional approach and JIT approach

31
from different purchasing functions points of view, as well as the effects of JIT
on quality, is illustrated in the following table.
TABLE 1. Comparison between JIT purchasing and traditional purchasing (adapted from Weele 2010, 264; Chung & Bakar 2001, 4.)
Purchasing
Activity
Traditional
Approach
JIT Approach JIT effect on
Quality
Supplier selection Minimum of two
suppliers; price is
central
Single source in
close geographical
area; frequent
deliveries
Rapid and better
understanding of
quality
requirements
Placing the order Order specifics
delivery time and
quality
Fixed order period;
deliveries called off
as needed
Fast detection and
correction of
relevant quality
problems
Change of orders Delivery time and
quality often
changed at the last
moment
Delivery time and
quality fixed;
quantities are
adjusted within
predetermined
margins if
necessary
Follow-up of orders Many contacts to
solve relevant
delivery problems
Few delivery
problems thanks to
sound agreements;
Quality and delivery
problems are not
tolerated
Incoming
inspection
Inspection of
quality and
quantities of nearly
every delivered
order
Initial sample
inspections;
Receiving
inspections are
gradually reduced
and eventually
eliminated
Quality of at source
is more effective
and less costly
Supplier
assessment
Qualitative
assessment;
delivery deviations
of up to 10% are
tolerated
Deviations are not
accepted; price is
fixed based on
open calculation
Suppliers put more
emphasis on their
product quality

32
2.4.2 Economic Order Quantity
Reorder Point Knowing the best timing of placing an order is crucial for the purchasing
department regarding inventory optimization. The easiest way to arrange this
is to define a reorder level, which can assure that each order can arrive just as
existing stock runs out. In the reorder point planning procedure, the inventory
control system is intended to compare current available stock level with the
reorder level. If available stock falls below the reorder level, an order proposal
is generated.
The reorder level (also known as the reorder point) is made up of the sum of
the safety stock plus the expected average consumption within the
replenishment lead time. Therefore, when determining the reorder level, the
safety stock, previous consumption values or future requirements, and the
replenishment lead time need to be taken into consideration. See Figure 5.
Invoicing Payment per order Invoices are
collected and
settled on a regular
basis (normally
monthly)
Suppliers can
afford cost of long-
term commitment to
meet quality
requirement, and
they become more
aware of buyer’s
true requirement
Paperwork Complex
paperwork and
documenting
system
Less formal system
and reduced
volume of
paperwork
More time available
for purchasing team
to devote to quality
matters

33
FIGURE 5. Reorder Point
When assuming that both demand and lead time are constant, the amount of
stock needed to cover the lead time is also constant, and the reorder level can
be defined as:
Reorder level = Lead time demand = Lead time x demand per unit time
ROL = LT x D (Waters 2007, 91.)
EOQ Model In order to answer another significant question “How much should we order?”
building the Economic order quantity (EOQ) Model is one of the effective
approaches to calculate the fixed order quantity that minimizes total costs.
The EOQ calculation is the most important analysis of inventory control, and
arguably one of the most important results derived in any area of operations
management (Waters 2007, 66).
One well-known mathematical formula based on the holding costs and the
ordering costs to decide the optimal economic order quantity is Camp’s
formula. The variables used in such kind of inventory control model are:
fixed usage per period
delivery period
order quantity

34
costs per order
inventory carrying costs for one unit during one time unit
The order quantity and a usage rate per period mean that in a given
period orders are required. The order costs for that specific period will be
x .
The average inventory level over one period is and the total holding
costs for the considered period are x .
Hence, the sum of total ordering costs and holding costs will be
The economic order quantity can be calculated as
√
Although the formula has received significant interest from different type of
organizations, it is based on the following assumptions:
the consumption of the item at hand is fairly stable
the consumption of the item is evenly spread over the course of time
the delivery time of the product is fixed and not due to fluctuation
the ordering costs per order are fixed
the inventory carrying costs do not depend on the ordered quantity, etc.
The economic order quantity is where the sum of the holding costs and the
ordering costs per unit is lowest. (Weele 2010, 261.) When ordering large
quantities from suppliers, the ordering costs can be spread out over the large
amount of purchased items. Therefore, large order quantities will lead to a
lower order cost per unit. However, the large quantities of products must be
kept in the warehouse for a longer period, and causing higher inventory
carrying costs per product accordingly. Comparing to the traditional condition
of applying EOQ formula, the JIT environment is more assured by the

35
advanced settled conditions such as negotiations with the supplier,
administrative processing, follow-up of orders and quality inspections, etc. By
systematically considering how savings can be accomplished for each item,
the purchaser can have more chances to be succeed in reducing the optimal
order quantity and the inventory costs (ibid.). The following figure shows the
relationship among the order quantity, the ordering costs and the inventory
carrying costs, at the same time the reducing trend of economic order quantity
and total costs after the adjustment is demonstrated as well.
Cost C’ C” 0 Q” Q’ Order Quantity FIGURE 6. Towards a reduction of the economic order quantity (Weele 2010, 262)
2.4.3 QM and JIT
Concerning the relationship between the quality management and the JIT
management, except the effects of QM on inventory control and JIT
Ordering cost = 𝑆 𝑄 x 𝐶
Holding cost = 𝑄 x 𝐶𝑖
Total cost = 𝑄 x 𝐶𝑖 + 𝑆 𝑄 x 𝐶

36
purchasing mentioned above, the use of JIT practices is also positively related
to quality performance improvement.
For example, the JIT practices leading to inventory reduction improve quality
performance by reducing waste and decreasing the amount of inventory
buffers. Firstly, as finished products spend less time in inventory, the potential
risk of spoilage and handling damage is reduced. Meanwhile, the reduced
inventory levels also have the impact on quality performance through the
related problems exposure. More specifically, the alternative employed under
JIT is to gradually lower the inventory level until a problem is exposed. At this
point, the surfacing of the exact problems is viewed as an opportunity to
improve the overall flow of the system rather than as a detriment. ((Flynn,
Sakakibara, & Schroeder 1995, 1330-1331.) The second aspect of the JIT
practices affecting on quality performance improvement reflects on their
impact on lot size control. Since the JIT practices reduce lot sizes, both quality
and timeliness of process feedback increase, leading to a corresponding
reduction of process variance. In terms of the setup process, according to
Flynn, Sakakibara, & Schroeder (1995, 1332), Goddard (1986) and Wantuck
(1989), as JIT encourages the simplification of setup procedures, the setups
become more frequent and the feedback loop is shortened, leading to
improved quality. And in terms of the benefit of smaller lot size, it helps to
prevent the possibility of producing large amounts of undetected quality
problems, and thereby minimizing the costs caused by scrap or rework. (ibid.,
1332.)
Even though the JIT and QM represent different approaches to improve the
effectiveness and efficiency of an organization’s operation, based on related
researches, it has been concluded that companies implementing the JIT
purchasing along with the QM perform better than companies implementing
only the QM or JIT. When companies implement the JIT purchasing and QM
together, they achieve a better results regarding financial, market and
operating performances than when they implement either the JIT or QM alone.
(Kaynak 1997, 111-114.)
According to the research done by Kaynak, theoretically the implementation of
the JIT and QM can increase firms’ performance. The benefits include higher

37
inventory turnover, increased purchasing quality and productivity, which
theoretically lead to a reduction in carrying costs that will usually result in
lower prices. And finally lower prices can lead to increased market share and
profits. Based on the above analysis, a model showing the relationship among
the Quality Management, JIT purchasing and business performance is
illustrated below.
FIGURE 7. Model of relationship among QM, JIT purchasing and business performance (adapted from kaynak 1997, 113)
Based on innovation theories, and their link with realistic strategy and
performance, four moderating variables are identified: industry type, firm size,
firm type, and duration of JIT purchasing and QM techniques (ibid., 125.)
Before implementing the QM and JIT purchasing in a company, those factors
should be analyzed carefully for improving the business performance
effectively. This thesis will be mainly concentrating on how the combination of
QM and JIT purchasing can affect inventory and purchasing activities
optimization.
BUSINESS PERFORMANCE
Financial
Market
Operating
Quality Management (QM)
Just-in-Time (JIT) Purchasing
MODERATING VARIABLES
Industry type
firm type
firm size
Duration of JIT purchasing & QM techniques

38
3. Case Company Analysis
3.1 Introduction In this section the mode of the research procedure and how the analysis was
carried out is introduced in more detail. Furthermore the current existing
problems of the company are highlighted as well.
Regarding the main research questions defined in the thesis plan, many
relevant research questions were formed during the start-up stage of the
thesis, and many of those questions were used in the interviews later on.
Three main research questions are:
- Have previous inventory situations and purchasing services met the
requirements of the customers?
- What are the optimum inventory situations and the optimum purchasing
strategies?
- What are the future plans regarding the improvement of the inventory
and purchasing performances based on the comparison between the
optimum situation and current situation?
3.1.1 Research Method
In order to answer and analyze the research question in the best possible
way, a combination of qualitative and quantitative methods was introduced.
Quantitative research relies on statistical analysis and a high degree of
generalization while qualitative research deals with a more complex context
aiming at understanding a certain phenomenon more deeply. In this thesis,
the quantitative method was adopted mainly for exploring the current existing
problems, compared to the qualitative method which helped more in the
problem solving process (Fenson & Edin 2008, 22). More specifically, the
quantitative methods included an ABC analysis, XYZ analysis, the Kraljic
portfolio approach, and the EOQ calculation. On the basis of the quantitative
method, the operations management method was used in order to study the
deep factors in causing the problems, and also to solve the problems and
prevent recurrence. The major management principle implemented for solving

39
the problems and improving future performance was selected on the basis of
the JIT-QM jointly concept.
In addition, by coming close to the information source, all the analysis is
based on interpretation and understanding of both realistic and estimated
data.
3.1.2 A Case Study as a Research Strategy
The thesis used case study method for investigating and analyzing how
purchasing activities affect inventory performance. There are number of
reasons for choosing case study as a research strategy. First of all, case
study is useful when examining contemporary phenomena within real-life
contexts, because it gives an understanding of how people and their actions
are connected in different situations (Fenson & Edin 2008, 23). Meanwhile, it
is also a good method to test the practicality of the relevant theory or even to
challenge the theoretical assumptions. A theoretical method may bring some
benefits by way of improving the current situation, while in some cases when
comparing to the company’s own business strategy, the theoretical way may
have an opposite effect and make the situation even worse. Furthermore, the
method makes it possible to study complex processes involving many
variables, enabling deep insight and exploration. On the one hand, for the
case company itself, a comprehensive assessment of a certain phenomenon
was firstly made to illustrate possible limitations within a certain period. Thus,
some customized solutions or recommendations were designed regarding the
current problems and the achievement of a better result in the future. On the
other hand, the case study method also provides grounds for generalization of
data. For example, the problems that the case company has may also exist in
other similar types of industries. Hence it is possible that the research and the
solution could be applied more generally.
40
3.1.3 Data Collection
The practical ways of data collection were direct investigations and interviews
in the case company. If the answers of specific questions were not exhaustive
enough, some further communications were made later by emails or
meetings.
With regard to the selection of the case company, first of all, some problems
relating to inventory level control were noticed during the author’s practical
training in the purchasing department of Company X. For example, too much
non-active stock caused extra carrying costs, and some unnecessary
problems resulted from increasing backorders, etc. Thus, the company
supervisor showed great interest in solving the current problems. Meanwhile,
all the other related departments also gave support when needed, aiming at
reducing costs and improving productivity through efficient coordination, both
within the purchasing team and other functions of the company. Furthermore,
confusions about how to handle the inventory level control still exist in similar
types of industries, especially in small and medium sized enterprises, even
though many related studies have previously been made based on literature
reviews. In this case, some further research and innovative solutions were
worth consideration.
With the guidance of the research target, the database research was divided
into two themes: inventory performance and purchasing performance. Most of
the relevant numerical data were in Excel format, which was convenient for
massive calculation. Another important research method was interviewing the
purchasing professionals and other personnel from the related departments.
The themes of the interviews mainly included the purchasing strategy, self-
evaluation of inventory and purchasing performance, and future purchasing
plans. Sometimes oral interviews were also supplemented by surveys when
needed.
Based on the historical data and information from the previous year (2014), an
analysis was made for evaluating the current performance, finding the existing
or potential defects, and promoting the sustainability of business development.

41
3.2 Current Situation of Company X
As a remarkable manufacturer and importer, Company X is dealing with oil
and water hydraulics components and systems with good reputation. During
past decades, however, lots of items left in the warehouse without usage, and
nowadays they become so called obsolete stocks. According to the managing
director, “Most of those items were the customized components ordered by
certain customers some years ago, but for some reason they did not order
those items anymore. However, we have already purchased and produced a
lot of them.” (Tuominen 2014.) In other words, the reason for causing these
troubles can be roughly concluded as the unreliable supply-demand relation
and the inaccurate decision making of purchasing activity. To improve the
company operations, some related problems are waiting to be solved. More
importantly, the company should learn how to prevent the similar problems
from happening in the future.
3.2.1 Imbalanced Inventory Structure
The most intractable problem that troubles the company is the imbalance
distribution of active items and non-active items. Until December 2014, there
were 9380 active items (trading parts only), as compared the estimated 13000
non-active items, which were even more than the active ones. Although the
unit value of non-active items is relatively low, the total value still takes its
place in the company’s account. In addition, the overstocks cause lots of extra
costs, such as inventory carrying cost, increased storage cost, and the cost
resulted from quality reduction and product degradation. To some extent,
these obsolete stocks become obstacle of company financial performance and
even cause some potential risks for company’s future development. In order to
get rid of these stumbling blocks more effectively, the current situation was
analyzed and corresponding solutions were considered.

42
3.2.2 Complicated Classification System
Currently, in order to achieve higher profitability and compensate the loss
caused by the non-active items, the purchasing team paid a lot of attention on
taking care of the active groups. To analyze the overall products more
comprehensively, the purchasing team made the ABC Analysis for trading
items based on the yearly consumption of products.
All the items were divided into 16 classes, from class A to class P. Although
this type of classification can be used for separating the essential from the
unessential, it is difficult to manage and time-consuming to analyze. Especially
when defining the level of service level, safety stock, and reorder point, etc.,
and making the specific purchasing strategies according to the item class, the
workload for purchasing staff might be increased while the forecasting
accuracy could be decreased. Hence, to simplify the decision making process
and ensure the correct purchasing actions is significant for company’s
economic controlling.
3.3 Purchasing Performance Assessment
The purchasing performance can be measured from two aspects: purchasing
effectiveness and purchasing efficiency. Purchasing effectiveness is mainly
related to the goals and objectives of the purchasing function – obtaining the
right material, in the right quantity, from the right source, at the right time, at
the right place and at the right price. Correspondingly the evaluation of
purchasing activities can be based on price/ cost dimension, product quality
dimension and logistics dimension. And purchasing efficiency more relates to
the resources which are required in order to meet the objectives of purchasing
function, meaning that the way purchasing is organized, the guidelines of
management and the performance of purchasing staff, etc. (Idea: Weele 2010,
306 – 307.)
Based on the evaluation standards mentioned above, by cooperating with the
purchasing department of Company X, a survey was conducted. The
assessment was on the basis of self-evaluation made by purchasing

43
executives and the author’s own research and analysis. The result reflects the
general purchasing performance during the past years, mainly according to
purchaser’s experiences. The evaluation results are demonstrated in the
following table.
TABLE 2. Purchasing performance evaluation
Factor How Measured Score
Price/ Cost
Budget situation Best = 5
Worst = 1
3
Price control Best = 5
Worst = 1
3
Cost reduction Best = 5
Worst = 1
3
Product quality
Reject rates of
incoming goods on
average
Lowest = 5
Highest = 1
4
Number of quality
claims to suppliers
Smallest = 5
Largest = 1
4
Number of ISO
certified suppliers
Largest = 5
Smallest = 1
3
Logistics
Delivery reliability
of suppliers
Highest = 5
Lowest = 1
4
Inventory turnover Highest = 5
Lowest = 1
4
Organization
Staff Best = 5
Worst = 1
3
Management Best = 5
Worst = 1
2
Information system
Best = 5
Worst = 1
2
Customer satisfaction
Product reject rate
on average
Lowest = 5
Highest = 1
4
Delivery reliability Highest = 5
Lowest = 1
4

44
Number of
backorders
Smallest = 5
Largest = 1
3
Total
70
46
According to the evaluation, the purchasing performance of Company X
scored 46 out of 70. Such result suggests that the current situation of
purchasing is “ok” but there is still a large space for making improvement.
More specifically, the price/ cost aspect scored 3 out 5, meaning that some
measures relating to cost reduction and price control can be taken. The
reduction of total cost can be achieved from reducing both purchasing cost
and management cost. Hence, in both aspects of buying process and
management system, some potential improvements could be made.
Regarding the product quality aspect, the number of ISO certified suppliers
gained relatively lower score, meaning that more relationship with ISO
certified suppliers could be established in order to improve the product quality
and contribute to the implementation of quality management.
The weakest aspect required for concern is the organizational dimension, as
all factors of this dimension scored lower than 4. The main problems are the
unsound management guidelines and poor information system. Moreover, the
training and education of purchasing staff also need to be continued in the
future. In terms of the whole structure of purchasing department, some
adjustments regarding the imbalanced-distributed workload are also
suggested to be made. Especially when it comes to the new acquisition
between Company X and its new partner, the quality improvement of
purchasing team is expected to be made as soon as possible, in order to
ensure the working efficiency and maintain the personnel motivation.
Except the factors mentioned above, the customer satisfaction is another
important issue. The relatively weaker part is the situation of backorders,
meaning that the delivery reliability can be improved in the future. And it is all
about the accuracy of purchasing process and the cooperation along the
supply chain.

45
4. Performance Improvement
4.1 Inventory Performance Improvement
With regard to the current issues, some adjustments could be made referring
to the product classification. Meanwhile, certain new policies or strategies
relating to obsolete stocks reduction and wrong decision-making prevention
are expect to be suggested.
4.1.1 Standard Item Reclassification
To make the management process easier, some new classifications were
made according to different variables, such as yearly consumption (sales),
yearly transaction volumes, and the combination of sales and transactions.
The classifying steps are as follows:
First of all, the ABC classification was made based on yearly consumption
values. Considering the complex composition structure of items, the
classification standard is made as follows on the basis of ABC analysis
principle:
A-items = first 50% of the sales or consumption
B-items = next 30% of the sales or consumption
C-items = next 18% of the sales or consumption
D-items = next 2% of the sales or consumption
E-items = no sales or consumption
Practically, there are 9380 active items in total, 0,5% means that 43 items are
classified as A items. 249 items are sorted into B items, which is about 3% of
the total amount. The next 1149 items belong to C class and representing
about 12% of the total consumption, while the D class consists of 2061 items,
representing about 22%. And the rest of those, 5878 items are E class items,
meaning that there is no sale of those items during the year 2014.

46
FIGURE 8. ABC Classification of standard items
Secondly, the XYZ classification was made based on yearly transaction
volumes. Similar to the ABC Analysis, the classification standard is:
A-items = first 50% of the transactions
B-items = next 30% of the transactions
C-items = next 18% of the transactions
D-items = next 2% of the transactions
E-items = no transactions
Practically, about 0,3% means that 30 items are classified as X items. 126
items are sorted into Y items, which is about 2% of the total amount. The next
752 items belonged to Z class and represent about 8% of the total
consumption, while the Zz class consists of 2839 items, representing about
30%. And the rest of those, 5633 items are Zo class items.
FIGURE 9. XYZ Classification of standard items
0 %
3 % 12 %
22 %
63 %
A B C D E
0 %
2 %
8 %
30 %
60 %
X Y Z Zz Zo

47
Based on the XYZ Analysis result, 60% of the items had no transactions
during the year 2014. But by considering that some of the items had sales
during the past years and may still have sales in the future. It would be wise to
handle those products separately in order to reduce the complexity of the
work.
Thirdly, when taking both consumption volume and transaction times into
account, the AB-XY Analysis was made, laying a basis for making the
portfolio-based purchasing strategies. The amount of AB-ZZz, AB-XY, CD-ZZz
and CD-XY items are 181, 111, 3140 and 45, which represent 5,2%, 3,2%,
90,3% and 1,3% respectively. The classification can be also used for making
assessment about profit impact and supply risk later.
FIGURE 10. AB-XY Classification of standard items
4.1.2 Non-active Inventory Management
First of all, learning the root cause of non-active inventory is fundamental.
According to Romanov (2013, 23), Crandall & Crandall (2003) has grouped
root causes of excess inventory into the following six greater categories, as
shown in Figure 11. Each category contains three sub-causes. However, each
company has its own situation, since the actual conditions of supply chain and
the causes of excess inventories vary from one to another.
Based on the case company interviews, the three aspects for causing the
obsolete stocks could be categorized as customers, strategic planning, and
demand forecasting. Obviously the direct reason for causing this problem is
5 % 3 %
91 %
1 %
AB-ZZz AB-XY CD-ZZz CD-XY

48
the change of orders from customers. This could be also defined as the
unreliable demand-supply relationship. Internally, the inaccurate demand
forecasting is unsound as well, leading to the wrong production decisions.
Moreover, the ineffective communication between the case company and its
certain customers is another important cause. If there were correct and timely
coordination, the situation would be entirely different.
Excess/ Obsolete Inventory
FIGURE 11. Obsolete inventory cause and effect diagram (Romanov 2013, 23) When it comes to the disposition of the obsolete inventory, the following
methods could be considered and judged:
1. Use as is – means that if the original customers no longer want the
inventory that has been produced for them, the company could look for
other customers and determine if they need the product similar to what
is on hand. However, in the case of Company X, since most of the
obsolete stocks are customized, it might be difficult to find customers
who require the similar type of products. So this method may not be the
most judicious choice.
2. Sell at a discount – this is one method that Company X is currently
using. The sales department is trying to sell the non-active items to

49
other companies or secondary industry market. Although getting some
part of the original value in cash is certainly better than annually
counting obsolete items, as the agreed prices are extremely low,
Company X is not willing to keep using the same way.
3. Use as components – this way could be considered if there are some
assembled or sub-assembly products, and it might be possible to reuse
them in producing other products or sell as spare parts. However, the
possibility of applying this method depends on the actual type and
condition of the items.
4. Re-work/ modify – means that some part of the items could be involved
into the new design and updated specification by communicating with
designers and personnel from production workshop. Even though this
approach seems insignificant due to the reason why those items have
been left in the warehouse, if there is any opportunity for reusing,
sorting out the items with good quality is a critical task to do.
5. Remarketing globally – this way seems relatively innovative but also
more risky. In brief, Company X could cooperate with certain reliable
service provider and implement auction on a global-based platform. By
making a pre-agreed revenue sharing agreement, such as a 60 – 40
percentage (Company X – service provider), both parties could gain
some benefits. Through this way, the service provider can perform
some value-added processes, such as detailed inspection, product
sorting, repacking, and labeling, etc., which also help to reduce the
workload of workers in Company X. However, the most challenging
step for using this method is to cooperate with a reliable third party
logistics service provider. But this method is at least worth trying, as
there will be more opportunities for selling the special products based
on an international platform, especially regarding the market of
developing countries.
6. Donate for tax credit – once the case company notices that there is no
way to use any method mentioned above, the last choice would be
donating the non-active inventory for a tax credit. But again, this
approach depends on the specific tax policy and should be studied
deeply in order to make a wise decision.

50
In terms of how to prevent obsolete stock in the future, it is crucial to learn the
lesson from the previous experience of gaining obsolete stocks. Firstly, it is
essential to create agreement or sign contract specifying the penalty of breach
performance with specific customers, in order to prevent the unexpected order
changes. Moreover, it is wise to introduce an electronic data interchange (EDI)
system that can help to promote the timely communication with customers or
suppliers. This kind of system could reduce material lead time, improve the
accuracy of demand forecasting, and make sure that the right part design
specifications are required by the customers.
Most importantly, to avoid carrying excess and obsolete stock, the company
needs to optimize the strategic planning, demand forecasting and
replenishment processes. After all, inventory management is primarily
concerned with maintaining a proper inventory level to satisfy customer
demand at an acceptable service level and at minimal costs. So the core
theory of inventory management are the concepts of economic order quantity
(EOQ), safety stock principles, and reorder point, which together form
inventory policy and can be implemented in purchasing activities (Romanov
2013, 26).
4.2 Purchasing Performance Improvement
4.2.1 Inventory Replenishment
To make the inventory input more accurate, consistent and complete, it is
crucial to decide when to order and how much to order. According to the result
of purchasing performance assessment, some improvements could be made
regarding budget control and cost reduction. From the buying process point of
view, the action could start from optimizing the reorder level and order
quantity, in order to assist the purchasing decision-making in the future.
Reorder Level To reduce the inventory costs while preventing the potential stock out,
determining a good reorder level is essential. One of the important steps is to

51
reduce the level of safety stock, which dramatically affects the company’s
business. Since too much safety stock can result in high inventory carrying
costs, while too little safety stock can cause sales loss. Thus, finding the
balance between too much and too little safety stock is significant.
Regarding the previous economic situation and business performance,
Company X has done some purchasing strategy adjustments to A class of
product – lowering the safety stock level by 20%. To assist the future
inventory control decision, some further calculations based on the theoretical
formula were made to determine the optimum safety stock level and reorder
point.
The calculation of safety stock was implemented based on sales forecasting,
which was on account of the sales history of the case company. The
theoretical formulas used are demonstrated as follows:
SD = Standard Deviation
Lead time factor = Square root of lead-time to forecast ratio
Service level factor Z = NORMSINV (Service level), for example Z = 1,64 for a 95%
service level
Comparing to the current safety stock and reorder level, some reductions
(from 4% to 78%) can be achieved for most of the standard items by using the
theoretical replenishment method. The results were calculated with the service
level of approximately 95%, which equals a z-value of 1,64, and with the
estimated lead time according to different class of items, meaning that 2
months for A item, 1,15 months for B item, and 1 month for C and D items.
The reductions percentages of safety stock and reorder level are shown in the
following table.

52
TABLE 3. Safety stock & Reorder level reductions
Item Class Percentage reduction
A 6% - 27%
B 60% - 69%
C, D 4% - 78%
However, some data used in calculation process, such as lead time, service
level, standard deviation of demand are mere estimates, based on the general
situation. As a result, the practicality of such replenishment method needs to
be tested in the practical life. Nevertheless, the outcomes and benefits of this
thesis are not limited to the result, as the formulas illustrate how service level
and lead time affect the stock level control, offering a more direct viewing for
the case company to define the optimum service level and to deal with the
lead-time problems caused by suppliers in the future.
Economic Order Quantity In terms of the order quantity, finding the appropriate quantity for
replenishment that minimizes total inventory costs will contribute to the
company’s budget performance. From a theoretical point of view, the
convenience of small and frequent deliveries was analyzed based on the EOQ
model. As a calculating method to minimize purchasing cost, inventory
carrying cost, and ordering cost, the EOQ method is complementary to the
safety stock optimization that focuses on finding the optimal threshold to
trigger the reorder (Vermorel 2012).
Alternative 1
The theoretical formulas relating to the EOQ calculation have been addressed
in the chapter 2.4.2. According to the practical calculation, about 10 000€ of
ordering cost can be saved by applying the EOQ method. And in the end,
about 1 million Euros of total inventory costs can be reduced annually. These
results were calculated with the estimated fixed ordering cost 135€/order,

53
which is based on the estimated initial total ordering costs and fixed numbers
of annual orders, and with the inventory carrying cost percentage of
approximately 30%.
However, as the result of total savings seemed unrealistic because of the
inaccuracy of some data involved into the calculation process, another
calculation was made in order to define the “ideal” result of the inventory
carrying cost.
Alternative 2
Another alternative calculation was made based on the recommended
situation where more realistic result is presented. By applying the EOQ
method, 73 589€ of annual ordering cost can be saved. And in the end, about
380 000€ of total inventory costs can be reduced annually. These results were
calculated by keeping the same fixed ordering cost 135€/order, but with the
internal interest rate of 10%, which means that the initial total carrying cost
can be reduced.
By following the normal EOQ principle, the smaller order quantities will result
in lower inventory levels but more orders, which will lead to the increase of
total ordering costs. However in this case study, as the initial ordering costs
were roughly defined by the case company X and not based on the real
number of orders made, the ordering costs and inventory carrying costs were
reduced synchronously in both Alternative 1 and 2.
Comparison between Alternative 1 and 2
Comparing with the calculation of Alternative 1, the second calculation
illustrates a more realistic situation in terms of the carrying cost percentage
and annual savings. As the carrying cost percentage (30%) involved into the
Alternative 1 calculation is merely a rough value based on estimation, the
results cannot be entirely trusted. However, in terms of the EOQ values and
suggested annual order numbers, the results of the Alternative 2 can be
questioned, especially regarding some A class items which are normally

54
ordered more often than suggested. In this case, both alternatives have their
own defects regarding the accuracy of the results.
Nevertheless, the EOQ provides a reference value of the ideal order quantities
to the purchasing executives. Moreover, the mathematical formula of EOQ
reveals the relationship between ordering cost per order, holding cost per unit,
and the number of units purchased annually, leading the purchasers to care
more about some previously ignored factors that may affect purchasing and
inventory performances. In the future, the purchasing executives should define
the relevant values more precisely according to the realistic conditions, since
a small aberration of the data involved can lead to totally different results, and
thus influence the accuracy of the buying decisions.
In addition, the EOQ method can be implemented according to different class
of items, in other words, to evaluate the demand frequency of different group
of items in order to manage the order frequencies and order quantities more
effectively. But because of the specific conditions of implementing JIT
principle, some negotiations need to be conducted with the suppliers who do
not comply with the JIT conditions, in order to apply optimized ordering
quantity and ordering process in a JIT environment.
4.2.2 Purchasing Strategy
When defining the general purchasing strategy, the Kraljic’s purchasing
product portfolio-approach can be used as a helpful organizational tool. Since
the Kraljic matrix is convenient for purchasing executives to understand the
structure of the purchasing items because of the visualization of different
product categories in a specific time span (Fenson & Edin 2008, 34).
Meanwhile, the model is a risk-analysis tool, which can display critical buyer-
supplier relationships and thereby build up relations based on the profit impact
and supply risk. Moreover, the model itself is easy to understand and does not
require any funding commitments, so it is also preferable from a budget and
investment perspective (ibid.,42). By developing such purchasing strategies,
the awareness of purchasing possibilities and the accuracy of purchasing

55
decisions will be improved, thus some remarkable savings could be achieved
in the long term.
Based on the original idea of Kraljic matrix, some attempts were made in order
to find possibility to adapt the model to the case of Company X. As the AB-XY
Classification classifies the standard items based on their sales values and
transaction volumes, which are closely related to the financial results and
supply risks, a combination of Kraljic model and AB-XY analysis could be
feasible. Taking the AB-XY items as an example, these are normally high-
volume products and also represent a high share in the cost price of end
product. As a result, in order to ensure the availability and quality of these
products, the company tries to build up a mutual partnership with certain
reliable supplier. However, the supply risk is increased correspondingly
because of the limited amount of the suppliers. Because of the features of AB-
XY products, they can be grouped as strategic products, meaning that both
purchasing’s impact on financial results and supply risk of them are highest.
And the similar analysis can be done to identify other groups of commodities.
The assumed model of classification is shown as follows:
High
Low
Low High
FIGURE 12. Combination of Kraljic's purchasing product portfolio-approach and AB-XY Analysis
Non-critical (CD-ZZz)
Leverage (AB-ZZz) Strategic (AB-XY)
Purchasing impact on financial results
Bottleneck (CD-XY)
Supply risk

56
Bottleneck Items
These items represent a relatively limited value in terms of the financial results
of a firm but they are vulnerable with regard to their supply. Suppliers have a
dominant power position for these products. (Caniels & Gelderman 2005, 145)
In the case of Company X, the bottleneck products account little proportion of
the total item amount and they are not hard to be managed. In order to reduce
the dependence on certain suppliers, increasing buying power and developing
new opportunities are crucial. For this group of product, a new positioning is
“better bottleneck”, which pursues minimizing supply risk on the one hand and
obtaining a better negotiating position on the other. In terms of some part of
the bottleneck items, the reason for causing them fall into this category is
over-specification, which leads to complicated purchasing processes. Hence,
the idea is to de-complex those items, in order to make them follow the
generic specifications. (Idea: Gelderman & Weele 2002, 33.) However, the
possibilities of standardization are expected to be investigated based on the
specific case.
Non-Critical Items
There products usually have a small value per unit and many alternative
suppliers can be found. These products produce only few technical or
commercial problems. However, the problem with this group is that the costs
of handling are even higher than the value of the product itself (Weele 2010,
198). Normally the items require 80% of the purchasing department’s time,
only represent less than 20% of the purchasing turnover (Caniels &
Gelderman 2005, 146).
Nevertheless, in Company X there are about 90% of the total products
belonging to this group, the importance of well managing this group is
obvious. On the one hand, the case company should consider lowering the
level of non-critical products, and on the other, the purchasing of these items
should be organized as efficient as possible, in order to spare more time for
the other crucial products. Thus, the main idea for handling this group of items
is to reduce the logistics and administrative complexity. To standardize the
purchasing process, the e-procurement and an electronic catalog and ordering

57
system could be implemented, at the same time the purchasers can order
directly from the pre-selected suppliers. However, in terms of some customer-
specific items, the business unit is locked into a higher level of dependence,
and the individual ordering could be used by means of a purchase card,
aiming at reducing the indirect purchasing costs such as ordering cost and
invoicing cost.
Leverage Items
Generally these are the products that can be obtained from various suppliers.
Leverage items represent a relatively large share of the end product’s cost
price while the supply risk of them is relatively low. Since a small change of
price usually involves large sums of the money, the buyer has strong
incentives for sourcing and negotiation. When building a desirable relationship
with a supplier, a comprehensive assessment of supplier’s performance is
essential. Meanwhile, the price performance becomes one of the key factors
in current global market.
For Company X, one strategy that could be applied is competitive bidding,
meaning that there is no need for signing long-term supply contracts with
certain supplier for this group of products, since suppliers and products are
interchangeable. The orders could be divided to different suppliers in order to
reduce the supply risk and the dependence. In terms of some special
business unit, some corporate agreements could be justified with certain
preferred suppliers by negotiation. However, the closely monitoring is required
to estimate the price changes caused by demand and supply changes. (Weele
2010, 199.)
Strategic Items
This group of items represents a considerable value to the company in terms
of the large impact on profit and high supply risk (Caniels & Gelderman 2005,
144). Because some of these products have limited amount of suppliers,
meaning that the supply risk is significant and the reliable cooperation with
suppliers should exist.

58
In terms of building up a mutual strategic partnership with certain supplier,
buyer and supplier need to be both involved into the partnership regarding the
improvement of product quality, delivery reliability and cost reduction.
Especially in this complex global market, choosing a reliable partner with
excellent technical and economical performance become increasingly
challenging. In case of any unacceptable supplier’s performance, Company X
should still keep on searching alternative suppliers in order to make it-self less
dependent on single supplier. Meanwhile, related purchasing activities that are
suggested to be done include accurate forecasting of the needed products so
that supplier could be informed timely and meet the demand, and supply risk
analysis meaning that the purchaser should monitor the service level of
current supplier constantly, etc. In short, maintaining the balance of power
between both parties involved is the key issue to establish reliable long-term
relationship.
4.2.3 JIT- QM Joint Strategy
From the inventory management point of view, the inventory stocks act as a
buffer to continue the operation of production or trading even when some
problems occur. However, with the implementation of JIT Purchasing, the
entire operation may shut down because of the occurrence of a small
problem. In this sense, the JIT Purchasing has two sides. On the one hand,
JIT is a useful tool to help organization expose problems and identify the root
cause. Correspondingly the organization can take measures to eliminate the
causes and make improvement in time. But on the other hand, the risk of
stock out of either raw materials or finished goods may increase, reducing the
efficiency of the whole supply chain and thus leading to customer
dissatisfaction.
In order to compensate the inherent defects of JIT, some improvement
strategies from other aspects may support the JIT operations. One suitable
concept is quality management. As the applicability of QM is much broader
than that of JIT, the actions of quality improvement can be taken from different
views such as organization, infrastructure and even top management. In this

59
sense, the following hypothesis can be made: The performance of firms
implementing both JIT and QM is better than the firms implementing JIT or
QM alone. Since the application of the JIT principle improves the quality
performance through problem exposure and process feedback, and in turn,
the use of QM improves the JIT performance through process variance
reduction and thereby provides the levels of quality that allow the minimum
inventory (Pardeep N.d.). Hence, the JIT-QM Joint strategy could be
implemented for improving the effectiveness of quality and productivity, as it
shown in the following figure.
JIT QM
JIT QM
QM
JIT
Effe
ctiv
enes
s Integration
Quality & Productivity
Quality & Productivity
FIGURE 13. JIT-QM Joint strategy (adapted from Vuppalapati, Ahire, & Gupta 1995, 92.) In terms of the functions, the JIT and QM are well coordinated with each other
regarding problem exposure and correction, as well as waste prevention.
Thus, one strategy considered to be applied in Company X is the combination

60
of JIT and QM, aiming at optimizing inventory and purchasing activities
through qualifying the supply chain, meaning promoting the cooperation
between suppliers, purchasing department of Company X and customers.
SuppliersCustomers (Internal & External)
Materials Procedures Information Methods
People Skills Knowledge Training & Education Plant & Equipment
Products Services Information Paperwork
Purchasing Process
Feedback
Quality & Reliability
Quality & Reliability
Quality & Reliability
Feedback
Information Flow
FIGURE 14. Quality improvement of supply chain
According to the quality improvement model above, the following practices
could be considered the essential operations of the JIT-QM joint strategy.
Develop a reliable relationship with suppliers
To achieve a more efficient process in inventory management and delivery
system, the main task is to assure that the supply is stable and available when
needed. The following practices are recommended regarding the current
situations of Company X.

61
Electronic Data Interchange (EDI)
In order to achieve the small batches purchasing and ensure the quantities as
exact as possible, the exchange of orders and other related information is
expected to be done more frequently between suppliers and purchasers. In
this case, the implementation of electronic data interchange (EDI) is highly
recommended. Since EDI has been an excellent tool for promoting the
exchange of updated plans and coordinate deliveries, a large amount of
inventory wastes can be prevented and remarkable cost savings can be
achieved as well. Even though such action requires the negotiation and
coordination with partners, the benefits of implementing EDI is attractive for all
parties involved.
Geographical Concentration
Obviously to concentrate the distribution of suppliers helps reduce the need
for transportation and thereby reduce the costs and lead time. In the case of
Company X, this strategy may be applied to domestic suppliers, but it seems
unrealistic regarding the others, as currently many remote suppliers are under
cooperation. In order to compensate the lack of concentration, some methods
such as shipment consolidation and communication improvements are
suggested regarding the cooperation with international suppliers. The major
targets focus on the attempts to reduce the ordering cost, transportation cost,
and replenishment lead time values.
The main outcome of the implementation of above two strategies are
improved flexibility and reduced inventory, since the company will be easier to
react to the changes from customer orders and thus increase the
competitiveness.
Building Long-lasting Relationships
As one of the important characteristics of the JIT Purchasing, signing long-
term contracts assures the stable cooperation to some extent. This kind of
relation is built based on a high degree of trust, meaning that both buyers and
suppliers should share information but also protect its confidentiality

62
(Gunasekaran 1999, 78). Accordingly the adequate supplier sourcing and
selection become essential. Currently in Company X there are more than 300
suppliers, and more than one third of them are international ones, thus, it
would be difficult to organize all the JIT operational activities and establish
effective relationships with all the suppliers. Instead, selecting limited amount
of suppliers and establish reliable partnerships with them would be more
effective regarding cost savings and quality assurance. In terms of the
assessment of supplier’s quality and competence, the ISO9000 standards are
the most popular criteria. Such kind of quality certification provides guarantees
to the capacities of supplier before initiating a relationship to some extent
(Benito & Spring 2000, 1045). However it is still significant to assess and
control suppliers’ performance constantly. For instance, by recording the
percentage of on time delivery and irregular visits to suppliers’ plants, the
reliability and quality can be monitored and controlled. Moreover, it is also
possible to rank the suppliers periodically in order to renew contracts or
develop new suppliers.
Identify and response to customers’ needs
Knowing the needs and expectation of customers is the core principle of the
quality management. The end users will satisfy if all parties along the supply
chain can satisfy the needs of their backward users. Previously in Company X
there were several quality problems resulted from inadequate communication
between the company and the end customers. Hence, remodeling the
relationship with end customers can help improve the operation efficiency of
supply chain system and achieve the win-win situation.
For a customer-driven industry, the principle of PDCA cycle (Figure 15) can be
used. When understanding the requirements of customers, the strategic
planning should be made regarding the process of realizing the objectives.
Based on the initial plan, the process performance should be continually
improved to meet the changing requirements of clients. For instance, to
improve on-time performance, reduce errors and costs, enhance quality of
product and service, and regulatory compliance system, etc. Next, according

63
to the customer feedback which is crucial for the company to learn the level of
customers’ satisfaction, some corresponding actions need to be made to
recheck the performance and thus improve client loyalty.
Information flow Customer Include end customer and internal customer
FIGURE 15. Supply chain quality management system Although establishing a relationship based on trust is important, in today’s
complex business environment, some other measures should be taken as well
in order to safeguard the rights and benefits of the company itself. For
example, the benefit/risk sharing is one strategy to make the corporation with
customers more sustainable. The benefit/risk sharing can be achieved through
signing pre-agreed contract, which specifies the incentive or penalty
regulations according to the actual performance of both parties. Moreover, if
the supplier (Company X) manages to improve the productivity with lower net
production costs, part of this improvement will accrue to the customer from
price reductions and part will accrue to the supplier itself in the form of
benefits. And the same should happen when productivity decreases. Through
this way, both suppliers and customers get benefits and have motivations to
enhance their performance. (Idea: Benito & Spring 2000, 1042.)
Realization
Evaluation
Improvement
Requirement
Cu
sto
mer
nee
ds
Cu
sto
mer
sat
isfa
ctio
n

64
Qualify internal purchasing activities
As another crucial member along the supply chain, the organization itself also
plays an essential role for improving the quality of whole system. To qualify
the internal performance of purchasing department, the improvements could
be done from the following aspects.
Commitment & Awareness
Guided by the ultimate goal of “satisfy customers”, the company should start
from strengthening the awareness of quality. In order to make it easier to
understand and accept the new idea, the target of improving quality needs to
be interpreted according to the realistic situation and the concept of quality
should be compatible with the company’s own culture. In the end, the
commitment of quality should be transmitted to every member of purchasing
team and even the whole organization.
Education & Training
Even though the purchasing executives are equipped with professional
purchasing knowledge and skills already, the company should still provide
opportunities for continuous staff training, in order to strengthen the
techniques and improve the implementation of purchasing tools.
Organization
In terms of the structure of purchasing department, the specific task
delegation defining who, what, how, how much, and who is responsible is
required to be updated in time. Meanwhile, the efficient and continuous
internal communication is necessary as well. When analyzing the current
situation in Company X, the performance of internal communication is on a
good level, and the communication atmosphere is also excellent. However,
the proportion of the number of employees and workload allocated is not that
optimistic, especially in terms of the new acquisition, it is highly recommended
to make some adjustments regarding the personnel structure and workload
distribution.

65
Investigation & Corrective actions
Another helpful method is to set up a system for investigating problems from
procedures, forms, documentations, etc. points of view, in order to investigate
the root cause of problems and even the accountability of employees.
Regarding the actual causes, some actions could be made to correct the
problems and also prevent recurrence.
Recognition
Last but not least, setting up the mechanism of achievement measurement is
also a wise action to maintain the motivation of employees, meaning that
achievements of individuals or groups should be rewarded periodically.
Currently, Company X has similar mechanism and it can be used still in the
future. But since the concept of quality is introduced, some adjustments
should be made regarding the evaluating criteria when needed.
In conclusion, the core idea of the JIT-QM joint strategy is to increase the
flexibility of the supply chain activities while maintaining or even improving the
quality of the whole supply chain performance. And for Company X, this
strategy can help to commit a long-term continuous improvement throughout
the organization and its partnership with both suppliers and customers. As a
result, the company will gain better reputations and remain competitive over
the long run.

66
5. Conclusion and Summary In conclusion, the thesis is focused on operations management in order to
achieve inventory optimization and purchasing activities improvement for the
case company X. In general, the thesis is of great reference and the output of
it is useful, since some recommended solutions were found to solve the
current existing problems through in-depth investigation and comprehensive
research, and some attempts were made to improve the current performance
and prevent the problems recurrence in the future.
The contribution for the company is optimizing the current inventory structure,
eliminating non-active stocks, and improving the quality of purchasing
activities and organization. And from a scholar point of view, the thesis deeply
analyzed the relationship between purchasing activities and inventory level
control. Since the purchasing activities are dealing with the input of inventory,
the purchasing executives have the responsibility to ensure the input to be
correct, consistent and complete. And in turn, the purchasing decisions have
to be made based on the accurate analysis of the present inventory situation.
The specific case analysis provides further evidence that the study for
understanding the interactions between purchasing and inventory
management is worth making.
To improve the current performance and enhance the overall business
competitiveness, the specific strategies and methods of operations
management were stressed in the thesis. More concentrating on purchasing
strategies, the JIT Purchasing principles were suggested in order to minimize
wastes and maximize cost savings. Meanwhile, regarding the current
performance of purchasing department, the concepts of quality management
and JIT-QM combined strategy were presented for qualifying the purchasing
organization and establishing the optimized relationships between the
suppliers, case company and customers.
All the improvement approaches were recommended to the company with an
ultimate goal to promote the sustainability of the whole business of Company
X in the long term. And the relevant approaches can provide reference to the
SMEs in the similar industry field if the solutions work out.

67
6. Discussion
Results Reliability
In general the reliability of the research results can be questioned since many
variables were defined according to estimations or experiences of purchasing
executives instead of the precise data, as some information was not available.
Safety Stock & Reorder Point Calculation
In order to define the accurate level of optimized safety stock and reorder
point, it would be advisable to perform a detailed analysis of some relevant
factors such as service level, lead time, and demand standard deviation.
Meanwhile it would be also useful to know the earlier reorder levels accurately
so that they can be compared with the theoretically optimized levels. However,
because of the unavailability of precise data, the service level was assumed to
be the same for all products, the lead times were defined depending on the
class of items, and the demand standard deviations were estimated based on
the consumption trend of products generally. Moreover because the reorder
level of Company X was defined according to different suppliers and different
lead times or even some other factors, it was challenging to know the accurate
reorder point for every single product.
EOQ calculation
The process of determining the economic order quantity turned out to be more
complicated. Like mentioned before, unfortunately some variables are mere
estimates such as ordering cost, carrying cost percentage, and average
inventory value. The total ordering cost for the year 2014 was defined as the
sum of ordering making cost, monitoring and control cost, warehouse
personnel cost, transportation cost, purchasing invoicing cost, and the cost for
entering data into the system, etc. And the ordering cost per unit was
assumed to be fixed, and it was calculated by the total ordering cost divided
by the estimated number of yearly orders. However, some other issues may
also affect the ordering cost. Taking the costs of materials handling as an
example, the costs were generated not only by the working hours put in, but
also the potential risk of damage to the items. In this case, the calculating
process became even more challenging. And the inventory carrying cost was

68
calculated by multiplying the estimated inventory value by the estimated
inventory carrying cost percentage. As the thesis considered the stocks
situation of trading parts only, currently it is too hard for the company to
exclude the manufacturing parts from the total stock. The estimated inventory
value used for calculation is the total stock value of trading parts on the data
collecting day.
Contributions to the case company
Due to the complexity of the calculation according to the theoretical formulas,
it is common that companies usually use their own calculating methods or
traditional benchmarks. But based on the calculation process demonstrated in
this thesis, the case company may start performing a detailed analysis to the
fields it neglected previously, such as service level, demand standard
deviation, ordering cost, and inventory carrying cost etc., in order to make the
decisions about purchasing and inventory level control more accurately in the
future. Meanwhile the new defined reorder point will hopefully gradually
reduce the current high stock value and help to increase the inventory
turnover rating. And the cost parameters defined in the thesis may support to
decide the amount and the workload of personnel when performing
purchasing activities. And the more precisely defined inventory carrying cost
percentage could be used as a benchmark when comparing to the other
companies in the same industry field.
Benefits for personal development
From professional development point view, the biggest gain of the author from
the thesis process is the improvement of researching and analyzing skills.
Moreover, the skills of combining and comparing theoretical knowledge and
practices were strengthened as well. As an excellent opportunity to connect
the theoretical knowledge gained from the past three years to the real working
life, the thesis implementing process provided a good chance to understand
how logistics affects businesses and even our daily life more deeply.
69
Some other personal transferrable skills were developed at the same time. For
instance, ICT skills were improved by practicing Excel and some related
software programs. Furthermore, the researching process cooperated with a
Finnish company has further developed the author’s cross-cultural
communication skills. Even though some delays occurred because of the new
acquisition of the case company and some misunderstandings caused by
language barriers, the expected results were achieved and the whole process
was definitely unforgettable. Thanks for everyone who gave supports during
the thesis implementation process!
Remark:
Due to the confidentiality agreement, all confidential data of the case
company such as values and numbers are not demonstrated in the
thesis.

70
References
A, Gunasekaran. 1999 Just-in-time Purchasing: An Investigation for research and applications International Journal of Production Economics 59, 77-84 Accessed on 24 March, 2015 Retrieved from http://www.sciencedirect.com/science/article/pii/S0925527398000255 Antic, Ljilja & Bojana Novicevic 2012 Just in Time and Total Quality Management for Need of Achieving Competitive Advantage of Companies. Series: Economics and Organization 9, 195-198. Accessed on 8 Februray, 2015 http://facta.junis.ni.ac.rs/eao/eao201202/eao201202-04.pdf A comprehensive guide on Materials Management N.d. Accessed on 5 January, 2015 http://www.materialsmanagement.info/inventory/abc-inventory-analysis.htm Advantages and Disadvantages of ABC Analysis Inventory N.d. Small Business – Choron.com. Accessed on 11 January, 2015 Retrieved from http://smallbusiness.chron.com/advantages-disadvantages-abc-analysis-inventory-34202.html Advantages & Disadvantages of Just-in-Time Inventory N.d. Small Business – Choron.com. Accessed on 10 Februray, 2015 Retrieved from http://smallbusiness.chron.com/advantages-disadvantages-justintime-inventory-21407.html Bulinski, Jerzy, Czeslaw Waszkiewicz, & Piotr Buraczewski 2013 Utilization of ABC/XYZ analysis in stock planning in the enterprise. Annals of Warsaw University of Life Sciences – SGGW, Agriculture 61, 89-96. Accessed on 11 January, 2015. http://annalswuls.sggw.pl/files/files/agriculture/afe2013no61art11.pdf Bierley, Jr, Jacob J. 2008 Inventory Turnover. Share/Learn page of Vital Enterprises website. Accessed on 12 January, 2015. https://www.vitalentusa.com/learn/turnover.php Chung, Chai Khin & Nooh Abu Bakar 2001 The Relevancy of Just-in-Time (JIT) Concept in Government purchasing. Jurnal Teknologi 35(A), Universiti Teknologi Malaysia, 1-4 Accessed on 9 Februray, 2015 http://eprints.utm.my/1019/1/JT35A1.pdf

71
Caniels, Marjolein C.J. & Cees J. Gelderman 2005 Purchasing Strategies in the Kraljic matrix – A Power and Dependence Perspective. Faculty of Management Sciences. Open University of the Netherlands. Accessed on 21 March, 2015. Retrieved from http://www.sciencedirect.com/
Donald J, Waters C.
2003 Inventory Control and Management. 2nd. ed. England: John Wiley & Sons Ltd.
Ditto, Steve
N.d. Building Quality Into Customer Relationship Management. Accessed on 26 March, 2015
Retrieved from frost.com/prod/servlet/cpo/159791229
Emmett, Stuart and Granville, David.
2007 Excellence in Inventory Management How to minimize costs and maximize service. Cambridge Academic.
Economic situation and outlook 4/2014
2014 The Federation of Finnish Technology Industries. Accessed on 20 December, 2014 http://teknologiateollisuus.fi/sites/default/files/file_attachments/tt_situationoutlook_4_2014.pdf Flynn, Barbara B, Sadao Sakakibara & Roger G. Schroeder 1995 Relationship Between JIT and TQM: Practices and Performance The Academy of Management Journal 38, 1326-1333 Accessed on 7 February, 2015 http://www.jstor.org/discover/10.2307/256860?sid=21105279118471&uid=70&uid=4&uid=2&uid=2129 Fenson, Carl & Pär Edin. 2008 How purchasing practitioners use the Kraljic matrix, A relative comparative case study with four big Swedish industrial manufacturing companies. Master Thesis. Stockholm School of Economics, Department of Marketing and Strategy. Accessed on 12 March, 2015. Retrieved from http://arc.hhs.se/download.aspx?MediumId=537 Gelderman, Cees J. & Arjan J. van Weele 2002 Strategic Direction through Purchasing Portfolio Management: A Case Study. Accessed on 21 March, 2015.
https://www.nevi.nl/sites/default/files/kennisdocument/LEV-PORT-art-014-bl.pdf

72
Gonzalez-Benito, Javier & Martin Spring 2000 JIT Purchasing in the Spanish Auto Components Industry, Implementation patterns and perceived benefits International Journal of Operations & Production Management 20, 1038-1061 Accessed on 24 March, 2015 Retrieved fromhttp://www.emeraldinsight.com/doi/pdfplus/10.1108/01443570010339145 Jakovljevic, P.J. N.d Is There a Smarter Way to Handle Excess Active and Obsolete Inventory? technologyevaluation.com. Accessed on 17 March, 2015 http://fm.sap.com/data/UPLOAD/files/Is%20There%20a%20Smarter%20Way%20to%20Handle%20Active%20and%20Obsolete%20Inventory.pdf Just-in-Time Inventory Definition N.d. Small Business – Choron.com. Accessed on 9 Februray, 2015 Retrieved from http://smallbusiness.chron.com/just-time-inventory-definition-23475.html Kaynak, Hale 1997 Total quality management and just-in-time purchasing: their effects on performance of firms operating in the U.S. Garland studies on industrial productivity, 111-125. Accessed on 12 Februray, 2015 Lopez, Marti & Joan Miquel Verd 2011 The Rewards of a Qualitative Approach to Life-Course Research. The Example of the Effects of Social Protection Policies on Career Paths. Forum Qualitative Sozialforschung / Forum: Qualitative Social Research. 12(3), Art. 15. Accessed on 3 November, 2014 http://www.qualitative-research.net/index.php/fqs/article/view/1753/3259 N Nayab 2011 Looking at the Benefits of TQM Accessed on 6 February, 2015 http://www.brighthubpm.com/monitoring-projects/70318-looking-at-the-benefits-of-tqm/ Pardeep, Gagan N.d Total Quality Management & Just In Time. Indus World School of Business. Accessed on 21 March, 2015. Retrieved from http://www.slideshare.net/GaganSharma3/tqm-jit
Russell, Roberta S. & Taylor, Bernard W.
2009 Operations Management Along the Supply Chain. 6th. ed. John Wiley & Sons (Asia) Pte Ltd.
Rama, Rao 2009 Advantages and Purpose of ABC Analysis. Accessed on 9 January, 2015 http://www.citeman.com/7537-advantages-and-purpose-of-abc-analysis.html

73
Reorder Point Planning N.d. help.sap.com. Accessed on 14 Februray, 2015 https://help.sap.com/saphelp_45b/helpdata/en/7d/c27102454011d182b40000e829fbfe/content.htm Romanov, Alexander. 2013 Analysis and Reduction of Excess Inventory at a Heavy Equipment Manufacturing Facility. MIT Sloan School of Management and the Department of Aeronautics and Astronautics. Accessed on 17 March, 2015. Retrieved from http://dspace.mit.edu/handle/1721.1/81016 Shields, Herbert C. N.d Excess & Obsolete Inventory: A Diminishing Asset with Hidden Costs M-Wave International.com. Accessed on 17 March, 2015 http://www.mwav.com/excess-obsolete-inventory-a-diminishing-asset-with-hidden-costs/ Vuppalapati, Kiran, Sanjay L. Ahire, & Tarun Gupta 1995 JIT and TQM: a case for joint implementation. International Journal of Operations & Production Management 15, 84-94 Accessed on 24 March, 2015 Retrieved from http://www.emeraldinsight.com/doi/full/10.1108/01443579510083686
Vermorel, Joannes
2012 Economic Order Quantity (EOQ), Definition and Formula. Accessed on 14 April, 2015
http://www.lokad.com/calculate-safety-stocks-with-sales-forecasting
Vermorel, Joannes
2007 Calculate Safety Stock with Sales Forecasting. Accessed on 14 April, 2015
http://www.lokad.com/economic-order-quantity-eoq-definition-and-formula
Weele, Arjan J. van.
2010. Purchasing and Supply Chain Management. 5th. ed. UK: Cengage Learning EMEA.
What are the Benefits of Total Quality Management? N.d WiseGEEK.com. Accessed on 6 February, 2015 http://www.wisegeek.com/what-are-the-benefits-of-total-quality-management.htm

74
Appendices
Appendix 1. Terminology
EOQ Economic Order Quantity
EDI Electronic Data Interchange
ERP Enterprise Resource Planning
ISO International Standard Organization
JIT Just in Time
MRP Requirement Planning
OM Operations Management
OEM Original Equipment Manufacturer
ROP Reorder Point
SME Small and Medium-sized Enterprise
QM Quality Management

75
Appendix 2. Survey about purchasing performance of Company X
Purchasing Performance Evaluation of Company X
Price/cost
Budget situation (purchasing materials, tooling, department/organization)
Price control
Cost reduction
Product quality
Reject rates of incoming goods (due to quality problems) on average
Number of quality claims to suppliers
Number of ISO certified suppliers
Logistics
Delivery reliability (in general) of suppliers
-on-time delivery
-late delivery
-backorders
Inventory turnover ratio
Organization
Purchasing staff (training & motivation)
Purchasing management (rules, guidelines, communication…)
Purchasing information system
Customer satisfaction
Product reject rate (due to quality problems) on average
Delivery reliability
Number of backorders (per buyer)