Inventory Management with SAP S/4HANA - hservers.org
497
-
Upload
khangminh22 -
Category
Documents
-
view
0 -
download
0
Transcript of Inventory Management with SAP S/4HANA - hservers.org


SAP PRESS is a joint initiative of SAP and Rheinwerk Publishing. The know-how offered by SAP specialists combined with the expertise of Rheinwerk Publishing offers the reader expert books in the field. SAP PRESS features first-hand information and expert advice, and provides useful skills for professional decision-making.
SAP PRESS offers a variety of books on technical and business-related topics for the SAP user. For further information, please visit our website: http://www.sap-press.com.
Bhattacharjee, Narasimhamurti, Desai, Vazquez, Walsh Logistics with SAP S/4HANA: An Introduction (2nd Edition) 2019, 589 pages, hardcover and e-book www.sap-press.com/4785
Justin Ashlock Sourcing and Procurement in SAP S/4HANA 2018, 503 pages, hardcover and e-book www.sap-press.com/4551
Jawad Akhtar Production Planning with SAP S/4HANA 2019, 1010 pages, hardcover and e-book www.sap-press.com/4821
Paul Ovigele Material Ledger in SAP S/4HANA: Functionality and Configuration 2019, 540 pages, hardcover and e-book www.sap-press.com/4863

Bernd Roedel, Johannes Esser
Inventory Management with SAP S/4HANA®

Dear Reader,In college, I learned that managing supplies for a three-day hike in the Grand Canyon is easier said than done.
How do you divvy out snacks, water, and Band-Aids at a sustainable rate as eight hikers grow hungry, thirsty, and blistered? What’s the best way to distribute supplies—includ-ing a 36-pound communal tent—across eight backpacks of varying sizes? How should you store the trail mix so it’s always within reach, and how often should you stop to monitor consumption? In our case, you make it up as you go and hope for the best.
So if a spring break hike is hard, imagine inventory management for global opera- tions. But, dear reader, if you have SAP S/4HANA to handle your processes and expert authors Bernd Roedel and Johannes Esser to guide you through them, you can manage inventory with the precision missing from our adventure in the Grand Canyon.
What did you think about Inventory Management with SAP S/4HANA? Your comments and suggestions are the most useful tools to help us make our books the best they can be. Please feel free to contact me and share any praise or criticism you may have.
Thank you for purchasing a book from SAP PRESS!
Megan Fuerst Editor, SAP PRESS
[email protected] www.sap-press.com Rheinwerk Publishing • Boston, MA

Notes on UsageThis e-book is protected by copyright. By purchasing this e-book, you have agreed to accept and adhere to the copyrights. You are entitled to use this e-book for personal purposes. You may print and copy it, too, but also only for personal use. Sharing an electronic or printed copy with others, however, is not permitted, neither as a whole nor in parts. Of course, making them available on the Internet or in a company network is illegal as well.
For detailed and legally binding usage conditions, please refer to the section Legal Notes.
This e-book copy contains a digital watermark, a signature that indicates which person may use this copy:

ImprintThis e-book is a publication many contributed to, specifically:
Editor Megan FuerstAcquisitions Editor Emily NichollsCopyeditor Julie McNameeCover Design Graham GearyPhoto Credit iStockphoto.com/182478772/© LordRunarProduction E-Book Graham GearyTypesetting E-Book SatzPro, Krefeld (Germany)
We hope that you liked this e-book. Please share your feedback with us and read the Service Pages to find out how to contact us.
ISBN 978-1-4932-1845-5 (print) ISBN 978-1-4932-1846-2 (e-book) ISBN 978-1-4932-1847-9 (print and e-book)
© 2019 by Rheinwerk Publishing, Inc., Boston (MA) 1st edition 2019
Library of Congress Cataloging-in-Publication Number: 2019946532

Contents
Preface ..................................................................................................................................................... 15
1 Introduction to SAP S/4HANA and SAP Fiori 21
1.1 SAP HANA Database ........................................................................................................... 22
1.1.1 Basics ........................................................................................................................ 22
1.1.2 In-Memory Database Limitations and Mitigation Strategies ............... 24
1.1.3 Database Benefits and Features ..................................................................... 27
1.2 A New Data Model .............................................................................................................. 29
1.2.1 Material Documents (Table MATDOC) .......................................................... 29
1.2.2 Accounting Documents (Table ACDOCA) ..................................................... 37
1.3 Functional Changes ............................................................................................................ 37
1.3.1 Simplification List ................................................................................................. 37
1.3.2 Industry Solution Retrofitting .......................................................................... 38
1.4 SAP Fiori ................................................................................................................................... 38
1.4.1 A New User Paradigm ......................................................................................... 39
1.4.2 SAP Fiori Applications .......................................................................................... 41
1.4.3 SAP Fiori Launchpad ............................................................................................ 50
1.5 Summary ................................................................................................................................. 64
2 Inventory Management Basics 65
2.1 Inventory as a Staple of the Supply Chain ............................................................... 65
2.2 End-User Role Templates ................................................................................................. 68
2.3 Key Considerations ............................................................................................................. 69
2.3.1 Service Levels, Inventory Costs, and Operational Profit .......................... 69
2.3.2 Lot Sizes, Replenishment Times, and Safety Stocks .................................. 71
2.3.3 Local versus Global Inventory Management ............................................... 74
2.3.4 New Technologies ................................................................................................ 75
7
Contents
2.4 Inventory Optimization in SAP S/4HANA ................................................................ 79
2.4.1 Optimization Schema ......................................................................................... 79
2.4.2 Plan and Adjust ..................................................................................................... 82
2.4.3 Execute .................................................................................................................... 82
2.4.4 Analyze .................................................................................................................... 84
2.5 Summary ................................................................................................................................. 85
3 Configuring Inventory Management 87
3.1 Implementation Guide Configuration ....................................................................... 87
3.1.1 Implementation Guide Overview ................................................................... 88
3.1.2 Organizational Units ........................................................................................... 91
3.1.3 Inventory Management ..................................................................................... 95
3.1.4 Procurement .......................................................................................................... 112
3.1.5 Logistics Execution .............................................................................................. 119
3.1.6 Production Planning ........................................................................................... 119
3.2 Cross Functions .................................................................................................................... 125
3.2.1 Date Functions ...................................................................................................... 125
3.2.2 Responsibility Management ............................................................................ 127
3.2.3 Situation Handling .............................................................................................. 130
3.2.4 Extensibility ........................................................................................................... 136
3.3 Servers ...................................................................................................................................... 143
3.3.1 Frontend .................................................................................................................. 144
3.3.2 Backend ................................................................................................................... 146
3.4 Basic Interfaces .................................................................................................................... 147
3.5 SAP Fiori ................................................................................................................................... 148
3.5.1 SAP Fiori Entities ................................................................................................... 149
3.5.2 Roles and Users ..................................................................................................... 150
3.5.3 SAP Fiori Apps Reference Library ..................................................................... 153
3.6 Summary ................................................................................................................................. 155
8

Contents
4 Planning and Adjusting Inventory 157
4.1 Planning Strategies ............................................................................................................. 158
4.1.1 Production Planning ............................................................................................ 160
4.1.2 Discrete versus Process Manufacturing ........................................................ 163
4.1.3 Demand-Driven versus Plan-Driven Planning ............................................ 163
4.2 Production Master Data Overview .............................................................................. 165
4.2.1 Bill of Material ....................................................................................................... 165
4.2.2 Work Center/Resource ....................................................................................... 166
4.2.3 Routing/Master Recipe ....................................................................................... 166
4.2.4 Production Version ............................................................................................... 166
4.2.5 Production Supply Area ...................................................................................... 167
4.3 MRP Overview ....................................................................................................................... 167
4.3.1 Generic MRP Capabilities in SAP S/4HANA .................................................. 168
4.3.2 Planning Process ................................................................................................... 168
4.3.3 MRP Live ................................................................................................................... 171
4.3.4 DDMRP ..................................................................................................................... 172
4.4 Kanban Overview ................................................................................................................ 173
4.5 Capacity Planning and Production Master Data ................................................... 174
4.5.1 Manage Work Center Capacity ........................................................................ 174
4.5.2 Display BOM, Display Multilevel BOM Explosion, and Find BOM
for Components .................................................................................................... 176
4.5.3 Display Routing/Display Master Recipe ........................................................ 180
4.6 Make-to-Order and Make-to-Stock ............................................................................. 182
4.7 MRP Live ................................................................................................................................... 186
4.7.1 Monitor Requirements and Material Coverage ......................................... 186
4.7.2 Manage Planned Orders ..................................................................................... 201
4.7.3 Convert Planned Orders ..................................................................................... 201
4.7.4 Schedule MRP Runs .............................................................................................. 202
4.7.5 Display MRP Key Figures .................................................................................... 207
4.7.6 Display MRP Master Data Issues ..................................................................... 211
4.7.7 Monitor External Requirements ...................................................................... 212
4.7.8 Monitor Internal Requirements ....................................................................... 214
4.7.9 Detect Unnecessary Supply Elements ........................................................... 217
9

Contents
4.8 DDMRP ..................................................................................................................................... 221
4.8.1 Configuration Process ........................................................................................ 221
4.8.2 Buffer Profile Maintenance .............................................................................. 222
4.8.3 Product Classification: Mass Maintenance of Products ......................... 223
4.8.4 Buffer Adjustment ............................................................................................... 225
4.8.5 Product Classification: Schedule Product Classification ........................ 226
4.8.6 Buffer Positioning ................................................................................................ 228
4.8.7 Schedule Lead Time Classification of Products .......................................... 231
4.8.8 Schedule Buffer Proposal Calculation ........................................................... 233
4.8.9 Manage Buffer Levels ......................................................................................... 236
4.8.10 Planners Overview ............................................................................................... 243
4.8.11 Replenishment Planning ................................................................................... 244
4.8.12 Replenishment Execution ................................................................................. 246
4.9 Kanban ..................................................................................................................................... 248
4.9.1 Manage Control Cycle ........................................................................................ 248
4.9.2 Summarized JIT Call Scheduler ....................................................................... 252
4.9.3 Kanban Calculation ............................................................................................. 254
4.10 What’s Ahead for Inventory Planning and Adjustment? .................................. 255
4.10.1 Prerequisites .......................................................................................................... 255
4.10.2 Schedule Predictive MRP Simulation Creation ........................................... 256
4.10.3 Process Predictive MRP Simulations .............................................................. 260
4.11 Summary ................................................................................................................................. 262
5 Goods Receipt 263
5.1 Purchase Order ..................................................................................................................... 263
5.1.1 Purchase Orders for Inventory ......................................................................... 264
5.1.2 Stock-Related Procurement .............................................................................. 268
5.2 Inbound Delivery ................................................................................................................. 272
5.3 Production Order ................................................................................................................. 274
5.4 Goods Receipt without Reference ............................................................................... 275
5.5 Process Variants ................................................................................................................... 277
5.5.1 Batch-Managed Materials ................................................................................ 277
10

Contents
5.5.2 Goods Receipt Blocked Stock ............................................................................ 280
5.5.3 Mandatory Quality Inspection ......................................................................... 280
5.5.4 Decentralized Warehouse Management ..................................................... 281
5.5.5 Return Delivery ...................................................................................................... 281
5.5.6 Single- or Multi-Account Assignment ........................................................... 282
5.6 What’s Ahead for Goods Receipt? ................................................................................ 285
5.7 Summary ................................................................................................................................. 285
6 Core Inventory Management 287
6.1 Monitoring Core Inventory Documents .................................................................... 288
6.1.1 Material Document Components ................................................................... 288
6.1.2 Use Enterprise Search to Identify Inventory Documents ........................ 289
6.1.3 Material Documents Overview ........................................................................ 291
6.1.4 Analyze the Document Flow via the Material Document
Object Page ............................................................................................................. 296
6.2 Stock Identification ............................................................................................................ 298
6.2.1 Stock – Single Material ....................................................................................... 299
6.2.2 Stock – Multiple Materials ................................................................................ 305
6.2.3 Display Stock Overview ...................................................................................... 307
6.3 Stock Transfer ........................................................................................................................ 309
6.3.1 Stock Transfer – In-Plant .................................................................................... 310
6.3.2 Transfer Stock – Cross-Plant ............................................................................. 314
6.3.3 Post Goods Movement ....................................................................................... 316
6.3.4 Working with Stock Transport Orders ........................................................... 318
6.4 Initial Entry and Scrapping .............................................................................................. 321
6.4.1 Manage Stock ........................................................................................................ 321
6.4.2 Post Goods Movement ....................................................................................... 324
6.5 Reversals .................................................................................................................................. 325
6.5.1 Reversals within the Material Document Object Page ............................ 326
6.5.2 Partial Material Document Reversal .............................................................. 326
6.6 Physical Inventory ............................................................................................................... 327
6.6.1 Physical Inventory Phases .................................................................................. 328
11

Contents
6.6.2 Create Physical Inventory Documents .......................................................... 330
6.6.3 Enter Inventory Count ........................................................................................ 333
6.6.4 Process Physical Inventory Count Results .................................................... 334
6.6.5 Physical Inventory Document Overview ...................................................... 335
6.7 What’s Ahead for Core Inventory? .............................................................................. 337
6.8 Summary ................................................................................................................................. 338
7 Production Execution 339
7.1 Working with Reservations ............................................................................................ 340
7.1.1 Automatic Creation of Reservations ............................................................. 341
7.1.2 Manual Reservation Management ................................................................ 341
7.1.3 Display Reservation List ..................................................................................... 343
7.2 Scheduling and Manufacturing Execution .............................................................. 345
7.2.1 Schedule Production ........................................................................................... 345
7.2.2 Monitor Work Center Schedules ..................................................................... 349
7.2.3 Stock Requirements List .................................................................................... 351
7.2.4 Display Planned Orders, Production Orders, and Process Orders ........ 352
7.2.5 Manage Change Requests ................................................................................ 356
7.2.6 Check Material Coverage ................................................................................... 359
7.2.7 Monitor Production Orders and Process Orders ........................................ 359
7.2.8 Manage Production Orders .............................................................................. 364
7.2.9 Confirm Production Operations ...................................................................... 370
7.2.10 Create Goods Receipt for Production Order ................................................ 372
7.3 Production Performance Monitoring ......................................................................... 372
7.3.1 Material Scrap ....................................................................................................... 372
7.3.2 Operation Scrap .................................................................................................... 374
7.3.3 Scrap Reason .......................................................................................................... 375
7.3.4 Excess Component Consumption .................................................................. 377
7.3.5 Monitor Production Execution Duration ..................................................... 379
7.4 Working with Kanban ....................................................................................................... 380
7.4.1 Display Kanban (Demand View) ..................................................................... 380
7.4.2 Display Kanban (Supply View) ......................................................................... 383
7.4.3 Due Replenishment Elements ......................................................................... 384
12

Contents
7.4.4 Correct Kanban ...................................................................................................... 386
7.4.5 Unlock Kanban Container .................................................................................. 387
7.4.6 Collective Kanban Print ...................................................................................... 387
7.4.7 Set Kanban Container Status ........................................................................... 388
7.5 What’s Ahead for Production Execution? ................................................................. 389
7.6 Summary ................................................................................................................................. 392
8 Inventory Analysis 395
8.1 Inventory Analytics in SAP S/4HANA ......................................................................... 396
8.1.1 Advances in Analytics .......................................................................................... 396
8.1.2 Choosing the Right Analytics Tool .................................................................. 397
8.2 Posted Stock Change Analysis ....................................................................................... 398
8.2.1 Stock Single Material and Stock Multiple Materials ................................. 398
8.2.2 Goods Movement Analysis ................................................................................ 398
8.2.3 Physical Inventory Document Analysis ......................................................... 403
8.3 Key Performance Indicator Monitoring and Analysis ......................................... 404
8.3.1 Overview Pages ..................................................................................................... 404
8.3.2 Inventory Turnover Analysis ............................................................................. 409
8.3.3 Inventory (Multiple) Key Performance Indicator Analysis ...................... 413
8.3.4 Material Valuation ............................................................................................... 419
8.4 Process Analysis Tools ....................................................................................................... 419
8.4.1 Dead Stock Analysis ............................................................................................. 420
8.4.2 Slow or Non-Moving Materials ........................................................................ 421
8.4.3 Overdue Stock in Transit .................................................................................... 425
8.4.4 Overdue Goods Receipt Blocked Stock .......................................................... 427
8.5 Custom Queries .................................................................................................................... 428
8.6 What’s Ahead for Analytics? .......................................................................................... 433
8.7 Summary ................................................................................................................................. 437
13

Contents
9 Inventory Management in the Cloud 439
9.1 SAP S/4HANA Cloud ........................................................................................................... 440
9.1.1 Solution Scope ...................................................................................................... 441
9.1.2 Implementation Methodology ........................................................................ 447
9.1.3 Configuration and Fine-Tuning ....................................................................... 448
9.1.4 Update Cycle .......................................................................................................... 453
9.2 Hybrid Deployment ............................................................................................................ 453
9.2.1 SAP S/4HANA and SAP S/4HANA Cloud ....................................................... 454
9.2.2 Decentralized Warehouse Management ..................................................... 457
9.2.3 Digital Procurement, Sourcing, and Supply Chain Process
with SAP Ariba ....................................................................................................... 459
9.3 SAP Cloud Solutions ........................................................................................................... 460
9.3.1 SAP Cloud Platform ............................................................................................. 460
9.3.2 SAP Analytics Cloud ............................................................................................. 460
9.3.3 SAP API Business Hub ......................................................................................... 464
9.3.4 SAP Leonardo Internet of Things .................................................................... 475
9.4 Summary ................................................................................................................................. 478
The Authors ........................................................................................................................................... 479
Index ........................................................................................................................................................ 481
Service Pages ..................................................................................................................................... I Legal Notes ......................................................................................................................................... I
14

0Preface
Welcome to the comprehensive book on inventory management in SAP S/4HANA.
With SAP S/4HANA as the SAP HANA-based, next-generation enterprise resource
planning (ERP) offering, SAP has also refactored core parts of SAP ERP, namely,
finance and logistics. Although SAP S/4HANA may appear just to be SAP ERP on SAP
HANA, much has been changed underneath.
First, this book will shed some light on these changes. Second, SAP S/4HANA entails
some impressive user interaction technologies often summarized as SAP Fiori. This
book will explain SAP Fiori and the advantages it brings to your daily work. Third and
most important, this book will describe the latest capabilities of SAP S/4HANA with
respect to inventory management. We understand inventory management as the
following:
� Representing logical structures to manage a company’s inventory
� Procedures to track and document physical and logical inventory changes
� As a service used by value-adding processes such as procure to pay, plan to deliver,
sell from stock, and so on
� Key differentiator when balancing service level versus capital lockup
� Part of the production planning and execution process
Looking at the evolution of ERP software, we see the next quantum leap happening
right now.
The very first (pre-) ERP systems were built on batch run processes and offered just a
few capabilities to business users to interact with the system. The second-generation
ERP started by clustering business processes into transactions so that business users
could display or manipulate data in the system in real time. The primary value add of
such an ERP system was to have all data integrated into one database instance that
could be used by any business transaction, presenting a tight integration of business
processes.
The third-generation ERP “outsourced” some business processes to separate system
instances such as the data warehouse, customer relationship management system,
and supply chain management system due to a high demand for processing power or
large data volumes to deal with. Sometimes, this was referred to as the “best of breed
approach” if each system instance ran on a different vendor’s software.
15

Preface
Now, new developments in hardware and software technology allow us to create
fourth-generation ERP systems that are built on one database instance but offer the
processing power of separate systems enriched with new methods for smart user
interaction, collaboration, built-in machine intelligence, and natural language inter-
action. Therefore, this generation of ERP systems is called the “intelligent ERP.”
Because it comes with different deployment models, such on premise, cloud, and
hybrid, the intelligence may be embedded or side by side.
It’s a safe bet that SAP would like the CIOs of every company to queue up in front of
its Walldorf-based headquarters to make sure that their company is the first to get
the latest release of SAP S/4HANA. The inventory management functionality and
improved logistics system, which we’ll explore in this book, are key reasons that the
line may start to form.
Who This Book Is For
This book addresses anyone who is interested in SAP S/4HANA with a logistics focus.
The book offers a lightweight technical background to system administrators, con-
sultants, and key users on the SAP HANA database and SAP Fiori. For experienced SAP
users in the area of logistics, this book explains the difference SAP S/4HANA makes
when it comes to designing logistics processes, which will motivate you to rethink
the current logistics implementation in SAP and to strive for improvements. To all
new SAP users, this book is a good starting point to get to know the SAP S/4HANA ter-
minology and directly start with modernized logistics, avoiding implementing a
third-generation ERP on a fourth-generation platform. If you’re a solution architect
or a system architect, you might be interested to get a glimpse of where ERP is head-
ing to in the future. As end users in logistics, you should be thrilled by all the new fea-
tures—such as the intuitive user interface (UI), the collaboration and knowledge-
sharing tools, mobilized applications, embedded analytics, and smart assistance sys-
tems described in this book—and immediately start to think how to leverage them.
As an active user of SAP S/4HANA, you’ll find the practical instructions and hints for
managing inventory in SAP S/4HANA in this step-by-step guide.
We are convinced that the main benefit of SAP S/4HANA is to run your core logistics
processes better with less effort compared to any other ERP system.
16

Preface
How This Book Is Organized
This book contains nine chapters. We recommend reading them sequentially from
Chapter 1 onward to get a comprehensive overview from technology to configuration
to inventory management and beyond.
Figure 1 shows how the chapter contents relate to each other. The white boxes refer to
content that is created on the scaffold of inventory management processes. The dark-
est box contains content explaining the planning processes, the medium-dark boxes
contain content detailing the execution processes, and the lightest box covers the
analytic processes. The book suggests organizing inventory management on the
basis of a continuous improvement process (CIP) cycle, with the following three
steps: plan/adjust (dark), execute (medium), and analyze (light). If you follow the con-
tent map while reading, it may help you find solutions for dedicated areas.
Figure 1 Content Map
Chapter 1
Introducing the SAP S/4HANAParadigms:
• Real-Time Inventory• SAP Fiori User Interface
Chapter 2
Inventory Management Basics:Establishing a Feedback Loop
Keeping Inventory Low andService-Level Agreements High
Chapter 3
Configuration: Explaining AllRequired System Configuration
Steps
Chapter 4
Planning/Adjusting Inventory
Chapter 5
Executing Inbound InventoryProcesses
Chapter 6
Executing Core InventoryProcesses
Chapter 7
Executing Production PlanningProcesses
Chapter 8
Analyzing Inventory Processes
Chapter 9
System Deployment Options
Execute
Analyze
Plan/Adjust
17

Preface
Further Resources
For each SAP Fiori app that we discuss, you can use the related SAP Fiori ID (for exam-
ple, F0843 — Post Goods Receipt for Purchase Order) or SAP GUI transaction shown
in parentheses for deeper analysis in the SAP Fiori apps reference library at http://s-
prs.co/v489206.
Let’s review what is covered in each chapter of this book:
� Chapter 1: Introduction to SAP S/4HANA and SAP Fiori
This chapter introduces the SAP S/4HANA database and explains how its in-memory
architecture is leveraged in the refactoring of core logistics. Secondly, the chapter
explains the SAP Fiori UI paradigm, which is designed to simplify and streamline
system–user interaction.
� Chapter 2: Inventory Management Basics
This chapter focuses on core inventory management basics and positions inven-
tory management within supply chain planning from the technical and end-user
role perspectives. The chapter also introduces the idea of SAP S/4HANA as an intel-
ligent ERP system supporting inventory optimization.
� Chapter 3: Configuring Inventory Management
In this chapter, we walk through the configuration steps in an SAP S/4HANA sys-
tem, which consist of the SAP IMG, business process extensibility, and setting up
user roles regarding technical interfaces.
� Chapter 4: Planning and Adjusting Inventory
This chapter covers the inventory planning part of the inventory optimization
cycle. Different planning strategies are mentioned, and the key SAP Fiori apps in
SAP S/4HANA supporting these strategies are explained in depth.
� Chapter 5: Goods Receipt
This chapter belongs to the execution part of the inventory optimization cycle and
covers the SAP Fiori apps used in the inbound processes of inventory manage-
ment.
� Chapter 6: Core Inventory Management
This chapter belongs to the execution part of the inventory optimization cycle and
covers the SAP Fiori apps used in the core processes of inventory management
(stock transfer posting, physical inventory, and more).
18

Preface
� Chapter 7: Production Planning and Execution
This chapter belongs to the execution part of the inventory optimization cycle and
covers the SAP Fiori apps used during production execution.
� Chapter 8: Inventory Analysis
This chapter belongs to the analysis part of the inventory optimization cycle and
presents all kinds of real-time analytical SAP Fiori apps, ranging from simple use
cases to professional use cases and from operational reporting to strategic analyt-
ics.
� Chapter 9: Inventory Management in the Cloud
This chapter gives an outlook beyond the on-premise deployment options of SAP
S/4HANA. There is a strong focus on SAP S/4HANA Cloud and SAP Cloud Platform
with some concrete examples of hybrid deployment scenarios.
Disclaimer
Throughout this book, the terms “material” and “product” are used as synonyms as
are “vendor” and “supplier”; however, SAP S/4HANA often replaces “material” with
“product” and replaces “vendor” with “supplier.”
Inventory management is a central part of the core logistic processes. In this book, we
look at inventory management from a production planning perspective. Therefore,
external procurement-related processes aren’t covered in detail. Furthermore, the
newly embedded SAP S/4HANA warehouse management capabilities are not part of
this book, as they are “downstream” of inventory management. Both topics deserve
their own book.
Acknowledgments
We have been supported while writing this book by many colleagues at SAP. We
would like explicitly to thank the following colleagues for actively reviewing this
book with us (in alphabetical order):
Thomas Friedrich, Bernhard Lokowandt, Michael Philipp, Benjamin Ringl, Manish
Saraswat, and Bernhard Trebels.
In the course of writing single chapters, we received additional support from the fol-
lowing colleagues (in alphabetical order):
19

Preface
Bince Mathew, Peter Gussmann, Thomas Hensel, Heike Hoffmann, Alexander Kra-
sinskiy, Katja Mueller, Carsten Riemer, Michael Schmidt, Jochen Strobel, Hardeep
Tulsi, Christine von Crailsheim, and Martin Wilmes.
We would also like to thank Emily Nicholls and Megan Fuerst at Rheinwerk Publi-
shing.
Last but not least, our respective families have co-invested considerable effort into
this book by freeing their husbands/fathers for writing. Both authors pay back now
with this acknowledgement to (in alphabetical order): Alexandra, Esther, Hannah,
Jan, Jonathan, and Rebecca.
In case we omit a colleague, we promise to correct this in the next edition.
Many screenshots are taken from test and demo systems. Without our colleagues
having created the demo data, this book wouldn’t look as it does right now. Thanks
very much indeed!
Conclusion
Reading this book will provide you with a comprehensive guide to inventory man-
agement in SAP S/4HANA. This book will serve as your foundational knowledge
source when planning your SAP S/4HANA implementation. It also serves as a starting
point to explore further the books from SAP PRESS. Let’s get on board now and pro-
ceed to Chapter 1 with a first glance at SAP S/4HANA in general.
20

Chapter 1
Introduction to SAP S/4HANA and SAP Fiori
Let’s begin with the basics—what is SAP S/4HANA, what is SAP Fiori,
and how does inventory management fit in? In this chapter, we’ll
build up the foundations of inventory management in SAP S/4HANA.
When talking about IT systems, solution architecture, or business processes, we often
face the situation that business analysts and end users use a different terminology
than IT people, which leads to misunderstandings and confusion during implemen-
tation projects. This chapter will shed some light on the latest IT terms introduced
with SAP S/4HANA in general and within inventory management in particular.
An IT system is supposed to collect, store, compute and present information to its
users. To separate these tasks a little bit, IT systems are constructed as layers, as
shown in Figure 1.1.
An enterprise resource planning (ERP) system is an IT system designed to collect,
store, compute, and present all kind of business information in support of end users
doing their business. SAP S/4HANA is the next generation ERP system that evolves
the technology of the database layer and the user interface (UI) layer.
This chapter will explain the evolution of the database layer by introducing in-
memory databases and the new data model in inventory management. We’ll then
explain the simplification of the application layer and conclude with a discussion
of the changes to the UI layer by introducing SAP Fiori.
21

1 Introduction to SAP S/4HANA and SAP Fiori
Figure 1.1 Software Architecture of an ERP System
1.1 SAP HANA Database
Databases are used to collect and store information. They represent the memory of
an ERP system. After reading this chapter, you’ll understand why the SAP HANA data-
base is a quantum leap in database technology.
Let’s break down SAP HANA into three parts: basics, limitations, and benefits.
1.1.1 Basics
To motivate this rather technical chapter, let’s assume you’re a financial accountant
transferring $1000 from account A holding $2000 to account B holding $1000. You
have the following expectation for your ERP system behavior:
� The ERP system will always display the correct figures of account A and B regard-
less of whether the system is in normal operation mode or there was a power fail-
ure, hardware defect, or technical upgrade. Either account A holds $2000 and
SAP HANADatabase
ABAP
SAP Fiori
SAP S/4HANA Architecture
Collect andStore
Compute
Present User Interface Layer
Application Layer
Database Layer
TaskSoftwareArchitecture Term
SAP S/4HANA System
Web Browser
HTTP(S)
Frontend
Backend
22

1.1 SAP HANA Database
B holds $1000, or vice versa. Neither with both accounts have $2000 during the
transfer nor will both accounts have $1000.
� If $1000 is withdrawn from account A, then the same sum of $1000 will appear in
account B.
� Your transfer of $1000 won’t affect any other posting in the system done by you or
by any other users.
� You can always rely on the result of the transfer after it’s executed and confirmed
by the ERP system.
Your expectations are met by the implementation of the atomicity, consistency, iso-
lation, and durability (ACID) principle for transactions. ACID describes in technical
terms the requirements of an ERP system designed to support business process used
in this example. The cornerstone of such an ERP system is the database, which pro-
vides these ACID capabilities to the application (refer to Figure 1.1).
The challenge to today’s database vendors is to provide these capabilities not just for
one transaction at a time but for millions of concurrent transactions changing tera-
bytes of data simultaneously. For a long time, database implementations have relied
on file systems such as storage on hard disks, where the data itself is organized in
tables, and each table consists of an arbitrary number of rows stored sequentially on
the hard disk. In our example, each row of the account table may have a column rep-
resenting the account identifier (A or B) and another column representing the
amount in currency for each account. A row may also be denoted in database termi-
nology as a record. To execute the $1000 transfer, the database would need to read
both rows of the account table from the hard disk into main memory, subtract the
$1000 from the value of row A’s $2000 amount column, add it to the value of row B’s
$1000 amount column, and then write both changes simultaneously back to the
hard disk while making sure that no other transaction has changed the values of
account A or account B in-between.
With SAP HANA, a new type of database implementation has been introduced. Due to
the advances in hardware, notably main memory and processing power, the SAP
HANA database doesn’t use the file system as memory anymore. It keeps all data in
the main memory (a change log of every operation is written to the hard disk to
recover the main memory in case of unexpected hardware outages). In addition, the
SAP HANA database organizes the data in columns instead of rows; for our example,
this results in a column account identifier with values A and B and a column account
23

1 Introduction to SAP S/4HANA and SAP Fiori
value with initial values $2000 and $1000. The row information (i.e., record) is pre-
served by the order of each column. In general, this organization of data is referred to
as column store in opposite to the row store outlined earlier.
The column store provides two advantages:
� As the database knows all the different values stored in one column all the time,
the database can use compression algorithms to reduce the main memory con-
sumption of a column. This is helpful if you have a limited number of discrete val-
ues per column. For example, a plant in SAP is identified by four alphanumeric
characters. Therefore, in a row store, you would normally reserve 4 bytes, or 8
bytes on Unicode systems, per plant. However, as long as you don’t have more
than 255 different plants per column, 1 byte is sufficient to represent all different
plants if it’s linked to a second table holding the true values of each plant. This is
referred to as Data Dictionary (DDIC) compression. Later, in Section 1.2.1, you’ll see
how DDIC compression significantly reduces the memory footprint in inventory
management.
� Many database operations comprise calculation within one column (sum, mini-
mum value, maximum value, etc.). This is straightforward within a column store,
as all values of one column are accessible in main memory. In a classical row store,
you need to read all rows from the hard disk, extract the value for each column,
and do the computation.
The main disadvantage of a column store is the use of delete and insert operations of
rows. Eventually, this requires a reordering of all columns linked to the database
table. To overcome this disadvantage, SAP HANA executes delete and insert opera-
tions per column in a transient area of the main memory and merges these changes
back to the column store from time to time.
Now that you’ve learned the basics of SAP HANA database with its in-memory col-
umn store of database tables, let’s take a closer look at its limitations and benefits.
1.1.2 In-Memory Database Limitations and Mitigation Strategies
Although Moore’s law about computer hardware evolution is still valid to some
degree, it’s obvious that there are physical boundaries that limit the size and process-
ing power of modern computer systems today. Of course, this limitation also applies
to in-memory database instances such as SAP S/4HANA.
24

1.1 SAP HANA Database
As outlined in Section 1.1.1, using a column store instead of a row store has clear
advantages regarding mathematical operations per column; however, when applica-
tions need to fetch row by row from the database, a row store will perform better.
With SAP S/4HANA, the limitations are minimized so that the benefits mentioned in
Section 1.1.3 create a unique user experience superior to all available ERP systems so
far.
Scale Up or Scale Out
With SAP S/4HANA, you can either increase the main memory/processing power of
the ERP systems if your business grows (scale up), or you can distribute the tables
held in memory between several SAP HANA server instances (scale out). The latter
strategy clusters database tables on SAP HANA server instances in a way that avoids
cross SAP HANA instance queries. Thus, you distribute your database content
between the main memory of several SAP HANA server instances to achieve optimal
performance for your business processes.
Data Aging
In your daily life, you’ll organize your bank statements so that the current year’s
statements are at hand, and the previous years’ statements are stored in a file in your
desk. SAP S/4HANA offers a comparable feature for database tables, which may hold
large amounts of data. Like the bank statement example, records that may not need
to be accessible during your daily business can be moved to a different storage called
“cold store,” which is the opposite of the hot store, where the records needed for daily
business are kept, as shown in Figure 1.2.
Technically, the cold store is an SAP HANA partition that isn’t consuming main mem-
ory but is residing in a special storage attached to the system with superfast band-
width. The process of moving data to the cold store is called data aging. You can
schedule data aging based on certain conditions on a regular basis to minimize main
memory consumption of nonbusiness critical data. Accessing aged data is transpar-
ent for end users (unlike archiving, as we’ll see in the next section); for example, if an
end user tries to access an aged document, the application moves the document from
the cold store to the hot store to make it accessible for all sorts of computations.
25

1 Introduction to SAP S/4HANA and SAP Fiori
Figure 1.2 Data Aging and Archiving
Archiving
At some point, the bank statements of the earlier example become obsolete. You may
keep a few of them to prove some critical transactions, but you’ll simply discard most
of them.
This process is called archiving in SAP S/4HANA, as shown previously in Figure 1.2.
Most of the database table, which held business-critical data, offers an archiving
object that can be linked to an archiving system. Like the preceding example,
archiving can also mean deletion. You can schedule archiving runs based on certain
conditions. Unlike data aging, archiving removes records from the SAP S/4HANA sys-
tem. If end users want to access the archived records, they need to use transactions
that are especially enabled to access archived data because normal business transac-
tions don’t access archived data. The entire process of information lifecycle manage-
ment is shown in Figure 1.3.
As mentioned, archiving can also be used to delete records from the SAP S/4HANA
system. Therefore, you can fulfill the legal obligation of data protection and privacy
with archiving.
SAP HANADatabase
Database Table
PermanentAging
Retrieval on Demand
Archive Object(1–n Database Tables) Archiving
Transparent AccessExplicit Access
Hot StoreCold Store
26

1.1 SAP HANA Database
Figure 1.3 Information Lifecycle Management
1.1.3 Database Benefits and Features
As explained in Section 1.1.1, the column store offers many options for fast and effi-
cient mathematical operations on the values of one database column. This allows
you to move application coding into the database and improve performance. More-
over, the core data services (CDS) and built-in SAP HANA libraries (as you’ll see in this
section) offer a rich collection of mathematical functions significantly enhancing the
available ABAP open SQL syntax. This feature is wildly used in performance-critical
processes such as available-to-promise (ATP) and material requirements planning
(MRP) (see Chapter 4).
Core Data Services
New database features are leveraged only if they are “consumable” by the application
and integrate nondisruptively into the existing code base. Therefore, SAP S/4HANA
comes along with the new technology of CDS. In a nutshell, CDS views are enhance-
ments of existing database views. Their main features are as follows:
� CDS views support basic software architecture requirements because they can be
stacked and designed in layers.
Today
Current yearYear n -2 Year n -1Year n -3Year n -4Year n -5Year n -6
Archived data (archiving system)
Historic data
Data is notchangedanymore
Data is not used incritical processes
anymoreEnd of
purposeEnd of retention and
destruction of personal data
Archiving and informationlifecycle management
Data aging
Current data (always accessible)
27

1 Introduction to SAP S/4HANA and SAP Fiori
� CDS views offer a tool-supported declarative design of database operations with-
out the need to learn Structured Query Language (SQL).
� CDS view syntax offers a rich set of data manipulation language (DML) commands.
� CDS views can be annotated to indicate reusability. They offer different kinds of
technically and semantically stable contracts.
� CDS views that are publicly available follow stable naming conventions for views
and attributes.
� CDS views are used to model access to SAP business objects. Each business object
represents one or many database tables, which form a strong business relation-
ship (i.e., header – item).
� CDS views offer an extension concept, so that you can easily extend business
objects with your own fields.
� CDS views may directly interact with native SAP HANA functions.
� CDS views allow the direct execution of authorization checks when retrieving data
from the database.
� CDS views support text-index based search (see Section 1.4.3).
� CDS views natively support OData.
� CDS views can be directly accessed by ABAP programs and are visible in the ABAP
DDIC.
Libraries
The SAP HANA database includes several build functionalities that are frequently
used in ERP systems:
� Enterprise search
Sometimes called fuzzy search or TREX, this functionality retrieves the best
matching text strings out of a set of text data based on a ranked similarity index.
� Predictive Analysis Library (PAL)
This functionality offers statistical and predictive analytical capabilities.
� Graph engine
This feature allows processing of mathematical graphs within the database.
� Geospatial engine
This features allows processing of geospatial data within the database.
28

1.2 A New Data Model
1.2 A New Data Model
In this section, you’ll learn about the improvements that are part of inventory man-
agement in SAP S/4HANA and, to some extent, in financial accounting, because the
material ledger intersects with our main topic. The cornerstones of the improvement
include the redesign of two core database tables, the elimination of redundant fields
distributed among various database tables holding aggregated data, the clear separa-
tion of transactional data and master data, and the nondisruptive integration of the
revised data model into the existing code base.
1.2.1 Material Documents (Table MATDOC)
Inventory management is about tracking physical or logical movements of materials
as part of your business processes, and it’s in the center of all business processes deal-
ing with procurement, production, sales and distribution, physical inventory count-
ing, warehouse management, and so on. The tracking is achieved by recording any
material movement with a material document posting (table MATDOC).
We’ll walk through the material documents components, as well as how the material
document differs pre- and post-SAP S/4HANA, in the following sections.
Basics
A material document contains a material document header and one or many mate-
rial document items. The material document header contains the following:
� Material document number (key)
� Material document year (key)
� Posting date
� Document date
� Additional administrative fields
There are many possible material document items, as follows:
� Key fields
The Material Document Number is derived from number range objects. The used
interval depends on the type of material document. The Material Document Year
is the calendar year of the posting.
� Posting date/document date
The Posting Date determines when the posting becomes valid from a business
29

1 Introduction to SAP S/4HANA and SAP Fiori
perspective. The Document Date normally contains the creation date of the mate-
rial document. Posting of material documents is only allowed in the two active
posting periods. After a posting period is closed, posting into this period is no lon-
ger possible. The active posting periods normally correspond to two successive
calendar months.
� Additional administrative fields
These fields contain information on the user, transaction, and so on of the mate-
rial document.
In most cases, each item is related to the posting of one material. The business pro-
cess of the movement is defined by the movement type of the Material Document
Item. In addition to the Material and the Movement Type each Material Document
Item contains the following:
– Document item number
– Quantities/quantity units
– Stock type
– Special stock type
– Special stock type identifier
– Organizational units
– Material supplementing data
– Links to direct predecessor or successor documents in the business process
– One link to the valuation of the material document item
– Fields used for specific industry processes
– Fields extended by customers (coding block)
� Quantities
Each material has a Base Unit of Measure and optional Alternative Units of Mea-
sure. The Quantities are always recorded in Base Unit of Measure and in the
inputted unit of measure.
� Stock types, special stock types, special stock type identifier
A stock type is a logical attribute identifying the purpose, state, or usage of a
defined quantity of material stock in SAP. There are 10 predefined stock types in
inventory management in SAP S/4HANA, such as Unrestricted-Use Stock, Quality
Inspection Stock, Blocked Stock, and so on (see Chapter 2, Section 2.1).
30

1.2 A New Data Model
Moreover, stock types might be subdivided by the Special Stock Type indicator.
Depending on the special stock type, additional special stock type identifiers are
required. Here are a few examples:
– Special stock type K (Supplier Consignment) requires the supplier number.
– Special stock type Q (Project Stock) requires the work breakdown structure
(WBS) element to identify the assigned project.
– Special stock type E (Orders at Hand) requires the sales order item.
Stock types and special stock types help the system and end user determine
whether a defined quantity of material stock is usable in a dedicated business pro-
cess. Changes of stock types are recorded with material documents containing the
designated movement types. For transfer postings, both issuing and receiving
stock types are recorded.
Note
The stock types discussed here are the inventory stock types. There are stock types in
SAP S/4HANA that aren’t managed by inventory management and thus not recorded
by material documents (e.g., non-valuated goods receipt blocked stock).
� Organizational units
To structure your business processes, you need to structure your organization (see
Chapter 3). In core inventory management, typical organizational units are as fol-
lows:
– Plant
– Storage location
To valuate a material movement, the company code might be required (derived
from the plant). For material transfer posting, the issuing and receiving organiza-
tional units are also recorded.
� Material supplementing data
In some cases, the material number itself isn’t sufficient and needs to be enhanced
with supplementary data. For example, if your material is subjected to batch man-
agement, the batch number is also part of the material document item.
� Links to direct predecessor or successor documents in the business process
If your material document item is created as part of a business process, the link to
the direct predecessor or successor document items are stored.
31

1 Introduction to SAP S/4HANA and SAP Fiori
For example, if you create a goods receipt for a purchase order item, then the
material document contains the appropriate movement type 101 and the pur-
chase order item.
� One link to the valuation of the material document item
Material documents only store the quantity-related information of material
movements. The financial impact of a material movement is stored in a different
table (see Section 1.2.2). The KALNR value in table MATDOC is the direct link between
the material document item and the accounting document item representing the
material valuation related to the quantity posting in table MATDOC.
� Fields used for specific industry processes
Some industry-specific processes fill additional fields during a material document
posting.
� Fields extended by customers (coding block)
Users can extend the material document item with custom specific fields to
extend the SAP S/4HANA predelivered business processes. For example, custom
specific fields in the goods receipt process control the account determination of
the involved financial document.
Note
In addition to the field group explained in the preceding list, table MATDOC contains
some technical attributes that don’t have any influence on business processes and
therefore aren’t mentioned here.
Material documents can’t be changed or updated. If a material document item is
incorrect, the material document item must be reversed by creating a reversal post-
ing (another material document with at least one item representing the reversal).
Normally, the movement type of the reversal posting is directly derived from the
movement type of the material document item to be reversed. As a rule of thumb,
movement types with odd numbers represent the normal business process flow, and
the movement type with the follow-up even number is the corresponding reversal
posting. In other words, reversal means the original material document is “neutral-
ized” by an inverted material document.
Thus, material documents can be considered as journals recording all material move-
ments within an SAP S/4HANA instance. As the number of material documents may
grow very quickly, an archiving strategy can be used to keep the size within reason-
able bounds (see Section 1.1.2).
32

1.2 A New Data Model
As the material documents record all logical and physical stock changes, the inven-
tory stock situation can be calculated at any given point by evaluating the appropri-
ate material document items.
Pre-SAP S/4HANA Design
The SAP system on previous SAP releases (such as SAP ERP) recorded the material
documents in two normalized database tables. One table stored all material docu-
ment headers (table MKPF), and a second table stored the material document items
(table MSEG). In addition, each material document posting updated several tables that
stored aggregated information on the material stock in the system. Some of the
tables contained master data attributes and aggregated material stock data (e.g.,
tables MARD and MARC), whereas others contained exclusively aggregated material
stock data (see Figure 1.4).
Figure 1.4 Old Data Model versus the Simplified Data Model for Material Documents
The first tables are denoted as hybrid tables in Figure 1.4. During a material document
posting, these table were exclusively locked for a short time by the posting process to
ensure data consistency. After closing the current posting period, the aggregated
stock data was transferred to history tables, for example, MARDH and MARCH.
MATDOC
SAP S/4HANASAP ERP
MaterialMaster Tables
MARC
MARD
MCHB
MKOL
MSKA
MSKU
MSLB
MSPR
MKPF
MSEG
HybridHistory
AggregateTables
MSSA
MSSQ
MSTB
MSTE
MSTQ
MSSAH
MSSQH
MSTBH
MSTEH
MSTQH
MARCH
MARDH
MCHBH
MKOLH
MSKAH
MSKUH
MSLBH
MSPRH
MARC
MARD
MCHB
MKOL
MSKA
Material Document Tables Material Document Tables
Master Data + On-the-Fly Aggregation Denormalized Material Documents
MSLB
MSPR
MSKU
33

1 Introduction to SAP S/4HANA and SAP Fiori
This design ensured the following:
� All stock changes were recorded as material documents.
� The actual stock quantity was stored per stock type in various tables.
� All stock quantities were modeled as key figures.
� Some preprocessed aggregates were available for analytical purposes.
� The stock history was preserved for each posting period end.
SAP S/4HANA Revised Data Model
As explained in the previous section, all stock changes are recorded as material docu-
ment items. Hence, the stock quantity at any given point could be calculated by sum-
ming up the relevant material document items. Based on this idea, a new
denormalized database table MATDOC was designed, containing all required fields to
calculate the quantity of any stock type at any given time. The table’s design was opti-
mized exactly for this purpose in the following ways:
� A globally unique identifier (GUID) was introduced as an artificial key split up
across several key fields to reduce memory.
� Quantity fields with sign and suitable size were introduced to support fast aggre-
gation.
� Header and item were merged into one denormalized table to avoid join opera-
tions on the database table level.
� A Record Type field was introduced to ensure the correct quantity calculation for
data migration, data aging, or data archiving.
� Attributes serving as logical keys for all known stock types were grouped as stock
identifying field (SIDs). More than 60 different inventory stock types are known in
SAP S/4HANA. This approach is called the account model.
� To support stock transfer posting, the appropriate logical issuing and receiving
attributes were included in the table definition.
� To support fast document flow analysis of reversals, the reversal document and
the reversed document were linked as a double-linked list.
� Fields holding posting information, such as week, month, day of week, and so on,
were introduced in addition to the posting date itself.
34

1.2 A New Data Model
Technically, a database table definition in the ABAP DDIC serves two purposes in SAP:
� Defines a database table, which is created by the data definition language (DDL) on
the database instance and is accessed by open SQL in ABAP
� Defines a structure type, which can be referred to in any ABAP program
Therefore, the new data model outlined here must also ensure that the existing ABAP
code still works correctly despite all the changes in table design and the new
approach to calculating stock quantities solely out of table MATDOC records. In spite of
replacing the functional purpose of table MKPF and table MSEG, their technical defini-
tion (and therefore their structure type) is still visible in SAP S/4HANA. Their ABAP
DDIC information has been enhanced by a so-called replacement object (sometimes
also called proxy or compatibility view), which redirects any read access to table MAT-DOC and returns the data records in the correct format, as shown in Figure 1.5.
Figure 1.5 ABAP DDIC Replacement Object of Table MARC (Plant-Related Data of a Material
Master Record)
35

1 Introduction to SAP S/4HANA and SAP Fiori
This technique is used to eliminate other redundant aggregate tables or aggregates in
master data tables, so that eventually all material document or stock quantity infor-
mation in SAP S/4HANA is calculated from table MATDOC on request.
Further Resources
SAP Note 2206980 helps you plan your upgrade to the revised data model in inven-
tory management in SAP S/4HANA. SAP Note 2569435 describes how to deal with the
content of the replaced tables after an upgrade to SAP S/4HANA.
Of course, adding up thousands of records will always take more time than just read-
ing a single preaggregated value. Therefore, all read access to the master data contain-
ing aggregates has been optimized in SAP S/4HANA, so that the aggregation isn’t
executed if the requesting coding merely needs the master data.
The new data model described so far has another advantage over the pre-SAP
S/4HANA design. Because there is no need to update several aggregate tables, there is
also no need to lock tables during material document posting. This “insert only”
design facilitates throughput and greatly increases the performance of material doc-
ument postings (see Figure 1.6). See Chapter 3, Section 3.1.3, for more details.
Figure 1.6 Comparison of Material Document Posting Performance
0
100
200
300
400
500
600
700
800
900
1 5 10 20 40 60 70 80
Simulated Backflush Posting with 100 Items per Material Document
SAP ERP SAP S/4HANA
Parallel Processes
Th
rou
gh
pu
t (I
tem
s/Se
c)
36
1.3 Functional Changes
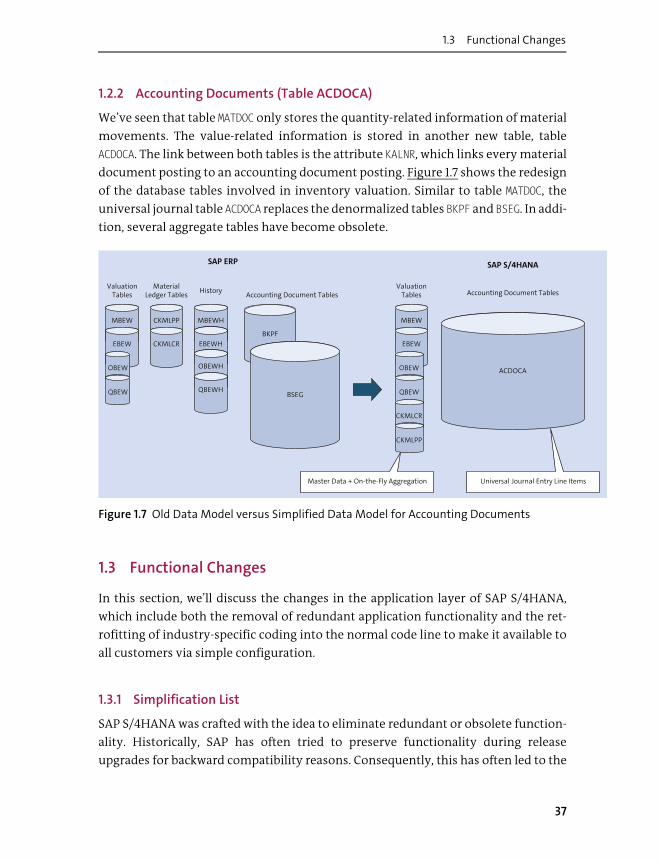
1.2.2 Accounting Documents (Table ACDOCA)
We’ve seen that table MATDOC only stores the quantity-related information of material
movements. The value-related information is stored in another new table, table
ACDOCA. The link between both tables is the attribute KALNR, which links every material
document posting to an accounting document posting. Figure 1.7 shows the redesign
of the database tables involved in inventory valuation. Similar to table MATDOC, the
universal journal table ACDOCA replaces the denormalized tables BKPF and BSEG. In addi-
tion, several aggregate tables have become obsolete.
Figure 1.7 Old Data Model versus Simplified Data Model for Accounting Documents
1.3 Functional Changes
In this section, we’ll discuss the changes in the application layer of SAP S/4HANA,
which include both the removal of redundant application functionality and the ret-
rofitting of industry-specific coding into the normal code line to make it available to
all customers via simple configuration.
1.3.1 Simplification List
SAP S/4HANA was crafted with the idea to eliminate redundant or obsolete function-
ality. Historically, SAP has often tried to preserve functionality during release
upgrades for backward compatibility reasons. Consequently, this has often led to the
ACDOCA
SAP S/4HANASAP ERP
ValuationTables
MBEW
EBEW
OBEW
QBEW
CKMLCR
CKMLPP
BKPF
BSEG
ValuationTables
History
MBEW
EBEW
MaterialLedger Tables
CKMLPP
CKMLCR
MBEWH
EBEWH
OBEWH
QBEWH
OBEW
QBEW
Accounting Document Tables Accounting Document Tables
Master Data + On-the-Fly Aggregation Universal Journal Entry Line Items
37

1 Introduction to SAP S/4HANA and SAP Fiori
situation in which functional equivalent applications coexisted within one system.
With SAP S/4HANA, SAP has decided to follow a different approach by publishing a
simplification list, which contains functions and technology that have become obso-
lete and are removed during an upgrade to SAP S/4HANA.
Note
This simplification list is published for each major on-premise release at http://
s-prs.co/v489200.
With the help of this list, you can upgrade your implemented processes during the
technical upgrade to SAP S/4HANA.
1.3.2 Industry Solution Retrofitting
SAP ERP basic architecture was built on the business function concept, which allowed
you to switch on industry-specific functionality or new developments shipped in
enhancement packages. This architecture has allowed SAP to enrich its ERP flagship
stepwise with additional features that only become active if the code is activated
when the assigned business function is turned on.
In SAP S/4HANA, the vast majority of the switchable code fragments are merged back
into the main code line and the business function is replaced by simple configura-
tion. Following are the most prominent retrofitted business functions:
� Long material number (40 digits), which is natively supported in SAP S/4HANA
� Catch weight management, which supports a parallel (second) unit of measure in
all logistic transactions
� Discrete industry and mill products
� Retail (partially)
1.4 SAP Fiori
Let’s now discuss the evolution of the UI layer in SAP S/4HANA. End users access an
ERP system via its UI. The easier and the faster an end user can perform his or her
tasks, the higher the business value of an ERP system. As part of SAP S/4HANA, SAP
38
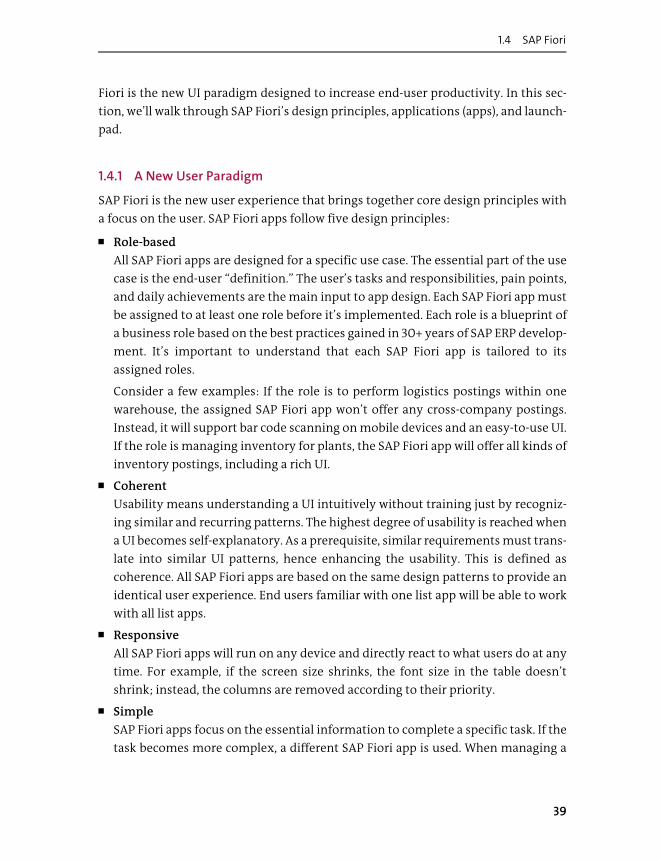
1.4 SAP Fiori
Fiori is the new UI paradigm designed to increase end-user productivity. In this sec-
tion, we’ll walk through SAP Fiori’s design principles, applications (apps), and launch-
pad.
1.4.1 A New User Paradigm
SAP Fiori is the new user experience that brings together core design principles with
a focus on the user. SAP Fiori apps follow five design principles:
� Role-based
All SAP Fiori apps are designed for a specific use case. The essential part of the use
case is the end-user “definition.” The user’s tasks and responsibilities, pain points,
and daily achievements are the main input to app design. Each SAP Fiori app must
be assigned to at least one role before it’s implemented. Each role is a blueprint of
a business role based on the best practices gained in 30+ years of SAP ERP develop-
ment. It’s important to understand that each SAP Fiori app is tailored to its
assigned roles.
Consider a few examples: If the role is to perform logistics postings within one
warehouse, the assigned SAP Fiori app won’t offer any cross-company postings.
Instead, it will support bar code scanning on mobile devices and an easy-to-use UI.
If the role is managing inventory for plants, the SAP Fiori app will offer all kinds of
inventory postings, including a rich UI.
� Coherent
Usability means understanding a UI intuitively without training just by recogniz-
ing similar and recurring patterns. The highest degree of usability is reached when
a UI becomes self-explanatory. As a prerequisite, similar requirements must trans-
late into similar UI patterns, hence enhancing the usability. This is defined as
coherence. All SAP Fiori apps are based on the same design patterns to provide an
identical user experience. End users familiar with one list app will be able to work
with all list apps.
� Responsive
All SAP Fiori apps will run on any device and directly react to what users do at any
time. For example, if the screen size shrinks, the font size in the table doesn’t
shrink; instead, the columns are removed according to their priority.
� Simple
SAP Fiori apps focus on the essential information to complete a specific task. If the
task becomes more complex, a different SAP Fiori app is used. When managing a
39

1 Introduction to SAP S/4HANA and SAP Fiori
business object, the SAP Fiori apps can be classified according to a pyramid-like
layering, as shown in Figure 1.8, with the simplest one on top displaying the busi-
ness essentials, and the complex ones with comprehensive editing capabilities
forming the bottom of the pyramid.
Figure 1.8 Pyramid Approach to Accessing the SAP S/4HANA System via SAP Fiori Apps
� Delightful
A good UI feels like talking to a good friend. It helps and supports end users so that
they enjoy their work.
SAP Fiori apps not only support different end-user roles but also different levels of
configuration and personalization.
When working with SAP Fiori apps, end users will see all the information needed to
do their daily work. If anything is missing, it will be just one click away. The system
supports users by automating as many steps as possible. Each end user may adjust
any SAP Fiori app to his or her personal preferences by different sorts of personaliza-
tion, such as app settings, selection and layout variants, personalized tiles, and per-
sonalized home pages.
Adaptation of SAP Fiori apps by administrators or key users ensures that all end users
have a productive working environment tailored to their needs. Adaptations always
affect all users of an SAP Fiori app (see Chapter 3, Section 3.2.4).
Former SAP GUI and Web Dynpro Apps
Launchpad and Search
Overview Page
Worklists and Approvals
Analytical Apps
Native SAP Fiori Transactional SAP Fiori Apps (<100% Scope)
Object Pages in Display Mode
Transformed SAP Fiori
Native SAP Fiori appwith full functionality
Native SAP Fiori appwith reduced functionality
Transformed SAP Fiori appwith full functionality
40

1.4 SAP Fiori
Theming and extension of SAP Fiori apps by developers creates a uniform working
environment within a company as well as customer-specific fields linked to business
objects and passed within processes.
1.4.2 SAP Fiori Applications
SAP Fiori apps may be classified according to the complexity, flexibility, and versatil-
ity they offer to users. In SAP S/4HANA, there are typically two basic types of techni-
cal SAP Fiori app implementations: native and former SAP GUI transactions. We’ll
explore both in the following sections.
Native SAP Fiori Applications
Native SAP Fiori apps are developed from scratch in SAP S/4HANA. They follow com-
mon floorplans:
� Overview page
An overview page (see Figure 1.9) displays mainly analytical information on the
highest aggregation level suitable for the end user.
Figure 1.9 Overview Page Warehouse Clerk
41

1 Introduction to SAP S/4HANA and SAP Fiori
Interaction is limited to navigation from the highly aggregated data to the SAP
Fiori app showing less aggregated data, which is shown in an interactive chart card
1 and a list card 2 with your navigation target. Filtering the information is possi-
ble 3.
� Simple list
A simple list (see Figure 1.10) provides information in a list-based layout with filter
options 1 and structured columns in a responsive table 2 offering navigation
inside or outside the original SAP Fiori apps, create/edit/delete row functions (if
applicable), sorting, grouping, and filtering. If navigation options are linked to a
list item, an arrow is displayed to the right of the list item on which you can click
to start navigation. Sometimes, simple list implementations offer a split column
layout so that they resemble a worklist.
Figure 1.10 Simple List Material Documents Overview
� Analytical list/SAP Smart Business app/design studio grid
All these floorplans have in common that they provide information as list and
charts displaying dimensions and measures. Measures are aggregated/disaggre-
gated if dimensions are removed or added to the table/chart. Navigation inside or
outside the original SAP Fiori apps, sorting, grouping, and filtering are supported.
There are slight differences depending on the use case, as follows:
42

1.4 SAP Fiori
– The analytical lists (see Figure 1.11) combine charts and tables for simple drill-
down operations. The filter bar allows you to restrict the initial result set
depicted by the chart and is switchable to graphical mode 1. Here you can use
chart elements to drill down on subsets 2 to be displayed in the analytical table
at the bottom 3.
Figure 1.11 Analytical List Page: Dead Stock Analysis
– SAP Smart Business apps offer threshold definitions to indicate the critical sta-
tus of key performance indicators (KPIs) to be displayed on the user’s home
screen (see Figure 1.12). You can see the filter bar 1, the mini charts (which are
also displayed in the SAP Fiori launchpad) 2, and the analytical chart and table
showing the results 3.
43

1 Introduction to SAP S/4HANA and SAP Fiori
Figure 1.12 Smart Business App Scrap Reason
– Design studio grids are spreadsheet-like apps that allow the arbitrary pivoting
of rows and columns. You can display the result set as chart 1 and/or table 2, as
shown in Figure 1.13. The left-hand section lists the dimensions and measures
that can populate the columns and rows 3.
44

1.4 SAP Fiori
Figure 1.13 Design Studio Grid: Goods Movement Analysis
� Object page
An object page (see Figure 1.14) is the simplest approach to display a business
object instance. It allows multilevel internal navigation to subobjects also dis-
played in an object page layout. Object pages can support create/edit/delete oper-
ations, if applicable. Object pages are structured with a header 1 and sections and
subsections; in this example, the sections include the form 2, table with item
details 3, and a graphic 4.
45

1 Introduction to SAP S/4HANA and SAP Fiori
Figure 1.14 Material Document Object Page
� Worklist
A worklist (see Figure 1.15) displays a filtered list of object instances 1, so that each
instance‘s details are displayed when selected 2. Worklists allow create/edit/
delete operations on each instance.
46
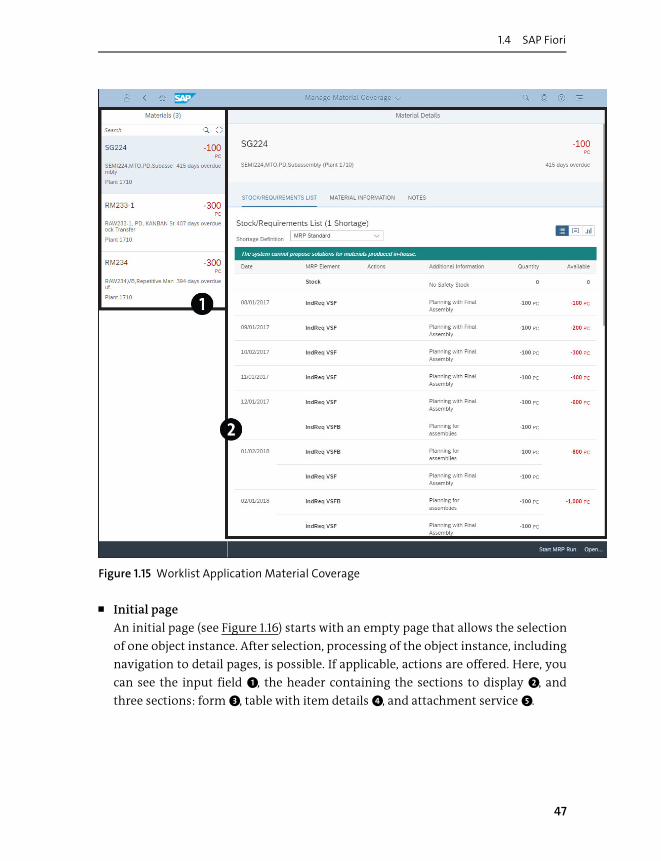
1.4 SAP Fiori
Figure 1.15 Worklist Application Material Coverage
� Initial page
An initial page (see Figure 1.16) starts with an empty page that allows the selection
of one object instance. After selection, processing of the object instance, including
navigation to detail pages, is possible. If applicable, actions are offered. Here, you
can see the input field 1, the header containing the sections to display 2, and
three sections: form 3, table with item details 4, and attachment service 5.
47

1 Introduction to SAP S/4HANA and SAP Fiori
Figure 1.16 Initial Page of Goods Receipt for Purchase Order
Each of these floorplans is composed of recurring design elements containing sec-
tions with filter bars, lists, tables, charts, and form elements. As a default, they offer
built-in personalization features to control layout and filter criteria.
Note
The variant management employed by filter bars is an especially useful tool to per-
sonalize, share, and standardize selection criteria in business processes. SAP ships
predefined variants, but you can also create your own private or public variants.
Native SAP Fiori apps use, in most cases, the OData protocol to exchange data
between frontend (browser) and backend systems, except in the case of analytical
apps. Because the OData protocol follows the Representational State Transfer (REST)
paradigm, native SAP Fiori apps need to ensure continuity between consecutive end-
user interaction steps. The SAP S/4HANA architecture allows the implementation of
48

1.4 SAP Fiori
native SAP Fiori apps in a stateless or stateful interaction mode. The interaction
mode ensures if and how users can preserve the input after disconnecting from the
backend system before saving the input. In addition, the interaction mode defines
what happens if concurrent accesses to the same business object instance occur.
A stateless SAP Fiori app doesn’t keep any internal state on the backend server. If the
stateless app executes a change operation on a business object, which may lead to a
conflict or inconsistency, different conflict resolution patterns may be applied
(rejected, last wins, first wins, merge of conflicting data). If a stateless implemented
SAP Fiori app is closed, or the communication to the backend is unexpectedly inter-
rupted, all end-user input is lost.
A stateful SAP Fiori app keeps the internal state on the backend server. In most cases,
the state is implemented as a transient draft of a business object. The draft instance
of a business object must be converted into an active instance of the business object;
for example, it must be activated or posted to become part of a business process.
Depending on the use case, the draft instance might be edited simultaneously by dif-
ferent end users or edited by one particular end user at the time. Closing the draft-
enabled SAP Fiori app and reopening the draft instance any time later is possible. In
case of a communication failure, only the very recent end-user input is lost. Because
all draft instances are kept on the backend, conflicts due to concurrent accesses to
one business object can be easily detected and displayed to the end user.
Transformed SAP GUI Transactions
If upgrading from SAP ERP to SAP S/4HANA, you’ll recognize many SAP GUI transac-
tions converted into SAP Fiori apps. These SAP GUI transactions were adjusted to the
SAP Fiori layout and are part of the business roles. They support the SAP Fiori naviga-
tion concept too (see Section 1.4.3). In many cases, the bottom of the pyramid (refer to
Figure 1.8) is formed by these kinds of SAP Fiori apps because their predecessors were
often used to solve complex business requirements. SAP Fiori apps based on former
SAP GUI transactions retained their interaction mode. In most cases, this is a session-
based interaction with a state, which is kept in the backend session and secured by
durable locks as part of the session; therefore, concurrent access to the same business
object is prevented by the locks. A typical example in inventory management is the
SAP Fiori app Post Goods Movement, which is based on the former SAP GUI Transac-
tion MIGO (see Figure 1.17).
49
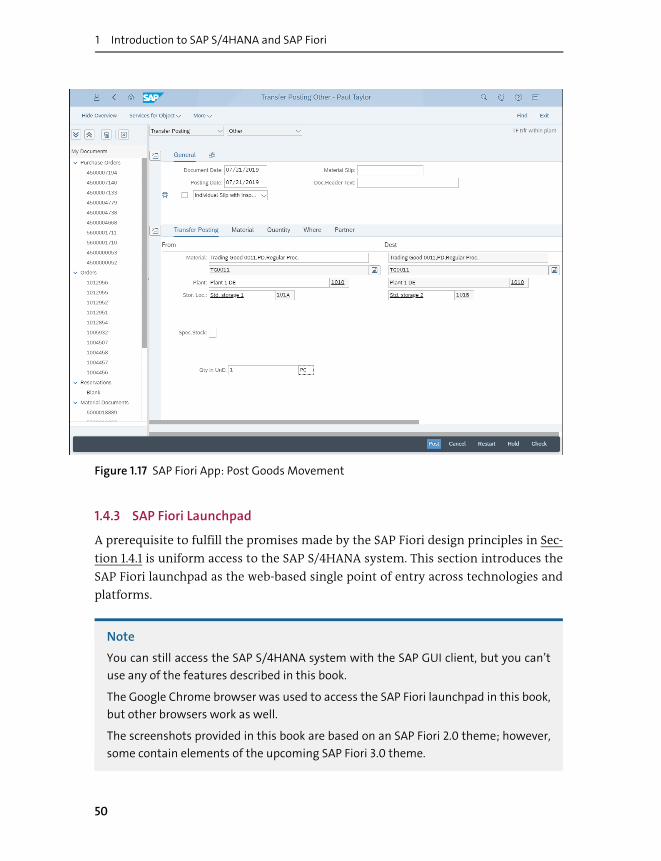
1 Introduction to SAP S/4HANA and SAP Fiori
Figure 1.17 SAP Fiori App: Post Goods Movement
1.4.3 SAP Fiori Launchpad
A prerequisite to fulfill the promises made by the SAP Fiori design principles in Sec-
tion 1.4.1 is uniform access to the SAP S/4HANA system. This section introduces the
SAP Fiori launchpad as the web-based single point of entry across technologies and
platforms.
Note
You can still access the SAP S/4HANA system with the SAP GUI client, but you can’t
use any of the features described in this book.
The Google Chrome browser was used to access the SAP Fiori launchpad in this book,
but other browsers work as well.
The screenshots provided in this book are based on an SAP Fiori 2.0 theme; however,
some contain elements of the upcoming SAP Fiori 3.0 theme.
50

1.4 SAP Fiori
The SAP Fiori launchpad is started from a URL prompting you to authenticate your-
self and choose the logon language, as shown in Figure 1.18.
Figure 1.18 SAP Fiori Launchpad Logon Screen
After logging on, you’ll be directed to your personal Home page, shown in Figure 1.19,
unless you started the SAP Fiori launchpad via direct link to an SAP Fiori app. The
Home page is rendered based on the business roles assigned to the user. It can be per-
sonalized in the Me Area 1. A business role contains all authorizations to start a col-
lection of SAP Fiori apps. A building block of the business role is the business catalog,
which is a reusable entity to group SAP Fiori apps belonging to the same business
context. Business roles are created by key users based on business role templates
shipped in SAP S/4HANA. Typically, you’ll design business roles according to your
requirements by copying an appropriate SAP template, editing the new business role
by adding or removing SAP Fiori apps, and adding or removing authorizations used
within the SAP Fiori apps (see Chapter 3).
Groups on your Home page 2 help you to structure the SAP Fiori apps you want to
use. The most prominent group is My Home, which can be used to store your favorite
SAP Fiori apps.
51

1 Introduction to SAP S/4HANA and SAP Fiori
Figure 1.19 Typical Home Page with Groups
There are also icons to access search 3, help 4, and notifications 5.
Features
This section describes all the features embedded in the SAP Fiori launchpad using the
Home page as a starting point. Let’s walk through each in the following sections.
Me Area
The Me Area, shown in Figure 1.20, can be accessed by clicking on the corresponding
icon of the Home page.
52

1.4 SAP Fiori
Figure 1.20 Me Area
The Me Area allows access to following key features:
� Sign Out
Signing out by this function ensures that all credentials linked to your browser
instance are cleared.
� App Finder
In the app finder, you can find an app in all business catalogs assigned to your user
by your business role. Here, you can personalize your SAP Fiori Home page by
“pinning” relevant SAP Fiori apps and assigning them to groups.
� Settings
You can update your user account information, language and region, default val-
ues, and more. You can only configure default values if they are supported by at
least one SAP Fiori app of your assigned business roles.
53

1 Introduction to SAP S/4HANA and SAP Fiori
� Edit Home Page
You can edit the layout of your Home page by creating, editing or deleting groups;
resetting SAP-delivered groups; and creating a link between SAP Fiori apps in dif-
ferent groups.
� Recent Activity/Frequently Used
If configured in your settings, the SAP Fiori launchpad tracks your recently and
most frequently used SAP Fiori apps. You can start the corresponding SAP Fiori
app out of this list.
Search
You can access enterprise search in SAP S/4HANA directly via the search icon in the
SAP Fiori launchpad.
Enterprise search is an unstructured (text) index-based search function used across
business objects and their relationships in SAP S/4HANA. You can narrow the search
by selecting a business object you want to search, as shown in Figure 1.21. You can also
search for SAP Fiori apps.
Figure 1.21 Search and Business Objects
Example
If you want to search for a materials document containing a material with material
description of “Product A”, “Product a”, or “product A”, for example, you select Mate-
rial Document as the entity and enter the search term as “Product A”. Enterprise
search will return material documents in a ranked list that match the search term—
the better the match, the higher the rank.
The result of the search query and the navigation targets, shown in Figure 1.22,
depend on the authorization of the end user after entering the search term 1. The
results are displayed as a list 2, and the selected result list item appears with more
details highlighting the search term (eBike). By using the filter criteria on the left-
hand side 3, you can filter on the primary result set, based on attributes in the pri-
mary result set based on a textual or graphical filter.
54

1.4 SAP Fiori
Figure 1.22 Enterprise Search Result on Material Documents
The enterprise search in SAP Fiori launchpad is a generic search capability embedded
in SAP S/4HANA to search for one or many business object instances and whether
any object attributes are related to the search term. The closer the relation is, the
higher the rank is in the result set.
Personalization
If you’ve started an SAP Fiori app that provides app-specific personalization capabili-
ties, you’ll find an additional Application Settings entry in the Me Area, as shown in
Figure 1.23. The settings that appear here depend on the application.
Figure 1.23 SAP Fiori App Personalization
55

1 Introduction to SAP S/4HANA and SAP Fiori
Notifications
Notifications offer a publish-subscribe mechanism within an SAP S/4HANA instance.
If any change within a business process occurs, the app might publish a notification
of a specific notification type. You can subscribe to notifications of a specific notifica-
tion type in the Me Area. Newly arrived notifications will show up in the icon as a lit-
tle number, and all notifications can be displayed by clicking on the icon, which will
open the notification center (see Figure 1.24).
Figure 1.24 Notification Center
56

1.4 SAP Fiori
Depending on the notification type, you can navigate to an appropriate SAP Fiori app
to process the notification. Alternatively, you can directly dismiss the notification.
SAP CoPilot
The SAP Fiori launchpad includes a personal digital assistant called SAP CoPilot,
which comes with two basic capabilities:
� Natural language interaction (NLI)
� Chat
SAP CoPilot can be started as a non-modal window in the SAP Fiori launchpad via its
icon in the top-right corner (Figure 1.25, 1). You can switch SAP CoPilot between the
NLI and chat function with the two icons in its window header 2. NLI allows you to
enter text by typing or voice. Depending on the available skills, SAP CoPilot can
understand the text and give an answer.
SAP CoPilot chat 3 allows you to invite other SAP Fiori launchpad users 4, to add
business objects shown in the active SAP Fiori app 5, to type text messages 6, and to
add screenshots or upload images 7.
Figure 1.25 SAP CoPilot Basic Functions
57

1 Introduction to SAP S/4HANA and SAP Fiori
You can create as many chats as you like and invite other users to them. Figure 1.26
shows how SAP CoPilot scans the active SAP Fiori app for business objects, lists them,
and then offers to add them by one click to a chat.
Figure 1.26 SAP CoPilot: Add Objects Screen
The details of an added business object in Figure 1.27 show all its attributes and pro-
vide navigation to object pages referenced in the attributes 1. In any case, you can
navigate to the SAP Fiori app 2, which was used to add the business object to SAP
CoPilot.
With SAP CoPilot, the SAP Fiori launchpad offers a lightweight and easy-to-use collab-
oration tool that allows you to share different kinds of information—most notably,
business objects embedded in a chat. Moreover, SAP CoPilot offers several quick
action features depending on the context in which SAP CoPilot is running.
58

1.4 SAP Fiori
Figure 1.27 Details of an SAP CoPilot Object (Purchase Order Item)
Embedded Documentation
The SAP Fiori launchpad includes an integrated help and support capability, which
can be switched on or off by clicking the ? icon 1, as shown in Figure 1.28.
If you start another SAP Fiori app, the help menu bar automatically adjusts its con-
tent. The help menu bar contains short explanatory texts of the SAP Fiori app’s dedi-
cated elements, which are marked by green bubbles 2 and linked to the text 3.
In addition, the What’s this app? entry points to the external documentation of the
SAP Fiori app.
59

1 Introduction to SAP S/4HANA and SAP Fiori
Figure 1.28 Integrated Help Feature
Navigation
The SAP Fiori launchpad applies intent-based navigation. Any SAP Fiori app is started
by calling its “intent,” which is composed of a semantical object and an action sepa-
rated by a dash, for example, Material—DisplayStockOverview. In the SAP Fiori
launchpad, the intent is part of the URL in the browser window.
Semantic objects normally identify business objects within SAP S/4HANA systems.
Actions can be freely chosen when defining an SAP Fiori app in the SAP Fiori launch-
pad (see Chapter 3).
The intents can also be used to pass additional parameters when starting an SAP Fiori
app. As the URL to the SAP Fiori app is stable, it can be bookmarked or shared. As long
as the end user opening the URL has the authorizations to start the SAP Fiori apps, he
or she will be able to start the SAP Fiori app directly.
This technique is also used if the end user shares SAP Fiori apps by the generic SAP
Fiori launchpad capabilities Send E-mail, Save As Tile, or Share in Jam (not shown), as
60
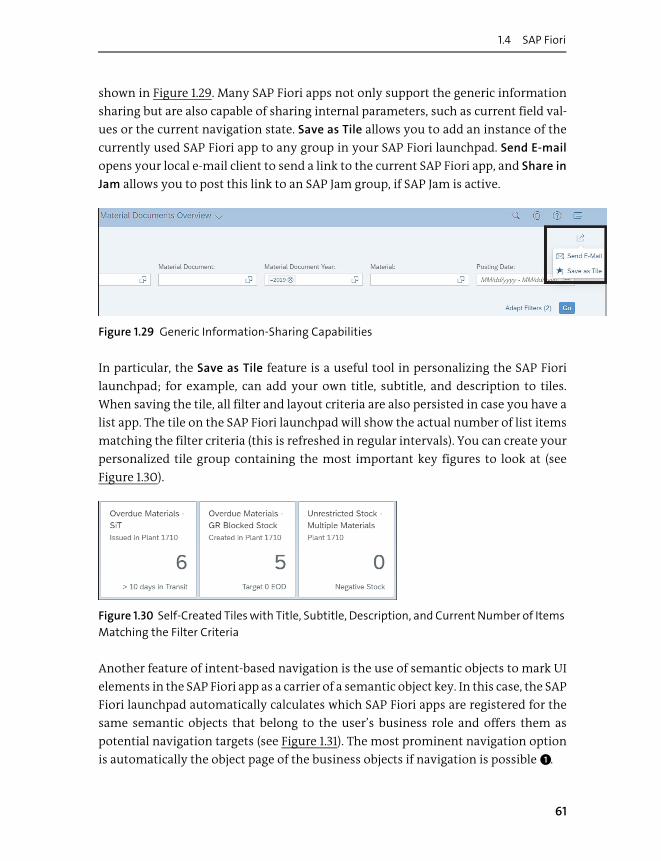
1.4 SAP Fiori
shown in Figure 1.29. Many SAP Fiori apps not only support the generic information
sharing but are also capable of sharing internal parameters, such as current field val-
ues or the current navigation state. Save as Tile allows you to add an instance of the
currently used SAP Fiori app to any group in your SAP Fiori launchpad. Send E-mail
opens your local e-mail client to send a link to the current SAP Fiori app, and Share in
Jam allows you to post this link to an SAP Jam group, if SAP Jam is active.
Figure 1.29 Generic Information-Sharing Capabilities
In particular, the Save as Tile feature is a useful tool in personalizing the SAP Fiori
launchpad; for example, can add your own title, subtitle, and description to tiles.
When saving the tile, all filter and layout criteria are also persisted in case you have a
list app. The tile on the SAP Fiori launchpad will show the actual number of list items
matching the filter criteria (this is refreshed in regular intervals). You can create your
personalized tile group containing the most important key figures to look at (see
Figure 1.30).
Figure 1.30 Self-Created Tiles with Title, Subtitle, Description, and Current Number of Items
Matching the Filter Criteria
Another feature of intent-based navigation is the use of semantic objects to mark UI
elements in the SAP Fiori app as a carrier of a semantic object key. In this case, the SAP
Fiori launchpad automatically calculates which SAP Fiori apps are registered for the
same semantic objects that belong to the user’s business role and offers them as
potential navigation targets (see Figure 1.31). The most prominent navigation option
is automatically the object page of the business objects if navigation is possible 1.
61

1 Introduction to SAP S/4HANA and SAP Fiori
Figure 1.31 Semantic Annotation
The navigation targets can be personalized, and the key of the semantic objects is
passed to the target SAP Fiori app when navigating 2.
Furthermore, some SAP Fiori apps may offer explicit navigation to other SAP Fiori
apps 3 if the targeted SAP Fiori app is part of the end user’s business role.
Note
It’s important to understand that navigating from SAP Fiori app A to SAP Fiori app B
usually means that SAP Fiori app A is terminated, and SAP Fiori app B is initiated (a
few SAP Fiori apps are kept alive in the background as an exception). When navigat-
ing back, the opposite process occurs; that is, the starting SAP Fiori app has to restore
its state (former user input, layout).
Theming and Extensibility
SAP S/4HANA includes a theme designer that allows administrators to modify the
themes shipped with SAP Fiori apps, for example, changing fonts, margins, and col-
ors to create individual branding for your SAP Fiori apps.
Further Resources
Details on theming can be found in SAP Fiori Implementation and Development by
Anil Bavaraju (www.sap-press.com/4401, SAP PRESS, 2017).
SAP Fiori apps have built-in extensibility capabilities as well. The development envi-
ronment SAP Web IDE supports helps you create custom SAP Fiori apps based on cus-
tom OData services. These custom SAP Fiori apps can be published in the SAP Fiori
launchpad (see Figure 1.32).
62

1.4 SAP Fiori
Figure 1.32 SAP Web IDE Cloud Development Environment of SAP Fiori Apps
Many SAP Fiori apps have built-in field extensibility on their own. Users can add new
fields to be displayed or changed by the SAP Fiori app. They can permanently change
the layout of existing SAP Fiori apps via the Key User Extensibility app tools (see
Figure 1.33), including custom field data 1, usage 2, and status 3.
Figure 1.33 Key User Extensibility App (Footer Actions Omitted)
63

1 Introduction to SAP S/4HANA and SAP Fiori
1.5 Summary
This chapter introduced the technical background of SAP S/4HANA. All three layers of
the ERP software were discussed, including their key capabilities. The database layer
is built on the new in-memory database SAP HANA using key features such as col-
umn stores of database tables, code pushdown, and a new API based on CDS. The app
layer is optimized to work with SAP HANA. Redundant features collected in a simpli-
fication list were removed from SAP S/4HANA, and new developments such as
denormalized tables MATDOC and ACDOCA were realized. The UI layer is implemented
with the new concept of browser-based access to SAP S/4HANA, offering a role-based,
coherent, and responsive collection of SAP Fiori apps that can be started within the
SAP Fiori launchpad as a uniform UI environment.
Leaving the technology behind, the next chapter will start with the business topic of
this book: inventory management.
64

Chapter 2
Inventory Management Basics
Now that we’ve established the technical details, we’ll begin our
discussion of inventory management and how it has changed in
SAP S/4HANA. Let’s start with the basics.
This chapter introduces the basics of inventory management by defining the key inventory terms and outlining the key activities of the planning/adjusting, execu-
tion, and analysis phases of inventory management. Looking at the content map pro-
vided in the preface (see Figure 1 under “How This Book Is Organized”), this chapter is like a node that ties together the configuration, planning, analysis, and execution parts of inventory management.
Let’s begin by explaining how inventory fits into the supply chain.
2.1 Inventory as a Staple of the Supply Chain
Inventory defines the entire quantity of stock used in the business processes of an enterprise. Different product types result in different inventory types, such as raw materials, semifinished goods, work-in-process (WIP), finished goods, and spare parts. Inventory falls into different categories called stock types. In SAP S/4HANA, up to 60 different stock types can be defined in the system. Stock types define how inventory can be used in the business processes, on what organizational level they are maintained, and how the inventory is valuated. In addition to the inventory stock types, there are a few stock types not controlled by inventory management. In SAP S/4HANA, stock types are represented technically by the Stock Type field and (optional) the Special Stock Type field, plus additional keys. The key combinations defining the inventory stock types used in your SAP S/4HANA system help you understand your inventory management processes. Frequently used inventory stock types in SAP S/4HANA business processes are as follows:
65

2 Inventory Management Basics
� Unrestricted-used stock
Stock can be consumed in any business process.
� Blocked stock
Stock is blocked from any usage, except transfer postings.
� Quality inspection stock
Stock is subjected to quality inspection. This stock type might be managed by qual-
ity management in SAP S/4HANA.
� Transfer stock
Stock is moved from one organizational unit to another in a two-step process only
by means of inventory management.
� Stock in transit
Stock is moved from one location to another but isn’t available for consumption.
There are different subtypes of stock in transit depending on the kind of transfer
of goods and title. These processes stretch beyond inventory management and
involve internal procurement and logistics execution.
� Vendor consignment stock
Stock is owned by the vendor but is available for consumption in your business
process.
� Customer consignment stock
Stock is owned by you as a supplier but located at a customer site and ready for
consumption by the customer.
� Orders at hand stock
Stock is linked to a specific sales order item.
� Project stock
Stock is linked to a specific project.
Some stock types are closely linked to industries processes, such as tight empties
(retail) or stock provided to vendor (subcontracting). Thus, the stock type might exist
only at the plant level (customer consignment stock), whereas other stock exists on
the storage location level.
Noninventory stock types in SAP S/4HANA include the following:
� Reservations
� Nonvaluated goods receipt blocked stock
The flow of inventory within an enterprise is called the supply chain. Thus, inventory
is the key factor to be looked at in supply chain planning. Inventory may be created
by external procurement and/or internal production.
66

2.1 Inventory as a Staple of the Supply Chain
Figure 2.1 shows the principal components of a supply chain for an example company
called My Company. Inventory is either procured externally, produced internally, or
produced by subcontractors externally. Inventory is consumed within production
processes and eventually sold as a finished product. These principal components
might be combined differently depending on the involved products, product lifecy-
cle, location strategy, or market requirements.
Figure 2.1 Supply Chain of My Company
An optimal supply chain keeps the costs linked to inventory low (procurement, pro-
duction, warehousing, distribution) while providing the desired service level to all
customers. Depending on your business process, there are multiple strategies to
achieve this goal:
� Just in time (JIT)/just in sequence (JIS) production
Prominently used in the automotive industry to ensure that all components of a
car reach their final assembly step exactly at the moment they need to be con-
sumed.
� Kanban
Helps to simplify your inventory replenishment strategy by using predefined lot
sizes tied to moving containers (see Chapter 4, Section 4.4 and Section 4.9).
My Company
Procure
Sell
MySubcontractors
ProduceExternally
Inventory
ProduceInternally
MyCustomers
MySuppliers
67

2 Inventory Management Basics
� Demand-driven material requirements planning (DDMRP)
Material requirements planning (MRP) strategy trying to decouple bottleneck
steps in supply chain planning (see Chapter 4, Section 4.3.4 and Section 4.8).
� Vendor-managed inventory
Shifts the inventory management responsibility to the vendor of a component.
� Make-to-order (MTO)/make-to-stock (MTS)
Allows you to plan your inventory based on concrete demands or on demand fore-
casts (see Chapter 4, Section 4.6).
� Make or buy
Decision regarding whether or not you outsource the procurement of a compo-
nent/finished good to an external contractor.
2.2 End-User Role Templates
When talking about inventory management, it’s also important to consider the
involved business roles. Each company will have a different organizational structure
with different responsibilities, which is often considered a competitive advantage.
Nevertheless, the basic requirements of supply chain planning must be fulfilled.
Therefore, the roles and responsibilities might have different names in each com-
pany, but the semantic will most likely exist. SAP S/4HANA entails several role tem-
plates that facilitate the system configuration (see Chapter 3, Section 3.5).
The major parts in supply chain planning are shown in Figure 2.2 (sales isn’t shown
because it’s not covered in this book). The role templates for external procurement
process are shown in the upper part and the templates for the internal production
process are shown in the lower part of the figure. Production input is demand plan-
ning and product engineering. Every time logical or physical movement of inventory
is required, the warehouse clerk/receiving specialist is involved. Production planning
is supported by the inventory analyst, and all inventory processes are supervised by
the inventory manager (plant manager).
68

2.3 Key Considerations
Figure 2.2 Roles and Responsibilities in Supply Chain Planning
2.3 Key Considerations
This section introduces some key aspects of inventory management. After all, our
motivation is to provide the best services/products to our customers at the best price
(approximate internal price + calculated margin). To keep the narrative focused, we
simplified the basic equations in hopes of not alienating product cost controllers.
2.3.1 Service Levels, Inventory Costs, and Operational Profit
Enterprises need to balance the service level with inventory cost and operating profit.
Normally a target is defined by the enterprise as part of its business model, contain-
ing an optimal zone surrounded by comfort zones in which the balance is still within
an acceptable range (see Figure 2.3).
PurchasingPlanning
• Planner of External Procurement
Purchasing
• Purchaser
GoodsReceipt
• Warehouse Clerk
• Receiving Specialist
ProductEngineering
• Production Engineer
Product/InventoryPlanning
• Production Planner
• Inventory Analyst
ProductionExecution
• Production Supervisor/ Operator
QualityInspection
• Quality Engineer
Goods Receipt
• Warehouse Clerk
• Receiving Specialist
DemandPlanning
• Demand Planner
Inventory
• Inventory Manager
Internal Production
External Procurement
69

2 Inventory Management Basics
Figure 2.3 Balancing Service Level with Inventory Value (Schematic Drawing)
Operating profit equals roughly the following equation, which is highly simplified:
Revenue – Inventory costs – Production costs = Operating profit
The service level defines the ability of a company to fulfill its customers’ requirement
so that revenue is generated. Customers’ requirement fulfillment refers to the
requirement that the company must deliver its goods/service to the customer on
time, in quality, and in budget. Inventory costs are all costs needed to obtain, process,
store, and distribute goods and have substantial impact on service level. Figure 2.4
illustrates roughly the formula to calculate inventory costs based on storage and
order costs. Although order costs tend to decrease with the ordered quantity, the
storage costs will consume this benefit at a certain quantity level.
Note
Not considered in the cost calculation of Figure 2.4 is the locked-in capital bound in
the inventory value.
0 10 20 30 40 50 60 70 80 90 100
Operating Profit
Legend:
Inventory Value
Service LevelO
pti
mu
mComfortZone
ComfortZone
Company Target
Business Failure Business Failure
Operating Profit versus Inventory Value
70

2.3 Key Considerations
Figure 2.4 Inventory Costs in Relation to Order Quantity
All strategies mentioned in Section 2.1 are intended to find the optimal balance or at
least reach the comfort zone in Figure 2.3. If you consider all factors influencing ser-
vice level and inventory costs, it’s obvious that this is a multidimensional optimiza-
tion challenge. SAP S/4HANA supports you in finding a local optimum and holding
on to it in a dynamic environment.
2.3.2 Lot Sizes, Replenishment Times, and Safety Stocks
To reduce the complexity of the optimization challenge, inventory planners typical
work with some key factors that essentially influence service level and inventory
costs during the product lifecycle.
The lot size is the amount of inventory that is obtained in one atomic step. Given a
constant linear consumption, the larger the lot size, the higher the locked-in capital,
and the lower the replenishment frequency. Figure 2.5 depicts how three different lot
sizes influence the procurement process.
The replenishment lead time is the duration in days to execute this step. It’s com-
prised of several steps, such as ordering, transport, and goods receipt. Figure 2.5
shows the inventory value over time based on a constant replenishment lead time.
The shorter the replenishment lead time, the more flexible your planning options.
Inventory stock will never fall below the safety stock level. It represents the lowest
limit of stock quantity that is required to fulfill the service-level agreement (SLA). The
higher the defined safety stock, the higher the bottom line of locked-in capital and
the storage costs (refer to Figure 2.4). Figure 2.5 shows a constant safety stock defini-
tion. Normally, replenishment is triggered way before the inventory value reaches
Order Quantity
Storage Cost + Order Cost
Storage Cost
Order Cost per Unit
Co
st
71

2 Inventory Management Basics
the safety stock. There are multiple planning strategies to implement an optimal
replenishment process, which will be discussed in Chapter 4, Section 4.1.
Figure 2.5 Key Factors in the Supply Chain Planning
You can see that a small lot size and a high frequency of replenishments create a
smoother curve in Figure 2.5, whereas a large lot size and a low frequency of replen-
ishments create a rough curve.
In general, Figure 2.5 illustrates the interdependence of the key factors of lot size,
safety stock, and replenishment lead time. It’s based on an ideal supply chain plan-
ning world of nonchanging linear consumption and 100% reliable replenishment.
Real-world supply chain planning needs to deal with sudden consumption changes,
delays in replenishment, production resource constraints, missing components,
unplanned changes in product lifecycles, quality issues, legal regulations, and prod-
uct and production variants. All these factors impact the comfort zone shown earlier
in Figure 2.3. Section 2.4 will shed some light on how SAP S/4HANA supports you in
consistently monitoring your supply chain processes and adjusting them to the opti-
mum level.
0
50
100
150
200
250
Inventory Value
Inventory Value
Legend:
Lot
Size
1 Lot
Size
2
Lot
Size
3
SafetyStock
Date of OrderDate of Goods
Receipt
ReplenishmentLead Time
Consumption
Order 1 Order 2 Order 3
Order 4Order 5 Order 6
Locked-inCapital
Time
72

2.3 Key Considerations
The product lifecycle impacts the planning strategy too. Figure 2.6 shows a simple
product lifecycle with the typical phases:
� Ramp-up
� Active demand
� Phase-out
� Ramp-down
� SLA
� Removal from stock
“Simple” means there are no demand fluctuations due to seasonal effects or market
changes, which require a more sophisticated planning. During ramp-up, the planning
strategy needs to be adjusted to the growing market requirements. Often, during
ramp-up, supply and demand aren’t balanced well. When market requirements cre-
ate a constant demand of the product, inventory can be planned on optimized non-
changing parameters. If the product lifecycle reaches its end, planning needs to be
adjusted. If SLAs influence the product lifecycle, inventory must be kept although the
product is no longer actively used. Eventually, the product becomes obsolete and is
removed from inventory. If the planned demand exceeds actual demand, excess
inventory will be created (arrows in Figure 2.6).
Figure 2.6 Typical Product Lifecycle
0
1000
2000
3000
4000
5000
6000
Ra
mp
up
Hig
h d
em
an
d
Hig
h d
em
an
d
Ph
ase
ou
t
Ph
ase
ou
t
En
d o
f active
lifecy
cle
Ra
mp
do
wn
Low
de
ma
nd
Low
de
ma
nd
+ S
LA
Low
de
ma
nd
+ S
LA
Low
de
ma
nd
,S
LA-trig
ge
red
rep
len
ishm
en
t
Low
de
ma
nd
+ S
LA
En
d o
flife
cycle
Re
mo
va
l from
stock
Stock value
Legend:
Stock consumption Active BOM usage
Gaps indicate unwanted excess of stock value
73

2 Inventory Management Basics
On the opposite side, if the planned demand is below the actual demand, your ability
to fulfill the market requirements is endangered (not shown in Figure 2.6). Therefore,
the more reliable your prognosis, the more accurate is your planning and the better
are your inventory key performance indicators (KPIs).
Every time the product lifecycle reaches a different phase, the planning strategy
needs to be adjusted again. The more proactively the phase changes are detected, the
better the inventory can be planned. SAP S/4HANA offers different capabilities, such
as prognosis tools and monitoring tools supported by machine learning to optimize
the product lifecycle. Section 2.4 will explain how SAP S/4HANA supports you in ana-
lyzing market trends and adjusting your prognosis and planning strategy proac-
tively.
2.3.3 Local versus Global Inventory Management
When considering inventory management, it’s also crucial to understand the organi-
zational scope of all your activities. Organizational units make up one dimension of
inventory management, and the second one is composed of functional aspects repre-
sented by stock types (which we discussed in Section 2.1). The typical organizational
planning unit is one plant in SAP S/4HANA. However, it’s also possible to subdivide a
plant into multiple MRP areas to execute planning on a smaller set of products. Sim-
ilar rules apply to analytics, which are performed on the plant level but can also be
executed across multiple plants or vice versa on organizational structures below the
plant level, for example, the MRP area. When it comes to execution, you can perform
activities within a plant or cross-plant. In SAP S/4HANA, the organization structure
above the plant is the company code.
All SAP Fiori apps in SAP S/4HANA support local as well as global inventory manage-
ment strategies by the following means:
� Organizational structures
� Filter criteria within all SAP Fiori apps along organizational structures
� Custom enhancements of filter criteria
� Authorization based on organizational structures
� Roles created for local or global inventory management tasks
74

2.3 Key Considerations
2.3.4 New Technologies
Technology helps end users complete their daily work as efficiently as possible. SAP
has been introducing some new technologies in SAP S/4HANA to improve end-user
productivity in a rapidly changing environment. Figure 2.7 sketches the evolution of
the intelligent ERP.
Figure 2.7 Evolution of the Intelligent ERP with an Increasing Number of Automated Tasks
Today, end users are performing a lot of daily routine tasks that consume most of
their working time due to the following:
� Breaks in communication medium
� Lack of adequate information while decision-making
� Distributed data, which needs to be collected by hand
� Process monitoring by manually defined and calculated KPIs
� Decisions based on experience/guessing, not on facts
0 10 20 30 40
Intelligent Enterprise
Task automation
Legend:
Simple routine tasks High value generating tasks Data collected in system
TotalWorkingTime
Typ
e o
f Ta
sk D
istr
ibu
tio
n
Time
75

2 Inventory Management Basics
Typical indicators of manual tasks are the abundant use of spreadsheets in e-mails,
shares, and the number of post-it notes attached to computer monitors. With SAP
S/4HANA, SAP has created the first release supporting an intelligent enterprise. In
informal terms, you may call it the vision of a “low-touch ERP.” Basically, a low-touch
ERP frees end users from their daily routine task, so that they can spend more time
on high value generating tasks, as illustrated by the darkest area in Figure 2.7.
Technically, the ERP system can be configured to record all manual decisions made
by human interaction. After a while (if the data set is large enough), the key user may
train and activate machine learning models based on this data set. These machine
learning models support end users in decision-making. Furthermore, key users may
define conditions that will lead to end-user notification or even automatic issue res-
olution based on those machine learning models.
In Chapter 1, Section 1.4.3, we already explained many features that comprise a low-
touch ERP, such as embedded navigation, information sharing, personalization of
the working environment, role-based UIs, built-in collaboration tools, and mobile
options. SAP S/4HANA includes additional capabilities to reduce manual tasks in end
users’ daily business. Figure 2.8 outlines the principles of typical tasks during daily
work:
1. You define conditions that require manual intervention by a dedicated group of
end users.
2. You need a set of information to complete this intervention successfully.
3. Depending on the provided information, you select the most appropriate action.
As shown in Figure 2.8, SAP S/4HANA offers you a framework called situation han-
dling, which allows key users to define conditions, the related information, and the
responsible set of end users to take the actions depending on their business roles.
This is called a situation.
Once defined, the situation creates notifications if the condition of the situation
applies and automatically informs the responsible end user, who can navigate to an
SAP Fiori app, getting proposals on how to solve the situation. The configuration
steps connected to situation handling are described in Chapter 3, Section 3.2.3. Exam-
ples of how to leverage situation handling in inventory management are provided in
Chapter 4 and Chapter 8.
76

2.3 Key Considerations
Figure 2.8 Situation Handling Framework
When interacting with the system, end users often are making decisions based on the
experience they have had in the past. In general, this is called learning. With the recent
progress in machine learning, an ERP system can support an end-user’s decision-making
by displaying his or her own (machine) learnings and offering an unbiased experience
based on mathematical principles.
Further Resources
Wondering if this is possible? Check out the story of Alpha Go, a computer Go pro-
gram that managed to win matches against professional Go players (http://s-prs.co/
v489201).
This is like a car navigation system recommending the best way home. If you know
the way yourself because it’s your daily route, the navigation system may just give a
second opinion enhanced with recent traffic information. If you don’t know the way
at all, the navigation system is normally the best choice you have.
Figure 2.9 displays the basics of machine learning. To set up a machine learning
model, you need to complete data analysis to shape the model. After the model is in
place, it must be trained to be consumable. Training isn’t a one-time task but may or
must be repeated once in a while if the underlying training data changes. If retraining
doesn’t take place, the machine learning model’s prediction will become more and
more inaccurate.
ConditionRelated
InformationAction
Situation
Key User:
Defines Condition Prepares RelatedInformation
Sets Responsibility/Functionsand Authorizes Actions
End User: Is Notified by the System Evaluates Informationand Takes Action
77

2 Inventory Management Basics
Technically, SAP S/4HANA offers two kinds of predictive models. You can have an
embedded model or a side-by-side installation in the SAP Cloud Platform. The first
type is simpler to set up because training and querying the model happens within
one system. The second type gives you more freedom, as you could also embed addi-
tional machine learning algorithms or use external data for training.
Figure 2.9 Machine Learning Principles/Types of Predictive Models
Figure 2.10 explains how the machine learning model training takes place. Prerequi-
site is a sufficient set of training data that is divided up into at least two buckets
during training. The larger bucket (normally 75% of the entire training data) is used to
train the model. After training, the model’s performance is validated with the second
bucket. If the performance of the model on both buckets is more or less equal, the
model is trained well. If not, training conditions need to be adjusted until a sufficient
predictive capability is accomplished.
In many cases, the performance of a predictive model is expressed as a confusion
matrix, which is an N × N matrix. N is the number of different states to be predicted
by the machine learning model. Figure 2.11 shows an example with N = 2. The light
segments represent the correct prediction, and the dark segments represent the false
prediction.
Machine Learning: Process Flow
Data AnalysisData Preparation
and TrainingModel Consumption
RetrainingCustomer Input
Types of Predictive Models: Embedded or Side by Side
Model
ModelBusiness Process
SAP S/4HANA Instance SAP Cloud Platform
Query andTraining
Query
Training onExternal Data
78

2.4 Inventory Optimization in SAP S/4HANA
Figure 2.10 Machine Learning Details Figure 2.11 Confusion Matrix with Two
Values A and B
2.4 Inventory Optimization in SAP S/4HANA
As pointed out in Section 2.3, supply chain management requires constant refine-
ment and adjustment of the company’s business processes. If this isn’t done, the sup-
ply chain isn’t operated at an optimal level, and the operating profit is reduced.
In the following sections, we’ll introduce the optimization cycle, discuss each step in
detail, and refer to the chapter in which the tool support provided by SAP S/4HANA is
explained.
2.4.1 Optimization Schema
Figure 2.12 depicts the optimization schema used throughout this book. The three
steps are detailed in the following sections. In general, the schema’s steps can be
found in various project management or product management optimization strate-
gies such as lean production, continuous improvement process (CIP), or Scrum. It
entails a planning step, an execution step, and an analysis step. Each step is the input
of its successor. The optimization cycle time is dependent on various factors, such as
the following:
� Type of product
� Involved business process
� Stability of the environment
Training Data
Model
Validation Data
True Values
Pre
dic
ted
Va
lues
A B
A
B
79

2 Inventory Management Basics
Figure 2.12 Optimization Cycle
Usually, the higher the uncertainty, the faster the cycle time. It’s quite common to
categorize products according to criteria such as contribution to operating profit
and/or product value. This is often referred to as ABC analysis or ABC/XYZ analysis.
The categories are also used to plan the optimization cycle time (see Figure 2.13). A
matrix, as shown in Figure 2.13, helps you focus your optimization planning. Essen-
tially, it clusters your inventory to help you focus on changes that have a significant
impact on your company’s overall performance.
Figure 2.13 Classification Matrix According to Product Value and Product
Consumption Variability
Note
During optimization, you focus on high value/high profit generating products (A
products). B and C products are taken into account with the lower frequency.
Plan andAdjust
ExecuteAnalyze
X Y Z
C
B
A
Pro
du
ct V
alu
e
Variable Consumption
80

2.4 Inventory Optimization in SAP S/4HANA
When looking at Figure 2.12 shown earlier, you may wonder what level of detail the
optimization cycle is about. Basically, this idea isn’t linked to any specific level of
detail. It can be used in strategic supply chain planning as well as in optimizing the
goods receipt process of a warehouse. If you look at the supply chain process of your
company, you’ll ideally find something like Figure 2.14.
Figure 2.14 Stacked Optimization Cycles at Various Levels
Figure 2.14 shows that there are various levels on which you execute the optimization
cycle:
� Strategic enterprise level (defining KPIs or shaping the planning strategy)
� Division or subdivision level (optimizing subprocesses, such as production plan-
ning, warehousing, or transportation planning)
� Single loading point, storage location, or material level (not shown in Figure 2.14)
Plan andAdjust
ExecuteAnalyze
Strategic SupplyChain Planning
Analytical KPIDefinition
StrategyEvaluation
Plan andAdjust
ExecuteAnalyze
Plan andAdjust
ExecuteAnalyze
ProductionPlanning
Plan andAdjust
ExecuteAnalyze
Warehousing
Plan andAdjust
ExecuteAnalyze
TransportationPlanning
Plan andAdjust
ExecuteAnalyze
81

2 Inventory Management Basics
2.4.2 Plan and Adjust
During the plan and adjust step, you typically share information and discuss the
impact on the business. The system provides automatic or semiautomatic solution
proposals. Your input is the analysis of the past and you target the future.
Figure 2.15 shows that the essential part of planning is sharing knowledge, looking at
historic figures, and considering the system proposals to adjust the system settings. In
Chapter 1, we already highlighted the generic collaboration tools embedded in the SAP
Fiori launchpad. Chapter 4 explains the SAP S/4HANA collaboration and knowledge-
sharing tools designed for production planning in depth. They can be used to asyn-
chronously exchange structured and unstructured information. They may also be
used to store historic discussions.
In upcoming chapters, we’ll discuss various examples where the SAP S/4HANA sys-
tem supports planning and adjusting by alerting about critical supply chain situa-
tions, by making automatic solution proposals, and by indicating process
disturbances. Synchronous interactions are supported natively in SAP Fiori apps
because most of them offer the capability of insight to action.
Figure 2.15 System and Human Collaboration during Planning
2.4.3 Execute
During the execute step, you typically run your daily tasks, such as monitoring busi-
ness processes, detecting and correcting plan deviations, and dealing with all
planned and unplanned tasks in your daily work schedule. As we’ll touch on in Chap-
ter 5, Chapter 6, and Chapter 7, SAP S/4HANA supports your daily work with a variety
Share and exchangeinformation
Adjust settings Alert/propose
SAP S/4HANA
Evaluatehistoric
data
82

2.4 Inventory Optimization in SAP S/4HANA
of role-based monitoring tools. Additionally, you may personalize your own KPI-
based monitoring apps within your SAP Fiori launchpad. There are role-based SAP
Fiori app used to collect worklists based on the end user’s responsibility. Based on the
pyramid approach (see Chapter 1, Section 1.4.1), SAP Fiori apps offer quick actions for
the most frequently required tasks and highly powerful transactions to solve
extreme cases.
Figure 2.16 depicts the sequence of SAP Fiori apps called by an end user in an SAP
S/4HANA system. As explained in Chapter 1, Section 1.4, SAP Fiori apps guide end
users seamlessly until they can complete their daily tasks. The role concept supports
the end user by only offering the features and functions required for this specific
role. Therefore, SAP Fiori apps greatly enhance end-user productivity in an SAP
S/4HANA system. As explained in Section 2.3.4, in the end, you strive to focus on high
value generating tasks and let the system do the routine work.
Figure 2.16 Different Users Executing Tasks in SAP S/4HANA
Let’s break down the examples shown in Figure 2.16:
� For a production planner taking care of a material shortage, the Material Shortage
Monitoring app (F0247) provides alerts for upcoming shortages and automatically
creates a solution proposal.
SAP FioriLaunchpad
MaterialShortagesWorklist
SAP FioriLaunchpad
WarehouseClerk Overview
Page
Overdue GoodsReceipt Blocked
Stock
Purchase OrderObject Page
Material DocumentObject Page
Good Receiptfor Purchase
Order
SAP FioriLaunchpad
Create GoodsMovement
SAP FioriLaunchpad
Goods Receiptfor Inbound
Delivery
Production PlannerTaking Care of Material
Shortages
Warehouse ClerkMonitoring Goods Receipt
Blocked Stock Process
Receiving Specialist Creating aGoods Receipt of an InboundDelivery on a Mobile Device
Plant ManagerCreating a Material-to-Material Posting
83
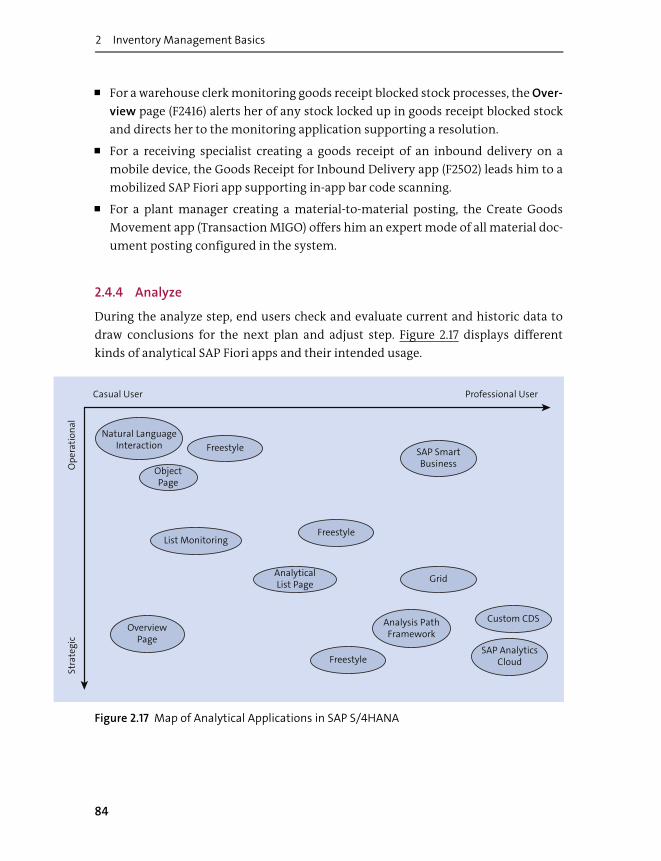
2 Inventory Management Basics
� For a warehouse clerk monitoring goods receipt blocked stock processes, the Over-
view page (F2416) alerts her of any stock locked up in goods receipt blocked stock
and directs her to the monitoring application supporting a resolution.
� For a receiving specialist creating a goods receipt of an inbound delivery on a
mobile device, the Goods Receipt for Inbound Delivery app (F2502) leads him to a
mobilized SAP Fiori app supporting in-app bar code scanning.
� For a plant manager creating a material-to-material posting, the Create Goods
Movement app (Transaction MIGO) offers him an expert mode of all material doc-
ument posting configured in the system.
2.4.4 Analyze
During the analyze step, end users check and evaluate current and historic data to
draw conclusions for the next plan and adjust step. Figure 2.17 displays different
kinds of analytical SAP Fiori apps and their intended usage.
Figure 2.17 Map of Analytical Applications in SAP S/4HANA
Op
era
tio
na
lSt
rate
gic
ObjectPage
OverviewPage
List Monitoring
AnalyticalList Page
SAP SmartBusiness
Natural LanguageInteraction
Analysis PathFramework
Grid
Custom CDS
SAP AnalyticsCloud
Freestyle
Freestyle
Freestyle
Professional UserCasual User
84

2.5 Summary
It’s important to understand that the user category on the x-axis depends on the
business context of the end user. A sales operator is a professional user for any ana-
lytical sales application, but merely a casual user for an inventory application. The
types of SAP Fiori apps mentioned in Figure 2.17 are explained in Chapter 1, Section
1.4.
The y-axis of Figure 2.17 defines the analytic capabilities of the SAP Fiori app, which is
normally proportional to its ease of use. The natural language interaction (NLI) will
support the casual user for operational analysis. The SAP Analytics Cloud and custom
core data services (CDS) views will support the professional user for strategic report-
ing. Most of the analytic SAP Fiori apps follow certain patterns; however, there may
be freestyle apps in all kind of categories. All analytical SAP Fiori apps have in com-
mon that the analysis is done in real time, that most of them are extensible, and that
they are role based. Some analytical KPIs are even integrated into predominant trans-
actional SAP Fiori apps. Results of any analysis can be shared with the collaboration
tools mentioned previously. The analytical SAP Fiori apps crucial to inventory man-
agement are explained in depth in Chapter 8.
2.5 Summary
This chapter defined some key terms of supply chain planning in general and inven-
tory management in particular. After reading this chapter, you should be familiar
with the concept of safety stock, replenishment lead time, and lot size. Moreover, you
should understand a product lifecycle and know the principle of an optimization
cycle consisting of three steps: plan and adjust, execute, and analyze. Finally, the idea
of a low-touch ERP, also known as intelligent enterprise, should have triggered some
expectations for the following chapters.
Before we start to enter the optimization cycle, we need to walk through the configu-
ration tasks in the next chapter.
85


Chapter 3
Configuring Inventory Management
To run inventory management, you must first configure or customize
it in your system. Inventory management is made up of many config-
urable pieces, ranging from organizational units to business processes
to servers, roles, interfaces, and beyond, as you’ll see in this chapter.
Now that we’ve outlined the basics of SAP S/4HANA and inventory management,
let’s move on to the required system configuration of inventory management to
enable the related business processes. Not all configuration steps are unique to
inventory management due to SAP’s philosophy of providing an integrated system.
We’ll also cover some hints for process automation to make life easier for end users.
This chapter gives step-by-step instructions for configuring inventory management
in SAP S/4HANA through the IMG. Normally, you configure your organizational
units first and then the processes linked to those units. You’ll also learn how to set up
cross functions, servers, and inbound and outbound interfaces, as well as the neces-
sary steps to use prepackaged SAP Fiori roles.
Note
The implementation steps described in this chapter are applicable to SAP S/4HANA
only. The SAP S/4HANA Cloud implementation methodology is significantly different
and explained in Chapter 9.
3.1 Implementation Guide Configuration
Configuration of an SAP system is mostly related to Customizing. A vital part of the config-
uration is also the system landscape used in the project. Figure 3.1 shows a three-system
landscape that is used in many SAP projects. It’s also possible to work with a two-system
landscape in smaller implementation projects or to use a five-system or larger number of
systems landscape in large implementation projects. Most of the configuration is done on
87
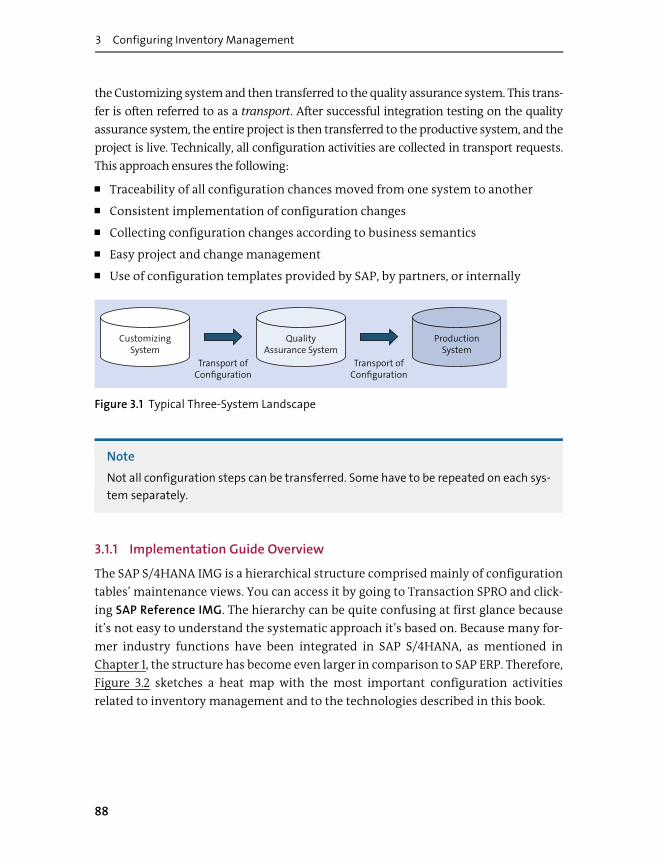
3 Configuring Inventory Management
the Customizing system and then transferred to the quality assurance system. This trans-
fer is often referred to as a transport. After successful integration testing on the quality
assurance system, the entire project is then transferred to the productive system, and the
project is live. Technically, all configuration activities are collected in transport requests.
This approach ensures the following:
� Traceability of all configuration chances moved from one system to another
� Consistent implementation of configuration changes
� Collecting configuration changes according to business semantics
� Easy project and change management
� Use of configuration templates provided by SAP, by partners, or internally
Figure 3.1 Typical Three-System Landscape
Note
Not all configuration steps can be transferred. Some have to be repeated on each sys-
tem separately.
3.1.1 Implementation Guide Overview
The SAP S/4HANA IMG is a hierarchical structure comprised mainly of configuration
tables’ maintenance views. You can access it by going to Transaction SPRO and click-
ing SAP Reference IMG. The hierarchy can be quite confusing at first glance because
it’s not easy to understand the systematic approach it’s based on. Because many for-
mer industry functions have been integrated in SAP S/4HANA, as mentioned in
Chapter 1, the structure has become even larger in comparison to SAP ERP. Therefore,
Figure 3.2 sketches a heat map with the most important configuration activities
related to inventory management and to the technologies described in this book.
CustomizingSystem
QualityAssurance System
ProductionSystem
Transport ofConfiguration
Transport ofConfiguration
88

3.1 Implementation Guide Configuration
Figure 3.2 Inventory Heat Map of SAP S/4HANA IMG
Note
You can use the search capabilities of the SAP menu to find nodes or configuration
activities.
Let’s walk through a few of the key nodes:
� SAP NetWeaver
Every technology-related configuration activity can be found below the SAP Net-
Weaver node in Figure 3.2. Normally, this kind of configuration is owned by the
system administrators, with one exception (as you’ll see in this section). Here you
find SAP Gateway configuration to set up the OData services used in SAP Fiori and
IMGSAP
NetWeaver
EnterpriseStructure
Cross-Application
Components
MaterialsManagement
Production
Productionfor ProcessIndustries
LogisticsExecution
SAPUI5
SAP Fiori
SAP Jam Integration
Logistics – General
Materials Management
Logistics – General
SAP HANA-Based Search …
Responsibility Management
Data Aging
Purchase Order
Set Up Stock Transport Order
Account Assignment
Decentralized WMS Integration
SAP Gateway
UI Technology
General Settings
Enterprise Search
Definition
Assignment
General Application Functions
General Settings for Materials …
Purchasing
Inventory Management and Ph..
Valuation and Account ….
Basic Data
Production Planning
Material Requirements Planning
Kanban
Master Data
Process Order
Logistics – General
89

3 Configuring Inventory Management
external interfaces. In particular, there are IMG activities to clear OData caches,
which is very helpful if you deploy new service versions.
� UI Technology
Below the UI Technology node, you find the configuration for SAP UI5, SAP Fiori
and SAP Jam Integration (see Chapter 1, Section 1.4, for more information on SAP
Fiori).
� General Settings
The General Settings node comprises the setup of units of measurements, curren-
cies, countries, and time zones.
Note
Inventory management may require adding additional units of measurements.
� Enterprise Search
The Enterprise Search node is important for setting up the search function in the
SAP Fiori Me Area (see Chapter 1, Section 1.4.3).
� Enterprise Structure
The Enterprise Structure node in contains all configuration activities to define the
organizational structure of your SAP S/4HANA instance. It’s important to under-
stand that the initial structure itself is configured with the activities below this
node. This is described in detail in Section 3.1.2. The business-specific attributes of
each organizational unit are maintained where the business process is main-
tained, for instance, in inventory management (see Section 3.1.3). To set up the ini-
tial organizational structure, you need to define the organizational units first
(Definition) and then assign them to each other (Assignment). The organizational
units are grouped into “modules,” and for inventory management, Logistics –
General and Materials Management are of interest.
� Cross-Application Components
The Cross-Application Components node contains SAP HANA-Based Search and
Responsibility Management (see Section 3.2.2) configuration.
� Inventory Management, Production, and Production for Process Industry
The Materials Management node (with the Purchasing and Material Management
and Physical Inventory subnodes), Production node, and Production for Process
Industry node embrace most of the business configuration referred to in this book
on inventory management in SAP S/4HANA. We’ll cover Purchasing in Section
90

3.1 Implementation Guide Configuration
3.1.4 when focusing on stock transport orders. Inventory Management and Physi-
cal Inventory is covered in Section 3.1.3, and Production and Production for Process
Industry will be covered in Section 3.1.5.
The IMG-based configuration of SAP S/4HANA systems isn’t an easy task, which is
why SAP and SAP partners offer preconfigured system configurations containing
various best practices. Depending on the SAP S/4HANA system setup, the best prac-
tice configuration is in client 000 or is created using the SAP Best Practice Explorer.
The latter is the cornerstone of the SAP S/4HANA Cloud configuration, which we’ll
explore in Chapter 9.
3.1.2 Organizational Units
Organizational units structure your enterprise organization in a logical way and sup-
port you in your business projects. Sometimes there is a direct mapping of physical
units to logical units, but this isn’t always the case. For example, a plant modeled in
SAP S/4HANA can’t always be related to a physical building. Sometimes it’s a logical
unit required to organize the material flow within a company. We’ll focus on inven-
tory management when discussing the organizational structure, in which the follow-
ing aspects need to be considered:
� A basic configuration step is to reflect the enterprise structure in the IMG configu-
ration as a basis to show the stock situation on different organizational levels.
� Valuation of the stock is an important aspect to consider when setting up the
enterprise structure.
� Processes have a strong impact when defining an organizational structure. For
example, if you plan to use the 3GL logistics provider, you’ll need to set up storage
locations that serve as proxy objects (see Section 3.1.5).
� Security and compliance may also play a role.
The main organizational units in inventory management are the storage location
(where inventory is stored as a rule) and the plant (where inventory is manufactured
as a rule). The company code serves as the scaffold for one or more plants and links
the plant with its logistic processes indirectly to financial processes. In material
requirements planning (MRP), the MRP area also plays an important role (as we’ll dis-
cuss in Section 3.1.6), but it isn’t part of the original enterprise structure.
Figure 3.3 outlines the aforementioned organizational units and presents an exam-
ple setup on the right-hand side. Note that you can do material valuation on the plant
91

3 Configuring Inventory Management
level or the company code level, depending on your configuration. In general, inven-
tory stock quantities are defined on a more granular level in the logistics processes
than in the financial processes. This can sometimes lead to confusion between end
users with a logistics view and end users with a controlling view. Some analytical
applications in inventory management break down inventory value according to the
rule of three if there is no one-to-one mapping between the material quantity kept in
inventory management and the material value kept in the material ledger. This
closely resembles the controlling view of inventory values, but it may result in
rounding differences. Alternatively, the inventory value is always calculated based
on the actual price multiplied with the material quantity, which resembles the plan-
ner view of inventory values.
Figure 3.3 Organizational Units in Inventory Management
Note
A plant key is unique within one SAP S/4HANA client, whereas a storage location key
can be assigned to more than one plant but is considered a different entity (as with
storage location 1011 in Figure 3.3).
As mentioned in Chapter 2, Section 2.1, there are several stock types and special stock
types used in SAP S/4HANA to define inventory. Some are defined on the storage
location level, and some are only available on the plant level of the organizational
hierarchy.
CompanyCode
Plant
StorageLocation
1000
1010
1011
1020
1011 1021
• Material valuation
• Link to financial accounting
• Material valuation
• Inventory
• MRP
• Material master data
• Inventory
• MRP
• Material master data
OrganizationalStructure Schema
Organizational StructureImplementation
92

3.1 Implementation Guide Configuration
An organizational structure is reflected in master data as well, most notably in the
material master data. A prerequisite to creating stock of a certain material in a stor-
age location is that the material must be created for this storage location (i.e., the
storage location view of the material must exist). The same rule applies to plants.
As shown previously in the IMG inventory heat map in Figure 3.2, you need to define
your organizational units first and then assign them (build the hierarchy in Figure
3.3). Figure 3.4 shows the relevant part of the IMG with the focus on the plant defini-
tion.
Figure 3.4 Plant Definition in the IMG
You can define the plant and storage location, as follows:
� Plant
A plant is the organizational and operational unit in which the company’s stock is
managed and reported. To define the plant, go to Enterprise Structure • Definition •
Logistics – General, and select Define, copy, delete, check plant, as shown in Figure
3.4. Each plant belongs to one company code and country. This company code
dependency becomes important for logistic processes and material movements
between different companies and countries because different currencies and valu-
ation capabilities come into account.
� Storage location
A storage location is on the lowest organizational level in inventory management
and is defined by going to Enterprise Structure • Definition • Materials Manage-
ment and selecting Maintain storage location, as shown in Figure 3.4. A standalone
93

3 Configuring Inventory Management
storage location can’t exist, so it’s always created in the context of a plant (see
Figure 3.5). Below the storage location level, there are bins, which are used in ware-
house management.
Figure 3.5 Organizational Units in Inventory Management
As shown earlier in the IMG inventory heat map in Figure 3.2, the next step is to
assign your plant to the company code using the Assign plant to company code activ-
ity found in the IMG menu path under Enterprise Structure • Assignment • Logistics –
General, as shown in Figure 3.6.
Figure 3.6 Assigning a Plant to a Company Code in the IMG
Plant (1000)
Storage Location(0001)
Storage Location(0002)
Storage Location (…)
Plant (…)
Storage Location(0001)
Storage Location(0002)
Storage Location (…)
Company Code(1000)
Company Code(…)
94

3.1 Implementation Guide Configuration
Beside the basic organizational units in inventory management, there are some addi-
tional organizational units that might be touched in inventory management:
� Purchasing organization
The purchasing organization belongs to procurement and is crucial to structure
the procurement process. A purchasing organization is in charge of procurement
of related goods from vendors and is referred to in stock transport orders (order
type UB) or in standard purchase orders (order type NB) for instance.
To define the purchasing organization, go to Enterprise Structure • Definition •
Materials Management • Maintain Purchasing Organization.
� MRP area
The MRP area is an element used to structure production planning for materials.
By linking a material to MRP areas, you can control when and how a material is
planned (see Section 3.1.6).
3.1.3 Inventory Management
Configuring inventory management essentially means configuring the processes
linked to material document postings. The related settings for inventory manage-
ment are clustered below IMG node Materials Management – Inventory Manage-
ment and Physical Inventory. To open the IMG, run Transaction SPRO.
Figure 3.7 displays the IMG section covering inventory management. There are five
main configuration clusters:
� Set up number range intervals for documents.
� Configure processes per plant.
� Configure processes per movement type.
� Set up physical inventory process.
� Configure transactions, reporting, printing, output management, authorization,
and stock determination.
We’ll walk through each in the following sections, after first taking a look at a key
activity outside of inventory management.
95

3 Configuring Inventory Management
Figure 3.7 Inventory Management and Physical Inventory in the IMG
Late Locking
Let’s start with an important setting for material document processing regarding the
database locking mechanism. With SAP S/4HANA, a new feature was implemented to
make use of an optimized database locking feature called late lock. Late locking can be
activated with IMG activity Set Material Lock for Goods Movements, as shown in
Figure 3.8, which can be accessed via the menu path Materials Management • General
Settings for Materials Management.
Figure 3.8 IMG Activity for Activating Late Locking
96

3.1 Implementation Guide Configuration
By activating this setting, performance benefits are available, especially regarding
high volume-based transactions that perform a large amount of material document
postings.
Further Resources
More detailed information and possible side effects of this setting are described in
SAP Notes 2267835 and 2338387.
Number Range Intervals
Before taking a deeper look into the predelivered movement types and how to adjust
or copy them, let’s first discuss the number range object for material movements and
physical inventory documents. Each posting of a material movement or physical
inventory document creates a new document in the system. Without an assigned
number range object, the document can’t be created at all. The number of this docu-
ment is taken from a number range object that is defined in the IMG menu path,
Materials Management • Inventory Management and Physical Inventory • Number
Assignment (see Figure 3.9). For the different categories of documents, different
number range intervals are defined.
Figure 3.9 Number Range Object for Material and Physical Inventory Documents in the IMG
After you start the Define Number Assignment for Material and Phys. Inv. Docs IMG
activity (see Figure 3.9), you have to click the pencil icon (Intervals) (or just Display,
not shown) to enter the screen shown in Figure 3.10.
97

3 Configuring Inventory Management
Figure 3.10 Different Categories of Number Ranges
The Number Assignment IMG activity also provides a feature to set the status of the
number range manually to a certain number. Be careful, though, because adapting
the number range status manually might lead to number collisions, which would
lead to a short dump during material document or physical inventory document
posting.
Plant Parameters
Many processes in inventory management are controlled on the organizational unit
level (plant) and on the transactional level (movement type). Figure 3.11 shows the
configuration of a plant with IMG activity Plant Parameters in the menu path Mate-
rials Management • Plant Parameters.
Figure 3.11 Configuration of a Selected Plant
98

3.1 Implementation Guide Configuration
You can control actions encompassing material document postings, set up the basic
parameters of the physical inventory counting process, and define which negative
stocks are allowed on the plant level.
There are four key sections to configure in Plant Parameters:
1 Goods Movements
These plant parameters control processes during goods movement. Often you
enable a process first on the organizational level and second on the transactional
level (see the next section).
2 Physical Inventory
This section controls parameters of the physical inventory process (see Chapter 6,
Section 6.6).
3 Reservations
This section controls parameters when using reservations (see Chapter 7, Section
7.1).
4 Negative Stocks
By default, SAP S/4HANA doesn’t allow you to create negative stock quantities.
Negative stock quantities typically hinder period-end closing activities. If a mate-
rial document posting would create a negative stock quantity, the posting is
rejected.
Note
Allowing negative stocks transiently eases sequencing issues during high-volume
material document postings of goods issue and goods receipts. You need to allow
the negative stocks also on the storage location level with Goods Issue/Transfer
Posting • Allow Negative Stocks IMG activity and in the material master for each
material.
Movement Types
The cornerstone of each material movement and related material document in
inventory management is the movement type concept. A rough glimpse into the
importance of movement types was given in Chapter 1.
A movement type is defined by a three-digit number plus related control indicators.
Figure 3.12 sketches the following four aspects that a movement type influences
during a material document posting:
99

3 Configuring Inventory Management
� The movement type controls which attributes of the material document posting
are populated. Most important, the movement type controls all stock-identifying
fields and hence the material stock quantity.
� Depending on the business process, the movement type requires a predecessor
document, such as a purchase order or delivery. The predecessor document gets
updated during the material document posting.
� Depending on the business process, the movement type initiates the automatic
creation of a successor document, such as an accounting document.
� Depending on the business process, the movement type creates some auxiliary
objects, for example, a material batch or the storage location view of a material.
Figure 3.12 Movement Type: Functional Perspective
The second point of the preceding list, regarding predecessor documents, may espe-
cially lead to the material document posting itself only being triggered due to the
successor document posting. One example is the posting of physical inventory dif-
ferences.
The material documents in SAP S/4HANA can’t be altered after posting, which means
a material document is reversed by creating a material document posting inverting
the original material document. This is called a material document reversal (posting).
Movement Type
CreateMaterial
DocumentEntry
UpdatePredecessorDocument
CreateSuccessorDocument
CreateAuxiliaryObjects
100
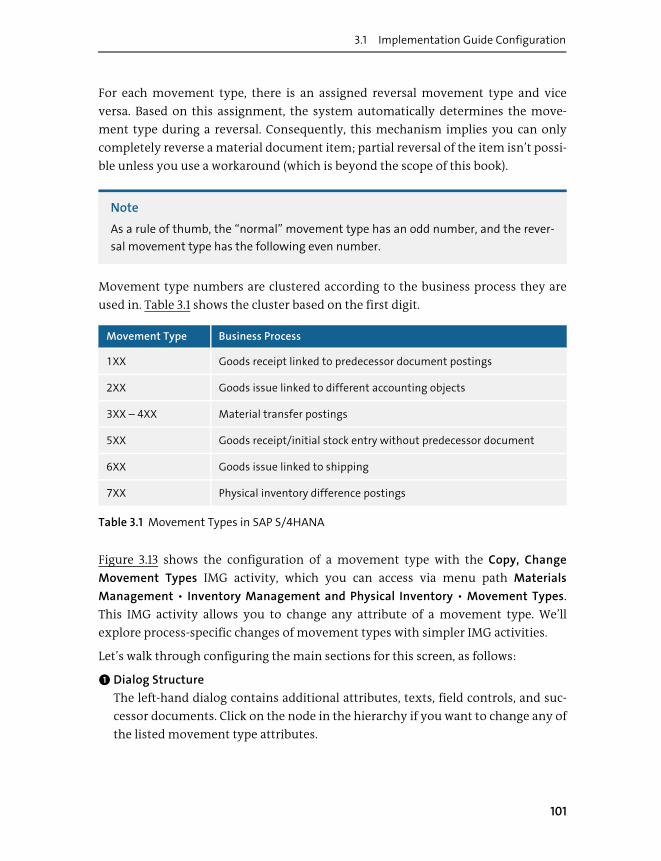
3.1 Implementation Guide Configuration
For each movement type, there is an assigned reversal movement type and vice
versa. Based on this assignment, the system automatically determines the move-
ment type during a reversal. Consequently, this mechanism implies you can only
completely reverse a material document item; partial reversal of the item isn’t possi-
ble unless you use a workaround (which is beyond the scope of this book).
Note
As a rule of thumb, the “normal” movement type has an odd number, and the rever-
sal movement type has the following even number.
Movement type numbers are clustered according to the business process they are
used in. Table 3.1 shows the cluster based on the first digit.
Figure 3.13 shows the configuration of a movement type with the Copy, Change
Movement Types IMG activity, which you can access via menu path Materials
Management • Inventory Management and Physical Inventory • Movement Types.
This IMG activity allows you to change any attribute of a movement type. We’ll
explore process-specific changes of movement types with simpler IMG activities.
Let’s walk through configuring the main sections for this screen, as follows:
1 Dialog Structure
The left-hand dialog contains additional attributes, texts, field controls, and suc-
cessor documents. Click on the node in the hierarchy if you want to change any of
the listed movement type attributes.
Movement Type Business Process
1XX Goods receipt linked to predecessor document postings
2XX Goods issue linked to different accounting objects
3XX – 4XX Material transfer postings
5XX Goods receipt/initial stock entry without predecessor document
6XX Goods issue linked to shipping
7XX Physical inventory difference postings
Table 3.1 Movement Types in SAP S/4HANA
101

3 Configuring Inventory Management
2 Entry Control
This section contains the attributes before posting. Here you may set defaults or
checks to control processes on the transactional level.
3 Updating Control
This section contains the actions during posting. Here you may also control pro-
cesses on the transactional level.
Figure 3.13 Configuration of a Selected Movement Type
Creation of custom additional movement types to the customer namespace should
be done by copying an existing movement type to ensure consistency of all depen-
dent parameters. New movement types are typically created to determine different
accounts in financial accounting or authorization-related controlling, for instance.
As pointed out at the beginning of this section, process control in inventory manage-
ment is most often done on the plant (i.e., organizational) level and on the move-
ment type (i.e., transactional) level. That is why the SAP S/4HANA IMG offers special
102

3.1 Implementation Guide Configuration
activities for each dedicated process summarizing both configuration activities and
offering only a suitable set of movement types. Figure 3.14 shows as example the
Goods Receipt process containing the following plant/movement type settings:
� Create Storage Location Automatically
If activated, the storage location view of the material master record is created auto-
matically, if missing.
� Create Purchase Order Automatically
If activated, a purchase order is created automatically based on defaults, if missing
during the goods receipt.
� Set Manual Account Assignment
If activated, a manual account assignment is supported.
� Set “Delivery Completed” Indicator
Allows you to configure when and how the goods receipt process is completed in
inventory management.
� For GR-Based IV, Reversal of GR Despite Invoice
Allows you to configure how reversals of material documents are handled in the
goods receipt process.
� Set Expiration Date Check
Allows you to configure how the shelf life process is handled (we’ll discuss shelf life
later in this section).
The identical settings exist for goods issue/transfer postings and automatic move-
ments.
Figure 3.14 Goods Receipt Process Configuration with Movement Type and/or Plant Set-
tings Highlighted
103
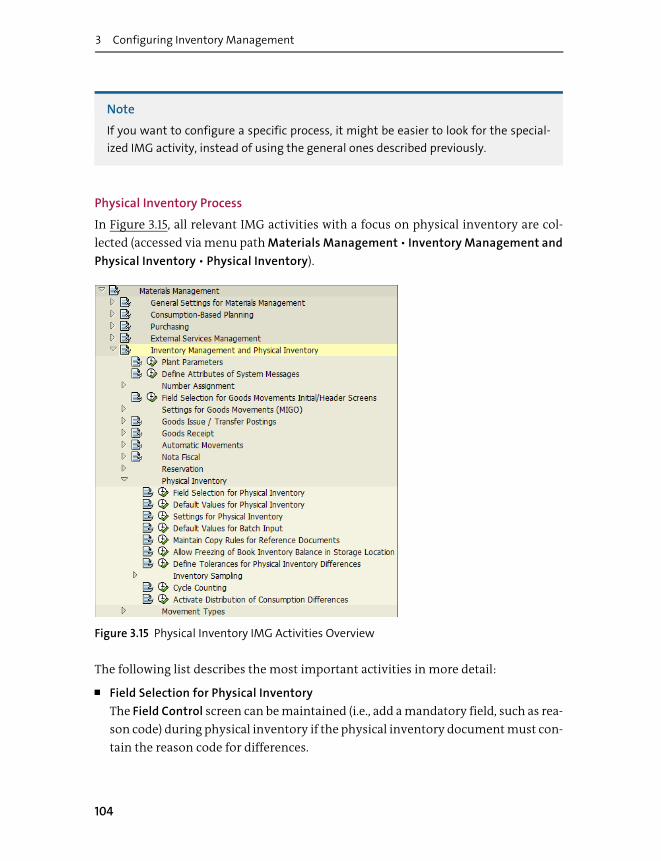
3 Configuring Inventory Management
Note
If you want to configure a specific process, it might be easier to look for the special-
ized IMG activity, instead of using the general ones described previously.
Physical Inventory Process
In Figure 3.15, all relevant IMG activities with a focus on physical inventory are col-
lected (accessed via menu path Materials Management • Inventory Management and
Physical Inventory • Physical Inventory).
Figure 3.15 Physical Inventory IMG Activities Overview
The following list describes the most important activities in more detail:
� Field Selection for Physical Inventory
The Field Control screen can be maintained (i.e., add a mandatory field, such as rea-
son code) during physical inventory if the physical inventory document must con-
tain the reason code for differences.
104

3.1 Implementation Guide Configuration
� Default Values for Physical Inventory
Plant-dependent values can be reset for physical inventory documents such as
stock type or reason code, as shown in Figure 3.16. Enter your required default val-
ues, that is, the Reason f. difference.
Figure 3.16 Defaults for Physical Inventory Documents
� Settings for Physical Inventory
The following settings are available at the plant level:
– Activate change documents for logging of changes made to physical inventory
documents.
– Activate the adjustment of the book inventory balance.
– Activate the serial number display and printing on the physical inventory doc-
ument.
� Default Values for Batch Input
The batch input technology (technology for automatic recording and replay of
user input on SAP GUI screens, which is used for dark background processing) for
processing physical inventory documents can be controlled related to the given
reports when accessing the IMG activity. Figure 3.17 outlines the possible settings
for the batch input creation of physical inventory documents during cycle count-
ing process:
– Batch Input Data
Define the batch input-related data. For instance, you can enter the maximum
number of items a physical inventory document should contain.
– Physical Inventory Data
Give the presettings for the physical inventory process itself. For instance, you
might block the stock that is part of the physical inventory by setting the Phys.
Inv. Block indicator.
105

3 Configuring Inventory Management
– Stock Types
Indicate the affected stock types.
– Control
Use this indicator to enable that in certain cases (e.g., errors), the processing is
switched back to direct processing rather than batch processing.
Figure 3.17 Defaults of Batch Input Processing
� Maintain Copy Rules for Reference Documents
When inventory differences are processed (see Chapter 6, Section 6.6), the system
can automatically set the provided physical inventory document items to prese-
lected for further processing and posting of differences if activated.
� Allow Freezing of Book Inventory Balance in Storage Location
One flag is provided per plant and storage location to allow the freezing of the
book inventory balance per storage location. As a result, the frozen inventory bal-
ance is recorded in the physical inventory document accordingly for further calcu-
lation of inventory differences after the count result is entered. Material
movements such as additional goods receipts, which might happen during count-
ing, won’t harm the calculation of the inventory differences afterwards because
106

3.1 Implementation Guide Configuration
the initial inventory balance is still present on the physical inventory document
level.
� Define Tolerances for Physical Inventory Differences
The value ranges of the amount of inventory differences that the user is allowed to
post are defined by first creating physical inventory tolerance groups (Phys.inv.
tolerance group) with related values ranges and assigning these groups to the
related users afterwards, as shown in Figure 3.18.
Figure 3.18 Physical Inventory Tolerance Group
In the example in Figure 3.18, the user group 0001 is allowed to post inventory dif-
ferences up to 100.000,00 euros for all items and up to 10.000,00 euros for a sin-
gle item.
� Cycle Counting
The cycle counting indicators are used to group the relevant materials that should
be taken into account for the cycle counting process. The definition is done per
plant and assignment of individual cycle counting indicators (e.g., A, B, C, D) in the
example shown in Figure 3.19, which is usually based on an ABC analysis (categori-
zation of materials according to their business relevancy). The key columns for
each plant are as follows:
– CC Phys. Inv. Ind.
In combination with the plant, a unique ID for the cycle counting indicator.
– No.of phys.inv.
Number of physical inventories per fiscal year.
– Interval
Definition of counting intervals.
– Float time
Number of working days that the current count date might differ from the
planned count date.
107

3 Configuring Inventory Management
– Percentage
Ratio of materials counted within this indicator. Sum of all cycle count indica-
tors per plant has to be 100%.
Figure 3.19 Definition of Cycle Counting Indicators
This indicator is assigned in the material master record of a material manually via
the related material master applications (see Figure 3.20) or automatically via
report RMCBIN00 (ABC Cycle Counting Analysis).
Figure 3.20 Material Master Record Cycle Counting Indicator
General Configuration Settings
This section introduces some rather generic, but important, settings for inventory
management in SAP S/4HANA:
� Allow Negative Stocks
In this IMG activity, underneath Goods Issue/Transfer Postings, negative stock for
unrestricted use stock can be enabled on different levels (e.g., plant; see Figure
3.21). In addition, the negative stock can be allowed for individual special stocks
(Sales order stock, in our example). The standard setting is that negative stocks
aren’t allowed.
108

3.1 Implementation Guide Configuration
Figure 3.21 Allowing Negative Stocks per Plant and Special Stock
This setting might be required if goods issues are posted before the related receipt
of the materials was posted. This helps keep the inventory balanced when the
goods receipts are entered in a later stage.
� Set Expiration Date Check
In Chapter 5, we’ll introduce native SAP Fiori apps for goods receipt processing.
These SAP Fiori apps can take into account the settings of the Set Expiration Date
Check IMG activity. Here, the expiration date check can be configured on the plant
and/or on the movement type level, as shown in Figure 3.22, and can be set to the
following:
– No check
– Enter and check
– Enter only
– No check at goods issue
Figure 3.22 Expiration Date Check for Movement Type
If the total shelf life is defined in the material master record, the shelf life expira-
tion date is calculated based on the entered production date.
109

3 Configuring Inventory Management
� Authorization Check for Storage Locations
Located under Authorization Management, the authorization check level in inven-
tory management can be detailed to the storage location level for individual stor-
age locations. The standard authorization check is on the plant level, but business
needs might require an authorization check on the storage location level, for
example, if materials with high values are handled within a certain storage loca-
tion, and only specific users will be allowed to post material movements for this
kind of material.
� Define Consumption Groups
Many analytical processes in inventory management require the calculation of
inventory consumption. By default, inventory consumption is recorded in mate-
rial document postings strictly linked to certain movement types. However,
inventory analytics often require inventory consumption to be calculated in the
context of the business process to be analyzed. Thus you can use a consumption
group to flexibly define the material document postings to be considered as con-
sumption in a certain business context.
Further Resources
For the exact details regarding movement types, refer to SAP Note 1832196.
Consumption groups can be specifically designed with this IMG activity to enable
more detailed analysis of consumption postings according to end-users’ needs.
Default consumption group “000” is predelivered and contains no movement
types, which means that the Consumption posting indicator shown earlier in
Figure 3.13 for each movement type is still used (default setting).
After you’ve defined your own consumption group by adding the movement
types describing inventory consumption in your desired analytical query, the
material document quantities linked to these movement types are used to calcu-
late inventory consumption, if you select your new consumption group while run-
ning the analytical query.
Note
The settings made in this IMG activity are only used in the Slow or Nonmoving Items
SAP Fiori app (F2137).
110

3.1 Implementation Guide Configuration
Data Aging
In SAP S/4HANA, a data aging mechanism is used to move data from the hot store to
the cold store to decrease the amount of data in the operational activities. You can
access the IMG activities outlined in Figure 3.23 by following the menu path Materials
Management • General Settings for Materials Management • Data Aging • Data
Aging for Material Documents, where the related setup can be performed.
Figure 3.23 Data Aging IMG Activities
For data aging, the most important aspect is the residence time to determine which
material documents will be moved to cold store. This is configured in the Define Data
Aging for Material Documents IMG activity. The setting can be done on the plant level
(also a wildcard * is possible to reflect all plants). The standard setting is two years (731
days). This setting can be adjusted. Only complete material documents are moved to
the cold store. Therefore, the residence time is reflected to all items of the material
document. If one item is still too young to be aged, the whole material document
isn’t taken into account for the data aging run.
In addition, if the residence time is adjusted after data aging runs have already taken
place, there is no automatic undo of already aged material documents. To move
material documents back from cold store to hot store, a separate undo data aging run
has to be performed.
By using the Analyze Data Aging for Material Documents IMG activity, also shown in
Figure 3.23, a precheck can be performed to determine how many material docu-
ments will be taken into account by a data aging run.
111

3 Configuring Inventory Management
If you require more specific checks to determine which material document should be
data aged besides the residence time, you might implement a business add-in (BAdI)
by using the BAdI: Aging of Material Documents IMG activity.
3.1.4 Procurement
Now let’s continue with the setup of procurement processes that directly impact
inventory management processes. First, we’ll cover the account assignment category
controlling the goods receipt process, and then we’ll discuss how to set up the stock
transfer process.
The IMG activities linked to procurement are located mainly under the Materials
Management node. In this section, we’ll walk through key procurement processes
and their associated activities, focusing only on those that directly impact inventory
management.
Document Flow
Figure 3.24 shows the document flow at the start of a procurement process. The pur-
chase requisition document containing the header and items collects the internal
requirements. It’s addressed to the purchasing organization and then approved and
converted into a purchase order with header and items, which represents a formal
request to procure goods from an external or internal supplier.
Figure 3.24 Document Flow in Procurement
There are some variants to how the procurement process continues, but from an
inventory perspective, the purchase order or the purchase order-based inbound
PurchaseRequisition
PurchaseOrder
Collection of InternalRequirements
Formal Request fromPurchasing Organization to
Supplier or Plant to Provide aDefined Quantity of Goods at
a Given Point in Time
Purchasing Organization
Conversion
112

3.1 Implementation Guide Configuration
delivery are the anchor documents to create the goods receipt document when the
goods arrive at the receiving plant. The goods receipt updates the purchase order his-
tory, eventually closes the process by setting the Delivery Completed indicator per
purchase order item, and initiates invoice verification. The process may also vary
depending on the type of procurement process, for example, standard, subcontract-
ing, consignment, stock transfer (which we’ll discuss later in this section), or external
service.
Account Assignment Category
One prominent attribute to be controlled in procurement is the account assignment
category of the purchase order item. Figure 3.25 shows that the account assignment
category influences the procurement process, but it also affects the account determi-
nation (costs are apportioned among various controlling objects) and—most of all—
the goods receipt process. For instance, the special stock type created during a goods
receipt is derived from the account assignment category settings of the purchase
order item (with one exception: vendor consignment stock is directly derived from
the item category K).
Figure 3.25 Account Assignment Categories: Influencing Different Factors
Account AssignmentCategory
AccountDetermination
ProcurementProcess
SpecialStockType
InventoryStock
Goods ReceiptProcess
113

3 Configuring Inventory Management
The account assignment category of the purchase order item also determines
whether inventory stock is created by the goods receipt or whether it’s a consumption
posting, where a goods receipt is directly consumed and internally billed according to
the account assignment category.
Figure 3.26 displays the Account Assignment IMG node and its activities, which you
can access via the menu path, Materials Management • Purchasing • Account Assign-
ment, as follows:
� Maintain Account Assignment Categories
Create/edit account assignment categories.
� Define Combination of Item Categories/Account Assignment Categories
Create the valid combination of the mentioned field in the purchase order item.
Figure 3.26 Account Assignment Node
Figure 3.27 presents the Account Assignment Categories detail screen. The Detailed
information area is important for configuring the factors mentioned earlier in Figure
3.25:
� Goods receipt
The goods receipt-related indicators control how the goods receipt is to be exe-
cuted.
� Stock
The Consumption posting and Special Stock fields regulate how and what kind of
special stock is created during the goods receipt process.
� Account determination
The account determination related attributes ensure how and how many accounts
are used when creating a goods receipt. Account Modification controls the account
determination, and ID: AcctAssgt Scrn controls whether there is a single or multi-
ple account assignment.
114

3.1 Implementation Guide Configuration
Figure 3.27 Account Assignment Details
Stock Transfer Posting
Stock transfer postings are a major part of your logistic processes if you have more
than one plant and need to move goods between these plants. Figure 3.28 displays the
involved entities: an issuing plant and a receiving plant. During the transfer, the
involved stock might be recorded in the SAP S/4HANA system as stock in transit. In
fact, the process can be quite complex depending on whether the issue plant and
receiving plant belong to the same company code (see Section 3.1.2), whether a pur-
chase order is used, or whether a deliver document is involved.
Figure 3.28 Stock Transfer Basics
Plant 0001 Plant 0002
Issuing Plant Stock in Transit Receiving Plant
115

3 Configuring Inventory Management
Table 3.2 and Table 3.3 list all possible variants of the stock transfer process. Basically,
you can distinguish between stock transfers without a stock transport order (Table
3.2) and stock transfers with a stock transport order (Table 3.3).
The first group is solely based on material document postings and the movement
types that are described in Section 3.1.3. Table 3.2 lists all aspects of the material docu-
ment postings. In addition, you can directly transfer inventory with some special
stock types with movement type 301, and the stock in transfer stock type at the plant
level, which is created by movement type 303, doesn’t hold any batch information.
Stock Transport Orders
Stock transport orders are purchase orders with a dedicated purchase order type. As
you can create your own purchase order type, and SAP S/4HANA delivers some pur-
chase order types linked to stock transport orders, the purchase order type UB and
the associated delivery types and movement types mentioned in Table 3.3 are just
the most common examples.
You may choose to create stock transport orders with or without a delivery docu-
ment. The second variant creates the goods issue while processing the outbound
delivery document. If involved plants don’t belong to the same company code, a
clearing between the company codes must exist in controlling, or the posting is
One-Step Plant-to-Plant Two-Step Plant-to-Plant
Movement type 301: Transfer plant-to-plant � 303: Removal from
storage
� 305: Placement in
storage
Price calculation Valuation in issuing plant
Able to be planned Reservation –
Stock type after goods issue – Stock in transfer at plant
level
Delivery costs No
Cross-company code Company code clearing
Table 3.2 Stock Transfer without Stock Transfer Order
116

3.1 Implementation Guide Configuration
rejected. Alternatively, you can use purchase order type NB to create an ordinary pur-
chase order, including pricing and billing/invoice verification, in the issuing/receiv-
ing plant.
Stock Transfer with-
out Delivery
Stock Transfer with
Delivery
Stock Transfer with
Delivery and Billing
Purchase order
type/item type
� Purchase order
type: UB
� Item type: U
� Purchase order
type: UB
� Item type: U
� Purchase order
type: NB
� Item type:
Empty/U
Sales and distribu-
tion delivery type
– NL NLCC
Sales and distribu-
tion scheduling line
category
– NN NC
Billing type, docu-
ment type material
management-
invoice verification
– – IV, RE
Price calculation Valuation in issuing plant Pricing in materials
management/sales
and distribution
Movement type � 351: Goods issue
� 101: Goods
receipt
� 641/647: Goods
issue
� 101: Goods
receipt
� 643/645: Goods
issue
� 101: Goods
receipt
Cross-company
code
Company code clearing Revenue/clearing
account
Able to be planned Stock transport order
Stock type after
goods issue
Stock in transit
Delivery costs Yes
Table 3.3 Stock Transfer with Stock Transport Order
117
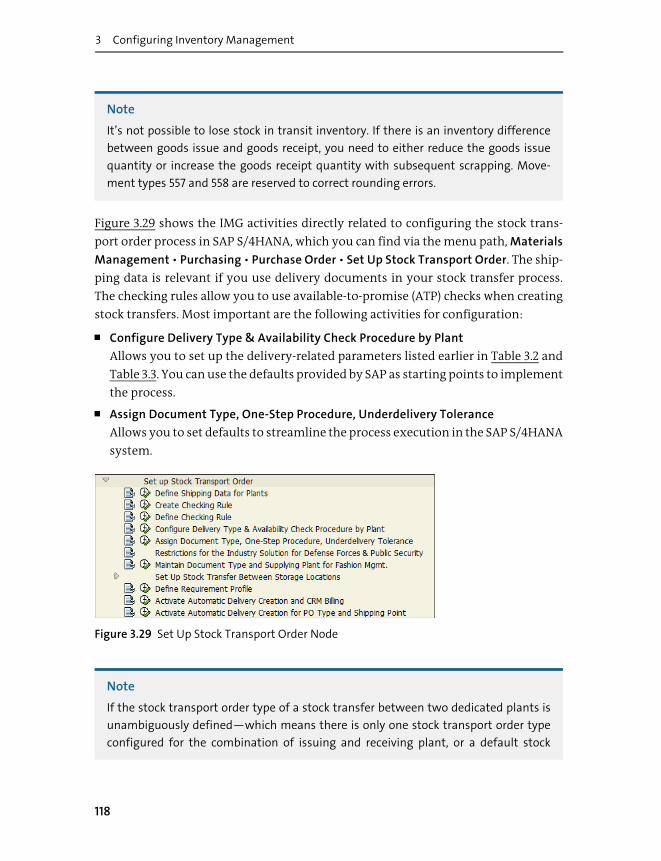
3 Configuring Inventory Management
Note
It’s not possible to lose stock in transit inventory. If there is an inventory difference
between goods issue and goods receipt, you need to either reduce the goods issue
quantity or increase the goods receipt quantity with subsequent scrapping. Move-
ment types 557 and 558 are reserved to correct rounding errors.
Figure 3.29 shows the IMG activities directly related to configuring the stock trans-
port order process in SAP S/4HANA, which you can find via the menu path, Materials
Management • Purchasing • Purchase Order • Set Up Stock Transport Order. The ship-
ping data is relevant if you use delivery documents in your stock transfer process.
The checking rules allow you to use available-to-promise (ATP) checks when creating
stock transfers. Most important are the following activities for configuration:
� Configure Delivery Type & Availability Check Procedure by Plant
Allows you to set up the delivery-related parameters listed earlier in Table 3.2 and
Table 3.3. You can use the defaults provided by SAP as starting points to implement
the process.
� Assign Document Type, One-Step Procedure, Underdelivery Tolerance
Allows you to set defaults to streamline the process execution in the SAP S/4HANA
system.
Figure 3.29 Set Up Stock Transport Order Node
Note
If the stock transport order type of a stock transfer between two dedicated plants is
unambiguously defined—which means there is only one stock transport order type
configured for the combination of issuing and receiving plant, or a default stock
118

3.1 Implementation Guide Configuration
transport order type is set—the Stock Transfer – Cross Plant app (F1957) in SAP Fiori
offers a one-click stock transport order creation function.
3.1.5 Logistics Execution
Figure 3.30 shows the IMG node that controls decentralized warehouse management
integration, which you can access via the menu path Logistics Execution • Decentral-
ized WMS Integration. Here, you define your warehouse under the Application sub-
node and assign it to a storage location when setting up the enterprise structure (see
Section 3.1.2). Decentralized warehouse management allows you to include third-
party logistics providers or external warehouse management software (see Chapter
9, Section 9.2.2).
Then you set up your technical interfaces and define your distribution model. After
synchronizing the inventory stock between the storage location and the decentral
warehouse, you activate the configuration per warehouse.
Figure 3.30 Decentralized WMS Integration Node
3.1.6 Production Planning
This section explains how to configure the essential entities used in production plan-
ning (see Chapter 4). Figure 3.31 shows the Production IMG node, which you can
access directly from the IMG root. It contains the configuration of most of the master
data objects used in production planning, as follows:
� Bill of material (BOM)
Describes what components a material is made of in a hierarchical structure (see
Chapter 4, Section 4.2.1).
� Work center
Describes where and how a production step is executed (see Chapter 4, Section
4.2.2).
� Routing
Describes how a material is made (see Chapter 4, Section 4.2.3).
119

3 Configuring Inventory Management
Further Resources
For the purposes of this book, we’ll walk through production planning configuration
only as is relevant to inventory management, and at a higher level. For a comprehen-
sive guide on production planning, we recommend Production Planning with SAP
S/4HANA by Jawad Akhtar (www.sap-press.com/4821, SAP PRESS, 2019).
Figure 3.31 Basic Data Node
The Production Planning IMG node in Figure 3.32 contains two subnodes. Demand
Management allows you to configure planned independent requirements (PIRs),
which are explained in Chapter 4, Section 4.6. Master Product Scheduling allows you
to configure the MRP strategy with the same name (see Chapter 4, Section 4.7).
Figure 3.32 Production Planning Node
120
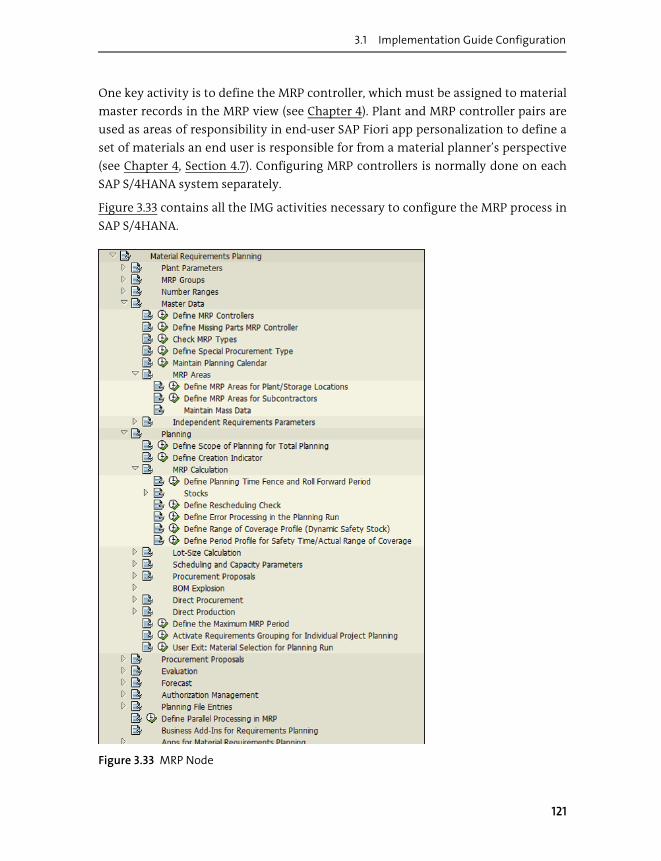
3.1 Implementation Guide Configuration
One key activity is to define the MRP controller, which must be assigned to material
master records in the MRP view (see Chapter 4). Plant and MRP controller pairs are
used as areas of responsibility in end-user SAP Fiori app personalization to define a
set of materials an end user is responsible for from a material planner’s perspective
(see Chapter 4, Section 4.7). Configuring MRP controllers is normally done on each
SAP S/4HANA system separately.
Figure 3.33 contains all the IMG activities necessary to configure the MRP process in
SAP S/4HANA.
Figure 3.33 MRP Node
121

3 Configuring Inventory Management
Let’s break down the key subnodes to configure:
� Plant Parameters
Configure all planning parameters per plant, such as number ranges, MRP control-
ler, special procurement, planned order conversion, BOM explosion, external pro-
curement, and performance and rescheduling.
Figure 3.34 shows the plant-dependent settings in production planning:
– Document settings: Configuration related to documents entails number range
intervals, default values, or document conversion rules.
– ATP checking rules: If a process step requires an availability check (e.g., depen-
dent requirements, back orders), an ATP checking rule needs to be provided.
– BOM exploration: BOM exploration defines how and when BOMs are evaluated
during the MRP run.
– MRP controller: As mentioned previously in this section, the MRP controller
role is in charge of material flow in the planning process.
– Available stocks: Available stocks and special procurement define how MRP
evaluates existing stocks and creates external requirements.
Figure 3.34 Plant-Dependent Settings
Plant 0001
ATPChecking
Rules
Rescheduling
BOMHeader
Subassembly1
Item 1 Item 2
Subassembly2
Item 3
BOM Exploration
DocumentSettings
MRP Controller
AvailableStocks
122

3.1 Implementation Guide Configuration
You’ll find the same IMG activities separated across several nodes under the Pro-
duction node. However, the Plant Parameters node allows you to execute and keep
track of all the parameter settings per one selected plant.
� Master Data
Helps you define MRP areas. Basically, you can plan with MRP on the plant level
(old approach used in SAP ERP) or on the MRP area level. MRP areas can be of three
different types:
– Plant type: Equals the old approach and means a planning run is carried out on
plant level. In this case, the MRP area key must equal the plant key.
– Storage location type: Allows planning runs on the storage location level. One
storage location must be assigned to only one MRP area. The Define MRP Areas
for Plant/Storage Location IMG activity is used for this configuration.
– Subcontracting type: Allows you to carry out planning runs for subcontractors.
This configuration (found in the Define MRP Areas for Subcontractors IMG
activity) needs to be repeated on the productive system because the sub-
contractor business partner number isn’t necessarily identical on two SAP
S/4HANA systems.
After the MRP areas are created in these activities, they must be assigned to the
material master record in the MRP view (see Chapter 4, Section 4.3.2).
� MRP Calculation
Below the MRP Calculation node, you’ll find the IMG activity Define Rescheduling
Check. In this activity, you set up the rescheduling check used to detect MRP situa-
tions requiring rescheduling of MRP (see Chapter 4, Section 4.7.1 for more details).
� Demand-Driven Replenishment
Allows you to choose the lead time calculation method, as shown in Figure 3.35.
You can use the historic average or a machine learning model (Chapter 4, Section
4.8).
Figure 3.35 Demand-Driven Replenishment Node
� Shop Floor Control
Allows you to configure the production order with the Order subnode plus number
ranges for confirmations, reservations, and operations and capacity requirements
(see Figure 3.36). Confirmations can be configured below the Operations node.
123

3 Configuring Inventory Management
Figure 3.36 Shop Floor Control Node
� KANBAN
Contains all Kanban-specific configuration options (see Figure 3.37). Notably, you
execute Define Number Range for Control Cycle and Define Number Range for
Kanban ID Number.
Figure 3.37 KANBAN Node
� Production Planning for Process Industries
Reflects the configuration activities required in SAP S/4HANA (see Figure 3.38).
You’ll notice that there are just a few additional features compared to the discrete
industries described so far. The most prominent one is the Process Order as coun-
terpart of the production order.
124

3.2 Cross Functions
Figure 3.38 Production Planning for Process Industry Node
3.2 Cross Functions
With activities related to cross functions, you can configure SAP S/4HANA functions
that aren’t related to a specific business process but are of a more generic nature. Let’s
walk through some key functions that are new as of SAP S/4HANA 1909.
3.2.1 Date Functions
Date functions allow users to specify a time period relative to a start date. This config-
uration is linked to the administrator role in the SAP Fiori launchpad and can be
reached with the Manage Date Functions app, as shown in Figure 3.39.
Figure 3.39 Simple List of Predefined Date Functions
125

3 Configuring Inventory Management
Date functions are used in various SAP Fiori apps. Although there is a list of SAP-
defined date functions, customers can also create their own if required.
Click on one list item to navigate to the Object page of each date function, which dis-
plays the definition’s details, as shown in Figure 3.40. You can’t edit SAP predefined
date functions, but you can create your own here.
Figure 3.40 Object Page of the Selected Date Function
To create your own date functions, click on +, and you’ll arrive at the screen shown in
Figure 3.41. You need to provide the mandatory Date Function Name. The various
options allow you to define a single date or a date range, different kinds of reference
dates, and a time frame.
Note
You can use the predefined date functions as a starting point and then copy them to
the customer namespace for further adaptations.
126

3.2 Cross Functions
Figure 3.41 Creating a Date Function in the Customer Namespace
3.2.2 Responsibility Management
Responsibility management in SAP S/4HANA allows you to define teams consisting
of one or more team members who will be responsible for a certain business process.
One prominent consuming application framework is situation handling (see Chapter
2, Section 2.3.4, for business motivation, and refer to Section 3.2.3 in this chapter for
configuration). SAP S/4HANA contains member functions and team types in its refer-
ence configuration. Responsibility management in the IMG allows you to extend the
reference configuration.
Figure 3.42 presents the basic attributes of a team in responsibility management.
Each team has a team type, which is linked to a team category. The team category
defines the consuming application framework. The responsibility definition of a
127

3 Configuring Inventory Management
team is a set of filter criteria that express when the team members will be involved in
a business process. Typical filter criteria in the responsibility definition are organiza-
tional units, master data attributes, or transactional attributes. Each team has at least
one team owner who is the administrator of the team. The team members are the end
users who will take over responsibility (and are involved via the consuming applica-
tion). When the team is invoked by the consuming application framework, the frame-
work may submit attributes mapping to the filter criteria in the responsibility
definition and member functions, which might be linked to each team member. The
end users only take over responsibility if the filter criteria and member function
match (see Chapter 4, Section 4.7.9).
Figure 3.42 Attributes of a Team
Figure 3.43 displays the Responsibility Management IMG node with all its subnodes
and configuration activities:
� Define Functions/Define Function Profiles
Allow you to create your own member functions if the SAP S/4HANA predelivered
member functions aren’t sufficient for your business case.
� Responsibility Definitions
Allows you to create your custom responsibility definition if the SAP S/4HANA
shipped definitions need to be extended.
� SAP Delivered Team Categories
Allows you to map your custom member function to the SAP S/4HANA Team Cat-
egories and, eventually, with Define Team Types, to create your own team types
with a predelivered team category.
Team Type Team Category
ResponsibilityDefinition
Team Owner
Team Member
Link to situationtemplate
Attribute to distinguish teams
Filter criteria to identify team
Administrator
End user optionally mappedto 1:n member functions
128

3.2 Cross Functions
Figure 3.43 Responsibility Management Node and Activities
After setting up your own member functions and team types, your administrator can
use them when defining the teams with the Manage Teams and Responsibilities app
(F2412) in SAP Fiori, as shown in Figure 3.44.
Figure 3.44 Manage Teams and Responsibilities App: Draft-Enabled List
After selecting one item, the detail screen in Figure 3.45 shows how the previously
described team attributes can be edited. When creating a new team, follow these
steps:
1. Select a team Category, which will define the Responsibility Definitions.
2. As an optional second step, enter values for one or many Responsibility Definitions.
129

3 Configuring Inventory Management
3. Add the Team Members. Optionally, you can assign Functions to each team mem-
ber (refer to Figure 3.43).
Chapter 4 and Chapter 5 provide business cases as examples.
Figure 3.45 Detail Screen to Edit a Selected Team
3.2.3 Situation Handling
Situation handling in SAP S/4HANA allows you to define business conditions that
trigger all the different kinds of notifications to a dedicated end user (see Chapter 2,
Section 2.3.4, for business motivation). SAP S/4HANA contains several situation tem-
plates that need to be copied to create an active situation type in the SAP S/4HANA
instance. The Manage Situation Types app (F2947) is used by the administrator to cre-
ate and activate situation types.
130

3.2 Cross Functions
A situation type contains the following attributes:
� ID
This is the unique key in the system.
� Status
This controls whether the situation type is active or not.
� Conditions
This option defines the filter criteria that will trigger a situation type instance.
� Batch Job Scheduling
This option defines when the criteria are evaluated during the day if the situation
template is triggered by batch jobs.
� In-App message and Notification
These settings allow you to edit how the situation type instance is displayed to the
end user in the SAP Fiori app and in the SAP Fiori launchpad notification (see Chap-
ter 1, Section 1.4).
� Preview
This option allows you to preview the situation while you’re editing.
� Notification Recipients
This option allows you to link one or more teams (see Section 3.2.2) and to set the
conditions that identify the to-be-notified team members (i.e., end users).
� Monitoring
With this option active, you can monitor the created situation type instance cen-
trally.
Figure 3.46 shows the Manage Situation Types SAP Fiori app displaying the Situation
Templates shipped with SAP S/4HANA.
Figure 3.46 Manage Situation Types App: Standard Templates Filtered for One Anchor
Object
131

3 Configuring Inventory Management
You can create user-defined situations by copying one of the SAP S/4HANA standard
templates in Figure 3.46. After copying the situation template, the situation shows up
under the Ready-to-Use Situation Types tab. Note that a situation must be enabled on
the detail screen to become usable (see Figure 3.47).
Figure 3.47 Manage Situation Types App: Created Situations Filtered for One Anchor Object
Figure 3.48 shows the detail page in edit mode, which you can access by clicking a
result item in the table. The Admin Information and the Conditions areas are outlined
on the screen, showing the Admin Information fields like ID and Name and Conditions
like the status of the purchase order to be met. The filter values on the right-hand side
control when a situation instance is created during the batch job run. With the pro-
cessing order on the left-hand side, you can also define conditions when the situation
instance should be removed.
Note
The Translate button helps you in creating language-dependent text of the situation
type.
If the situation template is defined to be triggered by a job, you need to complete the
next step. To schedule a batch job, go to the Batch Job Scheduling tab, as shown in
Figure 3.49, and set a Time Zone and a time (Start Batch Job At). This evaluates the
Conditions in Figure 3.48 on a daily basis.
132

3.2 Cross Functions
Figure 3.48 Detail Page of a Situation with the Admin Information and Condition Tabs
Figure 3.49 Batch Job Scheduling Tab
Next, go to the Situation Display tab, as shown in Figure 3.50. This area is used for
editing the visual appearance of the created situation instance. It’s preset by the
template and can be edited. You can use symbols (displayed with {}) representing
133
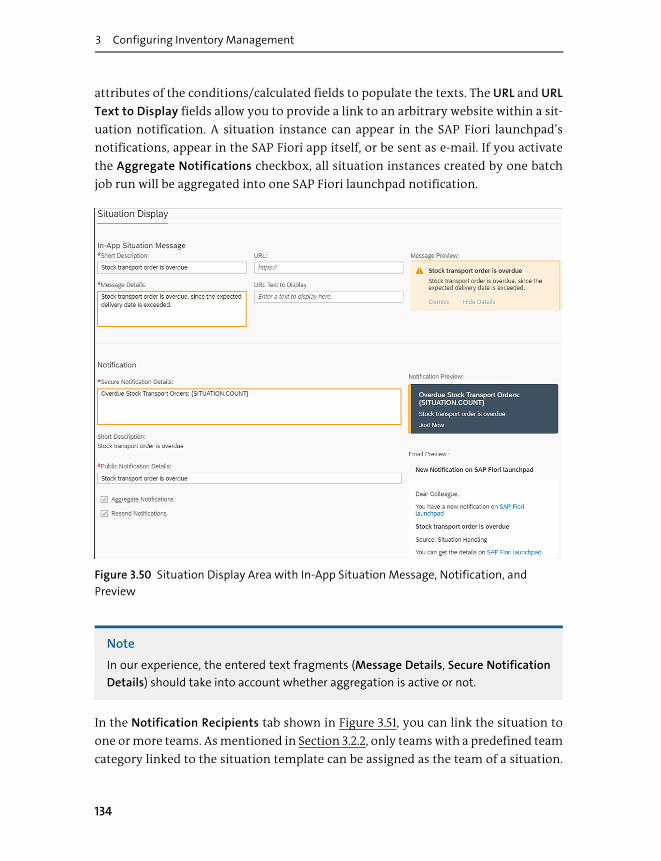
3 Configuring Inventory Management
attributes of the conditions/calculated fields to populate the texts. The URL and URL
Text to Display fields allow you to provide a link to an arbitrary website within a sit-
uation notification. A situation instance can appear in the SAP Fiori launchpad’s
notifications, appear in the SAP Fiori app itself, or be sent as e-mail. If you activate
the Aggregate Notifications checkbox, all situation instances created by one batch
job run will be aggregated into one SAP Fiori launchpad notification.
Figure 3.50 Situation Display Area with In-App Situation Message, Notification, and
Preview
Note
In our experience, the entered text fragments (Message Details, Secure Notification
Details) should take into account whether aggregation is active or not.
In the Notification Recipients tab shown in Figure 3.51, you can link the situation to
one or more teams. As mentioned in Section 3.2.2, only teams with a predefined team
category linked to the situation template can be assigned as the team of a situation.
134
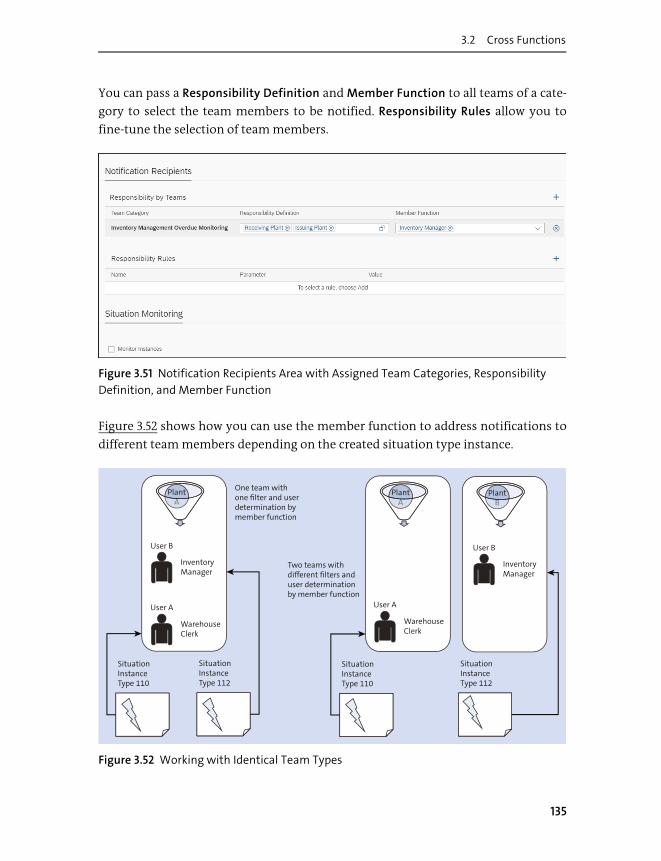
3.2 Cross Functions
You can pass a Responsibility Definition and Member Function to all teams of a cate-
gory to select the team members to be notified. Responsibility Rules allow you to
fine-tune the selection of team members.
Figure 3.51 Notification Recipients Area with Assigned Team Categories, Responsibility
Definition, and Member Function
Figure 3.52 shows how you can use the member function to address notifications to
different team members depending on the created situation type instance.
Figure 3.52 Working with Identical Team Types
PlantAA
InventoryManager
WarehouseClerk
User A
User B
One team withone filter and userdetermination bymember function
SituationInstanceType 110
SituationInstanceType 112
PlantAA
Two teams withdifferent filters anduser determinationby member function
SituationInstanceType 110
SituationInstanceType 112
PlantBB
WarehouseClerk
User A
InventoryManager
User B
135

3 Configuring Inventory Management
You can use one team with identical filter criteria (i.e., responsibility definitions) or
two teams with different filter criteria (see Section 3.2.2).
Figure 3.53 shows the setup with two different team types. Basically, which setup is
more convenient depends on the use case. If team members can be solely selected by
member functions, one team is sufficient. If your team definition requires different
responsibility definitions, you’ll need to create more than one team.
Figure 3.53 Working with Different Team Types
3.2.4 Extensibility
In SAP S/4HANA, data source extensibility supports customers in extending existing
user interfaces (UIs) (SAP Fiori, e-mail templates, Adobe forms) or technical interfaces
(OData services, Simple Object Access Protocol [SOAP] services, business application
programming interfaces [BAPIs], IDocs, etc.) with additional SAP-owned fields and
custom field extensibility is used with customer-created fields (see Figure 3.54). Fur-
thermore, SAP S/4HANA allows you to extend the existing business logic at strategic
hooks (custom logic). As administrator, you can perform extensibility via the Custom
Fields & Logic app (F1481) in SAP Fiori. We’ll start with custom field extensibility in the
next section.
PlantA
MRPGroup
01
WarehouseClerk
User A
SituationInstanceType 110
SituationInstanceType 112
PlantBB
InventoryManager
User B
InventoryManager
User A
Two teams withdifferent team types
136

3.2 Cross Functions
Figure 3.54 Field Extensibility Options in SAP S/4HANA
Custom Field Extensibility
Figure 3.55 shows the Custom Fields tab used to manage custom field extensibility.
You see all the created custom fields, their Business Context, and their Status. Fields
that aren’t Published cannot be used for extensibility. The Business Context deter-
mines for which interfaces the custom field can be enabled.
Figure 3.55 Custom Fields and Logic: List of All Implemented Custom Fields
As a first step, you need to create a custom field by clicking the + icon, as shown in
Figure 3.56. You need to fill in some mandatory fields. The mandatory Type field con-
trols the rendering on any UI. If you select Code List, you must provide the single key-
value pairs. There are many other types, such as quantity and value fields, check-
boxes, and various numerical and text field types.
SAP1 SAP2 SAP3 Custom
SAP1 SAP2 SAP3 Custom
Customer FieldsExtension
SAP Data SourceExtension
SAP StandardFields
User Interface
Database
137

3 Configuring Inventory Management
Figure 3.56 Creating a New Custom Field
Click the Create and Edit button to create the field. After creating the field, you can
edit attributes or create a Translation of texts in the General Information tab, as
shown in Figure 3.57.
As a second step, you need to add the created custom field to an interface technology.
The other sections are populated based on the business context and offer the UI or
technical interface for which this field can be enabled (see Figure 3.58). Often, the SAP
Fiori app documentation gives hints to the desired business context and requested
interface to be extended. To activate the custom field, the changes must be published
by clicking the Publish button.
Note
Keep in mind that some changes can’t be reverted after publishing because publish-
ing entails changes to database objects. After the database objects are enhanced, the
enhancement can’t be deleted.
138

3.2 Cross Functions
Figure 3.57 Editing a New Custom Field
Figure 3.58 Enabling the Custom Field
139

3 Configuring Inventory Management
Data Source Extensibility
Figure 3.59 displays the Data Source Extensions tab with the option to create a new
extension by clicking +. The Extended Data Source column hints to the interface,
which is extended. The extension isn’t visible unless the Status is Published.
Figure 3.59 Custom Fields and Logic: List of All Implemented Data Source Extensions
Click on the arrow of each item to access the details of an extension, as shown in
Figure 3.60. Here, you can see the Selected Fields on the right-hand side, which
become visible in the interface due to the data source extension. The Field Path indi-
cates the source of the field on the left-hand side, where all Available Fields are listed
in a hierarchy. By selecting fields out of all the Available Fields, they become part of
the extension.
Figure 3.60 Field Selection in Data Source Extensibility
140

3.2 Cross Functions
To publish the extension, click on Publish. The results, as shown in Figure 3.61, show
that within the filter option, four fields originate in the data source extensibility, and
one is an extended custom field (MyCustomField).
Figure 3.61 Results of Data Source (Upper Rectangle) and Custom Field (Lower Rectangle)
Extension
Note
In some SAP Fiori apps, you need to complete the extension process by laying out the
extended field via runtime adaptation (RTA), as we’ll discuss later in this section.
Custom Logic
Figure 3.62 displays the Custom Logic tab with the option to implement your own
business logic at predefined SAP S/4HANA hooks (see Chapter 7, Section 7.5).
141
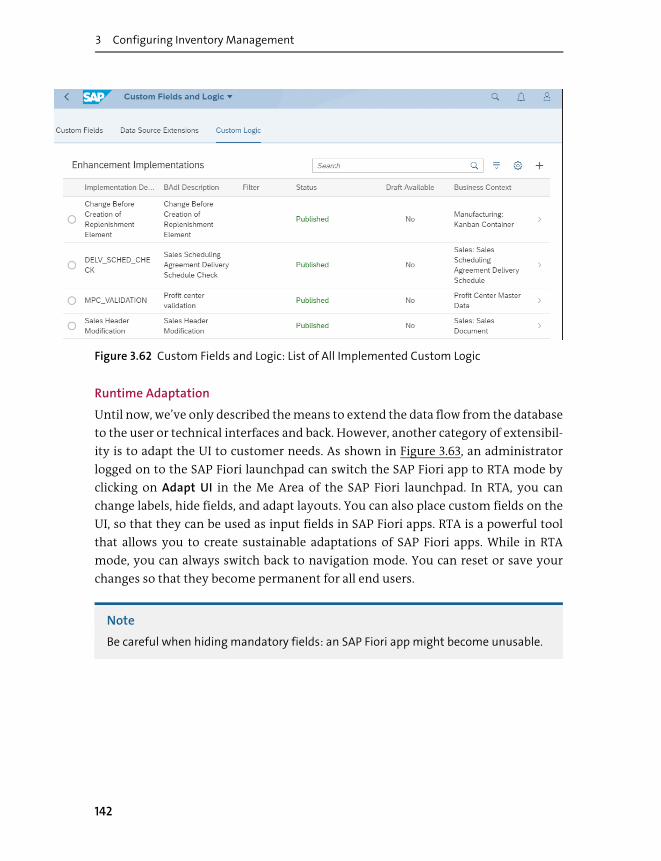
3 Configuring Inventory Management
Figure 3.62 Custom Fields and Logic: List of All Implemented Custom Logic
Runtime Adaptation
Until now, we’ve only described the means to extend the data flow from the database
to the user or technical interfaces and back. However, another category of extensibil-
ity is to adapt the UI to customer needs. As shown in Figure 3.63, an administrator
logged on to the SAP Fiori launchpad can switch the SAP Fiori app to RTA mode by
clicking on Adapt UI in the Me Area of the SAP Fiori launchpad. In RTA, you can
change labels, hide fields, and adapt layouts. You can also place custom fields on the
UI, so that they can be used as input fields in SAP Fiori apps. RTA is a powerful tool
that allows you to create sustainable adaptations of SAP Fiori apps. While in RTA
mode, you can always switch back to navigation mode. You can reset or save your
changes so that they become permanent for all end users.
Note
Be careful when hiding mandatory fields: an SAP Fiori app might become unusable.
142

3.3 Servers
Figure 3.63 Activating UI Adaptation and Switching an SAP Fiori App to Runtime
Adaptation Mode
3.3 Servers
In general, the SAP S/4HANA system architecture is based on two main entities. On
the one hand, all the UI-related technology is part of the frontend server, and on the
other hand, the more business logic- and database logic-dependent data is part of the
backend server. Technically, both servers can be installed on the same platform but
don’t have to be. In SAP S/4HANA Cloud, the frontend apps are usually also installed
on the same tenant as the backend stack (see Chapter 9). Figure 3.64 outlines the high-
level server stack architecture of SAP S/4HANA and its different layers.
Let’s walk through configuration for both the frontend and backend servers.
143
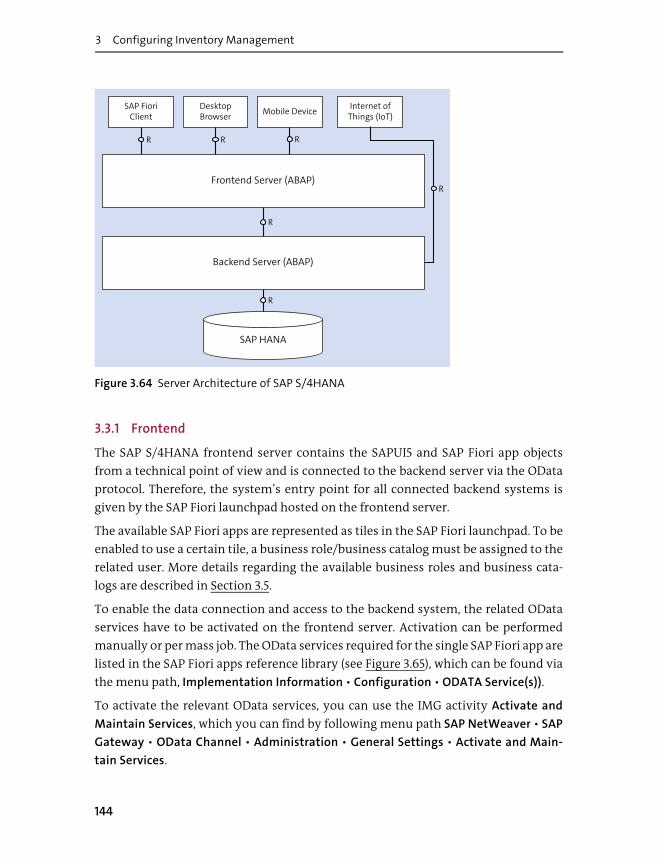
3 Configuring Inventory Management
Figure 3.64 Server Architecture of SAP S/4HANA
3.3.1 Frontend
The SAP S/4HANA frontend server contains the SAPUI5 and SAP Fiori app objects
from a technical point of view and is connected to the backend server via the OData
protocol. Therefore, the system’s entry point for all connected backend systems is
given by the SAP Fiori launchpad hosted on the frontend server.
The available SAP Fiori apps are represented as tiles in the SAP Fiori launchpad. To be
enabled to use a certain tile, a business role/business catalog must be assigned to the
related user. More details regarding the available business roles and business cata-
logs are described in Section 3.5.
To enable the data connection and access to the backend system, the related OData
services have to be activated on the frontend server. Activation can be performed
manually or per mass job. The OData services required for the single SAP Fiori app are
listed in the SAP Fiori apps reference library (see Figure 3.65), which can be found via
the menu path, Implementation Information • Configuration • ODATA Service(s)).
To activate the relevant OData services, you can use the IMG activity Activate and
Maintain Services, which you can find by following menu path SAP NetWeaver • SAP
Gateway • OData Channel • Administration • General Settings • Activate and Main-
tain Services.
Frontend Server (ABAP)
Backend Server (ABAP)
SAP HANA
SAP FioriClient
DesktopBrowser
Mobile Device
R R R
R
R
R
Internet ofThings (IoT)
144

3.3 Servers
Figure 3.65 Example of SAP Fiori Apps Reference Library: OData Services
Once you click the IMG activity, you enter the overview screen containing all of the
already activated OData services. To add and activate a new service, click the Add Ser-
vice button, as shown in Figure 3.66.
Figure 3.66 Add OData Service
In the following screen (see Figure 3.67), enter the related system alias that reflects
the connection to the backend system and press [Enter]. You can also enter the tech-
nical name of the service you want to activate (MMIM*, in our example). Then, press
[Enter], and all services that aren’t currently active and that meet the selection crite-
ria will be displayed in the table beneath the selection fields.
Figure 3.67 List of OData Services to Activate
145

3 Configuring Inventory Management
Now, select the OData service that you want to activate and press the Add Selected
Services to activate it.
Note
One more interesting aspect regarding the frontend server setup is the availability of
SAP Fiori Cloud (i.e., SAP Fiori as a service). Technically, this provides a cloud-based,
hosted frontend server environment where companies can just connect their exist-
ing SAP S/4HANA backend server environment without the need for taking care of
the IT infrastructure of the frontend server.
3.3.2 Backend
The SAP S/4HANA frontend server is connected to a backend server in the SAP
S/4HANA. In addition, for the backend server, the SAP Fiori apps reference library
provides information about the required prerequisites for a certain SAP Fiori app.
Figure 3.68 shows an example form the SAP Fiori apps reference library for important
Implementation Information.
Figure 3.68 Example of Backend Server Information in SAP Fiori Apps Reference Library
The backend server owns the OData service repository objects that represent the
interfaces for external communication. The communication isn’t limited to the con-
nection of the UI presentation layer (frontend server); warehouses of IoT devices also
can be connected to the SAP S/4HANA backend server via interfaces. In this sense, not
only is the OData protocol available but also additional communication protocols, as
described in Section 3.4.
146

3.4 Basic Interfaces
3.4 Basic Interfaces
Inventory management takes records about companies’ material movements and
stock figures. The business processes around the goods of a company are reflected by
any goods movement, which must be recorded in the system. From a business per-
spective, the material flow can be distinguished between inbound and outbound
material flows. For these kinds of movements, SAP S/4HANA provides interfaces so
that manufacturing execution systems (MES) or subsidiary systems also can be con-
nected, and their material flow can be recorded in a central SAP S/4HANA system.
From a technical point of view, several technologies are supported for connecting to
inventory management in S/4HANA:
� BAPIs
� OData
� SOAP
With these services, the inventory management business objects can be accessed
from outside, and external systems can get updated in case of relevant activities.
The following inventory management business objects provide interfaces for exter-
nal communication:
� Material document
� Physical inventory document
� Reservation
� Stock
To gain insight into these interfaces, the SAP API Business Hub (see Chapter 9, Section
9.3.3, or go http://s-prs.co/v489202) is a good starting point for research, as shown in
Figure 3.69.
Figure 3.69 SAP API Business Hub
147

3 Configuring Inventory Management
By just entering the related business object, you get the available interfaces as search
results based on the used protocol (e.g., OData or SOAP). Details about the structure
and definition of a certain interface can be checked by just navigating into the details
of a search result, as shown in Figure 3.70.
Figure 3.70 Interface Details in SAP API Business Hub
3.5 SAP Fiori
The SAP Fiori concept is based on user roles differentiating between apps. This means
that the available apps for an end user are based on his or her business role assign-
ment. The concept is mainly based on different entities:
� Business role
� Business catalog group
� Business catalog
Further Resources
While setting up your catalogs according your needs, you can use the SAP Fiori
launchpad content manager, which significantly simplifies the setup procedures. For
a detailed description of the SAP Fiori launchpad content manager, refer to SAP Note
2772270.
148

3.5 SAP Fiori
In this section, we’ll unpack these entities, explore user roles, and walk through the
SAP Fiori apps reference library.
3.5.1 SAP Fiori Entities
The relationship of the SAP Fiori entities is outlined in Figure 3.71. A business role con-
tains one or more business catalog groups. A business catalog group exists out of one
or more business catalogs.
Figure 3.71 Business Role Concept
The business catalog group builds a cluster of apps that belong together semantically.
In the SAP Fiori launchpad, these apps are combined also from a layout perspective,
as shown in Figure 3.72.
Figure 3.72 Business Catalog Group: Stock Monitoring
In this Stock Monitoring business catalog group example, you can see that it contains
six apps in the semantical area of stock analytical functions for monitoring stock fig-
ures.
Below the level of business catalogs, the technical catalogs provide the required infor-
mation about the app itself (like target mapping).
Business Role
Business Catalog Group Business Catalog Group …
……
Business CatalogRole
Business CatalogRole
Business CatalogRole
…
149

3 Configuring Inventory Management
The business role is focused on the business use case and processes a user might face.
Via the Maintain Business Roles app (F1303, role administrator; see Figure 3.73), you
can create your own business roles and assign business catalogs if the predelivered
business roles don’t meet your business needs.
Figure 3.73 SAP Fiori App: Maintain Business Role
3.5.2 Roles and Users
We’ve seen that the SAP Fiori launchpad concept is role based. In the SAP S/4HANA
standard delivery, role templates are included that serve as entry points for com-
pany-specific role setup.
The following business roles are predelivered with the related business catalogs
assigned in inventory management:
� SAP_BR_INVENTORY_ANALYST
� SAP_BR_INVENTORY_MANAGER
� SAP_BR_WAREHOUSE_CLERK
In the course of the book, we’ll point back to these three classic roles in inventory
management. This serves as a basis when we refer to these roles by introduction of
the different SAP Fiori apps in inventory management in SAP S/4HANA. Let’s first
take a high-level look at them:
150

3.5 SAP Fiori
� Inventory manager
The inventory manager is responsible for ensuring an uninterrupted inventory
flow that creates an optimal stock situation. This means to aim for a high through-
put of materials after goods receipt and picking of orders to keep stock level and
inventory costs low. Additionally, these tasks are performed with a low error rate.
He is responsible for implementation and documentation of quality standards
and fulfillment of legal obligations (i.e., physical inventory). His goals are met by
steady observation of relevant inventory KPIs.
� Warehouse clerk
The warehouse clerk ensures a high throughput of goods receipts and picking
orders from an operational point of view. He also checks deliveries for damages
and completeness. These tasks are performed with a low error rate and are docu-
mented according to the given process framework (i.e., physical inventory count-
ing). For his daily warehouse tasks, he makes use of transactional apps to post and
document inventory processes in the system (i.e., Post Goods Receipt for Purchase
Order app, F0843). In addition, he makes use of open-tasks check apps, such as
Overdue Materials, to focus on the important issues.
� Inventory analyst
The inventory analyst focuses on strategic inventory management by forecasting
inventory KPIs and analytic accuracy. The aim of the inventory analyst is to mini-
mize overstocks, avoiding scrapping, anticipate turnover for specific product
groups, and ensure delivery capability from a strategic point of view. She requires
effective software that delivers real-time data to ensure that analytics are as accu-
rate as possible. Observation of market trends and examination of new inventory
trends are crucial to developing future inventory management in her company.
Some more special business roles are delivered that are mainly based on the generic
ones mentioned previously.
These roles can be copied via Transaction PFCG to custom roles for specific needs.
After the role setup is finalized, the roles have to be assigned to the users in charge,
for instance, via Transaction PFCG (see Figure 3.74) or for user maintenance in Trans-
action SU01. Here, you can navigate to the User tab and enter the related users
directly on the business role level.
151

3 Configuring Inventory Management
Figure 3.74 Transaction PFCG View of Business Roles
In the course of this book, we’ll touch on several apps that you also might want to test
or make use of. The following lists a collection of related business roles and business
catalogs for your reference:
� Quality technician (SAP_BR_QUALITY_TECHNICIAN)
� Receiving specialist (SAP_BR_RECEIVING_SPECIALIST)
� Inventory accountant (SAP_BR_INVENTORY_ACCOUNTANT)
� Situation handling (SAP_BR_BUSINESS_PROCESS_SPEC)
� Predictive analytics (SAP_BR_ANALYTICS_SPECIALIST)
� Design engineer (SAP_BR_DESIGN_ENGINEER)
� Production engineer (SAP_BR_PRODN_ENG_DISC)
� Production planner (SAP_BR_PRODN_PLNR)
� Production supervisor (SAP_BR_PRODN_SUPERVISOR_DISC)
152

3.5 SAP Fiori
� Production operator (SAP_BR_PRODN_OPTR_DISC)
� Production process specialist/compliance engineer (SAP_BR_PRODN_SUPRVSR_
DISC_EPO/SAP_BR_PRODN_SUPRVSR_DISC_CAM)
Note
Because myriad business catalogs are assigned to the predelivered SAP business
roles, we’ve just mentioned the relevant business roles for simplicity reasons in this
book. If you just want to assign certain aspects of an SAP business role to your own
user and business role, you can check out the assigned business catalogs of the SAP
business roles and assign the business catalog accordingly.
3.5.3 SAP Fiori Apps Reference Library
The SAP Fiori apps reference library is a web-based tool that provides an overview
about the available app in the different product versions. The library can be used in
different stages of a project. To get an overview, prepare decisions regarding which
apps will be used, and during implementation, a lot of needful information is given,
for example, the required OData services that must be activated to be used in a cer-
tain SAP Fiori app.
You can select the app of interest by using the navigation bar (or just filtering), as
shown in Figure 3.75.
Figure 3.75 Selection of SAP Fiori Apps in SAP Fiori Apps Reference Library
153

3 Configuring Inventory Management
Select an app, and the related app information is displayed. In this example, Material
Documents Overview (F1077) is selected, which opens the screen shown in Figure
3.76.
Figure 3.76 Header of SAP Fiori App in SAP Fiori Apps Reference Library
By selecting the delivery version in the dropdown box (SAP S/4HANA, in this exam-
ple), the different deployment versions can be selected:
� SAP S/4HANA
� SAP S/4HANA Cloud
According to the selection of the delivery version, the SAP Fiori apps reference library
displays deployment-specific information.
The description of the PRODUCT FEATURES includes a screenshot and also a link to
the related app documentation. You can also access the IMPLEMENTATION INFORMA-
TION, which, as mentioned previously, contains important SAP notes to be imple-
mented, for example. In the SAP S/4HANA Cloud delivery version, the related Scope
Items are also listed here (see Chapter 9, Section 9.1.1).
Another piece of interesting information is outlined at the end of the product fea-
tures: a list of other apps in the same area that might give insight into related apps.
154

3.6 Summary
3.6 Summary
SAP S/4HANA provides a lot of configuration and setup capabilities to steer the
inventory management processes based on your requirements. The IMG allows you
to configure the organizational units and processes around inventory management.
Cross functions are services consumed by different apps, mainly supporting stream-
lining processes. Extensibility enables you to add additional custom fields to busi-
ness apps and business processes.
With several technical deployment options of the UI layer (frontend), more flexibility
is given with SAP S/4HANA. In addition, staring with the SAP Fiori launchpad is made
easy by the provision of predefined business roles and business catalogs that may be
the right entry point for you. On top of the configuration and enhanced user business
role handling, SAP S/4HANA provides many communication interfaces for connect-
ing your SAP S/4HANA core system to your related business environment.
After laying this foundation of information, we can now start to take a deeper look
into the inventory management business areas and how they are reflected in SAP
S/4HANA. We’ll start with planning and adjusting inventory in the next chapter.
155


Chapter 4
Planning and Adjusting Inventory
In this chapter, you’ll start to plan your inventory. We’ll discuss plan-
ning strategies, cover the master data of production planning, and
then dive deep into the SAP S/4HANA planning tool.
Before inventory processes can be executed, an organization needs to plan what
inventory to carry and where. When it comes to production planning, there are three
major steps, and each step is associated with the recommended SAP Fiori apps, which
will be discussed in detail in this chapter:
1. Managing production master data
Step 1 deals with activities related to production master data. Some production
master data originates in production engineering and therefore isn’t covered in
detail here. The relevant apps and transactions are as follows:
– Manage Work Center Capacity (F3289)
– Display BOM (Transaction CS03)
– Display Routing (Transaction CA03)
– Display Master Recipe (Transaction C203)
2. Make-to-order (MTO) and make-to-stock (MTS)
Step 2 is about creating planned independent requirements (PIRs), whereas
requirements based on sales orders are created in sales and distribution. The rele-
vant app is as follows:
– Manage Planned Independent Requirements (F3445)
3. Material requirements planning (MRP)
Step 3 lists all the direct planning activities, such monitoring material coverage/
shortages, monitoring internal and external requirements, scheduling and evalu-
ating MRP runs, converting planned orders/purchase requisitions, and handling
exceptions. The relevant apps are as follows:
157

4 Planning and Adjusting Inventory
– Monitor Requirements and Material Coverage (F0247)
– Manage/Convert Planned Orders (F4171)
– Schedule MRP Runs/Display MRP Key Figures/Display MRP Master Data Issues
(F1339, F1426, F1425A)
– Monitor External/Internal Requirements (F0246, F0263)
– Detect Unnecessary Supply Elements (F3853, see also SAP Note 2733550)
As explained in Chapter 2, Section 2.2, SAP S/4HANA includes role templates to help
customers quickly enable the end user in effectively using the SAP Fiori apps. This
chapter deals with the production planner (SAP_BR_PRODN_PLNR). Production
planners track materials and inventory, ensuring that materials are available when
they are needed and that a sufficient value of inventory is maintained. They also are
in charge of the production schedule, purchase requisitions, and production orders.
If the inventory falls below a necessary value and can’t meet material demand, typi-
cally an MRP run will create planned orders as needed. However, in special cases that
can’t be solved automatically, the production planner must step in.
Note
As explained in Chapter 2, the production planner can be supported by the inventory
analyst to analyze and monitor strategic challenges in inventory management. This is
the connection between the analysis phase and the plan and adjust phase in Chapter
2. Although the SAP Fiori apps described so far offer analytical capabilities, the strate-
gic analysis is carried out by different tools, which are all described in Chapter 8.
This chapter introduces different planning strategies and provides step-by-step
instructions for how to use SAP Fiori apps in SAP S/4HANA for capacity planning,
MTO and MTS, MRP, demand-driven material requirements planning (DDMRP), and
Kanban to match demand with supply and adjust each. We’ll close with a look at new
and upcoming functionalities.
4.1 Planning Strategies
Usually, organizations do their planning with a time horizon in mind. Long-term
planning takes into account business development strategy, marketing, and long-
term product strategies. Midterm planning is about executing these strategies based
on the long-term planning forecast.
158

4.1 Planning Strategies
SAP Integrated Business Planning (SAP IBP) is used for long-term and midterm
planning if your supply chain planning strategy is implemented outside the SAP
S/4HANA instance.
Further Resources
More information about SAP IBP can be found in SAP Integrated Business Planning:
Functionality and Implementation by Sandy Markin and Amit Sinha (www.sap-
press.com/4615, SAP PRESS, 2018).
Short-term planning is started by MRP in SAP S/4HANA. If required, capacity require-
ment planning (CRP) and production planning/detailed scheduling (PP-DS) is used to
further break down the MRP output into more detailed operations in SAP S/4HANA.
Eventually a manufacturing execution system (MES) is used to execute, monitor, and
confirm the production. This book focuses on the MRP part of the planning, as it has
the strongest impact on inventory management.
Figure 4.1 summarizes the interplay between the different planning horizons:
� Long-term planning
Falling under sales and operation planning (S&OP), long-term planning can be
done using SAP IBP or legacy software. The output of long-term planning feeds the
midterm planning.
� Midterm planning
Also falling under S&OP, midterm planning can be fulfilled by S&OP, SAP IBP, pre-
dictive MRP, or legacy software.
� Short-term planning
Short-term planning is executed by MRP, CRP, PP-DS, and production execution.
Note
You can feed PIRs as results of a legacy-based planning process into SAP S/4HANA
with the appropriate interface (see Chapter 3).
We’ll walk through the key planning strategies in the following sections.
159

4 Planning and Adjusting Inventory
Figure 4.1 Planning Horizons
4.1.1 Production Planning
When it comes to inventory management, there are several production planning
strategies to choose from. The main strategies are as follows:
� Make-to-stock (MTS)
The output of the production process is stocked because it’s not linked to a con-
crete customer requirement. Therefore, planning is often done based on forecasts.
� Assemble-to-order (ATO)
The output of the production process with a low vertical integration is linked to a
customer requirement based on a limited subset of product variants.
� Make-to-order (MTO)
The output of the production process with a high vertical integration is linked to a
customer requirement based on various product variants.
� Engineer-to-order (ETO)
The output of the production process with a high vertical integration is engi-
neered according to an individual single customer requirement.
Figure 4.2 shows the key factors influencing your production planning strategy and
hence also your inventory situation. The listed planning strategies are closely linked
to the following factors:
Long-TermPlanning
MidtermPlanning
Short-TermPlanning
160

4.1 Planning Strategies
� Production variants
How many different variants of one product do you plan to offer to your custom-
ers?
� Production volume
How many finished products do you plan to sell in the market?
� Value per product
How much value do you generate with each product?
� Production trigger
What business model are you using to sell your product to the market?
Figure 4.2 Planning Strategies
In addition to your go-to-market strategy, another factor that influences your pro-
duction planning strategy is the service-level agreement (SLA) you offer to your cus-
tomers or, in other words, the market lead time of your finished goods.
Figure 4.3 explains how the total production lead time is calculated by the maximum
replenishment lead time within all components, plus the production time of the fin-
ished good. If total production lead time is greater than the SLA (i.e., market lead
time), you’ll opt for an MTS planning strategy or risk your SLA. If the total production
lead time is shorter than your SLA, you have the choice to plan with MTS or MTO/ATO
strategies.
Key Factor Make-to-Stock Assemble-to-Order
Make-to-Order Engineer-to-Order
ProductVariants
ProductionVolume
Value perProduct
ProductionTrigger
Forecast orService-LevelAgreement
Sales Order Sales Order Sales Order
161

4 Planning and Adjusting Inventory
Figure 4.3 also outlines that the planning strategies within the supply chain of one
finished good might vary. As shown, one option to shorten the total production lead
time and increase the SLA is to stock semifinished goods within the supply chain (SA3
in Figure 4.3), which are on the critical path. Hence, you decouple the production of
finished goods from the availability of M3.
Figure 4.3 SLA and Lead Time Influencing the Planning Strategy
The production planning strategies outlined so far exist in theory. In real life, how-
ever, you’ll often plan with a combination of different planning strategies:
� For example, if you like to boost your market share with a special promotional
variant of your original product, you’ll plan this with an MTS strategy.
� If you have a complex supply chain network, you may plan the finished product
with MTO, but some components used in several product variants are planned
with MTS.
� Consumer behavior may influence planning strategies. For example, some cus-
tomers want to configure their desired car individually with the help of configura-
tions tools, resulting in an MTO planning strategy. Others simply buy the car
model displayed in the car shop “off the shelf,” which is planned according to an
MTS strategy.
t
FG
SA1
SA2
M1
M2
SA3
M3
Total lead time
Market lead time
Legend:
FG: Finished good
SA1, 2, 3: Subassembly
M1, 2, 3: Material
Inventory required
MTO, if product hascustomer-specific
configuration
Production ondemand, if supportedby market lead time
Reorder pointplanning, MTS, and
stable demand apply
Dependent requirement
MTS with planningagainst forecast
162

4.1 Planning Strategies
In fact, SAP S/4HANA supports these hybrid scenarios as you can plan each material
with a different planning strategy. As we’ll see in Section 4.8, SAP S/4HANA explicitly
supports the idea of demand-driven replenishment as a special kind of hybrid plan-
ning strategy with an intelligent automation-based decoupling strategy.
4.1.2 Discrete versus Process Manufacturing
SAP S/4HANA distinguishes between discrete and process industries in production
planning. Discrete manufacturing is the production of distinct items (automobiles,
smartphones), whereas process manufacturing yields rather undifferentiated prod-
ucts (chemicals, food, oil). Some of the differences are mainly in terminology (see Sec-
tion 4.2.2 and Section 4.2.3). Naturally some differences reside in the configuration
(see Chapter 3), and some differences are in the created documents; for example, each
planned order can be converted into a production order or a process order.
4.1.3 Demand-Driven versus Plan-Driven Planning
Demand-driven planning implies there is a concrete product demand out of the sales
process that triggers the manufacturing process. In SAP S/4HANA, this is, for exam-
ple, a sales order item on the finished good level (i.e., primary demand). Planning of a
sales order item may result in dependent requirements (i.e., secondary demand),
which are needed to assemble the finished product (see Figure 4.4).
Figure 4.4 Sales Order Item of Finished Good Creates Dependent Requirements
Desktop PC with Monitor Desktop PC Components
1X Monitor + Cable
1X Desktop Case1X Mainboard1X Power Supply + Cable1X CPU (Microprocessor X)4X 5 GB DRAM2X Hard Disc Drive 1 TB1X Optical Disc1X Keyboard + Cable1X Mouse + Cable1X High-End Graphics Card
Dependent RequirementsSales Order Item
163

4 Planning and Adjusting Inventory
Sales orders can be created in SAP S/4HANA automatically by the sales process, or the
demand can be entered manually (see Section 4.6).
Plan-driven planning, on the other hand, implies that the manufacturing process is
triggered based on a previously created plan. This plan is created based on calculated
forecasts, and its creation normally follows three general steps, as shown in Figure 4.5:
1. Forecast is collected for a defined time frame on an abstract level based on a previ-
ously agreed algorithm.
2. Forecast is distributed based on an applicable formula between products and pro-
duction intervals.
3. Planned primary demands are converted into PIRs per production interval.
Figure 4.5 Converting a Forecast into PIRs (Schema on Left; Example on Right)
If desired, the SAP S/4HANA system can be configured so that the forecast in a given
time period is matched against incoming sales orders. Thus, the forecast consump-
tion can be monitored. If there is a surplus at the end of the time period, the forecast
was too high (example in Figure 4.6); if there is a negative difference, the forecast was
too low.
SAP S/4HANA offers several functionalities, such as S&OP, to generate input for plan-
driven manufacturing and to monitor and adjust the execution of such plans.
AnnualForecast
Create PIRs• Convert forecast into PIRs
• Distribute total annual forecast per product and production interval
• Calculate total annual forecast per product group
Product andSeasonal
Breakdown
164

4.2 Production Master Data Overview
Figure 4.6 Forecast Consumption by Matching Sales Orders against the Forecast
4.2 Production Master Data Overview
Before we start with production planning, let’s begin with the master data. In this sec-
tion, we’ll define the master data elements and provide an overview of their relation-
ship.
4.2.1 Bill of Material
A bill of material (BOM) is a component hierarchy comprising all components needed
to assemble the finished product (see Figure 4.7). BOMs can have a different usage
and can have more than one alternative describing product variants. Each node of
the hierarchy—also called the subassembly—has its own BOM number and can be
referenced by different BOMs. In some cases, these references become recursive
(most likely in process industries).
The example in Figure 4.7 sketches the BOM of the desktop PC ordered in Figure 4.4.
The subassembly (mainboard) could also be part of another BOM belonging to differ-
ent finished products. Each BOM has a validity, and its lifecycle is normally maintained
600
Forecast
Sales Order 1
Sales Order 2
Sales Order 3
Sales Order 4
Sales Order 5
Non-Consumed Forecast
500500
-20
-40
-60
-70 225
-50400
300
200
100
0
165
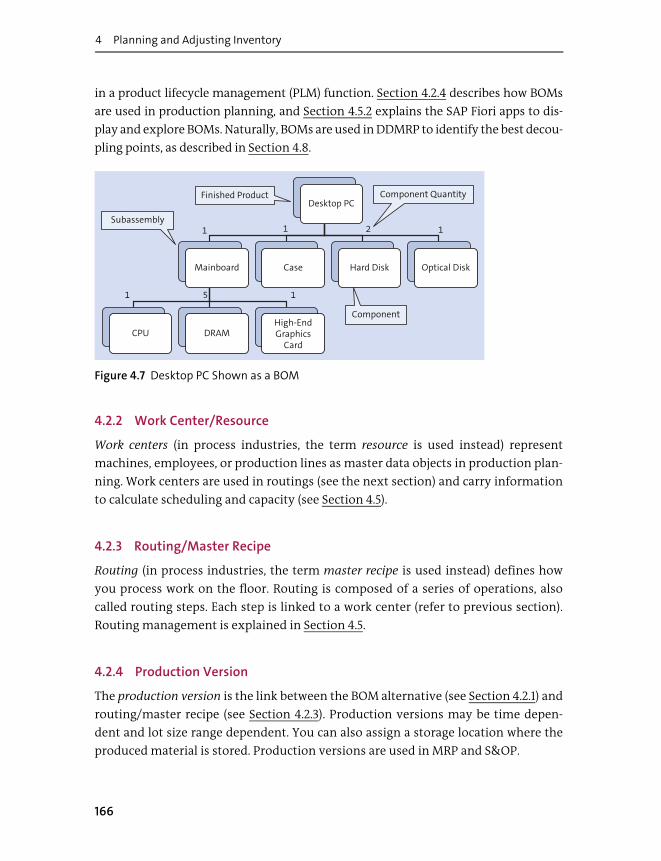
4 Planning and Adjusting Inventory
in a product lifecycle management (PLM) function. Section 4.2.4 describes how BOMs
are used in production planning, and Section 4.5.2 explains the SAP Fiori apps to dis-
play and explore BOMs. Naturally, BOMs are used in DDMRP to identify the best decou-
pling points, as described in Section 4.8.
Figure 4.7 Desktop PC Shown as a BOM
4.2.2 Work Center/Resource
Work centers (in process industries, the term resource is used instead) represent
machines, employees, or production lines as master data objects in production plan-
ning. Work centers are used in routings (see the next section) and carry information
to calculate scheduling and capacity (see Section 4.5).
4.2.3 Routing/Master Recipe
Routing (in process industries, the term master recipe is used instead) defines how
you process work on the floor. Routing is composed of a series of operations, also
called routing steps. Each step is linked to a work center (refer to previous section).
Routing management is explained in Section 4.5.
4.2.4 Production Version
The production version is the link between the BOM alternative (see Section 4.2.1) and
routing/master recipe (see Section 4.2.3). Production versions may be time depen-
dent and lot size range dependent. You can also assign a storage location where the
produced material is stored. Production versions are used in MRP and S&OP.
Desktop PC
Mainboard
CPU DRAMHigh-EndGraphics
Card
Case Hard Disk Optical Disk
1 1 1
1 1
2
5
Finished Product Component Quantity
Subassembly
Component
166

4.3 MRP Overview
4.2.5 Production Supply Area
The Production Supply Area (Fast Entry) app (Transaction PK05S) and the Manage
Production Supply Area app in SAP Fiori allow the creation and edition of production
supply areas required for planning with Kanban (see Section 4.4). The production sup-
ply area is linked to a storage location.
4.3 MRP Overview
MRP describes a process that explores independent requirements and creates depen-
dent requirements based on different algorithms using the production master data
explained in Section 4.2.
Input to MRP can be PIRs or sales orders of goods, which you plan to sell to your cus-
tomers. To plan your finished good, you need to maintain a set of information in the
system:
� Material master entry of the finished good, including planning strategy
� BOM of the finished good describing all its components and subassemblies (see
Section 4.2.1) or an external source of supply
� Routing describing the tasks to assemble the finished good (see Section 4.2.3)
� Material master entry of all components and subassemblies describing their sub-
assemblies, components, and routing
Overall, you need a nested description of where to get all the components of your fin-
ished goods and how to assemble them. Nesting terminates in the moment a compo-
nent is procured externally.
MRP calculates which components are needed when in which sequence for each fin-
ished good based on the preceding description and which resources are required to
assemble them when to fulfill the PIR/sales order. As intermediate output, planned
orders or purchase requisitions are created, which are converted into production
orders and purchase orders, respectively, or they can create dependent requirements
that are fed into the MRP process again. Eventually, the result of this multistep plan-
ning process is a set of purchase orders for external procurement and a set of produc-
tion orders for in-house production.
167

4 Planning and Adjusting Inventory
4.3.1 Generic MRP Capabilities in SAP S/4HANA
All SAP Fiori apps in production planning offer generic capabilities, although a few
are only available for specific SAP Fiori apps. You’ll see the following capabilities pop
up throughout the chapter:
� Area of responsibility
With the area of responsibility, all SAP Fiori apps offer a common tool to end users
so they can personalize their working environment. Each end user must define the
pairs of plant and MRP controllers he or she wants to use in data selection.
� Quick views
With quick views, users can start a quick inspection of objects such as MRP ele-
ments or master data by clicking on the visible link. Quick views also include addi-
tional navigation targets connected to the inspected object.
� Variant management
All simple lists offer variant management to end users so they can create person-
alized selection/layout variants for specific tasks. Variants can be private or public
(shared).
� Notes
Many objects support end users in taking notes and displaying note history to doc-
ument business decisions.
� Change management
An end user can activate change management so that changes to purchase orders
must be requested and approved by the vendor.
� Open related SAP Fiori apps
Based on the end-user authorizations, additional context-sensitive navigation tar-
gets (SAP Fiori apps) are offered for problem-solving.
4.3.2 Planning Process
Figure 4.8 outlines the entire planning process via MRP. In the upper-right corner, the
input to MRP is shown (PIRs, sales orders, dependent requirements). In the lower
part, the output of MRP (production orders, purchase orders) is shown.
During a planning run, MRP matches the required stock against the existing stock to
calculate the net requirements (upper part of Figure 4.9).
168

4.3 MRP Overview
Figure 4.8 Short-Term Planning Schema with Plan-Driven and Demand-Driven Strategies
Figure 4.9 MRP Strategies
PIRPlanningStrategy
InventorySituation
BOMExplosion
DependentRequirements
PlannedOrder
ProductionOrder
PurchaseRequisition
PurchaseOrder
DemandPlanning
MRP
In-HouseProduction
ExternalProcurement
Sales OrderSales and
Distribution
Plan-Driven
Demand-DrivenProcess Flow: MRP
Input: Demand
Output: Net Requirements
Supplier
MRPProcedure
None Deterministic
MasterProductionScheduling
MRP
Stochastic(Consumption-
Based)
Reorder Point Forcast-Based Time-Phased
Demand-Driven
Demand
Supply
Planned Independent RequirementsDependent Requirements
StockFixed Receipts
Net Requirements Calculation
• External Procurement (Purchase Requisition)• In-House Production (Production Order)
MRP Strategies: Overview
MRP Strategies: Algorithms
169

4 Planning and Adjusting Inventory
If the required component is procured externally, the output of MRP is eventually a
purchase requisition, which will be later converted into a purchase order. If the
required component is produced internally, the output of MRP is a planned order,
which will be eventually converted into a production order. The actual planning is
done with different algorithms (lower part of Figure 4.9), which can be subdivided
into three groups:
� Deterministic
� Stochastic
� Demand driven (see Section 4.8)
A deterministic algorithm is based on the assumption that the quantity of the
required material can be calculated according to the rules defined in the production
master data (see Section 4.2.1 – Section 4.2.5). The difference in the deterministic algo-
rithm lies in the way the dependent requirements are calculated and considered
during the planning run.
A stochastic algorithm is based on the assumption that the quantity of the required
material can be derived from consumption of the required material in the past.
Unlike a deterministic algorithm, a stochastic algorithm is consumption based by
reordering according to a set of rules, by taking forecast into account, or by using a
time-phased approach.
In SAP S/4HANA, the MRP strategy is determined by the MRP type assigned to the
material master record in the MRP view, as shown in Figure 4.10.
The MRP types starting with P or M represent the deterministic planning strategies.
Depending on the MRP type, additional fields, such as Planning Time Fence, must be
maintained in Figure 4.10. MRP types starting with M define master production
scheduling, whose algorithm creates dependent requirements only to the first BOM
level, allowing planners to adjust the intermediate result before all dependent
requirements are planned.
MRP types starting with V or R represent the stochastic planning strategies. Reorder
point (starting with V) is a simple algorithm, which creates planned orders if inven-
tory stock falls below a certain threshold, which is maintained as a Reorder Point in
Figure 4.10.
Depending on the MRP type, the reorder point is maintained manually or calculated
automatically. A time-phased planning strategy starting with R requires the Planning
Cycle field in the material master and ensures that the material is planned only in a
designated time frame.
170

4.3 MRP Overview
Figure 4.10 Material Master MRP View
MRP types starting with D represent demand-driven replenishment strategies, which
are explained in detail in Section 4.3.4.
4.3.3 MRP Live
MRP Live is a reimplementation of the classic MRP optimized for SAP S/4HANA with
performance improvements and allows live planning of dedicated materials. MRP
Live has stricter requirements for master data during planning. Hence, if planning
with MRP Live fails, the system automatically tries to plan with classic MRP. If plan-
ning fails, an error code is generated. Section 4.7.6 gives some hints on how to deal
with master data issues during MRP Live runs.
Further Resources
SAP Note 1914010 explains for each release the restriction for planning in MRP Live on
SAP HANA.
171

4 Planning and Adjusting Inventory
4.3.4 DDMRP
The Demand Driven Institute (http://s-prs.co/v489203) defines DDMRP as the follow-
ing:
“... a formal multi-echelon planning and execution method to protect and promote
the flow of relevant information.”
Essentially, DDMRP decouples the flow of semifinished goods at strategic steps of the
supply chain by establishing dynamic material buffers. These buffers smooth any
fluctuations in the material demand and reduce, for example, the bullwhip effect
known in supply chain planning. DDMRP can be used in a broad range of business
scenarios, such as MTO, MTS, component manufacturing, or subcontracting. One
advantage of DDMRP is the ability to ensure high SLAs while keeping the inventory
low. The key feature of DDMRP is the dynamic buffer management based on historic
figures, such as lead time or demand.
Figure 4.11 shows the execution cycle of DDMRP and how SAP S/4HANA supports the
different steps.
Figure 4.11 Implementation of the DDMRP Methodology in SAP S/4HANA
Another advantage of DDMRP is that it can gradually be implemented as a replenish-
ment strategy without disturbing existing replenishment strategies. Only the mate-
rials identified to be buffered need to be switched to the DDMRP replenishment
ReplenishmentPlanning
Buffer Sizing(Operational)
Buffer Positioning(Strategic)
ReplenishmentExecution
Individualized
Demand-Drivenwith Buffer
Ad Hoc Prod.
MaterialStock/
Stock Level
Stock+
Ordered
Proposed
Order Qty
FIO-NAV-0815 3 13 30
FIO-PST-1501 6 16 15
FIO-MST-3006 55 135 0
FIO-PRD-0807 22 56 0
FIO-NAV-0101 23 23 127
FIO-NAV-0404 44 44 26
FIO-MST-0821 25 25 0
FIO-PRD-0822 88 88 0
Lead Time
Average Daily Usage
Classification
Analytics(Including Basis for Feedback)
Lead Time
Average Daily Usage
…
172

4.4 Kanban Overview
strategy. Section 4.8 describes in detail the SAP Fiori apps supporting the implemen-
tation of the DDMRP replenishment strategy in SAP S/4HANA.
4.4 Kanban Overview
Kanban was developed by Toyota and represents a material flow control system
based on the pull principle (see Figure 4.12). All materials are transported in containers
(bins) to the work center. If a container is emptied, its refill is triggered (pull).
Figure 4.12 Kanban Control Cycle
In simple terms, Kanban is planning with a fixed lot size and a fixed reorder point.
SAP S/4HANA defines two main categories of the Kanban control cycle. The first is the
event-driven Kanban control cycle, which means that Kanban containers are created
on demand (e.g., triggered by an event). The second is the classical Kanban control
cycle with a predefined set of Kanban containers. There are three principal processes
of Kanban container replenishment in SAP S/4HANA:
� External procurement
External procurement can be fulfilled by a purchase order, scheduling agreement,
stock transport order, or summarized just in time (JIT) call (see Section 4.9.2).
� Transfer postings
Transfer postings are created by stock transfer reservation or direct material trans-
fer postings, SAP Extended Warehouse Management (SAP EWM) deliveries, ware-
house management transfer requirements, or warehouse tasks.
KanbanDemand
KanbanSupply
Filled Kanban container moves to the work center demanding the Kanban.
Empty Kanban container moves to thework center supplying the Kanban.
173

4 Planning and Adjusting Inventory
� Internal production
Internal production is fulfilled by planned orders eventually to be converted into
production orders.
A Kanban control cycle is always linked to a material, plant, and production supply
area (discussed in Section 4.2.5). From the inventory perspective, one Kanban control
cycle is also tied to a storage location (or destination bin if using SAP EWM) by its pro-
duction supply area in which its stock quantities are listed. From the production per-
spective, one Kanban control cycle is linked to a work center, where its content is
consumed (see Section 4.2.2). For a summarized JIT call as the replenishment process,
a summarized JIT call profile is assigned to the control cycle.
Section 4.9 explains in detail how SAP S/4HANA supports production planning with
Kanban.
4.5 Capacity Planning and Production Master Data
Before starting any planning activities, we need to take care of the production master
data evaluated during planning. To begin, we’ll briefly discuss how the work center
capacity is managed and production master data is maintained, before moving on to
key SAP Fiori apps for BOMs and routing.
Note
For material master planning data, the material object page displays the details of
one material master record. The sections related to external procurement are espe-
cially of interest for production planning.
You can quickly find the object page of a desired material by using enterprise search
in SAP Fiori launchpad (see Chapter 1, Section 1.4.3).
4.5.1 Manage Work Center Capacity
The Manage Work Center Capacity app (F3289), shown in Figure 4.13, allows you to
plan and adjust the capacity of work centers if the work center capacity is set to finite
scheduling. You can detect overload situations and balance several factors to achieve
optimal usage of the work center.
This is a draft-enabled simple list SAP Fiori app (see Chapter 1, Section 1.4.2), hence the
filter criteria allow you to select for a certain Editing Status. You can select a simple
174

4.5 Capacity Planning and Production Master Data
list of work centers based on the work center itself, master data attributes, transac-
tion data attributes, and administrative data. The Evaluation Horizon limits the time
frame to look at in the future by offering several time buckets, and the Load Type
allows you to filter for certain load conditions. The initial list displays the main attri-
butes per work center and summarizes the Utilization as a micro chart.
Figure 4.13 Capacity Center List
Click the arrow at the end of the line item to access the Work Center Capacity details
page, as shown in Figure 4.14. The details page shows the Utilization as a chart/table.
Selecting a chart column updates the Operation section below, displaying all opera-
tions within the selected time frame. If needed, you can focus exclusively on all over-
due operations by selecting Overdue in the Operations section in Figure 4.15.
Figure 4.14 Capacity Planning Details Page of a Work Center with Chart Overview
The Shifts section (see Figure 4.15) shows all shifts starting with the first day of the dis-
played time frame. If you switch to edit mode by clicking Edit, you can edit the shifts
175

4 Planning and Adjusting Inventory
of the work center. You can add (click the + button), Delete, or edit existing shift inter-
vals. When editing, you can change the Shift Utilization (i.e., net working time) or the
Number of Capacities (i.e., number of parallel tasks per work center).
Figure 4.15 Capacity Planning Details Page of a Work Center with Operations and Shifts in
Edit Mode
4.5.2 Display BOM, Display Multilevel BOM Explosion, and Find BOM
for Components
The following SAP Fiori apps are used for detailed analysis and display of BOM infor-
mation during production planning. There are more advanced SAP Fiori apps for
managing BOMs available to product engineers (not covered in this book).
The Display BOM app (Transaction C503) helps you display simple BOMs. On the
entry screen shown in Figure 4.16, you must enter the Material, Plant, BOM Usage,
and Alternative BOM (see Section 4.2.1). The BOM structure is always time dependent.
After clicking Item, the results screen shown in Figure 4.17 displays all components of
the BOM plus the BOM header information in detail. If you double-click a BOM Com-
ponent showing an assembly (i.e., the Asm column box is checked), you navigate to
the assembly.
176

4.5 Capacity Planning and Production Master Data
Figure 4.16 Entry Screen to Display a BOM
Figure 4.17 Material BOM Components List
The next SAP Fiori app, Display Multilevel BOM Explosion (Transaction CS12), helps
you explore all levels of a BOM from the top down. On the entry screen shown in
Figure 4.18, you must enter Material, Plant, and BOM Application (normally, “PP01”
for production-general BOM).
177

4 Planning and Adjusting Inventory
Figure 4.18 Entry Screen to Explode a Material BOM
After clicking Execute, the results screen shown in Figure 4.19 displays a hierarchical
list of all BOM levels.
Figure 4.19 Material BOM Explosion to All Levels
178

4.5 Capacity Planning and Production Master Data
The final SAP Fiori app for BOM information, Find BOM for Components (Transaction
CS15), allows you to find all components of any BOM containing a dedicated material.
You can explore a BOM one level up in the BOM hierarchy.
On the entry screen shown in Figure 4.20, you enter the Material, Type of where-used
list, and kind of BOM to look at in the Used in options (Material BOM, in our example).
You can access the view screen by clicking Next Screen in the upper-left corner, where
you can control the output (see Figure 4.21).
Figure 4.20 First Entry Screen Defining Search Criteria
Figure 4.21 Second Entry Screen Defining Output Criteria
After clicking Execute, the results screen shown in Figure 4.22 displays a simple list of
all components in which the material is used.
179

4 Planning and Adjusting Inventory
Figure 4.22 Material BOM Where-Used List
4.5.3 Display Routing/Display Master Recipe
The next two SAP Fiori apps we’ll discuss are used for detailed analysis and display of
routing/master recipe information, respectively.
The Display Routing app (Transaction CA03) helps you display routing of a material.
On the entry screen shown in Figure 4.23, you must enter Material and Plant.
Figure 4.23 Entry Screen to Display Routing (Buttons in the Footer Not Shown)
180

4.5 Capacity Planning and Production Master Data
After clicking Continue, the results screen shown in Figure 4.24 displays the opera-
tions per work center of this particular material.
Figure 4.24 Material Routing with Operations, Sequence, and Allocation
You can directly navigate to the Sequences, Operation, Allocation, and Work Center
by selecting an item and choosing the appropriate menu entry.
An additional SAP Fiori app, Display Master Recipe (Transaction C203), helps you dis-
play the master recipe of a material. On the entry screen shown in Figure 4.25, you
must enter the Recipe Group (all recipes belonging to one production process) or a
Material and Plant.
Figure 4.25 Entry Screen to Display the Master Recipe (Footer Buttons Not Shown)
181

4 Planning and Adjusting Inventory
After clicking Recipe Header, the results screen shown in Figure 4.26 displays the
operations per resource of this particular recipe group/material.
Figure 4.26 Master Recipe with Operations and Materials
If you switch to the Materials tab, you can see the finished good and the BOM this rec-
ipe group is using.
4.6 Make-to-Order and Make-to-Stock
In this section, we’ll create some PIRs in case we have a plan-driven scenario (either
MTO or MTS).
The Manage Planned Independent Requirements app (F3445) can be used to create
and edit PIRs per material having a forecast indicator in the material master record.
The initial screen shown in Figure 4.27 allows you to select the materials you want to
edit according to several filter criteria, most notably the following:
� Reach
Define the time horizon you want to look at.
� Accuracy
Match the PIRs to the actual demands in the system.
� Upload
Mass upload PIRs created externally in a column-separated values (CSV) format.
� Create
Create different versions of one material’s PIR to reflect different sources of the
PIR.
182

4.6 Make-to-Order and Make-to-Stock
Figure 4.27 Simple List to Maintain PIRs
You can navigate to a details page for each entry by clicking the arrow to arrive at the
screen shown in Figure 4.28. Here, you can see the PIRs of materials and compare PIRs
to sales quantity.
183

4 Planning and Adjusting Inventory
Figure 4.28 Details Screen after Navigation
If you select Edit in Figure 4.27, you’ll arrive at the screen shown in Figure 4.29 where
you can change the entered PIR quantities.
Figure 4.29 Editing Screen
184

4.6 Make-to-Order and Make-to-Stock
Alternatively, in Figure 4.27, you can select the checkbox for one or many entries and
start mass editing directly on the entry screen (via the Edit button). This will lead you
to the Mass Maintenance screen of Figure 4.30.
Figure 4.30 Mass Maintenance Screen
You have the following three options for your Proposed Quantity after selecting the
period you want to change:
� Copy from Reference Material
Enter a reference material, and the PIRs of this reference material are transferred
during mass maintenance.
� Enter Quantity Directly
Enter a quantity, which is transferred during mass maintenance.
� Forecast Quantity
The quantity calculated by a forecast is transferred.
Note
In addition to the Manage Planned Independent Requirements app, there are two
additional SAP Fiori apps called Create Planned Independent Requirements and
Change Planned Independent Requirements for detailed operations on PIRs that
aren’t covered by the Maintain PIRs app, such as schedule lines.
185

4 Planning and Adjusting Inventory
4.7 MRP Live
We’ll now start to plan according to the planning strategies outlined in Section 4.1.
Initially, we’ll discuss how MRP Live interactively supports planning and propose
solutions for material coverage issues. Then, we’ll cover how to set up regular plan-
ning runs in batch mode and how to evaluate the results. Finally, we’ll discuss how to
monitor requirements and how to be automatically notified of requirement changes.
4.7.1 Monitor Requirements and Material Coverage
The SAP Fiori apps Monitor Material Coverage (F0251) and Monitor Material Coverage
– Net Segments (F0247A) form the cornerstone of all planning-related activities in
SAP S/4HANA. As shown in Figure 4.31, you get a supply/demand overview per mate-
rial. You can inspect the material master, execute immediately an MRP Live planning
run, or use the system proposals/context-sensitive action to solve a critical situation.
You can document all actions by note-taking.
Figure 4.31 Monitor Material Coverage in the Center of All Planning Activities
MonitorMaterialCoverage
MaterialMaster
MRP LivePlanning
Supply/DemandOverview
Notes,Context-SensitiveActions
186

4.7 MRP Live
Note
In contrast to SAP ERP-based planning transactions like Transaction MD06, the SAP
Fiori app Monitor Material Coverage isn’t based on the results of the last MRP run
but displays real-time data.
There is then a further divide between two SAP Fiori apps (shown in Figure 4.32):
Monitor Material Coverage – Net Segments 1 and Monitor Material Coverage – Net/
Individual Segments 2. Material Coverage – Net Segments doesn’t show the demand
element (e.g., a sales order), and Material Coverage – Net/Individual Segments dis-
plays the demand element in the Individual Segment column (see Figure 4.32). The
second app is therefore ideally used in an MTO production planning scenario.
Figure 4.32 Comparing both Material Coverage Apps
Let’s take a closer look at the key aspects of these apps.
187

4 Planning and Adjusting Inventory
Area of Responsibility
Both applications offer the end user a personalized view of the core planning-related
activities by defining an Area Of Responsibility (combination of plant and MRP con-
troller).
You can access the app’s personalization in the Me Area of the SAP Fiori launchpad
(see Chapter 1, Section 1.4.3). Here you can set your Area Of Responsibility, as shown in
Figure 4.33, by clicking on Application Settings.
Figure 4.33 Area of Responsibility Setup
Note
If the selected materials displayed in the Material Coverage app don’t meet your
expectations, check your Area of Responsibility settings.
Both the Monitor Material Coverage – Net Segments and Monitor Material Coverage
– Net/Individual Segments apps allow you to filter for all materials with net require-
ment segments having a shortage issue according to the selected shortage definition
by your Area of Responsibility. They are designed according to the simple list pattern.
You can click Go to see the result list (see Figure 4.34).
188

4.7 MRP Live
Figure 4.34 Monitor Material Coverage App: List of Materials with Shortages
Stock Availability Views
The following Shortage Definitions (see Figure 4.32) are available:
� MRP Standard
Compares all receipts with all requirements. Shortage means available stock is
below safety stock level or below zero.
� Stock Days’ Supply
Compares stock with planned requirements. Shortage means available stock is
below zero. If available stock is below safety stock, the period is critical.
189

4 Planning and Adjusting Inventory
� Ordered Requirements
Compares planned receipts with ordered requirements. Shortage means available
stock is below zero. If available stock is below safety stock, the period is critical.
� Ordered Receipts
Compares planned requirements with ordered receipts. Shortage means available
stock is below zero. If available stock is below safety stock, the period is critical.
With the Time till Shortage filter criteria dropdown, you define the time period to
look at. There are some predefined time periods, such as Material Replenishment
Lead Time, Total Replenishment Lead Time, 7 Days, 14 Days, and so on.
The chart settings can be configured by Horizon and Number, as shown in Figure 4.35,
by clicking Configure Chart.
Figure 4.35 Configure Chart of Stock Availability
MRP elements or master data are displayed as links that offer a quick inspection of
each object, including additional navigation targets. Here, the Material No. can be
clicked to access a quick view. Quick views of materials and vendors allow you to
assess stock availability, material master data, and vendor master data with one click
(see Figure 4.36).
After selecting rows, you can click Start MRP Run to schedule an MRP run with the
selected materials (see Section 4.7.4) or click Revoke Acceptance to remove any previ-
ously accepted shortage to find a new solution. Clicking the Manage Materials button
takes you to the worklist of the Material Coverage app containing the selected mate-
rials of Figure 4.34 on the left-hand side, as shown in Figure 4.37.
190

4.7 MRP Live
Figure 4.36 Quick View of Stock Situation and Material Master Data
Figure 4.37 Worklist Material Coverage with Details on the Right
191

4 Planning and Adjusting Inventory
For each selected material of the worklist, you see details in three tabs:
� Stock Requirements List
This tab can be displayed in detail (see Figure 4.37), in aggregated format (not
shown), and as a time series chart (look ahead to Figure 4.40) by clicking on one of
the three toggle buttons on the left side.
The Stock Requirements List details in Figure 4.37 offers you quick views on the dis-
played MRP elements, as shown in Figure 4.38, or quick actions, as shown in Figure
4.39, depending on the context and your authorizations. You can see actions taken
on a purchase requisition in the top screen 1, and actions taken on production
orders or planned orders in the bottom screen 2. Later in this section, we’ll discuss
how to convert planned orders into production orders, which is mandatory to
complete the planning process as described in Section 4.3.
The time series displays the MRP elements in a waterfall chart with an aggregated
overview of the full period on the bottom and the selected window on the top, as
shown in Figure 4.40.
Figure 4.38 Quick View on MRP Element (Planned Order at Right and Production Order
at Left)
192

4.7 MRP Live
Figure 4.39 Available Actions on Single MRP Elements
Figure 4.40 Stock Requirements as Time Series (Overview with Selection Window at the
Bottom)
193

4 Planning and Adjusting Inventory
� Material Information
This tab summarizes all planning-relevant data of the selected material, such as
Stock Availability, MRP Data, and Material Data, as shown in Figure 4.41.
Figure 4.41 Material Information
� Notes
This tab allows you to take notes to document any decisions, as shown in Figure
4.42. Many objects support the end users in taking notes and displaying the note
history to document business decisions.
Figure 4.42 Note-Taking Option
194

4.7 MRP Live
If you need more detailed information on a selected material, clicking the Open but-
ton shown earlier in Figure 4.37 allows you to navigate to the stock requirements list
(see Section 4.7.7) or the material object page (which we mentioned at the beginning
of Section 4.5).
Managing Shortages
Several options are available to solve a shortage situation. Returning to the original
screen in Figure 4.34, you can do the following:
� You can use the Start MRP Run button to resolve the shortage.
� You can use the Accept button to accept the shortage.
� You can follow the proposals of the system, navigating through the views shown
from Figure 4.43 through Figure 4.46.
� You can use the rescheduling options offered by the system.
Figure 4.43 Material Shortage with Solution Proposal (Rectangle)
195

4 Planning and Adjusting Inventory
Let’s walk through the automatic proposal process. Figure 4.43 displays a material
shortage with solution proposal by the system, which you can access by clicking the
arrow.
When you click the solution proposal in the Available column (highlighted in Figure
4.43), you’ll be directed to the Material Shortage screen shown in Figure 4.44. You can
see the MRP Element that causes the shortage and the MRP Element proposed to solve
the shortage, including a Rating in brackets below.
Figure 4.44 Solution Proposal: Tabular View
With the Simulate button, you can mimic the proposed solution within the Shortage
list. Figure 4.45 outlines the simulated solution (graphical view switched on).
If you choose Accept on the tabular view (not shown), the proposed solution can be
created with prepopulated attributes in the Create Purchase Requisition screen, as
shown in Figure 4.46. Here, you can create the document by clicking OK.
196

4.7 MRP Live
Figure 4.45 Solution Proposal after Simulation: Graphical View
Figure 4.46 Realizing the Solution Proposal
197

4 Planning and Adjusting Inventory
Let’s look at another solution pattern, the rescheduling check. Rescheduling means
the system proposes changing the scheduling of an existing MRP element instead of
creating a new one. The rescheduling check proposes actions for the MRP element
based on the following exception messages:
� Reschedule in
Reschedule the MRP element to an earlier delivery date, indicated by the left-
pointing arrow buttons in Figure 4.47. Once clicked, you’ll arrive at the lower
screen shown in Figure 4.47.
Figure 4.47 Changing the Purchase Order Item with Change Management Offered as a
Rescheduling In Option
Further Resources
See SAP Note 25388 for detailed documentation regarding exception messages.
� Reschedule out
Postpone the delivery date of the MRP element, indicated by the arrow buttons in
Figure 4.48. Once clicked, you’ll arrive at the lower screens shown in Figure 4.48.
198

4.7 MRP Live
Figure 4.48 Changing the Planned Order Offered as Rescheduling In (Upper Part) and
Rescheduling Out (Lower Part) Option
� Plan process according to schedule
MRP can’t plan to meet the schedule, and manual intervention is required.
� Cancel process
Cancel the MRP element by clicking the Cancel button (highlighted Figure 4.49).
Figure 4.49 Cancellation Offered as a Rescheduling Option with the Refresh Toolbar Button
Highlighted
199

4 Planning and Adjusting Inventory
� Excess stock
Planned stock is higher than the maximum stock setting (not shown).
� Excess individual segment
Individual receipt segment exceeds actual demand (not shown).
Convert Planned Orders into Production or Process Orders
The Monitor Material Coverage app can also be used to convert planned orders into
production or process orders so that the planning process is completed.
The worklist shows all selected materials (refer to Figure 4.37). The details per material
on the right-hand side allow the conversion of the material’s planned orders by
choosing Edit • Convert.
The subsequently displayed modal window shown in Figure 4.50 allows you to choose
either Convert to Production Order or Convert to Process Order as the conversion tar-
get. Click OK to apply the change.
Figure 4.50 Conversion of Planned Order into Production Order or Process Order
We’ll discuss converting planned orders in more detail using alternative apps in Sec-
tion 4.7.3.
200

4.7 MRP Live
4.7.2 Manage Planned Orders
Planned orders are in most cases created automatically as an output of the MRP pro-
cess (see Section 4.3). The Manage Planned Orders app (F4171) helps you manage the
planned orders by selecting planned orders in the end user’s Area of Responsibility
and offering navigation to the Create New Order, Create Order with Reference,
Change Order, and Display Order (see Figure 4.51). You simply select the planned
orders in the list and click the appropriate button in the toolbar to execute the action.
Figure 4.51 Simple List: Manage Planned Orders
4.7.3 Convert Planned Orders
To complete the MRP process, the created planned order must be converted into a
production order to initiate production execution (refer to Section 4.3). The Convert
Planned Orders app (F4171) selects planned orders in the end user’s Area of Responsi-
bility and displays them in a list, as shown in Figure 4.52. Here, you can navigate in
each item to the relevant conversion application in the Action column. After select-
ing one or more items, you can trigger the following:
� Collective Conversion to Production Orders
You can select several items and convert them to a production order.
� Collective Conversion to Process Orders
You can select several items and convert them to a process order.
� Collective Conversion to Purchase Requisitions
You can select several items and convert them to purchase requisitions.
201

4 Planning and Adjusting Inventory
Figure 4.52 Simple List: Convert Planned Orders
In addition to the SAP Fiori app just described, there are additional SAP Fiori apps that
you can use if you need to perform the following changes not supported by the Mon-
itor Material Coverage app (see Chapter 1, Section 1.4.1):
� The Convert Planned Order to Production Order and Convert Planned Order to
Process Order apps are for detail operations on planned orders not covered by
Monitor Material Coverage, such as changing fields other than Quantity and Deliv-
ery Date.
� The Convert Planned Orders to Production Orders, Convert Planned Orders to Pro-
cess Orders, and Convert Planned Orders to Purchase Requisitions apps support
collective conversions of planned orders.
� The Create Planned Order, Change Planned Order, and Display Planned Order apps
support manual creation, change, and display of planned orders.
4.7.4 Schedule MRP Runs
The Schedule MRP Runs app (F1339) allows you to schedule MRP runs as background
jobs. With this SAP Fiori app, you finally automate the execution of your planning
strategy implemented in the previous sections.
Figure 4.53 shows the entry screen for the Schedule MRP Runs app, where you see a
simple list of all MRP jobs. You can use the filter bar to select for specific attributes
and time frames. The list indicates whether the job is Scheduled or Finished.
202
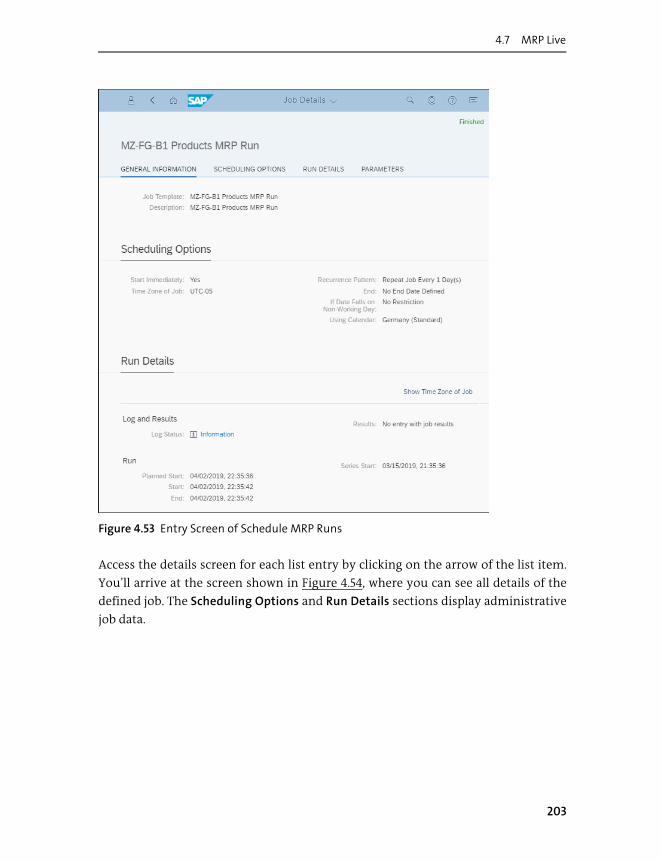
4.7 MRP Live
Figure 4.53 Entry Screen of Schedule MRP Runs
Access the details screen for each list entry by clicking on the arrow of the list item.
You’ll arrive at the screen shown in Figure 4.54, where you can see all details of the
defined job. The Scheduling Options and Run Details sections display administrative
job data.
203

4 Planning and Adjusting Inventory
Figure 4.54 Job Details: Scheduling Options and Run Details
The Parameter Section, shown in Figure 4.55, contains the control attributes of the
MRP job:
� Planning Scope
The Planning Scope section helps you to define the set of materials to be planned.
Notably the Material Scope helps you plan all material (A), only with MRP types of
master product scheduling type (M), or not having an MRP type of master product
scheduling type (S).
� Regenerative Planning
If Regenerative Planning isn’t set, only net changes are planned during an MRP
run.
204

4.7 MRP Live
� Scheduling
Scheduling affects the created/changed planned orders during an MRP run and
allows you to switch between determination of basic dates for planned orders (1)
or lead time scheduling and capacity planning (2).
� Planning Mode
Planning Mode affects unconfirmed procurement proposals of former MRP runs.
You can either delete and recreate procurement proposals or adapt existing ones.
� Changed BOM Components
If the Changed BOM Components indicator is set, the MRP run also plans the
dependent requirements of the planning scope irrespective of the plant.
� All Order BOM Components
If the All Order BOM Components indicator is set, the MRP run also plans the
dependent requirements of all order BOMs regardless of whether they are in the
Planning Scope.
� Stock Transfer Materials
If the Stock Transfer Materials indicator is set, the MRP run also plans the depen-
dent requirements in supplying plants in which a stock transfer is created regard-
less of whether they are in the Planning Scope. You can adapt the existing planning
data (1) or delete the old and recreate new planning data (3).
� Output Material List
The Output Material List indicator creates a list of all planned material within the
job log if set.
Figure 4.55 Job Details: Parameter Section
205
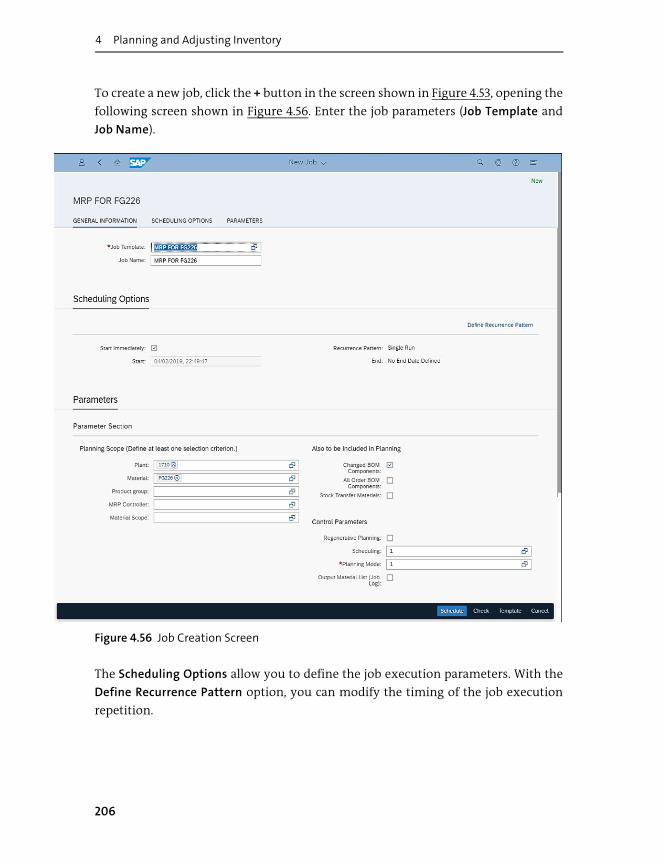
4 Planning and Adjusting Inventory
To create a new job, click the + button in the screen shown in Figure 4.53, opening the
following screen shown in Figure 4.56. Enter the job parameters (Job Template and
Job Name).
Figure 4.56 Job Creation Screen
The Scheduling Options allow you to define the job execution parameters. With the
Define Recurrence Pattern option, you can modify the timing of the job execution
repetition.
206
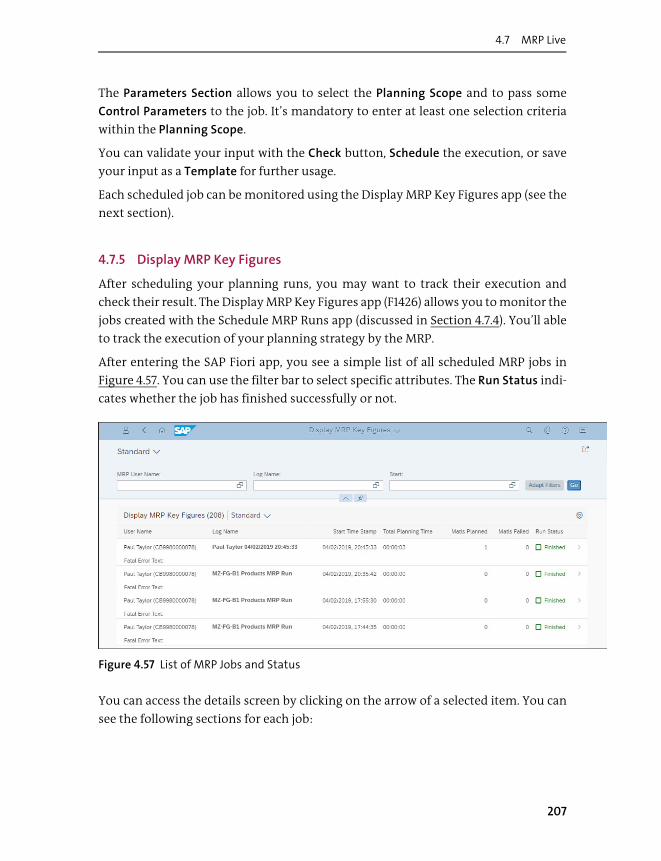
4.7 MRP Live
The Parameters Section allows you to select the Planning Scope and to pass some
Control Parameters to the job. It’s mandatory to enter at least one selection criteria
within the Planning Scope.
You can validate your input with the Check button, Schedule the execution, or save
your input as a Template for further usage.
Each scheduled job can be monitored using the Display MRP Key Figures app (see the
next section).
4.7.5 Display MRP Key Figures
After scheduling your planning runs, you may want to track their execution and
check their result. The Display MRP Key Figures app (F1426) allows you to monitor the
jobs created with the Schedule MRP Runs app (discussed in Section 4.7.4). You’ll able
to track the execution of your planning strategy by the MRP.
After entering the SAP Fiori app, you see a simple list of all scheduled MRP jobs in
Figure 4.57. You can use the filter bar to select specific attributes. The Run Status indi-
cates whether the job has finished successfully or not.
Figure 4.57 List of MRP Jobs and Status
You can access the details screen by clicking on the arrow of a selected item. You can
see the following sections for each job:
207

4 Planning and Adjusting Inventory
� Information
This section, shown in Figure 4.58, gives general runtime information, the settings
used to schedule the job, the number of planned materials, and the job data.
Figure 4.58 Job Details: Technical Details
� Run History
This section, shown in Figure 4.59, displays a line chart of the planned materials
and of those whose planning failed during the runtime.
208

4.7 MRP Live
Figure 4.59 Job Details: Run History and Low-Level Code Steps
� Low-Level Code Steps
This section, shown at the bottom of Figure 4.59, shows a table of all low-level code
steps. Click on a table item to access the details screen (not shown).
� All MRP Live Steps
This section in Figure 4.60 shows a table of all MRP Live steps. Click on the arrow of
a selected item to access a details screen (shown in Figure 4.61), which shows the
planning statistics of the MRP Live step.
209

4 Planning and Adjusting Inventory
Figure 4.60 Job Details: MRP Live Steps
Figure 4.61 Details of MRP Live Step
210
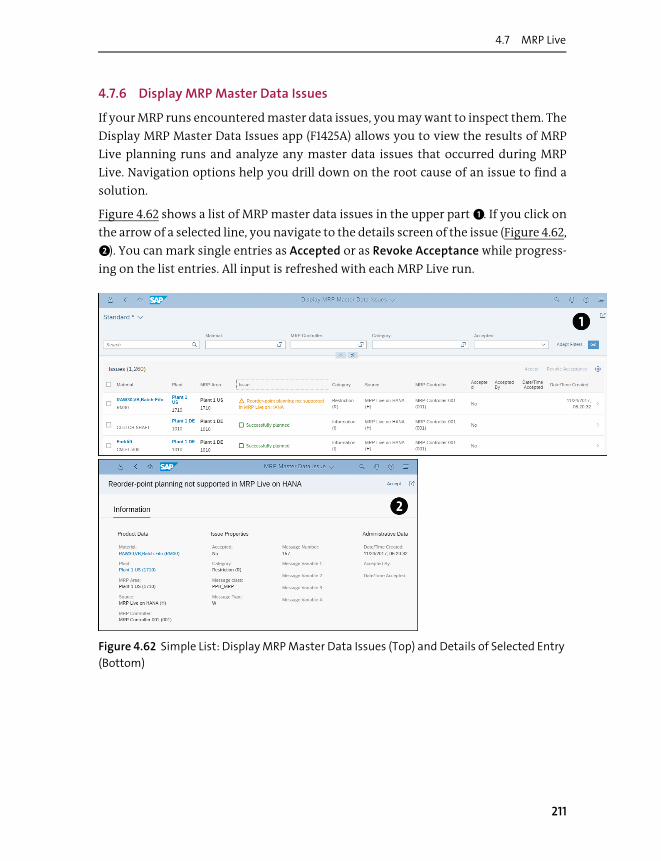
4.7 MRP Live
4.7.6 Display MRP Master Data Issues
If your MRP runs encountered master data issues, you may want to inspect them. The
Display MRP Master Data Issues app (F1425A) allows you to view the results of MRP
Live planning runs and analyze any master data issues that occurred during MRP
Live. Navigation options help you drill down on the root cause of an issue to find a
solution.
Figure 4.62 shows a list of MRP master data issues in the upper part 1. If you click on
the arrow of a selected line, you navigate to the details screen of the issue (Figure 4.62,
2). You can mark single entries as Accepted or as Revoke Acceptance while progress-
ing on the list entries. All input is refreshed with each MRP Live run.
Figure 4.62 Simple List: Display MRP Master Data Issues (Top) and Details of Selected Entry
(Bottom)
211

4 Planning and Adjusting Inventory
4.7.7 Monitor External Requirements
As a production planner, you need to ensure that all external requirements needed
during production execution are available on time. The Monitor External Require-
ments app (F0246) enables you to monitor uncovered requirements of materials
based on sales orders or stock transport orders.
Using the Time till Requirement Date filter criteria shown in Figure 4.63, you can
define the time frame to look at. The shortage is calculated by matching ordered
demand against planned supply. The item status is visualized as an overview chart
(showing Open Quantity and Missing Quantity). You can quickly track and react to
critical situations by selecting the desired item in the list shown in Figure 4.63 and
clicking the Manage Items button to navigate to the work list shown in Figure 4.64.
The worklist displays four sections for each selected object. Figure 4.64 shows the tab-
ular display of the Stock/Requirements List, including any shortages.
Alternatively, you can choose a graphical display icon to open the screen shown in
Figure 4.65. The waterfall diagrams list the stock quantity changes of all MRP ele-
ments in Figure 4.64 on a time axis with the option to select the displayed time frame
with the slider at the bottom.
Figure 4.63 Simple List: Monitor External Requirements
212

4.7 MRP Live
Figure 4.64 Worklist: External Requirements
Figure 4.65 Section Stock/Requirements List: Graphical Display
213

4 Planning and Adjusting Inventory
You have several options to resolve uncovered demands:
� Click the Start MRP Run button to initiate MRP for the particular material. MRP will try to find a solution based on the defined planning strategy.
� Open a related SAP Fiori app to pursue a solution depending on your business role (Stock/Requirements List app, see Chapter 4, Section 4.7.8).
� Choose one Action directly, if applicable (see Section 4.7.1).
� Navigate to the Material Shortage View, if applicable, and evaluate the automatic proposals (see Section 4.7.1) or Accept the shortage.
Other tabs in the Monitor External Requirements app include Material Information,
which contains all material-related information such as MRP Data, Master Data, and
Stock Availability; the Item Information, which created the requirement; and Notes,
where you take notes to document any action taken.
4.7.8 Monitor Internal Requirements
As a production planner, you need to ensure that all internal requirements needed
during production execution are available on time. The Monitor Internal Require-
ments app helps you to ensure that all internal requirements in your area of respon-
sibility originating from production orders, process orders, maintenance orders, and
network orders can be covered. The shortage definition is based on comparing
planned receipts with ordered requirements.
Many objects offer quick views for rapid inspections. After starting the app, you see a
simple requirement list in Figure 4.66 showing the most important data, such as
Component, Quantity Overview (Open versus Missing), and Affected Order. You can
navigate to a worklist for selected items with the Manage Components button.
The Manage Internal Requirements worklist, shown in Figure 4.67, offers for each
selected object similar sections as discussed for the Monitor External Requirements
app.
214

4.7 MRP Live
Figure 4.66 Simple List: Monitor Internal Requirements
Figure 4.67 Worklist: Selected Component in the Stock/Requirements List Section
215

4 Planning and Adjusting Inventory
The Stock/Requirements List section allows you to solve open issues. You have the
following options:
� If the system has a solution proposal for an issue, it will direct you to the Material
Coverage app, described in Section 4.7.1, when you click on an item (see Figure 4.67,
first two items).
� If you have the appropriate authorization, you can directly edit an MRP element
(Actions column in Figure 4.67).
� Additionally, you can choose Start MRP Run per material.
As with the Monitor External Requirements app, there is also a graphical display of
the Stock/Requirements List available. The waterfall chart shown in Figure 4.68 dis-
plays all MRP elements creating quantity changes in a selected time frame. You can
change the time frame selection with the slider on the bottom.
Figure 4.68 The Stock/Requirements List: Graphical Display
Other tabs in the Monitor Internal Requirements app include Material Information,
which contains all material-related information such as material master and material
stock-relevant data; the Order Information tab, which shows your type of order and
216

4.7 MRP Live
internal contact; and the Notes tab, where you take notes to document any action
taken.
4.7.9 Detect Unnecessary Supply Elements
As mentioned in Chapter 2, situation handling enables you to automatically notify a
defined set of users of a condition detected in SAP S/4HANA business processes. This
situation template supports you in detecting supply elements that are no longer
required, for example: If a sales order is canceled, this situation detects all MRP ele-
ments, which have been created to fulfill this sales order. In this case, the situation
automatically notifies the MRP controller.
The following exceptions are detected by the situation:
� CAN (cancel process)
No requirements for a receipt element exist. To avoid unnecessary warehouse
stock, the element should be reversed.
� EXC (excess stock)
The planned available stock exceeds the maximum stock as specified, and/or the
actual stock and the receipt elements exceed the requirements in the individual
segment such as MTO planning, individual project planning, direct production, or
direct procurement.
As a prerequisite, you must define the MRP element to be taken into account in IMG
activity Define Rescheduling Check for Plan:
� Firmed Planned Orders
� Production Order
� Fixed Purchase Requisitions
� PO/SA Schedule Line
� QM inspection lot
� Shipping Notification
To create a situation, you need first to define the team (see Chapter 3, Section 3.2.2).
The following setup attributes must be considered:
� Team type: SMRPT
� Team category: PPMRP
� Member function (shipped):
SMRPLAN
� Function profile: SMRP
Figure 4.69 shows the definition of the team, and Figure 4.70 shows the assignment
of team members. The Responsibility Definitions section helps to determine the cor-
rect team, and the Team Members identifies the end user within the team. Setting up
teams is explained in Chapter 3, Section 3.2.2 in detail.
217

4 Planning and Adjusting Inventory
The situation is created as a copy of the situation template SAP_PP_MRP_MATERIAL_
EXCEPTION as a batch-triggered situation (see Chapter 3 for details).
Figure 4.69 Setting Up a Team of Team Category PPRMP
The definition of the situation display is shown in Figure 4.71 with situation type CAN
as the filter value. Figure 4.72 shows the lower part of the situation with the assign-
ment of the team in Figure 4.69.
Figure 4.70 Assigning User to the Team
218

4.7 MRP Live
Figure 4.71 Copy of the Situation Template SAP_PP_MRP_MATERIAL_EXCEPTION with
Material Situation Type CAN
Figure 4.72 Assigning Teams with Member Function
The situation needs input of the job “PPH_MRP_SITUATIONS_CREATE”, which can be
scheduled using the Detect MRP Situations app, shown in Figure 4.73. You don’t need
to provide any additional mandatory parameter, except the Scheduling Options,
when you schedule a new job with the + button.
219

4 Planning and Adjusting Inventory
Figure 4.73 Detect MRP Situations: Simple List with Jobs
Figure 4.74 shows a selected job details page after clicking on the arrow of the selected
item. You can provide optional parameters to restrict the created situations to a ded-
icated Material, MRP Area, MRP Controller, or Plant.
Figure 4.74 Detect MRP Situations: Selected Job Details
220

4.8 DDMRP
Figure 4.75 shows the result for the end user defined in the team. The user will get a
notification in the SAP Fiori launchpad. Upon clicking on the notification, the user
will be directed to the Manage Material Coverage app (discussed in Section 4.7.1)
where he or she can solve the issue now and dismiss the situation.
Figure 4.75 Notification in SAP Fiori Launchpad with Subsequent Navigation to the Manage
Material Coverage App
4.8 DDMRP
In Section 4.3, we covered the rationale behind the DDMRP strategy. This section will
help you set up and work with DDMRP. We’ll start with the multistep configuration
process to identify the position and the size of the buffers. To finish, we’ll cover the
tools to monitor buffer performance.
4.8.1 Configuration Process
DDMRP requires some different configuration steps than you saw in Chapter 3, which
we’ll cover in this section. For DDMRP, setting up is a cycle that is closely linked with
execution. Setup isn’t a onetime effort but needs to be repeated on a regular basis to
221

4 Planning and Adjusting Inventory
keep the DDMRP process in an optimal state. Therefore, most of the setup steps are
highly automated. To find the optimal buffer position and buffer size, you classify
your products of the supply chain first according to four dimensions (see Section
4.8.3).
Four steps are required to complete this task:
1. All materials are classified according to value, BOM usage, and demand variability
(see Section 4.8.3 and Section 4.8.5).
2. All materials are classified according to their decoupled lead time (DLT) (see Sec-
tion 4.8.7).
3. Buffer positioning is executed, which means the components of the supply chain
to be buffered are selected (see Section 4.8.6).
4. The buffer size is calculated (see Section 4.8.8).
Each of these steps might be repeated once in a while to adapt the setup to changes in
the demand/supply conditions.
Let’s move on to execution. As a planner, you can use the overview page as a starting
point to detect deviations between actual and planned. The planning and execution
steps are supported by their own SAP Fiori app, nevertheless the DDMRP process is
embedded into the normal MRP of SAP S/4HANA, as pointed out in Section 4.3.
4.8.2 Buffer Profile Maintenance
A buffer profile defines how buffering is handled by DDMRP, for example, how buffer
size and lead time are calculated. Figure 4.76 shows how mandatory configuration
data needed for DDMRP product classification in the subsequent steps is maintained.
A set of buffer profiles are available in the system that can be modified by the produc-
tion planner with the Buffer Profile Maintenance app (Transaction PPH_DD_BUF_
PROF).
You can define buffer profiles (Figure 4.76, 1) and assign them to your plants in the
plant settings (Figure 4.76, 2). The Procurement Type used in Figure 4.76 is the default
source of supply calculated by MRP. You can see the assigned Variability Factor and
Lead Time Factor for each attribute of Procurement Type, Variability Indicator, and
Lead Time Indicator, which are used in product classification in Section 4.8.3.
222

4.8 DDMRP
Figure 4.76 Buffer Profile Maintenance Overview and Details
4.8.3 Product Classification: Mass Maintenance of Products
To start with DDMRP, you have to classify your materials so that the correct buffering
strategy can be applied for each material. The Mass Maintenance of Products (DD)
app (F2825) allows you to perform mass maintenance of attributes related to DDMRP.
Thus, you can manually carry out step 1 of the DDMRP setup discussed in Section
4.8.1. With this SAP Fiori app, you can classify your material master data in different
categories, as shown in Table 4.1.
After starting the SAP Fiori app, you can use the filter criteria to create a list of mate-
rials. First, you mark the products within a simple list, as shown in Figure 4.77.
Category Description
ABC classification Classification according to goods issue value
PQR classification Classification according to usage in BOMs
XYZ classification Classification according to demand variability
EFG classification Classification according to DLT
Table 4.1 Classification Categories
223

4 Planning and Adjusting Inventory
Figure 4.77 Mass Maintenance of Products Entry Screen
As a next step, click the Change button in Figure 4.77, and in the subsequent modal
window shown on the left in Figure 4.78, you choose the attributes to be changed and
enter their new value. On the right side of Figure 4.78, you can see the supported Lead
Time calculation methods and their descriptions. This is accessed by using the value
help of Lead Time Calc. Meth., which controls how the lead time is calculated in
DDMRP.
Figure 4.78 Mass Maintenance of Products: Change View (Left) and Lead Time Calculation
Methods (Right)
224

4.8 DDMRP
Note
Some changes are only accepted if the MRP Type is set to D1 (DDMRP).
4.8.4 Buffer Adjustment
We’ve seen that different algorithms can be used to calculate the lead time in Figure
4.78, and we discussed the configuration in Chapter 3. One of the algorithms (PRED) is
based on SAP S/4HANA predictive analytics integrator mentioned in Chapter 1 (SAP
HANA Predictive Analysis Library [PAL]).
As explained in Chapter 2, each machine learning model needs to be trained on an
appropriate data set before being activated. Figure 4.79 shows the details of the pre-
dictive model, including the model version history created by several trainings after
entering the Predictive Models app. Only one model version can be active. With the
Activate, Deactivate, Retrain, and Delete buttons, you can manage your model ver-
sion. When training the model, you can add filter criteria to optimize the training
data set.
Figure 4.79 Predictive Models: Predicted Individual Lead Time for Stock Transfer
Figure 4.80 shows the training results after clicking on the arrow of a selected item in
Figure 4.79. There is an overall indicator of the Quality and two KPIs indicating the
performance (Predictive Power) and the robustness (Predictive Confidence) of the
trained model. The closer the values are to 1, the better. The Performance section con-
tains the Key Influencers, that is, fields of the training view that contributed most to
the model version’s performance.
225

4 Planning and Adjusting Inventory
If the predictive model is active, it can also be used to calculate the lead time in
DDMRP (refer to Figure 4.78).
Figure 4.80 Training Results
4.8.5 Product Classification: Schedule Product Classification
The Schedule Product Classification SAP Fiori app supports you in classifying attri-
butes of your material master data with a background job according to the categories
described in Section 4.8.2. Thus, you can automatically carry out step 1 of the DDMRP
setup (refer to Section 4.8.1). When entering the app, you’ll see a simple list of classifi-
cation job runs, with their Status and their Log as in Figure 4.81, 1. When you click on
an arrow of a selected item, you navigate to the job’s details page (Figure 4.81, 2).
When you click on the + button shown in Figure 4.81, you can create a new job (see
Figure 4.82). The Product Selection Criteria allows you to define the set of products
processed by the job run.
226

4.8 DDMRP
Figure 4.81 Material Classification Job Maintenance
Figure 4.82 Entry Screen: Creating a New Material Classification Job (Part 1)
227

4 Planning and Adjusting Inventory
Figure 4.83 displays the fields (Thresholds for …) of the ABC, PQR, and XYZ classifica-
tions (refer to Table 4.1) to be used by the job run.
Figure 4.83 Entry Screen: Creating a New Material Classification Job (Part 2)
4.8.6 Buffer Positioning
After classifying your master data, you need to define the components whose mate-
rial stock quantities are to be buffered during DDMRP (refer to Section 4.3). The Buffer
Positioning app (F3282) helps you identify your components to be buffered so you
can carry out step 3 of the DDMRP setup discussed earlier in Section 4.8.1. The app
leverages the BOM information stored in SAP S/4HANA (refer to Section 4.2.1). Down-
stream of the supply chain, you can identify all parents of one particular component
up to the finished product. Upstream of the supply chain, you can identify all materi-
als used to assemble your component. This information helps you to decide whether
and how to buffer the component to protect its flow on the demand and supply side.
You enter the SAP Fiori app as a simple list showing DDMRP-relevant data such as the
following:
� Lead Time
Lead time of the item (refer to Chapter 2).
� Decoupled Lead Time
Lead time after buffer positioning (assuming that buffered materials are stocked).
� Classifications
Material classification, according to Section 4.8.2.
228

4.8 DDMRP
You can directly execute actions, such as Calculate DLT, Buffer, or Unbuffer, on the list
after selecting one or more items (see Figure 4.84).
Figure 4.84 Simple List: Buffer Positioning
You can access the details page for each entry by clicking on the arrow of the selected
item. Here, you see the upstream and downstream information (see Figure 4.85). You
can switch between different display modes in the Upstream or Downstream drop-
downs:
� BOM Usage
Counted usage in BOMs.
� Longest Path
Longest path upstream in the supply chain.
� Immediate Parent
Direct parents of the component.
You can also change the MRP Area of certain materials and thus change planning
(refer to Chapter 3).
229

4 Planning and Adjusting Inventory
Figure 4.85 Details Tabular Display: Buffer Positioning
If you select the toggle button for graphical display on the right-hand side, you switch
to an alternative view, that is, the network graph with the Graph Overview on the top-
right corner and the selected area in details below, as shown in Figure 4.86.
Figure 4.86 Details Network Graph: Buffer Positioning with Selected Material
230
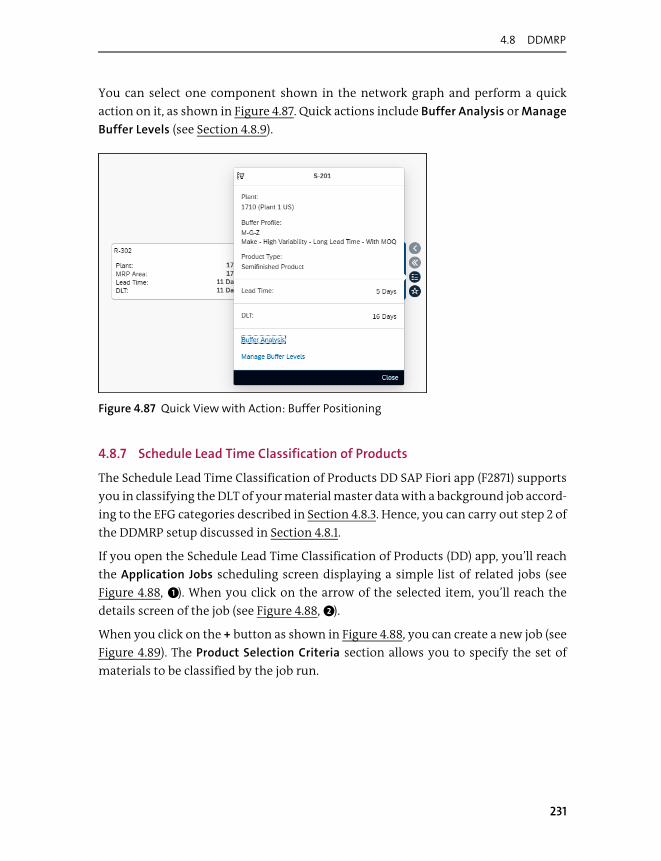
4.8 DDMRP
You can select one component shown in the network graph and perform a quick
action on it, as shown in Figure 4.87. Quick actions include Buffer Analysis or Manage
Buffer Levels (see Section 4.8.9).
Figure 4.87 Quick View with Action: Buffer Positioning
4.8.7 Schedule Lead Time Classification of Products
The Schedule Lead Time Classification of Products DD SAP Fiori app (F2871) supports
you in classifying the DLT of your material master data with a background job accord-
ing to the EFG categories described in Section 4.8.3. Hence, you can carry out step 2 of
the DDMRP setup discussed in Section 4.8.1.
If you open the Schedule Lead Time Classification of Products (DD) app, you’ll reach
the Application Jobs scheduling screen displaying a simple list of related jobs (see
Figure 4.88, 1). When you click on the arrow of the selected item, you’ll reach the
details screen of the job (see Figure 4.88, 2).
When you click on the + button as shown in Figure 4.88, you can create a new job (see
Figure 4.89). The Product Selection Criteria section allows you to specify the set of
materials to be classified by the job run.
231

4 Planning and Adjusting Inventory
Figure 4.88 Lead Time Classification Job Maintenance
Figure 4.89 Entry Screen: Creating a New Lead Time Classification Job (Part 1)
232

4.8 DDMRP
The fields in Figure 4.90 allow you to specify the DLT attributes in days to be used by
the job run.
Figure 4.90 Entry Screen: Creating a New Lead Time Classification Job (Part 2)
4.8.8 Schedule Buffer Proposal Calculation
After finishing buffer positioning, it’s necessary to create a buffer proposal. The
Schedule Buffer Proposal Calculation app (F2837) supports you in generating buffer
proposals based on the average daily usage (ADU), DLT, and buffer profiles of your
materials. Hence, you can carry out step 4 of the DDMRP setup discussed earlier in
Section 4.8.1. The proposals are the input of the Manage Buffer Levels app (see Section
4.8.9).
233

4 Planning and Adjusting Inventory
If you open the Schedule Buffer Proposal Calculation app, you’ll reach the Application
Jobs scheduling screen displaying a simple list of related jobs (see Figure 4.91, 1).
When you click on the arrow of the selected item, you’ll reach the details screen of the
job (see Figure 4.91, 2).
Figure 4.91 Buffer Proposal Calculation Job Maintenance
When you click on the + button in Figure 4.91, you can create a new job as shown in
Figure 4.92. The Product Selection Criteria section allows you to specify the set of
materials of which a buffer proposal will be calculated by the job run.
234

4.8 DDMRP
Figure 4.92 Entry Screen: Creating a New Buffer Proposal Calculation Job (Part 1)
The fields in Figure 4.93 allow you to specify the attributes to be used by the job run
for the buffer proposal calculation.
235

4 Planning and Adjusting Inventory
Figure 4.93 Entry Screen: Creating a New Buffer Proposal Calculation Job (Part 2)
4.8.9 Manage Buffer Levels
The Manage Buffer Levels draft-enabled app (F2706) helps you to manually control
the buffer level of your buffered components in DDMRP in changing demand/supply
situations. Buffer proposals for safety stock level, reorder point level, and maximum
stock level are calculated by the Schedule Buffer Proposal Calculation app (refer to
Section 4.8.8). The optimal buffer level balances excessive inventory costs with
changing demand to ensure adequate stock availability.
When entering the Manage Buffer Levels app, you can filter for the desired materials
in a simple list, as shown in Figure 4.94. You can see that micro charts visualize his-
toric buffer levels, ADU, and future proposals.
236

4.8 DDMRP
Figure 4.94 Simple List: Manage Buffer Level
After marking one or more entries, you can directly perform actions on the buffer
proposal such as Adopt, Discard, or Adjust. Adjusting allows you to change the buffer
zone or the demand by an absolute or relative factor or by copying the values from a
different material (see Figure 4.95).
In Figure 4.95, we’ve copied adjustments from the buffer of MZ-FG-B1 to MZ-FG-B2 by
entering “MZ-FG-B1” in the Product field under Copy Adjustments from Buffer.
237
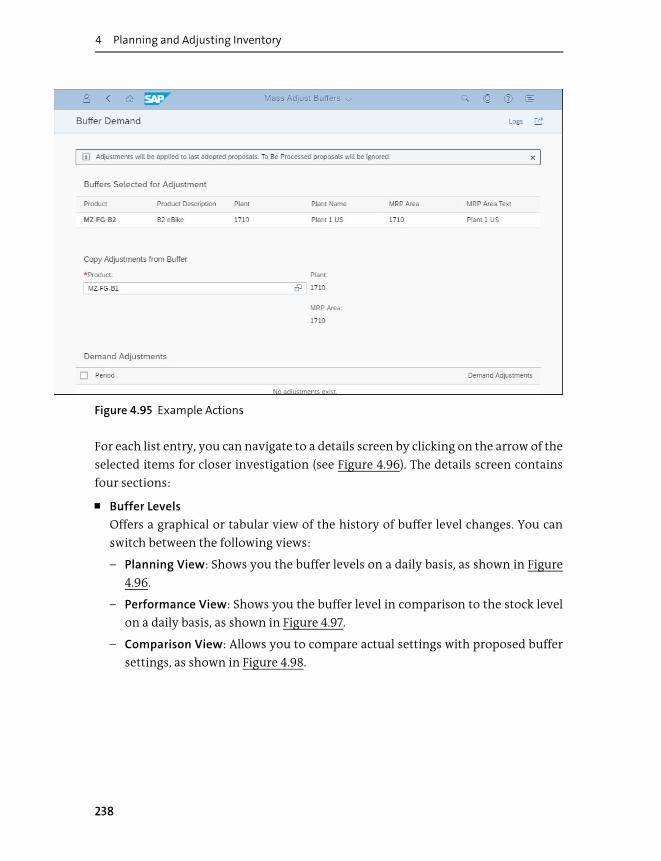
4 Planning and Adjusting Inventory
Figure 4.95 Example Actions
For each list entry, you can navigate to a details screen by clicking on the arrow of the
selected items for closer investigation (see Figure 4.96). The details screen contains
four sections:
� Buffer Levels
Offers a graphical or tabular view of the history of buffer level changes. You can
switch between the following views:
– Planning View: Shows you the buffer levels on a daily basis, as shown in Figure
4.96.
– Performance View: Shows you the buffer level in comparison to the stock level
on a daily basis, as shown in Figure 4.97.
– Comparison View: Allows you to compare actual settings with proposed buffer
settings, as shown in Figure 4.98.
238

4.8 DDMRP
Figure 4.96 Simple List and Details Screen in Split Screen Mode: Manage Buffer Level All
Sections
Figure 4.97 Buffer Levels: Performance View Visualizing Replenishment Operations
239

4 Planning and Adjusting Inventory
Figure 4.98 Buffer Levels: Comparison View Showing Current and Proposed Values
You can perform adjustments and simulate the changes of buffer levels when
you’re in edit mode and click on Show Adjustments (see the table toolbar in Figure
4.96).
� Average Daily Usage
Displays goods issue and PIRs plus the historic and the future ADU (see Figure
4.99). You can perform adjustments and simulate the changes when you’re in edit
mode by clicking on Show Adjustments (see the table toolbar in Figure 4.96).
Figure 4.99 Details Screen: Manage Buffer Level ADU
240

4.8 DDMRP
In addition to the ADU, you can see the network graph of the replenishment net-
work (Figure 4.100, top). For more details on the network graph, refer to Section
4.8.6.
� Classifications
Contains the DDMRP-relevant material information (see Figure 4.100, bottom).
Figure 4.100 Details Screen: Manage Buffer Level Classifications
Figure 4.101 shows the simulation features when adjusting buffer levels, and Figure
4.102 shows the simulation features when adjusting ADU. You just enter new time
frames and values and then click on Simulate Changes.
241

4 Planning and Adjusting Inventory
Figure 4.101 Manage Buffer Level Details Screen: Changing the Buffer Level
Figure 4.102 Manage Buffer Level Details Screen: Changing the ADU
242

4.8 DDMRP
4.8.10 Planners Overview
After finishing all configuration activities, we can now focus on monitoring our
DDMRP. The Planners Overview app is an overview page (see Chapter 1, Section 1.4)
supporting the daily work of DDMRP planners, as shown in Figure 4.103.
Figure 4.103 Overview Page Supporting DDMRP
It contains the following cards:
� Buffer Level Management
Shows you the total number of buffers with deviations (actual versus planned) on
the top and the same data in a column chart according to the selected category.
You can navigate to the Manage Buffer Level app (see Section 4.8.9).
� Replenishment Planning
Shows you the total number of buffers below the reorder point on the top and the
same data in a column chart according to the selected category. You can navigate
to the Demand-Driven Replenishment Planning app (see Section 4.8.11).
243

4 Planning and Adjusting Inventory
� Replenishment Execution
Shows you the total number of buffers below the safety stock on the top and the
number of buffers with low on-hand stock in a column chart according to the
selected category. You can navigate to the Demand-Driven Replenishment Execu-
tion app (see Section 4.8.12).
4.8.11 Replenishment Planning
The Demand-Driven Replenishment Planning app supports you in monitoring buf-
fer information sorted by planning priority. Based on this information, you can trig-
ger appropriate actions to avoid out-of-stock situations.
Figure 4.104 shows the Demand-Driven Replenishment Planning app after selecting
the desired data set and one immediate action to solve a shortage by creating a
planned order.
Figure 4.104 Simple List: DDMRP (Top), Direct Action Expedite Supply (Bottom)
On the details page of the selected entry (click on an arrow), you can see the Supply/
Demand List, Product Information, and Notes, as shown in Figure 4.105. You can switch
the Supply/Demand List to display All MRP Elements or only the DDMRP-relevant
ones.
244

4.8 DDMRP
Figure 4.105 Worklist: DDMRP with Selected Details Page
Quick views on single MRP elements support you in decision-making, and you can
trigger quick actions directly. For example, you can access the Create Order action
shown in Figure 4.105 to directly create a production order with the desired Receipt
Quantity, Availability Date, and Source of Supply (see Figure 4.106).
Figure 4.106 Action: Creating an Order
245

4 Planning and Adjusting Inventory
To document your action, you can add notes. Figure 4.107 shows the lower part of the
details page with Product Information and the Notes section.
Figure 4.107 Details Page: DDMRP Product Information and Notes
4.8.12 Replenishment Execution
The Demand-Driven Replenishment Execution app supports you in monitoring
today’s stock situation for each product. Based on this information, you can trigger
immediate actions to avoid out-of-stock situations and directly trigger the replenish-
ment by contacting the supplier of a purchase order or the production supervisor of
a component production order.
Figure 4.108 shows the SAP Fiori app after selecting the desired data set with On-Hand
Stock Status at risk, triggering one immediate action (Expedite Supply button) to
solve a shortage by creating a planned order (Figure 4.108, bottom). Moreover,
246

4.8 DDMRP
another planned action has already been scheduled (not shown) and is indicated as
Queued in Figure 4.108.
Figure 4.108 Simple List: DDMRP Execution
After you click the arrow of a selected item, you can see the Supply/Demand List,
Product Information, and Notes on the details page (see Figure 4.109). You can switch
the Supply/Demand List to display All MRP Elements or only the DDMRP-relevant
ones. Quick views on single MRP elements support you in decision-making. For
example, as shown on the right side of Figure 4.109, you can access the Stock action
by clicking on the MRP element Stock. Here, you can navigate to Display Stock Over-
view or configure additional navigation targets depending on your role (More Links).
To document your action, you can also add notes.
247

4 Planning and Adjusting Inventory
Figure 4.109 Worklist: DDMRP Execution
4.9 Kanban
If you plan with Kanban, this section will help you set up your planning strategy. Ini-
tially, we’ll get to know the Kanban control cycle and then we’ll discuss specific fea-
ture of Kanbans.
4.9.1 Manage Control Cycle
The Manage Control Cycle app (Transaction PKMC) enables creating, changing, and
displaying Kanban control cycles. You enter the application after filling in the man-
datory Plant field (“1710”, in this example) and clicking the Search button shown in
Figure 4.110. The upper part of Figure 4.110 lists the selected Kanban control cycles. In
our example, we have one event-driven and three classical Kanban control cycles.
248

4.9 Kanban
Figure 4.110 Manage Control Cycle (Search Button Not Shown)
If you select one control cycle in Figure 4.110, the details are shown. Figure 4.111 dis-
plays the details of the classical Kanban control cycle with replenishment by in-house
production.
Figure 4.111 Manage Control Cycle: Kanban with Replenishment by Production Order
249
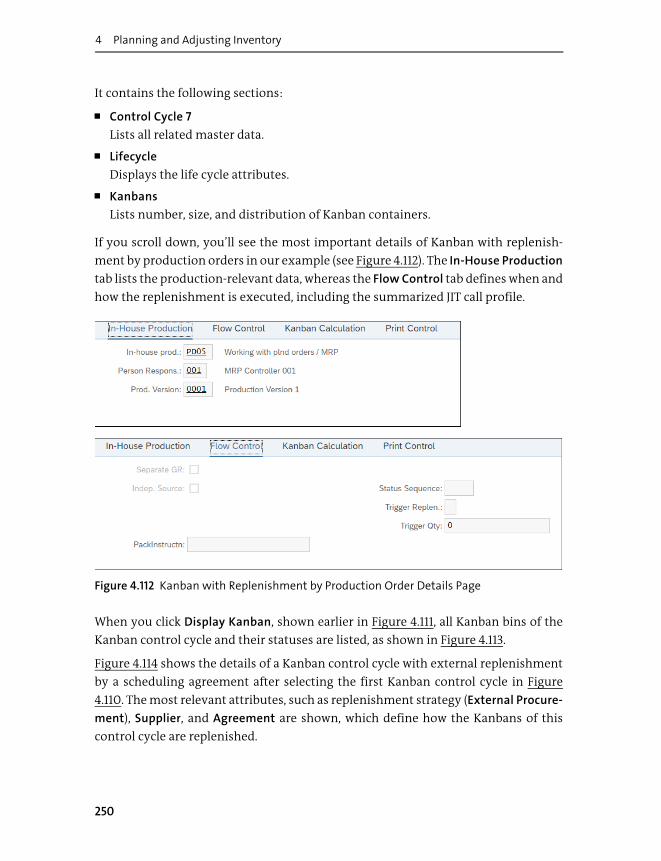
4 Planning and Adjusting Inventory
It contains the following sections:
� Control Cycle 7
Lists all related master data.
� Lifecycle
Displays the life cycle attributes.
� Kanbans
Lists number, size, and distribution of Kanban containers.
If you scroll down, you’ll see the most important details of Kanban with replenish-
ment by production orders in our example (see Figure 4.112). The In-House Production
tab lists the production-relevant data, whereas the Flow Control tab defines when and
how the replenishment is executed, including the summarized JIT call profile.
Figure 4.112 Kanban with Replenishment by Production Order Details Page
When you click Display Kanban, shown earlier in Figure 4.111, all Kanban bins of the
Kanban control cycle and their statuses are listed, as shown in Figure 4.113.
Figure 4.114 shows the details of a Kanban control cycle with external replenishment
by a scheduling agreement after selecting the first Kanban control cycle in Figure
4.110. The most relevant attributes, such as replenishment strategy (External Procure-
ment), Supplier, and Agreement are shown, which define how the Kanbans of this
control cycle are replenished.
250

4.9 Kanban
Figure 4.113 Display Kanban
Figure 4.114 Kanban with External Replenishment by Scheduling Agreement
251

4 Planning and Adjusting Inventory
4.9.2 Summarized JIT Call Scheduler
The Summarized JIT Call Scheduler app (Transactions PJ02, PJ03) allows you to define
and schedule background jobs, which convert Kanban JIT calls on a regular basis into
messages to suppliers, triggering the JIT replenishment.
Figure 4.115 shows the entry screen, which displays a simple job list. From here, you
can navigate to the details screen in Figure 4.116 by clicking on the arrow of a selected
item or creating a new job using the + button.
Figure 4.115 Scheduling Summarized JIT Calls: Simple List of Scheduled Jobs with Statuses
Figure 4.116 Details Page of Selected Job Entry
252

4.9 Kanban
The details page shown in Figure 4.116 displays the job’s details; most importantly,
the Scheduling Options and the Run Details with the job log are provided.
When creating a new job, the job template defines the parameters you have to submit
with the job. In the Scheduling Options section of Figure 4.117, you define when the
job with which recurrence pattern will be scheduled by filling out the Start field or
selecting the Start Immediately checkbox.
Figure 4.117 Creating a New Job: Scheduling Options
In Parameter Section of Figure 4.118, you define parameters used to start the job:
� Output Data
Defines the output generated by the job.
253
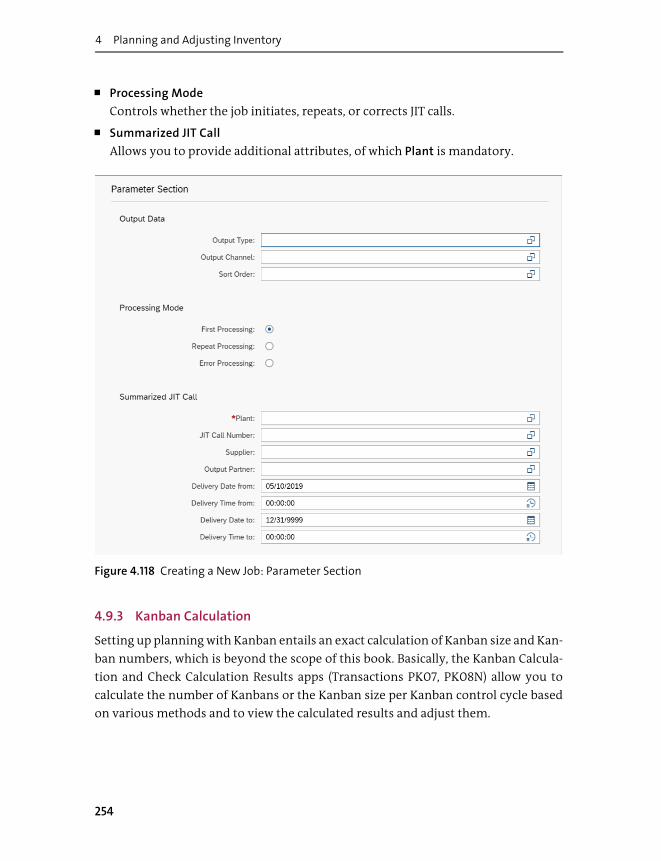
4 Planning and Adjusting Inventory
� Processing Mode
Controls whether the job initiates, repeats, or corrects JIT calls.
� Summarized JIT Call
Allows you to provide additional attributes, of which Plant is mandatory.
Figure 4.118 Creating a New Job: Parameter Section
4.9.3 Kanban Calculation
Setting up planning with Kanban entails an exact calculation of Kanban size and Kan-
ban numbers, which is beyond the scope of this book. Basically, the Kanban Calcula-
tion and Check Calculation Results apps (Transactions PK07, PK08N) allow you to
calculate the number of Kanbans or the Kanban size per Kanban control cycle based
on various methods and to view the calculated results and adjust them.
254

4.10 What’s Ahead for Inventory Planning and Adjustment?
4.10 What’s Ahead for Inventory Planning and Adjustment?
Figure 4.119 outlines the idea of predictive MRP, which is a new tool currently devel-
oped as part of SAP S/4HANA. Predictive MRP enables end users to optimize midterm
and long-term planning by simulating planning alternatives based on the operative
data of the SAP S/4HANA production planning functionality. The operative data is
converted and transferred to a new data structure optimized for planning simulation
within predictive MRP. The converted data allows real-time simulation and analysis
of what-if scenarios. Once optimized, the adjusted planning parameters can be
released to the SAP S/4HANA production planning functionality.
Figure 4.119 Predictive MRP Supporting Supply Chain Planning Optimization
Let’s take a closer look at new functionality for scheduling and processing predictive
MRP simulations, starting with the prerequisites.
4.10.1 Prerequisites
Figure 4.120 delineates how the reference scenarios are created. Basically, you choose
one anchor object (work center or material in Figure 4.120) and then extract the data
to a simulation ID. The prerequisites to a successful extraction are as follows:
SAP S/4HANAOperative Data
Simplifyand Transfer
Simulate PlanningParameter
Adaptations
ReleaseAdaptations
SAP S/4HANAPredictive MRP
SAP S/4HANAProduction Planning
Analyze Resultsin Real Time
255

4 Planning and Adjusting Inventory
� Materials created with applicable plant view
� Materials part of a BOM (BOM usage 1) with appropriate validity
� Work centers with capacity information
� Routings linking work centers and operations
� Production version linking BOM and routings
� PIRs
Figure 4.120 Two Possible Anchor Objects Used When Creating the Reference Scenarios
Materials are only taken into account as anchor objects if they create the primary
demand, which means they must be the root node of a BOM.
Let’s take a closer look at new functionality for scheduling and processing predictive
MRP simulations.
4.10.2 Schedule Predictive MRP Simulation Creation
As explained previously, we need to extract the data for simulation first. The Sched-
ule Predictive MRP Simulation Creation app allows you to define a reference plan,
which is a prerequisite to creating predictive MRP simulations via job scheduling. A
reference plan is basically a simplified extraction of operative data for material
resource planning that is used downstream in the Process Predictive MRP Simula-
tions app (which we’ll discuss in the next section). You can choose to create data
WorkCenter
Operation
Routing
ProductionVersion
Bill ofMaterial
Material
Capacity
256

4.10 What’s Ahead for Inventory Planning and Adjustment?
based on work center data or top-level material data. In the Job Template field, select
one of the corresponding templates:
� Creation of pMRP Data via Top-Level Materials
Anchor object will be the material.
� Creation of pMRP Data via Work Center
Anchor object will be the work center.
Figure 4.121 shows the general part of the job template when scheduling a new job to
create a predictive MRP simulation with the + button. In this section of the job tem-
plate, you define the Scheduling Options of the job, such as when and how often the
job is executed.
Figure 4.121 Scheduling a New Predictive MRP Simulation Creation: Scheduling Options
257

4 Planning and Adjusting Inventory
Figure 4.122 shows the predictive MRP job-specific Parameter Section:
� ID for Reference Plan
This mandatory field is the key of the reference scenario, whose simulation is cre-
ated by this job.
� Bucket Category
This field defines a monthly or weekly period pattern of the reference scenario’s
data. All relevant demands are distributed over the specified bucket data and dis-
played in the simulation plan as defined in this app.
� Start Date of Reference and End Date of Reference
These fields define the reference scenario’s time frame.
� Simulation ID
This mandatory field will be used in the Process Predictive MRP Simulations app to
identify the created simulation (see the next section).
� Limits
This section allows you to specify material-related master data that limits the data
processed in the simulation. The criteria enable you to identify materials that are
relevant for simulation.
Figure 4.122 Scheduling a New Predictive MRP Simulation Creation: Parameter Section
� Object Selection
This section in Figure 4.123 allows you to specify additional selection criteria to
restrict the data processed in the simulation in case the anchor object is material.
Figure 4.124 shows the layout if the work center is used as the anchor object.
258

4.10 What’s Ahead for Inventory Planning and Adjustment?
� Stock Transfer Behavior
This section allows you to specify how stock transfers should be included in the
simulation.
� Document Data
This section allows you to specify how stock quantities will be calculated in the
simulation. Opening Stock allows you to define whether to start your simulation
without opening stock, with safety stock, with current plant stock, or with plant
stock at the start of the reference scenario. In addition, you can select how PIRs and
material discontinuation will be treated.
Figure 4.123 Scheduling a New Predictive MRP Simulation Creation: Parameter Section with
Object Selection via Materials
Figure 4.124 Scheduling a New Predictive MRP Simulation Creation: Parameter Section
with Object Selection via Work Centers
259

4 Planning and Adjusting Inventory
4.10.3 Process Predictive MRP Simulations
The current implementation of predictive MRP supports capacity planning with the
Process Predictive MRP Simulations app (F3934). Figure 4.125 shows a list of all active
simulations within predictive MRP after starting the SAP Fiori app. They are created
by the jobs scheduled in the previous section or by copying existing simulations.
After selecting one or more entries, you can Override Errors, Copy, Rename, or Delete
simulations. If you feel a simulation’s settings are improving the production plan-
ning situation, you can Release the simulation to production planning so it becomes
real. A released simulation can’t be altered further.
Figure 4.125 Simple List: Predictive MRP Active Simulations
Each simulation can be worked on in the details screen by clicking on the arrow of a
selected item. Figure 4.126 shows a Demand Plan Simulation of dedicated materials
per time bucket. You can edit the demands and immediately see the impact on
Capacity Issues and Delivery Performance. You can switch between comparing Refer-
ence/Simulation (shown) or Simulation Only, Delta of Reference, and Simulation.
Figure 4.127 shows the impact of some changes after clicking Capacity Plan Simula-
tion of a work center per time bucket. The simulations consider only in-house pro-
duction. You can shift demands by clicking the Shift Top-Level Demands button, or
you can change the source of supply. In addition, the system will suggest preproduc-
tion to solve capacity overloads.
260

4.10 What’s Ahead for Inventory Planning and Adjustment?
Figure 4.126 Details Page: Demand Plan Simulation
Figure 4.127 Details Page: Capacity Plan Simulation
If you click the Simulation Summary button, you get to the screen shown in Figure
4.128, which shows the Simulation Summary of all changes done within the selected
261

4 Planning and Adjusting Inventory
simulation plan compared to the reference plan. When working with several simula-
tion plans, you can compare the impact of capacity changes on meeting your
planned deliveries.
Figure 4.128 Details Page: Simulation Summary
4.11 Summary
This chapter provided background about planning and adjusting inventory with the
help of the production planning capabilities of SAP S/4HANA. It covered basic factors
such as planning horizon, planning strategies (MTO, MTS, DDMRP, etc.), and planning
tools. The second part of the chapter introduced the master data elements used
during planning (BOMs, routing, master recipes, work centers, resources) and the SAP
Fiori apps to access them. The third part described the SAP Fiori apps to run, monitor,
and adjust the planning process itself. The last section gave some outlook on recent
developments regarding predictive MRP.
In the next chapter, we’ll look at inbound delivery processes and how to handle them
in SAP S/4HANA.
262

Chapter 5
Goods Receipt
After an inventory plan has been made and adjusted, inventory
execution begins. This chapter gives step-by-step instructions for
performing the first of several execution processes (goods receipt) in
SAP S/4HANA.
This chapter focuses on the material inward flow in different process facets of a goods
receipt. We’ll spotlight the different flavors of a goods receipt and focus on SAP
S/4HANA and SAP Fiori specialties.
The following SAP Fiori apps are discussed in this chapter:
� Goods Receipt for Purchase Order (F0843)
� Goods Receipt for Inbound Delivery (F2502)
� Goods Receipt for Production Order (F3110)
� Goods Receipt without Reference (F3244)
As of now, not all process variants that were supported by SAP ERP are also supported
via an SAP Fiori-based app (we’ll cover this in Section 5.6). In the meantime, the web-
based SAP GUI Post Goods Movement app (formerly known as Transaction MIGO)
provides all process variants for goods receipts.
We’ll begin with a walk-through of SAP Fiori apps for key goods receipt processes: the
purchase order, inbound delivery, and production order. We’ll then discuss the goods
receipt without reference scenario, before moving on to process variants and a look
at what’s ahead.
5.1 Purchase Order
One important step in a company’s procurement process is the receipt of procured or
produced goods. At receipt, these new goods are physically taken over in the com-
pany’s owned stock and can be treated accordingly, depending on follow-up activities
263

5 Goods Receipt
such as quality inspection. These goods receipt processes can have different flavors,
which are outlined in the following sections in more detail.
5.1.1 Purchase Orders for Inventory
The goods receipt process that is based on a given purchase can be performed in SAP
Fiori via the Post Goods Receipt for Purchase Order app. To enable users to use this
app via the SAP Fiori launchpad, special business roles must be assigned. SAP delivers
certain standard business roles as templates (see Chapter 3, Section 3.5.2, for assign-
ing roles). In this case, the business roles SAP_BR_INVENTORY_MANAGER and SAP_
BR_WAREHOUSE_CLERK include the target mapping of the Post Goods Receipt for
Purchase Order app.
After the user is assigned to the related target mapping, the SAP Fiori launchpad pro-
vides the related tile as shown in Figure 5.1.
Figure 5.1 SAP Fiori Launchpad Tile: Post Goods Receipt for Purchase Order
The Post Goods Receipt for Purchase Order app can post goods receipts for stock-
related procurement and for materials procured for direct consumption.
Click the Post Goods Receipt for Purchase Order tile, and then select the required pur-
chase order on the next screen. There are three different ways of selecting the right
purchase order:
� Entering the related purchase order manually
� Copying and pasting a given purchase order from the clipboard
� Selecting the purchase order via search help ((F4) help)
264

5.1 Purchase Order
Figure 5.2 illustrates the type-ahead search if you enter a purchase order number. In
this case, the app tries to identify the purchase order after four digits are entered and
provides the search result based on a “contains search” in a dropdown list while
you’re still entering the purchase order.
Figure 5.2 Entering the Purchase Order Number
Along with the purchase order number, the supplier name can also be used as search
term. In this case, three letters (case insensitive) are enough for the app to start using
the type-ahead search.
The functionality of the search help can be adjusted to your needs via the Application
Settings in your Me Area. Figure 5.3 and Figure 5.4 depict how to access the settings
and which settings can be performed.
First, you click on the user icon in the upper-right corner to open the screen shown in
Figure 5.3. In the screen that appears, you click on Application Settings to open the
screen shown in Figure 5.4 for adjusting the application-related settings.
The selection of standard purchase orders and/or stock transport orders can be con-
trolled here. In addition, the functionality of bar code scanning for mobile devices,
such as mobile phones or tablets, can be enabled. The bar code scanning unveils one
of the innovative features SAP Fiori provides. Each user can set his or her application
settings independently.
265
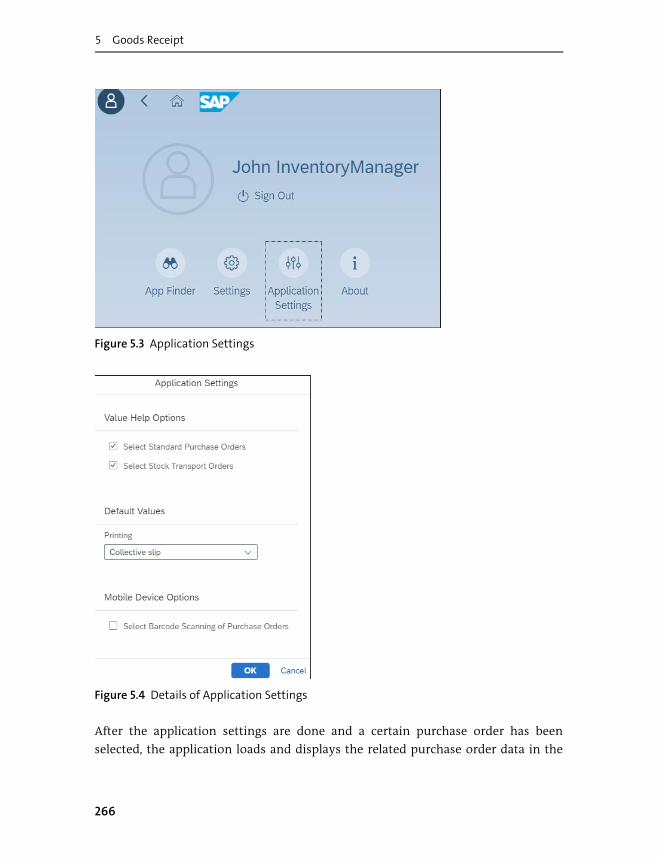
5 Goods Receipt
Figure 5.3 Application Settings
Figure 5.4 Details of Application Settings
After the application settings are done and a certain purchase order has been
selected, the application loads and displays the related purchase order data in the
266

5.1 Purchase Order
header at the top of the screen. In Figure 5.5, the purchase order number in the header
is blue because the SAP Fiori launchpad provides an intent-based navigation to the
purchase order object page if the user owns the related target mapping authoriza-
tions.
Figure 5.5 Main Screen with Purchase Order Data
The only mandatory fields in the header data are the Document Date and Posting
Date, which are already prefilled by the app but can be changed by the user.
Below the header data, the purchase order items are listed in a table view. Note that
the Post Goods Receipt for Purchase Order app only outlines purchase order items
that can successfully be processed within this application.
If a purchase order item meets one of the following criteria, it won’t be outlined by
the application:
� The related material is serialized.
� An unsupported account assignment is chosen.
� The Delivery Completed indicator is set.
Table 5.1 shows which account assignment categories are supported.
267
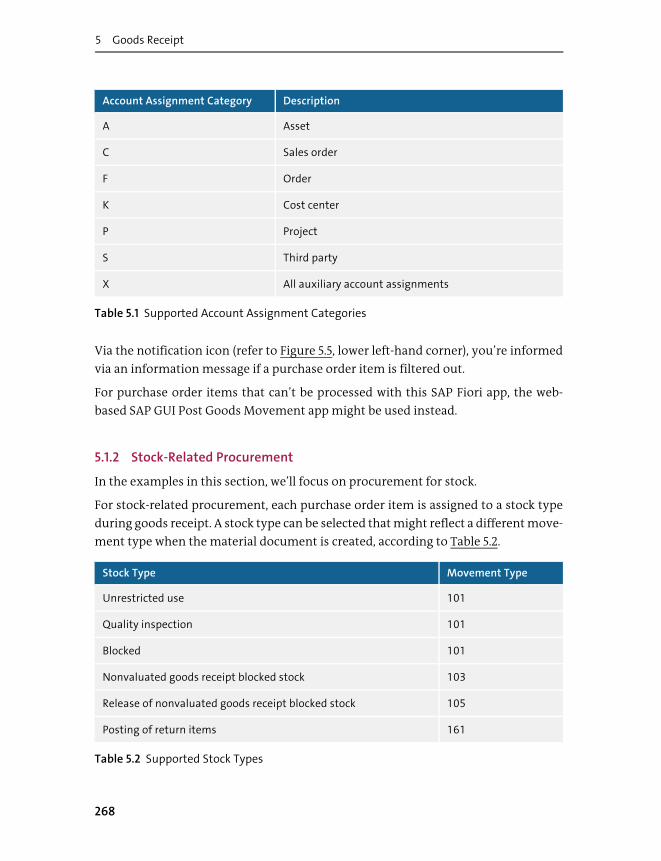
5 Goods Receipt
Via the notification icon (refer to Figure 5.5, lower left-hand corner), you’re informed
via an information message if a purchase order item is filtered out.
For purchase order items that can’t be processed with this SAP Fiori app, the web-
based SAP GUI Post Goods Movement app might be used instead.
5.1.2 Stock-Related Procurement
In the examples in this section, we’ll focus on procurement for stock.
For stock-related procurement, each purchase order item is assigned to a stock type
during goods receipt. A stock type can be selected that might reflect a different move-
ment type when the material document is created, according to Table 5.2.
Account Assignment Category Description
A Asset
C Sales order
F Order
K Cost center
P Project
S Third party
X All auxiliary account assignments
Table 5.1 Supported Account Assignment Categories
Stock Type Movement Type
Unrestricted use 101
Quality inspection 101
Blocked 101
Nonvaluated goods receipt blocked stock 103
Release of nonvaluated goods receipt blocked stock 105
Posting of return items 161
Table 5.2 Supported Stock Types
268

5.1 Purchase Order
Depending on the purchase order, it’s possible to post three material documents. For
movement types 103 and 105, separate material documents are posted for each; for
movement types 101 and 161, only one material document is posted covering both
types (see Chapter 3, Section 3.1.3). Figure 5.6 shows the dropdown list of possible
stock types you could select per purchase order item. The previously mentioned
movement types reflect certain stock types (refer to Table 5.2).
Figure 5.6 Different Stock Types
A split of purchase order items, that is, to post one purchase order item to different
stock types or storage locations, is possible by clicking the + button in the Distribu-
tion column (see Figure 5.7).
Figure 5.7 Purchase Order Item List in Table View
269

5 Goods Receipt
The table view of the purchase order items provides a Personalization functionality
that can be accessed by clicking on the gear icon on the upper-left side of the pur-
chase order item table (see Figure 5.8). To enable the open quantity to be presented to
the user for preassignment, you choose the Use open quantity option. To do the same
for the purchase order item short text if the related purchase order item is without a
reference to a material with a material master record, you choose the Use from Pur-
chase Order option.
Figure 5.8 Personalization Options
The Storage Location search help offers an implicit view of the current stock situation
based on a micro chart, as shown in Figure 5.9. The micro chart depicts the stock level
of the three support stock types (refer to Table 5.2). The goods receipt blocked stock
isn’t part of the company’s owned stock and therefore isn’t outlined here.
All storage locations that are already assigned in the related material master data
view (database table MARD) are listed in the Standard area of the search help. Plant stor-
age locations that aren’t yet assigned in the material master are listed in the Derived
area if the related setting is activated for the related movement type in the Customi-
zing activity Create Storage Location Automatically (see Chapter 3, Section 3.1.3). If
this setting is given, and the goods receipt is posted, the system automatically creates
the assignment between material master record and storage location.
270

5.1 Purchase Order
Figure 5.9 Storage Location Search Help with Stock Data
By clicking on a purchase order item (as shown earlier in Figure 5.7), an information
page is displayed outlining the details for each item, such as the Ordered quantity or
the Delivery Completed indicator (see Figure 5.10).
271

5 Goods Receipt
Figure 5.10 Detail Screen of a Purchase Order Item
5.2 Inbound Delivery
In this section, we’ll focus on goods receipts based on inbound deliveries. An inbound
delivery combines and maintains all relevant data about the delivery process, which
starts with the goods receipt, to serve the logistic process integration (i.e., in combi-
nation with warehouses).
The Post Goods Receipt for Inbound Delivery app in SAP Fiori is part of the business
role template SAP_BR_RECEIVING_SPECIALIST. To get started, click the Post Goods
Receipt for Inbound Delivery tile shown in Figure 5.11.
272

5.2 Inbound Delivery
Figure 5.11 SAP Fiori Launchpad Tile: Post Goods Receipt for Inbound Delivery
Now, you have to enter or search for an Inbound Delivery, as depicted in Figure 5.12.
Figure 5.12 Selection of Inbound Delivery in Type-Ahead Search
After you’ve entered the related inbound delivery, the SAP Fiori app displays all items
of the inbound delivery. You can enter goods receipt information such as delivered
quantity just as for a standard purchase order, which was described in the previous
section.
273

5 Goods Receipt
5.3 Production Order
Along with goods being procured externally, companies might also produce their
own goods. After production is finished, the produced goods have to enter the inven-
tory by performing a related goods receipt, which we’ll describe in this section.
The Post Goods Receipt for Production Order app in SAP Fiori is also part of the busi-
ness role template SAP_BR_WAREHOUSE_CLERK.
After starting the SAP Fiori app by clicking the SAP Fiori launchpad tile Post Goods
Receipt for Production Order, you have to enter a Production Order for which the
goods receipt shall be performed, as shown in Figure 5.13.
Figure 5.13 Input of Production Order
Once the production order is selected, the SAP Fiori app displays the related header
and item information, as shown in Figure 5.14.
Figure 5.14 Production Order Header and Items
In the header section of the screen, the production order details are displayed, includ-
ing a semantic object-based navigation capability to navigate to the production order
object page (the Production Order link 1000211 in the header section of Figure 5.14).
274

5.4 Goods Receipt without Reference
Generally, the goods receipt process steps look very similar to a standard purchase
order. After selecting the related production order, you have to enter the quantity,
storage location, and stock type information as shown in Figure 5.14. Data that is
already maintained in the production order is prefilled automatically by the app. In
our example, the storage location information is missing. Therefore, the Storage
Location field gets a red (highlighted) status.
Once the storage location is entered, you can click the Post button (located in the
bottom-right corner of the screen, not shown in Figure 5.14) to perform the goods
receipt accordingly. When the goods receipt is performed successfully, a material
document is created and the app shows a Success pop-up that provides a link to the
material document that was created, as shown in Figure 5.15.
Figure 5.15 Successful Goods Receipt for Production Order
5.4 Goods Receipt without Reference
Sometimes, there is no reference document or document number available (e.g., no
purchase order number can be found), but the related goods have arrived and have to
be put into the inventory to go ahead with dependent inventory management pro-
cesses. In this case, a goods receipt without a reference might be posted, as described
in this section.
The Post Goods Receipt without Reference app in SAP Fiori is part of the business role
template SAP_BR_WAREHOUSE_CLERK. After you start the related SAP Fiori app by
clicking on the Post Goods Receipt without Reference tile, the main screen of the app
opens and provides the required input fields (see Figure 5.16).
No item information can be provided because no reference document is given, so
you have to enter the required data manually (at least the material, quantity, plant,
storage location, and stock type).
275

5 Goods Receipt
Figure 5.16 Type-Ahead Search for Material
Figure 5.17 depicts a purchase order item without reference to a purchase order with
a manual user input.
Figure 5.17 Goods Receipt Item without Reference
Depending on the selected Stock Type per item, the movement types used for posting
the goods receipt are shown in Table 5.3.
By clicking on the item, the detailed screen can be accessed as mentioned previously
for different goods receipt apps (see Figure 5.18).
Stock Type Movement Type
Unrestricted use 501
Quality inspection 503
Blocked stock 505
Table 5.3 Movement Types Used in Goods Receipt without Reference
276

5.5 Process Variants
Figure 5.18 Item’s Detail Screen
5.5 Process Variants
Now that we’ve discussed the different sources of goods receipt (purchase order, pro-
duction order, etc.), we’ll outline some variants of goods receipts that hold true for all
goods receipt sources. Variants refers to the different possible shapes of materials in
a goods receipt item. Let’s start with batch-managed materials.
5.5.1 Batch-Managed Materials
All the previously mentioned SAP Fiori apps can process batch-managed materials. If
the Customizing of the related movement type is set accordingly in the Set Expira-
tion Date Check IMG activity (see Chapter 3, Section 3.1.3), a shelf life and/or produc-
tion date can also be entered per purchase order item, which is based on a batch-
managed material.
Figure 5.19 shows a purchase order item that is batch managed (last entry shown). In
this case, the apps dynamically display an additional Batch column to show the batch
input field. In this field, you can select the required batch to which the material will
be posted.
277

5 Goods Receipt
Figure 5.19 Batch-Managed Purchase Order Item
For enabled items, click the search icon in the Batch column field to open the screen
shown in Figure 5.20. This search help for selecting the batch contains stock informa-
tion for the three main stock types as shown in Figure 5.20. Here you can selected the
required batch by clicking on a list entry. The selected batch is taken over, and the
search help window is closed automatically.
Figure 5.20 Stock Information of a Batch
In addition, you can click the purchase order item to access the detail screen that con-
tains the batch information, as shown in Figure 5.21.
Figure 5.21 Purchase Order Item Detail Screen with Batch Information
If the Customizing setting Set Expiration Date Check (see Chapter 3, Section 3.1.3) is
activated for the chosen movement type (chosen via the Stock Type dropdown list), a
278

5.5 Process Variants
shelf life expiration date or a production date of the material has to be entered during
goods receipt processing that is dependent on the material master record. Figure 5.22
shows the two additional fields: Production Date and Shelf Life Expiration Date.
If a minimum remaining shelf life is entered in the material master record but no
total shelf life, then you have to enter the Shelf Life Expiration Date during goods
receipt processing.
If a total shelf life is entered in the material master record, then you enter a Produc-
tion Date during goods receipt. In this case, the app automatically calculates the shelf
life expiration date by adding the shelf life to the entered production date.
If the date entered isn’t sufficient in the sense of the shelf life, an appropriate mes-
sage is displayed during goods receipt processing.
Figure 5.22 Production Date and Shelf Life Date in the Details Screen
279

5 Goods Receipt
5.5.2 Goods Receipt Blocked Stock
If a goods receipt is posted into the goods receipt blocked stock, the app uses move-
ment type 103.
Generally, the goods receipt blocked stock isn’t owned by the receiving company at
the point of the goods receipt, so the goods receipt blocked stock is nonvaluated.
If the goods receipt is posted into the goods receipt blocked stock by selecting Goods
Receipt Blocked Stock, there are different possibilities to release the stock out of the
goods receipt blocked stock. These new posting possibilities are displayed after the
same purchase order is loaded again after the initial goods receipt was posted into
the goods receipt blocked stock.
The dropdown list in the Stock Type column is enhanced with the related stock types,
as shown in Figure 5.23, so that the goods receipt blocked stock can be released
accordingly by a related goods receipt posting.
Figure 5.23 Goods Receipt Blocked Stock Postings after the Initial Goods Receipt
5.5.3 Mandatory Quality Inspection
Goods receipts of materials can be posted directly into the quality inspection stock.
This is a stock where materials are kept that need to be checked by a quality inspec-
tion before they can be released for further usage (i.e., by posting into the unre-
stricted-use stock). In this case, in the quality management view of the material
master record, the Post to Inspection Stock setting has to be enabled. This setting is
then copied as the default to purchase order items and goods receipt items for this
material. The material posting will occur in this case without creation of an inspec-
tion lot.
280

5.5 Process Variants
This setting can be overruled by entering the more detailed inspection setup data in
the material master record (i.e., more detailed inspection types) that might create
inspection lots. If inspection types are assigned, the Post to Inspection Stock setting is
deactivated because a more detailed setting via inspection types was chosen.
If the mentioned preconditions are met, the stock type gets preassigned with Quality
Inspection accordingly, as shown in Figure 5.24, and can’t be changed by the user
during goods receipt processing.
Figure 5.24 Preassigned Stock Type Quality Inspection
5.5.4 Decentralized Warehouse Management
If a goods receipt is posted into a storage location that is managed by a decentralized
warehouse, the application automatically generates an inbound delivery to be pro-
cessed by the warehouse management system. More information about inventory
management and the linkage of decentralized warehouse management is provided
in Chapter 9, Section 9.2.2.
5.5.5 Return Delivery
Customer returns can be posted directly in inventory management without the use
of special sales and distribution (SD) functionality and without reference to a return
delivery document by the usage of movement type 451. In this case, a material move-
ment is posted into the returned blocked stock with reference to a certain customer.
Afterwards, it can be transferred to unrestricted use by releasing it with movement
type 453 (455 for releasing it to quality inspection stock). If a return from customer is
based on a delivery, movement types 651 (returns blocked stock) and 653/655 are used
for releasing it to unrestricted use or quality inspection stock, respectively. These
kinds of posting can be performed with the Post Goods Movement app (see Chapter
6, Section 6.3.3).
281

5 Goods Receipt
5.5.6 Single- or Multi-Account Assignment
Procurement for consumption requires an account assignment for each purchase
order item. The previously mentioned goods receipt apps in SAP Fiori dynamically
detect that an item is based on consumption and provide the related account assign-
ment information to the user. Per the purchase order item, the account assignment
information is displayed in the purchase order Items table view shown in Figure 5.25.
Figure 5.25 Account Assignment Information
Clicking on the Account Assignment micro chart opens a popup with more detailed
information, as shown in Figure 5.26.
Figure 5.26 Popup with Detailed Account Assignment Information
Click a purchase order item to access the detail screen shown in Figure 5.27. Here,
a table view with the related account assignment information is displayed for
consumption-based procurement.
If there is a multiple account assignment for a purchase order item, the share
between the different accounts can be seen on the detail screen of the purchase order
item. In this case, the purchase order item can be assigned to more than one account.
The related micro chart in the purchase order item table now displays the share
between the different accounts per purchase order item (see Figure 5.28).
282
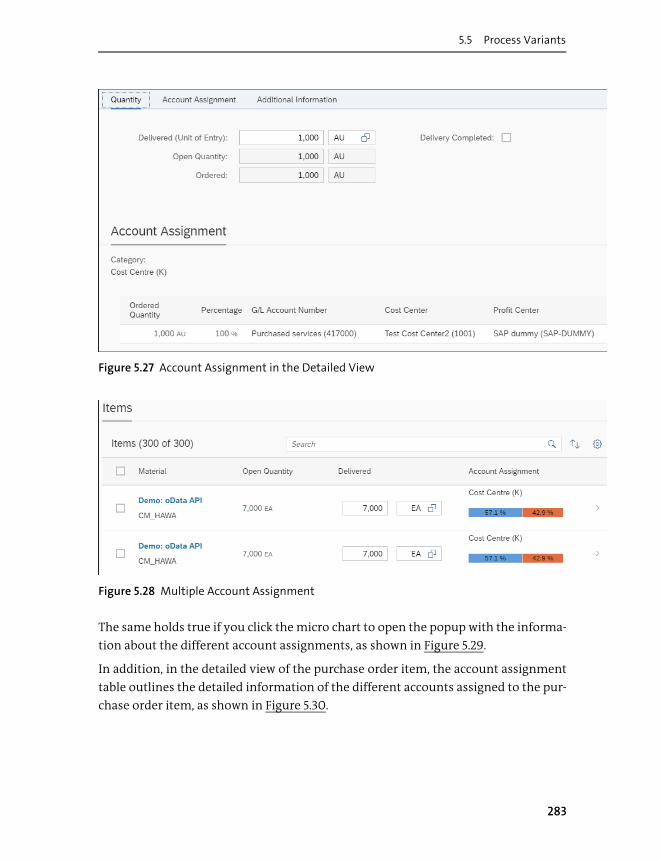
5.5 Process Variants
Figure 5.27 Account Assignment in the Detailed View
Figure 5.28 Multiple Account Assignment
The same holds true if you click the micro chart to open the popup with the informa-
tion about the different account assignments, as shown in Figure 5.29.
In addition, in the detailed view of the purchase order item, the account assignment
table outlines the detailed information of the different accounts assigned to the pur-
chase order item, as shown in Figure 5.30.
283

5 Goods Receipt
Figure 5.29 Popup with Multiple Account Assignments
Figure 5.30 Multiple Account Assignments in Detail View
Note
The account assignment information can be displayed in the Post Goods Receipt for
Purchase Order app in SAP Fiori. Adding or changing accounts isn’t supported as of
the time of writing (summer 2019). In such cases, the SAP GUI-based Post Goods
Movement app might be used instead.
284

5.7 Summary
5.6 What’s Ahead for Goods Receipt?
The goods receipt processing variants discussed in Section 5.5 are supported via
native SAP Fiori apps in SAP S/4HANA as of today. Besides these variants, there are
some more specific matters that aren’t yet supported in these native SAP Fiori apps:
� Serial number processing: Enablement of assigning serial numbers during goods
receipt processing
� Split valuation support: Reflection of valuation type during goods receipt process-
ing so that the related valuation of the different stock data for a certain material
can take place
� Quality certificates: If you request your vendor to deliver a quality certificate, then
the delivery of the quality certificate can be confirmed during goods receipt pro-
cessing
In addition, some movement types aren’t currently supported by native SAP Fiori
apps, such as movement type 107 and 109 for processing of valuated goods receipt
blocked stock and release of the same, respectively. In such cases, the Post Goods
Movement app based on Transaction MIGO must be used.
5.7 Summary
In this chapter, the role-based SAP Fiori apps for goods receipt processing were dis-
cussed for purchase orders, inbound deliveries, production orders, goods receipt
without reference, and process variants.
As of the time of writing (summer 2019), goods receipts might also have to be pro-
cessed with the Post Goods Movement app due to some lacking features in the cur-
rent version of the native SAP Fiori apps.
Beside these feature gaps, the native SAP Fiori apps offer modern and state-of-the-art
capabilities such as integrated navigation (semantic object based, i.e., to the supplier
object page) or increased usability of attachment services. Through the usage of
sophisticated user application presettings, such as preassignment of delivery quan-
tity or presetting of required print output forms, these native SAP Fiori apps make
end users’ daily work easier.
We’ve now looked at SAP S/4HANA applications supporting the flow of goods into
your company. In the next chapter, we’ll take a deeper look at the core inventory
management capabilities.
285

Chapter 6
Core Inventory Management
This chapter gives step-by-step instructions for performing “core”
inventory processes in SAP S/4HANA: inventory monitoring, exception
handling, physical inventory, transfers, scrapping, and so on.
In the previous chapter, we discussed the required steps and available SAP Fiori app
to control the inward flow of goods. After the required goods are received, they have
to be managed accordingly. To do so, we’ll now focus on the core inventory manage-
ment capabilities to manage the available goods.
All material movements take place based on a material document. In this chapter,
we’ll begin with a look at the available SAP Fiori apps to monitor these documents.
We’ll move on to the quantity and value of available materials, and how they are
shared between different stock types, with a discussion of stock identification capa-
bilities. In addition, we’ll see how stock can be moved between different stock types
or organizational entities, such as plants.
Sometimes, new storage locations or plants are set up, which makes an initial entry
necessary, or goods have to scrapped because they reach their shelf-life date or are
damaged. We’ll describe the handling of these special cases in this chapter as well. In
addition, if an incorrect material document posting is made—for instance, you
entered a wrong quantity—you might want to reverse the related material docu-
ment, which is also described in this chapter.
After discussing the physical inventory process and available apps required to keep
the stock and financial information up to date, we’ll conclude by covering what’s
ahead for core inventory.
287

6 Core Inventory Management
6.1 Monitoring Core Inventory Documents
The central entity in inventory management in SAP S/4HANA is the material docu-
ment. For each material movement, a material document is created and stored in the
database to ensure seamless documentation of a company’s stock situation.
The following sections describe in more detail how to monitor the material docu-
ment and the document flow in the different inventory management applications.
6.1.1 Material Document Components
A material document consists of a material document header and related material
document items.
The material document header contains the following information:
� Document Date
� Posting Date
� Created by
� Document Type
� Inventory Transaction Type
� Delivery Note
� Bill of Lading
� Note
On the material document item level, a lot of information is stored that is dependent
on the transaction type (movement type):
� Material Document Number
� Material Document Item Number
� Material Document Year
� Material
� Goods Movement Type
� Quantity
� Plant
� Storage Location
� Stock Type
288

6.1 Monitoring Core Inventory Documents
� Batch
� Customer
� Purchase Order
� Sales Order
Basically, the movement type controls which fields are mandatory to be filled.
6.1.2 Use Enterprise Search to Identify Inventory Documents
The enterprise search functionality is embedded in the SAP Fiori launchpad and pro-
vides a “Google-like” search pattern to easily search for business object instances,
such as a material document. This search also allows a fuzzy search, meaning that the
search term doesn’t necessarily have to be a material document. Plant or material
names can also be search terms for identifying material documents via enterprise
search. You can access enterprise search by clicking on the magnifier icon (see Figure
6.1).
Figure 6.1 Enterprise Search: Magnifier Icon
After the search term is entered (“Plant 1010”, in our example), the related result is
displayed, as shown in Figure 6.2, in a list format, including the total number for
search results. In addition, the value that was found is highlighted by the enterprise
search functionality. Depending on the given user authorizations (part of business
catalogs, see Chapter 3, Section 3.5), navigation targets are provided to the end user. In
general, the search result for the material document provides a navigation to the
Material Document Overview app in SAP Fiori (discussed in the next section) for
accessing more detailed information about the material document, such as account-
ing assignment information that isn’t given in the search result list directly. The
search result for the material document is based on the material document header
data. The fields used for searching the material document also include important
fields related to the material document item (see previous list), such as material,
plant, or storage location.
289

6 Core Inventory Management
Figure 6.2 Material Document Search Result
Usually, productive systems contain a lot of material documents up to a high triple-
digit million number of material documents. Therefore, sometimes the search pro-
vides a broad amount of material documents as a search result. To find the relevant
data, the search framework provides additional drilldown and filter capabilities
based on the given search result, as shown in Figure 6.3.
By just clicking on the relevant filter criteria (left-hand side of the screen), such as
Company Code or Plant, the search result can be narrowed down to a reasonable
result set.
After the relevant search result is found, you can get a more detailed view of the
material document by navigating to the material document object page, which is
part of the Material Documents Overview app described in the next section.
290

6.1 Monitoring Core Inventory Documents
Figure 6.3 Filters for the Search Result
6.1.3 Material Documents Overview
The Material Documents Overview app (F1077) in SAP Fiori is the central method for
accessing material document information. The app can be started standalone from
the related tile on the SAP Fiori launchpad home screen. In this case, the app is started
with a filter bar so that you can select the required material documents according to
your needs. The filter fields shown in Figure 6.4 can be adapted according to your
needs via the Adapt Filters functionality. Click the Adapt Filters button to open the
related popup in which you can choose additional filter fields. The adjusted filter bar
settings can also be saved as variants so that every time you start the application, the
relevant filter fields are displayed directly.
291

6 Core Inventory Management
Figure 6.4 Filter Bar
As described in the preceding chapters, the movement type is one central attribute
controlling the relevant information and fields of a material document. The move-
ment type is a three-digit number, for example, 101 for goods receipt. A lot of move-
ment types exist in the system, so it might be hard at times to remember the right
movement type that you’re searching for. Therefore, the Stock Change filter was
introduced in SAP S/4HANA that combines categories of movement types with
regards to their stock impact, as shown in Figure 6.5:
� No Stock Change
Material document postings that don’t change the stock level (e.g., goods move-
ment type 340, batch revaluation).
� Stock Decrease
Material document postings that lower the stock level (e.g., goods movement type
201, goods issue to cost center).
� Stock Increase
Material document postings that increase the stock level (e.g., goods movement
type 101, goods receipt).
� Transfer Posting
Material document postings within an issuing and receiving organizational unit
(e.g., goods movement type 311, one-step storage location to storage location).
Figure 6.5 Stock Change Filter
292

6.1 Monitoring Core Inventory Documents
After the right filter values are set and you click the Go button, the system outlines
the related material documents, as shown in Figure 6.6. The columns displayed in the
result list can be adjusted to your needs via the table settings feature by clicking the
gear icon at the top of the results table.
Note
The result list shows one line per material document item. This means if the material
document contains two items, both are outlined in the result if the search criteria
meet both material documents’ items.
The example in Figure 6.6 shows the breakdown of material documents items for
Material Document 4900008750.
Figure 6.6 Material Document Result List
You can navigate to the material document object page by selecting one of the mate-
rial document items.
In the header of the material document object page, the related material document
number and the material document year are shown. In addition, information about
reversed items is displayed here (see Figure 6.7). More information about how a mate-
rial document can be reversed is provided in Section 6.5.
Figure 6.7 Object Page Header
293

6 Core Inventory Management
The material document object page consists of four different tabs:
� General Information
This tab was already described at the beginning of the chapter and provides the
material document header data.
� Items
This tab offers the related material document item information. For the given
example of material document 4900008750, this means that four material docu-
ment items are displayed in a table format, as shown in Figure 6.8. In addition, this
table’s columns can be adjusted via the gear icon at the top of the table.
Figure 6.8 Object Page Item List
A detail page for each material document can be accessed by clicking on a material
document item.
Beside the header information of the material document number and material
document number item, the detail page contains two tabs. The Output Manage-
ment tab, shown in Figure 6.9, offers information if the material document items
included an output-related activity such as a print form or an email. The related
output can be displayed accordingly.
Figure 6.9 Output Management Tab in the Material Document Item Detail Page
In addition, a tab with more detailed Accounting information is given, as shown in
Figure 6.10. Here, you can find the related financial accounting information for the
general ledger account and cost center, for instance.
294

6.1 Monitoring Core Inventory Documents
Figure 6.10 Accounting Tab in the Material Document Item Detail Page
� Process Flow
In this tab, you gain a graphical illustration of the predecessor and successor busi-
ness documents of the current material document. We’ll walk through it in detail
in the next section.
� Attachment
This tab shows the attached items of the material document (see Figure 6.11). It’s
possible to display the attached items in detail, attach additional items, or remove
existing ones.
Figure 6.11 Attachment Tab
Material Documents Overview is the central application of inventory management
in SAP S/4HANA due to the importance of the material document entity. Therefore,
the material document object page can also be reached via direct navigation from
several apps on the SAP Fiori launchpad. To give a simple example, look at Chapter 5,
where we considered the different SAP Fiori-based goods receipt processes. If a goods
receipt is successfully posted in the system, and the related material document is cre-
ated accordingly, the system shows a popup outlining the newly created material
document, as shown in Figure 6.12.
295

6 Core Inventory Management
Figure 6.12 Success Popup with Material Document Number
Included in this popup is an implicit navigation that leads you directly to the mate-
rial document object page without displaying the initial filter bar so that the material
document information is directly displayed.
This navigation is based on the MaterialMovement sematic object so that it’s centrally
embedded in the SAP Fiori launchpad. This also enables apps that aren’t part of the
inventory management area to provide a navigation to the material document
object page. You must have sufficient authorization to display material documents,
however.
6.1.4 Analyze the Document Flow via the Material Document Object Page
While the material document is a rather central entity in the system, from a business
process perspective, there are several possible predecessors and successors (also
called follow-up documents) of a material document.
A predecessor document of a material document could be a purchase order or a deliv-
ery for instance. After a goods receipt is posted, and the related material document is
created, the material document contains the information about the predecessor doc-
ument.
Inventory management in SAP S/4HANA automatically triggers the creation of the
required successor documents, such as relevant accounting documents.
The Material Documents Overview app, which we discussed in the previous section,
offers a graphic illustration of the business process document flow in the Process
Flow tab.
The process flow contains separate steps for each relevant predecessor and successor
document, such as accounting documents that include the document number to
give the user a context of the given material document, as shown in Figure 6.13.
296

6.1 Monitoring Core Inventory Documents
Figure 6.13 Process Flow
In addition, the functionality of the process flow and the related business documents
isn’t restricted to just displaying the related documents. It also provides an embed-
ded navigation in the SAP Fiori launchpad that you can access by simply clicking on
the business document, as you can see in Figure 6.14.
Note
A display authorization is required for the business document in the process flow to
be enabled for using the related navigation target.
In general, the business process flow provides a comprehensive process and process
steps view, including the environment of the chosen material document, in a graph-
ical way.
297

6 Core Inventory Management
Figure 6.14 Navigation Out of the Process Flow
6.2 Stock Identification
One of the most critical and important functionalities of inventory management is
to provide up-to-date and accurate information regarding a company’s stock situa-
tion as the basis for daily work.
The current stock and the stock level over time for different reporting dates and time
frames might be of interest. Supplementary stock values may also help in making the
right decisions. Finally, all these figures have to be provided in a timely and perfor-
mant manner.
Note
It’s important to distinguish the daily stock information requirements faced by the
warehouse clerk and inventory manager, which are described in this chapter, from
the requirements faced by an inventory analyst. These analytical requirements are
described in Chapter 8.
298

6.2 Stock Identification
In this section, we’ll walk through how to identify stock using key SAP Fiori apps for
both a single material and multiple materials, before discussing the stock overview.
6.2.1 Stock – Single Material
The Stock – Single Material app (F1076) provides a view of the stock situation for a sin-
gle material. The stock types that can be accessed by this app are configured in data-
base table T200A, as shown in Figure 6.15. If an entry for a stock type is given in the
table, the SAP Fiori app provides the related column to be displayed in the results
table. So, if you want to hide a certain stock type permanently because it’s never used
in your company, you can simplify the SAP Fiori app output by removing (or not add-
ing) the related stock type in table T200A. The mechanism of table T200A and its entries
are used in several SAP Fiori apps for inventory management. For each app, we’ll
mention whether it makes use of the table T200A mechanism. You can access the data
maintenance of table T200A by running Transaction SM30 in your SAP S/4HANA
backend and entering “T200A” as the maintenance object.
Figure 6.15 Table T200A Entries for Stock Types
After opening the app from the SAP Fiori launchpad, enter the material you want to
check the stock situation for, as shown in Figure 6.16.
The app offers type-ahead search and standard value help for getting the required
material out of the system. Of course, the app can also be started via SAP Fiori launch-
pad navigation. In this case, a material is passed as a parameter, and the application
directly loads the stock figures for the material.
299

6 Core Inventory Management
Figure 6.16 Material Input Field
When the material is entered, the application provides some general header data of
the material, such as material number, material name, material type, and base unit of
measure, as shown in Figure 6.17.
Figure 6.17 Material Header Data
Below the header data, the stock figures are provided in a hierarchical view (see
Figure 6.18). The organizational levels plant and storage location are provided in the
table.
Figure 6.18 Stock Figures on the Plant Level
The storage location level can be expanded or collapsed via the arrows at the top of
the results table, providing the view shown in Figure 6.19. A search functionality is
also provided if the material has a wide variety of organizational assignments to
plants and or storage locations so that you can easily find your best fitting result.
300

6.2 Stock Identification
Figure 6.19 Stock Result Expanded to the Storage Location Level
If a batch will be assigned to the material, its batch name is provided in a separate col-
umn after the Storage Location column. The columns of the different stock types can
be adjusted according to your needs via the gear icon at the top-right of the table. This
setting allows you to decide, per stock type, if the related stock type should be shown
in the results table and if it should be shown in the micro chart of the Stock History.
In addition, the app provides three general settings via the application settings in the
Me Area that you can adjust to get a more focused view on the stock figures:
1. Expand list by default
If this setting is active, the organizational entities are expanded in the results table
once the data is loaded.
2. Hide all empty columns
If this setting is active, stock types with an empty result for all organizational enti-
ties are hidden.
3. Hide all empty rows
If this setting is active, rows with an empty result are hidden.
The given stock figures are determined with the current date as the reporting date
when the material is selected. If you need to get the stock figures from the past to a
certain date, you just change the Reporting Date to the required date in the past. The
system then determines the historical stock figures. If the Reporting Date is left
empty, the final stock of the current posting period is determined.
301

6 Core Inventory Management
In addition, you might need to convert the stock figures to a different unit measure
by changing the Unit Of Measure. Only the unit of measure in the same dimension
and the parallel units of measures that are maintained in the material master record
are provided as alternatives to the base unit of measure. Both capabilities are
included in the header of the results table as illustrated in Figure 6.18.
The app not only provides the stock figures as numbers but also contains a Stock His-
tory chart outlining the stock level for the different stock types for the last year. This
chart includes 12 different data points, one each for every month in the past year,
starting from the given reporting date.
If you don’t rely on the stock figures and require a more graphical view, the results
table can be toggled into a stock chart by selecting the upper right-hand icon, depict-
ing the different stock types in chart, as shown in Figure 6.20.
Figure 6.20 Chart View of Stock Figures
By clicking on the Stock History chart in the last column of the results table, you
access more detailed stock information of the selected item, as shown in Figure 6.21.
A popup window provides the stock figures as a chart with the different stock types
and allows you to select data points in the graphic for a deeper drill down.
302

6.2 Stock Identification
Figure 6.21 Stock History Chart
The Stock History chart not only contains the drilldown feature but also offers an SAP
CoPilot integration by clicking the Add to Co-Pilot button shown in Figure 6.22 so that
you can share the given information within your inventory management team. In
this case, the team members can access the same chart and drilldown level by just
selecting the shared information in the SAP CoPilot team chat. For more about SAP
CoPilot, see Chapter 1, Section 1.4.3.
303

6 Core Inventory Management
Figure 6.22 Drilling Down to Material Documents in the History Chart
With this drilldown functionality, you can step down into the selected data point and
break down the stock information into the different days in the past and the under-
lying material documents that cause certain stock situations you want to analyze.
The navigation to the Material Documents Overview app is also embedded in the
stock history chart (the Show Material Document button) so that you can directly
navigate further to the material document object page to gain more insight into the
material document in question or just add the material document to SAP CoPilot for
sharing it with your inventory management team.
304

6.2 Stock Identification
6.2.2 Stock – Multiple Materials
In comparison to the Stock – Single Material app just discussed, the Stock – Multiple
Materials app (F1595) provides a filter bar with a wide variety of possible filter values
beyond the Material Number and Plant filters. Figure 6.23 depicts the filter fields of
the standard variant. Of course, you can add additional filter fields by using the Adapt
Filters functionality, as we discussed in Section 6.1.3. Same as before, fill in the filter
for Reporting Date to determine the key date for which the application displays the
stock information.
Figure 6.23 Filter Bar of the Stock – Multiple Materials App
Click the OK button to see the standard results table, which is based on the standard
SAP Fiori table control and provides a more detailed granular result set regarding attri-
butes, as shown in Figure 6.24. In addition, standard table features, such as grouping,
sorting, and exporting to Excel, are supported. In comparison to the Stock – Single
Material app, no graphical information is provided in this application.
Figure 6.24 Result List with Stock Figures
305

6 Core Inventory Management
Besides the stock information in Stock – Multiple Materials, you can also provide
stock value information for the different stock types. Figure 6.25 shows the supported
stock values that can appear as columns in the results table. The screen can be
accessed by clicking on the gear icon in the upper-right corner of the table. Select the
stock value you want to display, and click OK to see the screen shown in Figure 6.26.
Figure 6.25 Configuration of Different Stock Values
Figure 6.26 Result List That Includes Stock Values
306

6.2 Stock Identification
Stock values can be provided in different currencies because the result set shows
cross-plant stock information and values. If these plants are assigned to different
company codes, which might have different currencies, the result set can provide
more than one currency.
In this case, the SAP Fiori app automatically provides a detailed view breaking down
the different stock values for the given currency of the stock values, as shown in
Figure 6.27. You can access this by clicking the Show Details option at the lower-left
corner of the screen.
Figure 6.27 Stock Values Listed by Currency
Note
Initially, in the standard display, the stock value filters and columns in the results
table are hidden and have to be added manually to be displayed. This setting can be
saved as an individual variant afterward.
More details about how stock values are calculated are provided in Chapter 8, Section
8.1.1 for value-based analytics and the related organizational units in Chapter 3, Sec-
tion 3.1.2.
6.2.3 Display Stock Overview
The Display Stock Overview web-based SAP GUI app is based on Transaction MMBE.
This app’s stock information overview provides some more information, like the
native SAP Fiori apps do, for special cases (e.g., reservations).
307

6 Core Inventory Management
After you’ve opened the Display Stock Overview app in the SAP Fiori launchpad
(based on Transaction MMBE), fill out your Database Selections, as shown in Figure
6.28. This includes your Material, Plant, Storage Location, and Batch, if applicable.
Figure 6.28 Stock Overview Selection Criteria
The remaining criteria to fill out are shown in Figure 6.29. With this more detailed
selection criteria, the list output can be adjusted to your needs. In this example,
entries with zero stock quantity are hidden to optimize the list output by checking
the No Zero Stock Lines box.
Figure 6.29 Stock Overview Detailed Selection Criteria
308

6.3 Stock Transfer
To access the results, click Execute. The application result header contains the stan-
dard material information and allows you to change the Unit of Measure in which the
stock information is displayed, as shown in Figure 6.30.
Figure 6.30 Stock Overview Result Header
Like the SAP Fiori stock information apps, the Stock Overview app shows the differ-
ent stock figures for the different stock types. In addition, reservations available for
the given material are shown in this application. More information about material
reservations is provided in Chapter 7, Section 7.1.
In addition, the result set contains information about stock that isn’t managed by
inventory management directly, such as On-Order Stock, as shown in Figure 6.31.
Figure 6.31 Different Stock Types in the Display Stock Overview App
Let’s move on to the material movements and related postings available in SAP
S/4HANA with a focus on native SAP Fiori apps.
6.3 Stock Transfer
We’ll begin with stock transfers. The essence of each stock transfer posting is that two
organizational units are affected by the material posting so that an issuing and a
309

6 Core Inventory Management
receiving organizational unit are involved. The issuing organizational unit is the
place where the goods are taken from, and the receiving organizational unit is where
the goods are received.
Generally, transfer postings might occur between two storage locations in the same
plant (discussed in Section 6.3.1). Materials stock transfer between plants is covered in
Section 6.3.2. Stock transfers with materials that have certain attributes to take care of
(e.g., serial numbers) which aren’t yet supported in the native SAP Fiori apps have to
be performed with the Post Goods Movement web-based SAP GUI app, which is
described in Section 6.3.3. Finally, transfer postings might need a stock transfer order
as a reference document, which is discussed in Section 6.3.4.
6.3.1 Stock Transfer – In-Plant
The Stock Transfer – In-Plant app (F1061) opens after you click the Stock Transfer – In-
Plant tile. Select your Material and Plant, as shown in Figure 6.32.
Figure 6.32 Transfer Stock – In-Plant App: Material and Plant Information
After you select the material, a micro chart showing the material master information
for three major stock types appears, as shown in Figure 6.33:
� Unrestricted-Use Stock
� Blocked Stock
� Stock in Quality Inspection
A calculation of an important inventory key performance indicator (KPI) is included
in the header by calculating the range of coverage on the fly when the material is
selected. In the given example, the range of coverage is calculated with 870 days. This
feature is an example of embedded analytics, which are part of transactional applica-
tions, and outlines one major benefit of SAP S/4HANA and SAP Fiori apps.
The transfer posting within the same plant is based on a touch-enabled usability con-
cept by providing buttons for selecting the source and target storage location. This
enables the app to be easily used on mobile devices.
310

6.3 Stock Transfer
Figure 6.33 Header with Range of Coverage KPI
After you enter the Material and Plant, the results table is shown (see Figure 6.34) and
contains all storage locations and their stock information for the selected plant and
material combination. In addition, an overall sum of each stock type is shown at the
end of each column.
Figure 6.34 Results Table Including Touch-Based Transfer Posting
The columns for the stock types are based on the configuration in table T200A. If a
stock type is maintained in table T200A, the related column is displayed accordingly.
A result line for a storage location is shown when the material master record for the
material is already maintained for the storage location. If the material master record
isn’t maintained accordingly yet, the application offers a Add Storage Location fea-
ture to select storage locations that aren’t assigned to the material in the material
master record as of now. Click Add Storage Location (top of table) to access the Select
Storage Location screen shown in Figure 6.35, and select the appropriate checkbox.
With the first material movement into this storage location, the material master
record is updated automatically. As a prerequisite, you must set the Create Storage
Location Automatically option in Customizing. In this setting, you can define
whether this feature should be enabled on the plant and/or storage location level.
311

6 Core Inventory Management
Figure 6.35 Creating the Storage Location Assignment Automatically
Note
This setting is available in SAP S/4HANA as an IMG activity and in SAP S/4HANA
Cloud as Self-Service Configuration UI (SSCUI). Refer to Chapter 3, Section 3.1.3, for
more details about the Create Storage Location Automatically setting.
Now let’s discuss how a transfer posting is performed. As described, the results table
contains buttons for selecting the sending storage location. You just have to click the
related button as outlined in Figure 6.36. After the selection is made, the button is
marked as active and the allow transfer posting target buttons are kept active so that
you can select the target location by just selecting the second button.
The selection of the button implicitly includes the selection of a certain movement
type because the button is located in a specific column for a certain stock type (in the
Unrestricted-Use Stock column, in our example).
312

6.3 Stock Transfer
Figure 6.36 Transfer Posting by Button Selection
After the target storage location is selected (second button clicked), a popup appears
containing the input fields for required information for the material movement, as
shown in Figure 6.37. Enter your Quantity and date information (Document Date and
Posting Date) in the mandatory fields.
Figure 6.37 Input for Transfer Posting
If you choose the wrong direction for the storage locations, you can just exchange the
target and source storage location by using the exchange button (the two arrows) in
the middle of the popup screen.
This app supports special stock types such as E (orders on hand), K (vendor consign-
ment), and Q (project stock). The selection of the special stock happens implicitly
313

6 Core Inventory Management
when a source storage location is chosen via the popup, which only appears when the
stock contains special stock, as shown in Figure 6.38.
Figure 6.38 Special Stock Popup
Special transfer postings in the same storage location but between the same special
stock indicators are also possible: from E to E or from Q to Q. The related information
for the special stock type, such as a sales order item for special stock type E, can be
entered in the posting popup. The related fields are displayed based on the chosen
special stock.
6.3.2 Transfer Stock – Cross-Plant
The Transfer Stock – Cross-Plant app (F1957) is structured in a similar way as the
Transfer Stock – In-Plant app. However, in this app, the Plant filter isn’t available. You
only need to choose a Material, as shown in Figure 6.39.
Figure 6.39 Material Selection
Once you select the material, the app loads the related data and provides stock fig-
ures for the most important stock types in the app header via a micro chart, as shown
in Figure 6.40.
314
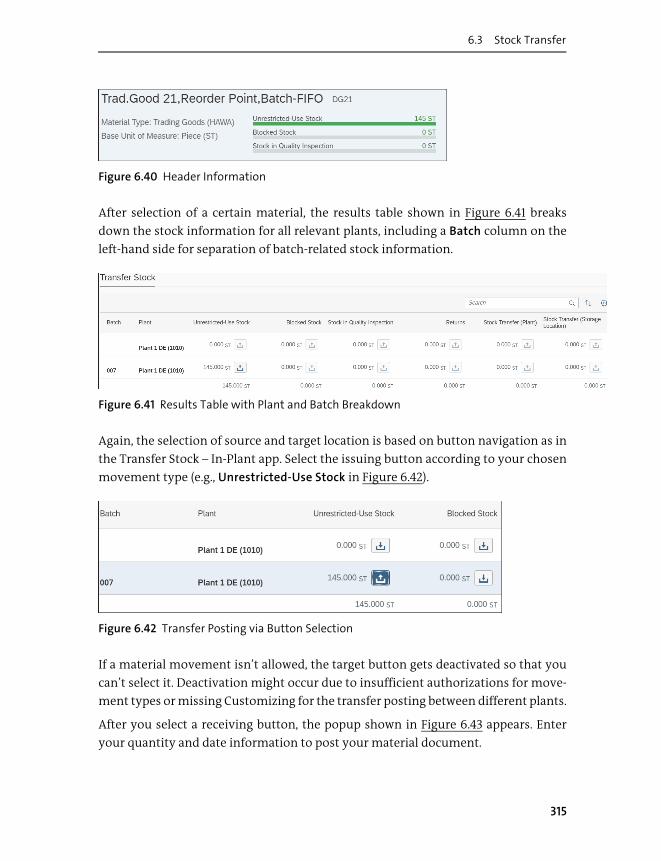
6.3 Stock Transfer
Figure 6.40 Header Information
After selection of a certain material, the results table shown in Figure 6.41 breaks
down the stock information for all relevant plants, including a Batch column on the
left-hand side for separation of batch-related stock information.
Figure 6.41 Results Table with Plant and Batch Breakdown
Again, the selection of source and target location is based on button navigation as in
the Transfer Stock – In-Plant app. Select the issuing button according to your chosen
movement type (e.g., Unrestricted-Use Stock in Figure 6.42).
Figure 6.42 Transfer Posting via Button Selection
If a material movement isn’t allowed, the target button gets deactivated so that you
can’t select it. Deactivation might occur due to insufficient authorizations for move-
ment types or missing Customizing for the transfer posting between different plants.
After you select a receiving button, the popup shown in Figure 6.43 appears. Enter
your quantity and date information to post your material document.
315

6 Core Inventory Management
Figure 6.43 Transfer Posting Popup
The stock transport order settings for this app are described in Section 6.3.4.
6.3.3 Post Goods Movement
In SAP S/4HANA, the Post Goods Movement web-based SAP GUI app, based on Trans-
action MIGO (or in this case, Transaction MIGO_TR), is available for processing stock
transfer postings.
Some features, such as support for serial numbers, aren’t available in the preceding
SAP Fiori app. In this case, the Post Goods Movement web-based SAP GUI app can be
used instead.
The web-based SAP GUI app renders the SAP GUI transaction in a browser HTML envi-
ronment. Execute the Post Goods Movement app from the SAP Fiori launchpad
(Transaction MIGO) to access the app entry screen shown in Figure 6.44.
316
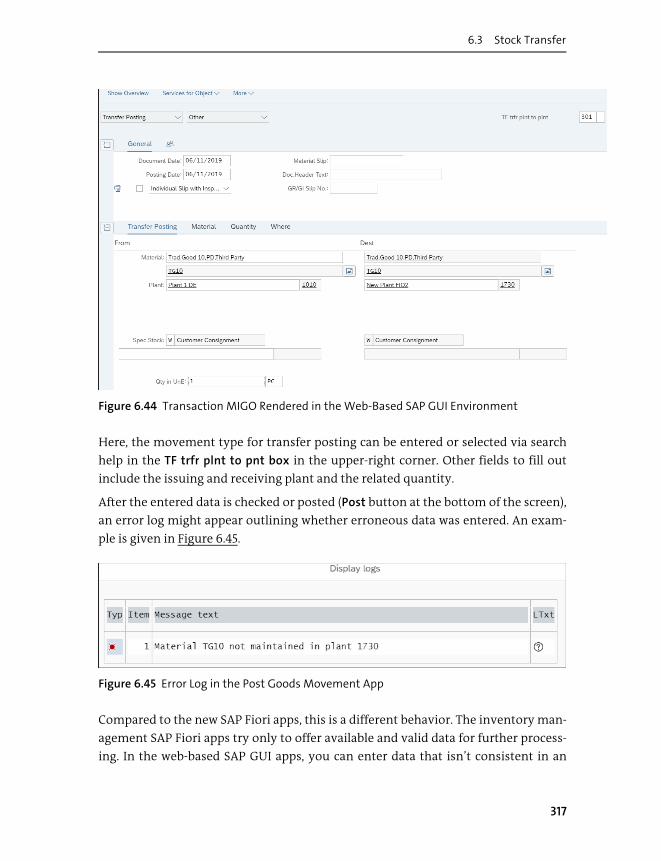
6.3 Stock Transfer
Figure 6.44 Transaction MIGO Rendered in the Web-Based SAP GUI Environment
Here, the movement type for transfer posting can be entered or selected via search
help in the TF trfr plnt to pnt box in the upper-right corner. Other fields to fill out
include the issuing and receiving plant and the related quantity.
After the entered data is checked or posted (Post button at the bottom of the screen),
an error log might appear outlining whether erroneous data was entered. An exam-
ple is given in Figure 6.45.
Figure 6.45 Error Log in the Post Goods Movement App
Compared to the new SAP Fiori apps, this is a different behavior. The inventory man-
agement SAP Fiori apps try only to offer available and valid data for further process-
ing. In the web-based SAP GUI apps, you can enter data that isn’t consistent in an
317

6 Core Inventory Management
attempt to process the data; you’re only warned or stopped after entering all data and
trying to check/post your input.
6.3.4 Working with Stock Transport Orders
In the Transfer Stock – Cross Plant app, you can post transfer postings between differ-
ent plants. From a business perspective, there are several ways to do this. The direct
posting is possible without a stock transport order, as described in Section 6.3.2.
Transfer posting can also be based on a stock transport order, which is a business doc-
ument containing all relevant information about the stock transfer that acts as a
hook for dependent business objects, such as delivery or accounting. The Transfer
Stock – Cross Plant app also allows the creation of a stock transport order via the Cre-
ate Stock Transport Order button shown in the posting popup in Figure 6.46.
Figure 6.46 Stock Transport Order Creation
The button becomes active if the Customizing for the involved plants is present. For
the related Customizing settings, refer to Chapter 3, Section 3.1.4.
318

6.3 Stock Transfer
In addition, in the Application Settings shown in Figure 6.47, a machine learning
functionality can be activated that enables the delivery date to be forecasted and pre-
filled with a proposal provided by the predictive model. Check both boxes to activate
this feature.
Figure 6.47 Predictive Forecast Delivery Date
Figure 6.48 shows the stock transport order process in SAP S/4HANA, which supports
the internal movement of one material from one plant to another. Several variants of
the process exist. They all have in common that the process is initiated by a stock
transport order as the special type of purchase order and is completed by a goods
receipt. During the process, the inventory stock has the stock in transit stock type
(see Chapter 2, Section 2.1). Stock transport orders can be created automatically by
material requirements planning (MRP) runs or manually by end users (see Chapter 7,
Section 7.1).
Figure 6.48 Stock Transport Order Process and Timeline
For creation and monitoring, it’s crucial to know whether the stock transport order
process timeline is on track or delayed. SAP S/4HANA contains a predictive model,
which can be trained based on completed stock transport orders to predict the dura-
tion of future stock transport orders.
Creation of StockTransport Order
Creation ofDelivery
Goods Issue Goods Receipt
Delivery Date
Plant 0001 Plant 0002
Track Various Steps with Documents Posted in SAP S/4HANA
Move Material A from One Plant to Another
Days in Transit
Picking/Packingin Warehouse
319

6 Core Inventory Management
Figure 6.49 shows the Predictive Models app to manage training of the predictive
models. Training, retraining, and activation are carried out centrally within this
application. You can create multiple versions of one model by training, but only one
can be the active version.
Figure 6.49 Predictive Model Overdue Stock in Transit: Training Overview
To train a model, click the Train button on the left side of the screen shown in Figure
6.49. Afterwards, your trained model appears on the right side with the Trained status
(not shown).
Figure 6.50 shows a training run’s results.
Figure 6.50 Predictive Model Overdue Stock in Transit: Training Results
320
6.4 Initial Entry and Scrapping
You enter the training result screen by clicking on a model version shown in Figure
6.49. Besides administrative data, the quality of the training run is indicated, and the
Key Influencers (model attributes that contributed most to the training results) are
shown.
After posting by clicking Create Stock Transport Order, a stock transport order is cre-
ated accordingly by the Transfer Stock – Cross Plant app.
These stock transport order can be monitored with a special Overdue Materials –
Stock in Transit app (F2139), which we’ll introduce in Chapter 8, Section 8.4.3.
6.4 Initial Entry and Scrapping
Initial entry and scrapping are two special cases in inventory management. Initial
entries are often used to set up the stock information for new plants or storage loca-
tions. During normal business, initial entries should be avoided because they are
nontransparent from a goods movement perspective.
Scrapping is used if a material is damaged or has reached its shelf life date to take it
out of stock with a material document as reference. In SAP S/4HANA, there are two
different applications available to post a scrapping for a certain material.
Both the SAP Fiori Manage Stock app (F1062) and the Post Goods Movement web-
based SAP GUI app (Transaction MIGO) provide scrapping functionality, depending
on your requirements. As of the time of writing (summer 2019), the Manage Stock
app allows a single posting per material only. If you want to post scrapping or initial
entries for more than one material at once, you must use the Post Goods Movement
app to post material documents with more than one material document item.
We’ll take a look at both apps in this section.
6.4.1 Manage Stock
The Manage Stock app in SAP Fiori has a similar layout to the Transfer Stock – In-Plant
app, which we discussed in Section 6.3.1. First a Material/Plant combination has to be
selected, as shown in Figure 6.51.
321

6 Core Inventory Management
Figure 6.51 Input of Material and Plant
After material selection, the material header data is displayed as shown in Figure 6.52.
Graphical stock information is shown as a micro chart for three important stock
types. Additionally, the Range of Coverage in Days KPI is calculated on the fly based
on the material consumptions of unrestricted-use stock in the past 30 days.
Figure 6.52 Material Header Data, Including the Range of Coverage KPI
After the material is selected, the results table shown in Figure 6.53 breaks down the
stock information on the storage location level for the given plant and provides a
button per stock type to take action. Again, the displayed stock type columns are con-
trolled via the settings in table T200A.
Figure 6.53 Selection of Material via Button
Clicking the button for a certain stock type in a storage location opens a popup, as
shown in Figure 6.54, which offers different stock change capabilities.
322

6.4 Initial Entry and Scrapping
Figure 6.54 Posting Popup with the Stock Change Field
Depending on your authorizations, the Stock Change dropdown list contains the
allowed stock change activities for certain movement types, as shown in Figure 6.55:
� 551: Scrapping from unrestricted-use stock
� 553: Scrapping from quality inspection stock
� 555: Scrapping from blocked stock
� 561: Initial entry of stock – unrestricted-use stock
� 563: Initial entry of stock – quality inspection stock
� 565: Initial entry of stock – blocked stock
Figure 6.55 Selection of Stock Change Type
In addition, a Reason Code for the material movement posting can be selected, as
shown in Figure 6.56, and is stored in the related material document.
323

6 Core Inventory Management
Figure 6.56 Selection of Reason Code
Note
Reason codes can be defined in the following IMG activity: Materials Management •
Inventory Management and Physical Inventory • Movement Types • Record Reasons
for Goods Movements. They are also available as SSCUIs in SAP S/4HANA Cloud.
After clicking Post, the related material document is created, and the material docu-
ment number is shown in a Success popup, providing a link navigation to the mate-
rial document object page and an Add to Co-Pilot icon next to the creation message,
as shown in Figure 6.57. If the storage location is managed via warehouse manage-
ment, an outbound delivery is created instead of a material document, as in our
example.
Figure 6.57 Successful Posting of Initial Entry
6.4.2 Post Goods Movement
To post a scrapping with the Post Goods Movement app, you must be aware of the
required movement type. In the entry screen of the Post Goods Movement app,
shown in Figure 6.58, enter the movement type in the GI scrapping field (“551”, in our
example).
324

6.5 Reversals
Figure 6.58 Entering the Movement Type
Press (Enter) to arrive at the screen shown in Figure 6.59. Here, you can enter the
Material and plant information.
Figure 6.59 Material Information
Next, click the Where tab to arrive at the screen displaying the plant information
shown in Figure 6.60. Enter the Plant, Storage Location, and quantity in the Quantity
tab, and post your scrapping by clicking Post.
Figure 6.60 Plant Information
6.5 Reversals
If a material document must be reversed, you can choose between the native Mate-
rial Documents Overview app in SAP Fiori and the Post Goods Movement web-based
SAP GUI app. We’ll discuss both applications in this section.
325

6 Core Inventory Management
6.5.1 Reversals within the Material Document Object Page
In the Material Documents Overview app in SAP Fiori, you can reverse the whole
material document or even just single material document items.
To do so, select a material document, and navigate to the material document object
page (refer to Section 6.1.3 for details). In the header information, the material docu-
ment item status is shown as described in Section 6.1.3 (refer to Figure 6.7).
In the header of the material document object page, the Reverse action (upper-right
corner) is provided. Click the Reverse button, and a popup is shown asking you to
select the reversed material document items. Enter the Posting Date and an Addi-
tional Note, if necessary (see Figure 6.61).
Figure 6.61 Material Document Reverse Popup
6.5.2 Partial Material Document Reversal
In the Post Goods Movement web-based SAP GUI app, a material document or its
items can be reversed by selecting the material document items in the table view
after the material document is selected. To access the table view shown in Figure 6.62,
choose Cancellation in the dropdown, and enter the related material document.
Select the line with the material you’d like to reverse, and then click Post.
Figure 6.62 Reversal of a Material Document
326

6.6 Physical Inventory
6.6 Physical Inventory
Inventory management is one of the essential building blocks of a company’s busi-
ness, especially regarding the current stock situation. Goods kept in stock reflect an
essential part of a company’s possessions. Therefore, it’s crucial that the overview of
the current stock figures is always up to date so that business decisions are based on
current and accurate stock figures. Along with stock figures, the financial impact of
the stock (meaning the stock value) must also be accurate. In the daily business of
warehouse tasks in inventory management, the stock information might deviate
from the real stock figures for many reasons. For instance, a material might have
exceeded its total shelf life or might be damaged due to breakage. If the real stock fig-
ures deviate from the figures present in the system, all dependent business processes
are using inaccurate stock figures (MRP, available-to-promise [ATP], etc.). Therefore,
maintaining the most accurate stock figures in the system is crucial, and, of course,
legal reasons might also drive different physical inventory processes.
In SAP S/4HANA, the following different physical inventory process flavors are sup-
ported:
� Periodic inventory
Generally, periodic inventory is done once a year (i.e., end of the year or business
year). This variant is chosen by most companies.
� Continuous inventory
Continuous inventory is commonly used in relationship with warehouse manage-
ment systems, and the counting is carried out at different times in the course of
the business year.
� Cycle counting
During cycle counting, inventory materials are counted in periodic cycles based
on the classification of the cycle counting indicator, which we introduced in Chap-
ter 3, Section 3.1.3.
� Sampling
The sampling inventory is a subset of the cycle counting inventory process and
takes a considerable amount and a number of kinds of companies’ materials into
account. The rest of the materials aren’t counted, but the result of the counted
ones is extrapolated to those materials.
In this section, we’ll discuss the physical inventory process steps for these
approaches and walk through each in detail with their corresponding apps.
327

6 Core Inventory Management
6.6.1 Physical Inventory Phases
For all these different physical inventory approaches, similar main phases have to be
performed to get the stock figures checked and updated, as shown in Figure 6.63.
Figure 6.63 Physical Inventory Process Steps
This rough overview is given because often these different phases are also reflected in
the user setup of the SAP system to distinguish the users who are allowed to count
and post the differences, for instance, due to legal reasons.
In the preparation phase, a decision must be made regarding which materials will be
counted for which plant and storage location. Overall, physical inventory can be per-
formed for the following stock types (see Chapter 2, Section 2.1):
� 01 – Unrestricted use stock
� 02 – Quality inspection stock
� 03 – Return stock (without special stock types)
� 04 – Stock in transfer at storage location level (without special stock types)
� 05 – Stock transfer stock at plant level
� 06 – Stock in transit
� 07 – Blocked stock
� 08 – Restricted stock
� 09 – Tied empties stock (without special stock types)
� 10 – Valuated goods receipt blocked stock
For the different physical inventory process steps, certain apps are available. In Sec-
tion 6.6.1 and Section 6.6.2, we’ll focus in more detail on the native SAP Fiori apps
available for physical inventory in inventory management. Let’s start with a high-
level look at all available physical inventory applications, including the web-based
SAP GUI applications:
Prepare
• Create physical inventory document
• Lock material posting
• Print physical inventory document
Evaluate
• Record count results in the system
• Initiate recount
• Post differences
Count
• Count
• Note results
328

6.6 Physical Inventory
� Prepare phase
– Create physical inventory documents
� Web-based SAP GUI application Transaction MI01 (and Transaction MI02 for
changes)
� SAP Fiori app: Create Physical Inventory Documents (F3197)
� Count phase
– Enter physical counts
� Web-based SAP GUI application: Enter Count Results (Transaction MI04)
� Transaction MI24 (Physical Inventory List)
� SAP Fiori app: Create Physical Inventory Documents
� Evaluate phase
– Report differences
� Transaction MI20 (List of Inventory Differences)
– Post inventory documents
� Transactions MI07 (Post Inventory Differences) and MI24 (Physical Inven-
tory List)
� SAP Fiori app: Create Physical Inventory Documents
If a recount is required, the related recount sheets can be printed with Transaction
MI11 (also possible with Transactions MI04 and MI24).
In addition, some shortcuts are available to combine different process steps:
� Posting the count result without reference to the physical inventory document
The physical inventory document is implicitly created when the count result is
posted.
� Posting stock differences without reference to the physical inventory document
The physical inventory document and count result are implicitly created when the
stock difference is posted.
� Posting counting and stock differences in one step
The stock differences are directly posted when the count result is entered in one
step.
The first two steps can be performed with the Enter and Post PI Count without Docu-
ment web-based SAP GUI application (Transaction MI10, business role SAP_BR_
INVENTORY_MANAGER).
329

6 Core Inventory Management
In Chapter 3, Section 3.1.3, we already introduced the related settings for physical
inventory that are used for entering count results and posting differences.
6.6.2 Create Physical Inventory Documents
The Create Physical Inventory Documents app (F3197) provides a filter bar to select
the related materials for which a physical inventory document will be created, as
shown in Figure 6.64. In addition, a filter for a date-dependent selection when the last
count of a material happened is provided. Further filter criteria, such as adjustment
values of counts or quantities, can be added to the filter bar via the gear icon.
Figure 6.64 Filter Bar for Physical Inventory
Select your filters, and then click Go to access the results list, as shown in Figure 6.65.
The results list outlines the material-related information, and again the table col-
umns can be adjusted to your needs by using the gear icon at the top-right corner of
the table.
Figure 6.65 Results Table
Clicking on one result line takes you to a details page for the selected material, as
shown in Figure 6.66.
330

6.6 Physical Inventory
Figure 6.66 Details Page: Header Data
The details page contains two different tabs. General Information outlines inventory
and material master data, as shown in Figure 6.67.
Figure 6.67 Details Page: General Information Tab
The Key Figures tab outlines the physical inventory information, such as adjustments
to count results or quantities in the past 12 months, as shown in Figure 6.68.
Figure 6.68 Details Page: Key Figures Tab
After the decision is made to perform a count for a certain material, you can create a
physical inventory document. To do so, click the related Create Physical Inventory
Documents button (bottom-right corner of results screen, not shown), and the Create
Physical Inventory Documents screen will appear, as shown in Figure 6.69.
All physical inventory documents are split by plant and storage location as a default.
In addition, the given situation might require a more detailed split of the physical
331

6 Core Inventory Management
inventory documents. The SAP Fiori app supports more detailed splitting on three
different layers from which you can choose in the Split Documents by dropdown:
� Storage Bin
� Material
� Material Group
� None
Enter your maximum number of items and the related date information as shown in
Figure 6.69.
Figure 6.69 Creating a New Physical Inventory Document
In addition, additional header data for the physical inventory documents can be set
up, as shown in Figure 6.70.
Figure 6.70 Header Data of the Physical Inventory Document
332

6.6 Physical Inventory
The Additional Header Data area contains two important flags. The Set Posting Block
indicator prevents (once set) further material movements for the given material
until the physical inventory count is completed. Something similar holds true for the
Freeze Book Inventory indicator, which prevents an incorrect book inventory balance
during the counting process if, for instance, goods receipts are still entered into the
system. If this indicator is set, the book inventory balance is stored for this physical
inventory document so that after entering the count results, any changes during the
count can be compared. This might be relevant if the count result isn’t entered into
the system in a timely manner.
6.6.3 Enter Inventory Count
After the inventory is counted based on the physical inventory document, the count
result must be entered into the system. This can be done with the Enter Inventory
Count web-based SAP GUI app (Transaction MI04, business role SAP_BR_WARE-
HOUSE_CLERK).
Starting with the selection of the relevant physical inventory document, the related
material must be selected, as shown in Figure 6.71. Afterward, the count result can be
entered and saved.
Figure 6.71 Selection of the Physical Inventory Document
After you’ve selected the Physical Inventory Document, click (Enter) to access the
screen shown in Figure 6.72. Select the related physical inventory document item,
333

6 Core Inventory Management
and enter the count result (Quantity 5 in this example). Or, you can mark a Zero Count
before saving by clicking the Post button (not shown).
Figure 6.72 Entering the Count Result
Note
If a count result has to be changed afterward (before posting differences), the
Change Inventory Count web-based SAP GUI application can be used to adjust the
counting information.
6.6.4 Process Physical Inventory Count Results
With the Process Physical Inventory Count Results web-based SAP GUI app (business
role SAP_BR_INVENTORY_MANAGER), the entered count result can be processed fur-
ther.
Execute the Process Physical Inventory Count Results app from the SAP Fiori launch-
pad (Transaction MI20), as shown in Figure 6.73. Here, you can post the differences for
the count results.
Figure 6.73 Processing Physical Inventory Documents
334

6.6 Physical Inventory
By selecting the related physical inventory document item and clicking the Post Dif-
ference button, the changes to the stock figures are posted into the system.
6.6.5 Physical Inventory Document Overview
After the physical inventory documents are created, the Physical Inventory Docu-
ment Overview app (F0379A) in SAP Fiori provides an overview of the given physical
inventory documents.
Figure 6.74 shows the entry screen with filter bar. The documents can be filtered via
the provided filter options.
Figure 6.74 Filter Bar of the Physical Inventory Document Overview App
When you click Go, the results table of the physical inventory documents, shown in
Figure 6.75, appears to provide status information about the count progress.
Figure 6.75 Count Progress in the Results Table
You can access the details screen of the physical inventory documents by clicking on
one line item in the results table, shown in Figure 6.76. The screen consists of header
data (count progress information) and three tabs.
The Items tab, shown in Figure 6.77, shows the different physical inventory document
items with related count information. Important information on the item level is
provided (i.e., whether the count result is different from the current book quantity).
335

6 Core Inventory Management
Many more details can be displayed in the item table when you add columns via the
gear icon.
Figure 6.76 Details Page: Header Data
Figure 6.77 Item Information with Comparison of Count Results
By clicking on one item in the item overview table, you can access a details page for
each item that provides more information in graphical way via micro charts in the
header, as shown in Figure 6.78.
Figure 6.78 Item Details Screen: Header Data
336

6.7 What’s Ahead for Core Inventory?
The detailed Count Results on this screen include quantity and value information, as
shown in Figure 6.79.
Figure 6.79 Count Results for a Physical Inventory Document Item
6.7 What’s Ahead for Core Inventory?
Recently, some enhancements to the SAP Fiori-based core inventory management
processes were released. For instance, more fine-grained support of batches in the
Manage Stock, Transfer Stock – In-Plant, and Transfer Stock – Cross Plant apps in SAP
Fiori was introduced for better usability. As of the time of writing (summer 2019),
there are some features that are lacking and worthwhile enhancements that could
enrich the native SAP Fiori apps for the core inventory processes:
� Goods issue: Availability of a native SAP Fiori app for posting of goods issues
� Field control: Availability of a configuration capability to steer the fields which are
available on the UI (that is, to set fields to optional or mandatory)
� Transfer Stock – Cross Plant: Enablement of transfer postings with multiple items;
currently only one item is supported
� Initial load: Enablement of initial loading for special stock types and for multiple
items at once in the Manage Stock app
� Scrapping: Enablement of scrapping with account assignments in addition to cost
centers for special stocks and for multiple items at once
In addition, more native SAP Fiori apps for supporting the physical inventory process
might be worthwhile in the future.
Looking at current IT trends, Internet of Things (IoT) will have a major impact on
physical inventory. Sensor-related data will make the physical inventory process
337

6 Core Inventory Management
faster and smarter. You might also check out Chapter 9, Section 9.3.4 with regards to
the SAP Leonardo IoT platform.
6.8 Summary
This chapter outlined the core inventory management processes and their represen-
tation as native SAP Fiori apps or web-based SAP GUI apps, such as Transaction MIGO
or the physical inventory processes. Web-based SAP GUI apps are still necessary due
to some missing features of native SAP Fiori apps as of now. Increased end user
usability and modern UIs will cause the usage of native SAP Fiori apps to increase
quickly, depending on further feature enhancements.
We walked through stock identification at the beginning to outline how stock figures
can be observed and analyzed. After this, we touched on a basic activity of inventory
with regards to stock transfer processes. In addition, some special areas reflecting ini-
tial stock entries and scrapping were described in a separate section. We also covered
reversal and the physical inventory process that guarantees the financial accuracy of
the available stock situation.
Now that we’ve laid the foundation for the core inventory processes, we’ll outline
production execution in the next chapter based on these fundamentals.
338

Chapter 7
Production Execution
In this chapter, we’ll execute our planning process using the recom-
mended SAP Fiori apps. We’ll start with reservations and continue
with the entire production process, from scheduling to confirmation,
step by step, and then take a look at monitoring and Kanban options.
This chapter describes all processes during production planning execution. In a nut-
shell, this is one follow-up step from Chapter 4, in which we discussed planning and
adjusting inventory, covering the processing of internal requirements, namely pro-
duction orders.
As explained in Chapter 2, SAP S/4HANA entails role templates that help customers
quickly enable the end user in effectively using the SAP Fiori apps. This chapter deals
with the production supervisor/operator. As this book covers inventory manage-
ment, it doesn’t distinguish between production supervisor and operator. The pro-
duction supervisor is in charge of the work centers where production occurs,
ensuring that orders are completed on time and are of good quality. Key tasks include
working with the production operator, ensuring production processes are followed
correctly, and machine maintenance. When a maintenance problem occurs or even a
machine breakdown, it’s the supervisor’s responsibility to escalate the problem, if
needed. Production operators, on the other hand, are on the shop floor. They operate
machines and perform the manual labor, which may necessitate a high level of skill
or may be somewhat simple, depending on the production process.
This chapter describes how to monitor the lifecycle of a production order beginning
with its execution, tracking and documenting deviations, until its final confirmation.
The process goes as follows, paired with the associated SAP Fiori apps:
1. Schedule production execution
– Schedule Production (F3770)
– Monitor Work Center Schedules (F3951)
339

7 Production Execution
2. Monitor production execution
– Monitor Production Order/Process Order (F0266)
– Manage Production Order (F0273)
– Manage Production Operations (F2335)
3. Confirm production execution
– Confirm Production Operation (F0245)
– Create Goods Receipt for the Production Order (F3110)
Naturally, the chapter will also cover some supplementary processes, such as Kan-
ban, reservation handling, and KPIs useful in production planning execution.
7.1 Working with Reservations
Reservations can be used to prepare a goods issue of a particular material at a defined
point in time for a certain purpose. Reservations can be created manually or auto-
matically, as shown in Figure 7.1. Automatically created reservations can’t be edited
manually, and they are based on orders, work breakdown structure (WBS) elements,
networks, and stock transfers. Reservations don’t decrease the unrestricted stock dis-
played in the various SAP Fiori apps (see Chapter 6), but they are considered during
materials requirement planning (MRP) (see Chapter 4).
Although it’s also possible to use reservations to plan the goods receipt process, this
normally isn’t required because purchase orders and production orders contain all
the required information anyway.
Figure 7.1 Business Processes Embedding Reservations
Which material?Which quantity?
When (requirement date)?Where (plant/storage location)?
Which recipient?Why (movement type)?
Which priority?
ManualReservation
Automatically CreatedReservation
• Based on orders, WBS elements, and networks
• Based on stock transfers
Reservation Document
340

7.1 Working with Reservations
In this section, we’ll walk through automatic and manual creation of reservations
and show how to display your reservation list.
7.1.1 Automatic Creation of Reservations
MRP runs can create stock transfer reservations at the issuing plant as part of a stock
transfer process to cover open demands in a different location.
Reservations are also created/changed automatically if the leading document (order,
network, WBS element) is created/changed.
7.1.2 Manual Reservation Management
The Create Reservation app (Transaction MB21) in SAP Fiori allows you to manually
create a reservation. On the initial screen in Figure 7.2, you enter Base Date, Move-
ment Type, and Plant, and then you proceed to the details screen by clicking Create
New Items.
Figure 7.2 Creating a Reservation: Initial Screen
341

7 Production Execution
In the details page shown in Figure 7.3, you enter the reservation details, such as var-
ious account assignment fields G/L Account, Goods Recipient, Cost Center, Material,
Quantity, and Storage Loc. You save your input by clicking Post.
Figure 7.3 Creating a Reservation: Details
After you’ve created your reservation, you can view it in the Manage Reservation app
shown in Figure 7.4. This is a mass maintenance tool for execution changes on reser-
vations, such as deleting, closing, or setting goods movement to Allowed.
Figure 7.4 Viewing a Reservation
342

7.1 Working with Reservations
7.1.3 Display Reservation List
The Display Reservation List app (Transaction MB24) allows you to monitor the reser-
vations created in the system. You start with a selection screen, split into Figure 7.5
and Figure 7.6. In Figure 7.5, you can use various attributes describing either the res-
ervation document itself or its account assignment information as selection criteria.
In Figure 7.6, you can limit the result set to certain aspects of a reservation. Layout
allows you to add a layout variant of the results list shown in Figure 7.7.
Figure 7.5 Reservation List: Selection Screen (Part 1)
343

7 Production Execution
Figure 7.6 Reservation List: Selection Screen (Part 2)
After clicking Execute in the screen shown in Figure 7.5, you’ll see the results list
shown in Figure 7.7 displaying all reservations matching the selection criteria.
Figure 7.7 Reservation List: Result Set
After selecting one item and clicking the Item button, you’ll be directed to the details
page of the selected entry (see Figure 7.8). Here you see the attributes defining the
process linked to the reservation item (Movement Type, Plant, Material, Storage
Location), Quantity information, and additional data, in particular the cost assign-
ment of the reservation item.
344

7.2 Scheduling and Manufacturing Execution
Figure 7.8 Reservation List: Selected Item Details
7.2 Scheduling and Manufacturing Execution
In this section, we’ll cover the entire manufacturing execution process, beginning
with production scheduling. We’ll then discuss how to monitor various execution
steps, briefly introduce change management, and finally cover the confirmation
step.
7.2.1 Schedule Production
The Schedule Production app (F3770) allows you to schedule orders on bottleneck or
pacemaker work centers (work centers that are critical for the production scheduling)
based on the production line settings in the material master record selected within
one Horizon (mandatory).
345

7 Production Execution
Within the app settings, you’ll need to define your Area of Responsibility and your
Industry Type (Discrete or Process).
Note
You need to maintain the correct production line in the MRP4 view of the material
master record to be able to schedule a production version.
You also need to maintain finite capacity planning at the work center to see each
order’s capacity requirements.
You can access the list of production operations by clicking Go, as shown in Figure 7.9.
Figure 7.9 Simple List with Production Operations
346

7.2 Scheduling and Manufacturing Execution
The Set Strategy button at the top of the screen brings you to the screen shown in
Figure 7.10, which enables you to personalize the planning parameters with the fol-
lowing options:
� Planning Mode: You can select the Bucket planning mode to display the capacity
view in Figure 7.11 as a table format with one column per day. You can use the
Sequence planning mode to display the capacity in time continuous format (not
shown).
� Scheduling Control: You can use a Finite or Infinite scheduling strategy.
� Direction: Forward scheduling considers the start date of the order, and Backward
considers the end date of the order.
Figure 7.10 Set Strategy
The Dispatch and Deallocate buttons allows you to change all selected production
operations shown in Figure 7.9.
To access the details screen shown in Figure 7.11, you click on the arrow of a selected
item. Here, you can do the following:
� Switch the production version, if applicable, by choosing from the Assign column.
� Dispatch an operation using the Dispatch button.
� Deallocate an operation using the Deallocate button in the top right-hand corner.
� Edit operation details in the Available Sources of Supply table, which takes you to
the screen shown in Figure 7.12.
347

7 Production Execution
Figure 7.11 Details of Selected Production Operations in a Flexible Column Layout
Figure 7.12 Editing Operation’s Details
348

7.2 Scheduling and Manufacturing Execution
7.2.2 Monitor Work Center Schedules
The Monitor Work Center Schedules app (F3951) allows you to monitor the progress
on operations of selected work centers in your area of responsibility. Thus, you’ll be
able to track the production execution. You need to fill in the mandatory Horizon fil-
ter to define the time frame to look at in Figure 7.13. On the left side, you see either the
Pacemaker Work Centers (in our example) or All Work Centers. The operations per
work center are delineated on a time axis (unit hours) on the right side. The legend
button in the toolbar explains the different color codes of the chart.
Figure 7.13 Entry Screen with Work Centers and Operations
You can select on operation in the chart and navigate via the Schedule Production
button to the respective SAP Fiori app, as shown in Figure 7.14 (see previous section).
Figure 7.14 Navigation to Schedule Production
349

7 Production Execution
You can select a Work Center from the column on the left side of Figure 7.13 to access
a quick view. Figure 7.15 shows how quick views help you retrieve additional informa-
tion on the work center to navigate to context-sensitive work center-related SAP Fiori
apps.
Figure 7.15 Work Center Quick View
If you have more than one operation per work center, you can expand the hierarchy
on the left side as shown in Figure 7.16. If you select an operation, you see the Opera-
tion Details in a side panel on the right side.
Figure 7.16 Work Center with Expanded Production Orders
350

7.2 Scheduling and Manufacturing Execution
If you select a production order in Figure 7.16 and click the Order Details button, you
can see all the Operations of the selected production order and their assignment and
schedule in the corresponding work center, as shown in Figure 7.17.
Figure 7.17 Operations per Production Order
7.2.3 Stock Requirements List
The Stock Requirements List app shows the supply and demand situation for each
material on a very detailed level. After entering Material, MRP Area, and Plant, the data
is loaded. As shown in Figure 7.18, you can see a list of key information, such as Date,
MRP element, Receipt/Reqmt, and Available Qty, normally sorted after date.
Figure 7.18 Stock Requirements List
351

7 Production Execution
7.2.4 Display Planned Orders, Production Orders, and Process Orders
This section will guide you through finding and displaying the transactional docu-
ments linked to manufacturing execution. We’ll take a look at both the enterprise
search option and the available SAP Fiori apps.
Enterprise Search
As explained in Chapter 1, Section 1.4.3, the main SAP S/4HANA business objects can
be searched for and displayed with the built-in SAP Fiori launchpad enterprise search
capability. This is particularly helpful if the primary intention is to do some basic
information retrieval with little information to start with. Figure 7.19 shows search-
ing with a production order number and the related action the systems offers based
on the end user’s role, which you can see by clicking the ellipsis button.
Figure 7.19 Searching for Production Order 2000140
352

7.2 Scheduling and Manufacturing Execution
Other typical information to start searching with includes the material number,
material short text, or plant. By selecting a business object to search in, you restrict
the result set to production orders, process orders, or planned orders.
If the information displayed by the enterprise search expanded view in the screen
shown in Figure 7.19 isn’t sufficient, you can go directly to the object page of the pro-
duction order by clicking the Production Order Object Page option to see a rich set of
additional data, as shown in Figure 7.20.
Figure 7.20 Object Page Header: Production Order
353

7 Production Execution
The object page header allows direct navigation to the section of interest via multiple
tabs. For example, you can view the Operations and Components details, as shown in
Figure 7.21.
Figure 7.21 Object Page Details: Production Order
SAP Fiori Applications
If enterprise search and object pages don’t contain the information, the Display Pro-
duction Order app (shown in Figure 7.22) or the Display Process Order app (shown
Figure 7.23) can be used to retrieve all data related to the business object in depth.
354

7.2 Scheduling and Manufacturing Execution
Figure 7.22 SAP Fiori App: Display Production Order
Figure 7.23 SAP Fiori App: Display Process Order
355

7 Production Execution
7.2.5 Manage Change Requests
If you’ve selected to use Change Requests (shown in Figure 7.24) in your personal set-
tings, changes to external requirements are managed by a change order process
involving the vendor. A change request can have the statuses New, Requested, and
Answered. The Manage Change Requests app (F0670) is used to handle this process.
Figure 7.24 Personalization: Activating Change Requests
Four SAP Fiori apps are available to manage change requests. Three are used exclu-
sively for each of the aforementioned states, and a fourth one is used to handle all
states.
Figure 7.25 shows a change with a change request. If you select Requested, waiting for
answer, the change request is created with status Requested.
Figure 7.25 Initiating a Change Request for a Purchase Order
356

7.2 Scheduling and Manufacturing Execution
If you select Request later, the status is New. You can enter a note and change the
desired attribute. Click OK to enact the change. To manage this change, you could use
either the Manage Change Requests – New app or the Manage Change Requests – All
app (F0670 and F3406, respectively).
Figure 7.26 shows the Manage Change Request – All app. The worklist contains the
vendors on the right side and all change requests of the selected vendor on the left
side. You can navigate to the details of all open change requests.
Figure 7.26 Worklist of All Change Requests
Figure 7.27 shows a change request with status New. To create automatic emails to the
selected vendor of change request with the status New, select the change request and
click on Compose E-Mail (not shown). The changed attributes (in this example, a new
Delivery Date of 03/26/2018) are shown and can be edited by clicking the Edit button.
You can also click the Set to Requested option, which changes the status to
Requested. The lower section shows all MRP elements of the Material as a table or
graphic. All actions can be documented in the Notes section.
Figure 7.28 shows a change request of status Requested. You can record the vendor’s
response with one of the Pending, Accepted, Rejected, or New Proposal buttons.
357

7 Production Execution
Figure 7.27 Change Request with Status New
Figure 7.28 Change Request with Status Requested
358

7.2 Scheduling and Manufacturing Execution
Click Apply Changes to automatically update the order if the vendor doesn’t reject
the changes. With the Discard button, you can close the change request if the vendor
rejects any changes. Both actions will close the change request.
7.2.6 Check Material Coverage
The Check Material Coverage app (F0251) allows you to directly check the material
coverage of a certain material. When starting the SAP Fiori app, a popup window
requires you to enter Material and Plant supported by value help, as shown in Figure
7.29.
Figure 7.29 Starting the SAP Fiori App
Subsequently, the Material Coverage app described in Chapter 4, Section 4.7.1 is
started.
7.2.7 Monitor Production Orders and Process Orders
The Monitor Production Orders app (F0266) helps you to track all the production
orders in your area of responsibility, detect critical situations, and react to them.
Many objects offer quick views for rapid inspections. Starting with a simple require-
ments list, you can navigate to a worklist for selected items.
Figure 7.30 shows the list with status information per material, such as start and end
time, delays in operations or missing components, and open quantities. The Status
column contains an aggregated overview. The calculations are based on the selected
Shortage Definition:
359

7 Production Execution
� MRP Standard
Represents standard MRP logic to compare supplies and demands.
� Stock Days’ Supply
Calculates stock days’ supply to compare available stock with planned demands.
� Ordered Requirements
Calculates whether the planned receipts will cover the ordered demands.
� Ordered Receipts
Calculates whether the ordered receipts will cover the planned demands.
Figure 7.30 Simple List: Monitor Production Orders
After selecting one or more item, click Manage Orders to navigate to the Manage Pro-
duction Orders worklist, as shown in Figure 7.31.
360

7.2 Scheduling and Manufacturing Execution
Figure 7.31 Worklist: Selected Production Orders with Five Sections per Object Details
Within this worklist, you work on the production orders. The following five sections
provide additional information to identify and solve any issue:
� Stock/Requirements List
You can solve the issue quickly by starting an MRP run from this section (see
Figure 7.31). Another option to solve an issue is to delete the MRP Element. If the
MRP run can’t solve the issue, and the material is externally procured, click on a
row with an arrow to navigate to the Material Shortage screen (see Chapter 4, Sec-
tion 4.7.1). This section offers a graphical display too (not shown).
� Components
You can identify any missing quantity you want to solve, as shown in Figure 7.32.
Click the Manage Components button to navigate to the Monitor Internal Require-
ments app described in Chapter 4, Section 4.7.8.
� Milestones
You get an overview of all operations, including their timeline and status, as
shown in Figure 7.33.
361
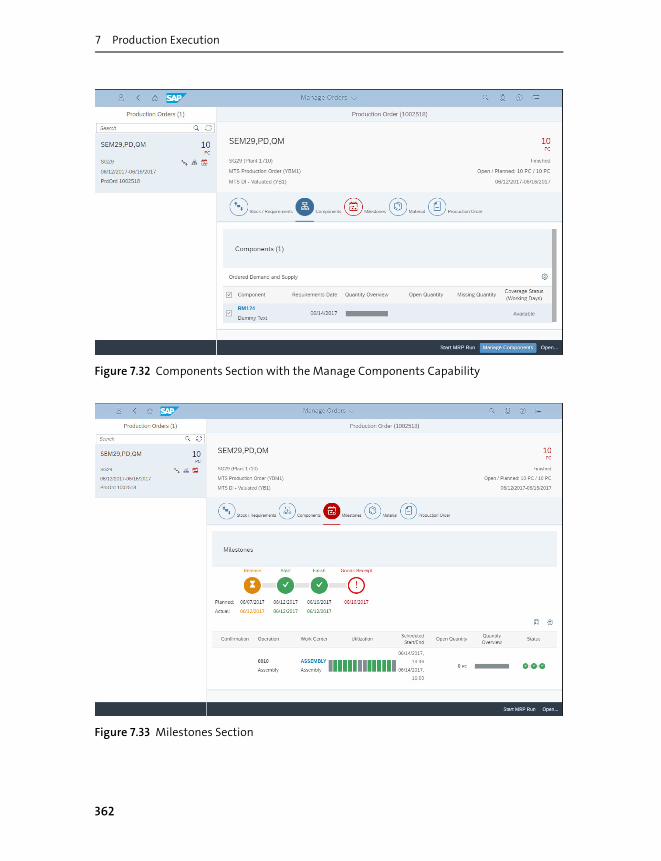
7 Production Execution
Figure 7.32 Components Section with the Manage Components Capability
Figure 7.33 Milestones Section
362

7.2 Scheduling and Manufacturing Execution
� Material
You can view material-related information, such as Stock Availability, Material
Data, and MRP Data, as shown in Figure 7.34.
Figure 7.34 Material Section with Master Data
� Production Order
You can see the details of the production order, such Order Type, Order Status, var-
ious date fields, and Order Quantity (see Figure 7.35).
The Monitor Process Orders app offers the same capabilities as the Monitor Produc-
tion Orders app.
363

7 Production Execution
Figure 7.35 Production Order Section
7.2.8 Manage Production Orders
The Manage Production Orders app (F0273) helps you supervise the progress of pro-
duction by monitoring production order operations. If you detect any issues, you can
drill down to identify the root cause and take immediate actions to resolve the issue
and keep your production process running as smoothly as possible. The usage is sup-
ported by personalization via Area of Responsibility, as shown in Figure 7.36.
Figure 7.36 Personalization by Area of Responsibility
364

7.2 Scheduling and Manufacturing Execution
The initial list in Figure 7.37 visualizes the progress of each production order opera-
tion, including any issues if applicable. Quick views on material, production order,
operation, work center, and previous statuses offer additional information. After
marking one entry, you can directly Change Dates and Quantities, Edit, or Release a
production operation, if applicable.
Figure 7.37 Simple List: Manage Production Orders
Based on the Progress of Operation and the symbols indicating Issues, you can navi-
gate to the details of each production order operation by clicking the arrow next to a
selected item, as shown in Figure 7.38, which provides sections for Issues, Order Infor-
mation, Components, Order Schedule, Confirmation, and Inspection. Any issues are
directly listed as the first section for closer investigation.
365

7 Production Execution
Figure 7.38 Object Page of Production Order Displaying Issues
The Components section shows the status of the assigned components (see Figure
7.39), indicating, for example, coverage, scrap, and storage location.
Operations shows the progress on the operations with the selected operation marked
and indicating key figures, such as Work Center and Actual Start/Actual End versus
Planned Start/Planned End, as shown in Figure 7.40.
366

7.2 Scheduling and Manufacturing Execution
Figure 7.39 Details Page with Section Components
Figure 7.40 Details Page with the Operation, Confirmation, and Inspection Sections
You can access additional data by clicking an item of interest to open quick views
(shown in Figure 7.41), or you can navigate to the details of the production operations
by clicking the arrow of the selected item (shown in Figure 7.42).
The production operation details in Figure 7.42 list the Operation Issues, Components
(assigned), Order Schedule, Work Center Schedule, Confirmation, and Inspection
(quality).
367

7 Production Execution
Figure 7.41 Quick View on Work Center
Figure 7.42 Details Page of One Selected Operation Displaying Operation Issues
368

7.2 Scheduling and Manufacturing Execution
The Order Schedule section displays the selected operation as marked. The Work Cen-
ter Schedule section shown in Figure 7.43 lists the Operations in Progress as well as
Operations not Started.
Figure 7.43 Details Page of One Selected Operation with the Work Center Schedule Section
Figure 7.44 shows the last two sections of the production operation details: Confirma-
tion and Inspection. Confirmation lists the production order Confirmations, includ-
ing the confirmed Quantity. Inspection lists the quality Inspection Lots linked to the
production order.
If required, you can directly navigate to the Change Production Order app via the
related actions button in the header (not shown) to access the app Header screen
shown in Figure 7.45.
369

7 Production Execution
Figure 7.44 Details Page of One Selected Operation with the Confirmation and Inspection
Sections
Figure 7.45 Change Production Order App
7.2.9 Confirm Production Operations
The Confirm Production Operations app (F0245) supports the confirmation process
of production operations. In Figure 7.46, you start the SAP Fiori app by entering the
production Order and Operation.
370

7.2 Scheduling and Manufacturing Execution
Figure 7.46 Confirmation Entry Screen
On the following screen shown in Figure 7.47, enter the following confirmation
details:
� Yield
Produced quantity to be confirmed.
� Scrap
Scrapped quantity.
� Rework
Quantity needs rework.
� Reason for Variance
Reason code for deviations.
You can completely or partially confirm the production operation.
After you’ve entered the confirmation details, you can click the Post or Post and Com-
plete buttons to post the production operation.
371

7 Production Execution
Figure 7.47 Confirmation Details
7.2.10 Create Goods Receipt for Production Order
You can directly create a goods receipt for a production order by using the Post Goods
Receipt for Production Order app presented in Chapter 5, Section 5.3.
7.3 Production Performance Monitoring
This chapter provides step-by-step instructions for inventory management as part of
the production planning and monitoring in SAP S/4HANA using the recommended
SAP Fiori apps. You can create your own visual alerts on key performance indicator
(KPI) tiles for a specific time period and other related features.
7.3.1 Material Scrap
The Material Scrap app (F2035) allows you to monitor expected scrapping defined in
the material master versus actual scrapping after confirmation. You can choose
372

7.3 Production Performance Monitoring
between several layout options in the Material Scrap entry screen, as shown in Figure
7.48, by choosing from the dropdown. We’ve selected a bubble chart in our example.
You can drill down by clicking on a bubble and clicking the down arrow button to
identify the root cause of an issue.
Figure 7.48 Material Scrap Displayed as a Bubble Chart
The following KPIs can be calculated, which you select from the dropdown:
� Material’s Expected Scrap Percentage
� Material’s Actual Scrap Percentage
� Material’s Actual Yield Percentage
� Material’s Actual Rework Percentage
373
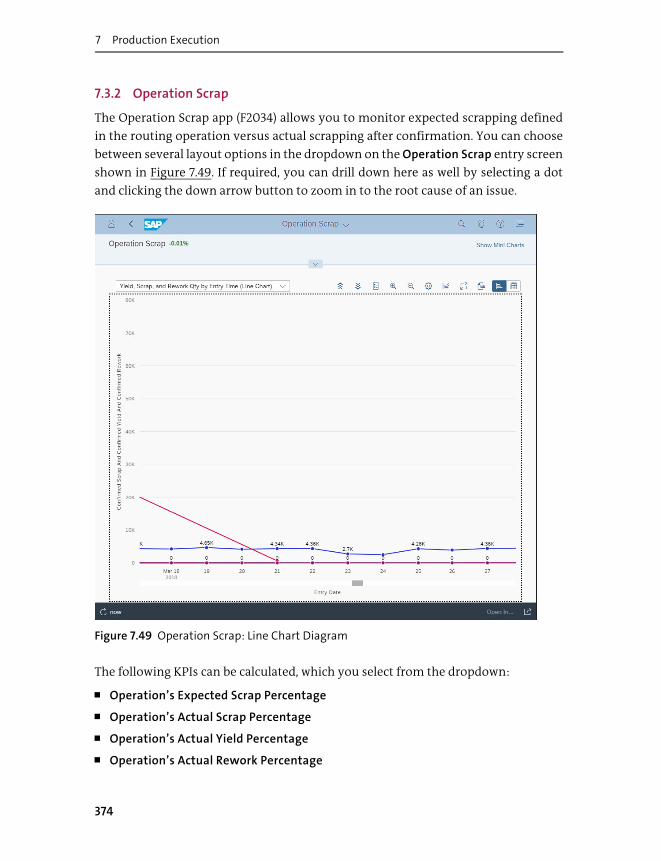
7 Production Execution
7.3.2 Operation Scrap
The Operation Scrap app (F2034) allows you to monitor expected scrapping defined
in the routing operation versus actual scrapping after confirmation. You can choose
between several layout options in the dropdown on the Operation Scrap entry screen
shown in Figure 7.49. If required, you can drill down here as well by selecting a dot
and clicking the down arrow button to zoom in to the root cause of an issue.
Figure 7.49 Operation Scrap: Line Chart Diagram
The following KPIs can be calculated, which you select from the dropdown:
� Operation’s Expected Scrap Percentage
� Operation’s Actual Scrap Percentage
� Operation’s Actual Yield Percentage
� Operation’s Actual Rework Percentage
374

7.3 Production Performance Monitoring
7.3.3 Scrap Reason
The Scrap Reason app (F2216) provides you with a step-by-step analysis to identify the
root cause for scrap in your production process. You can choose between several lay-
out options and drill down from different perspectives. Hence, you can analyze the
distribution of actual scrap recorded in production confirmations in the dimensions
of time, work center, material, plant, and reason for variance. Drilling down to the
reasons or root causes of the greatest loss of production will help prevent problems
in the future.
Begin on the Scrap Reason entry screen, shown in Figure 7.50. In our example, we’ve
started with a stacked column chart per work center (x-axis), but you can change your
layout using the dropdown.
Figure 7.50 Scrap and Rework per Work Center
375

7 Production Execution
Select a column to open the popup shown in Figure 7.51. You can choose between sev-
eral drilldown options. In our example, we’ve selected a Donut Chart.
Figure 7.51 Drilldown Options after Selecting Values
The preselected filters are automatically passed, and the drilldown to the reason code
is executed, as shown in Figure 7.52.
Figure 7.52 Drilldown to Scrap Reasons for the Selected Work Center
376
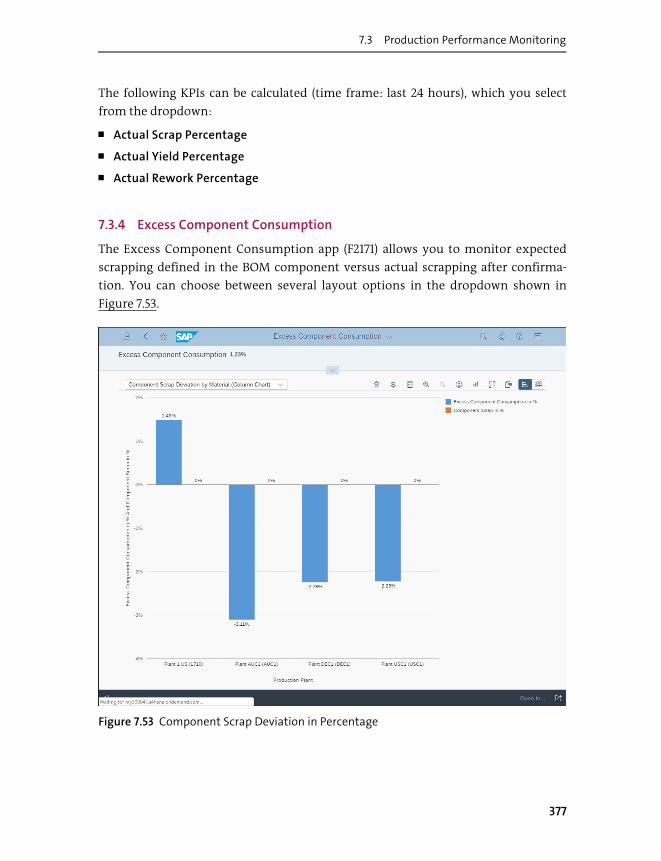
7.3 Production Performance Monitoring
The following KPIs can be calculated (time frame: last 24 hours), which you select
from the dropdown:
� Actual Scrap Percentage
� Actual Yield Percentage
� Actual Rework Percentage
7.3.4 Excess Component Consumption
The Excess Component Consumption app (F2171) allows you to monitor expected
scrapping defined in the BOM component versus actual scrapping after confirma-
tion. You can choose between several layout options in the dropdown shown in
Figure 7.53.
Figure 7.53 Component Scrap Deviation in Percentage
377
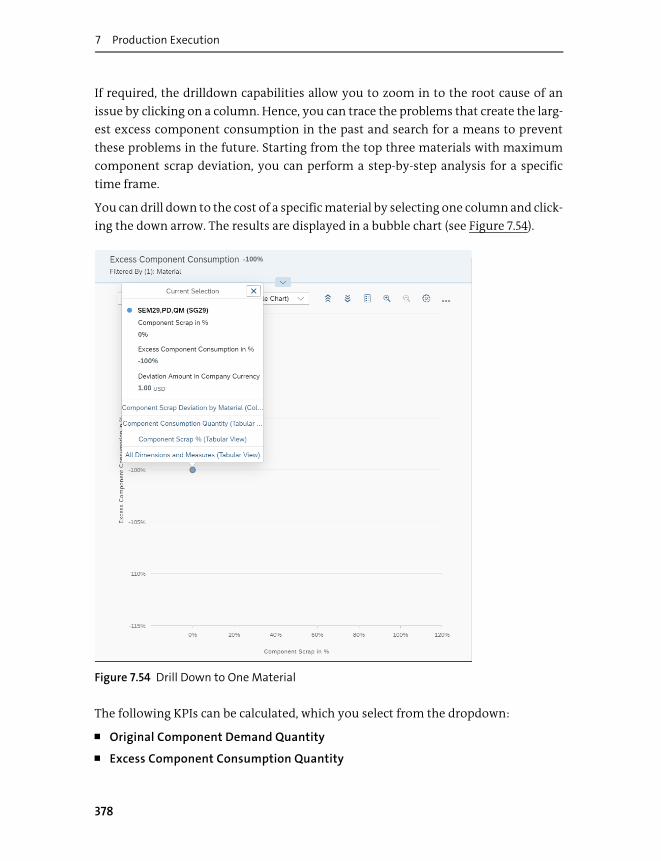
7 Production Execution
If required, the drilldown capabilities allow you to zoom in to the root cause of an
issue by clicking on a column. Hence, you can trace the problems that create the larg-
est excess component consumption in the past and search for a means to prevent
these problems in the future. Starting from the top three materials with maximum
component scrap deviation, you can perform a step-by-step analysis for a specific
time frame.
You can drill down to the cost of a specific material by selecting one column and click-
ing the down arrow. The results are displayed in a bubble chart (see Figure 7.54).
Figure 7.54 Drill Down to One Material
The following KPIs can be calculated, which you select from the dropdown:
� Original Component Demand Quantity
� Excess Component Consumption Quantity
378

7.3 Production Performance Monitoring
� Excess Component Consumption Quantity in Percent
� BOM Item Scrap in Percent
� BOM Item Scrap in Percent Deviation
7.3.5 Monitor Production Execution Duration
The Monitor Production Execution Duration app (F2172) allows you to compare
actual versus planned operation execution duration. The actual operation duration is
calculated based on the production order confirmation. The planned operation dura-
tion is defined in the production order and calculated based on the routing/master
recipe.
You can choose between several layout options via the dropdown, as shown in Figure
7.55.
Figure 7.55 Processing Execution: Line Chart Comparing Actual versus Planned
379

7 Production Execution
If required, the drilldown capabilities allow you to zoom in to perform a root cause
analysis of deviations by clicking on a column and clicking the down arrow. The
Reporting Period filter allows you to select a predefined time frame. You can enter dif-
ferent units of measure for time calculation.
The following KPIs can be calculated, which you select from the dropdown:
� Planned Operation Duration
� Actual Operation Duration
� Operation Duration Deviation
� Operation Duration Deviation Percent
7.4 Working with Kanban
Kanban as a means of production planning was introduced in Chapter 4. Here we’ll
cover the production execution part and explain how to monitor the demand and
the supply view of a Kanban control cycle.
7.4.1 Display Kanban (Demand View)
The Display Kanban (Demand View) app (Transaction PK13N)—sometimes also
known as the Kanban board by the production operator—allows you to track Kanban
containers from a demand perspective.
When entering the application, you need to enter the mandatory Plant field, as
shown in Figure 7.56. The other attributes are optional selection criteria to select the
Kanban container of interest. Because we don’t have additional criteria, we’ve
selected No Area Selection in our example and left the Material field blank.
Click the Continue button to view the selected Kanban container displayed as a list, as
shown in Figure 7.57. This view offers generic list capabilities such as sorting, filtering,
exporting to Excel, and printing, as well as Kanban container-specific functions. You
can change the Kanban status of the selected row by clicking Set to Empty or Set to
Full.
380
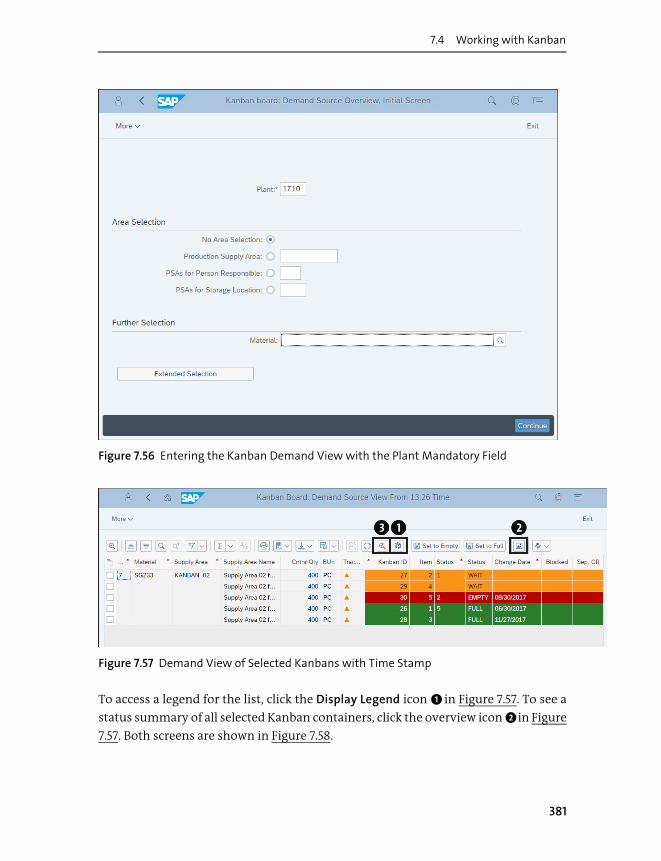
7.4 Working with Kanban
Figure 7.56 Entering the Kanban Demand View with the Plant Mandatory Field
Figure 7.57 Demand View of Selected Kanbans with Time Stamp
To access a legend for the list, click the Display Legend icon 1 in Figure 7.57. To see a
status summary of all selected Kanban containers, click the overview icon 2 in Figure
7.57. Both screens are shown in Figure 7.58.
381

7 Production Execution
Figure 7.58 Legend of Kanban Status (Left) and Kanban Board Overview (Right)
If you display the details of one Kanban container by clicking the details icon 3 in
Figure 7.57, you can navigate in Display mode (checkmark icon) or in Change mode
(pencil icon) to the Replenishment element (e.g., a planned order 393), as shown in
Figure 7.59.
Figure 7.59 Kanban Details with Replenishment Element (Planned Order)
382
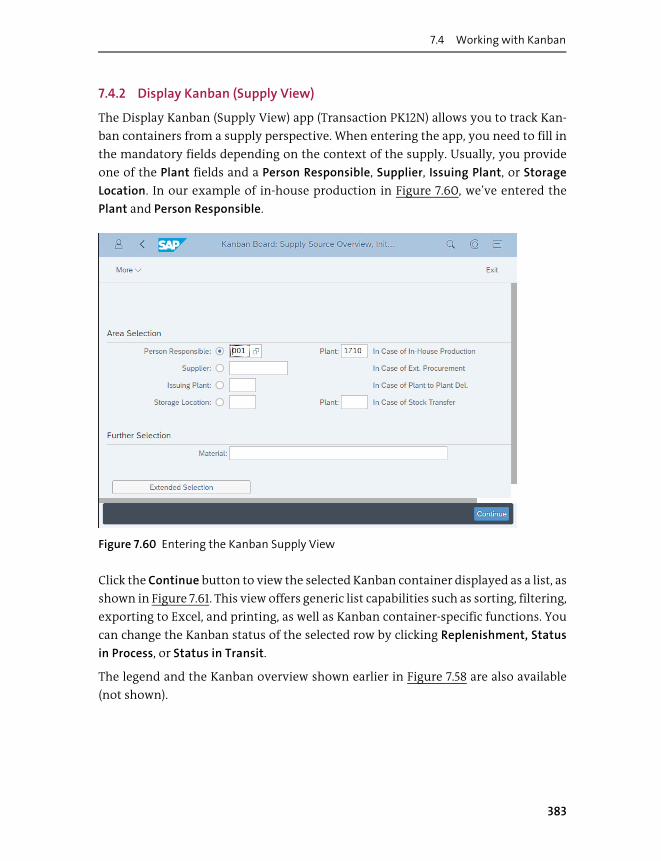
7.4 Working with Kanban
7.4.2 Display Kanban (Supply View)
The Display Kanban (Supply View) app (Transaction PK12N) allows you to track Kan-
ban containers from a supply perspective. When entering the app, you need to fill in
the mandatory fields depending on the context of the supply. Usually, you provide
one of the Plant fields and a Person Responsible, Supplier, Issuing Plant, or Storage
Location. In our example of in-house production in Figure 7.60, we’ve entered the
Plant and Person Responsible.
Figure 7.60 Entering the Kanban Supply View
Click the Continue button to view the selected Kanban container displayed as a list, as
shown in Figure 7.61. This view offers generic list capabilities such as sorting, filtering,
exporting to Excel, and printing, as well as Kanban container-specific functions. You
can change the Kanban status of the selected row by clicking Replenishment, Status
in Process, or Status in Transit.
The legend and the Kanban overview shown earlier in Figure 7.58 are also available
(not shown).
383
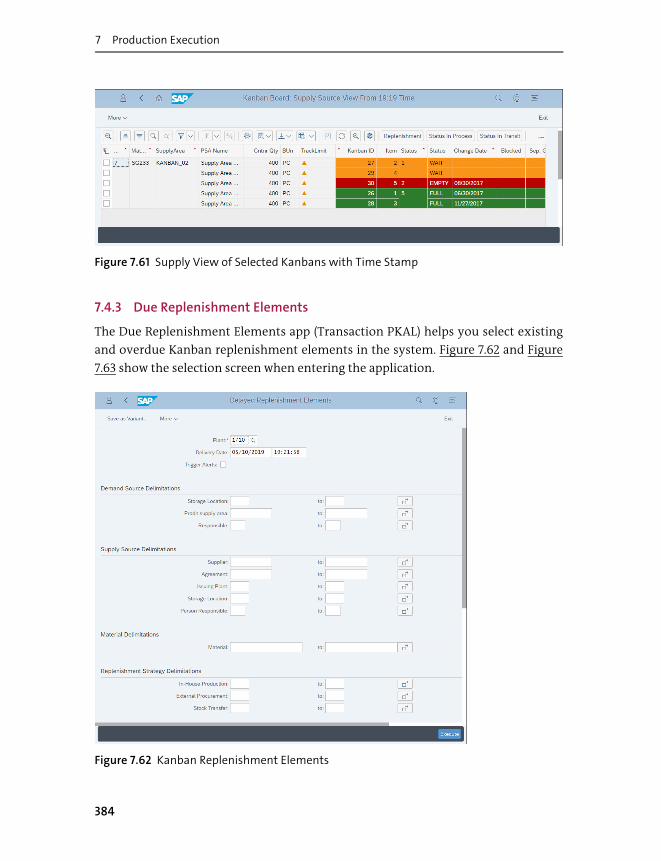
7 Production Execution
Figure 7.61 Supply View of Selected Kanbans with Time Stamp
7.4.3 Due Replenishment Elements
The Due Replenishment Elements app (Transaction PKAL) helps you select existing
and overdue Kanban replenishment elements in the system. Figure 7.62 and Figure
7.63 show the selection screen when entering the application.
Figure 7.62 Kanban Replenishment Elements
384

7.4 Working with Kanban
Figure 7.63 Kanban Replenishment Elements: Selection Screen
You start your selection with the mandatory Plant field. The optional selection
parameters allow you to restrict the result set further.
Click Execute to get to the result set. The results list in Figure 7.64 contains the list of
replenishment elements with their most important information:
� Material
Material number.
� Supply Area
Supply areas required for Kanban (See Chapter 4, Section 4.2.5).
� Kanban ID
Key to identify the Kanban container within the control cycle.
� MRP element
MRP element to fill the Kanban container.
� Replen. element
Key of the MRP element.
385

7 Production Execution
Figure 7.64 Selected Kanban Replenishment Elements
7.4.4 Correct Kanban
The Correct Kanban app (Transaction PK31) supports you in changing existing con-
tainers in a Kanban control cycle. Figure 7.65 shows the screen to enter a Kanban con-
tainer correction. Mandatory input fields are Material, Plant, and Supply area to
identify a dedicated Kanban control cycle.
Figure 7.65 Entry Screen of Kanban Corrections: Keys of the Kanban Control Cycle
Click the Continue button to access the selected Kanban control cycle, as shown in
Figure 7.66. The Status/Quantity, Replenishment, Quantity/Batch, Reverse, and Can-
cel buttons allow you to execute the desired actions on the Kanban control cycle.
386

7.4 Working with Kanban
Figure 7.66 Selected Kanban Control Cycle
7.4.5 Unlock Kanban Container
The Unlock Kanban Container app (Transaction PK09) supports you in locking and
unlocking selected Kanban containers. You can use this application to onboard and
offboard an entire Kanban control cycle.
7.4.6 Collective Kanban Print
The Collective Kanban Print app (Transaction PK17) allows you to print Kanban cards,
which can be attached to the Kanban container.
387

7 Production Execution
7.4.7 Set Kanban Container Status
The Set Kanban Container Status app (Transaction PKBC) allows you to set the Kan-
ban container status of selected containers from Full to Empty if the container’s con-
tent was consumed at the production supply side, so that a refill is initiated.
Figure 7.67 shows a worklist of Kanban containers on the left side, either manually
entered or automatically entered by bar code scanning, in the Entered tab. Accidently
entered containers can be removed from the worklist again (Remove button). In the
detail area, on the right side, you can set the container status and the batch if applica-
ble. After clicking the Save button, the container shows up in the Saved tab.
Figure 7.67 Worklist: Setting Selected Kanban Container Status
When using a bar code reader in “keyboard wedge” mode (i.e., the bar code reader’s
output is translated into the keyboard input), you can input the Kanban container
388

7.5 What’s Ahead for Production Execution?
and the container status via a single scanning operation. You can repeat this opera-
tion multiple times as the cursor focus is automatically positioned in the next empty
input field. Make sure that the bar code contains the following data: <container
ID><next status code><enter>.
Allowed values of <next status code> are listed in Table 7.1.
Note
You can also set the status manually by appending a status code to the container ID
in the input field.
7.5 What’s Ahead for Production Execution?
Now that we’ve walked through the flow of production execution tasks and the SAP
Fiori apps that support them, let’s move on to new and upcoming features. Process
extensibility is a main focus for the future of production planning execution, and we
can already see how this is being done with Kanban. In this section, we’ll explore the
process extensibility features of SAP S/4HANA with the example of the Kanban con-
tainer.
The main Kanban apps offer extensibility capabilities to extend the Kanban process.
Status Code Description
0 Next status will be determined automatically from the status sequence
1 Waiting
2 Empty
3 In process
4 In transit
5 Full
6 In use
Table 7.1 Possible Status Codes as Part of the Bar Code
389

7 Production Execution
Example
You may add a project ID to all Kanban operations to link the Kanban-based produc-
tion operations to a specific project.
Table 7.2 lists the SAP Fiori apps and the business context that can be extended (see
Chapter 3, Section 3.5).
SAP Fiori App Business
Context
Data Source BAdI Name BAdI Capabilities
Manage Con-
trol Cycle
Manufactur-
ing: Kanban
control cycle
PP_KANBAN_CONTROL_CYCLE_GUI
Kanban Control
Cycle Change/
Kanban Control
Cycle Check
� Change values
of custom fields
� Check standard
or custom fields
Display Kan-
ban (Demand
View)
Manufactur-
ing: Kanban
container
PP_KANBAN_CONTAINER_GUI
Kanban Contai-
ner Status
Change/Kan-
ban Container
Status Check/
Change Before
Creation of
Replenishment
Element
� Change value
of custom fields
during status
change
� Check value of
custom or stan-
dard fields
during status
change
� Change value
of custom fields
whenever
replenishment
element is cre-
ated on status
change to
Empty
Display Kan-
ban (Supply
View)
Manufactur-
ing: Kanban
container
PP_KANBAN_CONTAINER_GUI
Kanban Card PP_KANBAN_CARD
FDP_KAN-BAN_CARD_SRV_0001
— —
Table 7.2 Process Extensibility of Kanban Cards Ordered by SAP Fiori App
390

7.5 What’s Ahead for Production Execution?
If you want to enable a data flow to the purchase order item, you simply need to cre-
ate the same custom fields in the target business context, that is, Procurement: Pur-
chase Document Item. Any data is automatically passed from the business context
Manufacturing: Kanban Control Cycle or Manufacturing: Kanban Container to the
purchase order item.
Figure 7.68 shows as example the Project text field, which has been created in the
Manufacturing: Kanban Control Cycle business context. The Data Source PP_KAN-
BAN_CONTROL_CYCLE_GUI is enabled on the UI and Reports tab. This results in an
additional tab Custom Fields tab with the Project text field in the Manage Control
Cycle app, as explained in detail in Chapter 4, Section 4.9.1 (see Figure 7.69).
Figure 7.68 Custom Field Extensibility: Context PP_KANBAN_CONTROL_CYCLE_GUI
391

7 Production Execution
Figure 7.69 Custom Field Extended SAP Fiori App
7.6 Summary
The chapter explained how SAP S/4HANA supports the end user in production execu-
tion. It highlighted the SAP Fiori apps that can be used to schedule, monitor, and con-
firm production operations. The embedded change management capabilities, such
as change request handling and note-taking, support exception handling during exe-
cution. Furthermore, working with reservations and Kanbans as a means to control
392

7.6 Summary
inventory and material flow within your business processes was described. Analyti-
cal SAP Fiori apps support the end user in monitoring production execution KPIs.
Finally, the SAP S/4HANA process extensibility features were outlined with a Kanban
example in a look at what’s new.
The next chapter covers the analytical SAP Fiori apps in inventory management in
detail to complete our inventory optimization cycle.
393


Chapter 8
Inventory Analysis
Inventory analysis with SAP S/4HANA allows you to control and opti-
mize your inventory management processes based on SAP Fiori apps. It
provides an idea of which scenario you might make use of with the dif-
ferent tools to steer your inventory business in the right way.
So far, we’ve looked at basic information about SAP S/4HANA and how inventory pro-
cesses are reflected in SAP S/4HANA. To gain more insight into your inventory man-
agement processes, this chapter outlines the analytical capabilities of inventory
management in SAP S/4HANA.
Inventory analytics in SAP S/4HANA are mainly based on the data created during
inventory processing, which is stored in the new data model for material documents.
Due to this new performance-optimized data model, new analytical functionalities
are available with inventory management. The predelivered business role SAP_BR_
INVENTORY_ANALYST can be used with these analytical features. Some basic analyt-
ical capabilities are also include in the predelivered SAP_BR_INVENTORY_MANAGER
and SAP_BR_WAREHOUSE_CLERK business roles. These two business roles include
at least the related overview pages. For more details, check Chapter 3, Section 3.5.2,
where the business roles are described.
Referring to the control cycle of inventory management, which we introduced in
Chapter 2, Section 2.4, this chapter is about the controlling and analytical tools avail-
able within inventory management. The following sections touch on different
aspects of analytical views. We’ll start with analysis of the current and past stock
information. Afterwards, we’ll discuss monitoring of relevant key performance indi-
cators (KPIs) with inventory management in SAP S/4HANA. Based on this, we’ll intro-
duce analytical SAP Fiori apps that can be used for analysis and optimization of
process flows. Then, you’ll see how you might adopt analytical queries according to
your needs. We’ll finish the chapter by discussing the future of analytics.
395
8 Inventory Analysis
8.1 Inventory Analytics in SAP S/4HANA
Analytical capabilities are often used to gain business benefits by analyzing the avail-
able business data in the SAP system. This also holds true for inventory-based pro-
cesses. Knowledge about slow-moving materials or dead stock situations can be
worthwhile information to optimize the stock level and in the end the bounded cap-
ital of your company.
In this section, we’ll start out with a look at what advances SAP S/4HANA has brought
to analytics for your inventory management processes, before discussing the avail-
able tools.
8.1.1 Advances in Analytics
SAP S/4HANA provides several advances to analytics:
� Real-time data
Based on the new data model to store the main business-relevant data in inven-
tory management in SAP S/4HANA, the material document is kept in a column
store-oriented database (SAP HANA). This column store provides the basis for real-
time analytics on up-to-date transactional business data.
� Integrated data
In addition, a state-of-the-art and browser-based user interface (UI) (SAP Fiori)
gives the right presentation capability for process and stock monitoring and opti-
mization. The SAP Fiori pattern was also used to combine analytical with transac-
tional features (in-app analytics). For instance, the transactional SAP Fiori app
Manage Stock (see Chapter 6, Section 6.4.1) contains the inventory KPI range of
coverage.
� Insight to action
Beside the in-app analytics, the SAP Fiori pattern of insight to action brings a pow-
erful capability into the analytics world. Based on the semantic object and the
related navigation targets, the analytical results can be drilled down, for example,
to the material level, and transactional actions (e.g., transfer postings or scrapping)
can be performed directly, or a team of warehouse staff can be contacted by adding
the relevant business object into an SAP CoPilot chat.
396

8.1 Inventory Analytics in SAP S/4HANA
� Value-based analytics
Most of the analytical SAP Fiori apps offer the result set in regard to the stock
value. This offers the chance to compare different materials even if they have
different units of measure; however, financial aspects also can be judged directly.
It’s important to note that the stock value calculation in inventory management is
performed based on the current material price multiplied by the stock figures.
This holds true for all stock value determinations in the SAP Fiori apps of inven-
tory management, even if a different reporting date than today is selected. In this
case, historical stock values are multiplied with the current price of the material.
Only in the Stock – Multiple Materials app is the reporting date also used to deter-
mine the price information from that date as a basis for multiplication with the
historical stock figures.
8.1.2 Choosing the Right Analytics Tool
The inventory management optimization cycle was introduced in Chapter 2, Section 2.4. Now we’ll outline which tools and applications are available in SAP S/4HANA that support the analyze part of the inventory management optimization cycle. Related to Figure 2.17 in Chapter 2, Section 2.4.4, these applications are built upon different application templates or patterns.
The available tools and applications for analytics, which we’ll see in action through-
out the chapter, are as follows (many of which you’ll remember from our in-depth discussion of SAP Fiori apps in Chapter 1, Section 1.4.2):
� Object pages
SAP Fiori app pattern outlining important details for business objects such as
material document.
� Overview pages
SAP Fiori app pattern combining different KPIs and relevant data at one glance.
� Analytical list pages
SAP Fiori app pattern providing a standardized look and feel with graphical and
tabular result representations.
� SAP Smart Business
Application pattern that makes use of core data services (CDS)-based queries (SAP
Lumira, designer edition).
� Custom queries and CDS views
SAP Fiori app to adapt CDS queries to your needs (extensibility).
397

8 Inventory Analysis
8.2 Posted Stock Change Analysis
During warehouse business, many material movements take place that change the
stock situation frequently. To make the right decisions in daily business and meet the
demand and service level of the related goods, a comprehensive and most current
view on the stock level has to be provided by the system.
In the following sections, we’ll describe related SAP Fiori apps that support checking
the stock situation of your warehouse. A more detailed and fine-grained analysis
(similar to SAP Business Warehouse [SAP BW] reporting but based on the most cur-
rent system data) will then be discussed for the material document and the physical
inventory document.
8.2.1 Stock Single Material and Stock Multiple Materials
The basic analytical functions of inventory management were introduced in Chapter
6 regarding stock analysis.
Simple stock checks can be performed with the SAP Fiori app Stock – Single Material
by just entering the material and plant combination. Refer to Chapter 6, Section 6.2.1,
for more details.
More complex filter criteria are available in SAP Fiori app Stock – Multiple Materials
(i.e., special stock) and the selection of more than one material is possible. Refer to
Chapter 6, Section 6.2.2, for more details.
8.2.2 Goods Movement Analysis
From an analytical perspective, inventory management offers more detailed and
complex features for better process analysis in SAP S/4HANA.
Regarding goods movements, the SAP Fiori app Goods Movement Analysis (F2912) is
a comprehensive tool for detailed analysis of goods movement.
The SAP Fiori app is based on two CDS views:
� C_GoodsMovementQuery
� I_GoodsMovementCube
398
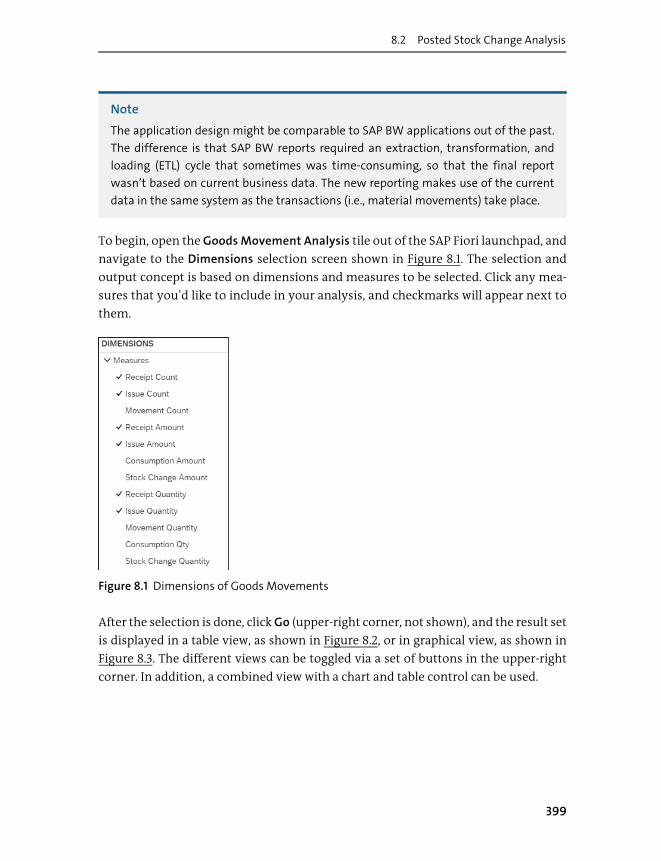
8.2 Posted Stock Change Analysis
Note
The application design might be comparable to SAP BW applications out of the past.
The difference is that SAP BW reports required an extraction, transformation, and
loading (ETL) cycle that sometimes was time-consuming, so that the final report
wasn’t based on current business data. The new reporting makes use of the current
data in the same system as the transactions (i.e., material movements) take place.
To begin, open the Goods Movement Analysis tile out of the SAP Fiori launchpad, and
navigate to the Dimensions selection screen shown in Figure 8.1. The selection and
output concept is based on dimensions and measures to be selected. Click any mea-
sures that you’d like to include in your analysis, and checkmarks will appear next to
them.
Figure 8.1 Dimensions of Goods Movements
After the selection is done, click Go (upper-right corner, not shown), and the result set
is displayed in a table view, as shown in Figure 8.2, or in graphical view, as shown in
Figure 8.3. The different views can be toggled via a set of buttons in the upper-right
corner. In addition, a combined view with a chart and table control can be used.
399

8 Inventory Analysis
Figure 8.2 Goods Movement Analysis Result in Table View
Figure 8.3 Goods Movement Analysis Result in Chart View
Based on the given result, a data point in the result set can be selected, and, via the
Jump To feature (upper-left corner, Figure 8.4), further navigation into all SAP Fiori
apps that share the same semantical object can be used for more detailed analysis.
The list of available navigation targets depends on your authorizations.
As in SAP BW applications, a drilldown of the results is available to dig down into
finer granular details regarding a dimension of interest. For example, you can drill
down into the dimension of material document after initially selecting the Plant
dimension as the entry point (see Figure 8.5).
Right-click on the dimension you want to drill down to, and select Filter • Drill Down
in the popup window.
400

8.2 Posted Stock Change Analysis
Figure 8.4 Many Navigation Targets
Figure 8.5 Filter Drilldown in the Plant Dimension
401

8 Inventory Analysis
Next, select the new dimension you want to see in the result set from the Select
Dimension dropdown. In this example, Material Document Item is selected, as shown
in Figure 8.6.
Figure 8.6 Selection of New Material Document Item Dimension
Click OK to access the result set. Now the result set gets drilled down in the next level
of the selected dimension, as shown in Figure 8.7.
Figure 8.7 Drilled Down Result Set by the New Material Document Item Dimension
Further Resources
A wide set of measures and dimensions can be taken into account in SAP Fiori app
Goods Movement Analysis, which could not all be listed in this book. For more
details, check the SAP online help (http://help.sap.com) to get familiar with all the
available measures and dimensions.
Note
The Goods Movement Analysis app is only available on desktop devices.
402

8.2 Posted Stock Change Analysis
8.2.3 Physical Inventory Document Analysis
Similar to the Goods Movement Analysis (F2912), the analysis of physical inventory
can be performed via the Physical Inventory Analysis app (F2913).
After starting the SAP Fiori app, two required parameters must be filled (can be pre-
filled)—Fiscal Year and Is Difference Posted—as shown in Figure 8.8. The Is Difference
Posted parameter breaks down the result set already by only considering physical
inventory documents that led to stock corrections after counting.
Figure 8.8 Entry Filter Values of Physical Inventory Analysis
The result set shown in Figure 8.9 can be displayed in the same variants as described
in the previous section for the Goods Movement Analysis app. After you click the Go
button (upper-right corner, not shown), the result set is displayed.
Figure 8.9 Result Table of Physical Inventory Analysis
In the Physical Inventory Analysis app, the Physical Inventory Document dimension
is drilled down into in the result set by following the steps described in the previous
section, creating the result set shown in Figure 8.10. A rather detailed analysis is pos-
sible, and analytical questions such as “Which items had the most book value impact
in the last year?” can be answered.
Figure 8.10 Drill Down into the Physical Inventory Analysis Dimension
403

8 Inventory Analysis
Further Resources
The whole list of dimensions and measure that can be taken into account can be
accessed via the SAP online help (http://help.sap.com).
8.3 Key Performance Indicator Monitoring and Analysis
Besides gaining knowledge of the stock level, which we described in Chapter 7, it’s
also important to monitor your most important KPIs to steer your business the best
way. In this section, we’ll introduce the tools available for this purpose in inventory
management SAP S/4HANA.
Note
There’s one related SAP Fiori app that we won’t dive into in this section. The Stock
Champion app (F2133) is available as part of business role SAP_BR_INVENTORY_ANA-
LYST, which provides monitoring of expiration dates and shortage information about
batches by using graphical illustrations. This SAP Fiori app was delivered in SAP
S/4HANA Cloud only and isn’t available in on-premise SAP S/4HANA.
8.3.1 Overview Pages
To reflect the role-centric approach of the SAP Fiori launchpad, the SAP Fiori app pat-
tern of overview pages was used to combine analytical applications in a kind of a
dashboard to provide a single point of entry for end users.
In general, inventory management provides three overview pages:
� Overview Inventory Management (F2769)
� Overview Inventory Processing (F2416)
� Inventory Analysis Overview (F3366)
We’ll discuss these pages in the following sections.
404

8.3 Key Performance Indicator Monitoring and Analysis
Overview Inventory Management
The Overview Inventory Management (F2769) overview page contains the following
cards:
� Stock Value by Stock Type
� Warehouse Throughput History
� Monitor Purchase Order Items
� Overdue Materials – GR Blocked Stock
� Recent Material Documents
� Stock Value by Special Stock Type
� Overdue Materials – Stock in Transit
The Stock Value by Special Stock Type card is shown in Figure 8.11 as an example. The
card includes navigation capabilities by clicking on the header or pie chart. The navi-
gation target is the Stock – Multiple Materials app. The navigation includes the
selected parameters of the card. In this example, by clicking on the 17k part of the pie
chart, the Stock – Multiple Materials app makes it so that only the special stock Orders
on Hand is taken into account for selection.
Figure 8.11 Card Example for the Overview Inventory Management Overview Page
405

8 Inventory Analysis
It’s also important to mention that the underlying SAP Fiori apps often provide
implicitly displayed application variants. For instance, if the Stock – Multiple Materi-
als app is navigated to from the Stock Value by Special Stock Type card, the filter and
columns that you select are automatically loaded with the Stock – Multiple Materials
app so that the relevant information is displayed directly.
You can check the available standard variants directly in the related Stock – Multiple
Materials app by clicking on the down arrow to open the list of available variants, as
shown in Figure 8.12.
Figure 8.12 Predefined Variants Also Used as Navigation Parameters
The cards that should be shown after the overview page is started can be influenced
via the Manage Cards settings, which you access by opening the user settings in the
SAP Fiori launchpad, as shown in Figure 8.13.
The Overview Inventory Management overview page has a mandatory Plant filter
that needs to be filled out before a data selection can take place due to the value-
based evaluation provided in the Stock Value by Stock Type and Stock Value by Spe-
cial Stock Type cards. These cards summarize the stock values accordingly, but this
can only be performed for stock values in the same currency. Based on the relation-
ship that each plant belongs to one company code (see Chapter 3), and each company
code has one company code currency, the selection by one plant leads to one cur-
rency of the stock values in the same plant.
406

8.3 Key Performance Indicator Monitoring and Analysis
Figure 8.13 Manage Cards
Overview Inventory Processing
The Overview Inventory Processing (F2416) overview page is part of the warehouse
clerk business role and offers the following cards:
� Recent Inventory Counts
� Monitor Purchase Order Items
� Warehouse Throughput History
� Recent Material Documents
� Overdue Materials – Stock in Transit
� Overdue Materials – GR Blocked Stock
� Outbound Delivery List
� Inbound Delivery List
In comparison to the Overview Inventory Management overview page, this overview
page doesn’t include stock values and is more focused on the daily warehouse busi-
ness and logistical aspects that are relevant for a warehouse clerk.
Inventory Analysis Overview
A more analytical focus is given in the third overview page: Inventory Analysis Over-
view (F3366).
407

8 Inventory Analysis
This overview page is especially designed for analytical purposes and provides ana-
lytical cards in a KPI-based manner. As of release SAP S/4HANA 1909, the overview
page contains four cards:
� Stock Value Increase despite Consumption
� More than 100 Days without Consumption
� Monitor Batches by Longest Time in Storage
� Monitor Batches by Shortest Expiration Date
Figure 8.14 shows an example of the Stock Value Increase despite Consumption ana-
lytical card, and Figure 8.15 displays an example of the More than 100 Days without
Consumption analytical card.
Figure 8.14 Stock Value Increase despite Consumption
408

8.3 Key Performance Indicator Monitoring and Analysis
Figure 8.15 Chart with More Than 100 Days without Consumption
8.3.2 Inventory Turnover Analysis
The Inventory Turnover Analysis app (F1956) allows you to analyze the inventory
turnover in relationship to average inventory value. In general, the inventory turn-
over is determined by taking into account the goods issues in relationship to the
average stock in a given time frame. If a material movement is a goods issue, the clas-
sification is taken from the related setting of the movement type (table T156, field
KZVBU → consumption posting; see also Chapter 3, Section 3.1.3). The average inven-
tory value is calculated based on the current price.
Like most of the SAP Fiori apps based on smart templates, the Inventory Turnover
Analysis app begins with a filter bar that allows you to specify the result set regarding
the given filter criteria, as shown in Figure 8.16.
Figure 8.16 Filter Bar of the Inventory Turnover Analysis App
409

8 Inventory Analysis
The following parameters can be used for filtering:
� Mandatory filter values:
– Start Date
– End Date
– Plant
� Optional filter values:
– Material
– ABC Indicator
– Material Type
– Material Group
The only field that requires a bit of explanation is the ABC Indicator field, which is
taken from the material master record of the material.
Note
The SAP Fiori app doesn’t consider special stocks like Transaction MC44 and intra-
company-related goods issues do.
The result is displayed in a scatter chart or bubble chart after you click the Go button.
The scatter chart is shown in Figure 8.17, and the legend is shown in Figure 8.18.
Figure 8.17 Scatter Chart of the Result Set
410

8.3 Key Performance Indicator Monitoring and Analysis
Figure 8.18 Legend for the Scatter Chart
The same result set can also be displayed as a bubble chart (shown in Figure 8.19 and
followed by the legend in Figure 8.20) by using the toggle button (upper-right corner
of the chart, not shown).
Figure 8.19 Result Set as a Bubble Chart
411

8 Inventory Analysis
Figure 8.20 Legend of a Bubble Chart
You can select one data point in the bubble chart in the SAP Fiori app to drill down
and gain more insight into selected data, as shown in Figure 8.21.
Figure 8.21 Selection in a Bubble Chart
The outline graphical result can be analyzed so that if the inventory turnover is high,
the material isn’t kept very long in storage, meaning the time between goods receipt
and goods issue is rather short.
412

8.3 Key Performance Indicator Monitoring and Analysis
On the one hand, the bubble chart makes use of a coefficient of variance for goods
issues (see the y-axis of the bubble chart). The coefficient is calculated based on stan-
dard deviation of goods issues quantity per day divided by the average goods issue
quantity in the selected time frame multiplied by 100. A low coefficient reflects a
steady goods issue.
On the other hand, the scatter charts make use of an average inventory value (see the
y-axis of the scatter chart). The average inventory value is calculated by multiplying
the average stock quantity of the selected time frame with the current price of the
material. In addition, the app automatically groups the result set into “top catego-
ries” such as Top 10% (see Figure 8.18).
By selecting a data point in the chart, the app offers a detail page for the selected
materials that outlines more detailed inventory turnover data.
8.3.3 Inventory (Multiple) Key Performance Indicator Analysis
The Inventory KPI Analysis app (F3749) offers a multiple KPI analysis tool that
enables you to compare different KPIs for different time series. The following KPIs
are supported:
� Stock Changes
� Consumption Changes
� Inventory Aging Changes
� Inventory Turnover Changes
� Range of Coverage Changes
When you open the app, you’re met with three mandatory filter values that must be
entered up front during data selection because they are essential for the result set
determination and processing, as shown in Figure 8.22:
� Display Currency
� Comparison of
� Reference Date
Display Currency is mandatory due to normalization of the inventory values to one
currency. Different plants in different company codes could have different curren-
cies, which would make summing up the stock values impossible. Therefore, the
inventory values are all converted to the same display currency.
Besides the mandatory filters, many additional filters related to stock identifiers (e.g.,
material or stock type) and some others (e.g., material type or material group) are
available for filtering.
413

8 Inventory Analysis
Figure 8.22 Filter Bar of the Inventory KPI Analysis App
After the data set is received, a table view outlines the result either in a stacked bar
chart or as a table. The view can be toggled between the chart and table by clicking the
toggle button (upper-right corner of chart, not shown). We’ll go with the bar chart, as
shown in Figure 8.23.
Figure 8.23 Column Bar Chart of the Inventory KPI Analysis App
To configure the axis and groups of the chart, click the gear icon in the upper-right
corner of the chart (not shown). You’ll arrive at the View Settings screen shown in
Figure 8.24.
414

8.3 Key Performance Indicator Monitoring and Analysis
Figure 8.24 Chart Configuration
The configuration contains a powerful way to adapt the outlined KPIs and groups
(refer to Figure 8.23) and provides the option to outline up to four measures as differ-
ent axes. In addition, you can select two groups and one series just by activating the
related checkbox and selecting the required occurrence in the dropdown list. The
additional axes show up as additional bars in the chart.
To narrow down the filtered result set in respect to the five different KPIs supported
by this app, a KPI filter is available, as shown in Figure 8.25. You can optimize and
influence the selection using the blue bars on the left and right-hand side of the KPI
graph show in Figure 8.25, which uses the example of the Stock Changes and Inven-
tory Turnover Changes KPIs.
415

8 Inventory Analysis
Figure 8.25 KPI Filter
The KPI filter offers an easy graphical way of showing figures of the given KPIs statis-
tically by representing outliers in a frequency distribution chart. The selection can be
changed by dragging and dropping the related blue frame (see Figure 8.25). After-
wards, this adjustment narrows down the result set of the stacked bar chart automat-
ically.
You can further analyze the given result by drilling down on a bar in the chart. First,
select the relevant bar, and then drill down into a dimension by clicking the leftmost
icon, as shown in Figure 8.26.
For example, select your chosen dimension (here, Company Code), which results in
the chart shown in Figure 8.27.
416

8.3 Key Performance Indicator Monitoring and Analysis
Figure 8.26 Drilling Down into a Dimension
Figure 8.27 Drilling Down by Company Code
417

8 Inventory Analysis
Now you can see that one company code owns the majority of the stock value in the
reference period.
The second step is to drill down by material to gain insight to determine which mate-
rials own this stock value, as shown in Figure 8.28. To do so, perform the same steps
as for Company Code, but this time, choose Material from the dropdown list.
Figure 8.28 Second Drilldown by Material
Based on the second drilldown, you hit the ground and can figure out that only a few
materials are responsible for the high stock values in the given company code, allow-
ing inventory managers to now act accordingly.
Note
If the result set after the drilldown contains too many entries that flood the chart
with different materials, for instance, use the magnifying glasses icons (refer to
Figure 8.26) to zoom in or out to get a more convenient graphical display.
418

8.4 Process Analysis Tools
8.3.4 Material Valuation
We’ve talked a lot about inventory management analytics in SAP S/4HANA with a
strong focus on stock figures. We also mentioned that the stock figures are just half
the truth and that the stock itself might not be enough to steer a company’s business
processes. In the end, the financial impact is the important factor for steering busi-
ness processes (even logistic ones). Therefore, inventory management analytical fea-
tures also contain price and inventory value information. The price considered is
always the current price. The inventory values are calculated by multiplying the stock
figures (current or historical) with the current price, which means the inventory val-
ues are derived from the current price.
The price itself isn’t directly related to inventory management. Its home ground is in
the area of material valuation in the material ledger.
Material valuation also provides some applications for analytical features related to
price and inventory value. These apps are part of the SAP_BR_INVENTORY_ACCOUN-
TANT business role; following are two examples of such apps:
� Material Inventory Values-Balance Summary (F1422)
Provides the capability of analyzing stock quantity information together with
inventory values for a certain reporting date.
� Material Inventory Values-Line Items (F1423A)
Provides the capability of drilling down stock and inventory value information to
a single line item.
Further Resources
For more detailed information, go to the SAP Fiori apps reference library and search
for one of the preceding apps. In addition, look at the rest of the apps that are part of
the SAP_BR_INVENTORY_ACCOUNTANT business role. To do so, open the SAP Fiori
apps reference library, and select All Apps. Enter your SAP Fiori ID (e.g., “F1422A”), and
check the Other Apps in Cost Accountant – Inventory section.
8.4 Process Analysis Tools
In Chapter 6, we introduced the core inventory management features that cover the
standard inventory management processes. In addition to these standard features,
some more process-specific SAP Fiori apps are available in SAP S/4HANA. With the
419

8 Inventory Analysis
tools that we’ll discuss in this section, you can analyze and optimize your process
performance. Therefore, these tools are an essential part of the inventory manage-
ment control cycle and support the check and cycle of plan and adjust, execute, and
analyze (see Chapter 2, Section 2.4).
8.4.1 Dead Stock Analysis
During usual warehouse and stock keeping processes, sometimes goods are no lon-
ger moved or consumed. In addition, an increase of stock values despite consump-
tion might occur for many reasons (e.g., less demand, decreasing usage in bill of
materials [BOM], etc.). However, the heaviest impact comes from no stock usage in a
certain time frame, which would mean that these goods are “dead stock,” which is
tied up capital.
In combination with the inventory value, dead stock becomes a relevant business
insight if there are high values or increasing values in a certain time frame.
The smart template pattern analytical list page was used for the Dead Stock Analysis
app (F2899) to gain insight into such a trend of dead stock. Because a sum of stock val-
ues is required, and a certain time frame for analysis has to be selected, the app con-
tains a standard filter bar with three mandatory filter values to fill out, as shown in
Figure 8.29:
� Analysis Start Date
� Analysis End Date
� Display Currency
Figure 8.29 Filter of Dead Stock Analysis
The result set becomes available after you click the Go button, and a graphical filter is
displayed that you can use to narrow down the results, as shown in Figure 8.30.
To configure the graphical filter, click the gear icon. Up to four different axes and two
categories/series can be selected to adapt the graphical filter according to your needs.
Below the graphical result filter, you find the results table with one line in the result
set per stock identifier (not shown, but similar to Figure 8.32 ahead).
420

8.4 Process Analysis Tools
Figure 8.30 Graphical Filter
8.4.2 Slow or Non-Moving Materials
Besides dead stock, slow or nonmoving materials might be of interest for the inven-
tory manager or analyst. With the Slow or Non-Moving Materials app (F2137), you can
search for these kinds of stock issues and get an overview of the affected materials. As
in the Dead Stock Analysis app, this app is based on the smart template pattern ana-
lytical list page and includes the elements filter, graphical filter, and result table.
You’ll start with the filter bar, as shown in Figure 8.31.
Figure 8.31 Filter Bar of the Slow or Non-Moving Materials App
This SAP Fiori app is special because it contains more powerful filter options related
to Customizing, as follows:
� Days with Low Consumption
Starting with the mandatory filter Days with Low Consumption, you can specify
the time frame in which you would expect and analyze low consumption of this
inventory.
� Reference Date
The endpoint of the time frame to be analyzed is the second mandatory filter,
421

8 Inventory Analysis
Reference Date. This means, if the user enters the reference date with 5/31/2019
and 90 days for Days with Low Consumption, the system will analyze the past 90
days beginning with the May 31, 2019.
� Display Currency
The Display Currency acts the same as in the rest of the SAP Fiori apps and serves
as a common factor for calculating the stock value across different plants.
� Inventory Consumption Group
Consumption postings can be threaded in a very differentiating way in this SAP
Fiori app via this filter value. Inventory consumption groups are defined in a sep-
arate IMG activity as described in Chapter 3, Section 3.1.3, and not only by the set-
ting per movement type. You can also define different groups of consumption
postings so that analysis can be performed for a certain group of consumption-
related movements.
� Slow-Moving Indicator
The last mandatory filter is the Slow-Moving Indicator supplementary option.
This new indicator introduced with SAP S/4HANA 1909 is based on the formula
consumption of the time frame divided by stock quantity in relation to the refer-
ence date multiplied by the days of the reporting time frame. The result reflects
the consumption-to-stock ratio. Different reporting periods can be compared
using this filter.
The list of materials shown in Figure 8.32 is displayed after you click the Go button.
Figure 8.32 Table Data in the Slow or Non-Moving Materials App
The Slow or Non-Moving Materials app also offers a detail screen for each result
entry, which you can access by clicking on the right-facing arrow on the right-hand
side.
The details screen contains a header and chart. Basic data around the slow or non-
moving item is given in the header section as outlined in Figure 8.33 by displaying
the most important information, such as Slow Moving Indicator and Stock Value.
422

8.4 Process Analysis Tools
Figure 8.33 Detail Screen Header Information
Slow-moving indicator data is displayed as a bar chart in the chart section of the
detail page, as shown in Figure 8.34. To access the detail page you have to click on one
result item. This chart is enhanced with a Predicted Slow-Moving Indicator (orange
line) based on two predictive models that must be activated and trained before the
predictive information is displayed in the chart. If the predictive models aren’t acti-
vated and/or trained successfully, the chart would only contain the blue bar chart.
The given historical data of the Slow-Moving Indicator (bar) is outlined for 12 months
into the past, starting with the selected reference date. Predictive data is added for the
next 3 months (line chart).
Figure 8.34 Chart with Predictive Information on the Detail Screen
The predictive models must be activated to benefit from the predicted data. The Pre-
dictive Models app is part of the SAP_BR_ANALYTICS_SPECIALIST business role and
423

8 Inventory Analysis
is required for activation and training of the following two relevant predictive mod-
els:
� MMSLO_CONSUMPTION_01
Contains consumption information.
� MMSLO_STOCK_LEVEL_01
Contains stock level information.
Both models are part of the ODATA_MM_IM_SLONOMOMAT catalog.
After the Predictive Models app is started from the SAP Fiori launchpad, the list of
predictive models is shown (see Figure 8.35).
Figure 8.35 Predictive Models: Slow or Non-Moving Materials
Both models need to be activated by selecting the checkbox and clicking the Train
button, as shown in Figure 8.36.
Figure 8.36 Activated Predictive Models
After this is done, different versions of the model can be trained. Training can be per-
formed on the detail screen of the model (click the arrow) again. Each training can be
performed by adding different training filter criteria. A broad amount of filter criteria
is part of the training views, but Figure 8.37 only outlines a handful of them to illus-
trate how to use training filters.
424

8.4 Process Analysis Tools
Figure 8.37 Model Training by Using Filters
Finally, the training can be started by clicking the Train button (not shown). It might
take some time until the version of the model is trained successfully because such a
huge amount of data must be processed.
Figure 8.38 illustrates the different possible statuses for a predictive model:
� Training Failed
This model version could not be trained successfully, possibly due to an insuffi-
cient amount of training data. Details can be analyzed by navigating into the
details screen of the model version.
� Active
This model version is currently in use by the Slow or Non-Moving Materials app.
� Training
This model version is trained in the background, and training is still ongoing.
Figure 8.38 Training Statuses of Predictive Models
8.4.3 Overdue Stock in Transit
Along with the KPI-based analytical SAP Fiori apps we introduced in Section 8.3,
inventory management in SAP S/4HANA also provides apps that are more focused
425

8 Inventory Analysis
on certain inventory processes and allow for inventory process optimization to meet
inventory process service KPIs.
For example, the Overdue Materials – Stock in Transit app (F2139) provides insight
into the processing of stock transport orders as related to the creation of the stock
transport order and the goods receipt.
The result chart of Overdue Materials – Stock in Transit outlines the shipping dura-
tion (see Figure 8.39, micro chart) and is shown after you click the Go button (not
shown). The micro chart starts with the Posting Date (PO) of the stock transport order
(i.e., 5/10/2019) and determines the delivery date based on the date given in the stock
transport order. On May 31, 2019, for example, there is an overdue stock transport
order because the Forecast Delivery Date was 5/12/2019 (line 1 in Figure 8.39). There-
fore, the stock has been in transit for 21 days already, as show in column Days in Tran-
sit. The Days in Transit column can be added to the result table by clicking the gear
icon, which brings you to the configuration options.
Figure 8.39 Overdue Stock Transport Orders
A predicted forecast of the delivery data can also be added to the result table as a Pre-
dicted Deviation separate column. To make use of this delivery date prediction, the
Predictive Scenario MATERIAL_OVERDUE_SIT in Catalog MM_IM_VDM_STOCK must
be activated and trained via the Predictive Models app (part of the SAP_BR_ANALYT-
ICS_SPECIALIST business role). Figure 8.40 shows the predictive model description in
the Predictive Models app.
426

8.4 Process Analysis Tools
Figure 8.40 Predictive Model for Delivery Date Prediction
The steps required to activate and train a predictive model are described in the previ-
ous section.
One final feature of the result tables is the toggle filter, which allows easy switching
and break down of the result set via buttons that reflect the different statuses of stock
transport orders. In the example shown in Figure 8.41, the Delivery Completed button
is selected. In this case, already-completed stock transport orders could be analyzed.
Figure 8.41 Status Filter for Stock Transport Orders
8.4.4 Overdue Goods Receipt Blocked Stock
Regarding overdue stock, the Overdue Materials – Goods Receipt Blocked Stock app is
available (F2347).
Background for this process monitoring app is the daily inventory management
business when goods receipts are posted into the nonvaluated goods receipt blocked
stock (movement type 103). Goods are received conditionally, aren’t valuated, and
aren’t free for use. For this kind of stock, companies often have internal service levels.
For instance, goods should not be kept longer than three days in good receipt blocked
427

8 Inventory Analysis
stock. They must be reverted to the supplier or posted into the unrestricted use stock
(movement type 105).
The SAP Fiori app offers a smart template-based pattern (filter + result table) for
analysis of overdue stock. By using the Days since Posting Date filter, you can select
only goods receipt postings that exceed the company’s service level, for instance,
greater than five days as a filter value. After you click the Go button, the result is
shown (see Figure 8.42).
Figure 8.42 Overdue Goods Receipt Blocked Stock
8.5 Custom Queries
In SAP S/4HANA, analytical functions are built on CDS views to ensure a consistent
view on the new data model in the SAP HANA database. CDS views in inventory man-
agement are especially implemented in a way that ensures the most consistent and
performant access to the required analytical data. These predefined and predelivered
CDS views might not be enough to serve your analytical reporting requirements
comprehensively. For example, the required data might be shared across database
tables that aren’t part of inventory management, such as material master data.
To meet this need for custom queries, the Custom CDS Views app (F1866) is available,
which allows you to create custom CDS views and queries to implement analytical
queries for special requirements that aren’t part of the SAP S/4HANA standard deliv-
ery.
Further Resources
Check out the SAP S/4HANA online help (http://help.sap.com) concerning Applica-
tions for General Functions for Key Users to gain more insight about available key
user tools.
428

8.5 Custom Queries
Custom CDS view queries have to be built on CDS views that are predelivered by SAP
and must be released in a way that they can be consumed in the Custom CDS Views
app. To find available CDS views that can be reused in custom CDS views, you have to
open the Custom CDS Views app and search for the required data source in the search
bar at the top of the screen, as shown in Figure 8.43. By navigating into the detail page
per data source entry, you can check out the parameters and fields of the selected
data source to determine whether it fits your needs.
Figure 8.43 Custom CDS Views Data Sources
Click the Add button (right-hand side, not shown) to create a new custom CDS view.
The New Custom CDS View screen will open, as shown in Figure 8.44.
Figure 8.44 New Custom CDS View
429

8 Inventory Analysis
Enter a Name and Label, and add a primary and associate data source by clicking the
Add button (lower-right corner, not shown) (see Figure 8.45).
Figure 8.45 Primary Data Source for a Custom CDS View
After you select the primary data source, you can choose the associate data source by
clicking on the Add button again, as shown in Figure 8.46.
Figure 8.46 Associate Data Source for a Custom CDS View
To connect these two data sources, you must maintain the association properties by click-
ing on the paper clip icon in the Actions column to access the screen shown in Figure 8.47.
In this example, both data sources are connected via their Product and Material
fields.
Now you must maintain the field list that the custom CDS view should return. In this
example, the product group has been added from the I_PRODUCT data source to the
result (see Figure 8.48). The editor provides a table with two sections. On the left-hand
side, the data sources and their result fields are outlined and can be taken over into
the result set of the new custom CDS view.
430
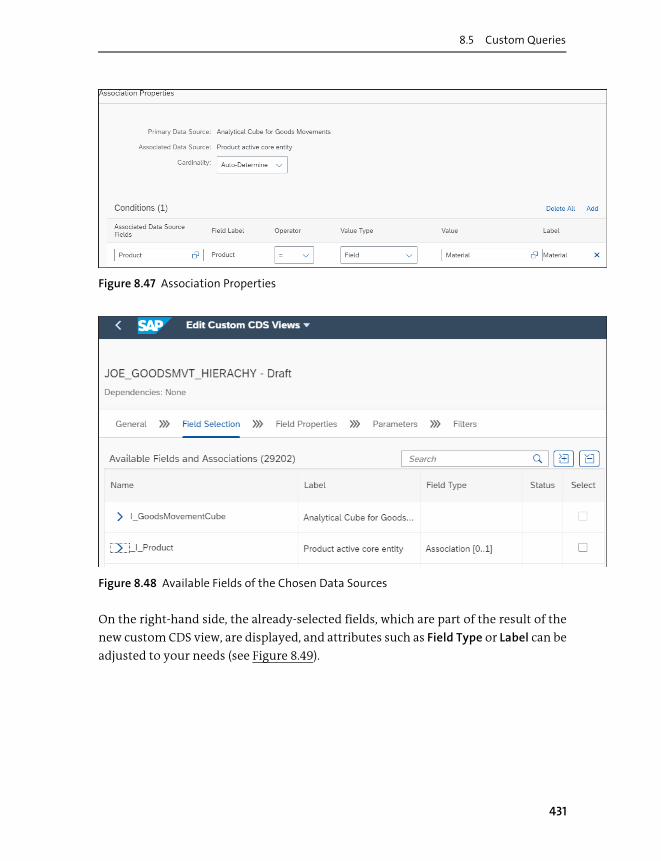
8.5 Custom Queries
Figure 8.47 Association Properties
Figure 8.48 Available Fields of the Chosen Data Sources
On the right-hand side, the already-selected fields, which are part of the result of the
new custom CDS view, are displayed, and attributes such as Field Type or Label can be
adjusted to your needs (see Figure 8.49).
431

8 Inventory Analysis
Figure 8.49 Selected Fields and Associations
You can save a draft (click Save Draft) or publish (click Publish) your new custom CDS
view so that it can be used in analytical queries afterwards. Before the custom CDS
view is published, you can also use the Preview function to see the result of the newly
created custom CDS view directly in the Custom CDS Views app, as shown in Figure
8.50.
Figure 8.50 Preview of the New Custom CDS View
432

8.6 What’s Ahead for Analytics?
You can see a graphical dependency overview by clicking the icon to the left of the
Save Draft button, shown previously in Figure 8.49. The screen shown in Figure 8.51
appears, and you can see the data sources that are mapped to the custom CDS view
now.
Figure 8.51 Graphical Outline of Data Source Dependencies
After the custom CDS view is published successfully, it can be used in SAP Lumira,
designer edition or business add-in (BAdI) implementations, for instance.
Further Resources
To learn more about SAP Lumira, designer edition, go to http://s-prs.co/v489204.
8.6 What’s Ahead for Analytics?
All inventory value calculations mentioned previously are based on the current
material price. In the future, the analytical SAP Fiori apps may offer the capability use
historical prices that are determined based on the reporting or reference dates in the
SAP Fiori apps.
We can dream of quantum leaps in the IT world if predictive analytics/machine learn-
ing can be combined with process automation. A first step into this new area is part
of the Overdue Materials – Stock in Transit app via automated information about
433

8 Inventory Analysis
stock transport orders that might be of interest for setting the Delivery Completed
indicator (see Figure 8.52). Based on the new situations framework in SAP S/4HANA,
you get notified if there are stock transport orders that you’re responsible for which
aren’t already completely delivered but already have a goods receipt.
In this regard, the My Situations app (F4154) has to be mentioned. This SAP Fiori app
provides access to all open situations and easy navigation into the single situations
for the end user to gain insight and act accordingly.
Figure 8.52 Warning Triangle for Possible Delivery Completed Purchase Orders
In the detail page of the Overdue Materials – Stock in Transit app (click on one item of
the result to enter the detail screen, as shown in Figure 8.53), an action button is
added to the header so you can choose Complete Delivery. This button is only visible
if the following are true:
� The currently displayed purchase order item isn’t already completely delivered.
� Sufficient authorizations are assigned to the user.
� A goods receipt was posted already, and the total goods receipt quantity equals the
total goods issue quantity.
434

8.6 What’s Ahead for Analytics?
Figure 8.53 Situation in Detail Page
You can decide to set the Delivery Completed indicator by just using the action pro-
vided by the situation framework.
Before the situation functionality can be used in the Overdue Materials – Stock in
Transit app, two administrative steps have to be performed:
� Set up a team
� Set up a situation
A setup of a new situations team can be done with the Manage Teams and Responsi-
bilities app (F2412), which is part of the SAP_BR_BUSINESS_PROCESS_SPEC business
435

8 Inventory Analysis
role. In Chapter 3, Section 3.2.3, the setup of situation handling was described in gen-
eral.
Follow these steps to set up a team:
1. Create a new team.
2. Enter the team name (e.g., “Overdue SiT Monitoring”).
3. Enter the type.
4. Add your user as a team member with the function “SMMIM_IM”.
5. If you have multiple users for the same team, assign another function for the next
user.
6. Save your team.
Next is to set up the situation itself, which is done by using the Manage Situation
Types app (F2947), as shown in Figure 8.54.
Figure 8.54 Search for Situation Template
Follow these steps to set up the situation (see Figure 8.55):
1. Select the standard template MAN_MATLOVERDUESITSITN, and click the Copy but-
ton.
2. Enter an ID (e.g., “Overdue_SiT”).
3. Maintain the batch job scheduling time.
4. Remove all responsibility definitions under Responsibility by Teams, and add the
Member Function you defined in the team setup. Only the team functions
assigned here will retrieve the related notifications (see Figure 8.56).
436

8.7 Summary
5. Click the Save button to enable your new situation type.
Figure 8.55 Admin Information of the Situation
Figure 8.56 Assignment of Responsibilities
Finally, how would inventory management in SAP S/4HANA look if the system not
only could predict trends of inventory KPIs or warn if a process is overdue but also
know how to resolve this in the best way and act accordingly? The user would get an
overview of automated system decisions and could steer the system in the right
manner. The first cornerstones are already available with SAP S/4HANA 1909 when
we consider the stock figures and KPI prediction and situation handling use cases,
enabling the first step into a new level of ERP software.
8.7 Summary
The analytical tool kits available within SAP S/4HANA cover a wide range of analytical
capabilities. With new SAP Fiori patterns and a modernized data model of the mate-
rial document in inventory management, real-time analytics are feasible. As outlined
in this chapter, analytical features were introduced in transactional applications, and
more process-oriented analytical tools are available, such as detection of overdue
stock or monitoring of process KPIs.
In the next and final chapter of this book, we’ll highlight some aspects of inventory
management in cloud deployments.
437


Chapter 9
Inventory Management in the Cloud
In this chapter, we’ll turn to inventory management deployment and
inventory management processes in the cloud. We’ll also discuss
hybrid deployments and take a look at key cloud products.
So far, we’ve focused on inventory management with an SAP S/4HANA system. Now,
we’ll switch gears to discuss your cloud deployment options. A cloud deployment has
the following features:
� Code is owned by the vendor:
– Upgrades or patches applied centrally at defined points in time by the software
vendor
– No access to code by the customer
� System isn’t operated by the customer.
� System is preconfigured, and configuration is highly standardized.
The transition of on-premise to cloud computing is sometimes fluent, and there isn’t a
clear distinction. Consider the following metaphor: You move to another city and need
somewhere to live. You have two options: buy your own house or rent an apartment.
In the moment you buy a property, you own it and can adapt it (within the technical
and legal boundaries) to your personal needs. You’ll need to pay some auxiliary costs
to keep the property in good shape from time to time. If you rent a property, your
contract clearly defines your obligations and restrictions. Buying normally means a
long-time engagement, capital investment, and stability, whereas renting gives you
the flexibility to switch to a better-suited location if the boundary conditions change.
You may want to enhance your house with new features such as a parking lot, solar
heating, and so on. You can’t do this with your rented apartment.
A self-owned house strongly resembles an on-premise solution, whereas a rented
apartment is like a cloud solution.
439

9 Inventory Management in the Cloud
Figure 9.1 explains the SAP S/4HANA deployment options. The dimensions used in
the diagram are technology and business processes. Of course, you can exclusively
opt for one deployment option only (see Figure 9.1, right-hand side). You can also
choose to split your deployment along the technology or the business processes as a
symmetric hybrid model (upper row, left and middle column). Finally, you can
choose an asymmetric hybrid model (lower row, left and middle).
Figure 9.1 Deployment Options for Cloud and On-Premise
In this section, we’ll dive into your deployment options beyond SAP S/4HANA in
more detail as we cover SAP S/4HANA Cloud or a hybrid deployment. We’ll then take
a look at new innovations for SAP cloud systems.
9.1 SAP S/4HANA Cloud
This section introduces the SAP S/4HANA Cloud solution. All cloud criteria men-
tioned previously also apply for SAP S/4HANA Cloud. When you watch SAP S/
4HANA Cloud demos for the first time, you’ll notice a strong similarity to the
SAP S/4HANA solution. Indeed, SAP S/4HANA Cloud is a prepackaged, scoping-
enabled, SAP-managed cloud solution based on SAP S/4HANA with a quarterly
Business Processes
Tech
no
log
y
On-Premise Deployment
Cloud Deployment
Business Processes
Tech
no
log
y
On-PremiseDeployment
Cloud Deployment
Business Processes
Tech
no
log
y
On-PremiseDeployment
CloudDeployment
Business Processes
Tech
no
log
y
Cloud Deployment
Business Processes
Tech
no
log
yOn-Premise Deployment
Business Processes
Tech
no
log
y
On-Premise Deployment
CloudDeployment
440

9.1 SAP S/4HANA Cloud
upgrade cycle. In the same way, each SAP S/4HANA edition contains most of the
features of the preceding SAP S/4HANA Cloud editions.
We’ll begin with a look at the SAP S/4HANA Cloud scope, before moving on to the
implementation methodology, configuration, and update cycle.
9.1.1 Solution Scope
The SAP S/4HANA Cloud solution scope is enhanced with each quarterly release. It
comprises several Scope Item Groups, as shown in Figure 9.2.
Figure 9.2 Solution Scope: SAP Best Practices for SAP S/4HANA Cloud
441

9 Inventory Management in the Cloud
The key Scope Item Groups are as follows:
� Finance
� Human Resources
� Sourcing and Procurement
� Manufacturing
� R&D Engineering
� Supply Chain
� Sales
� Services
� Professional Services
� Application and Platform Infrastruc-
ture
� Database and Data Management
Note
These screenshots were taken from SAP S/4HANA Cloud 1905. Due to the nature of
quarterly upgrades, they may differ later.
You can find a two-level hierarchy below each Scope Item Group with the scope items
on the lowest level. Figure 9.3 shows this part of the hierarchy containing inventory
management. Each scope item has a three-digit alphanumerical key and a descrip-
tion.
Figure 9.3 Scope Items below Inventory
442

9.1 SAP S/4HANA Cloud
When you click on a scope item, you’ll be directed to the scope item’s object page (see
Figure 9.4) containing version information; Overview, Country/Region Relevance,
and Details tabs; and references to other solutions. In the Overview tab, you’ll find
the key business benefits of the scope items and covered main processes.
Figure 9.4 Scope Item Core Inventory Management (BMC): Header and Overview
Figure 9.5 shows the country/regional information linked to the scope item. This
may, for instance, become interesting if you require localized tax rules, chart of
accounts, or other business-relevant, country-specific configuration.
443

9 Inventory Management in the Cloud
Figure 9.5 Scope Item Country Relevance
The details shown in Figure 9.6 always contain a process flow and a test script. They
support you in understanding the business processes covered by the scope item and
to test and execute the main flow.
Figure 9.6 Details of the Scope Item
In Figure 9.7, you can see the process flow linked to the scope item Core Inventory
Management (BMC). The process flow outlines the involved business roles, the links
444

9.1 SAP S/4HANA Cloud
to other scope items, and the single process steps, which are shown in detail as part of
the tutorials.
Figure 9.7 Fragment of the Core Inventory Management Process Flow
All tutorials are listed in Figure 9.8. You can start a tutorial by double-clicking on it,
and you’ll be directed via step-by-step instructions on how to complete the process
step.
For example, Figure 9.9 shows the Goods Receipt without Reference tutorial’s first
step, which starts with SAP Fiori launchpad as a starting point to launch the SAP Fiori
app (see Chapter 5, Section 5.4).
445

9 Inventory Management in the Cloud
Figure 9.8 Tutorials Overview
Figure 9.9 Goods Receipt without Reference Tutorial
446

9.1 SAP S/4HANA Cloud
In addition to the documentation and tutorials published in the SAP Best Practices
Explorer, SAP S/4HANA Cloud customers can sign up to the SAP Learning Hub and
join the SAP S/4HANA Cloud implementation learning room, which contains a rich
set of featured online tutorials, documents, blogs, and opportunities to connect with
other SAP S/4HANA Cloud customers.
Further Resources
If you want to try out the SAP S/4HANA Cloud offering, check out the SAP S/4HANA
Cloud Trial offering at http://s-prs.co/v489205.
9.1.2 Implementation Methodology
When customers begin an SAP S/4HANA Cloud implementation, they follow dedi-
cated phases. Within each phase, steps, checkpoints, and deliverables are defined.
Let’s walk through the key phases, as shown in Figure 9.10:
1. Explore
During the explore phase, they have the opportunity to test SAP S/4HANA Cloud
on a starter system instance (see Figure 9.10). A starter system contains SAP Best
Practice content and demo data, which allows you to test and fine-tune the
deployed process according to the provided test scripts mentioned in Section 9.1.1.
All configuration changes are local, which means they can’t be used in any imple-
mentation phases later.
At the end of the explore phase, customers receive a quality system (Q-system).
During the setup of the Q-system, initial scoping and the creation of the organiza-
tional structures are performed.
2. Realize
After setup, fine-tuning (see Section 9.1.3) of the configuration is used to adapt the
predefined scope to the customer requirements in the realize phase. The result is
transferred to the production system (P-system) approximately every two weeks,
so that both system configurations are kept in sync.
3. Deploy
At the end of the deploy phase, the p-system configuration is finished and the P-
system is ready for go-live. The last cycle (realize, deploy, run) may be repeated
several times to apply a stepwise implementation of processes or countries.
447

9 Inventory Management in the Cloud
Figure 9.10 SAP S/4HANA Cloud Implementation Phases
9.1.3 Configuration and Fine-Tuning
Most of the configuration is carried out on the Q-system and transferred to the P-system
in a consistent state. There are some rare exceptions when configurations can’t be trans-
ferred but have to be repeated on the P-system as well. One example is the configuration
of external system access.
The clear majority of all business process fine-tuning is performed within the Man-
age Your Solution app in SAP Fiori, which is unique to SAP S/4HANA Cloud. Figure 9.11
shows the entry screen of the Manage Your Solution app. The current phase is prom-
inently displayed in the header, and you can navigate to apps supporting migration,
testing, education, and configuration. The Set Country Version button allows you to
set Configure My Solution to the desired country, so that all country-dependent fine-
tuning is executed for this country.
To begin, click the Configure Your Solution button. Configuration as fine-tuning
starts with a simple list of implementation items, which is structured according to a
two-level hierarchy of Application Area and Sub Application Area, as shown in Figure
9.12. Additional attributes indicate whether an implementation items is mandatory,
country dependent, or needs to be repeated in the P-system (Redo in P System). More-
over, a Status helps you monitor the completeness of the implementation steps.
Discover Prepare Explore Realize Deploy Run
Phases
Starter SystemSAP Best
Practices Content
Q-SystemSAP Best
Practices Content
P-System
Configuration
448

9.1 SAP S/4HANA Cloud
Figure 9.11 Manage Your Solution App: Displaying the Current Phases
Figure 9.12 Configure Your Solution Displaying Implementation Items
449

9 Inventory Management in the Cloud
When selecting an implementation item, the flexible column layout shows all
assigned Self-Service Configuration UIs (SSCUIs) on the right-hand side as Configura-
tion Steps (see Figure 9.13). Only these SSCUIs are visible, which are linked to the acti-
vated scope (see Section 9.1.2). In addition to the Status, Mandatory, and Redo in P
System columns, the SSCUI ID is unique to each SSCUI.
Note
You can search for the ID directly in Figure 9.12 to reach the desired SSCUI.
The Description explains the implementation item, and the Comments section
allows you to comment on all configuration activities.
Figure 9.13 Selected Implementation Item Organization with Assigned SSCUIs
In addition to the actual configuration screen, each SSCUI offers an option to add
comments and an extended help text in the Actions dropdown, as shown in Figure
9.14.
450

9.1 SAP S/4HANA Cloud
Figure 9.14 Additional Help and Comment Capabilities from Each SSCUI
Figure 9.15 shows the Organizational Structure SSCUI, which is used in SAP S/4HANA
Cloud to create and edit the organizational structure of the cloud implementation.
Figure 9.15 SSCUI Organizational Structure
451

9 Inventory Management in the Cloud
The structure itself resembles strongly the organizational structure of SAP S/4HANA
installations as described in Chapter 3. The actual structure is displayed as a hierarchy
on the left-hand side. A detail page for each selected hierarchy node appears on the
left-hand side supporting editing of the node itself and its relationship to other orga-
nizational entities. You can navigate to the details of each organizational entity by
clicking on them. The country on top of the hierarchy is set in the Manage Your Solu-
tion app (refer to Figure 9.11).
If you click on the arrow of a selected plant, you’ll reach the editing screen of a
selected plant (see Figure 9.16).
Figure 9.16 Editing General Plant Attributes
452

9.2 Hybrid Deployment
The organizational structure SSCUI allows you to change general attributes of a plant,
such as address attributes, tax codes, time zones, and so on. Business process-specific
attributes can be changed in the SSCUIs linked to the appropriate Application Area
and Sub Application Area.
9.1.4 Update Cycle
As explained in Section 9.1.1, SAP S/4HANA Cloud deployments will be upgraded four
times a year at a predefined date to the next edition. Two weeks after the Q-system
upgrade, the P-system is upgraded, as shown in Figure 9.17.
Figure 9.17 SAP S/4HANA Upgrade Cycle
After the Q-system upgrade, SAP S/4HANA Cloud customers have two weeks to
explore the features of the next edition, and then the P-system is upgraded. The
whole cycle starts again in the next quarter. A new scope must be activated explicitly
by the customer after each upgrade. Any enhancements to the activated scope won’t
interfere with any business processes of the customer.
9.2 Hybrid Deployment
Now that we’ve introduced the cloud deployment model, let’s look at whether you
can combine cloud and on-premise and distribute the business processes between
them. We’ll look at key hybrid scenarios in the following sections.
11Weeks
2Weeks
SAP S/4HANAQuarterly Upgrade
Cycle
Q-SystemUpgrade
P-SystemUpgrade
453

9 Inventory Management in the Cloud
9.2.1 SAP S/4HANA and SAP S/4HANA Cloud
Today’s economy creates extraordinary challenges for IT. Business processes are rap-
idly changing. Companies invent new business models while discarding old ones.
The process is often accelerated by mergers and acquisitions. Moreover, the internal
supply chain plus all digital processes extended to suppliers and customers are con-
stantly optimized, often creating collaborative planning, forecasting, and replenish-
ment scenarios relying on emerging technologies such as Internet of Things (IoT),
machine learning, or block chain. This phenomenon is often referred to as the digital
transformation. IT’s challenge is to support this transformation while not disturbing
the enterprise core processes. One approach to supporting new scenarios is by defin-
ing IT environments whose components evolve at different speeds:
� The core component implements all business processes that are stable or evolving
at a lower speed.
� The agile component implements the rapidly evolving business processes de-
pending on the latest technology or recent process innovations.
This approach is sometimes referred to as bimodal IT or two-speed IT. Both compo-
nents must be linked to ensure consistency, which can become a nightmare if there
is no semantic compatibility of business objects between both environments. SAP
S/4HANA offers an easy-to-use solution to that challenge called “two-tier ERP.” Figure
9.18 displays four typical solution patterns consisting of an SAP S/4HANA solution
and SAP S/4HANA cloud instances:
� Pattern 1 delineates a headquarter on-premise and its subsidiaries on cloud.
� Pattern 2 depicts a similar setup for corporate and affiliate.
� Pattern 3 depicts how central services can be implemented in a cloud serving other
on-premise and cloud instances.
� Pattern 4 illustrates an ecosystem with the on-premise instance in the center and
subcontractors, dealers, and so on as connected cloud instances.
As SAP S/4HANA and SAP S/4HANA Cloud have the same technology base, a seman-
tic compatibility is built in by default. Of course, other solution patterns are also fea-
sible, such as central finance or central procurement instance.
This section focuses on hybrid scenarios impacting inventory management. One
possible example is a subsidiary producing a niche product that is nevertheless
crucial for the entire company. In Figure 9.19, the subsidiary is represented as an SAP
S/4HANA Cloud instance in the enterprise IT system landscape.
454

9.2 Hybrid Deployment
Figure 9.18 Possible Hybrid Deployment Scenarios of SAP S/4HANA and SAP S/4HANA
Cloud
Figure 9.19 Manufacturing Example 1 with Tier 2 Acting as Supplier (Scope Item 21T in Cloud
Solution Scope)
SAPS/4HANA
SAPS/4HANA
Cloud
Subcontractors
Headquarters
SAPS/4HANA
SAPS/4HANA
Cloud
Affiliates
Corporate
SAPS/4HANA
SAPS/4HANA
Cloud
Central Services
SAPS/4HANA
Cloud
SAPS/4HANA
Cloud
SAPS/4HANA
Ecosystem
SAPS/4HANA
Cloud
Subsidiaries Dealers
Subsidiary (Tier 2)
Headquarters (Tier 1)
Create purchase order
Create sales order
PO
SO
Create goods receipt
Create goods issue
GR
GI
AC
BL
Create billing document
Clear accountrecord
PrdO
SAP S/4HANA Cloud
SAP S/4HANAOn-Premise
455

9 Inventory Management in the Cloud
Thin arrows indicate the data flow between process steps, and large arrows indicate
the document flow within one tier. The advantage of this setup is that the internal
business processes of the headquarters and subsidiaries remain independent from
each other, so they can evolve at a different pace. The interface between them is
clearly defined by the processes and the involved business objects.
When ordering a product in the subsidiary, headquarters creates a purchase order,
which automatically triggers the creation of a sales order in the SAP S/4HANA Cloud
instance. This is available as scope items 2EL and 2EJ (see Section 9.1.1). As a demand
element, this sales order triggers the production order at the subsidiary, and then the
subsidiary will produce and issue the finished goods back to headquarters against the
sales order. When the ordered product arrives at headquarters, the goods receipt
against the purchase order triggers the financial postings, eventually clearing the
account receivables at the subsidiary. Additional interfaces are available in SAP
S/4HANA Cloud so that progress of the internal steps in tier 2 can be monitored from
tier 1 (see Section 9.3.3).
In the second example outlined in Figure 9.20, the subsidiary is also represented as
an SAP S/4HANA Cloud instance in the enterprise IT system landscape. Here as well,
thin arrows indicate the data flow between process steps, and large arrows indicate
the document flow within one tier. In this case, however, tier 2 acts as a subcontractor
of tier 1.
When ordering a product in the subsidiary, headquarters creates a subcontracting
purchase order, which automatically triggers the creation of a sales order in the SAP
S/4HANA Cloud instance. Furthermore, headquarters provides the free-issue stock
required to complete the production process at the subcontractor. This stock is kept
as the stock provided to supplier special stock type in the headquarters inventory
management. As the demand element, the sales order triggers the production order
at the subsidiary, and the subsidiary produces the finished goods using the free
goods from headquarters, and then issues the finished goods back to headquarters
against the sales order. When the finished good arrives at headquarters, the goods
receipt against the subcontracting purchase order triggers the financial postings,
eventually clearing the account receivables at the subsidiary and clearing the stock
provided to the supplier in inventory management.
The advantage of the subcontracting scenario is that the free-issue stock provided by
headquarters does have to be kept in the books of account at the subsidiary. Like
example 1, additional interfaces are available in SAP S/4HANA Cloud so that progress
of the internal steps in tier 2 can be monitored from tier 1 (see Section 9.3.3).
456

9.2 Hybrid Deployment
Figure 9.20 Manufacturing Example 2 with Tier 2 Acting as Subcontractor (Scope Item 2WL
in Cloud Solution Scope)
Both examples illustrate the advantages of semantic compatibility between SAP
S/4HANA and SAP S/4HANA Cloud. The SAP S/4HANA Cloud will incorporate the lat-
est technology with every quarterly upgrade, but the technical and the business
interfaces will remain stable. The SAP S/4HANA instance, on the other hand, will
most certainly evolve at a much slower pace from a technical perspective, as on-
premise upgrades are very time consuming. However, by using a two-tier scenario,
even on-premise instances can indirectly benefit from the latest technologies.
9.2.2 Decentralized Warehouse Management
SAP S/4HANA offers the capability to link inventory management to an external
warehouse management system (WMS). After setting up the basic communication,
pairs of plants and storage locations of the SAP S/4HANA organizational structure are
connected to the external WMS. All stock quantities must be synchronized between
Subsidiary (Tier 2)
Headquarters (Tier 1)
Create subcontractor purchase order
Create sales order
PO
SO
Create goods receipt
Create goods issue
GR
GI
AC
BL
Create billing document
Clear accounts receivable
PrdO
SAP S/4HANA Cloud
SAP S/4HANAOn-Premise
ST
ST
Provide
free-issuestock at
supplier
457

9 Inventory Management in the Cloud
both systems before this link is established. After the link is established, inventory
postings involving these pairs are automatically converted into outbound and
inbound delivery documents (see Figure 9.21). As this is an asynchronous process,
stock quantities in the involved plant/storage location aren’t updated until the pro-
cess is completed.
Figure 9.21 Integration between SAP S/4HANA and an External WMS (Scope Item 1ZQ in
Cloud Solution Scope)
Figure 9.22 shows the result of a posting involving a storage location linked to a
decentralized WMS.
Figure 9.22 Material Transfer Posting into a Storage Location Linked to a Decentralized
Warehouse
SAP S/4HANA
Outbound Delivery Document
External WarehouseManagement
Inbound Delivery Document
Plant A/ StorLoc01
Plant A/ StorLoc02
Plant A/ StorLoc01
Plant A/ StorLoc02
458
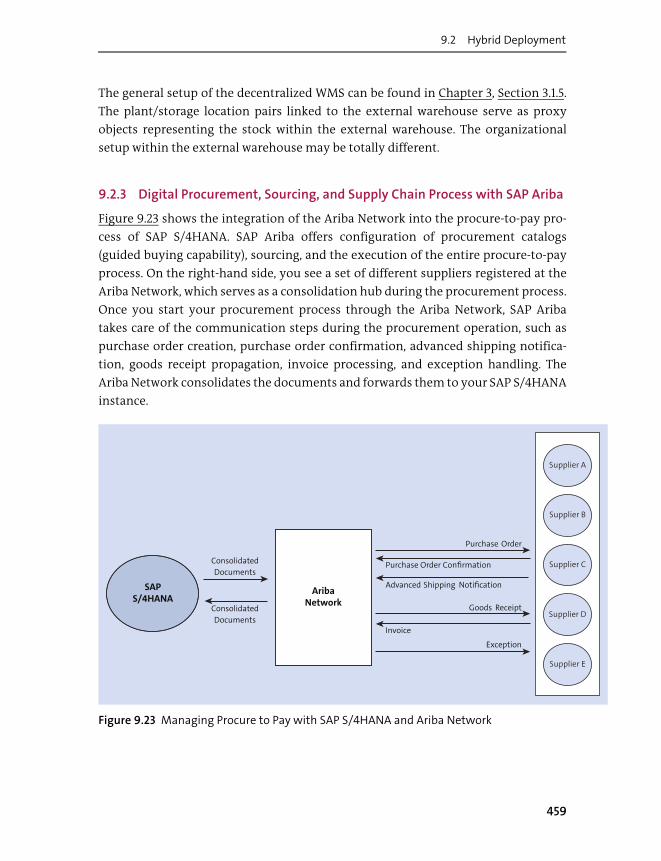
9.2 Hybrid Deployment
The general setup of the decentralized WMS can be found in Chapter 3, Section 3.1.5.
The plant/storage location pairs linked to the external warehouse serve as proxy
objects representing the stock within the external warehouse. The organizational
setup within the external warehouse may be totally different.
9.2.3 Digital Procurement, Sourcing, and Supply Chain Process with SAP Ariba
Figure 9.23 shows the integration of the Ariba Network into the procure-to-pay pro-
cess of SAP S/4HANA. SAP Ariba offers configuration of procurement catalogs
(guided buying capability), sourcing, and the execution of the entire procure-to-pay
process. On the right-hand side, you see a set of different suppliers registered at the
Ariba Network, which serves as a consolidation hub during the procurement process.
Once you start your procurement process through the Ariba Network, SAP Ariba
takes care of the communication steps during the procurement operation, such as
purchase order creation, purchase order confirmation, advanced shipping notifica-
tion, goods receipt propagation, invoice processing, and exception handling. The
Ariba Network consolidates the documents and forwards them to your SAP S/4HANA
instance.
Figure 9.23 Managing Procure to Pay with SAP S/4HANA and Ariba Network
SAPS/4HANA
Supplier A
Supplier B
Supplier C
Supplier D
Supplier E
Consolidated
DocumentsPurchase Order Confirmation
Advanced Shipping NotificationAriba
NetworkGoods Receipt
Invoice
Exception
Purchase Order
Consolidated
Documents
459

9 Inventory Management in the Cloud
9.3 SAP Cloud Solutions
Cloud solutions are one of the fastest evolving IT business areas. The same is true for
SAP’s cloud solutions. The following sections try to summarize the most prominent
trends and upcoming cloud products.
9.3.1 SAP Cloud Platform
SAP Cloud Platform is an open business platform offering a design and runtime envi-
ronment to create business applications. There is an entire set of available capabili-
ties, such as an integrated development environment for rich internet applications
(RIA); machine learning application programming interfaces (APIs); mobile services;
IoT services; and integration, collaboration, and analytic services.
SAP Cloud Platform is ideally suited to extend existing or create new SAP Fiori apps
in a side-by-side scenario to collect and process IoT data, to integrate data from vari-
ous sources, and to leverage machine learning capabilities. A side-by-side scenario
means you extend the core business processes in the SAP S/4HANA Cloud solution
with the means of the interfaces described in Section 9.3.3 on the SAP Cloud Platform.
9.3.2 SAP Analytics Cloud
SAP Analytics Cloud is a cloud-based, real-time analytical visualization tool that can
be connected to different data sources, as shown in Figure 9.24. You can evaluate que-
ries, create dashboards, and use built-in predictive capabilities across data sources.
Figure 9.24 SAP Analytics Cloud
SAP AnalyticsCloud
SAP S/4HANA
Dashboard Predictive
SAP S/4HANACloud
Third Party
Data Sources
460

9.3 SAP Cloud Solutions
You can find all prepackaged scenarios with the SAP Best Practices for analytics for
SAP S/4HANA. The preconfigured content supporting a manufacturing scenario for
accessing SAP S/4HANA Cloud is defined in scope item 28S (see Section 9.1.1).
The following scenarios are supported out of the box:
� Cost variance analysis
Analyze production cost actuals versus planned costs linked to production orders.
� Cost variance analysis
Perform work center cost analysis by plant.
� Cost variance analysis
Predict cost variance (fixed versus actual).
� Production scrap analysis
Analysis of production scrap distribution between organizational units/work cen-
ters.
� Current stock value and quantity analysis
Analysis of current stock quantities and values distributed among all stock types
and special stock types.
Figure 9.25 shows an example of the Production Cost Analysis dashboard.
Figure 9.25 Production Cost Dashboard: Overview
461

9 Inventory Management in the Cloud
The key figures on a reporting date are visible on the left-hand side. Aggregated fig-
ures per plant and company code are shown as charts on the right-hand side.
Figure 9.26 shows a detailed version of the Production Cost Analysis dashboard with
filters on the left-hand side and charts aggregating cost-related figures per profit cen-
ter, company code, or order type.
Figure 9.26 Production Cost Dashboard: Details
Figure 9.27 presents the manufacturing boardroom as an SAP Analytics Cloud exam-
ple linked to inventory management. Different production key performance indica-
tors (KPIs) are visualized as part of the boardroom. The key figures are shown on the
right-hand side. The production quantity is shown as a geolocated cluster with drill-
down capability. The same data is presented per dimension (plant) and as a time
series below the map.
Figure 9.28 is the geolocated production quantity per product as a table and pie chart.
You can drill down by using the filter options or just by zooming into the map.
462

9.3 SAP Cloud Solutions
Figure 9.27 SAP Analytics Cloud Boardroom: Manufacturing Overview
Figure 9.28 SAP Analytics Cloud Boardroom: Production Quantity per Plant, Drilldown on
Plants in Germany
463

9 Inventory Management in the Cloud
Figure 9.29 shows as an example the generic drilldown capabilities of the chart—
Incorrect Ratio and Production Quantity per Time—reachable by right-clicking the
chart bars. Many chart components support navigation or display disaggregated fig-
ures by right-clicking.
Figure 9.29 Generic Drilldown Capabilities
9.3.3 SAP API Business Hub
The SAP API Business Hub is the central API repository of all SAP solutions, such as
SAP S/4HANA, SAP S/4HANA Cloud, SAP C/4HANA, SAP Cloud Platform, SAP Success-
Factors, SAP Fieldglass, SAP Concur, and SAP Ariba.
APIs available in the SAP S/4HANA solution can be found at http://api.sap.com, as
shown in Figure 9.30.
Note
As a rule of thumb, SAP S/4HANA Cloud 1808 equals the SAP S/4HANA release in
2018. Consequently, SAP S/4HANA Cloud 1908 equals the SAP S/4HANA release in
2019. This rule can be derived from the cloud update cycle mentioned in Section 9.1.4.
464

9.3 SAP Cloud Solutions
Figure 9.30 Entry Page of SAP API Business Hub
Business Application Programming Interfaces
Figure 9.31 shows the entry screen to SAP S/4HANA Cloud APIs. The Details section
here provides news, secondary documentation, and links. The most important fea-
ture is the search capability, which helps you quickly find your desired API. Each API
is linked to an SAP S/4HANA business object type.
You can see the search results for Material Document in Figure 9.31, which are three
SOAP service-based APIs and one OData-based API. You can expect to find at least one
OData-based API per SAP S/4HANA business object type, which can be used to read
the SAP S/4HANA business object and perform create, update, or delete OData opera-
tions, if applicable.
465

9 Inventory Management in the Cloud
Using the OData protocol to access SAP S/4HANA business objects and using SOAP
for process integration are recommended.
Figure 9.31 Search and Display of Results of SAP S/4HANA Cloud Business APIs
The Details section contains some package information (change log) and most nota-
bly a Documents section containing links to supplementary information, such as
blogs, links, and hints (see Figure 9.32).
466

9.3 SAP Cloud Solutions
Figure 9.32 Details in the Documents Section
Note
In general, the APIs published with SAP S/4HANA Cloud are also available in SAP
S/4HANA; however, the API version and the API availability might differ. A detailed
document on how to verify which API version is available is listed in Figure 9.32.
When opening an API description (Process Material Documents in Figure 9.31), you’ll
be directed to a dedicated API overview page (see Figure 9.33). This example shows an
OData-based API with entity types to the left and supported operations of the
467

9 Inventory Management in the Cloud
selected entity type to the right, including Try out and Code Snippet features. The API
References section contains the technical API documentation, whereas the Details
section contains the secondary documentation. Download SDK and Code Snippet
help you to quickly start an implementation project using the chosen API.
Figure 9.33 API Overview
The Details section in Figure 9.34 contains a textual description of the API, so you can
verify whether it meets the requirements of the expected functions. Download Spec-
ification allows you to download the API metadata. As we’re looking into an OData-
based API, we get an OData metadata file, as shown in Figure 9.35.
If you’re using the API on an SAP S/4HANA Cloud instance, you need to know the
Scope Items to activate the visibility of SAP S/4HANA Cloud instance on the API (refer
to Section 9.1.1) and the Communication Scenario to configure the API in your SAP
S/4HANA Cloud instance.
468

9.3 SAP Cloud Solutions
Figure 9.34 Secondary Documentation of the OData API
Figure 9.35 Specification Example: OData Metadata File in XML Format
469

9 Inventory Management in the Cloud
The Business Documentation link shown in Figure 9.34 links you to the SAP Help Por-
tal entry of the API. The SAP Help Portal documentation of the API in Figure 9.36 doc-
uments the business function of the APIs and can also contain requests exemplifying
dedicated business scenarios, such as a goods receipt for purchase order or a goods
issue for cost center. It’s important to keep in mind that each API contains a contract
based on the technical interface definition, as shown in Figure 9.36, and a business
contract based on the configuration of the system.
Figure 9.36 SAP Help Portal Documenting the Business Context of the API
As shown in Figure 9.33, you can try out all supported operations on an OData entity
type. Figure 9.37 shows the section that allows you to enter OData request parameters
such as query options, filters, or sort criteria.
Figure 9.38 displays the response part. Execute triggers the request to the configured
system shown in Figure 9.37.
470
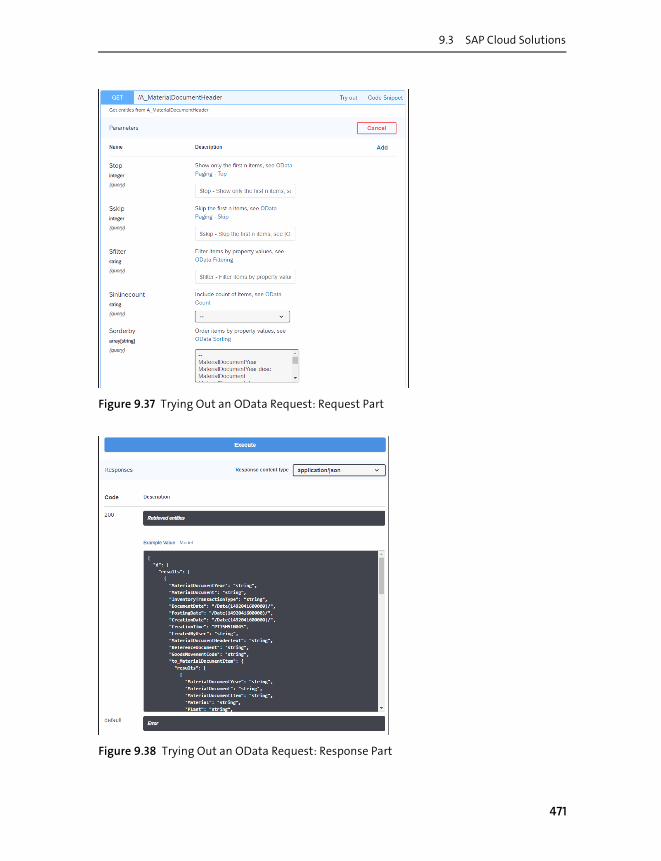
9.3 SAP Cloud Solutions
Figure 9.37 Trying Out an OData Request: Request Part
Figure 9.38 Trying Out an OData Request: Response Part
471

9 Inventory Management in the Cloud
As shown in Figure 9.33, the Download SDK button provides an automatic download
functionality providing an archive (software development kit [SDK]) with a Java-
coded project accessing the selected OData API. Figure 9.39 displays a code snippet of
the downloaded project. This feature helps you immediately start an implementa-
tion project, connecting an external system to your desired API in SAP S/4HANA.
Figure 9.39 Snippet of the Downloaded SDK
If you want to integrate access to the chosen API in your existing implementation
project, you can also use the Code Snippet feature in Figure 9.33 to get a coding block
accessing the selected OData operation (see Figure 9.40). Code snippets are available
in various programming languages.
Business Events
In addition to the OData and SOAP APIs, the SAP API Business Hub also offers SAP
S/4HANA Cloud business events (see Figure 9.41), which can be used for a loose cou-
pling between heterogenous systems.
472

9.3 SAP Cloud Solutions
Figure 9.40 Automatically Generated Code Snippets: Selected Programming Language on
the Left, Code on the Right
Figure 9.41 Package Info of SAP S/4HANA Business Events
473

9 Inventory Management in the Cloud
Business events follow a publish-subscribe pattern outlined in Figure 9.42. A con-
sumer interested in changes of business objects in a different system instance sub-
scribes to the corresponding event. When the event is triggered, the consumer gets
notified.
Figure 9.42 Publish-Subscribe Example between SAP S/4HANA Cloud and SAP Cloud Plat-
form
Similar to APIs, you can search for events by business objects. Figure 9.43 shows
searching for business events covering the business object Production Order.
After clicking on the Production Order Events card, you’ll reach the Production Order
Events detail page, shown in Figure 9.44, which lists the available events to subscribe
to and their HTTP implementation.
SAP Cloud Platform SAP S/4HANA Cloud
Event
SubscriptionConsumer
Event
SubscriptionConsumer
Event
SubscriptionConsumer
474

9.3 SAP Cloud Solutions
Figure 9.43 SAP S/4HANA Cloud Business Event for Production Order
Figure 9.44 Details of the Business Event Production Order
9.3.4 SAP Leonardo Internet of Things
In Chapter 1, we started with the definition of an IT system and soon met the term
ERP system as an IT system designed to support enterprise business processes. Look-
ing at an ERP system from a meta perspective, we can see that it contains an abstrac-
tion of the real world. Factories are mapped to plants, moving goods are mapped to
inventory, an explanation of how to create a good becomes a production version, and
475

9 Inventory Management in the Cloud
a place where steps of the creation are executed is a work center. In general, the real
world requires an abstracted counterpart in the IT world. If not, the IT system would
not be able to support the business.
However, there is a gap between the real world and the IT world, which is usually
bridged by the end user of the IT system. The end user collects the data in the real
world, translates the data, and maps it to the abstracted entities of the IT world. Then
he or she transfers it to the IT world, so the SAP S/4HANA system can process it. The
result is interpreted by the end user and transformed into actions in the real world.
The closer the IT world resembles the real world, the easier the bridging. If the end
user can close the gap without much training, simply by interacting with the IT world,
we call the ERP system user friendly.
From Chapter 2 to Chapter 8, we’ve explained how SAP S/4HANA with the SAP Fiori UI
narrows the gap physically by mobilizing the IT world and conceptually with the
intelligent enterprise and the intuitive user experience. A different type of bridge is
the IoT, as shown in Figure 9.45. IoT enables the real world to directly talk to the IT
world on many occasions without any human involvement. To do so, the real world’s
data needs to be collected, transformed, stored, and mapped to the IT world’s entity
and vice versa. This is exactly what the cloud-based SAP Leonardo platform does.
Figure 9.45 Bridging the Gap between the Real World and the IT World
SAP S/4HANA System
IT WorldReal World
IoT
Collecting
TranslatingMapping
Transfer
ProcessC
ProcessB
ProcessA
InterpretActing
Gap
End User
476

9.3 SAP Cloud Solutions
Figure 9.46 shows the services provided by the SAP Leonardo platform:
� Device management
Device management enables the secure onboarding/offboarding of IoT devices at
scale. Different IoT protocols are supported out of the box, plus there is an SDK to
implement additional protocols. The sensor data can be enriched with geospatial
information.
� Data management
Data management comprises two aspects: (1) the collection of sensor data, includ-
ing harmonizing, abstracting, and transforming the physical sensor data into
meaningful business data, and (2) integration of master data, including geo loca-
tion.
� Geo
Geo services allow you to define points or areas of interest and floorplans.
Figure 9.46 Services Provided by the SAP Leonardo Platform
The data is stored automatically in hot storage usable for analytical queries and in
warm and cold storage with different retention periods.
You can define aggregates with dimensions and measures with calculation views on
top that are consumable by SAP Analytics Cloud (refer to Section 9.3.2).
There is a rule engine available on streams and persisted data. Based on the rules
engine, there is an event service to implement a publish-subscribe architecture with
possible consumers if rules match certain criteria. Eventually, events trigger actions
and provide an IoT context to business processes running on SAP S/4HANA.
Big Data Storage
Event Service ActionActions andIntegration
Services
Streaming Data
Persisted Data
RulesAnalytics and Queries
Device Management
Data Management Geo Services
Rules
477

9 Inventory Management in the Cloud
9.4 Summary
This chapter set out to provide insight into your deployment options and how inven-
tory management functions in the cloud. In doing so, it has also provided an outlook
to the future of SAP S/4HANA.
Initially, different deployment options were discussed. In addition to an on-premise
deployment, the general aspects of cloud deployment were introduced, and hybrid
deployment models where either part of the technology or part of the business pro-
cesses are deployed in cloud were delineated schematically. The next section pre-
sented SAP S/4HANA Cloud as deployment model business in cloud. Then several
other hybrid deployment models (two-tier ERP, decentralized warehouse manage-
ment, digital procurement) with focus on inventory management were shown. The
final section focused on SAP Cloud Platform, in particular with SAP Analytics Cloud
and SAP Leonardo IoT with the SAP API Business Hub as the interface repository.
We hope you’ve enjoyed reading the book and that we were able to meet the expecta-
tions raised in the preface. One last closing remark: There is no need to travel to Wall-
dorf to get the latest SAP S/4 HANA package; details can be found at www.sap.com.
478

The Authors
Bernd Roedel is chief development architect within a central
architecture team in the area of core logistics, where he has
supported SAP S/4HANA development for the last two years.
He joined SAP in 2000 and worked as a developer and an
architect for sustainability management, human resources,
supply chain management, and inventory management proj-
ects. He has a bachelor’s degree in biology, a master’s degree in
computer science, and a PhD in natural science.
Johannes Esser joined SAP in 2002 and is an experienced proj-
ect management expert in SAP development and a certified
Scrum master. He has completed a broad range of projects
across sustainability management, supply chain management,
and inventory management, with a focus on cloud mindset
and agile software engineering.
479


Index
A
ABC analysis ............................................................... 80
Account assignment ............................................ 282
multiple ...................................................... 282, 284
Account assignment category ......................... 113
details ................................................................... 114
factors ................................................................... 113
purchase order .................................................. 267
Account determination ........................... 113, 114
Account model ......................................................... 34
Accounting document ........................................... 37
ACID principle ........................................................... 23
Adjusting inventory ............................................ 157
Analytical list ...................................................... 42, 43
Analytical list page ............................................... 397
App finder ................................................................... 53
Application programming interface
(API) ....................................................................... 464
business documentation ............................... 470
description .......................................................... 467
details ................................................................... 468
integrate .............................................................. 472
OData-based ...................................................... 468
overview page ................................................... 467
SAP S/4HANA Cloud ............................. 465, 467
Archiving ..................................................................... 26
Area of responsibility ................................ 168, 188
Ariba Network ........................................................ 459
Assemble-to-order (ATO) ................................... 160
Authorization check ............................................ 110
Authorization management ............................ 110
Automatic proposal ............................................. 196
graphical view ................................................... 196
realize ................................................................... 197
Auxiliary object ..................................................... 100
Available stock ....................................................... 122
Available-to-promise (ATP) checks ................ 118
Average daily usage (ADU) ................................ 240
B
Backend server ............................................. 143, 146
Batch input .............................................................. 105
defaults ................................................................ 106
Batch job scheduling
situations ............................................................ 132
Batch-managed material ................................... 277
details ................................................................... 278
search help .......................................................... 278
single ..................................................................... 301
Bill of material (BOM) ................................ 119, 165
display .................................................................. 176
explode ................................................................. 177
exploration ......................................................... 122
information ........................................................ 179
where-used list .................................................. 180
Bimodal IT ............................................................... 454
Bin .................................................................................. 94
Blocked stock ................................................... 66, 427
Bubble chart ............................................................ 413
Buffer ......................................................................... 221
adjust .................................................................... 225
control level ....................................................... 236
levels ..................................................................... 238
positioning ......................................................... 228
proposal ............................................................... 233
simulate ............................................................... 241
views ..................................................................... 238
Buffer Positioning app ....................................... 228
Buffer profile .......................................................... 222
define .................................................................... 222
Buffer Profile Maintenance app ..................... 222
Business Application Programming
Interface (BAPI) ........................................ 147, 465
Business catalog .................................... 51, 148, 152
Business catalog group ............................. 148, 149
Business events ..................................................... 472
publish-subscribe ............................................. 474
Business role .......................... 51, 68, 148, 149, 152
copy ....................................................................... 151
inventory analysis ........................................... 395
481

Index
Business role (Cont.)
predelivered ....................................................... 150
templates ............................................................... 68
C
Capacity center ...................................................... 175
Capacity planning ................................................ 174
details ................................................................... 175
shifts ...................................................................... 175
Capacity requirement planning (CRP) ......... 159
Catch weight management ................................. 38
CDS view ........................................... 27, 85, 397, 428
custom queries .................................................. 429
Change Inventory Count app .......................... 334
Change management ......................................... 168
Change PIRs app .................................................... 185
Change Planned Order app ............................... 202
Change Production Order app ........................ 369
Change request ...................................................... 356
activate ................................................................ 356
automatic emails ............................................. 357
initiate .................................................................. 356
new ........................................................................ 358
requested ............................................................. 358
Check Material Coverage app .......................... 359
Checking rule ................................................ 118, 122
Classification job .................................................. 226
Cloud deployment ............................................... 439
Cloud solutions ..................................................... 460
Cold store .......................................................... 25, 111
Collective Kanban Print app ............................ 387
Column store ............................................................ 24
Company code .......................................................... 91
plants ....................................................................... 93
Component scrap ................................................. 377
Configuration ........................................................... 87
cross functions .................................................. 125
DDMRP ................................................................ 221
general settings ................................................ 108
inventory management ................................... 95
logistics execution ........................................... 119
procurement ...................................................... 112
production planning ...................................... 119
Confirm Production Operations
app ................................................................ 340, 370
Confusion matrix .................................................... 78
Consumption group ............................................ 422
default ................................................................... 110
define ..................................................................... 110
Consumption posting ............................... 114, 422
Continuous inventory ........................................ 327
Control cycle ........................................................... 395
Controlling view ...................................................... 92
Convert Planned Order to Process Order
app .......................................................................... 202
Convert Planned Order to Production
Order app ............................................................. 202
Convert Planned Orders app .................. 158, 201
Convert Planned Orders to Purchase
Requisitions app ............................................... 202
Core data services (CDS) ....................................... 27
Core inventory management ........................... 287
Correct Kanban app .............................................. 386
Cost variance analysis ......................................... 461
Create Goods Movement app ............................ 84
Create Goods Receipt for the Production
Order app ............................................................. 340
Create Physical Inventory Documents
app ................................................................ 329, 330
Create PIRs app ....................................................... 185
Create Planned Order app .................................. 202
Create Reservation app ....................................... 341
Cross function ........................................................ 125
Current stock value and quantity
analysis ................................................................. 461
Custom CDS view .................................................. 428
associate data source ..................................... 430
data sources ....................................................... 429
field list ................................................................. 430
graphical outline .............................................. 433
primary data source ........................................ 430
publish .................................................................. 432
Custom CDS Views app ....................................... 428
Custom field ............................................................ 137
add to interface ................................................. 138
create ..................................................................... 137
edit .......................................................................... 139
publish .................................................................. 138
Custom Fields & Logic app ................................ 136
Custom logic ................................................. 136, 141
Custom query ......................................................... 428
482

Index
Customer consignment stock ............................ 66
Customer return ................................................... 281
Customizing ............................................................... 87
Cycle counting ............................................. 107, 327
indicators ............................................................ 108
D
Data aging ......................................................... 25, 111
undo ...................................................................... 111
Data Dictionary (DDIC) ................................... 24, 35
Data management ................................................ 477
Data source .............................................................. 140
extensions ........................................................... 140
Date function ......................................................... 125
create .................................................................... 126
details ................................................................... 126
Dead stock ............................................................... 420
Dead Stock Analysis app .................................... 420
Delivery completed indicator .......................... 434
Delivery document .............................................. 116
Demand element ........................................ 187, 456
Demand-driven material requirements
planning (DDMRP) ......................... 68, 172, 221
buffer adjustment ............................................ 225
buffer positioning ............................................ 228
classify materials ............................................. 223
configure ............................................................. 221
execution cycle .................................................. 172
lead time .............................................................. 224
maintain buffer profiles ................................ 222
manage buffer levels ...................................... 236
monitor ................................................................ 243
product classification ........................... 223, 226
replenishment ......................................... 244, 246
schedule buffer proposal ............................... 233
Demand-driven planning .................................. 163
Demand-driven replenishment ...................... 123
Deploy phase .......................................................... 447
Deployment ............................................................ 439
hybrid .......................................................... 440, 453
Design studio grid ............................................ 42, 44
Detect MRP Situations app ............................... 219
Detect Unnecessary Supply Elements
app ......................................................................... 158
Deterministic algorithm .................................... 170
Device management ........................................... 477
Discrete manufacturing ..................................... 163
Display BOM app ......................................... 157, 176
Display Kanban (Demand View) app ............ 380
extend ................................................................... 390
Display Kanban (Supply View) app ............... 383
extend ................................................................... 390
Display Master Recipe app ................................ 181
Display MRP Key Figures app ................. 158, 207
Display MRP Master Data Issues
app ................................................................ 158, 211
Display Multilevel BOM Explosion app ....... 177
Display Planned Order app ............................... 202
Display Process Order app ................................ 354
Display Production Order app ........................ 354
Display Reservation List app ............................ 343
Display Routing app ............................................ 180
Display Stock Overview app ............................. 307
Document date ......................................................... 30
Due Replenishment Elements app ................ 384
E
Embedded analytics ............................................ 310
Engineer-to-order (ETO) ..................................... 160
Enter Inventory Count app ............................... 333
Enterprise resource planning (ERP) ................. 21
Enterprise search .............................................. 28, 54
filter criteria ....................................................... 290
identify documents ......................................... 289
manufacturing execution ............................ 352
navigation targets ........................................... 289
node .......................................................................... 90
result ..................................................................... 290
Enterprise structure ............................................... 90
Excess component consumption .................. 377
KPIs ........................................................................ 378
Excess Component Consumption app ........ 377
Excess individual segment ............................... 200
Excess stock ................................................... 200, 217
Expiration date ...................................................... 279
Expiration date check ......................................... 109
Explore phase ......................................................... 447
Extensibility ........................................................... 136
custom fields ...................................................... 137
custom logic ....................................................... 141
483

Index
Extensibility (Cont.)
data source ................................................ 136, 140
runtime adaptation ........................................ 142
External procurement ........................................ 173
External warehouse management
system (WMS) ................................................... 457
F
Field control ............................................................ 337
Filter bar ...................................................................... 48
Find BOM for Components app ...................... 179
Follow-up document ........................................... 296
Forecast .................................................................... 164
converting to PIRs ........................................... 164
monitor ................................................................ 164
Freezing ........................................................... 106, 333
Frontend server ............................................ 143, 144
Fuzzy search ........................................................... 289
G
Geo services ............................................................ 477
Geospatial engine .................................................... 28
Globally unique identifier (GUID) .................... 34
Goods issue .................................................... 337, 409
Goods movement ................................................... 99
analysis result ................................................... 400
dimensions ......................................................... 399
drill down ............................................................ 400
navigation targets .......................................... 401
Goods Movement Analysis app ............. 398, 402
Goods receipt ................................................ 113, 263
account assignment ....................................... 282
batch ..................................................................... 277
blocked stock ..................................................... 280
decentralized warehouse .............................. 281
expiration date check .................................... 109
inbound deliveries ........................................... 272
post ........................................................................ 264
process variants ............................................... 277
production order .............................................. 274
purchase order .................................................. 264
quality inspection ............................................ 280
reservations ....................................................... 340
return delivery .................................................. 281
Goods receipt (Cont.)
settings ................................................................. 103
without reference ............................................. 275
Goods Receipt for Inbound Delivery app ...... 84
Goods Receipt for Purchase Order app ........ 267
Graph engine ............................................................ 28
H
Hot store ............................................................ 25, 111
Hybrid deployment .............................................. 453
decentralized warehouse
management ................................................. 457
SAP Ariba ............................................................. 459
scenarios .............................................................. 454
I
Implementation Guide (IMG) ............................ 87
inventory management ................................... 95
overview ................................................................. 88
production planning ....................................... 120
Inbound delivery ................................................... 272
items ...................................................................... 273
Information lifecycle management ................ 26
Initial entry .............................................................. 321
Initial load ................................................................ 337
Initial page ................................................................. 47
Insight to action .................................................... 396
Inspection lot .......................................................... 281
Inspection type ...................................................... 281
Integrated data ....................................................... 396
Interface .................................................................... 147
business objects ................................................. 147
technologies ....................................................... 147
Internal production ............................................. 174
Internet of Things (IoT) ............................. 337, 476
Inventory .................................................................... 66
Inventory analysis ................................................ 395
advances .............................................................. 396
custom queries .................................................. 428
KPIs ........................................................................ 404
posted stock change ........................................ 398
process analysis tools ..................................... 419
tools ....................................................................... 397
Inventory Analysis Overview page ...... 404, 407
484

Index
Inventory analyst .......................................... 68, 151
Inventory cost .................................................... 69, 70
Inventory KPI Analysis app .............................. 413
drill down ............................................................ 417
Inventory manager ....................................... 68, 151
Inventory optimization ........................................ 79
Inventory turnover .............................................. 409
analysis result ................................................... 410
parameters ......................................................... 410
Inventory Turnover Analysis app .................. 409
bubble chart ....................................................... 411
scatter chart ....................................................... 410
Inventory valuation tables .................................. 37
Inventory value ........................................................ 92
J
Just-in-sequence (JIS) production ..................... 67
Just-in-time (JIT)
calls ........................................................................ 252
production ............................................................. 67
K
Kanban ..................................................... 67, 173, 248
calculate .............................................................. 254
configure ............................................................. 124
container replenishment ............................... 173
demand view ...................................................... 381
display .................................................................. 250
JIT replenishment ............................................. 252
legend ................................................................... 381
production execution ..................................... 380
replenishment elements ................................ 384
status .......................................................... 380, 383
supply view ......................................................... 383
Kanban Calculation and Check
Calculation Results apps ............................... 254
Kanban Card app ................................................... 390
Kanban container ....................................... 380, 383
correct ................................................................... 386
details ................................................................... 382
process extensibility ....................................... 389
scanning operation ......................................... 388
status .................................................................... 388
Kanban control cycle ................................. 174, 386
classic ................................................................... 173
details ................................................................... 249
event-driven ....................................................... 173
external replenishment ................................. 250
manage ................................................................ 248
Key performance indicator (KPI) ... 43, 310, 404
boardroom ......................................................... 462
excess component consumption ............... 378
filter .............................................................. 415, 416
material scrap ................................................... 373
operation scrap ................................................ 374
production execution duration ................. 380
range of coverage ............................................ 322
scrap reason ....................................................... 377
time series ........................................................... 413
Key User Extensibility app ................................... 63
KPI Analysis app
bar chart .............................................................. 414
configure ............................................................. 415
L
Late locking ................................................................ 96
Long-term planning ................................... 158, 159
Lot size ......................................................................... 71
Low-touch ERP .......................................................... 76
M
Machine learning ................................... 76, 77, 225
Maintain Business Roles app ........................... 150
Maintain PIRs app ................................................ 182
Make or buy ............................................................... 68
Make-to-order (MTO) ................ 68, 160, 182, 187
Make-to-stock (MTS) ........................... 68, 160, 182
Manage Buffer Levels app ........................ 233, 236
Manage Change Requests – All app ............... 357
Manage Change Requests – New app ........... 357
Manage Change Requests app ......................... 356
Manage Control Cycle app ................................ 248
extend ................................................................... 390
Manage Date Functions app ............................ 125
Manage Material Coverage app ...................... 221
Manage Planned Independent
Requirements app ........................................... 157
485

Index
Manage Planned Orders app ................... 158, 201
Manage Production Operations app ............ 340
Manage Production Orders app .................... 340,
360, 364
Manage Production Supply Area app ........... 167
Manage Reservation app ................................... 342
Manage Situation Types app .................. 130, 436
Manage Stock app ............................. 321, 337, 396
Manage Teams and Responsibilities
app ................................................................ 129, 435
Manage Work Center Capacity app ...... 157, 174
Manage Your Solution app ...................... 448, 452
Manufacturing execution ................................. 345
transactional documents ............................. 352
Manufacturing execution system
(MES) ............................................................ 147, 159
Mass Maintenance of Products (DD) app ... 223
Master data ................................................................ 93
classification categories ............................... 223
issues ..................................................................... 211
material .................................................................. 93
MRP areas ........................................................... 123
production ................................................. 157, 165
Master recipe .......................................................... 166
display .................................................................. 181
Material coverage ................................................. 359
Material Coverage app ............................... 188, 190
Material document .......................................... 29, 32
accounting ......................................................... 294
APIs ........................................................................ 465
attachment ........................................................ 295
create .................................................................... 324
data aging .......................................................... 111
details ................................................................... 294
header ........................................................... 29, 288
items ....................................................... 29, 32, 288
monitor ................................................................ 287
output management ...................................... 294
process flow ....................................................... 295
result list .............................................................. 293
reversal ................................................................ 100
reverse .................................................................. 326
Material document object page ...................... 293
analyze document flow ................................. 296
cross-app navigation ..................................... 295
header .................................................................. 293
Material document object page (Cont.)
reversals ............................................................... 326
Material document posting
configure ................................................................ 95
movement types ................................................. 99
Material Documents Overview app .... 289, 291,
295, 304
process flow ........................................................ 296
reversals ............................................................... 325
Material information ........................................... 194
Material Inventory Values-Balance
Summary app .................................................... 419
Material Inventory Values-Line Items
app .......................................................................... 419
Material object page ............................................. 174
Material requirements planning
(MRP) .................................................... 91, 157, 159
activities ............................................................... 121
algorithms ........................................................... 170
calculation .......................................................... 123
configure .............................................................. 122
predictive ............................................................. 255
process .................................................................. 168
run .......................................................................... 168
types ...................................................................... 170
Material scrap ......................................................... 372
KPIs ........................................................................ 373
Material Scrap app ................................................ 372
Material Shortage Monitoring app .................. 83
Material valuation ......................................... 91, 419
Materials management (MM) node ............... 112
Me Area ....................................................................... 52
application settings ......................................... 265
features ................................................................... 53
Member function .................................................. 135
Midterm planning ...................................... 158, 159
Monitor External Requirements app ........... 158,
212, 214
Monitor Internal Requirements app ... 158, 214
Monitor Material Coverage – Net
Segments app ..................................................... 186
Monitor Material Coverage – Net/
Individual Segments app .............................. 187
Monitor Material Coverage app ............ 186, 200
Monitor Process Orders app ............................. 363
486

Index
Monitor Production Execution
Duration app ...................................................... 379
Monitor Production Order/Process
Order app ............................................................ 340
Monitor Production Orders app ..................... 359
Monitor Requirements and Material
Coverage app ..................................................... 158
Monitor Work Center Schedules
app ............................................................... 339, 349
Monitoring .................................................... 288, 339
Kanban ................................................................. 380
production performance ............................... 372
Movement type ....................................... 32, 99, 292
103 ....................................................... 269, 280, 427
105 ................................................................ 269, 428
107 .......................................................................... 285
109 .......................................................................... 285
453 .......................................................................... 281
455 .......................................................................... 281
557 ........................................................................... 118
558 .......................................................................... 118
651 ........................................................................... 281
653 .......................................................................... 281
655 .......................................................................... 281
business process ............................................... 101
configure ............................................................. 101
custom .................................................................. 102
normal .................................................................. 101
post goods movement ................................... 324
reversal ................................................................. 101
stock change ...................................................... 292
MRP area ...................................................................... 95
define .................................................................... 123
types ...................................................................... 123
MRP controller ....................................................... 122
define .................................................................... 121
MRP element
actions .................................................................. 193
quick view ........................................................... 192
MRP Live ......................................................... 171, 186
issues ..................................................................... 211
steps ....................................................................... 209
MRP run
create new job ................................................... 206
details ................................................................... 203
jobs ......................................................................... 202
MRP run (Cont.)
parameters ................................................ 204, 205
schedule ...................................................... 190, 202
status .................................................................... 207
MRP standard view ..................................... 189, 360
Multiple materials ................................................ 305
currencies ............................................................ 307
stock figures ....................................................... 305
stock values ........................................................ 306
My Situations app ................................................ 434
N
Natural language interaction (NLI) ................... 85
Negative stock ........................................................... 99
allow ..................................................................... 108
Nesting ...................................................................... 167
No zero stock lines ............................................... 308
Notes ................................................................. 168, 194
Notifications .............................................................. 56
Number range interval .......................................... 97
Number range object ............................................. 97
O
Object page ....................................................... 45, 397
Object page header .............................................. 354
OData ........................................................... 48, 89, 147
activate ................................................................ 144
add service .......................................................... 145
API .......................................................................... 467
entity type ........................................................... 470
protocol ...................................................... 144, 466
repository objects ............................................ 146
request .................................................................. 471
services ........................................................ 144, 145
Operating profit ....................................................... 69
equation ................................................................. 70
Operation scrap ..................................................... 374
KPIs ........................................................................ 374
Operation Scrap app ............................................ 374
Optimization cycle ........................................ 79, 397
analyze .................................................................... 84
execute .................................................................... 82
levels ........................................................................ 81
plan and adjust .................................................... 82
487

Index
Ordered receipts view ................................ 190, 360
Ordered requirements view .................... 190, 360
Orders at hand stock .............................................. 66
Organizational structure ...................................... 90
Organizational unit ........................... 31, 74, 90, 91
inventory management ................................... 94
issuing .................................................................. 310
receiving .............................................................. 310
Output material list ............................................. 205
Overdue Materials – Goods Receipt
Blocked Stock app ............................................ 427
Overdue Materials – Stock in Transit
app ...................................................... 426, 433, 434
Overdue Materials app ....................................... 151
Overview Inventory Management
page .............................................................. 404, 405
manage cards .................................................... 406
Overview Inventory Processing
page .............................................................. 404, 407
Overview page ......................................... 41, 84, 397
analytics .............................................................. 404
P
Periodic inventory ............................................... 327
Physical inventory ............................... 99, 104, 327
activities .............................................................. 104
analytics .............................................................. 403
batch input ......................................................... 105
count ..................................................................... 329
count results ...................................................... 334
cycle counting ................................................... 107
details ................................................................... 330
evaluate ............................................................... 329
filter bar ............................................................... 330
freezing ................................................................ 106
inventory count ................................................ 333
inventory differences ..................................... 106
phases ................................................................... 328
prepare ................................................................. 328
results ................................................................... 330
shortcuts ............................................................. 329
stock types .......................................................... 328
tolerance ............................................................. 107
types ...................................................................... 327
Physical Inventory Analysis app .................... 403
Physical inventory document ......................... 105
count results ....................................................... 337
create ........................................................... 330, 331
details .................................................................... 336
dimension ............................................................ 403
header ................................................................... 332
inventory count ................................................. 333
items ...................................................................... 335
overview ............................................................... 335
process .................................................................. 334
results table ........................................................ 335
select ...................................................................... 333
split ......................................................................... 332
Physical Inventory Document
Overview app ..................................................... 335
Plan-driven planning ........................................... 164
Planned independent requirement (PIR) .... 157
configure .............................................................. 120
details .................................................................... 184
edit .......................................................................... 184
list ........................................................................... 183
maintain .............................................................. 182
mass maintenance ........................................... 185
quantity ................................................................ 185
Planned order
convert ........................................................ 200, 201
manage ................................................................ 201
MRP ........................................................................ 170
Planner view .............................................................. 92
Planners Overview app ....................................... 243
Planning inventory .............................................. 157
Planning mode ....................................................... 347
Planning scope ....................................................... 204
Planning strategy .................................................. 158
hybrid .................................................................... 162
influences ............................................................. 162
production planning ....................................... 160
Plant ...................................................................... 74, 93
assign to company code .................................. 94
MRP area .............................................................. 123
parameters ................................................... 98, 122
Plant key ..................................................................... 92
Post Goods Movement app ... 49, 268, 281, 284,
285, 310, 316, 321, 324
error log ................................................................ 317
reversals ..................................................... 325, 326
488

Index
Post Goods Receipt for Inbound
Delivery app ....................................................... 272
Post Goods Receipt for Production
Order app ............................................................ 274
Post Goods Receipt for Purchase
Order app ......................................... 151, 264, 284
Post Goods Receipt without Reference
app ......................................................................... 275
Posted stock change analysis
goods movement ............................................. 398
physical inventory document ..................... 403
single/multiple materials ............................. 398
Posting date ............................................................... 29
Predecessor document ............................. 100, 296
Predictive Analysis Library (PAL) ............ 28, 225
Predictive model ............................................ 78, 225
performance .......................................................... 78
slow-moving indicator ................................... 423
statuses ................................................................ 425
stock transport orders .................................... 319
training ...................................................... 225, 320
Predictive Models app ........... 225, 320, 423, 426
Predictive MRP ...................................................... 255
prerequisites ....................................................... 255
process simulations ........................................ 260
schedule simulation ........................................ 256
simulation summary ...................................... 261
Primary demand ................................................... 163
Process extensibility ........................................... 389
Process flow ............................................................ 296
BMC ....................................................................... 445
navigate ............................................................... 297
Process manufacturing ...................................... 163
Process order .......................................................... 201
Process Physical Inventory Count Results
app ......................................................................... 334
Process Predictive MRP Simulations app ... 260
Procurement ........................................................... 112
account assignment ....................................... 282
digital .................................................................... 459
document flow .................................................. 112
stock-related ...................................................... 268
Product life cycle management (PLM) ......... 166
Product lifecycle ....................................................... 73
ramp-up .................................................................. 73
Production date ..................................................... 279
Production execution ......................................... 339
duration ............................................................... 379
Kanban ................................................................ 380
performance monitoring .............................. 372
reservations ....................................................... 340
Production input ..................................................... 68
Production lead time .......................................... 161
Production master data ..................................... 174
Production operation ................................ 346, 366
confirm ................................................................. 371
details .......................................................... 367, 369
Production operator ................................... 339, 380
Production order .................................................. 274
convert ................................................................. 201
details ................................................................... 365
enterprise search .............................................. 352
goods receipt ..................................................... 372
header ................................................................... 274
issues ..................................................................... 366
manage ................................................................ 364
monitor ................................................................ 359
object page ......................................................... 353
operations ........................................................... 351
visualize ............................................................... 365
worklist ................................................................ 360
Production planner ............................................. 158
Production planning .................................... 68, 157
configure ............................................................. 119
process industries ............................................ 124
strategies ............................................................. 160
Production planning/detailed scheduling
(PP-DS) .................................................................. 159
Production scrap analysis ................................. 461
Production supervisor ....................................... 339
Production supply area ...................................... 167
Production Supply Area (Fast Entry) app .... 167
Production trigger ................................................ 161
Production variant ............................................... 161
Production version ..................................... 166, 475
Production volume .............................................. 161
Project stock .............................................................. 66
Pull principle .......................................................... 173
Purchase order .............................................. 112, 263
account assignment categories ........ 113, 267
batch managed ................................................ 277
change request .................................................. 356
489

Index
Purchase order (Cont.)
data ....................................................................... 266
details ................................................................... 271
distribute ............................................................. 269
MRP ....................................................................... 170
multi-account assignment .......................... 282
NB ........................................................................... 117
personalize ......................................................... 270
select ..................................................................... 264
storage location ............................................... 270
type ........................................................................ 116
UB ........................................................................... 116
without reference ............................................. 276
Purchase requisition ........................................... 201
Purchasing organization ...................................... 95
Q
Quality assurance system .................................... 88
Quality certificate ................................................. 285
Quality inspection stock ............................. 66, 280
Quick view ............................................................... 168
R
Realize phase .......................................................... 447
Real-time data ........................................................ 396
Reason code ............................................................ 323
select ..................................................................... 324
Record .......................................................................... 23
Reference date ....................................................... 421
Reference document ........................................... 275
Reference scenario ............................................... 255
Regenerative planning ....................................... 204
Reorder point ......................................................... 170
Replenishment ............................................... 71, 244
execute ................................................................. 246
Replenishment element .................................... 384
details ................................................................... 385
Replenishment Execution app ....................... 246
Replenishment lead time ..................................... 71
Replenishment Planning app .......................... 244
Report RMCBIN00 ................................................ 108
Reporting date ....................................................... 301
Representational State Transfer (REST) .......... 48
Reschedule in ......................................................... 198
Reschedule out ....................................................... 198
Rescheduling check .............................................. 198
Reservation ....................................................... 99, 340
automatic .................................................. 340, 341
create ..................................................................... 341
details .................................................................... 342
item ........................................................................ 344
layout variant .................................................... 343
list ........................................................................... 343
manual ................................................................. 341
results .................................................................... 344
view ........................................................................ 342
Resource .................................................................... 166
Responsibility management ............................ 127
activities ............................................................... 128
Responsibility rule ................................................ 135
Return delivery document ................................ 281
Reversal ..................................................................... 325
Reversal posting ...................................................... 32
Routing ............................................................ 119, 166
display ................................................................... 180
steps ....................................................................... 166
Runtime adaptation (RTA) ....................... 141, 142
S
Safety stock level ..................................................... 71
Sales and distribution (SD) ................................ 281
Sales and operation planning (S&OP) ........... 159
Sales order ................................................................ 164
Sampling ................................................................... 327
SAP Analytics Cloud ...................................... 85, 460
manufacturing boardroom .......................... 462
production cost dashboard .......................... 461
scenarios .............................................................. 461
SAP API Business Hub ............................... 464, 472
interfaces ............................................................. 147
SAP Ariba .................................................................. 459
SAP Best Practices ................................................. 461
SAP Best Practices Explorer ....................... 91, 447
SAP Business Warehouse (SAP BW) ............... 399
SAP Cloud Platform ....................................... 78, 460
SAP CoPilot ............................................. 57, 303, 396
SAP ERP ....................................................................... 33
architecture .......................................................... 38
490

Index
SAP Fiori ..................................................... 21, 38, 148
design principles .................................................. 39
entities .................................................................. 149
SAP Fiori applications ........................... 40, 41, 144
analytical ............................................................... 85
converted SAP GUI .............................................. 49
extensibility ........................................................... 62
interaction mode ................................................ 49
native ................................................................ 41, 48
stateful .................................................................... 49
stateless .................................................................. 49
SAP Fiori apps reference library ........... 144, 146,
153, 419
information ........................................................ 154
select ...................................................................... 153
SAP Fiori Cloud ...................................................... 146
SAP Fiori launchpad ............................ 50, 144, 264
embedded documentation .............................. 59
features ................................................................... 52
groups ...................................................................... 51
layout .................................................................... 149
Me Area ................................................................... 51
navigation ............................................................. 60
notifications .......................................................... 56
personalization .................................................... 55
role-based ............................................................ 150
SAP CoPilot ............................................................ 57
search ....................................................................... 54
semantic objects .................................................. 61
tiles ............................................................................ 61
SAP Gateway .............................................................. 89
SAP GUI ........................................................................ 50
transactions .......................................................... 49
SAP HANA ................................................................... 22
basics ....................................................................... 22
benefits .................................................................... 27
database ................................................................. 23
limitations ............................................................. 24
SAP Integrated Business Planning
(SAP IBP) .............................................................. 159
SAP Jam ........................................................................ 61
SAP Learning Hub ................................................. 447
SAP Leonardo ......................................................... 476
services ................................................................. 477
SAP Leonardo Internet of Things ................... 475
SAP NetWeaver ......................................................... 89
SAP S/4HANA ............................................................ 21
architecture ........................................................... 38
data model ..................................................... 29, 34
deployment options ........................................ 440
extensibility ....................................................... 136
hybrid deployment .......................................... 454
hybrid planning ................................................ 163
IMG ........................................................................... 88
inventory analytics ......................................... 396
inventory optimization .................................... 79
new technologies ................................................ 75
servers .................................................................. 143
simplifications ..................................................... 37
stock types ............................................................. 65
SAP S/4HANA Cloud ............................................ 440
APIs ............................................................... 465, 467
best practices ..................................................... 441
configure ............................................................. 448
hybrid deployment .......................................... 454
implementation ............................................... 447
implementation items ................................... 448
servers .................................................................. 143
solution scope ................................................... 441
update cycle ....................................................... 453
versions ................................................................ 464
SAP Smart Business ............................................. 397
SAP Smart Business app ................................ 42, 43
SAPUI5 ...................................................................... 144
Scaling .......................................................................... 25
Scatter chart ............................................................ 413
Schedule Buffer Proposal Calculation
app ......................................................................... 233
Schedule Lead Time Classification of
Products DD app .............................................. 231
Schedule MRP Runs app ........................... 158, 202
Schedule Predictive MRP Simulation
Creation app ...................................................... 256
Schedule Product Classification app ............ 226
Schedule Production app ............... 339, 345, 349
Scheduling execution ......................................... 345
Scheduling production ...................................... 345
strategy ................................................................ 347
Scope item ...................................................... 443, 456
core inventory ................................................... 443
country relevance ............................................ 444
details ................................................................... 444
491

Index
Scope item (Cont.)
process flow ....................................................... 444
Scope item group ................................................. 441
inventory management ................................ 442
Scrap reason ........................................................... 375
donut chart ........................................................ 376
KPIs ........................................................................ 377
Scrap Reason app .................................................. 375
Scrapping ........................................................ 321, 337
post goods movement ................................... 324
Secondary demand .............................................. 163
Self-Service Configuration UIs (SSCUIs) ...... 450
organizational structure ..................... 451, 453
Serial number processing ................................. 285
Serial numbers ...................................................... 316
Service level ........................................................ 69, 70
Service-level agreement (SLA) ........... 71, 73, 161
Set Kanban Container Status app .................. 388
Shelf life .................................................................... 109
expiration ........................................................... 279
Shop floor control ................................................ 123
Shortage
calculate .............................................................. 212
definition .................................................... 189, 359
manage ................................................................ 195
Short-term planning ........................................... 159
Simple list ................................................................... 42
Simple Object Access Protocol
(SOAP) ......................................................... 147, 466
Simplification list .................................................... 38
Single material ....................................................... 299
batch ..................................................................... 301
header .................................................................. 300
input ...................................................................... 300
organizational levels ...................................... 300
Situation ...................................................................... 76
batch jobs ............................................................ 132
conditions ........................................................... 132
create .................................................................... 217
display .................................................................. 133
exceptions ........................................................... 217
link ......................................................................... 134
restrict .................................................................. 220
set up .................................................................... 436
template ........................................... 130, 131, 217
translate .............................................................. 132
Situation (Cont.)
type ........................................................................ 131
user-defined ........................................................ 132
Situation handling ............ 76, 127, 130, 217, 436
Slow or Non-Moving Materials app ..... 421, 422
Slow/nonmoving material ................................ 421
Slow-moving indicator ....................................... 422
bar chart ............................................................... 423
Special stock type ........................................... 31, 313
Split valuation support ....................................... 285
Stochastic algorithm ............................................ 170
Stock – Multiple Materials app .............. 305, 405
analytics ............................................................... 398
Stock – Single Material app ..................... 299, 305
analytics ............................................................... 398
Stock availability ................................................... 189
chart ....................................................................... 190
quick view ............................................................ 190
Stock Champion app ............................................ 404
Stock change ........................................................... 323
Stock days' supply view ............................ 189, 360
Stock history ........................................................... 302
chart ............................................................. 302, 304
Stock identification .............................................. 298
multiple materials ........................................... 305
overview ............................................................... 307
single material ................................................... 299
Stock identifying field (SID) ................................ 34
Stock in transit ................................................ 66, 115
overdue ................................................................. 425
Stock overview ....................................................... 307
criteria ................................................................... 308
header ................................................................... 309
Stock Requirements List app ............................ 351
Stock transfer ................................................ 116, 309
cross-plant ........................................................... 314
in plant ................................................................. 310
post goods movement .................................... 316
stock transport orders .................................... 318
with stock transport order ............................ 117
without stock transport order ..................... 116
Stock Transfer – Cross Plant app ..................... 119
Stock Transfer – In-Plant app ........................... 310
Stock transfer posting ............................... 115, 316
Stock transport order ................................ 116, 318
activities ............................................................... 118
492

Index
Stock transport order (Cont.)
create .................................................................... 318
forecast ................................................................ 319
overdue ................................................................ 426
process .................................................................. 319
status filter .......................................................... 427
train ....................................................................... 320
Stock type ......................................... 30, 65, 268, 269
batch ..................................................................... 278
blocked stock ..................................................... 280
chart ...................................................................... 302
goods receipt without reference ................ 276
in-plant transfer ............................................... 311
inventory ......................................................... 31, 65
manage stock .................................................... 322
noninventory ........................................................ 66
physical inventory ........................................... 328
quality inspection ............................................ 281
single material .................................................. 299
table ....................................................................... 299
Stock value .................................................... 306, 327
currencies ............................................................ 307
Stock/requirements list ..................................... 192
external requirements ................................... 212
graphical display .................................... 212, 216
internal requirements .................................... 216
production orders ............................................ 361
Storage location ................................................ 91, 93
authorization check ........................................ 110
decentralized WMS .......................................... 458
in-plant transfer ............................................... 311
manage stock .................................................... 322
MRP area ............................................................. 123
plant ...................................................................... 270
production order .............................................. 275
purchase order .................................................. 270
single material .................................................. 300
Storage location key ............................................... 92
Subcontracting ...................................................... 456
MRP area ............................................................. 123
Successor document ........................................... 296
Summarized JIT Call Scheduler app .............. 252
Supply chain .............................................................. 66
Supply/demand list ............................................. 247
System alias ............................................................ 145
T
Table
ACDOCA .................................................................. 37
BKPF ......................................................................... 37
BSEG ......................................................................... 37
MARC ....................................................................... 33
MARCH .................................................................... 33
MARD ...................................................................... 33
MARDH ................................................................... 33
MATDOC ............................................ 29, 32, 34, 35
MKPF ........................................................................ 33
MSEG ........................................................................ 33
T156 ........................................................................ 409
T200A ................................................ 299, 311, 322
Table locking ............................................................. 36
Team .......................................................................... 127
attributes ............................................................ 128
create .................................................................... 129
define .................................................................... 217
edit ......................................................................... 130
filter criteria ....................................................... 136
members .............................................................. 128
owner .................................................................... 128
set up .................................................................... 436
types ...................................................................... 136
Theme designer ........................................................ 62
Time series .............................................................. 192
Tolerance ................................................................. 107
Touch-enabled usability concept ................... 310
Training ........................................................... 320, 424
results ................................................................... 320
Transaction
C203 .............................................................. 157, 181
CA03 ............................................................. 157, 180
CS12 ........................................................................ 177
CS15 ........................................................................ 179
MB21 ...................................................................... 341
MB24 ..................................................................... 343
MC44 ..................................................................... 410
MD06 .................................................................... 187
MI01 ...................................................................... 329
MI02 ...................................................................... 329
MI04 ............................................................. 329, 333
MI07 ...................................................................... 329
MI10 ...................................................................... 329
493

Index
Transaction (Cont.)
MI11 ........................................................................ 329
MI20 ............................................................. 329, 334
MI24 ...................................................................... 329
MIGO ................................. 49, 263, 285, 316, 321
MIGO_TR ............................................................. 316
MMBE ................................................................... 307
PFCG ...................................................................... 151
PJ02 ....................................................................... 252
PJ03 ....................................................................... 252
PK05S .................................................................... 167
PK07 ...................................................................... 254
PK08N .................................................................. 254
PK09 ..................................................................... 387
PK12N .................................................................... 383
PK13N .................................................................... 380
PK17 ....................................................................... 387
PK31 ....................................................................... 386
PKAL ...................................................................... 384
PKBC ...................................................................... 388
PKMC .................................................................... 248
PPH_DD_BUF_PROF ...................................... 222
SM30 ..................................................................... 299
SPRO .................................................................. 88, 95
SU01 ...................................................................... 151
Transfer posting ........................................... 173, 310
cross-plant ................................................. 315, 316
in-plant ................................................................ 312
input ...................................................................... 313
special ................................................................... 314
stock transport order ..................................... 318
touch-based ....................................................... 311
Transfer stock ........................................................... 66
Transfer Stock – Cross Plant app ................... 314,
318, 337
Transport .................................................................... 88
Transport request ................................................... 88
Tutorial ...................................................................... 445
goods receipt without reference ................. 445
U
Unit of measure ..................................................... 302
Unlock Kanban Container app ........................ 387
Unrestricted use stock ................................. 66, 428
V
Value per product ................................................. 161
Value-based analytics .......................................... 397
Variant ............................................................. 277, 285
standard ............................................................... 406
Variant management ................................... 48, 168
Vendor consignment stock ................................. 66
Vendor-managed inventory ............................... 68
W
Warehouse clerk .................................................... 151
Warehouse management ........................... 94, 324
decentralized .................................. 119, 281, 457
Work breakdown structure (WBS) .................. 340
Work center ......................................... 119, 166, 476
capacity ...................................................... 174, 175
monitor ................................................................ 349
production orders ............................................ 350
quick view .................................................. 350, 368
schedule orders .................................................. 345
Worklist ....................................................................... 46
494

i
Service PagesThe following sections contain notes on how you can contact us.
Praise and Criticism
We hope that you enjoyed reading this book. If it met your expectations, please do recom-mend it. If you think there is room for improvement, please get in touch with the editor of the book: [email protected]. We welcome every suggestion for improve-ment but, of course, also any praise!
You can also share your reading experience via Twitter, Facebook, or email.
Technical Issues
If you experience technical issues with your e-book or e-book account at SAP PRESS, please feel free to contact our reader service: [email protected].
About Us and Our Program
The website http://www.sap-press.com provides detailed and first-hand infor-mation on our current publishing program. Here, you can also easily order all of our books and e-books. Information on Rheinwerk Publishing Inc. and additional contact options can also be found at http://www.sap-press.com.
Legal NotesThis section contains the detailed and legally binding usage conditions for this e-book.
Copyright Note
This publication is protected by copyright in its entirety. All usage and exploitation rights are reserved by the author and Rheinwerk Publishing; in particular the right of reproduc-tion and the right of distribution, be it in printed or electronic form.
© 2019 by Rheinwerk Publishing, Inc., Boston (MA)

ii
Your Rights as a User
You are entitled to use this e-book for personal purposes only. In particular, you may print the e-book for personal use or copy it as long as you store this copy on a device that is solely and personally used by yourself. You are not entitled to any other usage or exploitation.
In particular, it is not permitted to forward electronic or printed copies to third parties. Furthermore, it is not permitted to distribute the e-book on the Internet, in intranets, or in any other way or make it available to third parties. Any public exhibition, other publica-tion, or any reproduction of the e-book beyond personal use are expressly prohibited. The aforementioned does not only apply to the e-book in its entirety but also to parts thereof (e.g., charts, pictures, tables, sections of text).
Copyright notes, brands, and other legal reservations as well as the digital watermark may not be removed from the e-book.
Digital Watermark
This e-book copy contains a digital watermark, a signature that indicates which person may use this copy. If you, dear reader, are not this person, you are violating the copyright. So please refrain from using this e-book and inform us about this violation. A brief email to [email protected] is sufficient. Thank you!
Trademarks
The common names, trade names, descriptions of goods, and so on used in this publication may be trademarks without special identification and subject to legal regulations as such.
All of the screenshots and graphics reproduced in this book are subject to copyright © SAP SE, Dietmar-Hopp-Allee 16, 69190 Walldorf, Germany. SAP, the SAP logo, ABAP, Ariba, ASAP, Concur, Concur ExpenseIt, Concur TripIt, Duet, SAP Adaptive Server Enterprise, SAP Advantage Database Server, SAP Afaria, SAP ArchiveLink, SAP Ariba, SAP Business ByDesign, SAP Business Explorer, SAP BusinessObjects, SAP BusinessObjects Explorer, SAP BusinessObjects Lumira, SAP BusinessObjects Roambi, SAP BusinessObjects Web Intelligence, SAP Business One, SAP Business Workflow, SAP Crystal Reports, SAP Early-Watch, SAP Exchange Media (SAP XM), SAP Fieldglass, SAP Fiori, SAP Global Trade Services (SAP GTS), SAP GoingLive, SAP HANA, SAP HANA Vora, SAP Hybris, SAP Jam, SAP Max-Attention, SAP MaxDB, SAP NetWeaver, SAP PartnerEdge, SAPPHIRE NOW, SAP Power-Builder, SAP PowerDesigner, SAP R/2, SAP R/3, SAP Replication Server, SAP S/4HANA, SAP SQL Anywhere, SAP Strategic Enterprise Management (SAP SEM), SAP SuccessFactors,

iii
The Best-Run Businesses Run SAP, TwoGo are registered or unregistered trademarks of SAP SE, Walldorf, Germany.
Limitation of Liability
Regardless of the care that has been taken in creating texts, figures, and programs, neither the publisher nor the author, editor, or translator assume any legal responsibility or any liability for possible errors and their consequences.