Introduction to the Budget Document - Rockville, MD
384
FY 2012 Adopted Operating Budget PHYLLIS MARCUCCIO, MAYOR JOHN B.BRITTON, COUNCILMEMBER PIOTR GAJEWSKI, COUNCILMEMBER BRIDGET DONNELL NEWTON, COUNCILMEMBER MARK PIERZCHALA, COUNCILMEMBER Scott Ullery, City Manager Prepared by the Department of Finance Division of Budget Gavin Cohen, Chief Financial Officer Stacey Webster, Budget and Finance Manager Mary Sue Martin, Management and Budget Analyst Erica Tompkins, Management and Budget Analyst and the Staff of the City of Rockville CITY OF ROCKVILLE, MARYLAND JULY 2011
-
Upload
khangminh22 -
Category
Documents
-
view
2 -
download
0
Transcript of Introduction to the Budget Document - Rockville, MD
FY 2012 Adopted Operating Budget
PHYLLIS MARCUCCIO, MAYOR
JOHN B.BRITTON, COUNCILMEMBER
PIOTR GAJEWSKI, COUNCILMEMBER
BRIDGET DONNELL NEWTON, COUNCILMEMBER
MARK PIERZCHALA, COUNCILMEMBER
Scott Ullery, City Manager
Prepared by the Department of Finance
Division of Budget
Gavin Cohen, Chief Financial Officer
Stacey Webster, Budget and Finance Manager
Mary Sue Martin, Management and Budget Analyst
Erica Tompkins, Management and Budget Analyst
and the
Staff of the City of Rockville
CITY OF ROCKVILLE, MARYLAND JULY 2011


Acknowledgements
This document could not have been prepared without the support and leadership of the Mayor and Council and the City of Rockville Management Team. Each City department contributed additional time and effort to the budget development this year in order to present new information at a higher level of detail. The individuals listed below played an integral part in the preparation of this document.
Budget Preparation
Colette Anthony, Human Resources Administrator Sheldon Altshuler, Safety and Risk Manager
Carlos Aparicio, Community Services Manager Doug Breisch, Telecommunications and IT Operations Manager
Mark Charles, Chief of Environmental Management Whitney Coleman, CPDS Administrator
Sharon Collins, Senior Accountant Judy Ding, Deputy Director of Utilities
Emad Elshafei, P.E., Chief of Traffic and Transportation Michael W. England, Special Operations Bureau Commander
Raymond D. Evans, Golf Course Superintendent Eric Ferrell, Copy Center/Mail Specialist
Susan E. Fournier, Public Works Administrator Andrew Gunning, Assistant Director of CPDS
Christine M. Henry, Recreation and Parks Administration Manager Hillary Hurlbutt, Wellness Coordinator
Angela Joyner, Telecommunications Administrator David Levy, Chief of Long Range Planning and Redevelopment
Steve E. Mader, Superintendent of Parks and Facilities Timothy J. Marsh, Field Services Bureau Commander
Linda Moran, Assistant to the City Manager Eileen Morris, Contract Officer
Timothy Peifer, Financial Systems Manager Robert Purkey, Construction Inspection Supervisor
Robert J. Rappoport, Administrative Services Bureau Commander Matt Shanks, Fire Marshal
Steve Sokol, Operations Maintenance Superintendent Susan Straus, P.E., Chief of Engineering
Pat Stroud, Vehicle Maintenance Fleet Manager Betsy C. Thompson, Superintendent of Recreation
Tammy Jo Tucker, Human Resources Administrator Jim Wasilak, Chief of Planning
Marc Weinshenker, GIS Manager Michael Wilhelm, P.E., Chief of Construction Management
Jason Zimmerman, Revenue Supervisor Nancy M. Zombolas, Graphics and Printing Supervisor
Management Team
Marylou Berg, Communication Manager Michael Q. Cannon, Chief Information Officer
Gavin Cohen, Chief Financial Officer Debra Daniel, City Attorney
Glenda P. Evans, City Clerk/Treasurer Michelle Poche Flaherty, Organizational Development Manager
Burton R. Hall, Director of Recreation and Parks Jennifer Kimball, Assistant City Manager
Craig L. Simoneau, P.E., Director of Public Works Susan Swift, Director of Community Planning and Development
Terrance N. Treschuk, Chief of Police Carlos Vargas, Chief Human Resources Officer
Any individual with disabilities who would like to receive the information in this publication in another form (e.g., large print, Braille, tape, etc.) may contact the City's Americans with Disabilities Act Coordinator at (240) 314-8100; TTY (240) 314-8137. For additional information about the City of Rockville, please see our website (www.rockvillemd.gov).

Table of Contents
ii
Preface
Acknowledgements ......................................................................................... i
Management Team ......................................................................................... i
Table of Contents ........................................................................................... ii
Introduction to the Budget Document............................................................. v
Budget Ordinance ...................................................................................... viii
Changes from FY 2012 Proposed to Adopted .............................................. x
Community Profile ........................................................................................ xii
Demographic Statistics ............................................................................... xiv
Overview and Summary Information
1 - Executive Summary
City Manager’s Budget Message, July 1, 2011 .......................................... 1-1
Full Time Equivalent (FTE) Positions ....................................................... 1-11
Budget Development Process .................................................................. 1-14
City of Rockville Organizational Chart ...................................................... 1-16
2 - Policies and Goals
Mayor and Council Vision 2020 ................................................................. 2-1
Financial Management Policies ................................................................. 2-4
Summary of Major Policy Documents ...................................................... 2-14
Directory of Boards and Commissions Officials ....................................... 2-17
Boards and Commissions Descriptions ................................................... 2-18
3 - Fund Summaries
All Funds Summary – Fund Overview ........................................................ 3-1
All Funds Summary – Operating by Category ............................................ 3-2
All Funds Summary – Operating by Department ....................................... 3-3
All Funds Summary – Operating Revenue ................................................. 3-4
All Funds Summary – Operating Expenditures .......................................... 3-5
General Fund Summary ............................................................................. 3-6
General Fund Revenue, Detail of Major Revenue Sources:
Property Taxes .................................................................................... 3-8
Revenues from Other Governments ................................................. 3-10
Fines and Forfeitures ........................................................................ 3-11
Use of Money and Property .............................................................. 3-11
Charges for Services ........................................................................ 3-12
Licenses and Permits ........................................................................ 3-13
Other Revenue / Administrative Charges .......................................... 3-13
Enterprise Funds:
Water Fund ....................................................................................... 3-14
Revenues and Expenses [Graph] .............................................. 3-15
Water Rate History [Graph]........................................................ 3-15
Sewer Fund ....................................................................................... 3-16
Revenues and Expenses [Graph] .............................................. 3-17
Sewer Rate History [Graph] ....................................................... 3-17
Refuse Fund...................................................................................... 3-18
Revenues and Expenses [Graph] .............................................. 3-19
Refuse Rate History [Graph] ...................................................... 3-19
Parking Fund ..................................................................................... 3-20
Revenues and Expenses [Graph] .............................................. 3-21
Town Square Parking District Tax Rate History [Graph] ............ 3-21
Stormwater Management Fund ......................................................... 3-22
Revenues and Expenses [Graph] .............................................. 3-23
History of Stormwater Management Utility Fee [Graph] ............. 3-23
RedGate Golf Course Fund .............................................................. 3-24
Revenues and Expenses [Graph] .............................................. 3-25
Special Revenue Funds:
Special Activities Fund ...................................................................... 3-26
Revenues and Expenses [Graph] .............................................. 3-27
Community Development Block Grant Fund ..................................... 3-28
Revenues and Expenses [Graph] .............................................. 3-28
Town Center Management District Fund ........................................... 3-29
Revenues and Expenses [Graph] .............................................. 3-29
Speed Camera Fund……………………….…………………….………3-30
Revenues and Expenses [Graph] ............................................. 3-31
Statement of Projected Unreserved Equity in City Funds ........................ 3-32
Debt Service Fund:
Debt Service Fund ............................................................................ 3-34
Enterprise Funds – Debt Service Schedules .................................... 3-35
Capital Projects and Enterprise Funds – Debt Ratios .............................. 3-37
All Funds Summary – CIP ........................................................................ 3-38
Non-Routine CIP Projects ........................................................................ 3-39
Operating Cost Impacts of CIP Projects................................................... 3-41

Table of Contents
iii
4 - Five-Year Forecast
Five-Year Forecast - Overview ................................................................... 4-1
Total Revenue and Expenditure Summary by Fund .................................. 4-2
General Fund Revenue Assumptions ........................................................ 4-3
General Fund Expenditure Assumptions ................................................... 4-4
General Fund Five-Year Forecast .............................................................. 4-5
Water Fund Five-Year Forecast ................................................................. 4-6
Sewer Fund Five-Year Forecast ................................................................ 4-7
Refuse Fund Five-Year Forecast ............................................................... 4-8
Parking Fund Five-Year Forecast .............................................................. 4-9
Stormwater Management Fund Five-Year Forecast ................................ 4-10
RedGate Golf Course Fund Five-Year Forecast ...................................... 4-11
Speed Camera Fund Five-Year Forecast ................................................ 4-12
Operating Budgets
5 - Mayor and Council
Department Summary ................................................................................ 5-1
Expenditures and Sources of Funds .......................................................... 5-2
Staffing Summary ....................................................................................... 5-2
Office of the Mayor and Council ................................................................. 5-4
Office of the City Clerk ............................................................................... 5-6
6 - City Attorney
Department Summary ................................................................................ 6-1
Expenditures and Sources of Funds .......................................................... 6-2
Staffing Summary ....................................................................................... 6-2
7 - City Manager
Department Summary ................................................................................ 7-1
Expenditures and Sources of Funds .......................................................... 7-2
Staffing Summary ....................................................................................... 7-2
Executive Office ......................................................................................... 7-4
Communication and Public Information ................................................... 7-14
Neighborhood Resources Program .......................................................... 7-22
8 - Community Planning and Development Services
Department Summary ................................................................................ 8-1
Expenditures and Sources of Funds .......................................................... 8-2
Staffing Summary ....................................................................................... 8-2
Management and Support .......................................................................... 8-4
Long Range Planning and Implementation .............................................. 8-10
Planning and Zoning ................................................................................ 8-14
Inspection Services .................................................................................. 8-20
9 - Finance
Department Summary ................................................................................ 9-1
Expenditures and Sources of Funds .......................................................... 9-2
Staffing Summary ....................................................................................... 9-2
Administration ............................................................................................ 9-4
Accounting and Control .............................................................................. 9-6
Revenue ................................................................................................... 9-10
Purchasing and Stockroom ...................................................................... 9-14
Budget ...................................................................................................... 9-18
10 - Human Resources
Department Summary .............................................................................. 10-1
Expenditures and Sources of Funds ........................................................ 10-2
Staffing Summary ..................................................................................... 10-2
Human Resources ................................................................................... 10-4
Learning, Performance and Development................................................ 10-8
Health and Wellness Program ............................................................... 10-10
Safety and Risk Management ................................................................ 10-12
11 - Information Technology
Department Summary .............................................................................. 11-1
Expenditures and Sources of Funds ........................................................ 11-2
Staffing Summary ..................................................................................... 11-2
Information Technology Operations ......................................................... 11-4
Voice Communications ............................................................................ 11-8
GIS Operations....................................................................................... 11-12
12 - Police
Department Summary .............................................................................. 12-1
Expenditures and Sources of Funds ........................................................ 12-2
Staffing Summary ..................................................................................... 12-2
Office of the Chief of Police ...................................................................... 12-6
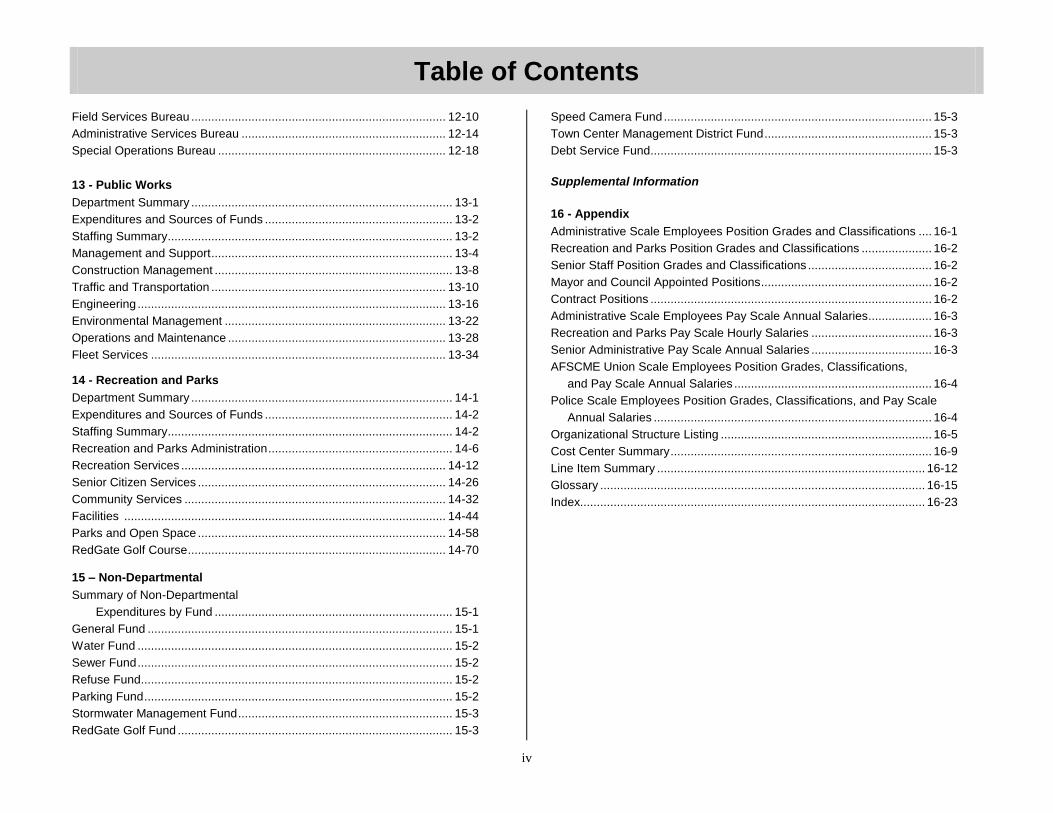
Table of Contents
iv
Field Services Bureau ............................................................................ 12-10
Administrative Services Bureau ............................................................. 12-14
Special Operations Bureau .................................................................... 12-18
13 - Public Works
Department Summary .............................................................................. 13-1
Expenditures and Sources of Funds ........................................................ 13-2
Staffing Summary ..................................................................................... 13-2
Management and Support ........................................................................ 13-4
Construction Management ....................................................................... 13-8
Traffic and Transportation ...................................................................... 13-10
Engineering ............................................................................................ 13-16
Environmental Management .................................................................. 13-22
Operations and Maintenance ................................................................. 13-28
Fleet Services ........................................................................................ 13-34
14 - Recreation and Parks
Department Summary .............................................................................. 14-1
Expenditures and Sources of Funds ........................................................ 14-2
Staffing Summary ..................................................................................... 14-2
Recreation and Parks Administration ....................................................... 14-6
Recreation Services ............................................................................... 14-12
Senior Citizen Services .......................................................................... 14-26
Community Services .............................................................................. 14-32
Facilities ................................................................................................ 14-44
Parks and Open Space .......................................................................... 14-58
RedGate Golf Course ............................................................................. 14-70
15 – Non-Departmental
Summary of Non-Departmental
Expenditures by Fund ....................................................................... 15-1
General Fund ........................................................................................... 15-1
Water Fund .............................................................................................. 15-2
Sewer Fund .............................................................................................. 15-2
Refuse Fund............................................................................................. 15-2
Parking Fund ............................................................................................ 15-2
Stormwater Management Fund ................................................................ 15-3
RedGate Golf Fund .................................................................................. 15-3
Speed Camera Fund ................................................................................ 15-3
Town Center Management District Fund .................................................. 15-3
Debt Service Fund.................................................................................... 15-3
Supplemental Information
16 - Appendix
Administrative Scale Employees Position Grades and Classifications .... 16-1
Recreation and Parks Position Grades and Classifications ..................... 16-2
Senior Staff Position Grades and Classifications ..................................... 16-2
Mayor and Council Appointed Positions ................................................... 16-2
Contract Positions .................................................................................... 16-2
Administrative Scale Employees Pay Scale Annual Salaries ................... 16-3
Recreation and Parks Pay Scale Hourly Salaries .................................... 16-3
Senior Administrative Pay Scale Annual Salaries .................................... 16-3
AFSCME Union Scale Employees Position Grades, Classifications,
and Pay Scale Annual Salaries ........................................................... 16-4
Police Scale Employees Position Grades, Classifications, and Pay Scale
Annual Salaries ................................................................................... 16-4
Organizational Structure Listing ............................................................... 16-5
Cost Center Summary .............................................................................. 16-9
Line Item Summary ................................................................................ 16-12
Glossary ................................................................................................. 16-15
Index....................................................................................................... 16-23

Introduction to the Budget Document
v
The City of Rockville’s Operating Budget and the companion Capital Improvements Program (CIP) provide citizens and City officials with detailed information about the City’s operations and spending. Through the elements listed below, the goal of the budget is to provide transparency to City of Rockville residents about programs, services, and policy implications of the City’s spending decisions. The Operating Budget and CIP together serve as a:
1. Policy Document – to describe financial and operating policies, goals, and priorities for the organization.
2. Financial Plan – to provide revenue and expenditure information by fund, department, division, and category.
3. Operations Guide – to describe activities, objectives for the fiscal year, performance measures to track progress on the objectives and the workforce.
4. Communications Device – to provide information on budgetary trends, planning processes, and integration of the operating and capital budgets.
FIGURE i-1. The City’s FY12 Adopted Operating Budget document.
The major sections of the operating budget include:
Overview and Summary Information (Sections 1 – 4)
Executive Summary This section includes the City Manager’s Budget Message, budget highlights, position changes and FTE summaries, and budget development overview. This section is intended to provide a high level overview of the City's budget and current financial position for FY 2012. Graphs with summary information including expenditures by type, revenues by category, and FTEs by fund and department are located throughout this section.
Policies and Goals This section lists the City’s financial management policies, the Mayor and Council Vision, a summary of major policy documents, and directories of officials and boards and commissions. This section is intended to provide the reader with the policies and documents that guide the City's financial practices. The City's formal Financial Management Policies are also located in this section.
Fund Summaries This section describes and analyzes each of the City’s funds both individually and in consolidated form using tables and graphs to highlight key aspects of the budget. Revenue and expenditure summary information is detailed by fund and department on the first several pages. If the reader finds that this overview of information is too general and more detailed information is needed, the reader can refer to the specific fund pages that follow in Section 3, or the reader can reference the department budget pages (Sections 5 through 14) that each fund supports. New for FY 2012, this section includes identical information for all funds, including revenues and expenditures by major type, revenues and expenditures by department, and rate or fee trend data when applicable. In addition, more detailed information is provided on the major revenue sources in the General Fund.
Five-Year Forecast This section is intended to facilitate the City in establishing priorities and allocating resources appropriately. The Forecast is a tool that assists the City in focusing its efforts on long-term initiatives, including necessary funding for infrastructure, maintenance, and capital needs. The Forecast paints a picture and is not predictive of future years budgets. The Forecast presents an overview of the revenues, expenditures, and changes in financial position for the City’s General Fund, six enterprise funds, and Speed Camera Fund. For the City's General Fund and Speed Camera Fund, financial position is defined as fund balance, and for the enterprise funds it is defined as working capital, which is equal to current assets less current liabilities. Several forecasting techniques or methods are used to project the revenues and expenditures in this section. The rationale for using one method over another depends on the type of revenue or expenditure. Regardless of the technique, staff's projections are conservative throughout the Forecast, ensuring prudent management of the City's resources.
etompkins
Underline

Introduction to the Budget Document
vi
Operating Budgets (Sections 5 – 14) Department Sections The departmental sections provide strategic, operational, performance, and budgetary information for each of the City’s departments. The first page of each departmental section includes: an organization chart, staffing trend graph, mission statement, expenditure history graph, and use of funds graph, each presented at the department level. Depending on the level of detail that the reader prefers, each department section contains a Department Summary, Division Summaries, and cost center sections. The paragraphs that follow explain the type of information found at each level of detail.
FIGURE i-2. Example of the first page of a department section, including the department’s mission statement and department-level charts and graphs.
The Department Summary begins with: 1) department expenditures by division, 2) department expenditures by type, 3) the source of department funds, and 4) a staffing summary by division. The remainder of the Department Summary explains significant changes between the prior year’s adopted and upcoming year’s proposed or adopted budgets, and an overview of the department. In some cases, this part of the budget includes supplemental information in the form of charts, graphs and text. These Department Summary pages are intended to be a high level overview of the department. If the reader finds that the information in the Department Summary is too general and more detailed information is needed, the reader can refer to the separate Division Summary pages within that department section.
FIGURE i-3. The Department Summary table example below highlights the breakout of department expenditures by division and by type in the left column, and revenues by type in the right column.

Introduction to the Budget Document
vii
Each Division Summary provides a greater level of detail for the reader. The first page of each Division Summary provides: 1) division expenditures by cost center, 2) division expenditures by type, 3) the source of division funds, and 4) a staffing summary by cost center. A division purpose statement and significant changes between the prior year’s adopted and upcoming year’s proposed or adopted budgets are also included. These Division Summary pages are intended to provide more specific information about each major City function. If the reader finds that the information in the Division Summary is too general and more detailed information is needed, the reader can refer to the separate cost center sections within the division section.
FIGURE i-4. The example below highlights the relationship between the Division Summary and Department Summary pages. Each division’s total expenditures and each division’s total revenues by source can be found on the Department Summary table. The Division Summary also contains a breakout of division expenditures by type.
A cost center is a sub-section of a division that is responsible for a specific activity or group of activities under the division. For each cost center, the budget presents a summary of expenditures and revenues, as well as objectives, performance and workload measures, regular position titles and numbers of FTEs (including grade), and supplemental information in the form of charts, graphs, maps and text. A cost center provides the lowest level of detail available in the budget book. If a reader is considering options for increasing or decreasing the overall budget, the cost center level is an ideal place to start since it provides the most information about a specific operation, including number of FTEs and actual performance and workload information.
FIGURE i-5. The example below highlights the relationship between the Cost Center Summary tables and the Division Summary tables. Each cost center’s total expenditures and revenues can be found in the cost center’s section. Total cost center expenditures can also be seen on the Division Summary table, and cost center revenues appear on the Division Summary table by revenue source.
Non-Departmental (Section 15)
This section summarizes the non-departmental operating expenditures, which are those costs not charged directly to specific departments but are general costs to the City. Expenditures that are budgeted within this section include fund contingencies, unemployment insurance, retiree health care contributions, property and liability insurance, debt service, and administrative charges. Each fund is listed separately and is broken down by major expenditure category.
Appendix (Section 16)
This section contains supporting information, such as employee/position grades, classifications and pay scales, organizational listing, cost center summary, line item summary, glossary, and index.

FY2012 Budget Ordinance
viii

FY2012 Budget Ordinance
ix

Changes from the FY 2012 Proposed to Adopted Budget
x
65,644,400
170,000
(3,740)
25,000
12,000
30,000
(1,220)
16,000
2,000
122,400
9,000
12,585
5,320
2,890
31,060
65,315
27,000
20,170
(13,600)
(29,680)
(19,580)
(12,550)
(45,500)
(38,000)
(17,200)
(11,200)
(24,430)
767,000
(2,560)
(700,000)
66,042,880
65,644,400
320,000
140,000
Revenue Proposed Total
Community Planning and Development Services
Addition: Building Permit Fees
Addition: Zoning Fees
Reduction: Special Events
Reduction: Transfer to Parking Fund
Reduction: Tow n Center Management Expenditures
Reduction: Sw im Center Clerk III [0.5 FTE]
Addition: Temp. Employee for Clerk III duties
Reduction: Lifeguard Temporary Employees
Reduction: Linkages to Learning Personnel Changes
Reduction: Community Services Outreach Worker [0.4 FTE]
Addition: Temp. Employee for Kids Club Director duties
Addition: Lincoln Park Community Center Personnel Changes
Addition: Senior Center Transportation Aide [1.0 FTE]
Reduction: Facilities Maintenance Laborer [1.0 FTE]
Addition: Facilities Maintenance Specialist [0.75 FTE]
Addition: Federal and State Lobbyist Contractor
Addition: Cityw ide Training
Reduction: Transportation Services
Reduction: Civic Center Supervisor [0.5 FTE]
Addition: Temp. Employee for Civic Center Supervisor duties
Reduction: Kids Club Director Position [0.4 FTE]
Human Resources
Addition: Cityw ide Training
Reduction: Mayor and Council Compensation Increase
City Manager's Office
Addition: Buy Rockville Campaign
Addition: Community Support Overtime
Police
Addition: Gasoline and Oil
Public Works
GENERAL FUND
Mayor and Council
Addition: Program Supplies
Expenditure Adopted Total
Expenditure Proposed Total
Recreation and Parks
Addition: Science Center
Reduction: Personnel Contingency
Addition: Contribution to CIP
Addition: Assistant Facilities Engineer [0.4 FTE]
Non-Departmental
16,000
60,000
6,800
(7,690)
589,800
378,760
(250,000)
(166,600)
(530,840)
(157,750)
66,042,880
10,101,470
9,470
123,320
(132,790)
10,101,470
8,087,000
9,710
390,280
(399,990)
8,087,000
5,950,810
58,060
6,008,870
5,950,810
58,060
6,008,870
Revenue Adopted Total
GENERAL FUND (continued)
Expense Adopted Total
Revenue Proposed Total
Non-Departmental
Addition: Use of Reserves
REFUSE FUND Expense Proposed Total
Public Works
Addition: Gasoline and Oil
Reduction: Addition to Reserves
Reduction: Addition to Reserves
Police
Addition: Community Support
Public Works
Revenue Adopted Total
Non-Departmental
Addition: New Debt
Expense Adopted Total
Addition: Permits and Fees
Recreation and Parks
Addition: Linkages to Learning Grant
Reduction: Wood Middle School Grant
Non-Departmental
SEWER FUND Expense Proposed Total
Public Works
Addition: Gasoline and Oil
Expense Adopted Total
Reduction: Property Tax
Addition: Highw ay User Revenue
Addition: Tax Duplication
Reduction: Use of Reserves
Reduction: Tow n Center Parking Garage Administrative Charge
Reduction: TCMD Administrative Charge
WATER FUND Expense Proposed Total
Public Works
Addition: Gasoline and Oil
Non-Departmental
Addition: New Debt

Changes from the FY 2012 Proposed to Adopted Budget
xi
4,238,800
(48,180)
(1,500)
1,230
(21,750)
(27,000)
(822,920)
60,000
270,100
(80,300)
(530,840)
3,037,640
4,238,800
300,000
98,840
(700,000)
(900,000)
3,037,640
3,182,870
3,310
3,186,180
3,182,870
3,310
3,186,180
1,787,480
1,310
(1,310)
1,787,480
Non-Departmental
Expense Adopted Total
Revenue Proposed Total
Non-Departmental
Reduction: Tow n Center Parking Garage Operating Expenses
Revenue Adopted Total
Expense Proposed Total
Recreation and Parks
STORMWATER MANAGEMENT FUND
Reduction: Facilities Maintenance Specialist [0.25 FTE]
Public Works
Expense Adopted Total
Reduction: Transfer from General Fund
Addition: Lease Revenue
Expense Proposed Total
Expense Proposed Total
Public Works
PARKING FUND
Reduction: Assistant Facilities Engineer [0.4 FTE]
Non-Departmental
Reduction: Addition to Reserves
Addition: Gasoline and Oil
Expense Adopted Total
Non-Departmental
REDGATE GOLF FUND
Addition: Use of Reserves
Revenue Proposed Total
Addition: Gasoline and Oil
Revenue Adopted Total
Addition: Contingency
Addition: Bond Interest
Police
Reduction: Parking Enforcement Officer [1.0 FTE]
Reduction: Parking Enforcement Overtime
Public Works
Addition: Gasoline and Oil
Reduction: Management of Tow n Center Parking Garages
Addition: Use of Reserves
Reduction: Violation and Parking Meter Revenue
Reduction: Administrative Charges
1,109,010
30,900
1,139,910
1,109,010
30,900
1,139,910
930,000
(43,530)
(695,690)
(33,030)
(157,750)
-
930,000
(930,000)
-
1,429,000
970
(970)
1,429,000
Reduction: Tow n Center Management District Operating Costs
Non-Departmental
Reduction: Administrative Charges
Reduction: Tow n Center Management District Operating Costs
TOWN CENTER MANAGEMENT DISTRICT FUND
Reduction: Facilities Maintenance Specialist [0.5 FTE]
Expenditure Proposed Total
Public Works
Addition: Gasoline and Oil
SPEED CAMERA FUND
Recreation and Parks
Revenue Adopted Total
Addition: Courthouse Square Fountain
Addition: Use of Reserves
Recreation and Parks
SPECIAL ACTIVITIES FUND
Expenditure Adopted Total
Expenditure Proposed Total
Revenue Proposed Total
Non-Departmental
Reduction: Addition to Reserves
Expenditure Proposed Total
Expenditure Adopted Total
Revenue Proposed Total
Recreation and Parks
Expenditure Adopted Total
Non-Departmental
Reduction: Real Property Tax
Revenue Adopted Total
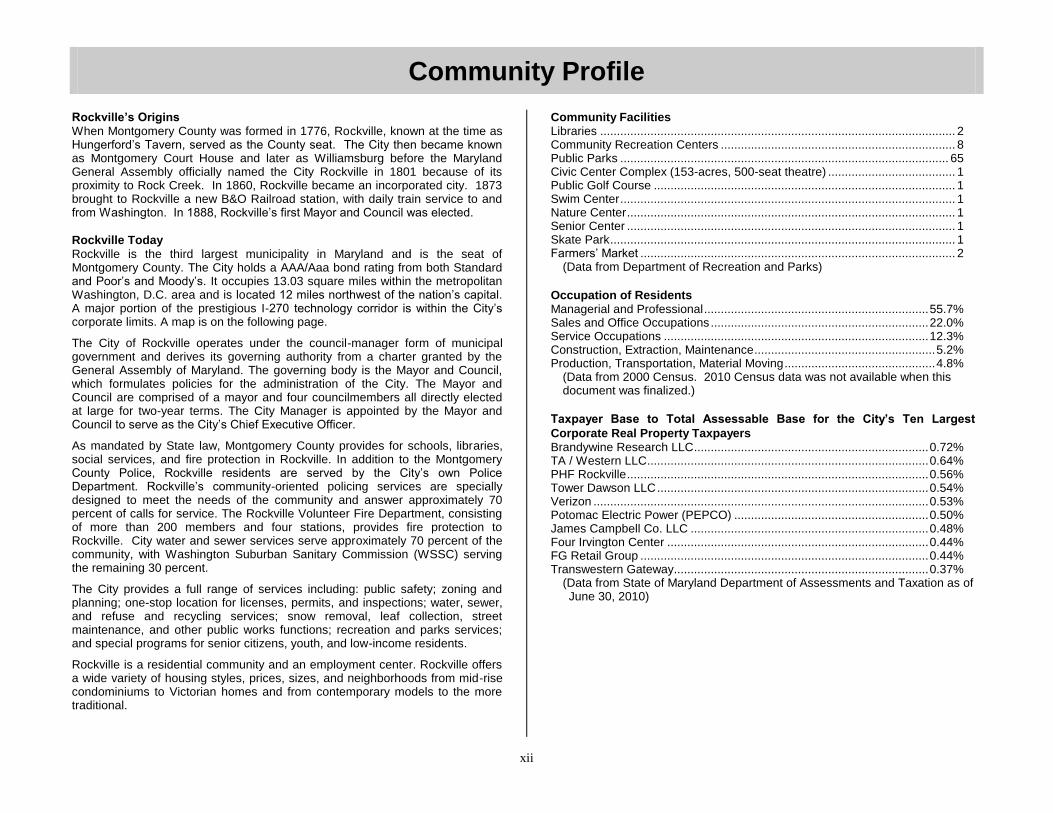
Community Profile
xii
Rockville’s Origins When Montgomery County was formed in 1776, Rockville, known at the time as Hungerford’s Tavern, served as the County seat. The City then became known as Montgomery Court House and later as Williamsburg before the Maryland General Assembly officially named the City Rockville in 1801 because of its proximity to Rock Creek. In 1860, Rockville became an incorporated city. 1873 brought to Rockville a new B&O Railroad station, with daily train service to and from Washington. In 1888, Rockville’s first Mayor and Council was elected.
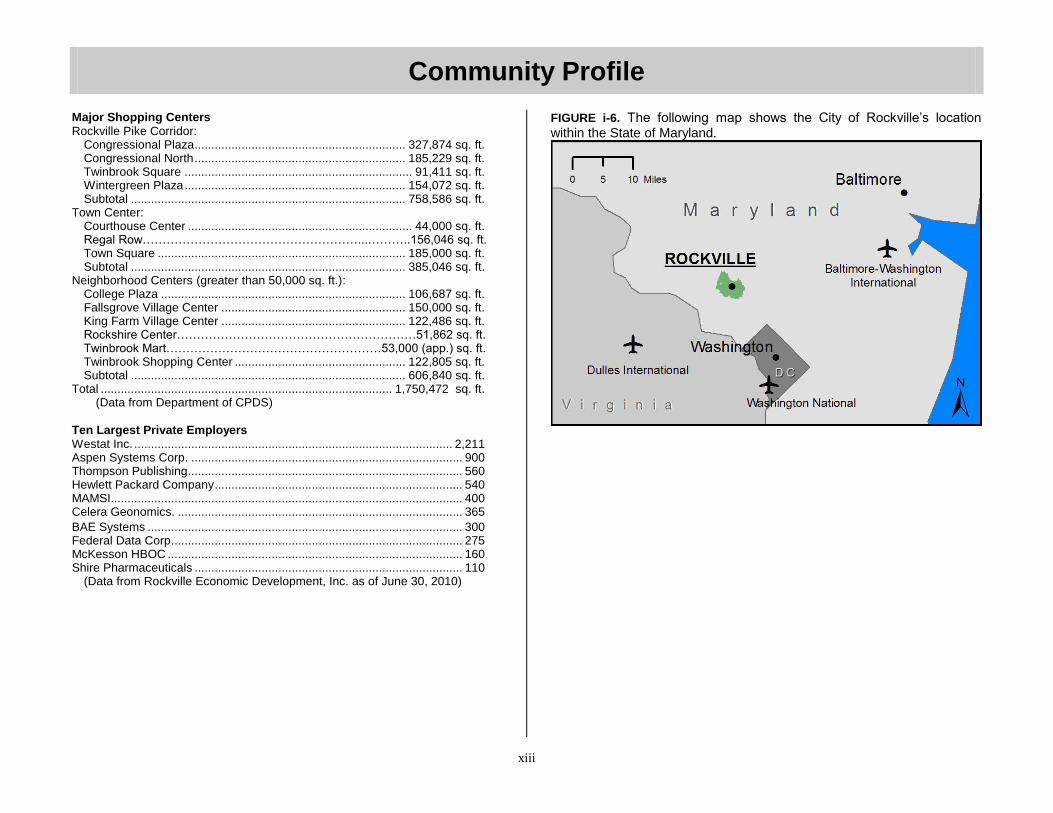
Rockville Today Rockville is the third largest municipality in Maryland and is the seat of Montgomery County. The City holds a AAA/Aaa bond rating from both Standard and Poor’s and Moody’s. It occupies 13.03 square miles within the metropolitan Washington, D.C. area and is located 12 miles northwest of the nation’s capital. A major portion of the prestigious I-270 technology corridor is within the City’s corporate limits. A map is on the following page.
The City of Rockville operates under the council-manager form of municipal government and derives its governing authority from a charter granted by the General Assembly of Maryland. The governing body is the Mayor and Council, which formulates policies for the administration of the City. The Mayor and Council are comprised of a mayor and four councilmembers all directly elected at large for two-year terms. The City Manager is appointed by the Mayor and Council to serve as the City’s Chief Executive Officer.
As mandated by State law, Montgomery County provides for schools, libraries, social services, and fire protection in Rockville. In addition to the Montgomery County Police, Rockville residents are served by the City’s own Police Department. Rockville’s community-oriented policing services are specially designed to meet the needs of the community and answer approximately 70 percent of calls for service. The Rockville Volunteer Fire Department, consisting of more than 200 members and four stations, provides fire protection to Rockville. City water and sewer services serve approximately 70 percent of the community, with Washington Suburban Sanitary Commission (WSSC) serving the remaining 30 percent.
The City provides a full range of services including: public safety; zoning and planning; one-stop location for licenses, permits, and inspections; water, sewer, and refuse and recycling services; snow removal, leaf collection, street maintenance, and other public works functions; recreation and parks services; and special programs for senior citizens, youth, and low-income residents.
Rockville is a residential community and an employment center. Rockville offers a wide variety of housing styles, prices, sizes, and neighborhoods from mid-rise condominiums to Victorian homes and from contemporary models to the more traditional.
Community Facilities Libraries .......................................................................................................... 2 Community Recreation Centers ...................................................................... 8 Public Parks .................................................................................................. 65 Civic Center Complex (153-acres, 500-seat theatre) ...................................... 1 Public Golf Course .......................................................................................... 1 Swim Center .................................................................................................... 1 Nature Center .................................................................................................. 1 Senior Center .................................................................................................. 1 Skate Park ....................................................................................................... 1 Farmers’ Market .............................................................................................. 2 (Data from Department of Recreation and Parks)
Occupation of Residents Managerial and Professional ................................................................... 55.7% Sales and Office Occupations ................................................................. 22.0% Service Occupations ............................................................................... 12.3% Construction, Extraction, Maintenance ...................................................... 5.2% Production, Transportation, Material Moving ............................................. 4.8%
(Data from 2000 Census. 2010 Census data was not available when this document was finalized.)
Taxpayer Base to Total Assessable Base for the City’s Ten Largest
Corporate Real Property Taxpayers Brandywine Research LLC ...................................................................... 0.72% TA / Western LLC .................................................................................... 0.64% PHF Rockville .......................................................................................... 0.56% Tower Dawson LLC ................................................................................. 0.54% Verizon .................................................................................................... 0.53% Potomac Electric Power (PEPCO) .......................................................... 0.50% James Campbell Co. LLC ....................................................................... 0.48% Four Irvington Center .............................................................................. 0.44% FG Retail Group ...................................................................................... 0.44% Transwestern Gateway............................................................................ 0.37% (Data from State of Maryland Department of Assessments and Taxation as of
June 30, 2010)
Community Profile
xiii
Major Shopping Centers Rockville Pike Corridor:
Congressional Plaza ............................................................... 327,874 sq. ft. Congressional North ............................................................... 185,229 sq. ft. Twinbrook Square .................................................................... 91,411 sq. ft. Wintergreen Plaza .................................................................. 154,072 sq. ft. Subtotal .................................................................................. 758,586 sq. ft.
Town Center: Courthouse Center ................................................................... 44,000 sq. ft. Regal Row………………………………………………...………..156,046 sq. ft. Town Square .......................................................................... 185,000 sq. ft. Subtotal .................................................................................. 385,046 sq. ft.
Neighborhood Centers (greater than 50,000 sq. ft.): College Plaza ......................................................................... 106,687 sq. ft. Fallsgrove Village Center ....................................................... 150,000 sq. ft. King Farm Village Center ....................................................... 122,486 sq. ft. Rockshire Center……………………………………………………51,862 sq. ft. Twinbrook Mart………………………………………………53,000 (app.) sq. ft. Twinbrook Shopping Center ................................................... 122,805 sq. ft. Subtotal .................................................................................. 606,840 sq. ft.
Total ....................................................................................... 1,750,472 sq. ft. (Data from Department of CPDS)
Ten Largest Private Employers Westat Inc. ............................................................................................... 2,211 Aspen Systems Corp. ................................................................................. 900 Thompson Publishing.................................................................................. 560 Hewlett Packard Company .......................................................................... 540 MAMSI......................................................................................................... 400 Celera Geonomics. ..................................................................................... 365
BAE Systems .............................................................................................. 300 Federal Data Corp ....................................................................................... 275 McKesson HBOC ........................................................................................ 160 Shire Pharmaceuticals ................................................................................ 110 (Data from Rockville Economic Development, Inc. as of June 30, 2010)
FIGURE i-6. The following map shows the City of Rockville’s location within the State of Maryland.

Demographic Statistics
xiv
FIGURE i-7. The following statistics provide comparative information about the City of Rockville based on 1990, 2000, and 2010 Census data.
1990 2000* 2010**
Total Population 44,835 47,388 61,209
Population < 18 10,379 11,081 13,147
Population 65 + 4,687 6,215 8,542
Population 19-64 29,769 30,092 39,520
Median Age 34.6 37.8 38.7
Total Households 15,660 17,247 23,686
Per Capita Income $21,484 $30,518 N/A
Median Household Income $52,073 $68,074 N/A
High School / College Graduate 26,250 29,601 N/A
Unemployment Rate 3.0% 2.1% N/A
White 35,491 33,262 36,973
Black / African American 3,699 4,675 5,858
American Indian / Alaska Native 119 403 205
Asian / Pacific Islander 4,394 7,688 12,609
Hispanic *** 3,863 5,529 8,781
Other 1,132 2,946 3,214
* Population figures beginning 2000 may add to more than the total population because individuals were able to report more than one race.
** Source: 2010 Census FactFinder website: http://factfinder2.census.gov, June 2011. Items marked “N/A” were not available at the time this document was finalized.
*** Hispanic is of any race.
FIGURE i-8. The statistics below are from the City of Rockville Comprehensive Annual Financial Report (CAFR) and were provided by the departments of Community Planning and Development Services, Public Works, and Recreation and Parks.
1990 2000 2010
Miles of City-Maintained Streets 131 138 157
Miles of Sidewalks 195 217 251
Miles of Storm Sewer 48 56 100
Miles of City-Maintained Water Pipes N/A 185 179
Miles of City-Maintained Sewer Pipes N/A 132 148
Number of Hydrants 1,132 1,229 1,372
Number of Street Lights * 4,020 4,723 3,064
Number of Building Permits Issued 687 1,413 721
Estimated Cost of Building Permits (in millions) $51 $177 $58
Acres of Parks 880.5 955.0 1,061
Number of Playgrounds 44 34 52
Number of Water Accounts 11,344 11,770 12,623
Number of Refuse/Recycling Accounts** N/A N/A 13,694
Average Daily Water Consumption (in millions of gallons) 4.83 4.92 4.81
* 1990 and 2000 include street lights that are owned by the City of Rockville and street lights that are owned by Pepco. 2010 includes only the street lights that are owned by the City of Rockville.
** The number of refuse/recycling accounts is not included in the CAFR but was provided by the Department of Finance. The number of accounts is not available for years 1990 or 2000.
1 - 1
July 1, 2011 Honorable Mayor and Members of the City Council City of Rockville, Maryland It is my privilege to present to you the adopted budget for the City of Rockville for Fiscal Year (FY) 2012. The total operating budget for all funds equals $107.2 million, an increase of 2.2 percent from last year. The General Fund budget equals $66 million, an increase of 4.6 percent. The budget is in line with policy direction set forth by the Mayor and Council throughout the FY 2012 budget process. The current real property tax rate of $0.292 per $100 of assessed valuation will remain the same for FY 2012. The FY 2012 budget discontinues the $100 property tax credit that previously applied to all owner-occupied residential properties from FY 2008 to FY 2011. The operating budget supports existing programs and services, but due to limited resources as a result of current economic conditions, the City continues to hold back on some major operating and capital expenditures. Some areas where the budget remains lean include regular and temporary employees, contract services, equipment and program supplies, and capital infrastructure. The FY 2012 adopted budget includes a (2.7) decrease in the total number of full-time equivalent positions, a 1.0 percent increase in salaries for all employees, and significant appropriations to support employee healthcare benefits and pension contributions. Another major expenditure that is included in the FY 2012 adopted budget is a General Fund transfer to the RedGate Golf Fund in the amount of $630,000. This transfer is comprised of $204,000 for high priority capital improvement needs and $426,000 for annual operating needs. Future transfers would need to equal approximately $490,000 in order to maintain a 30-day working capital balance at the end of the five-year projection period. While this projection appears in Section 4, it should be viewed as a placeholder pending the outcome of the responses to the request for proposal (RFP) for a management firm or lease, or new Mayor and Council direction. Unless the City receives an RFP response that has a realistic prospect of decreasing the future reliance on the General Fund, I would recommend that the City discontinue operations of the course, or reduce other recreation programs to accommodate ongoing subsidies of golf.
In order to balance the FY 2012 General Fund budget, the adopted budget includes several revenue increases in the Departments of Recreation and Parks, Community Planning and Development Services, Public Works, and Police. These revenue increases are consistent with the new fees adopted by the Mayor and Council as a result of the Comprehensive User Fee Study, as well as increases in Swim and Fitness Center memberships and sponsorships for Special Events. More information on the User Fee Study can be found on page 1-4. The FY 2012 adopted budget does not rely on reserves to balance the budget. In FY 2011, in order to balance the General Fund budget without resorting to layoffs or decreasing programs or services, the adopted budget utilized approximately $1.0 million of General Fund reserves in excess of the 15 percent reserve requirement. The estimate of fund balance above the 15 percent reserve requirement in FY 2012 is $1.5 million or 17.3 percent. According to the City's Financial Management Policies, the fund balance above the 15 percent reserve requirement is "available for pay-go capital projects and/or one time capital outlays." We do not recommend appropriating the fund balance at this time, but rather reserve it for future transfers to the Capital Projects Fund in order to reduce the amount the City needs to borrow, or to fund unfunded CIP projects. More information about FY 2012 expenditures and revenues by category, and changes from FY 2011 to FY 2012 can be found on pages 1-6 through 1-8. Improvements to the Budget Document
There are several improvements to the FY 2012 Operating Budget Book. The improvements were made based on recommendations from the Government Finance Officers Association (GFOA) budget reviewers and from the City of Rockville’s Finance and Budget Task Force. The Finance and Budget Task Force was formed in FY 2010 to review the City’s Financial Management Policies, the annual budget process, and the information in the budget book. The recommendations from the Finance and Budget Task Force focused on making the budget book more easily understandable to the reader. We are thankful for the hard work and dedication of the Task Force members, and we hope that they find the budget book improvements consistent with their recommendations. Significant changes in the book are listed below along with the associated section numbers. In addition to these items, several improvements were made to the entire book including labeling all graphs, tables, and figures, and adding footnotes or explanations where there are unusual variances.
Introduction – This section now includes an illustrative three-page explanation of how to read and understand the operating budget book.
Section 1 – This section includes more trend data in the form of historic graphs, a more detailed economic climate section that relates to the City’s budget, and more information on the City’s pension plan.
Section 2 – The Financial Management Policies now include page number references to where each numeric target appears in the budget and a policy regarding maintenance of the City’s triple-A bond rating. In addition to these smaller changes, this section includes a revised User Fee Cost Recovery Goals Section that can be found on pages 2-7 through 2-10. This section now allows for adjustments to regulatory fees on an annual basis based on changes to the Baltimore Washington CPI, assigns specific cost centers to
etompkins
Underline
etompkins
Underline
etompkins
Underline
etompkins
Underline
etompkins
Underline
etompkins
Underline
etompkins
Underline
etompkins
Underline
etompkins
Underline
etompkins
Underline
etompkins
Underline
etompkins
Underline
etompkins
Underline
etompkins
Underline
etompkins
Underline
etompkins
Underline

1 - 2
cost recovery categories, and defines the individual/community benefit category with revised recovery bands that reflect the market environment.
Section 3 – This section now includes a diagram of the City’s fund structure, an enhanced page 3-2 with reserve targets, a new department / fund matrix, more detail on the City’s General Fund revenues, and consistent formatting and information across all funds. At the end of this section, summary information from the Capital Improvements Program document can be found, which is prescribed in the GFOA requirements.
Section 4 – Each fund forecast now includes a table showing the estimated and minimum reserve levels for each year in the forecast. This information is also presented in the form of a line graph on each fund page.
Sections 5 through 14 – There were several changes throughout the department sections including: department tabs contain detailed organizational charts, department summary pages include percent change columns from FY 2011 adopted to FY 2012 adopted, regular position tables contain scale and grade information for each position, and all graphs have brief explanations of what they are portraying.
Preparing and presenting the annual budget is an exercise in continuous improvement. Each improvement to the budget document enhances the transparency with which we govern, demonstrates how tax dollars are prudently managed, and shows how the City is planning for the future. It is our goal to ensure all information is readily available and understandable in order to promote open and thoughtful discussions and decision making. Economic Climate and Impact on the Budget
The City’s budget and overall financial plans are directly impacted by the state of the regional and national economies. On the national level, the slowing economy has caused overall fixed income securities rates to remain low. The fixed income markets are tied to the Federal Funds Target Rate, which was set at 0.0 to 0.25 percent in December 2008 by the Federal Open Market Committee. The Target Rate remains unchanged as of July 2011. The national fixed income markets have a direct impact on the City’s financial health because of the interest earned on the City’s investment portfolio. Overall in FY 2010, the City earned $45,000 on its twelve operating accounts, which was down approximately 93 percent from the previous fiscal year. Rates have remained flat for most of FY 2011; however staff anticipates that rates will start to slowly trend upward in FY 2012 and future years. In an effort to increase the overall portfolio yield, during calendar 2010 staff invested available funds in the State of Maryland Local Government Investment Pool (―MLGIP‖). The MLGIP’s average interest earnings are generally higher than a government money market fund because the MLGIP invests in high-grade commercial securities and bankers’ acceptances. Because of the greater investment returns staff transferred all of the City’s available funds to the MLGIP. The City’s Investment Policy allows up to 100 percent investment in the MLGIP. Another national indicator, Gross Domestic Product (GDP), is one of the best indicators of the country's economic health because it measures the value of all goods and services produced in the United States. GDP increased at an annual rate of 2.9 percent in 2010, up from an annual decline of 2.6 percent in 2009
according to the Bureau of Economic Analysis. The growth in 2010 mainly reflects positive changes in exports, nonresidential fixed investments, consumer spending, and inventory investment. Many economists are calling for GDP to increase by 2.7 to 2.9 percent in calendar year 2011. This is down from the 3+ percent originally estimated in early 2011. Federal Reserve Chairman Ben Bernanke said that while the recovery is continuing at a moderate pace, growth is somewhat slower than expected. The Federal Reserve also issued new projections that call for higher unemployment and higher inflation in 2011 and 2012 than previously forecasted.
GRAPH 1-1. History of real gross domestic product.
On the regional level, the Washington area has experienced the same stresses as the national economy since the middle of 2008, although the economic impact has been less severe. The State of Maryland’s unemployment rate was 6.8 percent as of May 2011, compared to the national unemployment rate of 9.1 percent. (source: Bureau of Labor Statistics). The general increase in the unemployment rate since mid-2008 has had a negative impact on income tax revenue for many jurisdictions. The City’s FY 2012 estimate for income tax revenue represents a 6 percent decrease from its height in FY 2008. Other jurisdictions in the area are experiencing decreases in this revenue source in amounts upwards of 30 percent.
GRAPH 1-2. History of State of Maryland unemployment rate.
etompkins
Underline
etompkins
Underline
etompkins
Underline
etompkins
Underline
etompkins
Underline
etompkins
Underline
etompkins
Underline
1 - 3
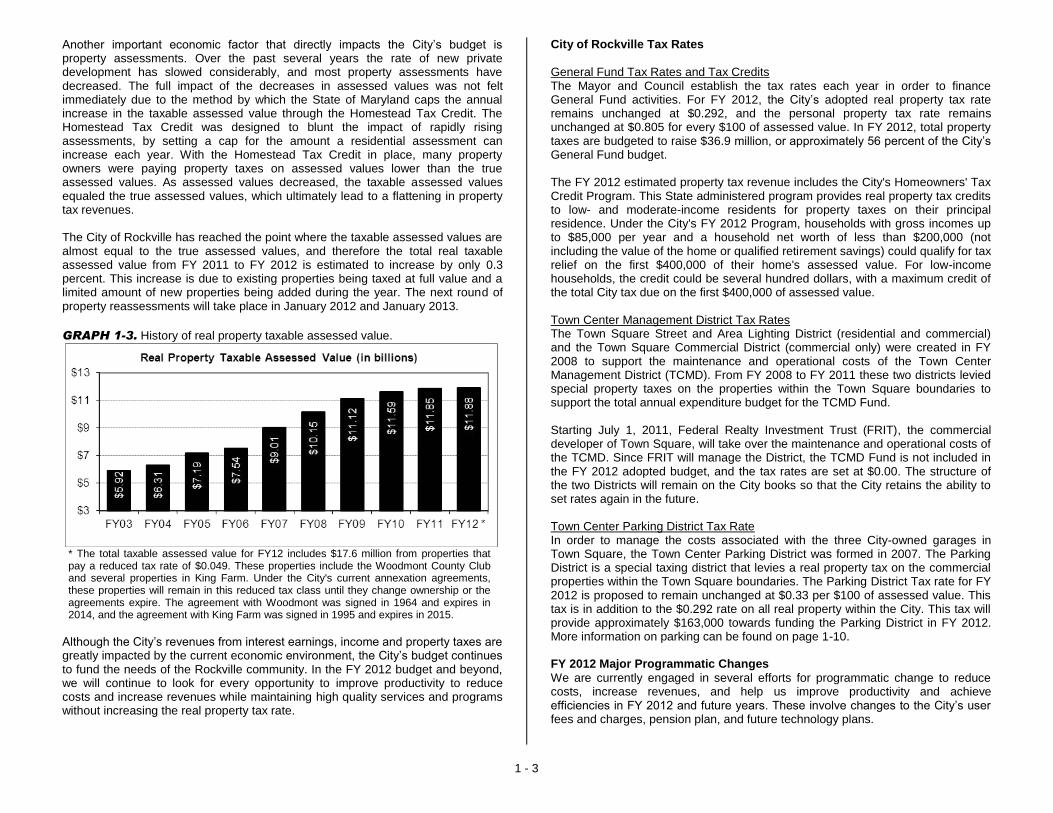
Another important economic factor that directly impacts the City’s budget is property assessments. Over the past several years the rate of new private development has slowed considerably, and most property assessments have decreased. The full impact of the decreases in assessed values was not felt immediately due to the method by which the State of Maryland caps the annual increase in the taxable assessed value through the Homestead Tax Credit. The Homestead Tax Credit was designed to blunt the impact of rapidly rising assessments, by setting a cap for the amount a residential assessment can increase each year. With the Homestead Tax Credit in place, many property owners were paying property taxes on assessed values lower than the true assessed values. As assessed values decreased, the taxable assessed values equaled the true assessed values, which ultimately lead to a flattening in property tax revenues. The City of Rockville has reached the point where the taxable assessed values are almost equal to the true assessed values, and therefore the total real taxable assessed value from FY 2011 to FY 2012 is estimated to increase by only 0.3 percent. This increase is due to existing properties being taxed at full value and a limited amount of new properties being added during the year. The next round of property reassessments will take place in January 2012 and January 2013.
GRAPH 1-3. History of real property taxable assessed value.
* The total taxable assessed value for FY12 includes $17.6 million from properties that pay a reduced tax rate of $0.049. These properties include the Woodmont County Club and several properties in King Farm. Under the City's current annexation agreements, these properties will remain in this reduced tax class until they change ownership or the agreements expire. The agreement with Woodmont was signed in 1964 and expires in 2014, and the agreement with King Farm was signed in 1995 and expires in 2015.
Although the City’s revenues from interest earnings, income and property taxes are greatly impacted by the current economic environment, the City’s budget continues to fund the needs of the Rockville community. In the FY 2012 budget and beyond, we will continue to look for every opportunity to improve productivity to reduce costs and increase revenues while maintaining high quality services and programs without increasing the real property tax rate.
City of Rockville Tax Rates
General Fund Tax Rates and Tax Credits The Mayor and Council establish the tax rates each year in order to finance General Fund activities. For FY 2012, the City’s adopted real property tax rate remains unchanged at $0.292, and the personal property tax rate remains unchanged at $0.805 for every $100 of assessed value. In FY 2012, total property taxes are budgeted to raise $36.9 million, or approximately 56 percent of the City’s General Fund budget. The FY 2012 estimated property tax revenue includes the City's Homeowners' Tax Credit Program. This State administered program provides real property tax credits to low- and moderate-income residents for property taxes on their principal residence. Under the City's FY 2012 Program, households with gross incomes up to $85,000 per year and a household net worth of less than $200,000 (not including the value of the home or qualified retirement savings) could qualify for tax relief on the first $400,000 of their home's assessed value. For low-income households, the credit could be several hundred dollars, with a maximum credit of the total City tax due on the first $400,000 of assessed value. Town Center Management District Tax Rates The Town Square Street and Area Lighting District (residential and commercial) and the Town Square Commercial District (commercial only) were created in FY 2008 to support the maintenance and operational costs of the Town Center Management District (TCMD). From FY 2008 to FY 2011 these two districts levied special property taxes on the properties within the Town Square boundaries to support the total annual expenditure budget for the TCMD Fund. Starting July 1, 2011, Federal Realty Investment Trust (FRIT), the commercial developer of Town Square, will take over the maintenance and operational costs of the TCMD. Since FRIT will manage the District, the TCMD Fund is not included in the FY 2012 adopted budget, and the tax rates are set at $0.00. The structure of the two Districts will remain on the City books so that the City retains the ability to set rates again in the future. Town Center Parking District Tax Rate In order to manage the costs associated with the three City-owned garages in Town Square, the Town Center Parking District was formed in 2007. The Parking District is a special taxing district that levies a real property tax on the commercial properties within the Town Square boundaries. The Parking District Tax rate for FY 2012 is proposed to remain unchanged at $0.33 per $100 of assessed value. This tax is in addition to the $0.292 rate on all real property within the City. This tax will provide approximately $163,000 towards funding the Parking District in FY 2012. More information on parking can be found on page 1-10. FY 2012 Major Programmatic Changes
We are currently engaged in several efforts for programmatic change to reduce costs, increase revenues, and help us improve productivity and achieve efficiencies in FY 2012 and future years. These involve changes to the City’s user fees and charges, pension plan, and future technology plans.
etompkins
Underline

1 - 4
Comprehensive User Fee Study The first programmatic change relates to increasing revenues from user fees, consistent with the results of the Comprehensive User Fee Study ("Study"). The Study, which was adopted in May 2011, is a tool that helped the Mayor and Council evaluate the cost of providing services and decide if these services should be tax versus fee supported. Once the costs and tax subsidy levels were identified, the Mayor and Council adopted increases to the fees and charges associated with those services in order to decrease the City's tax subsidy amount. This decision to update fees and charges was made in conjunction with the adoption of revisions to the City's Financial Management Policies ("Policies"), "User Fee Cost Recovery Goals" section. The following list summarizes some of the adopted changes that are reflected in Section 2 - Policies and Goals. All of these adopted changes are in alignment with recommendations made by the Finance and Budget Task Force.
The standard for regulatory fees was lowered to 100 percent of direct costs and not 100 percent of full costs, as the study reflected that a full cost approach was not compatible with benchmarking to surrounding jurisdictions for the majority of the City’s regulatory fees.
Cost centers were specifically identified under the appropriate cost recovery category.
In the Recreation and Parks program areas, four bands of recovery were added to the category of Community/Individual Benefit Services. These bands are as follows: Band A is for Recreation Programs (20%-50%), Band B is for Neighborhood Community Recreation Facilities (20%-50%), Band C is for Sports Programs (70%-100%), and Band D is for Major Recreation facilities (65%-100%). The bands for recovery were modified to reflect the reality of the market environment, and are an update of the original User Fee and Cost Recovery policy adopted in 2004.
The cost recovery goals are an important aspect to managing the fees and charges that the City sets annually. As fees and charges make up almost 13 percent of all General Fund revenues, these policies can make a significant difference to the City's budget. The FY 2012 budget includes over $800,000 in additional fee revenue due to staff being more aware of the full cost of the programs and trying to meet policy guidelines for cost recovery. Pension Plan A second major programmatic change involves amendments to the City’s pension plan (―Plan‖). Recognizing that the recent turmoil in the financial markets have significantly impacted the City’s budget, and in order for the City to continue to provide employees with retirement benefits that are competitive and economically sustainable, the Mayor and Council approved several Plan amendment changes which will establish a second tier of beneficiaries within the City's hybrid pension plan. The second tier of beneficiaries will become effective July 1, 2011 for new participants into the Plan. This second tier will have a higher retirement age (65), higher early retirement age (58), higher penalties for early retirements, and ten year vesting regardless of age. These changes will save the City millions of dollars in future pension contributions while still being able to provide a defined benefit component to the City’s pension plan. These changes to the City’s pension plan are a result of a comprehensive review of the plan, which was the most thorough
review since 1986 when the plan was converted from a defined benefit plan to a hybrid defined benefit and thrift plan for union and administrative employees. The changes do not impact the Police retirement Plan. Information Technology Strategic Plan The last major programmatic change involves the City’s Information Technology Strategic Plan (―Plan‖). Recognizing that technology is essential to achieving continuous improvement in service delivery during a period of constrained resources, we created a five-year Plan that was approved by the Mayor and Council. The Plan will serve as a roadmap for information technology acquisition, development, deployment, use, budgeting, work plans, maintenance and support. The Plan is based on extensive input from staff, on research conducted in the IT field, and on extensive discussions with senior management. The Plan identifies the City’s current and future IT needs, and identifies the resources and steps necessary to meet these needs. The effective use of technology can increase our efficiency, control costs, and improve government services in ways that benefit our citizens and improve internal management and operations. It is imperative that the City keeps pace with changing technology and applications. For this reason, included in the FY 2012 operating budget is funding for website redesign, and included in the capital budget is funding for an Enterprise Resource Planning System and Document Management and Imaging System. All three of these projects were identified as key priorities in the Plan. The website redesign project will cost the City approximately $100,000 and is funded in the Department of the City Manager’s budget. This project will redesign and improve the City’s website, and will include a usability review, full site redesign and professional photographs. As part of the City’s branding development, the branding consultant recommended that the City’s website be updated, including enhanced design and technology. By using technology in a compelling, informative manner, and making the site more interactive and easier to navigate, we anticipate more residents will visit the site and will stay longer to learn about City services. This helps the City to further its message of openness, transparency and ability to provide top-notch services. The Enterprise Resources Planning (ERP) System project (page 110 of the CIP) funds the analysis, purchase, and implementation of a comprehensive ERP system for the City. Currently, the City uses various software systems that are not integrated, thus limiting information sharing within and between departments. The ERP will provide an integrated system comprised of: asset management, GIS, permitting, code enforcement, finance and budget, human resources, utility billing, community engagement, employee self service, business intelligence, and citizen service requests. When fully implemented, the City will save time and money by keeping all information within one comprehensive system that all users can access. This solution may reside in a cloud-computing environment, which is Internet-based computing with shared software resources providing a single point for secure, redundant, 24/7 access. The Document Management and Imaging project (page 109 of the CIP) funds a plan that when fully implemented will dramatically improve internal operations by reducing paper storage requirements, streamlining document retrievals and
etompkins
Underline
etompkins
Underline
etompkins
Underline
etompkins
Underline
etompkins
Underline
etompkins
Underline
etompkins
Underline
etompkins
Underline

1 - 5
searches, and assisting departments in complying with legal and regulatory requirements for public information. In the IT Strategic Plan research, nearly every department identified document management and imaging as a key technology priority. Currently, departments do not have an effective way to manage paper and electronic documents. This project will add a total of $125,000 to the FY 2013 operating budget for annual maintenance costs and a new 1.0 FTE to manage the system. Maintaining Our Infrastructure/Capital Projects
Maintaining our investment in the City’s infrastructure continues to be challenging in the current economic environment. The adopted FY 2012 CIP budget includes new funding of $26.5 million to address the highest priorities of the Mayor and Council. This new funding combined with prior year unspent funding of $45.7 million will support a total of 51 CIP projects. Approximately 95 percent of all new FY 2012 funding will be utilized to support bridge reconstruction, pedestrian safety initiatives, upgrades and maintenance of the City’s water, sewer, and stormwater management systems, maintenance of the City’s playgrounds and athletic fields, asphalt and concrete repair and replacement, and improvements needed at the City’s Swim Center and RedGate Golf Course. In addition, some new funding will be dedicated to improvements that focus on the City’s information technology as discussed above. The future funding outlook for the CIP, in particular the Capital Projects Fund, remains uncertain. The Capital Projects Fund mainly supports CIP projects in the Recreation and Parks, Transportation and General Government program areas. Due to the limited amount of Capital Projects Fund revenue over the last several years, the FY 2012 adopted CIP includes 30 projects that are either fully or partially unfunded in the amount of $31.6 million over the five-year planning period from FY 2012 to FY 2016. Future funding for the CIP will be impacted by how much debt the City incurs, as bond proceeds have become an important revenue source for the City’s CIP. Future Capital Projects Fund borrowing is projected at $5.8 million in FY 2013, which will likely fund major infrastructure maintenance projects. In order to eliminate this future borrowing the City’s pay-go contribution would need to be increased beyond the currently planned amounts, or CIP projects would need to be canceled or delayed beyond FY 2016. City Staffing
The total number of full time equivalent (FTE) positions in the FY 2012 operating budget decreased by 2.7 FTEs (6.7 FTEs deleted and 4.0 FTE added) across all funds. GRAPH 1-4 shows the history of total regular FTEs for all funds and the General Fund. Despite the overall growth in the City’s population and the addition of several new programs including an in-house City Attorney, the total number of FTEs for all funds matches levels from FY 2007 and FY 2008, while the General Fund is at the lowest level since FY 2002.
GRAPH 1-4. History of total regular FTEs for all funds and the General Fund.
The (6.7) FTEs that were eliminated for FY 2012 are listed below. All positions are supported by the General Fund except the Meter Services Technician, which is in the Water Fund, and the Parking Enforcement Officer, which is funded by the Parking Fund. To maintain current programs and operations, the City will utilize temporary employees and current regular employees to perform the responsibilities of the deleted positions, as needed.
(0.2) FTE Assistant Sports Program Supervisor – Recreation and Parks
(0.5) FTE Recreation Program Supervisor – Recreation and Parks
(0.8) FTE Enrichment Club Directors – Recreation and Parks
(0.4) FTE Enrichment Club Leaders – Recreation and Parks
(1.0) FTE Laborer – Recreation and Parks
(0.4) FTE Kids Club Director – Recreation and Parks
(0.5) FTE Facility Supervisor II – Recreation and Parks
(0.5) FTE Clerk III – Recreation and Parks
(0.4) FTE Community Services Outreach Worker – Recreation and Parks
(1.0) FTE Meter Services Technician – Finance
(1.0) FTE Parking Enforcement Officer – Police
The 4.0 FTE positions that were added to the FY 2012 budget are listed below. The General Fund supports the Assistant City Attorney and the Civil Engineer II, and the Water Fund supports the Laborers.
1.0 FTE Assistant City Attorney – City Attorney’s Office
1.0 FTE Civil Engineer II – Public Works
2.0 FTE Laborers – Public Works The new 1.0 FTE Assistant City Attorney is needed primarily to provide in-house counsel representation for code enforcement. Currently, a majority of code enforcement items are being handled by outside counsel since there are limited resources in-house to manage this program. The City’s code enforcement program will be better handled in-house in order to provide readily accessible legal advice, as needed, and to ensure a consistent approach. This FTE will also provide additional legal support to the City’s Boards and Commissions, and will also be
etompkins
Underline
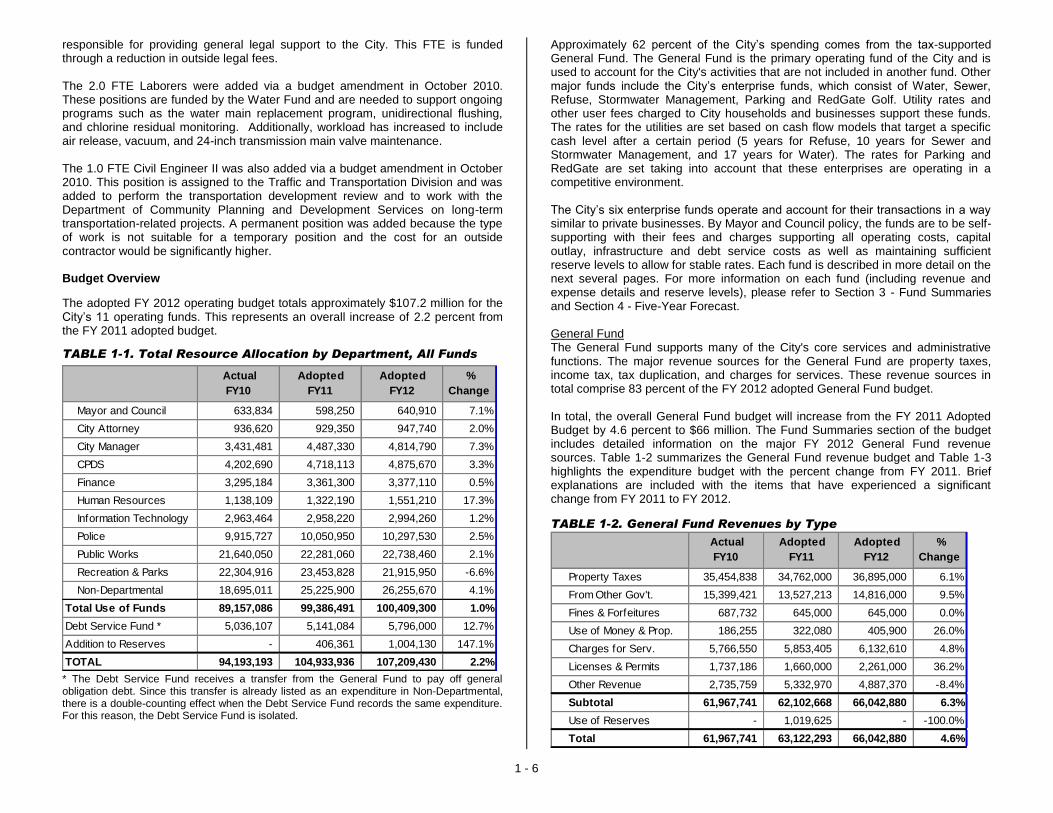
1 - 6
responsible for providing general legal support to the City. This FTE is funded through a reduction in outside legal fees. The 2.0 FTE Laborers were added via a budget amendment in October 2010. These positions are funded by the Water Fund and are needed to support ongoing programs such as the water main replacement program, unidirectional flushing, and chlorine residual monitoring. Additionally, workload has increased to include air release, vacuum, and 24-inch transmission main valve maintenance. The 1.0 FTE Civil Engineer II was also added via a budget amendment in October 2010. This position is assigned to the Traffic and Transportation Division and was added to perform the transportation development review and to work with the Department of Community Planning and Development Services on long-term transportation-related projects. A permanent position was added because the type of work is not suitable for a temporary position and the cost for an outside contractor would be significantly higher. Budget Overview
The adopted FY 2012 operating budget totals approximately $107.2 million for the City’s 11 operating funds. This represents an overall increase of 2.2 percent from the FY 2011 adopted budget.
TABLE 1-1. Total Resource Allocation by Department, All Funds
* The Debt Service Fund receives a transfer from the General Fund to pay off general obligation debt. Since this transfer is already listed as an expenditure in Non-Departmental, there is a double-counting effect when the Debt Service Fund records the same expenditure. For this reason, the Debt Service Fund is isolated.
Approximately 62 percent of the City’s spending comes from the tax-supported General Fund. The General Fund is the primary operating fund of the City and is used to account for the City's activities that are not included in another fund. Other major funds include the City’s enterprise funds, which consist of Water, Sewer, Refuse, Stormwater Management, Parking and RedGate Golf. Utility rates and other user fees charged to City households and businesses support these funds. The rates for the utilities are set based on cash flow models that target a specific cash level after a certain period (5 years for Refuse, 10 years for Sewer and Stormwater Management, and 17 years for Water). The rates for Parking and RedGate are set taking into account that these enterprises are operating in a competitive environment. The City’s six enterprise funds operate and account for their transactions in a way similar to private businesses. By Mayor and Council policy, the funds are to be self-supporting with their fees and charges supporting all operating costs, capital outlay, infrastructure and debt service costs as well as maintaining sufficient reserve levels to allow for stable rates. Each fund is described in more detail on the next several pages. For more information on each fund (including revenue and expense details and reserve levels), please refer to Section 3 - Fund Summaries and Section 4 - Five-Year Forecast. General Fund The General Fund supports many of the City's core services and administrative functions. The major revenue sources for the General Fund are property taxes, income tax, tax duplication, and charges for services. These revenue sources in total comprise 83 percent of the FY 2012 adopted General Fund budget. In total, the overall General Fund budget will increase from the FY 2011 Adopted Budget by 4.6 percent to $66 million. The Fund Summaries section of the budget includes detailed information on the major FY 2012 General Fund revenue sources. Table 1-2 summarizes the General Fund revenue budget and Table 1-3 highlights the expenditure budget with the percent change from FY 2011. Brief explanations are included with the items that have experienced a significant change from FY 2011 to FY 2012.
TABLE 1-2. General Fund Revenues by Type
Mayor and Council 633,834 598,250 640,910 7.1%
City Attorney 936,620 929,350 947,740 2.0%
City Manager 3,431,481 4,487,330 4,814,790 7.3%
CPDS 4,202,690 4,718,113 4,875,670 3.3%
Finance 3,295,184 3,361,300 3,377,110 0.5%
Human Resources 1,138,109 1,322,190 1,551,210 17.3%
Information Technology 2,963,464 2,958,220 2,994,260 1.2%
Police 9,915,727 10,050,950 10,297,530 2.5%
Public Works 21,640,050 22,281,060 22,738,460 2.1%
Recreation & Parks 22,304,916 23,453,828 21,915,950 -6.6%
Non-Departmental 18,695,011 25,225,900 26,255,670 4.1%
Total Use of Funds 89,157,086 99,386,491 100,409,300 1.0%
Debt Service Fund * 5,036,107 5,141,084 5,796,000 12.7%
Addition to Reserves - 406,361 1,004,130 147.1%
TOTAL 94,193,193 104,933,936 107,209,430 2.2%
Actual
FY10
Adopted
FY11
Adopted
FY12
%
Change
Property Taxes 35,454,838 34,762,000 36,895,000 6.1%
From Other Gov't. 15,399,421 13,527,213 14,816,000 9.5%
Fines & Forfeitures 687,732 645,000 645,000 0.0%
Use of Money & Prop. 186,255 322,080 405,900 26.0%
Charges for Serv. 5,766,550 5,853,405 6,132,610 4.8%
Licenses & Permits 1,737,186 1,660,000 2,261,000 36.2%
Other Revenue 2,735,759 5,332,970 4,887,370 -8.4%
Subtotal 61,967,741 62,102,668 66,042,880 6.3%
Use of Reserves - 1,019,625 - -100.0%
Total 61,967,741 63,122,293 66,042,880 4.6%
Actual
FY10
Adopted
FY11
Adopted
FY12
%
Change

1 - 7
Property Taxes Property tax revenue is the largest General Fund revenue source, constituting 56 percent of all General Fund revenues. Under the current tax rates, it is estimated that property tax revenues will increase by approximately $2.1 million or 6.1 percent from the FY 2011 adopted budget. The increase is due to new properties being added to the tax roll during the fiscal year and not offering the $100 income tax offset property tax credit valued at approximately $1.54 million. The $100 income tax credit was adopted in FY 2008 through FY 2011 in order to provide targeted tax relief for owner-occupied residential properties. Use of Money and Property Two significant changes in this category come from land rental and interest earnings. For FY 2012 the City estimates total monopole revenue, which is categorized under land rental, will equal $316,950 compared to the FY 2011 adopted total of $247,330. Interest earnings are expected to increase slightly due to better fixed income interest rates generating $50,000 in revenue compared to FY 2011's adopted budget of $30,000. Licenses and Permits The two largest sources of revenue in this category, building permits and rental licenses are estimated to increase by $495,000 and $100,000 respectively. The increases in building permits are a result of the Comprehensive User Fee Study, which evaluated the cost of providing City services. Several fees in this category were increased to improve cost recovery and increase compliance with financial management policies and goals. The $100,000 increase for rental licenses is based on the estimated number of licenses that will be renewed or obtained during FY 2012. Use of Reserves The FY 2012 adopted budget does not include the use of reserves to balance the budget. In FY 2011, in order to balance the General Fund budget without resorting to layoffs or decreasing core programs or services, the adopted budget utilized a portion of General Fund reserves in excess of the 15 percent reserve requirement. Approximately $1.0 million of funds above the reserve requirement were included in the FY 2011 adopted budget to close a budget gap created by decreased revenues and increased expenditures, including the $100 income tax offset credit. The estimate of fund balance above the 15 percent reserve requirement in FY 2012 is $1.5 million or 17.3 percent. According to the City's Financial Management Policies, the fund balance above the 15 percent reserve requirement is "available for pay-go capital projects and/or one time capital outlays." Staff does not recommend appropriating the fund balance at this time, but rather reserve it for future transfers to the Capital Projects Fund in order to reduce the amount the City needs to borrow, or to fund unfunded CIP projects.
TABLE 1-3. General Fund Expenditures by Type
Personnel and FTEs Total personnel costs increased by 3.1 percent, or $1.3 million. The FY 2012 adopted budget includes a 1 percent increase in all regular employee salaries, and a net decrease of (1.6) regular General Fund full time equivalent (FTE) positions. The 1 percent across the board increase is consistent with the AFSCME union contract that was renegotiated in FY 2010, which called for increases of at least 1 percent in FY 2012, 1 percent in FY 2013, and 1.25 percent in FY 2014. The FY 2012 proposed budget for employee benefits includes funding for all benefits such as healthcare. The City's budgeted healthcare costs are estimated to increase by approximately 15 percent from FY 2011 to FY 2012. This increase is based on the current increases that took effect January 1, 2011, and our estimated future increases scheduled for January 1, 2012. Also included in benefits are the City’s contributions to support the City's Defined Benefit Pension Plan, the Thrift Savings Plan, and the Retiree Benefit Trust. The City's required contribution to support the Defined Benefit Plan will increase from the FY 2011 amount of $3.5 million to $4.2 million (all funds) based on the April 2010 actuarial valuation report. The General Fund’s contribution will be approximately $3.4 million in FY 2012. The City anticipates similar increases in future years due to the severe losses in plan assets as a result of the turmoil in the financial markets during the latter part of 2008 and early 2009. In addition to the City’s Defined Benefit Plan contribution, employees other than Police participate in the Thrift Savings Plan. The City participates in the Thrift Savings Plan by matching employees’ contributions with 50 cents for every dollar contributed by the employee, up to a maximum of 5 percent of salary. The FY 2012 budget for the City’s match is $651,000 (all funds). The General Fund’s contribution equals approximately $497,000 in FY 2012.
Salaries 29,052,648 29,661,020 30,026,210 1.2%
Benefits 8,673,656 9,867,640 10,704,140 8.5%
Overtime 1,147,470 820,380 875,970 6.8%
Personnel Subtotal 38,873,774 40,349,040 41,606,320 3.1%
Contractual Services 7,286,501 6,725,625 7,088,580 5.4%
Commodities 4,858,076 4,992,238 5,273,420 5.6%
Operating Subtotal 12,144,577 11,717,863 12,362,000 5.5%
Capital Outlay 718,022 480,620 511,250 6.4%
Other / Transfer 2,221,461 2,333,770 2,496,310 7.0%
Contribution to CIP 2,378,000 3,141,000 3,967,000 26.3%
Debt Service Transfer 4,000,000 5,100,000 5,100,000 0.0%
Total 60,335,834 63,122,293 66,042,880 4.6%
Adopted
FY11
Adopted
FY12
%
Change
Actual
FY10

1 - 8
In addition to the retirement contributions, the City contributes to the retiree benefit trust based on projections from the actuary. In FY 2009, the City set up an irrevocable trust fund to begin prefunding retiree healthcare benefits as required under GASB 45. The City’s contribution for FY 2012 totals $426,000 (all funds). The General Fund’s contribution will equal approximately $336,000 in FY 2012. Operating Costs and Capital Outlay For operating costs, the majority of the 5.5 percent increase in this category is due to increases in current City contracts, additional funding for employee training and professional development, and increases in the price of gasoline and oil. This category includes items such as the City's I-net and wireless services, software maintenance, outside labor for snow and ice removal, insurance broker, outside trainers for recreation programs, and postage. The major change in capital outlay is due to an increase of $66,000 for equipment for snow and ice removal. This new equipment is consistent with the improvements that were listed in the Mayor and Council's after action plan for snow and ice removal. Other / Transfer This expenditure category increased by 7 percent mainly due to the FY 2012 General Fund transfer to the RedGate Golf Fund. The total transfer equals $630,000, which is comprised of $204,000 for high priority capital improvement needs and $426,000 for annual operating needs. These estimates come from a report prepared by the National Golf Foundation (NGF) that analyzed current operations and the feasibility of operating the course under a different management structure. Also as a result of the report, staff issued a request for proposal for a private management firm or lease, and were directed to identify the duties of a golf director if the operations stay in-house. The RedGate Golf Fund transfer was partially offset by the reduction in the General Fund transfer to the Parking Fund. This transfer was reduced from over $1 million in FY 2011 to $500,000 in FY 2012. It is anticipated that a General Fund transfer will be needed for future years, until such time as the new operations and management of the garages has stabilized. Also included in the Other / Transfers category are grants to human services or caregiver agencies. The City supports those with significant human service needs through an annual grant program. Each year the Division of Community Services coordinates the review and evaluation of all caregiver and outside agency funding requests. For FY 2012, two committees were again established for this process. The first committee, the employee panel, was made up of three City employees representing the departments of the City Manager, Finance, and Recreation and Parks. The second committee, the community panel, was made up of three members representing the Human Services Advisory Commission, the Human Rights Commission, and the Recreation and Park Advisory Board. The committees review and evaluate each application, and develop funding recommendations for each program. These recommendations take into account the number of City residents served, the demonstrated need for the service, and the quality of the application. Each committee’s funding recommendations were compared and, in an effort to increase the amount of funding the City provides to the caregivers in FY 2012, the higher of the two recommendations were included in the FY 2012 adopted budget.
The total Caregiver budget for FY 2012 equals $568,240 or 2.7 percent over FY 2011. More information regarding the caregiver budget can be found in Section 14 under the Division of Community Services. Expenditures by Department Table 1-4 shows total General Fund expenditures by department for FY 2012. Major changes include a 7.1 percent increase in the Department of the Mayor and Council due to the addition of election costs, a 17.3 percent increase in Human Resources due to the addition of training and professional development funding to be utilized throughout the organization, a 10.2 percent increase in the Department of Public Works due to personnel and operating costs that were added to enhance snow and ice removal operations and an increase in fuel costs, and an increase of 8.7 percent in Non-Departmental to reflect the changes in the General Fund transfers as described in the previous section. All major funding adjustments are detailed in each department’s section throughout the budget.
TABLE 1-4. General Fund Expenditures by Department
Mayor and Council 633,834 598,250 640,910 7.1%
City Attorney 936,620 929,350 947,740 2.0%
City Manager 3,426,824 4,078,530 4,306,160 5.6%
CPDS 3,866,116 4,103,765 4,282,670 4.4%
Finance 2,537,341 2,525,230 2,615,030 3.6%
Human Resources 1,138,109 1,322,190 1,551,210 17.3%
Information Technology 2,963,464 2,958,220 2,994,260 1.2%
Police 8,540,236 8,733,330 8,972,740 2.7%
Public Works 7,105,090 6,366,470 7,017,500 10.2%
Recreation & Parks 19,239,807 19,861,928 20,060,090 1.0%
Non-Departmental 9,948,393 11,645,030 12,654,570 8.7%
Total 60,335,834 63,122,293 66,042,880 4.6%
%
Change
Actual
FY10
Adopted
FY11
Adopted
FY12

1 - 9
Water Fund The Water Fund is used to account for all financial activity associated with the treatment and distribution of potable water. The City provides water service to 70 percent of the City, or approximately 13,000 accounts. In FY 2009 the City started a major water line replacement program, which is estimated to replace over 34 miles of water lines over a 20-year period. The Water Main Rehabilitation project, totaling $85 million, can be found on page 98 of the City's FY 2012 CIP. To fund the increases in both the operating and CIP budgets, and in accordance with the Mayor and Council's adopted plan, the water usage rates will increase by 24.5 percent in FY 2012. The rates for FY 2012 continue a three-tier structure, as follows: $4.33 per thousand gallons for the first 12,000 gallons per quarter; $6.23 per thousand gallons for the next 12,000 gallons per quarter; and $6.69 per thousand gallons for usage over 24,000 gallons per quarter. In addition to the water usage rate, customers pay a ready-to-serve charge that is split equally between the Water and Sewer funds. The amount of the charge is based on the size of the water meter and ranges from $6.78 to $810.00 per quarter, an increase of 3 percent from adopted FY 2011 (see page 3-15 for meter sizes and charges). Total regular FTEs for the Water Fund will increase by 0.9 from the FY 2011 adopted of 39.15 to FY 2012 adopted of 40.05. This change is a result of adding 2.0 FTE Laborers, eliminating (1.0) FTE Meter Services Technician, and eliminating (0.1) Water FTE due to a reorganization of the Engineering and Construction Management Divisions in the Department of Public Works.
GRAPH 1-5. History of water usage charges per 1,000 gallons, assuming an
average usage of 14,000 gallons per quarter.
* FY07 was the first year the City changed the rate structure from a flat rate to tiered rates based on usage.
Approximately 30 percent of Rockville residents do not receive water and sewer service from the City, but are serviced by the Washington Suburban Sanitary Commission’s (WSSC) system. The locations in WSSC’s system include King
Farm, Twinbrook (portion on the east side), Potomac Woods (small portion on the south side), and College Gardens. Sewer Fund The Sewer Fund accounts for the financial activity associated with the collection and disposal of sewage. Charges are based on water consumption. Nearly all of the capital costs in the Sewer Fund, and a substantial portion of the operating costs, are payments for the operation of and capital improvements to the District of Columbia Water and Sewer Authority’s (DCWASA) Blue Plains Advanced Wastewater Treatment Plant. The City’s share of Blue Plains’ capital improvements is proportionate to the City’s allocation of treatment capacity. The Blue Plains Wastewater Treatment CIP project contains additional information regarding the City’s capital costs for sewer treatment. The Sewer Fund budget for FY 2012 is based on a sewer charge of $5.26 per 1,000 gallons. This is an increase of $0.60 or 13 percent over the FY 2011 adopted rate of $4.66 per 1,000 gallons. In addition to the sewer charge, users pay a ready-to-serve charge that is split equally between the Water and Sewer funds. The amount of the charge is based on the size of the water meter and ranges from $6.78 to $810.00 per quarter, an increase of 3 percent from adopted FY 2011 (see page 3-17 for meter sizes and charges). Total regular FTEs for the Sewer Fund will increase by 0.25 from FY 2011 adopted of 17.65 to FY 2012 adopted of 17.90. This change is a result of adding 0.25 Sewer FTE due to a reorganization of the Engineering Division in the Department of Public Works.
GRAPH 1-6. History of sewer usage charges per 1,000 gallons.
Refuse Fund The Refuse Fund is used to account for the financial activity associated with the collection and disposal of recycling, refuse, and yardwaste. The FY 2012 refuse budget is based on a semi-automated once per week recycling and refuse program. The refuse rate for the FY 2012 budget will remain the same as the adopted FY 2011 rate of $392.40 per year. The semi-automated once per week system provides reduced operating expenses because fewer personnel,

1 - 10
contractual services, commodities, and vehicles and equipment are needed. Because of these reduced operating expenses, the rate has remained the same since FY 2008. Total regular FTEs for the Refuse Fund will remain flat at 35.8 for FY 2012. The number of regular FTEs has been reduced dramatically since the once per week system was put into place. In FY 2007, the regular FTEs for the Refuse Fund totaled 48.4. FY 2012 represents a reduction in FTEs of 26 percent from FY 2007.
GRAPH 1-7. History of annual refuse rates.
* FY08 was the first year the City implemented a semi-automated once per week recycling and refuse program.
Stormwater Management Fund The Stormwater Management (SWM) Fund accounts for the financial activity associated with maintaining existing SWM facilities and constructing new facilities. In FY 2008, an analysis showed that a stormwater utility fee would be needed to fund Rockville's existing and expanded stormwater, storm drainage and water quality programs. Historically, rapid development has funded much of Rockville's stormwater management with fees paid by developers. With few opportunities for new development, other funding sources were needed to cover new programs, maintain the public stormwater infrastructure, and comply with regulatory requirements. In FY 2008 the Mayor and Council approved an ordinance to amend the City Code to include a new Stormwater Management Utility Fee. This ordinance enables the City to charge an annual fee per Equivalent Residential Unit ("ERU"). The ERU fee for FY 2012 will equal $62.48. This is an increase of $13.28 or 27 percent over the FY 2011 adopted ERU fee of $49.20. This fee level assumes that all properties (including County properties) will pay the annual fee. If all properties do not pay the planned fees, staff will need to evaluate the planned fee increases and future operating programs and capital expenses, and adjust them accordingly. Each residential property will pay $62.48 or one ERU per year, and each commercial property will pay $62.48 multiplied by the number of ERUs measured on their property.
The ERU fee for future years will increase significantly in order to fund the level of programming that the Mayor and Council adopted in FY 2008. The Mayor and Council supported a mid-range level of CIP projects and operating programs and services that include: SWM facility and storm drainage maintenance and retrofits, stream restoration, drainage improvements, sediment control, and compliance with federally mandated water quality requirements such as illicit discharge prevention and watershed education and outreach. Total regular FTEs for the Stormwater Management Fund will decrease by (0.15) from FY 2011 adopted of 20.50 to FY 2012 adopted of 20.35. This change is a result of eliminating (0.15) Stormwater Management FTE due to a reorganization of the Engineering Division in the Department of Public Works.
GRAPH 1-8. History of stormwater management utility fees.
* Although the Mayor and Council adopted the ordinance that enabled the fee in FY08, no fee was adopted in FY09. The expenses for the program in FY09 were funded from the Stormwater Management's reserves. FY10 was the first year the City charged a Stormwater Management utility fee.
Parking Fund The Parking Fund was created to account for the revenue and expenses from parking related activities, including the issuance of parking tickets, the parking meter program, and costs associated with the three public parking garages in the City’s Town Center. The FY 2012 budget for the Parking Fund incorporates the anticipated leasing of the Town Square garage operations to Federal Realty Investment Trust (FRIT), the commercial developer of Town Square. The City has entered into negotiations with FRIT to enable FRIT to manage, operate and re-equip the garages under a long-term lease agreement. The anticipated start date of the new management and operations is September 1, 2011. Under the anticipated arrangement, FRIT will be responsible for setting the rates both for hourly parking and for monthly parking in the garages and it will also be responsible for all capital improvements and renovations during the term of the lease.

1 - 11
In anticipation of the lease agreement, the City’s budget has been changed to represent only operational costs for on-street meters along with the payment of debt service on the garages. The FY 2012 budgeted revenue includes a new line item called Building Rental, which is the anticipated lease payment from FRIT to the City that will help offset the City’s debt service costs on the garage bonds. In order for the City to enter into the lease agreement, the City is required to defease the current tax-exempt debt, and it intends to do so by issuing new taxable debt. The result of this transaction is to remove the old debt off the City’s books, yet the transaction remains transparent to the current bondholders until the bonds get called in FY 2014 and FY 2015. The City then issues taxable debt at higher borrowing rates, increasing the overall amount of debt service. Another anticipated change in the Parking Fund budget on the revenue side is a reduction in the transfer from the City’s General Fund from over $1 million in FY 2011 to $500,000 in FY 2012. It is anticipated that a General Fund transfer will be needed for future years, until such time as the new operations and management of the garages has stabilized. Based on the anticipated changes during FY 2012, the overall Parking budget appropriation was reduced by $1.4 million or 31 percent and by (1.65) FTEs. All service related contracts and utilities for the operations of the garages were eliminated in FY 2012 for a savings of over $1 million. The final savings results from a reduction in City administrative charges from $656,980 in FY 2011 down to $132,710 because a majority of charges being incurred were due to the garage operations. Overall, the anticipated changes to the garage operations should result in a positive financial change to the City’s parking fund financial status over time. RedGate Golf Fund The RedGate Golf Fund is used to account for the financial activity associated with the City's public golf course. After covering all of its operating, overhead and capital costs for nearly thirty years, RedGate began operating in the red in FY 2000. Recognizing that the financial situation of the Fund is not improving, the Mayor and Council directed staff to issue a request for proposal (RFP) for a private management firm or lease. This direction came after the Mayor and Council received a detailed report from the National Golf Foundation (NGF) analyzing current operations and the feasibility of operating the Course under a different management structure. At this time the Mayor and Council also directed staff to create a job description for a golf director position if the operations stay in-house. Pending completion of the competitive RFP process and further direction by the Mayor and Council, FY 2012 assumes the same course management for the first half of FY 2012, and a management agreement consistent with the NGF Study for the second half of FY 2012. As a result of Mayor and Council direction given at the February 2011 final budget preview, revenues include a $630,000 transfer from the General Fund to fund high priority capital improvements and annual operating needs. Conclusion
The City’s current financial situation requires that we continue our responsible fiscal practices in managing expenditures and revenues, while focusing on the overall financial health of the City. In these economic times it is important to focus our efforts on long-term initiatives, including necessary funding for infrastructure,
maintenance, and capital needs. This adopted budget largely accomplishes this; however, important capital needs remain unfunded or under-funded. On the operating side, short-term budget balancing has required tightening expenditures for employee compensation and benefits, increasing revenues from fee supported services, and maintaining basic programs and service levels. This is consistent with what most municipalities are experiencing across the country, and in many respects Rockville is in much better financial shape than many other city governments. In order to meet these financial challenges the Mayor and Council will need to continue to sharpen its focus on identifying top taxpayer-funded priorities. We are currently engaged in several major changes that may reduce our costs, increase our revenues, or help us achieve programmatic efficiencies in FY 2012 and future years. As our revenues remain relatively flat, we must look to these efficiencies or even cut back on lower priority expenditures in order to maintain our infrastructure and services. The adopted budget utilizes available resources effectively and responsibly, and is in line with policy direction set forth by the Mayor and Council. Many City staff contributed to preparing the budget. The many people working together on its production exemplify the values of teamwork, craftsmanship, and public service that guide our work throughout the year. The department directors and their staff contributed significantly to preparing this budget. The entire effort is lead by the City’s Budget Office, who strive to ensure the City’s finances are understandable and accessible to the public. We are most grateful to the Mayor and Council for their continued support and ongoing guidance. The GFOA recognizes the City’s budget document for its excellence as a communication device, policy document, financial plan, and operations guide. I hope you find it to be a valuable tool in making the important decisions that will impact Rockville citizens and the City government throughout the next year. On behalf of our dedicated City staff, we remain grateful for the opportunity to serve the Mayor and Council and the Rockville community, and we look forward to the challenges and opportunities in FY 2012.
Respectfully,
Scott Ullery City Manager
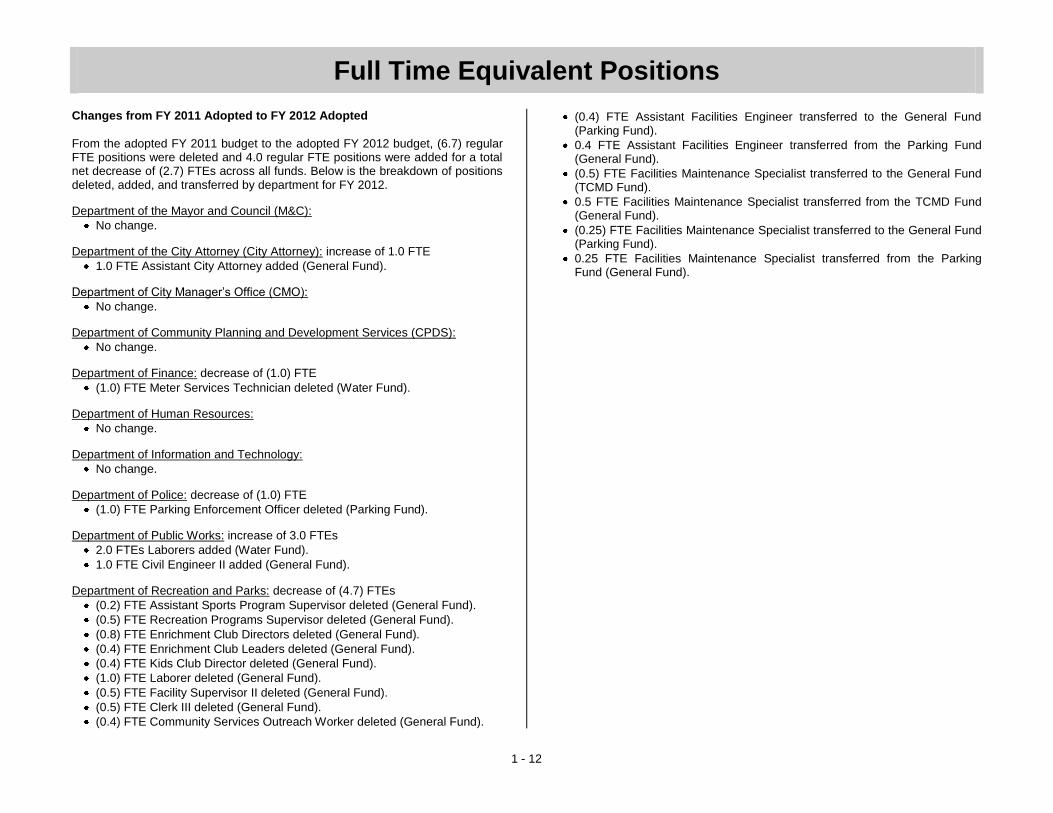
Full Time Equivalent Positions
1 - 12
Changes from FY 2011 Adopted to FY 2012 Adopted
From the adopted FY 2011 budget to the adopted FY 2012 budget, (6.7) regular FTE positions were deleted and 4.0 regular FTE positions were added for a total net decrease of (2.7) FTEs across all funds. Below is the breakdown of positions deleted, added, and transferred by department for FY 2012.
Department of the Mayor and Council (M&C):
No change.
Department of the City Attorney (City Attorney): increase of 1.0 FTE
1.0 FTE Assistant City Attorney added (General Fund).
Department of City Manager’s Office (CMO):
No change.
Department of Community Planning and Development Services (CPDS):
No change.
Department of Finance: decrease of (1.0) FTE
(1.0) FTE Meter Services Technician deleted (Water Fund).
Department of Human Resources:
No change.
Department of Information and Technology:
No change.
Department of Police: decrease of (1.0) FTE
(1.0) FTE Parking Enforcement Officer deleted (Parking Fund).
Department of Public Works: increase of 3.0 FTEs
2.0 FTEs Laborers added (Water Fund).
1.0 FTE Civil Engineer II added (General Fund).
Department of Recreation and Parks: decrease of (4.7) FTEs
(0.2) FTE Assistant Sports Program Supervisor deleted (General Fund).
(0.5) FTE Recreation Programs Supervisor deleted (General Fund).
(0.8) FTE Enrichment Club Directors deleted (General Fund).
(0.4) FTE Enrichment Club Leaders deleted (General Fund).
(0.4) FTE Kids Club Director deleted (General Fund).
(1.0) FTE Laborer deleted (General Fund).
(0.5) FTE Facility Supervisor II deleted (General Fund).
(0.5) FTE Clerk III deleted (General Fund).
(0.4) FTE Community Services Outreach Worker deleted (General Fund).
(0.4) FTE Assistant Facilities Engineer transferred to the General Fund (Parking Fund).
0.4 FTE Assistant Facilities Engineer transferred from the Parking Fund (General Fund).
(0.5) FTE Facilities Maintenance Specialist transferred to the General Fund (TCMD Fund).
0.5 FTE Facilities Maintenance Specialist transferred from the TCMD Fund (General Fund).
(0.25) FTE Facilities Maintenance Specialist transferred to the General Fund (Parking Fund).
0.25 FTE Facilities Maintenance Specialist transferred from the Parking Fund (General Fund).

Full Time Equivalent Positions
1 - 13
TABLE 1-5. Regular and Temporary Full Time Equivalents by Department. The
table below lists the allocation of regular FTEs and temporary FTEs by department for FY 2010, FY 2011, and FY 2012. These tables also show the additions and deletions from the FY 2011 adopted budget to FY 2012 adopted budget.
TABLE 1-6. Regular and Temporary Positions by Fund. Each regular or
temporary City of Rockville position is allotted a full-time equivalent (FTE). The FTE associated with each position is then charged against a fund (or funds) based on the scope of work being performed. Benefits provided with each position are offered on a pro-rata basis based on the FTE count. The charts below list the regular FTEs and the temporary FTEs by fund.
Mayor and Council 3.0 3.0 0.0 0.0 3.0
City Attorney 5.0 5.0 1.0 0.0 6.0
City Manager 28.0 28.0 0.0 0.0 28.0
CPDS 42.6 40.6 0.0 0.0 40.6
Finance 30.0 30.0 0.0 1.0 29.0
Human Resources 10.0 10.0 0.0 0.0 10.0
Info. Technology 17.5 17.5 0.0 0.0 17.5
Police 94.0 92.0 0.0 1.0 91.0
Public Works 164.1 156.1 3.0 0.0 159.1
Recreation and Parks 160.9 157.6 0.0 4.7 152.9
Regular FTE Total 555.1 539.8 4.0 6.7 537.1
Mayor and Council 0.2 0.1 0.1 0.0 0.2
City Attorney 0.2 0.0 0.0 0.0 0.0
City Manager 0.4 0.3 0.3 0.0 0.6
CPDS 0.5 0.1 0.1 0.0 0.2
Finance 0.0 0.0 0.0 0.0 0.0
Human Resources 0.1 0.1 0.1 0.0 0.2
Info. Technology 1.0 0.0 0.0 0.0 0.0
Police 1.0 1.0 0.0 0.0 1.0
Public Works 7.7 6.0 0.3 4.2 2.1
Recreation and Parks 82.6 84.5 3.2 3.4 84.3
Temp. FTE Total 93.7 92.1 4.1 7.6 88.6
Grand Total all FTEs 648.8 631.9 8.1 14.3 625.7
Regular Positions by Department
Temporary Positions by Department
FY 2010
ActualAdditions
FY 2011
AdoptedAdditions Deletions
FY 2011
Adopted
FY 2010
Actual
DeletionsFY 2012
Adopted
FY 2012
Adopted
412.80 404.40 403.70 402.85
38.80 39.15 39.15 40.05
17.10 17.65 17.65 17.90
39.80 35.80 35.80 35.80
6.90 5.90 5.90 4.25
0.50 0.50 0.50 N/A
21.80 20.50 20.50 20.35
9.80 9.80 9.80 9.80
0.00 0.00 0.00 0.00
0.60 0.60 0.60 0.60
7.00 5.50 5.50 5.50
555.1 539.8 539.1 537.1
80.7 81.0 78.7 81.0
2.0 2.2 2.2 0.3
0.0 0.2 0.2 0.3
4.0 2.2 2.2 1.0
0.0 0.0 0.0 0.0
0.8 0.3 0.3 0.3
5.7 5.7 5.7 5.7
0.5 0.5 0.0 0.0
93.7 92.1 89.3 88.6
648.8 631.9 628.4 625.7
Regular Positions by Fund
Temporary Positions by Fund
FY 2010
Actual
FY 2011
Est. Act.
FY 2011
Adopted
FY 2011
Adopted
FY 2012
Adopted
General
Water Facility
Sew er
Refuse
Parking
Tow n Center Management
Stormw ater Management
RedGate Golf Course
Special Activities
Community Development
Speed Camera
Regular FTE Total
FY 2010
Actual
FY 2011
Est. Act.
FY 2012
Adopted
General
Water Facility
Temporary FTE Total
Grand Total all FTEs
Sew er
Refuse
Parking
Stormw ater Management
RedGate Golf Course
Special Activities
etompkins
Underline
etompkins
Underline
etompkins
Underline
etompkins
Underline
etompkins
Underline
etompkins
Underline
etompkins
Underline
etompkins
Underline
etompkins
Underline
etompkins
Underline
etompkins
Underline
etompkins
Underline
etompkins
Underline
etompkins
Underline
etompkins
Underline
etompkins
Underline
etompkins
Underline
etompkins
Underline
etompkins
Underline
etompkins
Underline

Full Time Equivalent Positions
1 - 14
GRAPH 1-9. This graph breaks down the FY12 adopted regular FTEs by fund.
The General Fund supports 75% of all full time positions at the City.
GRAPH 1-10. This graph breaks down the FY12 adopted regular FTEs by
department. The departments of Recreation and Parks and Public Works combined house 58% of all regular employees at the City.
GRAPH 1-11. This graph depicts the City’s staffing trend for the past six fiscal
years. Total Staffing slowly increased from FY07 to a peak in FY09 of 653. Since FY09 staffing as been steadily decreasing.

Budget Development Process
1 - 15
General — The City Charter requires the City Manager to submit a budget to the
Mayor and Council at least one month before the beginning of each fiscal year. In addition to the operating budget, a five-year capital improvement plan is presented for the Mayor and Council’s consideration. The Mayor and Council schedule and publish advance notices of public hearings. The budget is approved in the form of an appropriations ordinance. Budget Amendments — During the fiscal year, the City Manager has authority
to transfer budgeted amounts between departments within any fund, but changes in the total appropriation level for a given fund can only be enacted by the Mayor and Council through an amendment to the budget ordinance. The City amends the budget throughout the fiscal year as needed, usually three or four times. The amendments to the budget ordinance apply to both the operating and CIP budgets. Generally if expenditure authority is added to a fund, an accompanying revenue source must be identified. In some cases, the City has appropriated reserves or fund balance to fund capital or other one-time needs during the year. FY 2012 Budget — In September 2010, in preparation for the development of
the FY 2012 Operating and CIP budgets, staff created four budget surveys for the Mayor and Council to communicate their budget priorities and preferences. These surveys were distributed early in the process, so that the results could be used to develop the FY 2012 budget guidelines. In October 2010, Budget staff conducted an internal review of each department’s base operating budget and all CIP projects. On October 18, 2010 staff presented the Mayor and Council with their first preview of the FY 2012 budget. At this preview staff reviewed each operating fund, and discussed any changes in the revenue forecasts since the FY 2011 budget was adopted. For the enterprise funds, the proposed FY 2012 utility rates were discussed. In November 2010, budget targets were established and worksheets were distributed to each City department. On November 8, 2010 staff presented the results of the budget surveys and draft budget guidelines to the Mayor and Council, and sought direction on how to proceed. On December 6, 2010, the first budget public hearing was held, which focused in the draft budget guidelines. On January 18, 2011, staff presented an updated set of FY 2012 budget guidelines that the Mayor and Council adopted. Internally, the City Manager held budget meetings with the senior management team and division heads to discuss their budgets and the priorities for the coming year.
On February 28, 2011, staff presented preliminary FY 2012 budget estimates and the Mayor and Council gave direction on how to balance the budget. During February and March 2011, the budget staff prepared the FY 2012 Proposed Operating Budget and CIP and presented it to the Mayor and Council on March 28, 2011. After the proposed budget was presented, public hearings were held
on April 4, and May 9, 2011 to solicit citizen responses to the proposed budget, and the Mayor and Council conducted four worksessions on April 11, April 25, May 2, and May 9, 2011 to discuss and finalize their priorities prior to adoption. On May 23, 2011 the Mayor and Council adopted the budget ordinances and resolutions that set the funding levels, tax rates and the utility rates for FY 2012.
During June 2011, the budget staff prepared and implemented the FY 2012 Adopted Operating Budget and FY 2012 – FY 2016 Capital Improvements Program. The adopted budget for FY 2012 took effect on July 1, 2011.
FY 2012 Capital Improvements Program — In October 2010, the City Manager
solicited requests from neighborhoods and homeowners associations for CIP projects. No requests were received from neighborhoods or homeowner associations for the FY 2012 budget. For FY 2012, the City continued the process of prioritizing CIP projects supported by the Capital Projects Fund. Projects were prioritized based on five criteria: Consistency with Mayor and Council Vision and adopted plans; Improves/maintains City facilities or infrastructure; Improves City operations and service delivery; Improves the safety and attractiveness of the City for residents, workers, businesses/employers and/or City staff; and Required to meet legal mandates. The City Manager used the prioritization findings to assist in determining the recommended funding levels for the projects in the FY 2012 – FY 2016 CIP budget. The prioritization process is discussed on page 6 of the CIP, and a sample prioritization sheet is included in the Appendix of the CIP.
The FY 2012 adopted operating budget and CIP are available on the City’s website (www.rockvillemd.gov).
FIGURE 1-1. The FY 2012 Operating and CIP Budget Process. The chart
below is a monthly time-line of the major components of the FY 2012 budget development process.
Oct 10 Nov 10 Dec 10 Jan 11 Feb 11 Mar 11 April 11 May 11
Public Hearings:
December 6, 2010
April 4, 2011
May 9, 2011
Worksessions:
April 11, 2011
April 25, 2011
May 2, 2011
May 9, 2011
Adoption:
May 23, 2011
Executive / Budget
Office Review
Formulation of Operating Budget
and CIP Requests
Presentation
of Proposed:
March 28,
2011
Budget Preview s:
October 18, 2010
November 8, 2010
January 18, 2011
February 28, 2011
Council Review and Adoption
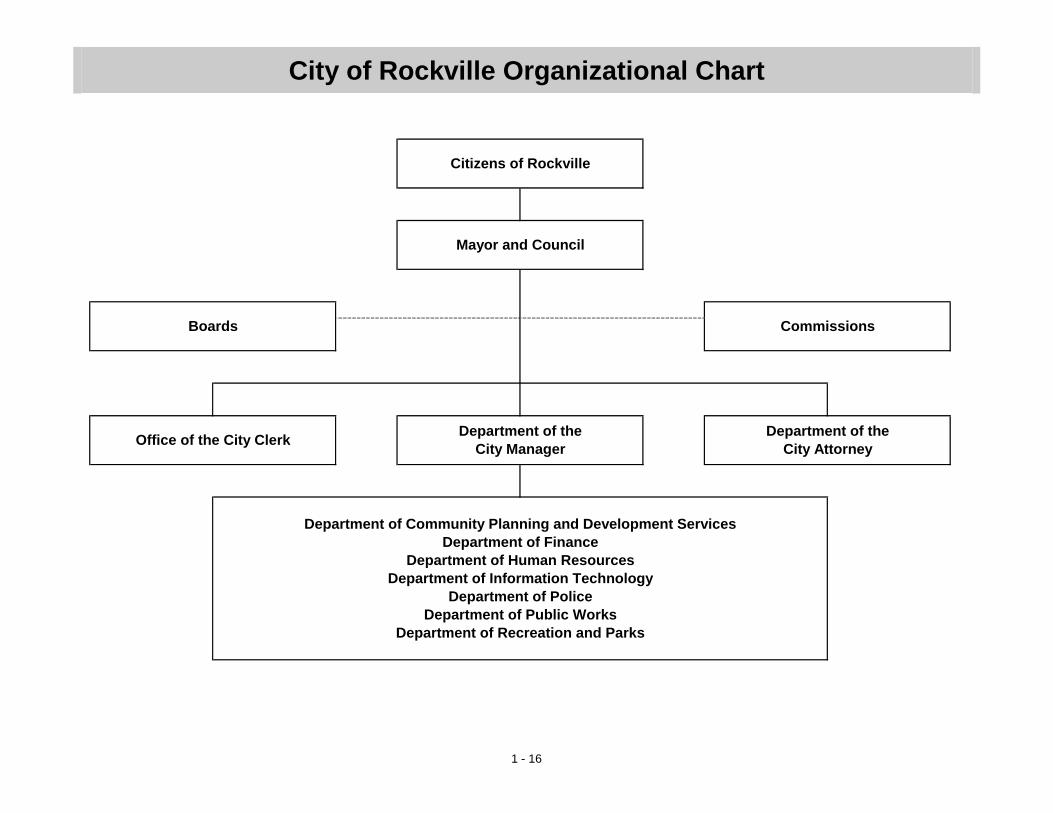
City of Rockville Organizational Chart
1 - 16
Office of the City ClerkDepartment of the
City Manager
Department of the
City Attorney
Department of Community Planning and Development Services
Department of Finance
Department of Human Resources
Department of Information Technology
Department of Police
Department of Public Works
Department of Recreation and Parks
Citizens of Rockville
Mayor and Council
Boards Commissions
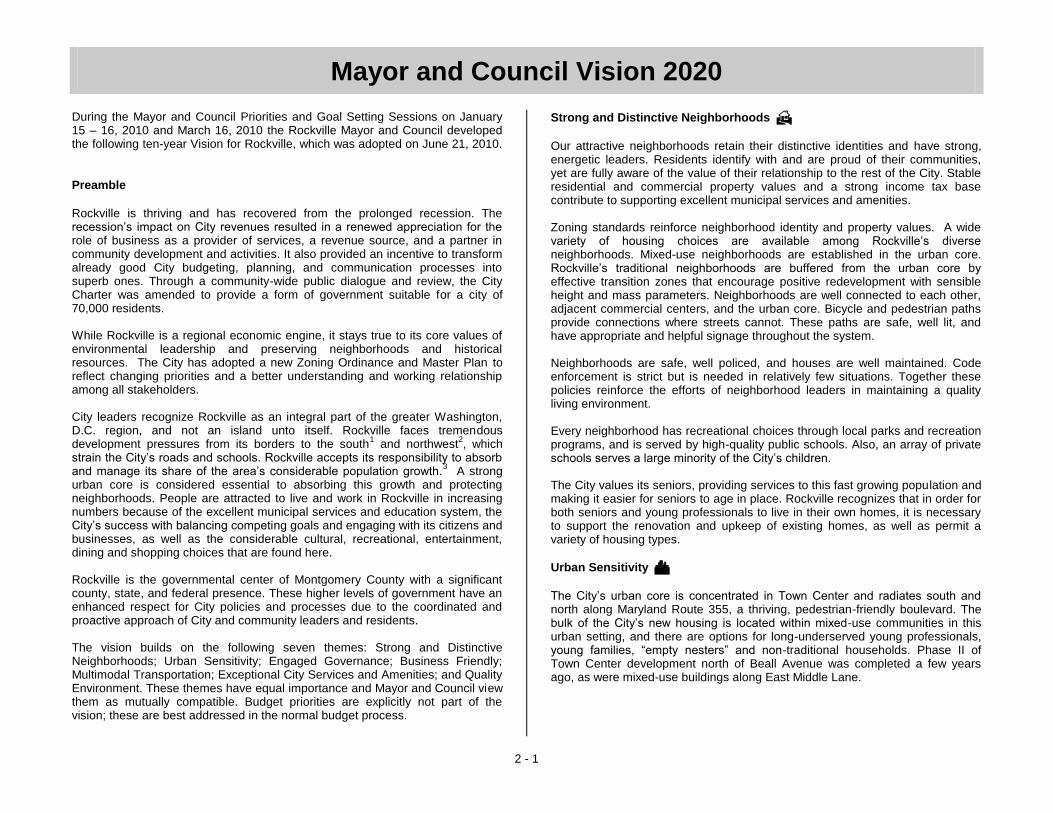
Mayor and Council Vision 2020
2 - 1
During the Mayor and Council Priorities and Goal Setting Sessions on January 15 – 16, 2010 and March 16, 2010 the Rockville Mayor and Council developed the following ten-year Vision for Rockville, which was adopted on June 21, 2010.
Preamble
Rockville is thriving and has recovered from the prolonged recession. The recession’s impact on City revenues resulted in a renewed appreciation for the role of business as a provider of services, a revenue source, and a partner in community development and activities. It also provided an incentive to transform already good City budgeting, planning, and communication processes into superb ones. Through a community-wide public dialogue and review, the City Charter was amended to provide a form of government suitable for a city of 70,000 residents. While Rockville is a regional economic engine, it stays true to its core values of environmental leadership and preserving neighborhoods and historical resources. The City has adopted a new Zoning Ordinance and Master Plan to reflect changing priorities and a better understanding and working relationship among all stakeholders. City leaders recognize Rockville as an integral part of the greater Washington, D.C. region, and not an island unto itself. Rockville faces tremendous development pressures from its borders to the south
1 and northwest
2, which
strain the City’s roads and schools. Rockville accepts its responsibility to absorb and manage its share of the area’s considerable population growth.
3 A strong
urban core is considered essential to absorbing this growth and protecting neighborhoods. People are attracted to live and work in Rockville in increasing numbers because of the excellent municipal services and education system, the City’s success with balancing competing goals and engaging with its citizens and businesses, as well as the considerable cultural, recreational, entertainment, dining and shopping choices that are found here. Rockville is the governmental center of Montgomery County with a significant county, state, and federal presence. These higher levels of government have an enhanced respect for City policies and processes due to the coordinated and proactive approach of City and community leaders and residents. The vision builds on the following seven themes: Strong and Distinctive Neighborhoods; Urban Sensitivity; Engaged Governance; Business Friendly; Multimodal Transportation; Exceptional City Services and Amenities; and Quality Environment. These themes have equal importance and Mayor and Council view them as mutually compatible. Budget priorities are explicitly not part of the vision; these are best addressed in the normal budget process.
Strong and Distinctive Neighborhoods
Our attractive neighborhoods retain their distinctive identities and have strong, energetic leaders. Residents identify with and are proud of their communities, yet are fully aware of the value of their relationship to the rest of the City. Stable residential and commercial property values and a strong income tax base contribute to supporting excellent municipal services and amenities. Zoning standards reinforce neighborhood identity and property values. A wide variety of housing choices are available among Rockville’s diverse neighborhoods. Mixed-use neighborhoods are established in the urban core. Rockville’s traditional neighborhoods are buffered from the urban core by effective transition zones that encourage positive redevelopment with sensible height and mass parameters. Neighborhoods are well connected to each other, adjacent commercial centers, and the urban core. Bicycle and pedestrian paths provide connections where streets cannot. These paths are safe, well lit, and have appropriate and helpful signage throughout the system. Neighborhoods are safe, well policed, and houses are well maintained. Code enforcement is strict but is needed in relatively few situations. Together these policies reinforce the efforts of neighborhood leaders in maintaining a quality living environment. Every neighborhood has recreational choices through local parks and recreation programs, and is served by high-quality public schools. Also, an array of private schools serves a large minority of the City’s children. The City values its seniors, providing services to this fast growing population and making it easier for seniors to age in place. Rockville recognizes that in order for both seniors and young professionals to live in their own homes, it is necessary to support the renovation and upkeep of existing homes, as well as permit a variety of housing types.
Urban Sensitivity
The City’s urban core is concentrated in Town Center and radiates south and north along Maryland Route 355, a thriving, pedestrian-friendly boulevard. The bulk of the City’s new housing is located within mixed-use communities in this urban setting, and there are options for long-underserved young professionals, young families, “empty nesters” and non-traditional households. Phase II of Town Center development north of Beall Avenue was completed a few years ago, as were mixed-use buildings along East Middle Lane.

Mayor and Council Vision 2020
2 - 2
Further south, Rockville Pike is transitioning to a denser and more pedestrian, bicycle and mass transit-friendly environment. To the north, the commercial segments along Hungerford Drive are revitalized and thriving, contributing to the City’s tax base and to Rockville’s reputation as a destination. To the east, properties along Veirs Mill Road have redeveloped in a manner consistent with the Twinbrook Neighborhood Plan. Commercial entities, residential developers, Montgomery College, and county and state government drive the development of the urban core. The development is accomplished with neighborhood input resulting in optimum outcomes. Stonestreet Avenue has redeveloped with mixed uses. Rockville is a major regional cultural center, and is recognized as such regionally, nationally, and internationally. Its entertainment and performance arts districts are well known throughout the area and contribute to Rockville’s reputation as a “destination.” There is a lively nightlife in the urban core and in some of the mixed-use centers. New urban cultural and civic amenities continue to emerge, and complement VisArts, the library, and Town Square. These are primarily private, but a few, such as the new Science Center, involve public/private partnerships. Historic preservation processes and standards have been refined, and many historic properties have been preserved through thoughtful and creative re-use. Peerless Rockville continues to be a strong and visible proponent for protecting Rockville’s history.
Engaged Governance
Through extensive public dialogue and review, the City Charter was revised several years ago. A high percentage of voters understand and act on the importance of participating in the electoral process. The community actively engages with City Hall and the Mayor and Council, thereby positively affecting the City’s responsiveness. Communication between the City government and the citizenry is effective and runs both ways. The City enjoys productive and respectful relationships with all levels of government, including other Maryland municipalities and Washington-area communities, and public institutions. For example, Montgomery County has been rebuilding its governmental center throughout Town Center, contributing to economic growth and vitality for the entire urban core. The Montgomery College campus is now fully integrated into the City’s bike and pedestrian pathways. Relationships between Mayor and Council and City staff run smoothly and are informed by well-understood and respected delineation of duties and responsibilities. The budget process is clear, and the growth of the government is constrained.
Development processes are transparent and there is ample and early opportunity for collaborative neighborhood input. The College Gardens Plaza is a sterling example of how a commercial owner and developer work with the community to define a highly profitable and well-accepted commercial and mixed-use project.
Business Friendly
The City’s Master Plan and Zoning Ordinance are clearly written and provide attractive alternatives for continued business investment. Opportunities for and limits on development are clear and reasonable. The City has a longstanding economic development unit, and possesses economic and tax-impact analysis capabilities so that it knows how the zoning ordinance and permitting processes impact business and the tax base. Permits and approval processes are clear and are executed efficiently. The business community is active and highly respected, and business people are fully and positively involved in the City. The City’s tax base is stable, reasonable, and slowly increasing. Property tax rates are defensible and competitive. Rockville has programs to actively attract and grow new small to medium size businesses. The business incubator in the Arts and Innovation Center continues to have waiting lists for the high-tech businesses in biotechnology, computing, and services. Businesses locate here because Rockville is a cultural, recreational, educational and entertainment leader, a transportation hub, and a great place to raise a family. Rockville boasts a highly educated and motivated workforce, which includes many young professionals and members of the “creative class.”
Multimodal Transportation
Improvements to the transportation infrastructure over the past decade have mitigated the impact of increased traffic. More viable transportation options exist throughout the City connecting Rockville neighborhoods and Rockville to the wider metropolitan area, including bus routes, trolley lines, the Corridor Cities Transitway, and expanded METRO and MARC service. Rockville is recognized as a “Pedestrian First City.” Pedestrian safety is a perennial Mayor and Council priority. Over the years pedestrians have been better accommodated through Zoning Ordinance provisions, improved pedestrian infrastructure, and pedestrian and driver education and outreach. The City continues to rigorously enforce speed limits and red light violations, and provides excellent pedestrian crossing infrastructure.

Mayor and Council Vision 2020
2 - 3
The car is still the predominant mode of transportation, but residents are more willing to use transit, cycle, or walk. As areas of the City are redeveloped, it has become easier to abandon cars for daily commutes. Mixed-use communities facilitate this, and many residents live either near their work places or in proximity to commuter transportation hubs. Rockville leads the nation in the adoption of energy-efficient cars. Many residents work from home through high-speed Internet services blanketing the City. The rehabilitated and renamed Rockville Town-Center Metro platform now extends over Park Street, and crossing 355 on foot has become a comfortable and safe experience.
Exceptional City Services and Amenities
City services and amenities continue to be exceptional. The City provides high-quality services including snow and leaf removal, well-maintained streets, and refuse and recycling services. The Police moved to their new headquarters in Town Center several years ago and continue to provide outstanding service to the Rockville community. The Recreation and Parks program remains the envy of the mid-Atlantic region. RedGate is still a jewel. There is a remarkable Science Center focused on the biotechnology sector. Reliable and extremely fast Wi-Fi is available everywhere in the City. The City’s longstanding efforts to upgrade its water system, including the 20-year project to replace worn-out water mains in the older parts of town, are proceeding on schedule and within budget. Rockville continues advancing inspection and preventive maintenance methods and technologies for its water, sewer, and storm water infrastructure. As a result, the incidences of water main breaks, sewer backups, and spot flooding have decreased dramatically. Rockville continues to apply reliable advanced information technology to improve the quality, cost, and speed of providing municipal services.
Quality Environment
Rockville is a “Green City” in all areas. Cities around the country have taken notice of the fact that Rockville has found a way to be both green and economically attractive. Incentives and education have effectively achieved the convergence of individual self-interest and environmentally sensitive behavior. Rockville has enticed a number of new “green” businesses to open their doors and provide employment in the City.
Rockville continues to be the regional leader in Storm Water Management and energy conservation, not only for City facilities, but also for residential and commercial properties. It does this through education and innovative programs, incentives, and regulation where appropriate. An energy conservation task force established in the early part of the decade developed federal and state grant opportunities that persuaded residents to aggressively adopt energy-conserving ways of life because they saw that this was in their self interest. The City is in the process of replacing its entire vehicle fleet with alternative energy-powered vehicles. The City addresses its planning and development issues by bringing all parties to the table from the outset, recognizing that sustainability has economic and environmental components that must work together. Development standards are high but not unreasonable, and are not a disincentive to development. Endnotes:
1 Base Realignment And Closure (BRAC) that results in more development in
Bethesda. Also the County’s White Flint Sector Plan just south of Rockville.
2 The Great Seneca Science Corridor development spearheaded by Johns
Hopkins University.
3 Council of Governments report of 2010 predicts two-million person population
growth in the Washington, DC region between 2010 and 2050.

Financial Management Policies
2 - 4
Statement of Purpose
The financial integrity of our City government is of utmost importance. To discuss, write, and adopt a set of financial policies is a key element to maintaining this integrity. These financial management policies are designed to ensure the fiscal stability of the City of Rockville and to guide the development and administration of the annual operating and capital budgets, as well as the debt program.
Written, adopted financial policies have many benefits, such as assisting the Mayor and Council and City Manager in the financial management of the City, saving time and energy when discussing financial matters, promoting public confidence, and providing continuity over time as Mayor and Council and staff members change. While these policies will be amended periodically, they will provide the foundation and framework for many of the issues and decisions facing the City. They will promote wise and prudent financial management, provide the foundation for adequate funding of services desired by the public, and help make the City more financially stable, efficient, and effective.
These policies were revised for the FY 2012 Adopted Budget Book based on the results of the Comprehensive User Fee Study.
Objectives
1. Assist the Mayor and Council and City management by providing accurate and timely information on financial conditions pertinent to City operations.
2. Provide sound financial principles with which to guide the important decisions of the Mayor and Council and management, which have significant fiscal impact.
3. Set forth operational principles that minimize the cost of government and financial risk, to the extent consistent with services desired by the public.
4. Enhance the policy-making ability of the Mayor and Council by providing accurate information on program costs.
5. Ensure the legal use of all City funds through a sound financial system and strong internal controls.
6. Employ revenue policies that diversify revenue sources, distribute the costs of municipal services fairly, and provide adequate funds to operate desired programs.
In order to meet these objectives, the City’s policies are divided into eight general categories for ease of reference. These categories include: 1) Operating Budget Policies, 2) Capital Improvement Program (CIP) Policies, 3) Revenue and Expenditure Policies, 4) Reserve Policies, 5) Debt Management Policies, 6) Cash Management/Investment Policies, 7) Accounting, Auditing, and Financial
Reporting Policies, 8) Productivity Policies. It is recommended that all policies included in this document be adhered to.
OOPPEERRAATTIINNGG BBUUDDGGEETT PPOOLLIICCIIEESS::
At least one month before the preparation of the proposed annual budget, the City Manager will meet with the Mayor and Council members to review and deliberate all policy guidelines that may affect the proposed budget.
1. The budget is approved in the form of an appropriations ordinance after
the Mayor and Council have conducted at least one advertised public hearing.
2. The operating budget and CIP together shall serve as the annual financial plan for the City. They will serve as the policy documents of the Mayor and Council for implementing Council visions, goals and objectives. The budget shall provide staff with the resources necessary to accomplish the Mayor and Council’s determined service levels.
3. The City Manager shall annually prepare and present a proposed operating budget to the Mayor and Council at least two months before the beginning of each fiscal year; and Mayor and Council will adopt said budget no later than May 31 of each year. Funds may not be expended or encumbered for the following fiscal year until the budget has been adopted by the Mayor and Council.
4. The City defines a balanced budget as a budget that has operating revenues equal to operating expenditures. It is the City’s policy to fund current year operating expenditures with current year revenues, inclusive of debt service. General Fund expenditures may exceed revenues in a given year only when the additional spending is funded by beginning fund balance and only for CIP expenditures or other one-time or non-recurring expenditures, as authorized by the Mayor and Council.
5. Each department and division prepares its own budget for review by the City Manager. Budget accountability rests primarily with each department. The basic format of the budget shall identify programs within organizational structures. Programs are defined as specific services provided to the public, other departments or other organizations.
6. The Operating Budget is adopted at the fund level. During the year, it is the responsibility of the City Manager, Department Directors, and the Budget and Finance Manager to administer the budget. The legal control, which the budget ordinance establishes, uses Generally Accepted Accounting Principles (GAAP).
7. As a management policy, budgetary control is maintained in the General, Special Revenue, and Enterprise Funds at the program level by the encumbrance of estimated purchase amounts prior to the
etompkins
Underline
etompkins
Underline
etompkins
Underline
etompkins
Underline
etompkins
Underline
etompkins
Underline
etompkins
Underline
etompkins
Underline
etompkins
Underline

Financial Management Policies
2 - 5
release of purchase orders to vendors. Purchase orders that result in overruns of balances are not processed until sufficient appropriations are made available through approved intrafund transfers. Encumbered amounts at year-end are recorded as a reservation of fund balance and are reflected as an adjustment to the ensuing year's budget.
8. A five-year projection of revenues and expenditures for the General, Special Revenue, and Enterprise Funds is prepared each fiscal year to provide strategic perspective to each annual budget process.
9. All appropriations shall lapse at the end of the budget year if not expended or encumbered.
10. Any year-end operating surpluses will revert to fund balances for use in maintaining reserve levels set by policy (see policy on reserves) and the balance will be available for pay-go capital projects and/or one time capital outlays.
11. The City Manager will submit budgetary reports to the Mayor and Council comparing actual revenues and expenditures with budgeted amounts quarterly.
Budget Transfers:
The City Manager has the authority to transfer budgeted amounts between departments within any fund, but changes in the total appropriation level for any given fund can only be enacted by the Mayor and Council through an amendment to the appropriations ordinance.
1. All budget transfers must receive approval by the Department Director, and Budget and Finance Manager regardless of the budget transfer amount. In addition, any budget transfer over $50,000 requires City Manager approval.
2. City Manager approval is required for transfers from one department to another.
3. Approval of the budget transfer must be obtained prior to requisition, encumbrance or expenditure of funds taking place.
Interfund Transfers and Loans:
1. Any interfund transfers between funds for operating purposes can only be made by the Chief Financial Officer with City Manager approval in accordance with the adopted budget.
2. These operating transfers, under which financial resources are transferred from one fund to another, are distinctly different from interfund borrowings, which are usually made for temporary cash flow reasons, and are not intended to result in a transfer of financial resources by the end of the fiscal year.
3. Interfund transfers result in a change in fund equity; interfund borrowings do not, as the intent is to repay the loan in the near term.
Fund Structure:
1. The accounts of the City are organized into funds. The operations of each fund are accounted for with a separate set of self-balancing accounts that comprise its assets, liabilities, fund equity, revenue, and expenditures (or expenses, as appropriate).
2. Government resources are allocated to and accounted for in individual funds based on the purposes for which they are to be expended and the means by which spending activities are controlled. The City uses governmental funds and enterprise funds. Governmental funds are those through which most governmental functions of the City are financed. The acquisition, use, and balance of the City’s expendable financial resources and the related liabilities (except for those accounted for in the enterprise funds) are accounted for through governmental funds.
3. The City’s governmental funds are the General Fund, the Special Revenue Funds, the Capital Projects Fund, and the Debt Service Fund.
The General Fund is the general operating fund of the City. It is used to account for all financial resources except those required to be accounted for in another fund.
The Special Revenue Funds are used to account for the proceeds of specific revenue sources (other than major capital projects) that are restricted by legal and regulatory provisions or budgeted contributions from outside sources to finance specific activities. The City’s Special Revenue Funds are the Special Activities Fund, the Community Development Block Grant Fund and the Speed Camera Fund.
The Capital Projects Fund is used to account for financial resources used for the acquisition or construction of major capital facilities and general capital construction, including: streets, parks, and public buildings (other than those financed by enterprise funds).
The Debt Service Fund, which includes special assessments, is used to account for the accumulation of resources for, and the payment of, general long-term debt principal, interest, and related costs.
4. The enterprise funds are the Water Fund, the Sewer Fund, the Refuse Fund, the Parking Fund, the Stormwater Management Fund, and the RedGate Golf Course Fund.
etompkins
Underline
etompkins
Underline
etompkins
Underline
etompkins
Underline
etompkins
Underline
etompkins
Underline
etompkins
Underline
etompkins
Underline
etompkins
Underline
etompkins
Underline
etompkins
Underline
etompkins
Underline

Financial Management Policies
2 - 6
5. Creation of new funds should be based on the following criteria:
I. The revenue source is ongoing; i.e., more than one fiscal year. II. The amounts to be recorded are material. III. Interest income is required to be allocated. IV. The amounts are specifically designated. V. There is not another fund that can be used to account for the
revenue source. VI. There are special circumstances that have led management to
create a separate fund. VII. If the State or Federal government requires a separate fund to
account for a particular source of revenue then such a fund can and must be created.
VIII. It is a requirement of GAAP to establish the fund.
Basis of Budgeting:
1. Budgets for governmental and enterprise (or proprietary) funds are adopted on a basis consistent with Generally Accepted Accounting Principles. Accordingly, all governmental fund budgets are presented on the modified accrual basis of accounting. Under this method of accounting, revenue and other governmental fund resources are recognized in the accounting period in which they become susceptible to accrual – that is, when they become both “measurable and available” to finance current operating expenditures for the fiscal period.
2. In applying the susceptible to accrual concept to real and personal property tax revenue recognition, “available” means property tax revenue is recognized currently if levied before the fiscal year end and collected by intermediaries within 60 days after the fiscal year end. Utility and franchise fees, licenses and permits, fines and forfeitures, charges for services, and miscellaneous revenue (except investment earnings) are recorded as revenue when cash is received because they are generally not measurable until actually received. Investment earnings are recorded as earned since they are both measurable and available.
3. For grant revenue such as the Community Development Block Grant (CDBG) program, which is dependent upon expenditures by the City, revenue is accrued when the related expenditures are incurred. Expenditures are generally recognized under the modified accrual basis of accounting when the related fund liability is incurred. An exception to this general rule is principal and interest on general long-term debt which are recognized when due.
4. The enterprise fund budgets are presented on the full accrual basis of accounting. Under this method of accounting, revenue is recognized when earned and expenses are recognized when they are incurred. For example, earned but unbilled utility revenues are accrued and reported
in the financial statements the same way they are incorporated within the operating budget. Enterprise fund capital purchases are budgeted in the operating budget and recorded as expenses during the year; at year-end, they are capitalized for financial statement purposes.
CCAAPPIITTAALL IIMMPPRROOVVEEMMEENNTT PPRROOGGRRAAMM ((CCIIPP)) PPOOLLIICCIIEESS:: With the operating budget, the City Manager submits a CIP to the Mayor and Council. This document provides for improvements to the City’s public facilities for the ensuing fiscal year and four years thereafter, and forms part of the City’s financial plan. The first year of the plan establishes a capital budget for the new fiscal year. The remaining four years serve as a guide for use in determining probable future debt issuance needs and operating cost impacts. The Capital Budget is adopted at the fund level. CIP expenditures are accounted for in the Capital Projects Fund or the appropriate enterprise funds and are funded by a variety of sources. The City strives to maintain a high reliance on “pay-go” financing for its capital improvements in order to maintain debt within prudent limits, and to ensure that the rates charged in the enterprise funds are competitive with those in the surrounding area. For projects to be included within the CIP, they should normally be eligible for debt financing, and have a defined beginning and end, as differentiated from ongoing programs in the operating budget. To qualify as a CIP project, one of the following six criteria must be met:
I. The acquisition of land for a public purpose. II. The construction of a significant facility, i.e. a building or road,
or the addition to or extension of an existing facility. III. Nonrecurring rehabilitation or major repair to all or part of a
facility, such as infrequent repairs that are not considered to be recurring maintenance, provided the total cost per fiscal year is more than $100,000.
IV. Any specific design work related to an individual project falling within the above three categories.
V. Any long-term project funded through a grant where the establishment of a CIP project is a condition of the grant, regardless of the amount of funding per fiscal year.
VI. A significant one-time investment in tangible goods of any nature, the benefit of which will accrue over a multi-year period such as a new phone system or vehicle acquisitions over $100,000.
1. Annually, a five-year Capital Improvements Program (CIP) plan will be developed analyzing all anticipated capital expenditures by year and identifying associated funding sources. The plan will also contain projections of how the City will perform over the five-year period in relation to the fiscal policies that refer to debt ratios.
etompkins
Underline
etompkins
Underline

Financial Management Policies
2 - 7
2. The first year of the five-year (CIP) and any unspent funds from prior years will be appropriated as part of the annual budget process. The CIP will be appropriated by fund. At least semi-annually, the City Manager will notify the Council of any transfers between projects within a fund.
3. The City will maintain a Capital Projects Monitoring Committee composed of City staff, which will meet not less than once every six months to review the progress on all outstanding projects as well as to revise spending projections. Each CIP project will have a project manager who will prepare the project proposal sheet, ensure that project is completed on schedule, authorize all project expenditures, and ensure that all regulations and laws are observed. Project managers will be responsible for reporting project status to the committee.
4. If new project appropriation needs are identified at an interim period during the fiscal year, at the fund level, the appropriations ordinance will be utilized to provide formal budgetary authority for the increase. Any significant impact resulting from the change on the overall CIP and on the debt ratios will be indicated at that time.
5. The City shall actively pursue funding, other than borrowing, from other levels of government or from private sources for all projects for the CIP where practical to do so.
6. Capital Projects shall be prioritized according to goals set by the Mayor and Council.
7. Unexpended project appropriations may be transferred to other projects within the same funding source with the approval of the City Manager.
8. Each year, a closing resolution will be submitted to the Mayor and Council to obtain formal authorization to close completed capital projects. The unexpended appropriations for these projects will be returned to the fund from which the appropriations were made. A report showing the amounts budgeted, expended, transferred and returning to fund balance shall be provided.
RREEVVEENNUUEE AANNDD EEXXPPEENNDDIITTUURREE PPOOLLIICCIIEESS::
1. The City will strive to develop and maintain a diversified and stable revenue stream to avoid becoming overly dependent on any single type of revenue, to minimize the effects of economic fluctuations on revenues and ensure its ability to provide for ongoing services.
2. Budgeted revenues shall be estimated conservatively using accepted standards and estimates provided by the State, County and other governmental agencies when available.
3. Revenue from “one-time” or limited duration sources will not be used to balance the City’s operating budget.
4. As appropriate within the marketing of the recreation programs, higher non-resident fees may be charged and priority registration will be given to Rockville residents.
5. Restricted revenue shall only be used for the purposes legally permissible and in a fiscally responsible manner.
6. On an annual basis, the City will set fees and rates for the enterprise funds at levels which fully cover total direct and indirect operating costs, and all capital outlay and debt service, except where the City is not the sole provider of the service and competitive rates must be taken into consideration. In these instances, fees and rates must at least cover all direct and indirect operating expenses.
7. The City shall actively pursue Federal, State, County and other grant opportunities when deemed appropriate. Before accepting the grant, the City shall thoroughly consider the implications in terms of ongoing obligations, indirect costs and matching requirements in connection with the grant.
8. Gifts, bequests and donations will be evaluated to determine what, if any, obligations are to be placed upon the City. Gifts, bequests and/or donations shall be used solely for the purpose intended by the donor.
9. General Fund revenues in an amount of $20,000 annually are to be set aside in accordance with resolution 20-85 that are dedicated to the upkeep and furnishing of Glenview Mansion. $20,000 is the maximum amount of General Fund revenue to set aside. Expenditures can only be authorized by the Director of Recreation and Parks as recommended by the Glenview Mansion Subcommittee.
10. An amount equal to one percent of the City’s costs for capital projects involving the construction of, or major improvements to, buildings, parks and other public structures is to be transferred annually from the General Fund to the Art in Public Architecture program in support of ordinance 3-04, pending appropriation by the Mayor and Council.
11. An amount equal to $1 per capita is to be transferred annually from the General Fund to the Art in Public Places program pending appropriation by the Mayor and Council.
User Fee Cost Recovery Goals:
Fees for services will be reviewed and updated on an ongoing basis to ensure that they keep pace with inflation. In addition, fees need to be updated for changes in methods or levels of service delivery to ensure that they are appropriate and equitable for all users. In order to implement this goal, a comprehensive analysis of City costs and fees should be undertaken at least every five years. The last such study was completed in FY 2011. In the interim, regulatory fees can be adjusted by annual
etompkins
Underline

Financial Management Policies
2 - 8
changes in the Baltimore-Washington Consumer Price Index (CPI). Fees may be adjusted during this interim period based on supplemental analysis whenever there have been significant changes in the method, or level of cost of service delivery. General concepts to be followed are:
Cost recovery goals should be based on the total cost of delivering the service, including all direct costs and all indirect costs (departmental administration costs, and organization-wide support costs such as accounting, personnel, IT, insurance etc.).
The method of assessing and collecting fees should be as simple as possible in order to reduce the administrative cost of collection.
Rate structures should be sensitive to the “market” for similar services as well as to smaller, infrequent users of the service.
Fees should be charged to all entities using City services including Federal, State and County jurisdictions unless exempt by law.
City Manager may exempt fees where it is in the City’s best interest to do so, and in accordance with business need.
Though the overall cost recovery goal is based on total cost recovery (direct and indirect costs), there are many programs that base their cost recovery on direct costs only. Where the City contracts out public employees to provide services to private individuals or businesses, such as police officers or meter readers, the fully loaded cost, (salary, benefits, overhead) should be charged to ensure that 100% of the employees time is paid for by the user of the service.
Definitions:
Direct costs are those that can be specifically identified with a particular cost objective, such as street maintenance, police protection, and water service. Indirect costs are not readily quantifiable with a direct operating program, but rather, are incurred for a joint purpose that benefits more than one cost objective. Common examples of indirect cost functions include accounting, purchasing, legal services, personnel administration and building maintenance. Although indirect costs are generally not directly linked with direct cost programs, their cost may be included as part of the total cost of providing specific goods and services.
Regulatory Programs: Services under this category include mainly Planning, Building and Safety, and Engineering. Cost recovery goals for these services in most instances should be 100 percent. However, in charging at this level, the City needs to clearly establish and articulate standards for its performance in reviewing developer
applications to ensure that there is “value for cost.” Despite having a cost recovery goal of 100 percent, there are reasons why staff would recommend a fee below this policy goal. These reasons include benchmarking fees to surrounding communities, the ability of the community and developers to pay, and the level of compliance with regulations. In all instances, fees established below the full cost recovery goal imply that there is a level of community benefit to that service. Revenue-generating cost centers whose activities fall mostly under the regulatory program category include:
Zoning and Development Review (CPDS) Application, Processing, and Permit Issuance, and Building, Fire and
Life Safety inspections(CPDS) Neighborhood Services (Police) Community Enhancement / Code Enforcement (Police) Development Review and Engineering (Public Works) Forestry Development Review (Recreation and Parks)
Recreation and Park Programs: Fees are reviewed annually by the Recreation and Parks Advisory Board. The fees that fall into this category include user fees of public recreation facilities and programs, rental fees for use of public grounds and facilities, admission fees for public events, special service fees for extraordinary items, and vendor fees for the privilege of selling goods and services on public property. In addition to these fees, grants and other financial contributions from businesses and other levels of government support recreation and parks programs. There are four categories of Recreation and Parks programs. The level of cost recovery in each category is based on different service levels provided throughout the community. Each revenue-generating cost center within the Department of Recreation and Parks has a target cost recovery goal that falls within the ranges defined as follows.
Basic Services, Parks and Facilities:
These services include operation and maintenance, open space and recreation facilities, neighborhood and Citywide parks, greenways, trails, right-of-way islands and landscaping including street trees, playgrounds, non-reservation amenities and other similar public facilities, maintenance operations facilities, as well as overall department administrative activities. These services primarily serve to support individual and small-group non-reserved/non-consumptive/non facility-based amenities and recreation activities. No cost recovery is associated with the following functions. These services are provided to the community with funds derived from tax revenues.
etompkins
Underline
etompkins
Underline
etompkins
Underline
etompkins
Underline
etompkins
Underline
etompkins
Underline
etompkins
Underline
etompkins
Underline
etompkins
Underline

Financial Management Policies
2 - 9
These activities include but are not limited to:
Bike and pedestrian pathways maintenance City uses for activities, meetings, etc. with no associated revenue Dog Park maintenance Facility landscaping and maintenance Nature observation Outdoor courts maintenance Parks maintenance Playgrounds maintenance Picnic areas maintenance Right-of-way landscaping Skate Park maintenance Trail and pathway maintenance Urban forestry maintenance
Cost centers whose activities fall mostly under this category include:
Athletic Fields Services East Parks Services Facilities Maintenance Horticulture Services Parks Administration and Support Rights-of Way Maintenance Urban Forestry Maintenance West Parks Services
Community Benefit –Programs, Services and Facilities: These services include basic recreation programs, activities and events which utilize parks, recreation facilities and other public spaces, providing benefits to the entire community or a large portion thereof, are not routinely provided by the private sector and are partially supported by fees and charges. These are considered to provide a baseline level of service and can be considered to enhance the quality of life for Rockville residents. Community Benefit programs and facility uses are expected to recover between 5 percent and 20 percent of direct costs from fees, sponsorships and grants. Supplemental funding is provided via tax dollars. These activities include but are not limited to:
Farmers’ Market Outdoor performing arts series Senior Social Services Senior transportation services
Seasonal programs and events Special events
Cost centers whose activities fall mostly under the Community Benefit category include:
Senior Citizen Support Services Special Events
Community/Individual Benefit Services:
These services provide benefits that accrue both to the community at large as well as to the individual served. They are available to all; however, space, time, consumptive use, cost of supply and other factors may limit or preclude participation. The private sector, in particular non-profits, may offer some of these services. Due to the limitations listed above and especially to “cost of supply” circumstances, these services have been designated to recover between 20 percent and 100 percent of direct costs. These programs have the following bands with associated cost recovery percentages: Band A Recreation Programs (20%-50%); Band B Neighborhood Community Recreation Facilities (20%-50%); Band C Sports Programs (70%-100%) and Band D Major Recreation Facilities (65%-100+%).
Supplemental funding is provided as necessary and appropriate with tax dollars.
These activities include but are not limited to:
Adult sports leagues After School programs Arts Programs Concert Band, Community Chorus, Rockville Regional Youth
Orchestra, Civic Ballet Grant supported programs Introductory or basic skill level activities of all types for all ages Outdoor adventure activities Recreation/Community center, civic center programs and rentals Resident Companies at F. Scott Fitzgerald Theater Senior citizen recreation programs Senior citizen sports and fitness programs Summer Playgrounds Swim and Fitness Center facility and program use (memberships, daily
admissions, classes, swim team, etc.) Teen programs Youth sports leagues, including partner non-profit leagues
etompkins
Underline
etompkins
Underline
etompkins
Underline
etompkins
Underline
etompkins
Underline
etompkins
Underline
etompkins
Underline
etompkins
Underline
etompkins
Underline
etompkins
Underline

Financial Management Policies
2 - 10
Cost centers whose activities fall mostly under the Community/Individual Benefit category include: Band A – Recreation Programs (20%-50%)
After School Recreation Arts Outdoor Recreation Senior Citizen Recreation Senior Citizen Sports and Fitness Summer Playgrounds Teens
Band B – Neighborhood/Community Recreation Facilities (20%-50%)
Croydon Creek Nature Center
Lincoln Park Community Center
Senior Center Operations
Thomas Farm Community Center
Twinbrook Community Recreation Center Band C – Sports Programs (70%-100%)
Adult Sports
Youth Sports Band D – Major Recreation Facilities (65%-100+%)
Civic Center Complex
Swim and Fitness Center
Individual Benefit Services: These services are defined as those products/processes for which benefits accrue almost entirely to the individual, group or organizational participant/consumer. They may be available to the entire city population or beyond, but substantial limitations on space, time consumption and cost have the effect of restricting use. The private sector can supply these services or they are provided through public/private partnerships. Due to “cost of supply” factors these services are required to fully recoup 100 percent of direct costs, as well as up to 100 percent of indirect costs. Fees are often established based on the appropriate local market demand. Tax supported funding is minimal. These activities include but are not limited to:
Licensed childcare programs Intermediate and advanced skill development activities for youth and
adults Summer camps – all types
Cost centers whose activities fall mostly under the Individual Benefit category include:
Childcare Classes Summer Camps
RREESSEERRVVEE PPOOLLIICCIIEESS:: The City utilizes a variety of funds for recording the revenue and expenditures of the City. At each fiscal year end, operating surpluses that revert to fund balance over time constitute available reserves of the City.
General Fund:
1. The City will maintain an unreserved General Fund fund balance at a level not less than 15 percent of annual General Fund revenue (shown on page 4-5). The purpose of this unreserved balance is to alleviate significant unanticipated budget shortfalls and to ensure the orderly provisions of services to residents. This is the minimum level necessary to maintain the City’s credit worthiness and maintain adequate cash flows. Use of funds below the 15 percent required level must be approved by specific action of the Mayor and Council.
2. To the extent that the unreserved General Fund fund balance exceeds the target, the City may draw upon the fund balance to provide pay-go financing for capital projects or for other one-time capital items.
3. The Mayor and Council may designate parts of the available fund balance that would represent tentative management plans rather than actual restrictions on the use of resources.
General Fund Contingency Account:
A contingency account equal to a maximum of 1 percent of the City’s General Fund budgeted appropriations will be maintained annually in the non-departmental budget. This account will be available for unanticipated, unbudgeted expenditures of a non-recurring nature and/or to meet unexpected cost increases that require City Manager approval. All spending from the contingency account shall be reported to the Mayor and Council quarterly.
Enterprise Funds:
For the Water, Sewer, and Stormwater Management Funds, the City will maintain as reserves a working capital balance of 90 days of operating expenses. For the Refuse Fund the City will maintain as reserves a working
etompkins
Underline
etompkins
Underline
etompkins
Underline
etompkins
Underline
etompkins
Underline
etompkins
Underline
etompkins
Underline
etompkins
Underline
etompkins
Underline
etompkins
Underline
etompkins
Underline
etompkins
Underline
etompkins
Underline
etompkins
Underline
etompkins
Underline
etompkins
Underline
etompkins
Underline
etompkins
Underline
etompkins
Underline
etompkins
Underline
etompkins
Underline

Financial Management Policies
2 - 11
capital balance of 30 days. (Note: Fund reserve levels for Water are shown on page 4-6, Sewer page 4-7, Refuse page 4-8, and Stormwater page 4-9). Enterprise funds with a negative cash balance should develop plans that will allow the fund to show a positive cash balance within five years, and rates and fees should be set accordingly.
Debt Service Fund:
The City will maintain a minimum fund balance equal to the average annual outstanding principal on the City’s general debt service schedule.
DDEEBBTT MMAANNAAGGEEMMEENNTT PPOOLLIICCIIEESS::
1. Debt management will provide for the protection and maintenance of the City’s AAA/Aaa bond rating, the maintenance of adequate debt service reserves, compliance with debt covenant provisions and appropriate disclosure to investors, underwriters and rating agencies.
2. The term of any City debt issue, including lease-purchases, shall not exceed the useful life of the assets being acquired by the debt issue.
3. All debt issuance shall comply with Federal, State and City charter requirements and adhere to Federal arbitrage regulations.
4. The City shall maintain an ongoing performance monitoring system of the various outstanding bond indebtedness issues and utilize this monitoring system as a performance criterion for the administration of the City’s outstanding indebtedness. This is particularly important as funds borrowed for a project today are not available to fund other projects tomorrow and funds committed for debt service payments today are not available to fund operations in the future.
5. The City will maintain good, ongoing communication with bond rating agencies about its financial condition. The City will follow a policy of full disclosure on every financial report and bond prospectus (Official Statement).
6. Accompanying each debt issue will be an assessment of the City’s capacity to repay the debt. The assessment will address the effects on the current operating budget, as well as identify the resources that will be utilized to repay the debt.
7. Long-term borrowing will not be used to finance current operations or normal maintenance and will only be considered for significant capital and infrastructure improvements.
8. The City will try to keep the average maturity of general obligation bonds at or below twenty years.
9. The City will generally conduct financings on a competitive basis. However, negotiated financings may be used due to market volatility or the use of an unusual or complex financing or security structure.
10. The City will not issue tax or revenue anticipation notes.
11. The City will strive to maintain a high reliance on pay-go financing for its capital improvements.
12. Neither Maryland State law nor the City Charter mandates a limit
on municipal debt. However, the City will strive to maintain its net tax-supported debt at a level not to exceed 1.0 percent of the assessed valuation of taxable property within the City (shown on page 3-37).
13. The City will strive to ensure that its net tax-supported debt per capita does not exceed $700.
14. The City will strive to ensure that its net tax-supported debt per capita as a percentage of Federal adjusted gross income does not exceed 2.5 percent (shown on page 3-37).
15. Required annual tax supported debt service expenditures should be kept at or below 15 percent of the City's annual adopted General Fund expenditures. This ratio reflects the City's budgetary flexibility to respond to changes in economic conditions (shown on page 3-37).
16. The City will set enterprise fund rates at levels needed to fully cover debt service requirements as well as operations, maintenance, administration and capital improvement costs. The ability to afford new debt for enterprise operations will be evaluated as an integral part of the City’s rate review and setting process.
17. Debt service coverage ratios will be calculated annually for all of the City’s enterprise funds. A minimum of a 1.2 coverage ratio should be maintained for each of the enterprise funds (shown on page 3-37).
Refinancing: Periodic reviews of all outstanding debt will be undertaken to determine refinancing opportunities. Refinancings will be considered (within Federal tax law constraints) under the following conditions:
I. There is a net economic benefit.
In general, refinancings for economic savings will be undertaken whenever net present value savings of at least 5 percent of the refunded debt can be achieved.
Refinancings that produce net present value savings of less than 5 percent will be considered on a case-by-case basis, provided that the present value savings are at least 3 percent of the refunded debt.
etompkins
Underline
etompkins
Underline
etompkins
Underline
etompkins
Underline
etompkins
Underline
etompkins
Underline
etompkins
Underline
etompkins
Underline

Financial Management Policies
2 - 12
Refinancings with savings of less than 3 percent will not be considered unless there is a compelling public policy objective.
II. It is needed to modernize covenants that are adversely affecting the City’s financial position or operations.
III. The City wants to reduce the principal outstanding in order to achieve future debt service savings, and it has available working capital to do so from other sources.
CCAASSHH MMAANNAAGGEEMMEENNTT//IINNVVEESSTTMMEENNTT PPOOLLIICCIIEESS::
1. Investments and cash management will be the responsibility of the Chief Financial Officer.
2. City funds will be managed in accordance with the prudent person standard with the emphasis on safety of principal, liquidity, and yield, in that order.
3. Investments of the City will be made in accordance with the City’s adopted Investment Policy.
4. The City is authorized to invest in any and all types of investments, as described in State Finance and Procurement Article 6-222(a) or Article 95, section 22-22N of the Annotated Code of Maryland, except where specifically prohibited by Maryland statutes.
5. The City will diversify use of investment instruments to avoid incurring unreasonable risks inherent in over-investing in specific instruments, individual financial institutions, or maturities.
6. The Chief Financial Officer shall present reports of the City’s investments and cash position quarterly to the Mayor and Council.
7. All cash is combined into one pooled operating account to facilitate effective management of the City’s resources, and to maximize yield from the overall portfolio.
8. Interest earnings shall be allocated to funds with a positive cash balance based on the average of the past six months cash balances by fund.
AACCCCOOUUNNTTIINNGG,, AAUUDDIITTIINNGG,, AANNDD FFIINNAANNCCIIAALL RREEPPOORRTTIINNGG PPOOLLIICCIIEESS::
1. It will be the policy of the City of Rockville to provide all financial information in a thorough, timely fashion and in a format that is easy for the Mayor and Council, Citizens, Committees and City employees to understand and utilize.
2. The City’s accounting finance systems will be maintained in accordance with Generally Accepted Accounting Principles (GAAP) as promulgated by the Government Accounting Standards Board (GASB).
3. The basis of accounting within governmental fund types used by the City of Rockville is modified accrual as well as the “current resource measurement focus.” Under this method of accounting, revenue is recorded when susceptible to accrual, such as when measurable and available for the funding of current appropriations. All enterprise funds follow the accrual basis of accounting, as well as the “capital maintenance measurement focus.” Under this method of accounting, revenues are recognized when earned, as billed and unbilled, and expenses are recorded when incurred.
4. The City places continued emphasis on maintenance of an accounting system which provides strong internal budgetary and accounting controls designed to provide reasonable, but not absolute, assurances regarding both the safeguarding of assets against loss from unauthorized use or disposition and the reliability of financial records for preparing financial statements and reports, such as the budget and the Comprehensive Annual Financial Report (CAFR) as well as the maintenance of accountability of assets.
5. An independent audit of the City of Rockville is performed annually. The auditor’s opinion will be included in the City’s CAFR. The City will strive for an unqualified auditor’s opinion.
6. An independent audit firm will be selected through a competitive process at least once every five years. The Mayor and Council will award the audit contract upon the recommendation of the City Manager and Chief Financial Officer.
7. The City of Rockville issues a CAFR within four months of the close of the previous fiscal year. It will be presented to the Mayor and Council within six months of the fiscal year end at a regularly scheduled City Council meeting. The CAFR will be submitted annually to The Government Finance Officers Association (GFOA) for peer review as part of the Certificate of Achievement for Excellence in Financial Reporting program. All reports prepared by the auditors, and management’s response to those reports will be presented to the Mayor and Council at a regularly scheduled Council meeting within six months of the fiscal year end.
8. The City offers its employees a defined benefit pension plan and a defined contribution pension plan. The plans are administered by the Retirement Board comprised of seven members appointed by the Mayor and Council to serve two-year terms.
9. The retirement plans do not issue separate financial statements, but plans shall be included as part of the City’s financial statements and accordingly be subjected to an annual audit.
10. The City’s annual contribution toward the pension plans shall be determined by an independent actuary and published as an annual actuarial report. The City will annually meet its obligation to funding its share of the pension plan contribution out of its operating budget.

Financial Management Policies
2 - 13
11. Beginning in FY09 the City will prefund its retiree health benefits in accordance with GASB 45 based upon an actuarial valuation study. The study shall be completed every other year, and the City will achieve full funding over a five-year period.
PPRROODDUUCCTTIIVVIITTYY::
Fiscal responsibility and accountability to the community are two values embodied within the “ROCKVILLE WAY” of providing premium services to the community. To this end, the City will constantly monitor and review our methods of operation to ensure that services continue to be delivered in the most cost effective manner possible. This review process encompasses a wide range of productivity issues, including:
I. Analyzing systems and procedures to identify and remove unnecessary review requirements.
II. Evaluating the ability of new technologies and related capital investments to improve productivity.
III. Developing the skills and abilities of all City employees.
IV. Developing and implementing appropriate methods of recognizing and rewarding exceptional employee performance.
V. Evaluating the ability of the private sector to perform the same level of service at a lower cost.
VI. Periodic formal reviews of operations on a systematic ongoing basis.
VII. Encouraging accountability by delegating responsibility to the lowest possible level.
VIII. Stimulating creativity, innovation and individual initiative.
IX. Improving the organization’s ability to respond to changing needs, and identify and implement cost-saving programs.
X. Assigning responsibility for effective operations and citizen responsiveness to the department.

Summary of Major Policy Documents
2 - 14
In addition to the City’s Financial Management Policies, the following policy documents guide the City’s strategic planning and ongoing operations, including the preparation and execution of the City’s annual operating and capital budgets.
Bikeway Master Plan The Rockville Bikeway Master Plan was originally adopted in October 1998, and an update to the Plan was adopted in April 2004. With the strong support of the Mayor, City Council, City staff, and citizens, new bicycle facilities were added and new bicycle safety and promotion programs were undertaken. This transformed Rockville from a city with a few unconnected bicycle trails into one of Maryland’s leading communities for bicycling. The 2004 Plan Update established the following vision statement: “Bicycling in Rockville is for all types of trips; for all types of people; for all parts of the City.” For additional information, please contact the Recreation Services Division of the Department of Recreation and Parks at (240) 314-8620.
City Charter The City of Rockville became incorporated through the adoption of a City Charter in 1860. The Charter empowers the City to pass ordinances, in accordance with the laws of the State of Maryland, necessary for the good government of the City. For additional information, please contact the Office of the City Clerk at (240) 314-8280.
City Code The City Code contains all general and permanent ordinances of the City of Rockville. These ordinances are codified in accordance with State law. For additional information, please contact the Office of the City Clerk at (240) 314-8280 or visit the City’s website, www.rockvillemd.gov/government/citycode.htm.
Comprehensive Master Plan The current Master Plan was adopted in November 2002 and has been updated with the adoption of the Bikeway Master Plan (2004), and the East Rockville (2004), Lincoln Park (2007) and Twinbrook (2009) Neighborhood Plans. The plan reaffirms the City’s commitment to neighborhoods, a variety of housing options, Town Center, the environment, open space, recreation and parks, and a multi-modal transportation system. It acts as a tool for guiding the coordinated and harmonious future development of the City. The Master Plan provides:
A factual basis for making major planning and zoning decisions
A guide for planning capital improvements and public services
Assistance in coordinating decision-making between public and private interests
In keeping with State requirements the 2002 Comprehensive Master Plan (CMP) was reviewed in 2008-2009. A decision was taken to amend it using a two-phase process, Phase 1 of which has been completed. Phase 2 is underway, broken into two components:
Phase 2a: 2011 – 2012
Continue and complete work on Rockville’s Pike Plan
Prepare and Adopt Historic Preservation Element
Prepare White Papers on other CMP elements, which will serve as a basis for additional CMP amendments (Areas of focus include Community Facilities, Demographics, Environment, Housing, Land Use and Transportation)
Revise CMP goals and objectives through an extensive public/community participation process
Phase 2b: 2012 – 2013
Prepare draft CMP elements and manage revision/approval process for Planning Commission and Mayor and Council
For additional information, please contact the Department of Community Planning and Development Services at (240) 314-8200, or visit the City’s website, www.rockvillemd.gov/masterplan.
Comprehensive User Fee Study The purpose of the Comprehensive User Fee Study ("Study") is to identify the costs and subsidy levels of City services. Once the costs and subsidy levels are identified, the Mayor and Council can then decide if they want to increase the fees and charges associated with those services in order to decrease the City's subsidy amount. The Study is a tool that helps the Mayor and Council evaluate what services should be tax- versus fee-supported. The Mayor and Council's decision is consistent with the City's Financial Management Policies, which state under the "User Fee Cost Recovery Goals" section that cost recovery goals should be based on the total cost of delivering the service, which includes direct, indirect, administration, and organization-wide or overhead costs. In addition to defining cost recovery goals, the Policies also categorize programs by different cost recoveries based on the type of service.
Cost Allocation Plan (CAP) The purpose of the City’s Cost Allocation Plan (CAP) is to identify the total cost of providing specific City services. The CAP makes determining total program costs possible by establishing a rational and consistent methodology for identifying and allocating indirect costs to direct cost programs. Because of this, the CAP is a valuable analytical tool in a number of situations, including allocating organizational resources, performing expense analyses, evaluating the cost of performing services in-house versus contract, establishing fees designed for full cost recovery, recovering indirect costs associated with grant programs and reimbursing support service costs provided by the General Fund to enterprise operations such as water, sewer, refuse and stormwater. For additional information please contact the Finance Department at (240) 314-8400 or visit the City’s website, www.rockvillemd.gov.

Summary of Major Policy Documents
2 - 15
Environmental Guidelines Adopted in 1999, the Environmental Guidelines establish a comprehensive and cohesive method to protect the City’s natural resources during and after the development process. They identify existing natural resources and present various environmental management strategies and criteria to govern development within the City of Rockville. For additional information, please contact the Department of Community Planning and Development Services at (240) 314-8200. This document is posted on the City’s website, www.rockvillemd.gov/environment/regulations/#environmental_guidelines.
IT Strategic Plan The five-year IT Strategic Plan (“Plan”) identifies the City’s current IT needs and, to the extent possible, anticipates future IT needs. The Plan lays out the means and steps necessary to meet those needs and the strategy to ensure the City’s IT resources support the delivery of high quality services to internal and external customers. The Plan specifies ways to take advantage of exciting developments in information technology to improve efficiency, effectiveness, responsiveness, transparency, and accessibility. It also includes tools to help City government better analyze information and make decisions.
Investment Policy The City of Rockville’s Investment Policy is a guide for the investment of public funds not required for immediate expenditure. The policy was revised in May 2006 to include a list of authorized financial institutions and a list of investment diversity specifications. The policy assures compliance with Federal, State and local laws governing the investment of public monies. The policy assures that sufficient liquidity is available to meet normal operating and unexpected expenditures, and protects the principal monies entrusted to the City while generating the maximum amount of investment income. The policy is reviewed annually and is revised as needed. For additional information please contact the Finance Department at (240) 314-8400 or visit the City’s website, www.rockvillemd.gov/government/finance/investments.htm.
Neighborhood/Area Plans Rockville’s Comprehensive Master Plan establishes citywide policies and priorities, but it also recognizes that different parts of Rockville have different needs and goals. The Master Plan divides Rockville into 18 planning areas in order to facilitate more focused attention. When desired by a neighborhood and upon direction by the Mayor and Council, Long Range Planning and other City staff work with communities to identify concerns, goals and recommended action steps. Once these neighborhood-specific plans are reviewed, amended and adopted by the Planning Commission and Mayor and Council, they become part of the overall Master Plan. Neighborhood plans integrate local goals with long-range citywide policies and programs.
Neighborhood plans typically address major aspects of the community, including: land use and zoning, housing, public safety, transportation, pedestrian and bicycle circulation/safety, community services and facilities, historic preservation, and the environment. When a planning area has more commercial activity, such as Town Center or Rockville Pike, the focus also includes such relevant aspects as economic development. Major adopted Neighborhood Plans include:
Twinbrook, adopted May 2009
Lincoln Park, adopted February 2007
East Rockville, adopted March 2004
Town Center Master Plan, adopted October 2001
Rockville Pike Corridor, adopted April 1989 (revision currently underway)
West End-Woodley Gardens East/West, adopted September 1989
Hungerford/New Mark Commons/Monroe - Lynfield, adopted March 1985
Westmont (Tower Oaks), adopted March 1985
Parks, Recreation and Open Space (PROS) Plan The PROS Plan is a long-range policy document that sets overall direction in terms of goals and objectives for parks and recreation in the City of Rockville for the next twenty years. The City’s parks, recreation and open spaces serve a diverse population of City residents, but also non-City residents, who frequently come from well beyond the City’s borders, and a large employment base. An updated version of the PROS Plan was presented to and approved by the Mayor and Council on March 15, 2010. The updated PROS Plan will be included in future updates to the Comprehensive Master Plan. For additional information, please contact the Parks and Open Space Division of the Department of Recreation and Parks at (240) 314-8702.
Strategy for a Sustainable Rockville Rockville has a long history of managing the City in a sustainable and environmentally sensitive manner. However, desiring to be known as a national leader in these areas, the Mayor and Council unanimously adopted a Sustainability Strategy on October 1, 2007. In taking this action, the Mayor and Council acknowledged that a combination of forces, including unprecedented population growth, economic expansion, upward urbanization trends, and ever-higher energy prices, particularly for fossil fuels, are stressing the earth's resources and society's economic ability to maintain our current standard of living. Further, it has become increasingly clear that many of these challenges are falling to local government to solve. Cities that act with innovation, creativity, and foresight and successfully address these challenges will likely enjoy economic advantages over other communities, and lead the way for others to follow.
etompkins
Underline
etompkins
Underline
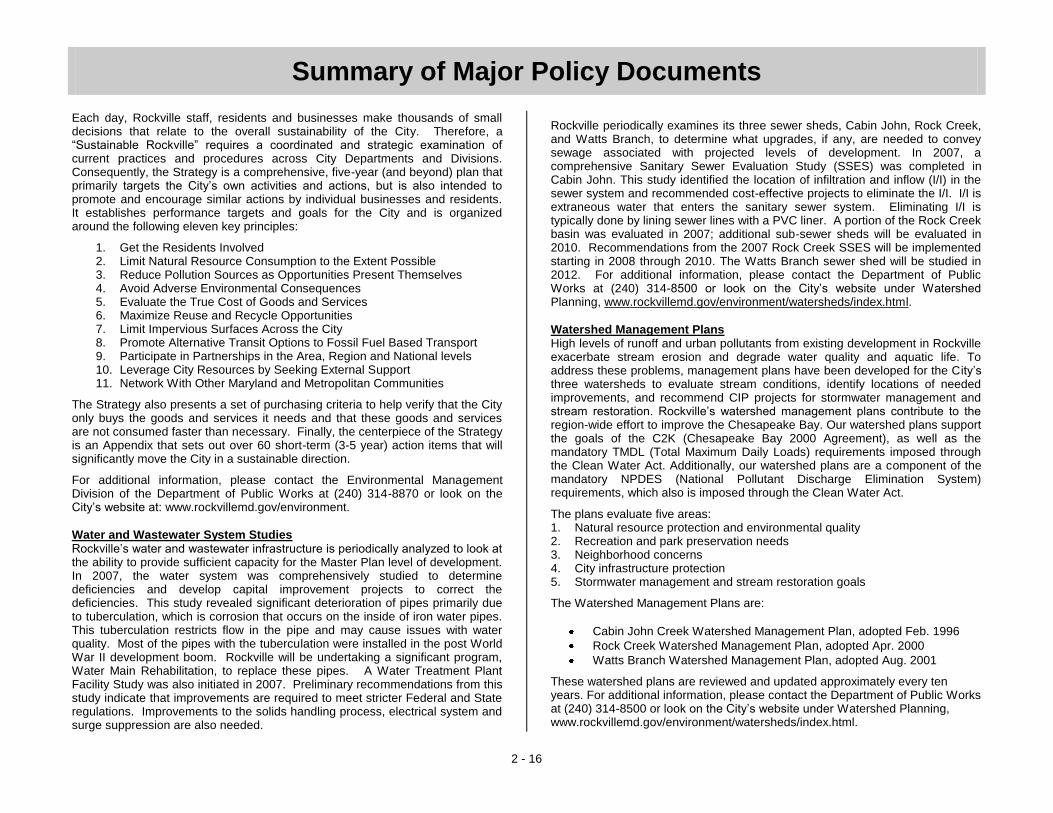
Summary of Major Policy Documents
2 - 16
Each day, Rockville staff, residents and businesses make thousands of small decisions that relate to the overall sustainability of the City. Therefore, a “Sustainable Rockville” requires a coordinated and strategic examination of current practices and procedures across City Departments and Divisions. Consequently, the Strategy is a comprehensive, five-year (and beyond) plan that primarily targets the City’s own activities and actions, but is also intended to promote and encourage similar actions by individual businesses and residents. It establishes performance targets and goals for the City and is organized around the following eleven key principles:
1. Get the Residents Involved 2. Limit Natural Resource Consumption to the Extent Possible 3. Reduce Pollution Sources as Opportunities Present Themselves 4. Avoid Adverse Environmental Consequences 5. Evaluate the True Cost of Goods and Services 6. Maximize Reuse and Recycle Opportunities 7. Limit Impervious Surfaces Across the City 8. Promote Alternative Transit Options to Fossil Fuel Based Transport 9. Participate in Partnerships in the Area, Region and National levels 10. Leverage City Resources by Seeking External Support 11. Network With Other Maryland and Metropolitan Communities
The Strategy also presents a set of purchasing criteria to help verify that the City only buys the goods and services it needs and that these goods and services are not consumed faster than necessary. Finally, the centerpiece of the Strategy is an Appendix that sets out over 60 short-term (3-5 year) action items that will significantly move the City in a sustainable direction.
For additional information, please contact the Environmental Management Division of the Department of Public Works at (240) 314-8870 or look on the City’s website at: www.rockvillemd.gov/environment.
Water and Wastewater System Studies Rockville’s water and wastewater infrastructure is periodically analyzed to look at the ability to provide sufficient capacity for the Master Plan level of development. In 2007, the water system was comprehensively studied to determine deficiencies and develop capital improvement projects to correct the deficiencies. This study revealed significant deterioration of pipes primarily due to tuberculation, which is corrosion that occurs on the inside of iron water pipes. This tuberculation restricts flow in the pipe and may cause issues with water quality. Most of the pipes with the tuberculation were installed in the post World War II development boom. Rockville will be undertaking a significant program, Water Main Rehabilitation, to replace these pipes. A Water Treatment Plant Facility Study was also initiated in 2007. Preliminary recommendations from this study indicate that improvements are required to meet stricter Federal and State regulations. Improvements to the solids handling process, electrical system and surge suppression are also needed.
Rockville periodically examines its three sewer sheds, Cabin John, Rock Creek, and Watts Branch, to determine what upgrades, if any, are needed to convey sewage associated with projected levels of development. In 2007, a comprehensive Sanitary Sewer Evaluation Study (SSES) was completed in Cabin John. This study identified the location of infiltration and inflow (I/I) in the sewer system and recommended cost-effective projects to eliminate the I/I. I/I is extraneous water that enters the sanitary sewer system. Eliminating I/I is typically done by lining sewer lines with a PVC liner. A portion of the Rock Creek basin was evaluated in 2007; additional sub-sewer sheds will be evaluated in 2010. Recommendations from the 2007 Rock Creek SSES will be implemented starting in 2008 through 2010. The Watts Branch sewer shed will be studied in 2012. For additional information, please contact the Department of Public Works at (240) 314-8500 or look on the City’s website under Watershed Planning, www.rockvillemd.gov/environment/watersheds/index.html.
Watershed Management Plans High levels of runoff and urban pollutants from existing development in Rockville exacerbate stream erosion and degrade water quality and aquatic life. To address these problems, management plans have been developed for the City’s three watersheds to evaluate stream conditions, identify locations of needed improvements, and recommend CIP projects for stormwater management and stream restoration. Rockville’s watershed management plans contribute to the region-wide effort to improve the Chesapeake Bay. Our watershed plans support the goals of the C2K (Chesapeake Bay 2000 Agreement), as well as the mandatory TMDL (Total Maximum Daily Loads) requirements imposed through the Clean Water Act. Additionally, our watershed plans are a component of the mandatory NPDES (National Pollutant Discharge Elimination System) requirements, which also is imposed through the Clean Water Act.
The plans evaluate five areas: 1. Natural resource protection and environmental quality 2. Recreation and park preservation needs 3. Neighborhood concerns 4. City infrastructure protection 5. Stormwater management and stream restoration goals
The Watershed Management Plans are:
Cabin John Creek Watershed Management Plan, adopted Feb. 1996
Rock Creek Watershed Management Plan, adopted Apr. 2000
Watts Branch Watershed Management Plan, adopted Aug. 2001
These watershed plans are reviewed and updated approximately every ten years. For additional information, please contact the Department of Public Works at (240) 314-8500 or look on the City’s website under Watershed Planning, www.rockvillemd.gov/environment/watersheds/index.html.
etompkins
Underline
etompkins
Underline
etompkins
Underline
etompkins
Underline

Directory of Boards and Commissions Officials
2 - 17
The City’s Boards and Commissions can be defined as primarily advisory, quasi-judicial, or administrative in function. Additionally, there are groups that are separate corporations, to which the Mayor and Council may appoint some or all of the members according to the by-laws of the group, which retains a separate identity. Many of the members of the City’s Boards and Commissions are experts in their respective fields and the wealth of information they provide on a voluntary basis to the City is immense.
Mayor and Council
Phyllis Marcuccio Mayor (240) 314-8291
John B. Britton Councilmember (240) 314-8292
Piotr Gajewski Councilmember (240) 314-8294
Bridget Donnell Newton Councilmember (240) 314-8293
Mark Pierzchala Councilmember (240) 314-8295
Boards and Commissions
Board or Commission Chairperson Staff Liaison Phone Number
Animal Matters Board Karen Becker Tom Howley (240) 314-8332
Board of Appeals Alan Sternstein Castor Chasten (240) 314-8223
Board of Supervisors of Elections
David Celeste Glenda P. Evans
(240) 314-8280
Compensation Commission
Tom Moore Glenda P. Evans
(240) 314-8280
Cultural Arts Commission
John Moser Betty Wisda (240) 314-8681
Environment Commission
Kris Dighe Mark Charles (240) 314-8871
Historic District Commission
Janet Hunt-McCool
Robin Ziek (240) 314-8236
Human Rights Commission
Debbie Dwyer Janet Kelly (240) 314-8316
Human Services Advisory Commission
Cynthia Cotte Griffiths
Carlos Aparicio (240) 314-8303
Landlord-Tenant Affairs Commission
Douglas Lunenfeld
Raymond Logan
(240) 314-8320
Personnel Appeals Board
Irving Shapiro Carlos Vargas (240) 314-8470
Board or Commission Chairperson Staff Liaison Phone Number
Planning Commission John Tyner, II Andrew Gunning
(240) 314-8206
Recreation and Park Advisory Board
Katherine Savage
Burt Hall (240) 314-8600
Retirement Board Alex Espinosa Gavin Cohen (240) 314-8400
Rockville Economic Development, Inc.
Albert Lampert Sally Sternbach*
(301) 315-8096
Rockville Housing Enterprises
Virginia Onley Vacant (301) 424-8265
Rockville Seniors, Inc. Mary Jane Walling
Terri Hilton (240) 314-8802
Rockville Sister City Corporation
James McConkey
Jon McLaren (240) 314-8625
Senior Citizens Commission
Kathy Neale Lorraine Schack
(240) 314-8812
Sign Review Board Douglas Worthing
Tamara Dietrich (240) 314-8254
Traffic and Transportation Commission
John Telesco Matthew Folden (240) 314-8509
* The City has a contract with REDI to strengthen and broaden the City's economic base. While the staff liaison listed is employed by REDI, this person represents the City as a contractor.

Boards and Commissions Descriptions
2 - 18
Animal Matters Board - A four-member body whose members are appointed by the Mayor and Council to serve three-year terms. The Board mediates petitions; provides written recommendations to the Chief of Police; provides education and counseling on responsible ownership, maintenance, and treatment of animals; and provides advice and recommendations to the Mayor and Council on matters related to the care, training, maintenance, and regulation of animals within the City. (Chapter 3, Rockville City Code)
Board of Appeals - A three-member body appointed by the Mayor and Council to serve three-year terms. The Board is charged with the responsibility of hearing and deciding all appeals and applications for variances and special exceptions, as provided for in the Zoning Ordinance of the City of Rockville. (Chapter 25, Rockville City Code)
Board of Supervisors of Elections - A five-member body whose members are appointed by the Mayor and Council to serve four-year terms. The Board is charged with the conduct of all City elections, registration of voters, and the keeping of records in connection with these functions. (Chapter 8, Rockville City Code and Article III, Charter of the City of Rockville)
Compensation Commission - A five-member body whose members are appointed by the Mayor and Council to serve four-year terms. Established in 1994, the Commission is charged with reviewing the compensation of the Mayor and Council every three years and recommending annual compensation for the five elected officials of the City. (Chapter 2, Rockville City Code)
Cultural Arts Commission - An 11-member body whose members are appointed by the Mayor and Council to serve three-year terms. The Commission is responsible for the encouragement of arts and culture in the City for the benefit of Rockville citizens. In addition, the Commission recommends to the Mayor and Council appropriate programs, activities, and utilization policies of the City facilities to add to the further development of Rockville as a cultural center. (Chapter 4, Rockville City Code)
Environment Commission - A nine-member body with backgrounds in science, the environment, and education, as well as a student member, whose members are appointed by the Mayor and Council to serve three-year terms. The Commission is responsible for a work program that includes recommending policies and procedures relating to the environment, watershed stewardship and protection, and promoting a sustainable community through initiatives related to natural resource management and development, energy efficiency, pollution and public education. (Resolution No. 20-02)
Historic District Commission - A five-member body whose members are appointed by the Mayor and Council to serve three-year terms. The members represent a demonstrated special interest, experience, or knowledge in the fields
of architecture, history, preservation, or urban design. The Commission is charged with recommending the boundaries of the districts that are deemed to be of historic or architectural value in the City of Rockville and in reviewing applications for construction or changes with in the historic districts. (Chapter 25, Rockville City Code)
Human Rights Commission - An 11-member body whose members are appointed by the Mayor and Council to serve three-year terms. The Commission provides community mediation to resolve disputes, as well as adjudicates cases of discrimination occurring in the City. Commissioners sponsor training in mediation and organize City events such as the annual Dr. Martin Luther King, Jr. celebration. (Chapter 11, Rockville City Code)
Human Services Advisory Commission - An 11-member body whose members are appointed by the Mayor and Council to serve three-year terms. The Commission assists the Mayor and Council in deciding appropriate City roles in human services; conducting an annual assessment of critical human service needs and developing recommendations on whether resources should be reallocated to meet these needs; exploring ways to develop new or enhanced services in areas identified as serious problems; and participating in oversight and evaluation activities to ensure accountability and cost-effectiveness of City and outside providers of human services. (Resolution No. 3-97)
Landlord-Tenant Affairs Commission - A seven-member body whose members are appointed by the Mayor and Council to serve three-year terms.
The Commission provides a forum for adjudicating differences or disputes between landlords and tenants. (Chapter 18, Rockville City Code)
Personnel Appeals Board - A three-member body whose members are appointed by the Mayor and Council to serve three-year terms. The Board is charged with hearing appeals filed by employees of the City of Rockville in cases of suspension, demotion, or dismissal action taken by the City Manager for disciplinary reasons. (Chapter 15, Rockville City Code)
Planning Commission - A seven-member body whose members are appointed by the Mayor and Council to serve five-year terms. The Commission is charged with formulating and revising a Master Plan for the City of Rockville. The Commission also reviews and makes recommendations to the Mayor and Council on applications for Map and Text Amendments; reviews and makes recommendations to the Board of Appeals on all Special Exception Applications; reviews and decides on applications for use permits; reviews and approves all subdivision plans; and initiates and conducts other planning studies and functions as necessary in the overall planning operation of the City. (Chapter 25, Rockville City Code)
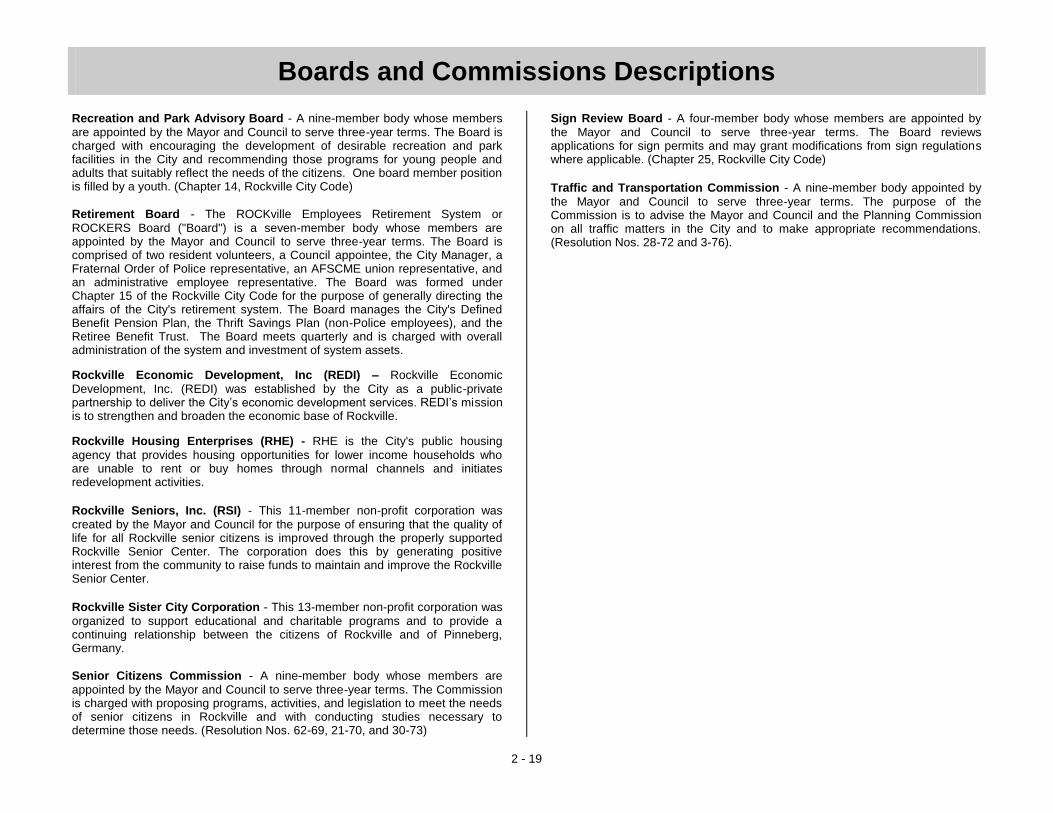
Boards and Commissions Descriptions
2 - 19
Recreation and Park Advisory Board - A nine-member body whose members are appointed by the Mayor and Council to serve three-year terms. The Board is charged with encouraging the development of desirable recreation and park facilities in the City and recommending those programs for young people and adults that suitably reflect the needs of the citizens. One board member position is filled by a youth. (Chapter 14, Rockville City Code)
Retirement Board - The ROCKville Employees Retirement System or ROCKERS Board ("Board") is a seven-member body whose members are appointed by the Mayor and Council to serve three-year terms. The Board is comprised of two resident volunteers, a Council appointee, the City Manager, a Fraternal Order of Police representative, an AFSCME union representative, and an administrative employee representative. The Board was formed under Chapter 15 of the Rockville City Code for the purpose of generally directing the affairs of the City's retirement system. The Board manages the City's Defined Benefit Pension Plan, the Thrift Savings Plan (non-Police employees), and the Retiree Benefit Trust. The Board meets quarterly and is charged with overall administration of the system and investment of system assets.
Rockville Economic Development, Inc (REDI) – Rockville Economic Development, Inc. (REDI) was established by the City as a public-private partnership to deliver the City’s economic development services. REDI’s mission is to strengthen and broaden the economic base of Rockville.
Rockville Housing Enterprises (RHE) - RHE is the City's public housing agency that provides housing opportunities for lower income households who are unable to rent or buy homes through normal channels and initiates redevelopment activities.
Rockville Seniors, Inc. (RSI) - This 11-member non-profit corporation was created by the Mayor and Council for the purpose of ensuring that the quality of life for all Rockville senior citizens is improved through the properly supported Rockville Senior Center. The corporation does this by generating positive interest from the community to raise funds to maintain and improve the Rockville Senior Center.
Rockville Sister City Corporation - This 13-member non-profit corporation was organized to support educational and charitable programs and to provide a continuing relationship between the citizens of Rockville and of Pinneberg, Germany.
Senior Citizens Commission - A nine-member body whose members are appointed by the Mayor and Council to serve three-year terms. The Commission is charged with proposing programs, activities, and legislation to meet the needs of senior citizens in Rockville and with conducting studies necessary to determine those needs. (Resolution Nos. 62-69, 21-70, and 30-73)
Sign Review Board - A four-member body whose members are appointed by the Mayor and Council to serve three-year terms. The Board reviews applications for sign permits and may grant modifications from sign regulations where applicable. (Chapter 25, Rockville City Code)
Traffic and Transportation Commission - A nine-member body appointed by the Mayor and Council to serve three-year terms. The purpose of the Commission is to advise the Mayor and Council and the Planning Commission on all traffic matters in the City and to make appropriate recommendations. (Resolution Nos. 28-72 and 3-76).

2 - 20
(This page intentionally left blank)

Water
(pgs. 3-14, 3-15)
Supports the
operating and CIP
projects needed to
supply safe and
potable water.
Sewer
(pgs. 3-16, 3-17)
Supports the
operating and CIP
projects needed to
transport sewage for
treatment and
disposal.
Refuse
(pgs. 3-18, 3-19)
Supports the
operating and CIP
projects needed to
collect recycling and
refuse.
Stormwater
Management
(pgs. 3-22, 3-23)
Supports the
operating and CIP
projects needed to
transport rain water.
Parking
(pgs. 3-20, 3-21)
Supports the parking
garage debt service
and operations of the
citywide parking meter
program.
RedGate Golf
Course
(pgs. 3-24, 3-25)
Supports the
operation of the
City's golf course.
Special Revenue Funds
3 - 1
Special Activities
(pg. 3-26,
3-27)
Supports specific
programs as defined
by legal or policy
restrictions.
Speed Camera
(pgs. 3-30,
3-31)
Supports
speed camera
operations and
pedestrian and public
safety initiatives.
CDBG
(pg. 3-28)
Supports non-profit
public service
providers who
repair, renovate,
and/or provide
housing for low-
income residents.
All Funds Summary - Fund Overview
FIGURE 3-1. The City of Rockville's Budget Contains 11 Operating Funds and 1 Capital Fund
General
(pgs. 3-6 to 3-13)
Primary operating
fund that is used to
account for the
City's activities that
are not included in
another fund.
Debt Service
(pgs. 3-34 to 3-37)
Supports principal
and interest
payments on
general debt used
to support the CIP.
Capital Projects
(pgs. 3-38 to 3-42)
Supports the
five-year capital
improvements
program (CIP).
Governmental Funds Proprietary / Enterprise Funds
etompkins
Underline
etompkins
Underline
etompkins
Underline
etompkins
Underline
etompkins
Underline
etompkins
Underline
etompkins
Underline
etompkins
Underline
etompkins
Underline
etompkins
Underline
etompkins
Underline
etompkins
Underline

Revenue
Property Taxes 36,895,000 - - - 163,000 - - - - - - 37,058,000
From Other Gov't. 14,816,000 - - - 295,000 - - - 593,000 - - 15,704,000
Fines & Forfeitures 645,000 - - - 700,000 - - - - 1,392,000 - 2,737,000
Use of Money & Prop. 405,900 34,000 4,000 25,000 15,000 19,500 - 783,690 - 37,000 300,000 1,624,090
Charges for Serv. 6,132,610 9,580,000 8,080,000 5,510,000 400,000 2,580,000 1,157,480 20,000 - - - 33,460,090
Licenses & Permits 2,261,000 - - - - 40,000 - - - - - 2,301,000
Other Revenue 4,887,370 36,500 3,000 122,600 300,000 1,700 - - - - - 5,351,170
Total Revenue 66,042,880 9,650,500 8,087,000 5,657,600 1,873,000 2,641,200 1,157,480 803,690 593,000 1,429,000 300,000 98,235,350
Transfers In - 450,970 - 41,200 500,000 - 630,000 7,170 - - 5,100,000 6,729,340
Total Resources 66,042,880 10,101,470 8,087,000 5,698,800 2,373,000 2,641,200 1,787,480 810,860 593,000 1,429,000 5,400,000 104,964,690
Use of Reserves * - - - 310,070 664,640 544,980 - 329,050 - - 396,000 2,244,740
TOTAL 66,042,880 10,101,470 8,087,000 6,008,870 3,037,640 3,186,180 1,787,480 1,139,910 593,000 1,429,000 5,796,000 107,209,430
Operating Exp.
Personnel 41,606,320 3,472,090 1,507,060 2,650,250 271,280 1,818,240 405,840 - 99,120 414,520 - 52,244,720
Operating 12,362,000 2,277,730 2,809,940 1,778,050 235,950 486,580 963,900 484,150 493,880 625,140 - 22,517,320
Capital Outlay 511,250 71,200 70,340 15,040 - - 19,750 569,630 - - - 1,257,210
Administrative - 1,010,110 547,070 987,250 132,710 610,990 197,400 - - 224,540 - 3,710,070
Other 1,317,940 1,715,000 1,510,000 352,000 766,500 260,000 125,100 86,130 - - 10,000 6,142,670
Total Operating Exp. 55,797,510 8,546,130 6,444,410 5,782,590 1,406,440 3,175,810 1,711,990 1,139,910 593,000 1,264,200 10,000 85,871,990
Other Uses of Funds
Principal - - - - - - - - - - 3,924,000 3,924,000
Interest - 971,120 1,141,280 86,800 1,631,200 10,370 10,200 - - - 1,862,000 5,712,970
Capital Improvements 3,967,000 - - - - - - - - - - 3,967,000
Transfers Out 6,278,370 - 311,490 139,480 - - - - - - - 6,729,340
Total Other Uses 10,245,370 971,120 1,452,770 226,280 1,631,200 10,370 10,200 - - - 5,786,000 20,333,310
Total Use of Funds 66,042,880 9,517,250 7,897,180 6,008,870 3,037,640 3,186,180 1,722,190 1,139,910 593,000 1,264,200 5,796,000 106,205,300
Addition to Reserves * - 584,220 189,820 - - - 65,290 - - 164,800 - 1,004,130
TOTAL 66,042,880 10,101,470 8,087,000 6,008,870 3,037,640 3,186,180 1,787,480 1,139,910 593,000 1,429,000 5,796,000 107,209,430
Required Reserve Target 15% of Rev. 90 day 90 day 30 day 30 day 90 day 30 day N/A* N/A* N/A* Average Prin. N/A
Required Reserve Level 9,906,432 2,379,313 1,974,295 500,739 253,137 796,545 143,516 N/A* N/A* N/A* 2,550,465 18,504,441
Projected 6/30/12 Reserve 11,428,189 (2,223,208) 1,022,798 1,979,686 1,856,220 1,919,227 (94,902) 3,693,416 - 2,663,385 1,820,831 24,065,642
Parking
(320)
SWM
(330)
RedGate
(340)
Refuse
(230)
Parking
(320)
3 - 2** The required reserve is equal to the average annual outstanding principal amount due on the City's general debt.
* The City does not have a policy about maintaining a balance in these funds because they are used to account for the proceeds of specific revenue sources that are restricted by legal and regulatory provisions.
Debt Serv.
(550) **
Total for
All Funds
General
(110)
Water
(210)
Sewer
(220)
CDBG
(360)
Speed
(380)
Refuse
(230)
Debt Serv.
(550)
General
(110)
Total for
All Funds
TABLE 3-3. Reserve Levels
Spec. Act.
(350)
CDBG
(360)
Sewer
(220)
SWM
(330)
Spec. Act.
(350)
* Addition to Reserves refers to the addition of fund balance or working capital balance.
RedGate
(340)
Speed
(380)
CDBG
(360)
Water
(210)
All Funds Summary - Operating by CategoryTABLE 3-1. FY 2012 Resources by Category
TABLE 3-2. FY 2012 Use of Funds by Category
General
(110)
Water
(210)
Sewer
(220)
Refuse
(230)
Parking
(320)
SWM
(330)
Speed
(380)
Debt Serv.
(550)
Total for
All Funds
* Use of Reserves refers to the appropriation of fund balance or working capital balance.
RedGate
(340)
Spec. Act.
(350)
etompkins
Underline
etompkins
Underline
etompkins
Underline
etompkins
Underline
etompkins
Underline
etompkins
Underline
etompkins
Underline
etompkins
Underline
etompkins
Underline
etompkins
Underline
etompkins
Underline
etompkins
Underline
etompkins
Underline
etompkins
Underline
etompkins
Underline
etompkins
Underline
etompkins
Underline
etompkins
Underline
etompkins
Underline
etompkins
Underline
etompkins
Underline
etompkins
Underline
etompkins
Underline
etompkins
Underline
etompkins
Underline
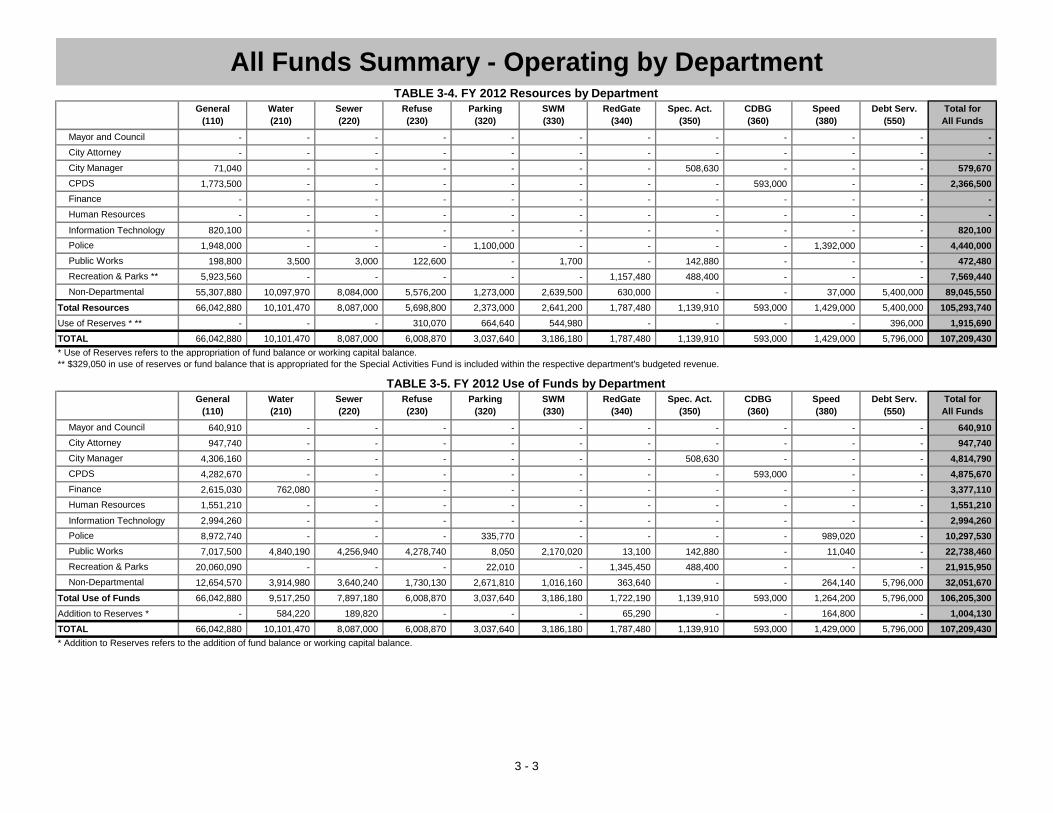
Mayor and Council - - - - - - - - - - - -
City Attorney - - - - - - - - - - - -
City Manager 71,040 - - - - - - 508,630 - - - 579,670
CPDS 1,773,500 - - - - - - - 593,000 - - 2,366,500
Finance - - - - - - - - - - - -
Human Resources - - - - - - - - - - - -
Information Technology 820,100 - - - - - - - - - - 820,100
Police 1,948,000 - - - 1,100,000 - - - - 1,392,000 - 4,440,000
Public Works 198,800 3,500 3,000 122,600 - 1,700 - 142,880 - - - 472,480
Recreation & Parks ** 5,923,560 - - - - - 1,157,480 488,400 - - - 7,569,440
Non-Departmental 55,307,880 10,097,970 8,084,000 5,576,200 1,273,000 2,639,500 630,000 - - 37,000 5,400,000 89,045,550
Total Resources 66,042,880 10,101,470 8,087,000 5,698,800 2,373,000 2,641,200 1,787,480 1,139,910 593,000 1,429,000 5,400,000 105,293,740
Use of Reserves * ** - - - 310,070 664,640 544,980 - - - - 396,000 1,915,690
TOTAL 66,042,880 10,101,470 8,087,000 6,008,870 3,037,640 3,186,180 1,787,480 1,139,910 593,000 1,429,000 5,796,000 107,209,430
Mayor and Council 640,910 - - - - - - - - - - 640,910
City Attorney 947,740 - - - - - - - - - - 947,740
City Manager 4,306,160 - - - - - - 508,630 - - - 4,814,790
CPDS 4,282,670 - - - - - - - 593,000 - - 4,875,670
Finance 2,615,030 762,080 - - - - - - - - - 3,377,110
Human Resources 1,551,210 - - - - - - - - - - 1,551,210
Information Technology 2,994,260 - - - - - - - - - - 2,994,260
Police 8,972,740 - - - 335,770 - - - - 989,020 - 10,297,530
Public Works 7,017,500 4,840,190 4,256,940 4,278,740 8,050 2,170,020 13,100 142,880 - 11,040 - 22,738,460
Recreation & Parks 20,060,090 - - - 22,010 - 1,345,450 488,400 - - - 21,915,950
Non-Departmental 12,654,570 3,914,980 3,640,240 1,730,130 2,671,810 1,016,160 363,640 - - 264,140 5,796,000 32,051,670
Total Use of Funds 66,042,880 9,517,250 7,897,180 6,008,870 3,037,640 3,186,180 1,722,190 1,139,910 593,000 1,264,200 5,796,000 106,205,300
Addition to Reserves * - 584,220 189,820 - - - 65,290 - - 164,800 - 1,004,130
TOTAL 66,042,880 10,101,470 8,087,000 6,008,870 3,037,640 3,186,180 1,787,480 1,139,910 593,000 1,429,000 5,796,000 107,209,430
Total for
All Funds
TABLE 3-5. FY 2012 Use of Funds by Department
General
(110)
Water
(210)
Sewer
(220)
Refuse
(230)
TABLE 3-4. FY 2012 Resources by Department
RedGate
(340)
* Use of Reserves refers to the appropriation of fund balance or working capital balance.
** $329,050 in use of reserves or fund balance that is appropriated for the Special Activities Fund is included within the respective department's budgeted revenue.
All Funds Summary - Operating by Department
General
(110)
CDBG
(360)
Sewer
(220)
SWM
(330)
Spec. Act.
(350)
Speed
(380)
3 - 3
Water
(210)
Refuse
(230)
Parking
(320)
Debt Serv.
(550)
Parking
(320)
SWM
(330)
* Addition to Reserves refers to the addition of fund balance or working capital balance.
Speed
(380)
Debt Serv.
(550)
Total for
All Funds
RedGate
(340)
Spec. Act.
(350)
CDBG
(360)
etompkins
Underline
etompkins
Underline
etompkins
Underline
etompkins
Underline
etompkins
Underline
etompkins
Underline
etompkins
Underline
etompkins
Underline
etompkins
Underline
etompkins
Underline
etompkins
Underline
etompkins
Underline
etompkins
Underline
etompkins
Underline
etompkins
Underline
etompkins
Underline
etompkins
Underline
etompkins
Underline
etompkins
Underline
etompkins
Underline
etompkins
Underline
etompkins
Underline
etompkins
Underline
etompkins
Underline
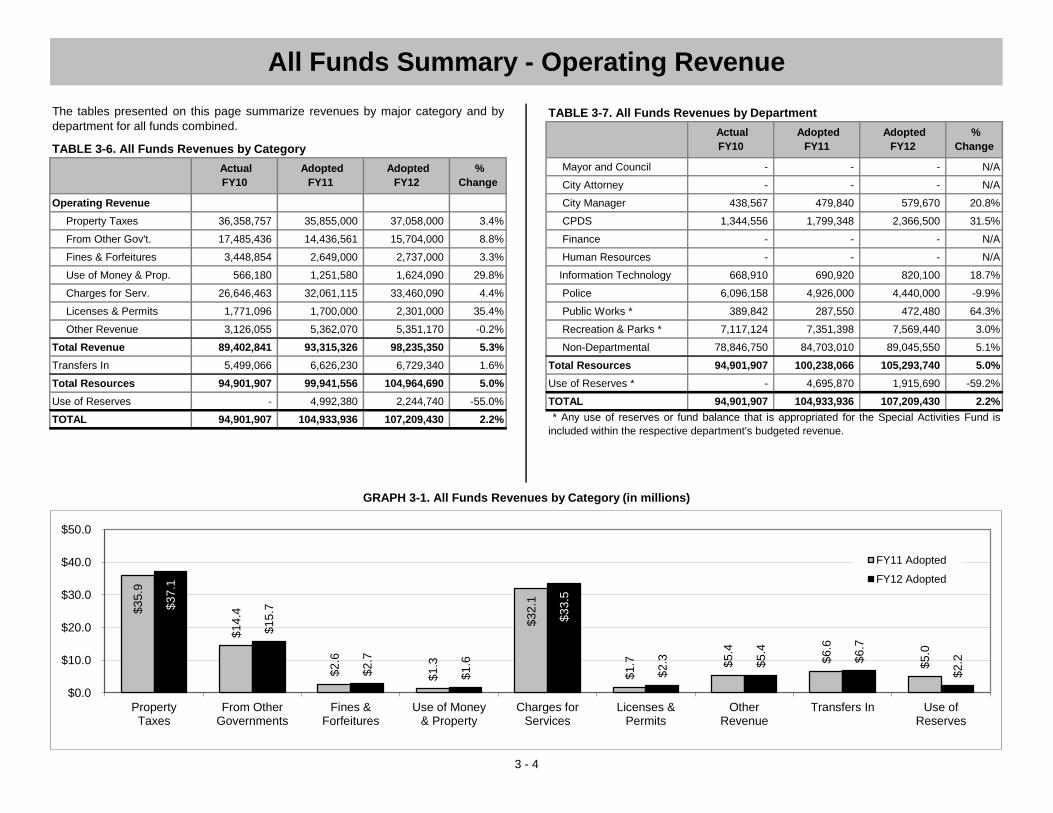
TABLE 3-7. All Funds Revenues by Department
TABLE 3-6. All Funds Revenues by Category
Mayor and Council - - - N/A
City Attorney - - - N/A
Operating Revenue City Manager 438,567 479,840 579,670 20.8%
Property Taxes 36,358,757 35,855,000 37,058,000 3.4% CPDS 1,344,556 1,799,348 2,366,500 31.5%
From Other Gov't. 17,485,436 14,436,561 15,704,000 8.8% Finance - - - N/A
Fines & Forfeitures 3,448,854 2,649,000 2,737,000 3.3% Human Resources - - - N/A
Use of Money & Prop. 566,180 1,251,580 1,624,090 29.8% Information Technology 668,910 690,920 820,100 18.7%
Charges for Serv. 26,646,463 32,061,115 33,460,090 4.4% Police 6,096,158 4,926,000 4,440,000 -9.9%
Licenses & Permits 1,771,096 1,700,000 2,301,000 35.4% Public Works * 389,842 287,550 472,480 64.3%
Other Revenue 3,126,055 5,362,070 5,351,170 -0.2% Recreation & Parks * 7,117,124 7,351,398 7,569,440 3.0%
Total Revenue 89,402,841 93,315,326 98,235,350 5.3% Non-Departmental 78,846,750 84,703,010 89,045,550 5.1%
Transfers In 5,499,066 6,626,230 6,729,340 1.6% Total Resources 94,901,907 100,238,066 105,293,740 5.0%
Total Resources 94,901,907 99,941,556 104,964,690 5.0% Use of Reserves * - 4,695,870 1,915,690 -59.2%
Use of Reserves - 4,992,380 2,244,740 -55.0% TOTAL 94,901,907 104,933,936 107,209,430 2.2%
TOTAL 94,901,907 104,933,936 107,209,430 2.2%
3 - 4
Adopted
FY11
Adopted
FY12
%
Change
Actual
FY10
Adopted
FY11
Adopted
FY12
* Any use of reserves or fund balance that is appropriated for the Special Activities Fund is
included within the respective department's budgeted revenue.
GRAPH 3-1. All Funds Revenues by Category (in millions)
All Funds Summary - Operating Revenue
The tables presented on this page summarize revenues by major category and by
department for all funds combined.
Actual
FY10
%
Change
$3
5.9
$1
4.4
$2
.6
$1
.3
$3
2.1
$1
.7
$5
.4
$6
.6
$5
.0
$3
7.1
$1
5.7
$2
.7
$1
.6
$3
3.5
$2
.3
$5
.4
$6
.7
$2
.2
$0.0
$10.0
$20.0
$30.0
$40.0
$50.0
PropertyTaxes
From OtherGovernments
Fines &Forfeitures
Use of Money& Property
Charges forServices
Licenses &Permits
OtherRevenue
Transfers In Use ofReserves
FY11 Adopted
FY12 Adopted

TABLE 3-9. All Funds Expenditures by Department
TABLE 3-8. All Funds Expenditures by Category
Mayor and Council 633,834 598,250 640,910 7.1%
City Attorney 936,620 929,350 947,740 2.0%
Operating Exp. City Manager 3,431,481 4,487,330 4,814,790 7.3%
Personnel 49,162,296 51,310,630 52,244,720 1.8% CPDS 4,202,690 4,718,113 4,875,670 3.3%
Operating 21,978,063 23,395,301 22,517,320 -3.8% Finance 3,295,184 3,361,300 3,377,110 0.5%
Capital Outlay 1,029,946 1,178,820 1,257,210 6.6% Human Resources 1,138,109 1,322,190 1,551,210 17.3%
Administrative 1,506,000 4,247,310 3,710,070 -12.6% Information Technology 2,963,464 2,958,220 2,994,260 1.2%
Other 4,584,228 6,193,540 6,142,670 -0.8% Police 9,915,727 10,050,950 10,297,530 2.5%
Total Operating Exp. 78,260,533 86,325,601 85,871,990 -0.5% Public Works 21,640,050 22,281,060 22,738,460 2.1%
Other Uses of Funds Recreation & Parks 22,304,916 23,453,828 21,915,950 -6.6%
Principal 3,464,030 3,332,298 3,924,000 17.8% Non-Departmental 18,695,011 25,225,900 26,255,670 4.1%
Interest 4,591,564 5,102,446 5,712,970 12.0% Total Use of Funds 89,157,086 99,386,491 100,409,300 1.0%
Capital Improvements 2,378,000 3,141,000 3,967,000 26.3% Debt Service Fund * 5,036,107 5,141,084 5,796,000 12.7%
Transfers Out 5,499,066 6,626,230 6,729,340 1.6% Addition to Reserves - 406,361 1,004,130 147.1%
Total Other Uses 15,932,660 18,201,974 20,333,310 11.7% TOTAL 94,193,193 104,933,936 107,209,430 2.2%
Total Use of Funds 94,193,193 104,527,575 106,205,300 1.6%
Addition to Reserves - 406,361 1,004,130 147.1%
TOTAL 94,193,193 104,933,936 107,209,430 2.2%
3 - 5
GRAPH 3-2. All Funds Expenditures by Category (in millions)
All Funds Summary - Operating Expenditures
The tables presented on this page summarize expenditures by major category and
by department for all funds combined.
* The Debt Service Fund receives a transfer from the General Fund to pay off general
obligation debt. Since this transfer is already listed as an expenditure in Non-Departmental,
there is a double-counting effect when the Debt Service Fund records the same expenditure.
For this reason, the Debt Service Fund is isolated.
Actual
FY10
Adopted
FY11
Adopted
FY12
%
Change
Adopted
FY12
%
Change
Actual
FY10
Adopted
FY11 $
51
.3
$2
3.4
$1
.2
$4
.2
$6
.2
$3
.3
$5
.1
$3
.1
$6
.6
$0
.4
$5
2.2
$2
2.5
$1
.3
$3
.7
$6
.1
$3
.9
$5
.7
$4
.0
$6
.7
$1
.0
$0.0
$10.0
$20.0
$30.0
$40.0
$50.0
$60.0
Personnel Operating CapitalOutlay
Admin. Charges Other Principal Interest Transferto CIP
TransfersOut
Addition toReserves
FY11 Adopted
FY12 Adopted
etompkins
Underline
etompkins
Underline
etompkins
Underline
etompkins
Underline
etompkins
Underline
etompkins
Underline
etompkins
Underline
etompkins
Underline
etompkins
Underline
etompkins
Underline
etompkins
Underline
etompkins
Underline

TABLE 3-10. General Fund Revenues by Category
Property Taxes 35,454,838 34,762,000 36,895,000 6.1%
From Other Gov't. 15,399,421 13,527,213 14,816,000 9.5%
Fines & Forfeitures 687,732 645,000 645,000 0.0%
Use of Money & Prop. 186,255 322,080 405,900 26.0%
Charges for Serv. 5,766,550 5,853,405 6,132,610 4.8%
Licenses & Permits 1,737,186 1,660,000 2,261,000 36.2%
Other Revenue 2,735,759 5,332,970 4,887,370 -8.4%
Subtotal 61,967,741 62,102,668 66,042,880 6.3%
Use of Reserves - 1,019,625 - -100.0%
Total 61,967,741 63,122,293 66,042,880 4.6%
TABLE 3-11. General Fund Expenditures by Category
Salaries 29,052,648 29,661,020 30,026,210 1.2%
Benefits 8,673,656 9,867,640 10,704,140 8.5%
Overtime 1,147,470 820,380 875,970 6.8%
Personnel Subtotal 38,873,774 40,349,040 41,606,320 3.1%
Contractual Services 7,286,501 6,725,625 7,088,580 5.4%
Commodities 4,858,076 4,992,238 5,273,420 5.6%
Operating Subtotal 12,144,577 11,717,863 12,362,000 5.5%
Capital Outlay 718,022 480,620 511,250 6.4%
Other / Transfer 2,221,461 2,333,770 2,496,310 7.0%
Contribution to CIP 2,378,000 3,141,000 3,967,000 26.3%
Debt Service Transfer 4,000,000 5,100,000 5,100,000 0.0%
Total 60,335,834 63,122,293 66,042,880 4.6%
Adopted
FY11
Adopted
FY12
%
Change
3 - 6
Actual
FY10
Throughout this section there are full descriptions of significant General Fund
revenues. Any major changes between Adopted FY 2011 and Adopted FY 2012
are discussed, along with applicable trend data. The City's largest revenue
source in the General Fund comes from property taxes. Real and personal
property tax rates and estimated assessed values are described in detail on
pages 3-8 and 3-9.
The General Fund is the primary operating fund of the City and is used to
account for the City's activities that are not included in another fund. Many of the
City administrative functions are supported through this fund. The major revenue
sources for the General Fund are property tax, income tax, hotel tax, tax
duplication payments from Montgomery County, and charges or user fees for
services.
Governmental Funds - General Fund
Actual
FY10
Adopted
FY11
Adopted
FY12
%
Change
etompkins
Underline
etompkins
Underline
etompkins
Underline
etompkins
Underline
etompkins
Underline
etompkins
Underline
etompkins
Underline

TABLE 3-12. General Fund Revenues by Department GRAPH 3-3. General Fund Revenues by Category
Mayor and Council - - - N/A
City Attorney - - - N/A
City Manager - 71,040 71,040 0.0%
CPDS 1,007,876 1,185,000 1,773,500 49.7%
Finance - - - N/A
Human Resources - - - N/A
Information Technology 668,910 690,920 820,100 18.7%
Police 2,206,121 1,812,000 1,948,000 7.5%
Public Works 164,588 121,400 198,800 63.8%
Recreation & Parks 5,874,591 5,882,298 5,923,560 0.7%
Non-Departmental 52,045,655 52,340,010 55,307,880 5.7%
Subtotal 61,967,741 62,102,668 66,042,880 6.3%
Use of Reserves - 1,019,625 - -100.0%
Total 61,967,741 63,122,293 66,042,880 4.6% GRAPH 3-4. General Fund Expenditures by Category
TABLE 3-13. General Fund Expenditures by Department
Mayor and Council 633,834 598,250 640,910 7.1%
City Attorney 936,620 929,350 947,740 2.0%
City Manager 3,426,824 4,078,530 4,306,160 5.6%
CPDS 3,866,116 4,103,765 4,282,670 4.4%
Finance 2,537,341 2,525,230 2,615,030 3.6%
Human Resources 1,138,109 1,322,190 1,551,210 17.3%
Information Technology 2,963,464 2,958,220 2,994,260 1.2%
Police 8,540,236 8,733,330 8,972,740 2.7%
Public Works 7,105,090 6,366,470 7,017,500 10.2%
Recreation & Parks 19,239,807 19,861,928 20,060,090 1.0%
Non-Departmental 9,948,393 11,645,030 12,654,570 8.7%
Total 60,335,834 63,122,293 66,042,880 4.6%
Adopted
FY11
Adopted
FY12
3 - 7
Governmental Funds - General Fund
%
Change
Actual
FY10
Adopted
FY11
Adopted
FY12
%
Change
Actual
FY10
$40.3
$1
1.7
$0
.5
$2
.3
$3.1
$5.1
$41.6
$12.4
$0.5
$2.5
$4.0
$5.1
$0
$10
$20
$30
$40
$50
Personnel Operating CapitalOutlays
Other /Transfers
CIPContrib.
DebtService
General Fund Expenditures (in millions)
FY11 Adopted FY12 Adopted
$34.8
$13.5
$0.6
$0.3
$5.9
$1.7
$5.3
$36.9
$14.8
$0.6
$0.4
$6.1
$2.3
$4.9
$0
$10
$20
$30
$40
$50
PropertyTaxes
From OtherGov't.
Fines &Forfeitures
Money /Property
Chargesfor Serv.
Lic. &Permits
OtherRevenue
General Fund Revenues (in millions)
FY11 Adopted FY12 Adopted
etompkins
Underline
etompkins
Underline
etompkins
Underline
etompkins
Underline
etompkins
Underline
etompkins
Underline
etompkins
Underline
etompkins
Underline
etompkins
Underline
etompkins
Underline
etompkins
Underline
etompkins
Underline
etompkins
Underline
etompkins
Underline
etompkins
Underline
etompkins
Underline
etompkins
Underline
etompkins
Underline
etompkins
Underline
etompkins
Underline
etompkins
Underline
etompkins
Underline

Real and Personal Property Taxes Real Property Tax Constant Yield Tax Rate
Real Property Tax Assumptions
GRAPH 3-5. History of Real Property Taxable Assessed Values
Real Property Tax Credit
* The total taxable assessed value for FY12 includes $17.6 million from properties that pay
a reduced tax rate of $0.049. These properties include the Woodmont County Club and
several properties in King Farm. Under the City's current annexation agreements, these
properties will remain in this reduced tax class until they change ownership or until the
agreements expire. The agreement with Woodmont was signed in 1964 and expires in
2014, and the agreement with King Farm was signed in 1995 and expires in 2015.
3 - 8
General Fund Revenues, Detail of Major Revenue Sources
The total real taxable assessed value from FY 2011 to FY 2012 is estimated to
increase by 0.3 percent. This increase is due to new properties being added
during the year, and existing properties being taxed at full value. The next round
of property reassessments will take place in January 2012 and January 2013.
The FY 2012 estimated real property tax revenue of $33.8 million includes the
City's Homeowners' Tax Credit Program. The Homeowners' Tax Credit Program is
a State administered program that provides real property tax credits to low- to
moderate-income residents for property taxes due on their principal residence.
Under the City's FY 2012 Program, households with gross incomes up to $85,000
per year and a household net worth of less than $200,000 (not including the value
of the home or qualified retirement savings) could qualify for tax relief on the first
$400,000 of their home's assessed value. For low-income households, the credit
could be several hundred dollars with the maximum credit totaling the City tax due
on the first $400,000 of assessed value.
The City of Rockville’s proposed real property tax rate for FY 2012 totals $0.292
for every $100 of assessed value. The State Department of Assessments and
Taxation (SDAT) reassesses real property every three years, and tax bills are
based on those assessments. For homeowners, any increase to assessed value
is phased in equally over a three-year period, and the resulting increase in the
property tax bill is capped at 10 percent (any decrease is fully factored into the
first full levy year after the assessment).
In accordance with Maryland law, the constant yield tax rate is defined as the
property tax rate that would yield the same tax revenue as the previous year, not
including new construction. When assessments increase and the tax rate
remains unchanged, property tax revenue increases. The constant yield rate is
the rate that would offset the increase in tax revenue that results from the
increase in assessed value. For FY 2012, the constant yield rate was calculated
to be $0.2891 per $100 of assessed value, or 1.0 percent lower than the City's
property tax rate of $0.292. In accordance with Maryland law, since the constant
yield tax rate is lower than the City's tax rate, the City is required to advertise the
constant yield tax rate and hold a public hearing, which took place on April 4,
2011.
The FY 2012 budget for taxes on real property is based on the following
information sources and assumptions:
The calculation of the assessed value begins with an estimate prepared by
SDAT of the assessed value of all real property that will be on the tax rolls as
of the beginning of FY 2012, based on assessment information from January
2011.
Real Property Tax
This category of revenue consists of taxes on the assessed value of real estate
(including land and structures on the land) and taxes on the assessed value of
personal property (inventory, furniture, and fixtures of business establishments).
The tax rate is the amount levied per $100 of assessed value, as determined by
the State of Maryland Department of Assessments and Taxation. The Mayor and
Council establish the tax rate each year in order to finance General Fund
activities. In FY 2012, total property taxes are budgeted to constitute
approximately 56 percent of the City’s General Fund budget.
The City adds its estimate of the value of residential and commercial
development that would be completed and assessed during the remainder of
FY 2011 and throughout FY 2012.
The revenue estimate is based on multiplying the assessed value by the tax
rate, taking into consideration when new property is levied, the impact of
appeals and late payments, and the possibility of less than anticipated
growth.
$5.9
2
$6.3
1
$7.1
9
$7.5
4
$9.0
1
$10.1
5
$11.1
2
$1
1.5
9
$11.8
5
$11.8
8
$3
$5
$7
$9
$11
$13
FY03 FY04 FY05 FY06 FY07 FY08 FY09 FY10 FY11 FY12 *
Real Property Taxable Assessed Value (in billions)

Personal Property Tax GRAPH 3-7. History of Real and Personal Property Tax Rates
GRAPH 3-6. History of Personal Property Taxable Assessed Values
31,957,545 31,717,000 33,750,000 6.4%
3,374,924 2,945,000 3,045,000 3.4%
35,454,838 34,762,000 36,895,000 6.1%
0.0%122,369 100,000 100,000
Over the past few years the total taxable assessed value of personal property in
the City of Rockville has remained relatively flat, mainly due to the number of
businesses that focus on technology. Computers and other types of high tech
equipment depreciate more rapidly leading to decreases in the overall assessed
value for personal property. The FY 2012 budget assumes the taxable assessed
value will increase by approximately 1.0 percent from the FY 2011 estimate.
TABLE 3-14. Property Tax Revenue Summary
General Fund Revenues, Detail of Major Revenue Sources
The City of Rockville’s FY 2012 personal property tax rate remains unchanged at
$0.805 cents per $100 of assessed value. In accordance with Maryland law, the
personal property tax only applies to businesses. The City has enacted the
following exemptions from personal property tax: (1) 82 percent of the value of
commercial inventory; (2) 82 percent of the value of manufacturing or research
and development inventory; and (3) 100 percent of the value of manufacturing or
research and development machinery.
Adopted
FY11
Adopted
FY12
Real Property Tax (pg. 3-8)
Total
Personal Property (pg. 3-9)
%
Change
Actual
FY10
3 - 9
Interest on Taxes - Interest on
delinquent taxes
$0.8
05
$0.8
05
$0.8
05
$0.8
05
$0.8
05
$0.8
05
$0.8
05
$0.8
05
$0.8
05
$0.8
05
0.3
22
0.3
22
0.3
22
0.3
22
0.3
12
0.3
02
0.2
92
0.2
92
0.2
92
0.2
92
$0.00
$0.20
$0.40
$0.60
$0.80
$1.00
FY03 FY04 FY05 FY06 FY07 FY08 FY09 FY10 FY11 FY12
Real and Personal Property Tax Rates
Personal
Real
$471
$406
$402
$401
$388
$394
$398
$414
$386
$390
$0
$100
$200
$300
$400
$500
FY03 FY04 FY05 FY06 FY07 FY08 FY09 FY10 FY11 FY12
Personal Property Assessed Value (in millions)
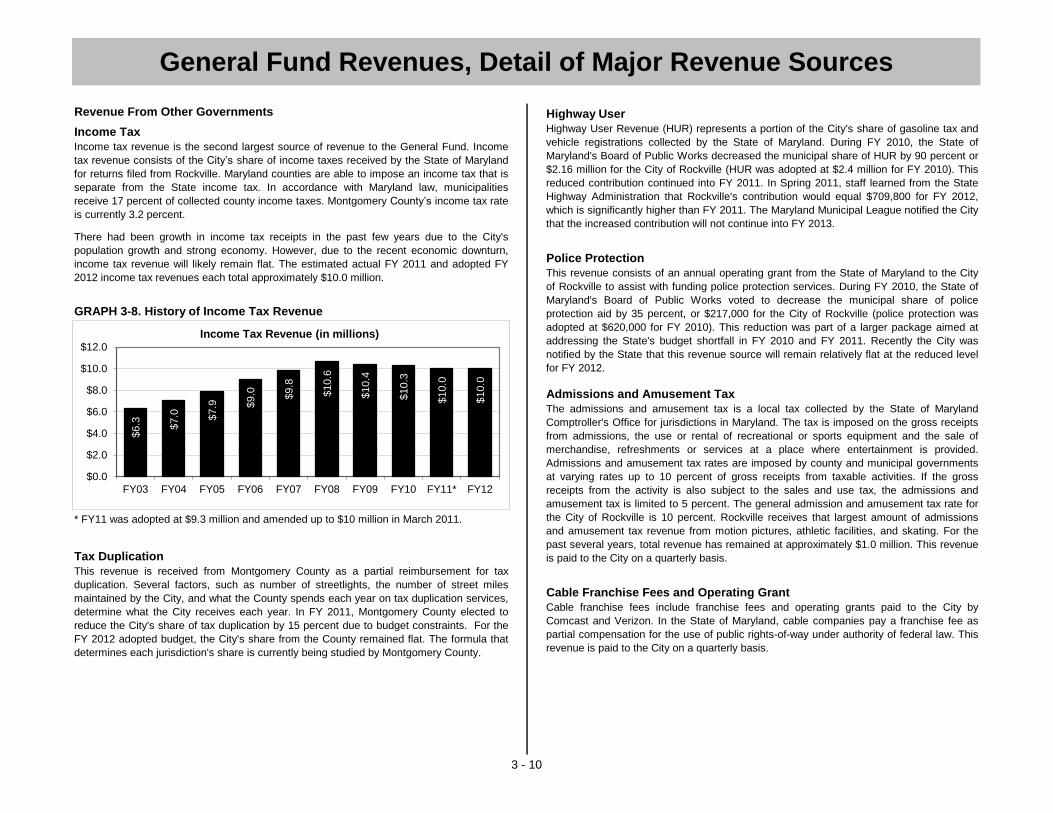
Revenue From Other Governments Highway User
Income Tax
Police Protection
GRAPH 3-8. History of Income Tax Revenue
Admissions and Amusement Tax
* FY11 was adopted at $9.3 million and amended up to $10 million in March 2011.
Cable Franchise Fees and Operating Grant
Highway User Revenue (HUR) represents a portion of the City's share of gasoline tax and
vehicle registrations collected by the State of Maryland. During FY 2010, the State of
Maryland's Board of Public Works decreased the municipal share of HUR by 90 percent or
$2.16 million for the City of Rockville (HUR was adopted at $2.4 million for FY 2010). This
reduced contribution continued into FY 2011. In Spring 2011, staff learned from the State
Highway Administration that Rockville's contribution would equal $709,800 for FY 2012,
which is significantly higher than FY 2011. The Maryland Municipal League notified the City
that the increased contribution will not continue into FY 2013.
Income tax revenue is the second largest source of revenue to the General Fund. Income
tax revenue consists of the City’s share of income taxes received by the State of Maryland
for returns filed from Rockville. Maryland counties are able to impose an income tax that is
separate from the State income tax. In accordance with Maryland law, municipalities
receive 17 percent of collected county income taxes. Montgomery County’s income tax rate
is currently 3.2 percent.
General Fund Revenues, Detail of Major Revenue Sources
Cable franchise fees include franchise fees and operating grants paid to the City by
Comcast and Verizon. In the State of Maryland, cable companies pay a franchise fee as
partial compensation for the use of public rights-of-way under authority of federal law. This
revenue is paid to the City on a quarterly basis.
Tax Duplication
This revenue consists of an annual operating grant from the State of Maryland to the City
of Rockville to assist with funding police protection services. During FY 2010, the State of
Maryland's Board of Public Works voted to decrease the municipal share of police
protection aid by 35 percent, or $217,000 for the City of Rockville (police protection was
adopted at $620,000 for FY 2010). This reduction was part of a larger package aimed at
addressing the State's budget shortfall in FY 2010 and FY 2011. Recently the City was
notified by the State that this revenue source will remain relatively flat at the reduced level
for FY 2012.
The admissions and amusement tax is a local tax collected by the State of Maryland
Comptroller's Office for jurisdictions in Maryland. The tax is imposed on the gross receipts
from admissions, the use or rental of recreational or sports equipment and the sale of
merchandise, refreshments or services at a place where entertainment is provided.
Admissions and amusement tax rates are imposed by county and municipal governments
at varying rates up to 10 percent of gross receipts from taxable activities. If the gross
receipts from the activity is also subject to the sales and use tax, the admissions and
amusement tax is limited to 5 percent. The general admission and amusement tax rate for
the City of Rockville is 10 percent. Rockville receives that largest amount of admissions
and amusement tax revenue from motion pictures, athletic facilities, and skating. For the
past several years, total revenue has remained at approximately $1.0 million. This revenue
is paid to the City on a quarterly basis.
This revenue is received from Montgomery County as a partial reimbursement for tax
duplication. Several factors, such as number of streetlights, the number of street miles
maintained by the City, and what the County spends each year on tax duplication services,
determine what the City receives each year. In FY 2011, Montgomery County elected to
reduce the City's share of tax duplication by 15 percent due to budget constraints. For the
FY 2012 adopted budget, the City's share from the County remained flat. The formula that
determines each jurisdiction's share is currently being studied by Montgomery County.
There had been growth in income tax receipts in the past few years due to the City's
population growth and strong economy. However, due to the recent economic downturn,
income tax revenue will likely remain flat. The estimated actual FY 2011 and adopted FY
2012 income tax revenues each total approximately $10.0 million.
3 - 10
$6
.3
$7.0
$7.9
$9.0
$9.8
$10.6
$10.4
$10.3
$10.0
$10.0
$0.0
$2.0
$4.0
$6.0
$8.0
$10.0
$12.0
FY03 FY04 FY05 FY06 FY07 FY08 FY09 FY10 FY11* FY12
Income Tax Revenue (in millions)

County Grant - Linkages to Learning Fines and Forfeitures
Youth and Family Services Grant TABLE 3-16. Fines and Forfeitures Summary
TABLE 3-15. Revenue from Other Governments Summary
10,306,947 9,300,000 10,000,000 7.5%
2,228,449 1,893,800 1,799,110 -5.0%
325,985 113,000 709,800 528.1%
687,732 645,000 645,000 0.0%
Use of Money and Property
Land Rental
TABLE 3-17. Use of Money and Property Summary
38,768 20,000 20,000 0.0%
1,295 600 600 0.0%
131,335 247,330 316,950 28.1%
186,255 322,080 405,900 26.0%
227,640 45,550 9,550 -79.0%
15,399,421 13,527,213 14,816,000 9.5%
This County grant funds a program at Maryvale Elementary School to provide accessible
services to at-risk children and their families to improve adjustment to and performance in
school, home, and community. Services include health, mental health, social services and
educational support.
This grant comes from the County Department of Health and Human Services and
Collaboration Council for Children, Youth, and Families. This grant supports core services
for at-risk youth, including formal counseling, crisis intervention and substance abuse
assessments. In addition, this grant helps fund school- and community-based youth
development and mentoring programs.
3 - 11
93,950 -6.4%
- 0.0%
13,300
Recreation Grants
13,300
100,328
3.3%
0.0%
6,600
Land rental, the largest revenue in this category, is estimated to increase due to the
installation of new monopoles on City property. The City collects revenues from
monopoles located at the RedGate Golf Course and the Glen Mill Pump Station.
13,265
117,800
6,600
14,920
Actual
FY10
General Fund Revenues, Detail of Major Revenue Sources
Tax Duplication (pg. 3-10)
Police Protection Grant
(pg. 3-10)417,386 403,000
5.3% 950,000
3.5%Total
%
Change
Adopted
FY12
167,005 172,500
11.6%574,190
179,236
Income Tax (pg. 3-10)
Adopted
FY11
537,575
1,006,370 1,000,000
Highway User (pg. 3-10)
Admissions and Amusement
Tax (pg. 3-10)
514,630
417,000
Actual
FY10
Miscellaneous Grants
Total
Cable Franchise Fees and
Operating Grant (pg. 3-10)
Payment in Lieu of Taxes -
From Montgomery County in
lieu of taxes
Traffic Signal Maintenance
Reimbursement - From the
State for maintenance
County Grant - Linkages
to Learning (pg. 3-11)
Youth and Family Services
Grant (pag. 3-11)
10,000
Confiscated Funds - Items
seized by City Police during
commission of a crime
Red Light Camera Revenue -
Revenue received from fines
for red light infractions (pg. 3-
11)
0.0%
0.0%5,000 5,000 6,866
Adopted
FY11
Revenues received from red light camera infractions make up most of this category. The
revenues from the red light camera citations cover the total cost to operate the program.
Revenue from red light cameras is estimated to remain flat from adopted FY 2011 to
adopted FY 2012.
663,427 630,000
10,000
%
Change
%
Change
Adopted
FY12
Actual
FY10
Municipal Infractions -
Revenues received from fines
for municipal infractions
Adopted
FY11
Adopted
FY12
630,000
0.0%17,440
Total
Interest Earnings - Interest on
the investment of City funds
38,350
30,000
Returned Check Fee
50,000 66.7%
-13.1%Building Rental - From the
rental of City buildings 38,705 44,150
Land Rental (pg. 3-11)
etompkins
Underline
etompkins
Underline
etompkins
Underline
etompkins
Underline
etompkins
Underline
etompkins
Underline
etompkins
Underline
etompkins
Underline
etompkins
Underline
etompkins
Underline
etompkins
Underline
etompkins
Underline

Charges for Services Theme Park Tickets
Recreation Program Fees
Zoning Fees F. Scott Fitzgerald Theatre Tickets
Swim and Fitness Center Charges
TABLE 3-18. Charges for Services Summary
Community Charges
2,729,193 2,753,405 2,764,330 0.4%
84,777 50,000 193,500 287.0%
Fire Safety and Fire Review Fees 93,521 104,000 120,000 15.4%
64,777 150,000 100,000 -33.3%
Public Works Permits 46,750 75,000 75,000 0.0%
102,514 100,000 160,000 60.0%
307,662 315,000 315,000 0.0%
707,510 690,500 771,000 11.7%
Swim Team Dues
760,253 771,700 760,800 -1.4%
Membership Fees
98,578 120,000 110,000 -8.3%
Facility Rental Fees
301,852 297,500 307,500 3.4%
5,766,550 5,853,405 6,132,610 4.8%
General Fund Revenues, Detail of Major Revenue Sources
Public Works Permits (pg. 3-12)
313,000
26,030
314,105 0.0%
53.1%31,309
This revenue source consists of dues paid by the Rockville-Montgomery Swim Club
(RMSC) team. The RMSC team is operated as a joint program between the City's
Department of Rec. and Parks and the Montgomery County Rec. Department.
Facility Rental Fees (pg. 3-12)
Actual
FY10
Adopted
FY11
Adopted
FY12
%
Change
This revenue source represents annual ticket sales at the F. Scott Fitzgerald Theatre. This revenue source is specific to the Community Planning and Development Services
Department and consists of fees paid by developers, property owners or their
representatives. The fees are paid for planning and development review services to
ensure that new development of private property is consistent, and compliant with, the
City's Comprehensive Master Plan, Zoning Ordinance and all applicable Codes and
policies. The increase from FY 2011 to FY 2012 is due to increasing fees as a result of the
Comprehensive User Fee Study, and to make certain fees are consistent with neighboring
jurisdictions.
3 - 12
Community Charges (pg. 3-12)
This revenue source consists of fees for memberships to the City's recreational facilities.
This includes but is not limited to memberships at the Twinbrook, Lincoln Park, and
Thomas Farm community centers.
Special Events Fees - Corporate
sponsorships77,771 40,000
17,000
Total
Internal Use of Facilities - Revenue
from internal use of City facilities
Swim & Fitness Center (pg. 3-12)
62.9%
18,800 18,161
22,304 20,000
F. Scott Fitzgerald Theatre Tickets
(pg. 3-12)
-28.6%12,500 17,500 5,513
18,800 0.0%
65,150
This revenue source is related to the sale of tickets to area theme parks through the
Maryland Recreation and Parks Association. The City purchases the tickets at a
discounted rate and sells them to City residents at that discounted rate (cost neutral to the
City).
This revenue source consists of fees paid for the rental of City facilities. This includes but
is not limited to rentals at the Civic Center, Swim and Fitness Center, and the Twinbrook,
Lincoln Park, and Thomas Farm community centers.
20,000 0.0%
This revenue source is specific to the Police Department and consists of charges for
community requests for police presence at community events and at local businesses.
These revenue sources are specific to the Department of Community Planning and
Development Services and consist of charges for fire inspections and permits, as well as
from fire code plans reviews.
This revenue source consists of all program fees and charges related to City recreation
programs. This includes but is not limited to camps, classes, outdoor recreation, and
childcare.
Social Services Fees - Senior
Center Social Services fees
Theme Park Tickets (pg. 3-12)
313,000
Rec. Program Fees (pg. 3-12)
Zoning Fees (pg. 3-12)
This revenue is received from admission charges to the City's Swim and Fitness Center,
and from merchandise sales at the Center.
Membership Fees (pg. 3-12)
Concessions - Revenue received
at City facilities
This revenue source is specific to the Department of Public Works and consists of fees
paid by contractors for design review and inspection services for work within the City's
rights-of-way. The $60,000 increase from FY 2011 to FY 2012 is mainly due to increasing
fees as a result of the Comprehensive User Fee Study.
Sale of Materials - revenues from
City publications
Swim Team Dues (pg. 3-12)
Fire Safety Fees (pg. 3-12)
Fire Review Fees (pg. 3-12)
etompkins
Underline
etompkins
Underline
etompkins
Underline
etompkins
Underline
etompkins
Underline
etompkins
Underline
etompkins
Underline
etompkins
Underline
etompkins
Underline
etompkins
Underline
etompkins
Underline
etompkins
Underline

Licenses and Permits Other Revenue / Administrative Charges
Building Permits Hotel Tax
Rental Licenses Administrative Charges
Other Licenses
TABLE 3-20. Other Revenue / Administrative Charges Summary
TABLE 3-19. Licenses and Permits Summary
770,454 850,000 950,000 11.8%
4,126 14,800 32,200 117.6%
394,954 110,500 91,000 -17.6%
690,330 800,000 1,295,000 61.9% - 20,000 20,000 0.0%
784,455 630,000 730,000 15.9% 695 500 500 0.0%
444,000 1,000,110 1,010,110 1.0%
248,200 541,650 547,070 1.0%
469,700 977,470 987,250 1.0%
133,306 112,000 118,000 5.4% 87,600 656,980 132,710 -79.8%
1,737,186 1,660,000 2,261,000 36.2% 158,600 604,940 610,990 1.0%
97,900 165,750 197,400 19.1%
- 78,090 - -100.0%
Speed Admin. Charge (pg. 3-13) - 222,320 224,540 1.0%
2,735,759 5,332,970 4,887,370 -8.4%
Traders Licenses - Fees
collected from local businesses
by the State and returned to the
City
General Fund Revenues, Detail of Major Revenue Sources
This revenue source consists of the City's share of tax levied on a person who pays for a
room or space at a hotel. FY 2009 was the first year the 2 percent hotel tax was levied. For
FY 2012, the City anticipates approximately $950,000 in hotel tax revenue, which is an
increase of $100,000 from Adopted FY 2011. The increase is partly due to two new hotels
that opened at the end of FY 2010, and overall increases in hotel rates and usage.
%
Change Adopted
FY11
Adopted
FY12
59,530
Building permits are the largest source of revenue in this category, and are estimated to
increase by $495,000 from $800,000 in FY 2011 to $1.3 million in FY 2012 as a result of
the Comprehensive User Fee Study. This revenue source is specific to the Department of
Community Planning and Development Services and consists of revenue received from
permits issued for building construction, electrical work, plumbing, sewer, water, and gas.
These charges represent centrally budgeted administrative or "overhead" costs. Each fund
pays for its share of the costs through a transfer to the General Fund. An update to the
City's Cost Allocation Plan (CAP), the document that determines the charges, was adopted
in FY 2010. The results of the CAP update showed that the administrative charges should
be increased across all existing funds, and should be added to the Town Center
Management District (TCMD) and Speed Camera funds. For FY 2012, all funds increased
by 1.0 percent consistent with the City's annual cost of living adjustment except for TCMD
which was eliminated (operations being managed by FRIT), Parking which decreased by 80
percent (garages being managed by FRIT), and RedGate which increased by $31,650 (6
months City operations and 6 months under a lease or management contract).
Actual
FY10
89,860
Adopted
FY11
83,600 -7.0%
Actual
FY10
90,000 0.0%
Refuse Admin. Charge (pg. 3-13)
Hotel Tax (pg. 3-13)
Miscellaneous Revenues
Recreation Fees (Swim)
SWM Admin. Charge (pg. 3-13)
0.0%
Animal Licenses - From the sale
of dog / cat licenses to owners
within the City
Other Licenses (pg. 3-13)
Total
30,908
3 - 13
Golf Admin. Charge (pg. 3-13) *
Sewer Admin. Charge (pg. 3-13)
Total
* To address the deficit in the Fund, the administrative charge was reduced by 50 percent
from FY 2007 to FY 2011. In FY 2012, the admin. charge includes 6 months consistent
with adopted CAP and 6 months consistent with Option 3 of the NGF Report.
28,000
Building Permits (pg. 3-13)
Rental Licenses (pg. 3-13)
Parking Admin. Charge (pg. 3-13)
Rental licenses is the second largest source of revenue in this category, and is currently
estimated to increase by $100,000 from $630,000 in FY 2011 to $730,000 in FY 2012.
Rental licenses are specific to the Police Department and consist of licensing fees for the
inspection of single- and multi-family dwelling units and hotels. The FY 2012 revenue
figure is based on the estimated number of licenses that will be renewed or obtained
during FY 2012.
TCMD Admin. Charge (pg. 3-13)
Miscellaneous Grant Revenue
28,000
Water Admin. Charge (pg. 3-13)
Sale of Auctioned Vehicles
This revenue source is specific to the Department of Community Planning and
Development Services and the Police Department, and mainly consists of revenue
received from licenses issued to master electricians, plumbers, and gasfitters.
90,000
Community Contribution - From
individuals / groups for programs
98,187
Adopted
FY12
%
Change
etompkins
Underline
etompkins
Underline
etompkins
Underline
etompkins
Underline

TABLE 3-21. Water Fund Revenues by Category
Sales of Materials 10,020 5,000 5,000 0.0%
Utility Charges 6,123,692 8,600,000 9,500,000 10.5%
Penalties 72,100 50,000 60,000 20.0%
Transfer From Sewer 350,200 308,400 311,490 1.0%
Transfer From Refuse 124,600 138,100 139,480 1.0%
Misc. Revenue 51,352 26,750 31,500 17.8%
Connection Charges 98,800 15,000 20,000 33.3%
Interest Income 4,048 5,800 34,000 486.2%
Subtotal 6,834,813 9,149,050 10,101,470 10.4%
Use of Reserves - 35,260 - -100.0%
Water Fund Total 6,834,813 9,184,310 10,101,470 10.0%
TABLE 3-22. Water Fund Expenses by Category
Salaries 2,291,888 2,371,490 2,393,370 0.9%
Benefits 705,361 815,500 923,110 13.2%
Overtime 191,584 135,430 155,610 14.9%
Personnel Subtotal 3,188,833 3,322,420 3,472,090 4.5%
Contractual Services 426,712 469,360 561,380 19.6%
Commodities 1,312,347 1,614,550 1,716,350 6.3%
Operating Subtotal 1,739,059 2,083,910 2,277,730 9.3%
Capital Outlay 142,560 91,700 71,200 -22.4%
Administrative Charge 444,000 1,000,110 1,010,110 1.0%
Other / Transfers* 1,078,699 1,706,000 1,715,000 0.5%
Debt Service (Interest) 800,750 980,170 971,120 -0.9%
Subtotal 7,393,901 9,184,310 9,517,250 3.6%
Addition to Reserves - - 584,220 N/A
Total 7,393,901 9,184,310 10,101,470 10.0%
* Includes depreciation and amortization.
Enterprise Funds - Water Fund
Actual
FY10
Adopted
FY11
Adopted
FY12
%
Change
Enterprise funds are used to account for operations financed and operated in a
manner similar to private business enterprises where the cost of expenses,
including both operations and capital, are financed or recovered from the users of
the services rather than general taxpayers. The City of Rockville, through the
Financial Management Policies, has designated the following operations as
enterprise funds: Water, Sewer, Refuse, Stormwater Management, Parking and
RedGate Golf Course.
3 - 14
%
Change
Adopted
FY11
Revenue projections for the Water Fund are based upon the City's growth forecast
regarding development planned for future years. The number of planned and
current water accounts is then multiplied by the estimated rates for the fund.
Water Fund utility revenues, which consists of utility charges, connections, and
penalties, are projected to total $9.6 million for FY 2012.
In order to fund the significant capital and operating expenses necessary to
support the City's water system, the water usage rates will increase by 24.5
percent for FY 2012. The FY 2012 rates are as follows: $4.33 per 1,000 gallons for
the first 12,000 gallons used in the quarter, $6.23 per 1,000 gallons for the next
12,000 gallons used in the quarter, and $6.69 per 1,000 gallons for usage beyond
24,000 gallons. Starting in FY 2013, rates will need to be adjusted to cover the
recent expenses associated with the 24-inch water main breaks on July 7, 2010
and July 12, 2010. These costs include the purchase of WSSC water, additional
overtime, and supplies and equipment. These costs will be factored into the rate
model on a multi-year basis in order to maintain consistency and reduce volatility
in the rates in the future. In addition to the usage rates, the FY 2012 budget will
continue with a ready-to-serve charge that is split between the Water and Sewer
funds. The amount of the charge is based on the size of the water meter and
ranges from $6.75 to $810.00 per quarter, an increase of 3 percent over FY 2011.
The goals in setting the City's utility rates are low rates over time, while covering
all operating and capital expenses and maintaining required reserves. The City
establishes rates on a multi-year basis to maintain consistency and reduce
volatility. In order to set the rates the City uses cash flow models that take into
account factors such as future changes in operating expenses, debt obligations,
and changes in revenues. For setting rates and fees for Parking and RedGate,
additional factors such as comparative pricing and user demand are considered.
Actual
FY10
The Water Fund is used to account for all financial activity associated with the
treatment and distribution of potable water. The City provides water service to 70
percent of the City, or approximately 13,000 accounts. In FY 2009 the City started
a major water line replacement program, which is estimated to replace over 34
miles of water lines over a 20-year period. The Water Main Rehabilitation project,
totaling $85 million, can be found on page 98 of the City's FY 2012 CIP.
Adopted
FY12

TABLE 3-23. Water Fund Revenues by Department Supplemental Information:
Public Works - 1,750 3,500 100.0%
Non-Departmental 6,834,813 9,147,300 10,097,970 10.4%
Total 6,834,813 9,149,050 10,101,470 10.4%
TABLE 3-24. Water Fund Expenses by Department
Finance 757,843 836,070 762,080 -8.8%
Public Works 4,164,081 4,470,960 4,840,190 8.3%
Non-Departmental 2,471,977 3,877,280 3,914,980 1.0%
Total 7,393,901 9,184,310 9,517,250 3.6%
GRAPH 3-9. Water Fund Revenues by Category
GRAPH 3-10. Water Fund Expenses by Category 5/8" $6.56 $6.75 3%
3/4" $9.84 $10.14 3%
1" $16.40 $16.89 3%
1 1/2" $32.80 $33.75 3%
2" $52.48 $54.00 3%
3" $104.96 $108.00 3%
4" $164.00 $168.75 3%
6" $328.00 $337.50 3%
8" $524.80 $540.00 3%
10" $787.20 $810.00 3%
Actual
FY10
Adopted
FY11
Adopted
FY12
%
Change
FY12
* FY07 was the first year the City changed the rate structure from a flat rate to tiered rates
based on usage.
Adopted
FY12
TABLE 3-25. FY 2012 Ready-to-Serve Charge. The table below reflects the fixed
quarterly charge that is based on meter size. The charge is split evenly between
Water and Sewer funds.
%
Change
Enterprise Funds - Water Fund
3 - 15
IncreaseMeter
SizeFY11
Actual
FY10
GRAPH 3-11. History of Rockville Water Rates. The rates shown below
represent the usage charge per 1,000 gallons, assuming an average usage of
14,000 gallons per quarter. For FY 2012, Rockville will also charge a flat fee of
$10.14 per quarter for households with a 3/4 inch meter (see table below).
Approximately 30 percent of Rockville residents do not receive water service from
the City, but are serviced by the Washington Suburban Sanitary Commission's
(WSSC) water system.
Adopted
FY11
$3.3
2
$2
.08
$0.0
9
$1.0
0
$1.7
1
$0.9
8
$3.4
7
$2.2
8
$0.0
7
$1.0
1
$1.7
2
$0.9
7
$0.0
$1.0
$2.0
$3.0
$4.0
$5.0
Personnel Operating Capital Admin. Other Debt Service
Water Fund Expenses (in millions)
FY11 Adopted FY12 Adopted
$8.6
0
$0.0
2
$0.0
9
$0.4
5 $
9.5
0
$0.0
2
$0.1
3
$0.4
5
$0.0
$2.0
$4.0
$6.0
$8.0
$10.0
Utility Charges ConnectionCharges
Other Transfers In
Water Fund Revenues (in millions)
FY11 Adopted FY12 Adopted
$1.9
2
$1.9
9
$2.0
7
$2
.26
$1.7
2
$1.8
9
$2.3
7
$2.9
5
$3.7
0
$4.6
0
$0.00
$1.00
$2.00
$3.00
$4.00
$5.00
$6.00
FY
03
FY
04
FY
05
FY
06
FY
07*
FY
08
FY
09
FY
10
FY
11
FY
12
City of Rockville Water Rate History
etompkins
Underline
etompkins
Underline
etompkins
Underline
etompkins
Underline

Sewer Fund TABLE 3-26. Sewer Fund Revenues by Category
Utility Charges 6,192,627 7,755,000 8,000,000 3.2%
Penalties 70,914 50,000 60,000 20.0%
Connection Charges 134,505 15,000 20,000 33.3%
Interest Income 2,002 2,000 4,000 100.0%
Premium on Bonds Sold 6,815 - - N/A
Other - 2,000 3,000 50.0%
Subtotal 6,406,863 7,824,000 8,087,000 3.4%
Use of Reserves - 351,290 - -100.0%
Total 6,406,863 8,175,290 8,087,000 -1.1%
TABLE 3-27. Sewer Fund Expenses by Category
Salaries 931,596 1,032,700 1,033,410 0.1%
Benefits 317,648 360,950 386,100 7.0%
Overtime 95,654 87,500 87,550 0.1%
Personnel Subtotal 1,344,898 1,481,150 1,507,060 1.7%
Contractual Services 2,714,806 3,227,720 2,596,710 -19.5%
Commodities 129,324 195,590 213,230 9.0%
Operating Subtotal 2,844,130 3,423,310 2,809,940 -17.9%
Capital Outlays 4,152 41,000 70,340 71.6%
Administrative Charge 248,200 541,650 547,070 1.0%
Other / Transfers * 1,255,678 1,813,400 1,821,490 0.4%
Debt Service (Interest) 686,137 874,780 1,141,280 30.5%
Subtotal 6,383,194 8,175,290 7,897,180 -3.4%
Addition to Reserves - - 189,820 N/A
Total 6,383,194 8,175,290 8,087,000 -1.1%
* Includes depreciation and amortization, and a transfer of $311,490 to the Water Fund.
Enterprise Funds - Sewer Fund
Actual
FY10
Adopted
FY11
Adopted
FY12
%
Change
The Sewer Fund accounts for the financial activity associated with the collection
and delivery of sewage for treatment and disposal. Charges are based on water
consumption. Nearly all of the capital costs in the Sewer Fund, and a substantial
portion of the operating costs, are payments for the operation of and capital
improvements to the District of Columbia Water and Sewer Authority’s
(DCWASA) Blue Plains Advanced Wastewater Treatment Plant. The City’s share
of Blue Plains’ capital improvements is proportionate to the City’s allocation of
treatment capacity. The Blue Plains Wastewater Treatment CIP project contains
additional information regarding the City’s capital costs for sewer treatment.
%
Change
3 - 16
Actual
FY10
Adopted
FY12
Adopted
FY11
The Sewer Fund budget for FY 2012 is based on a sewer charge of $5.26 per
1,000 gallons. This is an increase of $0.60 or 13 percent over the FY 2011
adopted rate of $4.66 per 1,000 gallons. In addition to the sewer charge, users
pay a ready-to-serve charge that is split equally between the Water and Sewer
funds. The amount of the charge is based on the size of the water meter and
ranges from $6.75 to $810.00 per quarter, an increase of 3 percent over the FY
2011.
Revenue projections for the Sewer Fund are based upon the City's growth
forecast regarding development planned for future years. The number of planned
and current sewer accounts is then multiplied by the estimated rates for the fund.
Sewer Fund utility revenues, which consist of utility charges, connections, and
penalties, are projected to total $8.1 million for FY 2012.

TABLE 3-28. Sewer Fund Revenues by Department Supplemental Information:
Public Works - - 3,000 N/A
Non-Departmental 6,406,863 7,824,000 8,084,000 3.3%
Total 6,406,863 7,824,000 8,087,000 3.4%
TABLE 3-29. Sewer Fund Expenses by Department
Public Works 4,134,952 4,815,460 4,256,940 -11.6%
Non-Departmental 2,248,242 3,359,830 3,640,240 8.3%
Total 6,383,194 8,175,290 7,897,180 -3.4%
GRAPH 3-12. Sewer Fund Revenues by Category
5/8" $6.56 $6.75 3%
GRAPH 3-13. Sewer Fund Expenses by Category 3/4" $9.84 $10.14 3%
1" $16.40 $16.89 3%
1 1/2" $32.80 $33.75 3%
2" $52.48 $54.00 3%
3" $104.96 $108.00 3%
4" $164.00 $168.75 3%
6" $328.00 $337.50 3%
8" $524.80 $540.00 3%
10" $787.20 $810.00 3%
TABLE 3-30. FY 2012 Ready-to-Serve Charge. The table below reflects the fixed
quarterly charge that is based on meter size. The charge is split evenly between
Water and Sewer funds.
%
Change
Actual
FY10
Adopted
FY11
Adopted
FY12
Enterprise Funds - Sewer Fund
3 - 17
%
Change
Actual
FY10
Adopted
FY11
Adopted
FY12
GRAPH 3-14. History of Rockville Sewer Rates. The rates shown below
represent the usage charge per 1,000 gallons. Rockville also charges a flat fee
that is $10.14 per quarter for households with a 3/4 inch meter (see table below).
Approximately 30 percent of Rockville residents do not receive sewer service from
the City, but are serviced by the Washington Suburban Sanitary Commission's
(WSSC) sewer system.
Meter
SizeFY11 FY12 Increase
$1.4
8
$3.4
2
$0.5
4 $
1.8
5
$0.8
7
$1.5
1 $
2.8
1
$0.5
5 $
1.8
9
$1.1
4
$0.0
$1.0
$2.0
$3.0
$4.0
$5.0
Personnel Operating Admin. Other Debt Service
Sewer Fund Expenses (in millions)
FY11 Adopted FY12 Adopted
$7
.76
$0.0
2
$0.0
5
$8.0
0
$0.0
2
$0.0
7
$0.0
$2.0
$4.0
$6.0
$8.0
$10.0
Utility Charges Connection Charges Other
Sewer Fund Revenues (in millions)
FY11 Adopted FY12 Adopted
$3.3
8
$3.5
0
$3.6
1
$3.7
5
$3.6
3
$3.8
2
$3.9
7
$4.1
2
$4.6
6
$5.2
6
$0.00
$1.00
$2.00
$3.00
$4.00
$5.00
$6.00
FY
03
FY
04
FY
05
FY
06
FY
07
FY
08
FY
09
FY
10
FY
11
FY
12
City of Rockville Sewer Rate History
etompkins
Underline
etompkins
Underline
etompkins
Underline
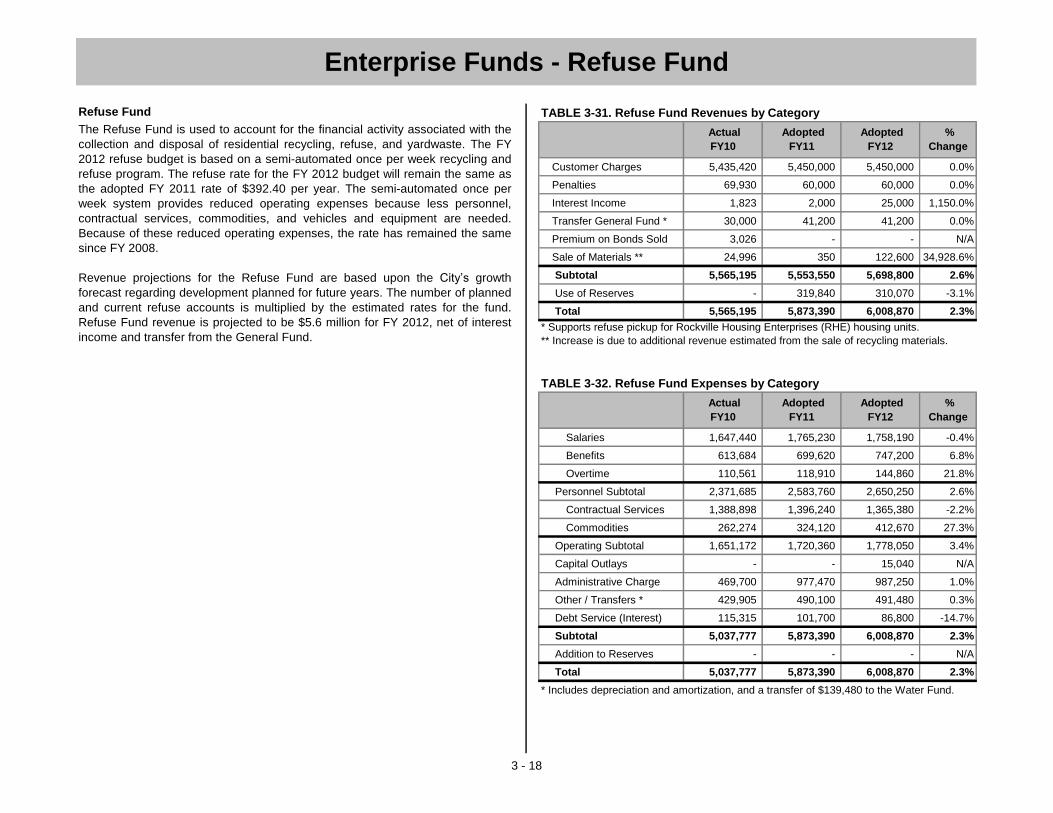
Refuse Fund TABLE 3-31. Refuse Fund Revenues by Category
Customer Charges 5,435,420 5,450,000 5,450,000 0.0%
Penalties 69,930 60,000 60,000 0.0%
Interest Income 1,823 2,000 25,000 1,150.0%
Transfer General Fund * 30,000 41,200 41,200 0.0%
Premium on Bonds Sold 3,026 - - N/A
Sale of Materials ** 24,996 350 122,600 34,928.6%
Subtotal 5,565,195 5,553,550 5,698,800 2.6%
Use of Reserves - 319,840 310,070 -3.1%
Total 5,565,195 5,873,390 6,008,870 2.3%
TABLE 3-32. Refuse Fund Expenses by Category
Salaries 1,647,440 1,765,230 1,758,190 -0.4%
Benefits 613,684 699,620 747,200 6.8%
Overtime 110,561 118,910 144,860 21.8%
Personnel Subtotal 2,371,685 2,583,760 2,650,250 2.6%
Contractual Services 1,388,898 1,396,240 1,365,380 -2.2%
Commodities 262,274 324,120 412,670 27.3%
Operating Subtotal 1,651,172 1,720,360 1,778,050 3.4%
Capital Outlays - - 15,040 N/A
Administrative Charge 469,700 977,470 987,250 1.0%
Other / Transfers * 429,905 490,100 491,480 0.3%
Debt Service (Interest) 115,315 101,700 86,800 -14.7%
Subtotal 5,037,777 5,873,390 6,008,870 2.3%
Addition to Reserves - - - N/A
Total 5,037,777 5,873,390 6,008,870 2.3%
* Includes depreciation and amortization, and a transfer of $139,480 to the Water Fund.
Enterprise Funds - Refuse Fund
%
Change
Actual
FY10
Adopted
FY11
Adopted
FY12
Adopted
FY12
%
Change
The Refuse Fund is used to account for the financial activity associated with the
collection and disposal of residential recycling, refuse, and yardwaste. The FY
2012 refuse budget is based on a semi-automated once per week recycling and
refuse program. The refuse rate for the FY 2012 budget will remain the same as
the adopted FY 2011 rate of $392.40 per year. The semi-automated once per
week system provides reduced operating expenses because less personnel,
contractual services, commodities, and vehicles and equipment are needed.
Because of these reduced operating expenses, the rate has remained the same
since FY 2008.
Revenue projections for the Refuse Fund are based upon the City’s growth
forecast regarding development planned for future years. The number of planned
and current refuse accounts is multiplied by the estimated rates for the fund.
Refuse Fund revenue is projected to be $5.6 million for FY 2012, net of interest
income and transfer from the General Fund. * Supports refuse pickup for Rockville Housing Enterprises (RHE) housing units.
** Increase is due to additional revenue estimated from the sale of recycling materials.
3 - 18
Actual
FY10
Adopted
FY11

TABLE 3-33. Refuse Fund Revenues by Department Supplemental Information:
GRAPH 3-17. History of Rockville Refuse Rates
Public Works 24,996 350 122,600 34,928.6%
Non-Departmental 5,540,200 5,553,200 5,576,200 0.4%
Total 5,565,195 5,553,550 5,698,800 2.6%
TABLE 3-34. Refuse Fund Expenses by Department
Public Works 3,931,014 4,127,020 4,278,740 3.7%
Non-Departmental 1,106,763 1,746,370 1,730,130 -0.9%
Total 5,037,777 5,873,390 6,008,870 2.3%
GRAPH 3-15. Refuse Fund Revenues by Category
GRAPH 3-16. Refuse Fund Expenses by Category
Adopted
FY11
Adopted
FY12
%
Change
3 - 19
Actual
FY10
* FY08 was the first year the City implemented a semi-automated once per week recycling
and refuse program. The semi-automated once per week system provides reduced
operating expenses because less personnel, contractual services, commodities, and
vehicles and equipment are needed. Because of these reduced operating expenses, the
rate has remained the same since implementation.
Enterprise Funds - Refuse Fund
%
Change
Actual
FY10
Adopted
FY11
Adopted
FY12
$2.5
8
$1.7
2
$0.9
8
$0.4
9
$0.1
0
$2.6
5
$1.7
8
$0.9
9
$0
.51
$0.0
9
$0
$1
$2
$3
$4
Personnel Operating Admin. Other Debt Service
Refuse Fund Expenses (in millions)
FY11 Adopted FY12 Adopted
$5.4
5
$0.1
0
$5.4
5
$0
.25
$0
$1
$2
$3
$4
$5
$6
Customer Charges Other
Refuse Fund Revenues (in millions)
FY11 Adopted FY12 Adopted
$285.0
0
$306.0
0
$333.0
0
$354.0
0
$372.0
0
$392.4
0
$392.4
0
$392.4
0
$392.4
0
$392.4
0
$0
$100
$200
$300
$400
$500
FY
03
FY
04
FY
05
FY
06
FY
07
FY
08*
FY
09
FY
10
FY
11
FY
12
City of Rockville Refuse Rate History (Annual)
etompkins
Underline
etompkins
Underline
etompkins
Underline

Parking Fund TABLE 3-35. Parking Fund Revenues by Category
Real Property Tax 140,388 163,000 163,000 0.0%
County Contribution 153,870 295,000 295,000 0.0%
Parking Meters 1,128,916 1,110,000 400,000 -64.0%
Parking Violations 800,086 660,000 700,000 6.1%
From General Fund 850,000 1,030,000 500,000 -51.5%
Interest Earnings / Other 5,351 4,000 15,000 275.0%
Building Rental - - 300,000 N/A
Subtotal 3,078,611 3,262,000 2,373,000 -27.3%
Use of Reserves - 1,156,715 664,640 -42.5%
Total 3,078,611 4,418,715 3,037,640 -31.3%
TABLE 3-36. Parking Fund Expenses by Category
Salaries 238,347 254,290 186,370 -26.7%
Benefits 81,893 93,375 79,910 -14.4%
Overtime 6,667 9,600 5,000 -47.9%
Personnel Subtotal 326,907 357,265 271,280 -24.1%
Contractual Services 732,084 954,270 90,110 -90.6%
Commodities 126,023 236,190 145,840 -38.3%
Operating Subtotal 858,107 1,190,460 235,950 -80.2%
Capital Outlays 2,337 - - N/A
Administrative Charge 87,600 656,980 132,710 -79.8%
Other / Transfers * 708,628 826,500 766,500 -7.3%
Debt Service (Interest) 1,409,821 1,387,510 1,631,200 17.6%
Subtotal 3,393,400 4,418,715 3,037,640 -31.3%
Addition to Reserves - - - N/A
Total 3,393,400 4,418,715 3,037,640 -31.3%
* Includes depreciation and amortization, and $60,000 for unrecoverable parking citations.
3 - 20
The FY 2012 budget for the Parking Fund incorporates the anticipated leasing of
the Town Square garage operations to Federal Realty Investment Trust (FRIT)
the commercial developer of Town Square. The City has entered into
negotiations with FRIT to enable FRIT to manage, operate and re-equip the
garages under a long-term lease agreement the details of which are being
finalized. The anticipated start date of the new management and operations is
September 1, 2011. Under the anticipated arrangement, FRIT will be responsible
for setting the rates both for hourly parking and for monthly parking in the
garages and it will also be responsible for all capital improvements and
renovations during the term of the lease.
In anticipation of the lease agreement, the City’s budget was changed to
represent only operational costs for on-street meters along with the payment of
debt service on the garages. The FY 2012 budgeted revenue includes a new
item called Building Rental, which is the anticipated lease payment from FRIT to
the City. In order for the City to enter into the lease agreement, the City is
required to defease the current tax-exempt debt, and it intends to do so by
issuing new taxable debt. The result of this transaction is to remove the old debt
off the City’s books, yet the transaction remains transparent to the current
bondholders until the bonds get called in FY 2014 and FY 2015. The City then
issues taxable debt at higher borrowing rates, and the increased costs are offset
in part by the annual lease revenue along with a share of any net income that
FRIT is able to generate from operating the garages. Another anticipated change
in the Parking Fund budget is a reduction in the transfer from the City’s General
Fund from over $1 million in FY 2011 to $500,000 in FY 2012. It is anticipated
that this transfer will continue for future years, until such time as the new
operations and management of the garages has stabilized.
Based on the anticipated changes during FY 2012, the overall Parking budget
appropriation has been reduced by $1.4 million or 31 percent. By not operating
the garages the City is able to reduce Parking Fund staffing by 1.65 FTEs, which
includes one full time Parking Enforcement Officer, for a total savings of
approximately $100,000 from FY 2011 to FY 2012. All service related contracts
and utilities for the operations of the garages were eliminated for a savings of
over $1 million. The final savings results from a reduction in City administrative
charges from $656,980 in FY 2011 down to $132,710 as the majority of charges
being incurred were due to the garage operations. Overall the anticipated
changes to the garage operations should result in a positive financial change to
the Parking Fund's financial status over time.
Enterprise Funds - Parking Fund
%
Change
Actual
FY10
Adopted
FY11
Adopted
FY12
%
Change
The Parking Fund was created to account for the revenue and expenses from
parking related activities, including the issuance of parking tickets, the parking
meter program, and costs associated with the debt service of the three public
parking garages in the City’s Town Center.
Actual
FY10
Adopted
FY11
Adopted
FY12
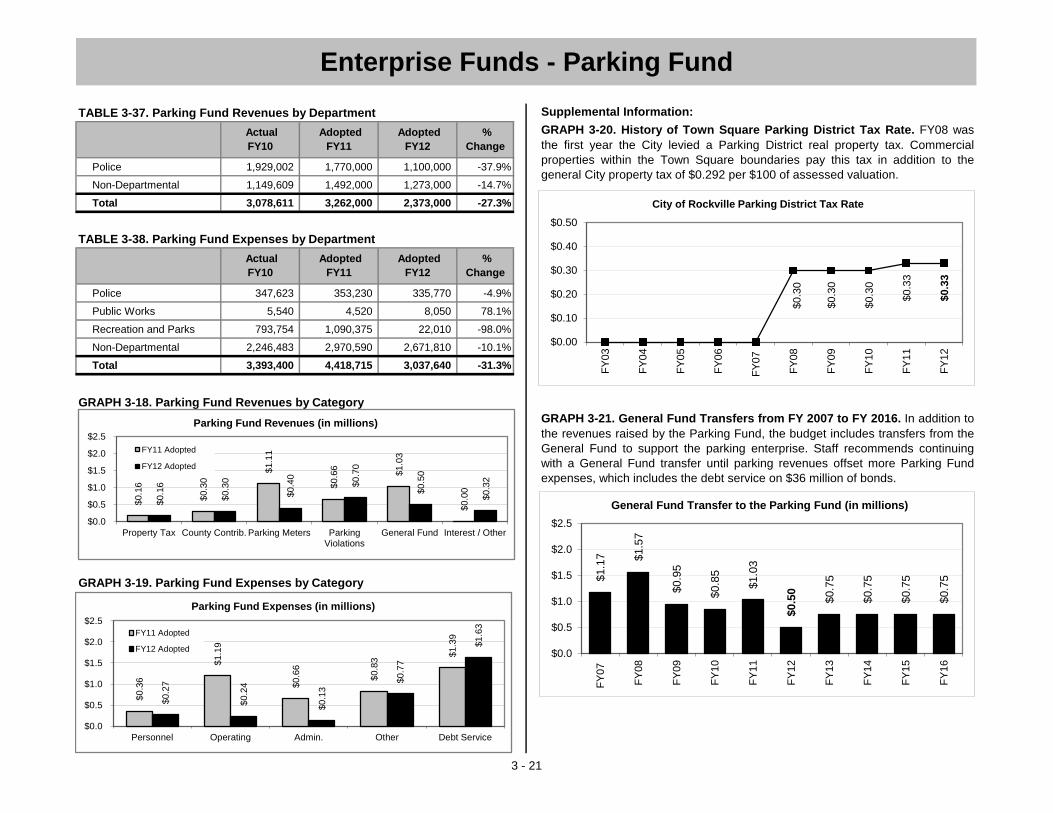
TABLE 3-37. Parking Fund Revenues by Department Supplemental Information:
Police 1,929,002 1,770,000 1,100,000 -37.9%
Non-Departmental 1,149,609 1,492,000 1,273,000 -14.7%
Total 3,078,611 3,262,000 2,373,000 -27.3%
TABLE 3-38. Parking Fund Expenses by Department
Police 347,623 353,230 335,770 -4.9%
Public Works 5,540 4,520 8,050 78.1%
Recreation and Parks 793,754 1,090,375 22,010 -98.0%
Non-Departmental 2,246,483 2,970,590 2,671,810 -10.1%
Total 3,393,400 4,418,715 3,037,640 -31.3%
GRAPH 3-18. Parking Fund Revenues by Category
GRAPH 3-19. Parking Fund Expenses by Category
Adopted
FY12
%
Change
3 - 21
GRAPH 3-20. History of Town Square Parking District Tax Rate. FY08 was
the first year the City levied a Parking District real property tax. Commercial
properties within the Town Square boundaries pay this tax in addition to the
general City property tax of $0.292 per $100 of assessed valuation.
GRAPH 3-21. General Fund Transfers from FY 2007 to FY 2016. In addition to
the revenues raised by the Parking Fund, the budget includes transfers from the
General Fund to support the parking enterprise. Staff recommends continuing
with a General Fund transfer until parking revenues offset more Parking Fund
expenses, which includes the debt service on $36 million of bonds.
Enterprise Funds - Parking Fund
Adopted
FY12
%
Change
Actual
FY10
Adopted
FY11
Actual
FY10
Adopted
FY11 $
0.3
6
$1.1
9
$0.6
6
$0.8
3 $
1.3
9
$0.2
7
$0.2
4
$0.1
3 $
0.7
7
$1.6
3
$0.0
$0.5
$1.0
$1.5
$2.0
$2.5
Personnel Operating Admin. Other Debt Service
Parking Fund Expenses (in millions)
FY11 Adopted
FY12 Adopted
$0.1
6
$0.3
0 $
1.1
1
$0.6
6
$1.0
3
$0.0
0
$0.1
6
$0.3
0
$0.4
0
$0.7
0
$0.5
0
$0.3
2
$0.0
$0.5
$1.0
$1.5
$2.0
$2.5
Property Tax County Contrib. Parking Meters ParkingViolations
General Fund Interest / Other
Parking Fund Revenues (in millions)
FY11 Adopted
FY12 Adopted
$0.3
0
$0.3
0
$0.3
0
$0.3
3
$0.3
3
$0.00
$0.10
$0.20
$0.30
$0.40
$0.50
FY
03
FY
04
FY
05
FY
06
FY
07
FY
08
FY
09
FY
10
FY
11
FY
12
City of Rockville Parking District Tax Rate
$1.1
7
$1.5
7
$0.9
5
$0.8
5
$1.0
3
$0.5
0
$0.7
5
$0.7
5
$0.7
5
$0.7
5
$0.0
$0.5
$1.0
$1.5
$2.0
$2.5
FY
07
FY
08
FY
09
FY
10
FY
11
FY
12
FY
13
FY
14
FY
15
FY
16
General Fund Transfer to the Parking Fund (in millions)
etompkins
Underline
etompkins
Underline
etompkins
Underline
etompkins
Underline
etompkins
Underline

TABLE 3-39. SWM Fund Revenues by Category
SWM Utility Fee 1,581,145 1,985,000 2,500,000 25.9%
SWM Permits 33,911 40,000 40,000 0.0%
Other / Interest Earnings 19,943 6,500 21,200 226.2%
Subtotal 1,719,358 2,111,500 2,641,200 25.1%
Use of Reserves - 1,139,150 544,980 -52.2%
Total 1,719,358 3,250,650 3,186,180 -2.0%
TABLE 3-40. SWM Fund Expenses by Category
Salaries 1,272,048 1,316,300 1,328,850 1.0%
Benefits 371,538 436,070 481,380 10.4%
Overtime 7,642 8,010 8,010 0.0%
Personnel Subtotal 1,651,228 1,760,380 1,818,240 3.3%
Contractual Services 374,477 482,780 357,430 -26.0%
Commodities 68,141 123,950 129,150 4.2%
Operating Subtotal 442,618 606,730 486,580 -19.8%
Capital Outlays 15,180 - - N/A
Administrative Charge 158,600 604,940 610,990 1.0%
Other / Transfers * 199,580 275,000 260,000 -5.5%
Debt Service (Interest) 170 3,600 10,370 188.1%
Subtotal 2,467,376 3,250,650 3,186,180 -2.0%
Addition to Reserves - - - N/A
Total 2,467,376 3,250,650 3,186,180 -2.0%
* Includes depreciation and $10,000 for the rainscapes rebates program.
The Stormwater Management (SWM) Fund accounts for the financial activity
associated with maintaining existing SWM facilities and constructing new
facilities. In FY 2008, Public Works staff recommended that a stormwater utility
fee would be needed to fund Rockville's existing and expanded stormwater,
storm drainage and water quality programs. Historically, new development has
funded much of Rockville's stormwater management with fees imposed on
developers. With few opportunities for new development, new funding sources
were needed to cover new programs and the maintenance of the public
stormwater infrastructure.
Enterprise Funds - Stormwater Management Fund
Stormwater Management Fund
80,000 80,000
In FY 2008 the Mayor and Council approved an ordinance to amend the City
Code to include a new Stormwater Management Utility Fee. This ordinance
enables the City to charge an annual fee per Equivalent Residential Unit ("ERU").
The ERU fee for FY 2012 will equal $62.48. This is an increase of $13.28 or 27
percent over the FY 2011 adopted ERU fee of $49.20. This fee level assumes
that all properties (including County properties) will pay the annual fee. If all
properties do not pay the planned fees, staff will need to evaluate the planned
fee increases and future operating programs and capital expenses, and adjust
them accordingly. Each residential property will pay $62.48 or one ERU per year,
and each commercial property will pay $62.48 multiplied by the number of ERUs
measured on their property.
Adopted
FY11
Revenue projections for the Stormwater Management Fund are based upon the
current number of ERUs in the City, as well as the City's growth forecast
regarding development planned for future years. Stormwater Management Fund
revenues, which include utility fees, permits, and regional participation fees, are
projected to total $2.6 million for FY 2012.
The ERU fee for future years will increase significantly in order to fund the level
of programming that the Mayor and Council adopted in FY 2008. The Mayor and
Council supported a mid-range level of CIP projects and operating programs and
services that include: SWM facility and storm drainage maintenance and retrofits,
stream restoration, drainage improvements, sediment control, and compliance
with federally mandated water quality requirements such as illicit discharge
prevention and watershed education and outreach.
3 - 22
0.0%
Actual
FY10
Adopted
FY11
Adopted
FY12
%
Change
Regional SWM
Participation Fees84,359
%
Change
Actual
FY10
Adopted
FY12

TABLE 3-41. SWM Fund Revenues by Department Supplemental Information:
Public Works - - 1,700 N/A
Non-Departmental 1,719,358 2,111,500 2,639,500 25.0%
Total 1,719,358 2,111,500 2,641,200 25.1%
TABLE 3-42. SWM Fund Expenses by Department
Public Works 2,084,765 2,306,910 2,170,020 -5.9%
Non-Departmental 382,611 943,740 1,016,160 7.7%
Total 2,467,376 3,250,650 3,186,180 -2.0%
GRAPH 3-22. SWM Fund Revenues by Category
GRAPH 3-23. SWM Fund Expenses by Category
3 - 23
Actual
FY10
Adopted
FY11
Adopted
FY12
%
Change
Enterprise Funds - Stormwater Management Fund
Actual
FY10
Adopted
FY11
Adopted
FY12
%
Change
GRAPH 3-24. History of Stormwater Management Utility Fee. Although the
Mayor and Council adopted the ordinance that enabled the fee in FY08, no fee
was adopted in FY09. The expenses for the program in FY09 were funded from
the Stormwater Management's reserves. FY10 was the first year the City charged
a Stormwater Management utility fee.
$1.7
6
$0.6
1
$0.6
0
$0.2
8
$1.8
2
$0.4
9
$0.6
1
$0.2
7
$0.0
$0.5
$1.0
$1.5
$2.0
Personnel Operating Admin. Other
SWM Fund Expenses (in millions)
FY11 Adopted FY12 Adopted
$1.9
9
$0.0
4
$0.0
8
$0.0
1
$2.5
0
$0.0
4
$0.0
8
$0.0
2
$0.0
$0.5
$1.0
$1.5
$2.0
$2.5
SWM Utility SWM Permits Particpate. Fees Interest Earnings
SWM Fund Revenues (in millions)
FY11 Adopted FY12 Adopted
$40.0
0
$49.2
0
$62.4
8
$0
$25
$50
$75
$100
FY
03
FY
04
FY
05
FY
06
FY
07
FY
08
FY
09
*
FY
10
FY
11
FY
12
City of Rockville Stormwater Management Utility Fee
etompkins
Underline
etompkins
Underline
etompkins
Underline

RedGate Golf Course
Fund
TABLE 3-43. RedGate Golf Fund Revenues by Category
Golf Course Fees 738,180 779,580 863,150 10.7%
Cart Rentals 206,248 219,830 237,950 8.2%
Pro Shop Rental 2,750 2,790 13,470 382.8%
Driving Range Fee 1,982 1,600 8,570 435.6%
Concessions / Other 12,251 13,910 34,340 146.9%
General Fund Transfer * - - 630,000 N/A
Subtotal 961,411 1,017,710 1,787,480 75.6%
Use of Reserves - 673,990 - -100.0%
Total 961,411 1,691,700 1,787,480 5.7%
TABLE 3-44. RedGate Golf Fund Expenses by Category
Salaries 644,799 647,020 323,600 -50.0%
Benefits 167,757 199,380 68,840 -65.5%
Overtime 23,003 26,800 13,400 -50.0%
Personnel Subtotal 835,559 873,200 405,840 -53.5%
Contractual Services 130,339 157,690 814,800 416.7%
Commodities 244,494 288,360 149,100 -48.3%
Operating Subtotal 374,833 446,050 963,900 116.1%
Capital Outlays 68,936 95,700 19,750 -79.4%
Administrative Charge * 97,900 165,750 197,400 19.1%
Other / Transfers ** 119,177 100,100 125,100 25.0%
Debt Service (Interest) 11,335 10,900 10,200 -6.4%
Subtotal 1,507,740 1,691,700 1,722,190 1.8%
Addition to Reserves - - 65,290 N/A
Total 1,507,740 1,691,700 1,787,480 5.7%
** Includes depreciation and amortization.
3 - 24
Actual
FY10
%
Change
Adopted
FY11
Adopted
FY12
* Refers to the transfer to the General Fund. FY12 includes 6 months consistent with
adopted CAP and 6 months consistent with Option 3 of the NGF Report (*Note: as part of
the five-year business plan this charge was reduced by half from FY 2007 through FY 2011
for a total RedGate savings of $540,350).
Enterprise Funds - RedGate Golf Course Fund
%
Change
Actual
FY10
Adopted
FY11
Adopted
FY12
Pending completion of the RFP and further direction by the Mayor and Council,
FY 2012 assumes the same Course management for the first half of FY 2012
and a management agreement consistent with the NGF Study for the second half
of FY 2012. Actual revenues and expenses for FY 2012 and future years may
differ depending on the results of the RFP. According to the Mayor and Council
direction given at the final budget preview, FY 2012 revenues include a $630,000
transfer from the General Fund to fund high priority capital improvements and
annual operating expenses in the Fund. Future General Fund transfers will be
needed under the current Option 3 projections from the NGF.
The RedGate Golf Fund is used to account for the financial activity associated
with the City's public golf course. After covering all of its operating, overhead and
capital costs for nearly thirty years, RedGate began operating in the red in FY
2000. Recognizing that the financial situation of the Fund is not improving, the
Mayor and Council directed staff to issue a request for proposal (RFP) for a
private management firm. This direction came after the Mayor and Council
received a detailed report from the National Golf Foundation (NGF) analyzing
current operations and the feasibility of operating the Course under a different
management structure. At this time the Mayor and Council also directed staff to
create a job description for a golf director position if the operations stay in-house.
* Refers to the transfer from the General Fund consistent with Mayor and Council direction
on 2/28/11.

TABLE 3-45. RedGate Golf Fund Revenues by Department Supplemental Information:
Recreation and Parks 961,411 1,017,710 1,157,480 13.7%
Non-Departmental - - 630,000 N/A
Total 961,411 1,017,710 1,787,480 75.6%
TABLE 3-46. RedGate Golf Fund Expenses by Department
Public Works 17,999 15,610 13,100 -16.1%
Recreation and Parks 1,207,236 1,321,540 1,345,450 1.8%
Non-Departmental 282,505 354,550 363,640 2.6%
Total 1,507,740 1,691,700 1,722,190 1.8%
GRAPH 3-25. RedGate Golf Fund Revenues by Category
GRAPH 3-26. RedGate Golf Fund Expenses by Category
3 - 25
%
Change
Actual
FY10
Adopted
FY11
Adopted
FY12
Enterprise Funds - RedGate Golf Course Fund
Adopted
FY11
Adopted
FY12
GRAPH 3-27. General Fund Transfers from FY 2007 to FY 2016. In addition to
the revenues raised by the RedGate Golf Fund, the budget includes transfers
from the General Fund to help fund capital improvements to the Course and
minimize the annual operating deficit.
%
Change
Actual
FY10 $
873
$446
$96
$166
$111
$406
$964
$20 $
197
$135
$0
$250
$500
$750
$1,000
Personnel Operating Capital Admin. Other
Golf Fund Expenses (in thousands)
FY11 Adopted
FY12 Adopted
$780
$220
$18
$863
$238
$686
$0
$200
$400
$600
$800
$1,000
Golf Course Fees Cart Rentals Other
Golf Fund Revenues (in thousands)
FY11 Adopted
FY12 Adopted
$0.1
1
$0.1
7
$0.0
9
$-
$2.3
9
$0.6
3
$0.4
9
$0.7
9
$0.4
9
$0.4
9
$0.0
$0.5
$1.0
$1.5
$2.0
$2.5
FY
07
FY
08
FY
09
FY
10
FY
11
FY
12
FY
13
FY
14
FY
15
FY
16
General Fund Transfer to the RedGate Fund (in millions)
etompkins
Underline
etompkins
Underline
etompkins
Underline
etompkins
Underline

TABLE 3-47. Special Activities Fund Revenues by Category
Mansion Rentals 20,000 20,000 20,000 0.0%
Community Contributions 115,943 123,500 131,530 6.5%
Special Activities Fund Developer Contributions 199,390 161,700 142,880 -11.6%
Cable Capital Grants 438,138 408,800 508,630 24.4%
Other / Money & Prop. 2,315 5,200 650 -87.5%
General Fund Transfer * 144,266 8,530 7,170 -15.9%
Subtotal 920,053 727,730 810,860 11.4%
Use of Reserves - 296,510 329,050 11.0%
Total 920,053 1,024,240 1,139,910 11.3%
TABLE 3-48. Special Activities Fund Expenditures by Category
Salaries 17,403 23,760 - -100.0%
Benefits 1,352 1,820 - -100.0%
Overtime - - - N/A
Personnel Subtotal 18,755 25,580 - -100.0%
Contractual Services 82,902 127,600 113,700 -10.9%
Commodities 192,858 291,360 370,450 27.1%
Operating Subtotal 275,760 418,960 484,150 15.6%
Capital Outlays 76,422 469,800 569,630 21.2%
Administrative Charge - - - N/A
Other / Transfers 66,125 109,900 86,130 -21.6%
Debt Service (Interest) - - - N/A
Subtotal 437,062 1,024,240 1,139,910 11.3%
Addition to Reserves - - - N/A
Total 437,062 1,024,240 1,139,910 11.3%
Special revenue funds are used to account for the proceeds of specific revenue
sources that are restricted by legal, regulatory, and policy provisions to finance
specific activities. Included in the special revenue funds are the Special
Activities, Community Development Block Grant, Town Center Management
District, and Speed Camera funds.
Actual
FY10
Adopted
FY11
Adopted
FY12
%
Change
3 - 26
There are currently 13 active accounts in the FY 2012 budget. These accounts
receive revenues from fund-raising and community activities, payment-in-lieu
programs, as well as from a variety of corporations and community service
organizations. The amount that is appropriated each year is directly related to the
overall revenues received in the past years, and projected revenues for the next
year (these accounts are not funded by General Fund revenues).
The City is currently in the process of reviewing each of these special activities
accounts to verify compliance with Governmental Accounting Standards Board
(GASB) 54. GASB 54 is a new standard that requires special revenue funds to
have legal or otherwise established guidelines for revenue restriction. For the FY
2012 adopted budget, one account, the Bike Program, was moved to the
General Fund because it did not have a legal revenue restriction.
* This transfer is for the Art in Public Architecture account, which requires an annual
contribution equal to 1.0 percent of the City's general construction costs for the year.
Governmental Funds - Special Activities Fund
Actual
FY10
Adopted
FY11
Adopted
FY12
%
Change
etompkins
Underline
etompkins
Underline
etompkins
Underline
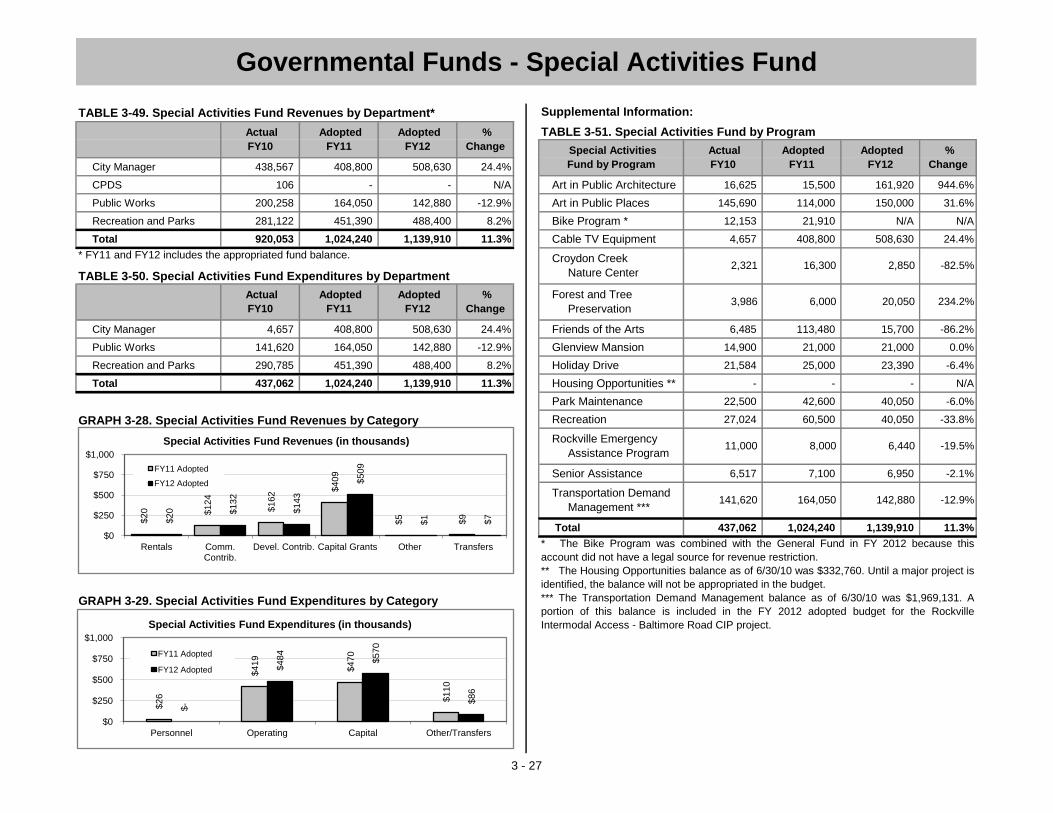
TABLE 3-49. Special Activities Fund Revenues by Department* Supplemental Information:
TABLE 3-51. Special Activities Fund by Program
City Manager 438,567 408,800 508,630 24.4%
CPDS 106 - - N/A Art in Public Architecture 16,625 15,500 161,920 944.6%
Public Works 200,258 164,050 142,880 -12.9% Art in Public Places 145,690 114,000 150,000 31.6%
Recreation and Parks 281,122 451,390 488,400 8.2% Bike Program * 12,153 21,910 N/A N/A
Total 920,053 1,024,240 1,139,910 11.3% Cable TV Equipment 4,657 408,800 508,630 24.4%
* FY11 and FY12 includes the appropriated fund balance.
TABLE 3-50. Special Activities Fund Expenditures by Department
City Manager 4,657 408,800 508,630 24.4% Friends of the Arts 6,485 113,480 15,700 -86.2%
Public Works 141,620 164,050 142,880 -12.9% Glenview Mansion 14,900 21,000 21,000 0.0%
Recreation and Parks 290,785 451,390 488,400 8.2% Holiday Drive 21,584 25,000 23,390 -6.4%
Total 437,062 1,024,240 1,139,910 11.3% Housing Opportunities ** - - - N/A
Park Maintenance 22,500 42,600 40,050 -6.0%
GRAPH 3-28. Special Activities Fund Revenues by Category Recreation 27,024 60,500 40,050 -33.8%
Senior Assistance 6,517 7,100 6,950 -2.1%
Total 437,062 1,024,240 1,139,910 11.3%
GRAPH 3-29. Special Activities Fund Expenditures by Category
%
Change
%
Change
Governmental Funds - Special Activities Fund
Adopted
FY12
%
Change
Special Activities
Fund by Program
Actual
FY10
Adopted
FY11
Adopted
FY12
Actual
FY10
* The Bike Program was combined with the General Fund in FY 2012 because this
account did not have a legal source for revenue restriction.
** The Housing Opportunities balance as of 6/30/10 was $332,760. Until a major project is
identified, the balance will not be appropriated in the budget.
*** The Transportation Demand Management balance as of 6/30/10 was $1,969,131. A
portion of this balance is included in the FY 2012 adopted budget for the Rockville
Intermodal Access - Baltimore Road CIP project.
3 - 27
Adopted
FY12
Actual
FY10
Adopted
FY11
Forest and Tree
Preservation
Rockville Emergency
Assistance Program
Transportation Demand
Management ***
6,440
141,620
11,000
Adopted
FY11
164,050
8,000
142,880 -12.9%
-19.5%
6,000
Croydon Creek
Nature Center
20,050
2,321 16,300 -82.5%
234.2%
2,850
3,986
$20
$124
$162 $409
$5
$9
$20
$132
$143
$509
$1
$7
$0
$250
$500
$750
$1,000
Rentals Comm.Contrib.
Devel. Contrib. Capital Grants Other Transfers
Special Activities Fund Revenues (in thousands)
FY11 Adopted
FY12 Adopted
$26
$419
$470
$110
$-
$484
$570
$86
$0
$250
$500
$750
$1,000
Personnel Operating Capital Other/Transfers
Special Activities Fund Expenditures (in thousands)
FY11 Adopted
FY12 Adopted
etompkins
Underline
etompkins
Underline
etompkins
Underline
etompkins
Underline
etompkins
Underline
etompkins
Underline
etompkins
Underline
etompkins
Underline
etompkins
Underline
etompkins
Underline
etompkins
Underline
etompkins
Underline
etompkins
Underline
etompkins
Underline
etompkins
Underline

TABLE 3-54. CDBG Fund Revenues by Department *
CPDS 336,574 614,348 593,000 -3.5%
Non-Departmental 6,301 - - N/A
Total 342,875 614,348 593,000 -3.5%
TABLE 3-52. CDBG Fund Revenues by Category *
CDBG Block Grant 336,574 289,000 304,000 5.2% TABLE 3-55. CDBG Fund Expenditures by Department *
Other / Money & Prop. 6,301 - - N/A
Prior Years' Approp. - 325,348 289,000 -11.2%
Subtotal 342,875 614,348 593,000 -3.5% CPDS 336,574 614,348 593,000 -3.5%
Use of Reserves - - - N/A Total 336,574 614,348 593,000 -3.5%
Total 342,875 614,348 593,000 -3.5%
GRAPH 3-30. CDBG Fund Revenues by Category
TABLE 3-53. CDBG Fund Expenditures by Category *
Salaries** 58,900 101,030 76,080 -24.7%
Benefits** 8,935 18,970 23,040 21.5%
Overtime - - - N/A
Personnel Subtotal 67,835 120,000 99,120 -17.4%
Contractual Services 268,739 494,348 493,880 -0.1%
Commodities - - - N/A
Subtotal 336,574 614,348 593,000 -3.5% GRAPH 3-31. CDBG Fund Expenditures by Category
Addition to Reserves - - - N/A
Total 336,574 614,348 593,000 -3.5%
Adopted
FY11
* Actual FY10 represents one fiscal year, while Adopted FY11 and Adopted FY12 represent
the current fiscal year plus the prior years' appropriations or expenditures.
Actual
FY10
Adopted
FY11
Adopted
FY12
%
Change
3 - 28
Adopted
FY11
Adopted
FY12
%
Change
* Actual FY10 represents one fiscal year, while Adopted FY11 and Adopted FY12 represent
the current fiscal year plus the prior years' appropriations or expenditures.
Actual
FY10
* Actual FY10 represents one fiscal year, while Adopted FY11 and Adopted FY12 represent
the current fiscal year plus the prior years' appropriations or expenditures.
** The City is able to utilize up to 20 percent of the grant funding to administer the program.
%
Change
Adopted
FY12
* Actual FY10 represents one fiscal year, while Adopted FY11 and Adopted FY12 represent
the current fiscal year plus the prior years' appropriations or expenditures.
Governmental Funds - CDBG
Community Development Block Grant Fund
The Community Development Block Grant (CDBG) Fund is a special revenue
fund supported by a sub-grant of federal funds via Montgomery County. The
annual budget for this fund consists of unexpended prior years’ grants as well as
the next year's anticipated grant and is based on the latest information available
from Montgomery County.
Actual
FY10
Actual
FY10
%
Change
Adopted
FY12
Adopted
FY11
$289
$325
$304
$289
$0
$150
$300
$450
$600
$750
CDBG Block Grant Prior Years' Approp.
CDBG Fund Revenues (in thousands)
FY11 Adopted
FY12 Adopted
$120
$494
$99
$494
$0
$150
$300
$450
$600
$750
Personnel Operating
CDBG Fund Expenses (in thousands)
FY11 Adopted
FY12 Adopted
etompkins
Underline

TABLE 3-58. TCMD Fund Revenues by Department
Non-Departmental 780,756 930,000 - -100.0%
Total 780,756 930,000 - -100.0%
TABLE 3-59. TCMD Fund Expenditures by Department
Recreation and Parks 773,335 728,595 - -100.0%
Non-Departmental 180 98,090 - -100.0%
Total 773,515 826,685 - -100.0%
TABLE 3-56. TCMD Fund Revenues by Category GRAPH 3-32. TCMD Fund Revenues by Category
Real Property Tax 761,469 930,000 - -100.0%
Other / Money & Prop. 19,287 - - N/A
Subtotal 780,756 930,000 - -100.0%
Use of Reserves - - - N/A
Total 780,756 930,000 - -100.0%
TABLE 3-57. TCMD Fund Expenditures by Category
GRAPH 3-33. TCMD Fund Expenditures by Category
Salaries 32,635 32,250 - -100.0%
Benefits 7,163 9,595 - -100.0%
Personnel Subtotal 39,798 41,845 - -100.0%
Contractual Services 699,988 586,350 - -100.0%
Commodities 33,729 120,400 - -100.0%
Operating Subtotal 733,717 706,750 - -100.0%
Administrative Charge - 78,090 - -100.0%
Subtotal 773,515 826,685 - -100.0%
Addition to Reserves - 103,315 - -100.0%
Total 773,515 930,000 - -100.0%
%
Change
Actual
FY10
Adopted
FY11
Adopted
FY12
Starting July 1, 2011, Federal Realty Investment Trust (FRIT) the commercial
developer of Town Square, will take over the maintenance and operational costs
of the TCMD. Since FRIT will manage the District, the TCMD Fund is not
included in the FY 2012 adopted budget, and the tax rates are set at $0.00. The
structure of the two Districts will remain on the City books so that the City retains
the ability to set rates again in the future.
%
Change
Actual
FY10
Adopted
FY11
Adopted
FY12
3 - 29
Governmental Funds - Town Center Management District
Adopted
FY11
Actual
FY10
%
Change
Adopted
FY12
Adopted
FY11
Adopted
FY12
The Town Square Street and Area Lighting District (residential and commercial)
and the Town Square Commercial District (commercial only) were created in FY
2008 to support the maintenance and operational costs of the Town Center
Management District. From FY 2008 to FY 2011 these two districts levied special
property taxes on the properties within the Town Square boundaries to support
the total annual expenditure budget for the TCMD Fund.
Town Center Management District (TCMD) Fund
Actual
FY10
%
Change
$930
$-
$-
$-
$0
$200
$400
$600
$800
$1,000
Real Property Tax Other / Money & Prop.
TCMD Fund Revenues (in thousands)
FY11 Adopted
FY12 Adopted
$42
$707
$78
$-
$-
$-
$0
$250
$500
$750
$1,000
Personnel Operating Admin. Charge
TCMD Fund Expenditures (in thousands)
FY11 Adopted
FY12 Adopted
etompkins
Underline
etompkins
Underline
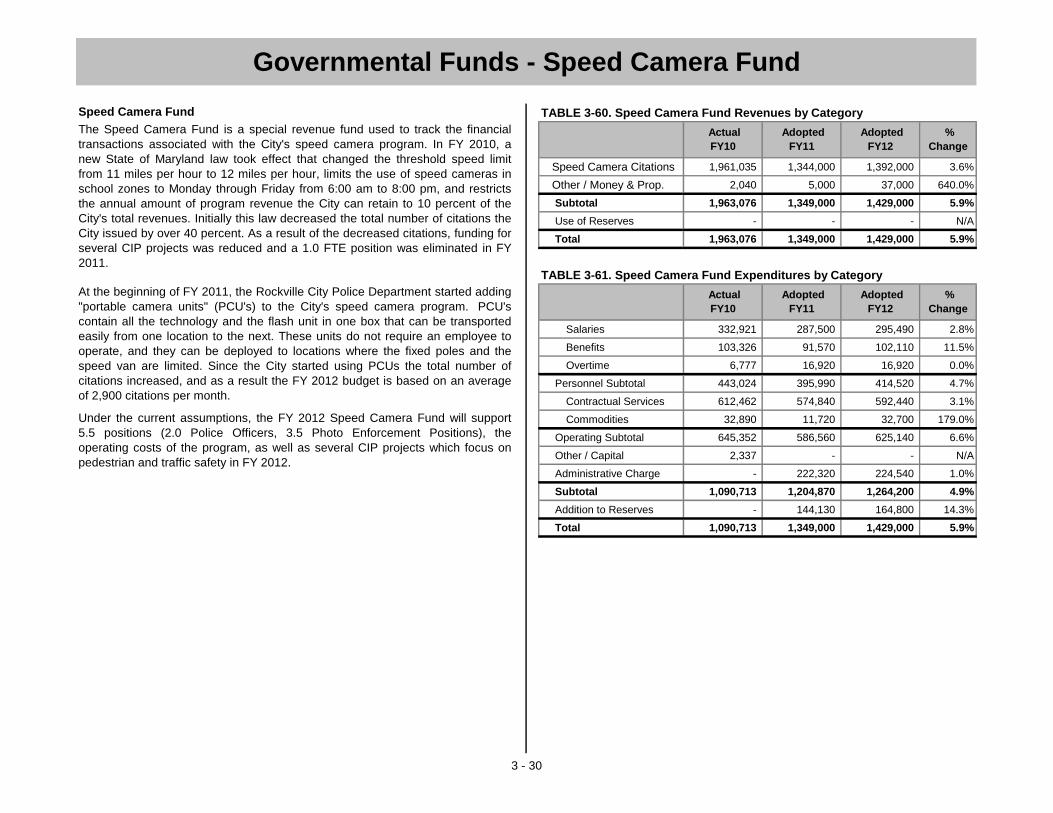
TABLE 3-60. Speed Camera Fund Revenues by Category
Speed Camera Citations 1,961,035 1,344,000 1,392,000 3.6%
Other / Money & Prop. 2,040 5,000 37,000 640.0%
Subtotal 1,963,076 1,349,000 1,429,000 5.9%
Use of Reserves - - - N/A
Total 1,963,076 1,349,000 1,429,000 5.9%
TABLE 3-61. Speed Camera Fund Expenditures by Category
Salaries 332,921 287,500 295,490 2.8%
Benefits 103,326 91,570 102,110 11.5%
Overtime 6,777 16,920 16,920 0.0%
Personnel Subtotal 443,024 395,990 414,520 4.7%
Contractual Services 612,462 574,840 592,440 3.1%
Commodities 32,890 11,720 32,700 179.0%
Operating Subtotal 645,352 586,560 625,140 6.6%
Other / Capital 2,337 - - N/A
Administrative Charge - 222,320 224,540 1.0%
Subtotal 1,090,713 1,204,870 1,264,200 4.9%
Addition to Reserves - 144,130 164,800 14.3%
Total 1,090,713 1,349,000 1,429,000 5.9%
Governmental Funds - Speed Camera Fund
Speed Camera Fund
Adopted
FY12
Adopted
FY11
3 - 30
The Speed Camera Fund is a special revenue fund used to track the financial
transactions associated with the City's speed camera program. In FY 2010, a
new State of Maryland law took effect that changed the threshold speed limit
from 11 miles per hour to 12 miles per hour, limits the use of speed cameras in
school zones to Monday through Friday from 6:00 am to 8:00 pm, and restricts
the annual amount of program revenue the City can retain to 10 percent of the
City's total revenues. Initially this law decreased the total number of citations the
City issued by over 40 percent. As a result of the decreased citations, funding for
several CIP projects was reduced and a 1.0 FTE position was eliminated in FY
2011.
Actual
FY10
%
Change
Adopted
FY12
Adopted
FY11
%
Change
At the beginning of FY 2011, the Rockville City Police Department started adding
"portable camera units" (PCU's) to the City's speed camera program. PCU's
contain all the technology and the flash unit in one box that can be transported
easily from one location to the next. These units do not require an employee to
operate, and they can be deployed to locations where the fixed poles and the
speed van are limited. Since the City started using PCUs the total number of
citations increased, and as a result the FY 2012 budget is based on an average
of 2,900 citations per month.
Under the current assumptions, the FY 2012 Speed Camera Fund will support
5.5 positions (2.0 Police Officers, 3.5 Photo Enforcement Positions), the
operating costs of the program, as well as several CIP projects which focus on
pedestrian and traffic safety in FY 2012.
Actual
FY10
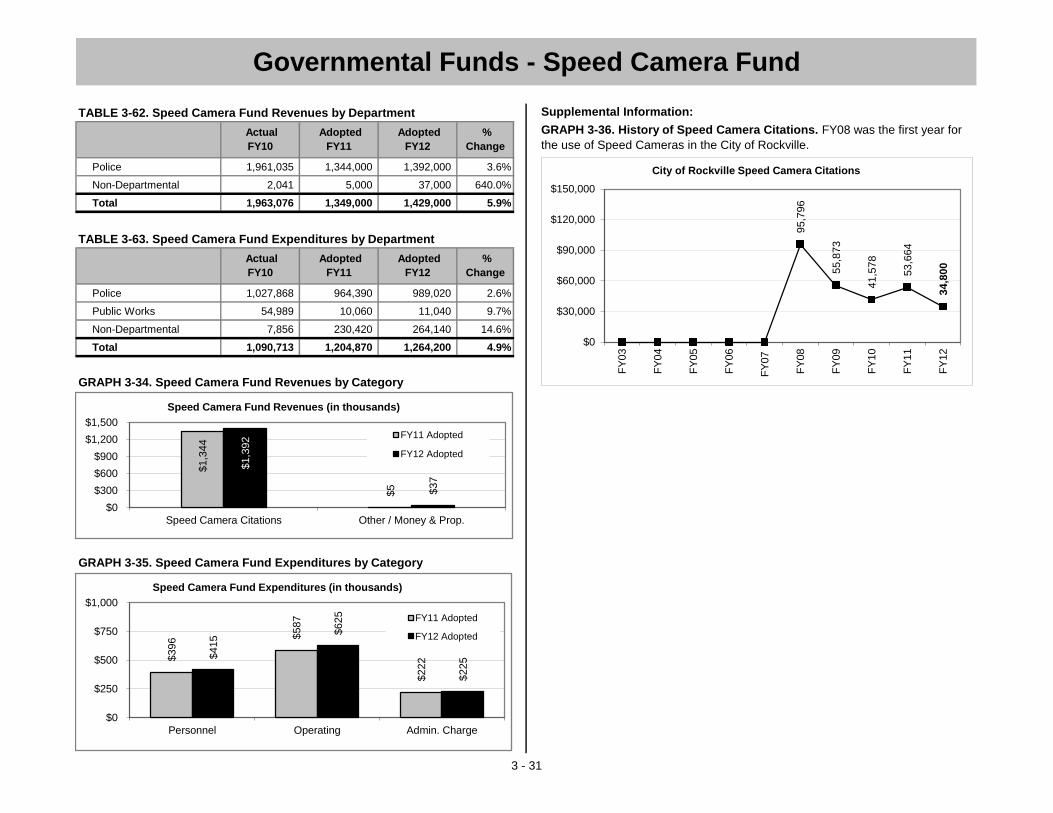
TABLE 3-62. Speed Camera Fund Revenues by Department Supplemental Information:
Police 1,961,035 1,344,000 1,392,000 3.6%
Non-Departmental 2,041 5,000 37,000 640.0%
Total 1,963,076 1,349,000 1,429,000 5.9%
TABLE 3-63. Speed Camera Fund Expenditures by Department
Police 1,027,868 964,390 989,020 2.6%
Public Works 54,989 10,060 11,040 9.7%
Non-Departmental 7,856 230,420 264,140 14.6%
Total 1,090,713 1,204,870 1,264,200 4.9%
GRAPH 3-34. Speed Camera Fund Revenues by Category
GRAPH 3-35. Speed Camera Fund Expenditures by Category
Adopted
FY11
Adopted
FY12
%
Change
3 - 31
Actual
FY10
Governmental Funds - Speed Camera Fund
Adopted
FY12
%
Change
Actual
FY10
Adopted
FY11
GRAPH 3-36. History of Speed Camera Citations. FY08 was the first year for
the use of Speed Cameras in the City of Rockville.
$1,3
44
$5
$1,3
92
$37
$0
$300
$600
$900
$1,200
$1,500
Speed Camera Citations Other / Money & Prop.
Speed Camera Fund Revenues (in thousands)
FY11 Adopted
FY12 Adopted
$396 $587
$222 $415 $
625
$225
$0
$250
$500
$750
$1,000
Personnel Operating Admin. Charge
Speed Camera Fund Expenditures (in thousands)
FY11 Adopted
FY12 Adopted
95,7
96
55
,87
3
41
,57
8
53,6
64
34,8
00
$0
$30,000
$60,000
$90,000
$120,000
$150,000
FY
03
FY
04
FY
05
FY
06
FY
07
FY
08
FY
09
FY
10
FY
11
FY
12
City of Rockville Speed Camera Citations
etompkins
Underline
etompkins
Underline
etompkins
Underline
etompkins
Underline

Water Fund - Variance of 20.8%
General 11,428,189 66,042,880 66,042,880 11,428,189 0.0%
Water (2,807,428) 10,101,470 9,517,250 (2,223,208) 20.8%
Sewer 832,978 8,087,000 7,897,180 1,022,798 22.8%
Refuse 2,289,756 5,698,800 6,008,870 1,979,686 -13.5% Sewer Fund - Variance of 22.8%
Parking 2,520,860 2,373,000 3,037,640 1,856,220 -26.4%
SWM 2,464,207 2,641,200 3,186,180 1,919,227 -22.1%
RedGate Golf* 43,808 1,787,480 1,722,190 (94,902) -316.6%
Special Act. 4,022,466 810,860 1,139,910 3,693,416 -8.2%
CDBG - 593,000 593,000 - N/A
Town Center (80,957) N/A N/A N/A N/A
Speed Camera** 2,948,585 1,429,000 1,264,200 2,663,385 -9.7%
Debt Service 2,216,831 5,400,000 5,796,000 1,820,831 -17.9% Refuse Fund - Variance of (13.5%)
Total 25,879,295 104,964,690 106,205,300 24,065,642 -7.0%
3 - 32
Estimated
Balance
6/30/12
The Water Fund's estimated working capital balance is estimated to increase by
20.8 percent, mainly due to the rate increase in FY 2012. In order to address the
current negative working capital balance, water usage rates increased by 24.5
percent for FY 2012, and will continue to increase in future years. The Water
Fund's beginning and ending working capital balances are negative, and
therefore are below the required 90-day operating reserve. A major component of
this negative balance is due to the July 2010 24-inch water main breaks. In
addition, the City is currently replacing over 34 miles of water lines over a 20-year
period. Future debt will help support this project, along with other Water Fund CIP
projects, however the current and future rate increases are essential for the
overall health of the Fund.
The Sewer Fund's working capital balance is estimated to increase by 22.8
percent, mainly due to the current rate increase of 13.0 percent that will help the
Sewer Fund to meet its required 90-day operating reserve. The Sewer Fund's
balance has fluctuated over the past few years due to the variance in the City's
contributions to the Blue Plains Wastewater Treatment Facility. In FY 2011 debt
was issued to support Blue Plains, and future debt will be issued to continue
supporting major capital improvements at Blue Plains.
The Refuse Fund's working capital balance continues to decrease because of the
City's planned use of reserves to help fund the difference in operating revenues
and expenses. Although the annual expenses exceed annual revenues,
expenses were dramatically reduced over the last few years as a result of the
semi-automated once per week system. This system provides for reduced
operating expenses because less personnel, contractual services, commodities,
and vehicles and equipment are needed. Because of these reduced operating
expenses, the rate has remained the same since FY 2008. Even with the rate
remaining the same for FY 2012, the Refuse Fund's working capital balance is
above the required 30-day operating reserve. The City will continue to utilize the
working capital balance in order to keep rate increases conservative in future
years.
* The Estimated Balance for 6/30/12 was adjusted down by $204,000 to reflect the funds
that will be used in the capital budget to support high priority capital projects.
** The Estimated Balance for 6/30/12 was adjusted down by $450,000 to reflect the funds
that will be used in the capital budget to support currently programmed CIP projects. For
future years, capital expenditures are only programmed after citation revenue has been
received since there is no guarantee of future revenue.
It is important to maintain a fund balance to ensure that City operations are not
negatively impacted by large, unexpected increases in expenditures or reductions
in revenues. For the General Fund, the City's Financial Management Policy is to
maintain an unreserved fund balance at a level not less than 15 percent of annual
General Fund revenue. The purpose of this unreserved balance is to alleviate
significant unanticipated budget shortfalls and to ensure the orderly provisions of
services to residents. This is the minimum level necessary to maintain the City’s
credit worthiness and maintain adequate cash flows. According to the City's
Financial Management Policies, use of funds below the 15 percent required level
must be approved by specific action of the Mayor and Council.
Statement of Projected Unreserved Equity in City Funds
Fund
Estimated
Balance
6/30/11
Plus
FY12
Revenue
Less
FY12
Exp.
%
Change
TABLE 3-64. Changes in Fund Balance / Working Capital. This table depicts
the anticipated beginning and ending unreserved fund balance (or, in the case of
an enterprise fund, working capital as defined as current assets less current
liabilities) for each of the City’s funds. Unreserved fund balance is the
accumulated total of all prior years’ actual revenues in excess of expenditures.
These amounts are not invested in capital assets nor have they been committed
or “reserved” for encumbrances, self-insurance, or other purposes.
Explanation of Variances - 10% or Greater
etompkins
Underline
etompkins
Underline
etompkins
Underline
etompkins
Underline
etompkins
Underline
etompkins
Underline
etompkins
Underline
etompkins
Underline

Parking Fund - Variance of (26.4%)
Stormwater Management Fund - Variance of (22.1%)
RedGate Golf Fund - Variance of (316.6%)
Debt Service - Variance of (17.9%)
Statement of Projected Unreserved Equity in City Funds
The Parking Fund's working capital balance continues to decrease because of
the City's planned use of reserves to help fund the difference in operating
revenues and expenses. In addition to the use of reserves, every year the City
transfers funding from the General Fund to the Parking Fund to help support the
Fund's obligations, including payments for current debt. The City will continue
with the annual General Fund transfer, as well as utilize the remaining reserves
over the next several years until the balance approximates a 30-day operating
reserve.
3 - 33
The Stormwater Management Fund's working capital balance continues to
decrease because of the City's planned use of reserves to help fund the
difference in operating revenues and expenses. In addition to the use of
reserves, current and future rate increases are planned to close the gap between
revenues and expenses. The City will continue to utilize the reserves over the
next several years until the balance approximates a 90-day operating reserve.
The fund balance in the Debt Service Fund will decrease by 17.9 percent
because of the City's planned use of reserves to help fund additional debt from
the FY 2011 debt issue. Initially the debt issue was projected at $13.0 million,
however the City issued an additional $4.5 million for asphalt repair and
replacement. The City planned to utilize reserves in FY 2012 in order to mitigate
the General Fund impact as a result of the increased amount of debt. The five-
year Debt Service Fund cash flow assumes a $5.1 million General Fund transfer
in FY 2012 and FY 2013, and $5.2 million transfers in FY 2014 through FY 2016.
The RedGate Golf Fund's working capital balance is projected to decrease by
316.6 percent, which assumes revenues and expenses consistent with the Mayor
and Council's direction at the February 2011 final budget preview. The FY 2012
budget assumes a transfer from the General Fund of $630,000, in-house
management for the first half of FY 2012, and a management contract or lease
agreement for the second half of FY 2012. Future transfers would need to equal
approximately $490,000 in order to maintain a 30-day working capital balance at
the end of the five-year projection period. While this projection appears in Section
4, it should be viewed as a placeholder pending the outcome of the responses to
the request for proposal (RFP) for a management firm or lease, or new Mayor
and Council direction.

2003 6,064,361 2.00 - 3.85% 2023
TABLE 3-65. Debt Service Fund Revenues by Category 2003 464,985 2.00 - 3.00% 2013
2004 7,410,000 4.00 - 5.00% 2029
2005 90,530 2.00% 2012
Interest Earnings 89,306 70,000 100,000 42.9% 2005 9,710,000 3.50 - 6.00% 2025
Assessments 271,849 130,000 200,000 53.8% 2007 8,320,000 4.00 - 4.25% 2027
Trans. from General Fund 4,000,000 5,100,000 5,100,000 0.0% 2010 17,610,000 2.00 - 4.10% 2031
Subtotal 4,361,155 5,300,000 5,400,000 1.9% General Improv. Refunding 2011 1,339,424 2.00 - 3.00% 2021
Use of Reserves - - 396,000 N/A 51,009,300
Total 4,361,155 5,300,000 5,796,000 9.4%
TABLE 3-66. Debt Service Fund Expenditures by Category Principal Interest Total
2012 3,923,729 1,861,444 5,785,173
2013 3,674,145 1,736,450 5,410,595
Principal 3,464,030 3,332,298 3,924,000 17.8% 2014 3,521,670 1,620,798 5,142,468
Interest 1,568,036 1,743,786 1,862,000 6.8% 2015 3,521,670 1,498,708 5,020,378
Other Charges 4,041 65,000 10,000 -84.6% 2016 3,510,061 1,378,748 4,888,809
Subtotal 5,036,107 5,141,084 5,796,000 12.7% 2017 3,507,858 1,252,515 4,760,373
Addition to Reserves - 158,916 - -100.0% 2018 3,507,858 1,123,956 4,631,814
Total 5,036,107 5,300,000 5,796,000 9.4% 2019 3,503,452 996,065 4,499,517
2020 3,496,249 867,794 4,364,043
TABLE 3-67. Debt Service Fund Revenues by Department 2021 3,494,359 738,671 4,233,030
2022 2,961,347 608,642 3,569,989
2023 2,956,902 493,988 3,450,890
Non-Departmental 4,361,155 5,300,000 5,400,000 1.9% 2024 2,455,000 375,700 2,830,700
Total 4,361,155 5,300,000 5,400,000 1.9% 2025 1,885,000 274,507 2,159,507
2026 1,195,000 200,969 1,395,969
TABLE 3-68. Debt Service Fund Expenditures by Department 2027 1,195,000 154,400 1,349,400
2028 675,000 107,325 782,325
2029 675,000 81,675 756,675
Non-Departmental 5,036,107 5,141,084 5,796,000 12.7% 2030 675,000 54,675 729,675
Total 5,036,107 5,141,084 5,796,000 12.7% 2031 675,000 27,675 702,675
Total 51,009,300 15,454,705 66,464,005
General Improvements
Adopted
FY12
%
Change
General Improvements
Actual
FY10
Adopted
FY11
%
Change
TABLE 3-70. General Debt Detail
Total
Governmental Funds - Debt Service Fund
Debt Service Fund
The Debt Service Fund is used to account for the accumulation of resources for,
and the payment of, general long-term principal, interest and debt issuance
related costs. The fund includes expenditures for the payment of principal and
interest due and service charges on general obligation debt.
Actual
FY10
Adopted
FY11 Loan Payable
Adopted
FY12
%
Change
TABLE 3-69. General Debt Summary. In addition to the existing debt listed here,
the City is planning to issue new debt in the amount of $5.8 million in FY 2013.
Final
Maturity
Interest Rate
Range
Outstanding
Principal Year
%
Change
3 - 34
Actual
FY10
Adopted
FY11
Adopted
FY12
Actual
FY10
Adopted
FY11
Proposed
FY12
General Improvements
General Improvements
General Improv. Refunding
General Improvements
etompkins
Underline

Year Principal Interest Total Year Principal Interest Total
2012 1,902,024 847,784 2,749,808 2012 1,450,143 750,291 2,200,434
General Improv. 1999 1,332,039 3.21% 2019 2013 1,877,561 790,926 2,668,487 2013 1,416,078 696,945 2,113,023
General Improv. 2000 1,076,009 3.64% 2020 2014 1,859,834 732,986 2,592,820 2014 1,383,526 650,944 2,034,470
General Improv. 2002 2,255,681 1.90% 2023 2015 1,867,289 672,444 2,539,733 2015 1,378,527 603,229 1,981,756
General Improv. 2003 1,970,639 2.00 - 3.88% 2023 2016 1,885,117 612,590 2,497,707 2016 1,370,136 557,113 1,927,249
General Improv. 2003 190,016 2.00 - 3.00% 2013 2017 1,898,332 538,777 2,437,109 2017 1,367,339 508,190 1,875,529
General Improv. 2004 5,860,000 4.00 - 5.00% 2029 2018 1,662,863 460,319 2,123,182 2018 1,362,338 457,369 1,819,707
General Improv. 2005 1,017,284 0.00% 2025 2019 1,395,964 401,666 1,797,630 2019 1,356,744 407,360 1,764,104
General Improv. 2005 35,545,000 3.50 - 6.00% 2036 2020 1,218,970 346,970 1,565,940 2020 1,353,947 357,382 1,711,329
General Improv. 2007 8,015,000 4.00 - 4.25% 2027 2021 1,085,350 301,000 1,386,350 2021 1,351,151 307,210 1,658,361
General Improv. 2008 10,655,000 3.00 - 4.50% 2028 2022 1,089,157 266,898 1,356,055 2022 1,189,518 256,886 1,446,404
Loan Payable 2010 998,100 1.00% 2031 2023 1,088,058 232,779 1,320,837 2023 1,188,478 211,290 1,399,768
General Improv. 2010 9,760,000 2.00 - 4.10% 2031 2024 949,060 186,938 1,135,998 2024 1,045,000 164,561 1,209,561
General Refund. 2011 1,700,576 2.00 -3.00% 2021 2025 880,000 151,725 1,031,725 2025 910,000 122,222 1,032,222
Total 80,375,344 2026 705,000 115,631 820,631 2026 565,000 86,309 651,309
2027 705,000 86,475 791,475 2027 565,000 63,922 628,922
2028 700,000 57,150 757,150 2028 260,000 41,340 301,340
2029 225,000 27,225 252,225 2029 260,000 31,460 291,460
2030 225,000 18,225 243,225 2030 260,000 21,060 281,060
2031 225,000 9,220 234,220 2031 260,000 10,655 270,655
Total 23,444,579 6,857,728 30,302,307 Total 20,292,925 6,305,738 26,598,663
Enterprise Funds - Debt Service Schedules
** In addition to the existing debt, the City is planning to
issue new debt in the amounts of $3.1 million in FY
2012, $12.1 million in FY 2013, and $24.8 million in FY
2015 for the Water Plant Upgrades, Water Tank
Repair, and Water System Rehabilitation CIP projects.
*** In addition to the existing debt, the City is planning
to issue new debt in the amount of $6.8 million in FY
2012, $13.9 million in FY 2013, and $11.3 million in FY
2015 for the Sewer Main Rehabilitation and the Blue
Plains Wastewater Treatment CIP projects.
3 - 35
TABLE 3-72. Water Fund Debt Detail ** TABLE 3-73. Sewer Fund Debt Detail ***
Year Outstanding
Principal
* The City anticipates that all amounts required for payment on
enterprise fund debt will be provided from the respective fund's
revenues, which are secured by the full faith and credit and taxing
power of the City.
Interest Rate
Range
Final
Maturity
TABLE 3-71. Enterprise Debt Summary *

Year Principal Interest Total Year Principal Interest Total Year Principal Interest Total
2012 760,000 1,361,061 2,121,061 2012 375,000 86,800 461,800 2012 117,992 10,364 128,356
2013 785,000 1,333,711 2,118,711 2013 375,000 71,900 446,900 2013 118,445 9,528 127,973
2014 820,000 1,302,312 2,122,312 2014 375,000 56,900 431,900 2014 118,903 9,070 127,973
2015 850,000 1,269,512 2,119,512 2015 365,000 41,900 406,900 2015 119,365 8,607 127,972
2016 885,000 1,238,699 2,123,699 2016 345,000 27,400 372,400 2016 119,832 8,140 127,972
2017 920,000 1,201,086 2,121,086 2017 340,000 13,600 353,600 2017 120,304 7,671 127,975
2018 960,000 1,161,894 2,121,894 Total 2,175,000 298,500 2,473,500 2018 120,780 7,192 127,972
2019 1,000,000 1,122,714 2,122,714 2019 121,262 6,711 127,973
2020 1,040,000 1,081,894 2,121,894 2020 121,748 6,225 127,973
2021 1,080,000 1,039,244 2,119,244 Year Principal Interest Total 2021 122,239 5,734 127,973
2022 1,125,000 994,669 2,119,669 2012 24,803 10,162 34,965 2022 122,734 5,239 127,973
2023 1,175,000 948,059 2,123,059 2013 24,804 9,418 34,222 2023 123,237 4,738 127,975
2024 1,220,000 898,609 2,118,609 2014 24,803 8,674 33,477 2024 123,743 4,232 127,975
2025 1,275,000 846,053 2,121,053 2015 24,803 7,930 32,733 2025 124,253 3,721 127,974
2026 1,330,000 791,140 2,121,140 2016 24,804 7,156 31,960 2026 52,104 3,205 55,309
2027 1,390,000 733,040 2,123,040 2017 24,804 6,349 31,153 2027 52,625 2,684 55,309
2028 1,450,000 672,300 2,122,300 2018 24,803 5,505 30,308 2028 53,153 2,158 55,311
2029 1,515,000 608,350 2,123,350 2019 24,803 4,637 29,440 2029 53,683 1,627 55,310
2030 1,580,000 541,525 2,121,525 2020 24,803 3,744 28,547 2030 54,220 1,090 55,310
2031 1,645,000 474,375 2,119,375 2021 24,804 2,827 27,631 2030 54,762 548 55,310
2032 1,715,000 404,463 2,119,463 2022 24,803 1,896 26,699 Total 2,015,384 108,484 2,123,868
2033 1,790,000 331,575 2,121,575 2023 24,618 954 25,572
2034 1,865,000 255,500 2,120,500 Total 297,455 69,252 366,707
2035 1,945,000 173,906 2,118,906
2036 2,030,000 88,813 2,118,813
Total 32,150,000 20,874,504 53,024,504
Enterprise Funds - Debt Service Schedules
3 - 36
TABLE 3-74. Parking Fund Debt Detail * TABLE 3-77. SWM Fund Debt Detail **TABLE 3-75. Refuse Fund Debt Detail
TABLE 3-76. RedGate Fund Debt Detail
** In addition to the existing debt, the City is planning to
issue new debt in the amount of $8.5 million in FY 2013 for
the Horizon Hills SWM Ponds, Watts Branch - Upper
Stream, Storm Drain Rehabilitation, and the SWM Facility
Retrofits CIP projects.
* This debt schedule represents the original debt schedule
for the tax exempt bonds issued to support the construction
of the three parking garages in Town Square. The City is in
the process of defeasing these tax exempt bonds with the
issuance and sale of taxable general obligation bonds.
Because taxable debt is issued at higher rates than tax
exempt debt, the City's cost to service the debt will
increase throughout the term of the debt. Issuing taxable
bonds is required before FRIT takes over the management
and operations of the garages.

TABLE 3-80. Sewer Fund Debt Ratios
FY 2012 FY 2013 FY 2014 FY 2015 FY 2016
Gross Revenue 8,087,000 9,116,651 10,450,499 10,893,005 11,070,116
Less: Operating Exp. 5,245,900 5,429,913 5,628,853 5,838,738 6,060,311
Net Available Revenue 2,841,100 3,686,738 4,821,646 5,054,267 5,009,805
Total Debt2 2,842,349 4,064,795 3,939,656 4,913,380 4,786,873
Coverage Target ≥ 1.2 1.0 0.9 1.2 1.0 1.0
TABLE 3-81. Refuse Fund Debt Ratios
FY 2012 FY 2013 FY 2014 FY 2015 FY 2016
Gross Revenue 5,698,800 6,032,872 6,424,792 6,811,270 7,213,914
TABLE 3-78. General Debt Ratios (includes Parking Garage debt) Less: Operating Exp. 5,570,070 5,699,673 5,844,829 5,999,180 6,163,566
FY 2012 FY 2013 FY 2014 FY 2015 FY 2016 Net Available Revenue 128,730 333,199 579,963 812,090 1,050,348
Total Debt3 461,800 446,900 431,900 406,900 372,400
Coverage Target ≥ 1.2 0.3 0.7 1.3 2.0 2.8
TABLE 3-82. Stormwater Management Fund Debt Ratios
FY 2012 FY 2013 FY 2014 FY 2015 FY 2016
Gross Revenue 2,641,200 3,342,047 4,314,410 5,190,062 5,285,367
Less: Operating Exp. 2,925,810 3,292,004 3,422,970 3,564,890 3,718,832
Net Available Revenue (284,610) 50,043 891,440 1,625,172 1,566,535
Total Debt4 128,356 935,473 916,348 897,222 878,097
Coverage Target ≥ 1.2 (2.2) 0.1 1.0 1.8 1.8
TABLE 3-83. Redgate Golf Fund Debt Ratios
TABLE 3-79. Water Fund Debt Ratios FY 2012 FY 2013 FY 2014 FY 2015 FY 2016
FY 2012 FY 2013 FY 2014 FY 2015 FY 2016 Gross Revenue 1,787,480 1,773,834 2,112,350 1,852,021 1,892,882
Gross Revenue 10,101,470 12,512,572 13,049,929 13,472,335 13,944,727 Less: Operating Exp. 1,586,890 1,567,620 1,606,369 1,646,280 1,687,388
Less: Operating Exp. 6,831,130 7,192,369 7,595,262 8,034,685 8,514,243 Net Available Revenue 200,590 206,214 505,981 205,741 205,494
Net Available Revenue 3,270,340 5,320,203 5,454,667 5,437,650 5,430,484 Total Debt5 34,965 34,222 33,477 32,733 31,960
Total Debt1 3,042,693 4,102,225 3,992,438 6,264,554 6,132,528 Coverage Target ≥ 1.2 5.7 6.0 15.1 6.3 6.4
Coverage Target ≥ 1.2 1.1 1.3 1.4 0.9 0.9
0.6% 0.6%
3 - 37
Debt Service as % of
Operating Budget
(15.0% target)
4 Includes principal and interest from current debt and $8.5 million in FY 2013 planned debt.
1Includes principal and interest from current debt and $40 million in planned debt, which
includes $3.1 million in FY 2012, $12.1 million in FY 2013, and $24.8 million in FY 2015.
Debt per Assessed
Value (1.0% target)
The City strives to set Enterprise Fund rates at levels needed to fully cover debt
service requirements as well as operations, maintenance, administration and
capital improvement costs. Debt service coverage ratios are calculated annually
and each fund should maintain a minimum of a 1.2 coverage ratio.
0.5%
2.3%
$1,117
12.3% 11.9%12.0% 11.3%
5 Includes principal and interest from current debt. No future debt is anticipated.
10.6%
$1,198
All Funds - Debt Ratios
Dept per Capita as a %
of per Capita Income
(2.5% target)
2.1% 2.0%
Debt per Capita
($700 target)$955
0.5%
$1,027
3 Includes principal and interest from current debt. No future debt is anticipated.
The General Debt ratios include the debt issued for the Town Center Parking
Garages. With the inclusion of the parking garage debt, some ratios exceed the
City's quantitative targets. Discussions with the bond rating agencies indicate that
this higher interim level is reasonable given the City's overall financial profile.
The debt ratios for the Capital Projects Fund and the Enterprise funds assist the
City in monitoring the overall financial health of each fund. Neither Maryland State
law nor the City Charter mandates a limit on municipal debt. In the Capital Projects
Fund, the City strives to 1) maintain its net tax-supported debt at a level not to
exceed 1.0 percent of the assessed valuation of taxable property within the City, 2)
ensure that its net tax-supported debt per capita does not exceed $700, 3) ensure
that its net tax-supported debt per capita as a percentage of Federal adjusted
gross income does not exceed 2.5 percent, and 4) maintain its annual net tax-
supported debt service costs at a level less than 15 percent of the City's annual
adopted General Fund expenditures.
2.6% 2.6%
$1,208
2Includes principal and interest from current debt and $32 million in planned debt, which
includes $6.8 million in FY 2012, $13.9 million in FY 2013, and $11.3 million in FY 2015.
0.6%
etompkins
Underline
etompkins
Underline

TABLE 3-84. FY 2012 Total Appropriations by Fund
Capital Water Sewer SWM
Recreation and Parks 4,903,498 - - -
Transportation 13,831,090 - - -
Stormwater Mgmt. - - - 2,847,218
Utilities - 9,698,139 15,336,857 -
General Government 19,115,391 241,590 195,002 93,300
Total 37,849,978 9,939,729 15,531,859 2,940,518
RedGate Speed Other TOTAL
Recreation and Parks 272,789 206,071 - 5,382,358
Transportation - 2,684,806 300,000 16,815,896
Stormwater Mgmt. - - - 2,847,218
Utilities - - - 25,034,996
General Government 87,261 4,497 2,437,333 22,174,374
360,050 2,895,374 2,737,333 72,254,841
TABLE 3-85. FY 2012 New Appropriations by Source
Fund Pay-go Bonds Contrib. Grants Total
Capital 9,605,995 - 590,985 224,000 10,420,980
Water 659,200 3,083,000 121,500 - 3,863,700
Sewer 3,315,600 6,757,000 - - 10,072,600
Refuse 248,200 - - - 248,200
SWM 1,290,300 - - - 1,290,300
RedGate 204,000 - - - 204,000
Spec. Act. 300,000 - - - 300,000
Speed 110,000 - - - 110,000
Total 15,733,295 9,840,000 712,485 224,000 26,509,780
All Funds Summary - Capital Improvements Program (CIP)
The Capital Improvements Program (CIP) is the City’s capital investment plan
for the next five years. The CIP is a fiscal and planning device that allows the
City to inventory and monitor capital project costs, funding sources,
departmental responsibilities, and timing schedules. Each year the CIP is
reviewed in the context of ongoing City, County, State, and Federal planning
programs and policies as well as the City’s Master Plan. Items included within
the CIP are usually defined within one of the following six categories:
1. The acquisition of land for a public purpose.
2. The construction of a significant facility, i.e., a building or a road, or the
addition to or extension of an existing facility.
3 - 38
Total
FIGURE 3-2. The CIP can be supported by several funds as listed below. The
Capital Projects Fund supports general City facilities and infrastructure, while
the other funds support the infrastructure and equipment needed to perform
their specific functions.
All Funds
Similar to the operating budget, the CIP budget is appropriated by fund through
an annual budget ordinance. The chart below shows the total appropriations by
fund and program area for FY 2012.
Of the $72.3 million in total FY 2012 appropriations as shown above, $26.5
million is new funding. Each fund that supports the CIP receives funding from
various sources. The most common source of funding is pay-go, which for the
Capital Projects Fund refers to transfers from the General Fund, and for the
other funds refers to their reserves or working capital balances. Other sources
include bond proceeds, developer contributions, and governmental grants.
5. Any long-term project funded through a grant where the establishment of
a CIP project is a condition of the grant.
3. Nonrecurring rehabilitation or major repair to all or part of a facility
provided the total cost per fiscal year is more than $100,000.
4. Any specific design work related to an individual project falling within
the above three categories.
6. A significant one-time investment in tangible goods of any nature, the
benefit of which will accrue over a multi-year period over $100,000.
Refuse
Sewer
Water
Redgate Golf
Stormwater Management
Parking
Special Activities Speed
Camera
Capital Projects
Enterprise Funds Governmental Funds
Special Revenue

TABLE 3-91. Outdoor Security Lighting
Fund FY 2012 FY 2013 FY 2014 FY 2015 FY 2016
Capital - 380,000 - - -
TABLE 3-86. Summary of Non-Routine vs. Routine CIP Projects
FY 2012 FY 2013 FY 2014 FY 2015 FY 2016
Non-Routine 4,495,680 12,631,700 3,700,000 1,665,000 6,700,000 TABLE 3-92. RedGate Golf Course Improvement
Routine 22,014,100 22,695,910 17,351,200 15,573,200 16,366,300 Fund FY 2012 FY 2013 FY 2014 FY 2015 FY 2016
Total 26,509,780 35,327,610 21,051,200 17,238,200 23,066,300 RedGate 204,000 - 300,000 - -
TABLE 3-87. F. Scott Fitzgerald Theatre Improvements
Fund FY 2012 FY 2013 FY 2014 FY 2015 FY 2016
Capital - 272,000 - - - TABLE 3-93. Senior Center Improvements
Fund FY 2012 FY 2013 FY 2014 FY 2015 FY 2016
Capital 93,750 - - - -
TABLE 3-88. Glenview Mansion and Cottage Improvements
Fund FY 2012 FY 2013 FY 2014 FY 2015 FY 2016 TABLE 3-94. Battery Back-Up Systems
Capital - 40,000 - - - Fund FY 2012 FY 2013 FY 2014 FY 2015 FY 2016
Speed 50,000 - - - -
TABLE 3-89. King Farm Farmstead Improvements
Fund FY 2012 FY 2013 FY 2014 FY 2015 FY 2016 TABLE 3-95. Rockville Intermodal Access - Baltimore Road
Capital - 128,000 - - - Fund FY 2012 FY 2013 FY 2014 FY 2015 FY 2016
Capital 600,000 - - - -
Developer 487,185 - - - -
Spec. Act. 300,000 - - - -
TABLE 3-90. Maryvale Park Improvements Total 1,387,185 - - - -
Fund FY 2012 FY 2013 FY 2014 FY 2015 FY 2016
Capital 106,745 - - - -
Non-Routine CIP Projects
3 - 39
This project funds installation and replacements of park, facility and parking lot
lighting to ensure safe and well-lit environments for users. For FY 2013, replace
existing 42-year-old parking lot and driveway lighting at Welsh Park with energy
efficient LED lighting system.
This project funds improvements to Maryvale Park. For FY 2012, install poured-
in-place playground safety surface, improve existing basketball courts, install
additional landscaping, and resurface exposed concrete inlet with stone veneer.
This project funds capital improvements at the RedGate Golf Course. FY 2012
includes roof repairs, asphalt pathway repairs, a tournament pavilion, and
restroom renovations. FY 2014 includes greens replacement.
This project funds improvements to the Senior Center based on a feasibility
study conducted in FY 2009 and the Senior Center Long Range Plan. For FY
2012, design and install emergency power generator to provide electric power
enabling use of the center during emergencies.
This project funds Battery Back-up Systems (BBS), which keep traffic signals
running for at least an 8-hour period during power outages. For FY 2012,
complete installation of BBS at all City-owned traffic signals.
The City defines non-routine CIP projects as projects that are one-time or major
infrastructure improvements, not ongoing or routine maintenance projects. Below
is a summary of the funded routine versus non-routine CIP projects, followed by
brief descriptions of the non-routine projects. Several of these projects also have
operating cost impacts, which are explained in detail on pages 3-41 and 3-42.
This project improves accessibility and connectivity of the intermodal systems
along Baltimore Road and its surrounding neighborhoods, from the City limits to
Town Center. For FY 2012, award bid and begin construction. Construction is
estimated to be complete in FY 2013 (approximately $4.1 million will carry over
in addition to the FY 2012 funds to support this major project).
This project funds renovations, improvements, and technical upgrades to the F.
Scott Fitzgerald Theatre which includes the Social Hall. For FY 2013, construct
restrooms (expand to serve large groups and replace 1980’s facilities) and new
food/coffee service area (replacing 1960 kitchen) to meet needs of the 20,000
annual visits using the Social Hall for a variety of events.
This project funds improvements and renovations to the Glenview Mansion and
Cottage, based on a five-year plan that is updated annually. For FY 2013,
replace mansion kitchen floor.
This project funds improvements to the five-acre "Farmstead", containing the
original King family farmhouse, dairy barns and other buildings. For FY 2013,
stabilize house, barns, and outbuildings.
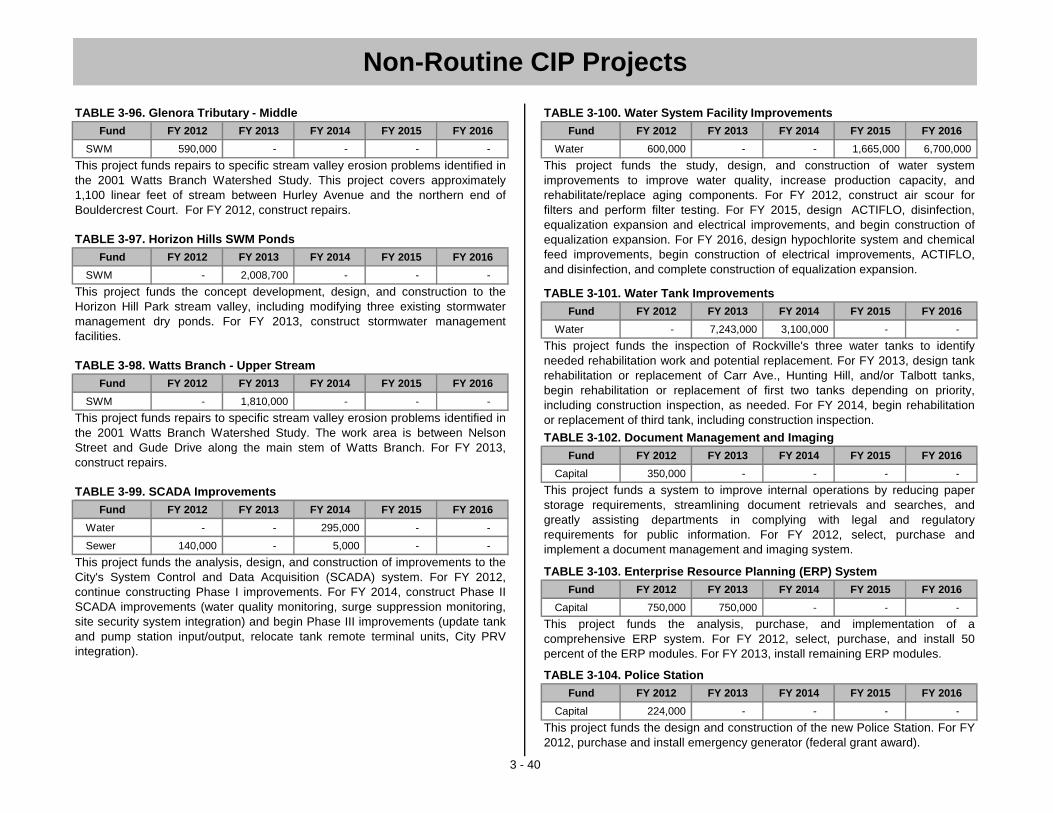
TABLE 3-96. Glenora Tributary - Middle TABLE 3-100. Water System Facility Improvements
Fund FY 2012 FY 2013 FY 2014 FY 2015 FY 2016 Fund FY 2012 FY 2013 FY 2014 FY 2015 FY 2016
SWM 590,000 - - - - Water 600,000 - - 1,665,000 6,700,000
TABLE 3-97. Horizon Hills SWM Ponds
Fund FY 2012 FY 2013 FY 2014 FY 2015 FY 2016
SWM - 2,008,700 - - -
TABLE 3-101. Water Tank Improvements
Fund FY 2012 FY 2013 FY 2014 FY 2015 FY 2016
Water - 7,243,000 3,100,000 - -
TABLE 3-98. Watts Branch - Upper Stream
Fund FY 2012 FY 2013 FY 2014 FY 2015 FY 2016
SWM - 1,810,000 - - -
TABLE 3-102. Document Management and Imaging
Fund FY 2012 FY 2013 FY 2014 FY 2015 FY 2016
Capital 350,000 - - - -
TABLE 3-99. SCADA Improvements
Fund FY 2012 FY 2013 FY 2014 FY 2015 FY 2016
Water - - 295,000 - -
Sewer 140,000 - 5,000 - -
TABLE 3-103. Enterprise Resource Planning (ERP) System
Fund FY 2012 FY 2013 FY 2014 FY 2015 FY 2016
Capital 750,000 750,000 - - -
TABLE 3-104. Police Station
Fund FY 2012 FY 2013 FY 2014 FY 2015 FY 2016
Capital 224,000 - - - -
Non-Routine CIP Projects
This project funds the analysis, design, and construction of improvements to the
City's System Control and Data Acquisition (SCADA) system. For FY 2012,
continue constructing Phase I improvements. For FY 2014, construct Phase II
SCADA improvements (water quality monitoring, surge suppression monitoring,
site security system integration) and begin Phase III improvements (update tank
and pump station input/output, relocate tank remote terminal units, City PRV
integration).
3 - 40
This project funds repairs to specific stream valley erosion problems identified in
the 2001 Watts Branch Watershed Study. This project covers approximately
1,100 linear feet of stream between Hurley Avenue and the northern end of
Bouldercrest Court. For FY 2012, construct repairs.
This project funds the concept development, design, and construction to the
Horizon Hill Park stream valley, including modifying three existing stormwater
management dry ponds. For FY 2013, construct stormwater management
facilities.
This project funds repairs to specific stream valley erosion problems identified in
the 2001 Watts Branch Watershed Study. The work area is between Nelson
Street and Gude Drive along the main stem of Watts Branch. For FY 2013,
construct repairs.
This project funds the inspection of Rockville's three water tanks to identify
needed rehabilitation work and potential replacement. For FY 2013, design tank
rehabilitation or replacement of Carr Ave., Hunting Hill, and/or Talbott tanks,
begin rehabilitation or replacement of first two tanks depending on priority,
including construction inspection, as needed. For FY 2014, begin rehabilitation
or replacement of third tank, including construction inspection.
This project funds the study, design, and construction of water system
improvements to improve water quality, increase production capacity, and
rehabilitate/replace aging components. For FY 2012, construct air scour for
filters and perform filter testing. For FY 2015, design ACTIFLO, disinfection,
equalization expansion and electrical improvements, and begin construction of
equalization expansion. For FY 2016, design hypochlorite system and chemical
feed improvements, begin construction of electrical improvements, ACTIFLO,
and disinfection, and complete construction of equalization expansion.
This project funds the design and construction of the new Police Station. For FY
2012, purchase and install emergency generator (federal grant award).
This project funds a system to improve internal operations by reducing paper
storage requirements, streamlining document retrievals and searches, and
greatly assisting departments in complying with legal and regulatory
requirements for public information. For FY 2012, select, purchase and
implement a document management and imaging system.
This project funds the analysis, purchase, and implementation of a
comprehensive ERP system. For FY 2012, select, purchase, and install 50
percent of the ERP modules. For FY 2013, install remaining ERP modules.

TABLE 3-111. Rockville Intermodal Access - Baltimore Road
Fund FY 2012 FY 2013 FY 2014 FY 2015 FY 2016
General - 3,000 - - -
TABLE 3-105. Ballfield Equipment Replacement TABLE 3-112. Sidewalks
Fund FY 2012 FY 2013 FY 2014 FY 2015 FY 2016 Fund FY 2012 FY 2013 FY 2014 FY 2015 FY 2016
General - - - (2,050) - General 5,000 1,000 400 400 400
TABLE 3-106. Outdoor Security Lighting
Fund FY 2012 FY 2013 FY 2014 FY 2015 FY 2016 TABLE 3-113. Street Lighting Improvements
General - - (790) - - Fund FY 2012 FY 2013 FY 2014 FY 2015 FY 2016
General - 5,000 5,000 5,000 5,000
TABLE 3-107. Senior Center Improvements
Fund FY 2012 FY 2013 FY 2014 FY 2015 FY 2016
General 58,200 31,550 - - - TABLE 3-114. Traffic Controls Citywide
Fund FY 2012 FY 2013 FY 2014 FY 2015 FY 2016
General 1,000 500 500 500 500
TABLE 3-108. Accessible Pedestrian Signals
Fund FY 2012 FY 2013 FY 2014 FY 2015 FY 2016
General - 7,000 - - - TABLE 3-115. Glenora Tributary - Middle
Fund FY 2012 FY 2013 FY 2014 FY 2015 FY 2016
General - - 8,100 - -
TABLE 3-109. Battery Back-Up Systems SWM - - 5,000 - -
Fund FY 2012 FY 2013 FY 2014 FY 2015 FY 2016
General 3,000 6,000 - - -
TABLE 3-116. Horizon Hills SWM Ponds
TABLE 3-110. Pedestrian Safety Fund FY 2012 FY 2013 FY 2014 FY 2015 FY 2016
Fund FY 2012 FY 2013 FY 2014 FY 2015 FY 2016 General - - 1,500 - -
General 5,000 1,375 1,375 1,375 1,375 SWM - - 36,500 - -
Operating Cost Impacts of CIP Projects
This project will add $200 per traffic signal (15 signals in FY 2012 and 30 in FY
2013) to the operating budget to fund signal maintenance.
This project will add $3,000 to the FY 2013 operating budget to fund landscaping
($1,000), snow removal ($1,500), and supplies ($500).
3 - 41
This project will add $13,100 to the FY 2014 operating budget for the
management of non-native invasive species plants ($8,100) and stream
monitoring ($5,000).
This project added $5,000 in FY 2012 and will add $1,375 in the FY 2013
through FY 2016 operating budgets for contracted signal maintenance for school
flashers, signs, concrete maintenance, and landscaping.
Construction of new sidewalks will add $5,000 to the FY 2012 operating budget,
$1,000 to the FY 2013, and $400 each year beginning in FY 2014 to fund
maintenance, supplies, snow removal, signs, and landscaping.
The addition of approximately 60 new streetlights each year will add $5,000 ($80
per light) to the operating budget each fiscal year to fund electrical and
maintenance costs.
Adding 14 new signals will add $500 per traffic signal to the FY 2013 operating
budget to fund signal maintenance following a one-year warranty period.
Some of the City's routine and non-routine CIP projects impact future operating
budgets due to increases or decreases in operating costs. These impacts vary
from project to project and are evaluated each year during the annual budget
process. The following charts list the budget amounts, by fund, project and fiscal
year, added to or subtracted from the City's operating budget.
The addition of new traffic controls will add $1,000 to the FY 2012 operating
budget and $500 each fiscal year after to fund traffic signal maintenance.
This project will add $38,000 to the FY 2014 operating budget to fund routine
pond maintenance and lawn mowing ($5,000), major pond maintenance
($30,000), and management of non-native invasive species ($3,000).
Replacement of the Broome Park sports lights in FY 2014 will save $2,050 in
electricity costs starting in FY 2015 due to energy efficient lighting.
Replacement of the Welsh Park lights in FY 2013 will save $790 in electricity
costs starting in FY 2014 due to energy efficient lighting.
This project will add $89,750 over FY 2012 and FY 2013 for additional fitness
and custodial staff, maintenance supplies and utility costs.

TABLE 3-117. Storm Drain Rehab and Improvements TABLE 3-123. Southlawn Lane Water Main
Fund FY 2012 FY 2013 FY 2014 FY 2015 FY 2016 Fund FY 2012 FY 2013 FY 2014 FY 2015 FY 2016
SWM 1,000 500 500 500 500 Water 400 - - - -
TABLE 3-124. Water Plant Upgrades
TABLE 3-118. SWM Facility Retrofit Fund FY 2012 FY 2013 FY 2014 FY 2015 FY 2016
Fund FY 2012 FY 2013 FY 2014 FY 2015 FY 2016 Water - 15,000 - - -
General - - - 1,500 -
SWM - - - 19,000 -
TABLE 3-125. Water Tank Improvements
Fund FY 2012 FY 2013 FY 2014 FY 2015 FY 2016
Water - - - 2,000 -
TABLE 3-119. Watts Branch - Upper Stream
Fund FY 2012 FY 2013 FY 2014 FY 2015 FY 2016
General - - - 22,400 - TABLE 3-126. Document Management and Imaging System
SWM - - - 5,000 - Fund FY 2012 FY 2013 FY 2014 FY 2015 FY 2016
General - 125,000 - - -
TABLE 3-120. Woodley Gardens - Stream TABLE 3-127. Enterprise Resource Planning System
Fund FY 2012 FY 2013 FY 2014 FY 2015 FY 2016 Fund FY 2012 FY 2013 FY 2014 FY 2015 FY 2016
General 30,700 - - - - General - - (17,140) - -
SWM 10,000 - - - -
TABLE 3-128. Police Station
TABLE 3-121. Hydraulic Surge Suppression Fund FY 2012 FY 2013 FY 2014 FY 2015 FY 2016
Fund FY 2012 FY 2013 FY 2014 FY 2015 FY 2016 General 13,200 213,750 (250,000) - -
Water 10,000 - - - -
TABLE 3-122. SCADA Improvements
Fund FY 2012 FY 2013 FY 2014 FY 2015 FY 2016
Water 5,000 10,000 - 5,000 -
This project will add $20,500 to the FY 2015 operating budget to fund routine
pond maintenance and lawn mowing ($2,500), major pond maintenance
($15,000), and management of non-native invasive species ($3,000).
In FY 2014 a net savings of $17,140 will be realized, due to the addition of
$150,000 for the annual maintenance cost for the ERP system and a reduction
of $167,140 in current software maintenance contracts.
3 - 42
This project will add $125,000 in FY 2013 for the annual maintenance costs
(35,000) and a new 1.0 FTE to manage the system ($90,000).
Operating Cost Impacts of CIP Projects
This project added $400 to the FY 2012 operating budget to fund water main
maintenance costs.
This project will add $15,000 to the FY 2013 operating budgets for chemicals,
electricity, and maintenance.
This project will add $2,000 to the FY 2015 operating budget to fund annual
inspections of the cathodic protection system.
This project added $40,700 to the FY 2012 operating budget for the continued
management of non-native invasive species plants ($30,700) and monitoring
required by regulatory agencies ($10,000).
The new operating cost impact for the police facility is $226,950 and will be split
between two fiscal years. During construction $13,200 will be added to FY 2012
for increased utilities and the remaining $213,750 will be added to the FY 2013
operating budget to fund maintenance, utilities, leased parking, copier lease and
phone lines for the portion of the year the police facility will be operational.
Taking advantage of the space vacated by the Police Department at City Hall,
two leases and associated expenses at Court House Square, in the amount of
$250,000, will be eliminated starting in FY 2014.
This project added $10,000 to the FY 2012 operating budget for maintenance.
This project will add $1,000 to the FY 2012 operating budget to fund storm drain
pipe and structure cleaning and contracted maintenance, and $500 to future
years to fund maintenance of storm drain pipe extensions.
This project will add $27,400 ($3,000 per acre impacted) to the FY 2015
operating budget to fund continued management of non-native invasive species
plants ($22,400) and ongoing effectiveness monitoring ($5,000).
This project added $5,000 to the FY 2012, and will add $10,000 to the FY 2013
and $5,000 to the FY 2015 operating budgets to fund maintenance.
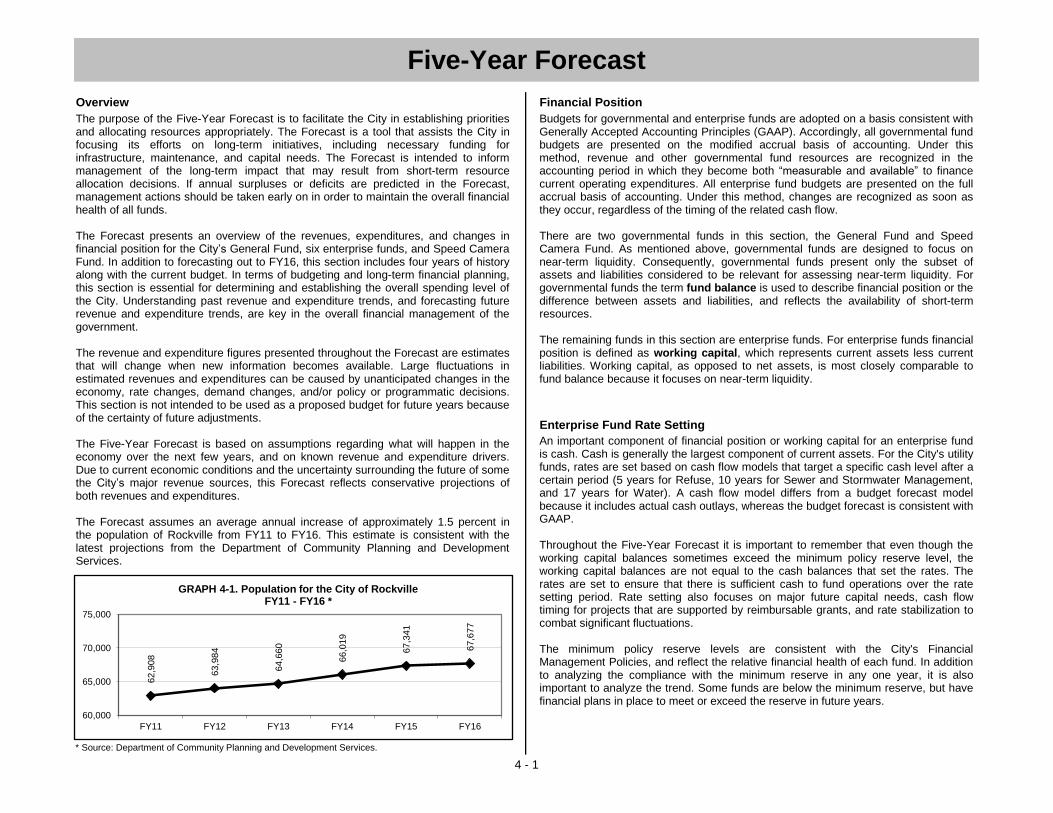
Overview Financial Position
Five-Year Forecast
Enterprise Fund Rate Setting
4 - 1
* Source: Department of Community Planning and Development Services.
62,9
08
63,9
84
64,6
60
66,0
19
67,3
41
67,6
77
60,000
65,000
70,000
75,000
FY11 FY12 FY13 FY14 FY15 FY16
GRAPH 4-1. Population for the City of Rockville FY11 - FY16 *
The purpose of the Five-Year Forecast is to facilitate the City in establishing priorities and allocating resources appropriately. The Forecast is a tool that assists the City in focusing its efforts on long-term initiatives, including necessary funding for infrastructure, maintenance, and capital needs. The Forecast is intended to inform management of the long-term impact that may result from short-term resource allocation decisions. If annual surpluses or deficits are predicted in the Forecast, management actions should be taken early on in order to maintain the overall financial health of all funds. The Forecast presents an overview of the revenues, expenditures, and changes in financial position for the City’s General Fund, six enterprise funds, and Speed Camera Fund. In addition to forecasting out to FY16, this section includes four years of history along with the current budget. In terms of budgeting and long-term financial planning, this section is essential for determining and establishing the overall spending level of the City. Understanding past revenue and expenditure trends, and forecasting future revenue and expenditure trends, are key in the overall financial management of the government. The revenue and expenditure figures presented throughout the Forecast are estimates that will change when new information becomes available. Large fluctuations in estimated revenues and expenditures can be caused by unanticipated changes in the economy, rate changes, demand changes, and/or policy or programmatic decisions. This section is not intended to be used as a proposed budget for future years because of the certainty of future adjustments. The Five-Year Forecast is based on assumptions regarding what will happen in the economy over the next few years, and on known revenue and expenditure drivers. Due to current economic conditions and the uncertainty surrounding the future of some the City’s major revenue sources, this Forecast reflects conservative projections of both revenues and expenditures. The Forecast assumes an average annual increase of approximately 1.5 percent in the population of Rockville from FY11 to FY16. This estimate is consistent with the latest projections from the Department of Community Planning and Development Services.
Budgets for governmental and enterprise funds are adopted on a basis consistent with Generally Accepted Accounting Principles (GAAP). Accordingly, all governmental fund budgets are presented on the modified accrual basis of accounting. Under this method, revenue and other governmental fund resources are recognized in the accounting period in which they become both “measurable and available” to finance current operating expenditures. All enterprise fund budgets are presented on the full accrual basis of accounting. Under this method, changes are recognized as soon as they occur, regardless of the timing of the related cash flow. There are two governmental funds in this section, the General Fund and Speed Camera Fund. As mentioned above, governmental funds are designed to focus on near-term liquidity. Consequently, governmental funds present only the subset of assets and liabilities considered to be relevant for assessing near-term liquidity. For governmental funds the term fund balance is used to describe financial position or the difference between assets and liabilities, and reflects the availability of short-term resources. The remaining funds in this section are enterprise funds. For enterprise funds financial position is defined as working capital, which represents current assets less current liabilities. Working capital, as opposed to net assets, is most closely comparable to fund balance because it focuses on near-term liquidity.
An important component of financial position or working capital for an enterprise fund is cash. Cash is generally the largest component of current assets. For the City's utility funds, rates are set based on cash flow models that target a specific cash level after a certain period (5 years for Refuse, 10 years for Sewer and Stormwater Management, and 17 years for Water). A cash flow model differs from a budget forecast model because it includes actual cash outlays, whereas the budget forecast is consistent with GAAP. Throughout the Five-Year Forecast it is important to remember that even though the working capital balances sometimes exceed the minimum policy reserve level, the working capital balances are not equal to the cash balances that set the rates. The rates are set to ensure that there is sufficient cash to fund operations over the rate setting period. Rate setting also focuses on major future capital needs, cash flow timing for projects that are supported by reimbursable grants, and rate stabilization to combat significant fluctuations. The minimum policy reserve levels are consistent with the City's Financial Management Policies, and reflect the relative financial health of each fund. In addition to analyzing the compliance with the minimum reserve in any one year, it is also important to analyze the trend. Some funds are below the minimum reserve, but have financial plans in place to meet or exceed the reserve in future years.

Actual FY07
Actual FY08
Actual FY09
Actual FY10
Modified FY11
AdoptedFY12
Estimated FY13
Estimated FY14
Estimated FY15
Estimated FY16
General (110) 60,155,929 61,362,753 62,837,727 61,967,741 63,022,026 66,042,880 67,809,061 69,775,087 71,350,275 74,560,046 Water (210) 5,399,636 5,280,165 5,801,418 6,834,813 9,244,050 10,101,470 12,512,572 13,049,429 13,472,335 13,944,727 Sewer (220) 6,406,730 6,022,976 6,275,621 6,406,863 7,874,000 8,087,000 9,116,651 10,450,499 10,893,005 11,070,116 Refuse (230) 5,182,941 5,555,482 5,602,058 5,565,195 5,583,550 5,698,800 6,032,872 6,424,792 6,811,270 7,213,914 Parking (320) 3,580,074 4,164,003 3,180,989 3,078,611 3,492,000 2,373,000 2,665,598 2,721,276 2,747,720 2,782,235 Stormwater Mgmt (330) 1,176,508 888,277 776,314 1,719,358 2,503,500 2,641,200 3,342,047 4,314,410 5,190,062 5,285,367 RedGate Golf Course (340) 1,262,148 1,335,655 1,169,150 961,411 3,408,355 1,787,480 1,773,834 2,112,350 1,852,021 1,892,882 Speed Camera (380) 81,991 4,061,034 2,777,447 1,963,075 2,132,000 1,429,000 1,417,100 1,458,100 1,451,200 1,445,700
Total Revenues / Sources * 83,245,957 88,670,346 88,420,724 88,497,067 97,259,481 98,160,830 104,669,736 110,305,943 113,767,889 118,194,987 Percent Increase 10.9% 6.5% -0.3% 0.1% 9.9% 0.9% 6.6% 5.4% 3.1% 3.9%
Actual FY07
Actual FY08
Actual FY09
Actual FY10
Modified FY11
AdoptedFY12
Estimated FY13
Estimated FY14
Estimated FY15
Estimated FY16
General (110) 61,439,495 61,978,081 64,284,016 60,335,834 66,882,686 66,042,880 67,299,308 70,007,637 72,144,270 74,221,198 Water (210) 5,747,544 6,183,215 6,965,004 7,393,901 11,120,280 9,517,250 10,459,533 10,860,403 12,417,277 12,846,247 Sewer (220) 5,443,124 5,979,682 6,016,986 6,383,194 8,515,506 7,897,180 8,704,380 8,976,833 9,783,401 10,087,839 Refuse (230) 4,675,342 4,852,917 5,129,830 5,037,777 5,896,586 6,008,870 6,148,393 6,300,829 6,460,050 6,637,466 Parking (320) 10,437,380 3,836,515 3,398,183 3,393,400 4,418,715 3,037,640 3,173,286 3,157,031 3,140,357 3,128,804 Stormwater Mgmt (330) 2,673,487 1,185,276 1,871,840 2,467,376 3,405,506 3,186,180 3,959,032 4,097,915 4,250,497 4,418,122 RedGate Golf Course (340) 1,292,306 1,382,071 1,508,188 1,507,740 1,731,200 1,722,190 1,702,138 1,740,143 1,804,310 1,844,644 Speed Camera (380) 107,879 1,498,747 1,387,025 1,090,713 1,719,870 1,264,200 1,280,775 1,299,767 1,319,996 1,341,578
Total Operating Exp. * 91,816,557 86,896,504 90,561,072 87,609,935 103,690,349 98,676,390 102,726,845 106,440,558 111,320,159 114,525,898 Percent Increase 25.0% -5.4% 4.2% -3.3% 18.4% -4.8% 4.1% 3.6% 4.6% 2.9%* Does not include revenues or expenditures from the Special Activities, CDBG, or Debt Service funds.
Total Revenue and Expenditure Summary by FundTABLE 4-1. Revenues / Sources by Fund
TABLE 4-2. Expenditures by Fund
4 - 2
$0
$15
$30
$45
$60
$75
$90
$105
$120
$135
$150
2007 2008 2009 2010 2011 2012 2013 2014 2015 2016
(in m
illio
ns)
GRAPH 4-2. Total Revenue and Expenditure BudgetsGeneral, Enterprise, and Speed Camera Funds, FY 2007 - FY 2016
Revenues
Expenditures
The funds represented in the forecast include the City's General Fund, six enterprise funds, and the Speed Camera Fund. The General Fund is the primary operating fund of the City and is used to account for the City's general or non-enterprise activities. Many of the City's administrative functions are supported through this Fund.
The enterprise funds are used to account for operations financed and operated in a manner similar to private business enterprises where the cost of expenses, including both operations and capital, are financed or recovered primarily through user charges.
The Speed Camera Fund is a special revenue fund that is used to account for the proceeds of speed camera citations. The revenues from this Fund are legally restricted to fund public safety activities.
etompkins
Underline
etompkins
Underline
etompkins
Underline
etompkins
Underline
etompkins
Underline
etompkins
Underline
etompkins
Underline
etompkins
Underline
etompkins
Underline
etompkins
Underline
etompkins
Underline
etompkins
Underline
etompkins
Underline
etompkins
Underline
etompkins
Underline
etompkins
Underline
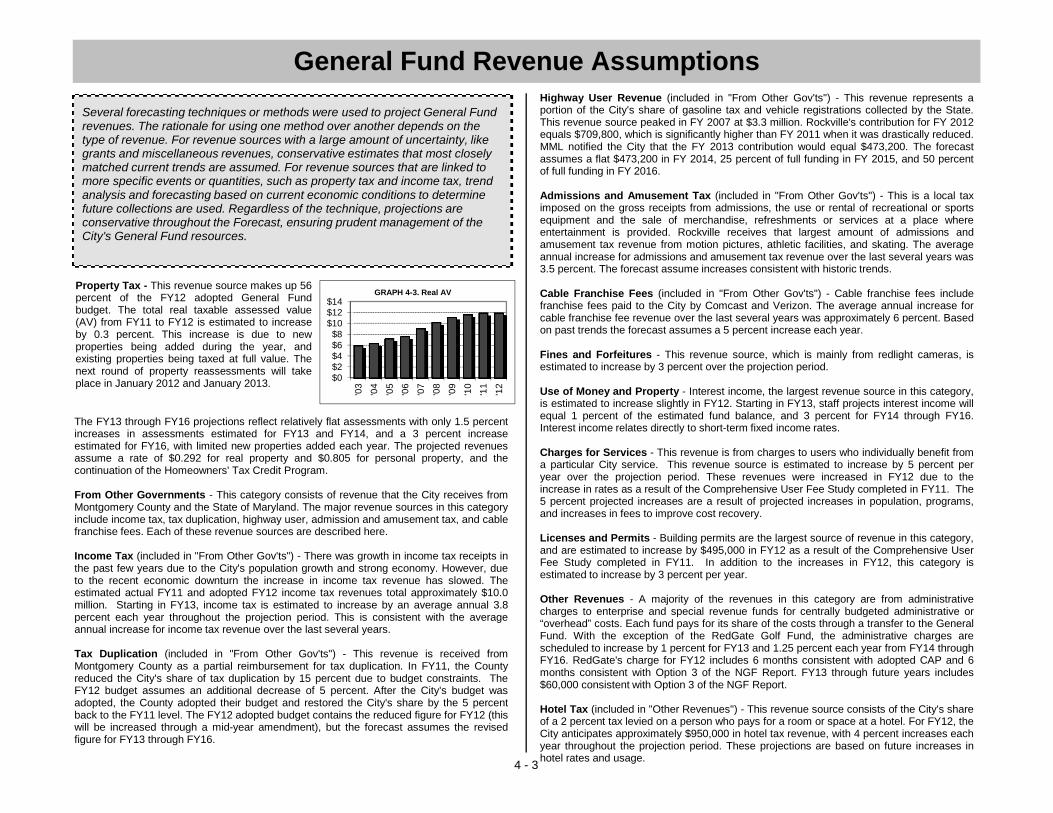
General Fund Revenue Assumptions
4 - 3
$0$2$4$6$8
$10$12$14
'03
'04
'05
'06
'07
'08
'09
'10
'11
'12
GRAPH 4-3. Real AV
Several forecasting techniques or methods were used to project General Fund revenues. The rationale for using one method over another depends on the type of revenue. For revenue sources with a large amount of uncertainty, like grants and miscellaneous revenues, conservative estimates that most closely matched current trends are assumed. For revenue sources that are linked to more specific events or quantities, such as property tax and income tax, trend analysis and forecasting based on current economic conditions to determine future collections are used. Regardless of the technique, projections are conservative throughout the Forecast, ensuring prudent management of the City's General Fund resources.
Highway User Revenue (included in "From Other Gov'ts") - This revenue represents aportion of the City's share of gasoline tax and vehicle registrations collected by the State.This revenue source peaked in FY 2007 at $3.3 million. Rockville's contribution for FY 2012equals $709,800, which is significantly higher than FY 2011 when it was drastically reduced.MML notified the City that the FY 2013 contribution would equal $473,200. The forecastassumes a flat $473,200 in FY 2014, 25 percent of full funding in FY 2015, and 50 percentof full funding in FY 2016.
Admissions and Amusement Tax (included in "From Other Gov'ts") - This is a local taximposed on the gross receipts from admissions, the use or rental of recreational or sportsequipment and the sale of merchandise, refreshments or services at a place whereentertainment is provided. Rockville receives that largest amount of admissions andamusement tax revenue from motion pictures, athletic facilities, and skating. The averageannual increase for admissions and amusement tax revenue over the last several years was3.5 percent. The forecast assume increases consistent with historic trends.
Cable Franchise Fees (included in "From Other Gov'ts") - Cable franchise fees includefranchise fees paid to the City by Comcast and Verizon. The average annual increase forcable franchise fee revenue over the last several years was approximately 6 percent. Basedon past trends the forecast assumes a 5 percent increase each year.
Fines and Forfeitures - This revenue source, which is mainly from redlight cameras, isestimated to increase by 3 percent over the projection period.
Use of Money and Property - Interest income, the largest revenue source in this category,is estimated to increase slightly in FY12. Starting in FY13, staff projects interest income willequal 1 percent of the estimated fund balance, and 3 percent for FY14 through FY16.Interest income relates directly to short-term fixed income rates.
Charges for Services - This revenue is from charges to users who individually benefit froma particular City service. This revenue source is estimated to increase by 5 percent peryear over the projection period. These revenues were increased in FY12 due to theincrease in rates as a result of the Comprehensive User Fee Study completed in FY11. The5 percent projected increases are a result of projected increases in population, programs,and increases in fees to improve cost recovery.
Licenses and Permits - Building permits are the largest source of revenue in this category,and are estimated to increase by $495,000 in FY12 as a result of the Comprehensive UserFee Study completed in FY11. In addition to the increases in FY12, this category isestimated to increase by 3 percent per year.
Other Revenues - A majority of the revenues in this category are from administrativecharges to enterprise and special revenue funds for centrally budgeted administrative or“overhead” costs. Each fund pays for its share of the costs through a transfer to the GeneralFund. With the exception of the RedGate Golf Fund, the administrative charges arescheduled to increase by 1 percent for FY13 and 1.25 percent each year from FY14 throughFY16. RedGate's charge for FY12 includes 6 months consistent with adopted CAP and 6months consistent with Option 3 of the NGF Report. FY13 through future years includes$60,000 consistent with Option 3 of the NGF Report.
Hotel Tax (included in "Other Revenues") - This revenue source consists of the City's shareof a 2 percent tax levied on a person who pays for a room or space at a hotel. For FY12, theCity anticipates approximately $950,000 in hotel tax revenue, with 4 percent increases eachyear throughout the projection period. These projections are based on future increases inhotel rates and usage.
The FY13 through FY16 projections reflect relatively flat assessments with only 1.5 percentincreases in assessments estimated for FY13 and FY14, and a 3 percent increaseestimated for FY16, with limited new properties added each year. The projected revenuesassume a rate of $0.292 for real property and $0.805 for personal property, and thecontinuation of the Homeowners' Tax Credit Program.
From Other Governments - This category consists of revenue that the City receives fromMontgomery County and the State of Maryland. The major revenue sources in this categoryinclude income tax, tax duplication, highway user, admission and amusement tax, and cablefranchise fees. Each of these revenue sources are described here.
Income Tax (included in "From Other Gov'ts") - There was growth in income tax receipts inthe past few years due to the City's population growth and strong economy. However, dueto the recent economic downturn the increase in income tax revenue has slowed. Theestimated actual FY11 and adopted FY12 income tax revenues total approximately $10.0million. Starting in FY13, income tax is estimated to increase by an average annual 3.8percent each year throughout the projection period. This is consistent with the averageannual increase for income tax revenue over the last several years.
Tax Duplication (included in "From Other Gov'ts") - This revenue is received fromMontgomery County as a partial reimbursement for tax duplication. In FY11, the Countyreduced the City's share of tax duplication by 15 percent due to budget constraints. TheFY12 budget assumes an additional decrease of 5 percent. After the City's budget wasadopted, the County adopted their budget and restored the City's share by the 5 percentback to the FY11 level. The FY12 adopted budget contains the reduced figure for FY12 (thiswill be increased through a mid-year amendment), but the forecast assumes the revisedfigure for FY13 through FY16.
Property Tax - This revenue source makes up 56percent of the FY12 adopted General Fundbudget. The total real taxable assessed value(AV) from FY11 to FY12 is estimated to increaseby 0.3 percent. This increase is due to newproperties being added during the year, andexisting properties being taxed at full value. Thenext round of property reassessments will takeplace in January 2012 and January 2013.

4 - 4
General Fund Expenditure Assumptions
Similar to the General Fund revenues, several forecasting techniques or methods were used to project General Fund expenditures. The rationale for using one method over another depends on the type of expenditure. For expenditures that fluctuate, like capital outlay, conservative estimates that most closely matched current trends are assumed. For expenditures that are linked to more specific activities or quantities, such as personnel and debt service, trend analysis or known schedules to determine future expenditures are used.
$10.3
1 $
7.8
3
$8.5
3
$2.3
8
$3.8
6
$3.9
7
$3.5
0
$4.0
0
$4.5
0
$4.5
0
$0.0
$3.0
$6.0
$9.0
$12.0
$15.0
'07
'08
'09
'10
'11
'12
'13
'14
'15
'16
GRAPH 4-5. Pay-go Transfer to CIP (millions)
$5.6
5
$4.9
1
$4.1
0
$4.0
0
$5.2
0
$5.1
0
$5.1
0
$5.2
0
$5.2
0
$5.2
0
$0.0
$2.0
$4.0
$6.0
$8.0
$10.0
'07
'08
'09
'10
'11
'12
'13
'14
'15
'16
GRAPH 4-6. Debt Service Transfer (millions)
$1.1
7
$1.5
7
$0.9
5
$0.8
5
$1.0
3
$0.5
0
$0.7
5
$0.7
5
$0.7
5
$0.7
5
$0.1
1
$0.1
7
$0.0
9
$0.0
0
$2.3
9
$0.6
3
$0.4
9
$0.7
9
$0.4
9
$0.4
9
$0.0
$0.5
$1.0
$1.5
$2.0
$2.5
'07
'08
'09
'10
'11
'12
'13
'14
'15
'16
GRAPH 4-4. Parking and RedGate Transfers (millions)
Parking RedGate
Personnel - Includes salary, benefits, and overtime. Salaries are estimated to increase by 1 percent in FY13 and 1.25 percent each year from FY14 through FY16. Benefits are estimated to increase by 10 percent each year over the projection period. The increases in benefits are consistent with the estimated contributions to employee retirement, as well as the future projection of healthcare costs. For this analysis overtime remains flat throughout the projection period. These increases assume General Fund staffing levels will remain relatively flat over the projection period. Contractual Services and Commodities - There is an estimated increase of 1 percent for contractual services and 3 percent for commodities over the projection period. The 1 percent increase in contractual services reflects the continued reduced levels of employee travel and training, position reclassifications, contract services, program supplies and equipment. These items were first reduced when the City's intergovernmental revenues were significantly decreased starting in mid-FY10. The 3 percent increase in commodities is mostly due to projected utility increases at City facilities. Capital Outlay - This expenditure category usually fluctuates from year to year because it is comprised of many one-time expenditures. Given the City's current financial condition, only high priority items will be purchased. Because spending in this category is more discretionary, capital outlay is estimated to remain flat throughout the projection period. Other / Transfers - This category is primarily comprised of transfers to the Parking Fund and RedGate Golf Fund and grants for Outside and Caregiver Agencies. The transfers are described here along with graphs that provide a history of the transfers. Outside and Caregiver Agency grants are estimated to increase by 1 percent in FY13 and 1.25 percent each year from FY14 through FY16. Transfer to Parking (included in "Other / Transfer") - The FY12 budget includes a $500,000 transfer from the General Fund to support the parking enterprise. Staff recommends continuing with a General Fund transfer of $750,000 per year starting in FY 2013 until parking revenues offset more Parking Fund expenses, which includes the debt service on $36 million of parking garage debt. Transfer to RedGate Golf (included in "Other / Transfer") - Refers to the transfer from the General Fund to assist with the annual operating deficit and to support capital improvements to the course. In FY11 the Mayor and Council directed staff to transfer approximately $2.39 million from the General Fund to eliminate the accumulated deficit and the FY11 annual operating deficit. For FY12, the $630,000 transfer includes $204,000 for high priority capital improvements and $426,000 to help with annual operating expenses while the City considers transitioning from in-house management to an outside arrangement.
Transfer to the CIP - The CIP program is mainly funded from four components: cash, debt, government grants, and developer contributions. The transfer from the General Fund is the cash or "pay-go" contribution. The pay-go contribution is critical in controlling the City's overall debt and maintaining the City's credit rating. In FY07, FY08, and FY09 the City transferred one-time savings (General Fund fund balance in excess of the 15 percent reserve requirement) in addition to the annual budgeted transfer amount in an effort to reduce borrowing (see graph below). The FY12 budget includes a transfer of $3.97 million, FY13 includes a transfer of $3.5 million, FY14 will assume $4.0 million, and FY15 and FY16 will assume $4.5 million. The transfer amounts are based on the Capital Projects Fund cash flow, which is presented in the CIP budget book, and is balanced over a five-year period. Debt Service - This represents the annual transfer to the Debt Service Fund to support the City's annual debt payments. The projected debt payments cover old and new General Fund debt, including $5.8 million that is planned for FY13. The transfer amounts are based on the Debt Service Fund cash flow, which is presented in the CIP budget book, and is balanced over a five-year period.

Actual
FY07
Actual
FY08
Actual
FY09
Actual
FY10
Modified
FY11
Adopted
FY12
Estimated
FY13
Estimated
FY14
Estimated
FY15
Estimated
FY16
Property Taxes 31,192,975 32,205,812 34,526,050 35,454,838 34,762,000 36,895,000 37,619,708 38,377,861 38,617,152 39,969,076
From Other Gov'ts 17,673,744 17,981,956 17,801,482 15,399,421 15,402,816 14,816,000 15,431,977 15,875,706 16,678,302 17,970,758
Fines and Forfeitures 877,137 634,907 648,477 687,732 645,000 645,000 664,350 684,281 704,809 725,953
Use of Money / Property 1,883,744 2,168,327 330,784 186,255 321,480 405,900 490,495 747,080 751,299 765,099
Charges for Service 4,652,890 4,859,899 5,473,186 5,766,550 5,617,160 6,132,610 6,439,241 6,761,203 7,099,263 7,454,226
Licenses and Permits 2,114,909 1,797,039 1,606,198 1,737,186 1,660,000 2,261,000 2,328,830 2,398,695 2,470,656 2,544,775
Other Revenues 1,760,530 1,714,813 2,451,549 2,735,759 4,613,570 4,887,370 4,834,461 4,930,262 5,028,795 5,130,159
Total Revenues / Sources 60,155,929 61,362,753 62,837,727 61,967,741 63,022,026 66,042,880 67,809,061 69,775,087 71,350,275 74,560,046
Percent Increase 7.2% 2.0% 2.4% -1.4% 1.7% 4.8% 2.7% 2.9% 2.3% 4.5%
ExpendituresActual
FY07
Actual
FY08
Actual
FY09
Actual
FY10
Modified
FY11
Adopted
FY12
Estimated
FY13
Estimated
FY14
Estimated
FY15
Estimated
FY16
Personnel 32,226,031 33,507,220 36,941,746 38,873,774 40,261,957 41,606,320 42,976,996 44,533,532 46,212,553 48,025,891
Contract Services 6,308,899 7,746,084 7,373,957 7,286,501 7,087,928 7,088,580 7,159,466 7,231,060 7,303,371 7,376,405
Commodities 4,153,091 4,457,595 4,517,281 4,858,076 5,058,597 5,273,420 5,431,623 5,594,571 5,762,408 5,935,281
Capital Outlay 540,260 749,700 644,462 718,022 660,789 511,250 511,250 511,250 511,250 511,250
Other / Transfers 2,247,590 2,780,090 2,173,247 2,221,461 4,757,415 2,496,310 2,619,973 2,937,223 2,654,688 2,672,372
Subtotal 45,475,871 49,240,689 51,650,692 53,957,834 57,826,686 56,975,880 58,699,308 60,807,637 62,444,270 64,521,198
Transfer to CIP 10,312,824 7,831,500 8,533,695 2,378,000 3,856,000 3,967,000 3,500,000 4,000,000 4,500,000 4,500,000
Debt Service 5,650,800 4,905,892 4,099,629 4,000,000 5,200,000 5,100,000 5,100,000 5,200,000 5,200,000 5,200,000
Total Operating Expenditures 61,439,495 61,978,081 64,284,016 60,335,834 66,882,686 66,042,880 67,299,308 70,007,637 72,144,270 74,221,198
Percent Increase 13.7% 0.9% 3.7% -6.1% 10.9% -1.3% 1.9% 4.0% 3.1% 2.9%
16,950,559 15,666,993 15,051,665 13,656,942 15,288,849 11,428,189 11,428,189 11,937,943 11,705,393 10,911,398
Net Change (1,283,566) (615,328) (1,446,289) 1,631,907 (3,860,660) - 509,754 (232,550) (793,995) 338,848
15,666,993 15,051,665 13,605,376 15,288,849 11,428,189 11,428,189 11,937,943 11,705,393 10,911,398 11,250,246
27.9% 25.6% 22.0% 24.6% 18.4% 17.3% 17.6% 16.8% 15.3% 15.1%
8,436,473 8,836,036 9,275,456 9,312,388 9,315,400 9,906,432 10,171,359 10,466,263 10,702,541 11,184,007
General Fund Five-Year Forecast
4 - 5
TABLE 4-3. General Fund Revenues / Sources
TABLE 4-4. General Fund Expenditures
TABLE 4-5. General Fund Balance and Target Reserve
Fund Balance, Beginning *
Fund Balance, Ending
Target Reserve Level
* FY10 Actual Fund Balance, Beginning was adjusted up by $51,566 consistent with the City's FY10 audited financial report.
Actual Reserve Percent
$0
$5
$10
$15
$20
$25
'07
'08
'09
'10
'11
'12
'13
'14
'15
'16
(in
mill
ion
s)
GRAPH 4-7. FY07 - FY16 Fund Balance
$0
$20
$40
$60
$80
$100
'07
'08
'09
'10
'11
'12
'13
'14
'15
'16
(in
mill
ion
s)
GRAPH 4-8. FY07 - FY16 Rev. and Exp.
Revenues
Expenditures
One of the City's financial management policies is to maintain a fund balance in the General Fund at or above 15% of adopted annual revenue. For FY 2012, the General Fund budget is $1.5 million over the 15% reserve requirement of $9.9 million. Over the five-year projection period, General Fund revenues and expenditures are estimated to increase by an average of just over 3 percent per year.
15% Reserve Requirement

No
te Actual
FY07
Actual
FY08
Actual
FY09
Actual
FY10
Modified
FY11
Adopted
FY12
Estimated
FY13
Estimated
FY14
Estimated
FY15
Estimated
FY16
Utility Charges 3,848,321 4,550,391 5,183,077 6,123,692 8,600,000 9,500,000 11,939,497 12,441,833 12,809,113 13,242,171
Penalties 34,334 47,626 48,477 72,100 60,000 60,000 60,000 60,000 60,000 60,000
Connection Charges 624,626 98,400 14,700 98,800 65,000 20,000 20,000 20,000 20,000 20,000
Interest Income B 213,862 62,960 43,931 4,048 - 34,000 - 27,700 76,400 108,700
Transfers In / Other C 678,493 520,788 511,233 536,173 519,050 487,470 493,075 499,896 506,822 513,856
Total Revenues / Sources 5,399,636 5,280,165 5,801,418 6,834,813 9,244,050 10,101,470 12,512,572 13,049,429 13,472,335 13,944,727
Percent Increase 31.9% -2.2% 9.9% 17.8% 35.2% 9.3% 23.9% 4.3% 3.2% 3.5%N
ote Actual
FY07
Actual
FY08
Actual
FY09
Actual
FY10
Modified
FY11
Adopted
FY12
Estimated
FY13
Estimated
FY14
Estimated
FY15
Estimated
FY16
Personnel D 2,304,174 2,412,085 2,735,025 3,188,833 3,373,950 3,472,090 3,588,335 3,720,093 3,862,383 4,016,226
Contract Services 305,246 334,163 368,410 426,712 2,221,520 561,380 617,518 679,270 747,197 821,916
Commodities 1,013,630 1,221,560 1,325,683 1,312,347 1,732,600 1,716,350 1,887,985 2,076,784 2,284,462 2,512,908
Capital Outlay 226,892 182,585 149,031 142,560 105,930 71,200 78,320 86,152 94,767 104,244
Admin. Charge F 406,000 418,000 431,000 444,000 1,000,110 1,010,110 1,020,211 1,032,964 1,045,876 1,058,949
Debt Service (Interest) G 353,805 394,485 744,147 800,750 980,170 971,120 1,466,414 1,374,353 2,397,265 2,247,411
Other H 1,137,797 1,220,337 1,211,708 1,078,699 1,706,000 1,715,000 1,800,750 1,890,788 1,985,327 2,084,593
Total Operating Expenses 5,747,544 6,183,215 6,965,004 7,393,901 11,120,280 9,517,250 10,459,533 10,860,403 12,417,277 12,846,247
Percent Increase 1.9% 7.6% 12.6% 6.2% 50.4% -14.4% 9.9% 3.8% 14.3% 3.5%
1,156,370 (240,476) (1,838,775) 2,536,426 (5,507,534) (2,807,428) (2,223,208) (170,169) 2,018,857 3,073,916
Net Change (1,396,846) (1,598,299) 4,375,201 (8,043,960) (1,876,230) 584,220 2,053,039 2,189,026 1,055,059 1,098,479
(240,476) (1,838,775) 2,536,426 (5,507,534) (2,807,428) (2,223,208) (170,169) 2,018,857 3,073,916 4,172,395
1,436,886 1,545,804 1,741,251 1,848,475 2,780,070 2,379,313 2,614,883 2,715,101 3,104,319 3,211,562
Working Capital, Beginning
Working Capital, Ending *
Water Fund Five-Year Forecast
A
E
TABLE 4-6. Water Fund Revenues / Sources
TABLE 4-7. Water Fund Expenses
4 - 6
* Modified FY11 Working Capital, Ending was adjusted up by $4.6 million as a result of the FY11 bond issue.
TABLE 4-8. Water Fund Working Capital and Reserve
Minimum 90-Day Reserve
The Water Fund is used to account for all financial activity associated with the treatment, transmission and distribution of potable water. In order to fund the significant capital and operating expenses necessary to support the City's water system, and to cover the expenses associated with the 24-inch transmission water main breaks in July 2010, water rates will increase by 24.5% for FY 2012 and FY 2013. Future rates are projected to increase by approximately 2%. Water rates are currently established over a 17-year period.
-$10
-$5
$0
$5
$10
$15
'07
'08
'09
'10
'11
'12
'13
'14
'15
'16
(in m
illio
ns)
GRAPH 4-9. FY07 - FY16 Working Capital
$0
$5
$10
$15
$20
'07
'08
'09
'10
'11
'12
'13
'14
'15
'16
(in m
illio
ns)
GRAPH 4-10. FY07 - FY16 Rev. and Expenses
Revenues
Expenses
NOTES: A. Charges for services are estimated to increase by 24.5% for FY13, and 2% each year for the rest of the projection period. Both the tiered usage fee and the ready-to-serve fee (estimated to increase by 3% each year) are included in the Utility Charges. B. Interest Income is approximately 3% of the estimated working capital balance for FY14 through FY16. C. Includes transfers in from the Sewer and Refuse funds, which will increase by 1% in FY13 and 1.25% each year from FY14 through FY16. D. Personnel is estimated to increase by an average annual 3.9% over the projection period, mainly due to increases in benefits. E. Operating, Commodity, and Capital Outlay expenses are estimated to increase by approximately 10% each year in order to address the concerns identified in the two water studies. F. Based on the adopted CAP, the Admin. Charge is estimated to increase by 1% in FY13 and 1.25% each year from FY14 through FY16. G. Debt Service amounts represent interest payments based on current and future debt schedules. Future debt equals $40 million. H. Includes depreciation which is estimated to increase by 5% each year due to the number of current Water Fund capital projects.
90-Day Reserve Requirement

No
te Actual
FY07
Actual
FY08
Actual
FY09
Actual
FY10
Modified
FY11
Adopted
FY12
Estimated
FY13
Estimated
FY14
Estimated
FY15
Estimated
FY16
Utility Charges 5,530,884 5,562,962 5,888,428 6,192,627 7,755,000 8,000,000 9,021,351 10,302,299 10,706,105 10,851,816
Penalties 50,186 62,938 55,768 70,914 50,000 60,000 60,000 60,000 60,000 60,000
Connection Charges 617,731 139,700 21,200 134,505 65,000 20,000 20,000 20,000 20,000 20,000
Interest Income B 201,815 250,557 49,566 2,002 2,000 4,000 12,300 65,200 103,900 135,300
Transfers In / Other 6,114 6,819 260,659 6,815 2,000 3,000 3,000 3,000 3,000 3,000
Total Revenues / Sources 6,406,730 6,022,976 6,275,621 6,406,863 7,874,000 8,087,000 9,116,651 10,450,499 10,893,005 11,070,116
Percent Increase 13.4% -6.0% 4.2% 2.1% 22.9% 2.7% 12.7% 14.6% 4.2% 1.6%N
ote Actual
FY07
Actual
FY08
Actual
FY09
Actual
FY10
Modified
FY11
Adopted
FY12
Estimated
FY13
Estimated
FY14
Estimated
FY15
Estimated
FY16
Personnel C 1,153,589 1,291,489 1,219,851 1,344,898 1,481,150 1,507,060 1,556,004 1,611,522 1,671,450 1,736,215
Contract Services D 2,326,920 2,487,670 2,538,835 2,714,806 3,543,340 2,596,710 2,716,797 2,842,791 2,974,986 3,113,692
Commodities 111,645 128,727 118,286 129,324 195,590 213,230 219,627 226,216 233,002 239,992
Capital Outlay - - 18,877 4,152 65,596 70,340 70,340 70,340 70,340 70,340
Admin. Charge F 227,000 233,800 241,000 248,200 541,650 547,070 552,541 559,447 566,441 573,521
Debt Service (Interest) G 571,416 718,638 734,352 686,137 874,780 1,141,280 1,613,467 1,520,880 1,934,853 1,816,737
Other H 1,052,554 1,119,358 1,145,783 1,255,678 1,813,400 1,821,490 1,975,605 2,145,637 2,332,329 2,537,342
Total Operating Expenses 5,443,124 5,979,682 6,016,986 6,383,194 8,515,506 7,897,180 8,704,380 8,976,833 9,783,401 10,087,839
Percent Increase 1.2% 9.9% 0.6% 6.1% 33.4% -7.3% 10.2% 3.1% 9.0% 3.1%
4,919,378 2,939,900 4,828,566 (109,671) (3,875,669) 832,978 1,022,798 1,435,069 2,908,734 4,018,338
Net Change (1,979,478) 1,888,666 (4,938,237) (3,765,998) (641,506) 189,820 412,271 1,473,666 1,109,604 982,277
2,939,900 4,828,566 (109,671) (3,875,669) 832,978 1,022,798 1,435,069 2,908,734 4,018,338 5,000,615
1,360,781 1,494,921 1,504,246 1,595,799 2,128,877 1,974,295 2,176,095 2,244,208 2,445,850 2,521,960
Sewer Fund Five-Year Forecast
A
E
TABLE 4-9. Sewer Fund Revenues / Sources
TABLE 4-10. Sewer Fund Expenses
* Modified FY11 Working Capital, Ending was adjusted up by $5.4 million as a result of the FY11 bond issue.
Working Capital, Beginning
Working Capital, Ending *
TABLE 4-11. Sewer Fund Working Capital and Reserve
Minimum 90-Day Reserve
4 - 7
The Sewer Fund accounts for the financial activity associated with the collection of sewage and sewage delivery to the Blue Plains Wastewater Treatment facility. The Sewer Fund budget for FY 2012 is based on a sewer charge of $5.26 per 1,000 gallons. This is an increase of $0.60 or 13% over the FY 2011 adopted rate of $4.66 per 1,000 gallons. Sewer rates are estimated to increase by 13% in FY 2013 and FY 2014, and 3% in FY 2015 and FY 2016. Sewer rates are established over a ten-year period.
-$5
-$2
$1
$4
$7
$10
'07
'08
'09
'10
'11
'12
'13
'14
'15
'16
(in m
illio
ns)
GRAPH 4-11. FY07 - FY16 Working Capital
$0
$3
$6
$9
$12
$15
'07
'08
'09
'10
'11
'12
'13
'14
'15
'16
(in m
illio
ns)
GRAPH 4-12. FY07 - FY16 Rev. and Expenses
Revenues
Expenses
NOTES: A. Charges for services are estimated to increase by 13% in FY13 and FY14, and 3% in FY15 and FY16. Both the usage fee and the ready-to-serve fee (increase by 3% each year) are included in the Utility Charges. B. Interest Income is approximately 1% of the estimated working capital balance for FY13 and 3% for FY14 through FY16. C. Personnel is estimated to increase by an average annual 3.8% over the projection period, mainly due to increases in benefits. D. Contractual Services includes the operating payment to Blue Plains, which decreased in FY12. In order to be conservative, the forecast assumes a 5% increase each year for Blue Plains, while all other Contractual Services are estimated to increase by 1% each year. E. Commodity expenses are estimated to increase by approximately 3% each year, while Capital Outlay remains flat. F. Based on the adopted CAP, the Admin. Charge is estimated to increase by 1% in FY13 and 1.25% each year from FY14 through FY16. G. Debt Service amounts represent interest payments based on current and future debt schedules. Future debt equals $32 million. H. Includes depreciation and transfer to the Water Fund. Depreciation is estimated to increase by 10% each year, while the Water Fund transfer is estimated to increase by 1% in FY13 and 1.25% each year from FY14 through FY16.
90-Day Reserve Requirement
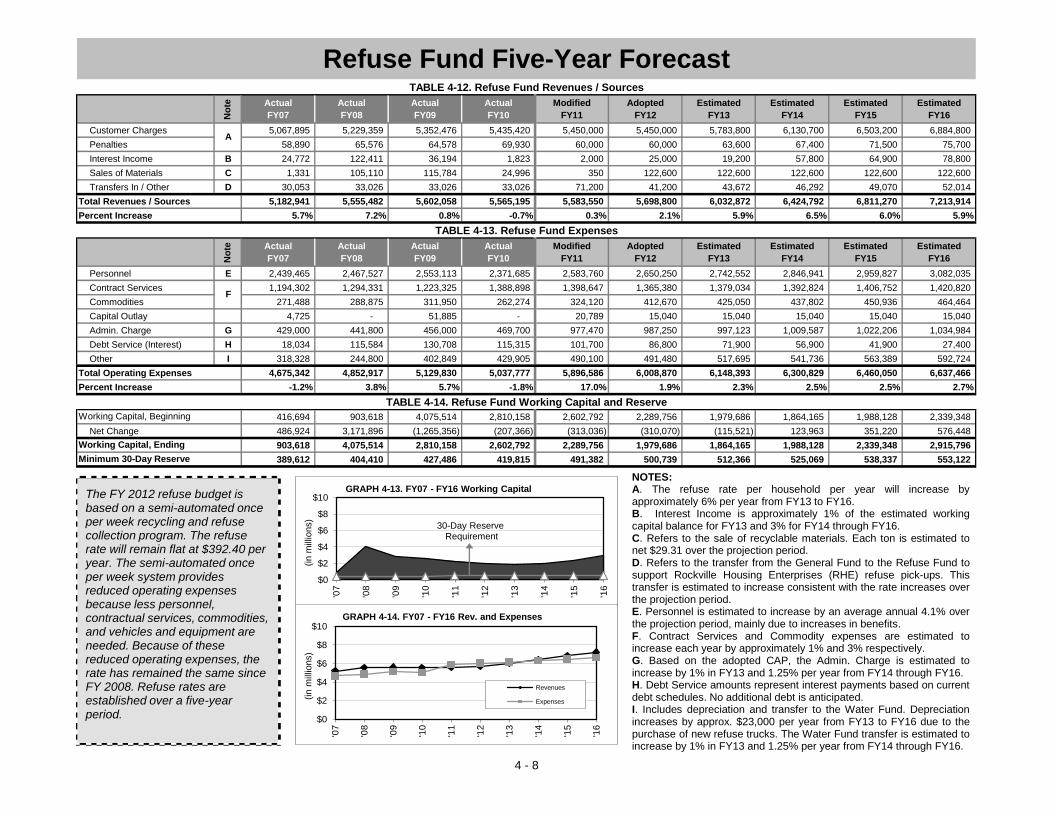
No
te Actual
FY07
Actual
FY08
Actual
FY09
Actual
FY10
Modified
FY11
Adopted
FY12
Estimated
FY13
Estimated
FY14
Estimated
FY15
Estimated
FY16
Customer Charges 5,067,895 5,229,359 5,352,476 5,435,420 5,450,000 5,450,000 5,783,800 6,130,700 6,503,200 6,884,800
Penalties 58,890 65,576 64,578 69,930 60,000 60,000 63,600 67,400 71,500 75,700
Interest Income B 24,772 122,411 36,194 1,823 2,000 25,000 19,200 57,800 64,900 78,800
Sales of Materials C 1,331 105,110 115,784 24,996 350 122,600 122,600 122,600 122,600 122,600
Transfers In / Other D 30,053 33,026 33,026 33,026 71,200 41,200 43,672 46,292 49,070 52,014
Total Revenues / Sources 5,182,941 5,555,482 5,602,058 5,565,195 5,583,550 5,698,800 6,032,872 6,424,792 6,811,270 7,213,914
Percent Increase 5.7% 7.2% 0.8% -0.7% 0.3% 2.1% 5.9% 6.5% 6.0% 5.9%N
ote Actual
FY07
Actual
FY08
Actual
FY09
Actual
FY10
Modified
FY11
Adopted
FY12
Estimated
FY13
Estimated
FY14
Estimated
FY15
Estimated
FY16
Personnel E 2,439,465 2,467,527 2,553,113 2,371,685 2,583,760 2,650,250 2,742,552 2,846,941 2,959,827 3,082,035
Contract Services 1,194,302 1,294,331 1,223,325 1,388,898 1,398,647 1,365,380 1,379,034 1,392,824 1,406,752 1,420,820
Commodities 271,488 288,875 311,950 262,274 324,120 412,670 425,050 437,802 450,936 464,464
Capital Outlay 4,725 - 51,885 - 20,789 15,040 15,040 15,040 15,040 15,040
Admin. Charge G 429,000 441,800 456,000 469,700 977,470 987,250 997,123 1,009,587 1,022,206 1,034,984
Debt Service (Interest) H 18,034 115,584 130,708 115,315 101,700 86,800 71,900 56,900 41,900 27,400
Other I 318,328 244,800 402,849 429,905 490,100 491,480 517,695 541,736 563,389 592,724
Total Operating Expenses 4,675,342 4,852,917 5,129,830 5,037,777 5,896,586 6,008,870 6,148,393 6,300,829 6,460,050 6,637,466
Percent Increase -1.2% 3.8% 5.7% -1.8% 17.0% 1.9% 2.3% 2.5% 2.5% 2.7%
416,694 903,618 4,075,514 2,810,158 2,602,792 2,289,756 1,979,686 1,864,165 1,988,128 2,339,348
Net Change 486,924 3,171,896 (1,265,356) (207,366) (313,036) (310,070) (115,521) 123,963 351,220 576,448
903,618 4,075,514 2,810,158 2,602,792 2,289,756 1,979,686 1,864,165 1,988,128 2,339,348 2,915,796
389,612 404,410 427,486 419,815 491,382 500,739 512,366 525,069 538,337 553,122
4 - 8
Minimum 30-Day Reserve
Refuse Fund Five-Year Forecast
A
F
TABLE 4-12. Refuse Fund Revenues / Sources
TABLE 4-13. Refuse Fund Expenses
Working Capital, Beginning
Working Capital, Ending
TABLE 4-14. Refuse Fund Working Capital and Reserve
The FY 2012 refuse budget is based on a semi-automated once per week recycling and refuse collection program. The refuse rate will remain flat at $392.40 per year. The semi-automated once per week system provides reduced operating expenses because less personnel, contractual services, commodities, and vehicles and equipment are needed. Because of these reduced operating expenses, the rate has remained the same since FY 2008. Refuse rates are established over a five-year period.
$0
$2
$4
$6
$8
$10
'07
'08
'09
'10
'11
'12
'13
'14
'15
'16
(in m
illio
ns)
GRAPH 4-13. FY07 - FY16 Working Capital
$0
$2
$4
$6
$8
$10
'07
'08
'09
'10
'11
'12
'13
'14
'15
'16
(in m
illio
ns)
GRAPH 4-14. FY07 - FY16 Rev. and Expenses
Revenues
Expenses
NOTES: A. The refuse rate per household per year will increase by approximately 6% per year from FY13 to FY16. B. Interest Income is approximately 1% of the estimated working capital balance for FY13 and 3% for FY14 through FY16. C. Refers to the sale of recyclable materials. Each ton is estimated to net $29.31 over the projection period. D. Refers to the transfer from the General Fund to the Refuse Fund to support Rockville Housing Enterprises (RHE) refuse pick-ups. This transfer is estimated to increase consistent with the rate increases over the projection period. E. Personnel is estimated to increase by an average annual 4.1% over the projection period, mainly due to increases in benefits. F. Contract Services and Commodity expenses are estimated to increase each year by approximately 1% and 3% respectively. G. Based on the adopted CAP, the Admin. Charge is estimated to increase by 1% in FY13 and 1.25% per year from FY14 through FY16. H. Debt Service amounts represent interest payments based on current debt schedules. No additional debt is anticipated. I. Includes depreciation and transfer to the Water Fund. Depreciation increases by approx. $23,000 per year from FY13 to FY16 due to the purchase of new refuse trucks. The Water Fund transfer is estimated to increase by 1% in FY13 and 1.25% per year from FY14 through FY16.
30-Day Reserve Requirement

No
te Actual
FY07
Actual
FY08
Actual
FY09
Actual
FY10
Modified
FY11
Adopted
FY12
Estimated
FY13
Estimated
FY14
Estimated
FY15
Estimated
FY16
Real Property Tax A 90,000 127,298 209,005 140,388 163,000 163,000 166,249 166,249 166,249 169,574
From Other Government B 310,000 310,000 310,000 153,870 295,000 295,000 297,349 297,349 297,349 299,696
Parking Meters 211,566 485,636 982,403 1,128,916 1,150,000 400,000 412,000 424,360 437,091 450,204
Parking Violations 480,555 776,800 685,934 800,086 850,000 700,000 721,000 742,630 764,909 787,856
Building Rental D - - - - - 300,000 303,000 306,788 310,622 314,505
Interest Income E 866,945 251,440 41,093 2,752 4,000 15,000 16,000 33,900 21,500 10,400
Transfers In / Other F 1,621,008 2,212,830 952,553 852,599 1,030,000 500,000 750,000 750,000 750,000 750,000
Total Revenues / Sources 3,580,074 4,164,003 3,180,989 3,078,611 3,492,000 2,373,000 2,665,598 2,721,276 2,747,720 2,782,235
Percent Increase 148.5% 16.3% -23.6% -3.2% 13.4% -32.0% 12.3% 2.1% 1.0% 1.3%
No
te Actual
FY07
Actual
FY08
Actual
FY09
Actual
FY10
Modified
FY11
Adopted
FY12
Estimated
FY13
Estimated
FY14
Estimated
FY15
Estimated
FY16
Personnel G 186,779 265,963 349,161 326,907 357,265 271,280 281,135 292,278 304,329 317,377
Contract Services 133,969 606,293 608,644 732,084 954,270 90,110 91,011 91,921 92,840 93,769
Commodities 27,550 129,256 107,868 126,023 236,190 145,840 47,215 48,632 50,091 51,593
Admin. Charge I 80,000 82,400 85,000 87,600 656,980 132,710 134,037 135,713 137,409 139,127
Debt Service (Interest) J 1,499,601 1,465,859 1,441,711 1,409,821 1,387,510 1,631,200 1,853,388 1,821,988 1,789,188 1,760,438
Other K 8,509,481 1,286,744 805,800 710,965 826,500 766,500 766,500 766,500 766,500 766,500
Total Operating Expenses 10,437,380 3,836,515 3,398,183 3,393,400 4,418,715 3,037,640 3,173,286 3,157,031 3,140,357 3,128,804
Percent Increase 2,343.0% -63.2% -11.4% -0.1% 30.2% -31.3% 4.5% -0.5% -0.5% -0.4%
17,555,678 5,121,279 4,280,189 3,846,375 3,447,575 2,520,860 1,856,220 1,348,533 912,778 520,142
Net Change (12,434,399) (841,090) (433,814) (398,800) (926,715) (664,640) (507,687) (435,755) (392,636) (346,568)
5,121,279 4,280,189 3,846,375 3,447,575 2,520,860 1,856,220 1,348,533 912,778 520,142 173,573
869,782 319,710 283,182 282,783 368,226 253,137 264,440 263,086 261,696 260,734
4 - 9
Working Capital, Beginning
Working Capital, Ending
Minimum 30-Day Reserve
Parking Fund Five-Year Forecast
C
H
TABLE 4-15. Parking Fund Revenues / Sources
TABLE 4-16. Parking Fund Expenses
TABLE 4-17. Parking Fund Working Capital and Reserve
The FY 2012 budget incorporates the anticipated leasing of the Town Square garage operations to Federal Realty Investment Trust (FRIT). The City has entered into negotiations to enable FRIT to manage, operate and re-equip the garages under a long-term lease agreement. In anticipation of the lease agreement, the City’s budget represents only operational costs for on-street meters along with the payment of debt service on the garages. FY 2012 revenue includes a new line item called Building Rental, which is the anticipated lease payment from FRIT to the City that will help offset a portion of the City’s debt service costs on the garage bonds.
$0
$2
$4
$6
$8
$10
$12
'07
'08
'09
'10
'11
'12
'13
'14
'15
'16
(in m
illio
ns)
GRAPH 4-15. FY07 - FY16 Working Capital
$0
$2
$4
$6
$8
$10
$12
'07
'08
'09
'10
'11
'12
'13
'14
'15
'16
(in
mill
ions)
GRAPH 4-16. FY07 - FY16 Rev. and Expenses
Revenues
Expenses
NOTES: A. The Parking District Tax rate for FY12 equals $0.33 per $100 of assessed valuation. For FY13 through FY16, the tax rate will remain flat, while assessments are estimated to increase by 2% in FY13 and FY16. B. Includes $115,000 PILOT payment and $180,000 in capital contributions from Montgomery County. Assessments related to PILOT are estimated to increase by 2% in FY13 and FY16. C. Revenues are projected to increase by 3% each year starting in FY13 due to overall improvements in the economy. D. Building Rental represents the anticipated payment for the lease of the Town Square parking garages. Building Rental is estimated to increase by 1% in FY13 and 1.25% each year from FY14 through FY16. E. Interest Income is approximately 1% of the estimated working capital balance for FY13 and 3% for FY14 through FY16. F. Refers to the annual subsidy from the General Fund. G. Personnel is estimated to increase by an average annual 4.2% over the projection period, mainly due to increases in benefits. H. Contract Services and Commodity expenses are estimated to increase each year by approximately 1% and 3% respectively. I. Based on the adopted CAP, the Admin. Charge is estimated to increase by 1% in FY13 and 1.25% each year from FY14 through FY16. J. Debt Service amounts represent interest payments based on estimated debt schedules. The City is in the process of defeasing tax exempt bonds with the issuance and sale of taxable bonds. Because taxable debt is issued at higher rates than tax exempt debt, the City's cost to service the debt will increase throughout the term of the debt. Issuing taxable bonds is required before FRIT takes over the management and operations of the garages. K. Represents depreciation and bad debt which are estimated to remain flat.
30-Day Reserve Requirement

No
te Actual
FY07
Actual
FY08
Actual
FY09
Actual
FY10
Modified
FY11
Adopted
FY12
Estimated
FY13
Estimated
FY14
Estimated
FY15
Estimated
FY16
Utility Fee A - - - 1,581,145 1,985,000 2,500,000 3,205,947 4,152,110 5,010,362 5,078,567
SWM Permits 257,266 300,690 37,875 33,911 100,000 40,000 40,000 40,000 40,000 40,000
SWM Part. Fees 485,581 261,040 111,380 84,359 400,000 80,000 80,000 80,000 80,000 80,000
Interest / Other C 433,661 326,547 627,058 19,943 18,500 21,200 16,100 42,300 59,700 86,800
Total Revenues / Sources 1,176,508 888,277 776,314 1,719,358 2,503,500 2,641,200 3,342,047 4,314,410 5,190,062 5,285,367
Percent Increase -33.0% -24.5% -12.6% 121.5% 45.6% 5.5% 26.5% 29.1% 20.3% 1.8%
No
te Actual
FY07
Actual
FY08
Actual
FY09
Actual
FY10
Modified
FY11
Adopted
FY12
Estimated
FY13
Estimated
FY14
Estimated
FY15
Estimated
FY16
Personnel D 378,654 506,775 1,197,202 1,651,228 1,760,380 1,818,240 1,879,667 1,949,395 2,024,628 2,105,899
Contract Services 235,097 246,177 282,737 374,477 631,995 357,430 393,173 432,490 475,739 523,313
Commodities 3,486 782 49,687 68,141 125,741 129,150 142,065 156,272 171,899 189,089
Capital Outlay - - 22,108 15,180 3,850 - - - - -
Admin. Charge F 145,000 149,300 154,000 158,600 604,940 610,990 617,100 624,814 632,624 640,532
Debt Service (Interest) G - - - 170 3,600 10,370 392,028 372,445 352,857 333,265
Other H 1,911,250 282,242 166,105 199,580 275,000 260,000 535,000 562,500 592,750 626,025
Total Operating Expenses 2,673,487 1,185,276 1,871,840 2,467,376 3,405,506 3,186,180 3,959,032 4,097,915 4,250,497 4,418,122
Percent Increase 27.7% -55.7% 57.9% 31.8% 38.0% -6.4% 24.3% 3.5% 3.7% 3.9%
9,474,271 8,102,590 7,360,683 5,830,946 3,366,213 2,464,207 1,919,227 1,302,242 1,518,736 2,458,301
Net Change (1,371,681) (741,907) (1,529,737) (2,464,733) (902,006) (544,980) (616,985) 216,495 939,565 867,245
8,102,590 7,360,683 5,830,946 3,366,213 2,464,207 1,919,227 1,302,242 1,518,736 2,458,301 3,325,546
668,372 296,319 467,960 616,844 851,377 796,545 989,758 1,024,479 1,062,624 1,104,531
Stormwater Management Fund Five-Year Forecast
B
E
Working Capital, Beginning
Working Capital, Ending
Minimum 90-Day Reserve
TABLE 4-18. Stormwater Management Fund Revenues / Sources
TABLE 4-19. Stormwater Management Fund Expenses
TABLE 4-20. Stormwater Management Fund Working Capital and Reserve
4 - 10
In FY 2008 the Mayor and Council approved an ordinance to amend the City Code to include a new Stormwater Management Utility Fee. For FY 2012 the utility fee will increase to $62.48, up from $49.20 in FY 2011. Each residential property will pay $62.48 or one equivalent residential unit (ERU) per year, and each commercial property will pay $62.48 multiplied by the number of ERUs measured on their property. Stormwater utility rates are established over a ten-year period.
$0
$2
$4
$6
$8
$10
'07
'08
'09
'10
'11
'12
'13
'14
'15
'16
(in m
illio
ns)
GRAPH 4-17. FY07 - FY16 Working Capital
$0
$2
$4
$6
$8
$10
'07
'08
'09
'10
'11
'12
'13
'14
'15
'16
(in m
illio
ns)
GRAPH 4-18. FY07 - FY16 Rev. and Expenses
Revenues
Expenses
NOTES: A. The City began charging the stormwater utility fee in FY10. The FY12 fee is $62.48 per ERU. The rate will increase by approximately 27% each year from FY12 to FY14, 18.7% in FY15, and 3% in FY16. B. These revenues are directly related to new development. With development in the City expected to remain relatively steady, these revenues are estimated to remain flat throughout the projection period. C. Interest Income is approximately 1% of the estimated working capital balance for FY13 and 3% for FY14 through FY16. D. Personnel is estimated to increase by an average annual 4.0% over the projection period, mainly due to increases in benefits. E. Contract Services and Commodity expenses are estimated to increase by approximately 10% each year in order to fully implement the new stormwater management program. F. Based on the adopted CAP, the Admin. Charge is estimated to increase by 1% in FY13 and 1.25% each year from FY14 through FY16. G. Debt Service amounts represent interest payments based on current and future debt schedules. Future debt equals $8.5 million. H. Includes depreciation, future capital expenses, and the Rainscapes Rebates Program. Depreciation is estimated to increase by 10% each year, while capital expenses ($250,000) and rainscapes rebates ($10,000) are estimated to remain flat. Depreciation and capital expenses are based on the current CIP projects.
90-Day Reserve Requirement

No
te Actual
FY07
Actual
FY08
Actual
FY09
Actual
FY10
Modified
FY11
Adopted
FY12
Estimated
FY13
Estimated
FY14
Estimated
FY15
Estimated
FY16
Golf Course Fees 869,521 887,553 827,324 738,180 779,580 863,150 934,918 962,966 991,855 1,021,611
Cart Rentals 252,324 265,553 230,766 206,248 219,830 237,950 252,441 260,014 267,815 275,849
Driving Range Fee 1,480 1,635 1,651 1,982 1,600 8,570 15,914 16,391 16,883 17,389
Concessions / Other 20,073 11,664 12,159 12,251 13,910 34,340 55,697 57,368 59,089 60,862
Pro Shop Rental 4,250 4,250 4,250 2,750 2,790 13,470 24,864 25,611 26,379 27,170
Transfers In - Operating - - - - 2,390,645 426,000 490,000 490,000 490,000 490,000
Transfers In - Capital 114,500 165,000 93,000 - - 204,000 - 300,000 - -
Total Revenues / Sources 1,262,148 1,335,655 1,169,150 961,411 3,408,355 1,787,480 1,773,834 2,112,350 1,852,021 1,892,882
Percent Increase 16.5% 5.8% -12.5% -17.8% 254.5% -47.6% -0.8% 19.1% -12.3% 2.2%N
ote Actual
FY07
Actual
FY08
Actual
FY09
Actual
FY10
Modified
FY11
Adopted
FY12
Estimated
FY13
Estimated
FY14
Estimated
FY15
Estimated
FY16
Personnel 664,098 732,933 805,091 835,559 873,200 405,840 - - - -
Contract Services 127,751 136,022 138,743 130,339 182,690 814,800 1,507,620 1,546,369 1,586,280 1,627,388
Commodities 226,227 240,513 261,032 244,494 288,360 149,100 - - - -
Capital Outlay 33,210 42,404 86,239 68,936 110,200 19,750 - - - -
Admin. Charge D 89,500 92,200 95,000 97,900 165,750 197,400 60,000 60,000 60,000 60,000
Debt Service (Interest) E 12,330 12,208 11,944 11,335 10,900 10,200 9,418 8,674 7,930 7,156
Other F 139,190 125,791 110,139 119,177 100,100 125,100 125,100 125,100 150,100 150,100
Total Operating Expenses 1,292,306 1,382,071 1,508,188 1,507,740 1,731,200 1,722,190 1,702,138 1,740,143 1,804,310 1,844,644
Percent Increase 8.3% 6.9% 9.1% 0.0% 14.8% -0.5% -1.2% 2.2% 3.7% 2.2%
(713,432) (749,503) (827,807) (1,108,828) (1,633,347) 43,808 (94,902) (23,206) 49,001 96,712
Net Change (36,071) (78,304) (281,021) (524,519) 1,677,155 65,290 71,696 372,207 47,711 48,238
(749,503) (827,807) (1,108,828) (1,633,347) 43,808 (94,902) (23,206) 49,001 96,712 144,950
107,692 115,173 125,682 125,645 144,267 143,516 141,845 145,012 150,359 153,720
Working Capital, Beginning
Working Capital, Ending *
C
B
RedGate Golf Fund Five-Year Forecast
4 - 11
TABLE 4-21. RedGate Golf Fund Revenues / Sources
TABLE 4-22. RedGate Golf Fund Expenses
Minimum 30-Day Reserve
* Adopted FY12 and Estimated FY14 Working Capital, Ending balances were adjusted down by $204,000 and $300,000 respectively to reflect the funds that will be spent in the capital budget for high priority capital
projects as identified in the NGF Report.
TABLE 4-23. RedGate Golf Fund Working Capital and Reserve
A
The RedGate Golf Fund is used to account for the financial activity associated with the City's public golf course. In FY 2011 the Mayor and Council directed staff to issue a request for proposal for a private management firm to operate the course. Lease proposals have also been solicited. Pending completion of the competitive bid process and further Mayor and Council direction, FY 2012 assumes the same course management for the first half of the year, and a management agreement consistent with the National Golf Foundation Study for the second half of FY 2012 and future years.
-$3
-$2
-$1
$0
$1
$2
'07
'08
'09
'10
'11
'12
'13
'14
'15
'16
(in m
illions)
GRAPH 4-19. FY07 - FY16 Working Capital
$0
$1
$2
$3
$4
$5
'07
'08
'09
'10
'11
'12
'13
'14
'15
'16
(in m
illions)
GRAPH 4-20. FY07 - FY16 Rev. and Expenses
Revenues
Expenses
NOTES: A. FY12 revenues represent 6 months of in-house Course management and 6 months of management by an outside firm. Management firm estimates are consistent with Option 3 of the NGF Report. All revenues for FY13 through FY16 are consistent with Option 3 of the NGF Report. B. Refers to the transfer from the General Fund to help fund annual operating expenses and to support capital improvements to the course. FY12 amounts are consistent with Mayor and Council direction on 2/28/11 (*Note: In FY11 the Mayor and Council directed staff to transfer approximately $2.39 million from the General Fund to eliminate the accumulated deficit and FY11 annual operating deficit.) C. FY12 expenses represent 6 months of in-house Course management and 6 months of management by an outside firm. Management firm estimates are consistent with Option 3 of the NGF Report. All expenses for FY13 through FY16 are consistent with Option 3 of the NGF Report. D. Refers to the transfer to the General Fund. FY12 includes 6 months consistent with adopted CAP and 6 months consistent with Option 3 of the NGF Report (*Note: as part of the five-year business plan this charge was reduced by half from FY 2007 through FY 2011 for a total RedGate savings of $540,350). E. Debt Service amounts represent interest payments based on current debt. F. Includes depreciation, which will increase in FY15 by $25,000 to reflect the capital projects that are recommended in the NGF Study.
30-Day Reserve Requirement

No
te Actual
FY07
Actual
FY08
Actual
FY09
Actual
FY10
Modified
FY11
Adopted
FY12
Estimated
FY13
Estimated
FY14
Estimated
FY15
Estimated
FY16
Speed Camera Citations A 81,991 4,036,564 2,756,463 1,961,035 2,127,000 1,392,000 1,392,000 1,392,000 1,392,000 1,392,000
Interest Income / Other B - 24,470 20,984 2,040 5,000 37,000 25,100 66,100 59,200 53,700
Total Revenues / Sources 81,991 4,061,034 2,777,447 1,963,075 2,132,000 1,429,000 1,417,100 1,458,100 1,451,200 1,445,700
Percent Increase N/A 4,853.0% -31.6% -29.3% 8.6% -33.0% -0.8% 2.9% -0.5% -0.4%
No
te Actual
FY07
Actual
FY08
Actual
FY09
Actual
FY10
Modified
FY11
Adopted
FY12
Estimated
FY13
Estimated
FY14
Estimated
FY15
Estimated
FY16
Personnel C 48,760 158,322 343,530 443,024 395,990 414,520 427,686 442,649 458,781 476,196
Contract Services 38,149 1,336,167 959,476 612,462 1,089,840 592,440 592,622 592,807 592,993 593,181
Commodities 2,115 4,258 22,470 32,890 11,720 32,700 33,681 34,691 35,732 36,804
Capital Outlay 18,855 - - 2,337 - - - - - -
Admin. Charge E - - - - 222,320 224,540 226,785 229,620 232,490 235,397
Other - - 61,549 - - - - - - -
Total Operating Expenditures 107,879 1,498,747 1,387,025 1,090,713 1,719,870 1,264,200 1,280,775 1,299,767 1,319,996 1,341,578
Percent Increase N/A 1,289.3% -7.5% -21.4% 57.7% -26.5% 1.3% 1.5% 1.6% 1.6%
N/A (25,888) 2,536,398 3,890,437 3,536,455 2,948,585 2,663,385 2,349,710 2,058,044 1,889,247
Net Change (25,888) 2,562,287 1,390,422 872,363 412,130 164,800 136,325 158,333 131,204 104,122
(25,888) 2,536,398 3,926,820 3,536,455 2,948,585 2,663,385 2,349,710 2,058,044 1,889,247 1,693,370
N/A N/A N/A N/A N/A N/A N/A N/A N/A N/A
D
*** The City does not have a policy about maintaining a balance in this fund because it is used to account for proceeds from a specific revenue source that is restricted by legal provisions.
** FY10 Actual Fund Balance, Ending was adjusted down by $1.2 million due to capital expenditures that took place during FY10. For FY11 through FY16, Fund Balance, Ending is adjusted down to account for capital
expenditures currently programmed in the CIP. Future capital expenditures that are based on future projected revenues will only be programmed after citation revenue has been received since there is no guarantee of
future revenue.
Fund Balance, Ending **
TABLE 4-25. Speed Camera Fund Expenditures
TABLE 4-26. Speed Camera Fund Balance and Reserve
Minimum Reserve ***
* FY10 Actual Fund Balance, Beginning was adjusted down by $36,383 consistent with the City's FY10 audited financial report.
Speed Camera Fund Five-Year Forecast
4 - 12
TABLE 4-24. Speed Camera Fund Revenues / Sources
Fund Balance, Beginning *
The Speed Camera Fund, created in FY 2007, tracks the financial transactions associated with the City's speed camera program. In FY 2011, the Police Department started adding "portable camera units" (PCU's) to the City's speed camera program. PCU's contain all the technology and the flash unit in one box that can be easily transported. Since the City started using PCUs the total number of citations increased to an estimated 2,900 citations per month. This Fund supports 5.5 FTEs (including 2 Police Officers) and several CIP projects dedicated to improving pedestrian and traffic safety.
$0
$1
$2
$3
$4
$5
$6
'07
'08
'09
'10
'11
'12
'13
'14
'15
'16
(in m
illio
ns)
GRAPH 4-21. FY07 - FY16 Fund Balance
$0
$1
$2
$3
$4
$5
$6
'07
'08
'09
'10
'11
'12
'13
'14
'15
'16
(in m
illio
ns)
GRAPH 4-22. FY07 - FY16 Rev. and Exp.
Revenues
Expenditures
NOTES: A. The projection assumes 2,900 citations paid per month. Revenues are based on a $40 citation fee which reflects gross revenue to be received. B. Interest Income is approximately 1% of the estimated working capital balance for FY13 and 3% for FY14 through FY16. C. Personnel is estimated to increase by an average annual 3.7% over the projection period, mainly due to increases in benefits. D. Contract Services includes payment to the speed camera vendor. The vendor receives $16.50 from each paid citation. Vendor payments are estimated to remain flat over the projection period, while Contract Services and Commodity expenditures are estimated to increase each year by approximately 1% and 3% respectively. E. Based on the adopted CAP, the Admin. Charge is estimated to increase by 1% in FY13 and 1.25% each year from FY14 through FY16.

The Department of the Mayor and Council preserves and enhances theCity's identity and quality of life for those who live and work in Rockvilleby providing strategic and policy direction for City services, facilities,and initiatives.
Department of the Mayor and CouncilDepartment Mission Statement
*See pages 2-16 through 2-18 for additional information on the City's Boards and Commissions
5 - 1
FIGURE 5-1. Department Organizational Chart
* The dramatic decrease in expenditures in FY10 is due to the Office of the City Attorneymoving out of the Department of the Mayor and Council to become a stand-aloneDepartment.
* The decrease in staffing in FY10 is due to the Office of the City Attorney moving out ofthe Department of the Mayor and Council to become a stand-alone Department.
$0
$400,000
$800,000
$1,200,000
$1,600,000
$2,000,000
ActualFY08
ActualFY09
ActualFY10
Est. Act.FY11
AdoptedFY12
GRAPH 5-2. Expenditures History*
Mayor and Council
38%
City Clerk62%
GRAPH 5-3. Use of Funds
0
2
4
6
8
10
ActualFY08
ActualFY09
ActualFY10
Est. Act.FY11
AdoptedFY12
FT
Es
GRAPH 5-1. Staffing Trend*
Total
Temporary
Regular
Department of the Mayor and Council
City Clerk Boards* Commissions*
etompkins
Underline
etompkins
Underline

Department of the Mayor and Council Department Summary
5 - 2
Department Summary
TABLE 5-1 Actual
FY10
Adopted
FY11
Est. Act.
FY11
Adopted
FY12
% Change
from Adpt.
Dept. Expenditures
by Division
Office of the Mayor and
Council234,581 237,110 237,110 240,810 1.6%
Office of the City Clerk 399,253 361,140 392,912 400,100 10.8%
Department Total $633,834 $598,250 $630,022 $640,910 7.1%
TABLE 5-2 Actual
FY10
Adopted
FY11
Est. Act.
FY11
Adopted
FY12
% Change
from Adpt.
Dept. Expenditures
by Type
Salary and Wages 373,063 369,920 369,920 358,100 (3.2%)
Benefits 68,982 82,500 83,215 81,310 (1.4%)
Overtime 0 0 0 0 N/A
Personnel Subtotal $442,045 $452,420 $453,135 $439,410 (2.9%)
Contractual Services 134,621 127,830 127,830 148,700 16.3%
Commodities 57,168 18,000 49,057 52,800 193.3%
Capital Outlays 0 0 0 0 N/A
Other 0 0 0 0 N/A
Operating Subtotal $191,789 $145,830 $176,887 $201,500 38.2%
Department Total $633,834 $598,250 $630,022 $640,910 7.1%
TABLE 5-3 Actual
FY10
Adopted
FY11
Est. Act.
FY11
Adopted
FY12
% Change
from Adpt.
Source of
Dept. Funds
Departmental Revenue 0 0 0 0 N/A
Subtotal $0 $0 $0 $0 N/A
Fund Contribution
General Fund (110) 633,834 598,250 630,022 640,910 7.1%
Subtotal $633,834 $598,250 $630,022 $640,910 7.1%
Department Total $633,834 $598,250 $630,022 $640,910 7.1%
TABLE 5-4 Actual
FY10
Adopted
FY11
Est. Act.
FY11
Adopted
FY12
% Change
from Adpt.
Staffing Summary
by Division (FTEs)
Regular
Office of the City Clerk 3.0 3.0 3.0 3.0 0.0%
Regular Subtotal 3.0 3.0 3.0 3.0 0.0%
Temporary
Office of the City Clerk 0.2 0.1 0.1 0.2 100.0%
Temporary Subtotal 0.2 0.1 0.1 0.2 100.0%
Department Total 3.2 3.1 3.1 3.2 3.2%
etompkins
Underline
etompkins
Underline
etompkins
Underline

Department of the Mayor and Council Department Summary
5 - 3
Department Summary
Department Overview
The Mayor and Council legislate for the protection and promotion of the health, safety, comfort, and welfare of the residents of Rockville and for the preservation of the City’s property, rights, and privileges. The Mayor and Council conduct regularly scheduled meetings, which may include public hearings required by City law. They use these meetings and hearings to receive citizen input, provide instruction to staff, introduce and adopt legislation, discuss issues of concern to the community and review and approve the annual operating budget and the Capital Improvements Program (CIP).
The Mayor and Council also meet with members of the City’s boards, commissions, committees, and neighborhood groups when circumstances dictate. Throughout the year, the Mayor and Council represent the City at many official functions and community activities, which range from meetings of neighborhood associations to events sponsored by businesses and organizations located in Rockville.
The Mayor and Council participate in a number of organizations and activities related to effective governance from a local, State, and national perspective. The Mayor and Council regularly attend the Maryland Municipal League’s (MML) chapter meetings and annual convention and some members have attended meetings of the National League of Cities (NLC). The Mayor is a member of the Maryland Mayors’ Association. Individual members of the Mayor and Council or their designees also serve on the following Metropolitan Washington Council of Government’s (COG) committees: Board of Directors; Human Services and Public Safety; Transportation Planning; Washington Air Quality; Metropolitan Development Policy; Climate Energy and Environmental Policy; and the Chesapeake Bay and Water Resources Policy.
The Office of the City Clerk supports the Mayor and Council in carrying out their mission by providing them with administrative and clerical assistance, attending all official meetings of the elected body, preparing and managing the records of actions of the meetings, serving as a liaison between the Mayor and Council and the citizens of Rockville, coordinating the appointment process for City boards and commissions, and working with the City’s Board of Elections to administer a fair and impartial City election.
Significant Changes from Adopted to Adopted
The Department of the Mayor and Council’s FY12 Adopted budget represents a 7.1% increase over the FY11 Adopted budget due to a combination of an overall reduction in personnel expenditures related to employee turnover, and the addition of $58,800 in funding for the November 2011 election.
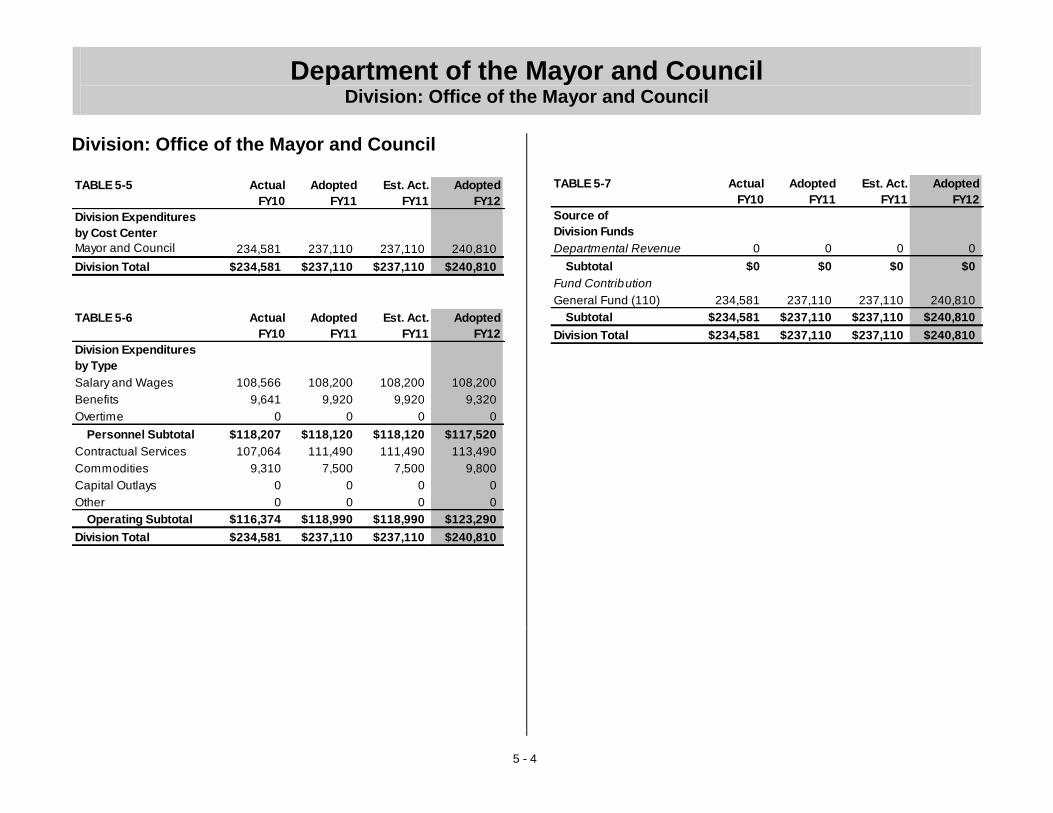
Department of the Mayor and Council Division: Office of the Mayor and Council
5 - 4
Division: Office of the Mayor and Council TABLE 5-5 Actual
FY10
Adopted
FY11
Est. Act.
FY11
Adopted
FY12
Division Expenditures
by Cost Center
Mayor and Council 234,581 237,110 237,110 240,810
Division Total $234,581 $237,110 $237,110 $240,810
TABLE 5-6 Actual
FY10
Adopted
FY11
Est. Act.
FY11
Adopted
FY12
Division Expenditures
by Type
Salary and Wages 108,566 108,200 108,200 108,200
Benefits 9,641 9,920 9,920 9,320
Overtime 0 0 0 0
Personnel Subtotal $118,207 $118,120 $118,120 $117,520
Contractual Services 107,064 111,490 111,490 113,490
Commodities 9,310 7,500 7,500 9,800
Capital Outlays 0 0 0 0
Other 0 0 0 0
Operating Subtotal $116,374 $118,990 $118,990 $123,290
Division Total $234,581 $237,110 $237,110 $240,810
TABLE 5-7 Actual
FY10
Adopted
FY11
Est. Act.
FY11
Adopted
FY12
Source of
Division Funds
Departmental Revenue 0 0 0 0
Subtotal $0 $0 $0 $0
Fund Contribution
General Fund (110) 234,581 237,110 237,110 240,810
Subtotal $234,581 $237,110 $237,110 $240,810
Division Total $234,581 $237,110 $237,110 $240,810
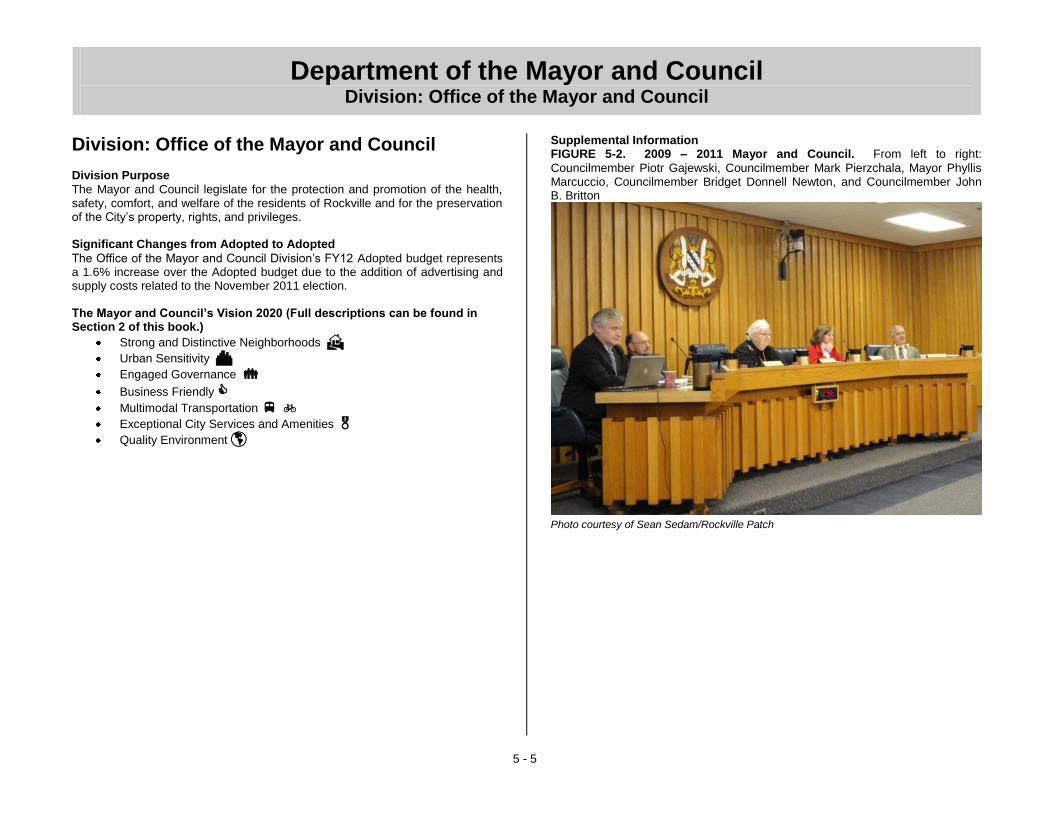
Department of the Mayor and Council Division: Office of the Mayor and Council
5 - 5
Division: Office of the Mayor and Council Division Purpose
The Mayor and Council legislate for the protection and promotion of the health, safety, comfort, and welfare of the residents of Rockville and for the preservation of the City’s property, rights, and privileges. Significant Changes from Adopted to Adopted
The Office of the Mayor and Council Division’s FY12 Adopted budget represents a 1.6% increase over the Adopted budget due to the addition of advertising and supply costs related to the November 2011 election. The Mayor and Council’s Vision 2020 (Full descriptions can be found in Section 2 of this book.)
Strong and Distinctive Neighborhoods
Urban Sensitivity
Engaged Governance
Business Friendly
Multimodal Transportation
Exceptional City Services and Amenities
Quality Environment
Supplemental Information FIGURE 5-2. 2009 – 2011 Mayor and Council. From left to right:
Councilmember Piotr Gajewski, Councilmember Mark Pierzchala, Mayor Phyllis Marcuccio, Councilmember Bridget Donnell Newton, and Councilmember John B. Britton
Photo courtesy of Sean Sedam/Rockville Patch

Department of the Mayor and Council Division: Office of the City Clerk
5 - 6
Division: Office of the City Clerk
TABLE 5-8 Actual
FY10
Adopted
FY11
Est. Act.
FY11
Adopted
FY12
Division Expenditures
by Cost Center
Office of the City Clerk 399,253 361,140 392,912 400,100
Division Total $399,253 $361,140 $392,912 $400,100
TABLE 5-9 Actual
FY10
Adopted
FY11
Est. Act.
FY11
Adopted
FY12
Division Expenditures
by Type
Salary and Wages 264,497 261,720 261,720 249,900
Benefits 59,341 72,580 73,295 71,990
Overtime 0 0 0 0
Personnel Subtotal $323,838 $334,300 $335,015 $321,890
Contractual Services 27,557 16,340 16,340 35,210
Commodities 47,858 10,500 41,557 43,000
Capital Outlays 0 0 0 0
Other 0 0 0 0
Operating Subtotal $75,415 $26,840 $57,897 $78,210
Division Total $399,253 $361,140 $392,912 $400,100
TABLE 5-10 Actual
FY10
Adopted
FY11
Est. Act.
FY11
Adopted
FY12
Source of
Division Funds
Departmental Revenue 0 0 0 0
Subtotal $0 $0 $0 $0
Fund Contribution
General Fund (110) 399,253 361,140 392,912 400,100
Subtotal $399,253 $361,140 $392,912 $400,100
Division Total $399,253 $361,140 $392,912 $400,100
TABLE 5-11 Actual
FY10
Adopted
FY11
Est. Act.
FY11
Adopted
FY12
Staffing Summary
by Cost Center (FTEs)
Regular
Office of the City Clerk 3.0 3.0 3.0 3.0
Regular Subtotal 3.0 3.0 3.0 3.0
Temporary
Office of the City Clerk 0.2 0.1 0.1 0.2
Temporary Subtotal 0.2 0.1 0.1 0.2
Division Total 3.2 3.1 3.1 3.2
etompkins
Underline

Department of the Mayor and Council Division: Office of the City Clerk
5 - 7
Division: Office of the City Clerk
Division Purpose
The Office of the City Clerk supports the Mayor and Council in carrying out their mission by providing administrative and clerical assistance, attending all official meetings of the elected body, preparing and managing the records of actions of the meetings, serving as a liaison between the Mayor and Council and the citizens of Rockville, coordinating the appointment process for the City boards and commissions, and administering a fair and impartial process for City elections. Significant Changes from Adopted to Adopted
The Office of the City Clerk Division’s FY12 Adopted budget represents a 10.8% increase over the FY11 Adopted budget due to a combination of a reduction in personnel expenditures due to employee turnover, and the addition of $54,500 in funding for temporary employee wages, postage, translation services, supplies and equipment for the November 2011 election.
Objectives
Maintain a comprehensive calendar and log of neighborhood and civic group meetings and events requesting the Mayor and Council’s participation, focusing on activities related to the Mayor and Council’s
goals
Continue to perfect electronic information on agendas, minutes, legal notices, and the City’s website to encourage participation in City government and to encourage citizens to serve on City boards and commissions, ensuring that minutes for not only the Mayor and Council meetings but also the Board of Supervisors of Elections and the Compensation Commission are posted in a timely manner onto the
City’s website
With the help of the City’s Board of Supervisors of Elections, facilitate the implementation of any changes to the City’s election laws and/or practices in order to incorporate the use of technology in the City’s
election process in anticipation of the 2011 election
Facilitate the appointment process for City boards and commissions
including any changes made by the Mayor and Council
Oversee the process of scanning contracts, deeds, easements and other agreements into a database and create and maintain a complete index of documents in the database that are stored on microfiche to
ensure easier retrieval of documents
TABLE 5-12. Performance Measures
Actual
FY10 Target
FY11 Est. Act.
FY11 Target
FY12
Increase the percent of employee users rating the overall quality of services provided by the Clerk’s Office as “excellent” or “good” to 85% *
172 / 206 or 83%
175 / 206 or 85%
175 / 206 or 85%
175 / 206 or 85%
Maintain 100% of absentee ballots processed within two business days of receiving a legitimate application during election years
230 / 230 or 100%
N/A N/A 320 / 320 or 100%
Increase the percentage of voters voting by absentee ballot to 5%
230 / 6,341
or 3.6% N/A N/A
320 / 6,400 or 5%
* The City conducts an internal employee survey. The last survey was conducted in FY11 and the next survey will take place in FY13.

Department of the Mayor and Council Division: Office of the City Clerk
5 - 8
TABLE 5-13. Workload Measures
Actual
FY10 Estimate
FY11 Est. Act.
FY11 Estimate
FY12
Number of Boards and Commissions:
Applications
Appointments and Reappointments
43
65
72
72
70
40
75
45
Number of Mayor and Council candidates processed during election years
12 N/A N/A 10
Number of documents prepared/processed:
Agenda meeting packets
Zoning applications
Public Hearing notices
32
15 30
45
20 25
37
19 42
40
20 25
Number of pages of minutes prepared
301 300 285 300
Number of meetings supported:
Mayor and Council meetings
Board of Supervisors of Elections, Compensation Commission, trainings
32
12
45
13
43
15
45
10 Number of documents
scanned / indexed* N/A N/A 500 100
* New measure for FY12. FY11 Estimate is high due to a backlog of documents waiting to be scanned/indexed.
TABLE 5-14. Regular Positions
Position Title Adopted
FY10 Adopted
FY11 Adopted
FY12
Assistant to the City Clerk (grade A14) 1.0 1.0 1.0
City Clerk/Treasurer (no grade – Mayor and Council appointed)
1.0 1.0 1.0
Deputy City Clerk (grade A19) 1.0 1.0 1.0
Total 3.0 3.0 3.0
Supplemental Information
The Clerk’s Office has made several improvements to commonly requested forms. To ensure compliance with an Attorney General Opinion, extensive revisions have been made to the Expression of Interest form, and this form has been posted on the City’s website as a fillable document. Also, the Campaign Fund Report has been converted to a fillable document and posted on the City’s website.
FIGURE 5-3. Election Day in the City of Rockville – November 3, 2009.

*The Office of the City Attorney became a stand alone department in FY10; however,historical staffing data from the cost center is shown on this Staffing Trend Graph forcomparison purposes.
6 - 1
Department of the City AttorneyDepartment Mission Statement
*The Office of the City Attorney became a stand alone department in FY10; however,historical expenditure data from the cost center is shown on this Expenditures HistoryGraph for comparison purposes.
FIGURE 6-1. Departmental Organizational ChartThe City Attorney’s Office is dedicated to providing expert legal adviceand skilled legal support to the Mayor and Council, the City’s Boardsand Commissions, and City staff on all legal matters affecting the City.The City Attorney’s Office strives to provide proactive counsel,preventive advice and early intervention to assist the City in developinga clear understanding of all of its legal options.
$0
$300,000
$600,000
$900,000
$1,200,000
ActualFY08
ActualFY09
ActualFY10
Est. Act.FY11
AdoptedFY12
GRAPH 6-2. Expenditures History*
City Attorney100%
GRAPH 6-3. Use of Funds
0
2
4
6
8
ActualFY08
ActualFY09
ActualFY10
Est. Act.FY11
AdoptedFY12
FT
Es
GRAPH 6-1. Staffing Trend*
Total
Temporary
Regular
Department of the City Attorney
Office of the City Attorney
etompkins
Underline

Department of the City Attorney Department Summary
6 - 2
Department Summary
TABLE 6-1 Actual
FY10
Adopted
FY11
Est. Act.
FY11
Adopted
FY12
% Change
from Adpt.
Dept. Expenditures
by Cost Center
Office of the City Attorney 936,620 929,350 929,350 947,740 2.0%
Department Total $936,620 $929,350 $929,350 $947,740 2.0%
TABLE 6-2 Actual
FY10
Adopted
FY11
Est. Act.
FY11
Adopted
FY12
% Change
from Adpt.
Dept. Expenditures
by Type
Salary and Wages 511,352 559,070 559,070 685,300 22.6%
Benefits 102,606 135,670 135,670 178,840 31.8%
Overtime 0 0 0 0 N/A
Personnel Subtotal $613,958 $694,740 $694,740 $864,140 24.4%
Contractual Services 310,081 225,710 225,710 74,700 (66.9%)
Commodities 7,722 3,900 3,900 3,900 0.0%
Capital Outlays 4,859 5,000 5,000 5,000 0.0%
Other 0 0 0 0 N/A
Operating Subtotal $322,662 $234,610 $234,610 $83,600 (64.4%)
Department Total $936,620 $929,350 $929,350 $947,740 2.0%
TABLE 6-3 Actual
FY10
Adopted
FY11
Est. Act.
FY11
Adopted
FY12
% Change
from Adpt.
Source of
Dept. Funds
Departmental Revenue 0 0 0 0 N/A
Subtotal $0 $0 $0 $0 N/A
Fund Contribution
General Fund (110) 936,620 929,350 929,350 947,740 2.0%
Subtotal $936,620 $929,350 $929,350 $947,740 2.0%
Department Total $936,620 $929,350 $929,350 $947,740 2.0%
TABLE 6-4 Actual
FY10
Adopted
FY11
Est. Act.
FY11
Adopted
FY12
% Change
from Adpt.
Staffing Summary
by Cost Center (FTEs)
Regular
Office of the City Attorney 5.0 5.0 5.0 6.0 20.0%
Regular Subtotal 5.0 5.0 5.0 6.0 20.0%
Temporary
Office of the City Attorney 0.2 0.0 0.0 0.0 N/A
Temporary Subtotal 0.2 0.0 0.0 0.0 N/A
Department Total 5.2 5.0 5.0 6.0 20.0%
etompkins
Underline

Department of the City Attorney Division: Office of the City Attorney
6 - 3
Department Summary Department Overview
The City Attorney’s Office (CAO) is the department responsible for providing legal support to the City of Rockville. In that capacity, the CAO serves as the legal advisor to the Mayor and Council, all Boards and Commissions, and the City staff on all legal matters affecting the City; reviews for legal sufficiency all agreements to which the City is a party; prepares and/or reviews legal documents for the City; is responsible for preparing and/or revising additions and amendments to the Rockville City Code for enactment by the Mayor and Council; and represents the City before administrative agencies and Federal and State courts in legal proceedings in which the City has an interest.
Significant Changes from Adopted to Adopted
The Department of the City Attorney’s FY12 Adopted budget represents a 2.0% increase over the FY11 Adopted budget due to increases in salary and benefit costs. The Department’s total regular FTE count increased by 1.0 for FY12 due to the addition of a 1.0 Assistant City Attorney, which was requested in order to maximize in-house legal services. Outside legal fees have been reduced to offset the cost of this additional FTE. Objectives
Provide legal advice and counsel to the Mayor and Council, the City’s Boards and Commissions, and the City staff on all legal matters
affecting the City
Represent the City before Federal and State courts in all legal
proceedings in which the City has an interest
Prepare, negotiate and/or review all legal documents involving the City including agreements, contracts, deeds, bonds, leases, procurement materials, releases, licenses, easements, and memoranda of
understanding
Prepare and/or review City ordinances and resolutions for adoption by
the Mayor and Council
Review proposed legislation for legal sufficiency and to ensure
compliance with Federal, State, and local law
TABLE 6-5. Workload Measures
Actual
FY10 Estimate
FY11 Est. Act.
FY11 Estimate
FY12
Number of Mayor and Council and Boards and Commissions meetings attended*
N/A 55 60 60
Number of ordinances and resolutions prepared and/or reviewed for adoption by the Mayor and Council*
N/A 24 30 30
Number of contracts reviewed and/or prepared*
N/A 50 140 140
Number of development related agreements reviewed / prepared* **
N/A 35 60 60
Number of administrative appeals defended in court*
N/A 3 5 4
Number of municipal infractions filed in court*
N/A 60 100 100
* These measures were new for FY11 and were estimates only. FY11 Estimated Actuals and FY12 Estimates are based on actual data.
** Development related agreements include, but are not limited to, stormwater management easements, storm drain and storm sewer easements, transportation demand management agreements, forest conservation and maintenance agreements, public access easements, and licenses.

Department of the City Attorney Division: Office of the City Attorney
6 - 4
TABLE 6-6. Regular Positions
Position Title Adopted
FY10 Adopted
FY11 Adopted
FY12
Assistant City Attorney* (grade A27/A30)
2.0 2.0 3.0
Assistant to the City Attorney (grade A20)
1.0 1.0 1.0
City Attorney (no grade – Mayor and Council appointed)
1.0 1.0 1.0
Legal Secretary (grade A16) 1.0 1.0 1.0
Total 5.0 5.0 6.0
* The Assistant City Attorney position is a banded position and can be hired at either of two levels.
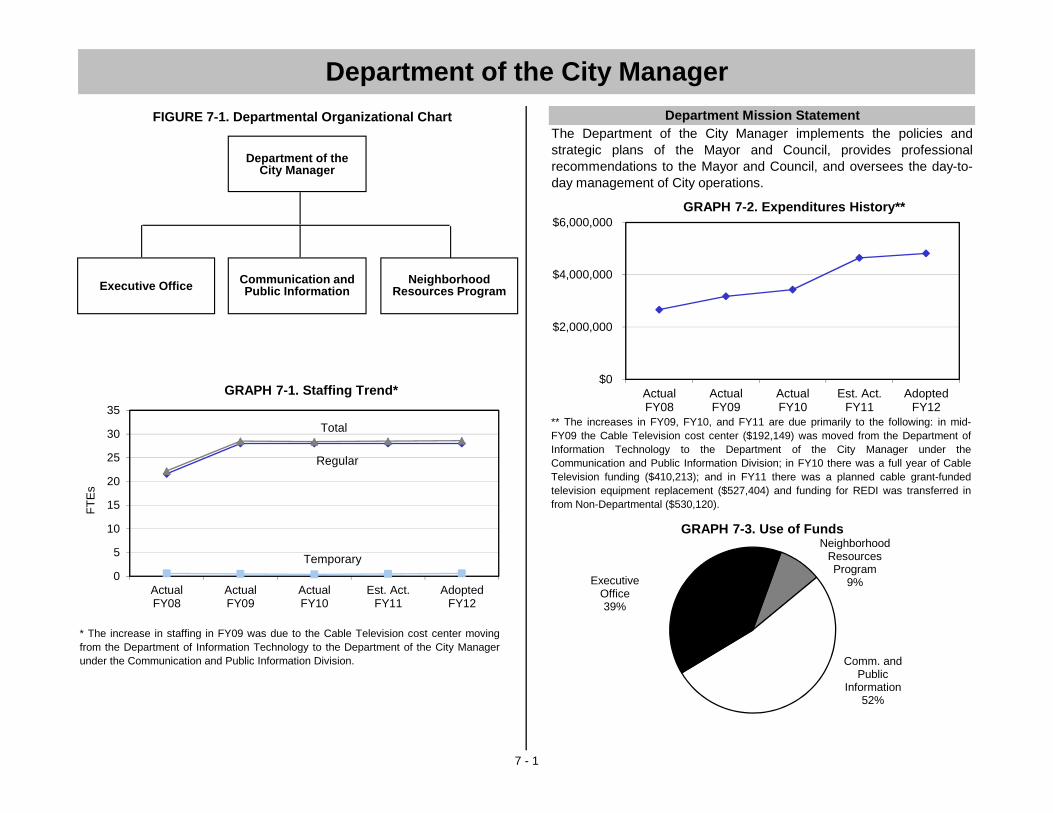
* The increase in staffing in FY09 was due to the Cable Television cost center movingfrom the Department of Information Technology to the Department of the City Managerunder the Communication and Public Information Division.
** The increases in FY09, FY10, and FY11 are due primarily to the following: in mid-FY09 the Cable Television cost center ($192,149) was moved from the Department ofInformation Technology to the Department of the City Manager under theCommunication and Public Information Division; in FY10 there was a full year of CableTelevision funding ($410,213); and in FY11 there was a planned cable grant-fundedtelevision equipment replacement ($527,404) and funding for REDI was transferred infrom Non-Departmental ($530,120).
FIGURE 7-1. Departmental Organizational Chart
Department of the City ManagerDepartment Mission Statement
7 - 1
The Department of the City Manager implements the policies andstrategic plans of the Mayor and Council, provides professionalrecommendations to the Mayor and Council, and oversees the day-to-day management of City operations.
$0
$2,000,000
$4,000,000
$6,000,000
ActualFY08
ActualFY09
ActualFY10
Est. Act.FY11
AdoptedFY12
GRAPH 7-2. Expenditures History**
Neighborhood Resources Program
9%
Comm. and Public
Information52%
Executive Office39%
GRAPH 7-3. Use of Funds
0
5
10
15
20
25
30
35
ActualFY08
ActualFY09
ActualFY10
Est. Act.FY11
AdoptedFY12
FT
Es
GRAPH 7-1. Staffing Trend*
Total
Temporary
Regular
Department of theCity Manager
Communication and Public InformationExecutive Office Neighborhood
Resources Program
etompkins
Underline
etompkins
Underline
etompkins
Underline
etompkins
Underline
etompkins
Underline
etompkins
Underline

Department of the City Manager Department Summary
7 - 2
TABLE 7-1 Actual
FY10
Adopted
FY11
Est. Act.
FY11
Adopted
FY12
% Change
from Adpt.
Dept. Expenditures
by Division
Executive Office 1,196,525 1,815,580 1,842,580 1,886,550 3.9%
Communication & Public
Information1,865,985 2,281,700 2,417,504 2,520,850 10.5%
Neighborhood
Resources Program368,971 390,050 383,188 407,390 4.4%
Department Total $3,431,481 $4,487,330 $4,643,272 $4,814,790 7.3%
TABLE 7-2 Actual
FY10
Adopted
FY11
Est. Act.
FY11
Adopted
FY12
% Change
from Adpt.
Dept. Expenditures
by Type
Salary and Wages 2,181,925 2,176,750 2,169,550 2,210,200 1.5%
Benefits 521,073 618,950 618,950 697,250 12.7%
Overtime 2,926 2,700 2,700 3,550 31.5%
Personnel Subtotal $2,705,924 $2,798,400 $2,791,200 $2,911,000 4.0%
Contractual Services 572,144 566,310 603,510 637,390 12.6%
Commodities 142,860 151,400 151,738 180,570 19.3%
Capital Outlays 10,553 410,600 529,204 513,030 24.9%
Other 0 560,620 567,620 572,800 2.2%
Operating Subtotal $725,557 $1,688,930 $1,852,072 $1,903,790 12.7%
Department Total $3,431,481 $4,487,330 $4,643,272 $4,814,790 7.3%
TABLE 7-3 Actual
FY10
Adopted
FY11
Est. Act.
FY11
Adopted
FY12
% Change
from Adpt.
Source of
Dept. Funds
Departmental Revenue
Cable Operating Grant *
(110)N/A 71,040 71,040 71,040 0.0%
Cable Capital Grants
(350)438,567 408,800 408,800 508,630 24.4%
Subtotal $438,567 $479,840 $479,840 $579,670 20.8%
Fund Contribution
General Fund (110) 3,426,824 4,007,490 4,044,828 4,235,120 5.7%
Special Activities (350) (433,910) 0 118,604 0 N/A
Subtotal $2,992,914 $4,007,490 $4,163,432 $4,235,120 5.7%
Department Total $3,431,481 $4,487,330 $4,643,272 $4,814,790 7.3%
TABLE 7-4 Actual
FY10
Adopted
FY11
Est. Act.
FY11
Adopted
FY12
% Change
from Adpt.
Staffing Summary
by Division (FTEs)
Regular
Executive Office 8.5 8.5 8.5 8.5 0.0%
Communication & Public
Information15.5 15.5 15.5 15.5 0.0%
Neighborhood
Resources Program4.0 4.0 4.0 4.0 0.0%
Regular Subtotal 28.0 28.0 28.0 28.0 0.0%
Temporary
Executive Office 0.0 0.0 0.0 0.1 N/A
Communication & Public
Information0.4 0.3 0.5 0.5 66.7%
Temporary Subtotal 0.4 0.3 0.5 0.6 100.0%
Department Total 28.4 28.3 28.5 28.6 1.1%
Department Summary
* The Cable Operating Grant revenue was moved from the Department of Information Technology into the Cable Television cost center for FY11 to more accurately reflect the purpose of that grant.
etompkins
Underline
etompkins
Underline
etompkins
Underline
etompkins
Underline
etompkins
Underline
etompkins
Underline
etompkins
Underline
etompkins
Underline
etompkins
Underline
etompkins
Underline
etompkins
Underline
etompkins
Underline
etompkins
Underline
etompkins
Underline

Department of the City Manager Department Summary
7 - 3
Department Summary Department Overview
The Department of the City Manager comprises three divisions and eleven cost centers. The Department’s Executive Office Division, with four cost centers, leads the day-to-day management of the entire City government organization and implements the policies, priorities, initiatives and strategic goals of the Mayor and Council. The Communication and Public Information Division, with five cost centers, provides strategic, community-wide and internal communication and public information services. Through the Neighborhood Resources Division, which consists of two cost centers, the Department maintains close connections with neighborhood and civic associations, individual residents, community organizations and local businesses to promote communication and ensure that the City responds to specific needs in the community. Department Objectives
Ensure the successful implementation of the Mayor and Council Vision
Manage the City government’s day-to-day operations to deliver high value
City services to Rockville residents
Keep the Mayor and Council, and the community, informed about City operations, projects and services, and changes affecting City operations and
services
Guide the development of a performance-based operating and capital budget that reflects the Mayor and Council Vision and makes the most
efficient use of taxpayer dollars
Ensure staff reports prepared for the Mayor and Council are clear, accurate, and complete, and include realistic, fact-based, and thoughtful options and
recommendations
Continue to develop ways to inform and engage residents by utilizing
existing and evolving communication technologies and methods
Coordinate interdepartmental policies, projects, and solutions to problems
Promote high quality internal and external customer service through training,
employee recognition, and customer surveys
Ensure high performance by promoting leadership, teamwork, and
continuous improvement
Anticipate the changing needs of the community, and effect organizational
change to meet those needs
Keep the City prepared for unanticipated emergencies, including natural,
man-made, and financial emergencies
Maintain productive relationships with Montgomery County, the State of
Maryland, the Federal Government and other partners in the community
Develop and advocate for a legislative program to protect and enhance the
City’s interests
Secure and manage State and Federal grants to support City projects and
programs
Significant Changes from Adopted to Adopted
The Department of the City Manager’s FY12 Adopted budget represents a 7.3% increase over the FY11 Adopted budget due to a combination of increases in salary and benefit costs, the removal of $39,200 in one-time funding for the citizen survey, the addition of $10,000 in one-time contractual services costs related to the November 2011 election for a Mayor and Council goals consultant, the addition of $30,000 for centralized employee professional development, the addition of $12,000 for an increase in the City’s Federal and State lobbyist contract, the addition of $100,000 in one-time consultant funding for the redesign of the City’s website, the reallocation of $6,080 in courier services costs to other City departments, and the addition of $99,830 in grant-funded capital equipment funding for the Cable TV Equipment Special Activities Fund.
The Department of the City Manager’s FY12 Adopted revenue budget represents a 20.8% increase over the FY11 Adopted budget due to an increase in projected cable capital grant revenue.
etompkins
Underline
etompkins
Underline
etompkins
Underline
etompkins
Underline
etompkins
Underline
etompkins
Underline
etompkins
Underline

Department of the City Manager Division: Executive Office
7 - 4
TABLE 7-5 Actual
FY10
Adopted
FY11
Est. Act.
FY11
Adopted
FY12
Division Expenditures
by Cost Center
Administration 692,738 672,000 684,000 701,180
Management Systems &
Intergovt. Affairs324,308 431,610 446,610 417,140
Organizational
Development179,479 181,850 181,850 226,930
Rockville Economic Dev.,
Inc. (REDI)*N/A 530,120 530,120 541,300
Division Total $1,196,525 $1,815,580 $1,842,580 $1,886,550
TABLE 7-6 Actual
FY10
Adopted
FY11
Est. Act.
FY11
Adopted
FY12
Division Expenditures
by Type
Salary and Wages 832,379 825,070 825,070 835,300
Benefits 189,814 223,910 223,910 248,750
Overtime 1,537 0 0 1,550
Personnel Subtotal $1,023,730 $1,048,980 $1,048,980 $1,085,600
Contractual Services 147,796 177,780 197,780 170,580
Commodities 24,999 28,200 28,200 57,570
Capital Outlays 0 0 0 0
Other 0 560,620 567,620 572,800
Operating Subtotal $172,795 $766,600 $793,600 $800,950
Division Total $1,196,525 $1,815,580 $1,842,580 $1,886,550
TABLE 7-7 Actual
FY10
Adopted
FY11
Est. Act.
FY11
Adopted
FY12
Source of
Division Funds
Departmental Revenue 0 0 0 0
Subtotal $0 $0 $0 $0
Fund Contribution
General Fund (110) 1,196,525 1,815,580 1,842,580 1,886,550
Subtotal $1,196,525 $1,815,580 $1,842,580 $1,886,550
Division Total $1,196,525 $1,815,580 $1,842,580 $1,886,550
TABLE 7-8 Actual
FY10
Adopted
FY11
Est. Act.
FY11
Adopted
FY12
Staffing Summary
by Cost Center (FTEs)
Regular
Administration 5.5 4.5 4.5 4.5
Management Systems &
Intergovt. Affairs2.0 3.0 3.0 3.0
Organizational
Development1.0 1.0 1.0 1.0
Regular Subtotal 8.5 8.5 8.5 8.5
Temporary
Administration 0.0 0.0 0.0 0.1
Temporary Subtotal 0.0 0.0 0.0 0.1
Division Total 8.5 8.5 8.5 8.6
Division: Executive Office
* For FY11, REDI became a stand-alone cost center and was transferred from Non-Departmental to the Department of the City Manager.
etompkins
Underline
etompkins
Underline
etompkins
Underline
etompkins
Underline
etompkins
Underline
etompkins
Underline
etompkins
Underline
etompkins
Underline
etompkins
Underline
etompkins
Underline
etompkins
Underline
etompkins
Underline
etompkins
Underline

Department of the City Manager Division: Executive Office
7 - 5
Division: Executive Office
Division Purpose
The Executive Office Division provides leadership and executive management for the City government, under the policy direction of the Mayor and Council. The Division collaborates with and directs departments to manage City operations, ensure the Mayor and Council’s goals are met, and develop and maintain productive relationships with citizens, businesses, community groups, and other governments. The Division implements and maintains systems that provide information for decision-making and ensures timely response to citizen needs. The Division anticipates organization and community needs, and prepares for and responds to changes that impact the City and its residents. The Division also designs and manages programs to promote high performance.
Significant Changes from Adopted to Adopted
The Executive Office Division’s FY12 Adopted budget represents a 3.9% increase over the FY11 Adopted budget due to a combination of increases in salary and benefit costs, the removal of $39,200 in one-time contractual services costs related to the citizen survey, the addition of $10,000 in one-time contractual services costs related to the November 2011 election for a Mayor and Council goals consultant, the reallocation of funding within the Department to fund additional Organizational Development supply needs in this Division, the addition of $11,180 in funding for REDI, the addition of $30,000 for centralized employee professional development, and the addition of $12,000 for an increase the City’s Federal and State lobbyist contract.
Cost Center: Administration TABLE 7-9. Cost Center Summary
Actual
FY10 Adopted
FY11 Est. Act.
FY11 Adopted
FY12
Total Expenditures 692,738 672,000 684,000 701,180
Total Revenues N/A N/A N/A N/A
Objectives
Maintain timely and effective communication with the Mayor and Council
Implement and communicate the Mayor and Council Vision to City
employees and the public
Anticipate future needs, and maintain an understanding of the major trends and conditions (regional, national and international) affecting the
community
Oversee the delivery of high value municipal programs and services to
residents that positively impact the quality of life in Rockville
Continuously improve systems for citizen input, striving to be efficient,
effective, fair, and inclusive
Manage an efficient and effective organization within the parameters and limits of the annual budget, in order to make best use of taxpayer
resources
Support departments’ work on the budget, Mayor and Council agenda materials, and problem solving to ensure City government runs
smoothly
Work with departments to continually assess and improve the City’s
effectiveness, efficiency, and financial health
Communicate and coordinate with the business community through the
Rockville Chamber of Commerce and REDI
etompkins
Underline
etompkins
Underline
etompkins
Underline
etompkins
Underline
etompkins
Underline

Department of the City Manager Division: Executive Office
7 - 6
TABLE 7-10. Performance Measures
Actual
FY10 Target
FY11 Est. Act.
FY11 Target
FY12
Number and percent of Mayor and Council vision priority action items:
Completed
In progress
Ongoing
In planning stage
Preliminary research Total*
23 (70%) 9 (27%) 1 (3%) 0 (0%) 0 (0%)
33(100%)
15 (48%) 9 (29%)
2 (7%) 5 (16%) 0 (0%)
31(100%)
8 (26%) 20 (65%) 0 (0%) 0 (0%) 3 (9%)
31(100%)
21 (68%) 10 (32%) 0 (0%)
0 (0%) 0 (0%)
31(100%)
Maintain the resident approval rating of the overall direction the City government is taking at 62% **
64% 68% 62% 62%
Maintain resident positive ratings of quality of life in Rockville at 93%**
94% 96% 93% 93%
Maintain the percent of residents who agree that the City welcomes citizen involvement at 69%**
71% 73% 69% 69%
Maintain resident ratings of good value for taxes paid at 61%**
64% 75% 61% 61%
Maintain the employee rating on overall customer service in the City Manager’s Office at 83%***
164 / 210 or 78%
224 / 264 or 85%
171 / 205 or 83%
171 / 205 or 83%
Actual
FY10 Target
FY11 Est. Act.
FY11 Target
FY12
Maintain the employee rating on responsiveness and support to employee inquiries at 85%***
164 / 201 or 82%
179 / 210 or 85%
55 / 65 or 85%
55 / 65 or 85%
* FY10 figures are applicable to the Mayor and Council’s 2008 – 2010 Vision. FY11 and FY12 figures relate to the Vision 2020, which can be found in Section 2 of this document.
** The City conducts a citizen survey every other year. A survey was conducted in FY11 and the next survey will take place in FY13.
*** The City conducts an employee survey. An employee survey was conducted in FY11 and the next survey will take place in FY13.
TABLE 7-11. Workload Measures
Actual
FY10 Estimate
FY11 Est. Act.
FY11 Estimate
FY12
Number of community meetings attended by the City Manager and the Assistant City Manager
61 50 57 60
Number of hours of professional development by the City Manager and Assistant City Manager*
136 80 52 65
Number of Mayor and Council meeting agendas prepared
37 42 39 39
Number of Chamber of Commerce meetings and events attended
21 26 36 36
* The FY11 figure represent a decrease in training hours due to the reduction of funding in all department budgets for travel, training, and professional association dues.

Department of the City Manager Division: Executive Office
7 - 7
TABLE 7-12. Regular Positions
Position Title Adopted
FY10 Adopted
FY11 Adopted
FY12
Administrative Support Coordinator (grade A16)
1.0 1.0 1.0
Assistant City Manager (grade SAI) 1.0 1.0 1.0
City Hall Facilities Manager (grade A11) 0.5 0.5 0.5
City Manager (no grade – Mayor and Council appointed)
1.0 1.0 1.0
Secretary I* (grade A10) 2.0 1.0 1.0
Cost Center Total 5.5 4.5 4.5
* A 1.0 FTE Secretary I position moved from the Administration cost center to the Management Systems & Intergovernmental Affairs cost center for FY11.
Supplemental Information
Rockville Scholarship Foundation Each fiscal year, the City awards funding to outside agencies that provide services to the residents of Rockville through a competitive application review process. The FY12 Administration cost center budget includes $6,500 for the Rockville Scholarship Foundation. The Foundation provides scholarships to enable members of the Rockville community to pursue education beyond high school, and to encourage members of the community to assume important roles as leaders in their professions and as future leaders of Rockville. Rockville Chamber of Commerce The City Manager’s Office provides a liaison to the Rockville Chamber of Commerce to maintain an understanding of the business community’s needs and share information about the City with businesses. The liaison role includes:
Serving as an ex officio member of the Chamber Board of Directors, a member of the Legislative Committee and a member of the Partnership Committee
Providing monthly updates to the Legislative Committee and the Board of Directors on City news and initiatives of interest to the business community
Responding to requests for information about the City Facilitating problem solving between the business community and the
City Arranging City speakers for Chamber events Keeping the City Manager and the Mayor and Council informed about
the Chamber and the business community in general
Cost Center: Management Systems & Intergovernmental Affairs
TABLE 7-13. Cost Center Summary
Actual
FY10 Adopted
FY11 Est. Act.
FY11 Adopted
FY12
Total Expenditures 324,308 431,610 446,610 417,140
Total Revenues N/A N/A N/A N/A
Objectives
Coordinate with departments to monitor project work plans in order to accomplish the Mayor and Council Vision in a timely and cost effective manner, and keep the Mayor and Council and the community informed
of progress
Implement the Citizen Survey in odd numbered fiscal years and increase survey response rates in order to receive ongoing citizen
feedback and drive continuous service improvement
Respond to citizen service requests (CSR) and complaints/concerns, and coordinate with departments to resolve issues in a timely manner
Lead initiatives to assess and improve customer service and serve as
the model for customer service in the organization
Develop and carry out the City’s legislative program to protect and promote City interests, seek funding, and develop and maintain positive and productive working relationships with County, State, and Federal
counterparts
TABLE 7-14. Performance Measures
Actual
FY10 Target
FY11 Est. Act.
FY11 Target
FY12
Achieve a score of 80% of employees that rate the support of the online project tracking system and preparation for project tracking meetings as “excellent or good”* **
N/A N/A 80% 80%
Maintain the average number of days to resolve CSRs at or below 7
12 9 6 7
etompkins
Underline
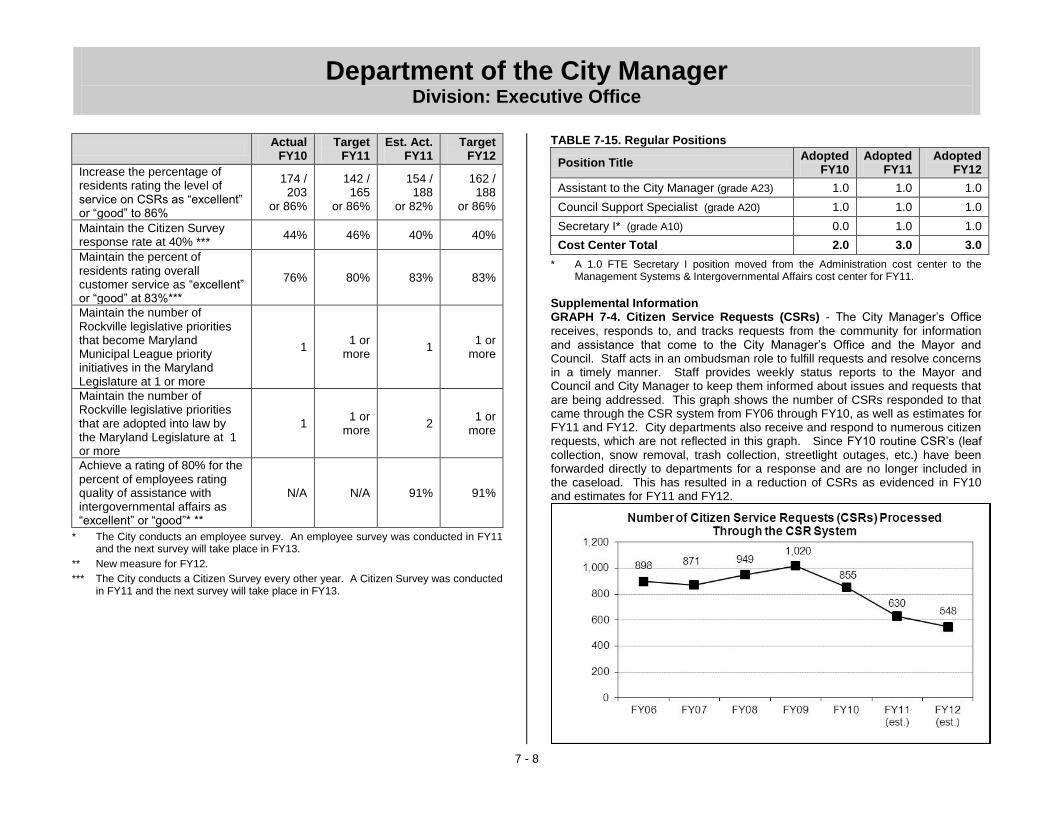
Department of the City Manager Division: Executive Office
7 - 8
Actual
FY10 Target
FY11 Est. Act.
FY11 Target
FY12
Increase the percentage of residents rating the level of service on CSRs as “excellent” or “good” to 86%
174 / 203
or 86%
142 / 165
or 86%
154 / 188
or 82%
162 / 188
or 86%
Maintain the Citizen Survey response rate at 40% ***
44% 46% 40% 40%
Maintain the percent of residents rating overall customer service as “excellent” or “good” at 83%***
76% 80% 83% 83%
Maintain the number of Rockville legislative priorities that become Maryland Municipal League priority initiatives in the Maryland Legislature at 1 or more
1 1 or
more 1
1 or more
Maintain the number of Rockville legislative priorities that are adopted into law by the Maryland Legislature at 1 or more
1 1 or
more 2
1 or more
Achieve a rating of 80% for the percent of employees rating quality of assistance with intergovernmental affairs as “excellent” or “good”* **
N/A N/A 91% 91%
* The City conducts an employee survey. An employee survey was conducted in FY11 and the next survey will take place in FY13.
** New measure for FY12.
*** The City conducts a Citizen Survey every other year. A Citizen Survey was conducted in FY11 and the next survey will take place in FY13.
TABLE 7-15. Regular Positions
Position Title Adopted
FY10 Adopted
FY11 Adopted
FY12
Assistant to the City Manager (grade A23) 1.0 1.0 1.0
Council Support Specialist (grade A20) 1.0 1.0 1.0
Secretary I* (grade A10) 0.0 1.0 1.0
Cost Center Total 2.0 3.0 3.0
* A 1.0 FTE Secretary I position moved from the Administration cost center to the Management Systems & Intergovernmental Affairs cost center for FY11.
Supplemental Information GRAPH 7-4. Citizen Service Requests (CSRs) - The City Manager’s Office
receives, responds to, and tracks requests from the community for information and assistance that come to the City Manager’s Office and the Mayor and Council. Staff acts in an ombudsman role to fulfill requests and resolve concerns in a timely manner. Staff provides weekly status reports to the Mayor and Council and City Manager to keep them informed about issues and requests that are being addressed. This graph shows the number of CSRs responded to that came through the CSR system from FY06 through FY10, as well as estimates for FY11 and FY12. City departments also receive and respond to numerous citizen requests, which are not reflected in this graph. Since FY10 routine CSR’s (leaf collection, snow removal, trash collection, streetlight outages, etc.) have been forwarded directly to departments for a response and are no longer included in the caseload. This has resulted in a reduction of CSRs as evidenced in FY10 and estimates for FY11 and FY12.
Department of the City Manager Division: Executive Office
7 - 9
FY11 Major Legislative and Intergovernmental Interactions – The
Department of the City Manager works with City departments, the Mayor and Council, the City’s Federal and State lobbyists, and the Maryland Municipal League to provide comments on intergovernmental projects and initiatives, weigh in on legislation with direct impact on Rockville, and seek Federal and State funding for City capital improvement projects
Federal Highlights Worked with Federal agencies on the following:
Received approval and entered into agreement with EPA to use $750,000 in federal funding for sanitary sewer rehabilitation (Sewer Rehabilitation CIP project). Project work will begin in July 2011 and will be completed in December 2011.
Submitted and received approval from FEMA for the emergency generator at the City Police Station to use $224,000 in federal funds (Police Station CIP project).
Submitted an application for an emergency generator at the Rockville Senior Center for $275,385 the Maryland Emergency Management Administration for review and approval to submit it to the Federal Emergency Management Administration.
Received approval from the Department of Justice and spent $100,000 to upgrade Police cruisers with new mobile computers.
Programmed $1,074,000 in federal funds for the Rockville Police Station, repairs and rehabilitation to the City’s sanitary sewer system, and upgrades to Police cruiser mobile computers. Monitored progress of FY11 Federal funding requests for: $1 million in planning, engineering, and design for the Rockville Pike Multi-Way Boulevard, $500,000 in Police technology upgrades, and $3 million for sanitary sewer repairs. Congress announced in February 2011 that it would not accept Federal appropriations (earmark) requests. The City will participate in the Federal executive agency competitive grants process, and will submit grants applications for priority projects to Federal agencies for consideration in the summer/fall 2011. The first of these applications submitted in spring 2011 was by the City police for a Community Oriented Police (COPS) Hiring Program grant in the amount of $674,474 to fund three police officers (for a three year period) that would be placed in school liaison/resource positions to help fill the gap created by significant cuts to the Montgomery County School Resource Officer program.
State Highlights Worked with the Maryland Municipal League (MML), the City’s state lobbyist, and the District 17 Delegation to restore municipal Highway User Revenue (HUR). These funds were cut by 95% in FY10. MML’s efforts achieved a restoration of approximately 25%, or more than $9.9 million, and Rockville will receive $709,800 in HUR funds in FY12. Worked to advocate for a statewide stormwater management charge for National Pollution Discharge Elimination System (NPDES) permit holders to cover the cost of complying with the new Total Maximum Daily Load requirements issued by EPA, to preserve the City’s program in its current form, and to codify in State law that all public and private entities discharging runoff into a local stormwater system pay for the service. Legislation on this topic failed in the 2011 session; however, the sponsor will convene a 2011 summer study group consisting of Montgomery County, municipal representatives with stormwater programs, and Montgomery Delegation legislators, to try to come to consensus on an all-payer system. Worked with the District 17 Delegation and the City’s State lobbyist to advocate for the Negligent Homicide bill to establish a middle ground between a mere traffic violation and a strong felony charge for motorists who cause injury or death to a pedestrian. The bill was passed by the General Assembly in the 2011 Session and was signed by the Governor in May 2011. Coordinated with the Maryland Department of Transportation to plan and coordinate the City’s and County’s vision for the future of Rockville Pike. Coordinated with the Maryland Transit Administration to support the Corridor Cities Transitway project and ensure that the locally preferred alternative does not negatively impact King Farm residents.
Worked with the District 17 Delegation to secure $20,000 for the renovation of the Rockville Swim and Fitness Center locker room.
County Highlights Worked with the Montgomery Chapter of the Maryland Municipal League to advocate for no further cuts to the tax duplication payment that Montgomery County makes to its municipalities. The County Council restored the 5% cut proposed by the County Executive (CE) in his proposed FY12 budget. The FY12 Adopted budget includes $1,799,110 for tax duplication and a budget amendment is planned for FY12 to recognize any additional payments to the City.

Department of the City Manager Division: Executive Office
7 - 10
Fiscal
Year
Lobbying
Expenditures
Federal Funding
Pending/Received
State Funding
Pending/Received
FY 2005 $123,000 $1,660,000 $1,500,000
FY 2006 $125,000 $4,000,000 $1,750,000
FY 2007 $135,000 $0 $100,000
FY 2008 $147,000 $0 $0
FY 2009 $30,000 $825,000 $100,000
FY 2010 $120,000 $1,500,000 $120,000
FY 2011 $120,000 $0 $20,000
Total: $800,000 $7,985,000 $3,590,000
$11,575,000 Total State and Federal Funds Approved/Received:
Advocated at the Board of Education and the County Council for feasibility studies and school construction funding to address overcrowding issues in the Richard Montgomery High School cluster. Funding was included for FY11 in the County’s FY12 Capital Budget and Amendments to the FY11-16 CIP for feasibility studies at Julius West Middle School and a potential new Richard Montgomery Elementary School at the former Hungerford Park Elementary site. Lobbying Services
Rockville retains the services of a lobbying firm to assist the City to formulate a policy agenda, identify funding opportunities, and guide the City through the State and Federal appropriations cycles. The services allow the City to have a constant, on-site presence in Annapolis and Capitol Hill. FIGURE 7-2. Lobbying Services Table. The following table illustrates the
funds expended on lobbying services and the total dollars secured from the State and Federal governments.
* In February 2011 Congress decided to not consider federal appropriations or earmark requests for FY11 and FY12. The City will be submitting FY11 grant applications for priority projects to federal agencies for consideration in the summer/fall of 2011. The outcome of grant applications will not be known until late 2011/ early 2012. The City will submit FY12 grant applications in the summer of 2012.
** In the 2011 General Assembly Rockville secured State bond bill funding in the amount of $20,000 for the Rockville Swim and Fitness Center to renovate the facility’s locker rooms.
Cost Center: Organizational Development TABLE 7-16. Cost Center Summary
Actual
FY10 Adopted
FY11 Est. Act.
FY11 Adopted
FY12
Total Expenditures 179,479 181,850 181,850 226,930
Total Revenues N/A N/A N/A N/A
Objectives
Improve customer service and employee effectiveness through increased delegation and sharing of decision-making throughout the
organization
Assist work groups seeking performance and morale improvements by collaborating with managers and work teams through organizational development interventions that create meaningful results for team
members and team leaders
Support the leadership development of all employees, and particularly of Department Heads and Division Chiefs, to improve their contributions
to their work teams
Support the strategic planning efforts of Senior Staff to improve their
effectiveness as a team
Improve the alignment between strategic planning and operations citywide, at the department level, and at the individual employee level by supporting the development of strategic plans, work plans and
employee development plans
Support the quality of the Human Resources Department’s orientation program for new employees by presenting useful High Performance
Organization (HPO) training
Support individual and team development efforts. Coordinate the work of the interdepartmental High Performance Organization (HPO) Committee; the Customer Service Action Team; and provide customized department- or division-specific development programs to
work groups throughout the organization
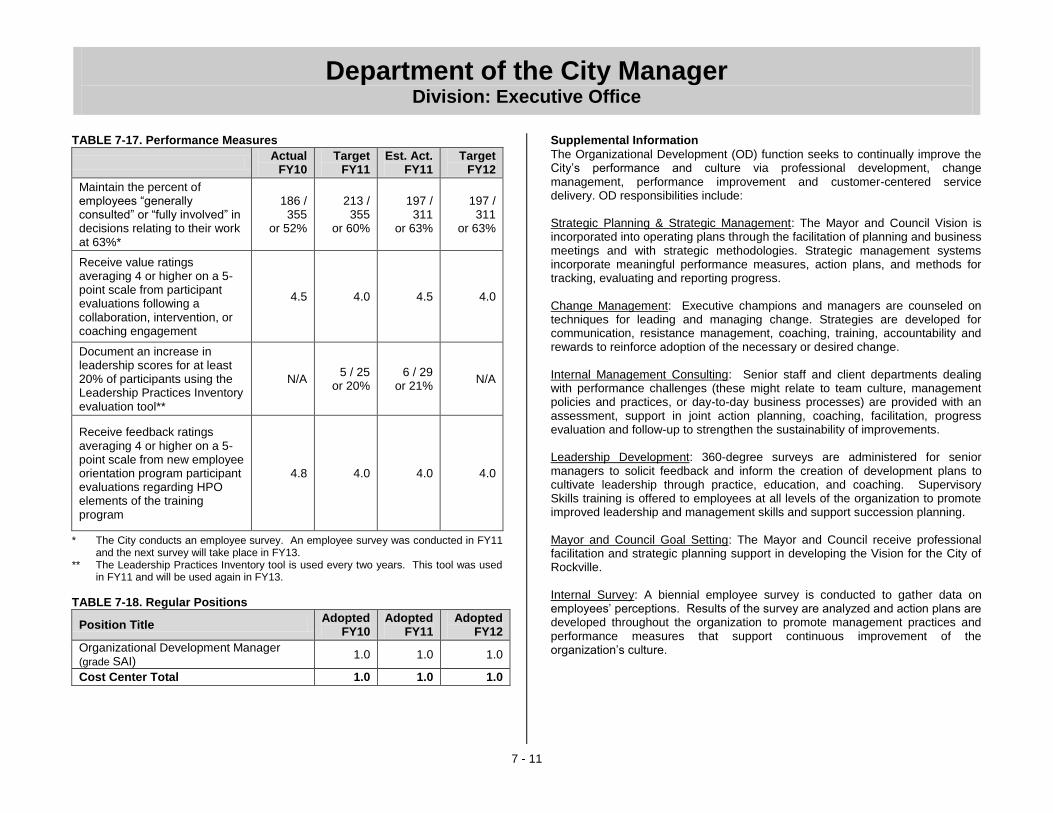
Department of the City Manager Division: Executive Office
7 - 11
TABLE 7-17. Performance Measures
Actual
FY10 Target
FY11 Est. Act.
FY11 Target
FY12
Maintain the percent of employees “generally consulted” or “fully involved” in decisions relating to their work at 63%*
186 / 355
or 52%
213 / 355
or 60%
197 / 311
or 63%
197 / 311
or 63%
Receive value ratings averaging 4 or higher on a 5-point scale from participant evaluations following a collaboration, intervention, or coaching engagement
4.5 4.0 4.5 4.0
Document an increase in leadership scores for at least 20% of participants using the Leadership Practices Inventory evaluation tool**
N/A 5 / 25
or 20% 6 / 29
or 21% N/A
Receive feedback ratings averaging 4 or higher on a 5-point scale from new employee orientation program participant evaluations regarding HPO elements of the training program
4.8 4.0 4.0 4.0
* The City conducts an employee survey. An employee survey was conducted in FY11 and the next survey will take place in FY13.
** The Leadership Practices Inventory tool is used every two years. This tool was used in FY11 and will be used again in FY13.
TABLE 7-18. Regular Positions
Position Title Adopted
FY10 Adopted
FY11 Adopted
FY12
Organizational Development Manager (grade SAI)
1.0 1.0 1.0
Cost Center Total 1.0 1.0 1.0
Supplemental Information
The Organizational Development (OD) function seeks to continually improve the City’s performance and culture via professional development, change management, performance improvement and customer-centered service delivery. OD responsibilities include: Strategic Planning & Strategic Management: The Mayor and Council Vision is incorporated into operating plans through the facilitation of planning and business meetings and with strategic methodologies. Strategic management systems incorporate meaningful performance measures, action plans, and methods for tracking, evaluating and reporting progress. Change Management: Executive champions and managers are counseled on techniques for leading and managing change. Strategies are developed for communication, resistance management, coaching, training, accountability and rewards to reinforce adoption of the necessary or desired change. Internal Management Consulting: Senior staff and client departments dealing with performance challenges (these might relate to team culture, management policies and practices, or day-to-day business processes) are provided with an assessment, support in joint action planning, coaching, facilitation, progress evaluation and follow-up to strengthen the sustainability of improvements. Leadership Development: 360-degree surveys are administered for senior managers to solicit feedback and inform the creation of development plans to cultivate leadership through practice, education, and coaching. Supervisory Skills training is offered to employees at all levels of the organization to promote improved leadership and management skills and support succession planning. Mayor and Council Goal Setting: The Mayor and Council receive professional facilitation and strategic planning support in developing the Vision for the City of Rockville. Internal Survey: A biennial employee survey is conducted to gather data on employees’ perceptions. Results of the survey are analyzed and action plans are developed throughout the organization to promote management practices and performance measures that support continuous improvement of the organization’s culture.

Department of the City Manager Division: Executive Office
7 - 12
Cost Center: Rockville Economic Development, Inc. (REDI)
TABLE 7-19. Cost Center Summary
Actual
FY10 Adopted
FY11 Est. Act.
FY11 Adopted
FY12
Total Expenditures* 517,424 530,120 530,120 541,300
Total Revenues N/A N/A N/A N/A
* REDI was transferred from Non-Departmental to the Department of the City Manager for FY11. FY10 expenditures are included in the total Non-Departmental General Fund Expenditures for Outside Agencies found in the summary table on pg. 15-1, but are shown here for comparison purposes.
Objectives
Support the Rockville and the Shady Grove Innovation Centers and the
Women’s Business Center
Facilitate business-to-business connections through Rockville Technology and Large Company Database, publish regular email newsletter, and promote the creation of businesses based on
commercializing technology from area laboratories
Sponsor the StartRight! Business Plan Competition
Sponsor and organize a regional postdoc conference
Organize and celebrate Rockville “Business Appreciation Week”
Advertise Rockville as a great place for business
TABLE 7-20. Performance Measures
Actual
FY10 Target
FY11 Est. Act.
FY11 Target
FY12
Number of Innovation Center tenant graduates
4 2 2 2
Innovation Center tenant occupancy rate
90% 95% 95% 95%
Number of Innovate Program:*
Graduates
Companies
N/A N/A
N/A 6
20 6
20 6
* Program began in FY10, with the first graduates anticipated in FY11. There was no target set for number of graduates for FY11.
TABLE 7-21. Workload Measures
Actual
FY10 Estimate
FY11 Est. Act.
FY11 Estimate
FY12
Number of StartRight! competitors
53 50 50 50
Number of StartRight! award sponsors (both cash and in-kind sponsors)
7 7 7 7
Number of ads placed 39 40 34 35
Number of cooperative marketing campaigns/ads*
Campaigns
Ads
1 26
1 26
1 26
1 26
Number of business visits 88 80 80 80
Number Business Week visitors
45 40 40 40
Number of Postdoc conference participants
460 455 425 425
Percentage of companies updated in company database
185 / 463 or 40%
463 / 463 or 100%
278 / 463 or 60%
232 / 463 or 50%
Number of newsletters 12 12 12 12
* Cooperative marketing campaigns are those in which REDI controls the content of the ads, but another entity pays for the ad space.
Department of the City Manager Division: Executive Office
7 - 13
Supplemental Information
Rockville Economic Development, Inc. (REDI) was established by the City as a public-private partnership to deliver the City’s economic development services. REDI’s mission is to assure the City’s future economic vitality. REDI strengthens Rockville’s economy by supporting knowledge-based industries, entrepreneurship and the development of assets that capitalize on local resources and align with national priorities to spur business growth. In FY10 Rockville was named:
- A top 10 City for Startups by Bloomberg Business Week - A top 100 Places to Live by Money - An Editor’s Pick, Top Place to Work by U.S. News & World Report
In FY10, REDI completed a Women’s Business Center (WBC) study and delivered 7 seminars. In FY11, REDI plans to establish an Interim Women’s Business Center. REDI’s INNoVATE program teaches people how to evaluate the commercial technology from federal and university laboratories, and how to write a business plan and form a company based on that technology. REDI’s annual Postdoc conference and Career Fair educates postdoctoral fellows from area laboratories about their career options, and connects them with local companies that wish to hire qualified science, technology, engineering and math talent.
FIGURE 7-3. REDI’s website, www.RockvilleREDI.org.

Department of the City Manager Division: Communication and Public Information
7 - 14
TABLE 7-22 Actual
FY10
Adopted
FY11
Est. Act.
FY11
Adopted
FY12
Division Expenditures
by Cost Center
Public Information Office 432,203 388,960 403,960 402,690
Website and Intranet 162,109 167,130 167,130 276,200
Cable Television 410,211 422,610 422,610 444,880
Cable TV Equipment
(350)4,657 408,800 527,404 508,630
Graphics and Printing 856,805 894,200 896,400 888,450
Division Total $1,865,985 $2,281,700 $2,417,504 $2,520,850
TABLE 7-23 Actual
FY10
Adopted
FY11
Est. Act.
FY11
Adopted
FY12
Division Expenditures
by Type
Salary and Wages 1,074,754 1,073,080 1,073,080 1,090,300
Benefits 258,262 303,790 303,790 345,910
Overtime 1,389 2,700 2,700 2,000
Personnel Subtotal $1,334,405 $1,379,570 $1,379,570 $1,438,210
Contractual Services 424,298 388,530 405,730 466,810
Commodities 96,729 103,000 103,000 102,800
Capital Outlays 10,553 410,600 529,204 513,030
Other 0 0 0 0
Operating Subtotal $531,580 $902,130 $1,037,934 $1,082,640
Division Total $1,865,985 $2,281,700 $2,417,504 $2,520,850
TABLE 7-24 Actual
FY10
Adopted
FY11
Est. Act.
FY11
Adopted
FY12
Source of
Division Funds
Cable Operating Grant *
(110)N/A 71,040 71,040 71,040
Cable Capital Grants
(350)438,567 408,800 408,800 508,630
Subtotal $438,567 $479,840 $479,840 $579,670
Fund Contribution
General Fund (110) 1,861,328 1,801,860 1,819,060 1,941,180
Special Activities (350) (433,910) 0 118,604 0
Subtotal $1,427,418 $1,801,860 $1,937,664 $1,941,180
Division Total $1,865,985 $2,281,700 $2,417,504 $2,520,850
TABLE 7-25 Actual
FY10
Adopted
FY11
Est. Act.
FY11
Adopted
FY12
Staffing Summary
by Cost Center (FTEs)
Regular
Public Information Office 3.0 3.0 3.0 3.0
Website and Intranet 2.0 2.0 2.0 2.0
Cable Television 4.5 4.5 4.5 4.5
Graphics and Printing 6.0 6.0 6.0 6.0
Regular Subtotal 15.5 15.5 15.5 15.5
Temporary
Cable Television 0.4 0.3 0.5 0.5
Temporary Subtotal 0.4 0.3 0.5 0.5
Division Total 15.9 15.8 16.0 16.0
Division: Communication and Public Information
* The Cable Operating Grant revenue was moved from the Department of Information Technology into the Cable Television cost center for FY11 to more accurately reflect the purpose of that grant.
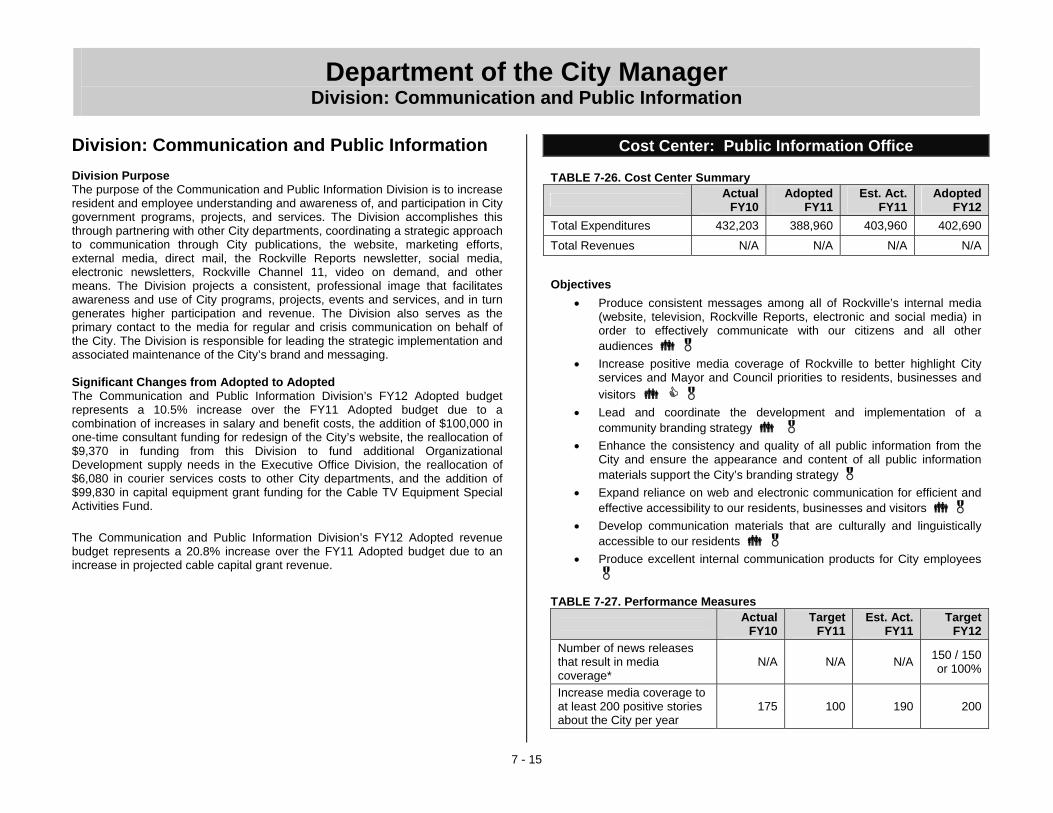
Department of the City Manager Division: Communication and Public Information
7 - 15
Division: Communication and Public Information Division Purpose The purpose of the Communication and Public Information Division is to increase resident and employee understanding and awareness of, and participation in City government programs, projects, and services. The Division accomplishes this through partnering with other City departments, coordinating a strategic approach to communication through City publications, the website, marketing efforts, external media, direct mail, the Rockville Reports newsletter, social media, electronic newsletters, Rockville Channel 11, video on demand, and other means. The Division projects a consistent, professional image that facilitates awareness and use of City programs, projects, events and services, and in turn generates higher participation and revenue. The Division also serves as the primary contact to the media for regular and crisis communication on behalf of the City. The Division is responsible for leading the strategic implementation and associated maintenance of the City’s brand and messaging. Significant Changes from Adopted to Adopted The Communication and Public Information Division’s FY12 Adopted budget represents a 10.5% increase over the FY11 Adopted budget due to a combination of increases in salary and benefit costs, the addition of $100,000 in one-time consultant funding for redesign of the City’s website, the reallocation of $9,370 in funding from this Division to fund additional Organizational Development supply needs in the Executive Office Division, the reallocation of $6,080 in courier services costs to other City departments, and the addition of $99,830 in capital equipment grant funding for the Cable TV Equipment Special Activities Fund. The Communication and Public Information Division’s FY12 Adopted revenue budget represents a 20.8% increase over the FY11 Adopted budget due to an increase in projected cable capital grant revenue.
Cost Center: Public Information Office
TABLE 7-26. Cost Center Summary
Actual FY10
Adopted FY11
Est. Act. FY11
Adopted FY12
Total Expenditures 432,203 388,960 403,960 402,690
Total Revenues N/A N/A N/A N/A
Objectives
• Produce consistent messages among all of Rockville’s internal media (website, television, Rockville Reports, electronic and social media) in order to effectively communicate with our citizens and all other audiences
• Increase positive media coverage of Rockville to better highlight City services and Mayor and Council priorities to residents, businesses and visitors
• Lead and coordinate the development and implementation of a community branding strategy
• Enhance the consistency and quality of all public information from the City and ensure the appearance and content of all public information materials support the City’s branding strategy
• Expand reliance on web and electronic communication for efficient and effective accessibility to our residents, businesses and visitors
• Develop communication materials that are culturally and linguistically accessible to our residents
• Produce excellent internal communication products for City employees
TABLE 7-27. Performance Measures
Actual FY10
Target FY11
Est. Act. FY11
Target FY12
Number of news releases that result in media coverage*
N/A N/A N/A 150 / 150 or 100%
Increase media coverage to at least 200 positive stories about the City per year
175 100 190 200
etompkins
Underline
etompkins
Underline

Department of the City Manager Division: Communication and Public Information
7 - 16
Actual FY10
Target FY11
Est. Act. FY11
Target FY12
Increase number of email addresses for electronic messaging by 15% each year
3,500 3,850 or +10%
7,500 or +114%
8,625 or +15%
Achieve translation of a minimum of one article per edition of Rockville Reports into another language
6 / 10 or 60%
10 / 10 or 100%
10 / 10 or 100%
10 / 10 or 100%
Increase average amount of online viewers of “This Just In” internal employee video by 10%*
N/A N/A 170
187 or +10%
Achieve an average of 3 twitter posts per month that are re-posted by other users (re-tweets)*
N/A N/A N/A 3
Achieve an average of 50 monthly interactions on Facebook*
N/A N/A N/A 50
* New measure for FY12. TABLE 7-28. Regular Positions
Position Title Adopted FY10
AdoptedFY11
Adopted FY12
Communication Manager (grade SAI) 1.0 1.0 1.0 Public Information Specialist (grade A17) 2.0 2.0 2.0 Cost Center Total 3.0 3.0 3.0
Supplemental Information The Public Information Specialists use a project management approach to strategically leverage Division-wide resources across television, print, web, electronic and social media, as well as the external media. They develop messages for use in all media to ensure consistency, efficiency and effectiveness. Rockville Reports remains our residents’ most important source for information about the City, but web-based media are becoming increasingly important. Over the next several fiscal years, this Division is concentrating efforts on increasing awareness of the City’s website. The Division has been systematically converting printed pieces into web pieces whenever practical.
This Division will continue to consult with the City’s revenue producing activity centers to increase attendance and participation through cross-marketing campaigns using all components of the City’s Communication and Public Information Division. Special projects completed in FY11 include:
• Historic Building Inventory – Using grant funding, the Communication Division supported design and production of a book listing all historic homes located in Rockville
• Rockville’s Pike Communication strategy – The Communication Division worked with the Planning Department to create and implement a comprehensive communication and outreach plan for this project
• Branding implementation – The Communication Division has begun the process of implementing the City’s new brand and tagline “Get Into It”
• Senior E-Newsletter – The Communication Division produced a very popular digital component to the E-newsletter
Cost Center: Website and Intranet TABLE 7-29. Cost Center Summary
Actual FY10
Adopted FY11
Est. Act. FY11
Adopted FY12
Total Expenditures 162,109 167,130 167,130 276,200 Total Revenues N/A N/A N/A N/A Objectives
• Provide a complete, accurate, and up-to-date website (www.rockvillemd.gov) to ensure 24/7 access to Rockville City Government, to effectively market and communicate news, City events and major initiatives, and to support and enhance e-government services
• Provide targeted opportunities for citizen feedback through the use of electronic surveys and comment forms
• Provide and support the City's intranet site, and other web-related services for employees in order to enhance access to information throughout the organization

Department of the City Manager Division: Communication and Public Information
7 - 17
TABLE 7-30. Performance Measures
Actual FY10
Target FY11
Est. Act. FY11
Target FY12
Achieve 4,500 average daily visits to Rockville's website*
4,954 4,500 3,000 3,500
Maintain the percentage of resident satisfaction with the City’s website at 70%**
N/A 80% 70% 70%
Maintain the rate of changes to website homepage content to at least once each business day
247 / 247 or 100%
247 / 247or 100%
247 / 247or 100%
247 / 247or 100%
Increase the number of electronic surveys and comment forms by 11% to 42
34 or +10%
38 or +12%
38 or +12%
42 or +11%
Increase daily visits to the home page by 17%*** N/A 1,500 1,200 1,400
or +17%
* Staff utilized a new and more accurate web tracking method beginning in FY11. ** The City conducts a Citizen Survey every other year. A Citizen Survey was conducted
in FY11 and the next survey will take place in FY13. *** New measure for FY12. TABLE 7-31. Regular Positions
Position Title Adopted FY10
Adopted FY11
Adopted FY12
Web Administrator (grade A24) 1.0 1.0 1.0 Web Assistant (grade A16) 1.0 1.0 1.0 Cost Center Total 2.0 2.0 2.0
Supplemental Information Rockville’s website has become a vital tool for City communication. The home page is updated daily, and new features and updates are continually added to improve and enhance the site. Web, print and video material produced by the Communication and Public Information Division are now tightly integrated. As a .gov domain, visitors to Rockville’s website are assured that they are viewing an official government website and that the content that they are viewing conforms to the strict regulations governing a .gov website.
The City’s website played an important role in the branding process conducted in the Fall of 2010. A survey about Rockville’s brand linked from the homepage, and three logo and tagline options developed by the City’s branding consultant were posted on the website along with an online form to solicit feedback about the artwork and taglines developed. In FY11, the Communication and Public Information Division began the process of conducting an inventory and review of all of the web pages added to the site since the content management system was implemented in 2003. As a part of this process, a date stamp is being added to pages as they are updated. This is part of a larger effort to ensure all information is up to date. The website offers a variety of opportunities for users to communicate and conduct business with the City online, such as paying water bills, applying for employment or paying for a parking or speeding ticket. The City continually seeks opportunities to increase interactivity online and user feedback to support ongoing efforts to effectively communicate with the public. New Features on www.rockvillemd.gov:
• Google Translate – Enables translation of Rockville’s website into any of the following 10 languages: Chinese (simplified and traditional), French, German, Hindi, Japanese, Korean, Russian, Spanish and Vietnamese
• Rockville Reports online – The newly redesigned Rockville Reports is now available for viewing online with links to other parts of the City’s website, allowing citizens to find additional information
• Google Analytics – Implemented in February 2010, Google analytics is a valuable tool for determining web traffic to the City’s site. The results are factored into marketing efforts on the Web and other media
• Home Page Upgrades - The home page was given a minor facelift, sidebar links were consolidated and a section was added for the “top five most visited” links.
• Teens Section – A unique section specially designed for teens, with teen oriented graphics and photos of teen programs and events
• Rockville Senior Center Web Page Redesign – Revised and updated with new information, new pages and photos
• Strategic Scan – Posted online, allowing for data to be updated as new information becomes available
• Rockville 11 Redesign – Detailed information and video links for Rockville’s cable channel, Rockville 11
• Zoomable Bike Map – This user friendly, detailed bike map produced by the transportation division allows users to pan and zoom to view Rockville’s biking amenities in greater detail

Department of the City Manager Division: Communication and Public Information
7 - 18
This Month in Rockville – Information distributed to Rockville school children is also available online
Cost Center: Cable Television TABLE 7-32. Cost Center Summary
Actual
FY10 Adopted
FY11 Est. Act.
FY11 Adopted
FY12
Total Expenditures 410,211 422,610 422,610 444,880
Total Revenues* N/A 71,040 71,040 71,040
* This revenue source was moved from the Department of Information Technology to the Cable Television cost center for FY11.
Objectives
Produce live and replayed television coverage of all Mayor and Council, Planning Commission, Historic District Commission, Board of Appeals meetings and other public meetings to enhance the public awareness of
and participation in the Rockville City Government
Assist the Mayor and Council to communicate with the community
Coordinate strategically with the rest of the Communication Division to inform and educate the community about Rockville City government
activities and services
Develop and produce high-quality, award-winning television programs that are culturally and linguistically suited for Rockville’s increasingly
diverse population
Produce television programs to ensure a consistent message in
alignment with the Mayor and Council strategic priorities
Respond efficiently to internal and external customer requests to increase awareness and understanding of, and participation in, City
government programs, projects and services
Become more interactive and accessible to the Rockville 11 viewing
audience by adopting the most current television technology
TABLE 7-33. Performance Measures
Actual
FY10 Target
FY11
Est. Act. FY11 FY11
Target FY12
Maintain the percent of citizen survey respondents who watched Rockville 11 in the last 12 months at 39%*
35% 50% 39% 39%
Maintain citizen survey customer satisfaction rating at 45%*
27% 45% 45% 45%
Increase the number of annual “hits” on Video On Demand programs on the City’s website to 30,000
23,696 28,000 28,000 30,000
Achieve 100% competency in advanced non-linear editing for all Rockville 11 staff members
0 / 0 or 0%
5 / 5 or 100%
4 / 5 or 80%
5 / 5 or 100%
Maintain number of foreign language programs at 8
8 8 8 8
Maintain the average number of hours required to produce one hour of original programming at 36
40 36 36 36
Increase the number of original programs by 9% (excluding public meetings)**
53 or +33%
58 or +9%
41 or -23%
58 or +41%
* The City conducts a citizen survey every other year. A survey was conducted in FY11. The next one will be conducted in FY13.
** The number of original programs decreased in FY11 because FY11 was not an election year.

Department of the City Manager Division: Communication and Public Information
7 - 19
TABLE 7-34. Workload Measures
Actual
FY10 Estimate
FY11 Est. Act.
FY11 Estimate
FY12
Number of meetings televised:
Mayor and Council
Planning Commission
Historic District Comm.
Board of Appeals*
37 16 20 6
45 23 17 7
40 23 17 7
42 24 12 12
Number of programs produced and aired:
News Program
Interview Programs/Specials
11 44
12 50
12 50
12 50
Number of programs produced using remote production equipment
12 10 10 12
* Rockville 11 began taping Board of Appeals meetings and providing access On Demand in FY10.
TABLE 7-35. Regular Positions
Position Title Adopted
FY10 Adopted
FY11 Adopted
FY12
Associate Producer / Director (grade A17) 1.0 1.0 1.0
Cable Television Production Manager (grade A24)
1.0 1.0 1.0
Cable TV Production Specialist II (grade A17)
2.0 2.0 2.0
Video Technician (grade A12) 0.5 0.5 0.5
Cost Center Total 4.5 4.5 4.5
Supplemental Information
From live cablecasts of Mayor and Council meetings to in-depth award-winning documentaries, Rockville 11 provides news and information for Rockville residents and visitors on Rockville City government. Rockville 11 can be found on channel 11 on Comcast cable, Verizon FIOS and RCN. Rockville 11 is also streamed live 24/7 at rockvillemd.gov/rockville11 with archived programs available to be viewed at any time, on demand. Programs on Rockville 11 include:
Meetings:
Live cablecasts of Mayor and Council, Planning Commission, Historic District Commission, Board of Appeals meetings
News:
Rockville’s 11: (countdown newscast of the top 11 stories in Rockville)
County Report This Week: Weekly newscast featuring stories from around Montgomery County through the PEG network of stations
Late-breaking Special Reports: Live or taped news updates during emergencies
Pilot of a Mayor and Council Roundtable program that aired in Spring 2011
Documentaries:
Inside VisArts: documentary featuring the artists that make up VisArts
Something Worth Telling: The Love of Writing: documentary featuring
the writers featured at the F. Scott Fitzgerald Literary Conference
The City Behind the Scenes: Series profiling the work of Rockville City government divisions
Where We Live: Series profiling Rockville’s diverse neighborhoods
Nature Center TV: Yearly program featuring student-produced programming from the Nature Center TV camp at Croydon Creek Nature Center
Special Productions:
Live Candidate Forums for City Council elections
Live & Taped Arts performances at F. Scott Fitzgerald Theatre
Live productions during Hometown Holidays
In addition to Rockville 11's award-winning original programming, Rockville 11 is focused on producing more remote "live" productions in the City for FY12 by making use of V-Brick technology and the County's Mobile Production Vehicle through our PEG partnerships. This technology, which is already available to the channel at no cost, will allow Rockville 11 to bring residents more live, informative and entertaining programming about the City of Rockville. Remote productions include live Mayor and Council meetings, Hometown Holidays coverage and other special events and performances.
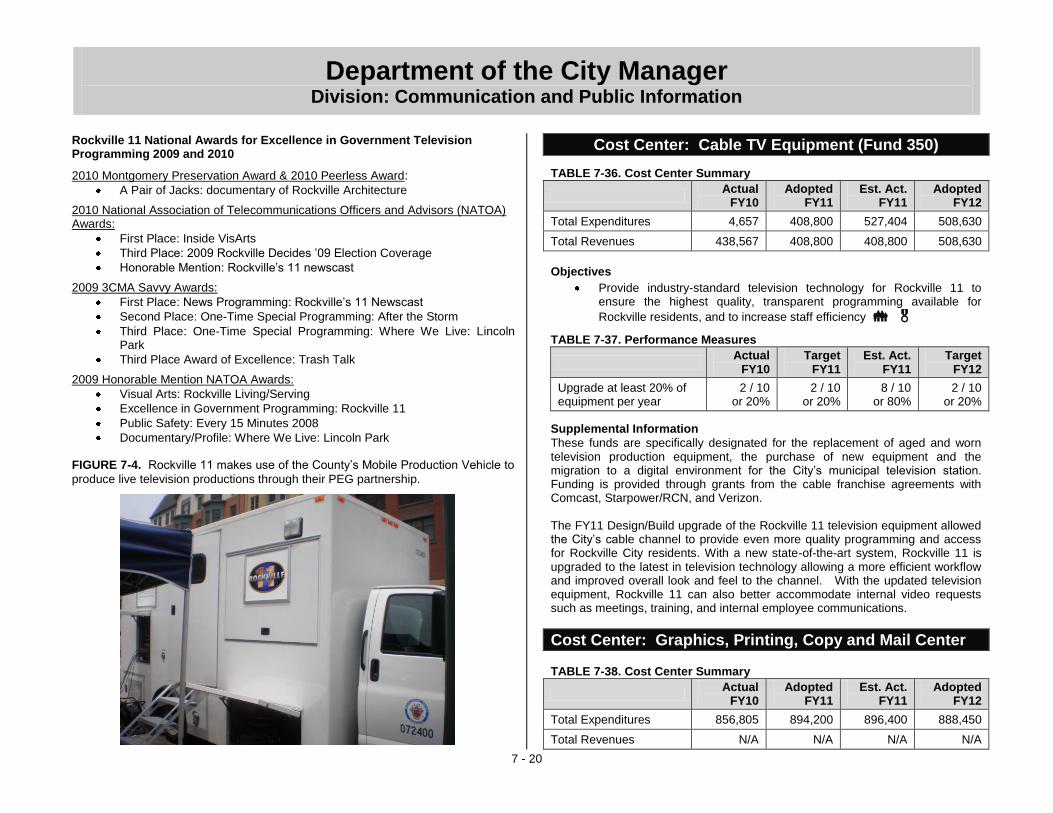
Department of the City Manager Division: Communication and Public Information
7 - 20
Rockville 11 National Awards for Excellence in Government Television Programming 2009 and 2010
2010 Montgomery Preservation Award & 2010 Peerless Award:
A Pair of Jacks: documentary of Rockville Architecture
2010 National Association of Telecommunications Officers and Advisors (NATOA) Awards:
First Place: Inside VisArts
Third Place: 2009 Rockville Decides ’09 Election Coverage
Honorable Mention: Rockville’s 11 newscast
2009 3CMA Savvy Awards:
First Place: News Programming: Rockville’s 11 Newscast
Second Place: One-Time Special Programming: After the Storm
Third Place: One-Time Special Programming: Where We Live: Lincoln Park
Third Place Award of Excellence: Trash Talk
2009 Honorable Mention NATOA Awards:
Visual Arts: Rockville Living/Serving
Excellence in Government Programming: Rockville 11
Public Safety: Every 15 Minutes 2008
Documentary/Profile: Where We Live: Lincoln Park
FIGURE 7-4. Rockville 11 makes use of the County’s Mobile Production Vehicle to
produce live television productions through their PEG partnership.
Cost Center: Cable TV Equipment (Fund 350)
TABLE 7-36. Cost Center Summary
Actual
FY10 Adopted
FY11 Est. Act.
FY11 Adopted
FY12
Total Expenditures 4,657 408,800 527,404 508,630
Total Revenues 438,567 408,800 408,800 508,630
Objectives
Provide industry-standard television technology for Rockville 11 to ensure the highest quality, transparent programming available for
Rockville residents, and to increase staff efficiency
TABLE 7-37. Performance Measures
Actual
FY10 Target
FY11 Est. Act.
FY11 Target
FY12
Upgrade at least 20% of equipment per year
2 / 10 or 20%
2 / 10 or 20%
8 / 10 or 80%
2 / 10 or 20%
Supplemental Information
These funds are specifically designated for the replacement of aged and worn television production equipment, the purchase of new equipment and the migration to a digital environment for the City’s municipal television station. Funding is provided through grants from the cable franchise agreements with Comcast, Starpower/RCN, and Verizon. The FY11 Design/Build upgrade of the Rockville 11 television equipment allowed the City’s cable channel to provide even more quality programming and access for Rockville City residents. With a new state-of-the-art system, Rockville 11 is upgraded to the latest in television technology allowing a more efficient workflow and improved overall look and feel to the channel. With the updated television equipment, Rockville 11 can also better accommodate internal video requests such as meetings, training, and internal employee communications.
Cost Center: Graphics, Printing, Copy and Mail Center TABLE 7-38. Cost Center Summary
Actual
FY10 Adopted
FY11 Est. Act.
FY11 Adopted
FY12
Total Expenditures 856,805 894,200 896,400 888,450
Total Revenues N/A N/A N/A N/A

Department of the City Manager Division: Communication and Public Information
7 - 21
Objectives
Decrease paper usage by City staff through education and awareness replacing paper invitations, newsletters and fliers with e-vites, e-letters and e-fliers in order to cut costs and continue environmentally friendly
practices
Provide timely and efficient completion of all Graphics, Print, and Copy
Center requests from internal clients
Provide excellent printed and graphic materials that provide
communication solutions for use in public information and outreach
Provide timely and cost efficient internal and external mail services to all departments by picking up out-going and inter-office mail twice daily,
delivering mail to off site facilities, affixing postage and mailing daily
Maintain daily delivery of completed graphics, printing and copy center
jobs to at least seven City facilities to better serve customer needs
TABLE 7-39. Performance Measures
Actual
FY10 Target
FY11 Est. Act.
FY11 Target
FY12
Decrease copy paper consumption throughout City Hall by 5%
2.1 million sheets or –5%
1.9 million sheets
or -10%
1.9 million sheets
or -10%
1.8 million sheets or -5%
Increase percent of Graphics, Print and Copy requests completed on time or early to 90%*
415 / 495 or 84%
565 / 628 or 90%
720 / 800 or 90%
720 / 800 or 90%
Increase percent of employees rating quality of graphic design as “good” or “excellent” to 95% or better**
30 / 31 or 97%
31 / 31 or 100%
20 / 22 or 91%
38 / 40 or 95%
Maintain percent of employees rating quality of finished print/copy products as “good” or “excellent” at 100%**
31 / 31 or 100%
31 / 31 or 100%
31 / 31 or 100%
60 / 60 or 100%
Maintain percent of employees rating their customer service experience as “good” or “excellent” at 95% or better** ***
28 / 29 or 97%
89 / 93 or 96%
89 / 93 or 96%
38 / 40 or 95%
Actual
FY10 Target
FY11 Est. Act.
FY11 Target
FY12
Increase percent of employees rating mail services as “good” or “excellent” to 100%**
28 / 29 or 97%
29 / 29 or 100%
29 / 29 or 100%
40 / 40 or 100%
* Increase in FY11 estimated actual and FY12 target is due to the 52 weekly e-letters, 10 months of senior e-letter blast, and increase in the number of requests for e-fliers, e-vites, in addition to the print materials produced for same jobs. Also new since recording the target for FY11 are the quarterly marketing collateral pieces produced for all recreation centers.
** Survey ratings obtained from post-job internal customer satisfaction surveys. *** Beginning in FY12 a new method to rate the customer service experience was
established.
TABLE 7-40. Regular Positions
Position Title Adopted
FY10 Adopted
FY11 Adopted
FY12
Copy Center and Mail Specialist (grade A11)
1.0 1.0 1.0
Graphics and Printing Supervisor (grade A21)
1.0 1.0 1.0
Graphics Specialist (grade A16) 2.0 2.0 2.0
Printing Specialist I (grade A15) 1.0 1.0 1.0
Printing Specialist II (grade A16) 1.0 1.0 1.0
Cost Center Total 6.0 6.0 6.0
Supplemental Information
The Graphics and Printing cost center partnered with City departments in FY11 to produce high quality publications for Rockville residents, including:
Strategic Scan
Historic Building Catalog
Proposed and Adopted Budget
Comprehensive and Popular Annual Financial Reports
Twelve “This Month In Rockville” brochures
Recreation Annual Report
Four Recreation and Parks Guides
Ten Rockville Reports
150th
Anniversary Book In addition to continuing to partner with City Departments to produce needed high-quality publications in FY12, the Graphics and Printing cost center will take the lead in developing the visual expression of the City’s new brand.

Department of the City Manager Division: Neighborhood Resources Program
7 - 22
TABLE 7-41 Actual
FY10
Adopted
FY11
Est. Act.
FY11
Adopted
FY12
Division Expenditures
by Cost Center
Neighborhood
Resources251,019 270,160 263,298 282,810
Human Rights &
Community Mediation117,952 119,890 119,890 124,580
Division Total $368,971 $390,050 $383,188 $407,390
TABLE 7-42 Actual
FY10
Adopted
FY11
Est. Act.
FY11
Adopted
FY12
Division Expenditures
by Type
Salary and Wages 274,792 278,600 271,400 284,600
Benefits 72,997 91,250 91,250 102,590
Overtime 0 0 0 0
Personnel Subtotal $347,789 $369,850 $362,650 $387,190
Contractual Services 50 0 0 0
Commodities 21,132 20,200 20,538 20,200
Capital Outlays 0 0 0 0
Other 0 0 0 0
Operating Subtotal $21,182 $20,200 $20,538 $20,200
Division Total $368,971 $390,050 $383,188 $407,390
TABLE 7-43 Actual
FY10
Adopted
FY11
Est. Act.
FY11
Adopted
FY12
Source of
Division Funds
Departmental Revenue 0 0 0 0
Subtotal $0 $0 $0 $0
Fund Contribution
General Fund (110) 368,971 390,050 383,188 407,390
Subtotal $368,971 $390,050 $383,188 $407,390
Division Total $368,971 $390,050 $383,188 $407,390
TABLE 7-44 Actual
FY10
Adopted
FY11
Est. Act.
FY11
Adopted
FY12
Staffing Summary
by Cost Center (FTEs)
Regular
Neighborhood
Resources 3.0 3.0 3.0 3.0
Human Rights &
Community Mediation1.0 1.0 1.0 1.0
Regular Subtotal 4.0 4.0 4.0 4.0
Temporary 0.0 0.0 0.0 0.0
Temporary Subtotal 0.0 0.0 0.0 0.0
Division Total 4.0 4.0 4.0 4.0
Division: Neighborhood Resources Program
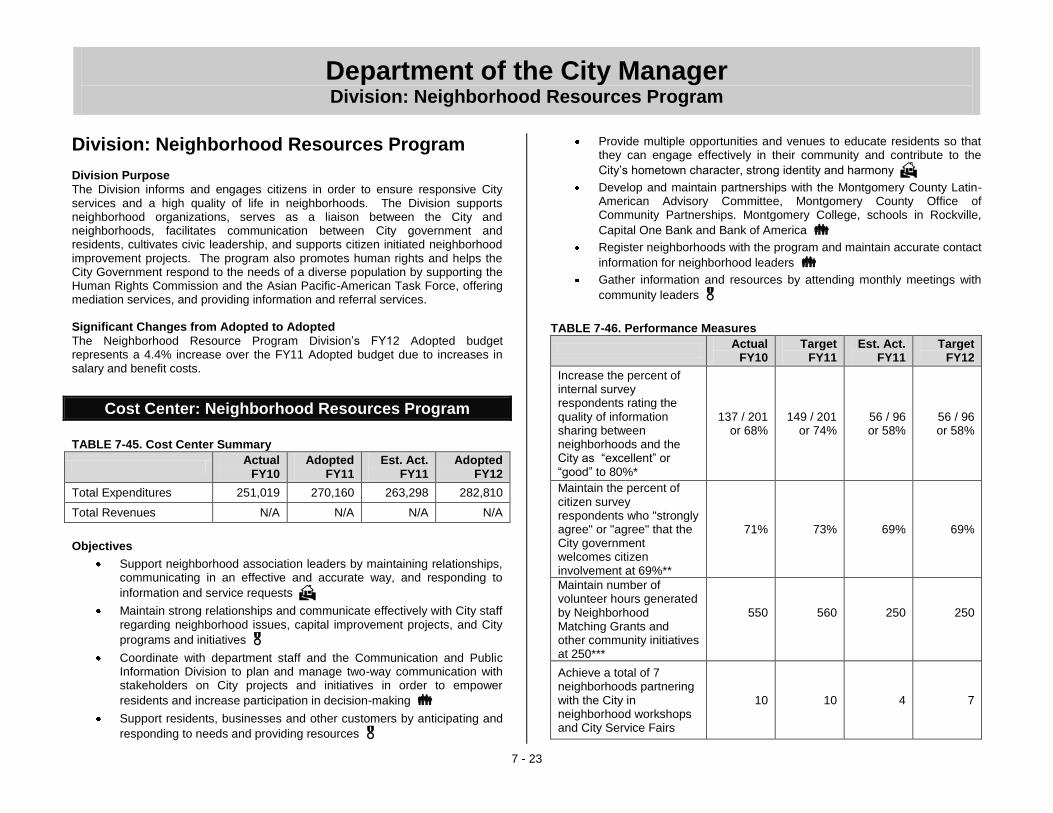
Department of the City Manager Division: Neighborhood Resources Program
7 - 23
Division: Neighborhood Resources Program Division Purpose
The Division informs and engages citizens in order to ensure responsive City services and a high quality of life in neighborhoods. The Division supports neighborhood organizations, serves as a liaison between the City and neighborhoods, facilitates communication between City government and residents, cultivates civic leadership, and supports citizen initiated neighborhood improvement projects. The program also promotes human rights and helps the City Government respond to the needs of a diverse population by supporting the Human Rights Commission and the Asian Pacific-American Task Force, offering mediation services, and providing information and referral services. Significant Changes from Adopted to Adopted
The Neighborhood Resource Program Division’s FY12 Adopted budget represents a 4.4% increase over the FY11 Adopted budget due to increases in salary and benefit costs.
Cost Center: Neighborhood Resources Program
TABLE 7-45. Cost Center Summary
Actual
FY10 Adopted
FY11 Est. Act.
FY11 Adopted
FY12
Total Expenditures 251,019 270,160 263,298 282,810
Total Revenues N/A N/A N/A N/A
Objectives
Support neighborhood association leaders by maintaining relationships, communicating in an effective and accurate way, and responding to
information and service requests
Maintain strong relationships and communicate effectively with City staff regarding neighborhood issues, capital improvement projects, and City
programs and initiatives
Coordinate with department staff and the Communication and Public Information Division to plan and manage two-way communication with stakeholders on City projects and initiatives in order to empower
residents and increase participation in decision-making
Support residents, businesses and other customers by anticipating and
responding to needs and providing resources
Provide multiple opportunities and venues to educate residents so that they can engage effectively in their community and contribute to the
City’s hometown character, strong identity and harmony
Develop and maintain partnerships with the Montgomery County Latin-American Advisory Committee, Montgomery County Office of Community Partnerships. Montgomery College, schools in Rockville,
Capital One Bank and Bank of America
Register neighborhoods with the program and maintain accurate contact
information for neighborhood leaders
Gather information and resources by attending monthly meetings with
community leaders
TABLE 7-46. Performance Measures
Actual
FY10 Target
FY11 Est. Act.
FY11 Target
FY12
Increase the percent of internal survey respondents rating the quality of information sharing between neighborhoods and the City as “excellent” or “good” to 80%*
137 / 201 or 68%
149 / 201 or 74%
56 / 96 or 58%
56 / 96 or 58%
Maintain the percent of citizen survey respondents who "strongly agree" or "agree" that the City government welcomes citizen involvement at 69%**
71%
73%
69%
69%
Maintain number of volunteer hours generated by Neighborhood Matching Grants and other community initiatives at 250***
550
560
250
250
Achieve a total of 7 neighborhoods partnering with the City in neighborhood workshops and City Service Fairs
10
10
4 7

Department of the City Manager Division: Neighborhood Resources Program
7 - 24
Actual
FY10 Target
FY11 Est. Act.
FY11 Target
FY12
Maintain 100% of Rockville University participants (adults) rating the program as “excellent” or “good”
18 / 18
or 100%
20 / 20
or 100%
15 / 15
or 100%
20 / 20
or 100%
Maintain 100% of School of Rock(ville) participants (students) rating the program as “excellent” or “good”
6 / 6 or 100%
10 / 10 or 100%
10 / 10 or 100%
10 / 10
or 100%
Develop partnerships with a minimum of 6 community organizations****
5
6 4 6
* The City conducts an internal survey. A survey was conducted in FY11. The next one will be conducted in FY13.
** The City conducts a citizen survey every other year. A survey was conducted in FY11 and the next survey will take place in FY13
*** A reduction in funds for matching grants and the types of grants awarded has resulted in fewer volunteer hours for FY11 and FY12.
**** Community organizations that the Division plans to partner with in FY12 include: Bank of America, University of Maryland, Montgomery Coalition for Adult English Literacy, Cantigas, Montgomery County Business Development Office, Latin-American Emphasis. NRD partners with community organizations to seek sponsorships for programs and events, to identify services provided by the organization that benefit the City of Rockville and its residents, and to share information, contacts in the community, and venues for events.
TABLE 7-47. Workload Measures
Actual
FY10 Estimate
FY11 Est. Act.
FY11 Estimate
FY12
Number of Good Neighbor Award winners
22 22 12 19
Number of City project communication plans contributed to
16 14 14 12
Number of Hispanic Heritage Celebration attendees*
N/A N/A 1,000 1,000
* New measure for FY12.
TABLE 7-48. Regular Positions
Position Title Adopted
FY10 Adopted
FY11 Adopted
FY12
Neighborhood Resources Coordinator (grade A21)
2.0 2.0 2.0
Senior Neighborhood Resources Coordinator (grade A23)
1.0 1.0 1.0
Cost Center Total 3.0 3.0 3.0
Supplemental Information
FY11 Accomplishments
Planned an event to celebrate Hispanic Heritage month with cultural performances and information about services for residents
Engaged and informed the community about the replacement projects for the Lakewood and Stonestreet Pedestrian bridges
Successfully coordinated with ICC managers to reduce truck traffic in residential areas of King Farm
Provided information about City services at Everything Rockville at Rockville High School, MCPS Information Day and Meadow Hall Elementary School International Night
Implemented neighborhood registration and web-based information sharing system to keep neighborhoods connected
Organized four workshops at Twinbrook Elementary in partnership with the PTA, the administration and the Rockville Latino Alliance on budgeting, health and education topics
Helped outreach and coordinate for community meetings on the Rockville Pike Plan

Department of the City Manager Division: Neighborhood Resources Program
7 - 25
Provided community outreach for several pedestrian safety projects
Created the Meet Your Neighbor section on the website to feature Rockville residents and how they help to build community in the City
Coordinated with Recreation and Parks staff to respond to Columbia Gas plans to maintain their right-of-way in Rockville and communicate with residents
FY12 Initiatives
Create a Neighborhood Resources handbook for residents on City services and other community resources
Build additional partnerships between the City and a diverse range of community faith, nonprofit and government groups in Montgomery County to extend our outreach to diverse segments of the population, especially the Y generation (20 – 25 years old)
Implement Neighborhood Registration System and network meetings
Provide communication and problem solving for neighbors near development projects and City CIP projects, including Victory Housing, Kol Shalon, Judicial center Annex, City Police Station, and Stonestreet Pedestrian Bridge
Work with City departments to respond to the Citizen Survey results in order to improve quality of life
Cost Center: Human Rights and Community Mediation TABLE 7-49. Cost Center Summary
Actual
FY10 Adopted
FY11 Est. Act.
FY11 Adopted
FY12
Total Expenditures 117,952 119,890 119,890 124,580
Total Revenues N/A N/A N/A N/A
Objectives
Educate residents and staff about diversity, human rights, civic responsibilities and conflict resolution strategies in order to promote a
more harmonious community
Develop programs that provide opportunities for residents of all ages and backgrounds to engage in social and human rights issues with a
local and global perspective
Work with City departments to engage and communicate effectively with Rockville’s diverse community in order to increase resident participation
in City activities and decision-making
Provide assistance on outreach to diverse populations in support of the goals and objectives of the Human Rights Commission and the Asian
Pacific-American Task Force
Visit and develop relationships with Rockville businesses in order to strengthen the coordination and cooperation between City government
and the business sector
TABLE 7-50. Performance Measures
Actual
FY10 Target
FY11 Est. Act.
FY11 Target
FY12
Increase the number/percent of formal mediation participants who were “satisfied” or “very satisfied” with the formal mediation process to 100%
10 / 11 or 91%
11 / 11 or 100%
8 / 8 or 100%
11 / 11 or 100%
Maintain 100% of mediation case participants who were ”satisfied” or “very satisfied” with the assistance provided by staff
47 / 75 or 63%
64 / 78 or 82%
60 / 60 or 100%
60 / 60 or 100%
Maintain the percent of respondents rating the Martin Luther King Jr. Celebration as “excellent” or “good” at 97% or above*
50 / 50
or 100%
145 / 150
or 97%
180 / 180 or 100%
174 / 180
or 97%
Maintain at 90% or greater the percentage of residents reporting they were “satisfied” or “very satisfied” with the education forums hosted by the Human Rights Commission
36 / 40 or 90%
36 / 40 or 90%
32 / 32 or 100%
36 / 40 or 90%
Provide assistance on outreach to diverse populations for at least 6 City projects and initiatives
5
6
2
6
Increase the number of new individuals registered to vote at Voter Registration Drives to 70
60 70 60 70

Department of the City Manager Division: Neighborhood Resources Program
7 - 26
TABLE 7-51. Workload Measures
Actual
FY10 Estimate
FY11 Est. Act.
FY11 Estimate
FY12
Number of mediation inquiries received
172 175 176 176
Number of mediation cases * 75 78 60 60
Number of formal mediations * 11 11 8 11
Number of Businesses visited and surveyed **
N/A N/A 50 60
* A mediation case refers to incidences when an individual(s) contacts the City to request mediation, staff invites the other parties involved, and attempts to organize a formal mediation. In some instances, a mediation case does not result in formal mediation (e.g., a problem is resolved prior to formal mediation or one party refuses to participate). A subset of the mediation cases result in formal mediation in which all parties and two mediators meet to attempt to resolve the problem through mediation.
** New measure for FY12.
TABLE 7-52. Regular Positions
Position Title Adopted
FY10 Adopted
FY11 Adopted
FY12
Human Rights/ Community Mediation Administrator (grade A21)
1.0 1.0 1.0
Cost Center Total 1.0 1.0 1.0
Supplemental Information
FY11 Accomplishments
Organized voter registration drives with an emphasis on helping diverse populations see the value of voting
Assisted the Human Rights Commission (HRC) and Asia Pacific American (APA) Task Force by coordinating the MLK Jr. event and Lunar New Year event
The HRC and APA Task Force hosted a Diversity Booth at Hometown Holidays to teach about Rockville’s diverse populations
Coordinated with the HRC to host workshops on the ever-changing family, human trafficking, defending religious freedoms and building interfaith bridges
Assisted in the creation of a culturally diverse and multi-generational program that promoted awareness of the accomplishments of the senior population while honoring this growing population
Provided training to teens on diversity and prejudice reduction
Attended the Everything Rockville event, the Back to School Jam event and the MCPS Information Day to distribute information about the HRC and APA Task Force
Learned about the needs of the business community and provided information about the City during business visits
FY12 Initiatives
Begin work on establishing an African American Alliance and explore the additional establishment of an African Caribbean Alliance
Continue with projects that will engage the teen population in matters of diversity and prejudice reduction, for example, production of multicultural awareness videos or assemblies at schools on peer pressure and human rights issues
Collaborate with the Senior Center to continue the Golden Years Event
Sponsor classes on Asian culture to increase education and awareness in the community
Expand the voter registration to more ethnic venues like business fairs, cultural events and social service settings
Continue the outreach to businesses and assess the needs the City can help address
Expand HRC forums to include methods of engaging multiple ethnic groups
Create awareness of the different resources that the City has for language access for non-English speakers

FIGURE 8-1. Department Organizational Chart
Department of Community Planning and Development Services
The Department of Community Planning and Development Services facilitatesand administers the standards and plans of the Rockville community which areintended to enhance the quality of the built environment, protect the naturalenvironment and preserve historic resources.
Department Mission Statement
8 - 1
$0
$1,500,000
$3,000,000
$4,500,000
$6,000,000
$7,500,000
$9,000,000
ActualFY08
ActualFY09
ActualFY10
Est. Act.FY11
AdoptedFY12
GRAPH 8-2. Expenditures History
Management and Support
30%
Planning and Zoning24%
Long Range Planning
13%
Inspection Services
33%
GRAPH 8-3. Use of Funds
0.0
15.0
30.0
45.0
60.0
ActualFY08
ActualFY09
ActualFY10
Est. Act.FY11
AdoptedFY12
FTE
s
GRAPH 8-1. Staffing Trend
Total
Temporary
Regular
Department of Community Planning and Development
Services
Inspection ServicesPlanning and Zoning
Long Range Planning and ImplementationManagement and Support
etompkins
Underline
etompkins
Underline
etompkins
Underline
etompkins
Underline
etompkins
Underline
etompkins
Underline
etompkins
Underline
etompkins
Underline

Department of Community Planning and Development Services Department Summary
8 - 2
Department Summary
TABLE 8-1 Actual
FY10
Adopted
FY11
Est. Act.
FY11
Adopted
FY12
% Change
from Adpt.
Dept. Expenditures
by Division
Management
and Support *1,055,471 1,376,173 992,475 1,465,380 6.5%
Long Range Planning
and Implementation588,498 584,470 654,224 635,110 8.7%
Planning and Zoning 1,103,763 1,172,710 1,194,750 1,149,540 (2.0%)
Inspection Services 1,454,958 1,584,760 1,584,760 1,625,640 2.6%
Department Total $4,202,690 $4,718,113 $4,426,209 $4,875,670 3.3%
TABLE 8-2 Actual
FY10
Adopted
FY11
Est. Act.
FY11
Adopted
FY12
% Change
from Adpt.
Division Expenditures
by Type
Salary and Wages 3,098,051 3,148,430 3,070,950 3,191,300 1.4%
Benefits 701,756 839,230 827,912 945,320 12.6%
Overtime 6,791 3,400 3,400 3,900 14.7%
Personnel Subtotal $3,806,598 $3,991,060 $3,902,262 $4,140,520 3.7%
Contractual Services 373,736 603,273 391,667 612,870 1.6%
Commodities 22,356 25,230 33,730 24,330 (3.6%)
Capital Outlays 0 850 850 0 (100.0%)
Other 0 97,700 97,700 97,950 0.3%
Operating Subtotal $396,092 $727,053 $523,947 $735,150 1.1%
Department Total $4,202,690 $4,718,113 $4,426,209 $4,875,670 3.3% * In FY12 the Executive Division was eliminated and all functions, including a 1.0 FTE,
were moved to the Management and Support Division. Although the Executive Division pages have been removed from this document the Actual FY10, Adopted FY11 and Est. Act. FY11 figures appear on page 8-4.
TABLE 8-3 Actual
FY10
Adopted
FY11
Est. Act.
FY11
Adopted
FY12
% Change
from Adpt.
Source of
Dept. Funds
Departmental Revenue
Building Permits (110) 686,981 800,000 800,000 1,295,000 61.9%
CDBG Grant (360) 336,574 614,348 223,690 593,000 (3.5%)
Fire Code Review (110) 46,750 75,000 75,000 75,000 0.0%
Fire Protection
Permit (110)64,777 150,000 150,000 100,000 (33.3%)
Grants (110) 0 0 30,000 0 N/A
Housing (350) 106 0 0 0 N/A
Non-Business
Licenses (110)124,591 110,000 110,000 110,000 0.0%
Zoning/Subdivision
Fees (110)84,777 50,000 50,000 193,500 287.0%
Subtotal $1,344,556 $1,799,348 $1,438,690 $2,366,500 31.5%
Fund Contribution
General Fund (110) 2,858,240 2,918,765 2,987,519 2,509,170 (14.0%)
Special Activities (350) (106) 0 0 0 N/A
Subtotal $2,858,134 $2,918,765 $2,987,519 $2,509,170 (14.0%)
Department Total $4,202,690 $4,718,113 $4,426,209 $4,875,670 3.3%
TABLE 8-4 Actual
FY10
Adopted
FY11
Est. Act.
FY11
Adopted
FY12
% Change
from Adpt.
Regular
Management
and Support *7.0 6.0 6.0 7.0 16.7%
Long Range Planning
and Implementation5.8 5.8 5.8 5.8 0.0%
Planning and Zoning 11.8 10.8 10.8 9.8 (9.3%)
Inspection Services 18.0 18.0 18.0 18.0 0.0%
Regular Subtotal 42.6 40.6 40.6 40.6 0.0%
Temporary
Management
and Support *0.2 0.1 0.1 0.2 100.0%
Long Range Planning
and Implementation0.3 0.0 0.0 0.0 N/A
Temporary Subtotal 0.5 0.1 0.1 0.2 100.0%
Department Total 43.1 40.7 40.7 40.8 0.2%
Staffing Summary by Cost Center (FTEs)

Department of Community Planning and Development Services Department Summary
8 - 3
Department Summary Department Overview
The Department of Community Planning and Development Services (CPDS) oversees property development and construction activities to ensure the vision for the City is achieved. The community expresses this vision through the City’s Master Plan, the recently adopted Zoning Ordinance and other development regulations. The CPDS Department is one of the most public and fields a large amount of phone calls and walk-ins requesting general zoning or permitting information, historic research, property information and building and fire code interpretations. The Department consists of four divisions: Management and Support, Long Range Planning and Implementation, Planning and Zoning, and Inspection Services. The role and perspective of each division is somewhat different in terms of scope. The scope ranges from the “big picture” perspective of the long range planners, to the neighborhood scope taken by the zoning staff, to the mechanical and safety review by the permitting staff and inspectors.
The Management and Support Division leads the planning, zoning and
permitting services of the City, as well as the City’s housing and historic preservation programs. A new Management and Support Division was created for FY12, which combines the former Housing and Executive Divisions. This streamlines all administrative and housing functions into one division and two cost centers, and recognizes recent changes in positions and responsibilities. In FY12, the management team will provide direction and oversight for several major ongoing initiatives such as the Rockville Pike Plan, the revision of the fire code, and will continue to reallocate resources for new work program items such as the new APFO Committee, Montgomery County School expansion planning, the heritage plan and a review of the sign ordinance. In addition, there will be a focus on technology and customer service enhancements such as implementation of the Communications Task Force recommendations, improving web information and conducting the second annual Citizen’s Planning Academy. The Long Range Planning and Implementation Division facilitates the drafting
and adoption of many community plans that reflect the overall policies of the community and direct future development and infrastructure decisions. These plans range from the citywide comprehensive Master Plan, which is revisited every six years per State law, to plans that relate to a special topic or geographic area such as the Rockville Pike Corridor Plan or Twinbrook Neighborhood Plan. The update of the Comprehensive Master Plan will be the focus of this Division for the next two (2) years.
The Planning and Zoning Division analyzes and coordinates development
applications for residential and commercial development in Rockville. This Division administers and interprets the Zoning Ordinance. The Development
Review cost center implements the procedures required by the code and reviews applications to ensure compliance with City codes. The Historic Preservation cost center works to preserve Rockville’s historic and archeological resources through design review, education and tax credit assistance. In FY12, this Division will continue to staff four boards/commissions: the Planning Commission, Board of Appeals, Historic District Commission and the Sign Review Board. The Inspection Services Division administers the building and fire safety codes
to ensure safe structures and occupancy for residential and commercial construction. The Application, Processing & Permit Issuance cost center processes all permit applications and reviews construction plans to ensure compliance with technical codes. This cost center also maintains contractor licenses and their associated annual renewals. The Building, Fire and Life Safety Inspections cost center enforces the regulations through the inspection of each project to insure that construction, design, and workmanship are compliant with approved plans. Enforcement of the Maryland Performance Building Standards, the Maryland State Fire Prevention Code, and the Rockville City Code (Chapters 5 and 9), will be the focus of this division for FY12.
Significant Changes from Adopted to Adopted
Personnel expenditures increased by $149,460 or 4% mainly due to a 1% cost of living adjustment to salary and wages and a $106,100 increase in benefits for FY12. Contractual Services increased by $9,600 mainly due to the addition of $6,200 to purchase updated codes and publications from the International Code Council (ICC); the addition of $4,400 in courier charges from the City Manager’s Department; and a reduction in training. Revenues increased by $567,150 due to a $495,000 increase in building permit fees and a $143,500 increase in Zoning/Subdivision Fees as a result of the User Fee Study, a decrease in the CDBG grant of $21,350 and a decrease of $50,000 in Fire Protection Permits due to a reduction in the scope of commercial projects that needed to modify existing fire protection systems.
etompkins
Underline
etompkins
Underline
etompkins
Underline
etompkins
Underline
etompkins
Underline
etompkins
Underline
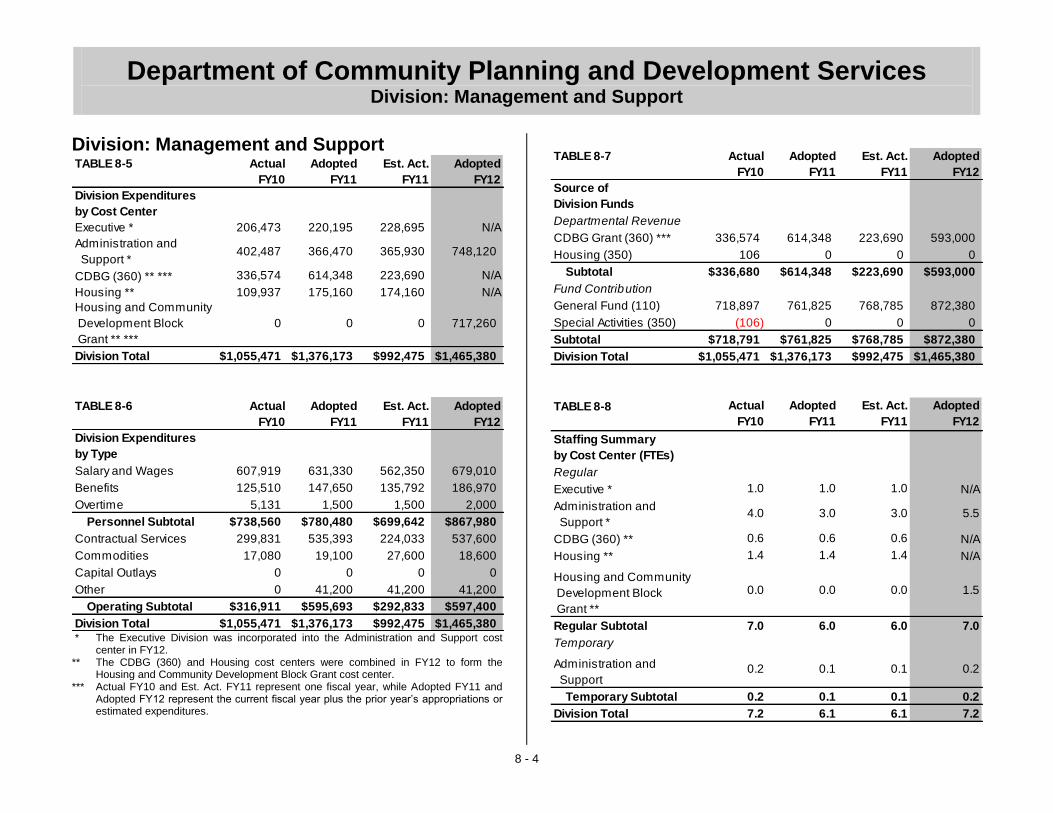
Department of Community Planning and Development Services Division: Management and Support
8 - 4
Division: Management and Support TABLE 8-5 Actual
FY10
Adopted
FY11
Est. Act.
FY11
Adopted
FY12
Division Expenditures
by Cost Center
Executive * 206,473 220,195 228,695 N/A
Administration and
Support *402,487 366,470 365,930 748,120
CDBG (360) ** *** 336,574 614,348 223,690 N/A
Housing ** 109,937 175,160 174,160 N/A
Housing and Community
Development Block
Grant ** ***
0 0 0 717,260
Division Total $1,055,471 $1,376,173 $992,475 $1,465,380
TABLE 8-6 Actual
FY10
Adopted
FY11
Est. Act.
FY11
Adopted
FY12
Division Expenditures
by Type
Salary and Wages 607,919 631,330 562,350 679,010
Benefits 125,510 147,650 135,792 186,970
Overtime 5,131 1,500 1,500 2,000
Personnel Subtotal $738,560 $780,480 $699,642 $867,980
Contractual Services 299,831 535,393 224,033 537,600
Commodities 17,080 19,100 27,600 18,600
Capital Outlays 0 0 0 0
Other 0 41,200 41,200 41,200
Operating Subtotal $316,911 $595,693 $292,833 $597,400
Division Total $1,055,471 $1,376,173 $992,475 $1,465,380 * The Executive Division was incorporated into the Administration and Support cost
center in FY12. ** The CDBG (360) and Housing cost centers were combined in FY12 to form the
Housing and Community Development Block Grant cost center. *** Actual FY10 and Est. Act. FY11 represent one fiscal year, while Adopted FY11 and
Adopted FY12 represent the current fiscal year plus the prior year’s appropriations or estimated expenditures.
TABLE 8-7 Actual
FY10
Adopted
FY11
Est. Act.
FY11
Adopted
FY12
Source of
Division Funds
Departmental Revenue
CDBG Grant (360) *** 336,574 614,348 223,690 593,000
Housing (350) 106 0 0 0
Subtotal $336,680 $614,348 $223,690 $593,000
Fund Contribution
General Fund (110) 718,897 761,825 768,785 872,380
Special Activities (350) (106) 0 0 0
Subtotal $718,791 $761,825 $768,785 $872,380
Division Total $1,055,471 $1,376,173 $992,475 $1,465,380
TABLE 8-8 Actual
FY10
Adopted
FY11
Est. Act.
FY11
Adopted
FY12
Staffing Summary
by Cost Center (FTEs)
Regular
Executive * 1.0 1.0 1.0 N/A
Administration and
Support * 4.0 3.0 3.0 5.5
CDBG (360) ** 0.6 0.6 0.6 N/A
Housing ** 1.4 1.4 1.4 N/A
Housing and Community
Development Block
Grant **
0.0 0.0 0.0 1.5
Regular Subtotal 7.0 6.0 6.0 7.0
Temporary
Administration and
Support0.2 0.1 0.1 0.2
Temporary Subtotal 0.2 0.1 0.1 0.2
Division Total 7.2 6.1 6.1 7.2
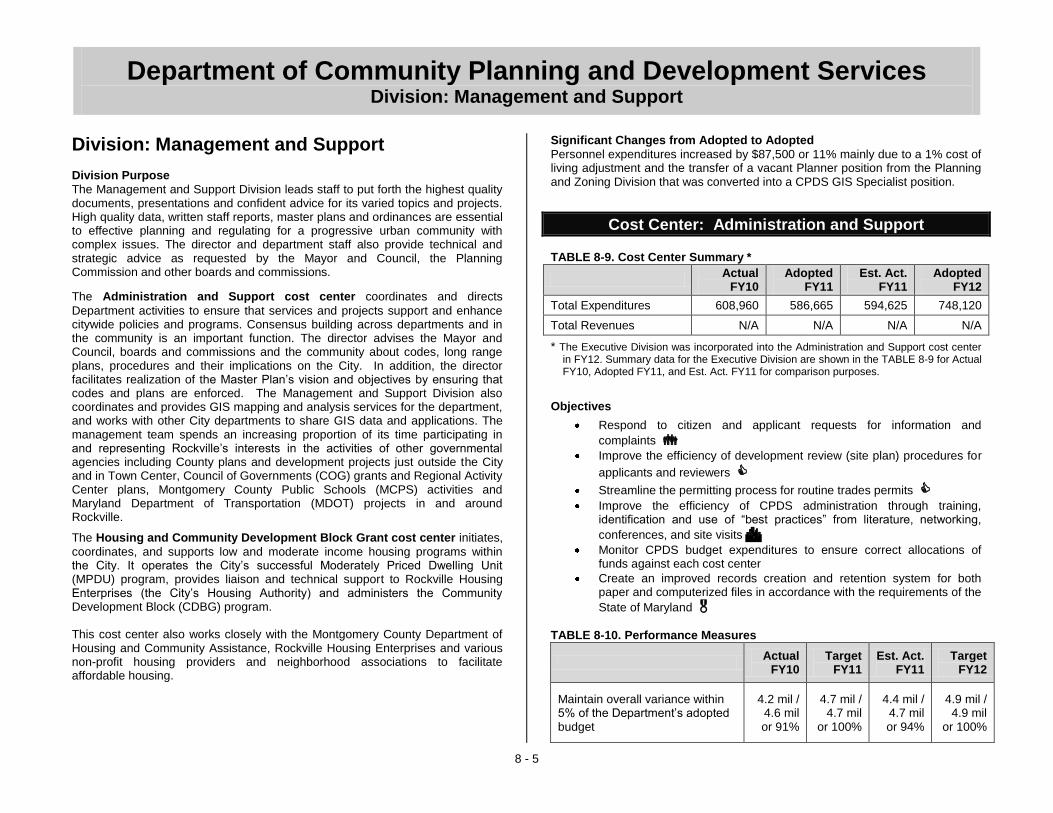
Department of Community Planning and Development Services Division: Management and Support
8 - 5
Division: Management and Support Division Purpose
The Management and Support Division leads staff to put forth the highest quality documents, presentations and confident advice for its varied topics and projects. High quality data, written staff reports, master plans and ordinances are essential to effective planning and regulating for a progressive urban community with complex issues. The director and department staff also provide technical and strategic advice as requested by the Mayor and Council, the Planning Commission and other boards and commissions.
The Administration and Support cost center coordinates and directs
Department activities to ensure that services and projects support and enhance citywide policies and programs. Consensus building across departments and in the community is an important function. The director advises the Mayor and Council, boards and commissions and the community about codes, long range plans, procedures and their implications on the City. In addition, the director facilitates realization of the Master Plan’s vision and objectives by ensuring that codes and plans are enforced. The Management and Support Division also coordinates and provides GIS mapping and analysis services for the department, and works with other City departments to share GIS data and applications. The management team spends an increasing proportion of its time participating in and representing Rockville’s interests in the activities of other governmental agencies including County plans and development projects just outside the City and in Town Center, Council of Governments (COG) grants and Regional Activity Center plans, Montgomery County Public Schools (MCPS) activities and Maryland Department of Transportation (MDOT) projects in and around Rockville.
The Housing and Community Development Block Grant cost center initiates,
coordinates, and supports low and moderate income housing programs within the City. It operates the City’s successful Moderately Priced Dwelling Unit (MPDU) program, provides liaison and technical support to Rockville Housing Enterprises (the City’s Housing Authority) and administers the Community Development Block (CDBG) program. This cost center also works closely with the Montgomery County Department of Housing and Community Assistance, Rockville Housing Enterprises and various non-profit housing providers and neighborhood associations to facilitate affordable housing.
Significant Changes from Adopted to Adopted
Personnel expenditures increased by $87,500 or 11% mainly due to a 1% cost of living adjustment and the transfer of a vacant Planner position from the Planning and Zoning Division that was converted into a CPDS GIS Specialist position.
Cost Center: Administration and Support TABLE 8-9. Cost Center Summary *
Actual
FY10 Adopted
FY11 Est. Act.
FY11 Adopted
FY12
Total Expenditures 608,960 586,665 594,625 748,120
Total Revenues N/A N/A N/A N/A
* The Executive Division was incorporated into the Administration and Support cost center in FY12. Summary data for the Executive Division are shown in the TABLE 8-9 for Actual FY10, Adopted FY11, and Est. Act. FY11 for comparison purposes.
Objectives
Respond to citizen and applicant requests for information and
complaints
Improve the efficiency of development review (site plan) procedures for
applicants and reviewers
Streamline the permitting process for routine trades permits
Improve the efficiency of CPDS administration through training, identification and use of “best practices” from literature, networking,
conferences, and site visits
Monitor CPDS budget expenditures to ensure correct allocations of funds against each cost center
Create an improved records creation and retention system for both paper and computerized files in accordance with the requirements of the
State of Maryland
TABLE 8-10. Performance Measures
Actual
FY10 Target
FY11 Est. Act.
FY11 Target
FY12
Maintain overall variance within 5% of the Department’s adopted budget
4.2 mil / 4.6 mil or 91%
4.7 mil / 4.7 mil
or 100%
4.4 mil / 4.7 mil or 94%
4.9 mil / 4.9 mil
or 100%
etompkins
Underline
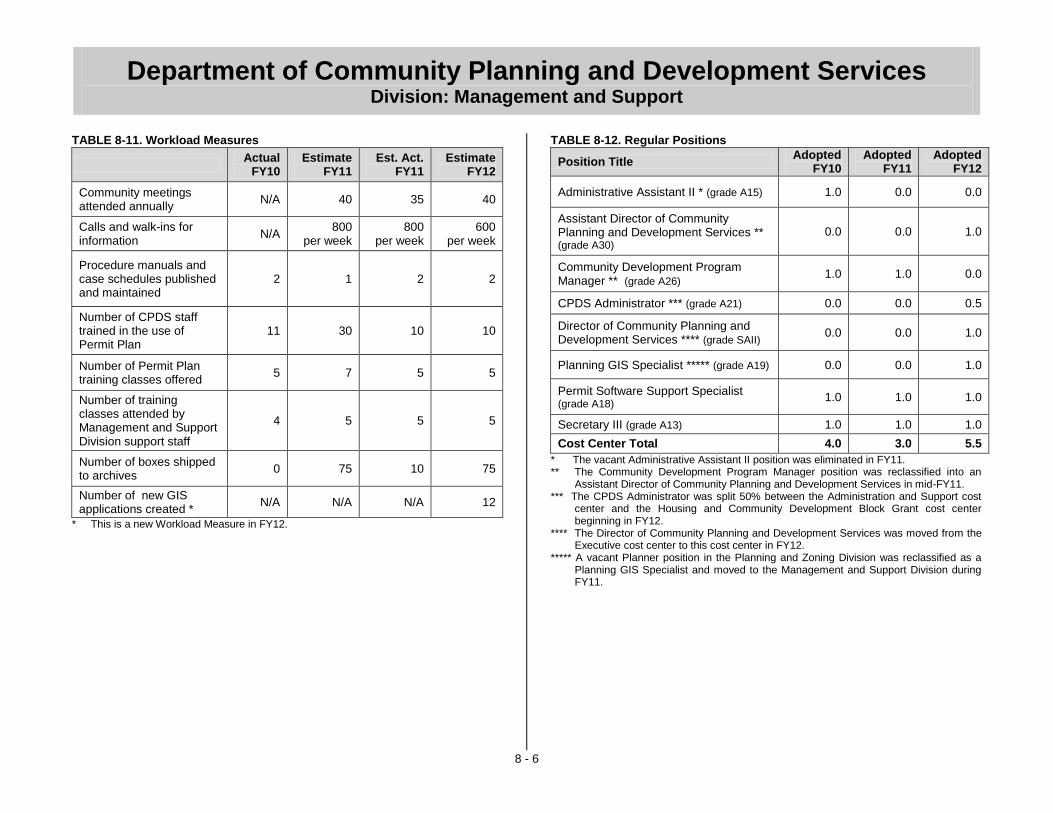
Department of Community Planning and Development Services Division: Management and Support
8 - 6
TABLE 8-11. Workload Measures
Actual
FY10 Estimate
FY11 Est. Act.
FY11 Estimate
FY12
Community meetings attended annually
N/A 40 35 40
Calls and walk-ins for information
N/A 800
per week 800
per week 600
per week
Procedure manuals and case schedules published and maintained
2 1 2 2
Number of CPDS staff trained in the use of Permit Plan
11 30 10 10
Number of Permit Plan training classes offered
5 7 5 5
Number of training classes attended by Management and Support Division support staff
4 5 5 5
Number of boxes shipped to archives
0 75 10 75
Number of new GIS applications created *
N/A N/A N/A 12
* This is a new Workload Measure in FY12.
TABLE 8-12. Regular Positions
Position Title Adopted
FY10 Adopted
FY11 Adopted
FY12
Administrative Assistant II * (grade A15) 1.0 0.0 0.0
Assistant Director of Community Planning and Development Services ** (grade A30)
0.0 0.0 1.0
Community Development Program Manager ** (grade A26)
1.0 1.0 0.0
CPDS Administrator *** (grade A21) 0.0 0.0 0.5
Director of Community Planning and Development Services **** (grade SAII)
0.0 0.0 1.0
Planning GIS Specialist ***** (grade A19) 0.0 0.0 1.0
Permit Software Support Specialist (grade A18)
1.0 1.0 1.0
Secretary III (grade A13) 1.0 1.0 1.0
Cost Center Total 4.0 3.0 5.5
* The vacant Administrative Assistant II position was eliminated in FY11. ** The Community Development Program Manager position was reclassified into an
Assistant Director of Community Planning and Development Services in mid-FY11. *** The CPDS Administrator was split 50% between the Administration and Support cost
center and the Housing and Community Development Block Grant cost center beginning in FY12.
**** The Director of Community Planning and Development Services was moved from the Executive cost center to this cost center in FY12.
***** A vacant Planner position in the Planning and Zoning Division was reclassified as a Planning GIS Specialist and moved to the Management and Support Division during FY11.

Department of Community Planning and Development Services Division: Management and Support
8 - 7
Cost Center: Housing and Community Development Block Grant
TABLE 8-13. Cost Center Summary *
Actual FY10
Adopted FY11
Est. Act. FY11
Adopted FY12
Total Expenditures 446,511 789,508 397,850 717,260
Total Revenues 336,680 614,348 223,690 593,000 * The CDBG (360) and Housing cost centers were combined into the Housing and
Community Development Block Grant cost center in FY12. Summary data for the CDBG (360) and Housing cost centers are shown in TABLE 8-13 for Actual FY10, Adopted FY11, and Est. Act. FY11 for comparison purposes.
Objectives
Explore and implement programs to produce and/or retain affordable housing options within the City of Rockville in order to constantly improve and update the City’s programs
Review the City’s current affordable housing policies in order to update their applicability to present conditions
Re-evaluate the MPDU Ordinance and procedures to reflect current real estate market conditions
Submit and administer the Federal Community Development Block Grant (CDBG) to ensure the City’s application is prepared and submitted and all funded programs meet Federal CDBG eligibility criteria and the needs of City residents
Provide resources to Rockville Housing Enterprises in order to maintain affordable and safe public housing within the City
Provide rehabilitation assistance to homeowners through the City Rehabilitation Program and the Community Ministries Safe and Habitable Home program to ensure all City residents’ homes meet minimum code standards
TABLE 8-14. Performance Measures
Actual FY10
Target FY11
Est. Act. FY11
Target FY12
Increase the percent of Citizen Survey respondents rating the access to quality affordable housing in Rockville as “excellent” or “good” to 40% *
33% 40% 33% 33%
Maintain the number of days to process MPDU applications at 5 days
5 days 5 days 5 days 5 days
Maintain the percent of the CDBG grant ending during the fiscal year expended at 75% or greater **
Year 33 310,299/ 310,299 or 100%
Year 34 244,011/ 325,348 or 75%
Year 34 325,348/ 325,348 or 100%
Year 35 289,000/ 289,000 or 100%
Maintain at least 50 houses brought up to code standards with CDBG
14 50 30*** 30***
Rehabilitate 100% of the public housing units funded by the CDBG grant
4 / 4 or 100%
18 / 18 or 100%
68 / 68 or 100%
27 / 27 or 100%
Maintain the number of CDBG managed projects completed at 100%
6 / 6 or 100%
6 / 6 or 100%
6 / 6 or 100%
6 / 6 or 100%
* The City conducts a citizen survey every other year. A survey was conducted in FY11 and the next survey will take place in FY13.
** The CDBG grant is awarded over an 18 month period and spans two of the City’s fiscal years. See FIGURE 8-3. Table of Approved CDBG Projects on page 8-9 for additional details.
*** Due to staff turnover it is estimated that only 30 houses will be brought up to code in FY11 and FY12 as the new Rehabilitation Specialist becomes acclimated.
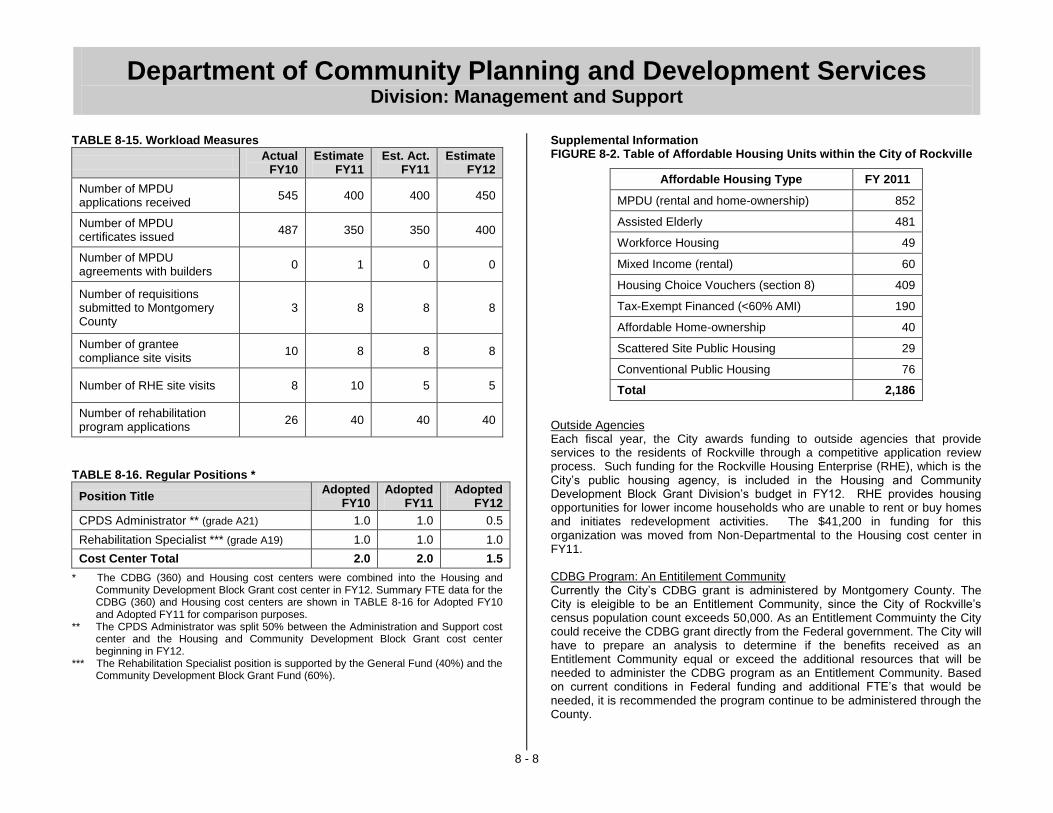
Department of Community Planning and Development Services Division: Management and Support
8 - 8
TABLE 8-15. Workload Measures
Actual
FY10 Estimate
FY11 Est. Act.
FY11 Estimate
FY12
Number of MPDU applications received
545 400 400 450
Number of MPDU certificates issued
487 350 350 400
Number of MPDU agreements with builders
0 1 0 0
Number of requisitions submitted to Montgomery County
3 8 8 8
Number of grantee compliance site visits
10 8 8 8
Number of RHE site visits 8 10 5 5
Number of rehabilitation program applications
26 40 40 40
TABLE 8-16. Regular Positions *
Position Title Adopted
FY10 Adopted
FY11 Adopted
FY12
CPDS Administrator ** (grade A21) 1.0 1.0 0.5
Rehabilitation Specialist *** (grade A19) 1.0 1.0 1.0
Cost Center Total 2.0 2.0 1.5
* The CDBG (360) and Housing cost centers were combined into the Housing and Community Development Block Grant cost center in FY12. Summary FTE data for the CDBG (360) and Housing cost centers are shown in TABLE 8-16 for Adopted FY10 and Adopted FY11 for comparison purposes.
** The CPDS Administrator was split 50% between the Administration and Support cost center and the Housing and Community Development Block Grant cost center beginning in FY12.
*** The Rehabilitation Specialist position is supported by the General Fund (40%) and the Community Development Block Grant Fund (60%).
Supplemental Information FIGURE 8-2. Table of Affordable Housing Units within the City of Rockville
Affordable Housing Type FY 2011
MPDU (rental and home-ownership) 852
Assisted Elderly 481
Workforce Housing 49
Mixed Income (rental) 60
Housing Choice Vouchers (section 8) 409
Tax-Exempt Financed (<60% AMI) 190
Affordable Home-ownership 40
Scattered Site Public Housing 29
Conventional Public Housing 76
Total 2,186
Outside Agencies Each fiscal year, the City awards funding to outside agencies that provide services to the residents of Rockville through a competitive application review process. Such funding for the Rockville Housing Enterprise (RHE), which is the City’s public housing agency, is included in the Housing and Community Development Block Grant Division’s budget in FY12. RHE provides housing opportunities for lower income households who are unable to rent or buy homes and initiates redevelopment activities. The $41,200 in funding for this organization was moved from Non-Departmental to the Housing cost center in FY11. CDBG Program: An Entitilement Community Currently the City’s CDBG grant is administered by Montgomery County. The City is eleigible to be an Entitlement Community, since the City of Rockville’s census population count exceeds 50,000. As an Entitlement Commuinty the City could receive the CDBG grant directly from the Federal government. The City will have to prepare an analysis to determine if the benefits received as an Entitlement Community equal or exceed the additional resources that will be needed to administer the CDBG program as an Entitlement Community. Based on current conditions in Federal funding and additional FTE’s that would be needed, it is recommended the program continue to be administered through the County.
etompkins
Underline

Department of Community Planning and Development Services Division: Management and Support
8 - 9
Year 32 Year 33 Year 34 Year 35 Year 36
(ended in
FY09)
(ended in
FY10)
(ending
FY11)
(ending
FY12)
(ending
FY13)
Community Ministries
Latino Outreach/
Naturalization $15,000 $20,000 $15,000 $16,000 $16,000
Community Ministries
Safe and Habitable
Home $12,500 $0 $0 $0 $0
Elderly Ministries $0 $12,500 $12,500 $12,500 $12,500
Rockville Housing
Enterprises Resident
Counselor $24,500 $24,500 $25,000 $0 $0
Interfaith Works $0 $0 $10,000 $0 $0
Top Banana Elderly
Grocery Delivery $5,000 $5,000 $0 $0 $0
Mobile Med
Healthcare $12,500 $0 $0 $0 $0
Korean Community
Service Center $0 $0 $0 $0 $5,000
Stepping Stones
Shelter $0 $0 $0 $12,500 $0
Rockville Housing
Enterprises Public
Housing Renovation $0 $34,000 $35,000 $70,000 $70,000
City of Rockville Single
Family Rehabilitation $381,487 $154,299 $170,128 $118,000 $140,500
CDBG Administration $60,000 $60,000 $57,720 $60,000 $60,000
Total $510,987 $310,299 $325,348 $289,000 $304,000
Project
FIGURE 8-3. Table of Approved CDBG Projects

Department of Community Planning and Development Services Division: Long Range Planning and Implementation
8 - 10
Division: Long Range Planning and Implementation
TABLE 8-17 Actual
FY10
Adopted
FY11
Est. Act.
FY11
Adopted
FY12
Division Expenditures
by Cost Center
Long Range Planning
and Implementation588,498 584,470 654,224 635,110
Division Total $588,498 $584,470 $654,224 $635,110
TABLE 8-18 Actual
FY10
Adopted
FY11
Est. Act.
FY11
Adopted
FY12
Division Expenditures
by Type
Salary and Wages 452,249 453,020 453,020 474,780
Benefits 109,267 120,610 120,610 147,510
Overtime 0 0 0 0
Personnel Subtotal $561,516 $573,630 $573,630 $622,290
Contractual Services 26,982 8,990 78,744 12,320
Commodities 0 1,000 1,000 500
Capital Outlays 0 850 850 0
Other 0 0 0 0
Operating Subtotal $26,982 $10,840 $80,594 $12,820
Division Total $588,498 $584,470 $654,224 $635,110
TABLE 8-19 Actual
FY10
Adopted
FY11
Est. Act.
FY11
Adopted
FY12
Source of
Division Funds
Departmental Revenue 0 0 0 0
Subtotal $0 $0 $0 $0
Fund Contribution
General Fund (110) 588,498 584,470 654,224 635,110
Subtotal $588,498 $584,470 $654,224 $635,110
Division Total $588,498 $584,470 $654,224 $635,110
TABLE 8-20 Actual
FY10
Adopted
FY11
Est. Act.
FY11
Adopted
FY12
Staffing Summary
by Cost Center (FTEs)
RegularLong Range Planning
and Implementation 5.8 5.8 5.8 5.8
Regular Subtotal 5.8 5.8 5.8 5.8
Temporary
Long Range Planning
and Implementation 0.3 0.0 0.0 0.0
Temporary Subtotal 0.3 0.0 0.0 0.0
Division Total 6.1 5.8 5.8 5.8

Department of Community Planning and Development Services Division: Long Range Planning and Implementation
8 - 11
Division: Long Range Planning and Implementation Division Purpose
The primary purpose of the Long Range Planning and Implementation Division is to prepare and coordinate implementation of the City’s Comprehensive Master Plan (CMP), neighborhood plans, and other special plans, under the direction of the Rockville Planning Commission and the Mayor and Council. The Division carries out this purpose in partnership with other City staff, and by working with Rockville citizens, businesses, organizations and other levels of government. These plans are based fundamentally on citizen-identified goals and the Mayor and Council Vision, but must also comply with State planning requirements. The City’s legal right to enforce its own land-use regulations, including zoning, is contingent on the City maintaining a CMP that is in accordance with Article 66b of the Maryland State code. Planning efforts that have been completed in recent years that have resulted in amendments to the CMP include neighborhood plans for Twinbrook, Lincoln Park, East Rockville, and Town Center; and the State-required Municipal Growth and Water Resources Elements. Other recently completed State requirements included the 6-year review of the overall CMP and the Annual Report on planning activities. Major ongoing CMP efforts include the planning process for Rockville Pike and the multi-dimensional multi-year update to the overall CMP. CMP areas being covered include, but are not limited to, Goals and Objectives, Land Use, Urban Design, Housing, Community Facilities, Parks and Open Space, the Economy, Environment, Transportation, and Historic Preservation. For some elements, the Division is in the lead role. For others, staff from other parts of the City leads the effort, with coordination from the Division. All elements involve collaboration with the public, boards and commissions, other City staff, and other levels of government. The Division also monitors and, where appropriate, participates in or comments on planning efforts led by Montgomery County, the State of Maryland, the Metropolitan Washington Council of Governments (COG) and the City of Gaithersburg. The Division represents the City in various working groups and committees, and supports the Mayor and Council in its advocacy efforts. Over the past two years, the Division has been the City’s monitoring staff for, among other initiatives, the Great Seneca Sciences Corridor, White Flint, COG’s Region Forward, PlanMaryland, Montgomery County Public Schools’ Capital Improvements Program, and Montgomery County’s Growth Policy.
The Division also prepares and maintains descriptive data, develops Geographic Information Systems (GIS) maps, special studies, and prepares Rockville growth projections that serve City, County, State and regional planning needs. The Division led the City’s effort to prepare for the 2010 Census, and continues to prepare relevant reports. The Strategic Scan of Rockville trends was completed in FY10 and will be updated in FY12. Significant Changes from Adopted to Adopted
Personnel expenditures increased by $48,660 or 8% mainly due to 1% cost of living adjustment and a $26,900 increase in benefits.
Cost Center: Long Range Planning and Implementation TABLE 8-21. Cost Center Summary
Actual
FY10 Adopted
FY11 Est. Act.
FY11 Adopted
FY12
Total Expenditures 588,498 584,470 654,224 635,110
Total Revenues N/A N/A N/A N/A
Objectives
Prepare and update the City’s Comprehensive Master Plan,
neighborhood plans and other special plans for the City
Provide support for the Planning Commission, and other boards,
commissions and citizen/neighborhood groups
Prepare data/information and growth projections in support of City, County, State and regional needs, including Rockville’s Comprehensive
Master Plan
Monitor planning efforts relevant to Rockville conducted by other agencies such as, Montgomery County, the City of Gaithersburg, Washington Metropolitan Area Transit Authority (WMATA), the Metropolitan Washington Council of Governments (COG) and the State of Maryland in order to provide timely information to the Planning Commission and Mayor and Council on initiatives that will have an
impact on the City of Rockville

Department of Community Planning and Development Services Division: Long Range Planning and Implementation
8 - 12
TABLE 8-22. Performance Measures
Actual
FY10 Target
FY11 Est. Act.
FY11 Target
FY12
Maintain or exceed 90 percent of meetings that participants rate the quality to be “good” or “excellent”
N/A 18 / 20 or 90%
18 / 20 or 90%
18 / 20 or 90%
Increase the percent of presentations that Planning Commission members rate the quality “good” or “excellent” to 85 percent or greater
3 / 4 or 75%
7 / 7 or 100%
3 / 3 or 100%
7 / 7 or 100%
Maintain or exceed 85 percent of reports that Planning Commission members rate the quality to be “good” or “excellent”
4 / 4 or 100%
7 / 7 or 100%
2 / 3 or 66%
7 / 7 or 100%
Maintain or exceed 85 percent of Planning Commission members rating the quality of staff technical knowledge to be “good” or “excellent”
4 / 4 or 100%
7 / 7 or 100%
3 / 3 or 100%
7 / 7 or 100%
Maintain the percent of reports on construction, demographic and economic data delivered to City, county and regional bodies on-time at 100%
7 / 7 or 100%
6 / 6 or 100%
6 / 6 or 100%
5 / 5 or 100%
TABLE 8-23. Workload Measures
Actual
FY10 Estimate
FY11 Est. Act.
FY11 Estimate
FY12
Community planning meetings managed
17 30 30 30
County/regional/State meetings attended
45 40 45 40
Planning Commission agenda items prepared
15 20 25 20
Presentations to other Boards and Commissions
8 15 20 15
Mayor and Council agenda items prepared
16 15 17 25
Other reports prepared, for City, County, State or regional bodies
7 15 15 15
TABLE 8-24. Regular Positions
Position Title Adopted
FY10 Adopted
FY11 Adopted
FY12
Chief of Long Range Planning and Redevelopment (grade A27)
1.0 1.0 1.0
CPDS Specialist (grade A23) 1.0 1.0 1.0
Planner * (grade A15 / A16 / A19 / or A21) 3.8 3.8 3.8
Cost Center Total 5.8 5.8 5.8
* The Planning Technician and all levels of the Planner positions are banded and can be hired at any level between a Planning Technician and Planner III.

Department of Community Planning and Development Services Division: Long Range Planning and Implementation
8 - 13
Supplemental Information Plans in Progress:
Rockville’s Pike: Envision A Great Place – Long Range Planning staff is leading the effort to develop an updated citizen-driven vision and plan for the Rockville Pike corridor within the City of Rockville. The process involves collaboration with the community, Public Works and other City staff, expert consultants, Montgomery County and the State of Maryland. The developing plan envisions a transformation of the Pike corridor area over time into a tree-lined boulevard that is attractive for business and residents; and that transit users, drivers, pedestrians and cyclists all can navigate successfully. The goal is for Rockville’s main commercial corridor to be a place of economic vitality, sustainability, and visual appeal. For more information please visit the City’s website at: http://www.rockvillemd.gov/rockvillespike/. Comprehensive Master Plan (CMP) – The Long Range Planning and Implementation Division is managing a 4-year, 2-phase process to update the City’s CMP, in accordance with direction from the Mayor and Council and Planning Commission. Phase l has involved developing and adopting the two State-required Municipal Growth and Water Resources elements, which were completed in FY11 (Water Resources was led by Public Works); adopting new planning strategies for Parks, Recreation and Open Space (led by the Department of Recreation and Parks); becoming part of Montgomery County’s Heritage Area; and updating key data that underlies the overall CMP. The first phase also involves the Rockville Pike plan and an active discussion with the Planning Commission on topics related to the CMP. Phase II, which is planned to begin in FY12, involves developing background data and information regarding the various elements of the CMP, and then engaging citizens, boards and commissions and others in visioning to establish policy and direction for the City. The Master Plan describes the broad vision for the City’s future on development and sustainability, and is used to test the appropriateness of both public and private development proposals. Key areas of the Plan include the City’s Goals and Objectives, Land Use, Urban Design, Housing, Infrastructure, Parks, Open Space, Transportation, Economic Development, Historic Preservation, Water Resources, and Municipal Growth.
FIGURE 8-4. Rockville’s Pike Envision A Great Place. The draft Rockville
Pike Plan is available on-line at http://www.rockvillemd.gov/rockvillespike/2010DraftPlan/ and on CD. Hardcopies can be viewed at City Hall, the Rockville and Twinbrook libraries.

Department of Community Planning and Development Services Division: Planning and Zoning
8 - 14
Division: Planning and Zoning
TABLE 8-25 Actual
FY10
Adopted
FY11
Est. Act.
FY11
Adopted
FY12
Division Expenditures
by Cost Center
Zoning 294,344 308,410 300,450 237,360
Development
Review705,367 722,285 722,285 766,960
Historic Preservation 104,052 142,015 172,015 145,220
Division Total $1,103,763 $1,172,710 $1,194,750 $1,149,540
TABLE 8-26 Actual
FY10
Adopted
FY11
Est. Act.
FY11
Adopted
FY12
Division Expenditures
by Type
Salary and Wages 881,660 860,400 851,900 825,910
Benefits 206,035 245,870 246,410 259,180
Overtime 0 0 0 0
Personnel Subtotal $1,087,695 $1,106,270 $1,098,310 $1,085,090
Contractual Services 16,068 9,940 39,940 7,700
Commodities 0 0 0 0
Capital Outlays 0 0 0 0
Other 0 56,500 56,500 56,750
Operating Subtotal $16,068 $66,440 $96,440 $64,450
Division Total $1,103,763 $1,172,710 $1,194,750 $1,149,540
TABLE 8-27 Actual
FY10
Adopted
FY11
Est. Act.
FY11
Adopted
FY12
Source of
Division Funds
Departmental Revenue
Grants (110) 0 0 30,000 0
Zoning/Subdivision
Fees (110) 84,777 50,000 50,000 193,500
Subtotal $84,777 $50,000 $80,000 $193,500
Fund Contribution
General Fund (110) 1,018,986 1,122,710 1,114,750 956,040
Subtotal $1,018,986 $1,122,710 $1,114,750 $956,040
Division Total $1,103,763 $1,172,710 $1,194,750 $1,149,540
TABLE 8-28 Actual
FY10
Adopted
FY11
Est. Act.
FY11
Adopted
FY12
Staffing Summary
by Cost Center (FTEs)
Regular
Zoning 3.0 3.0 3.0 2.0
Development
Review7.0 7.0 7.0 7.0
Historic Preservation 1.8 0.8 0.8 0.8
Regular Subtotal 11.8 10.8 10.8 9.8
Temporary 0.0 0.0 0.0 0.0
Temporary Subtotal 0.0 0.0 0.0 0.0
Division Total 11.8 10.8 10.8 9.8
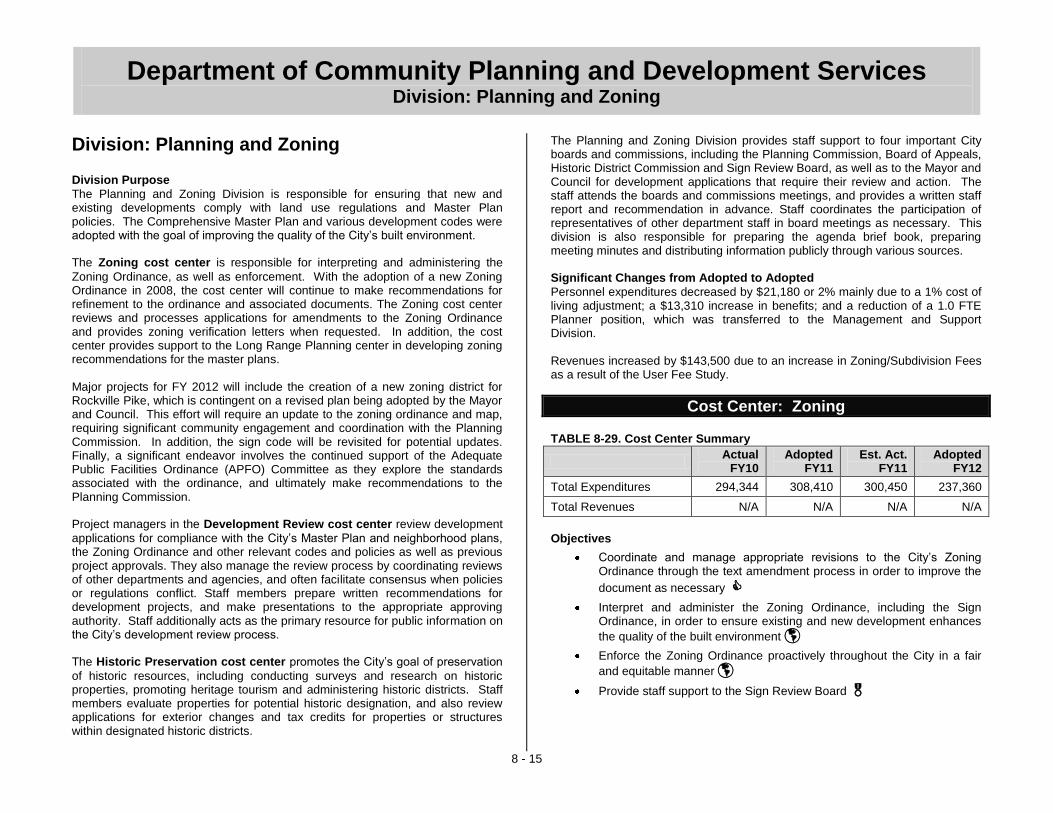
Department of Community Planning and Development Services Division: Planning and Zoning
8 - 15
Division: Planning and Zoning Division Purpose
The Planning and Zoning Division is responsible for ensuring that new and existing developments comply with land use regulations and Master Plan policies. The Comprehensive Master Plan and various development codes were adopted with the goal of improving the quality of the City’s built environment. The Zoning cost center is responsible for interpreting and administering the
Zoning Ordinance, as well as enforcement. With the adoption of a new Zoning Ordinance in 2008, the cost center will continue to make recommendations for refinement to the ordinance and associated documents. The Zoning cost center reviews and processes applications for amendments to the Zoning Ordinance and provides zoning verification letters when requested. In addition, the cost center provides support to the Long Range Planning center in developing zoning recommendations for the master plans. Major projects for FY 2012 will include the creation of a new zoning district for Rockville Pike, which is contingent on a revised plan being adopted by the Mayor and Council. This effort will require an update to the zoning ordinance and map, requiring significant community engagement and coordination with the Planning Commission. In addition, the sign code will be revisited for potential updates. Finally, a significant endeavor involves the continued support of the Adequate Public Facilities Ordinance (APFO) Committee as they explore the standards associated with the ordinance, and ultimately make recommendations to the Planning Commission. Project managers in the Development Review cost center review development
applications for compliance with the City’s Master Plan and neighborhood plans, the Zoning Ordinance and other relevant codes and policies as well as previous project approvals. They also manage the review process by coordinating reviews of other departments and agencies, and often facilitate consensus when policies or regulations conflict. Staff members prepare written recommendations for development projects, and make presentations to the appropriate approving authority. Staff additionally acts as the primary resource for public information on the City’s development review process. The Historic Preservation cost center promotes the City’s goal of preservation
of historic resources, including conducting surveys and research on historic properties, promoting heritage tourism and administering historic districts. Staff members evaluate properties for potential historic designation, and also review applications for exterior changes and tax credits for properties or structures within designated historic districts.
The Planning and Zoning Division provides staff support to four important City boards and commissions, including the Planning Commission, Board of Appeals, Historic District Commission and Sign Review Board, as well as to the Mayor and Council for development applications that require their review and action. The staff attends the boards and commissions meetings, and provides a written staff report and recommendation in advance. Staff coordinates the participation of representatives of other department staff in board meetings as necessary. This division is also responsible for preparing the agenda brief book, preparing meeting minutes and distributing information publicly through various sources. Significant Changes from Adopted to Adopted
Personnel expenditures decreased by $21,180 or 2% mainly due to a 1% cost of living adjustment; a $13,310 increase in benefits; and a reduction of a 1.0 FTE Planner position, which was transferred to the Management and Support Division. Revenues increased by $143,500 due to an increase in Zoning/Subdivision Fees as a result of the User Fee Study.
Cost Center: Zoning
TABLE 8-29. Cost Center Summary
Actual
FY10 Adopted
FY11 Est. Act.
FY11 Adopted
FY12
Total Expenditures 294,344 308,410 300,450 237,360
Total Revenues N/A N/A N/A N/A
Objectives
Coordinate and manage appropriate revisions to the City’s Zoning Ordinance through the text amendment process in order to improve the
document as necessary
Interpret and administer the Zoning Ordinance, including the Sign Ordinance, in order to ensure existing and new development enhances
the quality of the built environment
Enforce the Zoning Ordinance proactively throughout the City in a fair
and equitable manner
Provide staff support to the Sign Review Board
etompkins
Underline

Department of Community Planning and Development Services Division: Planning and Zoning
8 - 16
TABLE 8-30. Performance Measures
Actual
FY10 Target
FY11 Est. Act.
FY11 Target
FY12
Maintain the average number of days to respond to zoning verification letters at 10 or less
8 10 8 10
Improve the average number of days to process text amendments and forward to commission *
30 100 60 90
Maintain the average number of days to abate zoning violations at 4 or less
20 4 4 4
* In FY10 the two text amendments processed were Mayor and Council initiated and took less time to process. The Target FY11 and FY12 assumes the text amendments will not be Mayor and Council initiated and will take longer to process.
TABLE 8-31. Workload Measures
Actual
FY10 Estimate
FY11 Est. Act.
FY11 Estimate
FY12
Number of zoning verification letters received
14 25 21 25
Number of zoning text amendments processed
6 8 3 5
Number of zoning violations reported *
106 65 78 100
Number of sign permits processed
243 150 168 200
* FY10 was the first full fiscal year data was collected and the Est. Act. FY11 and the Estimate FY12 have been updated to reflect the actual violations being reported.
TABLE 8-32. Regular Positions
Position Title Adopted
FY10 Adopted
FY11 Adopted
FY12
Planner * ** (grade A15 / A16 / A19 / A21) 1.0 1.0 0.0
Principal Planner (grade A24) 1.0 1.0 1.0
Zoning Inspector II (grade A19) 1.0 1.0 1.0
Cost Center Total 3.0 3.0 2.0
* The Planning Technician and all levels of the Planner positions are banded and can be hired at any level between a Planning Technician and Planner III.
** The vacant Planner position was reclassified as a Planning GIS Specialist and moved to the Management and Support Division during FY11.
Cost Center: Development Review
TABLE 8-33. Cost Center Summary
Actual
FY10 Adopted
FY11 Est. Act.
FY11 Adopted
FY12
Total Expenditures 705,367 722,285 722,285 766,960
Total Revenues 84,777 50,000 50,000 193,500
Objectives
Ensure new development meets the City’s vision as expressed through the Comprehensive Master Plan, Zoning Ordinance and other
development regulations
Continue to improve the development review process, including continued use of Development Review Manual procedures to ensure coordinated, timely and professional review of development applications
Provide high quality professional support to the Planning Commission
and Board of Appeals
Provide accurate information in response to inquires regarding the City’s
development review process and development projects
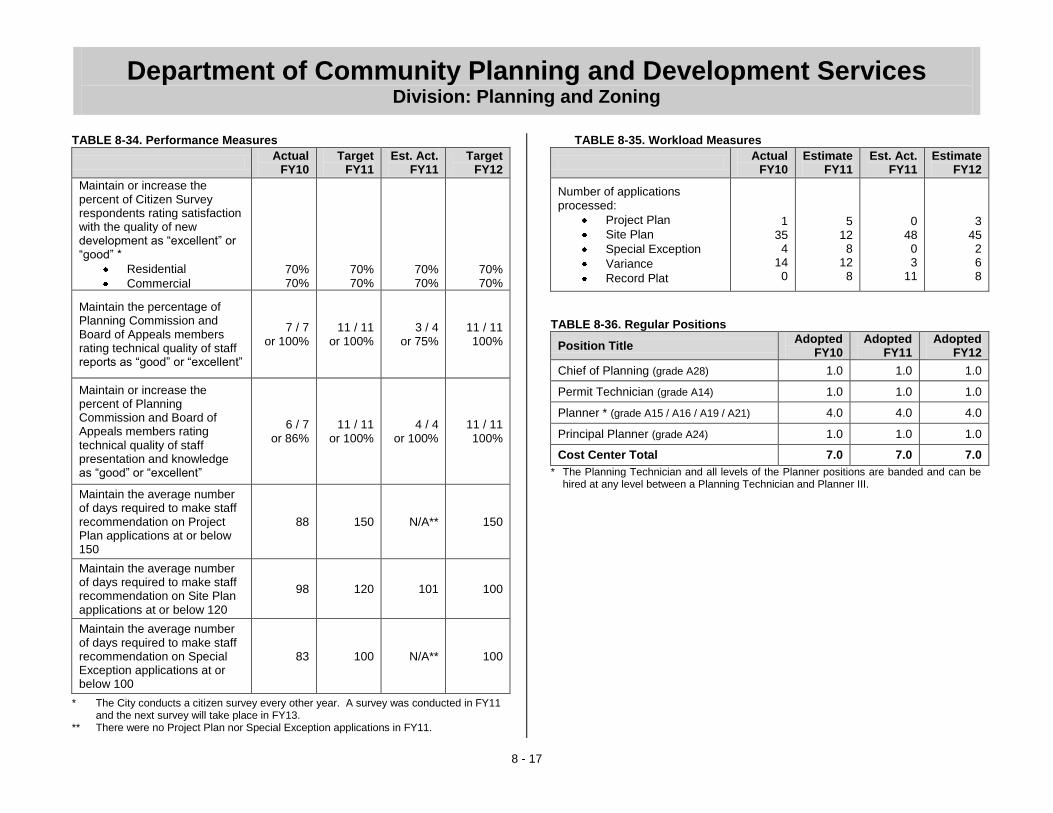
Department of Community Planning and Development Services Division: Planning and Zoning
8 - 17
TABLE 8-34. Performance Measures
Actual
FY10 Target
FY11 Est. Act.
FY11 Target
FY12
Maintain or increase the percent of Citizen Survey respondents rating satisfaction with the quality of new development as “excellent” or “good” *
Residential
Commercial
70% 70%
70% 70%
70% 70%
70% 70%
Maintain the percentage of Planning Commission and Board of Appeals members rating technical quality of staff reports as “good” or “excellent”
7 / 7 or 100%
11 / 11 or 100%
3 / 4 or 75%
11 / 11 100%
Maintain or increase the percent of Planning Commission and Board of Appeals members rating technical quality of staff presentation and knowledge as “good” or “excellent”
6 / 7 or 86%
11 / 11 or 100%
4 / 4 or 100%
11 / 11 100%
Maintain the average number of days required to make staff recommendation on Project Plan applications at or below 150
88 150 N/A** 150
Maintain the average number of days required to make staff recommendation on Site Plan applications at or below 120
98 120 101 100
Maintain the average number of days required to make staff recommendation on Special Exception applications at or below 100
83 100 N/A** 100
* The City conducts a citizen survey every other year. A survey was conducted in FY11 and the next survey will take place in FY13.
** There were no Project Plan nor Special Exception applications in FY11.
TABLE 8-35. Workload Measures
Actual
FY10 Estimate
FY11 Est. Act.
FY11 Estimate
FY12
Number of applications processed:
Project Plan
Site Plan
Special Exception
Variance
Record Plat
1 35 4
14 0
5 12 8
12 8
0 48 0 3
11
3 45 2 6 8
TABLE 8-36. Regular Positions
Position Title Adopted
FY10 Adopted
FY11 Adopted
FY12
Chief of Planning (grade A28) 1.0 1.0 1.0
Permit Technician (grade A14) 1.0 1.0 1.0
Planner * (grade A15 / A16 / A19 / A21) 4.0 4.0 4.0
Principal Planner (grade A24) 1.0 1.0 1.0
Cost Center Total 7.0 7.0 7.0
* The Planning Technician and all levels of the Planner positions are banded and can be hired at any level between a Planning Technician and Planner III.
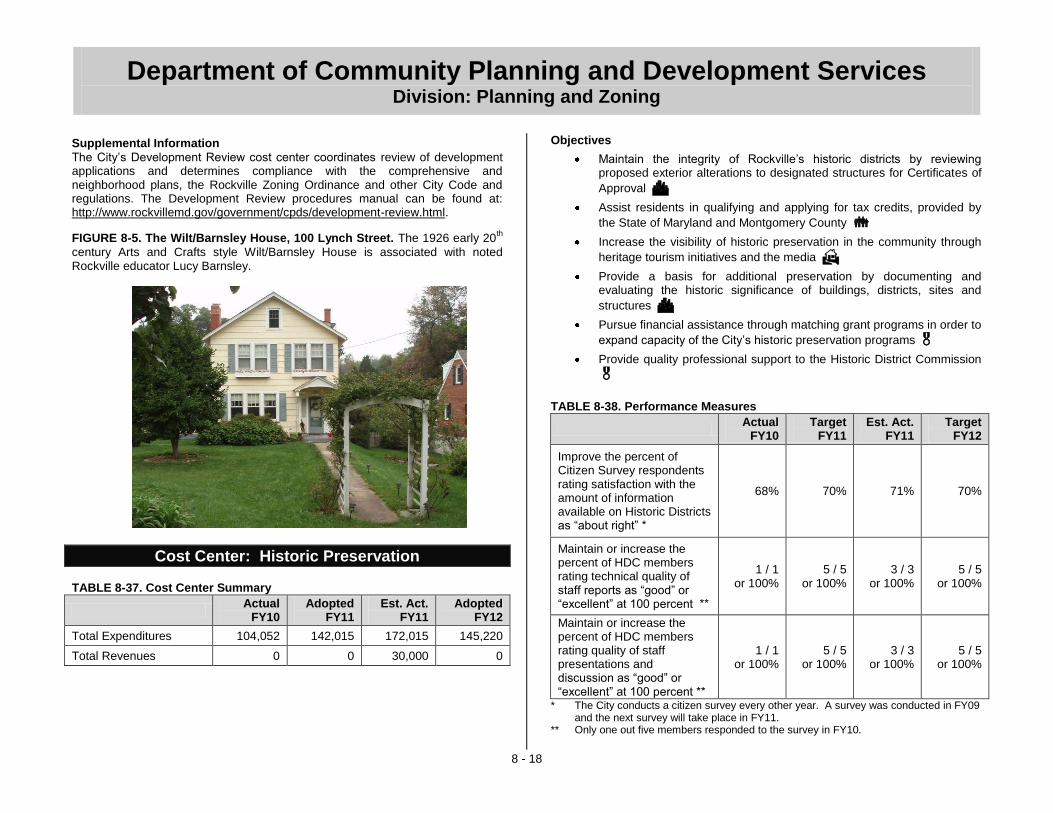
Department of Community Planning and Development Services Division: Planning and Zoning
8 - 18
Supplemental Information
The City’s Development Review cost center coordinates review of development applications and determines compliance with the comprehensive and neighborhood plans, the Rockville Zoning Ordinance and other City Code and regulations. The Development Review procedures manual can be found at: http://www.rockvillemd.gov/government/cpds/development-review.html.
FIGURE 8-5. The Wilt/Barnsley House, 100 Lynch Street. The 1926 early 20th
century Arts and Crafts style Wilt/Barnsley House is associated with noted Rockville educator Lucy Barnsley.
Cost Center: Historic Preservation TABLE 8-37. Cost Center Summary
Actual
FY10 Adopted
FY11 Est. Act.
FY11 Adopted
FY12
Total Expenditures 104,052 142,015 172,015 145,220
Total Revenues 0 0 30,000 0
Objectives
Maintain the integrity of Rockville’s historic districts by reviewing proposed exterior alterations to designated structures for Certificates of
Approval
Assist residents in qualifying and applying for tax credits, provided by
the State of Maryland and Montgomery County
Increase the visibility of historic preservation in the community through
heritage tourism initiatives and the media
Provide a basis for additional preservation by documenting and evaluating the historic significance of buildings, districts, sites and
structures
Pursue financial assistance through matching grant programs in order to
expand capacity of the City’s historic preservation programs
Provide quality professional support to the Historic District Commission
TABLE 8-38. Performance Measures
Actual
FY10 Target
FY11 Est. Act.
FY11 Target
FY12
Improve the percent of Citizen Survey respondents rating satisfaction with the amount of information available on Historic Districts as “about right” *
68% 70% 71% 70%
Maintain or increase the percent of HDC members rating technical quality of staff reports as “good” or “excellent” at 100 percent **
1 / 1 or 100%
5 / 5 or 100%
3 / 3 or 100%
5 / 5 or 100%
Maintain or increase the percent of HDC members rating quality of staff presentations and discussion as “good” or “excellent” at 100 percent **
1 / 1 or 100%
5 / 5 or 100%
3 / 3 or 100%
5 / 5 or 100%
* The City conducts a citizen survey every other year. A survey was conducted in FY09 and the next survey will take place in FY11.
** Only one out five members responded to the survey in FY10.
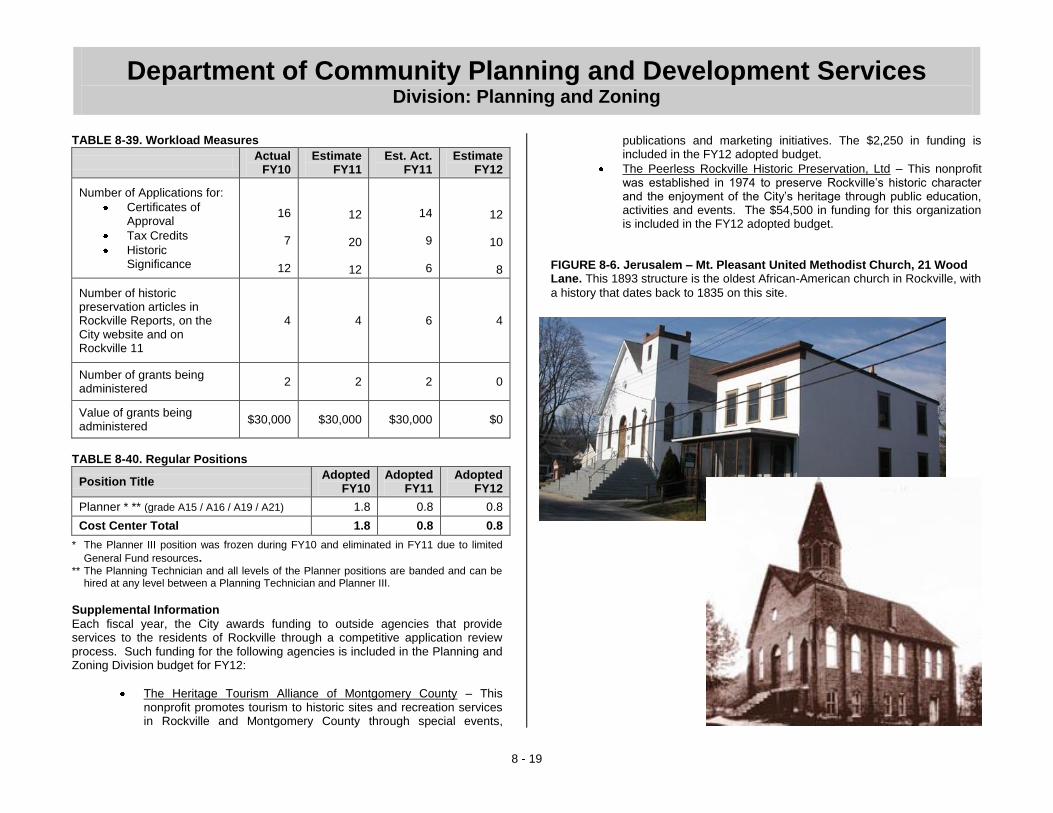
Department of Community Planning and Development Services Division: Planning and Zoning
8 - 19
TABLE 8-39. Workload Measures
Actual
FY10 Estimate
FY11 Est. Act.
FY11 Estimate
FY12
Number of Applications for:
Certificates of Approval
Tax Credits
Historic Significance
16
7
12
12
20
12
14
9
6
12
10
8
Number of historic preservation articles in Rockville Reports, on the City website and on Rockville 11
4 4 6 4
Number of grants being administered
2 2 2 0
Value of grants being administered
$30,000 $30,000 $30,000 $0
TABLE 8-40. Regular Positions
Position Title Adopted
FY10 Adopted
FY11 Adopted
FY12
Planner * ** (grade A15 / A16 / A19 / A21) 1.8 0.8 0.8
Cost Center Total 1.8 0.8 0.8
* The Planner III position was frozen during FY10 and eliminated in FY11 due to limited
General Fund resources. ** The Planning Technician and all levels of the Planner positions are banded and can be
hired at any level between a Planning Technician and Planner III. Supplemental Information
Each fiscal year, the City awards funding to outside agencies that provide services to the residents of Rockville through a competitive application review process. Such funding for the following agencies is included in the Planning and Zoning Division budget for FY12:
The Heritage Tourism Alliance of Montgomery County – This nonprofit promotes tourism to historic sites and recreation services in Rockville and Montgomery County through special events,
publications and marketing initiatives. The $2,250 in funding is included in the FY12 adopted budget.
The Peerless Rockville Historic Preservation, Ltd – This nonprofit was established in 1974 to preserve Rockville’s historic character and the enjoyment of the City’s heritage through public education, activities and events. The $54,500 in funding for this organization is included in the FY12 adopted budget.
FIGURE 8-6. Jerusalem – Mt. Pleasant United Methodist Church, 21 Wood Lane. This 1893 structure is the oldest African-American church in Rockville, with
a history that dates back to 1835 on this site.

Department of Community Planning and Development Services Division: Inspection Services
8 - 20
TABLE 8-41 Actual
FY10
Adopted
FY11
Est. Act.
FY11
Adopted
FY12
Division Expenditures
by Cost Center
Application, Processing
and Permit Issuance823,479 889,040 889,040 914,970
Building, Fire and Life
Safety Inspections *631,479 695,720 695,720 710,670
Division Total $1,454,958 $1,584,760 $1,584,760 $1,625,640
TABLE 8-42 Actual
FY10
Adopted
FY11
Est. Act.
FY11
Adopted
FY12
Department
Expenditures by Type
Salary and Wages 1,156,223 1,203,680 1,203,680 1,211,600
Benefits 260,944 325,100 325,100 351,660
Overtime 1,660 1,900 1,900 1,900
Personnel Subtotal $1,418,827 $1,530,680 $1,530,680 $1,565,160
Contractual Services 30,855 48,950 48,950 55,250
Commodities 5,276 5,130 5,130 5,230
Capital Outlays 0 0 0 0
Other 0 0 0 0
Operating Subtotal $36,131 $54,080 $54,080 $60,480
Division Total $1,454,958 $1,584,760 $1,584,760 $1,625,640
TABLE 8-43 Actual
FY10
Adopted
FY11
Est. Act.
FY11
Adopted
FY12
Source of
Division Funds
Departmental Revenue
Building Permits (110) 686,981 800,000 800,000 1,295,000Non-Business
Licenses (110) 124,591 110,000 110,000 110,000Fire Protection
Permit (110) 64,777 150,000 150,000 100,000
Fire Code Review (110) 46,750 75,000 75,000 75,000
Subtotal $923,099 $1,135,000 $1,135,000 $1,580,000
Fund Contribution
General Fund (110) 531,859 449,760 449,760 45,640
Subtotal $531,859 $449,760 $449,760 $45,640
Division Total $1,454,958 $1,584,760 $1,584,760 $1,625,640
TABLE 8-44 Actual
FY10
Adopted
FY11
Est. Act.
FY11
Adopted
FY12
Staffing Summary
by Cost Center (FTEs)
Regular
Application, Processing
and Permit Issuance10.0 10.0 10.0 10.0
Building, Fire and Life
Safety Inspections *8.0 8.0 8.0 8.0
Regular Subtotal 18.0 18.0 18.0 18.0
Temporary 0.0 0.0 0.0 0.0
Temporary Subtotal 0.0 0.0 0.0 0.0
Division Total 18.0 18.0 18.0 18.0
Division: Inspection Services
* The Inspection and Code Enforcement cost center was renamed to the Building, Fire and Life Safety Inspections cost center in FY12.

Department of Community Planning and Development Services Division: Inspection Services
8 - 21
Division: Inspection Services
Division Purpose
The Inspection Services Division enforces state-mandated codes and ordinances through the issuance of permits and contractor licenses, plan review, and the inspection of all phases of residential and commercial construction. In FY10 the staff led a complete rewrite of Chapter 5 of the City Code and the adoption of the 2009 International Codes. In FY12, the challenge will be the overhaul of Chapter 9 (Fire Safety Code) of the City Code, an ordinance over 30 years old. The staff administers the fire safety and building codes to increase safety and provide accessibility to the public that meets the requirements of the Maryland Accessibility Code. The Division will continue to implement means to increase effectiveness of service delivery to residents and contractors through training, process improvements, and public outreach and education. This includes implementation of an online construction trades permitting system. Significant Changes from Adopted to Adopted
Personnel expenditures increased by $34,480 or 2% mainly due to a 1% cost of living adjustment and a $26,560 increase in benefits. Contractual Services increased by $6,300 to purchase updated codes and publications from the International Code Council (ICC). Revenue increased by $445,000 due to a $495,000 increase in building permit fees as a result of the User Fee Study and a decrease of $50,000 in Fire Protection Permits due to a reduction in the scope of commercial projects that needed to modify existing fire protection systems.
Cost Center: Application, Processing & Permit Issuance TABLE 8-45. Cost Center Summary
Actual
FY10 Adopted
FY11 Est. Act.
FY11 Adopted
FY12
Total Expenditures 823,479 889,040 889,040 914,970
Total Revenues 923,099 1,135,000 1,135,000 1,580,000
Objectives
Provide accurate and timely customer service for permit application intake, processing, and issuance to reduce review time and provide a
better customer experience
Review commercial and residential plans in a timely manner to increase
the satisfaction and meet the needs of customers
TABLE 8-46. Performance Measures
Actual FY10
Target FY11
Est. Act. FY11
Target FY12
Increase the percent of Citizen Survey respondents rating the building permit process as “excellent” or “good” *
54% 60% 54% 54%
Maintain or decrease the average number of days to review plans each year
Residential new construction
23 20 33 30
Residential renovations/ remodeling
17 15 14 15
Commercial new construction
71 30 80 60
Commercial renovation 10 25 11 20
* The City conducts a citizen survey every other year. A survey was conducted in FY11 and the next survey will take place in FY13.
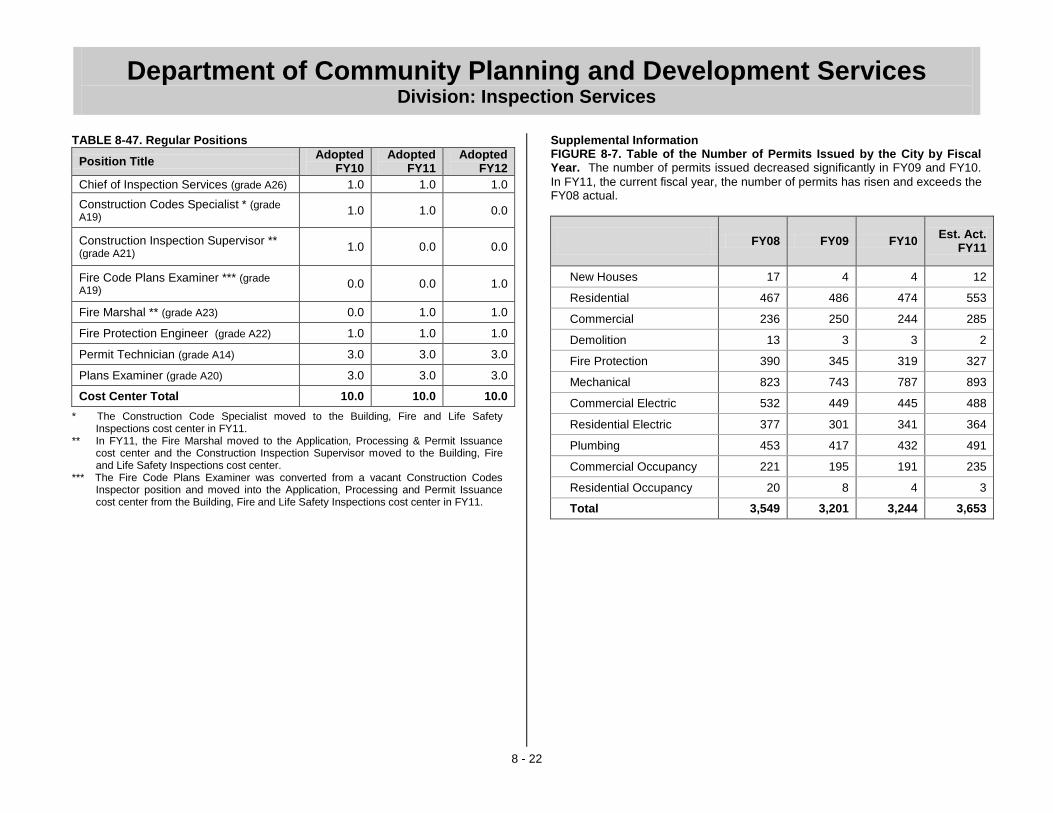
Department of Community Planning and Development Services Division: Inspection Services
8 - 22
TABLE 8-47. Regular Positions
Position Title Adopted
FY10 Adopted
FY11 Adopted
FY12
Chief of Inspection Services (grade A26) 1.0 1.0 1.0
Construction Codes Specialist * (grade A19)
1.0 1.0 0.0
Construction Inspection Supervisor ** (grade A21)
1.0 0.0 0.0
Fire Code Plans Examiner *** (grade A19)
0.0 0.0 1.0
Fire Marshal ** (grade A23) 0.0 1.0 1.0
Fire Protection Engineer (grade A22) 1.0 1.0 1.0
Permit Technician (grade A14) 3.0 3.0 3.0
Plans Examiner (grade A20) 3.0 3.0 3.0
Cost Center Total 10.0 10.0 10.0
* The Construction Code Specialist moved to the Building, Fire and Life Safety Inspections cost center in FY11.
** In FY11, the Fire Marshal moved to the Application, Processing & Permit Issuance cost center and the Construction Inspection Supervisor moved to the Building, Fire and Life Safety Inspections cost center.
*** The Fire Code Plans Examiner was converted from a vacant Construction Codes Inspector position and moved into the Application, Processing and Permit Issuance cost center from the Building, Fire and Life Safety Inspections cost center in FY11.
Supplemental Information FIGURE 8-7. Table of the Number of Permits Issued by the City by Fiscal Year. The number of permits issued decreased significantly in FY09 and FY10.
In FY11, the current fiscal year, the number of permits has risen and exceeds the FY08 actual.
FY08 FY09 FY10
Est. Act. FY11
New Houses 17 4 4 12
Residential 467 486 474 553
Commercial 236 250 244 285
Demolition 13 3 3 2
Fire Protection 390 345 319 327
Mechanical 823 743 787 893
Commercial Electric 532 449 445 488
Residential Electric 377 301 341 364
Plumbing 453 417 432 491
Commercial Occupancy 221 195 191 235
Residential Occupancy 20 8 4 3
Total 3,549 3,201 3,244 3,653
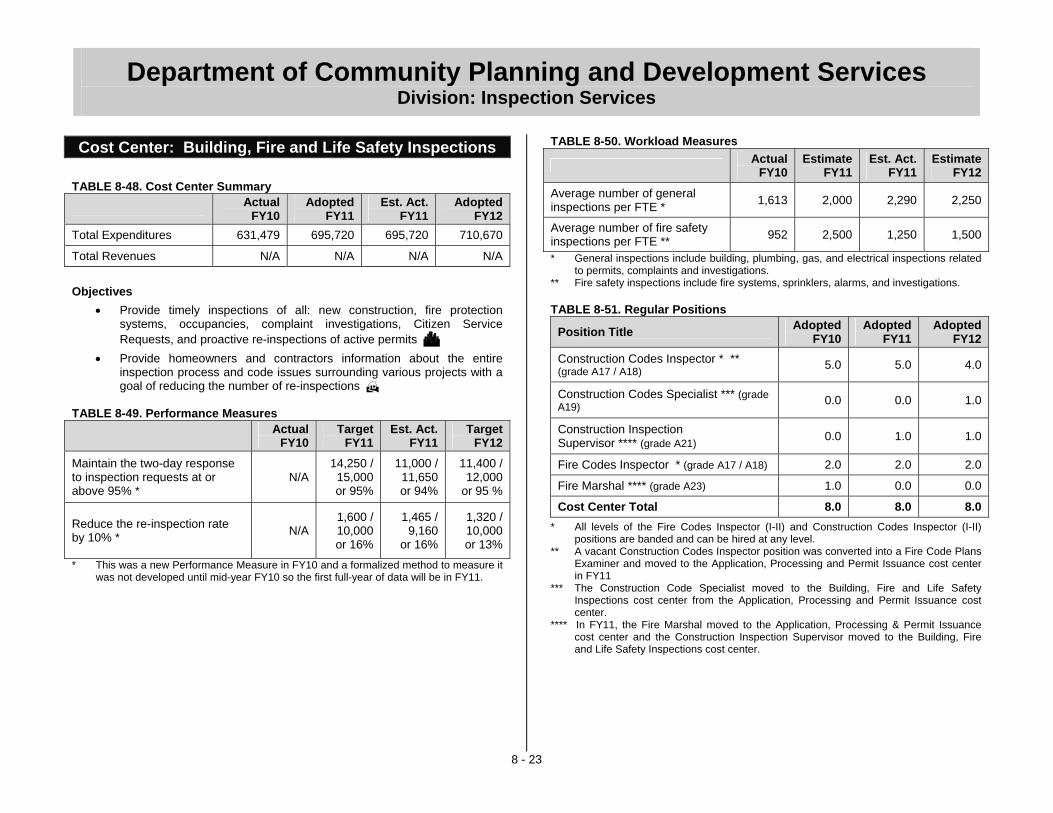
Department of Community Planning and Development Services Division: Inspection Services
8 - 23
Cost Center: Building, Fire and Life Safety Inspections
TABLE 8-48. Cost Center Summary
Actual FY10
Adopted FY11
Est. Act. FY11
Adopted FY12
Total Expenditures 631,479 695,720 695,720 710,670
Total Revenues N/A N/A N/A N/A Objectives
Provide timely inspections of all: new construction, fire protection systems, occupancies, complaint investigations, Citizen Service Requests, and proactive re-inspections of active permits
Provide homeowners and contractors information about the entire inspection process and code issues surrounding various projects with a goal of reducing the number of re-inspections
TABLE 8-49. Performance Measures Actual
FY10 Target
FY11 Est. Act.
FY11 Target
FY12 Maintain the two-day response to inspection requests at or above 95% *
N/A 14,250 / 15,000 or 95%
11,000 / 11,650 or 94%
11,400 / 12,000
or 95 %
Reduce the re-inspection rate by 10% * N/A
1,600 / 10,000 or 16%
1,465 / 9,160
or 16%
1,320 / 10,000 or 13%
* This was a new Performance Measure in FY10 and a formalized method to measure it was not developed until mid-year FY10 so the first full-year of data will be in FY11.
TABLE 8-50. Workload Measures
Actual FY10
Estimate FY11
Est. Act. FY11
Estimate FY12
Average number of general inspections per FTE * 1,613 2,000 2,290 2,250
Average number of fire safety inspections per FTE ** 952 2,500 1,250 1,500
* General inspections include building, plumbing, gas, and electrical inspections related to permits, complaints and investigations.
** Fire safety inspections include fire systems, sprinklers, alarms, and investigations. TABLE 8-51. Regular Positions
Position Title Adopted FY10
Adopted FY11
Adopted FY12
Construction Codes Inspector * ** (grade A17 / A18) 5.0 5.0 4.0
Construction Codes Specialist *** (grade A19) 0.0 0.0 1.0
Construction Inspection Supervisor **** (grade A21) 0.0 1.0 1.0
Fire Codes Inspector * (grade A17 / A18) 2.0 2.0 2.0
Fire Marshal **** (grade A23) 1.0 0.0 0.0
Cost Center Total 8.0 8.0 8.0
* All levels of the Fire Codes Inspector (I-II) and Construction Codes Inspector (I-II) positions are banded and can be hired at any level.
** A vacant Construction Codes Inspector position was converted into a Fire Code Plans Examiner and moved to the Application, Processing and Permit Issuance cost center in FY11
*** The Construction Code Specialist moved to the Building, Fire and Life Safety Inspections cost center from the Application, Processing and Permit Issuance cost center.
**** In FY11, the Fire Marshal moved to the Application, Processing & Permit Issuance cost center and the Construction Inspection Supervisor moved to the Building, Fire and Life Safety Inspections cost center.

Department of Community Planning and Development Services Division: Inspection Services
8 - 24
(This page intentionally left blank)

FIGURE 9-1. Departmental Organizational Chart
Department of FinanceDepartment Mission Statement
9 - 1
The Department of Finance maintains the City's high standard offinancial excellence by providing the citizens, employees, and vendorswith professional customer service through the collection anddisbursement of funds, financial reporting, and management of assets.
$0
$1,000,000
$2,000,000
$3,000,000
$4,000,000
ActualFY08
ActualFY09
ActualFY10
Est. Act.FY11
AdoptedFY12
GRAPH 9-2. Expenditures History
Administration12%
Budget10%
Accounting and Control
37%Revenue
23%
Purchasing & Stockroom
18%
GRAPH 9-3. Use of Funds
0
5
10
15
20
25
30
35
ActualFY08
ActualFY09
ActualFY10
Est. Act.FY11
AdoptedFY12
FT
Es
GRAPH 9-1. Staffing Trend
Total
Temporary
Regular
Department of Finance
Accounting and Control Revenue
Purchasing and Stockroom Budget
Administration
etompkins
Underline
etompkins
Underline
etompkins
Underline
etompkins
Underline
etompkins
Underline
etompkins
Underline
etompkins
Underline
etompkins
Underline
etompkins
Underline
etompkins
Underline

Department of Finance Department Summary
9 - 2
Department Summary
TABLE 9-1 Actual
FY10
Adopted
FY11
Est. Act.
FY11
Adopted
FY12
% Change
from Adpt.
Dept. Expenditures
by Division
Administration 471,116 404,590 426,228 414,670 2.5%
Accounting and Control 1,167,379 1,183,480 1,169,706 1,238,610 4.7%
Revenue 788,752 869,910 869,470 795,190 (8.6%)
Purchasing / Stockroom 560,391 579,800 581,703 596,960 3.0%
Budget 307,546 323,520 323,520 331,680 2.5%
Department Total $3,295,184 $3,361,300 $3,370,627 $3,377,110 0.5%
TABLE 9-2 Actual
FY10
Adopted
FY11
Est. Act.
FY11
Adopted
FY12
% Change
from Adpt.
Dept. Expenditures
by Type
Salary and Wages 2,190,638 2,181,660 2,162,560 2,157,410 (1.1%)
Benefits 507,013 603,860 603,860 649,970 7.6%
Overtime 14,056 5,000 5,000 5,000 0.0%
Personnel Subtotal $2,711,707 $2,790,520 $2,771,420 $2,812,380 0.8%
Contractual Services 502,162 441,100 474,777 434,850 (1.4%)
Commodities 16,510 16,780 16,530 16,730 (0.3%)
Capital Outlays 37,839 67,000 67,000 67,000 0.0%
Other 26,966 45,900 40,900 46,150 0.5%
Operating Subtotal $583,477 $570,780 $599,207 $564,730 (1.1%)
Department Total $3,295,184 $3,361,300 $3,370,627 $3,377,110 0.5%
TABLE 9-3 Actual
FY10
Adopted
FY11
Est. Act.
FY11
Adopted
FY12
% Change
from Adpt.
Source of
Dept. Funds
Departmental Revenue 0 0 0 0 N/A
Subtotal $0 $0 $0 $0 N/A
Fund Contribution
General Fund (110) 2,537,341 2,525,230 2,534,997 2,615,030 3.6%
Water (210) 757,843 836,070 835,630 762,080 (8.8%)
Subtotal $3,295,184 $3,361,300 $3,370,627 $3,377,110 0.5%
Department Total $3,295,184 $3,361,300 $3,370,627 $3,377,110 0.5%
TABLE 9-4 Actual
FY10
Adopted
FY11
Est. Act.
FY11
Adopted
FY12
% Change
from Adpt.
Staffing Summary
by Division (FTEs)
Regular
Administration 2.0 2.0 2.0 2.0 0.0%
Accounting and Control 10.0 10.0 10.0 10.0 0.0%
Revenue 9.0 9.0 9.0 8.0 (11.1%)
Purchasing / Stockroom 6.0 6.0 6.0 6.0 0.0%
Budget 3.0 3.0 3.0 3.0 0.0%
Regular Subtotal 30.0 30.0 30.0 29.0 (3.3%)
Temporary 0.0 0.0 0.0 0.0 N/A
Temporary Subtotal 0.0 0.0 0.0 0.0 N/A
Department Total 30.0 30.0 30.0 29.0 (3.3%)
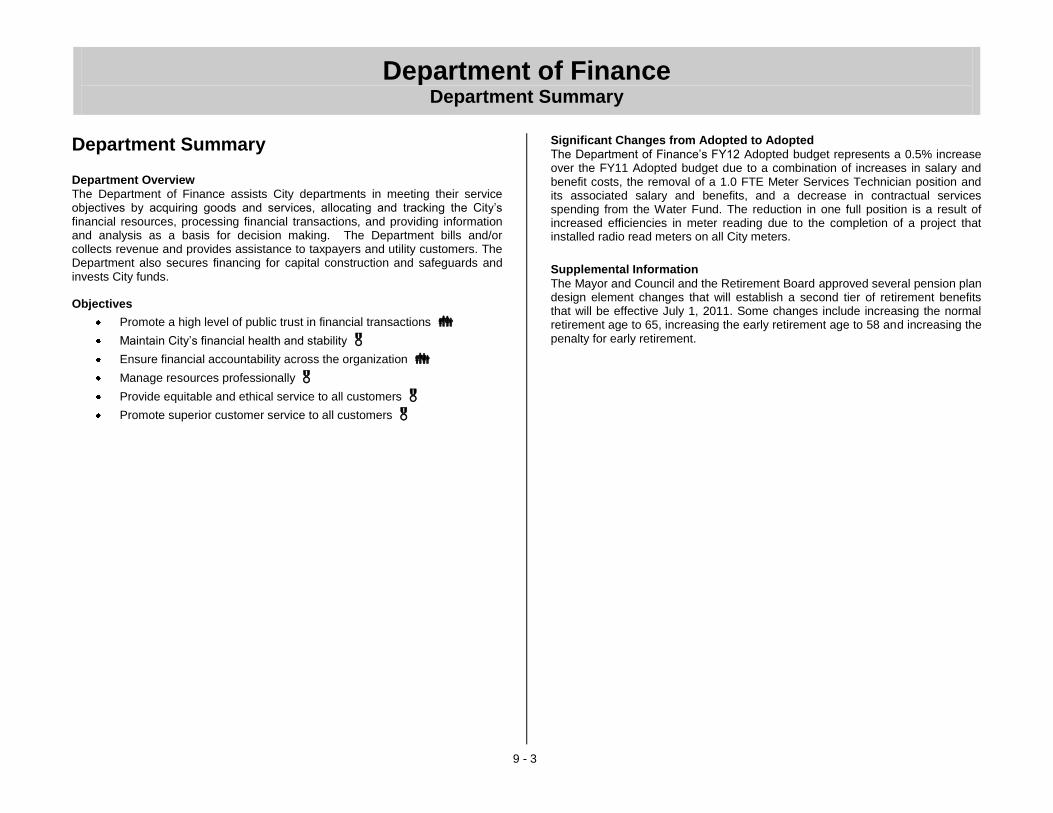
Department of Finance Department Summary
9 - 3
Department Summary Department Overview
The Department of Finance assists City departments in meeting their service objectives by acquiring goods and services, allocating and tracking the City’s financial resources, processing financial transactions, and providing information and analysis as a basis for decision making. The Department bills and/or collects revenue and provides assistance to taxpayers and utility customers. The Department also secures financing for capital construction and safeguards and invests City funds. Objectives
Promote a high level of public trust in financial transactions
Maintain City’s financial health and stability
Ensure financial accountability across the organization
Manage resources professionally
Provide equitable and ethical service to all customers
Promote superior customer service to all customers
Significant Changes from Adopted to Adopted
The Department of Finance’s FY12 Adopted budget represents a 0.5% increase over the FY11 Adopted budget due to a combination of increases in salary and benefit costs, the removal of a 1.0 FTE Meter Services Technician position and its associated salary and benefits, and a decrease in contractual services spending from the Water Fund. The reduction in one full position is a result of increased efficiencies in meter reading due to the completion of a project that installed radio read meters on all City meters.
Supplemental Information
The Mayor and Council and the Retirement Board approved several pension plan design element changes that will establish a second tier of retirement benefits that will be effective July 1, 2011. Some changes include increasing the normal retirement age to 65, increasing the early retirement age to 58 and increasing the penalty for early retirement.
etompkins
Underline

Department of Finance Division: Administration
9 - 4
Division: Administration TABLE 9-5 Actual
FY10
Adopted
FY11
Est. Act.
FY11
Adopted
FY12
Division Expenditures
by Cost Center
Administration 471,116 404,590 426,228 414,670
Division Total $471,116 $404,590 $426,228 $414,670
TABLE 9-6 Actual
FY10
Adopted
FY11
Est. Act.
FY11
Adopted
FY12
Division Expenditures
by Type
Salary and Wages 242,617 237,330 237,330 240,700
Benefits 51,323 60,060 60,060 66,920
Overtime 0 0 0 0
Personnel Subtotal $293,940 $297,390 $297,390 $307,620
Contractual Services 172,670 92,200 114,141 92,050
Commodities 4,506 5,000 4,697 5,000
Capital Outlays 0 0 0 0
Other 0 10,000 10,000 10,000
Operating Subtotal $177,176 $107,200 $128,838 $107,050
Division Total $471,116 $404,590 $426,228 $414,670
TABLE 9-7 Actual
FY10
Adopted
FY11
Est. Act.
FY11
Adopted
FY12
Source of
Division Funds
Departmental Revenue 0 0 0 0
Subtotal $0 $0 $0 $0
Fund Contribution
General Fund (110) 471,116 404,590 426,228 414,670
Subtotal $471,116 $404,590 $426,228 $414,670
Division Total $471,116 $404,590 $426,228 $414,670
TABLE 9-8 Actual
FY10
Adopted
FY11
Est. Act.
FY11
Adopted
FY12
Staffing Summary
by Cost Center (FTEs)
Regular
Administration 2.0 2.0 2.0 2.0
Regular Subtotal 2.0 2.0 2.0 2.0
Temporary 0.0 0.0 0.0 0.0
Temporary Subtotal 0.0 0.0 0.0 0.0
Division Total 2.0 2.0 2.0 2.0

Department of Finance Division: Administration
9 - 5
Division: Administration
Division Purpose
The Administration Division is responsible for developing financial management policies and strategies that promote the City’s financial integrity. The division develops equitable taxation systems and usage fees; maximizes the return on City investments at minimal risk; maintains banking relations; maintains relationships with Financial Advisors, Investment Advisors and rating agencies; plans and executes bond sales; and provides internal control oversight. The Chief Financial Officer serves as the Executive Secretary to the Retirement Board.
Significant Changes from Adopted to Adopted
The Administration Division’s FY12 Adopted budget represents a 2.5% increase over the FY11 Adopted budget due to increases in salary and benefit costs.
Cost Center: Administration
TABLE 9-9. Cost Center Summary
Actual
FY10 Adopted
FY11 Est. Act.
FY11 Adopted
FY12
Total Expenditures 471,116 404,590 426,228 414,670
Total Revenues N/A N/A N/A N/A
Objectives
Recommend and implement sound financial policies, practices, and
procedures to ensure the long-term financial health of the City
Carefully monitor cash flow needs with the goal of maximizing interest
income while maintaining a safe and liquid investment portfolio
Provide sound debt administration and management in order to maintain the City’s AAA / Aaa bond rating resulting in lower borrowing
costs for the City
Closely monitor the impact of economic conditions on major revenue sources and the City’s overall cash flow needs to ensure the timely
payment of vendor disbursements and payroll checks
Promote superior customer service among Finance Department staff
TABLE 9-10. Workload Measures
Actual
FY10 Estimate
FY11 Est. Act.
FY11 Estimate
FY12
Bond sales executed 0 1 1 1
TABLE 9-11. Performance Measures
Actual
FY10 Target
FY11 Est. Act.
FY11 Target
FY12
Maintain the General Fund fund balance at or above 15% of adopted revenues (figures shown in millions)
$15.29 / $62.08
or 24.6%
$9.32 / $62.10
or 15.0%
$11.43 / $62.10
or 18.4%
$9.91/ $66.04
or 15.0%
Maintain the investment interest rate earned as a % of the 3-month treasury-bill at or above 105%
0.10% / 0.12%
or 83%
0.20% / 0.19%
or 105%
0.20% / 0.19%
or 105%
1.00% / 0.95% or
105%
Maintain the City’s bond rating at AAA / Aaa
AAA / Aaa
AAA / Aaa
AAA / Aaa
AAA / Aaa
Maintain or increase the percentage of employees who rate Finance as “good” or “excellent” in the following:*
Knowledge
Courtesy
Responsiveness
Interdepartmental
Cooperation
237 / 293 or 81%
223 / 292 or 76%
209 / 292 or 72%
184 / 274 or 67%
237 / 293 or 81%
223 / 292 or 76%
209 / 292 or 72%
184 / 274 or 67%
203 / 224 or 91%
195 / 223 or 87%
184 / 219 or 84%
178 / 217 or 82%
203 / 224 or 91%
195 / 223 or 87%
184 / 219 or 84%
178 / 217 or 82%
* The City conducts an employee survey. An employee survey was performed in FY11 and the next survey will take place in FY13.
TABLE 9-12. Regular Positions
Position Title Adopted
FY10 Adopted
FY11 Adopted
FY12
Administrative Assistant I (grade A14) 1.0 1.0 1.0
Chief Financial Officer (grade SAII) 1.0 1.0 1.0
Cost Center Total 2.0 2.0 2.0
Supplemental Information
Each fiscal year, the City awards funding to outside agencies that provide services to the residents of Rockville through a competitive application review process. Included in the Administration Division for FY12 is $10,000 for the Rockville Volunteer Fire Department’s water utility bills.
etompkins
Underline
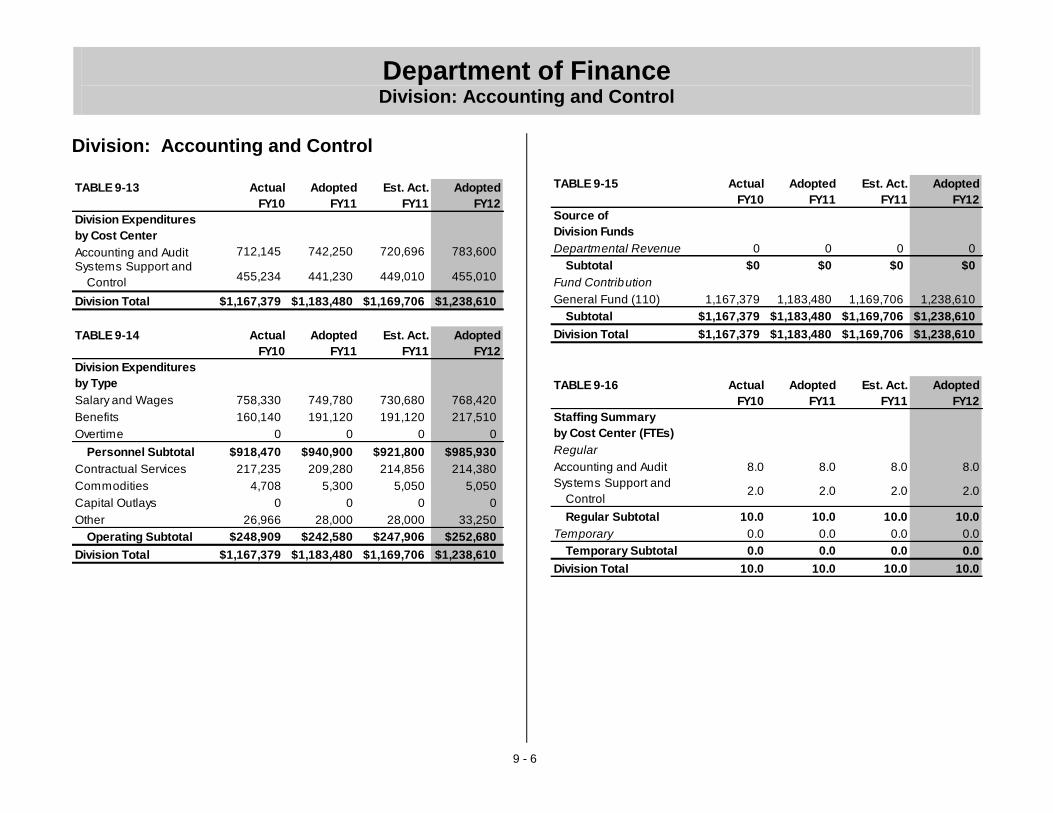
Department of Finance Division: Accounting and Control
9 - 6
Division: Accounting and Control
TABLE 9-13 Actual
FY10
Adopted
FY11
Est. Act.
FY11
Adopted
FY12
Division Expenditures
by Cost Center
Accounting and Audit 712,145 742,250 720,696 783,600
Systems Support and
Control455,234 441,230 449,010 455,010
Division Total $1,167,379 $1,183,480 $1,169,706 $1,238,610
TABLE 9-14 Actual
FY10
Adopted
FY11
Est. Act.
FY11
Adopted
FY12
Division Expenditures
by Type
Salary and Wages 758,330 749,780 730,680 768,420
Benefits 160,140 191,120 191,120 217,510
Overtime 0 0 0 0
Personnel Subtotal $918,470 $940,900 $921,800 $985,930
Contractual Services 217,235 209,280 214,856 214,380
Commodities 4,708 5,300 5,050 5,050
Capital Outlays 0 0 0 0
Other 26,966 28,000 28,000 33,250
Operating Subtotal $248,909 $242,580 $247,906 $252,680
Division Total $1,167,379 $1,183,480 $1,169,706 $1,238,610
TABLE 9-15 Actual
FY10
Adopted
FY11
Est. Act.
FY11
Adopted
FY12
Source of
Division Funds
Departmental Revenue 0 0 0 0
Subtotal $0 $0 $0 $0
Fund Contribution
General Fund (110) 1,167,379 1,183,480 1,169,706 1,238,610
Subtotal $1,167,379 $1,183,480 $1,169,706 $1,238,610
Division Total $1,167,379 $1,183,480 $1,169,706 $1,238,610
TABLE 9-16 Actual
FY10
Adopted
FY11
Est. Act.
FY11
Adopted
FY12
Staffing Summary
by Cost Center (FTEs)
Regular
Accounting and Audit 8.0 8.0 8.0 8.0
Systems Support and
Control2.0 2.0 2.0 2.0
Regular Subtotal 10.0 10.0 10.0 10.0
Temporary 0.0 0.0 0.0 0.0
Temporary Subtotal 0.0 0.0 0.0 0.0
Division Total 10.0 10.0 10.0 10.0
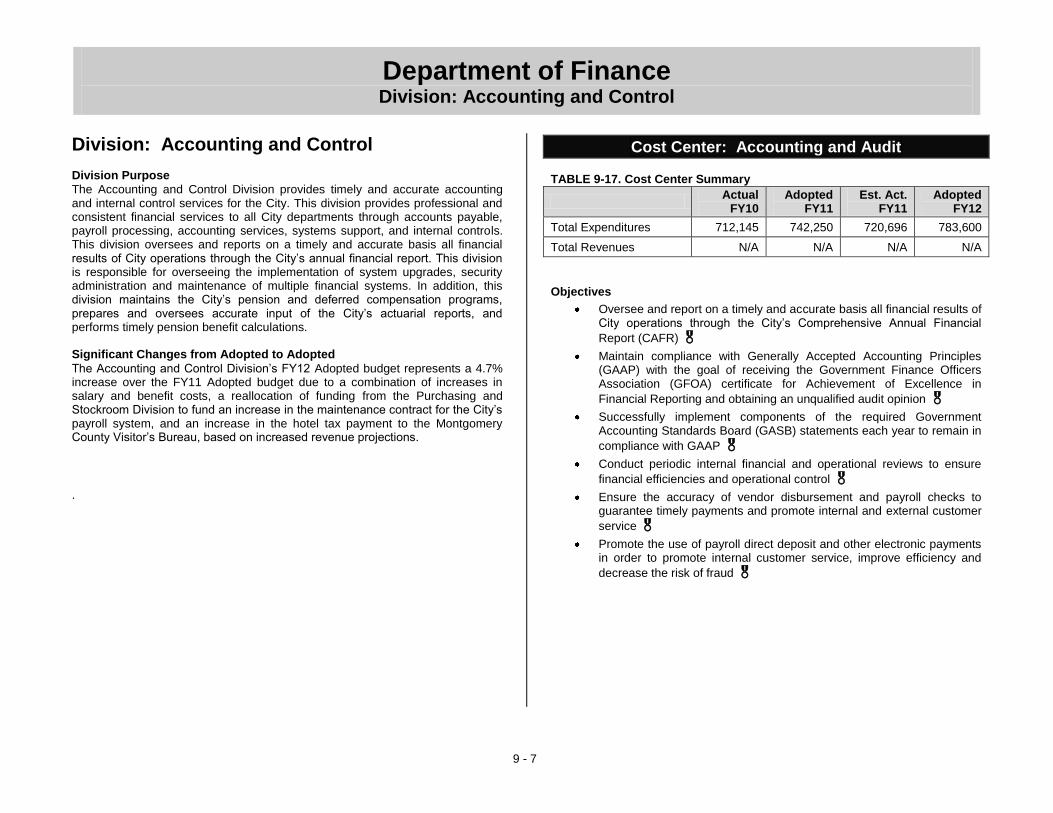
Department of Finance Division: Accounting and Control
9 - 7
Division: Accounting and Control Division Purpose
The Accounting and Control Division provides timely and accurate accounting and internal control services for the City. This division provides professional and consistent financial services to all City departments through accounts payable, payroll processing, accounting services, systems support, and internal controls. This division oversees and reports on a timely and accurate basis all financial results of City operations through the City’s annual financial report. This division is responsible for overseeing the implementation of system upgrades, security administration and maintenance of multiple financial systems. In addition, this division maintains the City’s pension and deferred compensation programs, prepares and oversees accurate input of the City’s actuarial reports, and performs timely pension benefit calculations. Significant Changes from Adopted to Adopted
The Accounting and Control Division’s FY12 Adopted budget represents a 4.7% increase over the FY11 Adopted budget due to a combination of increases in salary and benefit costs, a reallocation of funding from the Purchasing and Stockroom Division to fund an increase in the maintenance contract for the City’s payroll system, and an increase in the hotel tax payment to the Montgomery County Visitor’s Bureau, based on increased revenue projections.
.
Cost Center: Accounting and Audit TABLE 9-17. Cost Center Summary
Actual
FY10 Adopted
FY11 Est. Act.
FY11 Adopted
FY12
Total Expenditures 712,145 742,250 720,696 783,600
Total Revenues N/A N/A N/A N/A
Objectives
Oversee and report on a timely and accurate basis all financial results of City operations through the City’s Comprehensive Annual Financial
Report (CAFR)
Maintain compliance with Generally Accepted Accounting Principles (GAAP) with the goal of receiving the Government Finance Officers Association (GFOA) certificate for Achievement of Excellence in
Financial Reporting and obtaining an unqualified audit opinion
Successfully implement components of the required Government Accounting Standards Board (GASB) statements each year to remain in
compliance with GAAP
Conduct periodic internal financial and operational reviews to ensure
financial efficiencies and operational control
Ensure the accuracy of vendor disbursement and payroll checks to guarantee timely payments and promote internal and external customer
service
Promote the use of payroll direct deposit and other electronic payments in order to promote internal customer service, improve efficiency and
decrease the risk of fraud

Department of Finance Division: Accounting and Control
9 - 8
TABLE 9-18. Performance Measures
Actual FY10
Target FY11
Est. Act. FY11
Target FY12
Receive GFOA certificate for Achievement of Excellence in Financial Reporting for CAFR each year (shown in consecutive years)
Yes 21 Years
Yes 22 Years
Yes 22 Years
Yes 23 Years
Receive an unqualified City audit opinion each year
Yes Yes Yes Yes
Receive an unqualified single audit report each year
No Yes Yes Yes
Successfully implement 100% of required GASB statements*
0 / 0 or N/A
1 / 1 or 100%
1 / 1 or 100%
0 / 0 or N/A
Maintain the percent of internal financial and operational reviews in compliance at or above 80%
68 / 85 or 80%
68 / 85 or 80%
76 / 88 or 86%
68 / 85 or 80%
Maintain the number of voided payroll checks due to payroll error at zero
0 voids 0 voids 0 voids 0 voids
Decrease the number of voided vendor disbursement checks due to accounts payable error to zero
4 voids 0 voids 2 voids 0 voids
* In March 2009 the Governmental Accounting Standards Board (GASB) released GASB statement number 54, which makes changes to fund balance reporting and governmental fund type definitions. This statement must be implemented for financial statements beginning after June 2010, which is the City’s fiscal year 2011.
TABLE 9-19. Regular Positions
Position Title Adopted
FY10 Adopted
FY11 Adopted
FY12
Accountant (grade A19) 1.0 1.0 1.0
Accounts Payable Assistant I (grade A12)
1.0 1.0 1.0
Accounts Payable Assistant II (grade A13)
1.0 1.0 1.0
Financial Accounting Mgr. (grade A27) 1.0 1.0 1.0
Payroll Assistant I (grade A12) 1.0 1.0 1.0
Payroll Assistant II (grade A14) 1.0 1.0 1.0
Payroll Supervisor (grade A18) 1.0 1.0 1.0
Senior Accountant (grade A22) 1.0 1.0 1.0
Cost Center Total 8.0 8.0 8.0
Supplemental Information
New Audit Services During FY 2012, the City will issue a request for proposals (RFP) for new audit services. Comprehensive Annual Financial Report (CAFR) The Comprehensive Annual Financial Report (CAFR) is an annual financial report that is prepared by Finance in accordance the generally accepted accounting principles (GAAP). A CAFR has three major sections: introductory, financial, and statistical and is audited in accordance with generally accepted auditing standards (GAAS) by a firm of certified public accountants (CPA). The report is management’s representation of finances and is audited by the independent CPA firm of Reznick Group, PC. The City of Rockville’s most recent CAFR can be found at http://www.rockvillemd.gov/government/cafr/index.html.
The content and format of the CAFR is strictly prescribed, and many people have a difficult time understanding the contents of the CAFR. In order to make the financial information that is presented in the CAFR easier to read and understand, staff created the Popular Financial Annual Report (PAFR). The PAFR is not required to comply with GAAP, and provides summary information based on the numbers presented in the annual CAFR and the operating budget. The City of Rockville’s most recent PAFR can be found at http://www.rockvillemd.gov/government/pafr/index.html.
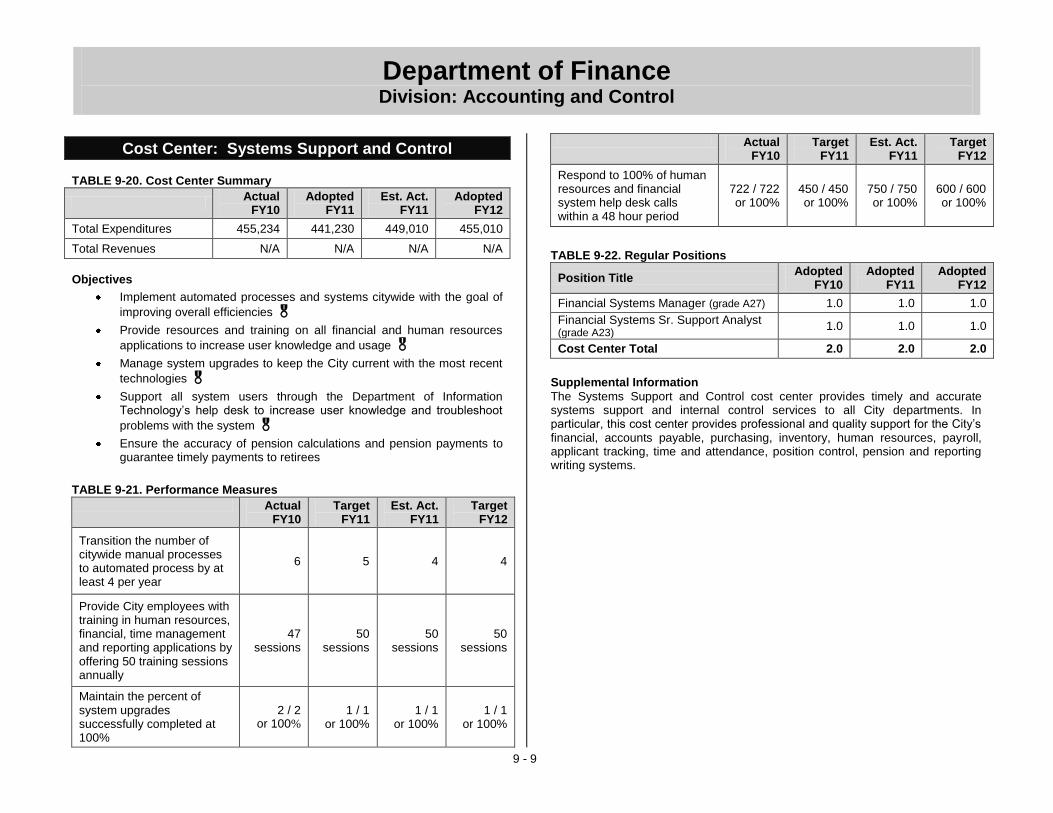
Department of Finance Division: Accounting and Control
9 - 9
Cost Center: Systems Support and Control TABLE 9-20. Cost Center Summary
Actual
FY10 Adopted
FY11 Est. Act.
FY11 Adopted
FY12
Total Expenditures 455,234 441,230 449,010 455,010
Total Revenues N/A N/A N/A N/A
Objectives
Implement automated processes and systems citywide with the goal of
improving overall efficiencies
Provide resources and training on all financial and human resources
applications to increase user knowledge and usage
Manage system upgrades to keep the City current with the most recent
technologies
Support all system users through the Department of Information Technology’s help desk to increase user knowledge and troubleshoot
problems with the system
Ensure the accuracy of pension calculations and pension payments to guarantee timely payments to retirees
TABLE 9-21. Performance Measures
Actual FY10
Target FY11
Est. Act. FY11
Target FY12
Transition the number of citywide manual processes to automated process by at least 4 per year
6 5 4 4
Provide City employees with training in human resources, financial, time management and reporting applications by offering 50 training sessions annually
47 sessions
50 sessions
50 sessions
50 sessions
Maintain the percent of system upgrades successfully completed at 100%
2 / 2 or 100%
1 / 1 or 100%
1 / 1 or 100%
1 / 1 or 100%
Actual FY10
Target FY11
Est. Act. FY11
Target FY12
Respond to 100% of human resources and financial system help desk calls within a 48 hour period
722 / 722 or 100%
450 / 450 or 100%
750 / 750 or 100%
600 / 600 or 100%
TABLE 9-22. Regular Positions
Position Title Adopted
FY10 Adopted
FY11 Adopted
FY12
Financial Systems Manager (grade A27) 1.0 1.0 1.0
Financial Systems Sr. Support Analyst (grade A23)
1.0 1.0 1.0
Cost Center Total 2.0 2.0 2.0
Supplemental Information
The Systems Support and Control cost center provides timely and accurate systems support and internal control services to all City departments. In particular, this cost center provides professional and quality support for the City’s financial, accounts payable, purchasing, inventory, human resources, payroll, applicant tracking, time and attendance, position control, pension and reporting writing systems.

Department of Finance Division: Revenue
9 - 10
Division: Revenue
TABLE 9-23 Actual
FY10
Adopted
FY11
Est. Act.
FY11
Adopted
FY12
Division Expenditures
by Cost Center
Revenue 788,752 869,910 869,470 795,190
Division Total $788,752 $869,910 $869,470 $795,190
TABLE 9-24 Actual
FY10
Adopted
FY11
Est. Act.
FY11
Adopted
FY12
Division Expenditures
by Type
Salary and Wages 496,194 502,350 502,350 447,140
Benefits 134,330 160,930 160,930 152,420
Overtime 14,056 5,000 5,000 5,000
Personnel Subtotal $644,580 $668,280 $668,280 $604,560
Contractual Services 100,194 129,530 129,090 118,530
Commodities 6,139 5,100 5,100 5,100
Capital Outlays 37,839 67,000 67,000 67,000
Other 0 0 0 0
Operating Subtotal $144,172 $201,630 $201,190 $190,630
Division Total $788,752 $869,910 $869,470 $795,190
TABLE 9-25 Actual
FY10
Adopted
FY11
Est. Act.
FY11
Adopted
FY12
Source of
Division Funds
Departmental Revenue 0 0 0 0
Subtotal $0 $0 $0 $0
Fund Contribution
General Fund (110) 30,909 33,840 33,840 33,110
Water Fund (210) 757,843 836,070 835,630 762,080
Subtotal $788,752 $869,910 $869,470 $795,190
Division Total $788,752 $869,910 $869,470 $795,190
TABLE 9-26 Actual
FY10
Adopted
FY11
Est. Act.
FY11
Adopted
FY12
Staffing Summary
by Cost Center (FTEs)
Regular
Revenue 9.0 9.0 9.0 8.0
Regular Subtotal 9.0 9.0 9.0 8.0
Temporary 0.0 0.0 0.0 0.0
Temporary Subtotal 0.0 0.0 0.0 0.0
Division Total 9.0 9.0 9.0 8.0

Department of Finance Division: Revenue
9 - 11
Division: Revenue Division Purpose
In a timely, accurate and equitable fashion, collect and record revenues for all City departments through the Finance cashier; manage the billing and collection of City water, sewer and refuse fees; and manage the billing and collection of special assessment charges. Significant Changes from Adopted to Adopted
The Revenue Division’s FY12 Adopted budget represents an 8.6% decrease over the FY11 Adopted budget due to a combination of increases in salary and benefit costs, the removal of a 1.0 FTE Meter Services Technician position and its associated salary and benefits, and a decrease in contractual services spending.
Cost Center: Revenue
TABLE 9-27. Cost Center Summary
Actual
FY10 Adopted
FY11 Est. Act.
FY11 Adopted
FY12
Total Expenditures 788,752 869,910 869,470 795,190
Total Revenues N/A N/A N/A N/A
Objectives
Perform periodic audits of the cashier and address any overage or
shortage issues to ensure fund collection accuracy
Prepare and analyze monthly reports in order to ensure utility bills are sent out on-time, and to ensure 100% of revenues are properly
collected and reported Perform periodic audits using CPDS information, GIS maps, refuse
operations information, and the Maryland Department of Assessments and Taxation records in order to ensure that all utility properties are
billed accurately and registered with the City Perform quarterly comparisons between single family permits and actual
onsite inspections in order to ensure that all accounts are billed
accurately in the utility billing system
Update the Water, Sewer, Refuse, and Stormwater Management Fund cash flows on an annual basis in order to ensure rates are equitable and
cover all operating and capital expenses
TABLE 9-28. Performance Measures
Actual FY10
Target FY11
Est. Act. FY11
Target FY12
Limit amount of cashier variance to no more than $25 for an entire year
$52 $25 $0 $25
Maintain the number and percent of monthly cashier spot audits that balance at 12 or 100%
12 / 12 or 100%
12 / 12 or 100%
12 / 12 or 100%
12 / 12 or 100%
etompkins
Underline

Department of Finance Division: Revenue
9 - 12
Actual FY10
Target FY11
Est. Act. FY11
Target FY12
Maintain the number and percent of bills sent out on time (by the 15
th of the month)
at 12 or 100%
11 / 12 or 92%
12 / 12 or 100%
12 / 12 or 100%
12 / 12 or 100%
Maintain 12 / 12 or 100% of monthly revenue that is properly collected and reported
12 / 12 or 100%
12 / 12 or 100%
12 / 12 or 100%
12 / 12 or 100%
Maintain 100% reconciliation between the Revenue Division’s refuse bill list to the Public Works’ refuse route list
4 / 4 or 100%
4 / 4 or 100%
4 / 4 or 100%
4 / 4 or 100%
Ensure 100% of comparisons between single family permits and actual onsite inspections are accurate
25 / 25 or 100%
25 / 25 or 100%
50 / 50 or 100%
50 / 50 or 100%
TABLE 9-29. Workload Measures
Actual
FY10 Estimate
FY11 Est. Act.
FY11 Estimate
FY12
Number of utility audits / year 4 4 4 4
Number of water meters read
Monthly
Quarterly
645
12,208
645
12,220
645
12,220
645
12,220
Number of bills issued:
Water / Sewer and Refuse
Special Assessments
79,432
64
79,500
77
79,500
77
79,500
87
Number of payments received through the online bill payment system*
N/A N/A 9,144 9,150
* This is a new Workload Measure for FY12.
TABLE 9-30. Regular Positions
Position Title Adopted
FY10 Adopted
FY11 Adopted
FY12
Cashier* (grade A11) 1.0 0.0 0.0
Meter Services Supervisor (grade A15) 1.0 1.0 1.0
Meter Services Technician** (grade A10) 3.0 3.0 2.0
Revenue Assistant I* (grade A12) 2.0 3.0 3.0
Revenue Assistant II (grade A14) 1.0 1.0 1.0
Revenue Supervisor (grade A24) 1.0 1.0 1.0
Cost Center Total 9.0 9.0 8.0
* A 1.0 FTE Cashier position was reclassified as a Revenue Assistant I position for FY11.
** A 1.0 FTE Meter Services Technician position was removed for FY12.

Department of Finance Division: Revenue
9 - 13
Supplemental Information GRAPH 9-4. The special assessment bills steadily decreased until FY10
because the front foot benefit charge is now assessed at the time of the building of a home and thus no longer handled by the City of Rockville. While this particular factor no longer creates a special assessment bill for the City, there are other reasons for special assessments, such as driveway repairs, which have contributed to the increase in special assessments in FY10, FY11 and FY12.
Number of Special Assessments
72
65
4245
24
64
77
87
0
10
20
30
40
50
60
70
80
90
100
FY
05
Actu
al
FY
06
Actu
al
FY
07
Actu
al
FY
08
Actu
al
FY
09
Actu
al
FY
10
Actu
al
FY
11
Estim
ate
FY
12
Estim
ate
FIGURE 9-2. The City’s Online Utility Bill Payment System. Customers can
log on to the City’s website, www.rockvillemd.gov, 24/7 to pay their utility bills online.

Department of Finance Division: Purchasing and Stockroom
9 - 14
Division: Purchasing and Stockroom
TABLE 9-31 Actual
FY10
Adopted
FY11
Est. Act.
FY11
Adopted
FY12
Division Expenditures
by Cost Center
Purchasing and Contracts 397,039 403,720 403,720 420,060
Stockroom 163,352 176,080 177,983 176,900
Division Total $560,391 $579,800 $581,703 $596,960
TABLE 9-32 Actual
FY10
Adopted
FY11
Est. Act.
FY11
Adopted
FY12
Division Expenditures
by Type
Salary and Wages 448,336 445,800 445,800 454,110
Benefits 100,622 120,520 120,520 134,170
Overtime 0 0 0 0
Personnel Subtotal $548,958 $566,320 $566,320 $588,280
Contractual Services 10,438 4,440 11,040 4,440
Commodities 995 1,140 1,443 1,340
Capital Outlays 0 0 0 0
Other 0 7,900 2,900 2,900
Operating Subtotal $11,433 $13,480 $15,383 $8,680
Division Total $560,391 $579,800 $581,703 $596,960
TABLE 9-33 Actual
FY10
Adopted
FY11
Est. Act.
FY11
Adopted
FY12
Source of
Division Funds
Departmental Revenue 0 0 0 0
Subtotal $0 $0 $0 $0
Fund Contribution
General Fund (110) 560,391 579,800 581,703 596,960
Subtotal $560,391 $579,800 $581,703 $596,960
Division Total $560,391 $579,800 $581,703 $596,960
TABLE 9-34 Actual
FY10
Adopted
FY11
Est. Act.
FY11
Adopted
FY12
Staffing Summary
by Cost Center (FTEs)
Regular
Purchasing and Contracts 4.0 4.0 4.0 4.0
Stockroom 2.0 2.0 2.0 2.0
Regular Subtotal 6.0 6.0 6.0 6.0
Temporary 0.0 0.0 0.0 0.0
Temporary Subtotal 0.0 0.0 0.0 0.0
Division Total 6.0 6.0 6.0 6.0

Department of Finance Division: Purchasing and Stockroom
9 - 15
Division: Purchasing and Stockroom
Division Purpose
To provide the City with the means to secure quality goods and services at the best value and in a timely manner while maintaining the integrity of the bidding process and conforming to City, State and Federal requirements. The Stockroom provides effective, efficient and accountable management of materials for the City by taking time to understand and satisfy the requirements of customers to the extent allowed while maintaining the financial and production controls necessary to run a responsible and transparent governmental operation. Significant Changes from Adopted to Adopted
The Purchasing and Stockroom Division’s FY12 Adopted budget represents a 3.0% increase over the FY11 Adopted budget due to a combination of increases in salary and benefit costs, and a reallocation of funding from this Division to fund an increase in the maintenance contract for the City’s payroll system in the Accounting and Control Division.
Cost Center: Purchasing and Contracts
TABLE 9-35. Cost Center Summary
Actual
FY10 Adopted
FY11 Est. Act.
FY11 Adopted
FY12
Total Expenditures 397,039 403,720 403,720 420,060
Total Revenues N/A N/A N/A N/A
Objectives
Ensure the integrity of the public bidding process in order to promote
competition
Increase the use of procurement cards for purchases to obtain
monetary rebates and reduce overall processing costs
Ensure best value procurement for all City to purchases in order to
reduce capital and operating costs
TABLE 9-36. Performance Measures
Actual FY10
Target FY11
Est. Act. FY11
Target FY12
Maintain the percent of formal solicitations awarded without valid protest at 100%
40 / 40 or 100%
40 / 40 or 100%
50 / 50 or 100%
50 / 50 or 100%
Maintain the percentage of formal bid savings at or above 10%*
29% 29% 29% 29%
Maintain or increase the number of procurement cards issued in the City at or above 84 annually
84 84 85 85
Maintain or increase the annual amount of rebates and incentives received at or above $30,000**
$0 $30,000 $10,000 $10,000
* Actual dollar amounts may vary greatly from year to year depending on the City’s needs. For this reason, only a target percentage of savings is given for all targets and estimates.
** There was no annual rebate in FY10 due to decreased expenditures under Cooperative Contract Group Spending. Staff replaced this contract with a more favorable contract for FY11.
TABLE 9-37. Regular Positions
Position Title Adopted
FY10 Adopted
FY11 Adopted
FY12
Buyer I (grade A17) 1.0 0.5 0.5
Buyer II (grade A18) 1.0 1.5 1.5
Contract Specialist (grade A23) 1.0 1.0 1.0
Purchasing Manager (grade A26) 1.0 1.0 1.0
Cost Center Total 4.0 4.0 4.0
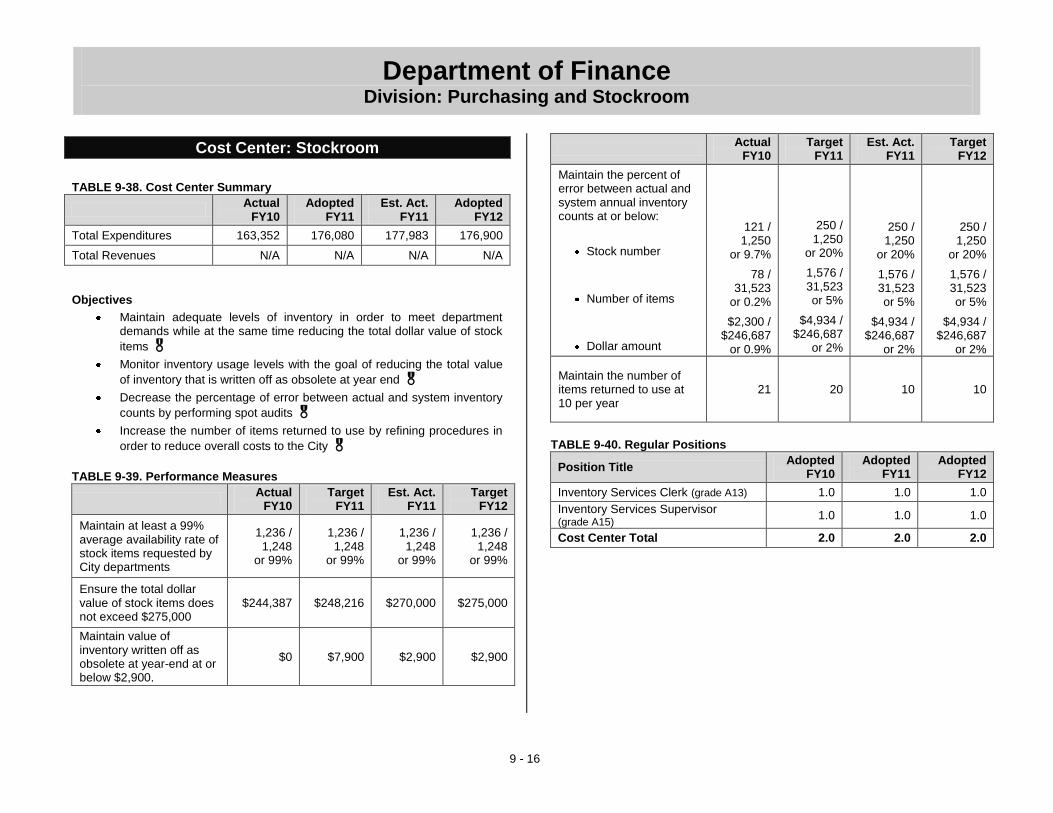
Department of Finance Division: Purchasing and Stockroom
9 - 16
Cost Center: Stockroom
TABLE 9-38. Cost Center Summary
Actual
FY10 Adopted
FY11 Est. Act.
FY11 Adopted
FY12
Total Expenditures 163,352 176,080 177,983 176,900
Total Revenues N/A N/A N/A N/A
Objectives
Maintain adequate levels of inventory in order to meet department demands while at the same time reducing the total dollar value of stock
items
Monitor inventory usage levels with the goal of reducing the total value
of inventory that is written off as obsolete at year end
Decrease the percentage of error between actual and system inventory
counts by performing spot audits
Increase the number of items returned to use by refining procedures in
order to reduce overall costs to the City
TABLE 9-39. Performance Measures
Actual
FY10 Target
FY11 Est. Act.
FY11 Target
FY12
Maintain at least a 99% average availability rate of stock items requested by City departments
1,236 / 1,248
or 99%
1,236 / 1,248
or 99%
1,236 / 1,248
or 99%
1,236 / 1,248
or 99%
Ensure the total dollar value of stock items does not exceed $275,000
$244,387 $248,216 $270,000 $275,000
Maintain value of inventory written off as obsolete at year-end at or below $2,900.
$0 $7,900 $2,900 $2,900
Actual
FY10 Target
FY11 Est. Act.
FY11 Target
FY12
Maintain the percent of error between actual and system annual inventory counts at or below:
Stock number
Number of items
Dollar amount
121 / 1,250
or 9.7%
78 / 31,523
or 0.2%
$2,300 / $246,687
or 0.9%
250 / 1,250
or 20%
1,576 / 31,523 or 5%
$4,934 / $246,687
or 2%
250 / 1,250
or 20%
1,576 / 31,523 or 5%
$4,934 / $246,687
or 2%
250 / 1,250
or 20%
1,576 / 31,523 or 5%
$4,934 / $246,687
or 2%
Maintain the number of items returned to use at 10 per year
21
20
10 10
TABLE 9-40. Regular Positions
Position Title Adopted
FY10 Adopted
FY11 Adopted
FY12
Inventory Services Clerk (grade A13) 1.0 1.0 1.0
Inventory Services Supervisor (grade A15)
1.0 1.0 1.0
Cost Center Total 2.0 2.0 2.0
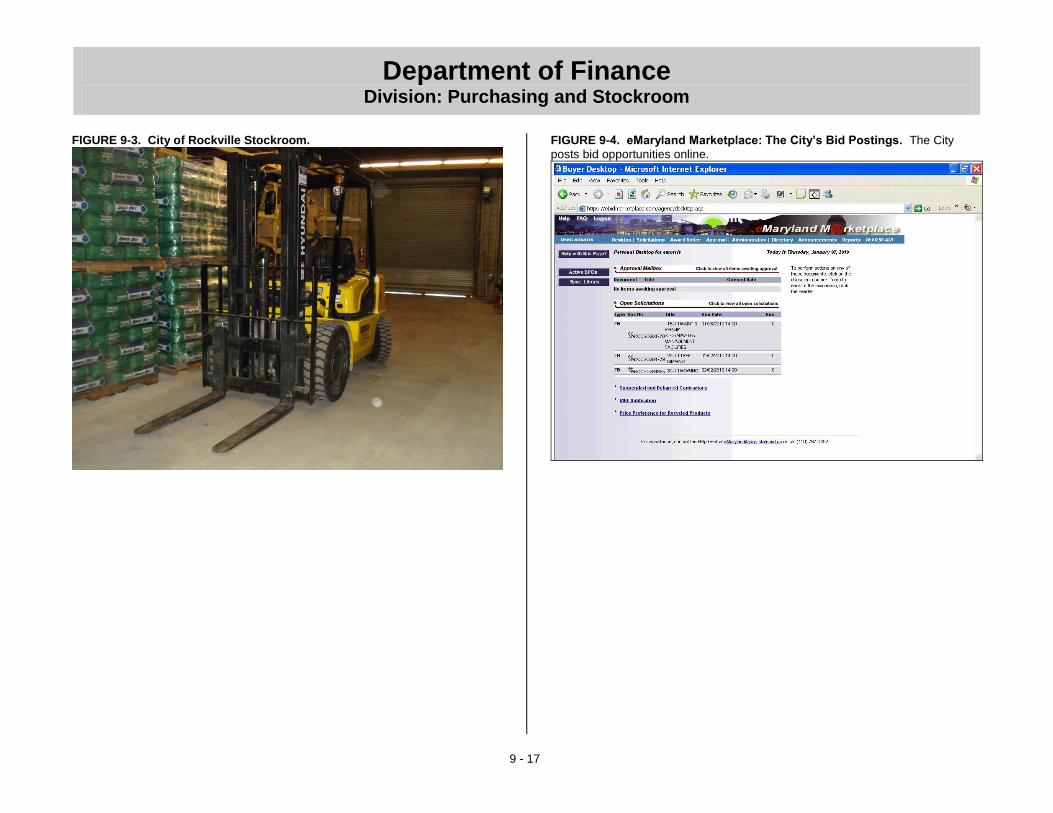
Department of Finance Division: Purchasing and Stockroom
9 - 17
FIGURE 9-3. City of Rockville Stockroom.
FIGURE 9-4. eMaryland Marketplace: The City’s Bid Postings. The City
posts bid opportunities online.

Department of Finance Division: Budget
9 - 18
Division: Budget
TABLE 9-41 Actual
FY10
Adopted
FY11
Est. Act.
FY11
Adopted
FY12
Division Expenditures
by Cost Center
Budget 307,546 323,520 323,520 331,680
Division Total $307,546 $323,520 $323,520 $331,680
TABLE 9-42 Actual
FY10
Adopted
FY11
Est. Act.
FY11
Adopted
FY12
Division Expenditures
by Type
Salary and Wages 245,161 246,400 246,400 247,040
Benefits 60,598 71,230 71,230 78,950
Overtime 0 0 0 0
Personnel Subtotal $305,759 $317,630 $317,630 $325,990
Contractual Services 1,625 5,650 5,650 5,450
Commodities 162 240 240 240
Capital Outlays 0 0 0 0
Other 0 0 0 0
Operating Subtotal $1,787 $5,890 $5,890 $5,690
Division Total $307,546 $323,520 $323,520 $331,680
TABLE 9-43 Actual
FY10
Adopted
FY11
Est. Act.
FY11
Adopted
FY12
Source of
Division Funds
Departmental Revenue 0 0 0 0
Subtotal $0 $0 $0 $0
Fund Contribution
General Fund (110) 307,546 323,520 323,520 331,680
Subtotal $307,546 $323,520 $323,520 $331,680
Division Total $307,546 $323,520 $323,520 $331,680
TABLE 9-44 Actual
FY10
Adopted
FY11
Est. Act.
FY11
Adopted
FY12
Staffing Summary
by Cost Center (FTEs)
Regular
Budget 3.0 3.0 3.0 3.0
Regular Subtotal 3.0 3.0 3.0 3.0
Temporary 0.0 0.0 0.0 0.0
Temporary Subtotal 0.0 0.0 0.0 0.0
Division Total 3.0 3.0 3.0 3.0

Department of Finance Division: Budget
9 - 19
Division: Budget Division Purpose
The Budget Division oversees and reports on a timely and accurate basis all budgetary policies and procedures through the City’s annual Operating and Capital Improvements Program budgets. This division also provides services related to resource allocation, fiscal analysis, and forecasting, and regularly provides objective information and recommendations to the Mayor and Council, City Manager, and City departments. Significant Changes from Adopted to Adopted
The Budget Division’s FY12 Adopted budget represents a 2.5% increase over the FY11 Adopted budget due to increases in salary and benefit costs.
Cost Center: Budget
TABLE 9-45. Cost Center Summary
Actual
FY10 Adopted
FY11 Est. Act.
FY11 Adopted
FY12
Total Expenditures 307,546 323,520 323,520 331,680
Total Revenues N/A N/A N/A N/A
Objectives
Oversee and report on a timely and accurate basis all budgetary information in the City’s annual Operating and Capital Improvements Program budgets to ensure proper management and reporting of the
City’s fiscal resources
Maintain compliance with the Government Finance Officers Association (GFOA) best practices in order to receive the GFOA Distinguished Budget Presentation Award and the GFOA Popular Annual Financial
Reporting Award each year
Provide group training to City employees with the goal of improving employee understanding and satisfaction with the overall budget
process
Provide services and reports related to resource allocation, fiscal analysis, and financial forecasting in order to assist the Mayor and Council, City Manager, and City departments in establishing priorities
and allocating resources appropriately
Implement realizable recommendations from internal and external users to ensure continuous improvements to the City’s budget process and budget documents
TABLE 9-46. Performance Measures
Actual
FY10 Target
FY11 Est. Act.
FY11 Target
FY12
Maintain overall variance within 5% of the adopted General Fund budget (amounts shown in millions)
Revenues
Expenditures
$62.0 / $62.1
or 100%
$60.3 / $62.1
or 97%
$62.1 / $62.1
or 100%
$63.1 / $63.1
or 100%
$63.0 / $62.1
or 101%
$66.9 / $63.1
or 106%
$66.0 / $66.0
or 100%
$66.0 / $66.0
or 100%
Receive the GFOA Distinguished Budget Presentation Award each year for the annual operating and CIP budgets (shown in consecutive years)
Yes 19 Years
Yes 20 Years
Yes 20 Years
Yes 21 Years
Receive the GFOA Popular Annual Financial Reporting Award each year for the PAFR (shown in consecutive years)
Yes 3 Years
Yes 4 Years
Yes 4 Years
Yes 5 Years
Increase the number and percent of training participants who rate budget management training as “excellent” by at least 10%
22 / 26 or 85%
27 / 30 or 90%
36 / 49 or 73%
42 / 50 or 84%
Maintain the percent of employees that rate the annual budget process as “excellent” or “good” at or above 80%*
161 / 230 or 70%
184 / 230 or 80%
88 / 90 or 98%
88 / 90 or 98%
* The City conducts an employee survey every other year. An employee survey was conducted in FY11 and the next survey will take place in FY13.

Department of Finance Division: Budget
9 - 20
TABLE 9-47. Regular Positions
Position Title Adopted
FY10 Adopted
FY11 Adopted
FY12
Budget and Finance Manager (grade A27)
1.0 1.0 1.0
Management and Budget Analyst (grade A22)
2.0 2.0 2.0
Cost Center Total 3.0 3.0 3.0
Supplemental Information FIGURE 9-5. Budget Reports. The Budget Division is responsible for preparing
reports and documents that are submitted to the Mayor and Council, City Manager, and City departments on a regular basis. This figure shows a list of reports that the Budget Division prepares with a description of the report and the distribution frequency.
Report Type and Description Distribution Frequency
Amendments to the Budget Ordinance – This
document is necessary to adjust the budget amounts in the Operating Budget or Capital Improvements Program Budget during the fiscal year. Since the budget is adopted at the fund level, a change in the appropriated amount of any fund requires the Mayor and Council to adopt an amendment to the budget ordinance. Amendments usually take place three to four times per fiscal year
As Needed (3 to 4 per year)
Bond Proceeds Spending Report – This report details
the amount of bond proceeds that are spent from a specific bond issue. It is important to track this information in order to maintain compliance with federal arbitrage rebate regulations
Quarterly
Budget-to-Actual Department Reports – These
reports identify how current expenditures and revenues compare to budgeted expenditures and revenues. In these reports budget staff identify areas that may require adjustments during the fiscal year. These reports serve as an important tool for the prudent management of citywide resources
Quarterly
Report Type and Description Distribution Frequency
Capital Improvements Program (CIP) Budget – The
CIP maps the City’s capital investment plan over a five-year period. The CIP is both a fiscal and planning device that allows the City to inventory and monitor all capital project costs, funding sources, departmental responsibilities, and project schedules
Annual
Cash and Investment Portfolio Summary Report –
This report presents a summary of the City’s investment portfolio and cash balances, required by Section XIX of the City’s Investment Policy. Due to the City’s passive strategy and limited trading, this report is quarterly
Quarterly
Financial Report – This report presents revenue and
expenditure data for the City's General and enterprise funds. This report is prepared on a modified accrual / accrual basis consistent with the City's budget and financial statements. This report compares the actual revenues and expenditure data to the adopted budget and modified budget
Quarterly
Operating Budget – The Operating Budget provides
the Mayor and Council, City residents, and City staff with detailed information about the City’s operations and spending. The Operating Budget serves as a policy document, financial plan, operations guide, and communications device
Annual
Popular Annual Financial Report (PAFR) – The
PAFR summarizes the City of Rockville's financial position at the end of the fiscal year. The PAFR highlights how tax dollars were spent, major initiatives, and ongoing financial challenges and opportunities the City may face. The PAFR is composed of financial information presented in the City’s Comprehensive Annual Financial Report (CAFR) and future information as estimated in the City's adopted budget
Annual
Salary Projection Report – This report summarizes
the estimated salary and benefit information for all City employees. This report is utilized during the budget planning process in order to obtain accurate estimates for total personnel costs across all funds
Annual
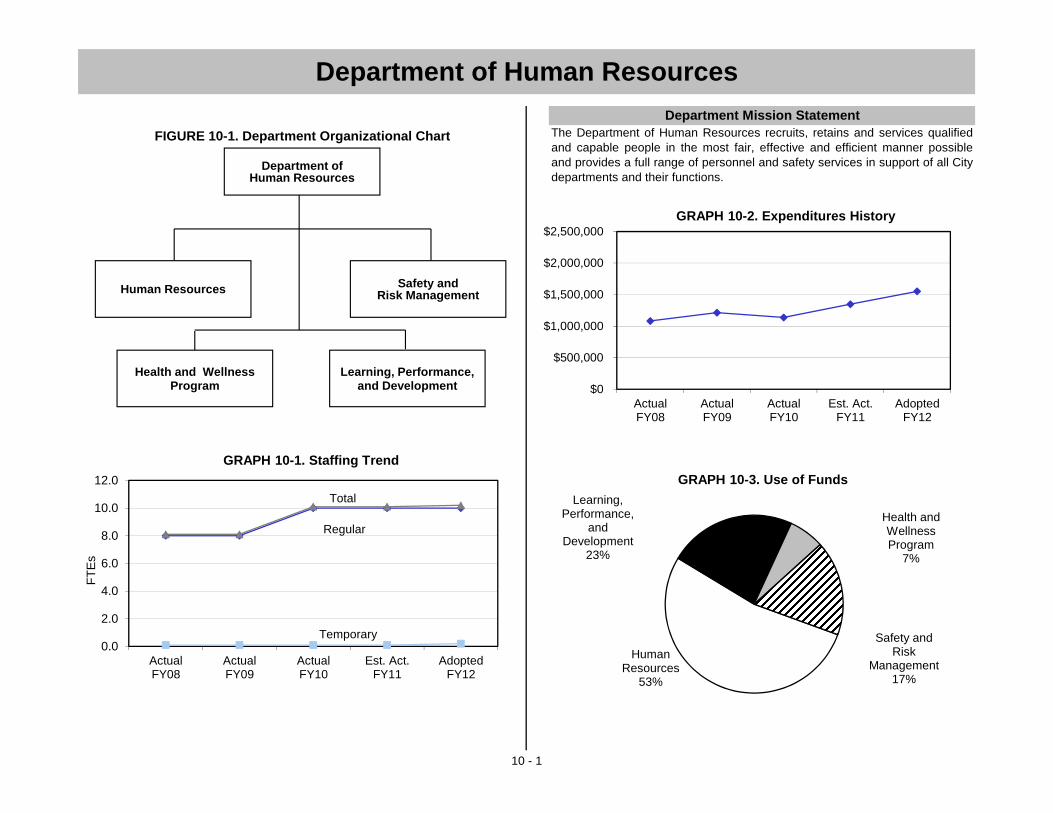
10 - 1
FIGURE 10-1. Department Organizational Chart
Department of Human Resources
The Department of Human Resources recruits, retains and services qualifiedand capable people in the most fair, effective and efficient manner possibleand provides a full range of personnel and safety services in support of all Citydepartments and their functions.
Department Mission Statement
$0
$500,000
$1,000,000
$1,500,000
$2,000,000
$2,500,000
ActualFY08
ActualFY09
ActualFY10
Est. Act.FY11
AdoptedFY12
GRAPH 10-2. Expenditures History
Human Resources
53%
Learning, Performance,
and Development
23%
Health and Wellness Program
7%
Safety and Risk
Management17%
GRAPH 10-3. Use of Funds
0.0
2.0
4.0
6.0
8.0
10.0
12.0
ActualFY08
ActualFY09
ActualFY10
Est. Act.FY11
AdoptedFY12
FT
Es
GRAPH 10-1. Staffing Trend
Total
Temporary
Regular
Department of Human Resources
Human Resources Safety and Risk Management
Learning, Performance, and Development
Health and Wellness Program
etompkins
Underline
etompkins
Underline
etompkins
Underline
etompkins
Underline
etompkins
Underline
etompkins
Underline
etompkins
Underline
etompkins
Underline
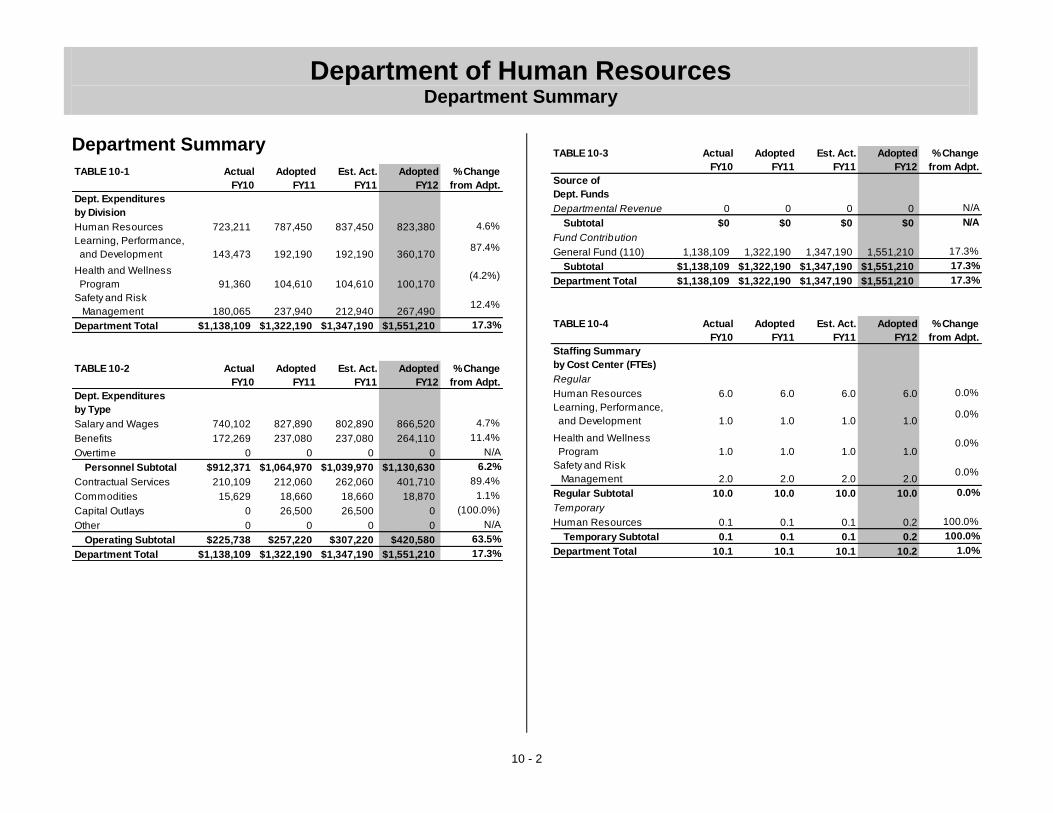
Department of Human Resources Department Summary
10 - 2
Department Summary
TABLE 10-1 Actual
FY10
Adopted
FY11
Est. Act.
FY11
Adopted
FY12
% Change
from Adpt.
Dept. Expenditures
by Division
Human Resources 723,211 787,450 837,450 823,380 4.6%
Learning, Performance,
and Development 143,473 192,190 192,190 360,17087.4%
Health and Wellness
Program 91,360 104,610 104,610 100,170(4.2%)
Safety and Risk
Management 180,065 237,940 212,940 267,49012.4%
Department Total $1,138,109 $1,322,190 $1,347,190 $1,551,210 17.3%
TABLE 10-2 Actual
FY10
Adopted
FY11
Est. Act.
FY11
Adopted
FY12
% Change
from Adpt.
Dept. Expenditures
by Type
Salary and Wages 740,102 827,890 802,890 866,520 4.7%
Benefits 172,269 237,080 237,080 264,110 11.4%
Overtime 0 0 0 0 N/A
Personnel Subtotal $912,371 $1,064,970 $1,039,970 $1,130,630 6.2%
Contractual Services 210,109 212,060 262,060 401,710 89.4%
Commodities 15,629 18,660 18,660 18,870 1.1%
Capital Outlays 0 26,500 26,500 0 (100.0%)
Other 0 0 0 0 N/A
Operating Subtotal $225,738 $257,220 $307,220 $420,580 63.5%
Department Total $1,138,109 $1,322,190 $1,347,190 $1,551,210 17.3%
TABLE 10-3 Actual
FY10
Adopted
FY11
Est. Act.
FY11
Adopted
FY12
% Change
from Adpt.
Source of
Dept. Funds
Departmental Revenue 0 0 0 0 N/A
Subtotal $0 $0 $0 $0 N/A
Fund Contribution
General Fund (110) 1,138,109 1,322,190 1,347,190 1,551,210 17.3%
Subtotal $1,138,109 $1,322,190 $1,347,190 $1,551,210 17.3%
Department Total $1,138,109 $1,322,190 $1,347,190 $1,551,210 17.3%
TABLE 10-4 Actual
FY10
Adopted
FY11
Est. Act.
FY11
Adopted
FY12
% Change
from Adpt.
Staffing Summary
by Cost Center (FTEs)
Regular
Human Resources 6.0 6.0 6.0 6.0 0.0%
Learning, Performance,
and Development 1.0 1.0 1.0 1.00.0%
Health and Wellness
Program 1.0 1.0 1.0 1.00.0%
Safety and Risk
Management 2.0 2.0 2.0 2.00.0%
Regular Subtotal 10.0 10.0 10.0 10.0 0.0%
Temporary
Human Resources 0.1 0.1 0.1 0.2 100.0%
Temporary Subtotal 0.1 0.1 0.1 0.2 100.0%
Department Total 10.1 10.1 10.1 10.2 1.0%

Department of Human Resources Department Summary
10 - 3
Department Summary Department Overview
The Department of Human Resources provides services to ensure that all City departments have the human resources necessary to support their respective missions, as well as to ensure appropriate classification, salary/grade, recruitment, testing, training, benefits, labor relations, equal opportunity employment, and diversity. The Department oversees safety and risk management; policy and program administration; and manages a variety of employee events and special projects.
Human Resources includes the following programs:
Staffing/Recruitment Services
The Staffing/Recruitment Services program is responsible for recruiting, testing, and certifying candidates to meet current and future needs of departments. These functions are carried out in ways that attract quality candidates in compliance with the expectations of all City employees.
Health and Wellness
The Health and Wellness program coordinates, promotes, and provides services that assist and encourage employees to be healthy in mind and body.
Learning, Performance, and Development
The Learning, Performance and Development program provides quality citywide training programs, organizational interventions, and consultation and administrative support to enhance the growth and performance of individuals, teams, departments, and the City organization.
Total Rewards
Our department goal is to provide a Total Rewards program emphasizing attraction, motivation and retention with a highly effective, strategically designed package including compensation, benefits, work-life, performance and recognition, and development and career opportunities.
Labor and Employee Relations
The Labor and Employee Relations program provides advice on labor and employment issues such as the meet and confer process with labor unions, grievance and dispute resolution, disciplinary actions and appeals, leave provisions, and Federal and State labor laws. The Human Resources Department serves as the primary point of contact for the City's recognized
labor organizations and negotiates on behalf of the City with regard to wages, hours, and terms and conditions of employment.
Safety and Risk Management
The Safety and Risk Management program provides a safe work environment for all City employees and ensures the safest possible delivery of City services. A proactive approach is taken towards regulatory compliance, claims management and the protection of City assets.
Significant Changes from Adopted to Adopted
Personnel expenditures increased by $65,660 or 6% mainly due to a 1% cost of living adjustment; an increase of $21,800 due to the hiring of two Human Resources Associates and a Loss Control Administrator; a $5,700 increase in temporary worker funding; and a $27,000 increase in benefits. Contractual Services increased by $189,650 mainly due to the addition of $170,000 for centralized employee professional development and $20,500 for the annual maintenance contract for the Talent Management system; an increase of $4,800 in recruitment and office equipment expenditures; and a decrease of $5,700 in consultants. Capital Outlays decreased by $26,500 due to the removal of the one-time purchase cost of the Talent Management system.
etompkins
Underline
etompkins
Underline
etompkins
Underline
etompkins
Underline
etompkins
Underline

Department of Human Resources Division: Human Resources
10 - 4
Division: Human Resources
TABLE 10-5 Actual
FY10
Adopted
FY11
Est. Act.
FY11
Adopted
FY12
Division Expenditures
by Cost Center
Human Resources 723,211 787,450 837,450 823,380
Division Total $723,211 $787,450 $837,450 $823,380
TABLE 10-6 Actual
FY10
Adopted
FY11
Est. Act.
FY11
Adopted
FY12
Division Expenditures
by Type
Salary and Wages 469,351 517,040 517,040 539,680
Benefits 105,377 144,590 144,590 153,010
Overtime 0 0 0 0
Personnel Subtotal $574,728 $661,630 $661,630 $692,690
Contractual Services 142,527 118,690 168,690 123,560
Commodities 5,956 7,130 7,130 7,130
Capital Outlays 0 0 0
Other 0 0 0 0
Operating Subtotal $148,483 $125,820 $175,820 $130,690
Division Total $723,211 $787,450 $837,450 $823,380
TABLE 10-7 Actual
FY10
Adopted
FY11
Est. Act.
FY11
Adopted
FY12
Source of
Division Funds
Departmental Revenue 0 0 0 0
Subtotal $0 $0 $0 $0
Fund Contribution
General Fund (110) 723,211 787,450 837,450 823,380
Subtotal $723,211 $787,450 $837,450 $823,380
Division Total $723,211 $787,450 $837,450 $823,380
TABLE 10-8 Actual
FY10
Adopted
FY11
Est. Act.
FY11
Adopted
FY12
Staffing Summary
by Cost Center (FTEs)
Regular
Human Resources 6.0 6.0 6.0 6.0
Regular Subtotal 6.0 6.0 6.0 6.0
Temporary
Human Resources 0.1 0.1 0.1 0.2
Temporary Subtotal 0.1 0.1 0.1 0.2
Division Total 6.1 6.1 6.1 6.2

Department of Human Resources Division: Human Resources
10 - 5
Division: Human Resources Division Purpose
The purpose of the Human Resources Division is to provide for the recruitment, selection, and evaluation of City employees; take an active role in personnel management, labor relations, wage administration, and human resource development; interpret union contracts and the Personnel Policies and Procedures; maintain the appropriate record keeping to remain in compliance with State and Federal employment guidelines; and to fulfill the benefit requirements for City of Rockville employees and their families in order to attract and retain a quality workforce which provides exceptional services to the constituents of the City in a cost effective manner. Significant Changes from Adopted to Adopted
Personnel expenditures increased by $31,060 or 5% mainly due to a 1% cost of living adjustment; an $8,600 increase due to the hiring of two Human Resources Associates; a $5,700 increase in temporary worker funding; and an $8,000 increase in the cost of benefits.
Cost Center: Human Resources
TABLE 10-9. Cost Center Summary
Actual
FY10 Adopted
FY11 Est. Act.
FY11 Adopted
FY12
Total Expenditures 723,211 787,450 837,450 823,380
Total Revenues N/A N/A N/A N/A
Objectives
Develop, manage, and improve the City of Rockville Human Resource (HR) programs for City employees to ensure equal employment opportunity, career development, and sound business practices in an
ethical, cost effective and innovative manner
Provide City departments with quality recruitment services and applicant
screening for all position vacancies
Provide benefits that are competitive and sustainable in order to attract
and retain key talent
Ensure that the City’s policy objectives are effectively incorporated into all bargaining matters with each of the City’s recognized bargaining units in order to ensure effective and efficient services for the City while
maintaining harmonious relationships with the labor organizations
TABLE 10-10. Performance Measures
Actual FY10
Target FY11
Est. Act. FY11
Target FY12
Increase the percent of Step 1 grievances by bargaining units resolved within 15 days (unless extension agreed upon by both parties) to 100%
6 / 11 or 55%
5 / 5 or 100%
10 / 10 or 100%
10 / 10 or 100%
Maintain the percentage of applications received using NeoGov online application system at 100%
100% or 8,455
100%
or 6,854
100% or 8,500
100% or 8,500
Reduce average number of days to conduct recruitments to 20
15 30 20 20
Increase the number of courses leading to job-related degrees approved for tuition reimbursement
6 / 10 or 60%
10 / 10 or 100%
7 / 10 or 70%
9 / 10 or 90%
etompkins
Underline
etompkins
Underline

Department of Human Resources Division: Human Resources
10 - 6
TABLE 10-11. Workload Measures
Actual FY10
Estimate FY11
Est. Act. FY11
Estimate FY12
Number of benefited regular, part-time, and temporary employees served
1,437 1,531 1,531 1,531
Number of positions filled (Regular)
10 25 25 25
Number of separations processed (Regular)
30 30 20 20
TABLE 10-12. Regular Positions
Position Title Adopted
FY10 Adopted
FY11 Adopted
FY12
Chief Human Resources Officer (grade SAII)
1.0 1.0 1.0
Human Resources Administrator * (grade A23)
3.0 3.0 2.0
Human Resources Assistant (grade A14)
2.0 1.0 1.0
Human Resources Associate * (grade A16)
0.0 1.0 2.0
Cost Center Total 6.0 6.0 6.0
* During FY11 a Human Resources Administrator was reclassified into a Human Resources Associate.
Supplemental Information The Human Resources cost center objectives will be accomplished by focusing on the following:
Promote effective dispute resolution;
Foster positive relationships through open communication between unions and management;
Support adherence to labor-related policies and procedures through continued education of employees and supervisors;
Encourage management to use labor relations to assist with relevant issues;
Continue to ensure that our benefit plans are competitive and sustainable when compared with other jurisdictions;
Continue to provide education and tools that enable participants to understand the benefits program and make informed decisions;
Improve accountability and customer service in recruitment; Utilize new technologies to improve customer services;
Assist departments with succession planning;
Assist departments to modify human resource practices that support their mission but comply with employment laws;
Market plans to support hiring and retention of a high performing workforce;
Continue to expand the number of employees teleworking in support of the City’s endorsement of the Metropolitan Council of Government’s (COG) regional telecommuting initiatives; and
Increase job vacancy exposure to a diverse population by continued use of the World Wide Web (i.e.GovtJobs.com, Monster.com) and other publications.
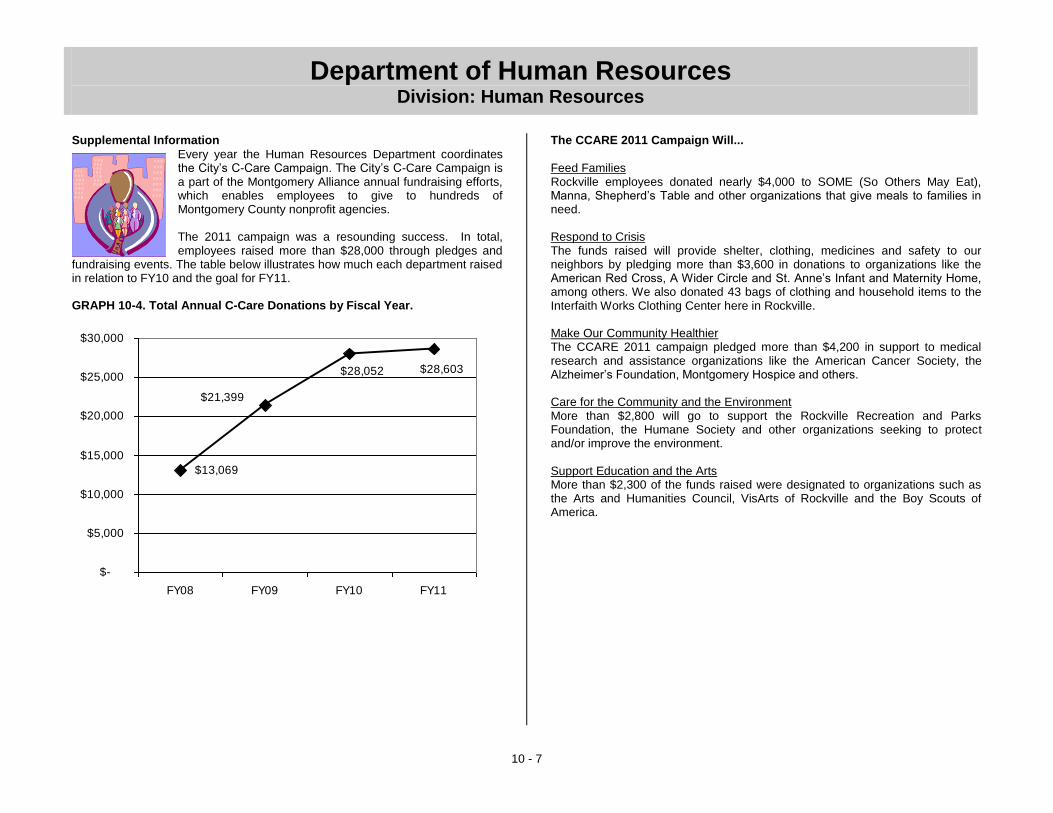
Department of Human Resources Division: Human Resources
10 - 7
$13,069
$28,603
$21,399
$28,052
$-
$5,000
$10,000
$15,000
$20,000
$25,000
$30,000
FY08 FY09 FY10 FY11
Supplemental Information
Every year the Human Resources Department coordinates the City’s C-Care Campaign. The City’s C-Care Campaign is a part of the Montgomery Alliance annual fundraising efforts, which enables employees to give to hundreds of Montgomery County nonprofit agencies. The 2011 campaign was a resounding success. In total, employees raised more than $28,000 through pledges and
fundraising events. The table below illustrates how much each department raised in relation to FY10 and the goal for FY11. GRAPH 10-4. Total Annual C-Care Donations by Fiscal Year.
The CCARE 2011 Campaign Will...
Feed Families Rockville employees donated nearly $4,000 to SOME (So Others May Eat), Manna, Shepherd’s Table and other organizations that give meals to families in need. Respond to Crisis The funds raised will provide shelter, clothing, medicines and safety to our neighbors by pledging more than $3,600 in donations to organizations like the American Red Cross, A Wider Circle and St. Anne’s Infant and Maternity Home, among others. We also donated 43 bags of clothing and household items to the Interfaith Works Clothing Center here in Rockville. Make Our Community Healthier The CCARE 2011 campaign pledged more than $4,200 in support to medical research and assistance organizations like the American Cancer Society, the Alzheimer’s Foundation, Montgomery Hospice and others. Care for the Community and the Environment More than $2,800 will go to support the Rockville Recreation and Parks Foundation, the Humane Society and other organizations seeking to protect and/or improve the environment. Support Education and the Arts More than $2,300 of the funds raised were designated to organizations such as the Arts and Humanities Council, VisArts of Rockville and the Boy Scouts of America.

Department of Human Resources Division: Learning, Performance, and Development
10 - 8
TABLE 10-13 Actual
FY10
Adopted
FY11
Est. Act.
FY11
Adopted
FY12
Division Expenditures
by Cost Center
Learning, Performance,
and Development 143,473 192,190 192,190 360,170
Division Total $143,473 $192,190 $192,190 $360,170
TABLE 10-14 Actual
FY10
Adopted
FY11
Est. Act.
FY11
Adopted
FY12
Division Expenditures
by Type
Salary and Wages 97,731 99,470 99,470 100,690
Benefits 20,247 24,460 24,460 27,220
Overtime 0 0 0 0
Personnel Subtotal $117,978 $123,930 $123,930 $127,910
Contractual Services 21,640 35,330 35,330 225,830
Commodities 3,855 6,430 6,430 6,430
Capital Outlays 0 26,500 26,500 0
Other 0 0 0 0
Operating Subtotal $25,495 $68,260 $68,260 $232,260
Division Total $143,473 $192,190 $192,190 $360,170
TABLE 10-15 Actual
FY10
Adopted
FY11
Est. Act.
FY11
Adopted
FY12
Source of
Division Funds
Departmental Revenue 0 0 0 0
Subtotal $0 $0 $0 $0
Fund Contribution
General Fund (110) 143,473 192,190 192,190 360,170
Subtotal $143,473 $192,190 $192,190 $360,170
Division Total $143,473 $192,190 $192,190 $360,170
TABLE 10-16 Actual
FY10
Adopted
FY11
Est. Act.
FY11
Adopted
FY12
Staffing Summary
by Cost Center (FTEs)
Regular
Learning, Performance,
and Development 1.0 1.0 1.0 1.0
Regular Subtotal 1.0 1.0 1.0 1.0
Temporary 0.0 0.0 0.0 0.0
Temporary Subtotal 0.0 0.0 0.0 0.0
Division Total 1.0 1.0 1.0 1.0
Division: Learning, Performance & Development

Department of Human Resources Division: Learning, Performance, and Development
10 - 9
Division: Learning, Performance & Development Division Purpose
The purpose of the Learning, Performance and Development Division is to provide employee development opportunities to all City departments so the City can meet its hiring needs efficiently, maintain legal compliance, and help organizations and employees accomplish the City's work in a productive and cost-effective manner. Significant Changes from Adopted to Adopted
Contractual Services increased by $190,500 mainly due to the addition of $170,000 for centralized employee professional development and $20,500 for the annual maintenance contract for the Talent Management system. Capital Outlays decreased by $26,500 due to the removal of the one-time purchase cost of the Talent Management system.
Cost Center: Learning, Performance, and Development TABLE 10-17. Cost Center Summary
Actual
FY10 Adopted
FY11 Est. Act.
FY11 Adopted
FY12
Total Expenditures 143,473 192,190 192,190 360,170
Total Revenues N/A N/A N/A N/A
Objectives
Identify, design and provide quality training programs that employees feel are relevant and enable employees to meet the diverse needs and
expectations of City residents
Contract for, market, schedule, and evaluate citywide classes in order to maintain compliance with relevant employment laws (e.g. EEO, FMLA, FLSA, etc.) and to develop employee skills to meet the changing needs
of the organization
Provide a comprehensive, knowledge-based new employee orientation
program in order to help employees acclimate to the City’s culture
TABLE 10-18. Performance Measures
Actual FY10
Target FY11
Est. Act. FY11
Target FY12
Maintain the percent of training participants rating courses as “related to my current job” or “related to a career objective” at or above 75%
117 / 147
or 80%
320 / 400
or 80%*
140 / 175
or 80%*
320 / 400
or 80%*
Maintain the percentage of training participants rating City training courses as “good” or “excellent” at or above 80%
140 / 147
or 95%
320 / 400
or 80%
140 / 175
or 80%
320 / 400
or 80%
Achieve 100% participation in new employee orientation by non-public safety employees
35 / 35 or 100%
25 / 25 or 100%
39 / 39 or 100%
40 / 40 or 100%
* The mandatory training class and training on the new Talent Management System will occur in FY12 instead of FY11.
TABLE 10-19. Regular Positions
Position Title Adopted
FY10 Adopted
FY11 Adopted
FY12
Human Resources Administrator (grade A23)
1.0 1.0 1.0
Cost Center Total 1.0 1.0 1.0
Supplemental Information
The following activities will aid in building and maintaining a sound learning, performance and development program:
Conduct ongoing learning needs assessments and environmental scans to determine what training activities are needed throughout the City;
Leverage collaborative training resources through other agencies (e.g. Montgomery County Government, WSSC, etc.); and
Establish a mandatory training program – Mandatory training will help provide the information and/or skills supervisors need to successfully manage their workgroups and minimize the City’s vicarious liability through its managers (e.g. EEO, ADA, workplace safety, etc.).

Department of Human Resources Division: Health and Wellness Program
10 - 10
Division: Health and Wellness Program TABLE 10-20 Actual
FY10
Adopted
FY11
Est. Act.
FY11
Adopted
FY12
Division Expenditures
by Cost Center
Health and Wellness
Program 91,360 104,610 104,610 100,170
Division Total $91,360 $104,610 $104,610 $100,170
TABLE 10-21 Actual
FY10
Adopted
FY11
Est. Act.
FY11
Adopted
FY12
Division Expenditures
by Type
Salary and Wages 60,835 61,800 61,800 61,360
Benefits 14,625 17,470 17,470 19,190
Overtime 0 0 0 0
Personnel Subtotal $75,460 $79,270 $79,270 $80,550
Contractual Services 10,752 20,740 20,740 15,020
Commodities 5,148 4,600 4,600 4,600
Capital Outlays 0 0 0 0
Other 0 0 0 0
Operating Subtotal $15,900 $25,340 $25,340 $19,620
Division Total $91,360 $104,610 $104,610 $100,170
TABLE 10-22 Actual
FY10
Adopted
FY11
Est. Act.
FY11
Adopted
FY12
Source of
Division Funds
Departmental Revenue 0 0 0 0
Subtotal $0 $0 $0 $0
Fund Contribution
General Fund (110) 91,360 104,610 104,610 100,170
Subtotal $91,360 $104,610 $104,610 $100,170
Division Total $91,360 $104,610 $104,610 $100,170
TABLE 10-23 Actual
FY10
Adopted
FY11
Est. Act.
FY11
Adopted
FY12
Staffing Summary
by Cost Center (FTEs)
Regular
Health and Wellness
Program 1.0 1.0 1.0 1.0
Regular Subtotal 1.0 1.0 1.0 1.0
Temporary 0.0 0.0 0.0 0.0
Temporary Subtotal 0.0 0.0 0.0 0.0
Division Total 1.0 1.0 1.0 1.0

Department of Human Resources Division: Health and Wellness Program
10 - 11
Division: Health and Wellness Program Division Purpose
The purpose of the Health and Wellness Program is to promote behavior change and healthy lifestyle choices. This change is achieved through various organizational practices, policies, programs and a philosophy that actively supports efforts to help employees achieve success at both work and home. The Health and Wellness program helps target specific health-related concerns like obesity, smoking, alcoholism and drug abuse along with related conditions. The Health and Wellness program strives to improve the health of employees, reduce medical-related costs, and reduce absenteeism. Significant Changes from Adopted to Adopted
Contractual Services decreased by $5,720 due to a decrease in consultants.
Cost Center: Health and Wellness Program TABLE 10-24. Cost Center Summary
Actual
FY10 Adopted
FY11 Est. Act.
FY11 Adopted
FY12
Total Expenditures 91,360 104,610 104,610 100,170
Total Revenues N/A N/A N/A N/A
Objectives
Offer employee wellness programs that encourage people to make behavioral changes that lead to healthier lifestyles
Offer health screenings to employees to detect potential illness and provide risk assessment
Provide a high quality, comprehensive health fair to educate employees on health related topics and issues
TABLE 10-25. Performance Measures
Actual FY10
Target FY11
Est. Act. FY11
Target FY12
Maintain or increase employee participation in Wellness Programs
340 / 500 or 68%
340 / 500 or 68%
340 / 500 or 68%
350 / 500 or 70%
Maintain the number of:
Wellness Programs (30) 30 30 35 30
Workshops (10) 13 13 10* 10*
Screenings (27) 27 27 27 27
Maintain the number of health fair survey respondents who rate the overall benefit as “good” or “excellent” at 97%
98 / 100 or 98%
97 / 100 or 97%
97 / 100 or 97%
97 / 100 or 97%
* The number of workshops offered in FY11 and projected for FY12 has decreased due to an increase in the cost of the nutritionist.
TABLE 10-26. Regular Positions
Position Title Adopted
FY10 Adopted
FY11 Adopted
FY12
Health and Wellness Coordinator (grade A20)
1.0 1.0 1.0
Cost Center Total 1.0 1.0 1.0
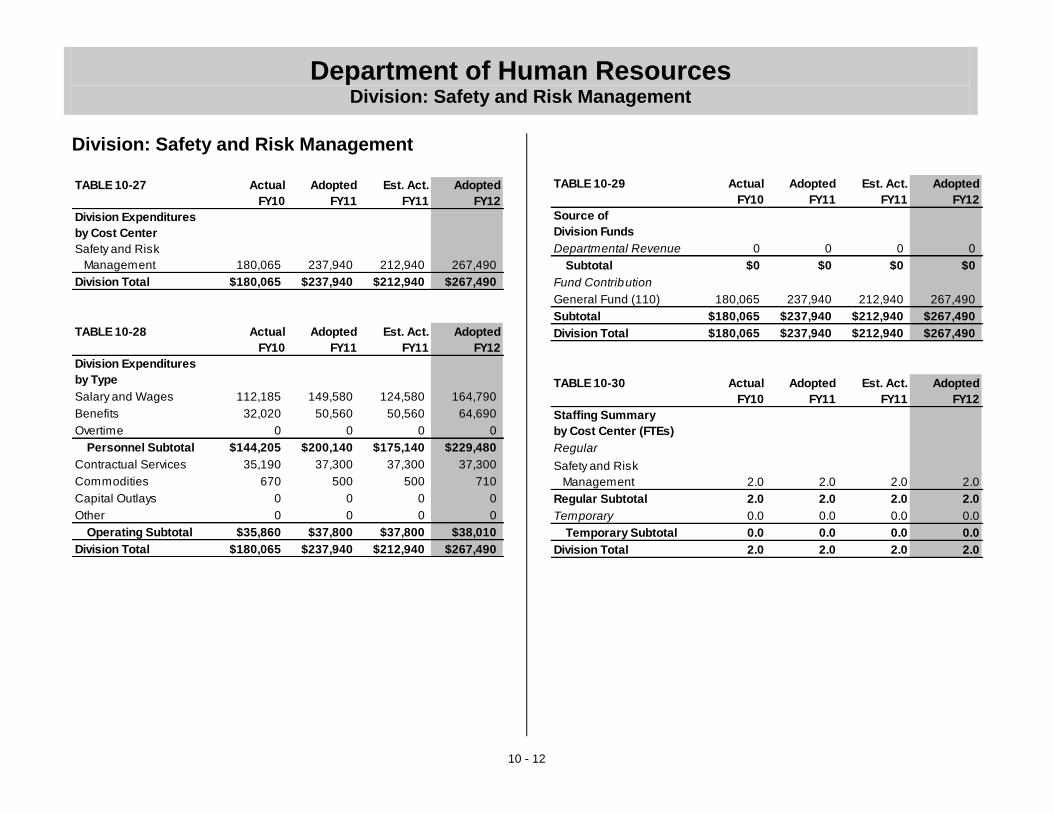
Department of Human Resources Division: Safety and Risk Management
10 - 12
Division: Safety and Risk Management TABLE 10-27 Actual
FY10
Adopted
FY11
Est. Act.
FY11
Adopted
FY12
Division Expenditures
by Cost Center
Safety and Risk
Management 180,065 237,940 212,940 267,490
Division Total $180,065 $237,940 $212,940 $267,490
TABLE 10-28 Actual
FY10
Adopted
FY11
Est. Act.
FY11
Adopted
FY12
Division Expenditures
by Type
Salary and Wages 112,185 149,580 124,580 164,790
Benefits 32,020 50,560 50,560 64,690
Overtime 0 0 0 0
Personnel Subtotal $144,205 $200,140 $175,140 $229,480
Contractual Services 35,190 37,300 37,300 37,300
Commodities 670 500 500 710
Capital Outlays 0 0 0 0
Other 0 0 0 0
Operating Subtotal $35,860 $37,800 $37,800 $38,010
Division Total $180,065 $237,940 $212,940 $267,490
TABLE 10-29 Actual
FY10
Adopted
FY11
Est. Act.
FY11
Adopted
FY12
Source of
Division Funds
Departmental Revenue 0 0 0 0
Subtotal $0 $0 $0 $0
Fund Contribution
General Fund (110) 180,065 237,940 212,940 267,490
Subtotal $180,065 $237,940 $212,940 $267,490
Division Total $180,065 $237,940 $212,940 $267,490
TABLE 10-30 Actual
FY10
Adopted
FY11
Est. Act.
FY11
Adopted
FY12
Staffing Summary
by Cost Center (FTEs)
Regular
Safety and Risk
Management 2.0 2.0 2.0 2.0
Regular Subtotal 2.0 2.0 2.0 2.0
Temporary 0.0 0.0 0.0 0.0
Temporary Subtotal 0.0 0.0 0.0 0.0
Division Total 2.0 2.0 2.0 2.0
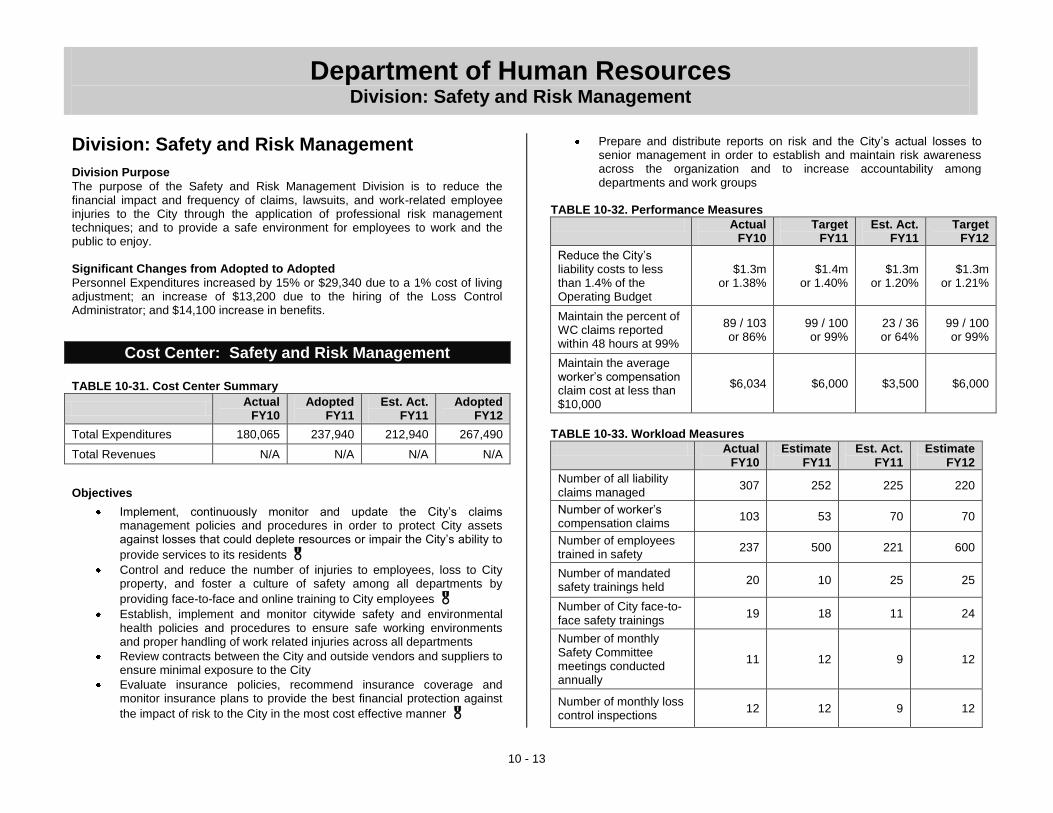
Department of Human Resources Division: Safety and Risk Management
10 - 13
Division: Safety and Risk Management
Division Purpose
The purpose of the Safety and Risk Management Division is to reduce the financial impact and frequency of claims, lawsuits, and work-related employee injuries to the City through the application of professional risk management techniques; and to provide a safe environment for employees to work and the public to enjoy. Significant Changes from Adopted to Adopted
Personnel Expenditures increased by 15% or $29,340 due to a 1% cost of living adjustment; an increase of $13,200 due to the hiring of the Loss Control Administrator; and $14,100 increase in benefits.
Cost Center: Safety and Risk Management
TABLE 10-31. Cost Center Summary
Actual
FY10 Adopted
FY11 Est. Act.
FY11 Adopted
FY12
Total Expenditures 180,065 237,940 212,940 267,490
Total Revenues N/A N/A N/A N/A
Objectives
Implement, continuously monitor and update the City’s claims management policies and procedures in order to protect City assets against losses that could deplete resources or impair the City’s ability to
provide services to its residents
Control and reduce the number of injuries to employees, loss to City property, and foster a culture of safety among all departments by
providing face-to-face and online training to City employees
Establish, implement and monitor citywide safety and environmental health policies and procedures to ensure safe working environments and proper handling of work related injuries across all departments
Review contracts between the City and outside vendors and suppliers to ensure minimal exposure to the City
Evaluate insurance policies, recommend insurance coverage and monitor insurance plans to provide the best financial protection against
the impact of risk to the City in the most cost effective manner
Prepare and distribute reports on risk and the City’s actual losses to senior management in order to establish and maintain risk awareness across the organization and to increase accountability among departments and work groups
TABLE 10-32. Performance Measures
Actual FY10
Target FY11
Est. Act. FY11
Target FY12
Reduce the City’s liability costs to less than 1.4% of the Operating Budget
$1.3m or 1.38%
$1.4m or 1.40%
$1.3m or 1.20%
$1.3m or 1.21%
Maintain the percent of WC claims reported within 48 hours at 99%
89 / 103 or 86%
99 / 100 or 99%
23 / 36 or 64%
99 / 100 or 99%
Maintain the average worker’s compensation claim cost at less than $10,000
$6,034 $6,000 $3,500 $6,000
TABLE 10-33. Workload Measures
Actual FY10
Estimate FY11
Est. Act. FY11
Estimate FY12
Number of all liability claims managed
307 252 225 220
Number of worker’s compensation claims
103 53 70 70
Number of employees trained in safety
237 500 221 600
Number of mandated safety trainings held
20 10 25 25
Number of City face-to-face safety trainings
19 18 11 24
Number of monthly Safety Committee meetings conducted annually
11 12 9 12
Number of monthly loss control inspections
12 12 9 12

Department of Human Resources Division: Safety and Risk Management
10 - 14
Actual FY10
Estimate FY11
Est. Act. FY11
Estimate FY12
Number of loss reports provided to senior management
4 14 3 4
TABLE 10-34. Regular Positions
Position Title Adopted
FY10 Adopted
FY11 Adopted
FY12
Loss Control Administrator * (grade A23)
0.0 1.0 1.0
Safety and Risk Manager (grade A24) 1.0 1.0 1.0
Secretary I * (grade A10) 1.0 0.0 0.0
Cost Center Total 2.0 2.0 2.0
* The vacant Secretary I position was eliminated in FY11 and a Loss Control Administrator position was created in FY11.
Supplemental Information
It is the vision of the Safety and Risk Management Division to positively impact the financial health of the City and the well being of its employees and residents. In any organization, a deficiency of clearly defined procedures and an absence of agreed upon departmental outcomes will increase the cost of risk for that organization in a variety of ways: increased cost of insurances, lost productivity, replacement labor, loss of employee morale, disruption of City services, loss of property or equipment, resident dissatisfaction and unfavorable coverage in the media.
For FY12, the Safety and Risk Management Division will continue to focus on the financial management of exposures, the internally explicit safety concerns of the City’s employees, and will attempt to incorporate additional support services in order to augment current safety training. As part of this increased focus the following programs and initiatives are being developed:
Assure a bi-weekly Toolbox/Tailgate talk program that meets training needs and reinforces employee knowledge;
Specific physical capacity requirements by major grouped positions to assure pre-hire suitability and fit-for-duty return-to-work efforts;
Safety Procedures, Emergency Action Plans, a Safety Handbook, safety training modules and better defined existing policies and procedures;
Increase communication channels through City outlets (Channel 11, SafetyWorks Newsletter etc.) to maintain safety as a priority;
Specialized training to meet certification requirements of our workforce;
A cost-allocation program that results in charge backs to departments based on their contribution to loss amounts. Quarterly Risk Management updates to Senior Staff on the leading cost factors that dictate our outcomes will compliment this program;
Reinforce Evacuation and Shelter-in-Place programs for all facilities;
Integrate safety programs with wellness initiatives;
Proceed with OSHA VPP for Water Treatment Plant;
Improve on Insurance Coverage and Program Scope;
Apply for Safe Community Status.
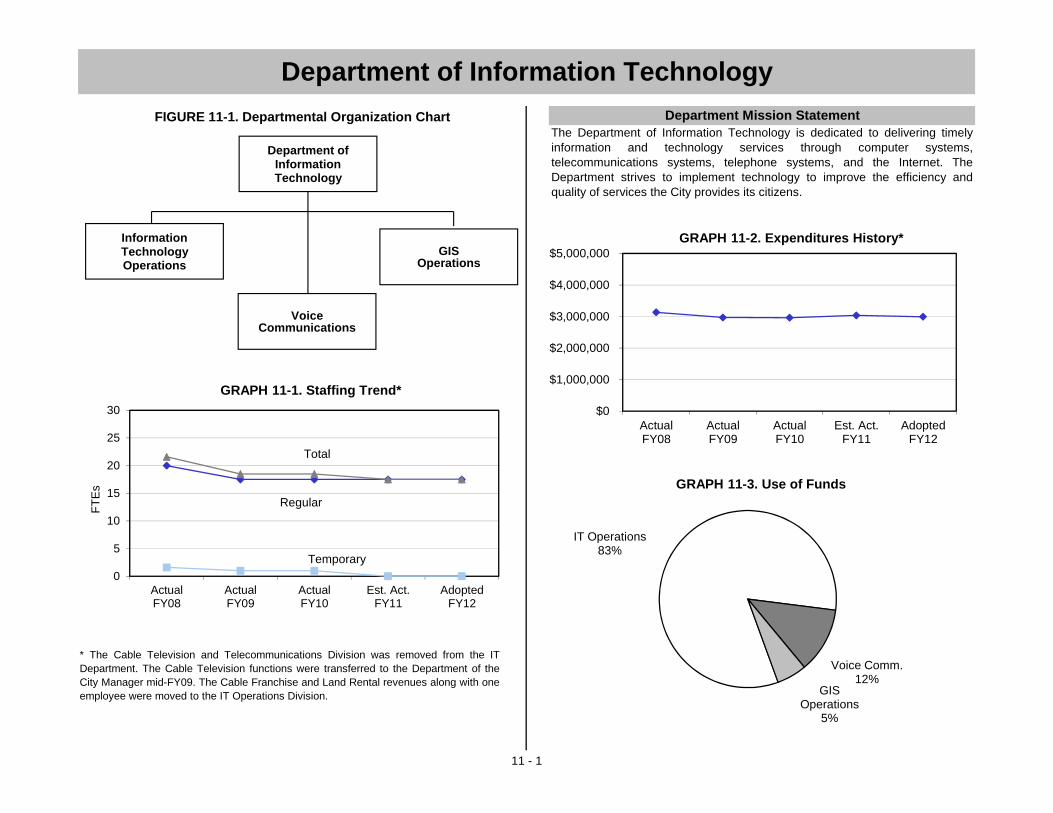
Department of Information TechnologyDepartment Mission Statement
* The Cable Television and Telecommunications Division was removed from the ITDepartment. The Cable Television functions were transferred to the Department of theCity Manager mid-FY09. The Cable Franchise and Land Rental revenues along with oneemployee were moved to the IT Operations Division.
11 - 1
FIGURE 11-1. Departmental Organization ChartThe Department of Information Technology is dedicated to delivering timelyinformation and technology services through computer systems,telecommunications systems, telephone systems, and the Internet. TheDepartment strives to implement technology to improve the efficiency andquality of services the City provides its citizens.
$0
$1,000,000
$2,000,000
$3,000,000
$4,000,000
$5,000,000
ActualFY08
ActualFY09
ActualFY10
Est. Act.FY11
AdoptedFY12
GRAPH 11-2. Expenditures History*
IT Operations83%
Voice Comm.12%
GIS Operations
5%
GRAPH 11-3. Use of Funds
0
5
10
15
20
25
30
ActualFY08
ActualFY09
ActualFY10
Est. Act.FY11
AdoptedFY12
FT
Es
GRAPH 11-1. Staffing Trend*
Total
Temporary
Regular
Department of InformationTechnology
VoiceCommunications
GIS Operations
Information Technology Operations
etompkins
Underline
etompkins
Underline
etompkins
Underline
etompkins
Underline
etompkins
Underline
etompkins
Underline

Department of Information Technology Department Summary
11 - 2
Department Summary
TABLE 11-1 Actual
FY10
Adopted
FY11
Est. Act.
FY11
Adopted
FY12
% Change
from Adpt.
Dept. Expenditures
by Division
IT Operations 2,465,667 2,452,990 2,508,970 2,472,080 0.8%
Voice Communications 323,804 326,060 347,930 358,090 9.8%
GIS Operations 173,993 179,170 180,290 164,090 (8.4%)
Department Total $2,963,464 $2,958,220 $3,037,190 $2,994,260 1.2%
TABLE 11-2 Actual
FY10
Adopted
FY11
Est. Act.
FY11
Adopted
FY12
% Change
from Adpt.
Dept. Expenditures
by Type
Salary and Wages 1,511,487 1,587,550 1,534,100 1,608,730 1.3%
Benefits 382,216 481,540 481,540 509,950 5.9%
Overtime 0 0 0 0 N/A
Personnel Subtotal $1,893,703 $2,069,090 $2,015,640 $2,118,680 2.4%
Contractual Services 598,457 516,650 619,110 520,590 0.8%
Commodities 43,435 32,650 32,650 32,650 0.0%
Capital Outlays 427,869 339,830 369,790 322,340 (5.1%)
Other 0 0 0 0 N/A
Operating Subtotal $1,069,761 $889,130 $1,021,550 $875,580 (1.5%)
Department Total $2,963,464 $2,958,220 $3,037,190 $2,994,260 1.2%
TABLE 11-3 Actual
FY10
Adopted
FY11
Est. Act.
FY11
Adopted
FY12
% Change
from Adpt.
Source of
Dept. Funds
Land Rental 131,335 247,330 177,505 316,950 28.1%
Cable Franchise Fees 537,575 443,590 528,550 503,150 13.4%
Subtotal $668,910 $690,920 $706,055 $820,100 18.7%
Fund Contribution
General Fund (110) 2,294,554 2,267,300 2,331,135 2,174,160 (4.1%)
Subtotal $2,294,554 $2,267,300 $2,331,135 $2,174,160 (4.1%)
Department Total $2,963,464 $2,958,220 $3,037,190 $2,994,260 1.2%
TABLE 11-4 Actual
FY10
Adopted
FY11
Est. Act.
FY11
Adopted
FY12
% Change
from Adpt.
Staffing Summary
by Cost Center (FTEs)
Regular
IT Operations 15.5 15.5 15.5 15.5 0.0%
Voice Communications 1.0 1.0 1.0 1.0 0.0%
GIS Operations 1.0 1.0 1.0 1.0 0.0%
Regular Subtotal 17.5 17.5 17.5 17.5 0.0%
Temporary
IT Operations 1.0 0.0 0.0 0.0 N/A
Temporary Subtotal 1.0 0.0 0.0 0.0 N/A
Department Total 18.5 17.5 17.5 17.5 0.0%

Department of Information Technology Department Summary
11 - 3
Department Summary Department Overview
The Department of Information Technology (IT) manages the City’s telecommunications and cable TV regulatory activities, telephone, and computer systems including, desktop computers, mobile computers, wireless communications devices, and local and wide area networks. The Department also maintains the City’s web servers and Geographic Information Systems (GIS), and collects revenues from telecommunication related activities, including wireless leases, rights-of-way agreements, and cable franchise agreements. The Department consists of three divisions: IT Operations, Voice Communications, and GIS Operations. The objectives and projects performed by the Department enhance the City government’s performance by providing staff with efficient and effective technological tools to perform their work and serve the public. Objectives
Implement a five-year Information Technology strategic plan to identify
and meet the City’s IT needs for internal and external customers
Pursue green computing initiatives, such as virtual servers, to support
the City’s sustainability strategy and reduce power consumption
Test the City’s comprehensive disaster recovery plan with table top drills and full server recovery tests to ensure the City’s ability to recover its
technology and information in case of a disaster
Support the renovation and construction of City facilities to make sure
that IT needs and systems are included
Extend the City’s I-Net to as many City facilities as feasible to provide high-capacity, high speed information communication via data, voice,
and video for effective and efficient transactions
Continue offering efficient and consistent computer training opportunities for City employees so employees can optimize the use of
City IT tools
Manage and coordinate negotiation of agreements for cable and telecommunications use of City facilities, property, and rights-of-way; and administer agreements to provide for consistency, efficiency,
compliance and protection of the City’s interests
Significant Changes from Adopted to Adopted
Personnel expenditures increased by $49,590 or 2% due to a 1% cost of living adjustment and a $28,400 increase in benefits. Capital Outlays decreased by $17,490 due to the removal of funding for the 2010 aerial orthophoto for GIS and mapping applications. Departmental revenues increased by $129,180 or 19% due to a full year’s revenue from new lease agreements with cell phone and wireless carriers and contractual escalators with all carriers, both of which increased Land Rental revenue by $69,620. In addition, there is a $59,560 increase in Cable Franchise Fees due to the increased customer base and revenues for Verizon and Comcast in the City.
etompkins
Underline
etompkins
Underline
etompkins
Underline
etompkins
Underline

Department of Information Technology Division: Information Technology Operations
11 - 4
TABLE 11-7 Actual
FY10
Adopted
FY11
Est. Act.
FY11
Adopted
FY12
Source of
Division Funds
Departmental Revenue
Land Rental 131,335 247,330 177,505 316,950
Cable Franchise Fees 537,575 443,590 528,550 503,150
Subtotal $668,910 $690,920 $706,055 $820,100
Fund Contribution
General Fund (110) 1,796,757 1,762,070 1,802,915 1,651,980
Subtotal $1,796,757 $1,762,070 $1,802,915 $1,651,980
Division Total $2,465,667 $2,452,990 $2,508,970 $2,472,080
TABLE 11-8 Actual
FY10
Adopted
FY11
Est. Act.
FY11
Adopted
FY12
Staffing Summary
by Cost Center (FTEs)
Regular
IT Operations 15.5 15.5 15.5 15.5
Regular Subtotal 15.5 15.5 15.5 15.5
Temporary
IT Operations 1.0 0.0 0.0 0.0
Temporary Subtotal 1.0 0.0 0.0 0.0
Division Total 16.5 15.5 15.5 15.5
Division: Information Technology Operations
TABLE 11-5 Actual
FY10
Adopted
FY11
Est. Act.
FY11
Adopted
FY12
Division Expenditures
by Cost Center
IT Operations 2,465,667 2,452,990 2,508,970 2,472,080
Division Total $2,465,667 $2,452,990 $2,508,970 $2,472,080
TABLE 11-6 Actual
FY10
Adopted
FY11
Est. Act.
FY11
Adopted
FY12
Division Expenditures
by Type
Salary and Wages 1,352,065 1,428,550 1,375,100 1,447,290
Benefits 346,131 436,400 436,400 461,640
Overtime 0 0 0 0
Personnel Subtotal $1,698,196 $1,864,950 $1,811,500 $1,908,930
Contractual Services 346,768 272,160 351,630 247,260
Commodities 40,817 30,550 30,550 30,550
Capital Outlays 379,886 285,330 315,290 285,340
Other 0 0 0 0
Operating Subtotal $767,471 $588,040 $697,470 $563,150
Division Total $2,465,667 $2,452,990 $2,508,970 $2,472,080

Department of Information Technology Division: Information Technology Operations
11 - 5
Division: Information Technology Operations Division Purpose
Manage and maintain the City's telecommunications and computer systems, including servers, firewall, desktop computers (PCs), laptops, network printers, mobile data units, and the institutional network. Support approved software applications used in all City operations. Manage and maintain the City’s Internet infrastructure, Intranet, and e-government services. Support use of smartphones for business use. Manage telecommunications and cable television regulatory matters.
Significant Changes from Adopted to Adopted
Personnel expenditures increased by $43,980 or 2% due to a 1% cost of living adjustment and a $25,240 increase in benefits.
Contractual services decreased by $24,900 due to the removal of $40,000 in one-time funding for a document imaging study which was contracted in FY11; a net increase in City contracts of $21,100 and the removal of $6,000 in one-time professional development expenditures.
Departmental revenues increased by $129,180 or 19% due to a full year’s revenue from new lease agreements with cell phone and wireless carriers and contractual escalators with all carriers, both of which increased Land Rental revenue by $69,620. In addition, there is a $59,560 increase in Cable Franchise Fees due to the increased customer base for Verizon and revenues for Comcast in the City.
FIGURE 11-2. FY 2012 Information Technology Projects
Project Estimated
Start Estimated/Actual
Completion Estimated
Cost
Assist in design and implementation of IT infrastructure at the new Police Station
Jun. 2009
Oct. 2011
Costs are part of CIP project
Assist in design and implementation of IT infrastructure for Gude Drive phase II renovation and construction
Jan. 2009
June 2012
TBD
Fiber to Thomas Farm Community Center
Sept. 2008
July 2011
No cost to City (part of right-of-way agreement with Fibertech)
Purchase and deploy ERP system Phase 1
Oct. 2011
June 2012
$750,000 (Enterprise Resource Planning System CIP project)
Purchase and deploy ERP system Phase 2
July 2012
June 2013
$750,000 (Enterprise Resource Planning System CIP project)
Purchase and deploy Document Management System
Nov. 2011
Nov. 2012
$350,000 (Document Management and Imaging CIP project)

Department of Information Technology Division: Information Technology Operations
11 - 6
Cost Center: IT Operations TABLE 11-9. Cost Center Summary
Actual
FY10 Adopted
FY11 Est. Act.
FY11 Adopted
FY12
Total Expenditures 2,465,667 2,452,990 2,508,970 2,472,080
Total Revenues 668,910 690,920 706,055 820,100
Objectives
Monitor, maintain, upgrade, and expand the City’s institutional network (I-Net) to provide for highly reliable, fast, flexible, and secure communications between the public and City government, and between City government
departments
Maintain and enhance City employee efficiency, effectiveness and communications by providing and maintaining hardware and software support for desktop computers, laptop computers, and servers, and by providing software and technical consultation support for smartphones used
by employees for business purposes
Maintain and support critical business applications such as the financial and human resources systems, email system, web based applications, utility
billing, and refuse systems
Replace a portion of the City’s servers on a rotating basis each fiscal year to make sure these centralized computer systems are up-to-date and compatible with industry standards, thereby spreading out the cost and
workload for replacement
Replace one-fourth of the City’s personal computers on a rotating basis each fiscal year to ensure that the hardware and software are up-to-date and compatible with the City’s network infrastructure and enterprise applications,
thereby spreading out the cost and workload for replacement
Maintain the City’s permitting system including an Interactive Voice Response system (IVR) that allows the public to schedule inspections via
telephone and determine the status of permits via the Internet
Maintain the CLASS Recreation Registration system throughout nine City locations, including point-of-sale terminals, identification card scanners and
printers
Monitor and maintain the City’s centralized file virus protection system to ensure the City’s computers are protected from the latest viruses and
malware
Maintain and enhance the City's information security posture by identifying and closing security gaps, monitoring for and responding to incidents, educating users, deploying new technical controls, and reviewing/revising
policies
Manage and coordinate negotiation of agreements for cable and telecommunications use of City facilities, property, and rights-of-way; and administer agreements to provide for consistency, efficiency, compliance
and protection of the City’s interests
Manage and coordinate, in concert with CPDS, interdepartmental response to applications for installation of cell towers for consistency and for
compliance with policies and laws
TABLE 11-10. Performance Measures
Actual
FY10 Target
FY11 Est. Act.
FY11 Target
FY12
Maintain citywide network uptime at 99.9%
8,751 hrs or 99.9%
8,751 hrs or 99.9%
8,649 hrs or 98.7%
8,751 hrs or 99.9%
Annually replace servers that are more than four years old
8 / 8 or 100%
5* / 5 or 100%
4 / 5 or 80%
5 / 5 or 100%
Replace about one fourth of PCs annually **
126 / 404 or 31%
101 / 404 or 25%
102 / 408 or 25%
102 / 408 or 25%
Maintain uptime of Human Resources’ application and servers at 99.9%
8,751 hrs or 99.9%
8,751 hrs or 99.9%
8,751 hrs or 99.9%
8,751 hrs or 99.9%
Maintain uptime of financial system application and servers at 99.9%
8,734 hrs or 99.7%
8,751 hrs or 99.9%
8,753 hrs or 99.9%
8,751 hrs or 99.9%
Maintain uptime of CLASS registration application and servers at 99.9%
8,751 hrs or 99.9%
8,751 hrs or 99.9%
8,751 hrs or 99.9%
8,751 hrs or 99.9%
Maintain uptime of Email/collaboration application and servers at 99.9%
8,664 hrs or 98.9%
8,751 hrs or 99.9%
8,751 hrs or 99.9%
8,751 hrs or 99.9%

Department of Information Technology Division: Information Technology Operations
11 - 7
Actual
FY10 Target
FY11 Est. Act.
FY11 Target
FY12
Maintain 99.9% uptime of permitting system application and servers
8,760 hrs or 100%
8,751 hrs or 99.9%
8,760 hrs or 100%
8,760 hrs or 100%
Maintain uptime of website to Internet Service Provider at 99.9%
8,757 hrs or 99.9%
8,751 hrs or 99.9%
8,751 hrs or 99.9%
8,751 hrs or 99.9%
Maintain availability of the Internet service firewall at 99.9%
8,751 hrs or 99.9%
8,751 hrs or 99.9%
8,751 hrs or 99.9%
8,751 hrs or 99.9%
Maintain or increase percent of PC & Network Support returned client satisfaction surveys indicating “satisfied” or “very satisfied”
989 / 992 or 100%
460 / 465 or 99%
594 / 600 or 99%
650 / 656 or 99%
* In FY11 a portion of the servers scheduled for replacement will either be phased out or switched to a virtual server.
** Due to budgetary constraints in FY11, the three-year replacement cycle was extended to a four-year cycle.
TABLE 11-11. Workload Measures
Actual
FY10 Target
FY11 Est. Act.
FY11 Estimate
FY12
Number of help desk requests for Network and PC Support services per FTE *
437 363 440 475
Total number of help desk requests
3,281 2,900 3,078 3,325
Number of supported:
desktops
laptops
servers - physical
servers - virtual
network printers
Smartphones
408
60 69 22 45 21
404
60 57 25 41 21
408
60 52 25 47 38
408
60 54 28 47 38
Number of City facilities supported by IT services
30 29 30 30
Actual
FY10 Target
FY11 Est. Act.
FY11 Estimate
FY12
Number of leases for cable and telecommunication facilities negotiated or administered
32 33 34 34
* In FY10 a temporary 1.0 FTE Intern is included in the PC Support services FTE count. Due to budgetary constraints the temporary position was eliminated in FY11.
TABLE 11-12. Regular Positions
Position Title Adopted
FY10 Adopted
FY11 Adopted
FY12
Administrative Assistant II (grade A15) 1.0 1.0 1.0
Computer Analyst/Programmer (grade A22)
1.0 1.0 1.0
Computer Operator – PT (grade A13) 0.5 0.5 0.5
Chief Information Officer (grade SAII) 1.0 1.0 1.0
Network and PC Support Specialist (grade A18)
2.0 2.0 2.0
Network and Systems Administrator * (grade A19 / A20)
2.0 2.0 2.0
Network and Systems Manager (grade A23)
1.0 1.0 1.0
Network Engineer (grade A23) 1.0 1.0 1.0
Security and Application Administrator (grade A24)
1.0 1.0 1.0
Senior Network Engineer (grade A25) 1.0 1.0 1.0
Senior Systems Analyst/Project Leader (grade A25)
2.0 2.0 2.0
Systems Analyst/Project Leader (grade A23)
1.0 1.0 1.0
Telecommunications and IT Operations Manager (grade A26)
1.0 1.0 1.0
Cost Center Total 15.5 15.5 15.5
* All levels of Network and PC Support Administrator (I – II) positions are banded and can be hired at either level.

Department of Information Technology Division: Voice Communications
11 - 8
Division: Voice Communications
TABLE 11-13 Actual
FY10
Adopted
FY11
Est. Act.
FY11
Adopted
FY12
Division Expenditures
by Cost Center
Voice Communications 323,804 326,060 347,930 358,090
Division Total $323,804 $326,060 $347,930 $358,090
TABLE 11-14 Actual
FY10
Adopted
FY11
Est. Act.
FY11
Adopted
FY12
Division Expenditures
by Type
Salary and Wages 73,972 74,000 74,000 75,850
Benefits 18,890 23,770 23,770 25,110
Overtime 0 0 0 0
Personnel Subtotal $92,862 $97,770 $97,770 $100,960
Contractual Services 230,942 228,290 250,160 257,130
Commodities 0 0 0 0
Capital Outlays 0 0 0 0
Other 0 0 0 0
Operating Subtotal $230,942 $228,290 $250,160 $257,130
Division Total $323,804 $326,060 $347,930 $358,090
TABLE 11-15 Actual
FY10
Adopted
FY11
Est. Act.
FY11
Adopted
FY12
Source of
Division Funds
Departmental Revenue 0 0 0 0
Subtotal $0 $0 $0 $0
Fund Contribution
General Fund (110) 323,804 326,060 347,930 358,090
Subtotal $323,804 $326,060 $347,930 $358,090
Division Total $323,804 $326,060 $347,930 $358,090
TABLE 11-16 Actual
FY10
Adopted
FY11
Est. Act.
FY11
Adopted
FY12
Staffing Summary
by Cost Center (FTEs)
Regular
Voice Communications 1.0 1.0 1.0 1.0
Regular Subtotal 1.0 1.0 1.0 1.0
Temporary 0.0 0.0 0.0 0.0
Temporary Subtotal 0.0 0.0 0.0 0.0
Division Total 1.0 1.0 1.0 1.0

Department of Information Technology Division: Voice Communications
11 - 9
Division: Voice Communications Division Purpose
Provide voice communications for City employees and visitors to City facilities by administering, monitoring, and effectuating all repairs, replacements, upgrades, purchases, and billing for the City's pay phones, telephone and voicemail systems. Significant Changes from Adopted to Adopted
Contractual Services increased by $28,840 due to an $18,800 increase in City contracts and the addition of $10,000 to expand the City’s internet bandwith.
Cost Center: Voice Communications TABLE 11-17. Cost Center Summary
Actual
FY10 Adopted
FY11 Est. Act.
FY11 Adopted
FY12
Total Expenditures 323,804 326,060 347,930 358,090
Total Revenues N/A N/A N/A N/A
Objectives
Provide efficient and reliable equipment, support and service for the users of Voice over Internet Protocol (VoIP) telephones and analog devices to communicate with residents, staff and agencies which do
business with the City of Rockville
Administer and support the City’s voice mailboxes, which provide residents with a reliable and continuous method of leaving messages
with City staff at any hour
Maintain informational mailboxes to provide residents with facts, directions, and general information about the City of Rockville
government and special events 24 hours a day
Maintain an accurate, centralized directory of numbers for all City telephone users and authorized wireless phone users for immediate
access
Negotiate, enforce and maintain contracts with vendors who provide communication services and equipment to the City to ensure efficient
and reliable contact between staff, residents and other agencies
Provide oversight and support for the wireless communications policy so that the City adheres to the strict guidelines of the IRS regulations for
cellular usage
Support and maintain Direct Connect only communication services to provide special work groups with a means of immediate and reliable contact between staff and departments for special events and
emergency situations
Maintain pagers for efficient and reliable communication for staff
members whose work areas prohibit cellular accessibility
TABLE 11-18. Performance Measures
Actual
FY10 Target
FY11 Est. Act.
FY11 Target
FY12
Increase telephone system uptime to 100%
8,757 hrs or 99.97%
8,760 hrs or 100%
8,752 hrs or 99.91%
8,760 hrs or 100%
Increase voicemail uptime to 100%
8,760 hrs or 100%
8,760 hrs or 100%
8,760 hrs or 100%
8,760 hrs or 100%
Decrease VoIP telephone device failure rate by at least 1% annually
22 / 462 or 4.8%
17 / 462 or 3.7%
6 / 463 or 1.3%
5 / 463 or 1.1%
Decrease the use of City pagers by at least five per year
23 16 16 6

Department of Information Technology Division: Voice Communications
11 - 10
ARABIC PUNJABI
ELSHAFEI, E. THUKRAL, O.
CHINESE THUKRAL, P.
CHEN, M SPANISH
DUTCH BAYONET, M.
THOMPSON, A. CALLES, C.
FRENCH CANDANEDO, T.
CANDANEDO, T. DAZA, M.
ELSHAFEI, E. DELEON-KERY, B
THOMPSON, A. DELGADO, M.
GERMAN DENIO, R.
CANNON, M. ESTRADA, R.
HURTADO, S. FRISHKORN, A.
OVER, E. LEMUS, L.
GREEK LEVY, D.
CANDANEDO, T. MILLER, P.
GUJRATI MINERA, M.
TEWARI, M. ROSALES, T.
HINDI TAYLOR, E
PAMUJULA,S TAMIL
TEWARI, M. PAMUJULA, S
THUKRAL, O. TELUGU
THUKRAL, P. PAMUJULA, S
ILOCANO URDU
MILLER, P. THUKRAL, O.
PILIPINO THUKRAL, P.
MILLER, P. VIETNAMESE
POLISH TUNG,D
GAWEL, D.
MULTI-LINGUAL EMPLOYEE
VOLUNTEER TRANSLATORS
TABLE 11-19. Workload Measures
Actual
FY10 Estimate
FY11 Est. Act.
FY11 Estimate
FY12
Number of VoIP telephones supported
462 462 463 463
Number of analog devices supported
72 75 74 76
Number of voice and information mailboxes maintained
771 771 772 772
Number of VoIP phones replaced due to equipment failure
22 17 6 4
Number of telephone help calls
170 200 310 250
Number of telephone data circuits supported
15 15 15 15
Number of cell phone stipend recipients supported
148 150 147 147
Number of Direct Connect only and emergency cell phones supported
28 28 28 28
TABLE 11-20. Regular Positions
Position Title Adopted
FY10 Adopted
FY11 Adopted
FY12
Telecommunications Systems Administrator (grade A18)
1.0 1.0 1.0
Division Total 1.0 1.0 1.0
Supplemental Information
Major FY2012 Project(s) In FY 2012 the City’s existing Internet service and local dial tone service contracts will expire. A major initiative of this division will be to negotiate new contracts.
Translation Services FIGURE 11-3. Table of City employees that provide translation services to walk-in and call-in customers.

Department of Information Technology Division: Voice Communications
11 - 11
FIGURE 11-4. Rockville City Facilities Connected to the City Institutional Network (I-Net).

Department of Information Technology Division: GIS Operations
11 - 12
Division: GIS Operations
TABLE 11-21 Actual
FY10
Adopted
FY11
Est. Act.
FY11
Adopted
FY12
Division Expenditures
by Cost Center
GIS Operations 173,993 179,170 180,290 164,090
Division Total $173,993 $179,170 $180,290 $164,090
TABLE 11-22 Actual
FY10
Adopted
FY11
Est. Act.
FY11
Adopted
FY12
Division Expenditures
by Type
Salary and Wages 85,450 85,000 85,000 85,590
Benefits 17,195 21,370 21,370 23,200
Overtime 0 0 0 0
Personnel Subtotal $102,645 $106,370 $106,370 $108,790
Contractual Services 20,747 16,200 17,320 16,200
Commodities 2,618 2,100 2,100 2,100
Capital Outlays 47,983 54,500 54,500 37,000
Other 0 0 0 0
Operating Subtotal $71,348 $72,800 $73,920 $55,300
Division Total $173,993 $179,170 $180,290 $164,090
TABLE 11-23 Actual
FY10
Adopted
FY11
Est. Act.
FY11
Adopted
FY12
Source of
Division Funds
Departmental Revenue 0 0 0 0
Subtotal $0 $0 $0 $0
Fund Contribution
General Fund (110) 173,993 179,170 180,290 164,090
Subtotal $173,993 $179,170 $180,290 $164,090
Division Total $173,993 $179,170 $180,290 $164,090
TABLE 11-24 Actual
FY10
Adopted
FY11
Est. Act.
FY11
Adopted
FY12
Staffing Summary
by Cost Center (FTEs)
Regular
GIS Operations 1.0 1.0 1.0 1.0
Regular Subtotal 1.0 1.0 1.0 1.0
Temporary 0.0 0.0 0.0 0.0
Temporary Subtotal 0.0 0.0 0.0 0.0
Division Total 1.0 1.0 1.0 1.0

Department of Information Technology Division: GIS Operations
11 - 13
Division: GIS Operations Division Purpose
The GIS Operations Division manages the overall infrastructure of the City's Geographic Information System (GIS). This Division’s primary purpose is to provide GIS technology access and technical support to all employees who use this tool to perform their work more efficiently. In addition, the GIS Operations Division provides public access to selected GIS data through the City's website. Significant Changes from Adopted to Adopted Capital Outlays decreased by $17,500 due to the removal of funding for the 2010 aerial orthophoto for GIS and mapping applications.
Cost Center: GIS Operations TABLE 11-25. Cost Center Summary
Actual FY10
Adopted FY11
Est. Act. FY11
Adopted FY12
Total Expenditures 173,993 179,170 180,290 164,090
Total Revenues N/A N/A N/A N/A
Objectives
Provide up-to-date GIS applications and data resources to City staff to create maps, to perform data analysis tasks, and to create and maintain GIS data in support of their activities
Provide selected GIS map and data access to Rockville residents and the general public for the communication of geospatial information through convenient interactive web maps
Provide GIS technical help and training to City staff to support and advance GIS skill sets and independent use of GIS
Produce maps, data, and other GIS related products to support City staff who are non-users or limited users of GIS
Provide technical support and maintenance for non-GIS applications to City staff to support the Alchemy Document Management System or other applications and systems
TABLE 11-26. Performance Measures
Actual FY10
Target FY11
Est. Act. FY11
Target FY12
Maintain property layer updates at least four times per year
4 4 4 4
Maintain one orthophoto aerial update every other year
1 1 1 0
Maintain one oblique aerial photo update every other year
0 1 1 0
Achieve at least 90% of employees rating quality of GIS Services “excellent” or “good” in biennial internal survey *
151 / 196 or 77%
180 / 200 or 90%
89 / 101 or 88%
89 / 101 or 88%
Increase Web map usage (# map draws) between 5% and 10% each year
255,518 (-9.9%
under FY09 actual)
273,000 (+7.5%
over FY10 estimate)
263,237 (+3.0%
over FY10 actual)
N/A **
Maintain number of GIS training classes for staff at 4 per year
5 4 5 4
Achieve GIS training class evaluation rating of “excellent or “good” from 85% or better of respondents
44 / 44 or 100%
30 / 35 or 86%
27 / 27 or 100%
33 / 36 or 92%
* The City conducts an internal employee survey. The last survey was conducted in FY11 and the next survey will take place in FY13.
** Beginning in FY11 and continuing into FY12 the web-based GIS maps will transition to new technology. During this transition period the means for tracking usage is expected to be incomplete and inconsistent. Hence, this performance measure will be on hiatus until a new and meaningful tracking system can be implemented in FY13.
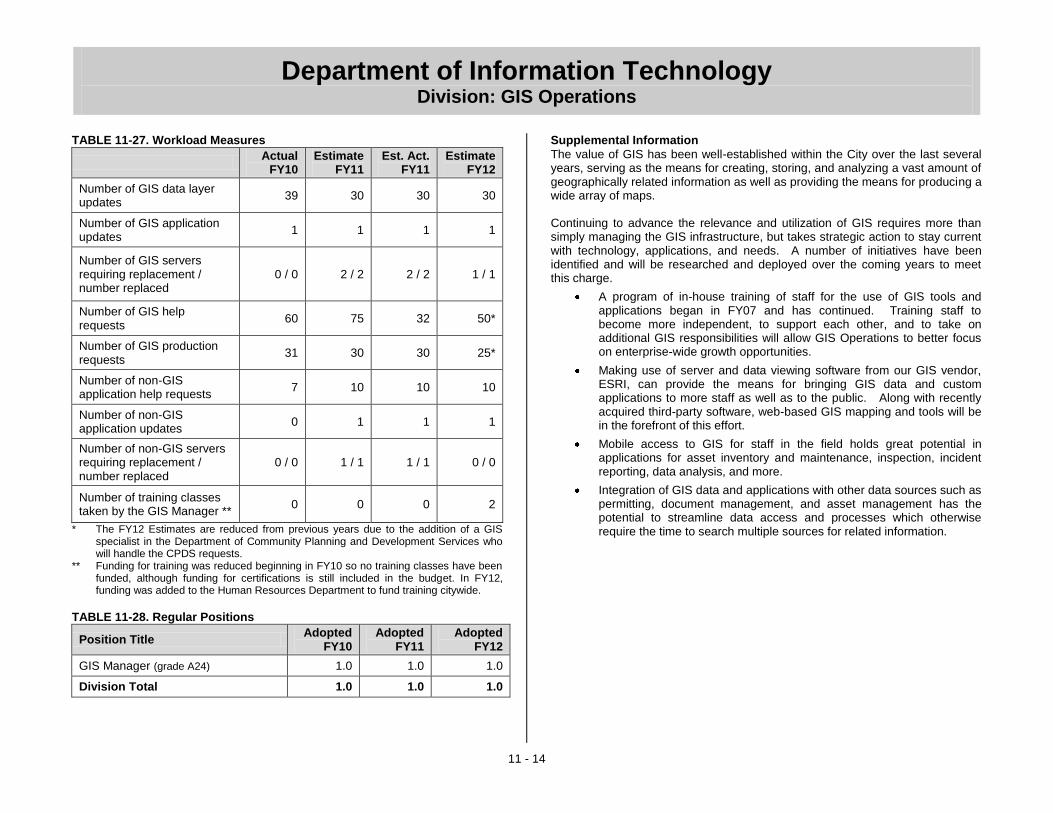
Department of Information Technology Division: GIS Operations
11 - 14
TABLE 11-27. Workload Measures
Actual
FY10 Estimate
FY11 Est. Act.
FY11 Estimate
FY12
Number of GIS data layer updates
39 30 30 30
Number of GIS application updates
1 1 1 1
Number of GIS servers requiring replacement / number replaced
0 / 0 2 / 2 2 / 2 1 / 1
Number of GIS help requests
60 75 32 50*
Number of GIS production requests
31 30 30 25*
Number of non-GIS application help requests
7 10 10 10
Number of non-GIS application updates
0 1 1 1
Number of non-GIS servers requiring replacement / number replaced
0 / 0 1 / 1 1 / 1 0 / 0
Number of training classes taken by the GIS Manager **
0 0 0 2
* The FY12 Estimates are reduced from previous years due to the addition of a GIS specialist in the Department of Community Planning and Development Services who will handle the CPDS requests.
** Funding for training was reduced beginning in FY10 so no training classes have been funded, although funding for certifications is still included in the budget. In FY12, funding was added to the Human Resources Department to fund training citywide.
TABLE 11-28. Regular Positions
Position Title Adopted
FY10 Adopted
FY11 Adopted
FY12
GIS Manager (grade A24) 1.0 1.0 1.0
Division Total 1.0 1.0 1.0
Supplemental Information
The value of GIS has been well-established within the City over the last several years, serving as the means for creating, storing, and analyzing a vast amount of geographically related information as well as providing the means for producing a wide array of maps. Continuing to advance the relevance and utilization of GIS requires more than simply managing the GIS infrastructure, but takes strategic action to stay current with technology, applications, and needs. A number of initiatives have been identified and will be researched and deployed over the coming years to meet this charge.
A program of in-house training of staff for the use of GIS tools and applications began in FY07 and has continued. Training staff to become more independent, to support each other, and to take on additional GIS responsibilities will allow GIS Operations to better focus on enterprise-wide growth opportunities.
Making use of server and data viewing software from our GIS vendor, ESRI, can provide the means for bringing GIS data and custom applications to more staff as well as to the public. Along with recently acquired third-party software, web-based GIS mapping and tools will be in the forefront of this effort.
Mobile access to GIS for staff in the field holds great potential in applications for asset inventory and maintenance, inspection, incident reporting, data analysis, and more.
Integration of GIS data and applications with other data sources such as permitting, document management, and asset management has the potential to streamline data access and processes which otherwise require the time to search multiple sources for related information.

Department of PoliceDepartment Mission Statement
12 - 1
FIGURE 12-1. Departmental Organizational ChartIn collaboration with others, the Police Department protects and promotescommunity safety, ensures the safe and orderly movement of traffic, and seekssolutions to any problems that create fear or threaten the quality of life inRockville.
$0
$4,000,000
$8,000,000
$12,000,000
$16,000,000
ActualFY08
ActualFY09
ActualFY10
Est. ActFY11
AdoptedFY12
GRAPH 12-2. Expenditures History
Office of the Chief 5%
Field Services Bureau
41%
Administrative Services Bureau
12%
Special Operations
Bureau42%
GRAPH 12-3. Use of Funds
0
20
40
60
80
100
120
ActualFY08
ActualFY09
ActualFY10
Est. ActFY11
AdoptedFY12
FT
Es
GRAPH 12-1. Staffing Trend
Total
Temporary
Regular
Department of Police
Field Services Bureau
Special Operations Bureau
Administrative Services Bureau
Office of the Chief of Police
etompkins
Underline
etompkins
Underline
etompkins
Underline
etompkins
Underline
etompkins
Underline
etompkins
Underline
etompkins
Underline
etompkins
Underline

Department of Police Department Summary
12 - 2
TABLE 12-1 Actual
FY10
Adopted
FY11
Est. Act.
FY11
Adopted
FY12
% Change
from Adpt.
Dept. Expenditures
by Division
Office of the Chief 499,881 513,480 513,480 537,810 4.7%
Field Services Bureau 3,821,011 3,913,220 4,057,378 4,262,450 8.9%
Admin. Services Bureau 1,237,380 1,285,370 1,377,539 1,286,710 0.1%
Special Operations
Bureau4,357,455 4,338,880 4,776,000 4,210,560 (3.0%)
Department Total $9,915,727 $10,050,950 $10,724,397 $10,297,530 2.5%
TABLE 12-2 Actual
FY10
Adopted
FY11
Est. Act.
FY11
Adopted
FY12
% Change
from Adpt.
Dept. Expenditures
by Type
Salary and Wages 5,948,035 6,135,150 6,120,150 6,181,890 0.8%
Benefits 1,692,921 1,847,650 1,847,650 1,995,790 8.0%
Overtime 570,553 571,200 625,042 585,700 2.5%
Personnel Subtotal $8,211,509 $8,554,000 $8,592,842 $8,763,380 2.4%
Contractual Services 1,228,635 1,214,050 1,734,168 1,237,250 1.9%
Commodities 299,999 250,100 254,219 256,100 2.4%
Capital Outlays 175,584 32,800 143,168 40,800 24.4%
Other 0 0 0 0 N/A
Operating Subtotal $1,704,218 $1,496,950 $2,131,555 $1,534,150 2.5%
Department Total $9,915,727 $10,050,950 $10,724,397 $10,297,530 2.5%
TABLE 12-3 Actual
FY10
Adopted
FY11
Est. Act.
FY11
Adopted
FY12
% Change
from Adpt.
Source of
Dept. Funds
Animal License (110) 30,908 28,000 28,000 28,000 0.0%
State / Federal Grant (110) 597,439 403,000 569,029 417,000 3.5%
Community Support (110) 93,521 104,000 104,000 120,000 15.4%
Confiscated Funds (110) 6,866 5,000 5,000 5,000 0.0%
Parking Meter Rev (320) 1,128,916 1,110,000 1,150,000 400,000 (64.0%)
Parking Violations (320) 800,086 660,000 850,000 700,000 6.1%
Rental Licenses, Fees,
Permits & Infractions
(110)
813,960 642,000 642,000 748,000 16.5%
Redlight Camera (110) 663,427 630,000 630,000 630,000 0.0%
Speed Camera (380) 1,961,035 1,344,000 2,127,000 1,392,000 3.6%
Subtotal $6,096,158 $4,926,000 $6,105,029 $4,440,000 (9.9%)
Fund Contribution
General Fund (110) 6,334,115 6,921,330 6,917,830 7,024,740 1.5%
Parking Fund (320) (1,581,379) (1,416,770) (1,646,770) (764,230) (46.1%)
Speed Camera (380) (933,167) (379,610) (651,692) (402,980) 6.2%
Subtotal $3,819,569 $5,124,950 $4,619,368 $5,857,530 14.3%
Department Total $9,915,727 $10,050,950 $10,724,397 $10,297,530 2.5%
TABLE 12-4 Actual
FY10
Adopted
FY11
Est. Act.
FY11
Adopted
FY12
% Change
from Adpt.
Staffing Summary
by Division (FTEs)
Regular
Office of the Chief 4.0 4.0 4.0 4.0 0.0%
Field Services Bureau 39.0 39.0 41.0 41.0 5.1%
Admin. Services Bureau 10.0 11.0 11.0 11.0 0.0%
Special Operations
Bureau41.0 38.0 36.0 35.0 (7.9%)
Regular Subtotal* 94.0 92.0 92.0 91.0 (1.1%)
Temporary
Admin. Services Bureau 1.0 1.0 1.0 1.0 0.0%
Temporary Subtotal 1.0 1.0 1.0 1.0 0.0%
Department Total 95.0 93.0 93.0 92.0 (1.1%)
Department Summary
* 57.0 of the total regular FTEs are sworn officers.

Department of Police Department Summary
12 - 3
Department Summary Department Overview
The Rockville City Police Department (RCPD) protects and promotes community safety. It is charged with the responsibilities of preserving the peace, protecting life and property, ensuring the safe and orderly movement of traffic, and providing the community with an overall sense of security.
Police Department Strategic Objectives
The work plan for the City of Rockville is defined by the Mayor and Council Vision for Rockville, along with short-term priorities that the City staff strives to achieve in partnership with the Mayor and Council and Rockville residents. The Police Department’s strategic objectives focus on this work plan as part of the unified effort to attain these goals:
Maintain a high level of visibility and security in the community
Continue to provide a wide variety of community outreach programs to assist residents, such as the Beacon of Safety program, National Night Out, crime prevention through environmental design program, citizen
police academies, and school programs and presentations
Continue to strive for cultural and ethnic diversity within the Police
Department organizational structure
Continue to address property maintenance issues through the Code Enforcement and Community Enhancement Unit, with particular
emphasis on identification and licensing of rental homes
Continue to assist in the development and implementation of a pedestrian safety action plan to promote community safety, protection of life and property, and regulation of safe and efficient vehicle and
pedestrian traffic
Enhance the Police Department’s patrol plans, which address the growing service needs of the City, with particular emphasis on the Town
Center, King Farm, Twinbrook and Fallsgrove communities
Continue to provide for a comprehensive public safety communication
strategy, including but not limited to:
Reverse 911 Notification System Rockville Alert Messaging System Neighborhood Watch Program Crime Statistic Booklets prepared for all active Homeowners and
Civic Associations
Significant Changes from Adopted to Adopted
The Department of Police’s FY12 Adopted budget represents a 2.5% increase over the FY11 Adopted budget due to a combination of an increase in salary and benefit costs, an increase in contractual services in the Parking and Speed Camera Funds and a reduction of one Parking Enforcement Officer.
The Department of Police’s FY12 Adopted revenue budget represents a 9.9% decrease from the FY11 Adopted budget due to the elimination of the Town Center Parking Garage meter and violation revenues because the City will no longer manage the garages and increases in projected police protection grant, rental license and speed camera citation revenue. Supplemental Information
The Department continues to be in full compliance with national standards of professional excellence. The RCPD was originally nationally accredited in 1994 and has been reaccredited for the fifth time in July, 2010. In FY11, the Department was recognized for the 15
th time by the Governor’s Council on Crime
Prevention for our traffic safety programs. The Department also received recognition by the Governor’s Office for our overall crime prevention programs. In 2010, fourteen members of the Police Department were recognized for meritorious service or valor at the 20th Annual Public Safety Services Award Program. Future focus will continue to concentrate on:
Ensuring that a high level of visibility and security is maintained
throughout the community
Continuing to focus available resources on activities and initiatives that
will have the highest positive impact for the community
Maintaining staffing levels, and aggressively pursuing personnel who
reflect the diversity of our customer base as vacancies occur
Helping to preserve property values through proactive property
maintenance enforcement
Ensuring maximized City police involvement in regional planning efforts
for emergency preparedness and disaster planning
Continuing to find ways to engage the community so residents may play a meaningful role in the problem solving and policing of their community
The RCPD continues to be recognized nationally as a model practitioner of community policing, and receives inquiries from across the United States about the Department’s community outreach partnership programs.
etompkins
Underline
etompkins
Underline
etompkins
Underline

Department of Police Department Summary
12 - 4
FIGURE 12-2. The Rockville City Police Department Honor Guard marches in
the Memorial Day Parade.
GRAPH 12-4. The chart below shows the number of sworn police officers from
2001 through 2011. The number of sworn officers increased between 2004 and 2008 in response to the City’s population growth, but has remained steady since.
Number of Sworn Police Officers
4950 50 50
5152
54
57 57 57 57
44
46
48
50
52
54
56
58
20
01
20
02
20
03
20
04
20
05
20
06
20
07
20
08
20
09
20
10
20
11
Calendar Year
Offic
ers
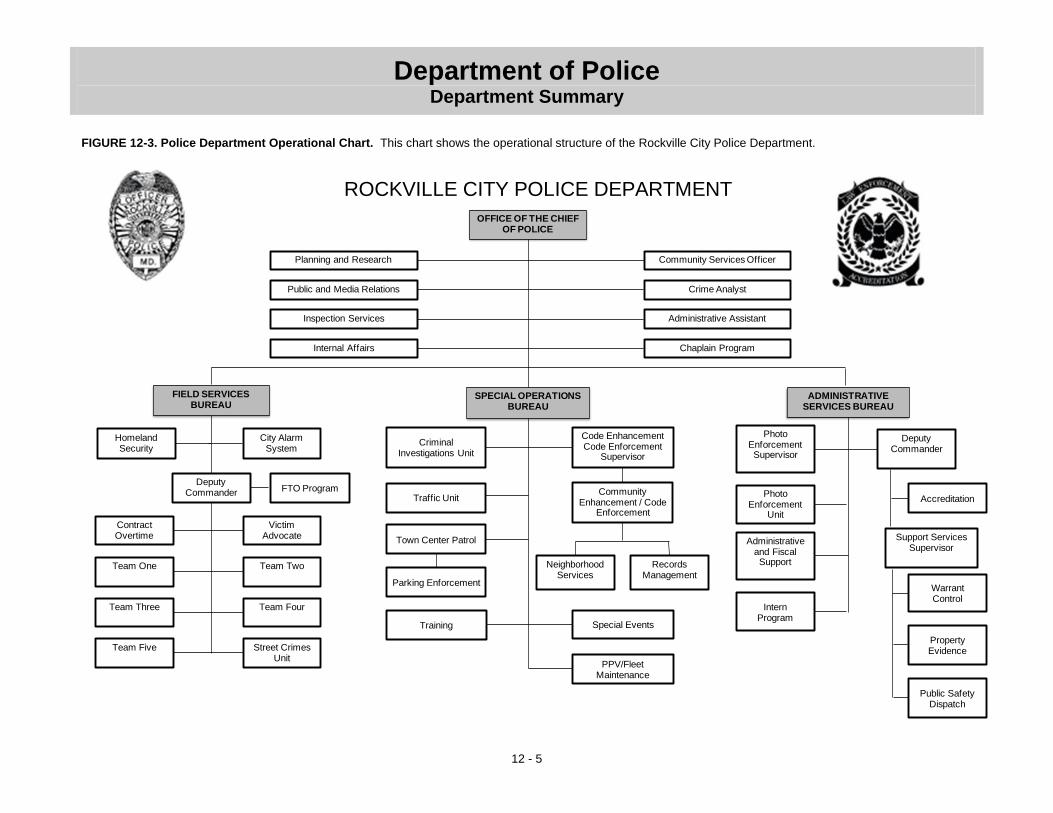
Department of Police Department Summary
12 - 5
ROCKVILLE CITY POLICE DEPARTMENT
FIELD SERVICES BUREAU
ADMINISTRATIVESERVICES BUREAU
OFFICE OF THE CHIEF OF POLICE
Planning and Research
Public and Media Relations
Inspection Services
Internal Affairs
Community Services Officer
Crime Analyst
Administrative Assistant
Chaplain Program
Homeland Security
City AlarmSystem
Deputy Commander
Contract Overtime
Victim Advocate
Team One Team Two
Team Three Team Four
Team Five Street Crimes Unit
SPECIAL OPERATIONS BUREAU
Code EnhancementCode Enforcement
Supervisor
Criminal Investigations Unit
Traffic Unit
Town Center Patrol
Parking Enforcement
Community Enhancement / Code
Enforcement
NeighborhoodServices
Records Management
Training
FTO Program
Special Events
PPV/Fleet Maintenance
Photo EnforcementSupervisor
Photo Enforcement
Unit
Administrative and Fiscal Support
Intern Program
Deputy Commander
Accreditation
Support Services Supervisor
WarrantControl
Property Evidence
Public Safety Dispatch
FIGURE 12-3. Police Department Operational Chart. This chart shows the operational structure of the Rockville City Police Department.

Department of Police Division: Office of the Chief of Police
12 - 6
TABLE 12-5 Actual
FY10
Adopted
FY11
Est. Act.
FY11
Adopted
FY12
Division Expenditures
by Cost Center
Management & Support 376,377 385,790 385,790 404,590
Community Services
Office123,504 127,690 127,690 133,220
Division Total $499,881 $513,480 $513,480 $537,810
TABLE 12-6 Actual
FY10
Adopted
FY11
Est. Act.
FY11
Adopted
FY12
Division Expenditures
by Type
Salary and Wages 390,863 383,650 383,650 390,620
Benefits 96,978 113,330 113,330 125,640
Overtime 2,835 8,700 8,700 8,700
Personnel Subtotal $490,676 $505,680 $505,680 $524,960
Contractual Services 3,800 2,200 2,200 3,250
Commodities 5,405 5,600 5,600 9,600
Capital Outlays 0 0 0 0
Other 0 0 0 0
Operating Subtotal $9,205 $7,800 $7,800 $12,850
Division Total $499,881 $513,480 $513,480 $537,810
TABLE 12-7 Actual
FY10
Adopted
FY11
Est. Act.
FY11
Adopted
FY12
Source of
Division Funds
Departmental Revenue
Comm. Support* (110) 93,521 N/A N/A N/A
Subtotal $93,521 N/A N/A N/A
Fund Contribution
General Fund (110) 406,360 513,480 513,480 537,810
Subtotal $406,360 $513,480 $513,480 $537,810
Division Total $499,881 $513,480 $513,480 $537,810
TABLE 12-8 Actual
FY10
Adopted
FY11
Est. Act.
FY11
Adopted
FY12
Staffing Summary
by Cost Center (FTEs)
Regular
Management & Support 3.0 3.0 3.0 3.0
Community Services
Office1.0 1.0 1.0 1.0
Regular Subtotal 4.0 4.0 4.0 4.0
Temporary 0.0 0.0 0.0 0.0
Temporary Subtotal 0.0 0.0 0.0 0.0
Division Total 4.0 4.0 4.0 4.0
Division: Office of the Chief of Police
* Community Support revenue moved from the Office of the Chief of Police Division to the Field Services Bureau Division for FY11.
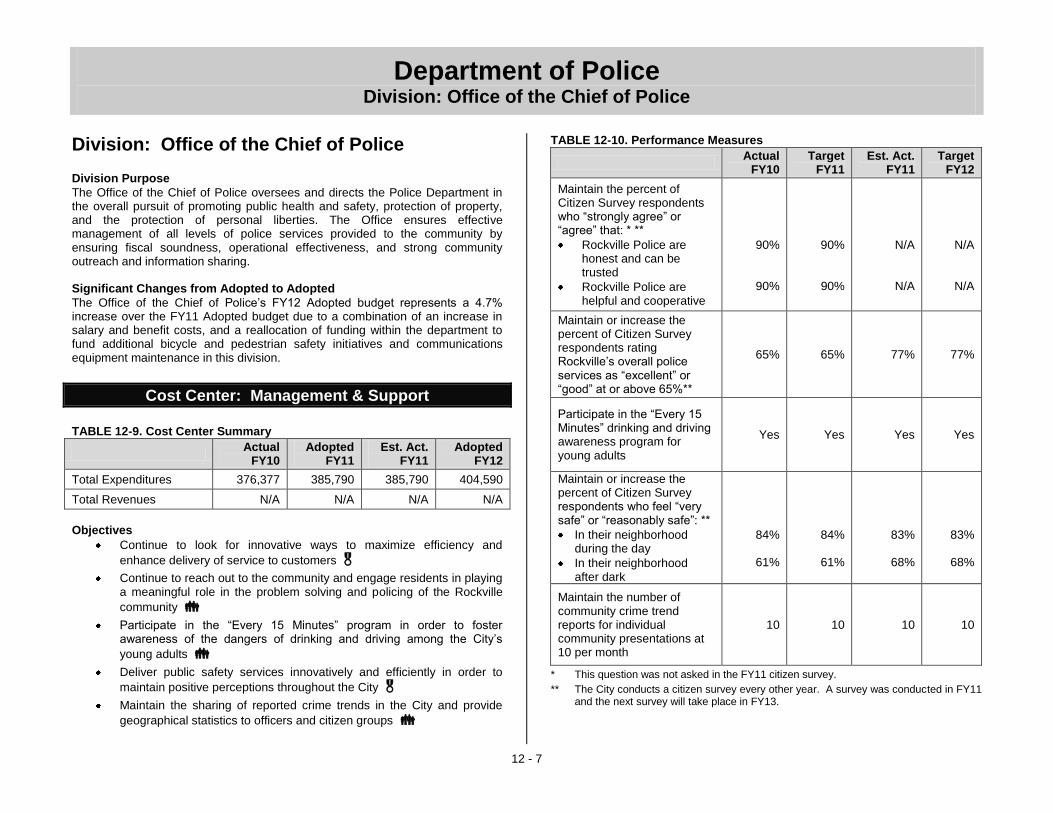
Department of Police Division: Office of the Chief of Police
12 - 7
Division: Office of the Chief of Police Division Purpose
The Office of the Chief of Police oversees and directs the Police Department in the overall pursuit of promoting public health and safety, protection of property, and the protection of personal liberties. The Office ensures effective management of all levels of police services provided to the community by ensuring fiscal soundness, operational effectiveness, and strong community outreach and information sharing. Significant Changes from Adopted to Adopted
The Office of the Chief of Police’s FY12 Adopted budget represents a 4.7% increase over the FY11 Adopted budget due to a combination of an increase in salary and benefit costs, and a reallocation of funding within the department to fund additional bicycle and pedestrian safety initiatives and communications equipment maintenance in this division.
Cost Center: Management & Support
TABLE 12-9. Cost Center Summary
Actual
FY10 Adopted
FY11 Est. Act.
FY11 Adopted
FY12
Total Expenditures 376,377 385,790 385,790 404,590
Total Revenues N/A N/A N/A N/A
Objectives
Continue to look for innovative ways to maximize efficiency and
enhance delivery of service to customers Continue to reach out to the community and engage residents in playing
a meaningful role in the problem solving and policing of the Rockville
community Participate in the “Every 15 Minutes” program in order to foster
awareness of the dangers of drinking and driving among the City’s
young adults
Deliver public safety services innovatively and efficiently in order to
maintain positive perceptions throughout the City
Maintain the sharing of reported crime trends in the City and provide
geographical statistics to officers and citizen groups
TABLE 12-10. Performance Measures
Actual
FY10 Target
FY11 Est. Act.
FY11 Target
FY12
Maintain the percent of Citizen Survey respondents who “strongly agree” or “agree” that: * **
Rockville Police are honest and can be trusted
Rockville Police are helpful and cooperative
90%
90%
90%
90%
N/A
N/A
N/A
N/A
Maintain or increase the percent of Citizen Survey respondents rating Rockville’s overall police services as “excellent” or “good” at or above 65%**
65% 65% 77% 77%
Participate in the “Every 15 Minutes” drinking and driving awareness program for young adults
Yes Yes Yes Yes
Maintain or increase the percent of Citizen Survey respondents who feel “very safe” or “reasonably safe”: **
In their neighborhood during the day
In their neighborhood after dark
84%
61%
84%
61%
83%
68%
83%
68%
Maintain the number of community crime trend reports for individual community presentations at 10 per month
10 10 10 10
* This question was not asked in the FY11 citizen survey.
** The City conducts a citizen survey every other year. A survey was conducted in FY11 and the next survey will take place in FY13.
Department of Police Division: Office of the Chief of Police
12 - 8
TABLE 12-11. Regular Positions
Position Title Adopted
FY10 Adopted
FY11 Adopted
FY12
Administrative Assistant I (grade A14) 1.0 1.0 1.0
Chief of Police (grade SAII) 1.0 1.0 1.0
Crime Analyst* (grade A14) 0.0 1.0 1.0
Victim Advocate* (grade A16) 1.0 0.0 0.0
Cost Center Total 3.0 3.0 3.0
* The Victim Advocate position moved to the Field Services Bureau, Management & Support cost center for FY11. The Crime Analyst position moved from the Field Services Bureau, Management & Support cost center to the Office of the Chief, Management & Support cost center for FY11.
Supplemental Information
FIGURE 12-4. The Police Department is dedicated to educating young people
about the possible long-reaching ramifications of drinking alcohol, poor driving and the impact it has on them as well as their friends, classmates and families. Since 1988, the RCPD has brought the “Every 15 Minutes” program to local high schools. This is a two-day program focusing on high school juniors and seniors, which challenges them to think about drinking, personal safety, driving habits and the responsibility of making mature decisions when lives are involved. The following photo shows a mock accident scene, which plays a significant role in this program.

Department of Police Division: Office of the Chief of Police
12 - 9
Cost Center: Community Services Office TABLE 12-12. Cost Center Summary
Actual
FY10 Adopted
FY11 Est. Act.
FY11 Adopted
FY12
Total Expenditures 123,504 127,690 127,690 133,220
Total Revenues* 93,521 N/A N/A N/A
* Community Support revenue moved from the Office of the Chief, Community Services Office cost center to the Field Services Bureau, Patrol Teams cost center for FY11.
Objectives
Continue to improve communication with neighborhood associations and foster neighborhood watch groups so that residents have a
thorough knowledge base for safety practices and awareness
Continue public safety programs and presentations to a diverse Rockville community, both residential and business, to enhance public knowledge and confidence in the Police Department and its public
safety activities
TABLE 12-13. Performance Measures
Actual
FY10 Target
FY11 Est. Act.
FY11 Target
FY12
Activate a minimum of 4 dormant Neighborhood Watch groups
3 / 10 4 / 11 4 / 11 4 / 9
Maintain a minimum of 325 Rockville businesses visited per year
325 325 325 330
TABLE 12-14. Regular Positions
Position Title Adopted
FY10 Adopted
FY11 Adopted
FY12
Community Services Officer (grade P1-P4) 1.0 1.0 1.0
Cost Center Total 1.0 1.0 1.0
Supplemental Information
In FY12 the Police Department will continue to maintain a very strong and cooperative relationship with all civic and homeowner associations throughout the City. Police Officers are in attendance at most civic meetings, and continue to provide up-to-date information on calls for service, traffic issues, and any possible criminal trends within that particular neighborhood/community.
FIGURE 12-5. The Community Services Officer, McGruff the Crime Dog, and a
citizen at the National Night Out block party.

Department of Police Division: Field Services Bureau
12 - 10
TABLE 12-15 Actual
FY10
Adopted
FY11
Est. Act.
FY11
Adopted
FY12
Division Expenditures
by Cost Center
Management & Support 433,409 427,250 446,004 423,230
Patrol Teams 3,387,602 3,485,970 3,611,374 3,839,220
Division Total $3,821,011 $3,913,220 $4,057,378 $4,262,450
TABLE 12-16 Actual
FY10
Adopted
FY11
Est. Act.
FY11
Adopted
FY12
Division Expenditures
by Type
Salary and Wages 2,526,340 2,686,510 2,768,664 2,896,840
Benefits 797,955 780,100 810,690 903,000
Overtime 414,500 379,610 397,310 395,610
Personnel Subtotal $3,738,795 $3,846,220 $3,976,664 $4,195,450
Contractual Services 0 0 0 0
Commodities 71,742 67,000 67,000 67,000
Capital Outlays 10,474 0 13,714 0
Other 0 0 0 0
Operating Subtotal $82,216 $67,000 $80,714 $67,000
Division Total $3,821,011 $3,913,220 $4,057,378 $4,262,450
TABLE 12-17 Actual
FY10
Adopted
FY11
Est. Act.
FY11
Adopted
FY12
Source of
Division Funds
State / Fed. Grants (110) 597,439 403,000 569,029 417,000
Comm. Support* (110) N/A 104,000 104,000 120,000
Confiscated Funds (110) 6,866 5,000 5,000 5,000
Subtotal $604,305 $512,000 $678,029 $542,000
Fund Contribution
General Fund (110) 3,216,706 3,401,220 3,379,349 3,720,450
Subtotal $3,216,706 $3,401,220 $3,379,349 $3,720,450
Division Total $3,821,011 $3,913,220 $4,057,378 $4,262,450
TABLE 12-18 Actual
FY10
Adopted
FY11
Est. Act.
FY11
Adopted
FY12
Staffing Summary
by Cost Center (FTEs)
Regular
Management & Support 3.0 3.0 3.0 3.0
Patrol Teams 36.0 36.0 38.0 38.0
Regular Subtotal 39.0 39.0 41.0 41.0
Temporary 0.0 0.0 0.0 0.0
Temporary Subtotal 0.0 0.0 0.0 0.0
Division Total 39.0 39.0 41.0 41.0
Division: Field Services Bureau
* Community Support revenue moved from the Office of the Chief of Police Division to the Field Services Bureau Division for FY11.

Department of Police Division: Field Services Bureau
12 - 11
Division: Field Services Bureau Division Purpose
The Field Services Bureau (FSB) maintains public order, protects lives and property, and reduces criminal activity through its proactive patrols and strict enforcement of State and City laws. The Bureau consists of police officers assigned to patrol duties, providing primary response and preliminary investigation for police events within the City. This Bureau oversees the Victim Advocate position. This position provides crime victims who are reported to the Rockville Police support and referral services to assist in their recovery if requested. This Bureau also contains both Rockville City Police patrol K-9 teams. One team is cross-trained in narcotics detection and the other in explosive detection. The Street Crimes Unit has been reconstituted and is now housed in this Bureau. The unit focuses on trends in criminal activity and crimes against persons. The unit works in both a plainclothes and uniformed capacity. Significant Changes from Adopted to Adopted
The Field Services Bureau’s FY12 Adopted budget represents an 8.9% increase over the FY11 Adopted budget due to a combination of an increase in salary and benefit costs, an additional $16,000 for Police overtime for community support, and the reallocation of 2.0 FTE Officer/Corporal positions and their related salary and benefits from the Special Operations Bureau into this division.
The Field Services Bureau’s FY12 Adopted revenue budget represents a 5.9% increase over the FY11 Adopted budget due to a projected increase in police protection grant and community support revenues.
Cost Center: Management & Support TABLE 12-19. Cost Center Summary
Actual
FY10 Adopted
FY11 Est. Act.
FY11 Adopted
FY12
Total Expenditures 433,409 427,250 446,004 423,230
Total Revenues 597,439 403,000 569,029 417,000
Objectives
Maintain a variance of 5% or less between adopted overtime budget and actual overtime expenditures (division-wide) while ensuring proper
staffing standards are maintained
Review police reports to determine which cases are appropriate for Victim Advocate follow-up. Provide support, information or referrals for
follow-up services as needed
TABLE 12-20. Performance Measures
Actual
FY10 Target
FY11 Est. Act.
FY11 Target
FY12
Maintain staffing standards while staying within 5% of adopted overtime budget
Actual*
Adopted
Percent Variance
$391,700 $341,700
+14%
$379,610 $379,610
0%
$379,610 $379,610
0%
$379,610 $379,610
0%
Maintain 100% of referrals for service as requested by victims of domestic violence or other crimes and/or witnesses for cases handled by RCPD officers **
112 / 112 or 100%
N/A 88 / 88
or 100% 60 / 60
or 100%
* Grant/special detail funding added to the budget after adoption is not included in the actual totals reported in this performance measure.
** This is a new performance measure for FY12.
TABLE 12-21. Regular Positions
Position Title Adopted
FY10 Adopted
FY11 Adopted
FY12
Bureau Commander (Major*) (grade P10)
1.0 1.0 1.0
Crime Analyst** (grade A14) 1.0 0.0 0.0
Deputy Bureau Commander (LT) (grade P9)
1.0 1.0 1.0
Victim Advocate** (grade A16) 0.0 1.0 1.0
Cost Center Total 3.0 3.0 3.0
* The Bureau Commander position titles were changed from Captain to Major in FY10. ** The Crime Analyst position moved to the Office of the Chief, Management & Support
cost center for FY11. The Victim Advocate position moved from the Office of the Chief, Management & Support cost center to the Field Services Bureau, Management & Support cost center for FY11.
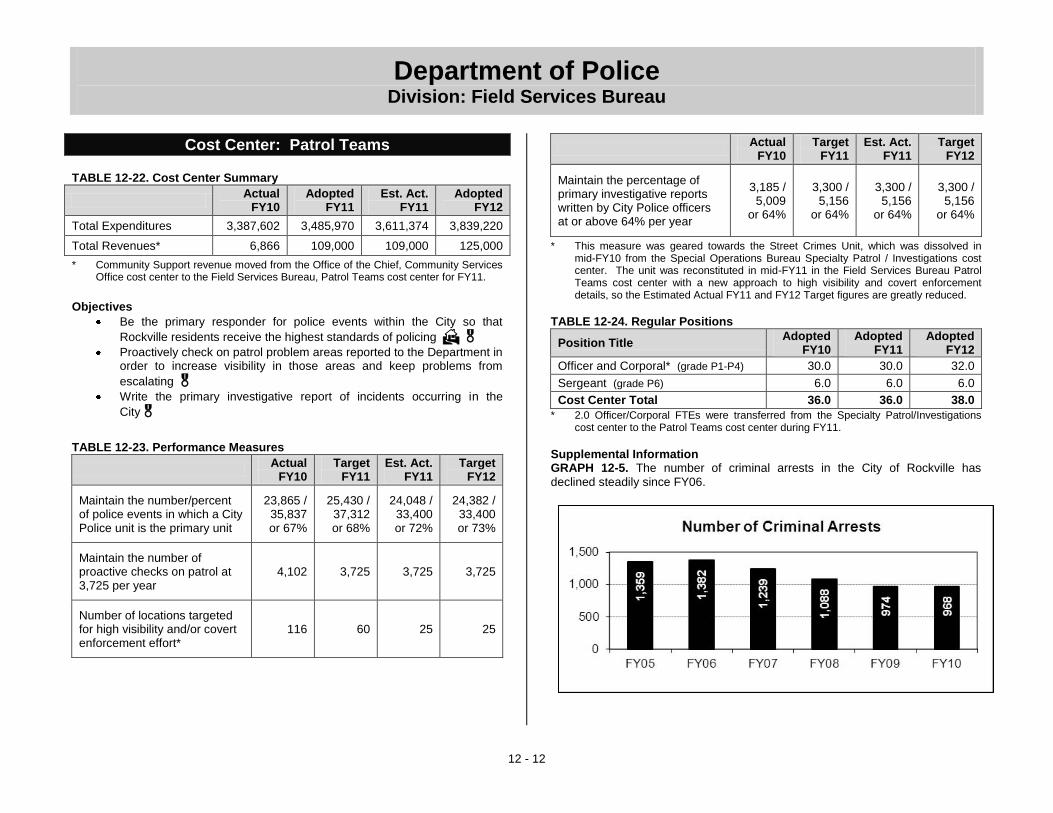
Department of Police Division: Field Services Bureau
12 - 12
Cost Center: Patrol Teams
TABLE 12-22. Cost Center Summary
Actual
FY10 Adopted
FY11 Est. Act.
FY11 Adopted
FY12
Total Expenditures 3,387,602 3,485,970 3,611,374 3,839,220
Total Revenues* 6,866 109,000 109,000 125,000
* Community Support revenue moved from the Office of the Chief, Community Services Office cost center to the Field Services Bureau, Patrol Teams cost center for FY11.
Objectives
Be the primary responder for police events within the City so that
Rockville residents receive the highest standards of policing
Proactively check on patrol problem areas reported to the Department in order to increase visibility in those areas and keep problems from
escalating
Write the primary investigative report of incidents occurring in the
City
TABLE 12-23. Performance Measures
Actual
FY10 Target
FY11 Est. Act.
FY11 Target
FY12
Maintain the number/percent of police events in which a City Police unit is the primary unit
23,865 / 35,837 or 67%
25,430 / 37,312 or 68%
24,048 / 33,400 or 72%
24,382 / 33,400 or 73%
Maintain the number of proactive checks on patrol at 3,725 per year
4,102 3,725 3,725 3,725
Number of locations targeted for high visibility and/or covert enforcement effort*
116 60 25 25
Actual
FY10 Target
FY11 Est. Act.
FY11 Target
FY12
Maintain the percentage of primary investigative reports written by City Police officers at or above 64% per year
3,185 / 5,009
or 64%
3,300 / 5,156
or 64%
3,300 / 5,156
or 64%
3,300 / 5,156
or 64%
* This measure was geared towards the Street Crimes Unit, which was dissolved in mid-FY10 from the Special Operations Bureau Specialty Patrol / Investigations cost center. The unit was reconstituted in mid-FY11 in the Field Services Bureau Patrol Teams cost center with a new approach to high visibility and covert enforcement details, so the Estimated Actual FY11 and FY12 Target figures are greatly reduced.
TABLE 12-24. Regular Positions
Position Title Adopted
FY10 Adopted
FY11 Adopted
FY12
Officer and Corporal* (grade P1-P4) 30.0 30.0 32.0
Sergeant (grade P6) 6.0 6.0 6.0
Cost Center Total 36.0 36.0 38.0
* 2.0 Officer/Corporal FTEs were transferred from the Specialty Patrol/Investigations cost center to the Patrol Teams cost center during FY11.
Supplemental Information GRAPH 12-5. The number of criminal arrests in the City of Rockville has
declined steadily since FY06.
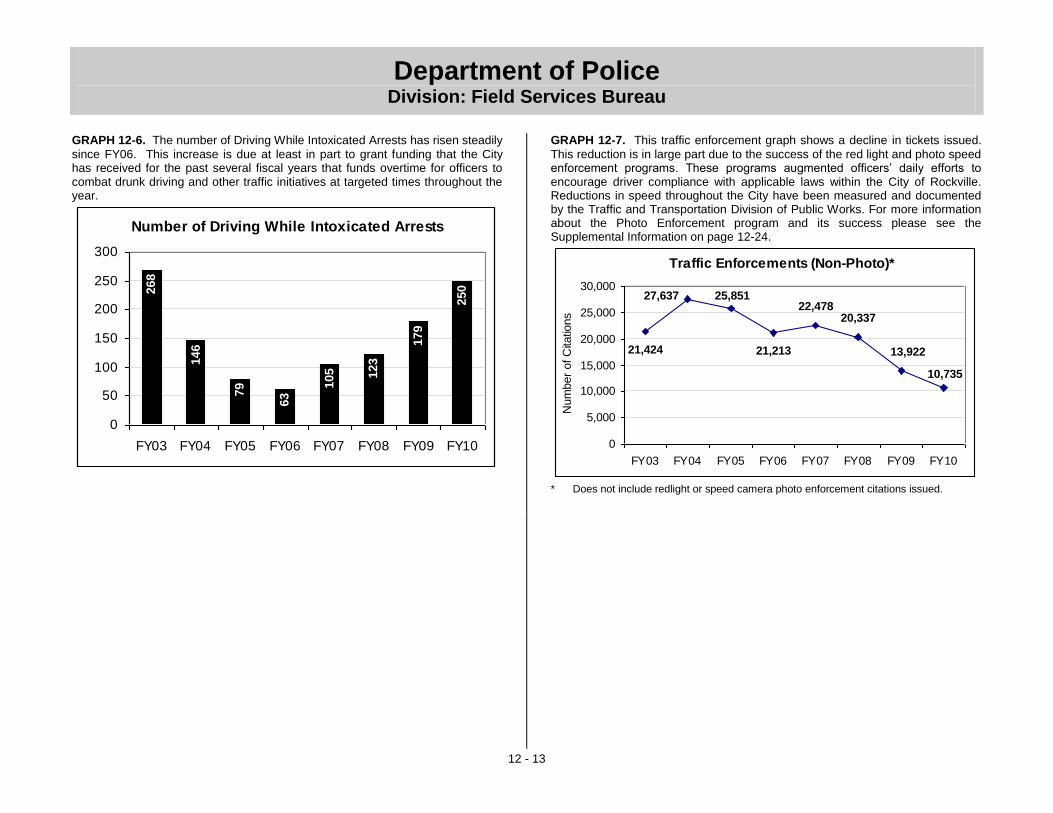
Department of Police Division: Field Services Bureau
12 - 13
GRAPH 12-6. The number of Driving While Intoxicated Arrests has risen steadily
since FY06. This increase is due at least in part to grant funding that the City has received for the past several fiscal years that funds overtime for officers to combat drunk driving and other traffic initiatives at targeted times throughout the year.
Number of Driving While Intoxicated Arrests
268
146
79
63
105 123
179
250
0
50
100
150
200
250
300
FY03 FY04 FY05 FY06 FY07 FY08 FY09 FY10
GRAPH 12-7. This traffic enforcement graph shows a decline in tickets issued.
This reduction is in large part due to the success of the red light and photo speed enforcement programs. These programs augmented officers’ daily efforts to encourage driver compliance with applicable laws within the City of Rockville. Reductions in speed throughout the City have been measured and documented by the Traffic and Transportation Division of Public Works. For more information about the Photo Enforcement program and its success please see the Supplemental Information on page 12-24.
Traffic Enforcements (Non-Photo)*
21,424
22,47827,637
21,213
25,851
10,735
20,337
13,922
0
5,000
10,000
15,000
20,000
25,000
30,000
FY03 FY04 FY05 FY06 FY07 FY08 FY09 FY10
Num
ber
of C
itatio
ns
* Does not include redlight or speed camera photo enforcement citations issued.

Department of Police Division: Administrative Services Bureau
12 - 14
TABLE 12-25 Actual
FY10
Adopted
FY11
Est. Act.
FY11
Adopted
FY12
Division Expenditures
by Cost Center
Management & Support 501,287 672,570 714,993 650,940
Public Safety
Communications
Dispatch Property /
Evidence Function
736,093 612,800 662,546 635,770
Division Total $1,237,380 $1,285,370 $1,377,539 $1,286,710
TABLE 12-26 Actual
FY10
Adopted
FY11
Est. Act.
FY11
Adopted
FY12
Division Expenditures
by Type
Salary and Wages 586,262 712,410 697,410 702,830
Benefits 169,536 226,760 221,720 240,530
Overtime 21,609 28,510 31,510 28,510
Personnel Subtotal $777,407 $967,680 $950,640 $971,870
Contractual Services 124,787 132,190 140,626 119,340
Commodities 177,087 152,700 156,819 154,700
Capital Outlays 158,099 32,800 129,454 40,800
Other 0 0 0 0
Operating Subtotal $459,973 $317,690 $426,899 $314,840
Division Total $1,237,380 $1,285,370 $1,377,539 $1,286,710
TABLE 12-27 Actual
FY10
Adopted
FY11
Est. Act.
FY11
Adopted
FY12
Source of
Division Funds
Departmental Revenue 0 0 0 0
Subtotal $0 $0 $0 $0
Fund Contribution
General Fund (110) 1,237,380 1,285,370 1,377,539 1,286,710
Subtotal $1,237,380 $1,285,370 $1,377,539 $1,286,710
Division Total $1,237,380 $1,285,370 $1,377,539 $1,286,710
TABLE 12-28 Actual
FY10
Adopted
FY11
Est. Act.
FY11
Adopted
FY12
Staffing Summary
by Cost Center (FTEs)
Regular
Management & Support 3.0 4.0 4.0 4.0
Public Safety
Communications
Dispatch Property /
Evidence Function
7.0 7.0 7.0 7.0
Regular Subtotal 10.0 11.0 11.0 11.0
Temporary
Management & Support 1.0 1.0 1.0 1.0
Temporary Subtotal 1.0 1.0 1.0 1.0
Division Total 11.0 12.0 12.0 12.0
Division: Administrative Services Bureau

Department of Police Division: Administrative Services Bureau
12 - 15
Division: Administrative Services Bureau Division Purpose
The Administrative Services Bureau provides the Department with proper communications technology to ensure officer safety and the technical services required to allow employees to perform their duties in an efficient and effective manner. The Bureau includes public safety communications, monitoring of the citywide alarm system, records retention, fiscal management, property/evidence control, warrant control, Homeland Security and the Department’s Accreditation Program. Significant Changes from Adopted to Adopted
None.
Cost Center: Management & Support TABLE 12-29. Cost Center Summary
Actual
FY10 Adopted
FY11 Est. Act.
FY11 Adopted
FY12
Total Expenditures 501,287 672,570 714,993 650,940
Total Revenues N/A N/A N/A N/A
Objectives
Participate in regional and local Homeland Security and emergency preparedness meetings, exercises, drills, and grant applications in order
to ensure Rockville residents are considered in emergency planning
Conduct internal emergency preparedness meetings and training exercises in order to ensure City police are equipped to serve and
protect in the event of a major emergency
Maintain documentation to prove Accreditation Standards compliance when the Commission on Accreditation for Law Enforcement Agencies
(CALEA) assessors evaluate the department every three years
TABLE 12-30. Performance Measures
Actual
FY10 Target
FY11 Est. Act.
FY11 Target
FY12
Represent City interests and participation in 100% of applicable regional emergency preparedness efforts
4 / 4 or 100%
4 / 4 or 100%
4 / 4 or 100%
4 / 4 or 100%
Conduct a minimum of one RCPD emergency preparedness exercise per year
1 1 1 1
Comply with 100% of the mandated national accreditation standards
384 / 384 or 100%
384 / 384 or 100%
384 / 384 or 100%
384 / 384 or 100%
Comply with 100% of the optional national accreditation standards
74 / 75 or 99%
75 / 75 or 100%
75 / 75 or 100%
75 / 75 or 100%
TABLE 12-31. Workload Measures
Actual
FY10 Estimate
FY11 Est. Act.
FY11 Estimate
FY12
Average percent of work time spent on Homeland Security projects and meetings (per 40-hour work week)
12 / 40 or 30%
16 / 40 or 40%
14 / 40 or 35%
14 / 40 or 35%

Department of Police Division: Administrative Services Bureau
12 - 16
TABLE 12-32. Regular Positions
Position Title Adopted
FY10 Adopted
FY11 Adopted
FY12
Accreditation Manager (LT)** (grade P9)
0.0 1.0 1.0
Bureau Commander (Major*) (grade P10)
1.0 1.0 1.0
Police Equipment and Budget Coordinator (grade A14)
1.0 1.0 1.0
Secretary II (grade A12) 1.0 1.0 1.0
Cost Center Total 3.0 4.0 4.0
* The Bureau Commander position titles were changed from Captain to Major in FY10. ** The Accreditation Manager (LT) position moved from the Special Operations Bureau,
Management & Support cost center for FY11.
Supplemental Information
Accreditation Accreditation is a process where state and local law enforcement agencies can voluntarily demonstrate that they comply with national standards, which are an indication of professional excellence. The Rockville City Police Department has been accredited since 1994. The benefits of accreditation are:
Nationwide recognition of professional excellence
A method of executing daily agency operations under a professional format
Continued planning, programming, and development
Better community understanding and support
State and local government confidence in the agency
State of the art impartial guidelines for evaluation and change
Proactive management and information systems to give feedback on policies and procedures
Better coordination with neighboring agencies and various components of the criminal justice system
Access to the latest in law enforcement practices, via interfacing with other accredited agencies
Pride, satisfaction and confidence, in the agency and confidence that comes with success
FIGURE 12-6. Chief Terry Treschuk and Lieutenant Eric Over are presented with
the Department’s sixth accreditation award from the Commission on Accreditation of Law Enforcement Agencies (CALEA).

Department of Police Division: Administrative Services Bureau
12 - 17
Cost Center: Public Safety Communications Dispatch Property / Evidence Function
TABLE 12-33. Cost Center Summary
Actual
FY10 Adopted
FY11 Est. Act.
FY11 Adopted
FY12
Total Expenditures 736,093 612,800 662,546 635,770
Total Revenues N/A N/A N/A N/A
Objectives
Process and enter each warrant into the State computer system within 72 hours in order to maximize safety for police officers who may
encounter wanted persons on the street
Validate each warrant within 90 days after initial entry as well as
annually in order to maintain compliance with all State regulations
Expeditiously log each after-hours contact for emergency situations (such as trees down, traffic lights out, electrical wires down) and forward the information to the appropriate department so the situation can be
resolved
Maintain the property/evidence room in a fashion that meets all State of Maryland and Commission on Accreditation for Law Enforcement Agencies standards in order to pass all announced and unannounced
inspections
TABLE 12-34. Performance Measures
Actual
FY10 Target
FY11 Est. Act.
FY11 Target
FY12
Enter 100% of warrants into the State computer system within 72 hours
455 / 455 or 100%
570 / 570 or 100%
570 / 570 or 100%
570 / 570 or 100%
Complete 100% of warrant validations within 10 days of receipt from the State
457 / 457 or 100%
325 / 325 or 100%
325 / 325 or 100%
325 / 325 or 100%
Maintain the percentage of after-hour emergency contacts made within one hour of initial notification at 100%
337 / 337 or 100%
450 / 450 or 100%
450 / 450 or 100%
450 / 450 or 100%
Process 100% of property/evidence items within two business days of receipt
975 / 975 or 100%
700 / 700 or 100%
700 / 700 or 100%
700 / 700 or 100%
TABLE 12-35. Regular Positions
Position Title Adopted
FY10 Adopted
FY11 Adopted
FY12
Public Safety Communications Dispatcher (grade A15)
6.0 6.0 6.0
Support Services Coordinator (grade A21)
1.0 1.0 1.0
Cost Center Total 7.0 7.0 7.0

Department of Police Division: Special Operations Bureau
12 - 18
TABLE 12-36 Actual
FY10
Adopted
FY11
Est. Act.
FY11
Adopted
FY12
Division Expenditures
by Cost Center
Management & Support 404,169 282,490 282,490 280,690
Neighborhood Services 389,450 394,030 394,030 423,540
Parking Enforement (320) 347,623 353,230 353,230 335,770
Redlight Camera (110) 431,669 457,910 458,674 461,450
Specialty Patrol /
Investigations1,284,392 1,325,480 1,250,918 1,147,950
Speed Camera (380) 1,027,868 964,390 1,475,308 989,020
Comm. Enhancement &
Code Enforcement472,284 561,350 561,350 572,140
Division Total $4,357,455 $4,338,880 $4,776,000 $4,210,560
TABLE 12-37 Actual
FY10
Adopted
FY11
Est. Act.
FY11
Adopted
FY12
Division Expenditures
by Type
Salary and Wages 2,444,570 2,352,580 2,270,426 2,191,600
Benefits 628,452 727,460 701,910 726,620
Overtime 131,609 154,380 187,522 152,880
Personnel Subtotal $3,204,631 $3,234,420 $3,159,858 $3,071,100
Contractual Services 1,100,048 1,079,660 1,591,342 1,114,660
Commodities 45,765 24,800 24,800 24,800
Capital Outlays 7,011 0 0 0
Other 0 0 0 0
Operating Subtotal $1,152,824 $1,104,460 $1,616,142 $1,139,460
Division Total $4,357,455 $4,338,880 $4,776,000 $4,210,560
TABLE 12-38 Actual
FY10
Adopted
FY11
Est. Act.
FY11
Adopted
FY12
Source of
Division Funds
Departmental Revenue
Animal License (110) 30,908 28,000 28,000 28,000
Parking Meter Rev (320) 1,128,916 1,110,000 1,150,000 400,000
Parking Violations (320) 800,086 660,000 850,000 700,000
Rental Licenses, Fees,
Permits & Infractions
(110)
813,960 642,000 642,000 748,000
Redlight Camera (110) 663,427 630,000 630,000 630,000
Speed Camera (380) 1,961,035 1,344,000 2,127,000 1,392,000
Subtotal $5,398,332 $4,414,000 $5,427,000 $3,898,000
Fund Contribution
General Fund (110) 1,473,669 1,721,260 1,647,462 1,479,770
Parking Fund (320) (1,581,379) (1,416,770) (1,646,770) (764,230)
Speed Camera (380) (933,167) (379,610) (651,692) (402,980)
Subtotal ($1,040,877) ($75,120) ($651,000) $312,560
Division Total $4,357,455 $4,338,880 $4,776,000 $4,210,560
TABLE 12-39 Actual
FY10
Adopted
FY11
Est. Act.
FY11
Adopted
FY12
Staffing Summary
by Cost Center (FTEs)
Regular
Management & Support 3.0 2.0 2.0 2.0
Neighborhood Services 5.0 5.0 5.0 5.0
Parking Enforement (320) 6.0 5.0 5.0 4.0
Redlight Camera (110) 0.5 0.5 0.5 0.5
Specialty Patrol /
Investigations12.0 12.0 10.0 10.0
Speed Camera (380) 6.5 5.5 5.5 5.5
Comm. Enhancement &
Code Enforcement8.0 8.0 8.0 8.0
Regular Subtotal 41.0 38.0 36.0 35.0
Temporary 0.0 0.0 0.0 0.0
Temporary Subtotal 0.0 0.0 0.0 0.0
Division Total 41.0 38.0 36.0 35.0
Division: Special Operations Bureau
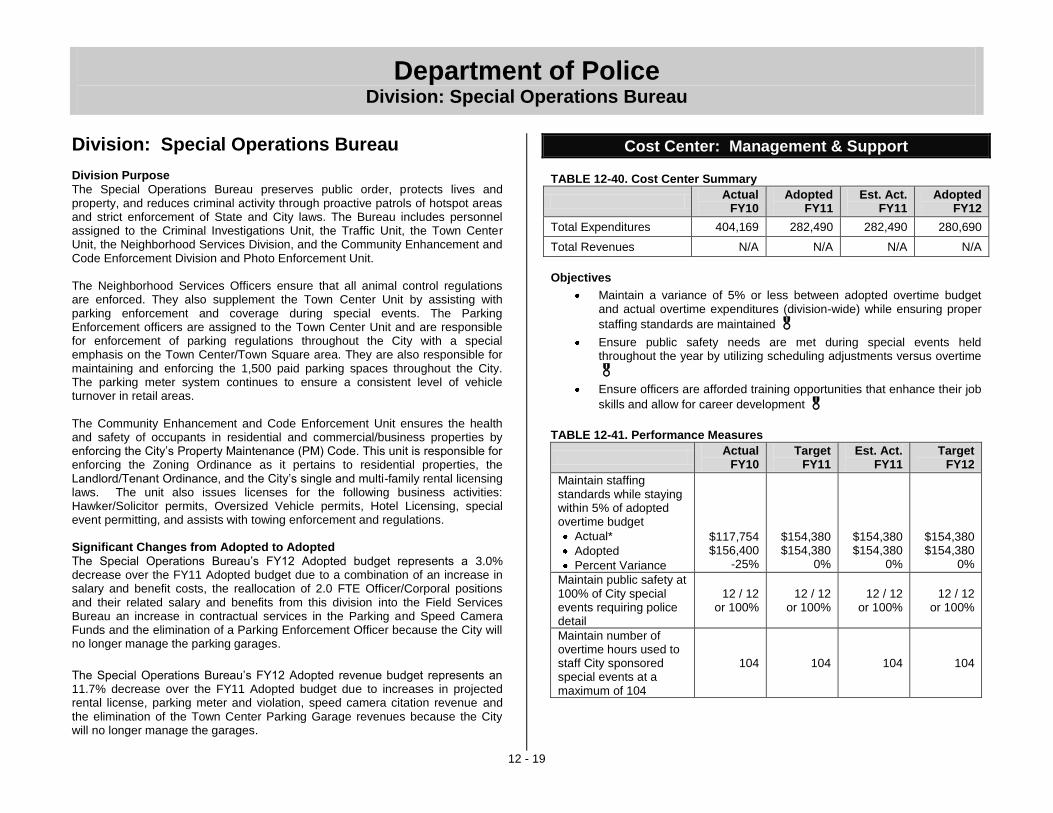
Department of Police Division: Special Operations Bureau
12 - 19
Division: Special Operations Bureau Division Purpose
The Special Operations Bureau preserves public order, protects lives and property, and reduces criminal activity through proactive patrols of hotspot areas and strict enforcement of State and City laws. The Bureau includes personnel assigned to the Criminal Investigations Unit, the Traffic Unit, the Town Center Unit, the Neighborhood Services Division, and the Community Enhancement and Code Enforcement Division and Photo Enforcement Unit. The Neighborhood Services Officers ensure that all animal control regulations are enforced. They also supplement the Town Center Unit by assisting with parking enforcement and coverage during special events. The Parking Enforcement officers are assigned to the Town Center Unit and are responsible for enforcement of parking regulations throughout the City with a special emphasis on the Town Center/Town Square area. They are also responsible for maintaining and enforcing the 1,500 paid parking spaces throughout the City. The parking meter system continues to ensure a consistent level of vehicle turnover in retail areas. The Community Enhancement and Code Enforcement Unit ensures the health and safety of occupants in residential and commercial/business properties by enforcing the City’s Property Maintenance (PM) Code. This unit is responsible for enforcing the Zoning Ordinance as it pertains to residential properties, the Landlord/Tenant Ordinance, and the City’s single and multi-family rental licensing laws. The unit also issues licenses for the following business activities: Hawker/Solicitor permits, Oversized Vehicle permits, Hotel Licensing, special event permitting, and assists with towing enforcement and regulations. Significant Changes from Adopted to Adopted
The Special Operations Bureau’s FY12 Adopted budget represents a 3.0% decrease over the FY11 Adopted budget due to a combination of an increase in salary and benefit costs, the reallocation of 2.0 FTE Officer/Corporal positions and their related salary and benefits from this division into the Field Services Bureau an increase in contractual services in the Parking and Speed Camera Funds and the elimination of a Parking Enforcement Officer because the City will no longer manage the parking garages.
The Special Operations Bureau’s FY12 Adopted revenue budget represents an 11.7% decrease over the FY11 Adopted budget due to increases in projected rental license, parking meter and violation, speed camera citation revenue and the elimination of the Town Center Parking Garage revenues because the City will no longer manage the garages.
Cost Center: Management & Support TABLE 12-40. Cost Center Summary
Actual
FY10 Adopted
FY11 Est. Act.
FY11 Adopted
FY12
Total Expenditures 404,169 282,490 282,490 280,690
Total Revenues N/A N/A N/A N/A
Objectives
Maintain a variance of 5% or less between adopted overtime budget and actual overtime expenditures (division-wide) while ensuring proper
staffing standards are maintained
Ensure public safety needs are met during special events held throughout the year by utilizing scheduling adjustments versus overtime
Ensure officers are afforded training opportunities that enhance their job
skills and allow for career development
TABLE 12-41. Performance Measures
Actual
FY10 Target
FY11 Est. Act.
FY11 Target
FY12
Maintain staffing standards while staying within 5% of adopted overtime budget
Actual*
Adopted
Percent Variance
$117,754 $156,400
-25%
$154,380 $154,380
0%
$154,380 $154,380
0%
$154,380 $154,380
0%
Maintain public safety at 100% of City special events requiring police detail
12 / 12 or 100%
12 / 12 or 100%
12 / 12 or 100%
12 / 12 or 100%
Maintain number of overtime hours used to staff City sponsored special events at a maximum of 104
104 104 104 104
etompkins
Underline
etompkins
Underline

Department of Police Division: Special Operations Bureau
12 - 20
Actual
FY10 Target
FY11 Est. Act.
FY11 Target
FY12
Train at least one-third of specialty unit members in their specialty skill area each year
6 / 11 or 55%
4 / 11 or 36%
4 / 11 or 36%
4 / 11 or 36%
* Grant funding added to the budget after adoption is not included in the actual totals reported in this performance measure.
TABLE 12-42. Regular Positions
Position Title Adopted
FY10 Adopted
FY11 Adopted
FY12
Bureau Commander (Major)* (grade P10)
1.0 1.0 1.0
Deputy Bureau Commander (Lieutenant)** (grade P9)
1.0 0.0 0.0
Supervisor of Comm. Enhancement / Code Enforcement (grade A23)
1.0 1.0 1.0
Cost Center Total 3.0 2.0 2.0
* The Bureau Commander position titles were changed from Captain to Major in FY10. ** The Deputy Bureau Commander (Lieutenant) position moved to the Administrative
Services Bureau, Management & Support cost center for FY11 to manage the accreditation process.
Cost Center: Neighborhood Services TABLE 12-43. Cost Center Summary
Actual
FY10 Adopted
FY11 Est. Act.
FY11 Adopted
FY12
Total Expenditures 389,450 394,030 394,030 423,540
Total Revenues 30,908 28,000 28,000 28,000
Objectives
Promote public health and safety by enforcement of City animal regulations, including the City’s licensing requirement for all dogs over
the age of 4 months
Encourage responsible ownership of animals through programs such as
rabies clinics and off-leash certification
TABLE 12-44. Performance Measures
Actual
FY10 Target
FY11 Est. Act.
FY11 Target
FY12
Maintain a minimum of 10 public education presentations regarding pets and ownership
10 20 12 12
TABLE 12-45. Workload Measures
Actual
FY10 Estimate
FY11 Est. Act.
FY11 Estimate
FY12
Total number of dogs registered
4,035 3,750 3,750 3,750
Number of dog licenses issued
1,812 1,950 1,950 1,950
Total animal control calls for service
2,556 2,600 2,600 2,600
Number of notices of violation issued
337 425 425 425
Number of warnings issued
459 570 570 570
Total animal review official hearings held
18 25 25 25
Total animal review cases heard
66 80 80 80
TABLE 12-46. Regular Positions
Position Title Adopted
FY10 Adopted
FY11 Adopted
FY12
Neighborhood Services Officer (grade A15)
3.0 3.0 3.0
Records Management Clerk (grade A12)
1.0 1.0 1.0
Secretary II (grade A12) 1.0 1.0 1.0
Cost Center Total 5.0 5.0 5.0
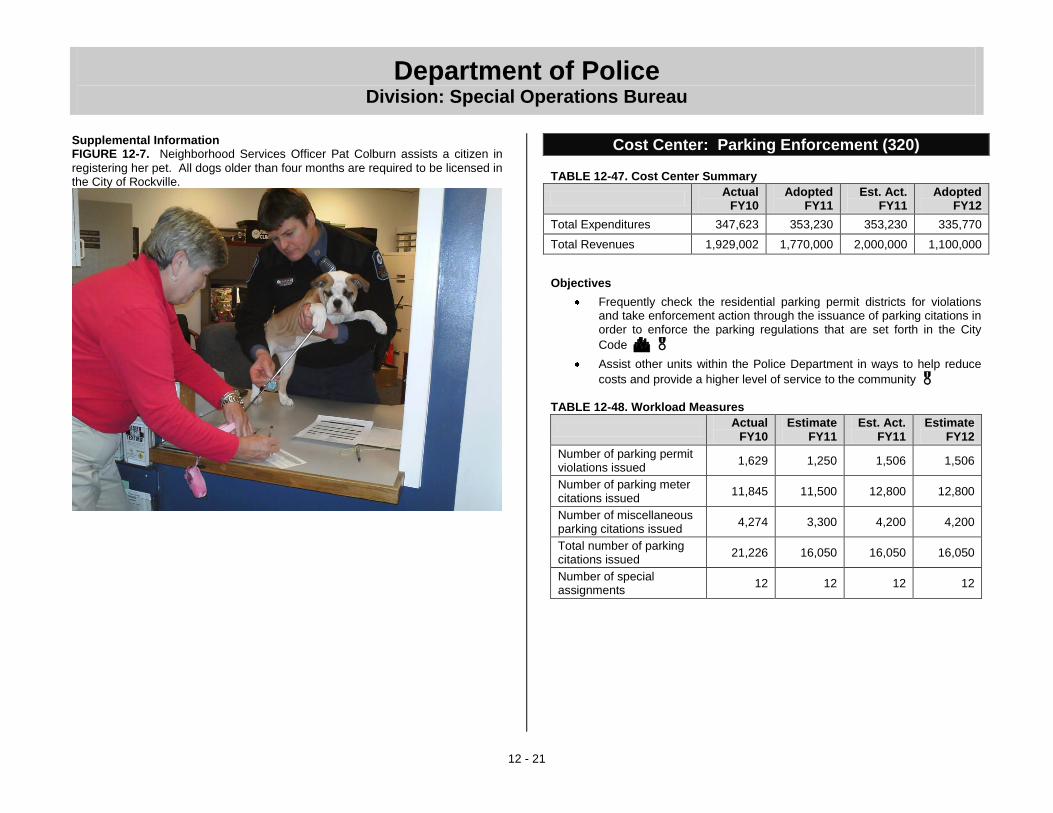
Department of Police Division: Special Operations Bureau
12 - 21
Supplemental Information FIGURE 12-7. Neighborhood Services Officer Pat Colburn assists a citizen in
registering her pet. All dogs older than four months are required to be licensed in the City of Rockville.
Cost Center: Parking Enforcement (320)
TABLE 12-47. Cost Center Summary
Actual
FY10 Adopted
FY11 Est. Act.
FY11 Adopted
FY12
Total Expenditures 347,623 353,230 353,230 335,770
Total Revenues 1,929,002 1,770,000 2,000,000 1,100,000
Objectives
Frequently check the residential parking permit districts for violations and take enforcement action through the issuance of parking citations in order to enforce the parking regulations that are set forth in the City
Code
Assist other units within the Police Department in ways to help reduce
costs and provide a higher level of service to the community
TABLE 12-48. Workload Measures
Actual
FY10 Estimate
FY11 Est. Act.
FY11 Estimate
FY12
Number of parking permit violations issued
1,629 1,250 1,506 1,506
Number of parking meter citations issued
11,845 11,500 12,800 12,800
Number of miscellaneous parking citations issued
4,274 3,300 4,200 4,200
Total number of parking citations issued
21,226 16,050 16,050 16,050
Number of special assignments
12 12 12 12

Department of Police Division: Special Operations Bureau
12 - 22
TABLE 12-49. Regular Positions
Position Title Adopted
FY10 Adopted
FY11 Adopted
FY12
Parking Enforcement Officer (grade A11) 3.0 3.0 3.0
Town Center Parking Enf. Officers* (grade A11) 3.0 2.0 1.0
Cost Center Total 6.0 5.0 4.0
* A 1.0 FTE Town Center Parking Enforcement Officer was eliminated for FY11 and another 1.0 FTE Town Center Parking Enforcement Officer was eliminated for FY12.
Supplemental Information GRAPH 12-8. The graph below shows the number of parking tickets issued by
month during FY10, broken down by ticket type.
FY 2010 Parking Ticket Statistics
1,3
13
1,3
33
1,2
44
1,1
27
292 228
337
344304
262
347
412
473 405 339489
255250 2411126412911 6 70 150 174 161
741
787
325
1,0
88
674 719
1,1
54
1,3
30
161
343
413304
484
275
367
128
203
290
308260
-
300
600
900
1,200
1,500
1,800
2,100
2,400
Jul
09
Aug
09
Sep
09
Oct
09
Nov
09
Dec
09
Jan
10
Feb
10
Mar
10
Apr
10
May
10
Jun
10
# o
f T
icke
ts
Permit Meter Garage Other
Cost Center: Redlight Camera TABLE 12-50. Cost Center Summary
Actual
FY10 Adopted
FY11 Est. Act.
FY11 Adopted
FY12
Total Expenditures 431,669 457,910 458,674 461,450
Total Revenues 663,427 630,000 630,000 630,000
Objectives
Monitor intersections and issue citations in order to create safer
intersections for both motorists and pedestrians
TABLE 12-51. Performance Measures
Actual
FY10 Target
FY11 Est. Act.
FY11 Target
FY12
Maintain the average number of monthly violations per camera at intersections monitored by redlight cameras at or above 69
78 69 73 69
TABLE 12-52. Workload Measures
Actual
FY10 Estimate
FY11 Est. Act.
FY11 Estimate
FY12
Number of redlight camera citations issued
9,446 8,922 8,800 8,280
TABLE 12-53. Regular Positions
Position Title Adopted
FY10 Adopted
FY11 Adopted
FY12
Photo Enforcement Supervisor (grade A14)
0.5 0.5 0.5
Cost Center Total 0.5 0.5 0.5

Department of Police Division: Special Operations Bureau
12 - 23
Cost Center: Specialty Patrol / Investigations TABLE 12-54. Cost Center Summary
Actual
FY10 Adopted
FY11 Est. Act.
FY11 Adopted
FY12
Total Expenditures 1,284,392 1,325,480 1,250,918 1,147,950
Total Revenues N/A N/A N/A N/A
Objectives
Identify and target criminal offenders in the City of Rockville and conduct follow-up investigations on property crimes and crimes against persons cases initially handled by Rockville City Police Department patrol officers in order to bring closure for victims and justice to criminals
TABLE 12-55. Performance Measures
Actual
FY10 Target
FY11 Est. Act.
FY11 Target
FY12
Meet or exceed the national average of 17% for closure of property crimes investigated
51 / 165 or 31%
49 / 176 or 28%
49 / 176 or 28%
49 / 176 or 28%
Meet or exceed the national average of 46% for closure of crimes against persons investigated
54 / 86 or 63%
50 / 78 or 64%
50 / 78 or 64%
50 / 78 or 64%
TABLE 12-56. Workload Measures
Actual
FY10 Estimate
FY11 Est. Act.
FY11 Estimate
FY12
Number of areas targeted for selective enforcement
595 625 530 550
Number of locations selected to conduct pedestrian safety checks
21 67 22 25
Actual
FY10 Estimate
FY11 Est. Act.
FY11 Estimate
FY12
Number of locations targeted for high visibility and/or covert enforcement effort*
116 60 25 25
* This workload measure was geared towards the Street Crimes Unit, which was dissolved in mid-FY10. The unit was reconstituted in mid-FY11 with a new approach to high visibility and covert enforcement details, so the Estimated Actual FY11 and FY12 Estimate figures are greatly reduced.
TABLE 12-57. Regular Positions
Position Title Adopted
FY10 Adopted
FY11 Adopted
FY12
Officer and Corpora*l (grade P1-P4) 9.0 9.0 6.0
Sergeant (grade P6) 3.0 3.0 4.0
Cost Center Total 12.0 12.0 10.0
* 2.0 Officer/Corporal FTEs were transferred from the Specialty Patrol/Investigations cost center to the Patrol Teams cost center during FY11.
Supplemental Information
The Traffic Unit became fully staffed in FY10 and will be able to continue its services in FY11 to meet the unique needs of the City of Rockville. In addition, the Town Center Unit continues to address the special needs (mixed use; residential and commercial) of the Town Center/Town Square Neighborhood and businesses. The Police Department is continuing to be a partner in the “Safe Routes to School” Federal grant program administered by the State of Maryland. The Police Department’s involvement in this program provides high visibility and a strong enforcement level at and around schools throughout the community during the time students are walking to and from school. In addition the Department participates in State Highway Grant programs that target intoxicated and drunk driving offenders and Motor Safety Carrier Program or Truck Inspection for larger vehicles traveling within the City of Rockville.

Department of Police Division: Special Operations Bureau
12 - 24
Cost Center: Speed Camera (380) TABLE 12-58. Cost Center Summary
Actual
FY10 Adopted
FY11 Est. Act.
FY11 Adopted
FY12
Total Expenditures 1,027,868 964,390 1,475,308 989,020
Total Revenues 1,961,035 1,344,000 2,127,000 1,392,000
Objectives
Enforce and increase motorist compliance with posted speed limits in order to increase motorist and pedestrian safety and to reduce collision-
related injuries and property damage Conduct traffic mitigation details in order to address neighborhood traffic
concerns
TABLE 12-59. Performance Measures
Actual
FY10 Target
FY11 Est. Act.
FY11 Target
FY12
Maintain the average number of monthly violations per location monitored by fixed pole speed cameras at approximately 160
204 298 159 159
Keep the number of motor vehicle collisions that involve personal injury or serious property damage at or below 1,210
1,090 1,210 1,210 1,210
Increase the number of traffic mitigation details/assignments conducted in the City from 400 to 425
406 350 400 425
TABLE 12-60. Workload Measures
Actual
FY10 Estimate
FY11 Est. Act.
FY11 Estimate
FY12
Number of Speed Camera citations issued
41,578 33,600 53,664 34,800
Number of speed van deployments conducted
1,456 2,436 971 971
Number of portable camera deployments conducted *
56 224 224 1,350
Directed patrol assignments accomplished
1,409 1,450 1,450 1,475
* In FY10, the City deployed two portable camera units for four months. In FY11, the City deployed four portable camera units.
TABLE 12-61. Regular Positions
Position Title Adopted
FY10 Adopted
FY11 Adopted
FY12
Officer and Corporal (grade P1-P4) 2.0 2.0 2.0
Photo Enforcement Analyst * (grade A12)
4.0 3.0 3.0
Photo Enforcement Supervisor (grade A14)
0.5 0.5 0.5
Cost Center Total 6.5 5.5 5.5
* In mid-FY10, a 1.0 FTE Photo Enforcement Analyst position was eliminated due to the decreased workload in this cost center that has resulted from changes to the speed camera program.
Supplemental Information
During FY10, the State General Assembly passed a bill that allowed speed monitoring systems statewide. The bill also placed some restrictions on the systems already operating in Montgomery County. There were two changes to the original law that affected the “operations” of the City’s speed camera program. The first was that the threshold for photographing speeding vehicles increased from 11 to 12 miles per hour over the posted speed limit. The other change was that speed cameras in school zones could only operate weekdays between 6 AM and 8 PM. As a result of these changes, and motorist compliance with traffic laws citywide, the City’s program has seen a significant drop in the number of violations issued. In FY10, the City’s speed camera program began deploying “portable camera units” (PCU’s). Portable Camera Units contain all the technology and the flash unit in one box that can be moved from location to location. They do not require

Department of Police Division: Special Operations Bureau
12 - 25
an employee to stay with the unit, and they can be deployed to locations where either fixed poles cannot be constructed or where the speed van cannot be parked safely. FIGURE 12-8. A portable camera unit (PCU) is deployed on a local roadway to
help enforce posted speed limits.
Cost Center: Comm. Enhancement / Code Enforcement
TABLE 12-62. Cost Center Summary
Actual
FY10 Adopted
FY11 Est. Act.
FY11 Adopted
FY12
Total Expenditures 472,284 561,350 561,350 572,140
Total Revenues 813,960 642,000 642,000 748,000
Objectives
Conduct property maintenance inspections in order to enhance health
and public safety
Maintain the unit as the City’s first stop for Landlord/Tenant inquiries in
order to provide an outlet to resolve Landlord/Tenant disputes
TABLE 12-63. Performance Measures
Actual
FY10 Target
FY11 Est. Act.
FY11 Target
FY12
Respond to 80 percent of property complaints within 24 business hours
517 / 659 or 78%
580 / 725 or 80%
422 / 570 or 74%
456 / 570 or 80%
TABLE 12-64. Workload Measures
Actual
FY10 Estimate
FY11 Est. Act.
FY11 Estimate
FY12
Number of rental property inspections
1,154 1,600 1,714 2,000
Number of rental properties licensed
767 800 1,000 1,050
Number of violation notices issued to rental properties
219 510 700 650
Number of Landlord/Tenant (L/T) inquires that do not result in a formal case
2,964 2,800 2,500 2,500
Number of L/T inquires that result in a formal case
27 80 150 150
L/T cases requiring a L/T Commission hearing
13 18 25 25

Department of Police Division: Special Operations Bureau
12 - 26
Actual
FY10 Estimate
FY11 Est. Act.
FY11 Estimate
FY12
Number of commercial property complaints received
419 225 376 350
Number of commercial property maintenance violation notices issued
353 85 378 350
Number of commercial property inspections
110 535 66 120
Number of residential properties inspected (non-rental)
3,398 3,950 3,970 3,800
Number of residential complaints (non-rental)
1,164 700 1,158 1,100
Number of property maintenance violations issued (non-rental)
655 2,050 726 700
Total number of citations with fines issued
265 190 340 300
Number of cases requiring court appearances
28 50 75 75
Number of troubled properties*
18 18 18 15
* Troubled properties are defined as properties for which the City has opened three or more property maintenance cases during a one-year period (with any number and type of violations).
TABLE 12-65. Regular Positions
Position Title Adopted
FY10 Adopted
FY11 Adopted
FY12
Commercial Property Codes Inspector (grade A17)
1.0 1.0 1.0
Housing Codes Inspector (grade A15) 5.0 5.0 5.0
Landlord/Tenant Specialist (grade A20) 1.0 1.0 1.0
Secretary II (grade A12) 1.0 1.0 1.0
Cost Center Total 8.0 8.0 8.0
Supplemental Information
In FY12 staff will continue to be involved in community association meetings as requested to educate the public on property maintenance issues. This educational process helps to increase citizen awareness concerning their property and may assist in preserving existing housing stock and improve the appearance of City of Rockville neighborhoods. FIGURE 12-9. Code Enforcement Officers conduct a property maintenance
inspection at a private residence.
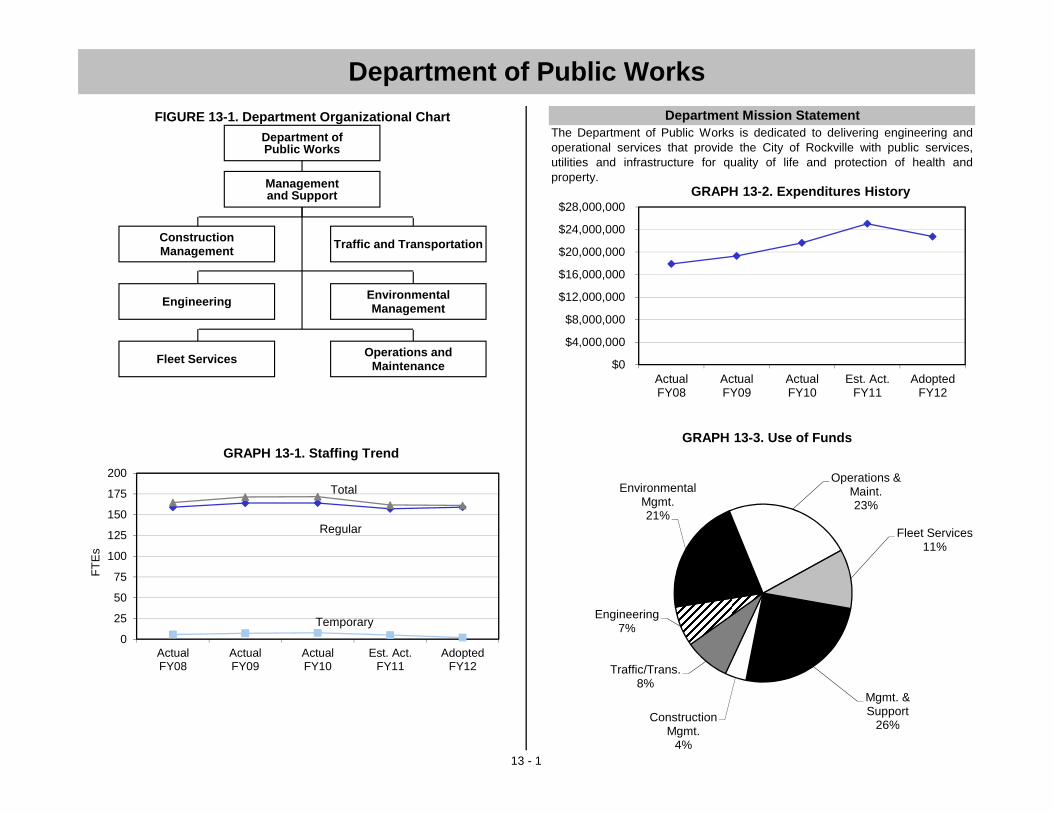
13 - 1
FIGURE 13-1. Department Organizational Chart
Department of Public Works
The Department of Public Works is dedicated to delivering engineering andoperational services that provide the City of Rockville with public services,utilities and infrastructure for quality of life and protection of health andproperty.
Department Mission Statement
$0
$4,000,000
$8,000,000
$12,000,000
$16,000,000
$20,000,000
$24,000,000
$28,000,000
ActualFY08
ActualFY09
ActualFY10
Est. Act.FY11
AdoptedFY12
GRAPH 13-2. Expenditures History
Mgmt. & Support
26%Construction
Mgmt.4%
Traffic/Trans.8%
Engineering7%
Environmental Mgmt.21%
Operations & Maint.23%
Fleet Services11%
GRAPH 13-3. Use of Funds
0
25
50
75
100
125
150
175
200
ActualFY08
ActualFY09
ActualFY10
Est. Act.FY11
AdoptedFY12
FT
Es
GRAPH 13-1. Staffing Trend
Total
Temporary
Regular
Department of Public Works
ConstructionManagement Traffic and Transportation
Engineering Environmental Management
Management and Support
Fleet Services Operations and Maintenance
etompkins
Underline
etompkins
Underline
etompkins
Underline
etompkins
Underline
etompkins
Underline
etompkins
Underline
etompkins
Underline
etompkins
Underline
etompkins
Underline
etompkins
Underline
etompkins
Underline
etompkins
Underline
etompkins
Underline
etompkins
Underline

Department of Public Works Department Summary
13 - 2
TABLE 13-1 ActualFY10
AdoptedFY11
Est. Act.FY11
AdoptedFY12
% Change from Adpt.
Dept. Expenditures by DivisionManagement and Support
5,529,673 6,144,100 7,664,090 5,756,550 (6.3%)
Construction Management
1,097,962 1,158,390 1,158,337 880,730 (24.0%)
Traffic/Transportation 1,752,136 1,845,530 1,795,843 1,877,310 1.7%Engineering 1,478,569 1,623,220 1,965,206 1,656,370 2.0%Environmental Management
4,217,983 4,579,620 4,780,474 4,841,450 5.7%
Operations and Maint. 5,354,149 4,869,730 5,506,814 5,278,220 8.4%Fleet Services 2,209,578 2,060,470 2,157,061 2,447,830 18.8%Department Total $21,640,050 $22,281,060 $25,027,825 $22,738,460 2.1%
TABLE 13-2 ActualFY10
AdoptedFY11
Est. Act.FY11
AdoptedFY12
% Change from Adpt.
Dept. Expenditures by TypeSalary and Wages 8,814,115 9,114,470 9,114,470 9,306,860 2.1%Benefits 2,541,988 2,998,780 3,004,330 3,356,710 11.9%Overtime 710,270 434,560 558,590 536,590 23.5%
Personnel Subtotal $12,066,373 $12,547,810 $12,677,390 $13,200,160 5.2%Contractual Services 5,654,736 5,838,920 8,311,501 5,139,730 (12.0%)Commodities 3,715,578 3,750,730 3,798,331 4,165,440 11.1%Capital Outlays 191,345 115,300 227,788 219,830 90.7%Other 12,018 28,300 12,815 13,300 (53.0%)
Operating Subtotal $9,573,677 $9,733,250 $12,350,435 $9,538,300 (2.0%)Department Total $21,640,050 $22,281,060 $25,027,825 $22,738,460 2.1%
TABLE 13-3 ActualFY10
AdoptedFY11
Est. Act.FY11
AdoptedFY12
% Change from Adpt.
Source of Dept. Funds
Grants/Misc.Rev./Traff Fees/Auct. Veh. (110) 62,074 21,400 21,400 38,800 81.3%Permit Fees (110) 102,514 100,000 100,000 160,000 60.0%Auctioned Vehicles (210) 0 1,750 1,750 3,500 100.0%Auct.Veh/Sale of Mat (220) 0 0 0 3,000 N/AAuct.Veh/Sale of Mat (230) 24,996 350 350 122,600 34,928.6%Auct.Veh/Sale of Mat (330) 0 0 0 1,700 N/ADeveloper Contr./ Other (350) 200,258 161,700 161,700 142,880 (11.6%)
Subtotal $389,842 $285,200 $285,200 $472,480 65.7%Fund ContributionGeneral (110) 6,940,502 6,245,070 6,509,175 6,818,700 9.2%Water (210) 4,164,082 4,469,210 6,410,620 4,836,690 8.2%Sewer (220) 4,134,951 4,815,460 5,155,676 4,253,940 (11.7%)Refuse (230) 3,906,018 4,126,670 4,173,062 4,156,140 0.7%Parking(320) 5,540 4,520 4,520 8,050 78.1%Stormwater (330) 2,084,765 2,306,910 2,461,552 2,168,320 (6.0%)Golf (340) 17,999 15,610 15,610 13,100 (16.1%)Special Activities (350) (58,638) 2,350 2,350 0 (100.0%)Speed Camera (380) 54,989 10,060 10,060 11,040 9.7%
Subtotal $21,250,208 $21,995,860 $24,742,625 $22,265,980 1.2%Department Total $21,640,050 $22,281,060 $25,027,825 $22,738,460 2.1%
TABLE 13-4 ActualFY10
AdoptedFY11
Est. Act.FY11
AdoptedFY12
% Change from Adpt.
Staffing Summary by Division (FTEs)Management and Support
17.00 17.00 17.00 17.00 0.0%
Construction Management 11.00 10.00 10.00 9.00 (10.0%)
Traffic/Transportation 9.00 7.00 8.00 8.00 14.3%Engineering 15.80 14.80 14.80 14.80 0.0%Environmental Management 44.30 40.30 40.30 41.30 2.5%
Operations and Maint. 54.00 54.00 54.00 56.00 3.7%Fleet Services 13.00 13.00 13.00 13.00 0.0%Regular Subtotal 164.10 156.10 157.10 159.10 1.9%TemporaryManagement and Support 0.10 0.00 0.00 0.00 N/A
Traffic/Transportation 0.80 1.20 0.20 0.20 (83.3%)Engineering 0.80 0.60 0.60 0.90 50.0%
Environmental Management
4.00 2.20 2.20 1.00 (54.5%)
Operations and Maint. 2.00 2.00 2.00 0.00 (100.0%)Temporary Subtotal 7.70 6.00 5.00 2.10 (65.0%)
Department Total 171.80 162.10 162.10 161.20 (0.6%)
Department Summary

Department of Public Works Department Summary
13 - 3
Department Summary Department Overview
The Department of Public Works provides for the effective and efficient design, acquisition, construction, operation, maintenance and inspection of the City’s physical infrastructure to provide transportation, water, sewage disposal, stormwater management, recycling and refuse, fleet services, environmental management, and similar services.
Significant Changes from Adopted to Adopted
Personnel expenditures increased by $652,350 or 5.2% mainly due to a 1% cost of living adjustment, an additional $357,930 in benefits and a $102,030 increase in overtime for snow removal and water maintenance.
Contractual services decreased by $699,190 mainly due to a $627,700 decrease in the City’s payment to the Washington Suburban Sanitary Commission (WSSC) for the City’s sewage disposal and a $48,700 reduction in consultants for the Engineering Division.
Commodities increased by $414,710 mainly due to a $333,500 increase in gasoline and oil; $77,500 increase in the Water Treatment Plant’s electricity costs; and a one-time addition of $17,000 for vehicle preparation costs.
Capital Outlays increased by $104,530 mainly due to $40,300 in new equipment and tools for sewer maintenance and $70,800 in new equipment and tools for snow removal. Other expenditures decreased by $15,000 mainly due to a reduction in the rainscape rebate program.
Revenues increased by $187,280 or 65.7% mainly due to a $60,000 increase in permit fees and a $119,500 increase from the sale of recyclable materials in the Refuse Fund.
Supplemental Information
The following Department of Public Works managed CIP projects were completed and/or closed in FY11:
Air Release Valves
College Gardens Park SWM Pond
Glenora SWM Pond
Illuminated Street Name Signs
Lakewood SWM Pond
Storm Sewer Rehabilitation (incorporated with the Storm Drain Rehabilitation Improvements)
Water Plant Generator
Welsh Park SWM Pond (incorporated with the Stormwater Facilities)
West Montgomery Alley
Woottons Mill Park – Lower (incorporated with the Stream Restoration)
etompkins
Underline
etompkins
Underline
etompkins
Underline
etompkins
Underline
etompkins
Underline
etompkins
Underline
etompkins
Underline
etompkins
Underline
etompkins
Underline
etompkins
Underline
etompkins
Underline
etompkins
Underline
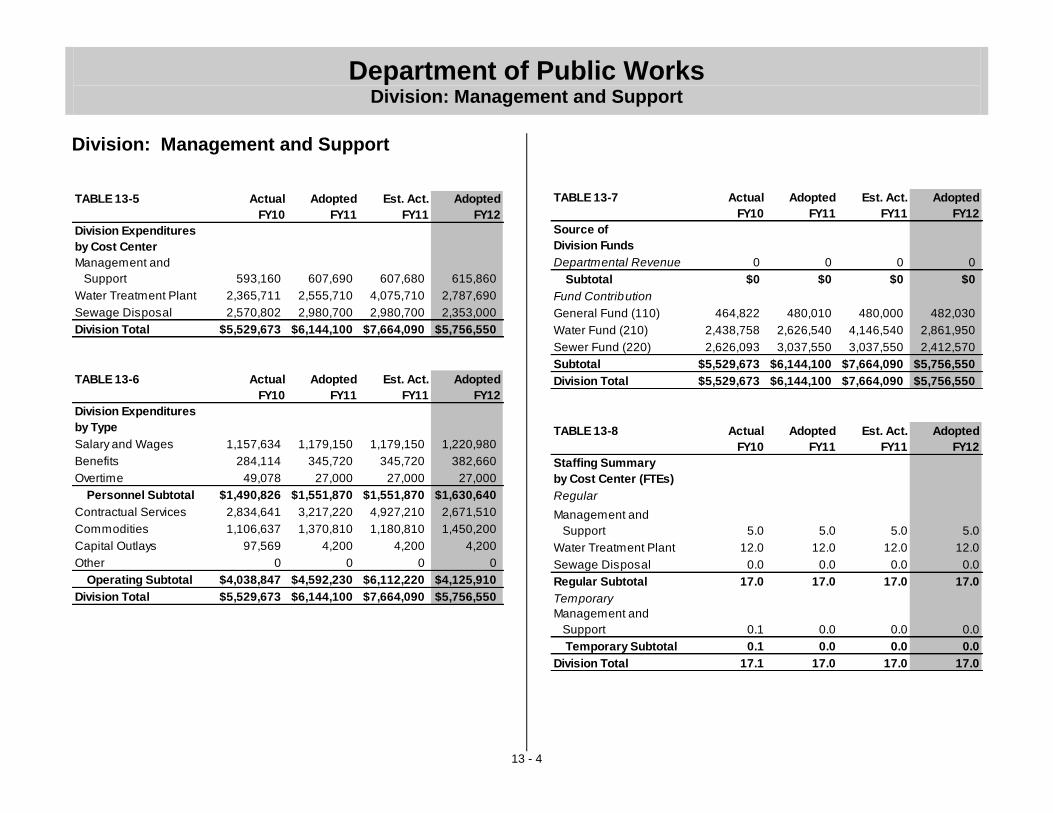
Department of Public Works Division: Management and Support
13 - 4
TABLE 13-5 Actual
FY10
Adopted
FY11
Est. Act.
FY11
Adopted
FY12
Division Expenditures
by Cost Center
Management and
Support 593,160 607,690 607,680 615,860
Water Treatment Plant 2,365,711 2,555,710 4,075,710 2,787,690
Sewage Disposal 2,570,802 2,980,700 2,980,700 2,353,000
Division Total $5,529,673 $6,144,100 $7,664,090 $5,756,550
TABLE 13-6 Actual
FY10
Adopted
FY11
Est. Act.
FY11
Adopted
FY12
Division Expenditures
by Type
Salary and Wages 1,157,634 1,179,150 1,179,150 1,220,980
Benefits 284,114 345,720 345,720 382,660
Overtime 49,078 27,000 27,000 27,000
Personnel Subtotal $1,490,826 $1,551,870 $1,551,870 $1,630,640
Contractual Services 2,834,641 3,217,220 4,927,210 2,671,510
Commodities 1,106,637 1,370,810 1,180,810 1,450,200
Capital Outlays 97,569 4,200 4,200 4,200
Other 0 0 0 0
Operating Subtotal $4,038,847 $4,592,230 $6,112,220 $4,125,910
Division Total $5,529,673 $6,144,100 $7,664,090 $5,756,550
TABLE 13-7 Actual
FY10
Adopted
FY11
Est. Act.
FY11
Adopted
FY12
Source of
Division Funds
Departmental Revenue 0 0 0 0
Subtotal $0 $0 $0 $0
Fund Contribution
General Fund (110) 464,822 480,010 480,000 482,030
Water Fund (210) 2,438,758 2,626,540 4,146,540 2,861,950
Sewer Fund (220) 2,626,093 3,037,550 3,037,550 2,412,570
Subtotal $5,529,673 $6,144,100 $7,664,090 $5,756,550
Division Total $5,529,673 $6,144,100 $7,664,090 $5,756,550
TABLE 13-8 Actual
FY10
Adopted
FY11
Est. Act.
FY11
Adopted
FY12
Staffing Summary
by Cost Center (FTEs)
Regular
Management and
Support 5.0 5.0 5.0 5.0
Water Treatment Plant 12.0 12.0 12.0 12.0
Sewage Disposal 0.0 0.0 0.0 0.0
Regular Subtotal 17.0 17.0 17.0 17.0
Temporary
Management and
Support 0.1 0.0 0.0 0.0
Temporary Subtotal 0.1 0.0 0.0 0.0
Division Total 17.1 17.0 17.0 17.0
Division: Management and Support

Department of Public Works Division: Management and Support
13 - 5
Division: Management and Support Division Purpose
Provides all oversight functions associated with managing the Department; provides coordination between its divisions and other departments by promoting cross-division responses, as appropriate, to resolve community requests and concerns; provides oversight for water treatment and sewage disposal functions; and promotes High Performance Organization (HPO) principles and initiatives throughout the Department.
Significant Changes from Adopted to Adopted
Personnel expenditures increased by $78,770 or 5% mainly due to a 1% cost of living adjustment; the addition of $18,000 for the promotion of four Water Treatment Plant Operators to three Water Treatment Plant Shift Leaders and one Water Treatment Plant Assistant Superintendent; and a $33,500 increase in benefits unrelated to the Water Treatment Plant promotions.
Contractual Services decreased by $545,710 mainly due to a $627,700 decrease in the Sewage Disposal cost center, which is the City’s payment to the Washington Suburban Sanitary Commission (WSSC) for the City’s sewage disposal and a $71,000 increase in the Water Treatment Plant’s budget to purchase WSSC water.
Commodities increased by $79,390 mainly due to a $77,500 increase in the Water Treatment Plant’s electricity costs.
Cost Center: Management and Support
TABLE 13-9. Cost Center Summary
Actual
FY10 Adopted
FY11 Est. Act.
FY11 Adopted
FY12
Total Expenditures 593,160 607,690 607,680 615,860
Total Revenues N/A N/A N/A N/A
Objectives
Improve efficiency of department management functions through
training and use of “best practices”
Provide excellent customer service via phone, in person and email
TABLE 13-10. Performance Measures
Actual
FY10 Target
FY11 Est. Act.
FY11 Target
FY12
Maintain the percent of e-mail inquires responded to within the City’s standard of 24-hours at 98% of the time
417 / 423 or 99%
475 / 500 or 95%
346 / 350 or 99%
346 / 350 or 99%
TABLE 13-11. Workload Measures
Actual
FY10 Estimate
FY11 Est. Act.
FY11 Estimate
FY12
Number of department staff attending training classes
94 75 100 100
Number of email inquiries through the City’s website *
423 500 350 350
Number of department agenda items processed
45 35 35 35
* This was a new Workload Measure for FY10; therefore, when the estimate was set for
FY11, no data was available. Based on Actual FY10 and Estimated Actual FY11, the FY11 estimate was overstated.
etompkins
Underline
etompkins
Underline
etompkins
Underline
etompkins
Underline
etompkins
Underline

Department of Public Works Division: Management and Support
13 - 6
TABLE 13-12. Regular Positions
Position Title Adopted
FY10 Adopted
FY11 Adopted
FY12
Administrative Assistant II * (grade A15)
1.0 1.0 0.0
Deputy Director of Utilities (grade A30) 1.0 1.0 1.0
Director of Public Works (grade SAII) 1.0 1.0 1.0
Public Works Administrator (grade A21)
1.0 1.0 1.0
Secretary II (grade A12) 1.0 1.0 2.0
Cost Center Total 5.0 5.0 5.0
* During FY11, the Administrative Assistant II position was reclassified into Secretary II.
Cost Center: Water Treatment Plant
TABLE 13-13. Cost Center Summary
Actual
FY10 Adopted
FY11 Est. Act.
FY11 Adopted
FY12
Total Expenditures 2,365,711 2,555,710 4,075,710* 2,787,690
Total Revenues N/A N/A N/A N/A
* The Water Treatment Plant’s FY11 budget significantly increased in FY11 as a result of additional costs associated with the 24-inch water transmission main break.
Objectives
Provide sufficient amounts of drinking water that meet or exceed all
State and Federal water quality standards
Monitor and test for contaminants as required by the Maryland
Department of the Environment to ensure the City’s compliance
Perform preventative maintenance to ensure the Water Treatment Plant
operates efficiently and effectively
Establish reliable programs and systems to control water loss, such as the water main rehabilitation and replacement projects and
unidirectional flushing program
TABLE 13-14. Performance Measures
Actual
FY10 Target
FY11 Est. Act.
FY11 Target
FY12
Maintain 100% daily compliance with State drinking water quality standards
365 / 365 or 100%
365 / 365 or 100%
365 / 365 or 100%
365 / 365 or 100%
Complete 100% of routine maintenance work orders by scheduled due date
1,250 / 1,254
or 100%
1,000 / 1,000
or 100%
1,350 / 1,350
or 100%
1,400 / 1,400
or 100%
Maintain or increase the percentage of water delivered to customers produced at the Rockville Water Treatment Plant and through scheduled water purchases from WSSC * **
N/A
1.75 / 1.8 billion
gallons or 97%
1.31 / 1.8 billion
gallons or 73%
1.75 / 1.8 billion
gallons or 97%
* This was a new Performance Measure for FY11.
** In FY11, the Water Treatment Plant was not in service for 89 days due to assessment and repairs on the 24-inch water transmission main.
TABLE 13-15. Regular Positions
Position Title Adopted
FY10 Adopted
FY11 Adopted
FY12
Water Treatment Plant Assistant Superintendent * (grade A19)
0.0 0.0 1.0
Water Treatment Plant Operator * (grade A16)
11.0 11.0 7.0
Water Treatment Plant Superintendent (grade A26)
1.0 1.0 1.0
Water Treatment Plant Shift Leader * (grade A17)
0.0 0.0 3.0
Cost Center Total 12.0 12.0 12.0
* In FY12, three Water Treatment Plant Operators will be promoted to Water Treatment Plant Shift Leaders and one Water Treatment Plant Operator will be promoted to a Water Treatment Plant Assistant Superintendent.

Department of Public Works Division: Management and Support
13 - 7
Supplemental Information
GRAPH 13-4. History of the City’s Unaccounted for Water. Every calendar
year, the Department of Public Works submits a Water Audit Summary to the Maryland Department of the Environment (MDE). This report tracks the percent of water loss by calendar year. MDE’s guideline for an acceptable amount of water loss is less than or equal to 10% for each calendar year. The City’s water loss was greater than 10% for 2009. Sources of water loss include, but are not limited to, unidentified water leaks, inaccurate water metering, and unmetered connections. The Department of Public Works continues to search for, identify and repair or correct these deficiencies.
FIGURE 13-2. Planned Improvement Project
Fiscal Year Funding Description
FY 2013 $50,000
Scheduled maintenance and replacement of equipment including clarifier covers, valves and actuators, rebuilding high service pumps and roadway maintenance
Cost Center: Sewage Disposal
TABLE 13-16. Cost Center Summary
Actual
FY10 Adopted
FY11 Est. Act.
FY11 Adopted
FY12
Total Expenditures 2,570,802 2,980,700 2,980,700 2,353,000
Total Revenues N/A N/A N/A N/A
Objectives
Coordinate with WSSC on their inflow and infiltration (I/I) projects in
Cabin John, Rock Creek, and Watts Branch
Examine and update agreements with WSSC for sewage handling and
disposal
Monitor sewage flows in Cabin John, Rock Creek, and Watts Branch to
ensure accuracy of flow data for billing purposes
TABLE 13-17. Performance Measures
Actual
FY10 Target
FY11 Est. Act.
FY11 Target
FY12
Ensure contractual arrangements are in place to provide 100% availability of service *
N/A N/A N/A 365 days/ 365 days or 100%
* This is a new Performance Measure for FY12.
Supplemental Information GRAPH 13-5. Actual FY10 Wastewater (Sewage) Flows. The majority of the
City’s sewage (4.68 million gallons per day or 69%) flows through the Watts Branch and Cabin John sewer sheds.
0%
2%
4%
6%
8%
10%
12%
14%
2006 2007 2008 2009
Calendar Year
% o
f U
na
cc
ou
nte
d f
or
Wa
ter Maximum rate set by MDE for
municipalities
Watts Branch
(2.05 MGD)
33%
Halpine
(0.84 MGD)
14%
Cabin John
(2.16 MGD)
36%Avery Road
(0.99 MGD)
17%

Department of Public Works Division: Construction Management
13 - 8
TABLE 13-18 Actual
FY10
Adopted
FY11
Est. Act.
FY11
Adopted
FY12
Division Expenditures
by Cost Center
Construction
Management1,097,962 1,158,390 1,158,337 880,730
Division Total $1,097,962 $1,158,390 $1,158,337 $880,730
TABLE 13-19 Actual
FY10
Adopted
FY11
Est. Act.
FY11
Adopted
FY12
Division Expenditures
by Type
Salary and Wages 676,747 696,780 696,780 638,540
Benefits 168,625 208,620 208,620 189,230
Overtime 3,244 4,830 4,830 4,430
Personnel Subtotal $848,616 $910,230 $910,230 $832,200
Contractual Services 246,092 245,880 245,880 46,250
Commodities 3,254 2,280 2,227 2,280
Capital Outlays 0 0 0 0
Other 0 0 0 0
Operating Subtotal $249,346 $248,160 $248,107 $48,530
Division Total $1,097,962 $1,158,390 $1,158,337 $880,730
TABLE 13-20 Actual
FY10
Adopted
FY11
Est. Act.
FY11
Adopted
FY12
Source of
Division Funds
Departmental Revenue 0 0 0 0
Subtotal $0 $0 $0 $0
Fund Contribution
General Fund (110) 584,547 566,890 566,837 562,740
Water Fund (210) 54,085 85,750 85,750 104,900
Sewer Fund (220) 52,364 84,630 84,630 86,760
Stormwater Fund (330) 406,966 421,120 421,120 126,330
Subtotal $1,097,962 $1,158,390 $1,158,337 $880,730
Division Total $1,097,962 $1,158,390 $1,158,337 $880,730
TABLE 13-21 Actual
FY10
Adopted
FY11
Est. Act.
FY11
Adopted
FY12
Staffing Summary
by Cost Center (FTEs)
Regular
Construction
Management 11.0 10.0 10.0 9.0
Regular Subtotal 11.0 10.0 10.0 9.0
Temporary 0.0 0.0 0.0 0.0
Temporary Subtotal 0.0 0.0 0.0 0.0
Division Total 11.0 10.0 10.0 9.0
Division: Construction Management
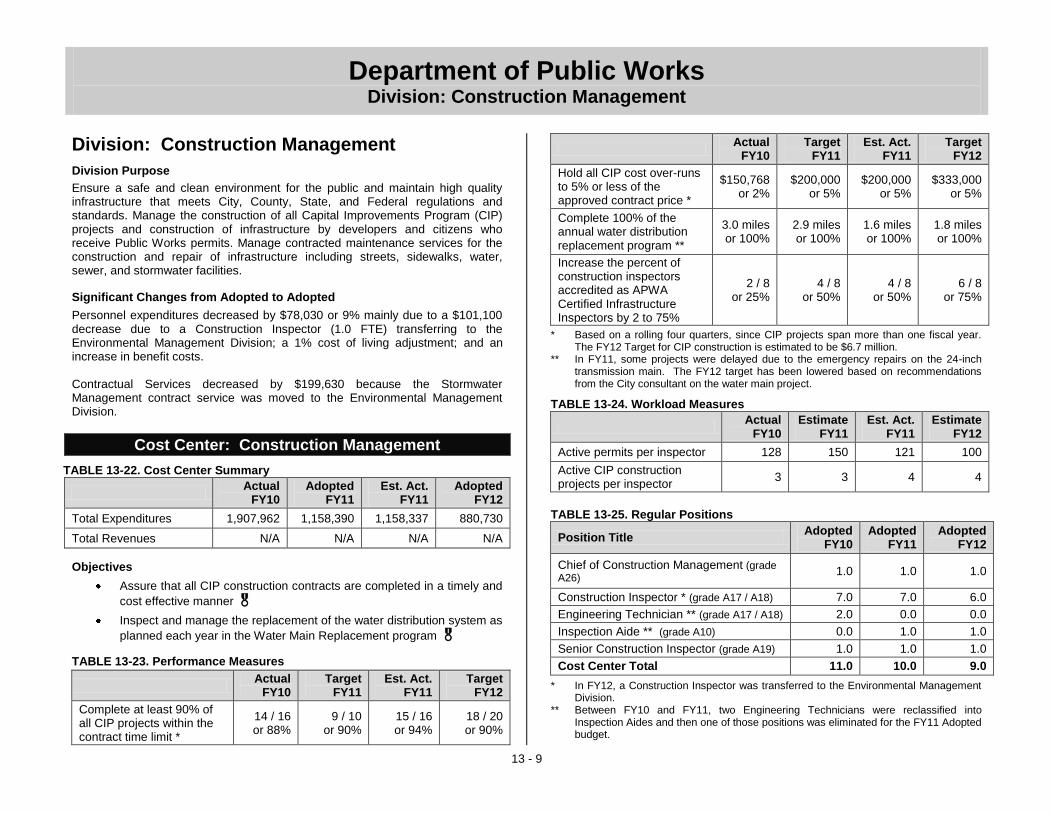
Department of Public Works Division: Construction Management
13 - 9
Division: Construction Management
Division Purpose
Ensure a safe and clean environment for the public and maintain high quality infrastructure that meets City, County, State, and Federal regulations and standards. Manage the construction of all Capital Improvements Program (CIP) projects and construction of infrastructure by developers and citizens who receive Public Works permits. Manage contracted maintenance services for the construction and repair of infrastructure including streets, sidewalks, water, sewer, and stormwater facilities.
Significant Changes from Adopted to Adopted
Personnel expenditures decreased by $78,030 or 9% mainly due to a $101,100 decrease due to a Construction Inspector (1.0 FTE) transferring to the Environmental Management Division; a 1% cost of living adjustment; and an increase in benefit costs. Contractual Services decreased by $199,630 because the Stormwater Management contract service was moved to the Environmental Management Division.
Cost Center: Construction Management
TABLE 13-22. Cost Center Summary
Actual
FY10 Adopted
FY11 Est. Act.
FY11 Adopted
FY12
Total Expenditures 1,907,962 1,158,390 1,158,337 880,730
Total Revenues N/A N/A N/A N/A
Objectives
Assure that all CIP construction contracts are completed in a timely and
cost effective manner
Inspect and manage the replacement of the water distribution system as
planned each year in the Water Main Replacement program
TABLE 13-23. Performance Measures
Actual
FY10 Target
FY11 Est. Act.
FY11 Target
FY12
Complete at least 90% of all CIP projects within the contract time limit *
14 / 16 or 88%
9 / 10 or 90%
15 / 16 or 94%
18 / 20 or 90%
Actual
FY10 Target
FY11 Est. Act.
FY11 Target
FY12
Hold all CIP cost over-runs to 5% or less of the approved contract price *
$150,768 or 2%
$200,000 or 5%
$200,000 or 5%
$333,000 or 5%
Complete 100% of the annual water distribution replacement program **
3.0 miles or 100%
2.9 miles or 100%
1.6 miles or 100%
1.8 miles or 100%
Increase the percent of construction inspectors accredited as APWA Certified Infrastructure Inspectors by 2 to 75%
2 / 8 or 25%
4 / 8 or 50%
4 / 8 or 50%
6 / 8 or 75%
* Based on a rolling four quarters, since CIP projects span more than one fiscal year. The FY12 Target for CIP construction is estimated to be $6.7 million.
** In FY11, some projects were delayed due to the emergency repairs on the 24-inch transmission main. The FY12 target has been lowered based on recommendations from the City consultant on the water main project.
TABLE 13-24. Workload Measures
Actual
FY10 Estimate
FY11 Est. Act.
FY11 Estimate
FY12
Active permits per inspector 128 150 121 100
Active CIP construction projects per inspector
3 3 4 4
TABLE 13-25. Regular Positions
Position Title Adopted
FY10 Adopted
FY11 Adopted
FY12
Chief of Construction Management (grade A26)
1.0 1.0 1.0
Construction Inspector * (grade A17 / A18) 7.0 7.0 6.0
Engineering Technician ** (grade A17 / A18) 2.0 0.0 0.0
Inspection Aide ** (grade A10) 0.0 1.0 1.0
Senior Construction Inspector (grade A19) 1.0 1.0 1.0
Cost Center Total 11.0 10.0 9.0
* In FY12, a Construction Inspector was transferred to the Environmental Management Division.
** Between FY10 and FY11, two Engineering Technicians were reclassified into Inspection Aides and then one of those positions was eliminated for the FY11 Adopted budget.

Department of Public Works Division: Traffic and Transportation
13 - 10
TABLE 13-26 Actual
FY10
Adopted
FY11
Est. Act.
FY11
Adopted
FY12
Division Expenditures
by Cost Center
Protect Neighborhoods 162,407 129,780 129,780 178,260
Mobility 260,043 302,830 303,143 292,290
Accessibility 269,470 265,420 265,420 295,830
Safety/Maintenance 918,596 983,450 933,450 968,050
Trans. Dem. Mgmt. (350) 141,620 164,050 164,050 142,880
Division Total $1,752,136 $1,845,530 $1,795,843 $1,877,310
TABLE 13-27 Actual
FY10
Adopted
FY11
Est. Act.
FY11
Adopted
FY12
Division Expenditures
by Type
Salary and Wages 624,288 586,930 586,930 600,480
Benefits 163,275 171,270 171,270 206,110
Overtime 11,450 13,950 13,950 14,010
Personnel Subtotal $799,013 $772,150 $772,150 $820,600
Contractual Services 107,276 163,470 164,195 169,300
Commodities 788,982 866,610 815,325 844,110
Capital Outlays 56,865 40,000 40,873 40,000
Other 0 3,300 3,300 3,300
Operating Subtotal $953,123 $1,073,380 $1,023,693 $1,056,710
Division Total $1,752,136 $1,845,530 $1,795,843 $1,877,310
TABLE 13-28 Actual
FY10
Adopted
FY11
Est. Act.
FY11
Adopted
FY12
Source of
Division Funds
Departmental Revenue
Traffic Signal Fees (110) 0 6,600 6,600 6,600
Developer Contr. (350) 199,390 161,700 161,700 142,880
Other (350) 868 0 0 0
Subtotal $200,258 $168,300 $168,300 $149,480
Fund Contribution
General Fund (110) 1,610,516 1,674,880 1,625,193 1,727,830
Special Activities (350) (58,638) 2,350 2,350 0
Subtotal $1,551,878 $1,677,230 $1,627,543 $1,727,830
Division Total $1,752,136 $1,845,530 $1,795,843 $1,877,310
TABLE 13-29 Actual
FY10
Adopted
FY11
Est. Act.
FY11
Adopted
FY12
Staffing Summary
by Cost Center (FTEs)
Regular
Protect Neighborhoods 2.25 1.25 1.75 1.75
Mobility 1.50 1.25 1.50 1.50
Accessibility 3.00 2.75 3.00 3.00
Safety/Maintenance 2.25 1.75 1.75 1.75
Trans. Dem. Mgmt. (350) 0.00 0.00 0.00 0.00
Regular Subtotal 9.00 7.00 8.00 8.00
Temporary
Mobility 0.50 0.90 0.20 0.20
Trans. Dem. Mgmt. (350) 0.30 0.30 0.00 0.00
Temporary Subtotal 0.80 1.20 0.20 0.20
Division Total 9.80 8.20 8.20 8.20
Division: Traffic and Transportation

Department of Public Works Division: Traffic and Transportation
13 - 11
Division: Traffic and Transportation Division Purpose
Provide a safe and efficient street and sidewalk system by ensuring that streets and sidewalks are designed to City standards; plan roadway and traffic improvements; improve pedestrian and bicyclist safety, connectivity, and facilities; operate and maintain traffic signals, flashing beacons, speed sensors, and street lights; review development applications; coordinate with other governments on traffic funding and planning; and provide staff support to the Traffic and Transportation Commission.
Significant Changes from Adopted to Adopted
Personnel expenditures increased by $48,450 or 6% mainly due to a 1% cost of living adjustment; the addition of $65,000 for a Civil Engineer II (1.0 FTE) position added during FY11; a $61,900 reduction in temporary worker funding; and a $34,800 increase in benefits.
Contractual Services increased by $5,830 mainly due to additional training for Transportation Engineers to maintain licenses.
Commodities decreased by $22,500 mainly due to a $25,000 reduction in electricity costs for the City’s street lights.
Cost Center: Protect Neighborhoods
TABLE 13-30. Cost Center Summary
Actual
FY10 Adopted
FY11 Est. Act.
FY11 Adopted
FY12
Total Expenditures 162,407 129,780 129,780 178,260
Total Revenues N/A N/A N/A N/A
Objectives
Implement the Guidelines For Neighborhood Traffic Management to
minimize cut-through traffic and speeding
Complete traffic calming projects at the worst speeding locations
Engage the public in the planning and design of traffic calming and traffic diversion projects through public meetings to provide an opportunity for
citizens to work actively to benefit the community
TABLE 13-31. Performance Measures
Actual
FY10 Target
FY11 Est. Act.
FY11 Target
FY12
Reduce speeding by 3 mph in at least 2 locations annually
3 locations
3 locations
3 locations
3 locations
TABLE 13-32. Workload Measures
Actual
FY10 Estimate
FY11 Est. Act.
FY11 Estimate
FY12
Number of mechanical (tube) traffic counts completed as scheduled
138 130 132 130
FIGURE 13-3. South Stonestreet Avenue/Baltimore Road Improvements (before/after). This is a pedestrian safety improvement near the Rockville Metro
Station.

Department of Public Works Division: Traffic and Transportation
13 - 12
TABLE 13-33. Regular Positions
Position Title Adopted
FY10 Adopted
FY11 Adopted
FY12
Chief of Traffic and Transportation (grade A27)
0.25 0.25 0.25
Transportation Engineer * (grade A20 / A22)
0.50 0.00 0.50
Traffic Signal & Lighting Technician ** (grade A16 / A17)
0.50 0.00 0.00
Transportation Planner (grade A16 / A19) 1.00 1.00 1.00
Cost Center Total 2.25 1.25 1.75
* A Transportation Engineer II position (0.50 FTE in this cost center) was added during FY11.
** The vacant Traffic Signal & Lighting Technician position was eliminated in FY11.
Cost Center: Mobility
TABLE 13-34. Cost Center Summary
Actual
FY10 Adopted
FY11 Est. Act.
FY11 Adopted
FY12
Total Expenditures 260,043 302,830 303,143 292,290
Total Revenues 0 6,600 6,600 6,600
Objectives
Modify and coordinate traffic signal timing in order to minimize
congestion and improve traffic flow on major roads
Maintain the City’s traffic signals, flashing beacons, and speed sensor
signs to ensure they function correctly and safely
Review development applications using Comprehensive Transportation Review (CTR) methodology to ensure that developers are providing
adequate mitigation to the traffic generated by their developments
TABLE 13-35. Workload Measures
Actual
FY10 Estimate
FY11 Est. Act.
FY11 Estimate
FY12
Number of traffic signals maintained
47 48 47 48
Number of signalized intersections where signal timing was modified to reduce congestion
10 10 10 10
Number of speed sensor signs and flashing beacons
17 20 20 22
TABLE 13-36. Regular Positions
Position Title Adopted
FY10 Adopted
FY11 Adopted
FY12
Chief Engineer/Transportation (grade A27)
0.25 0.25 0.25
Transportation Engineer * (grade A20 / A22)
1.00 0.75 1.00
Transportation Planner (grade A16 / A19) 0.25 0.25 0.25
Cost Center Total 1.50 1.25 1.50
* A Transportation Engineer II position (0.25 FTE in this cost center) was added during FY11.

Department of Public Works Division: Traffic and Transportation
13 - 13
Supplemental Information: GRAPH 13-6. Number of City Owned Traffic Signals and Miles of Street.
Between 1980 and 2010, the City has increased the number of streets by 36 miles or 25% and the number of City owned traffic signals has increased by 40 or 570%.
Cost Center: Accessibility
TABLE 13-37. Cost Center Summary
Actual
FY10 Adopted
FY11 Est. Act.
FY11 Adopted
FY12
Total Expenditures 269,470 265,420 265,420 295,830
Total Revenues N/A N/A N/A N/A
Objectives
Design and construct sidewalks, bus shelters, bike routes and crosswalk ramps compliant with the Americans with Disabilities Act (ADA) guidelines to improve pedestrian accessibility in City
neighborhoods, in line with the Complete-Streets Concept
Design sidewalks as part of the “Safe Routes to School” Federal grant
program to improve pedestrian accessibility in City neighborhoods
Engage the public in the planning and design of sidewalk projects through public meetings to provide an opportunity for citizens to work
actively for the benefit of the community
TABLE 13-38. Performance Measures
Actual
FY10 Target
FY11 Est. Act.
FY11 Target
FY12
Install 7 new bus shelters annually *
N/A 7 N/A 7
Maintain the number of new ADA Ramps **
90 70 60 60
Maintain or increase the percent of Citizen Survey respondents rating ease of travel as “excellent” or “good” by: ***
Bicycle
Walking
Transit
Car
54% 62% 72% 67%
54% 62% 72% 67%
51% 61% 73% 67%
51% 61% 73% 67%
* The bus shelter program was put on hold in FY10-11 while staff researched the possibility of signing an agreement for a bus-shelter advertising program.
** The available funding in FY11 allowed for 60 ramps, and the goal is to maintain this number for future years. For additional information, please see the Pedestrian Safety (380/420-850-4B71) project in the Capital Improvements Program (CIP) budget book.
*** The City conducts a Citizen Survey every other year. A survey was conducted in FY11 and the next survey will take place in FY13.
TABLE 13-39. Workload Measures
Actual
FY10 Estimate
FY11 Est. Act.
FY11 Estimate
FY12
Number of linear feet of new sidewalks installed *
10,000 8,000 6,000 4,000
* The FY11 estimate is reduced by 2,000 linear feet because Anderson Avenue will likely be completed in early FY12. The target amount for FY12 includes 2,000 feet of new sidewalks – to reflect the available funds in the Sidewalks CIP – in addition to the Anderson Avenue sidewalk. For additional information on sidewalk construction, please see the Sidewalks (380/420-850-6B21) project located in the CIP budget book.
139 146 161 175
2737
47
7
0
50
100
150
200
250
1980 1990 2000 2010
Fiscal Year
Nu
mb
er
Miles of Street Traffic Signals
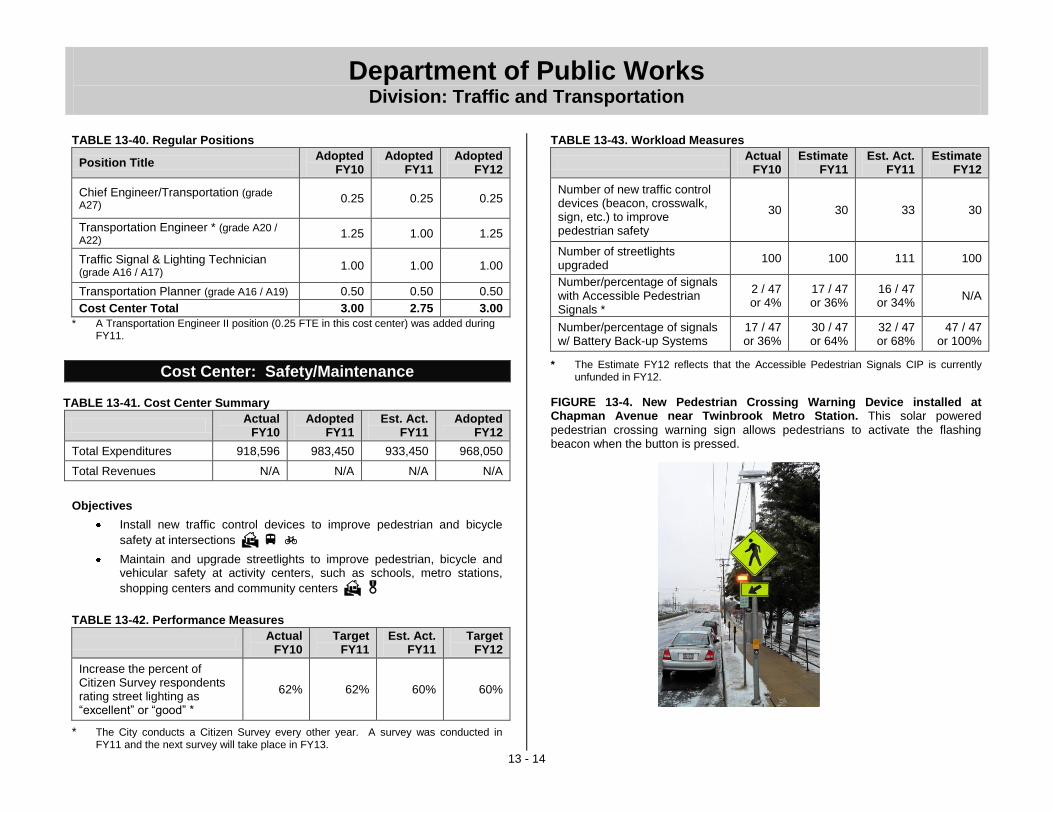
Department of Public Works Division: Traffic and Transportation
13 - 14
TABLE 13-40. Regular Positions
Position Title Adopted
FY10 Adopted
FY11 Adopted
FY12
Chief Engineer/Transportation (grade A27)
0.25 0.25 0.25
Transportation Engineer * (grade A20 / A22)
1.25 1.00 1.25
Traffic Signal & Lighting Technician (grade A16 / A17)
1.00 1.00 1.00
Transportation Planner (grade A16 / A19) 0.50 0.50 0.50
Cost Center Total 3.00 2.75 3.00
* A Transportation Engineer II position (0.25 FTE in this cost center) was added during FY11.
Cost Center: Safety/Maintenance
TABLE 13-41. Cost Center Summary
Actual
FY10 Adopted
FY11 Est. Act.
FY11 Adopted
FY12
Total Expenditures 918,596 983,450 933,450 968,050
Total Revenues N/A N/A N/A N/A
Objectives
Install new traffic control devices to improve pedestrian and bicycle
safety at intersections
Maintain and upgrade streetlights to improve pedestrian, bicycle and vehicular safety at activity centers, such as schools, metro stations,
shopping centers and community centers
TABLE 13-42. Performance Measures
Actual
FY10 Target
FY11 Est. Act.
FY11 Target
FY12
Increase the percent of Citizen Survey respondents rating street lighting as “excellent” or “good” *
62% 62% 60% 60%
* The City conducts a Citizen Survey every other year. A survey was conducted in FY11 and the next survey will take place in FY13.
TABLE 13-43. Workload Measures
Actual
FY10 Estimate
FY11 Est. Act.
FY11 Estimate
FY12
Number of new traffic control devices (beacon, crosswalk, sign, etc.) to improve pedestrian safety
30 30 33 30
Number of streetlights upgraded
100 100 111 100
Number/percentage of signals with Accessible Pedestrian Signals *
2 / 47 or 4%
17 / 47 or 36%
16 / 47 or 34%
N/A
Number/percentage of signals w/ Battery Back-up Systems
17 / 47 or 36%
30 / 47 or 64%
32 / 47 or 68%
47 / 47 or 100%
* The Estimate FY12 reflects that the Accessible Pedestrian Signals CIP is currently unfunded in FY12.
FIGURE 13-4. New Pedestrian Crossing Warning Device installed at Chapman Avenue near Twinbrook Metro Station. This solar powered
pedestrian crossing warning sign allows pedestrians to activate the flashing beacon when the button is pressed.

Department of Public Works Division: Traffic and Transportation
13 - 15
TABLE 13-44. Regular Positions
Position Title Adopted
FY10 Adopted
FY11 Adopted
FY12
Chief Engineer/Transportation (grade A27)
0.25 0.25 0.25
Transportation Engineer (grade A20 / A22)
0.25 0.25 0.25
Traffic Signal & Lighting Technician * (grade A16 / A17)
1.50 1.00 1.00
Transportation Planner (grade A16 / A19) 0.25 0.25 0.25
Cost Center Total 2.25 1.75 1.75
* The vacant Traffic Signal & Lighting Technician position was eliminated in FY11.
Cost Center: Transportation Demand Management (Fund 350)
TABLE 13-45. Cost Center Summary
Actual
FY10 Adopted
FY11 Est. Act.
FY11 Adopted
FY12
Total Expenditures 141,620 164,050 164,050 142,880
Total Revenues 200,258 161,700 161,700 142,880
Objectives
Create and implement a Transportation Demand Management (TDM)
Plan to reduce single occupant vehicles and congestion
Establish programs to encourage residents to use alternative modes of
transportation
Work with employers to foster use of alternative modes of transportation
TABLE 13-46. Workload Measures
Actual
FY10 Estimate
FY11 Est. Act.
FY11 Estimate
FY12
Number of parking spaces in Town Square that have Zipcar and Flexcar vehicles
1 2 2 2
Number of “Community Resource Packages” distributed through Citizen and HOAs and apartment buildings *
800 300 300 N/A **
Number of employers participating in a “Commuter Challenge” coordinated by the City
2 3 3 N/A **
* The “Community Resource Packages” include maps and information about metro, Ride-On bus routes, and other alternative modes of transportation.
** A new TDM Plan was approved by the Mayor and Council on March 21, 2011 and performance measures to evaluate the new program will be developed during FY12.
Supplemental Information
Transportation Demand Management (TDM) addresses the demand of transportation resources and aims to make more efficient use of those resources. TDM programs typically consist of education, marketing, outreach to employers and residents, and advocacy for a variety of commuting options other than driving alone. The City is using funds provided by developers to create and implement a comprehensive TDM program. For more information on the City’s TDM program please visit http://www.drivelessrockville.com/.

Department of Public Works Division: Engineering
13 - 16
TABLE 13-47 Actual
FY10
Adopted
FY11
Est. Act.
FY11
Adopted
FY12
Division Expenditures
by Cost Center
Development Review 487,740 534,380 534,553 659,410
Stormwater Engineering 251,249 265,000 265,742 241,710
Water and Sewer Utility
Projects487,622 590,080 930,335 484,280
Engineering 251,958 233,760 234,576 270,970
Division Total $1,478,569 $1,623,220 $1,965,206 $1,656,370
TABLE 13-48 Actual
FY10
Adopted
FY11
Est. Act.
FY11
Adopted
FY12
Division Expenditures
by Type
Salary and Wages 1,153,353 1,165,880 1,165,880 1,217,390
Benefits 288,948 337,990 337,990 378,870
Overtime 0 0 500 0
Personnel Subtotal $1,442,301 $1,503,870 $1,504,370 $1,596,260
Contractual Services 24,720 107,160 448,580 58,470
Commodities 947 1,190 1,256 1,640
Capital Outlays 10,601 11,000 11,000 0
Other 0 0 0 0
Operating Subtotal $36,268 $119,350 $460,836 $60,110
Division Total $1,478,569 $1,623,220 $1,965,206 $1,656,370
TABLE 13-49 Actual
FY10
Adopted
FY11
Est. Act.
FY11
Adopted
FY12
Source of
Division Funds
Departmental Revenue
Permits and Fees (110) 102,514 100,000 100,000 160,000
Subtotal $102,514 $100,000 $100,000 $160,000
Fund Contribution
General Fund (110) 142,158 172,860 173,483 254,510
Water Fund (210) 427,140 464,080 489,080 474,190
Sewer Fund (220) 166,071 279,110 594,730 192,110
Stormwater Fund (330) 596,940 607,170 607,913 575,560Speed Camera Fund
(380) 43,746 0 0 0
Subtotal $1,376,055 $1,523,220 $1,865,206 $1,496,370
Division Total $1,478,569 $1,623,220 $1,965,206 $1,656,370
TABLE 13-50 Actual
FY10
Adopted
FY11
Est. Act.
FY11
Adopted
FY12
Staffing Summary
by Cost Center (FTEs)
Regular
Development Review 5.10 5.20 5.20 6.00
Stormwater Engineering 2.90 2.45 2.45 2.50
Water and Sewer Utility
Projects4.80 4.90 4.90 4.30
Engineering 3.00 2.25 2.25 2.00
Regular Subtotal 15.80 14.80 14.80 14.80
Temporary
Engineering 0.80 0.60 0.60 0.90
Temporary Subtotal 0.80 0.60 0.60 0.90
Division Total 16.60 15.40 15.40 15.70
Division: Engineering

Department of Public Works Division: Engineering
13 - 17
Division: Engineering Division Purpose
Ensure that the citizens of Rockville enjoy the best environmental standard of living possible by planning and engineering City-constructed infrastructure for water and wastewater facilities; evaluating and conducting potable water and wastewater studies; reviewing site development plans to minimize impact on City streams and to ensure that development provides high quality infrastructure and it does not overburden water and wastewater infrastructure; and issuing permits to ensure that developments are engineered to comply with City, State, and Federal standards and regulations. Ensure that stormwater and stream improvement projects, roads and sidewalks are designed to City standards, to provide survey support, to prepare easement exhibits for City projects, and to manage the Department of Public Works Geographic Information System (GIS) program.
Significant Changes from Adopted to Adopted
Personnel expenditures increased by $92,390 or 6% mainly due to a 1% cost of living adjustment; the promotion and reorganization of the Engineering Supervisors and Civil Engineers; and a $40,900 increase in benefits. Contractual Services decreased by $48,690 mainly due to a reduction in consultants. Capital Outlays decreased by $11,000 due to removal of one-time funding to purchase sewer modeling software.
Revenues increased by $60,000 due to an increase in permit fees.
Cost Center: Development Review
TABLE 13-51. Cost Center Summary
Actual
FY10 Adopted
FY11 Est. Act.
FY11 Adopted
FY12
Total Expenditures 487,740 534,380 534,553 659,410
Total Revenues 102,514 100,000 100,000 160,000
Objectives
Support proposed development by reviewing development projects to ensure: adequate capacity of the water, wastewater, and stormwater infrastructure; that the material and design of the water, wastewater,
and stormwater infrastructure meet or exceed the City standard; and that proposed development mitigates impact on Rockville streams by providing acceptable stormwater management and sediment control to
ensure all new development is quality built
Perform reviews of detailed engineering plans to ensure proposed roads and utility infrastructure, sediment control, and stormwater management
(SWM) facilities meet design standards
TABLE 13-52. Performance Measures
Actual
FY10 Target
FY11 Est. Act.
FY11 Target
FY12
Complete 90% of reviews required by CPDS for the development process within the requested time frame*
49 / 55 or 89%
32 / 35 or 91%
59 / 65* or 91%
54 / 60 or 90%
Issue 100% of stormwater management concept approvals before CPDS permit issuance
9 / 9 or 100%
8 / 8 or 100%
12 / 12 or 100%
15 / 15 or 100%
Complete at least 80% of first-submittal engineering permit plan reviews within six weeks
27 / 32 or 84%
24 / 30 or 80%
28 / 32 or 88%
32 / 40 or 80%
Complete at least 80% of subsequent engineering permit plan reviews within four weeks
17 / 18 or 94%
16 / 20 or 80%
36 / 40 or 90%
40 / 50 or 80%
* The estimated actual CPDS reviews for FY11 (65) increased above the target FY11 CPDS reviews (35) because the Zoning Regulations, which became effective in 2010, added a new review process, for Preliminary Application Reviews, for all development.
TABLE 13-53. Workload Measures
Actual
FY10 Estimate
FY11 Est. Act.
FY11 Estimate
FY12
Number of utility permits issued
215 200 175 200
Number of right-of-way permits issued
39 50 70 70
Number of stormwater management and sediment control permits issued
21 20 55 50

Department of Public Works Division: Engineering
13 - 18
TABLE 13-54. Regular Positions
Position Title Adopted
FY10 Adopted
FY11 Adopted
FY12
Chief of Engineering * (grade A27) 0.25 0.25 0.00
Civil Engineer * ** (grade A20 / A22) 2.00 1.10 2.00
Civil Engineer III * (grade A23) 1.00 1.00 1.00
Engineering Supervisor * ** (grade A25) 0.00 1.00 1.00
Engineering Technician I * (grade A17) 1.60 1.60 1.00
Engineering Technician II * (grade A18) 0.25 0.25 1.00
Cost Center Total 5.10 5.20 6.00
* In FY12, staff allocations amongst the four Cost Centers (Development Review, Stormwater Engineering, Water and Sewer Utility Projects, and Engineering) were adjusted in conjunction with the reorganization of the Engineering Division.
** In FY11, a new Engineering Supervisor position was created and a current Civil Engineer was promoted into this position.
Cost Center: Stormwater Engineering
TABLE 13-55. Cost Center Summary
Actual
FY10 Adopted
FY11 Est. Act.
FY11 Adopted
FY12
Total Expenditures 251,249 265,000 265,742 241,710
Total Revenues N/A N/A N/A N/A
Objectives
Design and construct storm drain, stormwater management, and stream restoration projects that will meet National Pollutant Discharge Elimination System (NPDES) permit requirements in order to enhance
Rockville’s streams
Engage the public in the design of storm drain, stormwater, and stream
restoration projects to minimize the impact on the community
TABLE 13-56. Performance Measures
Actual
FY10 Target
FY11 Est. Act.
FY11 Target
FY12
Award 100% of CIP construction projects on time
2 / 2 or 100%
1 / 1 or 100%
1 / 2 or 50%
2 / 2 or 100%
Make two community contacts for 100% of active projects
3 / 3 or 100%
2 / 2 or 100%
3 / 4 or 75%
5 / 5 or 100%
TABLE 13-57. Workload Measures
Actual
FY10 Estimate
FY11 Est. Act.
FY11 Estimate
FY12
Number of active projects in the design phase
3 4 4 6
TABLE 13-58. Regular Positions
Position Title Adopted
FY10 Adopted
FY11 Adopted
FY12
Civil Engineer * (grade A20 / A22) 1.50 0.65 0.50
Civil Engineer III ** (grade A23) 0.50 0.40 0.00
Engineering Supervisor * ** (grade A25) 0.00 0.50 1.00
Engineering Technician I ** (grade A17) 0.90 0.65 1.00
Engineering Technician II ** (grade A18)
0.00 0.25 0.00
Cost Center Total 2.90 2.45 2.50
* In FY11, a new Engineering Supervisor position was created and a current Civil Engineer was promoted into this position.
** In FY12, staff allocations amongst the four Cost Centers (Development Review, Stormwater Engineering, Water and Sewer Utility Projects, and Engineering) were adjusted in conjunction with the reorganization of the Engineering Division.

Department of Public Works Division: Engineering
13 - 19
FIGURE 13-5. Planned Study
Fiscal Year Funding Description
FY 2013 $100,000
Perform a concept study for a SWM pond upstream of the pedestrian bridge at the lower end of Welsh Park to include development of the goals for the project and an analysis of the environmental and community impacts to assess the benefits of the project
FIGURE 13-6. College Gardens Stormwater Management and Park Improvement
Cost Center: Water and Sewer Utility Projects
TABLE 13-59. Cost Center Summary
Actual
FY10 Adopted
FY11 Est. Act.
FY11 Adopted
FY12
Total Expenditures 487,622 590,080 930,335 484,280
Total Revenues N/A N/A N/A N/A
Objectives
Assess the City’s water and sewer capacity and plan necessary upgrades to ensure adequate capacity for water and sewer systems that
meet the needs of the Master Plan and future development
Ensure water and wastewater systems meet or exceed regulatory
requirements
Implement the water main rehabilitation program to ensure adequate fire flows, minimize water quality concerns, and reduce water main
breaks
Engage the public in the design of water and sewer projects to minimize
the impact on the community
Prioritize and implement recommended rehabilitation projects from the analysis of pipe and manhole assessments conducted through the
sewer main preventative maintenance program
TABLE 13-60. Performance Measures
Actual
FY10 Target
FY11 Est. Act.
FY11 Target
FY12
Award 100% of water CIP construction projects on time*
10 / 11 or 91%
8 / 8 or 100%
8 / 18** or 44%
13 / 13 or 100%
Award 100% of sewer CIP construction projects on time*
7 / 11 or 64%
4 / 4 or 100%
6 / 6 or 100%
3 / 3 or 100%
Make two community contacts for 100% of active projects
16 / 16 or 100%
12 / 12 or 100%
12 / 12 or 100%
12 / 12 or 100%
* Beginning in FY12 the water and sewer CIP construction projects were separated into two Performance Measures.
** Five projects were deferred to FY12 due to the emergency repair and restoration of the 24-inch water transmission main.
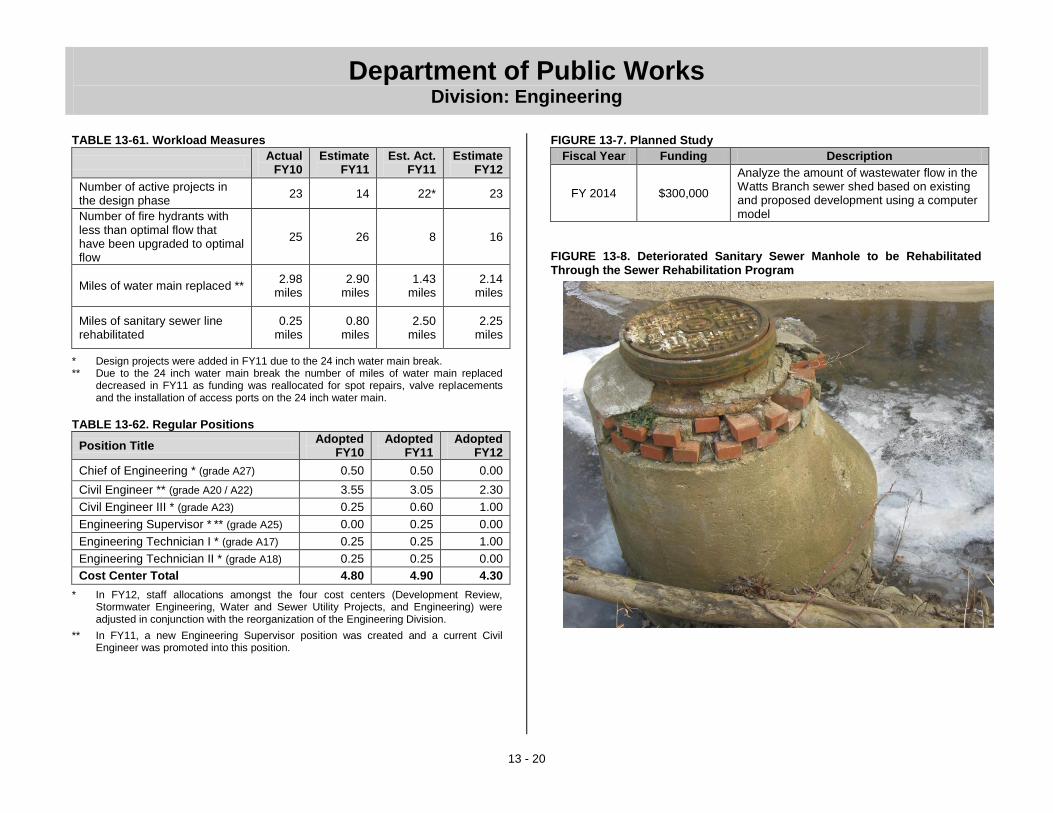
Department of Public Works Division: Engineering
13 - 20
TABLE 13-61. Workload Measures
Actual
FY10 Estimate
FY11 Est. Act.
FY11 Estimate
FY12
Number of active projects in the design phase
23 14 22* 23
Number of fire hydrants with less than optimal flow that have been upgraded to optimal flow
25 26 8 16
Miles of water main replaced ** 2.98
miles 2.90
miles 1.43
miles 2.14
miles
Miles of sanitary sewer line rehabilitated
0.25 miles
0.80 miles
2.50 miles
2.25 miles
* Design projects were added in FY11 due to the 24 inch water main break. ** Due to the 24 inch water main break the number of miles of water main replaced
decreased in FY11 as funding was reallocated for spot repairs, valve replacements and the installation of access ports on the 24 inch water main.
TABLE 13-62. Regular Positions
Position Title Adopted
FY10 Adopted
FY11 Adopted
FY12
Chief of Engineering * (grade A27) 0.50 0.50 0.00
Civil Engineer ** (grade A20 / A22) 3.55 3.05 2.30
Civil Engineer III * (grade A23) 0.25 0.60 1.00
Engineering Supervisor * ** (grade A25) 0.00 0.25 0.00
Engineering Technician I * (grade A17) 0.25 0.25 1.00
Engineering Technician II * (grade A18) 0.25 0.25 0.00
Cost Center Total 4.80 4.90 4.30
* In FY12, staff allocations amongst the four cost centers (Development Review, Stormwater Engineering, Water and Sewer Utility Projects, and Engineering) were adjusted in conjunction with the reorganization of the Engineering Division.
** In FY11, a new Engineering Supervisor position was created and a current Civil Engineer was promoted into this position.
FIGURE 13-7. Planned Study
Fiscal Year Funding Description
FY 2014 $300,000
Analyze the amount of wastewater flow in the Watts Branch sewer shed based on existing and proposed development using a computer model
FIGURE 13-8. Deteriorated Sanitary Sewer Manhole to be Rehabilitated Through the Sewer Rehabilitation Program

Department of Public Works Division: Engineering
13 - 21
Cost Center: Engineering
TABLE 13-63. Cost Center Summary
Actual
FY10 Adopted
FY11 Est. Act.
FY11 Adopted
FY12
Total Expenditures 251,958 233,760 234,576 270,970
Total Revenues N/A N/A N/A N/A
Objectives
Design sidewalks, streets and other pedestrian safety projects to
support the Transportation Program Area CIP projects
Design, assess, and construct bridge rehabilitation projects
Develop an Asset Management program to improve facility planning and
upgrades
TABLE 13-64. Performance Measures
Actual
FY10 Target
FY11 Est. Act.
FY11 Target
FY12
Update 100% of water, sewer, and stormwater base maps by December 1
72 / 72 or 100%
72 / 72 or 100%
72 / 72 or 100%
72 / 72 or 100%
TABLE 13-65. Workload Measures
Actual
FY10 Estimate
FY11 Est. Act.
FY11 Estimate
FY12
Number of Transportation Program Area CIP projects surveyed or designed
13 11 10 15
TABLE 13-66. Regular Positions
Position Title Adopted
FY10 Adopted
FY11 Adopted
FY12
Chief of Engineering * (grade A27) 0.25 0.25 1.00
Civil Engineer * ** (grade A20 / A22) 0.75 0.00 0.00
Civil Engineer III * (grade A23) 0.25 0.00 0.00
Engineering Supervisor * ** (grade
A25) 0.00 0.25 0.00
Engineering Technician II * (grade A18)
0.25 0.25 0.00
Engineering Technician I * (grade A17) 0.50 0.50 0.00
PW Data and GIS Specialist (grade A19)
1.00 1.00 1.00
Cost Center Total 3.00 2.25 2.00
* In FY12, staff allocations amongst the four cost centers (Development Review, Stormwater Engineering, Water and Sewer Utility Projects, and Engineering) were adjusted in conjunction with the reorganization of the Engineering Division.
** In FY11, a new Engineering Supervisor position was created and a current Civil Engineer was promoted into this position.

Department of Public Works Division: Environmental Management
13 - 22
TABLE 13-67 Actual
FY10
Adopted
FY11
Est. Act.
FY11
Adopted
FY12
Division Expenditures
by Cost Center
Environmental
Management154,132 147,000 147,000 179,300
Stormwater Management
and Implementation636,915 777,390 931,289 954,930
Recycling and Refuse
Collection3,426,936 3,655,230 3,702,185 3,707,220
Division Total $4,217,983 $4,579,620 $4,780,474 $4,841,450
TABLE 13-68 Actual
FY10
Adopted
FY11
Est. Act.
FY11
Adopted
FY12
Division Expenditures
by Type
Salary and Wages 1,964,618 2,079,680 2,079,680 2,180,640
Benefits 594,380 706,720 706,720 807,030
Overtime 105,778 117,910 117,910 143,940
Personnel Subtotal $2,664,776 $2,904,310 $2,904,310 $3,131,610
Contractual Services 1,485,371 1,583,090 1,766,378 1,622,550
Commodities 47,818 67,220 70,280 62,250
Capital Outlays 8,000 0 29,991 15,040
Other 12,018 25,000 9,515 10,000
Operating Subtotal $1,553,207 $1,675,310 $1,876,164 $1,709,840
Division Total $4,217,983 $4,579,620 $4,780,474 $4,841,450
TABLE 13-69 Actual
FY10
Adopted
FY11
Est. Act.
FY11
Adopted
FY12
Source of
Division Funds
Departmental Revenue
Sale of Materials (230) 24,996 0 0 119,500
Subtotal $24,996 $0 $0 $119,500
Fund Contribution
General Fund (110) 154,132 147,000 147,000 179,300
Refuse Fund (230) 3,401,940 3,655,230 3,702,185 3,587,720
Stormwater Fund (330) 636,915 777,390 931,289 954,930
Subtotal $4,192,987 $4,579,620 $4,780,474 $4,721,950
Division Total $4,217,983 $4,579,620 $4,780,474 $4,841,450
TABLE 13-70 Actual
FY10
Adopted
FY11
Est. Act.
FY11
Adopted
FY12
Staffing Summary
by Cost Center (FTEs)
Regular
Environmental
Management1.4 1.4 1.4 1.4
Stormwater Management
and Implementation5.6 5.6 5.6 6.6
Recycling and Refuse
Collection37.3 33.3 33.3 33.3
Regular Subtotal 44.3 40.3 40.3 41.3
Temporary
Recycling and Refuse
Collection4.0 2.2 2.2 1.0
Temporary Subtotal 4.0 2.2 2.2 1.0
Division Total 48.3 42.5 42.5 42.3
Division: Environmental Management

Department of Public Works Division: Environmental Management
13 - 23
Division: Environmental Management
Division Purpose
The Environmental Management Division provides leadership and coordination in realizing sustainability and pollution control goals throughout the City. The Division also is responsible for providing recycling and refuse services to residents, and planning and coordinating stormwater activities across City government, including ensuring that privately owned facilities comply with City and State requirements. The Division promotes and implements programs and actions designed to make Rockville a regional and national leader in sustainability and environmental sensitivity, including energy efficiency, green building development, natural resource stewardship, and water quality protection; ensures that the City’s own activities are performed in accordance with all applicable State and Federal environmental laws, rules, and permits; and supports the Rockville Commission on the Environment.
Significant Changes from Adopted to Adopted
Personnel expenditures increased $227,300 or 8% mainly due to the addition of $101,100 for a Sediment and Erosion Inspector (1.0 FTE), which transferred from the Construction Management Division; a 1% cost of living adjustment; a $26,030 increase in overtime costs and an increase in benefit costs.
Contractual services increased by $39,460 mainly due to a reduction of $160,000 in one-time funding for the Rock Creek watershed study; the addition of $199,600 for the Stormwater maintenance contract service that was moved from the Construction Management Division; the addition of $10,000 for ongoing Woodley Garden stream monitoring; a $27,300 reduction in refuse dump fees; and a $17,600 increase in recycling and refuse temporary agency personnel.
Capital Outlays increased by $15,040 for the purchase and maintenance of automatic vehicle locators to be used in the recycling and refuse program, which transferred from contractual services.
Other expenditures decreased by $15,000 due to a reduction in the rainscape rebate program. Revenues increased by $119,500 due to increasing revenue from the sale of recyclable materials.
Cost Center: Environmental Management
TABLE 13-71. Cost Center Summary
Actual
FY10 Adopted
FY11 Est. Act.
FY11 Adopted
FY12
Total Expenditures 154,132 147,000 147,000 179,300
Total Revenues N/A N/A N/A N/A
Objectives:
Provide leadership to move the City in a sustainable direction by ensuring City properties consume energy and water efficiently and residents and businesses have easy access to information and data on the benefits of
sustainable practices
Ensure the City’s land use planning documents, including the City Zoning Ordinance and the Comprehensive Master Plan contain thoughtful analyses
and recommendations addressing the environment and sustainability
In concert with the Finance Department, develop and continuously improve the City’s sustainable purchasing program under which goods and services are bought after considering their cycle life costs rather than their purchase
price alone
Monitor and provide guidance on climate change and adaptation strategies for the City to ensure that senior management, residents and the business community are aware of the issue and pursue prudent steps to minimize any
direct or indirect impacts from the phenomenon
Participate in sustainability network forums sponsored by local and regional businesses, government agencies, institutions, nonprofits and the Metropolitan Washington Council of Government (COG) in order to leverage
public resources and support mutual goals
Prepare and distribute high-quality outreach materials, trainings, Rockville Reports articles, blog stories, and website improvements to provide Rockville employees, residents, and businesses with information they need to make environmentally sensitive and sustainable choices
Provide staff support for the Rockville Environment Commission and its standing committees to ensure that they are effective, efficient and
productive
etompkins
Underline
etompkins
Underline
etompkins
Underline
etompkins
Underline
etompkins
Underline
etompkins
Underline
etompkins
Underline
etompkins
Underline
etompkins
Underline
etompkins
Underline

Department of Public Works Division: Environmental Management
13 - 24
TABLE 13-72. Performance Measures
Actual
FY10 Target
FY11 Est. Act.
FY11 Target
FY12
Draft 100% of Environment Commission meeting minutes within 5 days of the monthly meeting
12 / 12 or 100%
12 / 12 or 100%
12 / 12 or 100%
12 / 12 or 100%
Post 100% of Environment Commission meeting minutes within 5 days of approval at the subsequent monthly meeting
12 / 12 or 100%
12 / 12 or 100%
12 / 12 or 100%
12 / 12 or 100%
TABLE 13-73. Regular Positions
Position Title Adopted
FY10 Adopted
FY11 Adopted
FY12
Chief of Environmental Management (grade A27)
0.4 0.4 0.4
Sustainability Coordinator (grade A24) 0.8 0.8 0.8
Environmental Specialist (grade A17) 0.2 0.2 0.2
Cost Center Total 1.4 1.4 1.4
Supplemental Information FIGURE 13-9. Completed and Planned Projects
Project Estimated/
Actual Completion CompletionActual
Completion Current and Future Projects
Draft an Environmental Element for the Comprehensive Master Plan
Adopt May 2012
Prepare an annual report on the City sustainability accomplishments
January 2012
Completed Projects
Rockville Green Building Program Adopted May 2010; Effective July 2010
Water Resources Element of the Master Plan Adopted
December 2010
Cost Center: Stormwater Management and Implementation
TABLE 13-74. Cost Center Summary
Actual
FY10 Adopted
FY11 Est. Act.
FY11 Adopted
FY12
Total Expenditures 636,915 777,390 931,289 954,930
Total Revenues N/A N/A N/A N/A
Objectives
Restore and protect the water quality in Rockville’s three watersheds
(Cabin John, Rock Creek and Watts Branch)
Ensure that all City facilities and activities comply with all applicable
Federal and State stormwater requirements
Ensure that all privately-owned stormwater facilities comply with all
applicable requirements of City Code Chapters 19 and 23.5
Implement and enforce a fats, oils and grease (FOG) management program at food service establishments to prevent sewer system blockages leading to sewage overflows and discharges to storm drains
and streams
Implement a comprehensive inspection program ensuring all active construction sites comply with appropriate sediment and erosion
requirements of City Code Chapters 19 and 23.5
Monitor State and Federal stormwater program amendments, revisions, and updates in order to evaluate and comment on all proposed laws, rules, policies, guidance and training materials to ensure the City’s perspective and needs are considered in these State and Federal
actions
Periodically monitor and assess watershed health and the effectiveness of the City’s stormwater actions to quantify whether stream conditions are improving or declining in order to evaluate the effective use of the City’s stormwater resources and to identify priorities to further improve
stream health
Develop and implement a public involvement strategy designed to build awareness, understanding and support for City investments in
watershed health and protection

Department of Public Works Division: Environmental Management
13 - 25
FIGURE 13-10. Planned Study
Fiscal Year Funding Description
FY 2013 $250,000
Perform Watts Branch Watershed study. Every 10 years the City of Rockville assesses its three watersheds. In FY 2013, the Watts Branch Watershed is scheduled for evaluation. This study will take a snapshot of stream health and inform City staff where to focus stormwater-related activity. These activities can range from Capital Improvement Program projects like stream restoration to enforcement and education programs
TABLE 13-75. Performance Measures
Actual FY10
Target FY11
Est. Act. FY11
Target FY12
Ensure 95% of food service establishments are in compliance with FOG requirements within six months of receipt of a notice of violation or inspection report *
N/A 38 / 40 or 95%
43 / 45 or 96%
17 / 18 or 94%
Ensure 95% of all sediment and erosion control permitted sites are inspected once every two weeks *
N/A N/A N/A 95%
Oversee at least 25 stream clean up events each year *
N/A N/A 25 25
Inspect 25% of privately- owned stormwater management facilities *
N/A N/A N/A 98 / 393 or 25%
Inspect 25% of publicly- owned stormwater management facilities *
N/A N/A N/A 33 / 130 or 25%
* This is a new Performance Measure for FY12.
TABLE 13-76. Regular Positions
Position Title Adopted
FY10 Adopted
FY11 Adopted
FY12
Chief of Environmental Management (grade A27)
0.3 0.3 0.3
Sediment and Erosion Inspector * (grade A18)
0.0 0.0 1.0
Environmental Compliance Inspector II (grade A18)
1.0 1.0 1.0
Environmental Engineer III (grade A23) 1.0 1.0 1.0
Sustainability Coordinator (grade A24) 0.2 0.2 0.2
Stormwater Manager (grade A25) 1.0 1.0 1.0
Environmental Specialist (grade A17) 0.8 0.8 0.8
Watershed Protection Specialist (grade A6)
1.3 1.3 1.3
Cost Center Total 5.6 5.6 6.6
* A Construction Inspector was transferred from the Construction Management Division in FY12 and reclassified into a Sediment and Erosion Control Inspector.
Supplemental Information FIGURE 13-11. Completed and Planned Projects
Project Estimated/
Actual Completion
Current and Future Projects
Complete the Rock Creek watershed assessment October 2012
Amend the City Code to incorporate new and revised sediment and erosion controls in response to MDE promulgation
Adopt July 2012
Completed Projects
Adoption of Rockville Stormwater Management Code (Chapter 19)
Effective June 2010
Completed the Cabin John Creek Watershed assessment
July 2011

Department of Public Works Division: Environmental Management
13 - 26
Cost Center: Recycling and Refuse Collection
TABLE 13-77. Cost Center Summary
Actual
FY10 Adopted
FY11 Est. Act.
FY11 Adopted
FY12
Total Expenditures 3,426,936 3,655,230 3,702,185 3,707,220
Total Revenues 24,996 0 0 119,500
Objectives
Collect and recycle or reuse residential items in a cost-effective and
efficient manner
Collect and compost green waste including yard debris, garden
clippings and leaves in a cost-effective and efficient manner
Collect and dispose of residential refuse, including bulk refuse and
household hazardous materials in a cost-effective manner
Conduct all recycling and refuse activities in a safe manner avoiding
worker injuries and damage to City or private property
Maximize potential revenue and minimize City expenses, including tipping fees and transportation costs associated with recycling and
refuse activities
Move the City in a sustainable direction by continuously looking to
expand recycling and refuse opportunities for residents
Continuously and effectively promote participation in recycling and
refuse to City residents
Obtain favorable contract terms from recycling and refuse contractors
and vendors
TABLE 13-78. Performance Measures
Actual
FY10 Target
FY11 Est. Act.
FY11 Target
FY12
Respond to 96% of all special curbside collection requests within 3 weeks of each request *
N/A 43 / 45 or 96%
864 / 900 or 96%
912 / 950 or 96%
Deliver new or swapped carts to 95% of residents within 2 weeks of receiving each request *
N/A 225 / 300
or 75% 285 / 300
or 95% 238 / 250
or 95%
Actual
FY10 Target
FY11 Est. Act.
FY11 Target
FY12
Increase the citywide annual residential recycling rate (recycled & composted tons over all collected tons)
8,802 / 20,297 or 43%
8,932 / 20,300 or 44%
9,346 / 21,354 or 44%
10,120 / 22,000 or 46%
Maintain an excellent or good recycling rating of at least 85% on the biennial Citizen Survey **
85% 85% 88% 88%
Maintain an excellent or good refuse rating of at least 85% on the biennial Citizen Survey **
85% 85% 89% 89%
* This was a new Performance Measure in FY11. ** The City conducts a Citizen Survey every other year. A survey was conducted in FY11.
The next survey will take place in FY13.
TABLE 13-79. Workload Measures
Actual
FY10 Estimate
FY11 Est. Act.
FY11 Estimate
FY12
Number of tons of single stream items recycled
5,381 5,300 5,660 5,800
Number of tons of electronics recycled at the Montgomery County transfer facility
8 7 26 20
Number of tons of scrap metal recycled
101 105 48 50
Number of tons of green waste (yard waste) composted
3,320 6,100 6,750 6,800
Number of tons of all recycled materials
8,802 11,250 12,496 12,670
Number of tons of refuse collected and disposed
11,495 10,200 12,000 12,530

Department of Public Works Division: Environmental Management
13 - 27
Actual
FY10 Estimate
FY11 Est. Act.
FY11 Estimate
FY12
Maintain the number of on-the-job worker injuries to no more than 2 per year
10 2 4 2
TABLE 13-80. Regular Positions
Position Title Adopted
FY10 Adopted
FY11 Adopted
FY12
Chief of Environmental Management (grade A27)
0.30 0.30 0.30
Crew Supervisor (grade A14) 3.00 3.00 3.00
Laborer (grade U1) 1.75 1.75 1.75
Maintenance Communications Operator (grade A12)
0.75 0.75 0.75
Maintenance Worker (grade U2) 1.50 1.50 1.50
Operations and Maintenance Crew Supervisor (grade A17)
0.50 0.50 0.50
Recycling and Refuse Superintendent (grade A20) *
0.00 0.00 1.00
Sanitation Operator (grade U3) 14.00 13.00 13.00
Sanitation Supervisor (grade A18) * 1.00 1.00 0.00
Sanitation Worker (grade U2) 14.00 11.00 11.00
Secretary I (grade A10) 0.50 0.50 0.50
Cost Center Total 37.30 33.30 33.30
* During FY11, the Sanitation Supervisor (grade A18) position was reclassified into a Recycling and Refuse Superintendent (grade A20).
Supplemental Information:
GRAPH 13-7. History of the City’s Residential Single Stream Recycling. The
amount of recycling materials collected by the City has increased since FY06. The tonnage of recycling material collected decreased in FY08 and FY09 primarily as a result of economic conditions. However, the amount of recycling materials increased by 6% in FY10.
.
5,1
17
5,2
71
5,2
50
5,0
67
5,3
81
0
1,500
3,000
4,500
6,000
FY06 FY07 FY08 FY09 FY10
Fiscal YearT
on
s
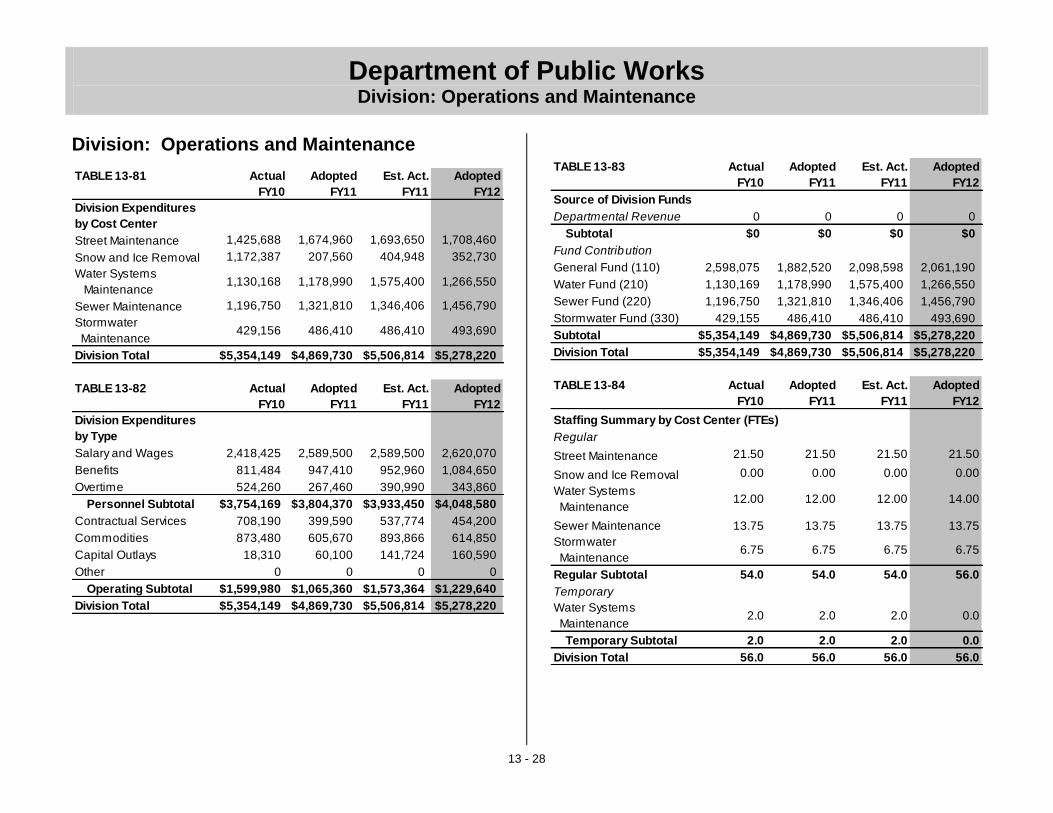
Department of Public Works Division: Operations and Maintenance
13 - 28
TABLE 13-81 Actual
FY10
Adopted
FY11
Est. Act.
FY11
Adopted
FY12
Division Expenditures
by Cost Center
Street Maintenance 1,425,688 1,674,960 1,693,650 1,708,460
Snow and Ice Removal 1,172,387 207,560 404,948 352,730
Water Systems
Maintenance1,130,168 1,178,990 1,575,400 1,266,550
Sewer Maintenance 1,196,750 1,321,810 1,346,406 1,456,790
Stormwater
Maintenance429,156 486,410 486,410 493,690
Division Total $5,354,149 $4,869,730 $5,506,814 $5,278,220
TABLE 13-82 Actual
FY10
Adopted
FY11
Est. Act.
FY11
Adopted
FY12
Division Expenditures
by Type
Salary and Wages 2,418,425 2,589,500 2,589,500 2,620,070
Benefits 811,484 947,410 952,960 1,084,650
Overtime 524,260 267,460 390,990 343,860
Personnel Subtotal $3,754,169 $3,804,370 $3,933,450 $4,048,580
Contractual Services 708,190 399,590 537,774 454,200
Commodities 873,480 605,670 893,866 614,850
Capital Outlays 18,310 60,100 141,724 160,590
Other 0 0 0 0
Operating Subtotal $1,599,980 $1,065,360 $1,573,364 $1,229,640
Division Total $5,354,149 $4,869,730 $5,506,814 $5,278,220
TABLE 13-83 Actual
FY10
Adopted
FY11
Est. Act.
FY11
Adopted
FY12
Source of Division Funds
Departmental Revenue 0 0 0 0
Subtotal $0 $0 $0 $0
Fund Contribution
General Fund (110) 2,598,075 1,882,520 2,098,598 2,061,190
Water Fund (210) 1,130,169 1,178,990 1,575,400 1,266,550
Sewer Fund (220) 1,196,750 1,321,810 1,346,406 1,456,790
Stormwater Fund (330) 429,155 486,410 486,410 493,690
Subtotal $5,354,149 $4,869,730 $5,506,814 $5,278,220
Division Total $5,354,149 $4,869,730 $5,506,814 $5,278,220
TABLE 13-84 Actual
FY10
Adopted
FY11
Est. Act.
FY11
Adopted
FY12
Staffing Summary by Cost Center (FTEs)
Regular
Street Maintenance 21.50 21.50 21.50 21.50
Snow and Ice Removal 0.00 0.00 0.00 0.00
Water Systems
Maintenance12.00 12.00 12.00 14.00
Sewer Maintenance 13.75 13.75 13.75 13.75
Stormwater
Maintenance6.75 6.75 6.75 6.75
Regular Subtotal 54.0 54.0 54.0 56.0
Temporary
Water Systems
Maintenance2.0 2.0 2.0 0.0
Temporary Subtotal 2.0 2.0 2.0 0.0
Division Total 56.0 56.0 56.0 56.0
Division: Operations and Maintenance

Department of Public Works Division: Operations and Maintenance
13 - 29
Division: Operations and Maintenance Division Purpose
Street Maintenance: Maintain City streets and sidewalks in a safe and clean condition; provide for safe movement of vehicular traffic by performing minor construction and repairs; install street signs and lane or line markings; and supervise the work of contractual service providers who perform street sweeping and weed control. Snow and Ice Removal: Remove snow and ice from City streets. Water Systems Maintenance: Maintain and repair the water distribution system on a 24-hour basis to ensure the flow of potable water and adequate fire protection by providing proactive preventative maintenance of water mains and service lines; repairing mains, valves and hydrants; and repairing and replacing water service connections. Sewer Maintenance: Maintain and repair the sewer system by providing dependable backup-free and odor-free collection of sewage from homes and businesses, and performing preventative maintenance and repair of sewer mains, access ways, and laterals. Stormwater Maintenance: Maintain and repair the storm drainage system by providing dependable distribution of stormwater from properties and performing preventive maintenance and repair of pipes and inlets. Significant Changes from Adopted to Adopted
Personnel expenditures increased by $244,210 or 6% mainly due to a 1% cost of living adjustment; a combined $76,400 increase in Water Systems Maintenance and Snow and Ice Removal overtime; and an increase in benefits. Contractual Services increased by $54,610 mainly due to a $51,700 increase in Sewer Maintenance’s contact repairs. Commodities increases by $9,180 mainly due to an increase in Water Systems Maintenance’s program supplies. Capital Outlays increased by $100,490 mainly due to $40,300 in new equipment and tools for Sewer Maintenance and $70,800 in new equipment and tools for Snow and Ice Removal.
Cost Center: Street Maintenance
TABLE 13-85. Cost Center Summary
Actual
FY10 Adopted
FY11 Est. Act.
FY11 Adopted
FY12
Total Expenditures 1,425,688 1,674,960 1,693,650 1,708,460
Total Revenues N/A N/A N/A N/A
Objectives
Perform asphalt roadway, curbs, gutter and sidewalk repairs in order to
maintain the City’s transportation infrastructure
Repair potholes in a timely manner to maintain City streets and reduce
the number of complaints from residents
Maintain City streets in a clean manner through regular street sweeping to increase resident satisfaction on the condition of roadways and
streets
Improve safety and mobility by installing, repairing or replacing City
street signs
TABLE 13-86. Performance Measures
Actual
FY10 Target
FY11 Est. Act.
FY11 Target
FY12
Reduce the number of pothole complaints from residents by at least 2% annually
33 or 0%
28 or -15%
29 or -12%
24 or -17%
Maintain at least 67% of Citizen Survey respondents rating street repairs and maintenance as “excellent” or “good” *
67% 68% 67% 67%
Increase the number/percent of street sign work orders completed within 48 hours to 85%
9 / 12 or 75%
380 / 400 or 95%
113 / 150 or 75%
128 / 150 or 85%
etompkins
Underline
etompkins
Underline
etompkins
Underline
etompkins
Underline
etompkins
Underline
etompkins
Underline
etompkins
Underline
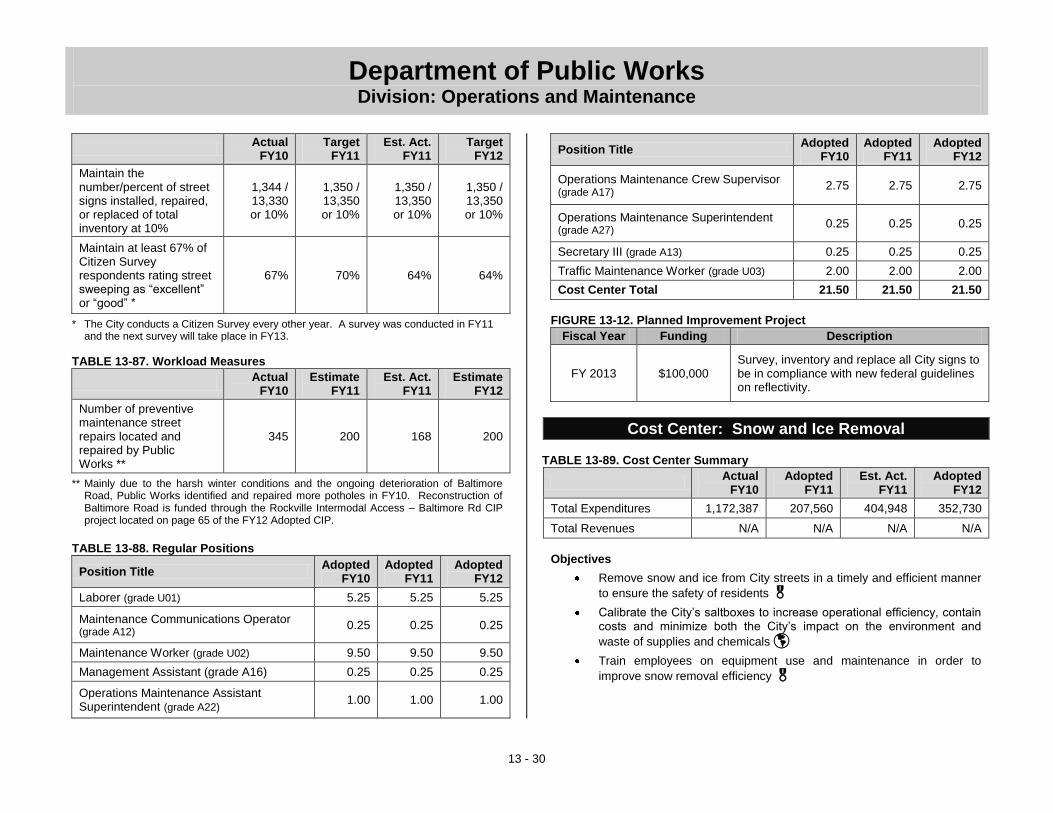
Department of Public Works Division: Operations and Maintenance
13 - 30
Actual
FY10 Target
FY11 Est. Act.
FY11 Target
FY12
Maintain the number/percent of street signs installed, repaired, or replaced of total inventory at 10%
1,344 / 13,330 or 10%
1,350 / 13,350 or 10%
1,350 / 13,350 or 10%
1,350 / 13,350 or 10%
Maintain at least 67% of Citizen Survey respondents rating street sweeping as “excellent” or “good” *
67% 70% 64% 64%
* The City conducts a Citizen Survey every other year. A survey was conducted in FY11 and the next survey will take place in FY13.
TABLE 13-87. Workload Measures
Actual
FY10 Estimate
FY11 Est. Act.
FY11 Estimate
FY12
Number of preventive maintenance street repairs located and repaired by Public Works **
345 200 168 200
** Mainly due to the harsh winter conditions and the ongoing deterioration of Baltimore Road, Public Works identified and repaired more potholes in FY10. Reconstruction of Baltimore Road is funded through the Rockville Intermodal Access – Baltimore Rd CIP project located on page 65 of the FY12 Adopted CIP.
TABLE 13-88. Regular Positions
Position Title Adopted
FY10 Adopted
FY11 Adopted
FY12
Laborer (grade U01) 5.25 5.25 5.25
Maintenance Communications Operator (grade A12)
0.25 0.25 0.25
Maintenance Worker (grade U02) 9.50 9.50 9.50
Management Assistant (grade A16) 0.25 0.25 0.25
Operations Maintenance Assistant Superintendent (grade A22)
1.00 1.00 1.00
Position Title Adopted
FY10 Adopted
FY11 Adopted
FY12
Operations Maintenance Crew Supervisor (grade A17)
2.75 2.75 2.75
Operations Maintenance Superintendent (grade A27)
0.25 0.25 0.25
Secretary III (grade A13) 0.25 0.25 0.25
Traffic Maintenance Worker (grade U03) 2.00 2.00 2.00
Cost Center Total 21.50 21.50 21.50
FIGURE 13-12. Planned Improvement Project
Fiscal Year Funding Description
FY 2013 $100,000 Survey, inventory and replace all City signs to be in compliance with new federal guidelines on reflectivity.
Cost Center: Snow and Ice Removal
TABLE 13-89. Cost Center Summary
Actual
FY10 Adopted
FY11 Est. Act.
FY11 Adopted
FY12
Total Expenditures 1,172,387 207,560 404,948 352,730
Total Revenues N/A N/A N/A N/A
Objectives
Remove snow and ice from City streets in a timely and efficient manner
to ensure the safety of residents
Calibrate the City’s saltboxes to increase operational efficiency, contain costs and minimize both the City’s impact on the environment and
waste of supplies and chemicals
Train employees on equipment use and maintenance in order to
improve snow removal efficiency

Department of Public Works Division: Operations and Maintenance
13 - 31
TABLE 13-90. Performance Measures
Actual
FY10 Target
FY11 Est. Act.
FY11 Target
FY12
Maintain at least 72% of Citizen Survey respondents rating snow and ice removal operations as “excellent” or “good” *
72% 75% 59% 59%
Maintain the number/percent of employees receiving 16 hours of equipment use and maintenance training annually at 100%
23 / 23 or 100%
23 / 23 or 100%
23 / 23 or 100%
23 / 23 or 100%
* The City conducts a citizen survey every other year. A survey was conducted in FY11
and the next survey will take place in FY13.
TABLE 13-91. Workload Measures
Actual
FY10 Estimate
FY11 Est. Act.
FY11 Estimate
FY12
Number/percent of saltboxes calibrated by December 1
16 / 16 or 100%
16 / 16 or 100%
16 / 16 or 100%
17 / 17 or 100%
Cost Center: Water Systems Maintenance
TABLE 13-92. Cost Center Summary
Actual
FY10 Adopted
FY11 Est. Act.
FY11 Adopted
FY12
Total Expenditures 1,130,168 1,178,990 1,575,400 1,266,550
Total Revenues N/A N/A N/A N/A
Objectives
Maintain the City’s water distribution system infrastructure (hydrants, valves, mains and connections) to ensure continuity of water services to
Rockville residents
Monitor and improve the City’s water distribution system on a continual basis and ensure the City’s drinking water meets current requirements
Continue unidirectional flushing program
TABLE 13-93. Performance Measures
Actual
FY10 Target
FY11 Est. Act.
FY11 Target
FY12
Maintain citizen complaints concerning disturbed water at or below 80
36 70 70 76
Maintain the percent of fire hydrants in service at or above 98%
1,365 / 1,368
or 100%
1,368 / 1,369
or 100%
1,368 / 1,369
or 100%
1,368 / 1,369
or 100%
Perform at least 80% of scheduled preventative maintenance on specialty valves
578 / 996 or 58%
797 / 996 or 80%
598 / 996 or 60%*
797 / 996 or 80%
Increase the percentage of Citizen Survey respondents rating water and sewer services as “excellent” or “good” **
83% 85% 81% 81%
* In FY11, the target has not been met because the 24-inch water transmission main break took resources away from the valve maintenance program.
** The City conducts a citizen survey every other year. A survey was conducted in FY11 and the next survey will take place in FY13.
TABLE 13-94. Workload Measures
Actual
FY10 Estimate
FY11 Est. Act.
FY11 Estimate
FY12
Number of water main breaks per fiscal year
41 60 55 60
TABLE 13-95. Regular Positions
Position Title Adopted
FY10 Adopted
FY11 Adopted
FY12
Laborer * (grade U01) 4.00 3.00 5.00
Maintenance Worker (grade U02) 4.00 5.00 5.00
Management Assistant (grade A16) 0.25 0.25 0.25
Operations Maintenance Assistant Superintendent (grade A22)
1.00 1.00 1.00

Department of Public Works Division: Operations and Maintenance
13 - 32
Position Title Adopted
FY10 Adopted
FY11 Adopted
FY12
Operations Maintenance Crew Supervisor (grade A17)
2.00 2.00 2.00
Operations Maintenance Superintendent (grade A27)
0.25 0.25 0.25
Secretary I (grade A10) 0.25 0.25 0.25
Secretary III (grade A13) 0.25 0.25 0.25
Cost Center Total 12.00 12.00 14.00
* In FY12, two new Laborer positions were added.
Cost Center: Sewer Maintenance
TABLE 13-96. Cost Center Summary
Actual
FY10 Adopted
FY11 Est. Act.
FY11 Adopted
FY12
Total Expenditures 1,196,750 1,321,810 1,346,406 1,456,790
Total Revenues N/A N/A N/A N/A
Objectives
Maintain the City’s pump stations to eliminate or reduce unscheduled
repairs
Clean, televise and inspect the City’s sewer lines through the use of closed circuit television “CCTV” to become more proactive in
implementation of needed repairs and replacements
Apply grease inhibitors to prevent Sanitary Sewer overflows due to fats,
oils and grease
Perform preventative maintenance on laterals to reduce blockages in
the City’s rights-of-way
TABLE 13-97. Performance Measures
Actual FY10
Target FY11
Est. Act. FY11
Target FY12
Maintain the percent of preventative maintenance performed on the City’s pump stations at 100%
104 / 104 or 100%
104 / 104 or 100%
104 / 104 or 100%
104 / 104 or 100%
Maintain the percent of the 15 miles of sewer line scheduled for condition assessment completed at 100%
23 / 15 or 153%
15 / 15 or 100%
15 / 15 or 100%
15 / 15 or 100%
Apply grease inhibitor to 50% of the City’s 42,000 ft of known grease-laden areas annually
18,000 / 42,000 or 43%
21,000 / 42,000 or 50%
40,250 / 42,000 or 96%
21,000 / 42,000 or 50%
Maintain the percent of preventative maintenance performed on laterals by scheduled due date
1,223 / 1,500
or 82%
1,350 / 1,500
or 90%
1,000 / 1,500
or 67%
1,300 / 1,500
or 87%
TABLE 13-98. Regular Positions
Position Title Adopted
FY10 Adopted
FY11 Adopted
FY12
Laborer (grade U01) 3.00 3.00 3.00
Maintenance Worker (grade U02) 7.00 7.00 7.00
Management Assistant (grade A16) 0.25 0.25 0.25
Operations Maintenance Assistant Superintendent (grade A22)
0.75 0.75 0.75
Operations Maintenance Crew Supervisor (grade A17)
2.00 2.00 2.00
Operations Maintenance Superintendent (grade A27)
0.25 0.25 0.25
Secretary I (grade A10) 0.25 0.25 0.25
Secretary III (grade A13) 0.25 0.25 0.25
Cost Center Total 13.75 13.75 13.75

Department of Public Works Division: Operations and Maintenance
13 - 33
Cost Center: Stormwater Maintenance
TABLE 13-99. Cost Center Summary
Actual
FY10 Adopted
FY11 Est. Act.
FY11 Adopted
FY12
Total Expenditures 429,156 486,410 486,410 493,690
Total Revenues N/A N/A N/A N/A
Objectives
Perform repairs to storm drain structures to improve the conveyance of
stormwater
Assess and clean the City’s storm drain inlets to ensure that minimal
storm sewer blockages occur during the year
TABLE 13-100. Performance Measures
Actual
FY10 Target
FY11 Est. Act.
FY11 Target
FY12
Maintain the percent of stormwater pipes scheduled for condition assessments completed at 100% *
1.7 mi. / 4.5 mi. or 38%
4.5 mi. / 4.5 mi.
or 100%
1.0 mi. / 4.5 mi. or 22%
N/A
Maintain the percent of storm structures repaired at 100%
20 / 25 or 80%
25 / 25 or 100%
12 / 25 or 48%
25 / 25 or 100%
* The City of Rockville’s storm drain inspection program is currently being assessed. Staff anticipates reinstating the storm drain inspection program during FY13; therefore, the Target FY12 is N/A.
TABLE 13-101. Workload Measures
Actual
FY10 Estimate
FY11 Est. Act.
FY11 Estimate
FY12
Storm drain inlets cleaned and assessed using the Manhole Assessment Certification Program (MACP) *
186 250 850 400
* The City will focus its efforts on inlet cleaning and inspection while it is reassessing the storm drain pipe inspection program and; therefore, has increased the workload measure for Estimate FY12.
TABLE 13-102. Regular Positions
Position Title Adopted
FY10 Adopted
FY11 Adopted
FY12
Laborer (grade U01) 2.00 2.00 2.00
Maintenance Worker (grade U02) 3.00 3.00 3.00
Management Assistant (grade A16) 0.25 0.25 0.25
Operations Maintenance Assistant Superintendent (grade A22)
0.25 0.25 0.25
Operations Maintenance Crew Supervisor (grade A17)
0.75 0.75 0.75
Operations Maintenance Superintendent (grade A27)
0.25 0.25 0.25
Secretary III (grade A13) 0.25 0.25 0.25
Cost Center Total 6.75 6.75 6.75
Supplemental Information
The City of Rockville’s storm drain inspection program was temporarily suspended due to issues with inspection equipment and equipment training requirements. Through contractor support, staff plans to refine storm drain line inspection protocols and identify more effective inspection equipment. The City will reinstate the storm drain inspection program during FY13. The City will focus its efforts on inlet cleaning and inspection.

Department of Public Works Division: Fleet Services
13 - 34
TABLE 13-103 Actual
FY10
Adopted
FY11
Est. Act.
FY11
Adopted
FY12
Division Expenditures
by Cost Center
Fleet Operations and
Maintenance2,209,578 2,060,470 2,157,061 2,447,830
Division Total $2,209,578 $2,060,470 $2,157,061 $2,447,830
TABLE 13-104 Actual
FY10
Adopted
FY11
Est. Act.
FY11
Adopted
FY12
Division Expenditures
by Type
Salary and Wages 819,050 816,550 816,550 828,760
Benefits 231,162 281,050 281,050 308,160
Overtime 16,460 3,410 3,410 3,350
Personnel Subtotal $1,066,672 $1,101,010 $1,101,010 $1,140,270
Contractual Services 248,446 122,510 221,484 117,450
Commodities 894,460 836,950 834,567 1,190,110
Capital Outlays 0 0 0 0
Other 0 0 0 0
Operating Subtotal $1,142,906 $959,460 $1,056,051 $1,307,560
Division Total $2,209,578 $2,060,470 $2,157,061 $2,447,830
TABLE 13-105 Actual
FY10
Adopted
FY11
Est. Act.
FY11
Adopted
FY12
Source of
Division Funds
Departmental Revenue
Auctioned Vehicles (110) 4,123 14,800 14,800 32,200
Grants/ Misc.
Revenues (110)57,951 0 0 0
Auctioned Vehicles (210) 0 1,750 1,750 3,500
Auctioned Vehicles (220) 0 0 0 3,000
Auctioned Vehicles (230) 0 350 350 3,100
Auctioned Vehicles (330) 0 0 0 1,700
Subtotal $62,074 $16,900 $16,900 $43,500
Fund Contribution
General Fund (110) 1,386,252 1,320,910 1,418,064 1,551,100
Water Fund (210) 113,930 113,850 113,850 129,100
Sewer Fund (220) 93,673 92,360 92,360 105,710
Refuse Fund (230) 504,078 471,440 470,877 568,420
Parking Fund (320) 5,540 4,520 4,520 8,050
Stormwater Fund (330) 14,789 14,820 14,820 17,810
Golf Fund (340) 17,999 15,610 15,610 13,100
Speed Cam. Fund (380) 11,243 10,060 10,060 11,040
Subtotal $2,147,504 $2,043,570 $2,140,161 $2,404,330
Division Total $2,209,578 $2,060,470 $2,157,061 $2,447,830
TABLE 13-106 Actual
FY10
Adopted
FY11
Est. Act.
FY11
Adopted
FY12
Staffing Summary
by Cost Center (FTEs)
Regular
Fleet Operations and
Maintenance13.0 13.0 13.0 13.0
Regular Subtotal 13.0 13.0 13.0 13.0
Temporary 0.0 0.0 0.0 0.0
Temporary Subtotal 0.0 0.0 0.0 0.0
Division Total 13.0 13.0 13.0 13.0
Division: Fleet Services

Department of Public Works Division: Fleet Services
13 - 35
Division: Fleet Services Division Purpose
Ensure the vehicles and equipment within the City’s fleet are well-maintained by providing an efficient, thorough, and effective preventive maintenance and repair program; managing vehicle acquisition and disposition; and managing fuel operations.
Significant Changes from Adopted to Adopted
Personnel expenditures increased by $39,260 or 4% mainly due to a 1% cost of living adjustment and a $27,100 increase in benefits. Contractual Services decreased by $5,060 mainly due to a $1,900 reduction in class and professional development and a $2,400 reduction in one-time communication equipment maintenance costs. Commodities increased by $353,160 mainly due to a $333,500 increase in gasoline and oil costs and a one-time addition of $17,000 for vehicle preparation costs.
Cost Center: Fleet Services
TABLE 13-107. Cost Center Summary
Actual
FY10 Adopted
FY11 Est. Act.
FY11 Adopted
FY12
Total Expenditures 2,209,578 2,060,470 2,157,061 2,447,830
Total Revenues 62,074 16,900 16,900 43,500
Objectives
Perform regular preventative maintenance on the City’s fleet to ensure a
high percentage of vehicle and equipment availability
Repair vehicles and equipment in a timely and efficient manner to keep the number of vehicles or equipment not in operation because of
required maintenance and unscheduled repairs to less than one day
TABLE 13-108. Performance Measures
Actual
FY10 Target
FY11 Est. Act.
FY11
Target FY12
Meet or exceed a fleet availability rate of 97%
93% 97% 95% 97%
Maintain the percent of vehicle and equipment downtime due to maintenance and repair to less than one day at or above 80%
104,630 / 120,974 (hours) or 86%
70,400 / 88,000 (hours) or 80%
90,000 / 108,000 (hours) or 83%
70,400 / 88,000 (hours) or 80%
TABLE 13-109. Workload Measure
Actual
FY10 Estimate
FY11 Est. Act.
FY11 Estimate
FY12
Number of work orders * 2,385 2,100 1,950 1,298
* Actual FY10 includes all unscheduled repairs and work requests generated during the fiscal year. Estimate FY11 is based on the average of actual work orders generated over four years. Estimate FY12 is based on recommended annual maintenance.
TABLE 13-110. Regular Positions
Position Title Adopted
FY10 Adopted
FY11 Adopted
FY12
Fleet Clerk (grade A12) 1.0 1.0 1.0
Fleet Maintenance Supervisor (grade A18) 1.0 1.0 1.0
Fleet Manager (grade A23) 1.0 1.0 1.0
Fleet Mechanic I (grade A13) 1.0 1.0 1.0
Fleet Mechanic II (grade A15) 6.0 6.0 6.0
Fleet Service Mechanic (grade A11) 3.0 3.0 3.0
Cost Center Total 13.0 13.0 13.0

Department of Public Works Division: Fleet Services
13 - 36
FLEET REVIEW AND REPLACEMENT PROCESS
Fleet Services is constantly monitoring the City’s fleet to ensure that all vehicles and equipment are kept to their most economical and efficient life. Upon replacement of most vehicles, emphasis is now given to the feasibility of replacing with “Green Vehicle Technology” such as electric, hybrid-electric plug in and natural gas. Currently the City has one Neighborhood Electric Vehicle (NEV) in the Police Department. The Vehicle and Equipment Replacement Schedule will be reviewed each year based on a 15-point replacement projection system that uses the guidelines of age, mileage (hours), condition, and maintenance cost. In addition, factors such as serviceability and technological life will be evaluated.
In some circumstances, projected replacement may have to be modified if a vehicle or equipment cannot be maintained as a safe unit or it is economical to replace it. When possible, vehicles will be reassigned within departments or between departments in order to maximize full unit life under the replacement criteria.
Vehicle and Equipment Replacement Criteria:
Age
o Sedans and compact vehicles up to 15 years. o Full size pickups and passenger vans up to 15 years. o Medium and heavy duty trucks up to 15 years. o Equipment will vary depending on the nature of use.
Heavy-duty construction/maintenance equipment (backhoes, loaders, etc.) up to 15 years.
Light equipment/constant usage equipment (skid-steers, chippers, etc) 5 to 10 years.
Grounds maintenance, leaf collector, support and snow equipment 5 to 15 years.
Equipment trailers and snowplows 15 to 20 years.
Meter (Mileage and/or Hours)
o 100,000 miles for sedans, SUV’s, and trucks up to 10,000 Gross Vehicle Weight Rating (GVWR) or 3,500 hours engine run time.
o 150,000 miles for medium and heavy-duty trucks and passenger buses or up to 6,500 hours engine run time.
o Equipment 2,000 to 6,000 hours depending on usage.
Condition
o In some circumstances, vehicles and equipment may be subject to premature life expectancy due to operational conditions. Factors such as accident damage, excessive maintenance cost, and major body and component deterioration will be cause for replacement.
Police Vehicles
o Replacement is based on a 5 to 7 year life cycle and 100,000 miles. However, depending on a vehicle’s condition and usage, it may be reassigned to obtain extended useful life.
Usefulness o Vehicle and equipment usage is consistent with its acquired task.
FIGURE 13-13: 2011 Fleet Replacement Review
Units Reviewed
Percentage of Fleet
Units Recommended for Replacement
Percentage of Fleet Recommended for
Replacement
95 23.0 % 31 7.5 %
FIGURE 13-14. FY 2012 Fleet Replacement Schedule
The following tables list new and replacement vehicles to be purchased in FY12. The replacement vehicles are funded through the Vehicles for City Use CIP project on page 116 of the FY12 – FY16 Adopted CIP Budget Book.
Police Department / Field Services Bureau
Meet One or More Replacement
Criteria ()
Specific unit replacement is determined at time of new acquisition based on
changing circumstances that are inherent in police vehicle operations.
Unit Description Age Meter Cond. Use Estimated
Funding
Police Vehicle $25,305
Police Vehicle $25,305
Police Vehicle $25,305
Police Vehicle $25,305
Police Vehicle $25,305
Police Vehicle $25,305
Police Vehicle $25,305
Police Vehicle $25,305
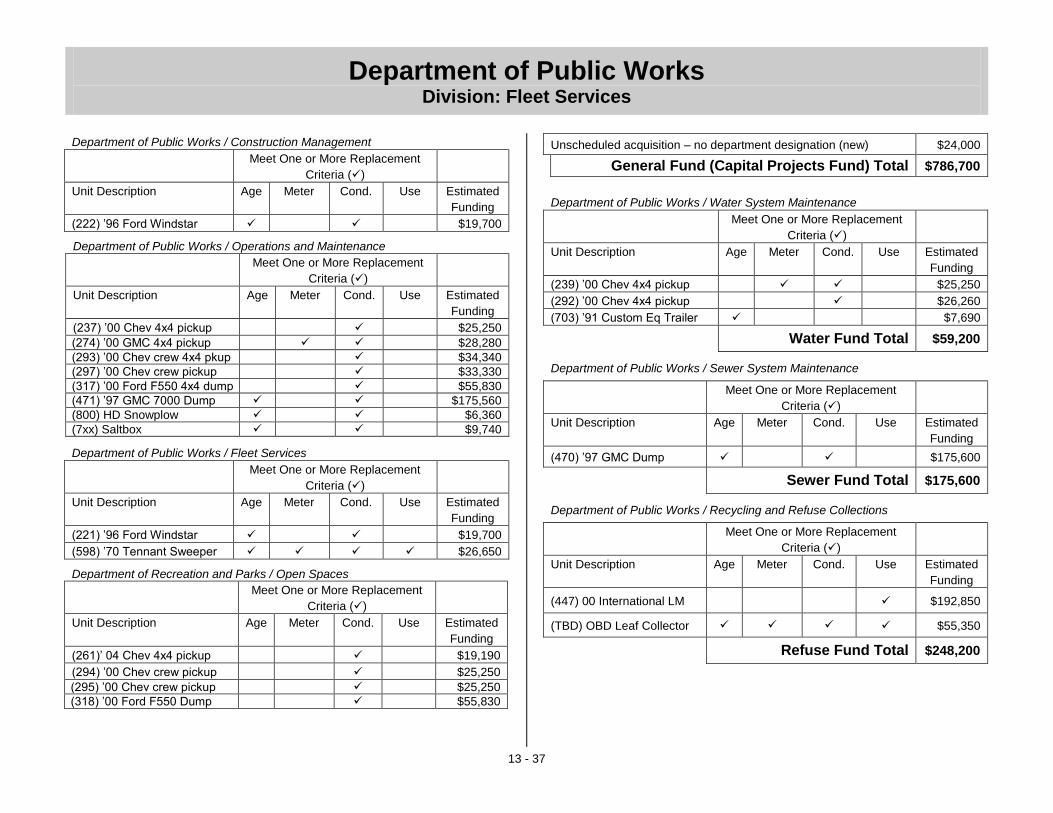
Department of Public Works Division: Fleet Services
13 - 37
Department of Public Works / Construction Management
Meet One or More Replacement
Criteria ()
Unit Description Age Meter Cond. Use Estimated
Funding
(222) ’96 Ford Windstar $19,700
Department of Public Works / Operations and Maintenance
Meet One or More Replacement
Criteria ()
Unit Description Age Meter Cond. Use Estimated
Funding
(237) ’00 Chev 4x4 pickup $25,250
(274) ’00 GMC 4x4 pickup $28,280
(293) ’00 Chev crew 4x4 pkup $34,340
(297) ’00 Chev crew pickup $33,330
(317) ’00 Ford F550 4x4 dump $55,830
(471) ’97 GMC 7000 Dump $175,560
(800) HD Snowplow $6,360
(7xx) Saltbox $9,740
Department of Public Works / Fleet Services
Meet One or More Replacement
Criteria ()
Unit Description Age Meter Cond. Use Estimated
Funding
(221) ’96 Ford Windstar $19,700
(598) ’70 Tennant Sweeper $26,650
Department of Recreation and Parks / Open Spaces
Meet One or More Replacement
Criteria ()
Unit Description Age Meter Cond. Use Estimated
Funding
(261)’ 04 Chev 4x4 pickup $19,190
(294) ’00 Chev crew pickup $25,250
(295) ’00 Chev crew pickup $25,250
(318) ’00 Ford F550 Dump $55,830
Unscheduled acquisition – no department designation (new) $24,000
General Fund (Capital Projects Fund) Total $786,700
Department of Public Works / Water System Maintenance
Meet One or More Replacement
Criteria ()
Unit Description Age Meter Cond. Use Estimated
Funding
(239) ’00 Chev 4x4 pickup $25,250
(292) ’00 Chev 4x4 pickup $26,260
(703) ’91 Custom Eq Trailer $7,690
Water Fund Total $59,200
Department of Public Works / Sewer System Maintenance
Meet One or More Replacement
Criteria ()
Unit Description Age Meter Cond. Use Estimated
Funding
(470) ’97 GMC Dump $175,600
Sewer Fund Total $175,600
Department of Public Works / Recycling and Refuse Collections
Meet One or More Replacement
Criteria ()
Unit Description Age Meter Cond. Use Estimated
Funding
(447) 00 International LM $192,850
(TBD) OBD Leaf Collector $55,350
Refuse Fund Total $248,200

Department of Public Works Division: Fleet Services
13 - 38
Department of Public Works / Stromwater Management
Meet One or More Replacement
Criteria ()
Unit Description Age Meter Cond. Use Estimated
Funding
(273) ’00 GMC 4x4 pickup $28,300
SWM Fund Total $28,300
Grand Total - All Funds $1,298,000
FIGURE 13-15. City Fleet Mechanic Performing Service on Backhoe.
FIGURE 13-16. City Fleet Mechanic Using a Mobile Lift.
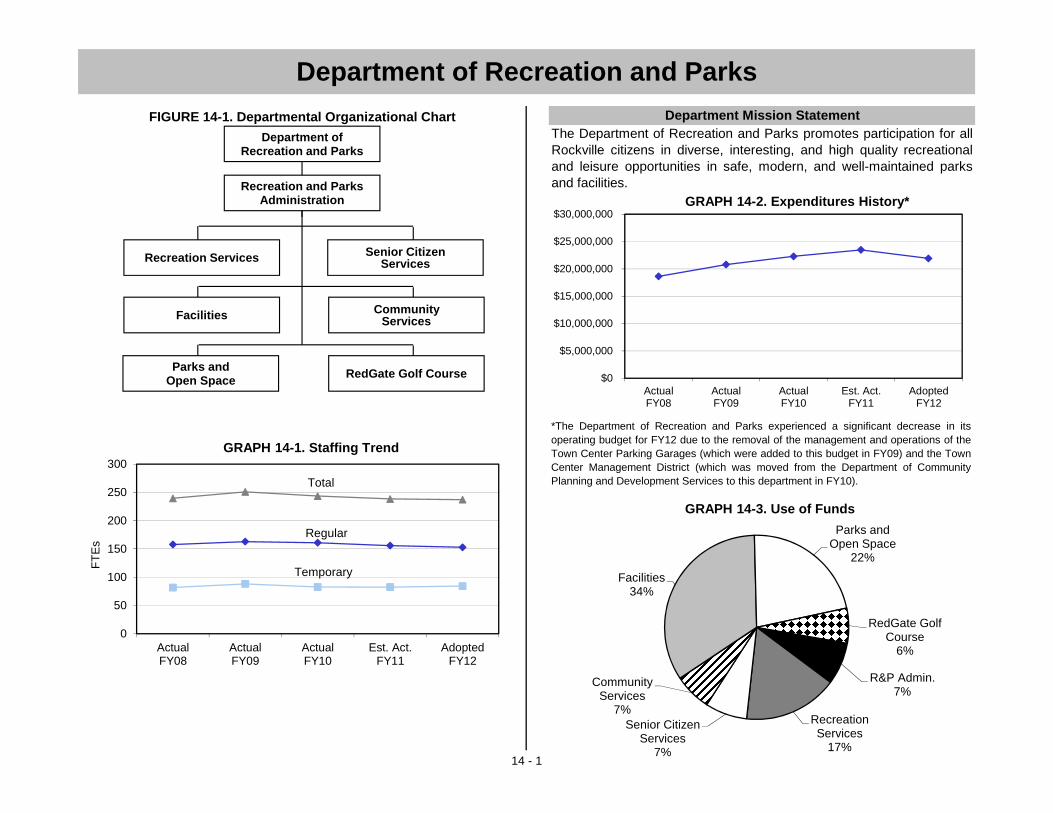
14 - 1
*The Department of Recreation and Parks experienced a significant decrease in itsoperating budget for FY12 due to the removal of the management and operations of theTown Center Parking Garages (which were added to this budget in FY09) and the TownCenter Management District (which was moved from the Department of CommunityPlanning and Development Services to this department in FY10).
Department of Recreation and ParksDepartment Mission StatementFIGURE 14-1. Departmental Organizational Chart
The Department of Recreation and Parks promotes participation for allRockville citizens in diverse, interesting, and high quality recreationaland leisure opportunities in safe, modern, and well-maintained parksand facilities.
$0
$5,000,000
$10,000,000
$15,000,000
$20,000,000
$25,000,000
$30,000,000
ActualFY08
ActualFY09
ActualFY10
Est. Act.FY11
AdoptedFY12
GRAPH 14-2. Expenditures History*
R&P Admin.7%
Recreation Services
17%
Senior Citizen Services
7%
Community Services
7%
Facilities34%
Parks and Open Space
22%
RedGate Golf Course
6%
GRAPH 14-3. Use of Funds
0
50
100
150
200
250
300
ActualFY08
ActualFY09
ActualFY10
Est. Act.FY11
AdoptedFY12
FT
Es
GRAPH 14-1. Staffing Trend
Total
Temporary
Regular
Department of Recreation and Parks
Recreation and Parks Administration
Recreation Services Senior Citizen Services
Community ServicesFacilities
Parks and Open Space RedGate Golf Course
etompkins
Underline
etompkins
Underline
etompkins
Underline
etompkins
Underline
etompkins
Underline
etompkins
Underline
etompkins
Underline
etompkins
Underline
etompkins
Underline
etompkins
Underline
etompkins
Underline
etompkins
Underline
etompkins
Underline
etompkins
Underline

Department of Recreation and Parks Department Summary
14 - 2
Department Summary
TABLE 14-1 Actual
FY10
Adopted
FY11
Est. Act.
FY11
Adopted
FY12
% Change
from Adpt.
Dept. Expenditures
by Division
Rec & Parks Admin 1,751,619 1,596,010 1,612,984 1,626,660 1.9%
Recreation Services 3,542,686 3,860,920 3,786,509 3,626,150 (6.1%)
Sr. Citizen Services 1,472,445 1,584,000 1,513,897 1,617,040 2.1%
Community Services 1,391,028 1,445,848 1,382,421 1,437,580 (0.6%)
Facilities 8,529,218 9,026,420 9,089,169 7,433,450 (17.6%)
Parks & Open Space 4,410,684 4,619,090 4,740,070 4,829,620 4.6%
RedGate Golf Course 1,207,236 1,321,540 1,361,040 1,345,450 1.8%
Department Total $22,304,916 $23,453,828 $23,486,090 $21,915,950 (6.6%)
TABLE 14-2 Actual
FY10
Adopted
FY11
Est. Act.
FY11
Adopted
FY12
% Change
from Adpt.
Dept. Expenditures
by Type
Salary and Wages 11,090,075 11,244,700 10,902,291 10,709,520 (4.8%)
Benefits 2,617,431 3,069,330 3,032,419 3,107,130 1.2%
Overtime 284,762 206,690 206,344 172,580 (16.5%)
Personnel Subtotal $13,992,268 $14,520,720 $14,141,054 $13,989,230 (3.7%)
Contractual Services 4,595,290 4,739,520 4,877,162 4,070,920 (14.1%)
Commodities 2,942,019 3,335,028 3,472,787 3,061,520 (8.2%)
Capital Outlays 159,257 180,940 311,267 89,210 (50.7%)
Other 616,082 677,620 683,820 705,070 4.1%
Operating Subtotal $8,312,648 $8,933,108 $9,345,036 $7,926,720 (11.3%)
Department Total $22,304,916 $23,453,828 $23,486,090 $21,915,950 (6.6%)
TABLE 14-3 Actual
FY10
Adopted
FY11
Est. Act.
FY11
Adopted
FY12
% Change
from Adpt.
Source of Dept. Funds
State / Rec Grants (110) 358,314 332,883 399,947 296,000 (11.1%)
Memberships (110) 707,510 690,500 690,500 771,000 11.7%
Tickets (110) 412,683 433,000 433,000 423,000 (2.3%)
Program Fees (110) 2,729,191 2,753,405 2,517,160 2,764,330 0.4%
Facility Rental Fees (110/350) 850,268 852,850 852,850 845,180 (0.9%)
Social Services Fees (110) 18,161 18,800 18,800 18,800 0.0%
Special Events Fees (110) 77,771 40,000 40,000 65,150 62.9%
Admission Charges (110) 300,580 295,000 295,000 305,000 3.4%
Sw im Team Dues (110) 307,662 315,000 315,000 315,000 0.0%
Golf Revenues (340) 961,411 1,017,710 1,017,710 1,157,480 13.7%
Comm. Contrib. (110/350) 175,475 213,360 238,190 215,180 0.9%
Other (110/350) 218,098 94,730 94,730 64,270 (32.2%)
Subtotal $7,117,124 $7,057,238 $6,912,887 $7,240,390 2.6%
General Fund (110) 13,295,746 14,001,540 14,009,942 14,136,530 1.0%
Parking Fund (320) 793,754 1,090,375 1,060,375 22,010 (98.0%)
Golf Fund (340) 245,825 303,830 343,330 187,970 (38.1%)
Special Activities (350) 79,132 272,250 430,966 329,050 20.9%
Tow n Center Mgt (370) 773,335 728,595 728,590 N/A N/A
Subtotal $15,187,792 $16,396,590 $16,573,203 $14,675,560 (10.5%)
Department Total $22,304,916 $23,453,828 $23,486,090 $21,915,950 (6.6%)
TABLE 14-4 Actual
FY10
Adopted
FY11
Est. Act.
FY11
Adopted
FY12
% Change
from Adpt.
Staffing Summary by Division (FTEs)
Regular
Rec & Parks Admin 10.8 10.8 10.8 10.8 0.0%
Recreation Services 22.4 21.6 19.9 19.3 (10.6%)
Sr. Citizen Services 15.4 15.4 15.4 15.4 0.0%
Community Services 9.0 9.0 9.0 8.6 (4.4%)
Facilities 46.0 44.5 44.5 42.5 (4.5%)
Parks & Open Space 47.5 46.5 46.5 46.5 0.0%
RedGate Golf Course 9.8 9.8 9.8 9.8 0.0%
Regular Subtotal 160.9 157.6 155.9 152.9 (3.0%)
Temporary
Rec & Parks Admin 1.9 1.6 1.6 1.5 (6.3%)
Recreation Services 27.3 30.6 28.6 27.7 (9.5%)
Sr. Citizen Services 6.8 6.8 6.8 7.5 10.3%
Community Services 0.9 0.9 0.9 1.1 22.2%
Facilities 37.3 36.2 36.2 38.5 6.4%
Parks & Open Space 2.7 2.7 2.7 2.3 (14.8%)
RedGate Golf Course 5.7 5.7 5.7 5.7 0.0%
Temporary Subtotal 82.6 84.5 82.5 84.3 (0.2%)
Department Total 243.5 242.1 238.4 237.2 (2.0%)
Department of Recreation and Parks Department Summary
14 - 3
Department Summary
Department Overview
The Department of Recreation and Parks participates in citizen input processes and with advisory groups and individual citizens to: assess the recreation and parks needs of individuals and neighborhoods; preserve and improve parks, rights-of-way and open spaces so they are green and environmentally sustainable, safe, accessible and aesthetically pleasing; ensure that public buildings are serviced at quality standards; support community and specialized recreation facilities that offer diverse programming opportunities; encourage community spirit and civic pride via special events and celebrations, offer a wide variety of programs that contribute to lifetime skills, cultural enrichment, wellness and personal fulfillment; and plan, design and construct functional recreation park facilities that balance the needs of participants and the preservation of the environment. The Recreation and Parks Department is divided into seven divisions:
Recreation and Parks Administration — This Division consists of three cost
centers that are responsible for: leadership and management of the Recreation and Parks Department; stewardship and management of all of the City’s parkland, open space and buildings; planning and delivery of high quality Special Events; and planning and management of 15 to 20 annual Capital Improvement Program projects. The Division also supports the Recreation and Park Advisory Board and the Rockville Recreation and Parks Foundation, Inc.
Recreation Services — This Division consists of fifteen cost centers that
annually provide over 3,000 high-quality, diverse, educational and recreational programs equitably to approximately 29,000 residents and guests in friendly and safe environments. This Division is composed of the Arts, After School, Teens, Summer Playgrounds, Summer Camps, Classes, Outdoor Recreation, Childcare, Adult Sports and Youth Sports cost centers. Four special activities funds support participation and programming, including the Recreation Fund through which financial subsidies are provided to low-income residents who would otherwise not be able to afford to participate; and the Art in Public Architecture, Art in Public Places, and the Friends of the Arts Funds which support various public art and cultural projects and programs. Staff liaisons to the Cultural Arts Commission, the Bikeway Advisory Committee and the Rockville Sister City Corporation are essential to the management of these diverse programs and services.
Senior Citizen Services — This Division consists of five cost centers that
provide for the social, recreational, educational, fitness and wellness needs of a diverse population of active employed, active retired and frail senior citizens. The 42,580 square foot Senior Center is a place where citizens may access information, services and support related to aging issues. The Senior Citizen Support Services, Recreation Services and Sports and Fitness cost centers offer programs and services for aging in place, transportation, socialization, recreation, leisure, education, trips, fitness, health and wellness. Staff provides support to Rockville Seniors, Inc. and the Senior Citizens Commission to meet their financial, outreach and aging in place goals. Through the Senior Assistance Fund cost center financial assistance is provided to senior citizens who would otherwise not be able to afford to participate or take full advantage of programs, trips and Senior Center membership.
Community Services — This Division consists of five cost centers that provide
supportive programs and services to help at-risk and disadvantaged youth and families become self sufficient, make positive life choices, and adjust to life and societal challenges. The Youth and Family Services cost center provides emergency assistance; youth development programs; counseling; parenting education; self-sufficiency workshops; and information and referral. The Montgomery County grant-funded Linkages to Learning cost center provides educational support services, counseling, case management and parent support groups for students and their families attending Maryvale Elementary School. The Community Programs Administration and the Community Services Funds cost centers conduct needs assessments, coordinate the City’s annual grant program to nonprofit human service agencies, provide staff support to the Human Services Advisory Commission and coordinate special projects such as the Rockville Holiday Drive. The Community Programs cost center covers nonprofit agencies receiving annual grant awards from the City to provide social services addressing residents’ basic needs (food, clothing, housing and emergency financial assistance).
etompkins
Underline
etompkins
Underline
etompkins
Underline
etompkins
Underline

Department of Recreation and Parks Department Summary
14 - 4
Facilities — The Facilities Division consists of nine cost centers that comprise
the City’s major recreational facilities as well as maintain all City facilities. In all, the Facilities Maintenance cost center cares for 75 buildings including City Hall, Water Treatment Plant, Gude Drive Maintenance Complex, Arts & Innovation Center, and neighborhood facilities (Elwood Smith, Rockcrest, etc.), as well as 20 park shelters and other structures. Major facilities including the Swim and Fitness Center, Civic Center Complex, Lincoln Park Community Center, Twinbrook Community Recreation Center, Thomas Farm Community Center and Croydon Creek Nature Center are each contained in individual cost centers in the General Fund. The Division includes two Special Activity Funds to support improvements and operations at the Glenview Mansion and Nature Center. Parks and Open Space — The Parks and Open Space Division consists of ten
cost centers that are responsible for the operation, maintenance and improvements to Rockville’s 65 parks. This Division is responsible for 904 acres of parkland and more than 25,000 street trees, 37 athletic fields, 111 athletic courts (basketball, tennis and volleyball), 142 acres of rights-of-way, and installation and care of more than 62,500 annual and perennial flowers in approximately 140 locations. The Parks Administration and Support cost center provides leadership, management and support to the overall division. The Forestry Development Review cost center administers Rockville’s Forest and Tree Preservation Ordinance. The Parks and Open Space Division provides essential support for sports, special events and other recreation programs.
RedGate Golf Course — This Division consists of two cost centers responsible
for providing a municipal golf course with excellent daily playing conditions and customer service. The Course Operations cost center provides maintenance and short- and long-term improvements to the golf course. The Clubhouse Services cost center provides customer service, collection of fees, marketing and scheduling/management of tournaments, outings and events. RedGate Golf Course operates in a separate enterprise fund in which the stated policy is to cover all operating costs with user fees. Recreation and Parks Department Strategic Objectives
Deliver excellent customer service every day
Adapt to the growing diversity of facility and program users through adjustments to communication, program and facility content
Provide opportunities for citizens to engage the Recreation and Parks Department and work actively for betterment of services and facilities
Be fully inclusive in citizen and neighborhood input processes relative to services, programs and projects, providing multiple opportunities to engage the Department and reach effective conclusions
Implement recommendations from the Parks, Recreation and Open Space (PROS) Plan to improve services to neighborhoods
Support neighborhood events with loan of equipment, funding, and event planning assistance
Provide information and referrals to community resources and emergency financial assistance to residents who cannot afford the increased cost of housing and utilities
Continue to provide a wide variety of free high value arts and entertainment opportunities at City facilities and at outdoor venues
Produce events, programs, community rituals, and celebrations that enhance community identity and pride and celebrate diversity
Offer English for Speakers of Other Languages (ESOL) and Citizenship classes for foreign-born residents
Enhance Rockville’s heritage through responsive management of City-owned historical resources
Manage the City’s parks, open spaces and rights-of-way to keep them ―clean and green‖
Promote biking and walking as alternate modes of transportation and increase awareness of the bicycle route system to promote recreation and wellness, and to reduce carbon emissions from vehicles
Maintain the City’s bike paths and bike/pedestrian facilities to promote enhanced usage of multi-modal transportation alternatives
Seek and apply for grants and other outside funding
Operate the Farmers Market, which provides the opportunity to purchase locally grown produce and reduce energy use
Strive to uphold the standard of a City park within a ten-minute walk of every Rockville household
Promote application of the City’s Environmental Guidelines and all environmental policies as they apply to development activities
Work to ensure that new developments and re-developments provide public parks and green space in accordance with City standards as defined in the PROS Plan and the Zoning Ordinance
Continue to enhance the visual environment by maintaining City parks and through continuation of the flower bed program and maintenance of the 25,000 publicly-owned street trees
Develop partnerships with the business community to foster involvement in community activities such as Rockville’s special events, and in support of the Recreation Fund, Senior Assistance Fund, Holiday Drive and Recreation and Parks Foundation
etompkins
Underline
etompkins
Underline
etompkins
Underline

Department of Recreation and Parks Department Summary
14 - 5
Continue Town Center special events and the Farmers Market to attract visitors
Provide support to the work of Recreation and Park Advisory Board, Senior Citizens Commission, Rockville Seniors, Inc., Cultural Arts Commission, Human Services Advisory Commission, Sister City Corporation and the Recreation and Parks Foundation
Work closely with the Neighborhood Resource Coordinators and Communications Team to ensure concerns and desires of residents and neighborhoods are addressed in program offerings, park/facility improvement projects and services provided
Significant Changes from Adopted to Adopted
The Department of Recreation and Parks’ FY12 Adopted budget represents a 7% decrease compared to the FY11 Adopted budget due mainly to a combination of the removal of 4.7 regular FTEs and their associated salary and benefit costs, the removal of $36,000 in one-time grant-funding for temporary employee wages, an increase in benefit costs, a net $34,110 reduction in overtime spending, the removal of operating expenditures related to the now closed Fallsmead Preschool program, the removal of operating expenditures related to the Town Square Management District and the Town Square Parking Garages, the addition of $131,900 in operating cost impacts related to CIP projects, a reduction in planned community assistance funding from the Recreation Special Activities Fund, and an increase in caregiver agency funding.
The Department of Recreation and Parks’ FY12 Adopted revenue budget represents a 3% increase over the FY11 Adopted budget due to a combination of the removal of $36,000 in one-time Safe Routes to School grant funding; increases in Senior Center, Swim and Fitness Center, and Thomas Farm Community Center membership revenue; the removal of $10,000 in theme park ticket revenue due to lower ticket sales; the removal of the revenue associated with the Fallsmead Preschool program; the addition of new recreation program fee revenue in the Recreation Services, Senior Citizen Services, and Facilities Divisions; a net decrease in facility rental revenue due to increases at the Senior Center and decreases in the Facilities Division; the addition of $25,150 in special event fee revenue from the Art and Craft Festival and Uncorked Wine and Music Festival; a $10,000 increase in Swim and Fitness Center admission revenue; a 13.7% increase in RedGate Golf Course revenue anticipated as a result of the planned change in golf course management; the removal of $21,260 in community contribution revenue based on anticipated contributions to the Recreation Special Activities Fund; and a decrease in other revenues including concession and miscellaneous Parks and Open Space revenue.
GRAPH 14-4. The graph below shows the age of recreation program participants
in FY10. The highest proportion of participants is children ages 5-12.
Age of Recreation Program
Participants - FY 2010 Actual
Age 5-12
42%
Age 60-79
18%
Age 13-20
11%
Age 21-39
5%
Age 40-59
7%
Age 80+
10%
Age 0-4
7%
etompkins
Underline
etompkins
Underline
etompkins
Underline
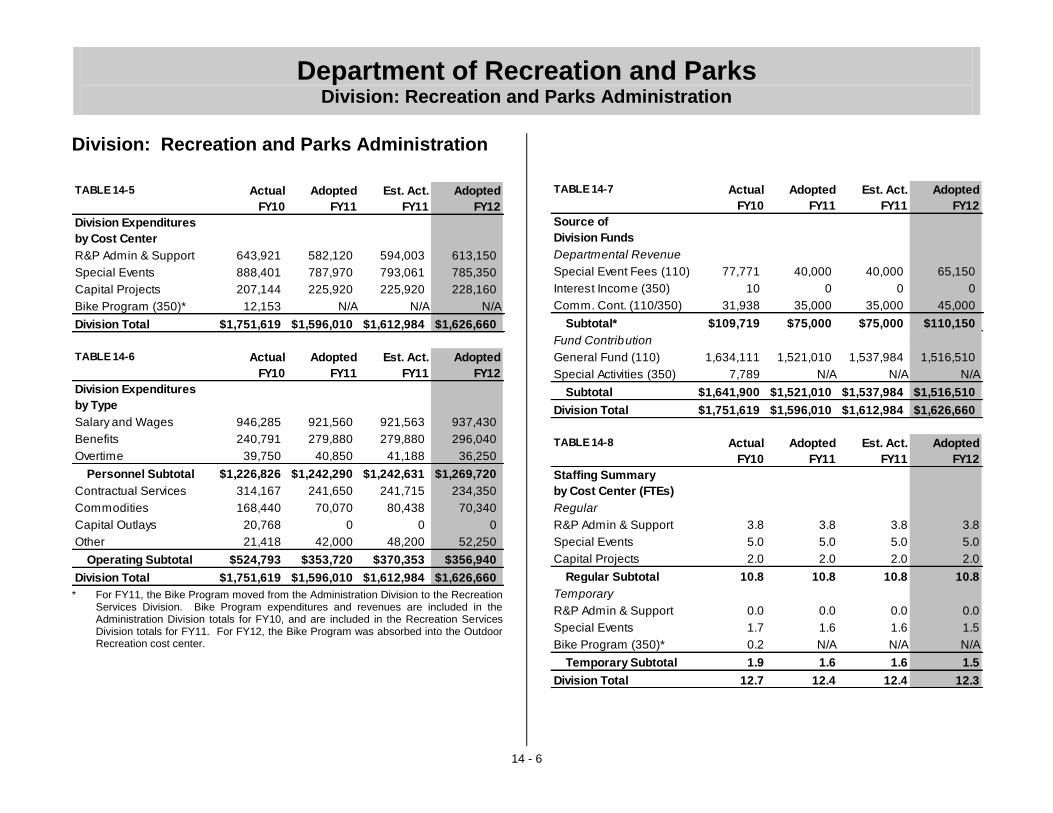
Department of Recreation and Parks Division: Recreation and Parks Administration
14 - 6
Division: Recreation and Parks Administration
TABLE 14-5 Actual
FY10
Adopted
FY11
Est. Act.
FY11
Adopted
FY12
Division Expenditures
by Cost Center
R&P Admin & Support 643,921 582,120 594,003 613,150
Special Events 888,401 787,970 793,061 785,350
Capital Projects 207,144 225,920 225,920 228,160
Bike Program (350)* 12,153 N/A N/A N/A
Division Total $1,751,619 $1,596,010 $1,612,984 $1,626,660
TABLE 14-6 Actual
FY10
Adopted
FY11
Est. Act.
FY11
Adopted
FY12
Division Expenditures
by Type
Salary and Wages 946,285 921,560 921,563 937,430
Benefits 240,791 279,880 279,880 296,040
Overtime 39,750 40,850 41,188 36,250
Personnel Subtotal $1,226,826 $1,242,290 $1,242,631 $1,269,720
Contractual Services 314,167 241,650 241,715 234,350
Commodities 168,440 70,070 80,438 70,340
Capital Outlays 20,768 0 0 0
Other 21,418 42,000 48,200 52,250
Operating Subtotal $524,793 $353,720 $370,353 $356,940
Division Total $1,751,619 $1,596,010 $1,612,984 $1,626,660
* For FY11, the Bike Program moved from the Administration Division to the Recreation Services Division. Bike Program expenditures and revenues are included in the Administration Division totals for FY10, and are included in the Recreation Services Division totals for FY11. For FY12, the Bike Program was absorbed into the Outdoor Recreation cost center.
TABLE 14-7 Actual
FY10
Adopted
FY11
Est. Act.
FY11
Adopted
FY12
Source of
Division Funds
Departmental Revenue
Special Event Fees (110) 77,771 40,000 40,000 65,150
Interest Income (350) 10 0 0 0
Comm. Cont. (110/350) 31,938 35,000 35,000 45,000
Subtotal* $109,719 $75,000 $75,000 $110,150
Fund Contribution
General Fund (110) 1,634,111 1,521,010 1,537,984 1,516,510
Special Activities (350) 7,789 N/A N/A N/A
Subtotal $1,641,900 $1,521,010 $1,537,984 $1,516,510
Division Total $1,751,619 $1,596,010 $1,612,984 $1,626,660
TABLE 14-8 Actual
FY10
Adopted
FY11
Est. Act.
FY11
Adopted
FY12
Staffing Summary
by Cost Center (FTEs)
Regular
R&P Admin & Support 3.8 3.8 3.8 3.8
Special Events 5.0 5.0 5.0 5.0
Capital Projects 2.0 2.0 2.0 2.0
Regular Subtotal 10.8 10.8 10.8 10.8
Temporary
R&P Admin & Support 0.0 0.0 0.0 0.0
Special Events 1.7 1.6 1.6 1.5
Bike Program (350)* 0.2 N/A N/A N/A
Temporary Subtotal 1.9 1.6 1.6 1.5
Division Total 12.7 12.4 12.4 12.3 **
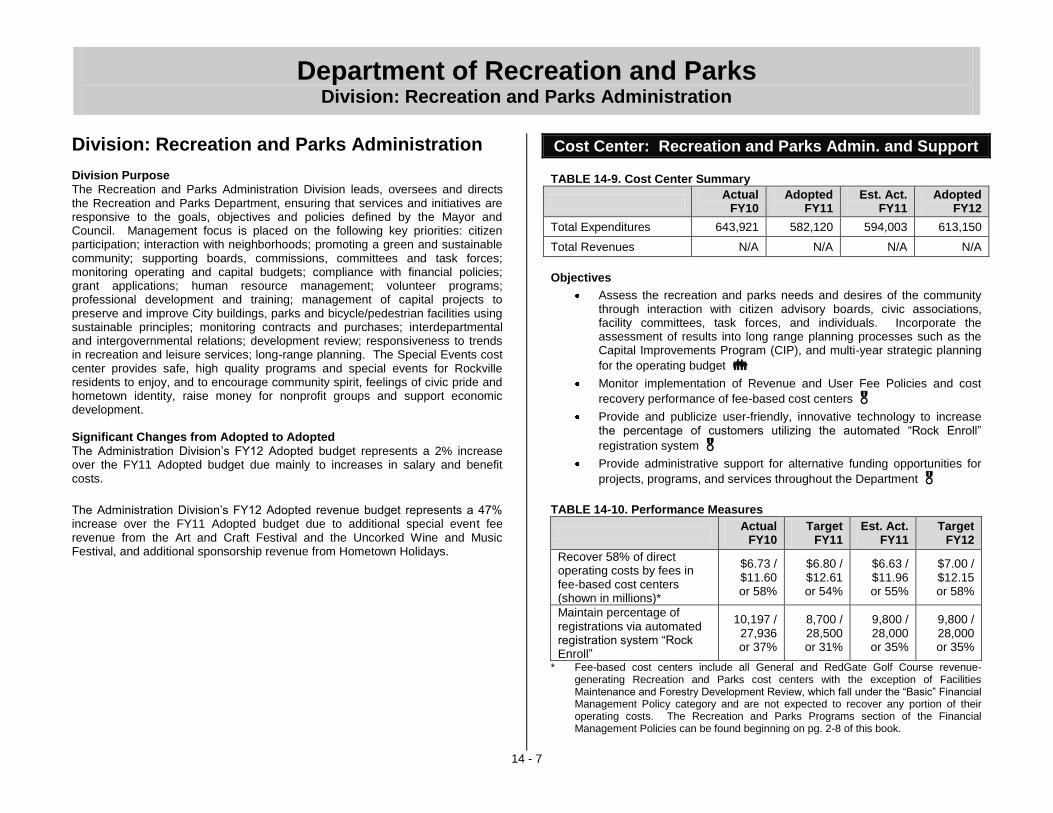
Department of Recreation and Parks Division: Recreation and Parks Administration
14 - 7
Division: Recreation and Parks Administration Division Purpose
The Recreation and Parks Administration Division leads, oversees and directs the Recreation and Parks Department, ensuring that services and initiatives are responsive to the goals, objectives and policies defined by the Mayor and Council. Management focus is placed on the following key priorities: citizen participation; interaction with neighborhoods; promoting a green and sustainable community; supporting boards, commissions, committees and task forces; monitoring operating and capital budgets; compliance with financial policies; grant applications; human resource management; volunteer programs; professional development and training; management of capital projects to preserve and improve City buildings, parks and bicycle/pedestrian facilities using sustainable principles; monitoring contracts and purchases; interdepartmental and intergovernmental relations; development review; responsiveness to trends in recreation and leisure services; long-range planning. The Special Events cost center provides safe, high quality programs and special events for Rockville residents to enjoy, and to encourage community spirit, feelings of civic pride and hometown identity, raise money for nonprofit groups and support economic development. Significant Changes from Adopted to Adopted
The Administration Division’s FY12 Adopted budget represents a 2% increase over the FY11 Adopted budget due mainly to increases in salary and benefit costs.
The Administration Division’s FY12 Adopted revenue budget represents a 47% increase over the FY11 Adopted budget due to additional special event fee revenue from the Art and Craft Festival and the Uncorked Wine and Music Festival, and additional sponsorship revenue from Hometown Holidays.
Cost Center: Recreation and Parks Admin. and Support TABLE 14-9. Cost Center Summary
Actual
FY10 Adopted
FY11 Est. Act.
FY11 Adopted
FY12
Total Expenditures 643,921 582,120 594,003 613,150
Total Revenues N/A N/A N/A N/A
Objectives
Assess the recreation and parks needs and desires of the community through interaction with citizen advisory boards, civic associations, facility committees, task forces, and individuals. Incorporate the assessment of results into long range planning processes such as the Capital Improvements Program (CIP), and multi-year strategic planning
for the operating budget
Monitor implementation of Revenue and User Fee Policies and cost
recovery performance of fee-based cost centers
Provide and publicize user-friendly, innovative technology to increase the percentage of customers utilizing the automated ―Rock Enroll‖
registration system
Provide administrative support for alternative funding opportunities for
projects, programs, and services throughout the Department
TABLE 14-10. Performance Measures
Actual
FY10 Target
FY11 Est. Act.
FY11 Target
FY12
Recover 58% of direct operating costs by fees in fee-based cost centers (shown in millions)*
$6.73 / $11.60 or 58%
$6.80 / $12.61 or 54%
$6.63 / $11.96 or 55%
$7.00 / $12.15 or 58%
Maintain percentage of registrations via automated registration system ―Rock Enroll‖
10,197 / 27,936 or 37%
8,700 / 28,500 or 31%
9,800 / 28,000 or 35%
9,800 / 28,000 or 35%
* Fee-based cost centers include all General and RedGate Golf Course revenue-generating Recreation and Parks cost centers with the exception of Facilities Maintenance and Forestry Development Review, which fall under the ―Basic‖ Financial Management Policy category and are not expected to recover any portion of their operating costs. The Recreation and Parks Programs section of the Financial Management Policies can be found beginning on pg. 2-8 of this book.

Department of Recreation and Parks Division: Recreation and Parks Administration
14 - 8
TABLE 14-11. Workload Measures
Actual
FY10 Estimate
FY11 Est. Act.
FY11 Estimate
FY12
Number of meetings with Boards & Commissions, Task Forces, Civic Associations, Community Groups, etc.
521 550 525 525
Number of grants:
Applied for
Awarded
17 16
15 12
15 10
15 12
TABLE 14-12. Regular Positions
Position Title Adopted
FY09 Adopted
FY10 Adopted
FY11
Community Rec. Manager (grade A23) 0.8 0.8 0.8
Director of Rec. and Parks (grade SAII) 1.0 1.0 1.0
Program Support Coordinator (grade A18) 1.0 1.0 1.0
Rec. and Parks Admin. Mgr. (grade A27) 1.0 1.0 1.0
Cost Center Total 3.8 3.8 3.8
Supplemental Information
Each fiscal year, the City awards funding to outside agencies that provide services to the residents of Rockville through a competitive application review process. For FY12, $35,000 in outside agency funding is included in the Administration Division’s budget for the Rockville Science Center, which aims to provide a vibrant facility that offers an educational forum for citizens of all ages to explore the wonders of science that underlie everyday life and that relate to the scientific community of the region. Additionally, $4,250 in outside agency funding is included in the Administration Division’s FY12 budget for the Rockville Consortium for Science, which encourages science awareness through the annual Rockville Science Day event held at Montgomery College, Rockville campus.
Cost Center: Special Events TABLE 14-13. Cost Center Summary
Actual
FY10 Adopted
FY11 Est. Act.
FY11 Adopted
FY12
Total Expenditures 888,401 787,970 793,061 785,350
Total Revenues 105,355 75,000 75,000 110,150
Objectives
Produce high quality events, including multi-cultural entertainment, for residents and visitors to enjoy and celebrate Rockville’s diverse
population
Build and strengthen relationships with residents, businesses, and community groups to strengthen economic impact and encourage
participation in City-sponsored events
Implement environmentally friendly practices into all events in order to
reduce waste and encourage sustainable lifestyles
TABLE 14-14. Performance Measures
Actual
FY10 Target
FY11 Est. Act.
FY11 Target
FY12
Maintain the percentage of Citizen Survey respondents rating City-sponsored special events as ―excellent‖ or ―good‖ at 80% or greater*
86% 86% 84% 84%
Maintain percentage of Citizen Survey respondents who attended a City-sponsored special event (outdoor concerts, Farmers’ Market, July 4th fireworks, Hometown Holidays, or Car Show) at least once at 70% or greater*
74% 74% 75% 75%
etompkins
Underline
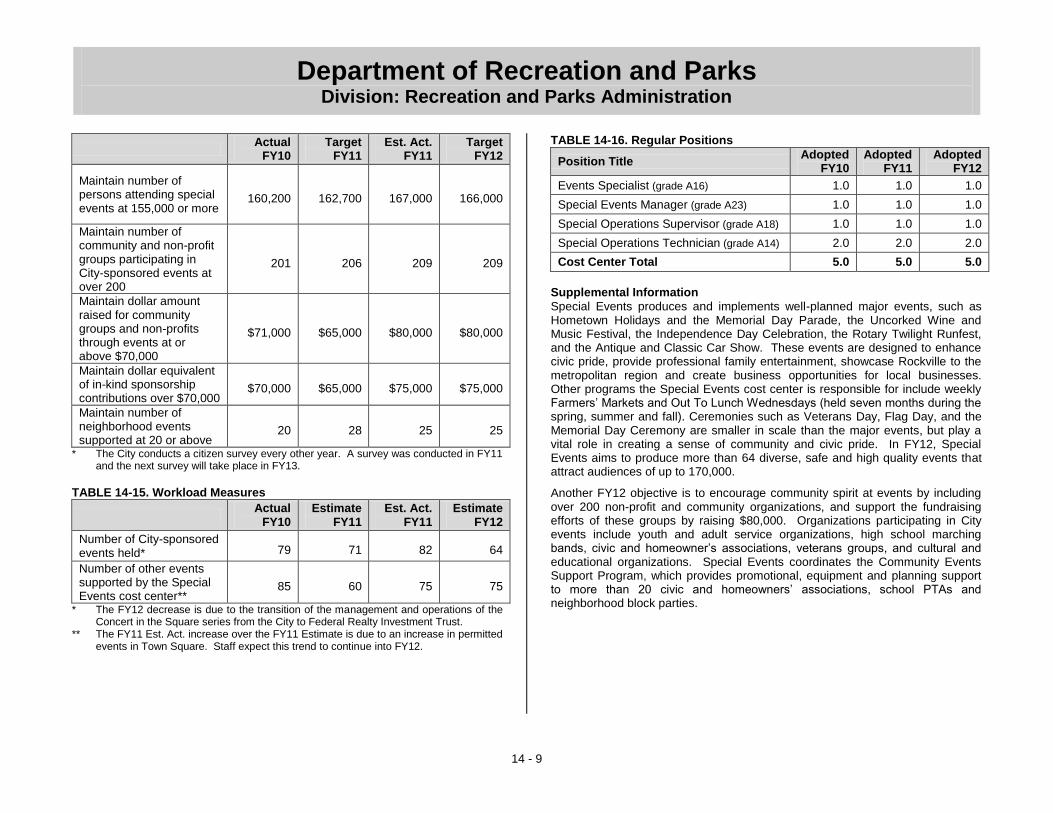
Department of Recreation and Parks Division: Recreation and Parks Administration
14 - 9
Actual
FY10 Target
FY11 Est. Act.
FY11 Target
FY12
Maintain number of persons attending special events at 155,000 or more
160,200 162,700 167,000 166,000
Maintain number of community and non-profit groups participating in City-sponsored events at over 200
201 206 209 209
Maintain dollar amount raised for community groups and non-profits through events at or above $70,000
$71,000 $65,000 $80,000 $80,000
Maintain dollar equivalent of in-kind sponsorship contributions over $70,000
$70,000 $65,000 $75,000 $75,000
Maintain number of neighborhood events supported at 20 or above
20 28 25 25
* The City conducts a citizen survey every other year. A survey was conducted in FY11 and the next survey will take place in FY13.
TABLE 14-15. Workload Measures
Actual
FY10 Estimate
FY11 Est. Act.
FY11 Estimate
FY12
Number of City-sponsored events held* 79 71 82 64
Number of other events supported by the Special Events cost center**
85 60 75 75
* The FY12 decrease is due to the transition of the management and operations of the Concert in the Square series from the City to Federal Realty Investment Trust.
** The FY11 Est. Act. increase over the FY11 Estimate is due to an increase in permitted events in Town Square. Staff expect this trend to continue into FY12.
TABLE 14-16. Regular Positions
Position Title Adopted
FY10 Adopted
FY11 Adopted
FY12
Events Specialist (grade A16) 1.0 1.0 1.0
Special Events Manager (grade A23) 1.0 1.0 1.0
Special Operations Supervisor (grade A18) 1.0 1.0 1.0
Special Operations Technician (grade A14) 2.0 2.0 2.0
Cost Center Total 5.0 5.0 5.0
Supplemental Information
Special Events produces and implements well-planned major events, such as Hometown Holidays and the Memorial Day Parade, the Uncorked Wine and Music Festival, the Independence Day Celebration, the Rotary Twilight Runfest, and the Antique and Classic Car Show. These events are designed to enhance civic pride, provide professional family entertainment, showcase Rockville to the metropolitan region and create business opportunities for local businesses. Other programs the Special Events cost center is responsible for include weekly Farmers’ Markets and Out To Lunch Wednesdays (held seven months during the spring, summer and fall). Ceremonies such as Veterans Day, Flag Day, and the Memorial Day Ceremony are smaller in scale than the major events, but play a vital role in creating a sense of community and civic pride. In FY12, Special Events aims to produce more than 64 diverse, safe and high quality events that attract audiences of up to 170,000.
Another FY12 objective is to encourage community spirit at events by including over 200 non-profit and community organizations, and support the fundraising efforts of these groups by raising $80,000. Organizations participating in City events include youth and adult service organizations, high school marching bands, civic and homeowner’s associations, veterans groups, and cultural and educational organizations. Special Events coordinates the Community Events Support Program, which provides promotional, equipment and planning support to more than 20 civic and homeowners’ associations, school PTAs and neighborhood block parties.

Department of Recreation and Parks Division: Recreation and Parks Administration
14 - 10
FIGURE 14-2. Special Events Cost Center Breakdown of Expenditures and Revenues by Event. The table below contains the events planned by the Special Events cost center for FY12, and each event’s associated direct expenditures and revenues.
EventFY 2012Adopted
Expenditure*
FY 2012Adopted
Revenue**
Independence Day Celebration 68,600 1,000
Rockville Twilight Rotary Runfest 15,700 2,000
Volunteer Appreciation Party 13,100 -
Uncorked Wine and Music Festival 38,500 30,000
Rockville Antique and Classic Car Show 15,100 6,000
Veteran's Day Ceremony 300 -
Banners and Décor 3,650 -
Farmers Market 3,350 4,000
Hometown Holidays 149,500 66,150
Memorial Day Ceremony and Parade 15,500 -
Flag Day Ceremony 1,000 -
Out To Lunch Wednesdays 11,150 1,000
Community Events 22,500 -
3 Road Races 3,000 -
Other - general supplies, uniforms, dues, etc. 14,990 -
Event Subtotal: 375,940 110,150
Regular Personnel and Benefits 409,410 -
Special Events Cost Center Total: 785,350 110,150
* Event expenditures shown above include equipment contractors, artisans, advertising, event supplies, temporary and overtime staffing.
** Event revenues shown above include vendor fees, sponsorship fees, and participant fees.
FIGURE 14-3. Hometown Holidays Event, May 2009.

Department of Recreation and Parks Division: Recreation and Parks Administration
14 - 11
Cost Center: Capital Projects TABLE 14-17. Cost Center Summary
Actual
FY10 Adopted
FY11 Est. Act.
FY11 Adopted
FY12
Total Expenditures 207,144 225,920 225,920 228,160
Total Revenues N/A N/A N/A N/A
Objectives
Conduct five-year planning processes for major CIP projects that fund improvements to the City’s infrastructure in parks, rights-of-way and buildings, utilizing input from citizens, civic associations and from City
staff at all levels
TABLE 14-18. Workload Measures
Actual
FY10 Estimate
FY11 Est. Act.
FY11 Estimate
FY12
Number of projects managed 19 10 11 8
TABLE 14-19. Regular Positions
Position Title Adopted
FY10 Adopted
FY11 Adopted
FY12
Parks and Facilities Devel. Manager (grade A23)
1.0 1.0 1.0
Parks and Facilities Devel. Specialist (grade A18)
1.0 1.0 1.0
Cost Center Total 2.0 2.0 2.0
Supplemental Information
Projects managed by the Recreation and Parks Administration Division include:
Asphalt/Concrete Improvement
Athletic Courts Repair/Replacement
City Hall Improvement
Gude Drive Facility Improvement
Police Station
Park Pedestrian Bridge Repair/Replacement
Senior Center Improvements
Swim and Fitness Center Improvements
TABLE 14-20. Planned Improvement Projects
Fiscal Year Funding Description
FY 2013 $67,000 Improvements to the Woodley Gardens Park shelter and bathroom
FY 2013 $65,000 Renovate Dogwood Park snack bar
FY 2014 $65,000 Mattie J. T. Stepanek Park shade gazebo

Department of Recreation and Parks Division: Recreation Services
14 - 12
Division: Recreation Services TABLE 14-21 Actual
FY10
Adopted
FY11
Est. Act.
FY11
Adopted
FY12
Division Expenditures
by Cost Center
Rec. Admin. & Support 471,456 537,080 528,380 526,610
Recreation Fund (350) 27,024 60,500 60,500 40,050
Arts 284,180 268,370 276,235 276,210
Art in Public Arch. (350) 16,625 15,500 101,259 161,920
Art in Public Places (350) 145,690 114,000 156,711 150,000
Friends of the Arts (350) 6,485 113,480 113,480 15,700
Summer Camps 424,034 435,280 435,280 439,540
Classes 344,958 344,480 344,480 352,840
Adult Sports 234,047 247,960 247,960 247,810
Youth Sports 395,543 406,670 398,970 353,770
After School 313,802 325,740 319,340 312,700
Childcare 346,698 399,360 179,674 215,290
Outdoor Recreation* 108,033 134,690 150,621 82,900
Bike Program (350)* N/A 21,910 25,020 N/A
Teens 252,529 231,120 243,819 246,080
Summer Playgrounds 171,582 204,780 204,780 204,730
Division Total $3,542,686 $3,860,920 $3,786,509 $3,626,150
TABLE 14-22 Actual
FY10
Adopted
FY11
Est. Act.
FY11
Adopted
FY12
Division Expenditures
by Type
Salary and Wages 2,205,025 2,248,810 2,105,738 2,038,610
Benefits 384,228 474,990 438,079 443,770
Overtime 18,055 18,930 16,030 15,920
Personnel Subtotal $2,607,308 $2,742,730 $2,559,847 $2,498,300
Contractual Services 489,714 529,270 513,990 508,420
Commodities 412,640 517,420 641,172 558,380
Capital Outlays 0 5,000 5,000 15,000
Other 33,024 66,500 66,500 46,050
Operating Subtotal $935,378 $1,118,190 $1,226,662 $1,127,850
Division Total $3,542,686 $3,860,920 $3,786,509 $3,626,150 * The Bike Program moved to the Recreation Services Division from the Administration
Division for FY11, and was absorbed into the Outdoor Recreation cost center for FY12. The Revenue Subtotals in TABLE 14-23 for Adopted FY11 and Est. Act. FY11 include $10,300 in Bike Program revenue that is not reflected in any cost center summary section since the Bike Program is no longer a separate cost center.
TABLE 14-23 Actual
FY10
Adopted
FY11
Est. Act.
FY11
Adopted
FY12
Source of Division Funds
Recreation Grants (110) 61,849 56,000 116,754 20,000
Rec. Program Fees (110) 1,986,894 1,986,355 1,750,110 1,875,610
Theme Park Tickets (110) 98,578 120,000 120,000 110,000
Comm. Contrib. (110/350) 75,496 84,860 84,860 63,600
Other (350) 145,134 11,330 11,330 7,520
Subtotal* $2,367,951 $2,258,545 $2,083,054 $2,076,730
Fund Contribution
General Fund (110) 1,124,045 1,385,225 1,332,815 1,234,270
Special Activities (350) 50,690 217,150 370,640 315,150
Subtotal $1,174,735 $1,602,375 $1,703,455 $1,549,420
Division Total $3,542,686 $3,860,920 $3,786,509 $3,626,150
TABLE 14-24 Actual
FY10
Adopted
FY11
Est. Act.
FY11
Adopted
FY12
Staffing Summary by Cost Center (FTEs)
Regular
Rec. Admin. & Support 4.0 4.0 4.0 4.0
Arts 2.0 2.0 2.0 2.0
Summer Camps 1.7 1.5 1.5 1.5
Classes 1.9 1.7 1.7 1.7
Adult Sports 1.5 1.5 1.5 1.5
Youth Sports 2.0 2.0 2.0 1.8
After School 2.0 2.0 2.0 1.6
Childcare 5.2 4.4 2.7 2.7
Outdoor Recreation 0.2 0.2 0.2 0.2
Teens 1.5 1.5 1.5 1.5
Summer Playgrounds 0.4 0.8 0.8 0.8
Regular Subtotal 22.4 21.6 19.9 19.3
Temporary
Rec. Admin. & Support 0.1 0.1 0.1 0.1
Arts 1.2 1.1 1.1 1.1
Summer Camps 4.7 5.2 5.2 4.9
Classes 0.7 1.1 1.1 1.1
Adult Sports 1.6 1.5 1.5 1.4
Youth Sports 3.0 2.9 2.9 2.9
After School 5.2 5.6 5.6 6.4
Childcare 2.5 3.5 1.5 1.5
Outdoor Recreation 1.2 1.7 1.7 0.8
Bike Program (350)* N/A 0.2 0.2 N/A
Teens 2.3 2.3 2.3 2.3
Summer Playgrounds 4.8 5.4 5.4 5.2
Temporary Subtotal 27.3 30.6 28.6 27.7
Division Total 49.7 52.2 48.5 47.0

Department of Recreation and Parks Division: Recreation Services
14 - 13
Division: Recreation Services Division Purpose
Deliver safe, innovative, high quality recreation services for residents by offering programs for preschoolers through seniors including classes, workshops, trips, sports, arts, outdoor adventure, camps, playgrounds, after school and childcare activities. Provide administrative support, training and/or orientation for regular and temporary staff, leagues, boards and commissions. Work closely with the Department of the City Manager, Communication and Public Information Division to market and promote programs and activities through the publication of seasonal recreation guides, cable television shows, electronic newsletters, the City’s website, and other media. Provide 24/7 access to registration using ―Rock Enroll,‖ the automated online and telephone registration system. Significant Changes from Adopted to Adopted
The Recreation Services Division’s FY12 Adopted budget represents a 6% decrease compared to the FY11 Adopted budget due to a combination of a reduction in salary and benefit costs due to employee turnover and the removal of 2.3 regular FTEs (0.2 from Youth Sports, 0.4 from After School, and 1.7 from Childcare), a reduction in temporary employee spending, the removal of operating expenditures related to the closed Fallsmead Preschool program, the addition of $15,000 in one-time funding for a feasibility study for Rockcrest Recreation Center, the addition of planned commodity spending in the Art in Public Architecture Special Activities Fund, the addition of $10,000 in one-time funding for repairs to the Skate Park, and a reduction in planned community assistance funding from the Recreation Special Activities Fund.
The Recreation Services Division’s FY12 Adopted revenue budget represents an 8% decrease compared to the FY11 Adopted budget due to the removal of $36,000 in one-time Safe Routes to School grant funding; the removal of $129,555 in recreation program fee revenue due to a combination of the removal of the revenue associated with the Fallsmead Preschool program, and the addition of new recreation program fee revenue for the Classes, Adult Sports, After School, and Teens cost centers; the removal of $10,000 in theme park ticket revenue due to low ticket sales; and the removal of $21,260 in community contribution revenue based on anticipated contributions to the Recreation Special Activities Fund.
Cost Center: Recreation Administration and Support TABLE 14-25. Cost Center Summary
Actual
FY10 Adopted
FY11 Est. Act.
FY11 Adopted
FY12
Total Expenditures 471,456 537,080 528,380 526,610
Total Revenues 99,473 121,500 121,500 111,500
Objectives
Provide a wide variety of high quality programs and services to maximize participation and meet the diverse needs and interests of the
community
Provide online and telephone registration to increase program
attendance and increase customer service
TABLE 14-26. Performance Measures
Actual
FY09 Target
FY11 Est. Act.
FY11 Target
FY12
Maintain percent of Citizen Survey respondents who have participated in a Rockville recreation program at 42%*
46% 50% 42% 42%
Maintain percent of Citizen Survey respondents who rated recreational programs as ―excellent‖ or ―good‖ at 81%*
81% 85% 81% 81%
Maintain percent of Citizen Survey respondents who rated the variety of programs (classes with staff instruction or supervision) offered as ―excellent‖ or ―good‖ at 75% or higher*
73% 75% 77% 77%
* The City conducts a citizen survey every other year. A survey was conducted in FY11
and the next survey will take place in FY13.
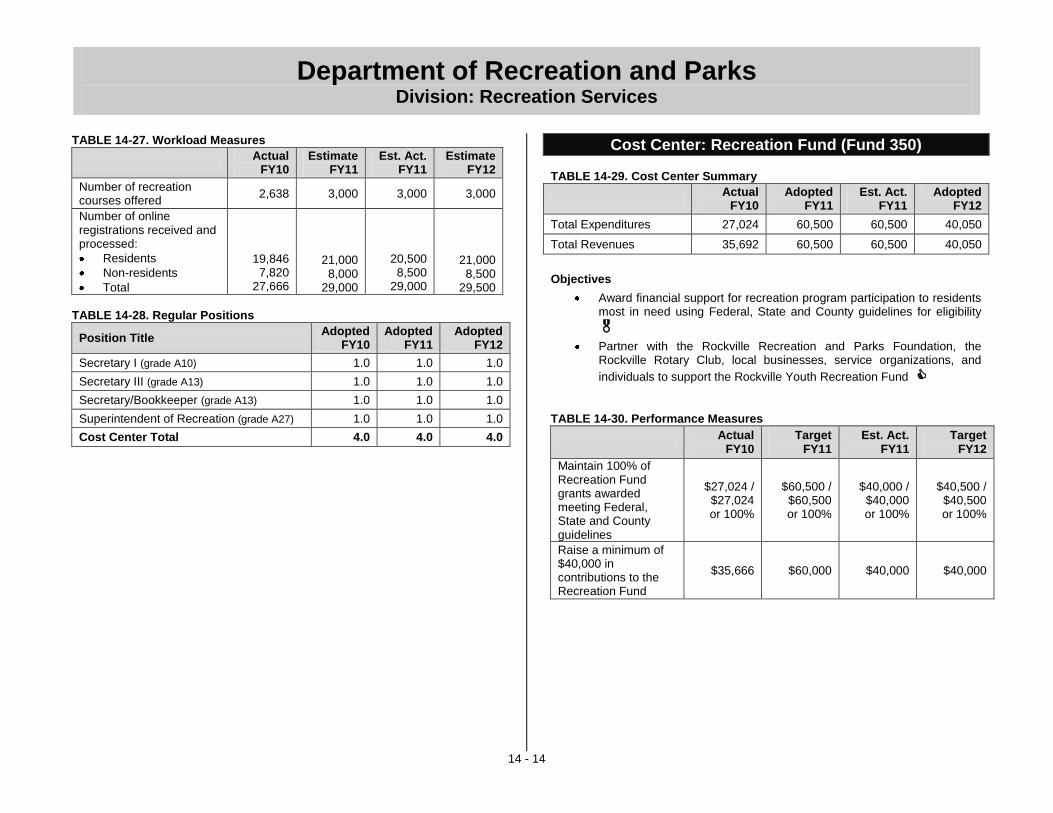
Department of Recreation and Parks Division: Recreation Services
14 - 14
TABLE 14-27. Workload Measures
Actual
FY10 Estimate
FY11 Est. Act.
FY11 Estimate
FY12
Number of recreation courses offered
2,638 3,000 3,000 3,000
Number of online registrations received and processed:
Residents
Non-residents
Total
19,846 7,820
27,666
21,000 8,000
29,000
20,500 8,500
29,000
21,000 8,500
29,500
TABLE 14-28. Regular Positions
Position Title Adopted
FY10 Adopted
FY11 Adopted
FY12
Secretary I (grade A10) 1.0 1.0 1.0
Secretary III (grade A13) 1.0 1.0 1.0
Secretary/Bookkeeper (grade A13) 1.0 1.0 1.0
Superintendent of Recreation (grade A27) 1.0 1.0 1.0
Cost Center Total 4.0 4.0 4.0
Cost Center: Recreation Fund (Fund 350) TABLE 14-29. Cost Center Summary
Actual
FY10 Adopted
FY11 Est. Act.
FY11 Adopted
FY12
Total Expenditures 27,024 60,500 60,500 40,050
Total Revenues 35,692 60,500 60,500 40,050
Objectives
Award financial support for recreation program participation to residents most in need using Federal, State and County guidelines for eligibility
Partner with the Rockville Recreation and Parks Foundation, the Rockville Rotary Club, local businesses, service organizations, and
individuals to support the Rockville Youth Recreation Fund
TABLE 14-30. Performance Measures
Actual
FY10 Target
FY11 Est. Act.
FY11 Target
FY12
Maintain 100% of Recreation Fund grants awarded meeting Federal, State and County guidelines
$27,024 / $27,024 or 100%
$60,500 / $60,500 or 100%
$40,000 / $40,000 or 100%
$40,500 / $40,500 or 100%
Raise a minimum of $40,000 in contributions to the Recreation Fund
$35,666 $60,000 $40,000 $40,000

Department of Recreation and Parks Division: Recreation Services
14 - 15
Cost Center: Arts TABLE 14-31. Cost Center Summary
Actual
FY10 Adopted
FY11 Est. Act.
FY11 Adopted
FY12
Total Expenditures 284,180 268,370 276,235 276,210
Total Revenues 72,715 61,000 70,865 64,000
Objectives
Provide community members the opportunity to volunteer and participate with the Rockville Civic Ballet, Rockville Concert Band, Rockville Chorus, and Rockville Regional Youth Orchestra and provide the opportunity to attend performances by these performing arts groups
In order to offer more accessible and affordable arts programs, continue to support the F. Scott Fitzgerald Literary Conference, Inc., Rockville Little Theatre, Rockville Musical Theatre, Victorian Lyric Opera Company, VisArts at Rockville and Rockville Art League with a staff
liaison and/or in-kind services
TABLE 14-32. Performance Measures
Actual
FY10 Target
FY11 Est. Act.
FY11 Target
FY12
Maintain 75% percent capacity attendance of City-sponsored performing arts groups
6,356 / 8,474
or 75%
7,359 / 9,812
or 75%
7,359 / 9,812
or 75%
7,002 / 9,336
or 75%
Maintain number of affiliated arts programs at 6
6 6 6 6
TABLE 14-33. Workload Measures
Actual
FY10 Estimate
FY11 Est. Act.
FY11 Estimate
FY12
Number of volunteer hours contributed in the arts
31,400 31,584 31,584 31,959
Number of volunteers 338 340 340 345
Actual
FY10 Estimate
FY11 Est. Act.
FY11 Estimate
FY12
Number of arts program registrants / attendees
18,100 18,800 18,950 19,350
TABLE 14-34. Regular Positions:
Position Title Adopted
FY10 Adopted
FY11 Adopted
FY12
Arts Programs Specialist (grade A16) 1.0 1.0 1.0
Arts Programs Supervisor (grade A22) 1.0 1.0 1.0
Cost Center Total 2.0 2.0 2.0
Cost Center: Art in Public Architecture (Fund 350) TABLE 14-35. Cost Center Summary
Actual
FY10 Adopted
FY11 Est. Act.
FY11 Adopted
FY12
Total Expenditures 16,625 15,500 101,259 161,920
Total Revenues 76,969 8,530 8,530 7,270
Objectives
Fund acquisitions and commissions for public art projects as
recommended by the Cultural Arts Commission and citizens
Supplemental Information
In support of the Art in Public Architecture ordinance, the City contributes an amount equal to one percent of the City’s costs for capital projects involving the construction of, or major improvements to, buildings, parks and other public structures to the Art in Public Architecture Fund for the procurement and installation of permanent artwork each year. In FY12, staff is planning a solicitation of artists for Rockville Senior Center, Gude Drive Maintenance Facility, and Rockville City Police Station art projects.
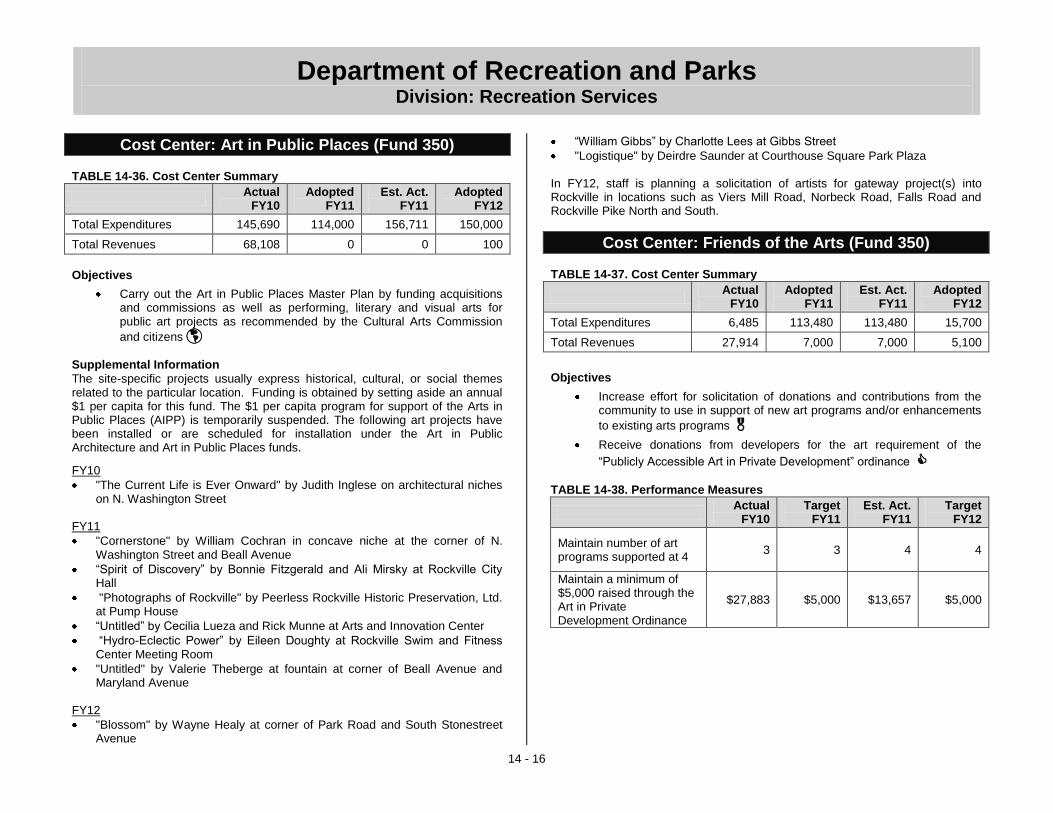
Department of Recreation and Parks Division: Recreation Services
14 - 16
Cost Center: Art in Public Places (Fund 350) TABLE 14-36. Cost Center Summary
Actual
FY10 Adopted
FY11 Est. Act.
FY11 Adopted
FY12
Total Expenditures 145,690 114,000 156,711 150,000
Total Revenues 68,108 0 0 100
Objectives
Carry out the Art in Public Places Master Plan by funding acquisitions and commissions as well as performing, literary and visual arts for public art projects as recommended by the Cultural Arts Commission
and citizens
Supplemental Information
The site-specific projects usually express historical, cultural, or social themes related to the particular location. Funding is obtained by setting aside an annual $1 per capita for this fund. The $1 per capita program for support of the Arts in Public Places (AIPP) is temporarily suspended. The following art projects have been installed or are scheduled for installation under the Art in Public Architecture and Art in Public Places funds.
FY10
"The Current Life is Ever Onward" by Judith Inglese on architectural niches on N. Washington Street
FY11
"Cornerstone" by William Cochran in concave niche at the corner of N. Washington Street and Beall Avenue
―Spirit of Discovery‖ by Bonnie Fitzgerald and Ali Mirsky at Rockville City Hall
"Photographs of Rockville" by Peerless Rockville Historic Preservation, Ltd. at Pump House
―Untitled‖ by Cecilia Lueza and Rick Munne at Arts and Innovation Center
―Hydro-Eclectic Power‖ by Eileen Doughty at Rockville Swim and Fitness Center Meeting Room
"Untitled" by Valerie Theberge at fountain at corner of Beall Avenue and Maryland Avenue
FY12
"Blossom" by Wayne Healy at corner of Park Road and South Stonestreet Avenue
―William Gibbs‖ by Charlotte Lees at Gibbs Street
"Logistique" by Deirdre Saunder at Courthouse Square Park Plaza In FY12, staff is planning a solicitation of artists for gateway project(s) into Rockville in locations such as Viers Mill Road, Norbeck Road, Falls Road and Rockville Pike North and South.
Cost Center: Friends of the Arts (Fund 350) TABLE 14-37. Cost Center Summary
Actual
FY10 Adopted
FY11 Est. Act.
FY11 Adopted
FY12
Total Expenditures 6,485 113,480 113,480 15,700
Total Revenues 27,914 7,000 7,000 5,100
Objectives
Increase effort for solicitation of donations and contributions from the community to use in support of new art programs and/or enhancements
to existing arts programs
Receive donations from developers for the art requirement of the
―Publicly Accessible Art in Private Development‖ ordinance
TABLE 14-38. Performance Measures
Actual
FY10 Target
FY11 Est. Act.
FY11 Target
FY12
Maintain number of art programs supported at 4
3 3 4 4
Maintain a minimum of $5,000 raised through the Art in Private Development Ordinance
$27,883 $5,000 $13,657 $5,000

Department of Recreation and Parks Division: Recreation Services
14 - 17
Cost Center: Summer Camps TABLE 14-39. Cost Center Summary
Actual
FY10 Adopted
FY11 Est. Act.
FY11 Adopted
FY12
Total Expenditures 424,034 435,280 435,280 439,540
Total Revenues 403,800 437,560 437,560 439,580
Objectives
Promote ―Go Green‖ initiative by utilizing camp buses for most camp
transportation needs
Offer high quality, cost effective camps to a diverse population, and adjust camp offerings to best meet the needs of the community and to
maximize registration levels
TABLE 14-40. Performance Measures
Actual
FY10 Target
FY11 Est. Act.
FY11 Target
FY12
Increase number of campers using the camp buses by 3%, from 650 to 670
630 or +6%
655 or +4%
650 or +3%
670 or +3%
Increase percentage of camp sessions meeting minimum registration requirements to 98%
99 / 105 or 94%
114 / 120 or 95%
111 / 120 or 93%
118 / 121 or 98%
TABLE 14-41. Workload Measures
Actual
FY10 Estimate
FY11 Est. Act.
FY11 Estimate
FY12
Number children attending summer camps
1,932 1,975 1,960 2,025
Number of camp sessions offered
105 120 120 121
TABLE 14-42. Regular Positions
Position Title Adopted
FY10 Adopted
FY11 Adopted
FY12
Program Assistant III (grade R6)* 0.4 0.2 0.2
Rec. Program Supervisor (grade A22) 1.3 1.3 1.3
Cost Center Total 1.7 1.5 1.5
* For FY11, the Program Assistant III position’s cost allocation changed from being split between Camps (0.4) and Classes (0.4) to being split between Camps (0.2), Classes (0.2), and Playgrounds (0.4).
Cost Center: Classes TABLE 14-43. Cost Center Summary
Actual
FY10 Adopted
FY11 Est. Act.
FY11 Adopted
FY12
Total Expenditures 344,958 344,480 344,480 352,840
Total Revenues 343,737 346,390 346,390 353,300
Objectives
Provide a variety of quality recreation opportunities for Rockville residents, with consideration for age and ability level, that encourage participation and enhance residents’ overall quality of life in Rockville
Provide a variety of quality programs for Rockville residents and
neighbors through partnerships with City businesses
Provide recreation programs at different geographic locations throughout the City in order to ensure all City residents have access to
City-sponsored recreation programs
Provide a variety of recreation programs for children that promote exercise and lifelong healthy habits

Department of Recreation and Parks Division: Recreation Services
14 - 18
TABLE 14-44. Performance Measures
Actual
FY10 Target
FY11 Est. Act.
FY11 Target
FY12
Maintain the number of programs offered at 645 or more
667 670 638 645
Maintain partnerships with a minimum of 15 City businesses to provide recreation programs
15 16 14 15
Maintain or increase number of locations where classes are offered throughout the City at or above 26
26 26 30 26
Increase the number of fitness and health related classes for children to 245
228 235 235 245
TABLE 14-45. Workload Measures
Actual
FY10 Estimate
FY11 Est. Act.
FY11 Estimate
FY12
Number of registrants served in classes
4,629 4,600 4,615 4,600
TABLE 14-46. Regular Positions
Position Title Adopted
FY10 Adopted
FY11 Adopted
FY12
Program Assistant III* (grade R6) 0.4 0.2 0.2
Rec. Program Supervisor (grade A22) 1.5 1.5 1.5
Cost Center Total 1.9 1.7 1.7
* For FY11, the Program Assistant III position’s cost allocation changed from being split between Camps (0.4) and Classes (0.4) to being split between Camps (0.2), Classes (0.2), and Playgrounds (0.4).
Cost Center: Adult Sports TABLE 14-47. Cost Center Summary
Actual
FY10 Adopted
FY11 Est. Act.
FY11 Adopted
FY12
Total Expenditures 234,047 247,960 247,960 247,810
Total Revenues 156,936 174,980 174,980 193,670
Objectives
Provide a variety of sports leagues and events to match the diverse interests and ability levels of our population and to maximize
participation
Provide latest softball equipment on the market, including testing of existing equipment, and continue to abide by Amateur Softball Association (ASA) rulings on recent banned items; maintain governing rules of play that focus on maximizing participants’ safety and reducing
injuries
Encourage program adaptations to meet the changing population, including provisions for the incorporations of private contractors or
leagues in partnerships where resources and inventory allow
TABLE 14-48. Performance Measures
Actual
FY10 Target
FY11 Est. Act.
FY11 Target
FY12
Ensure 100% of all offered sports leagues and events meet minimum registration requirements
11 / 13 or 85%
13 / 13 or 100%
13 / 13 or 100%
13 / 13 or 100%
Maintain reports of adult softball related injuries that require emergency medical services and transport to hospitals at or below 10
10 10 8 8
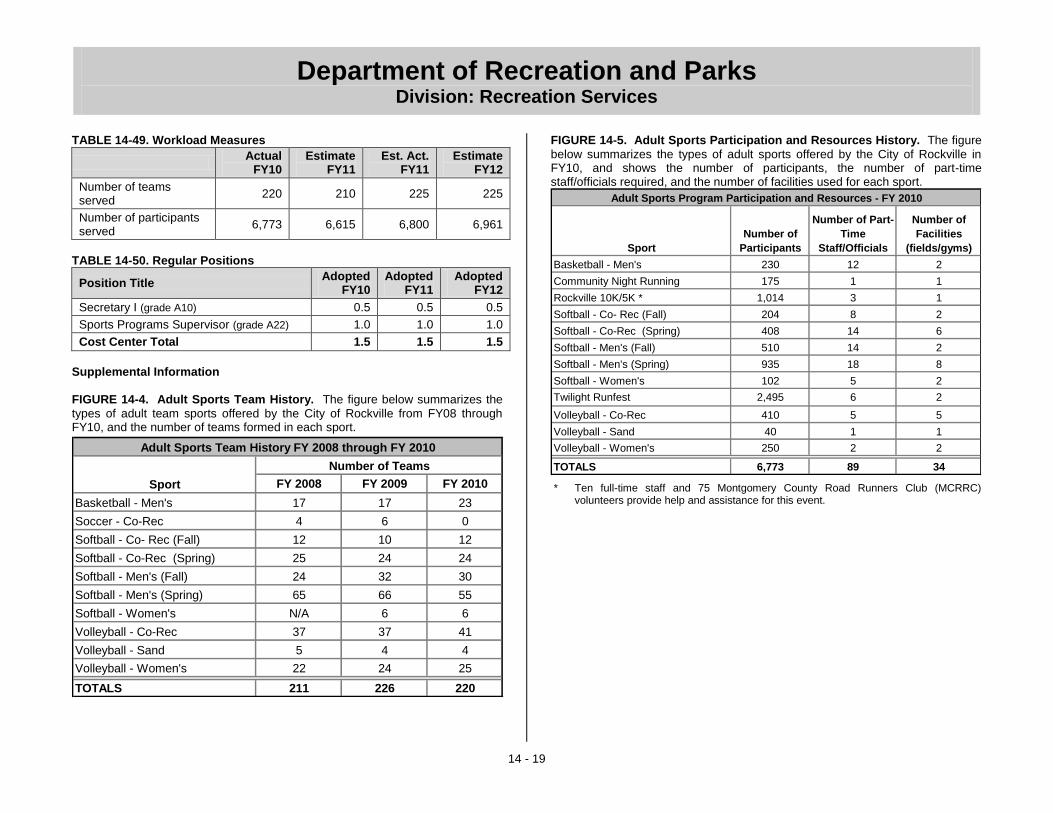
Department of Recreation and Parks Division: Recreation Services
14 - 19
TABLE 14-49. Workload Measures
Actual
FY10 Estimate
FY11 Est. Act.
FY11 Estimate
FY12
Number of teams served
220 210 225 225
Number of participants served
6,773 6,615 6,800 6,961
TABLE 14-50. Regular Positions
Position Title Adopted
FY10 Adopted
FY11 Adopted
FY12
Secretary I (grade A10) 0.5 0.5 0.5
Sports Programs Supervisor (grade A22) 1.0 1.0 1.0
Cost Center Total 1.5 1.5 1.5
Supplemental Information FIGURE 14-4. Adult Sports Team History. The figure below summarizes the
types of adult team sports offered by the City of Rockville from FY08 through FY10, and the number of teams formed in each sport.
Sport FY 2008 FY 2009 FY 2010
Basketball - Men's 17 17 23
Soccer - Co-Rec 4 6 0
Softball - Co- Rec (Fall) 12 10 12
Softball - Co-Rec (Spring) 25 24 24
Softball - Men's (Fall) 24 32 30
Softball - Men's (Spring) 65 66 55
Softball - Women's N/A 6 6
Volleyball - Co-Rec 37 37 41
Volleyball - Sand 5 4 4
Volleyball - Women's 22 24 25
TOTALS 211 226 220
Adult Sports Team History FY 2008 through FY 2010
Number of Teams
FIGURE 14-5. Adult Sports Participation and Resources History. The figure
below summarizes the types of adult sports offered by the City of Rockville in FY10, and shows the number of participants, the number of part-time staff/officials required, and the number of facilities used for each sport.
* Ten full-time staff and 75 Montgomery County Road Runners Club (MCRRC) volunteers provide help and assistance for this event.
Basketball - Men's 230 12 2
Community Night Running 175 1 1
Rockville 10K/5K * 1,014 3 1
Softball - Co- Rec (Fall) 204 8 2
Softball - Co-Rec (Spring) 408 14 6
Softball - Men's (Fall) 510 14 2
Softball - Men's (Spring) 935 18 8
Softball - Women's 102 5 2
Twilight Runfest 2,495 6 2
Volleyball - Co-Rec 410 5 5
Volleyball - Sand 40 1 1
Volleyball - Women's 250 2 2
TOTALS 6,773 89 34
Number of Part-
Time
Staff/OfficialsSport
Adult Sports Program Participation and Resources - FY 2010
Number of
Participants
Number of
Facilities
(fields/gyms)

Department of Recreation and Parks Division: Recreation Services
14 - 20
Cost Center: Youth Sports TABLE 14-51. Cost Center Summary
Actual
FY10 Adopted
FY11 Est. Act.
FY11 Adopted
FY12
Total Expenditures 395,543 406,670 398,970 353,770
Total Revenues 248,951 263,755 263,755 257,730
Objectives
Provide a variety of sports leagues and events to match the diverse interests and ability levels of the Rockville area youth to maximize
participation
Provide and encourage certification via National Youth Sports Coaches Association (NYSCA) for head and assistant coaches in order to
achieve a positive social experience for the youth
TABLE 14-52. Performance Measures
Actual
FY10 Target
FY11 Est. Act.
FY11 Target
FY12
Maintain survey ratings of ―excellent‖ or ―good‖ on overall quality of program, including achievement of a positive experience for the youth, as determined by our NYSCA certified head coaches
265 / 265 or 100%
277 / 277 or 100%
265 / 265 or 100%
270 / 270 or 100%
Maintain 100% of youth coaches NYSCA certified
370 / 370 or 100%
390 / 390 or 100%
370 / 370 or 100%
375 / 375 or 100%
TABLE 14-53. Workload Measures
Actual
FY10 Estimate
FY11 Est. Act.
FY11 Estimate
FY12
Number of teams served
302 323 323 325
Number of participants served
4,601 4,650 4,650 4,700
TABLE 14-54. Regular Positions
Position Title Adopted
FY10 Adopted
FY11 Adopted
FY12
Asst. Sports Prog. Supervisor (grade A19)* 1.0 1.0 0.8
Sports Program Specialist (grade A17) 1.0 1.0 1.0
Cost Center Total 2.0 2.0 1.8
* A 1.0 FTE Assistant Sports Program Supervisor was reduced to a 0.8 FTE for FY12.
Supplemental Information FIGURE 14-6. Youth Sports Participant History. The figure below
summarizes the types of youth sports offered by the City of Rockville from FY08 through FY10, and the number of participants in each sport.
Sport FY 2008 FY 2009 FY 2010
Baseball - Fall 258 228 210
Baseball - Spring 786 783 785
Basketball - Boys 633 633 575
Basketball - Girls 417 417 391
Basketball - Mighty Mites 258 245 230
Football (RFL) 1,073 1,260 1,398
Soccer 364 364 335
Softball - Girls 308 206 216
Tball Majors/Minors 169 129 143
Track & Field 322 307 300
Wrestling 28 20 18
TOTALS 4,616 4,592 4,601
Number of Participants
Youth Sports Participant History FY 2008 through FY 2010

Department of Recreation and Parks Division: Recreation Services
14 - 21
FIGURE 14-7. Youth Sports Participation and Resources History. The
figure below summarizes the types of youth sports offered by the City of Rockville in FY10, and shows the number of participants, volunteers, part-time staff/officials, and facilities used for each sport.
Cost Center: After School Recreation
TABLE 14-55. Cost Center Summary
Actual
FY10 Adopted
FY11 Est. Act.
FY11 Adopted
FY12
Total Expenditures 313,802 325,740 319,340 312,700
Total Revenues 206,073 165,000 165,000 192,500
Objectives
Offer high quality after school programs (Kidz Clubs, Renaissance) that are safe, supervised, accessible, appealing and affordable for school-aged children and teens, as age-appropriate options for ―latch-key‖ kids, and as resources for families who may not be able to afford higher cost
alternatives
Offer an appealing, affordable after school fitness program for youth and teens using the medium of performing arts and cultural awareness to focus on character-building, critical thinking, artistic talent and life-skills
development (The Finest! Youth Performance Troupe)
Offer environmental education in each of the after school programs to
encourage life-long sustainable behaviors
Offer free and/or low-cost annual cultural celebration events, including the African American Heritage Production in February, and the
American Indian Festival in November
TABLE 14-56. Performance Measures
Actual
FY10 Target
FY11 Est. Act.
FY11 Target
FY12
Maintain after school registration levels in programs at 85% or better
146 / 170 or 86%
170 / 196 or 87%
170 / 196 or 87%
170 / 196 or 87%
Include environmental education in 100% of Kidz Club programs
24 / 24 or 100%
24 / 24 or 100%
24 / 24 or 100%
24 / 24 or 100%
TABLE 14-57. Workload Measures
Actual
FY10 Estimate
FY11 Est. Act.
FY11 Estimate
FY12
Annual cultural celebration events offered
2
2
2 2
TABLE 14-58. Regular Positions
Position Title Adopted
FY10 Adopted
FY11 Adopted
FY12
Kids Club Director (grade R5)* 0.4 0.4 0.0
Program Assistant III (grade R6) 0.8 0.8 0.8
Rec. Programs Supervisor (grade A22) 0.8 0.8 0.8
Cost Center Total 2.0 2.0 1.6
* A 0.4 FTE Kids Club Director at Beall Elementary School was eliminated for FY12.
Baseball - Fall 210 27 10 4
Baseball - Spring 785 124 24 22
Basketball 1,196 160 50 22
Football 1,398 160 24 20
Soccer 335 46 10 10
Softball 216 28 8 10
T-Ball 143 14 3 12
Track and Field 300 12 10 3
Wrestling 18 2 0 2
TOTALS 4,601 573 139 105
Sport
Youth Sports Program Participation and Resources - FY 2010
Number of
Participants
Number of
Volunteers
Number of
Facilities
(fields/gyms)
Number of Part-
Time
Staff/Officials
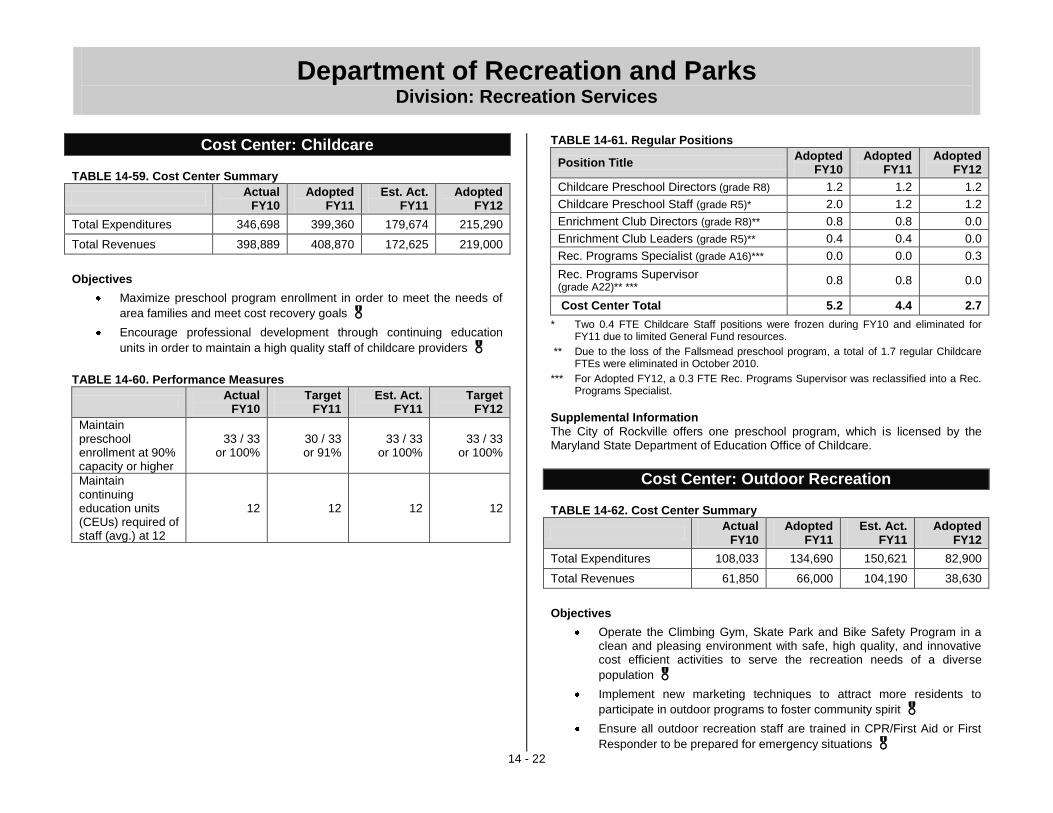
Department of Recreation and Parks Division: Recreation Services
14 - 22
Cost Center: Childcare TABLE 14-59. Cost Center Summary
Actual
FY10 Adopted
FY11 Est. Act.
FY11 Adopted
FY12
Total Expenditures 346,698 399,360 179,674 215,290
Total Revenues 398,889 408,870 172,625 219,000
Objectives
Maximize preschool program enrollment in order to meet the needs of
area families and meet cost recovery goals
Encourage professional development through continuing education
units in order to maintain a high quality staff of childcare providers
TABLE 14-60. Performance Measures
Actual
FY10 Target
FY11 Est. Act.
FY11 Target
FY12
Maintain preschool enrollment at 90% capacity or higher
33 / 33 or 100%
30 / 33 or 91%
33 / 33 or 100%
33 / 33 or 100%
Maintain continuing education units (CEUs) required of staff (avg.) at 12
12
12
12
12
TABLE 14-61. Regular Positions
Position Title Adopted
FY10 Adopted
FY11 Adopted
FY12
Childcare Preschool Directors (grade R8) 1.2 1.2 1.2
Childcare Preschool Staff (grade R5)* 2.0 1.2 1.2
Enrichment Club Directors (grade R8)** 0.8 0.8 0.0
Enrichment Club Leaders (grade R5)** 0.4 0.4 0.0
Rec. Programs Specialist (grade A16)*** 0.0 0.0 0.3
Rec. Programs Supervisor (grade A22)** ***
0.8 0.8 0.0
Cost Center Total 5.2 4.4 2.7
* Two 0.4 FTE Childcare Staff positions were frozen during FY10 and eliminated for FY11 due to limited General Fund resources.
** Due to the loss of the Fallsmead preschool program, a total of 1.7 regular Childcare FTEs were eliminated in October 2010.
*** For Adopted FY12, a 0.3 FTE Rec. Programs Supervisor was reclassified into a Rec. Programs Specialist.
Supplemental Information
The City of Rockville offers one preschool program, which is licensed by the Maryland State Department of Education Office of Childcare.
Cost Center: Outdoor Recreation TABLE 14-62. Cost Center Summary
Actual
FY10 Adopted
FY11 Est. Act.
FY11 Adopted
FY12
Total Expenditures 108,033 134,690 150,621 82,900
Total Revenues 61,850 66,000 104,190 38,630
Objectives
Operate the Climbing Gym, Skate Park and Bike Safety Program in a clean and pleasing environment with safe, high quality, and innovative cost efficient activities to serve the recreation needs of a diverse
population
Implement new marketing techniques to attract more residents to
participate in outdoor programs to foster community spirit
Ensure all outdoor recreation staff are trained in CPR/First Aid or First
Responder to be prepared for emergency situations
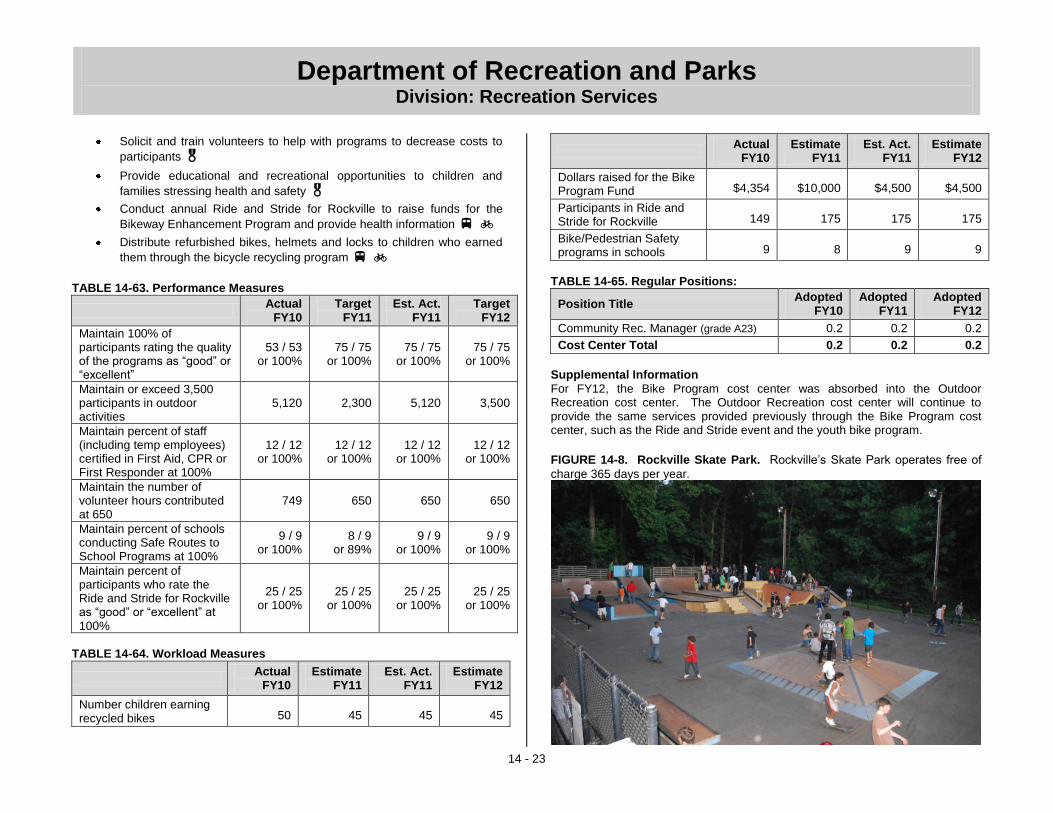
Department of Recreation and Parks Division: Recreation Services
14 - 23
Solicit and train volunteers to help with programs to decrease costs to
participants
Provide educational and recreational opportunities to children and
families stressing health and safety
Conduct annual Ride and Stride for Rockville to raise funds for the
Bikeway Enhancement Program and provide health information
Distribute refurbished bikes, helmets and locks to children who earned
them through the bicycle recycling program
TABLE 14-63. Performance Measures
Actual
FY10 Target
FY11 Est. Act.
FY11 Target
FY12
Maintain 100% of participants rating the quality of the programs as ―good‖ or ―excellent‖
53 / 53 or 100%
75 / 75 or 100%
75 / 75 or 100%
75 / 75 or 100%
Maintain or exceed 3,500 participants in outdoor activities
5,120 2,300 5,120 3,500
Maintain percent of staff (including temp employees) certified in First Aid, CPR or First Responder at 100%
12 / 12 or 100%
12 / 12 or 100%
12 / 12 or 100%
12 / 12 or 100%
Maintain the number of volunteer hours contributed at 650
749 650 650 650
Maintain percent of schools conducting Safe Routes to School Programs at 100%
9 / 9 or 100%
8 / 9 or 89%
9 / 9 or 100%
9 / 9 or 100%
Maintain percent of participants who rate the Ride and Stride for Rockville as ―good‖ or ―excellent‖ at 100%
25 / 25 or 100%
25 / 25 or 100%
25 / 25 or 100%
25 / 25 or 100%
TABLE 14-64. Workload Measures
Actual
FY10 Estimate
FY11 Est. Act.
FY11 Estimate
FY12
Number children earning recycled bikes 50 45 45 45
Actual
FY10 Estimate
FY11 Est. Act.
FY11 Estimate
FY12
Dollars raised for the Bike Program Fund $4,354 $10,000 $4,500 $4,500
Participants in Ride and Stride for Rockville 149 175 175 175
Bike/Pedestrian Safety programs in schools 9 8 9 9
TABLE 14-65. Regular Positions:
Position Title Adopted
FY10 Adopted
FY11 Adopted
FY12
Community Rec. Manager (grade A23) 0.2 0.2 0.2
Cost Center Total 0.2 0.2 0.2
Supplemental Information
For FY12, the Bike Program cost center was absorbed into the Outdoor Recreation cost center. The Outdoor Recreation cost center will continue to provide the same services provided previously through the Bike Program cost center, such as the Ride and Stride event and the youth bike program.
FIGURE 14-8. Rockville Skate Park. Rockville’s Skate Park operates free of
charge 365 days per year.

Department of Recreation and Parks Division: Recreation Services
14 - 24
Cost Center: Teens TABLE 14-66. Cost Center Summary
Actual
FY10 Adopted
FY11 Est. Act.
FY11 Adopted
FY12
Total Expenditures 252,529 231,120 243,819 246,080
Total Revenues 84,330 63,000 75,699 82,300
Objectives
Continue utilizing new marketing and outreach tools that provide easy access for Rockville teens to become involved in City sponsored programs and provide an effective way for participants to evaluate
programs
Maintain community center programs and events specifically for youth and teens and implement events at Rockville Town Plaza in order to
increase cross-neighborhood services
Sustain Go Green programs designed for middle and high school students that provide opportunities to volunteer and become more
environmentally friendly/knowledgeable
Continue to offer youth and teens the opportunity to participate in Let’s Move! healthy fitness and wellness activities to fight childhood obesity
TABLE 14-67. Performance Measures
Actual
FY10 Target
FY11 Est. Act.
FY11 Target
FY12
Maintain the number of teen program attendees at 1,690
1,690 1,690 1,688 1,690
Achieve 95% of participants rating teen programs as ―good‖ or ―excellent‖
380 / 400 or 95%
380 / 400 or 95%
380 / 400 or 95%
380 / 400 or 95%
Maintain number of teen programs offered at community centers to 25
22 22 25 25
Maintain the number of Teen events in Town Center at 5
4 5 5
5
Actual
FY10 Target
FY11 Est. Act.
FY11 Target
FY12
Establish 5 new fitness program partnerships with Rockville organizations
2 3 3 5
TABLE 14-68. Regular Positions
Position Title Adopted
FY10 Adopted
FY11 Adopted
FY12
Program Assistant III (grade R6) 0.5 0.5 0.5
Teen Prog. Coordinator (grade A20) 1.0 1.0 1.0
Cost Center Total 1.5 1.5 1.5
Supplemental Information
FIGURE 14-9. Teens participate in a wellness expo.

Department of Recreation and Parks Division: Recreation Services
14 - 25
Cost Center: Summer Playgrounds TABLE 14-69. Cost Center Summary
Actual
FY10 Adopted
FY11 Est. Act.
FY11 Adopted
FY12
Total Expenditures 171,582 204,780 204,780 204,730
Total Revenues 82,514 64,160 64,160 72,000
Objectives
Operate safe, supervised, high quality affordable neighborhood programs for children ages 6 – 12 as alternative choices for families
who might not be able to afford higher cost options
Provide opportunities for teens to earn Student Service Learning (SSL) credits for school by volunteering at area playgrounds through the
Junior Leader recreation program
Provide quality training in customer service and participant supervision
for Playground staff and volunteers
TABLE 14-70. Performance Measures
Actual
FY10 Target
FY11 Est. Act.
FY11 Target
FY12
Maintain a minimum of 85% of participants who rate the Playground program quality as ―good‖ or ―excellent‖
20 / 22 or 91%
22 / 25 or 88%
14 / 15 or 93%
18 / 20 or 90%
Involve a minimum of 25 teen volunteers in the Junior Leader Recreation program
27 27 36 30
Maintain a minimum of 3,000 Junior Leader volunteer hours
3,188 3,627 3,627 3,000
TABLE 14-71. Workload Measures
Actual
FY10 Estimate
FY11 Est. Act.
FY11 Estimate
FY12
Number of staff and volunteer training hours
9 9 12 12
Number of summer playground program sites using Junior Leader Volunteers
10 10 12 12
Number of participants served
628 890 896 896
TABLE 14-72. Regular Positions
Position Title Adopted
FY10 Adopted
FY11 Adopted
FY12
Program Assistant III (grade R6)* 0.0 0.4 0.4
Recreation Prog. Specialist (grade A16)** 0.0 0.0 0.2
Recreation Prog. Supervisor (grade A22)** 0.4 0.4 0.2
Cost Center Total 0.4 0.8 0.8
* For FY11, the Program Assistant III position’s cost allocation changed from being split between Camps (0.4) and Classes (0.4) to being split between Camps (0.2), Classes (0.2), and Playgrounds (0.4).
** For Adopted FY12, a 0.2 FTE Rec. Programs Supervisor was reclassified into a Rec. Programs Specialist.

Department of Recreation and Parks Division: Senior Citizen Services
14 - 26
Division: Senior Citizen Services
TABLE 14-73 Actual
FY10
Adopted
FY11
Est. Act.
FY11
Adopted
FY12
Division Expenditures
by Cost Center
Senior Center Oper. 463,501 526,630 482,527 519,870
Sr. Citizen Support Svc. 632,178 652,330 626,330 644,020
Senior Asst. Fund (350) 6,517 7,100 7,100 6,950
Senior Citizen Recreation 217,777 243,970 243,970 248,200
Senior Citizen Sports
& Fitness152,472 153,970 153,970 198,000
Division Total $1,472,445 $1,584,000 $1,513,897 $1,617,040
TABLE 14-74 Actual
FY10
Adopted
FY11
Est. Act.
FY11
Adopted
FY12
Division Expenditures
by Type
Salary and Wages 1,027,749 1,042,210 972,107 1,035,400
Benefits 218,984 259,140 259,140 293,770
Overtime 1,932 2,000 2,000 2,000
Personnel Subtotal $1,248,665 $1,303,350 $1,233,247 $1,331,170
Contractual Services 97,678 111,640 111,640 112,550
Commodities 119,585 161,910 161,910 166,370
Capital Outlays 0 0 0 0
Other 6,517 7,100 7,100 6,950
Operating Subtotal $223,780 $280,650 $280,650 $285,870
Division Total $1,472,445 $1,584,000 $1,513,897 $1,617,040
TABLE 14-75 Actual
FY10
Adopted
FY11
Est. Act.
FY11
Adopted
FY12
Source of
Division Funds
Departmental Revenue
Recreation Grants (110) 10,590 9,550 9,550 9,550
Memberships (110) 62,038 64,500 64,500 83,500
Facility Rental Fees (110) 24,806 15,100 15,100 26,200
Rec. Program Fees (110) 120,853 121,000 121,000 133,750
Social Support Fees 18,161 18,800 18,800 18,800
Interest Income (350) 1 200 200 50
Comm. Cont. (110/350) 25,921 49,000 49,000 24,000
Subtotal $262,370 $278,150 $278,150 $295,850
Fund Contribution
General Fund (110) 1,203,559 1,302,950 1,232,847 1,318,290
Special Activities (350) 6,516 2,900 2,900 2,900
Subtotal $1,210,075 $1,305,850 $1,235,747 $1,321,190
Division Total $1,472,445 $1,584,000 $1,513,897 $1,617,040
TABLE 14-76 Actual
FY10
Adopted
FY11
Est. Act.
FY11
Adopted
FY12
Staffing Summary
by Cost Center (FTEs)
Regular
Senior Center Oper. 5.0 5.0 5.0 5.0
Sr. Citizen Support Svc. 7.1 7.1 7.1 7.1
Senior Citizen Recreation 1.8 1.8 1.8 1.8
Senior Citizen Sports &
Fitness1.5 1.5 1.5 1.5
Regular Subtotal 15.4 15.4 15.4 15.4
Temporary
Senior Center Oper. 2.2 2.2 2.2 2.4
Sr. Citizen Support Svc. 2.8 2.8 2.8 2.9
Senior Citizen Recreation 0.8 0.8 0.8 0.6
Senior Citizen Sports
& Fitness1.0 1.0 1.0 1.6
Temporary Subtotal 6.8 6.8 6.8 7.5
Division Total 22.2 22.2 22.2 22.9

Department of Recreation and Parks Division: Senior Citizen Services
14 - 27
Division: Senior Citizen Services Division Purpose
The Senior Citizen Services Division is comprised of five cost centers: Senior Center Operations, Senior Citizen Support Services, Senior Assistance Fund, Senior Citizen Recreation, and Senior Citizen Sports and Fitness. Combined, these cost centers provide a vast variety of fulfilling and essential services, programs, classes and transportation to Rockville’s diverse senior citizens. This Division partners with Rockville Seniors, Inc., Rockville Senior Citizens Commission and the Woodley Gardens Neighborhood Association, and works to publicize the center through effective marketing and communication strategies. Significant Changes from Adopted to Adopted
The Senior Citizen Services Division’s FY12 Adopted budget represents a 2% increase over the FY11 Adopted budget mainly due to increases in employee benefit costs.
The Senior Citizen Services Division’s FY12 Adopted revenue budget represents a 6% increase over the FY11 Adopted budget due to a combination of an additional $42,850 in membership, facility rental, and program fee revenue related to the completion of the Senior Center Improvements CIP project, and the removal of a one-time $25,000 contribution from Rockville Seniors, Inc.
Cost Center: Senior Center Operations TABLE 14-77. Cost Center Summary
Actual
FY10 Adopted
FY11 Est. Act.
FY11 Adopted
FY12
Total Expenditures 463,501 526,630 482,527 519,870
Total Revenues 93,211 115,100 115,100 106,200
Objectives
Maintain consistent facility use at the Rockville Senior Center for programs, classes and services by raising awareness through
community outreach and enhanced marketing efforts
Retain volunteers by establishing a dedicated volunteer coordinator to
maintain volunteerism
Assist the fundraising efforts of Rockville Seniors, Inc. (the nonprofit fundraising organization for the Senior Center) through advertising to
enable them to meet their fundraising goal
Promote rentals at the Senior Center through promotional marketing
efforts such as newsletter advertisements and open houses
TABLE 14-78. Performance Measures
Actual
FY10 Target
FY11 Est. Act.
FY11 Target
FY12
Maintain or increase number of:
Volunteers
Volunteer hours
304 18,950
300 24,000
300 24,000
300 24,000
Assist in achieving projected amount of monies raised by Rockville Seniors, Inc.
$59,716 / $64,000 or 93%
$64,000 / $64,000 or 100%
$64,000 / $64,000 or 100%
$64,000 / $64,000 or 100%
Maintain rentals at 84 annually
56 84 84 84

Department of Recreation and Parks Division: Senior Citizen Services
14 - 28
TABLE 14-79. Regular Positions
Position Title Adopted
FY10 Adopted
FY11 Adopted
FY12
Facility Coordinator (grade A13) 1.0 1.0 1.0
Laborer (grade U1) 2.0 2.0 2.0
Secretary I (grade A10) 1.0 1.0 1.0
Senior Center Program Mgr. (grade A23) 1.0 1.0 1.0
Cost Center Total 5.0 5.0 5.0
Supplemental Information
The Senior Center Improvements project (CIP project 420-900-1D67) will be complete in early Fall 2012. This expansion includes renovated offices, enlarged fitness room, dance and aerobic room, multipurpose classroom, and new entrance in the rear of the building. This renovation will result in an enhanced fitness room, exercise rooms and lockers for participants. Senior Fitness Memberships will be increased to $75 per year upon completion of the project.
Cost Center: Senior Citizen Support Services TABLE 14-80. Cost Center Summary
Actual
FY10 Adopted
FY11 Est. Act.
FY11 Adopted
FY12
Total Expenditures 632,178 652,330 626,330 644,020
Total Revenues 38,112 41,350 41,350 41,350
Objectives
Provide door-to-door bus services to the Senior Center, and for
shopping and trips in order to enhance the quality of life of seniors
Provide subsidized taxi coupons to meet transportation needs of
seniors
Keep seniors and families informed of resources by providing
information and assistance
Provide Social Services support to Rockville seniors and families who choose to ―Age in Place‖
Provide wellness screenings, special interest classes, computer classes, English and citizenship classes, daily lunches and monthly
dinners to enhance quality of life
TABLE 14-81. Performance Measures
Actual
FY10 Target
FY11 Est. Act.
FY11 Target
FY12
Maintain at or above 125 the number of seniors who enroll in citizenship and English classes
125 150 150 150
Provide the following levels of transportation services:
Bus rides
Taxi coupons sold
32,226 1,576
32,500 1,450
33,000 1,500
33,000 1,550
Maintain or increase number of support services requests answered at or above 6,500
6,491 6,500 6,500 6,500
Achieve a minimum of 350 seniors provided with ―Home Maintenance and Safety‖ services
381 250 380 380
Increase special interest and wellness classes offered to 32 *
34 28 28 32
Maintain number of computer classes offered at 115
114 115 115 115
* Fewer classes were offered in FY11 due to reduced classroom space resulting from the Senior Center expansion project.
TABLE 14-82. Workload Measures
Actual
FY10 Estimate
FY11 Est. Act.
FY11 Estimate
FY12
Number of meals provided
17,646 16,700 17,000 17,000
Number of wellness screenings and health appointments *
3,269 5,500 2,200 2,200
* FY11 Est. Act. and FY12 are greatly reduced due to the loss of the Heartwell program, Mobile Med and cholesterol screenings.

Department of Recreation and Parks Division: Senior Citizen Services
14 - 29
TABLE 14-83. Regular Positions
Position Title Adopted
FY10 Adopted
FY11 Adopted
FY12
Aging in Place Specialist (grade A16) 0.5 0.5 0.5
Bus Driver (grade R5) 0.8 0.8 0.8
Secretary II (grade A12) 1.0 1.0 1.0
Senior Center Wellness Coordinator (grade A18)
0.5 0.5 0.5
Senior Outreach Worker II (grade R7) 1.3 1.3 1.3
Senior Services Fleet Supervisor (grade A14)
1.0 1.0 1.0
Senior Citizen Support Services Supervisor (grade A22)
1.0 1.0 1.0
Transportation Aide (grade A9) 1.0 1.0 1.0
Cost Center Total 7.1 7.1 7.1
Supplemental Information GRAPH 14-5. The graph below shows the cost of providing bus transportation to
Senior Center members. In FY10, the cost per ride increased more significantly than the total cost to provide the service due to a decrease in the number of rides.
Senior Bus Transportation Costs
$5.00
$5.67
$6.14
$198,314
$193,362
$171,216
$4.00
$4.50
$5.00
$5.50
$6.00
$6.50
FY08 FY09 FY10
Co
st P
er
Rid
e
$140,000
$150,000
$160,000
$170,000
$180,000
$190,000
$200,000
$210,000
$220,000
To
tal C
ost
Cost Per Ride Parts, Service, Fuel & Drivers
GRAPH 14-6. The graph below shows the number of seniors taking advantage
of the Senior Center’s free bus transportation. In FY10, the total number of rides provided decreased due mainly to several severe winter storms.
Rides Using Senior Center Buses
4,8
14
5,2
18
4,8
13
26,1
12
26,2
37
25,7
57
99
0
1,5
24
71
42,2
76
1,0
30
96
6
0
5,000
10,000
15,000
20,000
25,000
30,000
FY08 FY09 FY10
Num
ber
of R
ides
Shopping Senior Center Senior Trips Other (non-Senior)

Department of Recreation and Parks Division: Senior Citizen Services
14 - 30
Cost Center: Senior Assistance Fund (Fund 350)
The Senior Assistance Fund (SAF) assists those who meet age and income limits by subsidizing costs for center membership, recreation and education programs, club activities and trips. Eligible seniors may receive up to $50 per quarter for trips and up to $50 per quarter for programs. Funding comes from interest earned on the principal amount, fund raising, community donations, and annual Rockville Seniors, Inc. (RSI) contribution. TABLE 14-84. Cost Center Summary
Actual
FY10 Adopted
FY11 Est. Act.
FY11 Adopted
FY12
Total Expenditures 6,517 7,100 7,100 6,950
Total Revenues 5,922 4,200 4,200 4,050
Objectives
Provide scholarships to low income seniors for memberships, trips,
classes and medical transportation
TABLE 14-85. Performance Measures
Actual
FY10 Target
FY11 Est. Act.
FY11 Target
FY12
Maintain number of SAF scholarships Awarded at or above 180
181 200 180 180
Maintain annual contributions to the SAF at a minimum of $4,000
$5,922 $4,000 $5,000 $5,000
Cost Center: Senior Citizen Recreation TABLE 14-86. Cost Center Summary
Actual
FY10 Adopted
FY11 Est. Act.
FY11 Adopted
FY12
Total Expenditures 217,777 243,970 243,970 248,200
Total Revenues 58,302 62,000 62,000 62,000
Objectives
Offer education, fine arts, life skills classes, special events and senior club activities to foster learning and enrichment for the active, older, and
increasingly diverse senior population
Manage comprehensive trips and tours that offer leisure, educational
and cultural day and overnight travel opportunities for seniors
Solicit sponsorship and outside funding to reduce the cost of activities to
seniors
TABLE 14-87. Performance Measures
Actual
FY10 Target
FY11 Est. Act.
FY11 Target
FY12
Increase number of participants in special events, classes, and trips to 3,100*
3,005 2,610 2,610 3,100
Maintain or increase number of trips offered at 32 or above, and increase percent of trips completed to 94%
27 / 32 or 84%
30 / 32 or 94%
28 / 32 or 88%
30 / 32 or 94%
Maintain 100% of birthday parties that include sponsors
12 / 12 or 100%
12 / 12 or 100%
12 / 12 or 100%
12 / 12 or 100%
* Participation at the Senior Center was expected to temporarily decrease in FY11 due to the planned construction project that temporarily closed a portion of the center.

Department of Recreation and Parks Division: Senior Citizen Services
14 - 31
TABLE 14-88. Regular Positions
Position Title Adopted
FY10 Adopted
FY11 Adopted
FY12
Program Assistant III (grade R6) 0.8 0.8 0.8
Senior Citizen Recreation Coordinator (grade A21)
1.0 1.0 1.0
Cost Center Total 1.8 1.8 1.8
Cost Center: Senior Citizen Sports & Fitness TABLE 14-89. Cost Center Summary
Actual
FY10 Adopted
FY11 Est. Act.
FY11 Adopted
FY12
Total Expenditures 152,472 153,970 153,970 198,000
Total Revenues 66,823 55,500 55,500 82,250
Objectives
Manage an extensive, multi-equipped fitness room with a personal trainer to facilitate aerobic fitness and strength training for older adults
Provide a comprehensive sports and exercise program through classes, sports, leagues, special events, fitness assessments, and tournaments
for all levels of fitness in the senior population
Offer a variety of classes and programs taught by certified instructors to
ensure a safe, quality experience
TABLE 14-90. Performance Measures
Actual
FY10 Target
FY11 Est. Act.
FY11 Target
FY12
Achieve a minimum of 320 Fitness Club members*
359 250 290 320
Achieve a minimum of 12,500 visits to fitness room*
10,685 6,500 9,000 12,500
Achieve a minimum of 170 classes, programs and sports leagues*
170 130 150 170
Actual
FY10 Target
FY11 Est. Act.
FY11 Target
FY12
Maintain percentage of instructors certified at 100%
10 / 10 100%
10 / 10 or 100%
12 / 12 or 100%
14 / 14 or 100%
* Participation at the Senior Center was expected to temporarily decrease in FY11 due to the planned construction project that temporarily closed a portion of the center.
TABLE 14-91. Regular Positions
Position Title Adopted
FY10 Adopted
FY11 Adopted
FY12
Program Assistant III (grade R6) 0.5 0.5 0.5
Senior Sports & Fitness Supervisor (grade A20)
1.0 1.0 1.0
Cost Center Total 1.5 1.5 1.5
Supplemental Information GRAPH 14-7. The graph below shows historical participation data for senior
sports and fitness programs. FY10 participation numbers were lower than expected due to severe winter storms that caused program cancellations.
Participation in Senior Sports & Fitness Programs
2,5
78
2,7
51
2,8
48
0
1,000
2,000
3,000
Actual
FY08
Actual
FY09
Actual
FY10
# P
art
icip
an
ts
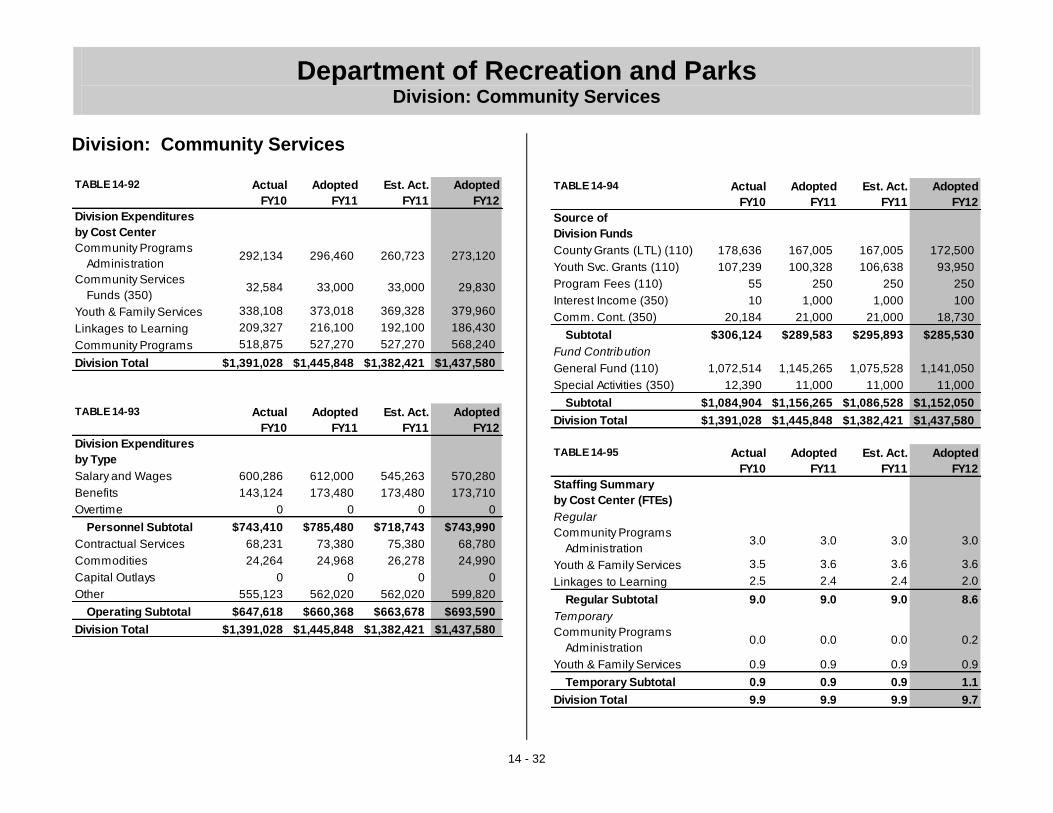
Department of Recreation and Parks Division: Community Services
14 - 32
Division: Community Services
TABLE 14-92 Actual
FY10
Adopted
FY11
Est. Act.
FY11
Adopted
FY12
Division Expenditures
by Cost Center
Community Programs
Administration292,134 296,460 260,723 273,120
Community Services
Funds (350)32,584 33,000 33,000 29,830
Youth & Family Services 338,108 373,018 369,328 379,960
Linkages to Learning 209,327 216,100 192,100 186,430
Community Programs 518,875 527,270 527,270 568,240
Division Total $1,391,028 $1,445,848 $1,382,421 $1,437,580
TABLE 14-93 Actual
FY10
Adopted
FY11
Est. Act.
FY11
Adopted
FY12
Division Expenditures
by Type
Salary and Wages 600,286 612,000 545,263 570,280
Benefits 143,124 173,480 173,480 173,710
Overtime 0 0 0 0
Personnel Subtotal $743,410 $785,480 $718,743 $743,990
Contractual Services 68,231 73,380 75,380 68,780
Commodities 24,264 24,968 26,278 24,990
Capital Outlays 0 0 0 0
Other 555,123 562,020 562,020 599,820
Operating Subtotal $647,618 $660,368 $663,678 $693,590
Division Total $1,391,028 $1,445,848 $1,382,421 $1,437,580
TABLE 14-94 Actual
FY10
Adopted
FY11
Est. Act.
FY11
Adopted
FY12
Source of
Division Funds
County Grants (LTL) (110) 178,636 167,005 167,005 172,500
Youth Svc. Grants (110) 107,239 100,328 106,638 93,950
Program Fees (110) 55 250 250 250
Interest Income (350) 10 1,000 1,000 100
Comm. Cont. (350) 20,184 21,000 21,000 18,730
Subtotal $306,124 $289,583 $295,893 $285,530
Fund Contribution
General Fund (110) 1,072,514 1,145,265 1,075,528 1,141,050
Special Activities (350) 12,390 11,000 11,000 11,000
Subtotal $1,084,904 $1,156,265 $1,086,528 $1,152,050
Division Total $1,391,028 $1,445,848 $1,382,421 $1,437,580
TABLE 14-95 Actual
FY10
Adopted
FY11
Est. Act.
FY11
Adopted
FY12
Staffing Summary
by Cost Center (FTEs)
Regular
Community Programs
Administration3.0 3.0 3.0 3.0
Youth & Family Services 3.5 3.6 3.6 3.6
Linkages to Learning 2.5 2.4 2.4 2.0
Regular Subtotal 9.0 9.0 9.0 8.6
Temporary
Community Programs
Administration0.0 0.0 0.0 0.2
Youth & Family Services 0.9 0.9 0.9 0.9
Temporary Subtotal 0.9 0.9 0.9 1.1
Division Total 9.9 9.9 9.9 9.7

Department of Recreation and Parks Division: Community Services
14 - 33
Division: Community Services Division Purpose
The Community Services Division provides supportive programs and services to help at-risk and disadvantaged youth and families to become self-sufficient, make positive life choices, and adjust to societal challenges. This Division utilizes an engaging community-based program model that relies on group programming and emphasizes strategic planning and needs assessment. Services include emergency assistance, youth development programs, formal and informal counseling, case management, parenting education, self-sufficiency workshops, and information and referral. This Division researches innovative approaches and best practices for offering these services. This Division also coordinates the City’s annual grant program to caregiver and outside agencies, provides staff support to the Human Services Advisory Commission and coordinates special projects such as the Rockville Holiday Drive. Significant Changes from Adopted to Adopted
The Community Services Division’s FY12 Adopted budget decreased slightly from the FY11 Adopted budget mainly due to the elimination of 0.4 FTE in Linkages to Learning, and the transfer of caregiver agency contingency funding from Non-Departmental to specific caregiver agencies within the Community Programs cost center.
The Community Services Division’s FY12 Adopted revenue budget represents a 1% decrease compared to the FY11 Adopted budget mainly due to a decrease in Special Activities Fund revenue.
Cost Center: Community Programs Administration TABLE 14-96. Cost Center Summary
Actual
FY10 Adopted
FY11 Est. Act.
FY11 Adopted
FY12
Total Expenditures 292,134 296,460 260,723 273,120
Total Revenues N/A N/A N/A N/A
Objectives
Conduct annual needs assessment related to low-income youth and families and produce a report summarizing changes in needs and community demographic trends in order to ensure Community Services
Division programs meet most pressing needs
Coordinate annual grant award process for Caregiver Agencies in order to ensure access by Rockville residents to needed social service
programs
Track Caregiver Agency service utilization data on a quarterly basis and conduct site visits to ensure that Caregiver Agencies serve Rockville
residents
Publicize local social service programs so Rockville residents can obtain
assistance to address their financial or social problems
Publish insert in Rockville Reports, sponsor Salute to Nonprofits and participate in Montgomery Alliance to promote charitable giving to local
nonprofit social service agencies
TABLE 14-97. Performance Measures
Actual FY10
Target FY11
Est. Act. FY11
Target FY12
Maintain or increase grant awards to Caregiver Agencies at or above $568,240*
$518,875 $527,270 $527,270 $568,240
Maintain number of local nonprofit agencies publicized through Rockville Reports insert and Salute to Nonprofits at 44
42 44 44 44
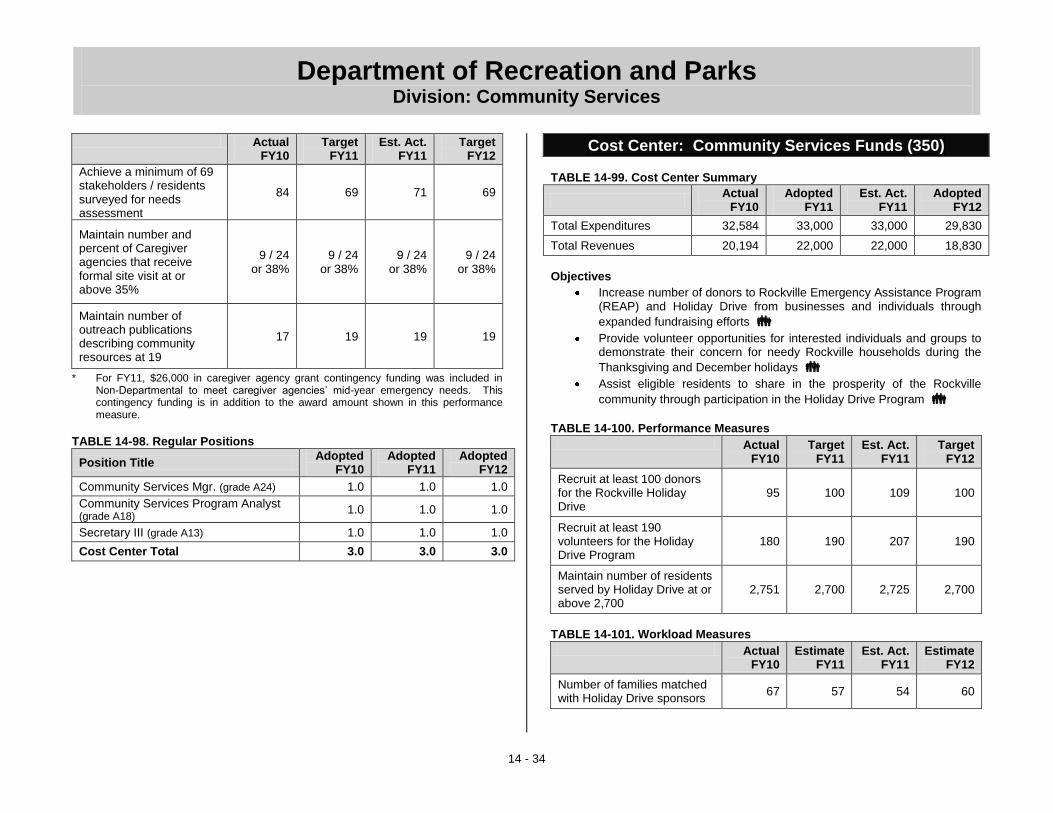
Department of Recreation and Parks Division: Community Services
14 - 34
Actual FY10
Target FY11
Est. Act. FY11
Target FY12
Achieve a minimum of 69 stakeholders / residents surveyed for needs assessment
84 69 71 69
Maintain number and percent of Caregiver agencies that receive formal site visit at or above 35%
9 / 24 or 38%
9 / 24 or 38%
9 / 24 or 38%
9 / 24 or 38%
Maintain number of outreach publications describing community resources at 19
17 19 19 19
* For FY11, $26,000 in caregiver agency grant contingency funding was included in Non-Departmental to meet caregiver agencies’ mid-year emergency needs. This contingency funding is in addition to the award amount shown in this performance measure.
TABLE 14-98. Regular Positions
Position Title Adopted
FY10 Adopted
FY11 Adopted
FY12
Community Services Mgr. (grade A24) 1.0 1.0 1.0
Community Services Program Analyst (grade A18)
1.0 1.0 1.0
Secretary III (grade A13) 1.0 1.0 1.0
Cost Center Total 3.0 3.0 3.0
Cost Center: Community Services Funds (350) TABLE 14-99. Cost Center Summary
Actual
FY10 Adopted
FY11 Est. Act.
FY11 Adopted
FY12
Total Expenditures 32,584 33,000 33,000 29,830
Total Revenues 20,194 22,000 22,000 18,830
Objectives
Increase number of donors to Rockville Emergency Assistance Program (REAP) and Holiday Drive from businesses and individuals through
expanded fundraising efforts
Provide volunteer opportunities for interested individuals and groups to demonstrate their concern for needy Rockville households during the
Thanksgiving and December holidays
Assist eligible residents to share in the prosperity of the Rockville
community through participation in the Holiday Drive Program
TABLE 14-100. Performance Measures
Actual FY10
Target FY11
Est. Act. FY11
Target FY12
Recruit at least 100 donors for the Rockville Holiday Drive
95 100 109 100
Recruit at least 190 volunteers for the Holiday Drive Program
180 190 207 190
Maintain number of residents served by Holiday Drive at or above 2,700
2,751 2,700 2,725 2,700
TABLE 14-101. Workload Measures
Actual FY10
Estimate FY11
Est. Act. FY11
Estimate FY12
Number of families matched with Holiday Drive sponsors
67 57 54 60

Department of Recreation and Parks Division: Community Services
14 - 35
Cost Center: Youth & Family Services TABLE 14-102. Cost Center Summary
Actual
FY10 Adopted
FY11 Est. Act.
FY11 Adopted
FY12
Total Expenditures 338,108 373,018 369,328 379,960
Total Revenues 107,294 100,578 106,888 94,200
Objectives
Provide community outreach, information and referrals so that Rockville
residents are able to access needed social services
Provide eligibility screening for Rockville families applying to the Rockville Emergency Assistance Program (REAP) to address their
financial and/or housing problems
Provide youth development and prevention programs so youth participants can improve their social/emotional well-being, self-esteem, conflict resolution skills, school performance, and/or family relations;
develop leadership and work skills; and perform community service
Recruit and train community volunteers to serve as mentors to at-risk
youth to improve youths’ self-esteem and school performance
Provide formal counseling to at-risk youth to assist in addressing their
social and/or emotional problems
Provide informal counseling (assessments and referrals) and psychoeducational groups to help youth who are experiencing mild school, family or personal problems to obtain needed assistance for
these problems
Provide workshops and classes to Rockville residents to increase their knowledge of affordable housing resources, financial literacy and employability and reduce their reliance on emergency assistance
programs
Provide education programming to Rockville residents to increase their
parenting skills and enhance parent-child relationships
TABLE 14-103. Performance Measures
Actual FY10
Target FY11
Est. Act. FY11
Target FY12
Maintain the percent of REAP recipients who do not return within 18 months at or near 95%
166 / 177 or 94%
152 / 160 or 95%
166 / 175 or 95%
152 / 160 or 95%
Maintain the percentage of at-risk youth in youth development groups who improve their social/emotional well-being at or near 75%
58 / 75 or 77%
56 / 75 or 75%
56 / 75 or 75%
56 / 75 or 75%
Maintain the number of Latino youth in prevention programs (soccer) who graduate to next grade level at 100%
45 / 45 or 100%
60 / 60 or 100%
60 / 60 or 100%
60 / 60 or 100%
Increase enrollment in youth development, prevention and mentoring groups by 3%, from 175 to 180
171 or +3%
177 or +4%
175 or +2%
180 or +3%
Maintain at least 94% of youth in formal counseling who successfully complete treatment and reduce their social and emotional problems
36 / 36 or 100%
30 / 32 or 94%
32 / 34 or 94%
30 / 32 or 94%
Increase number of community volunteers serving as mentors to at-risk youth to 36, and increase volunteer hours to 1,050 or above
Mentors
Volunteer hours
31 960
36 1,053
32 950
36 1,053

Department of Recreation and Parks Division: Community Services
14 - 36
Actual FY10
Target FY11
Est. Act. FY11
Target FY12
Maintain number of youth who receive informal counseling to address school, family or personal problems at or above 75
80 75 77 75
Maintain a minimum of 4 psycoeducational groups with a minimum of 24 total youth participants *
Groups
Youth served
6 43
6 42
5 35
4 24
Increase number of parenting education classes/workshops
Workshops
Parents served
7 63
5 75
4 70
5 75
* FY11 and FY12 estimates represent a decrease from FY10 actual figures due to new County contract requirements that mandate groups run for longer periods of time, which has decreased the total number of groups the City can provide.
TABLE 14-104. Workload Measures
Actual FY10
Estimate FY11
Est. Act. FY11
Estimate FY12
Number of REAP applicants approved for emergency assistance
130 160 150 160
Number of residents who are linked with needed social services
1,184 1,250 1,250 1,250
Number of residents who receive assistance in locating affordable housing
1,105 950 960 950
Number of residents provided with financial counseling
190 180 220 180
Number of residents provided with employment-counseling services (resume preparation, job links, etc)
1,079 650 900 650
TABLE 14-105. Regular Positions
Position Title Adopted
FY10 Adopted
FY11 Adopted
FY12
Community Services Outreach Worker (grade A14)*
0.5 0.6 0.6
Community Services Program Coord. (grade A18)
1.0 1.0 1.0
Community Services Referral Coord. (grade A18)
1.0 1.0 1.0
Youth and Family Counselor (grade A19) 1.0 1.0 1.0
Cost Center Total 3.5 3.6 3.6
* The Community Outreach Worker’s cost allocation changed for FY11 from being split equally between Youth & Family Services and Linkages to Learning, to being split 60% in Youth & Family Services and 40% in Linkages to Learning.
Supplemental Information GRAPH 14-8. The graph below shows a breakdown of how Rockville
Emergency Assistance Program (REAP) funds have been used for the past five fiscal years.
How REAP Funds Are Used
$3
6,1
87
$2
2,4
74
$4
3,2
07
$2
3,5
20
$2
7,2
35
$2
2,8
87
$3
4,4
61
$2
,149
$1
,338
$3
,065
$2
,398
$3
,325$
33,5
13
$2
2,1
01$1
6,3
09
-
10,000
20,000
30,000
40,000
50,000
FY06 FY07 FY08 FY09 FY10
Housing Utilities Medical

Department of Recreation and Parks Division: Community Services
14 - 37
Cost Center: Linkages to Learning TABLE 14-106. Cost Center Summary
Actual
FY10 Adopted
FY11 Est. Act.
FY11 Adopted
FY12
Total Expenditures 209,327 216,100 192,100 186,430
Total Revenues 178,636 167,005 167,005 172,500
Objectives
Provide culturally appropriate clinical services, including assessments and counseling, to at-risk children at Maryvale Elementary School to promote positive youth development and a decrease in maladaptive
behaviors
Provide case management and adult support groups/activities to parents of Maryvale Elementary School students to enhance their personal growth, family management skills, self-sufficiency and
community involvement
TABLE 14-107. Performance Measures
Actual FY10
Target FY11
Est. Act. FY11
Target FY12
Maintain the percentage of youth in counseling who show a decrease in negative school behavior incidents at or above 82%
24 / 27 or 89%
18 / 22 or 82%
22 / 26 or 85%
18 / 22 or 82%
Maintain the percentage of case management cases that meet at least half of their goals at 52% or better
40 / 56 or 71%
26 / 50 or 52%
26 / 50 or 52%
27 / 52 or 52%
Maintain an 80% consistency rate for participants attending adult support groups geared towards self-improvement, community involvement and family support
65 / 77 or 84%
60 / 75 or 80%
61 / 76 or 80%
60 / 75 or 80%
Actual FY10
Target FY11
Est. Act. FY11
Target FY12
Maintain the number of participants in Linkages to Learning programs and activities at 275 or greater
289 275 285 275
TABLE 14-108. Regular Positions
Position Title Adopted
FY10 Adopted
FY11 Adopted
FY12
Community Services Outreach Worker (grade A14)*
0.5 0.4 0.0
Outreach and Community Specialist (grade A20)
1.0 1.0 1.0
Youth, Family and Community Specialist I (grade A18)
1.0 1.0 1.0
Cost Center Total 2.5 2.4 2.0
* The Community Services Outreach Worker’s cost allocation changed for FY11 from being split equally between Youth & Family Services and Linkages to Learning, to being split 60% in Youth & Family Services and 40% in Linkages to Learning. In FY12, the 40% or 0.4 FTE in Linkages to Learning was eliminated.

Department of Recreation and Parks Division: Community Services
14 - 38
Cost Center: Community Programs TABLE 14-109. Cost Center Summary
Actual
FY10 Adopted
FY11 Est. Act.
FY11 Adopted
FY12
Total Expenditures 518,875 527,270 527,270 568,240
Total Revenues N/A N/A N/A N/A
Objectives
Provide social service support to Rockville individuals and families who are experiencing difficulty meeting one or more basic needs related to housing, food, clothing, financial resources, health care and/or family
well-being
TABLE 14-110. Performance Measures
Actual FY10
Target FY11
Est. Act. FY11
Target FY12
Maintain the percent of residents in transitional housing who move to permanent housing at 50%
10 / 16 or 63%
7 / 14 or 50%
8 / 16 or 50%
8 / 16 or 50%
Maintain number and percent of residents in emergency shelters who move to more stable housing at or above 40%
54 / 113 or 48%
50 / 124 or 40%
53 / 124 or 43%
50 / 115 or 43%
Achieve 46% graduation rate to next class level for adults in Latino Outreach Program and Chinese Culture and Community Service Center English classes
198 / 384 or 52%
188 / 405 or 46%
188 / 405 or 46%
159 / 345 or 46%
TABLE 14-111. Workload Measures
Actual FY10
Estimate FY11
Est. Act. FY11
Estimate FY12
Number of residents receiving emergency shelter
113 124 124 131
Number of residents receiving transitional or permanent housing
43 39 40 41
Number of residents receiving donated food
4,019 3,200 3,298 3,000
Number of residents receiving donated clothing
1,034 1,100 1,200 1,123
Number of at-risk households matched with family support services
16 12 12 14
Number of elderly residents receiving counseling, homemaker services or grocery deliveries
99 83 85 100
Number of adult residents who enroll in English classes
322 380 345 345
Number of residents who receive primary health care
282 830 830 808
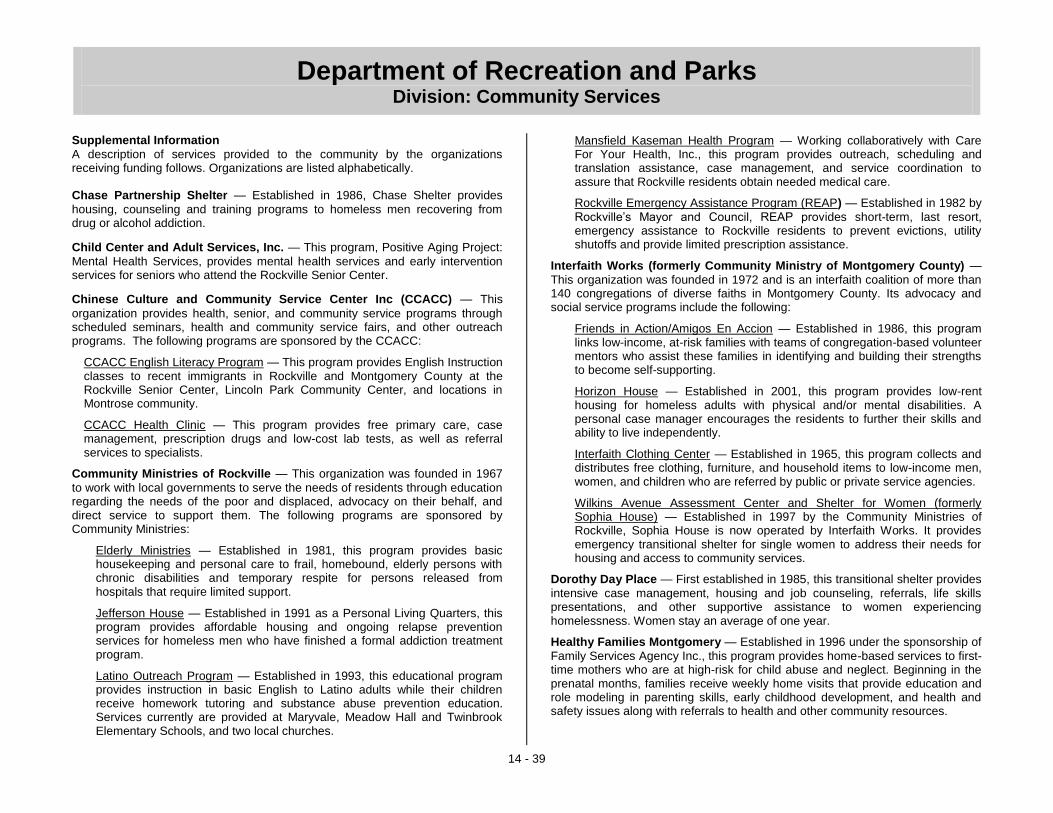
Department of Recreation and Parks Division: Community Services
14 - 39
Supplemental Information
A description of services provided to the community by the organizations receiving funding follows. Organizations are listed alphabetically.
Chase Partnership Shelter — Established in 1986, Chase Shelter provides
housing, counseling and training programs to homeless men recovering from drug or alcohol addiction.
Child Center and Adult Services, Inc. — This program, Positive Aging Project:
Mental Health Services, provides mental health services and early intervention services for seniors who attend the Rockville Senior Center.
Chinese Culture and Community Service Center Inc (CCACC) — This
organization provides health, senior, and community service programs through scheduled seminars, health and community service fairs, and other outreach programs. The following programs are sponsored by the CCACC:
CCACC English Literacy Program — This program provides English Instruction classes to recent immigrants in Rockville and Montgomery County at the Rockville Senior Center, Lincoln Park Community Center, and locations in Montrose community.
CCACC Health Clinic — This program provides free primary care, case management, prescription drugs and low-cost lab tests, as well as referral services to specialists.
Community Ministries of Rockville — This organization was founded in 1967
to work with local governments to serve the needs of residents through education regarding the needs of the poor and displaced, advocacy on their behalf, and direct service to support them. The following programs are sponsored by Community Ministries:
Elderly Ministries — Established in 1981, this program provides basic housekeeping and personal care to frail, homebound, elderly persons with chronic disabilities and temporary respite for persons released from hospitals that require limited support.
Jefferson House — Established in 1991 as a Personal Living Quarters, this program provides affordable housing and ongoing relapse prevention services for homeless men who have finished a formal addiction treatment program.
Latino Outreach Program — Established in 1993, this educational program provides instruction in basic English to Latino adults while their children receive homework tutoring and substance abuse prevention education. Services currently are provided at Maryvale, Meadow Hall and Twinbrook Elementary Schools, and two local churches.
Mansfield Kaseman Health Program — Working collaboratively with Care For Your Health, Inc., this program provides outreach, scheduling and translation assistance, case management, and service coordination to assure that Rockville residents obtain needed medical care.
Rockville Emergency Assistance Program (REAP) — Established in 1982 by
Rockville’s Mayor and Council, REAP provides short-term, last resort, emergency assistance to Rockville residents to prevent evictions, utility shutoffs and provide limited prescription assistance.
Interfaith Works (formerly Community Ministry of Montgomery County) —
This organization was founded in 1972 and is an interfaith coalition of more than 140 congregations of diverse faiths in Montgomery County. Its advocacy and social service programs include the following:
Friends in Action/Amigos En Accion — Established in 1986, this program links low-income, at-risk families with teams of congregation-based volunteer mentors who assist these families in identifying and building their strengths to become self-supporting.
Horizon House — Established in 2001, this program provides low-rent housing for homeless adults with physical and/or mental disabilities. A personal case manager encourages the residents to further their skills and ability to live independently.
Interfaith Clothing Center — Established in 1965, this program collects and distributes free clothing, furniture, and household items to low-income men, women, and children who are referred by public or private service agencies.
Wilkins Avenue Assessment Center and Shelter for Women (formerly Sophia House) — Established in 1997 by the Community Ministries of Rockville, Sophia House is now operated by Interfaith Works. It provides emergency transitional shelter for single women to address their needs for housing and access to community services.
Dorothy Day Place — First established in 1985, this transitional shelter provides
intensive case management, housing and job counseling, referrals, life skills presentations, and other supportive assistance to women experiencing homelessness. Women stay an average of one year.
Healthy Families Montgomery — Established in 1996 under the sponsorship of
Family Services Agency Inc., this program provides home-based services to first-time mothers who are at high-risk for child abuse and neglect. Beginning in the prenatal months, families receive weekly home visits that provide education and role modeling in parenting skills, early childhood development, and health and safety issues along with referrals to health and other community resources.

Department of Recreation and Parks Division: Community Services
14 - 40
Helping Hands Shelter — This organization was established in 1986 under the
sponsorship of the Mount Calvary Baptist Church. The shelter provides free temporary housing and food to homeless and abused women and children, assists in obtaining low rent housing, and offers social service counseling.
Home Builders Care Assessment Center — Established in 1990 by the
Montgomery County Coalition for the Homeless, this program provides year-round overnight shelter to homeless men. Using a new, larger facility built in November 2000, this program serves as entry point for men into the homeless services system.
Hope Housing — Established in 2002, this program provides low-rent housing
for single adults with physical and/or mental disabilities. Residents receive case management and other needed supportive services.
Korean Community Center of Greater Washington — Established in 1986,
this agency provides outreach, health care education, case management, English classes, and pedestrian safety training to recent Korean immigrants in Rockville.
Manna Food Center Inc. — Established in 1983, this agency receives and
stores surplus foods and community food collections for distribution on a once-per-month basis to persons who have been referred by a social service agency. Food supplies also are provided to local shelters, soup kitchens, and other helping organizations.
Montgomery Avenue Women’s Center — Established in 1984 as the Cordelia
House Shelter, this daytime program provides job training, case management, life skills training, psychiatric care, and other supports to homeless women.
Rainbow Place Shelter — Established in 1981, this is an emergency winter
(November through March) shelter for homeless women 18 years and older that provides three meals a day, clothing, laundry facilities, and showers.
Rockville Housing Enterprises (RHE) Neighborhood Video Gaming Night —
This program sponsors a video game program for neighborhood children twice each month that will provide children with a safe place to come together with their friends.
Stepping Stones Shelter — Established in 1980, this organization provides
emergency shelter and independent living to homeless families. Its services include provision of shelter, food, housing referrals, counseling programs, health workshops and seminars, employment counseling, clothing, furniture and household items, drug abuse education and counseling, and childcare.
Top Banana Home Delivered Groceries — Established in 1982, this program
provides personalized, supportive grocery delivery services to frail, disabled individuals. Participants order their food items by phone from a storehouse/office located in Brandywine, MD; drivers help put groceries away while checking on the participant’s well-being. FIGURE 14-10. Participants receive English language instruction through the
Latino Outreach Program sponsored by Community Ministries of Rockville.

Department of Recreation and Parks Division: Community Services
14 - 41
FIGURE 14-11. History of Caregiver Agency Funding.
Shelters
Chase Partnership Shelter 15,000 16,000 20,000 17,000
Dorothy Day Place 6,000 7,000 8,000 8,000
Helping Hands Shelter 17,000 17,000 18,000 18,000
Home Build. Care Assess. Ctr. 24,000 25,000 25,000 25,000
Hope Housing 6,000 8,500 10,000 10,000
Horizon House 4,000 5,000 5,000 5,000
Jefferson House 5,250 7,000 10,000 10,000
Montgomery Ave Women’s Ctr 20,000 20,000 20,000 20,000
Rainbow Place Shelter 15,000 17,345 17,348 17,350
Stepping Stones Shelter 10,000 10,000 15,000 12,000
Wilkins Avenue Center 20,000 20,000 20,000 20,000
Food/Clothing Services
Interfaith Clothing Center 13,600 15,000 15,000 15,000
Manna Food Center Inc. 23,250 24,500 25,725 25,730
Top Banana Home Delivered 5,000 - - -
Youth/Family Services
Friends in Action 12,500 12,500 15,000 12,500
Healthy Families Montgomery 10,000 11,000 15,000 13,000
RHE Neigh. Video Gaming Night 4,000 4,000 5,804 4,000
TSP Safe Sw imming Prog. - - 10,000 -
Health Care
Child Center and Adult Services 12,525 12,525 19,860 18,360
CCACC Health Clinic 10,000 10,000 10,000 10,000
Mansfield Kaseman Health 66,250 70,000 85,000 85,000
Elderly Ministries 61,500 61,500 66,500 65,500
Cultural Diversity
CCACC English Literacy Prog. 10,000 10,000 10,000 10,000
Korean C.C. of Greater Wash. 8,000 8,400 8,400 8,400
Latino Outreach Program 75,000 75,000 90,000 78,400
Emergency Funds
REAP 60,000 ** 60,000 60,000 60,000
TOTAL for Caregiver Agencies 513,875 527,270 604,637 568,240
FY10
Adopted
FY11
Adopted*
FY12
Request
FY12
Adopted
* For FY11, $26,000 in caregiver agency grant contingency funding is included in Non-
Departmental to meet caregiver agencies’ mid-year emergency needs. This grant contingency is in addition to the funding shown above.
** Of the $60,000 in funding for REAP in FY10, $6,000 was paid from the City’s Special Activities Fund.
GRAPH 14-9. The pie chart below shows the breakout of the total caregiver
agency funding for FY12 by program area. Shelters and health care agencies typically receive the bulk of the City’s total caregiver funding.
FY 2012 Caregiver Agency Funding
by Program Area
Emergency
Funds
$60,000
11%
Cultural Diversity
$96,800
17%
Youth/Family
Services
$29,500
5%
Food/Clothing
Services
$40,730
7%
Health Care
$178,860
31%
Shelters
$160,350
29%

Department of Recreation and Parks Division: Community Services
14 - 42
Outside Agency Funding In addition to the caregiver agency funding discussed on the previous pages, the City also provides funding to outside agencies through a similar grant application and review process. Outside agency funding is divided among City departments based on the department that manages each individual grant. A summary of this funding appears below, and is followed by descriptions of each agency receiving funding. FIGURE 14-12. History of Outside Agency Funding.
Heritage Tourism Alliance of
Montgomery County CPDS Historic Preservation 8-18 1,500 2,000 2,500 2,250
Peerless Rockville
Historic Pres., Ltd. CPDS Historic Preservation 8-18 54,500 54,500 54,500 54,500
Rockville Consortium
for Science Inc. * R&P R&P Administration 14-7 3,900 - 5,000 4,250
Rockville Housing
Enterprises (RHE) ** CPDS Housing and CDBG 8-7 80,000 41,200 41,200 41,200
Rockville Scholarship
Foundation (RSF) CMO Administration 7-5 5,000 5,500 10,000 6,500
Rockville Science
Center R&P R&P Administration 14-7 30,000 35,000 35,000 35,000
Rockville Volunteer
Fire Department FIN Administration 9-5 10,000 10,000 10,000 10,000
Total 184,900 148,200 158,200 153,700
FY12
Request
FY12
Adopted Dept Cost Center Outside Agency Name Page
FY10
Adopted
FY11
Adopted
* FY11 funding in the amount of $3,900 for the Rockville Consortium for Science was
awarded after the adoption of the FY11 budget. ** The FY10 amount represents the Refuse Fund charge of $30,000 to the General
Fund for refuse pickup, in addition to $50,000 for repairs to RHE housing units.
Heritage Tourism Alliance of Montgomery County — Initiated by the Cultural
Office of the Maryland-National Capital Park and Planning Commission, this non-profit promotes tourism to historic sites and recreation services in Rockville and Montgomery County through special events, publications and marketing initiatives. Peerless Rockville Historic Preservation, Ltd. — Established in 1974, this
non-profit organization is dedicated to the preservation of Rockville's historic character and the enjoyment of the City's heritage through public education, activities and events. Rockville Consortium for Science Inc. — Established in 1989, their mission is
to increase the understanding of science within the City. Rockville Housing Enterprises (RHE) — The City's public housing agency that
provides housing opportunities for lower income households who are unable to rent or buy homes and initiates redevelopment activities. Rockville Scholarship Foundation (RSF) — RSF provides scholarships to
enable members of the Rockville community to pursue education beyond high school, and to encourage members of the community to assume important roles as leaders in their professions and as future leaders of Rockville. Rockville Science Center — The Rockville Science Center aims to provide a
vibrant facility that offers an educational forum for citizens of all ages to explore the wonders of science that underlie everyday life and that relate to the scientific community of the region. Rockville Volunteer Fire Department — The City's volunteer fire department
consisting of over 200 members serving the Rockville area.

Department of Recreation and Parks Division: Community Services
14 - 43
(This page intentionally left blank)
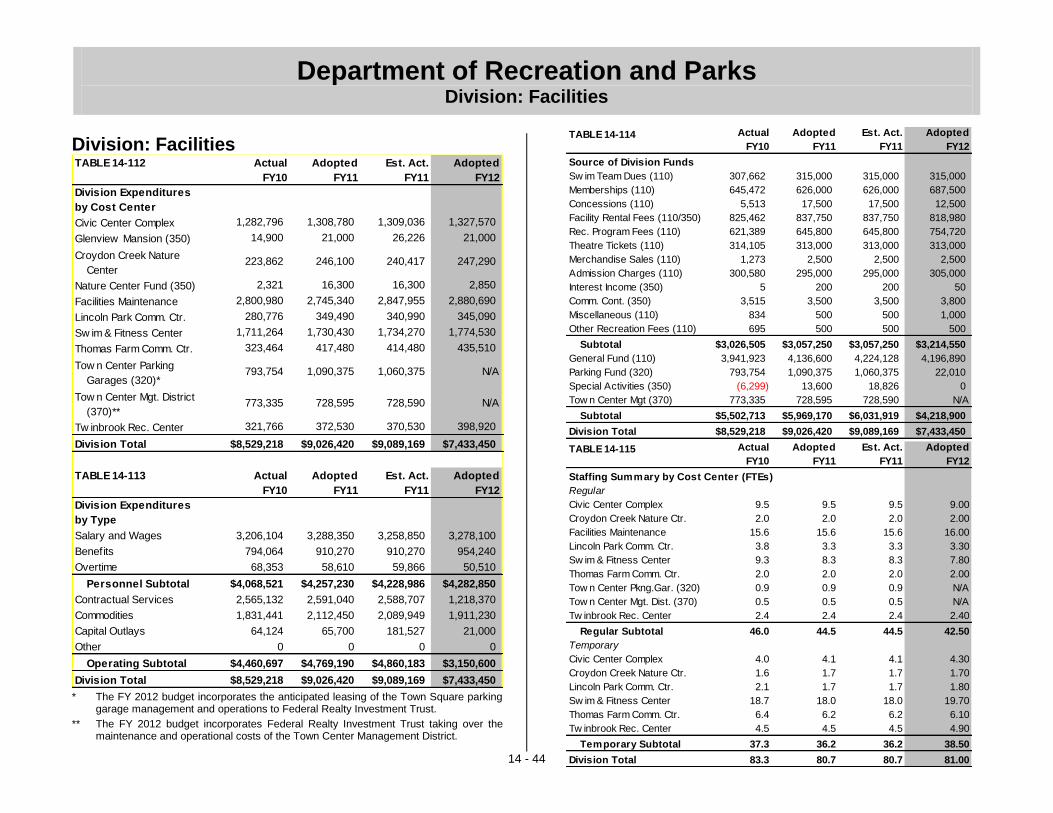
Department of Recreation and Parks Division: Facilities
14 - 44
TABLE 14-114 Actual
FY10
Adopted
FY11
Est. Act.
FY11
Adopted
FY12
Source of Division Funds
Sw im Team Dues (110) 307,662 315,000 315,000 315,000
Memberships (110) 645,472 626,000 626,000 687,500
Concessions (110) 5,513 17,500 17,500 12,500
Facility Rental Fees (110/350) 825,462 837,750 837,750 818,980
Rec. Program Fees (110) 621,389 645,800 645,800 754,720
Theatre Tickets (110) 314,105 313,000 313,000 313,000
Merchandise Sales (110) 1,273 2,500 2,500 2,500
Admission Charges (110) 300,580 295,000 295,000 305,000
Interest Income (350) 5 200 200 50
Comm. Cont. (350) 3,515 3,500 3,500 3,800
Miscellaneous (110) 834 500 500 1,000
Other Recreation Fees (110) 695 500 500 500
Subtotal $3,026,505 $3,057,250 $3,057,250 $3,214,550
General Fund (110) 3,941,923 4,136,600 4,224,128 4,196,890
Parking Fund (320) 793,754 1,090,375 1,060,375 22,010
Special Activities (350) (6,299) 13,600 18,826 0
Tow n Center Mgt (370) 773,335 728,595 728,590 N/A
Subtotal $5,502,713 $5,969,170 $6,031,919 $4,218,900
Division Total $8,529,218 $9,026,420 $9,089,169 $7,433,450
TABLE 14-115 Actual
FY10
Adopted
FY11
Est. Act.
FY11
Adopted
FY12
Staffing Summary by Cost Center (FTEs)
Regular
Civic Center Complex 9.5 9.5 9.5 9.00
Croydon Creek Nature Ctr. 2.0 2.0 2.0 2.00
Facilities Maintenance 15.6 15.6 15.6 16.00
Lincoln Park Comm. Ctr. 3.8 3.3 3.3 3.30
Sw im & Fitness Center 9.3 8.3 8.3 7.80
Thomas Farm Comm. Ctr. 2.0 2.0 2.0 2.00
Tow n Center Pkng.Gar. (320) 0.9 0.9 0.9 N/A
Tow n Center Mgt. Dist. (370) 0.5 0.5 0.5 N/A
Tw inbrook Rec. Center 2.4 2.4 2.4 2.40
Regular Subtotal 46.0 44.5 44.5 42.50
Temporary
Civic Center Complex 4.0 4.1 4.1 4.30
Croydon Creek Nature Ctr. 1.6 1.7 1.7 1.70
Lincoln Park Comm. Ctr. 2.1 1.7 1.7 1.80
Sw im & Fitness Center 18.7 18.0 18.0 19.70
Thomas Farm Comm. Ctr. 6.4 6.2 6.2 6.10
Tw inbrook Rec. Center 4.5 4.5 4.5 4.90
Temporary Subtotal 37.3 36.2 36.2 38.50
Division Total 83.3 80.7 80.7 81.00
Division: Facilities TABLE 14-112 Actual
FY10
Adopted
FY11
Est. Act.
FY11
Adopted
FY12
Division Expenditures
by Cost Center
Civic Center Complex 1,282,796 1,308,780 1,309,036 1,327,570
Glenview Mansion (350) 14,900 21,000 26,226 21,000
Croydon Creek Nature
Center223,862 246,100 240,417 247,290
Nature Center Fund (350) 2,321 16,300 16,300 2,850
Facilities Maintenance 2,800,980 2,745,340 2,847,955 2,880,690
Lincoln Park Comm. Ctr. 280,776 349,490 340,990 345,090
Sw im & Fitness Center 1,711,264 1,730,430 1,734,270 1,774,530
Thomas Farm Comm. Ctr. 323,464 417,480 414,480 435,510
Tow n Center Parking
Garages (320)* 793,754 1,090,375 1,060,375 N/A
Tow n Center Mgt. District
(370)**773,335 728,595 728,590 N/A
Tw inbrook Rec. Center 321,766 372,530 370,530 398,920
Division Total $8,529,218 $9,026,420 $9,089,169 $7,433,450
TABLE 14-113 Actual
FY10
Adopted
FY11
Est. Act.
FY11
Adopted
FY12
Division Expenditures
by Type
Salary and Wages 3,206,104 3,288,350 3,258,850 3,278,100
Benefits 794,064 910,270 910,270 954,240
Overtime 68,353 58,610 59,866 50,510
Personnel Subtotal $4,068,521 $4,257,230 $4,228,986 $4,282,850
Contractual Services 2,565,132 2,591,040 2,588,707 1,218,370
Commodities 1,831,441 2,112,450 2,089,949 1,911,230
Capital Outlays 64,124 65,700 181,527 21,000
Other 0 0 0 0
Operating Subtotal $4,460,697 $4,769,190 $4,860,183 $3,150,600
Division Total $8,529,218 $9,026,420 $9,089,169 $7,433,450 * The FY 2012 budget incorporates the anticipated leasing of the Town Square parking
garage management and operations to Federal Realty Investment Trust.
** The FY 2012 budget incorporates Federal Realty Investment Trust taking over the maintenance and operational costs of the Town Center Management District.

Department of Recreation and Parks Division: Facilities
14 - 45
Division: Facilities Division Purpose:
The Facilities Division maintains and operates all City buildings safely and efficiently. It ensures their readiness for use, and provides high quality, diverse and appropriate programming for six of Rockville’s major facilities. The Facilities Maintenance cost center relies on trained professional staff and licensed contractors to service and upkeep all physical facilities to their optimum efficiency and capacity. The Facilities Division is responsible for programming a wide variety of high quality activities for both drop-in use and structured programs, enhancing the participant’s quality of life. Such activities include: classes, educational and interpretive programs, workshops, fitness opportunities and special events. Significant Changes from Adopted to Adopted
The Facilities Division’s FY12 Proposed budget represents an 18% decrease compared to the FY11 Adopted budget due to a combination of increases in salary and benefit costs, a reallocation of contractual services, commodity, and capital outlay funding from this Division to fund other needs within the Department, increases in operating expenses related to additional programming at the Swim and Fitness Center and the Twinbrook Community Recreation Center, and the significant decreases associated with FRIT taking over the management and operations of the Town Center Management District and the Town Center Parking Garages. The Facilities Division’s FY12 Proposed revenue budget represents a 5% increase over the FY11 Adopted budget due to a combination of increases in Swim and Fitness Center and Thomas Farm Community Center membership revenue, a $5,000 decrease in concession revenue, a net $18,770 decrease in facility rental revenue, a $108,920 increase in recreation program fees due mainly to new programming at the Swim and Fitness Center and Twinbrook Community Recreation Center, and a $10,000 increase in Swim and Fitness Center admission revenue.
Figure 14-3. Family Valentine’s Dance at the City’s Twinbrook Community Recreation Center.

Department of Recreation and Parks Division: Facilities
14 - 46
Figure 14-14. Facilities Division FY12 Adopted Budget Detail by Cost Center
Civic Center
Glenview
Mansion
(350)
Croydon
Creek Nature
Center
Nature
Center Fund
(350)
Facilities
Maintenance*
Lincoln Park
Community
Center
Swim &
Fitness
Center
Thomas Farm
Community
Center
Twinbrook
Recreation
Center
Facilities
Division Total
Expenditures by Type
Regular Salary 502,780 - 117,470 - 842,900 166,550 462,330 136,530 130,780 2,359,340
Temp Wages 99,490 - 40,750 - - 48,900 503,330 127,510 98,780 918,760
Benefits 196,770 - 43,930 - 343,120 64,300 193,800 55,310 57,010 954,240
Overtime 5,400 - - - 43,400 - - 1,710 - 50,510
Personnel Subtotal 804,440$ -$ 202,150$ -$ 1,229,420$ 279,750$ 1,159,460$ 321,060$ 286,570$ 4,282,850$
Consultants / Outside Personnel - - 900 - - - 34,000 4,040 300 39,240
Travel / Prof. Development / Dues 1,440 - 180 - - 230 6,880 390 230 9,350
Contract Services / Maint. / Ads 316,100 - 300 - 381,640 2,800 73,860 19,030 8,200 801,930
Facility Rental - - - - 367,850 - - - - 367,850
Utilities 156,490 - 29,560 - 807,780 45,910 386,570 60,890 79,320 1,566,520
Supplies 49,100 - 14,200 2,850 94,000 16,400 113,760 30,100 24,300 344,710
Capital Outlays - 21,000 - - - - - - - 21,000
Operating Subtotal 523,130$ 21,000$ 45,140$ 2,850$ 1,651,270$ 65,340$ 615,070$ 114,450$ 112,350$ 3,150,600$
Cost Center Total 1,327,570$ 21,000$ 247,290$ 2,850$ 2,880,690$ 345,090$ 1,774,530$ 435,510$ 398,920$ 7,433,450$
Civic Center
Glenview
Mansion
(350)
Croydon
Creek Nature
Center
Nature
Center Fund
(350)
Facilities
Maintenance
Lincoln Park
Community
Center
Swim &
Fitness
Center
Thomas Farm
Community
Center
Twinbrook
Recreation
Center
Facilities
Division Total
Revenues by Type
Prog.Fees, Memberships,
Admission Charges- - 66,500 - - 23,500 1,719,940 137,400 114,880 2,062,220
Facility Rental Fees 548,000 20,000 200 - 38,350 28,600 95,000 55,600 33,230 818,980
Theatre Tickets 313,000 - - - - - - - - 313,000
Other* - 1,000 - 2,850 - 500 12,500 2,000 1,500 20,350
Cost Center Total 861,000$ 21,000$ 66,700$ 2,850$ 38,350$ 52,600$ 1,827,440$ 195,000$ 149,610$ 3,214,550$
*Other includes revenues such as Concessions, Merchandise Sales, Interest Income, and Community Contributions.
*The Facilities Maintenance cost center is responsible for the upkeep of all City facilities, including utilities, that are not housed within their own stand-alone cost centers or funds.
Examples of included facilities are City Hall, Gude Drive Maintenance Facility, Elwood Smith Community Center, and other buildings and shelters.

Department of Recreation and Parks Division: Facilities
14 - 47
Cost Center: Civic Center Complex TABLE 14-116. Cost Center Summary
Actual
FY10 Adopted
FY11 Est. Act.
FY11 Adopted
FY12
Total Expenditures 1,282,796 1,308,780 1,309,036 1,327,570
Total Revenues 867,067 861,000 861,000 861,000
Objectives
Continue to serve as an outstanding cultural destination for residents in the region via the F. Scott Fitzgerald Theatre year-long season of
performances and monthly Glenview Mansion Art gallery exhibitions
Offer well maintained and equipped facilities supported by outstanding customer service in order to remain a sought-out premium destination
Ensure Rockville Civic Center facilities remain a desirable place to do business and continue to be used by a variety of user groups from the region in order to attract people to Rockville and meet fiscal cost
recovery goals
TABLE 14-117. Performance Measures
Actual
FY10 Target
FY11 Est. Act.
FY11 Target
FY12
Maintain or increase City and Theatre Resident Co. (RESCO) performances while increasing private rentals at F. Scott Fitzgerald Theatre
City 32 RESCO 48 Private 66
City 30 RESCO 48 Private 66
City 31 RESCO 48 Private 61
City 30 RESCO 48 Private 63
Maintain 100% satisfaction through top scores for cleanliness of facilities and staff assistance provided to clients as documented in Mansion and Theatre client evaluations
31 / 31 or 100%
55 / 55 or 100%
45 / 45 or 100%
60 / 60 or 100%
Actual
FY10 Target
FY11 Est. Act.
FY11 Target
FY12
Maintain the number of annual events hosted at the Civic Center and the number of guests served at these events
Events 1,169
Guests 89,219
Events 1,200
Guests 90,000
Events 1,170
Guests 90,000
Events
1,200 Guests 90,000
TABLE 14-118. Workload Measures
Actual
FY10 Estimate
FY11 Est. Act.
FY11 Estimate
FY12
Number of events held at Glenview Mansion
City
Private
488 227
450 300
450 230
450 250
Number of permits issued for use of the 178 garden plots at Woottons Mill Park
178 178 178 178
City park/picnic rentals issued annually
85 75 65 70

Department of Recreation and Parks Division: Facilities
14 - 48
TABLE 14-119. Regular Positions
Position Title Adopted
FY10 Adopted
FY11 Adopted
FY12
Box Office Manager (grade A13) 1.0 1.0 1.0
Civic Center Superintendent (grade A23)
1.0 1.0 1.0
Crew Supervisor (grade A14) 1.0 1.0 1.0
Facility Supervisor II (grade R4)* 0.5 0.5 0.0
Maintenance Worker (grade U2) 2.0 2.0 2.0
Secretary III (grade A13) 1.0 1.0 1.0
Secretary II (grade A12) 1.0 1.0 1.0
Theatre / Civic Center Supervisor (grade A19)
1.0 1.0 1.0
Theatre Production Specialist (grade A17)
1.0 1.0 1.0
Cost Center Total 9.5 9.5 9.0
* A 0.5 FTE Facility Supervisor II was eliminated in FY12.
Supplemental Information
Facilities and rentals managed by the Civic Center Complex include Glenview Mansion, F. Scott Fitzgerald Theatre and Social Hall, Cottage, Elwood Smith Community Center, Pumphouse, Woottons Mill Park’s 178 garden plots, as well as park permits at twelve City park/picnic sites. Staff also serves as liaison to management of the Rockville Rooftop terrace in Rockville Town Square.
Cost Center: Glenview Mansion (Fund 350) TABLE 14-120. Cost Center Summary
Actual
FY10 Adopted
FY11 Est. Act.
FY11 Adopted
FY12
Total Expenditures 14,900 21,000 26,226 21,000
Total Revenues 20,132 21,000 21,000 21,000
Objectives
Continue enhancement and quality upkeep of the Glenview Mansion's furnishings and architectural details to ensure the historic integrity of the
mansion is maintained
Provide oversight of funds by the Glenview Mansion Sub-Committee consisting of representatives from the Recreation and Park Advisory Board, Cultural Arts Commission and Historic District Commission working with the Glenview Mansion historic consultant and Civic Center
staff
TABLE 14-121. Workload Measures
Actual
FY10 Estimate
FY11 Est. Act.
FY11 Estimate
FY12
Projects completed 3 4 6 4
Supplemental Information
The Glenview Mansion Fund purchases items such as rugs and furniture as well as provides support to special restoration projects to ensure the historic integrity of Glenview Mansion is maintained. Funding from Glenview Mansion Conference rental revenues in the amount of $20,000 annually is set aside in accordance with the City’s Financial Management Policies for this fund.

Department of Recreation and Parks Division: Facilities
14 - 49
Cost Center: Croydon Creek Nature Center TABLE 14-122. Cost Center Summary
Actual
FY10 Adopted
FY11* Est. Act.
FY11 Adopted
FY12
Total Expenditures 223,862 246,100 240,417 247,290
Total Revenues 68,165 66,700 66,700 66,700
* In order to more accurately reflect direct costs, utilities were moved from the Facilities Maintenance cost center to each community center’s budget beginning in FY11. In FY11, this move added a total of $28,930 for electricity, water, sewer, and stormwater costs to this cost center’s adopted budget.
Objectives
In an effort to mitigate ―Nature Deficit Disorder‖ and maintain the current number of yearly visits, provide a positive and educational visitor
experience
Provide high quality programs to participants by incorporating engaging interpretive methods in the delivery of environmental education
programs
Produce exhibits and signage on current environmental topics that foster a connection between the visitor and the environment in which
they live
TABLE 14-123. Performance Measures
Actual
FY10 Target
FY11 Est. Act.
FY11 Target
FY12
Maintain current number of students served each year at 2,500
2,530 2,500 2,500 2,500
Maintain 95% respondents evaluating programs as ―high quality‖
41 / 42 or 98%
71 / 75 or 95%
71 / 75 or 95%
71 / 75 or 95%
Achieve 100% satisfaction in meeting the curricular needs of school program participants
50 / 50 or 100%
50 / 50 or 100%
50 / 50 or 100%
50 / 50 or 100%
Actual
FY10 Target
FY11 Est. Act.
FY11 Target
FY12
Maintain 95% positive response rate from visitors who say they learned something new upon their visit to the Nature Center
78 / 79 or 99%
95 / 100 or 95%
95 / 100 or 95%
95 / 100 or 95%
TABLE 14-124. Workload Measures
Actual
FY10 Estimate
FY11 Est. Act.
FY11 Estimate
FY12
Number of visits 25,250 23,000 25,000 25,000
Number of volunteers 234 200 215 250
Number of volunteer hours
1,532 1,600 1,575 1,600
Number of programs offered
305 260 300 300
TABLE 14-125. Regular Positions
Position Title Adopted
FY10 Adopted
FY11 Adopted
FY12
Asst. Community Center Supervisor (grade A16)
1.0 1.0 1.0
Nature Center Supervisor (grade A20) 1.0 1.0 1.0
Cost Center Total 2.0 2.0 2.0
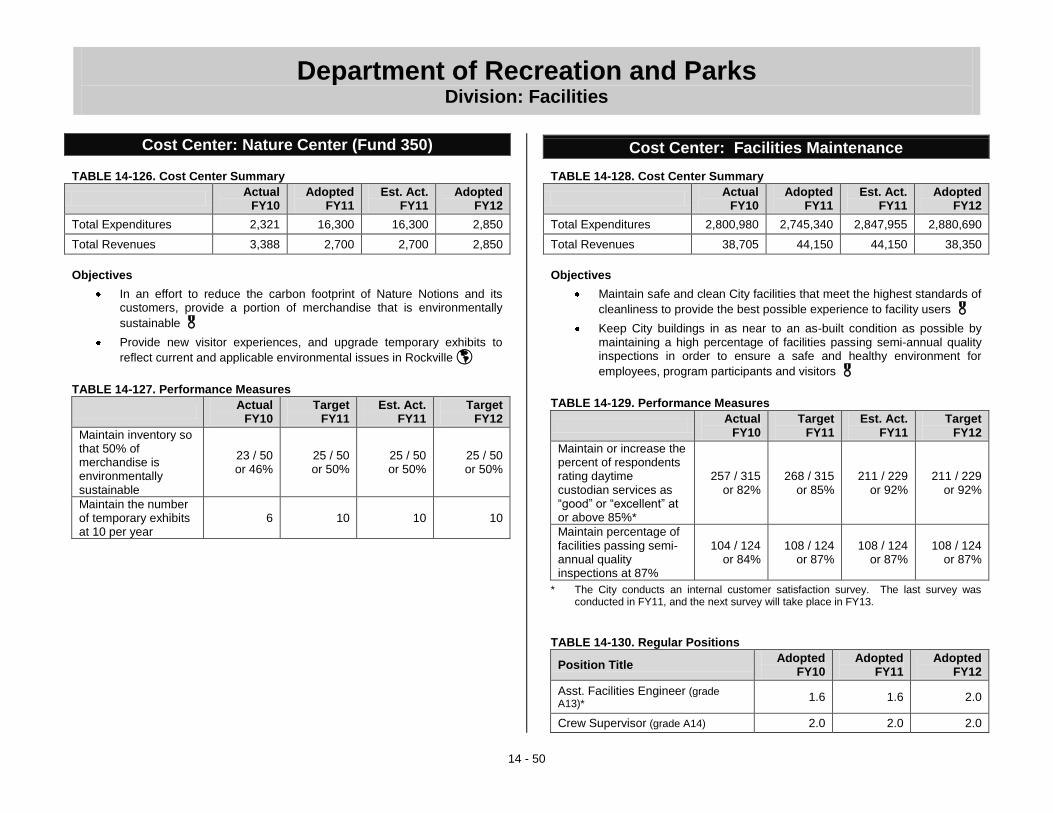
Department of Recreation and Parks Division: Facilities
14 - 50
Cost Center: Nature Center (Fund 350) TABLE 14-126. Cost Center Summary
Actual
FY10 Adopted
FY11 Est. Act.
FY11 Adopted
FY12
Total Expenditures 2,321 16,300 16,300 2,850
Total Revenues 3,388 2,700 2,700 2,850
Objectives
In an effort to reduce the carbon footprint of Nature Notions and its customers, provide a portion of merchandise that is environmentally
sustainable
Provide new visitor experiences, and upgrade temporary exhibits to
reflect current and applicable environmental issues in Rockville
TABLE 14-127. Performance Measures
Actual
FY10 Target
FY11 Est. Act.
FY11 Target
FY12
Maintain inventory so that 50% of merchandise is environmentally sustainable
23 / 50 or 46%
25 / 50 or 50%
25 / 50 or 50%
25 / 50 or 50%
Maintain the number of temporary exhibits at 10 per year
6 10 10 10
Cost Center: Facilities Maintenance
TABLE 14-128. Cost Center Summary
Actual
FY10 Adopted
FY11 Est. Act.
FY11 Adopted
FY12
Total Expenditures 2,800,980 2,745,340 2,847,955 2,880,690
Total Revenues 38,705 44,150 44,150 38,350
Objectives
Maintain safe and clean City facilities that meet the highest standards of
cleanliness to provide the best possible experience to facility users
Keep City buildings in as near to an as-built condition as possible by maintaining a high percentage of facilities passing semi-annual quality inspections in order to ensure a safe and healthy environment for
employees, program participants and visitors
TABLE 14-129. Performance Measures
Actual
FY10 Target
FY11 Est. Act.
FY11 Target
FY12
Maintain or increase the percent of respondents rating daytime custodian services as ―good‖ or ―excellent‖ at or above 85%*
257 / 315 or 82%
268 / 315 or 85%
211 / 229 or 92%
211 / 229 or 92%
Maintain percentage of facilities passing semi-annual quality inspections at 87%
104 / 124 or 84%
108 / 124 or 87%
108 / 124 or 87%
108 / 124 or 87%
* The City conducts an internal customer satisfaction survey. The last survey was conducted in FY11, and the next survey will take place in FY13.
TABLE 14-130. Regular Positions
Position Title Adopted
FY10 Adopted
FY11 Adopted
FY12
Asst. Facilities Engineer (grade A13)*
1.6 1.6 2.0
Crew Supervisor (grade A14) 2.0 2.0 2.0

Department of Recreation and Parks Division: Facilities
14 - 51
Square Footage of Facilities by Fiscal Year
826,299 855,275 870,129952,429
855,779844,385
200,000
400,000
600,000
800,000
1,000,000
1,200,000
FY07 FY08 FY09 FY10 FY11 FY12
Position Title Adopted
FY10 Adopted
FY11 Adopted
FY12
Facilities Engineer (grade A16) 1.0 1.0 1.0
Facilities Maint. Trades Worker (grade U4)
5.0 5.0 5.0
Facilities Maintenance Specialist (grade A18)**
0.0 0.0 1.0
Facilities Property Mgr. (grade A25) 1.0 1.0 1.0
Laborer (grade U1)*** 4.0 4.0 3.0
Maintenance Worker (grade U2) 1.0 1.0 1.0
Cost Center Total 15.6 15.6 16.0
* A 0.4 FTE Assistant Facilities Engineer moved from the Town Center Parking Garages cost center into the Facilities Maintenance cost center for FY12.
** A 0.5 FTE Facilities Maintenance Specialist moved from the Town Center Parking Garages cost center into the Facilities Maintenance cost center, and a 0.5 FTE Facilities Maintenance Specialist moved from the Town Center Management District cost center into the Facilities Maintenance cost center for FY12.
*** A 1.0 FTE Laborer was eliminated in FY12.
Supplemental Information: GRAPH 14-10. The square footage of City facilities doubled from FY06 to FY07.
This increase was due to the addition of the Town Center garages and the Arts and Innovation Center. The graph shows the following additions after that major increase: FY08 to FY11 include the Thomas Farm Community Center, the Swim Center Meet/Fit Room, and Salt Barn. For years FY11 and FY12 additions include a new Motor Vehicle Maintenance Shop at the Gude Drive Maintenance Complex, Senior Center fitness expansion and the Rockville City Police Station.
Cost Center: Lincoln Park Community Center
TABLE 14-131. Cost Center Summary
Actual
FY10 Adopted
FY11* Est. Act.
FY11 Adopted
FY12
Total Expenditures 280,776 349,490 340,990 345,090
Total Revenues 46,265 52,600 52,600 52,600
* In order to more accurately reflect direct costs, utilities were moved from the Facilities Maintenance cost center to each community center’s budget beginning in FY11. In FY11, this move added a total of $45,610 for electricity, water, sewer, and stormwater costs to this cost center’s adopted budget.
Objectives
Offer a variety of high quality educational, wellness and leisure opportunities in order to engage all members of the community in
positive activities and increase participation
Provide high quality activities that support healthy living
Provide a well maintained facility for drop-in and structured programs
Provide outstanding customer service in order to create a positive
experience for patrons and participants
TABLE 14-132. Performance Measures
Actual
FY10 Target
FY11 Est. Act.
FY11 Target
FY12
Maintain the number of visits to LPCC at or above 55,620
54,375 55,620 63,400 55,620
Maintain a minimum of 600 programs offered
518 518 611 600
Maintain the number of recreation programs at 386
294 304 386 386
Increase the number of rentals to 598
546 567 592 598

Department of Recreation and Parks Division: Facilities
14 - 52
Actual
FY10 Target
FY11 Est. Act.
FY11 Target
FY12
Maintain the customer satisfaction surveys from the center rating the service and programs as ―excellent‖ or ―good‖ at 95%*
90% 95% 95% 95%
* The citizen satisfaction survey is conducted every two years. A survey was conducted in FY11, and the next survey will be conducted in FY13.
TABLE 14-133. Regular Positions
Position Title Adopted
FY10 Adopted
FY11 Adopted
FY12
Activity Instructor I (grade R2) 0.5 0.5 0.5
Asst. Community Center Supervisor (grade A16)
1.0 1.0 1.0
Clerk II (grade R2) 0.8 0.8 0.8
Clerk III (grade R4)* 0.5 0.0 0.0
Community Center Supervisor (grade A21)
1.0 1.0 1.0
Cost Center Total 3.8 3.3 3.3
* The Clerk III position was frozen during FY10 and eliminated for FY11 due to limited General Fund resources.
Supplemental Information
The Lincoln Park Community Center (LPCC) provides a variety of high quality programs for drop-in use and/or structured events within a well-maintained facility. LPCC offers classes, educational programs, special workshops, fitness opportunities, special events, a compliment to the school curriculum for youth, computer activities and adventure sports activities.
Cost Center: Swim and Fitness Center
TABLE 14-134. Cost Center Summary
Actual
FY10 Adopted
FY11 Est. Act.
FY11 Adopted
FY12
Total Expenditures 1,711,264 1,730,430 1,734,270 1,774,530
Total Revenues 1,663,608 1,694,000 1,694,000 1,827,440
Objectives
Operate the Rockville Swim and Fitness Center as the premier
indoor/outdoor aquatic center in the area
Anticipate the changing needs and desires of Swim and Fitness Center patrons and adopt high quality instructional, fitness, and competitive
programs and opportunities to meet these demands
TABLE 14-135. Performance Measures
Actual
FY10 Target
FY11 Est. Act.
FY11 Target
FY12
Minimize the number of hours closed for unscheduled repairs or maintenance
0 hours 0 hours 0 hours 0 hours
Maintain 95% of clients rating program experience as ―good‖ or ―excellent‖
847 / 903
or 94 %
1,330 / 1,400
or 95%
1,034 / 1,100
or 94%
1,140 / 1,200
or 95%
TABLE 14-136. Workload Measures
Actual
FY10 Target
FY11 Est. Act.
FY11 Estimate
FY12
Number of members visiting *
4,726 N/A 4,800 4,900
Number of member visits *
112,267 N/A 115,000 118,000
Number of daily admissions *
55,625 N/A 55,500 56,000
Number of aquatic program registrations *
5,807 N/A 5,750 5,850

NumteamNumprog
* N TABL
Pos
Aqu(gradAquAquClerHeaLifeSecSenSwiSwi(gradCos
* T** T
l
mber competitive m registrations * mber of “dry” gram registrations *New measure for FY1
LE 14-137. Regula
sition Title
uatics Facilities Opede A12)
uatics Facility Manauatics Supervisor (grk III (grade R4) * ad Swim Coach (graguard II (grade R6)
cretary/Bookkeepernior Swim Instructorm Center Assistantm Center Superintede A24) st Center Total The Clerk III position wThe Lifeguard II posimited General Fund
Actual FY10
747
* 240
12.
ar Positions
erator
ager (grade A18) grade A19)
ade R7) )** r (grade A13) r (grade R8) t (grade A9) endent
was eliminated for FYition was frozen durresources.
Departm
Target FY11
Es
N/A
N/A
Adopted FY10
Ado
1.0
1.0 1.0 0.5 1.0 1.0 1.0 0.8 1.0
1.0
9.3 Y12. ring FY10 and elimin
ment of RDivisi
st. Act. FY11
EstimaFY1
720 75
300 40
opted FY11
AdopteFY1
1.0 1
1.0 11.0 10.5 01.0 10.0 01.0 10.8 01.0 1
1.0 1
8.3 7
nated for FY11 due
Recreatioion: Facilitie
14 - 53
te 12
50
00
ed 12
.0
.0
.0
.0
.0
.0
.0
.8
.0
.0
.8
to
SuppleGRAPHand Fitnlargest c
FIGUREChamp
on and Pes
mental InformatioH 14-11. Swim Ceness Center’s revencontributor to that i
E 14-15. Montgpionship.
Parks
on enter Revenue Hinue has increased ncrease being reve
gomery County S
story. This graphover the past seve
enues from swim le
Swim League Al
h shows the Swim eral years, with the essons.
ll-Star Individual

Department of Recreation and Parks Division: Facilities
14 - 54
Cost Center: Thomas Farm Community Center TABLE 14-138. Cost Center Summary
Actual
FY10 Adopted
FY11* Est. Act.
FY11 Adopted
FY12
Total Expenditures 323,464 417,480 414,480 435,510
Total Revenues 172,001 180,000 180,000 195,000
* In order to more accurately reflect direct costs, utilities were moved from the Facilities Maintenance cost center to each community center’s budget beginning in FY11. In FY11, this move added a total of $52,650 for electricity, water, and sewer costs to this cost center’s adopted budget.
Objectives
Provide high quality programs and services in order to attract visitors
and meet the needs of the community
Develop a marketing plan to reach residents and businesses for rental
opportunities in order to generate revenue
Partner with local businesses and/or community organizations in order to develop relationships that benefit both the community center and the
businesses
TABLE 14-139. Performance Measures
Actual
FY10 Target
FY11 Est. Act.
FY11 Target
FY12
Achieve a minimum of 85,500 total visits to the Thomas Farm Community Center
Total Visits
Member Visits
Day Pass Visits
Rental Visits
Other Visits
76,088 34,007 1,449
12,752 27,880
75,000 35,000 1,000
15,000 24,000
85,500 36,000 1,500
18,000 30,000
85,500 36,000 1,500
18,000 30,000
Maintain 1,000 rental hours annually
1,024 1,000 1,000 1,000
Establish a minimum of 6 partnerships
2 10 4 6
TABLE 14-140. Regular Positions
Position Title Adopted
FY10 Adopted
FY11 Adopted
FY12
Assistant Community Center Supervisor (grade A16)
1.0 1.0 1.0
Community Center Supervisor (grade A21)
1.0 1.0 1.0
Cost Center Total 2.0 2.0 2.0
Supplemental Information
The 18,000 square foot facility includes a fitness room, full-size gymnasium, recreation room, two multi-purpose rooms, kitchen, bathroom and shower facilities, large useable lobby area, storage, office space and parking lot. The Thomas Farm Community Center offers high quality programs and services for its members and for registered participants in City of Rockville classes, camps, workshops and sports leagues. Center participants of all ages have numerous opportunities for drop-in activities, fitness workouts, social activities, educational programs, special events and rentals for private parties, meetings and sporting events. FIGURE 14-16. Thomas Farm Community Center.

Department of Recreation and Parks Division: Facilities
14 - 55
Cost Center: Town Center Parking Garages
The FY12 budget for the Parking Fund incorporates the anticipated leasing of the Town Square parking garage operations to Federal Realty Investment Trust (FRIT). The City has entered into negotiations with FRIT to enable FRIT to manage, operate and renovate the garages under a long-term lease agreement the details of which are being finalized. The anticipated start date of the new management and operations is September 1, 2011. Under the anticipated arrangement, FRIT will be responsible for setting the rates both for hourly parking and for monthly parking in the garages and it will also be responsible for all capital improvements and renovations during the term of the lease. In anticipation of the lease agreement being finalized, the City’s budget for FY12 was changed to represent only operational costs for on-street meters along with the payment of debt service on the garages (budgeted in Police and Non-Departmental). This change eliminates the Town Square Parking Garages cost center from the Facilities Division in Recreation and Parks. This section remains in the FY12 Adopted Budget book for historical reference. TABLE 14-141. Cost Center Summary
Actual
FY10 Adopted
FY11 Est. Act.
FY11 Adopted
FY12
Total Expenditures 793,754 1,090,375 1,060,375 N/A
Total Revenues N/A N/A N/A N/A
TALBE 14-142. Performance Measures
Actual
FY10 Target
FY11 Est. Act.
FY11 Target
FY12
Increase average annual percent occupancy to 50%
374 / 958 or 39%
402 / 958 or 42%
448 / 958 or 47%
N/A
TABLE 14-143. Workload Measures
Actual
FY10 Estimate
FY11 Est. Act.
FY11 Estimate
FY12
Number of parking permits issued (by type):
Monthly
Three-month*
163 N/A
180 N/A
272 32
N/A N/A
* Three-month passes were not offered for a full year until FY11.
TABLE 14-144. Regular Positions
Position Title Adopted
FY10 Adopted
FY11 Adopted
FY12
Assistant Facilities Engineer (grade A13)* 0.4 0.4 N/A
Facilities Maintenance Specialist (grade A18)**
0.5 0.5 N/A
Cost Center Total 0.9 0.9 N/A
* A 0.4 FTE Assistant Facilities Engineer moved from the Town Center Parking Garages cost center into the Facilities Maintenance cost center for FY12.
** A 0.5 FTE Facilities Maintenance Specialist moved from the Town Center Parking Garages cost center into the Facilities Maintenance cost center for FY12.
FIGURE 14-17. The 355 Town Center Parking Garage.

Department of Recreation and Parks Division: Facilities
14 - 56
Cost Center: Town Center Management District (370)
Starting July 1, 2011, Federal Realty Investment Trust (FRIT), the commercial developer of Town Square, will take over the maintenance and operational costs of the Town Center Management District (TCMD). Since FRIT will manage the District, the TCMD Fund is not included in the FY 2012 adopted budget, and the tax rates are set at $0.00. This section remains in the FY12 Adopted Budget book for historical reference. TALBE 14-145. Cost Center Summary
Actual
FY10 Adopted
FY11 Est. Act.
FY11 Adopted
FY12
Total Expenditures 773,335 728,595 728,590 N/A
Total Revenues* N/A N/A N/A N/A
* A history of the Town Center Management District Revenues can be found in Section 3 (Fund Summaries), page 3-29, of this book.
TABLE 14-146. Performance Measures
Actual
FY10 Target
FY11 Est. Act.
FY11 Target
FY12
Maintain percent of Citizen Survey respondents rating the maintenance of Town Square as ―excellent‖ or ―good‖ at 85% or higher*
N/A 87% 87% N/A
* The City conducts a citizen survey every other year.
TABLE 14-147. Workload Measures
Actual
FY10 Estimate
FY11 Est. Act.
FY11 Estimate
FY12
Number of incidental service requests
95 90 90 N/A
TABLE 14-148. Regular Positions
Position Title Adopted
FY10 Adopted
FY11 Adopted
FY12
Facilities Maintenance Specialist (grade A18)*
0.5 0.5 N/A
Cost Center Total 0.5 0.5 N/A
* A 0.5 FTE Facilities Maintenance Specialist moved from the Town Center Management District cost center into the Facilities Maintenance cost center for FY12.
Cost Center: Twinbrook Community Recreation Center TABLE 14-149. Cost Center Summary
Actual
FY10 Adopted
FY11* Est. Act.
FY11 Adopted
FY12
Total Expenditures 321,766 372,530 370,530 398,920
Total Revenues 147,174 135,100 135,100 149,610
* In order to more accurately reflect direct costs, utilities were moved from the Facilities Maintenance cost center to each community center’s budget beginning in FY11. In FY11, this move added a total of $75,410 for electricity, water, sewer, and stormwater costs to this cost center’s adopted budget.
Objectives
Provide high quality customer service in order to create a positive
experience for patrons and participants
Initiate new marketing strategies, involving members of the community in program selections and recognizing changing demographics in the
community to attract visitors
Continue to schedule a wide variety of programs in order to meet the
needs of a diverse community
TABLE 14-150. Performance Measures
Actual
FY10 Target
FY11 Est. Act.
FY11 Target
FY12
Maintain percentage of patrons rating the service and programs as ―excellent‖ or ―good‖ on customer satisfaction surveys at or above 95%
475 / 500 or 95%
475 / 500 or 95%
480 / 500 or 96%
480 / 500 or 96%
Maintain total number of visits to the center at 65,000
65,949 70,000 65,000 65,000
Maintain number of rentals at 375
410 350 375 375

Department of Recreation and Parks Division: Facilities
14 - 57
TABLE 14-151. Workload Measures
Actual
FY10 Estimate
FY11 Est. Act.
FY11 Estimate
FY12
Number of programs 924 1,300 950 1,000
TABLE 14-152. Regular Positions
Position Title Adopted
FY10 Adopted
FY11 Adopted
FY12
After School Director (grade R5) 0.4 0.4 0.4
Asst. Community Center Supervisor (grade A16)
1.0 1.0 1.0
Community Center Supervisor (grade A21)
1.0 1.0 1.0
Cost Center Total 2.4 2.4 2.4
Supplemental Information
Twinbrook Community Recreation Center has a full-size gymnasium, a learning center with nine computers, two multipurpose rooms, a fitness room, locker rooms and an annex building. Services provided include after school care, classes, workshops, community meetings and gatherings, sporting events, dances, private and business rentals and special events throughout the year. The after school program provides tutoring, crafts, games, physical fitness, field trips and other age appropriate activities to 30 children during the school year.
The number of programs at Twinbrook Community Recreation Center represents the number of times a room is used for a specific activity. For example, basketball games are played on ten weekends, January through March, with six games on Saturday, and seven games on Sunday. This is reflected as 130 programs; approximately 17 classes are offered each semester for eight weeks, which is reflected as 136 programs using space in the center; and Teen Programs After School Lounge held in the multipurpose room five times a week for 36 weeks, which is reflected as 180 programs.
FIGURE 14-18. Twinbrook Community Recreation Center gymnasium.

Department of Recreation and Parks Division: Parks and Open Space
14 - 58
Division: Parks and Open Space
TABLE 14-153 Actual
FY10
Adopted
FY11
Est. Act.
FY11
Adopted
FY12
Division Expenditures
by Cost Center
Parks Admin & Support 625,788 598,350 587,200 642,470
East Parks Services 495,880 485,830 485,830 498,730
West Parks Services 479,103 567,720 567,720 632,510
Athletic Fields Services 534,000 555,900 547,900 554,290
Horticulture Services 805,476 854,700 854,250 886,870
Rights-of-Way Maint. 403,779 424,830 435,980 433,460
Urban Forestry Maint. 881,656 920,470 1,025,070 953,540
Forestry Dev. Review 158,516 162,690 162,690 167,650
Forest & Tree
Preservation (350)3,986 6,000 30,830 20,050
Park Maint. Fund (350) 22,500 42,600 42,600 40,050
Division Total $4,410,684 $4,619,090 $4,740,070 $4,829,620
TABLE 14-154 Actual
FY10
Adopted
FY11
Est. Act.
FY11
Adopted
FY12
Division Expenditures
by Type
Salary and Wages 2,458,297 2,504,750 2,471,750 2,531,840
Benefits 691,398 794,690 794,690 883,460
Overtime 133,669 59,500 60,460 54,500
Personnel Subtotal $3,283,364 $3,358,940 $3,326,900 $3,469,800
Contractual Services 957,880 1,070,560 1,198,750 1,132,460
Commodities 159,139 175,050 199,880 193,900
Capital Outlays 10,301 14,540 14,540 33,460
Other 0 0 0 0
Operating Subtotal $1,127,320 $1,260,150 $1,413,170 $1,359,820
Division Total $4,410,684 $4,619,090 $4,740,070 $4,829,620
TABLE 14-155 Actual
FY10
Adopted
FY11
Est. Act.
FY11
Adopted
FY12
Source of
Division Funds
Interest Income (350) 19 1,000 1,000 50
Comm. Cont. (350) 18,421 20,000 44,830 60,050
Miscellaneous (110) 64,604 60,000 60,000 40,000
Subtotal $83,044 $81,000 $105,830 $100,100
General Fund (110) 4,319,594 4,510,490 4,606,640 4,729,520
Special Activities (350) 8,046 27,600 27,600 0
Subtotal $4,327,640 $4,538,090 $4,634,240 $4,729,520
Division Total $4,410,684 $4,619,090 $4,740,070 $4,829,620
TABLE 14-156 Actual
FY10
Adopted
FY11
Est. Act.
FY11
Adopted
FY12
Staffing Summary
by Cost Center (FTEs)
Regular
Parks Admin & Support 6.0 6.0 6.0 6.0
East Parks Services 6.5 6.5 6.5 6.5
West Parks Services 8.0 8.0 8.0 8.0
Athletic Fields Services 7.5 7.5 7.5 7.5
Horticulture Services 7.0 7.0 7.0 7.0
Rights-of-Way Maint. 4.5 3.5 3.5 3.5
Urban Forestry Maint. 6.0 6.0 6.0 6.0
Forestry Dev. Review 2.0 2.0 2.0 2.0
Regular Subtotal 47.5 46.5 46.5 46.5
Temporary
Parks Admin & Support 0.7 0.6 0.6 0.3
Horticulture Services 0.6 0.6 0.6 0.5
Rights-of-Way Maint. 0.7 0.7 0.7 0.8
Urban Forestry Maint. 0.7 0.8 0.8 0.7
Temporary Subtotal 2.7 2.7 2.7 2.3
Division Total 50.2 49.2 49.2 48.8

Department of Recreation and Parks Division: Parks and Open Space
14 - 59
Division: Parks and Open Space
Division Purpose
The purpose of this Division is threefold: (1) to maintain 65 City parks and open space areas, 142 acres of rights-of-way and 27 acres of facility grounds in conditions that are safe, attractive and ready to function as designed; (2) to provide quality playing conditions on the City’s 37 athletic fields and (3) to promote, protect and enhance the urban forest throughout Rockville. Trained professionals perform maintenance activities in a safe, timely and efficient manner, using the highest workmanship standards and quality materials. Division responsibilities include turf maintenance, landscaping, minor construction, tree maintenance, athletic field maintenance, snow removal, playground safety and maintenance, athletic court maintenance, the installation of flowerbeds, tree planting, support of special events and Forest and Tree Preservation Ordinance administration. Significant Changes from Adopted to Adopted
The Parks and Open Space Division’s FY12 Adopted budget represents a 5% increase over the FY11 Adopted budget due to a combination of increases in salary and benefit costs, a $5,000 reduction in overtime spending, the addition of $60,500 in operating cost impacts for contractual services related to non-native invasive species plant management and construction and maintenance of pocket parks, an increase in planned Forest and Tree Preservation Special Activities Fund commodity spending, and the reallocation of funding from within the Department into this Division to fund replacement grounds maintenance equipment.
The Parks and Open Space Division’s FY12 Adopted revenue budget represents a 24% increase over the FY11 Adopted budget due to a combination of increases in anticipated contributions to the Forest and Tree Preservation and Park Maintenance Special Activities Funds, and a decrease in miscellaneous revenues, which are tied to development.
Supplemental Information
CIP Projects that support the activities of this Division include:
Asphalt/Concrete Improvements
Athletic Courts Repair/Replacement
Ballfield Equipment Replacement
Gude Drive Facility Improvements
King Farm Farmstead Improvement
Outdoor Security Lighting
Playground Equipment Replacement
Park Pedestrian Bridge Repair/Replacement
GRAPH 14-12. The City maintains a number of parks, playgrounds, and athletic
fields for resident recreation and enjoyment.
Park Amenities
21
54
9 10
53
43
104
1 2
0
20
40
60
So
ftb
all
Fie
lds
Ba
se
ba
ll
Fie
lds
Ba
ske
tba
ll
(Ou
tdo
or)
Ba
ske
tba
ll
(In
do
or)
Do
g P
ark
s
Fo
otb
all
Fie
lds
So
cce
r a
nd
Mu
lti-
Use
Fie
lds
Pla
y
Eq
uip
me
nt
Te
nn
is
Co
urt
s
Vo
lleyb
all
Co
urt
s
GRAPH 14-13. This park type graph has been updated in accordance with the
Parks, Recreation and Open Space (PROS) Plan adopted by the Mayor and Council in FY11, which included a more comprehensive accounting of City parks and open space than has been done previously.
Park and Open Space Acres by Park Type
64
407
210
142
27
354
0
200
400
600
Ath
letic
Park
s
/ F
ield
s
City
wid
e
Park
s
Neig
hborh
ood
Park
s
Open S
pace
and F
ore
ste
d
Are
as
Rig
hts
-of-
Way A
cre
s
Oth
er
Gro
unds
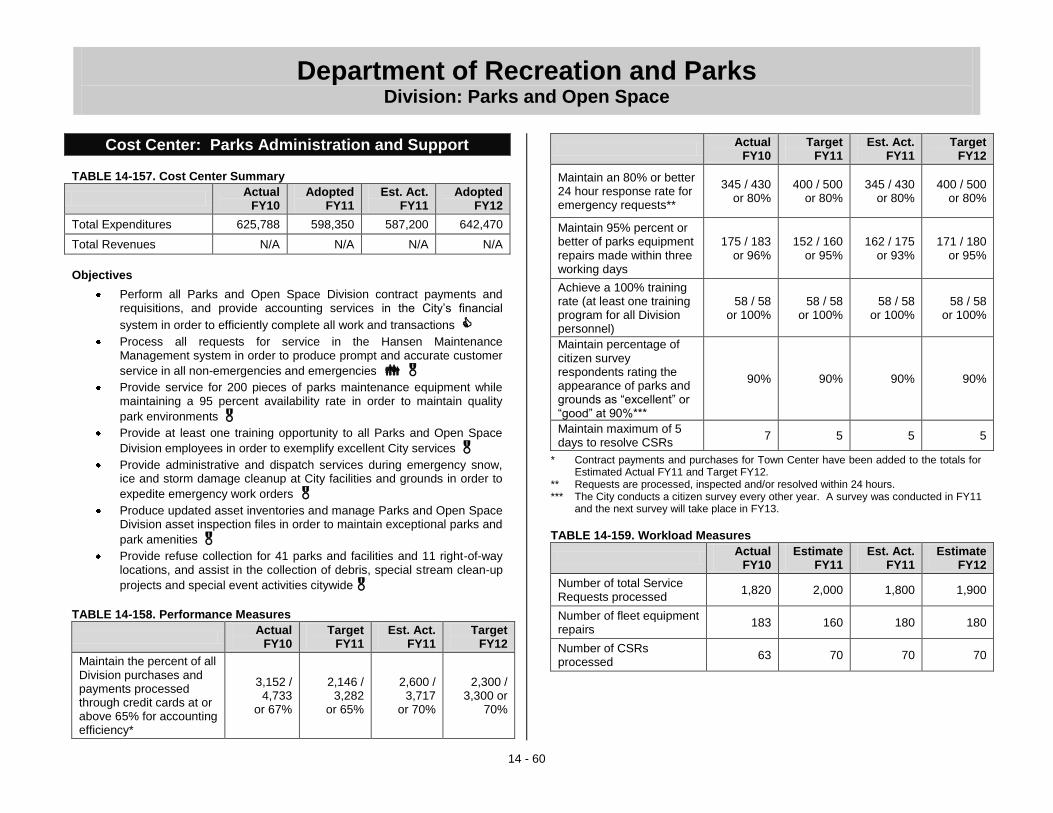
Department of Recreation and Parks Division: Parks and Open Space
14 - 60
Cost Center: Parks Administration and Support TABLE 14-157. Cost Center Summary
Actual
FY10 Adopted
FY11 Est. Act.
FY11 Adopted
FY12
Total Expenditures 625,788 598,350 587,200 642,470
Total Revenues N/A N/A N/A N/A
Objectives
Perform all Parks and Open Space Division contract payments and requisitions, and provide accounting services in the City’s financial
system in order to efficiently complete all work and transactions
Process all requests for service in the Hansen Maintenance Management system in order to produce prompt and accurate customer
service in all non-emergencies and emergencies
Provide service for 200 pieces of parks maintenance equipment while maintaining a 95 percent availability rate in order to maintain quality
park environments
Provide at least one training opportunity to all Parks and Open Space
Division employees in order to exemplify excellent City services
Provide administrative and dispatch services during emergency snow, ice and storm damage cleanup at City facilities and grounds in order to
expedite emergency work orders
Produce updated asset inventories and manage Parks and Open Space Division asset inspection files in order to maintain exceptional parks and
park amenities
Provide refuse collection for 41 parks and facilities and 11 right-of-way locations, and assist in the collection of debris, special stream clean-up
projects and special event activities citywide
TABLE 14-158. Performance Measures
Actual
FY10 Target
FY11 Est. Act.
FY11 Target
FY12
Maintain the percent of all Division purchases and payments processed through credit cards at or above 65% for accounting efficiency*
3,152 / 4,733
or 67%
2,146 / 3,282
or 65%
2,600 / 3,717
or 70%
2,300 /
3,300 or 70%
Actual
FY10 Target
FY11 Est. Act.
FY11 Target
FY12
Maintain an 80% or better 24 hour response rate for emergency requests**
345 / 430 or 80%
400 / 500 or 80%
345 / 430 or 80%
400 / 500 or 80%
Maintain 95% percent or better of parks equipment repairs made within three working days
175 / 183 or 96%
152 / 160 or 95%
162 / 175
or 93%
171 / 180 or 95%
Achieve a 100% training rate (at least one training program for all Division personnel)
58 / 58 or 100%
58 / 58 or 100%
58 / 58 or 100%
58 / 58 or 100%
Maintain percentage of citizen survey respondents rating the appearance of parks and grounds as ―excellent‖ or ―good‖ at 90%***
90% 90% 90% 90%
Maintain maximum of 5 days to resolve CSRs
7 5 5 5
* Contract payments and purchases for Town Center have been added to the totals for Estimated Actual FY11 and Target FY12.
** Requests are processed, inspected and/or resolved within 24 hours. *** The City conducts a citizen survey every other year. A survey was conducted in FY11
and the next survey will take place in FY13.
TABLE 14-159. Workload Measures
Actual
FY10 Estimate
FY11 Est. Act.
FY11 Estimate
FY12
Number of total Service Requests processed
1,820 2,000 1,800 1,900
Number of fleet equipment repairs
183 160 180 180
Number of CSRs processed
63 70 70 70

Department of Recreation and Parks Division: Parks and Open Space
14 - 61
TABLE 14-160. Regular Positions
Position Title Adopted
FY10 Adopted
FY11 Adopted
FY12
Management Assistant (grade A16) 1.0 1.0 1.0
Parks Equipment Mechanic (grade A15) 1.0 1.0 1.0
Parks and Facilities Admin. Supervisor (grade A19)
1.0 1.0 1.0
Parks Sanitation Operator (grade U2) 1.0 1.0 1.0
Secretary III (grade A13) 1.0 1.0 1.0
Superintendent of Parks and Facilities (grade A27)
1.0 1.0 1.0
Cost Center Total 6.0 6.0 6.0
Cost Center: East Parks Services TABLE 14-161. Cost Center Summary
Actual
FY10 Adopted
FY11 Est. Act.
FY11 Adopted
FY12
Total Expenditures 495,880 485,830 485,830 498,730
Total Revenues N/A N/A N/A N/A
Objectives
Provide maintenance and management for 18 parks, including 2 major athletic parks, and 24 public playgrounds, in order to provide high quality clean and green parks and open spaces that contribute to distinct neighborhoods and environmental quality. Quality standards are met through preventative services, including but not limited to, turf
maintenance, litter/leaf/graffiti removal and hardscape maintenance
Perform monthly safety inspection schedule for 24 public playgrounds to
ensure compliance with manufacturer and industry standards
TABLE 14-162. Performance Measures
Actual
FY10 Target
FY11 Est. Act.
FY11 Target
FY12
Achieve 85% or better for the percentage of parks that meet the minimum park standards*
16 / 18 or 89%
15 / 18 or 83%
15 / 18 or 83%
16 / 18 or 89%
Complete 100% of scheduled monthly playground safety inspections**
288 / 288 or 100%
228 / 228 or 100%
288 / 288 or 100%
288 / 288 or 100%
* Each inspection must meet 85 percent of the standards to pass. ** Inspections identify and correct safety related issues.
TABLE 14-163. Workload Measures
Actual
FY10 Estimate
FY11 Est. Act.
FY11 Estimate
FY12
Number of scheduled mowings
340 310 340 340
Number of non-routine and emergency work orders completed
80 150 120 120
Number of park maintenance standard quality assurance inspections completed
36 36 36 36
TABLE 14-164. Regular Positions
Position Title Adopted
FY10 Adopted
FY11 Adopted
FY12
Crew Supervisor (grade A14) 1.0 1.0 1.0
Laborer (grade U1) 4.0 4.0 4.0
Maintenance Worker (grade U2) 1.0 1.0 1.0
Parks Maintenance Supervisor (grade A21)
0.5 0.5 0.5
Cost Center Total 6.5 6.5 6.5

Department of Recreation and Parks Division: Parks and Open Space
14 - 62
Supplemental Information FIGURE 14-19. Map of sites covered by the East Parks Services cost center.
Cost Center: West Parks Services TABLE 14-165. Cost Center Summary
Actual
FY10 Adopted
FY11 Est. Act.
FY11 Adopted
FY12
Total Expenditures 479,103 567,720 567,720 632,510
Total Revenues N/A N/A N/A N/A
Objectives
Provide maintenance and management for 22 parks and 24 public playgrounds in order to provide high quality clean and green parks and open spaces that contribute to distinct neighborhoods and environmental quality. Quality standards are met through preventative services, including but not limited to, turf maintenance, litter/leaf/graffiti
removal and hardscape maintenance
Perform monthly safety inspection schedule for 24 public playgrounds to
ensure compliance with manufacturer and industry standards
Coordinate routine and emergency electric and security/surveillance system repairs and installations in order to maintain safe and energy
efficient City facilities
TABLE 14-166. Performance Measures
Actual
FY10 Target
FY11 Est. Act.
FY11 Target
FY12
Maintain 85% or higher for the percentage of parks that meet the minimum park standards*
21 / 22 or 95%
20 / 22 or 91%
19 / 22 or 86%
20 / 22 or 91%
Complete 100% of scheduled monthly playground safety inspections
288 / 288 or 100%
288 / 288 or 100%
288 / 288 or 100%
288 / 288 or 100%
Maintain the number / percent of emergency electric repairs responded to within 1 hour of notification of emergency at 100%
27 / 27 or 100%
85 / 85 or 100%
45 / 45 or 100%
45 / 45 or 100%
* Must meet 85 percent of the standards to pass inspection.
TABLE 14-167. Workload Measures
Actual
FY10 Estimate
FY11 Est. Act.
FY11 Estimate
FY12
Number of scheduled mowings
380 310 380 380
Number of scheduled electric work orders completed
104 100 100 100
Number of park maintenance standard quality assurance inspections completed
44 44 44 44
Number of non-routine and emergency work orders completed
58 100 75 75

Department of Recreation and Parks Division: Parks and Open Space
14 - 63
TABLE 14-168. Regular Positions
Position Title Adopted
FY10 Adopted
FY11 Adopted
FY12
Crew Supervisor (grade A14) 1.0 1.0 1.0
Groundskeeper (grade R5) 0.5 0.5 0.5
Laborer (grade U1) 5.0 5.0 5.0
Maintenance Worker (grade U2) 1.0 1.0 1.0
Parks Services Manager (grade A23) 0.5 0.5 0.5
Cost Center Total 8.0 8.0 8.0
Supplemental Information FIGURE 14-20. Map of sites covered by the West Parks Services cost center.
Cost Center: Athletic Field Services TABLE 14-169. Cost Center Summary
Actual
FY10 Adopted
FY11 Est. Act.
FY11 Adopted
FY12
Total Expenditures 534,000 555,900 547,900 554,290
Total Revenues N/A N/A N/A N/A
Objectives
Maintain 37 City athletic fields (some of which serve more than one sport and require multiple levels of maintenance), and 4 Montgomery County School fields in a safe and functional condition for scheduled
sport leagues, team games, team practices, and neighborhood use
Perform an elevated level of service during tournament play on weekends with Rockville leagues hosting visiting teams from outside of
the city.
TABLE 14-170. Performance Measures
Actual
FY10 Target
FY11 Est. Act.
FY11 Target
FY12
Maintain a minimum of 90% percent of Citizen Survey respondents rating athletic fields, such as baseball, soccer or football, as ―excellent‖ or ―good‖*
90% 90% 90% 90%
* The City conducts a citizen survey every other year. A survey was conducted in FY11 and the next survey will take place in FY13.
TABLE 14-171. Workload Measures
Actual
FY10 Estimate
FY11 Est. Act.
FY11 Estimate
FY12
Municipal and public fields maintained*
37 59 37 37
Number of pre-game or practice field set-ups and maintenance completed
6,200 6,600 6,200 6,200
* This figure decreased based on the PROS Plan adopted by the Mayor and Council in FY11. The PROS Plan counts the number of athletic fields, whereas the original FY11 Estimate was based on the total count of all the uses of all the fields (so fields were counted more than once if they were used for more than one sport).

Department of Recreation and Parks Division: Parks and Open Space
14 - 64
TABLE 14-172. Regular Positions
Position Title Adopted
FY10 Adopted
FY11 Adopted
FY12
Laborer (grade U1) 4.0 4.0 4.0
Maintenance Worker (grade U2) 1.0 1.0 1.0
Parks Services Manager (grade A23) 0.5 0.5 0.5
Sports Facilities & Athletic Field Maintenance Supervisor (grade A15)
1.0 1.0 1.0
Sports Field Specialist (grade A13) 1.0 1.0 1.0
Cost Center Total 7.5 7.5 7.5
Cost Center: Horticulture Services TABLE 14-173. Cost Center Summary
Actual
FY10 Adopted
FY11 Est. Act.
FY11 Adopted
FY12
Total Expenditures 805,476 854,700 854,250 886,870
Total Revenues N/A N/A N/A N/A
Objectives
Provide horticultural services to maintain detailed and attractive landscapes within parks, facilities and rights-of-ways throughout the City. Quality standards are met through preventative services, including but not limited to, turf maintenance, litter/leaf/graffiti removal and
hardscape maintenance
Provide maintenance and management for 20 parks, City Hall and 4 public playgrounds in order to provide high quality clean and green parks and open spaces that contribute to distinct neighborhoods and
environmental quality
Administer the policies of the Master Street Tree Plan with the goal to ensure that each suitable planting space in the City is planted, unless conditions prohibit doing so, through replanting trees following removals
from City rights-of-way
TABLE 14-174. Performance Measures
Actual
FY10 Target
FY11 Est. Act.
FY11 Target
FY12
Maintain or increase number of annual beds planted compared to previous year
140 140 170 175
Achieve 85% or higher for the percentage of parks that meet the minimum park standards*
41 / 42 or 98%
34 / 42 or 81%
38 / 42 or 90%
34 / 42 or 81%
Achieve 70% replanting of street trees removed
384 / 516 or 74%
300 / 500 or 60%
350 / 500 or 70%
350 / 500 or 70%
* Each inspection must meet 85 percent of the standards to pass.
TABLE 14-175. Workload Measures
Actual
FY10 Estimate
FY11 Est. Act.
FY11 Estimate
FY12
Number of scheduled work orders completed
1,860 1,500 1,500 1,500
TABLE 14-176. Regular Positions
Position Title Adopted
FY10 Adopted
FY11 Adopted
FY12
Crew Supervisor (grade A14) 1.0 1.0 1.0
Horticulturist (grade A23) 1.0 1.0 1.0
Laborer (grade U1) 3.0 3.0 3.0
Maintenance Worker (grade U2) 1.0 1.0 1.0
Parks Maintenance Specialist (grade A17)
1.0 1.0 1.0
Cost Center Total 7.0 7.0 7.0
TABLE 14-177. Planned Improvement Projects
Fiscal Year Funding Description
FY 2013 $15,000 Veterans Park landscape improvements
FY 2014 $107,700 Civic Center Park stream valley cleanup
FY 2014 $120,000 Adaptive re-use study for King Farm Farmstead Park
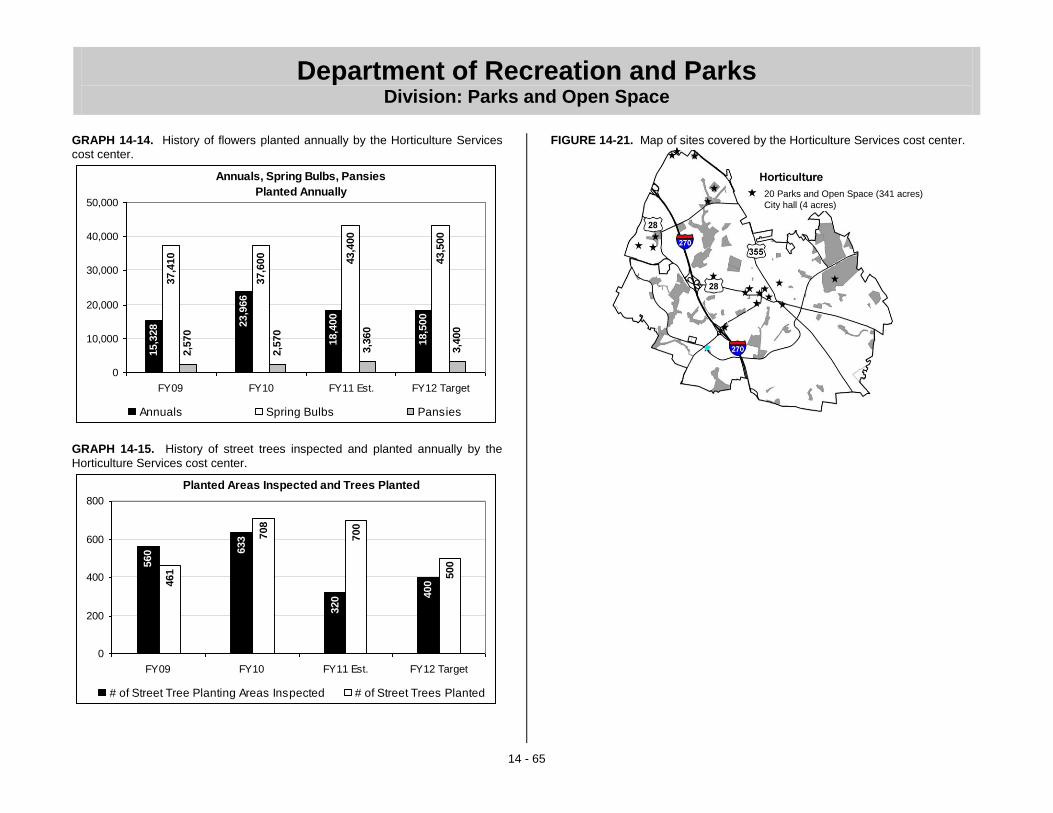
Department of Recreation and Parks Division: Parks and Open Space
14 - 65
GRAPH 14-14. History of flowers planted annually by the Horticulture Services
cost center.
Annuals, Spring Bulbs, Pansies
Planted Annually
15,3
28 2
3,9
66
18,4
00
18,5
00
37,4
10
37,6
00
43,4
00
43,5
00
2,5
70
2,5
70
3,3
60
3,4
00
0
10,000
20,000
30,000
40,000
50,000
FY09 FY10 FY11 Est. FY12 Target
Annuals Spring Bulbs Pansies
GRAPH 14-15. History of street trees inspected and planted annually by the
Horticulture Services cost center.
Planted Areas Inspected and Trees Planted
560 6
33
320 4
00461
708
700
500
0
200
400
600
800
FY09 FY10 FY11 Est. FY12 Target
# of Street Tree Planting Areas Inspected # of Street Trees Planted
FIGURE 14-21. Map of sites covered by the Horticulture Services cost center.
20 Parks and Open Space (341 acres)
City hall (4 acres)
20 Parks and Open Space (341 acres)
City hall (4 acres)

Department of Recreation and Parks Division: Parks and Open Space
14 - 66
Cost Center: Rights-of-Way Services TABLE 14-178. Cost Center Summary
Actual
FY10 Adopted
FY11 Est. Act.
FY11 Adopted
FY12
Total Expenditures 403,779 424,830 435,980 433,460
Total Revenues N/A N/A N/A N/A
Objectives
Maintain good or excellent service for all rights-of-way (121 parcels totaling 142 acres) and five parks (totaling 10.4 acres) at the highest standards possible using in-house staff and contracted services to provide high quality clean and green parks and open spaces that
contribute to distinct neighborhoods and environmental quality
Maintain 20+ miles of bicycle/pedestrian pathways, including regular maintenance such as sweeping, pruning, litter, leaf, and graffiti removal, to ensure the highest level of pedestrian safety as verified by quarterly
inspections
Oversee refuse collection for the division, providing refuse collection from 41 parks, 11 right-of-way locations, the collection of debris,
collection for stream clean-ups and special events city-wide
Provide maintenance for 4 major pedestrian bikeway bridges, including
litter, leaf, snow and ice and graffiti removal
TABLE 14-179. Performance Measures
Actual
FY10 Target
FY11 Est. Act.
FY11 Target
FY12
Achieve 85% of Citizen Survey respondents rating rights-of-way as ―good‖ or ―excellent‖*
85% 85% 85% 85%
Maintain 100% of scheduled quarterly bikeway inspections
4 / 4 or 100%
4 / 4 or 100%
4 / 4 or 100%
4 / 4 or 100%
* The City conducts a citizen survey every other year. A survey was conducted in FY11 and the next survey will take place in FY13.
TABLE 14-180. Workload Measures
Actual
FY10 Estimate
FY11 Est. Act.
FY11 Estimate
FY12
Number of bicycle/pedestrian path inspections completed*
60 92 60 60
Number of bicycle/pedestrian path sweepings completed
30 17 30 30
Number of unscheduled or emergency work orders completed
193 125 140 140
Number of right-of-way parcels mowed/maintained
47 47 47 47
Number of right-of-way quality assurance inspections completed
47 47 47 47
Number of park maintenance standard quality assurance inspections completed
10 10 10 10
Number of trash receptacles collected within the park system
237 237 237 237
* Inspections of paths are for loose debris, or obstructions. Inspections are also performed by the Bikeway Coordinator to identify repairs needed through the Asphalt / Concrete contractor and through CIP projects.
TABLE 14-181. Regular Positions
Position Title Adopted
FY10 Adopted
FY11 Adopted
FY12
Crew Supervisor (grade A14) 1.0 1.0 1.0
Laborer (grade U1)* 2.0 1.0 1.0
Maintenance Worker (grade U2) 1.0 1.0 1.0
Parks Maintenance Supervisor (grade A21)
0.5 0.5 0.5
Cost Center Total 4.5 3.5 3.5
* A 1.0 FTE Laborer position was frozen during FY10 and eliminated for FY11 due to limited General Fund resources.

Department of Recreation and Parks Division: Parks and Open Space
14 - 67
Cost Center: Urban Forestry Maintenance TABLE 14-182. Cost Center Summary
Actual
FY10 Adopted
FY11 Est. Act.
FY11 Adopted
FY12
Total Expenditures* 881,656 920,470 1,025,070 953,540
Total Revenues N/A N/A N/A N/A
* Est. Act. FY11 contains additional funding that was needed for emergency storm cleanup from the July 2010 and January 2011 storms.
Objectives
Preserve, protect and manage the existing population of more than 28,000 street trees through preventative maintenance and block
pruning on a 15-year cycle
Continue to update the City’s street tree inventory in order to prioritize
maintenance efforts
Enhance public safety by removing dead, dying, hazardous and
utility-conflicted trees, as appropriate for adjacent use area
Improve the quality of Rockville’s urban forest areas by implementing
an exotic and invasive plant management program
TABLE 14-183. Performance Measures
Actual
FY10 Target
FY11 Est. Act.
FY11 Target
FY12
Maintain the percentage of Citizen Survey respondents rating street trees as ―excellent‖ or ―good‖ at 75%*
75% 75% 75% 75%
* The City conducts a citizen survey every other year. A survey was conducted in FY11 and the next survey will take place in FY13.
TABLE 14-184. Workload Measures
Actual
FY10 Estimate
FY11 Est. Act.
FY11 Estimate
FY12
Number of trees pruned
2,276 2,000 2,300 2,300
Actual
FY10 Estimate
FY11 Est. Act.
FY11 Estimate
FY12
Number of street trees inventoried*
2,322 2,750 2,200 2,200
Number of trees removed**
521 450 500 450
* This Workload Measure reflects the number of trees that have been entered into the Hansen database, which is the asset and maintenance system for parks and facilities.
** Trees are replanted by the Horticulture cost center.
TABLE 14-185. Regular Positions
Position Title Adopted
FY10 Adopted
FY11 Adopted
FY12
City Forester (grade A23) 1.0 1.0 1.0
Forestry Crew Supervisor (grade A17)
1.0 1.0 1.0
Tree Climber (grade U4 / U5)* 4.0 4.0 4.0
Cost Center Total 6.0 6.0 6.0
* The Tree Climber position is banded and can be hired at either the Tree Climber or Certified Tree Climber level.
Supplemental Information GRAPH 14-16. This graph shows the work orders estimated to be completed by
the Urban Forestry Maintenance cost center in FY11. While City tree crews take care of the majority of the work orders, this cost center also relies on contractors to supplement their efforts.
* Work Orders - City Tree Crew contains 1,300 emergency storm response work orders related to the July 2010 and January 2011 storms.
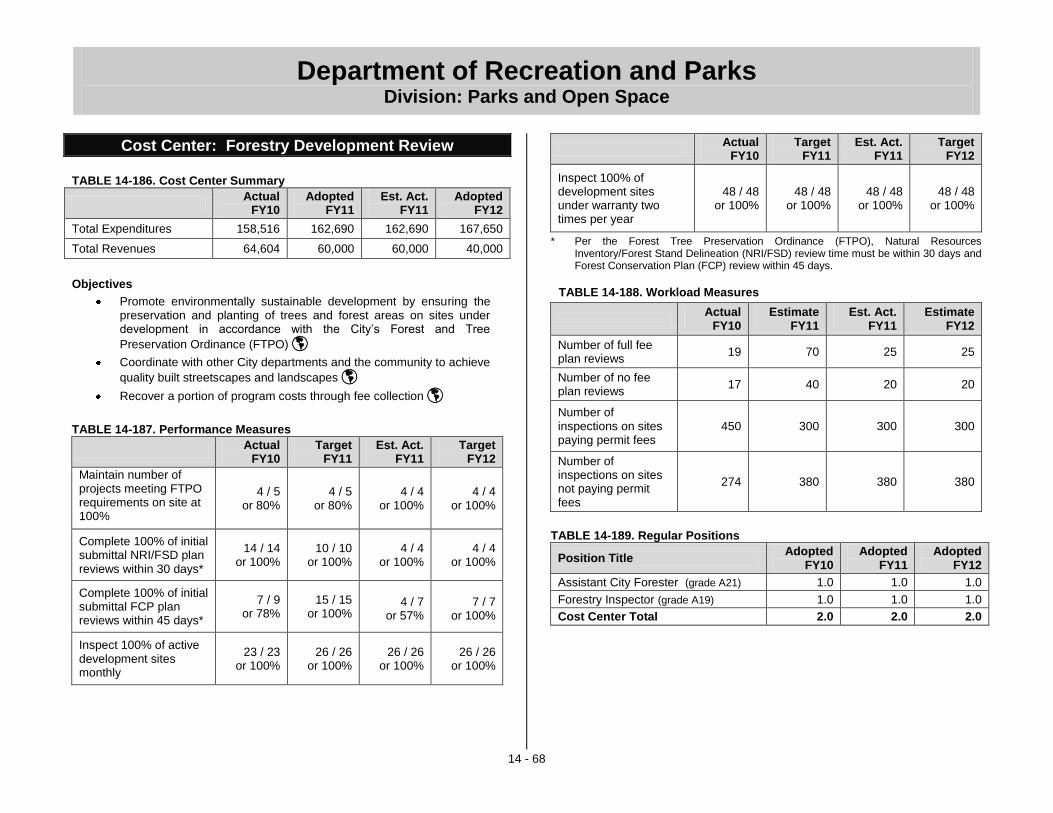
Department of Recreation and Parks Division: Parks and Open Space
14 - 68
Cost Center: Forestry Development Review
TABLE 14-186. Cost Center Summary
Actual
FY10 Adopted
FY11 Est. Act.
FY11 Adopted
FY12
Total Expenditures 158,516 162,690 162,690 167,650
Total Revenues 64,604 60,000 60,000 40,000
Objectives
Promote environmentally sustainable development by ensuring the preservation and planting of trees and forest areas on sites under development in accordance with the City’s Forest and Tree
Preservation Ordinance (FTPO)
Coordinate with other City departments and the community to achieve
quality built streetscapes and landscapes
Recover a portion of program costs through fee collection
TABLE 14-187. Performance Measures
Actual
FY10 Target
FY11 Est. Act.
FY11 Target
FY12
Maintain number of projects meeting FTPO requirements on site at 100%
4 / 5 or 80%
4 / 5 or 80%
4 / 4 or 100%
4 / 4 or 100%
Complete 100% of initial submittal NRI/FSD plan reviews within 30 days*
14 / 14 or 100%
10 / 10 or 100%
4 / 4 or 100%
4 / 4 or 100%
Complete 100% of initial submittal FCP plan reviews within 45 days*
7 / 9 or 78%
15 / 15 or 100%
4 / 7
or 57%
7 / 7
or 100%
Inspect 100% of active development sites monthly
23 / 23 or 100%
26 / 26 or 100%
26 / 26 or 100%
26 / 26 or 100%
Actual
FY10 Target
FY11 Est. Act.
FY11 Target
FY12
Inspect 100% of development sites under warranty two times per year
48 / 48 or 100%
48 / 48 or 100%
48 / 48 or 100%
48 / 48 or 100%
* Per the Forest Tree Preservation Ordinance (FTPO), Natural Resources Inventory/Forest Stand Delineation (NRI/FSD) review time must be within 30 days and Forest Conservation Plan (FCP) review within 45 days.
TABLE 14-188. Workload Measures
Actual
FY10 Estimate
FY11 Est. Act.
FY11 Estimate
FY12
Number of full fee plan reviews
19 70 25 25
Number of no fee plan reviews
17 40 20 20
Number of inspections on sites paying permit fees
450 300 300 300
Number of inspections on sites not paying permit fees
274 380 380 380
TABLE 14-189. Regular Positions
Position Title Adopted
FY10 Adopted
FY11 Adopted
FY12
Assistant City Forester (grade A21) 1.0 1.0 1.0
Forestry Inspector (grade A19) 1.0 1.0 1.0
Cost Center Total 2.0 2.0 2.0

Department of Recreation and Parks Division: Parks and Open Space
14 - 69
Supplemental Information GRAPH 14-17. The graph below shows the estimated number of forestry
inspections by type for FY11.
Estimated FY11 Forestry Inspections by Type
17
8
27
8
35
42
0
12
0
100
200
300
400
500
FC
P/F
SD
Re
vie
w
Insp
ectio
ns
Pre
-
Co
nstr
uctio
n
Me
etin
gs
Co
ntr
uctio
n
Me
etin
gs
Pla
ntin
g
Insp
ectio
ns
No
n-F
TP
O
Insp
ectio
ns/
DP
W
Cost Center: Forest and Tree Preservation (Fund 350) TABLE 14-190. Cost Center Summary
Actual
FY10 Adopted
FY11 Est. Act.
FY11 Adopted
FY12
Total Expenditures 3,986 6,000 30,830 20,050
Total Revenues 16,178 6,000 30,830 20,050
Objectives
Collect a fee-in-lieu of planting trees on new construction sites after all
planting locations have been filled
Use funds to supplement street tree replacement program
TABLE 14-191. Workload Measures
Actual
FY10 Estimate
FY11 Est. Act.
FY11 Estimate
FY12
Number of sites paying fee-in-lieu
0 2 2 2
Cost Center: Park Maintenance Fund (Fund 350) TABLE 14-192. Cost Center Summary
Actual
FY10 Adopted
FY11 Est. Act.
FY11 Adopted
FY12
Total Expenditures 22,500 42,600 42,600 40,050
Total Revenues 2,262 15,000 15,000 40,050
Objectives
Collect a fee-in-lieu of planting trees on new construction sites after all
planting locations have been filled
Use funds to install, maintain, and replace trees, shrubs, and other landscaping on City owned forest land. Maintenance may include
control and eradication of invasive/exotic plants
TABLE 14-193. Workload Measures
Actual
FY10 Estimate
FY11 Est. Act.
FY11 Estimate
FY12
Number of sites paying fee-in-lieu
0 2 2 2

Department of Recreation and Parks Division: RedGate Golf Course
14 - 70
Division: RedGate Golf Course
TABLE 14-194 Actual
FY10
Adopted
FY11
Est. Act.
FY11
Adopted
FY12*
Division Expenditures
by Cost Center
Course Operations 804,042 891,220 926,282 1,136,040
Clubhouse Services 403,194 430,320 434,758 209,410
Division Total $1,207,236 $1,321,540 $1,361,040 $1,345,450
TABLE 14-195 Actual
FY10
Adopted
FY11
Est. Act.
FY11
Adopted
FY12*
Division Expenditures
by Type
Salary and Wages 646,329 627,020 627,020 317,860
Benefits 144,842 176,880 176,880 62,140
Overtime 23,003 26,800 26,800 13,400
Personnel Subtotal $814,174 $830,700 $830,700 $393,400
Contractual Services 102,488 121,980 146,980 795,990
Commodities 226,510 273,160 273,160 136,310
Capital Outlays 64,064 95,700 110,200 19,750
Other 0 0 0 0
Operating Subtotal $393,062 $490,840 $530,340 $952,050
Division Total $1,207,236 $1,321,540 $1,361,040 $1,345,450 * Adopted FY12 figures assume the same Course management and revenues
consistent with the Adopted FY11 Five-Year Forecast for the first half of FY12, and a management agreement and revenues consistent with the NGF Study for the second half of FY12.
TABLE 14-196 Actual
FY10
Adopted
FY11
Est. Act.
FY11
Adopted
FY12*
Source of
Division Funds
Golf Fees (340) 738,180 779,580 779,580 863,150
Concessions (340) 12,251 13,910 13,910 34,340
Cart Rentals (340) 206,248 219,830 219,830 237,950
Pro Shop Rental (340) 2,750 2,790 2,790 13,470
Driving Range Fees (340) 1,982 1,600 1,600 8,570
Subtotal $961,411 $1,017,710 $1,017,710 $1,157,480
Fund Contribution
Golf Fund (340) 245,825 303,830 343,330 187,970
Subtotal $245,825 $303,830 $343,330 $187,970
Division Total $1,207,236 $1,321,540 $1,361,040 $1,345,450
TABLE 14-197 Actual
FY10
Adopted
FY11
Est. Act.
FY11
Adopted
FY12
Staffing Summary
by Cost Center (FTEs)
Regular
Course Operations 6.0 6.0 6.0 6.0
Clubhouse Services 3.8 3.8 3.8 3.8
Regular Subtotal 9.8 9.8 9.8 9.8
Temporary
Course Operations 3.2 3.1 3.1 3.1
Clubhouse Services 2.5 2.6 2.6 2.6
Temporary Subtotal 5.7 5.7 5.7 5.7
Division Total 15.5 15.5 15.5 15.5

Department of Recreation and Parks Division: RedGate Golf Course
14 - 71
Division: RedGate Golf Course Division Purpose
Provide the best possible playing conditions and customer service to the public by efficiently operating and maintaining the RedGate Golf Course. The golf course is the single largest tract of green space within the City limits and provides positive environmental benefits to all residents. Significant Changes from Adopted to Adopted
The RedGate Golf Course Division’s FY12 Adopted budget represents a 2% increase over the FY11 Adopted budget due to budgeting the same Course management for the first half of FY12, and a management agreement consistent with the NGF Study for the second half of FY12 (see Supplemental Information section for more information). While salary and benefits will increase for the first half of the fiscal year, as a whole those costs along with commodity and capital outlay costs will decrease in FY12 once the City transitions to a management agreement. Contractual services costs will significantly increase due to the payment of a management company for these services.
The RedGate Golf Course Division’s FY12 Adopted revenue budget represents a 14% increase over the FY11 Adopted revenue budget due budgeting a 5% increase consistent with the FY11 Adopted Five-Year Forecast for the first half of FY12, and revenues consistent with the management agreement presented in the NGF Study for the second half of FY12.
Cost Center: Course Operations TABLE 14-198. Cost Center Summary
Actual
FY10 Adopted
FY11 Est. Act.
FY11 Adopted
FY12
Total Expenditures 804,042 891,220 926,282 1,136,040
Total Revenues N/A N/A N/A N/A
Objectives
Actively market the facility and provide excellent customer service in
order to achieve cost recovery goals
Continue to maintain turf quality and playing conditions equal to private club standards while ensuring that players of all ability levels can enjoy
their golfing experience
TABLE 14-199. Performance Measures
Actual
FY10 Target
FY11 Est. Act.
FY11 Target
FY12
Achieve average dollars per round of $30.38 $28.21 $40.94* $31.04* $30.38**
Maintain the percent of golfers rating the facility as ―excellent‖ or ―good‖ at 80%
282 / 370 or 76%
260 / 325 or 80%
260 / 325 or 80%
260 / 325 or 80%
* FY11 Target is based on the five-year business plan. FY11 Est. Act. is based on staff estimates of rounds played.
** FY12 Target is based on staff estimates of rounds played and revenue consistent with the FY11 Adopted Five-Year Forecast for the first half of FY12, and projected rounds and revenues consistent with the management agreement presented in the NGF Study for the second half of FY12.
TABLE 14-200. Regular Positions
Position Title Adopted
FY10 Adopted
FY11 Adopted
FY12
Assistant Golf Course Superintendent (grade A17)
1.0 1.0 1.0
Golf Course Equipment Mechanic/Oper. (grade A12)
1.0 1.0 1.0
Golf Course Superintendent (grade A23) 1.0 1.0 1.0
Golf Course Technician (grade A10) 3.0 3.0 3.0
Cost Center Total 6.0 6.0 6.0
Cost Center: Clubhouse Services TABLE 14-201. Cost Center Summary
Actual
FY10 Adopted
FY11 Est. Act.
FY11 Adopted
FY12
Total Expenditures 403,194 430,320 434,758 209,410
Total Revenues 961,411 1,017,710 1,017,710 1,157,480
Objectives
Provide and promote classes, camps and instruction for all age groups
and playing abilities in order to maximize participation
Utilize the most effective means of advertising and discount programs to
increase the number of rounds played
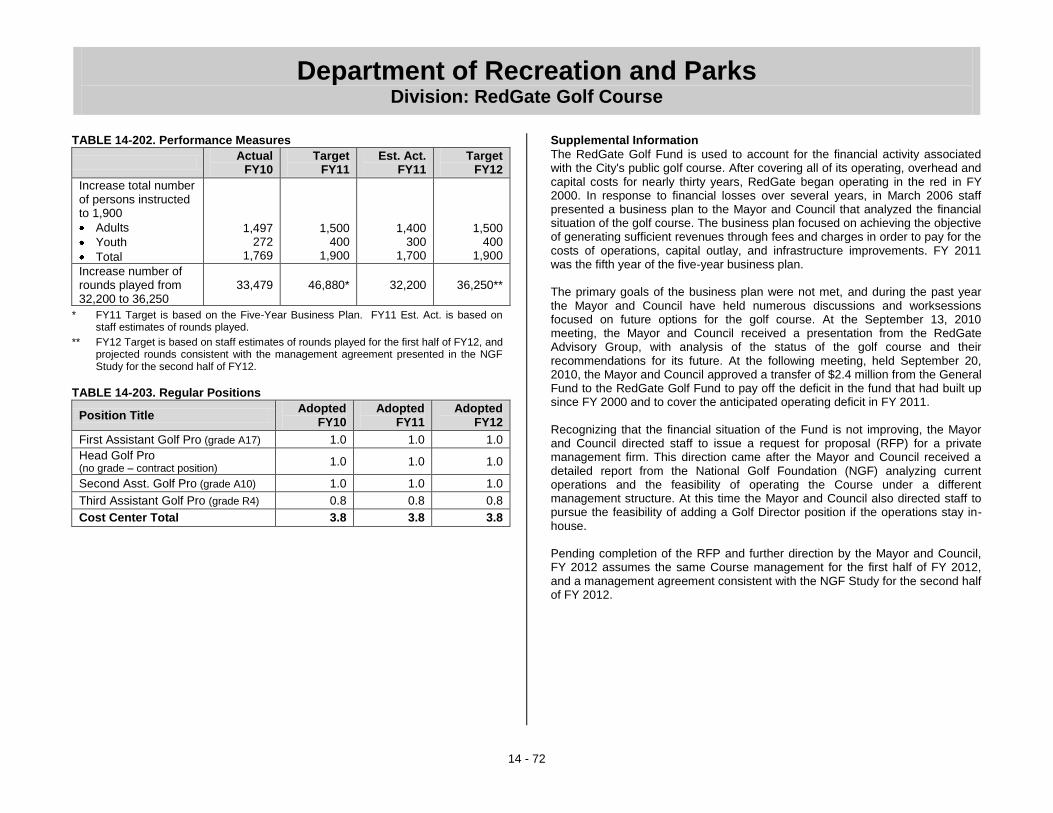
Department of Recreation and Parks Division: RedGate Golf Course
14 - 72
TABLE 14-202. Performance Measures
Actual
FY10 Target
FY11 Est. Act.
FY11 Target
FY12
Increase total number of persons instructed to 1,900
Adults
Youth
Total
1,497 272
1,769
1,500 400
1,900
1,400 300
1,700
1,500 400
1,900
Increase number of rounds played from 32,200 to 36,250
33,479 46,880* 32,200 36,250**
* FY11 Target is based on the Five-Year Business Plan. FY11 Est. Act. is based on staff estimates of rounds played.
** FY12 Target is based on staff estimates of rounds played for the first half of FY12, and projected rounds consistent with the management agreement presented in the NGF Study for the second half of FY12.
TABLE 14-203. Regular Positions
Position Title Adopted
FY10 Adopted
FY11 Adopted
FY12
First Assistant Golf Pro (grade A17) 1.0 1.0 1.0
Head Golf Pro (no grade – contract position)
1.0 1.0 1.0
Second Asst. Golf Pro (grade A10) 1.0 1.0 1.0
Third Assistant Golf Pro (grade R4) 0.8 0.8 0.8
Cost Center Total 3.8 3.8 3.8
Supplemental Information
The RedGate Golf Fund is used to account for the financial activity associated with the City's public golf course. After covering all of its operating, overhead and capital costs for nearly thirty years, RedGate began operating in the red in FY 2000. In response to financial losses over several years, in March 2006 staff presented a business plan to the Mayor and Council that analyzed the financial situation of the golf course. The business plan focused on achieving the objective of generating sufficient revenues through fees and charges in order to pay for the costs of operations, capital outlay, and infrastructure improvements. FY 2011 was the fifth year of the five-year business plan. The primary goals of the business plan were not met, and during the past year the Mayor and Council have held numerous discussions and worksessions focused on future options for the golf course. At the September 13, 2010 meeting, the Mayor and Council received a presentation from the RedGate Advisory Group, with analysis of the status of the golf course and their recommendations for its future. At the following meeting, held September 20, 2010, the Mayor and Council approved a transfer of $2.4 million from the General Fund to the RedGate Golf Fund to pay off the deficit in the fund that had built up since FY 2000 and to cover the anticipated operating deficit in FY 2011. Recognizing that the financial situation of the Fund is not improving, the Mayor and Council directed staff to issue a request for proposal (RFP) for a private management firm. This direction came after the Mayor and Council received a detailed report from the National Golf Foundation (NGF) analyzing current operations and the feasibility of operating the Course under a different management structure. At this time the Mayor and Council also directed staff to pursue the feasibility of adding a Golf Director position if the operations stay in-house. Pending completion of the RFP and further direction by the Mayor and Council, FY 2012 assumes the same Course management for the first half of FY 2012, and a management agreement consistent with the NGF Study for the second half of FY 2012.

Department of Recreation and Parks Division: RedGate Golf Course
14 - 73
GRAPH 14-18. The graph below compares the actual rounds played at RedGate
Golf Course over the course of the five-year business plan with the business plan projections.
Rounds Played at RedGate Golf Course
42,00043,220
44,44045,660
41,116
36,571
33,47932,200
46,880
39,538
25,000
30,000
35,000
40,000
45,000
50,000
FY 2007 FY 2008 FY 2009 FY 2010 FY 2011*
Business Plan
Actual
* Actual FY11 totals are estimated by RedGate staff.
FIGURE 14-22. A golfer plays in a tournament at RedGate Golf Course.
GRAPH 14-19. The graph below compares the actual dollars per round at
RedGate Golf Course over the course of the five-year business plan with the business plan projections.
Dollars Per Round
$36.40$37.86
$39.37$40.94
$28.05$25.82
$28.21$31.04
$35.00
$28.37
$0.00
$10.00
$20.00
$30.00
$40.00
$50.00
FY 2007 FY 2008 FY 2009 FY 2010 FY 2011*
Business Plan
Actual
* Actual FY11 totals are based on the amended budget and RedGate staff estimates of
rounds played.

Department of Recreation and Parks Division: RedGate Golf Course
14 - 74
(This page intentionally left blank)

Non-Departmental TABLE 15-2. Summary of General Fund Expenditures
Personnel * 1,490,011 1,490,500 1,516,200 1.7%
Banking / Credit Card 173,672 195,000 200,000 2.6%
Liability / Property Ins. 202,854 384,000 464,200 20.9%
City Manager Contingency - 250,000 250,000 0.0%
Other ** 59,319 46,000 20,000 -56.5%
TABLE 15-1. Summary of Non-Departmental Expenditures by Fund Outside Agencies *** 620,271 - - N/A
Transfer to Parking 850,000 1,030,000 500,000 -51.5%
Transfer to Refuse **** 30,000 - - N/A
General 9,948,393 11,645,030 12,654,570 8.7% Transfer to RedGate ***** - - 630,000 N/A
Water 2,471,977 3,877,280 3,914,980 1.0% Transfer to Capital 2,378,000 3,141,000 3,967,000 26.3%
Sewer 2,248,242 3,359,830 3,640,240 8.3% Transfer to Special Act. 144,266 8,530 7,170 -15.9%
Refuse 1,106,763 1,746,370 1,730,130 -0.9% Transfer to Debt Service 4,000,000 5,100,000 5,100,000 0.0%
Parking 2,246,483 2,970,590 2,671,810 -10.1% Total 9,948,393 11,645,030 12,654,570 8.7%
Stormwater Mgmt. 382,611 943,740 1,016,160 7.7%
RedGate Golf Course 282,505 354,550 363,640 2.6%
Speed Camera 7,856 230,420 264,140 14.6%
Town Center Mgmt. 180 98,090 N/A N/A
Debt Service 5,036,107 5,141,084 5,796,000 12.7%
Total 23,731,117 30,366,984 32,051,670 5.5%
GRAPH 15-1. Non-Departmental Expenditures By Fund
15 - 1
* FY12 Personnel includes general items like disability pay, workers compensation,
unemployment insurance, and retiree health care contributions.
** FY12 Other includes $20,000 contingency for mid-year grants.
*** Outside Agency grant funding was moved to the departmental budgets starting in FY11
in order to align grant awards with City goals and objectives.
**** This transfer supports the Rockville Housing Enterprises (RHE) refuse collection. This
transfer is considered an Outside Agency grant, and was moved to the CPDS budget
starting in FY11.
***** This transfer will fund operating expenses and high priority capital needs at the Course.
Adopted
FY12
%
Change
%
Change
Non-Departmental Expenditures by Fund
Non-departmental expenditures are generally defined as obligations that are not
directly attributable to one particular department or activity. Although costs
sometimes can be divided into personnel and non-personnel expenditures, it is
more appropriate to characterize them as overhead or “costs of doing business.”
For example, items that the City must continue to fund in order to operate (the
purchase of insurance and depreciation charges), or where a long-standing
financial commitment exists, such as debt service costs and the City-funded
disability program, are included in this area.
Actual
FY10
Adopted
FY11
Adopted
FY12
Actual
FY10
Adopted
FY11 1
1,6
45
3,8
77
3,3
60
1,7
46
2,9
71
944
355
230
98
5,1
41
12,6
55
3,9
15
3,6
40
1,7
30
2,6
72
1,0
16
364
264
-
5,7
96
-
2,000
4,000
6,000
8,000
10,000
12,000
14,000
Genera
l
Wate
r
Se
wer
Refu
se
Pa
rkin
g
SW
M
Golf
Sp
eed
TC
MD
Debt S
er.
Non-Departmental Exp. by Fund (in thousands)
FY11 Adopted FY12 Adopted
etompkins
Underline

TABLE 15-3. Summary of Water Fund Expenses TABLE 15-5. Summary of Refuse Fund Expenses
Personnel * 127,000 93,000 108,450 16.6% Personnel * 70,881 99,000 82,600 -16.6%
Operating 6,924 20,000 20,000 0.0% Operating 6,023 - - N/A
Liability / Property Ins. 14,603 18,000 30,300 68.3% Liability / Property Ins. 14,939 18,100 22,000 21.5%
Fund Contingency - 60,000 60,000 0.0% Fund Contingency - 60,000 60,000 0.0%
Other - - - N/A Other ** 124,600 138,100 139,480 1.0%
Interest 800,750 980,170 971,120 -0.9% Interest 115,315 101,700 86,800 -14.7%
Depreciation 1,070,229 1,700,000 1,700,000 0.0% Depreciation 304,053 350,000 350,000 0.0%
Amortization 8,470 6,000 15,000 150.0% Amortization 1,252 2,000 2,000 0.0%
Administrative Charge ** 444,000 1,000,110 1,010,110 1.0% Administrative Charge *** 469,700 977,470 987,250 1.0%
Total 2,471,977 3,877,280 3,914,980 1.0% Total 1,106,763 1,746,370 1,730,130 -0.9%
TABLE 15-4. Summary of Sewer Fund Expenses TABLE 15-6. Summary of Parking Fund Expenses
Personnel * 48,206 60,000 57,300 -4.5% Personnel * 8,946 13,500 14,400 6.7%
Operating 2,203 - - N/A Operating 29,876 24,000 4,000 -83.3%
Liability / Property Ins. 7,819 10,000 13,100 31.0% Liability / Property Ins. 1,611 2,100 3,000 42.9%
Fund Contingency - 60,000 60,000 0.0% Fund Contingency - 60,000 120,000 100.0%
Other ** 350,200 308,400 311,490 1.0% Other ** 19,062 120,000 60,000 -50.0%
Interest 686,137 874,780 1,141,280 30.5% Interest 1,409,821 1,387,510 1,631,200 17.6%
Depreciation 900,717 1,500,000 1,500,000 0.0% Depreciation 683,328 700,000 700,000 0.0%
Amortization 4,761 5,000 10,000 100.0% Amortization 6,238 6,500 6,500 0.0%
Administrative Charge *** 248,200 541,650 547,070 1.0% Administrative Charge *** 87,600 656,980 132,710 -79.8%
Total 2,248,242 3,359,830 3,640,240 8.3% Total 2,246,483 2,970,590 2,671,810 -10.1%
* FY12 Personnel includes workers compensation and retiree health care contributions.
** Other includes transfer to the Water Fund.
*** FY12 Admin. Charge increased by 1% consistent with the cost of living adjustment.
* FY12 Personnel includes workers compensation and retiree health care contributions.
** Other includes bad debt expense for unpaid citations.
*** FY12 Admin. Charge decreased by approximately 80% due to the City leasing the Town
Square parking garages.
%
Change
Adopted
FY12
Actual
FY10
Adopted
FY11
* FY12 Personnel includes workers compensation and retiree health care contributions.
** FY12 Admin. Charge increased by 1% consistent with the cost of living adjustment.
15 - 2
Actual
FY10
Adopted
FY11
Adopted
FY12
%
Change
* FY12 Personnel includes workers compensation and retiree health care contributions.
** Other includes transfer to the Water Fund.
*** FY12 Admin. Charge increased by 1% consistent with the cost of living adjustment.
Non-Departmental Expenditures by Fund
Adopted
FY12
%
Change
Actual
FY10
Adopted
FY11
%
Change
Adopted
FY11
Adopted
FY12
Actual
FY10

TABLE 15-7. Summary of SWM Fund Expenses TABLE 15-9. Summary of Speed Camera Fund Expenditures
Personnel * 32,346 21,500 68,000 216.3% Personnel * 6,898 6,900 15,800 129.0%
Operating 864 - - N/A Liability / Property Ins. 958 1,200 3,800 216.7%
Liability / Property Ins. 3,068 3,700 16,800 354.1% Fund Contingency - - 20,000 N/A
Fund Contingency - 60,000 60,000 0.0% Administrative Charge ** - 222,320 224,540 1.0%
Other - - - N/A Total 7,856 230,420 264,140 14.6%
Interest 170 3,600 10,370 188.1%
Depreciation 187,562 250,000 250,000 0.0%
Amortization - - - N/A
Administrative Charge ** 158,600 604,940 610,990 1.0% TABLE 15-10. Summary of TCMD Fund Expenditures
Total 382,611 943,740 1,016,160 7.7%
Personnel 180 - N/A N/A
Liability / Property Ins. - - N/A N/A
TABLE 15-8. Summary of RedGate Golf Fund Expenses Fund Contingency - 20,000 N/A N/A
Administrative Charge - 78,090 N/A N/A
Total 180 98,090 N/A N/A
Personnel * 21,385 42,500 12,440 -70.7%
Operating 28,270 30,000 15,300 -49.0%
Liability / Property Ins. 4,438 5,300 3,200 -39.6%
Fund Contingency - - - N/A
Other - - - N/A TABLE 15-11. Summary of Debt Service Fund Expenditures
Interest 11,335 10,900 10,200 -6.4%
Depreciation 119,101 100,000 125,000 25.0%
Amortization 76 100 100 0.0% Principal 3,464,030 3,332,298 3,924,000 17.8%
Administrative Charge ** 97,900 165,750 197,400 19.1% Interest 1,568,036 1,743,786 1,862,000 6.8%
Total 282,505 354,550 363,640 2.6% Other Charges 4,041 65,000 10,000 -84.6%
Total 5,036,107 5,141,084 5,796,000 12.7%
* FY12 Personnel includes workers compensation and retiree health care contributions.
** FY12 Admin. Charge increased by 1% consistent with the cost of living adjustment.
* The FY12 budget for the TCMD Fund was eliminated due to FRIT taking over the
operations and management of the Town Square Districts.
Actual
FY10
Adopted
FY11
%
Change
%
Change
* FY12 Personnel includes workers compensation.
** FY12 Administrative Charge represents half a year of the administrative charge consistent
with the adopted Cost Allocation Plan and half a year based on Option 3 of the NGF Study.
(Note: as part of the five-year business plan the Admin. Charge was reduced by half from
FY 2007 through FY 2011 for a total RedGate savings of $540,350.)
Actual
FY10
Adopted
FY11
Actual
FY10
Adopted
FY12
Actual
FY10
* FY12 Personnel includes workers compensation and retiree health care contributions.
** FY12 Admin. Charge increased by 1% consistent with the cost of living adjustment.
%
Change
15 - 3
%
Change
Actual
FY10
Adopted
FY11
Adopted
FY12 *
Adopted
FY11
Adopted
FY12
Adopted
FY12
Non-Departmental Expenditures by Fund
Adopted
FY12
%
Change
Adopted
FY11

15 - 4
(This page intentionally left blank)
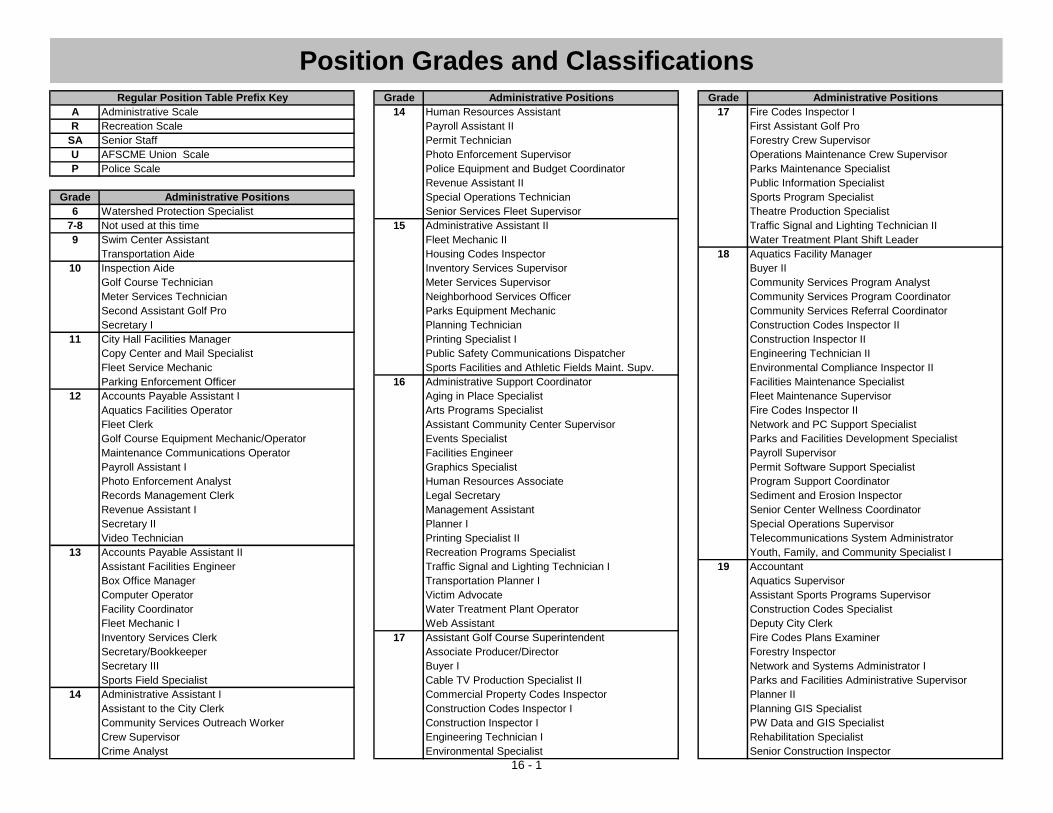
Grade Administrative Positions Grade Administrative Positions
A Administrative Scale 14 Human Resources Assistant 17 Fire Codes Inspector I
R Recreation Scale Payroll Assistant II First Assistant Golf Pro
SA Senior Staff Permit Technician Forestry Crew Supervisor
U AFSCME Union Scale Photo Enforcement Supervisor Operations Maintenance Crew Supervisor
P Police Scale Police Equipment and Budget Coordinator Parks Maintenance Specialist
Revenue Assistant II Public Information Specialist
Grade Administrative Positions Special Operations Technician Sports Program Specialist
6 Watershed Protection Specialist Senior Services Fleet Supervisor Theatre Production Specialist
7-8 Not used at this time 15 Administrative Assistant II Traffic Signal and Lighting Technician II
9 Swim Center Assistant Fleet Mechanic II Water Treatment Plant Shift Leader
Transportation Aide Housing Codes Inspector 18 Aquatics Facility Manager
10 Inspection Aide Inventory Services Supervisor Buyer II
Golf Course Technician Meter Services Supervisor Community Services Program Analyst
Meter Services Technician Neighborhood Services Officer Community Services Program Coordinator
Second Assistant Golf Pro Parks Equipment Mechanic Community Services Referral Coordinator
Secretary I Planning Technician Construction Codes Inspector II
11 City Hall Facilities Manager Printing Specialist I Construction Inspector II
Copy Center and Mail Specialist Public Safety Communications Dispatcher Engineering Technician II
Fleet Service Mechanic Sports Facilities and Athletic Fields Maint. Supv. Environmental Compliance Inspector II
Parking Enforcement Officer 16 Administrative Support Coordinator Facilities Maintenance Specialist
12 Accounts Payable Assistant I Aging in Place Specialist Fleet Maintenance Supervisor
Aquatics Facilities Operator Arts Programs Specialist Fire Codes Inspector II
Fleet Clerk Assistant Community Center Supervisor Network and PC Support Specialist
Golf Course Equipment Mechanic/Operator Events Specialist Parks and Facilities Development Specialist
Maintenance Communications Operator Facilities Engineer Payroll Supervisor
Payroll Assistant I Graphics Specialist Permit Software Support Specialist
Photo Enforcement Analyst Human Resources Associate Program Support Coordinator
Records Management Clerk Legal Secretary Sediment and Erosion Inspector
Revenue Assistant I Management Assistant Senior Center Wellness Coordinator
Secretary II Planner I Special Operations Supervisor
Video Technician Printing Specialist II Telecommunications System Administrator
13 Accounts Payable Assistant II Recreation Programs Specialist Youth, Family, and Community Specialist I
Assistant Facilities Engineer Traffic Signal and Lighting Technician I 19 Accountant
Box Office Manager Transportation Planner I Aquatics Supervisor
Computer Operator Victim Advocate Assistant Sports Programs Supervisor
Facility Coordinator Water Treatment Plant Operator Construction Codes Specialist
Fleet Mechanic I Web Assistant Deputy City Clerk
Inventory Services Clerk 17 Assistant Golf Course Superintendent Fire Codes Plans Examiner
Secretary/Bookkeeper Associate Producer/Director Forestry Inspector
Secretary III Buyer I Network and Systems Administrator I
Sports Field Specialist Cable TV Production Specialist II Parks and Facilities Administrative Supervisor
14 Administrative Assistant I Commercial Property Codes Inspector Planner II
Assistant to the City Clerk Construction Codes Inspector I Planning GIS Specialist
Community Services Outreach Worker Construction Inspector I PW Data and GIS Specialist
Crew Supervisor Engineering Technician I Rehabilitation Specialist
Crime Analyst Environmental Specialist Senior Construction Inspector
Position Grades and Classifications
Regular Position Table Prefix Key
16 - 1

Grade Administrative Positions Grade Administrative Positions Grade Administrative Positions
19 Theatre/Civic Center Supervisor 23 Contract Specialist 27 Chief of Long Range Planning and Redevel.
Transportation Planner II Environmental Engineer III Recreation and Parks Administration Mgr.
Water Treatment Plant Asst. Superintendent Financial Systems Senior Support Analyst Superintendent of Parks and Facilities
Youth and Family Counselor Fire Marshal Superintendent of Recreation
Zoning Inspector II Fleet Manager 28 Chief of Planning
20 Assistant to the City Attorney Golf Course Superintendent 29 Not used at this time
Civil Engineer I Horticulturalist 30 Assistant Director of CPDS
Council Support Specialist Human Resources Administrator Deputy Director of Utilities
Health and Wellness Coordinator Loss Control Administrator Senior Assistant City Attorney
Landlord/Tenant Specialist Network and Systems Manager
Nature Center Supervisor Network Engineer Grade Recreation Scale Positions
Network and Systems Administrator II Parks and Facilities Development Manager 2 Activity Instructor I
Outreach and Community Specialist Parks Services Manager Clerk II
Plans Examiner Senior Center Program Manager 3 Not used at this time
Recycling and Refuse Superintendent Senior Neighborhood Resources Coordinator 4 Clerk III
Senior Sports and Fitness Supervisor Special Events Manager Facility Supervisor II
Transportation Engineer I Supervisor of Comm. Enhancement and Code Enf. Third Assistant Golf Pro
Teen Programs Coordinator Systems Analyst/Project Leader 5 After School Director
21 Assistant City Forester 24 Community Services Manager Bus Driver
Community Center Supervisor Cable Television Production Manager Childcare Preschool Staff
CPDS Administrator GIS Manager Groundskeeper
Construction Inspection Supervisor Principal Planner 6 Program Assistant III
Graphics and Printing Supervisor Revenue Supervisor 7 Head Swim Coach
Human Rights/Community Mediation Admin. Safety and Risk Manager Senior Outreach Worker II
Neighborhood Resources Coordinator Security and Application Administrator 8 Childcare Preschool Director
Parks Maintenance Supervisor Sustainability Coordinator Senior Swim Instructor
Planner III Swim Center Superintendent
Public Works Administrator Web Administrator Grade Senior Staff Positions
Senior Citizen Recreation Coordinator 25 Engineering Supervisor SAI Assistant City Manager
Support Services Coordinator Facilities Property Manager Communication Manager
22 Arts Programs Supervisor Senior Network Engineer Organizational Development Manager
Civil Engineer II Senior Systems Analyst/Project Leader SAII Chief of Police
Computer Analyst/Programmer Stormwater Manager Director of CPDS
Fire Protection Engineer 26 Chief of Construction Management Chief Financial Officer
Management and Budget Analyst Chief of Inspection Services Chief Human Resources Officer
Operations Maintenance Assistant Super. Purchasing Manager Chief Information Officer
Senior Accountant Telecommunications and IT Operations Manager Director of Public Works
Senior Citizen Support Services Supervisor Water Treatment Plant Superintendent Director of Recreation and Parks
Sports Programs Supervisor 27 Assistant City Attorney
Transportation Engineer II Budget and Finance Manager Grade Mayor and Council Appointed
23 Assistant to the City Manager Chief of Engineering N/A City Attorney
City Forester Chief of Environmental Management City Clerk/Treasurer
Civic Center Superintendent Chief of Traffic and Transportation City Manager
Civil Engineer III Financial Accounting Manager
CPDS Specialist Financial Systems Manager Grade Contract Positions
Community Recreation Manager Operations Maintenance Superintendent N/A Head Golf Pro
Position Grades and Classifications
16 - 2

6 27,071 43,820 1 7.45 12.05
7 28,425 46,011 2 8.71 14.09
8 29,846 48,312 3 9.61 15.56
9 31,338 50,727 4 10.13 16.39
10 32,905 53,264 5 11.71 18.96
11 34,551 55,927 6 13.63 22.06
12 36,278 58,723 7 15.79 25.56
13 38,092 61,659 8 19.21 31.09
14 39,997 64,742 9 21.23 34.37
15 41,996 67,979 10 24.62 39.85
16 44,096 71,378
17 46,301 74,947
18 48,616 78,695
19 51,047 82,629
20 53,599 86,761 SA I 99,160 149,838
21 56,279 91,099 SA II 104,118 157,330
22 59,093 95,654 SA III 109,324 165,197
23 62,048 100,437
24 65,150 105,458
25 68,408 110,731
26 71,828 116,268
27 75,420 122,081
28 79,191 128,185
29 83,150 134,595
30 87,308 141,324
Pay GradeMinimum
Annual
Maximum
Annual
Senior Administrative Scale
Admin., Recreation and Parks, Senior Admin. Pay Scales
16 - 3
Administrative Scale
Pay GradeMinimum
Annual
Maximum
Annual
Recreation and Parks Scale
Pay GradeMinimum
Hourly
Maximum
Hourly

Grade Step 1 Step 2 Step 3 Step 4
1 30,387 31,375 32,394 33,447
2 32,970 34,041 35,148 36,290 Grade Step 1 Step 2 Step 3 Step 4 Step 5 Step 6 Step 7 Step 8 Step 9
3 35,772 36,935 38,135 39,375 PO 1 - - 45,566 47,161 48,812 50,520 52,288 54,118 56,013
4 38,813 40,074 41,377 42,722 PO 2 - - 47,845 49,519 51,252 53,046 54,903 56,824 58,813
5 42,112 43,481 44,894 46,353 PO 3 - - 50,237 51,995 53,815 55,698 57,648 59,666 61,754
PO 4 - - 52,749 54,595 56,506 58,483 60,530 62,649 64,842
Grade Step 5 Step 6 Step 7 Step 8 PO 5 - - 55,386 57,325 59,331 61,408 63,557 65,781 68,084
1 34,534 35,656 36,815 38,012 PO 6 - - 58,155 60,191 62,298 64,478 66,735 69,070 71,488
2 37,470 38,687 39,945 41,243 PO 9 66,502 68,829 71,238 73,732 76,312 78,983 81,748 84,609 87,570
3 40,654 41,976 43,340 44,748 PO 10 71,425 73,925 76,513 79,191 81,962 84,831 87,800 90,873 94,054
4 44,110 45,544 47,024 48,552
5 47,859 49,415 51,021 52,679 Grade Step 10 Step 11 Step 12 Step 13 Step 14 Step 15 Step 16 Step 17 Step 18
PO 1 57,973 60,002 62,102 64,276 66,525 68,854 71,264 73,758 -
Grade Step 9 Step 10 Step 11 Step 12 PO 2 60,872 63,002 65,207 67,490 69,852 72,296 74,827 77,446 -
1 39,247 40,523 41,840 43,200 PO 3 63,915 66,152 68,468 70,864 73,344 75,911 78,568 81,318 84,164
2 42,583 43,967 45,396 46,871 PO 4 67,111 69,460 71,891 74,407 77,011 79,707 82,497 85,384 88,372
3 46,203 47,704 49,255 50,856 PO 5 70,467 72,933 75,486 78,128 80,862 83,692 86,621 89,653 -
4 50,130 51,759 53,441 55,178 PO 6 73,990 76,580 79,260 82,034 84,905 87,877 90,953 94,136 97,431
5 54,391 56,159 57,984 59,868 PO 9 90,635 93,807 97,090 100,489 104,006 107,646 111,414 - -
PO 10 97,345 100,752 104,279 107,929 111,706 115,616 119,662 - -
Not used at this time
Police Lieutenant
Police Major
Step 1-12
Step 1-12
Step 2-12
Step 2-12
Step 2-12
Step 1-12
Police Corporal
16 - 4
Tree Climber
Certified Tree Climber
4
5
Sanitation Operator
Traffic Maintenance Worker
Facilities Maintenance Trades Worker
Step 2-12
Step 1-12
PO 3
PO 4
AFSCME Union and Police Pay Scales
Grade Step Progression
3
Position Classification
Step 1-12
Police Officer
AFSCME Union Scale Employees
PO 7
2
2
Laborer
Maintenance Worker
Sanitation Worker
3
3
4
Equipment Operator
PO 8
PO 9
PO 10 Step 1-16
N/A
Not used at this time
Police Sergeant
Not used at this time
PO 5
PO 6
N/A
Step 1-16
Step 3-17
Step 3-17
Step 3-18
Step 3-18
N/A
Step 3-18
Police Scale Employees
Grade
PO 11
PO 2
Position Classification
Police Officer
Police Officer
Step Progression

Department of Community Planning and Development Services (600)
Planning and Zoning
Development Review 0300
Zoning 0301
Historic Preservation 0302
Inspection Services
Department of the City Attorney (400) Application, Processing & Permit Issuance 0501
Office of the City Attorney 0100 Building, Fire and Life Safety Inspections 0502
Department of Human Resources (450) Department of Finance (700)
Human Resources 2101 Financial Administration 0100
Safety & Risk Management 2102 Budget 0101
Learning, Performance, & Development 2103 Accounting and Control
Health and Wellness Program 2104 Accounting and Audit 0200
Systems Support & Control 0800
Department of the Mayor and Council (500) Revenue 0300
Office of the Mayor and Council 0100 Purchasing and Stockroom
Office of the City Clerk 1100 Purchasing and Contracts 0600
Stockroom 0700
Department of the City Manager (550)
Executive Office Department of Information Technology (750)
Administration 0101 I.T. Operations 0100
Management Systems & Intergovernmental Affairs 0102 Voice Communications 0400
Organizational Development 0103 GIS Operations 0500
Rockville Economic Development, Inc. (REDI) 0104
Communication and Public Information Police Department (800)
Public Information Office (PIO) 1101 Office of the Chief of Police
Website and Intranet 1102 Management & Support 1001
Cable Television 0300 Community Services Office 1002
Graphics and Printing 1111 Field Services Bureau
Neighborhood Resources Program Management & Support 1101
Human Rights & Community Mediation 1201 Patrol Teams 1102
Neighborhood Resource Program 1202 Administrative Services Bureau
Management & Support 1201
Department of Community Planning and Development Services (600) Public Safety Communications / Evidence Function 1202
Management and Support Special Operations Bureau
Administration and Support 0101 Management & Support 1401
Housing and Comm. Development Block Grant 0200 Neighborhood Services 1402
Long-Range Planning and Implementation Redlight Camera 1405
Long-Range Planning and Implementation 0400 Specialty Patrol/Investigations 1404
Codes Enforcement & Community Enhancement 1406
16 - 5
Organizational Structure Listing
GENERAL FUND (110)
GENERAL FUND (110) ContinuedBelow is the organizational structure for the City of Rockville. The
organizational structure is broken down by Fund, by Department within the
Fund, by Division and by Cost Center where appropriate. Each Division and
Cost Center is assigned a number listed to the right of the column:

Department of Public Works (850) Department of Recreation and Parks (900)
Management and Support 0100 Community Services
Construction Management 0201 Community Programs Administration 9100
Traffic and Transportation Community Programs 9101
Protect Neighborhoods 0402 Youth and Family Services 9600
Mobility 0403 Linkages to Learning 9601
Accessibility 0404 Facilities
Safety/Maintenance 0405 Civic Center Complex 1101
Engineering Croydon Creek Nature Center 2133
Development Review 3302 Facilities Maintenance Services 8511
Engineering 3305 Lincoln Park Community Center 2131
Environmental Management Swim Center 8601
Environmental Management 9401 Thomas Farm Community Center 2135
Operations and Maintenance Twinbrook Community Recreation Center 2132
Street Maintenance 0702 Park and Open Space
Snow and Ice Removal 0703 Administration and Support 7501
Fleet Services 0803 Athletic Field Services 7531
Forestry Development Review 7520
Department of Recreation and Parks (900) Horticultural Services 7522
Recreation and Parks Administration East Parks Services 7532
Recreation and Parks Administration and Support 0101 West Parks Services 7530
Special Events 0150 Right-of-Way Services 7533
Capital Projects 0105 Urban Forestry Maintenance 7521
Recreation Services
Administration and Support 1001 Non-Departmental (950)
Adult Sports 5061 Other Charges 0100
Afterschool 2006 Debt Service 0200
Arts 2021
Childcare 3115
Classes 3016
Outdoor Recreation 2017 Department of Finance (700)
Summer Playgrounds 2011 Revenue 0300
Summer Camps 3012
Teens 2008 Department of Public Works (850)
Youth Sports 5062 Management and Support
Senior Citizen Services Management and Support 0100
Senior Center Operations 4041 Water Treatment Plant 0901
Senior Citizen Support Services 4043 Construction Management 0201
Senior Citizen Recreation 4045
Senior Citizen Sports and Fitness 4047
16 - 6
Organizational Structure Listing
WATER FUND (210)
GENERAL FUND (110) ContinuedGENERAL FUND (110) Continued

Department of Public Works (850) Non-Departmental (950)
Engineering Other Charges 0100
Development Review 3302 Debt Service 0200
Water and Sewer Utility Projects 3304
Engineering 3305
Fleet Services 0803
Operations and Maintenance Police Department (800)
Water Systems Maintenance 0502 Special Operations Bureau
Parking Enforcement Services 1403
Non-Departmental (950)
Other Charges 0100 Department of Public Works (850)
Debt Service 0200 Fleet Services 0803
Department of Recreation and Parks (900)
Facilities
Department of Public Works (850) Facilities Maintenance Services 8511
Management and Support
Management and Support 0101 Non-Departmental (950)
Sewage Disposal 0300 Other Charges 0100
Construction Management 0201 Debt Service 0200
Engineering
Development Review 3302
Water and Sewer Utility Projects 3304
Engineering 3305 Department of Public Works (850)
Fleet Services 0803 Construction Management 0201
Operations and Maintenance Engineering
Sewer Maintenance 0602 Development Review 3302
Stormwater Engineering 3303
Non-Departmental (950) Engineering 3305
Other Charges 0100 Environmental Management
Debt Service 0200 Stormwater Management and Implementation 9401
Operations and Maintenance
Stormwater Maintenance 0603
Fleet Services 0803
Department of Public Works (850)
Environmental Management Non-Departmental (950)
Recycling and Refuse Collection 9401 Other Charges 0100
Fleet Services 0803 Debt Service 0200
16 - 7
Organizational Structure Listing
REFUSE FUND (230)
STORMWATER MANAGEMENT FUND (330)
WATER FUND (210) Continued
SEWER FUND (220)
PARKING FUND (320)
REFUSE FUND (230) Continued

Department of Public Works (850) Department of Community Planning and Development Services (600)
Fleet Services 0803 Management and Support
Housing and Comm. Development Block Grant
Department of Recreation and Parks (900) CDBG Year 35 35xx
RedGate Golf Course CDBG Year 36 36xx
Course Operations 3401 CDBG Year 37 37xx
Clubhouse Services 3402
Non-Departmental (950)
Other Charges 0100
Debt Service 0200 Police Department (800)
Special Operations Bureau
Speed Camera Patrol Officers 1404
Speed Camera 1407
Department of the City Manager (550)
Cable TV Equipment Fund 7401 Department of Public Works (850)
Fleet Services 0803
Department of Public Works (850)
Transportation Demand Management 6501 Non-Departmental (950)
Other Charges 0100
Department of Recreation and Parks (900)
Recreation Services
Recreation Fund 6001
Art in Public Architecture 7601 Non-Departmental (950)
Art in Public Places 7701 Other Charges 0100
Friends of the Arts 6601 Debt Service 0200
Senior Citizens Services
Senior Assistance Fund 6201
Community Services
Holiday Drive 6301
REAP Endowment Fund 6401
Facilities
Glenview Mansion Fund 6101
Nature Center Fund 7101
Parks and Open Space
Forest and Tree Preservation 6901
Park Maintenance Fund 7301
Non-Departmental (950)
Other Charges 0100
Debt Service 0200
16 - 8
Organizational Structure Listing
CDBG FUND (360)GOLF FUND (340)
SPECIAL ACTIVITIES FUND (350)
DEBT SERVICE FUND (550)
SPEED CAMERA FUND (380)

Cost Center Summary Fund Key:
FIN Administration 414,670 - 2.00 110 9-5
General Fund 340 Accounting and Control
Water Fund 350 FIN Accounting and Audit 783,600 - 8.00 110 9-7
Sewer Fund 360 FIN Systems Support and Control 455,010 - 2.00 110 9-9
Refuse Fund 380 Speed Camera Fund Revenue
Parking Fund 550 FIN Revenue 33,110 - 0.50 110 9-11
Stormwater Fund FIN Revenue 762,080 - 7.50 210 9-11
Purchasing and Stockroom
FIN Purchasing and Contracts 420,060 - 4.00 110 9-15
FIN Stockroom 176,900 - 2.00 110 9-16
M&C 240,810 - - 110 5-5 FIN Budget 331,680 - 3.00 110 9-19
M&C 400,100 - 3.00 110 5-7 HR Human Resources 823,380 - 6.00 110 10-5
ATTY 947,740 - 6.00 110 6-3 HR Learning, Performance and Devel. 360,170 - 1.00 110 10-9
Executive Office HR Health and Wellness 100,170 - 1.00 110 10-11
CMO 701,180 - 4.50 110 7-5 HR Safety and Risk Management 267,490 - 2.00 110 10-13
CMO 417,140 - 3.00 110 7-7 IT IT Operations 2,472,080 820,100 15.50 110 11-6
CMO 226,930 - 1.00 110 7-10 IT Voice Communications 358,090 - 1.00 110 11-9
CMO 541,300 - - 110 7-12 IT GIS Operations 164,090 - 1.00 110 11-13
Communication and Public Information Office of the Chief of Police
CMO 402,690 - 3.00 110 7-15 POL Management and Support - Chief 404,590 - 3.00 110 12-7
CMO 276,200 - 2.00 110 7-16 POL Community Services Office 133,220 - 1.00 110 12-9
CMO 444,880 71,040 4.50 110 7-18 Field Services Bureau
CMO 508,630 508,630 - 350 7-20 POL Management and Support - Field Svc. 423,230 417,000 3.00 110 12-11
CMO 888,450 - 6.00 110 7-20 POL Patrol Teams 3,839,220 125,000 38.00 110 12-12
Neighborhood Resources Program Administrative Services Bureau
CMO 282,810 - 3.00 110 7-23 POL Management and Support - Admin. 650,940 - 4.00 110 12-15
CMO 124,580 - 1.00 110 7-25 POL Public Safety Comm. Dispatch 635,770 - 7.00 110 12-17
Management and Support Special Operations Bureau
CPDS 748,120 - 5.50 110 8-5 POL Management and Support - Spec. Ops 280,690 - 2.00 110 12-19
CPDS 124,260 - 0.90 110 8-7 POL Neighborhood Services 423,540 28,000 5.00 110 12-20
CPDS 593,000 593,000 0.60 360 8-7 POL Parking Enforcement 335,770 1,100,000 4.00 320 12-21
CPDS 635,110 - 5.80 110 8-11 POL Redlight Camera 461,450 630,000 0.50 110 12-22
Planning and Zoning POL Specialty Patrol and Investigations 1,147,950 - 10.00 110 12-23
CPDS 237,360 - 2.00 110 8-15 POL Speed Camera 989,020 1,392,000 5.50 380 12-24
CPDS 766,960 193,500 7.00 110 8-16 POL Comm. Enhance. and Code Enf. 572,140 748,000 8.00 110 12-25
CPDS 145,220 - 0.80 110 8-18 Management and Support
Inspection Services PW Management and Support 482,030 - 4.10 110 13-5
CPDS 914,970 1,580,000 10.00 110 8-21 PW Management and Support 74,260 - 0.50 210 13-5
CPDS 710,670 - 8.00 110 8-23 PW Management and Support 59,570 - 0.40 220 13-5
PW Water Treatment Plant 2,787,690 - 12.00 210 13-6
PW Sewage Disposal 2,353,000 - - 220 13-7
Cost Center Summary
FY 2012
Exp.
FY 2012
Rev.
Fund
Number
Fund
Name
Fund
Number
Fund
RedGate Golf Fund110
210
Fund
Name
Page
Fund
320
330
Dept Cost Center
Debt Service Fund
220
230
PageCost CenterFY 2012
Rev.
Mayor and Council
DeptFY 2012
Exp.
Special Activities Fund
Community Development Block Grant
FTEs
FTEs
16 - 9
City Clerk
City Attorney
Administration
Mgmt. Systems / Intergov't Affairs
Organizational Development
Rockville Economic Dev., Inc. (REDI)
Public Information Office
Web Site and Intranet
Cable Television
Administration and Support
Housing and CDBG
Housing and CDBG
Long Range Planning and Implement.
Cable TV Equipment
Graphics, Printing, Copy and Mail Ctr.
Neighborhood Resources
Human Rights and Comm. Mediation
Zoning
Development Review
Historic Preservation
App., Processing and Permit Issuance
Building, Fire and Life Safety Inspections
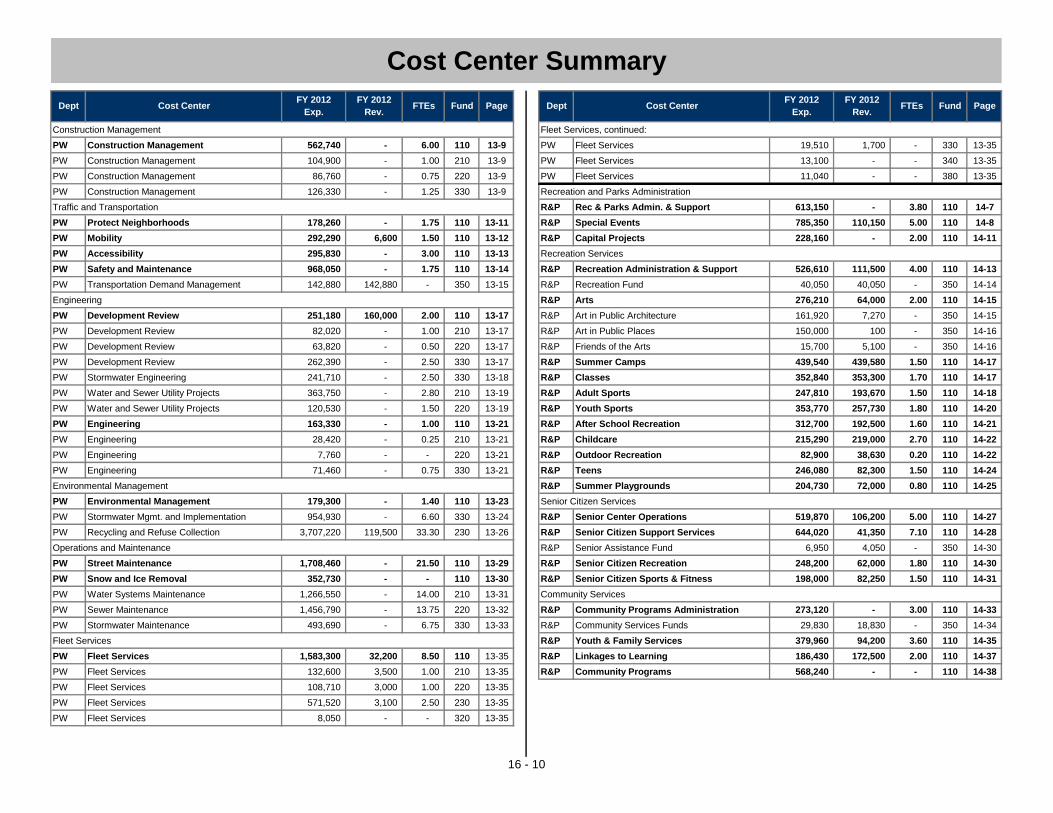
Construction Management Fleet Services, continued:
PW Construction Management 562,740 - 6.00 110 13-9 PW Fleet Services 19,510 1,700 - 330 13-35
PW Construction Management 104,900 - 1.00 210 13-9 PW Fleet Services 13,100 - - 340 13-35
PW Construction Management 86,760 - 0.75 220 13-9 PW Fleet Services 11,040 - - 380 13-35
PW Construction Management 126,330 - 1.25 330 13-9 Recreation and Parks Administration
Traffic and Transportation R&P Rec & Parks Admin. & Support 613,150 - 3.80 110 14-7
PW Protect Neighborhoods 178,260 - 1.75 110 13-11 R&P Special Events 785,350 110,150 5.00 110 14-8
PW Mobility 292,290 6,600 1.50 110 13-12 R&P Capital Projects 228,160 - 2.00 110 14-11
PW Accessibility 295,830 - 3.00 110 13-13 Recreation Services
PW Safety and Maintenance 968,050 - 1.75 110 13-14 R&P Recreation Administration & Support 526,610 111,500 4.00 110 14-13
PW Transportation Demand Management 142,880 142,880 - 350 13-15 R&P Recreation Fund 40,050 40,050 - 350 14-14
Engineering R&P Arts 276,210 64,000 2.00 110 14-15
PW Development Review 251,180 160,000 2.00 110 13-17 R&P Art in Public Architecture 161,920 7,270 - 350 14-15
PW Development Review 82,020 - 1.00 210 13-17 R&P Art in Public Places 150,000 100 - 350 14-16
PW Development Review 63,820 - 0.50 220 13-17 R&P Friends of the Arts 15,700 5,100 - 350 14-16
PW Development Review 262,390 - 2.50 330 13-17 R&P Summer Camps 439,540 439,580 1.50 110 14-17
PW Stormwater Engineering 241,710 - 2.50 330 13-18 R&P Classes 352,840 353,300 1.70 110 14-17
PW Water and Sewer Utility Projects 363,750 - 2.80 210 13-19 R&P Adult Sports 247,810 193,670 1.50 110 14-18
PW Water and Sewer Utility Projects 120,530 - 1.50 220 13-19 R&P Youth Sports 353,770 257,730 1.80 110 14-20
PW Engineering 163,330 - 1.00 110 13-21 R&P After School Recreation 312,700 192,500 1.60 110 14-21
PW Engineering 28,420 - 0.25 210 13-21 R&P Childcare 215,290 219,000 2.70 110 14-22
PW Engineering 7,760 - - 220 13-21 R&P Outdoor Recreation 82,900 38,630 0.20 110 14-22
PW Engineering 71,460 - 0.75 330 13-21 R&P Teens 246,080 82,300 1.50 110 14-24
Environmental Management R&P Summer Playgrounds 204,730 72,000 0.80 110 14-25
PW Environmental Management 179,300 - 1.40 110 13-23 Senior Citizen Services
PW Stormwater Mgmt. and Implementation 954,930 - 6.60 330 13-24 R&P Senior Center Operations 519,870 106,200 5.00 110 14-27
PW Recycling and Refuse Collection 3,707,220 119,500 33.30 230 13-26 R&P Senior Citizen Support Services 644,020 41,350 7.10 110 14-28
Operations and Maintenance R&P Senior Assistance Fund 6,950 4,050 - 350 14-30
PW Street Maintenance 1,708,460 - 21.50 110 13-29 R&P Senior Citizen Recreation 248,200 62,000 1.80 110 14-30
PW Snow and Ice Removal 352,730 - - 110 13-30 R&P Senior Citizen Sports & Fitness 198,000 82,250 1.50 110 14-31
PW Water Systems Maintenance 1,266,550 - 14.00 210 13-31 Community Services
PW Sewer Maintenance 1,456,790 - 13.75 220 13-32 R&P Community Programs Administration 273,120 - 3.00 110 14-33
PW Stormwater Maintenance 493,690 - 6.75 330 13-33 R&P Community Services Funds 29,830 18,830 - 350 14-34
Fleet Services R&P Youth & Family Services 379,960 94,200 3.60 110 14-35
PW Fleet Services 1,583,300 32,200 8.50 110 13-35 R&P Linkages to Learning 186,430 172,500 2.00 110 14-37
PW Fleet Services 132,600 3,500 1.00 210 13-35 R&P Community Programs 568,240 - - 110 14-38
PW Fleet Services 108,710 3,000 1.00 220 13-35
PW Fleet Services 571,520 3,100 2.50 230 13-35
PW Fleet Services 8,050 - - 320 13-35
16 - 10
FTEs Fund PageCost CenterFY 2012
Rev.
Cost Center Summary
Dept Cost CenterFY 2012
Exp.
FY 2012
Rev.FTEs Fund Page Dept
FY 2012
Exp.

All Funds Cost Center Summary Total:
Facilities
R&P Civic Center Complex 1,327,570 861,000 9.00 110 14-47 General (110) 66,042,880 66,042,880 402.85 R&P Glenview Mansion Fund 21,000 21,000 - 350 14-48 Water (210) 9,517,250 10,101,470 40.05
R&P Croydon Creek Nature Center 247,290 66,700 2.00 110 14-49 Sewer (220) 7,897,180 8,087,000 17.90
R&P Nature Center Fund 2,850 2,850 - 350 14-50 Refuse (230) 6,008,870 5,698,800 35.80
R&P Facilities Maintenance 2,858,680 38,350 15.75 110 14-50 Parking (320) 3,037,640 2,373,000 4.25
R&P Facilities Maintenance 22,010 - 0.25 320 14-50 Stormwater (330) 3,186,180 2,641,200 20.35
R&P Lincoln Park Community Center 345,090 52,600 3.30 110 14-51 RedGate Golf (340) 1,722,190 1,787,480 9.80
R&P Swim and Fitness Center 1,774,530 1,827,440 7.80 110 14-52 Special Activities (350) 1,139,910 810,860 -
R&P Thomas Farm Community Center 435,510 195,000 2.00 110 14-54 CDBG (360) 593,000 593,000 0.60
R&P Twinbrook Community Rec. Center 398,920 149,610 2.40 110 14-56 Speed Camera (380) 1,264,200 1,429,000 5.50
Parks and Open Space Debt Service (550) 5,796,000 5,400,000 -
R&P Parks Administration & Support 642,470 - 6.00 110 14-60 106,205,300 104,964,690 537.10 R&P East Parks Services 498,730 - 6.50 110 14-61R&P West Parks Services 632,510 - 8.00 110 14-62R&P Athletic Fields Services 554,290 - 7.50 110 14-63R&P Horticulture Services 886,870 - 7.00 110 14-64R&P Rights-of-Way Services 433,460 - 3.50 110 14-66R&P Urban Forestry Maintenance 953,540 - 6.00 110 14-67R&P Forestry Development Review 167,650 40,000 2.00 110 14-68R&P Forest and Tree Preservation Fund 20,050 20,050 - 350 14-69
R&P Park Maintenance Fund 40,050 40,050 - 350 14-69
RedGate Golf Course
R&P Course Operations 1,136,040 - 6.00 340 14-71
R&P Clubhouse Services 209,410 1,157,480 3.80 340 14-71
ND Non-Dept Expenditures 12,654,570 55,307,880 - 110 15-1ND Non-Dept Expenses 3,914,980 10,097,970 - 210 15-2
ND Non-Dept Expenses 3,640,240 8,084,000 - 220 15-2
ND Non-Dept Expenses 1,730,130 5,576,200 - 230 15-2
ND Non-Dept Expenses 2,671,810 1,273,000 - 320 15-2
ND Non-Dept Expenses 1,016,160 2,639,500 - 330 15-3
ND Non-Dept Expenses 363,640 630,000 - 340 15-3
ND Non-Dept Expenditures 264,140 37,000 - 380 15-3
ND Non-Dept Expenditures 5,796,000 5,400,000 - 550 15-3
Cost Center SummaryDept Cost Center FY 2012
Exp.FY 2012
Rev. FTEs FundFY 2012
Rev.
16 - 11
FTEs
All Funds Total:
PageFY 2012
Exp.Fund

Attorney HR M&C CMO CPDS Finance IT Police PW R&P Non-Dept TOTAL
0101 Regular Employee Wages 685,300 857,900 351,100 2,196,950 3,185,360 2,157,410 1,608,730 6,165,090 9,236,120 8,730,540 145,740 35,320,240
0103 Temporary Employee Wages - 8,620 7,000 13,250 5,940 - - 16,800 70,740 1,978,980 - 2,101,330
0104 Overtime - - - 3,550 3,900 5,000 - 585,700 536,590 172,580 - 1,307,320
0107 Disability - - - - - - - - - - 250,000 250,000
0108 Allowances 6,120 7,860 2,400 23,160 11,480 7,500 12,000 16,080 80,240 69,940 - 236,780
0121 FICA-City 36,210 49,580 21,780 125,780 192,370 128,140 94,820 412,530 608,740 671,960 5,000 2,346,910
0122 Defined Benefit Retirement-City 82,930 103,790 29,390 265,830 389,060 261,050 194,670 745,990 1,115,870 1,024,560 - 4,213,140
0123 Thrift Option Retirement-City 13,040 20,300 3,770 44,390 71,240 41,980 33,530 47,370 197,720 174,550 3,000 650,890
0124 Group Hospitalization-City 25,550 63,110 16,830 188,670 206,990 162,930 139,180 629,490 1,124,820 931,310 60,000 3,548,880
0126 Group Life-City 3,620 4,570 1,520 11,640 17,930 11,610 8,080 33,460 50,100 47,760 1,500 191,790
0127 Group Dental-City 1,430 2,350 530 5,960 9,050 5,470 4,360 18,460 35,550 28,360 1,500 113,020
0128 Workers Compensation Insurance - - - - - - - - - - 869,400 869,400
0129 Unemployment Insurance - - - - - - - - - - 70,000 70,000
0130 Medicare-City 9,940 12,550 5,090 31,820 47,200 31,290 23,310 92,410 143,670 158,690 1,500 557,470
0131 Additional Personnel Costs - - - - - - - - - - 467,550 467,550
0201 Consultants - 45,980 1,500 265,800 20,000 43,410 17,900 4,500 171,340 72,790 36,600 679,820
0202 Audit / Actuarial - - - - - 83,000 - - - - - 83,000
0204 Bank / Investment Services - - - - - 10,000 - 8,200 - - 54,000 72,200
0205 Legal Fees 44,600 - - - - - - - - - - 44,600
0206 Outside Trainers - 215,700 - - - - - - - 318,940 - 534,640
0207 Temporary Agency Personnel - - - - 500 - - - 159,920 16,200 - 176,620
0208 Artisans - - - - - - - - - 127,920 - 127,920
0209 Veterinary Services - - - - - - - 3,300 - 700 - 4,000
0210 Microfilming - - - - 35,000 - - - - - - 35,000
0211 Telephone Services - - - - - - 156,400 - 23,300 1,500 - 181,200
0212 Postage - - 16,000 200,000 - 45,150 - 1,400 3,000 - - 265,550
0213 Advertising-Non Recruitment - - 12,600 - - - - - - 71,650 - 84,250
0214 Data Processing Services - 20,500 - 26,000 - 155,500 190,940 - 9,730 - - 402,670
0215 Property Tax Processing - - - - - 25,000 - - - - - 25,000
0216 Office Equipment Rentals - - - 1,200 - - - - - 4,200 - 5,400
0217 Communication Equipment Rental - - - - - - - 5,800 - - - 5,800
0218 Cellular Services - - - - - - 23,480 26,000 4,170 - - 53,650
0219 Janitorial Services - - - - - - - - - 206,260 - 206,260
0220 Pager Services - - - - - - 2,400 - - - - 2,400
0221 Medical Exams - 16,300 - - - - - - - - - 16,300
0222 Recruitment Expenses - 51,190 - - - - - - - - - 51,190
0224 Travel 1,000 - 19,780 2,550 7,840 2,050 2,300 4,300 26,260 460 - 66,540
0225 Class / Professional Development 4,000 4,100 - 10,800 9,770 5,460 - 13,600 54,540 14,510 - 116,780
0226 Dues, Fees, and Publications 19,710 3,260 85,250 7,430 18,450 6,700 6,780 12,500 43,560 11,040 - 214,680
0228 Tuition Reimbursement - 30,000 - - - - - - - - - 30,000
0230 Contract Services-Building - - - - - - - - 14,000 270,520 - 284,520
0231 Contract Services-Grounds - - - - - - - - 199,630 1,039,720 - 1,239,350
Line Item Summary (All Funds)
16 - 12
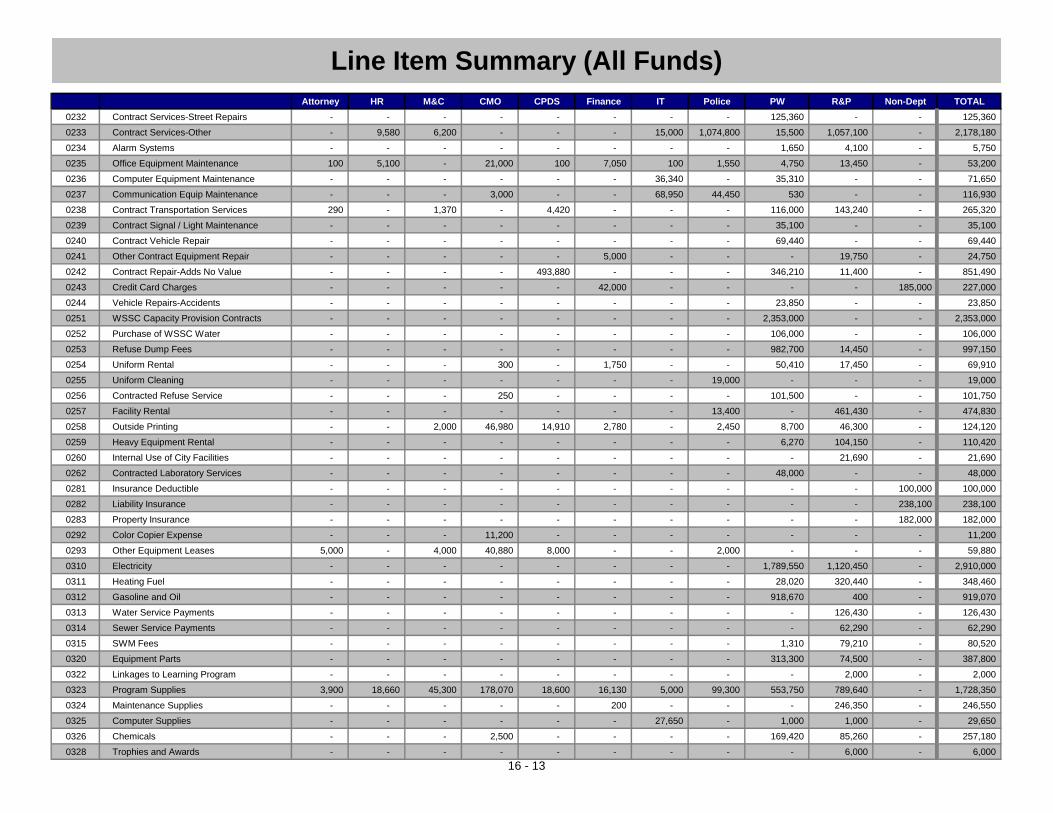
Attorney HR M&C CMO CPDS Finance IT Police PW R&P Non-Dept TOTAL
0232 Contract Services-Street Repairs - - - - - - - - 125,360 - - 125,360
0233 Contract Services-Other - 9,580 6,200 - - - 15,000 1,074,800 15,500 1,057,100 - 2,178,180
0234 Alarm Systems - - - - - - - - 1,650 4,100 - 5,750
0235 Office Equipment Maintenance 100 5,100 - 21,000 100 7,050 100 1,550 4,750 13,450 - 53,200
0236 Computer Equipment Maintenance - - - - - - 36,340 - 35,310 - - 71,650
0237 Communication Equip Maintenance - - - 3,000 - - 68,950 44,450 530 - - 116,930
0238 Contract Transportation Services 290 - 1,370 - 4,420 - - - 116,000 143,240 - 265,320
0239 Contract Signal / Light Maintenance - - - - - - - - 35,100 - - 35,100
0240 Contract Vehicle Repair - - - - - - - - 69,440 - - 69,440
0241 Other Contract Equipment Repair - - - - - 5,000 - - - 19,750 - 24,750
0242 Contract Repair-Adds No Value - - - - 493,880 - - - 346,210 11,400 - 851,490
0243 Credit Card Charges - - - - - 42,000 - - - - 185,000 227,000
0244 Vehicle Repairs-Accidents - - - - - - - - 23,850 - - 23,850
0251 WSSC Capacity Provision Contracts - - - - - - - - 2,353,000 - - 2,353,000
0252 Purchase of WSSC Water - - - - - - - - 106,000 - - 106,000
0253 Refuse Dump Fees - - - - - - - - 982,700 14,450 - 997,150
0254 Uniform Rental - - - 300 - 1,750 - - 50,410 17,450 - 69,910
0255 Uniform Cleaning - - - - - - - 19,000 - - - 19,000
0256 Contracted Refuse Service - - - 250 - - - - 101,500 - - 101,750
0257 Facility Rental - - - - - - - 13,400 - 461,430 - 474,830
0258 Outside Printing - - 2,000 46,980 14,910 2,780 - 2,450 8,700 46,300 - 124,120
0259 Heavy Equipment Rental - - - - - - - - 6,270 104,150 - 110,420
0260 Internal Use of City Facilities - - - - - - - - - 21,690 - 21,690
0262 Contracted Laboratory Services - - - - - - - - 48,000 - - 48,000
0281 Insurance Deductible - - - - - - - - - - 100,000 100,000
0282 Liability Insurance - - - - - - - - - - 238,100 238,100
0283 Property Insurance - - - - - - - - - - 182,000 182,000
0292 Color Copier Expense - - - 11,200 - - - - - - - 11,200
0293 Other Equipment Leases 5,000 - 4,000 40,880 8,000 - - 2,000 - - - 59,880
0310 Electricity - - - - - - - - 1,789,550 1,120,450 - 2,910,000
0311 Heating Fuel - - - - - - - - 28,020 320,440 - 348,460
0312 Gasoline and Oil - - - - - - - - 918,670 400 - 919,070
0313 Water Service Payments - - - - - - - - - 126,430 - 126,430
0314 Sewer Service Payments - - - - - - - - - 62,290 - 62,290
0315 SWM Fees - - - - - - - - 1,310 79,210 - 80,520
0320 Equipment Parts - - - - - - - - 313,300 74,500 - 387,800
0322 Linkages to Learning Program - - - - - - - - - 2,000 - 2,000
0323 Program Supplies 3,900 18,660 45,300 178,070 18,600 16,130 5,000 99,300 553,750 789,640 - 1,728,350
0324 Maintenance Supplies - - - - - 200 - - - 246,350 - 246,550
0325 Computer Supplies - - - - - - 27,650 - 1,000 1,000 - 29,650
0326 Chemicals - - - 2,500 - - - - 169,420 85,260 - 257,180
0328 Trophies and Awards - - - - - - - - - 6,000 - 6,000
Line Item Summary (All Funds)
16 - 13

Attorney HR M&C CMO CPDS Finance IT Police PW R&P Non-Dept TOTAL
0329 Purchase Uniform / Clothing - 210 - - 5,230 400 - 89,700 366,060 10,150 - 471,750
0331 Board and Commission Supplies - - 500 - 500 - - - 1,500 600 - 3,100
0332 Contingency - Regular - - - - - - - - - - 630,000 630,000
0333 Police Special Funds - - - - - - - 100 - - - 100
0334 Vehicle Preparation Costs - - - - - - - - 22,360 - - 22,360
0336 MRPA Theme Park Tickets - - - - - - - - - 110,000 - 110,000
0338 Senior Supper Club Program - - - - - - - - - 3,740 - 3,740
0350 Furniture & Equipment < $5,000 - - 7,000 - - - - 67,000 500 23,060 - 97,560
0422 Special Projects - - - - - - - - 40,000 15,000 - 55,000
0433 Communications Equipment - - - 508,630 - - - - - - - 508,630
0436 Equipment and Tools - - - - - - - - 125,540 45,750 - 171,290
0438 Computer Hardware - - - 2,000 - - 259,500 40,800 5,750 - - 308,050
0440 Computer Software 5,000 - - 2,400 - - 62,840 - 48,540 7,460 - 126,240
0443 Mansion Furnishings - - - - - - - - - 21,000 - 21,000
0453 Water Meters - - - - - 40,000 - - - - - 40,000
0455 Plumbers Meters - - - - - 27,000 - - - - - 27,000
0511 Principal - - - - - - - - - - 3,924,000 3,924,000
0512 Interest - - - - - - - - - - 5,712,970 5,712,970
0513 Bad Debt Expense - - - - - - - - - - 60,000 60,000
0521 Depreciation - - - - - - - - - - 4,625,000 4,625,000
0522 Amortization Expense - - - - - - - - - - 43,600 43,600
0524 Disposal of Inventory - Scrap - - - - - 2,900 - - - - - 2,900
0532 Community Assistance - - - - - - - - - 55,190 - 55,190
0539 Misc. Grant Expense - - - - - - - - - - 20,000 20,000
0540 Hotel Tax Payment - - - - - 33,250 - - - - - 33,250
0541 Rainscapes Rebate - - - - - - - - 10,000 - - 10,000
0542 Rec. & Parks Marketing Expense - - - - - - - - - 8,000 - 8,000
0600s Outside and Caregiver Agencies - - - 6,500 56,750 10,000 - - - 607,490 - 680,740
0602 Holiday Drive - - - - - - - - - 23,390 - 23,390
0604 REDI - - - 541,300 - - - - - - - 541,300
0608 Other Outside Agencies - - - 25,000 - - - - - 11,000 - 36,000
0644 C.O.G. Street Safe Campaign - - - - - - - - 3,300 - - 3,300
0711 Transfer to Parking Fund - - - - - - - - - - 500,000 500,000
0715 Transfer to Debt Service Fund - - - - - - - - - - 5,100,000 5,100,000
0754 Transfer to Water Fund - - - - - - - - - - 450,970 450,970
0757 Transfer to Refuse Fund - - - - 41,200 - - - - - - 41,200
0759 Transfer to RedGate Fund - - - - - - - - - - 630,000 630,000
0762 Transfer to Special Activities Fund - - - - - - - - - - 7,170 7,170
0765 Administrative Charge - - - - - - - - - - 3,710,070 3,710,070
0770 Contribution to CIP - - - - - - - - - - 3,967,000 3,967,000
947,740 1,551,210 640,910 4,814,790 4,875,670 3,377,110 2,994,260 10,297,530 22,738,460 21,915,950 32,051,670 106,205,300
Line Item Summary (All Funds)
16 - 14
TOTAL

Glossary
16 - 15
Definitions of terms used in this book are listed below and on the pages that follow. Accounting System −−−− The total structure of records and procedures that identify, record, classify, summarize, and report information on the financial position and results of operations of a government. Accrual Basis of Accounting −−−− The method of accounting where transactions are recognized when they occur, regardless of the timing of related cash flows. ADA −−−− Americans with Disabilities Act. This federal act gives civil rights protections to individuals with disabilities; similar to those provided to individuals on the basis of race, sex, national origin, and religion. American Reinvestment and Recovery Act (ARRA) 2009 – An economic stimulus package enacted by the 111th United States Congress in February 2009. The Act included federal tax cuts, expansion of unemployment benefits and other social welfare provisions and domestic spending in education, health care, and infrastructure. AFSCME −−−− American Federation of State, County and Municipal Employees. Largest public employee and health care workers union in the United States. Annexation −−−− The incorporation of additional territory within the domain of the City. Appropriation −−−− An authorization made by the Mayor and Council that permits City departments to make expenditures of governmental resources for specific purposes within a specific time frame. APWA −−−− American Public Works Association. Art in Public Architecture — An ordinance devoted to the furtherance of art intended to beautify the City. This ordinance identifies construction projects within the City in which an amount is reserved for permanent artwork at the site. Additional details regarding this ordinance can be found in chapter four of the Rockville City Code. ASCE −−−− American Society of Civil Engineers. Assessed Valuation −−−− A percent of appraisal value assigned to real estate and certain personal property for use as a basis for levying property taxes. AWWA −−−− American Water Works Association.
Balanced Budget −−−− A budget that has operating revenues equal to operating expenditures. Bond −−−− A written promise to pay a designated sum of money (called the principal), at a specific date in the future, together with periodic interest at a specified rate. In the Operating Budget, these payments are identified as debt service. Bonds are generally used to obtain long-term financing for capital improvements. Bond Rating −−−− A rating that indicates the probability of timely repayment of principal and interest on bonds issued. Budget – A plan of financial operation comprised of an estimate of proposed expenditures for a fiscal year and the proposed means of financing those expenditures to fund City services in accordance with adopted policy. Budget Year – The fiscal year for which the budget is being considered. Bulletin Board Programming – On-screen text graphics that run throughout Rockville 11 programming that inform viewers about City services, programs and events. C2K −−−− Chesapeake Bay 2000 Agreement. Capital Budget −−−− The annual adoption by the Mayor and Council of project appropriations. Project appropriations are for the amount necessary to carry out a capital project's expenditure plan, including multi-year contracts for which a total appropriation covering several years planned expenditures may be required. Capital Improvements Program (CIP) −−−− The annual updated plan or schedule of project expenditures for public facilities and infrastructure with estimated project costs, sources of funding, and timing of work over a five-year period. For financial planning and general management, the CIP is a plan of work and expenditures, and is the basis for annual appropriations and bond issues. Capital Outlays −−−− Expenditures that result in the acquisition of or addition to fixed assets. Any item with an expected life of three or more years and a value of more than $5,000, such as an automobile, truck, or furniture, is categorized as a capital outlay. Capital Project −−−− A governmental effort involving expenditures and funding for the creation of usually permanent facilities and other public assets having a relatively long life. Certain planning studies, consultant fees, City staff charges,

Glossary
16 - 16
and major equipment, furniture, and fixtures necessary to make facilities operational also may be considered part of capital projects. Capital Projects Fund −−−− A governmental fund used to account for general capital construction including streets, parks, and public buildings. Citizen Service Request (CSR) – A request from the community for information and/or assistance with a City service or program that comes into the City Manager’s Office or the Office of the Mayor and Council. Client-Server −−−− A computing platform where desktop personal computers (PCs), known as clients, access large pools of information stored on high-speed data servers. User interaction takes place at the PC, typically through graphical interfaces such as Windows. The server manages information storage. This approach combines the PC's innovation and ease-of-use with access to large pools of data traditionally associated with mainframe computers. CPDS −−−− The Department of Community Planning and Development Services is a department within the City's organizational structure. Current Year −−−− The fiscal year that is prior to the budget year. DCWASA − District of Columbia Water and Sewer Authority Debt Issuance −−−− The sale or issuance of any type of debt instrument, such as bonds. Debt Limit −−−− The statutory or constitutional maximum debt that an issuer can legally incur. Debt Ratios − The ratios that provide measures of assessing debt load and ability to repay debt, which play a part in the determination of credit ratings. They also are used to evaluate the City's debt position over time and against its own standards and policies. Debt Service −−−− The payment of interest on and repayment of principal on borrowed funds. The term also may be used to refer to payment of interest alone. Debt Service Fund −−−− A governmental fund that accounts for the payment of principal and interest on the general long-term debt of the City. Deficit −−−− The amount by which a government's budget outlays exceed its budget receipts for a given period, usually a fiscal year.
Department −−−− A major administrative unit of the City that indicates overall management responsibility for an operation or a group of related operations within a functional area. Depreciation −−−− An allocation made for the decrease in value of physical assets through wear, deterioration, or obsolescence. Disbursement −−−− The expenditure of monies from an account. Disinfectants and Disinfection By-Product Rule (Stage 2 D/BPR) −−−− The Stage 2 Disinfection By-Product Rule (Stage 2 D/BPR) regulates specific chemical contaminants in drinking water. The Stage 2 D/BPR (effective in 2013 for the City of Rockville) strengthens the Stage 1 D/BPR by providing specific guidance on where to draw water samples from the distribution system to ensure samples are drawn from areas with greater potential for DBP formation. The goal of this U.S. EPA regulation was to protect public health by limiting exposure to these DBPs. An additional component of the Stage 2 D/BPR is that the sample data must be averaged at each sample location for four consecutive quarters (called a locational running annual average). Distinguished Budget Presentation Award Program −−−− A voluntary program administered by the Government Finance Officers Association (GFOA) to encourage governments to publish efficiently organized and easily readable budget documents and to provide peer recognition and technical assistance to the fiscal officers preparing them. Division −−−− A categorization of organizational unit, indicating management responsibility for an operation or a group of related operations within a functional area, subordinate to the department level of organizational unit. Encumbrance −−−− A firm commitment to pay for future goods and services formally documented with a contract or agreement that may extend over more than one budget year. Both encumbrances and planned expenditures on a project must fit within an agency's appropriation. Enterprise Fund −−−− A fund established to account for operations that are financed and operated in a manner similar to a private business, where the intent of the governing body is that the costs (expenses, including depreciation) of providing goods or services to the general public on a continuing basis be financed or recovered primarily through user charges. The City's enterprise funds include Water, Sewer, Refuse, Parking, Stormwater Management (SWM), and RedGate Golf Course. Expenditure (Governmental funds) – The issuance of checks, disbursement of cash, or electronic transfer of funds made to liquidate an obligation. Where accounts are kept on an expense accrual or modified expenditure accrual basis,

Glossary
16 - 17
expenditures are recognized whether or not cash payments have been made. Where accounts are kept on a cash basis, they are recognized only when cash payments have been made. Expense (Enterprise funds) – The outflow of assets or incurrence of liabilities (or both) during a period as a result of rendering services, delivering or producing goods, or carrying out other normal operating activities. Federal Clean Water Act – The Clean Water Act (CWA) was enacted in 1948 and expanded in 1972. The purpose of this Federal law is to regulate discharges of pollutants into the waters of the United States and to regulate the quality standards for surface waters. Fees and Credits −−−− Income resulting from a billing for services or a sale made by the City. For example, athletic program registration fees, building permit fees, and animal licenses. Fiscal Policy −−−− The City's policies with respect to revenues, spending, and debt management as these relate to government services, programs, and capital investment. Fiscal policy provides a set of principles for the planning and programming of government budgets and their funding. Fiscal Year (FY) −−−− A twelve-month accounting period that has no relationship to a calendar year. The fiscal year for the City begins on July 1 of each year and ends on June 30 of the following year. It is designated by the calendar year in which it ends. For example, FY11 begins on July 1, 2010, and ends on June 30, 2011. Fixed Assets −−−− Assets of a long-term character which are intended to continue to be held and used. Examples of fixed assets include items such as land, buildings, machinery, furniture, and other equipment. Full Faith and Credit −−−− A pledge of the City's taxing power to repay debt obligations. Full-Time Equivalent (FTE) −−−− A measure of authorized personnel calculated by dividing hours of work per year by the number of hours worked per year by a full-time employee. Fund −−−− A fiscal entity with revenues and expenses that are segregated for the purpose of carrying out specific activities or attaining certain objectives in accordance with special regulations, restrictions, or limitations and constituting an independent fiscal and accounting entity. Fund Balance −−−− The cumulative difference between revenues and expenditures over the life of a fund. This is used for the City's governmental funds.
FY −−−− See Fiscal Year. GAAP −−−− See Generally Accepted Accounting Principles. GASB −−−− See Governmental Accounting Standards Board. General Fund −−−− The general operating fund that is used to account for all financial resources except for those required to be accounted for in another fund. This is the principal fund of the City and accounts for the normal recurring activities of the City. General Government Program Area −−−− The section in the CIP that focuses on: construction, renovation, and replacement of City-owned facilities; enhancements to the City's information and communications systems; development of the central business district; enhancement of the gateways to the City; and other projects that do not clearly fit into one of the other program areas of the CIP. General Obligation Bonds −−−− The type of bonds that are backed by the full faith and credit of the issuing government. Generally Accepted Accounting Principles (GAAP) −−−− Uniform minimum standards for financial accounting and recording, encompassing the conventions, rules, and procedures that define accepted accounting principles as determined through common practice or as promulgated by the Governmental Accounting Standards Board, Financial Accounting Standards Board, or various other accounting standard setting bodies. GFOA −−−− Government Finance Officers Association. GIS −−−− Geographic Information Systems provide geographic and mapping data. Golf Fund −−−− An enterprise fund used to account for the financial activity associated with the City's public golf course. Also called the RedGate Golf Course Fund. Governmental Accounting Standards Board (GASB) −−−− This organization was established as an arm of the Financial Accounting Foundation in April 1984 to promulgate standards of financial accounting and reporting with respect to activities and transactions of state and local governmental entities. Governmental Fund −−−− The funds through which most government functions are financed. The City's governmental funds are the General, Debt Service, Capital Projects, and Special Revenue Funds.
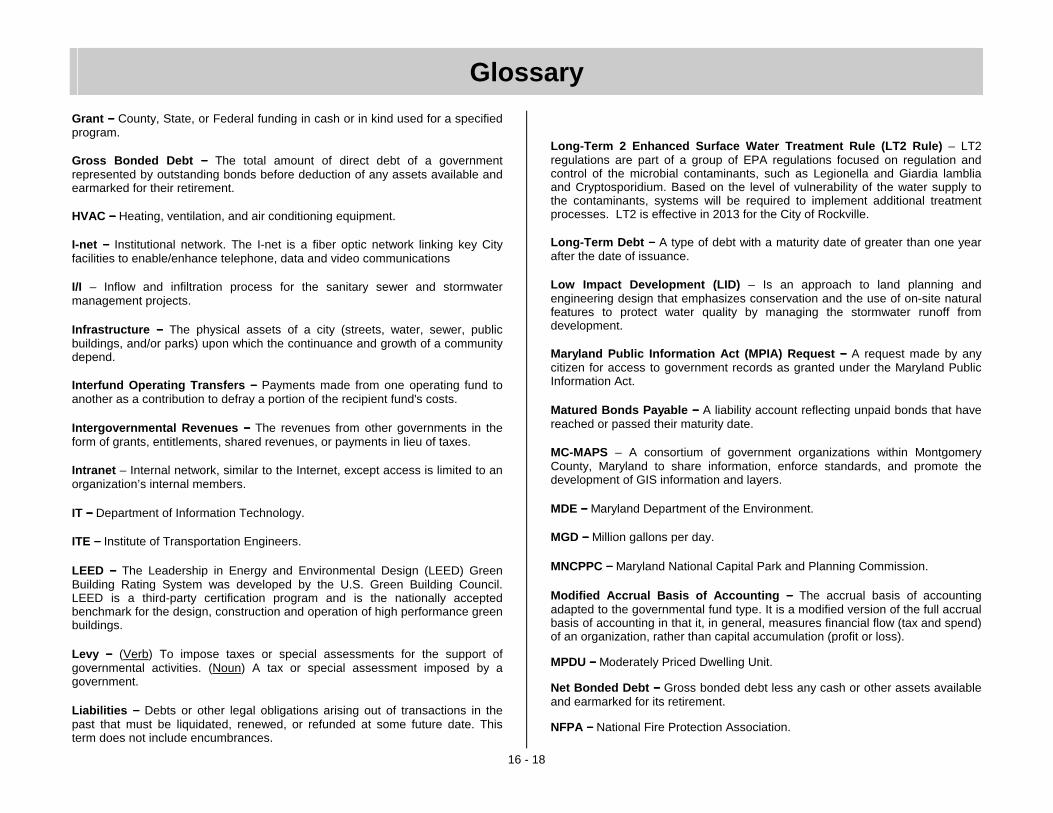
Glossary
16 - 18
Grant −−−− County, State, or Federal funding in cash or in kind used for a specified program. Gross Bonded Debt −−−− The total amount of direct debt of a government represented by outstanding bonds before deduction of any assets available and earmarked for their retirement. HVAC −−−− Heating, ventilation, and air conditioning equipment. I-net −−−− Institutional network. The I-net is a fiber optic network linking key City facilities to enable/enhance telephone, data and video communications I/I – Inflow and infiltration process for the sanitary sewer and stormwater management projects. Infrastructure −−−− The physical assets of a city (streets, water, sewer, public buildings, and/or parks) upon which the continuance and growth of a community depend. Interfund Operating Transfers −−−− Payments made from one operating fund to another as a contribution to defray a portion of the recipient fund's costs. Intergovernmental Revenues −−−− The revenues from other governments in the form of grants, entitlements, shared revenues, or payments in lieu of taxes. Intranet – Internal network, similar to the Internet, except access is limited to an organization’s internal members. IT −−−− Department of Information Technology. ITE −−−− Institute of Transportation Engineers. LEED −−−− The Leadership in Energy and Environmental Design (LEED) Green Building Rating System was developed by the U.S. Green Building Council. LEED is a third-party certification program and is the nationally accepted benchmark for the design, construction and operation of high performance green buildings. Levy −−−− (Verb) To impose taxes or special assessments for the support of governmental activities. (Noun) A tax or special assessment imposed by a government. Liabilities −−−− Debts or other legal obligations arising out of transactions in the past that must be liquidated, renewed, or refunded at some future date. This term does not include encumbrances.
Long-Term 2 Enhanced Surface Water Treatment Rule (LT2 Rule) – LT2 regulations are part of a group of EPA regulations focused on regulation and control of the microbial contaminants, such as Legionella and Giardia lamblia and Cryptosporidium. Based on the level of vulnerability of the water supply to the contaminants, systems will be required to implement additional treatment processes. LT2 is effective in 2013 for the City of Rockville. Long-Term Debt −−−− A type of debt with a maturity date of greater than one year after the date of issuance. Low Impact Development (LID) – Is an approach to land planning and engineering design that emphasizes conservation and the use of on-site natural features to protect water quality by managing the stormwater runoff from development. Maryland Public Information Act (MPIA) Request −−−− A request made by any citizen for access to government records as granted under the Maryland Public Information Act. Matured Bonds Payable −−−− A liability account reflecting unpaid bonds that have reached or passed their maturity date. MC-MAPS – A consortium of government organizations within Montgomery County, Maryland to share information, enforce standards, and promote the development of GIS information and layers. MDE −−−− Maryland Department of the Environment. MGD −−−− Million gallons per day. MNCPPC −−−− Maryland National Capital Park and Planning Commission. Modified Accrual Basis of Accounting −−−− The accrual basis of accounting adapted to the governmental fund type. It is a modified version of the full accrual basis of accounting in that it, in general, measures financial flow (tax and spend) of an organization, rather than capital accumulation (profit or loss).
MPDU −−−− Moderately Priced Dwelling Unit.
Net Bonded Debt −−−− Gross bonded debt less any cash or other assets available and earmarked for its retirement.
NFPA −−−− National Fire Protection Association.

Glossary
16 - 19
Non-Departmental Operating Expenditures −−−− Operating expenditures which are not charged directly to specific departments but are a cost to the City as a whole, such as debt service payments and general liability insurance. NPDES −−−− National Pollutant Discharge Elimination System; requirements imposed through the Clean Water Act. NRCS −−−− Natural Resource Conservation Service. Objective −−−− The desired output-oriented activities that can be measured and achieved within a given time frame such as the current fiscal year. Achievement of the objective advances an organization toward a corresponding long-range goal. Obligations −−−− Amounts that a government may be required legally to meet out of its resources. They include not only actual liabilities, but also unliquidated encumbrances. Operating Expenditures −−−− Costs other than expenditures for personnel directly employed by the City (salaries, wages, and fringe benefits) and capital outlays. Examples of operating expenditures include office supplies, telephone expense, consulting or professional services, travel expenses, and contracts. Ordinance −−−− A formal legislative enactment by the governing board of a municipality. If it is not in conflict with any higher form of law, such as a state statute or constitutional provision, it has the full force and effect of law within the boundaries of the municipality to which it applies. The difference between an ordinance and resolution is that the latter requires less legal formality and has a lower legal status. Ordinarily, the statutes or charter will specify or imply those legislative actions that must be enacted by ordinance and those which may be enacted by resolution. Overlapping Debt −−−− The proportionate share of the debts of local governments located wholly or in part within the limits of the reporting government that must be borne by property within each government. Parking Fund −−−− The enterprise fund used to account for the revenue and expenses from parking related activities, including the issuance of parking tickets, the parking meter program, and costs associated with the planning, design, construction, and operation of parking garages in Town Center. Parks, Recreation and Open Space (PROS) Plan – A long-range policy document that sets overall goals and objectives for the Department of Recreation and Parks for the next 5 to 20 years.
Pay-As-You-Go (or pay-go) −−−− Capital expenditures included in the CIP, which are funded by a contribution from an operating fund. PC −−−− Personal Computer. Per Capita −−−− Per unit of population; by or for each person. Pepco −−−− Potomac Electric Power Company. Personnel (Costs) −−−− Expenditures that include salary costs for full-time, part-time, temporary, and contract employees, overtime expenses, and all associated fringe benefits. Pipeline/Manhole Assessment Certification Program (P/MACP) – A set of standardized procedures developed by the NASSCO, Inc. association to inspect and assess sanitary sewer systems using closed circuit television cameras (CCTVs). Prior Year(s) −−−− The fiscal year(s) preceding the current year. Program Area −−−− CIP projects with a common focus. The five program areas in the City's CIP are: Recreation and Parks; Transportation; Water Resources; Utilities; and General Government. Projections −−−− The estimate of budget authority, outlays, receipts, or other amounts extending several years into the future. Projections generally are intended to indicate the budgetary implications of existing or proposed programs. Property Tax −−−− A tax levied on all real and certain personal property, tangible and intangible, according to the property's assessed valuation. The power to impose and collect property taxes is given to the Mayor and Council in Article IV, Section 1 of the City Charter. Reappropriation Ordinance −−−− Changes made to the appropriation ordinance during the fiscal year to reflect encumbered amounts added to the current budget from the prior fiscal year and adjustments to revenues and expenditures. Receipts −−−− Collections from the public based on a government's exercise of its sovereign powers. Governmental receipts consist of receipts from taxes, court fines, gifts and contributions, and compulsory licenses. Recreation and Parks Program Area −−−− The section of the CIP focused on projects that provide for an environment where citizens can enjoy nature and leisure time activities.
Glossary
16 - 20
RedGate Golf Course Fund −−−− See Golf Fund. Refuse Fund −−−− An enterprise fund used to account for the financial activity associated with the collection and disposal of refuse and yard waste. Regional Stormwater Management (SWM) Participation −−−− Fees paid by developers based on the amount of impervious area to be developed to finance the City's construction and maintenance of facilities. Regular Employee −−−− An employee who is hired to fill a position anticipated to have continuous service duration of longer than one year, whose compensation is derived from the City's Administrative, Police, or Union classification tables, and whose position is established in the Position Control System. Reimbursement −−−− A sum (1) that is received by the government as a repayment for commodities sold or services furnished either to the public or to another government account and (2) that is authorized by law to be credited directly to specific appropriation and fund accounts. Repurchase Agreement −−−− An agreement in which a governmental entity transfers cash to a broker-dealer or financial institution; the broker-dealer or financial institution transfers securities to the entity and promises to repay the cash plus interest in exchange for the same securities. Resolution −−−− A special or temporary order of a legislative body that requires less legal formality than an ordinance or statute. Retained Earnings −−−− The increase or decrease to net assets of an enterprise fund reduced by amounts transferred to capital accounts. Revenue −−−− Monies received or collected by the City as income, including such items as tax payments, fees from specific services, receipts from other govern-ments, fines, forfeitures, shared revenues, and interest income. Revenue Anticipation Notes −−−− Notes (sometimes called warrants) issued in anticipation of collection of non-tax revenues, retired after the collection of such revenues. Revenue Bonds −−−− The type of bonds where principal and interest payments are payable exclusively from the earnings from an enterprise fund. In addition to a pledge of revenues, such bonds sometimes contain mortgages on enterprise fund property. RFP – Request for Proposals. Federal mandate to request proposals from potential contractors for outsourced government services.
RHE −−−− Rockville Housing Enterprises. RockNet −−−− Rockville Community Electronic Network. SDWA −−−− Safe Drinking Water Act. Sewer Fund −−−− An enterprise fund used to account for the financial activity associated with the collection and treatment of sewage. SHA −−−− State Highway Administration. Special Activities Fund −−−− A fund in the governmental fund type used to account for funds earmarked for various purposes such as to assist financially disadvantaged citizens to participate in City programs, to enhance the historic Glenview Mansion, or to enhance the Citywide Bike Program. Special Assessment −−−− A compulsory levy made against certain properties to defray part or all of the cost of a specific improvement or service deemed to primarily benefit those properties. Special Revenue Fund −−−− A fund used to account for the proceeds of specific revenue sources (other than special assessments, expendable trusts, or major capital projects) that are legally restricted to expenditures for specified purposes. The City's special revenue funds are the Special Activities Fund, the Community Development Block Grant Fund, the Town Center Management Fund, and the Speed Camera Fund. Speed Camera Fund −−−− A fund used to account for proceeds of the City’s Speed Camera revenues that are restricted by law, and are to be used for new traffic or pedestrian safety expenditures. SQL/Server − Database for transaction processing. SSES – Sanitary Sewer Evaluation Study (SSES). Stormwater Management (SWM) − A means of controlling the quantity and quality of stormwater runoff flowing downstream. SWM can refer to structural practices such as underground storage facilities, dams for retention, and detention facilities, or it can refer to non-structural practices such as lower density of development and wider stream buffers. Stormwater Management Fund −−−− An enterprise fund used to account for costs of maintaining existing stormwater management facilities and the construction of new facilities.
Glossary
16 - 21
Stormwater Management Program Area – The section in the CIP focused on projects that provide for the preservation, restoration, and care of the City's natural and man-made physical resources, specifically through stormwater management and stream restoration. Structural Deficit – When annual budgeted expenditures exceed annual budgeted revenues in a given fiscal year. Surplus −−−− The amount by which the City's budget actual receipts exceed its budget actual outlays for a given period, usually a fiscal year. SWM −−−− See Stormwater Management. This is a division of the Department of Public Works. Tax Anticipation Notes −−−− Notes, sometimes called warrants, issued in anticipation of collection of taxes, retired from tax collections, and frequently from the proceeds of the tax levy whose collection they anticipate. Tax Base −−−− All forms of wealth under the City's jurisdiction that are taxable. Tax Duplication −−−− A state of affairs whereby both Montgomery County and the City of Rockville levy property taxes on property in Rockville to pay for services rendered by the City. The County makes a lump sum payment to the City as a mechanism for alleviating the inequities otherwise created by the duplicate taxation. Tax Rate −−−− The amount levied per $100 of assessed property value, as determined by the State assessor, on property within the City of Rockville. The Mayor and Council establish the tax rate each year in order to finance General Fund activities. TDD −−−− Telecommunications Device for the Deaf. Telecommunications −−−− Communicating by electronic or electric means. Temporary Employee − An employee who is hired to fill a position anticipated to have continuous service duration of less than one year, whose compensation is not derived from the City's Administrative, Police, Union, or Recreation and Parks classification tables, and whose position is not established in the Position Control System. These employees do not receive fringe benefits. TMDL − Total Maximum Daily Loads. Requirements imposed through the Clean Water Act.
Transfer − Shifting of all or parts of the budget authority in one appropriation or fund account to another as specifically authorized by law. Transportation Program Area −−−− The section in the CIP focused on projects that provide for the maintenance and construction of public ways and participation in the planning of mass transit. Unaccounted for Water −−−− A measure of the amount of water produced (gallons) less the total water metered (gallons). Water produced is measured at the City’s Water Treatment Plant. Metered water is comprised of billed water usage, unbilled water usage, and estimates based on field operations. Unaccounted for water is tracked to identify infrastructure and/or areas to target for maintenance and repair. Undesignated Fund Balance −−−− Funds remaining from the prior year, which are available for appropriation and expenditure in the current year. Unreserved Fund Balance −−−− That portion of a fund balance for which no binding commitments have been made. User Fees −−−− Payments for direct receipt of a public service by the party benefiting from the service. Also known as user charges. Utilities Program Area – The section in the CIP focused on projects that provide for the planning, study, design and construction of water projects to provide adequate and safe water for consumption and fire suppression. Waiver Fees − See Regional SWM Participation. Water Distribution System – The network of water pipes through which drinking water is delivered to Rockville consumers. Water Fund − An enterprise fund used to account for the financial activities associated with the treatment and distribution of potable water. Working Capital – A term used to describe the unreserved fund balance calculated by subtracting current liabilities from current assets. This is used for the City's enterprise funds. WSSC − Washington Suburban Sanitary Commission. Zoning − The partitioning of a city, borough, or township by ordinance into sections reserved for different purposes (i.e. residential, offices, manufacturing).

Index
16 - 22
The Budget Book is divided into sections numbered from 1 to 16. Each divider tab has a section number. The sections are as follows: 1 – Executive Summary, 2 – Policies and Goals, 3 – Fund Summaries, 4 – Five-Year Forecast, 5 – Mayor and Council, 6 – City Attorney, 7 – City Manager, 8 – Community Planning and Development Services, 9 – Finance, 10 – Human Resources, 11 – Information Technology, 12 – Police, 13 – Public Works, 14 – Recreation and Parks, 15 – General Government, 16 – Appendix. To find an item please use the first number in the sequence to identify the section and the second n umber to identify the page number in that section. A Accessibility Cost Center, PW ............................................................... 13-13 Accounting and Audit Cost Center, Finance .............................................. 9-7 Accounting and Control Division, Finance ................................................. 9-6 Accounting, Auditing, and Reporting Policies .......................................... 2-12 Acknowledgements ......................................................................................... i Administration Cost Center, CMO .............................................................. 7-5 Administration Cost Center, Finance ......................................................... 9-5 Administration Division, Finance ................................................................ 9-4 Administrative Scale Employees Position Grades and Classifications .... 16-1 Administrative Services Bureau Division, Police .................................... 12-14 Administrative Services Bureau Mngt. and Supp. Cost Center, Police .. 12-15 Administrative and Support Cost Center, CPDS ........................................ 8-5 Adult Sports Cost Center, R&P .............................................................. 14-18 After School Recreation Cost Center, R&P ............................................ 14-21 All Funds Forecast Revenues and Expenditures Forecast Summary ........ 4-2 All Funds Summary – CIP ........................................................................ 3-38 All Funds Summary – Fund Overview ........................................................ 3-1 All Funds Summary – Operating by Category ............................................ 3-2 All Funds Summary – Operating by Department ....................................... 3-3 All Funds Summary – Operating by Expenditure ....................................... 3-5 All Funds Summary – Operating by Revenue ............................................ 3-4 Application, Processing & Permit Issuance Cost Center, CPDS ............. 8-21 Art in Public Architecture Cost Center, R&P .......................................... 14-15 Art in Public Places Cost Center, R&P ................................................... 14-16 Arts Cost Center, R&P ........................................................................... 14-15 Athletic Field Services Cost Center, R&P .............................................. 14-63 AFSCME Union Scale Employees Position Grades, Classifications, and Pay Scale Annual Salaries ........................................................... 16-4
B Boards and Commissions Descriptions ................................................... 2-17 Budget Development Process .................................................................. 1-15 Budget Cost Center, Finance ................................................................... 9-19 Budget Division, Finance ......................................................................... 9-18 Budget Ordinance ....................................................................................... viii Building, Fire and Life Safety Cost Center, CPDS ................................... 8-23
C Cable Television Cost Center, CMO ........................................................ 7-18 Cable TV Equipment Cost Center, CMO .................................................. 7-20 Capital Improvement Program (CIP) Policies ............................................. 2-6 Capital Projects Cost Center, R&P ......................................................... 14-11 Cash Management/Investment Policies ................................................... 2-11 Changes from FY 2012 Proposed to Adopted Budget ...................................x Charges for Services Revenue ................................................................ 3-12 Childcare Cost Center, R&P ................................................................... 14-22 City Attorney Department Summary ........................................................... 6-1 City Attorney Expenditures and Sources of Funds ..................................... 6-2 City Attorney Staffing Summary ................................................................. 6-2 City Manager’s Budget Message of March 28, 2011 .................................. 1-1 City Manager Department Summary .......................................................... 7-1 City Manager Expenditures and Sources of Funds .................................... 7-2 City Manager Staffing Summary ................................................................ 7-2 City of Rockville Organizational Chart ...................................................... 1-16 Civic Center Complex Cost Center, R&P ............................................... 14-47 Classes Cost Center, R&P ..................................................................... 14-17 Communication and Public Information Division, CMO ............................ 7-14 Community Devel. Block Grant Revenues and Expenditures [Graph] ..... 3-28 Community Development Block Grant Fund ............................................ 3-28 Community Enhancement / Code Enforcement Cost Center, Police ..... 12-25 Comm. Planning and Dev. Services (CPDS) Department Summary ......... 8-1 Community Profile ........................................................................................ xii Community Programs Administration Cost Center, R&P ....................... 14-33 Community Programs Cost Center, R&P ............................................... 14-38 Community Services Division, R&P ....................................................... 14-32 Community Services Funds Cost Center, R&P ...................................... 14-34 Community Services Office Cost Center, Police ...................................... 12-9
etompkins
Underline
etompkins
Underline
etompkins
Underline
etompkins
Underline
etompkins
Underline
etompkins
Underline
etompkins
Underline
etompkins
Underline
etompkins
Underline
etompkins
Underline
etompkins
Underline
etompkins
Underline
etompkins
Underline
etompkins
Underline
etompkins
Underline
etompkins
Underline
etompkins
Underline
etompkins
Underline
etompkins
Underline
etompkins
Underline

Index
16 - 23
Comprehensive Master Plan .................................................................... 2-13 Construction Management Cost Center, PW ........................................... 13-9 Construction Management Division, PW ................................................. 13-8 Contract Positions .................................................................................... 16-2 Cost Center Summary .............................................................................. 16-9 CPDS Expenditures and Sources of Funds ............................................... 8-2 CPDS Staffing Summary ............................................................................ 8-2 Croydon Creek Nature Center Cost Center, R&P .................................. 14-49
D Debt Management Policies ...................................................................... 2-11 Debt Ratios .............................................................................................. 3-37 Debt Service Fund ................................................................................... 3-34 Demographic Statistics ............................................................................... xiv Development Review Cost Center, CPDS ............................................... 8-16 Development Review Cost Center, PW ................................................. 13-17 Directory of Boards and Commissions Officials ....................................... 2-17
E East Parks Services Cost Center, R&P ................................................. 14-61 Engineering Division, PW ...................................................................... 13-16 Engineering Cost Center, PW ................................................................ 13-21 Enterprise Funds Long-Term Debt ........................................................... 3-35 Environmental Management Cost Center, PW ...................................... 13-23 Environmental Management Division, PW ............................................. 13-22 Executive Office Division, CMO ................................................................. 7-4
F Facilities Division, R&P .......................................................................... 14-44 Facilities Division Budget Detail by Cost Center .................................... 14-46 Facilities Maintenance Cost Center, R&P .............................................. 14-50 Field Services Bureau Division, Police ................................................... 12-10 Field Services Bureau Mngt. and Support Cost Center, Police.............. 12-11 Finance Department Summary .................................................................. 9-1 Finance Expenditures and Sources of Funds ............................................ 9-2 Finance Staffing Summary ......................................................................... 9-2 Financial Management Policies ................................................................. 2-4
Fines and Forfeitures Revenue ................................................................ 3-11 Five-Year Forecast - Overview ................................................................... 4-1 Fleet Services Cost Center, PW ............................................................ 13-35 Fleet Services Division, PW ................................................................... 13-34 Forest and Tree Preservation Cost Center, R&P ................................... 14-69 Forestry Development Review Cost Center, R&P .................................. 14-68 Friends of the Arts Cost Center, R&P .................................................... 14-16
Full Time Equivalent (FTE) Positions by Fund, FY11 − FY12 .................. 1-12
G General Fund Five-Year Forecast .............................................................. 4-5 General Fund Expenditure Assumptions .................................................... 4-4 General Fund Expenditure Summary ......................................................... 3-6 General Fund Revenue and Expenditures [Graph] .................................... 3-7 General Fund Revenue Assumptions ........................................................ 4-3 General Fund Revenue Summary .............................................................. 3-6 General Fund Revenues, Detail of Major Revenue Sources...................... 3-8 Glenview Mansion Fund Cost Center, R&P ........................................... 14-48 Glossary ................................................................................................. 16-15 Graphics, Printing, Copy and Mail Center Cost Center, CMO .................. 7-20 GIS Operations Cost Center, IT ............................................................. 11-13 GIS Operations Division, IT .................................................................... 11-12
H Health and Wellness Program Cost Center, HR .................................... 10-11 Health and Wellness Program Division, HR ........................................... 10-10 Historic Preservation Cost Center, CPDS ................................................ 8-18 Horticulture Services Cost Center, R&P ................................................. 14-64 Housing and CDBG Cost Center, CPDS .................................................... 8-7 Human Resources Cost Center, HR ........................................................ 10-5 Human Resources Department Summary ............................................... 10-1 Human Resources Division, HR ............................................................... 10-4 Human Resources Expenditures and Sources of Funds ......................... 10-2 Human Resources Staffing Summary ...................................................... 10-2 Human Rights and Community Mediation Cost Center, CMO ................. 7-25

Index
16 - 24
I Income Tax .............................................................................................. 3-10 Inspection Services Division, CPDS ........................................................ 8-20 Introduction to the Budget Document............................................................. v Information Technology (IT) Department Summary ................................. 11-1 IT Expenditures and Sources of Funds .................................................... 11-2 IT Operations Cost Center, IT .................................................................. 11-6 IT Operations Division, IT ......................................................................... 11-4 IT Staffing Summary ................................................................................ 11-2
L Learning, Performance, and Development Cost Center, HR ................... 10-9 Learning, Performance, and Development Division, HR .......................... 10-8 Licenses and Permits Revenue ............................................................... 3-13 Lincoln Park Community Center Cost Center, R&P ............................... 14-51 Line Item Summary ................................................................................ 16-12 Linkages to Learning Cost Center, R&P ................................................ 14-37 Long-Range Planning and Implementation Cost Center, CPDS .............. 8-11 Long-Range Planning and Implementation Division, CPDS .................... 8-10
M Major Policy Documents, Summary ......................................................... 2-14 Management and Support Cost Center, PW............................................ 13-5 Management and Support Division, CDPS ................................................ 8-4 Management and Support Division, PW .................................................. 13-4 Management Systems & Intergovernmental Affairs Cost Center, CMO..... 7-7 Management Team ......................................................................................... i Mayor and Council Appointed Positions .................................................. 16-2 Mayor and Council Department Summary ................................................. 5-1 Mayor and Council Expenditures and Sources of Funds ........................... 5-2 Mayor and Council Staffing Summary ........................................................ 5-2 Mayor and Council Vision .......................................................................... 2-1 Mobility Cost Center, PW ....................................................................... 13-12
N Nature Center Fund Cost Center, R&P .................................................. 14-50 Neighborhood Plans................................................................................. 2-15 Neighborhood Resources Program Cost Center, CMO ........................... 7-23
Neighborhood Resources Program Division, CMO .................................. 7-22 Neighborhood Services Cost Center, Police .......................................... 12-20 Non-Departmental Expenditures by Fund ................................................ 15-1 Non-Routine CIP Projects ........................................................................ 3-39
O Office of the Chief of Police Division, Police ............................................ 12-6 Office of the Chief of Police Mngt. and Support Cost Center, Police ....... 12-7 Office of the City Attorney Division ............................................................. 6-3 Office of the City Clerk Division .................................................................. 5-6 Office of the Mayor and Council Division ................................................... 5-4 Operating Cost Impacts of CIP Projects................................................... 3-41 Operations and Maintenance Division, PW ............................................ 13-28 Organizational Development Cost Center, CMO ...................................... 7-10 Organizational Structure Listing ............................................................... 16-5 Outdoor Recreation Cost Center, R&P .................................................. 14-22
P Park Maintenance Fund Cost Center, R&P ............................................ 14-69 Parking Enforcement Cost Center, Police .............................................. 12-21 Parking Fund ............................................................................................ 3-20 Parking Fund Five-Year Forecast .............................................................. 4-9 Parking Revenues and Expenses [Graph] ............................................... 3-21 Parks Administration and Support Cost Center, R&P ............................ 14-60 Parks and Open Space Division, R&P ................................................... 14-58 Patrol Teams Cost Center, Police .......................................................... 12-12 Pay Scales – Administrative, Recreation & Parks, Senior Admin. ........... 16-3 Personal Property Tax ............................................................................... 3-9 Planning and Zoning Division, CPDS ....................................................... 8-14 Police Department Summary ................................................................... 12-1 Police Expenditures and Sources of Funds ............................................. 12-2 Police Scale Employees Position Grades, Classifications, and Pay Scale Annual Salaries ................................................................................... 16-4 Police Staffing Summary .......................................................................... 12-2 Position Changes, Summary .................................................................... 1-12 Property Taxes ........................................................................................... 3-8 Protect Neighborhoods Cost Center, PW .............................................. 13-11

Index
16 - 25
Public Information Office Cost Center, CMO............................................ 7-15 Public Safety Comm. Dispatch Prop./Evidence Cost Center, Police ..... 12-17 Public Works Department Summary ........................................................ 13-1 Public Works Expenditures and Sources of Funds .................................. 13-2 Public Works Staffing Summary .............................................................. 13-2 Purchasing and Contracts Cost Center, Finance ..................................... 9-15 Purchasing and Stockroom Division, Finance.......................................... 9-14
R Real Property Tax ...................................................................................... 3-8 Recreation and Parks Admin. and Support Cost Center, R&P ................ 14-7 Recreation and Parks Administration Division, R&P ................................ 14-6 Recreation and Parks Department Summary .......................................... 14-1 Recreation and Parks Expenditures and Sources of Funds .................... 14-2 Recreation and Parks Pay Scale Hourly Salaries .................................... 16-3 Recreation and Parks Scale Position Grades and Classifications ........... 16-2 Recreation and Parks Staffing Summary ................................................. 14-2 Recreation Fund Cost Center, R&P ....................................................... 14-14 Recreation Services Admin. and Support Cost Center, R&P ................. 14-13 Recreation Services Division, R&P ........................................................ 14-12 Recycling and Refuse Program Cost Center, PW ................................. 13-26 RedGate Golf Course Clubhouse Services Cost Center, R&P .............. 14-71 RedGate Golf Course Division, R&P ...................................................... 14-70 RedGate Golf Course Fund ..................................................................... 3-24 RedGate Golf Course Fund Five-Year Forecast ...................................... 4-11 RedGate Golf Course Operations Cost Center, R&P ............................. 14-71 RedGate Golf Course Revenues and Expenses [Graph] ......................... 3-25 Redlight Camera Cost Center, Police .................................................... 12-22 Refuse Fund............................................................................................. 3-18 Refuse Fund Five-Year Forecast ............................................................... 4-8 Refuse Revenues and Expenses [Graph] ................................................ 3-19 Revenue and Expenditure Policies ............................................................ 2-7 Revenue Cost Center, Finance ................................................................ 9-11 Revenue Division, Finance ...................................................................... 9-10 Revenue from Other Governments .......................................................... 3-10 Revenue, Other ........................................................................................ 3-13 REDI Cost Center, CMO .......................................................................... 7-12
Rights-of-Way Services Cost Center, R&P ............................................ 14-66
S Safety/Maintenance Cost Center, PW ................................................... 13-14 Safety and Risk Management Cost Center, HR ..................................... 10-13 Safety and Risk Management Division, HR ........................................... 10-12 Senior Assistance Fund Cost Center, R&P ............................................ 14-30 Senior Administrative Pay Scale Annual Salaries .................................... 16-3 Senior Center Operations Cost Center, R&P ......................................... 14-27 Senior Citizen Support Services Cost Center, R&P ............................... 14-28 Senior Citizen Recreation Cost Center, R&P ......................................... 14-30 Senior Citizen Sports and Fitness Cost Center, R&P ............................ 14-31 Senior Citizen Services Division, R&P ................................................... 14-26 Senior Staff Position Grades and Classifications ..................................... 16-2 Sewage Disposal Cost Center, PW ......................................................... 13-7 Sewer Fund .............................................................................................. 3-16 Sewer Fund Five-Year Forecast ................................................................ 4-7 Sewer Maintenance Cost Center, PW.................................................... 13-32 Sewer Rate History [Graph] ..................................................................... 3-17 Sewer Revenues and Expenses [Graph] ................................................. 3-17 Snow and Ice Removal Cost Center, PW .............................................. 13-30 Special Activities Fund ............................................................................. 3-26 Special Activities Fund Revenues and Expenditures [Graph] .................. 3-27 Special Events Cost Center, R&P ............................................................ 14-8 Special Operations Bureau Division, Police ........................................... 12-18 Special Operations Bureau Mngt. and Support Cost Center, Police ...... 12-19 Specialty Patrol / Investigations Cost Center, Police ............................. 12-23 Speed Camera Cost Center, Police ....................................................... 12-24 Speed Camera Fund ................................................................................ 3-30 Speed Camera Fund Five-Year Forecast ................................................ 4-12 Speed Camera Fund Revenues and Expenditures [Graph] ..................... 3-31 Statement of Projected Unreserved Equity .............................................. 3-32 Stockroom Cost Center, Finance ............................................................. 9-16 Stormwater Engineering Cost Center, PW ............................................. 13-18 Stormwater Maintenance Cost Center, PW ........................................... 13-33 Stormwater Management Fund ................................................................ 3-22 Stormwater Management Fund Five-Year Forecast ................................ 4-10 Stormwater Management and Implementation Cost Center, PW .......... 13-24

Index
16 - 26
Stormwater Management Revenues and Expenses [Graph] ................... 3-23 Street Maintenance Cost Center, PW .................................................... 13-29 Summer Camps Cost Center, R&P ........................................................ 14-17 Summer Playgrounds Cost Center, R&P ............................................... 14-25 Swim and Fitness Center Cost Center, R&P.......................................... 14-52 Systems Support and Control Cost Center, Finance ................................. 9-9
T Table of Contents ........................................................................................... ii Teens Cost Center, R&P ........................................................................ 14-24 Thomas Farm Community Center Cost Center, R&P ............................ 14-54 Town Center Management District Cost Center, R&P ........................... 14-56 Town Center Management District Fund .................................................. 3-29 Town Center Mgmt. District Fund Revenues and Expenditures [Graph] .. 3-29 Town Center Parking Garages Cost Center, R&P ................................. 14-55 Traffic and Transportation Division, PW ................................................ 13-10 Transportation Demand Management Cost Center, PW ....................... 13-15 Twinbrook Community Recreation Center Cost Center, R&P ................ 14-56
U Urban Forestry Maintenance Cost Center, R&P .................................... 14-67 Use of Money and Property Revenue ...................................................... 3-11
V Voice Communications Cost Center, IT ................................................... 11-9 Voice Communications Division, IT .......................................................... 11-8
W Water and Sewer Utility Projects Cost Center, PW................................ 13-19 Water Fund .............................................................................................. 3-14 Water Fund Five-Year Forecast ................................................................. 4-6 Water Rate History [Graph] ...................................................................... 3-15 Water Fund Revenues and Expenses [Graph] ........................................ 3-15 Water Systems Maintenance Cost Center, PW ..................................... 13-31 Water Treatment Plant Cost Center, PW ................................................. 13-6 Watershed Management Plans ................................................................ 2-16 Website and Intranet Cost Center, CMO ................................................. 7-16 West Parks Services Cost Center, R&P ................................................ 14-62
Y Youth and Family Services Cost Center, R&P ....................................... 14-35 Youth Sports Cost Center, R&P ............................................................. 14-20
Z Zoning Cost Center, CPDS ...................................................................... 8-15