Introduction to ... - ST.JOSEPH'S DEGREE & PG COLLEGE Unit - I
125
ST.JOSEPH'S DEGREE & PG COLLEGE MBA-OPERATIONS MANAGEMENT –SEMESTER II Unit - I: Introduction to Operations Management: Introduction to Operations Management – Nature and scope of Production and operations Management, Evolution of Production Function, Interface between the operation systems and systems of other functional areas, Production Planning and Control - Basic functions of Production Planning and Control, Process technologies- Project, Job Shop, Assembly, Batch, Continuous, Group Technology - Inter Relationship between product life cycle and process life cycle. INTRODUCTION TO OPERATIONS MANAGEMENT Production/Operation management is the process which combines and transforms various resources used in the production/operation subsystem of the organization into value added products/services in a controlled manner as per the policies of the organization. The set of interrelated management activities which are involved in manufacturing certain products is called production management and for service management, then corresponding set of management activities is called as operation management. Examples: (Products/goods) Boiler with a specific capacity, Constructing flats, Car, bus, radio, television. Examples: (Services) Medical facilities, Travel booking services. In the process of managing various subsystems of the organization executives at different levels of the organization need to track several management decisions. The management decisions are Strategic, tactical and operational. Productivity: Productivity is a relationship between the output (product/service) and input (resources consumed in providing them) of a business system. The ratio of aggregate output to the aggregate input is called productivity. Productivity = output/Input For survival of any organization, this productivity ratio must be at least 1.If it is more
-
Upload
khangminh22 -
Category
Documents
-
view
3 -
download
0
Transcript of Introduction to ... - ST.JOSEPH'S DEGREE & PG COLLEGE Unit - I

ST.JOSEPH'S DEGREE & PG COLLEGE
MBA-OPERATIONS MANAGEMENT –SEMESTER II
Unit - I: Introduction to Operations Management: Introduction to Operations Management – Nature and scope of Production and operations Management, Evolution of Production Function, Interface between the operation systems and systems of other functional areas, Production Planning and Control - Basic functions of Production Planning and Control, Process technologies- Project, Job Shop, Assembly, Batch, Continuous, Group Technology - Inter Relationship between product life cycle and process life cycle.
INTRODUCTION TO OPERATIONS MANAGEMENT
Production/Operation management is the process which combines and transforms various resources used in the production/operation subsystem of the organization into value added products/services in a controlled manner as per the policies of the organization.
The set of interrelated management activities which are involved in manufacturing certain products is called production management and for service management, then corresponding set of management activities is called as operation management.
Examples: (Products/goods)
Boiler with a specific capacity,
Constructing flats,
Car, bus, radio, television.
Examples: (Services)
Medical facilities,
Travel booking services.
In the process of managing various subsystems of the organization executives at different levels of the organization need to track several management decisions. The management decisions are Strategic, tactical and operational.
Productivity:
Productivity is a relationship between the output (product/service) and input (resources consumed in providing them) of a business system. The ratio of aggregate output to the aggregate input is called productivity.
Productivity = output/Input
For survival of any organization, this productivity ratio must be at least 1.If it is more

ST.JOSEPH'S DEGREE & PG COLLEGE
MBA-OPERATIONS MANAGEMENT –SEMESTER II
than 1, the organization is in a comfortable position. The ratio of output produced to the input resources utilized in the production.
NATURE AND SCOPE OF PRODUCTION AND OPERATIONS MANAGEMENT
Operation management, as the name suggests, is managing the operations and functionality of the business. It involves the tasks and skills required to plan, organise and direct the activities in order to achieve the task of the day. Usually, operation management is more identified with the manufacturing process. However, if one observes, the necessary process of operation
management is required in every industry. Operation management is one of the essential in every business, especially in the business of manufacturing. Hence, completing a course in the operation management would always help the people who want to be a subject matter expert in the field of operation management. The nature and scope of operation management are stated below.
Operation Management is very critical in achieving the objective of the business.
Every business is incepted with a specific objective in mind, and the business does its best to achieve it. If the resources within the company are not appropriately allocated to achieve these objectives, then this would affect the net profits of the company. Hence, to achieve the objective of the company in a structured and disciplined way operation management comes into the picture. Operation manager ensures that there is better coordination between the various departments of the business in order to achieve the objective of the business.
Operation Management helps in utilising the resources at the optimum level.
One of the jobs of the operation manager is the optimum utilisation of the resources. The operation manager is responsible for strategising the resource allocation in the business and for making sure that the resources are being used as per the decided strategies. This will help in getting a direction towards the achievement of the objective of the goals of the company. The operation manager always checks that the resources in the business are used to the optimum, and none of the resources is wasted while doing the job.
Operation Management aids in enhancing the productivity of the employees
With the increasing focus of the business to be customer-centric, it is imperative that the assignment or the project took for the client is given to them on time as any delay would affect the image of the company. Hence, here the skill of operation management comes into the picture; the operation managers deploy various techniques like improving the internal systems or monitoring the internal procedures. Therefore, one can say that operation management is the enforcement of the required practices for the business in the best possible way.
Operation Management is vital for all types of business organisation

ST.JOSEPH'S DEGREE & PG COLLEGE
MBA-OPERATIONS MANAGEMENT –SEMESTER II
The operating process of all the industries is the same. Hence the operation management is an essential department in all types of business, manufacturing and services industries alike. Operation management is considered a problem-solving department. With the help of the operation management organisation is able to achieve the objective with the maximum use of the resources available with the business.
OM is one of three major functions (marketing, finance, and operations) of any organization and we study how people organize themselves for productive enterprise. OPERATIONS MANAGEMENT is concerned with creating, operating and controlling a transformation system which takes inputs of a variety of resources and produces outputs of
goods and services which are needed by customers - Naylor, 1996
Nature of production:
1. Production as a system
I. Production as a conversion/transformation process II. Production as a means of creating utility
2. Production as an organisational function 3. Decision – making in production
1.Production as a system
• System is the Collection of interrelated entities o Production system o Conversion sub system o Control sub- system
• Production system receive inputs in the form of materials, personnel, capital, utilities and information
• Production system: A system whose function is to convert a set of inputs into a set of designed outputs

ST.JOSEPH'S DEGREE & PG COLLEGE
MBA-OPERATIONS MANAGEMENT –SEMESTER II
• Conversion subsystem: A sub-system of the larger production system where inputs are converted into output
• Control Sub-system: A sub-system of the larger production system where a portion of the output is monitored for feedback signals to provide corrective action if required.
• Output : desired products and services
i.Production as a conversion/transformation process
Conversion sub system is the core of production system because it consists of processes or activities wherein workers , materials, machines and equipment are used to convert inputs into outputs
ii.Production as a means of creating utility
• Adding value to the outputs/process of creating utility In outputs ( power of satisfying human needs)
• Form utility: change in shape, size, form, weight….
• Place utility:change in place of inputs
• Time utility: created by storage/preservation
• Possession utility: transferring the possession /ownership
• Service utility: created by rendering some service
• Knowledge utility: imparting knowledge to a person EX: PRODUCTION SYSTEM: EDUCATIONAL INSTITUTION
• Inputs: Students, teachers, books, rooms

ST.JOSEPH'S DEGREE & PG COLLEGE
MBA-OPERATIONS MANAGEMENT –SEMESTER II
• Conversion: Learning, communication
• Output: Qualified graduates
2.Production as an organization function
• Core/heart of production system – conversion sub-system (workers, machines, material – used )
• Production function plays a central role in achieving the objectives of the organisation
• Marketing , production/operations, finance and human resources function.
• Production creates good and services – marketing generates the demand of products, finance function keeps track of how well the organisation performs- cash inflows and outflows and human resources looks into the people aspect of the organizations & best utilisation of people
3.Decision-making in production – plan, organise, staff, direct and control
• Strategic decisions: o Relating to products, processes and manufacturing facilities o Major/strategic importance , long-term significance
• Operating decision: o Planning production to meet demand(inventory, schedule, hiring of
temporary/casual workers, volume of RM) o Achieve customer satisfaction at reasonable costs (Profits)
• Control Decisions: o Planning and controlling operations(productivity) o Day to day activities – workers performance, quality of products & services,
production and overhead costs and maintenance (preventive for key machinery/equipments)_

ST.JOSEPH'S DEGREE & PG COLLEGE
MBA-OPERATIONS MANAGEMENT –SEMESTER II
2. Scope of Operations Management
It includes from the selection of location, acquisition of land, constructing building, procuring and installing machinery, purchasing and storing raw materials and converting them into
saleable products
Apart from the above – TQM, maintenance management, production planning and control, methods improvement and work simplification and other related areas
– Includes two types of activities:
� Designing of the production system � Operation & control of production system
– Mainly involves/encompasses two decisions:
� Long term/strategic decision � Short term/operational decisions
1. STRATEGIC DECISIONS/long term
– Product: � Selection and design of Product (value engineering for best cost effective
design)
– Process: � Process selection and planning ( technology, machines & equipment –
optimum automation & mechanisation, capability of firm to invest in capital assets)
– Manufacturing facilities: – Facilities locations (cut down production & distribution Cost) – Plant layout and material handling (arrangement of machines/facilities – smooth,
handling is min.) – Capacity Planning (level of output over a period of time – tools (LPP,Decision
trees, marginal costing, learning curves….) – Job design – basic organisation of the work as well as matching workers to their
jobs
2. OPERATIONAL DECISIONS/short term – Production planning (setting goals & allocating resources – varied production
operations @optimum) – Production control( activities are carried on in-line with predetermined stds &
schedules) – Inventory control (MM,WIP,FP,Suppliers,tools) – Quality control(Statistical techniques, success – ability to maintain quality
standards – specifications, conform to the set std.) – Method study (time study, motion study,stds methods) – Maintenance & replacement: Policy for reliability – Cost reduction & control o value engineering , o budgetary control, o labour

ST.JOSEPH'S DEGREE & PG COLLEGE
MBA-OPERATIONS MANAGEMENT –SEMESTER II
EVOLUTION OF PRODUCTION FUNCTION
The subject Operations management has its own connection with the age old Industrial Revolution, which has started during the late 17th century in England and later spread to the rest of Europe and to the United States during the 19th century. Prior to that time, goods were manufactured in small quantities in smaller shops / factories by the local craftsmen and their apprentices, who were mostly their family members. Under that system, it was common for one person to be responsible for making a product, such as a horse-drawn wagon or a piece of furniture, from start to finish. Only simple tools were available; the machines that we use today had not been invented. Later, in the 18th century, many scientific inventions came into existence and changed the face of production / operations by substituting huge machines, which are operated by steam power and electric power. Perhaps the most significant of these inventions, was the steam engine; it had the ability to provide power to operate huge machineries in the factories. For example, the spinning jenny and the power looms revolutionized the textile industry. Ample supplies of coal and iron ore provided materials for generating power and making machinery. The new machines, made of iron, were much stronger and more durable than the simple wooden machines they replaced. From the late 17th century (1770) to the early years of the 18th century, series of events took place in England which together is called the Industrial Revolution. Industrial Revolution resulted in two major developments: widespread substitution of machine power for human power and establishment of the organized production system known as factory system. The events that took place from 1770 to the 1800s are characterized by great inventions. The great inventions were eight in number ,with six of them having been conceived in England, one in France and one in the United States .The eight inventions are—Hargreaves Spinning Jenny, Arkwright’s Water Frame, Crompton’s Mule, Cartwright’s Power Loom, Watt’s steam engine, Berthollet’s Chlorine Bleaching Discovery, Mandslay’s Screw-Cutting Lathe and Eli Whitney’s Interchangeable Manufacture. As observed from eight inventions, most of them have to do with the spinning of yarn and weaving of cloth. This is logical from the point of view that cloth was the principal export commodity of England at that time and was in short supply owing to the considerable expansion of England’s colonial empire and its commercial trade. The availability of machine power greatly facilitated the gathering of workers in factories that housed the machines. The large number of workers congregated in the factories, created the need for organizing them in logical ways to produce goods. The publication of Adam Smith’s The Wealth of Nations in 1776 advocated the benefits of the division of labor or specialization of labor, which broke production of goods into small specialized tasks that were assigned to workers on production lines. Thus, the factories of late 1700s not only had developed production machinery, but also ways of planning and controlling the output of workers.

ST.JOSEPH'S DEGREE & PG COLLEGE
MBA-OPERATIONS MANAGEMENT –SEMESTER II
The impact of the Industrial Revolution was first felt in England. From here, it spread to other European countries and to the United States. The Industrial Revolution advanced further with the development of the gasoline engine and electricity in the 1800s. Other industries emerged and along with them new factories came into being. By the middle of 18th century, the old cottage system of production had been replaced by the large scale factory system. As days went by, production capacities expanded, demand for capital grew and labor became highly dependent on jobs and urbanized. At the commencement of the 20th century, the one element that was missing was a management –the ability to develop and use the existing facilities to produce on a large scale to meet massive markets of today. Later, the Scientific Management Era has brought widespread changes to the practices and management of factories. The movement was spearheaded by the efficiency engineer and inventor Frederick Winslow Taylor, who is often referred to as the Father of Scientific
Management. Taylor believed in a “science of management” based on observation, measurement, analysis and improvement of work methods, and economic incentives. He studied work methods in great detail to identify the best method for doing each job. Taylor also believed that management should be responsible for planning, carefully selecting and training workers, finding the best way to perform each job, achieving cooperation between management and workers, and separating management activities from work activities.
INTERFACE BETWEEN THE OPERATION SYSTEMS AND SYSTEMS OF OTHER
FUNCTIONAL AREAS
Interface with other areas
Production/operations function: produce goods and services. Core of most business organisations. Essence of operations is to add value during transformation process.

ST.JOSEPH'S DEGREE & PG COLLEGE
MBA-OPERATIONS MANAGEMENT –SEMESTER II
Supporting functions that interface with operations (depend on the nature of the organisation)
1. Finance function: securing resources at favourable prices and allocating those
resources (current performance measures). production and finance exchange information – budgeting, economic analysis of investment proposals and provision of funds for various activities.(process improvements). Finance cannot judge the need for capital investments if they do not understand operations concepts and needs.
2. Accounting – furnishes the information (current performance measures) regarding cost of materials, labour and overheads, scrap, machine downtime, idle time ,inventories…(billing aspects and process improvements). Accounting needs to consider inventory management, capacity information, and labor standards
3. Marketing function: selling and promoting goods and services (new product development) assessing the customer needs and discovering of developing demand, maintaining relationship with potential customers/customers.(inventory levels & capacities. Marketing is not fully capable of meeting customer needs if they do not understand what operations can produce
4. Distribution: packing and shipping 5. Management Information system – MIS(technology)Info on design of systems to
process data into info, reports. Information systems enables the information flow throughout the organization
6. Purchasing :procurement of materials, supplies,, machinery, equipment, tools etc…(Quality, reliability, price, service and flexibility), receiving, inwards goods
inspection and bills payment 7. Personnel or human resources department:(labour skills and cost) recruitment,
selection and training of personnel labour relations, contract negotiation with trade unions, wage and salary admin, HRP & forecasting, enusring health and safety of employees.(labour requirements). Human resources must understand job requirements and worker skills
8. Public relations: build and maintain positive image of the organisation. Product,brand, employer, community acceptance, positive attitude among employees
9. Industrial engineering: method study, work measurement,performance and quality standards, layouts etc..(design requirements, ability to perform operations)
10. Maintenance: general upkeep and repair of plant, machinery and equipment, tools, material handling equipments, buildings, heating, lighting, air conditioning, waste disposal, safety and security……
PRODUCTION PLANNING AND CONTROL
PRODUCTION PLANNING AND CONTROL - meaning – It may be defined as the planning direction and coordination of the firm’s material and
physical facilities towards the attainment of predetermined production objectives in the most economical manner.
– Involves organisation and control of an overall manufacturing system to produce a product or a service.
– Production planning and control is concerned with directing production along the lines set by the planning department.
– DEFINITION: "Production planning and control is the co-ordination of series of functions according to a plan which will economically utilize the plant facilities and regulate the

ST.JOSEPH'S DEGREE & PG COLLEGE
MBA-OPERATIONS MANAGEMENT –SEMESTER II
orderly movement of goods through the entire manufacturing cycle from the procurement of all materials to the shipping of finished goods at a predetermined rate."
-CHARLES A. KOEPKE
BASIC FUNCTIONS OF PRODUCTION PLANNING AND CONTROL
1.Estimating:
Once the overall method and sequence of operations is fixed and process sheet for each operation is available, then the operations times are estimated. This function is carried out using extensive analysis of operations along with methods and routing and standard times for operation are established using work measurement techniques.
2. ROUTING
• Process of determining the sequence of operations to be performed in the production process- what, where and how the work has to be done?
• It is the selection of the path from where each unit has to pass before reaching the
final stage. The path must have the best and cheapest sequence of operations.
• Routing information is provided by product or process engineering function and is useful for prepare machine loading charts and schedules
3. SCHEDULING
• Fixing priorities for each job and determining the starting time and finishing time for each operation, the starting dates and finishing dates for each part, sub-assembly and final assembly.
• Scheduling is the determining of time and date when each operation is to be commenced
and completed. it includes the scheduling of materials, machines and all other requisites
of production.
• Scheduling means "fitting specific jobs into a general time table so that order may be
manufactured in accordance with contracted liability or in mass production, so that each
component may arrive at and enter into assembly in the order and as is required." -ALFORD AND BEATY
Scheduling is concerned with preparation of machine loads and fixation of Starting and completion dates for each of the operations
4.LOADING
• Deciding which jobs to be assigned to which work centre or machine
• Process of converting operation schedules into practice.
• Machine loading: process of assigning specific jobs to machines, men or work centres based on relative priorities and capacity utilisation.
• Machine loading chart – Gantt chart – prepared showing the planned utilisation of men and machines by allocating the jobs to machines or workers as per priority sequencing established at the time of scheduling.
• To avoid overloading and underloading the facilities, work centres or machines to maximize utilisation of resources
Machines have to be loaded according to their capability of performing the given task and according to their capacity.
Thus, the duties include:

ST.JOSEPH'S DEGREE & PG COLLEGE
MBA-OPERATIONS MANAGEMENT –SEMESTER II
(a) Loading the machines as per their capability and capacity.
(b) Determining the start and completion times for each operation.
(c) To Co-ordinate with sales department regarding delivery schedules.
5. Dispatching:
This is the execution phase of planning. It is the process of setting production activities in motion through release of orders and instructions. It authorises the start of Production activities by releasing materials, components, tools, fixtures and instruction sheets to the operator.
The activities involved are: (a) To assign definite work to definite machines, work centres and men.
(b) To issue required materials from stores.
(c) To issue jigs, fixtures and make them available at correct point of use.
(d) Release necessary work orders, time tickets etc. to authorise timely start of operations.
(e) To record start and finish time of each job on each machine or by each man.
6. Expediting:
This is the control tool that keeps a close observation on the progress of the work. It is a logical step after dispatching which is called “follow-up” or “Progress”. It co-ordinates extensively to execute the production plan. Progressing function can be divided in to three parts, i.e. follow up of materials, follow up of work in process and follow up of assembly.
The duties include: 1. Identification of bottlenecks and delays and interruptions because of which the production schedule may be disrupted.
2. To devise action plans (remedies) for correct the errors.
3 To see that production rate is in line with schedule.
7. Inspection:
It is a measure control tool. Though the aspects of quality control are the separate function, this is of very much important to PPC both for the execution of the current plans and in scope for future planning. This forms the basis for knowing the limitations with respects to methods, processes etc. which is very much useful for evaluation phase.
8. Evaluation:
This stage though neglected is a crucial to the improvement of productive efficiency. A thorough analysis of all the factors influencing the production planning and control helps to identify the weak spots and the corrective action with respect to preplanning and planning will be effected by a feed back. The success of this step depends on the communication, Data and information gathering and analysis.

ST.JOSEPH'S DEGREE & PG COLLEGE
MBA-OPERATIONS MANAGEMENT –SEMESTER II
PROCESS TECHNOLOGIES- PROJECT, JOB SHOP, ASSEMBLY, BATCH,
CONTINUOUS, GROUP TECHNOLOGY
PROCESS TECHNLOGY
• Refers to equipment, people and systems used to produce a firm’s products and services
• Key process technology decisions relate to: o Organising the process flows o Choosing the appropriate product- process mix o Adapting the process to meet strategic requirements o Evaluating automation and high-technology requirements o PROCESS
• A process is a sequence of activities that is intended to achieve some result, typically to create added value for the customers
• Converts inputs into output in a production system
TYPES OF PROCESS TECHNOLOGIES 1. Intermittent
a. 1. Job shop b. 2. Batch technology
2. Continuous :
a. Assembly line b. Continuous flow technology
3. Project technology 4. Group- technology(GT)/cellular manufacturing system(CM)
1.JOB SHOP
• Job shop production are characterised by manufacturing of one or few quantity of
products designed and produced as per the specification of customers within prefixed time and cost. The
• Distinguishing feature of this is low volume and high variety of products.
• A job shop comprises of general purpose machines arranged into different departments.
• Each job demands unique technological requirements, demands processing on machines in a certain sequence.
JOB SHOP
• Each product uses only a small portion of the shop’s human resources and general purpose equipment
• Elaborate job-tracking and control systems
• Must time is spent waiting - access to equipment CHARACTERISTICS
1. High variety of products and low volume. 2. Use of general purpose machines and facilities. 3. Highly skilled operators who can take up each job as a challenge because of uniqueness. 4. Large inventory of materials, tools, parts. 5. Detailed planning is essential for sequencing the requirements of each product, capacities
for each work centre and order priorities. 6. Uses flexible flow strategy (various routes/different patterns of processing)

ST.JOSEPH'S DEGREE & PG COLLEGE
MBA-OPERATIONS MANAGEMENT –SEMESTER II
Advantages 1. Because of general purpose machines and facilities variety of products can be produced. 2. Operators will become more skilled and competent, as each job gives them learning
opportunities. 3. Full potential of operators can be utilised. 4. Opportunity exists for creative methods and innovative ideas. 5. Small amount of investment in equipments and machinery 6. Flexible in nature & risks / managerial problems is less
Limitations 1. Higher cost due to frequent set up changes/difficult in loading 2. Higher level of inventory at all levels and hence higher inventory cost. 3. Production planning /system is complicated & requires elaborate scheduling 4. Larger space requirements & material handling is high 5. Made to order (costly and non-standardised) & requires high skilled ppl
2. BATCH TECHNOLOGY
• Suitable for a moderate variety of products in moderate varying volumes
• Wide range of products in a batch, several are produced repeatedly and that too in large volumes
• No product is sufficiently dominant to warrant dedicated equipment and process.
• Flexible for the low-volume/high-variety products
• High volume products – some batches for stocking rather than for customer order
• medium size enterprises
• Batch production is defined by American Production and Inventory Control Society (APICS) “as a form of manufacturing in which the job passes through the functional
departments in lots or batches and each lot may have a different routing.”
Characteristics 1. When there is shorter production runs. 2. When plant and machinery are flexible. 3. When plant and machinery set up is used for the production of item in a batch and change
of set up is required for processing the next batch. 4. When manufacturing lead time and cost are lower as compared to job order production.
Advantages 1. Better utilisation of plant and machinery. 2. Promotes and develops functional specialisation. 3. Cost per unit is lower as compared to job order production. 4. Lower investment in plant and machinery. 5. Flexibility to accommodate and process number of products. 6. Job satisfaction exists for operators.
Limitations
• Material handling is complex because of irregular and longer flows.
• Production planning and control is complicated
• Higher setup cost and process inventory is high when compared to continuous production 3. ASSEMBLY LINE/LINE
• Suitable for a narrow range of standardised products or services in high volumes
• Product designs are relatively stable
• Slight flexibility of equipment
• Specialised equipment

ST.JOSEPH'S DEGREE & PG COLLEGE
MBA-OPERATIONS MANAGEMENT –SEMESTER II
• Low Human skills
• Management systems developed and dedicated to limited range of products and volumes
• Less cost per unit, manufacture to stock
• Minimum material handling/resetting of machines
• Manufacture of discrete parts or assemblies using a continuous process are called mass
production.
• This production system is justified by very large volume of production. The machines are arranged in a line or product layout. Product and process standardisation exists and all outputs follow the same path.
Characteristics - Assembly 1. Standardisation of product and process sequence. 2. Dedicated special purpose machines having higher production capacities and output rates. 3. Large volume of products. 4. Shorter cycle time of production. 5. Lower in process inventory. 6. Perfectly balanced production lines. 7. Flow of materials, components and parts is continuous and without any back tracking. 8. Production planning and control is easy. 9. Material handling can be completely automatic.
Advantages 1. Higher rate of production with reduced cycle time. 2. Higher capacity utilisation due to line balancing. 3. Less skilled operators are required. 4. Low process inventory. 5. Manufacturing cost per unit is low.
Limitations 1. Breakdown of one machine will stop an entire production line. 2. Line layout needs major change with the changes in the product design. 3. High investment in production facilities. 4. The cycle time is determined by the slowest operation.
4. Continuous flow technology
• Production facilities are arranged as per the sequence of production operations
from the first operations to the finished product. The items are made to flow through
the sequence of operations through material handling devices such as conveyors, transfer devices, etc.
• Product has fast consumption rate and has continuous demand
• Continuous flow technology
• Suitable for producing a continuous flow of products
• Materials and products – produced in continuous, endless flows
• Highly standardised
• Manufacturing procedures, sequence of product build-up, material & equipment – standardised
• High volume, around the clock operation with capital intensive and specialised automation.
CHARACTERISTICS
• Dedicated plant and equipment with zero flexibility.
• Material handling is fully automated.
• Process follows a predetermined sequence of operations.
ST.JOSEPH'S DEGREE & PG COLLEGE
MBA-OPERATIONS MANAGEMENT –SEMESTER II
• Component materials cannot be readily identified with final product.
• Planning and scheduling is a routine action
• Proper maintenance and effective control of quality are the pre-requisites of continuous production system
Advantages
• Standardisation of product and process sequence.
• Higher rate of production with reduced cycle time.
• Higher capacity utilisation due to line balancing.
• Manpower is not required for material handling as it is completely automatic.
• Person with limited skills can be used on the production line & PPC is simple
• Unit cost is lower due to high volume of production.
Limitations
• Flexibility to accommodate and process number of products does not exist.
• Very high investment for setting flow & more efforts on planning
• Effective working depends on effective plant maintenance
5. PROJECT TECHNOLOGY
• High degree of job customization, the large scope of each project and need for substantial resources to complete the project
• Suitable for producing products that are tailor made to the unique requirements of each customer.
• One -of –a kind products, Not standardised
• Conversion process – flexible in its equipment capabilities, human skills and procedures, complex, take a long time
• requires team-work, problem solving and coordinated design
• PERT/CPM CHARACTERISTICS
1. Non-repetitive task (start and end points) 2. Objectives and output is clear and definite 3. Complex in nature and involves alteast 2 to 3 years 4. Requires huge investment 5. Subjected to risks and uncertainities 6. Uses PERT/CPM (planning, scheduling and controlling) 7. PERT projects – launching of satellite, CPM projects – construction of dam, roads,
bridges, building etc….
Advantages – Project technology 1. Scheduling the production system 2. Network models are used to scheduling complex projects 3. Long term planning of projects can be done 4. Delays in the job can be reduced 5. Used to ascertain the probability of completing the project on or before deadline/time
period 6. Designing and marketing the new product effectively 7. Corporate merger can be carried out with the help of project management
DISADVANTAGES/LIMITATIONS 1. Assumed Durations of activity are independent – which may not be always possible 2. Resources required such as equipment , man-power and money are limited and may result
into several problems.
ST.JOSEPH'S DEGREE & PG COLLEGE
MBA-OPERATIONS MANAGEMENT –SEMESTER II
3. Estimation of costs(variable costs) are very high 4. Scheduling of the project is complex and is subjected to various variations 5. Difficulty to plan and control resources, cost and time of completion
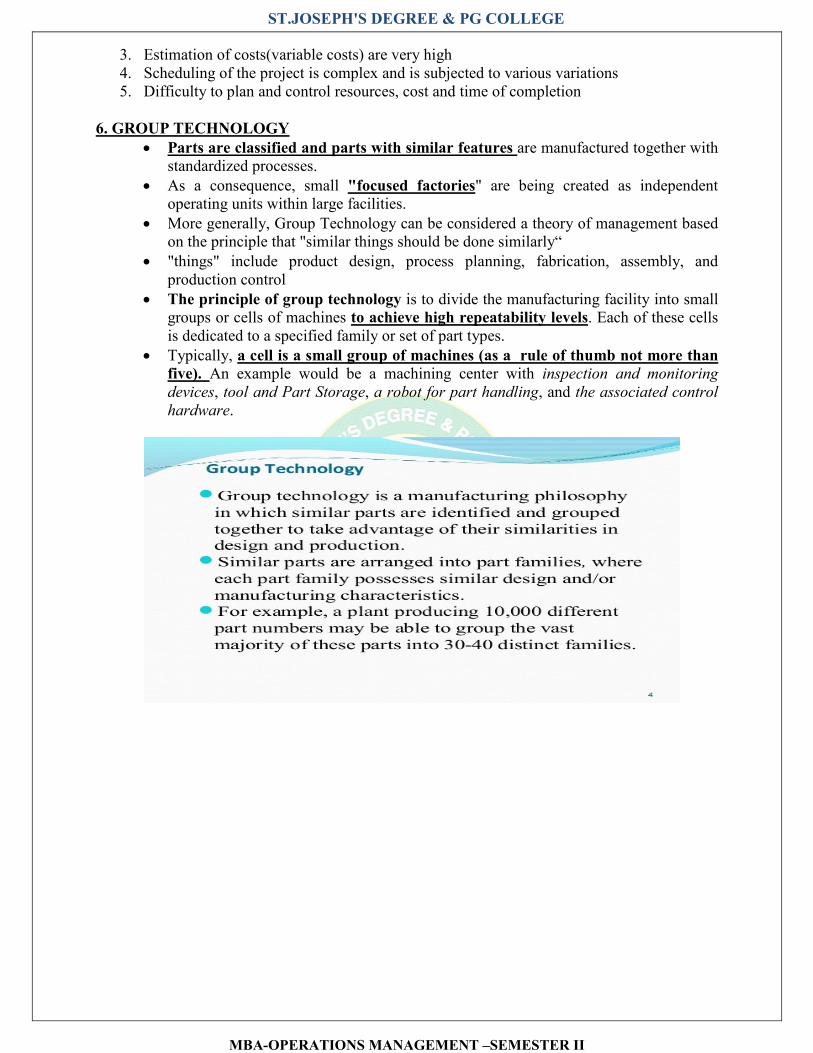
6. GROUP TECHNOLOGY
• Parts are classified and parts with similar features are manufactured together with standardized processes.
• As a consequence, small "focused factories" are being created as independent operating units within large facilities.
• More generally, Group Technology can be considered a theory of management based on the principle that "similar things should be done similarly“
• "things" include product design, process planning, fabrication, assembly, and production control
• The principle of group technology is to divide the manufacturing facility into small groups or cells of machines to achieve high repeatability levels. Each of these cells is dedicated to a specified family or set of part types.
• Typically, a cell is a small group of machines (as a rule of thumb not more than
five). An example would be a machining center with inspection and monitoring
devices, tool and Part Storage, a robot for part handling, and the associated control
hardware.

ST.JOSEPH'S DEGREE & PG COLLEGE
MBA-OPERATIONS MANAGEMENT –SEMESTER II
INTER RELATIONSHIP BETWEEN PRODUCT LIFE CYCLE AND PROCESS LIFE
CYCLE.
Inter Relationship between product life cycle and process life cycle
• Product life cycle starts from the stage of start up and ends in the stage of decline.
• Manufacturing processes undergo change from job shop production
• Process technologies involve various product life cycles and various w.r.t Through-put volume, rates of process innovation and degree of automation
Process technologies referes to the process which includes equipment, people and system that are being used to manufacture products and services. A product life cycle consist of 5 stages through which a product passes that is *introduction *growth*maturity*decline. the figure shown previously represent sales and profit associated with each stage and some practical example of products are also shown on it. 1. Introduction At this stage, sales begin and profit goes from –ve to +ve. In this stage ,the demand is low .because the costumer don’t know much about the product. The organization has to invest heavily in advertisement to make the product familiar to the costumers. the volume sales are low,and if proper care is not taken, there is chances to product failure. 2.Growth The product next enters a stage at rapid growth. Early in this stage (due to acceptability of the product by the costumer) there is drastic jump in sales and profit rise. It is because of limited or no competition. During this stage the mandate for operation is somehow to keep up with demand; efficiency is less of concern. 3.Maturity During this stage, sales level off and profit begins to decline. New competition create to cut costs and ultimately on unit profit margin. Now operation must stress on efficiency, although marketing can ease the pressure by intensifying to differentiate the product. 4.Decline At last the existing product enters to a declining stage and becomes obsolete. Either demand despisers or a better less expensive product. Life cycle suggest when to eliminate the existing product and introduce a new one. This life cycle varies greatly from product to product. For example it took 15 years for “Xerox” to introduce electrostatic copy m/c .in contrast and computer and microchip industry, products become obsolete in months.

ST.JOSEPH'S DEGREE & PG COLLEGE
MBA-OPERATIONS MANAGEMENT –SEMESTER II
R.ANITA, STJPGC Slide 1
TYPICAL LIFE OF A PRODUCT
CATEGORY
TIME IN YEAR
DE
MA
ND
AN
D S
AL
ES
VO
LU
ME
(Ru
pees)
loss
profit
Sales volume
introduction
growth
maturity
decline
Pg 49
Black and white TVTV with large display
LED plasma
Colour TV
R.ANITA, STJPGC Slide 163
Inter Relationship between product life
cycle and process life cycle
Time
Man
ufac
turi
ng c
ost/
unit
Job shop
batch
Assembly line
Continuous flow
startup Rapid
growth
maturity commodity
ST.JOSEPH'S DEGREE & PG COLLEGE
MBA-OPERATIONS MANAGEMENT –SEMESTER II
R.ANITA, STJPGC Slide 164
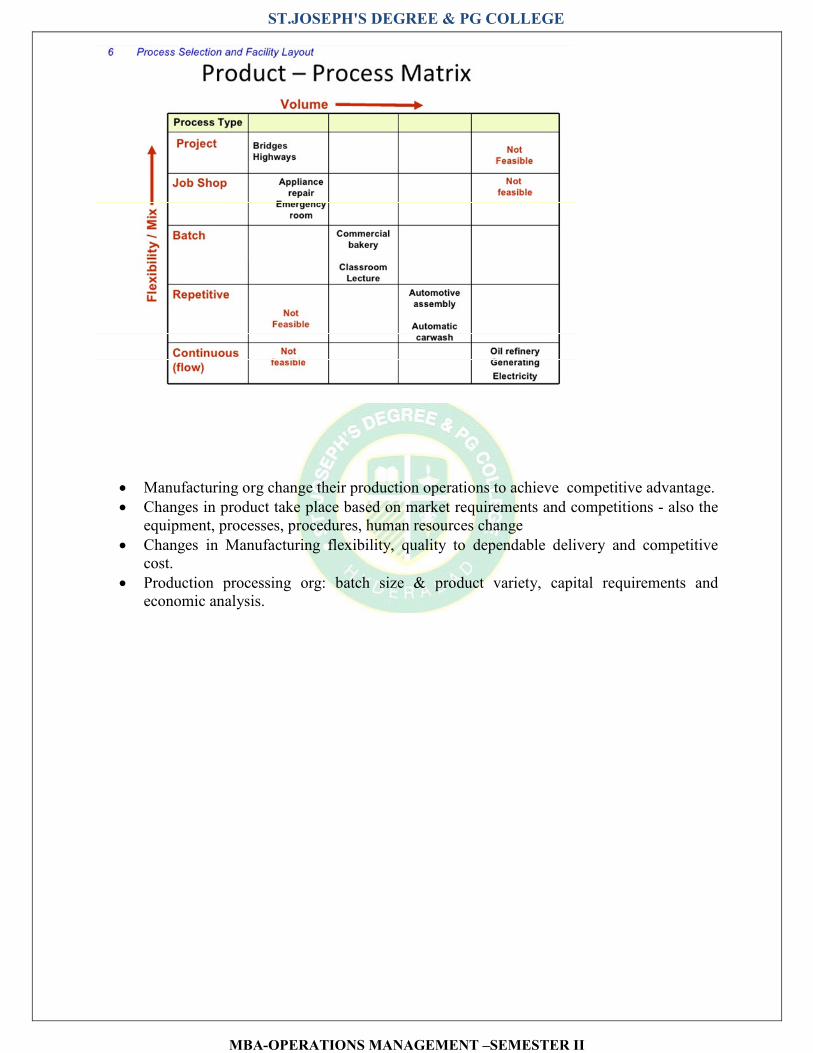
• Manufacturing org change their production operations to achieve competitive advantage.
• Changes in product take place based on market requirements and competitions - also the equipment, processes, procedures, human resources change
• Changes in Manufacturing flexibility, quality to dependable delivery and competitive cost.
• Production processing org: batch size & product variety, capital requirements and economic analysis.
ST.JOSEPH'S DEGREE & PG COLLEGE
MBA-OPERATIONS MANAGEMENT –SEMESTER II
Unit – II: Scheduling and Control of Production Operations: Concepts of Aggregate planning, Master Production Schedule, Operations scheduling, Product sequencing(simple problems of 2 machines and 3 machines), Plant Capacity and Line Balancing concept, Plant layout – types, Principles, Plant Location – steps and factors influencing location, Maintenance Management – Objectives, Types of maintenance, Failure Concept- Bath tub curve, Reliability concept.
CONCEPTS OF AGGREGATE PLANNING
An organization can finalize its business plans on the recommendation of demand forecast. Once business plans are ready, an organization can do backward working from the final sales unit to raw materials required. Thus annual and quarterly plans are broken down into labor, raw material, working capital, etc. requirements over a medium-range period (6 months to 18 months). This process of working out production requirements for a medium range is called aggregate planning.
Factors Affecting Aggregate Planning
Aggregate planning is an operational activity critical to the organization as it looks to
balance long-term strategic planning with short term production success. Following factors are critical before an aggregate planning process can actually start;
� A complete information is required about available production facility and raw materials. � A solid demand forecast covering the medium-range period � Financial planning surrounding the production cost which includes raw material, labor,
inventory planning, etc. � Organization policy around labor management, quality management, etc.
For aggregate planning to be a success, following inputs are required;
� An aggregate demand forecast for the relevant period � Evaluation of all the available means to manage capacity planning like sub-contracting,
outsourcing, etc. � Existing operational status of workforce (number, skill set, etc.), inventory level and
production efficiency
Aggregate planning will ensure that organization can plan for workforce level, inventory level and production rate in line with its strategic goal and objective.

ST.JOSEPH'S DEGREE & PG COLLEGE
MBA-OPERATIONS MANAGEMENT –SEMESTER II
Aggregate planning as an Operational Tool
Aggregate planning helps achieve balance between operation goal, financial goal and overall strategic objective of the organization. It serves as a platform to manage capacity and demand planning.
In a scenario where demand is not matching the capacity, an organization can try to balance both by pricing, promotion, order management and new demand creation.
In scenario where capacity is not matching demand, an organization can try to balance the both by various alternatives such as.
� Laying off/hiring excess/inadequate excess/inadequate excess/inadequate workforce until demand decrease/increase.
� Including overtime as part of scheduling there by creating additional capacity. � Hiring a temporary workforce for a fix period or outsourcing activity to a sub-contrator.
Importance of Aggregate Planning
Aggregate planning plays an important part in achieving long-term objectives of the organization. Aggregate planning helps in:
� Achieving financial goals by reducing overall variable cost and improving the bottom line
� Maximum utilization of the available production facility � Provide customer delight by matching demand and reducing wait time for customers � Reduce investment in inventory stocking � Able to meet scheduling goals there by creating a happy and satisfied work force
Aggregate Planning Strategies
There are three types of aggregate planning strategies available for organization to choose from. They are as follows.
1. Level Strategy
As the name suggests, level strategy looks to maintain a steady production rate and workforce level. In this strategy, organization requires a robust forecast demand as to increase or decrease production in anticipation of lower or higher customer demand. Advantage of level strategy is steady workforce. Disadvantage of level strategy is high inventory and increase back logs.
2. Chase Strategy
As the name suggests, chase strategy looks to dynamically match demand with production. Advantage of chase strategy is lower inventory levels and back logs. Disadvantage is lower productivity, quality and depressed work force.
ST.JOSEPH'S DEGREE & PG COLLEGE
MBA-OPERATIONS MANAGEMENT –SEMESTER II
3. Hybrid Strategy
As the name suggests, hybrid strategy looks to balance between level strategy and chase strategy.
MASTER PRODUCTION SCHEDULE
Introduction
The master production schedule (also commonly referred to as the MPS) is effectively the plan that the company has developed for production, staffing, inventory, etc.
It has as input a variety of data, e.g. forecast demand, production costs, inventory costs, etc and as output a production plan detailing amounts to be produced, staffing levels, etc for each of a number of time periods.
This production plan:
• operates at an aggregate level (that is it does not usually go into great detail about parts to be used, etc - hence the name aggregate planning); and
• is cost driven, that is it attempts to meet the specified requirements at minimum cost.
The idea of a master production schedule can best be illustrated by means of an example.
Example
In our example we have just a single product being produced.
Production takes place each period (week) either in the normal (regular) production shift or in overtime associated with that shift. There is only one shift (i.e. not operating a two/three shift system - such as with "round-the-clock" working).
Completed items can also be "bought-in" from a subcontractor (at a cost).
We are allowed to hire/fire workers (again at a cost). Backorders are also allowed (recall here that backorders are customer orders that cannot be satisfied in the required period, but the customer allows the order to remain open to be fulfilled in a later period). Lost sales are not allowed.
The diagram below illustrates the situation and the types of factor with which we are dealing graphically.

ST.JOSEPH'S DEGREE & PG COLLEGE
MBA-OPERATIONS MANAGEMENT –SEMESTER II
MPS sets the quantity of each end item – finished product to be completed in each time period of
the short-range planning horizon
1. CAPACITY PLANNING AND
CAPACITY REQUIREMENT PLANNING (CRP)
It is the technique for determining what labour/personnel and equipment capacities are needed to meet the production objectives symbolised in the master production schedule and MRP-I
2. Materials Requirements planning (MRP-1)
� Computer based information system for ordering and scheduling of dependent demand inventories.
� Objectives of MRP
1. To improve customer service
2. To reduce inventory costs .
3. To improve plant operating efficiency
❑ Objectives of MPS ❑ To schedule end items to be completed promptly as promised ❑ To avoid overloading and under loading the production facility ❑ Production capacity is efficiently utilised ❑ Low production costs

ST.JOSEPH'S DEGREE & PG COLLEGE
MBA-OPERATIONS MANAGEMENT –SEMESTER II
OPERATIONS SCHEDULING
Operations scheduling pertains to establishing both timing and utilization of resources within an organization. Within operations scheduling, scheduling coincides with the utilization of equipment, scheduling of human labor, and materials receipt Objectives of Operations Scheduling
The Objectives of Operations Scheduling include the following:
• Optimizing the Efficiency of Labor
• Utilizing Equipment to the Fullest Extent
• Increasing Profit and Output
• Service Level Improvement
• Manufacturing time Reduction
• Production Cost Minimization
• Worker Cost Minimization

ST.JOSEPH'S DEGREE & PG COLLEGE
MBA-OPERATIONS MANAGEMENT –SEMESTER II
• Inventory Minimization
Functions of Operations Scheduling
The Functions of Operations Scheduling include the following:
• Resource Allocation
• Shop Floor Control
• Sequence of Job Determination
• Up-to-Date information on Machines
• Specifies Start and End time for Each Job
• Maximum utilization of Plant While Minimizing Cost
• Optimize Manpower
❑ ADVANTAGES/USES OF SCHEDULING
❑ Planning – purchase, personnel, maintenance, manufacturing, sale
❑ Control
❑ Hence customer satisfaction
❑ Saving cost and increasing productivity
❑ On educational institutions- decreasing the need for expansion of facilities
❑ Hospitals: saving lives of the patients and increases the care
❑ Competitive environment: competitive edge
❑ OBJECTIVES OF SCHEDULING
❑ Evenly load all machines in the production line
❑ Utilise machines and labour – established lead times (to deliver the products/services in time, complete production in the shortest cycle time possible at min total cost of production)
❑ Reduce idle time of labour and machines
❑ Fix delivery dates
❑ Increase efficiency
❑ STAGES IN SCHEDULING
❑ Two stages:
– Loading – jobs are assigned based on priority sequencing / m/c utilisation

ST.JOSEPH'S DEGREE & PG COLLEGE
MBA-OPERATIONS MANAGEMENT –SEMESTER II
– Dispatching – issue of job order and sequencing & selecting the jobs which are waiting at different work centres when the capacity is available for processing.
– LOADING
❑ It is a process of determining which job(assignment ) must be assigned to which work centre during the scheduling period.
❑ Shop loading
❑ Finite loading: loading -comparison of actual hours required for performing each operation with that of the available hours of each work centre.
❑ Infinite loading: randomly allocated without considering the capacity of the work centre.
PRODUCT SEQUENCING (SIMPLE PROBLEMS OF 2 MACHINES AND 3
MACHINES)
❑ PRIORITY SEQUENCING ❑ It is a process by which different jobs waiting at their respective workstations can be
processed based on their priority ❑ Criteria used :
– Setup costs or change over costs – Work-in progress inventory cost – Idle time – No. percent of jobs late – Average job lateness – Average flow time – Avg. no. of jobs in the system – Avg. time to compete the job
❑ SINGLE CRITERION PRIORITY SEQUENCING RULES ❑ FCFS – First come first served Ex: super bazars ❑ SPT – Shortest processing time – Shortest operation time(SOT) – minimum processing
time(MINPRT) ❑ Longest processing time(LPT) or longest operation time(LOT) ❑ Least slack LS /minimum slack (MIN SLACK) job (available time – processing time) ❑ Earliest Due date – EDD ❑ Truncated shortest processing time(TSPT) ❑ Preferred customer order (PCO) ❑ Random selection ❑ COVERT – Cost over time – largest ratio (expected delay cost/processing time) ❑ Least change over cost ❑ SEQUENCING/ SEQUENCE ANALYSIS ❑ The order in which the jobs pass through machines or work-stations ❑ Assignment of various jobs to different machines. ❑ Applications:
– Manufacturing plant – Maintenance – Programs – computer

ST.JOSEPH'S DEGREE & PG COLLEGE
MBA-OPERATIONS MANAGEMENT –SEMESTER II
– aircraft waiting – Order of filling various vacancies – Customer orders
Sequencing of n jobs through 2 machines (Johnson’s rule)
Considering 2 machines and ‘n’ jobs as shown in Table 6.1. Table 6.1 Job sequencing
Step 1: Find the minimum among ti1 and ti2.
Step 2(a): If the minimum processing time requires m/c-1, place the associated job in the 1st available position in sequence.
Step 2(b): If the minimum processing time requires machine-2, place the associated job in the last available position in sequence.
Step 3: Remove the assigned job from the table and return to Step 1 until all positions in sequence are filled. (Ties may be considered randomly)
The above algorithm is illustrated with the following example.
Ex.1 Consider two machines and six jobs flow shop scheduling problem. Using Johnson’s algorithm, obtain the optimal sequence which will minimize the makespan.
Job Time taken by machines
1 2
1 5 4
2 2 3
3 13 14
1 t11 t12
2 t21 t22
3 t31 t32
4 t11 t42
. . .
. . . i ti1 ti2
. . . n tn1 tn2

ST.JOSEPH'S DEGREE & PG COLLEGE
MBA-OPERATIONS MANAGEMENT –SEMESTER II
4 10 1
5 8 9
6 12 11
Sum 50 42
Solution: The working of the algorithm is summarized in the form of a table which is shown below.
Stage Unscheduled job Min Assignment Partial sequence/ Full sequence
1 1 2 3 4 5 6 t42 Job 4-[6] × × × × × 4
2 1 2 3 5 6 t21 Job 2-[1] 2 × × × × 4
3 1 3 5 6 t12 Job 1-[5] 2 × × × 1 4
4 3 5 6 t51 Job 5-[2] 2 5 × × 1 4
5 3 6 t62 Job 6-[4] 2 5 × 6 1 4
6 3 t31 Job 3-[3] 2 5 3 6 1 4
Now the optimal sequence is 2-5-3-6-1-4. The makespan is determined as shown below.
Job M/C-1
M/C-1
Idle time on m/c-2
Time in Time out Time in Time out
2 0 2 2 5 2
5 2 10 10 19 5
3 10 23 23 37 4
6 23 35 37 48 0
1 35 40 48 52 0
4 40 50 52 53 0
The make span for this schedule is 53.
PLANT CAPACITY
Plant capacity also referred to as production capacity refers to the volume or number of units that can be manufactured during a given period Capacity in a production or process sense (Production Capacity) refers to the maximum amount of output that can be obtained through a certain machine or production line. Capacity can also be expressed in terms of an output rate of a certain number of units per unit of time. Capacity decisions abound in the business world, and balancing various capacities reflects how a company approaches business. Production capacity deals with output and how a manufacturer balances raw materials, machinery, labor and storage to match demand for its

ST.JOSEPH'S DEGREE & PG COLLEGE
MBA-OPERATIONS MANAGEMENT –SEMESTER II
products. Decisions about production capacity can be strategic and operational, long- and short term.
1. Fixed capacity – capital assets
2. Adjustable capacity- size of workers
3. Design capacity /installed capacity – planned rate of output under full-scale
operating conditions/ Maximum output rate under ideal conditions
4. System capacity- max output of specific product/ Maximum output rate under
normal (realistic) conditions
5. Potential capacity: within decision horizon of top mgt
6. Immediate capacity : available within current budgeted period
7. Effective capacity/practical/operating : theoretical capacity minus capacity lost due
to inefficiency and scrap factor – 75% - 85%
8. Normal capacity/rated capacity/average: estimated quantity (actual is expressed as
% of rated)
9. Actual or utilised capacity:actual output during particular period
• Design capacity
o Maximum obtainable output
• Effective/SYSTEM capacity, expected variations
o Maximum capacity subject to planned and expected variations such as
maintenance, coffee breaks, scheduling conflicts.
• Actual output, unexpected variations and demand
• Rate of output actually achieved--cannot exceed effective capacity. It is subject to
random disruptions: machine break down, absenteeism, material shortages and
most importantly the demand
LINE BALANCING CONCEPT
It is arranging a production line so that there is an even flow of production form one work station to the next i.e. no delays The apportionment of sequential work activities with work stations in order to gain a high utilisation of labour and equipment and therefore minimum idle time.
PLANT LAYOUT – TYPES, PRINCIPLES
According to Knowles and Thomson:
❑ Planning and arranging manufacturing machinery, equipment and services for the
first time in completely new plants.
The improvements in layouts already in use in order to introduce new methods and
improvement in manufacturing procedures
Plant layout means the disposition of the various facilities (equipment, material, manpower etc.) and services of the plant within the area of site located.

ST.JOSEPH'S DEGREE & PG COLLEGE
MBA-OPERATIONS MANAGEMENT –SEMESTER II
Layout can be classified into the following four categories:
1. process layout
2. product layout
3. Group layout(combination layout)
4. Fixed position layout
1. process layout:
= It is also known as functional layout.
= Here similar machines and services located together Ex. All the lathe machines will be at one place and all milling machines at another place and so on.
= This type of layout generally employed for industries engaged in job-shop production and non-repetitive kind of production.
= When there variety of products manufactured at low volume we prefer this type of layout.
= Ex. furniture manufacturer company, restaurant etc.

ST.JOSEPH'S DEGREE & PG COLLEGE
MBA-OPERATIONS MANAGEMENT –SEMESTER II
Fig 2.2 process layout
Product layout
i It is also known as line (type) layout.
ii The flow of product will smooth and logical.
iii When the machines and auxiliary services are located according to the processing sequence we prefer this layout.
iv It implies that various operations raw material are performed in a sequence and the machines are placed along the product flow line.
v The product layout is selected when the volume of production of a product is high such that separate production line to manufacture it can be justified.
vi Assembly line production or mass production prefer this type layout. Ex. Assembly of television sets assembly of computer key-board etc.
Fig 2.3 product layout
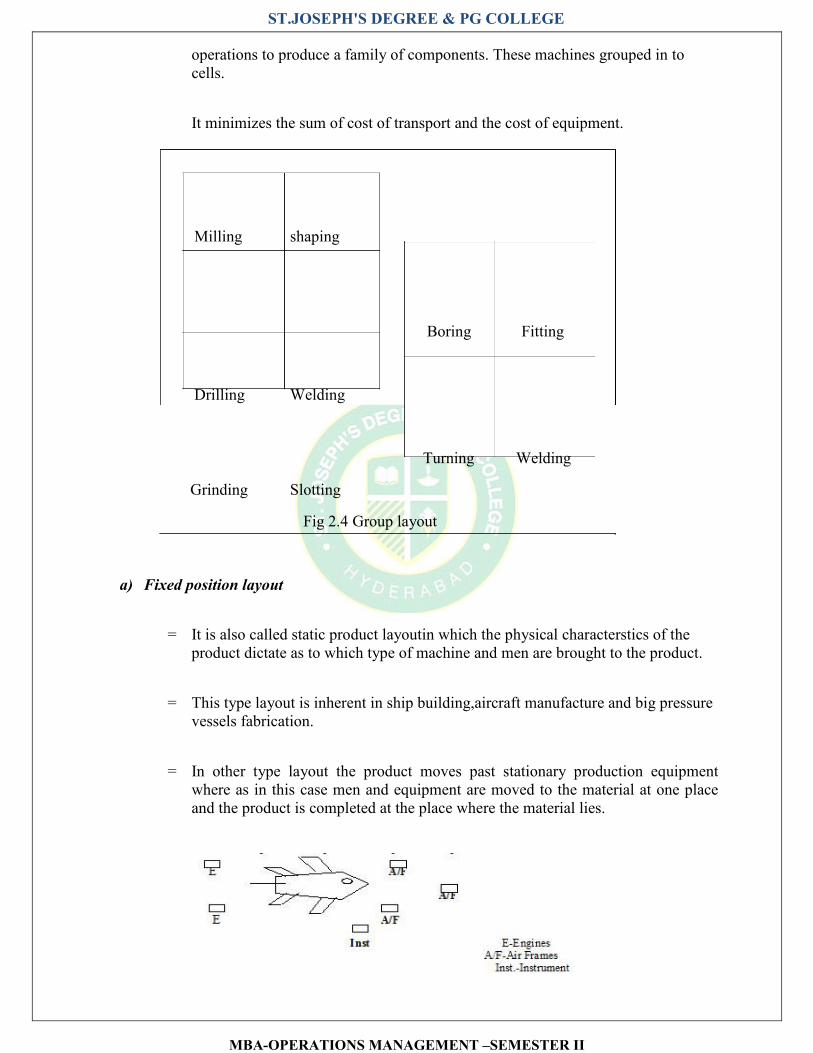
i) Group layout:
It is the combination of both process and product layout.
In this type of layout a set of machinery or equipment is grouped together in a section so that each group of machines or equipment is used to perform similar
ST.JOSEPH'S DEGREE & PG COLLEGE
MBA-OPERATIONS MANAGEMENT –SEMESTER II
operations to produce a family of components. These machines grouped in to cells.
It minimizes the sum of cost of transport and the cost of equipment.
Milling shaping
Boring Fitting
Drilling Welding
Turning Welding
Grinding Slotting
Fig 2.4 Group layout
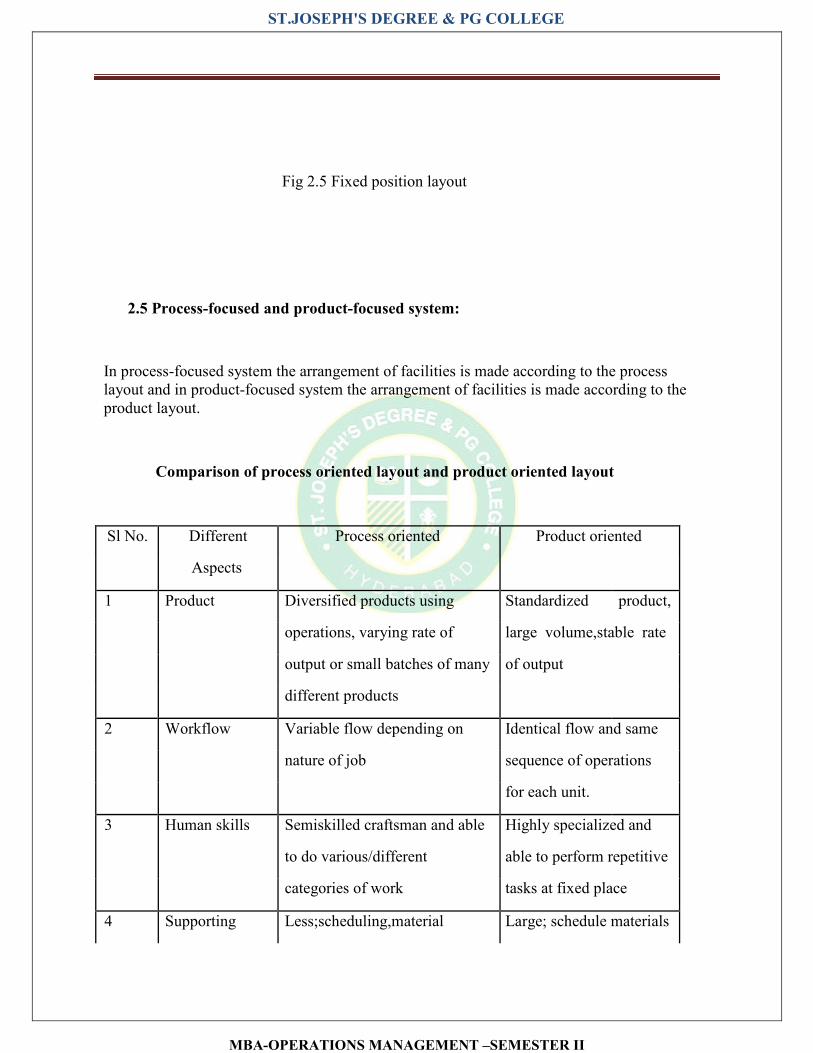
a) Fixed position layout
= It is also called static product layoutin which the physical characterstics of the product dictate as to which type of machine and men are brought to the product.
= This type layout is inherent in ship building,aircraft manufacture and big pressure vessels fabrication.
= In other type layout the product moves past stationary production equipment where as in this case men and equipment are moved to the material at one place and the product is completed at the place where the material lies.
ST.JOSEPH'S DEGREE & PG COLLEGE
MBA-OPERATIONS MANAGEMENT –SEMESTER II
Fig 2.5 Fixed position layout
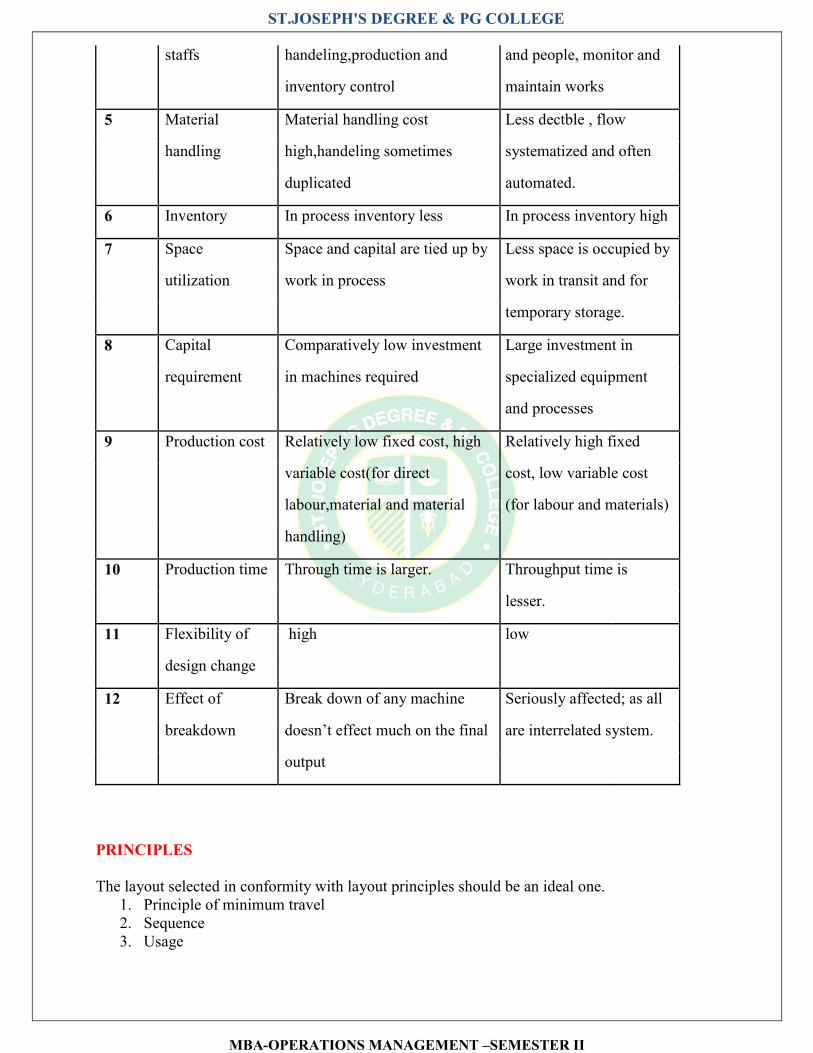
2.5 Process-focused and product-focused system:
In process-focused system the arrangement of facilities is made according to the process layout and in product-focused system the arrangement of facilities is made according to the product layout.
Comparison of process oriented layout and product oriented layout
Sl No. Different Process oriented Product oriented
Aspects
1 Product Diversified products using Standardized product,
operations, varying rate of large volume,stable rate
output or small batches of many of output
different products
2 Workflow Variable flow depending on Identical flow and same
nature of job sequence of operations
for each unit.
3 Human skills Semiskilled craftsman and able Highly specialized and
to do various/different able to perform repetitive
categories of work tasks at fixed place
4 Supporting Less;scheduling,material Large; schedule materials
ST.JOSEPH'S DEGREE & PG COLLEGE
MBA-OPERATIONS MANAGEMENT –SEMESTER II
staffs handeling,production and and people, monitor and
inventory control maintain works
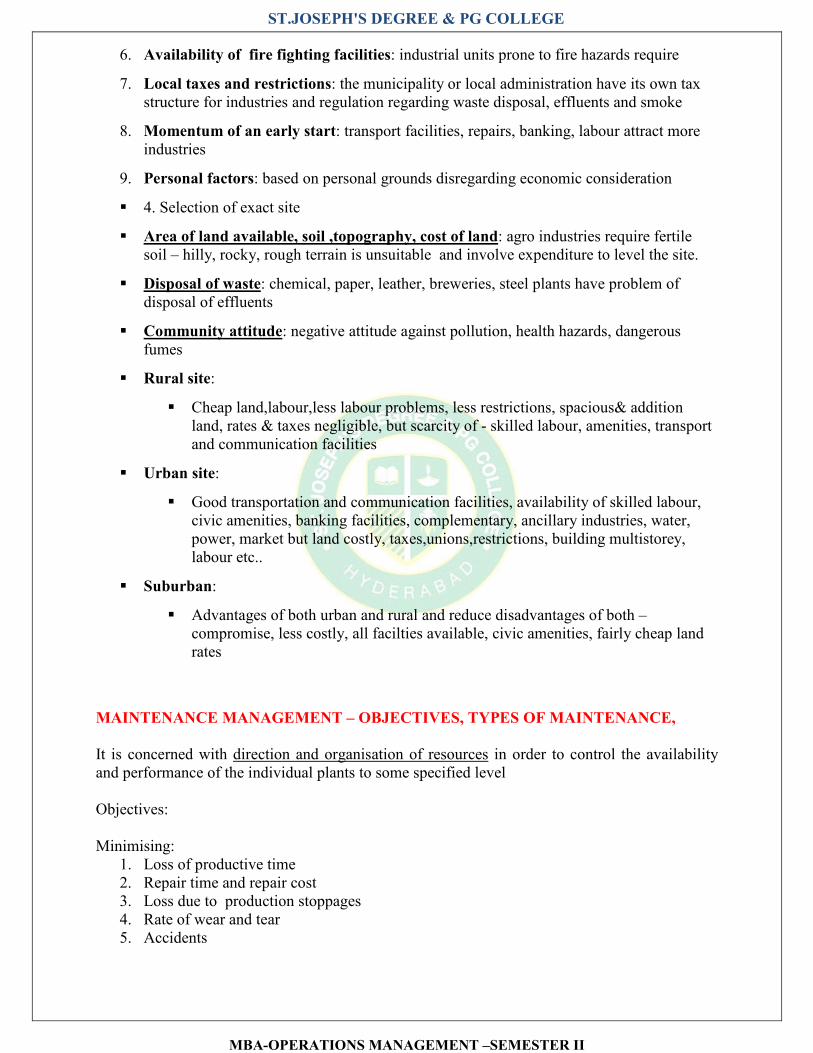
5 Material Material handling cost Less dectble , flow
handling high,handeling sometimes systematized and often
duplicated automated.
6 Inventory In process inventory less In process inventory high
7 Space Space and capital are tied up by Less space is occupied by
utilization work in process work in transit and for
temporary storage.
8 Capital Comparatively low investment Large investment in
requirement in machines required specialized equipment
and processes
9 Production cost Relatively low fixed cost, high Relatively high fixed
variable cost(for direct cost, low variable cost
labour,material and material (for labour and materials)
handling)
10 Production time Through time is larger. Throughput time is
lesser.
11 Flexibility of high low
design change
12 Effect of Break down of any machine Seriously affected; as all
breakdown doesn’t effect much on the final are interrelated system.
output
PRINCIPLES
The layout selected in conformity with layout principles should be an ideal one. 1. Principle of minimum travel 2. Sequence 3. Usage

ST.JOSEPH'S DEGREE & PG COLLEGE
MBA-OPERATIONS MANAGEMENT –SEMESTER II
4. Compactness 5. Safety and satisfaction 6. Flexibility 7. Minimum investment
1. Principle of minimum travel: Men and materials should travel the shortest distance
between operations so as to avoid waste and time and minimise the cost of material handling.
2. Principle of Sequence: Machinery and operations should b arranged in a sequential order. (product layout is the best, efforts to be put in process layout)
3. Principle of Usage: Every unit of available space should be effectively utilised especially in towns and cities where land is costly.
4. Principle of compactness: Harmonious fusion of all the relevant factors so that the final layout looks well integrated and compact (packed, solid).
5. Principle of safety and Satisfaction: contain built in provisions for safety to the workmen and comfort and convenience too so that they feel satisfied.
6. 6. Principle of Flexibility: Permit revisions with the least difficulty and at minimum cost 7. 7. Principle of Minimum Investment: Should result in savings in fixed capital investment,
not by avoiding installation of the necessary facilities but by an intensive use of available facilities.
PLANT LOCATION – STEPS AND FACTORS INFLUENCING LOCATION,
It is the process of determining a geographical site for a firms operations achieving maximum operating economy and effectiveness
� OBJECTIVES OF LOCATION DECISIONS
1. Profit oriented organisations – maximising the potential profits
2. Non – profit organisations – balance cost and level of customer service
3. Identify the best location for a firm or to find a number of acceptable locations from which to choose one.
4. To maximise the benefits of location of the firm
5. To have competitive advantage
� STEPS/GENERAL PROCEDURE FOR MAKING LOCATION DECISION
An organisations approach to location decision Depends on the size of the plant and nature or
scope of its operations. Steps
1. Decide on the criteria to use for evaluating location alternative (community service or increased revenue)
2. Identify crucial factors – locations of source of raw materials and location of markets
3. Develop location alternatives
1. Identify the general region for a location

ST.JOSEPH'S DEGREE & PG COLLEGE
MBA-OPERATIONS MANAGEMENT –SEMESTER II
2. Identify a small number of community alternatives
3. Identify sites among the community alternative
4. Evaluate each alternative and make a choice.
� STEPS - FACTORS AFFECTING LOCATION DECISIONS
1. Deciding on domestic or international location- country
2. Regional location decision- region
3. Selection of community- locality
4. Selection of exact site- rural-urban-suburban
� 1.Deciding on domestic or international location
With globalisation of business the choice is significant because a location in any country in the world will be considered to have competitive advantage derived from location. If the decision is to choose an international location , the next logical step is to decide about the country for
location(attract foreign investment): it depends on
� Political stability
� Export and import quotas
� Exchange rates
� Cultural and economic considerations
� Availability of natural resources, climate, cost of labour etc.,
� 2.Regional location decision
1. Availability of raw materials and nearness to the source of raw materials: to reduce the transportation cost, regular and proper/ uninterrupted supply and savings in the cost of storage of materials. Ex: sugar, iron & steel, paper, automobile and cement
industries. Sugar industries (Bihar & UP), Steel (Bihar, WB, Orissa, MP). Weight –
losing/gross materials (iron ore, sugarcane..), non-weight losing/pure materials
(cotton and woollen)
2. Nearness to the market: Consumer non-durable items such as bread, ice-cream, packed foods to reduce time and transportation cost. Render prompt service, provide after-sales services, execute replacement orders etc. Bottling plants of soft-drinks (bulky,
large, fragile or perishable). Ex: pesticides, insecticides, auto-servicing and
repairing units, distilled water etc..
3. Proximity to suppliers: because of perishability, transportation costs or bulkiness of materials
4. Availability of power: To move the wheels of an industry. Coal, oil and natural gas are sources of electric power in addition to generation of power through hydro electric power stations. Ex: Aluminum extraction plants, Tata steel,(consume heavy amt of electricity, require regularly and at cheap rates)

ST.JOSEPH'S DEGREE & PG COLLEGE
MBA-OPERATIONS MANAGEMENT –SEMESTER II
5. Govt. policy : backward regions(textile - Assam, Rajasthan, electric lamp- kerala) of our country (economically backward states for balanced regional development) licencing policy, freight rate policy, institutional finance and subsidies etc..
6. Transport facilities: Transportation of raw materials, supplies, employees to the plant as well as for carrying finished goods from the plant to the market place. Well connected by rail, road
and sea. Ex: petroleum refineries and fertiliser plants are located near the ports because they need shipping facility either to bring raw materials( crude oil) to the plant or ship the finished products (fertilizers) to other destinations (ports)
7. Suitability of climate: particular climatic conditions because of the nature of their production. Ex: Humid climate: cotton textile(Mumbai) and jute industries(Kolkota). Dust free climatic conditions: electronic industries.Extreme climate conditions affect labour efficiency.
8. Competition between states: compete among themselves to attract new industries by offering investment subsidies, cheap power and land, sales tax exemption, longer loan repayment period and low interest rates etc..small and medium sized plants are attracted these incentives
� TATA STEEL Jamshedpur Plant (Jamshedpur)
� The search for a site rich in the resources needed for the plant, namely iron, coal, limestone and water - Madhya Pradesh.
� They took nearly three years in a painstaking search across vast stretches of inhospitable terrain to find a suitable location.
� One day, almost by accident they came across a village called Sakchi, on the densely forested stretches of the Chhota Nagpur plateau, near the confluence of the Subarnarekha and Kharkai rivers.
� It seemed to be the ideal choice and the place was selected.
� 3.Selection of community
1. Availability of labour: skilled labour, attitude of labour, union activities and industrial disputes(despite mechanisation and autonomation) Ex: glass industry at Firozabad,
lock industry at Aligarh, silk sarees at Dahmavaram & Kanjeevaram.
2. Civic amenities for employees: good working conditions, housing, theatres, parks, clubs,medical facilities, sports and recreational facilities, educational facilities attract skilled labour and others.
3. Existence of complementary, ancillary and competing industries: job orders which are subcontracted by major industries. get raw materials, tools and supplies from Small scale industries located in the vicinity. Competing industries encourage health competition and tackle problems jointly problem regarding materials, labour, power, wastage, disposal, pollution control etc and also collectively negotiate with labour unions or govt. agencies.
4. Finance and research facilities: availability of banks, financial institutions, research and development laboratories.
5. Availability of water : Fertilizers, dyeing, bleaching, chemical and paper industries require plenty of water. (regularity of supply, cost and purity- canal, river, lake, borewell)
ST.JOSEPH'S DEGREE & PG COLLEGE
MBA-OPERATIONS MANAGEMENT –SEMESTER II
6. Availability of fire fighting facilities: industrial units prone to fire hazards require
7. Local taxes and restrictions: the municipality or local administration have its own tax structure for industries and regulation regarding waste disposal, effluents and smoke
8. Momentum of an early start: transport facilities, repairs, banking, labour attract more industries
9. Personal factors: based on personal grounds disregarding economic consideration
� 4. Selection of exact site
� Area of land available, soil ,topography, cost of land: agro industries require fertile soil – hilly, rocky, rough terrain is unsuitable and involve expenditure to level the site.
� Disposal of waste: chemical, paper, leather, breweries, steel plants have problem of disposal of effluents
� Community attitude: negative attitude against pollution, health hazards, dangerous fumes
� Rural site:
� Cheap land,labour,less labour problems, less restrictions, spacious& addition land, rates & taxes negligible, but scarcity of - skilled labour, amenities, transport and communication facilities
� Urban site:
� Good transportation and communication facilities, availability of skilled labour, civic amenities, banking facilities, complementary, ancillary industries, water, power, market but land costly, taxes,unions,restrictions, building multistorey, labour etc..
� Suburban:
� Advantages of both urban and rural and reduce disadvantages of both – compromise, less costly, all facilties available, civic amenities, fairly cheap land rates
MAINTENANCE MANAGEMENT – OBJECTIVES, TYPES OF MAINTENANCE,
It is concerned with direction and organisation of resources in order to control the availability and performance of the individual plants to some specified level Objectives: Minimising:
1. Loss of productive time 2. Repair time and repair cost 3. Loss due to production stoppages 4. Rate of wear and tear 5. Accidents

ST.JOSEPH'S DEGREE & PG COLLEGE
MBA-OPERATIONS MANAGEMENT –SEMESTER II
6. Total maintenance cost ( repair cost , cost of preventive maintenance, and inventory carrying costs)
7. Maximising Efficient use of maintenance personnel & equipments 8. Keep all Productive assets in good working conditions 9. Improve quality of products, productivity, 10. To maximise efficiency and Economy in production through optimum usage of facilities
• TYPES OF MAINTENANCE
1. Breakdown or corrective maintenance
2. Preventive maintenance
3. Predictive maintenance
4. Routine maintenance
5. Planned maintenance
• 1. CORRECTIVE /BREAKDOWN MAINTENANCE
• Corrective or remedial maintenance that occurs when equipments or machines fail and must be repaired on an urgent basis.
• There is Stoppage of work, becomes repair work and is performed to restore the equipment back to its acceptable performance.
• Also called as operate-to-failure maintenance /fire-fighting maintenance or unplanned maintenance
• BREAKDOWN /CORRECTIVE maintenance
• Objective:
– To get equipment back into operation as quickly as possible (quality, costs, capacity, satisfaction) to minimise interruptions to production.
– To Control the costs of repair crews (regular and overtime labour costs) and cost of operations of repair shops
– To control investments in replacement spare parts and machines(standup/backup)
– Perform appropriate amt of repairs at each malfunction
• Suitable under
– When plant capacity exceeds the market demand
– When standbys are available and quick switching over is possible
– For non-critical equipment this types of maintenance is cheaper.
• 2. PREVENTIVE MAINTENANCE
• Maintenance activities under taken before the machines or equipments fail.
ST.JOSEPH'S DEGREE & PG COLLEGE
MBA-OPERATIONS MANAGEMENT –SEMESTER II
• Undertaken before the need arises and aims to minimise the possibility of unanticipated production interruptions or major break-downs.
• The key to all good preventive maintenance is inspection.
• PREVENTIVE MAINTENANCE
• Consists of :
– Proper design & installation of equipment
– Periodic inspection of plant and equipment to prevent breakdowns before they occur
– Repetitive servicing, upkeep and overhaul of equipment and
– Adequate lubrication, cleaning and painting of buildings and equipment
• BENEFITS OF PREVENTIVE MAINTENANCE
1. Greater safety for workers
2. Decrease production downtime
3. Fewer large scale and repetitive repairs
4. Less cost for simple repairs made before breakdown
5. Less standby equipment required
6. Better spare parts control
7. Identification of items with high maintenance costs
8. Lower unit cost of manufacture
• 3. Predictive Maintenance
• It is a Modern approach to preventive maintenance using sensitive instruments ( vibration analysers, amplitude meters, audio gauges, optical tooling, pressure, temperature and resistance gauges) to predict anticipated failure of machines and equipments.
• Conditions can be measured periodically or on a continuous basis and this enables the maintenance people to plan for overhaul.
• This will allow an extension to the service life without fear to failure
• 4. Routine Maintenance
• This includes activities such as periodic inspection, cleaning, lubrication, and repair of production equipments after their service life. Routine maintenance may be classified as:
1. Running maintenance: In which the maintenance work is carried out while the equipment is in the operating condition e.g. greasing or lubricating the bearings while the machines is running

ST.JOSEPH'S DEGREE & PG COLLEGE
MBA-OPERATIONS MANAGEMENT –SEMESTER II
2. Shut down maintenance: in which the maintenance work is carried out when the machine or equipment is out of service that is after shutting down the machine or equipment e.g. repairing /discaling boiler tubes of a boiler
• 5. PLANNED MAINTENANCE
• Maintenance work can be planned well in advance.
• In which the Maintenance activities are carried out according to a predetermined
schedule. Also known as scheduled maintenance or productive maintenance.
• In involves inspection of all plant and equipments, machinery, buildings in order to service, overhaul, lubricate or repair before actual breakdown or deterioration in service occurs.
• It aims to reduce machine stoppage due to sudden breakdowns necessiating emergency maintenance.
• It reduces machine or equipment down time, reduces the cost of maintenance and increases productivity as compared to haphazard or unplanned maintenance.
• AREAS OF MAINTENANCE INCLUDE
1. Civil maintenance: building construction and maintenance, maintaining service facilities such as water, gas, steam, compressed air, heating and ventilating, air conditioning, painting, plumbing and carpentry work. Also included in civil maintenance are janitor, service, house-keeping, scrap disposal, fencing, land scaping, gardening and maintaining drainage, lawns and fire fighting equipments.
2. Mechanical Maintenance: maintaining machines and equipments, transport vehicles, material handling equipments, steam generators, boilers , compressors and furnaces. Lubricating the machines is also part of mechanical maintenance work.
• Electrical maintenance : maintaining electrical equipments such as generators, transformers, switch gears, motors, telephone systems, electrical installations lightening, fans, meters, gauges instruments, control panels and battery charging.
FAILURE CONCEPT- BATH TUB CURVE
– A situation in which an item – component or product does not perform as intended
– The failure occurs when the item does not function at all or its performance is
substandard
– Ex:
– Fire alarm might fail to respond to the presence of smoke (not operate at all)
– Sound an alarm that is too faint to provide an adequate warning (sub
standard performance)
– Sound an alarm even though no smoke is present (unintended performance)
Failure rate
– It is defined as the frequency with which a part of a component of equipment undergoes
breakage within a specified period of time.
– Usually represented as percentage (%)

ST.JOSEPH'S DEGREE & PG COLLEGE
MBA-OPERATIONS MANAGEMENT –SEMESTER II
– Failure rate (λ)= no. of failures/total unit operating hours
– Total unit operating hours = no. of units x no. of hours tested for
– Equipment failure rate is basically influenced by different stages of the life cycle of the
product. The variation in the equipment failure rate at different stages of product can
be studied with the help of a bath tub curve
BATH TUB CURVE
Reliability specialists often describe the lifetime of a population of products using a graphical representation called the bathtub curve. The bathtub curve consists of three periods: an infant mortality period with a decreasing failure rate followed by a normal life period (also known as "useful life") with a low, relatively constant failure rate and concluding with a wear-out period that exhibits an increasing failure rate. This article provides an overview of how infant mortality, normal life failures and wear-out modes combine to create the overall product failure distributions. It describes methods to reduce failures at each stage of product life and shows how burn-in, when appropriate, can significantly reduce operational failure rate by screening out infant mortality failures. The material will be presented in two parts. Part One (presented in this issue) introduces the bathtub curve and covers infant mortality and burn-in. Part Two (presented in next month's HotWire) will address the remaining two periods of the bathtub curve: normal life failures and end of life wear-out.
Figure 1: The Bathtub Curve The bathtub curve, displayed in Figure 1 above, does not depict the failure rate of a single item, but describes the relative failure rate of an entire population of products over time. Some individual units will fail relatively early (infant mortality failures), others (we hope most) will last until wear-out, and some will fail during the relatively long period typically called normal life. Failures during infant mortality are highly undesirable and are always caused by defects and blunders: material defects, design blunders, errors in assembly, etc. Normal life failures are normally considered to be random cases of "stress exceeding strength." However, as we'll see, many failures often considered normal life failures are actually infant mortality failures. Wear-

ST.JOSEPH'S DEGREE & PG COLLEGE
MBA-OPERATIONS MANAGEMENT –SEMESTER II
out is a fact of life due to fatigue or depletion of materials (such as lubrication depletion in bearings). A product's useful life is limited by its shortest-lived component. A product manufacturer must assure that all specified materials are adequate to function through the intended product life. Note that the bathtub curve is typically used as a visual model to illustrate the three key periods of product failure and not calibrated to depict a graph of the expected behavior for a particular product family. It is rare to have enough short-term and long-term failure information to actually model a population of products with a calibrated bathtub curve.
Also note that the actual time periods for these three characteristic failure distributions can vary greatly. Infant mortality does not mean "products that fail within 90 days" or any other defined time period. Infant mortality is the time over which the failure rate of a product is decreasing, and may last for years. Conversely, wear-out will not always happen long after the expected product life. It is a period when the failure rate is increasing, and has been observed in products after just a few months of use. This, of course, is a disaster from a warranty standpoint!
We are interested in the characteristics illustrated by the entire bathtub curve. The infant mortality period is a time when the failure rate is dropping, but is undesirable because a significant number of failures occur in a short time, causing early customer dissatisfaction and warranty expense. Theoretically, the failures during normal life occur at random but with a relatively constant rate when measured over a long period of time. Because these failures may incur warranty expense or create service support costs, we want the bottom of the bathtub to be as low as possible. And we don't want any wear-out failures to occur during the expected useful lifetime of the product.
Infant Mortality What Causes It and What to Do About It? From a customer satisfaction viewpoint, infant mortalities are unacceptable. They cause "dead-on-arrival" products and undermine customer confidence. They are caused by defects designed into or built into a product. Therefore, to avoid infant mortalities, the product manufacturer must determine methods to eliminate the defects. Appropriate specifications, adequate design tolerance and sufficient component derating can help, and should always be used, but even the best design intent can fail to cover all possible interactions of components in operation. In addition to the best design approaches, stress testing should be started at the earliest development phases and used to evaluate design weaknesses and uncover specific assembly and materials problems. Tests like these are called HALT (Highly Accelerated Life Test) or HAST (Highly Accelerated Stress Test) and should be applied, with increasing stress levels as needed, until failures are precipitated. The failures should be investigated and design improvements should be made to improve product robustness. Such an approach can help to eliminate design and material defects that would otherwise show up with product failures in the field. After manufacturing of a product begins, a stress test can still be valuable. There are two distinct uses for stress testing in production. One purpose (often called HASA, Highly Accelerated Stress Audit) is to identify defects caused by assembly or material variations that can lead to failure and to take action to remove the root causes of these defects. The other purpose (often called burn-in) is to use stress tests as an ongoing 100% screen to weed out defects in a product where the root causes cannot be eliminated.
The first approach, eliminating root causes, is generally the best approach and can significantly reduce infant mortalities. It is usually most cost-effective to run 100% stress screens only for early production, then reduce the screen to an audit (or entirely eliminate it) as root causes are identified, the process/design is corrected and significant problems are removed. Unfortunately,
ST.JOSEPH'S DEGREE & PG COLLEGE
MBA-OPERATIONS MANAGEMENT –SEMESTER II
some companies put 100% burn-in processes in place and keep using them, addressing the symptoms rather than identifying the root causes. They just keep scrapping and/or reworking the same defects over and over. For most products, this is not effective from a cost standpoint or from a reliability improvement standpoint.
There is a class of products where ongoing 100% burn-in has proven to be effective. This is with technology that is "state-of-the-art," such as leading edge semiconductor chips. There are bulk defects in silicon and minute fabrication variances that cannot be designed out with the current state of technology. These defects can cause some parts to fail very early relative to the majority of the population. Burn-in can be an effective way to screen out these weak parts
Conclusion In this issue, Part One, we have introduced the concept of the bathtub curve and discussed issues related to the first period, infant mortality, as well as the practices, such as burn-in, that are used to address failures of this type. As this article demonstrates, although burn-in practices are not usually a practical economic method of reducing infant mortality failures, burn-in has proven to be effective for state-of-the-art semiconductors where root cause defects cannot be eliminated. For most products, stress testing, such as HALT/HAST should be used during design and early production phases to precipitate failures, followed by analysis of the resulting failures and corrective action through redesign to eliminate the root causes.
RELIABILITY CONCEPT
Probability of a plant to give satisfactory performance in a particular period of time under specified operating conditions.
Reliability is defined as the probability that a component (or an entire system) will perform its function for a specified period of time, when operating in its design environment
= No. of products survived within a specified time limit/ total no. of parts analysed
Depends on the design of the equipment/plant design
Two basic types of functional linkages of equipment in a plant:
Series - R1xR2xR3
Parallel – 1- (1 – R1)(1-R2)
ST.JOSEPH'S DEGREE & PG COLLEGE
MBA-OPERATIONS MANAGEMENT –SEMESTER II
Unit - III: Statistical Quality Control: Concept of quality, definition - Introduction to Statistical Quality Control, objectives –quality control tools, Control Charts for Variables- Average, Range, Control charts for Attributes- fraction defective, defectives and number of defects(simple problems), Acceptance Sampling Plans, OC Curve, Work Study - Method Study, Work measurement, various techniques in the Methods Study, Work measurement methods, computation of Normal and standard time(simple problems).
UNIT - III: STATISTICAL QUALITY CONTROL
CONCEPT OF QUALITY, DEFINITION
Quality (from the Latin term qualita) is an attribute or a property Sum of attributes or
properties/ that describe the product. Quality is Conformance with requirements Quality is fitness for purpose Quality is fitness for use Quality is user dependent Characteristics features of the product or services which meets the needs of the customer. The quality of product or service is a customer’s perception of the degree to which the
product or service meets his or her expectations. It is an asset which may be offered to the potential customer of a product or a service. –
CD LEWIS
Excellent product or service that fulfills or exceeds our expectations(based on
intended use and price/based on perception)
Quality can be quantified as follows
Q=P/E
Where
Q = Quality
P = Performance
E = Expectation
Q > 1.0 implies customer feels good about the product
� Quality should be aimed at the needs of the customer, present and future. —Dr Edward Deming
� Quality is the total composite of product and services characteristics of marketing,
engineering, manufacturing and maintenance through which the product and service in
use will meet the expectations of the customer. —Armand V. Feigenbaum
� Quality is the degree of excellence at an acceptable price and control of variability at an acceptable cost.
—Robert A. Broh � Quality is meeting the requirements of customers, both internal and external, for defect-
free products services and business processes. —IBM
� Fitness for use or purpose is a definition of quality that evaluates how well the product performs for its intended use.
—Joseph Juran
Garvin’s Eight Dimensions of Product Quality

ST.JOSEPH'S DEGREE & PG COLLEGE
MBA-OPERATIONS MANAGEMENT –SEMESTER II
Dimension Description Example for Personal Computer
Performance A product’s primary operating characteristics
Clock speed; RAM; hard drive size
Features Characteristics that supplement basic functioning/secondary
Wireless mouse; flat-screen monitor; DVD-RW
Reliability 1- Probability of a product malfunctioning within a specific time period
Mean time between failures(Less failures…more reliability)
Conformance The degree to which a product’s design and operating characteristics meet established standards/meeting specifi.
mouse, monitor, keyboard included with CPU
Durability Expected product life/useful life Time to technical obsolescence; rated life of monitor
Serviceability (Service & Response)
ease of repair/resolution of problems & complaints / Speed, courtesy, competence – human - human interface
Warranty conditions; availability of customer service & replacement parts.
Aesthetics How a product looks, feels, sounds, tastes or smells/sensory
Computer housing colour scheme; keyboard “touch”
Reputation / Perceived quality
Past performance and other indirect measures of quality
Brand name; advertising
SERVQUAL - Dimensions of Service Quality- RATER
Dimension Description Example from the Banking Sector
Reliability Ability to perform the promised service with dependable and accurate results
Promised deadlines met; reassuring problem resolution

ST.JOSEPH'S DEGREE & PG COLLEGE
MBA-OPERATIONS MANAGEMENT –SEMESTER II
Assurance Knowledge and courtesy of employees and their ability to inspire trust and confidence
Trustworthiness; safe environment around ATMs; polite tellers
Tangibles Physical facilities, equipment and appearance of personnel
ATM access; lobby layout; tellers dressed professionally
Empathy Caring, individualized attention provided by the firm to its customers
Personal attention to customers; convenient hours
Responsiveness Willingness to help customers and provide prompt service
Respond quickly to customer requests; willingness to help customers
INTRODUCTION TO STATISTICAL QUALITY CONTROL, OBJECTIVES
It is the application of statistical techniques to accept or reject products already produced, or to control the process and, therefore, product quality while the part is being made/carried out. While the latter is called process control and former is named as acceptance sampling Objectives
� Assess the quality � Satisfies the need of the customers � Take necessary remedial steps � Suggest suitable improvements using statistical techniques � Develop quality consciousness � Assess the various techniques � Reduce wastages
QUALITY CONTROL TOOLS
QUALITY CONTROL TOOLS
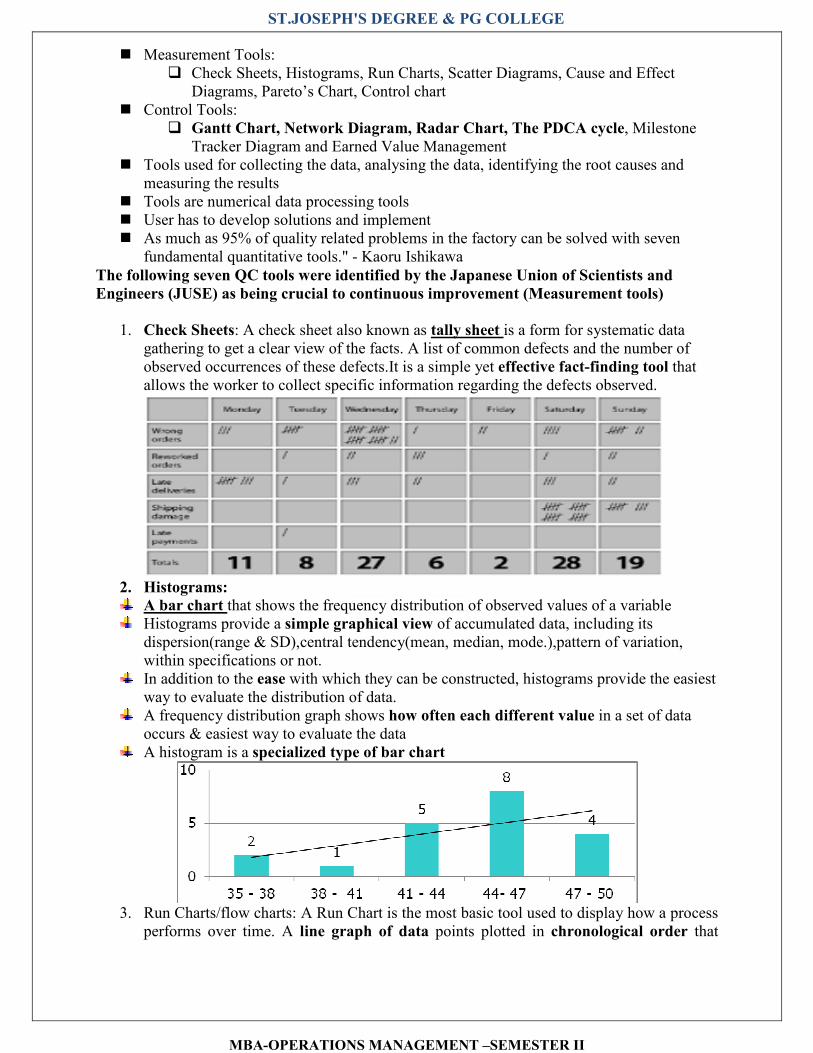
ST.JOSEPH'S DEGREE & PG COLLEGE
MBA-OPERATIONS MANAGEMENT –SEMESTER II
� Measurement Tools: � Check Sheets, Histograms, Run Charts, Scatter Diagrams, Cause and Effect
Diagrams, Pareto’s Chart, Control chart � Control Tools:
� Gantt Chart, Network Diagram, Radar Chart, The PDCA cycle, Milestone Tracker Diagram and Earned Value Management
� Tools used for collecting the data, analysing the data, identifying the root causes and measuring the results
� Tools are numerical data processing tools � User has to develop solutions and implement � As much as 95% of quality related problems in the factory can be solved with seven
fundamental quantitative tools." - Kaoru Ishikawa
The following seven QC tools were identified by the Japanese Union of Scientists and
Engineers (JUSE) as being crucial to continuous improvement (Measurement tools)
1. Check Sheets: A check sheet also known as tally sheet is a form for systematic data gathering to get a clear view of the facts. A list of common defects and the number of observed occurrences of these defects.It is a simple yet effective fact-finding tool that allows the worker to collect specific information regarding the defects observed.
2. Histograms:
A bar chart that shows the frequency distribution of observed values of a variable Histograms provide a simple graphical view of accumulated data, including its
dispersion(range & SD),central tendency(mean, median, mode.),pattern of variation, within specifications or not.
In addition to the ease with which they can be constructed, histograms provide the easiest way to evaluate the distribution of data.
A frequency distribution graph shows how often each different value in a set of data occurs & easiest way to evaluate the data
A histogram is a specialized type of bar chart
3. Run Charts/flow charts: A Run Chart is the most basic tool used to display how a process
performs over time. A line graph of data points plotted in chronological order that

ST.JOSEPH'S DEGREE & PG COLLEGE
MBA-OPERATIONS MANAGEMENT –SEMESTER II
helps detect special causes of variation.Plots the process characteristics against time
or in chronological sequence.Trend & relationship between variables.
4. Scatter Diagrams: A scatter diagram is also termed the scatter plot or the X–Y graph. It is
a quality tool used to display the type and degree of relationship between variables.
Some examples of relationships are
cutting speed and tool life,
breakdowns and equipment age,
training and errors,
speed and gas mileage,
production speed and number of defective parts
5. Cause and Effect Diagrams: The cause-and-effect diagram, also termed as the fishbone
diagram or the Ishikawa diagram, was the brainchild of Kaoru Ishikawa. It is a picture composed of lines and symbol designed to represent a meaningful relationship between an effect and its cause.
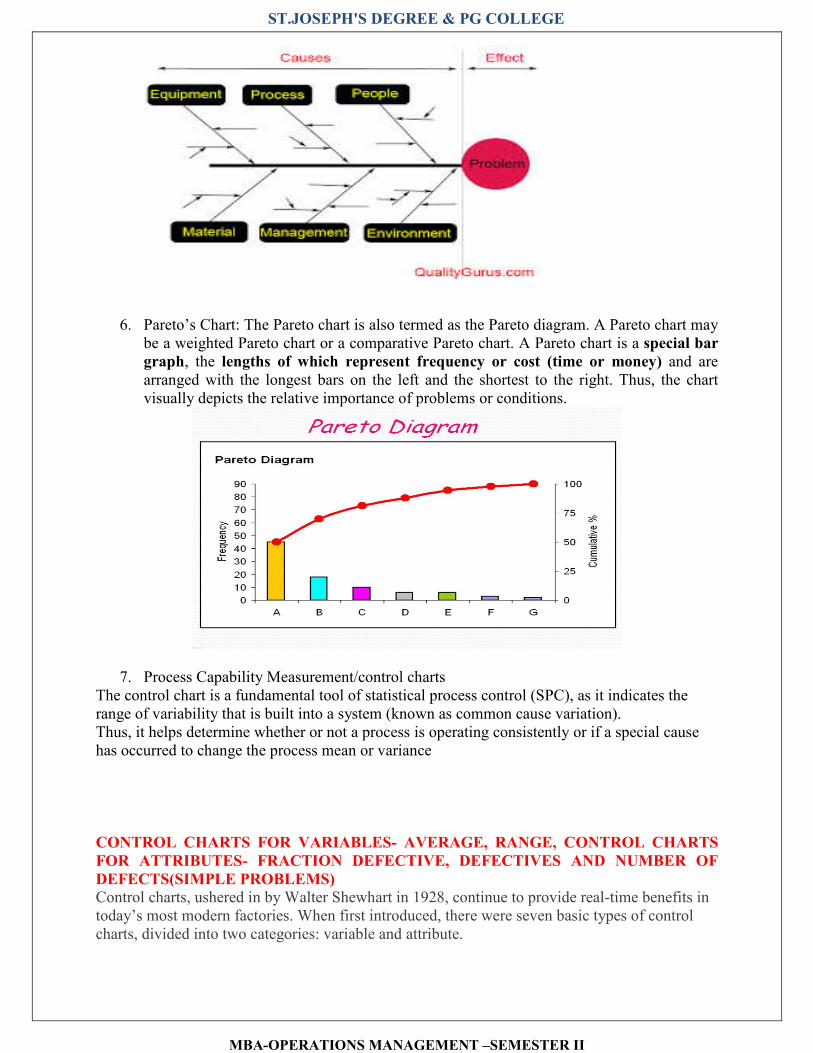
ST.JOSEPH'S DEGREE & PG COLLEGE
MBA-OPERATIONS MANAGEMENT –SEMESTER II
6. Pareto’s Chart: The Pareto chart is also termed as the Pareto diagram. A Pareto chart may be a weighted Pareto chart or a comparative Pareto chart. A Pareto chart is a special bar
graph, the lengths of which represent frequency or cost (time or money) and are arranged with the longest bars on the left and the shortest to the right. Thus, the chart visually depicts the relative importance of problems or conditions.
7. Process Capability Measurement/control charts The control chart is a fundamental tool of statistical process control (SPC), as it indicates the range of variability that is built into a system (known as common cause variation). Thus, it helps determine whether or not a process is operating consistently or if a special cause has occurred to change the process mean or variance
CONTROL CHARTS FOR VARIABLES- AVERAGE, RANGE, CONTROL CHARTS
FOR ATTRIBUTES- FRACTION DEFECTIVE, DEFECTIVES AND NUMBER OF
DEFECTS(SIMPLE PROBLEMS)
Control charts, ushered in by Walter Shewhart in 1928, continue to provide real-time benefits in today’s most modern factories. When first introduced, there were seven basic types of control charts, divided into two categories: variable and attribute.

ST.JOSEPH'S DEGREE & PG COLLEGE
MBA-OPERATIONS MANAGEMENT –SEMESTER II
Variable Data Charts
• Xbar-R (averages and ranges)
Attribute Data Charts
• p (proportion defective for subgroup sizes that vary) • np (number of defectives in a fixed subgroup size) • u (defects per unit for subgroup sizes that vary) • c (defect counts in a fixed subgroup size)
For those that make control charts their business know that there have been significant contributions to the chart offerings since the original seven were introduced; in fact, there are now 100’s of control charts to choose from. Options that perfectly model a process’ statistical personality can be realized as long as the right control chart is selected.
So, that brings up the reason for why I’m writing this blog – how do you pick the best control
chart for your specific situation? The answer is rooted in knowing the factors that contribute to defining the chart type. But before we get into the details of chart type combinations let’s define, at a high level, what control charts are and what they are not.
Control charts ARE:
1. REAL-TIME graphical process feedback tools 2. Designed to tell the operator to do SOMETHING or do NOTHING 3. Time-ordered representation of process PERSONALITIES or BEHAVIORS 4. Designed to SEPARATE signals from NOISE 5. Detect changes in either the process mean and/or standard deviation 6. Used to determine if a process is STABLE (predictable) or OUT-OF-CONTROL (not
predictable)
Control charts are NOT:
1. They are not a substituted for capability analysis 2. They are not useful in receiving inspection (time order is lost) 3. They are very inefficient comparative analysis tools 4. They are not to be confused with Run charts or PRE-Control charts a)Run charts are
time-ordered, but no statistical-based limits b)PRE-Control charts are comparing plot points to specification limits
Control charts utilize limits to help identify when the process has significantly change or to isolate an unusual event. Because control limits are derived from the data, one cannot know them until after a representative series of data have been collected. If used for the wrong reasons, control limits can cause confusion and counterproductive actions by those asked to use the charts to monitor and improve their processes.
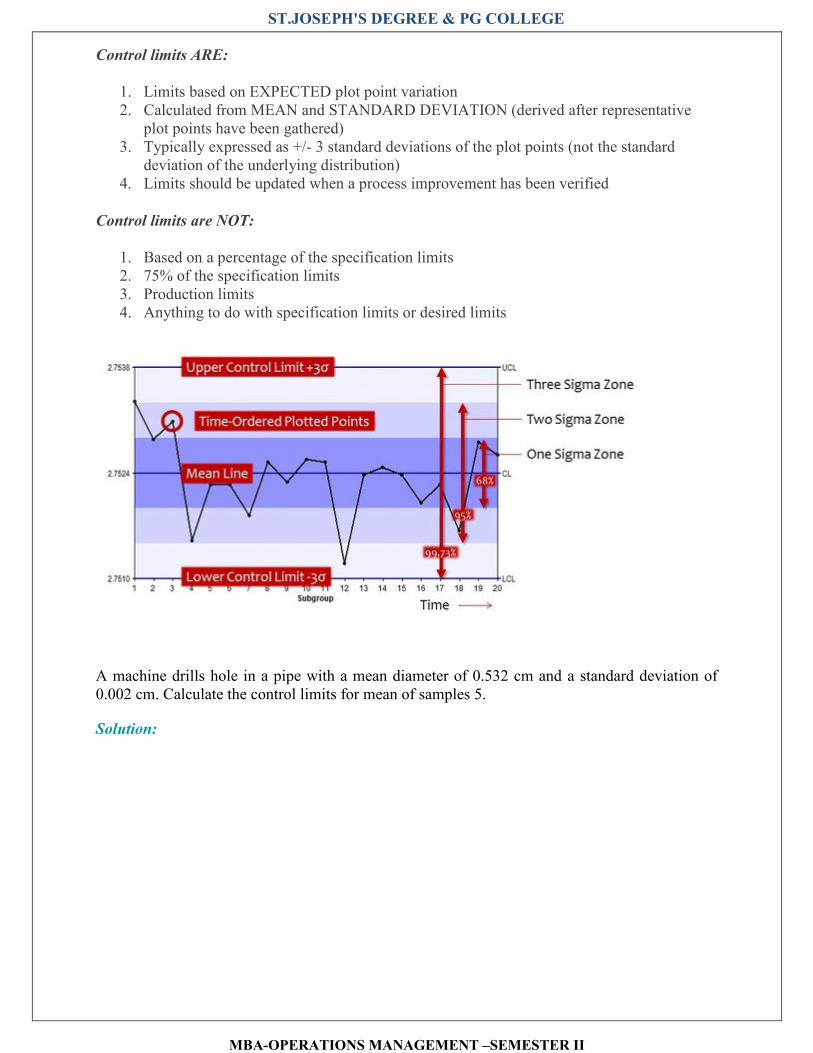
ST.JOSEPH'S DEGREE & PG COLLEGE
MBA-OPERATIONS MANAGEMENT –SEMESTER II
Control limits ARE:
1. Limits based on EXPECTED plot point variation 2. Calculated from MEAN and STANDARD DEVIATION (derived after representative
plot points have been gathered) 3. Typically expressed as +/- 3 standard deviations of the plot points (not the standard
deviation of the underlying distribution) 4. Limits should be updated when a process improvement has been verified
Control limits are NOT:
1. Based on a percentage of the specification limits 2. 75% of the specification limits 3. Production limits 4. Anything to do with specification limits or desired limits
A machine drills hole in a pipe with a mean diameter of 0.532 cm and a standard deviation of 0.002 cm. Calculate the control limits for mean of samples 5.
Solution:

ST.JOSEPH'S DEGREE & PG COLLEGE
MBA-OPERATIONS MANAGEMENT –SEMESTER II
Example 9.20
The following data gives the readings for 8 samples of size 6 each in the production of a certain product. Find the control limits using mean chart.
Given for n = 6, A2 = 0.483,
Solution:

ST.JOSEPH'S DEGREE & PG COLLEGE
MBA-OPERATIONS MANAGEMENT –SEMESTER II
Example 9.21
The data shows the sample mean and range for 10 samples for size 5 each. Find the control limits for mean chart and range chart.
Solution:
Example 9.22
The following data gives readings of 10 samples of size 6 each in the production of a certain product. Draw control chart for mean and range with its control limits.
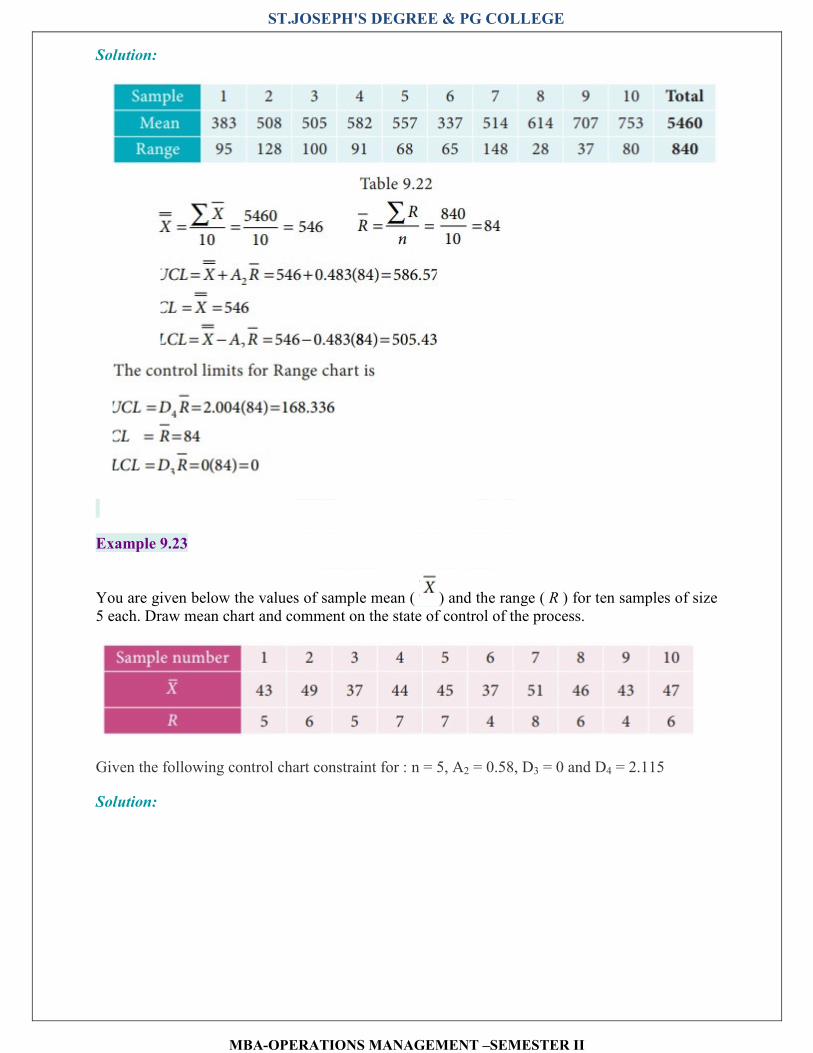
ST.JOSEPH'S DEGREE & PG COLLEGE
MBA-OPERATIONS MANAGEMENT –SEMESTER II
Solution:
Example 9.23
You are given below the values of sample mean ( ) and the range ( R ) for ten samples of size 5 each. Draw mean chart and comment on the state of control of the process.
Given the following control chart constraint for : n = 5, A2 = 0.58, D3 = 0 and D4 = 2.115
Solution:

ST.JOSEPH'S DEGREE & PG COLLEGE
MBA-OPERATIONS MANAGEMENT –SEMESTER II
The above diagram shows all the three control lines with the data points plotted, since four points falls out of the control limits, we can say that the process is out of control.
Construction of and R charts
Any production process is not perfect enough to produce all the products exactly the same. Some amount of variation is inherent in any production process. This variation is a total of number of characteristics of the production process such as raw materials, machine setting, operators,
handling new operations and new machines, etc. The chart is used to show the quality averages of the samples taken from the given process. The R chart is used to show the variability
or dispersion of the samples taken from the given process. The control limits of the and R charts shows the presence or absence of assignable causes in the production process.
Both and R charts are usually required for decision making to accept or reject the process.
The procedure for constructing and R charts are outlined below.

ST.JOSEPH'S DEGREE & PG COLLEGE
MBA-OPERATIONS MANAGEMENT –SEMESTER II
Procedure for
(i) Let X1,X2, X3, etc. be the samples selected, each containing ‘n’ observations (usually n = 4, 5 or 6)
(ii) Calculate mean for each samples 1 , 2 , 3 .... by using
total of ‘n’ values included in the sample Xi .
(iii) Find the mean ( ) of the sample means.
total of all the sample means.
Procedure for R -Charts.
Calculate R = xmax − xmin
Let R1, R2, R3… be the ranges of the ‘n’ samples. The average range is given by
The calculation of control limits for chart in two different cases is
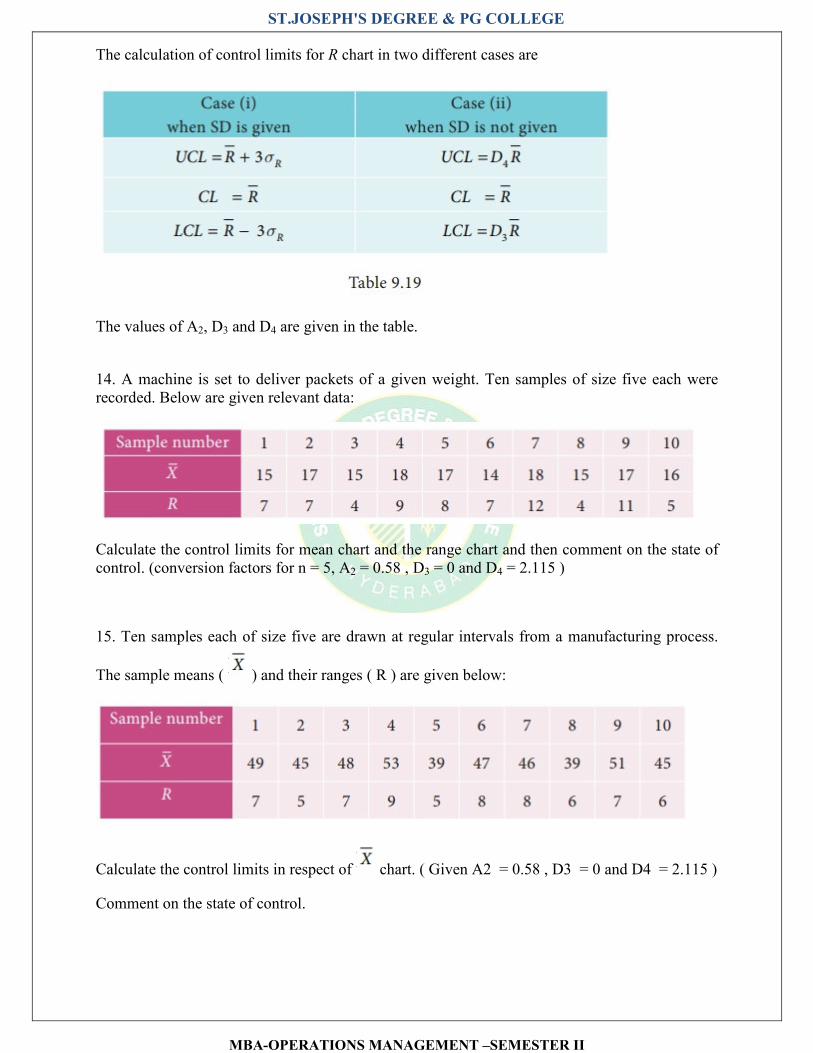
ST.JOSEPH'S DEGREE & PG COLLEGE
MBA-OPERATIONS MANAGEMENT –SEMESTER II
The calculation of control limits for R chart in two different cases are
The values of A2, D3 and D4 are given in the table.
14. A machine is set to deliver packets of a given weight. Ten samples of size five each were recorded. Below are given relevant data:
Calculate the control limits for mean chart and the range chart and then comment on the state of control. (conversion factors for n = 5, A2 = 0.58 , D3 = 0 and D4 = 2.115 )
15. Ten samples each of size five are drawn at regular intervals from a manufacturing process.
The sample means ( ) and their ranges ( R ) are given below:
Calculate the control limits in respect of chart. ( Given A2 = 0.58 , D3 = 0 and D4 = 2.115 )
Comment on the state of control.

ST.JOSEPH'S DEGREE & PG COLLEGE
MBA-OPERATIONS MANAGEMENT –SEMESTER II
16. Construct and R charts for the following data:
(Given for n = 3, A2 = 0.58 , D3 = 0 and D4 = 2.115 )
17. The following data show the values of sample mean ( ) and its range ( R ) for the samples of size five each. Calculate the values for control limits for mean , range chart and determine whether the process is in control.
( conversion factors for n = 5, A2 = 0.58 , D3 = 0 and D4 = 2.115 )
18. A quality control inspector has taken ten samples of size four packets each from a potato chips company.The contents of the sample are given below, Calculate the control limits for mean and range chart.

ST.JOSEPH'S DEGREE & PG COLLEGE
MBA-OPERATIONS MANAGEMENT –SEMESTER II
(Given for n = 5, A2 = 0.58 , D3 = 0 and D4 = 2.115 )
19. The following data show the values of sample means and the ranges for ten samples of size 4 each. Construct the control chart for mean and range chart and determine whether the process is in control.
20. In a production process, eight samples of size 4 are collected and their means and ranges are given below. Construct mean chart and range chart with control limits.

ST.JOSEPH'S DEGREE & PG COLLEGE
MBA-OPERATIONS MANAGEMENT –SEMESTER II
21. In a certain bottling industry the quality control inspector recorded the weight of each of the 5 bottles selected at random during each hour of four hours in the morning.
Answers:
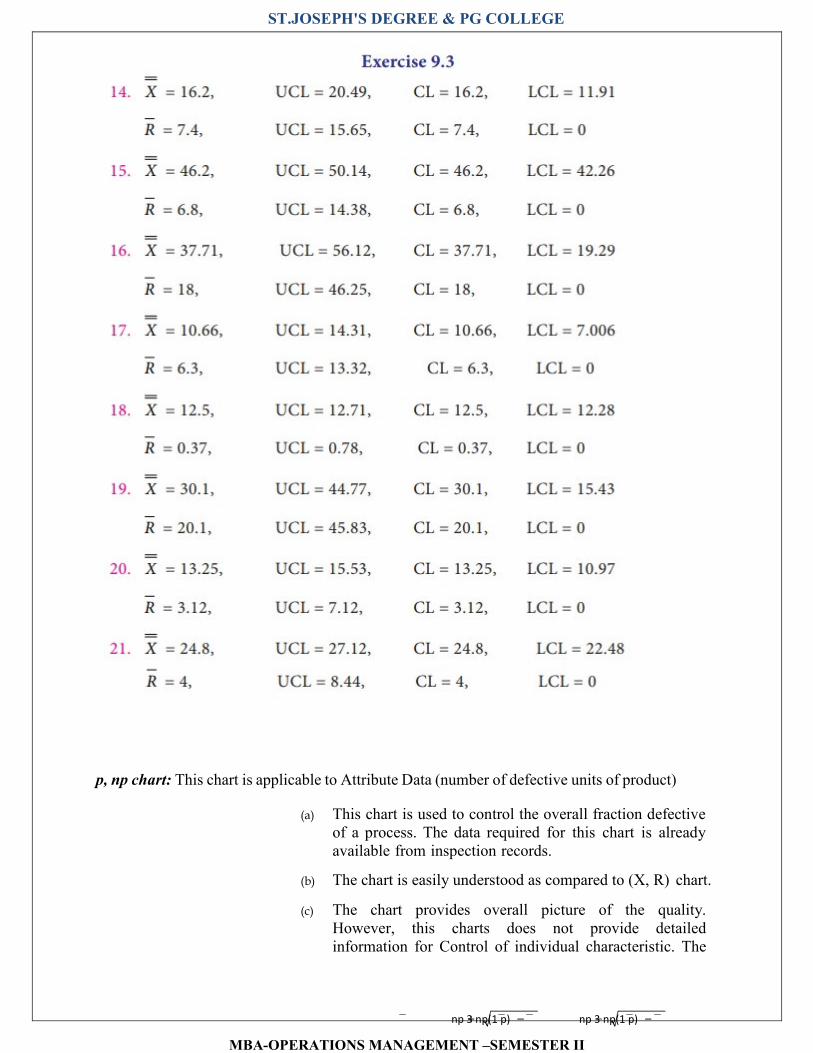
ST.JOSEPH'S DEGREE & PG COLLEGE
MBA-OPERATIONS MANAGEMENT –SEMESTER II
np 3 np(1 p) np 3 np(1 p)
p, np chart: This chart is applicable to Attribute Data (number of defective units of product)
(a) This chart is used to control the overall fraction defective of a process. The data required for this chart is already available from inspection records.
(b) The chart is easily understood as compared to (X, R) chart.
(c) The chart provides overall picture of the quality. However, this charts does not provide detailed information for Control of individual characteristic. The

ST.JOSEPH'S DEGREE & PG COLLEGE
MBA-OPERATIONS MANAGEMENT –SEMESTER II
charts do not recognise degree of defectiveness in units of product standard and limits vary the sample size.
C chart:
• C chart is applicable to attribute data (number of defects per unit of product).
• This chart is used to control the overall number of defects per unit.
• This chart gives all the advantages given alone for m-charts. Additionally, it provides the measure of degree of defectiveness in units of product.
However, it does not provide detailed information and control of individual characteristics as in case of (X, R) charts.

ST.JOSEPH'S DEGREE & PG COLLEGE
MBA-OPERATIONS MANAGEMENT –SEMESTER II
ACCEPTANCE SAMPLING PLANS
Acceptance sampling
� A statistical technique used to take a decision regarding acceptance or rejection of a lot without having to examine the entire lot.
� It is the process of inferring the quality of a large numbers of items ( a batch or lot) based on the quality of a small sample of the items.
� Type of Inspection which involves � Extracting a random sample from the lot to determine whether to accept or reject
the entire lot based on the quality of the sample or whether to subject the lot to 100% inspection and separate the good from the bad
� Acceptance samples plans have two imp concepts As background (attributes) � Average outgoing quality curves � Operating characteristic curves
three main types of sampling plans used for acceptance sampling. The types are: 1. Single
Sampling Plan 2. Double Sampling Plan 3. Sequential Sampling Plan. Sampling Plan # 1. Single Sampling Plan:
Procedure of single sampling plan is outlined as follows: (1) Pick up randomly number of items from the lot of N and inspect them.
(2) If the number of defectives found in the sample size is ≤ A1, accept the lot. (3) If the number of defectives in sample of n items > A1, inspect the remaining (N – n) items. (4) Correct or replace all the defective products found.
Example 1: ADVERTISEMENTS:
Let the values of N, n and A1, be as follows: N = 400
n = 20
A1= 2 A Sample of 20 products shall be taken from a batch of 400 pieces randomly. The 20 pieces shall be inspected and if the number of defectives found is ≤ 2, the lot of 400 pieces will be accepted without further inspection.
If the number of defectives in the sample of 20 is more than 2 then all the remaining products. (400 – 20) = 380 should be inspected and all the defectives should either be connected or replaced by good ones before the whole lot of 400 is accepted.

ST.JOSEPH'S DEGREE & PG COLLEGE
MBA-OPERATIONS MANAGEMENT –SEMESTER II
where, N = Number of items/products in the given lot.
n = Number of units of the product randomly selected from the batch of size N.
A = Acceptance number. It is the number of maximum defectives allowed in a sample of size n.
So A1, A2, A3, A4, A5 are the acceptance numbers to be used in double and multiple sampling plans.
Sampling Plan # 2. Double Sampling Plan:
A sample consisting of n units of products is inspected, if the number of defective is below A1 the lot is accepted, if it is above the second acceptance number A2 (where A2< A1) the lot is rejected. If the number of defectives falls between A1 and A2 the result is inconclusive and a second sample is drawn. The rule again is similar to that of a single sampling plan. If the total number of defectives of the two samples is below the pre-determinded acceptance number A2, the lot is accepted otherwise rejected.
Example 2: Let N = 600 A1 = 2, n1 = 30, n2 = 50, A2 = 4 then the interpretation of the above data is given
below: (i) The lot consists of 600 products.
(ii) Take a sample of 30 randomly from 600 and inspect them.
(iii) If the number of defectives is < 2 accept the lot of 600 without further inspection
(iv) If the number in 30 is more than 2 but < 4 take the second sample of 50 products from
From the remainder of N i.e., from (600-30) and inspect 50.
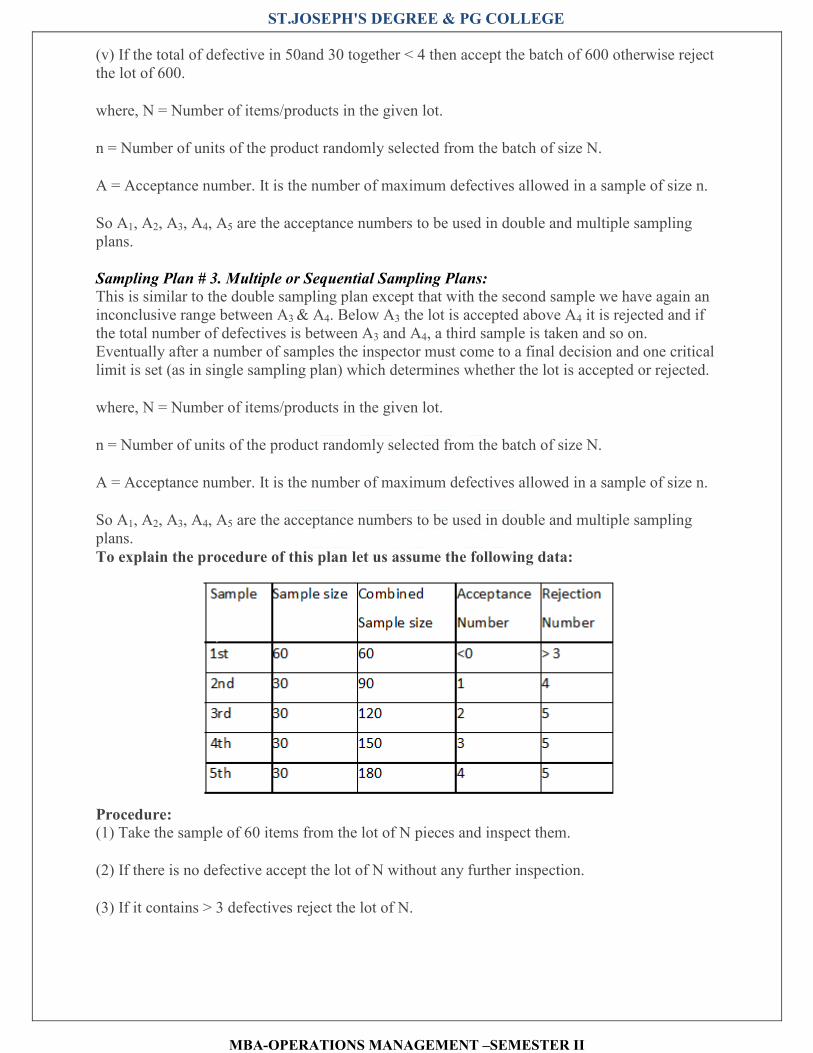
ST.JOSEPH'S DEGREE & PG COLLEGE
MBA-OPERATIONS MANAGEMENT –SEMESTER II
(v) If the total of defective in 50and 30 together < 4 then accept the batch of 600 otherwise reject the lot of 600.
where, N = Number of items/products in the given lot.
n = Number of units of the product randomly selected from the batch of size N.
A = Acceptance number. It is the number of maximum defectives allowed in a sample of size n.
So A1, A2, A3, A4, A5 are the acceptance numbers to be used in double and multiple sampling plans.
Sampling Plan # 3. Multiple or Sequential Sampling Plans:
This is similar to the double sampling plan except that with the second sample we have again an inconclusive range between A3 & A4. Below A3 the lot is accepted above A4 it is rejected and if the total number of defectives is between A3 and A4, a third sample is taken and so on. Eventually after a number of samples the inspector must come to a final decision and one critical limit is set (as in single sampling plan) which determines whether the lot is accepted or rejected.
where, N = Number of items/products in the given lot.
n = Number of units of the product randomly selected from the batch of size N.
A = Acceptance number. It is the number of maximum defectives allowed in a sample of size n.
So A1, A2, A3, A4, A5 are the acceptance numbers to be used in double and multiple sampling plans.
To explain the procedure of this plan let us assume the following data:
Procedure: (1) Take the sample of 60 items from the lot of N pieces and inspect them.
(2) If there is no defective accept the lot of N without any further inspection.
(3) If it contains > 3 defectives reject the lot of N.
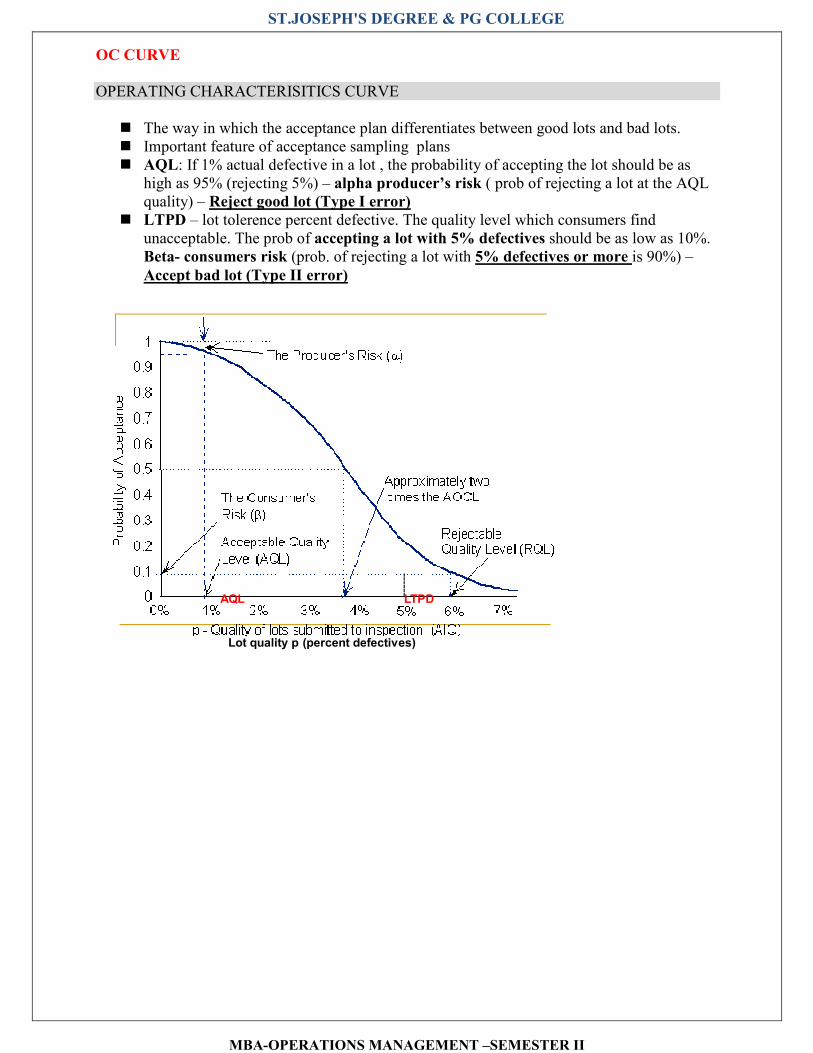
ST.JOSEPH'S DEGREE & PG COLLEGE
MBA-OPERATIONS MANAGEMENT –SEMESTER II
OC CURVE
OPERATING CHARACTERISITICS CURVE
� The way in which the acceptance plan differentiates between good lots and bad lots. � Important feature of acceptance sampling plans � AQL: If 1% actual defective in a lot , the probability of accepting the lot should be as
high as 95% (rejecting 5%) – alpha producer’s risk ( prob of rejecting a lot at the AQL quality) – Reject good lot (Type I error)
� LTPD – lot tolerence percent defective. The quality level which consumers find unacceptable. The prob of accepting a lot with 5% defectives should be as low as 10%. Beta- consumers risk (prob. of rejecting a lot with 5% defectives or more is 90%) –
Accept bad lot (Type II error)
Lot quality p (percent defectives)
------
LTPDAQL

ST.JOSEPH'S DEGREE & PG COLLEGE
MBA-OPERATIONS MANAGEMENT –SEMESTER II
IDEAL OC CURVE
WORK STUDY - METHOD STUDY, WORK MEASUREMENT
• MEANING OF WORK STUDY
• Work study is defined as that body of knowledge concerned with the analysis of the
work methods and the equipment used in performing a job, the design of an optimum
work method and the standardization of proposed work methods.
• Systematic, objective and critical examination of the factors affecting productivity for the purpose of improvement.
• It makes use of techniques of method study and work measurement to ensure the best possible use of human and material resources in carrying out a specific activity.

ST.JOSEPH'S DEGREE & PG COLLEGE
MBA-OPERATIONS MANAGEMENT –SEMESTER II
• Scope of WORK STUDY
• WORK STUDY
1. Method study: to study and standardise methods of work for a job (Improves operations by more effective utilization of all resources)
2. Work measurement : to measure work content of a job (improve control by more accurate planning- manning, estimating and evaluating performance)
• Method study
(Frank B. and Lillian Gilbreth)
• It is defined as a systematic recording, analysis and critical examination of existing and proposed ways of doing work and development and application of easier and more effective work methods to replace the existing work methods.
• Also called as Methods analysis /method engineering or work improvement or work simplification or motion study
• WORK MEASUREMENT
(F W.TAYLOR)
• Application of techniques designed to measure and establish the work content of a specified task or job by determining the time required for carrying our the task or job by a qualified worker at a defined standard of performance.
• In terms of standard time units (sec, min, hrs) and thereby establish the standard output of a worker in terms of standard units of output
• Aim: to assist mgt. to use available :
– human
– and material (plant and equipment ) resources effectively – predetermined objectives
– Better ways of doing work and avoiding waste in all forms
VARIOUS TECHNIQUES IN THE METHODS STUDY
� RECORDING TECHNIQUES
� Charts – for processes
� Outline process chart ( overall picture of the process 7 records principal operations and inspection – make ready, putaway, do )
� Flow process chart ( graphic representation of sequence of all operations of men, material or equipment – operation( ), inspection( ), transport ( ), delay (D) and storage( )
� Two handed process chart – both hands & limbs chronoigically

ST.JOSEPH'S DEGREE & PG COLLEGE
MBA-OPERATIONS MANAGEMENT –SEMESTER II
� Multiple activity chart – simultaneous – interrelated activities of operators/machine
� The man machine chart or worker- machine chart
� Motion charts: SIMO – Simultaneous motion cycle chart – movement of body – therbligs
� Operation process chart – basic process chart/graphic representation of the points at which the materials are introduced into the process and of the sequence of inspections and all operations except in materials handling
� Time –records – diagrams and models
� Flow & string diagram
� Two or three dimensional models
� Cycle graphs or chrono cycle graphs
� FLOW PROCESS CHART – 3 types
� Flow process chart material or product type
� Flow process chart- man type
� Flow process chart machine type or equipment type
� SIMO
� Type of two handed process chart in which the micromotion (therbligs) of both hands are recorded.
� Based on film analysis (motion picture of the operations, analyse the film and to prepare a SIMO chart)
� To record simultaneously on the common time scale the therbligs/group of therbligs performed by different parts of the body of one or more workers
� Search – Sr, Select – St, Grasp (G), Transport empty (TE), Hold (H), Position(P), Rest(R )
� Very small time values (1/2000 minute) may be obtained by reading a clock (micor-chronometer)
� FLOW DIAGRAM
� The flow diagram is a drawing or diagram drawn to scale to show the relative position of a machine or equipment, jigs, fixtures, gangways or aisles and shows the path followed by materials or machines
� STRING DIAGRAM
� Model or a scale plan of the shop, in which every machine or equipment is marked and a peg/pin is truck by or in the area representing the facility.

ST.JOSEPH'S DEGREE & PG COLLEGE
MBA-OPERATIONS MANAGEMENT –SEMESTER II
� A continous coloured thread/string traces and measure the path taken up by men or materials/equipments while performing the operation or during a specified sequence of events.
� CYCLE GRAPH
� Micro-motion study – graphic technique
� To make a cycle graph , a small electric bulb is attached to the finger, hand, or any
other part of the body whose motion is to be recorded. By using still photography, the path of light of bulb as it moves through space for one complete cycle is photographed. The working area is kept relatively less illuminated while photograph is being taken. More than one camera may be used in different planes to get more details. After the film is developed, the resulting picture (cycle graph) shows a permanent record of the motion pattern employed in the form of a closed loop of white continuous line with the working area in the background. A cycle graph does not indicate the direction or speed of motion. It can be used for • Improving the motion pattern, and • Training purposes in that two cycle graphs may be shown with one indicating a better motion pattern than the other.
� Principles of Motion Economy:
Three different groups
� Those related to the use of the human body.
� Those related to the workplace arrangement, and
� Those related to the design of tools and equipment.
� CHRONO CYCLE GRAPH
� The chrono cycle graph is similar to the cycle graph, but the power supply to the bulb is interrupted regularly by using an electric circuit. The bulb is thus made to flash. The procedure for taking photograph remains the same.
� The resulting picture (chrono cycle graph), instead of showing continuous line of motion pattern, shows short dashes of line spaced in proportion to the speed of the body member photographed.
� Wide spacing would represent fast moves while close spacing would represent slow moves.
� The jumbling of dots at one point would indicate fumbling or hesitation of the body member.
� To compute velocity, acceleration and retardation experienced by the body member at different locations.
� Space between the dots indicates the speed
� Size and shape indicates the acceleration/retardation
� MOTION STUDY – part of method study
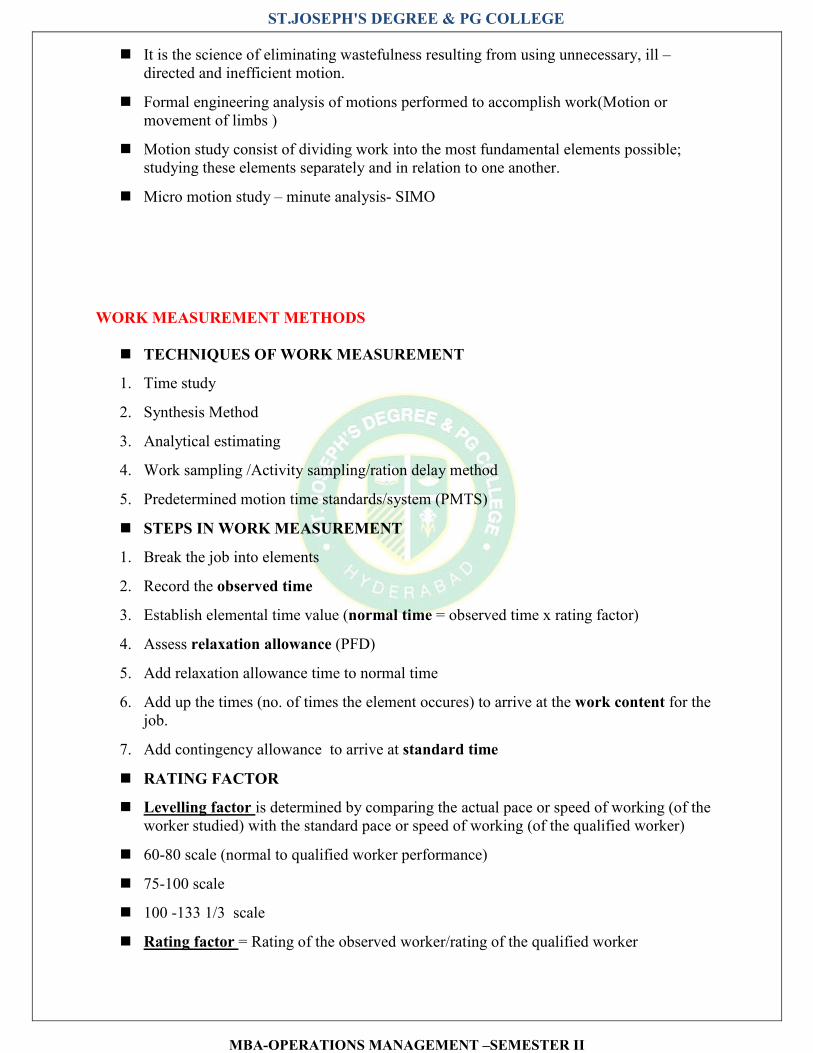
ST.JOSEPH'S DEGREE & PG COLLEGE
MBA-OPERATIONS MANAGEMENT –SEMESTER II
� It is the science of eliminating wastefulness resulting from using unnecessary, ill – directed and inefficient motion.
� Formal engineering analysis of motions performed to accomplish work(Motion or movement of limbs )
� Motion study consist of dividing work into the most fundamental elements possible; studying these elements separately and in relation to one another.
� Micro motion study – minute analysis- SIMO
WORK MEASUREMENT METHODS
� TECHNIQUES OF WORK MEASUREMENT
1. Time study
2. Synthesis Method
3. Analytical estimating
4. Work sampling /Activity sampling/ration delay method
5. Predetermined motion time standards/system (PMTS)
� STEPS IN WORK MEASUREMENT
1. Break the job into elements
2. Record the observed time
3. Establish elemental time value (normal time = observed time x rating factor)
4. Assess relaxation allowance (PFD)
5. Add relaxation allowance time to normal time
6. Add up the times (no. of times the element occures) to arrive at the work content for the job.
7. Add contingency allowance to arrive at standard time
� RATING FACTOR
� Levelling factor is determined by comparing the actual pace or speed of working (of the worker studied) with the standard pace or speed of working (of the qualified worker)
� 60-80 scale (normal to qualified worker performance)
� 75-100 scale
� 100 -133 1/3 scale
� Rating factor = Rating of the observed worker/rating of the qualified worker
ST.JOSEPH'S DEGREE & PG COLLEGE
MBA-OPERATIONS MANAGEMENT –SEMESTER II
� NORMAL TIME: Observed time X rating factor
� NORMAL TIME + ALLOWANCE = STANDARD TIME
� It is the time required to perform an explicitly defined task at the agreed pace by an individual possessing the mental and physical ability.
ALLOWANCE
The normal practice is to make an addition to the normal time by a suitable amount of time commonly referred to as an allowance to allow the worker to recover from fatigue and to attend the personal needs
STANDARD TIME = Normal time + allowance
Time taken to qualified worker to perform a particular operation.
� Types of allowances
� Fixed allowances (personal needs and basic fatigue,delay)
� Relaxation allowances – rest,compensatory rest, fatigue PFD Allowance – 10 – 20% NT
� Variable allowances( stress & strain, environmental)
� Policy allowance
� Process allowance – 5% of basic time (enforced idleness)
� Special allowance – permanent/temporary
� Interference allowance – 2 or 3 machines
� Periodic activity allowance – periodically during work cycle
� Contingency allowance – 5% of normal or basic time
� STANDARD TIME= NORMAL TIME + ALL RELEVANT ALLOWANCES
� 1.TIME STUDY/STOP WATCH STUDY
� Work measurement technique which records the times and working rate for the constituents(elements) of a specified job performed under certain conditions and also analyses the data to ascertain the time required to perform a job at a predefined level.
� Process of observing and recording the time required
� Non fly back, fly back and split hand type stop watches
� Repetitive element, occasional, constant, variable, manual, machine element etc….
� OBJECTIVES OF TIME STUDY
1. The quantity of human work in a specified task
2. Establish the std time within which an avg worker working at a normal pace
3. Basis of comparison for determining operating effectiveness

ST.JOSEPH'S DEGREE & PG COLLEGE
MBA-OPERATIONS MANAGEMENT –SEMESTER II
4. Set labour std
5. Determine std costs, equipment and labout requirements, basic/normal time, no. Of machines – handle
6. Balance the work of operators
7. Basis for setting piece rate or incentive wages
8. Schedules, cycle time
� 2. SYNTHESIS
� It is a technique of work measurement for building up the time required to do a job at
a defined level of performance by synthesizing or totaling elemental time values obtained from previous time studies on other jobs containing similar job elements or from standard data or synthetic data or built up time standard
� Used where time study techniques can be avoided.
� Std time computed by adding various elemental times- work
� Std data(catalogue of normal or basic time values) – made available – library
� Used for estimating labour times – cost estimates
� Economical and used for designing incentive schemes
� 3. ANALYTICAL ESTIMATING
� Determine the time values for jobs, having long and non-repetitive operations
� Time values determined : synthetic data or past experience
� PROCEDURE:
� Find out job details – std procedure,dimension
� Break the job into its elements
� Select time values from the std data – synthetic data
� Estimate the time values – past knowledge or exp.
� Add the time – 3 , 4- total basic/normal time
� Add the relaxation allowance
� Add any other allowances – arrive std. time
� 4.ACTIVITY SAMPLING /WORK SAMPLING or ratio – delay method
� Involves defining the state of working, observing the job over time and computing the portion of time the worker is working
� Ratio delay/snap reading method of observing
� Method of finding the ratio of delay and work element to the total process time by random observations (% of time spent by the employees in unavoidable delays)
� Process, machines or workers

ST.JOSEPH'S DEGREE & PG COLLEGE
MBA-OPERATIONS MANAGEMENT –SEMESTER II
� Work measurement technique that randomly samples the work of one or more employees
at periodic intervals to determine the proportion of total operation that is accounted for
in one particular activity
� USES OF WORK SAMPLING TECHNIQUES
1. Estimate the percentage of a protracted time period consumed by various activity states
2. Determine allowances
3. Nature of distribution of work activities
4. Estimate the % of utilisation of machines/equip
5. Indicate the usage of material handling equipments
6. Bases for indirect labour time stds
7. Determine Std time
� PROCEDURE FOR WORK SAMPLING STUDY
� Identify the activities
� Calculate the time proportion
� Choose the derived accuracy while arriving at study results
� Calculate specific times for each
� Recompute the required sample at least at 2 - 3 levels
� 5. PREDETERMINED MOTION TIME SYSTEM
� Work Measurement Technique by which normal or basic times are established for basic human motions and these time values are used to build up the time for a job at the defined level of performance
� Observing or thinking
� Types of PMTS:
� Methods time measurement (MTM)
� Work factor
� Basic motion times
1. METHODS TIME MEASURMENT(MTM) Predetermined time values for basic motions or therbligs – TMU (time measurement units)
� 1 TMU = 10-5 hr or 0.00001 hr or 0.0006 minutes 04 .036 seconds
2. Work factor:
basic motions which are modified elements of difficulty which make movement slower – modifies basic time value
3. Basic motion times (BMT)

ST.JOSEPH'S DEGREE & PG COLLEGE
MBA-OPERATIONS MANAGEMENT –SEMESTER II
Times were derived from the laboratory experiments -
� PROCEDURE OF PMTS
� Observe the job or think it
� Itemize the job elements
� Record std for each motion units
� Find the sum of the stds
� Estimate the allowance :
� Total sum is the predetermined time std for the job.
COMPUTATION OF NORMAL AND STANDARD TIME(SIMPLE PROBLEMS).
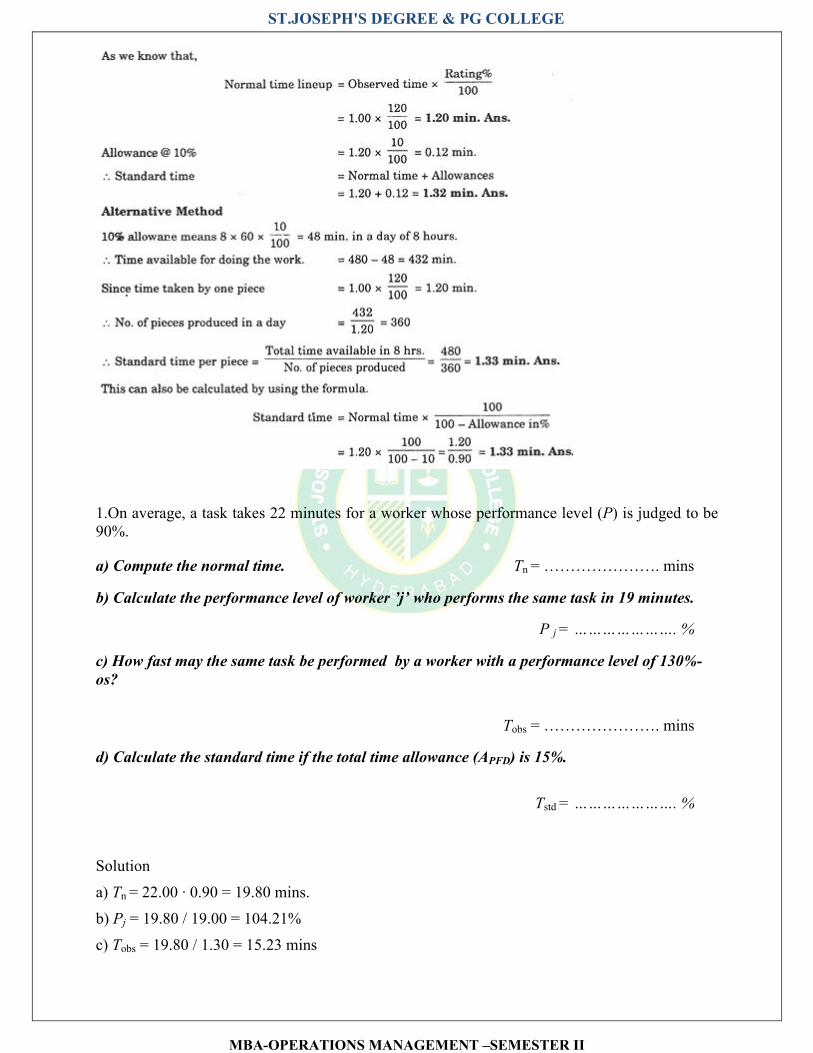
ST.JOSEPH'S DEGREE & PG COLLEGE
MBA-OPERATIONS MANAGEMENT –SEMESTER II
1.On average, a task takes 22 minutes for a worker whose performance level (P) is judged to be 90%.
a) Compute the normal time. Tn = …………………. mins
b) Calculate the performance level of worker ’j’ who performs the same task in 19 minutes.
P j = …………………. %
c) How fast may the same task be performed by a worker with a performance level of 130%-
os?
Tobs = …………………. mins
d) Calculate the standard time if the total time allowance (APFD) is 15%.
Tstd = …………………. %
Solution
a) Tn = 22.00 · 0.90 = 19.80 mins.
b) Pj = 19.80 / 19.00 = 104.21%
c) Tobs = 19.80 / 1.30 = 15.23 mins

ST.JOSEPH'S DEGREE & PG COLLEGE
MBA-OPERATIONS MANAGEMENT –SEMESTER II
d) Tstd = 19.80 (1.00 + 0.15) = 22.77 mins
2. Calculating normal and standard times
1st worker: 16 mins; 2nd worker: 15 mins; 3rd worker 15 mins; 4th worker: 18 mins. The average of the four workers’ observed task times is assigned to the 100% performance level.
a) Determine the normal time (Tn) of the task.
b) Compute the performance rate for all the workers (Pi) based on the normal time.
c) Calculate the standard time (Tstd) if the personal time allowance is 5%, the fatigue time
allowance is 7% and the delay allowance is 3%.
d) How many minutes does it need for each of the four workers to perform the given task 25
times?
e) Calculate the standard time for the 25 repetitions.
SOLUTION
a) Tn = (16+15+15+18)/4 = 16 mins.
b) P1 = 16/16 = 100.00%, P2 = 16/15 = 106.67%, P3 = 16/15 = 106.67%, P1 = 16/18 = 88.89%.
c) Tstd = Tobs(P)(1+APFD) = Tn(1+APFD), where APFD = (0.05 + 0.07 + 0.03) = 0,15. Thus Tstd = 18.40 mins.
d) Total time for 205 repetitions for a worker is 25(Tobs)(1 + APFD). Thus, for worker 1 it is 25(16)(1.15) = 460 mins; for worker 2 and 3 it is 431.25 mins; for worker 4 it is 517.50 mins.
e) 25(Tstd) = 25(18.40) = 460 mins = 7 hrs 40 mins
3.Calculating normal and standard times
1st worker: 100 mins; 2nd worker: 120 mins; 3rd worker 90 mins; 4th worker: 110 mins. The mean of the four workers’ observed task times is assigned to the 100% performance level.
a) Determine the normal time (Tn) of the task.
b) Compute the performance rate for all the workers (Pi) based on the normal time.
c) Calculate the standard time (Tstd) if the personal time allowance is 5%, the fatigue time
allowance is 7% and the delay allowance is 10%.
d) Calculate the standard time for 200 repetitions.
e) How many minutes does it need for each of the four workers to perform the given task 200
times?
f) Calculate the normal time, the standard time and the performance rates of all the four
employees if the normal time is increased to the work performance of the fastest working
employee.
SOLUTION
a) Tn = (100+120+90+110)/4 = 105 mins.

ST.JOSEPH'S DEGREE & PG COLLEGE
MBA-OPERATIONS MANAGEMENT –SEMESTER II
b) P1 = 105/100 = 105.00%, P2 = 105/120 = 87.50%, P3 = 105/90 = 116.67%, P1 = 105/110 = 95.45%.
c) Tstd = 105(1.22) = 128.10 minutes = 2 hours and 8.1 minutes
d) 200(128.10) = 25,620 minutes
e) 1st: 200(100)(1.22) = 24,400 mins; 2nd: 200(120)(1.22) = 29,280 mins; 3rd: 200(90)(1.22) = 21,960 mins; 4th: 26,840 mins
f) Tn = Tobs(3rd) = 90 mins; Tstd = 90(1.22) = 109.8; P1 = 90/100 = 90.00%, P2 = 90/120 = 75.00%, P3 = 90/90 = 100.00%, P1 = 90/110 = 81.82%.
Unit - IV: TQM:- The concept of TQM, Evolution & Historical perspective of TQM (inspection, SQC, QA, TQM), Contributions to the field of quality by Shewhart, Deming, Juran, crosby- Benefits and Costs of TQM, 5 Ss, PDCA cycles, Six Sigma concept. Objectives of Six Sigma, Value Analysis –Types of Value - Importance of cost reduction.
THE CONCEPT OF TQM
• TQM is a philosophy which applies equally to all parts of the organization.
• TQM can be viewed as an extension of the traditional approach to quality.
• TQM places the customer at the forefront of quality decision making.
• Greater emphasis on the roles and responsibilities of every member of staff within an organization to influence quality.
• Total Quality Management (TQM) is an enhancement to the traditional way of doing business.
1. Total - Made up of the whole
2. Quality - Degree of Excellence a Product or Service provides.
3. Management - Art of handling, controlling, directing etc.
TQM is the application of quantitative methods and human resources to improve all the processes within an organization and exceed CUSTOMER NEEDS now and in the future
TQM is an integrated effort designed to improve quality performance at every level of the organization.

ST.JOSEPH'S DEGREE & PG COLLEGE
MBA-OPERATIONS MANAGEMENT –SEMESTER II
• Total: Quality involves everyone and all the activities performed in the company.
• Quality: Conformance to the requirements (meeting customer requirements).
• Management: Quality can and must be managed.
TQM is a process for managing quality. It is viewed as a continuous way of life and a philosophy of perpetual improvement in everything we do
ISO DEFINITION
TQM is the management approach of an organization, centered on quality, based on participation of all its members and aiming at long-term success through customer
satisfaction and benefits to all members of organization and to society
EVOLUTION & HISTORICAL PERSPECTIVE OF TQM (INSPECTION, SQC, QA,
TQM)
ST.JOSEPH'S DEGREE & PG COLLEGE
MBA-OPERATIONS MANAGEMENT –SEMESTER II
HISTORICAL PERSPECTIVE 1. Quality in articles and artefacts produced by skilled craftsmen and artisans from the B.C.
era eg. goldsmiths,silversmiths, blacksmiths, potters,etc. 2. Artists & Artisans Guilds in the Middle ages spent years imparting quality skills and the
worksmen had pride in making quality products. 3. Industrial Revolution brought factory manufacturing where articles were mass-
produced and each worker made only a part of the product, and did not sense the importance of his contribution to the quality of the product
4. Frederick W. Taylor wrote Principles of Scientific Management in 1911 5. In 1924, W.A.Shewhart of Bell Telephone Labs developed a statistical chart for the
control of product variables – the beginning of SQC and SPC. wrote Economic Control of Manufactured Product in 1931.
6. In the same decade, H.F.Dodge and H.G.Romig of Bell Telephone Labs developed statistical acceptance sampling instead of 100% inspection.
7. In 1946,the American Society for Quality Control was formed.
8. W. Edwards Deming and Joseph M. Juran, students of Shewhart, went to Japan in
1950; began transformation from “shoddy” to “world class” goods. 9. (In 1950, W. Edwards Deming, who learnt SQC from Shewhart, taught SPC & SQC to
Japanese engineers and CEO’s) 10. In 1954,Joseph M.Juran taught Japanese managements their responsibility to achieve
quality . 11. In 1960, the first quality control circles were formed. SQC techniques were being
applied by Japanese workers. In 1960, Dr. K. Ishikawa formalized “quality circles” - the use of small groups to eliminate variation and improve processes.
12. 1970’s US managers were learning from Japan Quality implementation miracles. 13. In the late ‘70’s and early ‘80’s: 14. Deming returned from Japan to write Out of the Crisis, and began his famous 4-day
seminars in the United States 15. Phil Crosby wrote Quality is Free 16. NBC ran “If Japan can do it, why can’t we?” 17. Motorola began 6 Sigma 18. In 1980’s TQM principles and methods became popular.(also in auto industry) 19. In 1990’s ,the ISO 9000 model became the world-wide standard for QMS.
EVOLUTION OF TQM
The Four Stages of TQM 1. Inspection-based 2. System of quality control 3. Quality assurance 4. Total quality management
Level 1. Inspection • measure the characteristics of a product and compare them with its specifications;-
fitness of standards Level 2. Quality Control

ST.JOSEPH'S DEGREE & PG COLLEGE
MBA-OPERATIONS MANAGEMENT –SEMESTER II
• inspection performed by the workers themselves with a feedback loop to the production line;- Learning
Level 3. Quality Assurance • set of (implemented) predefined and systematic activities necessary to give confidence in
the process quality -coherent set of quality procedures/tests
Level 4. Total Quality Management • management centered on quality and based on the participation of everybody which aims
at the customer satisfaction and at the improvement of the company's personnel, of the company and of the society.-A quality assurance plan is operational
1. Inspection based
• The quality movement traces its roots back to medieval Europe, when craftsmen began
organizing themselves into unions called guilds in the late thirteenth century. • Until the early nineteenth century, manufacturing in the industrialized world tended to
follow this model. • The factory system, with its emphasis on product inspection, began in Great Britain in
themid-1750s and grew into the Industrial Revolution in the early 1800s. • In the early twentieth century, manufacturers began to include quality processes in
quality practices. • During the early days of manufacturing, an operative’s work was inspected and a
decision whether to accept or reject it was made. • As businesses expanded, so too did this role, and full-time inspection jobs were created.
This brought about the following other problems: • Technical problems requiring specialized skills, often not possessed by production
workers, occurred. • Some of the inspectors lacked training. • Inspectors were ordered to accept defective goods to increase output. • Skilled workers were promoted to other roles, leaving less skilled workers to perform
operational jobs, such as manufacturing. • These changes led to the birth of a separate inspection department with a “chief
inspector”, reporting to either the person in charge of manufacturing or the works manager.
• With the creation of this new department there came newer services such as standards, training, recording of data and the accuracy of measuring equipment.
• It became clear that the responsibilities of the “chief inspector” included more than just product acceptance, and a need to address defect prevention emerged
2.System of quality control
• actions and measures to control quality in a desired manner. • the “quality control manager” heading this department was responsible for inspection
services and quality control engineering. • In the 1920s, statistical theory began to be applied effectively to quality control and • in 1924, Shewart made the first sketch of a modern control chart. • His work was later developed by Deming. • The early works of Shewart, Deming, Dodge and Romig constitutes much of what
comprises the theory of statistical process control (SPC), today. • little use of these techniques in manufacturing companies until the late 1940s.
ST.JOSEPH'S DEGREE & PG COLLEGE
MBA-OPERATIONS MANAGEMENT –SEMESTER II
• At that time, Japan’s industrial system had been virtually destroyed and it had gained a reputation as a producer of cheap, imitation products and an illiterate workforce.
• The Japanese recognized these problems and set about solving them with the help of some notable quality gurus—Juran, Deming and Feigenbaum
• In the early 1950s, quality management practices developed rapidly in Japanese plants and become a major theme in Japanese management philosophy.
• By 1960, quality control and management had become a national preoccupation.
3.Quality assurance Quality control + the guidelines set by quality assurance. The whole idea is to see whether planned quality is actually being achieved. Thus,
quality assurance is more comprehensive and quality control is a part of it. By the late 1960s and early 1970s, Japan’s imports into the US and Europe increased
significantly due to its cheaper though better quality products compared to its Western counterparts.
In a Department of Trade and Industry publication of 1982, it was stated that Britain’s world trade share was declining and this was having a dramatic effect on the standard of living in the country. There was intense global competition and any country’s economic performance and reputation for quality was made up of the reputations and performances of its individual companies and products/services.
The British Standard (BS) 5750 for quality systems had been published in 1979. In
1983, the National Quality Campaign was launched using the BS 5750 as its main theme. The aim was to bring to the attention of industry the importance of quality for competitiveness and survival in the world market.
The International Organization for Standardization (ISO) 9000 has become the internationally recognized standard for quality management systems.
It comprises a number of standards that specify the requirements for the documentation,
implementation and maintenance of a quality system. These standards were published for the first time in 1987. The aim was to effectively document the requirements of the quality management
system, which had to be implemented to attain customer satisfaction. These standards were revised for the first time in 1994. Based on actual experiences of several thousand companies, these standards were revised
again leading to an improved version being published in 2000. These standards were developed to assure quality
5. Total quality management (TQM)
The birth of total quality in the United States came as a direct response to the quality revolution in Japan following World War II.
The Japanese welcomed the inputs of Americans, Joseph M. Juran and W. Edwards
Deming, and rather than concentrate on inspection, focused on improving all organizational processes through the people who used them.
In 1969, the first international conference on quality control sponsored by Japan,
America and Europe was held in Tokyo. Feigenbaum presented the paper, which used the term “total quality” for the first time,
and referred to wider issues such as planning, organization and management responsibility.

ST.JOSEPH'S DEGREE & PG COLLEGE
MBA-OPERATIONS MANAGEMENT –SEMESTER II
Ishikawa presented a paper explaining how “total quality control” in Japan was different in the sense that it implied “company-wide quality control,” and he described how all the employees, from the top management to the workers were required to study and participate in quality control for the process to be effective.
By the 1970s, the US industrial sectors of automobiles and electronics had been broadsided by Japan’s high-quality competition.
The US response, emphasizing not only statistics but approaches that embraced the entire organization, became known as total quality management (TQM).
CONTRIBUTIONS TO THE FIELD OF QUALITY BY SHEWHART, DEMING,
JURAN, CROSBY
Shewhart’s contributions to Process Improvement Reducing variation
Shewhart is best known for his simple schematic control chart which changed the manufacturing industry forever. This chart outlined principles essential to modern process quality control. These are followed to this day with certain improvements as production processes became more complicated.
A key thing to remember in any process is that no two products will ever be the same. Reducing these variations to improve quality has always been one of the manufacturing industry’s greatest challenges. Dr. Shewhart’s acknowledgment of two classes of variation, namely special-cause’ and common-cause’ led him to improve his control chart mentioned above.
He proposed variables which would reduce common-cause’ variations. According to him, to distinguish between the two, every manufacturing process would need to be brought under statistical control. This and other principles of Shewhart helped pave the way for modern analysis of manufacturing processes.
Deming Wheel Cycle and Six Sigma
One of Shewhart’s other well-known accomplishments included a simple plan termed PDCA or plan-do-check-act, an iterative four-step management method for the continual improvement of processes. This is also known famously as the Deming Wheel cycle.
In six sigma programmes, the above-mentioned cycle is renamed as DMAIC or define-measure-analyze-improve-control. A guiding principle of the PDCA/DMAIC is the iterative nature of the processes. More the number of iterations a product is subjected to, the better the end output.
To illustrate and highlight his contribution to six sigma and the PDCA cycle, the latter needs to be looked at from the perspective of a company which isn’t experiencing profits.
The company would brainstorm ideas for improvement which is the plan’ phase of the cycle. Next, the company chooses an actionable course, then pursues it, which constitutes the “do”

ST.JOSEPH'S DEGREE & PG COLLEGE
MBA-OPERATIONS MANAGEMENT –SEMESTER II
phase. The next phase check’ constitutes studies conducted to test the results of the actions taken prior. This phase also quantifies the efficacy of the prior phase and serves as the foundation stone for the next step. In the act phase, the company analyses the observed results. If the results are up to the mark, the process is set in stone until further improvements are needed. If they are not, this phase instructs the company to circle back to the original brainstorming pool to start the process over again and repeat the cycle until the company is pleased with the results.
This plan illustrates Shewhart’s brilliance and the thought process that the continuous evaluation of management procedures and the consideration of new ideas are vital in streamlining “common causes” and mitigating “special causes” in variation.
Conclusion
In conclusion, Shewhart is one of the most eminent contributors in Six Sigma and process improvement. His work and contributions help organizations identify unique attributes in their processes which influence customer experience and quality.
They will always be leveraged by organizations operating on the bleeding edge and wanting to re-define the way things are done.
Philip Crosby is best known for:
Quality is Free - His first book that made him famous. Zero Defects - One of his four absolutes of quality. The Four Absolutes of Quality - See the details below. The Crosby Vaccine - for management to prevent poor quality
The Fourteen Steps of Quality Improvement A Brief Introduction: The founder and chairman of the board of Career IV, an executive management consulting firm. Crosby also founded Philip Crosby Associates Inc. and the Quality College. He has authored many books, including Quality is free, Quality without tears, Let's talk Quality, and Leading: The art of becoming an executive. Crosby originated the concept of zero defects.
Timeline
1979: Philip Crosby started the management consulting company Philip Crosby Associates, Inc. 1979: Crosby published his first business book; Quality Is Free.
ST.JOSEPH'S DEGREE & PG COLLEGE
MBA-OPERATIONS MANAGEMENT –SEMESTER II
Four Absolutes of Quality
Crosby's response to the quality crisis was the principle of "doing it right the first time" (DIRFT). He also included four major principles:
The First Absolute
The definition of quality is conformance to requirements (not as goodness)
The Second Absolute
The system of quality is prevention (not appraisal)
The Third Absolute
The performance standard is zero defects (not “that’s close enough”).
The Fourth Absolute
The measurement of quality is the price of nonconformance (not indexes)
The Crosby Vaccine
In the Crosby style, the “Vaccine” is explained as medicine for management to prevent poor quality. It is in five sections that cover the requirements of Total Quality Management.
Integrity
Treat quality seriously throughout the whole business organization from top to bottom. That the companies future will be judged on its performance on quality.
Systems
Appropriate measures and systems should be put in place for quality costs, education, quality, performance, review, improvement and customer satisfaction.
Communication
The communication systems are of paramount importance to communicate requirements and specifications and improvement opportunities around the organization. Customers and operators know what needs to be put in place to improve and listening to them will give you the edge.

ST.JOSEPH'S DEGREE & PG COLLEGE
MBA-OPERATIONS MANAGEMENT –SEMESTER II
Operations
Work with and develop suppliers. Processes should be capable and improvement culture should be the norm.
Policies
Policies must be clear and consistent throughout the business.
The Fourteen Steps to Quality Improvement
1. Management Commitment
Make it clear that management is committed to quality.
2. Quality Improvement Teams
Form Quality Improvement Teams with senior representatives from each department.
3. Measure Processes
Measure processes to determine where current and potential quality problems lie.
4. Cost of Quality
Evaluate the cost of quality and explain its use as a management tool.
5. Quality Awareness
Raise the quality awareness and personal concern of all employees.
6. Correct Problems
Take actions to correct problems identified through previous steps.
7. Monitor Progress
Establish progress monitoring for the improvement process.

ST.JOSEPH'S DEGREE & PG COLLEGE
MBA-OPERATIONS MANAGEMENT –SEMESTER II
8. Train Supervisors
Train supervisors to actively carry out their part of the quality improvement program.
9. Zero Defects Day
Hold a Zero Defects Day to reaffirm management commitment.
10. Establish Improvement Goals
Encourage individuals to establish improvement goals for themselves and their group.
11. Remove Fear
Encourage employees to tell management about obstacles to improving quality.
12. Recognize
Recognize and appreciate those who participate.
13. Quality Councils
Establish Quality Councils to communicate on a regular basis.
14. Repeat the Cycle
Do it all over again to emphasize that the quality improvement process never ends
Deming Is best known for:
The 14 points for Managing Deming's fourteen points are management for transformation.
The Deming Cycle PDCA Cycle for continual improvement.
The system of Profound Knowledge (How managers should acquire new knowledge of the system?)
ST.JOSEPH'S DEGREE & PG COLLEGE
MBA-OPERATIONS MANAGEMENT –SEMESTER II
A Brief Introduction:
Edwards Deming was a prominent consultant, teacher, and author on the subject of Quality Management. Deming has published more than 200 works, including well-known books "Quality, Productivity and Competitive Position" and "Out of the Crisis".
Timeline
1946: After sharing his expertise in statistical quality control to help the US war effort during World War II, the War Department sent Deming to Japan to help the nation recover from its wartime losses. Deming taught Statistical Process Control (SPC) to the leaders of prominent Japanese organizations. 1951: The Deming Prize was established. The first Deming Prize ceremony was held on Sept 22, 1951. 1956: Deming was awarded the Shewhart medal by the American Society for Quality Control (ASQC - Now ASQ) 1960: Deming was honored by the Japanese Emperor with the Second Order of the Sacred Treasure for his teachings
If Japan can Why can't we?
This was an American television episode broadcast by NBC News. This was as part of the television show NBC White Paper on June 24, 1980. This TV documentary is credited with beginning the Quality Revolution in America and introducing the methods of W. Edwards Deming to American managers.
The Deming Cycle - PDCA
PDCA (Plan-Do-Check-Act) is an iterative four-step management method used in business for the control and continuous improvement of processes and products. It is also known as the Deming circle or, Shewhart cycle.
A variation of this is the Plan-Do-Study-Act (PDSA) cycle.
Plan
Plan the action. Assess the current state, and the future state, and plan how to close the gap. Identify alternate solutions.
Do
Try out or test the solutions (sometimes at a pilot level).
Check
Check to see if the tested solutions accomplished the objective.

ST.JOSEPH'S DEGREE & PG COLLEGE
MBA-OPERATIONS MANAGEMENT –SEMESTER II
Act
Analyze the difference between actual and planned results. If the gap is significant, determine the root cause and request a corrective action.
The Deming System of Profound Knowledge
The System of Profound Knowledge, or management by positive co-operation, is described in its four interrelated elements.
Appreciation for a System
The need for managers to understand the relationships between functions and activities, and that the long-term aim is for everyone to win employees, shareholders, customers, suppliers and the environment.
Knowledge of Variation
Knowledge and understanding of variation, process capability, control charts, interactions and the loss function.
Theory of Knowledge
As all plans require prediction based on historical information, the theory must be understood before it can successfully be copied.
Knowledge of Psychology
The understanding of human interactions, how people are motivated and what disillusions them.
The 14 points of managing
Deming's fourteen points for Total Quality Management include:
1. Create constancy of purpose
Create constancy of purpose toward improvement of product and service, with the aim to become competitive and to stay in business, and to provide jobs.
2. Adopt the new philosophy
Adopt the new philosophy. We are in a new economic age. Western management must awaken to the challenge, must learn their responsibilities, and take on leadership for change.
ST.JOSEPH'S DEGREE & PG COLLEGE
MBA-OPERATIONS MANAGEMENT –SEMESTER II
3. Cease dependence on inspection
Cease dependence on inspection to achieve quality. Eliminate the need for inspection on a mass basis by building quality into the product in the first place.
4. End the practice of awarding business on the basis of price tag
End the practice of awarding business on the basis of the price tag. Instead, minimize total cost. Move toward a single supplier for any one item, on a long-term relationship of loyalty and trust.
5. Improve constantly
Improve constantly and forever the system of production and service, to improve quality and productivity, and thus constantly decrease costs.
6. Institute training
Institute training on the job.
7. Institute leadership
Institute leadership (see Point 12). The aim of supervision should be to help people and machines and gadgets to do a better job. Supervision of management is in need of an overhaul, as well as supervision of production workers.
8. Drive out fear
Drive out fear, so that everyone may work effectively for the company.
9. Break down barriers
Break down barriers between departments. People in research, design, sales, and production must work as a team, to foresee problems of production and in use that may be encountered with the product or service.
10. Eliminate slogans, exhortations, and targets
Eliminate work standards (quotas) on the factory floor. Substitute leadership.
Eliminate management by objective. Eliminate management by numbers, numerical goals. Substitute leadership.
11. Pride of workmanship
Remove barriers that rob the hourly worker of his right to pride of workmanship. The responsibility of supervisors must be changed from sheer numbers to quality.
ST.JOSEPH'S DEGREE & PG COLLEGE
MBA-OPERATIONS MANAGEMENT –SEMESTER II
12. Abolishment of the annual or merit rating
Remove barriers that rob people in management and engineering of their right to pride of workmanship. This means, among other things, the abolishment of the annual or merit rating and of Management by Objectives.
13. Education and self-improvement
Institute a vigorous program of education and self-improvement.
14. Transformation
Put everybody in the company to work to accomplish the transformation. The transformation is everybody's job.
LIFE AND WORKS OF QUALITY GURU JOSEPH JURAN
Born: Dec 24, 1904 Died: Feb 28, 2008 Juran is best known for: Juran's Trilogy - Juran's trilogy consists of Quality Planning, Quality Control, and Quality Improvement.
10 Steps of Quality Improvement Quality Control Handbook — Juran published the first edition of the Quality Control Handbook in 1951. Cost of Quality - Juran defined the Cost of Quality as tangible and intangible costs. Pareto Principle - Juram emphasized the application of the Pareto Principle (80:20 rule) in the field of Quality Management. A Brief Introduction: Joseph Juran was a management consultant specializing in managing for quality. He has authored hundreds of papers and 12 books, including Juran's Quality control handbook, Quality Planning and Analysis, and Juran on Leadership for Quality. Timeline 1951: Joseph Juran publishing Quality Control Handbook. The Mid 50s: Like Deming, Joseph Juran travelled to Japan to conduct the Quality Management seminars for top and middle-level executives. Juran's Trilogy Juran's Quality Trilogy is an approach to cross-functional management that is composed of three managerial processes: planning, control, and improvement.
1. Quality Planning
Quality Planning is the activity of developing the products and processes required to meet customer's needs. It involves:
• Establish quality goals • Identify the customers- those who will be impacted by the efforts to meet the goal.

ST.JOSEPH'S DEGREE & PG COLLEGE
MBA-OPERATIONS MANAGEMENT –SEMESTER II
• Determine the customers' needs • Develop product features that respond to customers' needs • Develop processes that can produce those product features • Establish process controls, and transfer the resulting plans to the operating forces
2. Quality Control
This process consists of the following steps: • Evaluate actual quality performance • Compare actual performance to quality goals • Act on the difference
3. Quality Improvement
This process is the means of raising quality performance to unprecedented levels (breakthrough). This involves:
• Establish the quality improvement infrastructure
• Identify the improvement projects • For each project establish a project team with clear responsibility • Provide the resource, motivation, and training needed by the team
Cost of Quality The cost of quality, or not getting it right the first time, Juran maintained should be recorded and analyzed and classified into failure costs, appraisal costs and prevention costs.
1. Failure Cost Scrap, rework, corrective actions, warranty claims, customer complaints and loss of custom
2. Appraisal Cost Inspection, compliance auditing, and investigations
3. Prevention Cost Training, preventive auditing, and process improvement implementation Pareto Principle Juran emphasized that 80% of problems are created by 20% causes. Organizations should identify the vital few (20%) causes and take actions to remove them from the system. Quality Improvement - 10 Steps Juran proposed ten steps to quality improvement:
• Build awareness of the need and opportunity to improve
• Set goals for that improvement • Create plans to reach the goals • Provide training • Conduct projects to solve problems • Report on progress • Give recognition for success • Communicate results • Keep score • Maintain momentum

ST.JOSEPH'S DEGREE & PG COLLEGE
MBA-OPERATIONS MANAGEMENT –SEMESTER II
BENEFITS AND COSTS OF TQM
Total quality management benefits and advantages:
• Strengthened competitive position • Adaptability to changing or emerging market conditions and to environmental and other
government regulations • Higher productivity • Enhanced market image • Elimination of defects and waste • Reduced costs and better cost management • Higher profitability • Improved customer focus and satisfaction • Increased customer loyalty and retention • Increased job security • Improved employee morale • Enhanced shareholder and stakeholder value • Improved and innovative processes
Cost of Quality, Defined
Cost of quality is a method for calculating the costs companies incur ensuring that
products meet quality standards, as well as the costs of producing goods that fail to meet
quality standards. The goal of calculating cost of quality is to create an understanding of how quality impacts the bottom line. Whether it’s the cost of scrap and rework associated with poor quality, or the expense of audits and maintenance associated with good quality, both count. Cost of quality gives manufacturers an opportunity to analyze, and thus improve their quality operations. This two-pronged approach to quality can be categorized as “control” (good quality) vs. “failure of control” (bad quality).
Cost of Good Quality vs. Poor Quality
Cost of quality has four main components between the two buckets of “good” and “bad” quality.

ST.JOSEPH'S DEGREE & PG COLLEGE
MBA-OPERATIONS MANAGEMENT –SEMESTER II
Taken together, the four main costs of quality add up to make up the total cost of quality.
CoQ = Appraisal + Prevention + Internal Failure + External Failure
Four Types of Cost of Quality
Appraisal Costs:
Measurement and inspection activities during operations to determine conformance to quality requirements.
Examples include inspection, testing, process or service audits, calibration of measuring and test equipment.
Prevention Costs:
Activities planned and designed before operations to guarantee good quality and prevent bad quality products or services.
Examples include new product review, quality planning, supplier surveys, process reviews, quality improvement teams, education and training.
Internal Failure Costs:
Expenses incurred to remedy defects discovered before the delivery of a product or service.
Examples include scrap, rework, re-inspection, re-testing, material review, material downgrades.

ST.JOSEPH'S DEGREE & PG COLLEGE
MBA-OPERATIONS MANAGEMENT –SEMESTER II
External Failure Costs:
Expenses incurred to remedy defects discovered by customers after the customer receives the product or service.
Examples include processing customer complaints, customer returns, warranty claims, product recalls.
Conclusion
Companies should be proactive in managing cost of quality and heavily invest in prevention and appraisal costs in order to reduce exposure to both internal failure and external failure costs. This can be achieved by a variety of methods such as machine monitoring or adoption of IIoT technology.
5 SS
5S is a system for organizing spaces so work can be performed efficiently, effectively, and safely. This system focuses on putting everything where it belongs and keeping the workplace clean, which makes it easier for people to do their jobs without wasting time or risking injury.
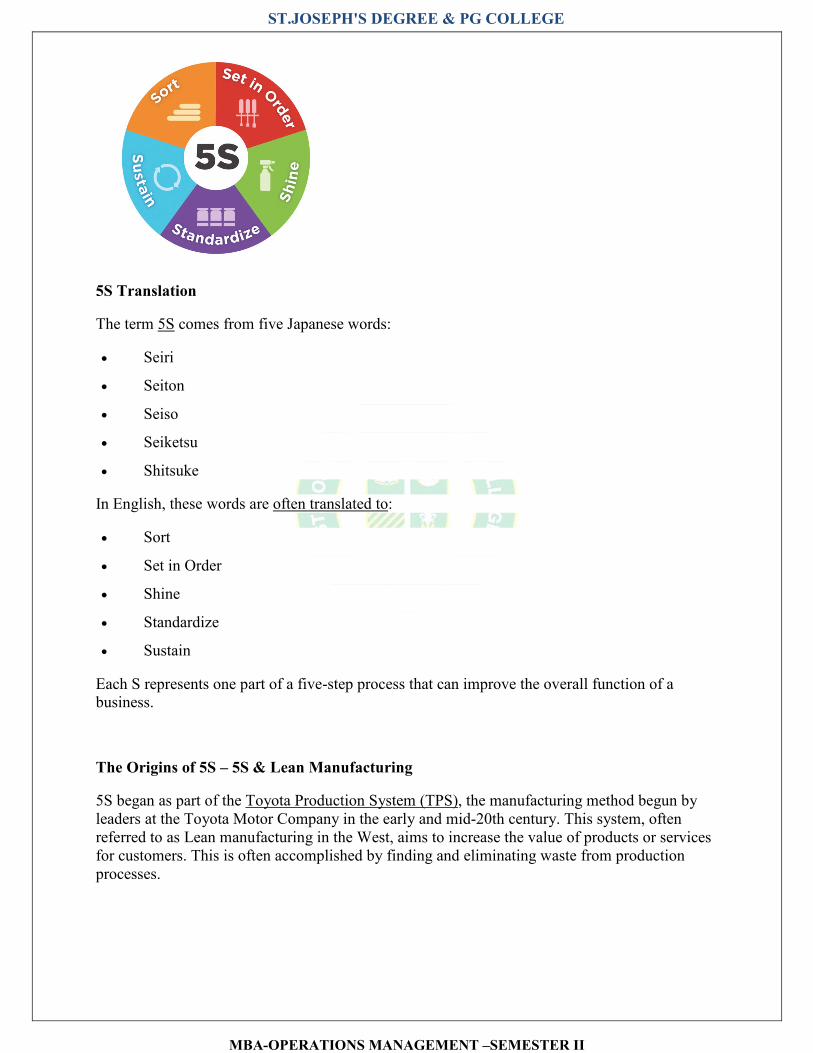
ST.JOSEPH'S DEGREE & PG COLLEGE
MBA-OPERATIONS MANAGEMENT –SEMESTER II
5S Translation
The term 5S comes from five Japanese words:
• Seiri
• Seiton
• Seiso
• Seiketsu
• Shitsuke
In English, these words are often translated to:
• Sort
• Set in Order
• Shine
• Standardize
• Sustain
Each S represents one part of a five-step process that can improve the overall function of a business.
The Origins of 5S – 5S & Lean Manufacturing
5S began as part of the Toyota Production System (TPS), the manufacturing method begun by leaders at the Toyota Motor Company in the early and mid-20th century. This system, often referred to as Lean manufacturing in the West, aims to increase the value of products or services for customers. This is often accomplished by finding and eliminating waste from production processes.
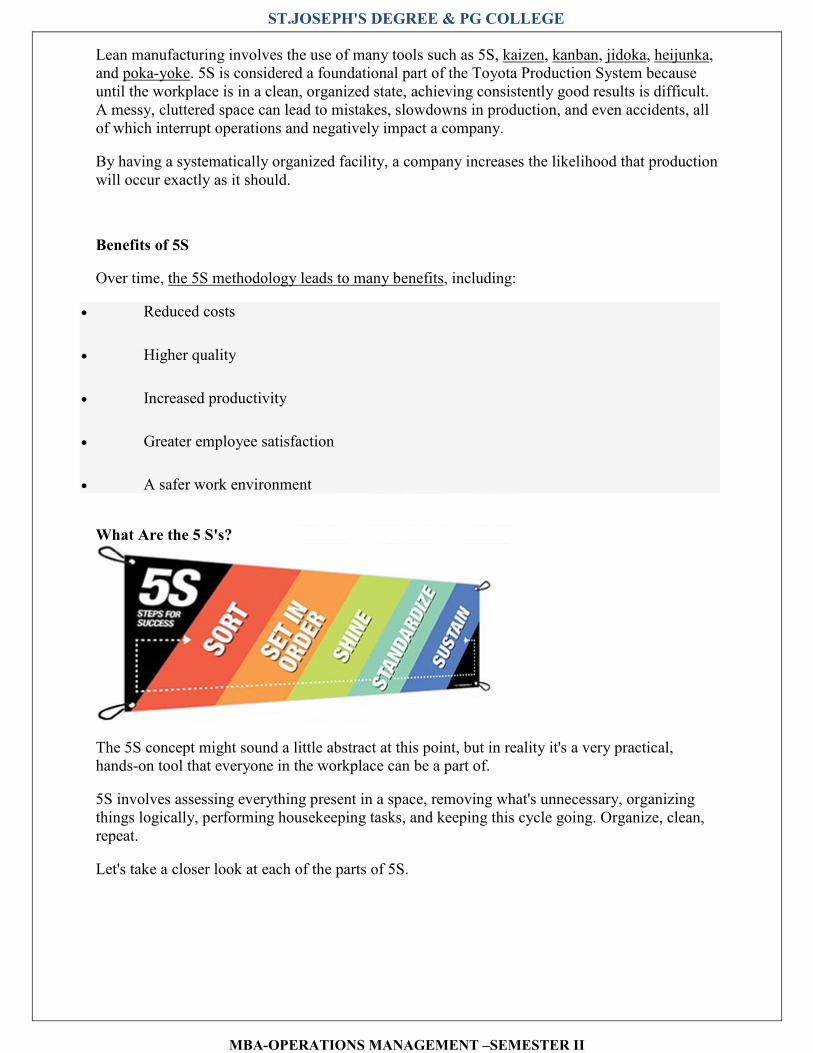
ST.JOSEPH'S DEGREE & PG COLLEGE
MBA-OPERATIONS MANAGEMENT –SEMESTER II
Lean manufacturing involves the use of many tools such as 5S, kaizen, kanban, jidoka, heijunka, and poka-yoke. 5S is considered a foundational part of the Toyota Production System because until the workplace is in a clean, organized state, achieving consistently good results is difficult. A messy, cluttered space can lead to mistakes, slowdowns in production, and even accidents, all of which interrupt operations and negatively impact a company.
By having a systematically organized facility, a company increases the likelihood that production will occur exactly as it should.
Benefits of 5S
Over time, the 5S methodology leads to many benefits, including:
• Reduced costs
• Higher quality
• Increased productivity
• Greater employee satisfaction
• A safer work environment
What Are the 5 S's?
The 5S concept might sound a little abstract at this point, but in reality it's a very practical, hands-on tool that everyone in the workplace can be a part of.
5S involves assessing everything present in a space, removing what's unnecessary, organizing things logically, performing housekeeping tasks, and keeping this cycle going. Organize, clean, repeat.
Let's take a closer look at each of the parts of 5S.

ST.JOSEPH'S DEGREE & PG COLLEGE
MBA-OPERATIONS MANAGEMENT –SEMESTER II
Sort
The first step of 5S, Sort, involves going through all the tools, furniture, materials, equipment, etc. in a work area to determine what needs to be present and what can be removed. Some questions to ask during this phase include:
• What is the purpose of this item?
• When was this item last used?
• How frequently is it used?
• Who uses it?
• Does it really need to be here?
These questions help determine the value of each item. A workspace might be better off without unnecessary items or items used infrequently. These things can get in the way or take up space.
Keep in mind the best people to assess the items in a space are the people who work in that space. They are the ones who can answer the above questions.
When a group has determined that some items aren't necessary, consider the following
options:
• Give the items to a different department
• Recycle/throw away/sell the items
• Put items into storage
For cases when an item's value is uncertain—for example, a tool hasn't been used recently, but someone thinks it might be needed in the future—use the red tag method. Red tags are usually cardboard tags or stickers that can be attached to the items in question. Users fill out information about the item such as:
• Location
• Description

ST.JOSEPH'S DEGREE & PG COLLEGE
MBA-OPERATIONS MANAGEMENT –SEMESTER II
• Name of person applying the tag
• Date of application
Then the item is placed in a “red tag area” with other questionable items. If after a designated amount of time (perhaps a month or two) the item hasn't been used, it's time to remove it from the workspace. It's not worth hanging onto things that never get used since they just take up space.
Tip: Set a reminder—on your phone or computer, or posted somewhere in the workspace—to check back in with the red tag area so it doesn't get forgotten.
Set in Order
Once the extra clutter is gone, it's easier to see what's what. Now work groups can come up with their own strategies for sorting through the remaining items. Things to consider:
• Which people (or workstations) use which items?
• When are items used?
• Which items are used most frequently?
• Should items be grouped by type?
• Where would it be most logical to place items?
o Would some placements be more ergonomic for workers than others?
o Would some placements cut down on unnecessary motion? • Are more storage containers necessary to keep things organized?
During this phase, everyone should determine what arrangements are most logical. That will require thinking through tasks, the frequency of those tasks, the paths people take through the space, etc.
Businesses may want to stop and think about the relationship between organization and larger Lean efforts. What arrangement will cause the least amount of waste?
In Lean manufacturing, waste can take the form of:
• Defects
• Waiting time
• Extra motion
• Excess inventory
• Overproduction

ST.JOSEPH'S DEGREE & PG COLLEGE
MBA-OPERATIONS MANAGEMENT –SEMESTER II
• Extra processing
• Unnecessary transportation
• Unutilized talents
Tip: For the purposes of 5S, specifically consider how the layout and organization of an area could increase/decrease waiting time, motion, and unnecessary transportation.
Shine
Everyone thinks they know what housekeeping is, but it's one of the easiest things to overlook, especially when work gets busy. The Shine stage of 5S focuses on cleaning up the work area, which means sweeping, mopping, dusting, wiping down surfaces, putting tools and materials away, etc.
In addition to basic cleaning, Shine also involves performing regular maintenance on equipment and machinery. Planning for maintenance ahead of time means businesses can catch problems and prevent breakdowns. That means less wasted time and no loss of profits related to work stoppages.
Shining the workplace might not sound exciting, but it's important. And it shouldn't just be left up to the janitorial staff. In 5S, everyone takes responsibility for cleaning up their workspace, ideally on a daily basis. Doing so makes people take ownership of the space, which in the long run means people will be more invested in their work and in the company.
Tip: How to clean may seem obvious, but make sure people know how to properly Shine their spaces. Show employees—especially new employees—which cleaners to use, where cleaning materials are stored, and how to clean equipment, particularly if it's equipment that could be easily damaged.
ST.JOSEPH'S DEGREE & PG COLLEGE
MBA-OPERATIONS MANAGEMENT –SEMESTER II
Standardize
Once the first three steps of 5S are completed, things should look pretty good. All the extra stuff is gone, everything is organized, spaces are cleaned, and equipment is in good working order.
The problem is, when 5S is new at a company, it's easy to clean and get organized…and then slowly let things slide back to the way they were. Standardize makes 5S different from the typical spring-cleaning project. Standardize systematizes everything that just happened and turns one-time efforts into habits. Standardize assigns regular tasks, creates schedules, and posts instructions so these activities become routines. It makes standard operating procedures for 5S so that orderliness doesn't fall by the wayside.
Depending on the workspace, a daily 5S checklist or a chart might be useful. A posted schedule indicating how frequently certain cleaning tasks must occur and who is responsible for them is another helpful tool.
Initially, people will probably need reminders about 5S. Small amounts of time may need to be set aside daily for 5S tasks. But over time, tasks will become routine and 5S organizing and cleaning will become a part of regular work.
Tip: Visual cues such as signs, labels, posters, floor marking tape, and tool organizers also play an important role in 5S. They can provide directions and keep items in place, in many cases without words.
Sustain
Once standard procedures for 5S are in place, businesses must perform the ongoing work of maintaining those procedures and updating them as necessary. Sustain refers to the process of keeping 5S running smoothly, but also of keeping everyone in the organization involved. Managers need to participate, as do employees out on the manufacturing floor, in the warehouse, or in the office. Sustain is about making 5S a long-term program, not just an event or short-term project. Ideally, 5S becomes a part of an organization's culture. And when 5S is sustained over time, that's when businesses will start to notice continuous positive results.
Tip #1: To help sustain 5S practices, make sure all new employees (or employees who switch departments) receive training about their area's 5S procedures.

ST.JOSEPH'S DEGREE & PG COLLEGE
MBA-OPERATIONS MANAGEMENT –SEMESTER II
Tip #2: Keep things interesting. Look at what other companies are doing with 5S. New ideas for organization can keep things improving and keep employees engaged.
Safety – The 6th S
Some companies like to include a sixth S in their 5S program: Safety. When safety is included, the system is often called 6S. The Safety step involves focusing on what can be done to eliminate risks in work processes by arranging things in certain ways.
This might involve setting up workstations so they're more ergonomic, marking intersections—such as the places where forklifts and pedestrians cross paths—with signs, and labeling the storage cabinet for cleaning chemicals so people are aware of potential hazards. If the layout of the workplace or the tasks people perform are dangerous, those dangers should be reduced as much as possible. That's what the sixth S focuses on.
Some people consider safety an outcome of performing the other five S's appropriately, and as a result say a sixth S isn't necessary. They think if the workspace is properly organized and cleaned and uses helpful visual safety cues, a separate safety step is unnecessary.
Neither approach to safety is right or wrong. But however a business wants to approach safety, it should be aware that paying attention to safety is important.
PDCA CYCLES

ST.JOSEPH'S DEGREE & PG COLLEGE
MBA-OPERATIONS MANAGEMENT –SEMESTER II
The Plan-do-check-act cycle (Figure 1) is a four-step model for carrying out change. Just as a circle has no end, the PDCA cycle should be repeated again and again for continuous improvement. The PDCA cycle is considered a project planning tool.
Plan-do-check-act cycle
WHEN TO USE THE PDCA CYCLE
Use the PDCA cycle when:
• Starting a new improvement project • Developing a new or improved design of a process, product, or service • Defining a repetitive work process • Planning data collection and analysis in order to verify and prioritize problems or root
causes • Implementing any change • Working toward continuous improvement
The Plan-do-check-act Procedure
1. Plan: Recognize an opportunity and plan a change. 2. Do: Test the change. Carry out a small-scale study. 3. Check: Review the test, analyze the results, and identify what you’ve learned. 4. Act: Take action based on what you learned in the study step. If the change did not work,
go through the cycle again with a different plan. If you were successful, incorporate what you learned from the test into wider changes. Use what you learned to plan new improvements, beginning the cycle again.
SIX SIGMA CONCEPT
Six Sigma is a method that provides organizations tools to improve the capability of their business processes. This increase in performance and decrease in process variation helps lead to defect reduction and improvement in profits, employee morale, and quality of products or services.
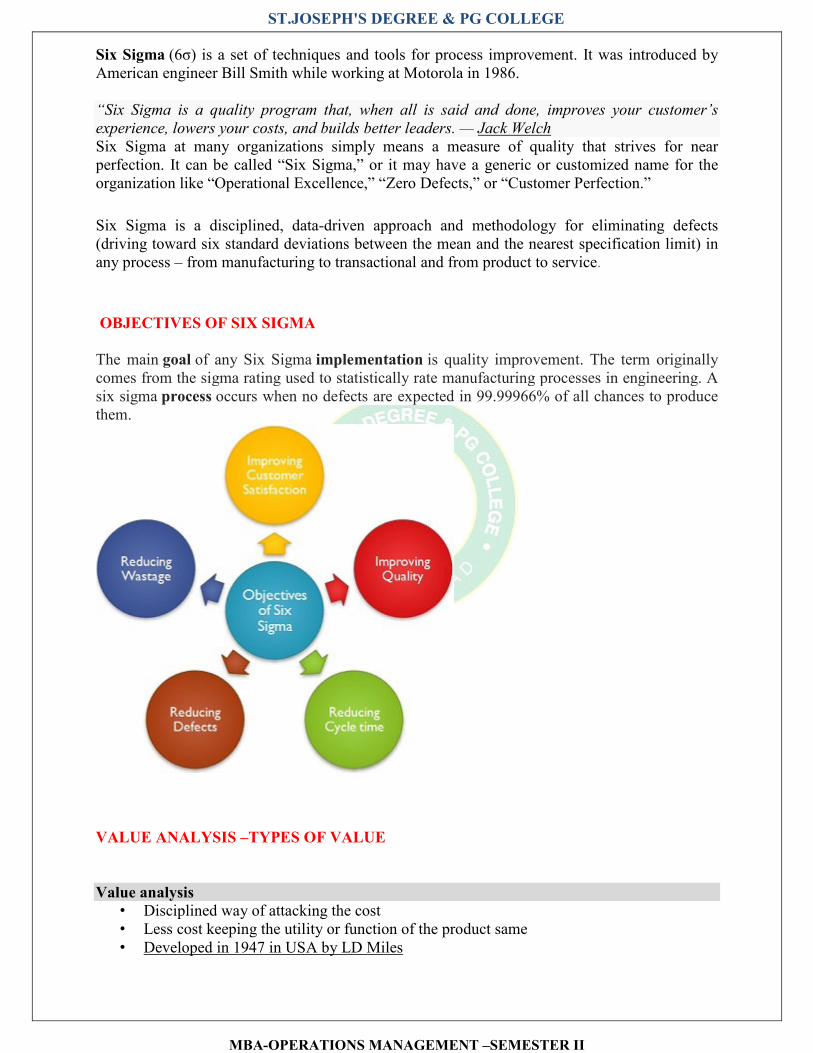
ST.JOSEPH'S DEGREE & PG COLLEGE
MBA-OPERATIONS MANAGEMENT –SEMESTER II
Six Sigma (6σ) is a set of techniques and tools for process improvement. It was introduced by American engineer Bill Smith while working at Motorola in 1986.
“Six Sigma is a quality program that, when all is said and done, improves your customer’s
experience, lowers your costs, and builds better leaders. — Jack Welch
Six Sigma at many organizations simply means a measure of quality that strives for near perfection. It can be called “Six Sigma,” or it may have a generic or customized name for the organization like “Operational Excellence,” “Zero Defects,” or “Customer Perfection.”
Six Sigma is a disciplined, data-driven approach and methodology for eliminating defects (driving toward six standard deviations between the mean and the nearest specification limit) in any process – from manufacturing to transactional and from product to service.
OBJECTIVES OF SIX SIGMA
The main goal of any Six Sigma implementation is quality improvement. The term originally comes from the sigma rating used to statistically rate manufacturing processes in engineering. A six sigma process occurs when no defects are expected in 99.99966% of all chances to produce them.
VALUE ANALYSIS –TYPES OF VALUE
Value analysis
• Disciplined way of attacking the cost • Less cost keeping the utility or function of the product same • Developed in 1947 in USA by LD Miles
ST.JOSEPH'S DEGREE & PG COLLEGE
MBA-OPERATIONS MANAGEMENT –SEMESTER II
• No place where all the designs are economical, simple and elegant • Producer: - Value = work/cost = (use + esteem)/cost • Customer : value = work/price= (use + esteem)/price • It is the minimum money which has to be expended in purchasing or manufacturing a
product to create the appropriate use or esteem factors. • Heart – functional approach.
Value = function/cost
• Value analysis is defined as the identification and elimination of unnecessary cost without reducing the quality, reliability, and aesthetic appeal of the product or service concerned
• It is an organised procedure for efficient identification of unnecessary cost • It is defined as systematic analysis and evaluation of every component at
operation/production in the machinery of a product and examine the function and usefulness in relation to cost
• Equal performance at lower cost • Also called as Functional analysis system technique • avoiding irrelevant cost and used to enhance the existing products utility after the product
is manufactured • It is a cost reduction and control technique which operates by attacking the basic design
of the product. • Value engineering- VA applied at the design stage of the component part and reduce the
costs without influencing the product utility. • Functionally oriented scientific method for improving the product value by relating the
elements of product worth to their corresponding elements of product cost – accomplish req function at least cost and resource.
• Efficient identification of unnecessary cost and elimination of them • Occurs jointly between purchasing and methods engineering (Supplier contacts) • Modifying the specifications of materials, parts and components to reduce their cost
without affecting their performance . • Close structure pattern of analysis
• Applicable at all the stages from the initial design of an item to the final stage of
packing and dispatching the product.
Essence of value analysis
• Identify the functions and to examine the alternative ways in which the function can
be achieved – choose least cost.
• Function: property which makes the product work/sell.
– Primary function: basic to the product(lamp gives light)
– Secondary function: in addition (recognize colour to identify the
organisation)
– Tertiary function: add value to the two functions (appearance, elegance)
Types of value
1. Cost value: sum of labour,materials, overheads, taxes and other costs required to produce it.

ST.JOSEPH'S DEGREE & PG COLLEGE
MBA-OPERATIONS MANAGEMENT –SEMESTER II
2. Use value: functions/properties/qualities – use , work or service 3. Esteem value: properties, features, qualities and appearance (Desire to possess) 4. Exchange value: properties or qualities which enables us to exchange it with something
else we want. Worth: utility of the product/service and its properties of attractiveness Price: cost plus/peneterating price
IMPORTANCE OF COST REDUCTION.
COST REDUCTION MEANING
• Planned, positive approach to reducing expenditure
• This involves the examination of the purposes for which costs are incurred and by a
variety of means, it eliminates or reduces the reasons or spending.
• It is also called as Corrective function, continuous, dynamic and innovative
procedure
• Starts where cost control ends
• The achievement of real and permanent reduction in the unit cost of good
manufactured /services rendered without impairing their quality and suitability for
use intended.
• Value analysis is an effective tool for cost reduction
IMPORTANCE
1. To bring down the cost of production 2. Need for increased profits 3. Improved competitive standing and thereby ensures survivial, growth and prosperity 4. Preserve company /nations’ scare resources by optimally utilisation of the resources of
the firm 5. Reduce waste 6. Reasonable prices to the consumers and hells the government in controlling inflation. 7. Planned, positive approach to reduce expenditure 8. Cost reduction should not be a fire-fighting exercise but a continuing process of
improving productivity within the organisation.
Unit - V: Materials Management, Stores management & Inventory management:
ST.JOSEPH'S DEGREE & PG COLLEGE
MBA-OPERATIONS MANAGEMENT –SEMESTER II
Need and importance of Materials management-MRP I & MRP II- Make or buy decision
concept - Vendor rating - determinants of vendor rating – Stores management - Objectives
of Stores Management – Requirements for efficient Management of Stores – Inventory
management - Inventory management & Control – Basic EOQ Model(simple problems)-
Different Systems of Inventory Control, Selective inventory control techniques.
Materials management
• L.J. De Rose: • “Material management is the planning, directing, controlling and co-ordination of all
those activities concerned with material and inventory requirements, from the point of their inception to their introduction into manufacturing process.”
• As per De Rose all those functions which start with the procurement of materials and end with completion of manufacturing are a part of material management.
• N.K. Nair: • “Material management is the integrated functioning of the various sections of an
organization dealing with the supply of materials and allied activities in order to achieve maximum co-ordination.
NEED & IMPORTANCE OF MATERIALS MANAGEMENT
NEED The need for materials management was first felt in manufacturing undertakings. The servicing organizations also started feeling the need for this control. And now even non-trading organizations like hospitals, universities etc. have realized the importance of materials management. Every organization uses a number of materials. It is necessary that these materials are properly purchased, stored and used.
Any avoidable amount spent on materials or any loss due to wastage of materials increases the cost of production. The object of materials management is to attack materials cost on all fronts and to optimize the overall end results. Materials management connotes controlling the kind, amount , location and turning of the various commodities used in and produced by the industrial enterprises. It is the control of materials in such a manner that it ensures maximum return on working capital.
1. It Keeps Inventory Accurate: The problems and consequences of a poorly managed inventory are far-reaching and expensive. Lost, stolen, misplaced, mislabeled inventory all impact production - and anything that impacts production creates waste and adds cost. Materials management starts with good inventory management practices and accurate

ST.JOSEPH'S DEGREE & PG COLLEGE
MBA-OPERATIONS MANAGEMENT –SEMESTER II
tracking of all the materials in a company's inventory.
2. Enables JIT (Just In Time) Inventory Management: The main tenant of Lean Production, JIT Inventory management is a strategy in which the materials and parts needed for production are delivered "Just In Time" before they are used at the factory. The cost savings realized by JIT are significant and understanding why good materials management is vital for successfully implementing JIT should be pretty clear.
3. Freight Costs Are Optimization: Fine-tuned materials planning helps to optimize freight costs. This occurs because expensive overnight and expedited deliveries are reduced. When quality suppliers know what is needed and when they can account for lead times and the necessary transit times for the lowest cost shipping option.
4. Quality Control Goes Up: A major part of materials management is ensuring materials going into production are correct and of high value. This helps to keep production running smoothly and improves overall finished goods quality.|
Importance of Material Management:
Material management is a service function. It is as important as manufacturing, engineering and finance. The supply of proper quality of materials is essential for manufacturing standard products. The avoidance of material wastage helps in controlling cost of production. Material management is essential for every type of concern.
The importance of material management may be summarized as follows: 1. The material cost content of total cost is kept at a reasonable level. Scientific purchasing helps in acquiring materials at reasonable prices. Proper storing of materials also helps in reducing their wastages. These factors help in controlling cost content of products.
2. The cost of indirect materials is kept under check. Sometimes cost of indirect materials also increases total cost of production because there is no proper control over such materials.
3. The equipment is properly utilized because there are no break downs due to late supply of materials.
4. The loss of direct labour is avoided.
5. The wastages of materials at the stage of storage as well as their movement is kept under control.
6. The supply of materials is prompt and late delivery instances are only few.
7. The investments on materials are kept under control as under and over stocking is avoided.
8. Congestion in the stores and at different stages of manufacturing is avoided
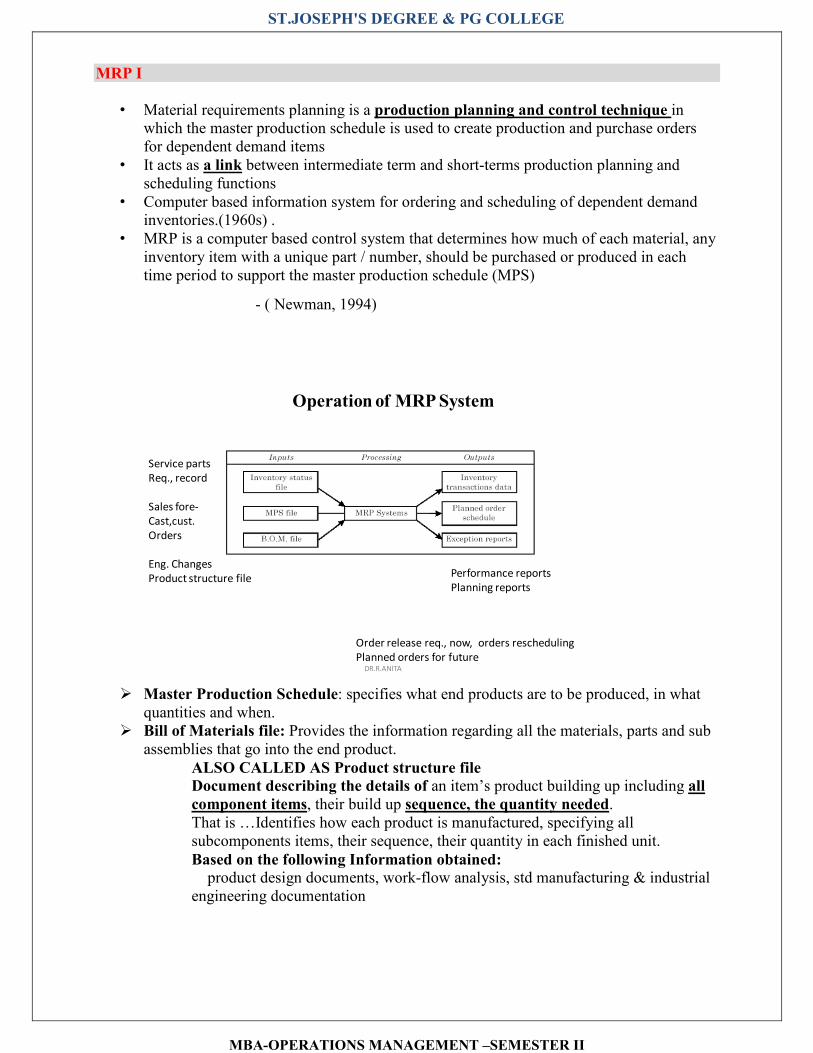
ST.JOSEPH'S DEGREE & PG COLLEGE
MBA-OPERATIONS MANAGEMENT –SEMESTER II
MRP I
• Material requirements planning is a production planning and control technique in
which the master production schedule is used to create production and purchase orders for dependent demand items
• It acts as a link between intermediate term and short-terms production planning and scheduling functions
• Computer based information system for ordering and scheduling of dependent demand inventories.(1960s) .
• MRP is a computer based control system that determines how much of each material, any inventory item with a unique part / number, should be purchased or produced in each time period to support the master production schedule (MPS)
- ( Newman, 1994)
Operation of MRP System
Service parts
Req., record
Sales fore-
Cast,cust.
Orders
Eng. Changes
Product structure filePerformance reports
Planning reports
Order release req., now, orders rescheduling
Planned orders for futureDR.R.ANITA
� Master Production Schedule: specifies what end products are to be produced, in what
quantities and when. � Bill of Materials file: Provides the information regarding all the materials, parts and sub
assemblies that go into the end product.
ALSO CALLED AS Product structure file Document describing the details of an item’s product building up including all
component items, their build up sequence, the quantity needed. That is …Identifies how each product is manufactured, specifying all subcomponents items, their sequence, their quantity in each finished unit.
Based on the following Information obtained: product design documents, work-flow analysis, std manufacturing & industrial engineering documentation

ST.JOSEPH'S DEGREE & PG COLLEGE
MBA-OPERATIONS MANAGEMENT –SEMESTER II
� Inventory Status file: Gives complete and up-to-date information on the on-hand inventories, gross requirements, scheduled receipts and planned order releases for the item
MRP II
• Manufacturing Resource Planning (MRP II) addresses the planning and control of
activities related to materials, capacity, finance, HR, engineering, sales and marketing and accounts.
• Extension of MRP I • Provides useful integrated information • Broad-based resource co-ordination system involving other areas of a firm in the
planning process Heart of corporate management information system
MAKE OR BUY DECISION
Reasons for Making
There are number of reasons a company would consider when it comes to making in-house. Following are a few:
• Cost concerns
• Desire to expand the manufacturing focus
• Need of direct control over the product
• Intellectual property concerns
• Quality control concerns
• Supplier unreliability
• Lack of competent suppliers
• Volume too small to get a supplier attracted
• Reduction of logistic costs (shipping etc.)
• To maintain a backup source
• Political and environment reasons
• Organizational pride
Reasons for Buying
Following are some of the reasons companies may consider when it comes to buying from a supplier:
• Lack of technical experience
• Supplier's expertise on the technical areas and the domain
• Cost considerations
• Need of small volume

ST.JOSEPH'S DEGREE & PG COLLEGE
MBA-OPERATIONS MANAGEMENT –SEMESTER II
• Insufficient capacity to produce in-house
• Brand preferences
• Strategic partnerships
The Process
The make or buy decision can be in many scales. If the decision is small in nature and has less impact on the business, then even one person can make the decision. The person can consider the pros and cons between making and buying and finally arrive at a decision.
When it comes to larger and high impact decisions, usually organizations follow a standard method to arrive at a decision. This method can be divided into four main stages as below.
1. Preparation
• Team creation and appointment of the team leader
• Identifying the product requirements and analysis
• Team briefing and aspect/area destitution
2. Data Collection
• Collecting information on various aspects of make-or-buy decision
• Workshops on weightings, ratings, and cost for both make-or-buy
3. Data Analysis
• Analysis of data gathered
4. Feedback
• Feedback on the decision made

ST.JOSEPH'S DEGREE & PG COLLEGE
MBA-OPERATIONS MANAGEMENT –SEMESTER II
By following the above structured process, the organization can make an informed decision on make-or-buy. Although this is a standard process for making the make-or-buy decision, the organizations can have their own varieties.
Conclusion
Make-or-buy decision is one of the key techniques for management practice. Due to the global outsourcing, make-or-buy decision making has become popular and frequent.
Since the manufacturing and services industries have been diversified across the globe, there are a number of suppliers offering products and services for a fraction of the original price. This has enhanced the global product and service markets by giving the consumer the eventual advantage.
If you make a make-or-buy decision that can create a high impact, always use a process for doing that. When such a process is followed, the activities are transparent and the decisions are made for the best interest of the company
VENDOR RATING
Vendor Rating (also called: supplier rating) is a system used by buying organizations or industry analysts to record, analyze, rank and report the performance of a supplier in terms of a range of predefined criteria, which may include such things as: Quality of the product or service. Evaluating the vendors in terms of price, quality, reputation, delivery and service.
DETERMINANTS OF VENDOR RATING
Vendor rating is a process where the suppliers are provided a status or a title based on several factors such as credibility, delivery time, price, quality of the goods supplied and or a set of such mixed variables.

ST.JOSEPH'S DEGREE & PG COLLEGE
MBA-OPERATIONS MANAGEMENT –SEMESTER II
The ratings are based on the vendor’s performance and can have several levels from good, average to best or anything that the firm decides on.
This system is a by-product of the just-in-time approach.
Just in time (JIT) is a lean manufacturing methodology designed to reduce waste of time and
resources by receiving goods only as they are needed. JIT process was developed in Japan to
make the maximum utilization of limited natural resources.
One of the important objectives of this system is that it helps the buyers to carefully choose the suppliers for future transactions. The available data can also help to negotiate better and help the buyer with any information that might be useful during the process.
Advantages
• It helps the buyer to understand the vendor from every important aspect and will help in knowing if the vendor is suitable to deal with or not. It does not plainly deal with prejudices and word-of-mouth. It is more dependent on data.
• It helps the buyers to strike the right kind of communication required.
• Ensuring a constant standard of vendor performance with updated reviews of their performance
• Pricing factors:
– Competitive pricing – Price stability – Price accuracy – Advance notice of price changes – Sensitive to costs – Billing – Inbound transportation costs – Exchange rate, taxes and duties
• Quality factors: – Compliance with purchase order – Conformity to specifications – Reliability/repairs – Durability – Support – Warranty – State of the art product/service
• Delivery factors: – Time – Quantity – Lead time – Packaging

ST.JOSEPH'S DEGREE & PG COLLEGE
MBA-OPERATIONS MANAGEMENT –SEMESTER II
– documentation – Emergency delivery/Reserve production facilities for emergency requirements – Delivery frequency/min lot size – Supply flexibility – Freight and delivery charges – Assurance and conformance of minimum delivery time schedules
• OTHER FACTORS – adequate facilities – financial adequacy and stability/ Not becoming insolvent after taking money
/Financial status certified by banker – outlook, reliable/Status and operational reliability – goodwill (quality, price, delivery, promises and after sales service), – location, industrial relations. – Design Collaboration and information coordination capability – Suppliers relations: competitive and cooperative orientation – Inventory plans – Market information – Services/Sales assistance – Employee training – Credit facilities/Credit availability and financial arrangements of seller – Maintenance of specification/Ability to provide maintenance contract needs of the
buyer – Proven integrity – Technical capability/Local contacts and their tech competence to help – Warranty, guarantee – Cost reduction programs – Labour management relationship – Adequate design & development wing – Suppliers capability for analytical engineering, installation and commission eng. – Capacity to train buyer’s engineers/ Capacity to provide selling aids, drawing – Ability to meet challenging and new tasks by technical leadership/Managerial
effectiveness – Research efforts – Quality of the after sales-service and spare parts availability – Dependability and reasonable price of after sales service – Convenience – Availability – Selling all types of ranges of related items
TECHNIQUES OF VENDOR RATING
• Methods, quality, price, delivery, schedule and service factor 1. Categorical plan: list of factors, preferred, neutral , unsatisfactory(diff. dept.) 2. Weighted point method: attributes of quality, price, delivery- weights (grading)(QC
mgr, accounts mgr, chief production eng./chief commercial mgr.) 3. Cost ratio method: unit cost (transportation, packaging, receiving, quality costs, delivery
costs, loss due to rejections,reworking, follow-up). Delivery Costs with respect to total purchases cost. Higher the cost lower is the supplier’s rating.
ST.JOSEPH'S DEGREE & PG COLLEGE
MBA-OPERATIONS MANAGEMENT –SEMESTER II
4. Critical incident method: record of events & occurrences related to the buyer-vendor relationship. Pos/neg.
5. Checklist system: Reliability,Technical capabilities,After sale service,Availability Buying convenience,sales assistance
6. Incoming material rating plan: developed by GE – popular method 40 points – quality, 35 points – price, 25 – service.
7. Matrix method: vendors – horizontally, factors vertically
STORES MANAGEMENT
Store management is concerned with ensuring that all the activities involved in storekeeping and stock control are carried out efficiently and economically by the store personnel. In many cases this also encompasses the recruitment, selection, induction and the training of store personnel, and much more
FUNCTIONS OF STORES The functions of stores can be classified as follows:
1. To receive raw materials, components, tools, equipment’s and other items and account for them.
2. To provide adequate and proper storage and preservation to the various items. 3. To meet the demands of the consuming departments by proper issues and account for
the consumption. 4. To minimize obsolescence, surplus and scrap through proper codification, preservation
and handling. 5. To highlight stock accumulation, discrepancies and abnormal consumption and effect
control measures. 6. To ensure good house keeping so that material handling, material preservation,
stocking, receipt and issue can be done adequately. 7. To assist in verification and provide supporting information for effective purchase
action.
OBJECTIVES OF STORES MANAGEMENT
The Objectives of Stores management play a vital role in the operations of company. It is in direct touch with the user departments in its day-to-day activities. The most important purpose served by the stores is to provide uninterrupted service to the manufacturing divisions. Further, stores are often equated directly with money, as money is locked up in the stores.
Basic objective : provide service to the operating functions. 1. Examine carefully on receipt 2. See that no item falls below the prescribed min. level/excess than fixed max. quantity
(EOQ) 3. Arrange – systematic & efficient storing of materials 4. Efficient and economically provision of rt.material- rt time - rt condition. 5. Maintain accurate and prompt distribution of items – dept.(issue requisition notes) 6. Maintain efficient quantity records of movement
Prevent theft, wastage or deterioration of stock

ST.JOSEPH'S DEGREE & PG COLLEGE
MBA-OPERATIONS MANAGEMENT –SEMESTER II
8. Facilitate a balanced and smooth flow of raw materials, components, tools and any other items
9. Protect goods in storage against losses 10. Make goods available on time 11. Provide low cost services of store keeping 12. Eliminate the storage of raw materials 13. Ensure the facilities of storage are located near the operating dept. 14. Stores maintained in clean and good condition 15. Ensure unauthorized person do not enter the stores 16. Achieve efficient utilisation of storage space 17. To reduce usage of material handling equipments 18. To provide codification of stored items for easy recognition 19. To enable flexibility in production schedules
REQUIREMENTS FOR EFFICIENT MANAGEMENT OF STORES
Requirements of efficient management of stores
1. Designation and qualification of store keeper (centralised /decentralised) 2. Stores location:
a. Materials classification
b. Similarity of materials c. Point of use d. Materials handling consideration e. Special requirements
3. Stores layout: comb types layout, tree type a. receiving, storing and issuing materials is referred to as stores layout. b. It is a fundamental factor in determining the efficient performance of stores dept. c. Factors considered are:
i. Factors ii. Types Type of materials stored
iii. Volume of materials stored iv. Availability of space
d. Physical layout of stores i. Comb type (stock on one side of aisle)
ii. Tree type (stock on either side of aisle)
4. Storage system: fixed location, random location,zoned location a. fixed location (supplier, use, similarity, size, freq.) b. random location (any position available) c. zoned location(particular product in a given area/random or fixed) d. Choosing he most suitable storage system means dealing with a number of
interacting and often conflicting factors. e. Compromises between the use of space and the use of time
5. Store manual(written statement of policies and procedures) 6. Proper classification and codification (consistency, comprehensiveness, mutual
exclusiveness, simple) 7. Stores efficiency index = no. of requisitions delivered on time/total no. of requisitions
ST.JOSEPH'S DEGREE & PG COLLEGE
MBA-OPERATIONS MANAGEMENT –SEMESTER II
INVENTORY MANAGEMENT
• Inventory: french word – inventaire, latin word- inventariom: list of things found • The terms inventory includes materials – raw,in process, finished, packaging, spares and
other stocked in order to meet an unexpected demand or distribution in the future. 1. Production inventories – raw materials, parts and components : special items, std
industrial items, 2. MRO inventories - maintenance, repair and operating supplies (oil, soap, repair
parts) 3. in – process inventories - semi-finished products 4. finished goods inventories: completed ready for shipment
• Inventory control 1. Administration of established policies, systems and procedures. 2. Ex: steps taken to maintain stock levels
• An inventory system provides the organizational structure and the operating policies
for maintaining controlling goods to be inventoried
Inventory management is a systematic approach to sourcing, storing, and selling inventory—both raw materials (components) and finished goods (products). In business terms, inventory
management means the right stock, at the right levels, in the right place, at the right time, and at the right cost as well as price
INVENTORY MANAGEMENT & CONTROL
Inventory management is the overseeing and controlling of the ordering, storage and use of components that a company will use in the production of the items it will sell as well as the overseeing and controlling of quantities of finished products for sale. A business's inventory is one of its major assets and represents an investment that is tied up until the item is sold or used in the production of an item that is sold. It also costs money to store, track and insure inventory. Inventories that are mismanaged can create significant financial problems for a business, whether the mismanagement results in an inventory glut or an inventory shortage.
BASIC EOQ MODEL(SIMPLE PROBLEMS)
The economic order quantity (EOQ) is the order quantity that minimizes total holding and ordering costs for the year. Even if all the assumptions don’t hold exactly, the EOQ gives us a good indication of whether or not current order quantities are reasonable.
• Cost Minimizing “Q”
• Assumptions:
o Relatively uniform & known demand rate

ST.JOSEPH'S DEGREE & PG COLLEGE
MBA-OPERATIONS MANAGEMENT –SEMESTER II
o Fixed item cost
o Fixed ordering and holding cost
• Constant lead time
EOQ Formula
Sample Problem
Pam runs a mail-order business for gym equipment. Annual demand for the TricoFlexers is 16,000. The annual holding cost per unit is $2.50 and the cost to place an order is $50. What is the economic order quantity?
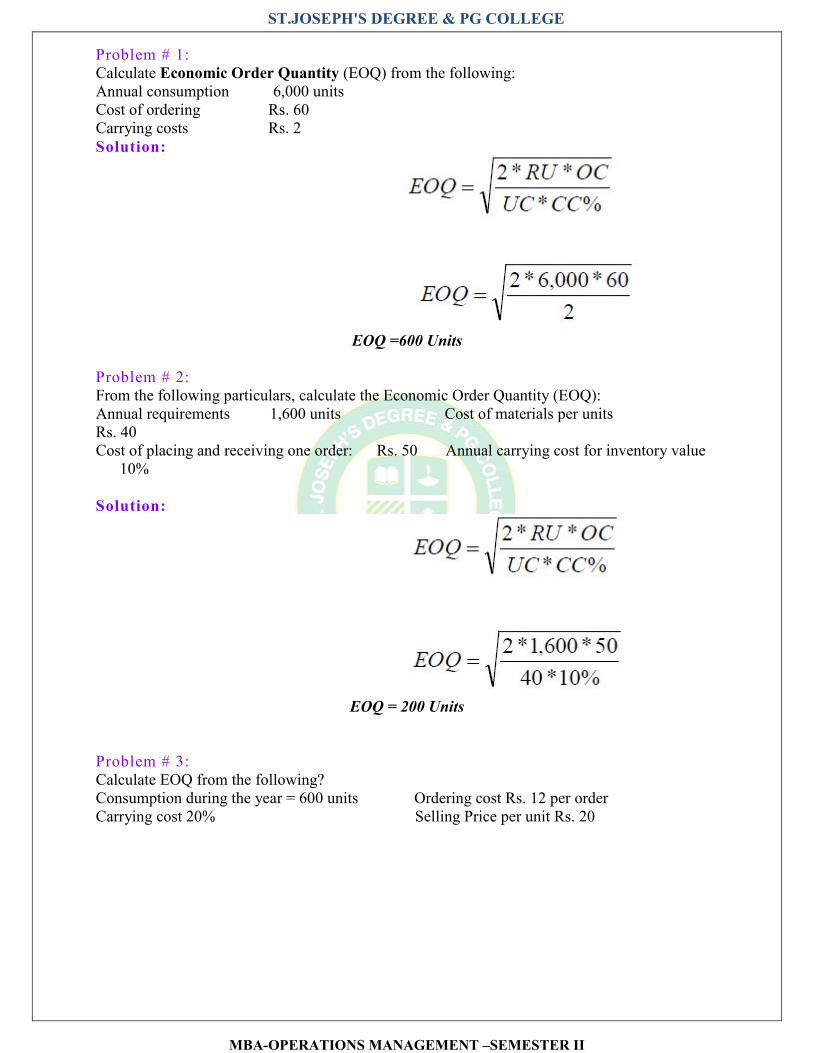
ST.JOSEPH'S DEGREE & PG COLLEGE
MBA-OPERATIONS MANAGEMENT –SEMESTER II
Problem # 1: Calculate Economic Order Quantity (EOQ) from the following: Annual consumption 6,000 units Cost of ordering Rs. 60 Carrying costs Rs. 2
Solution:
EOQ =600 Units
Problem # 2: From the following particulars, calculate the Economic Order Quantity (EOQ): Annual requirements 1,600 units Cost of materials per units Rs. 40 Cost of placing and receiving one order: Rs. 50 Annual carrying cost for inventory value 10%
Solution:
EOQ = 200 Units Problem # 3: Calculate EOQ from the following? Consumption during the year = 600 units Ordering cost Rs. 12 per order Carrying cost 20% Selling Price per unit Rs. 20
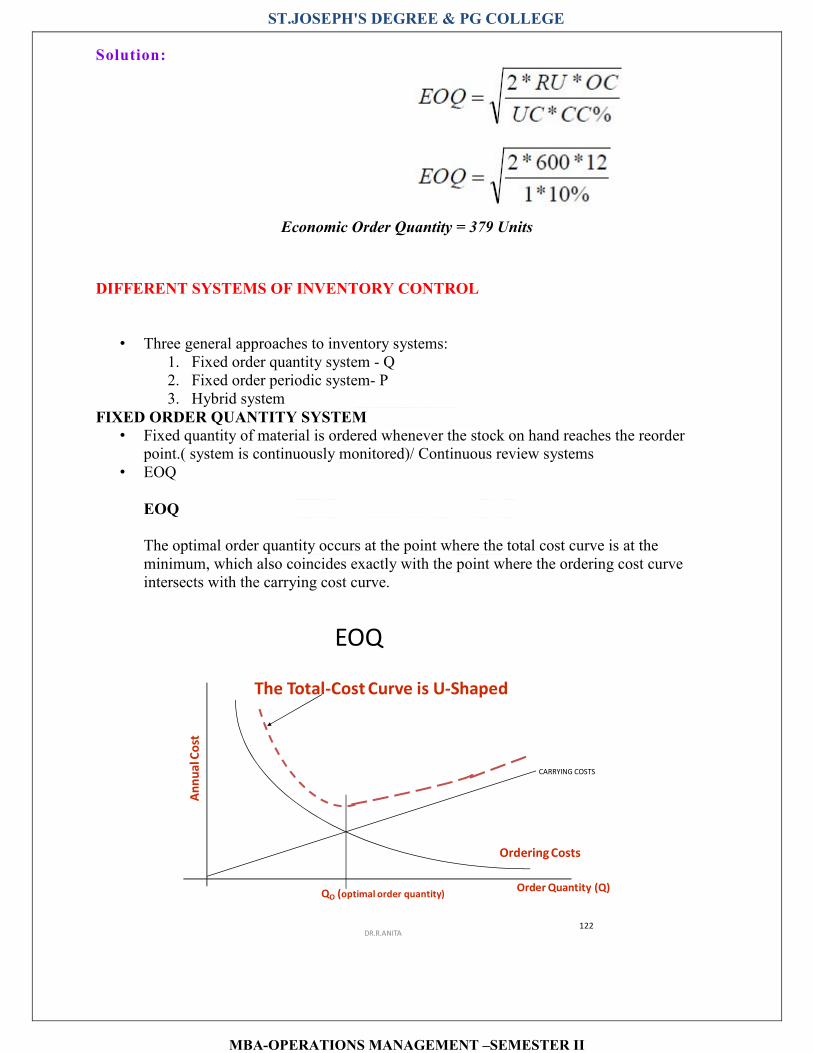
ST.JOSEPH'S DEGREE & PG COLLEGE
MBA-OPERATIONS MANAGEMENT –SEMESTER II
Solution:
Economic Order Quantity = 379 Units
DIFFERENT SYSTEMS OF INVENTORY CONTROL
• Three general approaches to inventory systems: 1. Fixed order quantity system - Q 2. Fixed order periodic system- P 3. Hybrid system
FIXED ORDER QUANTITY SYSTEM • Fixed quantity of material is ordered whenever the stock on hand reaches the reorder
point.( system is continuously monitored)/ Continuous review systems • EOQ
EOQ
The optimal order quantity occurs at the point where the total cost curve is at the minimum, which also coincides exactly with the point where the ordering cost curve intersects with the carrying cost curve.
122
EOQ
Order Quantity (Q)
The Total-Cost Curve is U-Shaped
Ordering Costs
QO
An
nu
al C
ost
(optimal order quantity)
CARRYING COSTS
DR.R.ANITA
ST.JOSEPH'S DEGREE & PG COLLEGE
MBA-OPERATIONS MANAGEMENT –SEMESTER II
ADVANTAGES OF Q SYSTEM
• Each material can be procured in the most economical quantity • Purchasing and inventory control personnel automatically devote attention to the items
that are needed only when required • Positive control can easily be exerted to maintain total inventory investment at the
desired level simply by manipulating the planned max and min values DISADVANTAGES OF Q SYSTEM • Orders are raised at irregular intervals which may not be convenient to the suppliers • Items cannot be grouped and ordered at a time since the reorder points occur
irregularly • The system assumes stable usage and definite lead time
II. Fixed order period system
• Stock position is regularly reviewed i.e two months. Lead time should be known(Periodic review systems)
• Some buffer stock is necessary to take care of any increased consumption or increase in lead time
• ADVANTAGES • Ordering and inventory costs are low • The suppliers will also offer attractive discounts as sales are guaranteed • The system works well for materials which exhibit an irregular or seasonal usage and
whose purchases must be planned in advance on the basis of sales estimates • DISADVANTAGES • It compels a periodic review of all items – inefficient • The system demands the establishment of rather inflexible order quantities in the interest
of administrative efficiency • Peak the purchasing work around the review dates
iii. HYBRID SYSTEMS
BASIC STOCK SYSTEM • Quantity ordered for restocking will be equal to the quantity issues • Sum of estimated demand and the buffer stock • JIT
OPTIONAL REPLENSIHMENT SYSTEM • Min-max system • Optional review system • P System • Reviewed at fixed time periods – meet the desired needs
SELECTIVE INVENTORY CONTROL TECHNIQUES
Main Objective of Inventory Control • To achieve satisfactory levels of customer service while keeping inventory costs within
reasonable bounds

ST.JOSEPH'S DEGREE & PG COLLEGE
MBA-OPERATIONS MANAGEMENT –SEMESTER II
– Level of customer service – Costs of ordering and carrying inventory
• Inventory control techniques • They represent the operational aspect of inventory management and help realise the
objectives of inventory management and control • Depends on the convenience of the firm to adopt any of the techniques (cover all the
items of inventory and all stages) – from the stage of receipt from suppliers to the stage of their use.
Selective Inventory Control is an essential part of Materials Management. Selective control is emphasizes on variations in methods of control from item to item based on selective basis. We can not apply uniform control since it’s expensive and gives diffused effect. For this purpose we can use some criterion such as lead time, consumption, criticality, cost of the items, procurement difficulties etc. The following classification can be used for selective treatment of various types of materials. INVENTORY TECHNIQUES
1. Always better control (ABC) Classification 2. High, medium and low (HML) classification 3. Vital, essential and desirable (VED) classification 4. Scarce, difficult and easy to obtain (SDE) 5. Fast moving, slow moving and non-moving(FSN) 6. Seasonal – off seasonal (SOS) classification 7. XYZ analysis for finished goods inventory 8. Government, ordinary , local and foreign (GOLF) supplies 9. Economic Order Quantity(EOQ) 10. Max- Minimum system 11. Two bin system 12. Materials requirement planning(MRP) 13. Just – in – Time(JIT)
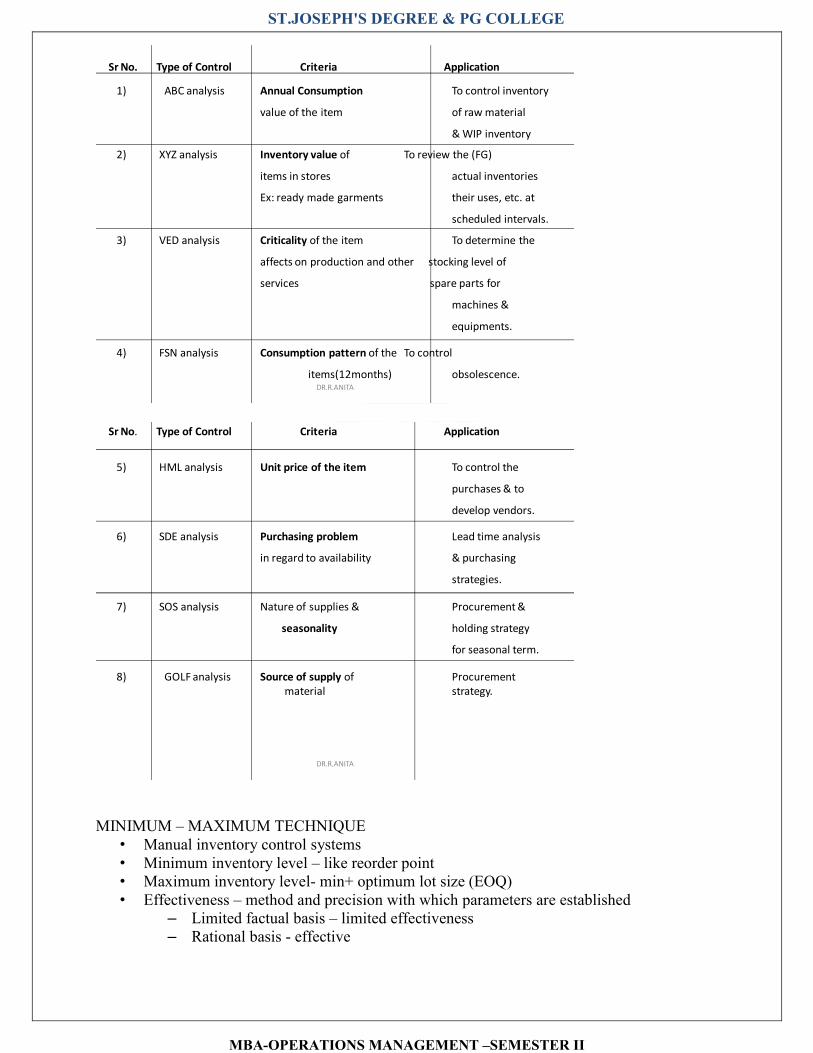
ST.JOSEPH'S DEGREE & PG COLLEGE
MBA-OPERATIONS MANAGEMENT –SEMESTER II
Sr No. Type of Control Criteria Application
1) ABC analysis Annual Consumption To control inventory
value of the item of raw material
& WIP inventory
2) XYZ analysis Inventory value of To review the (FG)
items in stores actual inventories
Ex: ready made garments their uses, etc. at
scheduled intervals.
3) VED analysis Criticality of the item To determine the
affects on production and other stocking level of
services spare parts for
machines &
equipments.
4) FSN analysis Consumption pattern of the To control
items(12months) obsolescence.DR.R.ANITA
Sr No. Type of Control Criteria Application
5) HML analysis Unit price of the item To control the
purchases & to
develop vendors.
6) SDE analysis Purchasing problem Lead time analysis
in regard to availability & purchasing
strategies.
7) SOS analysis Nature of supplies & Procurement &
seasonality holding strategy
for seasonal term.
8) GOLF analysis Source of supply of Procurement
material strategy.
DR.R.ANITA
MINIMUM – MAXIMUM TECHNIQUE
• Manual inventory control systems • Minimum inventory level – like reorder point • Maximum inventory level- min+ optimum lot size (EOQ) • Effectiveness – method and precision with which parameters are established
– Limited factual basis – limited effectiveness – Rational basis - effective

ST.JOSEPH'S DEGREE & PG COLLEGE
MBA-OPERATIONS MANAGEMENT –SEMESTER II
TWO – BIN TECHNIQUE • For C category items – traditional inventory control system • Two bins – stock of items • One bin contains stock just enough to last from the date a new order is placed until it is
received in inventory • The other bin contains a quantity of stock enough to satisfy probable demand during the
period of replenishment • Constant consumption and lead time – EOQ • Lower level staff can handle • Storage problem Just in time • ZIPS – Zero inventory production system • MAN –Materials as needed • NOT – Nick of time • ZIN – Zero inventories • No inventories are held at any state of production and that exact number of units are
brought to each successive stages of production at the right time • Motomachi plant of Toyota in Japan