INTRODUCTION TO DATA SCIENCE AND R PROGRAMMING
19
B.Sc DATA SCIENCE SUBJECTS MEMBERS OF THE BOARD SIGNATURES External Member: Prof Ch. Haritha HOD, Dept of CSE JNTUK Kakinada 1. Dr.M.KamalaKumari - Chairman Dept of CSE, AKNU, RJY 2. Dr.P.Venkateswara Rao – Member Dept of CSE, AKNU, RJY 3. Mr.M. Simhadri – Member Lecturer, Aditya Degree College, Kakinada 4. Mr.B N S Gupta – Member Lecturer, SVKP & Dr. K.S Raju Arts & Science College Penugonda PAPER 1: INTRODUCTION TO DATA SCIENCE AND R PROGRAMMING Objective Data Science is a fast-growing interdisciplinary field, focusing on the analysis of data to extract knowledge and insight. This course will introduce students to the collection. Preparation, analysis, modelling and visualization of data, covering both conceptual and practical issues. Examples and case studies from diverse fields will be presented, and hands-on use of statistical and data manipulation software will be included. Outcomes i. Recognize the various discipline that contribute to a successful data science effort. ii. Understand the processes of data science identifying the problem to be solved, data collection, preparation, modelling, evaluation and visualization. iii. Be aware of the challenges that arise in data sciences. iv. Be able to identify the application of the type of algorithm based on the type of the problem. v. Be comfortable using commercial and open source tools such as the R/python language and its associated libraries for data analytics and visualization.
-
Upload
khangminh22 -
Category
Documents
-
view
3 -
download
0
Transcript of INTRODUCTION TO DATA SCIENCE AND R PROGRAMMING

B.Sc DATA SCIENCE SUBJECTS
MEMBERS OF THE BOARD SIGNATURES
External Member: Prof Ch. Haritha
HOD, Dept of CSE
JNTUK Kakinada
1. Dr.M.KamalaKumari - Chairman
Dept of CSE, AKNU, RJY
2. Dr.P.Venkateswara Rao – Member
Dept of CSE, AKNU, RJY
3. Mr.M. Simhadri – Member
Lecturer, Aditya Degree College, Kakinada
4. Mr.B N S Gupta – Member
Lecturer, SVKP & Dr. K.S Raju Arts & Science College Penugonda
PAPER 1: INTRODUCTION TO DATA SCIENCE AND R PROGRAMMING
Objective
Data Science is a fast-growing interdisciplinary field, focusing on the analysis of data to extract
knowledge and insight. This course will introduce students to the collection. Preparation, analysis,
modelling and visualization of data, covering both conceptual and practical issues. Examples and
case studies from diverse fields will be presented, and hands-on use of statistical and data
manipulation software will be included.
Outcomes
i. Recognize the various discipline that contribute to a successful data science effort.
ii. Understand the processes of data science identifying the problem to be solved, data collection,
preparation, modelling, evaluation and visualization.
iii. Be aware of the challenges that arise in data sciences.
iv. Be able to identify the application of the type of algorithm based on the type of the problem.
v. Be comfortable using commercial and open source tools such as the R/python language and
its associated libraries for data analytics and visualization.

Unit-I
Defining Data Science and Big data, Benefits and Uses, facets of Data, Data Science Process.
History and Overview of R, Getting Started with R, R Nuts and Bolts
Unit-II
The Data Science Process: Overview of the Data Science Process-Setting the research goal,
Retrieving Data, Data Preparation, Exploration, Modeling, data Presentation and Automation.
Getting Data in and out of R, Using readr package, Interfaces to the outside world.
Unit-III
Machine Learning: Understanding why data scientists use machine learning-What is machine
learning and why we should care about, Applications of machine learning in data science, Where it is
used in data science, The modeling process, Types of Machine Learning-Supervised and
Unsupervised.
Unit-IV
Handling large Data on a Single Computer: The problems we face when handling large data, General
Techniques for handling large volumes of data, Generating programming tips for dealing with large
datasets. Case study- Predicting malicious URLs(This can be implemented in R)
Unit-V
Subsetting R objects, Vectorised Operations, Managing Data Frames with the dplyr, Control
structures, functions, Scoping rules of R, Coding Standards in R, Loop Functions, Debugging,
Simulation
References
1. DavyCielen, Arno.D.B.Maysman, Mohamed Ali, “Introducing Data Science” Manning
Publications, 2016.
2. Roger D. Peng, “R Programming for DataScience” Lean Publishing, 2015.
3. Nina Zumel, John Mount, “Practical Data Science with R”, Manning Publications, 2014.
4. Mark Gardener, “Beginning R - The Statistical Programming Language”, John Wiley &
Sons, Inc., 2012.
5. W. N. Venables, D. M. Smith and the R Core Team, “An Introduction to R”, 2013.
6.Tony Ojeda, Sean Patrick Murphy, Benjamin Bengfort, AbhijitDasgupta, “Practical Data
Science Cookbook”, Packt Publishing Ltd., 2014.
Student Activity
Students should be able to create a database and read and write from it. Transfer data to and from csv
and different types of files.
Should clean data and make it consistent for any sort of analysis in R
Perform statistical analysis on variety of data
Perform appropriate statistical tests using R and visualize the outcome

Continuous assessment:
Let the students be tested in the following questions from each unit
1. Define Data Science. Discuss any application as an example
2. What are the main components of R and explain basic R commands
3. Explain the phases in Data Science Process
4. What is machine learning. What are the differences between machine learning, artificial
intelligence and data science
5. What are the general techniques to handle large volumes of data
6. Develop any data visualisation ion application by creating data frames and applying operations on
it and using relevant packages
BASICS OF R LAB
1) Installing R and R studio
2) Basic operations in r
3) Getting data into R, Basic data manipulation, Loading Data into R
4) Basic plotting
5) Loops and functions
6) Create Vectors, Lists, Arrays, Matrices, Data frames and operations on them.
7) Demonstrate the visualization and graphics using visualization packages.
8) Implement Loop functions with lappy(), sapply(), tapply(), apply(), mapply().
9) Explore data using Single Variables: Unimodal, Bimodal, Histograms, Density Plots, Bar charts
10) Explore data using two Variables: Line plots, Scatter Plots, smoothing cures, Bar charts
11) Explore and implement commands usinfdplyr package
12) Generate random numbers and set seed

PAPER 1: INTRODUCTION TO DATA SCIENCE AND R PROGRAMMING
MODEL QUESTION PAPER
Part - A
Answer Any FIVE Questions 5*5=25M
1. What is data science and its benefits?
2. Explain role and stages in data science?
3. What are the goals of data science?
4. How to retering the data in data science?
5. Explain supervised and unsupervised machine Learning?
6. Why we need the machine Learning in data science?
7. What is cluster Analysis?
8. Explain case studies in R Language?
9. How to declare functions in R Language?
10. Explain vectorized operations in R Language?
Part - B
Answer Any FIVE Questions 5*10=50M
11. How to Install the R-studio?
12. What are input and output in R-Language?
13. Explain different stages of data Science?
14. How to getting the data in and out of R-Language?
15. What is machine learning? What is its role in data Science?
16. What are the applications of machine Learning in data science?
17. Explain general techniques for handling volumes of data?
18. What are the problems face when handling large data?
19. What are the data frames? Write its significance in R-Language?
20. Explain R Objects?

PAPER 2: DATA MINING CONCEPTS AND TECHNIQUES Objective
To understand Data mining techniques and algorithms.
Comprehend the data mining environments and application.
Outcomes
Students who complete this course will be able to
Compare various conceptions of data mining as evidenced in both research and application.
Evaluate mathematical methods underlying the effective application of data mining.
Should be able to apply the type of techniques based on the problems considered
Unit-I
An idea on Data Warehouse, Data mining-KDD versus data mining, Stages of the Data Mining
Process-Task primitives., Data Mining Techniques – Data mining knowledge representation.
Unit-II
Data mining query languages- Integration of Data Mining System with a Data Warehouse- Issues,
Data pre-processing – Data Cleaning,Data transformation – Feature selection – Dimensionality
reduction
Unit-III
Concept Description: Characterization and comparison What is Concept Description,Data
Generalization by Attribute-Oriented Induction(AOI), AOI for Data Characterization,
Efficient Implementation of AOI.
Mining Frequent Patterns, Associations and Correlations: Basic Concepts, FrequentItemset Mining
Methods: Apriori method, generating Association Rules, Improvingthe Efficiency of Apriori, Pattern-
Growth Approach for mining Frequent Item sets.
UNITIV
Classification Basic Concepts: Basic Concepts, Decision Tree Induction: Decision TreeInduction
Algorithm, Attribute Selection Measures, Tree Pruning. Bayes Classification Methods.
UNIT V
Classification by Back Propagation:Multi_Layer Feed Forward Neural Network.
Support Vector Machines: Cases when the data are linearly separable and linearly inseparable.
Cluster Analysis: Cluster Analysis, Partitioning Methods, Hierarchal methods, Density based
methods-DBSCAN.

References
1. Jiawei Han and MichelineKamber, “Data Mining: Concepts and Techniques”, 3rd
Edition,
Morgan Kaufmann Publishers, 2011.
2. AdelchiAzzalini, Bruno Scapa, “Data Analysis and Data mining” , 2nd
Ediiton, Oxford Univeristy
Press Inc., 2012.
3. Alex Berson and Stephen J. Smith, “Data Warehousing, Data Mining & OLAP”, 10th Edition,
TataMcGraw Hill Edition , 2007.
4. G.K. Gupta, “Introduction to Data Mining with Case Studies”, 1st Edition, Easter Economy
Edition, PHI, 2006.
Student Activities
1. Students should be able to implement Data Mining algorithms provided the relevant
data
2. Given the data, students can visualize all statistical measures
3. Differentiate the types of mining problems and identify what type of algorithms are to be
implemented.
Continuous assessment:
Let the students be tested in the following questions from each unit
1. What is Data Mining and KDD? Where Data Mining fits in KDD Process
2. Describe all Preprocessing methods
3. Explain Data Description and AOI Algorithm
4. Explain Classification and Write any Decision tree induction algorithm
5. Explain the concept of clustering and write any algorithm to form clusters.

DATA MINIG USING R PROGRAMMING LAB
1. Get and Clean data using swirl exercises.(Use ‘swirl’ package, library andinstall that topic from
swirl).
2. Visualize all Statistical measures(Mean ,Mode, Median, Range, Inter QuartileRange etc., using
Histograms, Boxplots and Scatter Plots).
3. Create a data frame with the following structure.
a. Extract two column names using column name.
b. Extract the first two rows and then all columns.
c. Extract 3rd and 5th row with 2nd and 4th column.
4. Create a data frame with 10 observations and 3 variables and add new rows and
columns to it using ‘rbind’ and ‘cbind’ function.
5. Create a function to discretize a numeric variable into 3 quantiles and label them as
low, medium, and high. Apply it on each attribute of any dataset to create a new
data frame. ‘discrete’ with Categorical variables and the class label.
6. Create a simple scatter plot using any dataset using ‘dplyr’ library. Use the
same data to indicate distribution densities using boxwhiskers.
7. Write R Programs to implement k-means clustering, k-medoids clustering and density
based clustering on any datasets.
8. Write a R Program to implement decision trees using ‘readingSkills’ dataset.
9. Implement decision trees using any dataset using package party and ‘rpart’.
10. Train SVM Model by taking any dataset.

PAPER 2: DATA MINING CONCEPTS AND TECHNIQUES
MODEL QUESTION PAPER
Part - A
Answer Any FIVE Questions 5*5=25M
1. What is data warehouse?
2. Explain KDD?
3. What is data Transformation?
4. Explain Feature selection?
5. Explain Attribute-Oriented Induction(AOI)?
6. Explain Apriori method?
7. Explain Decision Tree Induction?
8. Explain boyers classification methods?
9. Classification by Back Propagation briefly?
10. Explain briefly DBSCAN?
Part - B
Answer Any FIVE Questions 5*10=50M
11. Explain data mining knowledge representation?
12. What are data mining process Tasks?
13. What are data warehouse users?
14. Explain Data Cleaning, Data transformation?
15. Explain Decision TreeInduction Algorithm?
16. What are the FrequentItemset Mining Methods?
17. Explain about Attribute Selection Measures?
18. Explain Tree Pruning?
19. Explain vector Machines?
20. Explain Multi_Layer Feed Forward Neural Network?

PAPER 3: PYTHON PROGRAMMING FOR DATA ANALYSIS
Objective: To be able to Program in Python
To know and understand the data Analysis phases
To know the usage of all libraries
Outcomes Understands and learn all basic concepts of Python
Program Data Analysis methods in Python
Get used with Python Programming environments
UNIT I
What is Data Analysis? Differences between Data Analysis and Analytics, What is Python, Why
Python for Data Analysis? What is Library, Essential Python Libraries. Python Language basics,
IPython and Jupyter Notebook. Python Language Basics.
UNIT II
Built-in Data Structures, Functions, Files and Operating System.
NumPy Basics: Arrays and Vectorized Computation, The Numpyndarray, Universal Functions,
Array-Oriented Programming with Arrays, File Input and Output with Arrays, Linear Algebra,
Pseudorandom Number Generation.
UNIT III
Getting Started with Pandas: Introduction to Pandas Data Structures, Essential Functionality,
Summarizing and Computing Descriptive Statistics
Data Loading, Storage and File Formats: Reading and Writing Data in Text Format, Binary Data
Formats, Interacting with Web APIs, Interacting with Databases.
UNIT IV
Data Cleaning and Preperation: Handling Missing Data, Data Transformation, String Manipulation.
Data Wrangling: Join, Combine and Reshape: Hierarchical Indexing, Combining and Merging
Datasets, Reshaping and Pivoting.
UNIT V
Introduction to Modeling Libraries in Python: Interfacing between pandas and Model code, Creating
model descriptions with Patsy, Introduction to stas models.
Plotting and Visualization: A brief matplotlib API Primer, Plotting with Pandas and seaborn, Other
Python visualization tools.

Reference Books
1. Wes McKinney “Python for Data Analysis” O’reilly Publications Second edition
2. Charles R Suverance “Python for Everybody” Exploring data using Python 3
3. John Zelle Michael Smith Python Programming, second edition 2010
Student Activities Take up any application which involves the python coding.Example Case studies/Simulators:
(https://knightlab.northwestern.edu/2014/06/05/five-mini-programming-projects-for-the-python-
beginner/)
1. Dice Rolling Simulator
2. Guess the number
3. Text based adventure game
4. Hangman
Continuous assessment:
Let the students be tested in the following questions from each unit
1. What is Data Analysis.List out the differences between data analysis and data analytics
2. What is Python? Explain Python basics
3. Explain NumPy Basics
4. What is data loading. Explain Pandas Data Structures
5. What is data Cleaning. Explain different phases in it
6. Explain Plotting and Visualization in Python
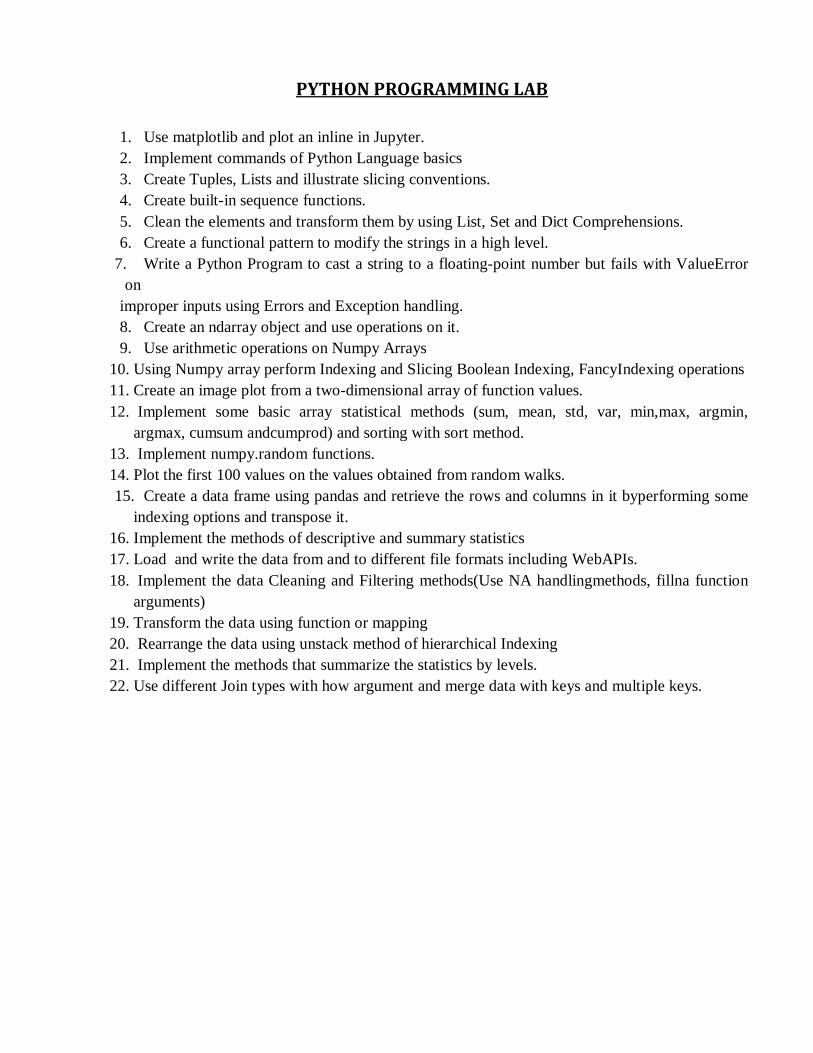
PYTHON PROGRAMMING LAB
1. Use matplotlib and plot an inline in Jupyter.
2. Implement commands of Python Language basics
3. Create Tuples, Lists and illustrate slicing conventions.
4. Create built-in sequence functions.
5. Clean the elements and transform them by using List, Set and Dict Comprehensions.
6. Create a functional pattern to modify the strings in a high level.
7. Write a Python Program to cast a string to a floating-point number but fails with ValueError
on
improper inputs using Errors and Exception handling.
8. Create an ndarray object and use operations on it.
9. Use arithmetic operations on Numpy Arrays
10. Using Numpy array perform Indexing and Slicing Boolean Indexing, FancyIndexing operations
11. Create an image plot from a two-dimensional array of function values.
12. Implement some basic array statistical methods (sum, mean, std, var, min,max, argmin,
argmax, cumsum andcumprod) and sorting with sort method.
13. Implement numpy.random functions.
14. Plot the first 100 values on the values obtained from random walks.
15. Create a data frame using pandas and retrieve the rows and columns in it byperforming some
indexing options and transpose it.
16. Implement the methods of descriptive and summary statistics
17. Load and write the data from and to different file formats including WebAPIs.
18. Implement the data Cleaning and Filtering methods(Use NA handlingmethods, fillna function
arguments)
19. Transform the data using function or mapping
20. Rearrange the data using unstack method of hierarchical Indexing
21. Implement the methods that summarize the statistics by levels.
22. Use different Join types with how argument and merge data with keys and multiple keys.

PAPER 3: PYTHON PROGRAMMING FOR DATA ANALYSIS MODEL PAPER
PART - A Answer Any FIVE Questions 5*5=25M
1. Difference between data Analysis and analytics?
2. Explain about basic of python language?
3. Write a python program for random number generation?
4. Explain about the concept functions with example in python?
5. How do you interact with database in python?
6. Explain about working with binary data in python?
7. How handling missing data in Python?
8. Explain about hierarchical index with example in python?
9. How to create stas models in python?
10. Explain about model descriptions with patsy?
PART - B Answer Any FIVE Questions 5*10=50M
11. What is python? Explain about python libraies?
12. What is data Analysis? Why python is used for data analysis?
13. Explain in detail about arrays and its related concepts in python?
14. Discuss about input and output files in python?
15. Explain about storage and file formats in python?
16. Discuss in detail about Pandas in python with suitable example.
17. Explain string manipulation functions in python?
18. Discuss about combing and merging data sets in python?
19. Describe about plotting and visulization concepts in python?
20. Explain modeling libraries in python?

PAPER 4: BIG DATA ANALYTICS USING SPARK
OBJECTIVES To Understand the Complete Architecture of Spark
To know the differences between Hadoop and Spark
To know the concepts of Spark Programming
OUTCOMES
Students will get well knowledge of what is Big Data
Knowledge in Spark Eco System
Mapping of Data Analytics techniques in Spark
Application of Spark Programming to Analytics problems
UNIT - I
Introduction to Big Data:What is Big Data-Characteristics, Data in the Warehouse and Data in
Hadoop, Why is Big Data Important- When to consider Big Data Solution, Applications.
Introduction to Hadoop: Hadoop- definition, Application development in Hadoop. The building
blocks of Hadoop, NameNode, DataNode, Secondary NameNode, JobTracker and Task Tracker.
UNIT-II
Introduction to Spark: What is Apache Spark, Why Spark when Hadoop is there, Spark Features, ,
Spark components, Spark program flow, Spark Eco System. Differences between implementation of
programs in Hadoop and Spark Programming environments.
UNIT III
Spark Fundamentals- Using spark in action VM, Using Spark Shell and writing first spark program,
Basic RDD actions and transformations.
Spark SQL-Working with Data Frames, Using SQL Commands, Saving and loading DataFrame.
UNIT IV
Streaming in Spark- Writing spark streaming applications, Using external data sources, structured
streaming.
Spark MLlib-Introduction to Machine Learning. Definition of Machine Learning, Machine Learning
with Spark.
UNIT V
Graph Representation in MapReduce:Graph Processing with Spark, Spark GraphX, GraphX
features, GraphXExamples, Graph algorithms-Shortest Path Algorithm.
REFERENCE BOOKS:
1. Understanding Big Data Analytics for Enterprise Class Hadoop and Streaming Data by Dirk
deRoos, Chris Eaton, George Lapis, Paul Zikopoulos, Tom Deutsch, 1st Edition, TMH,2012.
2. Spark in Action PetarZecevic, markoBonaci Manning Publications-2016.
3. Learning Spark“Holden KarauA. Konwinskietc.,”O’reilly Publications.
4. Hadoop in Action by Chuck Lam, MANNING Publishers.
5. Hadoop: The Definitive Guide by Tom White, 3rd Edition, O’reilly
6. Mining of massive datasets, AnandRajaraman, Jeffrey D Ullman, Wiley Publications.

Student Activities
Take any dataset and do the following machine learning steps.(https://www.guru99.com/pyspark-
tutorial.html)
1. Use basic Operations with PySpark(Spark with Python)
2. Data Preprocessing
3. Build a data processing pipeline
4. Build the classifier
5. Train and evaluate the model
6. Tune the hyperparameter
Continuous assessment:
Let the students be tested in the following questions from each unit
1. What is Big Data? Explain the characteristics of it
2. What is Spark? What are the advantages of it over Hadoop
3. Explain Spark SQL
4. Explain Spark Streaming
5. Explain Shortest Path Algorithm.
SPARK PROGRAMMING LAB
1. Using Python Implement the following Programs
a) Write Program to implement arithmetic operations
b) Write Program to find the biggest of two numbers
c) Write a program to find the matrix multiplication
2. Install Hadoop
3. Install Spark on top of Hadoop
4. Create and Implement the transformations in RDDs
5. Create a dataframe from an existing RDD using SparkSession
6. Execute a Word Count example in Spark Shell by creating RDDs.
7. Implement Spark SQL Queries in Python.
8. Write a Program to implement maximum temperature give the recordings of one year.
9. Write a Program to implement the Pie estimation
10. Write a User Defined Function to convert a given text to Uppercase.

PAPER 4: BIG DATA ANALYTICS USING SPARK
MODEL PAPER
PART - A
Answer any Five Questions 5*5=25M
1. Explain Why is Big Data Important?
2. Explain how to develop an application in Hadoop?
3. What is Apache Spark and Spark Features?
4. Explain about Spark components?
5. Explain about using spark in action VM?
6. Explain about Working with Data Frames?
7. Briefly explain spark streaming applications?
8. Explain about external data sources in streaming in sprak? 9. Explain about Graph Processing with Spark?
10. Explain about GraphX features?
PART - B
Answer any Five Questions 5*5=25M
11. Explaion about Big Data-Characteristics and applications?
12. Explain The building blocks of Hadoop?
13. Differences between implementation of programs in Hadoop and Spark Programming
environments?
14. Explain about Spark program flow, Spark Eco System?
15. Briefly explain about Spark Shell and writing first spark program?
16. Explain about Using Spark SQL Commands ?
17. Definition of Machine Learning? Explain about Machine Learning with Spark?
18. Explain about structured streaming with example?
19. Expain about Shortest Path Algorithm in graph?
20. Explain about Execution model in map reduce in Big Data?

PAPER 5: DATA VISUALIZATION
OBJECTIVES
To know the importance of data Visualization in the world of Data Analytics and Prediction
To know the important libraries in Tableau
To get equipped with Tableau Tool
OUTCOMES
Students should be able to visualize data through seven stages of data analysis process
Should be able to do explanatory and hybrid types of data visualization
Should be able to understand various stages of visualizing data
UNIT I
Creating Visual Analytics with tableau desktop, connecting to your data-How to Connect to your
data, What are generated Values? Knowing when to use a direct connection, Joining tables with
tableau, blending different datasources in a single worksheet.
UNIT II
Building your first Visualization- How Me works- Chart types, Text Tables, Maps, bar chart, Line
charts, Area Fill charts and Pie charts, scatter plot, Bullet graph, Gantt charts, Sorting data in tableau,
Enhancing Views with filters, sets groups and hierarchies.
UNIT III
Creating calculations to enhance your data- What is aggregation, what are calculated values and
table calculations, Using the calculation dialog box to create, Building formulas using table
calculations, Using table calculation functions
UNIT IV
Using maps to improve insights-Create a Standard Map View, Plotting your own locations on a
map, Replace Tableau’s standard maps, Shaping data to enable Point-to-Point mapping.
UNIT V
Developing an Adhoc analysis environment- generating new data with forecasts, providing self
evidence adhoc analysis with parameters, Editing views in tableau Server.
Reference Books
1. Tableau your data-Daniel G. Murray and the Inter works BI team, Wiley Publications
2. Tableau Data Visualizaton Cookbook, AshutoshNandeshwar, PACKT publishing.
3. Storytelling with Data: A Data Visualization Guide for Business Professionals by Cole
NussbaumerKnaflic (2014)
4. ggplot2: Elegant Graphics for Data Analysis by Hadley Wickham (2009)
5. Designing Data Visualizations: Representing Informational Relationships by Noah Iliinsky,
Julie Steele (2011)
6. Alexandru C. Telea – “Data Visualization principles and practice” Second Edition, CRC
Publications
7. Joshua N. Millign–“ Learning Tableau -2019” – Third Edition- Packt publications

Student Activity
Create a sample super store data set and visualize the following requirements
General Requirements
1. Dashboard size is 1250px wide by 750px tall.
2. Prefer using containers
3. The dashboard has a total of 5 containers (no more, no less)
4. The Filter Pane
5. Each filter has some padding
Charts Pane Requirement
1. All 3 charts must be in one vertical container
2. Do proper formatting
3. Each chart has some padding between them and other objects
4. Each chart has a grey border, slightly darker than the Pane background color.
5. The Pane under the Title has a border
Business Requirements
1. Show four filters- Category, Sub-Category, Region, and Segment. These filters should have only
relevant values.
2. The dashboard should have the title “Executive sales”
3. The first chart should have the title “YTS KPIs” and should show the following- Total Discount Overall Profit Total Quantity and Total Sales
4. The second graph should have the title as “Sales” and should show monthly sales per year. Make
sure it is an area chart with proper formatting.
5. The third graph should the title as “Profit” and should show monthly profit per year. Make sure it
is an area chart with proper formatting.
Continuous assessment:
Let the students be tested in the following questions from each unit
1. What are generated values? Join tables using Tableau
2. Create any visualization charts using Chart types, Text Tables, Maps, bar chart, Line charts, Area
Fill charts and Pie charts, scatter plot etc.,
3. What is aggregation, what are calculated values and table calculations?
4. Using Standard Map View, Plot your own locations on a map
5. Develop an Adhoc analysis environment.
DATA VISUALIZATION LAB USING TABLEAU
1. Connect to data Sources
2. Create Univariate Charts
3. Create Bivariate and Multivariate charts
4. Create Maps
5. Calculate user-defined fields
6. Create a workbook data extract
7. Save a workbook on a Tableau server and web
8. Export images, data.

PAPER 5: DATA VISUALIZATION
MODEL PAPER
PART - A
Answer any Five Questions 5*5=25M
1. How to creating visual analytics with tableau desktop?
2. Explain bending different data sources in a single worksheet?
3. Explain different chart types?
4. Explain filters?
5. What is a aggregation?
6. What are building formals?
7. What is a Shaping data to enable Point-to-Point mapping?
8. Replace tableau standard maps?
9. How to generating new data with forecasts?
10. Explain tableau server?
PART - A
Answer any Five Questions 5*10=50M
1. How to connecting to you data? What are generated values?
2. Explain Joining tables with tableau?
3. Explain sorting data in lab team?
4. Explain sets groups & hierarchies?
5. How to using calculation dialog box?
6. What are the table calculation functions?
7. How to creating a standard map view?
8. How to using maps to improve insights?
9. How to proving self evidence adhoc analysis with parameters?
10. How to editing views in server?

SKILL ENHANCEMENT COURSES
PAPER 6 - MULTIVARIATE TECHNIQUE FOR DATA ANALYSIS
PAPER 7 - PREDICTIVE ANALYTICS
MEMBERS OF THE BOARD SIGNATURES
External Member: Prof D. Haritha
HOD, Dept of CSE
JNTUK Kakinada
1. Dr.M.KamalaKumari - Chairman
Dept of CSE, AKNU, RJY
2. Dr.P.Venkateswara Rao – Member
Dept of CSE, AKNU, RJY
3. Mr.M. Simhadri – Member
Lecturer, Aditya Degree College, Kakinada
4. Mr.B N S Gupta – Member
Lecturer, SVKP & Dr. K.S Raju Arts & Science College Penugonda


![introduction to java programming [r18a0552] lecture notes b ...](https://static.fdokumen.com/doc/165x107/631cea17b8a98572c10d1e53/introduction-to-java-programming-r18a0552-lecture-notes-b-.jpg)