INTRODUCTION - opus4.kobv.de
151
Municipal Solid Waste Management and Groundwater Contamination in Limbe, Cameroon Kommunales Abfallmanagement und Grundwasserverunreinigung in Limbe, Kamerun Von der Fakultät für Umweltwissenschaften und Verfahrenstechnik der Brandenburgischen Technischen Universität Cottbus zur Erlangung des akademischen Grades eines Doktor rerum naturalium (Dr. rer. nat.) genehmigte Dissertation vorgelegt von M.Sc. Adeline Abimnwi Awemo Cheo aus Kumba, Kamerun Gutachter: Prof. Dr. rer. nat. habil. Hans-Jürgen Voigt Gutachter: Prof. Dr. Cornelius Mbifung Lambi Tag der mündlichen Prüfung: 20.01.2012
-
Upload
khangminh22 -
Category
Documents
-
view
6 -
download
0
Transcript of INTRODUCTION - opus4.kobv.de

Municipal Solid Waste Management and Groundwater
Contamination in Limbe, Cameroon
Kommunales Abfallmanagement und
Grundwasserverunreinigung in Limbe, Kamerun
Von der Fakultät für Umweltwissenschaften und Verfahrenstechnik der
Brandenburgischen Technischen Universität Cottbus zur Erlangung des
akademischen Grades eines Doktor rerum naturalium (Dr. rer. nat.) genehmigte
Dissertation
vorgelegt von
M.Sc.
Adeline Abimnwi Awemo Cheo
aus Kumba, Kamerun
Gutachter: Prof. Dr. rer. nat. habil. Hans-Jürgen Voigt
Gutachter: Prof. Dr. Cornelius Mbifung Lambi
Tag der mündlichen Prüfung: 20.01.2012
ii
DECLARATRION
I hereby declare that this dissertation is the result of my original research work carried out at
the Brandenburg University of Technology Cottbus, Germany within the framework of the
Doctorate programme in the Faculty of Environmental Engineering.
Professor Dr. rer. nat. habil. Hans-Jürgen Voigt, Head of the Chair of Environmental
Geology of the Brandenburg University of Technology Cottbus, is the main supervisor of this
research, while Professor Dr. Cornelius Mbifung Lambi of the Department of Geography
and former Vice-Chancellor of the University of Buea, Cameroon, is the co-supervisor.
I hereby admit that this dissertation has never been submitted in whole or in part for a degree
at Brandenburg University of Technology Cottbus, or elsewhere. References to other people’s
research have been duly cited and acknowledged in this research work accordingly.
-------------------------------------------------------------
Adeline Abimnwi Awemo Cheo
B.Sc, (Buea), M.Sc. (Cottbus)
Matriculation Number: 2219192
iii
DEDICATION
This dissertation is dedicated to
John Awemo (RIP) and Ruphina Awemo
Thecla Laison Cheo (RIP)
Germaine-Ashley, Erika-Kamille, Lea-Karen
and Victor Cheo
iv
ACKNOWLEDGEMENTS
I thank in a very special way my supervisors, Professor Dr. rer. nat. habil. Hans-Jürgen
Voigt and Professor Dr. Cornelius Mbifung Lambi for the invaluable support and
encouragement they gave me in the course of my study. Without them I would not have been
able to do my work with so much confidence and enthusiasm. I also want to heartily thank the
chair of Environmental Geology and the international office for their support within the
period of my doctorate programme.
I also like to thank Erika and Rudolf Schirmer for always being there for me and my family
since I came to Germany. Your all round assistance has been a big boost to all my
achievements in Germany. My thanks also go to Fr. Thomas Olickal for the moral and
spiritual support given to me especially in times when I had no interest in anything. My
sincere gratitude goes to Herr Schierack and family, Herr Hübner and family, Frau Richter
and family, Benno, Franklin and family, and all those who accepted me and my family into
their family.
I am also profoundly grateful to Elsie and family, Aloysius and Gwen Abety, and family,
Gifty, Maria, Melanie, Thomas, Bernice and Ekene, Honorie and family, Evelyn and Toni,
Krystie and family, Laura and family, Cheka and all who helped me in Cottbus. I cannot
express my gratitude in words. May God bless them all!
I thank in a very special way my in-laws who were there for me; sis Florence, Eleanor and
Leo Killi, Francis and Martha, Fidelis and Sylvia, M. Roger and sis Shene and kids, Bikei and
Laisin. They came into my life at very difficult time and they all stood by me and my family
in very special ways. They are special to me.
I also want to thank to all my brothers and sisters and their families from the bottom of my
heart; Nchungong and Nancy; Anuashie, Awung, Ngwi and John-Darvin; Joan and Ashu;
Lizette, Ngwikala and Awemo; my uncle, Dr. Godfrey and Aunt, sis Erica, and their families.
They were always there for me when times were difficult and I needed to be encouraged.
They showed me all the love I needed to carry on and their financial support pushed my
difficult life through.
Furthermore, special thanks to my parents for the infinite love they showed me in my whole
life. They made sure I had every support possible which pushed away all ideas of giving up. I
am who I am today because of them. I pray my mother enjoys the fruits of your labour. I love

v
her dearly. May the soul of my father rest in perfect peace! I miss him so much especially
because he left me when I was not prepared. I will follow their up-bringing without failure.
I thank my darling daughters, Nwesheligi, Dzekamo and Ngwimetoh, for coming into my life
while I was a student in a foreign land. They gave me the courage and energy to continue to
the end, and I did all these for them. Their smiles and cries, words and deeds, prayers and
songs made me just love them more. I thank them with all my heart. I love them in a special
and indescribable way.
My darling husband, Dr. Victor Cheo (MD), gave me everything. I am so thankful and cannot
go a step without thinking of what we went through. In spite of everything he stood by me.
All the love and concern I demanded, he gave me. There is no one like him. I love him with
all my heart.
My profound thanks go to Almighty God, the Merciful and the Compassionate for strength,
health and wisdom

vi
ABSTRACT
An increase in waste production is inextricably linked to population increase and increasing
civilization, and depending on the waste management approach, groundwater could be seriously
affected. In Limbe, for example, waste disposal methods (sewage, littering, open dumping and
burning) have led to the contamination of groundwater resources. This study aims at assessing the
degree to which the Limbe waste sites conform to prescribed standards of waste site location, the
extent to which the waste sites compromise or enhance groundwater protection. The study further
investigates groundwater management around waste sites; investigating the factors responsible for
groundwater contamination from waste sites; evaluating the extent to which past and present
municipal solid waste management practices minimise or enhance groundwater contamination and
suggesting possible methods (techniques) by which the existing situation can be improved. Seven
groundwater samples were collected for laboratory (microbiological and physic-chemical) analyses in
Cameroon and Germany. Field visits and observations made were supported by pictures and
interviews. The method of waste disposal used in Limbe by LUC (until 2006) and HYSACAM (from
2006) already show negative effects on groundwater. Results of microbial analysis are higher than the
standards of Cameroon, WHO and ISI 10500-91. Total Coliform showed values >1000CFU/100ml, E.
coli showed up to 346CFU/100ml and others showed up to 159CFU/100ml. These excessively high
values imply that water is highly contaminated biologically and so groundwater wells in Limbe are not
good for human consumption. Physico-chemical analysis revealed, in most samples, values lower than
the prescribed standards. However, NH4+ showed higher values in all samples (0.9mg/L-2.6mg/L).
The high level of ammonium could be related to high production of sewage in households. L7 and L1
showed the lowest values, whereas, L6 showed the highest values in almost all microbial and physico-
chemical parameters analysed. L6 was most contaminated with high values mostly exceeding the
given limits. This dominant wetland area must be evacuated and water highly treated because it is very
dangerous for human consumption. Vadose water in Limbe requires serious biological treatment and
subsequent groundwater monitoring to minimise hazards. L7 and L1 have characteristics of Basalt and
because of low level of contamination can be used as the base for comparison (that is natural water).
Water must also be thoroughly treated for NH4 contamination. Waste disposal in Limbe is poorly
practised and the site used must be changed. Improved waste management schemes like waste
reduction, sorting and treatment are required before final disposal. Landfill construction with emphasis
on barrier, leachate and gas collection systems will be most appropriate for waste disposal and in
minimising leachate spill, and groundwater and other contamination. Geological and hydrogeological
maps and investigations as well as recent climatic data are needed in order to choose an appropriate
site for landfill construction. Most of all groundwater monitoring and sewage collection should be a
very important consideration in the Limbe Municipality. Household dump sites must be thoroughly
cleaned and the public sensitised on the importance of proper waste management to reduce
groundwater contamination and its effects on man and the environment.
Keywords: Municipal Solid Waste Management, Groundwater Contamination, Limbe, Cameroon

vii
ZUSAMMENFASSUNG
Eine Zunahme der Abfallproduktion ist stark mit dem Bevölkerungswachstum und der Zivilisation
verbunden. Das Grundwasser kann, abhängig vom Abfallwirtschaftsansatz, ernsthaft beeinträchtigt
werden. In Limbe zum Beispiel haben die Abfallentsorgungsmethoden (Abwasser, Vermüllen, offene
Deponierung und Verbrennen) zur Verschmutzung des Grundwassers geführt. In dieser Hinsicht
untersucht die vorliegende Studie, inwieweit den Deponien in Limbe den vorgeschriebenen Vorgaben
für Mülldeponien entsprechen. Dazu wird ermittelt, in welchem Umfang die Deponien den
Grundwasserschutz gefährden oder verbessern. Des Weiteren untersucht die Studie auch die
Grundwasserbewirtschaftung rund um die Deponien. Die Untersuchung der Faktoren, die zur
Verschmutzung des Grundwassers führen; die Auswertung des Umfang, inwieweit die vergangene und
gegenwärtige Siedlungsabfallbewirtschaftung zu Minimierung oder zu Verbesserung der
Grundwasserverschmutzung führen; und Vorschläge möglicher Methoden (Techniken), durch die die
bestehenden Situation verbessert werden kann, sind alles Bestandteil dieser Studie. Sieben
Grundwasserproben wurden entnommen, um sie mikrobiologisch und physiko-chemisch in Kamerun
und Deutschland zu analysieren. Besuche vor Ort und Beobachtungen wurden anhand von Bildern und
Interviews unterstützt. Die eingesetzte Abfallbeseitigungsmethode in Limbe von LUC (bis 2006) und
HYSACAM (2006 bis heute) zeigen bereits negative Auswirkungen auf das Grundwasser. Die
Ergebnisse der mikrobiologischen Analysen weisen Werte über den kamerunischen Vorgaben (WHO
und ISI 10500-91) auf. Gesamt-Coliforme zeigten Werte über 1000CFU/100ml, E. coli Werte bis zu
346CFU/100ml und andere Werte bis zu 159CFU/100ml. Dies bedeutet, dass das Wasser biologisch
verschmutzt ist und somit sind die Grundwasserbrunnen in Limbe nicht mehr zum menschlichen
Gebrauch geeignet sind. Physiko-chemische Analysen in den meisten Proben ergaben Werte unterhalb
der vorgeschriebenen Vorgaben. NH4+ zeigte jedoch höhere Werte in allen Proben (0.9mg/L-
2.6mg/L). Die hohe Konzentration von Ammonium könnte auf hohe Abwasserproduktion von
Haushalten zurückgeführt werden. L7 und L1 zeigten die niedrigsten Werte, während L6 die höchsten
Werte in fast allen mikrobiellen und physiko-chemischen Parameter aufweist. L6 ist stark
kontaminiert; die Werte übersteigen meist die Grenzwerte. Diese Bereiche müssen evakuiert werden
und das Wasser intensiv behandelt werden, da es sehr gefährlich zum menschlichen Verzehr ist. Die
Aerationwasserzone in Limbe erfordert intensive biologische Behandlung und anschließende
Grundwasserüberwachung, dadurch wird die Gefahr minimiert. L7 und L1 sind von Basalt geprägt
und wegen geringer Kontamination lassen sie sich als Basis für den Vergleich (natürliches Wasser)
verwenden. Das Wasser ist auch gründlich gegen NH4-Kontamination zu behandeln. Die
Abfallentsorgung in Limbe wird mangelhaft durchgeführt und die Deponien müssen geändert werden.
Verbesserte Abfallwirtschaftsprogramme wie Abfallreduktion, -sortierung und -behandlung sind vor
der endgültigen Entsorgung erforderlich. Deponiebau mit Schwerpunkt auf Barriere, Sickerwasser und
Gassammelsysteme sind am besten für die Abfallentsorgung, die Minimierung des Sickerwassers, das
Grundwasser und andere Verunreinigungen geeignet. Geologische und hydrogeologische Karten und
Untersuchungen sowie aktuelle klimatischen Daten werden benötigt, um einen geeigneten Ort für
einen Deponiebau zu wählen. Vor allem die Grundwasserüberwachung und Abwassersammlung
sollen ein sehr wichtiger Aspekt in der Verwaltung Limbe werden. Haushaltsabfalldeponien sind
gründlich zu sanieren und die Öffentlichkeit soll für die Bedeutung einer ordnungsgemäßen
Müllentsorgung sensibilisiert werden, um Grundwasserverunreinigungen und deren Auswirkungen auf
Mensch und Umwelt zu reduzieren.
Stichwörte: Siedlungsabfallwirtschaft, Grundwasserverschmutzung, Limbe, Kamerun

viii
TABLE OF CONTENTS
DECLARATRION------------------------------------------------------------------------------------------------------------------------- II
DEDICATION ------------------------------------------------------------------------------------------------------------------------------III
ACKNOWLEDGEMENTS ------------------------------------------------------------------------------------------------------------ IV
ABSTRACT --------------------------------------------------------------------------------------------------------------------------------- VI
ZUSAMMENFASSUNG--------------------------------------------------------------------------------------------------------------- VII
TABLE OF CONTENTS --------------------------------------------------------------------------------------------------------------VIII
LIST OF TABLES ------------------------------------------------------------------------------------------------------------------------ XI
LIST OF FIGURES ---------------------------------------------------------------------------------------------------------------------- XII
LIST OF PLATES ----------------------------------------------------------------------------------------------------------------------- XIII
ABBREVIATIONS ----------------------------------------------------------------------------------------------------------------------XIV
CHAPTER ONE: GENERAL INTRODUCTION -------------------------------------------------------------------------------1
1.1 BACKGROUND TO THE STUDY ----------------------------------------------------------------------------------------------------1
1.2 PRESENTATION OF THE STUDY AREA -------------------------------------------------------------------------------------------5
1.2.1 An Overview of Cameroon ---------------------------------------------------------------------------------------------5
1.2.2 An Overview of Limbe ---------------------------------------------------------------------------------------------------6
1.2.2.1 Geology of Limbe -------------------------------------------------------------------------------------------------------------- 8
1.2.2.2 Climate of Limbe ------------------------------------------------------------------------------------------------------------- 12
1.3 STATEMENT OF THE PROBLEM ------------------------------------------------------------------------------------------------- 17
1.4 HYPOTHESES OF THE STUDY --------------------------------------------------------------------------------------------------- 18
1.5 OBJECTIVES OF THE STUDY ---------------------------------------------------------------------------------------------------- 19
CHAPTER TWO: METHODOLOGY -------------------------------------------------------------------------------------------- 20
2.1: GENERAL REVIEW ------------------------------------------------------------------------------------------------------------------ 20
2.2 SITE VISIT -------------------------------------------------------------------------------------------------------------------------- 20
2.3 SAMPLE COLLECTION ----------------------------------------------------------------------------------------------------------- 21
2.4 DATA ANALYSIS ------------------------------------------------------------------------------------------------------------------- 22
2.5 PRESENTATION AND DISCUSSION OF RESULTS ----------------------------------------------------------------------------- 23
CHAPTER THREE: LITERATURE REVIEW ------------------------------------------------------------------------------- 24
3.1 SOLID WASTE MANAGEMENT -------------------------------------------------------------------------------------------------- 24
3.1.1 Definition of Waste and Integrated Waste Management ----------------------------------------------------- 25
3.1.2 Types of Solid Waste --------------------------------------------------------------------------------------------------- 26
3.1.3 Municipal Solid Waste ------------------------------------------------------------------------------------------------- 26
3.1.4 Municipal Solid Waste Management (MSWM) Systems ------------------------------------------------------ 27
3.2 LANDFILL -------------------------------------------------------------------------------------------------------------------------- 29
3.2.1 Definition and Types of Landfills ----------------------------------------------------------------------------------- 29

ix
3.2.2 Municipal Solid Waste or Sanitary Landfill --------------------------------------------------------------------- 30
3.2.3 Landfill Site Selection and Investigation ------------------------------------------------------------------------- 31
3.2.3.1 Site Selection ------------------------------------------------------------------------------------------------------------------ 31
3.2.3.2 Site Investigation ------------------------------------------------------------------------------------------------------------- 35
3.2.4 Groundwater Monitoring --------------------------------------------------------------------------------------------- 37
3.2.5 Stages of landfill development and design ----------------------------------------------------------------------- 38
3.3 GROUNDWATER AND AQUIFER ------------------------------------------------------------------------------------------------ 39
3.4 GROUNDWATER CONTAMINATION FROM LANDFILLS/WASTE DISPOSAL SITES --------------------------------------- 42
3.4.1 Important Terms Related to Contamination --------------------------------------------------------------------- 45
3.4.2. Landfill Leachate and Gas ------------------------------------------------------------------------------------------- 46
CHAPTER FOUR: WASTE MANAGEMENT AND GROUNDWATER IN LIMBE ---------------------------- 49
4.1 WASTE MANAGEMENT IN CAMEROON ---------------------------------------------------------------------------------------- 49
4.2 ENVIRONMENTAL IMPACT ASSESSMENT ON WASTE MANAGEMENT IN CAMEROON ---------------------------------- 53
4.3 WASTE MANAGEMENT IN LIMBE ----------------------------------------------------------------------------------------------- 54
4.3.1 Waste Composition in Limbe ---------------------------------------------------------------------------------------- 54
4.3.2 Waste Management Practice in Limbe ---------------------------------------------------------------------------- 55
4.3.2.1 Waste Collection Methods ------------------------------------------------------------------------------------------------- 55
4.3.2.2 Waste Management by LUC ----------------------------------------------------------------------------------------------- 56
4.3.2.3 HYSACAM and Waste Management in Limbe ----------------------------------------------------------------------- 59
4.3.2.4 Problems faced at HYSACAM -------------------------------------------------------------------------------------------- 64
4.4 STATE OF GROUNDWATER IN THE LIMBE MUNICIPALITY ----------------------------------------------------------------- 65
CHAPTER FIVE: RESULTS AND DISCUSSION --------------------------------------------------------------------------- 69
5.1 FIELD VISIT AND OBSERVATIONS ---------------------------------------------------------------------------------------------- 69
5.1.1 The Karata Dump site ------------------------------------------------------------------------------------------------- 69
5.1.2 The Motowoh Area and Dump site --------------------------------------------------------------------------------- 73
5.1.3 Sample Collection Sites ----------------------------------------------------------------------------------------------- 78
L1: Cold water spring (Mile 2 Extension) ------------------------------------------------------------------------------------------- 78
L2: Spring (New Town Cemetery) ---------------------------------------------------------------------------------------------------- 78
L3: Well (Crab Quarters) ---------------------------------------------------------------------------------------------------------------- 79
L4: Well (Community Quarters) ------------------------------------------------------------------------------------------------------- 80
L5: Well beside FATECOL-Motowoh ----------------------------------------------------------------------------------------------- 81
L6: Well (Clerks Quarters) -------------------------------------------------------------------------------------------------------------- 82
L7: Borehole near Karata Dump Site ------------------------------------------------------------------------------------------------- 84
5.2 ONSITE AND LABORATORY ANALYSES----------------------------------------------------------------------------------------- 86
5.2.1 On-site analysis in Cameroon --------------------------------------------------------------------------------------- 87
5.2.2 Microbiological Analysis in Cameroon --------------------------------------------------------------------------- 89
5.2.3 Analysis in Cameroon ------------------------------------------------------------------------------------------------- 92
5.2.4 Analysis in Germany ------------------------------------------------------------------------------------------------- 100

x
5.3 STATISTICAL ANALYSIS--------------------------------------------------------------------------------------------------------- 101
CHAPTER SIX: CONCLUSION AND RECOMMENDATIONS ----------------------------------------------------- 105
6.1 CONCLUSION -------------------------------------------------------------------------------------------------------------------- 105
6.2 RECOMMENDATIONS ----------------------------------------------------------------------------------------------------------- 109
REFERENCES--------------------------------------------------------------------------------------------------------------------------- 116
BOOKS ------------------------------------------------------------------------------------------------------------------------------------ 116
BOOK ARTICLES ------------------------------------------------------------------------------------------------------------------------ 117
JOURNALS, REPORTS, CONFERENCE PAPERS AND NEWSPAPERS ------------------------------------------------------------- 117
UNPUBLISHED WORK AND NOTES --------------------------------------------------------------------------------------------------- 121
INTERNET -------------------------------------------------------------------------------------------------------------------------------- 122
APPENDICES ---------------------------------------------------------------------------------------------------------------------------- 124
APPENDIX I: WASTE COLLECTION PROGRAMME FOR HYSACAM -------------------------------------------------------------------- 124
APPENDIX II: LABORATORY CERTIFICATE FROM CBC MUTENGENE-CAMEROON ----------------------------------------------------- 131
APPENDIX III: CERTIFICATE OF RESULTS FROM BTU COTTBUS, GERMANY ------------------------------------------- 134

xi
LIST OF TABLES
Table 1: Intensity of threats in the Limbe Council (area in km²) ........................................................................... 9 Table 2: Key geographical variables around Mount Cameroon .......................................................................... 12 Table 3: Climatic variables, form of data supplied by CDC, basic values calculated and recording equipment used
......................................................................................................................................................... 13 Table 4: Summary of monthly rainfall, temperature and sunshine in Mokundange and Mabeta, Limbe ............ 13 Table 5: Annual monthly totals of rainfall (mm) ................................................................................................ 16 Table 6: Water and soil samples collection stations ........................................................................................... 22 Table 7: List of sample collection stations .......................................................................................................... 22 Table 8: Typical treatment and disposal methods for different types of waste .................................................. 25 Table 9: Contaminants produced from waste incineration ................................................................................. 28 Table 10: Criteria for site selection .................................................................................................................... 32 Table 11: Definitions and significance of siting criteria ...................................................................................... 32 Table 12: Roles and responsibilities of key ministerial departments related to waste management in Cameroon
......................................................................................................................................................... 50 Table 13: Key legislative aspects related to waste management in Cameroon ................................................... 51 Table 14: Waste collection timetable for Limbe adapted from HYSACAM timetable .......................................... 59 Table 15: Microbial analysis of four water samples in Limbe ............................................................................. 66 Table 16: Water bacteria and the diseases they cause ...................................................................................... 67 Table 17: The occurrence of water-borne diseases in Limbe .............................................................................. 67 Table 18: Physico-chemical analysis of four water samples ............................................................................... 68 Table 19: Classification of water hardness ......................................................................................................... 68 Table 20: Total annual rainfall of study area and adjoining regions ................................................................... 70 Table 21: Observed data from shallow wells in the Motowoh wetland area ...................................................... 77 Table 22: Deep-well data along foot-hills of the Motowoh wetland area ........................................................... 77 Table 23: GPS readings taken at various sample sites on April 19th 2010 ........................................................... 87 Table 24: Depth, temperature and pH done on-site (April 20th 2010) ................................................................. 89 Table 25: Results of microbial analysis .............................................................................................................. 90 Table 26: Results of physico-chemical analysis in Cameroon.............................................................................. 93 Table 27: Results of physico-chemical analysis three weeks after sample collection and transportation in
Cottbus, Germany ........................................................................................................................... 100 Table 28: Pearson correlation (analytical results from Cameroon) ................................................................... 102 Table 29: Pearson correlation (analytical results from Cottbus) ....................................................................... 104

xii
LIST OF FIGURES
Figure 1: Map of Cameroon showing its regional and international boundaries .................................................. 6 Figure 2: Map of the divisions of South West Region in Cameroon ...................................................................... 7 Figure 3: Map of Limbe ....................................................................................................................................... 7 Figure 4: A) Geographic location of Cameroon showing Cameroon Volcanic Line. B) Geological map of part of
West Africa showing the Cameroon volcanic line of rocks (black) and the Benue trough (stippled). The boundary between continental and oceanic crust are shown as bold broken lines. ............................. 8
Figure 5: Generalized profile of a typical scoriaceous cone showing the layered strata of the cones. Layering in some cases is not always visibly obvious in some pyroclastic cones ................................................... 11
Figure 6: Land use map of Limbe ....................................................................................................................... 12 Figure 7: Typical elements of a solid waste management system in low- or middle-income countries ............... 27 Figure 8: Types of Landfill .................................................................................................................................. 29 Figure 9: Landfilling-sources of impacts and effects on the environment ........................................................... 31 Figure 10: Scheme of the Multiple Barrier Concept (MBC) ................................................................................. 37 Figure 11: Components of a waste landfill capping barrier ................................................................................ 39 Figure 12: Groundwater resources of the world WHYMAP (simplified after the 1: 50 000 000 scale version of the
map; source: BGR, Hannover) ........................................................................................................... 40 Figure 13: Types of aquifers .............................................................................................................................. 41 Figure 14: Potential sources of groundwater contamination ............................................................................. 42 Figure 15: The water cycle and potential sources of groundwater contamination ............................................. 43 Figure 16: Vertical movement of contaminants along an old, abandoned or improperly constructed well ......... 44 Figure 17: Schematic sketch of Beddington recirculation trial geometry ............................................................ 46 Figure 18: Details of the stages of waste degradation in landfills ...................................................................... 47 Figure 19: Landfill gas composition and landfill gas wells .................................................................................. 48 Figure 20: Main stages of waste degradation in a landfill ................................................................................. 48 Figure 21: Existing patterns of solid waste management processes in Cameroon .............................................. 52 Figure 22: Typical composition of waste from different locations across Limbe ................................................. 55 Figure 23: Distribution of portable water supply in Limbe.................................................................................. 66 Figure 24: The morphological Settings of the Karata dumpsite ensconced by the horse-shoe string of scoriaceous
hills ................................................................................................................................................... 72 Figure 25: The assemblage of hills that give the horse-shoe formation in Figure 24 ........................................... 72 Figure 26: New Town Cemetery (Limbe) with its plateau-like location in relation to the housing located
southwards behind it ........................................................................................................................ 75 Figure 27: Wetland environment underlain by alluvium and scoriaceous deposits ............................................. 76 Figure 28: Elevated foot-hill slope areas of the Motowoh wetland environment................................................ 77 Figure 29: Limbe built-up and extension zones .................................................................................................. 86 Figure 30: Location of sample collection sites on the Limbe portable water map of Limbe ................................. 88 Figure 31: Percentage of each measured parameter at different sample sites ................................................... 95 Figure 32: Analysis of TDS and TH ..................................................................................................................... 95 Figure 33: Analysis of Ca2+, Mg2+, Cl-, HCO3
-, SO42- and NO3
- ............................................................................... 97 Figure 34: Analysis of Na
+, NH4
+ and K
+.............................................................................................................. 98
Figure 35: Different sample sites showing the occurrence of different compounds ............................................ 99 Figure 36: Flow chart for a search for a new waste disposal site (pragmatic approach) ................................... 112 Figure 37: Proposed steps for processing MSW at the source adapted from Notes of Prof. Gunter Busch ........ 113

xiii
LIST OF PLATES
Plate 1: Illustration of layered strata of pyroclastic and scoriaceous hills and cones .......................................... 10 Plate 2: Slaughter house dumpsite in Limbe ...................................................................................................... 57 Plate 3: New Market dumpsite; waste dumped by the local people with no access to public bins ...................... 58 Plate 4: Open dumps in slums and unplanned areas created by the local people ............................................... 58 Plate 5: Waste site at Karata and trucks used by HYSACAM for waste disposal ................................................. 60 Plate 6: Types of trucks used in waste disposal by HYSACAM............................................................................. 61 Plate 7: Cleaning a very dirty, but tourist-attractive area in Limbe (Limbe Down Beach) ................................... 63 Plate 8: Waste disposed at Karata dumpsite extending to road leading to Mokundange ................................... 65 Plate 9: Method of disposal at Karata; a) burning waste, b) smoke/vapour from waste, c) already burnt waste
ready for backward push, d) new waste disposed on cleared area .................................................... 69 Plate 10: Waste site, waste types, hills and plants around waste site and waste scavengers: a) Hill around
waste, b) Soil in waste dumpsite, c) Plantation and farms around waste and guard’s hut, d) Pushed back waste with scavenging vultures, e) Types of waste dumped at Karata, f) Pungent smoke from waste which is choking. .................................................................................................................... 71
Plate 11: Smoke from farm/plantation near waste. Smoke from waste can be seen from the Karata CDC camp (right) near the road about 2km away .............................................................................................. 73
Plate 12: Slaughter house and New Market dump sites ..................................................................................... 74 Plate 13: Different wells in the Motowoh area .................................................................................................. 75 Plate 14: Spring near cemetery used by local people for washing clothes .......................................................... 76 Plate 15: The German Spring ............................................................................................................................. 78 Plate 16: Spring water in February 2009 with one lived in abandoned house. .................................................... 79 Plate 17: In April 2010: Inhabitants in abandoned house (2009) near spring and another house undergoing
construction on the opposite side ..................................................................................................... 79 Plate 18: Well that shares boundary with wall of bathroom/toilet .................................................................... 80 Plate 19: February 2009: Dry season yet water is dirty and at the surface ......................................................... 80 Plate 20: April 2010: After a rainy night, water is very dirty and flows out of the well. Area around well has been
cleared for farming purposes and strong winds fell plantain tree ...................................................... 81 Plate 21: Well in February 2009: In the dry season water is a little clear ............................................................ 81 Plate 22: Well in April 2010: dirty water after rainfall the previous night........................................................... 82 Plate 23: Sample well in February 2009: Few plants, littered unsorted waste, piggery and the closest toilet to
this well ............................................................................................................................................ 83 Plate 24: Sample well in April 2010 (rainy season) with more plants and dirt .................................................... 83 Plate 25: Small exposed well with pit toilet and bathroom very close to it. Water in this well is very dirty with
particles, tadpoles and frogs. Well water has a very pungent odour ................................................. 83 Plate 26: Well in February 2009 (Lim 8 of samples for analysis in 2009) with dirty water and many particle and
same well in April 2010 now dried up and used as a waste pit (almost full)....................................... 84 Plate 27: Waste, plants and animal stalls around wells ..................................................................................... 84 Plate 28: View from borehole location. a) Karata dump can be seen from this point. b) Borehole tank which
supplies the public with water .......................................................................................................... 85 Plate 29: Borehole near Karata waste site ......................................................................................................... 85
xiv
ABBREVIATIONS
3Rs Reuse Reduction Recycling
5Rs Reduce, Reuse, Recycle, Recovery and Residual
ALUCAM Aluminium Cameroon (Compagnie Camérounaise de l’Aluminium)
ARP Authority for Regional Planning
BDCP Bio-resource Development and Conservation Program
BEAC Banque des États de L'Afrique Centrale (Bank of Central African States)
BMBF Bundesministerium für Bildung und Forschung (German Federal Ministry of
Education and Research)
BOD Biological Oxygen Demand
BTU Brandenburg Technical University, Cottbus
CAR Central African Republic
CBC Cameroon Baptist Convention
CBD Convention on Biodiversity
CDC Cameroon Development Corporation
CEC Cation exchange capacity
CFU Coliform Forming Units
CNN Cable News Network
COD Chemical Oxygen Demand
CVL Cameroon Volcanic Line
EBA Endemic Bird Species
EC Electric Conductivity
EIA Environmental Impact Assessment
EU European Union
FCFA Franc of the Financial Community of Africa
FEICOM Fonds Spécial d’Equipement et d’Intervention Intercommunale (French: Special
Council Support Fund)
GDP Goss Domestic Production
GIS Geographic Information System
GLP Good Laboratory Practices

xv
GPS Global Positioning System
GRA Govermnent Residential Area
HHW Household Hazardous Waste
HYSACAM Hygienne et Salubrité du Cameroun
ICMWM Inter-Ministerial Commission for Municipal Waste Management in Cameroon
IDRC International Disaster and Risk Conference
IMC Inter Ministerial Committee
IPR International Property Right
IR Institute Responsible
ITCZ Inter-Tropical Convergence Zone
IWM Integrated Waste Management
LAR Local authority responsible
LUC Limbe Urban Council
MBC Multiple Barrier Concept
MINDUH Ministry of Urban Development and Housing
MINEFI Ministry of Economy and Finance
MINEP Ministry of Environmental and Nature Protection
MINET Ministry of Environment and Technology
MINMITD Ministry of Mines, Industries and Technological Development
MINPH Ministry of Public Health
MINTAD Ministry of Territorial Administration and Decentralisation
MSW Municipal Solid Waste
MSWM Municipal Solid Waste Management
NA Not available
NGO Non-Governmental Organisation
NNW North North West
OAPI African Intellectual Property Organisation
ONADEF Organisation Nationale pour le Développement Forestière
Pilcam Battery Manufacturing Company Cameroon
QC Quality Control

xvi
RASIM Recommended Areas for Site Investigation Map
RCRA Resource Conservation and Recovery Act
SAP Structural Adjustment Programme
SNEC Société Nationale des Eaux du Cameroun (National Water Supply Company
Cameroon)
SONARA Société Nationale de Raffinage (Cameroon Oil Rifinery)
SPG Strategic Planning Guide
SS Quarters Senior Service Quarters
SSW South South West
TASi Technical Instructions of Waste for Human Settlement
TDS Total Dissolved Solids
TH Total Hardness
TOC Total Organic Carbon
UNEP United Nations Environmental Programme
UPOV Union for the Protection of New Variety of Plants
USRCRA United States Resource Conservation and Recovery Act
WB World Bank
WHO World Health Organisation
WMO World Meteorological Organisation

1
CHAPTER ONE: GENERAL INTRODUCTION
1.1 Background to the Study Today, many countries suffer from the depletion of natural resources as a result of
population increase and industrialisation. Owing to these developments, it has become more
urgent than ever before to take precautionary measures in view of repairing the already
existing damages and to prevent expected (future) hazards. Resources to be protected include
water, soil and air which suffer pollution from landfills, industrial sites and other areas used
by man (Knödel et al, 2007).
Water is one of the most valuable natural resources, because it supplies both the
animal and plant kingdoms with daily substances as well as provides highways for
transportation (Wisler and Brater, 1959). Without water, no form of life will be possible.
However, it can also be a source of destruction through floods and storms as it affects life,
transports waste to soil (through groundwater percolation) and other water bodies; erodes and
carries away many tons of fertile soil into the sea. Unfortunately, the current global increase
in population has enhanced increased demand for water resources.
The availability of water varies from one point (zone) to the next, that is, it varies from
the unlimited water supply in some mountain areas to nearly nothing in desert regions (Wisler
and Brater, 1959). The earth holds about 300 000 000 m3 of water beneath the land surface,
on the surface, and in the atmosphere, which is in constant motion in what is referred to as the
hydrologic cycle. The most important components of the hydrologic cycle are precipitation
and run-off. Others include evaporation, infiltration, transpiration, percolation, groundwater
recharge, interflow and groundwater discharge (Ward and Elliot, 1995).
Groundwater is a very important resource which is undergoing a lot of contamination
and must be protected. This is water found beneath the ground surface and constitutes about
4% of water in the hydrologic cycle (Wanielista et al, 1997; Ward and Elliot, 1995). It is the
most important source of drinking water in many parts of the world because it is believed to
be the safest source of pure water; but it is very vulnerable to contamination. It is also
believed that groundwater is an inexhaustible resource, but reality has proven it to show signs
of scarcity (Wisler and Brater, 1959). Over-pumping of this resource encourages the
infiltration of surface water which goes along with its pollutants (Botkin and Keller, 1995).
Groundwater is the main source of drinking water for more than 80% of the population
in Germany. In rural areas, 85-90 percent of the residents obtain their drinking water from
groundwater sources. Because of the importance to maintain the supply of good drinking
water quality, groundwater therefore merits protection from contamination. The movement of
contaminants through the soil to groundwater is dependent on many variables like the
properties of the contaminants, soil conditions, the nature of the underlying substratum, its
tectonic history as well as the prevailing climatic factors. A combination of these factors
makes the likelihood of groundwater contamination a very site-specific science. A thorough

2
understanding of these processes and variables is consequently critical for the effective
management of potential groundwater contaminants.
Groundwater located anywhere near a landfill must be monitored because of the
possibility of leachate formation and infiltration. Once a landfill site has been chosen, and
before filling starts, groundwater monitoring should begin. Monitoring involves a periodic
taking of water samples and gas from designed monitoring wells and this should go on as long
as there is a probability of contamination. This procedure should continue even after the
landfill is permanently closed and covered. This is because closed landfill sites are always
used for other purposes, and any small depression can collect surface water that can infiltrate
and produce leachate. Abandoned landfills should also undergo monitoring and proper
maintenance in order to reduce its pollution potential (Botkin and Keller, 2003).
Industrial societies have important infrastructure like waste disposal (landfill), mining
and industrial sites, which require suitable sites for construction. These sites are often difficult
to obtain because of the need for political approval, which will only be easy if state-of-the-art
methods are used to portray that barriers can prevent environmental contamination. Areas
with both consolidated and unconsolidated rock are suitable sites for landfill construction
(Knödel et al, 2007). More so, the disposal of waste is of great concern to those who are
interested in building a sustainable future, because it squanders the earth’s resources - the
more we throw away, the more minerals that must be mined and the more trees that must be
cut. Moreover, it is clear that much waste is generated than the acceptable space that is
available for permanent disposal (Botkin and Keller, 1995). Municipal Solid Waste (MSW-
garbage like discarded paper, metal, leftover food and other items from homes, businesses,
hospitals, airports, schools and stores in towns and cities) is the most generated waste
worldwide (Chiras, 1998).
The problem is that most waste is transferred from one point to another without
adequate management. For example, waste generated in urban areas when dumped in a
landfill might produce methane (CH4) and noxious liquids that cause air pollution, and could
also leak and contaminate the surrounding areas and groundwater (Botkin and Keller, 1995).
As a result, waste must be properly managed (that is, sorted, reused, recycled, reduced and
treated) before final disposal in order to ensure public health and safety. In Germany, waste
dumped in a municipal landfill should contain no more than 2% of organic matter. Waste
disposal can be achieved through the following methods: on-site disposal, composting,
incineration, open dumps and landfills.
Landfilling is the engineered deposit of waste onto or into land in such a way that
pollution or harm to the environment is prevented, and through restoration, land provided
which may be used for another purpose. The prevention of environmental harm requires
effective control of waste degradation processes and effective landfill design, engineering and
management (Westlake, 1995). Landfills can be divided into secure and sanitary landfills.
Secure landfills are designed specifically for hazardous waste, while sanitary landfills are for
municipal solid waste. Secure landfills are similar to sanitary landfills because they require
multiple barriers and collection systems to ensure that leachate does not contaminate the soil
and other resources (Botkin and Keller, 2003).

3
This study lays special emphasis on the construction of sanitary landfills because they
are most appropriate for municipal solid waste disposal. A sanitary landfill according to
Chiras, (1998) is defined as a solid waste disposal site where garbage is dumped and covered
daily with a layer of soil to reduce rodents, insects and odour. He also goes further to say that
this could be a natural or man-made depression into which solid wastes are dumped,
compressed and covered daily with a layer of dirt. It is a method of solid waste disposal
without creating a nuisance or hazard to public health and safety (Botkin and Keller, 2003).
In spite of the fact that sanitary landfills are generally unsustainable, they can be made
more environmentally acceptable if they are located away from groundwater supplies and if
toxic leachate is collected and treated, and methane gas captured (Chiras, 1998). The name
sanitary landfill comes from the fact that the waste is covered. The compacted layer of a
landfill performs the following functions:
Restricts continued access to waste by insects, rodents and other animals
Isolates the refuse, therefore minimising the amount of surface water percolating
and gas escaping from the waste.
Groundwater contamination can also be reduced if the landfill is located away from
streams, lakes and aquifers. Test wells dug around the landfill can be used to monitor and
control the movement of pollutants away from waste sites. Special drainage systems together
with careful landscaping can reduce water flow over the landfill surface and consequently the
amount of water that penetrates and percolates the landfill. Impermeable clay caps and liners
also reduce water infiltration and pollutant escape. Also, escaping contaminants/pollutants can
be collected through specially built drainage systems for detoxification (Chiras, 1998).
Global world statistics indicate that about 1.3 billion people lack access to adequate
supply of safe water, while 2 billion people do not have access to adequate sanitation (UNEP
et al, 1997; CNN News, 2006). However, it is important to note that the most important
hazard from a sanitary landfill is ground and surface water contamination. Groundwater will
be contaminated if it gets in contact with percolating water called leachate, which is any
noxious mineralised liquid that is capable of transporting bacterial pollutants. It is produced
when water (precipitation, surface water infiltration, water percolating from adjacent land and
contact between groundwater and landfill) infiltrates through waste material and becomes
contaminated and/or polluted (Botkin and Keller, 1995; 2003). Important pollutants found in
leachate include BOD, COD, Fe, Mn, chloride, nitrate, hardness and trace elements (Todd and
Mays, 2005).
However, the nature and strength of leachate is determined by the waste composition,
the amount of percolating water and the length of time that percolating water is in contact
with waste (Botkin and Keller, 2003). This is due to the fact that the moisture content of
ordinarily mixed waste is less than waste of field capacity (Todd and Mays, 2005).Leachate
from landfill and waste sites can be minimised if water is kept away from the fill. Landfill
leachate could be controlled and prevented from contaminating groundwater if the landfill is
properly located, constructed, managed and monitored.

4
There is a serious problem of waste disposal in developing countries, particularly in
Africa. In Cameroon, for example, waste disposal is a serious problem as most towns and
cities practise open dumping which is not healthy. There is actually no set system for the
collection of waste. Medical and household wastes, for example, are jointly disposed off in
many Cameroonian towns. However, there are laws that govern waste management, even
though these are hardly implemented. For example, Law No. 96/12, Environmental
Management Law states that any person producing waste shall eliminate or recycle it and is
required to inform the public of the effects of its production, elimination or recycling on the
environment and public health. Also, Law 89/027 forbids the introduction, production,
storage, transportation and disposal of hazardous waste in Cameroon. Nonetheless, it makes
flexible provision for projects that generate hazardous waste. The owner of such a project is
required to declare the volume and nature of waste produced, as well as he should ensure its
elimination without danger to man and his environment. The highest penalty in case of
infraction is the death penalty (Geovic Cameroon, 2007). However, these regulations are
unfortunately not implemented in most Cameroonian towns.
In Cameroon, like many African countries, waste management is poorly practised.
Results of a research carried out by Manga et al, (2007) indicate that solid waste management
services are rudimentary; they essentially collect and dump waste without proper management
methods. This form of management is due to factors like inadequate financial resources, low
levels of law enforcement and poor governance, lack of human resource, only to name a few.
Moreover, current regulations do not adequately address waste handling or disposal and there
exist an inefficient implementation of waste management policies and documentation due to
the devolved responsibilities between several governmental agencies and the local councils
(Manga et al, 2007). This scarcity of literature is inadequate for the proper functioning of
waste management units. In effect, waste management in Limbe is inefficient in hazard
minimisation since sustained efforts have not been made in the direction of waste collection,
transportation, treatment and final disposal.
The case of the Limbe Urban Council (LUC) has thus been used to emphasise some of
the waste management related problems in Cameroon. Literature on waste management
(collection, transportation, treatment, reuse, recycling, recovery and disposal) in Cameroon is
often very scarce and/or non-existent. This hampers an evaluation of the existing situation and
a comparison with other countries.
The sustainable management of solid waste systems is absolutely necessary in order to
minimise environmental and public health risks worldwide (Manga et al, 2007). The balance
between the specific components of this system in delivering sustainable waste management
are already well understood and established in most developed countries, unlike in some
developing countries like Cameroon. Waste management could be efficient through the
involvement of all stakeholders, that is, the waste generators, waste processors, formal and
informal sectors, financial institutions and private initiatives such as non-governmental and
community based organisations (Manga et al, 2007).
5
1.2 Presentation of the Study Area
1.2.1 An Overview of Cameroon
The Republic of Cameroon which is found in the Central African Region (2°-13°N
and 8°-16°E) is situated on the extreme north-eastern end of the Gulf of Guinea. This makes it
exposed to a very large variety of natural hazards, some of which are associated with volcanic
activity. Such hazards are concentrated around the Cameroon Volcanic Line (CVL),
especially around Mt. Cameroon, which is associated with effusive and explosive types of
activity (Zogning et al, 2009). Cameroon also shares boundaries with the Atlantic Ocean,
Nigeria, Central African Republic, Equatorial Guinea, Gabon and Congo Brazzaville (Fig. 1).
Cameroon is actually located between Central and West Africa, but belongs to the Central
African Union. It has a surface area of 469,440km² and population of about 20 million
inhabitants (Manga et al, 2007; Eyong and Mbuagbo, 2003).
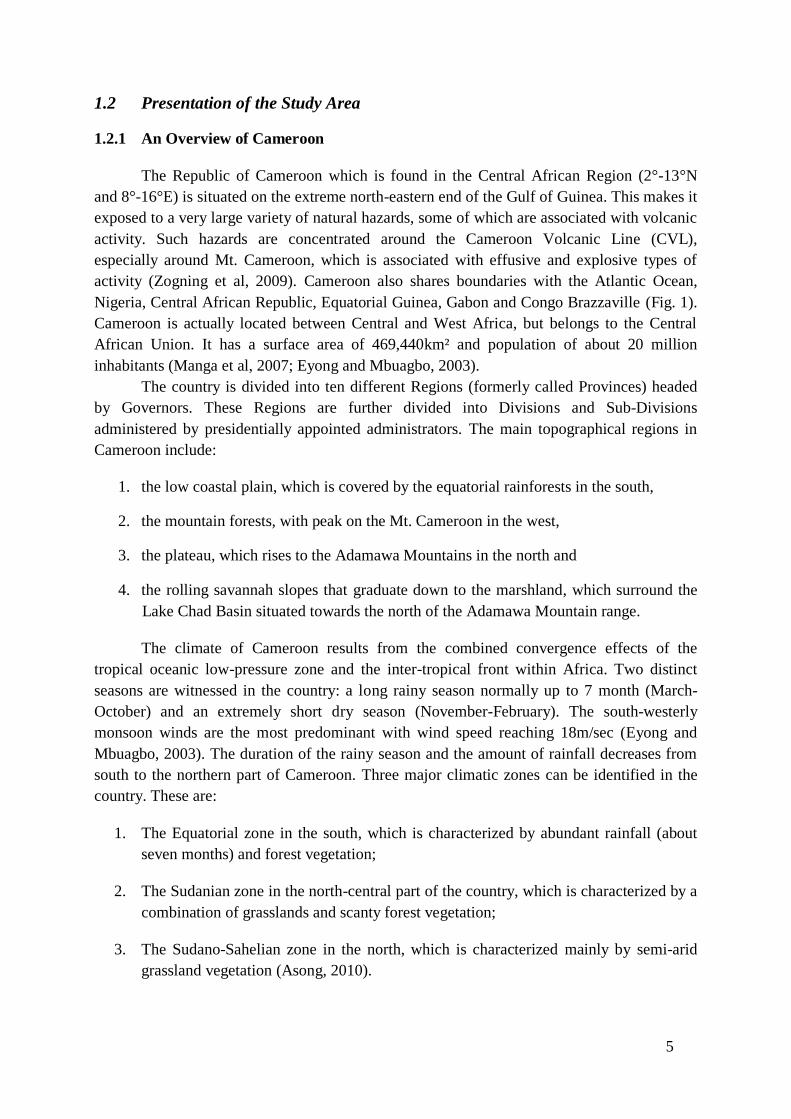
The country is divided into ten different Regions (formerly called Provinces) headed
by Governors. These Regions are further divided into Divisions and Sub-Divisions
administered by presidentially appointed administrators. The main topographical regions in
Cameroon include:
1. the low coastal plain, which is covered by the equatorial rainforests in the south,
2. the mountain forests, with peak on the Mt. Cameroon in the west,
3. the plateau, which rises to the Adamawa Mountains in the north and
4. the rolling savannah slopes that graduate down to the marshland, which surround the
Lake Chad Basin situated towards the north of the Adamawa Mountain range.
The climate of Cameroon results from the combined convergence effects of the
tropical oceanic low-pressure zone and the inter-tropical front within Africa. Two distinct
seasons are witnessed in the country: a long rainy season normally up to 7 month (March-
October) and an extremely short dry season (November-February). The south-westerly
monsoon winds are the most predominant with wind speed reaching 18m/sec (Eyong and
Mbuagbo, 2003). The duration of the rainy season and the amount of rainfall decreases from
south to the northern part of Cameroon. Three major climatic zones can be identified in the
country. These are:
1. The Equatorial zone in the south, which is characterized by abundant rainfall (about
seven months) and forest vegetation;
2. The Sudanian zone in the north-central part of the country, which is characterized by a
combination of grasslands and scanty forest vegetation;
3. The Sudano-Sahelian zone in the north, which is characterized mainly by semi-arid
grassland vegetation (Asong, 2010).

6
Figure 1: Map of Cameroon showing its regional and international boundaries
Source: Manga et al, 2007
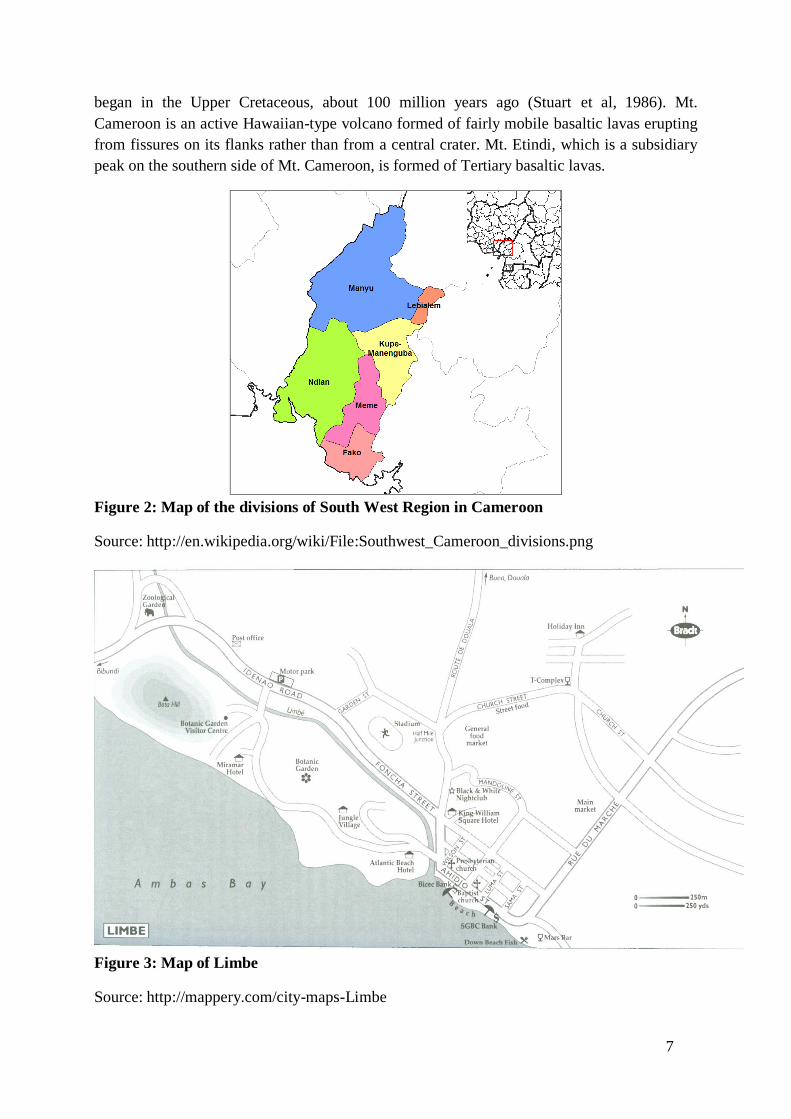
1.2.2 An Overview of Limbe
Limbe, located along the rocky coast of Cameroon, is found in the South West
Region. It is the capital of Fako Division and Limbe Sub-division (Figs. 2 and 3), and is made
up of more than 25 villages (Buh, 2009). It is a coastal city found along the Gulf of Guinea
located between longitude 9° 13’ and latitude 4° 1’ north of the equator (Awemo, 2000;
Awum et al, 2001). It has a total area of about 674km2 with an estimated population of about
120.000 inhabitants. The annual growth rate is at about 2.9% compared to the national rate of
4.1% with a total of 18,508 houses according to statistics of 2009 (Asong, 2010; Awum et al,
2001; Manga et al, 2007; World Bank, 2002; Zogning et al, 2009). It is a City Council since
January 2008 with three sub-divisional councils, called Limbe I (POH), Limbe II (Munkundange
Council) and Limbe III (Bimbia Council) each headed by a Mayor and 2 deputies (Asong; 2010).
It is found at the foot of Mount Cameroon and Mount Etindi. Mt Cameroon is a vast
volcanic massif some 50km long and 35km wide with a height of 4100m and an area of about
3000km2 (Zogning et al, 2009). It is the highest mountain in West Africa, with Mt. Etinde
commonly referred to as small Mt. Cameroon, near it and with a height of 1713m. Hence, the
soils of Limbe are of volcanic origin and Limbe lies along the Cameroon Volcanic Line
(CVL). Western Cameroon and Fako Division in particular, lie on the junction of the West
African and Congo continental plates. Stresses and instability in this area have resulted in the
formation of a series of volcanoes of which Mt. Cameroon is the largest. Volcanic activity
7
began in the Upper Cretaceous, about 100 million years ago (Stuart et al, 1986). Mt.
Cameroon is an active Hawaiian-type volcano formed of fairly mobile basaltic lavas erupting
from fissures on its flanks rather than from a central crater. Mt. Etindi, which is a subsidiary
peak on the southern side of Mt. Cameroon, is formed of Tertiary basaltic lavas.
Figure 2: Map of the divisions of South West Region in Cameroon
Source: http://en.wikipedia.org/wiki/File:Southwest_Cameroon_divisions.png
Figure 3: Map of Limbe
Source: http://mappery.com/city-maps-Limbe

8
Mount Cameroon is a stratovolcano-tectonic massive made dominantly of basaltic
rock above a basement of Precambrian metamorphic rocks that is covered with Cretaceous to
Quaternary sediments (Zogning et al, 2009). It is relatively very active, with eruption from
fissures on the flanks and the summit of the mountain. These eruptions have been recorded to
have large flows of lava. The earliest reported eruption of Mt Cameroon dates as far back as
2.500 BP, witnessed by the Carthaginian explorer, Hanno. Eruptive activity on the mountain
was reported only from the early 19th
Century, where a total of seven eruptions were dated:
1815, 1835, 1838, 1839, 1852, 1865-66 and 1868. Seven other eruptive activities occurred in
the 20th
Century, in 1909, 1922, 1954, 1959, 1982, 1999 and 2000 (Lambi et al, 2001;
Zogning et al, 2009).
1.2.2.1 Geology of Limbe
Figure 4: A) Geographic location of Cameroon showing Cameroon Volcanic Line. B)
Geological map of part of West Africa showing the Cameroon volcanic line of
rocks (black) and the Benue trough (stippled). The boundary between
continental and oceanic crust are shown as bold broken lines.
Source: Zogning et al, 2009
Limbe is found in an active and dynamic coastal zone that is characterized by a variety
of natural hazards like, geological, geomorphological, geophysical and climatic hazards
(Kometa, 2010; Zogning et al, 2009). It also belongs to the Cameroon Volcanic Line (CVL),
which is a 1600km y-shaped chain of Tertiary to Recent volcanic rocks (Ubangoh et al, 1998;
Zogning et al, 2009). The CVL is a South-West North-East volcano-tectonic trend that
straddles the continental margin. It extends some 900km across Cameroon from Biu and
Adamawa Plateaus to Mt. Cameroon, and Equatorial Guinea in the Gulf of Guinea. It
continues seaward for about 700km from the coast through the Atlantic Islands of Principe,
São Tomé and Pagalu (Ubangoh et al, 1998). In Figure 4, the red rectangle indicates the CVL,

9
the blue square indicates the Mount Cameroon area and the pink line indicates the border of
Cameroon (Zogning et al, 2009).
The fact that Limbe creates a link between the continental segment of the CVL and the
ocean explains why it is confined between surrounding hills and the Atlantic Ocean. These
hills are made up of scoriaceous cones that have been deeply weathered making them unstable
and highly vulnerable to slope movement. This further explains its vulnerability to floods,
earthquakes, landslides, mudflows and other natural hazards. Hence, human settlement on
such an area is dangerous. Table 1 below would enhance a better understanding of the level of
natural risks associated with Limbe. Unfortunately, food crop cultivation, for example, takes
place in 30km2 of very high hazard zones, that is, Limbe-Mabeta essentially and 50km
2 of
high hazard zone, that is, the slopes of Tamben-Misellele. Data in the Table were obtained
through the consideration of different stake values, which were quantified, such that the
number of inhabitants per locality, the level of importance relative to crisis management, the
evaluation of the unit cost of various infrastructures, the values of agricultural production and
others, could enable the establishment of a hierarchy as a function of the different periods of
crisis like out of crisis, pre-crisis, crisis and recuperation phase (Zogning et al, 2009).
Table 1: Intensity of threats in the Limbe Council (area in km²)
INTENSITY OF THREAT
Hazard weak Moderate High Very High Total
Lava 37.28 37.28
Fallback 170.41 170.41
Gas 170.41 170.41
Seismic 170.41 170.41
Lahar 6.29 6.29
Tidal wave 1.14 0.84 0.91 0.76 3.65
Inundation 8.31 1.17 10.11 9.53 29.12
Landslide 4.15 10.79 11.53 9.40 35.87
Deposit 22.43 22.43
Rockfall 4.26 7.24 8.40 8.22 28.12
Total 358.68 227.73 59.67 27.91 673.99
Source: Zogning et al, 2009
Limbe has experienced intermittent Tertiary volcanic activity in recent times. There
are igneous (basalt and pyroclastic materials) and sedimentary (mud rock or mudstone and
alluvial deposits) rocks found in this area. Sixty-six percent of the area is made of basalts
(partially affected by erosion), with scattered portions of sedimentary rocks and pyroclastic
material.

10
Basalts are of three types; vesicular (fine-grained and compacted with vesicles), fine-
grained (highly compacted with no traces of weathering) and porphyritic basalts. The
fine-grained basalts result from fast cooling of hot magma. Porphyritic basalts are either
Olivine crystals (hardly more than 1mm in size) or Augite (more abundant form in the
Limbe area) in origin. Basalts weather to dark red soils which form the best arable land
(Onege, 1998).
Pyroclasts are made up of fragmented volcanic material blown into the atmosphere by
explosive activity. They come from volcanoes with more viscous lava and can be
consolidated or unconsolidated. Unconsolidated pyroclasts include: volcanic bombs
(lava that solidified before reaching the ground), pumice and scoria (These are denser
than pumice and almost solidified when they reach the ground. They flatten out when
they fall to the ground because they are soft).
Mudstone/Mudrock is fine-grained sedimentary rock with clay or mud as its original
constituents. It has a grain size up to 0.0625mm and the individual grains are too small
to be distinguished without a microscope. This is deposited on basalts before pyroclasts.
It is brittle and dark in colour, and contains a certain amount of organic material.
Alluvial deposits are loose unconsolidated sediments which can be re-shaped and
transported by water. They consist mainly of sand, silt and organic material.
Plate 1: Illustration of layered strata of pyroclastic and scoriaceous hills and cones
This study focuses on the management of waste and groundwater contamination in
Limbe, which is the economic capital of the South West Region of Cameroon. Economically,
it is dominated by growing tourism, assorted commercial and industrial activities, and
plantation agriculture. Limbe is located near two important mountains in Cameroon, Mounts
Cameroon (in Buea) and Etindi (in Limbe). The central mountain dome consists of a mass of
volcanic rocks surrounded by a rim of sedimentary deposits. The rocks may be divided into
three main groups, namely, sedimentary deposits, Quaternary volcanic rocks and basement
complex rocks. The heart of the region consists of a vast thickness of volcanic rocks-lavas,
fine-grained ashes and coarse conglomerates which were poured out during long periods of
volcanic activity in the Holocene and Pliocene deposition, and sedimentary processes. These
include layers of volcanic materials representing mudflows among the volcanic materials. The

11
mountains (Mounts Cameroon and Etindi) are tectonic in origin and are surrounded at the foot
zone by pyroclastic and scoriaceous hills or cones as in Plate 1 and Figure 5.
The basement consists of Precambrian gneisses, schist, quartzite and some kinds of
plutonic rocks. Folded axes and faults in the basement rocks generally run from SSW to
NNW. These rocks make up a low relief erosion surface lying about 500m above sea level.
Reddish soils extensively cover the basement rocks except at the bottom of valleys (Awum et
al, 2001). The surface is covered with red or reddish brown soil.
In Limbe, sedimentary rocks of Cretaceous and Tertiary periods exist on the coastal
district. They consist of sand and gravel with mud beds and pyroclastic materials. Moreover,
this town is characterized by an irregular relief of high and lowland. This irregular lowland
relief erosion surface is less than 100m in height and agrees with the distribution of the
sedimentary formation (Asong, 2010; Kometa, 2010).
Figure 5: Generalized profile of a typical scoriaceous cone showing the layered strata of
the cones. Layering in some cases is not always visibly obvious in some
pyroclastic cones
A further description is that the town has a basin-like structure with a couple of topographic
elevations. However, its geomorphologic setting is defined by bays and headlands, and as a
result, it has a low lying land surface that grades into a hilly peripheral setting landwards.
Most of the low-lying areas are characterized by episodes of some degree of floods and
mudslides during the intense rainy season (June, July and August) coupled with the fact that
the water table is just a few meters below the surface. This also accounts for the swamps and
wetlands seen in this area (Asong, 2010; Awum et al, 2001). Apart from the torrential rainfall,
low-lying bedrocks are overlain by pyroclastic deposits with high susceptibility to coastal
erosion, prevailing winds and powerful sea waves, hence the floods, swamps and wetlands

12
(Asong, 2010; Kometa, 2010; Zogning et al, 2009). The drainage system in Limbe is very
poor and also enhances the occurrence of these hazards.
The land use map of Limbe (Figure 6) shows the different types of land activities that
take place in Limbe. The red portion shows the areas used by CDC as plantations of banana
and palm, the dark green patches are mangrove forests, the cream patches, especially
surrounded by the mangroves are sub-montane forests which have partially been undisturbed;
and the bluish-green patches represent areas used for industrial activities.
Figure 6: Land use map of Limbe
Source: Buh, 2009
1.2.2.2 Climate of Limbe
Limbe is a coastal town near the Atlantic Ocean. It experiences a tropical climate with
a rainy and dry season. Intermittent torrential rains lead to the overflow of small streams within
the city and trigger several voluminous torrents from highland areas towards the coast. In Limbe
and the Mount Cameroon Region, the CDC (Cameroon Development Corporation) has
maintained an extensive network of meteorological stations throughout their plantations. Until
1998, up to 40 active stations existed from which they could obtain climatic data. They also
have geographical data of the areas where these stations are found (Table 2).
Table 2: Key geographical variables around Mount Cameroon
Site Altitude (m) Distance from coast (km) Direction from coast
Mokoko 200 21 East

13
Idenau
Debundscha
Mokundange
Mabeta
Tole
Molyko
Mpundu
40
20
40
20
700
400
40
1
0.5
0.5
20
25
36
44
On the coast
On the coast
On the coast
In the mangroove creeks
North-East
North-East
North-East
Source: Fraser et al, 1998
Table 3: Climatic variables, form of data supplied by CDC, basic values calculated and
recording equipment used
Variable Form of data Statistics appended Recording equipment
Rainfall (mm)
Rainfall (days)
Monthly total
Monthly total
Mean, max and min
Mean, max and min
127mm diameter rainguage
Air temperature (°C)
Air temperature (°C)
Max monthly
Min monthly
Mean, max and min
Mean, max and min
Thermometer inside a Stephenson screen
Sunshine (hours)
Sunshine (days)
Monthly total
Monthly total
Mean, max and min
Mean, max and min
Campbell Strokes Pattern Mark 3 sunshine recorder
mounted on a 1m high concrete pillar
Source: Fraser et al, 1998
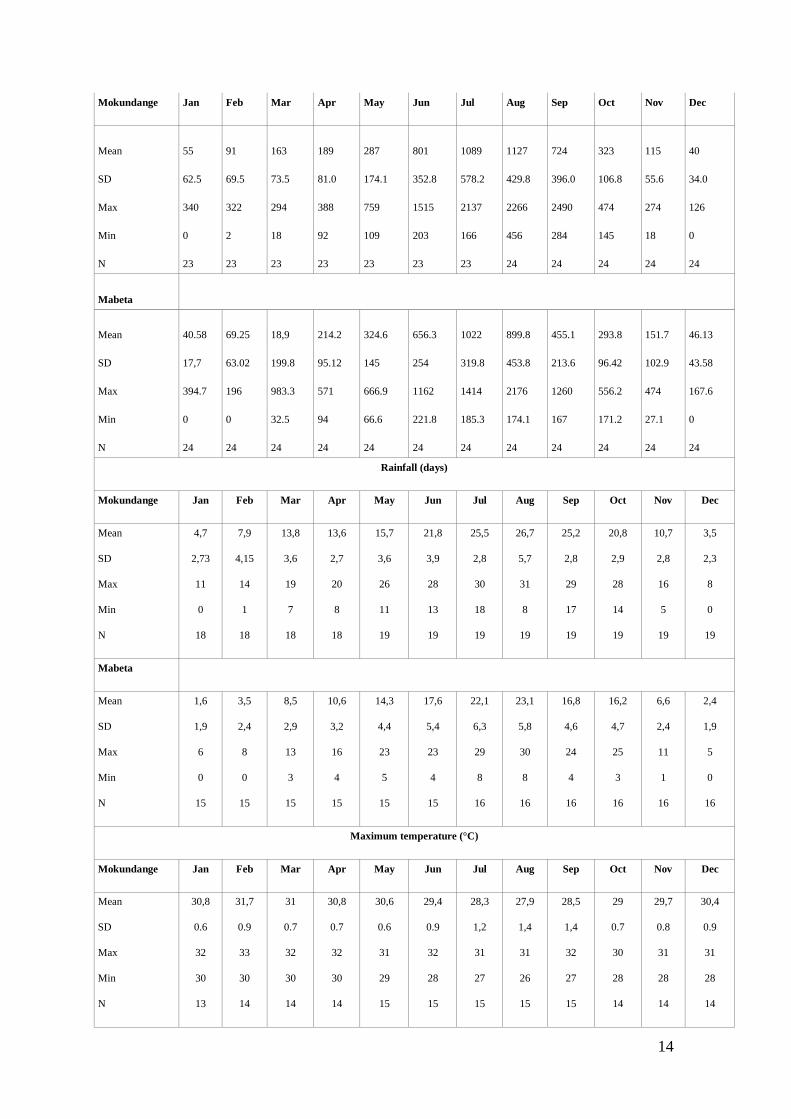
The climatic variables used by CDC are seen in Table 3. The data for the climate in
Limbe (Mabeta and Mokundange) include daily up to yearly data. These climatic data are
required in waste site location. Data obtained imply that Limbe is under continental winds
from the north-east and maritime winds from the south-west at different times of the year
(Fraser et al, 1998). Between November and April, there is the Harmattan which results in a
dusty dry season with visibility of less than 1km. In April or May the ITCZ (Inter-Tropical
Convergence Zone) moving northwards, draws pressure system and south-westerly moisture
laden winds over the country. This breaks the dry season and brings rains, which are
accompanied by frequent high wind and intense storms. Rainfall continues until September,
but not as heavy as in June, July and sometimes August. Rainfall in Limbe varies slightly
from high rainfall in areas near Debunscha and relatively low rainfall in the Mabeta area
(Tables 4 & 5). The temperature in Limbe ranges between 10°C, in the cold season and 32°C
or higher, in the dry season. The sun is always high in the sky like in other equatorial regions
which explain the little changes in the number of daylight hours (Fraser et al, 1998).
Table 4: Summary of monthly rainfall, temperature and sunshine in Mokundange and
Mabeta, Limbe
Rainfall (mm)
14
Mokundange Jan Feb Mar Apr May Jun Jul Aug Sep Oct Nov Dec
Mean
SD
Max
Min
N
55
62.5
340
0
23
91
69.5
322
2
23
163
73.5
294
18
23
189
81.0
388
92
23
287
174.1
759
109
23
801
352.8
1515
203
23
1089
578.2
2137
166
23
1127
429.8
2266
456
24
724
396.0
2490
284
24
323
106.8
474
145
24
115
55.6
274
18
24
40
34.0
126
0
24
Mabeta
Mean
SD
Max
Min
N
40.58
17,7
394.7
0
24
69.25
63.02
196
0
24
18,9
199.8
983.3
32.5
24
214.2
95.12
571
94
24
324.6
145
666.9
66.6
24
656.3
254
1162
221.8
24
1022
319.8
1414
185.3
24
899.8
453.8
2176
174.1
24
455.1
213.6
1260
167
24
293.8
96.42
556.2
171.2
24
151.7
102.9
474
27.1
24
46.13
43.58
167.6
0
24
Rainfall (days)
Mokundange Jan Feb Mar Apr May Jun Jul Aug Sep Oct Nov Dec
Mean
SD
Max
Min
N
4,7
2,73
11
0
18
7,9
4,15
14
1
18
13,8
3,6
19
7
18
13,6
2,7
20
8
18
15,7
3,6
26
11
19
21,8
3,9
28
13
19
25,5
2,8
30
18
19
26,7
5,7
31
8
19
25,2
2,8
29
17
19
20,8
2,9
28
14
19
10,7
2,8
16
5
19
3,5
2,3
8
0
19
Mabeta
Mean
SD
Max
Min
N
1,6
1,9
6
0
15
3,5
2,4
8
0
15
8,5
2,9
13
3
15
10,6
3,2
16
4
15
14,3
4,4
23
5
15
17,6
5,4
23
4
15
22,1
6,3
29
8
16
23,1
5,8
30
8
16
16,8
4,6
24
4
16
16,2
4,7
25
3
16
6,6
2,4
11
1
16
2,4
1,9
5
0
16
Maximum temperature (°C)
Mokundange Jan Feb Mar Apr May Jun Jul Aug Sep Oct Nov Dec
Mean
SD
Max
Min
N
30,8
0.6
32
30
13
31,7
0.9
33
30
14
31
0.7
32
30
14
30,8
0.7
32
30
14
30,6
0.6
31
29
15
29,4
0.9
32
28
15
28,3
1,2
31
27
15
27,9
1,4
31
26
15
28,5
1,4
32
27
15
29
0.7
30
28
14
29,7
0.8
31
28
14
30,4
0.9
31
28
14

15
Mabeta
Mean
SD
Max
Min
N
30,8
0.6
32
30
8
31,1
0.6
32
30
7
30,5
1,1
32
28
8
30
1,5
32
28
8
30,1
0.9
31
28
9
29,2
0.8
30
28
9
28,6
1,4
30
26
9
27,7
0.9
29
27
9
28,1
0.9
30
27
9
28,4
1
30
27
9
29,3
1,1
31
27
9
30,1
0.5
31
29
9
Minimum temperature (°C)
Mokundange Jan Feb Mar Apr May Jun Jul Aug Sep Oct Nov Dec
Mean
SD
Max
Min
N
18,8
4,2
26
13
10
18,5
3,3
24
14
9
18,9
3,2
23
15
10
18,8
3,4
23
14
10
18,4
3,2
23
14
10
17,7
3,3
22
13
10
17,8
4,1
26
13
11
17,5
3,7
22
13
11
17,3
3,6
22
13
11
17,1
3,5
22
13
10
17,6
3,9
23
13
10
17,9
3,6
23
13
10
Mabeta
Mean
SD
Max
Min
N
21,9
2,6
25
18
10
22,9
2,6
25
18
9
22,8
2,1
25
19
10
22,8
1,9
24
19
10
22,3
2,5
24
18
10
21,8
2,4
24
18
10
21,4
2,7
24
17
11
22,2
2
24
17
11
21,7
2,2
24
17
11
21,6
1,8
23
18
10
22,2
2,1
24
18
10
22,2
1,4
24
20
10
Sunshine (days)
Mokundange Jan Feb Mar Apr May Jun Jul Aug Sep Oct Nov Dec
Mean
SD
Max
Min
N
29
2,6
31
24
6
26,8
0,7
28
26
6
28
3,8
31
23
6
28,2
1,3
30
27
5
27,6
4,3
31
19
6
25,3
4,4
29
17
6
23,3
4,8
28
14
6
19,1
7,4
27
5
6
24,8
2,1
27
22
6
24
4,6
28
17
6
26
1,7
28
24
6
29
1,6
31
27
4
Mabeta
Mean
SD
Max
Min
N
28
2,2
31
25
6
25,3
1,89
27
23
6
26,6
2,8
30
22
6
27,8
2,2
30
24
6
28
2,5
31
25
6
24,2
4
28
19
5
17,5
6,7
27
9
6
15,3
7,9
26
5
6
21,6
3,2
25
16
6
23
9,7
31
4
6
24
7
29
10
6
27
1,5
29
25
5
Sunshine (hours)

16
Mokundange Jan Feb Mar Apr May Jun Jul Aug Sep Oct Nov Dec
Mean
SD
Max
Min
N
172.2
26,6
219.9
142.5
9
166.7
24,2
193.9
117.2
9
149.7
31,9
204.5
88.7
9
160
23,7
186.2
116.6
8
151.7
31,1
177.7
82
9
121.2
23,4
149.1
70,5
9
80.3
34,8
145.3
24,6
10
63.5
38,2
112.1
2,5
10
89.3
24,8
123.4
46,1
10
110.2
21,6
153.4
85,5
11
153
249
194.2
97,2
11
168.1
40,6
228.9
101,8
10
Mabeta
Mean
SD
Max
Min
N
159.7
31.4
210.1
100.7
10
164.4
26,6
209.8
128.2
10
143.3
22,6
174.9
105.6
10
160.8
34,7
220.7
106.4
10
176.9
22,5
200
132
9
129.3
29,1
173.1
76.2
9
81.1
47,7
151.1
18,6
10
49.4
30,4
99.2
6,3
10
90.0
29,2
140.9
43,5
10
108
32,7
148.7
32
11
136.7
39,6
180.6
70,6
11
152.9
43,4
205.6
57,6
10
Source: Fraser et al, 1998
Table 5: Annual monthly totals of rainfall (mm)
Mabeta Jan Feb Mar Apr May Jun Jul Aug Sep Oct Nov Dec
1970
1971
1972
1973
1974
1975
1976
1977
1978
1979
1980
1981
1982
1983
1984
1985
1986
1987
1988
22,8
36,4
40,8
33,6
16,8
15,4
5,4
31,8
5,3
4
61,5
0,8
427,7
0
0
46,5
0
6,5
0
15,1
29
31,8
184,8
165
23,8
124,4
36,6
163,2
5,2
24,4
20,3
67,5
0
109,3
51,5
21,1
70,8
55,2
69,1
113,4
65,8
249,5
265,2
254,2
42,2
49,4
495,8
124,5
105,1
983,3
141
64,4
245,3
172,1
196,9
177,1
79,6
323,8
167,4
312,7
247,6
154,2
179,2
218,9
241,4
571
181,8
125,1
212,3
258,6
121,6
166,4
234,6
124,8
154,7
136,5
240,1
66,6
292,6
248,3
322,6
192,4
312,4
214,2
580,8
102,2
330,3
479
522
666,9
200,2
318,8
297,1
334,9
396,1
1162
636,6
912,7
477,7
601,6
349
637,7
1079
378,8
605,7
881,5
599,9
727,6
883,8
221,8
340,1
351,9
261,4
450,2
1368
1146
1299
524,4
758,4
906,8
863
1331
500,4
854
1269
1177
996,6
1044
185,3
565,8
937,6
1091
854,1
536,8
613,5
707
700,6
2176
1172
357,6
646,8
800,4
760,6
1338
885,9
562,4
791,8
174,1
856,7
429,9
1227
360,8
382,6
398,9
339,2
252,6
414,7
451,6
313,6
184,4
258,6
629,6
450,6
497,4
390,6
480,2
167
355,8
580,6
298,7
529,3
389,8
196,1
203,4
448,5
246,2
390,6
171,2
214,4
229,6
294,2
396,4
348,2
239,1
237,8
325,6
282,1
386,2
235,9
266,3
176,4
56,8
42
85
474
231,8
217,8
27,1
45,8
184,2
108,6
115,4
35,2
289,7
83,1
150,9
225,2
178,2
105,3
49,8
81,8
22,4
62
0
67
67
7,8
9,2
100,1
0
93,8
5,5
111,7
50
0
0
79,4
167,6

17
1989
1990
1991
1992
1993
0
2
15,7
18,2
394,7
0
70,8
196
14,5
40,9
215,7
32,5
257,9
216,5
196,3
270,2
135,6
197,3
411,2
432,8
437,2
553,8
768
757,3
741,3
1136
1288
862,8
1414
1378
1527
1026
1345
492,3
463
517,1
1260
277,6
341,6
253
556,2
198,5
241,8
196
143,2
43,5
71,4
46,8
6,2
Source: Fraser et al, 1998
1.3 Statement of the Problem In spite of the fact that Limbe has been the cleanest town in the South West Region
(SWR), there are still lots of problems in managing the waste generated by the inhabitants
(Awemo, 2000). Until July 2006, waste generated in Limbe was managed by the Limbe
Urban Council (LUC). Waste was collected and dumped in an open area and later on burnt to
create more space for further disposal. The waste and surrounding area smelt and so attracted
insects and pests.
In July 2006, waste management in Limbe was handed over to HYSACAM (Hygienne
et Salubrité du Cameroun), a French waste management company. Waste management has
improved in the last few years; but a lot still has to be done. HYSACAM undertakes a slightly
better form of waste disposal. They collect; dump and burn waste more frequently than LUC
and have also cleaned up many other unofficial open dumps in the town. As a result, this
study investigates the effectiveness of HYSACAM in the direction of waste disposal methods,
waste treatment before disposal, groundwater monitoring (management) and future plans.
Both LUC and HYSACAM used waste collection trucks to carry waste and the
frequency of waste collection depended on the accessibility of the area by the truck. A waste
collection programme/schedule was made in each case. Waste collection ranged from up to
thrice a week in areas with higher living standards like, the Government Residential Area
(GRA) to once a month in the slums inhabited by the poor. Waste collected is not sorted
before disposal. This implies that hospital, household, battery; office and market wastes were
mixed and disposed of in the main dumpsite. The only difference is that HYSACAM collects
waste more frequently than LUC, but this is still not efficient according to the inhabitants of
Limbe. This inefficiency in waste collection is due to the following reasons:
Poor accessibility to waste collection points due to bad roads
The constant breakdown of the collection trucks which require repairs
Insufficient number of workers who sometimes fall ill due to improper medical health
care.
Too much work for the time allocated for waste collection
The infrequent collection of waste leads to waste overflowing and littering the big LUC waste
bins.

18
Also, workers of both LUC and HYSACAM complained bitterly about the poor
treatment they received from employers; they were given old cars which often break down;
they have low wages and inappropriate clothing; they received poor health attention and they
were overburdened with work, and all these contributed to their inefficiency in waste
collection. Workers had to use shovels and brooms to collect littered waste in some places.
This was very time-consuming and no one gave them attention and information on how to
ease waste collection of the waste.
This method of disposal which has been practised in Limbe so far is considered to be
very poor. To add to this, the disposal site is not properly located. Many people live around
the main dump site at Mokunda (Karata). There are farms of plantains (Musa paradisiaca
normalis), oil palm (Elias guineensis), cocoa and coffee around this area. The people who live
around here have food crop farms. These people have also dug wells from which they fetch
water for drinking, cooking and washing. The most serious problem here is that these people
are not even aware of the probability of groundwater contamination. Mosquitoes, as well as
other insects and pests breed here as a result of the open dumping method used in the area.
Nevertheless, some people in Limbe (to a small extent) already practise sustainable
techniques of waste management such as composting food waste, using leftover food to feed
animals, reusing plastic and metal containers, burning papers and using cleared grass and
leaves as manure on farmlands. This somehow already helps to reduce the waste that should
be managed by the council. However, some of this waste includes clinical and household
hazardous waste like paint, ink and detergents, which could seriously affect soil and
groundwater.
The above methods of waste disposal practised in Limbe are not monitored,
documented and controlled and this could possibly lead to soil, groundwater and air
contamination. The source and degree of contamination cannot be estimated or known
because there is no knowledge of the types and proportions of waste disposed of in this area.
There is also no monitoring of soil and groundwater, and HYSACAM and LUC have no unit
that should control the dumping of waste in this area. Contamination is also influenced by the
method of disposal, high rainfall (rainy season) on disposed waste and the possibility of
leachate infiltration.
1.4 Hypotheses of the Study In order to address the issues raised in the problem statement, the following research
hypotheses have been adopted:
1. The vulnerability of groundwater contamination is not a major consideration in the
location of waste sites in Limbe.
2. The inappropriate method of waste disposal in Limbe enhances the contamination of
groundwater.

19
3. Groundwater contamination in Limbe is enhanced by other factors such as soil and
waste types, barrier system, precipitation, surface water, and the level of the water
table.
4. Insufficient knowledge of waste management, limited equipment, managerial
incompetence, and limited human and financial resources impede the continuous
monitoring of waste sites for groundwater contamination or other environmental
hazards.
5. The population around waste sites is more susceptible to water related diseases.
1.5 Objectives of the Study
The objectives of the study include:
1. To assess the degree to which Limbe waste sites conform to prescribed standards of
waste site location, and groundwater management around waste sites.
2. To investigate the factors responsible, and the degree of susceptibility of groundwater
to contamination from waste sites.
3. To evaluate the extent to which past and present municipal solid waste management
practices minimise or enhance groundwater contamination.
4. To suggest possible methods (techniques) by which the existing situation can be
improved upon.

20
CHAPTER TWO: METHODOLOGY
2.1: General Review
Data for this study were obtained through a careful examination of both secondary and
primary sources. Secondary sources of data collection included books, journal articles,
specialized environmental and waste management magazines, the Cameroon national
environment and forest policy, other legal documents (decrees) relating to solid waste
management in the country, Cameroon national and local Newspapers, Tabloids and Internet
sources. The Cameroon Legislation regulating the use of the environment and forest resources
was consulted as well as the recent EIA law in Cameroon. This provided background
information that enabled the construction of a conceptual model of solid waste management in
Limbe.
Meanwhile, primary sources that were used for the purpose of first hand information
in the study included:
Visits to the waste sites to confirm types of waste, method of waste disposal,
residential area, farms and plantations around waste sites.
Structured personal and group interviews were conducted with local people and
workers of LUC and HYSACAM, as well as stakeholders in various sectors like
hygiene and sanitation and urban development.
Investigation and comparison of the criteria used by the Limbe Urban Council and
HYSACAM (waste management unit) to locate waste sites, monitor groundwater
around waste sites and control groundwater contamination.
Groundwater analysis was conducted using available testing techniques in
Mutegene, Cameroon and Cottbus, Germany. Water samples were collected from
household wells, springs and one boreholes, because there were no monitoring
wells for sample collection.
The quality of groundwater in this area was tested in order to ascertain the possibility and
degree of contamination. The type and level of contaminants were also investigated.
Empirical data from Limbe Municipal Council and HYSACAM were used to highlight
the constraints associated with solid waste management in Cameroon throughout the
discussion. The main reasons for data collection were to investigate conceptual models and to
consider different perspectives with regard to municipal solid waste management policy.
2.2 Site Visit
The first visit was made between December 2006 and February 2007. During this
visit, the various municipal waste sites were visited and pictures taken. The water sample
collection sites were also identified and secondary information was obtained. The methods of

21
collection and disposal used by the LUC and HYSACAM were also identified and
appointments for future interviews and discussions were made.
The second visit to Cameroon was made between December 2008 and March 2009 to
get more primary and secondary information on climate, groundwater and waste management
in Limbe. Field visits were organised to know the geology and hydrogeology of Limbe, the
state of the Limbe municipal dumpsites, the waste management methods used, and the state
and level of groundwater. Interviews were conducted both at the Limbe Urban Council and
HYSACAM head offices. Pictures were taken to confirm observations. Finally, groundwater
and soil samples were collected from municipal and home waste sites and analysed to know if
there is groundwater contamination. Results obtained were faulty.
Hence, a third and final visit was made in April 2010 to complete the previous
research in 2008/09. This trip was made because the results of the first sample analysis were
only, partially obtained for water samples and nothing for the soil samples. This was also
done to check if HYSACAM had started building a landfill as promised in 2009.
Unfortunately, no soil samples were collected because of financial and time constraints.
2.3 Sample Collection
During the second visit, sample collection was done in some prominent areas in
Limbe; prominent because these are areas which are densely populated and where “rich
people” as well as “poor people” live. Soil and groundwater, as well as spring water samples
were collected from 10 different areas. In each area, three groundwater samples of each
specimen were collected. One of the samples from each area was marked as the microbial
(mic) sample for microbial analyses. All samples were given the code Lim (number), for
chemical tests or Lim (number) mic for microbiological sample tests.
Water samples were collected in prepared sample bottles and soil samples in plastic
bags. Water samples were preserved in a cooler with ice blocks and cooling containers. The
cooler was closed after collection at each site or point. Soil and water samples were collected
from some points together and at others separately as seen in Table 6.
During the third visit, all seven samples were collected in one day (April 20, 2010) for
microbiological and physico-chemical analysis in Mutengene, Cameroon and physico-
chemical analysis in BTU Cottbus, Germany. Seven sample stations were used so as to reduce
cost and were collected in seven well-sealed 50ml, 100ml and 1000ml bottles. For analysis in
Cameroon, the 50ml bottles were used for microbial analysis and 1000ml bottles for physico-
chemical analysis. The 100ml bottles were used to collect the samples for analysis in BTU
Cottbus. Water was collected in a syringe and injected into bottles. The bottles were first
rinsed with the sample water before collection, to minimise sample contamination and the
probability of false results. At the end of each collection, the samples were labeled and put in
a cooler.

22
Table 6: Water and soil samples collection stations
Sample no. Groundwater and Spring Sample area Soil sample stations
Lim 1 Cité Cape Limbo, Mokundange (spring)x Cité Cape Limbo, Mokundange (spring)
Lim 2 Cold water (spring) Karata dumpsite, Mokundange
Lim 3 Spring near cemetery at Motowoh Cold water (spring)
Lim 4 Well 1, near cemetary, Motowoh Cow market (former LUC dumpsite)
Lim 5 Well 2, near cemetary, Motowohx Well at Motowoh
Lim 6 Well at Motowohx Community Quarters
Lim 7 Community Quarters Clerks Quarters 1
Lim 8 Clerks Quarters 1
Lim 9 Clerks Quarters 2 x Cancelled samples stations in April 2010 water analysis.
The samples were labeled Lx with L as Limbe and x as the station number (Table 7).
They were collected in the following order; sample station L7, L1, L6, L2, L3, L4 and L5,
that is, in-town moving outwards. This was done to minimize to and fro movements. There
was no on-site titration and on-site electric conductivity (EC) calculations.
Table 7: List of sample collection stations
Code Site name
L1 Cold water (Mile 2 Extension)
L2 Spring (New Town Cemetery)
L3 Well (Crab Quarters)
L4 Well (Community Quarters)
L5 Well beside FATECOL - Motowoh
L6 Well (Clerks Quarters)
L7 Borehole near Karata dump site
2.4 Data Analysis
The samples were analysed in three different laboratories. The first set of samples
(2009) were analysed in the microbiological laboratory in the University of Dschang,
Cameroon. These results were faulty for groundwater samples. No results were sent on soil
samples. The second set of samples collected in 2010 were analysed in the laboratory of the
Cameroon Baptist Convention (CBC) Central Pharmacy at the Quality Assurance
Department, Mutengene, Cameroon and the hydrology laboratory of the Brandenburg

23
Technical University of Cottbus, Germany. These results are presented in tables and more
specifically as microbiological and physico-chemical data as shown in Appendices II and III.
2.5 Presentation and Discussion of Results
Results obtained from laboratory analysis were presented in the form of tables, pie
charts, figures using Microsoft excel. A biveriate Pearson correlation was carried in SPSS to
find the relationship, as well as the significance of the correlation, between the parameters.
The observations were backed by pictures, and information obtained from interviews and
discussions. Then conclusions were drawn and recommendations made.

24
CHAPTER THREE: LITERATURE REVIEW
3.1 Solid Waste Management
The constant increase in waste generation, accumulation and management are
worldwide concerns. However, factors like technology, industrialisation, life-style and
economic standards determine the rate of waste generation for different communities. The
increase in human activities and civilization makes waste generation increasingly unavoidable;
hence there is the need for constant upgrading of waste management policies. These changes
in waste management policy caused by the colossal generation of waste materials have led to
an increase in the reuse and recycling of waste materials in developed countries (Delay et al,
2007).
Solid waste generated by municipal communities has two major components, namely,
organic and inorganic. Waste generated in developing countries has higher organic content
than that generated in developed countries. The organic components of waste can be
comfortably divided into putrescible, fermentable and non-fermentable waste. Putrescible
waste, which mostly comes from food preparations and consumption, decomposes very
rapidly with visual unpleasantness and disturbing odours. Fermentable waste, with examples
of crop and market debris, decomposes rapidly with no unpleasant accompaniments.
However, non-fermentable waste resists decomposition and breakdown only very slowly
(Diaz and Golueke, 1985).
Hence, environmental assessment requires test procedures to examine these waste
materials before reuse. It should be noted that waste generation must be avoided as much as
possible and when generated, recycling and reuse should be methods of priority in waste
management; for example, demolition waste can be used for road construction.
Notwithstanding the environmental risks presented by waste, reuse should be kept as minimal
as can be. This implies that waste must be assessed according to their release of organic and
inorganic pollutants. Required test procedures should be practicable and affordable to
authority and laboratories (e.g. leaching tests), and should also reflect possible scenarios
under natural deposition conditions (Delay et al, 2007).
The last decade has experienced the development and comparison of many leaching
tests in Europe. For example, the German Federal Ministry of Education and Research
(BMBF) developed and performed the batch and column leaching tests, with an aim to
determine the source strength (the total mass flow caused by natural leaching) of porous waste
materials with respect to inorganic pollutants. The high concentration of elements in seeping
water in the early stage of elution can be reflected by laboratory column leaching tests, whose
results could serve as basis for decision making. The eluent in batch tests are in constant
contact with the examined material while the elution agent is constantly renewed in column
tests. Therefore the question whether the measured or calculated average concentration should
finally be employed in risk assessment (Delay et al, 2007). This technology or test is very
expensive and so can be afforded only by few developed countries.

25
3.1.1 Definition of Waste and Integrated Waste Management
According to Batsone, (1989) cited in Awemo, (2000), waste is defined as something
that no longer has any value or use. It is also defined in Webster Dictionary as leftovers, super
flows, refuse no longer of use. Waste occurs in solid, liquid or gaseous forms. It is unfortunate
to realise that too much waste is generated, but very little acceptable space exists for its
permanent disposal (Botkin and Keller, 1995). Different types of waste should be disposed of
in different ways as seen in Table 8.
Table 8: Typical treatment and disposal methods for different types of waste
Waste type Incineration Physico-chemical treatment Biological
treatment
Landfill Recovery
MSW X X X
Clinical waste X
Commercial waste X X X
Effluents X X
Acids and alkalis X
Heavy metals (sludges) X
Oils and Solvents X X X
Resins and Paints X
Pesticides X X
Chlorinated organics X
Biodegradable industrial wastes X X
Reactive wastes X
Explosives X X
Source: Petts and Eduljie, 1994
However, there is a recent concept called Integrated Waste Management (IWM),
which involves a set of management tools like reuse, reduction, recycling, composting,
landfilling and incineration. But the most important are the three Rs of IWM, which are
reduce, reuse and recycle. The main objective of the three Rs is to reduce the amount of urban
and other waste that must be disposed of in landfills, incinerators and other facilities. Fifty
percent waste reduction can be attained if the following considerations are made:
Better designs of packaging to reduce waste. This is an element of source reduction
(10%)
Establishing recycling programmes (30%)
Large scale composting programmes (10%)

26
3.1.2 Types of Solid Waste
Solid waste according to the USRCRA ( united States Resource Conservation and
Recovery Act) includes liquid and gas. Its generation increases with increase in globalisation.
Its generation cannot be controlled since it depends on the activities of people and the fact that
it has many forms. These wastes may be generated as solid, liquid, sludge, gas or a
combination of all (Oweis and Khera, 1990). The different types of solid waste include
municipal, industrial and mineral waste.
Solid waste may be hazardous on non-hazardous depending on its form of generation
and properties. Hazardous waste can cause potential risk to human health and the
environment. Such waste must disposed of specially. Solid waste is referred to as hazardous if
it is listed as hazardous waste (with organic or inorganic constituents), corrosive, toxic,
ignitable and reactive.
Non-hazardous waste could be referred to as municipal waste. However, this study
emphasizes on municipal solid waste, which represents the largest amount of waste generated
in Limbe, and its management is of great concern to the community. The Limbe Community
mostly produces more household waste, including small amounts of household hazardous
waste. Household hazardous waste (HHW) contains toxic, corrosive, ignitable or reactive
ingredients. These include pesticides, fungicides, oven and other cleaners, paints, automotive
fuels and oil, polishes, paint removers, batteries, etc. These require special care when being
disposed of in household waste. Improper disposal of HHW can include pouring them down
the drain, on the ground, into storm sewers, or in some cases throwing them in the trash cans.
The dangers of such disposal methods might not be immediately obvious, but improper
disposal of these wastes can pollute the environment and pose a threat to human health. Many
communities in Germany offer a variety of options for conveniently and safely managing
HHW.
3.1.3 Municipal Solid Waste
Municipal Solid Waste (MSW) is waste generated in a municipality and this waste
should be primarily managed by an urban council. Moreover, waste management is a global
problem especially as most waste is only transported from one point to another without
adequate management (Botkin and Keller, 1995). Waste produced in urban areas is dumped in
landfills and might produce methane (CH4) gas that can be burned as fuel. This gas is most
often not collected for treatment or use and hence can pollute the air. Also, the disposal of
waste on land is often poorly controlled and managed especially in developing countries
(Westlake, 1995).
Rural areas worldwide suffer from illegal dumping of waste on roadsides. This form of
waste disposal is liable to cause soil and water (particularly groundwater) contamination, and
health hazards to plants, animals and people. Global world statistics indicate that 1.3 billion
people lack access to adequate supply of safe water while 2 billion people do not have access
to adequate sanitation (CNN News, 2006; UNEP et al, 1997).

27
3.1.4 Municipal Solid Waste Management (MSWM) Systems
MSWM systems in developing countries involves collection, transportation and
disposal of waste while other options as recovery, recycling and reprocessing for energy still
require consideration as in Fig 7 (Asong, 2010; Voigt, 2010). Developing countries face a
problem of better waste management strategies because they do not have well documented
data of waste type and generation. This knowledge could be the basis of sustainable waste
management, that is, waste reuse, recycling, incineration, composting or landfilling (Shimura
et al, 2001).
Figure 7: Typical elements of a solid waste management system in low- or middle-
income countries
Source: Voigt, 2010
According to Achankeng, (2003) sustainability also requires the great need to manage
MSW in a manner that is environmentally, socially, technologically and economically effective.
This is very difficult for developing countries first of all because of illegal choices of waste
disposal by households; secondly because of the lack of proper steps to waste disposal site
selection; and thirdly because of improper implementation of policies and regulations that govern
the operation of waste management facilities. This problem is further intensified by insufficient
finances which are poorly managed, and the fact that MSWM is influenced by a complex and

28
hard-to-understand interrelationship of environmental, socio-cultural, economic and political
factors (Asong, 2010).
The objectives of municipal solid waste management are to guarantee hygienic
disposal, protect the environment and resources (Busch, 2003). These should help ensure that
waste is reliably collected and disposed of at fair and affordable prices with special
consideration on the environment and man. The most effective way to implement sustainable
MSWM is through the 5Rs which, in order of desirability, include Reduce, Reuse, Recycle,
Recover and Residuals (Metro Vancouver, 2008).
Moreover, the collection and disposal of waste remains a problem because of repeated
insufficient and inadequate waste collection and transportation facilities. This could be due to lack
of finances, technical know-how, proper management skills and high rate of waste generation.
Waste generated can be disposed of in the following ways:
1. On-site disposal, for example, mechanical grinding of kitchen waste and emptying of
kitchen garbage into waste water pipe systems at the kitchen sink.
2. Composting, a biochemical process in which organic materials like kitchen scraps are
decomposed to soil-like material.
3. Incineration, where combustible waste is burned at temperatures of 900°C and 1000°C
(1650°F and 1830°F). These temperatures are high enough to consume all combustible
material leaving only ash and non-combustible waste for disposal in landfill. This
process releases some contaminants which are shown in Table 9.
Table 9: Contaminants produced from waste incineration
Dangerous substance Path Category Remark
Organic compounds
especially dioxins and
furans.
Gas, fly ash, residue Human
toxicology
Very important,
incineration is major
contributor.
Volatile heavy metals,
e.g., Cadmium, Lead.
Gas, fly ash, residues Eco-toxicology Important because of trans-
boundary movement.
Hydrogen chloride Gas Acidification Important
Metals, e.g. Arsenic,
Cadmium.
Gas, fly ash, residues Human
toxicology
Important, carcinogenic.
Salt, e.g. chlorides. Waste water, fly ash,
residues
Ecotoxicology Important, highly soluble,
transported to surface
water.
Source: Tapong, 2002
4. Open dumping is an old method where waste is piled up on the ground without
covering or protection.
5. Sanitary landfills are designed to concentrate and contain refuse without creating a
nuisance or hazard to public health and/or safety (Knödel et al, 2007).

29
3.2 Landfill
3.2.1 Definition and Types of Landfills
The most popular disposals method that has been used for the disposal of municipal
and commercial waste is landfilling (Ahel et al, 1998). A landfill is a structure that is carefully
designed and built into or on top of the ground so that trash is isolated from the surrounding
environment (Wroblewski et al, 2011). This is the final waste disposal option and it is defined
as the engineered deposit of waste onto and into land in such a way that pollution or harm to
the environment is prevented and, through restoration, land provided which may be used for
other purposes.
According to Bagchi, (2004) and Westlake, (1995), three forms of landfills exist
according to the principles of dilute and attenuate; containment and entombment. The
attenuate landfill is unconfined with minimal engineering thereby permitting leachate
migration into the surrounding environment and groundwater. A containment landfill has a
higher degree of site design, engineering and management exercising a level of control over
hazards from landfill waste disposal. It involves the construction of a leachate collection pipe
and a low permeable liner which restricts the percolation of leachate. This type of landfill is
recommended for hazardous waste disposal. An entombment landfill is a containment landfill
that prevents liquid infiltration, thereby storing waste in a relatively dry form. The different
types of landfills include; sanitary landfills, MSW landfills, construction and demolition
waste landfills and industrial waste landfills (Fig. 8).
Figure 8: Types of Landfill
Source: Wroblewski et al, 2011
Landfilling is only sustainable if it is managed in order not to pass its effects onto
future generations. At the end of its life-span, a landfill should not cause threat to man and the
environment. According to Knödel et al, (2007) the knowledge and experience with waste

30
disposal shows that numerous abandoned landfills must now be regarded as hazardous. As a
matter of fact, impermeable layers at such sites are the most important barriers that prevent
the spread or infiltration of contaminants and pollutants. Geological barriers are very
important since the present-day techniques for constructing landfill sites prevent the spread of
contaminants only for a given time. Other environmental considerations in landfill
construction include:
1. Climate, such as type of precipitation, intensity and duration of rainfall, the
distribution of rainfall within a basin and other climatic conditions that affect
evaporation and transpiration.
2. Physical characteristics of the drainage basin (physiographic factors), like land use,
soil type, area, shape, elevation, slope, orientation, type of drainage net, the extent of
indirect drainage and artificial drainage (Wisler and Brater, 1959).
3.2.2 Municipal Solid Waste or Sanitary Landfill
This could also be referred to as a municipal or sanitary landfill. Heterogeneous
(residential and commercial) mixtures of waste are disposed of in such landfills. The types of
waste mostly include food and garden waste, paper, plastics, rubber, textiles, wood and ashes.
At the end of each day the waste must be covered with soil and compacted. New landfills
should have liners, leachate and gas collection systems and final covers, so as to minimize the
chances of groundwater contamination. The dimension of the cell will depend on the volume
of waste received and the available cover material (Oweis and Khera, 1990). Municipal
landfills are well noted for the release of 4 groups of contaminants. These include:
Complex organic matter like chemical oxygen demand (COD) or total organic carbon (TOC)
Inorganic macro-constituents like Ca, Mg, Na, K, NH4, Fe, Mn, Cl, SO4, HCO3
Specific organic contaminants
Toxic metal which include heavy metals like Cd, Zn, Pb, Cu, Ni, Cr (Ahel et al, 1998).
The following are necessary components of a landfill; subgrade, liners (clay, flexible
membrane and admixed), leachate collection and detection systems, pipes for leachate
collection, gas vent, monitoring wells, capping and geotechnical instrumentation to monitor
settlements and assess stability (Oweis and Khera, 1990). Landfills are said to have the
greatest adverse impacts on the environment (see Fig. 9).
Sanitary landfills unlike open dumps are advantageous because they protect public
health and the environment. In constructing a landfill, there is the possibility to minimise
groundwater contamination from leachate through the building of leachate collection pipes.
This will consequently minimise the release of heavy metals from leachate. In building a gas
collection pipe, the risk of release and contamination of greenhouse gases is curbed. Sanitary
landfills involve the daily covering of waste and this helps reduce waste invasion by pests like

31
flies and mosquitoes; birds and rats, and prevents the release of bad odour from decomposing
waste (O’Leary and Walsh, 1993; Tapong, 2002).
Figure 9: Landfilling-sources of impacts and effects on the environment
Source: Petts and Eduljie, 1994
3.2.3 Landfill Site Selection and Investigation
3.2.3.1 Site Selection
The steps to landfill site selection are not based on personal judgment, but on scientific
principles. These steps involve all stakeholders including the public (Voigt et al, 2006).
Landfill site selection depends on a variety of criteria, some of which include, proximity and
road accessibility to site, the geological and hydrogeological stability of the site, and
environmental, economic and political issues (Oweis and Khera, 1990; Williams, 2005).
Politics in this case implies public participation in site selection. The most important issue is
selecting a site where environmental protection is natural in the event of technological failure
like liner failure. Site selection involves a number of criteria which ought to be fulfilled (see
Tables 10 and 11) as well as EIA. These criteria narrow the number of sites, and lead to
detailed site investigation and analysis. Public participation and geological investigations are
most important in the process of site selection.

32
Table 10: Criteria for site selection
Economic Socioeconomic Environmental
Development land
Slope
Utilities
Site access
Flexibility
Capacity
Development, operation and maintenance cost
Compatibility with existing solid waste
management systems
Archaeological and historical sites
Dedicated land
Land use
Noise impact
Sensitive receptor
Social impact
Wetlands
Threatened and endangered species
Slope
Air quality
Odours
Aesthetic impact
Flood plains
Soils
Geology
Groundwater
Monitoring
Surface and groundwater hydrology
topography
Source: Oweis and Khera (1990)
Table 11: Definitions and significance of siting criteria
Criteria Sub-criteria Definition significance
Soils Permeability Soil property that governs the rate
at which water moves through it
Subsoil permeability impacts release
of pollutants to groundwater; lower
subsoil permeability is preferable for
siting
pH Indication of acidity and
alkalinity (pH 7=neutral)
Characterises tendency of soil to
absorb heavy metals; greater pH is
preferable for siting
Cation exchange capacity
(CEC)
Capacity of soil to exchange
cations expressed as a sum for all
exchangeable cations
Indicates the ability of soil to attenuate
some contaminants, particularly heavy
metals; higher CEC is preferable for
siting
Surficial soils Unconsolidated material at the
Earth’s surface
Affects degree of attenuation and the
need for liners; Surficial soils with
lower permeability are preferable for
siting
Geology Bedrock and outcropping Carbonate rocks are susceptible to
solution; fractured rock facilitates
pollution migration; sites with more
overburden are preferable
Continuity and mass
permeability
Related to open discontinuities,
solution channels
Controls the potential for migration of
contaminants
Faults Mapped plans and zones of rock
along which displacement has
occurred
Impacts the stability of facility and
potential release of pollutants
Groundwater Aquifer/well yield Relates to geological formation or
group of formations capable of
Sites with high aquifer capabilities
may be off-limits for some facilities

33
yielding usable quantities of
groundwater to wells or springs
Aquifer use Use of aquifer could be within a
specific distance from facility,
potential, or sole source (solely or
principally supply drinking water
to a large percentage of populated
area)
Impacts the water supply; aquifers
with low actual or potential use are
preferable for siting purposes; sole-
source aquifers are considered very
significant even if yields are low
Groundwater quality Natural groundwater quality as
measured against drinking water
standards
Areas with poor natural groundwater
quality represent more suitable
locations, all else being equal
Groundwater flow system Refers to the occurrence and
movement of groundwater with
regard to direction and velocity
Sites where direction of groundwater
flow is a way for use, or where flow is
upward, or where water is deep, as
else being equal
Seasonal high groundwater
level
The maximum level to which
groundwater is expected to rise
Unsaturated zones act as a barrier (no
direct mixing) between base of facility
and groundwater. Most regulations
specify a minimum of 1.5m (5ft)
Monitoring aspects Monitoring aspects Refers to RCRA requirements for
groundwater monitoring
Sites that are easier to monitor (e.g.
presence of a layer of sand and gravel)
or a known discharge body like a lake
Cover Cover material Refers to earth material (available
on site) used for daily waste
sealing
Sites with abundance of workable and
relatively impervious soils are
preferable, all else being equal
Slope Slope Deviation of the land surface
from the horizontal measured as
the average topographic relief for
the site
Impacts release of contaminants, site
development and operation. Slopes
greater than 15% or 22% are
considered too steep
Surface and groundwater
hydrology
Proximity to streams/lake Refers to overland proximity and
protected uses of the nearest lake
or stream
Impacts opportunity for runoff and
contaminants polluting lakes/streams
Proximity to wells/aquifer See aquifer under geology above Impacts groundwater resources: sites
closer than 800m (2500ft) to a high
yield well (70g/m) may be excluded
Proximity to flood-prone
areas
Land areas inundated by flood of
specified frequency (usually
100years)
Impacts transport of hazardous waste
Proximity to recharge areas Refers to lands draining to
existing or planned storage
reservoirs
Impacts drinking water supply
Topography Slope erodibility Migration of soil particles by
surface water or other natural
phenomena
The potential of soil erosion impacts
facility construction and operation
Run-on and run-off Run-off refers to rainwater or
leachate that drains overland
away from the facility; run-on
refers to drainage overland on to
any part of the facility
Sites with little need for control of
run-on from upland and slow run-off
are preferable. Run-on is usually
controlled by berms (level spaces,
shelves, or raised barriers separating
two areas), stream diversion, etc. Run-
off control is impacted by velocity of
water traversing the site
Source: Oweis and Khera (1990)
In selecting a new disposal site, all regulations that govern landfill construction should
be considered. The proposed site should be free of immediate and clear hazards like floods,
earthquakes, landslide, tsunamis and aquifer contamination. A map showing these exclusions

34
must be produced and should include topography, precipitation, temperature, man-made water
bodies, floodplains, earthquake- and landslide-prone areas, soil, ecological aspects, etc. The
following steps are important in the process of site investigation:
1. Public participation is important because the population suffers the effects of poor site
selection and should have a right to all steps of site investigation. This will enhance the
process.
2. Geological investigation involves the use of geological information to produce
recommended areas for site investigation map (RASIM) which will be understood by
everyone. The proposed site must undergo detailed investigation for geology and
hydrogeology. Depths of between 50-150m and surface area of between 0.1-1km2 around
proposed site must also be investigated. Investigation should reveal if geological barrier
can minimise contamination.
3. Hydrogeological investigation will include the thorough investigation of all major
aquifers in order to know the groundwater condition. Climatic (humidity, precipitation,
temperature, runoff, evapo-transpiration) and hydrogeological (water content, water
table, direction and rate of flow, hydraulic conductivity, value of aquifer) condition must
be investigated and well tests made so as to minimise contamination and enhance
monitoring.
4. Geophysical investigation
5. Geochemical and hydro chemical investigation involves soil and water analysis for
chemical component like anions (Cl, SO4, NO3, HCO3, CO3, etc.), cations (Na, Ca, Mg,
K, Al, Mn, Fe, SI and NH4), organic (phenols, mineral oils), heavy metals. (As, Cd, Cr,
Cu, Hg, Ni, Pb, Zn), inorganic and others (BOD, COD, DO, EC, pH, TOC, DOC, etc.).
Sample collection and analysis should be done according to international standards and
should minimise errors especially at sample collection phase.
6. Natural attenuation capacity must also be considered with two of the most important
processes being retardation and biodegradation of contaminants. The preferred barrier
should have a clay-rich substrate with low hydraulic conductivity. Biodegradation is
most important because it reduces the volume of contaminants and retardation occurs
through sorption on fine-grained material and organic components. Lab tests must be
conducted to determine the possibility of retardation and biodegradation through batch
and column tests. Batch tests are used to estimate the parameter of sorption and
transformation like biodegradation, while column tests would estimate the parameter of
transportation, retardation and exchange between different phases like soil, air and water.
7. Geotechnical stability will include aerial photographs which will determine instability
like subsidence from landslide earthquake, sinkhole, floods, etc. Both landfill base and
body stability are important as they ensure the functionality of seepage collection, base
and body seals (Voigt et al, 2006).

35
3.2.3.2 Site Investigation
The main aim of site investigation is to minimise the impacts of waste disposal on the
environment. A thorough understanding of site geology is most required in site investigation
and assessment phase (Knödel et al, 2007). It is important to evaluate surface and sub-surface
conditions of the proposed site for proper design, operation and maintenance (Oweis and
Khera, 1990). Data must be collected through remote sensing, soil and rock samples,
geophysical methods, in situ tests which measure the properties of soil, rock and waste
materials, groundwater quality and profile. Also, environmental safety measures are also very
important and must be taken into consideration.
The investigation of the surrounding area must include that part of the geological
barrier that is needed for contaminant retention and that part of the regional groundwater
system that will possibly become contaminated. Each landfill (abandoned or operational) is
located within a groundwater system of several tens of square km. A detailed study must be
carried out in an area of 0.1-1km2
around the site itself. Depths of up to about 50m below
must be investigated in abandoned and planned waste disposal sites. This investigation, if
extended up to about 150m, is required to obtain information on the groundwater system.
Mapping scales of 1:10000 or larger are needed for detailed geo-environmental assessment of
landfills. Aerial photographs made at different times can reveal changes at the site suspected
to be hazardous.
The objectives of site investigation must be well defined. Also important is the fact
that suitable methods should be used to achieve objectives. Before establishing a project it is
important to determine its objectives and goals, so that most suitable techniques and methods
are used. Site investigation is active environmental protection and should be carried out in at
least two phases (Knödel et al, 2007; Voigt et al, 2006):
Orientating Investigation: This method that is accompanied by reconnaissance site survey
and historical investigations (through interviews) are view of previous use of the site. It also
requires the following information from maps and other achieved data;
● Topography, land use and vegetation, settlements, roads and railways
● Climate, precipitation, temperature, evapo-transpiration, direction and velocity of
wind, and the frequency of strong winds
● Hydrological and hydrogeological conditions: streams, lakes and ponds, springs,
wells, use and quality of surface and groundwater, runoff, water balance,
aquifer/aquiclude properties and stratigraphy, groundwater table, and groundwater
recharge and discharge
● Geology: soil, geological structure, stratigraphy and lithology
● Ecological aspects like nature reserves, protected geotopes, water protection areas
Detailed Investigation and Assessment: The following must be considered;

36
● Geology: thickness and lateral extent of strata and geological units, lithology,
homogeneity and heterogeneity, bedding conditions and tectonic structures, features,
impact of weathering
● Groundwater: water table, water content, direction and rate of groundwater flow,
hydraulic conductivity, value of aquifer
● Geochemical site characterisation: chemical composition of soil, rock and
groundwater, estimation of contaminant retention
● Geotechnical stability: the geological barrier must be capable of adsorbing strain from
the weight of a landfill, slag heap or industrial building
● Geogenic events: active faults, karsts, earthquakes, subsidence, landslides
● Anthropogenic activities: mining damage, buildings, quarries, gravel and clay pits, etc.
● Changes in soil and groundwater quality (Knödel et al, 2007; Voigt et al, 2006).
Geological and hydrogeological studies should be used to investigate lithological
structures, to determine the homogeneity of the rock, to locate features, to determine the
permeability of the rock with respect to water, gas and various contaminants, to assess the
mechanical stability of the ground and to obtain data on the groundwater system. The main
task of geological and hydrogeological surveys would be to gain information directly by
examining outcrop, digging trenches and drilling boreholes, conducting hydraulic tests (e.g.
pumping and tracer tests) in wells to determine hydraulic properties in situ. Drilling would
entail taking rock, soil and groundwater samples to determine physical, chemical,
petrographic and mineralogical parameters. Special laboratory experiments should be carried
out to estimate migration parameters and the texture of rock and soil samples. On the other
hand, geophysical and geochemical methods should be used to delineate and monitor
operating and abandoned landfills as well as to determine the spread of contaminants.
Landfill barrier systems should also be taken into consideration and serious measure
taken. It is advisable to take the Multiple Barrier Concept (MBC) approach which is made up
of the planning, construction, operation and follow-up care of a waste site. Groundwater
monitoring during the operation phase and after-care are also part of MBC. It was introduced
in Germany in 1993 under the regulation “Technical Instructions of Waste for Human
Settlement (TASi). It consist of two main barrier systems; technical and geological barriers
which could further be divided into three barriers; the landfill body, landfill sealing, and
drainage system and the landfill site (geological barrier) as shown in Fig. 10. Landfill and
barrier construction must be done such that drainage water is collected through outflow from
waste site and this will imply that the landfill should be constructed as a heap and not fill
existing pits. This will also determine the type of waste to be disposed of at the landfill. Such
waste must have minimised elution behaviour and should produce leachate with long-term
chemical stability and the most minimal possibility of toxicity. It should constitute low
concentration of organic components. If this is achieved the waste then in turn acts as a barrier
(Voigt et al, 2006).

37
Technical barriers include combination systems of mineral seals, plastic membranes,
drainage systems which offer long-term functionality (drainage beds) and gas collection
systems (gas drainage). A technical barrier retains leachate for the first few years until it is
chemically stable. The seal should provide access to leachate for monitoring. Surface seals
should be decided at the end of the deposition process and should not provide room for
cracks. Bitumen seals and capillary barriers with improved characteristics are safer since clay
seals crack when dry.
Figure 10: Scheme of the Multiple Barrier Concept (MBC)
Voigt et al, 2006
Geological barriers are special and important to MBC because they comprise
consolidated and unconsolidated rocks which are naturally arranged, slightly permeable and
several meters thick. They should have a high pollution retention capacity that is beyond the
dumping area. In areas where geological barriers are doubtful, technical barriers must be
constructed such that the errors are corrected. These, unlike geological barriers, are very
expensive.
3.2.4 Groundwater Monitoring
Numerous research reports have revealed that landfill and waste disposal sites are a
common source of groundwater contamination, especially in cases where there are provisions
for leachate collection (Ahel et al, 1998). Monitoring of groundwater helps to minimise
contamination of the resource and particularly that used for drinking. As a result, groundwater
monitoring is very important in the management of all types of landfill. Each landfill requires
monitoring wells which are used to monitor the state of groundwater in the uppermost aquifer.
This will help to determine the state of groundwater before, during and after landfill

38
construction and management. Monitoring should continue at least thirty years after closure of
the site.
RCRA requires at least one hydraulically up-gradient well to determine impacts of the
landfill on groundwater in the uppermost aquifer and at least three hydraulically down-
gradient wells to detect the significant amounts of hazardous waste constituents migrating
from waste to area to uppermost aquifer (Oweis and Khera, 1990). Parameters like phenol, Cl,
Fe, Mn, Na and SO, and indicators like pH, electric conductivity, TOC are very important in
determining the quality of groundwater and the degree of groundwater contamination,
respectively. Annual and semi-annual tests are required to assess these parameter and
indicators, respectively.
One very important way of avoiding further groundwater contamination around a waste site is
to cover the dump site and the adjacent areas with a one-metre (3.3ft) thick layer of
compacted clay and a polyethylene plastic cover to reduce surface water infiltration. This
method greatly reduces the amount of water that seeps through the soil. Water (leachate) that
successfully seeps through should be collected and treated through leachate collection pipes.
3.2.5 Stages of landfill development and design
In the process of landfill construction, certain things must be done to ensure that the
fill is secure. EIA is one of the first steps in a landfill project. A landfill should be constructed
such that its capacity allows for use for a period of 15-30 years. The capacity of the landfill
site is an important determinant of the amount of waste, the amount of intermediate and daily
cover required and the thickness of the capping system (Williams, 2005). Landfill waste
density will depend on the degree of pre-compaction before disposal, variation in waste
component, the amount of intermediate and daily cover and the rate of biodegradation. It is
necessary to provide a drainage system for the collection of rainwater or runoff to reduce
excessive water infiltrating waste.
There is also the need for leachate and gas collection systems, which will prevent the
contamination of groundwater and atmosphere, respectively. A leachate collection system is
made up of a drainage layer, leachate trench and pipe, leachate line clean-out ports, a leachate
collection pump and lift station, and a leachate storage tank. Generally, the leachate pipes are
put in trenches filled with gravel. In addition to this, the gas collection system is needed to
collect and use the gases produced in the landfill. A passive or active venting system could be
used depending on the type of design, soil surrounding the landfill, distance of landfill from
residential area, possibility for future use of landfill after closure, country or state regulations
and type of waste. Attenuate landfills have a high degree of landfill gas migration than
containment landfills (Bagchi, 2004). Passive venting systems are used in a landfill where gas
production is low and migration is not expected, while the active venting system is used in
cases where gas production and migration is unavoidable. The former is good for small
municipal landfills of about 40,000m3 and non-putrescible containment landfills. The latter is
made up of a series of deep extraction wells which are connected by a header pipe to a

39
blower. This pipe series sends the gas for reuse for energy purposes, to an on-site burner or to
the atmosphere.
Current landfills unlike those of the past are referred to as designed and managed
engineering project used as advanced treatment and disposal option (Williams, 2005). As a
result, the barrier systems used will depend on the type of waste to be disposed of in the
landfill. The types of barrier systems and the waste emplaced in the landfill are shown in
Figure 11. The barrier system should include natural or geological barrier and an artificial or
synthetic sealing system which contains leachate and gas in the landfill. Geological barrier
will depend on the geological and hydrogeological conditions underneath the landfill and
surroundings. A leachate sealing and collection system should be provided to ensure the
minimisation of leachate escape from fill.
Figure 11: Components of a waste landfill capping barrier
Source: Petts and Eduljie, 1994
A landfill cover, which is multi-layered with each layer having specific functions, is
needed so as to minimise water infiltration. These layers include, top soil, protective layer,
drainage layer, barrier layer and grading layer (Bagchi, 2004).
3.3 Groundwater and Aquifer
Groundwater is an important source of water supply throughout the world and its use
in irrigation, industries, municipalities and rural homes continues to increase. It is commonly
understood to mean water occupying all the voids within a geologic stratum. Monkhouse and

40
Small, (1978) define groundwater as the body of water derived from percolation that is
contained in the soil, subsoil and underlying rocks above the impermeable layer. This implies
that groundwater is found beneath the surface of the earth within the zone of saturation.
Wisler and Brater, (1959) refer to groundwater as water below the water table and above soil
moisture. The region above the water table is divided into three different zones, namely,
1. The capillary zone found above the water table at a distance ranging from about 0.3-
2.4m or 3m (1-8ft or 10ft) and is referred to as the capillary fringe.
2. Intermediate zone that is found between the capillary and soil zones.
3. Soil zone, which is the depth of overburden that is penetrated by the roots.
Figure 12: Groundwater resources of the world WHYMAP (simplified after the 1: 50
000 000 scale version of the map; source: BGR, Hannover)
Source: BGR, Hannover and www.fao.org/gtos/doc/ECVs/T03/T03-Groundwater-report-
v05.doc, 2008
The occurrence of groundwater is highly dependent on the geology of an area (Fig.
12). Groundwater moves as a result of factors like void spaces (porosity) and resistance
(permeability: a measure of the rate at which water moves in the soil) (Logan, 1995). The
earth has interstices which vary in shape and size, even though most of them are small. These
small interstices transmit water, while isolated (unconnected) ones cannot transmit water. The
degree to which a rock contains interstices is referred to as porosity (Wisler and Brater, 1959).

41
Porosity is defined by Ward and Elliot, (1995) as the measure of the amount of open
spaces in clay soils and rock layers which may contain water. It could also be defined as a
measure of void spaces (Logan, 1995). The porosity of rock or unconsolidated material ranges
from less than 1% to more than 50%. Porosity of less than 5% is referred to as small; that
between 5%-20% is medium while that more than 20% is large (Wisler and Brater, 1959).
Porosity, soil water content, texture, density, organic matter content and hydraulic
conductivity (how fast water flows through certain soils and rock layers) are some of the soil
properties that influence the rate of water infiltration (Ward and Elliot, 1995).
Folklore holds that the presence of soil protects groundwater quality by "filtering"
contaminants out of recharge water. Present knowledge, however, indicates that the capacity
of soils and the intermediate vadose zone (the area below the crop root zone that lies above
the permanent water table) to hold back potential contaminants as they move towards
groundwater, is limited. The major processes that determine the fate of contaminants in soil
and their potential to leach into groundwater are now well understood. This knowledge can be
used to reduce or eliminate contamination of drinking water supplies. However, some
important factors that contribute to quality considerations of groundwater include:
● The mineral composition of aquifer rocks,
● The general geo-hydrologic framework of the area,
● The potential of groundwater mixing and the occurrence of interactive geochemical
processes,
● Activities of man relative to the recycling capability of the aquifer (Logan, 1995).
Figure 13: Types of aquifers
Source: Government of Alberta, 2008
An aquifer is a water-bearing soil or rock that can release its water in sufficient
quantities to make it economically feasible to develop for water supply (Logan, 1995). It is
the geologic layer that is filled with water and could transmit enough water to supply a well

42
under normal hydraulic gradients. There are two main types of aquifers, namely, confined and
unconfined (Fig. 13). Confined aquifers receive water from distant sources and are protected
by an impermeable layer. Water in such an aquifer is subjected to pressure that is greater than
atmospheric pressure. The surface to which water from these aquifers would rise is called the
piezometric surface. Wells drilled in confined aquifers are called artesian wells and the
aquifers are referred to as artesian aquifers (Logan, 1995). Artesian aquifers when drilled use
artesian pressure to force water into the well. Unconfined aquifers are found in areas with
permeable material, thereby allowing easy movement of water into groundwater. The quantity
of water in such aquifers is dependent on seasonal changes. Unconfined aquifers are more
liable to contamination because they lack the impermeable layer that protects the seeping of
contaminants from other areas. Water in such aquifers occurs at atmospheric pressure.
3.4 Groundwater Contamination from Landfills/Waste Disposal Sites
Figure 14: Potential sources of groundwater contamination
Source: Voigt, 2010
Landfill contamination is the degradation of the natural quality of groundwater due to
human activities as shown in Figs. 14 &15 (Boulding, 1995). Todd and Mays, (2005) go

43
further to define groundwater contamination as artificially induced degradation of natural
water quality. It is not a new problem, but the occurrence of groundwater contamination has
increased over the years because of increased globalization and generation of waste. Soil and
groundwater contamination depends on the effect of soil moisture in two ways:
If the soil is quite dry at the start of a rain, the wetting of the top layer creates a strong
capillary potential just under the surface which supplements gravitational force in
causing infiltration.
When subjected to wetting, any colloids present in the soil swell and reduce the
infiltration capacity (the maximum rate at which a soil in any given condition is
capable of absorbing water) during the initial period of rainfall. Soil moisture is
usually high in the rainy season and low in the dry season (Wisler and Brater, 1959).
The contamination of groundwater could be intentional or unintentional (neglect or
accident). It could occur through recharge from surface water, direct migration, infiltration or
inter-aquifer transfer (Boulding, 1995). Recharge from surface water could occur if the
groundwater table lies below a stream, river or other water body or through flooding. Direct
migration of contaminants to groundwater is possible if there is a breakage of storage tanks or
transportation pipe located in the saturated zone.
Figure 15: The water cycle and potential sources of groundwater contamination
Source: Voigt, 2010

44
Infiltration is the process whereby water enters the surface strata of the soil and moves
downwards towards the water table (Logan, 1995). This is probably the most common
mechanism of groundwater contamination (Boulding, 1995). Infiltrating water passes through
an unsaturated to a saturated zone under the influence of gravity thereby replenishing soil
moisture and the excess moves downwards to form groundwater (Logan, 1995; Wisler and
Brater, 1959). Water infiltrating a contaminated zone may dissolve contaminants forming
leachate with organic and inorganic constituents. The leachate then percolates down to the
saturated zone where the contaminants spread vertically due to gravity and horizontally in the
direction of groundwater flow (Boulding, 1995).
Inter-aquifer transfer (exchange) can occur through hydraulic communication between
contaminated and uncontaminated aquifers. This normally occurs where a well is dug deep
enough to access more than one water-bearing unit as shown in Figure 16 (Boulding, 1995).
Wells which are not pumped and contain water from two different water-bearing units will
have water from the unit with greater potential moving to water with lesser potential. If the
water from the former is contaminated then the latter will also be contaminated. Abandoned
wells from landfills could also be a source of inter-aquifer exchange.
Figure 16 also shows a well that has been abandoned and improperly managed with a
corroded casing. This well used to tap a lower uncontaminated aquifer. Because the water is
no longer tapped, it has been contaminated by water from a contaminated overlying zone
through the corroded casing. Abandoned wells and landfills with depths close to groundwater
tables could also cause direct migration of contaminants to groundwater. A second well
nearby can be easily contaminated in the course of pumping even though the rate of
contaminant movement is slow through a confining layer than the direct connection of an
abandoned well.
Figure 16: Vertical movement of contaminants along an old, abandoned or improperly
constructed well
Source: Boulding, 1995

45
Soil surface conditions that affect infiltration include: compacted soil, vegetation,
topography, slope and roughness of the surface, and human activities (Ward and Elliot, 1995).
Other factors that affect infiltration capacity include:
Compaction due to rain, for example, the surface of exposed clay will become virtually
impermeable and hence minimise infiltration.
Vegetation cover also compacts soil and reduces infiltration capacity.
In-wash of fine material, such as very dry soil has very fine particles at the surface. In
case of rain, these fine particles then occupy interstitial spaces, hence reducing infiltration
capacity.
Compaction due to man, for example, pedestrian and vehicular traffic and other activities
like grazing, playgrounds and roads lead to the impervious nature of the soil (Wisler and
Brater, 1959).
3.4.1 Important Terms Related to Contamination
A contaminant, unlike a pollutant (any substance whose presence has a potential to
cause harm through environmental degradation, or to human and animal health), is a
substance whose presence is normally expected. In the case of water, this is any substance
other than a chemical substance (Logan, 1995). Boulding, (1995) defines a contaminant as
any physical, chemical, biological or radiological matter or substance in water. He goes
further to say that contaminants could also be referred to as all solutes which are introduced
into the hydrologic environment because of anthropogenic activities. The above definitions do
not specify the difference between various sources and levels of contamination.
There are two types of contaminants, namely, point source and non-point source
contaminants. Point source contaminants are those that are discharged to surface or
groundwater from a defined source, e.g. industrial discharges, municipal effluents, etc. Non-
point source (also called diffused source) contaminants are watershed sources of contaminants
that are distributed by runoff or percolation from land as a result of different land use
activities like agricultural fertilisers and pesticides (Logan, 1995).
The principal process of movement of contaminants in soils and groundwater is mass
flow. Dissolved constituents in water move through the soil; implying that water is a carrier of
contaminants. Mass flow is affected by properties of the contaminants, the soil, the
intermediate vadose zone and the aquifer, climatological factors, and vegetation patterns.
Groundwater hydrology is a part of hydrology that concentrates on the storage and
movement of water beneath the ground surface (Wanielista et al, 1997). This science is very
important in all aspects of water supply and use. Consequently, the science is valuable in
forestry, agriculture and other parts of environmental science (Ward and Elliot, 1995).
However, Wisler and Brater, (1959) define it as the science that deals with the processes
governing the depletion and replenishment of the water resources of land areas of the earth. It

46
is a science that treats the various phases of the hydrologic cycle because it is concerned with
the transportation of water through air, over the ground surface and through the earth strata.
Hydrology deals with atmospheric, surface- and sub-surface water.
According to Wisler and Brater, (1959), knowledge of hydrology is of basic
importance in practically all problems that involve the supply and use of water for any
purposes whatsoever. This implies that hydrology is important in engineering, forestry,
agriculture and other branches of natural sciences.
3.4.2. Landfill Leachate and Gas
Generally, the disposal of waste is a potential threat to groundwater underneath the
waste disposal facility and the atmosphere (Figures 18 & 20). Dumped solid waste slowly
releases initial interstitial water, as well as some of its by-products from decomposition mixes
with water that moves through waste (especially from precipitation). Mor et al, (2006) suggest
that this liquid is what constitutes leachate, which is the main source of groundwater
contaminants from waste sites. Leachate is defined as highly contaminated water that
emanates from a waste disposal site (Oweis and Khera, 1995). This accumulates at the bottom
of the waste facility and percolates through the soil to groundwater. The nature and
concentration of leachate from a waste site depends on waste composition, the rate and
amount of water infiltrating through waste to groundwater and the length of time that water
infiltrating waste is in contact with the waste (Grover, 2000).
Figure 17: Schematic sketch of Beddington recirculation trial geometry
Source: White et al, 2011

47
Landfill and waste dump site leachate depend on the kind of waste disposed of at site.
Leachate, if re-circulated, may be used to optimise the generation of landfill gas, which in
turn encourages biodegradation of the waste by raising the water content and transporting
bacteria, nutrients and potentially inhibitory waste products (Fig. 17). Recirculation enhances
leachate storage within the landfill and consequently reduces the leachate load on a leachate
treatment plant (White et al, 2011). This process enhances the production of a more uniform
type of leachate thereby facilitating waste treatment and disposal. It reduces the occurrence of
dry spots in the waste and consequently enhances the degradation of all waste. Nonetheless,
certain drawbacks include: clogging of sub-surface recirculation systems, excessively high
concentrations of dissolved salts which predominantly accept inorganic waste and high levels
of leachate in the site (Williams, 2005).
Figure 18: Details of the stages of waste degradation in landfills
Source: Williams, 2005
Landfill gas emissions on the other hand are mainly made of methane (CH4) and carbon
dioxide (CO2). These gases are the main greenhouse gases that enhance global warming (Figs.
18 and 19). These gases together with other landfill emitted gases are products of both aerobic
and anaerobic reaction of waste material in the landfill as in the equations below. Landfill gas

48
can move more than 150m away from landfill (Bagchi, 2004). In Europe the amount of
biodegradable waste disposed of in landfill has been reduced by about 65% in order to reduce
the amount of landfill gas produced. Germany, for example, produced 40,017,000 tons of
municipal solid waste in 1993, 72% of which was biodegradable. Seventy percent of waste
dumped in landfills was biodegradable (Williams, 2005).
Aerobic degradation: C6H12O6+6O2→6CO2+6 H2O-2.862KJ/mol
Anaerobic degradation: C6H12O6→3CO2+3CH4-Energy
Figure 19: Landfill gas composition and landfill gas wells
Source: Voigt, 2010
Figure 20: Main stages of waste degradation in a landfill
Source: Associates- the Landfill site, (2011)

49
CHAPTER FOUR: WASTE MANAGEMENT AND GROUNDWATER
IN LIMBE
4.1 Waste Management in Cameroon
Very little research has been carried out in the area of waste management and groundwater
contamination in Cameroon. Current research is mostly based on big and prominent cities of the
country, like Douala and Yaoundé. Research carried out by Achankeng, (2003) revealed that
civilization has contributed negatively to waste generation and management in Cameroon. Waste
generation has increased and practically nothing has been done to upgrade the management of this
waste and so waste is sometimes littered all over cities. The biggest problem is that waste in cities
is managed by the municipality which receives very little assistance from the government. For
this reason, and because they are expected to design and implement waste management plans,
they find the easiest and most comfortable method of waste management which minimises
financial strain. In doing so, they do not take many factors like groundwater, environmental
aesthetics and human health into consideration.
Cameroon, like most developing countries, is currently facing relatively high rates of
urbanization, estimated at about 4% annually, compared to an annual population growth of
about 2.7%. This growth is occurring at a time when the country has been experiencing socio-
economic pressures that have led to a decline in economic growth. A serious crisis in financial
resources due to a fall in oil prices since the mid 1980s was followed by the National
Structural Adjustment Programs (SAP) of the early 1990s. This caused the government to
drastically reduce investments and subsidies in the urban sector. Hence, living conditions
deteriorated, particularly in the areas of health and education (Manga et al, 2007). Municipal
solid waste management has thus been one of the most affected of all sectors.
Poor sanitary conditions in many parts of Africa have enhanced the prevalence of
parasites, tetanus, malaria, hookworm, cholera and diarrhoea since waste is littered around
cities, villages and other inhabited or settled areas. Incidents of flash floods, water pollution
and littered landscapes have also been attributed to poor waste management practices (Manga
et al, 2007). In spite of the fact that many factors affect the management of MSW; the
population size is also an important factor. The larger the population, the more the problems
encountered in waste management. It can be deduced that increasing city size poses more
problems in solid waste management in the sense that more waste is generated than can be
managed. For example, Yaoundé has a population of about 1.2 million people, and it produces
about 1,200 tonnes of waste per day as opposed to a population of 600,000 in the 1960s with
300 tonnes of waste produced per day. The city area also increased from 5000 hectares in
1963 to 20,000 in 2000 and the rate of waste collection has also risen from zero percent in the
1990s to 40-50% collection by HYSACAM (Achankeng, 2003). Previous studies on waste
management in Cameroon lay insignificant emphasis on the legislative and regulatory aspects.
However, the Cameroon government created the Ministry of Environment and
Forestry in 1992, and also developed a National Environmental Management Plan. In the last
decades, ministerial departments have undergone transformation (that is separated or merged)

50
which has enhanced emphasis on waste management (Manga et al, 2007). Though
interestingly, no significant emphasis has been made on sustainable approaches to waste
management with regard to collection, treatment, disposal and recycling.
Table 12: Roles and responsibilities of key ministerial departments related to waste
management in Cameroon
Ministerial
department
Key responsibilities related to waste management in Cameroon Statutory Order
Ministry of Territorial
Administration and
Decentralization
(MINTAD)
Follow-up and implement regulations for organization and
functioning of Councils; Oversees the execution of the budget of the government’s council support fund (FEICOM); Restoration of
hygiene and public sanitation; Supervises Urban Councils which
are responsible for follow-up and control-industrial waste management, management of all public spaces and infrastructure;
Sweeping of streets, collection, transportation and treatment of
household waste
Circular letter No.
0040/LC/MINAT/DCTD of 04/04/00, Order No.
00072/MINAT/MINVILLE of
21/05/00, Law No. 714/23 of 5/12/74, Law no. 2004/18 of
22/07/04
Ministry of Mines,
Industries
and Technological
Development (MINMITD)
Develop strategies for industrial development and the control of
classified and commercial installations for pollution, security,
hygiene and industrial nuisance; Define norms for industrial
pollution; List of dangerous, obnoxious and polluting facilities in order to inform the public; Develops regulations governing
installation and exploitation of facilities classified as dangerous,
obnoxious and polluting
Decree No. 99/818/PM of
9/11/99, Order No.
13/MINMEE/DMG/SL of
19/04/77, 02/MINMEE/DMG/SDAMI
of 4/01/99
Ministry of Economy
and Finance (MINEFI)
Financial control of organizations benefiting from supplementary
budgets and autonomous public establishments, i.e. councils;
Responsible for managing the finance law as enacted by Parliament
Constitution Decree No.
2004/320 of 08/12/04
Ministry of Urban
Development and Housing (MINDUH)
Develops and implements urban restructuring, management
strategies, sanitation and drainage; Defines and enforces norms of hygiene/sanitation, collection and/or treatment of household waste;
Liaises with international agencies for urban development
Order No.
00072/MINAT/MINVILL of 21/05/00
Ministry of
Environment and
Nature Protection
(MINENP)
Collaborates with other agencies to define measures for the rational
management of natural resources; Effective control of investigation
and pollution in the field; Specifies the criteria (project specific)
and supervises environmental impact assessments
Decree No. 2005/0577/PM of
23/02/05 7], Order No.
006/MINEP of 08/03/05
Ministry of Public
Health (MINPH)
Creates Hygiene and Sanitation Units in Councils; Renders
technical support to the Hygiene and Sanitation Units of Councils, Proposes norms for collection, transportation and treatment of
industrial, domestic waste and emptying of septic tanks; Designs
and implements public education campaigns on hygiene and
sanitation
Order No.
D67/NS/NN/ST/SG/BMPHP/NNPA of 11/08/87, Circular
letter No.
D69/N6/DMHK/SHPA of
August 1980
Source: Manga et al, 2007
MSW management in Cameroon is mainly co-ordinated by the Inter-Ministerial
Commission for Municipal Waste Management in Cameroon (ICMWM), which was created
by Prime Ministerial Decree No. 95/230/PM of 30/04/95, and charged with the responsibility
to develop policy and formulate appropriate municipal solid waste management strategies.
Ministerial departments responsible for the proper implementation of MSW management in
the country were assigned responsibilities as shown in Tables 12 and 13 below. A number of
key Statutory Orders related to solid waste management were also enacted as seen in both
tables (Manga et al, 2007). These roles and responsibilities, and key statutory orders
addressed issues concerning waste stream types, environmental and public health protection.

51
Table 13: Key legislative aspects related to waste management in Cameroon
Legislation Key elements related to waste management in Cameroon Statutory Order
Law related to
Environmental
Management (No. 96/12 of
5/08 1996)
National Environmental Management Plan related to the protection
of the atmosphere, marine and continental waters, soils, sub-soils
and human settlements; Regulates installations that pose dangers to
the public; Stipulates modalities for the conduct of Environmental
Impact Assessments (EIA) and categories of operations subject to
EIA; Specifies air emission and waste water discharge standards;
Sets conditions for issuing authorizations for allotment and
management of land for use, i.e. industrial, urban etc, conditions
for waste handling (e.g. collection, storage, recycling, etc.),
Prescriptions relating to waste elimination by persons producing or
treating waste; Stipulates the terms of reference for the supervision
of municipal dumps by the competent authorities
Decree No. 2005/0577/PM of
23/02/05, Order No. 006/MINEP of
08/03/05
National Environmental
Management Plan
Five year amendable plan; set up environmental information
system; Preparation of bi-annual reports on the state of the
environment in Cameroon, e.g. identifying problems arising from
urban pollution and devising suitable micro-projects to mitigate the
problems
–
Law relating to the
installation of Classified
establishments (Law No. 98/15
of 14/07/98)
Stipulates two types of Classified establishments (Class I and Class
II). Dump sites are classified as Class II establishments for which
operation and management must follow prescribed guidance. It
sets out the regulations governing the installation and exploitation
of facilities classified dangerous, obnoxious and polluting;
Decree No. 99/818/PM of
9/11/99, Order No.
13/MINMEE/DMG/SL of
19/04/77,
02/MINMEE/DMG/SDAMIC of
04/01/99
National Water Code (Law No.
98/005/ of 14/04/98)
Provides framework for the exploitation of water resources
including waste disposal, Specifies modalities for the protection of
surface and groundwater from pollution (including from dump
sites).
Decree No. 2001/165/PM of
08/05/01
New Urban strategy, 1999 Partnership among the state, local council authorities and civil
society in urban intervention in areas such as solid waste
management
–
Source: Manga et al, 2007
The fact is that Cameroon’s hierarchy is the top-down system where ministerial
departments control the local Councils and the wastage of human and capital resources inhibit
adequate and effective implementation of these regulations. Decisions (especially the
provision of technical assistance from the government to the local communities) made are
usually politically and are not scientifically inclined. Also, political interference limits the
efficient delivery and enforcement of available statutory instruments. For example, the duties
of undertaking regular visits to waste sites to monitor regulatory compliance is devolved
between four ministerial departments (Table 13) and this often results in low levels of
enforcement due to a lack of clarity in the definition of responsibilities (Manga et al, 2007).
The waste management legislation in Cameroon has evolved over the last ten years as
it encompasses environmental resource protection and the promotion of material conservation
through safe disposal and material recovery. This legislation is poorly implemented,
especially as the government does not provide mechanisms for effective implementation.
Hence, waste management in many Cameroonian cities is centred on the improper collection
and dumping of waste elsewhere because it is easy and cheap. This practice conforms to the
traditional approaches to waste management in developing countries where cheap solutions

52
are of importance. These practices are related to factors like lack of funding, limited human
resource personnel, implementation of inappropriate technologies and relative cost, and
political interference (Henry et al, 2006; Manga et al, 2007; Read, 1999; Wilson et al, 2005).
In Cameroon, municipal waste management is the prime duty of Municipal Councils.
These are required to provide and maintain waste management facilities like municipal bins,
transportation services for waste collection and disposal. Funds used by the Council come
from
Taxes and revenue from council activities
Supplementary budget from the government through MINEFI
Lending facilities from Government Council Development Fund (FEICOM) (Manga
et al, 2007).
Figure 21: Existing patterns of solid waste management processes in Cameroon
Source: Manga et al, 2007
Waste management related responsibilities are under the jurisdiction of health and
safety officers in the Hygiene and Sanitation Units of each Municipal Council. The highest
qualified member of staff in each authority is the supervisor who may be a health worker. The
Council is responsible for creating and managing these units with partial responsibility for
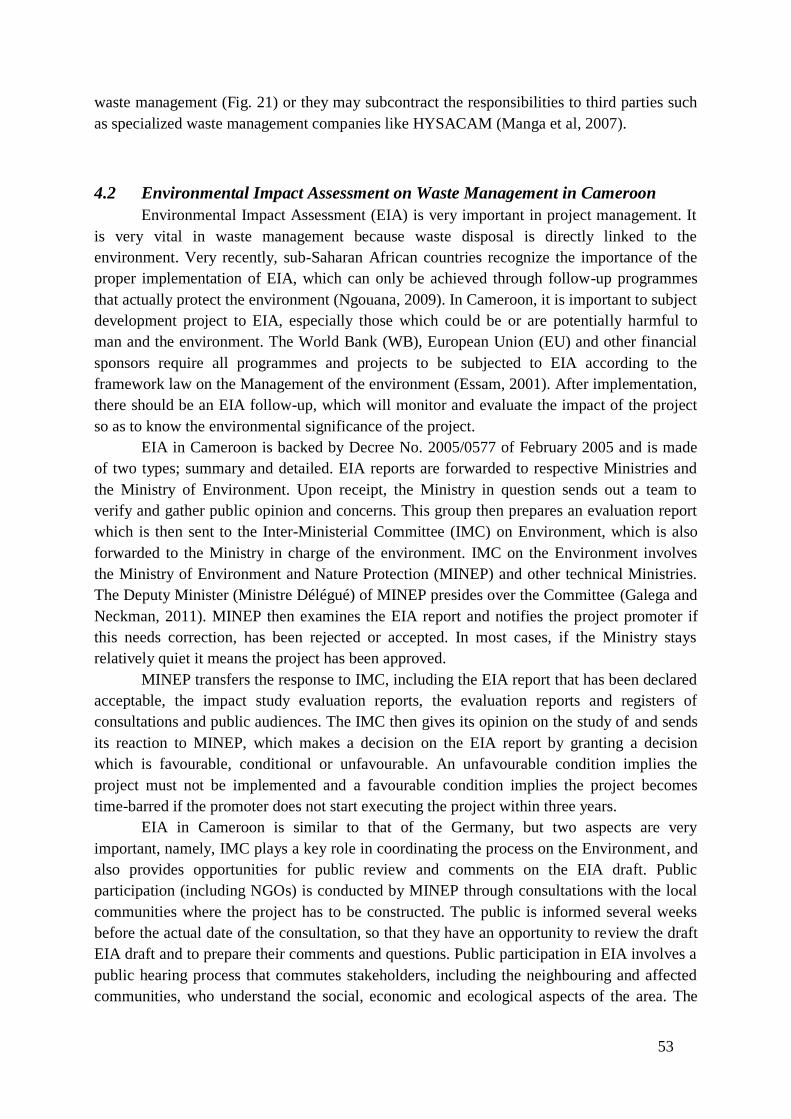
53
waste management (Fig. 21) or they may subcontract the responsibilities to third parties such
as specialized waste management companies like HYSACAM (Manga et al, 2007).
4.2 Environmental Impact Assessment on Waste Management in Cameroon
Environmental Impact Assessment (EIA) is very important in project management. It
is very vital in waste management because waste disposal is directly linked to the
environment. Very recently, sub-Saharan African countries recognize the importance of the
proper implementation of EIA, which can only be achieved through follow-up programmes
that actually protect the environment (Ngouana, 2009). In Cameroon, it is important to subject
development project to EIA, especially those which could be or are potentially harmful to
man and the environment. The World Bank (WB), European Union (EU) and other financial
sponsors require all programmes and projects to be subjected to EIA according to the
framework law on the Management of the environment (Essam, 2001). After implementation,
there should be an EIA follow-up, which will monitor and evaluate the impact of the project
so as to know the environmental significance of the project.
EIA in Cameroon is backed by Decree No. 2005/0577 of February 2005 and is made
of two types; summary and detailed. EIA reports are forwarded to respective Ministries and
the Ministry of Environment. Upon receipt, the Ministry in question sends out a team to
verify and gather public opinion and concerns. This group then prepares an evaluation report
which is then sent to the Inter-Ministerial Committee (IMC) on Environment, which is also
forwarded to the Ministry in charge of the environment. IMC on the Environment involves
the Ministry of Environment and Nature Protection (MINEP) and other technical Ministries.
The Deputy Minister (Ministre Délégué) of MINEP presides over the Committee (Galega and
Neckman, 2011). MINEP then examines the EIA report and notifies the project promoter if
this needs correction, has been rejected or accepted. In most cases, if the Ministry stays
relatively quiet it means the project has been approved.
MINEP transfers the response to IMC, including the EIA report that has been declared
acceptable, the impact study evaluation reports, the evaluation reports and registers of
consultations and public audiences. The IMC then gives its opinion on the study of and sends
its reaction to MINEP, which makes a decision on the EIA report by granting a decision
which is favourable, conditional or unfavourable. An unfavourable condition implies the
project must not be implemented and a favourable condition implies the project becomes
time-barred if the promoter does not start executing the project within three years.
EIA in Cameroon is similar to that of the Germany, but two aspects are very
important, namely, IMC plays a key role in coordinating the process on the Environment, and
also provides opportunities for public review and comments on the EIA draft. Public
participation (including NGOs) is conducted by MINEP through consultations with the local
communities where the project has to be constructed. The public is informed several weeks
before the actual date of the consultation, so that they have an opportunity to review the draft
EIA draft and to prepare their comments and questions. Public participation in EIA involves a
public hearing process that commutes stakeholders, including the neighbouring and affected
communities, who understand the social, economic and ecological aspects of the area. The

54
issues raised in the process of public participation are integrated into the project
environmental management plan (Galega and Neckman, 2011).
It is important to note that waste management facilities have Environmental, Health
and Safety guidelines which include:
Investigation of geology, soils, ground and water resources of the surface and
subsurface will be conducted to determine leachate migration potential and the need for
additional design requirements.
The designing of waste management facilities and access routes to minimize the impacts
of waste on air, surface and groundwater, sensitive ecosystems, natural and cultural
resources and land-use patterns.
Gas control systems, if required, will be included in the waste management facilities in
order to minimise possible explosions or toxic conditions from the accumulation of
waste disposal gas and protect soil-stabilising vegetation (that is, re-vegetated areas
along the facilities).
At the end of each working day, containment cells will be covered with soil or other
suitable material so as to minimise odour and prevent scavenging by animals (Geovic
Cameroon, 2007).
4.3 Waste Management in Limbe
4.3.1 Waste Composition in Limbe
The amount of municipal solid waste generated in Limbe is estimated at about 7300
tonnes per year, that is, 20 tonnes per day (Awum et al, 2001). This amount is considerably
low when compared to that generated in Cottbus, Germany, which is estimated at about 36
million tonnes a year. Limbe has a population of about 120.000 people as opposed to that of
Cottbus in 2007 which was 106.415, i.e. 618 persons per sq. km.
The main sources of waste in Limbe include waste from households, industries,
schools, hospitals, markets and hotels. The composition of waste varies widely in Limbe as
shown in Figure 22. According to Manga et al, (2007), the waste stream is a heterogeneous
mixture of materials and products whose composition varies with its sources of generation, as
well as the socio-economic classification of the locality.
It is can be seen from Figure 22 that the middle income social group produces higher
proportions of biodegradable and plastic waste, probably because of affluence and the
increased use of packaged food and materials. This can be associated with the lifestyle and
aspiration to be more civilised. Still in this group, a lot of toys and electronic products are
thrown. Biodegradable waste contains significant amounts of garden and yard waste unlike
the low income community who mostly reuse biodegradable waste for agriculture. Also, the
low income community generates more of metal and glass waste like broken bottle, car parts,
metal containers, iron and tins. This implies that different types of activities take place here,
like the sale of palm oil and kerosene, small shops, bars, mechanic garages and night clubs.

55
Figure 22: Typical composition of waste from different locations across Limbe
Source: Manga et al, 2007
4.3.2 Waste Management Practice in Limbe
4.3.2.1 Waste Collection Methods
Waste collection in Limbe is not very efficient as the waste collected does not
represent the amount of waste generated. The timetable (Appendix 1) provided by the Council
for waste collection was not adequately respected. Industrial, hospital and municipal wastes
are collected together, implying that no sorting is done. Three forms of collection approaches
are used in Limbe, namely; pre-collection, door-to-door and fixed point collection
(Achankeng, 2003; Awemo, 2000; Manga et al, 2007).
Pre-collection is the transportation of waste from generation points, mostly by children
to municipal waste bins (Achankeng, 2003). This method is encouraged by the Council which
has created the first Wednesday of the month as “Keep Limbe Clean” day. On this day
inhabitants of the town are expected to tidy their neighbourhood including open dumps so as
to ease waste management by the council for sanitation reasons.
Door-to-door collection involves the collection of waste by the council waste trucks.
The driver indicates his presence in the neighbourhood, so that people can bring out their
waste and throw into the truck. Door-to-door had a fixed program (2-3 times a week) and was
carried out in the so-called “High class” areas of the town, like GRA which is easily
accessible and inhabited by rich people. The only problem faced here is that the trucks always
breakdown and repairs normally take a long time.
Fixed point collection method is the picking up of waste from council bins located at
accessible points. This method also has schedules which depend on the popularity and

56
accessibility of the area. In some areas, waste is collected weekly and in others, fortnightly.
This form of collection is also impaired by the breakdown of the collection trucks, which
hampers collection for up to or more than a month. As a result, waste can stay in council bins
for weeks or months and creates situations where people are exposed to waste-associated
hazards. Scavengers who visit bins to recover usable waste also scatter waste and ease its
access by rats, flies and other organisms.
4.3.2.2 Waste Management by LUC
An interview was conducted with the Head of Sanitations Department in the Limbe
Urban Council, Mr. Otto Mussaka. He is the representative of LUC in HYSACAM, who
supervises the activities of the company and reports to the Ministry of Environment and
Technology (MINET). This interview revealed that a contract was signed in May 2006,
handing over the task of waste management to HYSACAM from July 2006. The company
had intensified and improved waste management in the municipality which according to
future plans would get better. The LUC municipal waste dump site at Mokundange was
handed over to HYSACAM as a temporary site. LUC had used it for over ten years.
HYSACAM was currently in the process of acquiring a new site at Batoke, since BEAC Bank
intended building a Bank complex near the current area.
The Municipal Council, through assistance from the government, finances waste
management by up to 85% (an equivalence of about 16million FCFA) annually. There was an
evaluation meeting in July 2009 to assess the effectiveness of HYSACAM and create a five-
year waste management plan for Limbe. This project goes on in connection with LUC and
MINET. The aim of this project was to improve on waste management standards, expand
waste collection to small streets and to lay emphasis on public sensitisation.
It was also disclosed that HYSACAM employed 310 workers, 20 of whom cleared the
seashore and 10 cleaned in and around the market. HYSACAM also employs seasonal
workers for a period of about three months to clean many parts of the town. Sorting is
currently not done, but has been included in the plan of action for public sensitisation on
sorting from home. The company also distributed blue plastic waste bags to homes for quite
some time, but stopped because the Council no longer provided finances for this activity.
At the time when LUC controlled waste management in Limbe, waste collected by the
waste collection trucks was transported to waste dumps in Mokundange (Karata) or Motowoh
which were built by the Council. The waste was usually dumped for three weeks and then
burned. After burning, the waste was then pushed to the back in order to create more space for
further waste disposal. From this method of waste disposal, it can be insinuated that the dump
sites used were selected and operated with no consideration to human health and the
environment. This is shown by the fact that there is no proper monitoring of groundwater, no
hydrogeological control and no proper data documentation.
At least six dump sites in different parts of the town have been used by LUC in the last
15 years. Some of these dumps have been abandoned because of increased construction of
residential and commercial structures. These sites have not been monitored for post-

57
environmental and groundwater contamination. Therefore, the exposure of the environment
and groundwater to contamination could be relatively high. Some of the dump sites were
located near farms, plantations, residential areas and streams used by the local people. Some
typical examples of council dump sites in Limbe include the New Market and Slaughterhouse
dump sites, which are located in swampy areas where flooding is very common in the rainy
season. Plates 2 and 3 clearly illustrate that no form of planning was done before site location
and waste deposition, especially in the area of groundwater contamination. The water table in
this area is very shallow and water in wells sometimes fills up to the surface, especially in the
rainy season.
Plate 2: Slaughter house dumpsite in Limbe
It was observed in slums and unplanned settlements that indiscriminate disposal of
MSW on roadsides, in streams, bushes, vacant lots and low-lying areas is very common.
Flies, maggots and other insects invaded these places which also released odour. This littered
waste is carried by rain runoff alongside its maggots and contaminants. Waste is usually burnt
in the dry season to reduce volume and create space for more waste. There is no assessment or
documentation on this method of disposal on human health and the environment because of
poor planning, implementation and lack of human resource development.

58
Plate 3: New Market dumpsite; waste dumped by the local people with no access to
public bins
Plate 4 shows open dumps in different parts of the town which have been created by
the local community where waste is rarely collected or managed by LUC. These places
normally smell and harbour different types of insects, especially flies and mosquitoes. During
the rainy season, these dumps (usually located in marshy areas) can easily cause health
hazards, environmental and groundwater contamination because they harbour insects and
other unwanted microbes.
Plate 4: Open dumps in slums and unplanned areas created by the local people

59
4.3.2.3 HYSACAM and Waste Management in Limbe
HYSACAM, Cameroon Hygiene and Sanitation Company, is a French company
created in Douala in 1969. It now manages waste in more than ten Cameroonian towns, some
of which are Yaoundé, Douala, Sangmélima, Dschang, Bafoussam, Limbe, Buea, Kribi,
Mbalamayo, Obala/Sa’a and Tiko. It serves more than 5 million people and has over 200
trucks (80 of which were bought in 2007), which collect over 3,000tonnes of MSW per day.
A discussion with the manager of HYSACAM Limbe, Mr. Michel Ngapanou, revealed
that HYSACAM Cameroon signed a Convention with VEOLIA PROPRIETE SA in 2007 to
improve on the collection of garbage nationwide. This is a multinational French company
with activities in four main areas, namely, water supply and water management, waste
management, energy and transport services. This is the 2nd
most renowned waste management
company worldwide and operates in about 35 countries. The aims of this agreement were to
improve environmental conditions by providing waste management services for the residents
of HYSACAM towns, and conform to international standards of collection, transportation,
safety and waste processing as stipulated by the Kyoto protocol. Both companies work hand-
in-hand to continually innovate and optimise the quality of service delivery. VEOLIA also
provides the technical know-how to ensure HYSACAM's efficiency, service quality
improvement and workers’ safety, while closely respecting global standards.
Table 14: Waste collection timetable for Limbe adapted from HYSACAM timetable
Section Different components Collection days Car No.
Section I Main Road Bota, PMI Road, Clerks Quarters, Down
Beach, MOTOMBI Street, Mbonjo Road, Main
Street, Church Street, Manga William Avenue, New
Town tarred Road
Daily Camion No. 33
Section II Mbende, Community Quarters, Gardens, Indian
Quarters, G.R.A., Cité Sic, opposite Cité Nanga, SS
Quarters
Monday, Wednesday, Friday Camion No. 05
Section III Coconut Island, Cassava Farms, Lumpsum, New Town untarred Road, Mabeta New Layout, Mawoh
Quarters, Potopto Quarters, Dockyard
Monday, Wednesday, Friday Camion No. 65
Section IV Middle Farms, Espoir, Quartier Face Depot Guiness,
Comprehensive, Animal Farm-caterpillar Field, Alpha club, Unity Quarters
Tuesday, Thursday, Saturday Camion No. 65
Section V Limbé camp, Main Road Mile Four, Mile Seven
Camp, Maternity Quarters
Monday, Wednesday, Friday Camion No. 62
Section VI Moussoumbou Camp, Samco Quarters, Moliwé, Quarter 14, Quarter 6, Route Bojongo, Wututu Park,
Main Road Garden, Inside Garde
Tuesday, Thursday, Saturday Camion No. 62
Section VII Batoke, Main Road Batoke, Inside Wovia, Inside
Botaland, Isokolo New Road and Old Road, Isokolo untarred
Tuesday, Thursday, Saturday Camion No.05
Source: Adapted from HYSACAM waste collection plan
Through this agreement, HYSACAM will receive assistance from VEOLIA to carry
out waste management through waste treatment. This will enhance the reduction of
greenhouse gas emissions like CO2 and CH4. HYSACAM also intends to set up compost and
biogas collection units. It also plans to intensify activities of industrial and medical waste

60
processing. This will provide hospital and industries with an alternative for processing
poisonous industrial and medical waste nationwide (Cameroon News, 2007).
Another interview at HYSACAM in 2009 revealed that HYSACAM was at the end of
the first three-year contract which took effect in July 2006 and was preparing reports of the
last years. The first evaluation meeting of their activities was due in July 2009.
The company divided Limbe into seven sections and appointed two workers to oversee
waste management in these areas. The waste collection plan is done according to these
sections (Table 14). HYSACAM has five collection trucks (Plate 5), which include a waste
bin carrier, two ordinary trucks and two waste compressors, and a bulldozer to push waste
after burning. The company sometimes has to loan another bulldozer from private owners in
case of the breakdown of the bulldozer.
Plate 5: Waste site at Karata and trucks used by HYSACAM for waste disposal
There was a plan to close and abandon the current dump site at Karata. Conclusions
for the acquisition of a new site at Batoke were to be done by the end of June 2009. According
to the contract signed with the Council, only domestic waste should be disposed of at this site.
Neither medical nor hazardous waste should be dumped here. But hospital and hazardous

61
wastes are mixed with household waste and dumped at Karata dump site since waste is not
sorted (Plates 5 and 8). Waste from the hospital should be treated by the hospital or another
company that takes charge of such waste.
The method of waste disposal used by HYSACAM is open dumping and burning.
There are two methods of collection;
Door-to-door collection, which is done by the trucks and waste compressors (Plate 6)
Fixed point collection
Plate 6: Types of trucks used in waste disposal by HYSACAM
After collection, the waste is taken to the Karata dump site and disposed of. This waste
is then either burnt and/or pushed behind, after which it is covered with soil. In the rainy
season burning is quite difficult since waste is very wet. So, waste is only pushed to the back
and covered with soil. Burning is often easier in the dry season since waste dries up than in
the rainy season. There is a lot of smoke and vapour emitted from burnt and fresh waste.
These account for gaseous releases to the environment. Some of the plants around the waste
dumps may be burnt or may die because of some chemical waste disposal. The waste

62
sometimes already comes with fire which spreads to surrounding plants and area. The people
who live in this area say that in the dry season, the waste is also burnt by HYSACAM.
Plate 6 shows pictures of the different vehicles used by HYSACAM. From field
observations, it could be seen that some of the cars are old and not well maintained. The
workers go about unprotected and hence are subjected to waste-related infections and injuries.
Some of them work bare body with no gloves and protective shoes. They also carry or touch
waste with their hands. This makes it easy for them to wound their hands and body as the
waste which they dump is not sorted and includes hospital and industrial waste components.
This is not only dangerous for these workers, but also for the environment. During the
research trip of 2009, a worker was killed. He fell from the truck which crushed his head. He
was bare-chest with no head protection.
However, information gathered from the local people reveals that the frequency of
waste collection and disposal in the municipality has drastically improved since the coming of
HYSACAM. Some locally created slums and dumps around Limbe town were properly
cleaned. Waste bins were repaired and placed at points which are relatively more accessible to
the public. The volume of waste disposed of at the main dump has relatively reduced since
most people now reuse some of the waste they generate. According to the Manager of
HYSACAM, before taking over the disposal site from the Council, HYSACAM checked on
the availability of water around the site and found out that there is practically no
environmental and health hazards from the site so far. There exist however, no prove to this
claim. Particular and conspicuous areas have been cleaned of littered waste. Areas that are
very popular and always visited have been exceptionally cleaned and HYSACAM waste bins
provided for household waste disposal (Plate 7).

63
Plate 7: Cleaning a very dirty, but tourist-attractive area in Limbe (Limbe Down Beach)
Public sensitisation by LUC. Very few people have adequate waste bins in their homes
and children (three out of ten) are often sent to dump waste in the municipal waste bins.
This enhances littering waste around the public waste bins. Also, sorting should start at
home in order to ease work for HYSACAM workers and ensure proper disposal.
A commission should be created to map out appropriate criteria for waste collection,
which is one of the biggest problems faced by HYSACAM. This commission should
involve the Mayor, Government Delegate, the Divisional Delegate for Environment and
the Divisional Delegate for Urban Development and Housing. This will enhance a lot of
development (road construction and repairs, the creation of new streets, town planning
and the demolition of poor structures) for the town to ease waste collection (easy access
to waste collection points).
The management of waste should lay emphasis on the need to prevent groundwater
contamination, protection, treatment and monitoring. So far, very little investigation has
been carried out on the state of groundwater in this area.
The proper steps in the construction of a new landfill, must involve barrier
specifications; groundwater monitoring before, during and after use, the collection and
treatment of leachate, and gas collection, treatment and use.
After the evaluation meeting in July 2009, a new contract (between LUC and
HYSACAM) was signed and the company proposed the following strategies for the next
project:
HYSACAM has further plans for a proper waste management strategy. The company
will improve on its method of communication through more frequent radio and television
programmes. They, together with LUC, will produce radio programmes, which will capitalise
on small, but important facts like:
The importance of and how to handle municipal waste properly,
Types and sorting of waste,
Types of waste bags (colours) and their use or meaning,
Waste management in connection with groundwater contamination.
The new site at Batoke had not undergone groundwater monitoring. These analyses
would be done immediately after site approval. Water and soil samples would be collected
and sent to HYSACAM head office in Douala for analysis. This Unit in Douala does
groundwater, rainwater and soil analysis. It also communicates information concerning
HYSACAM nationwide.

64
So far, only two towns have properly built landfills in the country; Yaoundé and
Douala. Douala closed the first landfill because it did not conform to the international
standards of landfill construction. The second one and the landfill in Yaoundé followed all
necessary steps. Preliminary and on-going groundwater monitoring was carried out. There is
also an existing policy for post landfill groundwater monitoring. In Douala, a very detailed
EIA report was produced before the site could was approved.
4.3.2.4 Problems faced at HYSACAM
HYSACAM encounters the discomfort of trucks and bulldozers breaking down. This
affects the work plan and effectiveness of the company. An example was a case in February
2010, when the bulldozer broke down and could not be repaired for almost two month. Waste
dumped extended to the road outside the entrance of the site and blocked the road leading to
the nearby village (Plate 8). The chief was sent to assist in solving the problem, because the
villagers were planning to destroy HYSACAM’s property. The Manager pleaded with the
chief to give him a little time in order that the bulldozer is repaired. Unfortunately, there was
no available bulldozer which could be hired and used during this time. After this dialogue, it
took HYSACAM another one week to repair the bulldozer. The manager has applied for the
acquisition of another bulldozer so that such a problem could be avoided in the future.
The company also faces problems with the job effectiveness since workers find it hard
to adapt to their jobs. The emotional discomfort of workers is one of the major factors that
slow work at the company. Workers need psychological preparation programmes which will
give them job pride, confidence and assurance. This can be done through training
programmes, meetings, workshops or seminars and environmental education on proper
hygiene and sanitation. The introduction of incentives, like congratulatory prizes to the best
workers, female workers, etc. will make most workers proud of their job. Even though the
payment of 60,000FCFA (approx. €90) per month is higher than that of LUC workers, they
are still not satisfied. The company also provides a health insurance and covers 80% of the
insurance costs and ensures pension for workers (L’actualité, 2007; Mbom, 2006). Limbe was
the first and lone HYSACAM Unit so far, where women are employed. Statistics have shown
that these women are more confident, comfortable, disciplined and responsible than most of
the men.

65
Plate 8: Waste disposed at Karata dumpsite extending to road leading to Mokundange
An interview was also made with an angry and disgruntled worker who complained
that he had been stopped abruptly from work without any notice or reason. He talked bitterly
about a very low salary of 60,000 FCFA per month (which is approximately 1,750 FCFA per
day). This money cannot sustain his family for one month; yet he has to go to work every day
from 6am to 1pm. Workers have worked for at least six months without gloves and dust mask,
which implies that they can easily contact an infection. They are forced to carry waste bins
(locally called truck pans) on their heads because they have been provided with no waste
carriers. Most of them are averagely educated; yet they are treated like illiterates. They do not
even have a say to their own rights.
The above problems are very serious and should be given due attention. Measures
could be taken to minimise such problems just like the manager proposes. All these plans are
included in the agenda and proposals of the evaluation meeting with the council.
4.4 State of Groundwater in the Limbe Municipality
Limbe has very shallow groundwater tables and because it is a coastal town with poor
drainage properties, it experiences lots of floods and landslides. This has probably caused
changes in the quality of groundwater. Figure 23 shows the distribution of portable water in
Limbe.
Previous studies in Limbe revealed that the groundwater in the vadose zone is highly
contaminated, especially biologically. The level of microbial contamination is so high that the
water is no longer fit for human consumption. E. coli, Salmonella spp., Bacillus spp., Shigella
spp., Neisseria spp. and Staphylococcus spp. are very prominent in almost all groundwater
bodies. Table 15 shows the results of groundwater analysis in Limbe at four prominent areas
with the low-income earners. The main sources of contamination include the environment,
organic matter, animal and plant waste, soil and faecal matter. This microorganisms should
preferably be absent in water samples. Their presence in groundwater is very dangerous to
health and can cause diseases like typhoid fever, diarrhoea, dysentery, food poisoning,
gastroenteritis and lung infections as in Table 16 (Njabe, 2008).

66
Figure 23: Distribution of portable water supply in Limbe
Source: Adapted from map of portable water network in Limbe SNEC, 1990
Table 15: Microbial analysis of four water samples in Limbe
Code Names Observations(TS & TG
Broth, sub cultures)
Organisms found
L1 CDC water supply Slight growth Enterobacter spp.
L2 CDE water supply Growth E. coli
Staphylococcus spp
L3 Spring water supply Slight growth E. coli
L4 Bonadikombi Community water supply Massive growth Shigella spp
Neisseria spp
E. coli
Salmonella spp.
Bacillus spp.
Source: Cameroon Baptist Health Board: Central Pharmacy, quality assurance department,
Mutengene

67
Table 16: Water bacteria and the diseases they cause
Bacteria Water-borne disease caused
Enterobacter spp Gastroenteritis
Staphylococcus spp. Diarrhea
Toxic shock syndrome
Shigella spp. Dysentery
Salmonella spp. Typhoid fever
Food poisoning
Bacillus spp. Lung disease
Neisseria spp. Meningitis
Gonorrhea
Source: Njabe, 2008
The degree of disease occurrence in Limbe compiled from monthly reports from the
Limbe health district in 2007 is shown in Table 17. This shows that microbial groundwater
contamination has a significant effect on human health. The highest cases of disease were
recorded in Bonadikombo. Apart from the state of the groundwater (already contamination)
other reasons for disease contraction include; the method of collection and the distance
covered after collection. This distance covered exposes the water to environmental
contamination. Also, the containers in which the water is collected are sometimes dirty and
the handling of food in poor hygienic conditions could also cause water-borne diseases. Cité
SIC had the least number of incidences and is inhabited by “high class” people who have
access to very good water including mineral water, which they use for drinking and even
cooking. The hygienic conditions in “high class” areas are better compared to those of the
other areas sampled (Njabe, 2008).
Table 17: The occurrence of water-borne diseases in Limbe
SN Disease Total no.
of cases
Residence of patience
Cité
SIC
New
Town
Bota Middle
Farms Bonadimkombo Towe Gardens
Cassava
Farms Others
1 Typhoid 763 04 42 60 320 72 40 98 111
2 Diarrhea 1123 09 65 77 340 118 111 140 268
3 Meningitis 120 - 03 - 58 05 07 11 34
4 Gastroenteritis 28 - 13 - - 03 07 05
Source: Njabe, 2008
Physico-chemical analysis of the water samples showed results with values lower than
the maximum standards of WHO and Cameroon (Table 18). Total Hardness (TH) fell within
the slightly hard range (Table 19).

68
Generally, water is considered an important natural resource by the inhabitant of
Limbe. They know that it is already undergoing contamination and needs treatment. They
local people mostly hand-dig wells in the vadose zone. Statistics also show that most people
migrate to or inhabit areas where water is available. This can be confirmed from the
increasing number of people at water points when there is water shortage. The availability of
potable water still remains a major problem (Lambi and Kometa, 2009).
Table 18: Physico-chemical analysis of four water samples
Parameters pH at
24°C
Parameters (mg/l)
Comments
TH Ca2+ Mg2+ Cl- HCO3- SO4
2-
Standard range 6.5-8.5 --- <400 <30 <250 <305 <250 WHO and Cameroon
L1 6.81 98.085 10.009 3.644 Not detected 43.039 38.402
All values are within
acceptable range
L2 7.15 109.097 11.010 0.833 Not detected 68.06 29.194
L3 6.42 98.087 10.009 2.027 Not detected 54.08 32.012
L4 6.63 112.010 11.010 5.888 Not detected 45.95 49.170
Source: Njabe, 2008
Impermeable layers of basalt underlie pyroclastic cones and water from the heavy
precipitation percolates through scoriaceous material and gets into perched water table (Lambi
and Kometa, 2009). High soil porosity is due to the jointed and fractured nature of basalts
plus the unwedded nature of pyroclastic deposits. The soil is highly porous and permeable
because of loose scoriaceous deposits which have interstitial spaces, cavities and gas vesicles
which allow the infiltration of water. It also has impermeable massive basalts which prevent
the infiltration of water making the soil impermeable to water and hence the formation of
springs.
Table 19: Classification of water hardness
Water hardness (mg/l) Class
0-50 Soft
50-100 Moderately soft
100-150 Slightly hard
150-200 Moderately hard
200-300 Hard
300+ Very hard
Twort et al, 1974

69
CHAPTER FIVE: RESULTS AND DISCUSSION
5.1 Field Visit and Observations
A number of field visits to the current and past dump sites of Karata and Motowoh,
were made. This was to see the waste disposal method practiced by LUC and HYSACAM,
and appraise the factors which were taken into consideration during the selection of the waste
dump sites.
5.1.1 The Karata Dump site
The Karata dump (Mokunda Dump) used by HYSACAM is located in the outskirts of
the Limbe town, near the Mokundange Village. The inhabitants of this village are referred to
as the Mokunda villagers. The dump site has an area of about 120m by 125m, which is about
15,000m2. The slopes in this area have a steepness of about 30° - 35° in the west, 35° - 40° in
the northwest and 70° in the north. There have been no major changes made on the site or
method of disposal. The only differences in the case of HYSACAM are that the entrance to
the site is guarded; the site is regularly cleaned, and the waste is constantly burnt, shifted and
covered with soil.
Plate 9: Method of disposal at Karata; a) burning waste, b) smoke/vapour from waste, c)
already burnt waste ready for backward push, d) new waste disposed on
cleared area
Information from LUC and HYSACAM about Karata Dump revealed that this is a
a
c
b
d

70
temporary site which must be evacuated soon. The Bank of Central African States also
referred to as Banque des États de l’Afrique Centrale (BEAC) bought much of this area and
was due to start construction in 2010. This is located between the entrance to and near the
Karata dump. Steps to acquire a new site at Batoke were going on already in 2009.
The method of waste disposal in Karata is open dumping without environmental
consideration (Plate 9). Waste is dumped for two weeks, then left to dry and later burnt. The
burnt residue is mechanically pushed to the back to create space for further dumping and
covered with soil. Covering minimises odour and easy access by rainwater, pests and vultures.
In the rainy season, it is difficult to burn because waste stays wet. So, most of the burning is
done in the dry season.
Table 20: Total annual rainfall of study area and adjoining regions
Site Mean (mm) Maximum
(mm)
Minimum
(mm)
s.d. Sample size
(yrs)
Maximum
expected in
8/10 yrs
Minimum
expected in
8/10 yrs
Mokoko 2844 3709 1899 509 12 - -
Idenau 8392 12449 3303 1866 30 9750 6710
Debundscha 9086 16965 4153 3792 39 - -
Mokundange 4935 8327 1816 1438 28 6150 3720
Mabeta 4384 6791 1928 1040 30 - -
Tole 2743 4978 1503 771 30 3291 2112
Molyko 2141 2867 1356 372 29 - -
Mpundu 2085 5246 438 1033 27 - -
Malende - - - - - - -
Mbonge 2192 3102 1475 444 29 - -
Source: Fraser et al, 1998
The problem of dump sites usually involves the probability of groundwater
contamination. The Karata dump area has a number of geological factors which could show
partial difficulty for groundwater contamination. The lithology shows that the area is made up
of scoriaceous deposits which are underlain by basaltic lava flows (Plates 10a and b). The
surrounding hills are also made of scoriaceous deposits, which are permeable and can allow
leachate percolation. The area also has volcano-karsts characteristics with a general absence
of surface water due to the high degree of porosity and permeability of the scoriaceous
substratum.
There are very few water wells and boreholes in the Karata area. The surrounding
villages hardly have any source of community water supply. The local people who live in this
area say that it is very difficult to dig into the soil and one has to dig very deep in order to get
access to available groundwater. This is due to the physiographic and geological settings in

71
the area. Inhabitants depend on pipe-borne water from distal sources for which they have to
pay. The volcano-karsts characteristic makes it difficult to get access to water. So whatever
leachate is produced seeps down into the groundwater or is washed off by runoff since rainfall
in this area is relatively high (>4000mm3 of annual rainfall as in Table 20). Much of the
rainwater rapidly flows as surface runoff, given the appreciable degree of slope between the
dump site and the coast. The site is also located approximately 1.05km from the coastline, and
there are very few exploitable water sources (wells and boreholes) within this distance.
Plate 10: Waste site, waste types, hills and plants around waste site and waste
scavengers: a) Hill around waste, b) Soil in waste dumpsite, c) Plantation and
farms around waste and guard’s hut, d) Pushed back waste with scavenging
vultures, e) Types of waste dumped at Karata, f) Pungent smoke from waste
which is choking.
The dump site is also surrounded by trees, grass and some food crops like palm and
plantain plantations/farms. These plants are affected by fire from the waste site. There are
a b
c d
e f

72
many vultures scavenging at the site and the road to the site is very poorly accessible.
Mokundange village, the Karata CDC camp and Bota Land New Layout are located about
1.0-1.5km away from the site. These people complain of pungent smell and poor roads to the
waste site. They feel the waste trucks in particular destroy the road even more. In the rainy
season, the area smells more and the waste is sometimes washed from dump site to the road.
Another problem is that scavenging birds act as vectors of diseases as they often make
repeated visits to residents and the open dump site.
Figure 24 shows the hills that surround the waste dump site showing a horse-shoe
formation. The entrance is located to the south of the site, through which waste truck access
site for waste disposal. Burnt or old waste is shifted to the north.
Figure 24: The morphological Settings of the Karata dumpsite ensconced by the horse-
shoe string of scoriaceous hills
A topographically low or depression-like structure is enclosed by a number of
peripheral hills giving a type of topographic trap. The hills form a horse-shoe formation as
seen in Figures 24 and 25. It is indeed a pseudo-intermontane depression, which has been
colonised by the municipal authorities.
Figure 25: The assemblage of hills that give the horse-shoe formation in Figure 24
Smoke can be seen coming from waste as far as the Karata CDC camp, which is about
2km away (Plate 11). This smoke is a sign of possible atmospheric contamination. This is
from burning and decomposing waste processes which release dangerous gases from waste.
This gas if collected can be of great importance to energy production for example.

73
Plate 11: Smoke from farm/plantation near waste. Smoke from waste can be seen from
the Karata CDC camp (right) near the road about 2km away
5.1.2 The Motowoh Area and Dump site
Field investigations were also made to the Limbe wetland area called Motowoh. Land
reclamation in this area is very poor even though it has a high number of inhabitants. After
timid or very little land reclamation, houses were quickly built, and so the marshy
characteristics remain with the most significant being the high levels of the water table. The
water table in this area is at most 1m deep. In some cases, the water table was less than 20-
30cm below the surface or even at surface level. This situation normally worsens in the rainy
season during which the area suffers a lot of wetness forming wetlands and swamps.
This area includes the Slaughter House, the New Market and Clerk’s Quarters (Plate
12). Most of the samples were collected in these areas because of their vast and very dirty
nature. The slaughter house, for example, is a very conspicuous, but dirty part of the town.
Waste generated from the slaughtering process is carelessly disposed of. HYSACAM cleaned
the area in 2008, but it still requires proper cleaning and disinfection. Blood and other waste
from cattle are left to flow into people's farms while cow horns are carelessly littered around
the area. The skin of the cattle is burnt behind the slaughter house as shown in the picture
below. All these enhance the release of a very pungent smell.

74
Plate 12: Slaughter house and New Market dump sites
Wells around the New Market and Clerk’s Quarters are very shallow. The water table
here ranges between 20cm and 1m below the surface. Some of these wells are built because
water overflows the wells in the rainy season (Plate 13). Houses in this area are mostly
protected with embarkments, stones, sand, slabs, ground and cement barriers, and gutters. The
water table here mostly depends on the altitude of the area. Water here is all vadose water
which is very dangerous to health. Substances like plastic and metal containers, electronics,
tadpoles and insects are found in the well. The water smells and is coloured. Wells with
deeper water tables are cleaner and less pungent. The higher the slope, the cleaner the water is
expected to be.
.

75
Plate 13: Different wells in the Motowoh area
There is also a cemetery located above Motowoh, the New Town Cemetery. This can
be considered a micro watershed because it is more highly elevated than other homes in this
area. It is actually located on a hill top. There is a spring located about 3m away from the
cemetery, (Fig. 26). Water from this spring is used by inhabitants of this area to wash clothes,
clean houses, and flush toilets; but not for cooking or drinking. The soil around this cemetery
(Plate 14), that is not elevated, is wet. Almost all homes around this area have dug out wells,
with maximum water table depth of about one metre. Water in these wells is very dirty, smells
very badly, and should under normal circumstances be avoided. It will be prudent if water
from watershed of human remain are not used for fear of possible health hazards from buried
corpses.
Figure 26: New Town Cemetery (Limbe) with its plateau-like location in relation to the
housing located southwards behind it
Most wells contain brownish yellow water. This is probably due to the presence of
alluvial deposits from oxidised scoria. The walls of wells are most often green in colour
because of the presence of algae and spirogyra. Well water is also grey in colour due to the
presence of humus (decomposed matter). Apart from colour, the water always has very strong
and disturbing odour probably as a result of high level contamination or pollution. Table 21
shows observed properties in wells in the Motowoh area, some of which were used as sample
collection sites for laboratory analysis. Between the months of December and March (dry
season) the water table in the Motowoh wetlands is generally very shallow with depths of
about 30-60cm.

76
Plate 14: Spring near cemetery used by local people for washing clothes
A cross-section of the soil was also observed and can be seen in Figure 27. This was
done at a building site which had already been dug to prepare for foundation construction.
The soil was very wet. The area has very wet soil with scoriaceous, alluvial and iron deposits,
clay and silt. The mixed composition of the soil shows man’s poor efforts at reclamation of
the wetland environment for settlement.
Figure 27: Wetland environment underlain by alluvium and scoriaceous deposits
This area also has elevated foot-hills or hill slope areas, which are inundated during
heavy floods with alluvial material and/or scoriaceous deposits (Figure 28). These are
underlain by basalts, some of which could be jointed or massive in nature. Wells in such foot-
hill locations contain water which is cleaner with little or no odour (Table 22). However, the
water table is only some 1-2m deep. All water tables in this wetland area are perched. Hence,
water from these shallow wells is used for washing of clothes, the cleaning of floors, washing
of cars and flushing of toilets. Water for cooking and drinking is mostly carried from pipe-
borne sources, which are sometimes quite expensive and far to reach.

77
Table 21: Observed data from shallow wells in the Motowoh wetland area
S/N Depth (m) Observations
1 0.4 Brownish, significant smell, tadpoles, metals, plants, algae
2 0.35 Grayish brown, pungent smell, plastic containers, etc
3 0.5 Coloured, smell
4 0.6 Brownish yellow, pungent smell, building materials (nails, paint, cement), dead leaves
5 0.3 Green, light smell, algae (spirogyra), frogs and tadpoles, insects
6 0.4 Reddish brown, v. pungent smell, oily, metals
7 0.5 Grayish, no smell, small particles
8 0.45 Reddish brown, tapoles, oily
Figure 28: Elevated foot-hill slope areas of the Motowoh wetland environment
Table 22: Deep-well data along foot-hills of the Motowoh wetland area
S/N Depth (m) Observed chracteristics
1 1 Dirty water, light odour
2 1,5 Dirty, no odour, plastic bags, metals
3 1,75 Clear water
4 1,5 Partially clear, soil particles, light odour, tadpoles, insects
5 1,8 Clear water
6 2 Clear water
7 1,45 Dirty water, brown colour, metals, plastic bags, dead leaves
8* 1,95 Clear water
* No buildings above well area (no settlement, only light cropping)

78
5.1.3 Sample Collection Sites
L1: Cold water spring (Mile 2 Extension)
This spring built by the Germans is locally called the German Spring. There are signs
of a shift in the source of this spring because of overuse and a drop in the water table (Plate
15). This water, according to some local people, unlike the authority, is boiled and used for
cooking and drinking. It is also used for washing as well, irrigation and other household
needs. This spring was formerly used for drinking. A tank seen in the picture was used to
store water for drinking. Water that did not go into the tank was used for irrigation as this area
is also used for plantation purposes and construction (molding of bricks).
Plate 15: The German Spring
L2: Spring (New Town Cemetery)
The spring at the New Town graveyard is more than 50 years old and it is located
about 3m away from the edge of the cemetery. The spring has fish, crayfish, spirogyra, fern
and household waste. Unlike in 2009, people now stay in house (2010) near the spring (Plates
16 and 17). This is really dangerous because the house already shows signs of future collapse.

79
Worse still, there are on-going constructions on the other side of the spring in spite of the
wetness of the area.
Plate 16: Spring water in February 2009 with one lived in abandoned house.
Plate 17: In April 2010: Inhabitants in abandoned house (2009) near spring and another
house undergoing construction on the opposite side
L3: Well (Crab Quarters)

80
Plate 18: Well that shares boundary with wall of bathroom/toilet
This is a private well used mostly for cleaning, bathing and washing of clothes. There
is a bathroom and toilet near the wall where the well is and a pit toilet and farm about 5m
away. Water in this well is translucent in colour with a very strong stench (Plate 18). The area
is called crab quarters because of a lot of crabs in water around the area. Crabs are also seen
in some of the wells.
L4: Well (Community Quarters)
Water in this well is at the surface. This water has colour and a pungent odour. There
are also food crops around this well. These include; plantains, sugar cane, lemon (fever) grass,
okra and other vegetables as seen in Plates 19 & 20. It is a household well used for bathing,
cleaning and the washing of clothes.
Plate 19: February 2009: Dry season yet water is dirty and at the surface

81
Plate 20: April 2010: After a rainy night, water is very dirty and flows out of the well.
Area around well has been cleared for farming purposes and strong winds
fell plantain tree
L5: Well beside FATECOL-Motowoh
This family-owned well is well covered, built with cement and used by many people
in the neighbourhood because of water scarcity, especially in the dry season. The water is
used for cooking as well, especially in the dry season when it is clear. The water is relatively
clearer than many other wells in the area (Plates 21 and 22). On the day of sample collection,
the water was a little dirty because of heavy rainfall the previous night. This is what normally
happens after rains in the rainy season.
Plate 21: Well in February 2009: In the dry season water is a little clear

82
Plate 22: Well in April 2010: dirty water after rainfall the previous night
L6: Well (Clerks Quarters)
This wetland area with low altitude is always flooded in rainy season. This is one of
the dirtiest parts in Limbe. Sea water sometimes floods the area and acts as groundwater
recharge. This explains the presence of fish, crayfish and crabs in some of the wells. The
whole area smells because of many toilets, animal and poorly dumped (littered) waste. These
are located about 6-15m away from the three wells. Houses built here were not planned and
people including children also go around bare-feet.
In 2009, samples were collected from two wells and by 2010 one well had dried up
(plate 26) and was now used for unsorted waste disposal. There are six toilets (5 pits and 1
flush), one piggery, chicken stall and a farm with food crops (plantain, banana, green and
spices), fruit trees (mango, guava and pawpaw) and palm trees (Plates 23-26) in the area. The
walls of the wells contain moss, spirogyra and ferns, while well water contains plastic papers
and containers, electronics, wooden substances, leaves, fish (from runoff and during floods),
tins, peelings (plantain, banana and cocoyam), frogs, tadpoles, dead insects, microbial
components (Plates 23 and 24). This water is used daily for washing of floors and clothes, and
for bathing. Certainly, this water is totally unfit for cooking. But who knows what the real
situation is? The ideology that vadose water is not good may be for such poor people a
strange or foreign concept. And for children particularly, water is water and should be drunk
if the need arises.

83
Plate 23: Sample well in February 2009: Few plants, littered unsorted waste, piggery
and the closest toilet to this well
Plate 24: Sample well in April 2010 (rainy season) with more plants and dirt
Plate 25: Small exposed well with pit toilet and bathroom very close to it. Water in this
well is very dirty with particles, tadpoles and frogs. Well water has a very
pungent odour

84
Plate 26: Well in February 2009 (Lim 8 of samples for analysis in 2009) with dirty water
and many particle and same well in April 2010 now dried up and used as a
waste pit (almost full)
Plate 27: Waste, plants and animal stalls around wells
L7: Borehole near Karata Dump Site
One very important discovery made during the 2010 visit was a borehole located about
300m away (horizontally) from the Karata dump site at Mokundange (Plate 25). This
borehole is owned by a SONARA worker, who distributes water to people in the
neighbourhood. It is said to have been dug for two months by Chinese because the geology of
this area consists of poorly jointed to massive basaltic flows which were overlain by
scoriaceous deposits. The borehole is no longer used for drinking purposes in the
neighbourhood because the water is said to have taste, colour and smell. It is now mainly used
for bathing and washing of things (excluding kitchen utensils in some homes). Some of the

85
people still use it for cooking and washing kitchen utensils. There is a high probability that
the water is contaminated.
Plate 28: View from borehole location. a) Karata dump can be seen from this point. b)
Borehole tank which supplies the public with water
There are two surface tanks, each of which carries about 1000 litres of water (Plates 25
and 26). The first tap has a tank about 50m away and was used by the local people. This tap
was closed because the local people refused to pay for the up-keep of the tank. This is because
they should pay the owner of the borehole for using this water.
Plate 29: Borehole near Karata waste site
The second is located about 100m away from borehole in a house where SONARA
workers stay. This is where the water is still used because the water is filtered in a 5µm filter.

86
Those who use it believe that it is good for consumption because it has no visible colour, taste
and smell. Some water sample was collected from this tank for analysis.
5.2 Onsite and Laboratory Analyses
The analysis of groundwater quality is very important to know its suitability for
various uses. Groundwater studies reveal that discrepancies in the quality of groundwater in
an area are mainly due to the concentration and available physico-chemical parameters, which
in turn are dependent on the geologic formation and the anthropogenic activities of that area.
These components/contaminants are released from leachate produced in municipal waste,
industrial discharges mostly from liquid waste, domestic waste, salt water intrusion,
agricultural chemicals and geologic formations (Abdulrafiu et al, 2011; Subramani et al,
2005). Also, the general practice of burning waste is not appropriate because it destroys the
organic component in both waste and soil, and oxides metals. Most importantly, landfills and
waste disposal sites are identified as major threats to groundwater bodies. Taking this
information into consideration, and the fact that waste is haphazardly dumped in the small
streets of Limbe, site visits were made in the dry (Dec 2008-March 2009) and rainy seasons,
while laboratory analysis was conducted in April 2010 (rainy season) to know how the rainy
season affects groundwater. Groundwater samples were collected for microbial and physico-
chemical laboratory analysis. It was also observed that most of the people in Limbe depend on
groundwater in hand-dug wells, a few boreholes and springs.
Figure 29: Limbe built-up and extension zones
Source: Awum et al, 2001

87
Some important on-site tests were made and data was also collected from each sample
station. The most important observations made were that the water table drops in the dry
season and rises in the rainy season. The rate of this rise and drop in the water table varies for
the different parts of the town. Secondly, water in wells and springs is comparatively dirtier
and has a relatively stronger odour in the rainy season than in the dry season. The odour in the
rainy season is due to the decomposition of waste carried by runoff and littered in the streets.
Thirdly, literature on groundwater in Limbe revealed that little or no laboratory analysis or
water quality management studies have been undertaken in the area. Lastly, there is currently
little or no town planning (Figure 29) in the whole city in spite of the rapid population growth.
This has resulted in the building of poorly planned houses, uncontrolled dumping of waste,
improper digging of wells, and poor location and construction of toilets and septic tanks.
5.2.1 On-site analysis in Cameroon
Groundwater samples were collected for microbial and physico-chemical analysis.
Seven water samples were collected, one borehole, four shallow hand-dug wells and two
springs from according to official norms for current Good Laboratory Practices (GLP) at
different locations within Limbe Municipality on the 20th
of April 2010. This analysis was
done between the 21st of April and the 5
th of June 2010.
Table 23 shows the sites to have altitudes of 7.0-91m above sea level. Springs and
wells in L2, L3, L4, L5 and L6 (Figure 30) have taste and this is probably due to sea water
intrusion and high TDS in L6. These shallow wells are as deep as 2.2m (Table 23) because
they are locally dug by the people with axes and spades. This is usually very difficult because
of the rocky nature of the soil. The higher the altitude, the deeper the water table; and water
naturally flows down the slope. This explains why wells at lower altitude contain water with
shallow water table.
Table 23: GPS readings taken at various sample sites on April 19th
2010
Code Site name Latitude
(North)
Longitude
(East)
UTM Altitude
(m)
East North
L1 Cold water (Mile 2 Extension) 04° 01' 48" 09° 12' 14" 32 522634 04 45600 50
L2 Spring (New Town Cemetery) 04° 00' 29" 09° 12' 56" 32 523917 04 43008 12
L3 Well (Crab Quarters) 04° 00' 28" 09° 12' 57" 32 523951 04 43002 7
L4 Well (Community Quarters) 04° 00' 21" 09° 12' 53" 32 523851 04 42784 7
L5 Well beside FATECOL - Motowoh 04° 00' 05" 09° 13' 04" 32 524183 04 42294 17
L6 Well (Clerks Quarters) 04° 00' 36" 09° 12' 40" 32 523438 0443240 11
L7 Borehole near Karata dump site 04° 01' 20" 09° 10' 29" 32 519389 04 44585 91

88
Figure 30: Location of sample collection sites on the Limbe portable water map of
Limbe
Source: Adapted from SNEC portable water map of Limbe
The pH is relatively normal for all water samples, except for L2 which has a slightly
acidic pH of 5.66. Acidic water is dangerous to man because it leads to ulcers, which when
chronic will cause perforation of the intestinal tissues (Abdulrafiu et al, 2011). L2 is the
spring near the 50-year old cemetery. It is just about 3m away. Most corpses in Cameroon are
treated with chemicals like formalin, formaldehyde, glutaraldehyde before burial. These
chemicals could be the possible cause of the acidic water condition. On average a human
corpse contains from 55 to 67% moisture, 14 to 24% protein and 12 to 24% fat (Creely 2004).
According to Santarsiero et al, (2000) in Creely, (2004), the material of the coffin, packaging,
rainfall and topography of area as well as burial practices also play a leading role in the
process of decomposition.
Water temperatures at collection point range between 25.6°-31.1°C. The temperature
value for water in the German spring (L1) was the lowest (25.6°C). This low temperature is
probably due to the location and source of this spring (Table 24). This spring is located at the
foot of the mountain and in an area where temperatures are moderately low. L2 shows a
temperature of 31.4°C, which is the highest. The decomposition of dead bodies is directly
dependent on the environmental conditions of the soil and above ground temperature. High
temperatures above the ground increase the rate of decomposition of corpses, but increase in
grave depth decreases decomposition rates. This causes the release of gases like aromatic
amines, methane and hydrogen sulphide, mercaptans, ammonia and phosphite, which release
odour (Creely, 2004).

89
Table 24: Depth, temperature and pH done on-site (April 20th
2010)
Code Site Name Measured Depth (m) Temperature (°C) pH
Calibration pH 4 25.8 4.01
pH 7 25.9 7.01
L1 Cold water (Mile 2 Extension) 25.6 6.71
L2 Spring (New Town Cemetery) 31.4 5.66
L3 Well (Crab Quarters) 1.75 27.7 6.51
L4 Well (Community Quarters) 1.30 31.1 7.00
L5 Well beside FATECOL - Motowoh 2.20 29.9 6.30
L6 Well (Clerks Quarters) 2 28.9 6.57
L7 Borehole near Karata dump site 40-60 27.1 6.68
L4 is the shallowest of all wells, with water at the surface. In the rainy season, the
water is dirty and smells, as well as it fills up and flows out of the well. Water in this area has
one of the highest temperature values with relatively low altitude. This area is also highly
populated with temperatures reaching 32°C in the dry season.
5.2.2 Microbiological Analysis in Cameroon
Most wells in Limbe are seasonal wells since they are dug in unconfined (vadose)
areas. Unconfined wells are very liable to contamination of all types, including
microbiological contaminants. The fact that Limbe has relatively porous and permeable
scoriaceous soil makes it easier for microbes from municipal waste to infiltrate into
groundwater. Contaminant concentrations vary from point to point and with the activities of
the area. All samples showed results higher than the required standards of Cameroon (Table
25).
L7 (borehole at Karata) showed the lowest level of microbial contamination. This is
probably due to the altitude, horizontal location of the borehole to the waste disposal site and
the depth of 40m. This sample station is located uphill at the foot of the Mt. Cameroon. The
borehole is horizontally located to the waste site. Hence, the possibility of waste contaminants
to move in the direction of the borehole is low. The disposal of sewage, toilet and household
waste could be the main source of contamination in this area. The contamination, even though
lower when compared to the other sites, could be as a result of reduced inter-aquifer
contamination from unconfined aquifer. Groundwater compounds could also come from
natural sources like rock, and volcanic activity. This borehole could be considered the natural
groundwater of Limbe, since no data on groundwater was found in Limbe.

90
Table 25: Results of microbial analysis
Sample
code
Organism(s) found Possible sources Count
(CFU/100ml)
Cameroon
Standards
(CFU/100ml)
Comments
L1 Total Coliforms (Enterobacter,
Citrobacter and Klebsiella sp)
Faecal matter, soil and
sewage
543 <1/250ml Results indicate that
water sources need to be
seriously treated
Escherichia coli (E. coli) Same as above 26 Absent/100ml
Staphyloccocus sp. Skin 24/100ml Absent/100ml
L2 Total Coliforms (Enterobacter,
Citrobacter and Klebsiella sp)
Faecal matter, soil and
sewage
>1000 <1/250ml
Escherichia coli (E. coli) Same as above 205 Absent/100ml
L3 Total Coliforms (Enterobacter,
Citrobacter and Klebsiella sp)
Faecal matter, soil and
sewage
>1000 <1/250ml
Escherichia coli (E. coli) Same as above 346 Absent/100ml
Salmonella sp. Faecal matter, sewage 103 Absent/100ml
L4 Total Coliforms (Enterobacter,
Citrobacter and Klebsiella sp)
Faecal matter, soil and
sewage
>1000 <1/250ml
Escherichia coli (E. coli) Same as above 256 Absent/100ml
Salmonella sp. Faecal matter, sewage 94 Absent/100ml
Faecal streptococcus Faecal matter, Soil sewage 159 <1/250ml Results indicate that
water sources need to be
seriously treated L5 Total Coliforms (Enterobacter,
Citrobacter and Klebsiella sp)
Faecal matter, soil and
sewage
735 <1/250ml
Escherichia coli (E. coli) Same as above 102 Absent/100ml
Salmonella sp. Faecal matter, sewage 56 Absent/100ml
Faecal streptococcus Faecal matter, Soil sewage 87 <1/250ml
L6 Total Coliforms (Enterobacter,
Citrobacter and Klebsiella sp)
Faecal matter, soil and
sewage
>1000 <1/250ml
Escherichia coli (E. coli) Same as above 157 Absent/100ml
Salmonella sp. Faecal matter, sewage 102 Absent/100ml
Staphylococcus aureus Faecal matter, Skin sewage 205/100ml NA
L7 Total Coliforms (Enterobacter,
Citrobacter and Klebsiella sp)
Faecal matter, soil and
sewage
06 <1/250ml Water source needs mild
treatment
Escherichia coli (E. coli) Same as above 04 Absent/100ml
Staphylococcus aureus Faecal matter, Skin sewage 08/100ml NA
Pseudomonas sp. Faecal matter, soil, sewage 03 Absent/100ml
The different microbes found in the water samples include E. coli, Staphylococcus
spp., Coliform (Enterobacter, Citrobacter, Klebsiella spp.), Salmonella spp., faecal

91
Strepococcus and Pseudomonas spp. These dangerous microorganisms which commonly
inhabit the guts of warm-blooded animals and humans are found in bodily waste, animal
waste, and sewage or occur naturally in the soil. Total Coliforms, also referred to as faecal
coliforms, are bacteria of common (particular) origin naturally found in the soil, and surface
water (Vendrell and Atiles, 2003: Water stewardship information series, 2007). They can also
exist in the intestines of warm-blooded animals and man, as well as they can be found in
bodily waste and animal droppings. These do not necessarily indicate recent water
contamination, but can cause very dangerous diseases, especially in people with weak
immune system like babies, children, old people and invalids.
Total Coliforms and E. coli are important indicators or tracer microorganisms, and
their presence in water is an indication of the presence of other harmful pathogens, viruses,
parasites and water-related diseases-causing microorganisms (Water stewardship information
series, 2007). Diseases and pathogens (disease-causing microorganisms) of contaminated
groundwater include;
Typhoid fever and cholera (bacterial infection)
Dysentery (mostly from protozoa)
Polio and hepatitis (viral infection)
Helminthes like roundworms and tapeworms
Odour, colour and taste cannot be used to confirm their presence in groundwater.
According to international standards for drinking water, there should be none of these present
in 100ml of water. The value of 10CFU/100ml implies that water is no longer fit for human
consumption. It should not even be used for cooking, preparing of raw vegetables, washing of
plates, brushing of teeth, bathing and making of ice cubes, ice cream and juice, without
treatment. The water must be boiled before use.
E. coli is a member of the coliform group and predominant in the guts (bowels) of
warm-blooded animals and man. Due to the fact that it cannot live or reproduce in the
environment, its presence in water is an indication of direct and recent contamination of faecal
matter, human sewage and animal droppings (Vendrell and Atiles, 2003; Water stewardship
information series, 2007). Simple water tests give results of E. coli and total coliform, which
will imply the presence or absence of disease-causing microorganisms.
Total coliform and E. coli were found in all samples, which imply that water is
contaminated and needs treatment. The concentrations of microorganisms vary from sample
to sample and depend on the activity in the area of collection. L7 is found in an area where
people with high living standards live. They have better hygienic conditions with well-built
toilets and septic tanks. L1 also has lower values than the other 5 very contaminated samples.
This is because it is a middle-class area with more frequent waste collection, minimal waste
litter and better hygiene. The other 5 sites (L2-L6) are located in the slums with very poor
hygienic conditions, lots of littered waste, open dumps, animal farms and poorly constructed
pit toilets. These are in the watershed area of Limbe, with no town planning, which
experience flooding, landslides and poor drainage. The main sources of these contaminants
include septic/sewage effluents, faecal matter and other waste from toilets, bathrooms,

92
kitchens and gardens. The infiltration of these contaminating microbes is easy because of the
soil with scoriaceous deposits, pyroclastic material and weathered basalt which are porous and
permeable. Also, household wells are dug in unconfined aquifers with depths of at most
2.20m. All these enhance the percolation of water from runoff, flood water, rainwater,
infiltrating water from septic tanks, pit toilets, waste, animal and human faeces. Other causes
of water contamination in these wells include:
Direct contact with surface water, especially during the rainy season when sea
water floods some areas
Improper planning, location and construction of the well. The walls are not built
and so water infiltration from other water sources is easy
Material entering wells from the surface. This is common with uncovered and even
partially covered wells
Shallow well of less than 18m usually have soils that cannot filter contaminants,
and all wells except borehole are less than 3m in depth.
Infiltration from waste water at disposal sites (waste litter and local open dumps)
Backflow during plumbing, as well as unsanitary plumbing. Because groundwater
generally does not contain chlorine, it does not undergo on-site treatment and so
artificial treatment is required (Vendrell and Atiles, 2007).
The results in Table 25 imply that intensive groundwater treatment is required, in the
areas where L1-L6 samples were collected. This is because they showed very high levels of
contamination making it unfit for human consumption. L2, L3, L4 and L6 samples show
contamination as high as 1000CFU/100ml of Coliforms, 346CFU/100ml of Escherichia coli,
103CFU/100ml of Salmonella spp. and 159/100ml of Streptococcus spp. These are very high
compared to Cameroon standards, which are still higher than international standards. L7
shows very low contamination levels of less than 10CFU/100ml, but still requires minimal
treatment and permanent management. According to given standards in Table 25, these
groundwater sources are no longer fit for human consumption.
Contaminated groundwater should not be used for irrigation purposes because the
crops when consumed may cause pathogenic diseases. Contaminated water with coliform
concentration of 200CFU/100ml will infect, for freshwater, 8 out of 1000 swimmers and, in
the case of marine beaches 19 out of 1000 swimmers (Vendrell and Atiles, 2007).
Uncovered wells are also very important sources of groundwater contamination. Apart
from the wells at L3 and L5 which were partially covered, all other sample wells (apart from
borehole) were open and exposed to many types of contamination.
5.2.3 Analysis in Cameroon
The results of physico-chemical analysis in Cameroon are displayed on Table 26 for
the following parameters; Ca2+
, Mg2+
, Cl-, HCO3
-, SO4
2-, TDS, TH, Na
+, NO3
-, NH4
+ and K
+.

93
This table shows that chemical contaminants are not a major problem in Limbe. This is
because Limbe is not an industrial town in a developing country.
Table 26: Results of physico-chemical analysis in Cameroon
PA
RA
ME
TE
RS
(m
g/L
)
Code Cameroon
standards
WHO
(1973)
ISI
10500-91
L1 L2 L3 L4 L5 L6 L7
Ca2+ <100 100 75 16.05 20.06 28.08 32.09 24.07 64.19 8.02
Mg2+ <30 150 30 19.47 19.47 24.33 29.20 17.03 51.10 19.47
Cl- <250 250 250 78.70 39.30 59.00 68.90 59.00 59.00 29.50
HCO3 <305 14.01 2.00 22.02 17.02 10.01 10.01 2.00
SO42- <250 250 200 50.56 36.54 43.68 29.79 16.90 66.87 18.55
TDS NA 1000 500 360 284 400 424 376 920 276
TH NA 500 300 100.09 78.07 118.11 108.10 68.06 192.17 48.04
Na+ <175 200 200 3.80 2.20 2.30 3.00 1.50 4.10 1.70
NO3- <50 5 45 3.70 37.80 13.80 28.10 28.50 118.10 2.60
NH4+ <0.5 1.90 0.90 1.60 1.80 0.90 2.60 1.30
K+ <12 5.30 2.10 5.00 6.00 2.60 13.60 4.70
NA: Not Available
CFU: Colony Forming Units
WHO and ISI 10500-91 standards were taken from Patil and Patil, (2010) and
Abdulrafiu et al, (2011). Cameroon standards were provided by the CBC laboratory in
Mutengene where analyses were done. Cameroon has no set standards for total dissolved
solids (TDS) and total hardness (TH); so the WHO and ISI 10500-91 standards were used.
The results obtained from Cameroon revealed that almost all parameters of physico-
chemical analysis did not exceed the required standards. This does not imply that the water
does not require treatment. The presence of these chemicals is a sign of mineral chemical
contamination which must be avoided. In the case of ammonium (NH4+), all samples showed
results that exceed the required standards of 0.5mg/L (Table 26). Figure 31 reveals L6 and L4
show high values in almost all parameters measured.
According to Cameroon standards, bicarbonates (HCO3-) should be less than 305mg/l.
Bicarbonates of calcium (Ca2+
), sodium (Na+) and potassium (K
+) are used to determine the
alkalinity of a water body. This is the capacity of water to neutralize a strong acid. Acidic
water subjects the human body to stomach ulcers which could, in chronic cases, further lead
to intestinal tissue perforation (Abdulrafiu et al, 2011). Potassium is released mainly from
weathering of rooks, but high values could be as a result of the disposal of waste water (Patil
and Patil, 2010). The values obtained from all samples were mostly extremely lower than
those prescribed by Cameroon, WHO and ISI 10500-91. Only L6 showed values (13,60mg/l)
of K higher than the prescribed standards of Cameroon. Also, L6 shows the highest values for

94
Ca (64.19mg/l) and Na (4.10mg/l). HCO3- had the highest value (22.02mg/l) in L3 and the
lowest in L7 (2.00mg/l) as shown in Figures 31 and 33. L6 shows a good example of
potassium from waste water since there is careless disposal of waste water (sewage, washing
water, etc.).

95
Figure 31: Percentage of each measured parameter at different sample sites
Total Dissolved Solids (TDS) is used to measure the salinity of groundwater (Patil,
and Patil, 2010). Oram, (2011) defines it as the sum of anions and cations in water. Hassinger
et al, (1994) refer to it as the measurement of the amount of dissolved ions in water. It is an
indication for aesthetic contamination, but it does not indicate that the water could cause
health problems. It is composed of inorganic salts like Ca, Mg, K, Na, HCO3, Cl and SO4.
Many of these salts are needed as life-sustaining nutrients. They occur naturally as spring
minerals, carbonate and salt deposits, and sea water intrusion. Anthropogenic sources include
urban and agricultural runoff, sewage, industrial waste water and chemicals used in water
treatment.
Figure 32: Analysis of TDS and TH

96
Elevated TDS cause bitter or salty taste of water and also reduces the efficiency water
filter and other water equipment. It also indicates the presence of heavy metals like arsenic,
aluminum and copper. TDS ranged from 276 in L7 to 920 in L6 (Figure 32). Taking into
consideration the altitude of the various sample sites, L7 is highest at 91m above sea level and
farthest from the sea, so there is a low probability of sea water intrusion. L6 has the highest
value of 920mg/l. This is due to the fact that the area is very flat and only 11m above sea
level. It also has very high values for all TDS related salts and has porous soil. The population
is very high and land use is varied and uncontrolled. This part of the city is the worst with no
planning and very poor waste management. Wells and toilets are constructed close to each
other. The very high TDS value could also be because the area always floods in the rainy
season, and the presence of many toilets release much sewage.
TDS in L1 is probably due to the mineral nature of the spring. TDS test is only used to
indicate general water quality and not specific water quality like corrosiveness. High
concentration of TDS could cause health hazards depending on the ions present. If an
indicator test shows high concentrations of TDS, specific analysis is then required for each
contaminant to determine potential health effects (Hassinger et al, 1994). Nevertheless, the
relationship between TDS and water quality can further be understood through the following;
Cations combined with carbonates, like CaCO3 and MgCO3, which are associated with
hardness, scale formation and bitter taste of water.
Cations combined with chlorides, like NaCl and KCl, which are associated with salty or
brackish taste and increased corrosive property.
TDS and TH show a similar trend as seen in Figure 32. Water hardness in groundwater
is from weathering of limestone, sedimentary rock and calcium bearing mineral rock.
Anthropogenic sources include chemical and mining industry effluents, and excessive
application of limestone to soil in agricultural areas. It can also be the amount of calcium and
magnesium in water. Total hardness (TH) causes unpleasant taste of waste. Soft water causes
pipe corrosion and increases the solubility of heavy metals like copper, zinc and lead. In
agricultural areas, it may be used as an indication of sodium from lime and fertilizer (Oram,
2011).
Total hardness (TH) is a water property that increases the boiling point of water and
prevents the formation of lather with soap (Patil and Patil, 2010). These would form soap
scum which look unappreciable (Abdulrafiu et al, 2011). The values range from 48.04mg/l
(L7) to 192.17mg/l (L6). TH most probably depends on the quantity of calcium (Ca2+
) and/or
magnesium (Mg2+
), present in all natural waters, rock and soil. They are both essential to the
human body. Magnesium values range from 17.03mg/l in L5 to 51.10mg/l in L6 (Figure 32).
Three sample stations have the same value 19.47mg/l. L6 has Mg value exceeding the
prescribed limits of Cameroon and ISI 10500-91 (30mg/l), but is within WHO limit
(150mg/l). This may lead to gastrointestinal irritation in human (Subramani et al, 2005).
Calcium increases bone mass and prevents certain types of cancer, but in high concentrations
it may affect the absorption of essential minerals in the body (Oram, 2011).

97
Figure 33: Analysis of Ca2+
, Mg2+
, Cl-, HCO3
-, SO4
2- and NO3
-
Chloride usually acts as an indicator of sewage contamination and their presence in
groundwater can cause laxative related problems (Patil and Patil, 2010). It also is an important
quality parameter, which affects the aesthetic property and taste of groundwater. In high
concentration, chloride makes water unfit for drinking. Chloride concentrations fall within the
prescribed limits with L1 showing the highest value of 78.70mg/l. The high concentration of
Cl in L1 could be due to the downward flow of contaminated groundwater from the main
waste disposal site at Karata, as well as the use of detergents in the spring for washing of
clothes. It is located about 3km away and downhill from the Karata waste site. High
concentrations of Cl in L4 could be because the well is located near the toilet and acts as a
collection point for sewage from the toilet/bathroom of the house (Plates 20-24). According to
Abdulrafiu et al, (2011), Cl concentrations above 50mg/l could possibly be as a result of
seepage from septic tanks and domestic effluents, like piggery waste, in residential area. This
could be true for L1, L3-L6 which are very near toilets and bathrooms. This is because NaCl
is a common component in the human diet which passes through the digestive system and into
human sewage in the toilets and bathrooms. It can also corrode buildings by extracting
calcium to form calcite (CaCl3).
The maximum value of sulphate (SO42-
) concentration prescribed is 250mg/l (Table
26). All samples show values far lower than this limit. The highest value is 66.87mg/l in L6,
and the lowest is 16.90mg/l in L5. The concentration of sulphate increases in areas of high
sewage production, but it occurs naturally in areas where gypsum and other common minerals
are leached (Patil and Patil, 2010). Sulphate becomes very unstable when it exceeds 400mg/l
and it has adverse effects on human, by causing laxative effects (Subramani et al, 2005).
Nitrate is produced when nitrogen is converted, under aerobic conditions, by nitrifying
bacteria. It is a major contaminant in water. The major sources of nitrate include agricultural,
industrial and municipal waste discharges like septic tank effluents, agricultural fertilizers,
animal manure and slurry spreading in buildings (Abdulrafiu et al, 2011; Logan, 1995). It is

98
an anion that is highly soluble in water and very mobile in soil because it is repelled by the
net negative charge in most soils. Nitrate does not form strong chemical bonds with minerals
surfaces like phosphorous. It is non-conservative, that is, it easily changes form in the
environment and moves between the soil-water-air compartments of the earth (Logan, 1995).
As a result, it easily percolates the soil in rain to groundwater bodies (Abdulrafiu et al, 2011).
Nitrate concentrations range between 2.60mg/l in L7 and 118.10mg/l in L6. All
samples except L6 have values below Cameroon, ISI 10500-91 and WHO standards. Taking
into consideration the number of toilets, animal farm and food crop farms around this well
(L6), the high NO3- value can be expected. The well is not even covered and is found at the
centre of all these sewage release points. Plates 20 and 21 show picture of toilets, animal and
crop farms. Nitrate is dangerous because it is reduced to nitrite (NO2-) by gastric enzymes of
humans and animals. This binds to haemoglobin and restricts the transfer of oxygen from the
lungs causing the blue baby syndrome, methamoglobinemia and gastric carcinomas. This can
subsequently lead to the formation of nitrosamines which may produce carcinogenic cells in
adults (Abdulrafiu et al, 2011; Logan, 1995; Subramani et al, 2005).
Figure 34: Analysis of Na
+, NH4
+ and K
+
Ammonium (NH4+) is normally produced when atmospheric nitrogen is fixed and
subsequently mineralized by soil bacteria (Subramani et al, 2005). It has the lowest prescribed
limit for all samples in Cameroon, but all samples show values higher than this limit. L6 has
the highest value of 2.60mg/l while L2 and L5 have values of 0.9mg/l each (Figure 34).
Possible sources include fertilizer and wastewater disposal. NH4+ can also be produced
through ammonification where soil nitrogen is used by soil microorganisms as an energy
source (Roy et al, 2003). Excess NH4+ can enhance bacteria and coliform population increase
in water. It can be oxidized by biotic and abiotic reactions to produce nitrite and nitrate,
respectively. NH4+ concentrations greater than 2.0mg/L require expensive treatment processes
to remove nitrogen species from water.
Biotic reaction: NH4++Nitrosomonas+2H2O↔8H
++NO2⁻

99
Abiotic reaction: NH4++Nitrobacter+3H2O↔10H
++NO3⁻
Ammonification: Soil organic N + Soil microorganisms→NH3++H
+↔ NH4
+
Also, ammonium is one of the main products of nitrogen metabolism in man. It is converted
to urea in the liver. This can lead to high concentration of ammonia in the human blood and
subsequently liver problems which can cause death (Lockwood et al, 1979).
Figure 35: Different sample sites showing the occurrence of different compounds

100
It can be seen from Figure 35 that total dissolved solids (TDS) has the largest value in
all sights. L6 has values higher than the required values of ISI 10500-91 (500mg/l) and lower
than that of WHO which is 1000mg/l.
5.2.4 Analysis in Germany
Samples were analysed in Germany three weeks after collection to be able to compare
the trend of contamination with samples analysed in Cameroon. Nine out of the eleven
parameters analysed in Cameroon were analysed in Germany. TH could not be analysed
because the samples were stale and would produce conflicting results. The trend of the results
was relatively the same, but there was a great change in values because of the chemical
changes which occurred in the samples during storage in and transportation from Cameroon.
Also, electric conductivity (EC), which could not be calculated or measured on-site
(collection day) was also calculated. From Table 27, it is seen that the values are either lower
(Cl, NO3, SO4, NH4, K, Mg, Ca and TDS) or higher (pH, HCO3 and Na) than those analysed
in Cameroon. Water samples were cooled during storage and transportation to Germany and
so temperature conditions affected the sample (from high temperatures in Cameroon and
winter temperatures in Germany). Drastic drop in TDS is due to changes in the state of ions
especially calcium and magnesium which highly impact TDS and TH.
Table 27: Results of physico-chemical analysis three weeks after sample collection and
transportation in Cottbus, Germany
101
According to analysis in Germany nitrate and potassium showed the same trend in
both analyses. L6 had the highest value in most of the elements analysed whereas L7 had the
lowest values. The charge of HCO3 was balanced which led to positive values. However,
geochemical modeling (phreeqc), which also considers factors like phase equilibria and pH,
did not always converge, and when it converged, carbonate values obtained were below the
ones given by the charge balance. The obtained pH was so high, that Iron (Fe) III phase
saturation indices calculated with phreeqc was substantially greater than zero. This is a clear
indication of Fe precipitation as seen in L4, where a yellowish brown precipitate was
observed and so it is assumed that Fe (II) in the original sample was oxidized during storage
and transportation. This consideration is independent of charge balance since Fe precipitation
is a pH buffering mechanism. The pH was measured so as to balance the charge and L4
converged with phreeqc.
Also, the World Meteorological Organisation (WMO) criteria were applied for
(Quality Control) QC. WMO criteria check both charge balance and Electric Conductivity
(EC) measured vs. EC calculated from analysed results. All sample except L7 easily passed
QC. An error of 21.8% (error) instead of 20% (maximum required) was obtained. The charge
could mathematically be violated by bringing EC to 20%, but maintaining QC limits and both
calculated and measured EC values were far below WHO limits of 1400µS/cm. TDS was
calculated from both the analysed result and measured EC, in which case the conversion
factor EC-TDS was used as a plausible check in the range of 0.5 to 0.8. The best fit is
normally achieved with an average factor of 0.62, which is plausible for the solution
chemistry determined.
Heavy metals usually cause mal-functioning of mental and neurological systems as
well as the alteration of the metabolic processes in man. They could induce impairment and
malfunctioning in blood, cardiovascular, endocrine, immune, reproductive and urinary
systems (Abdulrafiu et al, 2011). Aluminum (Al), lead (Pb) and manganese (Mn) were
analysed to determine the quantity of heavy metals in groundwater. All samples had values of
Mn and Pb <0,05mg/l and <5µg/l, respectively. Aluminum showed values <0,03mg/l except
for L4, which had a value of 1,15mg/l. The values of Pb were within the standards of
0.01mg/l and Mn values were beyond the standards of 0.05mg/l. Manganese usually occurs
with Fe and is known as one of the most biogeochemically active transition metals. They both
discolour water; Mn causes black and Fe reddish-brown colour in water (Sanga et al, 2006;
Tay and Kortatsi, 2008).
5.3 Statistical Analysis
Statistical analysis is very important because it helps in a better understanding of the
relation between the analysed variables, how they react to changes and eases decision making.
It involves interrelationship between the different variables which enhances research and
opens new areas of knowledge (Patil and Patil, 2010). Pearson correlation (r) was used
because it enhances an understanding of the strength of the linear relationship between two
variables.

102
Table 28: Pearson correlation (analytical results from Cameroon)
pH T (°C) Ca Mg Cl HCO3 SO4 NO3 Na TDS TH NH4 K
pH Pearson Correlation 1 -,410 ,129 ,266 ,472 ,521 ,074 -,579 ,377 ,218 ,222 ,589 ,421
Sig. (2-tailed) ,361 ,783 ,564 ,285 ,231 ,875 ,173 ,404 ,639 ,633 ,164 ,346
N 7 7 7 7 7 7 7 7 7 7 7 7 7
T (°C) Pearson Correlation -,410 1 ,260 ,110 -,190 -,180 -,256 ,930** -,250 ,040 ,006 -,318 -,154
Sig. (2-tailed) ,361 ,574 ,814 ,683 ,699 ,579 ,002 ,588 ,932 ,990 ,487 ,742
N 7 7 7 7 7 7 7 7 7 7 7 7 7
Ca Pearson Correlation ,129 ,260 1 ,945** ,299 ,260 ,699 ,066 ,598 ,962** ,935** ,729 ,858*
Sig. (2-tailed) ,783 ,574 ,001 ,515 ,573 ,080 ,888 ,157 ,001 ,002 ,063 ,013
N 7 7 7 7 7 7 7 7 7 7 7 7 7
Mg Pearson Correlation ,266 ,110 ,945** 1 ,183 ,156 ,734 -,150 ,675 ,964** ,924** ,846* ,960**
Sig. (2-tailed) ,564 ,814 ,001 ,695 ,738 ,060 ,748 ,096 ,000 ,003 ,017 ,001
N 7 7 7 7 7 7 7 7 7 7 7 7 7
Cl Pearson Correlation ,472 -,190 ,299 ,183 1 ,752 ,432 -,085 ,634 ,272 ,443 ,492 ,245
Sig. (2-tailed) ,285 ,683 ,515 ,695 ,051 ,334 ,855 ,126 ,555 ,319 ,262 ,596
N 7 7 7 7 7 7 7 7 7 7 7 7 7
HCO3 Pearson Correlation ,521 -,180 ,260 ,156 ,752 1 ,302 -,120 ,322 ,172 ,411 ,401 ,174
Sig. (2-tailed) ,231 ,699 ,573 ,738 ,051 ,510 ,798 ,482 ,713 ,360 ,372 ,708
N 7 7 7 7 7 7 7 7 7 7 7 7 7
SO4 Pearson Correlation ,074 -,256 ,699 ,734 ,432 ,302 1 -,300 ,875** ,744 ,888** ,820* ,760*
Sig. (2-tailed) ,875 ,579 ,080 ,060 ,334 ,510 ,514 ,010 ,055 ,008 ,024 ,047
N 7 7 7 7 7 7 7 7 7 7 7 7 7
NO3 Pearson Correlation -,579 ,930** ,066 -,150 -,085 -,120 -,300 1 -,327 -,170 -,141 -,509 -,406
Sig. (2-tailed) ,173 ,002 ,888 ,748 ,855 ,798 ,514 ,475 ,716 ,763 ,243 ,366
N 7 7 7 7 7 7 7 7 7 7 7 7 7
Na Pearson Correlation ,377 -,250 ,598 ,675 ,634 ,322 ,875** -,327 1 ,661 ,787* ,887** ,743
Sig. (2-tailed) ,404 ,588 ,157 ,096 ,126 ,482 ,010 ,475 ,106 ,036 ,008 ,056
N 7 7 7 7 7 7 7 7 7 7 7 7 7
TDS Pearson Correlation ,218 ,040 ,962** ,964** ,272 ,172 ,744 -,170 ,661 1 ,927** ,816* ,945**
Sig. (2-tailed) ,639 ,932 ,001 ,000 ,555 ,713 ,055 ,716 ,106 ,003 ,025 ,001
N 7 7 7 7 7 7 7 7 7 7 7 7 7
TH Pearson Correlation ,222 ,006 ,935** ,924** ,443 ,411 ,888** -,141 ,787* ,927** 1 ,871* ,892**
Sig. (2-tailed) ,633 ,990 ,002 ,003 ,319 ,360 ,008 ,763 ,036 ,003 ,011 ,007
N 7 7 7 7 7 7 7 7 7 7 7 7 7
NH4 Pearson Correlation ,589 -,318 ,729 ,846* ,492 ,401 ,820* -,509 ,887** ,816* ,871* 1 ,929**
Sig. (2-tailed) ,164 ,487 ,063 ,017 ,262 ,372 ,024 ,243 ,008 ,025 ,011 ,002
N 7 7 7 7 7 7 7 7 7 7 7 7 7
K Pearson Correlation ,421 -,154 ,858* ,960** ,245 ,174 ,760* -,406 ,743 ,945** ,892** ,929** 1
Sig. (2-tailed) ,346 ,742 ,013 ,001 ,596 ,708 ,047 ,366 ,056 ,001 ,007 ,002
N 7 7 7 7 7 7 7 7 7 7 7 7 7
**. Correlation is significant at the 0.01 level (2-tailed).
*. Correlation is significant at the 0.05 level (2-tailed).
The tailed values communicate if the Pearson correlation is statistically significant. If
this value increases towards 1 then the correlation is not clear and must be recalculated.
Values less than or equal to 0.05 imply that there is strong statistical significance. For
example, temperature shows a very strong correlation with nitrate and the statistical
significant value is 0.002. This means that the correlation between temperature and nitrate is
clear. This positive correlation implies that an increase in temperature leads to an increase

103
nitrate production. In the case of negative correlations, as one variable increase the other
decreases.
Elements like Na, Mg are of nutritional importance since they help in various
metabolic activities in the body. Cations like Ca, Na and Mg are constantly involved in Cation
exchange processes and interactions with aquifer material (Abdulrafiu et al, 2011). From
Table 28, temperature is positively correlated only to NO3 (0,930), with a strong statistical
significant value of 0.002. Calcium is positively related to Mg (0.945), TDS (0.962), TH
(0.935), K (0.858) and partially related to NH4 (0.729). Magnesium is positively related to
TDS (0.964), TH (0.924), NH4 (0.846), K (0.960), and partially related to SO4 (0.734) and Na
(0.675). Chloride is partially related to HCO3 (0.752) with a statistical significance of 0.051.
Sulphate is positively related to Na (0.875), TH (0.888) and NH4 (0.820), and partially
correlated to TDS (0.744) and K (0.760) with a tailed value of 0.047. Sodium is correlated to
NH4 (0.887) and partially to TH (0.787) and K (0.743). TDS is related to TH (0.927), NH4
(0.816) and K. (0.945) and all with a maximum tailed value of 0.003. TH is also related to
NH4 (0.871) and K (0.892). Last but not least, ammonium is positively related to K (0.929).
The correlated variables indicate that they have similar or related sources and/or they easily
bond to form compounds, and this eases decision making on waste management and
treatment. TDS and TH show correlations with most variables meaning they are affected by
their presence. Magnesium and calcium are strongly related with main source being
construction waste. Temperature enhances the formation of nitrate by enhancing nitrification
and denitrification processes. Nitrate on the other hand, shows negative correlation with most
components, even though minimal, which means that it is not related to most of the
components. pH has partial correlation with bicarbonate and ammonium meaning their
presence may affect the pH of water which is not statistically backed.
Looking at Table 29, measured electric conductivity (EC m) and TDS have clear
correlation (1.000) with a clear tailed value of zero. Both variables have almost the same
correlation with all. pH has partial correlation with HCO3 (0.701) and aluminum (0.515).
Chloride is strongly correlated with SO4 (0.875). Nitrate is correlated to K (0.820), Ca
(0.811), EC m (0.861), TDS (0.862) and partially with Na (0.783) and Mg (0.694). Sulphate is
related to Na (0.883), NH4 (0.905), Ca (0.827), EC m (0.847), TDS (0.847) and partially
correlated to K (0.648) and Mg (0.666). Bicarbonate has only partial correlations with Mg
(0.707). Sodium is correlated to NH4 (0.916), K (0.850), Mg (0.813), Ca (0.889), EC m
(0.950) and TDS (0.950). Ammonium has correlation with Ca (0.880), EC m (0.877), TDS
(0.876) and partially with K (0.780), Mg (0.703) and Al (0.502). Potassium is correlated to
Mg (0,887), Ca (0.882), EC m (0.932) and TDS (0.931). Magnesium is correlated with Ca
(0.894), EC m (0.912) and TDS (0.911). Calcium shows strong correlations with EC m
(0.971) and TDS (0.972).
In both analyses, some components/parameters show similar correlations with each
other and this implies that storage does not really affect this relationship. For example, pH has
a partial correlation with bicarbonate; Mg has strong correlation with Ca and TDS is strongly
correlated to most components. However, changes in samples in the process of storage and
transportation affected the correlation between certain elements. For example, SO4 is also

104
strongly correlation to Cl, Ca, TDS and EC m; HCO3 was slightly correlated to only Cl in the
fresh and to pH, and Mg, in the stale samples. Nitrate was positively correlated to temperature
in the fresh sample and positively correlated to Na, K, Ca, EC m and TDS, in the stale
sample.
Table 29: Pearson correlation (analytical results from Cottbus)
pH Cl NO3 SO4 HCO3 Na NH4 K Mg Ca Al EC m TDS
pH Pearson Correlation 1 -,327 -,230 ,121 ,701 ,206 ,441 ,304 ,183 ,166 ,515 ,144 ,142
Sig. (2-tailed) ,475 ,620 ,797 ,079 ,658 ,322 ,508 ,694 ,722 ,237 ,758 ,762
N 7 7 7 7 7 7 7 7 7 7 7 7 7
Cl Pearson Correlation -,327 1 ,604 ,875** -,063 ,642 ,608 ,385 ,444 ,623 ,020 ,646 ,646
Sig. (2-tailed) ,475 ,151 ,010 ,893 ,120 ,148 ,393 ,319 ,135 ,966 ,117 ,117
N 7 7 7 7 7 7 7 7 7 7 7 7 7
NO3 Pearson Correlation -,230 ,604 1 ,633 ,079 ,783* ,623 ,820* ,694 ,811* -,109 ,861* ,862
*
Sig. (2-tailed) ,620 ,151 ,127 ,866 ,037 ,135 ,024 ,084 ,027 ,816 ,013 ,013
N 7 7 7 7 7 7 7 7 7 7 7 7 7
SO4 Pearson Correlation ,121 ,875** ,633 1 ,357 ,883** ,905** ,648 ,666 ,827* ,317 ,847* ,847
*
Sig. (2-tailed) ,797 ,010 ,127 ,432 ,008 ,005 ,115 ,102 ,022 ,489 ,016 ,016
N 7 7 7 7 7 7 7 7 7 7 7 7 7
HCO3 Pearson Correlation ,701 -,063 ,079 ,357 1 ,536 ,546 ,569 ,707 ,504 ,302 ,514 ,512
Sig. (2-tailed) ,079 ,893 ,866 ,432 ,215 ,205 ,183 ,076 ,249 ,510 ,238 ,240
N 7 7 7 7 7 7 7 7 7 7 7 7 7
Na Pearson Correlation ,206 ,642 ,783* ,883** ,536 1 ,916** ,850* ,813* ,889** ,335 ,950** ,950
**
Sig. (2-tailed) ,658 ,120 ,037 ,008 ,215 ,004 ,015 ,026 ,007 ,462 ,001 ,001
N 7 7 7 7 7 7 7 7 7 7 7 7 7
NH4 Pearson Correlation ,441 ,608 ,623 ,905** ,546 ,916** 1 ,780* ,703 ,880** ,502 ,877** ,876
**
Sig. (2-tailed) ,322 ,148 ,135 ,005 ,205 ,004 ,039 ,078 ,009 ,251 ,010 ,010
N 7 7 7 7 7 7 7 7 7 7 7 7 7
K Pearson Correlation ,304 ,385 ,820* ,648 ,569 ,850* ,780* 1 ,887** ,882** -,008 ,932** ,931
**
Sig. (2-tailed) ,508 ,393 ,024 ,115 ,183 ,015 ,039 ,008 ,009 ,986 ,002 ,002
N 7 7 7 7 7 7 7 7 7 7 7 7 7
Mg Pearson Correlation ,183 ,444 ,694 ,666 ,707 ,813* ,703 ,887** 1 ,894** -,066 ,912** ,911
**
Sig. (2-tailed) ,694 ,319 ,084 ,102 ,076 ,026 ,078 ,008 ,007 ,889 ,004 ,004
N 7 7 7 7 7 7 7 7 7 7 7 7 7
Ca Pearson Correlation ,166 ,623 ,811* ,827* ,504 ,889** ,880** ,882** ,894** 1 ,158 ,971** ,972
**
Sig. (2-tailed) ,722 ,135 ,027 ,022 ,249 ,007 ,009 ,009 ,007 ,735 ,000 ,000
N 7 7 7 7 7 7 7 7 7 7 7 7 7
Al Pearson Correlation ,515 ,020 -,109 ,317 ,302 ,335 ,502 -,008 -,066 ,158 1 ,109 ,111
Sig. (2-tailed) ,237 ,966 ,816 ,489 ,510 ,462 ,251 ,986 ,889 ,735 ,816 ,813
N 7 7 7 7 7 7 7 7 7 7 7 7 7
EC m Pearson Correlation ,144 ,646 ,861* ,847* ,514 ,950** ,877** ,932** ,912** ,971** ,109 1 1,000**
Sig. (2-tailed) ,758 ,117 ,013 ,016 ,238 ,001 ,010 ,002 ,004 ,000 ,816 ,000
N 7 7 7 7 7 7 7 7 7 7 7 7 7
TDS Pearson Correlation ,142 ,646 ,862* ,847* ,512 ,950** ,876** ,931** ,911** ,972** ,111 1,000** 1
Sig. (2-tailed) ,762 ,117 ,013 ,016 ,240 ,001 ,010 ,002 ,004 ,000 ,813 ,000
N 7 7 7 7 7 7 7 7 7 7 7 7 7
**. Correlation is significant at the 0.01 level (2-tailed).
*. Correlation is significant at the 0.05 level (2-tailed).
105
CHAPTER SIX: CONCLUSION AND RECOMMENDATIONS
6.1 Conclusion
The prominent problems of solid waste management faced in Cameroon are weak and
unspecified legislation, poor town planning, inefficient/inappropriate recovery and disposal
practices with little or no groundwater monitoring. Figure 29 (pg 88) illustrates poor town
planning practised in Limbe. Most of the town is made of slums which are dirty and
inaccessible to waste collectors. Houses are built haphazardly even in watershed areas which
are even very dangerous to man. These areas often smell especially in the rainy season. Waste
litters area and water is highly contaminated. Waste management until now, has been a failure
as waste collection trucks can hardly access these areas because of poor planning, and the
scattered location of houses and roads.
More so, the involvement of public-private partnerships, public engagement and
training remains a significant problem in waste management. In this study, waste and
groundwater management policies in Cameroon with reference to a case study of the Limbe
Municipal Council was presented. In Cameroon, several waste management regulations
should ensure resource recovery from various waste streams, but the implementation methods
are severely lacking. Hence, there is an urgent need to improve and/or develop sustainable
waste management, through consensus building, consultation, encouragement and openness
prior to maximizing the potentials available for waste reuse, recycling and recovery Despite
governmental efforts to create and implement legislation related to sustainable waste
management and environmental protection, the current policy framework is not efficient.
An inadequate legislative framework and indifference in EIA in Cameroon explain the
lack of effective engagement of industry, commerce and the general public in more
sustainable waste management practices. In Cameroon and Limbe Municipality in particular,
this would suggest the need for the implementation of more robust measures including
learning from examples of best practices from other developing countries. However, there
would be the need to adapt and customize these best practice principles for an environment
specific to Cameroonian towns and cities. Such measures will guarantee the active
engagement of all stakeholders and hence, ensure the successful delivery of sustainable waste
management practices.
The method of collection and transportation of waste is acceptable according to
international standards. Some impediments include poor access to collection sites and
constant breakdown of waste collection trucks. Yet, the method of disposal is not acceptable
and has already exposed the environment and man to adverse conditions. Open dumping and
uncontrolled burning of waste is not appropriate, especially because it brings odour, pests,
microorganisms and scavengers to the Karata waste dump. Farms and plantations around the
waste site are affected by fire and smoke. It should be noted that at temperatures less than
800°C plastic waste produces dioxide which results in air pollution. Also, microorganisms and
bacteria which help in waste decomposition and leachate breakdown. Nevertheless, some of
the killed bacteria are dangerous and so are eliminated from waste, as well as organic

106
substances are reduced in the course of burning. This also reduces moisture content and
weight of the waste, hence minimising groundwater and soil contamination.
The covering of waste after mechanically pushing to the back is advantageous in that it
minimises the release of odour. However, in the rainy season, waste is not burnt and the odour
released from waste reaches neighbouring residential areas like Mokunda village and the
Karata CDC camp. Shifting waste manually does not minimise the effect of waste on the
environment. There is no artificial barrier and no effective measures were taken during site
selection. Site selection did not involve EIA and appropriate project implementation
especially with respect to the state and depth of groundwater. No landfills have been
constructed to enhance sustainable waste disposal to prevent contamination. In spite of these
emissions, groundwater monitoring before and during the use of the waste site is not done.
The geology of dump site shows that the site has scoriaceous soils which are permeable to
water. There is also no documented data on the geology or groundwater condition of the area.
Also, waste dumped here is not sorted, implying that clinical, industrial and municipal wastes
are jointly dumped.
There was no opportunity to access data on drinking water in Limbe as well as no way
to analyse its quality. There was also no means to collect groundwater samples from Karata
waste site because there is no well at the site. As a result, water analysis for this study was
based on existing local wells, springs and a private borehole. Attempts to rent an equipment to
dig a borehole at the Karata dumpsite proved futile as a fee of 6 million FCFA (approximately
€9000) only for renting the equipment was requested by the state department in charge of
borehole construction in Limbe. Sample results mostly showed physico-chemical values less
than those of prescribed standards while microbiological values all exceeded given standards.
It can therefore be concluded that L1 (German Spring) and L7 (Borehole) can be considered
natural groundwater because they were the least contaminated. They can be used as a basis of
comparison for different contamination since they very minimal values. Both samples showed
results that are typical of basalt rocks because the value of magnesium was higher than that of
calcium. Such soil conditions are good for landfill construction.
Ammonium (NH4+), unlike all other parameters showed results with values higher
than prescribed standards. Considering that ammonium can cause liver problems in man,
serious groundwater treatment is required. Treatment of water with NH4+ concentrations
exceeding 2.0mg/L (like L6) is very expensive. L6 (Clerks Quarters) showed higher
concentration in almost all parameters, a clear indication of sewage water. This is a very dirty
and unplanned wetland area which undergoes frequent flooding in the rainy season. Most of
the people who live here are poor and build wooden houses. The collection of waste from this
area is irregular, so waste litters the area and smells. Accessibility to the area is also impeded
by poor roads and the haphazard location of houses. In the rainy season, the roads are very
muddy, slippery and consists water-filled gutters (drains). In the rainy season shallow pit
toilets and wells overflow enhancing contamination as rain water washes substances into the
wells carrying contaminants from different sources. Some of the wells have a lot of particles
(batteries, metals, plastic, wood and others) in well water which are also sources of
contamination. This area should be considered a risk area because of its geological,
groundwater, environmental and social conditions (careless building of houses, poor toilet

107
construction, poor hygienic conditions, etc.). As a result, the area should be evacuated and
used for other purposes like a recreational, protected or conservation area.
In Cameroon and Limbe in particular, water related problems usually result from the
fact that some areas have too much water manifested as floods and poor drainage, while
others have too little water which dries up in the dry season or too little water due to
contaminated water which is unfit for human consumption. Microbial analysis of water
samples showed very poor results, which implies that the water is not fit for human
consumption. Therefore water must undergo immediate and intense treatment before use even
for bathing and washing of clothes. Very little or no concrete data exists on groundwater in
the Limbe municipality which makes it very difficult to know the original state of
groundwater in the area. For this reason, L7, which showed lower contamination levels, can
be used as the “natural” groundwater.
The main source of microbial contamination in Limbe is sewage, since almost all
samples showed high values of sewage related contaminants. People mostly use pit toilet and
have animal farms around wells, which are all major sewage input sources. It will be most
appropriate if these water resources are no longer used for household purposes even though
pipe-borne water in Limbe is either too expensive or rarely available. Contaminated waste-
and sewage water collection and treatment should be the responsibility of the state. Effective
management of drinking water must permanently include sewage water management. In
Germany, for example, there is a law which obliges citizens to dispose of sewage in the
central sewage tank or make provision for sewage collection by the state. This is not the case
in Cameroon and Limbe in particular. Sewage collection and treatment should be considered
and included in water management in Cameroon and Limbe in particular.
The people of Limbe are conscious of the consequences of poor waste management
and groundwater contamination. They are however, not aware that they have already
contaminated the groundwater they use. This is because the Council and HYSACAM do very
little on the state of groundwater in Limbe and do not inform them of the dangers they are
faced with. This incompetent and ineffective part played by LUC and HYSACAM encourages
the local people to poorly dispose of waste and continuously use contaminated water
resources. However, both agencies are faced with the problem of inadequate human, technical
and financial resources. They therefore, indulge in the cheapest possible method of waste and
groundwater management, with little implementation of methods that are sustainable to man,
groundwater and the environment.
It can be concluded from the state of Karata and New Town Market waste sites that
the latter did adversely affect the environment more that the former. The New Town Market
site, which is a flat wetland area now used as cow market, was used for about 10 years with
no burning of waste. Decomposable and other wastes were dumped at the site with no sorting
or pre-treatment and this led to relatively high groundwater contamination around the area. L3
(spring near Cemetery) and L4 (well at Community Quarters) are very close to this site and
show high degree of biological contamination with very shallow groundwater tables. There
are also aesthetic problems in this area like constant smell and floods, especially in the rainy

108
season. Moreover, this is an agricultural area with high use of fertilizers, the probable reason
for the high concentration of NH4+.
Correlations for analysis in Cameroon showed that strong positive correlation between
Ca with Mg, and K. This means that they have related sources Ca and Mg are important
indicators of construction waste and they also affects the concentration of TDS and TH.
Calcium and potassium are components of fertilizer. Magnesium is positively correlation with
NH4+ and K and lightly with Na and SO4
2+. Almost all parameters are strongly correlated to
TH and TDS; a further explanation for the trend in TDS values which implies that the higher
the concentration of ions, the higher the TDS; a clear sign of positive correlations. TDS in L6,
for example, is highest as L6 has the highest concentration of ions, while L7 has the lowest
TDS because which ties with its low ion concentration. Ammonium and potassium show
strong positive correlation with tailed value of 0.002, implying a clear conclusion that they are
component of Sewage and fertilizer. The correlation between most of the components is an
indication that most of them have similar input like sewage, fertilizer, construction waste and
other sources or they easily react to form compounds. Correlation values will subsequently
help in the selection of adequate methods of treatment and disposal to minimise the level of
contamination, and in decision making which will minimise the possible sources of
contamination. Most of the strong correlations are backed the tailed values below 0.05.
Analytical results from Cottbus show a slightly different correlation trend. For
example, nitrate has correlations with K, Ca, EC m; TDS has slight correlation with Na; Cl-
correlates with sulphate; and K is in the case of Cameroon slightly correlated with nitrate and
in the case of Germany with ammonium. Similarities exist in the case of Mg and Ca, TDS and
most of the variables. These changes could probably be the effects of storage and
transportation on the samples.
Finally, it can be concluded that HYSACAM in Limbe practises a relatively good
waste collection and transportation system, which is still undergoing adjustment. However,
the method of disposal is not the best and needs to be overhauled. The open-dump method is
an unacceptable method with lots of negative impact on man and the environment. The
collection of waste sometimes is disturbed by irregular collection due to poor access to
collection points. Waste is littered around waste bins and smells. In the slums where
collection is rare or non-existent, the local people dump waste in their locally created dumps
and pits. These together with the uncontrolled and inappropriate disposal of sewage are a
source of risk to the inhabitants. Water samples collected from wells, springs and borehole in
these areas were biologically contaminated and need serious treatment. The water should not
be used for drinking and household use. L6 is the most contaminated of all sample, while L2
and L7 are the least contaminated. Physico-chemical analysis show lower concentration of
analysed parameters than prescribed by given standards except for ammonium which showed
values higher than prescribed standards. Serious ammonium treatment as well as biological
treatment is required for all sites. As a result, LUC, HYSACAM and other companies are
obliged to come up with appropriate and effective methods of waste management which
should include the 3Rs, collection, treatment, sorting, disposal (landfill with appropriate
barriers) and groundwater monitoring. LUC needs to effectively implement stronger and

109
sustainable legislation and EIA in waste management and disposal which should include
constant and long-term groundwater monitoring.
6.2 Recommendations
The centralised system in Cameroon, with everything centred on the capital, Yaoundé,
negatively affects the implementation of the very good legislation on waste management. In
order to attain maximum implementation and effectiveness of these set regulations, the
following recommendations, if considered, will enhance proper and sustainable waste
management:
In order to achieve adequate implementation of rules and regulations radical changes of
the current policies and regulatory systems are required. One approach to achieving this
would be to implement guidelines such as those developed in the Strategic Planning
Guide (SPG) by Wilson et al, (2003) and Read and Wilson, (2003). The Guide lays down
procedures for assisting decision makers in actively engaging with all stakeholders in the
decision making process ranging from adequately identifying the baseline situation for
MSWM in the city, to establishing a framework for the delivery of sustainable waste
management solutions. SPG already is a key document in developing economic
situations, successfully combining the tools for planning and waste management service
delivery (Olley et al, 2006).
The decentralisation of responsibilities will enhance the creation and implementation of
rules. This will ease the work of Councils and waste management companies, who know
the situation in their municipality as they will jointly as well as separately create and
implement laws and regulations that meet the needs of the people in the municipality.
The formulation of a comprehensive framework of regulations for waste management
(with all relevant tools for its implementation), integrating materials conservation,
disposal, groundwater monitoring, public participation and data gathering which reflect
the realities of waste in Cameroon should be made.
The implementation of these waste management laws should be limited to fewer agencies
with well-defined roles. Institutional strengthening and cooperation (lateral and vertical)
between these agencies should be enhanced. This enhancement should aim at reducing
excessive and unnecessary bureaucracy, and introducing transparency and accountability
(Wilson et al, 2005). Municipal Councils should be given financial autonomy with more
financial resources and greater control.
Town planning laws should be implemented. This will ease the destruction of slums and
subsequently the construction of adequate and accessible streets and roads. As a result,
waste collection and hence, management will be easy.
Regulations on town planning should be implemented so as to ease the destruction of
slum area, construct adequate and accessible streets and roads, create a sustainable and
affordable town plan and issue building permits according to made plan. This will be a

110
big and positive step to waste collection, disposal and the minimisation of groundwater
contamination.
An increase in public participation will enhance effective waste management through a
genuine decentralization of Council control and the empowerment of members of the
civil society or community.
Public education and awareness related to neighbourhood services and issues must be
intensified (Wilson et al, 2005; Olley et al, 2006). However, while the civil society can
take an active role in awareness raising campaigns, ultimate success would depend on the
full backing of the key-decision makers so that stakeholders would feel that they have
ownership of the project outcomes (Ball, 2006).
Strengthening of private-public partnerships in waste management is required. Such
successful partnerships can be forged in the areas of material recovery, community
composting and final waste disposal. They should, in turn, encourage private investment
in the delivery of waste related recycling and recovery facilities (Ahmed and Ali, 2004).
In order to establish these partnerships, there is a need for major participative
consultation through facilitated workshops involving all key stakeholders like municipal
councillors, government agencies, waste contractors and representatives of community
groups. The workshops will facilitate the development of all perspectives regarding
sustainable waste management and groundwater protection, the building of consensus and
the implementation of policies and services (Henry et al, 2006; Wilson et al, 2005).
The method of waste management, especially waste sorting, treatment and disposal in
Cameroon in general and Limbe in particular, does not meet conventional standards. Waste is
not sorted or treated before disposal. It is simply moved from one point to the next, which
implies there is the possibility of environmental pollution, human hazards and groundwater
contamination. This study investigated existing methods of waste disposal in Cameroon, with
particular reference to Limbe. It also emphasised the importance of different waste disposal
methods, especially landfill construction in order to prevent groundwater contamination. As a
result, specific measures for improving the current waste management situation in Limbe
would include the following:
Waste management agencies like HYSACAM should comply with the EIA programme of
Cameroon in the sector of waste management strategies, site selection and Human
resource. EIA should involve historical and current investigations, groundwater
conditions, water table, residents around the area, public participation, waste type and
volume, drawing different types of maps, climate conditions, land use of the area and
other important steps as in Tables 10 an 11.
Open dumping and burning are methods of waste disposal used at the Karata waste site
by HYSACAM. Burning releases toxic substances to the environment. Instead of open
dumping, a municipal or containment landfill can be constructed at a well investigated
and secure site. If waste (e.g. clinical, municipal, industrial waste) must be co-disposed, a
containment landfill can be constructed otherwise, a municipal/sanitary landfill should be

111
constructed. A barrier system should be well constructed with provisions for appropriate
leachate and gas collection systems.
HYSACAM Limbe planned on constructing a new waste disposal site. The planned unit
should preferably be a landfill in the form of a project which involves EIA and the
following consideration:
o Site selection and investigation which should consider the steps and information
already in chapter three of this study. Public participation should be a very
important aspect of the project. The capacity and stability of the site should be
seriously taken into consideration.
o Accessibility of underground position from barrier perspective. According to
Knödel et al (2010), it is recommended to use the German barrier method and
standards which are more stable and secure.
o Planned monitoring systems should be included after acquiring information on
groundwater condition, depth and flow direction. This should include groundwater
monitoring wells which will provide data on the different types of contaminant.
o The landfill construction plan should also include gas collection system which will
minimise atmospheric contamination/pollution. These gases, mostly methane and
carbon dioxide, should be used for other purposes like energy production. The
European Commission has estimated that 32% of landfill gas is methane, which is
30 times more dangerous than carbon dioxide.
o Last but not least, the project should involve post groundwater monitoring and gas
collection, since the closed site could then be used in different ways.
Council waste bins should be put in reachable places and emptied more frequently. More
collection trucks and bins are needed in Limbe to ease and improve the collection of
waste. These trucks should undergo constant checks so as to avoid the problems of waste
staying at collection point for too long because of truck break-down.
A good waste management strategy should strive to avoid waste generation where
necessary. However, as long as there is production and consumption, a hundred percent
realisation of these remains illusory. Hence, the minimisation of the rate of waste
generation remains the best alternative. In this regard, there is need for the public
sensitization and education on the re-use of wastes like plastics, metals, papers, clothes
and other materials which contribute to reduce the environmental and health impacts of
waste. Recycling approaches like composting, are more applicable and appropriate in
developing countries where the waste stream contains up to 75% of organic waste which
can be effectively converted to compost and biogas production for purposes of manure
and energy usage respectively.

112
Figure 36: Flow chart for a search for a new waste disposal site (pragmatic approach)
Source: Voigt et al, 2006
The effects of a landfill on groundwater will greatly depend on the barrier system
used. In the case of Limbe, the Multiple Barrier Concept (MBC) with man-made (technical)
and natural (geological) barriers is strongly recommended (Voigt et al, 2006). The former
reduces pollution while the latter act as a component of safety. Geological barriers must only
be approved if geophysical, geohydrological, geochemical and hydrochemical studies are
carried out. HYSACAM Limbe needs geoscientific investigation and assessment data for
Limbe to find the most appropriate site with the most adequate geological barriers. This will
LAR: Definition of initial conditions
kind of landfill (kind of waste),
planning area (e.g. district),
quantity of waste per day, now and expected in the next 25 years,
size of landfill site according to PCD guidelines. Depend on utilization time
LAR and IR: First consultation with the IR
advice on the basic principles of site searches,
provision of available data for the proposed sites.
LAR in cooperation with ARP: Selection of possible waste disposal sites for
a suitability assessment.
Contractor: Conducts orientating site investigation and assessment (phase
1)
specification of objectives for orientating site investigation and assessment,
compilation of available data for the proposed sites,
exclusion of unfavourable sites
implementation of orientating geoscientific investigations,
comparative site assessment and recommendations for detailed follow-up
investigations.
LAR: Commissioning of the orientating site investigation and assessment
(phase 1)
Contractor: Conducts detailed site investigation and assessment
(phase 2)
LAR and IR: Second consultation with the IR (if needed)
assessment of results of orientating site investigation
Specification of requirements for
further investigations if necessary
If no selected site is suitable
as a waste disposal site, LAR should select new sites with
the support of IR
LAR: Commissioning of the detailed site investigation and
assessment (phase 2)
IR: Assesses results of detailed site investigation and, if possible,
gives approval for landfill planning

113
require professional techniques and experts who are transparent and free from political
influence or entanglement. Information on Figure 36 can be used to ease the process since
geoscientific investigation always involves social and political interests. The chart below can
be used in cases where no detailed geological and hydrogeological maps are available. This
eases decision making as extensive geological and hydrogeological data will be made
available. The following participants in the chart are important in site investigation:
1. LAR: local authority responsible, e.g. municipality
2. IR: institution responsible, in some cases more than one institution, e.g.
HYSACAM
3. ARP: authority for regional planning
4. Client: LAR for commissioning site investigations
5. Contractor: responsible for handling site investigations commissioned by the client
Workers should be encouraged through awareness seminars, increased salary and better
working conditions. They should be provided appropriate clothing (protective shoes and
clothes), constant medical checks paid by the company, better cleaning equipment and
fixed working time (at best in shifts). The employees should be trained on the methods
and importance of proper waste disposal. This should involve the encouragement of
sustainable methods of waste management. The most important part of waste management
will be the at-the-source processing of MSW as in Figure 37. The main objective of this
process should be to reduce the volume of MSW to be disposed of, encourage reuse of
waste material and recycling what is recyclable.
Figure 37: Proposed steps for processing MSW at the source adapted from Notes of
Prof. Gunter Busch
Another achievable means of waste reduction is through self information on the life span
of a product, possibility of maintenance, repair or restoration of the product with time and

114
availability of alternatives which are less complex or wasteful. Waste separation and
recycling are very important steps in waste reduction. Separation of waste into different
types like biodegradable waste, recyclable materials, plastics and metals, minimises
adverse effects on groundwater.
o Waste sorting will cause the creation of jobs for the local people; as well, it increases
the quality of each type of waste, e.g. organic waste, plastics, bottles, and recyclable
and reusable waste. Sorting also reduces the amount of waste for final disposal at
landfill and eases waste treatment before final disposal.
o Degradable waste can be composted and used as manure. This process referred to as
composting can be better managed in small scale. Municipal solid waste in most
developing countries has up to 75% of organic waste which can be transformed to a
plant-friendly humid substance called compost (Amera, 2009). This is achieved by
using water and oxygen to ease the degradation process by aerobic bacteria. This
takes a few months and requires frequent mixing and addition of small amounts of
water to hasten the process. This process releases carbon dioxide and energy; reduces
the amount of waste to be dumped in a landfill, cost in collection, transportation and
disposal of waste; improved hygienic and health conditions; improves water holding
capacity of the soil, structure and stability thereby preventing soil degradation and
erosion. This also increases crop yield, generates income, minimises the importation,
use and effects (release of ammonia. Composting involves thorough sorting of solid
waste and so enhances job creation for the local people.
o Waste recycling will imply sending metals to metal recycling companies like
ALUCAM for Al recycling, batteries to Pilcam Batteries, paper to paper recycling
companies like Samco Papers, and bottles and plastic containers could be returned to
various companies for recycle and reuse. Plastics can also be thermally heated for
energy production taking the minimisation of pollution into special consideration.
However, waste recycling also has contaminating effects, and in some cases
incineration and other treatment methods are advisable.
o Waste incineration on the other hand reduces waste for landfilling, even though it has
many adverse effects. This method of waste reduction can only be used if an
appropriate incineration system is constructed that complies with international norms
because this could release very toxic substances which are harmful to man and the
environment. Incineration ash has high amounts of harmful substances like SO4 and
magnesium, which can be treated and dumped in landfill, whereas gas released can
be collected and used for various purposes.
Groundwater results from this study can be used as the basis of the current state of
groundwater in Limbe. Further groundwater research (analysis and monitoring) is required to
enhance the elimination and prevention of contamination. Groundwater monitoring is very
important and helps to minimise groundwater contamination, particularly portable water. As a
result, the following steps if considered will assist the understanding of groundwater problems
in Limbe:

115
Before a new site is constructed, it is important to undertake groundwater research in
Limbe and the Karata dump site. This would further ease site selection and provide
information on groundwater at Karata site.
Further groundwater analysis must be carried out and documented, especially areas
with poor toilet conditions, excessive sewage release, waste litter and open dumps. For
example, microorganisms as well as phosphate and ammonium (showed high
concentration in all samples) should be analysed especially as they are contaminants
from domestic sewage, agricultural effluents, detergents and industrial waste water
(Patil and Patil, 2010).
The water used for drinking should also undergo analysis to assess whether it is good
for human consumption. Drinking water is provided by SNEC/CAMWATER.
Groundwater monitoring should be introduced in Limbe to enhance decision making
on the groundwater management and wastewater treatment. Groundwater monitoring
provides constant and continuous information on groundwater as well as information
on water components/contaminants, thereby influencing treatment and maintenance
methods. This will ease site selection and landfill construction in that the barrier
system can be decided upon as well as the method of leachate collection.
From results obtained, groundwater treatment is unavoidably required in Limbe as
well as further statistical analysis and modelling of long-term groundwater analysis and
monitoring is needed. Projects can be proposed and implemented which will lead to the
employment of people and poverty alleviation. This study can be used as a base for further
research since it gives a current background of groundwater situation in some, but most
populated parts of the city.
SNEC/CAMWATER Limbe should reconsider its method of water treatment and
storage, and embark on intensive and cost-effective ways of water management for drinking
purposes. It should most importantly include groundwater monitoring in order to locate
contamination sources and ways in which this can be minimised. This would enhance the goal
of providing portable water for the Municipality. Sewage collection and treatment should also
be included in the wastewater management plan as it will minimise groundwater
contamination. This seems to be the major source of biological pollution of groundwater.
The Cameroon National Radio, (2011), confirmed the high contamination level when
it announced that at least 70% of Cameroonians lack access to potable water. People carry
water from wells near pit toilets, hence the current wave of cholera in the country. As a result,
shallow wells should no longer except for washing floors, cars and flushing toilets because of
its excessive biological contamination. The quality of most of them is too low to warrant
treatment, even though intensive treatment is required. Boreholes should be dug at accessible
and groundwater-safe areas, while water in shallow wells should be well treated and pipe-
borne water checked for contamination before further use. Groundwater analysis is needed
and hence, the Council should consider a project that will lay emphasis on analysing
groundwater in the Limbe vicinity.

116
REFERENCES
Books
Bagchi, A., (2004). Design of landfills and integrated solid waste management (3rd
Edition).
John Wiley and Sons, Inc. Canada.
Batsone, R., (1989). The safe disposal of hazardous waste. The International Bank for
Reconstruction and Development/The World Bank.
Botkin, D. B. and Keller, E. S., (1995). Environmental Science: Earth as a living planet. John
Wiley and Sons, Inc. New York.
Botkin, D. B. and Keller, E. S., (2003). Environmental Science: Earth as a living planet (4th
Edition). John Wiley and Sons, Inc. New York.
Boulding, J. R., (1995). Practical handbook of soil, vadose zone and ground water
contamination: Assessment, prevention and remediation. Lewis Publishers.
Chiras, D. D., (1998). Environmental Science: A system approach to sustainable development
(5th
Edition). Wadsworth Publishing Company, Belmont, USA.
Essam S., (2001). Intégration de la biodiversité dans les procédures d’évaluation
environnementales: Cas du Cameroun. Etude financée par Komex Clarke Bond Limited.
Fetter, C. W., (1999). Contaminant Hydrogeology (2nd
Edition). Prentice-Hall, Inc.
Grover, V. I., (2000). Solid Waste Management. Rotterdam; Brookfield, VT, A.A. Balkema.
Monkhouse F. J. and Small J., (1978). A dictionary of the natural environment. Edward
Arnold.
Oweis, I. S and Khera, R. P., (1990). Geotechnology of waste management. Butterworth and
Co. Ltd.
Petts, J and Eduljie, G., (1994). Environmental Impact Assessment for waste treatment and
disposal facilities. John Wiley and Sons, Ltd, United Kingdom.
Stuart, S. N., (1986). Conservation of Cameroon Montane Forest. Internationl Council for
Bird Protection (ICBP), Cambridge (p. 263).
Todd, D. K. and Mays, L. W., (2005). Groundwater Hydrology (3rd
Edition). John Wiley and
Sons, Inc.
Wanielista, M., Kersten, R. and Eaglin, R., (1997). Hydrology: Water quantity and quality
control (2nd
Edition). John Wiley and Sons, Inc.
Williams, P. T., (2005). Waste treatment and disposal (2nd
Edition). John Wiley and Sons Ltd,
England.

117
Wisler, C. O. and Brater, E. F., (1959). Hydrology (2nd
Edition). John Wiley and Sons, Inc.
Book Articles
Knödel, K., Lange, G. and Voigt, H. J., (2007). Introduction. In Knödel, K., Lange, G. and
Voigt, H. J. Environment Geology: Handbook of field methods and case studies.
Springer-Verlag.
Knödel, K., Müller, K., Neuhaus, M., Jenn, F. and Voigt H-J., (2007). Geological,
hydrogeological, geochemical and microbiological investigation. In Knödel, K.,
Lange, G. and Voigt, H. J. Environment Geology: Handbook of field methods and
case studies. Springer-Verlag.
Lambi, C. M., Kometa, S. S., Fogwe, Z. N., and Apiapuh, G. E., (2001). The May 2000
Enigmatic Volcanic Eruption of Mount Cameroon: What lessons? In Lambi, C. M.
and Eze, B. E. Readings in Geography, Unique Printers Bamenda. Pp 60-68.
Logan, T. J., (1995). Water quality. In Andy, D. W. and William, J. E., (eds). Environmental
Hydrology. Lewis Publishers.
Scott, B. E., (1995). Hydrogeology. In Andy, D. W. and William, J. E., (eds). Environmental
Hydrology. Lewis Publishers.
Twort, A. C., Hoather, R. C. and Law, F. M., (1974). Water supply. Edward Arnold
Publishing Ltd, London.
Wards, D. A. and Elliot, J. W., (1995). The hydrologic cycle, water resources, and society. In
Andy, D. W. and William, J. E., (eds). Environmental Hydrology. Lewis Publishers.
Westlake, K., (1995). Landfill. In Hester, R. E. and Harrison R. M. Waste treatment and
disposal. issues in environmental science and technology. The Royal Society of
Chemistry, Letchworth, UK.
Journals, Reports, Conference Papers and Newspapers
Amera, T., (2009). Uses of gases for solid waste (with emphasis to landfill gas). Workshop
proceedings on Alumiportal Deutschland and technics of environmental protection for
sustainable development:opportunity for the cooperation between Ethiopia and
Germany. Association of Ethiopians educated in Germany.
Abdulrafiu, O. M., Adeleke, A. K. and Lateef, O. G., (2011). Quality assessment of
groundwater in the vicinity of dumpsites in Ifo and Lagos, Southwestern Nigeria.
Advances in Applied Science Research, 2011, 2(1): 289-298.
Achankeng E., (2003). Globalisation, urbanisation and municipal solid waste management in
Africa. Conference proceedings of African Studies Association of Australasia and the
Pacific: Africa on a global stage.

118
Ahel, M., Mikac, N., Cosovic, B., Prohic, E. and Soukup, V., (1998). The impact of
contamination from a municipal solid waste landfill (Zagreb, Croatia) on underlying
soil. Water Science and Technology 1998, Vol. 37(8), pp 203-210. Elsevier Science
Ltd, Great Britain.
Ahmed, S. A., and Ali, M., (2004). Partnerships for solid waste management in developing
countries: linking theories to realities. Habitat Inter 2004; 28(3):467–79.
Aysel, U., Emin, B. and Elmas, E., (2009). Ecological concerns over cemeteries. African
Journal of Agricultural Research, Vol. 4(13), pp 1505-1511.
Ball, J., (2006). Waste management in developing countries: seven characteristics and seven
principles. In: Proceedings WASTE 2006. Sustainable Waste & Resource Management;
2006. pp 687–96.
Baud, I., Grafakos, S., Hordijk, M. and Post, J., (2001). Quality of life and alliances in solid
waste management: contributions to urban sustainable development. Cities
2001; 18(1): 3–12.
Buh, W. G., (2009). Geographic information systems based demarcation of risk zones: The
case of The Limbe Sub-Division - Cameroon. Journal of Disaster Risk Studies.
Vol. 2, No. 1: 54-70.
CNN News (July 11th
2006).
Cameroon Calling (27.11.2011). Cameroon National Radio.
Creely, K. S., (2004). Infection risks and embalming. Research Report TM/04/01. Institute of
Occupational Medicine, UK.
Delay, M., Lager, T., Schulz, H. D. and Frimmel, F. H., (2007). Comparison of leaching tests
to determine and quantify the release of inorganic contaminants in demolition waste.
Waste Management (2007); Vol. 27, No. 2: 248 – 255. Elsevier Ltd.
Diaz, L. F. and Golueke, C. G., (1985). Solid waste management in developing countries.
BioCycle, 26: 46-52, September 1985.
Engelbrecht, J. F. P., (1998). Groundwater pollution from cemeteries. The Water Institute of
Southern Africa, Biennal Conference and Exhibition 1: 1-8.
Eyoung, C. T. & Mbuagbo, O. T., (2003). Assessment of the hygiene and sanaitation
campaign in cameroon. Environment, Development and Sustainability. Vol. 4(4):
391-402. Springer, The Netherlands.
Fraser, P. J., Hall, J. B., Healey, J. R., (1998). Climate of Mount Cameroon Region: long and
medium term rainfall, temperature and sunshine data. University of Wales, Bangor;
Mount Cameroon Project and Cameroon Development Corporation. School of
Agriculture and Forest Sciences Publication Number 16.

119
Geovic Cameroon, (2007). nkamouna project environmental and social assessment waste
management plan. Knight Piésold and Co. Project DV30200009.04.
Hassinger, E., Doerge, T. A., Baker, P. B., (1994). Water Facts: Number 1 Test your well for
safety. University of Arizona. College of Agriculture, USA.
Henry, R. K., Yongsheng Z., Jun D., (2006). Municipal solid waste management challenges
in developing countries—Kenyan case study. Waste Management 2006; 26(1): 92–100.
International Solid Waste Association (ISWA), (2002). Industry as a partner in sustainable
development-waste management. International Solid Waste Association, Copenhagen
Denmark.
Johannessen, L. M. and Boyer, G., (1999). Observations of solid waste landfills in developing
countries: Africa. Asia and Latin America. The International Bank for Reconstruction
and Development. Washington D.C.
Kettunen, R. H., Einola, J-K. M. and Rintala, J. A., (2006). Landfill methane oxidation in
engineered soil columns at low temperature. Water, Air and Soil Pollution 2006; 177;
1 - 4: 313 – 334. Springer.
Kometa, S. S., (2010). Ensuring human safety in the disaster prone coastal town of Limbe,
Cameroon. Proceedings of the International Disaster and Risk Conference (IDRC)
Davos, Switzerland.
Lambi, C. M. and Kometa, S. S., (2009). An evaluation of water reosources on the eastern
slopes of Mount Cameroon. Journal of Human Ecology, Vol. 28(1): 47-55 (2009).
Lockwood, A. H., McDonald, J. M., Reiman, R. E., Gelbard, A. S:, Laughlin, J. S., Duffy, T.
E. and Plum, F., (1979). The dynamics of ammonia metabolism in man. Effects of liver
disease and hyperammonemia. Journal of Clinical Investigation, Vol. 63(3): 449–460.
Manga, V. E., Forton, O. T. and Read, A. D., (2007). Waste management in Cameroon: A
new policy perspective? Resources Conservation Recycling 2007;
doi:10.1016/j.resconrec.2007.07.003.
Metro Vancouver, (2008). Strategy for updating the solid waste management plant.
Discussion document. Metro Vancouver, Canada.
Mor, S., Ravindra, K., Dahiya, R. P. and Chandra, A., (2006). Leachate characterization and
assessment of groundwater pollution near municipal solid waste landfill site.
Environmental Monitoring and Assessment (2006) 118: 435-456.
Ngouana, K. C. V., (2009). Environmental compliance and monitoring of Petroleum
development and pipeline project in developing countries: A case study of Chad–
Cameroon pipeline project. 'IAIA09 Conference Proceedings', Impact Assessment and
Human Well-Being, 29th Annual Conference of the International Association for Impact
Assessment, Accra, Ghana.

120
O’Leary, P. and Walsh, P., (1993). Developing and integrated collection strategy. Waste age.
Waste/Recycling Collection Course. University of Wisconsin, Madison USA.
Olley, J., Wilson, D. C. and Read, A., (2006). Getting results: realising the benefits of
community participation in strategic planning for municipal waste management; 2006.
Palczynski, R. J., (2002). Study on solid waste management options for Africa. Project Report
for the African Development Bank-Sustainable Development & Poverty Reduction
Unit. Abidjan, Côte d’Ivoire.
Patil, V. T. and Patil, P. R., (2010). Physico-chemical analysis of selected groundwater
samples of Amalner town in Jalgaon District, Maharashtra, India. E-Journal of
Chemistry 2010, 7(1), 111-116.
Read, A. D. and Wilson, D. C., (2003). The strategic planning guide for solid waste
management - an interactive toolkit for environmentally developing countries. In:
Proceedings of the Sardinia Waste Symposium 2003.
Read, A. D., (1999). Making waste work: making UK national solid waste strategy work at
the local scale. Resour Conser Recyc 1999; 26(3/4):259–85.
Rizwan, R. and Gurdeep, S., (2009). Physico-chemical analysis of groundwater in Angul-
Talcher Region of Orissa, India. Journal of American Science 2009; 5(5): 53-58.
Roy, W. R., Glessner, J. J. G., Krapac, I. G. and Larson, T. H., (2003). Possible geological-
geochemical sources of ammonium in groundwater: preliminary results. Proceedings of
the 13th
Annual Illinois Groundwater Consortum (IGC) Conference 2003.
Sanga, Y., Lib, F., Qingbao, G., Lianga, C. and Chena J., (2006). Heavy metal-contaminated
groundwater treatment by a novel nanofiber membrane. Desalination 2008, 223(1-3)
349–360.
Santarsiero, A., Cutilli, D., Cappiello, G. and Minelli, L., (2000). Environmental and
legislative aspects corcerning existing and new cemetery planning. Microchemistry
Journal, Vol. 67(1-3): 141-145.
Shimura, S., Yokota, I. and Nitta, Y., (2001). Research for MSW flow analysis in developing
countries. Journal of Material Cycles and Waste Management, 3, p. 48-59.
Subramani, T., Elango, L. and Damodarasamy, S. R., (2005). Groundwater quality and its
suitability for drinking and agricultural use in Chithar River Basin, Tamil Nadu, India.
Environmental Geology (2005) 47: 1099-1110. Springer-Verlag, Germany.
Tay, C. and Kortatsi, B., (2008). Groundwater quality studies: A case study of the Densu
Basin, Ghana. West African Journal of Applied Ecology, Vol. 12, 2008.
Ubangoh, R. U., Pacca, I. G. and Nyobe, J. B., (1998). Palaeomagnetism of the continental
sector of the Cameroon Volcanic Line, West Africa. Geophysical Journal International,
Volume 135, Issue 2, pp. 362-374.

121
Vendrell, P. F. and Atiles, J. H., (2003). Your household water quality: Coliform bacteria in
your water. Household Water Quality Series 7. Cooperative Extension Service, the
University Of Georgia.
Voigt, H.-J., (2004). Strategies and effectiveness of groundwater monitoring systems for
different aims. COST Action 629 Workshop, Louvain.
Voigt, H.-J., Noell, U., Knödel, K., Jenn, F., Rad-schinski, J., Grissemann, C., Lange, G.,
(2006). Recommended procedures for site investigations of waste disposal sites and
contaminated sites in Thailand. Thai-German Research Project (WADIS). Bangkok,
Berlin, Hannover, Cottbus.
Voigt, H.-J., Noell, U., Knödel, K., Jenn, F., Rad-schinski, J., Grissemann, C., Lange, G.,
(2006). Recommendations for site investigations of waste disposal sites and
contaminated sites in Thailand. Thai-German Research Project (WADIS). Bangkok,
Berlin, Hannover, Cottbus.
White, J.K., Beaven, R.P., Powrie, W. and Knox, K., (2011). Leachate recirculation in a
landfill: Some insights obtained from the development of a simple 1-D model. Waste
Management 31 (2011) 1210–1221. Elsevier Ltd.
Wilson, D. C., Pow, S., Read, A., Kolganov, D., (2005). Regional waste management
planning in the Kaliningrad Oblast of Russia-a case study of technical assistance to
achieve sustainable improvements in waste management. In: Proceedings Sardinia 2005,
Tenth International Waste Management and Landfill Symposium; 2005.
Wilson, D. C., Velis, C., Cheeseman, C., (2006). Role of informal sector recycling in waste
management in developing countries. Habitat Inter 2006; 30(4):797–808.
Wilson, D. C., Whiteman, A., Read, A. D., (2003). Strategic planning for solid waste
management; an interactive toolkit for developing countries. Waste Manage World
2003:55–60.
Zogning. A, Spinetti, C., Ngouanet, C., Tchoudam, D., Thierry, P., Bignami, C., Kouokam,
E., Buongiorno, M. F., Ilaria, M. and Apa, P., (2009). Risks Prevention Plans (RPP) and
the vulnerability of peoples around volcanoes: Case study of Mt. Cameroon.
Proceedings of the First international conference "Volcanoes, Landscapes and cultures",
11-14/11/2009, Catania, Italy.
Unpublished work and Notes
Asong, F. Z. (2010). recycling and material recovery in Cameroon: implications for poverty
alleviation and ecological sustainability. Unpublished PhD Thesis, Brandenburg
Technical University of Cottbus, Germany.
Awemo, A. A., (2000). Municipal solid waste generation and management in Limbe.
Unpublished B.Sc. Thesis, Department of Geology and Environmental Sciences,
University of Buea, Cameroon.

122
Busch, G., (2003). Lecture note on advanced topics in municipal solid waste management in
the course solid waste management. BTU, Cottbus.
Njabe, R. N., (2008). Population dynamics and its implications of potable water supply in
Limbe. Unpublished M.Sc. Thesis, Department of Geography, University of Buea,
Cameroon.
Onege, O. R., (1998). The geology of Limbe and its environs. Unpublished B.Sc. Project,
Department of Geology and Environmental Sciences, University of Buea, Cameroon.
Tapong, S., (2002). Environmentally based treatment of solid waste in Urban and Semi
Urban areas of Cameroon. Unpublished M.Sc. Thesis, University of Lund, Sweden.
Voigt, H.-J., (2010). Lecture notes no. 3 Landfill Emissions: Gas and Leachate in the course
Investigation and remediation of groundwater contamination. BTU, Cottbus.
Internet
Anschütz, J. and Keita, M., (2004). Integrated sustainable waste management in Bamako,
Mali. Lessons learnt from the UWEP programme WASTE; December 2004.
http://www.waste.nl/content/download/ 880/6295/file/Bamako%20City%20Study.pdf
(Accessed: 19th
January 2009).
Associates- the Landfill site, (2011). Waste decomposition: The main stages of waste
decomposition, or the waste degradation process. http://www.landfill-
site.com/html/waste_decomposition.html (Accessed: 14th
July 2011).
Awum, D., Kamanda, B., Ndongo, F., (2001). Mainstreaming potentials for sustainable
development in Limbe Urban Municipality, Yaoundé.
http://www.unhabitat.org/offices/roaas/france/limbe.pdf (Accessed: 3rd
April 2007).
BGR, Hannover and www.fao.org/gtos/doc/ECVs/T03/T03-Groundwater-report-v05.doc,
2008 (Accessed 20.03.2009)
Cameroon News, (2007). HYSACAM and VEOLIA PROPRETE at the Star Building.
http://www.spm.gov.cm/detail_art.php?id_art=1243&type=simpl&lang=en (Accessed:
20th
April 2008).
Galega, P. and Neckmen, S., (2011). Environmental Impact Assessment (EIA) process in
Cameroon.
http://www.unep.org/dec/onlinemanual/Enforcement/InstitutionalFrameworks/PublicPar
ticipationProcesses/Resource/tabid/1034/Default.aspx (Accessed 10th
July 2011).
Government of Alberta, (2008). Understanding groundwater.
http://www1.agric.gov.ab.ca/$department/deptdocs.nsf/all/wwg406 (Accessed: 27th
January 2011).

123
http://en.wikipedia.org/wiki/File:Southwest_Cameroon_divisions.png
http://mappery.com/city-maps-Limbe
Terrestrial ECV 03. Groundwater. www.fao.org/gtos/doc/ECVs/T03/T03-Groundwater-
report-v05.doc (accessed 12.01.2011)
L’actualité, (2007). HYSACAM présente officiellement sa nouvelle flotte.
http://www.hysacam-proprete.com (Accessed: 20th
April 2008).
Mbom, F. T., (July, 2006). HYSACAM Takes over cleaning of Limbe
http://www.postnewsline.com/2006/07/hysacam_takes_o.html (Accessed: 20th
April
2008).
Oram, B., (2011). Total dissolved solids and water quality. www.water-
research.net/totaldissolvedsolids.htm (Accessed: 1st September 2011).
UNEP/U.S NASA/WORLD BANK, (1997). Protecting Our Planet, Securing Our Future.
http:// www.gdrc.org/ngo/mea/factsheet/fs4.html (Accessed: 28th
June 2006).
Water stewardship information series (2007). Total, fecal & E. coli bacteria in groundwater.
http://www.env.gov.bc.ca/wsd/plan_protect_sustain/groundwater/library/ground_fact_s
heets/pdfs/coliform(020715)_fin2.pdf (Accessed: 1st March 2011).
World Bank, (2002). Upgrading low income settlement country assessment report.
http://web.mit.edu/urban%20upgrading/upgrading/case-examples/Cameroon.htm
(Accessed: 29th
Jan 2008).
Wroblewski, C., Smith, A., Zimmerman, B. and Gentz, F., (2011). Waste Management
Alternatives. http://sites.google.com/site/wastemanagementalternatives/types-of-
landfills (Accessed: 19th
September 2011).

124
APPENDICES
Appendix I: Waste Collection Programme for HYSACAM

125

126

127

128

129

130

131
Appendix II: Laboratory Certificate from CBC Mutengene-Cameroon
CBC CENTRAL PHARMACY
QUALITY ASSURANCE DEPARTMENT
CERTIFICATE OF ANALYSIS
17-05-10
Seven water samples were collected according to official norms for current Good Laboratory
Practices (GLP) at different locations within Limbe Municipality in the South West Region of
Cameroon on the 19th
of April 2010. Research work ordered by Mrs. Adeline Abimnwi
AWEMO CHEO, a Doctorate research student from the Brandenburgiche Technische
University, Cottbus-Germany.
Type of analysis carried out: MICROBIAL and PHYSICO-CHEMICAL
Date of analysis: 21-04-10 to 05-06-10
MICROBIAL ANALYSIS
SAMPLE
CODE
ORGANISM(S) FOUND POSSIBLE SOURCE(S) Count
(CFU/100ml)
Cameroon stds.
(CFU/100ml)
Comments
L1 Total Coliforms ( Enterobacter , Citrobacter
and Klebsiella sp)
Escherishia coli (E. coli)
Faecal matter, soil and sewage.
Same as above
543
26
1/250ml
Absent/100mL
RE
SU
LT
S I
ND
ICA
TE
TH
AT
WA
TE
R S
OU
RC
ES
NE
ED
TO
BE
TR
EA
TE
D S
ER
IOU
SL
Y
Staphyloccocus sp. Skin 24 /100ml NA
L2 Total Coliforms ( Enterobacter , Citrobacter
and Klebsiella sp)
Escherishia coli
Faecal matter, Soil, sewage
Same as above
1000
205
1/250ml
Absent/100ml
L3 Total Coliforms ( Enterobacter, Citrobacter
and Klebsiella sp)
Escherishia coli
Faecal matter, soil, sewage
Same as above
1000
346
1/250ml
Absent/100ml
Salmonella sp. Faecal matter, sewage 103 Absent/100ml

132
KEY
L1: Cold water spring
L2: Spring near cemetery
L3: Well 1, near cemetery (Motowoh)
L4: Community Quarters
L5: Motowoh hill
L6: Clerks Quarters
L7: Karata bore-hole
NA: Not Available
CFU: Colony forming units
L4 Total Coliforms ( Enterobacter , Citrobacter
and Klebsiella sp)
Escherishia coli
Faecal matter, soil, sewage
Same as above
1000
256
1/250ml
Absent/100ml
Salmonella sp. Faecal matter, sewage 94 Absent/100ml
Faecal streptoccocus Faecal matter, Soil sewage 159 1/250ml
L5 Total Coliforms (Enterobacter , Citrobacter
and Klebsiella sp)
Escherishia coli
Faecal matter, soil, Sewage
Same as above
735
102
1/250ml
Absent/100ml
RE
SU
LT
S I
ND
ICA
TE
TH
AT
WA
TE
R S
OU
RC
ES
NE
ED
TO
BE
TR
EA
TE
D S
ER
IOU
SL
Y
EX
CE
PT
FO
R L
7 T
HA
T N
EE
DS
MIL
D T
RE
AT
ME
NT
Salmonella sp. Faecal matter, sewage 56 Absent/100ml
Faecal streptoccocus Faecal matter, Soil sewage 87 1/250ml
L6 Total Coliforms ( Enterobacter , Citrobacter
and Klebsiella sp)
Escherishia coli
Faecal matter, soil, sewage
Same as above
1000
157
1/250ml
Absent/100ml
Salmonella sp. Faecal matter, sewage 102 Absent/100ml
Staphylococcus aureus Faecal matter, Skin sewage 205/100ml NA
L7 Total Coliforms (Enterobacter , Citrobacter
and Klebsiella sp)
Escherishia coli
Faecal matter, soil, sewage
Same as above
06
04
1/250ml
Absent/100ml
Staphylococcus aureus Faecal matter, soil, sewage 08 /100ml NA
Pseudomonas sp. Faecal matter, soil, sewage 03 Absent/100ml

133
PHYSICO-CHEMICAL ANALYSIS
PARAMETERS (mg/L)
CODE Ca2+ Mg2+ Cl- HCO3- SO4
2- TDS Total
Hardness Na+ NO3
- NH4+ K+
Standard 100 30 250 305 250 NA NA 175 50 0.5 12
L1 16.05 19.47 78.70 14.01 50.56 360 100.09 3.80 3.70 1.90 5.30
L2 20.06 19.47 39.30 2.00 36.54 284 78.07 2.20 37.80 0.90 2.10
L3 28.08 24.33 59.00 22.02 43.68 400 118.11 2.30 13.80 1.60 5.00
L4 32.09 29.20 68.90 17.02 29.79 424 108.10 3.00 28.10 1.80 6.00
L5 24.07 17.03 59.00 10.01 16.90 376 68.06 1.50 28.50 0.90 2.60
L6 64.19 51.10 59.00 10.01 66.87 920 192.17 4.10 118.10 2.60 13.60
L7 8.02 19.47 29.50 2.00 18.55 276 48.04 1.70 2.60 1.30 4.70
KEY
L1: Cold water spring
L2: Spring near cemetery
L3: Well 1, near cemetery (Motowoh)
L4: Community Quarters
L5: Motowoh hill
L6: Clerks Quarters
L7: Karata bore-hole
NA: Not Available

134
Appendix III: Certificate of Results from BTU Cottbus, Germany
Analysis in Cottbus, Germany:
Results of analysis
Please find attached the results from your Cameroon samples. I charged balanced HCO3,
which always gave positive values. However, the geochemical modeling (phreeqc), which
also considers things like phase equilibria and pH, did not always converge and, if converged,
produced carbonate values below the ones given by the charge balance.
As for Fe, pH is so high that the Fe (III) phase saturation indices calculated by phreeqc are
substantially >0, which is a clear indication of precipitation of Fe compounds. This was
obvious in sample L4, where we observed a yellowish-brownish precipitate. In such case one
must assume Fe (II) in the original sample, which was oxidized during transportation from
Cameroon. This consideration is independent from the charge balance, because Fe
precipitation is a pH buffering mechanism. We measured pH, so the charge should balance
anyway. (L4 converged well in phreeqc)
For QC we applied the WMO criteria, which check both charge balance and EC measured vs.
EC calculated from analysis results. All samples except L7 passed QC with no problems. The
QC criterion for L7 is almost met; we have 22% EC error instead of 20% required. Because
we have no options for additional analyses and because HCO3 was charged balanced, I
believe that there is no reason for concern in that matter. (Mathematically I could use the trick
to violate the charge balance, still leaving it inside the QC limits for charge balance, thus
bringing EC down to 20%).
Apart from this, you were also interested in TDS. I calculated TDS from both analysis results
and from measured EC, where I used the conversion factor EC -> TDS as a plausibility check.
It should be in the range from 0.5 to 0.8. The best fit is achieved with an average factor of
0.62, which is plausible for the solution chemistry determined.
Please, come to our lab and take the samples. The amount left should suffice for B.
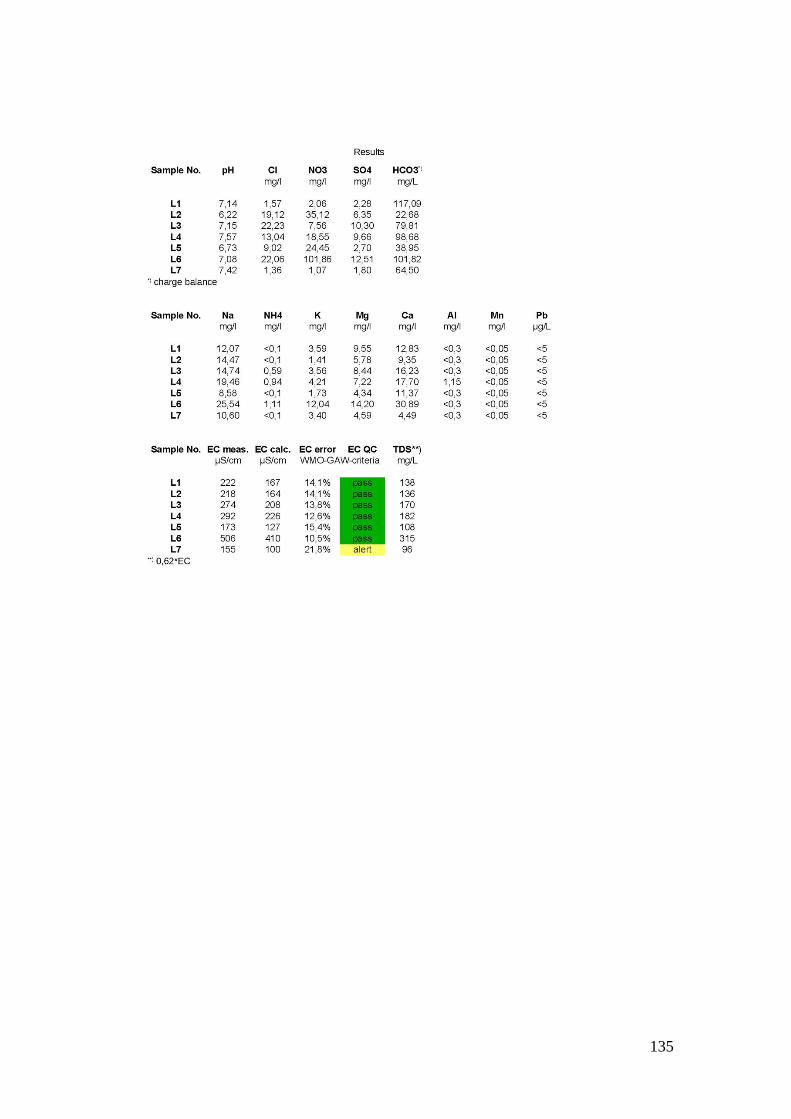
135