![EVcc`c Wc`^ 2W hZ]] SV UVR]e+ 45D - Daily Pioneer](https://static.fdokumen.com/doc/165x107/632551385c2c3bbfa803227c/evccc-wc-2w-hz-sv-uvre-45d-daily-pioneer.jpg)
Intracellular calcium activity in isolated bovine adrenal chromaffin cells in the presence and...
11
Bioelectromagnetics 23:557 ^ 567 (2002) Intracellular Calcium Activity in Isolated Bovine Adrenal Chromaffin Cells in the Presence and Absence of 60 Hz Magnetic Fields Gale L. Craviso, 1 * James Poss, 1 Christine Lanctot, 1 Steven S. Lundback, 1 Indira Chatterjee, 2 and Nelson G. Publicover 3 1 Department of Pharmacology, University of Nevada, Reno, Nevada 2 Department of Electrical Engineering, University of Nevada, Reno, Nevada 3 Department of Physiology and Cell Biology, University of Nevada, Reno, Nevada This study examined whether 60 Hz magnetic field (MF) exposure alters intracellular calcium levels ([Ca 2þ ] i ) in isolated bovine adrenal chromaffin cells, a classic model of neural responses. [Ca 2þ ] i was monitored by fluorescence video imaging of cells loaded with the calcium indicator fluo-4 during exposures to magnetic flux densities of 0.01, 0.1, 1.0, 1.4, or 2.0 mT. MFs generated by Helmholtz coils constructed from bifilar wire allowed both 60 Hz field and sham exposures. Following a 5 min monitoring period to establish baseline patterns, cells were subjected for 10 min to a 60 Hz MF, sham field or no field. Reference calcium responses and assessment of cell excitability were obtained by the sequential addition of the nicotinic cholinergic receptor agonist dimethylphenylpiperazinium (DMPP) and a depolarizing concentration of KCl. Throughout an 8 day culture period, cells exhibited spontaneous fluctuations in [Ca 2þ ] i . Comparisons of the number of cells exhibiting transients, the number and types of calcium transients, as well as the time during monitoring when transients occurred showed no significant differences between MF exposed cells and either sham exposed or nonexposed cells. With respect to the percentage of cells responding to DMPP, differences between 1 and 2 mT exposed cells and both nonexposed and sham exposed cells reached statistical significance during the first day in culture. No statistically significant differences were observed for responses to KCl. In summary, our data indicate that [Ca 2þ ] i in chromaffin cells is unaffected by the specific 60 Hz MF intensities used in this study. On the other hand, plasma membrane nicotinic receptors may be affected in a manner that is important for ligand–receptor interactions. Bioelectromagnetics 23:557–567, 2002. ȣ 2002 Wiley-Liss, Inc. Key words: neural-type cells; fluo-4 fluorescence imaging; intracellular calcium; calcium transients; acute field exposure INTRODUCTION Considerable research has been directed at determining how and to what extent electromagnetic fields (EMFs) produced by 50/60 Hz electric power affect living systems. Regarding the mammalian nervous system, exposure to 50/60 Hz EMFs has been implicated in a wide range of effects [Paneth, 1993]. In humans, for example, an increased incidence of headaches and depression has been reported for individuals residing near transmission lines [Poole et al., 1993]. In animal studies, alterations in central neurotransmitter turnover and pineal function have been observed after 60 Hz MF exposure [e.g., Kato et al., 1993; Lai et al., 1993]. These reports suggest that neural cells may be capable of transducing power line frequency EMFs into physiological responses. Because calcium plays an important role in regulating a variety of cellular processes in a wide range of cell types [Berridge et al., 1999], one way that MF exposure might cause biological effects is by altering intracellular calcium levels ([Ca 2þ ] i ). Indeed, ȣ 2002 Wiley-Liss,Inc. —————— Contract grant sponsor: NIEHS/DOE RAPID program through NIH; Contract grant number: RO3 ES08903; Contract grant sponsor: NIEHS; Contract grant number: RO1 ES07563. *Correspondence to: Gale L. Craviso, Department of Pharmacol- ogy, University of Nevada School of Medicine, Howard Building, Reno, NV 89557. E-mail: [email protected] Received for review 24 July 2001; Final revision received 11 February 2002 DOI 10.1002/bem.10045 Published online in Wiley InterScience (www.interscience.wiley.com).
-
Upload
nevada-reno -
Category
Documents
-
view
3 -
download
0
Transcript of Intracellular calcium activity in isolated bovine adrenal chromaffin cells in the presence and...
Bioelectromagnetics 23:557^567 (2002)
Intracellular Calcium Activity in Isolated BovineAdrenal Chromaffin Cells in the Presence and
Absence of 60 Hz Magnetic Fields
Gale L. Craviso,1* James Poss,1 Christine Lanctot,1 Steven S. Lundback,1 Indira Chatterjee,2
and Nelson G. Publicover3
1Department of Pharmacology, University of Nevada, Reno, Nevada2Department of Electrical Engineering, University of Nevada, Reno, Nevada
3Department of Physiology and Cell Biology, University of Nevada, Reno, Nevada
This study examined whether 60 Hz magnetic field (MF) exposure alters intracellular calcium levels([Ca2þ]i) in isolated bovine adrenal chromaffin cells, a classic model of neural responses. [Ca2þ]iwas monitored by fluorescence video imaging of cells loaded with the calcium indicator fluo-4during exposures to magnetic flux densities of 0.01, 0.1, 1.0, 1.4, or 2.0 mT. MFs generated byHelmholtz coils constructed from bifilar wire allowed both 60 Hz field and sham exposures.Following a 5 min monitoring period to establish baseline patterns, cells were subjected for 10 minto a 60 Hz MF, sham field or no field. Reference calcium responses and assessment of cellexcitability were obtained by the sequential addition of the nicotinic cholinergic receptor agonistdimethylphenylpiperazinium (DMPP) and a depolarizing concentration of KCl. Throughout an8 day culture period, cells exhibited spontaneous fluctuations in [Ca2þ]i. Comparisons of thenumber of cells exhibiting transients, the number and types of calcium transients, as well as thetime during monitoring when transients occurred showed no significant differences between MFexposed cells and either sham exposed or nonexposed cells. With respect to the percentage of cellsresponding to DMPP, differences between 1 and 2 mT exposed cells and both nonexposed and shamexposed cells reached statistical significance during the first day in culture. No statisticallysignificant differences were observed for responses to KCl. In summary, our data indicate that[Ca2þ]i in chromaffin cells is unaffected by the specific 60 Hz MF intensities used in this study. Onthe other hand, plasma membrane nicotinic receptors may be affected in a manner that is importantfor ligand–receptor interactions. Bioelectromagnetics 23:557–567, 2002. � 2002 Wiley-Liss, Inc.
Key words: neural-type cells; fluo-4 fluorescence imaging; intracellular calcium; calciumtransients; acute field exposure
INTRODUCTION
Considerable research has been directed atdetermining how and to what extent electromagneticfields (EMFs) produced by 50/60 Hz electric poweraffect living systems. Regarding the mammaliannervous system, exposure to 50/60 Hz EMFs has beenimplicated in a wide range of effects [Paneth, 1993].In humans, for example, an increased incidence ofheadaches and depression has been reported forindividuals residing near transmission lines [Pooleet al., 1993]. In animal studies, alterations in centralneurotransmitter turnover and pineal function havebeen observed after 60 Hz MF exposure [e.g., Katoet al., 1993; Lai et al., 1993]. These reports suggest thatneural cells may be capable of transducing power linefrequency EMFs into physiological responses.
Because calcium plays an important role inregulating a variety of cellular processes in a wide
range of cell types [Berridge et al., 1999], one way thatMF exposure might cause biological effects is byaltering intracellular calcium levels ([Ca2þ]i). Indeed,
�2002Wiley-Liss, Inc.
——————Contract grant sponsor: NIEHS/DOE RAPID program throughNIH; Contract grant number: RO3 ES08903; Contract grantsponsor: NIEHS; Contract grant number: RO1 ES07563.
*Correspondence to: Gale L. Craviso, Department of Pharmacol-ogy, University of Nevada School of Medicine, Howard Building,Reno, NV 89557. E-mail: [email protected]
Received for review 24 July 2001; Final revision received 11February 2002
DOI 10.1002/bem.10045Published online in Wiley InterScience (www.interscience.wiley.com).
several in vitro studies utilizing different types of cellsand different methodologies for analyzing cellularcalcium dynamics have provided evidence thatchanges in [Ca2þ]i occur in response to 50/60 Hz MFexposure. For example, 60-min exposure of mitogen-stimulated rat thymic lymphocytes to a 22 mT 60 HzMF caused a significant increase in 45Ca2þ influxcompared to nonexposed cells [Walleczek andLiburdy, 1990]. In a series of studies by Lindstromet al. [1993, 1995], application of a 50 Hz MF atmagnetic flux densities of 0.1 or 0.15 mT duringfluorescence imaging of [Ca2þ]i in the human T-lymphocyte cell line Jurkat resulted in pronouncedincreases in [Ca2þ]i in a subpopulation of the cells. Inendocrine cells isolated from rat anterior pituitary,fluorescence imaging of [Ca2þ]i revealed an increasein [Ca2þ]i for up to 3 h after exposure of the cells to a50 mT 50 Hz MF [Barbier et al., 1996].
Although effects of 50/60 Hz EMFs on [Ca2þ]ihave been reported for several types of cells, studies todate have not included an analysis of powerlinefrequency EMF effects on [Ca2þ]i in neural-type cells.The present study was undertaken to begin filling thisgap. The neural cell type chosen for the analysis,chromaffin cells isolated from the adrenal medulla,share fundamental similarities with sympathetic neu-rons of the peripheral nervous system. These include acommon derivation from the neural crest and commonmechanisms for the synthesis, storage, and calciumdependent exocytotic release of catecholamines inresponse to the binding of acetylcholine. Also, likesympathetic neurons, chromaffin cells are electricallyexcitable, with a resting membrane potential of ap-proximately �75 to �80 mV [Lopez et al., 1995]. Ofparticular relevance to the present study is the well-established use of chromaffin cells to examine themechanisms by which [Ca2þ]i is modulated inresponse to both receptor-mediated [e.g., O’Sullivanet al., 1989] and non-receptor-mediated [e.g., Lopezet al., 1995] stimuli.
We used the non-ratiometric, visible wavelengthdye fluo-4 to monitor [Ca2þ]i in a population of cellsduring simultaneous 60 Hz MF exposure. Effects on[Ca2þ]i as well as the ability of chromaffin cells torespond to stimuli that increase [Ca2þ]i were assessedafter exposure of the cells to magnetic flux densities ofeither 0.01, 0.10, 1.0, 1.4, or 2.0 mT. We show that avariety of spontaneous calcium fluctuations occur overthe time period of MF exposure, but that no significantdifferences in the pattern of calcium activity occurredin response to any of the magnetic flux densities in-vestigated. There was also no influence of MF ex-posure on the percentage of cells exhibiting calciumactivity.
MATERIALS AND METHODS
Preparation of Chromaffin Cells
Chromaffin cells were isolated from fresh bovineadrenal medullas as described by Waymire et al.[1983] and seeded into 100 mm plastic Petri dishes(Baxter) in Ham’s F-12 medium containing 10% (vol/vol) calf serum, 100 U/ml penicillin, 100 mg/mlstreptomycin, 0.25 mg/ml fungizone, and 32 mMcytosine arabinoside. As assessed by neutral red stain-ing, chromaffin cell homogeneity was greater than90%. The cells were maintained in suspension cultureat 36.5 8C in a humidified atmosphere of 95% air/5%CO2. Under these culture conditions, cells retainedtheir normal round morphology and large cell ag-gregates (up to 100 cells) often formed. Cells werecultured at low density (1� 105 cells/ml) to preventcell–cell contact mediated alterations in gene expres-sion [Saadat et al., 1987] that could potentiallydecrease the likelihood of observing EMF effects.
Dishes of cells were always placed on the sametwo shelves in a tissue culture incubator where ambientAC magnetic flux densities (measured with an EFMCompany EFM-131 MF measurement system) andstatic magnetic flux densities (measured with a WalkerScientific, Inc., Fluxgate FGM-3D1 magnetometer)were determined to be the lowest (�1 and 75 mT,respectively). In addition, ambient 60 Hz EMFs weremapped, monitored, and recorded at all sites within thelaboratory where cell handling occurred so thatexposure of the cells to incidental EMFs could beminimized [Valberg, 1995]. Because replacement ofthe culture medium was not required under our cultureconditions, there was no manipulation of the cells priorto experimentation.
Monitoring [Ca2þ]i by Fluorescence Imaging
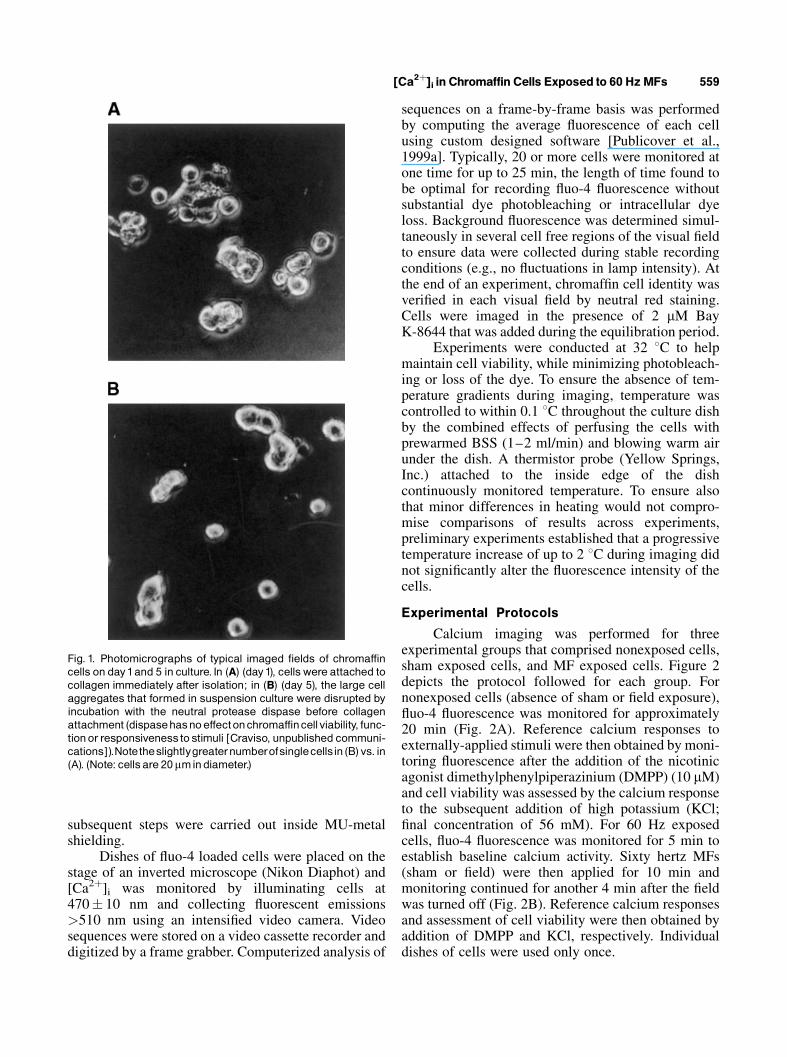
To monitor [Ca2þ]i, cells were plated at a densityof 3.9–4.9� 104 cells/cm2 in 35 mm culture dishescoated with 2% rat tail collagen the day before anexperiment. Visual inspection of the cells afterattachment showed the presence of both isolated cells(to the extent of 8–40%) and cells making contact withother cells in small clusters of up to nine cells (Fig. 1).Cells were incubated for 45–90 min at 30–32 8C with2.8 mM of the calcium fluorescent indicator dye, fluo-4/AM (Molecular Probes) that was dissolved in abalanced salt solution (BSS) (145 mM NaCl, 5 mMKCl, 1.2 mM NaH2PO4, 2 mM CaCl2, 1.3 mMMgCl2,10 mM glucose, and 15 mMHEPES, pH 7.4, and 0.1%bovine serum albumin). Cells were washed free of thedye and equilibrated for 10–15 min at 32 8C in thepresence of 2 mM of the calcium channel agonist, BayK-8644, before initiating experiments. These and all
558 Craviso et al.
subsequent steps were carried out inside MU-metalshielding.
Dishes of fluo-4 loaded cells were placed on thestage of an inverted microscope (Nikon Diaphot) and[Ca2þ]i was monitored by illuminating cells at470� 10 nm and collecting fluorescent emissions>510 nm using an intensified video camera. Videosequences were stored on a video cassette recorder anddigitized by a frame grabber. Computerized analysis of
sequences on a frame-by-frame basis was performedby computing the average fluorescence of each cellusing custom designed software [Publicover et al.,1999a]. Typically, 20 or more cells were monitored atone time for up to 25 min, the length of time found tobe optimal for recording fluo-4 fluorescence withoutsubstantial dye photobleaching or intracellular dyeloss. Background fluorescence was determined simul-taneously in several cell free regions of the visual fieldto ensure data were collected during stable recordingconditions (e.g., no fluctuations in lamp intensity). Atthe end of an experiment, chromaffin cell identity wasverified in each visual field by neutral red staining.Cells were imaged in the presence of 2 mM BayK-8644 that was added during the equilibration period.
Experiments were conducted at 32 8C to helpmaintain cell viability, while minimizing photobleach-ing or loss of the dye. To ensure the absence of tem-perature gradients during imaging, temperature wascontrolled to within 0.1 8C throughout the culture dishby the combined effects of perfusing the cells withprewarmed BSS (1–2 ml/min) and blowing warm airunder the dish. A thermistor probe (Yellow Springs,Inc.) attached to the inside edge of the dishcontinuously monitored temperature. To ensure alsothat minor differences in heating would not compro-mise comparisons of results across experiments,preliminary experiments established that a progressivetemperature increase of up to 2 8C during imaging didnot significantly alter the fluorescence intensity of thecells.
Experimental Protocols
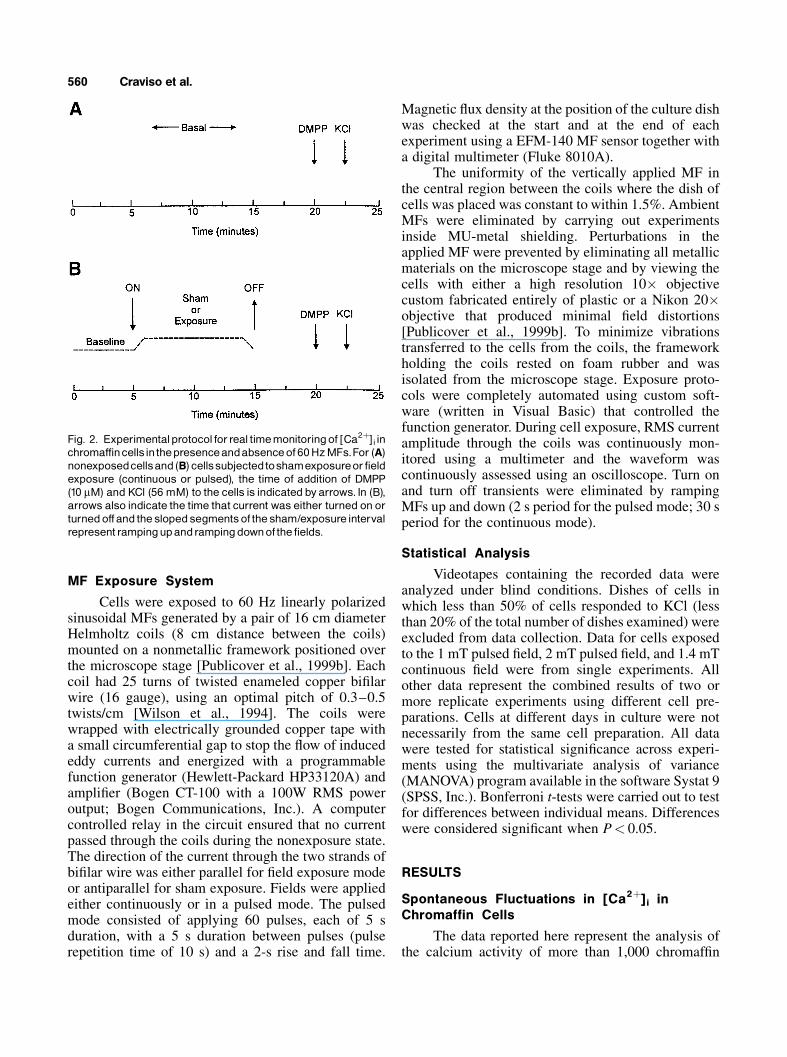
Calcium imaging was performed for threeexperimental groups that comprised nonexposed cells,sham exposed cells, and MF exposed cells. Figure 2depicts the protocol followed for each group. Fornonexposed cells (absence of sham or field exposure),fluo-4 fluorescence was monitored for approximately20 min (Fig. 2A). Reference calcium responses toexternally-applied stimuli were then obtained by moni-toring fluorescence after the addition of the nicotinicagonist dimethylphenylpiperazinium (DMPP) (10 mM)and cell viability was assessed by the calcium responseto the subsequent addition of high potassium (KCl;final concentration of 56 mM). For 60 Hz exposedcells, fluo-4 fluorescence was monitored for 5 min toestablish baseline calcium activity. Sixty hertz MFs(sham or field) were then applied for 10 min andmonitoring continued for another 4 min after the fieldwas turned off (Fig. 2B). Reference calcium responsesand assessment of cell viability were then obtained byaddition of DMPP and KCl, respectively. Individualdishes of cells were used only once.
Fig. 1. Photomicrographs of typical imaged fields of chromaffincells on day1and 5 in culture. In (A) (day1), cellswere attached tocollagen immediately after isolation; in (B) (day 5), the large cellaggregates that formed in suspension culture were disrupted byincubation with the neutral protease dispase before collagenattachment (dispasehasnoeffectonchromaffincellviability, func-tionorresponsivenessto stimuli [Craviso, unpublished communi-cations]).Notetheslightlygreaternumberofsinglecellsin (B)vs. in(A). (Note: cellsare 20mmindiameter.)
[Ca2þ]i in Chromaffin Cells Exposed to 60 HzMFs 559
MF Exposure System
Cells were exposed to 60 Hz linearly polarizedsinusoidal MFs generated by a pair of 16 cm diameterHelmholtz coils (8 cm distance between the coils)mounted on a nonmetallic framework positioned overthe microscope stage [Publicover et al., 1999b]. Eachcoil had 25 turns of twisted enameled copper bifilarwire (16 gauge), using an optimal pitch of 0.3–0.5twists/cm [Wilson et al., 1994]. The coils werewrapped with electrically grounded copper tape witha small circumferential gap to stop the flow of inducededdy currents and energized with a programmablefunction generator (Hewlett-Packard HP33120A) andamplifier (Bogen CT-100 with a 100W RMS poweroutput; Bogen Communications, Inc.). A computercontrolled relay in the circuit ensured that no currentpassed through the coils during the nonexposure state.The direction of the current through the two strands ofbifilar wire was either parallel for field exposure modeor antiparallel for sham exposure. Fields were appliedeither continuously or in a pulsed mode. The pulsedmode consisted of applying 60 pulses, each of 5 sduration, with a 5 s duration between pulses (pulserepetition time of 10 s) and a 2-s rise and fall time.
Magnetic flux density at the position of the culture dishwas checked at the start and at the end of eachexperiment using a EFM-140 MF sensor together witha digital multimeter (Fluke 8010A).
The uniformity of the vertically applied MF inthe central region between the coils where the dish ofcells was placed was constant to within 1.5%. AmbientMFs were eliminated by carrying out experimentsinside MU-metal shielding. Perturbations in theapplied MF were prevented by eliminating all metallicmaterials on the microscope stage and by viewing thecells with either a high resolution 10� objectivecustom fabricated entirely of plastic or a Nikon 20�objective that produced minimal field distortions[Publicover et al., 1999b]. To minimize vibrationstransferred to the cells from the coils, the frameworkholding the coils rested on foam rubber and wasisolated from the microscope stage. Exposure proto-cols were completely automated using custom soft-ware (written in Visual Basic) that controlled thefunction generator. During cell exposure, RMS currentamplitude through the coils was continuously mon-itored using a multimeter and the waveform wascontinuously assessed using an oscilloscope. Turn onand turn off transients were eliminated by rampingMFs up and down (2 s period for the pulsed mode; 30 speriod for the continuous mode).
Statistical Analysis
Videotapes containing the recorded data wereanalyzed under blind conditions. Dishes of cells inwhich less than 50% of cells responded to KCl (lessthan 20% of the total number of dishes examined) wereexcluded from data collection. Data for cells exposedto the 1 mT pulsed field, 2 mT pulsed field, and 1.4 mTcontinuous field were from single experiments. Allother data represent the combined results of two ormore replicate experiments using different cell pre-parations. Cells at different days in culture were notnecessarily from the same cell preparation. All datawere tested for statistical significance across experi-ments using the multivariate analysis of variance(MANOVA) program available in the software Systat 9(SPSS, Inc.). Bonferroni t-tests were carried out to testfor differences between individual means. Differenceswere considered significant when P< 0.05.
RESULTS
Spontaneous Fluctuations in [Ca2þ]i inChromaffin Cells
The data reported here represent the analysis ofthe calcium activity of more than 1,000 chromaffin
Fig. 2. Experimentalprotocol forreal timemonitoringof [Ca2þ]i inchromaffincellsinthepresenceandabsenceof 60HzMFs.For (A)nonexposedcellsand(B) cellssubjectedtoshamexposureor fieldexposure (continuous or pulsed), the time of addition of DMPP(10 mM) and KCl (56 mM) to the cells is indicated byarrows. In (B),arrows also indicate the time that current was either turned on orturnedoffand the slopedsegmentsof the sham/exposure intervalrepresent rampingupandrampingdownof the fields.
560 Craviso et al.
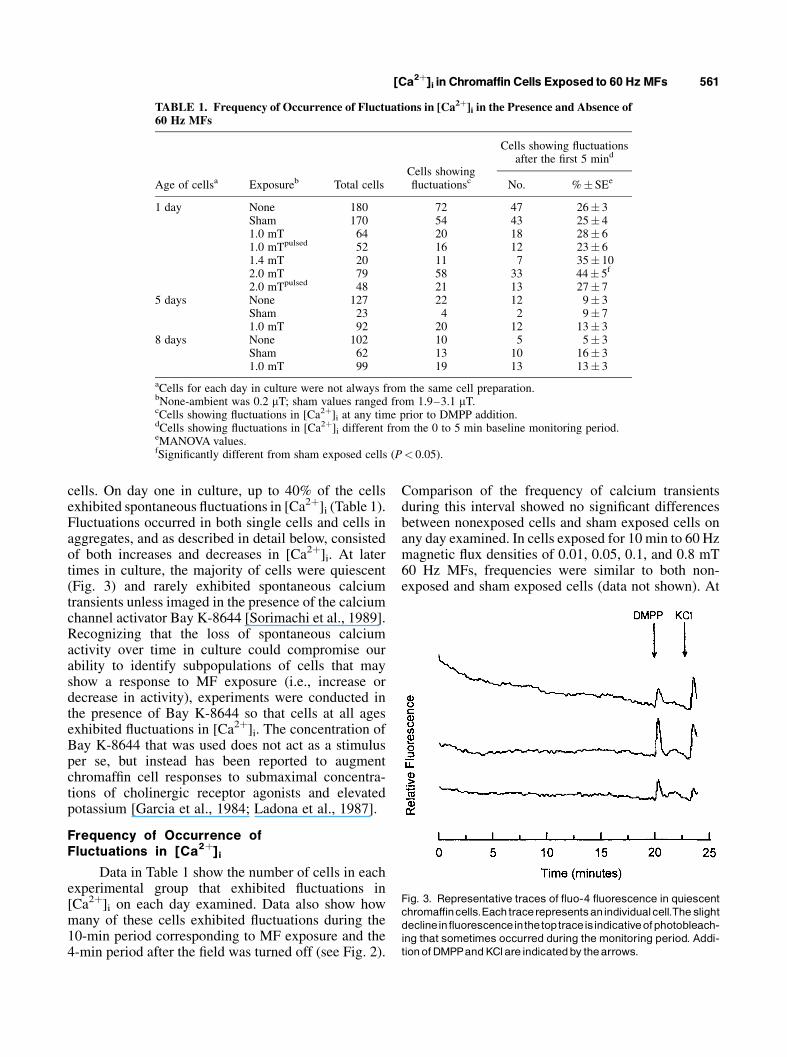
cells. On day one in culture, up to 40% of the cellsexhibited spontaneous fluctuations in [Ca2þ]i (Table 1).Fluctuations occurred in both single cells and cells inaggregates, and as described in detail below, consistedof both increases and decreases in [Ca2þ]i. At latertimes in culture, the majority of cells were quiescent(Fig. 3) and rarely exhibited spontaneous calciumtransients unless imaged in the presence of the calciumchannel activator Bay K-8644 [Sorimachi et al., 1989].Recognizing that the loss of spontaneous calciumactivity over time in culture could compromise ourability to identify subpopulations of cells that mayshow a response to MF exposure (i.e., increase ordecrease in activity), experiments were conducted inthe presence of Bay K-8644 so that cells at all agesexhibited fluctuations in [Ca2þ]i. The concentration ofBay K-8644 that was used does not act as a stimulusper se, but instead has been reported to augmentchromaffin cell responses to submaximal concentra-tions of cholinergic receptor agonists and elevatedpotassium [Garcia et al., 1984; Ladona et al., 1987].
Frequency of Occurrence ofFluctuations in [Ca2þ]i
Data in Table 1 show the number of cells in eachexperimental group that exhibited fluctuations in[Ca2þ]i on each day examined. Data also show howmany of these cells exhibited fluctuations during the10-min period corresponding to MF exposure and the4-min period after the field was turned off (see Fig. 2).
Comparison of the frequency of calcium transientsduring this interval showed no significant differencesbetween nonexposed cells and sham exposed cells onany day examined. In cells exposed for 10 min to 60 Hzmagnetic flux densities of 0.01, 0.05, 0.1, and 0.8 mT60 Hz MFs, frequencies were similar to both non-exposed and sham exposed cells (data not shown). At
TABLE 1. Frequency of Occurrence of Fluctuations in [Ca2þ]i in the Presence and Absence of60 Hz MFs
Age of cellsa Exposureb Total cellsCells showingfluctuationsc
Cells showing fluctuationsafter the first 5 mind
No. %� SEe
1 day None 180 72 47 26� 3Sham 170 54 43 25� 41.0 mT 64 20 18 28� 61.0 mTpulsed 52 16 12 23� 61.4 mT 20 11 7 35� 102.0 mT 79 58 33 44� 5f
2.0 mTpulsed 48 21 13 27� 75 days None 127 22 12 9� 3
Sham 23 4 2 9� 71.0 mT 92 20 12 13� 3
8 days None 102 10 5 5� 3Sham 62 13 10 16� 31.0 mT 99 19 13 13� 3
aCells for each day in culture were not always from the same cell preparation.bNone-ambient was 0.2 mT; sham values ranged from 1.9–3.1 mT.cCells showing fluctuations in [Ca2þ]i at any time prior to DMPP addition.dCells showing fluctuations in [Ca2þ]i different from the 0 to 5 min baseline monitoring period.eMANOVA values.fSignificantly different from sham exposed cells (P< 0.05).
Fig. 3. Representative traces of fluo-4 fluorescence in quiescentchromaffincells.Eachtracerepresentsanindividualcell.The slightdeclineinfluorescenceinthetoptraceisindicativeofphotobleach-ing that sometimes occurred during themonitoring period. Addi-tionofDMPPandKClare indicatedby thearrows.
[Ca2þ]i in Chromaffin Cells Exposed to 60 Hz MFs 561
higher magnetic flux densities of 1 and 2 mT, there wasone condition, day 1 cells exposed to a 2 mT con-tinuous MF, when calcium transients occurred moreoften compared to both nonexposed and sham exposedcells. The difference, however, was significant onlywith respect to sham exposed cells (P< 0.05).
Classification of the Types ofFluctuations in [Ca2þ]i
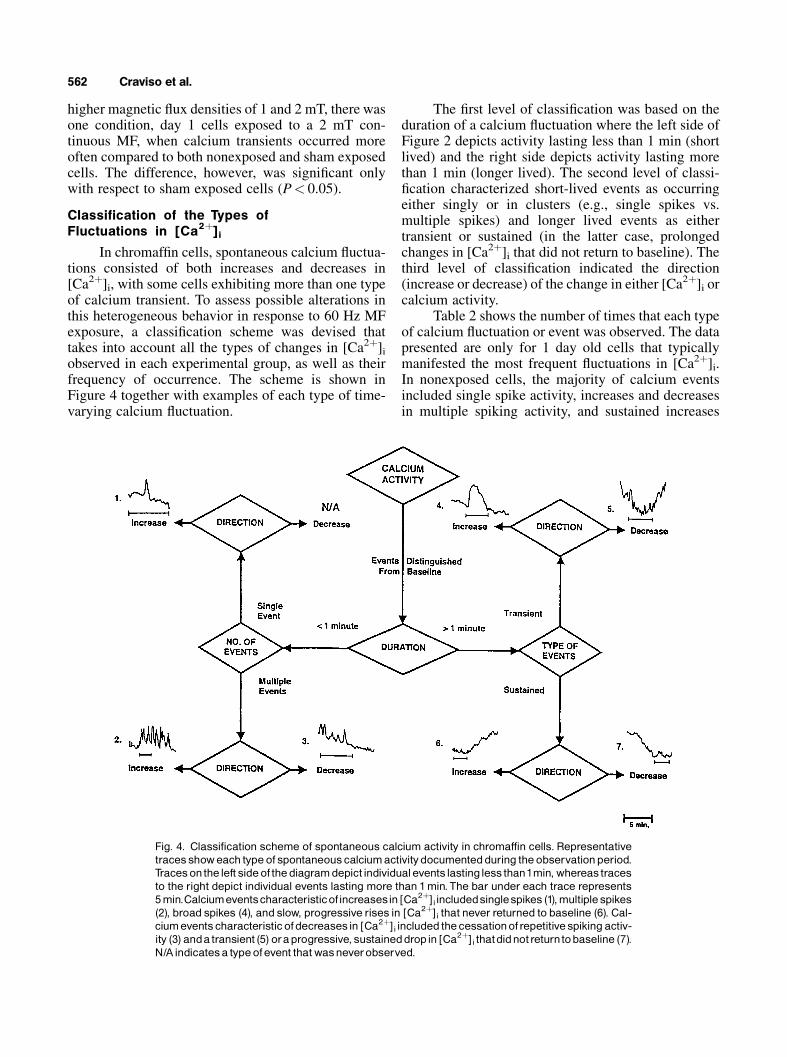
In chromaffin cells, spontaneous calcium fluctua-tions consisted of both increases and decreases in[Ca2þ]i, with some cells exhibiting more than one typeof calcium transient. To assess possible alterations inthis heterogeneous behavior in response to 60 Hz MFexposure, a classification scheme was devised thattakes into account all the types of changes in [Ca2þ]iobserved in each experimental group, as well as theirfrequency of occurrence. The scheme is shown inFigure 4 together with examples of each type of time-varying calcium fluctuation.
The first level of classification was based on theduration of a calcium fluctuation where the left side ofFigure 2 depicts activity lasting less than 1 min (shortlived) and the right side depicts activity lasting morethan 1 min (longer lived). The second level of classi-fication characterized short-lived events as occurringeither singly or in clusters (e.g., single spikes vs.multiple spikes) and longer lived events as eithertransient or sustained (in the latter case, prolongedchanges in [Ca2þ]i that did not return to baseline). Thethird level of classification indicated the direction(increase or decrease) of the change in either [Ca2þ]i orcalcium activity.
Table 2 shows the number of times that each typeof calcium fluctuation or event was observed. The datapresented are only for 1 day old cells that typicallymanifested the most frequent fluctuations in [Ca2þ]i.In nonexposed cells, the majority of calcium eventsincluded single spike activity, increases and decreasesin multiple spiking activity, and sustained increases
Fig. 4. Classification scheme of spontaneous calcium activity in chromaffin cells. Representativetracesshoweach typeof spontaneouscalciumactivitydocumentedduring theobservationperiod.Tracesonthe left sideof thediagramdepict individualeventslastinglessthan1min, whereastracesto the right depict individual events lasting more than 1min.The bar under each trace represents5min.Calciumeventscharacteristicofincreasesin [Ca2þ]iincludedsinglespikes (1),multiple spikes(2), broad spikes (4), and slow, progressive rises in [Ca2þ]i that never returned to baseline (6). Cal-ciumeventscharacteristic ofdecreasesin [Ca2þ]i included the cessationofrepetitivespikingactiv-ity (3) anda transient (5) oraprogressive, sustaineddropin [Ca2þ]i thatdidnot returntobaseline (7).N/Aindicatesa typeofevent that wasneverobserved.
562 Craviso et al.
in [Ca2þ]i. Calcium activity profiles were generallysimilar for sham exposed cells as well as for all MFexposed cells. There were no pronounced differencesamong experimental groups according to any of thethree levels of classification. Thus, 60 Hz MF exposurehad no apparent effect on the kind of spontaneouscalcium activity that the cells exhibited.
Number of Fluctuations in [Ca2þ]iIn some cells, we had noted the occurrence of two
or more distinct calcium transients during the intervalbetween the start of MF exposure and DMPP ap-plication. Data in Table 3 demonstrate that the oc-currence of multiple fluctuations in [Ca2þ]i during thisinterval was similar among experimental groups,indicating the lack of effect of 60 Hz MF exposureon how often cells exhibited more than one calciumtransient.
Time of Occurrence ofFluctuations in [Ca2þ]i
Further evaluation of 60 Hz MF effects on[Ca2þ]i included a comparison of when calcium trans-ients appeared after the 5 min baseline monitoringperiod. As shown by the data in Table 3, the occurrenceof individual calcium events during each successive5 min interval after baseline monitoring was similar fornonexposed, sham exposed, and 60 Hz MF exposedcells. Thus, 60 Hz MF exposure did not appear toaccelerate or delay the time at which cells typicallyexhibited fluctuations in [Ca2þ]i.
Waveform Characteristics of RepetitiveCalcium Spiking Activity
In cells that exhibited repetitive calcium spiking(condition 2 in Fig. 4), we determined whether 60 HzMF exposure caused a change in the frequency or
TABLE 3. Time of Occurrence of Calcium Events in the Presence and Absence of 60 HzMFs*
Exposure Totala Per cellb 5–10 minc 10–15 minc15 min toDMPPc
None 68/47 1.5 34/68 21/68 13/68Sham 52/43 1.2 2/52 15/52 15/521 mT 23/18 1.3 6/23 10/23 7/231 mTpulsed 14/12 1.2 6/14 3/14 5/141.4 mT 12/7 1.7 5/12 3/12 4/122 mT 51/33 1.6 21/51 23/51 7/512 mTpulsed 15/13 1.2 5/15 9/15 1/15
*Data from Table 1 for day 1 cells only.aTotal number of cells showing calcium events divided by the total number of calcium events.bAverage number of calcium events per cell.cNumber of calcium events at each 5 min interval after baseline monitoring divided by the totalnumber of calcium events.
TABLE 2. Occurrence of Each Type of Calcium Activity* in the Presence and Absence of60 Hz MFs
Number of eventsa
Exposure: None Sham 1 mT 1 mTpulsed 1.4 mT 2 mT 2 mTpulsed
Single spikesIncrease 13 10 4 2 1 9 3
Multiple spikesIncrease 11 5 3 4 3 8 1Decrease 16 20 6 5 3 22 9
Transient eventsIncrease 6 3 3 0 2 3 1Decrease 4 1 0 0 0 0 0
Sustained eventsIncrease 11 5 6 2 2 7 0Decrease 7 8 1 1 2 2 1
Total of all events 68 52 23 14 12 51 15
*See Figure 4 for classification.aData from Table 1 for day 1 cells only.
[Ca2þ]i in Chromaffin Cells Exposed to 60 HzMFs 563
waveform characteristics of the activity [see Galva-novskis et al., 1996, 1999]. To explore this possibility,a power spectrum analysis of spiking activity wasperformed on five cells from each experimental group,using MATLAB (version 5.3). For nonexposed andsham exposed cells, more than 90% of the powerwas located between 50 and 120 mHz. The powerspectrum of spiking in cells exposed to 1 and 2 mTMFs exhibited no significant differences compared tononexposed or sham spectra, further indicating thelack of an effect of 60 Hz MFs on intracellular calciumdynamics.
Response of Chromaffin Cells toNicotinic Receptor Stimulation
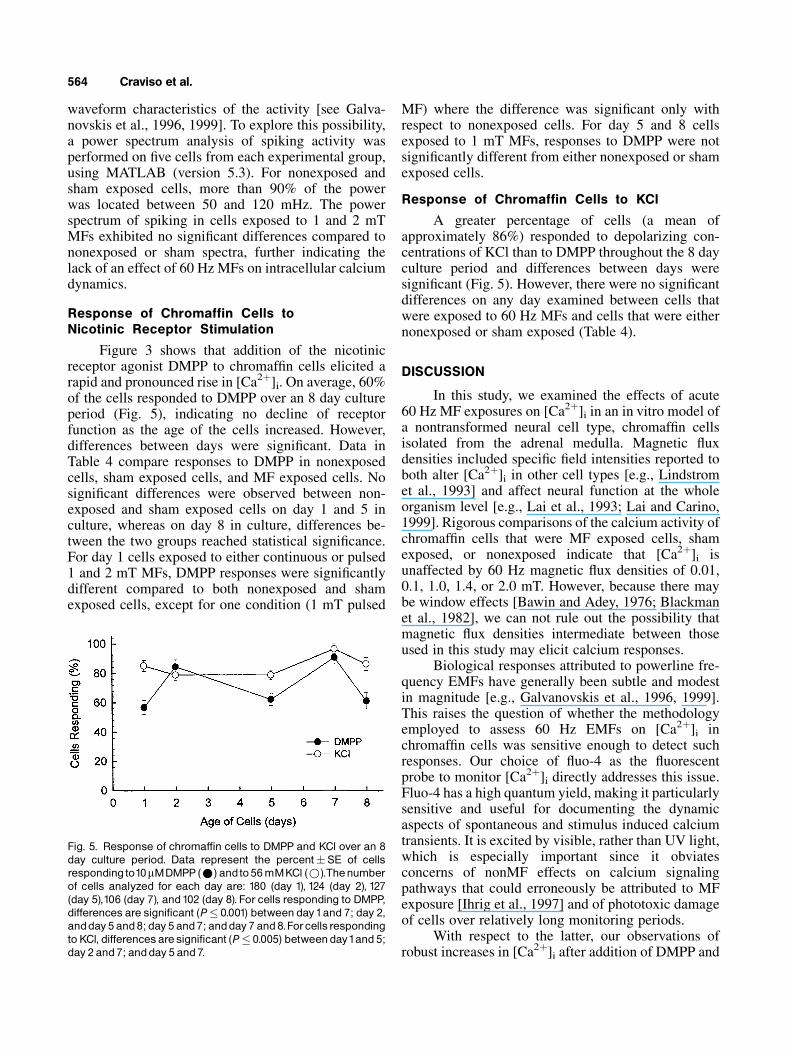
Figure 3 shows that addition of the nicotinicreceptor agonist DMPP to chromaffin cells elicited arapid and pronounced rise in [Ca2þ]i. On average, 60%of the cells responded to DMPP over an 8 day cultureperiod (Fig. 5), indicating no decline of receptorfunction as the age of the cells increased. However,differences between days were significant. Data inTable 4 compare responses to DMPP in nonexposedcells, sham exposed cells, and MF exposed cells. Nosignificant differences were observed between non-exposed and sham exposed cells on day 1 and 5 inculture, whereas on day 8 in culture, differences be-tween the two groups reached statistical significance.For day 1 cells exposed to either continuous or pulsed1 and 2 mT MFs, DMPP responses were significantlydifferent compared to both nonexposed and shamexposed cells, except for one condition (1 mT pulsed
MF) where the difference was significant only withrespect to nonexposed cells. For day 5 and 8 cellsexposed to 1 mT MFs, responses to DMPP were notsignificantly different from either nonexposed or shamexposed cells.
Response of Chromaffin Cells to KCl
A greater percentage of cells (a mean ofapproximately 86%) responded to depolarizing con-centrations of KCl than to DMPP throughout the 8 dayculture period and differences between days weresignificant (Fig. 5). However, there were no significantdifferences on any day examined between cells thatwere exposed to 60 Hz MFs and cells that were eithernonexposed or sham exposed (Table 4).
DISCUSSION
In this study, we examined the effects of acute60 Hz MF exposures on [Ca2þ]i in an in vitro model ofa nontransformed neural cell type, chromaffin cellsisolated from the adrenal medulla. Magnetic fluxdensities included specific field intensities reported toboth alter [Ca2þ]i in other cell types [e.g., Lindstromet al., 1993] and affect neural function at the wholeorganism level [e.g., Lai et al., 1993; Lai and Carino,1999]. Rigorous comparisons of the calcium activity ofchromaffin cells that were MF exposed cells, shamexposed, or nonexposed indicate that [Ca2þ]i isunaffected by 60 Hz magnetic flux densities of 0.01,0.1, 1.0, 1.4, or 2.0 mT. However, because there maybe window effects [Bawin and Adey, 1976; Blackmanet al., 1982], we can not rule out the possibility thatmagnetic flux densities intermediate between thoseused in this study may elicit calcium responses.
Biological responses attributed to powerline fre-quency EMFs have generally been subtle and modestin magnitude [e.g., Galvanovskis et al., 1996, 1999].This raises the question of whether the methodologyemployed to assess 60 Hz EMFs on [Ca2þ]i inchromaffin cells was sensitive enough to detect suchresponses. Our choice of fluo-4 as the fluorescentprobe to monitor [Ca2þ]i directly addresses this issue.Fluo-4 has a high quantum yield, making it particularlysensitive and useful for documenting the dynamicaspects of spontaneous and stimulus induced calciumtransients. It is excited by visible, rather than UV light,which is especially important since it obviatesconcerns of nonMF effects on calcium signalingpathways that could erroneously be attributed to MFexposure [Ihrig et al., 1997] and of phototoxic damageof cells over relatively long monitoring periods.
With respect to the latter, our observations ofrobust increases in [Ca2þ]i after addition of DMPP and
Fig. 5. Response of chromaffin cells to DMPP and KCl over an 8day culture period. Data represent the percent�SE of cellsrespondingto10mMDMPP(*) andto56mMKCl (*).Thenumberof cells analyzed for each day are: 180 (day 1), 124 (day 2), 127(day 5),106 (day 7), and102 (day 8). For cells responding to DMPP,differences are significant (P� 0.001) between day1and 7; day 2,andday5 and8; day 5 and7; andday 7 and8.Forcellsrespondingto KCl, differencesaresignificant (P� 0.005) betweenday1and 5;day 2 and 7; andday 5 and 7.
564 Craviso et al.
high potassium clearly indicate an unimpaired abilityof chromaffin cells to respond to external stimuli. Asan additional confirmation, preliminary experimentsestablished that two other measures of cell respon-siveness to nicotinic receptor stimulation, 45Ca2þ
influx and release of catecholamines, are unaffectedby the presence of the dye within the cells. Thus, ifchromaffin cells are sensitive to 60 Hz EMFs,alterations in [Ca2þ]i should have been observed influo-4 loaded cells unless some other condition used inthis study did not allow an effect to be manifested. Thelatter is always a possibility since seemingly trivialdetails in how MF experiments are conducted mightdetermine whether an MF effect is observed andwhether the findings can be replicated by otherlaboratories [Ihrig et al., 1997; Boorman et al., 2000].
In characterizing spontaneous fluctuations in[Ca2þ]i in chromaffin cells, we documented episodesof both quiescence and activity during a 20 minobservation period. When calcium activity occurred, ittook many different forms that included transient orsustained increases and decreases in [Ca2þ]i, as well assuppression or induction of spiking activity (oscilla-tions). Adding to the heterogeneity of spontaneouscalcium activity were differences pertaining to whencalcium fluctuations occurred during the observationperiod as well as the number of calcium fluctuationsthat individual cells exhibited. In the latter case, morethan one type of calcium fluctuation was sometimesobserved. Thus, it was against a high background levelof heterogeneous calcium activity that the effects ofMF exposure were gauged.
Some investigators circumvent this problem bypreselecting cells on the basis of one particular type ofcalcium activity. For example, Lindstrom et al. [1993,1995] used only quiescent cells in their analysis of50 Hz EMF effects on [Ca2þ]i in Jurkat cells, whereasGalvanovskis et al. [1996, 1999] restricted theiranalysis of EMF effects to Jurkat cells that had beenforced into spiking activity. Whether this experimentalstrategy provides a more reliable way of detectingpowerline frequency EMF effects on [Ca2þ]i is open tospeculation since attempts by different laboratories toreplicate the findings of EMF-stimulated alterations in[Ca2þ]i in Jurkat cells have been unsuccessful [Lyleet al., 1997; Wey et al., 2000].
In the present study, only day 1 cells exposed to a2 mT continuous MF show an apparent increase influctuations in [Ca2þ]i. However, we do not feel thatthe data provide convincing evidence of an effect dueto MF exposure. First, the apparent increase in calciumactivity was statistically significant only with respectto sham exposed cells (P< 0.05) and not nonexposedcells. Second, the total number of cells exhibitingalterations in [Ca2þ]i during baseline monitoring was,for an unexplained reason, much greater in this par-ticular experimental group. Thus, the apparent increasein the number of cells exhibiting calcium events duringthe exposure period is likely a consequence of theincreased calcium activity of the cells overall ratherthan a consequence of MF exposure. Not adequatelytaking details such as these into consideration, togetherwith less rigorous analyses of spontaneous changes incalcium due to shorter exposure periods and smaller
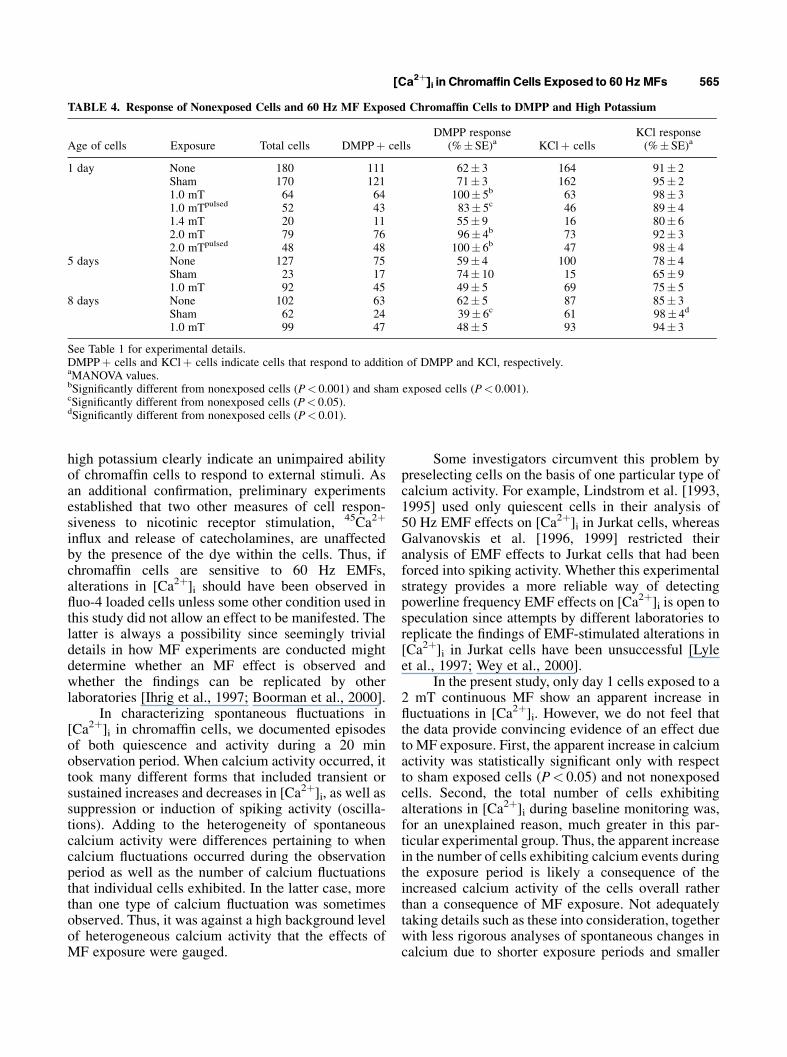
TABLE 4. Response of Nonexposed Cells and 60 Hz MF Exposed Chromaffin Cells to DMPP and High Potassium
Age of cells Exposure Total cells DMPPþ cellsDMPP response
(%� SE)a KClþ cellsKCl response(%� SE)a
1 day None 180 111 62� 3 164 91� 2Sham 170 121 71� 3 162 95� 21.0 mT 64 64 100� 5b 63 98� 31.0 mTpulsed 52 43 83� 5c 46 89� 41.4 mT 20 11 55� 9 16 80� 62.0 mT 79 76 96� 4b 73 92� 32.0 mTpulsed 48 48 100� 6b 47 98� 4
5 days None 127 75 59� 4 100 78� 4Sham 23 17 74� 10 15 65� 91.0 mT 92 45 49� 5 69 75� 5
8 days None 102 63 62� 5 87 85� 3Sham 62 24 39� 6c 61 98� 4d
1.0 mT 99 47 48� 5 93 94� 3
See Table 1 for experimental details.DMPPþ cells and KClþ cells indicate cells that respond to addition of DMPP and KCl, respectively.aMANOVA values.bSignificantly different from nonexposed cells (P< 0.001) and sham exposed cells (P< 0.001).cSignificantly different from nonexposed cells (P< 0.05).dSignificantly different from nonexposed cells (P< 0.01).
[Ca2þ]i in Chromaffin Cells Exposed to 60 HzMFs 565
sample sizes, may have been factors that contributed topreliminary reports from our laboratory indicatingapparent increases in [Ca2þ]i in chromaffin cellsduring exposure to 0.8, 1.0, and 1.2 mT MFs [Cravisoet al., 1998, 1999].
Our data showing an apparent increased respon-siveness of day 1 cells to nicotinic receptor agoniststimulation after exposure to 1 or 2 mT MFs couldmean that 60 Hz EMFs are capable of altering chromaf-fin cell plasma membrane receptors or properties ofthe membrane that are crucial for agonist receptorinteractions. That the apparent increase in responsive-ness to DMPP was observed only for cells early inculture could further imply that there is a critical timein which plasma membrane components are sensitiveto 60 Hz EMFs. These are intriguing possibilities,especially in view of reports of powerline frequencyEMF effects not only on extracellular receptors, suchas b-adrenergic receptors [Luben, 1993] and serotonin5-HT-1B receptors [Massot et al., 2000], but also onmembrane fluidity [Santoro et al., 1997]. However, weare reluctant to say at this time that a true MF effectexists in our case since cells exposed to a 1.4 mT MFdid not show a greater responsiveness to DMPPcompared to either nonexposed or sham exposed cells.Also, there was sufficient variability in cell respon-siveness to DMPP from day to day that drawing validconclusions about EMF effects on nicotinic receptorson day 1 cells is not prudent. Obviously, additionalstudies using different methodologies to assess 60 HzEMF effects on nicotinic receptor function in chro-maffin cells will be needed to resolve this issue. Suchstudies are currently underway in our laboratory[Craviso et al., 2000].
ACKNOWLEDGMENTS
The authors thank Lyn Davis for constructing theHelmholtz coils and plastic microscope stage, DanaMcPherson and Noha Hassan for technical assistancein automating the exposure system, and Dr. SitadriBagchi for help with the statistical analysis of the data.We also thank WL Associates and members of theRAPID project review team (Frederick Dietrich, JohnLaskey and William Wisecup) for helpful suggestionsregarding our experimental protocol.
REFERENCES
Barbier E, Dufy B, Veyret B. 1996. Stimulation of Ca2þ influx inrat pituitary cells under exposure to a 50 Hz magnetic field.Bioelectromagnetics 17:303–311.
Bawin SM, Adey WR. 1976. Sensitivity of calcium bindingin cerebral tissue to weak environmental electric fields
oscillating at low frequency. Proc Natl Acad Sci USA73:1999–2003.
Berridge M, Lipp P, Bootman M. 1999. Calcium signaling. CurrentBiol 9:R157–R159.
Blackman CF, Benane SG, Kinney LS, Joines WT, House DE.1982. Effects of ELF fields on calcium-ion efflux. RadiatRes 92:510–520.
Boorman GA, Owen RD, Lotz WG, Galvin MJ Jr. 2000. Evalua-tion of in vitro effects of 50 and 60 Hz magnetic fields inregional EMF exposure facilities. Radiat Res 153:648–657.
Craviso GL, Lundback SS, Chatterjee I, Publicover NG. 1998.Fluorescence imaging of intracellular calcium levels inprimary cultures of adrenal chromaffin cells during exposureto 60 Hz EMFs. Proceedings of the 20th Annual Bioelectro-magnetics Society Meeting, St. Pete Beach, FL: 196 p.
Craviso GL, Poss J, Lanctot C, Lundback SS, Chatterjee I,Publicover NG. 1999. Intracellular calcium levels in pri-mary cultures of adrenal chromaffin cells exposed to 60 HzEMFs: influence of culture conditions and cell responsive-ness to DMPP. Proceedings of the 21st Annual Bio-electromagnetics Society Meeting, Long Beach, CA: 107 p.
Craviso GL, Schmidt J, Chatterjee I, Publicover NG. 2000.Measurement of catecholamine release from culturedbovine adrenal medullary chromaffin cells exposed to60 Hz EMFs. Proceedings of the 22nd Annual Bioelec-tromagnetics Society Meeting, Munich, Germany: 172 p.
Galvanovskis J, Sandblom J, Bergqvist B, Galt S, Hamnerius Y.1996. The influence of 50-Hz magnetic fields on cytoplas-mic Ca2þ oscillations in human leukemia T-cells. Sci TotalEnviron 180:19–33.
Galvanovskis J, Sandblom J, Bergqvist B, Galt S, Hamnerius Y.1999. Cytoplasmic Ca2þ oscillations in human leukemia T-cells are reduced by 50 Hz magnetic fields. Bioelectromag-netics 20:269–276.
Garcia AG, Sala F, Reig JA, Viniegra S, Frias J, Fonteriz R, GandiaL. 1984. Dihydropyridine BAY-K-8644 activates chromaffincell calcium channels. Nature 309:69–71.
Ihrig I, Heese C, Glaser R. 1997. Alterations of intracellularcalcium concentration in mice neuroblastoma cells byelectrical field and UVA. Bioelectromagnetics 18:595–597.
Kato M, Honma K-I, Shigemitsu T, Shiga Y. 1993. Effects ofexposure to a circularly polarized 50-Hz magnetic field onplasma and pineal melatonin levels in rats. Bioelectromag-netics 14:97–106.
Ladona MG, Aunis D, Gandia L, Garcia AG. 1987. Dihyropyridinemodulation of the chromaffin cell secretory response. JNeurochem 48:483–490.
Lai H, Carino MA. 1999. 60 Hz magnetic fields and centralcholinergic activity: effects of exposure intensity andduration. Bioelectromagnetics 20:284–289.
Lai H, Carino MA, Horita A, Guy AW. 1993. Effects of a 60 Hzmagnetic field on central cholinergic systems of the rat.Bioelectromagnetics 14:5–15.
Lindstrom E, Lindstrom P, Berglund A, Mild KH, Lundgren E.1993. Intracellular calcium oscillations induced in a T-cellline by a weak 50 Hz magnetic field. J Cell Physiol 156:395–398.
Lindstrom E, Lindstrom P, Berglund A, Lundgren E, Mild HK.1995. Intracellular calcium oscillations in a T-cell line afterexposure to extremely-low-frequency magnetic fields withvariable frequencies and flux densities. Bioelectromagnetics16:41–47.
Lopez MG, Artalejo AR, Garcia AG, Neher E, Garcia-Sancho J.1995. Veratridine-induced oscillations of cytosolic calcium
566 Craviso et al.
andmembrane potential in bovine chromaffin cells. J Physiol482.1:15–27.
Luben RA. 1993. Effects of low-energy electromagnetic fields(EMF) on signal transduction by g protein-linked receptors.In: Blank M, editor: Electricity and magnetism in biologyand medicine. San Francisco: San Francisco Press, Inc.,pp 57–62.
Lyle DB, Fuchs TA, Casamento JP, Davis CC, Swicord ML. 1997.Intracellular calcium signaling by Jurkat T-lymphocytesexposed to a 60 Hz magnetic field. Bioelectromagnetics 18:439–445.
Massot O, Grimaldi B, Bailly J-M, Kochanek M, Deschamps F,Lambrozo J, Fillion G. 2000. Magnetic field desensitizes 5-HT1B receptor in brain; pharmacological and functionalstudies. Brain Res 858:143–150.
O’Sullivan AJ, Cheek TR, Moreton RB, Berridge MJ, BurgoyneRD. 1989. Localization and heterogeneity of agonist-induced changes in cytosolic calcium concentration insingle bovine adrenal chromaffin cells from video imagingof fura-2. EMBO J 8:401–411.
Paneth N. 1993. Neurobehavioral effects of power-frequencyelectromagnetic fields. Environ Health Perspect 101(Suppl 4):101–106.
Poole C, Kavet R, Funch DP, Donelan K, Charry JM, Dreyer NA.1993. Depressive symptoms and headaches in relation toproximity of residence to an alternating-current transmis-sion line. Am J Epidemiol 137:318–330.
Publicover NG, Smith TK, Stevens RJ. 1999a. Fluorescenceimaging of the propagation of excitability in gastrointestinalmuscles. Proceedings of Biomedical Imaging: Receptors,dyes, and instrumentation. Soc Photo-Optical Instrumenta-tion Engineers 3600:42–50.
Publicover NG, Marsh CG, Vincze CA, Craviso GL, Chatterjee I.1999b. Effects of microscope objectives on magnetic fieldexposures. Bioelectromagnetics 20:387–395.
Saadat S, Stehle AD, Lamouroux A, Mallet J, Thoenen H. 1987.Influence of cell–cell contact on levels of tyrosinehydroxylase in cultured bovine adrenal chromaffin cells.J Biol Chem 262:13007–13014.
Santoro N, Lisi A, Pozzi D, Pasquali E, Serafino A, Grimaldi S.1997. Effect of extremely low frequency (ELF) magneticfield exposure on morphological and biophysical propertiesof human lymphoid cell line (Raji). Biochim Biophys Acta1357:281–290.
Sorimachi M, Yamagami K, Yada T, Nishimura S. 1989.Spontaneous and secretagogue-induced changes in cytosolicfree Ca concentration measured by microfluorimetry withfura-2 on single bovine adrenal chromaffin cells. Jpn JPhysiol 39:687–701.
Valberg PA. 1995. Designing EMF experiments: what is requiredto characterize ‘‘exposure.’’ Bioelectromagnetics 16:396–401.
Walleczek J, Liburdy RP. 1990. Nonthermal 60 Hz sinusoidalmagnetic-field exposure enhances 45Ca2þ uptake in ratthymocytes: dependence on mitogen activation. FEBS Lett271:157–160.
Waymire JC, Bennett WF, Boehme R, Hankins L, Gilmer-WaymireK, Haycock JW. 1983. Bovine adrenal chromaffin cells:high-yield purification and viability in suspension culture.J Neurosci Methods 7:329–351.
Wey HE, Conover DP, Mathias P, Toraason M, Lotz WG. 2000.50-Hz magnetic field and calcium transients in Jurkat cells:results of a research and public information dissemination(RAPID) program study. Environ Health Perspect 108:135–140.
Wilson BW, Caputa K, Stuchly MA, Saffer JD, Davis KC,Washam CE, Washam LA, Washam AR, Wilson MA.1994. Design and fabrication of well confined uniformmagnetic field exposure systems. Bioelectromagnetics 15:563–577.
[Ca2þ]i in Chromaffin Cells Exposed to 60 Hz MFs 567