aplikasi penyewaan alat pesta pernikahan wedding organizer ...
Virchows Archiv B Cell Pathol (1992) 62:303-309 V/rchows Arch& B Cell Pathology Including Molecular Pathology �9 Springer-Verlag 1992
Interphasic nucleolar organizer regions expression and cell kinetics evaluation during gastric carcinogenesis induced by nitrosoguanidine in the rat L. Scucchi 1, G. Silecchia 2, D. Di Stefano 1, E. Spaziani 2, L. Polimeno 3, A. Materia 2, P.L. Mingazzini 1, N. Basso z, and V. Marinozzi 1
1 Department of Human Biopathology, University "La Sapienza", Rome, Italy z II Surgical Clinic, University "La Sapienza", Rome, Italy 3 Department of Gastroenterology, University of Bari, Italy
Received September 15, 1991 / Accepted June 19, 1992
Summary. An increased number of interphasic nucleolar organizer regions containing ribosomal cistrons asso- ciated with argyrophilic proteins (AgNORs) has been described in human malignant tumor cells. In this study variations in AgNOR numbers have been compared with changes of cell kinetics, evaluated by the mitotic count (MC) and bromodeoxyuridine labeling index (BrdU LI), during gastric carcinogenesis induced with N-methyl-N'-nitro-N-nitrosoguanidine (NG) in rats. Significant differences (2P<0.005) in AgNOR mean numbers, evaluated in the antral isthmic cells, in MC mean values and BrdU LI, evaluated in the whole antral cellular population, were found when comparing areas of acute gastritis, atrophy and hyperplasia in NG-treated rats with the normal mucosa in controls.
No differences were observed in MC and BrdU LI between normal antrum and carcinoma cells which showed an AgNORs mean number lower than in the isthmic cells of controls (2P< 0.005). Moreover, signifi- cant correlations were found comparing changes in Ag- NOR numbers with MC (r=0.89, P<0.001) and BrdU LI (r = 0.66, P < 0.001) in different lesions.
These data show that evaluation of AgNOR numbers does not allow the identification of malignant cells in NG-induced gastric carcinoma. However AgNOR quan- tification seems to be a reliable index of cell kinetics and related well with the cellular dividing fraction.
Key words: Experimental carcinogenesis - Rat stomach- N-methyl-N'nitro-N-nitrosoguanidine (NG) - Nucleolar organizer regions (AgNORs)
Introduction
Metaphase nucleolar organizer regions (NORs) are the sites of 18 S and 28 S ribosomal RNA genes in man and
Correspondence to: L. Scucchi, Dipartimento di Biopatologia Umana, Patologia Ultrastrutturale, Viale Regina Elena 324, 1-00161, Roma, Italy
in several mammalian species (Henderson et al. 1972; Hsu et al. 1975).
Their interphase counterpart is represented by the nucleolar fibrillar centers and the fibrillar dense ribonu- cleic component (Hernandez-Verdun 1986; Hernandez- Verdun et al. 1978; Daskal et al. 1980; Goessens 1984). These structures are identified by their argyrophilic asso- ciated proteins (AgNORs) (Goodpasture and Bloom 1975; Howell et al. 1975) and have been called interphas- ic NORs (Derenzini et al. 1988). The specificity of this reaction has been confirmed by RNA hybridization stu- dies (Warburton and Henderson 1979). The number and distribution pattern of AgNORs can be easily detected by light microscopy in paraffin-embedded samples stained for AgNOR proteins according to the method of Ploton et al. (1986).
By light microscopy, interphasic NORs appear as silver-stained dots. This method has recently been ap- plied in histopathology and seems useful for detecting malignant cells which are characterized by a higher number, smaller size and irregular distribution of NORs when compared with normal or hyperplastic cells (Crocker 1990).
The increased number of interphasic NORs in cancer cells has been attributed to polyploidy, increased ribo- somal transcriptional activity and/or continuous prolif- erative activity (Goessens 1984; Hernandez-Verdun 1986; Derenzini et al. 1989; Di Stefano et al. 1991).
The carcinogenic effect of N-methyl-N'-nitro-N-ni- trosoguanidine (NG) on the glandular stomach of rats is well known and detailed histologic changes from atrophic gastritis to adenocarcinoma through hyperplas- tic or dysplastic lesions have been described (Kobory et al. 1977; Kunze et al. 1979).
The purpose of this study was to investigate the sig- nificance of the AgNOR enumeration as a discriminant for malignancy employing an experimental model which allows the evaluation of AgNORs modifications in the sequential phases of gastric carcinogenesis induced by NG in the rat.
304
In the same samples M and S-phases were assessed respectively by per forming mitot ic counts (MC) and de- te rmin ing the Bromodeoxyur id ine labeling index (BrdU LI) to correlate directly the A g N O R counts with prolif- erative activity.
Materials and methods
Sixty male, 6 weeks old, Sprague-Dawley outbred rats (Charles River, Como, Italy), weighting 200-250 g, were used. All the rats were housed in individual cages with wide wire bottoms to prevent coprophagia and they were kept in an air-conditioned room at 18 ~ C with 12 h-12 h light-dark cycles and free access to food and water. The carcinogen 1-Methyl-3-Nitro-l-Nitrosoguanidine (N N' N) 97% (NG) was purchased from Aldrich Chemical Company Inc., Steinheim, Germany. Every week NG was dissolved in tap water at the concentration of 1 mg/ml and stored in a cool dark place. The stock solution was used at a dilution of 120 mg/1 in tap water and given in dark bottles to avoid light denaturation.
The treated group (36 rats) received NG solution (120 mg/1) and the controls (24 rats) tap water only. Body weight was evalu- ated every week. Four rats from each group were sacrificed after 1, 4, 12, 30, 40 weeks of treatment and the remaining at the end of the experiment (52 weeks).
At 3 h before sacrifice performed by ether overdose, the rats were given a subcutaneous injection of bromodeoxyuridine (BrdU) (50 mg/Kg body weight).
At autopsy the stomach was removed, opened along the greater curvature, rinsed with physiologic saline and pinned flat on a cork board with the mucosal surface facing upward for gross examina- tion. Also the liver and the fibroadipose tissues from the lesser and greater curvatures were removed to search for possible metas- tases. The organs were fixed for 24 h in a 10% neutral formalin solution for histologic examination. The fixed stomach was cut into 3-mm-wide, longitudinal strips to the lesser curvature. Tissues were routinely processed, paraffin-embedded, cut into 3-micron- thick sections and stained with haematoxylin-eosin. Variations in the mean thickness of the antral mucosa were measured by means of an image analyzer system (Videoplan, Kontron, Munchen, FRG).
The gastric lesions were classified according to the criteria sug- gested by Saito et al. (1970). Specimens clearly representative of their respective pathological type were selected and stained for AgNORs and immunohistochemically with anti-BrdU monoclonal antibodies.
Ag-nor staining technique. Sections (3 I-tm thick) were dewaxed by successive baths in xylene and ethanol, post-fixed in 3:1 ethanol/ acetic acid solution at 4 ~ C for 30 min and then rehydrated through descending ethanol concentrations. For silver staining, two solu- tions were prepared: the first consisted of 2% (w/v) gelatin in 1% formic acid and, the second of 50% (w/v) silver nitrate in water. These solutions were then mixed, 1:2 volumes, to give the final working solution that was poured over the tissue sections and left for 15 min at room temperature in a dark place. The silver colloid was then washed off with distiffed water. The sections were immersed in a 5% (w/v) thiosulphate solution for 2 rain and finally rinsed in water, dehydrated to xylene and mounted. NORs were visualized as distinct black intranuclear dots. A short incuba- tion time in the silver solution (15 min) was used in order to avoid overstaining, which may cause coalescence of dots and/or non- specific reactivity of the whole nucleolus, as recently pointed out by Rfischoff et al. (1990).
Immunohistochemical study of S-phase cells by anti-BrdU monoclon- al antibody. Sections (4 ~tm thick) were rehydrated through succes- sive baths in xylene and alcohols, incubated for 30 min in 2N hydrochloric acid, neutralized with 0.1 mol/l of sodium borate and rinsed with phosphate-buffered saline (PBS). Slides were then incu-
bated with normal rabbit serum for 20 min, and with mouse anti- body anti-bromodeoxyuridine (DAKOpatts, Glostrup, Denmark) at a 1:20 dilution overnight at 4 ~ C, washed in PBS, incubated with a biotinylated rabbit anti-mouse diluted 1:200 for 30 min and, after washing in PBS, with the Avidin-Biotin Peroxidase Com- plex (ABC) at pH 9.4 for 45 min. After washing in PBS the sections were stained with aminoethyl carbisol substrate for 20 min, coun- terstained with 1% Mayer's haemalum for 3 rain and mounted in glycerol gelatin. Nuclear staining was observed in BrdU-positive cells.
Evaluation of M-phase cells by mitotic count. In this study the mitot- ic count (mean number of mitoses per 1000 antral epithelial cells) was preferred to the mitotic index because of the uneven distribu- tion of cells in the different lesions (edema in gastritis, stromal fibrosis in atrophy, cellular crowding in hyperplasia, diffuse pattern of growth, desmoplastic response and/or cystic ectasia of glands in carcinoma). This method of evaluating M-phase cells performed on routinely stained H&E sections provides a more reliable index of proliferative activity and a better correlation with BrdU LI.
Counting procedure. Only selected samples pertinent to the 16 con- trols and 25 NG-treated rats were examined for statistical pur- poses.
Specimens showing acute gastritis were obtained from the four rats killed at 1 week and showing mucosal atrophy specimens from the four rats killed at 30 weeks. Among the 15 rats killed between 40 and 52 weeks, specimens showing mucosal hyperplasia were ob- tained from four rats which had no evidence of neoplasia while specimens from all seven rats with invasive carcinoma (killed at 52 weeks) were studied. Samples of normal gastric mucosa ob- tained from 12 control rats killed at 1, 30, 40 and 52 weeks were selected. In addition, samples of normal mucosa from four controls were examined and compared with samples of normal-appearing gastric mucosa from six NG-treated rats sacrificed at 4, 12 and 52 weeks (Table 2) in order to assess whether the administration of NG "per se" might modify the parameters evaluated (Ohgaki et al. 1989).
All the slides were examined blind. In each non-neoplastic sample the evaluation of AgNOR numbers was performed in 100 epithelial cell nuclei respectively counted in the isthmic (regenerative), in the glandular and in the foveolar zones, using a 100x oil-immersion lens. In each invasive carcinoma 100 neoplastic nuclei, randomly selected, were also analyzed (Table 2). By light microscopy continu- ous focusing allowed a good resolution of dots lying in different planes. Nuclei containing clumps where the dots could not be easily resolved were not considered.
The counts of mitoses and anti-BrdU labeled nuclei were per- formed in serial sections obtained from the same blocks. In both cases 300 cells were counted in each of ten 40x power fields to determine the mean number of mitoses per 1000 cells and the aver- age S-phase fraction, which was expressed as a percentage (BrdU LI). In non-neoplastic samples, the counts were performed on lon- gitudinal sections of the whole pit columns (both sides, from the bottom of the glands to the luminal surface of the foveolar epitheli- um).
Table I
Lesions observed within 30 weeks (16 rats)
Erosion 10 (62.5%) Regenerative hyperplasia 5 (31.2%) Gastritis 11 (68.7%) Atrophy 4 (25%)
Lesions observed after 30 weeks (l 5 rats)
Invasive carcinoma 7 (46.6%) Hyperplasia 14 (93.3%) Erosion 4 (26.6%)
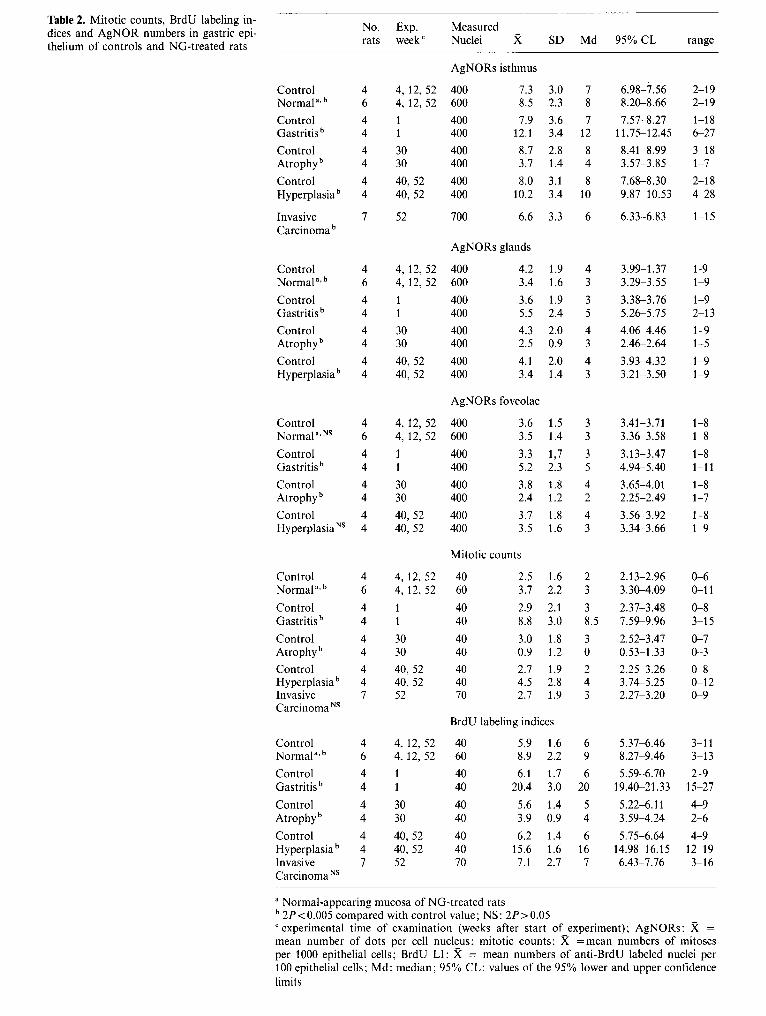
Table 2. Mitotic counts, BrdU labeling in- dices and AgNOR numbers in gastric epi- thelium of controls and NG-treated rats
Control Normala, b
Control Gastritis b
Control Atrophy b
Control Hyperplasia b
Invasive Carcinoma b
Control Normal ~' b
Control Gastritis b
Control Atrophy b
Control Hyperplasia b
No. Exp. Measured rats week c Nuclei X SD Md 95% CL range
AgNORs isthmus
4 4, 12, 52 400 7.3 3.0 7 6.98-:7.56 2-19 6 4, 12, 52 600 8.5 2.3 8 8.20-8.66 2-19
4 1 400 7.9 3.6 7 7.57-8.27 1-18 4 1 400 12.1 3.4 12 11.75-12.45 6-27
4 30 400 8.7 2.8 8 8.41-8.99 3-18 4 30 400 3.7 1.4 4 3.57-3.85 1-7
4 40, 52 400 8.0 3.1 8 7.68-8.30 2-18 4 40, 52 400 10.2 3.4 10 9.87-10.53 4-28
7 52 700 6.6 3.3 6 6.33-6.83 1-15
AgNORs glands
4 4, 12, 52 400 4.2 1.9 4 3.99-1.37 1-9 6 4, 12, 52 600 3.4 1.6 3 3.29-3.55 1-9
4 1 400 3.6 1.9 3 3.38-3.76 1-9 4 1 400 5.5 2.4 5 5.26-5.75 2-13
4 30 400 4.3 2.0 4 4.06-4.46 1-9 4 30 400 2.5 0.9 3 2.46-2.64 1-5
4 40, 52 400 4.1 2.0 4 3.93-4.32 1-9 4 40, 52 400 3.4 1.4 3 3.21-3.50 1-9
Control Normal a, NS
Control Gastritis b
Control Atrophy b
Control Hyperplasia NS
AgNORs foveolae
4 4, 12, 52 400 3.6 1.5 3 3.41-3.71 1-8 6 4, 12, 52 600 3.5 1.4 3 3.36-3.58 1-8
4 1 400 3.3 1,7 3 3.13-3.47 1-8 4 1 400 5.2 2.3 5 4.94-5.40 1-11
4 30 400 3.8 1.8 4 3.65-4.01 1-8 4 30 400 2.4 1.2 2 2.25-2.49 1-7
4 40, 52 400 3.7 1.8 4 3.56-3.92 1-8 4 40, 52 400 3.5 1.6 3 3.34-3.66 1-9
Control Normala'b
Control Gastritis b
Control Atrophy b
Control Hyperplasia b Invasive Carcinoma NS
Mitotic counts
4 4, 12, 52 40 2.5 1.6 2 2.13-2.96 0-6 6 4, 12, 52 60 3.7 2.2 3 3.30-4.09 0-11
4 1 40 2.9 2.1 3 2.37-3.48 0-8 4 1 40 8.8 3.0 8.5 7.59-9.96 3-15
4 30 40 3.0 1.8 3 2.52-3.47 0-7 4 30 40 0.9 1.2 0 0.53-1.33 0-3
4 40, 52 40 2.7 1.9 2 2.25-3.26 0-8 4 40, 52 40 4.5 2.8 4 3.74-5.25 0-12 7 52 70 2.7 1.9 3 2.27-3.20 0-9
BrdU labeling indices
4 4, 12, 52 40 5.9 1.6 6 5.37-6.46 3-11 6 4, 12, 52 60 8.9 2.2 9 8.27-9.46 3-13
4 1 40 6.1 1.7 6 5.59-6.70 2-9 4 1 40 20.4 3.0 20 19.40-21.33 15-27
4 30 40 5.6 1.4 5 5.22-6.11 4-9 4 30 40 3.9 0.9 4 3.59-4.24 2-6
4 40, 52 40 6.2 1.4 6 5.75-6.64 4-9 4 40, 52 40 15.6 1.6 16 14.98-16.15 12-19 7 52 70 7.1 2.7 7 6.43-7.76 3-16
Control Normal a, b
Control Gastritis b
Control Atrophy b
Control Hyperplasia b Invasive Carcinoma Ns
"Normal-appearing mucosa of NG-treated rats b 2 P < 0.005 compared with control value; NS: 2 P > 0.05 c experimental time of examination (weeks after start of experiment); AgNORs: ,X = mean number of dots per cell nucleus; mitotic counts: Y( = m e a n numbers of mitoses per 1000 epithelial cells; BrdU LI: Y( = mean numbers of anti-BrdU labeled nuclei per 100 epithelial cells; Md: median; 95% CL: values of the 95% lower and upper confidence limits
306
Statistical analysis. The Mann-Whitney test (two tailed) was used to compare AgNOR numbers (obtained in the isthmus, glands and foveolae), MC data and BrdU LI, evaluated in the different lesions, with the corresponding values in the respective controls. The correlation analysis of the M-phase and S-phase numbers with the AgNOR counts obtained during the different steps of the exper- iment was performed applying the rank correlation procedure of Spearman. Only the AgNOR numbers counted in the isthmic (re- generative) zones of non-neoplastic samples and in carcinoma nu- clei were used for this analysis.
Results
No lesions were observed in control rats in which MC and AgNORs mean number per nucleus did not show significant modifications through the experiment. The antral mucosa mean thickness was 232 ~tm.
Five rats of the NG group, died from gastric bleeding between the 34th and 40th week, and could not be exam- ined histologically because of gastric autolysis.
The mean body-weight increase was similar in NG- treated and in control rats.
Histopathology of gastric mucosa in NG-treated rats
During the first 30 weeks the lesions were mainly reac- tive in nature (Table 1). Multiple shallow and deep fresh erosions were found in the fundic region and antrum in ten of the 16 rats sacrificed at this period. Fresh and healed erosions were frequently observed simultaneously in the antrum and fundic mucosa until the end of the experiment.
Chronic active gastritis was seen in the antral mucosa away from the erosions at 1 and 4 weeks. No inflamma- tory changes were observed in the fundic mucosa. By the 30th week gastritis had subsided and a marked antral mucosal atrophy (mean thickness 156 txm) was observed in all NG-treated rats.
In the following periods proliferative lesions devel- oped in the antral mucosa and these lesions were de- tected in all specimens studied histologically. By the 40th week the mucosa of the antral area showed marked hyperplasia with widening of the proliferative zone in both apical and basal direction (mean thickness 498 ~tm). At 52 weeks seven of the 11 remaining rats had devel-
<
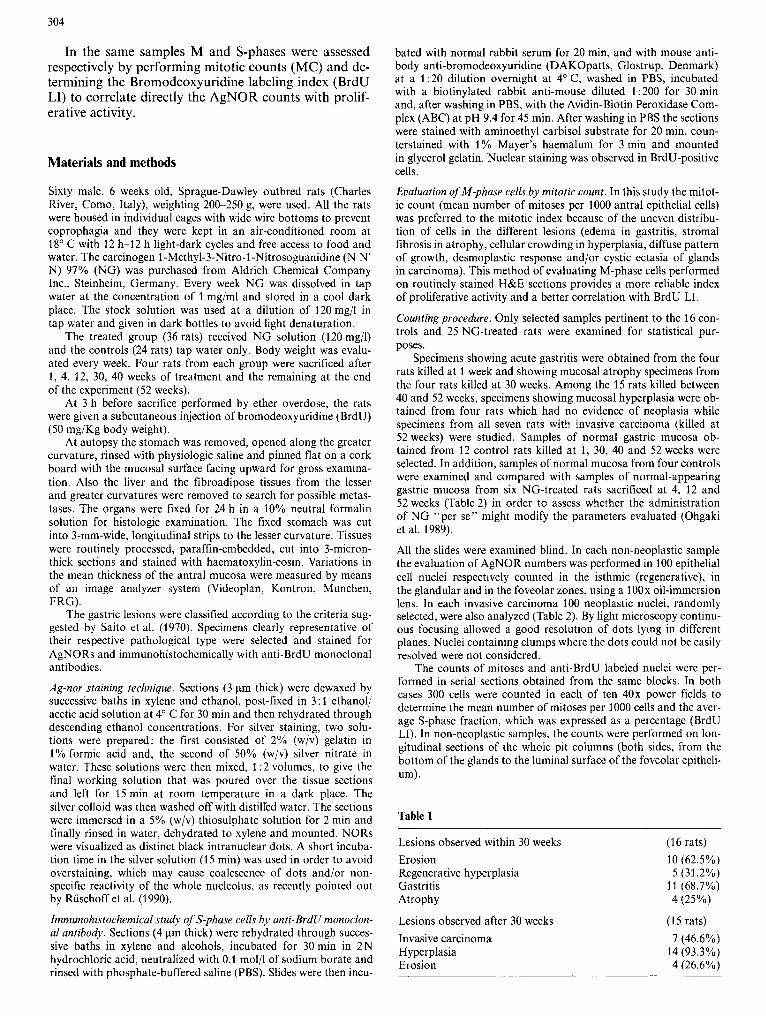
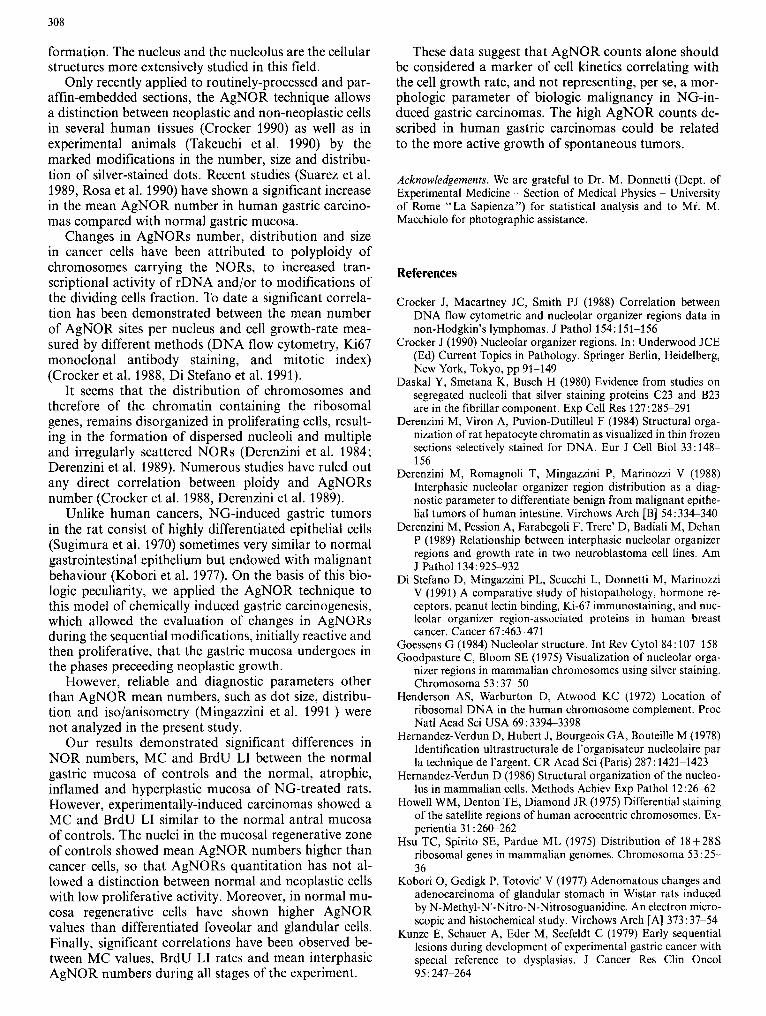
Fig. 1. AgNORs distribution in the antral mucosa of controls; the number of silver stained dots is greater in isthmic cells (arrowheads) compared with foveolar or glandular epithelium (arrows)
Fig. 2. Atrophic mucosa: a mucosa appears thin. b The reduction in black dot numbers in the whole pit columns is evident
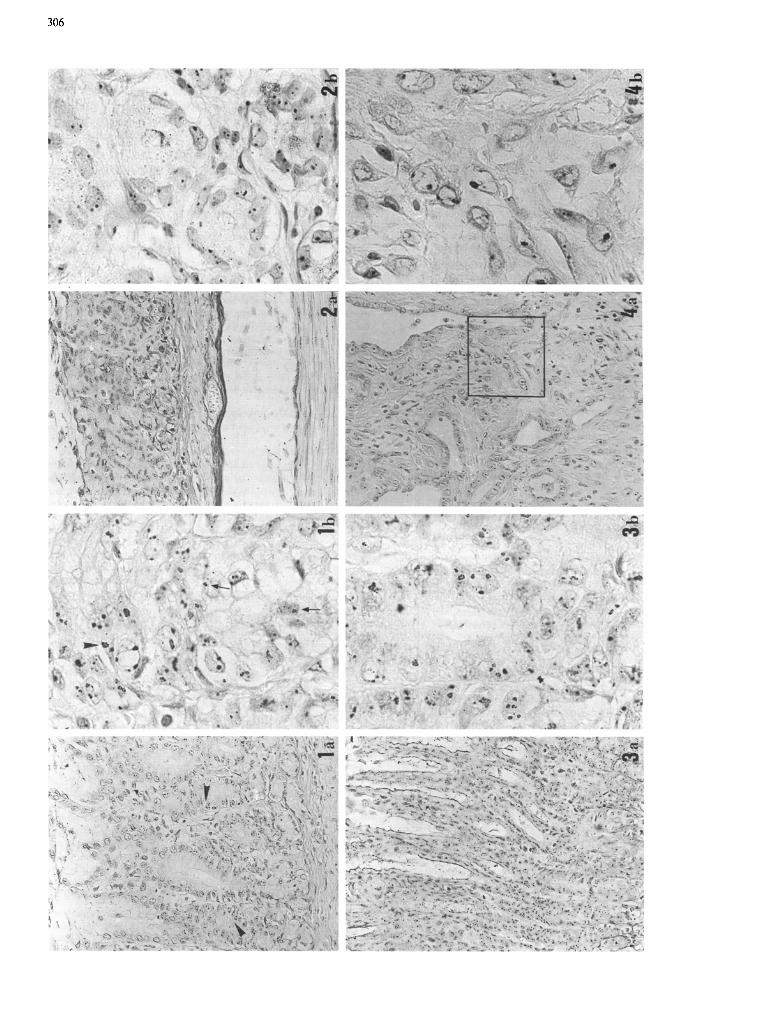
Fig. 3.a Hyperplastic mucosa, b Note the striking increase in dot numbers in the hyperplastic epithelium
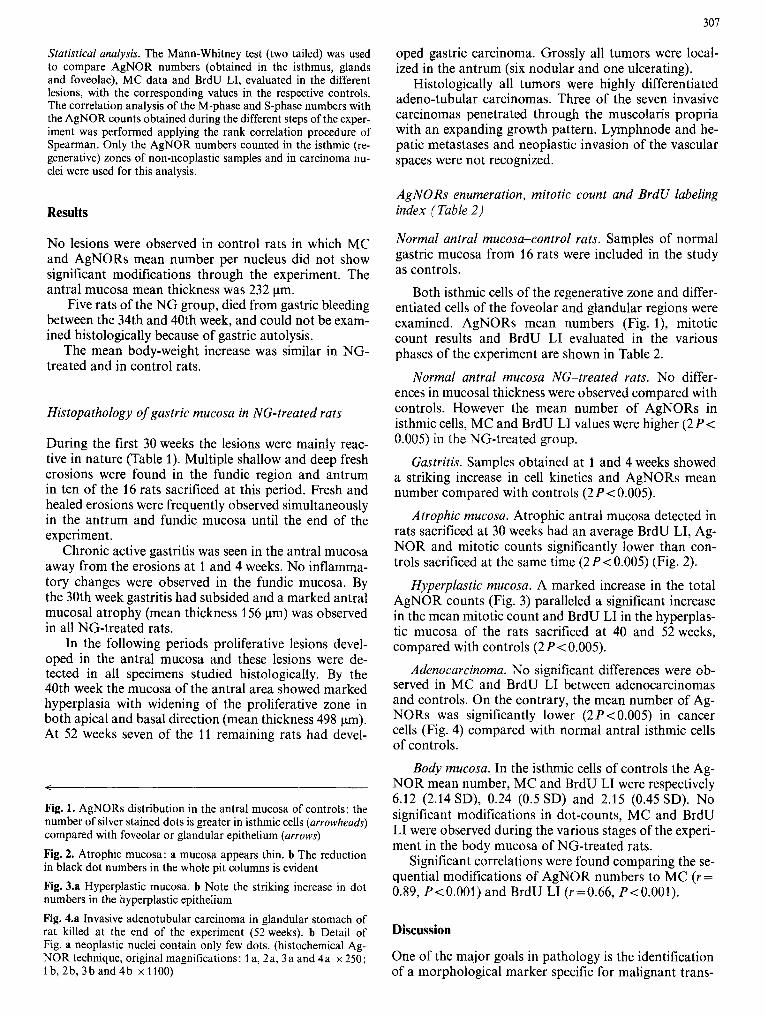
Fig. 4.a lnvasive adenotubular carcinoma in glandular stomach of rat killed at the end of the experiment (52 weeks), b Detail of Fig. a neoplastic nuclei contain only few dots. (histochemical Ag- NOR technique, original magnifications: 1 a, 2a, 3a and 4a • 250; lb, 2b, 3b and 4b x 1100)
307
oped gastric carcinoma. Grossly all tumors were local- ized in the antrum (six nodular and one ulcerating).
Histologically all tumors were highly differentiated adeno-tubular carcinomas. Three of the seven invasive carcinomas penetrated through the muscolaris propria with an expanding growth pattern. Lymphnode and he- patic metastases and neoplastic invasion of the vascular spaces were not recognized.
AgNORs enumeration, mitotic count and BrdU labeling index (Table 2)
Normal antral mucosa-control rats. Samples of normal gastric mucosa from 16 rats were included in the study as controls.
Both isthmic cells of the regenerative zone and differ- entiated cells of the foveolar and glandular regions were examined. AgNORs mean numbers (Fig. 1), mitotic count results and BrdU LI evaluated in the various phases of the experiment are shown in Table 2.
Normal antral mucosa NG-treated rats. No differ- ences in mucosal thickness were observed compared with controls. However the mean number of AgNORs in isthmic cells, MC and BrdU LI values were higher (2 P < 0.005) in the NG-treated group.
Gastritis. Samples obtained at 1 and 4 weeks showed a striking increase in cell kinetics and AgNORs mean number compared with controls (2 P < 0.005).
Atrophic mucosa. Atrophic antral mucosa detected in rats sacrificed at 30 weeks had an average BrdU LI, Ag- NOR and mitotic counts significantly lower than con- trols sacrificed at the same time (2 P < 0.005) (Fig. 2).
Hyperplastic mucosa. A marked increase in the total AgNOR counts (Fig. 3) paralleled a significant increase in the mean mitotic count and BrdU LI in the hyperplas- tic mucosa of the rats sacrificed at 40 and 52 weeks, compared with controls (2 P < 0.005).
Adenocarcinoma. No significant differences were ob- served in MC and BrdU LI between adenocarcinomas and controls. On the contrary, the mean number of Ag- NORs was significantly lower (2P<0.005) in cancer cells (Fig. 4) compared with normal antral isthmic cells of controls.
Body mucosa. In the isthmic cells of controls the Ag- NOR mean number, MC and BrdU LI were respectively 6.12 (2.14 SD), 0.24 (0.5 SD) and 2.15 (0.45 SD). No significant modifications in dot-counts, MC and BrdU LI were observed during the various stages of the experi- ment in the body mucosa of NG-treated rats.
Significant correlations were found comparing the se- quential modifications of AgNOR numbers to MC (r = 0.89, P<0.001) and BrdU LI (r=0.66, P<0.001).
Discussion
One of the major goals in pathology is thc idcntification of a morphological marker specific for malignant trans-
308
formation. The nucleus and the nucleolus are the cellular structures more extensively studied in this field.
Only recently applied to routinely-processed and par- affin-embedded sections, the AgNOR technique allows a distinction between neoplastic and non-neoplastic cells in several human tissues (Crocker 1990) as well as in experimental animals (Takeuchi et al. 1990) by the marked modifications in the number, size and distribu- tion of silver-stained dots. Recent studies (Suarez et al. 1989, Rosa et al. 1990) have shown a significant increase in the mean AgNOR number in human gastric carcino- mas compared with normal gastric mucosa.
Changes in AgNORs number, distribution and size in cancer cells have been attributed to polyploidy of chromosomes carrying the NORs, to increased tran- scriptional activity of rDNA and/or to modifications of the dividing cells fraction. To date a significant correla- tion has been demonstrated between the mean number of AgNOR sites per nucleus and cell growth-rate mea- sured by different methods (DNA flow cytometry, Ki67 monoclonal antibody staining, and mitotic index) (Crocker et al. 1988, Di Stefano et al. 1991).
It seems that the distribution of chromosomes and therefore of the chromatin containing the ribosomal genes, remains disorganized in proliferating cells, result- ing in the formation of dispersed nucleoli and multiple and irregularly scattered NORs (Derenzini et al. 1984; Derenzini et al. 1989). Numerous studies have ruled out any direct correlation between ploidy and AgNORs number (Crocker et al. 1988, Derenzini et al. 1989).
Unlike human cancers, NG-induced gastric tumors in the rat consist of highly differentiated epithelial cells (Sugimura et al. 1970) sometimes very similar to normal gastrointestinal epithelium but endowed with malignant behaviour (Kobori et al. 1977). On the basis of this bio- logic peculiarity, we applied the AgNOR technique to this model of chemically induced gastric carcinogenesis, which allowed the evaluation of changes in AgNORs during the sequential modifications, initially reactive and then proliferative, that the gastric mucosa undergoes in the phases preceeding neoplastic growth.
However, reliable and diagnostic parameters other than AgNOR mean numbers, such as dot size, distribu- tion and iso/anisometry (Mingazzini et al. 1991 ) were not analyzed in the present study.
Our results demonstrated significant differences in N O R numbers, MC and BrdU LI between the normal gastric mucosa of controls and the normal, atrophic, inflamed and hyperplastic mucosa of NG-treated rats. However, experimentally-induced carcinomas showed a MC and BrdU LI similar to the normal antral mucosa of controls. The nuclei in the mucosal regenerative zone of controls showed mean AgNOR numbers higher than cancer cells, so that AgNORs quantitation has not al- lowed a distinction between normal and neoplastic cells with low proliferative activity. Moreover, in normal mu- cosa regenerative cells have shown higher AgNOR values than differentiated foveolar and glandular cells. Finally, significant correlations have been observed be- tween MC values, BrdU LI rates and mean interphasic AgNOR numbers during all stages of the experiment.
These data suggest that AgNOR counts alone should be considered a marker of cell kinetics correlating with the cell growth rate, and not representing, per se, a mor- phologic parameter of biologic malignancy in NG-in- duced gastric carcinomas. The high AgNOR counts de- scribed in human gastric carcinomas could be related to the more active growth of spontaneous tumors.
Acknowledgements. We are grateful to Dr. M. Donnetti (Dept. of Experimental Medicine - Section of Medical Physics - University of Rome "La Sapienza") for statistical analysis and to Mr. M. Macchiolo for photographic assistance.
References
Crocker J, Macartney JC, Smith PJ (1988) Correlation between DNA flow cytometric and nucleolar organizer regions data in non-Hodgkin's lymphomas. J Pathol 154:151-156
Crocker J (1990) Nucleolar organizer regions. In: Underwood JCE (Ed) Current Topics in Pathology. Springer Berlin, Heidelberg, New York, Tokyo, pp 91-149
Daskal Y, Smetana K, Busch H (1980) Evidence from studies on segregated nucleoli that silver staining proteins C23 and B23 are in the fibrillar component. Exp Cell Res 127:285-291
Derenzini M, Viron A, Puvion-Dutilleul F (1984) Structural orga- nization of rat hepatocyte chromatin as visualized in thin frozen sections selectively stained for DNA. Eur J Cell Biol 33:148- 156
Derenzini M, Romagnoli T, Mingazzini P, Marinozzi V (1988) Interphasic nucleolar organizer region distribution as a diag- nostic parameter to differentiate benign from malignant epithe- lial tumors of human intestine. Virchows Arch [B] 54:334-340
Derenzini M, Pession A, Farabegoli F, Trere' D, Badiali M, Dehan P (1989) Relationship between interphasic nucleolar organizer regions and growth rate in two neuroblastoma cell lines. Am J Pathol 134:925-932
Di Stefano D, Mingazzini PL, Scucchi L, Donnetti M, Marinozzi V (1991) A comparative study of histopathology, hormone re- ceptors, peanut lectin binding, Ki-67 immunostaining, and nuc- leolar organizer region-associated proteins in human breast cancer. Cancer 67:463-471
Goessens G (1984) Nucleolar structure. Int Rev Cytol 84:107 158 Goodpasture C, Bloom SE (1975) Visualization of nucleolar orga-
nizer regions in mammalian chromosomes using silver staining. Chromosoma 53:37 50
Henderson AS, Warburton D, Atwood KC (1972) Location of ribosomal DNA in the human chromosome complement. Proc Natl Acad Sci USA 69:3394-3398
Hernandez-Verdun D, Hubert J, Bourgeois GA, Bouteille M (1978) Identification ultrastructurale de rorganisateur nucleolaire par la technique de l'argent. CR Acad Sci (Paris) 287:1421-1423
Hernandez-Verdun D (1986) Structural organization of the nucleo- lus in mammalian cells. Methods Achiev Exp Pathol 12:2662
Howell WM, Denton TE, Diamond JR (1975) Differential staining of the satellite regions of human aerocentric chromosomes. Ex- perientia 31:260-262
Hsu TC, Spirito SE, Pardue ML (1975) Distribution of 18+28S ribosomal genes in mammalian genomes. Chromosoma 53 : 25- 36
Kobori O, Gedigk P, Totovic' V (1977) Adenomatous changes and adenocarcinoma of glandular stomach in Wistar rats induced by N-Methyl-N'-Nitro-N-Nitrosoguanidine. An electron micro- scopic and histochemical study. Virehows Arch [A] 373 : 37-54
Kunze E, Schauer A, Eder M, Seefeldt C (1979) Early sequential lesions during development of experimental gastric cancer with special reference to dysplasias. J Cancer Res Clin Oncol 95 : 247-264
309
Mingazzini PL, Scucchi L, Di Stefano D, Malchiodi Albedi F, Ciaralli F, Falchi M, Marinozzi V (1991) Expression of inter- phasic nucleolar organizer regions in normal, dysplastic and neoplastic colorectal mucosa Virchows Arch [A] 419:487-491
Ohgaki H, Szentirmay Z, Take M, Sugimura T (1989) Effects of 4-week treatment with gastric carcinogens and enhancing agents on proliferation of gastric mucosa cells in rats. Cancer Lett 46:117-122
Ploton D, Menager M, Jeannesson P, Himber G, Pigeon F, Adnet JJ (1986) Improvement in the staining and in the visualization of the argyrophilic proteins of the nucleolar organizer region at the optical level. Histochem J 18:5-14
Rosa J, Metha A, Filipe MI (1990) Nucleolar organizer regions in gastric carcinoma and its precursor stages. Histopathology 16: 265-269
Riischoff J, Plate K, Contractor H, Thomas C (1990) Silver stained structures (AgNORs), their dependence on tissue fixation and absence of prognostic relevance in rectal adenocarcinomas (Let- ter). J Pathol 161:89-90
Saito T, Inokuchi K, Takayama S, Sugimura T (1970) Sequential morphological changes in N-Methyl-N'Nitro-N-Nitrosoguani- dine carcinogenesis in the glandular stomach of rats. JNCI 44:769-783
Suarez V, Newman J, Hiley C, Crocker J, Collins M (1989) The value of NOR numbers in neoplastic and non-neoplastic epithe- lium of the stomach. Histopathology 14:61-66
Sugimura T, Fujimura S, Baba T (1970) Tumor production in the glandular stomach and alimentary tract of the rat by N-Methyl- N'-Nitro-N-Nitrosoguanidine. Cancer Res 30:455-465
Takeuchi T, Tanaka T, Ohno T, Yamamoto N, Kobayashi S, Kur- iyama M, Kawada Y, Mori H (1990) Nucleolar organizer re- gions in rat urinary bladder tumors induced by N-Bulty-N-(4- hydroxybutyl) nitrosamine. Virchows Arch [B] 58:383-387
Warburton D, Henderson AS (1979) Sequential silver staining and hybridization in situ on nucleolus organizing regions in human celis. Cytogenet Cell Genet 24:168-175
Copyright © 2022 FDOKUMEN