Internship report on - Daffodil International University
48
INTERNSHIP REPORT ON Financial Performance Analysis of Bangladesh Commerce Bank Limited Prepared By Chhabi Biswas Roy ID: 151-11-4429, BBA (Finance) Department of Business Administration Faculty of Business & Entrepreneurship
-
Upload
khangminh22 -
Category
Documents
-
view
4 -
download
0
Transcript of Internship report on - Daffodil International University
INTERNSHIP REPORT ON
Financial Performance Analysis of Bangladesh Commerce
Bank Limited
Prepared By
Chhabi Biswas Roy
ID: 151-11-4429, BBA (Finance)
Department of Business Administration
Faculty of Business & Entrepreneurship
ii © “Daffodil International University”
INTERNSHIP REPORT ON
Financial Performance Analysis of Bangladesh Commerce
Bank Limited
Submitted To
Mr. Md. Kamruzzaman Didar
Senior Lecturer
Department of Business Administration
Faculty of Business & Entrepreneurship
Submitted By
Chhabi Biswas Roy
ID: 151-11-4429
Department of Business Administration
Faculty of Business & Entrepreneurship
Date of Submission: November 25, 2018
iii © “Daffodil International University”
Letter of Transmittal
November 25, 2018
Mr. Md. Kamruzzaman Didar
Senior Lecturer
Department of Business Administration
Faculty of Business & Entrepreneurship
Daffodil International University
Subject: Submission of Internship Report.
Honorable Sir,
I take pleasure in submitting the report on “Financial Performance Analysis of Bangladesh
Commerce Bank Limited” as a requirement of the BBA program of the Department of Business
Administration for your consideration. I have completed the report in due time and met all the
proposed objectives. Apart from the academic knowledge gained, this internship program and
preparation of report has given me the opportunity to understand the topic related knowledge.
I have undertaken sincere effort for successful completion of the report. It has to be mentioned
further that without your advice and cooperation it would not be possible for me to complete this
report. I shall be gratified to answer any sort of queries you think necessary regarding this report.
Therefore, I expect your kind consideration in this regard, I will be very grateful if you accept my
report and oblige thereby.
Yours Sincerely,
Chhabi Biswas Roy
ID: 151-11-4429, BBA (Finance)
Department of Business Administration
Faculty of Business & Entrepreneurship

iv © “Daffodil International University”
Approval Certificate
This is certify that Chhabi Biswas Roy, ID # 151-11-4429, BBA (Finance), is a regular student
of Department of Business Administration, Faculty of Business and Entrepreneurship, Daffodil
International University. He has successfully completed his internship program at Bangladesh
Commerce Bank Limited and has prepared this internship under my direct supervision. His
assigned internship topic is “Financial Performance Analysis of Bangladesh Commerce Bank
Limited”. I think that the report is worthy of fulfilling the partial requirements of BBA program.
I also declare that the study has been prepared for academic purposes only and this paper may not
be used in actual market scenario.
I have gone through the report and found it a well written report. He has completed the report by
himself. I wish him every success in life.
Mr. Md. Kamruzzaman Didar
Senior Lecturer
Department of Business Administration
Faculty of Business & Entrepreneurship
v © “Daffodil International University”
Acknowledgment
In the name of God the beneficent the merciful. This paper wouldn't have been possible while not
the guidance and also the help of many people who in one way or another contributed and extended
their valuable help within the preparation and completion of this study.
I started this internship report and finally, it has been completed. However, the special thanks goes
to my helpful supervisor, Mr. Md. Kamruzzaman Didar, Senior Lecturer, Department of Business
Administration. The supervision and support that he gave truly help the progression and
smoothness of the internship program. The co-operation is much indeed appreciated. I’m grateful
to all the senior officials of the bank who had created the opportunity to get the practical
knowledge. Besides, this internship program makes me realized the value of working together as
a team and as a new experience in the working environment, which challenges us every minute.
Last but not least I am also owed to each person who concerned inside and outside of Bangladesh
Commerce Bank Limited in carrying out this report.

vi © “Daffodil International University”
Abstract
Bangladesh Commerce Bank Limited is scheduled commercial bank registered by the Bangladesh
Bank. The functions of the bank cover a wide range of banking and functional activities to
individuals, firms, corporate bodies, and different multinational agencies. In this report, I have
discussed the financial Performance analysis and general banking activities of BCBL. Financial
Performance Analysis has given that to know the banking present situation. Financial Performance
analysis of BCBL includes Ratio analysis (liquidity ratio, activity ratio, credit risk ratio, and
profitability ratio), Trend analysis, Common size etc. General Banking is a very important unit of
Bangladesh Commerce Bank Limited. Under the wholesale banking division with the objective of
fulfilling the need for banking products of customers. It is a major player in General banking,
combining deep local knowledge capability to offer the full scope of innovative and customized
solutions for customers. They are committed to providing the customer with integrated local
services. Efficient dealing process Reliable financial data Innovative products foremost clearing
services.

A © “Daffodil International University”
Table of Content
Contents Abstract………………………………………………………………………………………………………………………………………………….vi
Chapter-01 (Introduction) ..................................................................................................................1
1.1 Introduction .................................................................................................................................2
1.2 Background of the Study...............................................................................................................2
1.3 Scope of the Study ........................................................................................................................3
1.4 Objective of the Study ..................................................................................................................3
1.4.1 General Objective: ........................................................................................................................... 3
1.4.2 Specific Objectives: .......................................................................................................................... 3
1.5 Methodology of the Study ............................................................................................................4
1.5.1 Data Collection: ................................................................................................................................ 4
1.5.2 Sources of data: ............................................................................................................................... 4
1.5.3 Data Analysis: ................................................................................................................................... 4
1.6 Limitations of the Study ................................................................................................................5
Chapter-02 (About Bangladesh Commerce Bank Limited) ....................................................................6
2.1 Profile of Bangladesh Commerce and Investment Limited .............................................................7
2.2 Mission of Bangladesh Commerce and Investment Limited ............................................................7
2.3 Vision of Bangladesh Commerce and Investment Limited ..............................................................7
2.4 Strategic Priorities Bangladesh Commerce and Investment Limited ...............................................7
2.5 Activities of BCBL ..........................................................................................................................8
2.6 Hierarchy of Bangladesh Commerce Bank Limited .........................................................................9
2.7 Product Offered by BCBL ..............................................................................................................9
2.7.1 Retail Banking .................................................................................................................................. 9
Deposit: ................................................................................................................................................. 9
Loans and Advances: .......................................................................................................................... 10
BCB Credit Card: ................................................................................................................................. 10
BCB Debit Card: .................................................................................................................................. 10
Utility Bills Pay Services: .................................................................................................................... 10
Sure Cash (Mobile Banking): .............................................................................................................. 11
Locker Services: .................................................................................................................................. 11
2.7.2 Corporate Banking: ........................................................................................................................ 11

B © “Daffodil International University”
General Loan ....................................................................................................................................... 11
Trade Financing .................................................................................................................................. 11
Working Capital Financing .................................................................... Error! Bookmark not defined.
2.7.3 SME and Agriculture Banking:........................................................................................................ 12
SME Product ....................................................................................................................................... 12
AGRI Product ...................................................................................................................................... 12
2.7.4 NRB Services................................................................................................................................... 12
Foreign Remittance ............................................................................................................................ 12
Chapter-03 (Theory Analysis)............................................................................................................ 13
3.1 ………………………………………………………………………………………………………………………………….Ratio Analysis
........................................................................................................................................................ 14
3.1.1 Liquidity Ratio ......................................................................................................................... 15
3.1.2 Activity Ratio ........................................................................................................................... 15
3.1.3 Efficiency Ratio ........................................................................................................................ 16
3.1.4 Profitability Ratio .................................................................................................................... 16
3.1.5 Credit Risk Ratio ...................................................................................................................... 17
3.2 .................................................................................................................... Common Size Analysis
........................................................................................................................................................ 17
3.2.1 Common Size of Balance Sheet ............................................................................................... 18
3.2.2 Common Size of Income Statement ....................................................................................... 18
3.3 ................................................................................................................................ Trend Analysis
........................................................................................................................................................ 19
3.3.1 Trend Analysis of Balance Sheet ............................................................................................. 19
3.3.2 Trend Analysis of Income Statement ...................................................................................... 19
Chapter-04 (Financial Performance of BCBL) ..................................................................................... 20
4.1 ................................................................................................................................. Ratio Analysis
........................................................................................................................................................ 21
4.1.1 Liquidity Ratio ......................................................................................................................... 21
4.1.2 Activity Ratio: .......................................................................................................................... 22
4.1.3 Efficiency Ratio: ....................................................................................................................... 23
4.1.4 Profitability Ratio: ................................................................................................................... 24
4.1.5 Credit Risk Ratio: ..................................................................................................................... 25
4.1.6 Others Ratio: ........................................................................................................................... 26
C © “Daffodil International University”
4.2 .................................................................................................................... Common Size Analysis
........................................................................................................................................................ 27
4.2.1 Common Size of Balance Sheet ............................................................................................... 27
Common Size of assets: ...................................................................................................................... 27
Common Size of Liability & Equity: .................................................................................................... 28
4.2.2 Common Size of Income Statement ....................................................................................... 30
4.3Trend Analysis ............................................................................................................................. 31
4.3.1 Trend Analysis of Balance Sheet ............................................................................................. 31
Trend Analysis of Assets: ................................................................................................................... 31
Trend Analysis of Liability & Equity: .................................................................................................. 32
4.3.2 Trend Analysis of Income Statement ...................................................................................... 34
Chapter-05 (Problems, Recommendation & Conclusion) ................................................................... 35
5.1 Problems Identified .................................................................................................................... 36
5.2 Recommendations for BCBL ........................................................................................................ 37
5.3 Conclusion ................................................................................................................................. 38
References: ...................................................................................................................................... 39
Web Site: ......................................................................................................................................... 39

1 © “Daffodil International University”
Chapter-01
Introduction
2 © “Daffodil International University”
1.1 Introduction
A public limited company incorporated in Bangladesh on June 01, 1998 under the Companies Act
1994, the Bank Company Act 1991 and Act 12 of 1997.
Bangladesh Commerce Bank Limited is known as a commercial bank. Like all commercial banks
BCBL’s core business is obtaining deposit and providing loans. It is a financial institution
providing services for businesses, organizations and individuals. Service includes offering
different types of deposit account such as current deposit accounts, saving deposit accounts and
other scheme accounts as well as giving out loans to businesses and individuals.
BCB make its profit by taking small, short-term, relatively liquid deposits and transforming these
into small, medium, larger loans for short, medium and longer maturity loans. These processes of
asset transformation generate net income for BCB. BCB also does investment banking though it
is not considered its main business area.
However, BCB is primarily engaged in deposit and lending activities to private and corporate
clients in wholesale and retail banking. Other services typically include credit cards, mobile
banking, custodial service and guarantees, cash management and settlement as well as trade
finance.
1.2 Background of the Study
As a prerequisite for the Bachelor of Business Administration (BBA) degree from Daffodil
International University (DIU), it is required to complete an internship from a reputed business
organization & prepare a report. As a student of BBA, I have completed one (1) months internship
from Bangladesh Commerce Bank Limited, Dhaka and has prepared internship report named
“Financial Performance Analysis of Bangladesh Commerce Bank Limited” by utilizing the real
expertise of a short lived position at BCBL, capital of Bangladesh Division.
3 © “Daffodil International University”
1.3 Scope of the Study
The scope of the study covers general banking activities and financial Performance analysis of
BCBL
The fundamental focal point of this report is to investigate:
i. Ratio Analysis
ii. Trend Analysis
iii. Common Analysis
1.4 Objective of the Study
The objectives of this study are listed below –
1.4.1 General Objective:
To analyze the financial statements of Bangladesh Commerce Bank Limited with the key
focus of its overall financial performance.
1.4.2 Specific Objectives:
To know the theoretical background of the financial performance of Bangladesh
Commerce Bank Limited.
To know the five years financial performance of BCBL by using different types of tools
like ratio, common size and trend analysis.
To identify the problems related to the financial performance of BCBL.
This general procedure of approach is given in beneath that has been followed in the
examination.

4 © “Daffodil International University”
1.5 Methodology of the Study
1.5.1 Data Collection:
The study requires a systematic procedure from a selection of the topic to final report presentation.
In this study, the descriptive method was undertaken to gain insights & understanding of the
financial performance of BCBL. To perform the study data sources were identified & collected,
they were classified, analyzed, interpreted & presented in a systemic manner & key points are find
out. This general procedure of approach is given in beneath that has been followed in the
examination.
1.5.2 Sources of data:
The data used to complete this report has been collected from the Primary sources &
Secondary sources.
Primary Sources:
Discussion with officials of BCBL
Face to confront discussion with the separate officer of the branch
Exposure on a different desk of the bank
Secondary Sources:
Website of BCBL (http://www.bcblbd.com/)
BCBL Annual report 2013-2017
Product brochure of BCBL
Website of Wikipedia (http://www.wikipedia.org)
Google search
1.5.3 Data Analysis:
To analyze the data, MS Excel has been used.
5 © “Daffodil International University”
1.6 Limitations of the Study
There were some limitations in completing the report with rich resources. Some of the crucial
limitations are-
The period of 1 month, is insufficient to learn about all the banking activities of any branch
A single workstation cannot be a complete arena to study banking system.
It is very difficult to collect all the actual information from various personnel for their job
constraint
As some of the banking fields are not covered by our courses, there was difficult to
understand some activities
Bank’s Policy of not disclosing confidential data & information is a big obstacle in
preparing the report
Because of limited information, in some cases assumptions adopted. Therefore, there may
be some mistakes in assuming
6 © “Daffodil International University”
Chapter-02
About Bangladesh Commerce Bank Limited
7 © “Daffodil International University”
2.1 Profile of Bangladesh Commerce and Investment Limited
The Bank can trace its origins to the former Bangladesh Commerce and Investment Limited was
set up on 27 January 1986. It was a non-bank financial institution. In April 1992 its activities were
suspended by Bangladesh Bank due to a liquidity crisis. To protect the banking sector, the
employees and customers of the firm it was changed into a bank by Bangladesh Bank Bangladesh
Commerce Bank Limited was incorporated on 1 June 1998
Its authorized capital is Taka 10,000 million and the paid-up capital is BDT 1,989 million.
2.2 Mission of Bangladesh Commerce and Investment Limited
Bangladesh Commerce Bank Ltd. is committed to fulfill its customer needs and become their first
choice in banking so that a sustainable growth, reasonable return and contribution to the
development of the country can be ensured with a motivated and professional work force
2.3 Vision of Bangladesh Commerce and Investment Limited
To become a Bank of first choice by the customers with meaningful contributions to the society.
2.4 Strategic Priorities Bangladesh Commerce and Investment Limited
To maintain a healthy growth of business in all core activities with desired image
To acquire state-of –the art technologies and adopt innovative ideas for financial inclusion
To strengthen the risk management technique and compliance culture
To expand the customer base and maintain an incremental deposit & reduce the non-
performing assets
To develop appropriate corporate governance system and culture with best practice
To establish relationship banking & continuously improve service quality
To extend banking services to all classes of people
8 © “Daffodil International University”
To ensure environment friendly investment in line with the “Green Banking Guideline”
issued by Bangladesh Bank
To take effective measures to increase capital base and provision shortfall.
To enrich management capacity & human resources quality and develop a pro-active work
force with a suitable compensation package
To be a trend-setter in the socio-economic development of the country
2.5 Activities of BCBL
General banking activities of Bangladesh Commerce Bank Limited is divided into five sectors.
1. Account opening section
2. Clearing Section
3. Remittance Section
4. Deposit Section
5. Cash Section
9 © “Daffodil International University”
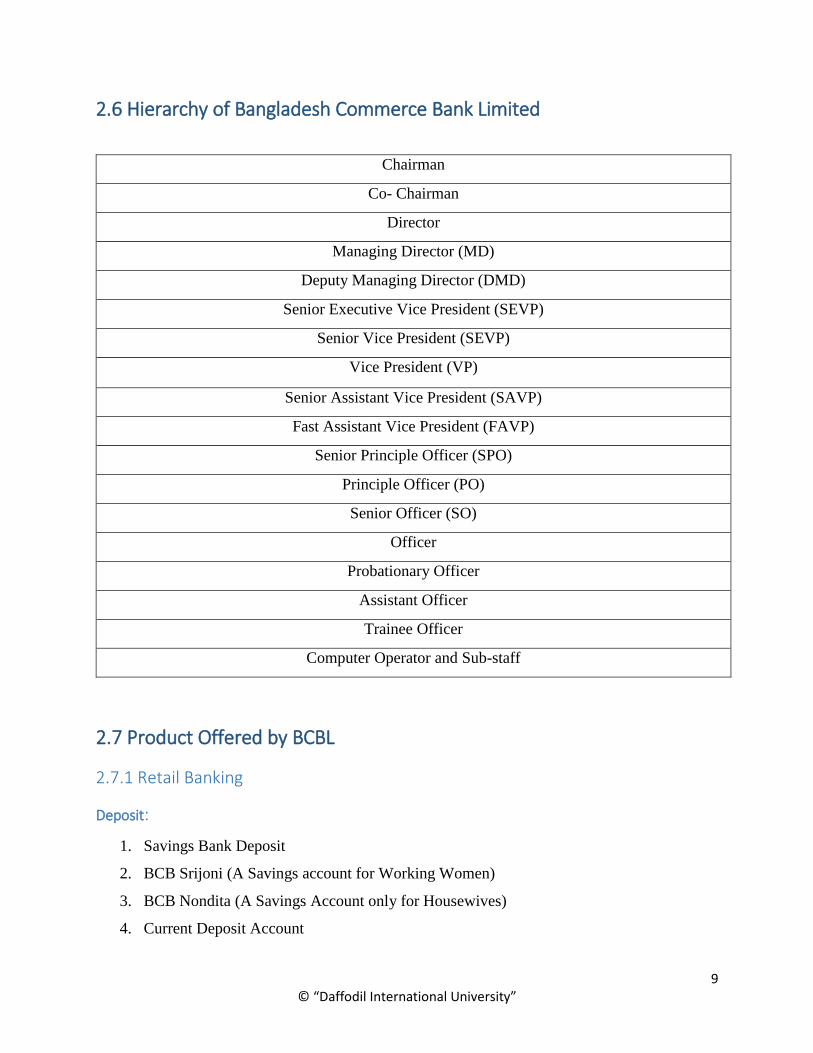
2.6 Hierarchy of Bangladesh Commerce Bank Limited
Chairman
Co- Chairman
Director
Managing Director (MD)
Deputy Managing Director (DMD)
Senior Executive Vice President (SEVP)
Senior Vice President (SEVP)
Vice President (VP)
Senior Assistant Vice President (SAVP)
Fast Assistant Vice President (FAVP)
Senior Principle Officer (SPO)
Principle Officer (PO)
Senior Officer (SO)
Officer
Probationary Officer
Assistant Officer
Trainee Officer
Computer Operator and Sub-staff
2.7 Product Offered by BCBL
2.7.1 Retail Banking
Deposit:
1. Savings Bank Deposit
2. BCB Srijoni (A Savings account for Working Women)
3. BCB Nondita (A Savings Account only for Housewives)
4. Current Deposit Account

10 © “Daffodil International University”
5. Special Notice Deposit (SND)
6. BCB Students’ Savings Account
7. BCB Monthly Savings Scheme
8. BCB Double Benefit Scheme
Loans and Advances:
1. BCB Teachers’ Loan
2. BCB Special Loan (For Service Holders)
3. BCB Consumer Credit Scheme
BCB Credit Card:
1. Wide ATM Coverage
2. Interest free Purchase
3. Lowest Interest Rate
4. No hidden charge
5. Document required applying for BCB Credit Card
BCB Debit Card:
1. 24/7 Accessibility across our Country
2. BCB Debit card is accepted at all BCB,Q-Cash, Omnibus and DBBL ATM's
3. you Can cheek Balance Enquiry
4. you can Change your PIN number
5. No Interest or Hidden Charge.
Utility Bills Pay Services:
1. Titas Gas
2. Bangladesh Telegraph And Telephone Board
3. Rural Electrification Board
4. Dhaka Power Distribution Company
5. WASA
6. West Zone Power Distribution Company
11 © “Daffodil International University”
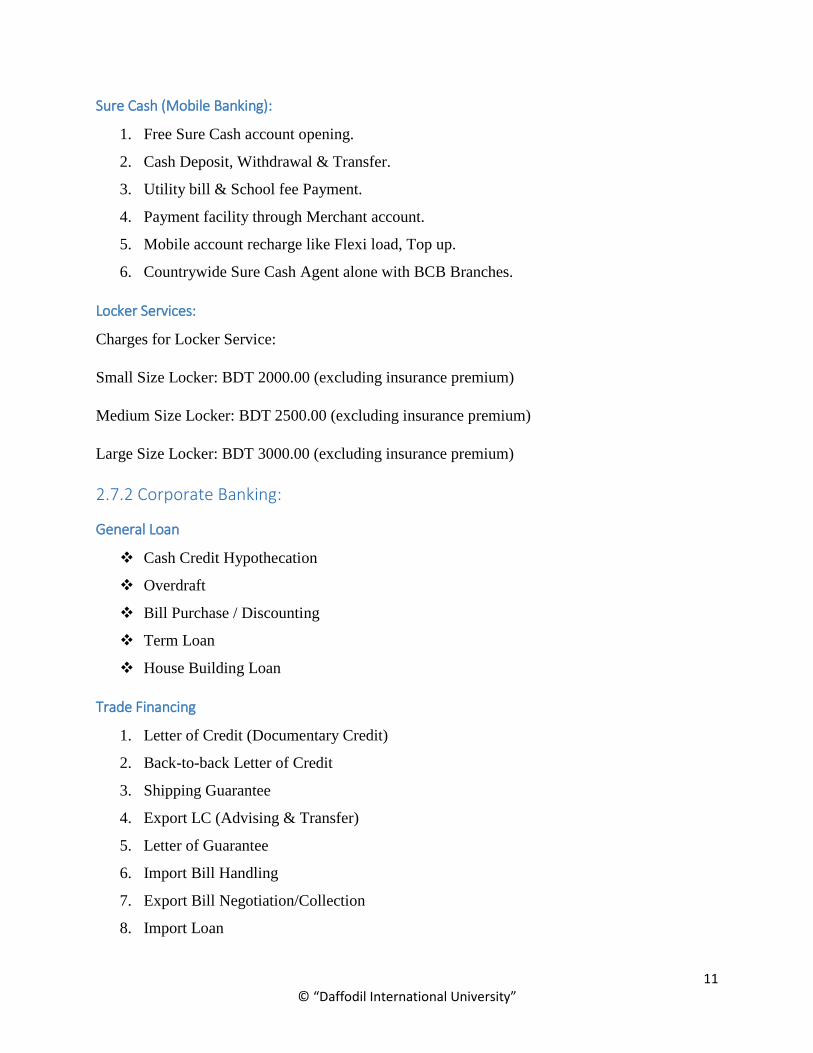
Sure Cash (Mobile Banking):
1. Free Sure Cash account opening.
2. Cash Deposit, Withdrawal & Transfer.
3. Utility bill & School fee Payment.
4. Payment facility through Merchant account.
5. Mobile account recharge like Flexi load, Top up.
6. Countrywide Sure Cash Agent alone with BCB Branches.
Locker Services:
Charges for Locker Service:
Small Size Locker: BDT 2000.00 (excluding insurance premium)
Medium Size Locker: BDT 2500.00 (excluding insurance premium)
Large Size Locker: BDT 3000.00 (excluding insurance premium)
2.7.2 Corporate Banking:
General Loan
Cash Credit Hypothecation
Overdraft
Bill Purchase / Discounting
Term Loan
House Building Loan
Trade Financing
1. Letter of Credit (Documentary Credit)
2. Back-to-back Letter of Credit
3. Shipping Guarantee
4. Export LC (Advising & Transfer)
5. Letter of Guarantee
6. Import Bill Handling
7. Export Bill Negotiation/Collection
8. Import Loan
12 © “Daffodil International University”
9. Letter of Trust Receipt (LTR)
2.7.3 SME and Agriculture Banking:
SME Product
1. BCB Seasonal Loan
2. BCB Term Loan
3. BCB Cash Credit
4. BCB Kollani
AGRI Product
1. BCB Agriculture & Rural Loan
2. BCB Apiculture
3. BCB Kollani
2.7.4 NRB Services
Foreign Remittance
1. MoneyGram
2. Xpress Money
3. Western Union
4. IME
5. Trans fast
6. Placid Express
7. Ria

13 © “Daffodil International University”
Chapter-03
Theoretical Analysis
14 © “Daffodil International University”
3.1 Ratio Analysis
Ratio analysis could be a study of the relationships between financial variables. It’s won’t to
measure varied aspects of a company’s in operation and financial performance like its efficiency,
liquidity, profitability and economic condition. The trend of those ratios over time is studied to
visualize whether or not they square measure up or deteriorating. Ratios may be expressed as a
percent, rate or proportion. The ratio analysis is an essential technique for financial statements
analysis. Different users such as investors, management, bankers and creditors use the ratio to
analyze the financial situation of a company for their decision making purpose. Here, this report
contains the most common ratios and analyzed to evaluate the operating and financial performance
of Bangladesh Commerce Bank Limited (BCBL) over the years 2013, 2014, 2015, 2016 and 2017.
Ratios are among the more widely used tools of financial statement analysis because they provide
clues to and symptoms of underlying conditions. A quantitative relation can facilitate us uncover
conditions and trends tough to observe by inspecting individual parts creating up the quantitative
relation. Ratios, like alternative analysis tools, are typically future adjusted. They’re usually
adjusted for their probable future trend and magnitude, and their quality depends on the skillful
interpretation. A ratio expresses a relation between 2 quantities. It is expressed as a %, rate, or
proportion. Computation of quantitative relation could be a straightforward mathematical
operation, however, its interpretation isn't. To be meaningful, a ratio should sit down with an
economically necessary relation. During this section a very important set of monetary ratios and
its applications area unit described. The chosen ratios are organized into the four building blocks
of financial statement analysis.
These are as follows:
Liquidity Ratio
Activity Ratio
Efficiency Ratio
Profitability Ratio
Credit Risk Ratio.
15 © “Daffodil International University”
3.1.1 Liquidity Ratio
Liquidity refers to the availability of resources of a company to meet short-term cash requirements.
It is stricken by the temporal order of cash inflows and outflows together with prospects for future
performance. Analysis of liquidity is aimed at a company’s funding requirements.
If a corporation fails to satisfy its current obligations, its continued existence is uncertain. From
this read purpose, all different measures of study area unit in secondary importance. Although
accounting measurements assume the company’s continued existence, our analysis must always
assess the validity of this assumption using liquidity measures.
This section describes the key ratios relevant to assessing liquidity ratio:
i. Cash Ratio
ii. Cash to Assets
iii. Cash to Deposits
iv. Loan to Total Deposits
v. Loan to Total Assets.
3.1.2 Activity Ratio
An activity ratio may be a metric that determines the power of a corporation to convert its balance
sheet accounts into revenue. Activity ratios live the relative efficiency of a firm supported its use
of its assets, leverage, or alternative similar balance sheet things and are important in crucial
whether a company's management is doing a decent enough job of generating revenues and cash
from its resources. Activity ratios gauge associate organization's operational efficiency and
profitability. These ratios square measure most helpful when put next to a competition or trade to
determine whether an entity's processes square measure favorable or unfavorable. Activity ratios
will type a basis of comparison across multiple news periods to see changes over time.
This section describes the key ratios relevant to assessing activity ratio:
Total Assets Turnover
Fixed Assets Turnover
16 © “Daffodil International University”
3.1.3 Efficiency Ratio
Efficiency refers to however productive an organization in victimization its assets. Efficiency is
sometimes measured relative to what proportion revenue is generated from a particular level of
assets. Moreover, inefficient use of assets can cause liquidity problems. A lack of liquidity usually
precedes lower gain and fewer opportunities. A company’s customers and suppliers are also
affected by short-term liquidity problems, and it is keener when it is a banking company.
This section describes the key ratios relevant to assessing efficiency ratio:
Interest Income to Expense
Operating Expenses to Assets
Operating Income To Assets
Operating Expense to Revenue
3.1.4 Profitability Ratio
Profitability ratios area unit a category of financial metrics that are used to assess a business's
ability to come up with earnings relative to its associated expenses. For many of these ratios,
having a better value relative to a competitor's ratio or relative to a similar ratio from a previous
amount indicates that the corporation is doing well. We are particularly curious about a company’s
ability to use its assets efficiently to provide profits and positive cash flows. Profitability refers to
a company’s ability to get an adequate return on invested with capital. Return is judged by
assessing earnings relative to the level and source of financing. Profitability is also relevant to
solvency. This section describes key profit measures and their importance to finances analysis.
This section describes the key ratios relevant to profitability activity ratio:
Return on Assets
Return on Equity
Return on Deposit
Net Interest Margin
Net Operating Margin
EPS
17 © “Daffodil International University”
3.1.5 Credit Risk Ratio
Credit risk is that the risk of non-payment of a loan by the borrower. In alternative words, we are
able to define it because of the risk that the borrower might not repay the principal amount or the
interest payments associated with it (or both) partly or fully. This ends up in the loss for the lender
within the form of disruption of cash flows and increased collection cost. It will be a result of any
of the subsequent reasons – poor cash flows of the borrower creating it difficult to pay the interest
and also the principal amount, rising rate of interests just in case of floating interest rate loans,
changes in market conditions, business failure, unwillingness to repay, etc.
This section describes the key ratios relevant to credit risk activity ratio:
Equity to Assets
Equity to Net Loans
3.2 Common Size Analysis
Common size analysis is a tool to evaluate individual financial statement items or a group of items
on the term of a species based amount. We usually define a key aggregate figure as the base, which
for a bank’s income statement is total income or revenue income and for a balance sheet is usually
total assets. Common size analysis is required common-size statements. So, for common size
analysis of BCBL’s financial statements I have prepared its common-size income statements and
common-size balance sheets for five years. I use common-size statements of BCBL to reveal the
changes in the relative importance of each financial statement items. All individual amounts in
common-size statements square measure redefined in terms of common-size percentages. The
common-size balance sheets and income statements are shown comparatively from 2013 to 2017.
18 © “Daffodil International University”
3.2.1 Common Size of Balance Sheet
A common size balance sheet could be a balance sheet that displays each the numeric worth and
relative proportion for total assets, total liabilities and equity accounts.
A common size balance sheet permits for the relative level of every asset, liability and equity
account to be quickly analyzed. Any single asset line item is compared to the worth of total assets.
Likewise, any single liability is compared to the worth of total liabilities and any equity account is
compared to the value of total equity. For this reason, every major classification of account can
equal 100%, as all smaller parts can add up to the major account classification.
3.2.2 Common Size of Income Statement
A common size income statement is associate income statement within which every account is
expressed as a percentage of the worth of sales. It’s used for vertical analysis, within which every
line item in an exceedingly financial statement is listed as a percentage of a base figure among the
states, to create comparisons easier.
A common size income statement analysis makes it easier to check what's driving a company’s
profits, and compare that performance to its peers. By viewing however that performance has been
changing over time, common size financial statements facilitate investor’s spot trends that a raw
financial statement might not uncover. Massive changes within the percentage of revenue utilized
by totally different expense categories over a given period of time can be a sign that the business
model is changing, or that manufacturing costs are changing.
19 © “Daffodil International University”
3.3 Trend Analysis
Trend analysis could be a technique used in technical analysis that tries to predict the future stock
price movements supported recently determined trend data. Trend analysis relies on the concept
that what is going on within the past offers traders an idea of what will happen within the future.
Trend analysis could be a form of horizontal analysis. It involves computing trend percent for a
series of financial numbers and is a variation on the use of percentage changes. In trend analysis,
base period refers to only one successive period, not the previous period of the analysis period.
trend analysis tries to predict a trend like a securities industry run, and ride that trend till data
suggests a trend reversal, like a bull-to-bear market. Trend analysis is useful as a result of moving
with trends, and not against them, can cause profit for an investor. A trend is that the general
direction the market is taking during a fixed period of time. Trends will be each upward and
downward, with reference to optimistic and bearish markets, respectively. While there's no
specified minimum amount of time needed for a direction to be thought-about a trend, the longer
the direction is maintained, a lot of notable the trend.
3.3.1 Trend Analysis of Balance Sheet
Balance sheet could be a photograph of a company’s financial position at a certain purpose in time.
The accounts listed facilitate determine if the company is facing any kind of financial stress. When
trend analysis is performed, a company is ready to check if its financial position is improving or
declining supported the percentage change within the balance sheet accounts. To determine the
modification, an organization will inspect the dollar amount of balance sheet accounts over 2 or
more years.
3.3.2 Trend Analysis of Income Statement
Horizontal analysis (also referred to as trend analysis) is a financial statement analysis technique
that shows changes within the amounts of corresponding financial statement things over a period
of time. It’s a great tool to evaluate the trend situations. The statements for 2 or more periods area
unit used in the horizontal analysis. The earliest period is sometimes used because of the base
period and also the items on the statements for all later period’s area unit compared with items on
the statements of the base period. The changes area unit generally shown both in dollars and
percentage.
20 © “Daffodil International University”
Chapter-04
Financial Performance of BCBL
21 © “Daffodil International University”
4.1 Ratio Analysis
4.1.1 Liquidity Ratio
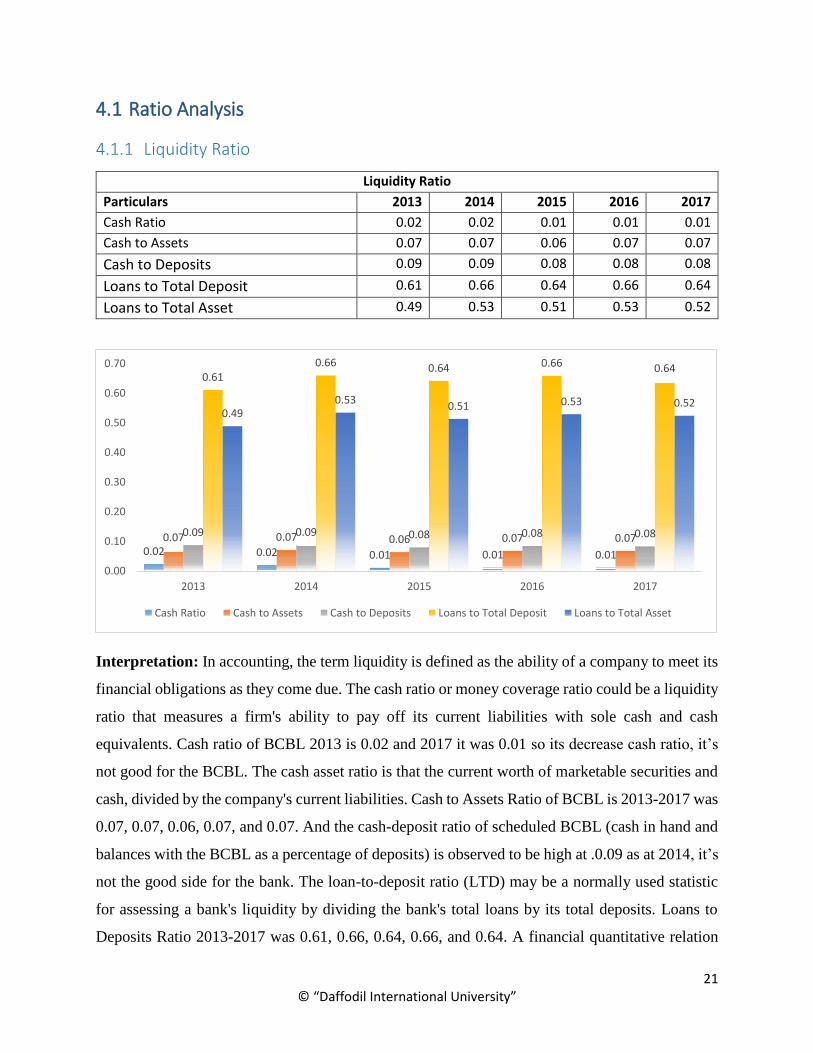
Liquidity Ratio
Particulars 2013 2014 2015 2016 2017
Cash Ratio 0.02 0.02 0.01 0.01 0.01
Cash to Assets 0.07 0.07 0.06 0.07 0.07
Cash to Deposits 0.09 0.09 0.08 0.08 0.08
Loans to Total Deposit 0.61 0.66 0.64 0.66 0.64
Loans to Total Asset 0.49 0.53 0.51 0.53 0.52
Interpretation: In accounting, the term liquidity is defined as the ability of a company to meet its
financial obligations as they come due. The cash ratio or money coverage ratio could be a liquidity
ratio that measures a firm's ability to pay off its current liabilities with sole cash and cash
equivalents. Cash ratio of BCBL 2013 is 0.02 and 2017 it was 0.01 so its decrease cash ratio, it’s
not good for the BCBL. The cash asset ratio is that the current worth of marketable securities and
cash, divided by the company's current liabilities. Cash to Assets Ratio of BCBL is 2013-2017 was
0.07, 0.07, 0.06, 0.07, and 0.07. And the cash-deposit ratio of scheduled BCBL (cash in hand and
balances with the BCBL as a percentage of deposits) is observed to be high at .0.09 as at 2014, it’s
not the good side for the bank. The loan-to-deposit ratio (LTD) may be a normally used statistic
for assessing a bank's liquidity by dividing the bank's total loans by its total deposits. Loans to
Deposits Ratio 2013-2017 was 0.61, 0.66, 0.64, 0.66, and 0.64. A financial quantitative relation
0.02 0.02 0.01 0.01 0.01
0.07 0.07 0.06 0.07 0.070.09 0.09 0.08 0.08 0.08
0.610.66 0.64 0.66 0.64
0.490.53
0.51 0.53 0.52
0.00
0.10
0.20
0.30
0.40
0.50
0.60
0.70
2013 2014 2015 2016 2017
Cash Ratio Cash to Assets Cash to Deposits Loans to Total Deposit Loans to Total Asset
22 © “Daffodil International University”
that measures the extent of a company's or consumer's leverage. The debt ratio is outlined as the
ratio of total – long-term and short-term – debt to total assets, expressed as a decimal or percentage.
Banks Loans to Total Assets ratio also up and down so it’s also not perfect good side for the Bank.
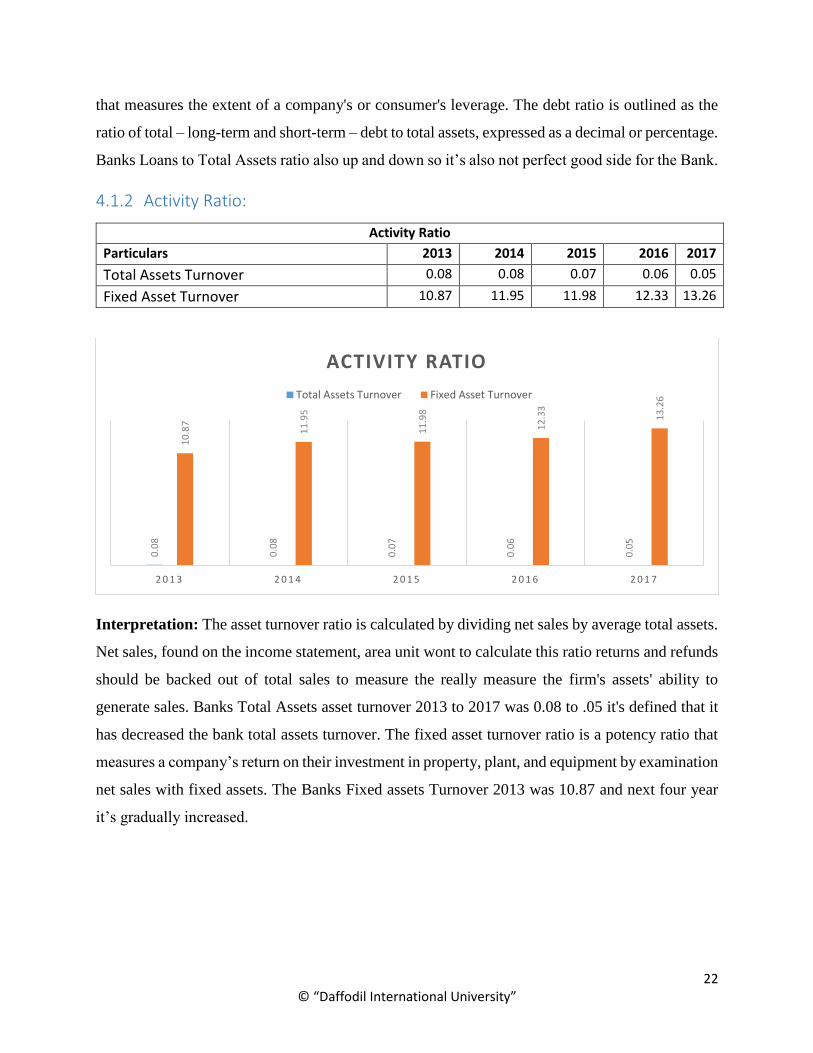
4.1.2 Activity Ratio:
Activity Ratio
Particulars 2013 2014 2015 2016 2017
Total Assets Turnover 0.08 0.08 0.07 0.06 0.05
Fixed Asset Turnover 10.87 11.95 11.98 12.33 13.26
Interpretation: The asset turnover ratio is calculated by dividing net sales by average total assets.
Net sales, found on the income statement, area unit wont to calculate this ratio returns and refunds
should be backed out of total sales to measure the really measure the firm's assets' ability to
generate sales. Banks Total Assets asset turnover 2013 to 2017 was 0.08 to .05 it's defined that it
has decreased the bank total assets turnover. The fixed asset turnover ratio is a potency ratio that
measures a company’s return on their investment in property, plant, and equipment by examination
net sales with fixed assets. The Banks Fixed assets Turnover 2013 was 10.87 and next four year
it’s gradually increased.
0.0
8
0.0
8
0.0
7
0.0
6
0.0
5
10
.87
11
.95
11
.98
12
.33
13
.26
2 0 1 3 2 0 1 4 2 0 1 5 2 0 1 6 2 0 1 7
ACTIVITY RATIO
Total Assets Turnover Fixed Asset Turnover

23 © “Daffodil International University”
4.1.3 Efficiency Ratio:
Efficiency Ratio
Particulars 2013 2014 2015 2016 2017
Interest Income to Expense 0.03 0.04 0.03 0.04 0.04
Operating Expense to assets 0.03 0.03 0.03 0.03 0.03
Operating Income to assets 0.03 0.05 0.03 0.04 0.04
Operating Expense to Revenue 0.82 0.72 0.97 0.80 0.74
Interpretation: Interest expense is going to be on the higher facet during periods of rampant
inflation since most companies will have incurred debt that carries a higher interest rate. The Banks
Interest Income to Expense is 2013 to 2017 was 0.03, 0.04, 0.03, 0.04, and 0.04. Operating Expense
to Assets is 2013 to 2017 it’s as above or same its 0.03, 0.03, 0.03, 0.03, and 0.03. Operating
Income to Assets 2014 is highest was 0.05 and 2013 to 2017 it’s gradually Decreased. The
operating expense ratio (OER) is a measure of what it costs to operate a piece of property compared
to the income that the property brings in the higher the BEP ratio. Operating Expense to Revenue
its best side of the bank and its year of 2013 was 0.82, 2014 was 0.72, 2015 was 0.97 and it’s
highest in the year and 2016 was 0.80 and 2017 was 0.74.
0.0
3
0.0
4
0.0
3
0.0
4
0.0
4
0.0
3
0.0
3
0.0
3
0.0
3
0.0
3
0.0
3
0.0
5
0.0
3
0.0
4
0.0
4
0.8
2
0.7
2
0.9
7
0.8
0
0.7
4
2 0 1 3 2 0 1 4 2 0 1 5 2 0 1 6 2 0 1 7
EFFICIENCY RATIO
Interest Income to Expense Operating Expense to assets
Operating Income to assets Operating Expense to Revenue
24 © “Daffodil International University”
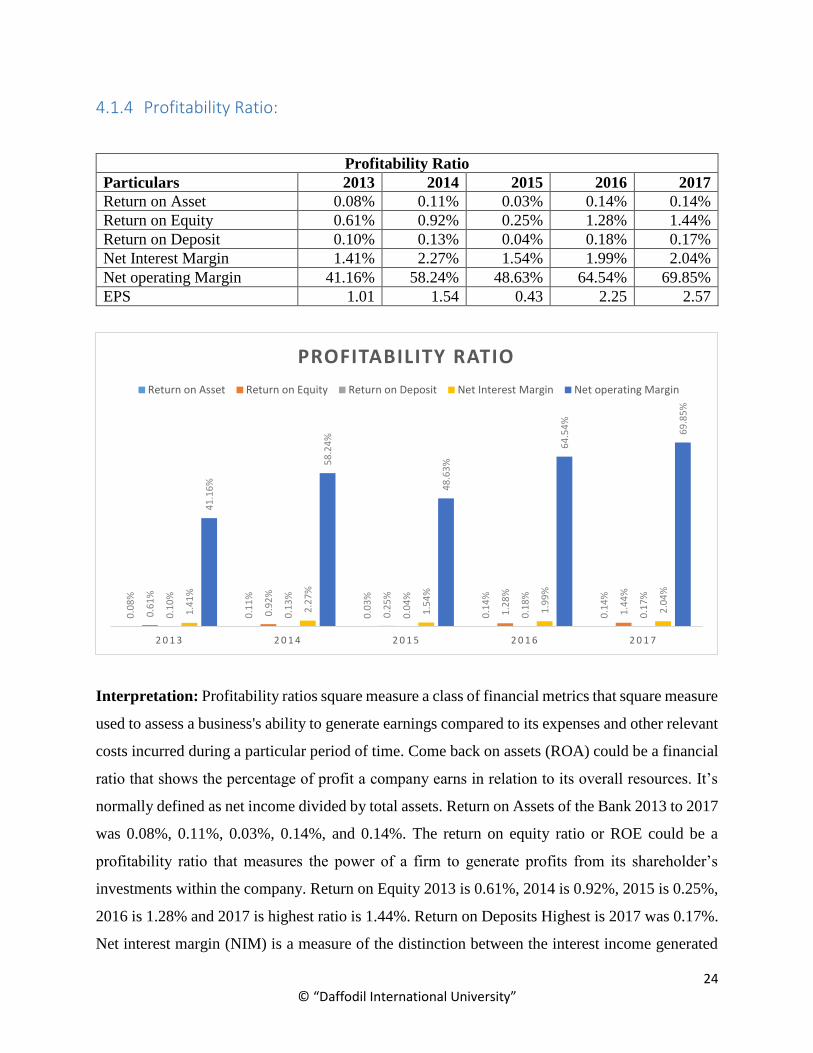
4.1.4 Profitability Ratio:
Interpretation: Profitability ratios square measure a class of financial metrics that square measure
used to assess a business's ability to generate earnings compared to its expenses and other relevant
costs incurred during a particular period of time. Come back on assets (ROA) could be a financial
ratio that shows the percentage of profit a company earns in relation to its overall resources. It’s
normally defined as net income divided by total assets. Return on Assets of the Bank 2013 to 2017
was 0.08%, 0.11%, 0.03%, 0.14%, and 0.14%. The return on equity ratio or ROE could be a
profitability ratio that measures the power of a firm to generate profits from its shareholder’s
investments within the company. Return on Equity 2013 is 0.61%, 2014 is 0.92%, 2015 is 0.25%,
2016 is 1.28% and 2017 is highest ratio is 1.44%. Return on Deposits Highest is 2017 was 0.17%.
Net interest margin (NIM) is a measure of the distinction between the interest income generated
Profitability Ratio
Particulars 2013 2014 2015 2016 2017
Return on Asset 0.08% 0.11% 0.03% 0.14% 0.14%
Return on Equity 0.61% 0.92% 0.25% 1.28% 1.44%
Return on Deposit 0.10% 0.13% 0.04% 0.18% 0.17%
Net Interest Margin 1.41% 2.27% 1.54% 1.99% 2.04%
Net operating Margin 41.16% 58.24% 48.63% 64.54% 69.85%
EPS 1.01 1.54 0.43 2.25 2.57
0.0
8%
0.1
1%
0.0
3%
0.1
4%
0.1
4%
0.6
1%
0.9
2%
0.2
5%
1.2
8%
1.4
4%
0.1
0%
0.1
3%
0.0
4%
0.1
8%
0.1
7%
1.4
1%
2.2
7%
1.5
4%
1.9
9%
2.0
4%
41
.16
%
58
.24
%
48
.63
%
64
.54
%
69
.85
%
2 0 1 3 2 0 1 4 2 0 1 5 2 0 1 6 2 0 1 7
PROFITABILITY RATIO
Return on Asset Return on Equity Return on Deposit Net Interest Margin Net operating Margin
25 © “Daffodil International University”
by banks or different financial institutions and the amount of interest paid out to their lenders (for
example, deposits), relative to the amount of their (interest-earning) assets. Operating margin is a
margin ratio used to measure a company's pricing strategy and operating efficiency.Net Profit
Margin is 2012 to 2017was 1.41%, 2.27%, 1.54%, 1.99%, 2.04% above and its increased from the
First Year so it’s good for the bank. Operating margin is a measure of what proportion of a
company's revenue is left over after paying for variable costs of production like wages, raw
materials. Net Operating margin the AIBL is 2013 was 41.16% 2014 was 58.24% and 2015 was
48.63% then it’s increased the last two years it’s good.
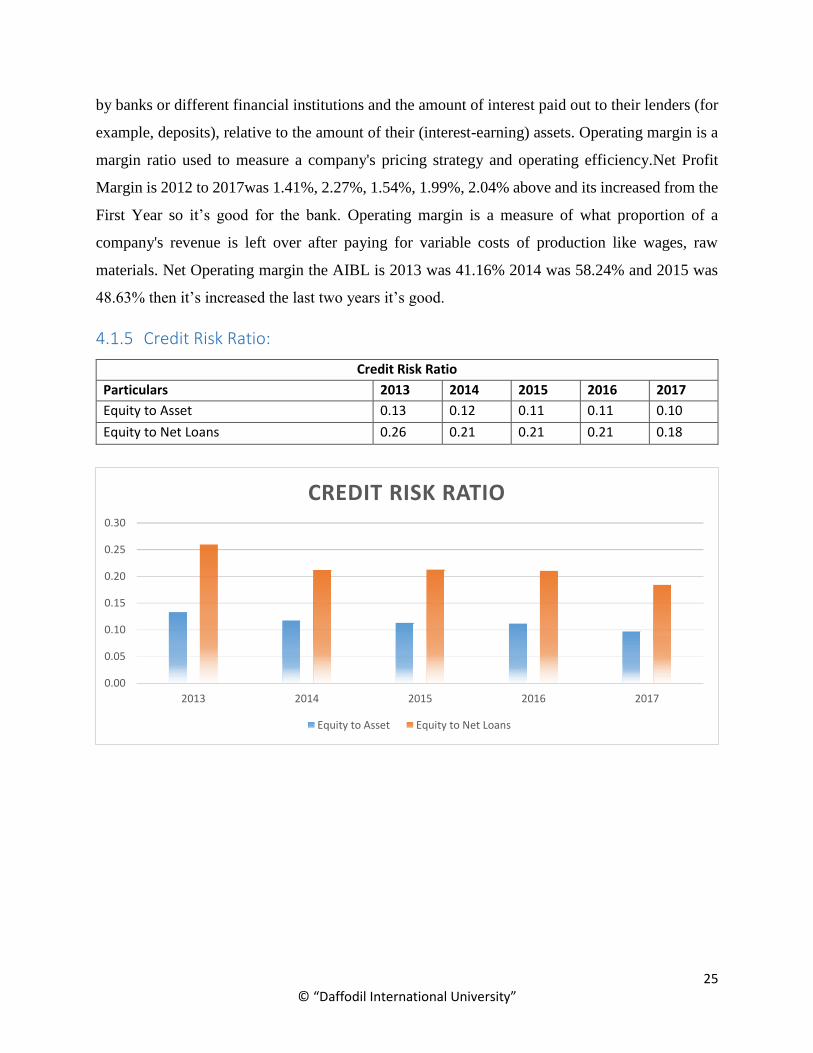
4.1.5 Credit Risk Ratio:
Credit Risk Ratio
Particulars 2013 2014 2015 2016 2017
Equity to Asset 0.13 0.12 0.11 0.11 0.10
Equity to Net Loans 0.26 0.21 0.21 0.21 0.18
0.00
0.05
0.10
0.15
0.20
0.25
0.30
2013 2014 2015 2016 2017
CREDIT RISK RATIO
Equity to Asset Equity to Net Loans
26 © “Daffodil International University”
Interpretation: Credit risk is calculated on the basis of the general ability of the customer to repay
the loan. Individuals with a debt-to-income ratio below 35% square measure considered as
acceptable credit risks. Factor in the potential debt of the borrower. The Equity ratio may be a
sensitive indicator of the level of leverage utilized by a company. The Equity ratio measures the
proportion of the total assets that are financed by stockholders, as against creditors. Equity to
Assets of the BCBL the year of 2013 was 0.13 and it’s step by step diminished and 2017 is 0.10.
Debt/Equity ratio may be a debt ratio accustomed measure a company's financial leverage,
calculated by dividing a company's total liabilities by its stockholders' equity. Equity to net Loans
2013 is 0.26 and therefore the last Four Years it’s step by step decreased.
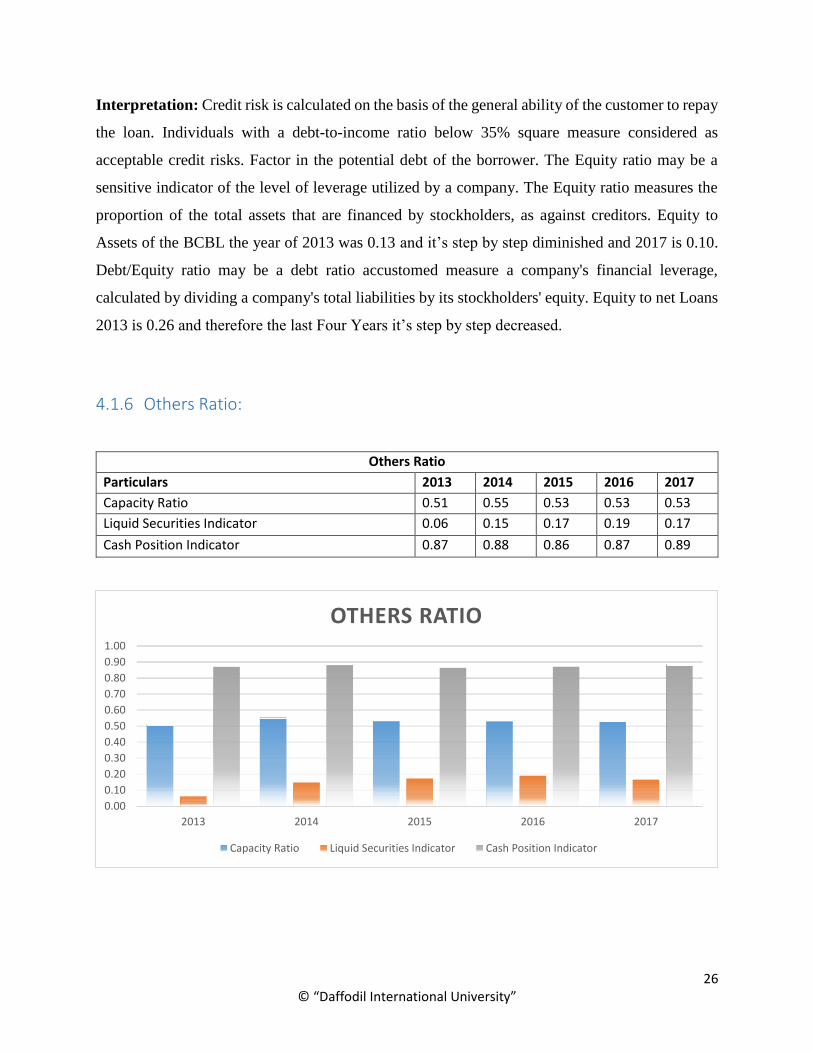
4.1.6 Others Ratio:
Others Ratio
Particulars 2013 2014 2015 2016 2017
Capacity Ratio 0.51 0.55 0.53 0.53 0.53
Liquid Securities Indicator 0.06 0.15 0.17 0.19 0.17
Cash Position Indicator 0.87 0.88 0.86 0.87 0.89
0.00
0.10
0.20
0.30
0.40
0.50
0.60
0.70
0.80
0.90
1.00
2013 2014 2015 2016 2017
OTHERS RATIO
Capacity Ratio Liquid Securities Indicator Cash Position Indicator
27 © “Daffodil International University”
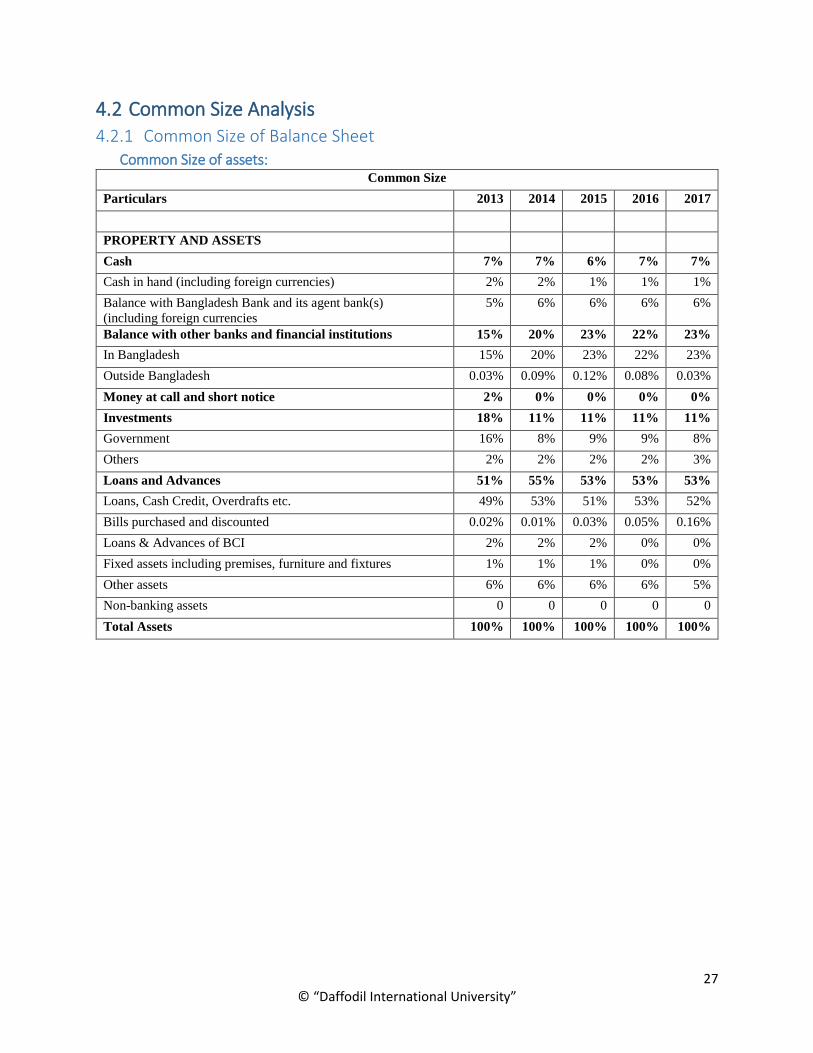
4.2 Common Size Analysis 4.2.1 Common Size of Balance Sheet
Common Size of assets: Common Size
Particulars 2013 2014 2015 2016 2017
PROPERTY AND ASSETS
Cash 7% 7% 6% 7% 7%
Cash in hand (including foreign currencies) 2% 2% 1% 1% 1%
Balance with Bangladesh Bank and its agent bank(s)
(including foreign currencies
5% 6% 6% 6% 6%
Balance with other banks and financial institutions 15% 20% 23% 22% 23%
In Bangladesh 15% 20% 23% 22% 23%
Outside Bangladesh 0.03% 0.09% 0.12% 0.08% 0.03%
Money at call and short notice 2% 0% 0% 0% 0%
Investments 18% 11% 11% 11% 11%
Government 16% 8% 9% 9% 8%
Others 2% 2% 2% 2% 3%
Loans and Advances 51% 55% 53% 53% 53%
Loans, Cash Credit, Overdrafts etc. 49% 53% 51% 53% 52%
Bills purchased and discounted 0.02% 0.01% 0.03% 0.05% 0.16%
Loans & Advances of BCI 2% 2% 2% 0% 0%
Fixed assets including premises, furniture and fixtures 1% 1% 1% 0% 0%
Other assets 6% 6% 6% 6% 5%
Non-banking assets 0 0 0 0 0
Total Assets 100% 100% 100% 100% 100%
28 © “Daffodil International University”
Common Size of Liability & Equity: Common Size
Particulars 2013 2014 2015 2016 2017
LIABILITIES AND CAPITAL
Liabilities
Borrowings from other banks, financial
institutions and agents
0.24% 0.10% 0.76% 0.03% 0.55%
Deposits and other accounts 92.23% 91.72% 90.18% 90.32% 90.55%
Current Account and Other Accounts etc. 3.99% 4.26% 4.80% 4.82% 5.72%
Savings Bank Deposits 6.53% 6.79% 7.86% 10.19% 9.45%
Short Term Deposits 7% 17% 19% 21% 18%
Fixed Deposits 59.16% 44.96% 40.10% 34.64% 34.29%
Deposit under Different Schemes 8.96% 9.17% 9.92% 10.24% 8.63%
Bills Payable 1.00% 0.72% 0.89% 1.01% 1.07%
Bank Deposit 2.57% 5.58% 4.10% 4.30% 9.35%
Other Deposits 2.93% 3.50% 3.06% 3.77% 3.68%
Deposits (BCI) 0.26% 0.18% 0.17% 0.00% 0.00%
Other liabilities 7.27% 8.00% 8.89% 9.65% 8.91%
Total Liabilities 100.00% 100.00% 100.00% 100.00% 100.00%
Capital/Shareholders' Equity
Paid-up-Capital 61% 60% 58% 57% 56%
Share Capital BCI Ltd. 1% 1% 1% 1% 1%
Minority Interest 0.00% 0.00% 0.00% 0.00% 0.00%
Right Share Application Money 28% 28% 27% 26% 26%
Statutory Reserve 6% 7% 6% 7% 8%
Other Reserve 0% 0% 0% 0% 0%
Revaluation Reserve for HTM Securities 1% 1% 3% 4% 4%
Exchange Equalization Account 0% 0% 0% 0% 0%
Profit and Loss Account-Retained Earnings 3% 4% 4% 4% 5%
Total Shareholders' Equity 100% 100% 100% 100% 100%
Total Liabilities and Shareholders' Equity
29 © “Daffodil International University”
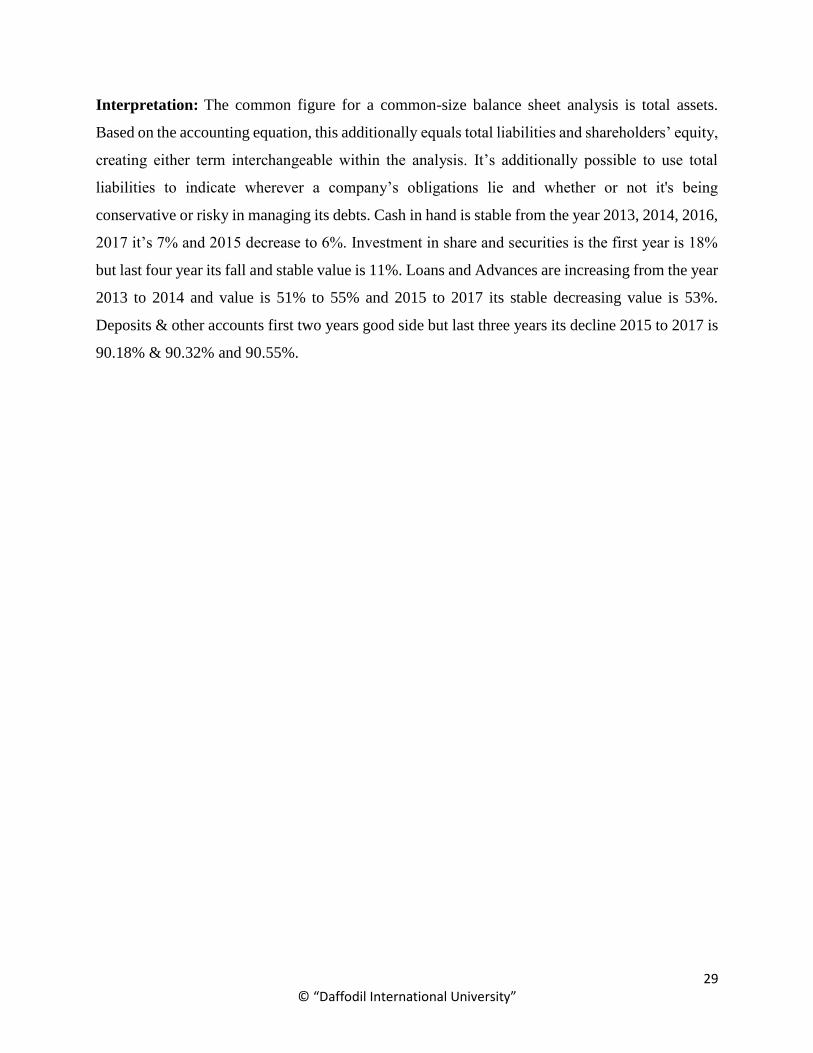
Interpretation: The common figure for a common-size balance sheet analysis is total assets.
Based on the accounting equation, this additionally equals total liabilities and shareholders’ equity,
creating either term interchangeable within the analysis. It’s additionally possible to use total
liabilities to indicate wherever a company’s obligations lie and whether or not it's being
conservative or risky in managing its debts. Cash in hand is stable from the year 2013, 2014, 2016,
2017 it’s 7% and 2015 decrease to 6%. Investment in share and securities is the first year is 18%
but last four year its fall and stable value is 11%. Loans and Advances are increasing from the year
2013 to 2014 and value is 51% to 55% and 2015 to 2017 its stable decreasing value is 53%.
Deposits & other accounts first two years good side but last three years its decline 2015 to 2017 is
90.18% & 90.32% and 90.55%.

30 © “Daffodil International University”
4.2.2 Common Size of Income Statement Common Size
Particulars 2013 2014 2015 2016 2017
Interest Income 100% 100% 100% 100% 100%
Interest Paid on Deposits and Borrowings etc. 83% 72% 77% 67% 63%
Total Interest Income 17% 28% 23% 33% 37%
Income from Investments 13% 13% 14% 18% 17%
Commission, Exchange Earnings & Brokerage 6% 10% 7% 9% 12%
Other Operating Income 5% 6% 4% 4% 3%
Net Interest Income 25% 30% 25% 31% 32%
Total operating income (A) 41% 58% 49% 65% 70%
Salary and Allowances 19% 25% 28% 31% 30%
Rent, Taxes, Insurance, Electricity, etc. 5% 5% 7% 7% 7%
Legal Expenses 0% 0% 0% 0% 0%
Postage, Stamp, Telecommunication etc. 1% 1% 1% 1% 1%
Stationery, Printing, Advertisement etc. 1% 1% 1% 1% 1%
Managing Director's salary and allowances 0% 0% 0% 0% 0%
Directors' Fee 0% 0% 0% 0% 0%
Audit & Evaluation Fee 0% 0% 0% 0% 0%
Depreciation & Repair of Fixed Assets 3% 3% 3% 3% 3%
Other Expenses 5% 7% 8% 8% 8%
Total operating expenses (B) 34% 42% 47% 51% 51%
Profit before Provision (C)=A-B 7% 16% 1% 13% 18%
Provision for classified loans 2% 9% 0% 2% 1%
Provision for unclassified loans 1% 0% 0% 0% 0%
Other provisions 0% 1% 0% 3% 8%
Total provision (D) 3% 11% 0% 5% 9%
Profit/(loss) before taxes (C-D) 4% 6% 1% 8% 9%
Provision for Taxation 4% 5% 1% 6% 7%
Current tax 4% 4% 1% 6% 7%
Deferred tax 0% 0% 0% 0% 0%
Net profit/ (loss) after taxation 1% 1% 0% 2% 3%
Appropriations
Statutory Reserve 1% 1% 0% 1% 1%
General Reserve 0% 0% 0% 0% 0%
Dividends etc. 0% 0% 0% 0% 0%
1% 1% 0% 1% 1%
Retained surplus 0% 0% 0% 1% 1%

31 © “Daffodil International University”
4.3 Trend Analysis
4.3.1 Trend Analysis of Balance Sheet Trend Analysis of Assets:
Trend Analysis
Particulars 2013 2014 2015 2016 2017
PROPERTY AND ASSETS
Cash 100% 117% 112% 124% 145%
Cash in hand (including foreign currencies) 100% 99% 57% 63% 73%
Balance with Bangladesh Bank and its agent bank(s)
(including foreign currencies
100% 124% 132% 146% 170%
Balance with other banks and financial institutions 100% 155% 185% 188% 231%
In Bangladesh 100% 154% 184% 188% 231%
Outside Bangladesh 100% 398% 584% 397% 187%
Money at call and short notice 100% 10% 9% 34% 8%
Investments 100% 68% 76% 79% 92%
Government 100% 61% 71% 74% 77%
Others 100% 117% 113% 114% 190%
Loans and Advances 100% 125% 127% 132% 153%
Loans, Cash Credit, Overdrafts etc. 100% 126% 129% 138% 159%
Bills purchased and discounted 100% 43% 215% 349% 1177%
Loans & Advances of BCI 100% 98% 93% 0% 0%
Fixed assets including premises, furniture and fixtures 100% 99% 87% 79% 78%
Other assets 100% 108% 117% 120% 133%
Non-banking assets 0% 0% 0% 0% 0%
Total Assets 100% 115% 123% 127% 149%
32 © “Daffodil International University”
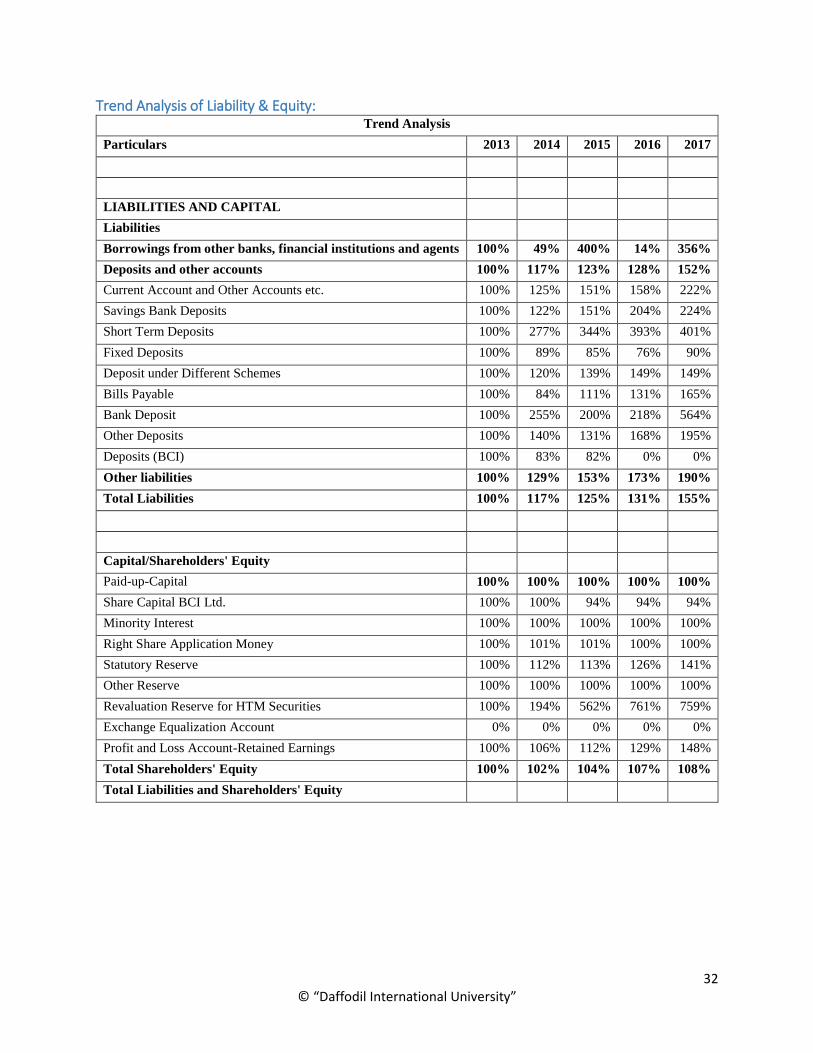
Trend Analysis of Liability & Equity: Trend Analysis
Particulars 2013 2014 2015 2016 2017
LIABILITIES AND CAPITAL
Liabilities
Borrowings from other banks, financial institutions and agents 100% 49% 400% 14% 356%
Deposits and other accounts 100% 117% 123% 128% 152%
Current Account and Other Accounts etc. 100% 125% 151% 158% 222%
Savings Bank Deposits 100% 122% 151% 204% 224%
Short Term Deposits 100% 277% 344% 393% 401%
Fixed Deposits 100% 89% 85% 76% 90%
Deposit under Different Schemes 100% 120% 139% 149% 149%
Bills Payable 100% 84% 111% 131% 165%
Bank Deposit 100% 255% 200% 218% 564%
Other Deposits 100% 140% 131% 168% 195%
Deposits (BCI) 100% 83% 82% 0% 0%
Other liabilities 100% 129% 153% 173% 190%
Total Liabilities 100% 117% 125% 131% 155%
Capital/Shareholders' Equity
Paid-up-Capital 100% 100% 100% 100% 100%
Share Capital BCI Ltd. 100% 100% 94% 94% 94%
Minority Interest 100% 100% 100% 100% 100%
Right Share Application Money 100% 101% 101% 100% 100%
Statutory Reserve 100% 112% 113% 126% 141%
Other Reserve 100% 100% 100% 100% 100%
Revaluation Reserve for HTM Securities 100% 194% 562% 761% 759%
Exchange Equalization Account 0% 0% 0% 0% 0%
Profit and Loss Account-Retained Earnings 100% 106% 112% 129% 148%
Total Shareholders' Equity 100% 102% 104% 107% 108%
Total Liabilities and Shareholders' Equity
33 © “Daffodil International University”
Interpretation: A trend analysis is a facet of technical analysis that tries to predict the long run
movement of a stock supported past data. Trend analysis relies on the idea that what is going on
in the past provides traders an idea of what is going to happen within the future. Cash in hand is
increasing every year for 2013 to 2017 and value is 100% to 145%. Investment in shares and
securities decrease and loans & advances increase from the year 2013 to 2017. Banks fixed assets
(Land, building, furniture, and fixtures) also decrease per year from 2013 to 2017 and the value is
100% to 78%. It’s bad side. Borrowings from other banks, financial institutions, and agents it’s
also gradually increased and the highest value is 356% and the year is 2017. Deposits and other
accounts also gradually increased from the year 2013 to 2017 value is 100% to 152%. Bills payable
is the first-year increase but second-year decrease third year to the fifth year increased. So from
year 2013 to 2017 value is 100% & 84% & 111% & 131% & 165%.
34 © “Daffodil International University”
4.3.2 Trend Analysis of Income Statement Trend Analysis
Particulars 2013 2014 2015 2016 2017
Interest Income 100% 108% 96% 89% 96%
Interest Paid on Deposits and Borrowings etc. 100% 93% 88% 71% 72%
Total Interest Income 100% 185% 134% 180% 215%
Income from Investments 100% 110% 102% 122% 127%
Commission, Exchange Earnings & Brokerage 100% 178% 111% 128% 184%
Other Operating Income 100% 130% 76% 74% 55%
Net Interest Income 100% 132% 99% 113% 127%
Total operating income (A) 100% 153% 113% 140% 162%
Salary and Allowances 100% 148% 141% 147% 156%
Rent, Taxes, Insurance, Electricity, etc. 100% 108% 128% 130% 138%
Legal Expenses 100% 147% 215% 130% 127%
Postage, Stamp, Telecommunication etc. 100% 132% 176% 178% 190%
Stationery, Printing, Advertisement etc. 100% 125% 91% 76% 111%
Managing Director's salary and allowances 100% 382% 382% 423% 491%
Directors' Fee 100% 140% 141% 154% 195%
Audit & Evaluation Fee 100% 138% 63% 144% 218%
Depreciation & Repair of Fixed Assets 100% 95% 90% 89% 95%
Other Expenses 100% 133% 135% 131% 140%
Total operating expenses (B) 100% 135% 134% 136% 146%
Profit before Provision (C)=A-B 100% 237% 19% 158% 235%
Provision for classified loans 100% 516% 16% 114% 63%
Provision for unclassified loans 100% 72% 0% 0% 0%
Other provisions 100% 248% 0% 572% 1860%
Total provision (D) 100% 381% 11% 150% 290%
Profit/(loss) before taxes (C-D) 100% 142% 24% 163% 199%
Provision for Taxation 100% 139% 19% 147% 183%
Current tax 100% 127% 14% 134% 173%
Deferred tax 100% -62% -72% -88% 0%
Net profit/ (loss) after taxation 100% 153% 43% 224% 255%
Appropriations
Statutory Reserve 100% 149% 10% 154% 181%
General Reserve 0% 0% 0% 0% 0%
Dividends etc. 0% 0% 0% 0% 0%
100% 149% 10% 154% 181%
Retained surplus 100% 170% 184% 527% 576%
35 © “Daffodil International University”
Chapter-05
Problems, Recommendation & Conclusion
36 © “Daffodil International University”
5.1 Problems Identified
BCBL is one of the leading banks in Bangladesh and has a strong position in the banking sector
of the country. From the general banking and financial performance of the bank, there are some
findings which need to be justified.
The findings are as follows-
Decreased Cash ratio: BCBL’s cash ratio has been decreasing since 2013. Considering
liquidity of the bank, it’s critical and needs to be addressed.
Total Assets Turnover: The Banks total assets turnover is decreasing in every year. Since
Asset Turnover ratio is often used as an indicator of the efficiency, the bank should take care
of it.
Return on Assets: Return on assets (ROA) is a financial ratio that shows the percentage of
profit a company earns in relation to its overall resources. The banks return on assets is
decreasing in every year from 2013 to 2017
Decreasing Equity to Assets Ratio: The ratio, expressed as a percentage, is calculated by
dividing total shareholders ‘equity by total assets of the firm, and it represents the number of
assets on that shareholders have a residual claim. BCBL equity to assets ratio is decreasing in
every year from 2013 to 2017 and it’s not good for the bank.
Net Interest Margin: BCBL net interest is decreasing every year from 2014 to 2017. Net
interest margin (NIM) is a live of the distinction between the interest income generated by
banks or different financial institutions and also the amount of interest paid out to their lenders
(for example, deposits), relative to the amount of their (interest-earning) assets.
Clearing Sections: Bank’s clearing sections is not good. Because the bank use the old model
of PC and Internet is very slow that’s why clearing sections take huge of time. PC of Bank is
not modern and comprehensive banking software. It does not provide adequate support to
provide the services.
Few number of Exporter and Importer: The number of exporter and importer who operate
through this bank is not enough to achieve the goal. If the bank wants to increase its total
foreign business then it should increase total export, import, and remittance.
37 © “Daffodil International University”
5.2 Recommendations for BCBL
It is really difficult to draw recommendation based on three months’ work experience and it would
be audacious of me to give suggestions to the people who have better understanding and expertise
than me. However, there square measure few areas during which I feel the organization will
improve-
The bank should focus on cash ratio and should figure out the way to increase it. If the bank
falls in a liquidity crisis, it will not be able to reply current obligations.
The BCBL total asset turnover is decreasing in every year. The bank should focus on the
utilization of its assets in the coming years so that total asset turnover will be increased.
Return on asset is the indicator of how the bank uses its asset to generate returns. The bank
needs to pay attention to increase ROA.
BCBL’s equity to assets ratio is decreasing in every year from 2013 to 2017. The bank should
focus on it.
The Bank’s net interest margin need to increase. It’s decreasing per year from 2013 to 2017.
As net interest margin in one of the major indicators of a bank’s performance, it should be
addressed.
The bank’s remittance problem is one of the main reasons for decreasing cash collection.
The bank’s remittance system is inadequate compared with other banks. So, the bank should
increase money exchange system.
The Banks need to increase the number of Exporters and importers by providing better
services.

38 © “Daffodil International University”
5.3 Conclusion
Due to some unavoidable situation, 2017 was not a good business year for the financial
institutions. In spite of that, BCBL has achieved its business target in 2017. The management of
the bank is always keen and active to take any initiative and action in favor of the betterment of
the customers and shareholders. In recent years, the bank has a specific focus on developing skilled
human capital, increase low-cost deposit, special focus on the SME sector. The bank has offered
a diverse array of products and services to satisfy its customers’ need and demand. It has a special
focus on taking care of each segment of the clients’ base.
Bangladesh Commerce Bank Ltd. is a new generation Bank. It is committed to providing top
quality financial services/products to contribute to the growth of G.D.P of the country through
stimulating trade and commerce, accelerating the pace of industrialization, boosting up export,
making employment chance for the educated youth, poverty alleviation, raising normal of living
of limited income cluster and overall sustainable socio-economic development of the country.
Bangladesh Commerce Bank Ltd definitely satisfies its customers and to maintain this scenario in
a more efficient manner. To enrich and maintain additional robust an improved name is that the
only solution to make a business more progressive. From the starting period of an internship, I
really enjoyed very much. During this period I can learn more things and gather more experience
in banking sector activities. I really enjoyed my internship at Bangladesh Commerce Bank Ltd.
from the very first day. I am sure that this Three months internship program at Bangladesh
Commerce Bank Ltd. will absolutely help me to build up my carrier in the job market.

39 © “Daffodil International University”
References:
Annual Report of BCB – Bangladesh Commerce Bank Limited 2013 to 2017
Different Types of From of BCBL
Daily Statement of Bangladesh Commerce Bank Limited, Dhaka
Analysis Guide Of Bangladesh Bank
Prospectus of BCB
Web Site:
http://www.bcblbd.com/
https://www.bb.org.bd/links/links.php
https://en.wikipedia.org/wiki/Bangladesh_Commerce_Bank_Limited