International Supply Chains as Real Transmission Channels of Financial Shocks
17
Journal The Capco Institute Journal of Financial Transformation #31 Cass-Capco Institute 03.2011 Recipient of the Apex Awards for Publication Excellence 2002-2010 10 Year Anniversary
Transcript of International Supply Chains as Real Transmission Channels of Financial Shocks
JournalThe Capco Institute Journal of Financial Transformation
#31Cass-Capco Institute
03.2011
Recipient of the Apex Awards for Publication Excellence 2002-2010
10Year Anniversary
83
PART 1
AbstractThe article analyzes the role of international supply chains as
transmission channels of a financial shock. In these produc-
tion networks, individual firms rely on each other, either as
supplier of intermediate goods or client for their own pro-
duction. An exogenous financial shock affecting a single
firm, such as the termination of a line of credit, reverberates
through the productive chain, with potential disruption ef-
fects. A resonance effect amplifies the back and forth inter-
action between real and monetary circuits when banks oper-
ate at the limit of their institutional capacity, defined by the
capital adequacy ratio, and their assets are priced to market.
The transmission of the initial financial shock through real
channels is tracked by modeling supply-driven international
input-output interactions. The paper applies the proposed
methodology on an illustrative set of interconnected econ-
omies: the U.S. and nine developed and developing Asian
countries.
Hubert Escaith — Chief Statistician, Economic Research and Statistics Division, WTO
Fabien Gonguet — Ecole Polytechnique-ENSAE1
International Supply Chains as Real Transmission Channels of Financial Shocks
1 This article revises and updates a WTO Staff Working Paper published in
2009 (ERSD-2009-06). The views expressed in this document are those
of the authors and do not represent a position, official or unofficial, of the
WTO.
84
For the past 20 years, trade in tasks has been progressively competing
with trade in final goods as the major driver of globalization. Global value
chains have emerged as a dominant business model, based on the geo-
graphical dissociation of consumption and production and the fragmen-
tation of the production processes within networks of firms. Nowadays,
specific industrial operations, from the conception to the assembly of
final products, are no longer undertaken by a single establishment but are
increasingly outsourced within these global supply chains. It is becoming
common practice for firms to process unfinished goods through affili-
ate or non affiliate firms. Indeed, most of the enormous growth in trade
recorded in the last 20 years has consisted of relatively similar goods
(manufactures) between relatively similar countries; moreover, a high pro-
portion of trade takes place within industries rather than between them
[Neary (2009)].
Economic theory predicts that if the production process of a final good
can be segmented, then opportunities for economies of scale or scope
may exist. In such a case, slicing the value chain into smaller segments
leads to more efficient production, especially when done in an interna-
tional context, due to wider differences in factor endowments and com-
parative advantages. However, the greater supply interconnection has
also provided greater and faster channels of propagation of adverse ex-
ternal shocks. Because production is internationally diversified, adverse
external shocks may affect firms not only through final demand (a sudden
decline in exports), but also through a disruption of the flow of inputs re-
ceived from their suppliers. Optimal chain length is, therefore, determined
by the trade-off between the gains to specialization and the higher failure
rate associated with longer chain length [Levine (2010)]. Indeed, the large
drop in trade registered in 2008-2009 is attributed to the leverage effect
induced by the geographical fragmentation of production [Tanaka (2009),
Yi (2009)], albeit the estimation of trade elasticity in times of crisis is a
complex matter [Escaith et al. (2010)].
While the financial and macroeconomic channels of shock transmission
have received much attention, the role of industrial linkages as vectors of
contagion remains to be thoroughly investigated. The disruptive poten-
tial of a failure in the international supply chain is becoming larger with
time: trade in manufactures represented a quarter of the world industrial
output in 2000, this proportion doubled in only five years. Almost 40% of
this trade relates to the exchange of intermediate inputs and goods for
processing, either traded between establishments pertaining to the same
multinational enterprise, or exported to contracting parties for process-
ing, then re-imported.
The objective of the article is to focus on the real transmission channels
of financial shocks. The paper formalizes, from a combination of mac-
roeconomic and sectorial perspectives, how financial restrictions – for
example, a credit crunch initiating in a particular country – can disrupt
a series of productive activities, affect worldwide production processes,
and lead to self-sustained debt deflation. To do so, the paper develops an
approach that builds on two interrelated concepts (input-output analysis
and the monetary circuit) to model the sequence of financial and produc-
tive interactions along the international supply chain. Because firms rely
on suppliers in carrying out part of the production process (outsourcing
or off-shoring), and/or because they sell their production to other firms,
the smooth realization of production plans from initial investment to final
sales depends on the availability of credit at all stages of the produc-
tion chain. An initial exogenous monetary shock, occurring, for example,
when a bank shuts down an existing line of credit, will, therefore, replicate
through the production chain. Through this ‘real transmission channel,’
the initial financial shock will propagate itself along the chain, affecting all
firms in the supply network. Modeling how these supply-driven impulses
propagate through open economies and feedback into the monetary cir-
cuit are the main objectives of this paper. An application is made on the
U.S.-Asian case in 2000 and 2008. A section of conclusions presents the
main findings.
The conceptual building blocks: monetary circuit and international input-output models The turmoil that led to the 2008-2009 trade collapse was initially a finan-
cial crisis, which translated into a series of real effects. Modeling the par-
allel transmission of real and financial shocks along inter-industry chan-
nels is important to understand the systemic nature of the crisis. The
approach used in this paper builds on two interrelated concepts inherited
from the Physiocrats: the monetary circuit and input-output analysis.
The monetary circuit Resolute believers that credits made deposits, Physiocrats viewed money
as a medium of exchange, a mere ‘signe représentatif’ (token money). In
this ‘entrepreneur’ economy, money circulates as a counterpart to goods
and services. Physiocrats attributed to bankers the double responsibility
of validating productive projects, extending the credit which would al-
low firms to produce those products. By the same stroke of a pen, they
would also create the money which would allow their consumption by
households. The monetary counterpart of production begins with credit
granted by the banks to the producers, and it ends when the goods that
were produced are sold and the initial loan is reimbursed (money is ‘de-
stroyed’ at the end of the circuit).
The monetary circuit closely matches the production process. This pro-
cess is divided into a finite number of stages, so that the output of one
stage constitutes the input of the next – with the final stage yielding con-
sumable output. All firms depend on credit to finance the current produc-
tion costs (wages, intermediate consumption, and use of capital goods).
The ‘temps du circuit,’ the elapsed time between money creation and its
destruction, is closely related with the production time.
85
This monetary concept went through several years of relative neglect
during the 1980s, when the focus of macroeconomics was controlling
inflation. Controlling the quantity of an (exogenous) stock of money was
central to monetarist policies. Since then, the instability of monetary ag-
gregates and the contagion of financial crisis since the late 1990s called
for alternative paradigms. It is certainly not a coincidence if endogenous
money is making a ‘come back’ in the recent macroeconomic literature,
like the New Institutional Economics [Stiglitz and Greenwald (2003)] and
the Post Keynesians [Godley and Lavoie (2007)]. From the practitioner’s
perspective, which guides this essay, the monetary circuit and its close
links to production are attractive features when analyzing the actual func-
tioning of an economy. Indeed, the concept of endogenous money is at
the core of financial regulations such as minimum reserve requirements,
which aim at controlling the capacity of banks to extend new loans and
is closely associated with the establishment of international standards as
those of Basel.
A canonical version of the monetary model starts with a request for credit
by a firm to a bank in order to start a production process. Using the
borrowed money, the firm purchases inputs and pays workers to pro-
duce the merchandises. The goods produced are sold to consumers or
to other firms (if the firm produces investment or intermediate goods).
When the firm is paid, it uses the money resulting from the sale to repay
its debt to the bank (plus interest rate), and its own suppliers if they had
extended payment facilities.2 In order to simplify the model, without mod-
ifying the reasoning, it will be assumed that all profits made by the firm
are redistributed to owners, so that there are no retained earnings. All the
value-added created in the production process goes back to households
as wages or distributed profits.
Since this is credit money, any money injected in the circuit is balanced
by a debt obligation. The repayment of outstanding loans not only ‘de-
stroys money,’ but also allows the bank to extend new credit within the
limit of the prudential loans/assets ratio. The record of debt and its ratio
with respect to the bank’s assets (gold in the Physiocrats’ perspective, or
any asset considered as secure by the regulatory authorities in a contem-
porary context) is a key feature of our model.3 It acts as a bridge between
flows and stocks, between real and monetary shocks, and between mi-
cro and macro effects. Because the price of the asset is also linked to the
macroeconomic conjuncture (business cycle), the regulatory process is
pro-cyclical: in phases of boom, asset prices go up, increasing the lend-
ing capacity of banks; when the business cycle is downward oriented,
asset prices go down and banks have to cut on their credits in order to
respect the prudential ratio.4
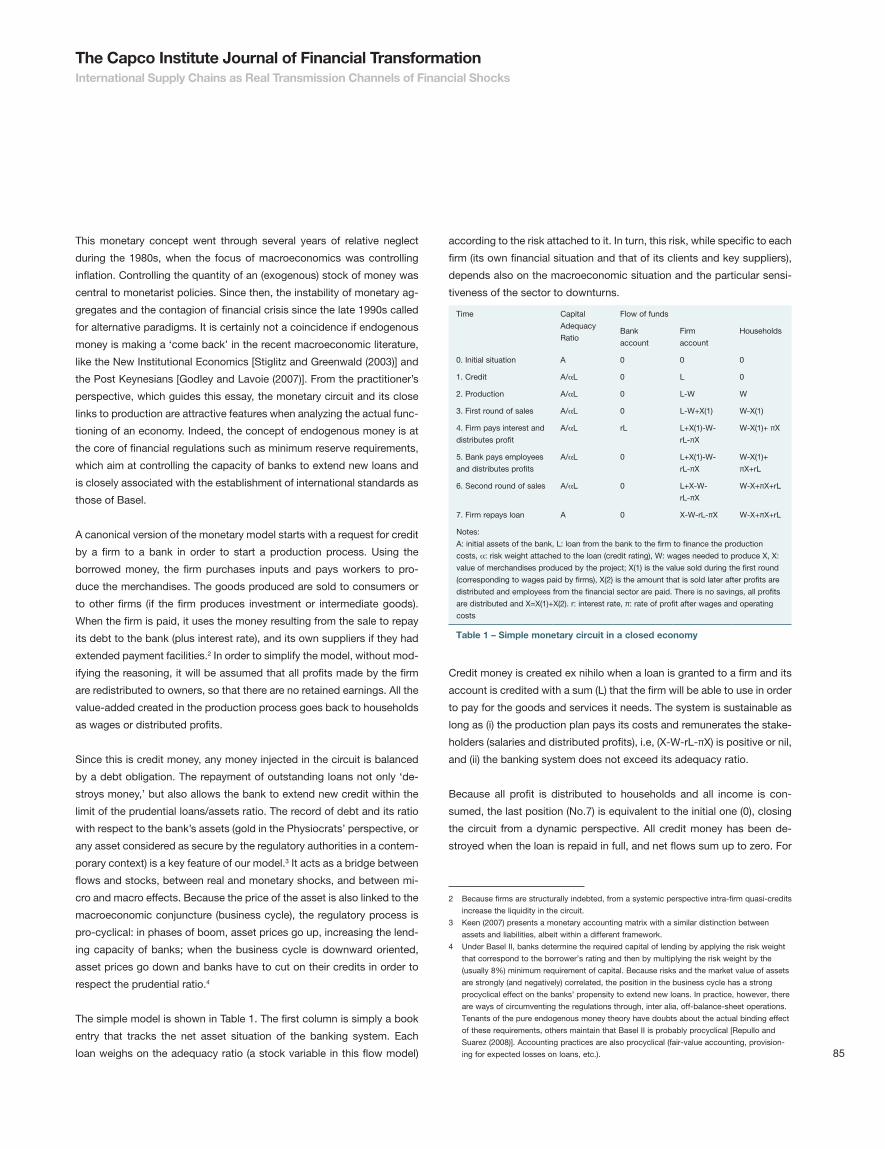
The simple model is shown in Table 1. The first column is simply a book
entry that tracks the net asset situation of the banking system. Each
loan weighs on the adequacy ratio (a stock variable in this flow model)
according to the risk attached to it. In turn, this risk, while specific to each
firm (its own financial situation and that of its clients and key suppliers),
depends also on the macroeconomic situation and the particular sensi-
tiveness of the sector to downturns.
Time Capital
Adequacy
Ratio
Flow of funds
Bank
account
Firm
account
Households
0. Initial situation A 0 0 0
1. Credit A/aL 0 L 0
2. Production A/aL 0 L-W W
3. First round of sales A/aL 0 L-W+X(1) W-X(1)
4. Firm pays interest and
distributes profit
A/aL rL L+X(1)-W-
rL-πX
W-X(1)+ πX
5. Bank pays employees
and distributes profits
A/aL 0 L+X(1)-W-
rL-πX
W-X(1)+
πX+rL
6. Second round of sales A/aL 0 L+X-W-
rL-πX
W-X+πX+rL
7. Firm repays loan A 0 X-W-rL-πX W-X+πX+rL
Notes:
A: initial assets of the bank, L: loan from the bank to the firm to finance the production
costs, a: risk weight attached to the loan (credit rating), W: wages needed to produce X, X:
value of merchandises produced by the project; X(1) is the value sold during the first round
(corresponding to wages paid by firms), X(2) is the amount that is sold later after profits are
distributed and employees from the financial sector are paid. There is no savings, all profits
are distributed and X=X(1)+X(2). r: interest rate, π: rate of profit after wages and operating
costs
Table 1 – Simple monetary circuit in a closed economy
Credit money is created ex nihilo when a loan is granted to a firm and its
account is credited with a sum (L) that the firm will be able to use in order
to pay for the goods and services it needs. The system is sustainable as
long as (i) the production plan pays its costs and remunerates the stake-
holders (salaries and distributed profits), i.e, (X-W-rL-πX) is positive or nil,
and (ii) the banking system does not exceed its adequacy ratio.
Because all profit is distributed to households and all income is con-
sumed, the last position (No.7) is equivalent to the initial one (0), closing
the circuit from a dynamic perspective. All credit money has been de-
stroyed when the loan is repaid in full, and net flows sum up to zero. For
2 Because firms are structurally indebted, from a systemic perspective intra-firm quasi-credits
increase the liquidity in the circuit.
3 Keen (2007) presents a monetary accounting matrix with a similar distinction between
assets and liabilities, albeit within a different framework.
4 Under Basel II, banks determine the required capital of lending by applying the risk weight
that correspond to the borrower’s rating and then by multiplying the risk weight by the
(usually 8%) minimum requirement of capital. Because risks and the market value of assets
are strongly (and negatively) correlated, the position in the business cycle has a strong
procyclical effect on the banks’ propensity to extend new loans. In practice, however, there
are ways of circumventing the regulations through, inter alia, off-balance-sheet operations.
Tenants of the pure endogenous money theory have doubts about the actual binding effect
of these requirements, others maintain that Basel II is probably procyclical [Repullo and
Suarez (2008)]. Accounting practices are also procyclical (fair-value accounting, provision-
ing for expected losses on loans, etc.).
The Capco Institute Journal of Financial TransformationInternational Supply Chains as Real Transmission Channels of Financial Shocks
86
money to be destroyed all real transactions should take place as planned,
i.e., there is no unsold final or intermediary goods. This characteristic of
the monetary circuit provides an insight on an important property of the
system: any stock of goods remaining in the ‘real’ system (where it is
reported as gross investment in national accounts) has a counterpart in
outstanding credit money in the financial circuit.
Outstanding inventories can be voluntary, when firms wish to smooth
production and sales (i.e., to protect themselves from disruption in their
production chain, or to be able to face a surge in demand). But stocks can
be undesired when they correspond to negative shocks or when produc-
tion plans based on ex-ante previsions prove to be too optimistic when
confronted with the ex-post situation. Any accumulation of inventories,
either desired or undesired, must be financed out of retained profits or
bank credit. In practice, because firms have a structural saving gap, any
increase in their inventories (assimilated to gross investment in national
accounts) will increase their net demand for credit and the quantity of
outstanding money.5 Since this outstanding credit money has a counter-
part in the capital adequacy ratio of banks, a limit may be reached (either
because ‘too much’ credit has already been extended – in relation to
bank’s assets – or because the underlying quality of the borrowing firms
has deteriorated, or because the value of bank’s assets went down).
When the limit is reached, it constrains the supply of new loans and the
renewal of existing lines of credit. In their most severe forms, the binding
constraints may cause a ‘credit crunch.’
The procyclical nature of prudential ratios is a central feature of the mod-
el, and the object of much debate. In many reports on the implications of
minimum capital-requirements, the potential restrictions are often quali-
fied by mentioning that most banks hold capital in excess of the regula-
tory minima or are able to circumvent the binding constraints. Accord-
ing to Repullo and Suarez (2008), this ‘benign neglect’ of the potential
procyclical effect is due to a series of misconceptions. The 2008-2009
crisis showed that larger than expected market swings, with deteriorating
balance-sheet quality, severely limit access to equity and financial mar-
kets. As mentioned by Krugman (2008), in time of crisis, the core problem
is capital rather than liquidity.
This very simple model grossly underestimates the complexity of the ac-
tual circuit.6 In reality, a multiplicity of simultaneous production plans are
in place and the closure of the system (the sale of the production) does
not depend on the wages and profits distributed by the producer, but on
a stream of activities going on in the rest of the economy. In the same
way, firms are not homogeneous: some produce mainly final goods, oth-
ers investment or intermediate goods and the productive process can
be fragmented among various establishments. Both the productive and
monetary circuits are longer, and the elapsed time between initial and
final positions (the ‘temps du circuit’) is increased. The longer the circuit,
the larger the number of individual firms participating in the supply chain,
the higher the probability of outstanding credit money.
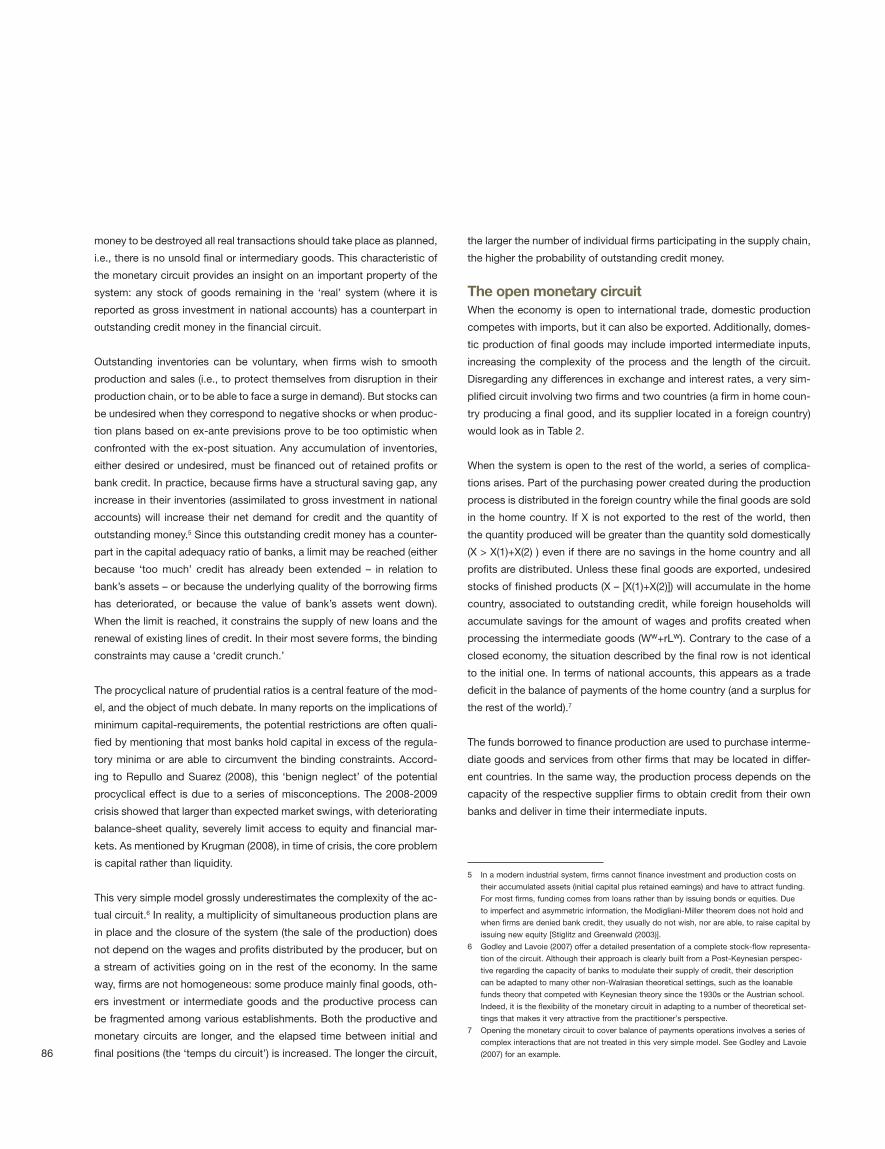
The open monetary circuitWhen the economy is open to international trade, domestic production
competes with imports, but it can also be exported. Additionally, domes-
tic production of final goods may include imported intermediate inputs,
increasing the complexity of the process and the length of the circuit.
Disregarding any differences in exchange and interest rates, a very sim-
plified circuit involving two firms and two countries (a firm in home coun-
try producing a final good, and its supplier located in a foreign country)
would look as in Table 2.
When the system is open to the rest of the world, a series of complica-
tions arises. Part of the purchasing power created during the production
process is distributed in the foreign country while the final goods are sold
in the home country. If X is not exported to the rest of the world, then
the quantity produced will be greater than the quantity sold domestically
(X > X(1)+X(2) ) even if there are no savings in the home country and all
profits are distributed. Unless these final goods are exported, undesired
stocks of finished products (X – [X(1)+X(2)]) will accumulate in the home
country, associated to outstanding credit, while foreign households will
accumulate savings for the amount of wages and profits created when
processing the intermediate goods (Ww+rLw). Contrary to the case of a
closed economy, the situation described by the final row is not identical
to the initial one. In terms of national accounts, this appears as a trade
deficit in the balance of payments of the home country (and a surplus for
the rest of the world).7
The funds borrowed to finance production are used to purchase interme-
diate goods and services from other firms that may be located in differ-
ent countries. In the same way, the production process depends on the
capacity of the respective supplier firms to obtain credit from their own
banks and deliver in time their intermediate inputs.
5 In a modern industrial system, firms cannot finance investment and production costs on
their accumulated assets (initial capital plus retained earnings) and have to attract funding.
For most firms, funding comes from loans rather than by issuing bonds or equities. Due
to imperfect and asymmetric information, the Modigliani-Miller theorem does not hold and
when firms are denied bank credit, they usually do not wish, nor are able, to raise capital by
issuing new equity [Stiglitz and Greenwald (2003)].
6 Godley and Lavoie (2007) offer a detailed presentation of a complete stock-flow representa-
tion of the circuit. Although their approach is clearly built from a Post-Keynesian perspec-
tive regarding the capacity of banks to modulate their supply of credit, their description
can be adapted to many other non-Walrasian theoretical settings, such as the loanable
funds theory that competed with Keynesian theory since the 1930s or the Austrian school.
Indeed, it is the flexibility of the monetary circuit in adapting to a number of theoretical set-
tings that makes it very attractive from the practitioner’s perspective.
7 Opening the monetary circuit to cover balance of payments operations involves a series of
complex interactions that are not treated in this very simple model. See Godley and Lavoie
(2007) for an example.
87
The real circuit One prominent and often discussed new element in contemporaneous
business models is the emergence of global value chains, that built on
outsourcing and offshoring opportunities to develop comparative advan-
tages. Among the structural changes that have impacted the way trade
has been conducted since the last decade of the twentieth century is the
geographical slicing up of the value chain into core and support activities,
and the emergence of ‘trade in tasks.’ An early appraisal of the extent
of outsourcing can be found in Feenstra (1998) who compares several
measures of outsourcing and argues that all have risen since the 1970s.
An illustrative example of a globalized value chain can be found in Linden
et al. (2007), who study the case of Apple’s iPod.
The greater industrial interconnection of the global economy has also
created newer and faster channels for the propagation of adverse exter-
nal shocks. Referring to the 2008-2009 breakdown, some authors have
pointed out that these productive chains may explain the abrupt decrease
in trade or the synchronization of the trade collapse.8 One reason for
blaming global value chains and trade in tasks for the depth of the crisis
is the inherent magnification effect of global production networks: inter-
mediate inputs may cross borders several times before the final prod-
uct is shipped to the final costumer. Because all the different production
stages of the global value chain rely on each other – as suppliers and as
customers, an external shock is transmitted quickly to the other stages of
the supply chain through both backward and forward linkages.
In addition, since the intermediate goods produced are not commodi-
ties, but are specific to the client’s need, it is usually not easy — and it is
certainly costly — to shift to another supplier in case of disruption. The
technological dimension of complexity related with the imperfect sub-
stitutability of inputs and the associated search costs on international
markets is reviewed in Altomonte and Békés (2010). Firms dealing with
very specific, low-substitutability goods that require particular produc-
tion processes or specialized channels face higher trade complexity. As a
corollary, the failure of any single supplier will affect the entire production
chain in the short- and medium-term. At best, as a result of this supply
shock, the client-firm will suffer an increase in costs of production when
shifting to an alternative supplier; at worse, it will have to stop its produc-
tion.9
As a result, both exporters and importers face some uncertainty within
their trading relationship. The higher the complexity of the goods being
traded, the higher the uncertainty. To reduce those risks in times of cri-
ses, leading firms may extend short-term trade finance to their suppliers
and extend payment facilities to their customers. This reduction in the
risk of supply chain disruption is compensated by higher financial risks
for the leading firm.
8 Incidentally, by helping U.S. firms improve their productivity, global manufacturing con-
tributed significantly in the low interest rate policy that paved the ground for the financial
bubble which burst in 2008. Thanks to higher domestic productivity, the potential output in
manufacturing increased in line with actual production. The gains in total factor productiv-
ity sustained a long period of higher activity without creating the inflationary pressures that
would have forced a change in the lenient monetary policy.
9 In times of crisis, the firms with a greater market power (and financial capacities) may help
their key suppliers in resolving their cash-flow problems, even when it means worsening
their own cash-flow situation. Examples were found in the automobile sector during the
2008-2009 crisis.
Home country Rest of the world
Time index Capital
adequacy
ratio
Bank
account
Firm account Households Capital
adequacy
ratio
Bank
account
Firm account Households
0. Initial situation Ad 0 0 0 Aw 0 0 0
1. Credit production in home country Ad/(adLd) 0 Ld 0 Aw 0 0 0
2. Credit intermediate inputs in RofW Ad/(adLd) 0 Ld 0 Aw/(awLw) 0 Lw 0
3. Production intermediate inputs M Ad/(adLd) 0 Ld 0 Aw/(awLw) 0 Lw–Ww Ww
4. Import of inputs and production of X Ad/(adLd) 0 Ld – Wd –M Wd Aw/(awLw) 0 Lw+ M –Ww Ww
5. First round: sales of X(1) Ad/(adLd) 0 Ld +X(1)- Wd -M Wd – X(1) Aw/(awLw) 0 Lw+ M –Ww Ww
6. Firms pay interest and distribute profit Ad/(adLd) rLd Ld+ X(1)- rLd – Wd
–M–πX
Wd +πX– X(1) Aw/(awLw) rLw Lw+M–rLw–Ww- πM Ww+πM
7. Banks pay employees and distribute profits Ad/(adLd) 0 Ld+ X(1)– Wd – rLd
–M–πX
Wd +πX+ rLd
– X(1)
Aw/(awLw) 0 Liw+M–rLw–Ww- πM Ww+πM+ rLw
8. Second round of sales X(2) Ad/(adLd) 0 Ld+X– Wd – rLd
–M–πX
Wd +πX+ rLd –X Aw/(awLw) 0 Lw+M–rLw–Ww– πM Ww+πM+ rLw
9. Firms reimburse loans Ad 0 X– Wd – rLd –M –πX Wd +πX+ rLd –X Aw 0 M–rLw–Ww– πM Ww+πM+ rLw
Notes: Same notations as Table 1, except: a: risk adjusted weights, Subscripts: d: domestic; w: rest of the world, M: intermediate goods produced in the rest of the world.
Table 2 – Simple monetary circuit in an open economy
The Capco Institute Journal of Financial TransformationInternational Supply Chains as Real Transmission Channels of Financial Shocks
88
At the microeconomic level, only anecdotic information on intra-firm in-
terdependence is available, usually based on case studies. Fortunately,
at macroeconomic and sectoral levels, it is possible to exploit the infor-
mation provided by national accounts, linking them to form international
input-output tables (IIO). Because IIOs track the inter-industry flows of in-
termediate goods in an international context, they can be used to model
at industry level the real transmission channels of such a financial shock
occurring at any stage of the production chains across the countries. In
an IIO framework, the ‘real channel impact’ from a country of origin to a
country of destination is proportional to (i) the foreign final demand for
exported consumer goods and services, and (ii) the volume of trade in
intermediate goods linking industries of both countries.
Supply-driven shocks are simulated through forward linkages, with IIO
tables adapted into what is known as the Ghosh matrix (see Appendix 1).
Ignoring final demand effects (the usual ‘Leontief approach’ based on
backward linkages), the intensity of inter-country transmission of finan-
cial shocks following a credit crunch affecting the industrial sectors will
differ according to the degree of vertical integration, as measured by the
strength and depth of forward industrial linkages. Accordingly, we define
the imported real supply-driven impact coefficient (IRSIC) as:
IRSIC = %ΔP/P =ΔX(I-B)-1 ♦ 1/X (1)
Where:
X: a row vector of initial sectoral output,
ΔX: a row vector of supply-driven shocks,
%ΔP/P: a vector of price shocks in percentage,
(I-B)-1: The Ghosh Inverse Matrix,
♦ denotes the Hadamard product.10
The Ghosh multipliers computed on international I-O tables simulate the
transmission of the higher production costs caused by the initial shock
through the entire supply chain. By factoring-in the direct and indirect cost
effects, it provides the analyst with an adequate ‘tracking methodology’
which incorporates transnational impacts. As trade in intermediate goods
can be either imports or exports, similarly, the IIOs can be used to measure
either the vulnerability to imported exogenous shocks, or the disruptive
potential of exporting national industries’ problems to foreign industries.
As mentioned in the appendix, only non-disruptive supply-driven shocks
– translating into an increase in production prices – can be captured by
the indicator. The price shock hypothesis is obviously well-suited for
segmented markets, with semi-monopolistic characteristics, but is also
compatible with standard neoclassical hypotheses, as long as marginal
costs are increasing in the short term. It implies that client firms are al-
ways able to find a substitute supplier instantly, but at a higher cost. In
addition, the distance of the initial shock to the final demand is taken into
account by the indicator, because the Ghosh matrix ponders the suite
of technical coefficients according to the proximity of each round to the
initial demand. The closer the shock the larger the impact.11
These additional production costs are related to the elasticity of techni-
cal substitution in production, including elasticity of substitution between
domestic and imported inputs (Armington elasticity). When Armington
elasticities are low, large price changes are required to accommodate
small changes in quantities. This is typically the case when manufactured
intermediate inputs are differentiated and client-specific, at the difference
of commodities like oil and minerals. Substitution in a supply constrained
situation is difficult and takes time in the long run. In the short-run frame-
work of this essay, it takes money and has a big impact on supply chain
management: buying critical components on the spot market, paying
premium air or sea fare rates to get material, and over-time compensa-
tions to subcontractors [Stadtler and Kilger (2008)].
Unifying the two circuits: banks’ assessment of business risks and credit transitionThe previous two sections presented sequentially, from the monetary and
supply chain perspectives, the linkages that exist within and between
globalized industrial systems. The following section will formalize the
connections between both financial and real circuits, through the model-
ing of the ‘a’ parameter in the capital adequacy ratio that appears origi-
nally as a simple accounting device in the monetary circuit (see Table 1
and Table 2). This institutional ratio constrains the total amount of credit
that a bank may issue. International standards, issued by the Bank for
International Settlements (BIS) under Basel II, set a 8% threshold for total
risk-weighted assets.
The monetary circuit starts with a request for credit by a firm to a bank in
order to finance a production process. The bank’s decisions of granting
the loan is based on a mix of (i) microeconomic considerations, directly
related to the financial situation of the firm and the quality of its manage-
ment; (ii) sectoral specificities, such as the cyclical nature of the business
in which the firm operates; (iii) macroeconomic considerations, such as
the probability of expansion or recession, and (iv) the institutional capac-
ity of the bank to extend new credit within the limit of its loans/assets
adequacy ratio.
The microeconomic component of the bank’s decision-making process
is based, inter alia, on the direct supply-use connections of the firm re-
questing a loan. In a vertically integrated production chain, the default
10 Entry-wise product: A♦B= (a1.b1, a2.b2, ..., an.bn) on two matrices or vectors of same
dimensions.
11 Because technical coefficients are less than unity, An (the impact of initial demands at the
nth stage of the production chain) rapidly tends to 0 when n increases. The incidence of the
average length of the supply chains is analyzed in a following section.
89
of a client can cause distress to its suppliers, and the difficulties of a
key supplier can jeopardize the viability of a production plan. Business
cycles, beside their macroeconomic impact, have also industry-specific
effects. Some industrial sectors (like construction or automobiles) are
more ‘procyclical’ than others. According to the strength of its backward
and forward linkage, the credit worthiness of a procyclical firm will reflect,
through the microeconomic channel, on its direct clients and suppliers,
even when they do not operate in the same sector.
Also, because risks and the market value of assets are strongly related,
the position in the business cycle has a greatly inflated procyclical effect
on the banks’ propensity to extend new loans. When a firm’s request for
credit is turned down, it must scale down production; it affects in turn its
suppliers and even its clients through the supply chain, and influence fi-
nal demand through lower household income (wages and profits). For the
most vulnerable sectors, that are both vertically and cyclically integrated,
the conjunction of two waves of shocks, supply- and demand-driven,
can lead to a first resonance effect. The total effect of the shock is then a
multiple of each component taken in isolation.
This multiplier effect can be greatly amplified by a second resonance ef-
fect, when banks operate close to their lending limits. According to the
monetary circuit described in Table 2, the shock will affect both flow vari-
ables (additional demand for credit money to cope with the shock) and
stock variables (the credit rating of individual firms requesting additional
loans, and the capital adequacy ratio of the banks extending loans).
When a downward phase develops into a recession (i.e., when systemic
risks materialize), the credit rating of many firms is downgraded and as-
set prices go down. The capital adequacy ratio is doubly affected and
may reach a critical value, forcing banks to stop any new credit activity,
canceling existing credit arrangements to reduce risk exposure irrespec-
tive of the merit of investment projects and firms creditworthiness. This
situation defines what is called a ‘credit crunch.’
In a recessive cycle, the conjunction of real supply and demand shock,
on the one hand, and of stock-flow financial shocks, on the other hand,
may therefore have large systemic effects, even when the initial shocks
are rather limited in scope. Thus, even if a financial shock is initially ex-
ogenous, its effects on the industrial chain will cause this shock to re-
verberate through the real circuit, affecting in turn the monetary circuit
through the default risks, as perceived by the financial sector. The size of
the multiplier effect depends on the initial balance sheets of the financial
intermediaries.
Actually, modeling the weights ‘ai’ (the financial rating of productive sec-
tors) in the capital adequacy ratio (A/ΣLiai) synthesizes most of the real-
monetary dynamics embedded in the present approach, including stock-
flow interactions:
■■ From a ‘flow’ perspective, the ‘ai’ are the result of a credit rating
process that considers both financial and productive aspects, associ-
ated with (i) the firm itself and its management (what we called the
microeconomic dimension), (ii) its mode of insertion in the productive
economy and the related risks of supply-driven shocks transmitted
through the supply chain, and (iii) its exposure to the macroeconomic
business cycle, as captured by the demand-driven shocks.
■■ From a ‘stock’ perspective, the real shocks translate into the accu-
mulation of undesired stocks and extend the life expectancy of credit
money, with the related accumulation of liquidity, because loans are
not reimbursed in full. Not only money is not destroyed as expected,
but on the financial side, the accumulation of bad debts deteriorates
the banks’ balance sheet (loss provisions) and its capital adequacy
ratio (A/ΣLiai).
The ‘stock’ effect on the capital adequacy ratio is not limited to the do-
mestic industries. In a globalized economy such as described in our
model, the national financial sectors are also closely integrated and all
economies now share ‘leveraged common creditors.’ In such a context,
balance sheet contagion becomes pervasive [Krugman (2008)].
To resume, the chain of causalities, from a short-term perspective, is as
follows:
a. The shock initiates in the monetary circuit (i.e., an existing line of
credit is unexpectedly shut down), and it affects the production plans
of a firm that are inserted at some point in a larger production chain.
Because both its clients and suppliers cannot shift to other produc-
ers immediately and at no cost, the discontinuity in the production
flow will reverberate through higher costs across the system repre-
sented by the IIO matrix. The real shock, once it has fully reverber-
ated through the entire supply chains across industries and across
countries, is measured by IRSIC and is proportional to the Ghosh
coefficients that factor – in direct and indirect forward effects.
b. Exogenous supply-driven shocks also affect demand because increas-
es in production costs reflect into higher prices and lead to lower
demand. The resulting negative demand-driven secondary shocks
can be modeled individually using the traditional Leontief model (final
demand impulses), or by capturing the backward (demand) sectoral
effects of supply-driven multipliers [Papadas and Dahl (1999)].
c. The real (demand and supply) shocks feed back into the monetary
circuit through (i) the building-up of undesired stocks of finished and
intermediate goods through the supply chain, leading to the accumu-
lation of outstanding credit-money in the circuit; and (ii) the contagion
of financial risks affecting the rating of firms. In a recessive cycle,
12 As mentioned, the core problem in the 2008/2009 financial crisis was capital, not liquidity.
The Capco Institute Journal of Financial TransformationInternational Supply Chains as Real Transmission Channels of Financial Shocks
90
Origin of the shock, year: From all manufacturing sectors, 2008 b All other
countries c
Change
2000-2008 c
From China to: China Indonesia Japan Korea Malaysia Taipei Philippines Thailand U.S. Average 00-08 (%)
Agriculture 4.6 0.2 0.4 0.5 0.6 0.5 0.4 0.7 0.4 0.5 177
Mining 4.6 0.1 0.6 0.4 1.0 0.4 0.6 0.2 0.2 0.5 244
Agroindustries … 0.2 0.5 0.8 1.0 0.7 0.4 0.7 0.5 0.6 82
Textile and clothing … 1.2 4.4 3.3 3.1 2.6 1.1 1.2 2.9 2.5 85
Industrial machinery … 3.8 1.8 3.7 2.6 3.4 1.7 3.6 1.4 2.7 254
Computers and electronic equipment … 2.2 2.5 4.6 6.0 5.4 4.6 6.3 2.4 4.2 316
Other electrical equipment … 2.0 2.2 4.4 5.7 4.7 1.7 6.8 2.1 3.7 240
Transport equipment … 1.0 1.8 3.6 2.3 2.4 1.4 2.9 1.5 2.1 183
Other products … 0.6 0.9 2.2 1.9 1.5 0.8 0.8 0.9 1.2 107
Utilities (water, gas, elect.) 6.7 0.2 0.1 0.1 0.7 0.0 0.5 0.1 0.2 0.3 57
Construction 19.3 1.1 1.0 2.4 2.3 2.0 0.8 1.9 1.1 1.6 221
Trade and transport services 8.8 0.3 0.2 0.3 0.5 0.2 0.5 0.2 0.3 0.3 178
Other services 7.8 0.3 0.3 0.4 0.7 0.5 0.5 0.5 0.3 0.4 185
Total 30.5 0.5 0.7 1.8 2.4 1.7 1.0 1.6 0.6 1.3 200
From Japan to: China Indonesia Japan Korea Malaysia Taipei Philippines Thailand U.S. Average 00-08 (%)
Agriculture 0.1 0.2 7.7 0.5 0.6 0.8 0.4 1.3 0.2 0.5 7
Mining 0.2 0.2 10.3 0.3 1.0 0.6 0.7 0.4 0.1 0.4 -22
Agroindustries 0.2 0.2 … 0.7 0.9 1.1 0.4 1.0 0.2 0.6 -8
Textile and clothing 0.5 0.4 … 1.2 1.6 2.8 0.4 1.0 0.3 1.0 -40
Industrial machinery 1.4 4.9 … 2.9 3.1 5.0 2.3 7.5 0.6 3.5 -15
Computers and electronic equipment 3.6 1.5 … 3.0 4.3 5.6 7.4 5.7 0.8 4.0 -21
Other electrical equipment 2.3 1.4 … 3.0 4.3 5.2 1.9 6.3 0.6 3.1 -29
Transport equipment 1.4 1.6 … 2.9 3.8 3.4 2.1 5.8 1.0 2.7 -46
Other products 0.7 0.6 … 1.8 2.1 2.3 0.9 1.2 0.3 1.2 -36
Utilities (water, gas, elect.) 0.4 0.2 1.4 0.1 0.8 0.0 0.6 0.1 0.1 0.3 -43
Construction 0.9 1.2 12.0 1.7 2.6 2.7 0.9 2.4 0.3 1.6 -13
Trade and transport services 0.4 0.4 3.6 0.3 0.6 0.3 0.7 0.5 0.1 0.4 -21
Other services 0.4 0.4 4.2 0.4 0.7 0.6 0.6 0.6 0.1 0.5 -10
Total 0.8 0.5 19.4 1.3 2.1 2.1 1.4 2.2 0.2 1.3 -22
From Korea to: China Indonesia Japan Korea Malaysia Taipei Philippines Thailand U.S. Average 00-08 (%)
Agriculture 0.1 0.1 0.1 8.0 0.3 0.2 0.3 0.3 0.1 0.2 2
Mining 0.2 0.0 0.2 3.9 0.3 0.2 0.5 0.1 0.0 0.2 10
Agroindustries 0.2 0.1 0.1 42.7 0.4 0.3 0.2 0.3 0.1 0.2 1
Textile and clothing 0.5 0.8 0.3 … 0.7 0.9 0.5 0.3 0.2 0.5 -55
Industrial machinery 1.0 0.8 0.5 … 0.9 1.3 0.9 1.6 0.2 0.9 11
Computers and electronic equipment 2.9 0.7 0.6 … 2.2 2.6 2.6 1.6 0.4 1.7 6
Other electrical equipment 1.8 0.7 0.5 … 2.1 1.8 0.7 1.8 0.3 1.2 3
Transport equipment 0.8 0.4 0.4 … 0.9 0.8 0.7 1.1 0.3 0.7 -11
Other products 0.6 0.3 0.3 … 0.8 0.7 0.5 0.4 0.1 0.5 -31
Utilities (water, gas, elect.) 0.3 0.1 0.0 … 0.3 0.0 0.6 0.0 0.0 0.2 -21
Construction 0.7 0.5 0.2 11.0 0.9 0.7 0.4 0.6 0.1 0.5 9
Trade and transport services 0.3 0.2 0.1 4.5 0.2 0.1 0.4 0.1 0.0 0.2 -7
Other services 0.4 0.1 0.1 4.6 0.3 0.2 0.3 0.2 0.0 0.2 21
Total 0.7 0.3 0.2 24.6 0.9 0.8 0.6 0.5 0.1 0.5 -2
From Malysia to: China Indonesia Japan Korea Malaysia Taipei Philippines Thailand U.S. Average 00-08 (%)
Agriculture 0.0 0.1 0.0 0.1 4.4 0.1 0.1 0.2 0.0 0.1 31
Mining 0.0 0.1 0.1 0.0 2.6 0.1 0.2 0.1 0.0 0.1 15
Agroindustries 0.0 0.1 0.0 0.1 … 0.2 0.1 0.2 0.0 0.1 -13
Textile and clothing 0.1 0.3 0.1 0.1 … 0.2 0.1 0.2 0.1 0.1 -12
Industrial machinery 0.2 0.6 0.1 0.1 … 0.4 0.3 0.8 0.1 0.3 -13
Computers and electronic equipment 1.3 0.5 0.3 0.5 … 1.0 1.3 2.5 0.5 1.0 23
Other electrical equipment 0.6 0.5 0.2 0.4 … 0.6 0.4 2.3 0.3 0.7 9
Transport equipment 0.1 0.3 0.1 0.2 … 0.2 0.3 0.8 0.1 0.3 7
Other products 0.1 0.3 0.1 0.1 … 0.2 0.2 0.3 0.1 0.2 -30
Utilities (water, gas, elect.) 0.1 0.2 0.1 0.1 3.2 0.0 0.3 0.0 0.0 0.1 -22
Construction 0.1 0.4 0.1 0.1 10.7 0.2 0.2 0.6 0.1 0.2 1
Trade and transport services 0.1 0.2 0.0 0.0 3.1 0.1 0.2 0.1 0.0 0.1 20
Other services 0.1 0.1 0.0 0.0 3.2 0.1 0.2 0.2 0.0 0.1 39
Total 0.2 0.2 0.1 0.1 24.3 0.3 0.3 0.5 0.1 0.2 10
91
both value-to-market asset pricing and the accumulation of bad loans
affect banks’ capital adequacy ratio.
d. Because the capacity of banks to create new money is limited by
their capital adequacy ratio, their capacity to extend new credit is
severely constrained, initiating a vicious circle. Credit crunch affects
the most vulnerable firms (those more closely connected to the sector
of activity affected by the initial shock), but has also a systemic impact
through the supply chain effect that affect other sectors of activity and
reduces the banks’ systemic capacity to extend new credit, regard-
less of the individual merits of the investment programs.13
A simulation on the international U.S. - Asia production compactThis reduced model of contagion through the supply chain only requires
two variables to simulate and track the systemic implications of an exog-
enous financial shock: one flow variable (coefficient IRSIC, constructed
on the real circuit, and possibly augmented for secondary demand-driven
effects) and one stock variable (capital adequacy ratio, derived from the
monetary circuit). Because the stock-variable is partially dependent on
the flow-variable, the only strategic variable to be measured in order to
evaluate the risk of contagion from supply shocks is IRSIC.
We build our case study on ten economies (China, Indonesia, Japan, Ko-
rea, Malaysia, Chinese Taipei, Philippines, Singapore, Thailand, and the
U.S.). All these economies are key international or regional traders at differ-
ent stages of industrial development and with strong specificities in terms
of their insertion in the global economy. We use a subset of the Asian in-
ternational input-output tables (AIO tables) developed by the Institute of
13 When the adequacy ratio is reaching a critical limit, the banking sector turns down most
loan requests and flies for safety by investing in good quality government bonds, especially
the U.S. bonds. The flight for quality that followed the 2008 subprime crisis and the subse-
quent melting down of the international banking system illustrate this point and explain why
the dollar appreciated despite the fact that the U.S. economy was at the core of the crisis.
Origin of the shock, year: From all manufacturing sectors, 2008 b All other
countries c
Change
2000-2008 c
From Thailand to: China Indonesia Japan Korea Malaysia Taipei Philippines Thailand U.S. Average 00-08 (%)
Agriculture 0.0 0.1 0.1 0.1 0.4 0.1 0.2 9.1 0.0 0.1 80
Mining 0.0 0.1 0.1 0.0 0.3 0.0 0.2 2.5 0.0 0.1 122
Agroindustries 0.0 0.1 0.1 0.1 0.9 0.2 0.2 … 0.0 0.2 34
Textile and clothing 0.1 0.2 0.1 0.1 0.7 0.2 0.2 … 0.1 0.2 -39
Industrial machinery 0.1 1.5 0.2 0.1 0.7 0.2 0.3 … 0.1 0.4 151
Computers and electronic equipment 0.9 0.3 0.2 0.3 0.9 0.5 0.6 … 0.2 0.5 -2
Other electrical equipment 0.4 0.4 0.2 0.2 1.0 0.3 0.3 … 0.1 0.4 26
Transport equipment 0.1 0.5 0.2 0.1 1.3 0.2 0.9 … 0.1 0.4 106
Other products 0.1 0.2 0.1 0.1 0.7 0.1 0.2 … 0.0 0.2 9
Utilities (water, gas, elect.) 0.0 0.1 0.0 0.0 0.2 0.0 0.2 0.6 0.0 0.1 17
Construction 0.1 0.3 0.1 0.1 0.6 0.1 0.2 6.9 0.0 0.2 58
Trade and transport services 0.1 0.2 0.0 0.0 0.3 0.0 0.2 3.5 0.0 0.1 99
Other services 0.1 0.2 0.0 0.0 0.2 0.0 0.2 5.5 0.0 0.1 59
Total 0.1 0.2 0.1 0.1 0.6 0.1 0.2 24.9 0.0 0.2 16
From U.S. to: China Indonesia Japan Korea Malaysia Taipei Philippines Thailand U.S. Average 00-08 (%)
Agriculture 0.1 0.1 0.3 0.4 0.4 0.7 0.3 0.4 8.8 0.3 -2
Mining 0.1 0.1 0.3 0.2 0.6 0.2 0.4 0.1 3.4 0.2 -18
Agroindustries 0.1 0.2 0.3 0.5 0.8 0.9 0.3 0.4 … 0.4 -28
Textile and clothing 0.2 0.3 0.4 0.6 1.1 1.5 0.2 0.4 … 0.6 -43
Industrial machinery 0.4 1.5 0.7 1.0 1.5 1.6 0.6 1.4 … 1.1 -28
Computers and electronic equipment 1.4 0.5 0.7 1.4 4.0 2.4 5.6 2.1 … 2.3 -25
Other electrical equipment 0.8 0.6 0.7 1.3 3.5 1.9 1.0 2.0 … 1.5 -39
Transport equipment 0.5 0.4 0.9 1.2 1.5 1.1 0.6 1.2 … 0.9 -28
Other products 0.3 0.3 0.4 0.6 1.0 0.9 0.4 0.4 … 0.5 -45
Utilities (water, gas, elect.) 0.1 0.1 0.1 0.1 0.4 0.0 0.3 0.0 2.1 0.1 -47
Construction 0.3 0.3 0.3 0.5 0.9 0.8 0.3 0.5 11.4 0.5 -17
Trade and transport services 0.1 0.2 0.1 0.1 0.3 0.1 0.4 0.1 3.7 0.2 -33
Other services 0.2 0.2 0.1 0.2 0.4 0.3 0.4 0.3 3.8 0.2 -28
Total 0.3 0.2 0.3 0.5 1.5 0.9 0.9 0.6 14.3 0.7 -29
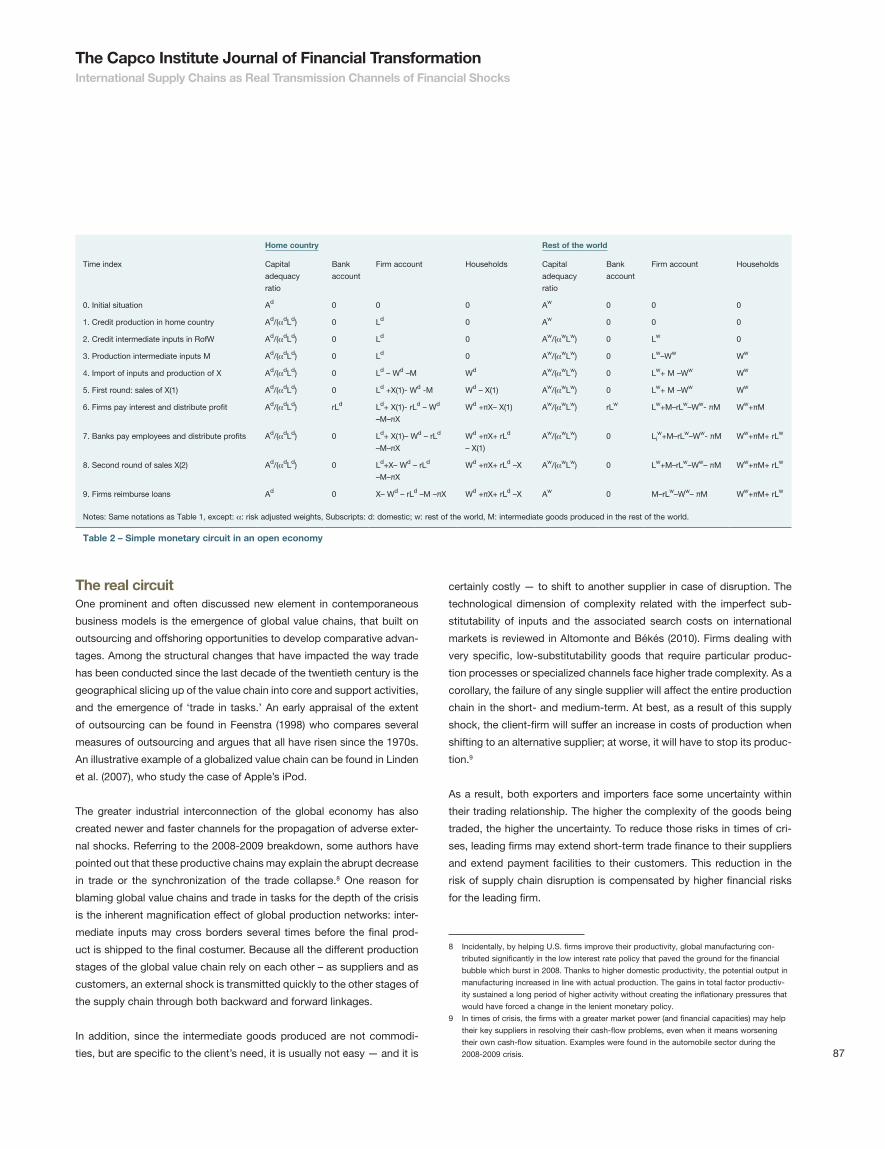
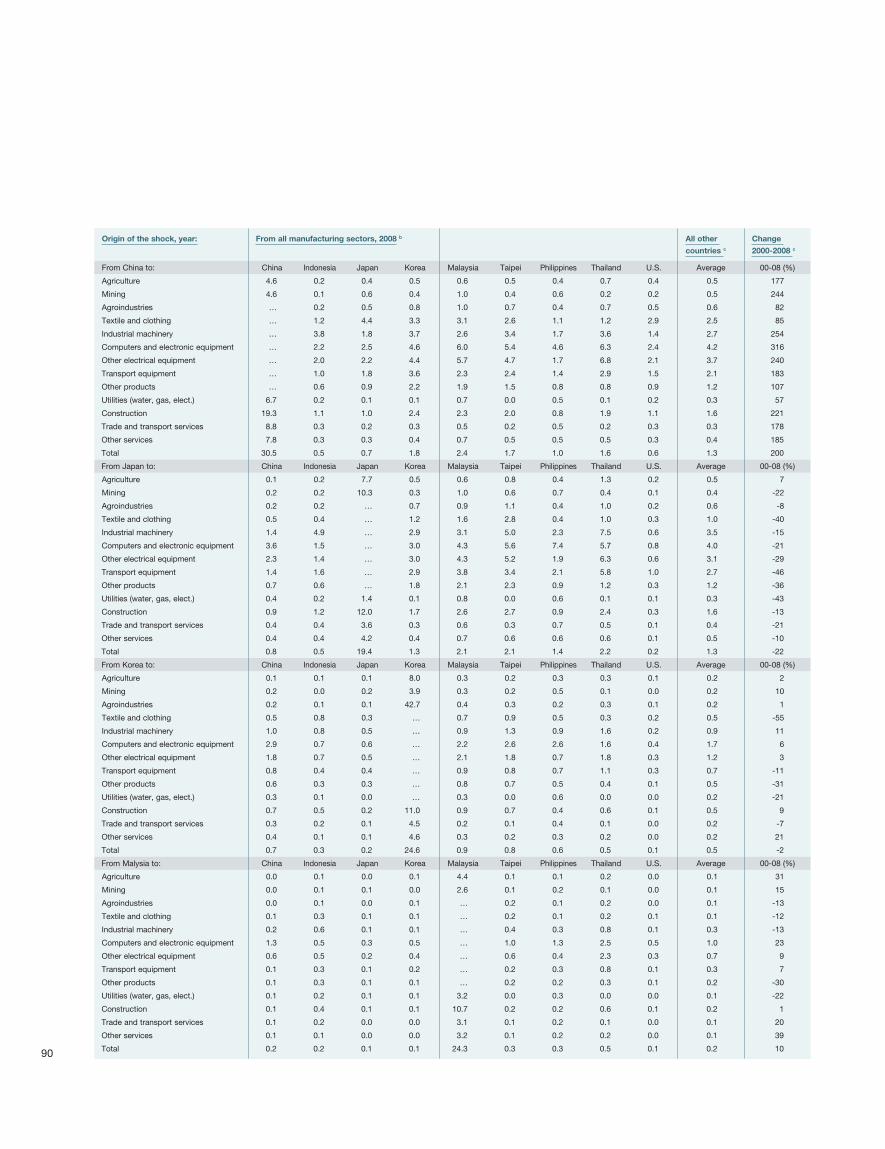
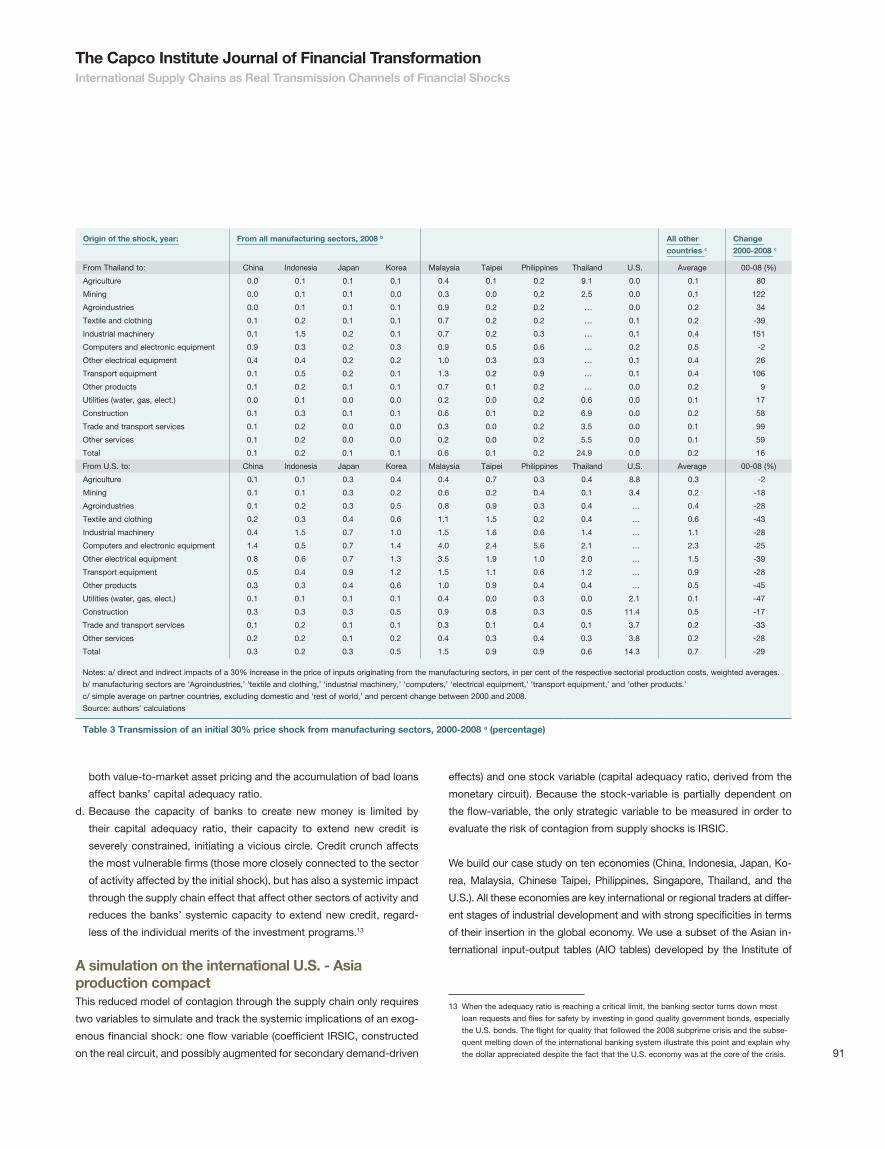
Notes: a/ direct and indirect impacts of a 30% increase in the price of inputs originating from the manufacturing sectors, in per cent of the respective sectorial production costs, weighted averages.
b/ manufacturing sectors are ‘Agroindustries,’ ‘textile and clothing,’ ‘industrial machinery,’ ‘computers,’ ‘electrical equipment,’ ‘transport equipment,’ and ‘other products.’
c/ simple average on partner countries, excluding domestic and ‘rest of world,’ and percent change between 2000 and 2008.
Source: authors’ calculations
Table 3 Transmission of an initial 30% price shock from manufacturing sectors, 2000-2008 a (percentage)
The Capco Institute Journal of Financial TransformationInternational Supply Chains as Real Transmission Channels of Financial Shocks
92
Developing Economies, for year 2000 [IDE-Jetro (2006)]. A 2008 estimate
was derived from the AIO matrix, incorporating updated information on
multilateral trade and national accounts aggregates in current US$.14
Simulation resultsSupply-driven shocks occurring in the regional sourcing network are
modeled as price shocks emanating from one of the ten economies
linked in the international I-O table. An arbitrary value of 30% will be
used for the size of the shock, and all manufacturing sectors are shocked
simultaneously.15 The simulation computes the domestic impacts and
its transmission to the other regional partners through the imported real
supply-driven impact coefficient (IRSIC) as previously described. As IR-
SIC uses the Ghosh Inverse Matrix, the sectoral impacts include primary
and secondary effects (i.e., the real transmission channels follow both
direct and indirect forward linkages). 2000 and 2008 results are not di-
rectly comparable because of exchange rate movements and changes in
the composition of trade with the rest of the world that occurred between
these two years; in addition, 2008 is based on an estimate. Nevertheless,
the evolution of the IRSIC values provides relevant information on the
direction of changes.
As seen in Table 3, the largest secondary impacts from a price shock are
felt domestically. The relative effect on the domestic economy depends
negatively on its degree of openness and on the relative size of the origi-
nating sector in relation to the rest of the economy. As expected, manu-
facturing industries are more sensitive to imported shocks originating
from foreign manufacturers, especially transport equipments. With the
exception of Thailand (and Philippines, not shown in the table), the na-
tional impact of a shock originating in the domestic manufacturing sector
tends to decrease between 2000 and 2008, indicating a greater openness
to imported inputs and/or a greater participation of non-manufacture do-
mestic inputs in the domestic content of manufacturing sectors.
Between 2000 and 2008, China emerged as a key element of the re-
gional and international supply chains. This trend is particularly clear in
the industry of computer equipment, where its IRSIC values for exported
shocks increased fourfold. Thailand followed a similar trend, albeit with
less strength, and its role as international supplier increased in all sec-
tors, except in textile and clothing. Conversely, the role of others as key
suppliers decreased. The influence of Malaysia (and Chinese Taipei, not
shown in the table) lowered in industrial sectors, although it increased in
other sectors; the relative role of Japan and the U.S. declined across the
industrial board.
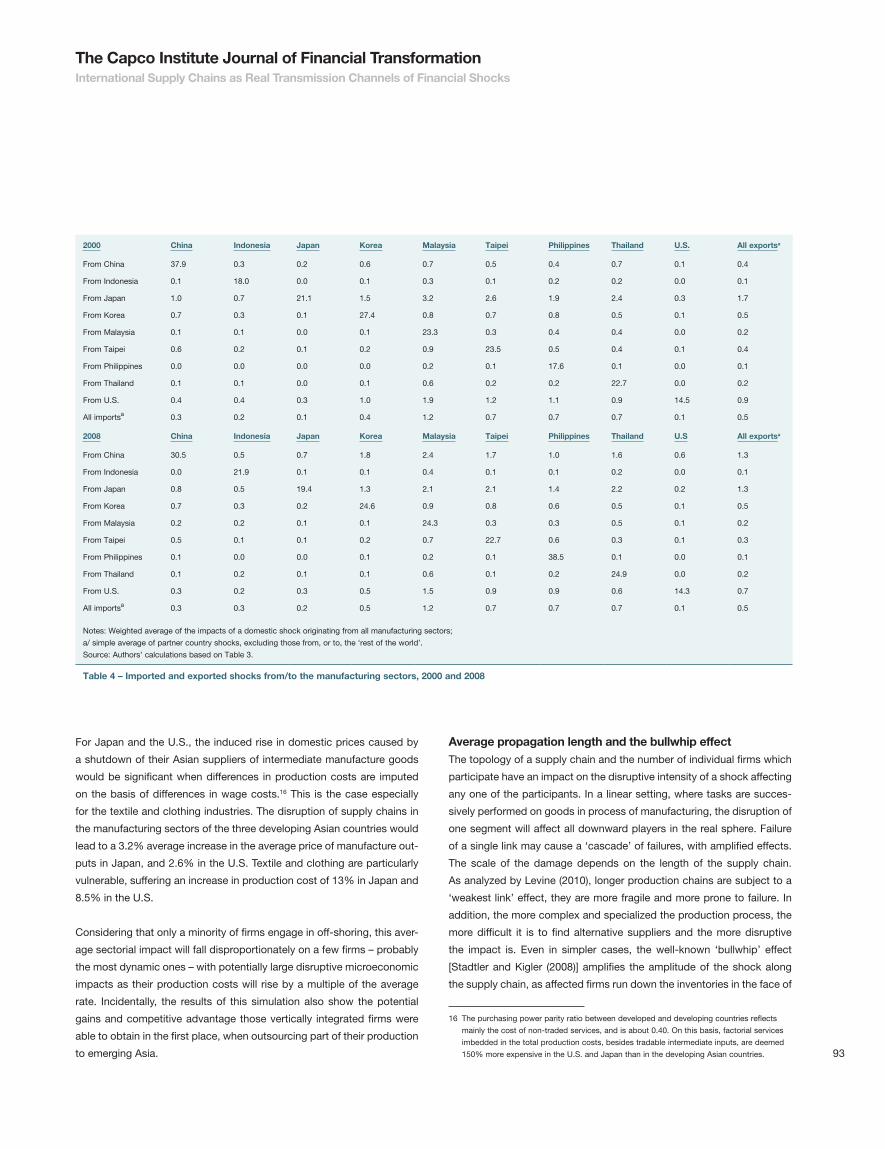
To visualize the changes in the relative position of each country between
2000 and 2008, Table 4 presents a summary of the results obtained for
shocks initiating from their manufacturing sectors. Based on the existing
intra and inter-industrial linkages, in 2000 and 2008, Japan is potentially
the largest exporter of price shocks. Nevertheless, its dominant posi-
tion as supplier of intermediate inputs has been eroded from 2000 to
2008 due to the rise of other competitors (from the region or from the
rest of the world). China, which ranked 4th in 2000, gained two spots
and became the second potential exporter of supply shocks through its
industrial sectors. On the contrary, Korea and the U.S. retrograded at the
3rd and 4th position in 2008. The relative position of other economies
remained unaffected.
Malaysia remains the first importer of shocks in both 2000 and 2008 be-
cause of the high degree of integration of its manufacturing sectors and
reliance on imported inputs from other partners. Thailand became more
reliant on imported parts and components and ranked second among
importers in 2008, gaining two spots. At the other extreme of the spec-
trum, we found large economies with a relatively small external sector
compared with their domestic activities. It is the case of the U.S. and Ja-
pan, two advanced economies where services dominate the GDP struc-
ture, but also of China and Indonesia.
Further considerations on the simulation results Disruptive shocksOne should remember that IRSIC works only for non-disruptive supply
impacts, maintaining constant production levels. It may sub-estimate the
intensity of an imported supply-driven shock for two reasons:
■■ For the relatively less developed countries, if the shock originates
from an industrialized country or from a domestic trade credit crunch,
it might become disruptive since the affected national firm cannot
shift easily to another domestic or external supplier.
■■ For the most advanced industrialized countries, there is always the
possibility of substituting domestically an intermediate input pro-
duced in a less developed country. But the increase in production
costs may be much higher than the standard 30% used in the simula-
tion, due to, inter alia, the difference in the cost of factorial services
(primary inputs).
As discussed in Appendix 1, the input-output framework is inappropriate
to measure the first type of disruptive shocks because the combination
of strict complementarities of inputs and forward linkages would progres-
sively bring the economy to an almost complete halt. In a more realistic
scenario, one can consider that the affected export-oriented activities
would stop, generating a severe macroeconomic shock to the economy.
14 See Escaith and Gonguet (2009), Inomata and Uchida (2009), and Pula and Peltonen
(2009) for examples.
15 This conservative option may underestimate the price impact of a supply shock for devel-
oped countries for labor intensive products, if the alternate suppliers have to be found in
the domestic market (see next section).
93
For Japan and the U.S., the induced rise in domestic prices caused by
a shutdown of their Asian suppliers of intermediate manufacture goods
would be significant when differences in production costs are imputed
on the basis of differences in wage costs.16 This is the case especially
for the textile and clothing industries. The disruption of supply chains in
the manufacturing sectors of the three developing Asian countries would
lead to a 3.2% average increase in the average price of manufacture out-
puts in Japan, and 2.6% in the U.S. Textile and clothing are particularly
vulnerable, suffering an increase in production cost of 13% in Japan and
8.5% in the U.S.
Considering that only a minority of firms engage in off-shoring, this aver-
age sectorial impact will fall disproportionately on a few firms – probably
the most dynamic ones – with potentially large disruptive microeconomic
impacts as their production costs will rise by a multiple of the average
rate. Incidentally, the results of this simulation also show the potential
gains and competitive advantage those vertically integrated firms were
able to obtain in the first place, when outsourcing part of their production
to emerging Asia.
Average propagation length and the bullwhip effect The topology of a supply chain and the number of individual firms which
participate have an impact on the disruptive intensity of a shock affecting
any one of the participants. In a linear setting, where tasks are succes-
sively performed on goods in process of manufacturing, the disruption of
one segment will affect all downward players in the real sphere. Failure
of a single link may cause a ‘cascade’ of failures, with amplified effects.
The scale of the damage depends on the length of the supply chain.
As analyzed by Levine (2010), longer production chains are subject to a
‘weakest link’ effect, they are more fragile and more prone to failure. In
addition, the more complex and specialized the production process, the
more difficult it is to find alternative suppliers and the more disruptive
the impact is. Even in simpler cases, the well-known ‘bullwhip’ effect
[Stadtler and Kigler (2008)] amplifies the amplitude of the shock along
the supply chain, as affected firms run down the inventories in the face of
16 The purchasing power parity ratio between developed and developing countries reflects
mainly the cost of non-traded services, and is about 0.40. On this basis, factorial services
imbedded in the total production costs, besides tradable intermediate inputs, are deemed
150% more expensive in the U.S. and Japan than in the developing Asian countries.
2000 China Indonesia Japan Korea Malaysia Taipei Philippines Thailand U.S. All exportsa
From China 37.9 0.3 0.2 0.6 0.7 0.5 0.4 0.7 0.1 0.4
From Indonesia 0.1 18.0 0.0 0.1 0.3 0.1 0.2 0.2 0.0 0.1
From Japan 1.0 0.7 21.1 1.5 3.2 2.6 1.9 2.4 0.3 1.7
From Korea 0.7 0.3 0.1 27.4 0.8 0.7 0.8 0.5 0.1 0.5
From Malaysia 0.1 0.1 0.0 0.1 23.3 0.3 0.4 0.4 0.0 0.2
From Taipei 0.6 0.2 0.1 0.2 0.9 23.5 0.5 0.4 0.1 0.4
From Philippines 0.0 0.0 0.0 0.0 0.2 0.1 17.6 0.1 0.0 0.1
From Thailand 0.1 0.1 0.0 0.1 0.6 0.2 0.2 22.7 0.0 0.2
From U.S. 0.4 0.4 0.3 1.0 1.9 1.2 1.1 0.9 14.5 0.9
All importsa 0.3 0.2 0.1 0.4 1.2 0.7 0.7 0.7 0.1 0.5
2008 China Indonesia Japan Korea Malaysia Taipei Philippines Thailand U.S All exportsa
From China 30.5 0.5 0.7 1.8 2.4 1.7 1.0 1.6 0.6 1.3
From Indonesia 0.0 21.9 0.1 0.1 0.4 0.1 0.1 0.2 0.0 0.1
From Japan 0.8 0.5 19.4 1.3 2.1 2.1 1.4 2.2 0.2 1.3
From Korea 0.7 0.3 0.2 24.6 0.9 0.8 0.6 0.5 0.1 0.5
From Malaysia 0.2 0.2 0.1 0.1 24.3 0.3 0.3 0.5 0.1 0.2
From Taipei 0.5 0.1 0.1 0.2 0.7 22.7 0.6 0.3 0.1 0.3
From Philippines 0.1 0.0 0.0 0.1 0.2 0.1 38.5 0.1 0.0 0.1
From Thailand 0.1 0.2 0.1 0.1 0.6 0.1 0.2 24.9 0.0 0.2
From U.S. 0.3 0.2 0.3 0.5 1.5 0.9 0.9 0.6 14.3 0.7
All importsa 0.3 0.3 0.2 0.5 1.2 0.7 0.7 0.7 0.1 0.5
Notes: Weighted average of the impacts of a domestic shock originating from all manufacturing sectors;
a/ simple average of partner country shocks, excluding those from, or to, the ‘rest of the world’.
Source: Authors’ calculations based on Table 3.
Table 4 – Imported and exported shocks from/to the manufacturing sectors, 2000 and 2008
The Capco Institute Journal of Financial TransformationInternational Supply Chains as Real Transmission Channels of Financial Shocks
94
uncertainty. A slowdown in activity may transform itself into a complete
standstill for the supplying fi rms that are located upstream because of
the amplifi ed fl uctuations in ordering and inventory levels in the manage-
ment of production-distribution systems.
In the monetary circuit, the costs already incurred by upward fi rms can-
not be recovered nor credit reimbursed as long as the fi nal good is not
produced and sold. As money is not destroyed, outstanding loans accu-
mulate in the circuit, their quality decreases, and systemic risks increase.
Levine (2010) refl ects on the similarity between fi nancial interconnection
and the interdependence revealed by the disruption of a long chain of
production caused by the failure of a single producer. The greater the
specialization of the supply chain, the greater the effi ciency returns to
specialization but also the higher the risks.
Although it is not possible to differentiate individual fi rms and supply
chains in an input-output setting, a rough measure of the depth of supply
chains can be given by the average propagation length (APL) of a shock.
Based on the ability of an inverse Leontief or Ghosh matrix to trace both
direct and indirect impacts, APL is formulated as a weighted average of
the number of production stages through which the impact from industry
j goes until it ultimately reaches industry i. At each iteration, the net im-
pact is used as a weight; it tends to zero when the number of iterations
increases. APL is closely related to the notion of vertical integration, as
shown by Inomata (2008).
Compared to the specialized supply chains analyzed by Levine (2010)
in the microeconomic referent, the aggregated IIO approach considers
only undifferentiated shock among largely independent fi rms, where the
amplitude of the shock falls rapidly with the length of the chain. In other
words, APL estimated on IIOs will almost certainly underestimate the ex-
tent of the issue at hand, especially when considering that only a few
fi rms participate in international outsourcing.
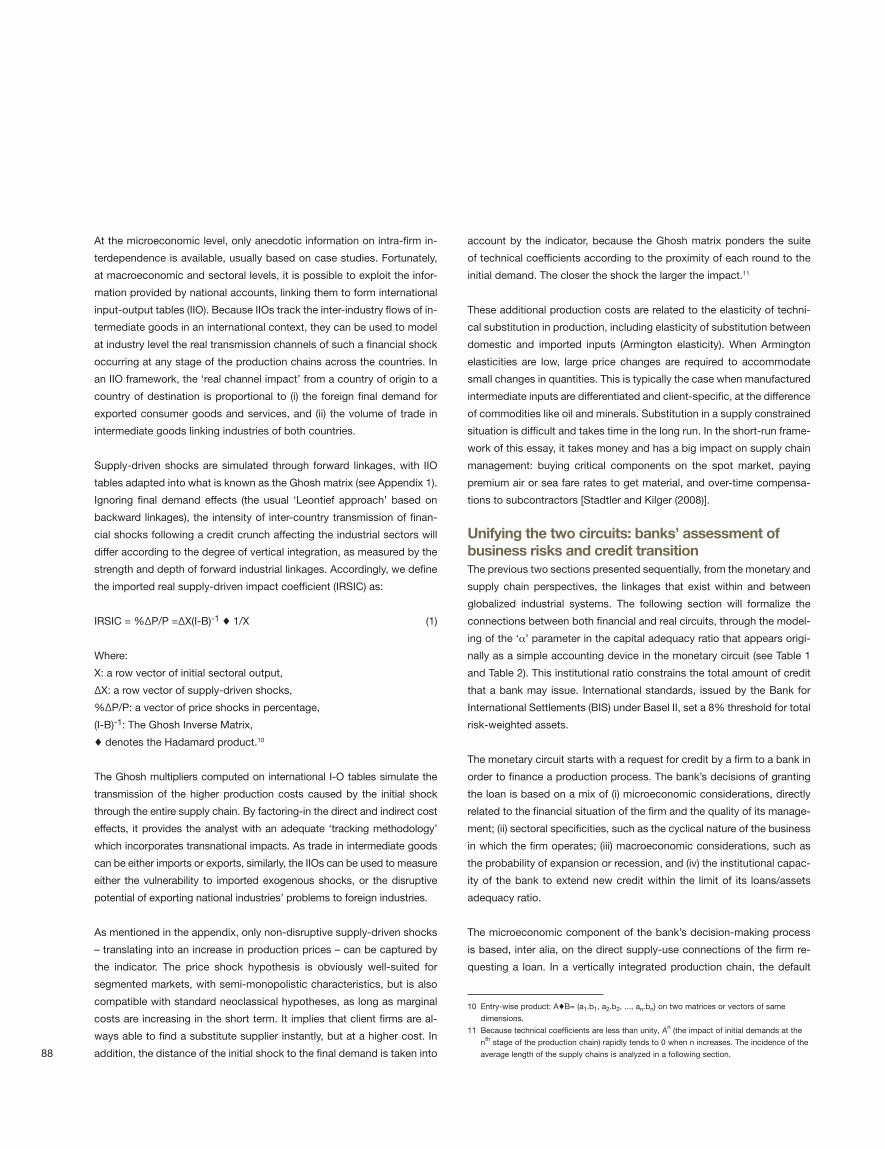
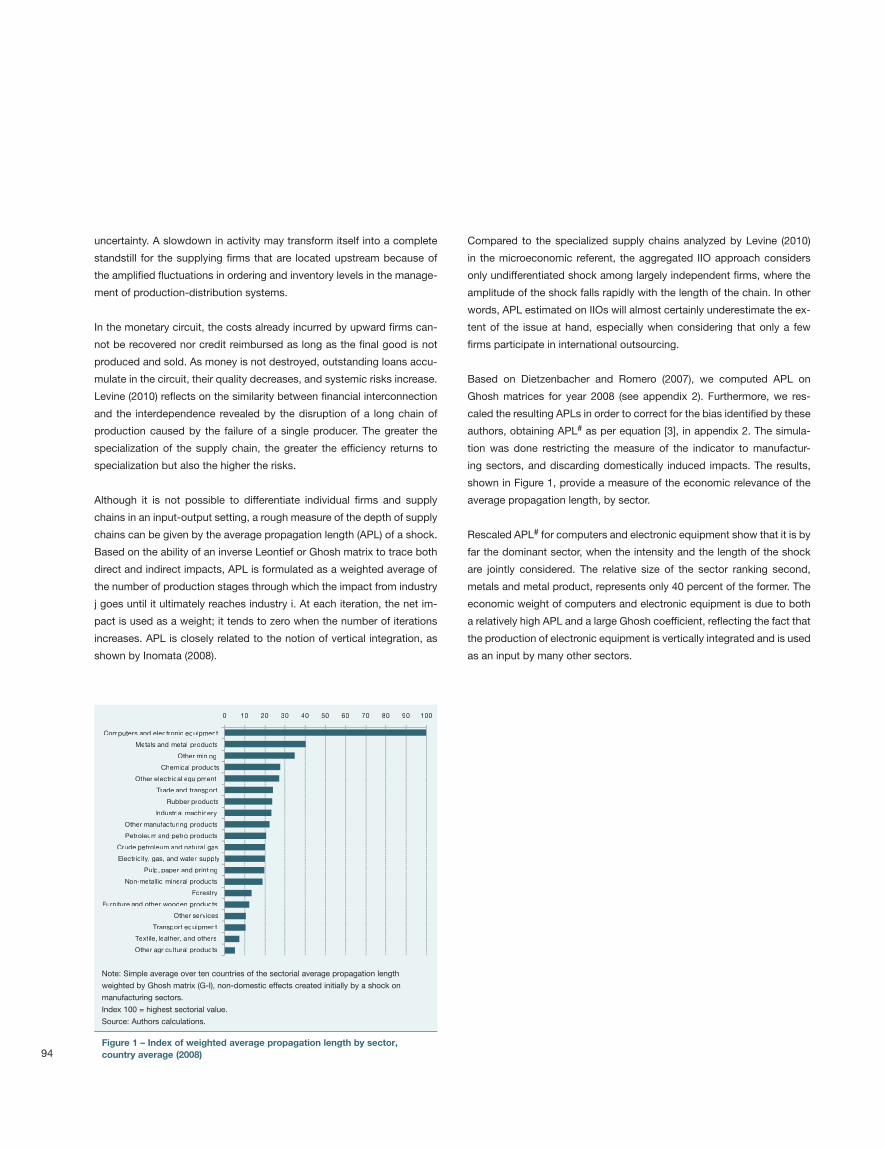
Based on Dietzenbacher and Romero (2007), we computed APL on
Ghosh matrices for year 2008 (see appendix 2). Furthermore, we res-
caled the resulting APLs in order to correct for the bias identifi ed by these
authors, obtaining APL# as per equation [3], in appendix 2. The simula-
tion was done restricting the measure of the indicator to manufactur-
ing sectors, and discarding domestically induced impacts. The results,
shown in Figure 1, provide a measure of the economic relevance of the
average propagation length, by sector.
Rescaled APL# for computers and electronic equipment show that it is by
far the dominant sector, when the intensity and the length of the shock
are jointly considered. The relative size of the sector ranking second,
metals and metal product, represents only 40 percent of the former. The
economic weight of computers and electronic equipment is due to both
a relatively high APL and a large Ghosh coeffi cient, refl ecting the fact that
the production of electronic equipment is vertically integrated and is used
as an input by many other sectors.
0 10 20 30 40 50 60 70 80 90 100
Computers and electronic equipment
Metals and metal products
Other mining
Chemical products
Other electrical equipment
Trade and transport
Rubber products
Industrial machinery
Other manufacturing products
Petroleum and petro products
Crude petroleum and natund natund na ral gas
Electricity, gas, and water supply
Pulp, paper and printing
Non-metallic mineral products
Forestry
Furniture and other wooden products
Other services
Transport equipment
Textile, leather, and others
Other agricultural products
Note: Simple average over ten countries of the sectorial average propagation length
weighted by Ghosh matrix (G-I), non-domestic effects created initially by a shock on
manufacturing sectors.
Index 100 = highest sectorial value.
Source: Authors calculations.
Figure 1 – Index of weighted average propagation length by sector, country average (2008)
95
ConclusionsThis study has analyzed the role of international supply chains as trans-
mission channels of a financial shock from the monetary circuit into the
real economy. As the initial monetary shock reverberates through the
production chains and affects final demand, more and more firms face
difficulties in completing their production plans or selling their output. Be-
cause individual firms are interdependent and rely on each other, either
as supplier of intermediate goods or client for their own production, an
exogenous financial shock affecting a single firm – such as the termina-
tion of a line of credit – reverberates through the production chain. The
transmission of the shock through real channels can be tracked, at mac-
roeconomic level, by modeling input-output interactions. In this respect,
the article illustrates the methodology by devising and computing IRSIC,
an indicator of supply-driven shocks based on forward linkages.
These disruptions that occur in the real economy eventually do feed-
back into the monetary circuit. The disruption of the production chain and
the building-up of undesired stocks impede the expected destruction of
money and determine the accumulation of outstanding loans as well as a
further downgrading of the exposed firms. Since the downgrading of an
indebted individual firm affects the capital adequacy ratio of its banker,
both flows and stocks are affected in the monetary circuit and all firms
see their access to credit potentially restricted.
This paper shows that if banks are operating at the limit of their institu-
tional capacity, defined by the capital adequacy ratio, and if assets are
priced to market, then a resonance effect amplifies the back and forth
transmission between real and monetary circuits. The chaotic behavior
of the international financial system at the end of 2008 and the dire con-
sequences on the real economy observed in 2009, are examples of such
resonance and amplification.
Using an international version of the input-output matrices, this paper
illustrates the calculation of an indicator of supply-driven impact (IRSIC)
on ten interconnected economies including the U.S. and 9 developed
and developing Asian economies. Results indicate that the real transmis-
sion effects through the international supply chain linking firms among
these economies were heterogeneous across industries and across
countries. Based on the existing inter- and intra-industrial linkages, Ja-
pan was the largest exporter of potential price shock, while Malaysia and
Thailand were the most vulnerable to such shocks, because of the high
degree of vertical integration of their manufacturing sectors. Between
2000 and 2008, China registered a notable increase in both inter-country
forward linkages and domestic backward linkages, which increased its
influence as an exporter of price shocks, while its vulnerability to an im-
ported shock remained relatively stable. When both the intensity of the
shock and its average propagation length across countries and sectors
are accounted for, computers and electronic equipment are the most
noteworthy channels of transmission. Because IRSIC are industry aver-
ages based on national account data, they underestimate the intensity of
the shock for the export-oriented firms, especially for small developing
countries.
The synchronization of domestic business cycles after September 2008
was unprecedented, especially between advanced economies, even
when compared to the oil shocks of the 1970s. The potential role of in-
ternational supply chains as transmission channels during the 2008-2009
financial crises has been thoroughly investigated. A number of govern-
ments, due to their concerns that decline in trade finance would deepen
the slowdown of world economy, took a number of initiatives through im-
proved insurance schemes or specific credit lines. Focusing on the Japa-
nese financial crisis, Amiti and Weinstein (2009) attribute about one-third
of the aggregate drop in exports to the credit crunch. Nevertheless, as
these authors recognize, a more general impact of credit crunch affecting
trade finance and causing the disruption of specific value chains has so
far not been identified, due to measurement and endogeneity issues.17
Available information based on firm-level data in developed countries
seems to support the idea that the financial restrictions acted through a
reduction on final demand rather than through micro-disruption, at least
for firms involved in international trade. Yet, firms located in emerging
countries might face stronger risks of propagation of shock [Menichini
(2009)]. Be they of macro or micro in nature, the financial implications
of the 2008 crisis provide evidence for the need to address problems of
macro-prudential procyclicality in order to minimize the risks of boom
and bust cycles initiating from the financial sector and reverberating
through international supply chains.
17 Levchenko et al. (2010) do not find overwhelming support for the hypothesis that trade
credit has been important for the 2008-2009 collapse. Bricongne et al. (2010), on the
French case, and Behrens et al. (2010) for Belgium, show that the micro-economic impact
of credit constraints on disrupting trade has been rather limited.
The Capco Institute Journal of Financial TransformationInternational Supply Chains as Real Transmission Channels of Financial Shocks
96
References• Altomonte, C., and G Békés, 2010, “Trade complexity and productivity,” CeFIG Working Paper
No. 12, October 2010
• Amiti, M., and D. Weinstein, 2009, “Exports and financial shocks,” NBER Working Paper 15556
• Behrens, K., G. Corcos, and G. Mion, 2010, “Trade crisis? What trade crisis?” Research series
201009-23, National Bank of Belgium
• Bricongne, J.-C., L. Fontagné, and G. Gaulier, 2010, “Firms and the global crisis: French
exports in the turmoil,” Working Paper Series 1245, European Central Bank
• Dietzenbacher, E., 1989. “On the relationship between the supply-driven and the demand-
driven input-output model,” Environment and Planning A, 21, 11: 1533-39
• Dietzenbacher, E., and I. Romero, 2007, “Production chains in an interregional framework:
identification by means of average propagation lengths,” International Regional Science
Review, 30:4, 362–383
• Escaith, H., and F. Gonguet, 2009, “International trade and real transmission channels of
financial shocks in globalized production networks,” WTO Working Paper, May
• Escaith, H., N. Lindenberg, and S. Miroudot, 2010, “International supply chains and trade
elasticity in times of global crisis,” WTO Staff Working Papers, February
• Feenstra, R., 1998, “Integration of trade and disintegration of production in the global
economy,” Journal of Economic Perspectives, Fall, 31-50
• Godley, W., and M. Lavoie, 2007, Monetary economics: an integrated approach to credit,
money, income, production and wealth, Palgrave Macmillan
• IDE-JETRO, 2006, “How to make Asian Input-Output Tables”, March
• Inomata, S., 2008, “A new measurement for international fragmentation of the production
process: an international input-output approach,” IDE Discussion Papers No.175, December
• Inomata, S., and Y. Uchida, 2009 “Asia beyond the crisis – visions from international input-
output analyses,” IDE-Jetro, December
• Keen, S., 2007, “A simple approach to modelling endogenous money,” ICAPE, June
• Krugman, P., 2008, “The international finance multiplier,” mimeo, October
• Levchenko, A. A., L. T. Lewis, and L. L. Tesar, 2010, “The collapse of international trade during
the 2008-2009 crisis: in search of the smoking gun,” IMF Economic Review, 58:2, 214-253
• Levine, D., 2010, “Production chains,” NBER Working Paper No. 16571, December
• Linden, G., K. Kraemer, and J. Dedrick, 2007, “Who captures value in a global innovation
system? The case of Apple’s iPod,” Personal Computing Industry Center (PCIC), Irvine
• Menichini, A-M., 2009 “Inter-firm trade finance in times of crisis,” World Bank Policy Research
Working Paper 5112
• Mesnard (de), L., 2007, “About the Ghosh model: clarifications,” Laboratoire d’Economie et de
Gestion, Dijon
• Neary, P., 2009, “Putting the ‘new’ into new trade theory: Paul Krugman’s Nobel Memorial Prize
in Economics,” University of Oxford and CEPR Discussion Paper Series, 423 March
• Papadas, Ch., and D. Dahl, 1999, “Supply-driven input-output multipliers,” Journal of
Agricultural Economics, 50:2, 269-285
• Pula, G., and T. Peltonen, 2009, “Has emerging Asia decoupled? An analysis of production and
trade linkages using the Asian international input-output table,” European Central Bank WPS
No993, January
• Repullo, R., and J. Suarez, 2008, “The procyclical effects of Basel II,” paper presented at the
9th Jacques Polack Annual Research Conference, IMF, November.
• Saito, M., 2004, “Armington elasticities in intermediate inputs trade: a problem in using
multilateral trade data,” IMF Working Paper WP/04/22
• Stadtler, H., and Ch. Kigler, 2008, Supply chain management and advanced planning, Springler-
Verlag
• Stiglitz, J., and B. Greenwald, 2003, Towards a new paradigm in monetary economics,
Cambridge University Press
• Tanaka, K., 2009, “Trade collapse and international supply chains: evidence from Japan”
VoxEU.org, 7 May
• Yi, K-M., 2009, “The collapse of global trade: The role of vertical specialisation,” in Baldwin,
R., and S. Evenett (eds), The collapse of global trade, murky protectionism, and the crisis:
recommendations for the G20, VoxEU publication
Appendix 1 – Supply-driven input-output modelsThe well-known ‘demand-driven’ model was developed by Wassily
Leontief in the 1930s. Two decades later, Ambica Ghosh adapted the
I-O model to analyze supply shocks. The Ghosh approach states that
each intermediate output is sold to a series of industrial sectors in fixed
proportions. When the production of an intermediate product ‘i’ is exog-
enously altered, the primary effect is felt by those sectors that need ‘i’ as
input. This will trigger forward, either direct (to the sectors requiring ‘i’ as
input for their production) or secondary effects (sectors depending on
intermediate goods that had required ‘i’ as input). As in the Leontief case,
the iterative process dies down to reach another equilibrium.
The accumulation of impacts can be measured by the Ghosh inverse
(I-B)-1. As in the Leontief case, the matrix B is built using the inter-sec-
toral transaction matrix, but the allocation coefficients are normalized in
rows (destination of output) by the value of production, and not in col-
umns as for technical coefficients (origin of productive factors used in
the production).
The Leontief logic for backward linkage is based on standard econom-
ics: sectors do respond to changes in demand. The Ghoshian approach
is much weaker, and its theoretical aspects are somewhat contentious.
Indeed, the theoretical reservations about the Ghosh model led to its
relative demise as a macroeconomic modeling tool in the quantity space.
Nevertheless, the Ghosh approach is still useful in the price space, and
can be used, within certain limits, to model the transmission of shocks
through costs of production [Dietzenbacher (1989); Mesnard (2007)]. It is
particularly true for short-term analysis, when firms have limited capacity
for substituting the disrupted input by shifting to alternative and more
expensive suppliers.
The mechanism is as follows: a quantity restriction on any single interme-
diate good used as input forces the client-firm to shift to other suppliers
(foreign or domestic). While this is always possible in the model, it has a
cost, as alternative suppliers will supply the needed quantities at a higher
price. It should be noted that the dual of the Leontief model could also be
used to model price effects, when the shocks originate in primary inputs
(i.e., wages).
The final impact on production costs depends on a conjunction of quan-
titative and qualitative factors. The quantitative factor is proportional to
the contribution of the disrupted input in the production function and is
captured by the allocation coefficients of the I-O matrix. The qualitative
factor is determined by the particular market structure for this product, in
particular by the possibility of substitution (Armington elasticity). Estimat-
ing these elasticities has generated an abundant literature, especially in
areas linked with international trade literature and ‘computable general
equilibrium’ models. A review of existing results show that the elasticities
97
The Capco Institute Journal of Financial TransformationInternational Supply Chains as Real Transmission Channels of Financial Shocks
(estimated using multilateral trade data) for the intermediate inputs in-
dustries tend to be higher than those for the final consumption goods
industries [Saito (2004)].
Appendix 2 – Average propagation lengthAverage propagation length (APL) measures, in a forward-looking model
proper to Ghosh matrices, the average number of steps it takes a cost-
push in one sector to affect the output value of others. It should be noted
than APLs are symmetric in the demand and supply domain, and both
Leontief and Ghosh approaches yield the same result.
APL= G.(G-I)♦(1/G’)
With g’ij = gij if i≠j and g’ii=gii-1 (2)
With
G=(I-B)-1
(I-B)-1: The Ghosh inverse matrix,
♦ denotes the Hadamard product; in this case, H♦(1/G’)=(hij/g’ij)
APLs are usually inversely correlated to the intensity of the linkage. As
mentioned by Dietzenbacher and Romero (2007), many linkages with a
large APL are often also almost irrelevant in terms of size. In order to limit
this bias, we rescaled each of APLs coefficients using the strength of its
respective forwards linkage:
APL# = APL ♦ (G-I) (3)