International Journal of Research in Management ISSN 22
13
International Journal of Research in Management ISSN 2249-5908 Available online on http://www.rspublication.com/ijrm/ijrm_index.htm Issue 5, Vol. 2 (March 2015) RSPUBLICATION , [email protected] Page 10 A STUDY ON PROFITABILITY OF SPINNING INDUSTRY IN COIMBATORE DISTRICT- TAMILNADU Dr. K. SURESHBABU Head -Department of Commerce Sankara College of Science and Commerce Saravanampatty Comibatore – 641035. ABSTRACT The economic growth of a country depends mainly on the constructive and continuous industrial growth. Industrial sector consist of small, medium and large scale industries including the co-operative sector. The management of these industries, either the co-operative sector or the other sectors, considerably gained importance right from the inception of the business to achieve the above said economic growth. India is a land of lofty mountains and mighty rivers. No other country in the world is so rich in economic grandeur as India is and the panorama of contrasting landscape at different stages of evolution has always attracted the attention of the world. As one of the oldest civilizations with rich natural resources, the country has been self-sufficient in agricultural production which has been the reason for rapid growth of industrialisation. No doubt, the process of rapid development has been blessed with the best natural resources. The economic development of a country raises the material conditions of life, not of some, but of all. Textile industry is one of the oldest and most firmly established major industries in India. During the Indus Valley Civilization, Indians produced raw cotton and started the art of spinning. In the Rigveda, there are references to cotton cloth. Woollen and silk clothes were worn by people of the age. The Mahabharata talks of fabric, with pearl woven borders, and Kautalya in his Arthashasthra, refers to extensive textile industry all over the country. 1. INTRODUCTION The pioneers of Indian textile industry were, undoubtedly, men of vision and enterprise. India became an agricultural colony for manufacturing industries. Britain needed it as a source of raw materials for its industries. While India had been for centuries the largest exporter of hand woven cotton goods in the world, it has now been transformed into an importer of machine-made British cotton products and exporter of raw cotton [1] . Cotton, like food and shelter, has become one of the basic necessities of the civilised human world. Yarn is the main raw material used for the production of cloth. The country in general, and the state in particular, had been producers of both yarn and cloth since time immemorial. India is regarded as one of the birth places of both yarn and hand- made cloth. The yarn, required for weaving to produce cloth, was hand-spun by the artisans. The cloth produced by hand is called as Swadeshi cloth. With the invention of the spinning machine by Jenny in England in the nineteenth century, the cost of production of yarn and cloth became incredibly cheap [2] . The idea of starting factory production of cotton cloth and yarn in India took shape during the first two decades of the nineteenth century. The textile mills in India were started by British nationals and, among Indians, by the Parsis, the Hindus and the Muslims. Bombay took the lead in establishing a large number of textile mills in rapid succession since 1854. The partition of India resulted in the division of the most fertile and irrigated land of Sind and west Punjab to Pakistan. Before partition in India in the year 1946-47, out of the total 1,49,01,000 acres of the land were under cotton cultivation, about 1,16,71,000 acres were in the Indian union, which meant that about 22 percent of the land was in Pakistan. Out of a production of 43 lakhs bales in 1946-47 in the undivided India, Indian union accounted for 26.5 lakhs bales as against 1.65 lakhs bales. Out of 423 textile mills in the country remained with India. The consumption of cotton by the mills of Indian union was 38.6 lakhs bales, and as such, India had to import cotton from other countries and it was dependent specially on Pakistan cotton to the extent of 9.8lakhs tones. India imported nearly 12 lakhs bales yearly from other countries.
-
Upload
khangminh22 -
Category
Documents
-
view
1 -
download
0
Transcript of International Journal of Research in Management ISSN 22
International Journal of Research in Management ISSN 2249-5908
Available online on http://www.rspublication.com/ijrm/ijrm_index.htm Issue 5, Vol. 2 (March 2015)
RSPUBLICATION , [email protected] Page 10
A STUDY ON PROFITABILITY OF SPINNING INDUSTRY IN
COIMBATORE DISTRICT- TAMILNADU
Dr. K. SURESHBABU
Head -Department of Commerce
Sankara College of Science and Commerce
Saravanampatty
Comibatore – 641035.
ABSTRACT
The economic growth of a country depends mainly on the constructive and continuous industrial
growth. Industrial sector consist of small, medium and large scale industries including the co-operative sector.
The management of these industries, either the co-operative sector or the other sectors, considerably gained
importance right from the inception of the business to achieve the above said economic growth. India is a land
of lofty mountains and mighty rivers. No other country in the world is so rich in economic grandeur as India is
and the panorama of contrasting landscape at different stages of evolution has always attracted the attention of
the world. As one of the oldest civilizations with rich natural resources, the country has been self-sufficient in
agricultural production which has been the reason for rapid growth of industrialisation. No doubt, the process of
rapid development has been blessed with the best natural resources. The economic development of a country
raises the material conditions of life, not of some, but of all. Textile industry is one of the oldest and most firmly
established major industries in India. During the Indus Valley Civilization, Indians produced raw cotton and
started the art of spinning. In the Rigveda, there are references to cotton cloth. Woollen and silk clothes were
worn by people of the age. The Mahabharata talks of fabric, with pearl woven borders, and Kautalya in his
Arthashasthra, refers to extensive textile industry all over the country.
1. INTRODUCTION
The pioneers of Indian textile industry were, undoubtedly, men of vision and enterprise. India became
an agricultural colony for manufacturing industries. Britain needed it as a source of raw materials for its
industries. While India had been for centuries the largest exporter of hand woven cotton goods in the world, it
has now been transformed into an importer of machine-made British cotton products and exporter of raw cotton [1]
. Cotton, like food and shelter, has become one of the basic necessities of the civilised human world. Yarn is
the main raw material used for the production of cloth. The country in general, and the state in particular, had
been producers of both yarn and cloth since time immemorial. India is regarded as one of the birth places of
both yarn and hand- made cloth. The yarn, required for weaving to produce cloth, was hand-spun by the
artisans. The cloth produced by hand is called as Swadeshi cloth. With the invention of the spinning machine
by Jenny in England in the nineteenth century, the cost of production of yarn and cloth became incredibly cheap
[2].
The idea of starting factory production of cotton cloth and yarn in India took shape during the first two
decades of the nineteenth century. The textile mills in India were started by British nationals and, among
Indians, by the Parsis, the Hindus and the Muslims. Bombay took the lead in establishing a large number of
textile mills in rapid succession since 1854. The partition of India resulted in the division of the most fertile and
irrigated land of Sind and west Punjab to Pakistan. Before partition in India in the year 1946-47, out of the total
1,49,01,000 acres of the land were under cotton cultivation, about 1,16,71,000 acres were in the Indian union,
which meant that about 22 percent of the land was in Pakistan. Out of a production of 43 lakhs bales in 1946-47
in the undivided India, Indian union accounted for 26.5 lakhs bales as against 1.65 lakhs bales. Out of 423
textile mills in the country remained with India. The consumption of cotton by the mills of Indian union was
38.6 lakhs bales, and as such, India had to import cotton from other countries and it was dependent specially on
Pakistan cotton to the extent of 9.8lakhs tones. India imported nearly 12 lakhs bales yearly from other countries.

International Journal of Research in Management ISSN 2249-5908
Available online on http://www.rspublication.com/ijrm/ijrm_index.htm Issue 5, Vol. 2 (March 2015)
RSPUBLICATION , [email protected] Page 11
The textile and clothing industry in India accounts for 14 % of the manufacturing sector output, around 30% of
export earnings and employs about 28% of total industrial employment. Its net foreign exchange earning is also
one of the highest - around 75% of the exports. The Indian textile industry consists of widely diversified sectors
with organised Integrated Mill sector, Medium and Small Scale Powerloom sector, Handloom sector, Hosiery
sector and Spinning mill sector spread all over India. It has a significant presence in the world textile economy
by virtue of its production of textile fibres or yarns. The Indian industry accounts for about 21 percent of the
world spindleage, the second largest after China and three percent of the world rotorage. With almost 5.7
million looms (including handlooms), the industry has the highest loomage; about 64 percent of world loomage,
excluding handlooms, the industry contribute 42 percent of the world loomage. The contribution of this
industry to the world production of textile fibres and yarns, including jute, at 6 million tones is about 12 per
cent. It is the largest producer of silk and the third largest producer of cotton, cotton yarn and cellulosic fibre or
yarn. It is also the fifth largest producer of synthetic fibre or yarn.
2. SPINNING
It is an ancient textile art in which plant, animal or synthetic fibers are twisted together to form yarn.
For thousands of years, fiber was spun by hand using simple tools - the spindle and distaff [3]
. Only in the High
Middle Ages did the spinning wheel increase the output of individual spinners, and mass-production arose only
in the 18th century with the beginning of the Industrial Revolution. Hand-spinning remains a popular handicraft [4]
. There seems little doubt that one of the earliest textile fibres available, for spinning into yarn and then
weaving into cloth, was wool from sheep. The two stage spinning process requires that a fleece is opened to
form a sliver of fibres which can be drawn out to produce an increasingly fine thread. This is then twisted to
form a yarn. Our early ancestors probably twisted a few fibres from a lock of wool to form an extending length
of yarn which would be wound into a ball. At a later stage, the yarn was wound on to a stick and a simple
flywheel added at the lower end to produce a spindle. From this the spinning wheel developed, invented first in
India and then reaching Europe sometime in the late 14th
century [5]
.
Spinning is the conversion of fibers into yarn. These fibers can be natural fibers (cotton) or manmade
fibers (polyester). Spinning also entails production of manmade filament yarn (yarn that is not made from
fibers). Final product of spinning is yarn. Cotton value chain starts from Ginning that adds value to it by
separating cotton from seed and impurities. Spinning is the foundation process and all the subsequent value
additions i.e. Weaving, Knitting, Processing, Garments and Made ups, depend upon it. Any variation in quality
of spinning product directly affects the entire value chain [6]
.
3. COTTON DEFINITION
Cotton is probably one of the most common fabrics you are likely to have in your home as clothing.
Cotton is a natural fiber and is used in a wide variety of clothing and home furnishings. Cotton can easily be
washed and/or dry cleaner. Cotton is a good strong fabric that is absorbent and easy to work with. Cotton has a
tendency to wrinkle very easily, so cotton and polyester are always in demand. Many people prefer the year-
round "breathing" and lack of pilling of one hundred percent cotton [7]
.
4. COTTON - SPINNING
Spinning is the process of transforming cotton fibre into yarn or thread. The cotton fibres go through
various stages in preparation for spinning. Spinning draws out the short fibres from the mass of cotton and twists
them together into a long, apparently continuous thread. Most Indian spinning machines are types of chakra,
which means wheel. A portable version of the chakra, still used today, was designed by Mahatma Ghandi as part
of the khadi movement to develop Indian self- sufficiency. The finest threads used for muslin are spun on a hand
spindle called a takli [8]
.
International Journal of Research in Management ISSN 2249-5908
Available online on http://www.rspublication.com/ijrm/ijrm_index.htm Issue 5, Vol. 2 (March 2015)
RSPUBLICATION , [email protected] Page 12
5. COTTON AND TEXTILE INDUSTRY
Cotton dominates the handloom industry in the country, accounting for 83% of overall production.
Cotton blends account for another 5% while non-cotton cloth is only 12%. The textile industry of the state today
is cotton based to the extent of 89%. Tamil Nadu produces only 1/6th
of its cotton requirements and the balance
is met by purchases from up-country markets[9]
.
YARN
Yarn is a long continuous length of interlocked fibres, suitable for use in the production of textiles,
sewing, crocheting, knitting, weaving, embroidery and rope making. Thread is a type of yarn intended for
sewing by hand or machine. Modern manufactured sewing threads may be finished with wax or other lubricants
to withstand the stresses involved in sewing. Embroidery threads are yarns specifically designed for hand or
machine embroidery.
COTTON YARN
Cotton was independently domesticated in the Old and New Worlds. The fiber is most often spun into
yarn or thread and used to make a soft, breathable textile. The use of cotton for fabric is known to date to
prehistoric times; fragments of cotton fabric dated from 5000 BC have been excavated in Mexico and Pakistan.
Although cultivated since antiquity, it was the invention of the cotton gin that so lowered the cost of production
that led to its widespread use, and it is the most widely used natural fiber cloth in clothing today.
SYNTHETIC
Synthetic is usually used in the sense of synthesis, the combination of two or more parts, whether
by design or by natural processes. Furthermore, it may simply being prepared or made artificially, in contrast
to naturally [10]
.
6. IMPORTANCE OF THE STUDY
The spinning mills in India, particularly in Tamil Nadu, have been growing at a rapid pace. The
spinning industry is dominated by large units and it has been able to undergo significant modernization since the
1990s. The main factors behind the modernization include lowering of custom duties and other restrictions on
imports of machinery, equipment and on imports and exports of raw cotton and yarn. The spinning industry
which is dominated by medium and large units producing more than 90 percent of the output and total value
added. During an early period of policy reform (1983–1990), the demand increased due to spurt in exports,
which caused better utilization of existing spindles and led to reduction in idle capacity. During later phase
(1990–2005), the investment in new spindles increased at a very rapid rate. This lead to rise in financial
efficiency of the working spindles and relative productivity of working spindles compared to the most recent
technology that improved over time. Increase in financial effectiveness is imperative in order to make targeted
sales and earnings. Improvement in performance efficiency is also essential to increase total production of the
company. Like any other functional management in a firm financial performance is a vital functional organ of
the company. If financial performance does not operate well, the whole organisations activity will be ruined.
7. STATEMENT OF THE PROBLEM
The textile industry in Coimbatore, which accounts for a predominant part of the industry in southern
India, is facing a crisis. A substantial part of the capacity of the spinning mills in and around the city, which
manufacture yarn, remains idle. Thousands of mill workers have not received their wages for months. They face
even more serious prospect of losing their jobs, as the danger of several units closing down in the immediate
future appears to be real. The small units are the worst affected. However, the larger mills have not been spared.
The mills are burdened by mounting stocks of unsold yarn and their working capital base has been eroded.
Moreover, many mills are in danger of defaulting on the repayment of term loans from banks and financial
International Journal of Research in Management ISSN 2249-5908
Available online on http://www.rspublication.com/ijrm/ijrm_index.htm Issue 5, Vol. 2 (March 2015)
RSPUBLICATION , [email protected] Page 13
institutions. Mill owners complain that matters have been made worse by the "mismatch" between cotton and
yarn prices and by the 15 percent increase in power charges, which was effected in Tamil Nadu in July 1998.
Industry sources said that owing to cash flow problems, mill managements had defaulted on payments to
workers and to the Government. Only a few mills that supply yarn to niche markets have managed to stay afloat.
Among these are some of the bigger mills which supply yarn to markets in Europe and the United States, which
have so far escaped the effects of the global recession. Many mills in Coimbatore have closed down, but the
official figures in respect of closures do not adequately reflect this fact. Many more are running at reduced
capacities, working fewer shifts. Trade union and management sources admit that a substantial portion of the
capacity has remained idle for several months. Trade unions claim that 46 mills in the private, public and
cooperative sectors have closed down in the last two years due to increase in cost of production and incurred
heavy loss. The crisis has engulfed other segments of the industry in and around the town. Some of India's
leading textile machinery manufacturers, located in Coimbatore, which are already under pressure owing to the
import of machinery at lower costs, are now battered by the severe demand recession sweeping the industry. The
downturn in the machinery sector has, in turn, hit the foundries in Coimbatore, many of which have been
traditional suppliers of spare parts for textile machinery [11]
. Continuous technological upgradation and
assimilation of the latest technology is essential for the spinning mills. The induction of innovative technology
helps the spinning mills to reduce cost of production and increase its earnings. In a competitive business growth
and success of spinning mills depends mainly on profitability of such mills. Hence the researcher would like to
analyze the profitability of spinning mills.
8. SCOPE OF THE STUDY
The present study is directed towards analyzing the profitability of spinning mills in Coimbatore
region. The study covers the various problems relating to profitability of the selected companies of Coimbatore
from 2001-2002 to 2010-2011. The profitability of the sample companies is evaluated in terms of profitability,
liquidity, financial health and value creation to its shareholders. The suggestion tendered in this study will
definitely knock the doors of the government for the betterment of performance of spinning mills. Finance is
one of the basic foundations of all kinds of economic activities. It is the master key which provides access to all
the sources for being employed in manufacturing and merchandising activities. It has rightly been said that
business needs money to make more money. However it is also true that money generate more money, only
when it is properly managed. Hence, efficient management of every business enterprise is closely linked with
the efficient management of its finance. Financing of a firm means providing money for investment in the form
of fixed assets and also in the form of working capital for day to day operations. Business finance mainly
involves rising of funds and thus effective utilisation keeping in view the overall objective of the firm. This
requires great caution and wisdom on part of management. The management makes use of various financial
techniques, devices etc for administering the financial affairs of the firm in most efficient way to improve
profitability.
9. REVIEW OF LITERATURE
A literature review is an account of what has been published on a topic by accredited scholars and
researchers. A literary review is a critical and in depth evaluation of previous research. It is a summary and
synopsis of a particular area of research, allowing anybody reading the paper to establish why researcher is
pursuing this particular research program. A good literary review expands upon the reasons behind selecting a
particular research question. The study has been carried out with the following reviews: Kranthi, Keshav Raj
(2011)[12]
in his research says that, currently, about 90 percent of the cotton area in India is producing the
American cotton species, About 70 percent of the 30 million bales produced in India consist of long-staple,
superior-quality fiber, most of which are also exported. The Economic Times (Online) (2011)[13]
, "The industry
is in a hand-to-mouth situation. We have no option but to extend our production cut till the unused stocks find
takers," said chairperson of Confederation of Indian textile Industry (CITI) and MD of Ginni Filaments Shishir
Jaipuria. Spinning contributes $10 billion to India's $62 billion textile and clothing sector. Price volatility of
cotton that touched a record of 63% high of `62,000 per candy in the 2010-11 crop season and then came

International Journal of Research in Management ISSN 2249-5908
Available online on http://www.rspublication.com/ijrm/ijrm_index.htm Issue 5, Vol. 2 (March 2015)
RSPUBLICATION , [email protected] Page 14
crashing at `44,000 per candy, destablised the prices of yarn that moved from `204 per kg in October to `253 per
kg in March and then fell to `185 per kg in May. India produced 3,500 million kg of cotton yarn and maintains a
stock enough for 10-15 days.
10. OBJECTIVES OF THE STUDY
The study has been carried out with the following objectives
To analyse the origin and growth of spinning mills in India
To know the profile of selected spinning mills in Coimbatore
To study the role of spinning mills and economic development.
To study the financial health of spinning mills.
To analyse the profitability of spinning mills.
To offer recommendations for the improvement of spinning mills
11. METHODOLOGY
Data Sources
The study is mainly based on secondary data secondary data. Secondary data are collected from
prowess which is the most reliable and empowered corporate database of CMIE. The data required for the study
were collected from the annual reports of the mills. The annual reports of the sample mills are downloaded
from the database called prowess.
Period of Study
The present study covers a period of 10 years from 2001-02 to 2010-11 in order to evaluate the
profitability of spinning mills in Coimbatore region.
Formulation of Sample Selection
The study concentrates on spinning mills, in Coimbatore district of Tamil Nadu. It is decided to select
spinning mills based on the working from 2001-02 to 2010-11. There are 29 spinning mills in Tamil Nadu. Out
of 29 mills 16 mills are situated in Coimbatore region. Owing to several constraints such as non availability of
financial statements or non availability of working results of mills in a particular year etc., the researcher is
compelled to restrict the number of mills to eight. To draw a logical and meaningful conclusion eight mills have
been selected based on its earnings.
Such selected mills are:
1. VTX Industries Ltd
2. Bannari Amman Spinning Mills Ltd
3. Precot Meridian Ltd
4. Ambika Cotton Mills Ltd
5. Super Spinning Mills Ltd
6. Lambodhara Textiles Ltd
7. Super Sales India Ltd
8. Salona Cotspin Ltd
12. LIMITATIONS OF THE STUDY
The study has the following limitations
The firm‟s overall efficiency cannot be evaluated merely by profitability analysis alone.
The efficiency level of the management cannot be assessed fully from the profitability measurement.
Technical measures and other areas are to be considered.
This study is based on secondary data taken from CMIE Prowess as such its findings depends entirely on
the accuracy of such data.
International Journal of Research in Management ISSN 2249-5908
Available online on http://www.rspublication.com/ijrm/ijrm_index.htm Issue 5, Vol. 2 (March 2015)
RSPUBLICATION , [email protected] Page 15
13. ANALYSIS OF PROFITABILITY
FULMER MODEL-H SCORE:
Though there are so many models to predict the bankruptcy position of a concern, Fuller Model
(U.S.1984) has been used to predict the insolvency status as the given data very correctly fits into the model .
Fuller has used the stepwise Multiple Discriminant. In stepwise discriminant analysis, a model of
discrimination is built step-by-step. Specifically, at each step all variables are reviewed and evaluated to
determine which one will contribute most to the discrimination between groups. That variable will then be
included in the model, and the process starts again. The stepwise procedure is "guided" by the respective F to
enter and F to remove values. The F value for a variable indicates its statistical significance in the
discrimination between groups, that is, it is a measure of the extent to which a variable makes a unique
contribution to the prediction of group membership. General Model of Discriminant Analysis takes the
following form:
D = v1X1 + v2X2 + v3X3 = ……… viXi + A
Where D = Discriminate function
v = the discriminant coefficient or weight for that variable
X = repondent‟s score for that variable
a = a constant
i = the number of predictor variables
Fulmer (U.S.1984) has used step-wise Multiple Discriminate Analysis to Evaluate 40 financial ratios to
a sample of 60 companies-30 failed and 30 successful. He has reported a 98 percent accuracy rate in classifying
the test companies one year prior to failure and an 81 percent accuracy rate more than one year prior to
bankruptcy. This model is applied to find the financial healthiness of the companies under study. The Model
takes the following form:
H =5.528V1+0.212V2+ 0.073V3 + 1.270V4 + 0.120V5 + 2.335V6+ 0.575V7 + 1.083V8 +0.894V9 -6.075
H <0 , then the firm is classified as „Failed‟ otherwise „Successfull‟
Where,
V1 = Retained Earnings/Total Assets
V2 = Sales/Total Assets
V3 = EBIT/EQUITY
V4 = Cash Flows//Total Debt
V5 = Debt/Total Assets
V6 = Current Liabilities/Total Assets
V7 = Log Tangible Total Assets
V8 = Working Capital/Total Assets
V9 = Log EBIT/Interest.
The H-Score like umbrella covers the areas of profitability, Efficiency, Liquidity and Solvency status
of a firm.
14. MULTIPLE REGRESSION ANALYSIS
Linear Regression estimates the coefficients of the linear equation, involving one or more independent
variables that best predict the value of the dependent variable. The General model of the Multiple Regression
model can be written as:
y = β0 + β1x1 + β2x2 + β3x3 + ….. + βkxk + u,
Where β0 is the intercept , β1 is the parameter associated with x1, β2 is the parameter associated with x2
and so on.Since there are k independent variables and an intercept ,equation contains k+1(Unknown) population
parameters.The variable u is the error term.or disturbance.
Here b0 is the intercept and b1, b2, b3, …, bk are analogous to the slope in linear regression equation
and are also called regression coefficients. They can be interpreted the same way as slope. Thus if bi = 2.5, it

International Journal of Research in Management ISSN 2249-5908
Available online on http://www.rspublication.com/ijrm/ijrm_index.htm Issue 5, Vol. 2 (March 2015)
RSPUBLICATION , [email protected] Page 16
would indicates that Y will increase by 2.5 units if Xi increased by 1 unit. The appropriateness of the multiple
regression model as a whole can be tested by the F-test in the ANOVA table. A significant F indicates a linear
relationship between Y and at least one of the X's.Once a multiple regression equation has been constructed; one
can check how good it is (in terms of predictive ability) by examining the coefficient of determination (R2). R2
always lies between 0 and 1.
R2 - coefficient of determination
The closer R2 is to 1, the better is the model and its prediction. Statistically the null hypothesis is tested by using
t-test. If the t-test of a regression coefficient is significant, it indicates that the variable is in question influences
Y significantly while controlling for other independent explanatory variables.
15. PRINCIPAL COMPONENT ANALYSIS:
Principal Components Analysis is a method that reduces data dimensionality by performing a
covariance analysis between factors. It is recommended as an exploratory tool to uncover unknown trends in the
data. PCA is a way of identifying patterns in data, and expressing the data in such a way as to highlight their
similarities and differences. The procedures carried out and its results are given below:
1. Principal components analysis (PCA) is a procedure for finding hypothetical Variables (components) which
account for as much of the variance in the multidimensional data as possible. These new variables are linear
combinations of the original variables.
2. The Newly Created variables satisfy the following two conditions:
a) PC‟s are orthogonal Liner functions of the original variable.
b) First (PC1) Principal Component has large variance when compared with other variables. Then PC2 is
then chosen from the remaining variations among the variables .The same procedure is followed to
arrive the variations.
3. The PCA routine finds the eigenvalues and eigenvectors of the variance-covariance matrix or the
correlation matrix. The eigenvalues, giving a measure of the variance accounted for by the corresponding
eigenvectors (components) are given for all components.
4. The percentages of variance accounted for by these components and also its cumulative variations are also
given.
5. Most of the variances are accounted for by the first one or two components if the spread is deep. However if
the variance is spread more or less evenly among the components, the PCA has in a sense not been very
successful.
6. The Jolliffe cut-off value gives an informal indication of how many principal Components should be
considered significant. Components with eigenvalues smaller than the Jolliffe cut-off may be considered
insignificant, but too much weight should not be put on this criterion.
16. TIME SERIES -TREND ANALYSIS:
A time series is a chronological sequence of observations on a particular variable. It assumes that the
underlying time series is stationary. If a time series is stationary, its mean, variance, and auto covariance (at
various lags) remain the same no matter at what point we measure them; that is, they are time invariant. An
observed time series can be decomposed into three components: the trend (long term direction), the seasonal
(systematic, calendar related movements) and the irregular (unsystematic, short term fluctuations). A time series
analysis consists of two steps: (1) building a model that represents a time series, and (2) using the model to
predict (forecast) future values. An attempt has been made to fit the time series data to find its trend. Trend
analysis has been used to forecast the data for the fourth coming periods. Suitable trend method is used to find
trend and predict the data.
17. COMPOUND ANNUAL GROWTH RATE
The compounded Annual Growth Rate is the rate at which a variable grows over a period of years,
taking into account the effect of compounding. It is used to find the smoothed annualized return or gain of an
International Journal of Research in Management ISSN 2249-5908
Available online on http://www.rspublication.com/ijrm/ijrm_index.htm Issue 5, Vol. 2 (March 2015)
RSPUBLICATION , [email protected] Page 17
investment over a given period of time. It describes the growth over a period of time of some element of
business
It is expressed as:
CAGR(to,tn) = [V(tn)/V(t0)](1/(t
n-t
0)) -1
Where V(tn)= End value
V(t0) =Initial Value
(tn-t0)= Gap Period
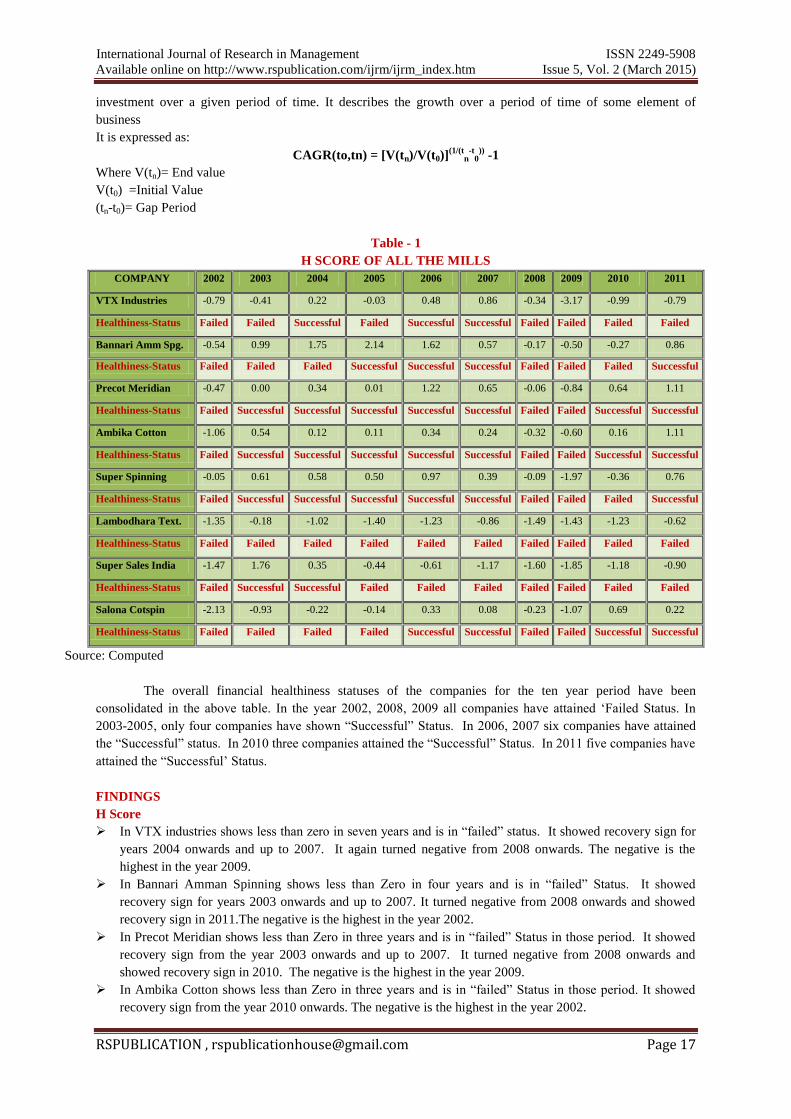
Table - 1
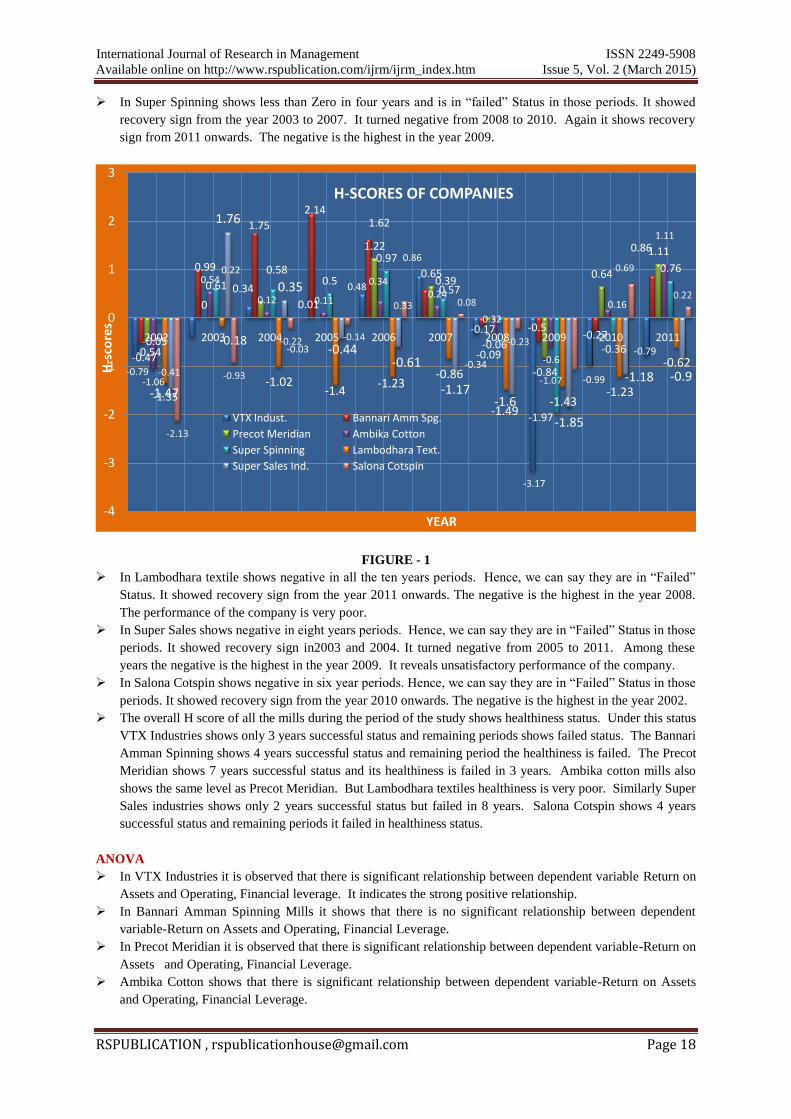
H SCORE OF ALL THE MILLS
COMPANY 2002 2003 2004 2005 2006 2007 2008 2009 2010 2011
VTX Industries -0.79 -0.41 0.22 -0.03 0.48 0.86 -0.34 -3.17 -0.99 -0.79
Healthiness-Status Failed Failed Successful Failed Successful Successful Failed Failed Failed Failed
Bannari Amm Spg. -0.54 0.99 1.75 2.14 1.62 0.57 -0.17 -0.50 -0.27 0.86
Healthiness-Status Failed Failed Failed Successful Successful Successful Failed Failed Failed Successful
Precot Meridian -0.47 0.00 0.34 0.01 1.22 0.65 -0.06 -0.84 0.64 1.11
Healthiness-Status Failed Successful Successful Successful Successful Successful Failed Failed Successful Successful
Ambika Cotton -1.06 0.54 0.12 0.11 0.34 0.24 -0.32 -0.60 0.16 1.11
Healthiness-Status Failed Successful Successful Successful Successful Successful Failed Failed Successful Successful
Super Spinning -0.05 0.61 0.58 0.50 0.97 0.39 -0.09 -1.97 -0.36 0.76
Healthiness-Status Failed Successful Successful Successful Successful Successful Failed Failed Failed Successful
Lambodhara Text. -1.35 -0.18 -1.02 -1.40 -1.23 -0.86 -1.49 -1.43 -1.23 -0.62
Healthiness-Status Failed Failed Failed Failed Failed Failed Failed Failed Failed Failed
Super Sales India -1.47 1.76 0.35 -0.44 -0.61 -1.17 -1.60 -1.85 -1.18 -0.90
Healthiness-Status Failed Successful Successful Failed Failed Failed Failed Failed Failed Failed
Salona Cotspin -2.13 -0.93 -0.22 -0.14 0.33 0.08 -0.23 -1.07 0.69 0.22
Healthiness-Status Failed Failed Failed Failed Successful Successful Failed Failed Successful Successful
Source: Computed
The overall financial healthiness statuses of the companies for the ten year period have been
consolidated in the above table. In the year 2002, 2008, 2009 all companies have attained „Failed Status. In
2003-2005, only four companies have shown “Successful” Status. In 2006, 2007 six companies have attained
the “Successful” status. In 2010 three companies attained the “Successful” Status. In 2011 five companies have
attained the “Successful‟ Status.
FINDINGS
H Score
In VTX industries shows less than zero in seven years and is in “failed” status. It showed recovery sign for
years 2004 onwards and up to 2007. It again turned negative from 2008 onwards. The negative is the
highest in the year 2009.
In Bannari Amman Spinning shows less than Zero in four years and is in “failed” Status. It showed
recovery sign for years 2003 onwards and up to 2007. It turned negative from 2008 onwards and showed
recovery sign in 2011.The negative is the highest in the year 2002.
In Precot Meridian shows less than Zero in three years and is in “failed” Status in those period. It showed
recovery sign from the year 2003 onwards and up to 2007. It turned negative from 2008 onwards and
showed recovery sign in 2010. The negative is the highest in the year 2009.
In Ambika Cotton shows less than Zero in three years and is in “failed” Status in those period. It showed
recovery sign from the year 2010 onwards. The negative is the highest in the year 2002.
International Journal of Research in Management ISSN 2249-5908
Available online on http://www.rspublication.com/ijrm/ijrm_index.htm Issue 5, Vol. 2 (March 2015)
RSPUBLICATION , [email protected] Page 18
In Super Spinning shows less than Zero in four years and is in “failed” Status in those periods. It showed
recovery sign from the year 2003 to 2007. It turned negative from 2008 to 2010. Again it shows recovery
sign from 2011 onwards. The negative is the highest in the year 2009.
FIGURE - 1
In Lambodhara textile shows negative in all the ten years periods. Hence, we can say they are in “Failed”
Status. It showed recovery sign from the year 2011 onwards. The negative is the highest in the year 2008.
The performance of the company is very poor.
In Super Sales shows negative in eight years periods. Hence, we can say they are in “Failed” Status in those
periods. It showed recovery sign in2003 and 2004. It turned negative from 2005 to 2011. Among these
years the negative is the highest in the year 2009. It reveals unsatisfactory performance of the company.
In Salona Cotspin shows negative in six year periods. Hence, we can say they are in “Failed” Status in those
periods. It showed recovery sign from the year 2010 onwards. The negative is the highest in the year 2002.
The overall H score of all the mills during the period of the study shows healthiness status. Under this status
VTX Industries shows only 3 years successful status and remaining periods shows failed status. The Bannari
Amman Spinning shows 4 years successful status and remaining period the healthiness is failed. The Precot
Meridian shows 7 years successful status and its healthiness is failed in 3 years. Ambika cotton mills also
shows the same level as Precot Meridian. But Lambodhara textiles healthiness is very poor. Similarly Super
Sales industries shows only 2 years successful status but failed in 8 years. Salona Cotspin shows 4 years
successful status and remaining periods it failed in healthiness status.
ANOVA
In VTX Industries it is observed that there is significant relationship between dependent variable Return on
Assets and Operating, Financial leverage. It indicates the strong positive relationship.
In Bannari Amman Spinning Mills it shows that there is no significant relationship between dependent
variable-Return on Assets and Operating, Financial Leverage.
In Precot Meridian it is observed that there is significant relationship between dependent variable-Return on
Assets and Operating, Financial Leverage.
Ambika Cotton shows that there is significant relationship between dependent variable-Return on Assets
and Operating, Financial Leverage.
-0.79 -0.41
0.22
-0.03
0.48
0.86
-0.34
-3.17
-0.99
-0.79-0.54
0.99
1.75
2.141.62
0.57
-0.17 -0.5-0.27
0.86
-0.47
0
0.34
0.01
1.22
0.65
-0.06
-0.84
0.64
1.11
-1.06
0.54
0.12 0.11
0.340.24
-0.32
-0.6
0.16
1.11
-0.05
0.61
0.580.5
0.97
0.39
-0.09
-1.97
-0.36
0.76
-1.35
-0.18
-1.02-1.4
-1.23-0.86
-1.49-1.43
-1.23
-0.62
-1.47
1.76
0.35
-0.44-0.61
-1.17-1.6
-1.85
-1.18 -0.9
-2.13
-0.93
-0.22 -0.14
0.33 0.08
-0.23
-1.07
0.69
0.22
-4
-3
-2
-1
0
1
2
3
2002 2003 2004 2005 2006 2007 2008 2009 2010 2011
H-s
core
s
YEAR
H-SCORES OF COMPANIES
VTX Indust. Bannari Amm Spg.
Precot Meridian Ambika Cotton
Super Spinning Lambodhara Text.
Super Sales Ind. Salona Cotspin

International Journal of Research in Management ISSN 2249-5908
Available online on http://www.rspublication.com/ijrm/ijrm_index.htm Issue 5, Vol. 2 (March 2015)
RSPUBLICATION , [email protected] Page 19
Super Spinning reveals that that there is no significant relationship between dependent variable-Return on
Assets and Operating, Financial Leverage.
In Lambodhara Textiles it shows that there is significant relationship between dependent variable-Return on
Assets and Operating, Financial Leverage.
Salona Cotspin shows that there is no significant relationship between dependent variable-Return on Assets
and Operating, Financial Leverage.
In Super Sales it shows that there is significant relationship between dependent variable-Return on Assets
and Operating, Financial Leverage.
In Overall return on Assets and Leverage Status of all companies. It is observed that the Operating leverage
of all the mills except Super sales Industries are negatively contributing to the ROA. Also the Financial
leverage of all the mills except Super spinning and Salona Cotspin are negatively contributing to the ROA.
MULTIPLE REGRESSION ANALYSIS
In VTX Industries, it is observed that there is a positive relationship between operating profit and sales,
contribution margin and cash return on assets.
The relationship between operating profit and other variables of Bannari Amman Spinning mills ltd., it is
observed that there is a positive relationship between operating profit and sales and contribution margin
but negative relationship with cash return on assets.
The relationship between operating profit and other variables of Precot Meridian Ltd., there is a positive
relationship between operating profit and sales and contribution margin but negative relationship with cash
return on assets. Operating profit is negatively contributed to return on assets.
The relationship between operating profit and other variables of Ambika Cotton Ltd., there is a positive
relationship between operating profit and sales, contribution margin and cash return on assets.
The relationship between operating profit and other variables of Super Spinning Ltd., there is a positive
relationship between operating profit and sales, contribution margin and cash return on assets.
To test the relationship between operating profit and other variables of Lambodhara Textiles Ltd., shows that
there is a positive relationship between operating profit and sales but negative relationship with contribution
margin and cash return on assets. Operating profit is negatively contributed to contribution margin and
return on assets.
FACTOR ANALYSIS
The variable of Return on Equity, Return on Assets, Return on investment, cash debt coverage ratio, cash
return on assets, EBIT/Sales and Contribution Margin ratio are having positive higher scores they are
significantly influencing the profitability of VTX Industries.
Bannari Amman Spinning Mills shows the significant influence of profitability and solvency factors, with the
variable of Return on Equity, Return on Assets, Return on investment, cash debt coverage ratio, and cash
return on assets.
In factor analysis of Precot Meridian the variable of Contribution Margin, EBIT/Sales and Return on Assets,
cash debt coverage ratio, and cash return on assets are having positive higher scores they are significantly
influencing the profitability.
The variable of Return on Equity, Return on Assets, Return on investment, cash debt coverage ratio, cash
return on assets, EBIT/Sales and Contribution Margin ratio are having positive higher scores they are
significantly influencing the profitability of Ambika Cotton.
Profitability of Super Spinning is significantly influenced by the variables the contribution margin ratio,
EBIT/ Sales and Return on investment. Similarly, Solvency of the mill is also significantly influenced by the
variable of Cash Return on Assets and Cash Debt Coverage ratio.
Profitability and profit contribution of Lambodhara Textiles is significantly influenced by
TREND ANALYSIS
In VTX Industries Ltd., it is observed that the model suitable for forecasting operating profit is Linear Trend
Model. The Forecasted operating profit of VTX Industries discloses marginal increase in the next five years.
International Journal of Research in Management ISSN 2249-5908
Available online on http://www.rspublication.com/ijrm/ijrm_index.htm Issue 5, Vol. 2 (March 2015)
RSPUBLICATION , [email protected] Page 20
In Bannari Amman Spinning Mills., it is identified that the model suitable for forecasting operating profit is
Linear Trend Model. The Forecasted operating profit of Bannari Amman Spinning Mills., shows high
growth in the next five years.
The Exponential Trend model is suitable for forecasting the operating profit for Precot Meridian. The
Forecasted figure shows normal increase in trend of operating profit for the next five years.
The Exponential Trend model is suitable for forecasting the operating profit for Ambika Spinning Mills. The
Forecasted figure shows that the increase in trend of operating profit for the next five years which is more
satisfactory.
SUGGESTIONS
The financial health of VTX Industries showed failed status for 7 years. It shows poor status of the spinning
mill. Hence the spinning mill should improve its profitability by reducing the overheads.
Bannari amman spinning mill is financially unhealthy status for 4 years. It reveals unsatisfactory status of
the spinning mills. For improving financial healthiness of spinning mill they should improve its turnover to
earn more profit.
Precot Meridian shows failed status for 3 years it reveals unsatisfactory position of the mill. In future it
reduces the overheads by adopting modern technology.
Ambika Cotton is financially not in healthy status for 4 years. It is not good. for the spinning mill. For
improving financial healthiness of spinning mill it should improve its profitability by replacing old and worn-
out machinery.
The financial health of Super Spinning discloses failed status for 4 years. It should avoid failed status to
maintain solvency and liquidity.
Lambodara Textile shows a very poor status for all the ten years. Financial healthiness of this mill is not up
to the mark. Hence the spinning mill should reduce the overheads to improve turnover in the competitive
market. It should maintain solvency, liquidity and profitability to survive in the competitive business.
Super Sales shows very poor status for 8 years. It is almost similar to lambodara textiles. It should avoid
failed status to maintain liquidity and solvency.
Salona Cotspin is financially not in healthy status for 6 years. It shows unsatisfactory status of the spinning
mill. For improving financial healthiness of spinning mill it should adopt innovative technology to increase
the turnover improve marketing capability to increase profitability.
In overall financial healthiness of the selected companies is not satisfactory status. For improving their
financial healthiness as successful, they should replace the old and worn-out machinery to adopt
modernisation to reduce cost of production and increase profit and maintain solvency and liquidity.
The low rated companies in CAGR of sales should increase their turnover by improving the primary factors.
In CAGR of EBIT of the low rated companies should improve their profitability by using lower cost of
power and labour and lower interest cost etc.
In CAGR of Return On Investment (ROI) of the low rated companies should increase their return or earnings
by using minimum necessary level of technology of machines.
Bannari Amman Spinning Mills shows there is a negative relationship between return on assets and operating
and financial leverage hence the spinning mill must improve the financial position.
Super Spinning reveals that there is no significant relationship between return on assets and operating and
financial leverage. The spinning mill can increase their operating profit by increasing its production sales
volume and reduce interest cost on loan.
Salona Cotspin shows there is no significant relationship between return on assets and operating and
financial leverage. Hence the spinning mill can increase the sales by reducing the operating expenses and
take required step to reduce more loan capital.
Bannari Amman Spinning mill and Precot Meridian show the negative relationship with cash return on assets
and Lambodhara Textiles show the negative relationship with contribution margin and cash return on assets.
Similarly Super sales industries also shows the negative relationship with operating profit and contribution
margin. Negative result companies should increase the operational efficiency.
In trend analysis VTX Industries and Super Spinning Mills show the marginal increase in profit and should
concentrate on profitability.
International Journal of Research in Management ISSN 2249-5908
Available online on http://www.rspublication.com/ijrm/ijrm_index.htm Issue 5, Vol. 2 (March 2015)
RSPUBLICATION , [email protected] Page 21
The mills should ensure unnecessary stoppage of ring frames should be avoided to increase machine
efficiency.
Roving waste and yarn waste should be minimized to increase productivity and adopt quality control.
Chinese auto toffer for ring frames should be installed for improving labour productivity.
Energy conservation cell to be established to save the energy consumption.
OTHER SUGGESTIONS
Using Key Performance Indicators (KPIs) to analyse strengths and weaknesses - e.g. rising costs or falling
sales
Regularly reviewing the pricing of the products
Testing the prices of any product the mills review before making the changes permanent
Improving the profitability through the mills best customers - use up-selling, cross selling and diversifying
techniques to improve profit margins
Long-term deals with suppliers to negotiate a better price on products
Researching new opportunities in the business sector and identifying where the mills could expand the
market by finding out who your potential new customers are and how they would buy the product
Measuring the operational efficiency regularly and put monitoring systems and processes in place - eg
benchmarking
The Agreement on Textiles and Clothing (ATC) promises abolition of all quota restrictions in international
trade in textiles and clothing. This provides tremendous scope for export expansion from developing
countries.
TCIDS is a part of the drive to improve infrastructure facilities at potential Textile growth centers and
therefore, aims at removing bottlenecks in exports so as to achieve the target.
TCIDS Scheme funds can be for development of infrastructure directly benefiting the spinning and textile
units.
Comprehensive analysis of profit performance should be adopted by mills.
Technology Upgradation Fund Scheme (TUFS) which provides for reimbursing 5% interest on the
loans/finance raised from designated financial institutions for bench marked projects of modernisation.
IDBI, SIDBI, IFCI have been designed as nodal agencies for large and medium small scale industry and
jute industry respectively. This scheme is useful for technology upgradation for mills.
To provide the industry with world-class infrastructure facilities for setting up their textile units,
Government has launched the “Scheme for Integrated Textile Parks (SITP)” by merging the „Scheme for
Apparel Parks for Exports (APE)‟ and „Textile Centre Infrastructure Development Scheme (TCIDS)‟. This
scheme is based on Public-Private Partnership (PPP) and envisages engaging of a professional agency for
project execution. The Ministry of Textiles (MOT) would implement the Scheme through Special Purpose
Vehicles (SPVs).
National Textile Corporation Ltd. (NTC) is the single largest Textile Central Public Sector Enterprise under
Ministry of Textiles managing 52 Textile Mills through its 9 Subsidiary Companies spread all over India to
strengthen the spinning and textile industries.
The Cotton Corporation of India Ltd (CCI), Mumbai, under the Ministry of Textiles is engaged in
commercial trading of cotton. The CCI also undertakes Minimum Support Price Operation (MSP) on behalf
of the Government of India.
The Ministry of Textiles is responsible for policy formulation, planning, and development export promotion
and trade regulation in respect of the textile sector. This included all natural and manmade cellulosic fibres
that go into the making of textiles, clothing and handicrafts.
18. CONCLUSION
Spinning and textile sector is the oldest and largest manufacturing sector in India. At present large
demand for cotton yarn in the world market much of which is currently being supplied by major cotton
producing countries such as India and Pakistan. To meet the global competition important technological
developments are aimed mainly at raising productivity, improving quality and control and making
International Journal of Research in Management ISSN 2249-5908
Available online on http://www.rspublication.com/ijrm/ijrm_index.htm Issue 5, Vol. 2 (March 2015)
RSPUBLICATION , [email protected] Page 22
manufacturing more environmental friendly and eco friendly to develop innovative new products that will gain
more demand for the products to improve profitability for the economic development of the country. The
analysis of profitability plays a significant role in judging the financial healthiness of the spinning mills.
Government policies and availability of incentive package comprising investment incentives, fiscal incentives,
the availability of export finance at concessional interest rate efficient infrastructure, skilled labour and
moderate demand growth are reviewed to strengthen the spinning mills to improve financial soundness by
increasing profitability. The mills with stronger capital structure, efficient cotton procurement, and diversified
cotton mix and favourable economies of scale are better positioned to tide over the volatility in the market and
increase the earnings. To sustain a healthy balance sheet the gradual improvement in the spread between yarn
and cotton price and optimum capacity utilization will be critical factors for cotton spinning mills in the short to
medium term. The major spinning mills have to take all the efforts need to stabilize their earnings. Yet there are
industries whose performance is comparatively better than other industries in their earnings. Among them are
Bannari Amman Spinning mills ranks first followed by Precot Meridian Ltd., Super Spinning Mills Ltd.,
Ambika Cotton Mills Ltd., Salona Cotspin Ltd., VTX Industries Ltd., Super Sales India Ltd., and Lambodhara
Textiles Ltd., ranks last.
19. REFERENCES:
1. "Economic Times” (2010), Economictimes.indiatimes.com.
2. Sherry Sabbarwal, “Organizational Approach to Environmental control” – S.B. Nangia, Ashish
Publishing House, New Delhi. Pg.16-18.
3. Lewis Hackett, “Industrial Revolution” – History-world.org
4. Mr. Barber, “History of Clothing and textile” - From Wikipedia, the free encyclopaedia.
5. “Early spinning” – Textile guide.
6. APITCO Ltd., Engineering growth, “Spinning mill” – formerly Andhra Pradesh industrial and
Technical consultancy Organisation Limited, Pg.2.
7. Sarah Aguiree, About.com Guide
8. Tamil Nadu-Textile Policy, “Importance of Textile Sector in Tamil Nadu” – Tamil Nadu Textile
policy.
9. “Cotton – Spinning” – Plant cultures, Exploring plants and people.
10. www.en.wikipedia.org
11. V.Sridhar, “Mills in Crisis” – Frontline, India‟s National Magazine (1999).
12. Mr. Kranthi, Keshav raj, “Research focuses on yield and improved resistance” – Cotton international
Magazine, 2011, Pg.112-113.