
INTERNATIONAL FMCG/CPG REPORT 2021 - YouGov plc
58
yougov.com/fmcg Consumer goods in a crisis INTERNATIONAL FMCG/CPG REPORT 2021 FMCG/CPG
-
Upload
khangminh22 -
Category
Documents
-
view
4 -
download
0
Transcript of INTERNATIONAL FMCG/CPG REPORT 2021 - YouGov plc
yougov.com/fmcg
Consumer goods in a crisis
INTERNATIONAL
FMCG/CPG
REPORT 2021
FMCG/CPG


CONTENTS
Executive summary
Introduction
How the pandemic has impacted
channel behavior and choices
Changing dynamics of “click and
collect" and online grocery delivery
services
How the pandemic has impacted
planned vs. impulse shopping behavior
Changes in category consumption:
Food, cosmetics, and alcohol
All made up and nowhere to go:
COVID-19 and cosmetic products
Category snapshot: The growth of
frozen foods during the pandemic
Category snapshot: Changing
consumption levels of alcohol during
the pandemic
Category snapshot: The growth of
home cleaning products
After the crisis: Consumers plan to shop
local and prioritise sustainability
Conclusion
04
06
11
15
22
26
30
38
43
48
50
56

4 YOUGOV.COM/FMCG YouGov's International FMCG/CPG Report 2021
Main findings
• A plurality of consumers - ranging from 44% to
83% - across all markets in our study agree that
their shopping habits have changed as a result
of the pandemic.
• Most consumers (82% across all markets) have
a regular grocery shopping routine.
• Intention to use online shopping and delivery
services is highly variable ranging, from a
quarter (24%) to two-thirds (67%) of consumers.
• In almost all markets, delivery services are
more popular than "click and collect" services.
• On average, three in ten global consumers
(29%) say they’ve been buying more frozen
foods during the pandemic – rising to nearly six
in ten (58%) in markets such as Hong Kong.
• Cosmetics have struggled during the crisis,
with a third (32%) of consumers across all
markets saying they are buying these items
less than before.
• Home cleaning product purchases have been
highly variable, increasing amongst three-
quarters (76%) of consumers in some markets
and by as few as 15% of consumers in others.
• Over half (54%) of consumers across all markets
intend to buy more sustainable products once
the pandemic subsides.
EXECUTIVE
SUMMARY

6 YOUGOV.COM/FMCG YouGov's International FMCG/CPG Report 2021
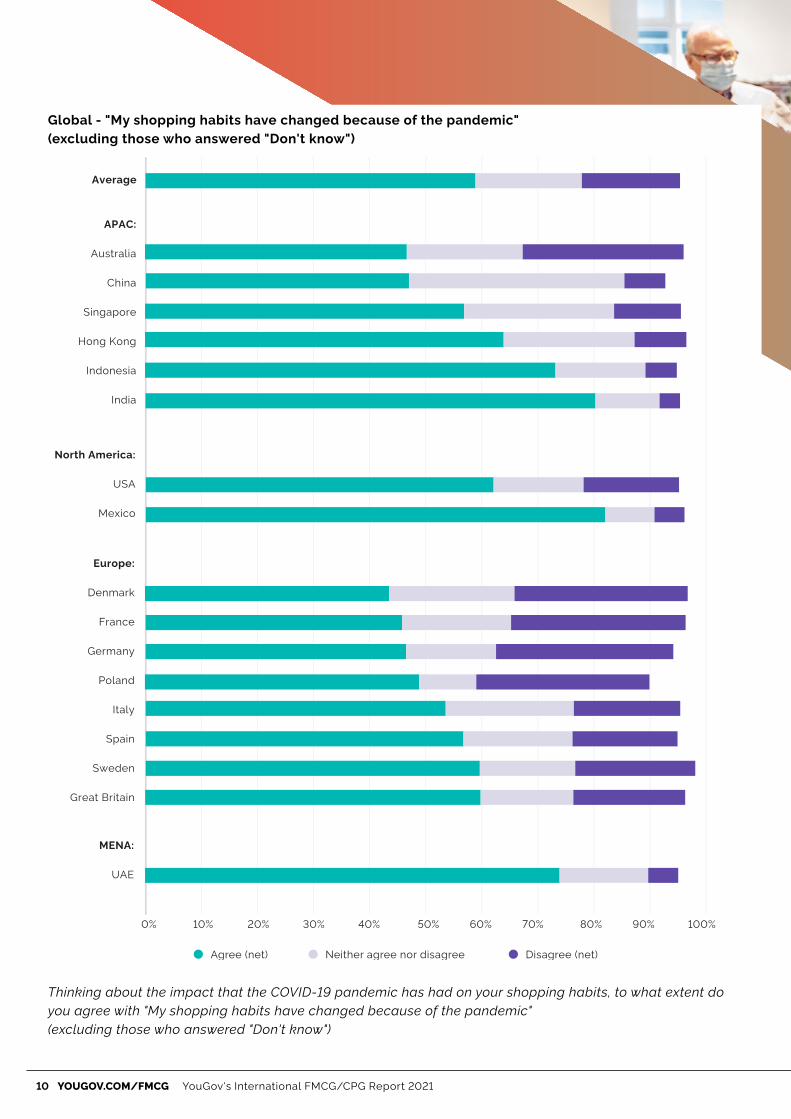
Our international report into the sector for 2021
reveals that, in every one of the 17 markets
featured in our study, a plurality of consumers
say that their shopping habits have changed over
the course of the coronavirus crisis. In 11 markets
more than half of consumers say they have
altered their behaviors (Figure 1).
The pandemic has created both challenges
and opportunities in the fast-moving consumer
goods/consumer packaged goods sector. Using
syndicated survey data from YouGov Profiles and
BrandIndex in tandem with deep-dive custom
research, this report investigates how attitudes
and behaviors have shifted in these
17 markets – and which FMCG/CPG categories
have prospered or suffered as a result.
INTRODUCTION

7 YouGov's International FMCG/CPG Report 2021 YOUGOV.COM/FMCG
The pandemic hasn't had a one-size-fits-all impact
on shopping behavior in the FMCG/CPG sector.
There are very real differences between different
markets and it will be interesting to track how these
behaviors continue to change - or whether they are
more reflexive and we eventually return to the way
things were.”
Chris Todd, VP of New Business Sales - US
"
8 YOUGOV.COM/FMCG YouGov's International FMCG/CPG Report 2021
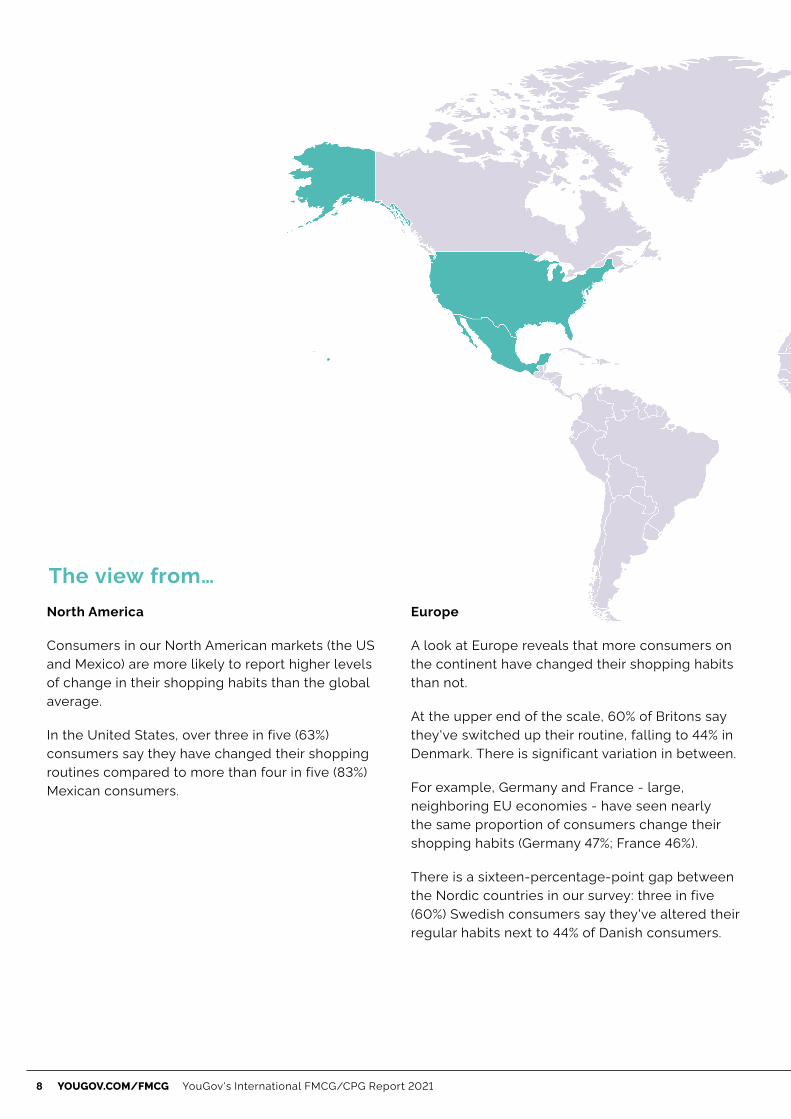
The view from…
North America
Consumers in our North American markets (the US
and Mexico) are more likely to report higher levels
of change in their shopping habits than the global
average.
In the United States, over three in five (63%)
consumers say they have changed their shopping
routines compared to more than four in five (83%)
Mexican consumers.
Europe
A look at Europe reveals that more consumers on
the continent have changed their shopping habits
than not.
At the upper end of the scale, 60% of Britons say
they've switched up their routine, falling to 44% in
Denmark. There is significant variation in between.
For example, Germany and France - large,
neighboring EU economies - have seen nearly
the same proportion of consumers change their
shopping habits (Germany 47%; France 46%).
There is a sixteen-percentage-point gap between
the Nordic countries in our survey: three in five
(60%) Swedish consumers say they've altered their
regular habits next to 44% of Danish consumers.

9 YouGov's International FMCG/CPG Report 2021 YOUGOV.COM/FMCG
APAC
There is no consistent trend across the APAC
region: the markets in our study vary in terms
of economic size, population size, and their
respective responses to the pandemic.
China, for example, introduced lockdowns and
contact tracing early, which could partially explain
why it has among the lowest levels of change to
overall shopping habits (47%). If normal shopping
options are available, there's less reason to change
a normal shopping routine. It's a similar story with
Australia (47%), which took measures to introduce
backwards-tracing after experiencing a second
wave of the virus and - on the shopping side of
things - has now returned to relative normality.
India has seen four out of five consumers (81%)
make changes to their regular routine, while in
Southeast Asia, Indonesia has seen three-quarters
switch up their shopping (74%) - compared to three
in five Singaporean consumers (58%).
MENA
Looking towards MENA, COVID-19 had a
substantial impact on shopping in the UAE, with
restrictions limiting footfall and forcing three-
quarters (75%) of consumers to change their
shopping habits.
10 YOUGOV.COM/FMCG YouGov's International FMCG/CPG Report 2021
Global - "My shopping habits have changed because of the pandemic"
(excluding those who answered "Don't know")
0% 10% 20% 30% 40% 50% 60% 70% 80% 90% 100%
Average
APAC:
Australia
China
Singapore
Hong Kong
Indonesia
India
North America:
USA
Mexico
Europe:
Denmark
France
Germany
Poland
Italy
Spain
Sweden
Great Britain
MENA:
UAE
Agree (net) Disagree (net)Neither agree nor disagree
Thinking about the impact that the COVID-19 pandemic has had on your shopping habits, to what extent do
you agree with "My shopping habits have changed because of the pandemic"
(excluding those who answered "Don't know")

11 YouGov's International FMCG/CPG Report 2021 YOUGOV.COM/FMCG
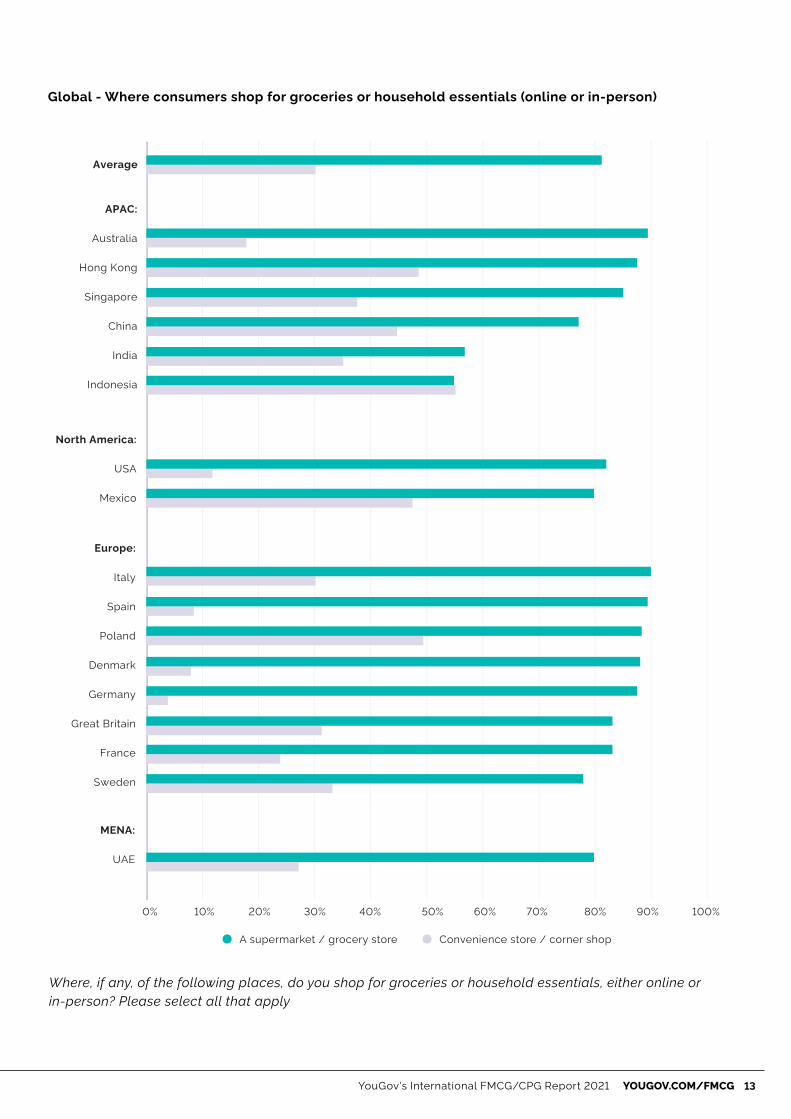
YouGov data from the pandemic indicates that
consumers in most markets are much more
likely to shop at supermarkets for groceries and
household essentials than at corner shops or
convenience stores. While the gap varies, in most
markets – and every market where we have a
nationally representative sample (rather than urban
or online sample*) – it is nonetheless very large. In
Australia, for example, the public are 61 percentage
points more likely to shop at a large retailer than a
smaller local one (Figure 2).
HOW THE PANDEMIC
HAS IMPACTED CHANNEL
BEHAVIOR AND CHOICES

12 YOUGOV.COM/FMCG YouGov's International FMCG/CPG Report 2021
The view from…
North America
In both Mexico and the US, supermarkets
overwhelm smaller, local stores to the point where
eight in ten consumers say they buy groceries and
household essentials from the former (US 81%;
Mexico 79%).
But while consumers visit supermarkets in similar
proportions, there is more divergence in how
they use corner shops and convenience stores.
In Mexico, for example, corner shops - while
significantly less popular than supermarkets - are
still used by nearly half of the country's population
(47%); in the US, this amounts to just 12% of the
public. This may be because they trust larger
stores to implement the necessary safety protocols
and to have all the items they need (therefore
reducing the need for multiple trips).
Europe
Supermarkets reign supreme across the European
markets in our study: between 89% (Italy) and 77%
(Sweden) of consumers say they use them for
either online or in-person shopping.
There is significantly more variation in terms of
convenience store shopping: while it rises to as
many as half (49%) of consumers in Poland, it falls
to just 4% of consumers in Germany. Even among
Nordic countries, there isn't much consistency:
Sweden, for example, has a third (33%) of
consumers shopping at their local corner store,
while one in twelve (8%) Danish shoppers say
the same.
APAC
Across the APAC markets in our survey, consumers
are broadly more likely to use convenience stores
for groceries and household essentials than they
are in most other markets.
In Indonesia (54%), Hong Kong (48%), China (44%),
Singapore (37%) and India (35%), convenience
stores and corner shops are visited in significantly
higher proportions than they are elsewhere in
the world.
13 YouGov's International FMCG/CPG Report 2021 YOUGOV.COM/FMCG
Global - Where consumers shop for groceries or household essentials (online or in-person)
0% 10% 20% 30% 40% 50% 60% 70% 80% 90% 100%
Average
APAC:
Australia
Hong Kong
Singapore
China
India
Indonesia
North America:
USA
Mexico
Europe:
Italy
Spain
Poland
Denmark
Germany
Great Britain
France
Sweden
MENA:
UAE
A supermarket / grocery store Convenience store / corner shop
Where, if any, of the following places, do you shop for groceries or household essentials, either online or
in-person? Please select all that apply

14 YOUGOV.COM/FMCG YouGov's International FMCG/CPG Report 2021
Consumers have turned away from farm/market
and speciality retailers in UK and US
There is evidence that local farm/market and
specialty retailers of consumer goods are in
decline. In some cases, this seems to be part of
a longer-term decline. In the US, local farm and
market purchases have fallen year-on-year since
2018. The same is true for specialty food shops
(Figure 3).
While there has been similar overall erosion
in Great Britain, it has not been as linear. The
proportion of consumers buying from a local farm
or market was relatively stagnant in 2018 and 2019
before sharply dropping in 2020.
Meanwhile specialty food shops saw a two-
percentage point rise between 2018 and 2019
before dropping five percentage points in 2020
(Figure 4).
US: Proportion of people shopping at local farm/market and specialty food shops over time
GB: Proportion of people shopping at local farm/market and specialty food shops over time
Figure 3
A local farm or market Specialty food shops (e.g. butcher, bakery, etc.)
50%
40%
30%
20%
10%
0%
2018 2019 2020
A local farm or market Specialty food shops (e.g. butcher, bakery, etc.)
50%
40%
30%
20%
10%
0%
2018 2019 2020
Where, if any, of the following places, do you shop for groceries or household essentials, either online or in-
person? Please select all that apply
Where, if any, of the following places, do you shop for groceries or household essentials, either online or in-
person? Please select all that apply

15 YouGov's International FMCG/CPG Report 2021 YOUGOV.COM/FMCG
Our research shows that coronavirus has not
stopped people visiting the supermarket.
An average of 81% of consumers across the
17 markets in our study bought groceries or
household essentials in-store in the month prior
to being asked.
But the data also indicates that consumers within
these markets intend to make more use of ‘click
and collect’ and online delivery services – ranging
from 24% to 67% of respondents – across the
focus markets (Figure 5).
CHANGING DYNAMICS
OF “CLICK AND COLLECT"
AND ONLINE GROCERY
DELIVERY SERVICES

16 YOUGOV.COM/FMCG YouGov's International FMCG/CPG Report 2021
The view from…
North America
The view across the North American markets in our
study shows that over half of consumers in Mexico
(54%) are more likely to say they intend to increase
their online grocery shopping – compared to a
third of consumers in the US (34%).
Europe
Across the board, Europeans are generally less
likely to say they intend to increase their use of
online delivery and "click and collect" services. At
just under two in five (38%) consumers, Britons are
on the upper end of the regional scale. At the other
end of the spectrum, German (26%), French (26%)
and Danish (24%) consumers account for the
bottom three.
APAC
The APAC region registers higher levels of intent
to use online shopping and delivery services than
any other.
The three largest nations in Asia by population -
India (67%), China (64%) and Indonesia (63%) - also
have the most consumers who plan to increase
their use of these services. Even in the Asian
markets where intent is lower, more than half of the
public (Singapore 53%; Hong Kong 53%) still plan to
do more online shopping and arrange more online
deliveries.
MENA
As mentioned earlier in the report, lockdowns had
a major impact on retail and supermarket shopping
in the UAE - which may have influenced the
greater-than-average intent to use online shopping
and delivery services. Over half of consumers say
they plan to use these services in future (54%).

17 YouGov's International FMCG/CPG Report 2021 YOUGOV.COM/FMCG
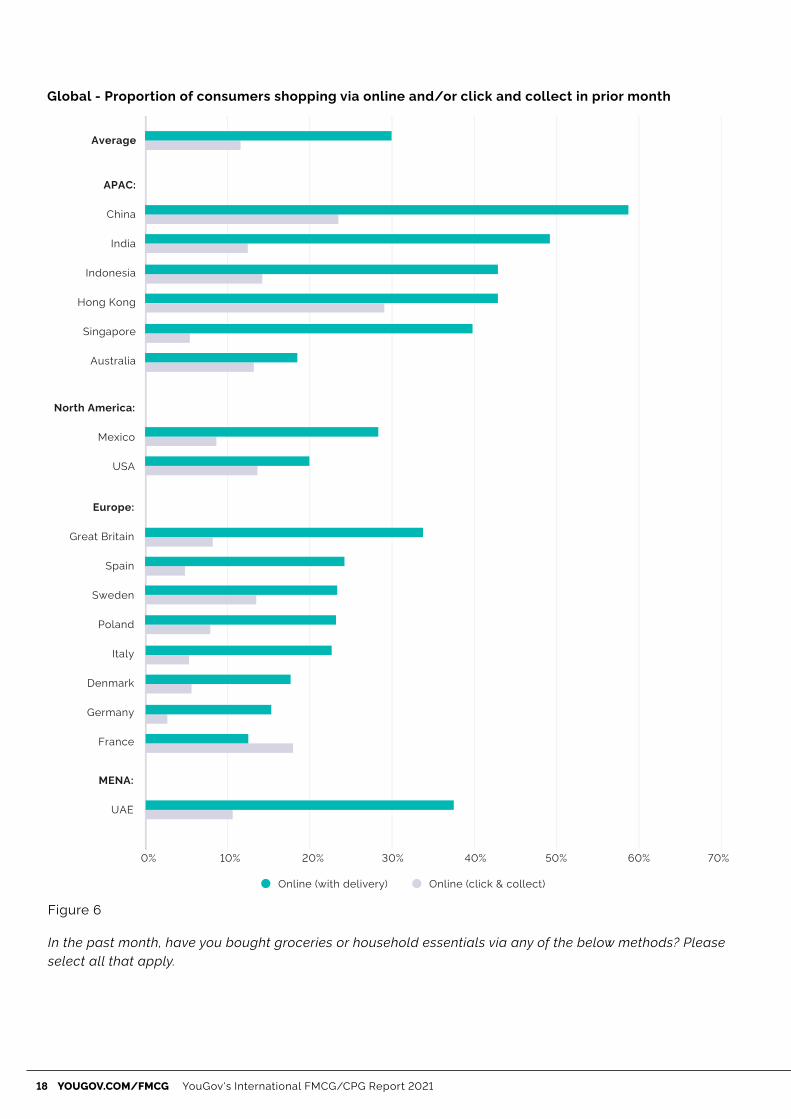
In 16 of the 17 markets surveyed, online delivery
was much more popular than click and collect
services. The exception is France, where click and
collect services enjoy a lead of five percentage
points (18% click and collect vs. 13% online
delivery).
The gap between services varies in size – in
markets such as Singapore, for example, there
is a 34 percentage point difference between
consumers who get their shopping delivered to
their doorstep (40%) and those who pick it up (6%);
in Australia it is as small as six percentage points
(19% online delivery; 13% click and collect)
(Figure 6).
There are straightforward drivers of this. Not only
is having groceries delivered more convenient
than picking them up – even taking into account
delivery fees – but with many areas under stay-
at-home orders, some consumers had a powerful
disincentive to leave the house for anything but
the most important reasons. In markets such as
Singapore, for example, population density makes
driving (and therefore click and collect) less
attractive; in markets where the population is less
dense, the reverse may be true.
COVID-19's impact on online shopping and delivery: I will make more use of online shopping/delivery
0% 10% 20% 30% 40% 50% 60% 70% 80% 90% 100%
Average
APAC:
India
China
Indonesia
Singapore
Hong Kong
Australia
North America:
Mexico
USA
Europe:
Great Britain
Poland
Spain
Italy
Sweden
Germany
France
Denmark
MENA:
UAE
Figure 5
Do you agree or disagree that as a result of coronavirus: "I will make more use of online shopping/delivery
(% agree)"
18 YOUGOV.COM/FMCG YouGov's International FMCG/CPG Report 2021
Global - Proportion of consumers shopping via online and/or click and collect in prior month
Figure 6
0% 10% 20% 30% 40% 50% 60% 70%
Average
APAC:
China
India
Indonesia
Hong Kong
Singapore
Australia
North America:
Mexico
USA
Europe:
Great Britain
Spain
Sweden
Poland
Italy
Denmark
Germany
France
MENA:
UAE
Online (with delivery) Online (click & collect)
In the past month, have you bought groceries or household essentials via any of the below methods? Please
select all that apply.

19 YouGov's International FMCG/CPG Report 2021 YOUGOV.COM/FMCG
Big business: Online produce purchases in Germany
With around one in five (18%) Germans buying
groceries online, there is plenty of room for
expansion by FMCG brands and supermarkets and
our data points to where these opportunities exist.
Among those who buy their groceries online the
over-55s are underrepresented (35% vs. 42% nat
rep) while those aged 18-24 are overrepresented
(13% vs. 9% nat rep). Current online grocery
shoppers are also more likely to be male (57% vs.
48% nat rep) (Figure 7).
Germany - Age-gender breakdown of online shoppers
18-24 25-34 35-44 45-54 55+ Male Female
70%
60%
50%
40%
30%
20%
10%
0%
Online shoppers Nat rep
Figure 7

20 YOUGOV.COM/FMCG YouGov's International FMCG/CPG Report 2021
While the majority use supermarkets, they’re less
likely to order through traditional chains or grocery
stores than the general public (87% vs. 75%) – and
more likely to use a specialist online retailer such
as Amazon Fresh (35% vs. 8% nat rep).
They also demonstrate a greater preference for
ordering products directly from the manufacturer
(8% vs. 3% nat rep) (Figure 8).
Germany - Where online shoppers are buying their groceries
Figure 8
0% 10% 20% 30% 40% 50% 60% 70% 80% 90% 100%
Other
Via online supermarket / grocery store
(e.g. Amazon Fresh etc.)
Direct from manufacturer
Health and Beautyspecialist retailer
Speciality shops (e.g. pharmacy, butchers,
bakery etc.)
A supermarket / grocery store
Specific food shops(e.g. international food or
ingredients shop etc.)
Convenience store / corner shop
A local farm or market
Nap repOnline shoppers of grocery
In the last month how frequently have you shopped, either online or in store, for groceries to be consumed at
home? This is not including meals on the go.

21 YouGov's International FMCG/CPG Report 2021 YOUGOV.COM/FMCG
One area where retailers and brands can broaden
their appeal to digital-centric consumers is organic
and natural foods. Germans who shop online are
15 percentage points more likely to say they prefer
these foods than the general public (59% vs. 44%
nat rep).
They may also prefer premium products: the data
suggests they’re nine percentage points more
likely to say they enjoy owning quality goods (71%
vs. 60% nat rep) (Figure 9)
Germany - Consumer attitudes to food: online shoppers vs. nat rep
Figure 9
0% 10% 20% 30% 40% 50% 60% 70% 80% 90% 100%
Subscription boxes areconvenient & save time
Prefer serving organicand natural food to family
Like uniquecoffee creations
Like owningquality products
Prefer buying thingsonline rather than
in stores
Online shoppers of grocery Nap rep
Various questions
22 YOUGOV.COM/FMCG YouGov's International FMCG/CPG Report 2021
HOW THE PANDEMIC
HAS IMPACTED
PLANNED VS. IMPULSE
SHOPPING BEHAVIOR
Great Britain: Supermarket visits declined in 2020
In Britain, there is evidence to suggest that a slight
uptick in the proportion of people planning their
shopping happened while people paid fewer trips
to the supermarket.
The proportion of Britons who visited the
supermarket or shopped online two to three times
a week declined between 2019 and 2020 – with
a corresponding uptick in the proportion who
shopped just once a week or once a fortnight
(Figure 10).
It may be that, with more time to plan their shop
(or their online grocery order), the British public
have less reason to visit the supermarket or
arrange a delivery. As an ongoing threat to public
health, coronavirus may also act as a powerful
disincentive for consumers who might otherwise
shop more frequently.

23 YouGov's International FMCG/CPG Report 2021 YOUGOV.COM/FMCG
Germany - Consumer attitudes to food: online shoppers vs. nat rep
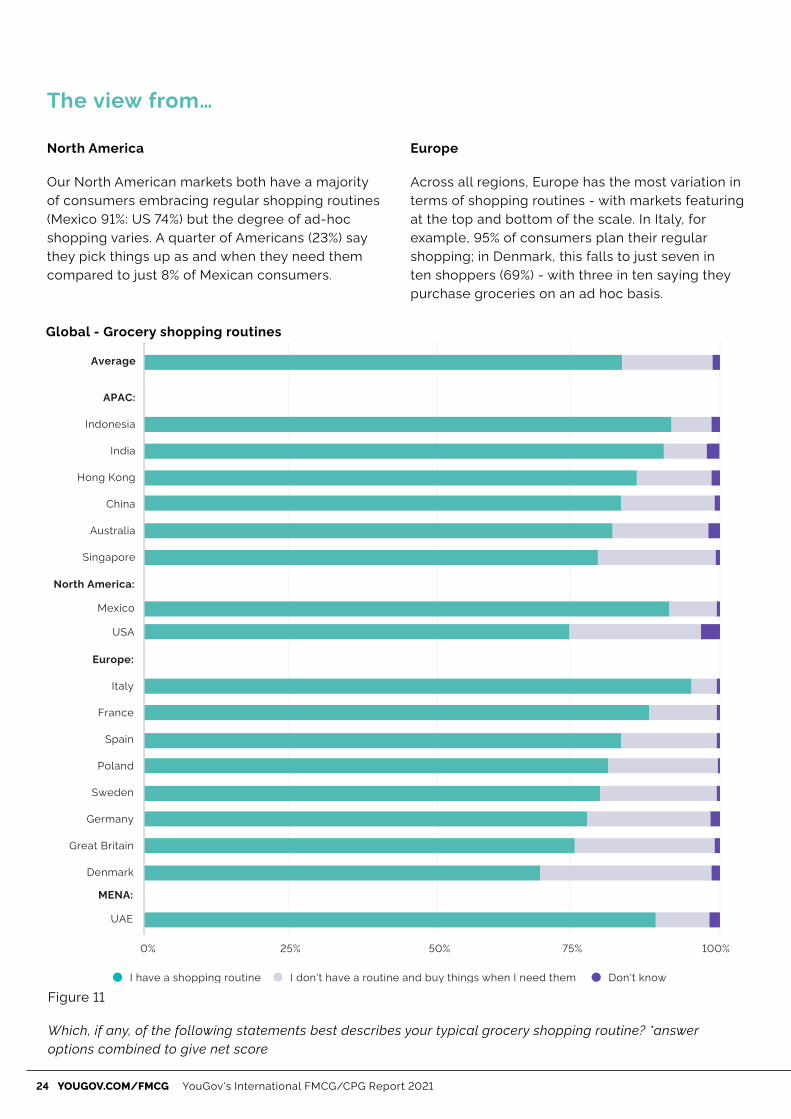
Globally, the majority of the public prefer regular shopping
Taking a more global view, four out of five respondents (82%) across all 17 markets have a regular shopping
routine. However, there are notable variations within regions.
4 or more times a week
2 to 3 timesa week
Once a week Once a fortnight Once every3 weeks
50%
40%
30%
20%
10%
0%
2019 average 2020 average
Great Britain - Shopping frequency: 2019-2020
Figure 10
In the last month how frequently have you shopped, either online or in store, for groceries to be consumed at
home? This is not including meals on the go. *answer options combined to give net score
24 YOUGOV.COM/FMCG YouGov's International FMCG/CPG Report 2021
The view from…
North America
Our North American markets both have a majority
of consumers embracing regular shopping routines
(Mexico 91%: US 74%) but the degree of ad-hoc
shopping varies. A quarter of Americans (23%) say
they pick things up as and when they need them
compared to just 8% of Mexican consumers.
Europe
Across all regions, Europe has the most variation in
terms of shopping routines - with markets featuring
at the top and bottom of the scale. In Italy, for
example, 95% of consumers plan their regular
shopping; in Denmark, this falls to just seven in
ten shoppers (69%) - with three in ten saying they
purchase groceries on an ad hoc basis.
0% 25% 50% 75% 100%
Average
APAC:
Indonesia
India
Hong Kong
China
Australia
Singapore
North America:
Mexico
USA
Europe:
Italy
France
Spain
Poland
Sweden
Germany
Great Britain
Denmark
MENA:
UAE
I don't have a routine and buy things when I need themI have a shopping routine Don't know
Global - Grocery shopping routines
Figure 11
Which, if any, of the following statements best describes your typical grocery shopping routine? *answer
options combined to give net score
25 YouGov's International FMCG/CPG Report 2021 YOUGOV.COM/FMCG
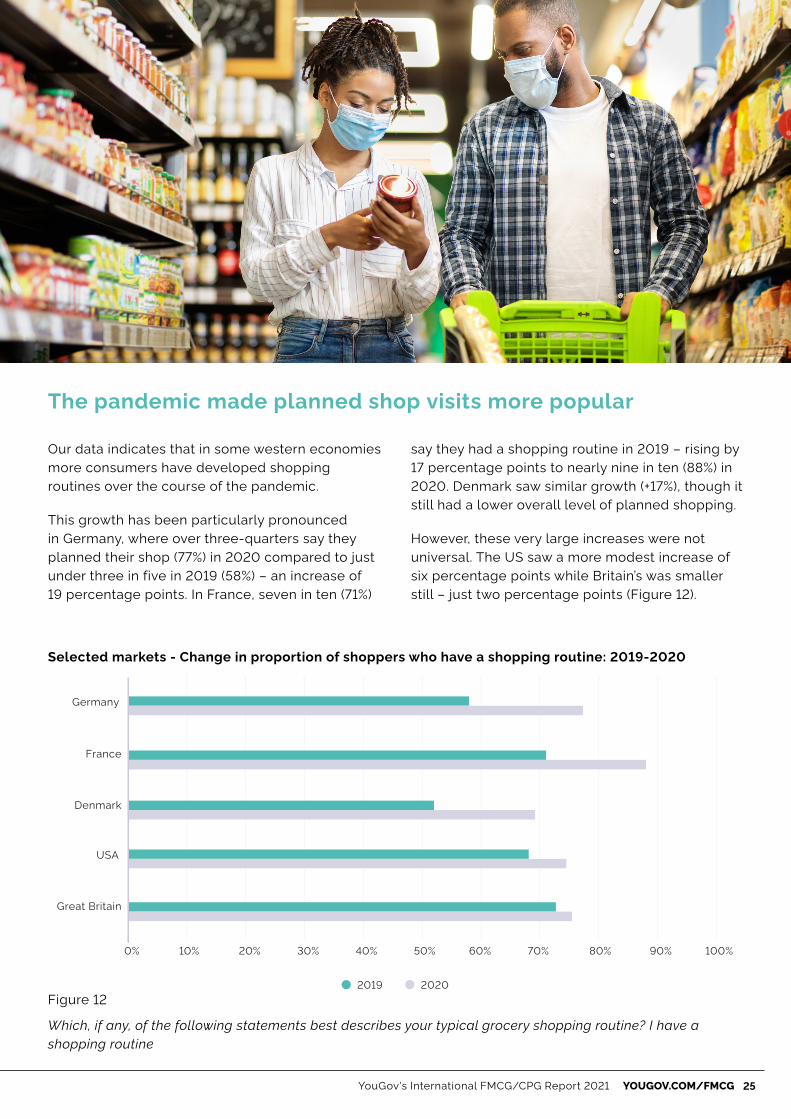
The pandemic made planned shop visits more popular
Our data indicates that in some western economies
more consumers have developed shopping
routines over the course of the pandemic.
This growth has been particularly pronounced
in Germany, where over three-quarters say they
planned their shop (77%) in 2020 compared to just
under three in five in 2019 (58%) – an increase of
19 percentage points. In France, seven in ten (71%)
say they had a shopping routine in 2019 – rising by
17 percentage points to nearly nine in ten (88%) in
2020. Denmark saw similar growth (+17%), though it
still had a lower overall level of planned shopping.
However, these very large increases were not
universal. The US saw a more modest increase of
six percentage points while Britain’s was smaller
still – just two percentage points (Figure 12).
Selected markets - Change in proportion of shoppers who have a shopping routine: 2019-2020
Figure 12
0% 10% 20% 30% 40% 50% 60% 70% 80% 90% 100%
Denmark
France
Germany
Great Britain
USA
2019 2020
Which, if any, of the following statements best describes your typical grocery shopping routine? I have a
shopping routine

26 YOUGOV.COM/FMCG YouGov's International FMCG/CPG Report 2021
CHANGES IN CATEGORY
CONSUMPTION: FOOD,
COSMETICS AND ALCOHOL
Our data shows that during the pandemic
consumers have responded in different ways
across different FMCG/CPG categories. For
example, while there has been an increase in the
consumption of fruit and vegetables there has
been a decrease in the purchase of cosmetics
(Figure 13).
Food
Across all 17 markets, approaching four in ten (38%) say they eat
more fresh fruit and vegetables, while just 6% say they eat less. At
the same time, junk food remained essentially static: 27% say they
are buying more: 28% say they were buying less. Consumption of
dairy items increased for 24% of consumers (decreasing for 6%),
while more people ate baked goods (22% increase vs. 13% decrease).
Alcohol
A quarter (26%) also say they have been consuming more alcohol,
while a fifth (20%) say they have been drinking less.
Cosmetics
Cosmetics appears to have particularly struggled during the crisis:
32% say they are buying fewer products in this category.

27 YouGov's International FMCG/CPG Report 2021 YOUGOV.COM/FMCG
Global - Change in consumption of consumer products
Figure 13
0% 10% 20% 30% 40% 50% 60% 70% 80% 90% 100%
Chilled ready meals andother prepared foods
Dairy items
Bakery goods
Junk food(incl. confectionery)
Fresh fruitsand vegetables
Food cupboard items
Frozen foods
Alcohol
Cosmetics (incl. moisturizers
& hair products)
Increased Stayed the same Decreased
How has your consumption of each of the following food products changed during the COVID-19 pandemic?
Percentage shown excludes non-users within each category
28 YOUGOV.COM/FMCG YouGov's International FMCG/CPG Report 2021
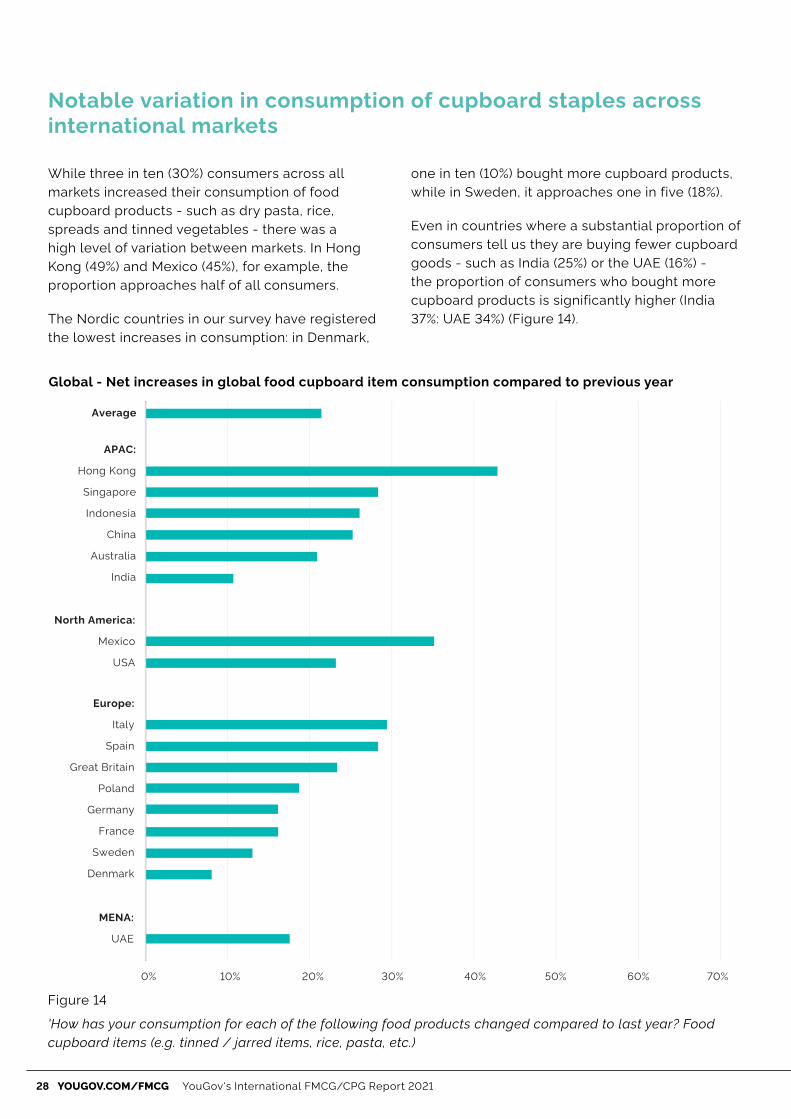
Notable variation in consumption of cupboard staples across
international markets
While three in ten (30%) consumers across all
markets increased their consumption of food
cupboard products - such as dry pasta, rice,
spreads and tinned vegetables - there was a
high level of variation between markets. In Hong
Kong (49%) and Mexico (45%), for example, the
proportion approaches half of all consumers.
The Nordic countries in our survey have registered
the lowest increases in consumption: in Denmark,
one in ten (10%) bought more cupboard products,
while in Sweden, it approaches one in five (18%).
Even in countries where a substantial proportion of
consumers tell us they are buying fewer cupboard
goods - such as India (25%) or the UAE (16%) -
the proportion of consumers who bought more
cupboard products is significantly higher (India
37%: UAE 34%) (Figure 14).
Global - Net increases in global food cupboard item consumption compared to previous year
Figure 14
0% 10% 20% 30% 40% 50% 60% 70%
Average
APAC:
Hong Kong
Singapore
Indonesia
China
Australia
India
North America:
Mexico
USA
Europe:
Italy
Spain
Great Britain
Poland
Germany
France
Sweden
Denmark
MENA:
UAE
'How has your consumption for each of the following food products changed compared to last year? Food
cupboard items (e.g. tinned / jarred items, rice, pasta, etc.)

29 YouGov's International FMCG/CPG Report 2021 YOUGOV.COM/FMCG
Significant numbers stockpiled during 2020
Our data shows that a significant minority still
stockpiled goods in the pandemic. Across all
markets, just under two in five (38%) say they
have stocked up on goods. However, there was a
great variation by market. In several, at least half
of our sample (62% India; 51% China; 51% UAE;
50% Mexico) report that they are more likely to
buy items in bulk during 2020. At the lower end
of the scale, a quarter or more (24% Germany;
25% France; 30% GB; 30% Australia) say the same
(Figure 15).
Average
APAC:
Australia
Singapore
Indonesia
Hong Kong
India
China
North America:
USA
Mexico
Europe:
Germany
France
Poland
Great Britain
Denmark
Sweden
Italy
Spain
MENA:
UAE
Net agree Net disagree
33%
42%
31%
31%
21%
16%
12%
27%
20%
52%
51%
47%
40%
38%
37%
37%
36%
19%51%
31%
31%
31%
34%
30%
37%
25%
24%
24%
42%
51%
62%
45%
42%
35%
30%
38%
Global - Agreement/disagreement with the statement "I am more likely to buy items in bulk" (as a
result of the pandemic)
Figure 15
Thinking about the impact that the COVID-19 pandemic has had on your shopping habits, to what extent do
you agree with the following statements…

30 YOUGOV.COM/FMCG YouGov's International FMCG/CPG Report 2021
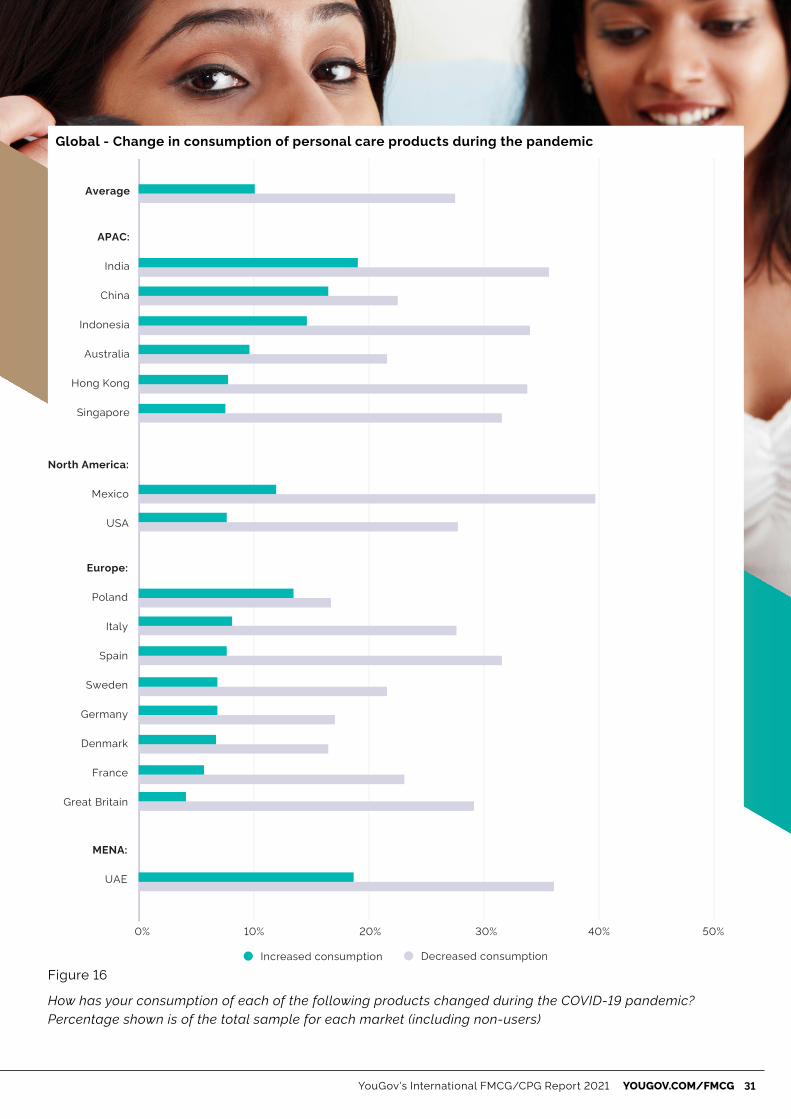
The view from…
Europe
European consumers were, on the whole, less
likely to increase their consumption of personal
care products than other consumers - in some
cases notably so.
For example, in Great Britain, just 3% say they used
more of these products while nearly three in ten
used less of them (28%). France (6%), Germany (7%),
and Spain (8%) also saw lower increases than the
global average.
North America
North Americans are - as in every market - more
likely to decrease their consumption of personal
care products than increase it.
While the US sits firmly in the middle of the pack,
with 27% decreasing their use of personal care
products and 7% increasing it, Mexico saw two in
five consumers saying they had limited their use
of these items (39%), the highest proportion of any
market in our study.
APAC
Consumers in every APAC market surveyed
are more likely to have decreased their use of
personal care products than the global average
- with the exception of people who live in China
(22%), where the worst of the pandemic is in the
rear-view mirror, and Australia (21%). In China, the
public are also more likely to have increased their
consumption of personal care products (16%) than
the global average.
Earlier, we showed that cosmetics was one of the
product types hardest hit by changing consumer
choices as people went out less. In every country
we surveyed, consumers are more likely to have
decreased their consumption of these products
than increased them. Only in Poland are the two
consumer groups even close (13% increased; 16%
decreased) (Figure 16).
ALL MADE UP
AND NOWHERE TO GO:
COVID-19 AND COSMETIC
PRODUCTS
31 YouGov's International FMCG/CPG Report 2021 YOUGOV.COM/FMCG
Figure 16
Decreased consumptionIncreased consumption
0% 10% 20% 30% 40% 50%
Average
APAC:
India
China
Indonesia
Australia
Hong Kong
Singapore
North America:
Mexico
USA
Europe:
Poland
Italy
Spain
Sweden
Germany
Denmark
France
Great Britain
MENA:
UAE
Global - Change in consumption of personal care products during the pandemic
How has your consumption of each of the following products changed during the COVID-19 pandemic?
Percentage shown is of the total sample for each market (including non-users)

32 YOUGOV.COM/FMCG YouGov's International FMCG/CPG Report 2021
Click and make-up: The future of the Singaporean
cosmetics market
Two in five (40%) Singaporean women say they’ve
limited their purchases of cosmetics during the
pandemic compared to just over a fifth (22%)
of men. There’s also evidence to suggest that
the group who has reduced their cosmetics
consumption skews slightly younger (Figure 17).
Singapore: Cosmetics usage during the COVID-19 pandemic
Figure 17
50%
40%
30%
20%
10%
0%18-24 25-34 35-44 45-54 55+ Male Female
Increased DecreasedStayed the same I do not consume/use this type of product
How has your consumption of each of the following products changed during the COVID-19 pandemic?
Cosmetic products (e.g.make-up products, moisturizers, hair wax, hair gel etc.)

33 YouGov's International FMCG/CPG Report 2021 YOUGOV.COM/FMCG
In Singapore, cosmetics sales have increasingly moved
online due to the pandemic. To overcome consumer
desire to test cosmetics products prior to purchase,
retailers such as Watsons and Sephora have started
rolling out AI apps which can be downloaded on mobile.
These apps have helped to overcome the limitations of
in-store testing of colors by allowing consumers to upload
their photos and virtually trial products on themselves
before committing to the purchase."
Fang Ying Goh, Associate Director - Singapore
"

34 YOUGOV.COM/FMCG YouGov's International FMCG/CPG Report 2021
Our data profiles consumers who have reduced
their usage of cosmetic products and points to
how cosmetics companies can win them back.
As a group, they are committed to looking good.
Over six in ten say it is important to them to be
physically attractive (64%) and that they take care
of their appearance at all times (62%).
This audience are twice as likely to pay attention
to marketing on digital channels (63%) as they are
print newspapers (32%) or TV adverts (31%) (Figure
18). Cosmetics companies looking to achieve
greater ROI with their marketing could invest
more on digital channels and allocate budgets
accordingly within their overall channel mix.
Preferred advertising channels: Singaporean consumers who have reduced their use of cosmetics
Figure 18
100%
90%
80%
70%
60%
50%
40%
30%
20%
10%
0%Online Printed newspapers TV adverts Radio
35 YouGov's International FMCG/CPG Report 2021 YOUGOV.COM/FMCG
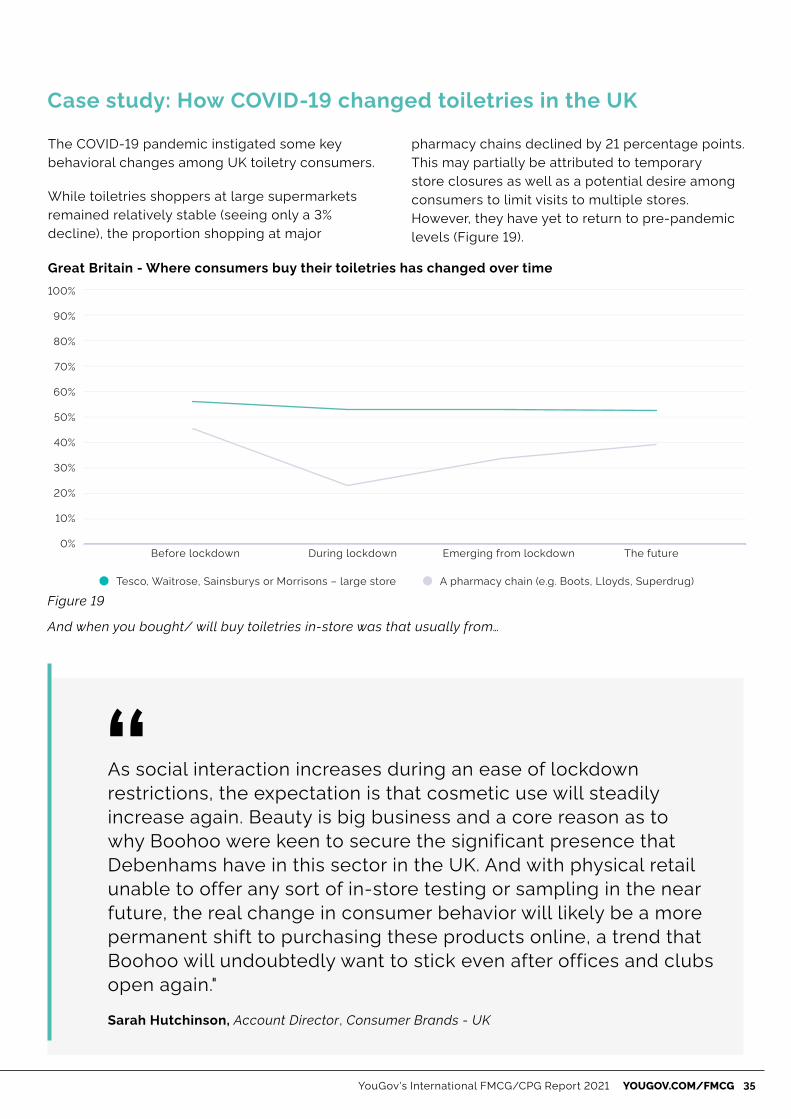
Case study: How COVID-19 changed toiletries in the UK
The COVID-19 pandemic instigated some key
behavioral changes among UK toiletry consumers.
While toiletries shoppers at large supermarkets
remained relatively stable (seeing only a 3%
decline), the proportion shopping at major
pharmacy chains declined by 21 percentage points.
This may partially be attributed to temporary
store closures as well as a potential desire among
consumers to limit visits to multiple stores.
However, they have yet to return to pre-pandemic
levels (Figure 19).
Great Britain - Where consumers buy their toiletries has changed over time
Figure 19
100%
90%
80%
70%
60%
50%
40%
30%
20%
10%
0%Before lockdown During lockdown Emerging from lockdown The future
Tesco, Waitrose, Sainsburys or Morrisons – large store A pharmacy chain (e.g. Boots, Lloyds, Superdrug)
As social interaction increases during an ease of lockdown
restrictions, the expectation is that cosmetic use will steadily
increase again. Beauty is big business and a core reason as to
why Boohoo were keen to secure the significant presence that
Debenhams have in this sector in the UK. And with physical retail
unable to offer any sort of in-store testing or sampling in the near
future, the real change in consumer behavior will likely be a more
permanent shift to purchasing these products online, a trend that
Boohoo will undoubtedly want to stick even after offices and clubs
open again."
Sarah Hutchinson, Account Director, Consumer Brands - UK
"And when you bought/ will buy toiletries in-store was that usually from…
36 YOUGOV.COM/FMCG YouGov's International FMCG/CPG Report 2021
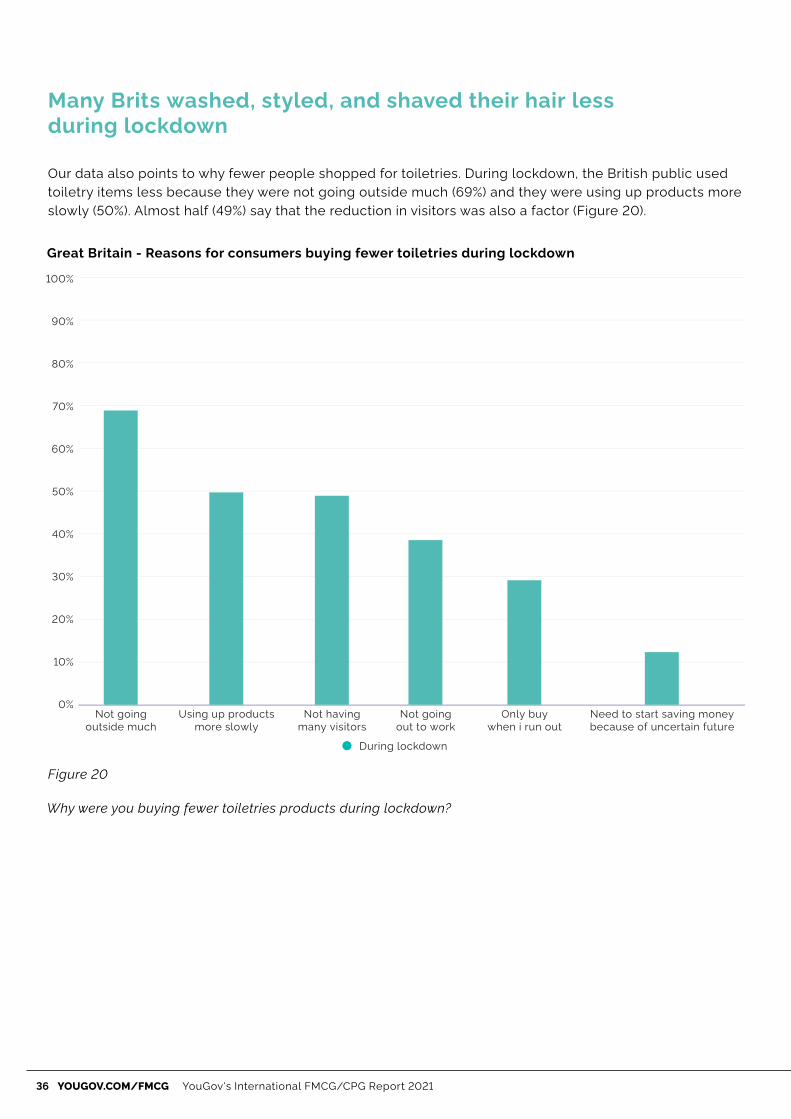
Many Brits washed, styled, and shaved their hair less
during lockdown
Our data also points to why fewer people shopped for toiletries. During lockdown, the British public used
toiletry items less because they were not going outside much (69%) and they were using up products more
slowly (50%). Almost half (49%) say that the reduction in visitors was also a factor (Figure 20).
Great Britain - Reasons for consumers buying fewer toiletries during lockdown
Figure 20
During lockdown
100%
90%
80%
70%
60%
50%
40%
30%
20%
10%
0%Not going
outside muchUsing up products
more slowlyNot having
many visitorsNot going
out to workOnly buy
when i run outNeed to start saving moneybecause of uncertain future
Why were you buying fewer toiletries products during lockdown?
37 YouGov's International FMCG/CPG Report 2021 YOUGOV.COM/FMCG
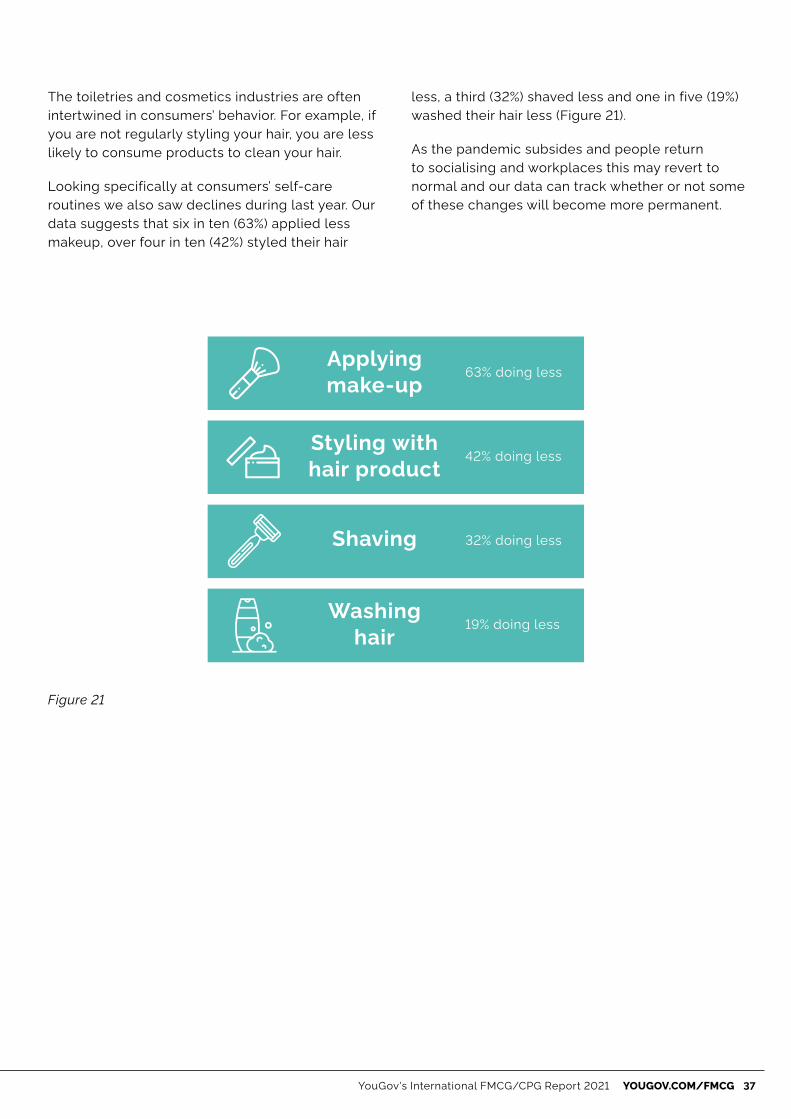
The toiletries and cosmetics industries are often
intertwined in consumers’ behavior. For example, if
you are not regularly styling your hair, you are less
likely to consume products to clean your hair.
Looking specifically at consumers’ self-care
routines we also saw declines during last year. Our
data suggests that six in ten (63%) applied less
makeup, over four in ten (42%) styled their hair
less, a third (32%) shaved less and one in five (19%)
washed their hair less (Figure 21).
As the pandemic subsides and people return
to socialising and workplaces this may revert to
normal and our data can track whether or not some
of these changes will become more permanent.
Figure 21
Shaving 32% doing less
Washing
hair19% doing less
Applying
make-up63% doing less
Styling with
hair product42% doing less

38 YOUGOV.COM/FMCG YouGov's International FMCG/CPG Report 2021
CATEGORY SNAPSHOT:
THE GROWTH OF
FROZEN FOOD DURING
THE PANDEMIC
Our study reveals that, in many markets,
consumers took to buying more frozen foods
in 2020. In every market except India and
China (where our samples are urban and
online representative, rather than nationally
representative) the percentage of the public that
increased their consumption of these products
handily outnumbered the proportion who
decreased their consumption (Figure 22).
The view from…
Europe
In every European market, consumers are more
likely to have increased their consumption of
frozen foods. The highest proportion are found in
Spain (31%) and Italy (30%), where three in ten are
buying more freezer-based foods.
In every other European market, though, the
proportion who are increasing their consumption
was lower than the global average (29%). In
Germany, for example, 18% are buying more frozen
foods, while in Denmark it is just 12% of the public.
North America
Nearly a third of US consumers (32%) and Mexican
consumers (31%) say they're buying more frozen
foods, though the Mexican public are significantly
more likely to also say they are buying less frozen
food.
APAC
Frozen foods have seen the biggest jump in
popularity in our APAC markets - especially Hong
Kong, where nearly three in five say they're buying
more of them (58%) and just 3% say they're buying
less. In fact, APAC markets account for the top two
"increasers" on a global scale: Hong Kong (58%),
Singapore (40%), and even at the lower end tend to
hover around the global average (Australia 29%).
However, India is an outlier: a greater proportion of
consumers have decreased their consumption of
frozen foods than in any other market featured in
our study (38%).
MENA
In the UAE, consumers are both more likely to say
they have bought more frozen foods (33%) and less
frozen foods (25%) than the global average.

39 YouGov's International FMCG/CPG Report 2021 YOUGOV.COM/FMCG
Global - Net change in consumption of frozen foods during pandemic
Average
APAC:
Hong Kong
Singapore
Australia
Indonesia
China
India
North America:
USA
Mexico
Europe:
Spain
Italy
Great Britain
Sweden
France
Germany
Poland
Denmark
MENA:
UAE
-1%
-7%
18%
55%
33%
23%
18%
24%
12%
24%
23%
20%
20%
15%
12%
11%
9%
9%
Figure 22
How has your consumption of each of the following products changed during the COVID-19 pandemic? frozen
foods (i.e. stored in the freezer)

40 YOUGOV.COM/FMCG YouGov's International FMCG/CPG Report 2021
Americans who bought more frozen food still prefer it fresh
Among the 32% of Americans who increased their
consumption of frozen food in 2020, many may
have done so out of convenience or necessity
rather than preference.
When US consumers as a whole are asked if they
prefer fresh food or frozen, they overwhelmingly
favor fresh food (81%). And while a significant
minority say that frozen food represents better
value for money (41%), it still amounts to under half
of the general population (Figure 23).
The early stages of the pandemic saw shortages
of foods and produce in many categories –
and even more recently, there have been real
concerns about potential shortages of fruit and
vegetables. That may explain why consumers
have increased their consumption of frozen food,
even if they don’t necessarily enjoy it more than
fresh alternatives. With consumers restricted from
leaving their homes, and with concern about the
virus continuing, long-life foods may have had
more appeal.
Figure 23
Frozen foodoffers better
value formoney
(top 2 box)
Fresh foodis better
than frozen(top 2 box)
0% 10% 20% 30% 40% 50% 60% 70% 80% 90% 100%
Buy more frozen food
While we saw several instances of consumers choosing to either
stock up on non-perishables or frozen foods in the US, some of
the data indicates that these changes in consumption may not
be their preference (e.g. 81% of respondents who bought frozen
food still think that fresh food is better than frozen). It is possible
that during a pandemic, convenience is what wins the day and in
scenarios where a consumer may have been likely to buy local
or sustainable products pre-pandemic, we’ve seen them choose
mass produced products with a longer shelf-life."
Chris Todd, VP of New Business Sales - US
"US - Attitudes towards frozen foods
% Agreement

41 YouGov's International FMCG/CPG Report 2021 YOUGOV.COM/FMCG
The frozen foods Americans are buying
The frozen foods US consumers are buying are
a mixture of staples and essentials, health foods,
and indulgent treats. Potato products such as hash
browns and french fries – purchased by just under
two-thirds (64%) of those who bought more frozen
foods – come top, followed by pizzas and garlic
bread (61%), with store-bought desserts and fruit
and vegetables coming in joint third (58%).
Meat and poultry (57%) and seafood (55%) round
out the top five, with more variety further down the
top ten (Figure 24).
Figure 24
Figure 23
0% 10% 20% 30% 40% 50% 60% 70% 80% 90% 100%
Buy more frozen food
Fries, and other frozenpotato products
Pizzas andgarlic bread
Shop bought desserts,ice cream, popsicles
and frozen yogurt
Vegetables or Fruit
Meat and poultry
Fish and seafood
Ready meals
Frozen processedmeat or fish
Bakery
Party food
US - Types of frozen food purchased
Which of the following frozen food have you already considered buying?

42 YOUGOV.COM/FMCG YouGov's International FMCG/CPG Report 2021
Americans’ reasons for freezing: Quality, value,
convenience and taste
The most popular reasons for buying frozen foods
– cited by at least half of respondents – are quality
of food (56%), good value for money (54%) and
simplicity of cooking (50%). Most other reasons
given have some echoes of these top three factors:
taste (cited by 49%) ties into quality, “quick to
prepare” (47%) correlates neatly with simplicity,
while “previous experience” (44%) and “retains
freshness” (43%) speak to value for money
(Figure 25).
US - Factors motivating frozen food purchases
Figure 25
0% 10% 20% 30% 40% 50% 60% 70% 80% 90% 100%
US consumers who purchased more frozen food
Quality of food
Good valuefor money
Simple to cook
Taste of product
Quick to prepare
Previous experience (i.e.,have bought
it before)
Retains freshness
Easy to store
Healthy
Choice of options
Which, if any, of the following reasons are important to you when buying frozen food? Please select all
that apply.

43 YouGov's International FMCG/CPG Report 2021 YOUGOV.COM/FMCG
Our data indicates that alcohol consumption increased in most of our featured markets in 2020, with 19%
of consumers seeing their alcohol intake rise and 14% reporting a decrease. There are four exceptions,
however - Mexico, Sweden, Denmark and Germany (Figure 26).
CATEGORY SNAPSHOT:
CHANGING CONSUMPTION
LEVELS OF ALCOHOL
DURING THE PANDEMIC
44 YOUGOV.COM/FMCG YouGov's International FMCG/CPG Report 2021
The view from…
Europe
European countries have differed in terms of their
alcohol intake during the pandemic. While Britons
lead the continent in terms of consumption - with
a quarter (24%) saying they've upped their alcohol
consumption - they're also more likely to have
decreased their consumption than the global
average (16% vs. 14% global average).
European countries are otherwise more likely to
be closer to the bottom of the global table than
the top: in Germany, for example, more consumers
have decreased their alcohol intake than increased
it (13% decreased vs 11% increased), and the
same is true in Denmark (14% decreased vs. 12%
increased) and Sweden (16% decreased vs. 12%
increased).
North America
The North American picture is, again, not wholly
consistent. Americans are about as likely as
consumers across the globe to have increased
their alcohol intake (18% vs. 19% global average)
and slightly less likely to have decreased their
intake (10% vs. 14% global average).
Mexican consumers are slightly more likely to
have increased their alcohol consumption and ten
percentage points more likely to have decreased it
(24% vs. 14% global average).
APAC
APAC countries account for four of the top
five countries in terms of increased alcohol
consumption. Among Indian consumers, this
is particularly high - amounting to three in ten
members of the public (29%) - and Chinese
respondents follow closely behind (27% of the
public).
The lowest levels of consumption in the region are
in Indonesia, where those with increased alcohol
intake still outnumber those who've done the
opposite (16% vs. 11%).

45 YouGov's International FMCG/CPG Report 2021 YOUGOV.COM/FMCG
Figure 26
DecreasedIncreased
0% 10% 20% 30% 40% 50%
Average
APAC:
India
China
Indonesia
Singapore
Hong Kong
Australia
North America:
Mexico
USA
Europe:
Great Britain
Spain
Poland
France
Italy
Sweden
Denmark
Germany
Global - Changes in alcohol consumption over 2020
How has your consumption of each of the following food products changed during the COVID-19 pandemic?
Alcohol Percentage shown is of the total sample for each market (including non-users)

46 YOUGOV.COM/FMCG YouGov's International FMCG/CPG Report 2021
A quarter of Brits who increased their alcohol consumption have
been drinking alone
Our data shows that 95% of Britons who bought
more alcohol did so from a supermarket or grocery
shop. Of this group, 57% say they bought alcohol
once a week or more, with almost a quarter (23%)
saying they purchased it several times a week.
Among those that drank less, over a third (36%)
bought alcohol from supermarkets less than once
a month (Figure 27).
Great Britain - Frequency of buying alcohol from a supermarket or grocery shop to consume at
home or elsewhere
Figure 27
Drank moreDrank less
More thanonce a day
Once a day
Several timesa week
Once a week
Several timesa month
Once a month
Less often
Never
Don’t know
0%
0%1%
3%
14%
16% 16%
15%
36% 10%
4%12%
2% 1%
13%
34%
23%
And how often do you buy alcohol from a supermarket or grocery shop to consume at home or elsewhere?

47 YouGov's International FMCG/CPG Report 2021 YOUGOV.COM/FMCG
When asked how they consumed this alcohol, over
half (55%) say they did so with a partner or spouse
(55%), over a third (36%) say they consumed their
purchase as a regular or everyday drink, and a
quarter (24%) say they did so alone (Figure 28).
Great Britain – Occasions/situations when alcohol purchased has been consumed (last four weeks)
Figure 28
100%
90%
80%
70%
60%
50%
40%
30%
20%
10%
0%
Drink less Drink more
Staying in withpartner/spouse
Regular/everyday drink (e.g. with meals, weekend drinks, etc.)
Alone
For which, if any, of the following occasions/times have you consumed alcoholic drinks purchased from shops
(e.g. grocery, independent retailers, off license, etc.) in the last 4 weeks? Please select all that apply.
48 YOUGOV.COM/FMCG YouGov's International FMCG/CPG Report 2021
CATEGORY SNAPSHOT:
THE GROWTH OF HOME
CLEANING PRODUCTS
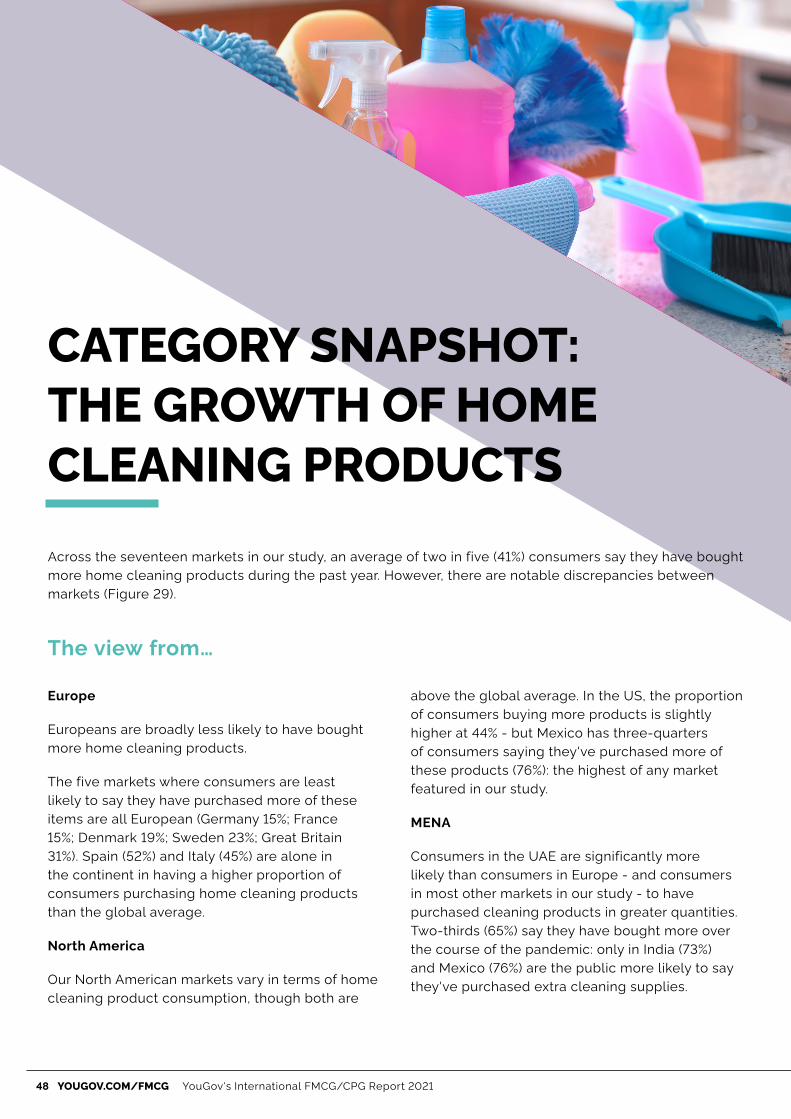
Across the seventeen markets in our study, an average of two in five (41%) consumers say they have bought
more home cleaning products during the past year. However, there are notable discrepancies between
markets (Figure 29).
The view from…
Europe
Europeans are broadly less likely to have bought
more home cleaning products.
The five markets where consumers are least
likely to say they have purchased more of these
items are all European (Germany 15%; France
15%; Denmark 19%; Sweden 23%; Great Britain
31%). Spain (52%) and Italy (45%) are alone in
the continent in having a higher proportion of
consumers purchasing home cleaning products
than the global average.
North America
Our North American markets vary in terms of home
cleaning product consumption, though both are
above the global average. In the US, the proportion
of consumers buying more products is slightly
higher at 44% - but Mexico has three-quarters
of consumers saying they've purchased more of
these products (76%): the highest of any market
featured in our study.
MENA
Consumers in the UAE are significantly more
likely than consumers in Europe - and consumers
in most other markets in our study - to have
purchased cleaning products in greater quantities.
Two-thirds (65%) say they have bought more over
the course of the pandemic: only in India (73%)
and Mexico (76%) are the public more likely to say
they've purchased extra cleaning supplies.

49 YouGov's International FMCG/CPG Report 2021 YOUGOV.COM/FMCG
Agree (net) Disagree (net)Neither agree nor disagree
0% 10% 20% 30% 40% 50% 60% 70% 80% 90% 100%
Average
APAC:
India
Hong Kong
Indonesia
China
Singapore
Australia
North America:
Mexico
USA
Europe:
Spain
Italy
Poland
Great Britain
Sweden
Denmark
France
Germany
MENA:
UAE
Figure 29
Global - Agreement/disagreement with the statement "I have bought more home cleaning products"
Thinking about the impact that the COVID-19 pandemic has had on your shopping habits, to what extent do
you agree with the following statements, I have bought more home cleaning products
50 YOUGOV.COM/FMCG YouGov's International FMCG/CPG Report 2021
AFTER THE CRISIS:
CONSUMERS PLAN
TO SHOP LOCAL AND
PRIORITISE SUSTAINABILITY
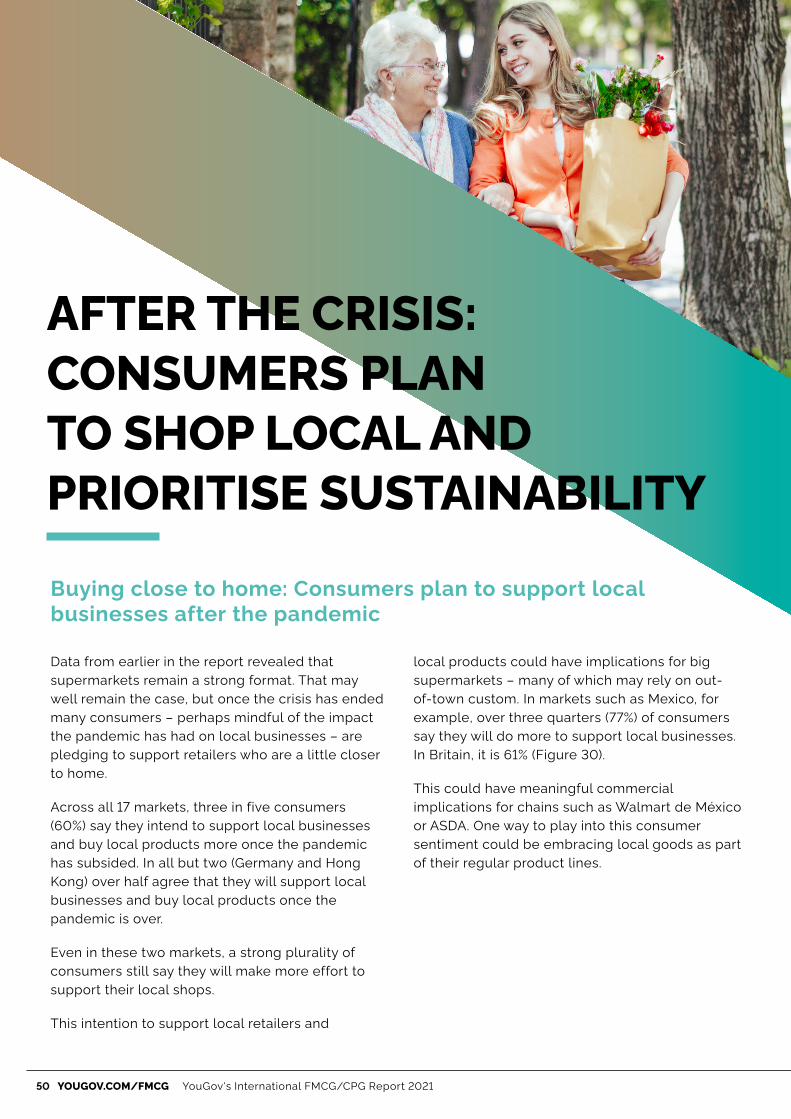
Buying close to home: Consumers plan to support local
businesses after the pandemic
Data from earlier in the report revealed that
supermarkets remain a strong format. That may
well remain the case, but once the crisis has ended
many consumers – perhaps mindful of the impact
the pandemic has had on local businesses – are
pledging to support retailers who are a little closer
to home.
Across all 17 markets, three in five consumers
(60%) say they intend to support local businesses
and buy local products more once the pandemic
has subsided. In all but two (Germany and Hong
Kong) over half agree that they will support local
businesses and buy local products once the
pandemic is over.
Even in these two markets, a strong plurality of
consumers still say they will make more effort to
support their local shops.
This intention to support local retailers and
local products could have implications for big
supermarkets – many of which may rely on out-
of-town custom. In markets such as Mexico, for
example, over three quarters (77%) of consumers
say they will do more to support local businesses.
In Britain, it is 61% (Figure 30).
This could have meaningful commercial
implications for chains such as Walmart de México
or ASDA. One way to play into this consumer
sentiment could be embracing local goods as part
of their regular product lines.

51 YouGov's International FMCG/CPG Report 2021 YOUGOV.COM/FMCG
The view from…
Europe
When it comes to local shopping, European
consumers are more likely to agree that they
intend to shop closer to home than disagree. The
degree of agreement, however, is highly variable.
Spain, for instance, is at the upper end of the
scale, with more than two-thirds (68%) saying they
intend to buy local; Germany, however, is rock
bottom, with just 45% saying they plan to support
businesses in their area.
North America
Our North American consumers are broadly agreed
that they intend to do more to support local
businesses, although as with Europe, the degree
of support varies. In Mexico, for example, three-
quarters (77%) say they plan to shop locally - but in
the US, this amounts to just over half of the general
public (54%).
APAC
As with Europe, more APAC consumers plan to
shop locally than not - and as with Europe, there
is considerable diversity when it comes to the
overall level of agreement. At the top of the global
table is Indonesia - joint-first with three quarters of
consumers claiming they intend to buy from local
businesses (77%). India also features near the top
(with 77% of consumers also agreeing that they
plan to shop locally, albeit less emphatically than
Indonesians), as does Australia (66%).
But APAC markets also feature towards the bottom
of the table: Hong Kong, for example, has just half
of consumers (49%) planning to do more local
shopping - and in Singapore, the proportion is just
over half (54%).

52 YOUGOV.COM/FMCG YouGov's International FMCG/CPG Report 2021
Definetely agree Tend to agree Tend to disagree Definitely disagree N/ANeither agree nor disagree
Average
APAC:
Indonesia
India
Australia
China
Hong Kong
Singapore
North America:
Mexico
USA
Europe:
Spain
Italy
Great Britain
Sweden
Denmark
France
Germany
Poland
MENA:
UAE
0% 10% 20% 30% 40% 50% 60% 70% 80% 90% 100%
Figure 30
Global: Agreement/disagreement with the statement "I will make more effort to support local
businesses / buy local products" after the pandemic has ended
As you start to think about life in the future and what happens once the COVID-19 pandemic has ended, do
you agree or disagree that as a result of coronavirus...I will make more effort to support local businesses / buy
local products
53 YouGov's International FMCG/CPG Report 2021 YOUGOV.COM/FMCG
Global consumers intend to buy more sustainable products once
the pandemic has ended
Beyond supporting local businesses, many global
consumers are also considering doing more to
help the planet. Over half (54%) of the people
surveyed in our study say they intend to buy more
sustainable products once the pandemic is over.
As with supporting local businesses, it is again the
case that in most markets a clear majority say
they wish to develop greener shopping habits
(Figure 31).
The view from…
Europe
Europeans are - with a couple of exceptions -
largely less likely to say they intend to buy more
sustainable products than the global average. In
fact, the bottom three markets where consumer
intent is lowest are all European: just a third of
Danish (33%), Swedish (34%), and German (35%)
respondents say they planned to buy more
sustainably.
Even in markets where intent is higher, such as
Spain (61%) and Italy (59%), it is only slightly above
the global average (54%).
North America
The North American markets in our survey occupy
opposite ends of the scale.
Mexican consumers, for example, are
overwhelmingly likely to say they plan to buy more
sustainable products. Three-quarters say they plan
to do so after the pandemic (74%). US consumers,
however, are among the least likely: just two in five
(40%) intend to buy more of these products once
the pandemic is over.
APAC
In general, consumers in APAC have more positive
intentions about purchasing sustainable products
than the global average. Indonesians, for example,
are the most likely to say they plan to buy more
sustainable products once the pandemic is over
(79%), while Indian consumers are the third-
most likely (73%). A comfortable majority of the
Chinese public also say they intend to buy more
sustainable products (65%).
In smaller markets such as Singapore (53%), Hong
Kong (53%), and Australia (50%), intention is lower,
but at least half of consumers still intend to buy
more sustainably.
MENA
Consumers in the UAE have broadly good
intentions when it comes to purchasing sustainable
products. Two-thirds say that once the pandemic
subsides, they intend to buy more of these items
(66%).

54 YOUGOV.COM/FMCG YouGov's International FMCG/CPG Report 2021
Definetely agree Tend to agree Tend to disagree Definitely disagree N/ANeither agree nor disagree
Average
APAC:
Indonesia
India
China
Australia
Singapore
Hong Kong
North America:
Mexico
USA
Europe:
Spain
Italy
Poland
France
Great Britain
Sweden
Denmark
Germany
MENA:
UAE
0% 10% 20% 30% 40% 50% 60% 70% 80% 90% 100%
Figure 31
Global: Agreement/disagreement with the statement "I will buy more sustainable products" after
the pandemic has ended
As you start to think about life in the future and what happens once the COVID-19 pandemic has ended, do
you agree or disagree that as a result of coronavirus...I will buy more sustainable products
55 YouGov's International FMCG/CPG Report 2021 YOUGOV.COM/FMCG
This report was partially conceived as a point
of reference for future editons. But even in and
of itself, it has much to say about the consumer
mindset in these 17 international markets at the
end of 2020 and the beginning of 2021.
For this year’s international FMCG report, our key
findings are:
1. Bulk buying has become big business
Over the course of the COVID-19 crisis, certain
consumer behaviors could have contributed to
supermarkets’ continuing dominance over smaller
retailers. Bulk buying is among them: across all
17 markets, nearing two in five (38%) have been
purchasing items in larger quantities as a result of
coronavirus – whether through fear of scarcity, a
reluctance to leave the house regularly or other
reasons altogether.
Whatever the cause, stockpiling rose in 2020. In
2021, we may well be able to see whether this is a
blip or a longer-term trend.
2. The pandemic giveth…
From a commercial perspective, COVID-19 has
been beneficial to some parts of the global
FMCG industry. In some categories (fresh fruit/
vegetables, food cupboard items, frozen food)
at least three times as many consumers say they
had increased their consumption compared to
those who say it had decreased. Here again,
supermarkets (which carry larger and less
expensive quantities of these items) could have
particular reason to cheer.
Whether these benefits are sustainable in the
long-term remains to be seen: Will the increased
demand for cleaning products, for example,
endure as vaccination programmes are rolled out
across the globe?
3. …and the pandemic taketh away.
With working from home on the rise – and with
socialising expressly forbidden in many markets
for at least some of 2020 – COVID-19 has dealt a
significant blow to the cosmetics industry. Some
32% of consumers say they had reduced their
use of makeup, moisturisers, hair wax, and other
products in this category. There’s bad news for
others too - our evidence suggests that in some
markets, local businesses have suffered due to
coronavirus.
4. Consumers behaviors may change again in the
future
But these trends could have silver linings. For
example, there could be more rationale for
buying cosmetics if people successfully return
to work (and play) in 2021. And local businesses
can probably take heart from the fact that most
people intend to support them once the COVID-19
pandemic subsides. Alongside their good
intentions in this area, most consumers also plan
to adopt a more sustainable approach to their
buying habits in future (54%).
Of course, there can be a wide gap between
people’s stated values and their eventual actions.
In 2022 we will see how successful these efforts
to buy greener, more local products have been
– assuming the pandemic is over by then. In
the meantime, our tools will continue to track
consumers’ perceptions, preferences, values and
more.
This paper represents just a fraction of the data we
have on the global FMCG/CPG industry. Please get
in touch with one of our experts to find out more.
CONCLUSION
56 YOUGOV.COM/FMCG YouGov's International FMCG/CPG Report 2021
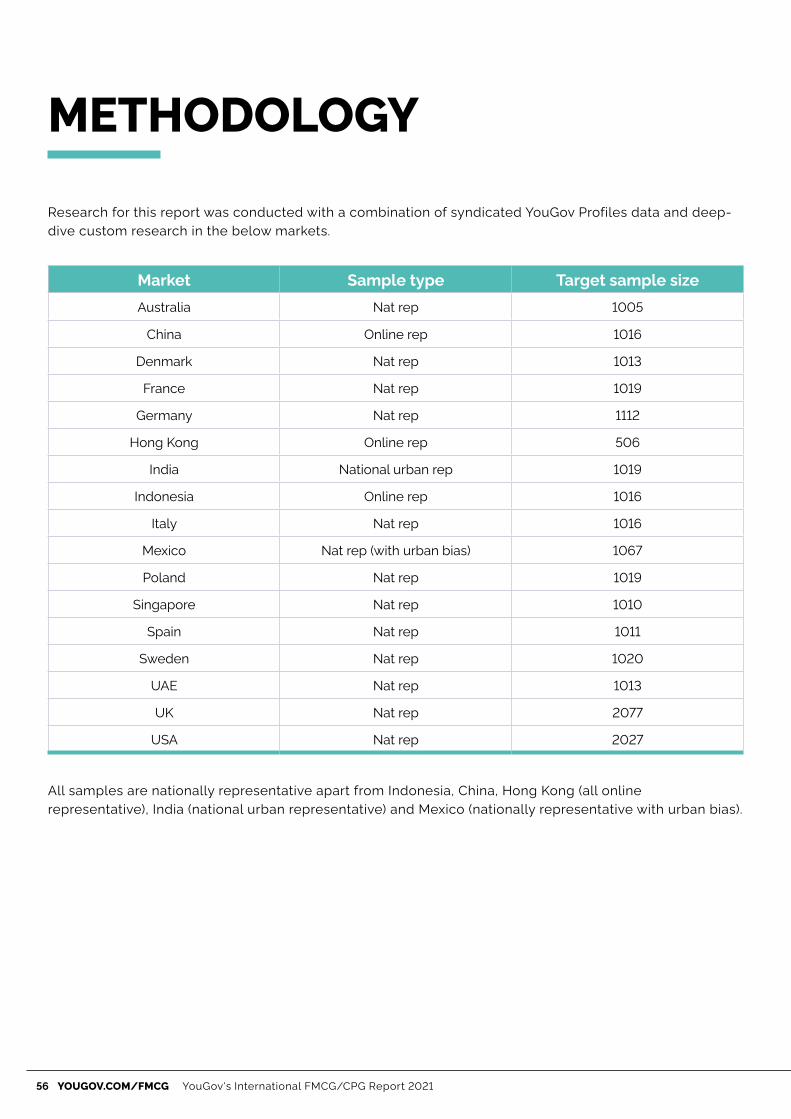
METHODOLOGY
Research for this report was conducted with a combination of syndicated YouGov Profiles data and deep-
dive custom research in the below markets.
All samples are nationally representative apart from Indonesia, China, Hong Kong (all online
representative), India (national urban representative) and Mexico (nationally representative with urban bias).
Market Sample type Target sample size
Australia Nat rep 1005
China Online rep 1016
Denmark Nat rep 1013
France Nat rep 1019
Germany Nat rep 1112
Hong Kong Online rep 506
India National urban rep 1019
Indonesia Online rep 1016
Italy Nat rep 1016
Mexico Nat rep (with urban bias) 1067
Poland Nat rep 1019
Singapore Nat rep 1010
Spain Nat rep 1011
Sweden Nat rep 1020
UAE Nat rep 1013
UK Nat rep 2077
USA Nat rep 2027

© 2021 YouGov PLC. All rights reserved | WP0421
ABOUT YOUGOV
YouGov is an international research data and analytics group headquartered in London. Our data-led
offering supports and improves a wide spectrum of marketing activities for our customer base that
includes media owners, brands and media agencies. We work with some of the world’s most
recognised brands.
Our line of products and services include YouGov BrandIndex, YouGov Profiles, YouGov RealTime, YouGov
Custom Research, YouGov Crunch and YouGov Direct.
With over 11 million registered panellists in more than 55 countries, YouGov’s market research covers the
UK, the Americas, Mainland Europe, the Middle East, and Asia-Pacific. Our panellists come from all ages,
socio-economic groups, and other demographic types – allowing us to create representative samples of
whole populations and different sections of society.
For more information, visit yougov.com/business
yougov.com/fmcg