International Competitiveness in Visegrad Countries: Macro and Micro Perspectives
204
-
Upload
independent -
Category
Documents
-
view
0 -
download
0
Transcript of International Competitiveness in Visegrad Countries: Macro and Micro Perspectives

Doris KiendlDoris KiendlDoris KiendlDoris Kiendl----WendnerWendnerWendnerWendner Krzysztof WachKrzysztof WachKrzysztof WachKrzysztof Wach
Editors (Eds)
International Competitiveness
in Visegrad Countries: Macro and Micro Perspectives
GrazGrazGrazGraz 2014201420142014

RezensentenRezensentenRezensentenRezensenten //// ReviewersReviewersReviewersReviewers:::: Josef Taušer (University of Economics in Prague, Czech Republic)
Zsuzsanna Katal in Szabó (Petru Maior University in Târgu Mures, Romania)
HerausHerausHerausHerausggggeeeebbbber (Hrsg.)er (Hrsg.)er (Hrsg.)er (Hrsg.) / / / / Scientific EditorsScientific EditorsScientific EditorsScientific Editors (Eds)(Eds)(Eds)(Eds):::: Doris Kiendl-Wendner (Fachhochschule Joanneum in Graz, Austria)
Krzysztof Wach (Cracow University of Economics, Poland)
VerfasserVerfasserVerfasserVerfasser //// AuthorsAuthorsAuthorsAuthors:::: Zoltán Bartha (University of Miskolc, Hungary)
Nelly Daszkiewicz (Gdańsk University of Technology, Poland) Maciej J. Grodzicki (Jagiellonian University, Poland) Andrea S. Gubik (University of Miskolc, Hungary)
Wioletta Kilar (Pedagogical University of Cracow, Poland) Doris Kiendl-Wendner (Fachhochschule Joanneum in Graz, Austria)
Witold Nowiński (Poznań School of Banking, Poland) Magdalena Olczyk (Gdańsk University of Technology, Poland)
Piotr Stanek (Cracow University of Economics, Poland) Krzysztof Wach (Cracow University of Economics, Poland)
Copyright by © Authors, CC-BY license, 2014
ISBN ISBN ISBN ISBN 978978978978----3333----200200200200----03673036730367303673----4444
KorrekturKorrekturKorrekturKorrektur / / / / ProofreadingProofreadingProofreadingProofreading::::
Team
Umschlag und Umschlag und Umschlag und Umschlag und ZusammensZusammensZusammensZusammensetzungetzungetzungetzung //// Cover and DTPCover and DTPCover and DTPCover and DTP:::: FH JOANNEUM UNIVERSITY OF APPLIED SCIENCES
Alte Poststraße 147 - 154 Eggenberger Allee 9 - 13
A-8020 Graz, Austria (Österreich)
VerlagVerlagVerlagVerlag / / / / PublisherPublisherPublisherPublisher:::: Fachhochschule Joanneum Gesellschaft mbH
Eggenberger Allee 11 A-8020 Graz, Austria (Österreich)
T.: +43 (0) 316 5453-6800 E.: [email protected]

The publication is fully funded by the International Visegrad Fund (IVF) within the project no. StG-21310034 entitled “Patterns of Business Internationalization in Visegrad Patterns of Business Internationalization in Visegrad Patterns of Business Internationalization in Visegrad Patterns of Business Internationalization in Visegrad Countries Countries Countries Countries –––– In Search for Regional SpecificsIn Search for Regional SpecificsIn Search for Regional SpecificsIn Search for Regional Specifics”
conducted in the years 2013-2014 by five universities from four Visegrad countries and coordinated by Krzysztof WachKrzysztof WachKrzysztof WachKrzysztof Wach from Cracow University of Economics (Poland).
This is an Open Access publication fully fully fully fully financed by public fundsfinanced by public fundsfinanced by public fundsfinanced by public funds and distributed under the terms of the Creative Commons CC-BY 4.0 License (http://creativecommons.org/licenses/by/4.0/), allowing third parties to copy and redistribute the material in any medium or format and to remix, transform, and build upon the material for any
purpose, even commercially, provided the original work is properly cited and states its license.
Research Research Research Research Project Project Project Project Coordinator University:Coordinator University:Coordinator University:Coordinator University:
Kraków, Poland
Research Project Partner UniversitiesResearch Project Partner UniversitiesResearch Project Partner UniversitiesResearch Project Partner Universities::::
Miskolc, Hungary Prague, Czech Republic Nitra, Slovakia Gdańsk, Poland
Associate Partner Universities:Associate Partner Universities:Associate Partner Universities:Associate Partner Universities:
Graz, Austria Zagreb, Croatia Cartagena, Spain

Recommended BooksRecommended BooksRecommended BooksRecommended Books
Duréndez, A.Duréndez, A.Duréndez, A.Duréndez, A. & Wach, K.Wach, K.Wach, K.Wach, K. (eds) (2014). Patterns of
Business Internationalisation in Visegrad Countries – In
Search for Regional Specifics. Cartagena: Universidad
Politécnica de Cartagena.
Gubik, A.S.Gubik, A.S.Gubik, A.S.Gubik, A.S. & Wach, K. Wach, K. Wach, K. Wach, K. (eds) (2014). International
Entrepreneurship and Corporate Growth in Visegrad
Countries. Miskolc: Miskolc University Press.
Knežević, B.Knežević, B.Knežević, B.Knežević, B. & Wach, K.Wach, K.Wach, K.Wach, K. (eds) (2014). International
Business from the Central European Perspective. Zagreb:
University of Zagreb.
Daszkiewicz, N.Daszkiewicz, N.Daszkiewicz, N.Daszkiewicz, N. & Wach, K.Wach, K.Wach, K.Wach, K. (eds) (2014). Business Environment and Its Internationalisation – Selected Evidences
from CEE and SEE Countries. Gdańsk: Gdańsk University of Technology Publishers.

TABLE OF CONTENTSTABLE OF CONTENTSTABLE OF CONTENTSTABLE OF CONTENTS
IntroductionIntroductionIntroductionIntroduction (Doris Kiendl-Wendner & Krzysztof Wach) ...................................... 9
PartPartPartPart 1. Macro Level of International Competitiveness 1. Macro Level of International Competitiveness 1. Macro Level of International Competitiveness 1. Macro Level of International Competitiveness
1111. Global Value Chain and Competitiveness of V4 Countries . Global Value Chain and Competitiveness of V4 Countries . Global Value Chain and Competitiveness of V4 Countries . Global Value Chain and Competitiveness of V4 Countries (Maciej J. Grodzicki) ......................................................................................... 13 1.1. Introductory Remarks ................................................................................ 14 1.2. Fragmentation of Production in Economics ............................................... 16 1.3. Empirical Research Review ........................................................................ 19 1.4. Research Methods...................................................................................... 20 1.5. Results and Discussion .............................................................................. 22 1.6. Conclusions ............................................................................................... 29 References ........................................................................................................ 30
2. Competitiveness of the Visegrad Countries 2. Competitiveness of the Visegrad Countries 2. Competitiveness of the Visegrad Countries 2. Competitiveness of the Visegrad Countries ---- Paths for Competitiveness Paths for Competitiveness Paths for Competitiveness Paths for Competitiveness
Growth Growth Growth Growth (Nelly Daszkiewicz & Magdalena Olczyk) ........................................... 33 2.1. Introductory Remarks ................................................................................ 34 2.2. Literature Review ....................................................................................... 35 2.3. Material and Methods ............................................................................... 40 2.4. Competitiveness of the V4 Countries - Empirical Analysis ......................... 41 2.5. Conclusions .............................................................................................. 48 References ....................................................................................................... 49 Appendix .......................................................................................................... 50
3. The Outward focused Development Path in the Visegrad Countries 3. The Outward focused Development Path in the Visegrad Countries 3. The Outward focused Development Path in the Visegrad Countries 3. The Outward focused Development Path in the Visegrad Countries
(Zoltán Bartha & Andrea S. Gubik) .................................................................. 53 3.1. Introductory Remarks ................................................................................ 53 3.2. Literature Review ....................................................................................... 54 3.3. Material and Methods ............................................................................... 62 3.4. The FOI Analysis of the OEDC Countries ................................................ 65 3.5. The Outward Focused Development Strategy in V4 .................................. 70 3.6. Conclusions ............................................................................................... 74 References ........................................................................................................ 75

4. Collective Decision Making in Monetary Policy 4. Collective Decision Making in Monetary Policy 4. Collective Decision Making in Monetary Policy 4. Collective Decision Making in Monetary Policy –––– A Survey A Survey A Survey A Survey (Piotr Stanek) . 77 4.1. Introductory Remarks ................................................................................ 78 4.2. Conceptual Framework ............................................................................. 78 4.3. Individual Central Banker vs. Monetary Policy Committee ....................... 80 4.4. External Factors ......................................................................................... 83 4.5. Internal Features ........................................................................................ 87 4.6. Conclusions ............................................................................................... 92 References ......................................................................................................... 95
Part 2. Micro Level of International CompetitivenessPart 2. Micro Level of International CompetitivenessPart 2. Micro Level of International CompetitivenessPart 2. Micro Level of International Competitiveness 5. The Theoretical Modelling of the Firm5. The Theoretical Modelling of the Firm5. The Theoretical Modelling of the Firm5. The Theoretical Modelling of the Firm----Level International Competitiveness Level International Competitiveness Level International Competitiveness Level International Competitiveness
in Business Studies in Business Studies in Business Studies in Business Studies (Krzysztof Wach) ............................................................. 101 5.1. Introductory Remarks .............................................................................. 102 5.2. Competition and Competitiveness in Business Studies ............................ 102 5.3. Designing Business Competitiveness ........................................................ 105 5.4. Nature of the Firm-Level of International Competitiveness ..................... 111 5.5. Selected Models of International Competitiveness of the Firm ................. 114 5.6. Conclusions ............................................................................................. 119 References ....................................................................................................... 121
6. The Role of Business Knowledge in the Internationalisation Process of 6. The Role of Business Knowledge in the Internationalisation Process of 6. The Role of Business Knowledge in the Internationalisation Process of 6. The Role of Business Knowledge in the Internationalisation Process of
HungarianHungarianHungarianHungarian Corporations Corporations Corporations Corporations (Zoltán Bartha & Andrea S. Gubik) ....................... 125 6.1. Introductory Remarks .............................................................................. 126 6.2. Literature Review ..................................................................................... 126 6.3. Material and Methods: Measuring Business Knowledge ........................... 132 6.4. Results and Discussion ............................................................................. 135 6.5. Conclusions: Knowledge Elements Important for Internationalisation ..... 139 References ....................................................................................................... 141
7. The Role of Knowledge in the Internationalisation Process: An Empirical 7. The Role of Knowledge in the Internationalisation Process: An Empirical 7. The Role of Knowledge in the Internationalisation Process: An Empirical 7. The Role of Knowledge in the Internationalisation Process: An Empirical
Investigation among Polish Businesses Investigation among Polish Businesses Investigation among Polish Businesses Investigation among Polish Businesses (Krzysztof Wach) ............................. 143 7.1. Introductory Remarks .............................................................................. 144 7.2. Literature Review ..................................................................................... 144 7.3. Material and Methods ............................................................................. 150 7.4. Results and Discussion ............................................................................. 152 7.5. Conclusions ............................................................................................. 155 References ....................................................................................................... 156
8. Shareholder Value Effects of Cross8. Shareholder Value Effects of Cross8. Shareholder Value Effects of Cross8. Shareholder Value Effects of Cross----Border Acquisitions Conducted by Border Acquisitions Conducted by Border Acquisitions Conducted by Border Acquisitions Conducted by Poland’s Asseco Group Poland’s Asseco Group Poland’s Asseco Group Poland’s Asseco Group (Witold Nowiński) ................................................... 159 8.1. Introductory Remarks .............................................................................. 159 8.2. Literature Review ..................................................................................... 161 8.3. Material and Methods ............................................................................. 163 8.4. Results and Discussion ............................................................................ 165 8.5. Conclusions ............................................................................................. 168 References ...................................................................................................... 169
9. Differentiation of Visegrad Group International Corporations in 9. Differentiation of Visegrad Group International Corporations in 9. Differentiation of Visegrad Group International Corporations in 9. Differentiation of Visegrad Group International Corporations in
Comparison to World’s Largest Corporations Comparison to World’s Largest Corporations Comparison to World’s Largest Corporations Comparison to World’s Largest Corporations (Wioletta Kilar) .................... 171 9.1. Introductory Remarks .............................................................................. 172 9.2. Material and Methods ............................................................................. 173 9.3. Results and Discussion: Changes in the Importance of Global
Corporations Located in the Visegrad Group countries ........................... 174 9.4. Conclusions ............................................................................................. 183 References ...................................................................................................... 184
BibliographyBibliographyBibliographyBibliography ....................................................................................................... 187


IntroductionIntroductionIntroductionIntroduction
Competitiveness en bloc as well as international competitiveness are attractive and
very popular concepts at various levels of study (Nelson, 1992) in economics,
management science and business studies, including the individual firm level (micro-
competitiveness), mesoeconomic level for industry policies (meso-competitiveness),
and the macroeconomic level for the competitive positions of national economies
(macro-competitiveness). This is the reason why the individual co-authors of this
monograph decided to elaborate on international competitiveness from both macro
(the economy-level) and micro (the firm-level) perspectives.
The monograph is a result of the research project no. StG-21310034 entitled
“Patterns of Business Internationalization in Visegrad Countries Patterns of Business Internationalization in Visegrad Countries Patterns of Business Internationalization in Visegrad Countries Patterns of Business Internationalization in Visegrad Countries –––– In Search for In Search for In Search for In Search for
Regional SpecificsRegional SpecificsRegional SpecificsRegional Specifics” funded by the International Visegrad Fund (IVF) with its
headquarters in Bratislava (Slovakia) and conducted in the period from July 2013 to
June 2014 by five Central European universities and coordinated Cracow University
of Economics (Kraków, Poland) in the cooperation with its international partners
from all Visegrad countries, namely the University of Economics in Prague (Praha,
Czech Republic), the University of Miskolc (Miskolc, Slovakia), Slovak University of
Agriculture (Nitra, Slovakia) as well as Gdańsk University of Technology (Gdańsk,
Poland).
As mentioned above, the book is divided into two parts and it includes nine
research papers dedicated to different aspects of international competitiveness in four
Visegrad countries (Knežević, & Wach, 2014; Gubik & Wach, 2014; Duréndez &
Wach, 2014; Daszkiewicz & Wach, 2014).
Chapter 1 written by Maciej Grodzicki from Jagiellonian University (Kraków,
Poland) discusses the issue of global value chain and its impact and role in building
competitiveness of V4 economies.
Chapter 2 prepared by Nelly Daszkiewicz and Magdalena Olczyk from Gdańsk
University of Technology (Gdańsk, Poland) continues the issue of competitiveness of
V4 economies by discussing the paths for competitiveness growth.
Chapter 3 written by Zoltán Bartha and Andrea S. Gubik from the University
of Miskolc (Miskolc, Hungary) aims to describe how the macroeconomic
development path taken by the Visegrad countries affects the internationalisation
process of their domestic businesses.
Chapter 4 prepared by Piotr Stanek from Cracow University of Economics
(Kraków, Poland) offers a much wider perspective of macroeconomic conditions for

10101010 Introduction
international competitiveness. It discusses the issues of decision making in monetary
policy, which is one of the conditions for increasing competitiveness.
Chapter 5 written by Krzysztof Wach from Cracow University of Economics
(Kraków, Poland) begins the second part of the book. It discusses the theoretical
modelling of the firm-level international competitiveness.
Chapter 6 prepared again by Zoltán Bartha and Andrea S. Gubik from the
University of Miskolc (Miskolc, Hungary) identifies the knowledge elements that are
crucial in the internationalisation process among Hungarian firms.
Chapter 7 written again by Krzysztof Wach from Cracow University of
Economics (Kraków, Poland) continues the discussion from the previous chapter by
revealing the same aspects of the knowledge acquisition and utilisation, but among
Polish internationalised firms.
Chapter 8 prepared by Witold Nowiński from Poznań School of Banking
(Poznań, Poland) investigates the impact of cross-border acquisitions on shareholder
value using a case study and comparing the results of acquisitions into Eastern and
Western European markets.
Chapter 9 written by Wioletta Kilar from the Pedagogical University of Cracow
(Kraków, Poland) discusses different aspect of international corporations in Visegrad
countries in comparison to world’s largest corporations.
Graz – July 2014 Doris KiendlDoris KiendlDoris KiendlDoris Kiendl----Wendner Wendner Wendner Wendner
Krzysztof Krzysztof Krzysztof Krzysztof WachWachWachWach
scientific editors of the book
REFERENCESREFERENCESREFERENCESREFERENCES
Daszkiewicz, N. & Wach, K. (eds) (2014). Business Environment and Its Internationalisation –
Selected Evidences from CEE and SEE Countries. Gdańsk: Gdańsk University of
Technology Publishers.
Duréndez, A. & Wach, K. (eds) (2014). Patterns of Business Internationalisation in Visegrad
Countries – In Search for Regional Specifics. Cartagena: Universidad Politécnica
de Cartagena.
Gubik, A.S. & Wach, K. (eds) (2014). International Entrepreneurship and Corporate Growth
in Visegrad Countries. Miskolc: Miskolc University Press.
Knežević, B. & Wach, K. (eds) (2014). International Business from the Central European
Perspective. Zagreb: University of Zagreb Publishing Service.
Nelson, R. (1992). Recent writings on competitiveness: boxing the compass. California
Management Review, 34(2), pp. 127–137.

Part 1Part 1Part 1Part 1
Macro Level of Macro Level of Macro Level of Macro Level of
International International International International
CompetitivenessCompetitivenessCompetitivenessCompetitiveness


S u g g e s t e d C i t a t i o n :S u g g e s t e d C i t a t i o n :S u g g e s t e d C i t a t i o n :S u g g e s t e d C i t a t i o n :
GrodzickiGrodzickiGrodzickiGrodzicki, , , , M.M.M.M.J.J.J.J. (2014). Global Value Chain and Competitiveness of V4 Economies (chapter 1). In:
KiendlKiendlKiendlKiendl----Wendner, D. Wendner, D. Wendner, D. Wendner, D. & Wach, K.Wach, K.Wach, K.Wach, K. (eds), International Competitiveness in Visegrad Countries: Macro and
Micro Perspectives. Graz: Fachhochschule Joanneum, pp. 13-31. 1111
Global Value Chain and CompetitivenessGlobal Value Chain and CompetitivenessGlobal Value Chain and CompetitivenessGlobal Value Chain and Competitiveness
of V4 Economiesof V4 Economiesof V4 Economiesof V4 Economies
Maciej Jan GrodzickiMaciej Jan GrodzickiMaciej Jan GrodzickiMaciej Jan Grodzicki
Jagiellonian University
Faculty of Management and Social Communication
Institute of Economics and Management
ul. Łojasiewicza 4, 30-348 Kraków, Poland
e-mail: [email protected]
Summary:Summary:Summary:Summary:
The paper aims to investigate the competitiveness of V4 economies from a new angle, related to
fragmentation of global value chains (GVC). In the paper, a new methodology of analysing
competitiveness of economies, developed by Timmer et al. (2012), was employed. Making use of
World Input-Output Database, a value of GVC income of particular industries in V4 economies in
1995-2010 was calculated. Then, a thorough examination of computed values was conducted, in
order to observe evolving openness, revealed comparative advantages (RCA) and position of
V4 economies in the GVC. V4 economies since 1995 have become increasingly integrated in global
value chains. On the one hand, they have imported more and more intermediate inputs for
manufacturing industries. On the other, their contribution to GVC production have steadily
increased. Although some tendencies were common for all V4 countries, some significant differences
were detected as well. Firstly, level of integration into the GVC varied: Poland, probably due to size
of the economy, is to a least extent dependent on participation in GVC, either by imports of by
exports; while Hungary is the leader in both categories. Czech Republic, Slovakia and Hungary
managed to develop RCA in capital-intensive and high-tech industries. Conversely, Poland finds it
comparative advantage still predominantly in resource-based industries. Employment of a relatively
new research technique sheds new light on the processes of integration of V4 into global economy.
Comparison of our results with traditional ones, based on raw exports and imports data points to
some important differences. So far, at least to our knowledge, no analysis like this for V4 has been
performed.
KeywordsKeywordsKeywordsKeywords: manufacturing, global value chain, input-output analyses, competitiveness, CEE
JEL classificationJEL classificationJEL classificationJEL classification: F60, O47, O57
* The article was prepared within the research project entitled “Convergence in countries and regions of the
European Union” funded by the Polish National Science Centre, on the basis of the decision No. DEC-
2011/01/N/HS4/03077.
14141414 Maciej Jan Grodzicki
1111.1. .1. .1. .1. INTRINTRINTRINTROOOODUCTORY REMARKSDUCTORY REMARKSDUCTORY REMARKSDUCTORY REMARKS
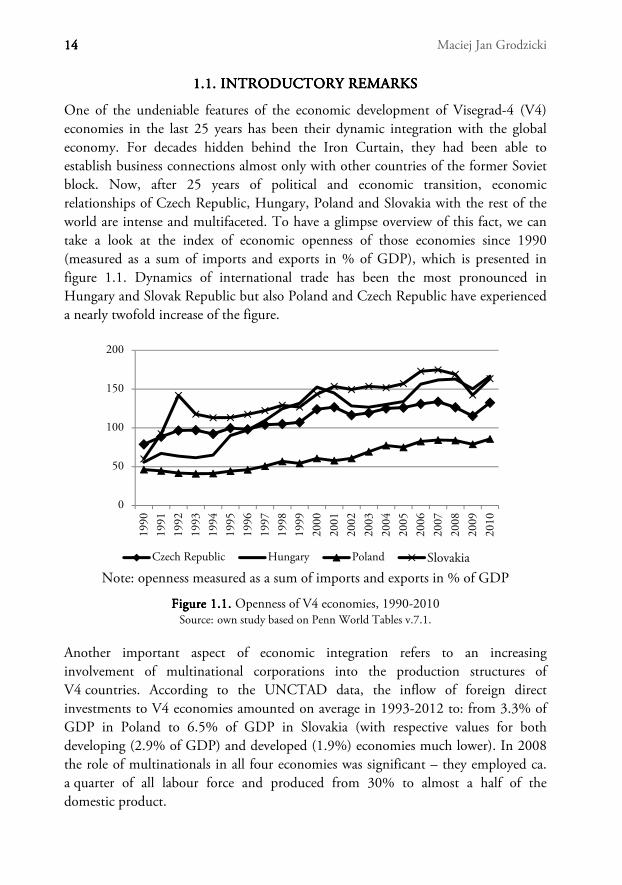
One of the undeniable features of the economic development of Visegrad-4 (V4)
economies in the last 25 years has been their dynamic integration with the global
economy. For decades hidden behind the Iron Curtain, they had been able to
establish business connections almost only with other countries of the former Soviet
block. Now, after 25 years of political and economic transition, economic
relationships of Czech Republic, Hungary, Poland and Slovakia with the rest of the
world are intense and multifaceted. To have a glimpse overview of this fact, we can
take a look at the index of economic openness of those economies since 1990
(measured as a sum of imports and exports in % of GDP), which is presented in
figure 1.1. Dynamics of international trade has been the most pronounced in
Hungary and Slovak Republic but also Poland and Czech Republic have experienced
a nearly twofold increase of the figure.
Note: openness measured as a sum of imports and exports in % of GDP
FigureFigureFigureFigure 1.1. 1.1. 1.1. 1.1. Openness of V4 economies, 1990-2010 Source: own study based on Penn World Tables v.7.1.
Another important aspect of economic integration refers to an increasing
involvement of multinational corporations into the production structures of
V4 countries. According to the UNCTAD data, the inflow of foreign direct
investments to V4 economies amounted on average in 1993-2012 to: from 3.3% of
GDP in Poland to 6.5% of GDP in Slovakia (with respective values for both
developing (2.9% of GDP) and developed (1.9%) economies much lower). In 2008
the role of multinationals in all four economies was significant – they employed ca.
a quarter of all labour force and produced from 30% to almost a half of the
domestic product.
0
50
100
150
200
1990
1991
1992
1993
1994
1995
1996
1997
1998
1999
2000
2001
2002
2003
2004
2005
2006
2007
2008
2009
2010
Czech Republic Hungary Poland Slovak RepublicSlovakia

Global Value Chain and Competitiveness of V4 Economies 15151515
The up-to-date overall impact of both mentioned phenomena – international
trade and presence of multinationals – on development of V4 economies was
undoubtedly positive. It is a fact widely supported by empirical research that
international relationships fostered economic convergence of the region, via the
channels of capital accumulation, knowledge diffusion, structural transformation and
others (Jakab et al., 2000; Hotopp et al., 2002; Baldone et al., 2001; Parteka
& Wolszczak-Derlacz, 2011).
However, the increasing involvement of V4 economies into global production
networks raises concerns regarding their real-world consequences but also of an
analytical nature. Many observers doubt whether the convergence of the whole
region can be sustained within current development model, named by some as the
dependent market economy (Nölke & Vliegenthart, 2009). Jerzy Hausner, former
minister of economy and labour of Poland, argued in a recent interview:
“We are indeed in the global value chains, however through the foreign
firms - we account for the role of suppliers and assemblers. It means that
although we export more and more, its value added is low. And if so, it is
difficult to increase the incomes of employees significantly”
(Hausner, 2014).
Vladimír Baláž (2013), Slovakian economist, asks in his article about the future of his
country in a similar tone: “how to avoid becoming the Detroit of Europe?”.
In essence, those two remarks underline limits and risks of a development model
based on foreign technology and capital. In this article, we are not going to tackle
those profound and complex issues. Instead, we will present how global
interdependencies make traditional categories of international trade economics
unsuitable for descriptive purposes. Hausner’s words lead us to a first limitation of
the traditional approach: how can we tell what the true value added of exported
goods, which comes from the reporting country, is? Are we truly contributing to the
value of export or do we simply re-export imported intermediate goods after
a low-value added processes of assembly? Another examples of problems that might
appear when using traditional analytical approach will be presented in further parts
of the text.
The article is situated within the theoretical approach of global value chains and
fragmentation of production (Gereffi, 2005; Jones & Kierzkowski, 2005; Baldwin
2006). It is a quite novel approach, which tries to analyse contemporary phenomena
within the international economics and for this purpose develops new theoretical
categories and research techniques. The main objective of the article is to describe in
details involvement of V4 economies in global value chains (GVC) making use of
world input-output data. We will draw some implications about the true
competitiveness and development potential of V4 economies.

16161616 Maciej Jan Grodzicki
The article is probably the first one to describe the competitiveness of
V4 economies from the GVC perspective in such a comprehensive manner. In that
way it presents undoubtedly a value added for current discussions on the
development model of V4 economies. Some previous works took into consideration
whole European Union and therefore will serve as a useful reference. In the article we
also modify some of the already existing techniques, in order to get a more insightful
view of the problem.
The structure of the article is as follows. Section 2 presents theoretical
description of the fragmentation of production and its economic consequences.
In section 3 we will briefly describe up-to-date empirical research on GVC, with
special recognition of the situation of V4 economies. Section 4 contains a short
description of the methodology in use, with a reference to appropriate literature
which presents it in details. In section 5 the results are demonstrated and discussed,
while section 6 concludes.
1111.2.2.2.2.... FRAGMENTATION OF PROFRAGMENTATION OF PROFRAGMENTATION OF PROFRAGMENTATION OF PRODUCTION IN ECONOMICDUCTION IN ECONOMICDUCTION IN ECONOMICDUCTION IN ECONOMICSSSS
The problem of fragmentation of production can be viewed as a contemporary
version of the discussion on consequences of division of labour, which has its sources
in the writings of Adam Smith. In general, every division of complex production
processes into simpler tasks, performed by separate workers or production units,
generates positive economies, due to effects of specialization. However, at the same
time it raises the costs of coordination of multiple tasks, which might include the
management of dispersed units, communication and transportation of processed
goods between them. In other words, organization of production is always a question
of balance between the transformation and transaction costs (Baldwin, 2006; 2009).
At different stages of development of global economy this question referred to
different levels of production structures. Initially, Smith had in mind division of
labour between particular workers that took part within a single manufacturing
plant. In contemporary analyses three other dimensions gain in importance.
A company might decide to slice its value chain between a number of plants, each of
them focusing on a different part of the whole process (intra-firm level). It can also
outsource some of the activities to other companies, which specialize in them
(inter-firm level). Finally, the decision to split some production tasks between plants
or firms might have the international dimension – when some activities are offshored
to other countries. This third aspect of the division of labour is of a high importance
for our analyses. According to Gereffi (2005, p. 166) three characteristics distinguish
the current stage of globalization from the previous ones:
1. larger share of trade in intermediate inputs in total trade;
Global Value Chain and Competitiveness of V4 Economies 17171717
2. the fact that many companies are able to disperse their production processes all
around the globe;
3. “the emergence of a global production networks framework”, with their
consequences for governance and distribution of economic returns.
Those features lead to a whole range of new phenomena, which deserve
a thorough explanation. At the moment the new paradigm functions in economic
theory under different names, each of them highlighting some of its aspects. The
’global value chain’ refers to a truly international character of value flows and to
contribution, direct and indirect, of multiple nations to bringing “a good or service
from conception, through the different phases of production,(...) delivery to final
consumers, and final disposal after use” (Gereffi, 2005, p. 168). Similarly, the
concept of ’vertical specialisation’ puts emphasis on involvement of different
countries at different stages of a vertically-sliced production process – within one,
multinational or a multiple of smaller firms (Gereffi, 2005). ’Trade in tasks’
underlines the fact that nowadays a large part of the international trade concerns not
final goods, but different types of activities, which are necessary to produce those
goods. These activities might take a physical form of intermediate goods, but more
and more often services of different kinds are being traded (Lanz et al., 2011).
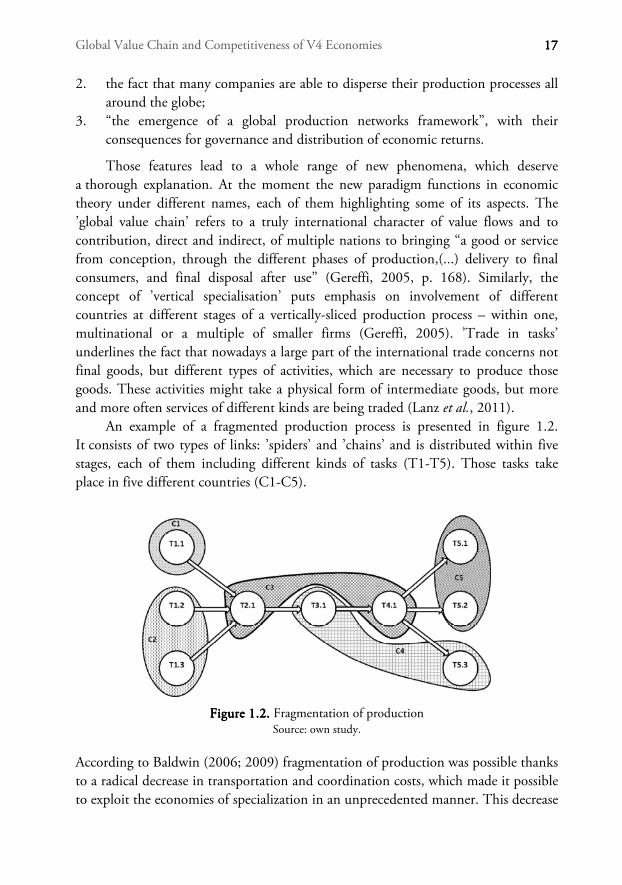
An example of a fragmented production process is presented in figure 1.2.
It consists of two types of links: ’spiders’ and ’chains’ and is distributed within five
stages, each of them including different kinds of tasks (T1-T5). Those tasks take
place in five different countries (C1-C5).
FigureFigureFigureFigure 1.1.1.1.2.2.2.2. Fragmentation of production Source: own study.
According to Baldwin (2006; 2009) fragmentation of production was possible thanks
to a radical decrease in transportation and coordination costs, which made it possible
to exploit the economies of specialization in an unprecedented manner. This decrease
18181818 Maciej Jan Grodzicki
took place in two steps, which triggered two waves of globalization. Each of them
consisted in, in words of Baldwin, an unbundling of the supply chain. Each of those
waves changed the global economic landscape, but it also made previous economic
theories insufficient to explain the new phenomena.
The first unbundling was taking place from the late 19th century, but it had its
peak in the post-war period and its sources were the advancements in means
of transportation. Lower transport costs allowed firms to move goods and production
factors between regions and countries - production no longer had to be placed close
to final consumers. Consequently, firms could undertake location decisions on the
basis of new motives and benefit from agglomeration economies, which found
a proper description in the New Economic Geography (Baldwin, 2006; 2009).
Whereas the first unbundling and its description by NEG referred to location
decisions of whole firms, the key novelty of the second unbundling lies in the
possibility of division of production processes into several stages. It means that the
analysis of agglomeration and dispersion forces no longer refers to whole sectors
of production, but to single types of activities.
From the point of view of middle-income economies, such as the V4, the new
paradigm brings profound consequences for their convergence. On the one hand,
fragmentation of production gives to such economies many possibilities of entering
the global production networks. Since competition takes place no longer on the level
of whole sectors but on the level of single tasks, it becomes much easier to develop
new types of activities and to attract foreign investors. However, since the
competition is truly global, sustained development requires constant upgrading
to activities bringing higher value added (Gereffi, 2005).
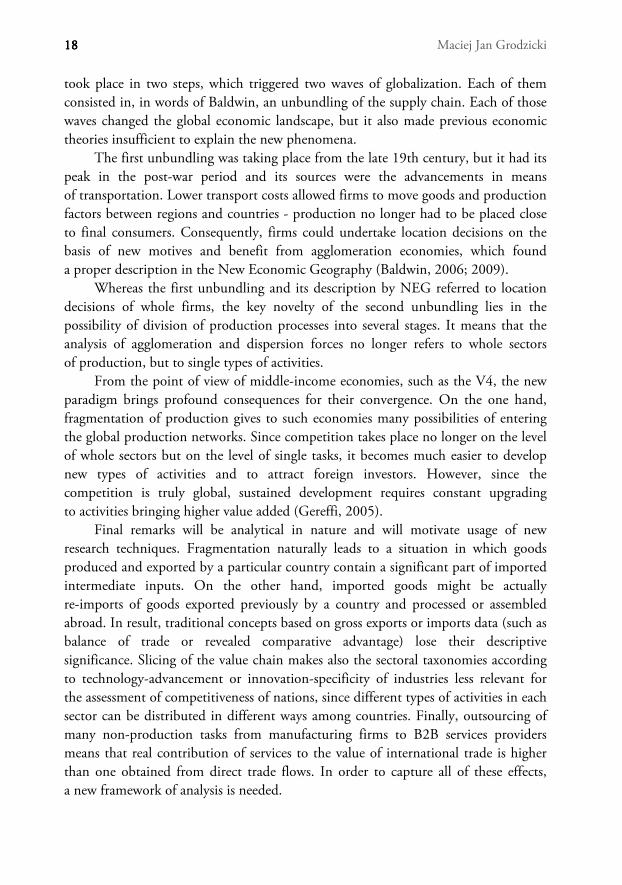
Final remarks will be analytical in nature and will motivate usage of new
research techniques. Fragmentation naturally leads to a situation in which goods
produced and exported by a particular country contain a significant part of imported
intermediate inputs. On the other hand, imported goods might be actually
re-imports of goods exported previously by a country and processed or assembled
abroad. In result, traditional concepts based on gross exports or imports data (such as
balance of trade or revealed comparative advantage) lose their descriptive
significance. Slicing of the value chain makes also the sectoral taxonomies according
to technology-advancement or innovation-specificity of industries less relevant for
the assessment of competitiveness of nations, since different types of activities in each
sector can be distributed in different ways among countries. Finally, outsourcing of
many non-production tasks from manufacturing firms to B2B services providers
means that real contribution of services to the value of international trade is higher
than one obtained from direct trade flows. In order to capture all of these effects,
a new framework of analysis is needed.

Global Value Chain and Competitiveness of V4 Economies 19191919
1111....3333 EMPIRICAL RESEARCH REMPIRICAL RESEARCH REMPIRICAL RESEARCH REMPIRICAL RESEARCH REVIEWEVIEWEVIEWEVIEW
Previous empirical research demonstrates a dynamic integration of the whole Central
and Eastern Europe region with the global economy, especially with the European
Union. Both exports and imports of CEE countries were increasing at a high pace
long before their accession to the EU. Early studies indicated that Czech Republic
and Hungary were the best integrated economies, while Slovakia and Poland lagged
behind (Jakab et al., 2000; Bussiére et al., 2005). Other analyses show positive
consequences of economic openness for economic development of the region: it
supported the structural change and technological development (Baldone et al.,
2001; Hotopp et al., 2002; Parteka & Wolszczak-Derlacz, 2011).
During the transition period, specialisation patterns and comparative
advantages of V4 economies changed heavily. Initially, their exports was based on
commodities and natural resources. In time, more and more manufactured goods
from those countries have been traded, with a growing share of human-capital and
technology-intensive products (Hotopp et al., 2002; Zaghini, 2005; Fertö & Soós,
2008). First differences within the V4 group take shape, with Poland lagging behind
the other three countries in terms of the exports structure.
Another growing strand of research is devoted to analyses of fragmentation of
production and its impact on particular countries and industries. Several studies
describe a changing model of organization and management, both in multinational
corporations and in smaller enterprises, which leads to global production sharing
(Yeats, 1997; Jones & Kierzkowski, 2005; Baldwin, 2009). The production chains
become increasingly complex and globally dispersed, which is not necessarily visibly
in the pure data on trade in intermediates (Yeats, 1997; Hummels et al., 2001).
Those processes are especially well documented empirically for the European Union
(see: Stehrer et al., 2012; Timmer et al., 2012).
V4 economies are heavily involved in those processes – their presence in global
production networks resembles the European average levels, particularly in small
countries – the Czech Republic, Hungary and Slovakia. The CEE region increased
its share in the European incomes from participation in the global value chain from
4.4% in 1995 to 9.3% in 2008, with a continuous growth of number of high-skilled
workers involved in production processes. The V4 economies specialize mainly
in electronics (HU, SK), machinery (CZ, SK) and transport equipment (all
countries) (Timmer et al., 2012).
More detailed case-studies demonstrate an ongoing industrial upgrading in the
Visegrad region. Whereas early involvement of those countries in the GVC focused
mainly on assembly operations, more and more tasks of higher complexity are being
performed in the region. CEE-10 countries became an important supplier of network
products and parts (Kaminsky & Ng, 2005). Examples of two industries – apparel

20202020 Maciej Jan Grodzicki
and textiles and automotive – show that CEE countries make use of their traditional
comparative advantages and of early presence of multinationals (Baldone et al., 2011;
Fortwengel, 2011). On the other hand, some authors indicate that, due to the fact
that most of the strategic decision regarding the location of processes are being made
in the Western Europe, further upgrading might be very difficult to achieve
(Fortwengel, 2011; Jacoby, 2010).
This study aims to describe in details industrial development of V4 economies,
taking into account the specificity of the current stage of globalization. Making use
of input-output research methods, it focuses on involvement of those economies
in the GVC and on following dimensions of competitiveness: production structures,
revealed comparative advantages and position in value chains.
1111....4444.... RESEARCH METHODSRESEARCH METHODSRESEARCH METHODSRESEARCH METHODS
Description of research methods used in the article will focus on the most important
issues. A detailed derivation and discussion of all presented concepts can be found in
works of Koopman et al. (2010) and Timmer et al. (2012). All calculations are based
on the World Input-Output Database (Timmer, 2012), which presents direct flows
of gross output between countries and sectors for 1995-2011. It includes
40 countries (and Rest of the World as a separate unit) and 35 economic sectors.
A following notation will be used (Timmer et al., 2012):
yi(s) - gross output of sector i in country s; fi(s,t) - final demand for goods of sector i in country s from users from country t;
mij(s,t) - intermediate inputs from sector i in country s used in production in sector j in country t;
S - number of sectors, N – number of countries.
In the first step, on the basis of input-output tables a (SNxSN) matrix AAAA is
calculated which contains coefficients of direct intermediate inputs between
country-sectors:
)(/),(),( tytsmtsa jijij = (1)
Product of each sector is distributed between final demand of N countries and
intermediate inputs of SN country-sectors:
∑+∑ ∑= Nt i
Sj
Nt iji tsftsmsy ),(),()( (2)
On the basis of (1) and (2), we can write a following matrix equation:
y = Ay + f (3)
where: y – a (SNx1) vector of gross output of country-sectors; f – a (SNx1) vector of final demand of country-sectors.

Global Value Chain and Competitiveness of V4 Economies 21212121
After simple transformations of (3) we obtain a so-called Leontief-inverse matrix:
y = (I – A)-1 f = Lf (4)
where: L ≡ (I – A)-1 is the Leontief-inverse matrix and I is a (SNxSN) identity matrix.
Values of Leontief-inverse, lij(s,t), inform us how many units of gross output of sector i in country s were needed, both directly and indirectly, to produce a unit
of gross output of sector j in country t. Now, thanks to pre- and post-multiplications
of Leontief-inverse by proper matrices of inputs and outputs, we can obtain
information about absolute value added flows between country-sectors. For this
purpose, let us form two additional matrices:
P – an (SNxSN) diagonal matrix in which each diagonal element pi(s) is a ratio of value added to gross output in sector i in country s;
D – an (SNxSN) diagonal matrix in which each diagonal element di(s) is value of final demand for products of sector i in country s.
To investigate the role of foreign final demand, a separate matrix D(s) for each country is needed, which contains final demand from all countries, apart from the
country s. After a calculation: V = PLD we receive a (SNxSN) matrix V, where vij(s,t)
informs us about total value added of sector i in country s embodied in gross output of sector j in country t. Proper summations of columns or vectors of this matrix will give us all the information about the global value flows. The empirical part of the
article consists in calculation for V4 economies and for EU-27 (for comparison), for
1995-2011 period, of following measures:
1. In order to obtain GVC Income of sector i in country s we multiply matrices:
�� = Vu (5)
where u is a (SNx1) vector with 1 in places related to manufacturing industries and 0 elsewhere.
���(s) informs us about the total value added of sector i in country s embodied in global manufacturing value chain.
2. GVC income of country s is a summation of GVC income of its all sectors and its interpretation is analogous:
GVC(s) ≡ ��(s) = ∑ ����� (s) (6)
3. Contribution of country s to global production of industry j:
GVCj(s) = ∑ ∑ ���
�� (s,t) (7)

22222222 Maciej Jan Grodzicki
On the basis of those contributions, revealed comparative advantages can be
calculated:
RCA_GVCj(s) = �� ���� �� ��
�� ��� �� ⁄.1 (8)
They will serve to inform us about evolving patterns of specialization of
V4 economies.
4. Finally, two measures will be calculated that will provide information about the
position of country-sectors in the manufacturing global value chain:
− Indirect GVC income ratio – IGVC – is a share of GVC income of a country-sector, due to final demand for goods of foreign producers:
IGVCIGVCIGVCIGVCj(s) = [∑ ∑ �����
�� (s,t)]/GVCj(s) (9)
The higher the IGVC, the higher the dependence of a country-sector on foreign producers – recipients.
− Ratio of foreign value added embodied in gross output – FVA:
FVA i(s) = [∑ ∑ �����
�� (s,t)]/yj(s) (10)
This measure indicates the extent of dependence of a country-sectors on
foreign suppliers.
1.51.51.51.5.... RESULTS AND DISCUSSIRESULTS AND DISCUSSIRESULTS AND DISCUSSIRESULTS AND DISCUSSIONONONON
GVC Income of V4 EconomiesGVC Income of V4 EconomiesGVC Income of V4 EconomiesGVC Income of V4 Economies
GVC income is the measure that captures total contribution of a country to global
production of manufacturing goods. Its values, presented in figure 1.3, suggest
a truly dynamic integration of V4 countries with global economy, especially after
2001-2003. Economic Crisis in 2009 hit manufacturing production and
international trade in the region, but a slow rebuilt has been observed since 2010.
GVC income increased in the whole period by: from 132% in Hungary to 206% in
Slovakia. When we combine it with the fact, that in whole EU27 GVC income did
not grow almost at all, we receive a proof of a fast catching-up of the whole region.
Comparison of tendencies for GVC income and economic openness indicates a first
difference, stemming from different research approaches. In 1995-2000 we can
observe a sharp increase of trade value, especially in Hungary, with a simultaneous
slight decline in GVC income.
Table 1.1 presents detailed information about the GVC income of V4
economies. The region more than doubled its share in European GVC income: from
1 It is an adaptation of a simple Balassa RCA index: ���_������ =
������ ���⁄
����� ��⁄.

Global Value Chain and Competitiveness of V4 Economies 23232323
3% to 7%. Manufacturing production in all V4 economies has a clearly external
orientation - most of their GVC income comes from abroad. Slovakia and Czech
Republic are the most dependent on foreign markets; Poland, probably since it has
much bigger internal market - only in about two thirds. In that way V4 economies,
apart from Poland, are much more export-oriented than European average.
Note: series for V4 countries - left axis, series for EU27 - right axis; values deflated by US CPI index.
Figure 1.3. Figure 1.3. Figure 1.3. Figure 1.3. GVC income of V4 economies (mln USD 1995), 1995-2011 Source: own study based on WIOD data (Timmer, 2012).
Table 1Table 1Table 1Table 1.1..1..1..1. GVC income - summary of basic information, 1995-2011
Country
Country
Country
Country GVC IncomeGVC IncomeGVC IncomeGVC Income
(mln USD 1995)(mln USD 1995)(mln USD 1995)(mln USD 1995)
Share of EU27 Share of EU27 Share of EU27 Share of EU27
GVCGVCGVCGVC %Foreign%Foreign%Foreign%Foreignaaaa GrowthGrowthGrowthGrowthbbbb
1995199519951995 2011201120112011 1995199519951995 2011201120112011 1995199519951995 2011201120112011 1995199519951995----2011201120112011
CZ 14 477 38 523 0.7% 1.7% 57% 79% 6.3%
HU 11 120 25 824 0.5% 1.1% 45% 77% 5.4%
PL 33 439 79 457 1.6% 3.5% 43% 67% 5.6%
SK 5 060 15 482 0.2% 0.7% 64% 82% 7.2%
EU27 2 072 175 2 280 466 100% 100% 52%c 67% 0.6%
Notes: aaaaGVC income due to final demand from abroad as a share of GVC income due to total final
demand. bbbbaverage annual growth rate of GVC income. cpercentages for EU27 measure weighted average
for all countries.
Source: own study based on WIOD data (Timmer 2012).
0
500 000
1 000 000
1 500 000
2 000 000
2 500 000
3 000 000
0
10 000
20 000
30 000
40 000
50 000
60 000
70 000
80 000
90 000
1995
1996
1997
1998
1999
2000
2001
2002
2003
2004
2005
2006
2007
2008
2009
2010
2011
CZE HUN POL SVK UE27EU27

24242424 Maciej Jan Grodzicki
Country’s GVC income can be also analysed from the point of view of
contributing sector - division of the income into 5 main economic sectors in 1995
and 2011 is presented in figure 1.4. In all countries manufacturing holds the
dominant position, however its role varies considerably. In Czech Republic and in
Hungary manufacturing share in GVC income is nearly 60% and it has increased
distinctly since 1995. Conversely, it is much lower in Poland and Slovakia, with a big
drop since 1995. Those two countries are much closer to production patterns of
Western Europe, with an important role of services in generation of value added of
manufacturing goods.
Figure 1.Figure 1.Figure 1.Figure 1.4444. . . . Contribution of economic sectors to GVC income of V4, EU27 and EU15,
1995 and 2011 Source: own study based on WIOD data (Timmer, 2012).
RCA Based on GVC IncomeRCA Based on GVC IncomeRCA Based on GVC IncomeRCA Based on GVC Income
In the next part specialisation patterns of V4 economies will be discussed. Following
figures demonstrate how those patterns changed in 1995-2011 in all four countries.
For better understanding, industries are placed on the graph in a specific order:
a) upper- right part consists of traditional sectors, producing non-durable goods,
b) in the lower-right part of the figures resource-based industries are situated,
c) in the lower-left part of the figure chemicals-related industries are placed,
54%54%54%54%
59%59%59%59%53%53%53%53%
58%58%58%58%
53%53%53%53%
47%47%47%47%58%58%58%58%
52%52%52%52%
56%56%56%56%
51%51%51%51%
57%57%57%57%
51%51%51%51%
30%30%30%30%
31%31%31%31%31%31%31%31%
31%31%31%31%
28%28%28%28%
38%38%38%38%30%30%30%30%
37%37%37%37%
34%34%34%34%
41%41%41%41%
35%35%35%35%
42%42%42%42%
0%
20%
40%
60%
80%
100%
CZE 1995
CZE 1995
CZE 1995
CZE 1995
CZE 2011
CZE 2011
CZE 2011
CZE 2011
HUN 1995
HUN 1995
HUN 1995
HUN 1995
HUN 2011
HUN 2011
HUN 2011
HUN 2011
POL 1995
POL 1995
POL 1995
POL 1995
POL 2011
POL 2011
POL 2011
POL 2011
SVK 1995
SVK 1995
SVK 1995
SVK 1995
SVK 2011
SVK 2011
SVK 2011
SVK 2011
EU27 1995
EU27 1995
EU27 1995
EU27 1995
EU27 2011
EU27 2011
EU27 2011
EU27 2011
EU15 1995
EU15 1995
EU15 1995
EU15 1995
EU15 2011
EU15 2011
EU15 2011
EU15 2011
Agr Manuf Services Mining Energ&Constr

Global Value Chain and Competitiveness of V4 Economies 25252525
d) upper-left part of the figures consists of modern industries, e.g. machinery and
electronics.
The figures (1.5a-1.5d) demonstrate a diversity of revealed comparative advantages,
which might seem surprising for such a small and, seemingly, homogenous group of
countries. In 1995 (solid line) all of them specialized in traditional, labour-intensive
industries. Additionally, Czech Republic and Poland specialized in resource-based
industries, while Hungary and Slovakia – in chemicals. The most important change
in 1995-2011 is that all V4 economies lost their previous advantage in traditional
industries, which probably should be assigned to a growing role of imports of
non-durables from developing countries. However, they found their new RCAs in
different types of industries. Czech Republic, Slovakia and Hungary managed to
maintain some of their previous advantages in resourced-based manufacturing (CZ,
SK) and chemicals (HU). At the same time those three countries developed new,
strong industries in modern types of activities: machinery (CZ, HU), electrical
products (HU, SK) and transportation (CZ, HU, SK). Poland, on the contrary, did
not undergo such a potentially beneficial structural change – its RCAs are still mainly
in resource-based industries. Both reasons and consequences of such diverse
developments should be subject to further investigation.
Position of V4 Economies in Global Value Chains of Manufacturing GoodsPosition of V4 Economies in Global Value Chains of Manufacturing GoodsPosition of V4 Economies in Global Value Chains of Manufacturing GoodsPosition of V4 Economies in Global Value Chains of Manufacturing Goods
The last dimension of our analysis refers to the degree of integration of
V4 economies into the global production networks. Measures presented in this part
can be used also to find the position of a country or industry in the global value
chain or its dependence on foreign suppliers or customers. In table 1.2 two measures
are presented – foreign value added share in manufacturing output (FVA) and
indirect GVC income (IGVC).
It is visible that three small economies are highly dependent on foreign
inputs – about a half of their gross output in manufacturing comes from abroad.
Poland is more alike to EU27 average, however it has experienced a twofold increase
of FVA in 1995-2011. Similar observations can be made in reference to IGVC.
In Czech Republic, Hungary and Slovakia a large part (ca. 40%) of GVC income is
obtained by supplying inputs to final product of other countries. Poland again has
a much more moderate figure, which might be assigned to a larger internal market.
Both figures were calculated also for each manufacturing industry, but here, for
lack of space, only results for the whole V4 region as a one unit are presented2. In the
figure 1.6 position of each industry in global value chain in 1995 and 2011
2 Detailed analysis of GVC positions of particular industries of V4 economies, as well as their
consequences for development potential will be an object of further research.
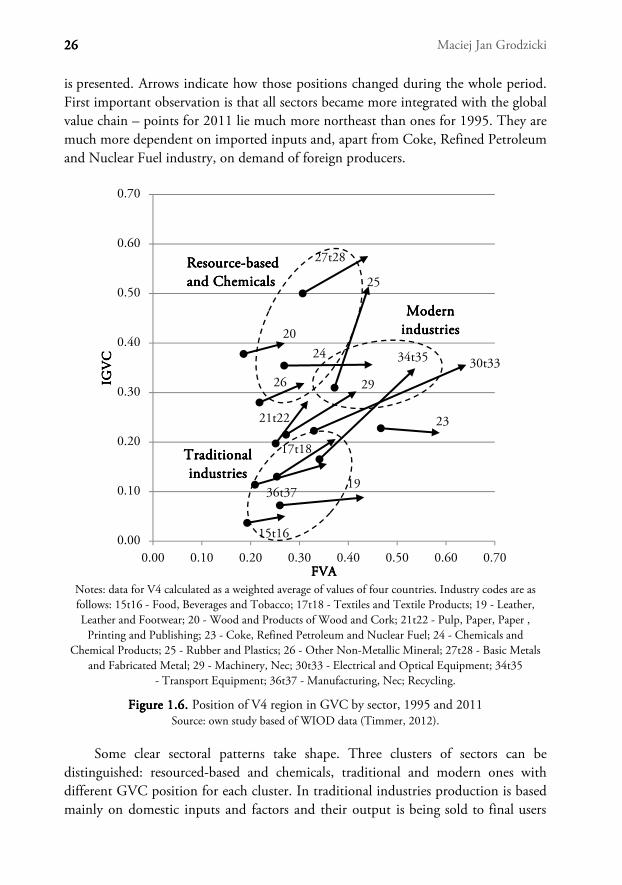
26262626 Maciej Jan Grodzicki
is presented. Arrows indicate how those positions changed during the whole period.
First important observation is that all sectors became more integrated with the global
value chain – points for 2011 lie much more northeast than ones for 1995. They are
much more dependent on imported inputs and, apart from Coke, Refined Petroleum
and Nuclear Fuel industry, on demand of foreign producers.
Notes: data for V4 calculated as a weighted average of values of four countries. Industry codes are as
follows: 15t16 - Food, Beverages and Tobacco; 17t18 - Textiles and Textile Products; 19 - Leather,
Leather and Footwear; 20 - Wood and Products of Wood and Cork; 21t22 - Pulp, Paper, Paper ,
Printing and Publishing; 23 - Coke, Refined Petroleum and Nuclear Fuel; 24 - Chemicals and
Chemical Products; 25 - Rubber and Plastics; 26 - Other Non-Metallic Mineral; 27t28 - Basic Metals
and Fabricated Metal; 29 - Machinery, Nec; 30t33 - Electrical and Optical Equipment; 34t35
- Transport Equipment; 36t37 - Manufacturing, Nec; Recycling.
Figure Figure Figure Figure 1111....6666. . . . Position of V4 region in GVC by sector, 1995 and 2011 Source: own study based of WIOD data (Timmer, 2012).
Some clear sectoral patterns take shape. Three clusters of sectors can be
distinguished: resourced-based and chemicals, traditional and modern ones with
different GVC position for each cluster. In traditional industries production is based
mainly on domestic inputs and factors and their output is being sold to final users
19
20
25
23
26 29
15t16
17t18
21t22
27t28
30t3334t35
36t37
24
0.00
0.10
0.20
0.30
0.40
0.50
0.60
0.70
0.00 0.10 0.20 0.30 0.40 0.50 0.60 0.70
IGVC
IGVC
IGVC
IGVC
FVAFVAFVAFVA
ResourceResourceResourceResource----basedbasedbasedbased
and Chemicalsand Chemicalsand Chemicalsand Chemicals
Modern Modern Modern Modern
industriesindustriesindustriesindustries
Traditional Traditional Traditional Traditional
industriesindustriesindustriesindustries

Global Value Chain and Competitiveness of V4 Economies 27272727
Figure Figure Figure Figure 1111....5555....aaaa----bbbb Revealed comparative advantage based on GVC income,
V4 countries, 1995 and 2011.
Source: own study based on WIOD data (Timmer, 2012).
0
0.5
1
1.5
2
Food, Beverages and
TobaccoTextiles and Textile
Products
Leather, Leather and
Footwear
Pulp, Paper, Paper ,
Printing and…
Manufacturing, Nec;
Recycling
Wood and Products of
Wood and Cork
Other Non-Metallic
MineralBasic Metals and
Fabricated Metal
Coke, Refined
Petroleum and…
Chemicals and
Chemical Products
Rubber and Plastics
Machinery, Nec
Electrical and Optical
Equipment
Transport Equipment
a) Czech Republic
1995 2011
0
0.5
1
1.5
2
Food, Beverages and
TobaccoTextiles and Textile
Products
Leather, Leather and
Footwear
Pulp, Paper, Paper ,
Printing and Publishing
Manufacturing, Nec;
Recycling
Wood and Products of
Wood and Cork
Other Non-Metallic
MineralBasic Metals and
Fabricated Metal
Coke, Refined
Petroleum and…
Chemicals and
Chemical Products
Rubber and Plastics
Machinery, Nec
Electrical and Optical
Equipment
Transport Equipment
b) Hungary
1995 2011

28282828 Maciej Jan Grodzicki
Note: for Slovakia a data point for Wood and Products of Wood and Cork was deleted in order to
improve clarity of the figure. RCA of Slovakia in this industry in 2011 was very high: 5.10.
Figure Figure Figure Figure 1111....5555....cccc----dddd Revealed comparative advantage based on GVC income,
V4 countries, 1995 and 2011.
Source: own study based on WIOD data (Timmer, 2012).
0
0.5
1
1.5
2
2.5
3
3.5
Food, Beverages and
TobaccoTextiles and Textile
Products
Leather, Leather and
Footwear
Pulp, Paper, Paper ,
Printing and Publishing
Manufacturing, Nec;
Recycling
Wood and Products of
Wood and Cork
Other Non-Metallic
MineralBasic Metals and
Fabricated Metal
Coke, Refined Petroleum
and Nuclear Fuel
Chemicals and Chemical
Products
Rubber and Plastics
Machinery, Nec
Electrical and Optical
Equipment
Transport Equipment
c) Poland
1995 2011
0
0.5
1
1.5
2
2.5
Food, Beverages and
TobaccoTextiles and Textile
Products
Leather, Leather and
Footwear
Pulp, Paper, Paper ,
Printing and Publishing
Manufacturing, Nec;
Recycling
Wood and Products of
Wood and Cork
Other Non-Metallic
MineralBasic Metals and
Fabricated Metal
Coke, Refined
Petroleum and…
Chemicals and Chemical
Products
Rubber and Plastics
Machinery, Nec
Electrical and Optical
Equipment
Transport Equipment
d) Slovakia
1995 2011

Global Value Chain and Competitiveness of V4 Economies 29292929
mainly by domestic producers. It might be assigned to the fact that V4 economies
were in the 90’s relatively competitive in those sectors and probably managed
to maintain previous networks of suppliers and distributors. In resource-based and
chemicals sectors the content of foreign value added is also relatively low, however
a large share of output of those sectors serves as an input to foreign production of
final goods. Since those sectors naturally serve as suppliers of intermediate inputs, it
might be a sign that they underwent a positive, export-oriented development.
Finally, modern industries (and to some extent Chemicals and Chemical Products
industry, which might be due to the role of Pharmaceuticals) are highly dependent
on foreign value added in production and on foreign producers in distribution of
output. It is in line with the ‘conventional wisdom’ that in production of machinery,
electronics and transport equipment V4 economies serve as assemblers and suppliers
for multinational corporations.
Table Table Table Table 1111....2222.... Position of V4 economies in GVC
CountryCountryCountryCountry FVAFVAFVAFVA IGVCIGVCIGVCIGVC
1995199519951995 2011201120112011 1995199519951995 2011201120112011
CZ 34% 51% 33% 40%
HU 34% 51% 25% 39%
PL 18% 36% 20% 30%
SK 34% 49% 41% 43%
EU27 23% 34% 23% 31%
Notes: FVA – is foreign value added share in manufacturing gross output of a country. IGVC – is a
ratio of GVC income due to final demand for foreign products to total GVC income.
Source: own study based on WIOD data (Timmer, 2012).
1111....6666 CONCLUSIONSCONCLUSIONSCONCLUSIONSCONCLUSIONS
In the article a comprehensive description of the involvement of V4 economies in the
global value chain was presented. In some respects those results present a view which
is in contradiction to traditional analyses, based on gross trade data. The research
supports the notion of an ongoing integration of V4 economies with global value
chain, however this integration brought those economies benefits to in terms of
increased GVC income only after 2001. In 2011 V4 economies accounted for ca. 7%
of European GVC income, with a major part of it coming from abroad. Although,
still most of this income is being provided by manufacturing industries, in Poland
and Slovakia services have gained a very important position in GVC production.
Another evidence for an ongoing integration of the region is the increased
dependence of domestic companies on foreign suppliers and on demand of foreign
producers. Three clusters of industries were distinguished on the basis of V4 position
in the global value chain: traditional, modern and resource-based and chemicals ones.
30303030 Maciej Jan Grodzicki
Our results demonstrate that within the V4 region important differences
between the countries have taken shape. Small countries – the Czech Republic,
Hungary and Slovakia – are to a much higher extent dependent on global supply and
demand than Poland. Those three countries managed to undergo in 1995-2011
a substantial structural change, as presented by their revealed comparative
advantages. Poland, on the other hand, still specialises in traditional, resource-based
industries.
The article provides a number of questions, which should serve as a basis for
further research. Firstly, is involvement and the position in the GVC related to
labour productivity of a sector? Secondly, what is the nature of relationships between
the GVC position and patterns of specialisation? Answers to those questions could
shed more light on the growth potential of V4 economies and their capabilities to
converge to the Western Europe development levels.
REFERENCESREFERENCESREFERENCESREFERENCES
Baláž, V. (2013). How to avoid becoming the Detroit of Europe? Available from
<http://www.presseurop.eu/en/content/article/4019471-how-avoid-becoming-detroit-
europe>. [6 February 2014].
Baldone, S., Sdogati, F. & Tajoli, L. (2001). Patterns and Determinants of International
Fragmentation of Production: Evidence from Outward Processing Trade between the
EU and Central Eastern European Countries. Weltwirtschaftliches Archiv, 137(1),
pp. 80–104.
Baldwin, R. (2006). Globalisation: the great unbundling(s). Office of the Prime Minister of
Finland, Helsinki.
Baldwin, R. (2009). Integration of the North American Economy and Newparadigm
Globalization. CEPR Discussion Papers, no. 7523.
Bussiére, M., Fidrmuc, J., & Schnatz, B. (2005). Trade integration of Central and Eastern
European countries. Lessons from a gravity model. ECB Working Paper Series, no. 545.
Fertö, I. & Soós, K.A. (2008). Trade Specialization in the European Union and in
Postcommunist European Countries. Eastern European Economics, 46(3), pp. 5–28.
Fortwengel, J. (2011). Upgrading through Integration? The Case of the Central Eastern
European Automotive Industry. Transcience Journal, 2(1).
Gereffi, G. (2005). The Global Economy: Organization, Governance, and Development.
In: N.J. Smelser & R. Swedberg (eds),The Handbook of Economic Sociology, Princeton:
Princeton University Press, pp. 160–182.
Hausner, J. (2014). Budujemy zamki na pustyni, interview by M. Sutowski, 07.01.2014.
Available from <http://www.krytykapolityczna.pl/artykuly/gospodarka/20140107/
hausner-budujemy-zamki-na-pustyni>. [6 February 2014].

Global Value Chain and Competitiveness of V4 Economies 31313131
Hotopp, U., Radosevic, S. & Bishop, K. (2002). Trade and Industrial Upgrading in
Countries of Central and Eastern Europe: Patterns of Scale and Scope-based Learning.,
University College London, Centre for the Study of Economic and Social Change in Europe
Working Papers, no. 23.
Hummels, D., Ishii, J. & Yi, K.M. (2001). The Nature and Growth of Vertical Specialization
in World Trade. Journal of International Economics, 54(1), pp. 75–96.
Jacoby, W. (2010). Managing globalization by managing Central and Eastern Europe: the
EU’s backyard as threat and opportunity. Journal of European Public Policy, 17(3).
Jakab, Z.M., Kovács, M.A. & Oszlay, A. (2000). How far has trade integration advanced? An
analysis of actual and potential trade of three Central and Eastern European countries.
NBH Working Paper, no. 1/2000.
Jones, R.W. & Kierzkowski, H. (2005). International fragmentation and the new economic
geography. The North American Journal of Economics and Finance, 16(1), pp. 1–10.
Kaminski, B. & Ng, F. (2005). Production disintegration and integration of Central Europe
into global markets. International Review of Economics and Finance, 14, pp. 377–390.
Koopman, R., Powers, W., Wang, Z. & Wei, S.J. (2010). Give Credit Where Credit Is Due:
Tracing Value Added in Global Production Chains. NBER Working Papers, no. 16426.
Krugman, P. (1991). Increasing Returns and Economic Geography. Journal of Political
Economy, 99, pp. 483–499.
Lanz, R., Miroudot, S. & Nordås, H.K. (2011). Trade in Tasks. OECD Trade Policy Papers,
no. 117.
Nölke, A. & Vliegenthart, A. (2009). Enlarging the Varieties of Capitalism. The Emergence
of Dependent Market Economies in East Central Europe. World Politics, 61(4),
pp. 670–702.
Parteka, A. & Wolszczak-Derlacz, J. (2011). Market Size, Competitiveness and Technological
Frontier - the Impact of Trade Integration with the UE on Productivity in Polish
Manufacturing Sectors., National Bank of Poland Working Paper, 82.
Stehrer, R., Borowiecki, M., & Dachs, B. (2012). Global Value Chains and the EU Industry.
wiiw Research Reports, no. 383.
Timmer, M.P., Los, B., Stehrer, R. & de Vries, G.J. (2012). Fragmentation, incomes and
jobs: an analysis of European competitiveness. Economic Policy, 28(76), pp. 613–661.
Timmer, M.P. (ed.) (2012). The World Input-Output Database (WIOD): Contents, Sources
and Methods. WIOD Working Paper, no. 10.
Yeats, A.Z. (1997). Just How Big Is Global Production Sharing?. World Bank Policy Research
Paper, No. 1871.
Zaghini, A. (2005). Evolution of trade patterns in the new EU member states. Economics of
Transition, 13(4), pp. 629–658.

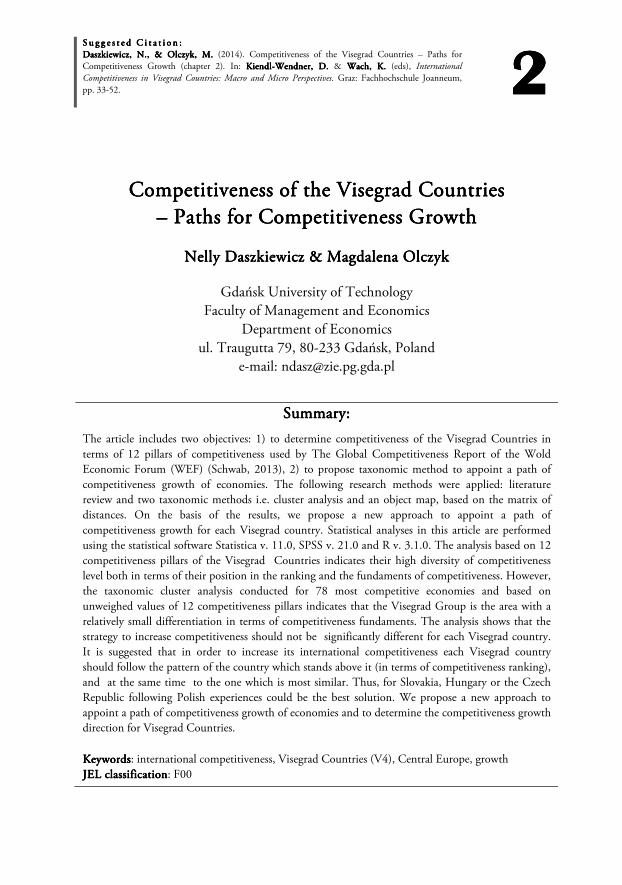
S u g g e s t e d C i t a t i o n :S u g g e s t e d C i t a t i o n :S u g g e s t e d C i t a t i o n :S u g g e s t e d C i t a t i o n : Daszkiewicz, N., & Olczyk, M.Daszkiewicz, N., & Olczyk, M.Daszkiewicz, N., & Olczyk, M.Daszkiewicz, N., & Olczyk, M. (2014). Competitiveness of the Visegrad Countries – Paths for Competitiveness Growth (chapter 2). In: KiendlKiendlKiendlKiendl----Wendner, D. Wendner, D. Wendner, D. Wendner, D. & Wach, K.Wach, K.Wach, K.Wach, K. (eds), International
Competitiveness in Visegrad Countries: Macro and Micro Perspectives. Graz: Fachhochschule Joanneum, pp. 33-52. 2222
Competitiveness of the Visegrad CountriesCompetitiveness of the Visegrad CountriesCompetitiveness of the Visegrad CountriesCompetitiveness of the Visegrad Countries –––– Paths for Competitiveness GrowthPaths for Competitiveness GrowthPaths for Competitiveness GrowthPaths for Competitiveness Growth
Nelly Daszkiewicz & Magdalena OlczykNelly Daszkiewicz & Magdalena OlczykNelly Daszkiewicz & Magdalena OlczykNelly Daszkiewicz & Magdalena Olczyk
Gdańsk University of Technology Faculty of Management and Economics
Department of Economics ul. Traugutta 79, 80-233 Gdańsk, Poland
e-mail: [email protected]
Summary:Summary:Summary:Summary:
The article includes two objectives: 1) to determine competitiveness of the Visegrad Countries in terms of 12 pillars of competitiveness used by The Global Competitiveness Report of the Wold Economic Forum (WEF) (Schwab, 2013), 2) to propose taxonomic method to appoint a path of competitiveness growth of economies. The following research methods were applied: literature review and two taxonomic methods i.e. cluster analysis and an object map, based on the matrix of distances. On the basis of the results, we propose a new approach to appoint a path of competitiveness growth for each Visegrad country. Statistical analyses in this article are performed using the statistical software Statistica v. 11.0, SPSS v. 21.0 and R v. 3.1.0. The analysis based on 12 competitiveness pillars of the Visegrad Countries indicates their high diversity of competitiveness level both in terms of their position in the ranking and the fundaments of competitiveness. However, the taxonomic cluster analysis conducted for 78 most competitive economies and based on unweighed values of 12 competitiveness pillars indicates that the Visegrad Group is the area with a relatively small differentiation in terms of competitiveness fundaments. The analysis shows that the strategy to increase competitiveness should not be significantly different for each Visegrad country. It is suggested that in order to increase its international competitiveness each Visegrad country should follow the pattern of the country which stands above it (in terms of competitiveness ranking), and at the same time to the one which is most similar. Thus, for Slovakia, Hungary or the Czech Republic following Polish experiences could be the best solution. We propose a new approach to appoint a path of competitiveness growth of economies and to determine the competitiveness growth direction for Visegrad Countries.
KeywordsKeywordsKeywordsKeywords: international competitiveness, Visegrad Countries (V4), Central Europe, growth JEL classificationJEL classificationJEL classificationJEL classification: F00

34343434 Nelly Daszkiewicz & Magdalena Olczyk
2222.1..1..1..1. INTRINTRINTRINTROOOODUCTORY REMARKSDUCTORY REMARKSDUCTORY REMARKSDUCTORY REMARKS
The discussion on competitiveness and search for its determinants began in the 70s of the twentieth century and have dominated the research in the area of international economics. Until now, however, scientists have failed to create a single definition of competitiveness. Moreover, researchers are faced with a huge excess of definitions. It is because, the phenomenon of competitiveness is analysed on four levels, i.e. micro-, meso-, macro- and megacompetiveness (Olczyk, 2008, p.12-14; Daszkiewicz & Olczyk, 2008, pp.13-20).
Microcompetitiveness refers to businesses, mesocompetitiveness can relate to analyses of sectors industries or regions. In this article we focus on macrocompetitiveness of the Visegrad Group countries. The oldest definitions of macrocompetitiveness refer most frequently to the performance of the country in international trade and specify it as the ability to cope with international competition and maintain a high rate of domestic demand without deteriorating the current account balance. In contrast, in the international market it is expressed by acceptance of products of a particular country and enlarging its shares in export markets” (Wysokińska, 2001, p.37). Later definitions of macrocompetitiveness combine good results of a country in foreign trade with the welfare of its citizens. A principal example of such an approach may be the definition of the OECD which describes competitiveness as a country's ability to produce goods and services that compete well in the international market while increasing the real income of its population in the long term (OECD, 1992, p.12).
According to the Global Competitiveness Report, the term competitiveness is defined as “the set of institutions, policies, and factors that determine the level of productivity of a country. The level of productivity, in turn, sets the level of prosperity that can be reached by an economy. The productivity level also determines the rates of return obtained by investments in an economy, which in turn are the fundamental drivers of its growth rates” (Schwab, 2013, p. 4). Thus, a more competitive economy is one that is likely to grow faster over time.
The Visegrad Group countries originated on the 15th February 19911 for the purposes of their further European integration as well as economic, military and energy cooperation. Visegrad Four (V4) formed a heterogeneous group in terms of economic potential, macroeconomic situation, pace and the course of political changes and market reforms. Despite these differences, the V4 countries have developed cooperation, which has stimulated the modernisation of their economies and consequently they have improved their international competitiveness. What is
1 The Visegrad Group originated at a summit meeting of the heads of state or government of
Czechoslovakia, Hungary and Poland. The Czech Republic and Slovakia became members of after dissolution of Czechoslovakia in 1993.
Competitiveness of the Visegrad Countries – Paths for Competitiveness Growth 35353535
more, integration within the global economy is another factor, which has influenced the development of national competitiveness of the Visegrad Countries since their accession to the European Union (Molendowski & Żmuda, 2013, p. 123).
The goal of this paper is to determine the level of the Visegrad Countries competitiveness in terms of 12 competitiveness pillars (table 2.1) from The Global Competitiveness Report (Schwab, 2013). The results of analysis are verified with additional study based on taxonomic methods. The cluster analysis conducted for 78 most competitive economies and based on unweighted values of 12 competitiveness pillars allows to assess the similarity of competitiveness fundaments among Visegrad Countries. In addition, the authors propose a new approach (an object map) to determine the competitiveness path for growth of Visegrad Countries.
2222.2..2..2..2. LITERATURE REVIEWLITERATURE REVIEWLITERATURE REVIEWLITERATURE REVIEW
Until 1970s international trade theory had been dominated by the theory of competitive advantage. This theory assumes that a country can enhance competitive advantage if it specialises in production of those products that can produce relatively more efficiently than other countries (Krugman & Obsfeld, 2003, Smit 2007). However, since World War II, a growing part of trade has come from massive two-way trade in similar industries and could not be longer explained by the competitive advantage theory. It was primarily driven by advantages resulting from economies of scale (Smit, 2007). In the late 1970s the new models of monopolistic competition were developed (Krugman, 1990). The new trade theories assumed that at the level of intra-industry trade, economies of scale could explain trade flows of differentiated products. However, both theories assumed that advantage comes through specialisation (Smit, 2007). Later the focus of scholars shifted towards oligopolistic competition, where economies of scale at the level of firm are sufficient to limit the number of competitors (Krugman, 1992). These resulted in development of trade models that assumed an oligopoly market structure (Krugman & Obsfeld, 2003). The models imply that even without comparative advantage trade still occurs as two-way trade in identical products and can be still mutually beneficial in industries where internal economies of scale are important (Krugman & Obsfeld, 2003).
The theories of monopolistic and oligopolistic competition do not explain where the actual production should be located (Smit, 2007). Porter (1990; 1998) proposed a “new theory” that explains location advantages and thus the competitive advantage of nations.
In 1990, Porter published a book “The Competitive Advantage of Nations”, in which he presented a new, four-factor model of economic competitiveness called National Diamond. Porter (1990) in search for sources of competitiveness in 1985-1989 conducted a survey in ten countries (together having more than 50% share in

36363636 Nelly Daszkiewicz & Magdalena Olczyk
world exports) which differ in structure, size, geographical location or population. Seeking answers to the question what is macrocompetitiveness he focused on innovative sectors / segments of the industry. The project also employed 30 researchers who used the same method of research. The aim of the study was to identify an industry which had been successful in international markets and to analyse its history in each country (Olczyk, 2008, pp.12-14; Daszkiewicz & Wach, 2013, p. 122)
Porter (1990) asked the question why some countries are more successful in particular industries than others. The proposed National Diamond which identifies four classes of country attributes that determine national competitive advantage of nations: factor conditions, demand conditions, related and support industries and company strategy, structure and rivalry. He also pointed at two other factors – government policy and chance (exogenous shocks) that support the system of national competiveness but do not create it (Figure 2.1).
Figure Figure Figure Figure 2222.1. .1. .1. .1. Determinants of competitiveness according to M.E. Porter Source: Porter (1990, p. 72).
Factor conditionsFactor conditionsFactor conditionsFactor conditions include human resources, physical resources, knowledge resources, capital resources and infrastructure. Factor conditions are further subdivided into basic and advanced factors. Basic factors include unskilled labour, raw materials, climatic conditions and water resources and require little or no new investment to be utilised in the production process. In turn advanced factors are created and upgraded through reinvestment and innovation to specialised factors, which are basic for the sustainable competitive advantage of a country.
Demand conditions. Demand conditions. Demand conditions. Demand conditions. The essential conditions of demand are home demand that anticipates international demand, industry segments with a significant share of
FACTORFACTORFACTORFACTOR CONDITIONSCONDITIONSCONDITIONSCONDITIONS
RELATED & RELATED & RELATED & RELATED & SUPPORTING SUPPORTING SUPPORTING SUPPORTING INDUSTRIESINDUSTRIESINDUSTRIESINDUSTRIES
FIRM STRATEGY, FIRM STRATEGY, FIRM STRATEGY, FIRM STRATEGY, STRUCTURE STRUCTURE STRUCTURE STRUCTURE & RIVALRY& RIVALRY& RIVALRY& RIVALRY
DEMAND DEMAND DEMAND DEMAND CONDITIONSCONDITIONSCONDITIONSCONDITIONS

Competitiveness of the Visegrad Countries – Paths for Competitiveness Growth 37373737
home demand, and sophisticated and demanding buyers. Different demand conditions in countries, leading to different demand structures, can determine location economies of increasing returns, as explained by the new trade theories (Smit, 2007).
Strategy, structure and rivalry. Strategy, structure and rivalry. Strategy, structure and rivalry. Strategy, structure and rivalry. The strategies and structures of firms depend on national environment. There are important differences in the business sectors in different countries that determine how firms compete and thus enhance their competitive advantage. Porter (1990) believed that rivalry is the most critical driver of competitive advantage. It forces firms to be cost competitive, innovative and to improve quality (Smit, 2007).
Related and support industries. Related and support industries. Related and support industries. Related and support industries. Porter claimed that specialisation leads to the sticky (not easily moveable) location advantages that are the true sources of sustainable competitive advantage of countries (Smit, 2007). However Porter introduced related and support industry clusters as a separate determinant of national competitive advantage. This is regarded as one of the most important contributions of Porter’s Diamond Theory. According to Porter, it is the external economies of related and support industry clusters, such as networks of specialised input providers, institutions and the spill-over effects of local rivalry, that become the true source of competitive advantage (Porter, 2000; 2003).
Figure Figure Figure Figure 2222....2222. . . . Extensions of Porter’s Diamond Model Source: Dunning (1993, p. 9).
Firm strategy, Firm strategy, Firm strategy, Firm strategy, structurestructurestructurestructure &&&& rivalryrivalryrivalryrivalry
DemandDemandDemandDemand ConditionsConditionsConditionsConditions
Related & Related & Related & Related & supporting industriessupporting industriessupporting industriessupporting industries
FactorFactorFactorFactor ConditionsConditionsConditionsConditions
Pro-competitive mentality
Transnational Business Activity
Goverment

38383838 Nelly Daszkiewicz & Magdalena Olczyk
Although the National Diamond was a breakthrough in the study of competitiveness it met with criticism. As Porter was an expert in management he was criticized for not considering international activities in the diamond. Dunning enriched Porter’s diamond with foreign direct investment, government policies and pro-competitive mentality (Dunning, 1993) (Figure 2.2).
Cho and Moon extended Porter’s original model and created the nine-factor model (Cho, 1994; Cho & Moon, 2000). In addition to the four physical determinants of Porter’s single diamond, this model includes four additional human variables: workers, politicians and bureaucrats, entrepreneurs, and professionals (Choo et al., 2007, p. 177). Although Porter’s single diamond included some of these human variables, it treated the human variables separately from the physical variables. Moreover, the government variable, was treated as exogenous in Porter’s model. In the nine-factor model it is incorporated as endogenous. Also the government factor is treated as endogenous since the government is the main factor for a nation’s competitiveness (Choo et al., 2007, p. 177).
Table Table Table Table 2222.1..1..1..1. Competitiveness pillars according to the Global Competitiveness Report 2013-14
TheTheTheThe ffffirst pillar: Institutionsirst pillar: Institutionsirst pillar: Institutionsirst pillar: Institutions
The institutional environment is determined by legal and administrative framework for the functioning of individuals, firms and governments. The quality of institutions has a strong impact on economies’ competitiveness and growth.
The The The The ssssecondecondecondecond pillar: Infrastructurepillar: Infrastructurepillar: Infrastructurepillar: Infrastructure
The level of development of infrastructure is crucial for effective functioning of the economy. It is an important factor in determining the location of economic activity. Well-developed infrastructure reduces the effect of distance between regions, income inequalities and poverty in a variety of ways as well as integrates national markets and influences economic growth.
The The The The tttthird pillar: Macroeconomic Environmenthird pillar: Macroeconomic Environmenthird pillar: Macroeconomic Environmenthird pillar: Macroeconomic Environment
Macroeconomic stability is crucial for overall competitiveness of a country. It drew the attention of the public most recently when some advanced economies (the US and some European countries), needed to take urgent action to prevent macroeconomic instability when their public debt reached unsustainable and caused the global financial crisis.
The The The The ffffourth pillaourth pillaourth pillaourth pillar: Health and Primary Educationr: Health and Primary Educationr: Health and Primary Educationr: Health and Primary Education
This pillar takes into account the quantity and quality of the basic education received by the population. Nowadays, health and primary education are crucial for a country’s competitiveness and productivity.
The The The The ffffifth pillarifth pillarifth pillarifth pillar: Higher Education and Training: Higher Education and Training: Higher Education and Training: Higher Education and Training
This pillar measures secondary and tertiary enrolment rates as well as the quality of education (evaluated by business leaders). This pillar is crucial for economies that want to move up the value chain beyond simple production processes and products.
The The The The ssssixthixthixthixth pillar: Good Market Efficiencypillar: Good Market Efficiencypillar: Good Market Efficiencypillar: Good Market Efficiency

Competitiveness of the Visegrad Countries – Paths for Competitiveness Growth 39393939
Economies having efficient goods markets can produce right mix of products and services which can be efficiently traded in the economy. Market efficiency depends on many factors e.g. demand conditions, government intervention.
The The The The sssseventh pillar: Laboeventh pillar: Laboeventh pillar: Laboeventh pillar: Labouuuur Market r Market r Market r Market EfficiencyEfficiencyEfficiencyEfficiency
The efficiency and flexibility of the labour market allocate workers to their most effective use in the economy. Labour markets must be therefore flexible to shift workers from one economic activity to another rapidly and at low cost as well as to allow for wage fluctuations without much social disruption.
The The The The eeeeight pillaight pillaight pillaight pillar: Financial Market Developmentr: Financial Market Developmentr: Financial Market Developmentr: Financial Market Development
An efficient financial sector allocates the resources to their most productive uses. It channels resources to those entrepreneurial or investment projects with the highest expected rates of return.
The The The The nnnninth inth inth inth pillar: Technological Readinesspillar: Technological Readinesspillar: Technological Readinesspillar: Technological Readiness
This pillar measures the agility with which an economy adopts existing technologies to enhance the productivity of its industries. Particular importance is attached to the capacity of industries to fully leverage information and communication technologies (ICTs) in daily activities and production processes.
The The The The ttttenth pillar: Market Sizeenth pillar: Market Sizeenth pillar: Market Sizeenth pillar: Market Size
The size of the market affects productivity since large markets allow firms to exploit economies of scale. The measure of market size includes both domestic and foreign markets WEF gives credit to export-driven economies and geographic areas (such as the European Union) that are divided into many countries but have a single common market.
The The The The eeeeleventh leventh leventh leventh pillar: Business sophisticationpillar: Business sophisticationpillar: Business sophisticationpillar: Business sophistication
This pillar concerns two elements: he quality of a country’s overall business networks and the quality of individual firms’ operations and strategies. These factors are particularly important for countries at an advanced stage of development.
The The The The ttttwelfth pillar: Innovationswelfth pillar: Innovationswelfth pillar: Innovationswelfth pillar: Innovations
This pillar focuses on technological innovations which can, in the long run, enhance standards of living.
Source: own study based on Global Competitiveness Report 2013-2014 (Schwab, 2013, pp. 4-8).
In recent years, the concept of international competitiveness has significantly expanded and now includes a growing number of determinants. Thus, it is becoming more widely understood and difficult to measure.. The effect of this broadening of the concept of international competitiveness is visible in the methodology developed by the WEF. According to the WEF, many determinants drive competitiveness of economies. The approach of the WEF towards competitiveness is based on the assumption that the level of productivity of an economy sets the level of its propensity. Moreover, productivity level is fundamental for growth rates of economies. Thus, “a more competitive economy is likely to grow faster over time” (Schwab, 2013, p. 4). Following this assumption, the WEF constructed the Growth Competitiveness Index (GCI) which includes a weighted average of many different

40404040 Nelly Daszkiewicz & Magdalena Olczyk
components. These components are grouped into 12 pillars of competitiveness and each of them measures a different aspect of competitiveness.
2222....3333.... MATERIAL AND METHODSMATERIAL AND METHODSMATERIAL AND METHODSMATERIAL AND METHODS
Our analysis is based on the above set of 12 competitiveness pillars (diagnostic variables) of the Global Competitiveness Report 2013-2014 (Schwab, 2013). We used data for 78 countries, ranked from the 1st to the 78th position in the WEF ranking. The set contains the most competitive countries in the world including four
Visegrad countries with the Slovak Republic on the 78th position. Two taxonomic methods are used to identify similarity in the competitiveness
level of the Visegrad Countries. Firstly, to group the analysed countries into relatively homogeneous groups cluster analysis is applied. This method allows for determination of the similarity of objects without establishing a hierarchy among them. Classification and separation of the object clusters is carried out by means of a distance matrix. To create this, Ward’s method is used. It is based on an analysis of variance to evaluate the distances between clusters, i.e. it attempts to minimize the sum of the squared distances of points from the cluster’s centroid. The error sum of squares and r2 values are computed using the following formulae:
ESS (error sum of squares)=∑ ∑ ∑ ����� − �̅���
��� , (1)
TSS (total sum of squares) = ∑ ∑ ∑ ����� − �̅��
��� , (2)
R Squared (r2) = TSS – ESS / TSS, (3)
where: ���� denotes the value for variable k in observation j belonging to cluster i,
�̅�� denotes the cluster mean for variable k, and �̅� denotes the mean for variable k.
Among very different distance (similarity) matrices, Euclidean distance is chosen, as it is the recommended distance measure for Ward’s method (Kaufman & Rousseeu, 1990; Everitt, Landau & Leese, 2001).
Secondly, to create the path of competitiveness growth for each Visegrad country an object map is used. To create this, two steps are needed. The first one requires building the above-discussed matrix of distances, indicating the metric distance of an object relative to the rest. The second is to rank all the objects (countries) in a ranking procedure. To create the ranking we calculate a synthetic variable for each country, which is the sum of 12 competitiveness pillars values. The value of 12 subindexes are unweighted opposite to the the WEF methodology. Based on this ranking of the 78 countries and on the distance matrix, an object maps for four Visegrad Countries are created. The list of 78 most competitive countries according to the Global Competitiveness Report 2012-2013 (Schwab, 2013) are

Competitiveness of the Visegrad Countries – Paths for Competitiveness Growth 41414141
presented in appendix. All the statistical analyses in this article are performed using the statistical software such as Statistica® v.11.0, SPSS® v.21.0 and R® v.3.1.0.
2222....4444.... COMPETITIVENESS OF TCOMPETITIVENESS OF TCOMPETITIVENESS OF TCOMPETITIVENESS OF THE V4 COUNTRIESHE V4 COUNTRIESHE V4 COUNTRIESHE V4 COUNTRIES ---- EMPIRICAL ANALYSISEMPIRICAL ANALYSISEMPIRICAL ANALYSISEMPIRICAL ANALYSIS
According to the Global Competitiveness Report 2013-2014 (Schwab, 2013), Poland is ranked 42nd, with a relatively stable performance across all 12 pillars of competitiveness. The strengths of Polish economy include its large market size (20th)2, high educational standards (18th) and well developed financial sector (38th). However, further enhancing competitiveness will require a significant upgrading of transport infrastructure and reduction of high burden of government regulations for business sector (133rd). To improve country’s competitiveness Poland should focus on developing capacities in R&D and business sophistication and Polish companies should be more oriented towards R&D and intensify their collaboration with universities.
The Czech Republic is ranked 46th by the Global Competitiveness Report 2013-2014 (Schwab, 2013) seven positions below as compared to the previous year. The main reason is the quality of the country’s public institutions, with public trust in politicians ranked an extremely low (146th). The macroeconomic environment has worsened slightly with rising deficits and debt (55th). However, Czech businesses are relatively sophisticated and innovative, supported by a strong uptake of new technologies. The country’s competitiveness further growth requires improvements of the educational system and greater flexibility of the labour market.
Hungary is ranked 63rd in the Global Competitiveness Report 2013-2014 (Schwab, 2013). The weaknesses of Hungarian economy include weak institutions, especially burden of government regulations (140th), low efficiency of legal framework (139th) and transparency of government policymaking (132nd). The macroeconomic environment is characterized by high government debt (125th) and inflation (102nd). However the strengths of Hungarian economy includes the quality of overall infrastructure (49th), especially quality of railroad infrastructure (41st) and higher education and training. What concerns innovativeness, Hungary is highly ranked in the areas of quality of scientific research institutions (21st), university-industry collaboration (41st) and PTC patents (28th).
Slovakia is a small country, ranked 78th by the Global Competitiveness Report 2013-2014 (Schwab, 2013). The weaknesses of the Slovak Republic include
2 The Report features 148 economies. It contains a detailed profile for each of the economies included in the study, as well as an extensive section of data tables with global rankings covering over 100 indicators.

42424242 Nelly Daszkiewicz & Magdalena Olczyk
institutions (119th), with the focus on the burden of government regulations (139th) and efficiency of legal framework (143rd). The macroeconomic environment is not stable enough with relatively high government deficit (118th) and debt (98th). Unfortunately, the innovation pillar situates the country at low positions, except PTC patents (39th). The strengths of the Slovak Republic emerge in the area of financial market development, especially soundness of banks (32nd) and access to loans (49th). Moreover, the technological readiness of the country is quite high, with an emphasis on FDI and technology transfer (26th). Figures 2.3-2.5 show the main pillars for Visegrad Countries.
FigureFigureFigureFigure 2.3. 2.3. 2.3. 2.3. Basic requirements (1st, 2nd, 3rd and 4th pillar of competitiveness) in Visegrad Countries according to the Global Competitiveness Report 2013-2014
Source: own study based on the Global Competitiveness Report 2013-2014 (Schwab, 2013).
Basing on strengths and weaknesses analysis of the Visegrad Countries we can infer a high diversity of competitiveness level of four analysed countries: both in terms of their position in the ranking and the base of competitiveness. However the authors decided to verify this argument, using the taxonomic methods and basing on the unweighted values of 12 pillars of competitiveness.
First, we created distance matrices, and based on it, we did the dendrogram. It shows how many clusters, i.e. homogeneous groups of countries, can be found among 78 analysed countries. The interpretation of the dendrogram, i.e. the identification of the number of clusters, depends on the bond distance chosen as the
0
1
2
3
4
5
6
7Institutions
Infrastructure
Macroeconomicenvironment
Health & primaryeducation
Poland Czech Republic Hungary Slovakia

Competitiveness of the Visegrad Countries – Paths for Competitiveness Growth 43434343
FigureFigureFigureFigure 2.4. 2.4. 2.4. 2.4. Efficiency enhancers (5th, 6th, 7th, 8th and 9th pillar of competitiveness) in Visegrad Countries according to the Global Competitiveness Report 2013-2014
Source: own study based on the Global Competitiveness Report 2013-2014 (Schwab, 2013).
FigureFigureFigureFigure 2.5. 2.5. 2.5. 2.5. Business sophistication and innovation (11th and 12th pillar of competitiveness) in Visegrad Countries according to the Global Competitiveness Report 2013-2014 Source: own study based on the Global Competitiveness Report 2013-2014 (Schwab, 2013).
0
2
4
6Higher education
Good market efficiency
Labour marketefficiency
Financial marketdevelopment
Technological readiness
Market size
Poland Czech Republic Hungary Slovakia
Business sophistication Innovation
Poland 4.1 3.2
Czech Republic 4.4 3.7
Hungary 3.7 3.5
Slovakia 4 3
0
1
2
3
4
5
44444444 Nelly Daszkiewicz & Magdalena Olczyk
point of interpretation. The rule proposed by Mojena, based on the relative size of the different levels of junctions, was chosen to determine the cut-off Milligan & Cooper (1985, p. 8). The constant in Mojena’s inequality has a value of 1.25, which is recommended by Milligan & Cooper (Milligan & Cooper 1985, p. 12).
According to the result of this inequality, a cut-off at the level of 3.72 gives a satisfactory division of the 78 countries into clusters. Using Ward’s method, six large homogenous groups of countries (clusters) can be distinguished (Figure 2.6).
The cluster analysis confirms the hypothesis that the group of 78 most competitive countries is a highly differentiated area in terms of their competitiveness level. However we cannot say the same about the Visegrad Countries. Hungary and the Czech Republic are very similar in terms of unweighed values of 12 pillars of competitiveness and together with Croatia, Lithuania, Slovenia and Costa Rica form one small cluster. Despite the fact that Poland and Slovenia belong to others clusters, we can still maintain the hypothesis of a relatively small heterogeneity in the fundaments of the competitiveness in the Visegrad group. If we choose the 7th bond distance as the point of interpretation, all Visegrad Countries will belong to the same large cluster.
Hence the question, what should Visegrad Group countries do to improve their position in the ranking? Should they follow the same strategy? The best path for increasing the competitiveness of each economy is to focus on the solutions used in countries which are higher in the ranking. However, for example, Poland, which is ranked 42nd the WEF ranking, does not have to catch up with all the countries ahead of it.
The proposal here is to build an easily affordable strategy to improve each country's position in the rankings by adopting the pattern of a country which has a better position in the competitiveness ranking but at the same time is also the most similar. Relying on the experiences of this country, which is more competitive but at the same time very similar, ensures easy implementation of the selected solutions. This approach only allows an indication of a particular economy from which a selected economy should draw patterns. The method does not, however, explain why two countries similar to one another should occupy different positions in the competitiveness ranking.
A tool, which allows to analyse each country's position in the ranking and allows to find a better and most similar object (country), is a map of the objects. The map is a polar diagram, where each point on the map is defined by two values. The first value is the value of the synthetic variable (a measure of angle), with the worst countries on the left and the best objects in the ranking on the right. The second value is the distance matrix for each selected country compared to other countries (this distance is represented by semi-circles). The analysed country is always at the bottom of the map, and the bold radius indicates its position in the ranking.

Competitiveness of the Visegrad Countries – Paths for Competitiveness Growth 45454545
FigureFigureFigureFigure 2222....6666. . . . Dendrogram for 78 most competitiveness countries in 2013-2014 Source: own study based on the Global Competitiveness Report 2013-2014 (Schwab, 2013).

46464646 Nelly Daszkiewicz & Magdalena Olczyk
To identify the path of competitiveness growth, we need to pay attention to all the countries on the map lying to the right of the designated radius and at the same time closest to it.
The path of competitiveness growth for the Polish economy is illustrated in Figure 2.7. Analysis of this figure shows that to increase the competitiveness of Polish economy, we should try to implement competitiveness growth instruments from China, Chile, Oman, Brunei, South Africa and we should base on Maltese and Estonian experiences too.
FigureFigureFigureFigure 2222....7777. . . . The competitiveness path for growth of Poland Source: own study based on the Global Competitiveness Report 2013-2014 (Schwab, 2013).
FigureFigureFigureFigure 2222....8888.... The competitiveness path for growth of the Czech Republic Source: own study based on the Global Competitiveness Report 2013-2014 (Schwab, 2013).
The Czech Republic (see Figure 2.8) should mainly follow the same path as Poland and try to use Polish experiences too. So Poland and the Czech Republic
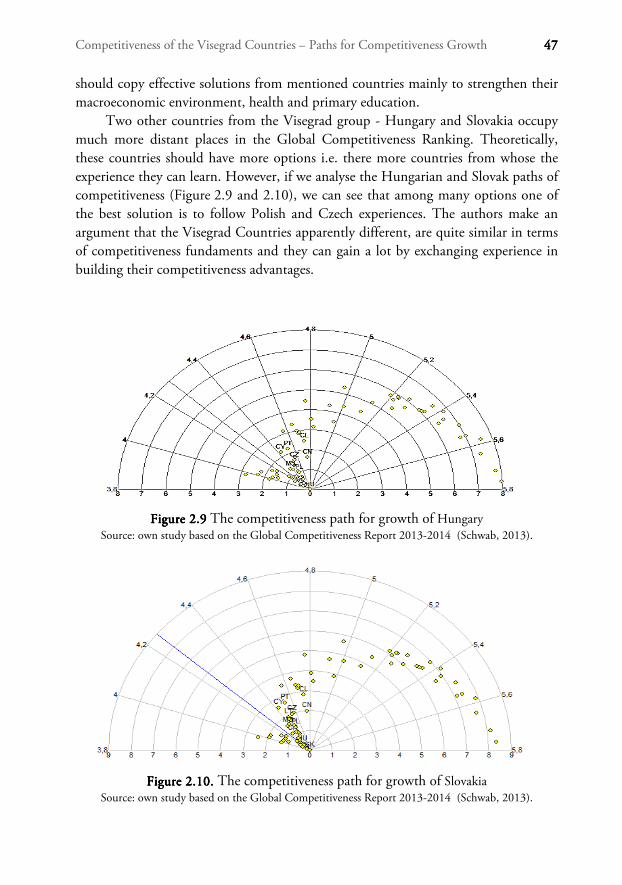
Competitiveness of the Visegrad Countries – Paths for Competitiveness Growth 47474747
should copy effective solutions from mentioned countries mainly to strengthen their macroeconomic environment, health and primary education.
Two other countries from the Visegrad group - Hungary and Slovakia occupy much more distant places in the Global Competitiveness Ranking. Theoretically, these countries should have more options i.e. there more countries from whose the experience they can learn. However, if we analyse the Hungarian and Slovak paths of competitiveness (Figure 2.9 and 2.10), we can see that among many options one of the best solution is to follow Polish and Czech experiences. The authors make an argument that the Visegrad Countries apparently different, are quite similar in terms of competitiveness fundaments and they can gain a lot by exchanging experience in building their competitiveness advantages.
FigureFigureFigureFigure 2222....9999 The competitiveness path for growth of Hungary Source: own study based on the Global Competitiveness Report 2013-2014 (Schwab, 2013).
FigureFigureFigureFigure 2222....10101010.... The competitiveness path for growth of Slovakia Source: own study based on the Global Competitiveness Report 2013-2014 (Schwab, 2013).

48484848 Nelly Daszkiewicz & Magdalena Olczyk
2222....5555.... CONCLUSIONSCONCLUSIONSCONCLUSIONSCONCLUSIONS
Understanding the factors influencing competitiveness has been the research object for hundreds years. Currently the concept of international competitiveness has significantly expanded and includes a large number of determinants. Nowadays, the most popular method to evaluate the changes in a country competitiveness is the analysis of the shifts in country ranking, based on the Global Competitiveness Index. But the study of the WEF reports doesn't provide information, how to improve the competitiveness of an economy.
The authors propose, based on the values of 12 pillars of competitiveness from the Global Competitiveness Report 2013-2014 (Schwab, 2013) and two taxonomic methods to build an easy affordable strategy to improve each country's position in the rankings by adopting the pattern of a country which has a better position in the competitiveness ranking but at the same time is also the most similar. Relying on the experiences of this country, which is more competitive but at the same time very similar, ensures easy implementation of the selected solutions. This approach only allows an indication of the countries from which a selected economy should draw patterns
The carried out cluster analysis for 78 most competitive economies and based on unweighted values of 12 competitiveness pillars indicates that the Visegrad Group is an area with a relatively small differentiation in terms of competitiveness fundaments. The analysis shows that the strategy to increase competitiveness should not be significantly different for each Visegrad country. The analysis allows us to formulate a conclusion that in order to increase its international competitiveness each Visegrad country should follow the pattern of the country which stands above it (in terms of competitiveness ranking), but at the same time is the most similar. Thus, for Slovakia, Hungary or the Czech Republic following Polish experiences could be the best solution.
REFERENCESREFERENCESREFERENCESREFERENCES
Cho, D.S. (1994). A dynamic approach to international competitiveness: the case of Korea. Journal of Far Eastern Business, 1 (1), pp. 17–36.
Cho, D.S., & Moon, H.C. (2000). From Adam Smith to Michael Porter. Singapore: World Scientific.
Cho, D.S., & Moon, H.C., & Kim, M.J. (2008). Characterizing international competitiveness in international business research: A MASI approach to national competitiveness, Research in International Business and Finance, 22, pp. 175–192.
Daszkiewicz, N. (ed) (2008). Konkurencyjność: poziom makro, mezo, mikro. Warszwa: Wydawnictwo Naukowe PWN.

Competitiveness of the Visegrad Countries – Paths for Competitiveness Growth 49494949
Daszkiewicz, N. & Olczyk, M. (2008). Konkurencyjność podmiotów – ujęcie teoretyczne (chapter 1), In: N. Daszkiewicz (ed.), Konkurencyjność: poziom makro, mezo, mikro. Warszawa: Wydawnictwo Naukowe PWN.
Daszkiewicz, N. & Wach K. (2013). Małe i średnie przedsiębiorstwa na rynkach
międzynarodowych, Kraków: Wydawnictwo Uniwersytetu Ekonomicznego w Krakowie.
Dunning, J.H. (1993). Internationalizing Porter’s Diamond, Management International
Review, 33, pp. 7-15, special issue “Extensions of the Porter Diamond Framework”.
Everitt, B. S., & Landau, S., & Leese, M. (2001). Cluster Analysis. London: Edward Arnold.
Kaufman, L., & Rousseeuw, P. J. (1990). Finding Groups in Data. New York: John Wiley & Sons.
Krugman, P.R. (1990). Rethinking International Trade. Cambridge, MA: MIT Press.
Krugman, P.R. (1992). Does the new trade theory require a new trade policy?, World
Economy, 5(4), pp. 423-442.
Krugman, P.R. & Obstfeld, M. (2003). International Economics: Theory and Policy, 4th edition. New York: HarperCollins.
Milligan G., & Cooper M. (1985). An Examination of Procedures for Determining the Number of Clusters in a Data Set. Psychometrika, 50.
Molendowski, E. & Żmuda, M. (2013). Changes In Competitiveness Among The Visegrad Countries After Accession To The European Union: A Comparative Analysis Based On A Generalized Double Diamond Model, Comparative Economic Research, 16(4), pp. 121-153.
OECD, (1992). Programme on Technology and the Economy. Paris.
Olczyk, M. (2008). Konkurencyjność. Teoria i praktyka, Warszawa: CeDeWu Wydawnictwa Fachowe.
Porter, M.E. (1990). The Competitive Advantage of Nations. New York, NY: Free Press, MacMillan.
Porter, M.E. (1998). Clusters and the new economics of competition. Harvard Business
Review, 76(6), pp. 77–90.
Porter, M.E. (2000). Location, competition, and economic development: local clusters in a global economy. Economic Development Quarterly, 14(1), pp. 15–35.
Porter, M.E. (2003). The economic performance of regions. Regional Studies, 37, pp. 549–578.
Schwab, K. (ed.) (2013). The Global Competitiveness Report 2013-2014: Full Data Edition. Geneva: World Economic Forum.
Smit, A.J. (2007). The competitive advantage of nations: is Porter’s Diamond Framework a new theory that explains the international competitiveness of countries?, Sothern
Africa Business Review, 14(1), pp. 105-130.
Wysokińska, Z. (2001). Konkurencyjność w międzynarodowym i globalnym handlu
technologiami. Warszawa-Łódź: PWN.

50505050 Nelly Daszkiewicz & Magdalena Olczyk
AppendixAppendixAppendixAppendix:::: 78 most competitive countries according to the Global Competitiveness Report 2013-2014.
Cod
eC
ode
Cod
eC
ode
CountryCountryCountryCountry 12 of competitiveness pillars12 of competitiveness pillars12 of competitiveness pillars12 of competitiveness pillars
IIII IIIIIIII IIIIIIIIIIII IVIVIVIV VVVV VIVIVIVI VIIVIIVIIVII VIIIVIIIVIIIVIII IXIXIXIX XXXX XIXIXIXI XIIXIIXIIXII
AU Australia 5.04 5.60 5.75 6.36 5.1 4.72 4.45 5.41 5.82 5.15 4.66 4.45
AT Austria 5.07 5.72 5.37 6.37 5.57 4.88 4.56 4.56 5.59 4.63 5.46 4.82
AZ Azerbaijan 4.06 4.06 6.42 5.07 4.00 4.27 4.72 3.80 4.17 3.60 3.97 3.45
BH Bahrain 4.77 5.18 5.90 6.00 4.52 4.96 4.87 4.75 4.95 2.93 4.25 3.17
BB Barbados 4.80 5.52 3.89 6.36 5.29 4.25 4.79 4.71 5.26 2.06 4.30 3.51
BE Belgium 5.00 5.60 4.71 6.72 5.83 5.08 4.34 4.48 5.61 4.82 5.27 4.87
BW Botswana 4.67 3.43 5.76 4.55 3.56 4.10 4.51 4.34 3.11 3.03 3.61 2.99
BR Brazil 3.73 4.02 4.63 5.43 4.22 3.82 4.13 4.40 4.14 5.65 4.42 3.42
BN Brunei Darussalam 4.96 4.29 7.00 6.33 4.52 4.52 5.06 4.29 3.75 2.42 4.23 3.38
BG Bulgaria 3.38 3.93 5.61 6.00 4.25 4.19 4.36 3.95 4.45 3.87 3.59 2.97
CA Canada 5.38 5.80 5.08 6.55 5.46 5.00 5.26 5.21 5.58 5.49 4.80 4.47
CL Chile 4.88 4.54 6.02 5.68 4.87 4.64 4.53 4.83 4.48 4.49 4.25 3.60
CN China 4.24 4.51 6.29 6.06 4.23 4.32 4.63 4.32 3.44 6.85 4.31 3.89
CO Colombia 3.35 3.50 5.59 5.32 4.33 4.01 4.16 4.08 3.39 4.70 4.06 316
CR Costa Rica 4.20 3.92 4.56 5.81 5.01 4.30 4.48 3.75 4.16 3.41 4.54 3.74
HR Croatia 3.60 4.66 4.71 5.80 4.53 3.92 3.94 3.90 4.41 3.59 3.81 3.12
CY Cyprus 4.47 4.63 3.73 6.54 5.01 4.74 4.62 4.07 4.78 2.83 4.34 3.41
CZ Czech Republic 3.64 4.71 5.01 5.84 4.85 4.41 4.20 4.20 4.88 4.50 4.43 3.70
DK Denmark 5.21 5.53 5.28 6.17 5.54 4.87 5.03 4.57 6.05 4.24 5.29 4.99
EC Ecuador 3.61 3.81 5.24 5.91 4.22 3.97 3.96 3.78 3.49 4.01 3.97 3.40
EE Estonia 4.90 4.70 5.89 6.22 5.22 4.73 5.03 4.59 5.20 3.06 4.26 3.89
FIN Finland 6.10 5.55 5.42 6.82 6.27 5.03 4.85 5.57 5.89 4.20 5.51 5.79
FR France 4.79 6.21 4.65 6.33 5.21 4.43 4.31 4.61 5.69 5.76 5.00 4.68
GE Georgia 4.00 4.31 4.91 5.75 3.79 4.29 4.59 3.91 3.83 2.96 3.47 2.68
DE Germany 5.30 6.24 5.68 6.36 5.90 4.92 4.57 4.69 5.72 6.02 5.68 5.50
HK Hong Kong SAR 5.61 6.74 6.09 6.18 5.24 5.57 5.74 6.02 6.03 4.84 5.22 4.44
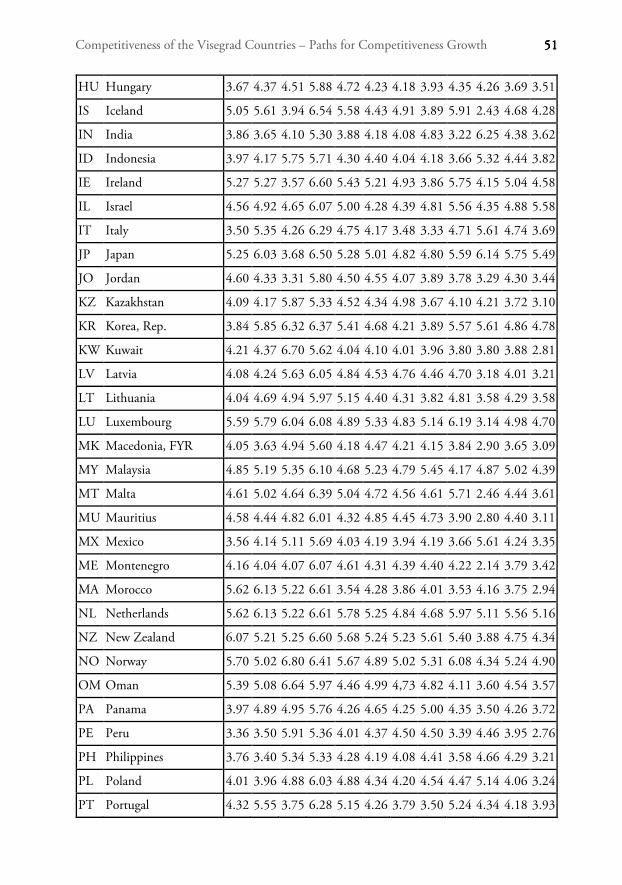
Competitiveness of the Visegrad Countries – Paths for Competitiveness Growth 51515151
HU Hungary 3.67 4.37 4.51 5.88 4.72 4.23 4.18 3.93 4.35 4.26 3.69 3.51
IS Iceland 5.05 5.61 3.94 6.54 5.58 4.43 4.91 3.89 5.91 2.43 4.68 4.28
IN India 3.86 3.65 4.10 5.30 3.88 4.18 4.08 4.83 3.22 6.25 4.38 3.62
ID Indonesia 3.97 4.17 5.75 5.71 4.30 4.40 4.04 4.18 3.66 5.32 4.44 3.82
IE Ireland 5.27 5.27 3.57 6.60 5.43 5.21 4.93 3.86 5.75 4.15 5.04 4.58
IL Israel 4.56 4.92 4.65 6.07 5.00 4.28 4.39 4.81 5.56 4.35 4.88 5.58
IT Italy 3.50 5.35 4.26 6.29 4.75 4.17 3.48 3.33 4.71 5.61 4.74 3.69
JP Japan 5.25 6.03 3.68 6.50 5.28 5.01 4.82 4.80 5.59 6.14 5.75 5.49
JO Jordan 4.60 4.33 3.31 5.80 4.50 4.55 4.07 3.89 3.78 3.29 4.30 3.44
KZ Kazakhstan 4.09 4.17 5.87 5.33 4.52 4.34 4.98 3.67 4.10 4.21 3.72 3.10
KR Korea, Rep. 3.84 5.85 6.32 6.37 5.41 4.68 4.21 3.89 5.57 5.61 4.86 4.78
KW Kuwait 4.21 4.37 6.70 5.62 4.04 4.10 4.01 3.96 3.80 3.80 3.88 2.81
LV Latvia 4.08 4.24 5.63 6.05 4.84 4.53 4.76 4.46 4.70 3.18 4.01 3.21
LT Lithuania 4.04 4.69 4.94 5.97 5.15 4.40 4.31 3.82 4.81 3.58 4.29 3.58
LU Luxembourg 5.59 5.79 6.04 6.08 4.89 5.33 4.83 5.14 6.19 3.14 4.98 4.70
MK Macedonia, FYR 4.05 3.63 4.94 5.60 4.18 4.47 4.21 4.15 3.84 2.90 3.65 3.09
MY Malaysia 4.85 5.19 5.35 6.10 4.68 5.23 4.79 5.45 4.17 4.87 5.02 4.39
MT Malta 4.61 5.02 4.64 6.39 5.04 4.72 4.56 4.61 5.71 2.46 4.44 3.61
MU Mauritius 4.58 4.44 4.82 6.01 4.32 4.85 4.45 4.73 3.90 2.80 4.40 3.11
MX Mexico 3.56 4.14 5.11 5.69 4.03 4.19 3.94 4.19 3.66 5.61 4.24 3.35
ME Montenegro 4.16 4.04 4.07 6.07 4.61 4.31 4.39 4.40 4.22 2.14 3.79 3.42
MA Morocco 5.62 6.13 5.22 6.61 3.54 4.28 3.86 4.01 3.53 4.16 3.75 2.94
NL Netherlands 5.62 6.13 5.22 6.61 5.78 5.25 4.84 4.68 5.97 5.11 5.56 5.16
NZ New Zealand 6.07 5.21 5.25 6.60 5.68 5.24 5.23 5.61 5.40 3.88 4.75 4.34
NO Norway 5.70 5.02 6.80 6.41 5.67 4.89 5.02 5.31 6.08 4.34 5.24 4.90
OM Oman 5.39 5.08 6.64 5.97 4.46 4.99 4,73 4.82 4.11 3.60 4.54 3.57
PA Panama 3.97 4.89 4.95 5.76 4.26 4.65 4.25 5.00 4.35 3.50 4.26 3.72
PE Peru 3.36 3.50 5.91 5.36 4.01 4.37 4.50 4.50 3.39 4.46 3.95 2.76
PH Philippines 3.76 3.40 5.34 5.33 4.28 4.19 4.08 4.41 3.58 4.66 4.29 3.21
PL Poland 4.01 3.96 4.88 6.03 4.88 4.34 4.20 4.54 4.47 5.14 4.06 3.24
PT Portugal 4.32 5.55 3.75 6.28 5.15 4.26 3.79 3.50 5.24 4.34 4.18 3.93

52525252 Nelly Daszkiewicz & Magdalena Olczyk
PRI Puerto Rico 4.70 4.17 5.12 5.28 5.09 4.83 4.59 4.86 4.60 3.49 5.03 4.39
QA Qatar 5.95 5.20 6.58 6.32 5.11 5.49 5.29 5.19 5.10 3.96 5.36 4.80
RO Romania 3.34 3.33 5.14 5.47 4.41 3.89 3.96 3.95 4.14 4.44 3.62 3.01
RU Russian Federation 3.28 4.61 5.93 5.71 4.66 3.80 4.31 3.39 3.97 5.78 3.56 3.13
RW Rwanda 5.20 3.20 4.41 5.37 3.00 4.52 5.06 4.23 3.10 2.46 3.86 3.44
SA Saudi Arabia 5.13 5.18 6.69 5.92 4.65 4.79 4.31 4.71 4.60 5.07 4.74 3.93
SG Singapore 6.04 6.41 6.01 6.72 5.91 5.59 5.77 5.82 6.01 4.66 5.08 5.19
SK Slovakia 3.32 4.12 4.91 6.07 4.44 4.24 4.24 4.49 4.16 4.03 3.95 3.02
SI Slovenia 3.94 4.91 5.03 6.38 5.21 4.32 4.00 2.98 4.90 3.46 4.14 3.63
ZA South Africa 4.53 4.13 4.39 3.89 3.94 4.75 3.93 5.80 3.92 4.89 4.49 3.64
ES Spain 4.07 5.97 3.97 6.21 5.19 4.32 3.93 3.72 5.26 5.45 4.52 3.75
LK Sri Lanka 4.09 4.00 3.90 5.94 4.31 4.63 3.53 4.49 3.30 3.90 4.51 3.49
SE Sweden 5.72 5.60 6.05 6.45 5.69 5.10 4.88 5.32 6.22 4.64 5.48 5.43
CH Switzerland 5.63 6.20 6.29 6.48 5.88 5.26 5.76 5.23 5.93 4.56 5.75 5.70
TW Taiwan, China 4.95 5.77 5.60 6.49 5.65 5.26 4.67 4.95 5.19 5.24 5.20 5.25
TH Thailand 3.79 4.53 5.61 5.52 4.29 4.67 4.35 4.61 3.56 5.10 4.42 3.24
TR Turkey 4.08 4.45 4.62 5.86 4.29 4.52 3.74 4.40 4.05 5.30 4.36 3.47
AE United Arab Emirates 5.55 6.20 6.42 5.97 4.93 5.39 5.20 4.79 5.22 4.44 5.13 4.22
UK United Kingdom 5.43 6.12 3.98 6.39 5.45 5.05 5.35 5.00 6.06 5.80 5.40 4.90
US United States 4.64 577 3.95 6.10 5.75 4.93 5.37 5.26 5.72 6.94 5.49 5.37
VN Vietnam 3.54 3.69 4.44 5.78 3.69 4.25 4.40 3.76 3.14 4.64 3.68 3.14

S u g g e s t e d C i t a t i o n :S u g g e s t e d C i t a t i o n :S u g g e s t e d C i t a t i o n :S u g g e s t e d C i t a t i o n :
Bartha, Z. & Gubik, S. A. Bartha, Z. & Gubik, S. A. Bartha, Z. & Gubik, S. A. Bartha, Z. & Gubik, S. A. (2014). The Outward Focused Development Path in the Visegrad Countries
(chapter 3). In: KiendlKiendlKiendlKiendl----Wendner, D. Wendner, D. Wendner, D. Wendner, D. & Wach, K.Wach, K.Wach, K.Wach, K. (eds), International Competitiveness in Visegrad Countries: Macro and Micro Perspectives. Graz: Fachhochschule Joanneum,
pp. 53-76. 3333
The Outward Focused Development PathThe Outward Focused Development PathThe Outward Focused Development PathThe Outward Focused Development Path
in the Visegrad Countriesin the Visegrad Countriesin the Visegrad Countriesin the Visegrad Countries
Zoltán Bartha & Andrea S. GubikZoltán Bartha & Andrea S. GubikZoltán Bartha & Andrea S. GubikZoltán Bartha & Andrea S. Gubik
University of Miskolc
Faculty of Economics
3515 Miskolc-Egyetemváros
Miskolc, Hungary
e-mail: [email protected]
Summary:Summary:Summary:Summary:
The aim of this chapter is to describe how the macroeconomic development path taken by the
Visegrad countries affects the internationalisation process of their domestic companies. The
macroeconomic development paths are derived with the FOI model (focusing on the future, outside
and inside potentials of the developed economies). The FOI-indices are calculated for all 34 OECD
members, and then a factor and cluster analysis is conducted, with the help of which it is identified
that the Visegrad countries have all chosen an outward focused development path. This development
path involves the heavy reliance on outside resources, and forces the domestic firms to face tough
international competition even in local markets. The outward focus of a country’s development
strategy therefore should help local enterprises in becoming more competitive. Yet, this strategy
usually result in a dual structure, where a good portion of the local businesses are characterised with
a low level of competitiveness, and have very little chance of going international.
KeywordsKeywordsKeywordsKeywords: development factors, FOI model, Visegrad countries
JEL classificationJEL classificationJEL classificationJEL classification: O11, O43, O57
3333.1..1..1..1. INTRINTRINTRINTROOOODUCTORY REMARKSDUCTORY REMARKSDUCTORY REMARKSDUCTORY REMARKS
The transition period of the 1990s has brought a difficult economic policy dilemma
for the Visegrad countries, as they had to choose a new development path for their
economies. Some elements of the transition were obvious (liberalisation of markets,
deregulation etc.), but in many respects these countries could have had the option

54545454 Zoltán Bartha & Andrea S. Gubik
to take their own path toward the market economy and development. As there are
clear trade-offs among key development factors (e.g. low wages offer short term
competitiveness edges in global markets, but they limit the possibility of consumers
to invest in goods and services that help in creating value over the long run), the
Visegrad countries had to make important long term commitments.
It was established based on an FOI model analysis that there are indeed several
distinctive development paths even among the most developed economies (namely
the OECD countries). Interestingly enough all four Visegrad countries have taken
the same route, namely a development model that we call the outward focused
development path. Although there are significant differences among them, some
common keys characteristics distinguish the Visegrad countries (and some other
OECD members) from the other groups of developed countries. These common
characteristics include the extreme openness of their economies, the excessive reliance
of outside resources (capital and technology), policies that favour foreign direct
investors, a dual economic and social structure. The outward focus affects local
corporations as much as foreign ones. Due to the openness of their economies, local
corporations have to face fierce international competition even in domestic markets.
This feature is directly linked to the internationalisation process of local corporations,
as the high level of openness means that from a competitiveness point of view many
local firms face similar challenges in both domestic and international markets.
This chapter contains four major parts. The theoretical and methodological
background of the FOI model is presented first, then the FOI-indices are calculated
for the Visegrad countries. Based on a factor and a cluster analysis the typical
development paths within the OECD are presented as a third step. Finally the main
characteristics and policy implications of the outward focused development path are
discussed in detail.
3333....2222.... LITERATURE REVIEWLITERATURE REVIEWLITERATURE REVIEWLITERATURE REVIEW
Growth and development are mentioned almost as synonyms in this paper, although
the literature usually addresses them separately. The simplest approach is to say that
growth is the narrower, and development is the more complex class, as growth is
usually defined as an increase in certain quantitative variables, while development
describes a process of moving from a lower level of quality to a higher one (Szentes,
2011). As the measurement of the phenomena economics usually deals with is
problematic anyway, the most popular, formalised growth models (e.g. Domar,
1947, Harrod, 1948, Solow, 1956, Romer, 1986, Lucas, 1988) concentrate on the
national income or on its per capita version. These models therefore map the
problem of growth/development through the quantitative change of a single

The Outward Focused Development Path in the Visegrad Countries 55555555
indicator, so they offer tools to analyse the problem of growth, the narrower
category.
The GDP however – being an aggregate indicator – veils more profound
processes that are crucial for development, such as the structure of the economic
system, changes in employment, income distribution or the institutional framework,
etc. For this reason, from now on, we will use the more complex approach to
development whenever we touch upon issues of growth and/or development paths,
factors of growth and/or development, meaning that we interpret development as
a combination of two things: growth in the indicators of national income, and the
modernising of the socioeconomic structures.
Theories of DevelopmentTheories of DevelopmentTheories of DevelopmentTheories of Development
The different schools of economics have had different views on the rules of the
economy, and they do not agree on the basic assumptions either; hence, a wide
variety of theories have been developed over the centuries. While most schools
implicitly assume that the models used are universal, List (1841) was convinced that
the classical theories may only apply to the most developed economies; the followers
of new institutionalism (for example see Williamson, 2000) point out that the
institutional structure of different countries can be very different. A similar
confrontation can be observed regarding the development paths. It is widely accepted
that development is unilinear, meaning that all countries have to go through the
same development stages (with timing being the only difference among them).
Veblen (1919) on the other hand argued against the teleological approach
of economics, and suggested an evolutionary one instead.
It worth mentioning that mainstream theories do not consider the effects of
national interests and bargaining power in their models; heterodox schools on the
other hand cannot accept the independent development of countries (although there
is no agreement among them considering the exact nature of the interdependencies).
It may seem natural to choose the countries and national economies as the unit of
analysis; Wallerstein (1974), however, when describing the economic history
of medieval Europe, concludes that modernisation cannot be understood within
the national economy framework. He chooses the world system as the unit of
analysis instead.
Some scholars have developed models with few explanatory factors; others have
gone for more variables. The well-known growth theories pick one or two variables;
Porter’s diamond model (1990) combines four quite complex factors; the empirical
study of Barro (1998) of 100 countries spanning over 30 years finds seven factors
that are strongly connected to the growth rate of the real GDP.
56565656 Zoltán Bartha & Andrea S. Gubik
The factors of development identified in the economics literature can be
categorised along many principles, but the location of factors is probably the most
important division line. One camp of economists traces back differences in economic
development to reasons that can be found inside the country. They point to factors
whose presence (e.g. physical or human capital) or lack (e.g. government failures)
enables high growth rates. Another group of economists finds the causes of
underdevelopment in outside factors. Usually these theories take the differences in
the development level as given in the world economy, and they assume that these
differences lead to asymmetric dependencies. The asymmetric dependencies on the
other hand make it very difficult for underdeveloped countries to catch up with the
rich world. The inside-outside distinction among the factors of development plays
a crucial role in the model developed during our research.
The Inside Factors of DevelopmentThe Inside Factors of DevelopmentThe Inside Factors of DevelopmentThe Inside Factors of Development
Adam Smith (1776) saw the division of labour as the main source of wealth. The
countries that are able to extend the division of labour among their firms and citizens
can become wealthier, as they are able to produce a higher quantity with the same
labour input. The main finding of the Harrod–Domar model (1947, 1948) is that
investments are the key to economic growth. Investments on the other hand are
mainly dependent on the savings rate. Around a decade later Solow (1956) pointed
out that investments and savings cannot contribute to growth in the long run. In his
view, long-term economic growth is driven by technical change.
Keynes (1936) suggested crises are generated by limits in demand, and the latter
may be strengthened by large income differences. The speculative demand for money
of those who are well off can be especially high, which prevents a substantial part of
the income from turning into effective market demand. Inequalities in income
distribution thus can be a setback for balanced growth.
Schumpeter (1934) stressed that cyclical fluctuations should be regarded as
a natural part of the economy, as entrepreneurs may only draw profits if they break
the status quo of equilibrium. The way to break the status quo is through innovation,
which therefore becomes the primary driver of the cyclical development. McClelland
(1957) also emphasised the importance of the entrepreneurial class. In his view
entrepreneurs are the pioneers of development, and their biggest motivator is not
profit, but the achievement of some special goals (N-achievement).
When the big colonial empires collapsed, several academics explained the
situation of the underdeveloped former colonies with a value system and social
structure that was different from the Western one. In underdeveloped countries the
rural characteristics of the society are dominant, meaning that labour is inefficient,
immobile, the social structure is rigid, and the general attitude rejects individualism

The Outward Focused Development Path in the Visegrad Countries 57575757
and risk taking (Meier, 1964). When local values confront the Western values, the
society is split into two groups, and a dual social structure is formed (Boeke, 1953),
which is completed with a dual economic structure as well (where the traditional and
modern sectors are insulated from each other).
The role of human capital in growth and development is highlighted in various
forms in the literature. Szentes (2011) quotes from A. Marshall: from a national
perspective the capital invested in workers’ children is just as productive as capital
invested in horses or machinery. Newer theories unquestionably suggest that capital
invested in children is far more productive than that invested in horses and
machinery. Endogenous growth theories see increasing returns as a prime source
of long- term growth, and they directly or indirectly explain increasing returns with
human capital. Lucas (1988) treats human capital as a reproducible one, an element
of capital that the society is able to broaden at a constant rate. The expansion of
human capital, on the other hand, leads to a constant increase in the productivity of
the physical capital. Romer (1986) also can be connected to human capital. In his
model, investments made in research and development produce positive externalities
that enable a constant increase in the productivity of physical capital.
Veblen (1919) points out that human behaviour is deeply affected by
institutionalised rules of society. His views were taken over by new institutional
economists (e.g. North, 1993; Williamson, 1998). According to them institutions
affect the incentive system of an economy, while the incentive system on the other
hand influences the behaviour, size and competition of firms, the level of investments
and technological development, and so, ultimately the level of development of an
economy. Underdevelopment thus is explained by institutional frameworks
consisting of bad incentives, according to the new institutional school.
Partially connected to the institutional approach is the theory of government
failures, which was mainly brought into the attention of development experts by
Tullock (1993). It was back in the 1960s when Tullock suggested (1967) that the
super profit that monopolistic structures offer can be an incentive for firms to lobby
for government regulations granting monopolistic positions and monopoly profits.
According to calculations made by Krueger (1974), the rent seeking behaviour of
firms in the field of import licences caused a 7.3% GDP loss in India, and a 15%
GDP loss In Turkey in 1964. The more corrupt a country is, the weaker the state is,
the heavier the costs of rent seeking are, and so rent seeking can be one of the major
obstacles of economic development.
Porter’s (1990) national competitiveness theory adds some highly complex
factors to the literature of economic development. A somewhat similar idea is
suggested by Freeman (1987), who developed the theory of national innovation
systems. These systems are centred around cooperation among businesses, the
education system and the research infrastructure.

58585858 Zoltán Bartha & Andrea S. Gubik
The Outside Factors of DevelopmentThe Outside Factors of DevelopmentThe Outside Factors of DevelopmentThe Outside Factors of Development
The theory of comparative advantage developed by Ricardo (1817) had become one
of the cornerstones of the laissez-faire approach of international relations. According
to Ricardo the highest welfare level can only be ensured if trade is conducted along
the lines of comparative advantages, and there is a free flow of goods. This free trade
principle was questioned by many. List (1841) argued against laissez-faire. He defended protectionism, and suggested protective tariffs for newly established
industries (the infant industry argument). His suggestions echoed those of Alexander
Hamilton (1791) made in the newly formed USA.
After the Second World War the focus of development economics shifted
towards the power relations of different countries. Prebisch (1964) and Myrdal
(1957) point out that underdeveloped states are dependent on richer countries, and
so the current system of international division of labour is not based on comparative
advantages. The internal economic structures of most of the developing countries are
directly influenced by the developed ones through the colonial system (Myrdal:
forced bilateralism). Balogh (1963) argues that as a result of power inequalities
among parties, the economic structure of the developing countries has to be adjusted
time after time to the changes generated by technical progress made in the developed
economies, and the adjustment process prevents them from achieving long-term
growth. The dependency relations lead to one-track specialisation (Singer 1964). The
majority of exports of the developing countries are primary products and
commodities, which leads to a decrease in the terms of trade over the long run.
Bhagwati in his 1958 paper titled “Immiserizing growth” showed that the decrease in
terms of trade can result in a decrease in the national income even if there is dynamic
growth in the production of the export sector. One lesson learned from the literature
of interdependencies is that a diversified export structure can be an important
development factor.
Emmanuel (1972) has gone as far as claiming that trade between developing
and developed countries is an unequal exchange, which is a manifestation of the
imperialism of trade. Unequal exchange was triggered by wage differences, and
is sustained by the immobility of labour. Wallerstein (1974) also accepted the
concept of unequal exchange, though he argued that it is a result of the different
bargaining power of nations. The core-periphery relations and the geographical
position basically predestine the fate of nations, according to Wallerstein.
As the role played by transnational companies in the international flow of goods
and capital became more and more dominant, a great deal of attention was directed
towards them. Furtado (1970) suggested that the most important development factor
is not the interdependencies among countries any more, but the investment strategies
of transnational companies. Transnational companies can bring capital to a country,

The Outward Focused Development Path in the Visegrad Countries 59595959
creating jobs, but the newly formed subsidiaries may be isolated from the local
economy (Singer, 1964). The ability of a country to attract foreign capital, especially
if the capital is invested in fields that can fit in well to the current economic structure
of the economy, is another important development factor.
TableTableTableTable 3333.1..1..1..1. Inside and outside development factors
Inside factors Outside factors
Division of labour (Smith) Free trade – international division of labour
(Ricardo)
Savings rate (Harrod-Domar)
Abundance-scarcity of capital
Protectionism
Defence of infant industries (List)
Equal-unequal income distribution
(Keynes)
Equal or unequal trade partners (Balogh)
Pressure to fit to modern patterns (Balogh)
Drive to innovate (Schumpeter) Unilateral dependency - diversification
(Myrdal)
Entrepreneurial behaviour (McClelland) One-sided specialisation (Singer)
Rigid-flexible social structure (Meier)
Imported or organically developed social
structures (Boeke)
Immiserising growth – terms of trade
(Bhagwati)
Forced bilateralism (Myrdal)
Dual-homogeneous economic structures
(Meier)
International wage division- mobility of
labour (Emmanuel)
Investments into human capital (Marshall)
Human capital, as a renewable resource
(Lucas)
Positive externalities of R&D (Romer)
Geographical position – core and periphery
(Wallerstein)
Institutional incentives (North)
Path-dependent development
Investment strategies of multinational
companies (Furtado)
Government failure (Tullock)
Rent-seeking (Krueger)
Demonstration effect National diamond (Porter)
Innovation systems (Freeman)
Rule of law, democracy (Barro)
Source: own study.
The demonstration effects of modern consumer societies are worth mentioning, too.
Generally the consumers of the developing countries try to follow the consumption
patterns of the developed nations. This usually has a cut-down effect on local growth,
as the goods fitting to the most current consumption trends are generally produced
overseas, so following the trends increases imports, and can contribute to the trade
balance deficit.
60606060 Zoltán Bartha & Andrea S. Gubik
The Role of Institutions in DevelopmentThe Role of Institutions in DevelopmentThe Role of Institutions in DevelopmentThe Role of Institutions in Development
According to the followers of the institutional school, institutions affect human
behaviour, in other words they influence the decisions of economic agents. Veblen
was the first to point that out (1919), and also added that it is an oversimplification
to assume that market decisions can be analysed independently from any other
outside factors, like family, culture, community, politics, etc. His views were
neglected by mainstream economics, but the topic was brought into the forefront
again by two new research agendas.
On the one hand it was proved by a series of psychological experiments that we
are not capable of making such rational decisions as is assumed by economics. The
notion of homo economicus was debunked by the theory of bounded rationality (Simon, 1957). Agents with bounded rationality behave opportunistically. On the
other hand Coase’s pioneering article (Coase, 1937) shed light on the fact that the
transactions conducted among agents are not frictionless, and depending on the rate
of frictions, very different market solutions may prove to be the most efficient ones.
If we take a closer look at market transactions, it becomes clear that there are
numerous social phenomena that are disregarded by mainstream economics, yet they
influence the opportunistic behaviour of market agents and the rate of frictions
during transactions. These social phenomena are collectively called institutions.
Hodgson defines institutions (2006) as systems of established and prevalent social
rules that structure social interactions. According to the definition above, language,
money, etiquette, the measurement system, and firms can all be regarded as
institutions. Institutions make it easier to calculate and forecast the behaviour of
agents, thus they contribute to the decrease of uncertainty and frictions during
transactions. North (1993) offers a similar definition of institutions: institutions are
the rules of the game in a society or, more formally, are the humanly devised
constraints that shape human interaction.
Institutions have proved especially important in the transition process of the
Visegrad countries, as we have all learnt it during the last two decades. A transition to
the market economy without the proper market institutions can lead to chaotic
conditions, and to a drop in economic efficiency (compared to countries with a long
market economy history). That is why adopting the best practices of more successful
economies rarely yield the expected returns.
Williamson (1998) suggested a hierarchy that proved very useful during our
analysis. He separated social analysis into four levels (Figure 3.1). The different levels
are ranked according to the time needed to change them, but they also show what
influences what in the society. Higher levels directly influence the level just below
them, meaning that no practices may be adopted on the lower levels that are not
compatible with the superior levels.

The Outward Focused Development Path in the Visegrad Countries 61616161
Level Frequency (years) Purpose
102 - 103
10 - 102
1 - 10
continuous
Often noncalculative, spontaneous
Get the institutional environment right
1st-order economizing
Get the governance structures right
2nd-order economizing
Get the marginal conditions right
3rd-order economizing
L1
L2
L3
L4
Embeddedness:
informal institutions, customs, traditions,
norms, religion
Governance: play of the game – esp. contract (aligning governance
structures with transactions)
Resource allocation and employment
(prices and quantities, incentive alignment)
Institutional environment: formal
rules of the game – esp. property (polity,
judiciary, bureaucracy)
FigureFigureFigureFigure 3333.1. .1. .1. .1. Economics of institutions Source: Williamson (1998, p. 26).
Social embeddedness is on top of the hierarchy (L1). Williamson puts norms,
customs, ethical principles, traditions, conventions and religion into this category.
Some development factors found in the literature at least partly belong to this level
(e.g. the dual structure of the society, entrepreneurial behaviour).
The institutional environment forms the second level (L2). While the informal
rules were placed in Level 1, the rules of L2 are formal, codified ones
62626262 Zoltán Bartha & Andrea S. Gubik
(e.g. constitution, laws, property rights). Although the change of Level 2 rules is also
partly evolutionary in nature, calculated interference is also possible on this level
(unlike on L1). Such interferences are called first-order economising, which is about
finding the ideal combination of formal rules. Many of the development factors
belong to the institutional environment: the rule of law, democratic rights, market
regulation and protectionism.
First-order economising, however, does not ensure the optimal economic
structure. As agents behave opportunistically, they do not keep the formal rules of
the economy all the time. Jurisdiction has also got its frictions, meaning that those
who follow the rules are not able to enforce their rights against the opportunists
instantly and without any costs. This is where the third level (L3) kicks in, called
governance by Williamson. The unit of analysis in governance is the transactions
made among economic agents, and the contracts mediating those transactions. Such
development factors as the coordination of education and research, Porter’s national
diamond, government failures or rent seeking, can all be reckoned among L3 items.
The final level (L4) is concerned with the allocation of resources, an area which is
traditionally addressed by neoclassical economics. The factors of the better-known
growth theories (quantities of labour and capital, savings, investments, etc.) all
belong to this level.
Williams thinks that new institutional economics addresses problems belonging
mainly to Levels 2 and 3. North’s and Hodgson’s definitions cited above, however,
suggest that all phenomena belonging to L1, L2 and L3 can be regarded as
institutions. This paper therefore treats all factors as institutional factors that can be
categorised in one of the top three levels of Williamson’s hierarchy.
3333....3333.... MATERIAL AND METHMATERIAL AND METHMATERIAL AND METHMATERIAL AND METHODSODSODSODS
Structure of the ModelStructure of the ModelStructure of the ModelStructure of the Model
The original idea behind the FOI model was to identify the crucial development
factors of Hungary, but potential development paths detected with the method apply
to all OECD countries. The model is primarily based on the factors collected from
the literature, but these factors are structured in a unique way which allows us to
draw up characteristic development paths that can be clearly separated from each
other. We used the following assumptions when the FOI model was set up:
− National economies are the unit of our analysis; international interdependencies are mostly disregarded in the paper.
− The key to development is not a single factor, but rather a combination of many factors. According to our assumption there are several important motors of
development; sometimes these factors do influence each other, and it is very

The Outward Focused Development Path in the Visegrad Countries 63636363
difficult to determine what causes what, still they can be equally important, and
they all have to be used to draw up a potential development path for the Visegrad
countries.
− Among the many factors considered in the model, the so-called institutional factors play a primary role. Institutional factors are detected using the hierarchy
put forward by Williamson (1998). In fact the model was developed with the aim
of stressing the importance of institutional factors in development.
− Development can take more than one shape and form. There are several feasible development paths, and the Viosegrad countries are not constrained to only one of
them, but may choose from a (limited) number of such paths. To determine these
development paths, the FOI model was used to test the OECD countries.
The FOI model offers a new typology of development factors, but it is also capable of
structuring these factors along three clear directions of development. As shown
previously, the inside-outside typology of development factors is a standard part of
the literature. The FOI model, however, is based on a three-dimensional structure.
These three dimensions are:
− FFFF, i.e. the future potential of a country, − OOOO, i.e. the outside potential of a country, − IIII, i.e. the inside potential of a country.
All three dimensions are complex, composed of a large scale of factors. Yet they can
still be clearly distinguished from each other, which is useful because the clear
distinction can help in the formulation of distinctive development strategies.
The future potential includes factors that are regarded to be crucial for the
sustainability and future competitiveness of an economy. As sustainability has
become one of the main paradigms of all social sciences, we felt that the inclusion of
it as a separate development dimension was essential. In our case sustainability
translates to ensuring that the typical signs and indicators of a developed country
characterise not only the current state of the economy but also the relatively distant
future.
The outside potential includes factors that are crucial to the current world
market position of an economy. This second dimension can be treated as an
equivalent of the outside factors listed based on the literature. Some of the elements
of the outside potential may not be influenced from the inside; others, like the
conditions affecting the international flow of goods, services and factors of
production, are a standard part of economic policy.
The inside potential is made up of factors that are regarded to be crucial to the
current well-being and development of a developed economy. Most of the inside
factors listed in Table 3.1 fall into this potential. Countries that offer favourable

64646464 Zoltán Bartha & Andrea S. Gubik
conditions to local entrepreneurs, and provide a high level of quality of life to their
inhabitants, can have remarkable inside potential.
It is not difficult to spot that certain trade-offs exist among the three potentials.
Higher wage levels, for example, are absolutely favourable from the perspective of the
inside potential, but they can be dangerous for the outside potential of the country.
They can also be threatening to the future potential, if the result of a high wage level
is overconsumption. If a country is well endowed with natural resources, this can
boost its inside and outside potentials, but the abundance of resources usually leads
to high proportions of waste, which again harms the future potential. The three
potentials were drafted with these trade-offs in mind.
Formulating a Measurement MethodFormulating a Measurement MethodFormulating a Measurement MethodFormulating a Measurement Method
During a brainstorming session a list of 50 indicators was compiled with the help of
experts. These 50 indicators were chosen to measure the relevant development
factors, and they were all included in a questionnaire.
TableTableTableTable 3333....2222.... The components of the future, outside and inside potentials
Future potentialFuture potentialFuture potentialFuture potential Outside potentialOutside potentialOutside potentialOutside potential Inside potentialInside potentialInside potentialInside potential
Social responsibility (L1-3) Trade to GDP ratio (L3-4) Burden of government
regulation (L2-3)
Industrial disputes (L1) Country credit rating (L4) Quality of life (L4)
Energy infrastructure (L3) Exchange rate stability (L3) Collected total tax revenues
(L3)
Total public expenditure on
education per capita (L3)
Financial institutions'
transparency (L3)
Pension funding (L2-3)
Ageing of society (L1-2) English proficiency (L4) GDP (PPP) per capita (L4)
Renewable energies (L3) Real GDP Growth (L4)
Healthy life expectancy (L3) Ease of access to loans (L3)
Ecological footprint (L1-2) Rigidity of employment (L3)
Total expenditure on R&D
per capita (L3)
Labour force (L4)
Total R&D personnel
nationwide per capita (L3)
Skilled labour (L3)
Educational assessment /
Mathematics (L3)
The final version of the model was fine-tuned using the statistical data of the OECD countries
Source: own study.
Experts were asked to rank all 50 indicators on a 1-7 scale (1=not relevant at all;
7= of highest significance). Each indicator received three separate scores: one for
future potential, one for outside potential and one for inside potential.

The Outward Focused Development Path in the Visegrad Countries 65656565
The respondents had to give a high score to an indicator if they believed it greatly
contributed to the sustainability and future competitiveness (F potential), current
world market position (O potential) or current well-being (I potential) of Hungary.
The questionnaire was completed by 28 experts. Most of them were active members
of the Committee on Future Research of the Hungarian Academy of Sciences.
Representing several academic fields (arts, engineering, medicine, natural and social
sciences), they offered a wide perspective and a strong future-oriented attitude, values
that are highly useful in this kind of research.
During the processing of the questionnaires every indicator was placed in the
group (F, O or I potential) where it scored highest, meaning that an indicator could
only be part of one of the potentials. In order to eliminate some of the less important
factors (which received low scores in all three dimensions), we disregarded everything
that had a score below average. The final transformation left us with 27 factors: 12 of
them influence the future potential, 10 the inside and 5 the outside potential
(Table 3.2).
3333....4444.... THE FOI ANALYSIS OF THE FOI ANALYSIS OF THE FOI ANALYSIS OF THE FOI ANALYSIS OF THE OECD COUNTRIESTHE OECD COUNTRIESTHE OECD COUNTRIESTHE OECD COUNTRIES
To quantify the future, outside and inside potentials, the FOI-indices were
calculated. The value of the 27 components (listed in Table 3.2) were gathered for all
34 OECD members for the year 2010, and then all values were transformed
to a 1-7 scale using the min-max method. By averaging the standardised values, we
were able to calculate the F-, O- and I-indices of all 34 countries (Table 3.3).
FactorFactorFactorFactor AnalysisAnalysisAnalysisAnalysis
In order to better understand, what background factors drive the value of the
different F-, O- and I-indices, a factor analysis was conducted with SPSS 19. Almost
150 variables were tested during the analysis. In the first step, we checked how
closely related those variables are to the three index values in the OECD countries,
and what the direction of the relationship is. As a second step, all variables were only
considered in the factor analysis of the index they had the highest correlational
relationship with.
We were able to establish three main groups of indicators that showed
a significant correlation with the index of the future potential of the OECD
countries. They were labelled Human capital, Accountable corporations and Quality
of the education system. The Human capital factor is a combination of indicators
measuring the education and health sectors, and the productivity. The Accountable
corporations factor combines such factors as the ethical and social responsibility
of organisations and the credibility of managers, and so it represents the social,
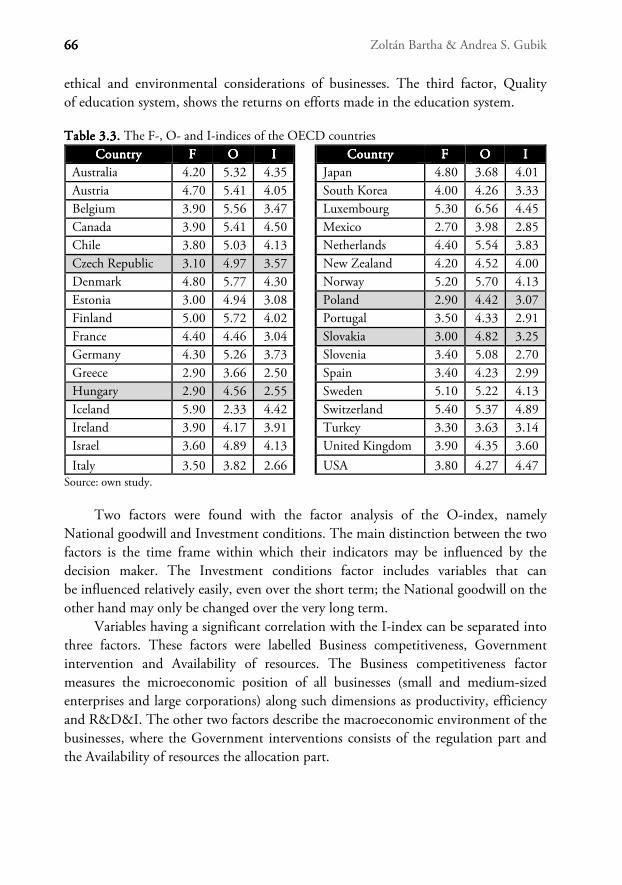
66666666 Zoltán Bartha & Andrea S. Gubik
ethical and environmental considerations of businesses. The third factor, Quality
of education system, shows the returns on efforts made in the education system.
TableTableTableTable 3333....3333.... The F-, O- and I-indices of the OECD countries
CountryCountryCountryCountry FFFF OOOO IIII CountryCountryCountryCountry FFFF OOOO IIII
Australia 4.20 5.32 4.35 Japan 4.80 3.68 4.01
Austria 4.70 5.41 4.05 South Korea 4.00 4.26 3.33
Belgium 3.90 5.56 3.47 Luxembourg 5.30 6.56 4.45
Canada 3.90 5.41 4.50 Mexico 2.70 3.98 2.85
Chile 3.80 5.03 4.13 Netherlands 4.40 5.54 3.83
Czech Republic 3.10 4.97 3.57 New Zealand 4.20 4.52 4.00
Denmark 4.80 5.77 4.30 Norway 5.20 5.70 4.13
Estonia 3.00 4.94 3.08 Poland 2.90 4.42 3.07
Finland 5.00 5.72 4.02 Portugal 3.50 4.33 2.91
France 4.40 4.46 3.04 Slovakia 3.00 4.82 3.25
Germany 4.30 5.26 3.73 Slovenia 3.40 5.08 2.70
Greece 2.90 3.66 2.50 Spain 3.40 4.23 2.99
Hungary 2.90 4.56 2.55 Sweden 5.10 5.22 4.13
Iceland 5.90 2.33 4.42 Switzerland 5.40 5.37 4.89
Ireland 3.90 4.17 3.91 Turkey 3.30 3.63 3.14
Israel 3.60 4.89 4.13 United Kingdom 3.90 4.35 3.60
Italy 3.50 3.82 2.66 USA 3.80 4.27 4.47 Source: own study.
Two factors were found with the factor analysis of the O-index, namely
National goodwill and Investment conditions. The main distinction between the two
factors is the time frame within which their indicators may be influenced by the
decision maker. The Investment conditions factor includes variables that can
be influenced relatively easily, even over the short term; the National goodwill on the
other hand may only be changed over the very long term.
Variables having a significant correlation with the I-index can be separated into
three factors. These factors were labelled Business competitiveness, Government
intervention and Availability of resources. The Business competitiveness factor
measures the microeconomic position of all businesses (small and medium-sized
enterprises and large corporations) along such dimensions as productivity, efficiency
and R&D&I. The other two factors describe the macroeconomic environment of the
businesses, where the Government interventions consists of the regulation part and
the Availability of resources the allocation part.

The Outward Focused Development Path in the Visegrad Countries 67676767
TableTableTableTable 3333....4444.... The factors of the F-, O- and I-index
FFFF----indexindexindexindex OOOO----indexindexindexindex IIII----indexindexindexindex
F1 Human capitalF1 Human capitalF1 Human capitalF1 Human capital O1 National O1 National O1 National O1 National
goodwillgoodwillgoodwillgoodwill
I1 Business I1 Business I1 Business I1 Business
competitivenesscompetitivenesscompetitivenesscompetitiveness
Labour productivity (PPP)
Overall productivity (PPP)
Total health expenditure per
capita
Total public expenditure on
education per capita
Healthy life expectancy
Total expenditure on R&D per
capita
Parallel economy
Investment risk
Image abroad
Country credit rating
Brain drain
Risk of political
instability
Innovative capacity
Productivity of companies
Small and medium-size
enterprises
Information technology
Large corporations
F2 Accountable corporationsF2 Accountable corporationsF2 Accountable corporationsF2 Accountable corporations O2 Investment O2 Investment O2 Investment O2 Investment
conditionsconditionsconditionsconditions
I2 Government I2 Government I2 Government I2 Government
interventioninterventioninterventionintervention
Ethical practices
Social responsibility
Credibility of managers
Foreign investors
Exchange rate stability
Capital markets
Investment incentives
State ownership of
enterprises
Subsidies
Finance and banking
regulation
Protectionism
Legal and regulatory
framework
Ease of doing business
Bureaucracy
F3 Quality of the education F3 Quality of the education F3 Quality of the education F3 Quality of the education
systemsystemsystemsystem
I3 Availability of I3 Availability of I3 Availability of I3 Availability of
resourcesresourcesresourcesresources
Educational assessment /
Mathematics
Educational assessment / Sciences
Science in schools
Educational system
Labour force
Total primary energy
supply per capita
Burden of government
regulation
Employment rate
Gross domestic savings
F-index: KMO=0.823, explained proportion 76.4%; O-index: KMO=0.803, explained proportion 73.7%; I-index: KMO=0.791, explained proportion 73.408% 1.
Source: own study.
1 The Kaiser-Meyer-Olkin (KMO) value helps in determining how suited our variables are to factor
analysis. A KMO value above 0.8 means that the variables are highly suitable. Principal component
analysis and Varimax rotation were used during the analysis. (To get a better understanding of the
method see Varga & Szilágyi, 2011)

68686868 Zoltán Bartha & Andrea S. Gubik
Forming ClustersForming ClustersForming ClustersForming Clusters
The FOI-indices and the factors determined during the factor analysis were used to
identify typical clusters within the OECD countries. These artificial clusters were
created based on the values of the F-, O- , and I-index, with the so-called half-scale
method. As the indices can have a value between 1 and 7, 4 is the mid-value. So all
three indices were split into two groups: the values from 1 to 4 went into the group
labelled as “low” (1), while the values above 4 were labelled as “high” (2).
Theoretically all 8 clusters could represent feasible combinations, but most of
the 34 OECD members fall into 4 groups (the distribution is shown in Table 3.5).
In our interpretation these four groups of countries represent the development
models within the OECD.
The current chapter focuses on Group 3, which is called the dual model,
representing the outward focused development strategy. As half-scaling was used as
a method of clustering, it is obvious that the countries of Group 33 perform above
average in their outside potential. A closer inspection of the factors shows, however,
that these countries are especially strong in ensuring favourable Investment
conditions, and their National goodwill (the other factor of the O-index) is below
average. They are all characterised by liberalised capital flow regulations, exchange
rate stability, accessible capital markets and incentive policies for investments. As far
as the F-index is concerned, they perform poorly in the Quality of the education
system and Human capital, while they are barely below average in the Accountable
corporations factor. In the case of the I-index, the value of the Government
intervention factor is slightly above average, although that cannot compensate for
their weak performance in the other factors of Business competitiveness and
Availability of resources.
It is not difficult to spot a strong focus on outside resources in the factor
structure of the third cluster. These countries create a favourable environment for the
world market-oriented companies, and they adopt policies that lead to a more
liberalised government regulation. For this reason their economies may be
characterised with the classical dual structure: a competitive, outside-oriented sector
that relies substantially on outside resources, and a traditional sector applying local
capital that is at least partially isolated from the other sector. The main characteristic
of the dual model therefore is a strong focus on attracting outside resources, with the
help of which the economy can be modernised and a higher growth rate might be
achieved.
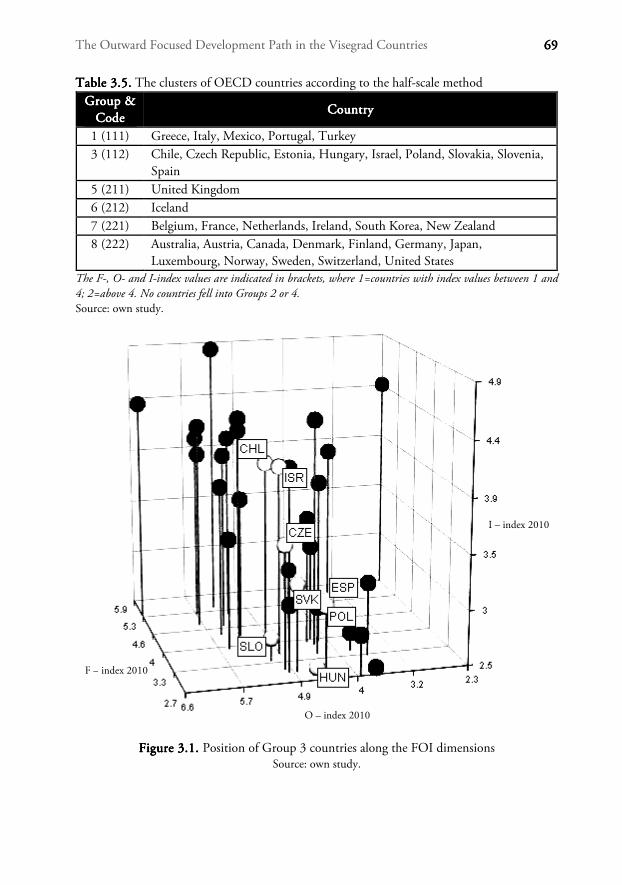
The Outward Focused Development Path in the Visegrad Countries 69696969
TableTableTableTable 3333....5555.... The clusters of OECD countries according to the half-scale method
Group & Group & Group & Group &
CodeCodeCodeCode CountryCountryCountryCountry
1 (111) Greece, Italy, Mexico, Portugal, Turkey
3 (112) Chile, Czech Republic, Estonia, Hungary, Israel, Poland, Slovakia, Slovenia,
Spain
5 (211) United Kingdom
6 (212) Iceland
7 (221) Belgium, France, Netherlands, Ireland, South Korea, New Zealand
8 (222) Australia, Austria, Canada, Denmark, Finland, Germany, Japan,
Luxembourg, Norway, Sweden, Switzerland, United States
The F-, O- and I-index values are indicated in brackets, where 1=countries with index values between 1 and 4; 2=above 4. No countries fell into Groups 2 or 4. Source: own study.
FigureFigureFigureFigure 3333.1. .1. .1. .1. Position of Group 3 countries along the FOI dimensions Source: own study.
F – index 2010
O – index 2010
I – index 2010

70707070 Zoltán Bartha & Andrea S. Gubik
3333....5555.... THE OUTWARD FOCUSED THE OUTWARD FOCUSED THE OUTWARD FOCUSED THE OUTWARD FOCUSED DEVELOPMENT STRATEGYDEVELOPMENT STRATEGYDEVELOPMENT STRATEGYDEVELOPMENT STRATEGY IN V4IN V4IN V4IN V4
Group 3 – the dual model implies a strategy that is focused on the attraction
of outside resources. In other words we argue that if the goal is to move towards the
dual model, the economic policy should concentrate on a strategy centred on the
attraction of outside resources. If we draw a parallel between the development model
(deducted from the clusters of countries) and the economic policy strategy, we can
also tell which factors are most important for the outward focused strategy. We have
seen that the third cluster exceeds in one of the outside factors, called Investment
conditions, and in one of the inside ones, called Government intervention. These
two will be the areas that the economic policy needs to address when the
strengthening of the dual model is the goal.
As a next step we checked which of the OECD members scored well in these
two factors. In Investment conditions Ireland scores the highest, Austria is seventh,
Finland and Denmark are eleventh and twelfth respectively; in Government
intervention Finland is second, Denmark is fifth, Ireland is ninth and Austria
is eleventh. Country studies were prepared of these four countries to detect those best
practices that allowed them to excel in the areas measured by the two factors above.
The country studies are fairly extensive and therefore cannot be included in the
paper, but the lessons learned from them are featured in the final sections (the
country studies are accessible in the Appendix of Bartha, Gubik & Tóthné Szita,
2013). The final goal is to use the FOI analysis and the country studies to offer
relevant policy recommendations for the Visegrad countries.
Our suggestions were put forward using Williamson’s (1998) hierarchy (Table
3.6). As the lowest level (L4) summarises the current issues of resource allocation, the
actions listed here theoretically can have an instant effect on the economy. Economic
policy measures may belong to this level as well, if we assume that changes in
regulations, taxes or subsidies have an instant effect on the market behaviour of firms
and individuals. The longer-term effect of central intervention is that persistent
measures change the structure of the market and the economy, and the relationships
among firms. These belong to the governance part of the economy (L3). The strategy
focusing on the attraction of outside resources requires a predictable government,
and that on the other hand requires the stability of the political system. That is why
Level 2 is also present in Table 3.6, but it has to be said that changes on this level
may take decades, according to Williamson.
We shall start the presentation of our suggestions with those belonging to the
highest level (L2). Because of the hierarchical system, the factors higher above are the
prerequisites of anything below them. We have found that one of the pillars of best
practice is the reliability of the economic policy. The corporate tax decrease policy in
Ireland was started more than two decades ago, and it was consistently carried out;
The Outward Focused Development Path in the Visegrad Countries 71717171
the many decades of minority governments has led to a special culture of political
consensus seeking in Denmark that makes it possible to carefully plan and fine-tune
long- term social policies; the state is committed to long-term development goals in
Austria and Finland. Political stability is coupled with the transparency of the public
sector and a very low level of corruption in all cases. The latter two further enforce
the reliability of economic policy, as they decrease the chance of interest groups
capturing the state, and destabilising the policy making.
Disciplined public finances are also an important part of the best practices.
After the 2008 financial crisis it is clear that balanced budgets are important, but they
seem to be an absolute must for a reliable investment environment. A stable budget
position guarantees that the government does not have to take unexpected measures
that affect company costs (e.g. tax raises or new taxes, withdrawing tax remedies,
subsidies).
The reliability of monetary policy, more particularly the reliability of exchange rate
policy, is equally as important as that of fiscal policy. It is well known that exchange
rate stability is a central element of the economic policy measures of open economies.
The euro partially ensures that stability, although the exchange rate against other
major currencies can still be very volatile. Because at least two-thirds of the trade of
the European countries is conducted within Europe, the euro is able to provide
a relative stability on the continent, and lets the member countries get rid of the best
part of their exchange rate risks.
The institutional framework that ensures the stability of the labour market was
placed between Levels 2 and 3. Labour market issues are basically part of the
allocation problem, so they should belong to Level 4. But it is also known that the
pure market model is not an efficient one on the labour market, and usually there are
dozens of institutional factors regulating it. This why the institutional framework of
the labour market is higher up in Williamson’s hierarchy. In Austria and Denmark
the collective bargaining system is completely integrated into the institutions of the
central government, and therefore it is linked to Level 2, but it also has an effect on
the governance of companies (L3), which is why it was put as a transition between
the two levels.
The dependency on the higher level structures is especially true of labour
market institutions. More precisely, the Danish-Austrian type of social partnership
and collective bargaining system can only be successful if the willingness to seek
compromises and solidarity are an integral part of a country’s culture (factors
belonging to L1 and L2). Hungary had experimented with the system in the 1990es,
but gave up on it after several failures, so the suggestions on L2-L3 are only for the
sake of comparison. Immediate action cannot be taken based on them. What is
worth remembering is that long-term labour market stability is key to the
outside-resources-oriented strategy, and this can only be achieved if
72727272 Zoltán Bartha & Andrea S. Gubik
a well-functioning institutional framework is in place. Some areas require some sort
of central regulation and planning: the smoothing of cyclical fluctuations
(e.g. compensating for lost income in case of becoming unemployed); balancing
structural weaknesses (e.g. the feedback of labour market needs to the education
system). In other cases institutional guarantees may be needed to prevent the state
from distorting the market (e.g. separating real wage changes from market powers).
TableTableTableTable 3333....6666.... Development areas for the strategy focused on the attraction of outside resources
Level Component
L2 Advanced political culture
Low level of corruption
Stable and foreseeable socio-economic environment
Stable public finances
Exchange rate stability – Eurozone membership
L2-L3
transition
Social partnership in labour market affairs
Collective agreement of employers and employees on national, sectorial
and company level
L3 Transparent government, e-government solutions
Regulatory impact assessment – measuring the effects of government
interventions
L3-L4
transition
Persistently low corporate tax rate, with additional tax exemptions
State of the art infrastructure
Stable investment environment, coordinated tax and subsidy system
Support for company-university-researcher cooperation
L4 Clearly defined development goals: research and development,
information and communication technologies
Substantial state subsidies on corporate innovation
Substantial central help for start-ups and export expansion, involving
subsidies, information and counselling services, and business support
agencies
Low level of corporate tax rates
Flexible labour market
Source: own study.
The second-order economising called governance by Williamson (L3) represents the
efficiency of the government regulations in case of an economic policy analysis. This
is important for the attraction of outside resources, because the administrative
burdens of the bureaucracy increase the transaction costs of everyone, including the
owners of foreign resources. The extent of transaction costs caused by the state
therefore is a prime indicator of both capital investors and immigrants. Denmark and
Finland are front runners in e-government solutions. These solutions provide huge
advantages: e.g. they make bureaucracy more transparent, increase the speed at which

The Outward Focused Development Path in the Visegrad Countries 73737373
services can be provided by the state, make it easier to declare and pay taxes, and help
in creating huge databases that make public policy decisions more reliable.
Ireland is a great example for regulatory impact analysis. Stating from 2000 they
gradually adopted the principle that the market distortion effects of government
regulations are assessed. Basically a systematic attempt was made to quantify the
transaction costs and changes in market behaviour caused by the intervention of the
state. Thanks to the regulatory impact analysis the instruments that have the
strongest market distortion effect may be filtered out, and the costs of both the state
and the business sector can be decreased. The introduction of this approach has the
added bonus of showing a more rational image of the bureaucracy, and making it
look more attractive for investors.
All of our other suggestions consist of economic policy measures that have
a direct effect on the allocation of resources, and an instant impact on the economy,
and so they belong to Level 4 (or to the transition between L3 and L4). The
hierarchical structure still applies, of course; the lower-level suggestions can only
work efficiently if they are compatible with the higher-level characteristics of the
country.
Ireland, Denmark and Austria have each set up a tax system where the relatively
high overall tax burden is achieved with a low corporate tax rate (although the orders
of magnitude are different: Ireland has one the lowest corporate tax rates in the
world, its effective value is below 10%; the Danish is somewhat higher than the Irish,
while the Austrian corporate tax rate can only be considered low if we compare it to
the average of the developed welfare states). As the tax rate is a pivotal point in the
investment decisions of the transnational companies, a consistently low corporate tax
can be a great attraction.
In all countries the state support for clusters is a main priority. Clusters usually
involve the cooperation of companies, research institutes, universities, development
agencies and risk capital firms, but they are also supported by the state. The practice
of Denmark, Austria, Ireland or Finland shows that state support alone is not
enough; the clusters may only be successful if they carry special knowledge that is
competitive in the world market. Those industries are worth supporting that have
traditionally performed well and whose main companies are well known on the
world market (good examples for the Danish are food, pharmaceutics and wind
energy, for the Finnish wood or information technology, for the Irish process
innovation, and for the Austrians car manufacturing clusters).
The flexible labour market is another attraction for transnational companies.
If the termination of employment does not require a lot of administrative tasks, and
can be carried out with relatively low costs, companies are able to adjust to the
fluctuations in the world market demand. Denmark also has a social safety net, and
74747474 Zoltán Bartha & Andrea S. Gubik
applies several active labour market instruments that ensure that the unemployed can
find a new job relatively quickly.
The suggestions in Table 3.6 will not only strengthen the model based on the
attraction of outside resources, but the FOI analysis showed that they primarily affect
the factors that are the pillars of such an economic policy orientation. The economic
policy should concentrate on these instruments, if the main priority is the attraction
of outside resources.
3333....6666.... CONCLUSIONSCONCLUSIONSCONCLUSIONSCONCLUSIONS
Group 3 detected with the FOI model can be characterised as an outward focused
development path, a development strategy based on the attraction of outside
resources. Countries choosing this as a priority try to create an internal business and
regulation environment that will make them attractive to outside investors. The more
attractive environment may encourage the inflow of outside resources, which are
needed because the local capital and knowledge generation is not sufficient. Many
historical examples confirm that such a development strategy can prove successful,
but the global environment has its risks as well. On the one hand overreliance on
outside resources can result in a dependent position, because the sudden withdrawal
of resources may lead to the collapse of the economy. The dependent position on the
other hand can push the country toward an institutional environment favouring
outside agents to the local ones – a process that further strengthens the exposure of
the country.
Most of the policy recommendations suggested in the chapter generally favour
local corporations as well as foreign-owned or foreign-based ones. The outward focus
of a country’s development strategy therefore should help local enterprises in
becoming more competitive. Yet, this strategy usually result in a dual structure,
where a good portion of the local businesses are characterised with low level of
competitiveness, and have very little chance of going international. Our
recommendations are based on the best practices of the countries where this dual
structure phenomenon cannot be detected. Therefore the long term success of the
outward focused strategy is dependent on additional economic policy instruments
that can adequately address the problems derived from the dual structure of the
economy and the society.
The hierarchy presented in Figure 3.1 shows that careful consideration of
instruments is needed before any steps are taken, because positive outcomes can only
be expected from economic policy measures that are in harmony with the
institutional framework of the country. Instruments requiring institutional elements
higher up the hierarchy, often fail for this reason.
The Outward Focused Development Path in the Visegrad Countries 75757575
REFERENCESREFERENCESREFERENCESREFERENCES
Balogh, T. (1963). Unequal Partners 1-2. Oxford: Blackwell.
Barro, J.B. (1998). Determinants of Economic Growth: A Cross-Country Empirical Study. Cambridge, Massachusetts: MIT Press Books.
Bartha, Z., Gubik, S.A. & Tóthné Szita, K. (2013). Intézményi megoldások, fejlődési modellek (Institutional solutions, development models). Miskolc: GNR Szolgáltató és
Kereskedelmi Bt.
Bhagwati, J. (1958). Immiserizing Growth: A Geometrical Note. The Review of Economic Studies, 25(3), 201-205.
Boeke, J.H. (1953). Economics and Economic Policy of Dual Societies. New York: Institute of Pacific Relations.
Coase, R.H. (1937). The Nature of the Firm. Economica 4(16), 386-405.
Domar, E. (1947). Expansion and Employment. American Economic Review, 37(1), 343-355.
Emmanuel, A. (1972). Unequal Exchange: A Study of the Imperialism of Trade. New York: Monthly Review Press.
Freeman, C. (1987). Technology Policy and Economic Performance: Lessons from Japan. London: Pinter Publishers.
Furtado, C. (1970). Economic Development of Latin America. London: Cambridge University Press.
Hamilton, A (1791). Report to Congress on Manufactures. Philadelphia. http://memory. loc.gov/cgi-bin/ampage?collId=llsp&fileName=009/llsp009.db&Page=123
Harrod, R.F. (1948). Towards a Dynamic Economics. London: MacMillan.
Hodgson, M.H. (2006). What Are Institutions? Journal of Economic Issues, 40(1), 1-25.
Keynes, J.M. (1936). The General Theory of Employment, Interest and Money. London: MacMillan.
Krueger, A.O. (1974). The political economy of the rent seeking society. The American Economic Review, 64(3), 291-303.
List, F. (1841). Das Nationale System der Politischen Ökonomie. Stuttgart: Cotta'schen Verlag.
Lucas, R.E. (1988). On the Mechanics of Economic Development. Journal of Monetary Economics, 22(1), 3-42.
Marshall, A. (1890). Principles of Economics (First Edition ed.). London: Macmillan.
McClelland, D.C. (1957). Community development and the nature of human motivation. Cambridge: Harvard University Press.
Meier, G.M. (1964). Leading Issues in Economic Development. New York: Oxford University Press.
Myrdal, G. (1957). Economic Theory and Underdeveloped Regions. London: Gerald Duckworth.
76767676 Zoltán Bartha & Andrea S. Gubik
North, D.C. (1993). Institutions, institutional change and economic performance. Cambridge: Cambridge University Press.
Porter, M.E. (1990). The Competitive Advantage of Nations. Harvard Business Review, 68(2), 73-91.
Prebisch, R. (1964). Towards a new trade policy for development. New York: United Nations.
Ricardo, D. (1817). On the Principles of Political Economy and Taxation. London: John Murray.
Romer, P. (1986). Increasing Return and Long Run Growth. Journal of Political Economy, 94(5), 1002-1037.
Schumpeter, J.A. (1934). The Theory of Economic Development: An Inquiry Into Profits, Capital, Credit, Interest, and the Business Cycle. Cambridge: Harvard University Press.
Simon, H.A. (1957). Models of Man. New York: Wiley.
Singer, H.W. (1964). International Development: Growth and Change. New York: McGraw-Hill.
Smith, A. (1776). Enquiry into the Nature and Causes of the Wealth of Nations. Edinburgh: J. R. McCulloch.
Solow, R. (1956). A Contribution to the Theory of Economic Growth. Quarterly Journal of Economics, 70(1), 65-94.
Szentes, T. (2011). Fejlődés-gazdaságtan (Development economics). Budapest: Akadémiai Kiadó.
Tullock, G. (1967). The Welfare Costs of Tariffs, Monopolies and Theft. Western Economic Journal, 5(3), 224-232.
Tullock, G. (1993). Rent Seeking. Brookfield: Edward Elgar Publishing.
Varga, B., & Szilágyi, R. (2011). Kvantitatív információképzési technikák. Budapest: Nemzeti Tankönyvkiadó.
Veblen, T. (1919). The Place of Science in Modern Civilization. B. W. Huensch, New York.
Wallerstein, I. (1974). The Modern World System: Capitalist Agriculture and the Origins of the European World Economy in the Sixteenth Century. New York: Academic Press.
Williamson, O.E. (1998). Transaction Cost Economics: How It Works; Where It Is Headed.
De Economist, 146(1), 23-58.
Williamson, O.E. (2000). The New Institutional Economics: Taking Stock, Looking Ahead.
Journal of Economic Literature, 38(3), 595-613.
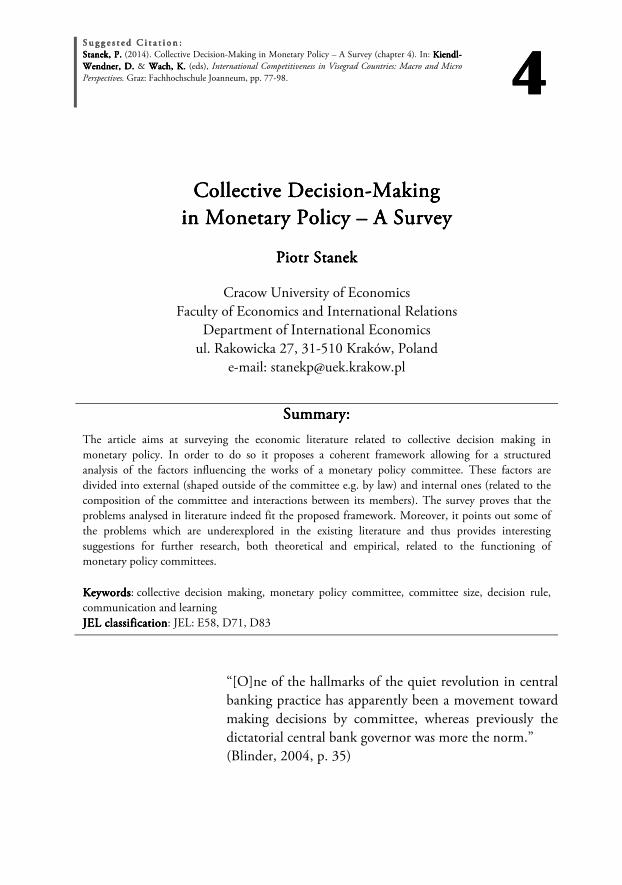
S u g g e s t e d C i t a t i o n :S u g g e s t e d C i t a t i o n :S u g g e s t e d C i t a t i o n :S u g g e s t e d C i t a t i o n :
StanekStanekStanekStanek, , , , PPPP.... (2014). Collective Decision-Making in Monetary Policy – A Survey (chapter 4). In: KiendlKiendlKiendlKiendl----
Wendner, D. Wendner, D. Wendner, D. Wendner, D. & Wach, K.Wach, K.Wach, K.Wach, K. (eds), International Competitiveness in Visegrad Countries: Macro and Micro Perspectives. Graz: Fachhochschule Joanneum, pp. 77-98. 4444
Collective DecisionCollective DecisionCollective DecisionCollective Decision----MakingMakingMakingMaking
in Monetary Policy in Monetary Policy in Monetary Policy in Monetary Policy –––– A SurveyA SurveyA SurveyA Survey
Piotr StanekPiotr StanekPiotr StanekPiotr Stanek
Cracow University of Economics
Faculty of Economics and International Relations
Department of International Economics
ul. Rakowicka 27, 31-510 Kraków, Poland
e-mail: [email protected]
Summary:Summary:Summary:Summary:
The article aims at surveying the economic literature related to collective decision making in
monetary policy. In order to do so it proposes a coherent framework allowing for a structured
analysis of the factors influencing the works of a monetary policy committee. These factors are
divided into external (shaped outside of the committee e.g. by law) and internal ones (related to the
composition of the committee and interactions between its members). The survey proves that the
problems analysed in literature indeed fit the proposed framework. Moreover, it points out some of
the problems which are underexplored in the existing literature and thus provides interesting
suggestions for further research, both theoretical and empirical, related to the functioning of
monetary policy committees.
KeywordsKeywordsKeywordsKeywords: collective decision making, monetary policy committee, committee size, decision rule,
communication and learning
JEL JEL JEL JEL classificationclassificationclassificationclassification: JEL: E58, D71, D83
“[O]ne of the hallmarks of the quiet revolution in central
banking practice has apparently been a movement toward
making decisions by committee, whereas previously the
dictatorial central bank governor was more the norm.”
(Blinder, 2004, p. 35)

78787878 Piotr Stanek
4444.1. .1. .1. .1. INTRINTRINTRINTROOOODUCTDUCTDUCTDUCTORY REMARKSORY REMARKSORY REMARKSORY REMARKS
Theoretical arguments indicating superiority of collective decision making over
individual decisions are old and go back at least to Condorcet (1785). In practice,
however, the strength of this argument depends upon the fulfilment of many
conditions (see e.g. Gerling et al., 2005) and the context of the decision-making.
Among the key examples of committees making decisions in some important
domains, one can mention parliaments, governments juries, supervisory and
managing boards of enterprises or even editorial boards of scientific journals.
Nevertheless, the most powerful, or at least enjoying the highest reputation, among
them are probably the monetary policy committees (MPCs)1.
The presence of MPCs in public consciousness is a proof of both its importance
and the need for a more precise understanding of their functioning. Thus, the aim of
the present chapter is to survey the relevant economic literature analysing the
internal characteristics and external influences over the collective monetary policy
making.
A general view and analysis of collective decision making presented by Stanek
(2013) is obviously valid also for decision-making process in monetary policy.
Nevertheless, such a specific context necessitates also a deeper analysis and allows for
more precise argumentation and modelling.
The discussion will be organized around a simple conceptual framework
introduced in the next section. Thus, the following parts of the chapter will present
the research concerning MPCs by grouping it around two main lines: external and
internal factors shaping decision-making process within the committee. The analysis
will be started, however, by presenting some more precise arguments in favour of
delegating the monetary powers to a committee, which is a relatively recent trend.
4444.2. .2. .2. .2. CONCEPTUAL FRAMEWORKCONCEPTUAL FRAMEWORKCONCEPTUAL FRAMEWORKCONCEPTUAL FRAMEWORK
To conceptualise the analysis of decision making in an MPC and its determinants,
a simple scheme is proposed: a committee obtains some information (possibly
divergent or differently interpreted by different members) and reaches a decision
through a decision-making process. However, two groups of factors may influence its
work and outcomes.
First, external determinants influence the committee and the process of
reaching the decision. They represent structural and institutional characteristics
shaped by laws regulating the framework of monetary policy making and include
1 Hereafter, MPC will designate any committee whose competence is interest rate setting. Thus, this
term covers the British Monetary Policy Committee, the American Federal Open Market Committee,
the Board of Governors of the European Central Bank and other similar decision making bodies.

Collective Decision-Making in Monetary Policy – A Survey 79797979
such elements as the organisational setup (number of committee members, decision-
making rule, etc.), appointment process and also possibly encompass external
pressure (political pressure or “central bank bashing” being the most common
examples). Second, internal features, including preferences of the committee
members and diverse interactions among members clearly exert effect on quality and
character of the decision-making activity. It seems logical, that preferences
of committee members are shaped by their personal experience and thus can be
proxied by their demographic and social characteristics. This broad idea is visualised
by figure 4.1.
Figure Figure Figure Figure 4444.1..1..1..1. Decision-making by a monetary policy committee Source: own elaboration, see also Stanek (2013, p. 105).
The simplicity and clarity of the illustration requires an omission of some
interactions among internal and external factors. For instance, personal
characteristics of (potential) committee members obviously influence their eligibility
and, theoretically, the optimal number of members is related to the voting rule (see
below).
Elements presented on figure 4.1 will be analysed throughout the present
chapter. The next section starts with some arguments for delegating monetary policy
to committees rather than to individuals. In what follows, internal/external factors
analysis is applied to interest rate setting, but expanded to some particular questions
such as appointment process and political influence as well as internal factors exerting
effects on monetary decision making.
Monetary Policy Monetary Policy Monetary Policy Monetary Policy
CommitteeCommitteeCommitteeCommittee Information Outcome Decision-making
External factors
Internal factors
Number of members
Committee structure
Appointment process
Political pressure
Decision-making scheme
Decision rule
Members’ background (education, professional
career, national/regional considerations etc.)
Committee’s demography
(members’ age, gender etc.)
Interactions
(communication,
learning etc.)

80808080 Piotr Stanek
4444....3333. . . . INDIVIDUAL CENTRAL BINDIVIDUAL CENTRAL BINDIVIDUAL CENTRAL BINDIVIDUAL CENTRAL BANKER VS. MONETARYANKER VS. MONETARYANKER VS. MONETARYANKER VS. MONETARY
POLICY COMMITTEEPOLICY COMMITTEEPOLICY COMMITTEEPOLICY COMMITTEE
Modelling of monetary policy making has been dominated by a vision of a 'central
banker' whose decisions optimize social welfare usually defined as minimal gaps
between natural and effective levels of inflation and output. This is true for the
seminal Barro and Gordon (1983a; 1983b) models, which were themselves
influenced by Kydland and Prescott's (1977) argument highlighting the advantage
of rules over discretion. These works lead to the idea of a conservative central banker
(Rogoff, 1985) as an effective cushion against inflation bias or time-inconsistency
problems of monetary policy.
All these works as well as a considerable amount of other related research,
contributing substantially to an understanding of the art and science of monetary
policy, has not explored the collective dimension of monetary policy making, which
became in recent years the rule rather than the exception2. Major theoretical works
were rarely focused on this specific feature of monetary policy.
One of the early examples, founded on reputation motivations of monetary
policy committee members (thus joining the above quoted time-inconsistency
literature) has been presented by Cothren (1988). In his model of n-member
committee serving for n overlapping terms, (n being an odd number), less
experienced (and more sensitive for future losses implied by higher inflation)
members are able to outvote opportunistic ones, willing more inflation. Thus,
individual considerations of finitely-lived committee members may generate
credibility for the whole committee, which has been proved to be of special concern
for the efficiency of monetary policy3.
Sibert (2003) analyses individual credibility seeking and its implications for the
committee4. In her model, social welfare depends negatively on (squared) actual
inflation and positively on unanticipated inflation (because it boosts output).
The MPC is modelled here as a two-member committee with staggered terms.
A committee member may be more or less inflation-prone; her type is constant
during the mandate and is drawn with a probability ρ, which is common knowledge.
The focus on reputation issues, which may be traced back to Backus and Drifill
(1985) and Barro and Gordon (1983a; 1983b), logically implies that the model
2 These exceptions are constituted by New Zealand (with its “optimal central bank contract”), Norway,
Malta and Israel (which recently announced its plans to reshape the central bank law and introduce an
MPC, see Fischer, 2006). Blinder (2004, p. 35) remarks that probably Canada should also be
considered as an economy guided by a single monetary policy maker. A few other countries where
decisions are made by single person are, in fact, currency boards with no interest rate decisions to take. 3 See e.g. Cukierman's (1992) reference work. 4 Interestingly, the model employs a Bayesian updating in the private sector, who acquires the signal
about the type monetary policy maker in order to form its inflation expectations.

Collective Decision-Making in Monetary Policy – A Survey 81818181
is based on the standard time-consistency framework. During the meeting
the committee members announce their preferred inflation rates (0 or 1, depending
on type of policy maker), and if they agree, the rate is implemented while in case
of disagreement some consensual rate α (0<α<1) is decided upon. The author
searches for the probability with which the junior opportunistic committee member
votes for zero inflation (in order to gain reputation and be able to implement higher
inflation in her second term).
Sibert (2003) analyses three cases: (i) full transparency of voting (implying that
the type of the senior policy maker is publicly known), (ii) voting records published
with a lag (making the junior member ignoring his older colleague's type) and (iii)
hierarchical structure of central bank (where a senior member's vote is more
important than the junior's one).
The presented comparison of efficiency (understood as expected social welfare)
between monetary policy lead by the individual and the committee shows
the superiority of the collective decision making (under some plausible assumptions
about the consensual rate of inflation). This is implied by stronger reputation
incentives for an opportunistic junior not to reveal his inflation preference if he takes
part in the committee, than if he is the sole responsible for the policy making.
Thus, on average inflation is smaller and expected social welfare is greater. Moreover,
when the committee makes decisions, inflation (and welfare) is less volatile because
there exists a compromise level of inflation, while in case of single decision-maker
inflation can be equal to either 0 or 1.
Other findings of Sibert's model include negative welfare implication of
delaying the publication of voting record. This is so because it creates lower
incentives for the opportunistic junior to vote against inflation. Thus, average
inflation increases and expected welfare declines. Inversely, a higher weight of the
senior committee member increases the incentives for reputation building of the
junior one, hence expected inflation lowers and welfare increases.
The analysis, exposed in Sibert (2003), highly stylizes individual preferences
categorizing policy makers as hawks or doves (who always prefer 0 or 1 inflation)5.
Doves, in their potential decision of voting for zero inflation are guided only by
reputational considerations and hawks always vote for zero inflation, irrespective
of prevailing economic conditions (which are not explicitly modelled). One might
also argue that the quadratic loss function, although standard, is not a very realistic
one6. Another potential flaw is that any interaction inside the committee is ignored
5 This quite journalistic language is appropriated from ornithology (sometimes used, however, also in
international relations, foreign affairs as well as in economic research): advocates of a looser monetary
policy are called doves while more conservative central bankers are given the label of hawks. This makes
allusion on the preferred level of interest rates (flight altitude). 6 For a review of more “behavioral” central bank loss functions see Al-Nowaihi and Stracca (2003).

82828282 Piotr Stanek
(there is no explicit modelling and, moreover, junior member can only guess the type
of the senior member if he knows the voting record of previous voting).
A possibility of testing empirically the hypothesis that groups make monetary
decisions differently than individuals is offered by “laboratory experiments”. Blinder
and Morgan (2005) performed an interesting experiment facing individual students
and five-student committees with a simple macroeconomic stochastic model and
asking them to decide on monetary policy, which should accommodate unknown
fiscal shocks. Participants were also incited to smooth interest rates (or discouraged to
test the reactions of the economy), because each rate movement incurred a (small)
cost. Unsurprisingly, group decisions, thanks to interaction, information and
knowledge sharing as well as (supposedly) some heuristic techniques, outperformed
individuals on average. The first participation in a group experiment7 was also linked
to a significant learning effect. The last, less expected, result was that the group did
not need more time to take their decisions to change rates8. In fact, committees took
their decisions with smaller lags on average, though the difference was not significant.
A similar experiment, which yielded analogue results, was led by Lombardelli
et al. (2006). Differences concerned the applied model (which was slightly simpler),
and the focus of their research – beside individual versus committee comparison, the
authors looked for a more precise assessment of learning effects. They found
significant improvement of the quality of decisions taken when the experiment
progressed, with the exception that groups outperformed individuals independently
on the stage of the research9. Perhaps surprisingly, the authors did not found any
support for a positive impact of interaction among committee members.
These two experiments test only a restrained scope of committee decision
making in monetary policy. As both used exclusively five-person groups, it is
impossible to measure any impact of the committee size on the decision making
process. Similarly, as in both experiments the subjects were only economics students
(Princeton University in the case of Blinder and Morgan, 2005; and the London
School of Economics in the case of Lombardelli et al., 2005) which make the samples
much more homogeneous then real life MPCs10. Finally, in both cases groups prove
7 The same individuals took part in individual and group decision-making experiences. 8 At least in terms of 'lags' – number of meetings between the fiscal shock and accommodation of the
policy stance. However, groups required more 'clock time' to reach a decision, but this was not taken
into consideration. This experimental design corresponds closely to the real world requirement to get
the right decision during the scheduled meeting, no matter how long it would take. 9 The experience consisted of sixteen stages (ten periods each), four individual, then eight in committees
(four and four without possibility of interaction) and once again four individual. 10 Whose members are usually issued from various economic environments, such as private or public
sector, government institutions, and central banking circles or others. Moreover, the educational
attainments of MPC members are very often relatively heterogeneous. More on these subjects in
Farvaque et al. (2009).
Collective Decision-Making in Monetary Policy – A Survey 83838383
to be good bumpers against the worst individuals (who, besides, are able to learn the
most during the experiment). The groups perform, however, similarly to the best
individuals, but not significantly better than them. However, the difference between
the group's and the best individuals' performance is probably of little relevance to the
real world, where MPC members are usually chosen very carefully among the
individuals with the best educational and professional background.
4444....4444. . . . EXTERNAL FACTORSEXTERNAL FACTORSEXTERNAL FACTORSEXTERNAL FACTORS
After both theoretical and empirical confirmations that committees outperform, on
average, individuals in monetary policy making, the question to be asked is how to
reach these good decisions. The framework to be defined includes, as exposed in
section 4.24, the number of members, the voting rule, the decision-making scheme
as well as appointment process and potential political pressure.
Number oNumber oNumber oNumber of Membersf Membersf Membersf Members
The attribute of a committee which is the easiest to perceive is its size. Although
intuitive remarks, indicating relations between the size and accuracy of decisions or
the size and time needed by an MPC to reach a decision have been given (e.g. Berger,
2002; Blinder, 2004), a complete theoretical analysis of the subject has not been
presented. This gap is, at least to certain extent, filled in by two studies by Berk and
Bierut (2003; 2004). The former article, even if focused mainly on optimal structure
of the committee, confirms the Condorcet theorem (provided that members vote
individually and assess the true state of the economy with a probability higher than
0.5). Further, the authors, by introducing a small marginal cost of adding
a decision-maker, prove its intuitive bounding effect on the committee size.
Additionally, the authors show that (in the setup with marginal cost) the optimal size
is larger if a fraction of members (the board) can interact prior to the meeting. Such
prior meeting may end with taking a common position by the board, if a (qualified)
majority emerges. Thus, some information may be lost through such an interaction,
and adding some members should compensate this loss.
In their following work, Berk and Bierut (2004) introduce a possibility of
learning (see below for details). The impact on the optimal size of the committee
depends on the amount of time the committee designer is willing to assign to the
committee. As learning requires time, if committee meetings are long-lasting, the
number of members should be reduced and inversely, if the decision-makers' time is
costly, it is better to increase the committee size (and shorten the meetings).
In their two studies, Berk and Bierut (2003; 2004) have assumed that the
committee takes its decisions by simple majority rule (when equal skills are assumed)
or by the optimal weighted voting rule (as proposed by Ben Yashar and Nitzan,
84848484 Piotr Stanek
1997, p. 4). Nevertheless, this interesting factor is not expressly modelled in these
(and many other) works.
Empirically it has been shown by Berger et al. (2008) that bigger and more
heterogeneous countries as well as those which follow a floating exchange rate regime
have bigger central bank boards (monetary policy committees). This can be explained
by a need of better (or more) information to take the appropriate decisions.
The authors also show that bigger (on average) boards exist in more democratic
countries and in the central banks which are more independent and have more
numerous staff.
AppointmentsAppointmentsAppointmentsAppointments
Chang (2003), in her theoretical model of appointments to the FOMC has shown
that appointing is an effective method of affecting monetary policy stance. She proves
that the President must take care about Senate's preferences so that the appointee
could be accepted. This spatial bargaining model stylizes twelve-member FOMC
appointments and predicts balance of power between main American political
bodies. It clearly shows, using (similarly to Waller, 2000), the median voter theorem,
that appointing candidates to the policy board in order to replace the members
stepping down allows for influencing policy stance and its future path.
The author verifies empirically the model, using original datasets for FOMC
members' preferences at the time of each meeting11 and on Senate's signalling as well
as existing Presidential signalling12 and macroeconomic data. An important
contribution of the book is an estimation of “ideal points” of every FOMC member
(as well as members of Senate Banking Committee and US Presidents) during
1970-1995, which proxy their policy preferences. In what follows, Chang uses these
estimations to confirm her theoretical model where presidential appointees must also
satisfy Senate's preferences. In the context of the present dissertation, it would be
interesting to ask which features of FOMC members, shape their tighter or looser
monetary policy preferences.
Such a question was raised by Chappell, McGregor, Havrilesky and Vermilyea
in a series of publications13. This stream of literature is founded on the observation
that, for most of the twentieth century, the American monetary policy has been
11 This is different from usually constructed datasets based on dissenting votes. Moreover, the setup is
binary (tighter-easier) and does not allow for status quo. The obvious advantage is that the author
obtains more estimation points but at the cost of objectivity (the argument that voters always have some
bias on the policy does not seem fully convincing). 12 These have been constructed by Havrilesky (1995). 13 Havrilesky and Schweitzer (1990), Havrilesky and Gildea (1991), Havrilesky (1991 and 1995),
Chappell, Havrilesky, McGregor (1995), Chappell, McGreggor (2000), Chappell, McGreggor,
Verlmilyea (2004 and 2005)

Collective Decision-Making in Monetary Policy – A Survey 85858585
gradually politicized (Havrilesky, 1991). The proof is a significant decreasing trend
in the participation of members with private sector experience (and an increase
of politically associated ones) on the FOMC14. It seems that the signal to initiate the
debate was given by Belden (1989). In that early article, dissent votes have been used
as a proxy for policy preferences. The obvious advantage of this approach (compared
to e.g. Chang, 2003), is the full observability of the explained variable achieved,
nevertheless, at the expense of the number of observations.
Political InfluencePolitical InfluencePolitical InfluencePolitical Influence
The appointments analysed above are believed to be substantially influenced by
political preferences. Waller (1992; 2000) exposes (bi)partisan bargaining models.
In the latter model, the board, which members are chosen for overlapping staggered
terms by two partisan branches of government (appointing – the President and
confirming – the Senate) assures monetary stability equal to that of a policy rule,
while allowing for political accountability. Thus, Waller (2000) shows that if the
institutional (external) setup is correct, political bargaining over monetary policy
institution is innocuous by itself. Nevertheless, the author ignores (which is natural
in such a theoretical setup) how political affiliations will in reality influence the work
of an MPC. This gap is filled by the exposed above empirical literature on the
FOMC.
An interesting discussion, which comes within the scope of this topic, took
place on the pages of the Journal of Monetary Economics. Grier (1991; 1996) argued
that more liberal preferences of Senate's committees (principal) supervising the Fed
(agent) were translated into looser monetary policy, measured by higher money base
growth. This finding has been challenged by Chopin et al. (1996a; 1996b), who
found that the Fed may actually counterbalance Congress preferences by contracting
monetary growth when Democrats (with more expansionist preferences) possess
majority. This exchange of views, although empirical and concerning only one
country, is very interesting from a theoretical point of view, as it reflects the debate
on central bank independence15 and central bank as an agent of society16. In fact,
Grier's results support the principal-agent theory, where the preferences of the
principal (proxied by the preferences of the Senate Banking Committee) are
translated into the Fed's monetary policy, while Chopin et al. show that the Fed is
14 The trend to politicization of the FOMC might have been a factor towards a loosing of monetary
condition (ceteris paribus), as private sector (as well as Federal Reserve Bank) career is believed to make
a person a more conservative central banker (Havrilesky & Schweitzer, 1990). 15 See e.g. Cukierman (1992), Cukierman et al. (1992), Alesina and Summers (1993) for first empirical
explorations of the concept or Berger et al. (2001) as a more critical review of evidence. 16 See Persson and Tabellini (1993) as well as Walsh (1995a; 1995b).

86868686 Piotr Stanek
indeed independent. As both researches are purely empirical, the diverging results are
probably caused by different measures of congressional preferences. Another, broader
explanation, is that the policy of the Fed is determined by personal preferences of the
FOMC members. These preferences, however, may be shaped by different factors,
other than the wishes of the principal (see section 4.5 below).
Decision RuleDecision RuleDecision RuleDecision Rule
The starting point for the majority of studies in the field is admitting that the simple
majority rule is the most frequently used in legal acts regulating the activity of central
banks. Hence (as discussed in Gerling et al., 2005 or Stanek, 2013), the median voter
theorem is the most frequently applied to the modelling of monetary policy decisions
and for analysing the implications of appointments, different preferences of members
etc. Nevertheless, studies modelling explicitly the implications of different decision
rules for the outcome of MPCs are relatively scarce.
An interesting attempt in such an analysis by introducing the “state of
economy” as the foundation of “an optimal level of interest rates” has been presented
by Gerlach-Kristen (2005). Her model focuses on the impact of the application of
several majority rules in a committee, which members observe the state of the
economy with a given precision, which is common to all committee members17.
Their opinions are also influenced by (imperfect) understanding of other members'
signals. After having assessed the state of the economy, committee members set the
desired interest rate (by voting) as close as possible to the imperfectly observed
optimal one. This instrumental variable may be only adjusted gradually, and steps
reflect central bank tendency to change interest rates by threshold of 0.25 basis points
(or its multiples).
The author shows that too strict majority requirements, approaching
unanimity, may cause a high (suboptimal) degree of interest rate inertia. Likewise,
a higher uncertainty in optimal interest rate observation (lower decision makers'
ability) implies that policy reactions lag behind changes occurring in the economy.
This signal-extracting Bayesian analysis framework seems an excellent starting point
for the exploration of inside-committee affairs. However, some further insights, such
as allowing for differences among committee members (be it in their way of
acquiring signal, which is probably costly or a way of perceiving “optimal” interest
rate, which can be biased for some members18) or communication appear necessary
to make it closer to the reality of monetary policy making.
17 Thus, committee members are supposed equally skilled. More technically, all members observe the
true state of the nature with an error, following a zero-mean normal distribution. Additionally,
observation errors are correlated among committee members. 18 E.g. stylizing Sibert's (2003) hawks and doves framework.
Collective Decision-Making in Monetary Policy – A Survey 87878787
Committee StructureCommittee StructureCommittee StructureCommittee Structure
According to the simple diagram introduced at the beginning of this chapter,
committee structure is another external feature impacting on its decisions. Berk and
Bierut (2005) directed their research on this topic. They find that an appropriate
central bank design may allow to overcome the non-optimality of the simple majority
as a decision rule19. Namely, the committee consisting of the core (with members
responsible for preparing the meeting and endowed with information of higher
quality) and spokes (regional representatives) can assure efficient decision-making
under simple majority rule. Such a structure is clearly influenced by real life
examples: the ECB Governing Council and the American FOMC.
The mechanism on which this finding relies is implied by the fact that better
informed (or alternatively better skilled) members of the core adopt a common
position prior to the meeting. Thus, as all core members vote for the same option,
their opinions are de facto weighted.
The structure, being one of the exogenous factors influencing the work of the
committee, determines also some intrinsic features. Namely, as mentioned and
analysed by Berk and Bierut (2003; 2004) in their works, the design of the central
bank board influences the interactions taking place between members. Thus,
members working in the “core” of the committee have increased possibility to
interact and, as mentioned, to learn from each other.
4444....5555. . . . INTERNAL FEATURESINTERNAL FEATURESINTERNAL FEATURESINTERNAL FEATURES
Taking into consideration the specific aspects of decision-making within the MPCs
allows for a more detailed research and modelling of the inside-committee
interactions. That is, the precise definitions of monetary policy tools (adjusting
interest rate) and goals (price stability and possibly fostering growth or, more or less
equivalently, fighting unemployment) permit to model information flows (among
MPC members) as well as personal and collective preferences. Moreover, this
knowledge along with the observation of the macroeconomic performance of the
country(s) makes possible the assessment of an MPC efficiency (with respect to
achieving the objectives).
Communication, Learning and Order of SpeechCommunication, Learning and Order of SpeechCommunication, Learning and Order of SpeechCommunication, Learning and Order of Speech
Communication and the related possibility of learning from better skilled individuals
were the focus of attention of the second of two of the theoretical works by Berk and
Bierut (2004; 2009). They prove that interaction (which is supposed to improve
19 As proved by Ben-Yashar and Nitzan (1997).

88888888 Piotr Stanek
decision abilities of the less skilled members) may ameliorate the outcome though it
occurs at the expense of time of discussion. Thus, there is a trade-off between the
discussion time and the committee's size assuring optimal decisions. This result,
however, depends on the premise that interaction leads only to improving skills and
not to realigning positions (members should vote according to their own
information)20. This seems also somewhat at odds with their own findings on
structure21, where they argued that such a design and common position adopted by
the “core” members improve the results (see above).
All in all, the research of Berk and Bierut (2003; 2004; 2005) is clearly
influenced by the structure of the ECB Governing Council. However, an important
number of theoretical advances in modeling monetary policy making by a committee
have been inspired by the relative success of the Federal Open Market Committee
(FOMC). The American monetary system has been also subjected to extensive
empirical research, aiming at confirming different theoretical approaches.
Berk and Bierut (2011) find also that a kind of anti-seniority rule (in spirit of
Ottaviani and Sørensen, 2001) should also be applied in a monetary policy context.
The propose, somewhat less specifically, that if monetary policy council is relatively
homogeneous then proposals to be voted should not be put forward by the chairman
but rather should emerge as an outcome of discussions. They document, that this
type of practice is indeed applied at the Bank of England or in the Federal Reserve
under chairman Bernanke (as opposed to Greenspan, who was known to be “the
Maestro”).
Personal CharacterisPersonal CharacterisPersonal CharacterisPersonal Characteristics of Committee Memberstics of Committee Memberstics of Committee Memberstics of Committee Members
Havrilesky and Gildea (1991) in their critique of Belden's (1989) work underline
that the dissenting votes are shaped by three categories of factors: the state of the
economy, political (partisan) influences but also (and what is especially important for
the present dissertation) training background and career experience. Their probit
regression on dissents (0 for tightness and 1 for ease) taking as explaining variables
only career and educational characteristics of voters, confirms the significant impact
of prestige degree and private banking experience on tighter monetary preferences.
However, in this setup they fail to prove the hypothesis that government exercise or
Ph.D. make a person more inflation-prone.
In further works Chappell et al. (1993; 1995; 1997) as well as Chappell and
McGregor (2000) explore dissenting votes by estimating underlying interest rate
20 This hypothesis, taking into account the possibility that members are not able to convince each other,
leads to the result which is contrary to e.g. Nitzan and Paroush (1985), who argued that communication
implies information losses through interdependent voting. 21 Berk and Bierut (2005).

Collective Decision-Making in Monetary Policy – A Survey 89898989
preferences of FOMC members. The authors follow roughly the same methodology
throughout these articles. They assume that these unobserved preferences after
a (weighted) averaging are translated into the policy directive. Thus, even if the true
desired interest rate remains unobserved, the authors are able to impute them to
every policy maker. They estimate reaction functions (which differ with respect to the
constant, which demonstrates tighter or easier policy preferences) characterizing
different individuals (or their categories such as Federal Reserve Bank Presidents vs.
Governors, or, within the latter, Democratic vs. Republican appointees). Moreover,
they take into consideration (and estimate) a dissent threshold, which turns out to be
relatively large (exceeding 2 percentage points). Policy makers are supposed to react
to macroeconomic variables, such as inflation, unemployment, monetary base and
industrial production growth or (in extension) presidential signalling. Two of these
papers are of special interest, as they indicate (without giving conclusive answers)
some of the problems, which came again into the fore in some more recent research.
First, in their 1995 article, the authors argue that a possible reshaping of the
Fed22 might have significant implications for long-term inflation performance. After
presenting convincing evidence that regional Reserve Bank Presidents tend to be
more “hawkish”, they assess a potential impact of a relative increase of the voting
power of Presidential appointees on inflation bias. They find it as large as
3.5 percentage points higher steady-state inflation if all FRB Presidents were replaced
by new Governors (which, however, had not been proposed) and 0.8 average
inflation increase for the precise case of the reform proposal. A similar case for the
reform of the ECB has been undertaken by the European Union in 2003 in order to
prepare it for the enlargement of the euro area. This is discussed in details in Stanek
(2004).
The second interesting fact, pointed out by Chappell and McGregor (2000), is
that policy-maker's gender may also play a role in shaping their preferences. Namely,
applying the method above described , they rank all FOMC members who served
between 1966 and 1996 in order of their “conservativeness”. They remark that six
women (out of seven overall) have been ranked among the 13 members with the
highest “preference for ease”, which seems to confirm that female policy makers are
on average more “dovish”. This, however, could be influenced by their political
affiliation (Democrats are known as monetary “doves” and at the same time are more
sensitive to gender equality), which has not been tested by the authors. Nevertheless,
research on influences of personal characteristics of MPC members (based on a larger
sample of countries) on policy efficiency yielding somewhat different results were led
by Farvaque et al. (2009; 2011). They show e.g. that women tend to be more
22 A project of “Sarbanes and Gonzales bill” was presented to the Congress at the time, aiming at giving
more influence to the centrally appointed Governors instead of Federal Reserve Bank Presidents.

90909090 Piotr Stanek
hawkish (contrarily to the Chappell and McGregor findings), but also, possibly due
to such preferences, might be less efficient in managing aggregate inflation-output
volatility (Farvaque et al., 2014). In recent contributions, Chappel et al. (2004; 2005) refine their methodology
for the subsample for which minutes of discussion are available. Basing their study on
an original dataset, which is derived from the analysis of “Memoranda of Discussion”
and the Ford Library Transcripts23, they are able to estimate more precise reaction
functions for each FOMC member. Analyzing the discussions within the FOMC,
they are able to directly observe the desired interest rate of some members. The
authors test the hypothesis of a simple majority voting within the FOMC (applying
the median voter theorem), a more consensual approach (with the mean of desired
interest rates) as well as a chairman's dominance hypothesis and find significant
support for a chairman's vote weight as large as 0.4824. Nevertheless, mean and
median desired federal rates were also significant, which supports the thesis that other
members' preferences are important as well.
Other interesting results about chairman's dominance concern the difference in
other members' behaviour when they speak before and after the chairman.
The average difference between stated desired rates was significantly higher when the
other member spoke before Burns, the gap being more important in case of
Governors than for Federal Reserve Banks Presidents (which indicates that the latter
are more independent)25.
The publication of FOMC voting records and discussion transcripts allows for
the analysis of individual policy preferences and has been certainly a major
determinant (beside the importance and exploit of the Fed in maintaining monetary
stability and contributing to the general American prosperity) of the development of
research in that field. A similar exercise would be, however, much more difficult in
case of other principal central banks, be it because of much shorter time span (as in
the case of British MPC, which was inaugurated in 1997)26 or of lower “procedural
transparency”27.
23 The last published “Memoranda” concern 1976 (they were published with a five-year lag). Thus, the
second one (being the originals belonging to Arthur Burns) completes the account of all 99 meetings
under Burns' leadership (1970-78). 24 This value is a simple average of two estimates reported by the authors (0.38 and 0.58). 25 This result seems to confirm the founding hypothesis of Ottaviani and Sørensen (2001) that
a member of a committee who is supposed less skilled does not dare to reveal his personal information if
it is contrary to the previously revealed information of a higher-skilled member. Building on such
formalized assumption they show that anti-seniority rule allows for a better information accumulation. 26 Which, however, is not impossible and has been performed by Cobham (2003), Gerlach-Kirsten
(2004) or Bhattacharjee and Holly (2010). 27 This term has been introduced by Eijffinger and Geraats (2006) in their transparency index to
encompass explicit strategy, publication of voting record and minutes of policy meetings. In their last

Collective Decision-Making in Monetary Policy – A Survey 91919191
Both of these limitations are true for the European Central Bank, which was
inaugurated in 1999 and whose minutes and votes will be published only after
a fifty-year lag. This lack of openness can be, however, at least to a certain extent,
explained by the necessity of (collective) credibility building and repelling any
accusations of (too much/any) weight put on national (regional) considerations28.
Nevertheless, researchers focusing on the FOMC are endowed with a huge
comparative (and absolute) advantage in terms of data availability over those focusing
on other central banks.
This does not necessarily mean that some studies focused on other central banks
or cross-country studies are not possible. While facing unobservable voting behavior,
the attention has been paid directly on policy outcomes. Interestingly, personal
features of central bankers in different countries as factors influencing monetary
policy has recently entered into the focus of researchers' scrutiny. Thies (2004) put
the stress on the fact “that different types of individuals working within different
types of institutions achieved different levels of success in attaining price stability
during the Asian Crisis.” He has studied the impact of “conceptual complexity”29 of
central bankers on their inflation performance during the 1998-2001 financial
turmoil and finds that higher levels of complexity are associated with lower levels of
inflation. The article, though being eminently stimulating in itself, leaves some
doubts on the objectivity of the concept, however. It seems that applying some more
objective measures of central bankers' capacities might yield different results.
Göhlman and Vaubel (2007) have presented such preliminary attempts. They
investigate the impact of educational backgrounds and past careers of central bankers
on inflation. Unsurprisingly, in their (unbalanced) panel data analysis with (two-year)
lagged inflation as the explained variable, the authors find a significant impact of
professional experience of MPC members. The results of educational background
effect on inflation seem less convincing.
observation (July 2001), only Japan, UK, US and New Zealand were publishing votes and minutes
(moreover, in the last case these data are not very valuable, as monetary decisions are taken by the sole
Governor). 28 It is interesting to remark (after Chant, 2003), pointed also out in Eijfinger and Geraats' (2006)
index, that among five covered federal countries only the US publish their minutes while four other
(monolithic) countries follow full “procedural transparency”. Chant (2003) argued also that “the
disclosure of minutes and voting records pose significant dangers by creating identifiable regional
pressures on monetary policy”. For the ECB the same problem was also discussed by Stanek (2004). 29 The author assesses this personal feature through the analysis of the speeches of central bankers.
Direct and simple wording indicates a low level of “conceptual complexity”, which may be insufficient
to cope with an unusual situation whereas indirect expressions and more complex wording signify a high
level of “conceptual complexity” which is a sign of a higher potential of reaction to unpredictable
difficulties like financial crisis.
92929292 Piotr Stanek
This first (to the best of my knowledge) empirical cross-country time-series study of
MPC members' personal features on central bank performance leaves, however, some
questions without answers. Namely, institutional design (central bank independence,
MPC structure etc.) should also influence inflation performance. The question of
preponderance or correlation of either factor remains thus opened. Moreover, the
only independent economic variable explaining inflation used in regressions is
unemployment, which also leaves some important doubts about their model
specification. Similar research on a more recent sample of similar (major) central
banks, also yielding interesting results are presented by Farvaque et al. (2009; 2011). Finally, a highly technical vision of interest rate decisions has been presented by
Rizzi et al. (2003). The authors show that an adaptive fuzzy expert system may
perform comparably to a human committee (viz. ECB Governing Council).
Nevertheless, a real transfer of monetary policy making to some software neither
seems to be politically acceptable in any foreseeable future. Moreover, designing
a system, which can (even perfectly) mimic human behaviour or decision-making
only in quantitative dimension is not equal to devising a software being able to
implement monetary policy. This is obviously not to say that computer aided tools
and models are not useful in preparing policy decisions, but it seems that final
decisions, as touching the whole human societies, should be taken by human beings.
4444....6666. . . . CONCLUSIONSCONCLUSIONSCONCLUSIONSCONCLUSIONS
The literature reviewed in this chapter (and summarized in Table 4.1 above) explores
in a detailed manner questions concerning monetary policy committees that were
conceptualised in the section 4.2 above and in Stanek (2013). On theoretical grounds
the most interesting and prone to be modelled are external (size, decision rule and
structure) and internal (communication, learning and signal-extracting processes)
elements of the monetary policy-making framework. On the empirical side, the most
attractive subjects concern internal (i.e. career and education related) and external
(i.e. appointment and pressure related) determinants of MPC members behaviour.
The lessons that can be drawn from the reviewed literature may be summarized as
follows.
First, it seems that committees outperform individuals in decision-making,
which is even better documented in case of monetary policy making than in
general theory.
That is so, because a more specific context of monetary policy making allows
for a better modelling of such decisions. Consequently, the results are more
convincing, because they are based on theoretical as well as experimental research.
Beside the preference given by all the studies to collective decision making, some
offered also arguments supporting the thesis that the number of committee members

Collective Decision-Making in Monetary Policy – A Survey 93939393
is limited, especially under the plausible assumption that expanding the committee is
costly. This finding can be found in both general studies and these focused on
monetary policy committees. It seems, however, that important further advances may
be made in exploring such relations as the linkages between the number of members,
their expertise as well as the heterogeneity of the committee.
Table 4.1.Table 4.1.Table 4.1.Table 4.1. Main problems of collective decision making in the field of monetary policy
QuestionQuestionQuestionQuestion ReferencesReferencesReferencesReferences FindingsFindingsFindingsFindings
Committee
or individual
Cothren (1988) Committees are a tool guaranteeing stable and
“conservative” policy, without unreal assumptions of
“ever-living” agents with an infinite horizon of
expectations.
Waller (1992) Committee with staggered terms assures monetary
stability equal to a policy rule
Sibert (2003) Committees, clearly outperform individuals in
reputation building.
Blinder (2004) Committees, because allow for pooling more
information and application of more heuristic
techniques which makes policy less volatile and
moderate.
Blinder &
Morgan (2004)
Committees outperform individuals in term of
optimality of the policy with insignificantly lower lag
of reaction.
Lombardelli et al. (2005)
Committees always outperform individuals.
Optimal size
Berk & Bierut
(2003)
Limited if additional members are costly and the
smaller the bigger are these costs. Optimal size also
diminishes if a part of members may interact prior to
the meeting.
Berk & Bierut
(2004)
A trade-off exists between the optimal size of the
committee and the time required to get the optimal
decision.
Decision rule
Gerlach-Kristen
(2005)
Too strict majority requirement leads to a suboptimal
committee inertia.
Waller (2000) Median voter (simple majority rule) assures policy
smoothing, which is influenceable by appointments.
Berk & Bierut
(2003)
Unanimity leads to “zero activism” and allows for
good decision only if decisional skills of voters are
very high.
Committee
structure
Berk & Bierut
(2005)
Simple majority is suboptimal, but can be eliminated
by an appropriate structure ('hub-and-spokes') of the
committee.

94949494 Piotr Stanek
Influencing
the
committee
decisions and
its members'
preferences
Havrilesky &
Gildea (1991)
Dissent votes (as measured by Belden, 1989) are
shaped by three categories of factors: state of the
economy, partisan issues and personal experience
Chappell et al. (1993; 1995;
1997; 2004;
2005), Chappell
& McGregor
(2000)
FOMC members' votes may be explained by their
individual reaction functions (on economic variables),
but also by other factors: political affiliations,
professional experience, position in the FOMC
(Governors vs. FRB Presidents), or potentially other
features like gender or age.
Chang (2003) Appointments to monetary committee (and thus
appointer's preferences) affect policy stance and its
future path
Göhlmann &
Vaubel (2007)
Preferences of committee members with regard to
inflation are clearly influenced by their educational
and career experience
Farvaque et al. (2011; 2014)
Monetary policy performance depends on
professional background, and to a smaller extend on
education and demographic features. These features
become even more visible under inflation targeting.
Grier (1991 and
1996), Chopin et al. (1996 a&b)
Incumbent Senate's preferences (and its Monetary
Committee's ones) influence FOMC decisions, but
the direction is uncertain (disputable).
Communica-
tion,
interactions,
learning…
Berk & Bierut
(2004)
Interaction between members is beneficial as a
possibility of learning.
Berk & Bierut
(2011)
Options to be voted should not be proposed by an
“agenda setter” (chairman) but should rather emerge
endogenously according to the views expressed during
the meeting.
Lombardelli et al. (2005)
Interaction between policy makers has no effect on
decisions but learning effects are significant.
Alternatives
to MPC
Rizzi et al. (2003)
An adaptive fuzzy expert system performs comparably
to the ECB Governing Council
Source: own study.
Second, studies concentrated on decision rule yield the conclusion that both
most commonly analysed solutions - simple majority (favouring the median voter)
and unanimity (granting veto power to each decision maker) - are suboptimal. The
truly optimal rule would weigh the decision-makers according to their abilities or,
equivalently, according to the quality of information they possess. These general
findings are confirmed in the particular context of monetary policy. However, the
simple majority rule, assures policy smoothing which seems positive in monetary

Collective Decision-Making in Monetary Policy – A Survey 95959595
policy, and unanimity (as well as too strict majority requirements) leads to
suboptimally high policy inertia.
Moreover, the suboptimality of the simple majority rule might be reduced by
a suitable committee design: structure or rotation scheme. The latter, however,
increases the efficiency of decisions at the cost of incentives to strategic behaviour.
Third, interactions between members positively influence the outcomes,
especially because of their important learning effects and reducing conflicting
interests. However, here also the abilities matter and the best skilled members should
speak later during the meeting.
Finally, empirical studies on monetary policy committees prove that personal
preferences matter for the decisions made and that they may be shaped by personal
experience, political affiliations, education, demographic features etc.
REFERENCESREFERENCESREFERENCESREFERENCES
Alesina, A., Summers, L.H., (1993). Central bank independence and macroeconomic
performance: Some comparative evidence. Journal of Money, Credit, and Banking, 25(2), pp. 151-162.
Al-Nowaihi, A., Stracca, L., (2003). Behavioural Central Bank Loss Functions, Skewed Risks
and Cerntainty Equivalence. The Manchester School, Supplement, pp. 21-38.
Backus, D., Drifill, J., (1985). Inflation and reputation, American Economic Review, 75(3), pp. 530-538.
Barro, R., Gordon, D., (1983). Rules, discretion and reputation in a model of monetary
policy. Journal of Monetary Economics, 12(1), pp. 101-121.
Barro, R., Gordon, D., (1983). A positive theory of monetary policy in a natural rate model.
Journal of Political Economy, 91(4), pp. 589-610.
Belden, S., (1989). Policy Preferences of FOMC Members as Revealed by Dissenting Votes.
Journal of Money, Credit and Banking, 14(1), pp. 98-118.
Ben-Yashar, R.C., Nitzan, S.I., (1997). The optimal decision rule for fixed-size committees in
dichotomous choice situations: the general result. International Economic Review, 38(1), pp. 175-186.
Berger, H., (2002). The ECB and Euro-Area Enlargement. IMF Working Paper no. 02/175.
Berger, H., de Haan, J., Eijfinger, S.C.W., (2001). Central Bank Independence: an update of
theory and evidence. Journal of Economic Surveys, 15(1).
Berger, H., Nitsch, V., Lybek, T. (2008). Central bank boards around the world: Why does
membership size differ?. European Journal of Political Economy, 24(4), pp. 817-832.
Berk, J.M., Bierut, B., (2003). Committee structure and its implications for monetary policy
decision-making. De Nederlandsche Bank, MEB Series 2003-5.
Berk, J.M., Bierut, B., (2004). The effects of learning in interactive monetary policy
committees. Tinbergen Institute Discussion Paper TI 2004-029/2.
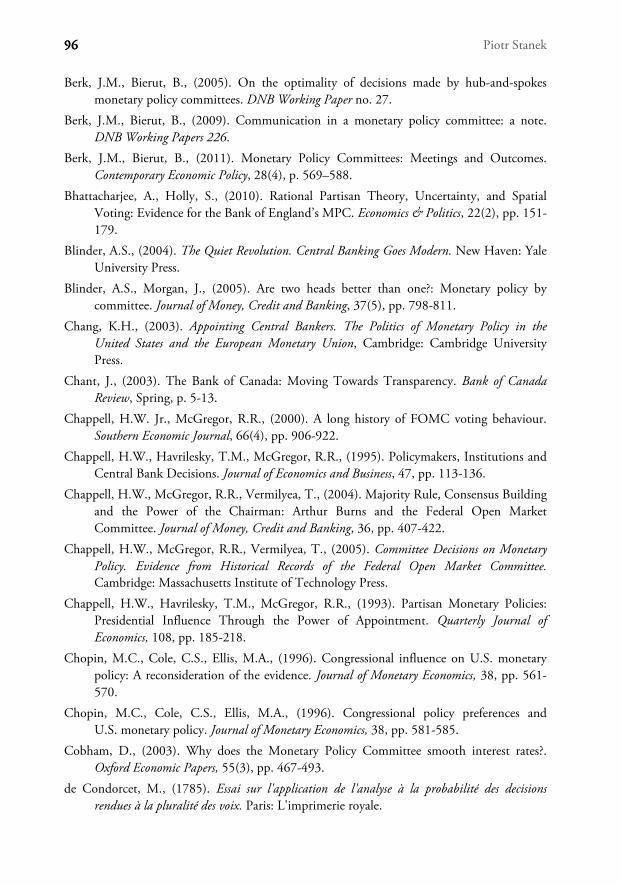
96969696 Piotr Stanek
Berk, J.M., Bierut, B., (2005). On the optimality of decisions made by hub-and-spokes
monetary policy committees. DNB Working Paper no. 27.
Berk, J.M., Bierut, B., (2009). Communication in a monetary policy committee: a note.
DNB Working Papers 226.
Berk, J.M., Bierut, B., (2011). Monetary Policy Committees: Meetings and Outcomes.
Contemporary Economic Policy, 28(4), p. 569–588.
Bhattacharjee, A., Holly, S., (2010). Rational Partisan Theory, Uncertainty, and Spatial
Voting: Evidence for the Bank of England’s MPC. Economics & Politics, 22(2), pp. 151-179.
Blinder, A.S., (2004). The Quiet Revolution. Central Banking Goes Modern. New Haven: Yale
University Press.
Blinder, A.S., Morgan, J., (2005). Are two heads better than one?: Monetary policy by
committee. Journal of Money, Credit and Banking, 37(5), pp. 798-811.
Chang, K.H., (2003). Appointing Central Bankers. The Politics of Monetary Policy in the United States and the European Monetary Union, Cambridge: Cambridge University
Press.
Chant, J., (2003). The Bank of Canada: Moving Towards Transparency. Bank of Canada Review, Spring, p. 5-13.
Chappell, H.W. Jr., McGregor, R.R., (2000). A long history of FOMC voting behaviour.
Southern Economic Journal, 66(4), pp. 906-922.
Chappell, H.W., Havrilesky, T.M., McGregor, R.R., (1995). Policymakers, Institutions and
Central Bank Decisions. Journal of Economics and Business, 47, pp. 113-136.
Chappell, H.W., McGregor, R.R., Vermilyea, T., (2004). Majority Rule, Consensus Building
and the Power of the Chairman: Arthur Burns and the Federal Open Market
Committee. Journal of Money, Credit and Banking, 36, pp. 407-422.
Chappell, H.W., McGregor, R.R., Vermilyea, T., (2005). Committee Decisions on Monetary Policy. Evidence from Historical Records of the Federal Open Market Committee. Cambridge: Massachusetts Institute of Technology Press.
Chappell, H.W., Havrilesky, T.M., McGregor, R.R., (1993). Partisan Monetary Policies:
Presidential Influence Through the Power of Appointment. Quarterly Journal of Economics, 108, pp. 185-218.
Chopin, M.C., Cole, C.S., Ellis, M.A., (1996). Congressional influence on U.S. monetary
policy: A reconsideration of the evidence. Journal of Monetary Economics, 38, pp. 561-570.
Chopin, M.C., Cole, C.S., Ellis, M.A., (1996). Congressional policy preferences and
U.S. monetary policy. Journal of Monetary Economics, 38, pp. 581-585.
Cobham, D., (2003). Why does the Monetary Policy Committee smooth interest rates?.
Oxford Economic Papers, 55(3), pp. 467-493.
de Condorcet, M., (1785). Essai sur l'application de l'analyse à la probabilité des decisions rendues à la pluralité des voix. Paris: L'imprimerie royale.

Collective Decision-Making in Monetary Policy – A Survey 97979797
Cothren, R., (1988). Equilibrium inflation as determined by a policy committee. Quarterly Journal of Economics, 103(2), pp. 429 - 434.
Cukierman, A., (1992). Central Bank Strategy, Credibility and Independence. Cambridge:
Massachusetts Institute of Technology Press.
Cukierman, A., Neyapti, B., Webb, S.B., (1992). Measuring the Independence of Central
Banks and Its Effects on Policy Outcomes. The World Bank Economic Review, 6(3), pp. 353-398.
Eijffinger, S.C.W., Geraats, P.M., (2006). How Transparent Are Central Banks?. European Journal of Political Economy, 22, pp. 1–21.
Farvaque E., Hammadou, H., Stanek, P., (2009). Select your Committee: The Impact of
Central Bankers' Background on Inflation. Économie Internationale / International Economics, 117(1), pp. 99-129.
Farvaque, E., Hammadou, H., Stanek, P. (2011). Selecting Your Inflation Targeters:
Background and Performance of Monetary Policy Committee Members. German Economic Review, 12(2), pp. 223-238.
Farvaque, E., Stanek, P., Vigeant, S., (2014). On the performance of monetary policy
committees. Kyklos, 67(2), pp. 177–203.
Gerlach-Kristen, P., (2004). Is the MPC's voting record informative about future
UK monetary policy?. Scandinavian Journal of Economics, 106(2), pp. 299-314.
Gerlach-Kristen, P., (2005). Too little, too late: Interest rate setting and the costs of
consensus. Economics Letters, 88, pp. 376–381.
Gerling, K., Grüner, H.P., Kiel, A., Schulte, E., (2005). Information Acquisition and
Decision Making in Committees: a survey. European Journal of Political Economy, 21(3), pp. 563-597.
Göhlman, S., Vaubel, R., (2007). The educational and occupational background of central
bankers and its effect on inflation: An empirical analysis. European Economic Review, 54(4), pp. 925-941.
Grier, K.B., (1991). Congressional influence on U.S. monetary policy: An empirical test.
Journal of Monetary Economics, 28, pp. 201-220.
Grier, K. B., (1996). Congressional oversight committee influence on U.S. monetary policy
revisited, Journal of Monetary Economics, 38, pp. 571-579.
Havrilesky, T., (1991). The Federal Reserve Chairman as Hero: Our Defense against
Monetary Excesses?. Cato Journal, 11(1), pp. 65-72.
Havrilesky, T., (1995). The Pressures on Monetary Policy, 2nd ed., New York: Kluwer.
Havrilesky, T., Gildea, J., (1991). The Policy Preferences of FOMC Members as Revealed by
Dissenting Votes. Journal of Money, Credit and Banking, 23(1), pp. 130-138.
Havrilesky, T., Schweitzer, R., (1990). A Theory of FOMC Dissent Voting with Evidence
from the Time Series. In: Mayer, T., (ed.), The Political Economy of American Monetary Policy, Cambridge: Cambridge University Press.
98989898 Piotr Stanek
Kydland, F., Prescott, E., (1977). Rules rather than discretion: the inconsistency of optimal
plans. Journal of Political Economy, 85(3), pp. 473-491.
Lombardelli, C., Proudman, J., Talbot, J., (2006). Committees Versus Individuals:
An Experimental Analysis of Monetary Policy Decision Making. International Journal of Central Banking, 1(1), pp. 181-205.
Maier, P., Bezoen, S., (2004). Bashing and supporting central banks: the Bundesbank and the
European Central Bank. European Journal of Political Economy, 20, pp. 923-939.
Nitzan, S., Paroush, J., (1985). Collective Decision Making. An Economic Outlook. Cambridge:
Cambridge University Press.
Ottaviani, M., Sørensen, P., (2001). Information aggregation in debate: who should speak
first?. Journal of Public Economics, 81, pp. 393-421.
Persson, T., Tabellini, G., (1993). Designing Institutions for Monetary Stability. Carnegie-Rochester Conference Series on Public Policy, 39, pp. 53-84.
Rizzi, L., Bazzana, F., Kasabov, N., Fedrizzi, M., Erzegovesi, L., (2003). Simulation of ECB
decisions and forecast of short term Euro rate with an adaptive fuzzy expert system.
European Journal of Operational Research, 143, pp. 363-381.
Rogoff, K., (1985). The optimal degree of commitment to an intermediate monetary target,
Quarterly Journal of Economics. C(4), pp. 1169-1190.
Sibert, A., (2003). Monetary Policy Committees: Individual and Collective Reputations.
Review of Economic Studies, 70(3), pp. 649-665.
Stanek, P., (2004). How to assess the enlargement reform of the European Central Bank,
Revue de l’Observatoire Français des Conjonctures Economiques. Special Issue: “The new
European Union Enlargement”, ed. Jérôme Creel & Sandrine Levasseur, Paris, April,
pp. 209-239.
Stanek, P., (2013). Theoretical aspects of collective decision making - survey of economic
literature. Comparative Economic Research, 16(1), pp. 103-122.
Thies, C. G., (2004). Individuals, institutions, and inflation: conceptual complexity, central
bank independence, and the Asian Crisis. International Studies Quarterly, 48(3), pp. 579-602.
Waller, C.J., (1992). A Bargaining Model of Partisan Appointments to the Central Bank.
Journal of Monetary Economics, XXIX, pp. 411-28.
Waller, C., (2000). Policy Boards and Policy Smoothing. Quarterly Journal of Economics, 115(1), pp. 305-339.
Walsh, C.E., (1995). Optimal Contracts for Central Bankers. American Economic Review, 85(1), pp. 150-67.
Walsh, C.E., (1995). Is New Zealand's Reserve Bank Act of 1989 an Optimal Central Bank
Contract?. Journal of Money, Credit and Banking, 27(4).

Part Part Part Part 2222
MMMMiiiicro Level of cro Level of cro Level of cro Level of
International International International International
CompetitivenessCompetitivenessCompetitivenessCompetitiveness


S u g g e s t e d C i t a t i o n :S u g g e s t e d C i t a t i o n :S u g g e s t e d C i t a t i o n :S u g g e s t e d C i t a t i o n : WWWWach, K.ach, K.ach, K.ach, K. (2014). The Theoretical Modelling of the Firm-Level International Competitiveness in Business Studies (chapter 5). In: KiendlKiendlKiendlKiendl----Wendner, D. Wendner, D. Wendner, D. Wendner, D. & Wach, K.Wach, K.Wach, K.Wach, K. (eds), International Competitiveness
in Visegrad Countries: Macro and Micro Perspectives. Graz: Fachhochschule Joanneum, pp. 101-124. 5555
The Theoretical Modelling of the FirmThe Theoretical Modelling of the FirmThe Theoretical Modelling of the FirmThe Theoretical Modelling of the Firm----Level Level Level Level International CompInternational CompInternational CompInternational Competitiveness in Business Studiesetitiveness in Business Studiesetitiveness in Business Studiesetitiveness in Business Studies
Krzysztof WachKrzysztof WachKrzysztof WachKrzysztof Wach
Cracow University of Economics Faculty of Economics and International Relations Department of Entrepreneurship and Innovation
ul. Rakowicka 27, 31-510 Kraków, Poland e-mail: [email protected]
Summary:Summary:Summary:Summary:
Competition, rivalry, competitiveness are manifested both when a firm operates on the domestic market and on the international market, but international competitiveness can also manifest itself in relation to domestic businesses which are forced to compete on the local market with foreign competitors or even with global players. It is determined by the degree of internationalisation of the industry in which a given firm functions, among others, but most of all by the scope, that is the territorial extent of the firm internationalisation. The aim of the paper is a specific diagnosis of the modelling of the firm-level international competitiveness available in the literature, integrating the output of economics and management studies. In order to achieve the assumed goal, literature study as well as the criticism of literature on the analysed research strand was used. Initially, competition and competitiveness were analysed from the perspective of economics, however, recent decades have brought extreme intensification of the research into competitiveness of a firm, conducted mainly from the perspective of management studies. In firm-level competitiveness modelling, the process paradigm of building competitiveness is most frequently adapted, which consists of a four-element sequence: competitive potential, competitive advantage and its sources, competitive strategies and actions, and competitive position. International competitiveness of a firm concerns not only internationalised businesses, but also local firms whose the competitors are foreign entities. In the literature of the subject there is a whole spectrum of various models which try to explain the issue of international competitiveness of a firm, but the classical ones base more on organisational and managerial factors, and the latest ones on the dynamic entrepreneurial competences and organisational learning.
KeywordsKeywordsKeywordsKeywords: international competitiveness, corporate growth, internationalisation JEL classificationJEL classificationJEL classificationJEL classification: D21, F23, L21, L26, M16
* Modelling of is used in the epistemological meaning as discussed by McCarthy (2004).

102102102102 Krzysztof Wach
5555.1. .1. .1. .1. INTRINTRINTRINTROOOODUCTORY REMARKSDUCTORY REMARKSDUCTORY REMARKSDUCTORY REMARKS
Competition, competing, competitiveness are manifested both when a firm operates in the domestic market and in the international market, but international competitiveness can also manifest itself in relation to domestic businesses which are forced to compete in the local market with foreign competitors or even with global players. It is determined, as R.M. Gant (2005, p. 412) or C.A. Solberg (1997, p. 11) confirm, by the degree of internationalisation of the industry in which a given firm functions (Wach, 2014, pp. 19-20), among others, but most of all by the scope, that is the territorial extent of the firm internationalisation.
The aim of the paper is a specific diagnosis of the modelling of the firm-level international competitiveness (international microinternational microinternational microinternational micro----competitivenesscompetitivenesscompetitivenesscompetitiveness) available in the literature, integrating the output of economics and management studies. In order to achieve the assumed goal, literature study as well as the criticism of literature on the analysed research strand was used.
5555.2. .2. .2. .2. COMPETITION AND COMPCOMPETITION AND COMPCOMPETITION AND COMPCOMPETITION AND COMPETITIVENESSETITIVENESSETITIVENESSETITIVENESS IN BUSINESS STUDIESIN BUSINESS STUDIESIN BUSINESS STUDIESIN BUSINESS STUDIES1
The classical theory of economics considers competition the basic mechanism of a market economy. Most frequently, in the literature of the subject it is assumed that competition is rivalry among participants of a given market play, and depending on a market entity. W. Redmon (2013, pp. 423-446) distinguishes three kinds of competition in the theory of economics, namely type 1 horizontal competition which occurs between producers or vendors, vertical competition occurring between a vendor or a producer and a buyer, as well as type 2 horizontal competition which occurs between buyers. Following M.J. Stankiewicz (2005, p. 18), we can adopt a very general definition of competition as “a phenomenon the participants of which rival with one another in the strive for analogous goals, which means that activities undertaken by some of them to achieve specific goals hinder (and sometimes even prevent from) achieving the same goals by others”. Similarly, J.W. Bossak and W. Bieńkowski (2004, p. 17) define economic competition as “rivalry of entities, aiming at achieving benefits related to business activities in the domestic and international market”.
Initially, competition was examined from the point of view of the whole economy, only later the theory of competition was started to be referred to the functioning of a firm, at the beginning in economics, and then in management studies (Cho et al., 2002). The first significant contribution towards building theoretical bases for the functioning of competitive markets in the theory of
1 Business studies are understood broadly as both business economics and business management.

The Theoretical Modelling of the Firm-Level International Competitiveness in … 103103103103
economics, that is the economic fundamentals of competitive play in the market was brought by A. Smith ([1776] 1812). Not only did he examine the mechanisms of market competition, but he also described them with much greater accuracy than his predecessors. The general theory of competition was then developed by D. Ricardo, T. Malthus, or J.S. Mill, among others. In the neo-classical economics and in post-Keynesian theories, owing to A.A. Cournot (1897, p. 60), competition from the point of view of the subjective structure of the market is analysed in theoretical models, distinguishing perfect competition, imperfect competition (monopolistic competition), pure monopoly competition and oligopolistic competition (including its special case - duopolistic competition). Economic models of competition, namely the forms of market rivalry are discussed from the point of view of the theory of price, and as I. Kirzner ([1973]2010, p. 17) observes, the feature connecting all the economic models of competition is generally disregarding the role of an entrepreneur and entrepreneurship, which means that it is not analysed on the internal level of a firm, but it is only a notion related exclusively to the market exchange.
It is only to so-called alternative concepts that economics owes the formation of a mature theory of business competitiveness (Rosińska-Bukowska, 2012, p. 81), which not only derived both from the classical economics and the later streams, but fist of all introduced a dynamic aspect of the competition process analysis (Maślak, 2002, p. 39), and primarily combined two complementary theoretical approaches developed in economics and in management studies. Competitiveness is not a univocal notion and is defined in various ways in the literature of the subject. For example, M.J. Stankiewicz (2005, p. 36) defines competitiveness as “an ability to accomplish goals efficiently on the market arena of competition”. Still differently competitiveness is defined by J. Zagórski (1947, p. 4), for whom it is “the choice of the most favourable interchangeable conditions ensuring the maximum real income to a given individual”. Z. Pierścionek (2003, p. 164) observes that „in its general sense, it is closest to the notion of economic efficiency - used in the economics, and efficiency and effectiveness - used in management studies”. Therefore, distinguishing those two co-dependent notions (competition, competitiveness), on a high level of generalisation we should claim that competitiveness is an ability to compete to which the functional meaning of competitiveness should be assigned. In other words, competitiveness is a quality of entities operating in the conditions of competition.
When conducting a theoretical and pragmatic analysis, on one hand combining the pragmatic aspects of firms competing in the market and their theoretical modelling in the theory of economics, A. Noga (2009, pp. 253-279) in the retrospective approach distinguishes five waves of competition, as he defines it himself. The Harvard school represents the first wave of competition for which the attention was paid on the level of production and sales concentration, which limited market competition. Contradictory views can be found with representatives of the

104104104104 Krzysztof Wach
Chicago school who sought the sources of competitiveness in the use of economies of scale and economies of scope. The third wave of competition was related to the development of strategic management in 1960s, 1970s and 1980s, which articulated an effort of a particular firm in forming its competitive strategy. The theory of contestable markets, developed since the early 1980s, is related to the advent of the fourth wave of competition.
Table 5.1.Table 5.1.Table 5.1.Table 5.1. Typologisation of the types of competitiveness Classification criterionClassification criterionClassification criterionClassification criterion Types of competitivenessTypes of competitivenessTypes of competitivenessTypes of competitiveness
An entity participating in the rivalry
competitiveness of economies competitiveness of sectors, industries and sections competitiveness of firms
Territorial scope of rivalry domestic competitiveness international competitiveness
Industrial scope of rivalry intra-industry competitiveness inter-industry competitiveness * * * competitiveness on the market of a specific type of goods competitiveness on the market of specific products competitiveness on the market of specific segments * * * competitiveness on the market of specific types of resources competitiveness on the market of specific resources
Criterion of an action or consequences
factor-based competitiveness result-based competitiveness
Winning resources or sales demand-based competitiveness (on the outputs) supply-based competitiveness (on the inputs)
Range of assessment operating competitiveness system competitiveness
Moment of assessment ex post competitiveness ex ante competitiveness
Time of observation static competitiveness dynamic competitiveness
Way of rivalry price competitiveness quality competitiveness information competitiveness
Source: own study based on Stankiewicz (2005, pp. 37-40).
The authors of this theory created a very general theory of competition for which neither the dispersion nor the concentration are per se a condition of competition but their optimum levels are various for individual markets, and only their proper structure can enable to achieve higher effectiveness. R.A. D’Aveni and R. Gunther
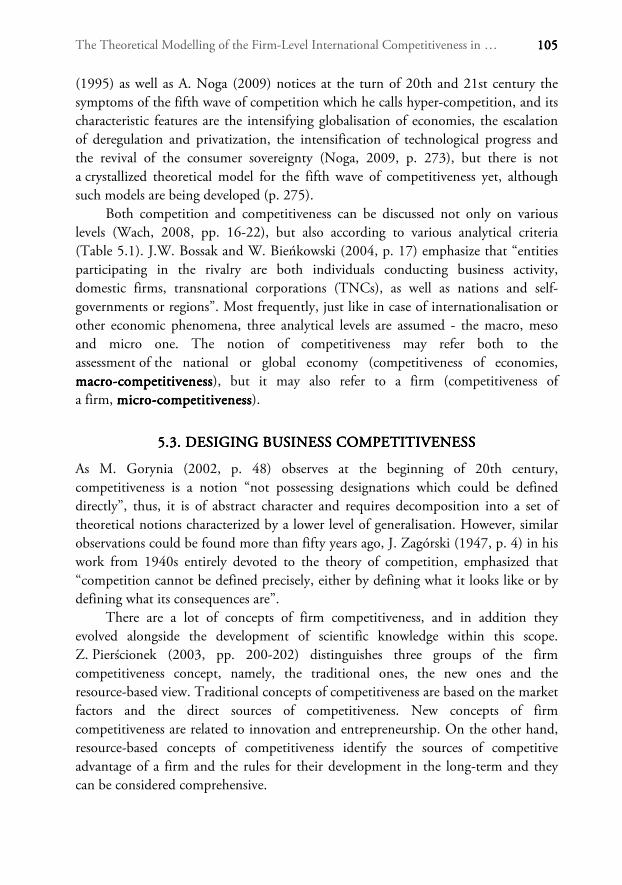
The Theoretical Modelling of the Firm-Level International Competitiveness in … 105105105105
(1995) as well as A. Noga (2009) notices at the turn of 20th and 21st century the symptoms of the fifth wave of competition which he calls hyper-competition, and its characteristic features are the intensifying globalisation of economies, the escalation of deregulation and privatization, the intensification of technological progress and the revival of the consumer sovereignty (Noga, 2009, p. 273), but there is not a crystallized theoretical model for the fifth wave of competitiveness yet, although such models are being developed (p. 275).
Both competition and competitiveness can be discussed not only on various levels (Wach, 2008, pp. 16-22), but also according to various analytical criteria (Table 5.1). J.W. Bossak and W. Bieńkowski (2004, p. 17) emphasize that “entities participating in the rivalry are both individuals conducting business activity, domestic firms, transnational corporations (TNCs), as well as nations and self-governments or regions”. Most frequently, just like in case of internationalisation or other economic phenomena, three analytical levels are assumed - the macro, meso and micro one. The notion of competitiveness may refer both to the assessment of the national or global economy (competitiveness of economies, macromacromacromacro----competitivenesscompetitivenesscompetitivenesscompetitiveness), but it may also refer to a firm (competitiveness of a firm, micromicromicromicro----competitivenesscompetitivenesscompetitivenesscompetitiveness).
5.5.5.5.3333. . . . DESIGINGDESIGINGDESIGINGDESIGING BUSINESS COMPETITIVEBUSINESS COMPETITIVEBUSINESS COMPETITIVEBUSINESS COMPETITIVENESSNESSNESSNESS
As M. Gorynia (2002, p. 48) observes at the beginning of 20th century, competitiveness is a notion “not possessing designations which could be defined directly”, thus, it is of abstract character and requires decomposition into a set of theoretical notions characterized by a lower level of generalisation. However, similar observations could be found more than fifty years ago, J. Zagórski (1947, p. 4) in his work from 1940s entirely devoted to the theory of competition, emphasized that “competition cannot be defined precisely, either by defining what it looks like or by defining what its consequences are”.
There are a lot of concepts of firm competitiveness, and in addition they evolved alongside the development of scientific knowledge within this scope. Z. Pierścionek (2003, pp. 200-202) distinguishes three groups of the firm competitiveness concept, namely, the traditional ones, the new ones and the resource-based view. Traditional concepts of competitiveness are based on the market factors and the direct sources of competitiveness. New concepts of firm competitiveness are related to innovation and entrepreneurship. On the other hand, resource-based concepts of competitiveness identify the sources of competitive advantage of a firm and the rules for their development in the long-term and they can be considered comprehensive.

106106106106 Krzysztof Wach
A significant concept formulation was proposed by G.S. Day (1997, pp. 52-54) suggesting a cycle of strengthening firm competitiveness (continuous cycle of the creation and maintenance of advantages) basing on the sources of competitiveness (sources of positional advantages) and the competitive position (position of competitive superiority). Among others, the concept was used to model the competitiveness structure by M.J. Stankiewicz (2005, p. 89), or J. Światowiec-Szczepańska (2011, pp. 310-311). The firm competitiveness structure model is based on five structural elements of the competitiveness management process, which constitute a kind of sub-systems of the firm competitiveness system (Bednarz, 2013, p. 25), among which cause and effect relationships occur (Figures 5.1-5.2). These are: competitive potential, competitive actions, competitive strategy, competitive position (Stankiewicz, 2005, pp. 89-91). They constitute a logical sequence of modelling of firm competitiveness defined by M. Rosińska-Bukowska (2012, p. 97) as firm competitiveness in the systematic formulation which basically has a well-established position in the literature of the subject, and numerous experts in the subject refer in their considerations to exactly this logics of firm competitiveness modelling. In his early works, M. Gorynia (Gorynia, 2000, pp. 48-67; 2002, pp. 48-68; Gorynia, Jankowska, pp. 51-77; Gorynia 2009, pp. 67-99) applied an authorial approach to the modelling of firm competitiveness, rooted, as one might conclude - in economics, but in his latest work (Gorynia, Jankowska, Tarka, 2011, pp. 19-43; Dzikowska, Gorynia, 2012, pp. 1-30) he uses precisely these four notions (potential, superiority, strategy with actions and position) for the modelling of an eclectic, as he names it, concept of firm competitiveness, in accordance with the modelling of this issue in management studies, and to be more exact, strategic management, established as early as in 1990s.
CompetitiveCompetitiveCompetitiveCompetitive potentialpotentialpotentialpotential determines an ability of a firm to participate in the market play, and includes the entirety of tangible and intangible resources of a firm (Figure 5.3), and M. Gorynia broadly completes with all kinds of organisational factors (among others, organisational structure, organisational culture) (Gorynia, Jankowska, 2008, p. 69). On the other hand, G. Głód (2010, p. 65) stresses that the development of resource-based competitiveness concepts of an entrepreneurial character was noticeable in 1980s and 1990s, and their dynamic bloom is still continuing (capabilities-based competition, distinctive capabilities, core competences, entrepreneurial skills and competencies). Competitive potential is strictly dependant not only on the size of a firm but also on the scope of its activities. The potential of firms operating on local markets is different than of those which operate on international markets. B. Godziszewski (1999, pp. 79-82) proposes structuring of competitive potential, considering its 11 functional areas of resources (information, research and development, manufacturing, quality management, logistics, distribution, marketing, finances, organisation and leadership, human

The Theoretical Modelling of the Firm-Level International Competitiveness in … 107107107107
resources, intangibles resources), within which as many as 91 components were distinguished. Building competitive potential must be discussed in the convention which is already commonplace in the literature: resources - capabilities - competences - core competences.
Figure 5.1. Figure 5.1. Figure 5.1. Figure 5.1. Business competition system according to M.J. Stankiewicz
Source: Stankiewicz (2005, p. 90).
Competitive
potential
of a firm
Sources of
competitive
advantage
necessary to compete
for a customer
Supply market
Strategies
and actions
necessary to compete
for a customer
Competitive
position
of a firm
as a seller
Competitive
position
of a firm
on the resource market
Strategies
and actions
necessary to compete
for resources
Sources of
competitive
advantage
necessary to compete
for resources
Competitive
potential
of a firmSales market
Figure 5.2. Figure 5.2. Figure 5.2. Figure 5.2. Business competition system according to J. Światowiec-Szczepańska Source: Światowiec-Szczepańska (2011, p. 311).

108108108108 Krzysztof Wach
Figure 5.3. Figure 5.3. Figure 5.3. Figure 5.3. Competitive potential in building the firm-level competitiveness Source: Rosińska-Bukowska (2012, p. 99).
Competitive advantageCompetitive advantageCompetitive advantageCompetitive advantage is defined in various ways by individual authors2 although it is W. Alderson (1937, pp. 189-190) who is considered to be the precursor of the notion. M.J. Stankiewicz (2005, p. 172) defines competitive advantage of a firm as “an ability to use competitive potential to the extent which is enabled by so effective generation of an attractive market offer and effective competitive actions that it ensures the creation of value added”. M.E. Porter ([1985]2006, p. 29) observes that “the source of competitive advantage is the value that a firm is able to work out for its customers”. Porter indicates two basic kinds of competitive advantages, namely cost advantage and differentiation advantage. Cost advantage occurs when a firm produces at the lowest cost of all the firms in the industry. There are a lot of reasons for cost leadership. It may be economies of scale, preferential access to raw materials, applied technology, or labour costs in case of international firms. On the other hand, differentiation advantage is based on uniqueness. The essence of differentiation is manifested in the uniqueness in the area of the business operations which is appreciated by customers. There are also numerous sources of differentiation advantage. For example, it may be the durability of a product, know-how or servicing. Interesting modelling of competitive advantage was proposed by Ph.A. Wickham (2006, pp. 494-499) who embedded his model in a broader context of strategic entrepreneurship (Figure 5.4).
2 The overview of the definitions can be found in the study of Stankiewicz, (2005, pp. 166-168).

The Theoretical Modelling of the Firm-Level International Competitiveness in … 109109109109
Figure 5.4. Figure 5.4. Figure 5.4. Figure 5.4. Sustainable competitive advantage from the perspective of strategic entrepreneurship
Source: own study based on Wickham (2006, pp. 494-499).
According to M.E. Porter ([1980]1992), competitive strategy constitutes a general formula on how the firm is going to compete, what its goals should be and what course of action will be needed to fulfil these goals. On the highest level of generalisation, Z. Pierścionek singles out four basic types of behaviours towards competitors, because the ways of locating a firm towards competitors can consist in (Pierścionek, 2003, p. 429): − confrontation, that is a conflict with competitors (a firm operates in the conditions
of aggressive competition, market struggle), − cooperation (a firm operates by agreement with competitors on the basis of
alliances, arrangements and/or agreements between competing firms), − adaptation, that is avoiding competitors (a firm adjusts its operations to the
competitors’ operations), − indifference, that is ignoring competitors (a firm operates independently of the
decisions and operations of the competitors).
Following M.J. Stankiewicz (2005, p. 89 and pp. 243-244) it should be assumed that competitive actionscompetitive actionscompetitive actionscompetitive actions3 (a competitive weapona competitive weapona competitive weapona competitive weapon) are measures which are intentionally created by a firm in order to win counterparties for the presented planned offer (Figure 5.5). They can be considered on two levels, as competitive
3 H. Gatignon and D. Reibstein (1997, p. 248) call them a competitive weapon

110110110110 Krzysztof Wach
actions to gain resources and competitive actions to win a customer. According to M. Haffer (1999, p. 52), competitive actions include, among others, the quality of products, price, advertising, assortment, promotion, scope of services, business image, brand, terms of payment. D. Aaker (1989, pp. 91-106) emphasizes that the choice of competitive actions and strategies performs a significant role in building and managing firm’s competitiveness.
Figure 5.5. Figure 5.5. Figure 5.5. Figure 5.5. The system of competitive actions and business competitiveness strategies Source: Rosińska-Bukowska (2012, p. 101).
Competitive positionCompetitive positionCompetitive positionCompetitive position is perceived differently in the literature of the subject. Firstly, competitive position may be understood as a source of advantage being achieved, that is the sum of strengths and weaknesses of a given firm (Strategor, [1997]1999, p. 68). Secondly, competitive position is treated as a result of competition (Gorynia, Jankowska, 2008, p. 70), namely as a measure of the achieved competitive advantage. Thirdly, competitive position is seen as a source, sign and measure of competitiveness at the same time (Stankiewicz 2005, p. 295). Competitive position as a result of competition may be perceived as: − dominating (leader on the market), − strong (top players on the market), − average (competing with difficulty), − poor (below average, bad or even no possibility of effective competition).

The Theoretical Modelling of the Firm-Level International Competitiveness in … 111111111111
As a group of French scientists, Strategor (1999, p. 76), emphasizes the stability of a firm competitive position is based on the durability of competitive advantage created or achieved by it.
The literature of the subject is rich in numerous model representations of firm competitiveness, which, to a greater or lesser extent use the components presented above. An interesting model of the competitive advantage composition is presented by H. Ma (2000, pp. 15-32), who, basing on the competitive potential and the public support, introduces two pejorative factors, namely an improper combination of advantages or even lost profits. On the other hand, R.A. D’Aveni and R. Gunther (1995) propose a firm competitiveness model based on the (already mentioned) concept of hyper-competition.
5.5.5.5.4444. . . . NATURE OF THE FIRMNATURE OF THE FIRMNATURE OF THE FIRMNATURE OF THE FIRM----LEVEL INTERNATIONAL LEVEL INTERNATIONAL LEVEL INTERNATIONAL LEVEL INTERNATIONAL COMPETITIVENESSCOMPETITIVENESSCOMPETITIVENESSCOMPETITIVENESS
Due to the subject of the considerations in this study, the attention will be focused on the problem of the firm-level international competitiveness, namely the micro-competitiveness in international markets. M. Gorynia stresses that it is necessary to distinguish competitiveness in the domestic market and on the international market because even an internationalised local business can compete with foreign competitors (Gorynia, 2009, pp. 61-62; Gorynia & Jankowska, 2001, pp. 54-55), nevertheless we can also analyse the issue of international business competitiveness (Bartha & Gubik, 2014). This specific nature comes down here to the scope of territorial competition, the generic mechanisms of competitiveness or competition are the same, just like the strategies of competition, although the international specific character is extremely important, as it is observed by M. Rosińska-Bukowska (2012, P. 103) “competitiveness in the era of globalisation means de facto international competitiveness, since achieving permanent advantage requires an ability to be competitive in the global business space”. M. Gorynia, B. Jankowska and P. Tarka (2013, p. 42) add that competitive advantage is often achieved by searching for new, undiscovered resources in new geographical areas and new markets. Expansion is understood quite simply here4, as occupying new territories, or expanding to new markets. During the expansion, firms, as G. Nizard ([1991]1998, p. 142) observes, resist the temptation to reach for easy solutions consisting in making superficial changes, and they daringly face the problems which accompany rapid shocks and deep changes. Expansion leads to the fast growth of a firm and the significant improvement of its situation in the environment.
4 More on the international growth, see: Wach (2012, pp. 68-69).

112112112112 Krzysztof Wach
Table 5.2.Table 5.2.Table 5.2.Table 5.2. The characteristics of four types of supranational competition International competitionInternational competitionInternational competitionInternational competition Multinational competitionMultinational competitionMultinational competitionMultinational competition
º competition limited to specific foreign markets,
º uneven distribution of competitors’ shares in foreign markets,
º competing with diverse offers produced in branches located in the countries of sales,
º using coordinated competitive moves by competitors,
º using research findings and competences of parent corporations transferred to foreign branches,
º implementing individual phases of technological process in branches located in different countries,
º concentrated strategic and operating decision taking in the seats of competing firms.
º competition limited to specific foreign markets,
º uneven distribution of competitors’ shares in foreign markets,
º competing with offers adjusted to the expectations of local markets, created in foreign branches located in the countries of sales,
º using independent competitive moves by individual foreign branches,
º using research findings of branches, as well as knowledge and skills transferred from parent corporations by competitors,
º decentralised operating decision taking in foreign branches with pressure on decentralisation of strategic decisions.
Global competitionGlobal competitionGlobal competitionGlobal competition Transnational competitionTransnational competitionTransnational competitionTransnational competition º the world-wide scope of competition, º the strive competes to the even shares in
foreign markets, º competing with homogenous offers
created and produced in the concentrated way, most often in the native countries of the competitors,
º using coordinated adjacent moves by rivals,
º using the sources of concentrated resources in selected countries by rivals,
º concentrated strategic and operating decisions in the rivals’ seats.
º the world-wide scope of competition, º the strive competes the even shares in
foreign markets, º competing with offers adjusted to the
expectations of local markets assembled in foreign branches,
º using parts and sub-assemblies produced in the concentrated way most often in the native countries of the rivals,
º using key competences created by the transfer of knowledge and skills created between headquarters and all foreign branches by the rivals,
º concentrating strategic decision taking in the centres and decentralisation of operating decisions.
Source: Haffer (2006, p. 47).
An interesting concept of corporate growth is proposed by Ch. Zook (2004, p. 37), basing development on adjacency moves in six different dimensions, namely: − expansion to new geographical territories (local expansion, global expansion),

The Theoretical Modelling of the Firm-Level International Competitiveness in … 113113113113
− expansion through a new channel (distribution channel, Internet channels, indirect channel),
− expansion to new segments of customers (micro-segmentation of the existing segments, unexplored segments, new segments),
− expansion through new products (another generation of products, after-sales services, complementary goods, absolute novelties),
− expansion through new activities (needs not known before, new substitutes, new models),
− expansion to new levels of value chain (through shifting value chain up and down, and the development of external sales opportunities).
Adjacency moves in the territorial (geographical) dimension, both on the domestic and the global market, are, according to Zook, an underestimated move determining the further growth of a firm and its competitiveness.
As M. Ma and M. Liao (2006, p. 22-23) emphasize, the studies into the international competitiveness of firms is a sign of the emergence of three research areas: − research into competitive strategies (embedded in strategic management), − research into the internationalisation process of a firm (embedded in the theory of
internationalisation and in the theory of international business), − research into export behaviours and strategic behaviours of exporters (embedded in
the theory of competitiveness and the theory of organisational behaviours).
Basing on the output of those three research strands (mostly embedded in management studies), the foundations of a comprehensive theory of the firm international competitiveness (international micro-competitiveness) are being created, combining innovative capabilities, skills, as well as entrepreneurial and managerial competences and sources of competitive advantage.
Basing on the four models of internationalisation strategy by Ch.A. Bartlett and S. Goshal (international, multinational, transnational, global), (Daszkiewicz & Wach, 2013, pp. 111-114), M. Haffer (2006, pp. 47-53) propose a modified concept of the four main types of supranational competition: international, multinational, transnational, global (Table 5.2).
5.5.5.5.5555. . . . SELECTED MODELS OF ISELECTED MODELS OF ISELECTED MODELS OF ISELECTED MODELS OF INTERNATIONALNTERNATIONALNTERNATIONALNTERNATIONAL COMPETITIVENESS OF TCOMPETITIVENESS OF TCOMPETITIVENESS OF TCOMPETITIVENESS OF THE FIRMHE FIRMHE FIRMHE FIRM
While studying the literature, we can come across numerous models of both competitiveness of a firm and the firm-level international competitiveness. The study presents four selected models which are interesting because of the possibility of their implementation in the empirical research and because of combining two

114114114114 Krzysztof Wach
variables - internationalisation of the firm and competitiveness of the firm. What is also worth mentioning is a very interesting tri-element theoretical model verified by the empirical research with the use of a survey method, which was proposed by M. Gorynia and B. Jankowska (2013, pp. 106-109), combining the introduction of euro as an independent variable as well as internationalisation of the firm and competitiveness of the firm as dependent variables.
M. Ma and M. Liao (2006, pp. 24-25) perceive an opportunity for the increase or development of firm-level international competitiveness thanks to innovation, research and development, and the lack of them is identified by them with the loss of competitiveness. They build their model around the assumptions of the resource-based view (RBV) developed in strategic management putting resources and competences in the first place. The three factors distinguished by them are co-dependent, and these are: managerial capabilities, resources exploitation capabilities, technological capabilities (Figure 5.6).
Figure 5.6. Figure 5.6. Figure 5.6. Figure 5.6. Determinants of firm’s international competitiveness according to M. Ma and M. Liao
Source: Ma & Liao (2006, p. 25).
P.J. Buckly et al. (1988) focus on measures while building the firm-level model of competitiveness and then international competitiveness. They emphasize that competitiveness is a very complex issue need a very complex measuring system, thus they propose three measuring components (Figure 5.7) taking into special consideration the international issues (Buckly et al., 1988, p. 1979):

The Theoretical Modelling of the Firm-Level International Competitiveness in … 115115115115
− competitive performance (the total international performance in respect of all sales: exporting sales arising from foreign investment and licensed sales must be built into the measures),
− competitive potential (the potential of the parent company and all foreign affiliates must be taken into consideration if total potential is to be assessed),
− competitive process (the management process within the parent company and foreign affiliates and between the parent company and its foreign affiliates must be considered).
Figure 5.7. Figure 5.7. Figure 5.7. Figure 5.7. Firm-Level competitiveness model of P.J. Buckley et al. Source: Buckley, Pass, & Prescott (1988, p. 178).
As T.W.Y. Man et al. (2002) notice a similar framework to Buckley’s three-measures model of competitiveness can be found in the World Competitiveness Report, which uses ‘‘world competitiveness formula,’’ or simple ‘‘world competitiveness’’ (Figure 5.8) understood as a combination of assets (competitive potential), which are inherited or created, as well as processes (competitive process), which transform assets into economic results (competitive performance). What is more, they stress that competitiveness must be discussed and observed in the long run and especially in relational configuration (Figure 5.9) taking

116116116116 Krzysztof Wach
the sustainable competitive advantage (characteristics of the competitiveness address) into special consideration. The whole process is determined by numerous and multidimensional external and internal constructs including the business external environment, the internal resources and performance indicators as well as the entrepreneur (Man et al., 2002, pp. 130-131). They do believe that entrepreneurial competences (such as opportunity competences, relationship competencies, conceptual competencies, organizing competences, strategic competencies, commitment competences) play crucial and leading role in building competitiveness and competitive advantage of a firm (Man et al., 2002, p. 134).
Figure 5.8. Figure 5.8. Figure 5.8. Figure 5.8. Firm-level world competitiveness formula model Source: Man, Lau & Chan (2002, p. 127).
Figure 5.9. Figure 5.9. Figure 5.9. Figure 5.9. Relational model of firm-level international competitiveness Source: Man, Lau & Chan (2002, p. 131).
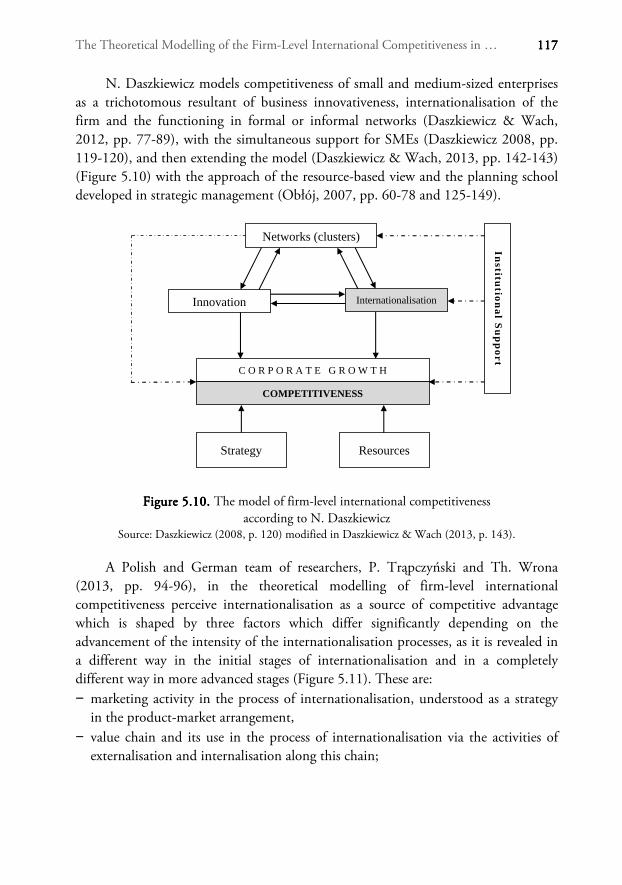
The Theoretical Modelling of the Firm-Level International Competitiveness in … 117117117117
N. Daszkiewicz models competitiveness of small and medium-sized enterprises as a trichotomous resultant of business innovativeness, internationalisation of the firm and the functioning in formal or informal networks (Daszkiewicz & Wach, 2012, pp. 77-89), with the simultaneous support for SMEs (Daszkiewicz 2008, pp. 119-120), and then extending the model (Daszkiewicz & Wach, 2013, pp. 142-143) (Figure 5.10) with the approach of the resource-based view and the planning school developed in strategic management (Obłój, 2007, pp. 60-78 and 125-149).
Figure 5.10. Figure 5.10. Figure 5.10. Figure 5.10. The model of firm-level international competitiveness according to N. Daszkiewicz
Source: Daszkiewicz (2008, p. 120) modified in Daszkiewicz & Wach (2013, p. 143).
A Polish and German team of researchers, P. Trąpczyński and Th. Wrona (2013, pp. 94-96), in the theoretical modelling of firm-level international competitiveness perceive internationalisation as a source of competitive advantage which is shaped by three factors which differ significantly depending on the advancement of the intensity of the internationalisation processes, as it is revealed in a different way in the initial stages of internationalisation and in a completely different way in more advanced stages (Figure 5.11). These are: − marketing activity in the process of internationalisation, understood as a strategy
in the product-market arrangement, − value chain and its use in the process of internationalisation via the activities of
externalisation and internalisation along this chain;
Innovation Internationalisation
C O R P O R A T E G R O W T H
Institu
tion
al S
up
po
rt
Networks (clusters)
COMPETITIVENESS
Strategy Resources
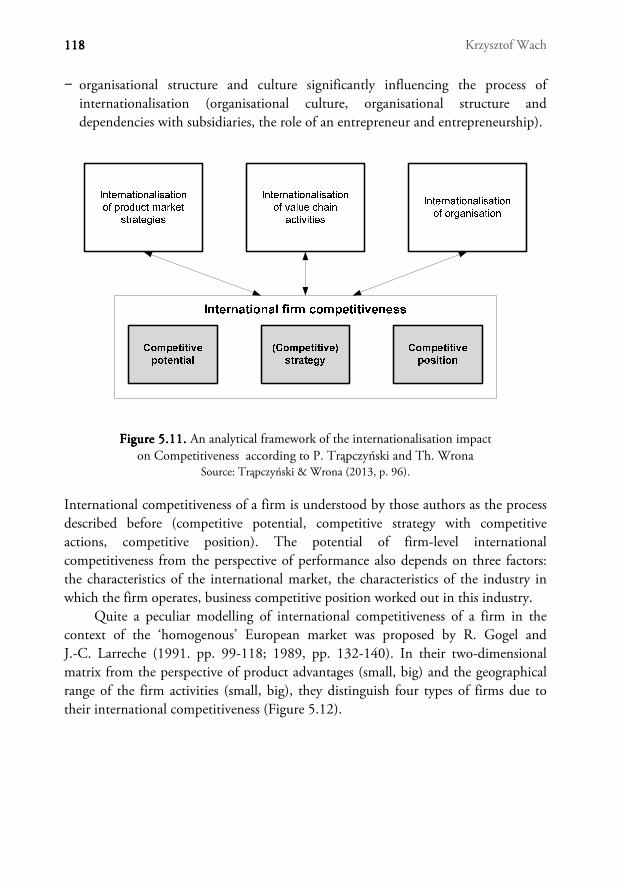
118118118118 Krzysztof Wach
− organisational structure and culture significantly influencing the process of internationalisation (organisational culture, organisational structure and dependencies with subsidiaries, the role of an entrepreneur and entrepreneurship).
FigureFigureFigureFigure 5.11. 5.11. 5.11. 5.11. An analytical framework of the internationalisation impact on Competitiveness according to P. Trąpczyński and Th. Wrona
Source: Trąpczyński & Wrona (2013, p. 96).
International competitiveness of a firm is understood by those authors as the process described before (competitive potential, competitive strategy with competitive actions, competitive position). The potential of firm-level international competitiveness from the perspective of performance also depends on three factors: the characteristics of the international market, the characteristics of the industry in which the firm operates, business competitive position worked out in this industry.
Quite a peculiar modelling of international competitiveness of a firm in the context of the ‘homogenous’ European market was proposed by R. Gogel and J.-C. Larreche (1991. pp. 99-118; 1989, pp. 132-140). In their two-dimensional matrix from the perspective of product advantages (small, big) and the geographical range of the firm activities (small, big), they distinguish four types of firms due to their international competitiveness (Figure 5.12).
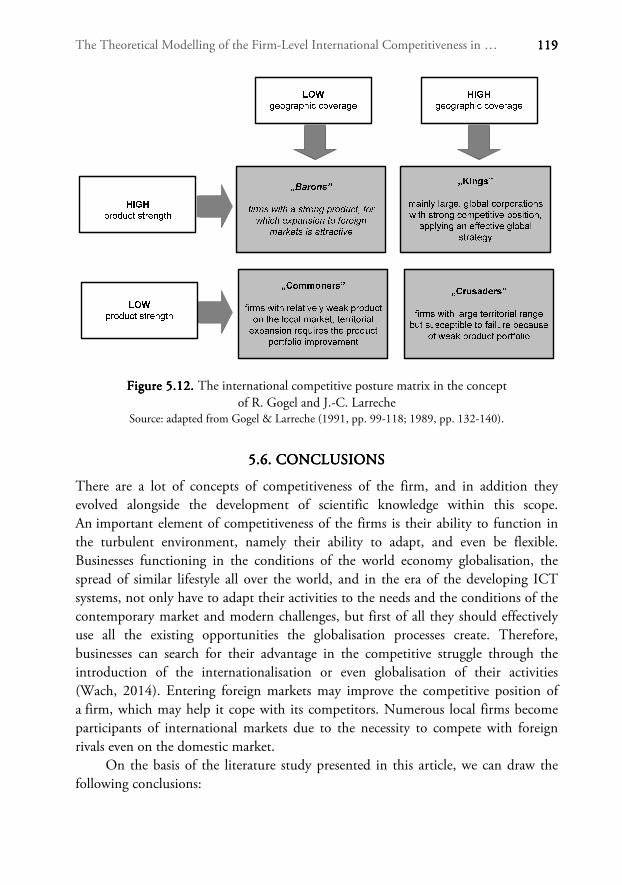
The Theoretical Modelling of the Firm-Level International Competitiveness in … 119119119119
Figure 5.12. Figure 5.12. Figure 5.12. Figure 5.12. The international competitive posture matrix in the concept of R. Gogel and J.-C. Larreche
Source: adapted from Gogel & Larreche (1991, pp. 99-118; 1989, pp. 132-140).
5.5.5.5.6666. . . . CONCLUSIONSCONCLUSIONSCONCLUSIONSCONCLUSIONS
There are a lot of concepts of competitiveness of the firm, and in addition they evolved alongside the development of scientific knowledge within this scope. An important element of competitiveness of the firms is their ability to function in the turbulent environment, namely their ability to adapt, and even be flexible. Businesses functioning in the conditions of the world economy globalisation, the spread of similar lifestyle all over the world, and in the era of the developing ICT systems, not only have to adapt their activities to the needs and the conditions of the contemporary market and modern challenges, but first of all they should effectively use all the existing opportunities the globalisation processes create. Therefore, businesses can search for their advantage in the competitive struggle through the introduction of the internationalisation or even globalisation of their activities (Wach, 2014). Entering foreign markets may improve the competitive position of a firm, which may help it cope with its competitors. Numerous local firms become participants of international markets due to the necessity to compete with foreign rivals even on the domestic market.
On the basis of the literature study presented in this article, we can draw the following conclusions:
120120120120 Krzysztof Wach
1. Initially, competition and competitiveness were analysed from the perspective of economics, however, recent decades have brought extreme intensification of the research into competitiveness of a firm, conducted mainly from the perspective of management studies.
2. In firm-level competitiveness modelling, the process paradigm of building competitiveness is most frequently adopted, which consists of a four-element sequence: competitive potential, competitive advantage and its sources, competitive strategies and actions, and competitive position.
3. Firm-level international competitiveness is operationalised in the same dimensions as micro-competitiveness en bloc, yet with focus on the specific character of the territorial range of its activities.
4. International competitiveness of a firm concerns not only internationalised businesses, but also local firms whose the competitors are foreign entities.
5. The mechanisms of international competition of firms are very diverse and their choice depends on the adopted strategy and the range of the territorial expansion. We can distinguish four specificities of supra-national competition: international, multinational, trans-national and global.
6. In the literature of the subject there is a whole spectrum of various models which try to explain the issue of international competitiveness of a firm, but the classical ones base more on organisational and managerial factors (e.g. value chain, marketing activities, resource potential, competitive strategies), and the latest ones on the dynamic entrepreneurial competences and organisational learning.
REFERENCESREFERENCESREFERENCESREFERENCES
Aaker, A. (1989). Managing Assets and Skills. The Key to a Sustainable Competitive Advantage. California Management Review, 31(2).
Aldreson, W. (1937). A Marketing View of Competition, The Journal of Marketing, 1(3).
Bartha, Z. & Gubik, A.S. (2014). Specifics of International Business Competitiveness in Visegrad Countries – Qualitative Analysis of Selected Case Studies (chapter 7). In: Duréndez, A. & Wach, K. (eds.), Patterns of Business Internationalisation in Visegrad
Countries – In Search for Regional Specifics. Cartagena: Universidad Politécnica de Cartagena.
Bednarz, J. (2013). Konkurencyjność polskich przedsiębiorstw na rynkach europejskich na
przykładzie wybranych branż, Gdańsk: Wydawnictwo Uniwersytetu Gdańskiego .
Bossak, J.W. & Bieńkowski W. (2004). Międzynarodowa zdolność konkurencyjna kraju
i przedsiębiorstw. Wyzwania dla Polski na progu XXI wieku, Warszawa: Oficyna Wydawnicza Szkoły Głównej Handlowej .

The Theoretical Modelling of the Firm-Level International Competitiveness in … 121121121121
Buckley, P.J., Pass, C.L. & Prescott, K. (1988). Measures of International Competitiveness: A Critical Survey. Journal of Marketing Management, 4(2), pp. 175–200.
Cournot, A.A. (1897). Researches into the Mathematical Principles of the Theory of Wealth,
New York NY: A.M. Kelley.
D’Aveni, R.A. & Gunther, R. (1995). Hipercompetitive Rivalries: Competing in Highly
Dynamic Environments, New York, NY: Free Press.
Daszkiewicz, N. (2008). Konkurencyjność małych i średnich przedsiębiorstw w procesie
internacjonalizacji (chapter 6) In: Daszkiewicz, N. (ed.), Konkurencyjność. Poziom
makro, mezo i mikro, Warszawa: PWN.
Daszkiewicz, N. & Wach, K. (2012). Internationalization of SMEs: Context, Models and
Implementation, Gdańsk: Gdańsk University of Technology Publishers.
Daszkiewicz, N. & Wach, K. (2013). Małe i średnie przedsiębiorstwa na rynkach
międzynarodowych. Kraków: Wydawnictwo Uniwersytetu Ekonomicznego w Krakowie.
Day, G.S. (1997). Marinating the Competitive Edge: Creating and Sustaining Advantages in Dynamic Competitive Environments. In: G.S. Day, D.J. Reibstein & R.E. Gunther (eds),Wharton on Dynamic Competitive Strategy, New York, NY: John Wiley & Sons Inc.
Dzikowska, M. & Gorynia, M. (2012). Teoretyczne aspekty konkurencyjności przedsiębiorstwa – w kierunku koncepcji eklektycznej?, Gospodarka Narodowa, vd. LXXX/XXI, no. 4(248).
Flak, O. & Głód, G. (2009). Konkurencyjność przedsiębiorstwa. Pojęcia, definicje, modele,
Katowice: Wydawnictwo Akademii Ekonomicznej w Katowicach.
Cho, D.-S. & Moon, H.-Ch. (eds). (2002). From Adam Smith to Michael Porter: Evolution of
Competitiveness Theory. London: World Scientific Publishing.
Gatignon, H. & Reibstein, D.J. (1997). Creative Strategies for Responding to Competitive Actions. In: G.S. Day and D.J. Reibstein (eds.), Wharton on Dynamic Competitive
Strategy, New York, NY: John Wiley and Sons.
Głód, G. (2010). Konkurencyjność i budowanie przewagi konkurencyjnej przedsiębiorstwa
(chapter 3), In: T. Kraśnicka (ed.), Przywództwo a konkurencyjność organizacji
przedsiębiorczych, Katowice: Wydawnictwo Akademii Ekonomicznej w Katowicach.
Godziszewski, B. (1999). Potencjał konkurencyjności przedsiębiorstwa jako źródło przewag
konkurencyjnych i podstawa stosowanych instrumentów konkurowania In: M.J. Stankiewicz (ed.), Budowanie potencjału konkurencyjności przedsiębiorstwa,
Toruń: TNOiK.
Gogel, R. & Larreche, J.-C. (1989). The Battlefield for 1992: Product Strength and Geographic Coverage. European Management Journal, 7(2), pp. 132-140.
Gogel, R. & Larreche, J.-C. (1991). Pan-European Marketing: Combining Product Strength and Geographical Coverage. In: S.G. Makridakis, San Francisco (eds), Single Market
Europe: Opportunities and Challenges for Business. CA: Jossey-Basspp, pp. 99-118.

122122122122 Krzysztof Wach
Gorynia, M. (2000). Luka konkurencyjna w przedsiębiorstwach a przystąpienie do Unii Europejskiej. Gospodarka Narodowa, 10.
Gorynia, M. (2002). Konkurencyjność przedsiębiorstwa – próba modelu (sub-chapter 1.5) In: M. Gorynia (ed.), Luka konkurencyjna na poziomie przedsiębiorstwa a przystąpienie
Polski do Unii Europejskiej, Implikacje dla strategii firm i polityki gospodarczej. Poznań: Wydawnictwo AE w Poznaniu.
Gorynia, M. (2002). Pojęcie konkurencyjności – istota i poziomy In: M. Gorynia (ed), Luka
konkurencyjna na poziomie przedsiębiorstwa a przystąpienie Polski do Unii Europejskiej. Poznań: Wydawnictwo Akademii Ekonomicznej w Poznaniu.
Gorynia, M. (2009). Konkurencyjność w ujęciu mikroekonomicznym (chapter 3) In: M. Gorynia, E. Łaźniewska,Kompendium wiedzy o konkurencyjności (eds). Warszawa: PWN .
Gorynia, M. & Jankowska B. (2008). Klastry a międzynarodowa konkurencyjność
i internacjonalizacja przedsiębiorstwa. Warszawa: Difin.
Gorynia, M., Jankowska B. & Tarka P. (2013). Basic concepts of company competitiveness
(chapter 1) In: M. Gorynia, B. Jankowska (eds), The Influence of Poland’s Accession to the
Euro Zone on the International Competitiveness and Internationalisation of Polish Companies. Warsaw: Difin
Grant, R.M. (2005). Contemporary Strategy Analysis, Chichester: John Whiley & Sons.
Haffer, M. (1999). Instrumenty konkurowania In: M.J. Stankiewicz (ed.), Budowanie
potencjału konkurencyjności przedsiębiorstwa. Toruń: TNOiK.
Haffer, M. (2006). Ogólna charakterystyka współczesnej konkurencji międzynarodowej (chapter 1) In: M.J. Stankiewicz (ed.), Zarządzanie wiedzą jako kluczowy czynnik
międzynarodowej konkurencyjności przedsiębiorstwa. Toruń: TNOiK, pp. 47-53.
Kirzner, I. (1973). Competition and Entrepreneurship. Chicago: University of Chicago.
Ma, H. (2000). Competitive Advantage and Firm Performance. Competitiveness Review, 10(2), pp. 15-32.
Ma, M. & Liao M. (2006). A Firm-Level Study on the International Competitiveness: Theoretical Analysis and Empirical Findings. International Journal of Innovation and
Technology Management, 3(1), pp. 22-23.
McCarty, W. (2014). Modeling: A Study in Words and Meanings (chapter 19). In: S. Schreibman, R. Siemens, J. Unsworth (eds), A Companion to Digital Humanities. Oxford: Blackwell.
Man, T.W.Y., Lau, Th. & Chan, K.F. (2002). The competitiveness of small and medium enterprises: A conceptualization with focus on entrepreneurial competencies. Journal of
Business Venturing, 17, pp. 123–142.
Maślak, E. (2002). Koncepcje konkurencji w naukach ekonomicznych In: M. Gorynia (ed.), Luka konkurencyjna na poziomie przedsiębiorstwa a przystąpienie Polski do Unii
Europejskiej. Poznań: Wyd. AE w Poznaniu.
The Theoretical Modelling of the Firm-Level International Competitiveness in … 123123123123
Nizard, G. (1998). Metamorfozy przedsiębiorstwa. Zarządzanie w zmiennym otoczeniu
organizacji (Les métamorphoses de l'entreprise. Pour une écologie du management, Paris: Economica). Warszawa: PWN.
Noga, A. (2009). Teorie przedsiębiorstw. Warszawa: PWE.
Obłój, K. (2007). Strategia organizacji. Warszawa: PWE.
Pierścionek, Z. (2003). Strategie konkurencji i rozwoju przedsiębiorstwa, Warszawa: PWN.
Porter, M.E. (1980). Competitive Strategy: Techniques for Analyzing Industries and Companies,
New York, NY: Free Press.
Porter, M.E. (1985). Competitive Advantage: Creating and Sustaining Superior Performance, New York, NY: Free Press.
Redmond, W. (2013). Three Modes of Competition in the Marketplace. The American
Journal of Economics and Sociology, 72(2).
Rosińska-Bukowska, M. (2012). Rozwój globalnych sieci biznesowych jako strategia
konkurencyjna korporacji transnarodowych. Przykład sektora motoryzacyjnego. Łódź: Wyd. Uniwersytetu Łódzkiego.
Smith, A. (1812). An Inquiry into the Nature and Causes of the Wealth of Nations. London: Ward, Lock & Co.
Solberg, C.A. (1997). A Framework for Analysis of Strategy Development in Globalizing Markets. Journal of International Marketing, 5(1).
Stankiewicz, M.J. (2005). Konkurencyjność przedsiębiorstwa. Budowanie konkurencyjności
przedsiębiorstwa w warunkach globalizacji. Toruń: TNOiK.
Strategor (1999). Zarządzanie firmą. Strategie, struktury, decyzje, tożsamość, transl. K. Bolesta-Kukułka (Politique générale de l'entreprise, Paris: Dunod). Warszawa: PWE.
Światowiec-Szczepańska, J. (2011). Strategiczne narzędzia konkurowania (chapter 9). In: Podstawy wyborów strategicznych w przedsiębiorstwach. Warszawa: PWE.
Trąpczyński, P. & Wrona, Th. (2013). From going international to being international - strategies for international competitiveness. Poznan University of
Economics Review, 13(1).
Wach, K. (2008). Skutki akcesji do Unii Europejskiej dla polskich przedsiębiorstw. Kraków: Wydawnictwo Uniwersytetu Ekonomicznego w Krakowie.
Wach, K. (2012). Europeizacja małych i średnich przedsiębiorstw: rozwój przez
umiędzynarodowienie. Warszawa: PWN.
Wach, K. (2014). Europeanisation of Firms as Their International Growth within the European Union: The Empirical Investigation into the Internationalisation Level among Polish Firms (chapter 1) In: B. Knežević & K. Wach (eds), International Business
from the Central European Perspective. Zagreb: University of Zagreb, pp. 3-14
Wach, K. (2014). Internationalisation and Globalisation as the Wider Context of Europeanisation Processes from the Macro- and Microeconomic Perspective. Horyzonty Polityki, 5(10).

124124124124 Krzysztof Wach
Wickham, Ph.A. (2006). Strategic Entrepreneurship. Harlow: Prentice Hall.
Zagórski, J. (1947). Ogólna teoria konkurencji. Warszawa-Łódź: Wydawnictwo Kazimierza Rutskiego.
Zook, Ch. (2004). Beyond the Core: Expand Your Market without Abanding Your Roots.
Boston, MA: Harvard Business School Press – Bran & Company.

S u g g e s t e d C i t a t i o n :S u g g e s t e d C i t a t i o n :S u g g e s t e d C i t a t i o n :S u g g e s t e d C i t a t i o n :
Bartha, Z. & Gubik, A.S.Bartha, Z. & Gubik, A.S.Bartha, Z. & Gubik, A.S.Bartha, Z. & Gubik, A.S. (2014). The Role of Business Knowledge in the Internationalisation Process
of Hungarian Corporations (chapter 6). In: KiendlKiendlKiendlKiendl----Wendner, D. Wendner, D. Wendner, D. Wendner, D. & Wach, K.Wach, K.Wach, K.Wach, K. (eds), International Competitiveness in Visegrad Countries: Macro and Micro Perspectives. Graz: Fachhochschule Joanneum,
pp. 125-142. 6666
The Role of Business KnowledgeThe Role of Business KnowledgeThe Role of Business KnowledgeThe Role of Business Knowledge
in the Internationalisationin the Internationalisationin the Internationalisationin the Internationalisation ProcessProcessProcessProcess
of Hungarian Corporationsof Hungarian Corporationsof Hungarian Corporationsof Hungarian Corporations
Zoltán Bartha & Andrea S. GubikZoltán Bartha & Andrea S. GubikZoltán Bartha & Andrea S. GubikZoltán Bartha & Andrea S. Gubik
University of Miskolc
Faculty of Economics
3515 Miskolc-Egyetemváros
Miskolc, Hungary
e-mail: [email protected]
Summary:Summary:Summary:Summary:
The aim of this paper is to identify the knowledge elements that are crucial in the
internationalisation process of Hungarian firms. It uses a two-dimensional model of business
knowledge, which separates business knowledge along two dimensions: the tacit or explicit nature;
and the codified or uncodified one. This model tells us that tacit and codified knowledge is the most
difficult to transfer, while the explicit-uncodified part is the easiest. The five types of business
knowledge were measured with a questionnaire. It is non-representative, filled in by 104 Hungarian
firms among which the larger and more internationalised ones are overrepresented. Based on this
non-representative sample we have found that the organisational beliefs and habits, and the
competence of the employees are the two business knowledge elements that are most closely
associated with the internationalisation of the firms. This makes it especially difficult to promote
internationalisation through the transfer of knowledge, because these key knowledge elements are the
stickiest, the hardest to transfer.
KeywordsKeywordsKeywordsKeywords: Internationalisation, business knowledge
JEL classificationJEL classificationJEL classificationJEL classification: M16, L20, L21
* This article was prepared within the research project no. StG-21310034 entitled ‘Patterns of Business
Internationalization in Visegrad Countries – In Search for Regional Specifics’ financed by the International Visegrad
Grand IVF and conducted by five Central European universities coordinated by Cracow University of Economics.

126126126126 Zoltán Bartha & Andrea S. Gubik
6666.1. .1. .1. .1. INTRINTRINTRINTROOOODUCTORY REMARKSDUCTORY REMARKSDUCTORY REMARKSDUCTORY REMARKS
Government support to smaller or larger local corporations is a standard structural
policy instrument in the Visegrad countries. The support can come as a direct
subsidy (for creating extra jobs, engaging in innovation, exporting goods etc.), or it
can come in some indirect form as well (providing key infrastructure, information,
consultancy services etc.). Apart from the fact that standard economic models
discourage from the use of any form of government subsidy (with the small exception
of market failure remedies) as they claim that such transfers inevitably distorts
efficiency, deciding on the correct form of government support is a major economic
policy dilemma. The dilemma is related to the question of whether it is resources
(capital, energy), infrastructure (financial, transportation, telecommunication) or
information and knowledge (qualified labour, market information, experience) that
are in the scarcest supply.
This chapter focuses on the latter part, namely business knowledge. Using the
Hungarian results of the V4 Survey (CZ, HU, PL, SK) obtained through the support
of IVF Standard Grant no. 21310034 (Duréndez & Wach, 2014) we identify which
knowledge elements are most closely related to the international activities of the
surveyed firms. The pattern uncovered can be used to determine the areas which
government sponsored consultancy services should concentrate at. As, depending on
the stickiness, business knowledge can be rather easy but also extremely difficult to
transfer, our research can enlighten why some consultancy efforts seem to lack
efficiency.
The chapter is made up of three sections. A model of business knowledge is
presented first, which shows which parts of knowledge are easy, and which ones are
difficult to transfer. An analysis of the survey data follows in the next section,
pointing out the key correlation relationships among business knowledge parts and
international activities. Finally, the conclusion sections points out the main lessons to
be learnt from the analysis.
6666....2222. . . . LITERATURE REVIEWLITERATURE REVIEWLITERATURE REVIEWLITERATURE REVIEW
A TwoA TwoA TwoA Two----Dimensional Model Dimensional Model Dimensional Model Dimensional Model oooof Business Knowledgef Business Knowledgef Business Knowledgef Business Knowledge
As John Naisbitt wrote in 1982 in his famous book, Megatrends: ‘We are drowning
in information, but starved for knowledge’. The dual nature of knowledge and
information is clearly shown by this quote, and this duality affects the transferability
of knowledge quite significantly. Statistical data, for example, are quite easy to
transfer. It can be made available online, in easy to process format, but in order to
make profitable decisions based on it, one has to be able to understand the pattern
behind raw data, which can be rather difficult and time consuming. On the other

The Role of Business Knowledge in the Internationalisation Process … 127127127127
hand, if one possesses adequate data processing skills that make it possible to crunch
big chunks of data, the previous problem can be solved within hours, however if that
knowledge is not available inside the company, the transfer (learning) can take years.
The tacit or explicit nature of knowledge is one dimension along which different
elements of it can be sorted.
Some elements of knowledge may only be valuable within a certain firm or
industry (e.g. experience on whom you have to contact to successfully push through
a cost cutting plan; who are the most valuable partners in a given sector). Others can
be widely used across many firms and industries (e.g. knowledge on how to avoid
taxes through offshoring). The codified/uncodified nature of knowledge is the other
dimension that greatly influences the success rate of knowledge transfers. Our model
incorporates these two dimensions into the analysis.
Literature Review on Knowledge ElementsLiterature Review on Knowledge ElementsLiterature Review on Knowledge ElementsLiterature Review on Knowledge Elements
Polanyi (1966) was the first one to distinguished tacit and explicit knowledge.
Knowledge can be publicly available and private at the same time. It is this duality of
knowledge that is reflected in the different categories of Polanyi. A smaller part of
our knowledge is public and for that reason explicit, consisting of factual knowledge
and knowledge of rules and regulations. Tacit knowledge on the other hand forms
the basis of all our explicit one, it can be regarded as tool that helps us in acquiring
and creating new knowledge. Usually we would not even call it knowledge, and use
expressions like intuition, logic, associative skills, experience, traditions or
apprehension instead. These are the skills that are used to identify and understand
new knowledge, and help us integrating into the community.
One of the first attempts at the classification of business knowledge (knowledge
relevant for companies) was done by Lundvall. He set up four categories (Lundvall &
Johnson, 1994):
− Know what: it basically is equal to information. It comprises of knowledge that is
easily recorded and stored in forms of bits.
− Know why: includes the knowledge of scientific rules.
− Know how: it comprises skills and experiences that help the solving of certain
problems. Know how usually is acquired when doing things. Because of that we
tend to think that know how is rather a practical than a theoretical category, but
this is far from the truth. We not only need know how to carry out practical tasks,
but theoreticians also heavily rely on it. It was Polanyi (1966) who pointed out
that the mind schemes used to help in understanding complicated situations, are
key to theoreticians as well.
− Know who: consists of information and experience about who knows things about
certain problems. As organisations become more and more complicated,
128128128128 Zoltán Bartha & Andrea S. Gubik
coordination becomes more and more important. When we have to coordinate in
a large organisation, know who is of key importance.
This classification is quite similar to Polanyi’s. The first two, know what and
know why can be called explicit knowledge, while the second two, know how and
know who are tacit knowledge.
The market value and the book value of public companies often is very
different, with the market value being a lot higher than the book value. It was
pointed out long ago that the difference is largely thanks to the accumulation of
intangible assets. The intangible part is called goodwill, the intellectual value of
business. Opinions differ on what exact types of intangible assets does goodwill
comprise of. Sveiby (1997) attempts to detect the intangible assets of the company,
and distinguishes among three types of so called invisible assets: external structure,
internal structure and competence.
Sveiby’s classification was driven by the will to separate intangible assets linked
to individuals from the ones linked to the organisation. Personal knowledge is shown
by the competencies of the employees, structural knowledge on the other hand by
the inside and outside structure. The competencies of the employees mean the ability
of employees to create physical and intellectual value. Into the inside structure
category fall the patents, theories, models, IT and administration systems either
created by the company or purchased by it, and also the corporate culture, and the
organisational atmosphere. All the links formed with clients and sellers, are part of
the outside structure, and also the signs that help distinguishing the company and its
products from the competitors: trade marks and corporate image.
The idea behind Sveiby’s three categories was used to formulate our own
model, however the structure had to be rearranged and complemented with another
dimension (complexity or the specific nature of knowledge) to better suit the
purposes of our analysis. Specific nature means the rate at which the knowledge is
linked to the organisation, and we consider a certain body of business knowledge
more and more specific if it is linked more and more to the inside systems of the
organisation. Specific business knowledge is deeply coded in the routines of the
organisation, and without knowing these routines it is impossible to interpret it.
We can also distinguish between specific knowledge coded into employees (Starbuck
1992) and organisational routines (March & Levitt, 1988). While in case of
availability we have explicit and tacit on the two ends of the scale, in case of specific
nature we can talk about codified and non-codified knowledge. The latter is also in
line with Kuwada’s typology of corporate strategic knowledge (Kuwada & Asaba,
1989), separating corporate level knowledge from industry level knowledge.

The Role of Business Knowledge in the Internationalisation Process … 129129129129
The Dual Knowledge ModelThe Dual Knowledge ModelThe Dual Knowledge ModelThe Dual Knowledge Model
The model presented here was first suggested in 2006 (Bartha, 2006), and made
available in English in 2011. Most of this section follows the ideas put forward in
Bartha (2011). The dual typology makes it possible to separate individual-bound
knowledge from explicit one, and also corporate-bound knowledge from more
general one, that can be easily interpreted in all circumstances. So the specific and
tacit part of business knowledge is very sticky, it is difficult to copy or transfer, while
the explicit-non-specific part of business knowledge can get easily out of control.
We now proceed by discussing all five elements in Figure 6.1 one by one, and
we also list the questions posed in our survey that may be used as a proxy to measure
them.
tacit explicit
Intellectual
property
Corporate procedures
Compe-tence of
employees
Connections of employees
Organisational beliefs and
habits
Stickiness
uncodified
codified
FigureFigureFigureFigure 6666.1. .1. .1. .1. The dual or two-dimensional knowledge model Source: (Bartha, 2011, p. 4.4).
Competence of EmployeesCompetence of EmployeesCompetence of EmployeesCompetence of Employees
The first category of Sveiby, the competency of employees is directly transferred to
our model. But we will not only include the competency of employees into this
category, but also those of the entrepreneur or owner-manager. This first group of
business knowledge therefore reflects the ability of people to create new physical or
intellectual value through interactions. What abilities are we talking about?

130130130130 Zoltán Bartha & Andrea S. Gubik
The know what and know why of all the employees, the experience and logical
models applied by them.
While the competency of employees is evidently tacit, the specific nature of it is
unclear. Some elements are non-specific, like know what or know why. Other
elements however are highly codified, they cannot be learnt in school (unlike the
previous, non-specific parts), and can only be acquired and increased after joining the
company.
Organisational Beliefs and HabitsOrganisational Beliefs and HabitsOrganisational Beliefs and HabitsOrganisational Beliefs and Habits
The competency of employees is a unanimous category because the organisational
beliefs and habits integrate the employees working on the managerial level with the
ones working lower down the organisational hierarchy. These beliefs and habits are
integrated into the minds of the employees, and so they contribute to the efficient
cooperation. The organisational beliefs and habits form the common knowledge of
all of the employees, so they are the common knowledge of the whole organisation.
As a result they are tacit and specific in nature. They can only be learnt after joining
the organisation, and when an employee changes a job, loses this part of his business
knowledge.
Connections of EmployeesConnections of EmployeesConnections of EmployeesConnections of Employees
The cooperation among parties taking part in the creation and diffusion of
knowledge is crucial for success. Those who have a lot of friends, and know a lot of
people who are willing to help them, can learn faster, and so they can solve problems
at a quicker pace. That is why the know who of individuals is part of business
knowledge, and it will be called the connections of employees. The basis of the
connections of employees is trust, the belief in the fact that the help given will result
in help received when needed. The trust is linked to persons, so it is tacit, but it is
mostly unrelated to organisations, so it is non-specific. Its value is not decreased if
someone leaves an organisation, and is not necessarily increased when joining a new
firm.
Corporate ProceduresCorporate ProceduresCorporate ProceduresCorporate Procedures
Most of the explicit knowledge that is possessed by the company at a given time was
created by the tacit knowledge of the company. A smaller part comes for
procurements, or some other forms of non-commercial transfer. Obviously there are
some companies which get most of their explicit knowledge from transfers (like
franchise firms, for example), but they cannot be called typical for an average
company. The explicit knowledge base of the enterprise can be divided into two
main categories. The factor of division is whether the explicit knowledge can be

The Role of Business Knowledge in the Internationalisation Process … 131131131131
patented or not, more precisely whether there is any reason to patent the knowledge.
Patented explicit business knowledge can be regarded as a product as well, the
commercial transfer of it is more or less possible. Those elements of business
knowledge that cannot be patented (or for some practical reasons there is not much
point is patenting them) on the other hand, embody the most quickly evaporating
resources of the company. As they were already recorded, there are low cognitive
barriers during the learning process, so the competitors can copy them with relative
ease. These unpatented explicit elements of business knowledge are called corporate
procedures.
Despite the above statements corporate procedures have elements that are
relatively difficult to copy. The reason for that is the fact that many of these
procedures are highly codified. Many elements of the corporate procedures are only
efficient if some other conditions also apply, like a certain type of corporate culture,
organisational hierarchy etc. These bodies of knowledge are not patented, still, the
fact that they are hard coded into the organisation, makes it difficult for other
companies to mimic and copy them.
Intellectual PropertyIntellectual PropertyIntellectual PropertyIntellectual Property
All other parts of explicit knowledge that are patented fall into the category of
intellectual property. These bodies of business knowledge are very general, and the
least coded into the organisational specifications. The two main subcategories here
are patents coding technological instructions and copyrights protecting the
intellectual property of individuals. Patents usually represent a high value for
corporations, copyrights on the other hand only if the copyrighted material is
relevant to the main profile of the company.
The Role The Role The Role The Role oooof Knowledge f Knowledge f Knowledge f Knowledge iiiin Internationalisationn Internationalisationn Internationalisationn Internationalisation
Besides geographic distance other dimensions like cultural differences, language
barriers, differences in educational and political systems (Johanson & Wiedersheim-
Paul, 2006) has to be overcome during the internationalisation process.
Different internationalisation theories emphasise different knowledge elements
in the process, but there’s no consensus which of them are crucial (Daszkiewicz &
Wach, 2012, pp. 100-102; Wach, 2014c, pp. 14-17).
One group of models emphasize the gradualism in the internationalisation
process. This perspective is included in the Uppsala model (Johanson & Vahlne,
1977, 1990) according to which the engagement in international activities evolves
gradually. In the first stage, when a company has insufficient knowledge of the
market and the partners operating in it, it chooses a simple form of appearance in the

132132132132 Zoltán Bartha & Andrea S. Gubik
market (for example, export). Later, due to its accumulated experience, the company
transforms in a more complex form (for example, sets up a subsidiary).
In this model knowledge is based on previous experience, obtaining it in
a learning-by-doing process. As a result this knowledge is embedded in individuals.
According to the model as the employees’ knowledge increases, their international
involvement of the company increases as well.
Knowledge can be embedded not only in individuals, but also in teams and
company organisations. Organizational learning is viewed as routine-based,
history-dependent, and target-oriented (March & Levitt, 1988).
The export development models, such as the Reid export behaviour model
(Reid, 1981), also emphasize the gradual character of the company’s
internationalisation process. However, they primarily analyse decision-making
processes in terms of export activities and main factors related to this. This model
pays far more attention to individual characteristics and how these influence export
behaviour.
In the 1990s a new group of companies emerged, which rapidly broke into
international markets (born-global enterprises). Their common characteristics are
that the entrepreneur has a strong international entrepreneurial orientation, he is
proactive and aggressive during the internationalisation (Cavusgil & Knight, 2009).
There is a general consensus that apart from personal experience and
professional knowledge of company managers, social and economic networks created
around companies also play a key role in decision-making processes. Network theory
(Johanson & Mattsson, 1987) highlights the firm’s business context as a crucial
factor in companies operation. It emphasizes the role of long term relationships and
the role of the individual’s personal networks in firms’ successful operation.
6666....3333. . . . MATERIAL AND METHODSMATERIAL AND METHODSMATERIAL AND METHODSMATERIAL AND METHODS: : : :
MEASURINGMEASURINGMEASURINGMEASURING BUSINESS KNOWLEDGEBUSINESS KNOWLEDGEBUSINESS KNOWLEDGEBUSINESS KNOWLEDGE
The data was obtained from an empirical research conducted within the framework
of the Visegrad Fund project “Patterns of business internationalization in Visegrad
countries – in search for regional specifics” (StG-21310034) conducted in four
countries (Czech Republic, Hungary, Poland, Slovakia) by five universities and
coordinated by Cracow University of Economics1 (Gubik & Karajz, 2014; Wach,
2014a; Daszkiewicz & Wach, 2014; Duréndez & Wach, 2014; Gubik & Wach,
2014). The questionnaire was available online (Wach 2014b)2.
1 More details on the research project at: http://www.visegrad.uek.krakow.pl/ 2 The online survey has been available in four languages at: http://www.visegrad.uek.krakow.pl/survey
The Role of Business Knowledge in the Internationalisation Process … 133133133133
The sample does not represent Hungarian companies since this was not the
purpose of the data collection. A sample with the same ratio of different company
size groups would have encompassed mainly micro-sized enterprises, which were less
active internationally and would have been less suitable for achieving the goals of the
research. The purpose of this survey was to include the same amount of companies of
different sizes in the research, that’s why large and internationally active companies
are over-represented in the sample. When evaluating the results of this paper this fact
has to be considered because it may affect the generalizability and applicability of the
results. Company size is especially important, because the larger the firm, the higher
the chance that it uses some sort of business information system (Sasvari, 2012), and
such systems can form the backbone of the corporate-level business knowledge.
Sample CharacteristicsSample CharacteristicsSample CharacteristicsSample Characteristics
As for company size, approximately 26% of companies were micro-sized enterprises,
30% were small-sized enterprises, 21% were middle-sized companies and 23% were
large companies. The respondents employed about 287 workers on average and in
total the number of employed amounted to 30,000 people.
Most companies were founded after 1990, less than 15% had a longer lifespan
than 25 years. Only 27 companies reported that the business was a family business.
According to our definition they are firms that are solely (or dominantly) owned by
the same family, employ family members or are active in supporting the business
processes of the family members.
In our database 87 companies are owned by Hungarian investors and
8 companies are in foreign ownership with 100% share. There are only 3 companies
in the sample with foreign ownership below 50%, and 5 with more than 50%.
As for the business activities of the surveyed companies, almost half of them are
industrial companies (49%), 35% are service providers, 14% are trade companies
and 2% are involved in agricultural activities. Within the industrial firms,
construction and manufacturing were the most often mentioned economic activities.
Besides them companies with professional, scientific and technical activities and
information and communication technology firms are also above the average.
Questions Used to Assess The Business Knowledge of FirmsQuestions Used to Assess The Business Knowledge of FirmsQuestions Used to Assess The Business Knowledge of FirmsQuestions Used to Assess The Business Knowledge of Firms
The proxy variables used to measure the five elements of business knowledge come
from the IVF survey conducted during 2014. Some of these knowledge elements will
only be measured by one variable, while a combination of two or more variables is
used two operationalize others. Table 6.1 summarises the proxies of our analysis.
In case of the competence of employees we rely on the answers given to the
following three questions:

134134134134 Zoltán Bartha & Andrea S. Gubik
1. Evaluate the internal resources of your firm for the internationalization process,
please. Human resources for internationalization (e.g. staff members fluent in
foreign languages, experienced with foreign markets and different cultures)
2. Evaluate the attitude of the owner/entrepreneur/manager of your firm for the
internationalization process, please. Experience on international markets
3. Evaluate the attitude of the owner/entrepreneur/manager of your firm for the
internationalization process, please. Professional business experience in general
TableTableTableTable 6666.1..1..1..1. Proxies used to measure the five elements of business knowledge
Business knowledge Business knowledge Business knowledge Business knowledge
elementelementelementelement ProxyProxyProxyProxy
Measurement Measurement Measurement Measurement
methodmethodmethodmethod
Competence of
employees
1. Human resources for
internationalization
2. Experience on international markets
3. Professional business experience in
general
1-5 Likert scale
Organisational
beliefs and habits
1. Motivation to go international
2. Cosmopolitism and international
openness
1-5 Likert scale
Connections of
employees
Cooperation methods Multiple choice
question
Corporate
procedures
1. Planned strategy
2. Knowledge on international markets
Multiple choice
question
1-5 Likert scale
Intellectual property Innovations implemented Multiple choice
question
Source: own elaboration.
Organisational beliefs and habits are measured using the answers given to questions:
1. Evaluate the attitude of the owner/entrepreneur/manager of your firm for the
internationalization process, please. Motivation to go international
2. Evaluate the attitude of the owner/entrepreneur/manager of your firm for the
internationalization process, please. Cosmopolitism and international openness.
The following question measured the connections of employees:
While going international, do you operate in any formal or at least informal
networks? (we do not cooperate in any international and/or national networks
for internationalization / we operate in at least one informal network, which
helps us in the internationalization process / we operate in at least one formal
network, which helps us in the internationalization process)

The Role of Business Knowledge in the Internationalisation Process … 135135135135
For the measurement of corporate procedures two questions were used:
1. Do you have a planned strategy for internationalization of your firm?
(no / partially, but the strategy is not formalised / yes, we have the international
strategy).
2. Evaluate the attitude of the owner/entrepreneur/manager of your firm for the
internationalization process, please. Knowledge on international markets.
Finally, the intellectual property of firms was evaluated with this question:
Has your firms implemented any innovation for the last 3 years (yes/no)? If yes, what
type of innovation was it and what was the scope of innovation?
6666....4444. . . . RESULTS AND DISCUSSIRESULTS AND DISCUSSIRESULTS AND DISCUSSIRESULTS AND DISCUSSIONONONON
Appearance in International MarketsAppearance in International MarketsAppearance in International MarketsAppearance in International Markets
The relationship between each individual proxy variable and the international
activity of firms was tested. The question related to measuring international
appearance was the following: Does your firm run any international activities, at least
importing from other countries? Table 6.2 shows the result of the analysis. The
survey shows that the decision of the firms about internationalisation depends on
three knowledge elements, which are as follows: employees’ competence,
organisational beliefs and habits, and the intellectual property. Except for the
TableTableTableTable 6666....2222.... Decisive factors of going international
Business Business Business Business
knowledge knowledge knowledge knowledge
elementelementelementelement
ProxyProxyProxyProxy Cramer VCramer VCramer VCramer V Sig.Sig.Sig.Sig.
Competence
of employees
Human resources for internationalization
Experience on international markets
Professional business experience in general
.519
.419
.356
.000
.002
.013
Organisation
al beliefs and
habits
Motivation to go international
Cosmopolitism and international openness
.544
.576
.000
.000
Connections
of employees
While going international, do you operate in any
formal or at least informal networks?
. .
Corporate
procedures
Do you have a planned strategy for
internationalization of your firm?
Knowledge on international markets
.
.380
.
.006
Intellectual
property
Has your firms implemented any innovation for
the last 3 years?
.235
.017
--- No statistics are computed because Does your firm run any international activities, at least importing
from other countries? is a constant.
Source: own elaboration based on the V4 survey results of 2014 (n =104).

136136136136 Zoltán Bartha & Andrea S. Gubik
implemented innovation variable, where there was only a weak correlation, the
relationships between the analysed variables were moderate or strong. The variables
for connections of employees and partly for the corporate procedures cannot be
computed here.
The strongest relationship can be experienced in case of Cosmopolitism and
international openness (Cramer V=0.573) and Motivation to go international
(Cramer V=0.544). Both of them are parts of organisational beliefs and habits.
Figure 6.2 shows the differences in average values of the proxy variables according to
the international activity of companies.
3,28
3,58
3,67
3,74
3,93
4,18
2,03
2,38
2,69
2,31
2,54
3,41
1,00 1,50 2,00 2,50 3,00 3,50 4,00 4,50
Human resources for
international ization
Experience on
international
Knowledge on
international
Motivation to go
international
Cosmopol i tism and
international
Profess ional
bus iness experience
yes no
FigureFigureFigureFigure 6666....2222. . . . Does your firm run any international activities, at least importing
from other countries? Source: own elaboration based on the V4 survey results of 2014 (n = 104).
Since the variables also show a significant correlation with each other, it is hard
to determine their real effect on the decision. In order to avoid this, a regression
analysis was applied. The dependent variable is measured on a dichotomous scale
(with yes and no answers), that is why binomial logistic regression was applied.
All the variables in the Table 6.2 were independent variables in this model.

The Role of Business Knowledge in the Internationalisation Process … 137137137137
TableTableTableTable 6666....3333.... Variables in the Equation
VariablesVariablesVariablesVariables BBBB S.E.S.E.S.E.S.E. WaldWaldWaldWald dfdfdfdf Sig.Sig.Sig.Sig. Exp(B)Exp(B)Exp(B)Exp(B)
Step 1a Cosmopolitism and international openness
Constant
1.049 .246 18.125 1 .000 2.855
-2.403 .798 9.060 1 .003 .090
Step 2b Human resources for internationalization
Cosmopolitism and international openness
Constant
.522 .265 3.882 1 .049 1.686
.820 .270 9.225 1 .002 2.271
-3.044 .894 11.587 1 .001 .048 Source: own elaboration based on the V4 survey results of 2014 (n = 104).
Although the explanatory power of the model was 37.7 percent (Nagelkerke
R2=0.377), only two variables entered the model (with forward method): the Human
resources for internationalization and the Cosmopolitism and international openness.
The first variable was the competence of employees, the second one was
organisational beliefs and habits.
TableTableTableTable 6666....4444.... Classification Tablea
PredictedPredictedPredictedPredicted
Does your firm run any Does your firm run any Does your firm run any Does your firm run any
international activities?international activities?international activities?international activities? Percentage Percentage Percentage Percentage
CorrectCorrectCorrectCorrect nononono yesyesyesyes
Ob
serv
edO
bse
rved
Ob
serv
edO
bse
rved
Ste
p 1
Ste
p 1
Ste
p 1
Ste
p 1
Does your firm run any
international activities?
no 13 13 50.0
yes 5 67 93.1
Overall Percentage 81,6
Ste
p 2
Ste
p 2
Ste
p 2
Ste
p 2
Does your firm run any
international activities?
no 15 11 57.7
yes 6 66 91.7
Overall Percentage 82.7 aThe cut value is .500.
Source: own elaboration based on the V4 survey results of 2014 (n = 104).
Based on the analysis presented in Table 6.4 the overall predictive power of our
model is 87.2%, although in case of no answers (Does your firm run any
international activities?) it drops to 57.7%.
This model suggests that when a company intended to go international, the
staff members’ knowledge and experience (e.g. staff members were fluent in foreign
languages, had experience in foreign markets and different cultures) although a basic
requirement, it was not sufficient. The openness of entrepreneurs to
internationalisation was also essential. That is why, emphases should be laid not only
on improving the provision of the financial support, but on promoting
entrepreneurs’ openness to internationalisation as well, so that they will be able to
appear and operate successfully in international markets.

138138138138 Zoltán Bartha & Andrea S. Gubik
Intensity of InternationalisationIntensity of InternationalisationIntensity of InternationalisationIntensity of Internationalisation
A considerable proportion of companies are engaged in more than one international
activity. An intensity indicator has been elaborated to measure internationalisation
(Gubik, Karajz, 2014). It indicates how many possible foreign market entry modes
a company has utilised during its international activities. The indicator ranges from
0 to 1, where 0 means that the company does not conduct activities in international
markets and 1 means engagement in all activity types (import, direct export, indirect
export, cooperative export, contractual modes and investment).
There are divergences in terms of size and activity areas of the companies. It is
obvious, that the more resources are available, the more intensive internationalisation
is. Beyond that, growing size of companies is closely correlated to the increase in
motivation, knowledge and experience related to internationalisation. Beside the
physical resources the importance of human resources like the employees’ appropriate
foreign language knowledge and experience in foreign market (Hitt et al., 2006) and
experiential knowledge (Barkema et al., 1996; Erramilli, 1991) is also indisputable.
TableTableTableTable 6666....5555.... Decisive factors of intensity
CategoryCategoryCategoryCategory CriteriumCriteriumCriteriumCriterium Spearman’s Spearman’s Spearman’s Spearman’s
RhoRhoRhoRho3333 Sig.Sig.Sig.Sig.
Competence of
employees
Human resources for internationalization .519 .000
Experience on international markets .419 .000
Professional business experience in general .356 .001
Organisational
beliefs and habits
Motivation to go international .544 .000
Cosmopolitism and international openness .573 .000
Connections of
employees
While going international, do you operate in
any formal or at least informal networks?
.266* .085
Corporate
procedures
Knowledge of international markets .421 .000
Do you have a planned strategy for
internationalization of your firm?
.407*
.002
Intellectual
property
Has your firms implemented any innovation
for the last 3 years?
.155* .116
*In case of these variables Eta was calculated.
Source: own elaboration based on the V4 survey results of 2014 (n = 104).
The responses showed that all variables of competencies of employees,
organisational beliefs and habits and corporate procedures correlate with the intensity
indicator. Here again, the relationship between the variables of organisational beliefs
and habits knowledge element (Motivation to go international, Cosmopolitism and
3 As the precise measurement of these variables is not possible, an attitude scale was used, and so only
rank correlation can be used (Varga & Szilagyi, 2011).

The Role of Business Knowledge in the Internationalisation Process … 139139139139
International openness) was the strongest. Table 6.5 shows the strength of the
relationships and the significance levels.
As for intensity, both financial recourses and attitudes toward
internationalisation seem to be important determinants. Similar to the decision
about going international, the knowledge elements, which are deeply embedded into
the firms’ habits, are also of determining importance.
If subjective matters affecting internationalisation are taken into account and
the support apart from the financial ones (coaching, consulting, etc.) is provided to
promote internationalisation, companies are likely to take a more active part in
different support programs.
6666....5555. . . . CONCLUSIONSCONCLUSIONSCONCLUSIONSCONCLUSIONS
KnoKnoKnoKnowledge Elements Important wledge Elements Important wledge Elements Important wledge Elements Important ffffor Internationalisationor Internationalisationor Internationalisationor Internationalisation
The strongest relationship between internationalisation and the different elements of
business knowledge was identified in the area of organisational beliefs and habits.
It was closely followed by the competence of employees, while some significant
relationships were detected in case of intellectual property and corporate procedures.
The connections of employees had no significant effect on the internationalisation
process in our sample (see Table 6.6).
TableTableTableTable 6666....6666.... Relevant knowledge elements based on our sample
FeatureFeatureFeatureFeature Competence Competence Competence Competence
of employeesof employeesof employeesof employees
Organisational Organisational Organisational Organisational
beliefs and beliefs and beliefs and beliefs and
habitshabitshabitshabits
Connections Connections Connections Connections
of employeesof employeesof employeesof employees
Corporate Corporate Corporate Corporate
proceduresproceduresproceduresprocedures
Intellectual Intellectual Intellectual Intellectual
propertypropertypropertyproperty
International
activities ++ +++ x + +
Intensity of
internationalisation ++ +++ x ++ x
+: significant relationship (weak+; moderate++; strong+++), x: no significant relationship.
Source: own elaboration based on the V4 survey results of 2014 (n = 104).
One of the striking features of our findings is that easily transferable business
knowledge elements (explicit and uncodified ones) have little effect on
internationalisation. Intellectual property, which is both explicit and uncodified,
therefore the easiest to transfer, has a weak influence on the international activity of
the firm. Corporate procedures on the other hand, an explicit but highly codified
knowledge element, moderately affect the intensity of internationalisation.
Yet, most of the government sponsored services provide knowledge on these,
easier to transfer areas. They offer market information, they try to teach young

140140140140 Zoltán Bartha & Andrea S. Gubik
entrepreneurs how to prepare a formal strategy for the internationalisation process.
They also provide information on the red tape barriers related to internationalisation.
Based on the findings above, such support is of no real help to firms looking to
go international. More than that, the success would be questionable even if the
government wanted to restructure its instruments, and focus on tacit and codified
elements, because they are way more difficult, and very time consuming to transfer.
Organisational beliefs and habits, the knowledge element most strongly associated
with internationalisation are exactly like that: tacit and codified in the same time.
They are determined inside the firm, dependent on the corporate culture, and so
they can barely be transferred outside.
tacit explicit
Intellectual
property
Corporate procedures
Compe-tence of
employees
Connections of employees
Organisational beliefs and
habits
Stickiness
uncodified
codified
FigureFigureFigureFigure 6666....3333. . . . Relevant elements from the dual model Source: own elaboration based on Bartha, 2011.
One of the most common ways of transferring such sticky knowledge
components is through formal and informal meetings, conversations. Meetings for
exchanging experience among entrepreneurs, government institutions and researchers
are not uncommon. Some government agencies regularly organise such conferences
and gatherings. The other striking feature of our findings however is that
connections which may easily be established at such meetings are in no significant
relationship with the internationalisation process what so ever.
It has to be mentioned that the sample on which our findings are based is rather
small (n = 104), and it is not representative. One has to be very cautious therefore

The Role of Business Knowledge in the Internationalisation Process … 141141141141
when interpreting the results, and further research on a larger and more
representative sample is definitely needed before policy recommendations are
established.
REFERENCESREFERENCESREFERENCESREFERENCES
Barkema, H., Bell, J.H., & Pennings, J.M. (1996). Foreign Entry, Cultural Barriers, and the
experience factor in foreign market entry behavior of service firms. Learning. Strategic Management Journal, 17, 151-166.
Bartha, Z. (2006). Az üzleti tudás sajátosságai és hozzáférhetőségének körülményei. PhD
dissertation: http://193.6.1.94:9080/JaDoX_Portlets/documents/document_5611
_section_1179.pdf
Bartha, Z. (2011). Network Economics. Budapest: Nemzeti Tankönyvkiadó
Cavusgil, S.T., & Knight, G. (2009). Born global firms – A new international enterprise. New
York: Business Expert Press, LCC
Daszkiewicz, N., & Wach, K. (2012). Internationalization of SMEs: Context, Models and Implementation. Gdańsk: Gdańsk University of Technology Publishers.
Daszkiewicz, N., & Wach, K. (2014). Motives for Going International and Entry Modes of
Family Firms in Poland, Journal of Intercultural Management, 6(2).
Duréndez, A., & Wach, K. (2014). Patterns of Business Internationalisation in Visegrad Countries – In Search for Regional Specifics. Cartagena: Politéncina Universitad
de Cartagena.
Erramilli, M. K. (1991). The Experience Factor in Foreign Market Entry Behavior of Service
Firms. Journal of International Business Studies 22(3), 479-501.
Gubik, A.S. & Karajz, S. (2014). The Choice of Foreign Market Entry Modes – The Role of
Resources and Industrial Driving Forces. Entrepreneurial Business and Economics Review,
2 (1).
Gubik, A.S. & Wach, K. (eds) (2014). International Entrepreneurship and Corporate Growth in Visegrad Countries. Miskolc: Miskolc University Press
Hitt, M.A., Bierman, L., Uhlenbruck, K., & Shimizu, K. (2006). The Importance of
Resources in the Internationalization of Professional Service Firms: The Good, the Bad
and the Ugly. The Academy of Management Journal 49(6), 1137-1157.
Johanson, J., & Vahlne, J.E. (1990). The Mechanism of Internationalisation. International
Marketing Review, 7(4), 11-24.
Johanson, J., & Mattsson, L.G. (1987). Interorganizational relations in industrial systems:
a network approach compared with the transaction cost approach. International Studies of Management & Organization 17(1), 34.
Johanson, J., & Wiedersheim-Paul, F. (2006). The Internationalization of the Firm. Four
Swedish Cases. In: Buckley, P., & Ghauri, P.N. (eds.) (2006): The Internationalization of the Firm. New York: International Thomson Business Press.

142142142142 Zoltán Bartha & Andrea S. Gubik
Kuwada, K., & Asaba, S. (1989). The continuous side of discontinuity. Tokyo Metropolitan University - Journal of the Faculty of Economics, 63.
Lundvall, B. A., & Johnson, B. (1994). The Learning Economy. Journal of Industry Studies, 1(2), 23-42.
March, J. G., & Levitt, B. (1988). Organizational learning. Annual Review of Sociology, 14, 319-338.
Naisbitt, J. (1982). Megatrends. Ten New Directions Transforming Our Lives. New York:
Warner Books.
Polanyi, M. (1966). The Tacit Dimension. London: Routledge and Kegan.
Reid, S.D. (1981). The Decision-Maker and Export Entry and Expansion. Journal of International Business Studies, 12, 101–112.
Sasvari, P. (2012). A Conceptual Framework for Definition of the Correlation Between
Company Size Categories and the Proliferation of Business Information Systems in
Hungary. Theory, Methodology, Practice, 8(2), 51-59.
Starbuck, W. H. (1992). Learning by knowledge intensive firms. Journal of Management Studies, 29 (6), 713-740.
Sveiby, K. E. (1997). The New Organizational Wealth. San Francisco: Berrett-Koehler
Publishers.
Varga, B., & Szilágyi, R. (2011). Kvantitatív információképzési technikák. Budapest: Nemzeti
Tankönyvkiadó.
Wach, K. (2014a). Familiness and Born Globals: Rapid Internationalisation among Polish
Family Firms, Journal of Intercultural Management, 2(3-4).
Wach, K. (2014b). Research Methodology of the Field Study on the Firm-Level
Internationalisation in Visegrad Countries (chapter 2), In: Duréndez, A., & Wach, K.
(2014). Patterns of Business Internationalisation in Visegrad Countries – In Search for Regional Specifics. Cartagena: Politencina Universitad de Cartagena, pp. 33-42.
Wach, K. (2014c). Theoretical Framework of the Firm-Level Internationalisation in Business
Studies (chapter 1), In: Duréndez, A., & Wach, K. (2014). Patterns of Business Internationalisation in Visegrad Countries – In Search for Regional Specifics. Cartagena:
Politencina Universitad de Cartagena, pp. 13-30.
S u g g e s t e d C i t a t i o n :S u g g e s t e d C i t a t i o n :S u g g e s t e d C i t a t i o n :S u g g e s t e d C i t a t i o n :
WachWachWachWach, K., K., K., K. (2014). The Role of Knowledge in the Internationalisation Process: An Empirical
Investigation among Polish Businesses (chapter 7). In: KiendlKiendlKiendlKiendl----Wendner, D. Wendner, D. Wendner, D. Wendner, D. & Wach, K.Wach, K.Wach, K.Wach, K. (eds),
International Competitiveness in Visegrad Countries: Macro and Micro Perspectives. Graz: Fachhochschule
Joanneum, pp. 143-158. 7777
The Role of Knowledge The Role of Knowledge The Role of Knowledge The Role of Knowledge
in the Internationalisation Process: in the Internationalisation Process: in the Internationalisation Process: in the Internationalisation Process:
An An An An EmpiricalEmpiricalEmpiricalEmpirical InvestigationInvestigationInvestigationInvestigation among Polishamong Polishamong Polishamong Polish BusinessesBusinessesBusinessesBusinesses
Krzysztof WachKrzysztof WachKrzysztof WachKrzysztof Wach
Cracow University of Economics
Faculty of Economics and International Relations
Department of Entrepreneurship and Innovation
ul. Rakowicka 27, 31-510 Kraków, Poland
e-mail: [email protected]
Summary:Summary:Summary:Summary:
In the era of the knowledge-based economy, especially with the constitution of the new paradigm of
the entrepreneurial economy, it is knowledge which is attributed to play the key role in economic
growth and socio-economic development, what is more knowledge plays a especial role for firms, in
their corporate growth. Nowadays, business knowledge is increasingly used as an important variable
to explain the process of internationalisation of firms. The aim of this study is to present the essence
and role of knowledge in the internationalisation process as well as nature of knowledge-based
models of internationalisation of the firm and to show the empirically proved dependences between
knowledge and internationalisation process among surveyed Polish businesses. The research results
do not let generalise and absolutise, nevertheless they prove that the level of experience on
international markets among top management team is positively related to the acquisition and
utilisation of knowledge on international markets, which proves the theoretical assumptions from the
literature on knowledge-based models and learning process models. The mechanism of knowledge
acquisition and utilisation impacts on the intensiveness of internationalisation coefficient, however
there is weak correlation. The V4 survey was dedicated to general patterns of internationalisation and
it was not assumed to research deeply into knowledge-based models, so this is why it is to be
undertaken in the future.
KeywordsKeywordsKeywordsKeywords: internationalisation, knowledge-based models, learning approach, business knowledge
JEL classificationJEL classificationJEL classificationJEL classification: M16, L20, L21
* The article was prepared within the project no. StG-21310034 entitled “Patterns of Business Internationalization in
Visegrad Countries – In Search for Regional Specifics” financed by the International Visegrad Fund in the years
2013-2014 and coordinated by Cracow University of Economics.

144144144144 Krzysztof Wach
7777.1. .1. .1. .1. INTRINTRINTRINTROOOODUCTORY REMARKSDUCTORY REMARKSDUCTORY REMARKSDUCTORY REMARKS
In the era of the knowledge-based economy, especially with the constitution of the
new paradigm of the entrepreneurial economy, it is knowledge which is attributed to
play the key role in economic growth and socio-economic development, what is
more knowledge plays a especial role for firms, in their corporate growth. Widely
recognised approaches such as the learning approach or knowledge-based approach at
the earliest appeared in management studies, but then gained in popularity also in
economics, especially in the theories of the growth of the firm. At the turn of the first
and second decade of the twenty-first century, business knowledge is increasingly
used as an important variable to explain the process of internationalisation of firms.
The literature is rich in numerous attempts to implement the concept of knowledge
to modelling the firm-level internationalisation (Wach, 2012b, pp. 245-264). Hence,
the aim of this study is to present the essence and role of knowledge in the
internationalisation process as well as nature of knowledge-based models of
internationalisation of the firm and to show the empirically proved dependences
between knowledge and internationalisation process among surveyed Polish
businesses. The selection of presented models was based on the criterion of frequency
of citations in the literature.
7.2. LITERATURE REVI7.2. LITERATURE REVI7.2. LITERATURE REVI7.2. LITERATURE REVIEWEWEWEW
Internationalisation ModelsInternationalisation ModelsInternationalisation ModelsInternationalisation Models
Although there are numerous proposals, concepts, models or theories of
internationalisation of the firm, in the literature (Wach, 2014b), there is a common
agreement in principle on the major assumptions for systematics the trends in the
firm-level internationalisation modelling, however – for obvious reasons – there are
some inconsistencies, because of the fact that some models can be classified in many
ways, especially these aspiring to be considered holistic as to a lesser or greater extent
they are based on earlier theories and models, assumptions of which can be easily
seen. N.E. Coviello and A. McAuley (1999, pp. 223-256) distinguish three schools,
which are supposed to be used to study the internationalisation of the firm, especially
SMEs, namely neoclassical school of foreign direct investment; behavioural school of
stages models as well as network approach of the relational school. B. Rundh (2001,
pp. 319-320) distinguishes three approaches to analyse the internationalisation
process of firms, particularly in relation to SMEs, which are: incremental approach
based on various stages of internationalisation; network approach, in which
internationalisation is based on cooperation among firms operating in networks as
well as business-and-strategic approach, where internationalisation is described as
a result of international growth due to the intended and realized business strategy.

The Role of Knowledge in the Internationalisation Process: An Empirical … 145145145145
In turn, K. Mejri and K. Umemoto (2010, pp. 157159) distinguish two very broad
trends, which include above mentioned models, and they are: process theories
highlighting the increasing commitment to foreign markets with the passing of time
and secondly, adaptive concepts explaining the adaptation of corporate operations to
the international environment. M. Ruzzier, R.D. Hisrich and B. Antoncic (2006,
pp. 478-489) propose one of the most extensive typology of approaches to
internationalisation of firms, especially SMEs, pointing out four or five perspectives
such as (i) process or stages models as well as innovation-based models (as a special
subgroup of process models), (ii) network approach, (iii) resource-based view, (iv)
international entrepreneurship theory. M. Gorynia (2007, p. 68) identifies four
broad groups of internationalisation theories, namely sequential (conventional)
models and their developments; unconventional (simultaneous) models; network
approach and finally other concepts of internationalisation, including born globals.
J. Whitelock (2002) divides theories of internationalisation into four groups, namely:
U-model, OLI theory (eclectic paradigm), network approach, and last but not least
strategic approach. M.K. Witek-Hajduk (2010, p. 29) recognises contemporary
theories of internationalisation into four groups, namely: stage theories (including
Uppsala model, innovative models, Finnish models), network theories, theories of
early internationalisation (INV), alternative theories of internationalisation
(including models of the strategic, decision-making and organizational capabilities
approach). N. Daszkiewicz (2004, pp. 38-62) proposes the 5-groups scheme of the
internationalisation models, namely: stages models (including U-model,
innovation-related models, models based on the learning process), resource-based
view (including organisational life cycle models), intentions-based models, network
approach, as well as other models). Presented systematic approaches to analysis of the
internationalisation process of the firm, especially small and medium-sized
enterprises have a lot in common, however, they are in many aspects divergent.
Taking into account the dominant features of the particular models and the prospect
of the theory and practice of entrepreneurship (Wach, 2012a, pp. 94-131; Wach,
2012b, pp. 254-264), the authorial typology of 7-currents can be tempted to be
assumed and promoted (Table 7.1).
Models explaining internationalisation of the firm – as a main focus – are dated
back to 1970s and at the beginnings they used the process approach (stages), but
drew from the learning process assumptions by explaining the phenomenon of
corporate involvement in international activities through the prism of gaining
knowledge about new international markets. It should be noted, however, that over
time the knowledge-based models, especially the learning process approach, have
developed considerably, not necessarily referring to the original assumptions of stages
models, and thus constituted a separate current of internationalisation models, which
is trying to holistically treat the process of internationalisation of the firm.

146146146146 Krzysztof Wach
TableTableTableTable 7.1.7.1.7.1.7.1. Typology of the modern theories of internationalisation of the firm
AproachesAproachesAproachesAproaches ModelsModelsModelsModels RepresentativesRepresentativesRepresentativesRepresentatives
Stages models U-model J. Johanson & F. Wiedersheim-Paul (1975),
J. Johanson & J.E. Vahlne (1977)
I-model W.J. Bilkey & G. Tesar (1977),
S.T. Cavusgil (1980), S.D. Reid (1981),
L.H. Wortzel & H.V. Wortzel (1981),
M.R. Czinkota (1982), J.S. Lim,
T.W. Sharkey & K.I. Kim (1991), R. Rei,
T.R. Rao & G.M. Naldu (1992)
Hybrid models K. Yoshihar (1978), R. Swedenborg (1982),
M. Juul & P. Waters (1987)
Resource-based
view
Resources-based models,
Capabilities-based models,
Resources-and-Capabilities-
based models
P. Westhead, M. Wright & D. Ucbasaran
(2001), O.N. Toulan (2002)
Networking
approach
Theories of network
internationalisation
J. Johanson & L.G. Mattsson (1988), H.
Håkanson & J. Johanson (1992) ,
J. Johanson & F. Wiedersheim-Paul (2009)
International
entrepreneurship
International
entrepreneurship general
models (GIEMs)
M. Ruzzier, R.D. Hisrich & B. Antoncic
(2006), H. Etemad (2004), R. Schweizer,
J.-E. Vahlne & J. Johanson (2010)
International new ventures
(INVs)
P.P. McDougall & B.M. Oviatt (1994)
Born globals (BGs) G.A. Knight, T.K. Madsen & P. Servias
(2004), R. McNaughton & J. Bell (2004)
Rapid internationalisation I. Kalinic & C.Forza (2012), N. Hashai,
T. Almor (2004)
Managerial and
strategic approach
Strategies-based models J. Bell, D. Crick & S. Young (2004),
B. Hagen, A. Zucchella & P. Cerchiello,
N. De Giovanni (2012)
Decision-making models R. Schweizer (2011)
Organization-based models S. Andersson & H. Florén (2008)
Protoholistic
approach
(integrative
models)
General holistic models R. Flecher (2001), J. Bell, S. McNaughton,
S. Young & D. Crick (2003), H. Etemad
(2004)
Knowledge-based models K. Mejri & K. Umemoto (2010),
M. Kutschker, I. Bäurle, S. Schmid (1997)
Alternative
concepts
Alternative theories of the
firm-level internationalisation
K. Liuhto (2001), P.A. Havens (1994)
Source: (Wach, 2012a, p. 99).
The Role of Knowledge in the Internationalisation Process: An Empirical … 147147147147
Role of Knowledge in Internationalisation of the FirmRole of Knowledge in Internationalisation of the FirmRole of Knowledge in Internationalisation of the FirmRole of Knowledge in Internationalisation of the Firm
Stages models formed the basis and even gave rise to the emergence of, as already
mentioned, a separate current of internationalisation models which are learning
process models, hence the synthetic presentation of the process theories (stages
models) seems to be reasonable (Forsgren, 2002, pp. 257-277). J. Johanson and
J.-E. Vahlne (1974; 1977; 1990), and F. Wiedersheim-Paul (1975) treat the
internationalisation of the firm as an incremental process of international
commitment which is a result of the learning process, whereby incrementality is
understood as a consequence of the series of decisions. The U-model assumes
a stepwise expansion in four stages (Johanson & Wiedersheim-Paul, 1975, p. 307),
which are associated with greater commitment of resources leading to different
market experience and market knowledge. The first stage (no regular export
activities) is associated with the lack of commitment by the firm of its resources in
the export activities, which results in the impossibility of obtaining the required
knowledge about foreign markets. On contrary, the second stage (export through
independent intermediaries), allows the firm to obtain regular information on foreign
markets, which of course is associated with the market exposure. The third stage
(commercial subsidiaries) is associated with a controlled channel of information that
allows the firm to acquire information from the market. This step also allows to gain
direct experience of resource factors that determine the further internationalisation
process. The fourth stage (manufacturing subsidiaries) means even greater
commitment of resources. This sequence is defined as a an establishment chain.
While developing the original concept, the U-model was elaborated by dividing these
four factors into state aspects and change aspects. The input state variables (market
knowledge and market commitment) influence the output dynamic variables
(commitment decisions and current activities). The level of internationalisation is
dependent on the associated risks. The scale of further internationalisation will
therefore be limited to market commitment, while the decisions will be constrained
by the uncertainty (Johanson, Vahlne, 1990).
J. Johanson and J.-E. Vahlne (2009) proposed a modified version of their stages
model of 1977 adapting it to the network approach. The updated model assumes
that the firm is embedded in the active network of interdependent actors. As in the
original model, there are four interrelated variables, two state aspects associated with
the storage of knowledge and two variables related to the flow and transfer of
knowledge. These variables determine the dynamic cumulative process of learning,
but also a commitment to building trust among partners of the network (Johanson
& Vahlne, 2009, p. 1424). The increasing level of knowledge has a positive or
negative impact on building trust. An important change compared to the original
model is the introduction of an element of entrepreneurship theory manifested in
148148148148 Krzysztof Wach
recognition of opportunities to the knowledge. These opportunities constitute
knowledge, acting in a subset, in addition to the needs, skills, strategy and
relationship network (Johanson & Vahlne, 2009, p. 1424). Since the
internationalisation process occurs in the network, hence the variable ‘market
commitment’ of the original model was replaced by the variable 'network position'.
Learning by building trust, as one of two dynamic variables, expresses the result of
current operations. This contributes to an increase in knowledge. The last variable of
the model was only completed in relation to the original concept of attribute
'relational' to emphasize the key role of networks in the decision making process
(‘relationship commitment decisions’).
M. Kutschker, I. Bäurle and S. Schmid (1997) propose the three Es model (3E
model), which is based on a process (consecutive) approach and the managerial and
strategic approach. It explains the process of internationalisation of the firm (defined
as an increase in the involvement of business in international activities) taking into
account the implications that brings this concept to the practice of managing the
process of internationalisation. This model distinguishes three categories of processes,
namely (i) international evolution, (ii) international episodes and (iii) international
epochs (3E). In this sense, it is based on an earlier concept of the four types of
internationalisation processes introduced by L. Melin (1992, pp. 101-102), which
are (i) events or states, (ii) episodes, (iii) epochs and (iv) biographic history, while the
latter process corresponds to the international evolution in terms of 3Es model,
which in turn consist of individual evolutionary steps. The internationalisation of the
firm is determined by three factors, namely the geographical and cultural distance to
foreign markets, the range of value added in these markets and the degree of
integration of international activities. A business is becoming more internationalised
if the firm enters new markets, what is more if the firm expands its activities in
existing international markets and if the firm further integrates its international
business (Melin, 1992, p. 104). This model is based on the sociological concept of
deep structure introduced in the 1960s by Claude Lévi-Strauss. It is a kind of
invisible (internal) skeleton phenomena in the firm, and is contrasted with the
concept of the surface structure, which is the visible part of the structure of the firm.
Deep structure, using well-known in the social sciences the concept of contextual
orientation, is defined as the specific constellation of data and values, which are
fragments of knowledge (Kutschker et al., 1997, p. 108). Deep structure and surface
structure are the two layers of the organisation, which differently affect the three
processes of internationalisation, as managers play crucial role in the
internationalisation of the firm.
J.C. Casillas, A.M. Moreno, F.J. Acedo, M.A. Gallego and E. Ramos (2009)
recently have proposed an integrated model of internationalisation of the firm, which
articulates the role of knowledge in the process. It combines the four processes of

The Role of Knowledge in the Internationalisation Process: An Empirical … 149149149149
generation, absorption, spreading and implementation of knowledge in the
internationalisation process. The model tries to explain three important issues in the
internationalisation process: entry mode, entry scope and entry pace. The essence of
the model is reduced to four variables, including three inputs and one output. The
dependent variables are therefore prior knowledge (K1), the search for new
knowledge (K2), which is here understood as the recognition of the
internationalisation of the firm as a market opportunity. The combination of these
two variables, which both are a third variable (knowledge integration) determining
the behaviour of the firm in the field of internationalisation. The integration of
knowledge (K3) is understood as a suitable absorption of new knowledge and its
combination with the previously acquired knowledge in order to intensify the process
of internationalisation. Prior knowledge is the result of an individual (the founder)
and collective (managers) activities supported by adequate communication and
activities in the formal and informal networks. This knowledge affects the degree and
intensity of the search for new knowledge. The degree of internationalisation of the
firm positively affects international learning, and thus the pace of further
internationalisation (Casillas et al., 2009, p. 318).
K. Mejri and K. Umemoto (2010) refer to resource-based view initiated by
E.T. Penrose (1959) and developed by J.B. Barney (1991), and knowledge is treated
as an intangible resource. They discuss three phases of internationalisation, which are
pre-internationalisation, novice internationalisation and experienced
internationalisation (Daszkiewicz & Wach, 2012, pp. 100-102). K. Mejri and
K. Umemoto (2010) distinguish four types of knowledge: market knowledge,
network knowledge, cultural knowledge, entrepreneurial knowledge. Hence, this
concept also refers to the theory of entrepreneurship, which is currently the focal
point of all the latest models of internationalisation, especially those integrative
models (embedded in the international business). Experimental knowledge includes
network knowledge cultural knowledge and entrepreneurial knowledge, while market
knowledge is objective. The acquisition and utilization of these types of knowledge is
different at the different stages of internationalisation process.
R.G. Javalgi, S. Deligonul, A. Dixit and S.T. Cavusgil (2011) puts knowledge
in the centre while explaining re-entry phenomenon. They take into account three
processes: exploration of knowledge, acquisition of knowledge and the use of
knowledge (knowledge utilisation). Decisions on re-entry to the given foreign market
is determined by knowledge gained during the previous expansion, which is called de novo entry. During the initial entry into the international market, knowledge
exploration, both explicit and tacit knowledge, takes place. The knowledge
acquisition and knowledge utilisation are correlated.

150150150150 Krzysztof Wach
7.3. MAT7.3. MAT7.3. MAT7.3. MATERIAL AND METHODSERIAL AND METHODSERIAL AND METHODSERIAL AND METHODS
The article presents the results of the research project no. StG-21310034 entitled
“Patterns of Business Internationalization in Visegrad Countries – In Search for
Regional Specifics” financed by the International Visegrad Fund in the years
2013-2014 and coordinated by Cracow University of Economics in cooperation with
four partner universities (University of Economics in Prague, Czech Republic;
University of Miskolc, Hungary; Slovak University of Agriculture in Nitra, Slovakia;
Gdańsk University of Technology, Poland). The main research method, which was
applied, was the survey (an e-mail or a telephone conversation request followed by an
online password protected questionnaire) conducted among 1149 firms from
V4 countries, including 274 Polish firms, 618 Czech firms, 113 Hungarian firms
and 144 Slovak firms. In Poland 190 completely filled in questionnaires (out of
274 all questionnaires) were selected to further statistical preparations. The survey
was conducted between October 2013 and February 2014 (Wach, 2014; Wach &
Wojciechowski, 2014; Daszkiewicz & Wach, 2014; Daszkiewicz, 2014; Gubik
& Karajz, 2014; Duréndez & Wach, 2014). It seems that research into the issue of
the role of knowledge in the firm-level internationalisation process among Polish
businesses can be treated as the supplementation to the internationalisation research
in Poland (Jarosiński, 2014). The statistical calculations were made by the use of the
statistical software package Stata/SE® 12.0 as well as Statistica® PL v. 10. In order to
verify the assumed hypothesis the following statistical tests were applied: Spearman's
rank correlation coefficient (Spearman’s Rho) as well as Cramér’s V as a measure of
associations between two nominal variables, which are based on Pearson's chi-
squared statistics. The studies on the role of knowledge in the internationalisation
process takes two main research hypotheses:
H1:H1:H1:H1: The level of experience on international among top management team is
positively related to the acquisition and unitisation of knowledge on
international markets, which proves the theoretical assumptions from the
literature on knowledge-based models and learning process models.
H2:H2:H2:H2: The knowledge acquisition and utilisation impacts on the intensiveness of
internationalisation.
The QuestionaireThe QuestionaireThe QuestionaireThe Questionaire
The questionnaire was prepared in English and translated into four national
languages (Czech, Hungarian, Polish and Hungarian). Computer-assisted web
interviewing (CAWI) was applied as a main survey method. It means that responders
answered the questions on their own using the online questionnaire, which was

The Role of Knowledge in the Internationalisation Process: An Empirical … 151151151151
password protected1. The responders were selected on the basis of Polish Exporters
Database and the request to take part in the survey was sent to almost 7 thousands
internationalised firms. Only 274 firms replied, so the return rate was rather low
(ca. 4%), thus the results are not representative for the whole population of Polish
internationalised firms. The questionnaire was divided into four parts dedicated to
different aspects such as:
1. the characteristics of the firm (e.g. year of establishment, year of
internationalisation, staff, foreign ownership percentage, familiness, localisation,
NACE code, scope of internationalisation, internal resources, innovation
activities),
2. the characteristics of the owner, entrepreneur and principal management
(e.g. sex, level of education, type of education, age, personal attitude including
beliefs and habits),
3. the characteristics of the industry, in which the firm operates (e.g. high-tech vs.
low-tech, competition, innovativeness),
4. the patterns of internationalisation (e.g. motives for going international,
entry modes, entry combination, internationalisation performance,
international strategy, networking, plans for further internationalisation vs.
de-internationalisation).
Managerial perception was chosen as an operationalisation method, thus it assures
the acceptable correctness and the reliability, and first of all tops other methods in
relation to its practical usage, what is more it is applied in analogous research very
often (Lyon, Lumpki & Dess, 2000). This method was applied for all qualitative
variables.
In order to discuss the issue of the role of knowledge in the internationalisation
process among Polish firms, six simple knowledge variables were selected (Table 7.2).
On that basis the standardised indicators consisting of the simple indicators were
applied, namely basic PIKAU (basic potential index of knowledge acquisition and
utilisation) including the first four simple variables as well as extended PIKAU by
adding two more simple indicators describing the international orientation,
cosmopolitism and international openness.
An overall assessment index was constructed through the sum of values (the
interval from 1 to 5 of Likert’s scale) indicated by the respondents at each question,
and then it was divided by the sum of maximum values possible to be obtained.
Finally, the averaged total assessment was obtained, standardised in the interval from
0 to 1 (given in percentage in the interval from 0 to 100).
1 The questionnaire was available at http://www.visegrad.uek.krakow.pl/survey.
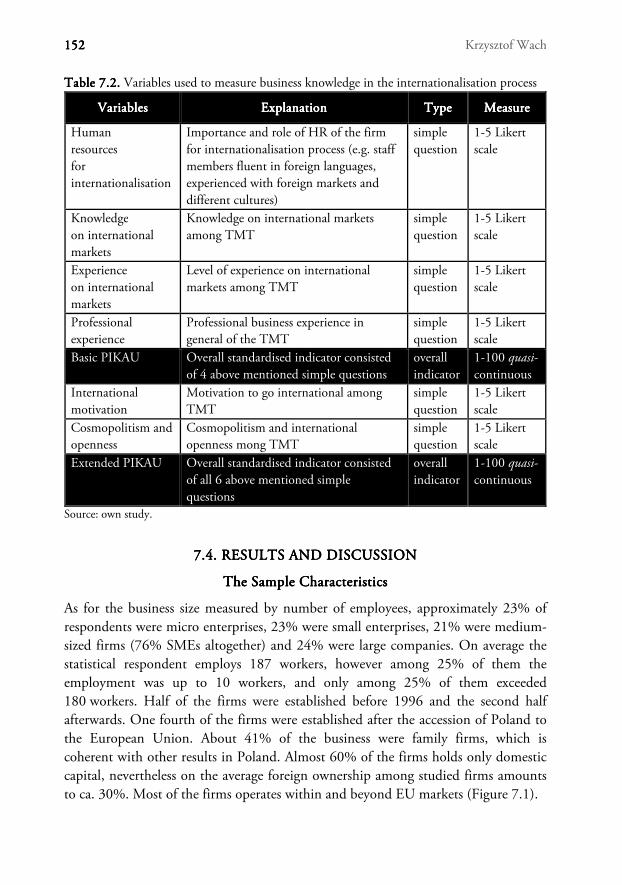
152152152152 Krzysztof Wach
TableTableTableTable 7.2.7.2.7.2.7.2. Variables used to measure business knowledge in the internationalisation process
VariablesVariablesVariablesVariables ExplanationExplanationExplanationExplanation TypeTypeTypeType MeasureMeasureMeasureMeasure
Human
resources
for
internationalisation
Importance and role of HR of the firm
for internationalisation process (e.g. staff
members fluent in foreign languages,
experienced with foreign markets and
different cultures)
simple
question
1-5 Likert
scale
Knowledge
on international
markets
Knowledge on international markets
among TMT
simple
question
1-5 Likert
scale
Experience
on international
markets
Level of experience on international
markets among TMT
simple
question
1-5 Likert
scale
Professional
experience
Professional business experience in
general of the TMT
simple
question
1-5 Likert
scale
Basic PIKAU Overall standardised indicator consisted
of 4 above mentioned simple questions
overall
indicator
1-100 quasi-continuous
International
motivation
Motivation to go international among
TMT
simple
question
1-5 Likert
scale
Cosmopolitism and
openness
Cosmopolitism and international
openness mong TMT
simple
question
1-5 Likert
scale
Extended PIKAU Overall standardised indicator consisted
of all 6 above mentioned simple
questions
overall
indicator
1-100 quasi-continuous
Source: own study.
7.4. RESULTS AND DIS7.4. RESULTS AND DIS7.4. RESULTS AND DIS7.4. RESULTS AND DISCUSSIONCUSSIONCUSSIONCUSSION
The Sample CharacteristicsThe Sample CharacteristicsThe Sample CharacteristicsThe Sample Characteristics
As for the business size measured by number of employees, approximately 23% of
respondents were micro enterprises, 23% were small enterprises, 21% were medium-
sized firms (76% SMEs altogether) and 24% were large companies. On average the
statistical respondent employs 187 workers, however among 25% of them the
employment was up to 10 workers, and only among 25% of them exceeded
180 workers. Half of the firms were established before 1996 and the second half
afterwards. One fourth of the firms were established after the accession of Poland to
the European Union. About 41% of the business were family firms, which is
coherent with other results in Poland. Almost 60% of the firms holds only domestic
capital, nevertheless on the average foreign ownership among studied firms amounts
to ca. 30%. Most of the firms operates within and beyond EU markets (Figure 7.1).

The Role of Knowledge in the Internationalisation Process: An Empirical … 153153153153
FigureFigureFigureFigure 7.1. 7.1. 7.1. 7.1. The territorial scope of studied firms Source: own study based on the V4 survey results of 2014 (n = 190).
Elements of Business Knowledge for InternationalisationElements of Business Knowledge for InternationalisationElements of Business Knowledge for InternationalisationElements of Business Knowledge for Internationalisation
The responders were asked to evaluate how six different aspects of knowledge impact
the internationalisation process in the given firm. Most of the Polish firms evaluated
these dimensions rather or extremely high (comparing to results in the Czech
Republic, Hungary and Slovakia the so high self-evaluation was the exception in the
case of Poland). International orientation as well as cosmopolitism and international
openness, and also general professional experience in business were evaluated
extremely positively (Table 7.3).
TableTableTableTable 7.3.7.3.7.3.7.3. Evaluation of knowledge elements according to the studied firms
ProxiesProxiesProxiesProxies ScaleScaleScaleScale MinMinMinMin MaxMaxMaxMax MeanMeanMeanMean MeMeMeMe S.D.S.D.S.D.S.D. Q1Q1Q1Q1 Q3Q3Q3Q3
HR for internationalisation ⦃1-5⦄ 1 5 3.93 4 1.00 3 5
Knowledge on int’l markets ⦃1-5⦄ 1 5 3.77 4 0.90 3 4
Experience on int’l markets ⦃1-5⦄ 1 5 3.69 4 0.96 3 4
Professional experience ⦃1-5⦄ 1 5 4.244.244.244.24 4 0.79 4 5
Basic PIKAU Basic PIKAU Basic PIKAU Basic PIKAU ⦃1-100⦄ 70 90 77.87 80 13.97 70 90
International motivation ⦃1-5⦄ 1 5 4.274.274.274.27 4 0.81 4 5
Cosmopolitism and openness ⦃1-5⦄ 1 5 4.204.204.204.20 4 0.81 4 5
Extended PIKAU Extended PIKAU Extended PIKAU Extended PIKAU ⦃1-100⦄ 30 100 80 80 12.42 73 90
Source: own study based on the V4 survey results of 2014 (n = 190).
Checking the relations among these six knowledge elements can be interesting (Table
7.4. and 7.5). The strongest relation is experienced in case of knowledge on
international markets and experience on international markets among top
17%17%17%17%
mainly
domestic
market3%3%3%3%
only
neighbouring
countries
17%17%17%17%
within
EU markets
63%63%63%63%
within and
beyond
EU markets

154154154154 Krzysztof Wach
management team, which was proved by using two tests (Cramér’s V = 0.686,
p < 0.000 as well as Spearman’s Rho=0.732, p < 0.000). On one hand, the results are
quite obvious, nevertheless there are very optimistic, as it proves that
internationalised firms can make use of the knowledge gained on international
markets, so the model of knowledge acquisition and utilisation discussed in the
literature is also valid for Polish tested businesses (Mejri & Umemoto, 2010; Casillas
et al., 2009). The fact that the high level of professional experience in business in
general makes top management much more cosmopolitan and open to foreign
markets (Cramér’s V = 0.406, p < 0.000), is a very good proof as it may testify that
general experience is based or can be based in the future on international cooperation
due to the openness. These managers who have good working knowledge on
international markets declare also excellent professional experience in general
(Spearman’s Rho=0.471, p < 0.000 as well as Cramér’s V = 0.324, p < 0.000), which
is very important for stages models of internationalisation, and it proves the most
commonly accepted concept (Johanson & Vahlne, 2009) that the market
commitment and international activities require some time. It also tell us that the
selection of the staff involved in international operations can’t be stochastic, but
must be very careful and well-thought-out.
TableTableTableTable 7.7.7.7.4444.... Cramér’s V associations between knowledge variables
V a r i a b l e sV a r i a b l e sV a r i a b l e sV a r i a b l e s [HRINT][HRINT][HRINT][HRINT] [KNOW][KNOW][KNOW][KNOW] [INTEXP][INTEXP][INTEXP][INTEXP] [PROFEXP][PROFEXP][PROFEXP][PROFEXP] [MOTIV][MOTIV][MOTIV][MOTIV] [COSMP][COSMP][COSMP][COSMP]
[HRINT][HRINT][HRINT][HRINT] 1111
[KNOW][KNOW][KNOW][KNOW] .210*** 1111
[INTEXP][INTEXP][INTEXP][INTEXP] .242*** .686***.686***.686***.686*** 1111
[PROFEXP][PROFEXP][PROFEXP][PROFEXP] .173† .324***.324***.324***.324*** .347***.347***.347***.347*** 1111
[MOTIV][MOTIV][MOTIV][MOTIV] .274*** .237*** .229*** .204* 1111
[COSMP][COSMP][COSMP][COSMP] .0191* .229*** .237*** .406***.406***.406***.406*** .333* 1111
Correlation is significant at: † p > 0.1; * p < 0.05; ** p < 0.01; *** p < 0.000. Notes: [HRINT] HR for internationalisation; [KNOW] Knowledge on international markets;
[INTEXP] Experience on int’l markets; [PROFEXP] Professional experience; [MOTIV] International
motivation; [COSMP] Cosmopolitism and openness.
Source: own study based on the V4 survey results of 2014 (n = 190).
Using the data from the questionnaire, the transnationality index (TNI) was
calculated based on the provided data. TNI is one of the most popular and
commonly accepted measures of internationalisation (Wach, 2012a, p. 132).
The dependence between TNI and extended PIKAU (discussed above in the article)
index was checked by using Pearson correlation coefficient (r=0.2, p=0.01). Although

The Role of Knowledge in the Internationalisation Process: An Empirical … 155155155155
there is weak correlation, but at the widely-accepted p-value. The results are not so
strong to support the hypotheses absolutely or unconditionally.
TableTableTableTable 7.7.7.7.5555.... Spearman's rank correlation coefficient among knowledge variables
V a r i a b l e sV a r i a b l e sV a r i a b l e sV a r i a b l e s [HRINT][HRINT][HRINT][HRINT] [KNOW][KNOW][KNOW][KNOW] [INTEXP][INTEXP][INTEXP][INTEXP] [PROFEXP][PROFEXP][PROFEXP][PROFEXP] [MOTIV][MOTIV][MOTIV][MOTIV] [COSMP][COSMP][COSMP][COSMP]
[HRINT][HRINT][HRINT][HRINT] 1
[KNOW][KNOW][KNOW][KNOW] .262*** 1
[INTEXP][INTEXP][INTEXP][INTEXP] .301*** .732***.732***.732***.732*** 1
[PROFEXP][PROFEXP][PROFEXP][PROFEXP] .138* .471***.471***.471***.471*** .452***452***452***452*** 1
[MOTIV][MOTIV][MOTIV][MOTIV] .348***.348***.348***.348*** .314*** .310*** .206** 1
[COSMP][COSMP][COSMP][COSMP] .235** .373***.373***.373***.373*** .350***.350***.350***.350*** .348***.348***.348***.348*** .525***.525***.525***.525*** 1
Correlation is significant at: * p < 0.05; ** p < 0.01; *** p < 0.000. Notes: [HRINT] HR for internationalisation; [KNOW] Knowledge on international markets;
[INTEXP] Experience on int’l markets; [PROFEXP] Professional experience; [MOTIV] International
motivation; [COSMP] Cosmopolitism and openness.
Source: own study based on the V4 survey results of 2014 (n = 190).
7.7.7.7.5555. . . . CONCLUSIONSCONCLUSIONSCONCLUSIONSCONCLUSIONS
In the literature, especially in the recent decades, knowledge plays a crucial role while
explaining the internationalisation process of the firm. What is more, there are
numerous different and peculiar models and their beginnings are dated back to the
U-model from 1970s. J.C. Casillas et al. (2009, pp. 312-313) believe that
knowledge-based models and learning process models of internationalisation can be
divided into three groups:
− concepts rooted in stages models, which treat knowledge in a sequential approach,
− international entrepreneurship models that assign a key role to knowledge,
especially in terms of recognition of international market opportunities (in
particular the concept of international new ventures, INV),
− integrative knowledge-based models using the perspective of organisational
learning.
Concluding, knowledge seems to be a key variable explaining the process of
internationalisation of the firm. Knowledge is explicitly expressed as an important
variable while modelling the process of internationalisation, what is more, knowledge
has gained in popularity for the last two decades, the heyday of knowledge-based
internationalisation models and learning process approach is dated back at the turn
of the first and second decade of the twenty-first century. It seems that the
knowledge-based models as well as international entrepreneurship models will
dominate in the coming years as a major issue of research on the internationalisation

156156156156 Krzysztof Wach
of the firm (Wach & Wehrmann, 2014). The top management teams through
continual learning can “change and re-direct the composition of their responsiveness
and efficiency activities in ways sensitive to an ever-changing world” (Morris,
Hammond & Snell, 2014, p. 405).
The research results do not let generalise and absolutise, nevertheless they prove
that the level of experience on international markets among top management team is
positively related to the acquisition and utilisation of knowledge on international
markets, which proves the theoretical assumptions from the literature on
knowledge-based models and learning process models (Cramér’s V = 0.686,
p < 0.000 as well as Spearman’s Rho=0.732, p < 0.000). The mechanism of
knowledge acquisition and utilisation impacts on the intensiveness of
internationalisation coefficient (r=0.2, p=0.01), however there is weak correlation,
but at the widely-accepted p-value.
The V4 survey was dedicated to general patterns of internationalisation and it
was not assumed to research deeply into knowledge-based models, so this is why it is
to be undertaken in the future. It would be good to explore the knowledge
mechanisms among Polish businesses in details as well as their impact on the
firm-level international competitiveness.
REFERENCESREFERENCESREFERENCESREFERENCES
Barney, J.B. (1991). Firm Resources and Sustained Competitive Advantage. Journal of Management, 14(1), pp. 33-46.
Casillas, J.C., Moreno, A.M., Acedo, F.J., Gallego, M.A., Ramos, E. (2009). An Integrative
Model of the Role of Knowledge in the Internationalization Process. Journal of World Business, 44.
Coviello, N.E., McAuley, A. (1999). Internationalisation and the Smaller Firm: A Review of
Contemporary Empirical Research. Management International Review, 39(3).
Daszkiewicz, N. (2004). Internacjonalizacja małych i średnich przedsiębiorstw we współczesnej gospodarce. Gdańsk: Scientific Publishing Group.
Daszkiewicz, N. (2014). Internationalization and Europeanization of Businesses in the Single
European Market (chapter 2), In: B. Knežević & K. Wach (eds), International Business from the Central European Perspective. Zagreb: University of Zagreb, pp.15-24.
Daszkiewicz, N. & Wach, K. (2012). Internationalization of SMEs: Context, Models and Implementations. Gdańsk: Gdańśk University of Technology Publishers.
Daszkiewicz, N. & Wach, K. (2014). Motives for Going International and Entry Modes of Family Firms in Poland. Journal of Intercultural Management, 6(2).
Duréndez, A. & Wach, K. (eds) (2014). Patterns of Business Internationalisation in Visegrad Countries – In Search for Regional Specifics. Cartagena: Universidad Politécnica
de Cartagena.

The Role of Knowledge in the Internationalisation Process: An Empirical … 157157157157
Forsgren, M. (2002). The Concept of Learning In the Uppsala Internationalization Process
Model: A Critical Review. International Business Review, 11.
Gorynia, M. (2007). Strategie zagranicznej ekspansji przedsiębiorstw, Warszawa: PWE.
Gubik, A.S. & Karajz, S. (2014). The Choice of Foreign Market Entry Modes – The Role
of Resources and Industrial Driving Forces. Entrepreneurial Business and Economics Review, 2(1).
Jarosiński, M. (2014). Characteristics of Polish Firms’ Internationalisation Processes (chapter
4), In: B. Knežević & K. Wach (eds), International Business from the Central European Perspective. Zagreb: University of Zagreb, pp. 43-52.
Javalgi, R.G., Deligonul, S., Dixit, A., Cavusgil, S.T. (2011). International market Reentry:
A Review and research Framework. International Business Review, 20(5).
Johanson, J., Vahlne, J.-E. (1977). The Internationalization Process of the Firm: A Model of
Knowledge Development and Increasing Foreign Commitments. Journal of International Business Studies, 8(1).
Johanson, J., Vahlne, J.-E. (1974). The Internationalization Process of the Firm.
Mimeographed Working Paper, Uppsala: Department of Business Administration.
Johanson, J., Vahlne, J.-E. (1990), The Mechanism of Internationalization. International Business Review, 7(4).
Johanson, J., Vahlne, J.-E. (2009). The Uppsala Internationalization Process Model
Revisited: From Liability of Foreignneess to Liability of Outsidership. Journal of International Business Studies, 40(9).
Johanson, J., Wiedersheim-Paul, F. (1975). The Internationalization of the Firm: Four
Swedish Cases. Journal of Management Studies, 12(3).
Kutschker, M., Bäurle, I., Schmid, S. (1997). International Evolution, International
Episodes, and International Epochs – Implications for Managing Internationalization.
Management International Review, 37(2), special issue.
Mejri, K., Umemoto, K. (2010). Small- and Medium-Sized Enterprise Internationalization:
Towards the Knowledge-Based Model. Journal of International Entrepreneurship, 8(2).
Melin, L. (1992). Internationalization as a Strategy Process. Strategic Management Journal, 13.
Morris, Sh., Hammond, R. & Snell, S. (2014). A microfoundations approach to
transnational capabilities: The role of knowledge search in an ever-changing world.
Journal of International Business Studies, 45(4), pp. 405-427.
Penrose, E.T. (1959). The Theory of the Growth of the Firm, Oxford: Oxford University Press.
Rundh, B. (2001), International Market Development: New Patterns in SMEs International
Market Behaviour?. Market Intelligence & Planning, 19(5).
Ruzzier, M., Hisrich, R.D., Antoncic, B. (2006). SME Internationalization Research: Past,
Present, and Future. Journal of Small Business and Enterprise Development, 13(4).
Wach, K. (2012a). Europeizacja małych i średnich przedsiębiorstw: rozwój przez umiędzynarodowienie, Warszawa: PWN.

158158158158 Krzysztof Wach
Wach, K. (2012b). Wybrane modele internacjonalizacji przedsiębiorstw bazujące na wiedzy. In: S. Wydymus & M. Maciejewski (eds), Innowacyjność i wiedza we współczesnym handlu międzynarodowym. Kraków: Fundacja Uniwersytetu Ekonomicznego w
Krakowie.
Wach, K. (2014a). Familiness and Born Globals: Rapid Internationalisation among Polish
Family Firms. Journal of Intercultural Management, 2(3/4).
Wach, K. (2014b). Theoretical Framework of the Firm-Level Internationalisation in Business
Studies (chapter 1). In: A. Duréndez, K. Wach (eds), Patterns of Business Internationalisation in Visegrad Countries – In Search for Regional Specifics. Cartagena:
Universidad Politécnica de Cartagena.
Wach, K., Wehrmann, C. (2014). Entrepreneurship in International Business: International
Entrepreneurship as the Intersection of Two Fields (chapter 1). In: A.S. Gubik &
K. Wach (eds.), International Entrepreneurship and Corporate Growth in Visegrad Countries. Miskolc: University of Miskolc Press.
Wach, K., Wojciechowski, L. (2014). The Size and the Strategic International Orientation:
The Use of EPRG Model among Polish Family and Non-Family Firms.
Przedsiębiorczość i Zarządzanie, XV(7[1]), pp. 143-156.
Whitelock, J. (2002). Theories of Internationalization and Their Impact on Market Entry.
International Market Review, 19(4).
Witek-Hajduk, M. (2010), Strategie internacjonalizacji polskich przedsiębiorstw w warunkach akcesji Polski do Unii Europejskiej. Warszawa: OW SGH.

S u g g e s t e d C i t a t i o n :S u g g e s t e d C i t a t i o n :S u g g e s t e d C i t a t i o n :S u g g e s t e d C i t a t i o n :
NowińskiNowińskiNowińskiNowiński, , , , WWWW.... (2014). Shareholder Value Effects of Cross-Border Acquisitions Conducted by Poland’s
Asseco Group (chapter 8). In: KiendlKiendlKiendlKiendl----Wendner, D. Wendner, D. Wendner, D. Wendner, D. & Wach, K.Wach, K.Wach, K.Wach, K. (eds), International Competitiveness in Visegrad Countries: Macro and Micro Perspectives. Graz: Fachhochschule Joanneum, pp. 159-170. 8888
Shareholder Value Effects of CrossShareholder Value Effects of CrossShareholder Value Effects of CrossShareholder Value Effects of Cross----Border Border Border Border
Acquisitions Conducted by Poland’s Asseco GroupAcquisitions Conducted by Poland’s Asseco GroupAcquisitions Conducted by Poland’s Asseco GroupAcquisitions Conducted by Poland’s Asseco Group
Witold NowińskiWitold NowińskiWitold NowińskiWitold Nowiński
Poznan School of Banking
Institute of Economics
al.Niepodległości 2, 61-874 Poznań, Poland
e-mail: [email protected]
Summary:Summary:Summary:Summary:
The purpose of the paper was to investigate the impact of cross-border acquisitions on shareholder
value, to verify the impact of prior foreign presence for acquisition performance and to compare
results of acquisitions into Eastern and Western European markets. Event method was applied for a
sample of multiple acquisitions conducted by a single acquirer. While we find that cross-border
acquisitions in the studied sample tend to destroy value, these findings are not statistically significant.
We find a weak tendency for transactions constituting the first entry into the market to have slightly
better outcome for shareholders than transactions constituting subsequent entries, which confirms
market access hypothesis. While on average cross-border acquisitions do not create value for Asseco
Group, their impact on shareholder value seems to be less adverse than in case of domestic
acquisitions. Our findings suggest that Asseco, and perhaps other similar Polish companies, could use
acquisitions to enter a foreign market, but subsequently grow in this market organically. The paper
constitutes a first approach to study an underexplored topic of outbound cross-border acquisitions
from Poland.
KeywordsKeywordsKeywordsKeywords: M&A, cross-border acquisitions, shareholder value, internationalization, performance
JEL classificationJEL classificationJEL classificationJEL classification: M16, G14, L25, L86, F23, G34
8888.1. .1. .1. .1. INTRINTRINTRINTROOOODUCTORY REMARKSDUCTORY REMARKSDUCTORY REMARKSDUCTORY REMARKS
The question of why companies internationalize and what are performance
implications of internationalization has long been the focus of International Business
research. Substantial part of this research has been devoted to Multinational
Corporations MNCs, sometimes referred to also as Multinational Enterprises MNEs.

160160160160 Witold Nowiński
Multinational Corporations are defined in the literature in various ways, although
operationalization of this concept has most often referred in the past to the number
of foreign subsidiaries and foreign sales, while less frequently to foreign assets,
employees and other factors (Aggarwal et al., 2011). Emerging market multinational
companies and their specific investment path is sometimes regarded as one of the big
questions for International Business research in 21st century (Mathews, 2006). It is
also argued, that International Business needs to focus on entry modes of these
MNCs, particularly into developed markets, and performance consequences of entry
mode choice (Griffith, Cavusgil & Xu, 2008). Cross-border acquisitions are an
advanced entry mode that yields relatively greatest control but also is related to
substantial risk. This makes them an interesting topic of research, especially that
cross-border acquisition activity in case of emerging firms is a relatively new
phenomenon. Some recent studies of outward foreign investment OFDI from
Poland show (Klimek, 2011) that companies engaged in OFDI overall show better
performance than companies which are not engaged in such activities. It is not,
however, certain whether better performance is the result or a contributing factor to
such an engagement. Therefore research into performance consequences of OFDI,
and cross-border acquisitions of Polish companies is needed.
Research studies in the past have often indicated (Moeller, Schlingemann
& Stulz, 2005) that acquisitions more often destroy than create value. Evidence on
cross-border acquisitions is less conclusive, although they also do not seem to create
value for bidder’s shareholders (Aybar & Ficici, 2009, Danbolt & Maciver, 2012).
However, even if shareholders of an average acquirer do not benefit from acquisitions
this does not preclude that in individual cases, companies may successfully apply
cross-border acquisitions for their international expansion. Research on cross-border
acquisitions of Central European, even less Polish MNCs is very scarce. This leaves
open the question, to what extent findings from cross-sectional studies apply in these
specific circumstances.
This paper will contribute to analysing cross-border acquisitions from Poland
by studying one particular company, which has extensively used this form of
international expansion, namely Asseco Group. Asseco Poland is the largest Polish IT
company with market valuation of around 3,8 milliard PLN and annual turnover of
over 5,5 milliard PLN. It is present directly or indirectly in over 50 countries world-
wide. Asseco Group makes up a federation of companies active in software
development or more broadly speaking in IT services. While companies from Asseco
group are active in diverse fields such as ERP software for SMEs, CRM and
workflow packages, internet services, ATM services and hardware, its core
competences and main revenues come from its solutions and custom software
development for banking, financial sector, as well as public and corporate sectors.
Asseco has received recently, along with four other Polish companies, an award for its

Shareholder Value Effects of Cross-Border Acquisitions Conducted by … 161161161161
foreign investments in the competition ‘Polish company- International Champion’
(PWC, 2013). It is frequently mentioned as an example for other Polish companies
considering international expansion, both by popular media and research papers
(Dolistowska & Bąkowska, 2013; Kaszuba, 2010; Rudke, 2013). For these reasons
Asseco constitutes an interesting case for studying shareholder effects of cross-border
acquisitions. This paper will thus assess the consequences of
cross-border acquisitions for Asseco’s shareholders as well as their determinants,
simultaneously contributing to knowledge on cross-border acquisitions from Poland.
8.2. LITERATURE REVI8.2. LITERATURE REVI8.2. LITERATURE REVI8.2. LITERATURE REVIEWEWEWEW
King, Dalton, Daily and Covin (2004) contend on the basis of meta analysis of
a large number of M&A studies from developed markets, that acquisition
transactions do not contribute to superior financial results and even destroy value to
some extent. Moeller, Schlingemann and Stulz (2005) claim that during the merger
wave between 1998 and 2001 bidder’s shareholders lost on average 12%. In case of
emerging market MNCs Aybar and Ficici (2009) also find that cross-border
acquisitions tend to destroy rather than create value.
For reasons explained in the previous section, we might expect that Asseco
could actually be different from majority of acquirers. To assess this, we want to test
empirically, and perhaps reject, the following hypothesis:
H1:H1:H1:H1: Cross-border acquisitions by Asseco Group do not create value for its
shareholders.
While findings for cross-border acquisitions and their impact for bidder’s
shareholders are not very positive, Danbolt and Maciver (2012) comparing domestic
and cross-border acquisitions find that acquisition bidders gain relatively more in
cross-border transactions. Research is not, however, completely unambiguous and
results may depend on the acquirer’s domestic market. While more positive
outcomes for cross-border acquisitions are found for acquisitions undertaken by
British companies (Danbolt & Maciver, 2012) findings concerning Russian acquirers
show a different picture. Bertrand and Betschinger (2012) find in this context that
both domestic and cross-border deals destroy value. While cross-border deals destroy
shareholder’s value slightly more, the difference is not significant. These ambiguous
results call for research in still other context. As Asseco Poland was very active in
terms of mergers and acquisitions not only internationally, but also domestically, we
can test whether results of Asseco’s cross-border acquisitions are superior to those of
domestic acquisitions by hypothesizing that:
H2:H2:H2:H2: Asseco’s shareholders gain more from its cross-border acquisitions than
from domestic acquisitions.

162162162162 Witold Nowiński
Traditional internationalization models, such as Uppsala model (Johanson
& Vahlne, 1977) claim that international presence is increased gradually. Companies
enter first psychically close countries and apply low-risk entry modes. As they gain
foreign market experience, they gradually move to psychically more distant markets
and switch to more advanced entry modes. In the context of emerging market
multinationals, Mathews (2006) argues, that as they create cross-border linkages and
leverage resources of their foreign partners, they also gain new organizational
capabilities and as a result improve, with time, efficiency of such linkage-leverage
strategies. These arguments suggest that first acquisition into a new foreign market
might pose a greater challenge and create less value than subsequent acquisitions into
the same market. However, entering completely new markets by means of
cross-border acquisitions offers also potential benefits from market expansion. Such
acquisitions might for example provide access to networks, the lack of which could
prevent the acquirer from entry. They also pose a lower threat of overlap between
target’s and acquirer’s operations.
Research does not answer unambiguously whether cross-border acquisitions are
more effective when they constitute initial entry into a foreign market or when they
constitute an entry into a market where the acquirer previously operated. Aybar and
Ficici (2009) indicate that lack of previous operations on the market of the target
may increase difficulties in proper assessment of the target. Danbolt (2004) does not
find a difference between first entries into a new market and acquisitions in markets
where the bidder operated prior to the acquisition. In turn, Danbolt and Maciver
(2012) find a weak but positive effect for cross-border acquisitions into new markets.
As the previous research is not conclusive, it is reasonable to test if Asseco’s
cross-border acquisitions into completely new markets create more or less value than
acquisitions into markets where Asseco had earlier acquired a company. Therefore we
want to test the following hypothesis:
H3:H3:H3:H3: Value creation from cross-border acquisitions into countries where Asseco
Group had previously established its presence (by an acquisition) is higher
than in case of cross-border acquisitions into completely new markets.
As it has been argued earlier, cross-border acquisitions may be expected to
contribute to value creation more than domestic acquisitions. By acquiring foreign
targets acquirers can gain access to markets, new resources and/or capabilities. The
extent to which this access will contribute to acquirer’s value may depend on the
characteristics of the target market. Research on cross-border acquisitions by
emerging market firms has shown so far that acquisitions of emerging market
multinationals into Western, developed markets create more value than acquisitions
into other emerging markets. This has been shown for example on a sample of Indian
companies (Gubbi, Aulakh, Ray, Sarkar & Chittoor, 2010). Gubbi et al. (2010)

Shareholder Value Effects of Cross-Border Acquisitions Conducted by … 163163163163
argue that emerging markets MNCs may benefit in case of acquiring companies from
Western countries by obtaining access to better quality of resources and institutions
in the developed markets. Two other recent studies also provide supportive
arguments concerning superior results of acquisitions into Western markets
(Chernykh, Liebenberg, & Macias, 2011; Nicholson & Salaber, 2013). Thus overall,
previous studies are relatively unambiguous on the superior benefits derived from
choosing targets from Western markets. As these studies rely mostly on data from
Asian emerging markets we want to test whether these findings apply to East
European multinational like Asseco. Therefore following hypothesis is to be tested:
H4:H4:H4:H4: Cross-border acquisitions into Western markets create more value than
cross-border acquisitions into emerging markets.
8888.2. .2. .2. .2. MATERIAL AND METHODSMATERIAL AND METHODSMATERIAL AND METHODSMATERIAL AND METHODS
The object of this study are acquisitions undertaken by Asseco Poland, Asseco
Slovakia, Asseco Germany, Asseco Romania and Asseco South Eastern Europe ASEE
(see Table 8.1 for the list of acquisitions). Acquisitions were identified from EMISTM
DealWatch database provided by Emerging Markets Information Service. Countries
of the targets were classified as East or West European. We also classified acquisitions
as first entry into the market or subsequent entry. For the sake of this classification
we treated former Yugoslavia countries as one, thus treating entry into Serbia by
means of acquiring Pexim DOO as the first entry into the market and treating other
acquisitions, such as for example acquisition of two Croatian companies Arbor and
Logos as subsequent entries. In several cases acquisition of more than one company
was announced on a single day. In such a case we treated such acquisitions as one
event, as it would be unfeasible to discern separately the impact of each of them.
We also considered only these transactions which led to gaining control either by
Asseco Poland or its direct subsidiary. We dismissed deals undertaken by subsidiary
of a subsidiary. We also did not include deals which constituted an increase in
shareholdings in a company which was already controlled by Asseco Group or
transactions which constituted an internal restructuring of Asseco holding.
We included in the analysis transactions conducted from the beginning of
Asseco Poland’s presence on the Warsaw Stock Exchange until the end of 2013.
Deals of undisclosed value or valued at less than 2 million Euro were excluded due to
expectations of negligible impact on shareholder value. For the sake of comparisons
with domestic deals carried out by Asseco Poland, we compiled also a list of domestic
transactions by this company in the same period (Table 8.2).

164164164164 Witold Nowiński
TableTableTableTable 8888....1111.... List of foreign companies acquired by Asseco Group between 2007 and 2013 N
o.
No
.N
o.
No
.
Target companyTarget companyTarget companyTarget company Target Target Target Target
countrycountrycountrycountry AcquirerAcquirerAcquirerAcquirer
1 FIBa Software S.R.L./ Net Consulting S.R.L. Romania Asseco Romania
2 AP Automation+Productivity AG Germany Asseco Germany
3 Sintagma Lithuania Asseco Poland
4 Uniquare Software Development GmbH Austria Asseco Slovakia
5 Pexim DOO Serbia ASEE
6 Arbor Informatika d.o.o. Rijeka/ Logos d.o.o. Zagreb Croatia ASEE
7 matrix42 Germany Asseco Germany
8 Pexim Cardinfo DOO Belgrad Serbia ASEE
9 Antegra DOO Serbia ASEE
10 update4u Software Germany Asseco Germany
11 Raxon Informatica Spain Asseco Poland
12 IT Practice Denmark Asseco Poland
13 Terminal Systems Spain Asseco Poland
14 Pronet IT Konsalting Inxhiniering Telekomunikime
Sh.p.k. Kosovo ASEE
15 Professional Bank Systems & Software - Probass Romania Asseco Poland
16 Statlogics Szoftverfejleszto Hungary Asseco Slovakia
17 Globenet Szamitastechnikai Hungary Asseco Slovakia
18 ITD (Iletisim Teknoloji Danismanlik Ticaret A.S.)/ EST -
Elektronik Sanal Ticaret Bilişim Hizmetleri A.Ş. Turkey ASEE
19 Necomplus Mantenimiento, S.L.; Necomplus, S.L.;
Necomplus Portugal; Grupo Drie, S.L. Spain Asseco Poland
20 Formula Systems Israel Asseco Poland
21 Biro Data Servis/ Cardinfo BDS Bosnia ASEE
22 Sigma Danismanlik Turkey ASEE
23 R-Style Softlab Russia Asseco Poland
24 Racunalstvo Croatia ASEE
Source: Emerging Markets Information Service EMIS.
We used in the study event methodology, which is common for studies
assessing the impact of M&A on shareholder value. Market model and WIG index
were used for estimating expected returns of Asseco Poland, according to the
following formula
tmtt RR εβα ++= (1)
where :
Rt – is the return on Asseco Poland share at time t,

Shareholder Value Effects of Cross-Border Acquisitions Conducted by … 165165165165
Rmt – is the return on WIG at time t, β – is the coeeficient which links returns of Asseco Poland with WIG to be estimated
from the regression
α – is the intercept term
ε – is a random error at time t.
This model allows to estimate expected returns on Asseco Poland’s shares
during the event window. For the sake of this analysis we decided for 120 day long
estimation period ending d-3 (3 days before the event) and 3 days long event window
(-1,0,1), where 0 denotes the day of the announcement. The Abnormal Return AR is
calculated according to the following formula, by subtracting expected return from
actual return on each day of the event window.
( )tmttt RRAR βα +−= (2)
where :
ARt – is the abnormal return at time t.
The sum of abnormal returns for the event window is called Cumulative
Abnormal Return CAR and the cumulative average abnormal return CAAR for the
event window is the arithmetical average of CAR.
TableTableTableTable 8888.2..2..2..2. List of domestic companies acquired by Asseco Group between 2007 and 2013
DateDateDateDate Target CompanyTarget CompanyTarget CompanyTarget Company Deal TypeDeal TypeDeal TypeDeal Type
2013-02-15 Zeto Bydgoszcz SA Acquisition
2012-09-18 Centrum Informatyki ZETO S.A. Acquisition
2012-06-27 SKG SA Acquisition
2011-12-09 Centrum Komputerowe ZETO S.A. Acquisition
2009-11-26 Otago Acquisition
2008-10-22 Systemy Informacyjne Kapital SA Acquisition
2008-05-13 ABG Ster-Projekt Merger
2008-02-20 Prokom Software Merger
2007-10-01 Anica System Acquisition
2007-09-29 Prokom Software Merger
Source: Emerging Markets Information Service EMIS.
8888....4444. . . . RESULTS AND DISCUSSIRESULTS AND DISCUSSIRESULTS AND DISCUSSIRESULTS AND DISCUSSIONONONON
Cumulative Average Abnormal Return CAAR for cross-border acquisitions
is -0.00142, while Median of CAR is -0.003616. Both values are below 0. Thus we
cannot reject H1, that cross-border acquisitions do not create value.

166166166166 Witold Nowiński
This is even more clear when we look at abnormal returns for particular event
window days, as d0 and d1 show clearly negative outcomes (Table 8.3).
TableTableTableTable 8888.2..2..2..2. Average values and Median for Cumulative Abnormal Returns obtained during
individual days of the event window
dddd----1111 d0d0d0d0 d1d1d1d1
CAAR 0.001676 -0.0007 -0.0025
MEDIAN 0.002591 -0.00182 -0.00499
Source: own calculations.
Furthermore, we compared cross-border to domestic acquisitions. Both CAAR and
Median of CAR for domestic acquisitions are lower than for cross-border
acquisitions (Figure 8.1) although the difference between them as calculated by
U Mann-Whitney test is not statistically significant. Thus while we find that both
CAAR and Median are lower for domestic acquisitions than cross-border acquisitions
we can only speak of some tendency, as we do not find statistical significance for
these differences.
FigureFigureFigureFigure 8.1.8.1.8.1.8.1. CAAR and Median of CAR for cross-border vs domestic
acquisitions of Asseco Group Source: own elaboration.
In order to verify H3 concerning impact of prior experience in the market of
the target on acquisition performance, we analyzed whether cross-border acquisitions
which constituted first entry into a specific foreign market generated worse results
than acquisitions into markets where Asseco Group was already present at the time of
transaction.

Shareholder Value Effects of Cross-Border Acquisitions Conducted by … 167167167167
Figure 8.2.Figure 8.2.Figure 8.2.Figure 8.2. CAAR for cross-border acquisitions which constitute first entry
into the foreign market (0) versus acquisitions into markets,
where the bidder had earlier acquired another company (1) Source: own elaboration.
FigureFigureFigureFigure 8888....3333. . . . CAAR for Asseco’s cross-border acquisitions into East
versus West European markets Source: own elaboration.
Our findings suggest that there might exist a difference between these two groups of
acquisitions (Figure 8.2) but contrary to expectations first time acquisitions in new
foreign markets generated better returns than acquisitions into markets where Asseco
previously had acquired a company. Nevertheless again, probably due to small size
of our sample these differences are not statistically significant.

168168168168 Witold Nowiński
The last objective was to test whether acquisitions into Western markets were
superior as compared to acquisitions into East European markets. As Figure 8.3
indicates, differences between these countries are not substantial. What we do
observe is that variance in results of acquisitions into West European markets
(0.001354) is actually greater than in case of targets from East European markets
(0.000405). Contrary to intuition, acquisitions of companies in Western Europe
seem to present potentially both greater opportunities and greater risks.
8888....5555. . . . CONCLUSIONSCONCLUSIONSCONCLUSIONSCONCLUSIONS
Our research on the value creation stemming from acquisitions, particularly cross-
border acquisitions of Asseco Group, show that at least in the short run these
transactions do not create shareholder value. While our results are statistically
inconclusive, we observe that descriptive statistical measures (in our case CAAR and
Median for CAR) for cross-border acquisitions are higher than in case of domestic
M&A transactions, suggesting that cross-border acquisitions might be superior.
We also find that cross-border transactions which constitute a first entry into
a foreign market tend to make shareholders better off than acquisitions in countries
where Asseco, had previously acquired a company. Our analysis indicates also that
value creation does not depend on whether the target is in a West or East European
country. All this indicates that value creation in acquisitions of the Asseco Group
might be related to accessing new markets. Further growth in these markets,
however, should rather be conducted in an organic way.
While our findings are generally statistically inconclusive this could be ascribed
to small sample size. Therefore further research into cross-border acquisitions
conducted by Visegrad 4 companies is warranted, especially that existing studies
only marginally refer to transactions from the region (Aybar & Ficici, 2009). Such
studies would, however, certainly benefit from larger sample size that would increase
statistical significance of the results and enable more elaborate approaches to analysis,
controlling, among others, for bidder and target characteristics.
It is not certain to what extent conclusions from this study could be
extrapolated to other cross-border acquisitions from Poland. The fact that we have
concentrated on a single acquirer from a single industry might limit extending these
findings to other contexts. In order to achieve more universal findings one should
control also for other acquirer’s characteristics, such as for example acquisitions
experience.
Despite these limitations current study offers some interesting findings. While
it is in line with research that suggests greater benefits from cross-border as compared
to domestic acquisitions, it does not support the notion that emerging market
acquirers will benefit more from acquiring Western rather than other emerging

Shareholder Value Effects of Cross-Border Acquisitions Conducted by … 169169169169
market companies. Perhaps East European acquirers are different in this respect from
Asian acquirers? The other interesting finding, even if not completely conclusive,
refers to shareholder value effects for first time acquisitions on foreign markets as
compared to subsequent acquisitions. It seems that the market doubts whether
increased knowledge about the foreign market gained from the initial acquisitions
outweighs management challenges related to a following acquisition in the same
market.
REFERENCESREFERENCESREFERENCESREFERENCES
Aggarwal, R., Berrill, J., Hutson, E., & Kearney, C. (2011). What is a multinational
corporation? Classifying the degree of firm-level Multinationality. International Business Review, 20(5), 557–577.
Aybar, B., & Ficici, A. (2009). Cross-border acquisitions and firm value: An analysis of
emerging market multinationals. Journal of International Business Studies, 40(8), 1317–
1338.
Bąkowska, K. (2013). Asseco Poland – przykład polskiej firmy rozwijającej się przez akwizycje
krajowe i zagraniczne. In L. Pałys & H. Kępka (Eds), Polskie inwestycje za granicą 2010-2012 (pp.102-105), Warszawa: Instytut Badań Rynku, Konsumpcji i Koniunktur.
Bertrand, O., & Betschinger, M-A. (2012). Performance of domestic and cross-border
acquisitions: Empirical evidence from Russian acquirers. Journal of Comparative Economics, 40(3), 413–437.
Chernykh, L., Liebenberg, I.A., & Macias, A.J. (2011). Changing Direction: Cross Border
Acquisitions by Emerging Market Firms, (October 4, 2011). Retrieved March 19,
2014, from http://dx.doi.org/10.2139/ssrn.1540260 .
Danbolt, J. (2004). Target company cross-border effects in acquisitions into the UK.
European Financial Management, 10(1), 83-108.
Danbolt, J., & Maciver, G. (2012). Cross-Border versus Domestic acquisitions and the
Impact on Shareholder Wealth. Journal of Business Finance & Accounting, 39(7 & 8),
1028–1067.
Dolistowska, D., Asseco szturmuje rynki wschodnie. Retrieved February 13, (2014), from
http://www.polandgoglobal.pl/artykuly/asseco-szturmuje-rynki-wschodnie-
1#.Uvz14FKgYQ4 .
Griffith, DA., Cavusgil, ST., & Xu, S. (2008). Emerging themes in international business
Research. Journal of International Business Studies, 39(7), 1220–1235.
Gubbi, S.R., Aulakh, P.S., Ray, S., Sarkar, M.B., & Chittoor, R. (2010). Do international
acquisitions by emerging-economy firms create shareholder value? The case of Indian
firms. Journal of International Business Studies, 41(3), 397–418.
Johanson, J., & Vahlne, J.E. (1977). The Internationalization Process of the Firm: A Model
of Knowledge Development and Increasing Foreign Market Commitments. Journal of International Business Studies, 8, 23–32.

170170170170 Witold Nowiński
Kaszuba, K. (2010). Rozwój Asseco Poland S.A. jako przykład tworzenia międzynarodowej
grupy kapitałowej. Studia i Prace Kolegium Zarządzania i Finansów, Szkoła Główna
Handlowa, 101, 108-116.
King, D.R., Dalton, D.R., Daily, M., & Covin, J.G. (2004). Meta-analyses of
post-acquisition performance: Indications of unidentified moderators. Strategic Management Journal, 25(2), 187–200.
Klimek, A. (2011). Emergence of Multinational Firms from Middle Income Countries: The
Case of Poland. Argumenta Oeconomica, 26(1), 91- 110.
Mathews, J.A. (2006). Dragon multinationals: New players in 21st century globalization. Asia Pacific Journal of Management, 23(1), 5–27.
Moeller, S., Schlingemann, F.P., & Stulz, R.M. (2005). Wealth Destruction on a Massive
Scale? A Study of Acquiring-Firm Returns in the Recent Merger Wave. The Journal of Finance, 60(2), 757-782.
Nicholson, R.R., & Salaber, J. (2013). The motives and performance of cross-border
acquirers from emerging economies: Comparison between Chinese and Indian firms.
International Business Review, 22(6), 963–980.
PriceWaterhouseCoopers (2013). Znamy już zwycięzców konkursu “Polska Firma
– Międzynarodowy Czempion 2013”, Retrieved February 13, 2014, from
http://www.pwc.pl/pl/biuro-prasowe/2013-12-06-zwyciezcy-polska-firma-
miedzynarodowy-czempion-2013.jhtml.
Rudke, M. (2013). Polskie firmy coraz śmielej poczynają sobie na światowym rynku.
Rzeczpospolita, Retrieved February 13, 2014, from
http://www.ekonomia.rp.pl/artykul/1072869.html?p=1.

S u g g e s t e d S u g g e s t e d S u g g e s t e d S u g g e s t e d C i t a t i o n :C i t a t i o n :C i t a t i o n :C i t a t i o n : KilarKilarKilarKilar, , , , WWWW.... (2014). Differentiation of Visegrad Group International Corporations in Comparison to World’s Largest Corporations (chapter 9). In: KiendlKiendlKiendlKiendl----Wendner, D. Wendner, D. Wendner, D. Wendner, D. & Wach, K.Wach, K.Wach, K.Wach, K. (eds), International Competitiveness in Visegrad Countries: Macro and Micro Perspectives. Graz: Fachhochschule Joanneum, pp. 171-186. 9999
Differentiation of Visegrad Group Differentiation of Visegrad Group Differentiation of Visegrad Group Differentiation of Visegrad Group InternationalInternationalInternationalInternational Corporations in ComparisonCorporations in ComparisonCorporations in ComparisonCorporations in Comparison
totototo World’s Largest CorporationsWorld’s Largest CorporationsWorld’s Largest CorporationsWorld’s Largest Corporations
Wioletta KilarWioletta KilarWioletta KilarWioletta Kilar
Pedagogical University of Cracow Faculty of Geography and Biology
Department of Entrepreneurship and Spatial Management ul. Podchorążych 2, 30-084 Kraków, Poland
e-mail: [email protected]
Summary:Summary:Summary:Summary:
The role of international corporations in the global economy cannot be emphasised enough as their economic potential, operations, investment and the network of interests influence economic transformations, Furthermore, their competition triggers a rapid technological progress and a growth of knowledge resources in a variety of disciplines. For this reason, each area in the global space should create conditions supporting development of such entities and attracting their presence on their territory. In the light of the above, this paper focuses on international corporations headquartered in the Visegrad Group states ranked among 2,000 largest global corporations The purpose of the paper is to present positions occupied by international corporations headquartered in the Visegrad Group countries in the ranking of the largest international corporations as well as discuss changes in their economic potential based on variables (sales, profit and asset value) from 2003 to 2012. Furthermore, the author intends to identify the types of business transacted by the largest global corporations headquartered in Poland, the Czech Republic, Slovakia and Hungary and determine the root causes of the status quo and transformations in the current status of these corporations.
KeywordsKeywordsKeywordsKeywords: economic potential, global corporations, corporation JEL classificationJEL classificationJEL classificationJEL classification: F23, F40, F63, G32, O14, O16, O3

172172172172 Wioletta Kilar
9999.1. .1. .1. .1. INTRINTRINTRINTROOOODUCTORY REMARKSDUCTORY REMARKSDUCTORY REMARKSDUCTORY REMARKS
International corporations play an important role in the global economy. They organise the global economic, social and cultural space by creating systems of spatial and production relations. While competing on the global market and investing in many countries, they evolve by adjusting to global technological and economic transformations. Knowledge development, application and multiplication represent particularly important change factors; their trends affect decisions made by the corporations on their FDI and foreign branches and have an impact on the economies of their host countries (Hajdukiewicz, Michalik, 2007; Weresa, 2010; Driouchi, Bennett, 2011).
In turn, the existing markets are transformed while a search for new locations, supply and sales markets for new products begins (Dorocki, 2010). Here, headquarters of the leading global companies - “the centres of command” – play a very important role (Śleszyński, 2002; Zioło, 2006). “On the basis of accepted strategic assumptions which are based on the process of economic development and foreseeable transformative trends in the global, national or regional or even local systems, management boards make decisions on the flow of cash supporting the agreed direction of R&D works, new locations, expansion of the existing production capacities, production range and volume, its modernization, their supply markets and corporate relations, sales markets for finished products, marketing, etc.” (Zioło, 2006a, p. 9).
Global corporations based in the Visegrad Group countries are relatively seldom discussed in the research and analysis context in the literature in the field, largely due to the fact that, because of their history, the countries embarked on the process of transforming their economies as late as in 1990s, creating conditions for setting up and growing enterprises of all sizes. For this reason, even if global corporations are mentioned in the context of the Visegrad Group countries, typically, they are discussed in the context of locating branches of foreign corporations in these countries (see Fojutowski, 2006, Nölke, Vliegenthart, 2009; Overbeek, Apeldoorn, Nölke, 2007; Rosińska-Bukowska, 2011; Wie, Andreosso-O’Callaghan, Wuntsch, 2007; Zorska, 2002b).
International corporations chose to operate in Central and Eastern Europe (CEE) (including the Visegrad Group countries) (Raźniak, 2014, Raźniak, Winiarczyk-Raźniak, 2013; Knežević, Wach, 2014; Duréndez, Wach, 2014) largely because of its large-scale market and availability of core production factors such as well-educated and skilled workforce (Borowiec, Dorocki, Jenner 2009; Wach, 2007). In spite of differences in conditions and investment risk, the Visegrad Group countries come before other CEE countries in terms of the size of their sales market (Poland as a prime example), central location, availability of well-trained and
Differentiation of Visegrad Group International Corporations in … 173173173173
motivated workforce and absence of ethnic and border conflicts (Zorska, 2002a). By forming the Visegrad Group and creating the free trade zone (CEFTA) and EU membership, they endeavour to strengthen their mutual economic and commercial relations. Such approach enhances their attractiveness among other CEE countries, stimulating the flow of their FDI.
Research shows that, as a result of globalisation and regionalisation processes and by pursuing their characteristic operational strategies, the Visegrad Group corporations may become entities who target their operations at local, regional and global market at the same time (Banalieva, Santoro, 2009; Talpová, Žáková, 2011).
9999.2. .2. .2. .2. MATERIAL MATERIAL MATERIAL MATERIAL AND METHODSAND METHODSAND METHODSAND METHODS
As mentioned in the research of Dobrai, Farkas, Karoliny, Poór (2012), universities of Central and Eastern Europe had set up the Central and Eastern European International Research Team (CEEIRT) to facilitate knowledge transfer in the Visegrad Group. The CEEIRT studies and analyses concentrate on human resources management practices in the region.
As indicated above, this paper focuses on international corporations headquartered in the Visegrad Group in the ranking of the world’s 2,000 largest global corporations.
The purpose of the paper is to present spots occupied by international corporations headquartered in the Visegrad Group countries among the largest international corporations as well as changes in their economic potential on the basis of three metrics (profit, asset value and sales), 2003 – 2012. Furthermore, the author intends to identify the types of business of the largest global corporations headquartered in Poland, the Czech Republic, Slovakia and Hungary. Two hypothesis are framed in the research and put up for verification: − progressing polarisation of headquarters of global corporations stimulated by
a difference in conditions they are offered in each country of operation, − in the Visegrad Group countries, corporations representing traditional types of
business prevail.
The research covered an analysis of the Global 2000 Forbes report 2004 – 2013 on 2,000 largest global corporations. The ranking of global companies was helpful in ranking corporations by year and tracking fluctuation in their positions in the analysed period and their classification by business sector and country of their registered seats. The above-mentioned data and indicators measuring their potential was revised against annual reports published by the corporations analysed in the paper.
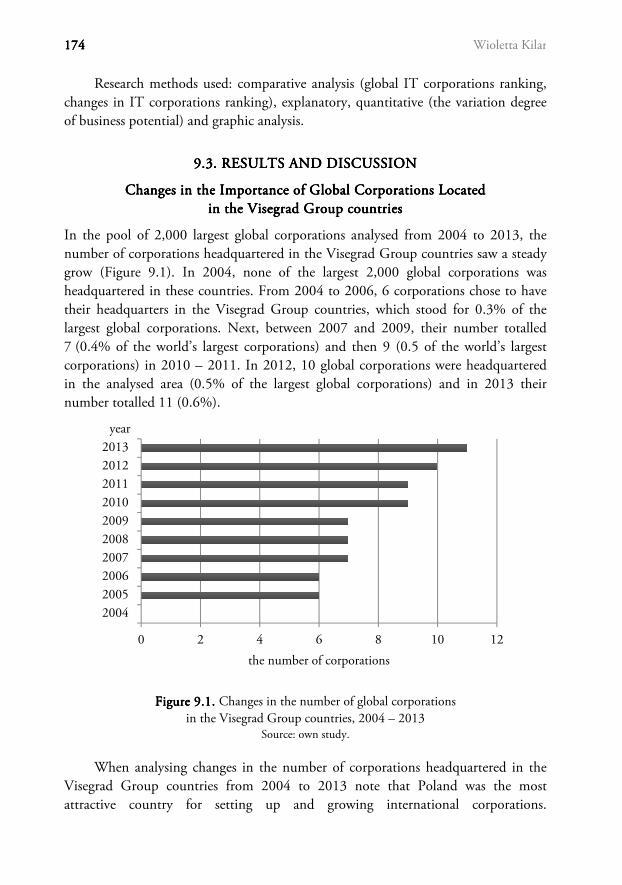
174174174174 Wioletta Kilar
Research methods used: comparative analysis (global IT corporations ranking,
changes in IT corporations ranking), explanatory, quantitative (the variation degree of business potential) and graphic analysis.
9999....3333. . . . RESULTS AND DISCUSSIRESULTS AND DISCUSSIRESULTS AND DISCUSSIRESULTS AND DISCUSSIONONONON
Changes in the Importance of Global Corporations LocatedChanges in the Importance of Global Corporations LocatedChanges in the Importance of Global Corporations LocatedChanges in the Importance of Global Corporations Located in the Visegrad Group countriesin the Visegrad Group countriesin the Visegrad Group countriesin the Visegrad Group countries
In the pool of 2,000 largest global corporations analysed from 2004 to 2013, the number of corporations headquartered in the Visegrad Group countries saw a steady grow (Figure 9.1). In 2004, none of the largest 2,000 global corporations was headquartered in these countries. From 2004 to 2006, 6 corporations chose to have their headquarters in the Visegrad Group countries, which stood for 0.3% of the largest global corporations. Next, between 2007 and 2009, their number totalled 7 (0.4% of the world’s largest corporations) and then 9 (0.5 of the world’s largest corporations) in 2010 – 2011. In 2012, 10 global corporations were headquartered in the analysed area (0.5% of the largest global corporations) and in 2013 their number totalled 11 (0.6%).
FiguFiguFiguFigurererere 9999.1. .1. .1. .1. Changes in the number of global corporations in the Visegrad Group countries, 2004 – 2013
Source: own study.
When analysing changes in the number of corporations headquartered in the Visegrad Group countries from 2004 to 2013 note that Poland was the most attractive country for setting up and growing international corporations.
0 2 4 6 8 10 12
2004200520062007200820092010201120122013
the number of corporations
year

Differentiation of Visegrad Group International Corporations in … 175175175175
The number of corporations headquartered in Poland was going up continuously to reach 8 in 2013 (Figure 9.2). Since 2005, two of the analysed corporations were headquartered in Hungary and 2 in the Czech Republic but that number dropped to 1 for both countries subsequently. No major international corporation was headquartered in Slovakia in the period from 2004 to 2013.
This shows that Poland reported the highest growth in the number of global corporations in the Visegrad Group countries while no such corporation was set up in Slovakia. An important reason for the difference was that Poland, contrary to Slovakia, experienced the fastest social and economic development when compared to other CEE countries. As a result, suitable conditions were created for setting up and achieving a rapid growth of business entities of different sizes, including corporations.
FigureFigureFigureFigure 9999....2222. . . . Change in the number of global corporations headquartered in the Visegrad Group countries by country, 2004 – 2013
Source: own study.
Among 13 corporations headquartered in the Visegrad Group countries from 2005 to 2013, CEZ and MOL came the highest in the ranking of 2,000 global corporations above No. 700 spot in the ranking (Table 9.1). JSW Group, Cesky Telecom and Lotos Group came the lowest in the ranking, below 1600 spot in the ranking.
When analysing ranking of global corporations headquartered in the Visegrad Group countries in the period covered by the research note that KGHM Polska Miedź bumped up in the ranking between 2006 and 2013, surging from No. 1579 spot to No. 785 spot on the i.e. up by 794 spots (Figure 9.3). CEZ Corporation also reported a considerable improvement, moving up from No.870 spot in the ranking
0123456789
2004 2005 2006 2007 2008 2009 2010 2011 2012 2013
the
num
ber
of c
orpo
ratio
ns
Czech Republic Poland Hungary

176176176176 Wioletta Kilar
in 2005 to No. 429 spot in 2013. On the other hand, OTP Bank’s position deteriorated in the analysed period, as it slumped from No. 572 spot in the ranking in 2005 to No. 1121 spot in 2012 and No. 905 in 2013 i.e. by 333 spots. Hungarian MOL also showed a decline, dropping by 168 spots in the ranking since 2005 (No. 492 to No. 660).
The analysed corporations represented 7 out of 80 types of businesses sectors covered by the ranking, including: Banking, Diversified Metal & Mining, Electric Utilities, Materials, Oil & gas operations, Property & Casualty Insurance, Telecommunications services. Oil & gas corporations had the biggest representation with 4 corporations, followed by Banking (since 2011: Regional Banks) and the Utilities (since 2011 the Electric Utilities) represented by 2-3 corporations per sector and other businesses were represented by one of analysed companies or not included in the ranking.
FigureFigureFigureFigure 9999....3333.... Fluctuation of Visegrad Group corporations in the top corporation ranking, 2004-2013
Source: own study.
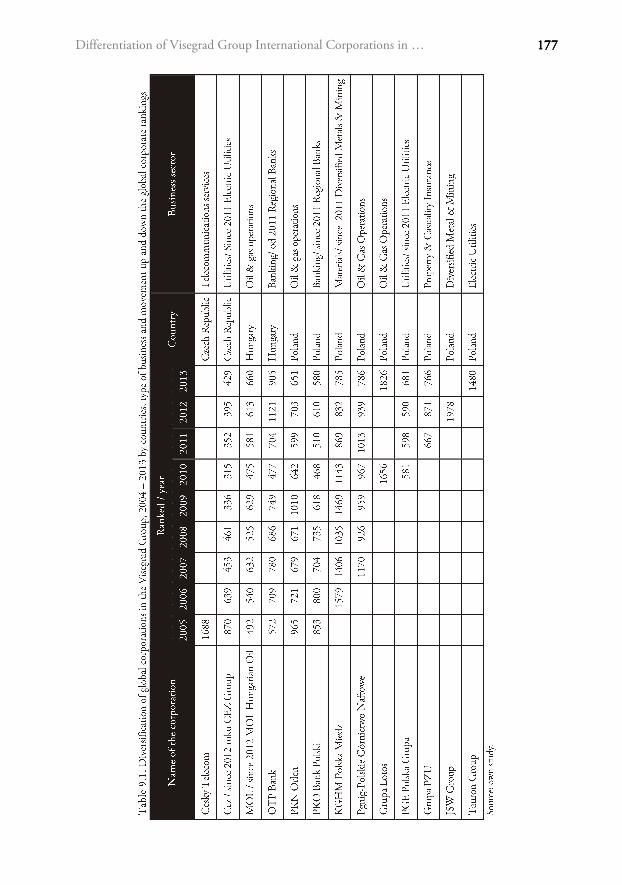
Differentiation of Visegrad Group International Corporations in … 177177177177

178178178178 Wioletta Kilar
The analysis shows that corporations of global importance, originating from the Visegrad Group countries operate predominantly in traditional sectors related to natural resources, banking and electricity production. However, sectoral differentiation of the largest global corporations headquartered in the Visegrad Group countries is insignificant because of their very small representation in the pool. They operate in business sectors which were developing in the analysed area in the period before introduction of the market economy. The sectors can hardly be classified to drive by innovation. As pointed out B. Domański (2006), expanded mining capacities and mined material processes as well as energy production capacities were the heritage of the economic policy of the socialist system. For a characteristic feature of investment made by corporations from developing countries that they base their competitive advantage on domestic resources and capacities. This phenomenon is confirmed by analyses of business operations performed for the most powerful corporations from the CEE region based on the UNCTAD World Investment Reports (WIR UNCTAD).
The analysed corporations reported different values of the indicator of their potential. From 2004 to 2012, MOL and PKN Orlen saw the highest sales while Cesky Telecom and PKO Bank Polski reported the lowest (Table 9.2).
FigureFigureFigureFigure 9999....4444.... Changes in the sales value of the largest global corporations in the Visegrad Group, 2004 -2012
Source: own study.
0.05.0
10.015.020.025.030.035.040.045.0
2004 2005 2006 2007 2008 2009 2010 2011 2012
mld USD
Cez MOLOTP Bank PKN OrlenPKO Bank Polski KGHM Polska Miedz

Differentiation of Visegrad Group International Corporations in … 179179179179
FigureFigureFigureFigure 9999....5555. . . . . Changes in the profit value of the largest global corporations in the Visegrad Group, 2004 -2012
Source: own study.
FigureFigureFigureFigure 9999....6666. . . . Changes in the asset value of the largest global corporations in the Visegrad Group, 2004 -2012
Source: own study.
-0.5
0
0.5
1
1.5
2
2.5
3
3.5
2004 2005 2006 2007 2008 2009 2010 2011 2012
mld USD
Cez MOLOTP Bank PKN OrlenPKO Bank Polski KGHM Polska MiedzPgnig
0
10
20
30
40
50
60
70
2004 2005 2006 2007 2008 2009 2010 2011 2012
mld USD
Cez MOLOTP Bank PKN OrlenPKO Bank Polski KGHM Polska Miedz
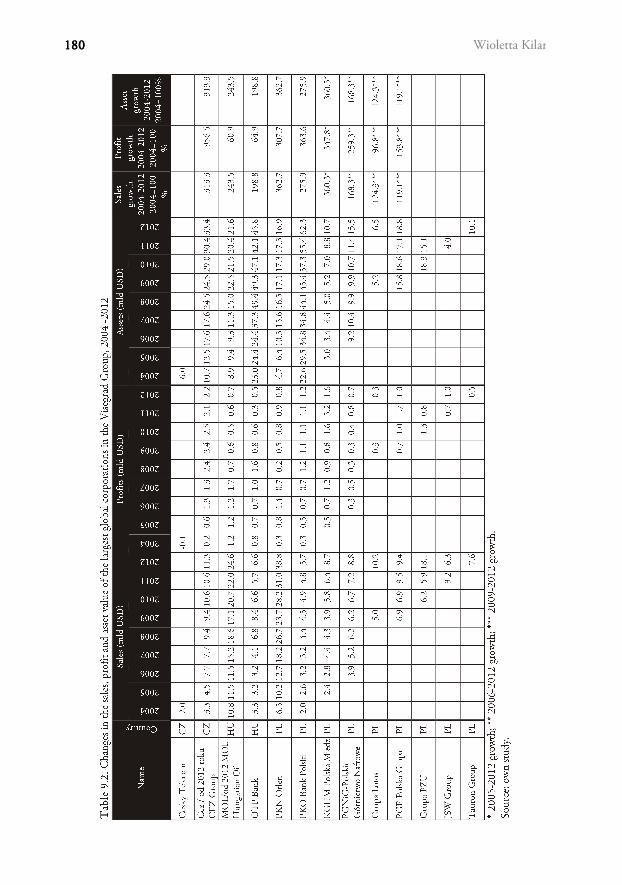
180180180180 Wioletta Kilar

Differentiation of Visegrad Group International Corporations in … 181181181181
Financial performance of corporations analysed in the paper varied
considerably. For this metric, the period from 2004 to 2012 can be divided into two periods: before and including 2006 i.e. before the global crises erupted and after 2006. In the first period, the group’s top performers were Hungarian MOL and OTP Bank, and the poorest were: Cez, PKO Bank Polski and PKN Orlen. In the latter, CEZ, KGHM Polska Miedź and PKO Bank Polski reported the best results against poorly performing PKN Orlen, PGNiG and MOL.
PKO Bank Polski, OTP Bank and Cez reported the highest asset value contrary to KGHM Polska Miedz. However, note that the high asset value is largely dependent on a business sector, where corporations in the Banking sector are leaders.
Trends in the potential metrics fluctuations were different for different corporations in the period 2004 – 2012. In general terms, the sales value of all the corporations analysed in the paper was steadily growing. The highest growth in the sales value, in excess of 300% in the analysed period, was reported by Cez, PKN Orlen and KGHM Polska Miedź and the lowest one was generated by Lotos Group and PGE Polska Grupa (Figure 9.4).
FigureFigureFigureFigure 9999....7777. . . . Variability of the aggregate weight for the Visegrad Group country corporations 2004-2012
Source: own calculations.
Financial performance of the corporations was significantly more differentiated in time (Figure 9.5).
0.0 10.0 20.0 30.0 40.0
CezPKO Bank Polski
PKN OrlenMOL
OTP BankKGHM Polska…
PGE Polska…Pgnig
Tauron GroupJSW Group
Grupa LotosGrupa PZU
Cesky Telecom
2012 2004

182182182182 Wioletta Kilar

Differentiation of Visegrad Group International Corporations in … 183183183183
Because of the above-mentioned global financial crisis, some corporations operating in the analysed markets, in spite of the global market turbulences, reported a considerable improvement in their performance, while performance of others deteriorated. A major growth in profits up to 956.5% was reported by CEZ, PKO Bank Polski and KGHM Polska Miedz, while MOL and OTP Bank deteriorated by 60 to 65%.
In the analysed period, the asset value of the corporations was steadily growing (Figure 9.6) in parallel to the growth in their sales. Cez, KGHM Polska Miedz and PKN Orlen reported the highest value of their assets while the lowest growth of this metric was reported by Logos Group and PGE Polska Grupa.
Summarising, in the analysed period, CEZ, KGHM Polska Miedz and PKN Orlen reported a considerable growth in sales, profits and asset value while MOL, OTP Bank, Grupa Lotos PGE Polska Grupa reported recession or a lower growth rate in these categories.
With these three above-discussed weights, the aggregate weight of the business potential of global corporations was calculated for the corporations headquartered in the Visegrad Group countries (Table 9.3, Figure 9.7). The value of the aggregate weight shows that, early in the analysed period, in 2004, Hungarian MOL and OTP Bank represented the highest business potential. These two corporations jointly represented more than 50% of the potential of all corporations analysed for the purpose of this paper. In case of MOL, its dominant position is influenced both by its sales and profit figures while OTP Bank reported a high value of its assets and profit. However, in time, their potential was dispersed. In 2012, CEZ, PKO Bank Polski and PKN Orlen reported the highest business potential, jointly representing less than 50% of the potential of the analysed corporations. Recently, CEZ has reached its position owing to its profits and assets, PKO Bank Polski has reported a high asset value and PKN Orlen proudly announced its excellent sales. 2004 – 2012, CEZ and PKN Orlen reported the highest growth in their economic potential contrary to MOK and OTP Bank reporting the biggest drop in this category.
9999....4444. . . . CONCLUSIONSCONCLUSIONSCONCLUSIONSCONCLUSIONS
The observations and analysis presented in the paper lead to the conclusion that between 2004 and 2012, the number of corporations classified to the world’s largest corporations was growing on a regular basis. Strong polarisation in the location of headquarters of global corporations in the Visegrad Group countries occurred as the biggest number of corporations was headquartered in Poland and no corporation chose Slovakia for its headquarters. These differences result from social and economic conditions as well as historical developments in each country. In Poland,
184184184184 Wioletta Kilar
corporations classified to the largest global companies are enterprises set up before the system transformation and, after their privatisation, they were growing their business chiefly on the basis of the existing large internal sales market. On the other hand, Slovakia with its rather small internal sales market focused on exporting. Predominantly through its numerous foreign corporations setting up their offices in the country and appreciating Slovakia’s infrastructure and low operating costs.
The most numerous part of the Visegrad Group was formed by corporations from the oil & gas sectors. Again, it confirms the continued importance of traditional branches of industry in this part of the world and Europe (see Rachwał, Wiedermann, Kilar 2009).
In terms of the economic potential of analysed corporations and its growth rate, Cez and PKN Orlen demonstrated the biggest growth, both in terms of indicators measuring their potential and the aggregate weight. However, note both competition and continuous collaboration of corporations covered by the research: e.g. MOL works closely with the Czech utility giant ČEZ (http://wyszehrad.com/) and the collaboration is facilitated by the fact that both countries – seats of the Corporation – are members of the Visegrad Group.
In the light of the above, the research shows that the both research hypotheses have been confirmed as polarisation of corporate headquarters of global corporations in Poland is in progress while corporations set up in Visegrad Group countries represent mainly traditional business sectors. However, note that the future of corporations headquartered in the Visegrad Group countries is largely dependent on the capital whose accumulation is the main business objective of enterprises, as the capital is a sine-qua-non conditions for their growth. Furthermore, irrespective of their sector, the corporations should work towards an intensive growth of their R&D activities and innovation to be able to expand swiftly to foreign markets. The ability to create knowledge is therefore the essence in competing for a position in the global economy. On the other hand, states should both encourage and attract foreign investment as well as focus more on creating conditions favourable for setting up and growing local businesses capable of transforming into global corporations. In consequence, both corporations and national economies will benefit from such approach also by increasing the number of new jobs and reducing their unemployment in the regions where they are located or by generating higher fiscal revenue to the state and regional budgets.
REFERENCESREFERENCESREFERENCESREFERENCES
Banalieva, E.R. & Santoro, M.D. (2009). Local, regional, or global? Geographic orientation and relative financial performance of emerging market multinational enterprises. European Management Journal, 27, pp. 344–355.

Differentiation of Visegrad Group International Corporations in … 185185185185
Borowiec, M. & Dorocki, S. & Jenner, B. (2009). Wpływ zasobów kapitału ludzkiego na
kształtowanie społeczeństwa informacyjnego i innowacyjności struktur przemysłowych. Prace Komisji Geografii Przemysłu Polskiego Towarzystwa Geograficznego, 13, pp. 95-109.
Rosińska-Bukowska, M. (2011). Korporacje transnarodowe na rynkach Europy Środkowo-Wschodniej – wybrane aspekty inwestowania, In: Stępień-Kuczyńska, A., Potz, M, & Słowikowski, M. (eds), Dialog europejski Zachód-Wschód. Dwie dekady transformacji w Europie Środkowo-Wschodniej 1989–2009. Toruń: Wydawnictwo Adam Marszałek, pp. 137–156.
Domański, B. (2006). Polski przemysł na tle przemysłu Europy Środkowej i Wschodniej. Prace Komisji Geografii Przemysłu Polskiego Towarzystwa Geograficznego, 8, pp. 27-36.
Driouchi, T. & Bennett D. (2011). Real options in multinational decision-making: Managerial awareness and risk implications. Journal of World Business, 46, pp. 205–219.
Dobrai, K. & Farkas, F. & Karoliny, Z. & Poór, J. (2012). Knowledge Transfer in Multinational Companies – Evidence from Hungary. Acta Polytechnica Hungarica, 9(3), pp. 149-161.
Dorocki, S. (2010). Współczesne procesy internacjonalizacji produkcji i delokalizacji przemysłu samochodowego Francji. Prace Komisji Geografii Przemysłu Polskiego Towarzystwa Geograficznego, 16, pp. 125-136.
Duréndez, A., Wach, K. (eds) (2014). Patterns of Business Internationalisation in Visegrad Countries – In Search for Regional Specifics. Cartagena: Universidad Politécnica de Cartagena.
Fojutowski, Ł. (2006). Oddziaływanie korporacji transnarodowych na przedsiębiorstwa krajowe – przykład Państw Europy Środkowej i Wschodniej. Ruch Prawniczy, Ekonomiczny i Socjologiczny, 3, pp. 173-187.
Hajdukiewicz, A. & Michalik, A. (2007). Rola korporacji transnarodowych w gospodarce światowej i handlu międzynarodowym, Zeszyty Naukowe Akademii Ekonomicznej w Krakowie, 751, pp. 45-62.
Kilar, W. (2009). Zróżnicowanie potencjału ekonomicznego światowych korporacji informatycznych. Prace Komisji Geografii Przemysłu Polskiego Towarzystwa Geograficznego, 13, pp. 110-121.
Kilar, W. (2010). Zmiany potencjału korporacji informatycznych w Unii Europejskiej w latach 2004–2008. Przedsiębiorczość-Edukacja, 6, pp. 49-66.
Knežević, B., Wach, K. (eds) (2014). International Business from the Central European Perspective. Zagreb: University of Zagreb Publishing Service.
Nölke, A & Vliegenthart, A (2009). ‘Enlarging the Varieties of Capitalism: The Emergence of Dependent Market Economies in East Central Europe’, World Politics, vol. 61, no. 4 (October 2009), pp. 670–702.
Overbeek, H & Apeldoorn, B & Nölke. A (2007). The Transnational Politics of Corporate Governance Regulation, Routledge, London and New York.

186186186186 Wioletta Kilar
Rachwał, T. & Wiedermann, K. & Kilar, W. (2009). Rola przemysłu w gospodarce układów
regionalnych Unii Europejskiej. Prace Komisji Geografii Przemysłu Polskiego Towarzystwa Geograficznego, 14, pp. 31-42.
Raźniak, P. (2014). Pozycja gospodarcza miast na arenie międzynarodowej i krajowej, In: Kuć-Czajkowska, K., Sidor, M. (eds), Miasta, aglomeracje, metropolie w nurcie globalnych przemian. Lublin: Katolicki Uniwersytet Lubelski.
Raźniak, P. & Winiarczyk-Raźniak, A. (2013). Spatial distribution and differences in migration patterns and revenues of gminas in the Kraków Metropolitan Area. Bulletin of Geography. Socio-economic Series, 19, pp. 73-86.
Śleszyński, P. (2002). Struktura i koncentracja przestrzenna siedzib ważniejszych przedsiębiorstw w Warszawie w 1999 roku. Prace Komisji Geografii Przemysłu Polskiego Towarzystwa Geograficznego, 4, pp. 89-114.
Talpová Žáková, S. (2011). Strategies of Domestic and Multinational Firms in the Czech Republic. Journal of Competitiveness, 4, pp. 39-50.
Wach, K (2007). Regional Social Mobility as a Factor Affecting Small and Medium-sized Enterprises Development. In: D. Kopycińska (ed.), Competitiveness of Labour Market. (“Economics & Competition Policy” No. 8). Szczecin: Microeconomics Department of the University of Szczecin, pp. 87-94.
Wie, X. & Andreosso-O’Callaghan, B. & Wuntsch, M. (2007). ‘German Investment in Ireland and in the Central and East European Countries’, Intereconomics, 42(3), pp. 156 – 166.
Weresa, M.A. (2010). Motywy ekspansji korporacji międzynarodowych do sektora bankowego krajów Europy Środkowej, In: Menkes, J. & Gardocka, T. (eds), Korporacje transnarodowe. Jeden temat, różne spojrzenia. Warszawa: Wydawnictwo SWPS Academica.
Zioło, Z. (2006). Zróżnicowanie światowej przestrzeni przemysłowej w świetle koncentracji siedzib zarządów wiodących korporacji. Prace Komisji Geografii Przemysłu Polskiego Towarzystwa Geograficznego, 8, pp. 9-26.
Zioło, Z. (1972). Próba konstrukcji miernika syntetycznego w zastosowaniu do badań przemysłu. Komisja Nauk Geograficznych, Sprawozdania z posiedzeń Komisji Naukowych PAN Oddział w Krakowie, XV(1), pp. 191–194.
Zioło, Z. (1973). Analiza struktury przestrzennej i form koncentracji przemysłu województwa rzeszowskiego w świetle wybranych mierników. Folia Geographica, Series: Geographica-Oeconomica, VI, pp. 95–116.
Zorska, A. (1998). Ku globalizacji? Przemiany w korporacjach transnarodowych i w gospodarce światowej. Warszawa: Wydawnictwo Naukowe PWN.
Zorska, A. (2002). Korporacje międzynarodowe w Polsce. Wyzwania w dobie globalizacji i regionalizacji. Warszawa: Centrum Doradztwa i Informacji Difin.
Wyszehrad: Portal o Czechach, Słowacji i Węgrzech, http://wyszehrad.com/ (27 March 2014).

BBBBibliographyibliographyibliographyibliography
Aaker, A. (1989). Managing Assets and Skills. The Key to a Sustainable Competitive Advantage. California Management Review, 31(2).
Aggarwal, R., Berrill, J., Hutson, E., Kearney, C. (2011). What is a multinational corporation? Classifying the degree of firm-level Multinationality. International Business Review, 20(5), 557–577.
Aldreson, W. (1937). A Marketing View of Competition, The Journal of Marketing, 1(3).
Aybar, B., Ficici, A. (2009). Cross-border acquisitions and firm value: An analysis of emerging market multinationals. Journal of International Business Studies, 40(8), 1317–1338.
Bąkowska, K. (2013). Asseco Poland – przykład polskiej firmy rozwijającej się przez akwizycje krajowe i zagraniczne. In L. Pałys & H. Kępka (Eds), Polskie inwestycje za granicą 2010-2012 (pp.102-105), Warszawa: Instytut Badań Rynku, Konsumpcji i Koniunktur.
Baláž, V. (2013). How to avoid becoming the Detroit of Europe? Available from <http://www.presseurop.eu/en/content/article/4019471-how-avoid-becoming-detroit-europe>. [6 February 2014].
Baldone, S., Sdogati, F., Tajoli, L. (2001). Patterns and Determinants of International Fragmentation of Production: Evidence from Outward Processing Trade between the EU and Central Eastern European Countries. Weltwirtschaftliches Archiv, 137(1), pp. 80–104.
Baldwin, R. (2006). Globalisation: the great unbundling(s). Helsinki: Office of the Prime Minister of Finland.
Baldwin, R. (2009). Integration of the North American Economy and Newparadigm Globalization. CEPR Discussion Papers, no. 7523.
Banalieva, E.R. & Santoro, M.D. (2009). Local, regional, or global? Geographic orientation and relative financial performance of emerging market multinational enterprises. European Management Journal, 27, pp. 344–355.
Barkema, H., Bell, J.H., Pennings, J.M. (1996). Foreign Entry, Cultural Barriers, and the experience factor in foreign market entry behavior of service firms. Learning. Strategic Management Journal, 17, 151-166.
Barro, J.B. (1998). Determinants of Economic Growth: A Cross-Country Empirical Study. Cambridge, Massachusetts: MIT Press Books.
Bartha, Z. (2006). Az üzleti tudás sajátosságai és hozzáférhetőségének körülményei. PhD dissertation: http://193.6.1.94:9080/JaDoX_Portlets/documents/document_5611 _section_1179.pdf
188 Bibliography
Bartha, Z. (2011). Network Economics. Budapest: Nemzeti Tankönyvkiadó
Bartha, Z., Gubik, A.S. (2014). Specifics of International Business Competitiveness in Visegrad Countries – Qualitative Analysis of Selected Case Studies (chapter 7). In: Durendez, A. & Wach, K. (eds.), Patterns of Business Internationalisation in Visegrad Countries – In Search for Regional Specifics. Cartagena: Universidad Politécnica de Cartagena.
Bartha, Z., Gubik, S.A., Tóthné Szita, K. (2013). Intézményi megoldások, fejlődési modellek (Institutional solutions, development models). Miskolc: GNR Szolgáltató és Kereskedelmi Bt.
Bednarz, J. (2013). Konkurencyjność polskich przedsiębiorstw na rynkach europejskich na przykładzie wybranych branż, Gdańsk: Wydawnictwo Uniwersytetu Gdańskiego .
Bertrand, O., Betschinger, M-A. (2012). Performance of domestic and cross-border acquisitions: Empirical evidence from Russian acquirers. Journal of Comparative Economics, 40(3), 413–437.
Bhagwati, J. (1958). Immiserizing Growth: A Geometrical Note. The Review of Economic Studies, 25(3), 201-205.
Boeke, J.H. (1953). Economics and Economic Policy of Dual Societies. New York: Institute of Pacific Relations.
Borowiec, M., Dorocki, S. & Jenner, B. (2009). Wpływ zasobów kapitału ludzkiego na kształtowanie społeczeństwa informacyjnego i innowacyjności struktur przemysłowych. Prace Komisji Geografii Przemysłu Polskiego Towarzystwa Geograficznego, 13, pp. 95-109.
Bossak, J.W., Bieńkowski W. (2004). Międzynarodowa zdolność konkurencyjna kraju i przedsiębiorstw. Wyzwania dla Polski na progu XXI wieku, Warszawa: Oficyna Wydawnicza Szkoły Głównej Handlowej .
Buckley, P.J., Pass, C.L. & Prescott, K. (1988). Measures of International Competitiveness: A Critical Survey. Journal of Marketing Management, 4(2), pp. 175–200.
Bussiére, M., Fidrmuc, J., & Schnatz, B. (2005). Trade integration of Central and Eastern European countries. Lessons from a gravity model. ECB Working Paper Series, no. 545.
Casillas, J.C., Moreno, A.M., Acedo, F.J., Gallego, M.A., Ramos, E. (2009). An Integrative Model of the Role of Knowledge in the Internationalization Process. Journal of World Business, 44.
Cavusgil, S.T., Knight, G. (2009). Born global firms – A new international enterprise. New York: Business Expert Press, LCC
Chernykh, L., Liebenberg, I.A., Macias, A.J. (2011). Changing Direction: Cross Border Acquisitions by Emerging Market Firms, (October 4, 2011). Retrieved March 19, 2014, from http://dx.doi.org/10.2139/ssrn.1540260 .
Cho, D.S. (1994). A dynamic approach to international competitiveness: the case of Korea. Journal of Far Eastern Business, 1 (1), pp. 17–36.
Cho, D.-S., H.-Ch. Moon (eds) (2002). From Adam Smith to Michael Porter: Evolution of Competitiveness Theory. London: World Scientific Publishing.

Bibliography 189189189189
Cho, D.S., Moon, H.C., & Kim, M.J. (2008). Characterizing international competitiveness in international business research: A MASI approach to national competitiveness, Research in International Business and Finance, 22, pp. 175–192.
Coase, R.H. (1937). The Nature of the Firm. Economica, 4(16), 386-405.
Cournot, A.A. (1897). Researches into the Mathematical Principles of the Theory of Wealth. New York NY: A.M. Kelley.
Coviello, N.E., McAuley, A. (1999). Internationalisation and the Smaller Firm: A Review of Contemporary Empirical Research. Management International Review, 39(3).
D’Aveni, R.A., Gunther, R. (1995). Hipercompetitive Rivalries: Competing in Highly Dynamic Environments, New York, NY: Free Press.
Danbolt, J. (2004). Target company cross-border effects in acquisitions into the UK. European Financial Management, 10(1), 83-108.
Danbolt, J., Maciver, G. (2012). Cross-Border versus Domestic acquisitions and the Impact on Shareholder Wealth. Journal of Business Finance & Accounting, 39(7 & 8), 1028–1067.
Daszkiewicz, N. (2004). Internacjonalizacja małych i średnich przedsiębiorstw we współczesnej gospodarce. Gdańsk: Scientific Publishing Group.
Daszkiewicz, N. (2008). Konkurencyjność małych i średnich przedsiębiorstw w procesie internacjonalizacji (chapter 6) In: Daszkiewicz, N. (ed.), Konkurencyjność: Poziom makro, mezo i mikro, Warszawa: PWN.
Daszkiewicz, N. (ed) (2008). Konkurencyjność: poziom makro, mezo, mikro. Warszwa: Wydawnictwo Naukowe PWN.
Daszkiewicz, N. (2014). Internationalization and Europeanization of Businesses in the Single European Market (chapter: 2), In: B. Knežević & K. Wach (eds), International Business from the Central European Perspective. Zagreb: University of Zagreb, pp. 15-24.
Daszkiewicz, N., Olczyk, M. (2008). Konkurencyjność podmiotów – ujęcie teoretyczne (chapter 1), In: N. Daszkiewicz (ed.), Konkurencyjność: poziom makro, mezo, mikro. Warszawa: Wydawnictwo Naukowe PWN.
Daszkiewicz, N., Wach, K. (2012). Internationalization of SMEs: Context, Models and Implementation, Gdańsk: Gdańsk University of Technology Publishers.
Daszkiewicz, N., Wach, K. (2013). Małe i średnie przedsiębiorstwa na rynkach międzynarodowych. Kraków: Wydawnictwo Uniwersytetu Ekonomicznego w Krakowie.
Daszkiewicz, N., Wach, K. (2014). Motives for Going International and Entry Modes of Family Firms in Poland, Journal of Intercultural Management, 6(2).
Day, G.S. (1997). Marinating the Competitive Edge: Creating and Sustaining Advantages in Dynamic Competitive Environments. In: G.S. Day, D.J. Reibstein & R.E. Gunther (eds),Wharton on Dynamic Competitive Strategy, New York, NY: John Wiley & Sons Inc.
Dobrai, K., Farkas, F., Karoliny, Z. & Poór, J. (2012). Knowledge Transfer in Multinational Companies – Evidence from Hungary. Acta Polytechnica Hungarica, 9(3), pp. 149-161.

190 Bibliography
Dolistowska, D., Asseco szturmuje rynki wschodnie. Retrieved February 13, (2014), from http://www.polandgoglobal.pl/artykuly/asseco-szturmuje-rynki-wschodnie-1#.Uvz14FKgYQ4 .
Domański, B. (2006). Polski przemysł na tle przemysłu Europy Środkowej i Wschodniej. Prace Komisji Geografii Przemysłu Polskiego Towarzystwa Geograficznego, 8, pp. 27-36.
Domar, E. (1947). Expansion and Employment. American Economic Review, 37(1), 343-355.
Dorocki, S. (2010). Współczesne procesy internacjonalizacji produkcji i delokalizacji przemysłu samochodowego Francji. Prace Komisji Geografii Przemysłu Polskiego Towarzystwa Geograficznego, 16, pp. 125-136.
Driouchi, T., Bennett D. (2011). Real options in multinational decision-making: Managerial awareness and risk implications. Journal of World Business, 46, pp. 205–219.
Dunning, J.H. (1993). Internationalizing Porter’s Diamond, Management International Review, 33, pp. 7-15, special issue “Extensions of the Porter Diamond Framework”.
Duréndez, A., Wach, K. (eds) (2014). Patterns of Business Internationalisation in Visegrad Countries – In Search for Regional Specifics. Cartagena: Universidad Politécnica de Cartagena.
Dzikowska, M., Gorynia, M. (2012). Teoretyczne aspekty konkurencyjności przedsiębiorstwa – w kierunku koncepcji eklektycznej?, Gospodarka Narodowa, r. LXXX/XXI, nr 4(248).
Emmanuel, A. (1972). Unequal Exchange: A Study of the Imperialism of Trade. New York: Monthly Review Press.
Erramilli, M. K. (1991). The Experience Factor in Foreign Market Entry Behavior of Service Firms. Journal of International Business Studies 22(3), 479-501.
Everitt, B. S., Landau, S., Leese, M. (2001). Cluster Analysis. London: Edward Arnold.
Fertö, I., Soós, K.A. (2008). Trade Specialization in the European Union and in Postcommunist European Countries. Eastern European Economics, 46(3), pp. 5–28.
Flak, O., Głód, G. (2009). Konkurencyjność przedsiębiorstwa. Pojęcia, definicje, modele, Katowice: Wydawnictwo Akademii Ekonomicznej w Katowicach.
Fojutowski, Ł. (2006). Oddziaływanie korporacji transnarodowych na przedsiębiorstwa krajowe – przykład Państw Europy Środkowej i Wschodniej. Ruch Prawniczy, Ekonomiczny i Socjologiczny, 3, pp. 173-187.
Forsgren, M. (2002). The Concept of Learning In the Uppsala Internationalization Process Model: A Critical Review. International Business Review, 11.
Fortwengel, J. (2011). Upgrading through Integration? The Case of the Central Eastern European Automotive Industry. Transcience Journal, 2(1).
Freeman, C. (1987). Technology Policy and Economic Performance: Lessons from Japan. London: Pinter Publishers.
Furtado, C. (1970). Economic Development of Latin America. London: Cambridge University Press.

Bibliography 191191191191
Gatignon, H., Reibstein, D.J. (1997). Creative Strategies for Responding to Competitive Actions. In: G.S. Day and D.J. Reibstein (eds.), Wharton on Dynamic Competitive Strategy, New York, NY: John Wiley and Sons.
Gereffi, G. (2005). The Global Economy: Organization, Governance, and Development. In: N.J. Smelser & R. Swedberg (eds),The Handbook of Economic Sociology, Princeton: Princeton University Press, pp. 160–182.
Głód, G. (2010). Konkurencyjność i budowanie przewagi konkurencyjnej przedsiębiorstwa (chapter 3), In: T. Kraśnicka (ed.), Przywództwo a konkurencyjność organizacji przedsiębiorczych, Katowice: Wydawnictwo Akademii Ekonomicznej w Katowicach.
Godziszewski, B. (1999). Potencjał konkurencyjności przedsiębiorstwa jako źródło przewag konkurencyjnych i podstawa stosowanych instrumentów konkurowania In: M.J. Stankiewicz (ed.), Budowanie potencjału konkurencyjności przedsiębiorstwa, Toruń: TNOiK.
Gogel, R., Larreche, J.-C. (1991). Pan-European Marketing: Combining Product Strength and Geographical Coverage. In: S.G. Makridakis, San Francisco (eds), Single Market Europe: Opportunities and Challenges for Business. CA: Jossey-Basspp, pp. 99-118.
Gogel, R., Larreche, J.-C. (1989). The Battlefield for 1992: Product Strength and Geographic Coverage. European Management Journal, 7(2), pp. 132-140.
Gorynia, M. (2000). Luka konkurencyjna w przedsiębiorstwach a przystąpienie do Unii Europejskiej. Gospodarka Narodowa, 10.
Gorynia, M. (2002). Konkurencyjność przedsiębiorstwa – próba modelu (sub-chapter 1.5) In: M. Gorynia (ed.), Luka konkurencyjna na poziomie przedsiębiorstwa a przystąpienie Polski do Unii Europejskiej, Implikacje dla strategii firm i polityki gospodarczej. Poznań: Wydawnictwo AE w Poznaniu.
Gorynia, M. (2002). Pojęcie konkurencyjności – istota i poziomy In: M. Gorynia (ed), Luka konkurencyjna na poziomie przedsiębiorstwa a przystąpienie Polski do Unii Europejskiej. Poznań: Wydawnictwo Akademii Ekonomicznej w Poznaniu.
Gorynia, M. (2007). Strategie zagranicznej ekspansji przedsiębiorstw. Warszawa: PWE.
Gorynia, M. (2009). Konkurencyjność w ujęciu mikroekonomicznym (chapter 3) In: M. Gorynia, E. Łaźniewska,Kompendium wiedzy o konkurencyjności (eds). Warszawa: PWN.
Gorynia, M., Jankowska B. (2008). Klastry a międzynarodowa konkurencyjność i internacjonalizacja przedsiębiorstwa. Warszawa: Difin.
Gorynia, M., Jankowska B., Tarka P. (2013). Basic concepts of company competitiveness (chapter 1) In: M. Gorynia, B. Jankowska (eds), The Influence of Poland’s Accession to the Euro Zone on the International Competitiveness and Internationalisation of Polish Companies. Warsaw: Difin
Grant, R.M. (2005). Contemporary Strategy Analysis, Chichester: John Whiley & Sons.
Griffith, DA., Cavusgil, ST., Xu, S. (2008). Emerging themes in international business Research. Journal of International Business Studies, 39(7), 1220–1235.

192 Bibliography
Gubbi, S.R., Aulakh, P.S., Ray, S., Sarkar, M.B., & Chittoor, R. (2010). Do international acquisitions by emerging-economy firms create shareholder value? The case of Indian firms. Journal of International Business Studies, 41(3), 397–418.
Gubik, S.G., Karajz, S. (2014). The Choice of Foreign Market Entry Modes – The Role of Resources and Industrial Driving Forces. Entrepreneurial Business and Economics Review, 2 (1).
Gubik, A.S., Wach, K. (eds) (2014). International Entrepreneurship and Corporate Growth in Visegrad Countries. Miskolc: Miskolc University Press.
Haffer, M. (1999). Instrumenty konkurowania In: M.J. Stankiewicz (ed.), Budowanie potencjału konkurencyjności przedsiębiorstwa. Toruń: TNOiK.
Haffer, M. (2006). Ogólna charakterystyka współczesnej konkurencji międzynarodowej (chapter 1) In: M.J. Stankiewicz (ed.), Zarządzanie wiedzą jako kluczowy czynnik międzynarodowej konkurencyjności przedsiębiorstwa. Toruń: TNOiK, pp. 47-53.
Hajdukiewicz, A., Michalik, A. (2007). Rola korporacji transnarodowych w gospodarce światowej i handlu międzynarodowym, Zeszyty Naukowe Akademii Ekonomicznej w Krakowie, 751, pp. 45-62.
Hamilton, A (1791). Report to Congress on Manufactures. Philadelphia. http://memory. loc.gov/cgi-bin/ampage?collId=llsp&fileName=009/llsp009.db&Page=123
Harrod, R.F. (1948). Towards a Dynamic Economics. London: MacMillan.
Hausner, J. (2014). Budujemy zamki na pustyni, interview by M. Sutowski, 07.01.2014. Available from <http://www.krytykapolityczna.pl/artykuly/gospodarka/20140107/ hausner-budujemy-zamki-na-pustyni>. [6 February 2014].
Hitt, M.A., Bierman, L., Uhlenbruck, K., Shimizu, K. (2006). The Importance of Resources in the Internationalization of Professional Service Firms: The Good, the Bad and the Ugly. The Academy of Management Journal 49(6), 1137-1157.
Hodgson, M.H. (2006). What Are Institutions? Journal of Economic Issues, 40(1), 1-25.
Hotopp, U., Radosevic, S. & Bishop, K. (2002). Trade and Industrial Upgrading in Countries of Central and Eastern Europe: Patterns of Scale and Scope-based Learning., University College London, Centre for the Study of Economic and Social Change in Europe Working Papers, no. 23.
Hummels, D., Ishii, J. & Yi, K.M. (2001). The Nature and Growth of Vertical Specialization in World Trade. Journal of International Economics, 54(1), pp. 75–96.
Jacoby, W. (2010). Managing globalization by managing Central and Eastern Europe: the EU’s backyard as threat and opportunity. Journal of European Public Policy, 17(3).
Jakab, Z.M., Kovács, M.A., Oszlay, A. (2000). How far has trade integration advanced? An analysis of actual and potential trade of three Central and Eastern European countries. NBH Working Paper, no. 1/2000.
Jarosiński, M. (2014). Characteristics of Polish Firms’ Internationalisation Processes (chapter 4), In: B. Knežević & K. Wach (eds), International Business from the Central European Perspective. Zagreb: University of Zagreb, pp. 43-52.
Bibliography 193193193193
Javalgi, R.G., Deligonul, S., Dixit, A., Cavusgil, S.T. (2011). International market Reentry: A Review and research Framework. International Business Review, 20(5).
Johanson, J., Mattsson, L.G. (1987). Interorganizational relations in industrial systems: a network approach compared with the transaction cost approach. International Studies of Management & Organization 17(1), 34.
Johanson, J., Vahlne, J.-E. (1974). The Internationalization Process of the Firm. Mimeographed Working Paper, Uppsala: Department of Business Administration.
Johanson, J., Vahlne, J.E. (1977). The Internationalization Process of the Firm: A Model of Knowledge Development and Increasing Foreign Market Commitments. Journal of International Business Studies, 8, 23–32.
Johanson, J., Vahlne, J.-E. (1990). The Mechanism of Internationalisation. International Marketing Review, 7(4), 11-24.
Johanson, J., Vahlne, J.-E. (2009). The Uppsala Internationalization Process Model Revisited: From Liability of Foreignneess to Liability of Outsidership. Journal of International Business Studies, 40(9).
Johanson, J., Wiedersheim-Paul, F. (1975). The Internationalization of the Firm: Four Swedish Cases. Journal of Management Studies, 12(3).
Johanson, J., Wiedersheim-Paul, F. (2006). The Internationalization of the Firm. Four Swedish Cases. In: Buckley, P., & Ghauri, P.N. (eds.) (2006): The Internationalization of the Firm. New York: International Thomson Business Press.
Jones, R.W., Kierzkowski, H. (2005). International fragmentation and the new economic geography. The North American Journal of Economics and Finance, 16(1), pp. 1–10.
Kaminski, B., Ng, F. (2005). Production disintegration and integration of Central Europe into global markets. International Review of Economics and Finance, 14, pp. 377–390.
Kaszuba, K. (2010). Rozwój Asseco Poland S.A. jako przykład tworzenia międzynarodowej grupy kapitałowej. Studia i Prace Kolegium Zarządzania i Finansów, Szkoła Główna Handlowa, 101, 108-116.
Kaufman, L., Rousseeuw, P. J. (1990). Finding Groups in Data. New York: John Wiley & Sons.
Keynes, J.M. (1936). The General Theory of Employment, Interest and Money. London: MacMillan.
Kilar, W. (2009). Zróżnicowanie potencjału ekonomicznego światowych korporacji informatycznych. Prace Komisji Geografii Przemysłu Polskiego Towarzystwa Geograficznego, 13, pp. 110-121.
Kilar, W. (2010). Zmiany potencjału korporacji informatycznych w Unii Europejskiej w latach 2004–2008. Przedsiębiorczość-Edukacja, 6, pp. 49-66.
King, D.R., Dalton, D.R., Daily, M., & Covin, J.G. (2004). Meta-analyses of post-acquisition performance: Indications of unidentified moderators. Strategic Management Journal, 25(2), 187–200.
Kirzner, I. (1973). Competition and Entrepreneurship, Chicago: University of Chicago.

194 Bibliography
Klimek, A. (2011). Emergence of Multinational Firms from Middle Income Countries: The Case of Poland. Argumenta Oeconomica, 26(1), 91- 110.
Knežević, B., Wach, K. (eds) (2014). International Business from the Central European Perspective. Zagreb: University of Zagreb.
Koopman, R., Powers, W., Wang, Z. & Wei, S.J. (2010). Give Credit Where Credit Is Due: Tracing Value Added in Global Production Chains. NBER Working Papers, no. 16426.
Krueger, A.O. (1974). The political economy of the rent seeking society. The American Economic Review, 64(3), 291-303.
Krugman, P. (1991). Increasing Returns and Economic Geography. Journal of Political Economy, 99, pp. 483–499.
Krugman, P.R. & Obstfeld, M. (2003). International Economics: Theory and Policy, 4th ed. New York: HarperCollins.
Krugman, P.R. (1990). Rethinking International Trade. Cambridge, MA: MIT Press.
Krugman, P.R. (1992). Does the new trade theory require a new trade policy?, World Economy, 5(4).
Kutschker, M., Bäurle, I., Schmid, S. (1997). International Evolution, International Episodes, and International Epochs – Implications for Managing Internationalization. Management International Review, 37(2), special issue.
Kuwada, K., Asaba, S. (1989). The continuous side of discontinuity. Tokyo Metropolitan University - Journal of the Faculty of Economics, 63.
Lanz, R., Miroudot, S., Nordås, H.K. (2011). Trade in Tasks. OECD Trade Policy Papers, no. 117.
List, F. (1841). Das Nationale System der Politischen Ökonomie. Stuttgart: Cotta'schen Verlag.
Lucas, R.E. (1988). On the Mechanics of Economic Development. Journal of Monetary Economics, 22(1), 3-42.
Lundvall, B. A., Johnson, B. (1994). The Learning Economy. Journal of Industry Studies, 1(2), 23-42.
Ma, H. (2000). Competitive Advantage and Firm Performance. Competitiveness Review, 10(2), pp. 15-32.
Ma, M., Liao M. (2006). A Firm-Level Study on the International Competitiveness: Theoretical Analysis and Empirical Findings. International Journal of Innovation and Technology Management, 3(1), pp. 22-23.
Man, T.W.Y., Lau, Th., Chan, K.F. (2002). The competitiveness of small and medium enterprises: A conceptualization with focus on entrepreneurial competencies. Journal of Business Venturing, 17, pp. 123–142.
March, J. G., Levitt, B. (1988). Organizational learning. Annual Review of Sociology, 14, 319-338.
Marshall, A. (1890). Principles of Economics (First Edition ed.). London: Macmillan.

Bibliography 195195195195
Maślak, E. (2002). Koncepcje konkurencji w naukach ekonomicznych In: M. Gorynia (ed.), Luka konkurencyjna na poziomie przedsiębiorstwa a przystąpienie Polski do Unii Europejskiej. Poznań: Wyd. AE w Poznaniu.
Mathews, J.A. (2006). Dragon multinationals: New players in 21st century globalization. Asia Pacific Journal of Management, 23(1), 5–27.
McCarty, W. (2014). Modeling: A Study in Words and Meanings (chapter 19). In: S. Schreibman, R. Siemens, J. Unsworth (eds), A Companion to Digital Humanities. Oxford: Blackwell.
McClelland, D.C. (1957). Community development and the nature of human motivation. Cambridge: Harvard University Press.
Meier, G.M. (1964). Leading Issues in Economic Development. New York: Oxford University Press.
Mejri, K., Umemoto, K. (2010). Small- and Medium-Sized Enterprise Internationalization: Towards the Knowledge-Based Model. Journal of International Entrepreneurship, 8(2).
Melin, L. (1992). Internationalization as a Strategy Process. Strategic Management Journal, 13.
Milligan G., Cooper M. (1985). An Examination of Procedures for Determining the Number of Clusters in a Data Set. Psychometrika, 50.
Moeller, S., Schlingemann, F.P., & Stulz, R.M. (2005). Wealth Destruction on a Massive Scale? A Study of Acquiring-Firm Returns in the Recent Merger Wave. The Journal of Finance, 60(2), 757-782.
Molendowski, E., Żmuda, M. (2013). Changes In Competitiveness Among The Visegrad Countries After Accession To The European Union: A Comparative Analysis Based On A Generalized Double Diamond Model, Comparative Economic Research, 16(4), pp. 121-153.
Morris, Sh., Hammond, R., Snell, S. (2014). A microfoundations approach to transnational capabilities: The role of knowledge search in an ever-changing world. Journal of International Business Studies, 45(4), pp. 405-427.
Myrdal, G. (1957). Economic Theory and Underdeveloped Regions. London: Gerald Duckworth.
Naisbitt, J. (1982). Megatrends. Ten New Directions Transforming Our Lives. New York: Warner Books.
Nicholson, R.R., Salaber, J. (2013). The motives and performance of cross-border acquirers from emerging economies: Comparison between Chinese and Indian firms. International Business Review, 22(6), 963–980.
Nizard, G. (1998). Metamorfozy przedsiębiorstwa. Zarządzanie w zmiennym otoczeniu organizacji (Les métamorphoses de l'entreprise. Pour une écologie du management, Paris: Economica), Warszawa: PWN.
Noga, A. (2009). Teorie przedsiębiorstw. Warszawa: PWE.

196 Bibliography
Nölke, A., Vliegenthart, A. (2009). Enlarging the Varieties of Capitalism. The Emergence of Dependent Market Economies in East Central Europe. World Politics, 61(4), pp. 670–702.
North, D.C. (1993). Institutions, institutional change and economic performance. Cambridge: Cambridge University Press.
Obłój, K. (2007). Strategia organizacji, Warszawa: PWE.
OECD, (1992). Programme on Technology and the Economy. Balogh, T. (1963). Unequal Partners 1-2. Oxford: Blackwell.
Olczyk, M. (2008). Konkurencyjność. Teoria i praktyka. Warszawa: CeDeWu Wydawnictwa Fachowe.
Overbeek, H & Apeldoorn, B & Nölke. A (2007). The Transnational Politics of Corporate Governance Regulation. London and New York: Routledge.
Parteka, A., Wolszczak-Derlacz, J. (2011). Market Size, Competitiveness and Technological Frontier - the Impact of Trade Integration with the UE on Productivity in Polish Manufacturing Sectors. National Bank of Poland Working Paper, 82.
Penrose, E.T. (1959). The Theory of the Growth of the Firm. Oxford: Oxford University Press.
Pierścionek, Z. (2003). Strategie konkurencji i rozwoju przedsiębiorstwa. Warszawa: PWN.
Polanyi, M. (1966). The Tacit Dimension. London: Routledge and Kegan.
Porter, M.E. (1980). Competitive Strategy: Techniques for Analyzing Industries and Companies. New York, NY: Free Press.
Porter, M.E. (1985). Competitive Advantage: Creating and Sustaining Superior Performance. New York, NY: Free Press.
Porter, M.E. (1990). The Competitive Advantage of Nations. Harvard Business Review, 68(2), 73-91.
Porter, M.E. (1990). The Competitive Advantage of Nations. New York, NY: Free Press, MacMillan.
Porter, M.E. (1998). Clusters and the new economics of competition. Harvard Business Review, 76(6), pp. 77–90.
Porter, M.E. (2000). Location, competition, and economic development: local clusters in a global economy. Economic Development Quarterly, 14(1), pp. 15–35.
Porter, M.E. (2003). The economic performance of regions. Regional Studies, 37, pp. 549–578.
Prebisch, R. (1964). Towards a new trade policy for development. New York: United Nations.
PriceWaterhouseCoopers (2013). Znamy już zwycięzców konkursu "Polska Firma – Międzynarodowy Czempion 2013", Retrieved February 13, 2014, from http://www.pwc.pl/pl/biuro-prasowe/2013-12-06-zwyciezcy-polska-firma-miedzynarodowy-czempion-2013.jhtml.
Bibliography 197197197197
Rachwał, T., Wiedermann, K., Kilar, W. (2009). Rola przemysłu w gospodarce układów regionalnych Unii Europejskiej. Prace Komisji Geografii Przemysłu Polskiego Towarzystwa Geograficznego, 14, pp. 31-42.
Raźniak, P. (2014). Pozycja gospodarcza miast na arenie międzynarodowej i krajowej, In: Kuć-Czajkowska, K., Sidor, M. (eds), Miasta, aglomeracje, metropolie w nurcie globalnych przemian. Lublin: Katolicki Uniwersytet Lubelski.
Raźniak, P., Winiarczyk-Raźniak, A. (2013). Spatial distribution and differences in migration patterns and revenues of gminas in the Kraków Metropolitan Area. Bulletin of Geography. Socio-economic Series, 19, pp. 73-86.
Redmond, W. (2013). Three Modes of Competition in the Marketplace. The American Journal of Economics and Sociology, 72(2).
Reid, S.D. (1981). The Decision-Maker and Export Entry and Expansion. Journal of International Business Studies, 12, 101–112.
Ricardo, D. (1817). On the Principles of Political Economy and Taxation. London: John Murray.
Romer, P. (1986). Increasing Return and Long Run Growth. Journal of Political Economy, 94(5), 1002-1037.
Rosińska-Bukowska, M. (2011). Korporacje transnarodowe na rynkach Europy Środkowo-Wschodniej – wybrane aspekty inwestowania, In: Stępień-Kuczyńska, A., Potz, M, & Słowikowski, M. (eds), Dialog europejski Zachód-Wschód. Dwie dekady transformacji w Europie Środkowo-Wschodniej 1989–2009. Toruń: Wydawnictwo Adam Marszałek, pp. 137–156.
Rosińska-Bukowska, M. (2012). Rozwój globalnych sieci biznesowych jako strategia konkurencyjna korporacji transnarodowych. Przykład sektora motoryzacyjnego, Łódź: Wyd. Uniwersytetu Łódzkiego.
Rudke, M. (2013). Polskie firmy coraz śmielej poczynają sobie na światowym rynku. Rzeczpospolita, Retrieved February 13, 2014, from http://www.ekonomia.rp.pl/artykul/ 1072869.html?p=1.
Rundh, B. (2001), International Market Development: New Patterns in SMEs International Market Behaviour?. Market Intelligence & Planning, 19(5).
Ruzzier, M., Hisrich, R.D., Antoncic, B. (2006). SME Internationalization Research: Past, Present, and Future. Journal of Small Business and Enterprise Development, 13(4).
Sasvari, P. (2012). A Conceptual Framework for Definition of the Correlation Between Company Size Categories and the Proliferation of Business Information Systems in Hungary. Theory, Methodology, Practice, 8(2), 51-59.
Schumpeter, J.A. (1934). The Theory of Economic Development: An Inquiry Into Profits, Capital, Credit, Interest, and the Business Cycle. Cambridge: Harvard University Press.
Simon, H.A. (1957). Models of Man. New York: Wiley.
Singer, H.W. (1964). International Development: Growth and Change. New York: McGraw-Hill.

198 Bibliography
Śleszyński, P. (2002). Struktura i koncentracja przestrzenna siedzib ważniejszych przedsiębiorstw w Warszawie w 1999 roku. Prace Komisji Geografii Przemysłu Polskiego Towarzystwa Geograficznego, 4, pp. 89-114.
Smit, A.J. (2007). The competitive advantage of nations: is Porter’s Diamond Framework a new theory that explains the international competitiveness of countries?. Sothern Africa Business Review, 14(1), pp. 105-130.
Smith, A. (1776). An Inquiry into the Nature and Causes of the Wealth of Nations. Edinburgh: J.R. McCulloch.
Smith, A. (1812). An Inquiry into the Nature and Causes of the Wealth of Nations, London: Ward, Lock & Co.
Solberg, C.A. (1997). A Framework for Analysis of Strategy Development in Globalizing Markets. Journal of International Marketing, 5(1).
Solow, R. (1956). A Contribution to the Theory of Economic Growth. Quarterly Journal of Economics, 70(1), 65-94.
Stankiewicz, M.J. (2005). Konkurencyjność przedsiębiorstwa. Budowanie konkurencyjności przedsiębiorstwa w warunkach globalizacji. Toruń: TNOiK.
Starbuck, W. H. (1992). Learning by knowledge intensive firms. Journal of Management Studies, 29 (6), 713-740.
Stehrer, R., Borowiecki, M., & Dachs, B. (2012). Global Value Chains and the EU Industry. wiiw Research Reports, no. 383.
Strategor (1999). Zarządzanie firmą. Strategie, struktury, decyzje, tożsamość, transl. K. Bolesta-Kukułka (Politique générale de l'entreprise, Paris: Dunod), Warszawa: PWE.
Sveiby, K. E. (1997). The New Organizational Wealth. San Francisco: Berrett-Koehler Publishers.
Światowiec-Szczepańska, J. (2011). Strategiczne narzędzia konkurowania (chapter 9). In: Podstawy wyborów strategicznych w przedsiębiorstwach. Warszawa: PWE.
Szentes T. (2011). Fejlődés-gazdaságtan (Development economics). Budapest: Akadémiai Kiadó.
Talpová Žáková, S. (2011). Strategies of Domestic and Multinational Firms in the Czech Republic. Journal of Competitiveness, 4, pp. 39-50.
The Global Competitiveness Report (2013-2014), World Economic Forum, Geneva.
Timmer, M.P. (ed.) (2012). The World Input-Output Database (WIOD): Contents, Sources and Methods. WIOD Working Paper, no. 10.
Timmer, M.P., Los, B., Stehrer, R. & de Vries, G.J. (2012). Fragmentation, incomes and jobs: an analysis of European competitiveness. Economic Policy, 28(76), pp. 613–661.
Trąpczyński, P., Wrona, Th. (2013). From going international to being international - strategies for international competitiveness. Poznan University of Economics Review, 13(1).
Bibliography 199199199199
Tullock, G. (1967). The Welfare Costs of Tariffs, Monopolies and Theft. Western Economic Journal, 5(3), 224-232.
Tullock, G. (1993). Rent Seeking. Brookfield: Edward Elgar Publishing.
Varga, B., & Szilágyi, R. (2011). Kvantitatív információképzési technikák. Budapest: Nemzeti Tankönyvkiadó.
Veblen, T. (1919). The Place of Science in Modern Civilization. B.W. Huensch, New York.
Wach, K. (2007). Regional Social Mobility as a Factor Affecting Small and Medium-sized Enterprises Development. In: D. Kopycińska (ed.), Competitiveness of Labour Market. (“Economics & Competition Policy” No. 8). Szczecin: Microeconomics Department of the University of Szczecin, pp. 87-94.
Wach, K. (2008). Skutki akcesji do Unii Europejskiej dla polskich przedsiębiorstw. Kraków: Wydawnictwo Uniwersytetu Ekonomicznego w Krakowie.
Wach, K. (2012). Europeizacja małych i średnich przedsiębiorstw: rozwój przez umiędzynarodowienie. Warszawa: PWN.
Wach, K. (2012). Wybrane modele internacjonalizacji bazujące na wiedzy, In: S. Wydymus & M. Maciejewski (eds), Innowacyjność i wiedza we współczesnym handlu międzynarodowym. Kraków: Fundacja Uniwersytetu Ekonomicznego w Krakowie.
Wach, K. (2014). Europeanisation of Firms as Their International Growth within the European Union: The Empirical Investigation into the Internationalisation Level among Polish Firms (chapter 1) In: B. Knežević & K. Wach (eds), International Business from the Central European Perspective. Zagreb: University of Zagreb Publishing Service, pp. 3-14
Wach, K. (2014). Familiness and Born Globals: Rapid Internationalisation among Polish Family Firms. Journal of Intercultural Management, 2(3-4).
Wach, K. (2014). Internationalisation and Globalisation as the Wider Context of Europeanisation Processes from the Macro- and Microeconomic Perspective. Horyzonty Polityki, 5(10) pp. 10-30.
Wach, K. (2014). Research Methodology of the Field Study on the Firm-Level Internationalisation in Visegrad Countries (chapter 2), In: Duréndez, A., & Wach, K. (2014). Patterns of Business Internationalisation in Visegrad Countries – In Search for Regional Specifics. Cartagena: Politéncina Universitad de Cartagena, pp. 33-42.
Wach, K. (2014). Theoretical Framework of the Firm-Level Internationalisation in Business Studies (chapter 1), In: A. Duréndez, K. Wach (eds), Patterns of Business Internationalisation in Visegrad Countries – In Search for Regional Specifics. Cartagena: Universidad Politécnica de Cartagena.
Wach, K., Wehrmann, C. (2014). Entrepreneurship in International Business: International Entrepreneurship as the Intersection of Two Fields (chapter 1). In: A.S. Gubik & K. Wach (eds.), International Entrepreneurship and Corporate Growth in Visegrad Countries. Miskolc: Miskolc University Press.

200 Bibliography
Wach, K., Wojciechowski, L. (2014). The Size and the Strategic International Orientation: The Use of EPRG Model among Polish Family and Non-Family Firms. Przedsiębiorczość i Zarządzanie, XV(7[1]), pp. 143-156.
Wallerstein, I. (1974). The Modern World System: Capitalist Agriculture and the Origins of the European World Economy in the Sixteenth Century. New York: Academic Press.
Weresa, M.A. (2010). Motywy ekspansji korporacji międzynarodowych do sektora bankowego krajów Europy Środkowej, In: Menkes, J. & Gardocka, T. (eds), Korporacje transnarodowe. Jeden temat, różne spojrzenia. Warszawa: Wydawnictwo SWPS Academica.
Whitelock, J. (2002). Theories of Internationalization and Their Impact on Market Entry. International Market Review, 19(4).
Wickham, Ph.A. (2006). Strategic Entrepreneurship, Harlow: Prentice Hall.
Wie, X., Andreosso-O’Callaghan, B., Wuntsch, M. (2007). German Investment in Ireland and in the Central and East European Countries. Intereconomics, 42(3), pp. 156 – 166.
Williamson, O.E. (1998). Transaction Cost Economics: How It Works; Where It Is Headed. De Economist, 146(1), 23-58.
Williamson, O.E. (2000). The New Institutional Economics: Taking Stock, Looking Ahead. Journal of Economic Literature, 38(3), 595-613. (Paris).
Witek-Hajduk, M. (2010), Strategie internacjonalizacji polskich przedsiębiorstw w warunkach akcesji Polski do Unii Europejskiej, Warszawa: OW SGH.
Wysokińska, Z. (2001). Konkurencyjność w międzynarodowym i globalnym handlu technologiami. Warszawa-Łódź: PWN.
Wyszehrad: Portal o Czechach, Słowacji i Węgrzech, http://wyszehrad.com/ (27 March 2014).
Yeats, A.Z. (1997). Just How Big Is Global Production Sharing?. World Bank Policy Research Paper, No. 1871.
Zaghini, A. (2005). Evolution of trade patterns in the new EU member states. Economics of Transition, 13(4), pp. 629–658.
Zagórski, J. (1947). Ogólna teoria konkurencji. Warszawa-Łódź: Wydawnictwo Kazimierza Rutskiego.
Zioło, Z. (1972). Próba konstrukcji miernika syntetycznego w zastosowaniu do badań przemysłu. Komisja Nauk Geograficznych, Sprawozdania z posiedzeń Komisji Naukowych PAN Oddział w Krakowie, XV(1), pp. 191–194.
Zioło, Z. (1973). Analiza struktury przestrzennej i form koncentracji przemysłu województwa rzeszowskiego w świetle wybranych mierników. Folia Geographica, Series: Geographica-Oeconomica, VI, pp. 95–116.
Zioło, Z. (2006). Zróżnicowanie światowej przestrzeni przemysłowej w świetle koncentracji siedzib zarządów wiodących korporacji. Prace Komisji Geografii Przemysłu Polskiego Towarzystwa Geograficznego, 8, pp. 9-26.

Bibliography 201201201201
Zook, Ch. (2004). Beyond the Core: Expand Your Market without Abanding Your Roots, Boston, MA: Harvard Business School Press – Bran & Company.
Zorska, A. (1998). Ku globalizacji? Przemiany w korporacjach transnarodowych i w gospodarce światowej. Warszawa: Wydawnictwo Naukowe PWN.
Zorska, A. (2002). Korporacje międzynarodowe w Polsce. Wyzwania w dobie globalizacji i regionalizacji. Warszawa: Centrum Doradztwa i Informacji Difin.