International competitiveness and current account: “UK and Ireland compared”
17
International Business Summer semester 2012 International Economics Topic: International competitiveness and current account: “UK and Ireland compared” Supervisor: - Prepared by:- Prof. Claus Thomasberger Mr. Rajab H. Kaoneka - 0529990 Due: August 31, 2012
-
Upload
uni-erlangen -
Category
Documents
-
view
1 -
download
0
Transcript of International competitiveness and current account: “UK and Ireland compared”

International Business
Summer semester 2012
International Economics
Topic:
International competitiveness and current account:
“UK and Ireland compared” Supervisor: - Prepared by:-
Prof. Claus Thomasberger Mr. Rajab H. Kaoneka - 0529990
Due: August 31, 2012
1
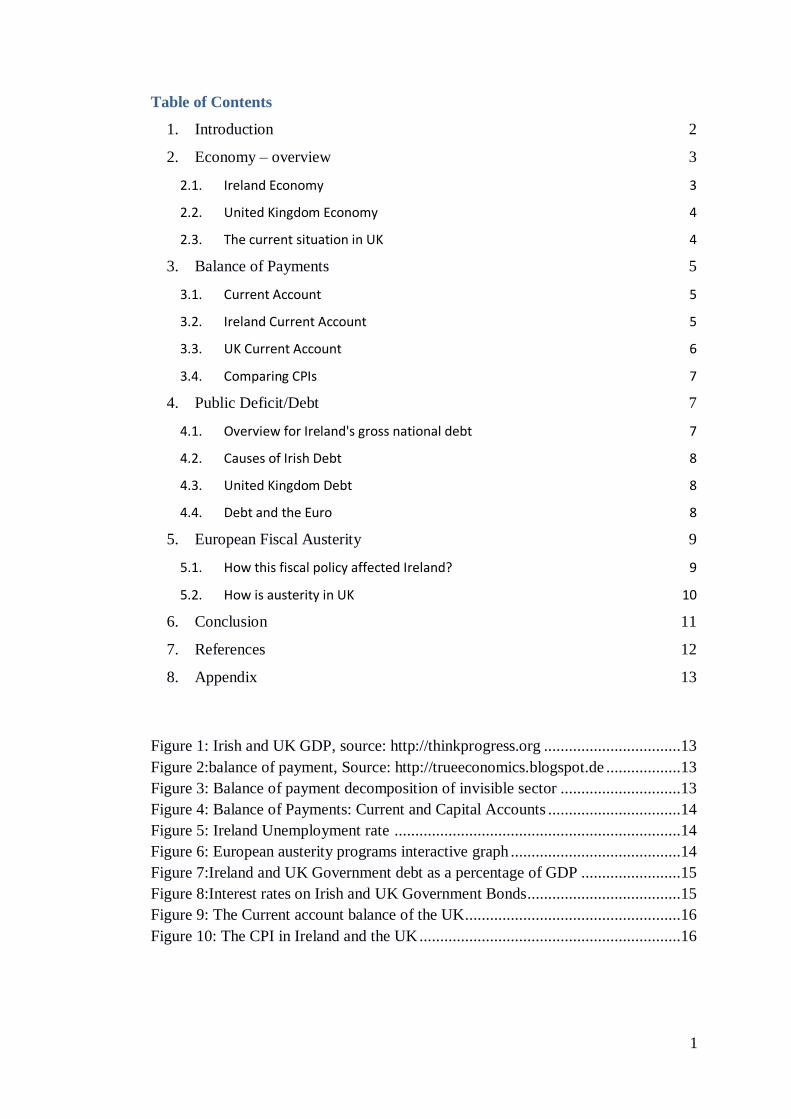
Table of Contents
1. Introduction 2
2. Economy – overview 3
2.1. Ireland Economy 3
2.2. United Kingdom Economy 4
2.3. The current situation in UK 4
3. Balance of Payments 5
3.1. Current Account 5
3.2. Ireland Current Account 5
3.3. UK Current Account 6
3.4. Comparing CPIs 7
4. Public Deficit/Debt 7
4.1. Overview for Ireland's gross national debt 7
4.2. Causes of Irish Debt 8
4.3. United Kingdom Debt 8
4.4. Debt and the Euro 8
5. European Fiscal Austerity 9
5.1. How this fiscal policy affected Ireland? 9
5.2. How is austerity in UK 10
6. Conclusion 11
7. References 12
8. Appendix 13
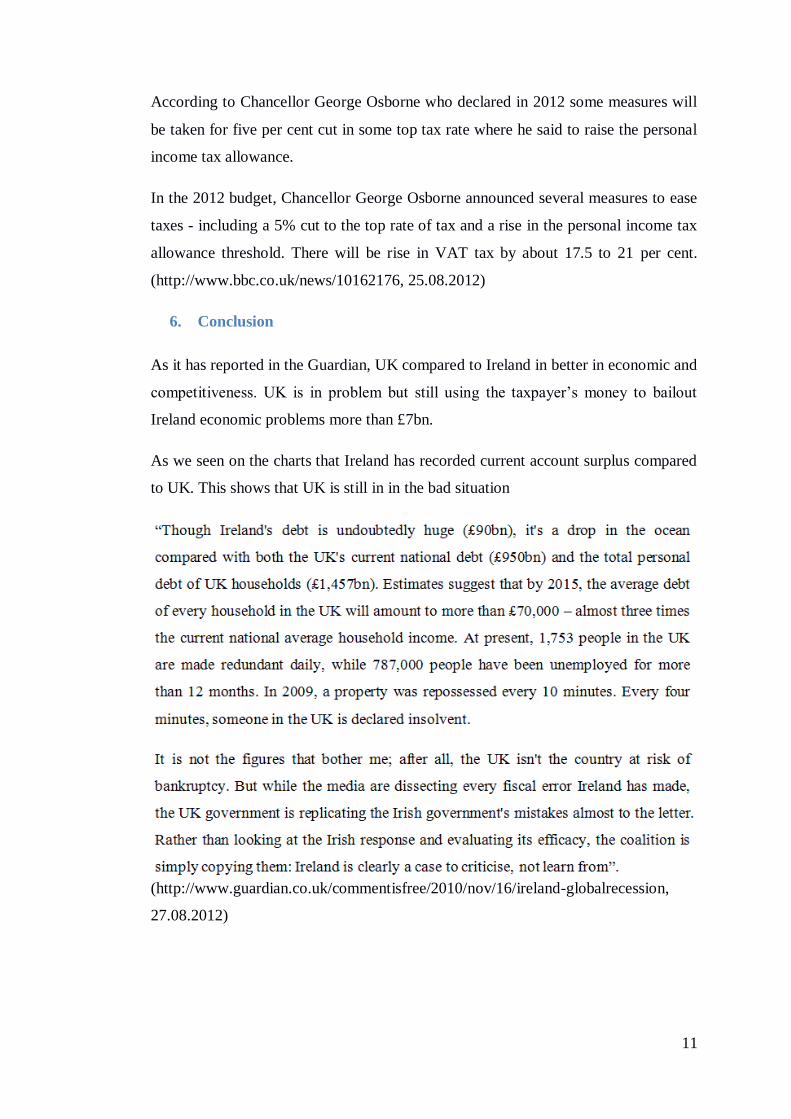
Figure 1: Irish and UK GDP, source: http://thinkprogress.org .................................13
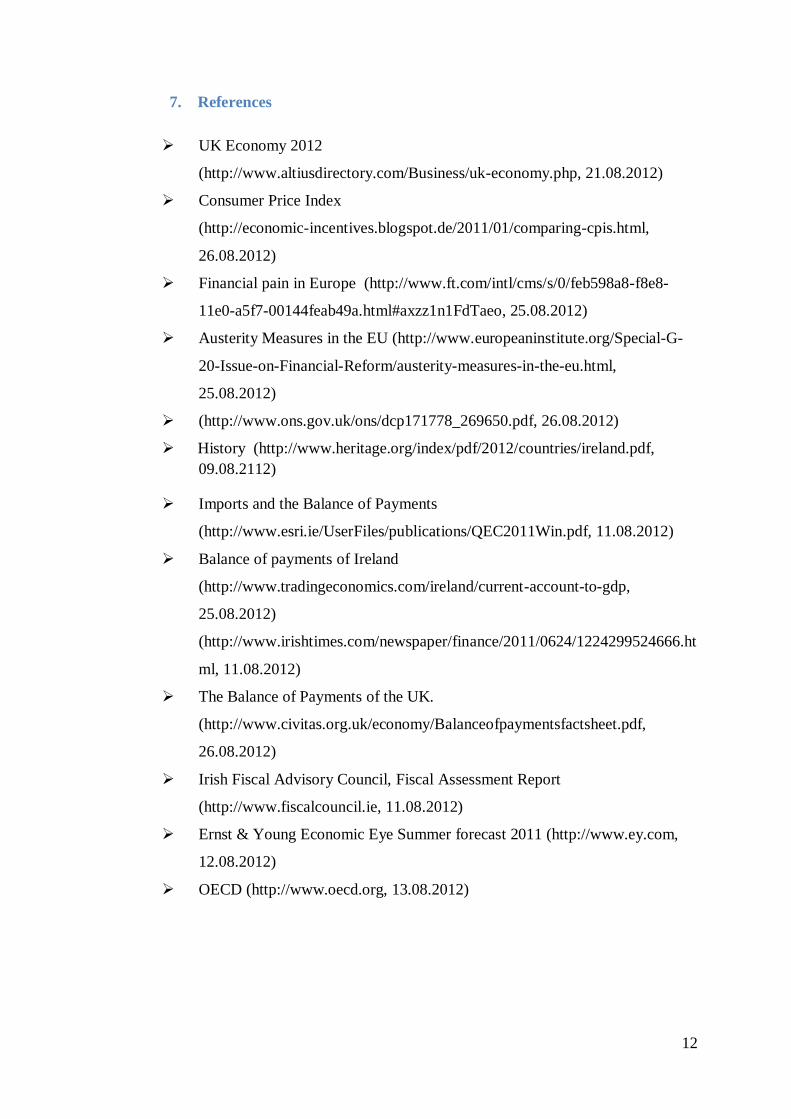
Figure 2:balance of payment, Source: http://trueeconomics.blogspot.de ..................13
Figure 3: Balance of payment decomposition of invisible sector .............................13
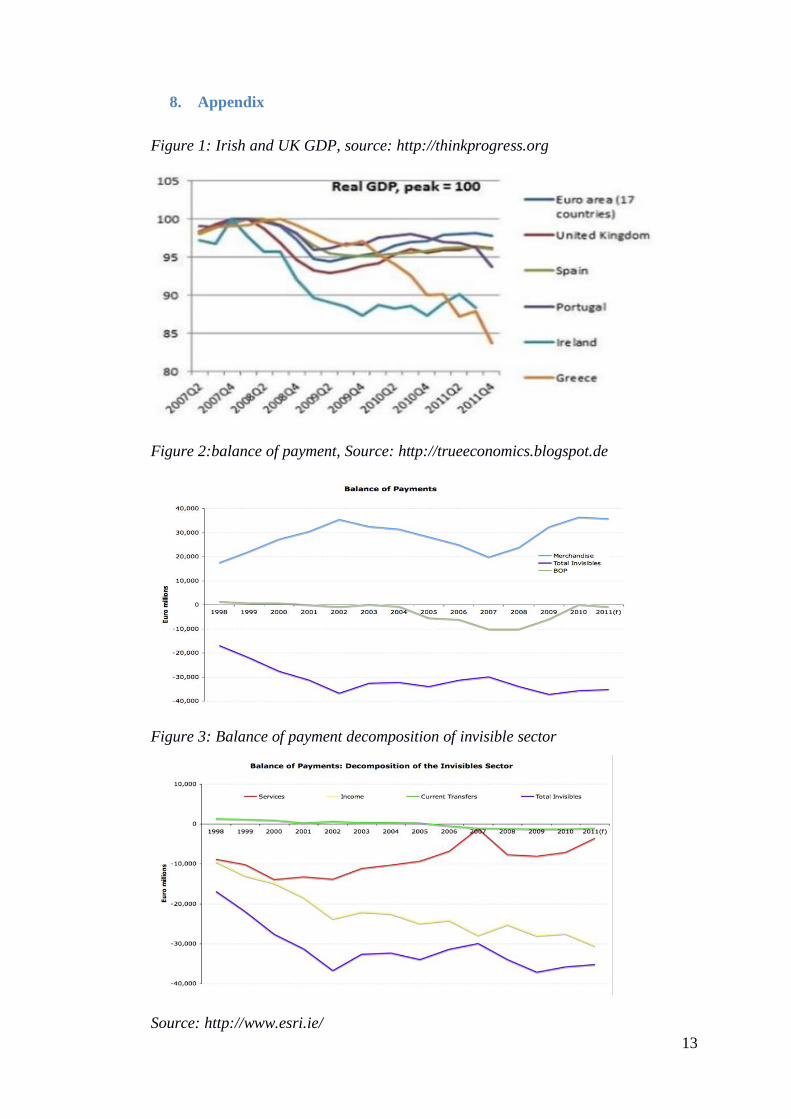
Figure 4: Balance of Payments: Current and Capital Accounts ................................14
Figure 5: Ireland Unemployment rate .....................................................................14
Figure 6: European austerity programs interactive graph .........................................14
Figure 7:Ireland and UK Government debt as a percentage of GDP ........................15
Figure 8:Interest rates on Irish and UK Government Bonds .....................................15
Figure 9: The Current account balance of the UK ....................................................16
Figure 10: The CPI in Ireland and the UK ...............................................................16
2
1. Introduction
This paper compares the International competitiveness and the current account on the
two countries Republic of Ireland and United Kingdom. This paper explain much the
balance of payments, Public Deficit/Debit and all factors which contribute to the
Country competitiveness including Export and Import which are the main factors
which determine the GDP.
UK and Ireland are countries in European Union but UK is not in Eurozone but
Ireland in the one of the Eurozone country. This explains some economical facts
which make the economical comparison between this tow countries in which one is
in Eurozone and one not in Eurozone.
This paper studies the economy of Republic of Ireland and UK in which explain
much on Balance of payments, Public Deficit/Debt and Financial Austerity, Starting
with Economical Overview especially before financial Crisis and After Financial
crisis, What happened during the financial crisis and to what extent the countries
have been affected and what measure taken to come out of financial crisis.
It seems that the main factors dominating the Irish and UK Economy are Budget
deficit, public debt and Austerity. Iris and Economy were strongest before thus why
we can see that the country affected much on financial crisis.
3
2. Economy – overview
In this part, explain the economic overview in order to compare the economic status
for both countries i.e. Republic of Ireland and The United Kingdom.
2.1. Ireland Economy
Ireland is a small country, which has modern economy, not only that but also Ireland
its economy is trade-dependent. Ireland was among the first Countries to join EU, as
started to use euro in January 2002. Ireland had growth average of 6% from 1995 to
2007, since financial crisis the economy dropped sharply which contributed much to
the falling of GDP over 3% in 2008 which also rose to 8% in 2009 and 1%2010.
Ireland was in great depression in 2008 which it was the first time since more than
decades, the collapse of the Ireland caused by the construction and the domestic
consumption (www.taxpayersnetwork.org, 17.08.2012).
In 2007 the prices was too high compared to other developed countries, on the same
year the prices of houses fallen by 50%. And that was the downturn in export sector,
consumer spending and business investment along with collapse of construction
sector; all these were dominated by foreign multinationals companies which was the
key factor for Ireland’s economy. The most important sector was Agriculture where
now is led by Industry and services. In 2008 the government moved to guarantee all
bank deposits, recapitalize the banking system, and establish partly-public venture
capital funds in response to the country's economic downturn.
(www.taxpayersnetwork.org, 12.08.2012)
The Irish Government aimed to stabilize the financial sector that’s why established
the National Asset Management Agency (NAMA) in 2009. Its role was to make the
banking system and property stable which may lead to the developing loans for the
consumer from the banks for Ireland. NAMA played big role in reducing the budget
deficit. It affected many sectors including cut in spending, wage reductions for all
public servants. The budget deficit came up to 32.5% of GDP in the year of 2010
which it was larger deficit compared to other countries like UK.
(www.taxpayersnetwork.org, 17.08.2012). See Appendix: figure 1.
4
Irish Economy grown up little bit in the year of 2011 and the budget was 10.2% of
GDP in which we can see the growth and also there was some expectation that in
2012 the economy would contract because of the euro crisis.1
2.2. United Kingdom Economy
The UK economy was highest worldwide in the period of British Empire in 1990s.
UK was one of the leading financial centres. It is considered that UK is the 3rd
largest
economy in Europe after Germany and France2.
Its economy shrunk after the Second World War in which the war had cost a lot of
resources which contributed to the great decline.
UK practiced the free market in 1979 which created the term “sick man of Europe”
from the Prime Minister Margaret Thatcher where he broke up the union which lead
to the free markets (http://www.altiusdirectory.com, 21.08.2012).
There was an increase of unemployment due to the decline of its economy in 1990 -
1993 which caused by recession.
2.3. The current situation in UK
During the financial crisis 2008, UK hit badly where by the currency (pound)
devaluated much more than other currencies and also this situation contributed much
to the higher unemployment.
During this UK’s recession in 2009 where by it was higher compared to 2008 many
sectors have been affected including Property finance, Industries, Agriculture and
employment and so on. See Appendix: figure 1.
UK experienced growth in 2010 first quarter where by the economy was higher than
0.29%, the economy continued to grow in which in second quarter was much higher
than first quarter up to 0.69% (http://www.altiusdirectory.com, 21.08.2012). See
Appendix: figure 1.
1 http://www.theodora.com/, (12.08.2012) 2 http://www.altiusdirectory.com (21.08.2012)
5
3. Balance of Payments
In this section of Balance of payment explains the current account for the UK and
Ireland which shows competitiveness.
As by definition:
“The Balance of Payments details all of the transactions made between the
government consumers, businesses and Government and the rest of the world
over the course of a year. The components of the balance of payments must
necessarily sum to zero: Current account + Capital and Financial account +
balancing item = 0”3
3.1. Current Account
The current account issue between the two countries, this part shows the current
account balance which indicates the way country competes internationally.
Compare the two countries as usual Ireland and United Kingdom if the countries
recorded surplus or deficit. Sometimes country may have surplus where by it depend
deeply on the revenue from export in which it may have much savings with weak
domestic consumption. In other way country may record deficit with import
dependent, low savings and much consumptions4.
3.2. Ireland Current Account
Ireland have shown growth this year where by the current account reported
0.11percent of the GDP last year 2011. Whereby from the history in 1980s to recent
the current account to GDP was -1.90 per cent in which in 1994 was much higher up
to 4.10 per cent in the year of 199 also was recorded low percentage of -13.30% in
the year 1981.
According to the publication from the Statistical Office Centre, Ireland recorded the
surplus of €762 million, in which the previous was deficit of €1.11 billion from the
first estimation published in the 1st quarter (http://www.theodora.com, 25.08.2012).
In 2011, a deficit of €1 billion was recorded in the 1st quarter. This doesn’t mean that
this is good forecast toward the surplus; evidence can be taken in two year.
3 (http://www.civitas.org.uk/economy/Balanceofpaymentsfactsheet.pdf, 26.08.2012) 4 (http://www.tradingeconomics.com/ireland/current-account-to-gdp, 25.08.2012)
6
Irish services export has been seen as most changing fast sector on the economy for
past ten years, so you can see that the balance of payment give all information about
the services exports (www.theodora.com, 25.08.2012).
Services exports performed worse in the first quarter of the year which when you
compare to other previous years. See appendix: figure 2. Illustrate the trends on the
annual basis, providing forecast for 2011 based on data through September.
ICT services are seems to be the sources which have largest services export earnings
see Appendix figure. 3& 4 where it put overall increase since statistics were to put in
accordance in the year of 1990s
This service of ICT has increased the exports at least 15 per cent on the previous
years which it was €7.21 billion in the 1st quarter. Business services are seems to be
2nd
largest source or export, which contribute €5.4billion in the first three months
which it was 8 per cent increase (http://www.esri.ie, 26.08.2012)
3.3. UK Current Account
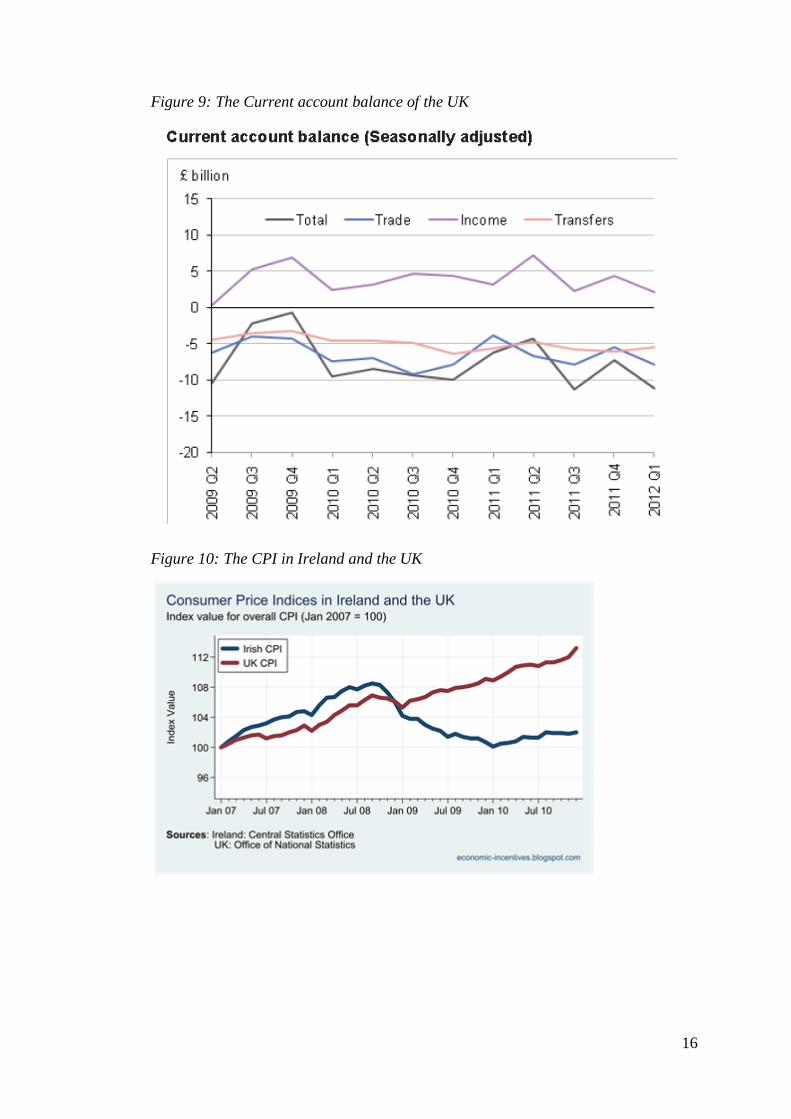
In the 1st quarter in 2012 the UK has a record of £11.20 billion on the current account
deficit which was more than the previous quarter record of £7.2 billion
The equivalence is 2.90 per cent of GDP in the 1st quarter. The decomposition of the
current account deficit is:-
There was increase in trade deficit from around £2.31 billion to about
£7.80 billion
Surplus from income went down from 2.20 billion to £2.20 billion
More on the current account transfer have downturn of £0.51 billion to
£5.50 billion
The total account which has been obtained from the addition of current account
balance and capital balance which all this implication that the country is in surplus or
in deficit.
In 2012, the UK seemed to have £10.22 billion net borrow; this was in the 1st quarter
where by in the 1st quarter recorded £6.41 billion, the causes of this record was the
7
decrease of income surplus and trade surplus.
(http://www.ons.gov.uk/ons/dcp171778_269650.pdf, 26.08.2012)
See Appendix: figure 9, Current account balance (Seasonally adjusted).
3.4. Comparing CPIs
In the figure 10 in the appendix, compares the CPI of the UK and Ireland from the
year of crisis to the current years. The UK CPI rose to 13.20 per cent where by
compared to Ireland which has 2.1 per cent. As you can see that there is big
difference between these two countries.
I the year 2007 the CPI of Ireland came up to 4.81 per cent from comparison of 3.0
in UK. Further year of 2008 the Irish CPI decreased to 2.11% while of the UK went
up to 7.49%5. See Appendix: figure 10
4. Public Deficit/Debt
In this part explains and compare the National debt for both countries Ireland and
United Kingdom. The total amount the Irish and United Kingdom government owe
to the private sector.
4.1. Overview for Ireland's gross national debt
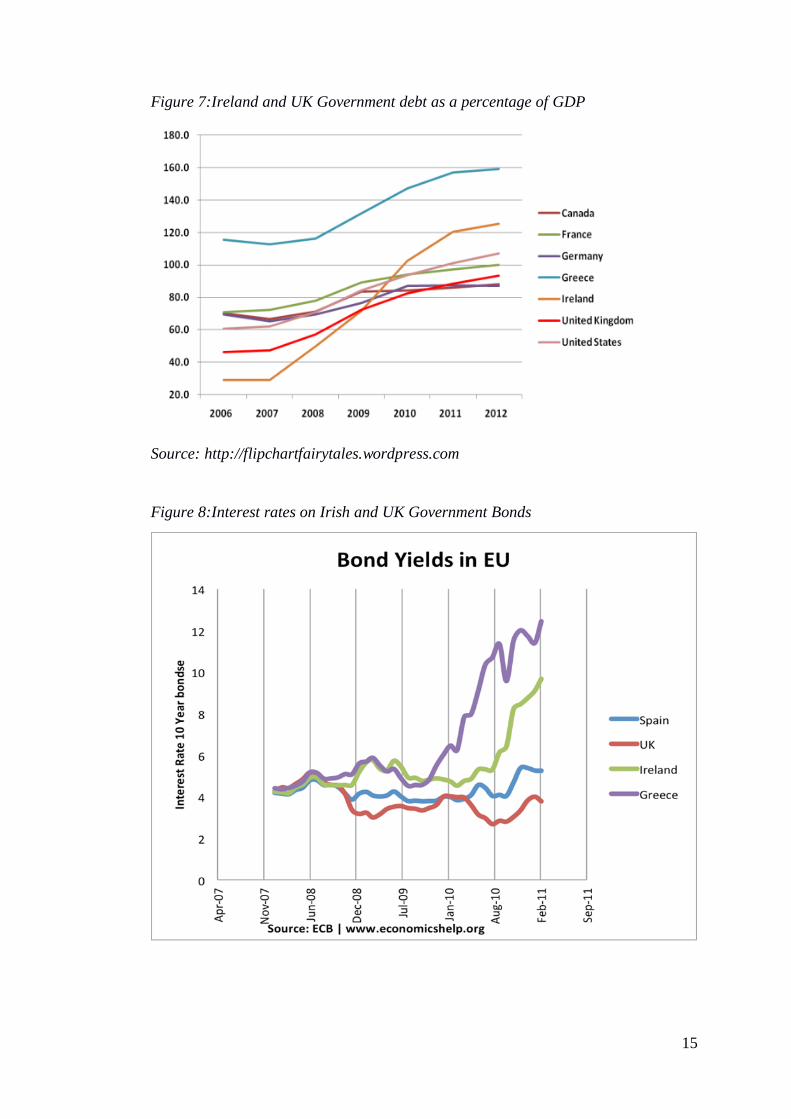
As it has been reported in the OECD report, the Irish debt has been recorded 105 per
cent of the GDP which is 109,610m euros or 109 billion euros. The forecast debt is
seems to be less than 113.6% of GDP by the year 2013, See Appendix: figure 8.
(http://www.economicshelp.org/blog/3118/economics/ireland-national-debt/,
26.08.2012).
According to the Eurozone rules in Growth and Stability which states that “National
debt should not exceed 60% of GDP”
Due to this criteria Ireland could be one of the country which has more debt to GDP
in the Eurozone (www.accountancyireland.ie, 11.06.2012)
5 (http://economic-incentives.blogspot.de/2011/01/comparing-cpis.html, 26.08.2012)
8
4.2. Causes of Irish Debt
One of the most causes for the Irish Debt was one year before crisis 2008. The debt
was 19.6 per cent of the GDP which was believed to be the lowest in the Europe as
about €37.59 billion.
After crisis 2008 to current years the debt went to 49.30% of GDP which is 95 billion
euros. This caused by recession and buildings property downturn in which
government depended much on the tax revenue which at the end fallen to low.
Another big problem is the biggest fund given to the banks to rescue from the crisis
which was about €31.5 cost of the GDP used to rescue the banks which was equal to
€60.6billions which recorded the deficit of 31.9% of GPD in the year 2010
(http://www.economicshelp.org, 26.08.2012).
Interest rates on Irish and UK Government Bonds: See appendix: figure 9.
4.3. United Kingdom Debt
The debt for the UK is the total money the government of England owes to the
private owners where by the total public sectors debt was about £1,032.5 billion in
the year 2012 which is equal to 65.8 per cent of GDP
(http://www.economicshelp.org/blog/334/uk-economy/uk-national-debt/, 26.08.2012)
By including all financing sectors the Net debts seem to be £2311.7 billion (147.4%
of GDP. See appendix: figure 8, shows the national debt compared to other countries
including Ireland (http://www.economicshelp.org, 26.08.2012)
4.4. Debt and the Euro
UK compared to other countries in Eurozone its current debt is not causes of rising of
the Government bond yields. Compared to the Eurozone which seem to have same or
similar level of the debt but the bond yields is high which led to the government
spending cut (http://www.economicshelp.org, 26.08.2012).
Also see appendix: figure 8
9
5. European Fiscal Austerity
Talking about austerity in Europe, it seems that much programs about austerity has
been implemented and are seems to be good by the outcome are hard according to
the Financial Times which has made nice graphic presentation6
(http://krugman.blogs.nytimes.com, 25.08.2012), See appendix: figure 7.
It seems that cutting spending in a country with weak economy depresses as much
the economy as much people think that it could be better. According to Nobel Prize
winning “the economist Paul Krugman”
“None of the countries slashing spending have seen the predicted private-sector
surge. Instead, the depressing effects of fiscal austerity have been reinforced by
falling private spending.” See appendix: figure 1 (http://krugman.blogs.nytimes.com,
25.08.2012)
5.1. How this fiscal policy affected Ireland?
On May 31st Ireland voted the European fiscal compact where by only half of the
voted but according to The Irish Times the results has a favor on the ratifying the
policy which could controlling and ruling the debt and Eurozone countries. The
Prime Minister Enda Kenny of Ireland received the policy by two hands whereby he
won the vote by 60.30% “YES” and 39.70% was “NO” (www.theepochtimes.com,
25.08.2012)
According to the Irish Times: “The referendum debate was dominated by a single
question: how can Ireland, which leaves an EU/IMF bailout program next year, fund
itself if it cannot then borrow on sovereign debt markets, and needs a second bailout
in 2014? For the Yes campaign, led by the government parties and supported by
Fianna Fail, the leading opposition party, that was the central argument. Only
countries that ratify the fiscal treaty can access the European Stability Mechanism,
the euro zone’s permanent €500 billion ($618 billion) bailout fund. So, if voters
rejected the treaty and access to EU finance was thereby denied, who would lend
Ireland money? On that, Sinn Fein and some smaller left-wing parties that led the No
6 (http://www.ft.com/intl/cms/s/0/feb598a8-f8e8-11e0-a5f7-00144feab49a.html#axzz1n1FdTaeo, 25.08.2012)
10
campaign struggled to produce an answer to convince a skeptical electorate in
somber mood.”
As it has been written in the (www.accountancyireland.ie, 25.08.2012)
“Ireland’s general government debt has increased by 320% over the same period.
The level of national debt has increased rapidly as a result of successive bank
bailouts, allied to the budget deficits associated with running a pro-cyclical taxation
and expenditure mix.”
The bank of Ireland as a 2nd largest contribution to the economy has accounted the
bailout of 14.5% of its nominal GDP in 2009 where by 32% in 2010. The general
Government of Ireland planned to stabilize the debt at 108% of GDP by 2014
(www.ul.ie, 11.06.2012). Unemployment rose from 4.6% in 2007 to 14.2% in June
2011 as shown in the Appendix: figure 6
5.2. How is austerity in UK
In last year 2010, The UK government announced the steepest or the biggest public
spending cut which was biggest for over 59 years, It has been planned that there will
be more than €84 billion spending cuts in up to the year 2015, this cut will make up
11.1% of the GDP, which will be lower to 1% for the more 5 year to come. See
Appendix: figure 1.
The plan will reduce the government department cost up to 19.1 per cent; department
of culture will be affected by 23.9% cut. Retirement also will be affected where by
retirement age in 2020 will be 66, public sector will be affected where elimination of
490,000 jobs will be done over four years to come, and even university will be on the
cuts, benefit from unemployment will be lowed for long term from 94.9 per cent to
70.1 per cent and also the benefit fro who don’t find jobs will be eliminated, For
parent who their income is more than 70,000 euros their child benefit will be cut
including eliminating more on social welfare
(http://www.europeaninstitute.org/Special-G-20-Issue-on-Financial-
Reform/austerity-measures-in-the-eu.html, 25.08.2012)
More cut will also be in Defence where will be eliminated by 8% and 4% for police
will be eliminated.
11
According to Chancellor George Osborne who declared in 2012 some measures will
be taken for five per cent cut in some top tax rate where he said to raise the personal
income tax allowance.
In the 2012 budget, Chancellor George Osborne announced several measures to ease
taxes - including a 5% cut to the top rate of tax and a rise in the personal income tax
allowance threshold. There will be rise in VAT tax by about 17.5 to 21 per cent.
(http://www.bbc.co.uk/news/10162176, 25.08.2012)
6. Conclusion
As it has reported in the Guardian, UK compared to Ireland in better in economic and
competitiveness. UK is in problem but still using the taxpayer’s money to bailout
Ireland economic problems more than £7bn.
As we seen on the charts that Ireland has recorded current account surplus compared
to UK. This shows that UK is still in in the bad situation
(http://www.guardian.co.uk/commentisfree/2010/nov/16/ireland-globalrecession,
27.08.2012)
12
7. References
UK Economy 2012
(http://www.altiusdirectory.com/Business/uk-economy.php, 21.08.2012)
Consumer Price Index
(http://economic-incentives.blogspot.de/2011/01/comparing-cpis.html,
26.08.2012)
Financial pain in Europe (http://www.ft.com/intl/cms/s/0/feb598a8-f8e8-
11e0-a5f7-00144feab49a.html#axzz1n1FdTaeo, 25.08.2012)
Austerity Measures in the EU (http://www.europeaninstitute.org/Special-G-
20-Issue-on-Financial-Reform/austerity-measures-in-the-eu.html,
25.08.2012)
(http://www.ons.gov.uk/ons/dcp171778_269650.pdf, 26.08.2012)
History (http://www.heritage.org/index/pdf/2012/countries/ireland.pdf,
09.08.2112)
Imports and the Balance of Payments
(http://www.esri.ie/UserFiles/publications/QEC2011Win.pdf, 11.08.2012)
Balance of payments of Ireland
(http://www.tradingeconomics.com/ireland/current-account-to-gdp,
25.08.2012)
(http://www.irishtimes.com/newspaper/finance/2011/0624/1224299524666.ht
ml, 11.08.2012)
The Balance of Payments of the UK.
(http://www.civitas.org.uk/economy/Balanceofpaymentsfactsheet.pdf,
26.08.2012)
Irish Fiscal Advisory Council, Fiscal Assessment Report
(http://www.fiscalcouncil.ie, 11.08.2012)
Ernst & Young Economic Eye Summer forecast 2011 (http://www.ey.com,
12.08.2012)
OECD (http://www.oecd.org, 13.08.2012)
13
8. Appendix
Figure 1: Irish and UK GDP, source: http://thinkprogress.org
Figure 2:balance of payment, Source: http://trueeconomics.blogspot.de
Figure 3: Balance of payment decomposition of invisible sector
Source: http://www.esri.ie/
14
Figure 4: Balance of Payments: Current and Capital Accounts
Figure 5: Ireland Unemployment rate
Figure 6: European austerity programs interactive graph
Source: http://krugman.blogs.nytimes.com
15
Figure 7:Ireland and UK Government debt as a percentage of GDP
Source: http://flipchartfairytales.wordpress.com
Figure 8:Interest rates on Irish and UK Government Bonds
16
Figure 9: The Current account balance of the UK
Figure 10: The CPI in Ireland and the UK