
International asset pricing models: The case of ASEAN stock markets
25
International Journal of Banking and Finance Volume 6 | Issue 1 Article 7 September 2008 International asset pricing models: e case of ASEAN stock markets Chee-Wooi Hooy University Science Malaysia Kim-Leng Goh e University of Malaya Follow this and additional works at: hp://epublications.bond.edu.au/ijbf is Journal Article is brought to you by the Bond Business School at ePublications@bond. It has been accepted for inclusion in International Journal of Banking and Finance by an authorized administrator of ePublications@bond. For more information, please contact Bond University's Repository Coordinator. Recommended Citation Hooy, Chee-Wooi and Goh, Kim-Leng (2008) "International asset pricing models: e case of ASEAN stock markets," International Journal of Banking and Finance: Vol. 6: Iss. 1, Article 7. Available at: hp://epublications.bond.edu.au/ijbf/vol6/iss1/7
-
Upload
independent -
Category
Documents
-
view
0 -
download
0
Transcript of International asset pricing models: The case of ASEAN stock markets

International Journal of Banking and Finance
Volume 6 | Issue 1 Article 7
September 2008
International asset pricing models: The case ofASEAN stock marketsChee-Wooi HooyUniversity Science Malaysia
Kim-Leng GohThe University of Malaya
Follow this and additional works at: http://epublications.bond.edu.au/ijbf
This Journal Article is brought to you by the Bond Business School at ePublications@bond. It has been accepted for inclusion in International Journalof Banking and Finance by an authorized administrator of ePublications@bond. For more information, please contact Bond University's RepositoryCoordinator.
Recommended CitationHooy, Chee-Wooi and Goh, Kim-Leng (2008) "International asset pricing models: The case of ASEAN stock markets," InternationalJournal of Banking and Finance: Vol. 6: Iss. 1, Article 7.Available at: http://epublications.bond.edu.au/ijbf/vol6/iss1/7

The International Journal of Banking and Finance, 2008/09 Vol. 6. Number 1: 2008: 117-140 117
INTERNATIONAL ASSET PRICING MODELS: THE CASE OF ASEAN STOCK MARKETS
Chee-wooi Hooy and Kim-leng GohUniversity Science Malaysia and The University of Malaya
Abstract
This paper is about the role of economic grouping as it affects international capital asset pricing models, ICAPM. The conventional ICAPM is extended to include the economic grouping, regional and world factors. Inclusion of the economic grouping factor increases the explanatory power of the asset pricing models. Data on ASEAN (Indonesia, Malaysia, Philippines, Singapore and Thailand) stock markets are used in tests of the proposed models. The economic grouping factor turned out to be most important while the regional factor is least important for asset pricing in these stock markets. While four of the markets have higher systematic risk exposure to the economic group, the Singapore market, the largest market, exhibits higher exposure to world risk. The segmentation of emerging markets offers a possible explanation for these results.
Keywords: CAPM, GARCH, integration, market risk, trading blocJEL classification: F360, G120
1. Introduction
The decade of the 1990s witnessed a surge in regional trade agreements.1 Some proponents of trade regionalism argue that, since trading blocs involve lesser number of participants in the process of liberalization, blocs offer a more efficient way of moving towards globalization. Frankel et al. (1995) and Frankel and Wei (1998) suggest that the recent trade regionalisms are likely to be welfare-improving. The formation of regional trading blocs not only induces intra-trade among the member countries leading to higher economic integration, but also stimulates active capital mobilization through FDI and portfolio investment flows across capital markets. This is usually supported by the regulation and policy cooperation in the financial system and the increased likelihood of coordination in monetary and exchange rate policies. The experience of European countries 1 http://www.cid.harvard.edu/cidtrade/issues/regionalism.html.
IJBF
1
Hooy and Goh: International asset pricing models
Published by ePublications@bond, 2008

118 The International Journal of Banking and Finance, 2008/09 Vol. 6. Number 1: 2008: 117-140
in the formation of the European Union (EU) provides a supporting case (Fratzscher, 2002).
When the formation of a trading bloc opens up trade opportunities, newly created economic activities boost prosperity of the trading region while also attracting capital inflows from member countries. What started as a trading bloc often leads to wider cooperation among eonomic grouping. Improved liquidity and market depth encourage monetary integration and a closer economic linkage among the member countries, in particular in the financial sector.
Many studies in the literature focused on the issues of portfolio diversification, market liberalization and contagion effect of an economic or financial crisis in their analysis of stock market linkages among member countries of groups. One of the early studies is by Lessard (1973) who investigated the diversification opportunity in an investment union formed by four Latino countries. That study documented evidence that the stock markets of the union members have closer relation compared to that of non-member countries. The formation of the EU has generated research interests on its capital markets some two decades later. Akdogan (1992), for example, found evidence of integration among the stock markets of EU members, suggesitng increasing relaxation of capital controls among the union members. That result is further supported by studies of Johnson and Soenen (1993) and Johnson et al. (1994) using covariance and correlation analysis.
A number of studies investigated linkages of markets in other regional blocs. Soydemir (2000) documented that the Mexican stock market is weakly linked to the markets of Argentina and Brazil, but has strong ties with the US market. The result reveals the simple fact of different trading bloc memberships – Mexico is a member of NAFTA (North American Free Trade Agreement) that includes the US, while the other two Latino markets are members of MERCOSUR (Mercado Comun del Cono Sur). The paper concludes that stock market interdependence is a result of economic convergence. Similarly, Chen et al. (2002) established evidence of a long-run equilibrium relationship among six Latino markets, attributing their findings to the formation of MERCOSUR. Although Mexico is included in their analysis, the degree of exogeneity of its market is higher, and has a weaker linkage with the other markets. More recently, Johnson and Soenen (2003) reported significant simultaneous responses that exist between Canada and Mexico (both NAFTA members) and among Argentina, Brazil, Chile (which are members of MERCOSUR) and Peru.
The literature provides clear indication that stock markets are systematically linked to their counterparts belonging to the same economic grouping. Such linkages would in turn affect the way assets are priced in these markets. On the latter aspect, however, there is little evidence in the literature documenting how economic grouping affects the asset pricing mechanism.
This study investigated the economic grouping effects on asset pricing in the case of ASEAN (Association of Southeast Asian Nations). The ASEAN Free Trade Area, or AFTA, was established with the aim of promoting intra-regional trade. Subsequent developments led to wider economic cooperation among
2
International Journal of Banking and Finance, Vol. 6, Iss. 1 [2008], Art. 7
http://epublications.bond.edu.au/ijbf/vol6/iss1/7

The International Journal of Banking and Finance, 2008/09 Vol. 6. Number 1: 2008: 117-140 119
ASEAN members. The concept of an ASEAN Investment Area was endorsed in order to lower barriers to intra-regional investment, to liberalize regulations, and to streamline incentives to be offered to boost regional investments. Efforts are also underway for moving towards a higher degree of monetary and financial integration by fostering closer linkages through cross-border movements within the ASEAN securities markets.2 In the capital market, for example, the FTSE/ASEAN Index series was recently launched as an indicator to the performance of the five oldest stock markets in ASEAN, i.e., the stock markets of Indonesia, Malaysia, Philippines, Singapore and Thailand. This study includes these five countries, which are also the founding members of ASEAN. The different size and the degree of openness of the five markets offer an interesting case study. The markets of Malaysia and Singapore are relatively larger in size, matching the ratio of market capitalization to GDP of the markets in some industrialized countries, and their degree of financial openness is also much higher (Rillo, 2004) compared to the other three markets. By these measurements, Singapore has the most developed market.
This study also proposes a direct modeling of the economic grouping impact using the international asset pricing model (ICAPM), while accounting for the time-varying nature of asset prices. The contribution of this paper is threefold. First, we show that the international asset pricing model, to which an economic grouping factor is added, has a higher explanatory power than the conventional ICAPM models. Second, a dynamic analysis adopted in this study indicates that the pricing mechanism in a more developed market within the economic group is far more stable. Lastly, this study offers new evidence that the stock markets of ASEAN have a higher tendency to converge within the economic group than to the world market.
The rest of this paper is organized as follows. Section 2 introduces the modified ICAPM model to study economic grouping framework and the methodology for analysis. Section 3 reports the results and Section 4 concludes the paper.
2. Models and Methodology
The ICAPM offers a theoretical framework for the pricing of risky assets in a fully integrated world of financial markets. The conditional expected return of a national equity market is exposed to the movement in returns of the world portfolio given by the following process:
(1)
where Rit and R
wt represent the returns of market-i and global portfolio,
respectively, is the world risk-free rate, and all expectations are taken with respect to the information set available at time t-1, ; Ω
t-1. This version of one-
2 http://www.ASEAN.org.
i );|R,Rcov(R)|R(E tWtitWtFttit ∀�=−� −− 11 δ
3
Hooy and Goh: International asset pricing models
Published by ePublications@bond, 2008

120 The International Journal of Banking and Finance, 2008/09 Vol. 6. Number 1: 2008: 117-140
factor ICAPM assumes that the expected excess return of an individual market above an international risk-free rate is proportional to the country specific and non-diversifiable risk in the world market. The global portfolio return is the only source of systematic risk that affects the return of each individual market in model (1).
Some researchers including Errunza and Losq (1985), Campbell and Hamao (1992), Davidson et al. (2003) and Bekaert et al. (2005) have added the returns of dominant markets in the region into the ICAPM to reflect the regional effects. In this paper, the region refers to Asia. We consider a two-factor model given as:
(2)
where RRt
represents the return to a regional portfolio. Apart from exposure to the world market risk, model (2) includes movements in the markets within the region as an additional source of systematic risk that affects the return of each individual market. Although the regional influence is included, the effect due to formation of economic groupings is not considered in the two-factor model. We propose a three-factor model specified as follows:
(3)
where RGt
, the returns to the portfolio of the economic group, provides a new factor to capture the risk exposure to the grouping where country-i is a member.
Following the above discussion, a number of different versions of ICAPM are obtained. For ease of exposition, the conditional expectation operation is dropped. Three versions of one-factor ICAPM model are considered. First is the version that relates to the world market systematic risk that is given by:
(4)
where ERi denotes the excess return of market-i and ER
W is the global
portfolio excess return. The coefficient βiW captures the systematic risk of market-
i due to exposure to the world market, as suggested in model (1). The other two single-factor models account for the exposure to market risk of the region and market risk of the economic grouping. These models are stated as
(5)
and (6)
where ERR and ER
G represent the excess returns of the regional portfolio
and economic grouping portfolio, respectively. Henceforth, we refer to models (4), (5) and (6) as the W-CAPM, R-CAPM and G-CAPM, respectively.
i );|R,R(Cov)|R,R(Cov R)|R(E tWtitWttRtitRtFttit ∀�+�=−� −−− 111 δδ
)|R,R(Cov)|R,R(Cov R)|R(E tRtitRttGtitGtFttit 111 −−− �+�=−� δδ
i );|R,R(Cov tWtitWt ∀�+ −1δ
itWtWiiit ERER εβα ++=
itRtR
iiit ERER εβα ++=
itGtGiiit ERER εβα ++=
4
International Journal of Banking and Finance, Vol. 6, Iss. 1 [2008], Art. 7
http://epublications.bond.edu.au/ijbf/vol6/iss1/7

The International Journal of Banking and Finance, 2008/09 Vol. 6. Number 1: 2008: 117-140 121
Three possible specifications of two-factor ICAPM can be formed by including the exposure to market risks of the region and world, economic grouping and world, and, economic grouping and region. The specifications of the two-factor models are as follows:
(7)
(8)
(9)
The models are referred to as RW-CAPM, GW-CAPM and GR-CAPM, respectively in this paper.
The three-factor ICAPM model incorporates the economic grouping, regional and global effects. The model, denoted as GRW-CAPM, is as follows:
(10)
We conduct a preliminary analysis of models (4) to (10) using OLS estimation in a static framework. The best model is selected based on the Akaike information criterion (AIC) and Schwarz criterion (SC). The parameter stability of the selected model is examined using the CUSUM of squares test (Brown et al., 1975) and the N-step forecast test. Evidence of recursive residuals outside the error bounds determined at the 5 per cent level is taken to indicate parameter or variance instability.
The selected model is then re-estimated using the generalized autoregressive conditional heteroscedasticity (GARCH) model of Bollerslev (1986) to account for temporal dependence in unconditional residuals which can be induced by time-varying volatility. The conditional expectation underlying models (1) to (3) is stated as follows:
where, the conditional variance σ2it
follows the specification which can be written as:
(11)
This simple specification of GARCH(1,1) is found to be generally sufficient for empirical modeling (Engle and Ng, 1993). To account for non-normal conditional residual distribution, we apply the robust consistent variance-covariance estimator suggested by Bollerslev and Wooldridge (1992). A dynamic framework is used whereby the model is estimated using rolling regression method. The window is set at 3 years.
This study is based on monthly data collected for the period January 1988 and November 2004. The Morgan Stanley Capital International (MSCI) Country
itWtWiRt
Riiit ERERER εββα +++=
itWtWiGt
Giiit ERERER εββα +++=
itRtRiGt
Giiit ERERER εββα +++=
itWtWiRt
RiGt
Giiit ERERERER εβββα ++++=
),(N~| it1-tit20 σε �
21
21
2−− ++= t,it,iit βσαεωσ
5
Hooy and Goh: International asset pricing models
Published by ePublications@bond, 2008

122 The International Journal of Banking and Finance, 2008/09 Vol. 6. Number 1: 2008: 117-140
Index is used in the computation of returns of the individual country. The world portfolio is proxied by the MSCI All Country World Index, a free float-adjusted market capitalization index computed from the stock exchanges of 49 leading markets. The MSCI All Country Asia Index based on indices of 12 leading Asian markets is used to compute the returns on the regional portfolio. The return on the portfolio of the ASEAN group for a member country is computed from an equal weighted market index of the remaining four members. The three-month Treasury bill rates of US, downloaded from the website of The Federal Reserve, represent the risk-free rate used in this study.
3. Results
Table 1: presents some summary statistics and the correlation matrix of the market returns.
Table 1: Summary Statistics and Correlation Matrix of Returns
Summary Statistics
Indonesia Malaysia Philippines Singapore Thailand Region World
Mean 0.004 0.004 0.002 0.005 0.002 -0.001 0.005
Std. Dev. 0.149 0.093 0.098 0.073 0.121 0.063 0.042
Skewness 0.422 -0.207 -0.009 -0.478 -0.381 0.002 -0.566
Kurtosis 7.042 6.415 4.609 5.152 4.628 3.468 3.785
Jarque-Bera 144.206 100.091 21.910 46.912 27.319 1.855 16.045
(p-value) (0.000) (0.000) (0.000) (0.000) (0.000) (0.396) (0.000)
No. of Observations
203 203 203 203 203 203 203
Correlation Indonesia Malaysia Philippines Singapore Thailand Region World
Indonesia 1
Malaysia 0.479 1
Philippines 0.500 0.549 1
Singapore 0.505 0.658 0.617 1
Thailand 0.466 0.566 0.634 0.655 1
Region 0.231 0.391 0.348 0.528 0.438 1
World 0.261 0.424 0.409 0.622 0.467 0.785 1
Note: Std. Dev. - standard deviation.
With the exception of the regional returns, the Jarque-Bera test rejects the normality assumption of the unconditional distribution of all the series. The returns of the Indonesian market have the highest standard deviation while the return variability of the Singapore market is the lowest. The ASEAN markets
6
International Journal of Banking and Finance, Vol. 6, Iss. 1 [2008], Art. 7
http://epublications.bond.edu.au/ijbf/vol6/iss1/7

The International Journal of Banking and Finance, 2008/09 Vol. 6. Number 1: 2008: 117-140 123
experienced more volatile movements than the global market. All correlation coefficients are positive, indicating co-movements of the same direction. Malaysia and Singapore are the most closely related markets compared to other markets. The Indonesian market has the lowest correlation not only with its ASEAN counterparts, but also with the regional and world markets. Being the most developed and liberalized stock market, the Singapore market has the highest correlation with the regional and world markets.
3.1. Static EstimationThe results of the OLS estimation of the W-, R- G-, RW-, GW-, GR- and GRW-CAPM models stated in equations (4) to (10) are reported in Table 2.
Note that the economic grouping factor is significant at 1% in all the models across all five countries. The inclusion of the economic grouping factor also increases the adjusted-R2, i.e., models with this factor has better explanatory power than models without. The world and regional returns are not always significant in explaining returns of the individual markets. While regional returns are significant in the one-factor R-CAPM model, they are not significant with the incorporation of the global returns in the RW-CAPM model. Similarly, the regional factor is also not significant in the GRW-CAPM model. This suggests that the world market movements have higher influence on the ASEAN stock markets compared to regional dynamics. The economic grouping dynamics have higher impact than the world market movements. Of the GRW-CAPM models, the economic grouping is always significant, but the world factor is only significant in two out of the five models.
The magnitude of the betas suggests that the economic grouping factor has a dominant role in equity pricing of the ASEAN markets. The presence of economic grouping factor reduces the magnitude of the world and regional betas when the one-factor model is extended to the two- and three-factor models. The exposure to systematic risks due to economic grouping is also consistently higher than those due to the regional and world factors. The only exception is Singapore, where exposure to the world factor is higher than the economic grouping factor.
The above findings are further supported by the model selection result. The GW-CAPM model outperforms the other models in four of the markets, while the GR-CAPM setting is the preferred model for Thailand. The results are indicative that inclusion of the economic grouping returns has enhanced the goodness-of-fit and explanatory power of the conventional ICAPM model. The diagnostic results, however, suggest that the OLS estimation suffers from ARCH effects. This problem is taken into account in the next section.
Two tests are conducted to show that the selected models experienced parameter instability. The results of the CUSUM of squares and N-step forecast tests are illustrated in Figure 1. Both the tests consistently show that the parameters in the selected models are not stable over time in all but the Philippine market. Some instability occurred in the early 1990s, but instability is most predominantly around the period of the 1997 financial crisis. To deal with this problem, the rolling window estimation is conducted.
7
Hooy and Goh: International asset pricing models
Published by ePublications@bond, 2008

124
T
he I
nter
nati
onal
Jou
rnal
of B
anki
ng a
nd F
inan
ce, 2
008/
09 V
ol. 6
. Num
ber
1: 2
008:
117
-140
Table 2: ICAPM Models-Static Estimations
Model Constant Group Region World Q(12) Q2(12) Normality ARCH LM F Adj R2 AIC SC
Indonesia
W-CAPM 0.001 0.778 24.627 32.905 180.521 4.026 31.378 0.131 -1.040 -1.007
(0.889) (0.000)*** (0.017)** (0.001)*** (0.000)*** (0.000)*** (0.000)***
R-CAPM 0.006 0.621 20.557 28.920 156.448 3.627 27.277 0.115 -1.022 -0.989
(0.531) (0.000)*** (0.057)* (0.004)*** (0.000)*** (0.000)*** (0.000)***
G-CAPM 0.001 0.937 15.509 40.940 418.920 7.695 119.114 0.369 -1.360 -1.327
(0.867) (0.000)*** (0.215) (0.000)*** (0.000)*** (0.000)*** (0.000)***
RW-CAPM 0.002 0.170 0.601 23.293 31.813 181.006 3.950 15.871 0.128 -1.032 -0.983
(0.807) (0.557) (0.043)** (0.025)** (0.001)*** (0.000)*** (0.000)*** (0.000)***
GW-CAPM 0.004 1.147 -0.391 13.693 41.485 374.164 8.270 63.281 0.381 -1.375 -1.326
(0.679) (0.000)*** (0.027)** (0.321) (0.000)*** (0.000)*** (0.000)*** (0.000)***
GR-CAPM 0.001 1.095 -0.266 13.072 41.079 375.583 8.198 62.218 0.377 -1.369 -1.320
(0.881) (0.000)*** (0.050)** (0.364) (0.000)*** (0.000)*** (0.000)*** (0.000)***
GRW-CAPM 0.003 1.152 -0.070 -0.323 13.359 41.442 370.343 8.314 42.034 0.379 -1.366 -1.300
(0.708) (0.000)*** (0.749) (0.248) (0.343) (0.000)*** (0.000)*** (0.000)*** (0.000)***
8
International Journal of Banking and Finance, Vol. 6, Iss. 1 [2008], Art. 7
http://epublications.bond.edu.au/ijbf/vol6/iss1/7

The
Int
erna
tion
al J
ourn
al o
f Ban
king
and
Fin
ance
, 200
8/09
Vol
. 6. N
umbe
r 1:
200
8: 1
17-1
40 1
25
Malaysia
W-CAPM 0.000 0.876 31.640 167.200 59.203 7.642 115.337 0.361 -2.105 -2.072
(0.030)** (11.795) (0.002)*** (0.000)*** (0.000)*** (0.000)*** (0.000)***
R-CAPM 0.006 0.705 21.594 113.650 32.372 6.126 98.538 0.326 -2.051 -2.018
(0.344) (0.000)*** (0.042)** (0.000)*** (0.000)*** (0.000)*** (0.000)***
G-CAPM 0.003 0.747 12.129 82.995 16.221 4.714 263.557 0.565 -2.489 -2.457
(0.596) (0.000)*** (0.435) (0.000)*** (0.000)*** (0.000)*** (0.000)***
RW-CAPM 0.002 0.222 0.644 26.060 153.060 53.899 7.384 59.162 0.365 -2.106 -2.058
(0.798) (0.120) (0.000)*** (0.011)** (0.000)*** (0.000)*** (0.000)*** (0.000)***
GW-CAPM 0.001 0.632 0.247 14.478 123.060 20.584 6.333 139.751 0.579 -2.516 -2.467
(0.813) (0.000)*** (0.017)** (0.271) (0.000)*** (0.000)*** (0.000)*** (0.000)***
GR-CAPM 0.003 0.646 0.195 16.734 115.290 21.925 5.977 139.419 0.578 -2.515 -2.466
(0.590) (0.000)*** (0.008)*** (0.160) (0.000)*** (0.000)*** (0.000)*** (0.000)***
GRW-CAPM 0.002 0.627 0.100 0.148 15.779 123.570 21.892 6.318 93.247 0.578 -2.510 -2.444
(0.722) (0.000)*** (0.402) (0.382) (0.202) (0.000)*** (0.000)*** (0.000)*** (0.000)***
Table 2: ICAPM Models-Static Estimations (continued)
9
Hooy and Goh: International asset pricing models
Published by ePublications@bond, 2008

126
T
he I
nter
nati
onal
Jou
rnal
of B
anki
ng a
nd F
inan
ce, 2
008/
09 V
ol. 6
. Num
ber
1: 2
008:
117
-140
Table 2: ICAPM Models-Static Estimations (continued)
Model Constant Group Region World Q(12) Q2(12) Normality ARCH LM F Adj R2 AIC SC
Philippines
W-CAPM -0.004 1.040 17.229 13.430 2.440 1.062 144.366 0.415 -1.986 -1.953
(0.550) (0.000)*** (0.141) (0.339) (0.295) (0.395) (0.000)***
R-CAPM 0.003 0.799 13.036 6.769 0.256 0.493 105.099 0.340 -1.865 -1.832
(0.634) (0.000)*** (0.366) (0.873) (0.880) (0.917) (0.000)***
G-CAPM -0.001 0.894 10.113 25.129 0.121 2.270 329.290 0.619 -2.415 -2.382
(0.791) (0.000)*** (0.606) (0.014)** (0.941) (0.011)** (0.000)***
RW-CAPM -0.003 0.087 0.949 16.619 12.645 1.704 0.986 72.086 0.413 -1.977 -1.928
(0.611) (0.600) (0.000)*** (0.164) (0.395) (0.427) (0.464) (0.000)***
GW-CAPM -0.003 0.732 0.342 10.408 27.965 1.653 2.378 182.228 0.642 -2.472 -2.423
(0.497) (0.000)*** (0.000)*** (0.580) (0.006)*** (0.437) (0.007)*** (0.000)***
GR-CAPM -0.001 0.792 0.193 9.841 22.971 0.210 1.910 172.397 0.629 -2.437 -2.388
(0.803) (0.000)*** (0.006)*** (0.630) (0.028)** (0.900) (0.036)** (0.000)***
GRW-CAPM -0.004 0.737 -0.081 0.422 10.547 28.879 2.156 2.497 121.282 0.641 -2.464 -2.399
(0.432) (0.000)*** (0.531) (0.018)** (0.568) (0.004)*** (0.340) (0.005)*** (0.000)***
10
International Journal of Banking and Finance, Vol. 6, Iss. 1 [2008], Art. 7
http://epublications.bond.edu.au/ijbf/vol6/iss1/7

The
Int
erna
tion
al J
ourn
al o
f Ban
king
and
Fin
ance
, 200
8/09
Vol
. 6. N
umbe
r 1:
200
8: 1
17-1
40 1
27
Singapore
W-CAPM 0.001 0.948 12.226 101.370 36.305 6.307 293.565 0.592 -2.882 -2.849
(0.849) (0.000)*** (0.428) (0.000)*** (0.000)*** (0.000)*** (0.000)***
R-CAPM 0.007 0.741 12.061 59.878 6.159 5.096 204.807 0.502 -2.684 -2.652
(0.119) (0.000)*** (0.441) (0.000)*** (0.046)** (0.000)*** (0.000)***
G-CAPM 0.005 0.675 15.281 23.029 41.912 1.881 411.017 0.670 -3.095 -3.063
(0.205) (0.000)*** (0.226) (0.027)** (0.000)*** (0.039)** (0.000)***
RW-CAPM 0.002 0.138 0.804 10.676 93.288 32.790 6.304 148.372 0.593 -2.882 -2.833
(0.688) (0.164) (0.000)*** (0.557) (0.000)*** (0.000)*** (0.000)*** (0.000)***
GW-CAPM 0.002 0.454 0.503 16.363 47.638 45.667 2.775 329.416 0.765 -3.429 -3.380
(0.613) (0.000)*** (0.000)*** (0.175) (0.000)*** (0.000)*** (0.002)*** (0.000)***
GR-CAPM 0.005 0.507 0.345 25.006 40.655 76.921 2.978 283.661 0.737 -3.316 -3.268
(0.167) (0.000)*** (0.000)*** (0.015)** (0.000)*** (0.000)*** (0.001)*** (0.000)***
GRW-CAPM 0.002 0.452 0.040 0.464 17.547 47.577 49.807 2.828 218.899 0.764 -3.421 -3.355
(0.557) (0.000)*** (0.615) (0.000)*** (0.130) (0.000)*** (0.000)*** (0.001)*** (0.000)***
Table 2: ICAPM Models-Static Estimations (continued)
11
Hooy and Goh: International asset pricing models
Published by ePublications@bond, 2008

128
T
he I
nter
nati
onal
Jou
rnal
of B
anki
ng a
nd F
inan
ce, 2
008/
09 V
ol. 6
. Num
ber
1: 2
008:
117
-140
Table 2: ICAPM Models-Static Estimations (continued)
Model Constant Group Region World Q(12) Q2(12) Normality ARCH LM F Adj R2 AIC SC
Thailand
W-CAPM -0.005 1.216 30.032 103.230 10.534 4.376 135.878 0.400 -1.612 -1.580
(0.538) (0.000)*** (0.003)*** (0.000)*** (0.005)*** (0.000)*** (0.000)***
R-CAPM 0.003 0.996 18.874 61.432 1.676 3.271 121.346 0.373 -1.568 -1.536
(0.694) (0.000)*** (0.092)* (0.000)*** (0.432) (0.000)*** (0.000)***
G-CAPM -0.002 1.101 16.263 36.122 297.860 3.102 309.758 0.605 -2.029 -1.996
(0.721) (0.000)*** (0.180) (0.000)*** (0.000)*** (0.001)*** (0.000)***
RW-CAPM -0.002 0.386 0.814 24.646 86.510 5.621 4.064 71.119 0.410 -1.623 -1.574
(0.751) (0.063)* (0.000)*** (0.017)** (0.000)*** (0.060)** (0.000)*** (0.000)***
GW-CAPM -0.004 0.908 0.390 15.154 41.754 148.087 3.378 169.663 0.625 -2.078 -2.029
(0.450) (0.000)*** (0.009)*** (0.233) (0.000)*** (0.000)*** (0.000)*** (0.000)***
GR-CAPM -0.002 0.917 0.339 14.570 44.631 144.553 3.879 172.567 0.629 -2.089 -2.040
(0.734) (0.000)*** (0.005)*** (0.266) (0.000)*** (0.000)*** (0.000)*** (0.000)***
GRW-CAPM -0.003 0.896 0.248 0.142 14.816 44.698 134.620 3.799 114.994 0.629 -2.082 -2.017(0.617) (0.000)*** (0.116) (0.471) (0.252) (0.000)*** (0.000)*** (0.000)*** (0.000)***
Note: Figures in the parentheses are the p-values. * denotes significance at the 0.10 level; ** denotes significance at the 0.05 level; and *** denotes significance at the 0.01 level. The coefficient significance test is based on the White (1980) heteroskedasticity consistent covariance estimates. AIC and SC denotes the Akaike and Schwarz information criteria. The underlined values show the model chosen using adjusted (Adj) R2, AIC and SC. Q(12) and Q2(12) are the LM tests for serial dependence in the residuals and squared residuals at 12 lags, respectively. Normality is the Jacque-Bera test for normality. ARCH LM is the test for presence of ARCH effects at 12 lags. F indicates the overall test for model significance.
12
International Journal of Banking and Finance, Vol. 6, Iss. 1 [2008], Art. 7
http://epublications.bond.edu.au/ijbf/vol6/iss1/7

The International Journal of Banking and Finance, 2008/09 Vol. 6. Number 1: 2008: 117-140 129
Figure 1: Tests for Parameter Instability
CUSUM of Squares Test N-step Forecast Test
Indonesia
Malaysia
Philippines
Singapore
Thailand
13
Hooy and Goh: International asset pricing models
Published by ePublications@bond, 2008
130
T
he I
nter
nati
onal
Jou
rnal
of B
anki
ng a
nd F
inan
ce, 2
008/
09 V
ol. 6
. Num
ber
1: 2
008:
117
-140
Table 3: Rolling Regression Estimates of the GW-CAPM Model for Indonesia
Constant Mean Group World Constant Variance ARCH GARCH Q(12) Q2(12) Normality ARCH LM Adj R2
88/1-90/12 0.012 0.422 -0.806 0.001 -0.112 1.183 11.397 12.177 8.458 0.335 0.156(0.420) (0.100)*** (0.011)** (0.701) (0.572) (0.000)*** (0.495) (0.432) (0.015)** (0.963)
89/1-91/12 -0.013 1.416 -1.351 0.007 0.910 -0.047 10.782 3.082 6.805 0.479 0.128(0.271) (0.000)*** (0.033)** (0.018)** (0.381) (0.007)*** (0.548) (0.995) (0.033)** (0.889)
90/1-92/12 -0.023 1.273 -0.724 0.001 -0.277 1.134 14.560 20.293 2.015 0.699 0.406(0.007)*** (0.000)*** (0.000)*** (0.001)*** (0.208) (0.000)*** (0.266) (0.062)* (0.365) (0.727)
91/1-93/12 -0.019 0.666 0.203 0.000 -0.201 1.167 5.712 13.836 1.345 0.926 0.358(0.066)* (0.000)*** (0.155) (0.000)*** (0.348) (0.000)*** (0.930) (0.311) (0.510) (0.554)
92/1-94/12 -0.005 0.535 0.567 0.002 -0.027 0.531 13.250 13.024 1.520 0.901 0.567(0.637) (0.000)*** (0.005)*** (0.699) (0.800) (0.671) (0.351) (0.367) (0.468) (0.572)
93/1-95/12 0.003 0.907 0.169 0.000 0.333 0.595 14.430 17.321 0.303 0.912 0.516(0.770) (0.000)*** (0.402) (0.639) (0.038)** (0.087)* (0.274) (0.138) (0.859) (0.564)
94/1-96/12 0.008 1.100 0.134 0.000 -0.166 1.070 6.654 7.642 1.987 0.883 0.657(0.142) (0.000)*** (0.345) (0.445) (0.481) (0.006)*** (0.880) (0.812) (0.370) (0.585)
95/1-97/12 0.021 1.262 -0.147 0.000 1.286 0.056 11.733 7.999 1.965 0.965 0.626(0.000)*** (0.000)*** (0.390) (0.120) (0.002)*** (0.558) (0.467) (0.785) (0.374) (0.527)
96/1-98/12 0.014 1.052 0.673 0.000 0.514 0.752 12.593 7.764 1.195 0.367 0.244(0.070)* (0.000)*** (0.001)*** (0.835) (0.112) (0.001)*** (0.399) (0.803) (0.550) (0.951)
97/1-99/12 0.019 1.358 -0.137 0.002 0.473 0.594 18.482 17.371 1.015 0.772 0.350(0.442) (0.000)*** (0.756) (0.408) (0.032)** (0.000)*** (0.102) (0.136) (0.602) (0.669)
98/1-00/12 -0.039 1.255 -0.633 -0.001 -0.082 1.048 13.353 14.038 1.795 1.084 0.318(0.001)*** (0.000)*** (0.008)*** (0.000)*** (0.634) (0.000)*** (0.344) (0.298) (0.408) (0.450)
99/1-01/12 -0.007 1.459 -0.553 0.002 -0.083 0.853 6.882 6.210 1.929 0.532 0.532(0.655) (0.000)*** (0.006)*** (0.416) (0.392) (0.005)*** (0.865) (0.905) (0.381) (0.853)
00/1-02/12 0.009 1.077 -0.318 0.002 -0.239 1.057 12.274 5.939 2.129 0.395 0.395(0.512) (0.000)*** (0.012)** (0.318) (0.052)* (0.000)*** (0.424) (0.919) (0.345) (0.937)
01/1-03/12 0.020 0.802 -0.177 0.001 -0.259 1.131 4.433 7.066 0.890 0.411 0.154(0.042)** (0.000)*** (0.033)** (0.000)*** (0.027)** (0.000)*** (0.974) (0.853) (0.641) (0.929)
02/1-04/11 0.022 0.982 -0.008 0.002 0.036 0.702 7.179 22.320 1.574 2.747 0.394(0.156) (0.011)** (0.987) (0.801) (0.744) (0.500) (0.846) (0.034)** (0.455) (0.060)*
Full Sample 0.004 1.232 -0.258 0.000 0.306 0.763 8.348 18.773 356.015 7.839 0.359(0.524) (0.000)*** (0.094)* (0.500) (0.027)** (0.000)*** (0.757) (0.094)* (0.000)*** (0.000)***
14
International Journal of Banking and Finance, Vol. 6, Iss. 1 [2008], Art. 7
http://epublications.bond.edu.au/ijbf/vol6/iss1/7

The
Int
erna
tion
al J
ourn
al o
f Ban
king
and
Fin
ance
, 200
8/09
Vol
. 6. N
umbe
r 1:
200
8: 1
17-1
40 1
31 Table 4: Rolling Regression Estimates of the GW-CAPM Model for Malaysia
Constant Mean Group World Constant Variance ARCH GARCH Q(12) Q2(12) Normality ARCH LM Adj R2
88/1-90/12 0.001 0.364 0.827 0.000 -0.219 1.124 11.312 6.797 0.603 0.631 0.619(0.894) (0.000)*** (0.000)*** (0.000)*** (0.000)*** (0.000)*** (0.502) (0.871) (0.740) (0.780)
89/1-91/12 0.002 0.440 0.573 0.000 0.216 0.544 13.432 7.770 1.067 0.210 0.709(0.706) (0.000)*** (0.001)*** (0.528) (0.292) (0.295) (0.338) (0.803) (0.586) (0.994)
90/1-92/12 0.001 0.595 0.361 0.000 -0.223 1.149 6.748 10.178 1.335 0.981 0.771(0.765) (0.000)*** (0.000)*** (0.000)*** (0.001)*** (0.000)*** (0.874) (0.600) (0.513) (0.516)
91/1-93/12 0.008 0.646 0.242 0.001 -0.141 0.592 13.635 5.892 0.468 0.371 0.708(0.000)*** (0.000)*** (0.036)** (0.000)*** (0.336) (0.010)** (0.325) (0.921) (0.792) (0.949)
92/1-94/12 0.000 0.809 0.106 0.001 0.071 0.485 19.398 10.390 0.512 0.463 0.640(0.971) (0.000)*** (0.682) (0.634) (0.605) (0.614)*** (0.079)* (0.582) (0.774) (0.899)
93/1-95/12 -0.004 1.037 0.174 0.000 0.931 0.216 26.146 14.322 0.951 0.651 0.606(0.259) (0.000)*** (0.136) (0.128) (0.002)*** (0.049)** (0.010)** (0.281) (0.622) (0.764)
94/1-96/12 0.005 0.615 0.353 0.000 -0.175 1.008 5.369 10.832 1.454 0.570 0.530(0.312) (0.000)*** (0.000)*** (0.000)*** (0.039)** (0.000)*** (0.945) (0.543) (0.483) (0.826)
95/1-97/12 0.010 0.888 0.056 0.000 0.050 1.187 10.460 9.527 1.040 0.564 0.643(0.225) (0.000)*** (0.808) (0.000)*** (0.779) (0.000)*** (0.576) (0.657) (0.594) (0.831)
96/1-98/12 0.012 0.842 -0.185 0.000 0.253 0.854 8.034 7.032 1.006 0.325 0.535(0.257) (0.000)*** (0.475) (0.946) (0.258) (0.000)*** (0.782) (0.856) (0.605) (0.967)
97/1-99/12 0.000 1.041 -0.713 0.001 -0.205 1.106 8.320 13.270 1.413 0.717 0.563(0.969) (0.000)*** (0.009)*** (0.000)*** (0.089)* (0.000)*** (0.760) (0.350) (0.493) (0.712)
98/1-00/12 0.003 0.794 -0.637 0.007 -0.272 0.684 8.041 12.549 0.002 0.659 0.297(0.768) (0.000)*** (0.011)** (0.000)*** (0.015)** (0.000)*** (0.782) (0.403) (0.999) (0.758)
99/1-01/12 0.033 0.400 0.380 0.000 -0.116 1.143 10.719 15.445 1.147 1.465 0.221(0.001)*** (0.000)*** (0.001)*** (0.000)*** (0.642) (0.000)*** (0.553) (0.218) (0.564) (0.267)
00/1-02/12 0.023 0.325 0.411 0.000 -0.143 1.071 7.696 14.116 1.846 1.583 0.317(0.001)*** (0.000)*** (0.000)*** (0.166) (0.642) (0.006)*** (0.808) (0.293) (0.397) (0.227)
01/1-03/12 0.019 0.418 0.317 0.002 -0.156 0.354 3.663 6.761 0.865 0.377 0.552(0.013)** (0.000)*** (0.013)** (0.309) (0.059)* (0.624) (0.989) (0.873) (0.649) (0.946)
02/1-04/11 -0.002 0.310 0.551 0.001 0.232 0.166 8.658 7.758 1.412 0.492 0.683(0.747) (0.008)*** (0.000)*** (0.368) (0.181) (0.813) (0.732) (0.804) (0.494) (0.878)
Full Sample 0.002 0.522 0.398 0.000 0.159 0.797 7.872 9.846 0.700 0.722 0.565(0.654) (0.000)*** (0.000)*** (0.270) (0.042)** (0.000)*** (0.795) (0.629) (0.705) (0.729)
15
Hooy and Goh: International asset pricing models
Published by ePublications@bond, 2008
132
T
he I
nter
nati
onal
Jou
rnal
of B
anki
ng a
nd F
inan
ce, 2
008/
09 V
ol. 6
. Num
ber
1: 2
008:
117
-140
Table 5: Rolling Regression Estimates of the GW-CAPM Model for Philippines
Constant Mean Group World Constant Variance ARCH GARCH Q(12) Q2(12) Normality ARCH LM Adj R2
88/1-90/12 -0.010 0.541 0.274 0.003 -0.141 0.567 12.357 19.316 2.794 1.548 0.229(0.198) (0.000)*** (0.010)** (0.177) (0.018)** (0.116) (0.417) (0.081)* (0.247) (0.239)
89/1-91/12 0.008 0.616 0.385 0.003 -0.137 0.618 15.643 15.265 6.775 0.882 0.399(0.363) (0.000)*** (0.004)*** (0.015)** (0.056)* (0.002)*** (0.208) (0.227) (0.034)** (0.585)
90/1-92/12 0.009 0.738 0.424 0.003 -0.096 0.543 7.235 3.996 5.634 1.360 0.570(0.320) (0.000)*** (0.030)** (0.327) (0.085)** (0.438) (0.842) (0.984) (0.060)* (0.309)
91/1-93/12 0.014 1.091 0.122 0.001 -0.397 1.077 9.193 13.672 2.164 0.935 0.626(0.011)** (0.000)*** (0.303) (0.147) (0.014)** (0.000)*** (0.686) (0.322) (0.339) (0.548)
92/1-94/12 0.012 1.078 0.001 0.001 -0.054 0.766 15.482 16.378 1.347 1.533 0.698(0.222) (0.000)*** (0.997) (0.797) (0.738) (0.460) (0.216) (0.175) (0.510) (0.244)
93/1-95/12 -0.004 1.358 -0.490 0.001 -0.310 1.004 14.182 17.805 0.450 1.361 0.750(0.367) (0.000)*** (0.000)*** (0.000)*** (0.001)*** (0.000)*** (0.289) (0.122) (0.799) (0.308)
94/1-96/12 0.007 1.115 -0.292 0.000 -0.189 1.117 18.227 12.471 0.101 1.342 0.677(0.213) (0.000)*** (0.015)** (0.000)*** (0.352) (0.000)*** (0.109) (0.409) (0.951) (0.317)
95/1-97/12 -0.012 0.916 0.302 0.000 -0.032 1.139 10.994 5.671 0.066 0.239 0.542(0.227) (0.000)*** (0.271) (0.320) (0.931) (0.000)*** (0.529) (0.932) (0.967) (0.990)
96/1-98/12 0.009 0.796 0.210 0.000 -0.119 1.142 11.632 6.463 0.296 0.283 0.640(0.332) (0.000)*** (0.372) (0.551) (0.563) (0.000)*** (0.476) (0.891) (0.862) (0.980)
97/1-99/12 -0.023 0.610 0.671 0.006 -0.104 0.044 16.154 7.253 0.151 0.501 0.667(0.055)* (0.000)*** (0.007)*** (0.334) (0.319) (0.969) (0.184) (0.840) (0.927) (0.874)
98/1-00/12 -0.028 0.588 0.908 0.000 -0.194 1.166 8.545 9.897 1.139 2.177 0.696(0.000)*** (0.000)*** (0.000)*** (0.000)*** (0.090)** (0.000)*** (0.741) (0.625) (0.566) (0.104)
99/1-01/12 -0.034 0.663 0.521 0.002 0.662 -0.300 6.669 14.126 2.244 0.541 0.713(0.000)*** (0.000)*** (0.000)*** (0.017)** (0.002)*** (0.125) (0.879) (0.293) (0.326) (0.847)
00/1-02/12 -0.016 0.790 0.317 0.005 0.659 -0.659 10.109 10.568 0.951 0.638 0.595(0.000)*** (0.000)*** (0.000)*** (0.001)*** (0.000)*** (0.000)*** (0.606) (0.566) (0.622) (0.774)
01/1-03/12 -0.026 0.934 0.342 0.000 -0.203 1.177 12.926 5.538 1.830 0.348 0.610(0.003)*** (0.000)*** (0.009)*** (0.000)*** (0.189) (0.000)*** (0.374) (0.938) (0.401) (0.959)
02/1-04/11 -0.023 0.912 -0.034 0.001 -0.305 1.190 12.214 10.476 1.857 0.826 0.551(0.001)*** (0.000)*** (0.851) (0.000)*** (0.209) (0.000)*** (0.429) (0.574) (0.395) (0.628)
Full Sample -0.003 0.732 0.341 0.003 -0.004 0.334 10.383 27.781 1.656 2.380 0.637(0.493) (0.000)*** (0.000)*** (0.938) (0.934) (0.969) (0.582) (0.006)*** (0.437) (0.007)***
16
International Journal of Banking and Finance, Vol. 6, Iss. 1 [2008], Art. 7
http://epublications.bond.edu.au/ijbf/vol6/iss1/7

The
Int
erna
tion
al J
ourn
al o
f Ban
king
and
Fin
ance
, 200
8/09
Vol
. 6. N
umbe
r 1:
200
8: 1
17-1
40 1
33
Table 6: Rolling Regression Estimates of the GW-CAPM Model for Singapore
Constant Mean Group World Constant Variance ARCH GARCH Q(12) Q2(12) Normality ARCH LM Adj R2
88/1-90/12 0.002 0.378 0.615 0.001 -0.207 0.770 16.504 11.278 1.042 0.594 0.720(0.691) (0.000)*** (0.000)*** (0.004)*** (0.284) (0.002)*** (0.169) (0.505) (0.594) (0.808)
89/1-91/12 0.006 0.400 0.631 0.000 0.337 0.507 12.093 8.062 3.799 0.501 0.816(0.286) (0.000)*** (0.000)*** (0.484) (0.467) (0.300) (0.438) (0.780) (0.150) (0.874)
90/1-92/12 0.003 0.427 0.567 0.000 -0.167 1.070 9.140 5.987 0.636 0.585 0.911(0.330) (0.000)*** (0.000)*** (0.000)*** (0.003)*** (0.000)*** (0.691) (0.917) (0.727) (0.814)
91/1-93/12 0.004 0.427 0.570 0.000 -0.114 1.207 9.054 5.107 1.691 0.730 0.877(0.245) (0.000)*** (0.000)*** (0.000)*** (0.696) (0.000)*** (0.698) (0.954) (0.429) (0.702)
92/1-94/12 0.002 0.399 0.569 0.000 -0.164 1.160 4.780 13.290 2.028 1.308 0.839(0.571) (0.000)*** (0.000)*** (0.000)*** (0.399) (0.000)*** (0.965) (0.348) (0.363) (0.332)
93/1-95/12 0.004 0.512 0.470 0.000 -0.171 1.138 4.627 18.196 1.273 0.844 0.824(0.262) (0.000)*** (0.000)*** (0.000)*** (0.233) (0.000)*** (0.969) (0.110) (0.529) (0.614)
94/1-96/12 -0.001 0.501 0.402 0.000 -0.185 1.144 14.895 14.963 0.421 1.363 0.778(0.576) (0.000)*** (0.000)*** (0.000)*** (0.471) (0.000)*** (0.247) (0.243) (0.810) (0.308)
95/1-97/12 -0.012 0.261 0.825 0.000 0.034 1.169 12.082 15.700 1.042 1.129 0.696(0.049)** (0.000)*** (0.000)*** (0.000)*** (0.888) (0.000)*** (0.439) (0.205) (0.594) (0.424)
96/1-98/12 -0.011 0.309 0.771 0.000 0.295 0.749 13.477 14.261 2.244 0.430 0.657(0.103) (0.038)** (0.000)*** (0.293) (0.253) (0.000)*** (0.335) (0.284) (0.326) (0.919)
97/1-99/12 0.012 0.426 0.729 0.000 0.280 0.630 9.280 12.295 0.786 0.522 0.684(0.143) (0.000)*** (0.000)*** (0.473) (0.286) (0.015)** (0.679) (0.422) (0.675) (0.860)
98/1-00/12 0.018 0.504 0.808 0.001 0.561 0.192 6.761 13.868 1.424 0.938 0.637(0.002)*** (0.000)*** (0.000)*** (0.063)* (0.010)** (0.188) (0.873) (0.309) (0.491) (0.545)
99/1-01/12 0.006 0.372 0.409 0.004 0.280 -0.452 19.134 9.508 1.998 0.338 0.578(0.467) (0.000)*** (0.004)*** (0.078)* (0.261) (0.254) (0.085)* (0.659) (0.368) (0.962)
00/1-02/12 0.002 0.239 0.432 0.001 1.144 -0.139 17.495 6.482 0.627 0.603 0.537(0.693) (0.000)*** (0.000)*** (0.001)*** (0.001)*** (0.005)*** (0.132) (0.890) (0.731) (0.801)
01/1-03/12 -0.003 0.309 0.446 0.002 0.547 -0.384 9.632 12.749 0.610 0.520 0.644(0.459) (0.000)*** (0.000)*** (0.004)*** (0.024)** (0.021)** (0.648) (0.388) (0.737) (0.862)
02/1-04/11 -0.001 0.402 0.567 0.000 -0.145 1.089 9.320 10.980 0.439 0.777 0.811(0.709) (0.000)*** (0.000)*** (0.000)*** (0.493) (0.000)*** (0.675) (0.531) (0.803) (0.665)
Full Sample 0.002 0.401 0.572 0.000 0.174 0.799 11.058 10.061 3.139 0.864 0.759(0.520) (0.000)*** (0.000)*** (0.217) (0.034)** (0.000)*** (0.524) (0.611) (0.208) (0.585)
17
Hooy and Goh: International asset pricing models
Published by ePublications@bond, 2008

134
T
he I
nter
nati
onal
Jou
rnal
of B
anki
ng a
nd F
inan
ce, 2
008/
09 V
ol. 6
. Num
ber
1: 2
008:
117
-140
Table 7: Rolling Regression Estimates of the GW-CAPM Model for Thailand
Constant Mean Group World Constant Variance ARCH GARCH Q(12) Q2(12) Normality ARCH LM Adj R2
88/1-90/12 0.005 0.676 0.844 0.002 -0.262 0.914 9.417 8.857 1.549 0.484 0.498(0.504) (0.000)*** (0.000)*** (0.000)*** (0.054)* (0.000)*** (0.667) (0.715) (0.461) (0.886)
89/1-91/12 0.008 0.800 0.544 0.002 -0.379 0.829 14.638 17.344 2.027 0.564 0.620(0.450) (0.000)*** (0.000)*** (0.000)*** (0.090)* (0.000)*** (0.262) (0.137) (0.363) (0.831)
90/1-92/12 0.003 0.884 0.316 0.001 -0.298 1.079 16.278 10.486 1.761 0.992 0.617(0.668) (0.000)*** (0.094)* (0.000)*** (0.001)*** (0.000)*** (0.179) (0.573) (0.414) (0.509)
91/1-93/12 0.014 1.068 -0.118 0.002 -0.348 0.991 14.697 6.019 1.151 0.579 0.504(0.061)* (0.000)*** (0.300) (0.000)*** (0.013)** (0.000)*** (0.258) (0.915) (0.562) (0.819)
92/1-94/12 0.000 1.075 -0.215 0.003 -0.265 0.564 22.854 17.516 0.550 0.805 0.638(0.949) (0.000)*** (0.023)** (0.001)*** (0.001)*** (0.049)** (0.029)** (0.131) (0.759) (0.643)
93/1-95/12 -0.004 1.198 -0.161 0.000 -0.162 1.096 13.749 19.978 1.111 0.637 0.755(0.291) (0.000)*** (0.057)* (0.000)*** (0.409) (0.000)*** (0.317) (0.068)* (0.574) (0.775)
94/1-96/12 -0.007 1.206 -0.116 0.000 -0.036 1.144 10.173 5.117 2.798 0.443 0.676(0.226) (0.000)*** (0.386) (0.670) (0.763) (0.000)*** (0.601) (0.954) (0.247) (0.911)
95/1-97/12 -0.010 1.191 -0.182 0.000 -0.140 1.307 9.568 6.138 1.007 0.245 0.554(0.017)** (0.000)*** (0.320) (0.000)*** (0.489) (0.000)*** (0.654) (0.909) (0.604) (0.989)
96/1-98/12 -0.049 0.641 1.532 0.009 -0.107 0.498 10.731 15.678 6.493 0.665 0.563(0.000)*** (0.000)*** (0.005)*** (0.317) (0.138) (0.474) (0.552) (0.206) (0.039)** (0.753)
97/1-99/12 -0.042 0.680 1.348 0.008 -0.100 0.506 10.550 14.459 2.705 0.381 0.583(0.003)*** (0.000)*** (0.009)*** (0.475) (0.157) (0.582) (0.568) (0.272) (0.259) (0.944)
98/1-00/12 -0.017 1.009 0.671 0.001 -0.174 0.945 20.034 8.504 1.490 0.674 0.539(0.208) (0.000)*** (0.005)*** (0.000)*** (0.000)*** (0.000)*** (0.066)* (0.745) (0.475) (0.746)
99/1-01/12 -0.020 1.231 0.266 0.006 0.188 -0.185 60.674 6.622 0.938 0.760 0.704(0.163) (0.000)*** (0.173) (0.238) (0.405) (0.829) (0.000)*** (0.882) (0.626) (0.679)
00/1-02/12 -0.002 1.162 0.172 0.000 -0.175 1.096 15.731 12.514 0.919 0.665 0.630(0.832) (0.000)*** (0.208) (0.107) (0.278) (0.000)*** (0.204) (0.405) (0.632) (0.753)
01/1-03/12 0.022 0.677 0.407 0.000 -0.152 1.086 7.768 6.339 1.771 0.418 0.511(0.016)** (0.000)*** (0.008)*** (0.305) (0.476) (0.000)*** (0.803) (0.898) (0.413) (0.925)
02/1-04/11 0.020 0.519 0.621 0.002 0.095 0.348 8.272 5.803 10.098 0.282 0.653(0.044)** (0.004)*** (0.001)*** (0.632) (0.731) (0.763) (0.764) (0.926) (0.006)*** (0.979)
Full Sample 0.000 0.880 0.335 0.000 0.103 0.848 10.265 12.251 29.167 1.001 0.617(0.972) (0.000)*** (0.007)*** (0.355) (0.115) (0.000)*** (0.593) (0.426) (0.000)*** (0.450)
18
International Journal of Banking and Finance, Vol. 6, Iss. 1 [2008], Art. 7
http://epublications.bond.edu.au/ijbf/vol6/iss1/7

The
Int
erna
tion
al J
ourn
al o
f Ban
king
and
Fin
ance
, 200
8/09
Vol
. 6. N
umbe
r 1:
200
8: 1
17-1
40 1
35 Table 8: Rolling Regression Estimates of the GR-CAPM Model for Thailand
Constant Mean Group Region Constant Variance ARCH GARCH Q(12) Q2(12) Normality ARCH LM Adj R2
88/1-90/12 0.000 0.866 0.353 0.005 0.291 -0.458 20.305 9.956 1.463 1.637 0.430(0.933) (0.000)*** (0.003)*** (0.005)*** (0.056)* (0.042)** (0.062)* (0.620) (0.481) (0.212)
89/1-91/12 0.018 0.858 0.359 0.001 -0.341 1.054 10.837 11.527 2.675 0.572 0.601(0.023)** (0.000)*** (0.000)*** (0.000)*** (0.054)* (0.000)*** (0.543) (0.484) (0.262) (0.824)
90/1-92/12 0.011 0.943 0.159 0.001 -0.292 1.127 21.705 11.456 2.349 0.804 0.619(0.145) (0.000)*** (0.090)* (0.000)*** (0.052)* (0.000)*** (0.041)** (0.490) (0.309) (0.644)
91/1-93/12 0.010 0.999 -0.074 0.002 -0.320 0.808 18.156 7.207 1.436 0.371 0.513(0.144) (0.000)*** (0.204) (0.000)*** (0.000)*** (0.000)*** (0.111) (0.844) (0.488) (0.949)
92/1-94/12 0.008 1.234 -0.133 0.000 -0.020 1.050 12.102 13.001 0.494 0.673 0.642(0.304) (0.000)*** (0.214) (0.000)*** (0.916) (0.000)*** (0.438) (0.369) (0.781) (0.747)
93/1-95/12 -0.006 1.224 -0.182 0.000 -0.162 1.099 17.121 26.717 1.592 0.840 0.769(0.141) (0.000)*** (0.002)*** (0.000)*** (0.448) (0.000)*** (0.145) (0.008)*** (0.451) (0.617)
94/1-96/12 -0.011 1.148 -0.143 0.000 -0.081 1.178 7.821 6.170 2.210 0.529 0.671(0.022)** (0.000)*** (0.108) (0.002)*** (0.316) (0.000)*** (0.799) (0.907) (0.331) (0.855)
95/1-97/12 -0.013 1.154 -0.194 0.000 -0.088 1.228 8.336 5.517 0.403 0.272 0.553(0.001)*** (0.000)*** (0.045)** (0.714) (0.525) (0.000)*** (0.758) (0.938) (0.818) (0.983)
96/1-98/12 -0.032 0.725 0.948 0.001 -0.145 1.051 14.262 16.407 7.825 3.039 0.570(0.005)*** (0.000)*** (0.000)*** (0.000)*** (0.270) (0.000)*** (0.284) (0.173) (0.020)** (0.038)**
97/1-99/12 -0.014 0.675 1.011 0.008 -0.129 0.552 12.756 17.292 3.743 0.879 0.590(0.416) (0.000)*** (0.002)*** (0.031)** (0.134) (0.129) (0.387) (0.139) (0.154) (0.588)
98/1-00/12 -0.022 0.717 0.920 0.005 -0.145 0.607 11.455 4.333 0.949 0.766 0.602(0.089)* (0.000)*** (0.000)*** (0.000)*** (0.001)*** (0.000)*** (0.490) (0.977) (0.622) (0.674)
99/1-01/12 -0.021 1.169 0.405 0.004 0.206 0.054 50.657 8.980 1.140 0.791 0.724(0.134) (0.000)*** (0.039)** (0.231) (0.343) (0.939) (0.000)*** (0.705) (0.565) (0.654)
00/1-02/12 -0.015 1.274 0.273 0.010 0.419 -0.823 14.436 10.586 0.896 0.483 0.640(0.082)* (0.000)*** (0.033)** (0.000)*** (0.000)*** (0.000)*** (0.274) (0.565) (0.639) (0.887)
01/1-03/12 0.018 0.575 0.524 0.000 -0.197 1.125 8.849 2.688 3.089 0.521 0.525(0.049)** (0.000)*** (0.000)*** (0.416) (0.559) (0.003)*** (0.716) (0.997) (0.213) (0.861)
02/1-04/11 0.018 0.701 0.439 0.002 0.230 0.251 8.806 4.628 10.061 0.258 0.622(0.054)* (0.000)*** (0.028)** (0.529) (0.285) (0.741) (0.719) (0.969) (0.007)*** (0.985)
Total 0.001 0.933 0.247 0.000 0.100 0.852 9.383 14.302 32.996 1.226 0.621(0.857) (0.000)*** (0.010)** (0.357) (0.142) (0.000)*** (0.670) (0.282) (0.000)*** (0.268)
19
Hooy and Goh: International asset pricing models
Published by ePublications@bond, 2008

136 The International Journal of Banking and Finance, 2008/09 Vol. 6. Number 1: 2008: 117-140
-2
-1 .5
-1
-0 .5
0
0 .5
1
1 .5
2
8 8 /1 -
9 0 /1 2
8 9 /1 -
9 1 /1 2
9 0 /1 -
9 2 /1 2
9 1 /1 -
9 3 /1 2
9 2 /1 -
9 4 /1 2
9 3 /1 -
9 5 /1 2
9 4 /1 -
9 6 /1 2
9 5 /1 -
9 7 /1 2
9 6 /1 -
9 8 /1 2
9 7 /1 -
9 9 /1 2
9 8 /1 -
0 0 /1 2
9 9 /1 -
0 1 /1 2
0 0 /1 -
0 2 /1 2
0 1 /1 -
0 3 /1 2
0 2 /1 -
0 4 /1 1
Economic Group W orld
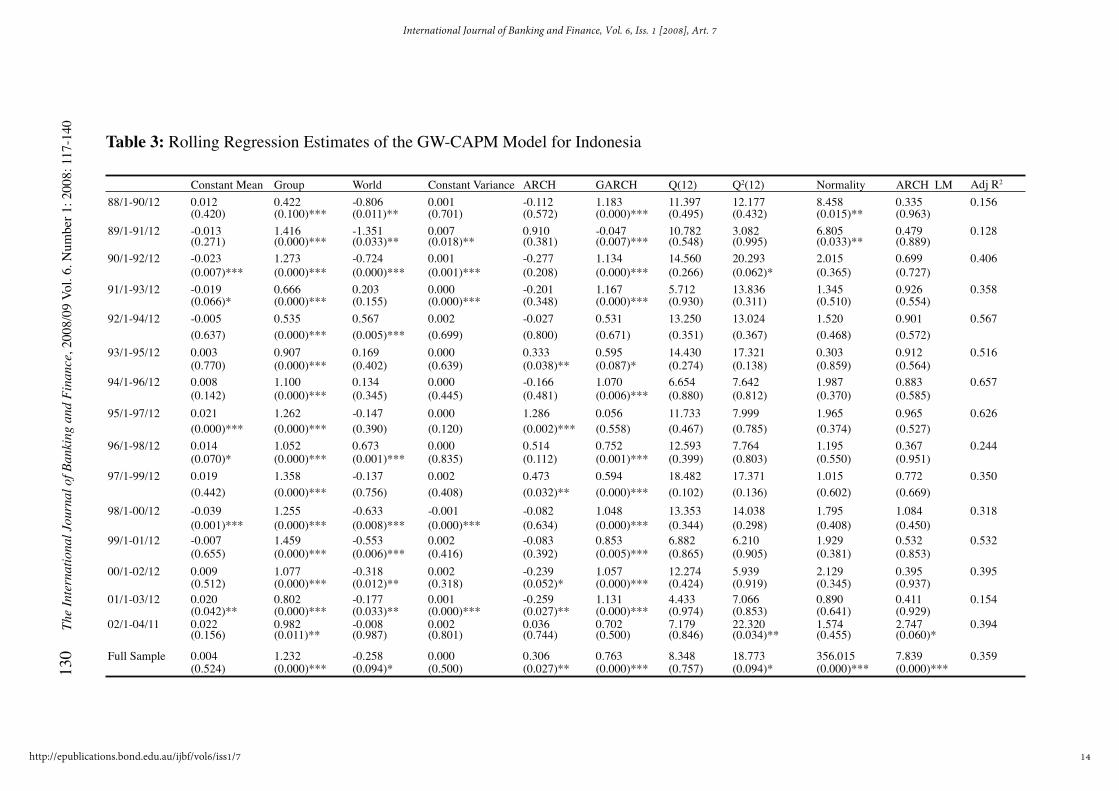
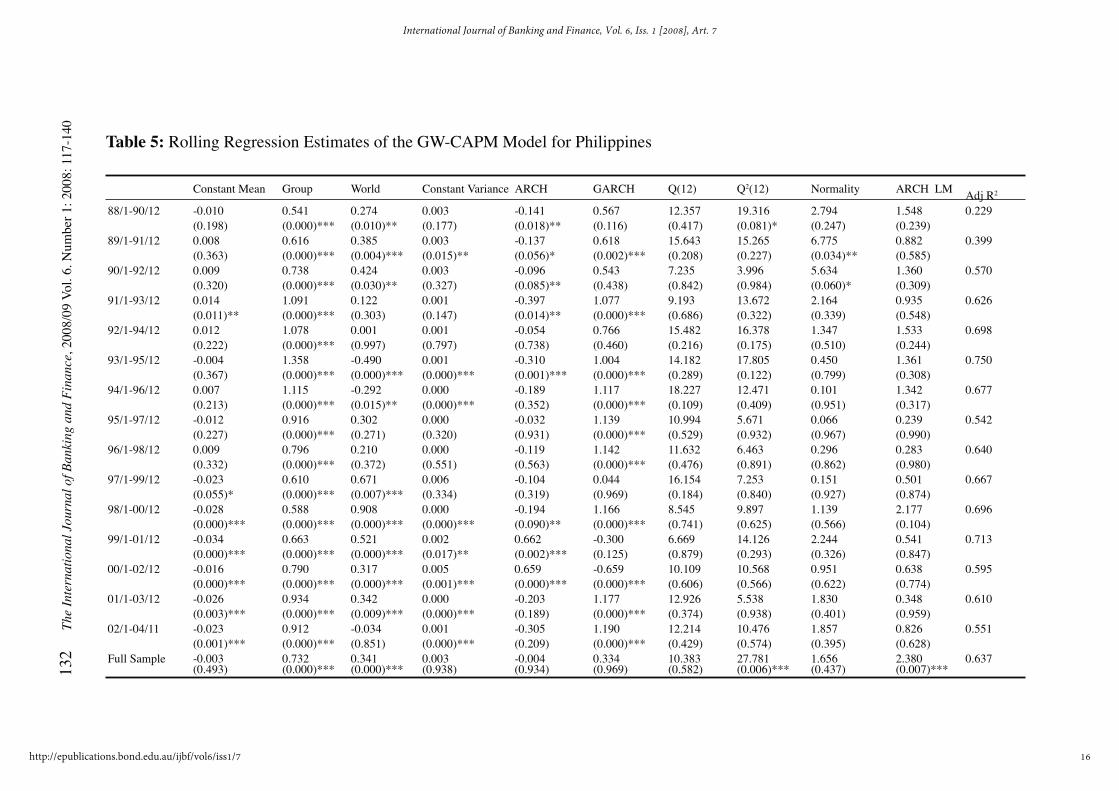
3.2. Rolling Regression EstimationThe GW-CAPM model is reestimated using the GARCH(1,1) specification and a rolling window of three years. A total of 15 windows are considered. The GR-CAPM model is also estimated for Thailand following the model selection results from the last section. The estimates are given in Tables 3 to 8. The diagnostic results suggest that the models are generally well specified. The ARCH-LM test and Q-statistic for the squared residuals indicate that the problem of ARCH effects has been adequately dealt with. The Jarque-Bera normality test shows no evidence against the normality assumption in most of the cases.
The economic grouping variable is significant in all 15 windows as well as the full sample period for all the five markets. In contrary, the world factor, (and regional factor for Thailand) is not always significant. For Singapore, however, the exposure to world risk is significant for all the windows. For the other four markets, it is interesting to note that the world market returns are not significant in many instances prior to and during the 1997 crisis.
The betas obtained from the rolling estimates of the GW-CAPM model are plotted in Figure 2. These estimates are generally not stable, thus supporting the use of rolling windows. Singapore is the only market with stable betas, and instability is only observed around the 1997-8 financial crisis years. Bigger fluctuations are seen in the other markets, in particular, Indonesia. It is also clear that the financial crisis caused higher instability in beta estimates of four markets.
Figure 2: World and Economic Group Betas of the GW-CAPM Model
Indonesia
Malaysia
20
International Journal of Banking and Finance, Vol. 6, Iss. 1 [2008], Art. 7
http://epublications.bond.edu.au/ijbf/vol6/iss1/7

The International Journal of Banking and Finance, 2008/09 Vol. 6. Number 1: 2008: 117-140 137
-2
-1 .5
-1
-0 .5
0
0 .5
1
1 .5
2
8 8 /1 -
9 0 /1 2
8 9 /1 -
9 1 /1 2
9 0 /1 -
9 2 /1 2
9 1 /1 -
9 3 /1 2
9 2 /1 -
9 4 /1 2
9 3 /1 -
9 5 /1 2
9 4 /1 -
9 6 /1 2
9 5 /1 -
9 7 /1 2
9 6 /1 -
9 8 /1 2
9 7 /1 -
9 9 /1 2
9 8 /1 -
0 0 /1 2
9 9 /1 -
0 1 /1 2
0 0 /1 -
0 2 /1 2
0 1 /1 -
0 3 /1 2
0 2 /1 -
0 4 /1 1
Economic Group W orld
Figure 2: World and Economic Group Betas of the GW-CAPM Model (continued)
Philippines
Singapore
Thailand
Risk exposures to the economic grouping and world generally move in opposite direction. Markets with low world betas are likely to have a relatively high exposure to economic grouping risks, and vice versa. Specifically, the exposure to the economic grouping factor is relatively higher in Indonesia, Malaysia, Philippines and Thailand except for a small number of windows. The Singapore market has a different behaviour, where the exposure to the world factor is more prominent. Nevertheless, the economic grouping beta for Singapore is only
-2
-1.5
-1
-0.5
0
0.5
1
1.5
2
88/1-
90/12
89/1-
91/12
90/1-
92/12
91/1-
93/12
92/1-
94/12
93/1-
95/12
94/1-
96/12
95/1-
97/12
96/1-
98/12
97/1-
99/12
98/1-
00/12
99/1-
01/12
00/1-
02/12
01/1-
03/12
02/1-
04/11
Economic Group W orld
-2
-1.5
-1
-0.5
0
0.5
1
1.5
2
88/1-90/12
89/1-91/12
90/1-92/12
91/1-93/12
92/1-94/12
93/1-95/12
94/1-96/12
95/1-97/12
96/1-98/12
97/1-99/12
98/1-00/12
99/1-01/12
00/1-02/12
01/1-03/12
02/1-04/11
Economic Group W orld
21
Hooy and Goh: International asset pricing models
Published by ePublications@bond, 2008

138 The International Journal of Banking and Finance, 2008/09 Vol. 6. Number 1: 2008: 117-140
slightly lower than the world beta, suggesting that the influence of the former cannot be overlooked.
The five markets have different reactions to the financial crisis. While Malaysia and Indonesia markets saw a drop in exposure to the world risk, the magnitude of the world beta for the other three markets has increased during around the financial crisis period.
These three markets re-anchored themselves to the global market but returned to the pre-crisis position after 1999. The case of Malaysia, however, is different. The exposure to the economic grouping risk has dropped since the crisis. This supports the evidence provided by Goh et al. (2005) that degree of exogeneity of the Malaysia market has increased within the ASEAN group since the implementation of the capital control policy by the Malaysian government in the last quarter of 1998. They show a reduction in the contemporaneous movements between the Malaysia and the other four ASEAN stock markets since the crisis.
4. Conclusion
This article tested different specifications of the ICAPM model and proposed the economic grouping factor as an additional variable in the asset pricing. Using data on five stock markets of ASEAN, the importance of exposure to systematic risks in this economic group is shown. We found that the economic grouping factor, if included, increases the explanatory power of the ICAPM model. Some evidence is found that the exposure to world and regional risks has reduced in importance when the economic grouping risks are taken into account.
This article also shows that the pricing mechanism is not stable over time. The Singapore market, which is perhaps most developed market, exhibited relatively stable pricing behaviour compared to any of the other four other markets (Indonesia, Malaysia, Philippines and Thailand). The exposure to world risk is generally higher in the Singapore market, but the other four markets have higher exposure to the economic grouping risk. However, the effect of the economic grouping factor on the Singapore market is rather sizeable and not negligible.
Given that exposure to economic grouping behaviour is not be neglected in international asset pricing model, the findings offer some explanation for segmentation in emerging markets. The higher exposure to movement in returns of the economic group comes together with the reduction in the impact of global market movements on the individual markets, and hence there is lower degree of integration into the world market.
Author statement: The submitting author is Kim-leng Goh: E-mail: [email protected]. Author statement: The submitting author is Kim-leng Goh: E-mail: [email protected] at the University of Malaya. The authors express their gratitude for the comments of the reviewer and the assistance of the editors to expedite the copy editing of the paper. The authors are jointly responsible for any remaining errors.
22
International Journal of Banking and Finance, Vol. 6, Iss. 1 [2008], Art. 7
http://epublications.bond.edu.au/ijbf/vol6/iss1/7

The International Journal of Banking and Finance, 2008/09 Vol. 6. Number 1: 2008: 117-140 139
References
Akdogan, H. (1992). “Behaviour of systematic risk in a regionally integrated model for stock prices”, Economics Letters, Vol 39: 213-216.
Bekaert, K.G., Harvey, C.R. and Ng, A. (2005). “Market integration and contagion”, Journal of Business, Vol 78: 39-69.
Bollerslev, T. (1986). “Generalized autoregressive conditional heteroskedasticity”, Journal of Econometrics, Vol 31: 307-327.
Bollerslev, T. and Wooldridge, J.M., (1992). “Quasi-maximum likelihood estimation and inference in dynamic models with time varying covariances”, Econometric Reviews, Vol 11: 143-172.
Brown, R.L., Durbin, J. and Evans, J. M., (1975). “Techniques for testing the constancy of regression relationships over time”, Journal of the Royal Statistical Society, Series B, Vol 37: 149-192.
Campbell, J.Y. and Hamao, Y., (1992). “Predictable stock returns in the United States and Japan: a study of long-term capital market integration”, Journal of Finance, Vol 47: 43-69.
Chen G.M., Firth, M. and Rui, O.M., (2002). “Stock market linkages: evidence from Latin America”, Journal of Banking and Finance, Vol 26: 1113-1141.
Davidson, S., Faff, R. and Hillier, D., (2003). “Gold factor exposures in international asset pricing”, Journal of International Financial Markets, Institutions & Money, Vol 13: 271-289.
Engle, R.F. and Ng, V.K., (1993). “Measuring and testing the impact of news on volatility”, Journal of Finance, Vol 48: 1749-1778.
Frankel, J.A. and Wei, S.J., (1998). “Open regionalism in a world of continental trade blocs”, IMF Working Paper, No. WP/98/10.
Frankel, J.A., Stein, E. and Wei, S.J., (1995). “Trading blocs and the Americas: the natural, the unnatural, and the super-natural”, Journal of Development Economics, Vol 47 (No 1): 61-96.
Fratzscher, M., (2002). “Financial market integration in Europe: on the effects of EMU on stock markets”, International Journal of Finance and Economics, Vol 7: 165-193.
Goh, K.L., Wong, Y.C. and Kok, K.L., (2005). “Financial crisis and intertemporal linkages across the ASEAN-5 stock markets”, Review of Quantitative Finance and Accounting, Vol 24: 359-377.
Johnson, R. and Soenen, L., (1993). “Stock market reaction to EC economic and monetary intention”, European Management Journal, Vol 11 (No 1): 85-92.
Johnson, R. and Soenen, L., (2003). “Economic integration and stock market comovement in the Americas”, Journal of Multinational Financial Management, Vol 13: 85-100.
Johnson, R., Lindvall, J. and Soenen, L., (1994). “EC economic and monetary integration: implications for European equity investors”, European Management Journal, Vol 12 (No 1): 94-101.
23
Hooy and Goh: International asset pricing models
Published by ePublications@bond, 2008

140 The International Journal of Banking and Finance, 2008/09 Vol. 6. Number 1: 2008: 117-140
Lessard, D.R., (1973). “International portfolio diversification: A multivariate analysis for a group of Latin American countries”, Journal of Finance, Vol 28: 619-633.
Rillo, A.D., (2004). “Trade and financial integration: is there a link?”, ASEAN One, November 7-8.
Ripley, D.M., (1973). “Systematic elements in the relationships of national stock market indices”, Review of Economics and Statistics, Vol 55: 356-361.
Soydemir, G., (2000). “International transmission mechanism of stock market movements: evidence from emerging equity markets”, Journal of Forecasting, Vol 19: 149-176.
24
International Journal of Banking and Finance, Vol. 6, Iss. 1 [2008], Art. 7
http://epublications.bond.edu.au/ijbf/vol6/iss1/7