Intermediate DNA at low added salt: DNA bubbles slow the diffusion of short DNA fragments
11
arXiv:1010.0731v3 [cond-mat.soft] 5 Jan 2011 Intermediate DNA at low added salt: DNA bubbles slow the diffusion of short DNA fragments T. Vuleti´ c, 1, ∗ S. Dolanski Babi´ c, 1 T. Ban, 1 J.R¨ adler, 2 F. Livolant, 3 and S. Tomi´ c 1 1 Institut za fiziku, 10000 Zagreb, Croatia 2 Ludwig-Maximilians-Universit¨ at, Sektion Physik, Geschwister-Scholl-Platz 1, D-80539 Munich, Germany 3 Laboratoire de Physique des Solides, Universit´ e Paris Sud - F-91405 Orsay, France (Dated: January 6, 2011) We report a study of DNA (150 bp fragments) conformations in very low added salt < 0.05mM, across wide DNA concentration range 0.0015 ≤ c ≤ 8 mM (bp). We found an intermediate DNA conformation in the region 0.05 <c< 1 mM, by means of fluorescence correlation spectroscopy (FCS) and UV-absorbance measurements. FCS detected that in this region DNA has the diffusion coefficient, Dp reduced below the values for both ssDNA coils and native dsDNA helices of similar polymerization degree N . Thus, this DNA population can not be a simple mix of dsDNA and of ssDNA which results from DNA melting. Here, melting occurs due to a reduction in screening concomitant with DNA concentration being reduced, in already very low salt conditions. The intermediate DNA is rationalized through the well known concept of fluctuational openings (DNA bubbles) which we postulate to form in AT-rich portions of the sequence, without the strands coming apart. Within the bubbles, DNA is locally stretched, while the whole molecule remains rod-like due to very low salt environment. Therefore, such intermediate DNA is elongated, in comparison to dsDNA, which accounts for its reduced Dp. PACS numbers: 82.35.Rs 87.15.hp 87.15.-v I. INTRODUCTION For transcription to proceed in a chromosome, DNA has to be separated from the histone proteins and then it has to be unwound and the strands separated to allow the access of transcription factors (enzymes). This rather complicated process has, from a physicist point of view, a lot in common with a simple, thermally induced, in vitro process of DNA melting/denaturation, where dsDNA he- lix completely separates into two ssDNA strands. Sta- bility of the double stranded DNA molecule reflects the nature of the DNA as a polyelectrolyte [1, 2]. When dis- solved in polar solvents polyelectrolytes dissociate into a polyion and small counterions. Electrostatic interactions and entropy of all those charges, as well as those of added salt control their phenomenology. Thus, the stability of dsDNA depends on added salt, DNA concentrations and temperature [3–6]. The DNA melting temperature will decrease with a decrease in added salt, and also with a decrease in concentration of DNA itself, even more so if there is no added salt. The latter is due to a change in concentration of counterions. E.g., at high added salt, up to physiological levels of the order of 0.1-1 M the DNA would melt at high temperatures (80-97 o C). Contrary, below 1 mM (total counterions and added salt) dsDNA may be unstable already at ambient temperature [4, 7]. These extrinsic parameters are complemented with in- trinsic ones: the DNA sequence, conformation and struc- * URL: http://tvuletic.ifs.hr/ ; Electronic address: [email protected] ture. Primarily, the sequence of A-T or G-C pairs influ- ences the melting. For example, G-C base pairs are con- nected with three hydrogen bonds, while the A-T pairs with only two, and thus the sequences rich in A-T pairs are less thermally stable. The stability of a Watson- Crick pair is also determined by its first neighbours, due to stacking interactions [8]. This dependence on the lo- cal sequence relates to a rather well accepted concept [9] that the denaturation proceeds from local, cooperative openings of several bp long, A-T rich sequences, called DNA bubbles, which occur well below melting temper- ature [10–12]. Close to the melting temperature these fluctuations zipper along the strands and the strands sep- arate. The bubbles indeed correlate with the actual tran- scription initiation sites [13]. Physically, there is about a 10 k B T barrier for opening a bubble and the cost for breaking consecutive base-pairs is only about 0.1 k B T , which results in the so-called zippering denaturation pro- cess [14]. For the very short fragments, ≈ 10 bp, the transition may well be described with a two-state model. For a longer DNA molecule, partially open states may be conceived, where a part of the sequence is open and part still closed. Such molecules, if stable, may be recognized to be the intermediate DNA, nor ssDNA, neither dsDNA [15–17]. Models for DNA denaturation start from these general concepts. Models may be simple Ising-like, starting from the original Poland-Scheraga model [18], where only the energy difference is counted for open and closed base- pairs. In more detailed models base interaction depends on the distance between the bases (Dauxois-Peyrard- Bishop type)[6]. Some models account for the entropy contribution from the more flexible ssDNA loops [14, 19],
-
Upload
independent -
Category
Documents
-
view
1 -
download
0
Transcript of Intermediate DNA at low added salt: DNA bubbles slow the diffusion of short DNA fragments

arX
iv:1
010.
0731
v3 [
cond
-mat
.sof
t] 5
Jan
201
1
Intermediate DNA at low added salt: DNA bubbles slow the diffusion of short DNA
fragments
T. Vuletic,1, ∗ S. Dolanski Babic,1 T. Ban,1 J.Radler,2 F. Livolant,3 and S. Tomic1
1Institut za fiziku, 10000 Zagreb, Croatia2Ludwig-Maximilians-Universitat, Sektion Physik,
Geschwister-Scholl-Platz 1, D-80539 Munich, Germany3Laboratoire de Physique des Solides, Universite Paris Sud - F-91405 Orsay, France
(Dated: January 6, 2011)
We report a study of DNA (150 bp fragments) conformations in very low added salt < 0.05mM,across wide DNA concentration range 0.0015 ≤ c ≤ 8 mM (bp). We found an intermediate DNAconformation in the region 0.05 < c < 1 mM, by means of fluorescence correlation spectroscopy(FCS) and UV-absorbance measurements. FCS detected that in this region DNA has the diffusioncoefficient, Dp reduced below the values for both ssDNA coils and native dsDNA helices of similarpolymerization degree N . Thus, this DNA population can not be a simple mix of dsDNA and ofssDNA which results from DNA melting. Here, melting occurs due to a reduction in screeningconcomitant with DNA concentration being reduced, in already very low salt conditions. Theintermediate DNA is rationalized through the well known concept of fluctuational openings (DNAbubbles) which we postulate to form in AT-rich portions of the sequence, without the strands comingapart. Within the bubbles, DNA is locally stretched, while the whole molecule remains rod-like dueto very low salt environment. Therefore, such intermediate DNA is elongated, in comparison todsDNA, which accounts for its reduced Dp.
PACS numbers: 82.35.Rs 87.15.hp 87.15.-v
I. INTRODUCTION
For transcription to proceed in a chromosome, DNAhas to be separated from the histone proteins and thenit has to be unwound and the strands separated to allowthe access of transcription factors (enzymes). This rathercomplicated process has, from a physicist point of view, alot in common with a simple, thermally induced, in vitroprocess of DNA melting/denaturation, where dsDNA he-lix completely separates into two ssDNA strands. Sta-bility of the double stranded DNA molecule reflects thenature of the DNA as a polyelectrolyte [1, 2]. When dis-solved in polar solvents polyelectrolytes dissociate into apolyion and small counterions. Electrostatic interactionsand entropy of all those charges, as well as those of addedsalt control their phenomenology. Thus, the stability ofdsDNA depends on added salt, DNA concentrations andtemperature [3–6]. The DNA melting temperature willdecrease with a decrease in added salt, and also with adecrease in concentration of DNA itself, even more so ifthere is no added salt. The latter is due to a change inconcentration of counterions. E.g., at high added salt, upto physiological levels of the order of 0.1-1 M the DNAwould melt at high temperatures (80-97oC). Contrary,below 1 mM (total counterions and added salt) dsDNAmay be unstable already at ambient temperature [4, 7].
These extrinsic parameters are complemented with in-trinsic ones: the DNA sequence, conformation and struc-
∗URL: http://tvuletic.ifs.hr/; Electronic address:
ture. Primarily, the sequence of A-T or G-C pairs influ-ences the melting. For example, G-C base pairs are con-nected with three hydrogen bonds, while the A-T pairswith only two, and thus the sequences rich in A-T pairsare less thermally stable. The stability of a Watson-Crick pair is also determined by its first neighbours, dueto stacking interactions [8]. This dependence on the lo-cal sequence relates to a rather well accepted concept [9]that the denaturation proceeds from local, cooperativeopenings of several bp long, A-T rich sequences, calledDNA bubbles, which occur well below melting temper-ature [10–12]. Close to the melting temperature thesefluctuations zipper along the strands and the strands sep-arate. The bubbles indeed correlate with the actual tran-scription initiation sites [13]. Physically, there is abouta 10 kBT barrier for opening a bubble and the cost forbreaking consecutive base-pairs is only about 0.1 kBT ,which results in the so-called zippering denaturation pro-cess [14]. For the very short fragments, ≈ 10 bp, thetransition may well be described with a two-state model.For a longer DNA molecule, partially open states may beconceived, where a part of the sequence is open and partstill closed. Such molecules, if stable, may be recognizedto be the intermediate DNA, nor ssDNA, neither dsDNA[15–17].
Models for DNA denaturation start from these generalconcepts. Models may be simple Ising-like, starting fromthe original Poland-Scheraga model [18], where only theenergy difference is counted for open and closed base-pairs. In more detailed models base interaction dependson the distance between the bases (Dauxois-Peyrard-Bishop type)[6]. Some models account for the entropycontribution from the more flexible ssDNA loops [14, 19],

2
and find a continuous (II order) or discontinuous (I or-der) transition [20, 21]. The latter result was cruciallybased on taking into account the self-avoiding interac-tions between the various parts of the chain.
For the experimentalist, it is not straightforward todemonstrate the existence of the DNA bubbles. Cer-tainly, experiments evaluating the basepair opening prob-ability rates and bubble lifetimes, in any specific set ofconditions for their existence, would contribute to themodeling effort and our general knowledge of DNA sta-bility and dynamics. The information on base-pair open-ing was initially provided by NMR study [11, 22] of theimino-proton exchange, i.e. study of protons, formerlyparticipating in hydrogen bonds, that bases exchangewith D2O water when a base pair opens. This NMRstudy actually points that the bubble opening is a verylocal phenomenon, occuring on the level of a single base-pair. Opening probabilities (dissociation constants) at25oC are actually quite low: 10−5
− 10−6 for an AT pairand 10−6
− 10−7 for a GC pair. The lifetime of a base-pair is of the order of 10 ms and the rate for closingthe bubble is 108s−1. Only recently these NMR stud-ies have been complemented by other studies of bubbledynamics. An FCS study by Libchaber et al. [23] hasfound that fluctuations occur with closing rates 3-4 or-ders of magnitude higher than estimated by NMR, i.e.104 − 105s−1. The size of the bubbles was 2 to 10 bpon a fragment only 18bp long. These authors found nocontradiction with NMR rate estimates, concluding thatNMR registers much smaller conformational change withrespectively higher fluctuation rates. That is, they con-sidered that the openings detected by FCS are more bi-ologically relevant as they relate to larger, nm-scale sep-arations.
Peyrard et al. [17, 24] were able (by two-photon excita-tion of guanines) to detect when GC pairs were not pairedin short ≈ 50bp DNA while temperature was raised andDNA melted. Thus they obtained localized informa-tion on bubble opening and provided sequence dependentDNA melting curves. Importantly, they noted that shortAT rich sequences (TATA boxes) would fluctuate anddisturb both neighbouring and distant GC pairs well be-low the melting temperature. The fact that the openingfluctuations can have a non-local (non-single basepair)effect is related to nonlinear dynamics of DNA [9], but itwas emphasized that this effect becomes negligible as itaverages out for kbp or longer DNA sequences.
From the above it may be recognized that intermedi-ate DNA states should exist below the melting transition,however only one group of authors has insofar managedto quantify the fraction of intermediate DNA in the pop-ulation of DNA molecules. Montrichok et al. [25] havedesigned DNA constructs, ones with the TATA box atone end, and the others with TATA box (”soft” region)in the middle and GC clamps at both ends. When melt-ing was stopped before complete denaturation, and thesolution cooled quickly (quenched), strands which werecompletely separated were not able to find their comple-
ments and formed hairpins instead. Their fraction wasquantified by simple gel electrophoresis. Fraction of theopen molecules was compared (at equal temperatures) tothe fraction of open basepairs in the solution, quantifiedby UV-absorption measurements. If the latter fractionwas higher then there must have been some partly de-natured, intermediate molecules before the quench. In-termediate DNA states identified from these experimentswere succesfully modeled by Monte Carlo simulations us-ing the Dauxois-Peyrard-Bishop model [16].
One issue that arises is whether the local fluctua-tions influence mechanical properties of the whole DNAmolecule. Early experiment, where self-diffusion coef-ficient of 17 kbp DNA molecules was probed in tem-perature by dynamic light scattering found no effect offluctuations on DNA rigidity (persistence length) [26].Only recently it has been noted that there is the effectof fluctuations, but only on very short (10 -90 bp) DNAfragments, which could behave as having a persistencelength as low as 10-20 nm [27, 28], much shorter than theagreed value Lp = 50 nm [29]. Also, Tomic et al. havenoted that persistence length of DNA might be reducedin some conditions [30]. They worked with mononucleo-somal ≈ 150bp DNA fragments, which have the contourlength Lc = 50 nm similar to the persistence length, sothey are practically rodlike. Their dielectric spectroscopytechnique, which provides characteristic length scales ofa polyelectrolyte system, complementary to e.g. data bysmall angle X-ray scattering [31], indeed found a 50 nmlength scale for fragments in pure water. However forfragments in 1 mM NaCl the characteristic length scalewas 20-30 nm, lower both than Lc or Lp. This wouldindicate that added salt, which does reduce the electro-static contribution to the persistence length [32], has re-vealed Lp lower than the agreed value. We may presumethat the reduced Lp is the consequence of partial DNAdenaturation in thesee conditions of low salt.
In this paper, we propose that intermediate DNA is themajor constituent in mononucleosomal DNA (denoted asDNA146) conformations population in the concentrationrange 0.05 < c < 1 mM (bp) at very low salt conditions,csalt < 0.05mM. We infer the presence of intermediateDNA from the DNA146 polyion self-diffusion coefficientDp, obtained by the fluorescence correlation spectroscopymeasurements (FCS, method described in Sec.II). InSec.III we present the Dp value for 0.05 < c < 1 mMrange which is below the values for both ssDNA and na-tive dsDNA. This means that DNA conformation pop-ulation there can not be a simple mix of native dsDNAhelix and separated ssDNA strands. In Sec.IV we arguethat an intermediate DNA conformation must be present,hydrodynamically larger than both ssDNA or dsDNA ofsimilar polymerization degree. We suggest that underthese conditions the basepair opening and closing rateshave changed in such a manner to induce a variation ofthe diffusion properties of the whole molecule. In thissense, the intermediate DNA may be considered to be astable form. Eventually, we analyze Dp data and extract

3
the fraction of completely open DNA molecules, ssDNA,against partly open, intermediate DNAs and native ds-DNA. We also compare these fractions with measuredfraction of open DNA base-pairs, following the procedureof Montrichok et al. [25].
II. MATERIALS & METHODS
A. Samples
We studied solutions of nucleosomal dsDNA fragmentsabout 150 bp and 50 nm long. This DNA is denotedas DNA146, since there are 146 bp of DNA wrappedaround a histone octamer in a nucleosome core particle.DNA146 pellets from the same stock as in [33] was used.The monodispersity of fragments was checked by gel elec-trophoresis. We also checked whether the pellets containany added salt. DNA concentrations will be expressedas molar concentrations of basepairs in the remainder ofthis paper.Several solution sets with different DNA146 and added
salt concentrations were prepared, which we describe be-low:
set I Solutions with varying DNA concentration, in very
low added salt: A set of 40 solutions covering therange of DNA concentrations c = 0.001−8mM wasprepared by dilution with pure water of aliquotsfrom the mother solution to reach the desired con-centration. The mother solution was obtained bydissolving 10 mg of dry DNA146 in 0.55 mL purewater - the final concentration was c = 27 mM. TheUV-absorbance at 260 nm was measured, at 25oCfor all the solutions in the set. Only then, for FCSmeasurements, the DNA146 solutions were fluores-cently labeled by addition of synthetic 110bp DNAfrom a 0.5 mM stock kept in 10 mM TE buffer. This110bp dsDNA will be further denoted DNA110*.The asterisk * denotes the fluorescent labeling byCy5 fluorophore at one end of DNA molecule [33].DNA110* was added to a concentration 1.5-2 µMto achieve 20 nM Cy5 label concentration. Thebuffer of DNA110* stock gets diluted after addi-tion into pure water DNA146 samples, thus intro-ducing a minimal added ionic strength, not above0.05mM. In this manner we regarded these samplesas very low salt solutions, csalt < 0.05mM, and la-beled them appropriately. FCS results for this setare presented also in [33].
set II Solutions with varying DNA concentration, in 10mM TE buffer: From c = 27 mM pure watermother solution (see above) a 0.1 mL sample wastaken and diluted with 0.25 mL of 35 mM TEbuffer. We used 10:1 TrisHCl:EDTA buffer set topH7.5. Thus we obtained DNA146 starting so-lution with c = 7.7 mM in 10 mM TE buffer .For FCS measurements DNA110* was added to
this solution, to a concentration 1.5-2 µM. AfterFCS measurement the sample was further dilutedwith appropriate volume of 10 mM TE buffer toproduce a next lower DNA146 concentration sam-ple. The procedure was repeated and 15 differentDNA concentrations were measured in the rangec = 0.03− 8mM. On each dilution appropriate vol-umes of DNA110* stock were being added to main-tain the 20 nm Cy5 level.
set III Solutions with fixed DNA concentration, in varyingadded salt: DNA146 mother solution, c = 7.5 mMwas prepared by dissolving a pellet in 10 mM NaCl.By dilution with appropriate volumes of pure waterand 1mM NaCl we prepared a solution set whereDNA concentration was always c = 0.75 mM, whileNaCl concentrations were 0.2, 0.5, 1, and 2 mM.
B. UV absorption measurements
DNA146 sample set I (varying DNA, very low salt< 0.05 mM) has been tested without dilution for UV-absorbance at 260 nm with Nanodrop (ThermoScien-tific). This instrument shows a linear response in ab-sorbance for a very broad DNA concentration range,c = 0.003 − 15 mM, with the sample volume of only1-2 µL. The Nanodrop instrument was critical to get theactual UV absorbance of DNA samples without dilution.
For DNA melting experiments on set III (fixed DNA,varying salt) in 0-90 oC range we have used Agilent -HP 8452 Spectrophotometer with a Peltier based tem-perature control. From the temperature dependent UV-absorbance at 260 nm (hyperchromicity) curves we ex-tracted the melting transition temperature Tm and tran-sition width dependence on total ion concentration.
C. Fluorescence correlation spectroscopy
We have used Zeiss ConfoCor II FCS instrument.Focal volume was defined by a Zeiss Plan-NeoFluar100x/NA1.3 water immersion objective, epi-illuminationwas by He-Ne 632.8 nm 5mW laser, for excitation of Cy5fluorophore. Measurements were performed at 25oC, theambient temperature of the temperature stabilized clean-room.
Fluorescence correlation spectroscopy is used to mea-sure the diffusion coefficient of the fluorescently labeledmolecules. Number fluctuations of the molecules enter-ing and leaving the focal volume of the instrument areregistered as fluorescence variation. An autocorrelationfunction is calculated for the fluorescence intensity trace.This function decays exponentially with autocorrelationtime τc:

4
G(τc) =1
Nf
·1
1 + τcτ
1√
(1 + (w0
z0)2 τc
τ)(1+
T
1− Texp(−
τcτT
))
(1)Nf is the average number of fluorescent molecules in thefocal volume, z0/w0 is the focal volume structure pa-rameter and T , average fraction of fluorophores in thetriplet state (thus, non-fluorescing). The lifetime τT ofthe triplet state is taken into account when fitting. Thecharacteristic decay time τ is the diffusion time that thefluorescent molecule takes to traverse the focal volume.The details of the procedure we used to extract τ maybe found in [33].In Fig.1, besides the autocorrelation function experi-
mental curve and fit for Cy5, we present the G(τc) curvesrecorded for 2 µM of DNA110* found in either 0.2 mMDNA146 in very low salt csalt < 0.05mM, (set I) or 0.2mM DNA146 in 10 mM TE buffer (set II). The experi-mental curves have been normalized, and thus they ap-pear to overlap due to a rather small difference in thediffusion times. Nevertheless, the diffusion times τ thatwe extracted are different, with values of 390 and 430µs, respectively. To demonstrate that the fits reliablydistinguish between the two experimental data sets forDNA110*, the area of the main panel, denoted with therectangle, is shown enlarged in the inset [34]. The ar-row in the inset denotes the 40 µs difference between therespective diffusion times obtained by fits.The diffusion time is inversely proportional to the self-
diffusion coefficient Dp of the molecule. The relationshipbetween τ and Dp may be obtained from the measure-ment of τCy5 for Cy5 fluorophore, whose diffusion coeffi-cient is known, DCy5 = 3.16 · 10−10 m2/s [35]:
Dp = DCy5
τCy5
τ(2)
The diffusion times Dp that we can obtain from τ are forthe fluorescently labeled DNA110* molecules at a rela-tively low concentration, diffusing in solutions of varying,but mostly higher DNA146 concentration. That is, weobtain Dexp
110∗, diffusion coefficient for DNA110* which,however, depends on DNA146 concentration c. However,we assume that it is possible to rescale Dexp
110∗(c) to getthe values for DNA146 Dexp
146 (c). We remind that dsDNApersistence length Lp = 50 nm [29] is comparable to con-tour lengths of both DNA110* and DNA 146, 38 and 50nm, respectively. Therefore, we expect that they assumean extended, rodlike configuration. According to Tiradoet al.[36] the translational diffusion coefficient calculatedfor a rodlike macromolecule is given by
Dth =kT
3πη
ln(Lc/d) + 0.312
Lc
(3)
Here Lc = Nb is contour length, d is polyion diameter,η = 8.9 ·10−4Pas is viscosity of water (T = 298 K). With
τc (µs)
100 101 102 103 104
G(τ
c)
1.0
1.2
1.4
1.6
1.8
Cy5
25oC
τc (µs)300 400 500
G(τ
c)
1.20
1.25
DNA110*+0.2mM DNA146+10mM TE buffer
DNA110*+0.2mM DNA146+salt<0.05mM
DNA110*
FIG. 1: Experimental autocorrelation functions G(τc) (de-noted DNA110*) recorded for a sample from set I (2 µMDNA110* in 0.2 mM DNA146 in very low salt < 0.05mM)or a sample from set II (2 µM DNA110* in 0.2 mM DNA146in 10 mM TE buffer). For comparison, the autocorrelationfunction (denoted Cy5) is shown for 20 nM Cy5 fluorophorein pure water, without any DNA. The inset zooms the corre-lation time range 250− 550µs, denoted by a rectangle in themain panel. The experimental values of G(τc) are shown withsymbols and the respective fits with lines.
b = 0.34 nm and d = 2.6 nm, the diffusion coefficient for110bp DNA is Dth
110∗ = 3.98 · 10−11 m2/s and for 146bpDNA is Dth
110∗ = 3.27 · 10−11 m2/s. Stellwagen et al.[37]have reviewed the literature and shown that the expres-sion by Tirado et al. is well applicable to experimentaldata obtained for DNA molecules in size from 10 to 1000basepairs.Thus,
Dexp146 (c) =
Dth146
Dth110∗
Dexp110∗(c) (4)
In this manner, fluorescence correlation spectroscopy wasused to obtain the self-diffusion coefficient of DNA146,Dexp
146 (c) for varying DNA (DNA110* and DNA146 com-bined) concentrations c = 0.0015 − 8 mM. Most impor-tantly, we were able to distinguish and compare the val-ues obtained for samples in very low salt (set I) and sam-ples in 10 mM TE buffer (set II).
III. RESULTS
A. DNA melting in very low salt conditions
Classically, UV absorbance measurements at 260 nmare used to study the DNA melting, i.e.helix-coil tran-

5
c UV/c
temperature (oC)
10 20 30 40 50 60 70 80
1.0
1.1
1.2
1.3
1.4
0.75mM DNA146 with added salt
a
d
cb
ssDNA
dsDNA
FIG. 2: Melting curves for DNA146, c = 0.75 mM (bp)with varying added salt 0.2, 0.5, 1, and 2 mM NaCl (set III),denoted as a, b, c, d, respectively. Melting appears as anincrease in cUV /c ratio. The arrows denote melting tempera-tures Tm defined at half height of the maximum cUV /c rise.
sition [2, 4]. Since the extinction coefficient for the ds-DNA, 1 O.D.=50 µg/mL is about 40% higher than forssDNA, 1 O.D.=35 µg/mL, concomitantly with temper-ature induced DNA denaturation, occurs a 40% rise inabsorbance (hyperchromicity effect).
In Fig.2, we present thermal denaturation curves forDNA146 samples at a fixed DNA concentration c =0.75 mM, in varying added salt, 0.2-2 mM NaCl. Themeasured UV absorbance rise is presented as the riseof the ratio between UV-spectrophotometrically deter-mined concentration cUV and the gravimetrically deter-mined (during sample preparation) concentration. Theabsorbance was converted into cUV concentrations us-ing the extinction coefficient for the dsDNA. cUV /c ratioclose to 1.4 thus corresponds to fully denatured DNA andcUV /c = 1.0 corresponds to the native dsDNA. Meltingtemperatures Tm are therefore defined at half height ofthe maximum cUV /c rise, where half of the basepairsshould be open. For DNA146 in 0.2 mM NaCl solu-tion we note that already at ambient temperature UV-absorbance, (cUV /c > 1) is enhanced. Therefore we pre-sume that this sample was already partly denatured atambient conditions, due to the low salt content.
In Fig. 3 we present the ratio cUV /c, measured at25oC for DNA146 dissolved in very low added saltcsalt < 0.05 mM (set I). At higher concentrations, abovec = 1 mM cUV and c seem to comply indicating thatthe DNA remains native. At the lowest concentrationscUV /c increases to about 1.4, which easily relates to 40%hyperchromicity of denatured DNA. Therefore, in Fig. 3dashed lines at cUV /c ≈ 1.4 and 1 are respectively labeledssDNA and dsDNA. The scatter in the data is mostlydue to errors in DNA sample preparation, and to someextent due to the very minute sample droplets applied(a cuvette free spectrophotometer is used), which mayevaporate and change concentration rather quickly.
c (mM)
10-3 10-2 10-1 100 101
c UV/c
1.0
1.2
1.4
salt<0.05mM
ssDNA
25oC dsDNA
DNA146e
FIG. 3: The cUV /c ratio for DNA146 in very low salt csalt <0.05 mM (set I). The dashed lines at cUV /c ≈ 1.4 and 1 denotefully denatured ssDNA and native dsDNA, respectively. Thearrows and letter e denote the concentration range where theratio cUV/c is just below 1.2, halfway between ssDNA anddsDNA levels.
Further, we note DNA146 samples from the interme-diate concentration range c = 0.4 − 0.75 mM that showcUV /c ≈ 1.2, corresponding to about 20% hyperchromic-ity (cf. Fig.2). These samples are thus halfway throughthe melting transition, at ambient temperature. Thus,for DNA146 in the c = 0.4− 0.75 mM range we estimatethe temperature where we performed measurements tobe the melting temperature, Tm = 25oC.
In Fig.4 we show DNA146 melting temperature Tm
vs. total ionic concentration of the solutions. We showthe values obtained from melting curves (sample set III,Fig.2, points a, b, c, d) alongside the just above definedTm = 25oC for DNA146 c = 0.4 − 0.75 mM concentra-tion range (sample set I, Fig.3, points e). Total ionicconcentration ctot is a sum of all the ions present in thesolution: counterions ci = 2c and added salt anions andcations 2cNaCl = cNa+ + cCl− , thus ctot = ci + 2cNaCl.
As predicted by Manning [38] we obtain the linearslope dTm/d log ctot = 28 ± 3oC per decade, which com-pares very well with the slope 27oC per decade foundby Record [4] for T4 (170 kbp) and T7 (40 kbp) bacte-riophage DNA solutions without added salt. The slopereflects the counterion condensation and should be inde-pendent of the chain size and thus invariant from the typeof DNA used in the experiment, as, indeed, we observed.While the slope is similar, we note that the transitiontemperatures for DNA146 are about 10oC lower than forlong T4 and T7 DNAs, for equal ctot. We also note thatthe melting transitions for DNA146 are much broader,≈20-30oC, than for T4 and T7 DNAs, where they areonly 4-9oC. That the melting temperature decreases andthe transition width increases for shorter DNA chain sizeis to be expected [39, 40].
The above determined ability of DNA146 to keep thenative conformation at ambient temperature, in the verylow salt (< 0.05 mM) environment, but only above a cer-tain DNA concentration c = 1 mM, reflects the findingsby Record [4] and by Tomic et al. [41]. In the following
6
ci+2cNaCl (mM)
1 10
Tm
(o C
)
20
40
60
80DNA146
28oC/decade
dc
ba
e
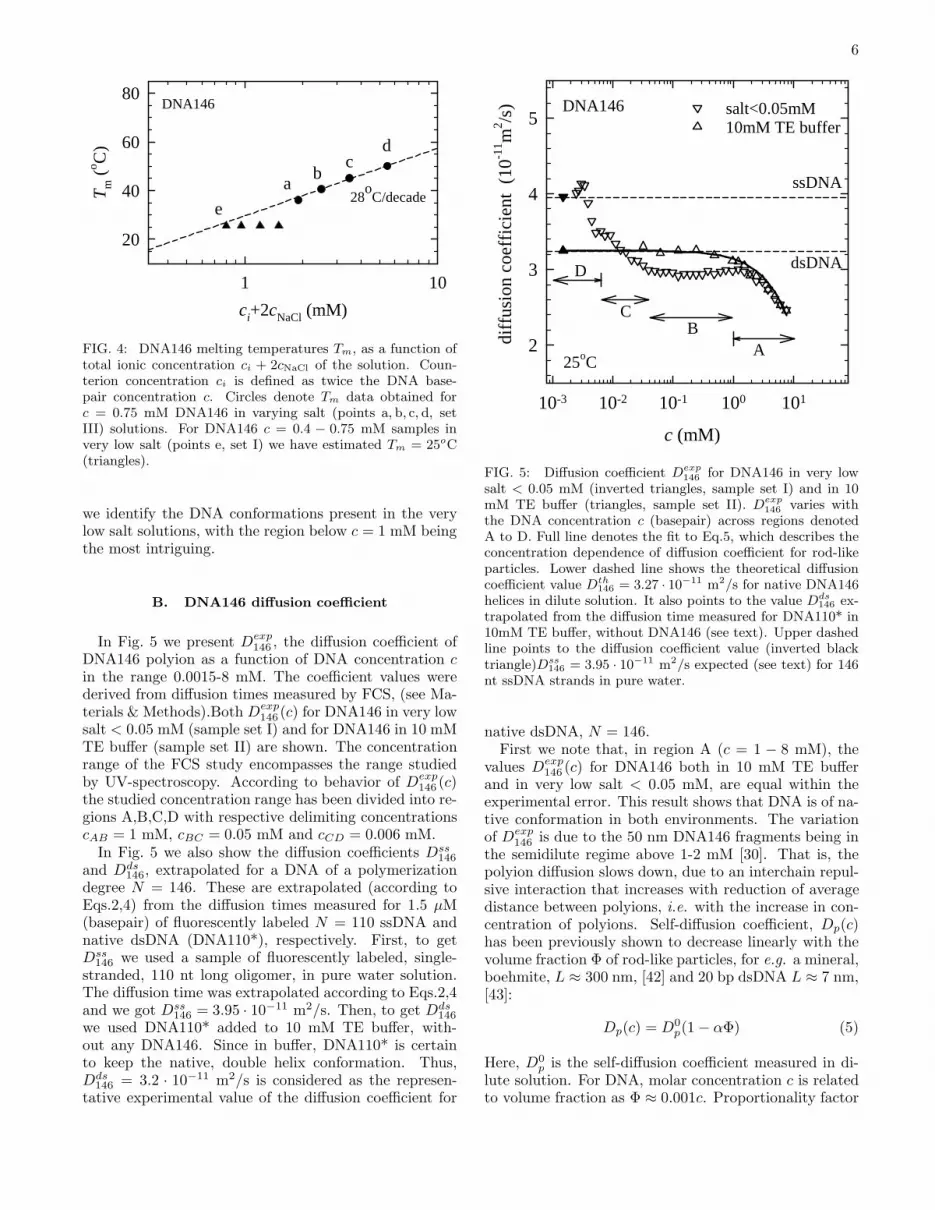
FIG. 4: DNA146 melting temperatures Tm, as a function oftotal ionic concentration ci + 2cNaCl of the solution. Coun-terion concentration ci is defined as twice the DNA base-pair concentration c. Circles denote Tm data obtained forc = 0.75 mM DNA146 in varying salt (points a, b, c, d, setIII) solutions. For DNA146 c = 0.4 − 0.75 mM samples invery low salt (points e, set I) we have estimated Tm = 25oC(triangles).
we identify the DNA conformations present in the verylow salt solutions, with the region below c = 1 mM beingthe most intriguing.
B. DNA146 diffusion coefficient
In Fig. 5 we present Dexp146 , the diffusion coefficient of
DNA146 polyion as a function of DNA concentration cin the range 0.0015-8 mM. The coefficient values werederived from diffusion times measured by FCS, (see Ma-terials & Methods).Both Dexp
146 (c) for DNA146 in very lowsalt < 0.05 mM (sample set I) and for DNA146 in 10 mMTE buffer (sample set II) are shown. The concentrationrange of the FCS study encompasses the range studiedby UV-spectroscopy. According to behavior of Dexp
146 (c)the studied concentration range has been divided into re-gions A,B,C,D with respective delimiting concentrationscAB = 1 mM, cBC = 0.05 mM and cCD = 0.006 mM.In Fig. 5 we also show the diffusion coefficients Dss
146
and Dds146, extrapolated for a DNA of a polymerization
degree N = 146. These are extrapolated (according toEqs.2,4) from the diffusion times measured for 1.5 µM(basepair) of fluorescently labeled N = 110 ssDNA andnative dsDNA (DNA110*), respectively. First, to getDss
146 we used a sample of fluorescently labeled, single-stranded, 110 nt long oligomer, in pure water solution.The diffusion time was extrapolated according to Eqs.2,4and we got Dss
146 = 3.95 · 10−11 m2/s. Then, to get Dds146
we used DNA110* added to 10 mM TE buffer, with-out any DNA146. Since in buffer, DNA110* is certainto keep the native, double helix conformation. Thus,Dds
146 = 3.2 · 10−11 m2/s is considered as the represen-tative experimental value of the diffusion coefficient for
10-3 10-2 10-1 100 101
2
3
4
5
diff
usio
n co
effi
cien
t (1
0-11 m
2 /s)
c (mM)
10mM TE buffer salt<0.05mMDNA146
25oC
ssDNA
dsDNA
AB
C
D
FIG. 5: Diffusion coefficient Dexp146
for DNA146 in very lowsalt < 0.05 mM (inverted triangles, sample set I) and in 10mM TE buffer (triangles, sample set II). Dexp
146varies with
the DNA concentration c (basepair) across regions denotedA to D. Full line denotes the fit to Eq.5, which describes theconcentration dependence of diffusion coefficient for rod-likeparticles. Lower dashed line shows the theoretical diffusioncoefficient value Dth
146 = 3.27 · 10−11 m2/s for native DNA146helices in dilute solution. It also points to the value Dds
146 ex-trapolated from the diffusion time measured for DNA110* in10mM TE buffer, without DNA146 (see text). Upper dashedline points to the diffusion coefficient value (inverted blacktriangle)Dss
146 = 3.95 · 10−11 m2/s expected (see text) for 146nt ssDNA strands in pure water.
native dsDNA, N = 146.First we note that, in region A (c = 1 − 8 mM), the
values Dexp146 (c) for DNA146 both in 10 mM TE buffer
and in very low salt < 0.05 mM, are equal within theexperimental error. This result shows that DNA is of na-tive conformation in both environments. The variationof Dexp
146 is due to the 50 nm DNA146 fragments being inthe semidilute regime above 1-2 mM [30]. That is, thepolyion diffusion slows down, due to an interchain repul-sive interaction that increases with reduction of averagedistance between polyions, i.e. with the increase in con-centration of polyions. Self-diffusion coefficient, Dp(c)has been previously shown to decrease linearly with thevolume fraction Φ of rod-like particles, for e.g. a mineral,boehmite, L ≈ 300 nm, [42] and 20 bp dsDNA L ≈ 7 nm,[43]:
Dp(c) = D0p(1− αΦ) (5)
Here, D0p is the self-diffusion coefficient measured in di-
lute solution. For DNA, molar concentration c is relatedto volume fraction as Φ ≈ 0.001c. Proportionality factor

7
α depends on the aspect ratio L/d of the particle [42].For DNA146, p ≈ 20− 25, leading to α ≈ 15. Fit of Eq.5to our DNA146 in TE buffer data gives α ≈ 30 (full linein Fig. 5), in a reasonable agreement with the theoreti-cal value. Measurements at higher concentrations wouldbe necessary to elucidate significance of this discrepancy,however this is out of scope here.Below cAB = 1 mM (basepair), Dexp
146 (c), when mea-sured in 10 mM TE is practically concentration indepen-dent across almost two decades in concentration (regionsB,C). These values are very close both to just abovedefined experimental value for 146 bp dsDNA Dds
146 =3.2·10−11 m2/s, and to the theoreticalDth
146 = 3.27·10−11
m2/s value, calculated according to Eq.3 for a rodlike 146bp dsDNA, 50nm long with d = 2.6 nm diameter. Thatis, DNA146 in 10mM TE buffer keeps the native state.Also, since this is dilute regime, diffusion coefficient isconstant.On the contrary,Dexp
146 (c) in very low salt, deviates fromthe native DNA146 value, below cAB = 1 mM (basepair).Specifically, in the intermediate concentration region B(c = 0.05 − 1 mM) Dexp
146 = 2.9 · 10−11 m2/s is ratherconstant, but below (beyond the experimental error) thenative DNA146 value. This reduction in Dexp
146 (c) meansthat in region B, DNA polyions diffuse more slowly, thanDNA polyions which keep the native conformation.Below cBC = 0.05 mM (basepair), in region C, Dexp
146
measured in very low salt starts to rise continuously andoverpasses the native dsDNA146 value. Eventually, be-low cCD = 0.006 mM, in region D, Dexp
146 finally risessharply to come very close to Dss
146 = 3.95 · 10−11 m2/s,the value that we ascribe to 146 nt ssDNA. Here wenote that Dss
146 value is higher than the theoretical value,3 · 10−11 m2/s for a rodlike ssDNA that may be calcu-lated according to Eq.3, using b = 4.3 nm and d = 1.2nm. Further, Dss
146 value is lower than the experimentalvalue 5 · 10−11 m2/s that may be extrapolated for 146 ntssDNA in the high salt (10 mM or higher) [44]. In thesehigh salt conditions ssDNA has a persistence length ofthe order of 1 nm and assumes a conformation of a com-pact, random walk coil [32, 44]. E.g., 146 nt ssDNA,which has a contour length of about 60 nm, would forma coil with a hydrodynamic radius of 3 nm. Consideringthe hereabove presented range of diffusion coefficients forssDNA, we judge that ssDNA in our, very low salt con-ditions neither assumes the form of a compact coil, nora rigid rod, but a rather extended coil.
IV. DISCUSSION
A. Fraction of open basepairs
As we have noted in previous Section, FCS measure-ments show that DNA146 in very low salt < 0.05 mM(sample set I) assumes native, double-helix (and rodlike)conformation, but only in region A, above DNA concen-tration cAB = 1 mM. Also, we found that in region D, be-
low cCD = 0.006 mMDNA appears to be single-stranded,forming a rather extended coil. In this manner, we rec-ognize the concentration of DNA itself as a parameter toinduce DNA melting in very low salt environment.Therefore we propose that our UV-absorbance data,
that is, cUV /c ratio presented in Fig.3, may be regardedas a DNA melting curve, recorded, however vs. DNA con-centration as the parameter which induces melting. Weremind that UV-absorbance only provides the amountof basepairs that have opened in a given DNA sample.Therefore, analysis of cUV /c data should provide thefraction f(c) of open basepairs in the ensemble of DNAmolecules in samples from set I.We also use the Manning free counterion fraction θ(c)
data that we presented in Ref. [33], in support of cUV /cdata. Both data sets have been obtained for sample set I.The reported θ(c) variation occurs within the range de-fined by the theoretical θ values for dsDNA and ssDNA.The relative variation that we obtain is also similar tothe relative difference in θ values for dsDNA and ssDNAobserved experimentally by other authors [7]. Thus, weconsider that θ(c) curve represents DNA melting in lowsalt, and measures the fraction of open basepairs, as wellas cUV /c data.The open basepair fraction is derived in a following
manner
f(c) =(A(c) −Amin)
(Amax −Amin)(6)
Here Amin and Amax are the minimum and maximumvalue for the parameter being analyzed, either A(c) =cUV /c or A(c) = θ(c).Fig. 6 shows a very good correlation between the
open basepair fraction calculated from UV-absorbancef(cUV /c) and from free counterion fraction f(θ(c)),across the studied DNA concentration range c = 0.015−8 mM. We judge that the f(c) that we obtained is, indeed,a very god measure of fraction of open basepairs presentin very low salt solutions of varying DNA146 concentra-tions. Both cUV /c and θ(c) data appear to be valid forcharacterization of the melting transition.
B. Intermediate DNA
The most important result of this study is that inregion B the diffusion coefficient Dexp
146 measured forDNA146 in very low salt is diminished compared to val-ues both for ssDNA and native dsDNA (DNA in 10 mMTE buffer). In this same region a fraction between 10and 90% basepairs are open (cf. Fig.6 and Fig.5).Careful consideration of the above leads to a conclusion
that the DNA population in region B is NOT a simplemix of native dsDNA helix and separated ssDNA strands.If it were a mix then the measured diffusion time and thecorresponding diffusion coefficient should be of some in-termediate value [45], between the experimental valuesfor native dsDNA and ssDNA, Dds
146 = 3.2 · 10−11 m2/s

8
c (mM)
10-3 10-2 10-1 100 101
frac
tion
:op
en b
asep
airs
0.00.20.40.60.81.0
25oC
ABCD
DNA146salt<0.05mM
f(θ(c))
f(cUV/c)
FIG. 6: The fraction f of open basepairs vs. DNA146 base-pair concentration. The circles are derived from cUV /c ratio(see also Fig.3). For comparison we show data (diamonds) de-rived from free counterion parameter θ(c) taken from Ref. [33].Fraction f ≈ 0 above 1 mM (region A) relates to dsDNA,while f approaching the value of 1 below 0.05 mM (region C)means that only ssDNA remains in the solution.
and Dss146 = 3.95 ·10−11 m2/s, respectively. However, the
actual value is only 2.9 ·10−11 m2/s! The DNA moleculesthere diffuse more slowly than either a rigid-rod dsDNAor an ssDNA strand. In other words, the DNA146 con-formation present in this region is distinguished by beinghydrodynamically larger entity than native DNA146 he-lix. As this is a dilute solution regime, the interactionsbetween the molecules are not a plausible explanation,as they are for the decrease of Dexp
146 (c) above 1-2 mM, inthe semidilute regime (region A, Fig.5).
Wilk et al. have also found a diffusion coefficient to bereduced for DNA fragments (20 bp) in low salt, 0.01 mMNaCl in comparison to high salt, 0.2 M NaCl solutionsand for a rather similar DNA concentration range [43].However, they have neglected in their analysis the factthat DNA denatures in the conditions of very low salt,which we have carefully analyzed in the previous sub-section. To account for the reduction in diffusion ceoffi-cient, they have proposed that the hydrodynamic volumeof the DNA molecule is enlarged, by the amount of theDebye screening length κ−1, that is, the contour lengthLc becomes Lc+κ−1, and the diameter becomes d+κ−1.We consider this scenario to be inappropriate. Alreadyfor DNA146 in 10 mM TE buffer (and a rather smallκ−1 = 1 nm), the value of the diffusion coefficient Dth
146
thus calculated (using Eq.3) would deviate for 10% fromthe experimental result we got. We remind, we get thediscrepancy of only 1-2% between our experimental Dds
146
result and theory, if we do not use a correction like Wilket al..
Theoretically, the diffusion coefficient for rodlikemolecules (see Eq.3) is linearly dependent on the con-tour length of the molecule, and only logarithmically onits diameter. Thus, the most plausible mechanism forDexp
146 (c) becoming reduced in region B would be if DNAcontour length increased about 10%, leading to a 10% de-
crease in diffusion coefficient. Now, we note that dsDNAmonomer size is 0.34 nm while for ssDNA it is 0.43 nm,20% longer [44]. When a sequence of several basepairsin a dsDNA molecule breaks hydrogen bonds and un-stacks (DNA bubble), then each strand locally assumesan ssDNA coil conformation. Consequently the moleculewould elongate in the region of the bubble. The moleculesbeing elongated by 10% - half the maximum 20% - shouldthen have half of the basepairs open. Simply, half of thesequence would be DNA bubbles and half native helix -an intermediate DNA would form. We assume that thefraying, separating ends of a dsDNA molecule would havea similar effect as DNA bubbles, on slowing the interme-diate DNA diffusion.Remaining issue would be whether these elongated, in-
termediate DNA molecules really maintain rodlike shape,otherwise application of Eq.3 would not be justified. Weremind that, in these very low salt conditions, the chargesalong the DNA backbones repel strongly due to the lackof Debye screening and it is very plausible that this al-lows the intermediate DNA molecule to remain extended,rodlike in shape, despite having defects of lower intrinsicrigidity [27–30, 41, 44]. We provide an illustration abovethe data panel of Fig.7.
C. Fractions of DNA conformations
For the analysis of fractions of conformations in thepopulation of DNA146 molecules, we will postulate thatintermediate DNA146 is of a rodlike form and is char-acterized with about 50% basepairs open, and that theonly other conformations that may appear in here ana-lyzed solutions are fully separated ssDNA coils and rod-like native dsDNA helices. In other words, we do not ex-pect DNA intermediate states with varying proportionsof open base-pairs to coexist along the melting transition.Accordingly, we will analyze the diffusion coefficient data,and find how the fractions of dsDNA helices, intermediateDNA and strands of ssDNA vary with the DNA concen-tration, in very low salt solution, Fig.7. Eventually, wewill provide arguments to support this proposition.First, we compare diffusion coefficient data obtained
for DNA146 in very low salt (set I) and in buffer (set II)in regions A and B. We denote theseDexp
146 (c) andDds146(c),
respectively. Specifically, Dds146(c), being obtained for
DNA in buffer is thus the value for native helices, wherethe concentration dependence is due to samples abovec = 1 mM being in the semi-dilute regime. Variation inDexp
146 (c) is also due to this influence, but, as DNA concen-tration is lowered below about 1-2 mM, Dexp
146 (c) deviatesfrom Dds
146(c), showing that intermediate DNA starts toappear in the molecular population. The difference be-tween Dexp
146 (c) and Dds146(c) stabilizes in the lower part of
region B, c = 0.05− 0.3 mM, indicating that only inter-mediate DNA remained in the population. We remindthat the diffusion coefficient value Dim
146 = 2.9 · 10−11
m2/s in this region is lower than values either for ds-
9
✁�✂✄☎��✂✄☎
✆✝✞✟✠✡✟☛✆☞✞✟
✌✍✎
c (mM)
10-3 10-2 10-1 100 101
frac
tion:
DN
A c
onfo
rmat
ions
0.0
0.2
0.4
0.6
0.8
1.0
inter-mediateDNA
ssDNA
25oC
DNA146salt<0.05mM
ABCD
dsDNA
✏
∆✏✑✒✓✔✏
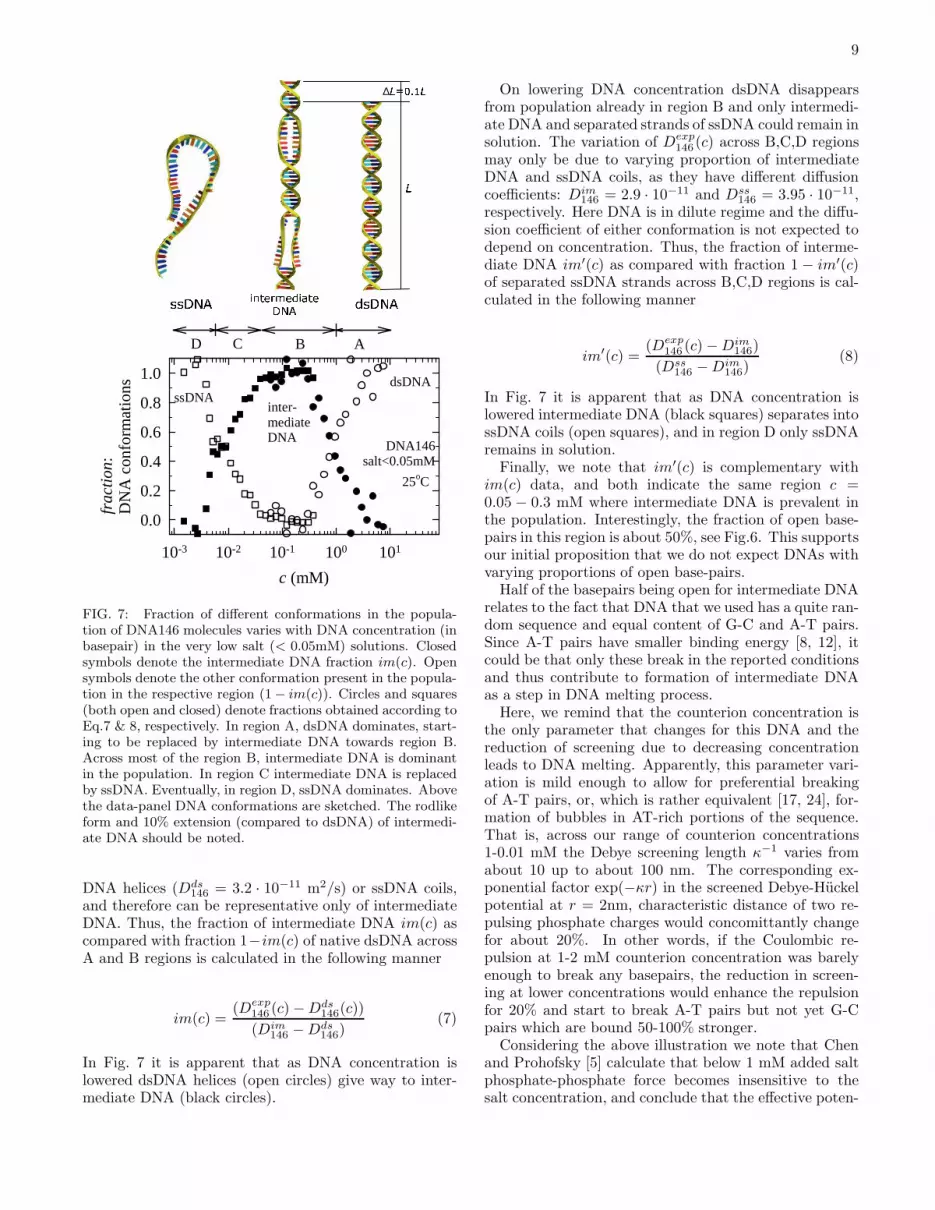
FIG. 7: Fraction of different conformations in the popula-tion of DNA146 molecules varies with DNA concentration (inbasepair) in the very low salt (< 0.05mM) solutions. Closedsymbols denote the intermediate DNA fraction im(c). Opensymbols denote the other conformation present in the popula-tion in the respective region (1− im(c)). Circles and squares(both open and closed) denote fractions obtained according toEq.7 & 8, respectively. In region A, dsDNA dominates, start-ing to be replaced by intermediate DNA towards region B.Across most of the region B, intermediate DNA is dominantin the population. In region C intermediate DNA is replacedby ssDNA. Eventually, in region D, ssDNA dominates. Abovethe data-panel DNA conformations are sketched. The rodlikeform and 10% extension (compared to dsDNA) of intermedi-ate DNA should be noted.
DNA helices (Dds146 = 3.2 · 10−11 m2/s) or ssDNA coils,
and therefore can be representative only of intermediateDNA. Thus, the fraction of intermediate DNA im(c) ascompared with fraction 1−im(c) of native dsDNA acrossA and B regions is calculated in the following manner
im(c) =(Dexp
146 (c)−Dds146(c))
(Dim146 −Dds
146)(7)
In Fig. 7 it is apparent that as DNA concentration islowered dsDNA helices (open circles) give way to inter-mediate DNA (black circles).
On lowering DNA concentration dsDNA disappearsfrom population already in region B and only intermedi-ate DNA and separated strands of ssDNA could remain insolution. The variation of Dexp
146 (c) across B,C,D regionsmay only be due to varying proportion of intermediateDNA and ssDNA coils, as they have different diffusioncoefficients: Dim
146 = 2.9 · 10−11 and Dss146 = 3.95 · 10−11,
respectively. Here DNA is in dilute regime and the diffu-sion coefficient of either conformation is not expected todepend on concentration. Thus, the fraction of interme-diate DNA im′(c) as compared with fraction 1 − im′(c)of separated ssDNA strands across B,C,D regions is cal-culated in the following manner
im′(c) =(Dexp
146 (c)−Dim146)
(Dss146 −Dim
146)(8)
In Fig. 7 it is apparent that as DNA concentration islowered intermediate DNA (black squares) separates intossDNA coils (open squares), and in region D only ssDNAremains in solution.Finally, we note that im′(c) is complementary with
im(c) data, and both indicate the same region c =0.05 − 0.3 mM where intermediate DNA is prevalent inthe population. Interestingly, the fraction of open base-pairs in this region is about 50%, see Fig.6. This supportsour initial proposition that we do not expect DNAs withvarying proportions of open base-pairs.Half of the basepairs being open for intermediate DNA
relates to the fact that DNA that we used has a quite ran-dom sequence and equal content of G-C and A-T pairs.Since A-T pairs have smaller binding energy [8, 12], itcould be that only these break in the reported conditionsand thus contribute to formation of intermediate DNAas a step in DNA melting process.Here, we remind that the counterion concentration is
the only parameter that changes for this DNA and thereduction of screening due to decreasing concentrationleads to DNA melting. Apparently, this parameter vari-ation is mild enough to allow for preferential breakingof A-T pairs, or, which is rather equivalent [17, 24], for-mation of bubbles in AT-rich portions of the sequence.That is, across our range of counterion concentrations1-0.01 mM the Debye screening length κ−1 varies fromabout 10 up to about 100 nm. The corresponding ex-ponential factor exp(−κr) in the screened Debye-Huckelpotential at r = 2nm, characteristic distance of two re-pulsing phosphate charges would concomittantly changefor about 20%. In other words, if the Coulombic re-pulsion at 1-2 mM counterion concentration was barelyenough to break any basepairs, the reduction in screen-ing at lower concentrations would enhance the repulsionfor 20% and start to break A-T pairs but not yet G-Cpairs which are bound 50-100% stronger.Considering the above illustration we note that Chen
and Prohofsky [5] calculate that below 1 mM added saltphosphate-phosphate force becomes insensitive to thesalt concentration, and conclude that the effective poten-

10
tial has become a simple Coulomb potential. However,this is a long range potential and contributes to the en-ergy balance of the intermediate molecule specifically inthe open, ssDNA sections, where the interaction occursnot only between complementary bases, but among atleast several neighboring bases. That is, disrupted bondforce constant is not zero. We emphasize that this ren-ders the calculation of free energy of such an intermedi-ate state nontrivial. Phosphate-phosphate contributionis non-additive, depends on DNA concentration, and onthe size of the bubbles. As such it is not tractable and notpredicted by present models for thermally induced DNAmelting, where Coulomb potential was neglected, beingscreened (at most, Coulomb potential has only renormal-ized the hydrogen bonds).
D. Concluding remarks
In our scenario the intermediate DNA with about halfbasepairs open coexists with dsDNA helices or ssDNAcoils in very low salt environment. We suggest that thelow DNA concentration and very low salt conditions ofthis study allowed for DNA to open preferably along AT-rich portions of the sequence, without the strands sepa-rating further. These local lesions reflect on hydrody-namic properties of the whole molecule, i.e. its diffusioncoefficient has been reduced measurably below the valuefor the original dsDNA helix. However, whether theseDNA lesions remain stably open or it is a dynamical sit-uation where the bubbles open and close often enough tochange the diffusion properties may not be judged fromour result. Experiments capable of measuring the fluctu-ation rates at a given site within the sequence, as thosementioned in the Introduction (optical spectroscopy of Gbases, FRET, FCS) should be performed on DNA frag-ments in the very low added salt conditions. Only in thismanner the nature of intermediate DNA could be judgedand then also the stability mechanism would be more eas-ily inferred. An interesting scenario would be the criti-cal slowing of fluctuations, a concept known from thestudies of glass forming systems [46]. Finally, our find-ing of intermediate DNA provides another novel twist.That is, to explain the diffusion properties of intermedi-
ate DNA in very low salt, the ssDNA loops within sucha molecule have to be extended, and the molecule has tokeep the rodlike form. This may be perceived contraryto the ususal notion that the fluctuational openings, forDNA in an added salt environment, remove the moleculeaway from the rigid rod form [20, 21, 27].
V. SUMMARY
In this work we have revealed the presence of novelintermediate DNA conformation at low DNA concentra-tions (c < 1 mM basepair) in very low salt (< 0.05mM)solutions at ambient temperature. The diffusion coefi-cient for DNA146 below 1 mM and above 0.05 mM (inDNA basepair) occurs to be below the values for bothnative dsDNA helices and ssDNA strands of equal poly-merization degree. Thus the population in the interme-diate regime is not a mixture of these two conformations.Intermediate DNA molecules, consisting of dsDNA seg-ments and ssDNA loops would have appropriate hydro-dynamical properties to explain for the diffusion data.The ssDNA loops are possibly due to DNA fluctuationalopenings (bubbles) that open and close at such rates,that they may be considered to have become stabilizedsince they influence the diffusion of the whole molecule.We suggest that the especially long-range Coulombic re-pulsion in the very low salt conditions of our experimentmight allow for this effective stability.
Acknowledgement
We gratefully acknowledge A.S. Smith and A. Siber forilluminating discussions and A.R. Bishop for inspiringthis work. We thank A. Omerzu for kindly providingaccess to the UV-spectrophotometer. This work is basedon the support from the Unity through Knowledge Fund,Croatia under Grant 22/08. The work was in part fundedby IntElBioMat ESF activity. The group at the Instituteof physics works within Project No. 035-0000000-2836 ofCroatian Ministry of Science, Education and Sports.
[1] M. Rubinstein, R. H. Colby Polymer Physics Oxford Uni-
versity Press, USA (2003); J. R. C. van der Maarel In-troduction to Biopolymer Physics World Scientific, Sin-
gapore (2007)[2] V. A. Bloomfield, D. M. Crothers and I. Tinocco, Jr., Nu-
cleic Acids (University Science Books, Sausalito, 2000).[3] W. F. Dove and N. Davidson, J. Mol. Biol.,5, 467-478
(1962).[4] M. T. Record, Jr., Biopolymers 14, 2137 (1975).[5] Y. Z. Chen, and E. W. Prohofsky, Phys. Rev. E 48, 3099
(1993).
[6] M. Peyrard and A. R. Bishop, Phys. Rev. Lett. 62,2755 (1989); T. Dauxois, M. Peyrard, and A. R. Bishop,Phys. Rev. E 47, 684 (1993).
[7] H. E. Auer and Z. Alexandrowicz, Biopolymers 8, 1(1969).
[8] K. J. Breslauer, R. Franks, H. Blockers, and L. A. Marky,Proc. Natl. Acad. Sci. USA 83, 3746-3750 (1986).
[9] L. V. Yakushevich, Nonlinear Physics of DNA, 2nd edi-
tion, Wiley-VCH, Weinheim (2004).[10] M. D. Frank-Kamenetskii, Nature, 328, 17-18 (1987).[11] M. Gueron, M. Kochoyan, and J. L. Leroy, Nature, 328,

11
89-92 (1987).[12] A. Krueger, E. Protozanova, and M. D. Frank-
Kamenetskii, Biophys. J. 90, 3091-3099 (2006).[13] C. H. Choi, G. Kalosakas, K. Ø. Rasmussen, M. Hiro-
mura,A. R. Bishop, and A. Usheva, Nucl. Acids. Res. 32,1584-1590 (2005); Z. Rapti, A. Smerzi, K. Ø. Ras-mussen, A. R. Bishop, C. H. Choi, and A. Usheva, Euro-phys. Lett., 74, 540546 (2006).
[14] M. Manghi, J. Palmeri and N. Destainville,Phys. Rev. Lett. 99, 088103 (2007).
[15] G. D. Pearson, J. Virol., 16, 17-26 (1975).[16] S. Ares, N. K. Voulgarakis, K. Ø. Rasmussen, and
A. R. Bishop, Phys. Rev. Lett., 94, 035504 (2005).[17] M. Peyrard, S. Cuesta Lopez and D. Angelov, J. Phys.:
Condens. Matter 21, 034103 (2009).[18] D. Poland and H. A. Scheraga, J. Chem. Phys., 45, 1456;
45, 1464 (1966).[19] M. Manghi, J. Palmeri and N. Destainville, J. Phys.:
Condens. Matter 21, 034104 (2009).[20] Y. Kafri, D. Mukamel and L. Peliti, Phys. Rev. Lett.,
85, 4988 (2000); A. Bar, Y. Kafri, and D. Mukamel,Phys. Rev. Lett., 98, 038103 (2007); H. C. Fogedby, andR. Metzler, Phys. Rev. Lett., 98, 070601 (2007).
[21] E. Carlon, E. Orlandini, A. L. Stella, Phys. Rev. Lett.,88, 198101 (2002).
[22] J. L. Leroy, M. Kochoyan, T. Huynh-Dinh, andM. Gueron, J. Mol. Biol. 200, 2238 (1988).
[23] G. Altan-Bonnet, A. Libchaber, and O. Krichevsky,Phys. Rev. Lett., 90, 138101 (2003).
[24] S. Cuesta Lopez, D. Angelov and M. Peyrard, Euro-phys. Lett. 87, 48009 (2009).
[25] Y. Zeng, A. Montrichok, and G. Zocchi,Phys. Rev. Lett. 91, 148101 (2003); A. Montri-chok, G. Gruner and G. Zocchi, Europhys. Lett. 62,4528 (2003); Y. Zeng, A. Montrichok, and G. Zocchi,J. Mol. Biol. 339, 67 (2004).
[26] J. Wilcoxon and J. Michael Schurr, Biopolymers 22,2273-2321 (1983).
[27] C. Yuan, H. Chen, X. W. Lou, and L. A. Archer,Phys. Rev. Lett., 100, 018102 (2008).
[28] O-chul Lee, Jae-Hyung Jeon, and Wokyung Sung,Phys. Rev. E 81, 021906 (2010).
[29] C. G. Baumann, S. B. Smith, V. A. Bloomfield andC. Bustamante, Proc. Natl. Acad. Sci. USA 94, 6185
(1997).[30] S. Tomic, S. Dolanski Babic, T. Ivek, T. Vuletic, S. Krca,
F. Livolant, and R. Podgornik, Europhys. Lett. 81, 68003(2008).
[31] S. Tomic, D. Grgicin, T. Ivek, S. Dolanski Babic,T. Vuletic, G. Pabst, and R. Podgornik, accepted inMacromol. Symp.
[32] T. Odijk, J. Polym. Sci.: Polym. Phys. 15, 477 (1977);J. Skolnick and M. Fixman, Macromolecules 10, 944(1977).
[33] T. Vuletic, S. Dolanski Babic, D. Grgicin, D. Aumiler,J. Radler, F. Livolant and S. Tomic, submitted toPhys. Rev. E.
[34] S. Mangenot, S. Keller and J. Raedler, Biophys. J. 85,1817-1825 (2003).
[35] Carl Zeiss: Applications Manual LSM 510 - ConfoCor 2Application Handbook
[36] M. Mercedes Tirado, C. Lopez Martinez, J. Garcia de laTorre, J. Chem. Phys. 81, 2047-2051 (1984).
[37] E. Stellwagen, Y. Lu, N. C. Stellwagen, Biochemistry bf42, 11745-11750 (2003).
[38] G. S. Manning, Biopolymers 11, 937-949 (1972)[39] R. M. Wartell and A. S. Benight, Phys. Rep. 126, 67-107
(1985).[40] I. E. Scheffler, E. L. Elson, and R. L. Baldwin,
J. Mol. Biol. 48, 145 (1970); S. Buyukdagli andM. Joyeux, Phys. Rev. E 78, 021917 (2007).
[41] S. Tomic, S. Dolanski Babic, T. Vuletic, S. Krca,D. Ivankovic, L. Griparic and R. Podgornik, Phys. Rev. E75, 021905 (2007).
[42] M. P. B. Van Bruggen, H. N. W. Lekkerkerker, andJ. K. G. Dhont, Phys. Rev. E 56, 4394 (1997);J. K. G. Dhont, M. P. B. Van Bruggen, and W. J. Briels,Macromolecules 32, 3809 (1999).
[43] A. Wilk, J. Gapinski, A. Patkowski, R. Pecora,J. Chem. Phys. 121, 10794 (2004).
[44] B. Tinland, A. Pluen, J. Sturm, and G. Weill, Macro-molecules 30, 5763-5765 (1997).
[45] P. Schwille, J. Bieschke, F. Oehlenschlager, Bio-phys. Chem. 66, 211-228 (1997).
[46] P. Lunkenheimer, U. Schneider, R. Brand and A. Loidl,Contemporary Physics 41, 15-36 (2000).