Interannual variability of net ecosystem productivity in forests is explained by carbon flux...
13
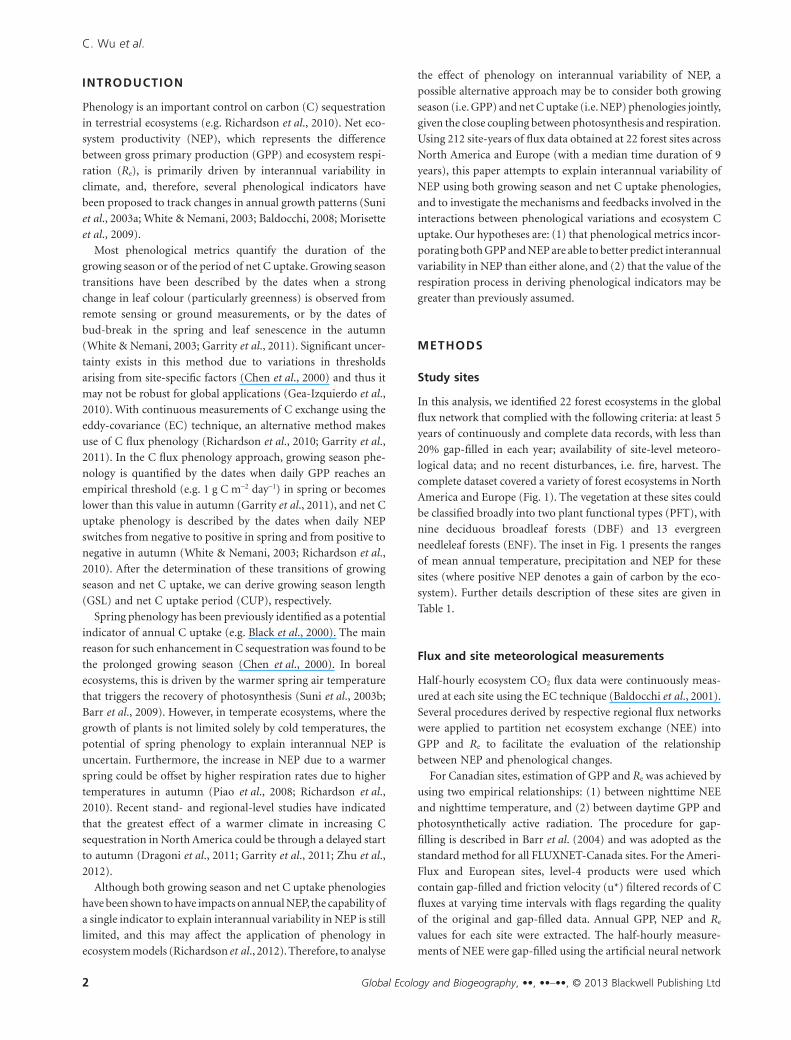
RESEARCH PAPER Interannual variability of net ecosystem productivity in forests is explained by carbon flux phenology in autumn Chaoyang Wu 1 *, Jing M. Chen 1 , T. Andrew Black 2 , David T. Price 3 , Werner A. Kurz 4 , Ankur R. Desai 5 , Alemu Gonsamo 1 , Rachhpal S. Jassal 2 , Christopher M. Gough 6 , Gil Bohrer 7 , Danilo Dragoni 8 , Mathias Herbst 9 , Bert Gielen 10 , Frank Berninger 11 , Timo Vesala 12 , Ivan Mammarella 12 , Kim Pilegaard 13 and Peter D. Blanken 14 1 Department of Geography and Program in Planning, University of Toronto, Toronto, ON, Canada, 2 Faculty of Land and Food Systems, University of British Columbia, Vancouver, BC, Canada, 3 Natural Resources Canada, Canadian Forest Service, Edmonton, AB, Canada, 4 Natural Resources Canada, Canadian Forest Service-Pacific Forestry Centre, Victoria, BC, Canada, 5 Department of Atmospheric and Oceanic Sciences, University of Wisconsin-Madison, Madison, WI, USA, 6 Department of Biology, Virginia Commonwealth University, Richmond, VA 23284-2012, USA, 7 Department of Civil, Environmental and Geodetic Engineering, The Ohio State University, Columbus, OH, USA, 8 Department of Geography, Indiana University, Bloomington, IN, USA, 9 Department of Bioclimatology, Göttingen University, Büsgenweg 2, 37077 Göttingen, Germany, 10 University of Antwerp, Research Group Plant and Vegetation Ecology, Universiteitsplein 1, 2610 Wilrijk, Belgium, 11 Department of Forest Sciences, University of Helsinki, PO Box 27, 00014 Finland, 12 Department of Physics, University of Helsinki, PO Box 48, 00014, Helsinki, Finland, 13 Department of Chemical and Biochemical Engineering, Technical University of Denmark (DTU), 2800 Kgs. Lyngby, Denmark, 14 Department of Geography, University of Colorado, 260 UCB, Boulder, CO 80309-0260, USA ABSTRACT Aim To investigate the importance of autumn phenology in controlling interan- nual variability of forest net ecosystem productivity (NEP) and to derive new phenological metrics to explain the interannual variability of NEP. Location North America and Europe. Method Flux data from nine deciduous broadleaf forests (DBF) and 13 evergreen needleleaf forests (ENF) across North America and Europe (212 site-years) were used to explore the relationships between the yearly anomalies of annual NEP and several carbon flux based phenological indicators, including the onset/end of the growing season, onset/end of the carbon uptake period, the spring lag (time inter- val between the onset of growing season and carbon uptake period) and the autumn lag (time interval between the end of the carbon uptake period and the growing season). Meteorological variables, including global shortwave radiation, air temperature, soil temperature, soil water content and precipitation, were also used to explain the phenological variations. Results We found that interannual variability of NEP can be largely explained by autumn phenology, i.e. the autumn lag. While variation in neither annual gross primary productivity (GPP) nor in annual ecosystem respiration (Re) alone could explain this variability, the negative relationship between annual NEP and autumn lag was due to a larger Re/GPP ratio in years with a prolonged autumn lag. For DBF sites, a longer autumn lag coincided with a significant decrease in annual GPP but showed no correlation with annual Re. However, annual GPP was insensitive to a longer autumn lag in ENF sites but annual Re increased significantly. Main conclusions These results demonstrate that autumn phenology plays a more direct role than spring phenology in regulating interannual variability of annual NEP. In particular, the importance of respiration may be potentially under- estimated in deriving phenological indicators. Keywords Carbon cycle, ecosystem respiration, forest, gross primary productivity, net carbon exchange, phenology. *Correspondence: Chaoyang Wu, Department of Geography, University of Toronto, 100 St. George Street, Room 5047, Toronto, ON, M5S G3, Canada. E-mail: [email protected] Global Ecology and Biogeography, (Global Ecol. Biogeogr.) (2013) ••, ••–•• © 2013 Blackwell Publishing Ltd DOI: 10.1111/geb.12044 http://wileyonlinelibrary.com/journal/geb 1
-
Upload
independent -
Category
Documents
-
view
0 -
download
0
Transcript of Interannual variability of net ecosystem productivity in forests is explained by carbon flux...
RESEARCHPAPER
Interannual variability of net ecosystemproductivity in forests is explained bycarbon flux phenology in autumnChaoyang Wu1*, Jing M. Chen1, T. Andrew Black2, David T. Price3,
Werner A. Kurz4, Ankur R. Desai5, Alemu Gonsamo1, Rachhpal S. Jassal2,
Christopher M. Gough6, Gil Bohrer7, Danilo Dragoni8, Mathias Herbst9,
Bert Gielen10, Frank Berninger11, Timo Vesala12, Ivan Mammarella12,
Kim Pilegaard13 and Peter D. Blanken14
1Department of Geography and Program in
Planning, University of Toronto, Toronto, ON,
Canada, 2Faculty of Land and Food Systems,
University of British Columbia, Vancouver,
BC, Canada, 3Natural Resources Canada,
Canadian Forest Service, Edmonton, AB,
Canada, 4Natural Resources Canada,
Canadian Forest Service-Pacific Forestry
Centre, Victoria, BC, Canada, 5Department of
Atmospheric and Oceanic Sciences, University
of Wisconsin-Madison, Madison, WI, USA,6Department of Biology, Virginia
Commonwealth University, Richmond, VA
23284-2012, USA, 7Department of Civil,
Environmental and Geodetic Engineering,
The Ohio State University, Columbus, OH,
USA, 8Department of Geography, Indiana
University, Bloomington, IN, USA,9Department of Bioclimatology, Göttingen
University, Büsgenweg 2, 37077 Göttingen,
Germany, 10University of Antwerp, Research
Group Plant and Vegetation Ecology,
Universiteitsplein 1, 2610 Wilrijk, Belgium,11Department of Forest Sciences, University of
Helsinki, PO Box 27, 00014 Finland,12Department of Physics, University of
Helsinki, PO Box 48, 00014, Helsinki, Finland,13Department of Chemical and Biochemical
Engineering, Technical University of Denmark
(DTU), 2800 Kgs. Lyngby, Denmark,14Department of Geography, University of
Colorado, 260 UCB, Boulder, CO 80309-0260,
USA
ABSTRACT
Aim To investigate the importance of autumn phenology in controlling interan-nual variability of forest net ecosystem productivity (NEP) and to derive newphenological metrics to explain the interannual variability of NEP.
Location North America and Europe.
Method Flux data from nine deciduous broadleaf forests (DBF) and 13 evergreenneedleleaf forests (ENF) across North America and Europe (212 site-years) wereused to explore the relationships between the yearly anomalies of annual NEP andseveral carbon flux based phenological indicators, including the onset/end of thegrowing season, onset/end of the carbon uptake period, the spring lag (time inter-val between the onset of growing season and carbon uptake period) and theautumn lag (time interval between the end of the carbon uptake period and thegrowing season). Meteorological variables, including global shortwave radiation,air temperature, soil temperature, soil water content and precipitation, were alsoused to explain the phenological variations.
Results We found that interannual variability of NEP can be largely explained byautumn phenology, i.e. the autumn lag. While variation in neither annual grossprimary productivity (GPP) nor in annual ecosystem respiration (Re) alone couldexplain this variability, the negative relationship between annual NEP and autumnlag was due to a larger Re/GPP ratio in years with a prolonged autumn lag. For DBFsites, a longer autumn lag coincided with a significant decrease in annual GPP butshowed no correlation with annual Re. However, annual GPP was insensitive to alonger autumn lag in ENF sites but annual Re increased significantly.
Main conclusions These results demonstrate that autumn phenology plays amore direct role than spring phenology in regulating interannual variability ofannual NEP. In particular, the importance of respiration may be potentially under-estimated in deriving phenological indicators.
KeywordsCarbon cycle, ecosystem respiration, forest, gross primary productivity, netcarbon exchange, phenology.
*Correspondence: Chaoyang Wu, Departmentof Geography, University of Toronto, 100 St.George Street, Room 5047, Toronto, ON, M5SG3, Canada.E-mail: [email protected]
bs_bs_banner
Global Ecology and Biogeography, (Global Ecol. Biogeogr.) (2013) ••, ••–••
© 2013 Blackwell Publishing Ltd DOI: 10.1111/geb.12044http://wileyonlinelibrary.com/journal/geb 1
INTRODUCTION
Phenology is an important control on carbon (C) sequestration
in terrestrial ecosystems (e.g. Richardson et al., 2010). Net eco-
system productivity (NEP), which represents the difference
between gross primary production (GPP) and ecosystem respi-
ration (Re), is primarily driven by interannual variability in
climate, and, therefore, several phenological indicators have
been proposed to track changes in annual growth patterns (Suni
et al., 2003a; White & Nemani, 2003; Baldocchi, 2008; Morisette
et al., 2009).
Most phenological metrics quantify the duration of the
growing season or of the period of net C uptake. Growing season
transitions have been described by the dates when a strong
change in leaf colour (particularly greenness) is observed from
remote sensing or ground measurements, or by the dates of
bud-break in the spring and leaf senescence in the autumn
(White & Nemani, 2003; Garrity et al., 2011). Significant uncer-
tainty exists in this method due to variations in thresholds
arising from site-specific factors (Chen et al., 2000) and thus it
may not be robust for global applications (Gea-Izquierdo et al.,
2010). With continuous measurements of C exchange using the
eddy-covariance (EC) technique, an alternative method makes
use of C flux phenology (Richardson et al., 2010; Garrity et al.,
2011). In the C flux phenology approach, growing season phe-
nology is quantified by the dates when daily GPP reaches an
empirical threshold (e.g. 1 g C m-2 day-1) in spring or becomes
lower than this value in autumn (Garrity et al., 2011), and net C
uptake phenology is described by the dates when daily NEP
switches from negative to positive in spring and from positive to
negative in autumn (White & Nemani, 2003; Richardson et al.,
2010). After the determination of these transitions of growing
season and net C uptake, we can derive growing season length
(GSL) and net C uptake period (CUP), respectively.
Spring phenology has been previously identified as a potential
indicator of annual C uptake (e.g. Black et al., 2000). The main
reason for such enhancement in C sequestration was found to be
the prolonged growing season (Chen et al., 2000). In boreal
ecosystems, this is driven by the warmer spring air temperature
that triggers the recovery of photosynthesis (Suni et al., 2003b;
Barr et al., 2009). However, in temperate ecosystems, where the
growth of plants is not limited solely by cold temperatures, the
potential of spring phenology to explain interannual NEP is
uncertain. Furthermore, the increase in NEP due to a warmer
spring could be offset by higher respiration rates due to higher
temperatures in autumn (Piao et al., 2008; Richardson et al.,
2010). Recent stand- and regional-level studies have indicated
that the greatest effect of a warmer climate in increasing C
sequestration in North America could be through a delayed start
to autumn (Dragoni et al., 2011; Garrity et al., 2011; Zhu et al.,
2012).
Although both growing season and net C uptake phenologies
have been shown to have impacts on annual NEP, the capability of
a single indicator to explain interannual variability in NEP is still
limited, and this may affect the application of phenology in
ecosystem models (Richardson et al., 2012). Therefore, to analyse
the effect of phenology on interannual variability of NEP, a
possible alternative approach may be to consider both growing
season (i.e. GPP) and net C uptake (i.e. NEP) phenologies jointly,
given the close coupling between photosynthesis and respiration.
Using 212 site-years of flux data obtained at 22 forest sites across
North America and Europe (with a median time duration of 9
years), this paper attempts to explain interannual variability of
NEP using both growing season and net C uptake phenologies,
and to investigate the mechanisms and feedbacks involved in the
interactions between phenological variations and ecosystem C
uptake. Our hypotheses are: (1) that phenological metrics incor-
porating both GPP and NEP are able to better predict interannual
variability in NEP than either alone, and (2) that the value of the
respiration process in deriving phenological indicators may be
greater than previously assumed.
METHODS
Study sites
In this analysis, we identified 22 forest ecosystems in the global
flux network that complied with the following criteria: at least 5
years of continuously and complete data records, with less than
20% gap-filled in each year; availability of site-level meteoro-
logical data; and no recent disturbances, i.e. fire, harvest. The
complete dataset covered a variety of forest ecosystems in North
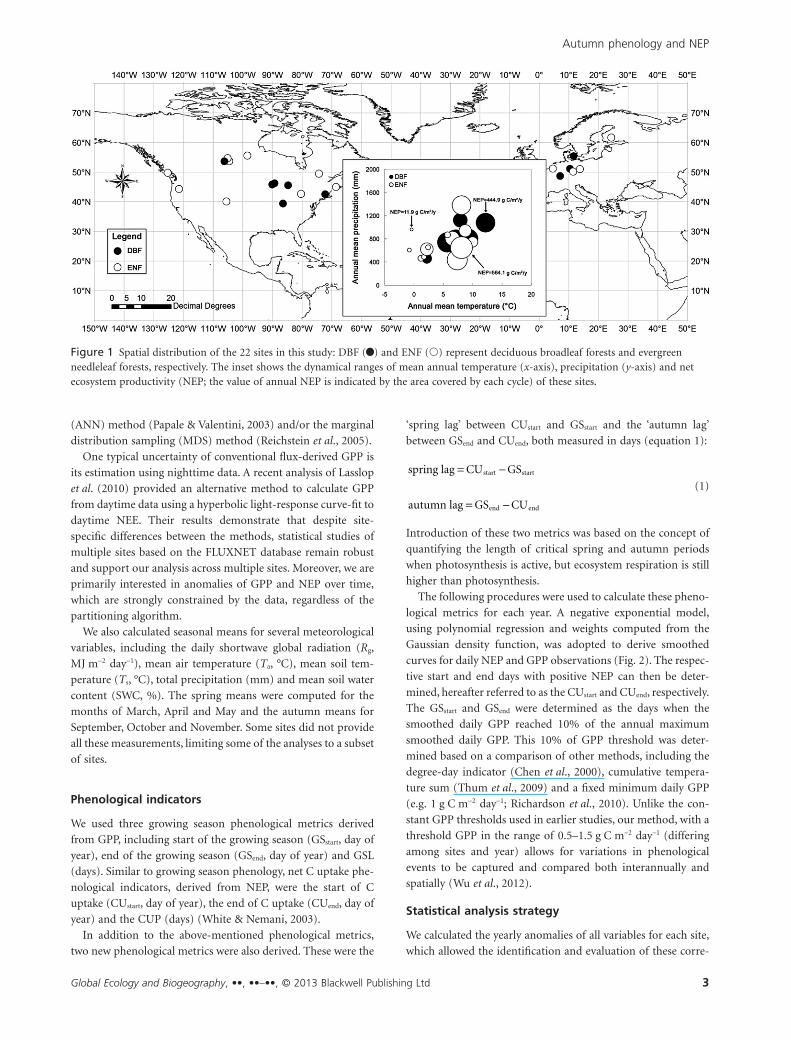
America and Europe (Fig. 1). The vegetation at these sites could
be classified broadly into two plant functional types (PFT), with
nine deciduous broadleaf forests (DBF) and 13 evergreen
needleleaf forests (ENF). The inset in Fig. 1 presents the ranges
of mean annual temperature, precipitation and NEP for these
sites (where positive NEP denotes a gain of carbon by the eco-
system). Further details description of these sites are given in
Table 1.
Flux and site meteorological measurements
Half-hourly ecosystem CO2 flux data were continuously meas-
ured at each site using the EC technique (Baldocchi et al., 2001).
Several procedures derived by respective regional flux networks
were applied to partition net ecosystem exchange (NEE) into
GPP and Re to facilitate the evaluation of the relationship
between NEP and phenological changes.
For Canadian sites, estimation of GPP and Re was achieved by
using two empirical relationships: (1) between nighttime NEE
and nighttime temperature, and (2) between daytime GPP and
photosynthetically active radiation. The procedure for gap-
filling is described in Barr et al. (2004) and was adopted as the
standard method for all FLUXNET-Canada sites. For the Ameri-
Flux and European sites, level-4 products were used which
contain gap-filled and friction velocity (u*) filtered records of C
fluxes at varying time intervals with flags regarding the quality
of the original and gap-filled data. Annual GPP, NEP and Re
values for each site were extracted. The half-hourly measure-
ments of NEE were gap-filled using the artificial neural network
C. Wu et al.
Global Ecology and Biogeography, ••, ••–••, © 2013 Blackwell Publishing Ltd2
(ANN) method (Papale & Valentini, 2003) and/or the marginal
distribution sampling (MDS) method (Reichstein et al., 2005).
One typical uncertainty of conventional flux-derived GPP is
its estimation using nighttime data. A recent analysis of Lasslop
et al. (2010) provided an alternative method to calculate GPP
from daytime data using a hyperbolic light-response curve-fit to
daytime NEE. Their results demonstrate that despite site-
specific differences between the methods, statistical studies of
multiple sites based on the FLUXNET database remain robust
and support our analysis across multiple sites. Moreover, we are
primarily interested in anomalies of GPP and NEP over time,
which are strongly constrained by the data, regardless of the
partitioning algorithm.
We also calculated seasonal means for several meteorological
variables, including the daily shortwave global radiation (Rg,
MJ m-2 day-1), mean air temperature (Ta, °C), mean soil tem-
perature (Ts, °C), total precipitation (mm) and mean soil water
content (SWC, %). The spring means were computed for the
months of March, April and May and the autumn means for
September, October and November. Some sites did not provide
all these measurements, limiting some of the analyses to a subset
of sites.
Phenological indicators
We used three growing season phenological metrics derived
from GPP, including start of the growing season (GSstart, day of
year), end of the growing season (GSend, day of year) and GSL
(days). Similar to growing season phenology, net C uptake phe-
nological indicators, derived from NEP, were the start of C
uptake (CUstart, day of year), the end of C uptake (CUend, day of
year) and the CUP (days) (White & Nemani, 2003).
In addition to the above-mentioned phenological metrics,
two new phenological metrics were also derived. These were the
‘spring lag’ between CUstart and GSstart and the ‘autumn lag’
between GSend and CUend, both measured in days (equation 1):
spring lag CU GSstart start= −(1)
autumn lag GS CUend end= −
Introduction of these two metrics was based on the concept of
quantifying the length of critical spring and autumn periods
when photosynthesis is active, but ecosystem respiration is still
higher than photosynthesis.
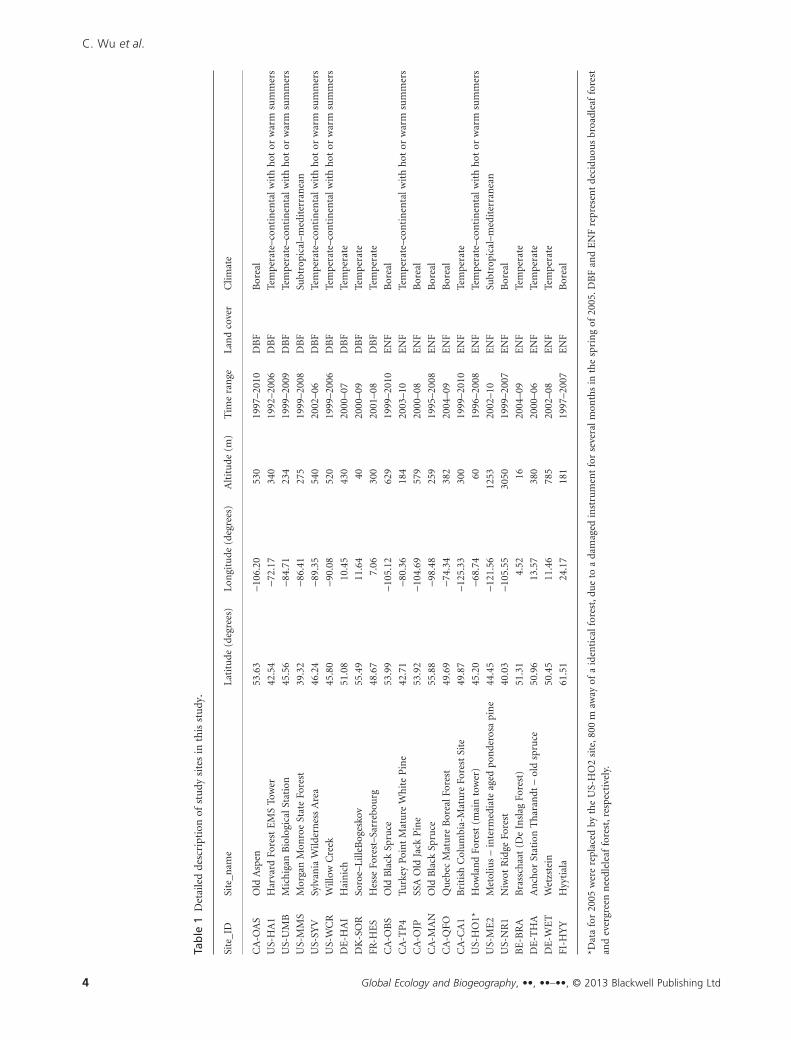
The following procedures were used to calculate these pheno-
logical metrics for each year. A negative exponential model,
using polynomial regression and weights computed from the
Gaussian density function, was adopted to derive smoothed
curves for daily NEP and GPP observations (Fig. 2). The respec-
tive start and end days with positive NEP can then be deter-
mined, hereafter referred to as the CUstart and CUend, respectively.
The GSstart and GSend were determined as the days when the
smoothed daily GPP reached 10% of the annual maximum
smoothed daily GPP. This 10% of GPP threshold was deter-
mined based on a comparison of other methods, including the
degree-day indicator (Chen et al., 2000), cumulative tempera-
ture sum (Thum et al., 2009) and a fixed minimum daily GPP
(e.g. 1 g C m-2 day-1; Richardson et al., 2010). Unlike the con-
stant GPP thresholds used in earlier studies, our method, with a
threshold GPP in the range of 0.5–1.5 g C m-2 day-1 (differing
among sites and year) allows for variations in phenological
events to be captured and compared both interannually and
spatially (Wu et al., 2012).
Statistical analysis strategy
We calculated the yearly anomalies of all variables for each site,
which allowed the identification and evaluation of these corre-
Figure 1 Spatial distribution of the 22 sites in this study: DBF (•) and ENF (�) represent deciduous broadleaf forests and evergreenneedleleaf forests, respectively. The inset shows the dynamical ranges of mean annual temperature (x-axis), precipitation (y-axis) and netecosystem productivity (NEP; the value of annual NEP is indicated by the area covered by each cycle) of these sites.
Autumn phenology and NEP
Global Ecology and Biogeography, ••, ••–••, © 2013 Blackwell Publishing Ltd 3
Tab
le1
Det
aile
dde
scri
ptio
nof
stu
dysi
tes
inth
isst
udy
.
Site
_ID
Site
_nam
eLa
titu
de(d
egre
es)
Lon
gitu
de(d
egre
es)
Alt
itu
de(m
)T
ime
ran
geLa
nd
cove
rC
limat
e
CA
-OA
SO
ldA
spen
53.6
3-1
06.2
053
019
97–2
010
DB
FB
orea
l
US-
HA
1H
arva
rdFo
rest
EM
STo
wer
42.5
4-7
2.17
340
1992
–200
6D
BF
Tem
pera
te–c
onti
nen
talw
ith
hot
orw
arm
sum
mer
s
US-
UM
BM
ich
igan
Bio
logi
calS
tati
on45
.56
-84.
7123
419
99–2
009
DB
FTe
mpe
rate
–con
tin
enta
lwit
hh
otor
war
msu
mm
ers
US-
MM
SM
orga
nM
onro
eSt
ate
Fore
st39
.32
-86.
4127
519
99–2
008
DB
FSu
btro
pica
l–m
edit
erra
nea
n
US-
SYV
Sylv
ania
Wild
ern
ess
Are
a46
.24
-89.
3554
020
02–0
6D
BF
Tem
pera
te–c
onti
nen
talw
ith
hot
orw
arm
sum
mer
s
US-
WC
RW
illow
Cre
ek45
.80
-90.
0852
019
99–2
006
DB
FTe
mpe
rate
–con
tin
enta
lwit
hh
otor
war
msu
mm
ers
DE
-HA
IH
ain
ich
51.0
810
.45
430
2000
–07
DB
FTe
mpe
rate
DK
-SO
RSo
roe–
Lill
eBog
esko
v55
.49
11.6
440
2000
–09
DB
FTe
mpe
rate
FR-H
ES
Hes
seFo
rest
–Sar
rebo
urg
48.6
77.
0630
020
01–0
8D
BF
Tem
pera
te
CA
-OB
SO
ldB
lack
Spru
ce53
.99
-105
.12
629
1999
–201
0E
NF
Bor
eal
CA
-TP
4Tu
rkey
Poin
tM
atu
reW
hit
eP
ine
42.7
1-8
0.36
184
2003
–10
EN
FTe
mpe
rate
–con
tin
enta
lwit
hh
otor
war
msu
mm
ers
CA
-OJP
SSA
Old
Jack
Pin
e53
.92
-104
.69
579
2000
–08
EN
FB
orea
l
CA
-MA
NO
ldB
lack
Spru
ce55
.88
-98.
4825
919
95–2
008
EN
FB
orea
l
CA
-QFO
Qu
ebec
Mat
ure
Bor
ealF
ores
t49
.69
-74.
3438
220
04–0
9E
NF
Bor
eal
CA
-CA
1B
riti
shC
olu
mbi
a-M
atu
reFo
rest
Site
49.8
7-1
25.3
330
019
99–2
010
EN
FTe
mpe
rate
US-
HO
1*H
owla
nd
Fore
st(m
ain
tow
er)
45.2
0-6
8.74
6019
96–2
008
EN
FTe
mpe
rate
–con
tin
enta
lwit
hh
otor
war
msu
mm
ers
US-
ME
2M
etol
ius
–in
term
edia
teag
edpo
nde
rosa
pin
e44
.45
-121
.56
1253
2002
–10
EN
FSu
btro
pica
l–m
edit
erra
nea
n
US-
NR
1N
iwot
Rid
geFo
rest
40.0
3-1
05.5
530
5019
99–2
007
EN
FB
orea
l
BE
-BR
AB
rass
chaa
t(D
eIn
slag
Fore
st)
51.3
14.
5216
2004
–09
EN
FTe
mpe
rate
DE
-TH
AA
nch
orSt
atio
nT
har
andt
–ol
dsp
ruce
50.9
613
.57
380
2000
–06
EN
FTe
mpe
rate
DE
-WE
TW
etzs
tein
50.4
511
.46
785
2002
–08
EN
FTe
mpe
rate
FI-H
YY
Hyy
tial
a61
.51
24.1
718
119
97–2
007
EN
FB
orea
l
*Dat
afo
r20
05w
ere
repl
aced
byth
eU
S-H
O2
site
,800
maw
ayof
aid
enti
calf
ores
t,du
eto
ada
mag
edin
stru
men
tfo
rse
vera
lmon
ths
inth
esp
rin
gof
2005
.DB
Fan
dE
NF
repr
esen
tde
cidu
ous
broa
dlea
ffo
rest
and
ever
gree
nn
eedl
elea
ffo
rest
,res
pect
ivel
y.
C. Wu et al.
Global Ecology and Biogeography, ••, ••–••, © 2013 Blackwell Publishing Ltd4
lations interannually across sites (Richardson et al., 2010). Yearly
anomalies of these variables, i.e., annual C fluxes, phenological
indicators and meteorological variables, were calculated using
the following approach. The yearly anomaly of a variable with a
significant trend over the length of the record was defined as the
difference between an observed value and its predicted value
using a regression function fitted to annual values,
A x fi i i= − ( , ).year (2)
For variables without trends (correlation test was set at 0.05
significant level), the yearly anomalies were calculated as the
difference between an observed value and the mean of annual
value,
A x Xi i= − mean (3)
where Ai is the anomaly of a variable, xi is the observation value
in year i, f(year, i) is the predicted value from the regression func-
tion, and Xmean represents the mean annual value for the length
of the record for the variable.
RESULTS
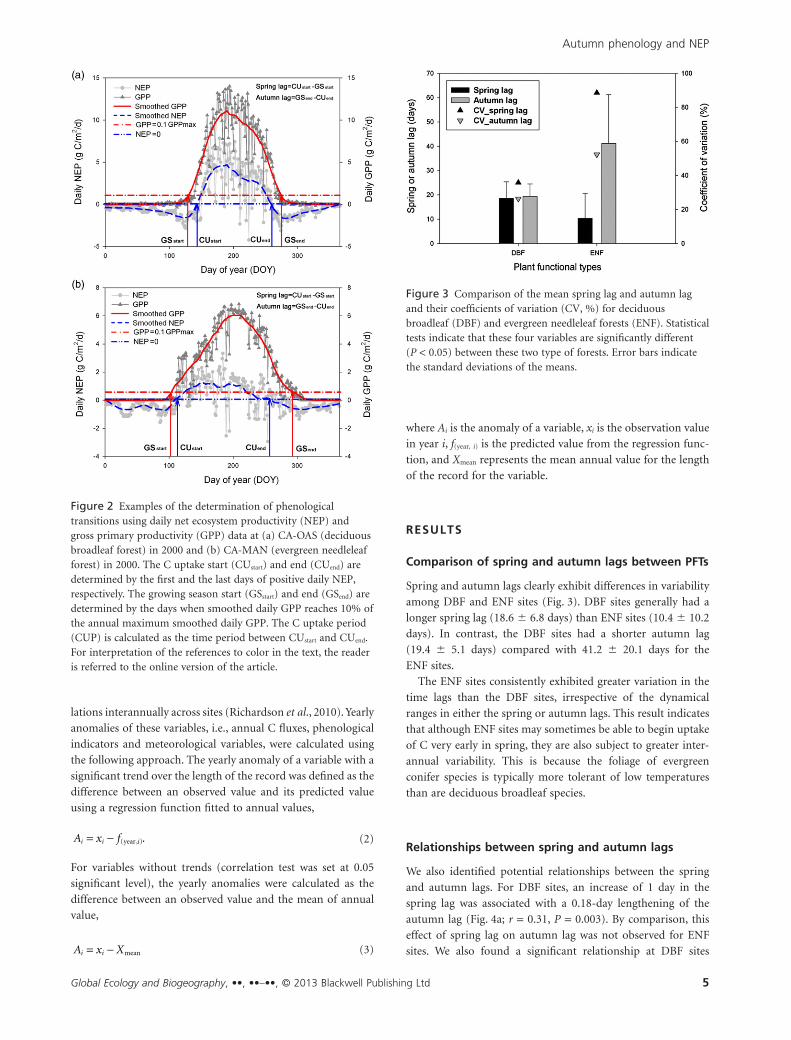
Comparison of spring and autumn lags between PFTs
Spring and autumn lags clearly exhibit differences in variability
among DBF and ENF sites (Fig. 3). DBF sites generally had a
longer spring lag (18.6 � 6.8 days) than ENF sites (10.4 � 10.2
days). In contrast, the DBF sites had a shorter autumn lag
(19.4 � 5.1 days) compared with 41.2 � 20.1 days for the
ENF sites.
The ENF sites consistently exhibited greater variation in the
time lags than the DBF sites, irrespective of the dynamical
ranges in either the spring or autumn lags. This result indicates
that although ENF sites may sometimes be able to begin uptake
of C very early in spring, they are also subject to greater inter-
annual variability. This is because the foliage of evergreen
conifer species is typically more tolerant of low temperatures
than are deciduous broadleaf species.
Relationships between spring and autumn lags
We also identified potential relationships between the spring
and autumn lags. For DBF sites, an increase of 1 day in the
spring lag was associated with a 0.18-day lengthening of the
autumn lag (Fig. 4a; r = 0.31, P = 0.003). By comparison, this
effect of spring lag on autumn lag was not observed for ENF
sites. We also found a significant relationship at DBF sites
Figure 2 Examples of the determination of phenologicaltransitions using daily net ecosystem productivity (NEP) andgross primary productivity (GPP) data at (a) CA-OAS (deciduousbroadleaf forest) in 2000 and (b) CA-MAN (evergreen needleleafforest) in 2000. The C uptake start (CUstart) and end (CUend) aredetermined by the first and the last days of positive daily NEP,respectively. The growing season start (GSstart) and end (GSend) aredetermined by the days when smoothed daily GPP reaches 10% ofthe annual maximum smoothed daily GPP. The C uptake period(CUP) is calculated as the time period between CUstart and CUend.For interpretation of the references to color in the text, the readeris referred to the online version of the article.
Figure 3 Comparison of the mean spring lag and autumn lagand their coefficients of variation (CV, %) for deciduousbroadleaf (DBF) and evergreen needleleaf forests (ENF). Statisticaltests indicate that these four variables are significantly different(P < 0.05) between these two type of forests. Error bars indicatethe standard deviations of the means.
Autumn phenology and NEP
Global Ecology and Biogeography, ••, ••–••, © 2013 Blackwell Publishing Ltd 5
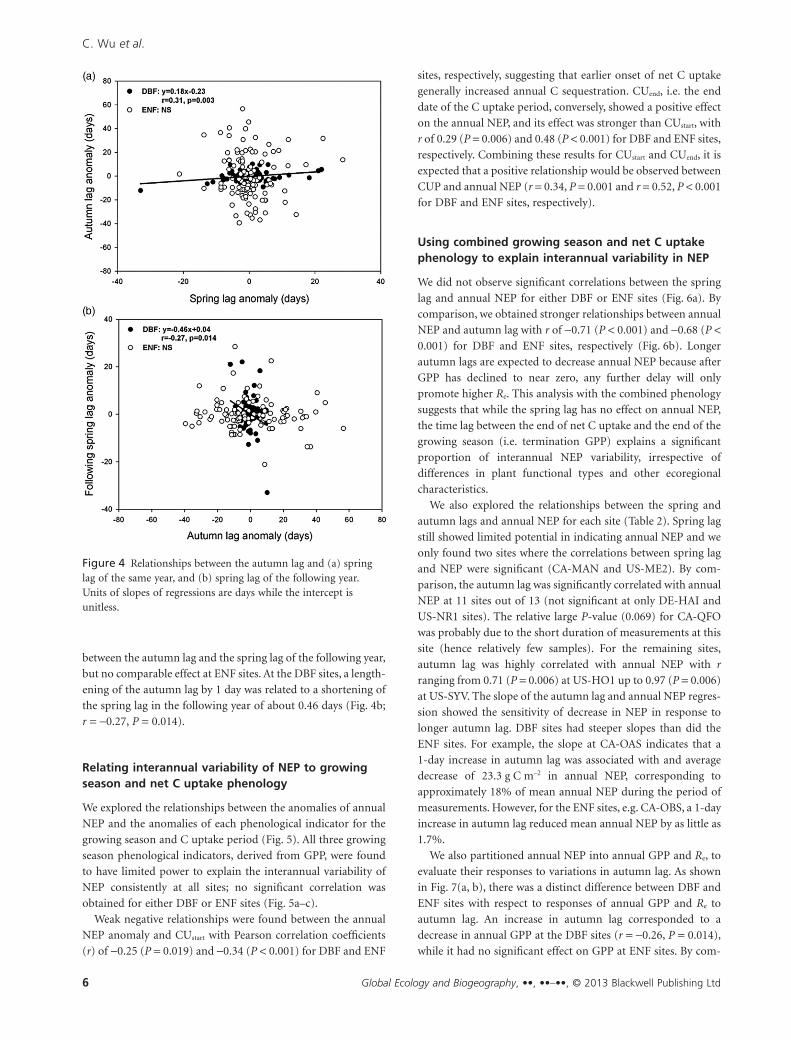
between the autumn lag and the spring lag of the following year,
but no comparable effect at ENF sites. At the DBF sites, a length-
ening of the autumn lag by 1 day was related to a shortening of
the spring lag in the following year of about 0.46 days (Fig. 4b;
r = -0.27, P = 0.014).
Relating interannual variability of NEP to growingseason and net C uptake phenology
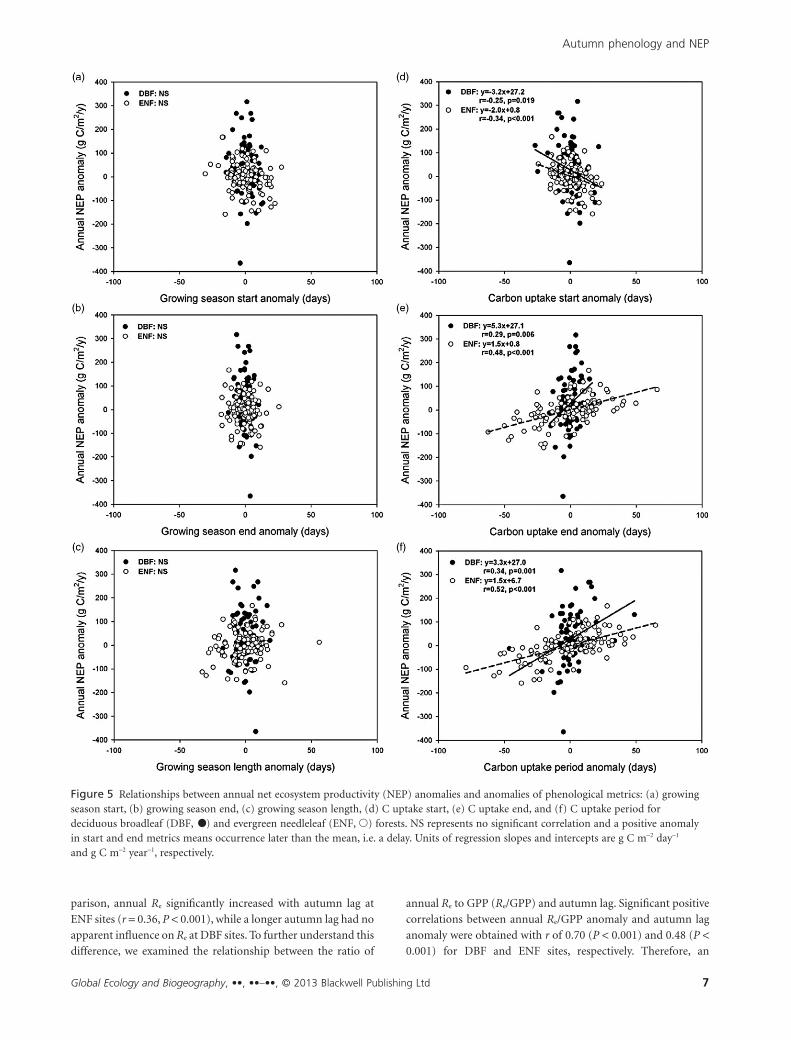
We explored the relationships between the anomalies of annual
NEP and the anomalies of each phenological indicator for the
growing season and C uptake period (Fig. 5). All three growing
season phenological indicators, derived from GPP, were found
to have limited power to explain the interannual variability of
NEP consistently at all sites; no significant correlation was
obtained for either DBF or ENF sites (Fig. 5a–c).
Weak negative relationships were found between the annual
NEP anomaly and CUstart with Pearson correlation coefficients
(r) of -0.25 (P = 0.019) and -0.34 (P < 0.001) for DBF and ENF
sites, respectively, suggesting that earlier onset of net C uptake
generally increased annual C sequestration. CUend, i.e. the end
date of the C uptake period, conversely, showed a positive effect
on the annual NEP, and its effect was stronger than CUstart, with
r of 0.29 (P = 0.006) and 0.48 (P < 0.001) for DBF and ENF sites,
respectively. Combining these results for CUstart and CUend, it is
expected that a positive relationship would be observed between
CUP and annual NEP (r = 0.34, P = 0.001 and r = 0.52, P < 0.001
for DBF and ENF sites, respectively).
Using combined growing season and net C uptakephenology to explain interannual variability in NEP
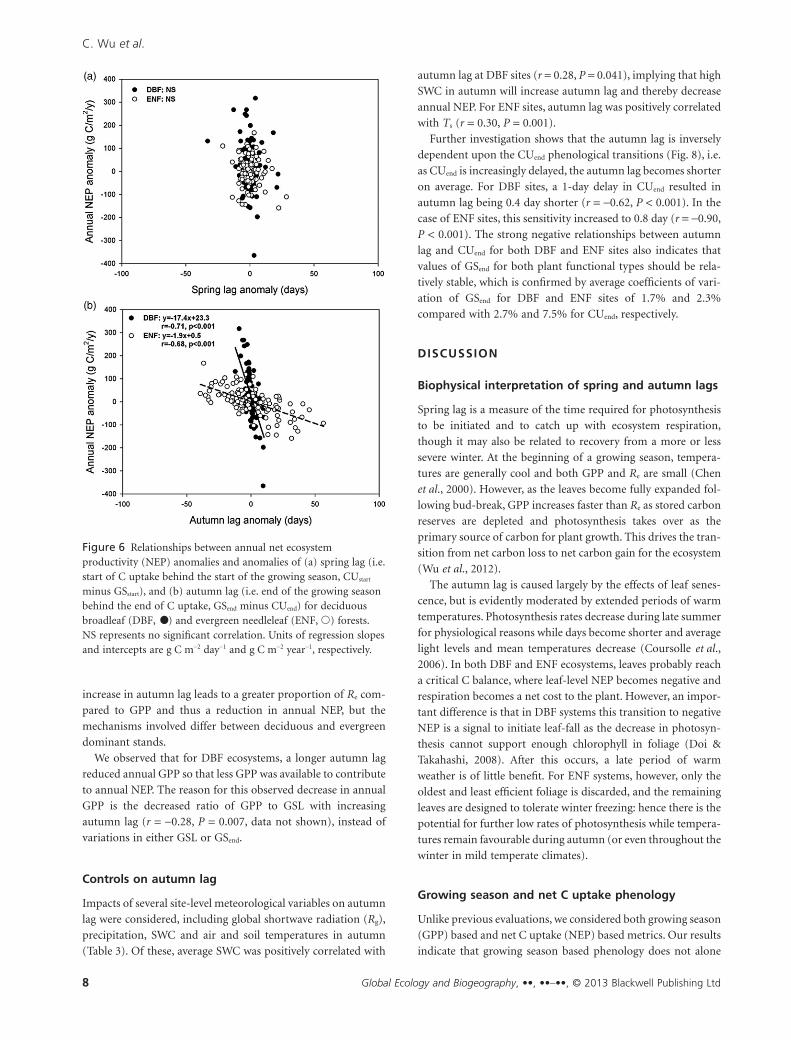
We did not observe significant correlations between the spring
lag and annual NEP for either DBF or ENF sites (Fig. 6a). By
comparison, we obtained stronger relationships between annual
NEP and autumn lag with r of -0.71 (P < 0.001) and -0.68 (P <0.001) for DBF and ENF sites, respectively (Fig. 6b). Longer
autumn lags are expected to decrease annual NEP because after
GPP has declined to near zero, any further delay will only
promote higher Re. This analysis with the combined phenology
suggests that while the spring lag has no effect on annual NEP,
the time lag between the end of net C uptake and the end of the
growing season (i.e. termination GPP) explains a significant
proportion of interannual NEP variability, irrespective of
differences in plant functional types and other ecoregional
characteristics.
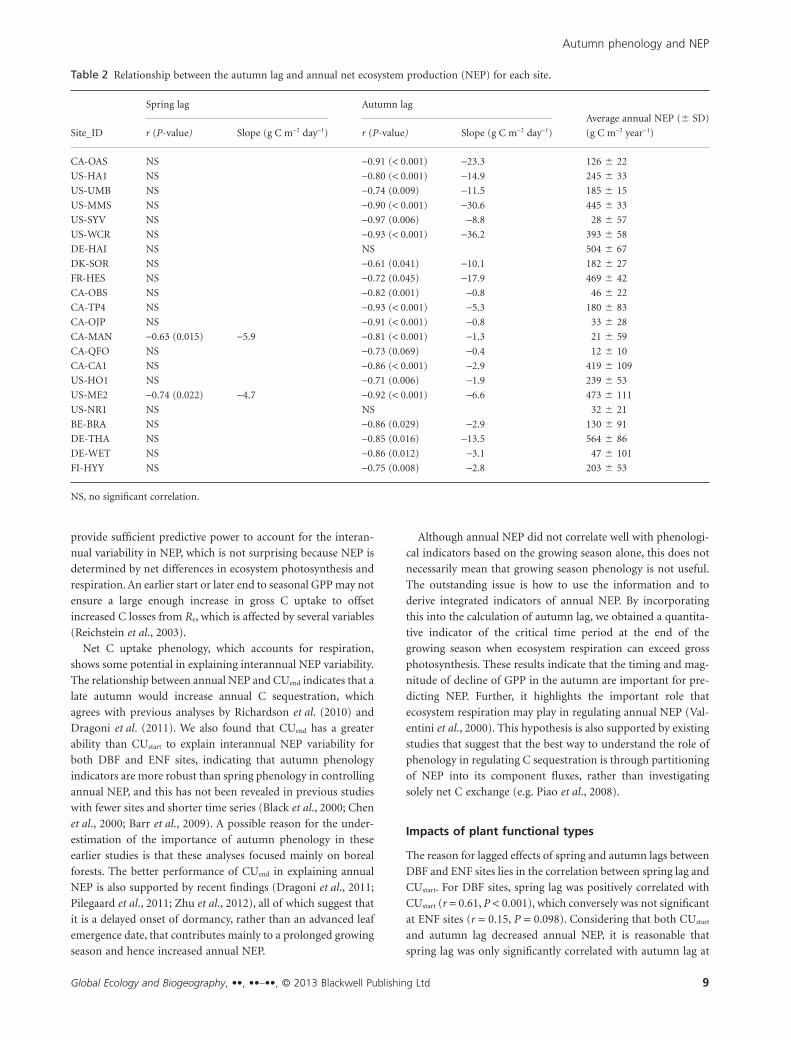
We also explored the relationships between the spring and
autumn lags and annual NEP for each site (Table 2). Spring lag
still showed limited potential in indicating annual NEP and we
only found two sites where the correlations between spring lag
and NEP were significant (CA-MAN and US-ME2). By com-
parison, the autumn lag was significantly correlated with annual
NEP at 11 sites out of 13 (not significant at only DE-HAI and
US-NR1 sites). The relative large P-value (0.069) for CA-QFO
was probably due to the short duration of measurements at this
site (hence relatively few samples). For the remaining sites,
autumn lag was highly correlated with annual NEP with r
ranging from 0.71 (P = 0.006) at US-HO1 up to 0.97 (P = 0.006)
at US-SYV. The slope of the autumn lag and annual NEP regres-
sion showed the sensitivity of decrease in NEP in response to
longer autumn lag. DBF sites had steeper slopes than did the
ENF sites. For example, the slope at CA-OAS indicates that a
1-day increase in autumn lag was associated with and average
decrease of 23.3 g C m–2 in annual NEP, corresponding to
approximately 18% of mean annual NEP during the period of
measurements. However, for the ENF sites, e.g. CA-OBS, a 1-day
increase in autumn lag reduced mean annual NEP by as little as
1.7%.
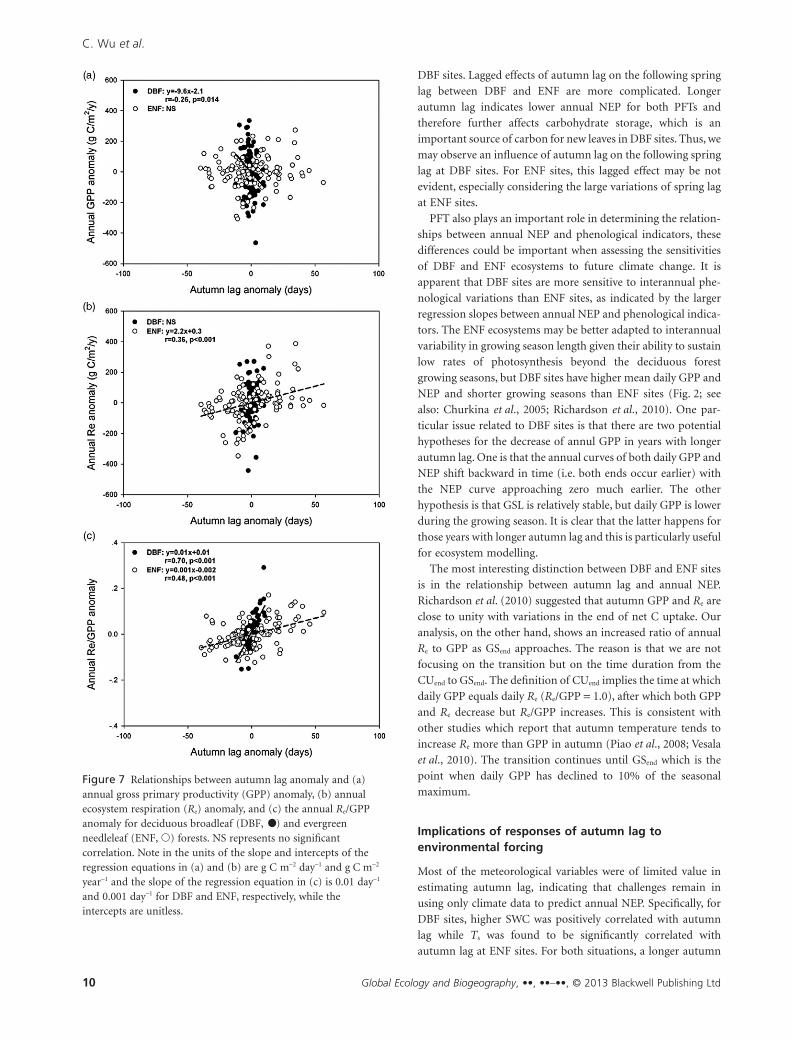
We also partitioned annual NEP into annual GPP and Re, to
evaluate their responses to variations in autumn lag. As shown
in Fig. 7(a, b), there was a distinct difference between DBF and
ENF sites with respect to responses of annual GPP and Re to
autumn lag. An increase in autumn lag corresponded to a
decrease in annual GPP at the DBF sites (r = -0.26, P = 0.014),
while it had no significant effect on GPP at ENF sites. By com-
Figure 4 Relationships between the autumn lag and (a) springlag of the same year, and (b) spring lag of the following year.Units of slopes of regressions are days while the intercept isunitless.
C. Wu et al.
Global Ecology and Biogeography, ••, ••–••, © 2013 Blackwell Publishing Ltd6
parison, annual Re significantly increased with autumn lag at
ENF sites (r = 0.36, P < 0.001), while a longer autumn lag had no
apparent influence on Re at DBF sites. To further understand this
difference, we examined the relationship between the ratio of
annual Re to GPP (Re/GPP) and autumn lag. Significant positive
correlations between annual Re/GPP anomaly and autumn lag
anomaly were obtained with r of 0.70 (P < 0.001) and 0.48 (P <0.001) for DBF and ENF sites, respectively. Therefore, an
Figure 5 Relationships between annual net ecosystem productivity (NEP) anomalies and anomalies of phenological metrics: (a) growingseason start, (b) growing season end, (c) growing season length, (d) C uptake start, (e) C uptake end, and (f) C uptake period fordeciduous broadleaf (DBF, •) and evergreen needleleaf (ENF, �) forests. NS represents no significant correlation and a positive anomalyin start and end metrics means occurrence later than the mean, i.e. a delay. Units of regression slopes and intercepts are g C m-2 day-1
and g C m-2 year-1, respectively.
Autumn phenology and NEP
Global Ecology and Biogeography, ••, ••–••, © 2013 Blackwell Publishing Ltd 7
increase in autumn lag leads to a greater proportion of Re com-
pared to GPP and thus a reduction in annual NEP, but the
mechanisms involved differ between deciduous and evergreen
dominant stands.
We observed that for DBF ecosystems, a longer autumn lag
reduced annual GPP so that less GPP was available to contribute
to annual NEP. The reason for this observed decrease in annual
GPP is the decreased ratio of GPP to GSL with increasing
autumn lag (r = -0.28, P = 0.007, data not shown), instead of
variations in either GSL or GSend.
Controls on autumn lag
Impacts of several site-level meteorological variables on autumn
lag were considered, including global shortwave radiation (Rg),
precipitation, SWC and air and soil temperatures in autumn
(Table 3). Of these, average SWC was positively correlated with
autumn lag at DBF sites (r = 0.28, P = 0.041), implying that high
SWC in autumn will increase autumn lag and thereby decrease
annual NEP. For ENF sites, autumn lag was positively correlated
with Ts (r = 0.30, P = 0.001).
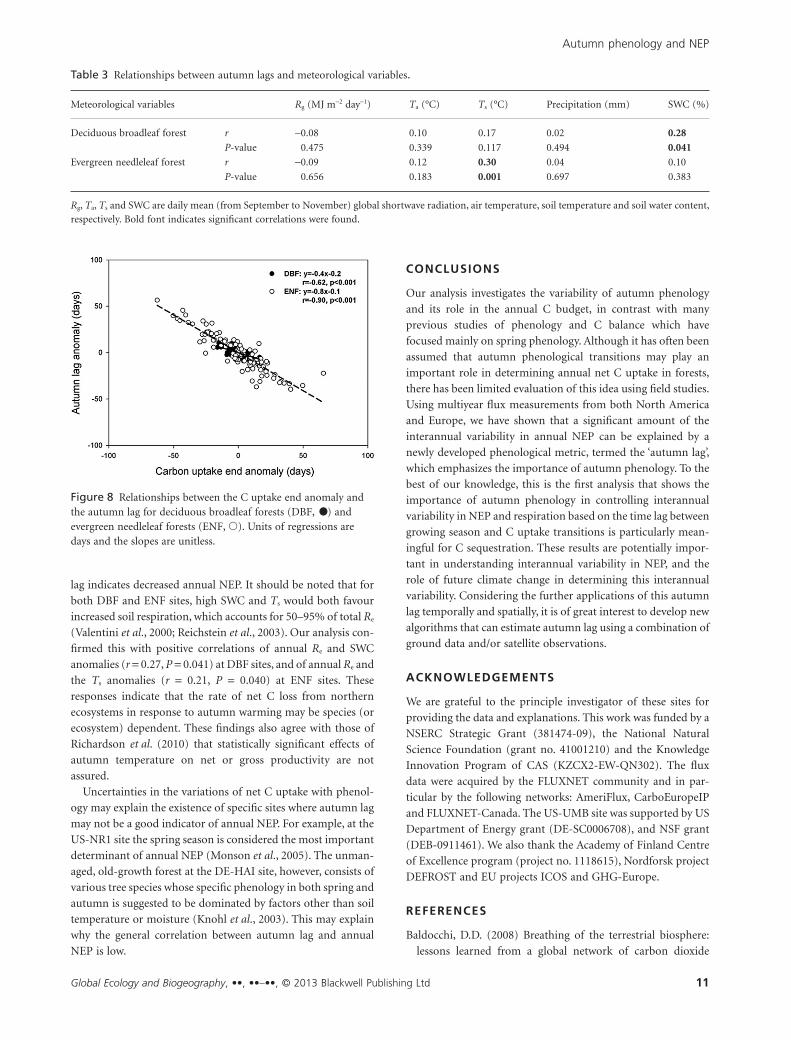
Further investigation shows that the autumn lag is inversely
dependent upon the CUend phenological transitions (Fig. 8), i.e.
as CUend is increasingly delayed, the autumn lag becomes shorter
on average. For DBF sites, a 1-day delay in CUend resulted in
autumn lag being 0.4 day shorter (r = -0.62, P < 0.001). In the
case of ENF sites, this sensitivity increased to 0.8 day (r = -0.90,
P < 0.001). The strong negative relationships between autumn
lag and CUend for both DBF and ENF sites also indicates that
values of GSend for both plant functional types should be rela-
tively stable, which is confirmed by average coefficients of vari-
ation of GSend for DBF and ENF sites of 1.7% and 2.3%
compared with 2.7% and 7.5% for CUend, respectively.
DISCUSSION
Biophysical interpretation of spring and autumn lags
Spring lag is a measure of the time required for photosynthesis
to be initiated and to catch up with ecosystem respiration,
though it may also be related to recovery from a more or less
severe winter. At the beginning of a growing season, tempera-
tures are generally cool and both GPP and Re are small (Chen
et al., 2000). However, as the leaves become fully expanded fol-
lowing bud-break, GPP increases faster than Re as stored carbon
reserves are depleted and photosynthesis takes over as the
primary source of carbon for plant growth. This drives the tran-
sition from net carbon loss to net carbon gain for the ecosystem
(Wu et al., 2012).
The autumn lag is caused largely by the effects of leaf senes-
cence, but is evidently moderated by extended periods of warm
temperatures. Photosynthesis rates decrease during late summer
for physiological reasons while days become shorter and average
light levels and mean temperatures decrease (Coursolle et al.,
2006). In both DBF and ENF ecosystems, leaves probably reach
a critical C balance, where leaf-level NEP becomes negative and
respiration becomes a net cost to the plant. However, an impor-
tant difference is that in DBF systems this transition to negative
NEP is a signal to initiate leaf-fall as the decrease in photosyn-
thesis cannot support enough chlorophyll in foliage (Doi &
Takahashi, 2008). After this occurs, a late period of warm
weather is of little benefit. For ENF systems, however, only the
oldest and least efficient foliage is discarded, and the remaining
leaves are designed to tolerate winter freezing: hence there is the
potential for further low rates of photosynthesis while tempera-
tures remain favourable during autumn (or even throughout the
winter in mild temperate climates).
Growing season and net C uptake phenology
Unlike previous evaluations, we considered both growing season
(GPP) based and net C uptake (NEP) based metrics. Our results
indicate that growing season based phenology does not alone
Figure 6 Relationships between annual net ecosystemproductivity (NEP) anomalies and anomalies of (a) spring lag (i.e.start of C uptake behind the start of the growing season, CUstart
minus GSstart), and (b) autumn lag (i.e. end of the growing seasonbehind the end of C uptake, GSend minus CUend) for deciduousbroadleaf (DBF, •) and evergreen needleleaf (ENF, �) forests.NS represents no significant correlation. Units of regression slopesand intercepts are g C m-2 day-1 and g C m-2 year-1, respectively.
C. Wu et al.
Global Ecology and Biogeography, ••, ••–••, © 2013 Blackwell Publishing Ltd8
provide sufficient predictive power to account for the interan-
nual variability in NEP, which is not surprising because NEP is
determined by net differences in ecosystem photosynthesis and
respiration. An earlier start or later end to seasonal GPP may not
ensure a large enough increase in gross C uptake to offset
increased C losses from Re, which is affected by several variables
(Reichstein et al., 2003).
Net C uptake phenology, which accounts for respiration,
shows some potential in explaining interannual NEP variability.
The relationship between annual NEP and CUend indicates that a
late autumn would increase annual C sequestration, which
agrees with previous analyses by Richardson et al. (2010) and
Dragoni et al. (2011). We also found that CUend has a greater
ability than CUstart to explain interannual NEP variability for
both DBF and ENF sites, indicating that autumn phenology
indicators are more robust than spring phenology in controlling
annual NEP, and this has not been revealed in previous studies
with fewer sites and shorter time series (Black et al., 2000; Chen
et al., 2000; Barr et al., 2009). A possible reason for the under-
estimation of the importance of autumn phenology in these
earlier studies is that these analyses focused mainly on boreal
forests. The better performance of CUend in explaining annual
NEP is also supported by recent findings (Dragoni et al., 2011;
Pilegaard et al., 2011; Zhu et al., 2012), all of which suggest that
it is a delayed onset of dormancy, rather than an advanced leaf
emergence date, that contributes mainly to a prolonged growing
season and hence increased annual NEP.
Although annual NEP did not correlate well with phenologi-
cal indicators based on the growing season alone, this does not
necessarily mean that growing season phenology is not useful.
The outstanding issue is how to use the information and to
derive integrated indicators of annual NEP. By incorporating
this into the calculation of autumn lag, we obtained a quantita-
tive indicator of the critical time period at the end of the
growing season when ecosystem respiration can exceed gross
photosynthesis. These results indicate that the timing and mag-
nitude of decline of GPP in the autumn are important for pre-
dicting NEP. Further, it highlights the important role that
ecosystem respiration may play in regulating annual NEP (Val-
entini et al., 2000). This hypothesis is also supported by existing
studies that suggest that the best way to understand the role of
phenology in regulating C sequestration is through partitioning
of NEP into its component fluxes, rather than investigating
solely net C exchange (e.g. Piao et al., 2008).
Impacts of plant functional types
The reason for lagged effects of spring and autumn lags between
DBF and ENF sites lies in the correlation between spring lag and
CUstart. For DBF sites, spring lag was positively correlated with
CUstart (r = 0.61, P < 0.001), which conversely was not significant
at ENF sites (r = 0.15, P = 0.098). Considering that both CUstart
and autumn lag decreased annual NEP, it is reasonable that
spring lag was only significantly correlated with autumn lag at
Table 2 Relationship between the autumn lag and annual net ecosystem production (NEP) for each site.
Site_ID
Spring lag Autumn lagAverage annual NEP (� SD)
(g C m-2 year-1)r (P-value) Slope (g C m-2 day-1) r (P-value) Slope (g C m-2 day-1)
CA-OAS NS -0.91 (< 0.001) -23.3 126 � 22
US-HA1 NS -0.80 (< 0.001) -14.9 245 � 33
US-UMB NS -0.74 (0.009) -11.5 185 � 15
US-MMS NS -0.90 (< 0.001) -30.6 445 � 33
US-SYV NS -0.97 (0.006) -8.8 28 � 57
US-WCR NS -0.93 (< 0.001) -36.2 393 � 58
DE-HAI NS NS 504 � 67
DK-SOR NS -0.61 (0.041) -10.1 182 � 27
FR-HES NS -0.72 (0.045) -17.9 469 � 42
CA-OBS NS -0.82 (0.001) -0.8 46 � 22
CA-TP4 NS -0.93 (< 0.001) -5.3 180 � 83
CA-OJP NS -0.91 (< 0.001) -0.8 33 � 28
CA-MAN -0.63 (0.015) -5.9 -0.81 (< 0.001) -1.3 21 � 59
CA-QFO NS -0.73 (0.069) -0.4 12 � 10
CA-CA1 NS -0.86 (< 0.001) -2.9 419 � 109
US-HO1 NS -0.71 (0.006) -1.9 239 � 53
US-ME2 -0.74 (0.022) -4.7 -0.92 (< 0.001) -6.6 473 � 111
US-NR1 NS NS 32 � 21
BE-BRA NS -0.86 (0.029) -2.9 130 � 91
DE-THA NS -0.85 (0.016) -13.5 564 � 86
DE-WET NS -0.86 (0.012) -3.1 47 � 101
FI-HYY NS -0.75 (0.008) -2.8 203 � 53
NS, no significant correlation.
Autumn phenology and NEP
Global Ecology and Biogeography, ••, ••–••, © 2013 Blackwell Publishing Ltd 9
DBF sites. Lagged effects of autumn lag on the following spring
lag between DBF and ENF are more complicated. Longer
autumn lag indicates lower annual NEP for both PFTs and
therefore further affects carbohydrate storage, which is an
important source of carbon for new leaves in DBF sites. Thus, we
may observe an influence of autumn lag on the following spring
lag at DBF sites. For ENF sites, this lagged effect may be not
evident, especially considering the large variations of spring lag
at ENF sites.
PFT also plays an important role in determining the relation-
ships between annual NEP and phenological indicators, these
differences could be important when assessing the sensitivities
of DBF and ENF ecosystems to future climate change. It is
apparent that DBF sites are more sensitive to interannual phe-
nological variations than ENF sites, as indicated by the larger
regression slopes between annual NEP and phenological indica-
tors. The ENF ecosystems may be better adapted to interannual
variability in growing season length given their ability to sustain
low rates of photosynthesis beyond the deciduous forest
growing seasons, but DBF sites have higher mean daily GPP and
NEP and shorter growing seasons than ENF sites (Fig. 2; see
also: Churkina et al., 2005; Richardson et al., 2010). One par-
ticular issue related to DBF sites is that there are two potential
hypotheses for the decrease of annul GPP in years with longer
autumn lag. One is that the annual curves of both daily GPP and
NEP shift backward in time (i.e. both ends occur earlier) with
the NEP curve approaching zero much earlier. The other
hypothesis is that GSL is relatively stable, but daily GPP is lower
during the growing season. It is clear that the latter happens for
those years with longer autumn lag and this is particularly useful
for ecosystem modelling.
The most interesting distinction between DBF and ENF sites
is in the relationship between autumn lag and annual NEP.
Richardson et al. (2010) suggested that autumn GPP and Re are
close to unity with variations in the end of net C uptake. Our
analysis, on the other hand, shows an increased ratio of annual
Re to GPP as GSend approaches. The reason is that we are not
focusing on the transition but on the time duration from the
CUend to GSend. The definition of CUend implies the time at which
daily GPP equals daily Re (Re/GPP = 1.0), after which both GPP
and Re decrease but Re/GPP increases. This is consistent with
other studies which report that autumn temperature tends to
increase Re more than GPP in autumn (Piao et al., 2008; Vesala
et al., 2010). The transition continues until GSend which is the
point when daily GPP has declined to 10% of the seasonal
maximum.
Implications of responses of autumn lag toenvironmental forcing
Most of the meteorological variables were of limited value in
estimating autumn lag, indicating that challenges remain in
using only climate data to predict annual NEP. Specifically, for
DBF sites, higher SWC was positively correlated with autumn
lag while Ts was found to be significantly correlated with
autumn lag at ENF sites. For both situations, a longer autumn
Figure 7 Relationships between autumn lag anomaly and (a)annual gross primary productivity (GPP) anomaly, (b) annualecosystem respiration (Re) anomaly, and (c) the annual Re/GPPanomaly for deciduous broadleaf (DBF, •) and evergreenneedleleaf (ENF, �) forests. NS represents no significantcorrelation. Note in the units of the slope and intercepts of theregression equations in (a) and (b) are g C m-2 day-1 and g C m-2
year-1 and the slope of the regression equation in (c) is 0.01 day-1
and 0.001 day-1 for DBF and ENF, respectively, while theintercepts are unitless.
C. Wu et al.
Global Ecology and Biogeography, ••, ••–••, © 2013 Blackwell Publishing Ltd10
lag indicates decreased annual NEP. It should be noted that for
both DBF and ENF sites, high SWC and Ts would both favour
increased soil respiration, which accounts for 50–95% of total Re
(Valentini et al., 2000; Reichstein et al., 2003). Our analysis con-
firmed this with positive correlations of annual Re and SWC
anomalies (r = 0.27, P = 0.041) at DBF sites, and of annual Re and
the Ts anomalies (r = 0.21, P = 0.040) at ENF sites. These
responses indicate that the rate of net C loss from northern
ecosystems in response to autumn warming may be species (or
ecosystem) dependent. These findings also agree with those of
Richardson et al. (2010) that statistically significant effects of
autumn temperature on net or gross productivity are not
assured.
Uncertainties in the variations of net C uptake with phenol-
ogy may explain the existence of specific sites where autumn lag
may not be a good indicator of annual NEP. For example, at the
US-NR1 site the spring season is considered the most important
determinant of annual NEP (Monson et al., 2005). The unman-
aged, old-growth forest at the DE-HAI site, however, consists of
various tree species whose specific phenology in both spring and
autumn is suggested to be dominated by factors other than soil
temperature or moisture (Knohl et al., 2003). This may explain
why the general correlation between autumn lag and annual
NEP is low.
CONCLUSIONS
Our analysis investigates the variability of autumn phenology
and its role in the annual C budget, in contrast with many
previous studies of phenology and C balance which have
focused mainly on spring phenology. Although it has often been
assumed that autumn phenological transitions may play an
important role in determining annual net C uptake in forests,
there has been limited evaluation of this idea using field studies.
Using multiyear flux measurements from both North America
and Europe, we have shown that a significant amount of the
interannual variability in annual NEP can be explained by a
newly developed phenological metric, termed the ‘autumn lag’,
which emphasizes the importance of autumn phenology. To the
best of our knowledge, this is the first analysis that shows the
importance of autumn phenology in controlling interannual
variability in NEP and respiration based on the time lag between
growing season and C uptake transitions is particularly mean-
ingful for C sequestration. These results are potentially impor-
tant in understanding interannual variability in NEP, and the
role of future climate change in determining this interannual
variability. Considering the further applications of this autumn
lag temporally and spatially, it is of great interest to develop new
algorithms that can estimate autumn lag using a combination of
ground data and/or satellite observations.
ACKNOWLEDGEMENTS
We are grateful to the principle investigator of these sites for
providing the data and explanations. This work was funded by a
NSERC Strategic Grant (381474-09), the National Natural
Science Foundation (grant no. 41001210) and the Knowledge
Innovation Program of CAS (KZCX2-EW-QN302). The flux
data were acquired by the FLUXNET community and in par-
ticular by the following networks: AmeriFlux, CarboEuropeIP
and FLUXNET-Canada. The US-UMB site was supported by US
Department of Energy grant (DE-SC0006708), and NSF grant
(DEB-0911461). We also thank the Academy of Finland Centre
of Excellence program (project no. 1118615), Nordforsk project
DEFROST and EU projects ICOS and GHG-Europe.
REFERENCES
Baldocchi, D.D. (2008) Breathing of the terrestrial biosphere:
lessons learned from a global network of carbon dioxide
Table 3 Relationships between autumn lags and meteorological variables.
Meteorological variables Rg (MJ m-2 day-1) Ta (°C) Ts (°C) Precipitation (mm) SWC (%)
Deciduous broadleaf forest r -0.08 0.10 0.17 0.02 0.28
P-value 0.475 0.339 0.117 0.494 0.041
Evergreen needleleaf forest r -0.09 0.12 0.30 0.04 0.10
P-value 0.656 0.183 0.001 0.697 0.383
Rg, Ta, Ts and SWC are daily mean (from September to November) global shortwave radiation, air temperature, soil temperature and soil water content,respectively. Bold font indicates significant correlations were found.
Figure 8 Relationships between the C uptake end anomaly andthe autumn lag for deciduous broadleaf forests (DBF, •) andevergreen needleleaf forests (ENF, �). Units of regressions aredays and the slopes are unitless.
Autumn phenology and NEP
Global Ecology and Biogeography, ••, ••–••, © 2013 Blackwell Publishing Ltd 11
flux measurement systems. Australian Journal of Botany, 56,
1–26.
Baldocchi, D.D., Falge, E., Gu, L. et al. (2001) FLUXNET: a new
tool to study the temporal and spatial variability of
ecosystem-scale carbon dioxide, water vapor, and energy flux
densities. Bulletin of the American Meteorological Society, 82,
2415–2434.
Barr, A., Black, T.A. & McCaughey, H. (2009) Climatic and
phenological controls of the carbon and energy balances of
three contrasting boreal forest ecosystems in western Canada.
Phenology of ecosystem processes (ed. by A. Noormets), pp.
3–34. Springer, New York.
Barr, A.G., Black, T.A., Hogg, E.H., Kljun, N., Morgenstern, K. &
Nesic, Z. (2004) Interannual variability in the leaf area index
of a boreal aspen–hazelnut forest in relation to net ecosystem
production. Agricultural and Forest Meteorology, 126, 237–
255.
Black, T.A., Chen, W., Barr, A.G., Arain, M.A., Chen, Z., Nesic,
Z., Hogg, E.H., Neumann, H.H. & Yang, P.C. (2000) Increased
carbon sequestration by a boreal deciduous forest in years
with a warm spring. Geophysical Research Letters, 27, 1271–
1274.
Chen, J.M., Chen, W., Liu, J. & Cihlar, J. (2000) Annual carbon
balance of Canada’s forests during 1895–1996. Global Biogeo-
chemical Cycles, 14, 839–850.
Churkina, G., Schimel, D., Braswell, B. & Xiao, X. (2005)
Spatial analysis of growing season length control over
net ecosystem exchange. Global Change Biology, 11, 1777–
1787.
Coursolle, C., Margolis, H.A., Barr, A.G., Black, T.A., Amiro,
B.D., McCaughey, J.H., Flanagan, L.B., Lafleur, P.M., Roulet,
N.T., Bourque, C.P.A., Arain, M.A., Wofsy, S.C., Dunn, A.,
Morgenstern, K., Orchansky, A.L., Bernier, P.Y., Chen, J.M.,
Kidston, J., Saigusa, N. & Hedstrom, N. (2006) Late-summer
carbon fluxes from Canadian forests and peatlands along an
east-west continental transect. Canadian Journal of Forest
Research, 36, 783–800.
Doi, H. & Takahashi, M. (2008) Latitudinal patterns in the phe-
nological responses of leaf colouring and leaf fall to climate
change in Japan. Global Ecology and Biogeography, 17, 556–
561.
Dragoni, D., Schmid, H.P., Wayson, C.A., Potter, H., Grimmond,
C.S.B. & Randolph, J.C. (2011) Evidence of increased net
ecosystem productivity associated with a longer vegetated
season in a deciduous forest in south-central Indiana, USA.
Global Change Biology, 17, 886–897.
Garrity, S.R., Bohrer, G., Maurer, K.D., Mueller, K.L., Vogel, C.S.
& Curtis, P.S. (2011) A comparison of multiple phenology
data sources for estimating seasonal transitions in deciduous
forest carbon exchange. Agricultural and Forest Meteorology,
151, 1741–1752.
Gea-Izquierdo, G., Mäkelä, A., Margolis, H., Bergeron, Y.,
Black, T.A., Dunn, A., Hadley, J., Paw, U.K.T., Falk, M.,
Wharton, S., Monson, R., Hollinger, D.Y., Laurila, T., Aurela,
M., McCaughey, H., Bourque, C.P.A., Vesala, T. & Berninger,
F. (2010) Modeling acclimation of photosynthesis to
temperature in evergreen conifer forests. New Phytologist, 188,
175–186.
Knohl, A., Schulze, E.D., Kolle, O. & Buchmann, N. (2003) Large
carbon uptake by an unmanaged 250-year-old deciduous
forest in central Germany. Agricultural and Forest Meteorology,
118, 151–167.
Lasslop, G., Reichstein, M., Papale, D., Richardson, A.D., Arneth,
A., Barr, A., Stoy, P. & Wohlfahrt, G. (2010) Separation of net
ecosystem exchange into assimilation and respiration using a
light response curve approach: critical issues and global evalu-
ation. Global Change Biology, 16, 187–208.
Monson, R.K., Sparks, J.P., Rosenstiel, T.N., Scott-Denton, L.E.,
Huxman, T.E., Harley, P.C., Turnipseed, A.A., Burns, S.P.,
Backlund, B. & Hu, J. (2005) Climatic influences on net eco-
system CO2 exchange during the transition from wintertime
carbon source to springtime carbon sink in a high-elevation,
subalpine forest. Oecologia, 146, 130–147.
Morisette, J.T., Richardson, A.D., Knapp, A.K., Fisher, J.I.,
Graham, E.A., Abatzoglou, J., Wilson, B.E., Breshears, D.D.,
Henebry, G.M., Hanes, J.M. & Liang, L. (2009) Tracking the
rhythm of the seasons in the face of global change: phenologi-
cal research in the 21st century. Frontiers in Ecology and the
Environment, 7, 253–260.
Papale, D. & Valentini, A. (2003) A new assessment of European
forests’ carbon exchange by eddy fluxes and artificial neural
network spatialization. Global Change Biology, 9, 525–535.
Piao, S., Ciais, P., Friedlingstein, P., Peylin, P., Reichstein, M.,
Luyssaert, S., Margolis, H., Fang, J., Barr, A., Chen, A., Grelle,
A., Hollinger, D.Y., Laurila, T., Lindroth, A., Richardson, A.D.
& Vesala, T. (2008) Net carbon dioxide losses of northern
ecosystems in response to autumn warming. Nature, 451,
49–52.
Pilegaard, K., Ibrom, A., Courtney, M.S., Hummelshøj, P. &
Jensen, N.O. (2011) Increasing net CO2 uptake by a Danish
beech forest during the period from 1996 to 2009. Agricultural
and Forest Meteorology, 151, 934–946.
Reichstein, M., Rey, A., Freibauer, A. et al. (2003) Modeling
temporal and large scale spatial variability of soil respiration
from soil water availability, temperature and vegetation pro-
ductivity indices. Global Biogeochemical Cycles, 17, 1–15.
Reichstein, M., Falge, E., Baldocchi, D. et al. (2005) On the sepa-
ration of net ecosystem exchange into assimilation and eco-
system respiration: review and improved algorithm. Global
Change Biology, 11, 1424–1439.
Richardson, A.D., Black, T.A., Ciais, P. et al. (2010) Influence of
spring and autumn phenological transitions on forest ecosys-
tem productivity. Philosophical Transactions of the Royal
Society B: Biological Sciences, 365, 3227–3246.
Richardson, A.D., Anderson, R.S., Arain, M.A. et al. (2012) Ter-
restrial biosphere models need better representation of veg-
etation phenology: results from the North American Carbon
Program Site Synthesis. Global Change Biology, 18, 566–584.
Suni, T., Berninger, F., Markkanen, T., Keronen, P., Rannik, Ü. &
Vesala, T. (2003a) Interannual variability and timing of
growing season CO2 exchange in a boreal forest. Journal of
Geophysical Research, 108, 4265. doi:10.1029/2002JD002381.
C. Wu et al.
Global Ecology and Biogeography, ••, ••–••, © 2013 Blackwell Publishing Ltd12
Suni, T., Berninger, F., Vesala, T., Markkanen, T., Hari, P., Mäkelä,
A., Ilvesniemi, H., Hänninen, H., Nikinmaa, E., Huttula, T.,
Laurila, T., Aurela, M., Grelle, A., Lindroth, A., Arneth, A.,
Shibistova, O. & Lloyd, J. (2003b) Air temperature triggers the
recovery of evergreen boreal forest photosynthesis in spring.
Global Change Biology, 9, 1410–1426.
Thum, T., Aalto, T., Laurila, T., Aurela, M., Hatakka, J., Lindroth,
A. & Vesala, T. (2009) Spring initiation and autumn
cessation of boreal coniferous forest CO2 exchange assessed
by meteorological and biological variables. Tellus B, 61,
701–717.
Valentini, R., Matteucci, G., Dolman, A.J. et al. (2000) Respira-
tion as the main determinant of carbon balance in European
forests. Nature, 404, 861–865.
Vesala, T., Launiainen, S., Kolari, P., Pumpanen, J., Sevanto, S.,
Hari, P., Nikinmaa, E., Kaski, P., Mannila, H., Ukkonen, E.,
Piao, S.L. & Ciais, P. (2010) Autumn temperature and carbon
balance of a boreal Scots pine forest in southern Finland.
Biogeosciences, 7, 163–176.
White, M.A. & Nemani, R.R. (2003) Canopy duration has little
influence on annual carbon storage in the deciduous broad
leaf forest. Global Change Biology, 9, 967–972.
Wu, C., Chen, J.M., Gonsamo, A., Price, D.T., Black, T.A. & Kurz,
W.A. (2012) Interannual variability of carbon sequestration is
determined by the lag between ends of net uptake and pho-
tosynthesis: evidence from long records of two contrasting
forest stands. Agricultural and Forest Meteorology, 164, 29–38.
Zhu, W., Tian, H., Xu, X., Pan, Y., Chen, G. & Lin, W. (2012)
Extension of the growing season due to delayed autumn over
mid and high latitudes in North America during 1982–2006.
Global Ecology and Biogeography, 21, 260–271.
BIOSKETCH
Chaoyang Wu is a post-doctoral fellow at the
Department of Geography and Program in Planning,
University of Toronto, Canada. His research interests
are climate change and carbon cycling, mainly focusing
on the impacts of future climate change (e.g.
precipitation, CO2 and temperature) on ecosystem
carbon sequestration.
Editor: Bill Shipley
Autumn phenology and NEP
Global Ecology and Biogeography, ••, ••–••, © 2013 Blackwell Publishing Ltd 13