2,4-dichlorophenoxyacetic acid-induced oxidative stress - PLOS

982 PHYTOPATHOLOGY
Biological Control
Interactions Between Strains of 2,4-Diacetylphloroglucinol-Producing Pseudomonas fluorescens in the Rhizosphere of Wheat
Blanca B. Landa, Dmitri M. Mavrodi, Linda S. Thomashow, and David M. Weller
First and second authors: Department of Plant Pathology, Washington State University, Pullman 99164; and third and fourth authors: U.S. Department of Agriculture-Agricultural Research Service, Root Disease and Biological Control Research Unit, Washington State University, Pullman 99164.
Current address of B. B. Landa: Departamento de Agronomía, Escuela Técnica Superior de Ingenieros Agrónomos y de Montes, Universidad de Córdoba, Apdo. 3084, 14080 Córdoba, Spain.
Accepted for publication 14 March 2003.
ABSTRACT
Landa, B. B., Mavrodi, D. M., Thomashow, L. S., and Weller, D. M. 2003. Interactions between strains of 2,4-diacetylphloroglucinol-pro-ducing Pseudomonas fluorescens in the rhizosphere of wheat. Phytopath-ology 93:982-994.
Strains of fluorescent Pseudomonas spp. that produce the antibiotic 2,4-diacetylphoroglucinol (2,4-DAPG) are among the most effective rhizobacteria controlling diseases caused by soilborne pathogens. The genotypic diversity that exists among 2,4-DAPG producers can be exploited to improve rhizosphere competence and biocontrol activity. Knowing that D-genotype 2,4-DAPG-producing strains are enriched in some take-all decline soils and that P. fluorescens Q8r1-96, a representa-tive D-genotype strain, as defined by whole-cell repetitive sequence-based polymerase chain reaction (rep-PCR) with the BOXA1R primer, is a superior colonizer of wheat roots, we analyzed whether the exceptional rhizosphere competence of strain Q8r1-96 on wheat is characteristic of other D-genotype isolates. The rhizosphere population densities of four D-genotype strains and a K-genotype strain introduced individually into the soil were significantly greater than the densities of four strains belong-ing to other genotypes (A, B, and L) and remained above log 6.8 CFU/g of root over a 30-week cycling experiment in which wheat was grown for
10 successive cycles of 3 weeks each. We also explored the competitive interactions between strains of different genotypes inhabiting the same soil or rhizosphere when coinoculated into the soil. Strain Q8r1-96 became dominant in the rhizosphere and in nonrhizosphere soil during a 15-week cycling experiment when mixed in a 1:1 ratio with either strain Pf-5 (A genotype), Q2-87 (B genotype), or 1M1-96 (L genotype). Fur-thermore, the use of the de Wit replacement series demonstrated a competitive disadvantage for strain Q2-87 or strong antagonism by strain Q8r1-96 against Q2-87 in the wheat rhizosphere. Amplified rDNA re-striction analysis and sequence analysis of 16S rDNA showed that species of Arthrobacter, Chryseobacterium, Flavobacterium, Massilia, Microbacterium, and Ralstonia also were enriched in culturable popula-tions from the rhizosphere of wheat at the end of a 30-week cycling experiment in the presence of 2,4-DAPG producers. Identifying the interactions among 2,4-DAPG producers and with other indigenous bacteria in the wheat rhizosphere will help to elucidate the variability in biocontrol efficacy of introduced 2,4-DAPG producers and fluctuations in the robustness of take-all suppressive soils.
Additional keywords: Gaeumannomyces graminis var. tritici, microbial ecology, plant growth-promoting rhizobacteria, root colonization.
Many plant species stimulate and support populations of rhizo-
sphere bacteria (rhizobacteria) as a first line of defense against soil-borne plant pathogens (6). Disease-suppressive soils provide one of the best examples in which indigenous microorganisms protect plant roots against pathogens (51) and are excellent sources of rhizobacteria that can be developed into biocontrol agents. Several studies have demonstrated that rhizobacteria must establish and maintain a threshold population density in the rhizosphere to pre-vent or limit pathogen infection (3,39). However, most introduced rhizobacteria initially establish high population densities in the rhizosphere after inoculation, but then decline with time and dis-tance from the inoculum source, comprising a progressively smaller proportion of the total rhizosphere microflora. Densities of intro-duced rhizobacteria also vary considerably from root to root and plant to plant, leaving some plants or roots unprotected (52). Vari-able root colonization has remained one of the major impediments to the widespread use of rhizobacteria in agriculture for biological control; thus, research over the past 2 decades has been directed
toward finding approaches to lower the dose of rhizobacteria needed to provide biological control, to lengthen the time during which a threshold population density is sustained in the rhizosphere, and to increase the magnitude of disease control provided by introduced rhizobacteria (50). Studies to improve colonization have focused on bacterial traits and genes that contribute to rhizosphere compe-tence (22,28), plant host genes that promote the rhizobacteria–root association (46,47), and soil biotic and abiotic factors that affect colonization and biological control (52).
Strains of Pseudomonas fluorescens that produce the broad-spectrum antibiotic 2,4-diacetylphoroglucinol (2,4-DAPG) (e.g., CHA0, Pf-5, F113, Q2-87, Q8r1-96, and SSB17) are recognized as some of the most effective rhizobacteria controlling diseases caused by soilborne pathogens (7,8,10,12,16,37,39,45,48). The 2,4-DAPG biosynthetic locus includes six genes (phlF and phlACBDE) that function in the regulation, synthesis, and export of the antibiotic (2) and is conserved among all known 2,4-DAPG-producing fluorescent Pseudomonas spp., including iso-lates from soils in the United States, Europe, South America, and Africa (17,26,31,36). Several molecular fingerprinting methods have been used to characterize the genetic diversity among 2,4-DAPG producers, including amplified rDNA restriction analysis (ARDRA), whole-cell repetitive sequence-based-polymerase chain reaction (rep-PCR), random amplified polymorphic DNA (RAPD) analysis, and restriction fragment length polymorphism (RFLP)
Corresponding author: D. M. Weller; E-mail address: [email protected]�
Publication no. P-2003-0610-01R This article is in the public domain and not copyrightable. It may be freely re-printed with customary crediting of the source. The American PhytopathologicalSociety, 2003.
Vol. 93, No. 8, 2003 983
analysis of phlD (17,20,26,30,31,36,40,49). We distinguished 17 distinct genotypes (A through Q) within a worldwide collection of 2,4-DAPG-producing fluorescent Pseudomonas spp., using rep-PCR with the BOXA1R primer (BOX-PCR) (20,31), and these groups correlate very closely with those identified by RFLP analy-sis of phlD (20,26,30).
The genotypic diversity that exists within natural populations of 2,4-DAPG producers can be exploited to improve the rhizosphere competence and biocontrol activity of introduced rhizobacteria (20,40,45). Raaijmakers and Weller (40) showed that P. fluores-cens Q8r1-96 (D genotype), applied at only 100 CFU/g of soil, maintained rhizosphere population densities on wheat significantly greater than strains Q2-87 (B genotype) or 1M1-96 (L genotype), and strain Q8r1-96 also was significantly more suppressive to take-all. Recently, Landa et al. (20) showed that D-genotype strains (including Q8r1-96) and P-genotype strains had signifi-cantly greater rhizosphere competence on pea than strains of six other genotypes (A, B, E, L, O, and Q). The exceptional rhizo-sphere competence of D-genotype isolates in wheat and pea rhizo-spheres is consistent with the key role that they play in plant defense against soilborne pathogens. 2,4-DAPG producers are pri-marily responsible for the suppressiveness of some take-all de-cline (TAD) soils in Washington State and the Netherlands to Gaeumannomyces graminis var. tritici (10,39,51), and D-genotype isolates were the most abundant 2,4-DAPG producers recovered from roots of wheat grown for multiple successive cycles in TAD soils from Lind, Moses Lake, and Quincy, WA (40). D-genotype isolates also were dominant among 2,4-DAPG producers on pea roots grown in a Fusarium wilt suppressive soil from Mount Vernon, WA, that had been cropped continuously to pea for more than 30 years (20). The substantial differences in rhizosphere competence and biocontrol activity among genotypes of 2,4-DAPG producers are especially surprising because strains of most genotypes are very similar physiologically and in the production of 2,4-DAPG (26,31,40).
The first objective of this study was to determine whether the exceptional rhizosphere competence of the D-genotype strain Q8r1-96 on wheat is a characteristic common among other D-genotype isolates. The population dynamics of D-genotype strains from two TAD soils and genotypes A, B, K, and L strains were compared over successive cycles of wheat. The second objective was to explore the competitive interactions between strains of different genotypes inhabiting the same soil or rhizosphere. Fi-nally, we identified other indigenous culturable heterotrophic bac-teria that may interact with populations of 2,4-DAPG producers in the rhizosphere.
MATERIALS AND METHODS
Soil and plants. The Shano sandy loam soil (designated Quincy virgin) used in this study was collected from a noncropped site near Quincy, WA, in May 2000. The soil was collected from the upper 30 cm of the soil profile, air dried for 1 week, passed through a 0.5-cm-mesh screen, and stored at room temperature. Spring wheat (Triticum aestivum L.) cv. Penawawa was used throughout the study.
Bacterial strains and growth media. Nine 2,4-DAPG-producing (phlD+) P. fluorescens strains were used in this study. Strains Q2-87, Q8r1-96, and Q8r2-96 were isolated from roots of wheat grown in TAD soil collected from a field near Quincy, WA, in 1987, 1996, and 1996, respectively. Strains L5.1-96 and W2-6 were isolated from roots of wheat grown in TAD soil near Lind, WA, in 1996 and 1998, respectively (19,30,31,39,40). Strain 1M1-96 (40) was isolated from roots of wheat grown in soil from Mount Vernon, WA, that had been cropped continuously to pea for more than 30 years and is suppressive to Fusarium wilt of pea (20). P. fluorescens strains CHA0, Pf-5, and F113 originally were isolated from the rhizospheres of tobacco (16,48), cotton (14), and
sugar beet (35), respectively. The strains used in this study are from six different geographic locations and represent five distinct genotypes (A, B, D, K, and L) (26,31). The ability to produce 2,4-DAPG correlates with the presence of phlD in a strain; thus, we use the terms 2,4-DAPG producer and phlD+ interchangeably. P. fluorescens strain 2-79, which does not contain phlD, was used as a negative control for PCR (20).
Chemicals were obtained from Sigma Chemical (St. Louis) unless otherwise noted. Strains were routinely cultured on one-third-strength King’s medium B (1/3× KMB) supplemented with ampicillin (40 µg/ml), chloramphenicol (13 µg/ml), and cyclohexi-mide (100 µg/ml) (1/3× KMB+++) at 25°C as described previously (30). All strains used in this study were spontaneous rifampicin-resistant mutants selected as described previously (20,27). For the replacement series experiment, a strain (Q2-87) with spontaneous nalidixic acid resistance (Q2-87NA) was selected. Introduced strains were isolated from the soil or the rhizosphere in 1/3× KMB+++ broth supplemented with rifampicin (100 µg/ml) (1/3× KMB+++rif). Strain Q2-87NA was isolated in 1/3× KMB+++rif sup-plemented with 40 µg of nalidixic acid (1/3× KMB+++rif,NA) per ml. In some experiments, these media were solidified with 17 g of agar per liter of medium, and population densities were deter-mined by dilution plating. Stock cultures of all strains were stored in 1/3× KMB+++ plus 18% glycerol at –80°C.
Soil cycling. The rhizosphere competence of phlD+ P. fluores-cens strains was determined in cycling experiments with wheat as described previously (20,40). Bacteria were introduced into soil in a suspension (about 105 bacteria per ml) of 1% methylcellulose (to enhance survival) as described previously (19,20) to establish an initial population density of approximately 104 CFU/g fresh weight of soil. Each pot was filled with 200 g of inoculated or noninoculated soil, 12 wheat seeds were sown, and seeds were covered with noninoculated soil. Each pot received 50 ml of water supplemented with metalaxyl (Syngenta, Greensboro, NC) at 2.5 mg/ml active ingredient after sowing to control Pythium root rot. Plants were grown in a growth chamber at 15 � 1°C with a 12-h photoperiod. Pots were covered with a plastic film for 72 h to prevent the surface of the soil from drying before the seedlings emerged. Each treatment was replicated six times, with each pot serving as a replicate. Pots were watered at 2-day intervals and twice a week received 50 ml of a fertilizer solution (20). Bacteria were introduced into the soil only at the beginning of the first cycle. One plant was selected randomly from the 12 plants in each pot at the end of each 3-week cycle to determine the population size of the introduced bacteria. Shoots of the remaining plants were excised, and the soil and associated root systems were de-canted into a plastic bag and mixed by shaking. The soil was re-turned to the pots and immediately replanted with 12 wheat seeds, beginning the next 3-week cycle. The process of growth, harvest-ing, and determination of population sizes was repeated for a total of 4 to 10 cycles (12 to 30 weeks) depending on the experiment.
Determination of population densities of introduced 2,4-DAPG producers and indigenous bacteria. Population densities of phlD+ P. fluorescens in soil and root samples were determined by one of two methods, which provided similar results (19). The first was dilution plating onto 1/3× KMB+++rif agar plates as described previously (19). Briefly, either soil (0.5 g) or roots with tightly adhering soil were placed in centrifuge tubes with 10 ml of sterile distilled water, shaken for 1 min on a Vortex mixer, and sonicated for 1 min in an ultrasonic cleaner. One hundred micro-liters of the wash solution was serially diluted and plated in dupli-cate onto 1/3× KMB+++rif agar plates, and colonies were counted after 72 � 4 h. Bacteria from two representative colonies per plate (12 colonies per treatment) were confirmed to contain phlD by PCR, and the genotype was determined by RFLP analysis.
Population densities also were determined by the phlD-specific PCR-based dilution-endpoint method (19,20,30). Briefly, the wash solution obtained as described previously was serially diluted

984 PHYTOPATHOLOGY
(1:3) in a 96-well microtiter plate prefilled with 200 µl of sterile distilled water per well, and 50 µl of each dilution was transferred to a well of a plate containing 200 µl of fresh 1/3× KMB+++rif or 1/3× KMB+++rif,NA (replacement series experiment). Microtiter plates were incubated at room temperature (24 � 1°C), and growth was measured with a microplate reader (MR500; Dynatech Laboratories, Burlington, MA) after 72 � 4 h. Optical density at 600 nm (OD600nm) � 0.05 was scored as positive. Bacteria from the terminal dilution that scored positive for growth (terminal dilution culture [TDC]) were confirmed to contain cells with phlD by PCR, and the genotype of the phlD+ strain was determined by RFLP analysis. The TDC containing a signal for phlD was used to calculate the population density of the phlD+ strain (19,20,30).
Densities of total culturable heterotrophic bacteria (TCB) were determined by transferring 50-µl aliquots from the serially diluted (1:3) washes into microtiter plates containing 1/10th-strength tryptic soy (TS) broth (3 g of TS broth per liter [Difco Labora-tories, Detroit]) (19) supplemented with cycloheximide (100 µg/ml) (1/10× TS+ broth). Bacterial growth after 48 � 4 h at an OD600nm � 0.05 was scored as positive. The TDC was used to calculate the total population size of TCB in a sample. In the last (10th) cycle of one of the cycling experiments, the most abundant culturable bacteria present in the TDC of some treatments (Pf-5, Q2-87, F113, 1M1-96, Q8r1-96, and L5.1-96) (described below) were re-covered by streaking a loopful of broth onto 1/10× TS+ agar. Cells of a representative colony were stored at –80°C. When two mor-photypes were recovered from a single TDC, both were purified and stored in glycerol. Bacterial isolates recovered from the TDC were designated TRPx:y–z, where x represents a bacterial treat-ment, y represents a replicate, and z represents the isolate number. Bacteria with an orange colony were designated O-TRPx:y–z.
Determination of the rhizosphere competence of genotypes of 2,4-DAPG producers. Cycling experiments were conducted to determine the rhizosphere competence of each phlD+ strain. In one experiment, wheat was cycled four times, and population densities were determined by dilution plating onto 1/3× KMB+++rif agar plates. In another, wheat was cycled 10 times in each treatment, and population densities were determined by the phlD-specific PCR-based dilution-endpoint assay. Densities of TCB also were determined.
Competition between genotypes of 2,4-DAPG-producing P. fluorescens strains in the rhizosphere. To determine the ability of strain Q8r1-96 to compete with strains of other genotypes, strains Pf-5 (A genotype), Q2-87 (B genotype), F113 (K geno-type), and 1M1-96 (L genotype) were applied to soil alone or in combination with Q8r1-96 in a 1:1 mixture to give a final concen-tration of approximately 104 CFU/g of soil as described previ-ously. Three different treatments were established to determine whether the interaction between genotypes differed in bulk soil and in the rhizosphere environment. One set of pots was filled with soil inoculated with the bacteria, sown to 12 wheat seeds, and cycled five times. These pots were used to determine the population dynamics of the introduced strains in the rhizosphere environment. Samples consisted of roots with adhering rhizo-sphere soil and were processed as described previously. A second set of pots was filled with soil inoculated with the bacteria, sown to six wheat seeds, and cycled five times. However, in contrast to the standard cycling procedure described previously, after each cycle the roots were not incorporated back into the soil after harvest. These pots were used to determine the population dy-namics of the introduced bacteria in nonrhizosphere soil subjected to wheat cropping. Samples consisted of soil without roots and were processed as described previously. A third set of pots was filled with soil inoculated with the bacteria, but no seeds were sown. At the end of each cycle, the soil was removed from the pots, shaken, and returned to the same pots. Pots without plants were watered on the same schedule as the pots with plants but re-ceived less water and fertilizer. These pots were used to determine
the population dynamics of the introduced bacteria in bulk soil without wheat cropping. Samples consisted of soil (designated bulk soil) and were processed as described previously. Samples of soil from pots with or without plants were dried in an oven at 80°C for 3 days to determine bacterial populations per gram of dry soil. Population densities of the introduced strains in all treatments were determined by the phlD-specific PCR-based dilution-end-point assay.
de Wit replacement series. A competition experiment based on the de Wit replacement series (1,53) was used to study the inter-action between strain Q8r1-96 (D genotype) and strain Q2-87NA (B genotype) in the wheat rhizosphere. Cell suspensions were combined in five different proportions (Q8r1-96/Q2-87NA ratios of 0:1, 0.3:0.7, 0.5:0.5, 0.7:0.3, and 1:0) and added to Quincy virgin soil to give a total concentration of approximately 104 CFU/g of soil. Seeds were planted in each pot and soils were cycled twice as described previously. Population densities were determined at the end of the second cycle using the phlD-specific PCR-based dilu-tion-endpoint assay.
Interactions in vitro between genotypes of 2,4-DAPG-pro-ducing P. fluorescens strains. In the competition experiments described previously, the phlD-specific PCR-based dilution-end-point method (30) was used to determine the densities of single or pairs of phlD+ strains in the rhizosphere or soil. This assay is limited by the fact that phlD+ genotypes that are not dominant (subordinate) in a sample are difficult to detect by RFLP analysis when they comprise less than one-third of the total phlD+ cells in a sample because of the threefold dilution scheme used (30). To confirm the ability of this assay to detect each strain in a mixture of two different genotypes, strains were grown individually or in pairs in 1/3× KMB+++rif. Strains Pf-5, Q2-87, Q8r1-96, F113, and 1M1-96 were adjusted to 105 cells per ml in 1/3× KMB+++rif. One hundred microliters of each bacterial suspension or threefold serial dilution (105 cells per ml down to 1.2 × 10³ cells per ml) was mixed with 100 µl of a suspension of strain Q8r1-96 (105 cells per ml) in 1/3× KMB+++rif in 96-well-microtiter plates. Plates were incubated at room temperature (24 � 1°C) for 72 h. Bacterial growth was monitored at 3-h intervals by measuring the OD600nm with a microplate reader. Samples (10 µl) were taken at 8-h intervals for PCR and RFLP analysis. There were six repli-cations (wells) for each treatment to monitor bacterial growth, and two replications (wells) for sampling. Each treatment was re-peated twice in different microplates. Aliquots taken for PCR analysis were pooled together and immediately frozen at –80°C for a minimum of 1 h prior to PCR analysis.
PCR amplification, RFLP analysis of phlD, and charac-terization of most abundant cultured bacterial populations. Oligonucleotide primers B2BF and BPR4 were used to amplify phlD (20,30). The genotype of a phlD+ strain was determined by RFLP analysis of amplification products after digestion with HaeIII (New England Biolabs Inc., Beverly, MA) as described previously (19,20,30). The RFLP patterns generated by digestion with HaeIII were sufficient to distinguish the A-, B-, D-, K-, and L-genotype strains used in this study (19,20,30). When strains Pf-5 and Q8r1-96 were present in the same treatment, an additional digestion with TaqI was needed due to the presence of co-migrating bands.
The genotype of the dominant bacteria recovered from the TDC in 1/10× TS+ broth was determined by ARDRA of 16S rDNA as described by McSpadden Gardener and Weller (32). Whole cell templates of strains Pf-5 and CHA0 (genotype A), Q2-87 (geno-type B), Q8r1-96 (genotype D), F113 (genotype K), and 1M1-96 (L genotype) were included as controls in the PCR reactions. Briefly, nearly full-length portions of 16S rDNA were amplified by PCR with oligonucleotide primers 8F and 1492R in a 25-µl reaction mixture containing 5 µl of thawed cell lysate. Restriction digestions included 7 µl of the PCR reaction mixture and 10 units of either MspI or RsaI (New England Biolabs) in a total volume of
Vol. 93, No. 8, 2003 985
30 µl. Restriction fragments were separated on 1.5% agarose gels. The ARDRA patterns were digitalized, converted, normalized with a 100-bp molecular size marker, and compared with GelCom-par 4.0 software (Applied Maths, Kortrijk, Belgium). A band-matching algorithm was selected to calculate pair-wise similarity matrices with the Dice coefficient, and cluster analysis of simi-larity matrices was performed by the unweighted pair group method using arithmetic averages (UPGMA) as described previ-ously (20).
Representative isolates from each of the most common ARDRA groups were analyzed by partial sequencing of amplified 16S rDNA. The 16S rDNA PCR products were separated on a prepa-rative 0.9% agarose gel and extracted with a gel extraction kit (QIAEX II; Qiagen, Valencia, CA) according to manufacturer’s recommendations. Purified DNA fragments were partially se-quenced using primers 8F and 1492R and a cycle sequencing ready reaction kit (ABI PRISM BigDye Terminator; Applied Biosystems, Foster City, CA). Sequence data were edited with the OMIGA 2.0 software package (Accelerys, San Diego, CA). Data-base similarity searches were performed using the web-based BLASTN search engine with default parameters at the National Center for Biotechnology Information. Additional analyses were performed using the Sequence Match 2.7 search engine at the Ribosomal Database Project website (23). The sequences were deposited as GenBank Accession nos. AF481829 to AF481836, AF482701, AF482702, AF516908, and AF516909.
Statistical analysis. In all experiments, treatments were ar-ranged in a randomized complete block design. Population data were converted to log CFU/g dry weight of soil or fresh weight of root to satisfy the assumptions of the parametric statistical test used. Data were analyzed using STATISTIX 7.0 (Analytical Soft-ware, St. Paul, MN). Rhizosphere competence of 2,4-DAPG producers was determined by calculating three variables indicative of rhizosphere colonization (20): (i) mean population density for all cycles; (ii) cycle with the maximum population density; and (iii) area under the colonization progress curve (AUCPC) using the trapezoidal integration method representing the total rhizo-sphere colonization for all cycles. Differences in population densi-ties among treatments were determined by standard analysis of variance, and mean comparisons among treatments were performed by Fisher’s protected least significant difference test at P = 0.05. The de Wit replacement series (1,53) was used to determine whether there was competition between strains Q8r1-96 and Q2-87NA in the rhizosphere of wheat when coinoculated in the soil. For this experiment, relative colonization (RC) values for each strain (colonization for each strain in the mixture divided by its colonization average when present alone) was calculated and plotted against the input proportion (0, 0.3, 0.5, 0.7, and 1). RC totals (RTC) were calculated by adding the RC values at each input proportion. For each strain, observed RC lines were com-pared statistically with the reference lines by paired comparison t test, which compared observed RC values with expected RC values using a null-hypothesis model in which inter- and intra-specific competition were equal. The observed RTC were com-pared by a nonparametric sign test, with a reference line having a value of 1.0 (1).
RESULTS
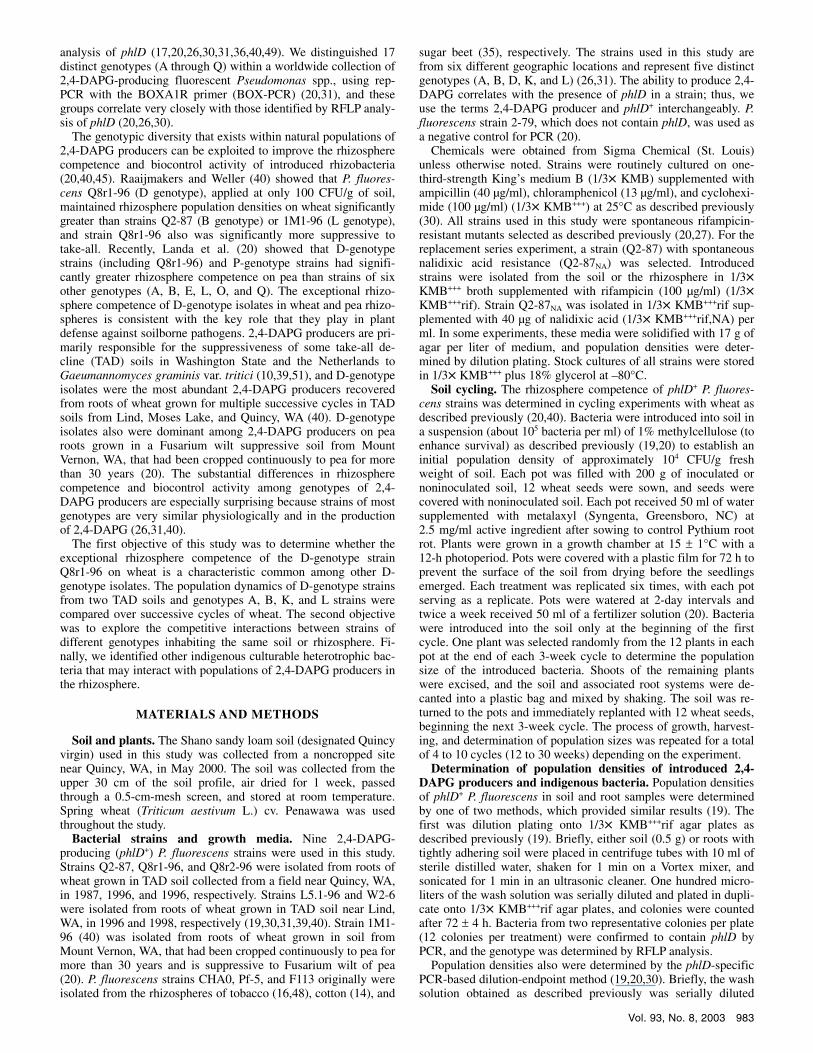
Rhizosphere competence of genotypes of 2,4-DAPG pro-ducers. Population sizes among the nine introduced phlD+ strains 1 h after inoculation (cycle 0) ranged from log 4.02 to 4.54 CFU/g of soil and did not differ significantly (P � 0.05) (Fig. 1). Rhizo-sphere colonization by D- and K-genotype strains was signifi-cantly greater than that of A-, B-, and L-genotype strains. D- and K-genotype strains showed similar population dynamics during the 10 cycles (Fig. 1). Population densities of D- and K-genotype strains in the rhizosphere increased during the first cycle relative
to the densities originally established in the soil and remained above log 6.0 CFU/g of root for the entire duration of the ex-periment (30 weeks). Maximum population sizes for strains of these two genotypes generally did not occur until cycle 2 or 4 (Fig. 1; Table 1). The mean rhizosphere population density for all D- and K-genotype strains was greater than log 6.8 (strains W2-6 and Q8r2-96) or log 7.3 CFU/g of root (strains Q8r1-96, L5.1-96, and F113). In contrast, the population sizes of A-, B-, and L-geno-type strains increased in cycle 1 or 2, when maximum population densities occurred, and then declined to about log 4.0 to 5.0 CFU/g
�
�
�
�
��
�
�
�
�
��
�
�
�
�
��
�
�
�
�
��
�
�
�
�
��
�
�
�
�
��
�
�
�
�
��
�
�
�
�
��
�
�
�
�
��
�
�
�
�
��
�������������� ���������������
���������������������
������ � � � � � � � � ��
�������
������
� ���
������
��� �����
���������
� � � � �
� � � � � � � � � ��
�����
������
�������
� �����
��� �����
���������
���������������������
������ � � � � � � � � ��
�������
������
� ���
������
��� �����
���������
� � � � �
� � � � � � � � � ��
�����
������
�������
� �����
��� �����
���������
� � � � � � � � � ��
�����
������
�������
� �����
��� �����
���������
Fig. 1. Population dynamics of phlD+ Pseudomonas fluorescens Pf-5 and CHA0 (A genotype); Q2-87 (B genotype); W2-6, L5.1-96, Q8r1-96, and Q8r2-96 (D genotype); F113 (K genotype); and 1M1-96 (L genotype) and of total culturable heterotrophic bacteria on roots and in the rhizosphere of wheat (cv. Penawawa) grown in Quincy virgin soil for 10 successive cycles of 3 weeks each. Each strain was introduced into the soil to give a final density of approximately 104 CFU/g of soil (cycle 0). Cycle 0 also shows the population size of total cultural bacteria present in soil at the beginning of the experiment. Mean values and standard deviations are presented. No phlD+ strains were detected in the control treatment.

986 PHYTOPATHOLOGY
of root (Fig. 1; Table 1). Strains CHA0, Q2-87, and 1M1-96 had mean rhizosphere population sizes below log 5.5 CFU/g of root, and strain Pf-5 had a mean rhizosphere population size below log 5.0 CFU/g of root (Fig. 1; Table 1). All D- and K-genotype strains had AUCPC values (used as an indicator of rhizosphere coloni-zation over all cycles) significantly (P < 0.0001) greater than the values for strains of all the other genotypes. AUCPC values among D-genotype strains also differed significantly. RFLP analy-ses of phlD from the TDC confirm that the genotypes recovered from roots were the same as those originally introduced into the soil (data not shown). The phlD gene was not detected from rhizo-sphere samples of the nontreated control (Fig. 1). In cycles 9 and 10, neither the TDC nor any of the sub-TDC from some replicate pots with strains Pf-5, CHA0, Q2-87, and 1M1-96 gave a positive signal for phlD; the population densities for these replicates were considered to be below the detection limit (<log 3.26 phlD+ per g of fresh root weight) and were assigned a value of log 3.26.
In all treatments, population densities of TCB in the rhizosphere increased during the first cycle compared with population den-sities in the soil, and remained greater than log 7.0 CFU/g of root for the duration of the experiment. Maximum population sizes for TCB generally occurred in cycles 9 or 10, when the lowest popu-lation densities of phlD+ strains were detected (Fig. 1; Table 1). Mean rhizosphere populations of TCB in all treatments were greater than log 8.4 CFU/g of root (Table 1). All treatments with an introduced phlD+ strain had AUCPC values greater than the AUCPC value for the control treatment, but only treatments with strains Q2-87 and F113 differed significantly (P < 0.05) from the control (Table 1). Introduced phlD+ strains comprised less than 6.4% of the TCB in the soil 1 h after inoculation (cycle 0). How-ever, at the end of cycle 1, phlD+ strains comprised from 18.5 to 88.9% of the TCB in the rhizosphere depending on the bacterial treatment. In general, the percentage of the TCB represented by phlD+ strains diminished after the first cycle, but this trend was more pronounced with strains Pf-5, CHA0, Q2-87, and 1M1-96 compared with strains of the D and K genotypes.
Competition between genotypes of 2,4-DAPG producers in the rhizosphere. In an early experiment, each of the nine phlD+ strains was added individually to soil, wheat was cycled four times, and population densities were detected by dilution plating on 1/3× KMB+++rif agar. Initial population sizes of introduced phlD+ strains in the soil 1 h after inoculation did not differ sig-nificantly (P � 0.05) and ranged from log 4.07 to 4.72 CFU/g of soil. The population dynamics of the D- and K-genotype strains were nearly identical to those shown in Figure 1 (data not shown). RFLP analysis of phlD amplification products from randomly
picked rifampicin-resistant colonies taken from all four cycles with the D- and K-genotype strains revealed patterns (data not shown) typical of the strain initially introduced into the soil. Sur-prisingly, however, beginning in cycle 2, D- and/or K-genotype strains were detected in the control soil and treatments with strains Pf-5, CHA0, Q2-87, or 1M1-96, and their frequency in-creased in subsequent cycles. Prior to the second cycle, no con-tamination was detected (Fig. 2). The population densities of D-genotype phlD+ isolates on roots grown in the control soil were 4.72, 5.05, and 6.34 log CFU/g of root in cycles 2, 3, and 4, re-spectively. The reason(s) for the cross-contamination was not obvious, because soils were not accidentally mixed. However, pots in this experiment were initially covered with a common piece of plastic and after each cycle the soil from all of the pots of a single treatment was pooled, mixed, and then added back into the pots to initiate the next cycle. In subsequent cycling experi-ments (Fig. 1), cross-contamination was eliminated by (i) cover-ing pots of the same treatment with a separate piece of plastic until after emergence, when they were randomized; (ii) spacing pots farther apart; and (iii) handling soil from each pot indi-vidually rather than pooling soil from all pots of the same treat-ment. The observations in the above experiment prompted us to examine further the ability of P. fluorescens Q8r1-96 (D genotype) to compete with A-, B-, K-, and L-genotype strains over five cycles in the rhizosphere environment of wheat, in nonrhizosphere soil, and in noncropped bulk soil.
Population sizes of introduced phlD+ strains in the soil 1 h after inoculation in single or coinoculated treatments did not differ significantly (P > 0.05) and ranged from log 4.19 to 4.43 CFU/g of soil (Fig. 3). RFLP analysis of the TDC from the inoculated soil (cycle 0) showed that in treatments with coinoculated geno-types, both could be detected (data not shown). When data from all treatments were pooled, the AUCPC value for the root plus rhizosphere soil was significantly (P < 0.05) greater than the non-rhizosphere soil and bulk soil AUCPC values, and the AUCPC value for the nonrhizosphere soil was significantly (P < 0.05) greater than the value for the bulk soil (Table 2). Rhizosphere colonization by strains Q8r1-96 and F113 was similar to that seen in other experiments and significantly (P < 0.05) greater than colonization by strains Pf-5, Q2-87, and 1M1-96 (Fig. 3). The mean rhizosphere population densities of Q8r1-96 or F113 when inoculated alone or Q8r1-96 when coinoculated with another genotype were greater than log 7.7 CFU/g of root, whereas the mean rhizosphere population densities of strains 1M1-96, Pf-5, and Q2-87 were less than log 6.8 (Table 2). AUCPC values were significantly (P < 0.0001) greater for all treatments that included
TABLE 1. Colonization by 2,4-diacetylphloroglucinol (2,4-DAPG)-producing Pseudomonas fluorescens strains and total culturable bacteria of the roots of wheat grown in Quincy virgin soil for 10 cycles
Introduced 2,4-DAPG-producing strains Total culturable bacteria
Treatmentv
BOX genotypew
Mean colonization (log CFU/g root)x
Cycle of maximum colonization
AUCPCy
Mean colonization (log CFU/g root)x
Cycle of maximum colonization
AUCPCy
Control … ndz nd nd 8.42 10 75.84 c Pf-5 A 4.92 1 43.89 f 8.47 9 76.42 bc CHA0 A 5.55 1 49.78 e 8.55 9 77.09 a–c Q2-87 B 5.59 1 50.05 e 8.52 9 77.27 ab W2-6 D 6.85 2 61.98 d 8.47 9 76.37 bc L5.1-96 D 7.78 2 70.15 a 8.50 9 76.43 bc Q8r1-96 D 7.26 2 65.91 c 8.48 9 76.17 bc Q8r2-96 D 6.82 4 61.59 d 8.56 10 76.85 bc F113 K 7.47 3 67.73 b 8.66 9 78.15 a 1M1-96 L 5.44 2 49.00 e 8.44 9 76.26 bc
v Bacterial isolates were introduced to give a final density of approximately 104 CFU/g of soil. Each treatment consisted of 6 pots with 12 plants per pot. Plants were grown for 10 cycles of 3 weeks each in a growth chamber at 15 � 1°C.
w Genotypes were defined previously by BOX-PCR genomic fingerprinting. x Mean population density across all cycles except cycle 0. Population data were converted to log CFU/g fresh weight of root. y Area under the colonization progress curve (AUCPC), using the trapezoidal integration method. Means in a column followed by the same letter are not
significantly different (P = 0.05) according to Fisher’s protected least significant difference test. z phlD+ strains were not detected in the control treatment.

Vol. 93, No. 8, 2003 987
strain Q8r1-96 than treatments with strains Pf-5, Q2-87, and 1M1-96 alone, but they did not differ significantly from those of F113 (Table 2). RFLP patterns of phlD amplification products from treatments with individual strains were identical to those of the phlD+ strains introduced into the rhizosphere (Fig. 3). However, in treatments with strain Pf-5, Q2-87, or 1M1-96 coinoculated with Q8r1-96, only the Q8r1-96 RFLP profile was observed in cycle 1 and subsequent cycles. In contrast, in the treatment with Q8r1- 96 + F113, only the F113 RFLP profile was detected (Fig. 3; Table 2). Attempts to detect the less dominant genotype by PCR of lower dilutions were not successful (data not shown). Thus, we concluded that the less dominant genotype was at least threefold less abundant than the dominant strain (in vitro interactions be-tween 2,4-DAPG producers are described below).
Population sizes of strains 1M1-96, F113, and F113 + Q8r1-96 from nonrhizosphere soil and noncropped bulk soil in general were greater than densities of the other introduced bacteria (Fig. 3). Furthermore, the mean population sizes for these three treatments were close to log 6.0 and higher than log 5.0 CFU/g of dry soil in nonrhizosphere soil and noncropped bulk soil samples, respectively. In nonrhizosphere soil, the AUCPC value for F113 was significantly (P < 0.0001) higher than the values for the other treatments, except for 1M1-96 and F113 + Q8r1-96. In bulk soil, the AUCPC values for F113 and 1M1-96 were significantly higher (P < 0.0001) than the values for the other treatments, ex-cept for F113 + Q8r1-96 (Table 2). RFLP analysis of phlD from the TDC of soil samples showed only the pattern of the D geno-type in treatments consisting of Pf-5 + Q8r1-96, Q2-87 + Q8r1-96, and 1M1-96 + Q8r1-96 in cycle 1 and all subsequent cycles. In contrast, in the F113 + Q8r1-96 treatment, only the F113 RFLP profile was detected (Fig. 3; Table 2).
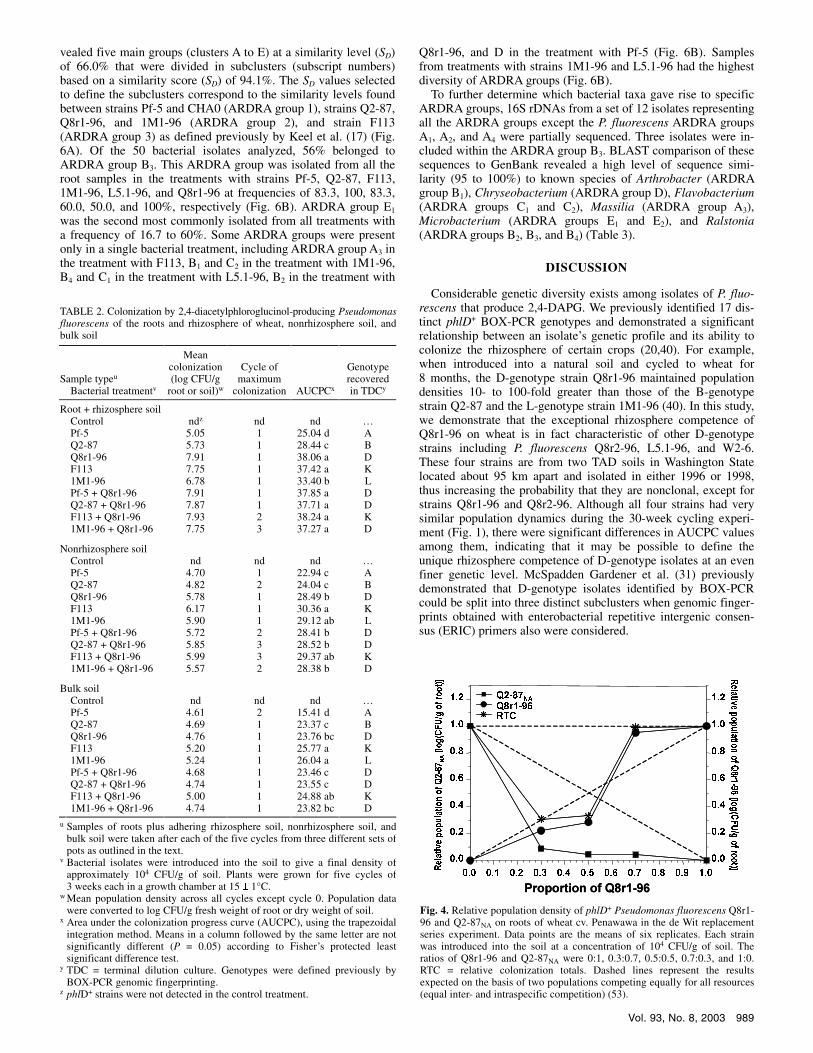
Competition in de Wit replacement series. An experiment based on the de Wit replacement series was performed with strains Q8r1-96 and Q2-87NA to assess further the interaction be-tween strains of the B and D genotypes in the rhizosphere. The final population size of Q2-87NA in the rhizosphere when intro-duced as a mixture with Q8r1-96 was smaller than predicted and accounted for less than 1% of the total population even when applied at a ratio of 0.3:0.7 (Q8r1-96/Q2-87NA), indicating a com-petitive disadvantage for Q2-87NA under these conditions. How-ever, the final population density of Q2-87NA applied alone was log 6.8 CFU/g of root, similar to the value typically obtained for Q2-87 after two cycles of wheat. All initial inoculum densities of strain Q8r1-96, which ranged from 3 × 10³ to 1 × 10⁴ CFU/g of soil, yielded population densities higher than log 8.0 CFU/g of root, independent of whether Q2-87NA was present.
To determine statistically whether there was a competitive effect between strains, the observed RC values for Q2-87NA and Q8r1-96 were plotted against their input proportions in mixture and the lines were compared statistically with the references lines. For each treatment (mixture of Q8r1-96 and Q2-87 in different ratios), the colonization of each strain was expressed relative (RC units of 0 to 1) to its colonization in single-inoculation treatments, which was assigned a value of 1.0 (Fig. 4). When the observed and ex-pected RC lines were compared by a paired comparison t test, the RC line of strain Q2-87NA did not significantly fit (P = 0.0004) the reference RC line, and the RC values were consistently lower than those expected. In contrast, the observed RC values for strain Q8r1-96 did not differ significantly from the expected model (Fig. 4). Additionally, the observed RTC data line was lower than 1.0 (i.e., concave downward) and significantly lower (P = 0.0002) than the reference line (RTC = 1.0), as determined by the non-parametric sign test (Fig. 4). Such concave downward RTC lines are indicative of competition (i.e., antagonism) (1).
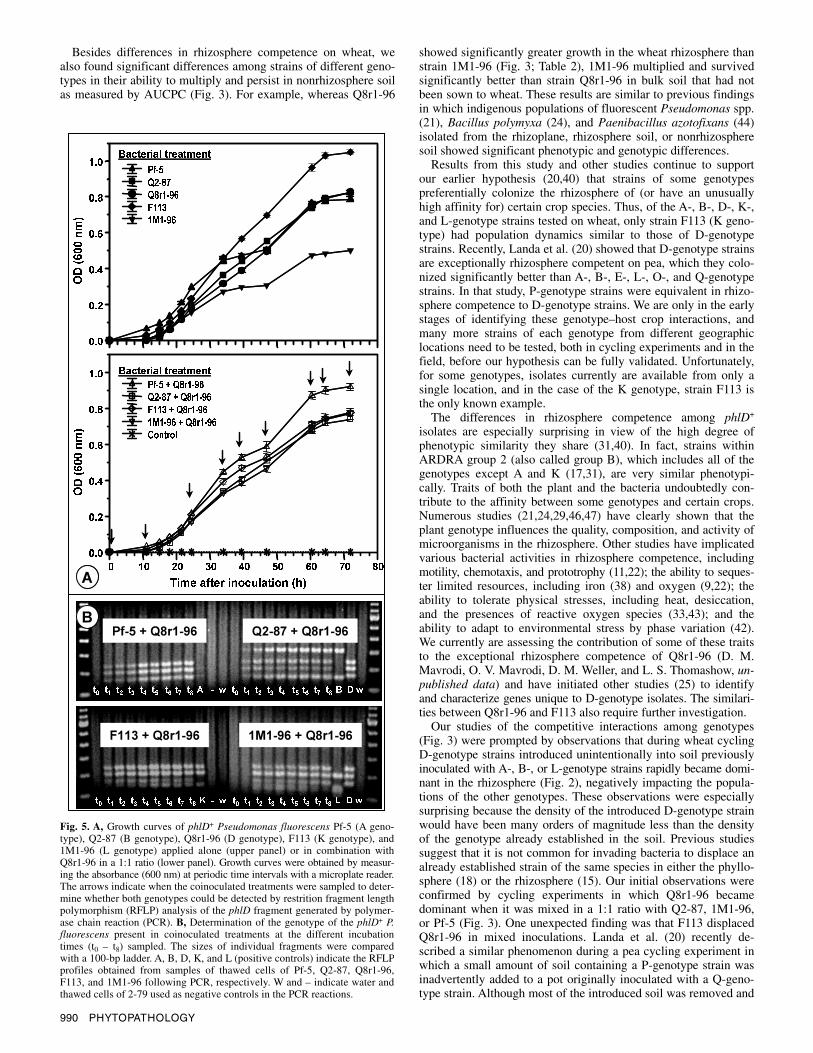
In vitro interactions between 2,4-DAPG-producing P. fluo-rescens strains. Strain Q8r1-96 at 105 cells per ml was co-inoculated into 1/3× KMB+++rif with Pf-5, Q2-87, F113, or 1M1-96 at 3.3 × 10⁴, 1.1 × 10⁴, 3.7 × 10³, and 1.2 × 10³ cells per ml.
There were significant (P < 0.05) differences in bacterial growth in 1/3× KMB+++rif among strains when they were grown alone and when grown in combination with strain Q8r1-96 (Fig. 5A). For example, the final OD values after 72 h (OD72h) for strains F113 and 1M1-96 were significantly (P < 0.05) higher and lower, respectively, than values for the other strains grown alone. Furthermore, the OD72h for strains Pf-5 and 1M1-96 and strains Q2-87 and F113 were significantly (P < 0.05) lower and greater, respectively, than the OD72h obtained when these strains were coinoculated with Q8r1-96 (Fig. 5A). When coinoculated samples containing Q8r1-96 plus Pf-5, Q2-87, F113, or 1M1-96 at a ratio of 1:1 or 3:1 were examined by PCR and RFLP analysis with HaeIII (30), both genotypes could be detected after 12 h or 60 to 72 h of incubation (Fig. 5B). With strain Pf-5, the assay was less efficient, the amplification was suboptimal, and an additional di-gestion with TaqI was necessary to detect Pf-5 in a background of
��������
�
��
��
��
��
����
��
��
��
��
���
�
�
�
�
�
����� �����
�������
���������
�
���
����� ����
�
��
��
��
��
����
��
��
��
��
����
��
��
��
��
���
�����
�� �
����
�����
������
�������
������
���� ������
����
�����
�� �
����
�����
������
�������
������
���� ������
����
������������������������������������������������������������
Fig. 2. Frequency of recovery of A, B, D, K, and L genotypes from the roots and rhizosphere of wheat (cv. Penawawa) grown in Quincy virgin soil inocu-lated with either phlD+ Pseudomonas fluorescens Pf-5 and CHA0 (A geno-type); Q2-87 (B genotype); W2-6, L5.1-96, Q8r1-96, and Q8r2-96 (D geno-type); F113 (K genotype); or 1M1-96 (L genotype). Plants were grown for four successive cycles of 3 weeks each. Frequencies were obtained by di-viding the number of colonies of each genotype found in a treatment by the total number of rifampicin-resistant colonies analyzed in that treatment. The genotype of each colony sampled was determined by restriction fragment length polymorphism analysis of phlD.

988 PHYTOPATHOLOGY
Q8r1-96 due to the presence of comigrating bands that differen-tiate the A and D genotypes (data not shown). In the 1:1 mixture of Q8r1-96 and 1M1-96, the RFLP profile of strain 1M1-96 was stronger at 12 h than at 60 to 72 h after coinoculation (Fig. 5B). In 3:1 mixtures of Q8r1-96 plus Pf-5, Q2-87, F113, or 1M1-96, the RFLP patterns of the latter genotypes were weaker at 60 to 72 h than at 12 h, but still clear enough to detect the strain inoculated at the lower density. However, in 9:1, 27:1, and 81:1 mixtures, only the RFLP pattern for the D genotype could be detected at 12 h and 60 to 72 h (data not shown).
Characterization of most abundant cultured bacterial popu-lations. In one cycling experiment (Fig. 1), we noted that the decline of some D-genotype strains in the last two cycles roughly
correlated with increased densities of TCB. To characterize the most abundant culturable bacteria (i.e., those isolated from the TDC) that could be associated with the decline in the populations of phlD+ strains, single colonies were obtained by streaking samples from TDC of root washes from cycle 10 (Fig. 1) onto 1/10× TS+ agar. Six (Pf-5, Q2-87, F113, 1M1-96, L5.1-96, and Q8r1-96) of the ten treatments were selected for this purpose. Nearly full-length portions of 16S rDNAs of 50 isolates and six phlD+ reference strains were amplified by PCR with primers 8F and 1492R. The individual RFLP patterns obtained by digestion with MspI and RsaI are shown in Figure 6A. Thirteen different restriction patterns were distinguished from the combined restric-tion profiles. Cluster analysis of these patterns by UPGMA re-
����
������ ��� ������ ������� ����
�����������
�������������
�����������
������������
� � � � � � � � � � � � � � � � � �� � � � � �� � � � � � �
�
�
�
�
���
�
�
�
���
�
�
�
��
� � � � � � � � � � � � � � � � � �
���� �!����"�#$ �""%�!����"�#$
&�'�!����"�#$�""% "("�#$
���"�#$&�' ����
"("�#$�!����"�#$
�����
������������ )*����
� � � � � � � � � � � �� � � � � �� � � � � �� � � � ���
+
��
������������� ���
,)*���
-./�
�
�� �
-+����
������ ��� ������ ������� ����
�����������
�������������
�����������
������������
� � � � � � � � � � � � � � � � � �� � � � � �� � � � � � �� � � � � � � � � � � �� � � � � � � � � � � �� � � � � �� � � � � �� � � � � � �
�
�
�
�
���
�
�
�
���
�
�
�
��
�
�
�
�
���
�
�
�
���
�
�
�
��
� � � � � � � � � � � � � � � � � �� � � � � � � � � � � � � � � � � �
���� �!����"�#$ �""%�!����"�#$
&�'�!����"�#$�""% "("�#$
���"�#$&�' ����
&�'�!����"�#$�""% "("�#$
���"�#$&�' ����
"("�#$�!����"�#$
�����
������������ )*����
� � � � � � � � � � � �� � � � � �� � � � � �� � � � ���� � � � � �� � � � � � � � � � � �� � � � � �� � � � � �� � � � � �� � � � � �� � � � � �� � � � � � � � ���
+
��
������������� ���
,)*���
-./�
�
�� �
-+
Fig. 3. A, Population dynamics of phlD+ Pseudomonas fluorescens Pf-5 (A genotype), Q2-87 (B genotype), Q8r1-96 (D genotype), F113 (K genotype), and 1M1-96 (L genotype) applied alone or in combination with Q8r1-96 on the roots and in the rhizosphere soil (RRS) of wheat cv. Penawawa or in nonrhizosphere soil (NRS) or bulk soil (BS). Single or pairs of strains were introduced into the soil to give a final density of approximately 104 CFU/g of soil (cycle 0). Soil was cycled five times with (RRS or NRS) or without (BS) wheat. Mean values and standard deviations are presented. B, The gel electrophoresis image shows the genotype of the phlD+ P. fluorescens strain detected in the terminal dilution of each treatment. In the treatment with genotypes A+D, an additional digestion with TaqI was needed. The sizes of individual fragments were compared with a 100-bp ladder. Numbers 1 to 6 indicate each replicate of a treatment. Letters A, B, D, K, and L and – indicate, respectively, the restriction fragment length polymorphism profiles obtained from thawed cell samples of each phlD+ strain (positive) and 2-79 (negative) used as controls in the polymerase chain reaction, respectively.
Vol. 93, No. 8, 2003 989
vealed five main groups (clusters A to E) at a similarity level (SD) of 66.0% that were divided in subclusters (subscript numbers) based on a similarity score (SD) of 94.1%. The SD values selected to define the subclusters correspond to the similarity levels found between strains Pf-5 and CHA0 (ARDRA group 1), strains Q2-87, Q8r1-96, and 1M1-96 (ARDRA group 2), and strain F113 (ARDRA group 3) as defined previously by Keel et al. (17) (Fig. 6A). Of the 50 bacterial isolates analyzed, 56% belonged to ARDRA group B3. This ARDRA group was isolated from all the root samples in the treatments with strains Pf-5, Q2-87, F113, 1M1-96, L5.1-96, and Q8r1-96 at frequencies of 83.3, 100, 83.3, 60.0, 50.0, and 100%, respectively (Fig. 6B). ARDRA group E1 was the second most commonly isolated from all treatments with a frequency of 16.7 to 60%. Some ARDRA groups were present only in a single bacterial treatment, including ARDRA group A3 in the treatment with F113, B1 and C2 in the treatment with 1M1-96, B4 and C1 in the treatment with L5.1-96, B2 in the treatment with
Q8r1-96, and D in the treatment with Pf-5 (Fig. 6B). Samples from treatments with strains 1M1-96 and L5.1-96 had the highest diversity of ARDRA groups (Fig. 6B).
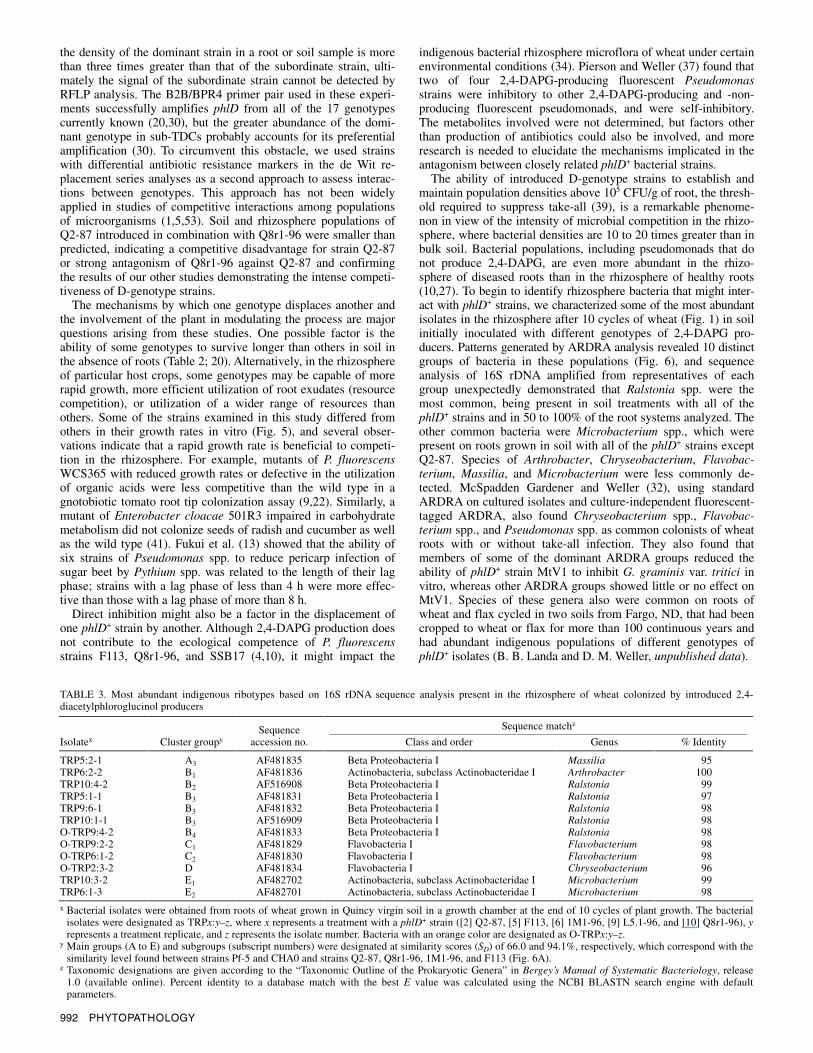
To further determine which bacterial taxa gave rise to specific ARDRA groups, 16S rDNAs from a set of 12 isolates representing all the ARDRA groups except the P. fluorescens ARDRA groups A1, A2, and A4 were partially sequenced. Three isolates were in-cluded within the ARDRA group B3. BLAST comparison of these sequences to GenBank revealed a high level of sequence simi-larity (95 to 100%) to known species of Arthrobacter (ARDRA group B1), Chryseobacterium (ARDRA group D), Flavobacterium (ARDRA groups C1 and C2), Massilia (ARDRA group A3), Microbacterium (ARDRA groups E1 and E2), and Ralstonia (ARDRA groups B2, B3, and B4) (Table 3).
DISCUSSION
Considerable genetic diversity exists among isolates of P. fluo-rescens that produce 2,4-DAPG. We previously identified 17 dis-tinct phlD+ BOX-PCR genotypes and demonstrated a significant relationship between an isolate’s genetic profile and its ability to colonize the rhizosphere of certain crops (20,40). For example, when introduced into a natural soil and cycled to wheat for 8 months, the D-genotype strain Q8r1-96 maintained population densities 10- to 100-fold greater than those of the B-genotype strain Q2-87 and the L-genotype strain 1M1-96 (40). In this study, we demonstrate that the exceptional rhizosphere competence of Q8r1-96 on wheat is in fact characteristic of other D-genotype strains including P. fluorescens Q8r2-96, L5.1-96, and W2-6. These four strains are from two TAD soils in Washington State located about 95 km apart and isolated in either 1996 or 1998, thus increasing the probability that they are nonclonal, except for strains Q8r1-96 and Q8r2-96. Although all four strains had very similar population dynamics during the 30-week cycling experi-ment (Fig. 1), there were significant differences in AUCPC values among them, indicating that it may be possible to define the unique rhizosphere competence of D-genotype isolates at an even finer genetic level. McSpadden Gardener et al. (31) previously demonstrated that D-genotype isolates identified by BOX-PCR could be split into three distinct subclusters when genomic finger-prints obtained with enterobacterial repetitive intergenic consen-sus (ERIC) primers also were considered.
TABLE 2. Colonization by 2,4-diacetylphloroglucinol-producing Pseudomonasfluorescens of the roots and rhizosphere of wheat, nonrhizosphere soil, and bulk soil
Sample typeu
Bacterial treatmentv
Mean colonization (log CFU/g
root or soil)w
Cycle of
maximum colonization
AUCPCx
Genotype recovered in TDCy
Root + rhizosphere soil Control ndz nd nd … Pf-5 5.05 1 25.04 d A Q2-87 5.73 1 28.44 c B Q8r1-96 7.91 1 38.06 a D F113 7.75 1 37.42 a K 1M1-96 6.78 1 33.40 b L Pf-5 + Q8r1-96 7.91 1 37.85 a D Q2-87 + Q8r1-96 7.87 1 37.71 a D F113 + Q8r1-96 7.93 2 38.24 a K 1M1-96 + Q8r1-96 7.75 3 37.27 a D
Nonrhizosphere soil Control nd nd nd … Pf-5 4.70 1 22.94 c A Q2-87 4.82 2 24.04 c B Q8r1-96 5.78 1 28.49 b D F113 6.17 1 30.36 a K 1M1-96 5.90 1 29.12 ab L Pf-5 + Q8r1-96 5.72 2 28.41 b D Q2-87 + Q8r1-96 5.85 3 28.52 b D F113 + Q8r1-96 5.99 3 29.37 ab K 1M1-96 + Q8r1-96 5.57 2 28.38 b D
Bulk soil Control nd nd nd … Pf-5 4.61 2 15.41 d A Q2-87 4.69 1 23.37 c B Q8r1-96 4.76 1 23.76 bc D F113 5.20 1 25.77 a K 1M1-96 5.24 1 26.04 a L Pf-5 + Q8r1-96 4.68 1 23.46 c D Q2-87 + Q8r1-96 4.74 1 23.55 c D F113 + Q8r1-96 5.00 1 24.88 ab K 1M1-96 + Q8r1-96 4.74 1 23.82 bc D
u Samples of roots plus adhering rhizosphere soil, nonrhizosphere soil, and bulk soil were taken after each of the five cycles from three different sets of pots as outlined in the text.
v Bacterial isolates were introduced into the soil to give a final density of approximately 104 CFU/g of soil. Plants were grown for five cycles of 3 weeks each in a growth chamber at 15 � 1°C.
w Mean population density across all cycles except cycle 0. Population data were converted to log CFU/g fresh weight of root or dry weight of soil.
x Area under the colonization progress curve (AUCPC), using the trapezoidal integration method. Means in a column followed by the same letter are notsignificantly different (P = 0.05) according to Fisher’s protected least significant difference test.
y TDC = terminal dilution culture. Genotypes were defined previously by BOX-PCR genomic fingerprinting.
z phlD+ strains were not detected in the control treatment.
���
���
���
���
���
���
���
���
���
���
���
���
���
���
��� ��� ��� ��� ��� ��� ��� �� ��� �� ���
&���������������"�#$
������
�� ������
������������������� ������
���������������� �
������������������ �����������������������
���
���
���
���
���
���
���
���
���
���
���
���
���
���
���
���
���
���
���
���
���
���
���
���
���
���
���
���
��� ��� ��� ��� ��� ��� ��� �� ��� �� ���
&���������������"�#$
������
�� ������
������������������� ������
���������������� �
������������������ �����������������������
Fig. 4. Relative population density of phlD+ Pseudomonas fluorescens Q8r1-96 and Q2-87NA on roots of wheat cv. Penawawa in the de Wit replacement series experiment. Data points are the means of six replicates. Each strain was introduced into the soil at a concentration of 104 CFU/g of soil. The ratios of Q8r1-96 and Q2-87NA were 0:1, 0.3:0.7, 0.5:0.5, 0.7:0.3, and 1:0. RTC = relative colonization totals. Dashed lines represent the results expected on the basis of two populations competing equally for all resources (equal inter- and intraspecific competition) (53).
990 PHYTOPATHOLOGY
Besides differences in rhizosphere competence on wheat, we also found significant differences among strains of different geno-types in their ability to multiply and persist in nonrhizosphere soil as measured by AUCPC (Fig. 3). For example, whereas Q8r1-96
showed significantly greater growth in the wheat rhizosphere than strain 1M1-96 (Fig. 3; Table 2), 1M1-96 multiplied and survived significantly better than strain Q8r1-96 in bulk soil that had not been sown to wheat. These results are similar to previous findings in which indigenous populations of fluorescent Pseudomonas spp. (21), Bacillus polymyxa (24), and Paenibacillus azotofixans (44) isolated from the rhizoplane, rhizosphere soil, or nonrhizosphere soil showed significant phenotypic and genotypic differences.
Results from this study and other studies continue to support our earlier hypothesis (20,40) that strains of some genotypes preferentially colonize the rhizosphere of (or have an unusually high affinity for) certain crop species. Thus, of the A-, B-, D-, K-, and L-genotype strains tested on wheat, only strain F113 (K geno-type) had population dynamics similar to those of D-genotype strains. Recently, Landa et al. (20) showed that D-genotype strains are exceptionally rhizosphere competent on pea, which they colo-nized significantly better than A-, B-, E-, L-, O-, and Q-genotype strains. In that study, P-genotype strains were equivalent in rhizo-sphere competence to D-genotype strains. We are only in the early stages of identifying these genotype–host crop interactions, and many more strains of each genotype from different geographic locations need to be tested, both in cycling experiments and in the field, before our hypothesis can be fully validated. Unfortunately, for some genotypes, isolates currently are available from only a single location, and in the case of the K genotype, strain F113 is the only known example.
The differences in rhizosphere competence among phlD+ isolates are especially surprising in view of the high degree of phenotypic similarity they share (31,40). In fact, strains within ARDRA group 2 (also called group B), which includes all of the genotypes except A and K (17,31), are very similar phenotypi-cally. Traits of both the plant and the bacteria undoubtedly con-tribute to the affinity between some genotypes and certain crops. Numerous studies (21,24,29,46,47) have clearly shown that the plant genotype influences the quality, composition, and activity of microorganisms in the rhizosphere. Other studies have implicated various bacterial activities in rhizosphere competence, including motility, chemotaxis, and prototrophy (11,22); the ability to seques-ter limited resources, including iron (38) and oxygen (9,22); the ability to tolerate physical stresses, including heat, desiccation, and the presences of reactive oxygen species (33,43); and the ability to adapt to environmental stress by phase variation (42). We currently are assessing the contribution of some of these traits to the exceptional rhizosphere competence of Q8r1-96 (D. M. Mavrodi, O. V. Mavrodi, D. M. Weller, and L. S. Thomashow, un-published data) and have initiated other studies (25) to identify and characterize genes unique to D-genotype isolates. The similari-ties between Q8r1-96 and F113 also require further investigation.
Our studies of the competitive interactions among genotypes (Fig. 3) were prompted by observations that during wheat cycling D-genotype strains introduced unintentionally into soil previously inoculated with A-, B-, or L-genotype strains rapidly became domi-nant in the rhizosphere (Fig. 2), negatively impacting the popula-tions of the other genotypes. These observations were especially surprising because the density of the introduced D-genotype strain would have been many orders of magnitude less than the density of the genotype already established in the soil. Previous studies suggest that it is not common for invading bacteria to displace an already established strain of the same species in either the phyllo-sphere (18) or the rhizosphere (15). Our initial observations were confirmed by cycling experiments in which Q8r1-96 became dominant when it was mixed in a 1:1 ratio with Q2-87, 1M1-96, or Pf-5 (Fig. 3). One unexpected finding was that F113 displaced Q8r1-96 in mixed inoculations. Landa et al. (20) recently de-scribed a similar phenomenon during a pea cycling experiment in which a small amount of soil containing a P-genotype strain was inadvertently added to a pot originally inoculated with a Q-geno-type strain. Although most of the introduced soil was removed and
���
���
���
���
���
���
���
���
���
���
���
���
� �� �� �� �� �� �� � ��
�� ������ ��� ���
���� �!����"�#$&�'�!����"�#$
�""%�!����"�#$
������������������������������������������������ �
"("�#$�!����"�#$
��������������������������������������������������
����������������������������������������������� � �������������������������������������������� ���
-
�����������
�������������� �������+
�����������
���������������� ������������������������������������
�������� ����������
�� ������ ��� ���
���
���
���
���
���
���
���
���
���
���
���
���
���
���
���
���
���
���
���
���
���
���
���
���
� �� �� �� �� �� �� � ��� �� �� �� �� �� �� � ��
�� ������ ��� ���
���� �!����"�#$&�'�!����"�#$
�""%�!����"�#$
������������������������������������������������ �
"("�#$�!����"�#$
��������������������������������������������������
����������������������������������������������� � �������������������������������������������� ���
-
�����������
�������������� �������+
�����������
���������������� ������������������������������������
�������� ����������
�� ������ ��� ���
Fig. 5. A, Growth curves of phlD+ Pseudomonas fluorescens Pf-5 (A geno-type), Q2-87 (B genotype), Q8r1-96 (D genotype), F113 (K genotype), and 1M1-96 (L genotype) applied alone (upper panel) or in combination with Q8r1-96 in a 1:1 ratio (lower panel). Growth curves were obtained by measur-ing the absorbance (600 nm) at periodic time intervals with a microplate reader. The arrows indicate when the coinoculated treatments were sampled to deter-mine whether both genotypes could be detected by restrition fragment length polymorphism (RFLP) analysis of the phlD fragment generated by polymer-ase chain reaction (PCR). B, Determination of the genotype of the phlD+ P. fluorescens present in coinoculated treatments at the different incubation times (t0 – t8) sampled. The sizes of individual fragments were compared with a 100-bp ladder. A, B, D, K, and L (positive controls) indicate the RFLP profiles obtained from samples of thawed cells of Pf-5, Q2-87, Q8r1-96,F113, and 1M1-96 following PCR, respectively. W and – indicate water and thawed cells of 2-79 used as negative controls in the PCR reactions.

Vol. 93, No. 8, 2003 991
new seed planted, the P-genotype strain became dominant in sub-sequent cycles. Again, the surprising aspect of this finding was the small amount of the P-genotype strain that apparently was needed to displace the Q genotype.
We utilized the RFLP pattern of the phlD fragment amplified during the phlD-specific PCR-based endpoint-dilution assay to determine the identity of the dominant and subordinate genotypes in these studies. However, one limitation of this assay is that when
�
��
��
��
��
���
������������� ����� �����
��
��
��
��
��
��
��
��
��
�
��
��
����� �������
��������������������� ������� ��������������� ������� ������� �������� �������� ������� ������� ������� ������� ������� �������� �������� �������� �������� �������� �������� ������� ������� ������� ������� ������� ������� ������� ������� ������� ������� ������� ������� ������� ������� ������� ��������� ��������� ��������� ��������� ��������� ��������� ������� �������� �������� �������� ������� ������� ������� ������� ������� ������� ������� ������
�������������������������
��
�����������-
+
�����������
�������
�������
�������
�
�� �� �� �� �� �� �� � �� ��
������
�
��
��
��
��
���
�
��
��
��
��
���
������������� ����� �����
������������� ����� �����
��
��
��
��
��
��
��
��
��
�
��
��
����� �������
��������������������� ������� ��������������� ������� ������� �������� �������� ������� ������� ������� ������� ������� �������� �������� �������� �������� �������� �������� ������� ������� ������� ������� ������� ������� ������� ������� ������� ������� ������� ������� ������� ������� ������� ��������� ��������� ��������� ��������� ��������� ��������� ������� �������� �������� �������� ������� ������� ������� ������� ������� ������� ������� ������
�������������������������
��
��
��
��
��
��
��
��
��
��
�
��
��
����� �������
��������������������� ������� ��������������� ������� ������� �������� �������� ������� ������� ������� ������� ������� �������� �������� �������� �������� �������� �������� ������� ������� ������� ������� ������� ������� ������� ������� ������� ������� ������� ������� ������� ������� ������� ��������� ��������� ��������� ��������� ��������� ��������� ������� �������� �������� �������� ������� ������� ������� ������� ������� ������� ������� ������
��������������������� ������� ��������������� ������� ������� �������� �������� ������� ������� ������� ������� ������� �������� �������� �������� �������� �������� �������� ������� ������� ������� ������� ������� ������� ������� ������� ������� ������� ������� ������� ������� ������� ������� ��������� ��������� ��������� ��������� ��������� ��������� ������� �������� �������� �������� ������� ������� ������� ������� ������� ������� ������� ������
����������������� �������������������������
��
�����������-
+
�����������
�������
�������
�������
�
�� �� �� �� �� �� �� � �� ��
������
Fig. 6. A, Cluster analysis of combined amplified rDNA restriction analysis (ARDRA) patterns obtained with MspI and RsaI restriction enzymes from 50 isolates of culturable heterotrophic bacteria. The unweighted pair-group method with arithmetic average algorithm was applied to the similarity matrix generated with the Dice coefficient. Main groups (A to E) and subgroups (subscript numbers) were designated at a similarity score (SD) of 66.0 or 94.1%, respectively, which correspond to the similarity level found between strains Pf-5 and CHA0 and strains Q2-87, Q8r1-96, 1M1-96, and F113. Bacterial isolates were obtained from the terminal dilution cultures from roots of wheat cv. Penawawa grown in Quincy virgin soil in a growth chamber at the end of 10 cycles of plant growth. The bacterial isolates were designated as TRPx:y–z, where x represents a treatment with a phlD+ strain ([2] Pf-5, [4] Q2-87, [5] F113, [6] 1M1-96, [9] L5.1-96, and [10]) Q8r1-96), y represents a treatment replicate, and z represents the isolate number. Bacteria with an orange colony were designated as O-TRPx:y–z. B, Frequency of each ARDRA group found in root samples from treatments with Pf-5, Q2-87, F113, 1M1-96, L5.1-96, and Q8r1-96 phlD+ strains. Frequencies were obtained by dividing the number of samples with an ARDRA group within a treatment by the total number of samples evaluated in the same treatment (n = 6).
992 PHYTOPATHOLOGY
the density of the dominant strain in a root or soil sample is more than three times greater than that of the subordinate strain, ulti-mately the signal of the subordinate strain cannot be detected by RFLP analysis. The B2B/BPR4 primer pair used in these experi-ments successfully amplifies phlD from all of the 17 genotypes currently known (20,30), but the greater abundance of the domi-nant genotype in sub-TDCs probably accounts for its preferential amplification (30). To circumvent this obstacle, we used strains with differential antibiotic resistance markers in the de Wit re-placement series analyses as a second approach to assess interac-tions between genotypes. This approach has not been widely applied in studies of competitive interactions among populations of microorganisms (1,5,53). Soil and rhizosphere populations of Q2-87 introduced in combination with Q8r1-96 were smaller than predicted, indicating a competitive disadvantage for strain Q2-87 or strong antagonism of Q8r1-96 against Q2-87 and confirming the results of our other studies demonstrating the intense competi-tiveness of D-genotype strains.
The mechanisms by which one genotype displaces another and the involvement of the plant in modulating the process are major questions arising from these studies. One possible factor is the ability of some genotypes to survive longer than others in soil in the absence of roots (Table 2; 20). Alternatively, in the rhizosphere of particular host crops, some genotypes may be capable of more rapid growth, more efficient utilization of root exudates (resource competition), or utilization of a wider range of resources than others. Some of the strains examined in this study differed from others in their growth rates in vitro (Fig. 5), and several obser-vations indicate that a rapid growth rate is beneficial to competi-tion in the rhizosphere. For example, mutants of P. fluorescens WCS365 with reduced growth rates or defective in the utilization of organic acids were less competitive than the wild type in a gnotobiotic tomato root tip colonization assay (9,22). Similarly, a mutant of Enterobacter cloacae 501R3 impaired in carbohydrate metabolism did not colonize seeds of radish and cucumber as well as the wild type (41). Fukui et al. (13) showed that the ability of six strains of Pseudomonas spp. to reduce pericarp infection of sugar beet by Pythium spp. was related to the length of their lag phase; strains with a lag phase of less than 4 h were more effec-tive than those with a lag phase of more than 8 h.
Direct inhibition might also be a factor in the displacement of one phlD+ strain by another. Although 2,4-DAPG production does not contribute to the ecological competence of P. fluorescens strains F113, Q8r1-96, and SSB17 (4,10), it might impact the
indigenous bacterial rhizosphere microflora of wheat under certain environmental conditions (34). Pierson and Weller (37) found that two of four 2,4-DAPG-producing fluorescent Pseudomonas strains were inhibitory to other 2,4-DAPG-producing and -non-producing fluorescent pseudomonads, and were self-inhibitory. The metabolites involved were not determined, but factors other than production of antibiotics could also be involved, and more research is needed to elucidate the mechanisms implicated in the antagonism between closely related phlD+ bacterial strains.
The ability of introduced D-genotype strains to establish and maintain population densities above 105 CFU/g of root, the thresh-old required to suppress take-all (39), is a remarkable phenome-non in view of the intensity of microbial competition in the rhizo-sphere, where bacterial densities are 10 to 20 times greater than in bulk soil. Bacterial populations, including pseudomonads that do not produce 2,4-DAPG, are even more abundant in the rhizo-sphere of diseased roots than in the rhizosphere of healthy roots (10,27). To begin to identify rhizosphere bacteria that might inter-act with phlD+ strains, we characterized some of the most abundant isolates in the rhizosphere after 10 cycles of wheat (Fig. 1) in soil initially inoculated with different genotypes of 2,4-DAPG pro-ducers. Patterns generated by ARDRA analysis revealed 10 distinct groups of bacteria in these populations (Fig. 6), and sequence analysis of 16S rDNA amplified from representatives of each group unexpectedly demonstrated that Ralstonia spp. were the most common, being present in soil treatments with all of the phlD+ strains and in 50 to 100% of the root systems analyzed. The other common bacteria were Microbacterium spp., which were present on roots grown in soil with all of the phlD+ strains except Q2-87. Species of Arthrobacter, Chryseobacterium, Flavobac-terium, Massilia, and Microbacterium were less commonly de-tected. McSpadden Gardener and Weller (32), using standard ARDRA on cultured isolates and culture-independent fluorescent-tagged ARDRA, also found Chryseobacterium spp., Flavobac-terium spp., and Pseudomonas spp. as common colonists of wheat roots with or without take-all infection. They also found that members of some of the dominant ARDRA groups reduced the ability of phlD+ strain MtV1 to inhibit G. graminis var. tritici in vitro, whereas other ARDRA groups showed little or no effect on MtV1. Species of these genera also were common on roots of wheat and flax cycled in two soils from Fargo, ND, that had been cropped to wheat or flax for more than 100 continuous years and had abundant indigenous populations of different genotypes of phlD+ isolates (B. B. Landa and D. M. Weller, unpublished data).
TABLE 3. Most abundant indigenous ribotypes based on 16S rDNA sequence analysis present in the rhizosphere of wheat colonized by introduced 2,4-diacetylphloroglucinol producers
Sequence Sequence matchz
Isolatex Cluster groupy accession no. Class and order Genus % Identity
TRP5:2-1 A3 AF481835 Beta Proteobacteria I Massilia 95 TRP6:2-2 B1 AF481836 Actinobacteria, subclass Actinobacteridae I Arthrobacter 100 TRP10:4-2 B2 AF516908 Beta Proteobacteria I Ralstonia 99 TRP5:1-1 B3 AF481831 Beta Proteobacteria I Ralstonia 97 TRP9:6-1 B3 AF481832 Beta Proteobacteria I Ralstonia 98 TRP10:1-1 B3 AF516909 Beta Proteobacteria I Ralstonia 98 O-TRP9:4-2 B4 AF481833 Beta Proteobacteria I Ralstonia 98 O-TRP9:2-2 C1 AF481829 Flavobacteria I Flavobacterium 98 O-TRP6:1-2 C2 AF481830 Flavobacteria I Flavobacterium 98 O-TRP2:3-2 D AF481834 Flavobacteria I Chryseobacterium 96 TRP10:3-2 E1 AF482702 Actinobacteria, subclass Actinobacteridae I Microbacterium 99 TRP6:1-3 E2 AF482701 Actinobacteria, subclass Actinobacteridae I Microbacterium 98
x Bacterial isolates were obtained from roots of wheat grown in Quincy virgin soil in a growth chamber at the end of 10 cycles of plant growth. The bacterial isolates were designated as TRPx:y–z, where x represents a treatment with a phlD+ strain ([2] Q2-87, [5] F113, [6] 1M1-96, [9] L5.1-96, and [10] Q8r1-96), yrepresents a treatment replicate, and z represents the isolate number. Bacteria with an orange color are designated as O-TRPx:y–z.
y Main groups (A to E) and subgroups (subscript numbers) were designated at similarity scores (SD) of 66.0 and 94.1%, respectively, which correspond with the similarity level found between strains Pf-5 and CHA0 and strains Q2-87, Q8r1-96, 1M1-96, and F113 (Fig. 6A).
z Taxonomic designations are given according to the “Taxonomic Outline of the Prokaryotic Genera” in Bergey’s Manual of Systematic Bacteriology, release 1.0 (available online). Percent identity to a database match with the best E value was calculated using the NCBI BLASTN search engine with default parameters.

Vol. 93, No. 8, 2003 993
Collectively, our studies of interactions among phlD+ strains suggest a hierarchy of dominance among members of the 17 known genotypes in the rhizosphere. The outcome of an interac-tion between two genotypes, with the dominant genotype devel-oping the greater population density, will be determined by both the genotype of the strains involved and the host crop supporting their growth (B. B. Landa and D. M. Weller, unpublished data). Identifying the strain–host interactions as well as the interactions among 2,4-DAPG-producing strains and other bacteria in the rhiz-sphere will help to elucidate the reasons why biological control with introduced phlD+ strains sometimes fails, why the suppres-siveness of TAD soils is lost when continuous cropping of wheat or barley is broken by a nonhost crop of the take-all fungus, and why yearly fluctuations in the robustness of the suppressiveness are a common feature of TAD soils (51).
ACKNOWLEDGMENTS
This research was supported by the U.S. Department of Agriculture, National Research Initiative, Competitive Grants Program (grant 01-35107-1011). B. B. Landa was the recipient of a postdoctoral fellowship from the Fulbright Commission and the Spanish Ministry of Science and Technology. We thank S. Blovin Bankhead, A. Brown, and C. E. Sachs for technical assistance; J. A. Navas-Cortés for suggestions in the analysis of data from the replacement series experiment; and T. Paulitz and P. Okubara for helpful comments.
LITERATURE CITED
1. Adee, S. R., Pfender, W. F., and Hartnett, D. C. 1990. Competition between Pyrenophora tritici-repentis and Septoria nodorum in the wheat leaf as measured with de Wit replacement series. Phytopathology 80: 1177-1182.
2. Bangera, M. G., and Thomashow, L. S. 1999. Identification and charac-terization of a gene cluster for synthesis of the polyketide antibiotic 2,4-diacetylphloroglucinol from Pseudomonas fluorescens Q2-87. J. Bacteriol. 181:3155-3163.
3. Bull, C. T., Weller, D. M., and Thomashow, L. S. 1991. Relationship be-tween root colonization and suppression of Gaeumannomyces graminis var. tritici by Pseudomonas fluorescens 2-79. Phytopathology 81:954-959.
4. Carroll, H., Moënne-Loccoz, Y., Dowling, D. N., and O’Gara, F. 1995. Mutational disruption of the biosynthesis genes coding for the antifungal metabolite 2,4-diacetylphloroglucinol does not influence the ecological fitness of Pseudomonas fluorescens F113 in the rhizosphere of sugar-beets. Appl. Environ. Microbiol. 61:3002-3007.
5. Chancey, S. T., Wood, D. W., Pierson, E. A., and Pierson, L. S., III. 2002. Survival of GacS/GacA mutants of the biological control bacterium Pseudomonas aureofaciens 30-84 in the wheat rhizosphere. Appl. Environ. Microbiol. 68:3308-3314.
6. Cook, R. J., Thomashow, L. S., Weller, D. M., Fujimoto, D., Mazzola, M., Bangera, G., and Kim, D. S. 1995. Molecular mechanisms of de-fense by rhizobacteria against root disease. Proc. Natl. Acad. Sci. USA 92:4197-4201.
7. Cronin, D., Moënne-Loccoz, Y., Fenton, A., Dunne, C., Dowling, D. N., and O’Gara, F. 1997. Role of 2,4-diacetylphloroglucinol in the interac-tion of the biocontrol pseudomonad strain F113 with the potato cyst nematode Globodera rostochiensis. Appl. Environ. Microbiol. 63:1357-1361.
8. Cronin, D., Moënne-Loccoz, Y., Fenton, A., Dunne, C., Dowling, D. N., and O’Gara, F. 1997. Ecological interaction of a biocontrol Pseudo-monas fluorescens strain producing 2,4-diacetylphloroglucinol with the soft rot potato pathogen Erwinia carotovora subsp. atroseptica. FEMS Microbiol. Ecol. 23:95-106.
9. Dekkers, L. C., van der Bij, A. J., Mulders, I. H. M., Phoelich, C. C., Wentwoord, R. A. R., Glandorf, D. C. M., Wijffelman, C. A., and Lugtenberg, B. J. J. 1998. Role of the O-antigen of lipopolysaccharide, and possible roles of growth rate and of NADH:ubiquinone oxidore-ductase (nuo) in competitive tomato root-tip colonization by Pseudo-monas fluorescens WCS365. Mol. Plant-Microbe Interact. 11:763-771.
10. de Souza, J. T., Weller, D. M., and Raaijmakers, J. M. 2003. Frequency, diversity, and activity of 2,4-diacetylphloroglucinol-producing fluores-cent Pseudomonas spp. in Dutch take-all decline soils. Phytopathology 93:54-63.
11. deWeert, S., Vermeiren, H., Mulders, I. H. M., Kuiper, I., Hendrickx, N., Bloemberg, G. V., Vanderleyden, J., De Mot, R., and Lugtenberg, B. J. J.
2002. Flagella-driven chemotaxis towards exudate components is an important trait for tomato root colonization by Pseudomonas fluores-cens. Mol. Plant-Microbe Interact. 15:1173-1180.
12. Duffy, B. K., and Défago, G. 1997. Zinc improves biocontrol of Fu-sarium crown and root rot of tomato by Pseudomonas fluorescens and represses the production of pathogen metabolites inhibitory to bacterial antibiotic biosynthesis. Phytopathology 87:1250-1257.
13. Fukui, R., Schroth, M. N., Hendson, M., Hancock, J. G., and Firestone, M. K. 1994. Growth patterns and metabolic activity of pseudomonads on sugar beet spermospheres: Relationship to pericarp colonization by Pythium ultimum. Phytopathology 84:1331-1338.
14. Howell, C. R., and Stipanovic, R. D. 1980. Suppression of Pythium ultimum-induced damping-off of cotton seedlings by Pseudomonas fluorescens and its antibiotic pyoluteorin. Phytopathology 70:712-715.
15. Ikeda, K., Toyota, K., and Kimura, M. 1998. Effects of bacterial coloni-zation of tomato roots on subsequent colonization by Pseudomonas fluorescens MelRC2Rif. Can. J. Microbiol. 44:630-636.
16. Keel, C., Schnider, U., Maurhofer, M., Voisard, C., Burger, D., Haas, D., and Défago, G. 1992. Suppression of root diseases by Pseudomonas fluorescens CHA0: Importance of the bacterial secondary metabolite 2,4-diacetylphloroglucinol. Mol. Plant-Microbe Interact. 5:4-13.
17. Keel, C., Weller, D. M., Natsch, A., Défago, G., Cook, R. J., and Thomashow, L. S. 1996. Conservation of the 2,4-diacetylphloroglucinol biosynthesis locus among fluorescent Pseudomonas strains from diverse geographic locations. Appl. Environ. Microbiol. 62:552-563.
18. Kinkel, L. L., and Lindow, S. E. 1993. Invasion and exclusion among coexisting Pseudomonas syringae strains on leaves. Appl. Environ. Microbiol. 59:3447-3454.
19. Landa, B. B., de Werd, H. A. E., McSpadden Gardener, B. B., and Weller, D. M. 2002. Comparison of three methods for monitoring populations of different genotypes of 2,4-diacetylphloroglucinol-producing Pseudo-monas fluorescens in the rhizosphere. Phytopathology 92:129-137.
20. Landa, B. B., Mavrodi, O. V., Raaijmakers, J. M., McSpadden-Gardener, B. B., Thomashow, L. S., and Weller, D. M. 2002. Differential ability of genotypes of 2,4-diacetylphloroglucinol-producing Pseudomonas fluorescens to colonize the roots of pea. Applied Environ. Microbiol. 68:3226-3237.
21. Lemanceau, P., Corberand, T., Gardan, L., Latour, X., Laguerre, G., Boeufgras, J.-M., and Alabouvette, C. 1995. Effect of two plant species, flax (Linum usitatissimum L.) and tomato (Lycopersicon esculentum Mill.), on the diversity of soilborne populations of fluorescent pseudo-monads. Appl. Environ. Microbiol. 61:1004-1012.
22. Lugtenberg, B. J. J., Dekkers, L., and Bloemberg, G. V. 2001. Molecular determinants of rhizosphere colonization by Pseudomonas. Annu. Rev. Phytopathol. 39:461-490.
23. Maidak, B. L., Cole, J. R., Lilburn, T. G., Parker, C. T., Jr., Saxman, P. R., Farris, R. J., Garrity, G. M., Olsen, G. J., Schmidt, T. M., and Tiedje, J. M. 2001. The RDP-II (ribosomal database project). Nucleic Acids Res. 29:173-174.
24. Mavingui, P., Laguerre, G., Berge, O., and Heulin, T. 1992. Genetic and phenotypic diversity of Bacillus polymyxa in soil and in the wheat rhizosphere. Appl. Environ. Microbiol. 58:1894-1903.
25. Mavrodi, D. V., Mavrodi, O. V., McSpadden Gardener, B. B., Landa, B. B., Weller, D. M., and Thomashow, L. S. 2002. Identification of differ-ences in genome content among PhlD-positive Pseudomonas fluorescens using PCR-based subtractive hybridization. Appl. Environ. Microbiol. 68:5170-5176.
26. Mavrodi, O. V., McSpadden Gardener, B. B., Mavrodi, D. V., Bonsall, R. F., Weller, D. M., and Thomashow, L. S. 2001. Genetic diversity of phlD from 2,4-diacetylphloroglucinol-producing fluorescent Pseudomonas spp. Phytopathology 91:35-43.
27. Mazzola, M., and Cook, R. J. 1992. Effects of fungal root pathogens on the population dynamics of fluorescent pseudomonads in the wheat rhizosphere. Appl. Environ. Microbiol. 57:2171-2178.
28. Mazzola, M., Cook, R. J., Thomashow, L. S., Weller, D. M., and Pierson, L. S., III. 1992. Contribution of phenazine antibiotic biosynthesis to the ecological competence of fluorescent pseudomonads in soil habitats. Appl. Environ. Microbiol. 58:2616-2624.
29. Mazzola, M., and Gu, Y.-H. 2002. Wheat genotype-specific induction of soil microbial communities suppressive to disease incited by Rhizoctonia solani anastomosis group (AG)-5 and AG-8. Phytopathology 92:1300-1307.
30. McSpadden Gardener, B. B., Mavrodi, D. V., Thomashow, L. S., and Weller, D. M. 2001. A rapid polymerase chain reaction-based assay characterizing rhizosphere populations of 2,4-diacetylphloroglucinol-producing bacteria. Phytopathology 91:44-54.
31. McSpadden Gardener, B. B., Schroeder, K. L., Kalloger, S. E., Raaijmakers, J. M., Thomashow, L. S., and Weller, D. M. 2000. Geno-typic and phenotypic diversity of phl-D-containing Pseudomonas iso-lated from the rhizosphere of wheat. Appl. Environ. Microbiol. 66:

994 PHYTOPATHOLOGY
1939-1946. 32. McSpadden Gardener, B. B., and Weller, D. M. 2001. Changes in popu-
lations of rhizosphere bacteria associated with take-all disease of wheat. Appl. Environ. Microbiol. 67:4414-4425.
33. Miller, K. J., and Wood, J. M. 1996. Osmoadaptation by rhizosphere bacteria. Annu. Rev. Microbiol. 50:101-136.
34. Moënne-Loccoz, Y., Tichy, H.-V., O’Donnell, A., Simon, R., and O’Gara, F. 2001. Impact of 2,4-diacetylphloroglucinol-producing biocontrol strain Pseudomonas fluorescens F113 on intraspecific diversity of resi-dent culturable fluorescent pseudomonads associated with the roots of field-grown sugar beet seedlings. Appl. Environ. Microbiol. 67:3418-3425.
35. O’Sullivan, D. J., and O’Gara, F. 1992. Traits of fluorescent Pseudo-monas spp. involved in suppression of plant root pathogens. Microbiol. Rev. 56:662-676.
36. Picard, C., Di Cello, F., Ventura, M., Fani, R., and Guckert, A. 2000. Frequency and biodiversity of 2,4-diacetylphloroglucinol-producing bac-teria isolated from the maize rhizosphere at different stages of plant growth. Appl. Environ. Microbiol. 66:948-955.
37. Pierson, E. A., and Weller, D. M. 1994. Using rhizobacteria mixtures to improve the consistency and effectiveness of biological control of take-all of wheat. Phytopathology 84:940-947.
38. Raaijmakers, J. M., Bitter, W., Punte, H. L. M., Bakker, P. A. H. M., Weisbeek, P. J., and Schippers, B. 1994. Siderophore receptor PupA as a marker to monitor wild-type Pseudomonas putida WCS358 in natural environments. Appl. Environ. Microbiol. 60:1184-1190.
39. Raaijmakers, J. M., and Weller, D. M. 1998. Natural plant protection by 2,4-diacetylphloroglucinol-producing Pseudomonas spp. in take-all decline soils. Mol. Plant-Microbe Interact. 11:144-152.
40. Raaijmakers, J. M., and Weller, D. M. 2001. Exploiting genotypic diver-sity of 2,4-diacetylphloroglucinol-producing Pseudomonas spp.: Charac-terization of superior root-colonizing P. fluorescens strain Q8r1-96. Appl. Environ. Microbiol. 67:2545-2554.
41. Roberts, D. P., Dery, P. D., Yucel, I., and Buyer, J. S. 2000. Importance of pfkA for rapid growth of Enterobacter cloacae during colonization of crop seeds. Appl. Environ. Microbiol. 66:87-91.
42. Sánchez-Contreras, M., Martín, M., Villacieros, M., O’Gara, F., Bonilla, I., and Rivilla, R. 2002. Phenotypic selection and phase variation occur during alfalfa root colonization by Pseudomonas fluorescens F113. J. Bacteriol. 184:1587-1596.
43. Schnider-Keel, U., Lejbølle, K. B., Baehler, E., Haas, D., and Keel, C.
2001. The sigma factor AlgU (AlgT) controls exopolysaccharide pro-duction and tolerance towards desiccation and osmotic stress in the biocontrol agent Pseudomonas fluorescens CHA0. Appl. Environ. Microbiol. 67:5683-5693.
44. Seldin, L., Soares Rosado, A., da Cruz, D. W., Nobrega, A., van Elsas, J. D., and Paiva, E. 1998. Comparison of Paenibacillus azotofixans strains isolated from rhizoplane, rhizosphere, and non-root-associated soil from maize planted in two different Brazilian soils. Appl. Environ. Microbiol. 64:3860-3868.
45. Sharifi-Tehrani, A., Zala, M., Natsch, A., Moënne-Loccoz, Y., and Défago, G. 1998. Biocontrol of soil-borne fungal plant diseases by 2,4-diacetylphloroglucinol-producing fluorescent pseudomonads with differ-ent restriction profiles of amplified 16S rDNA. Eur. J. Plant Pathol. 104:631-643.
46. Smith, K. P., and Goodman, R. M. 1999. Host variation for interactions with beneficial plant-associated microbes. Annu. Rev. Phytopathol. 37:473-491.
47. Smith, K. P., Handelsman, J., and Goodman, R. M. 1999. Genetic basis in plants for interactions with disease-suppressive bacteria. Proc. Natl. Acad. Sci. USA 96:4786-4790.
48. Stutz, E., Défago, G., and Kern, H. 1986. Naturally occurring fluorescent pseudomonads involved in suppression of black root rot of tobacco. Phytopathology 76:181-185.
49. Wang, C., Ramette, A., Punjasamarnwong, P., Zala, M., Natsch, A., Moënne-Loccoz, Y., and Défago, G. 2001. Cosmopolitan distribution of phlD-containing dicotyledonous crop-associated biocontrol pseudomo-nads of world wide origin. FEMS Microbiol. Ecol. 1267:1-12.
50. Weller, D. M. 1988. Biological control of soilborne plant pathogens in the rhizosphere with bacteria. Annu. Rev. Phytopathol. 26:379-407.
51. Weller, D. M., Raaijmakers, J. M., McSpadden-Gardener, B. B., and Thomashow, L. S. 2002. Microbial populations responsible for specific soil suppressiveness to plant pathogens. Annu. Rev. Phytopathol. 40:309-348.
52. Weller, D. M., and Thomashow, L. S. 1994. Current challenges in introducing beneficial microorganisms into the rhizosphere. Pages 1-18 in: Molecular Ecology of Rhizosphere Microorganisms. F. O’Gara, D. N. Dowling, and B. Boesten, eds. VCH, Weinheim, Germany.
53. Wilson, M., and Lindow, S. E. 1994. Ecological similarity and coexis-tence of epiphytic ice-nucleating (Ice+) Pseudomonas syringae strains and a non-ice-nucleating (Ice–) biological control agent. Appl. Environ. Microbiol. 60:3128-3137.
Copyright © 2022 FDOKUMEN