The Impact of Foreign Direct Investment On Economic Growth ...
1
Interactions between Foreign Direct Investment and Trade in a General Equilibrium Framework
Hiro Lee Research Institute for Economics and Business Administration, Kobe University
2-1 Rokkodai, Nada-ku, Kobe 657-8501, Japan E-mail: [email protected]
Dominique van der Mensbrugghe Development Prospects Group, The World Bank 1818 H Street NW, Washington, DC 20433, USA
E-mail: [email protected]
Revised: November 2005
For presentation at the ADB Experts’ Meeting on Long-Term Scenarios for Asia’s Growth and Trade, Asian Development Bank, 10-11 November 2005
Abstract The theoretical literature on trade and foreign direct investment (FDI) indicates that they could be either substitutes or complements. The empirical evidence on U.S.-Japan and APEC countries suggests that trade and FDI exhibit a complementary relationship. To examine interactions between FDI and trade adjustments, we consider APEC trade and investment liberalization scenarios using a six-region applied general equilibrium model that incorporates FDI. The preliminary results suggest that FDI liberalization would bring about greater benefits to most of the APEC economies than trade liberalization. In the manufacturing sector, trade and FDI are found to be complements in the APEC regions. JEL classification codes: F13, F15, F21, O53 Keywords: Foreign direct investment, trade liberalization, APEC, CGE model
2
1. Introduction
In the past two decades, inflows of foreign direct investment (FDI) have facilitated
economic development and technology transfer in many developing countries. Although
FDI flows to developing countries declined considerably in 2001 and 2002, they increased
moderately in 2003 before expanding rapidly in 2004. During the 1985-2004 period, FDI
flows to developing countries increased at an annual rate of 15.5 percent, compared with a
12.2 percent increase for developed countries (UNCTAD, 2005b). In 2004, developing
countries hosted 25.0 percent of inward FDI stock, noticeably higher than 20.6 percent
share in 1990. Among developing countries, East and Southeast Asia hosted 50.6 percent
of inward FDI stock in 2004, up sharply from 40.4 percent share in 1990 but down from
56.6 percent share in 2000. The relative decline in the inward FDI stock in this region over
the 2000-2003 period may be largely attributable to the sharp fall in the world output of
electronic equipment in 2001 and a large share of inward FDI stock in this industry
relative to other industries in East and Southeast Asia.
FDI is subject to a number of impediments, including restrictions on entry and
establishment, ownership and control restrictions, operational restrictions (e.g., local
content requirements), and lack of transparency in laws and regulations. 1 Such
impediments distort capital allocation across countries, between foreign and domestic
investment, and between FDI and portfolio investment (Hardin and Holmes, 1997).
Barriers to FDI are relatively high in services, such as finance, insurance, and
communications.
Host countries may not benefit from inward FDI when there are domestic
distortions or insufficient levels of human capital. Naya (1990) shows that liberalization of
FDI could reduce economic welfare in a protected economy. This is because protection in
the host country would induce foreign investors to make non-optimal FDI decisions. Fry
(1993) finds that inward FDI contributed significantly to economic growth in East Asian
developing countries where the extent of domestic distortions, such as trade controls and
financial repression, were relatively low. By contrast, in a group of developing countries
with relatively high domestic distortions, inward FDI were associated with a low or
1 See PECC (1995, Chapter 6) and Hardin and Holmes (1997) for further information on impediments to FDI, particularly in the APEC economies.
3
negative growth.2 In a cross-country study employing data on FDI flows from developed
countries to 69 developing countries, Borensztein et al. (1998) show that FDI contributes
relatively more to growth than domestic investment. The effect of FDI on growth,
however, is dependent on the level of human capital available in the host economy. For
countries with very low levels of human capital, the direct effect of FDI is negative.
FDI and trade can be substitutes or complements. The theoretical literature
indicates that they can be either of them depending upon the assumptions (e.g., Mundell,
1957; Markusen, 1983; Neary and Ruane, 1988; Wong, 1986, 1995). The empirical
evidence on the United States and Japan suggests that bilateral FDI and trade flows are
complements in many manufacturing sectors (Kawai and Urata, 1998; Lee and Roland-
Holst, 1998). Petri (1997) finds that not only inward and outward FDI stocks are reduced
when investment liberalization is excluded from APEC liberalization but trade flows also
tend to decline, particularly for China and ASEAN-4 countries, compared with full
liberalization. This result suggests that FDI and trade are likely to be complements at the
economywide level in the APEC economies.
To examine interactions between FDI and trade adjustments, we conduct some
counterfactual experiments of APEC trade and investment liberalization using a six-region,
three-sector computable general equilibrium (CGE) model. The next section provides an
overview of FDI patterns and barriers in the APEC economies. Section 3 contains a brief
description of the model used for quantitative assessments. In section 4, we present the
aggregate and sectoral results of liberalization experiments, and the final section offers
conclusions.
2. FDI Patterns and Impediments in the APEC Economies
2.1 Patterns of FDI
Developing members of APEC have benefited from FDI inflows from more
developed members. The growth in FDI flows has generally led to greater diversification
2 Fry (1993) divides the sample of sixteen developing countries between one group consisting of five East Asian countries (Korea, Indonesia, Malaysia, Philippines, and Thailand) and the other consisting of Argentina, Brazil, Chile, Egypt, India, Mexico, Nigeria, Pakistan, Sri Lanka, Turkey, and Venezuela. The estimation period is 1966-88 with the exception of Brazil (1966-85), Chile (1966-84), Indonesia (1967-88), and Pakistan (1968-88).
4
of production and higher rates of growth in trade and productivity. During the 1985-2000
period, FDI flows to the developing economies in East and Southeast Asia increased at an
annual rate of 25.7 percent, significantly faster than the growth rate of trade in the region
(UNCTAD, 2005b). However, the growth was halted in 2001 and 2002, resulting from the
worldwide slowdown in high-technology industries, followed by a mild recovery in 2003
and resurgence in 2004.
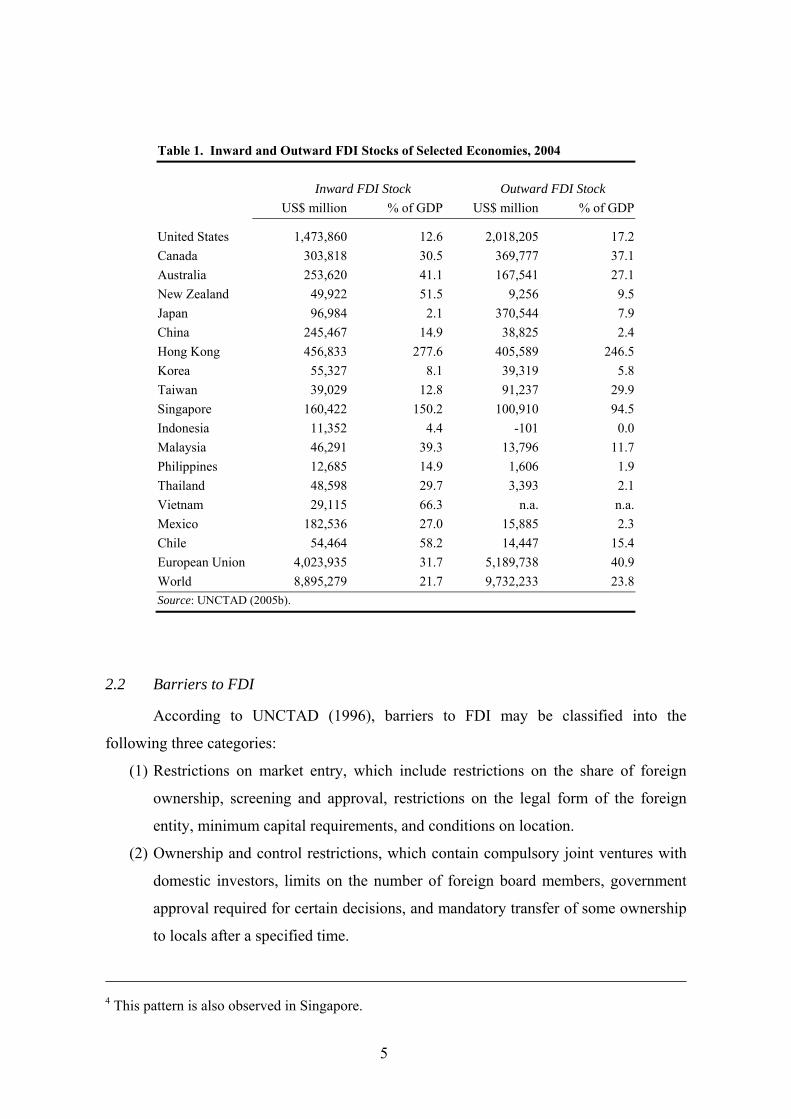
Table 1 provides inward and outward FDI stocks of selected economies in 2004.
UNCTAD computes these stock values as the accumulation of FDI flows at historical cost.
The original source of the data on FDI inflows and outflows is International Monetary
Fund’s Balance of Payments Statistics Yearbook. For some economies (e.g., Hong Kong),
FDI flows are estimated because there are no balance of payments data.3 The world FDI
stock was about $9 trillion in 2004. About 45 percent of inward FDI was hosted by the
European Union, 17 percent by the United States, and 8 percent by China and Hong Kong.
The European Union and the United States owned 53 and 21 percent, respectively, of the
world FDI stock. Japan’s share in world outward FDI stock declined from 12 percent in
1988 to 4 percent in 2004, largely attributable to its significant economic slowdown over
the 1991-2002 period.
Among the APEC economies, Hong Kong, Singapore, Vietnam, and Chile have
had high inward FDI stock to GDP ratios. By contrast, Japan has attracted very little FDI
relative to the size of its economy. According to the data on the FDI stocks by source and
destination regions that are calibrated to the FTAP model (Hanslow, Phamduc, and
Verikios, 2000), Japan and the United States together accounted for more than 50 percent
of inward FDI stocks in Hong Kong, Korea, Philippines, Taiwan, and Thailand in 1995.
Singapore and Taiwan each accounted for over 10 percent of Malaysia’s inward stock,
whereas the EU contributed over 20 percent of inward stock in Singapore. Over a half of
inward FDI stock in China was sourced from Hong Kong. It is important to note, however,
that a large share of Hong Kong’s outward FDI is undertaken by foreign-owned firms,4 a
sizable portion of which is “round-tripping FDI” that originates from parent firms in China
and is then channeled back into China through affiliates in Hong Kong (Low et al., 1996;
Ramstetter, 2000).
3 See UNCTAD (2005, pp. 297-302). Ramstetter (2000) provides estimates for FDI flows in eleven Asian economies during the 1980-99 period.
5
Table 1. Inward and Outward FDI Stocks of Selected Economies, 2004
Inward FDI Stock Outward FDI Stock
US$ million % of GDP US$ million % of GDP
United States 1,473,860 12.6 2,018,205 17.2
Canada 303,818 30.5 369,777 37.1
Australia 253,620 41.1 167,541 27.1
New Zealand 49,922 51.5 9,256 9.5
Japan 96,984 2.1 370,544 7.9
China 245,467 14.9 38,825 2.4
Hong Kong 456,833 277.6 405,589 246.5
Korea 55,327 8.1 39,319 5.8
Taiwan 39,029 12.8 91,237 29.9
Singapore 160,422 150.2 100,910 94.5
Indonesia 11,352 4.4 -101 0.0
Malaysia 46,291 39.3 13,796 11.7
Philippines 12,685 14.9 1,606 1.9
Thailand 48,598 29.7 3,393 2.1
Vietnam 29,115 66.3 n.a. n.a.
Mexico 182,536 27.0 15,885 2.3
Chile 54,464 58.2 14,447 15.4
European Union 4,023,935 31.7 5,189,738 40.9
World 8,895,279 21.7 9,732,233 23.8 Source: UNCTAD (2005b).
2.2 Barriers to FDI
According to UNCTAD (1996), barriers to FDI may be classified into the
following three categories:
(1) Restrictions on market entry, which include restrictions on the share of foreign
ownership, screening and approval, restrictions on the legal form of the foreign
entity, minimum capital requirements, and conditions on location.
(2) Ownership and control restrictions, which contain compulsory joint ventures with
domestic investors, limits on the number of foreign board members, government
approval required for certain decisions, and mandatory transfer of some ownership
to locals after a specified time.
4 This pattern is also observed in Singapore.

6
(3) Operational restrictions, which include performance requirements (e.g., minimum
exports to output ratios), local content requirements, restrictions on imports of
labor, capital, and intermediate inputs, and restrictions on repatriation of capital
and profits. Previous studies that estimate barriers to FDI have concentrated on services sectors.
This is because commercial presence abroad, primarily through FDI, is the most important
means of delivering services to other countries. Hoekman (1995) uses frequency ratios of
services barriers to estimate tariff equivalent measures of relative restrictiveness of
barriers to services trade across countries and sectors. His estimates are based on
judgmental benchmark tariff equivalents for each sector to reflect a country that is highly
restricted in market access.
Hoekman’s (1995) estimates have been used by Brown et al. (1996), Petri (1997),
Robinson et al. (1999), and Chadha (2001) in their model simulations. Table 2 summarizes
ad valorem equivalents of FDI barriers used by Petri. The rates for the services sector are
based on Hoekman’s estimates, whereas the rates for the primary and manufacturing
sectors are assumed to be one-half as high (relative to total costs) as tariff equivalents for
these sectors that are available in the GTAP database (Hertel, 1997).
Table 2. FDI Barriers Used by Petri (1997)
(percent) UCANa Japan NIEsb ASEAN-4 China ROW
Primary 6.4 48.3 34.7 14.5 21.6 16.6
Manufacturing 34.6 25.7 22.7 44.6 61.1 32.5
Services 80.7 79.1 70.4 70.1 77.0 76.6
Notes: a) United States, Canada, Australia, and New Zealand.
b) Korea, Taiwan, Hong Kong, and Singapore.
Source: Petri (1997).
Hardin and Holmes (1997) develop alternative indices of the relative
restrictiveness of FDI. Their estimates are based upon information on actual restrictions
not only on market access but also on other aspects of FDI. The weights on different types
of barriers are set to reflect their relative restrictions. It is found that communications and
financial services have some of the highest FDI barriers in the APEC economies. In
communications, Thailand has the highest restrictiveness index (0.84), followed by China

7
(0.82) and Philippines (0.76). In financial services, countries with high FDI restrictions
include Philippines (0.95), Korea and Thailand (both with the value of 0.88).5
Australian Productivity Commission (2001) provides the trade restrictiveness
indexes for a wider coverage of services for up to 136 economies: accounting,
architectural, banking, distribution, engineering, legal, maritime, and telecommunications
services. This database has been constructed from the studies by Kalirajan (2000),
McGuire and Schuele (2000), McGuire, Schuele, and Smith (2000), Nguyen-Hong (2000),
and Warren (2000a). Again, some of developing APEC economies rank very high in the
foreign restrictiveness index. In banking, Malaysia (0.65), Indonesia (0.54), and the
Philippines (0.53) are among the top 5 out of the 38 economies. In distribution, Malaysia
(0.40), Thailand (0.39), and the Philippines (0.37) occupy the first three places out of the
same number of economies. In telecommunications, China (0.81), Thailand (0.79), and
Vietnam (0.71) have high foreign restrictiveness index.
Hanslow, Phamduc, Verikios, and Welsh (2000) compute ad valorem equivalents
of barriers to establishment (impediments on capital) and those of barriers to ongoing
operation (impediments on output) for both domestic and foreign firms, based on estimates
of impediment rates in banking (Kaleeswaran et al., 2000) and telecommunications
(Warren, 2000b). Table 3 gives the updated ad valorem equivalents of these barriers used
by Dee and Hanslow (2001) and Dee, Hanslow, and Phamduc (2003) in their studies on
services trade liberalization.
Compared with Hoekman’s (1995) estimates on relative restrictiveness of barriers
to services trade, the rates of impediments to establishment provided in Table 3 are lower
in all regions with the exception of China. Compared with Hardin and Holmes’s (1997)
FDI restrictiveness indices, these rates are generally lower in all the APEC regions with
the exceptions of China and Indonesia. Hanslow et al.’s (2000) estimates and updated
estimates used by Dee and Hanslow (2001) and Dee et al. (2003) have some shortcomings,
however, because they are derived from the impediment rates in only banking and
telecommunications services.6
5 See Hardin and Holmes (1997, pp. 112-113) for detailed results. 6 Hertel (2000) and Brown and Stern (2001) use Francois’ (1999) estimates of services protection based on a gravity model.

8
Table 3. Ad Valorem Equivalents of Barriers to Establishment and Ongoing Operations in the Services Sector
(percent)
Barriers to Establishment Barriers to Ongoing Operations
Domestic Foreign Domestic Foreign
United States 0.0 3.8 0.1 1.1
Canada 0.5 6.1 0.3 1.7
Australia 0.6 14.8 0.0 0.7
New Zealand 0.4 4.2 0.0 0.7
Japan 0.3 3.0 3.6 4.8
China 123.5 250.7 18.8 36.4
Hong Kong 1.4 5.4 1.4 2.4
Korea 1.9 22.0 5.1 6.8
Taiwan 1.9 19.2 2.9 4.9
Singapore 2.4 24.5 3.4 8.3
Indonesia 22.7 68.1 13.2 28.1
Malaysia 15.4 37.6 3.6 10.2
Philippines 7.4 54.3 8.4 22.7
Thailand 12.2 36.5 4.7 13.4
Mexico 0.7 13.0 2.2 5.6
Chile 14.2 20.4 3.0 4.1
Rest of Cairns 7.2 19.5 1.0 5.6
European Union 1.3 6.5 0.1 1.3
Rest of World 39.1 87.0 4.9 13.9 Sources: Dee and Hanslow (2001), Table 4; Dee, Hanslow, and Phamduc (2003), Table 1.2.
3. The Model
Distinguishing between the activities of domestic and foreign-owned firms is an
important feature of a CGE model that incorporates foreign direct investment. Petri (1997)
assumes that product varieties are differentiated by firms headquartered in different
regions. Under his demand structure, a foreign variety can be purchased from the local
subsidiary of a foreign firm, the parent abroad, and the foreign firm’s subsidiaries located
in third countries. A domestic variety can be obtained either from domestic producers or
from foreign subsidiaries of the domestic firm.
We have extended a simple world CGE model developed by van der Mensbrugghe
(2000) to include features of FDI, closely following those developed by Petri (1997). As in
Petri the model contains six regions – UCAN (consisting of the United States, Canada,
Australia, and New Zealand), Japan, NIEs (consisting of Korea, Taiwan, Hong Kong, and

9
Singapore), ASEAN-4, China, and the rest of the world – and three sectors (primary,
manufacturing, and services).
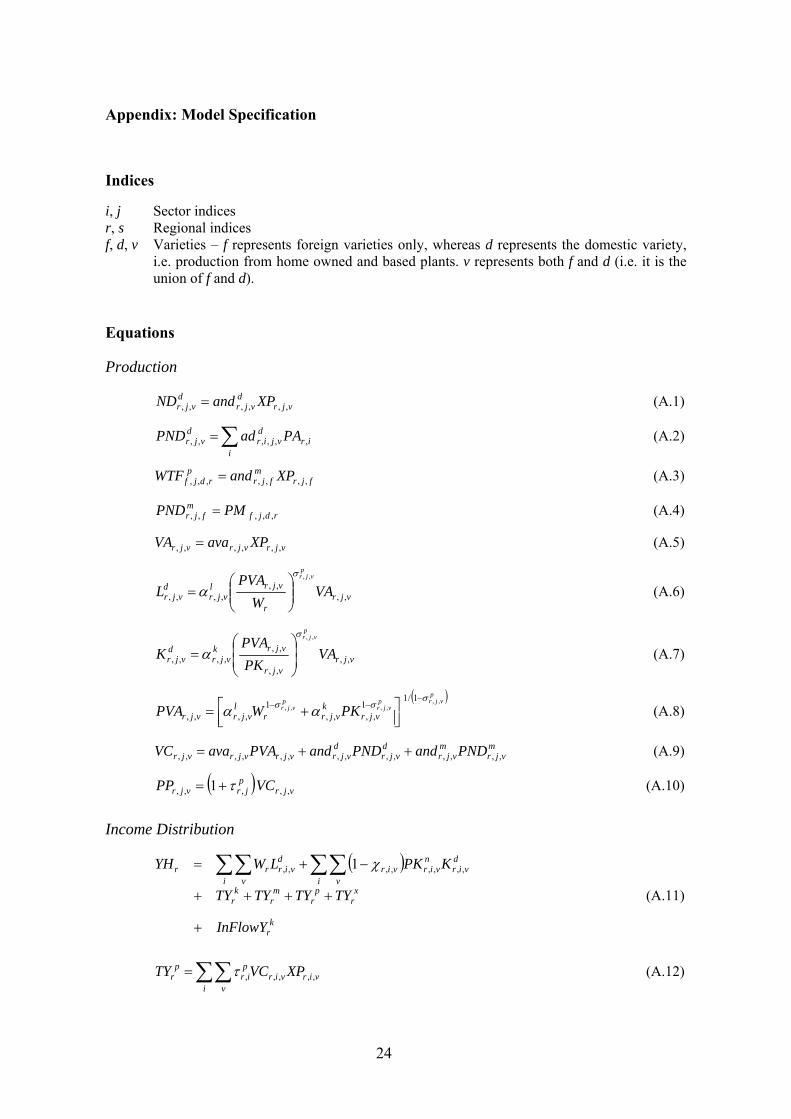
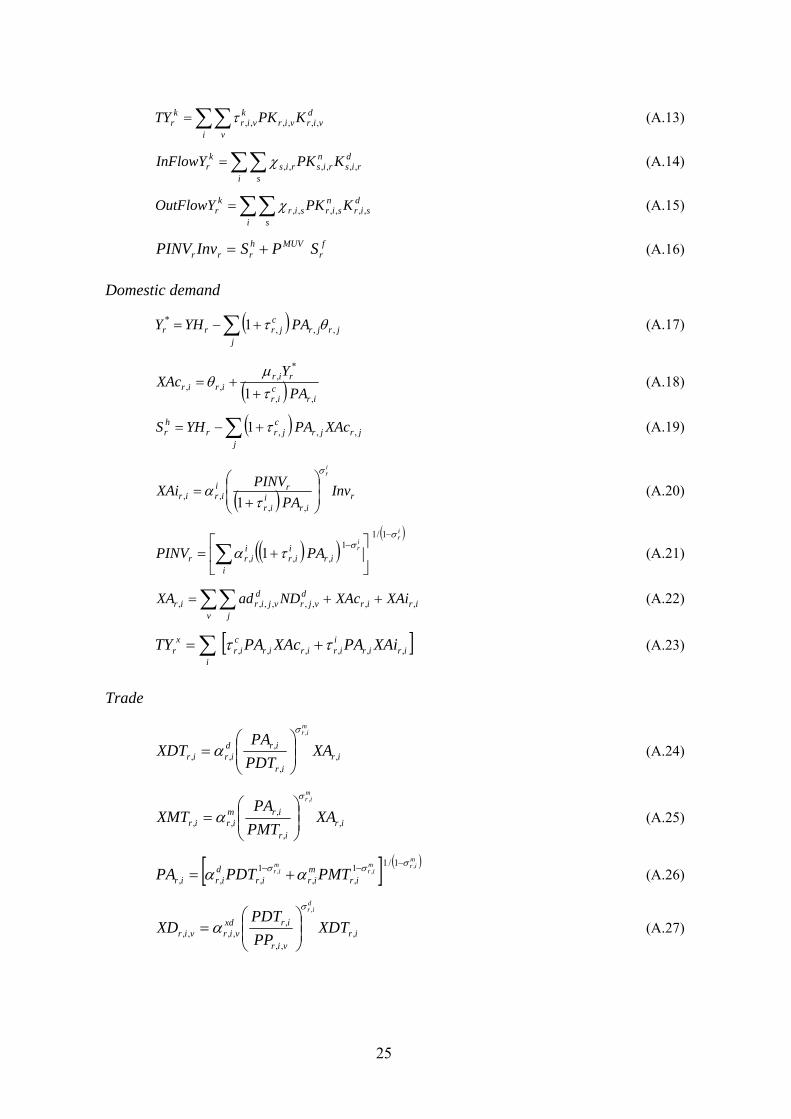
The model equations are presented in the Appendix. Products are identified by
ownership of capital, and these are called varieties. Thus output, XPr,i,v, is identified by
region of production (r), by sector (i), and by variety (v). Similar to the simple model,
production is modeled as a series of nested CES functions. However, each variable in the
nest is associated with both a sector and a variety, and not simply a sector (see Eq. A.1,
A.3 and A.5 in the Appendix). The main deviation from the simple model is that foreign-
owned production is assumed to import essential imports from its ‘home’ base. For
example, Japanese auto plants in the United States import directly a fixed share (relative to
output) of intermediate goods from Japan.
Household and government accounts are consolidated. The consolidated household
sector accrues income from factor remuneration as well as tax receipts (Eq. A.11). Gross
capital income is distributed three ways. Domestic households receive a share of after-tax
capital remuneration. The share is determined by ownership percentage. By definition,
domestic-variety capital is 100 percent owned locally. FDI-based capital is assumed to
operate as a joint venture, where the share of foreign ownership, , is fixed. Thus
percent of after-tax capital remuneration flows overseas (local re-investment of earnings
is not allowed in the current version of the model). The third component of gross capital
remuneration is the tax on capital. Impediments to FDI flows are modeled as ad valorem
taxes on capital, and the capital tax rate, k, is specific to varieties (Eq. A.13).
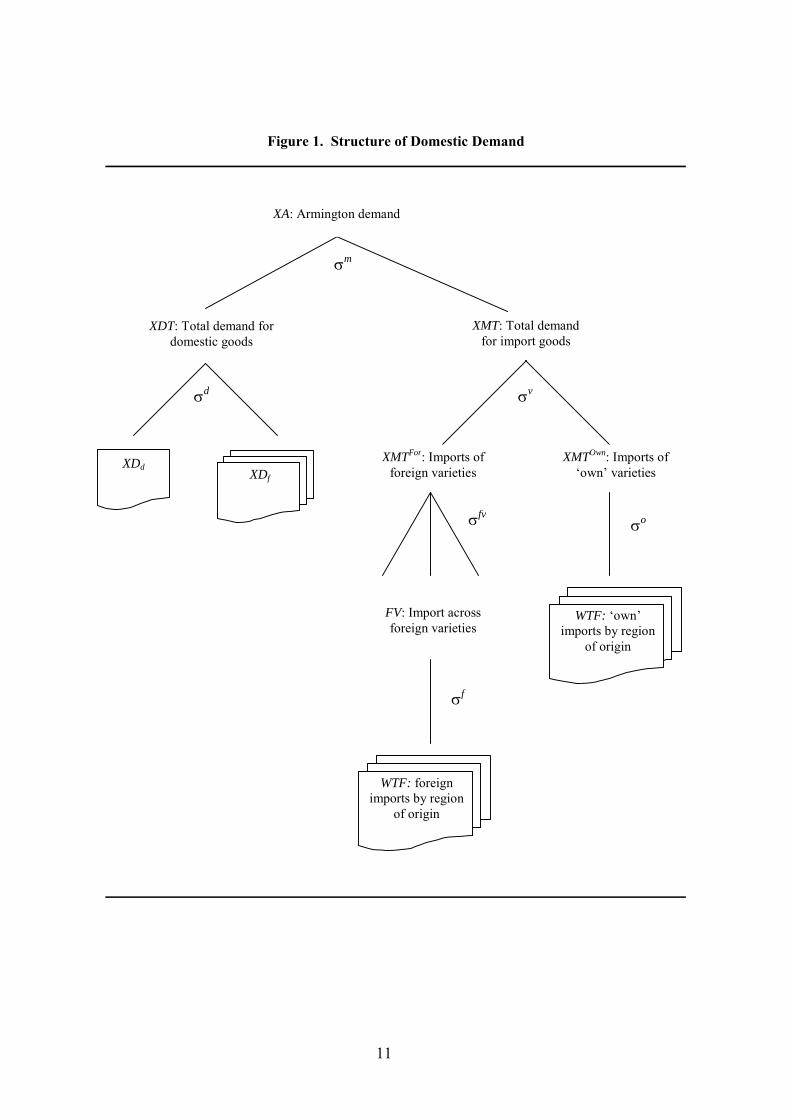
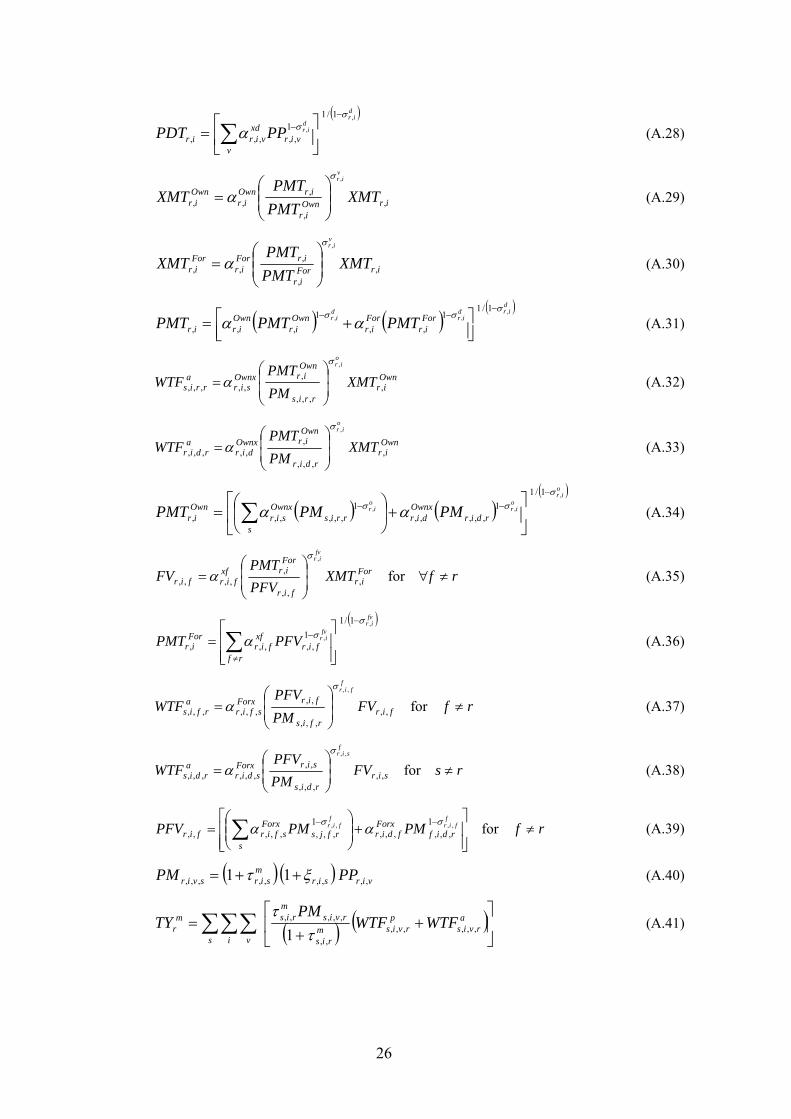
One important aspect in which our model differs from Petri is the order of CES
nesting of demand for goods. In Petri’s demand structure, each agent first allocates
expenditures between an aggregate of goods produced by firms headquartered in the home
region and an aggregate of those produced by firms headquartered in foreign regions. In
our model, as in Figure 1, each agent first allocates expenditures between an aggregate of
goods produced domestically, including those produced by foreign plants located in the
domestic economy, and an aggregate of all imports (Eq. A.24 and A.25). Aggregate
demand for goods produced domestically is split across all plants located domestically
(Eq. A.27). At the other nest, we disaggregate by “own” varieties, i.e., those produced by
domestic firms located abroad and an aggregate of foreign varieties produced abroad
(Eq. A.29 and A.30). Own varieties are allocated across plant locations (Eq. A.32 and
10
A.33), 7 whereas an aggregate of foreign varieties are first disaggregated by foreign
ownership and finally across plant locations (Eq. A.35 and A.37).8
The order of our demand nesting appears to be in accord with reality, particularly
in services. For example, foreign banks in any given country generally provide services to
fulfill the needs of domestic consumers. Thus, goods and services provided by domestic
and foreign-owned firms in a given location appear to be closer substitutes than those
provided by firms headquartered in the same country but produced in different locations.
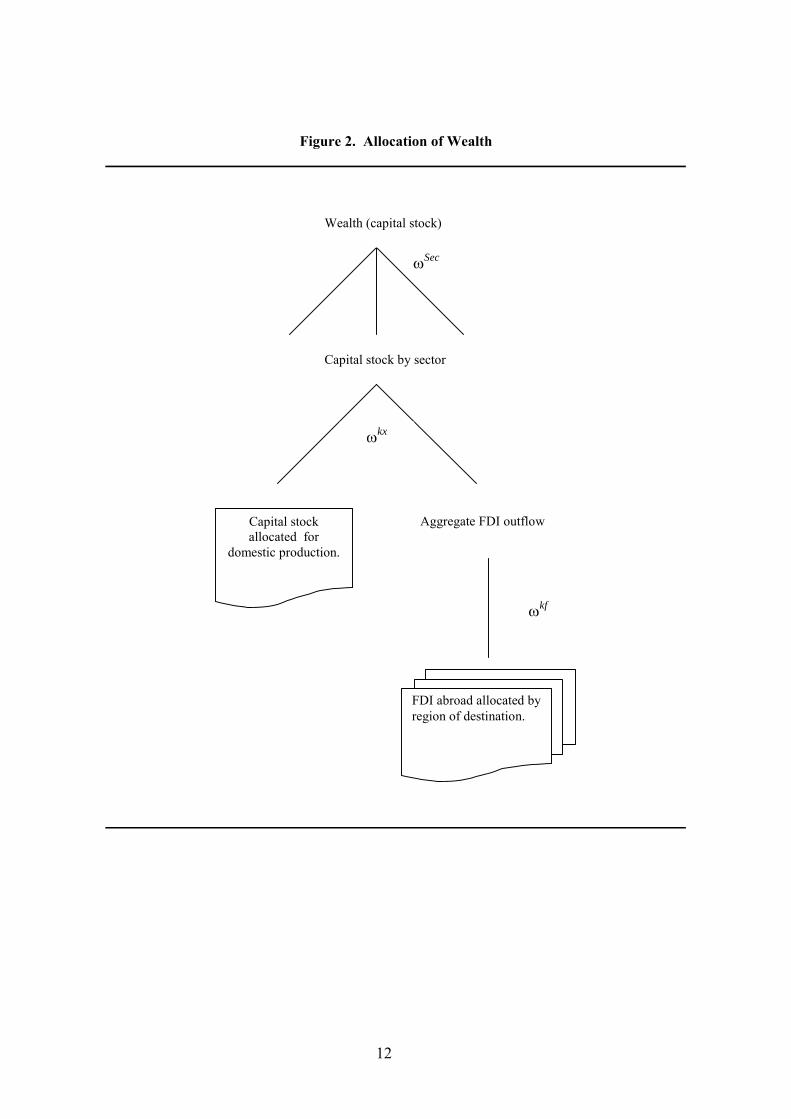
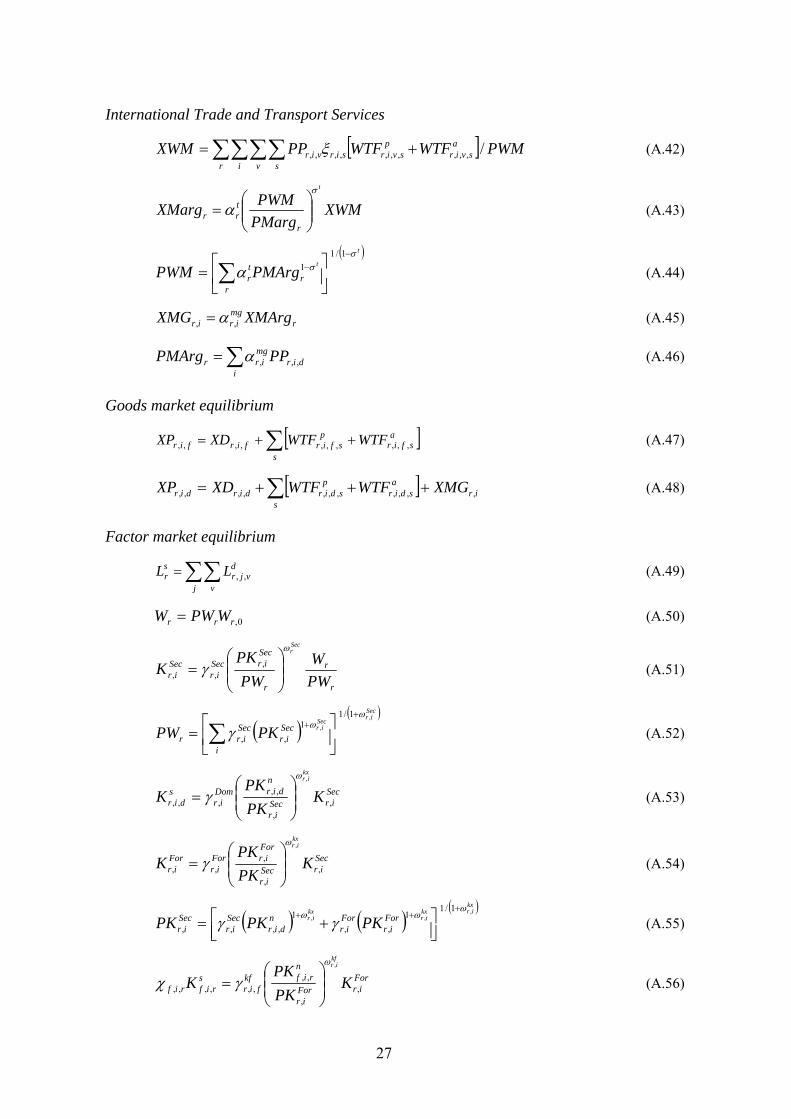
The allocation of capital is modeled using the same CET transformation structure
as in Petri (1997), which is shown in Figure 2. First, aggregate wealth for each region, Wr,
is allocated across sectors as a function of the relative rate of return on capital invested in
various sectors (Eq. A.51). Second, capital in each sector is allocated between domestic
market and an aggregate of foreign markets (Eq. A.53 and A.54). Finally, foreign capital is
allocated across plant locations (Eq. A.56). A reduction in FDI barriers would raise the
after-tax rate of return to capital, PKn, which leads to an increase in the inward FDI stock
(Eq. A.53 and A.56). The world capital stock is assumed to be fixed. With finite
elasticities of transformation, capital is less than perfectly mobile across regions and
sectors.
Labor is assumed to be freely mobile across sectors but not across regions
(Eq. A.49). Thus there is a single equilibrium wage rate for each region. The supply of
labor is held constant. To produce output overseas, subsidiaries employ local labor, the
stock of FDI, inputs sourced from parents, and other intermediate inputs. In the current
version of the model, we assume constant-returns-to-scale technology in all sectors and
competitive product markets.9
7 Equation (A.33) would typically be redundant. However, due to aggregation of regions, intra-regional imports (imports of the domestic variety from r to r) would be represented by variable
ardirWTF ,,, .
8 The structure of demand nesting is similar to the one adopted in the FTAP model (Hanslow et al., 1999). 9 It may be more realistic to assume increasing-returns-to-scale and imperfectly competitive product markets. See, e.g., Brown and Stern (2001).
11
Figure 1. Structure of Domestic Demand
d
m
XDT: Total demand for domestic goods
XDd XDf
XA: Armington demand
XMT: Total demand for import goods
v
XMTFor: Imports of foreign varieties
XMTOwn: Imports of ‘own’ varieties
WTF: ‘own’ imports by region
of origin
FV: Import across foreign varieties
WTF: foreign imports by region
of origin
fv o
f
12
Figure 2. Allocation of Wealth
Sec
Wealth (capital stock)
Capital stock by sector
Capital stock allocated for
domestic production.
Aggregate FDI outflow
FDI abroad allocated by region of destination.
kx
kf

13
The model is calibrated to social accounting matrices (SAMs) of the six regions for
the year 1992, constructed primarily from the GTAP database (version 3) and the FDI
database used by Petri (1997). Since the data are relatively outdated, it is highly desirable
to update the data, but major efforts are required to update the data on FDI, as well as to
disaggregate supply and demand not only by sector, but also by variety, where variety is
associated with capital ownership.
Three caveats need to be mentioned before examining the results of APEC trade
and FDI liberalization experiments presented in the next section. First, we used the same
protection rates on FDI as Petri (1997) in this preliminary version. Since we suspect that
these estimates are likely to be too high, conducting the same experiments using other
estimates (e.g., Francois, 1999; Hanslow et al., 2000) might have been desirable. Second,
the APEC leaders’ agreement at the 1994 summit to remove trade and investment barriers
by 2010 for developed members and 2020 for developing members is not binding. In the
past several years the impetus for APEC-wide liberalization has subsided. Instead, East
Asian countries have started to negotiate a number of bilateral and regional free trade
agreements (FTAs). Third, the current model is static and does not account for capital
accumulation. However, the capital stock is expected to increase over time, particularly
when the real return to capital increases.
4. Computational Results
We have conducted three APEC liberalization experiments: (1) the five APEC
regions remove trade barriers on a Most-Favored Nation (MFN) basis, (2) they reduce
barriers to FDI by 50 percent on an MFN basis, and (3) the combination of (1) and (2). We
first examine aggregate results in section 4.1, followed by assessments of sectoral results
in section 4.2.
4.1 Aggregate Results
Table 4 summarizes aggregate results from three APEC liberalization experiments.
In the aggregate, world real GDP would gain $100 billion from trade liberalization, $339
billion from FDI liberalization, and $441 from the combination of the two. These
estimates should be interpreted with caution because the ad valorem equivalents of FDI
barriers used in the model may be biased upward, particularly for UCAN.
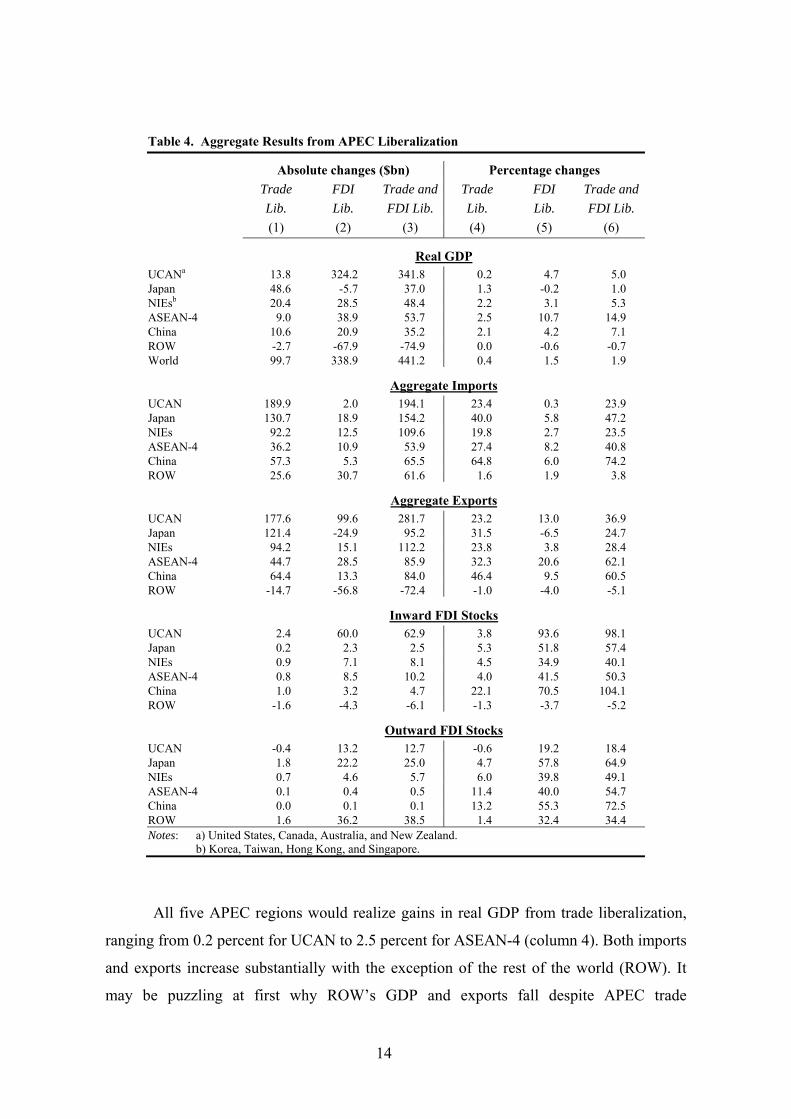
14
Table 4. Aggregate Results from APEC Liberalization
Absolute changes ($bn) Percentage changes
Trade FDI Trade and Trade FDI Trade and
Lib. Lib. FDI Lib. Lib. Lib. FDI Lib.
(1) (2) (3) (4) (5) (6)
Real GDP UCANa 13.8 324.2 341.8 0.2 4.7 5.0 Japan 48.6 -5.7 37.0 1.3 -0.2 1.0 NIEsb 20.4 28.5 48.4 2.2 3.1 5.3 ASEAN-4 9.0 38.9 53.7 2.5 10.7 14.9 China 10.6 20.9 35.2 2.1 4.2 7.1 ROW -2.7 -67.9 -74.9 0.0 -0.6 -0.7 World 99.7 338.9 441.2 0.4 1.5 1.9
Aggregate Imports UCAN 189.9 2.0 194.1 23.4 0.3 23.9 Japan 130.7 18.9 154.2 40.0 5.8 47.2 NIEs 92.2 12.5 109.6 19.8 2.7 23.5 ASEAN-4 36.2 10.9 53.9 27.4 8.2 40.8 China 57.3 5.3 65.5 64.8 6.0 74.2 ROW 25.6 30.7 61.6 1.6 1.9 3.8
Aggregate Exports UCAN 177.6 99.6 281.7 23.2 13.0 36.9 Japan 121.4 -24.9 95.2 31.5 -6.5 24.7 NIEs 94.2 15.1 112.2 23.8 3.8 28.4 ASEAN-4 44.7 28.5 85.9 32.3 20.6 62.1 China 64.4 13.3 84.0 46.4 9.5 60.5 ROW -14.7 -56.8 -72.4 -1.0 -4.0 -5.1
Inward FDI Stocks UCAN 2.4 60.0 62.9 3.8 93.6 98.1 Japan 0.2 2.3 2.5 5.3 51.8 57.4 NIEs 0.9 7.1 8.1 4.5 34.9 40.1 ASEAN-4 0.8 8.5 10.2 4.0 41.5 50.3 China 1.0 3.2 4.7 22.1 70.5 104.1 ROW -1.6 -4.3 -6.1 -1.3 -3.7 -5.2
Outward FDI Stocks UCAN -0.4 13.2 12.7 -0.6 19.2 18.4 Japan 1.8 22.2 25.0 4.7 57.8 64.9 NIEs 0.7 4.6 5.7 6.0 39.8 49.1 ASEAN-4 0.1 0.4 0.5 11.4 40.0 54.7 China 0.0 0.1 0.1 13.2 55.3 72.5 ROW 1.6 36.2 38.5 1.4 32.4 34.4 Notes: a) United States, Canada, Australia, and New Zealand. b) Korea, Taiwan, Hong Kong, and Singapore.
All five APEC regions would realize gains in real GDP from trade liberalization,
ranging from 0.2 percent for UCAN to 2.5 percent for ASEAN-4 (column 4). Both imports
and exports increase substantially with the exception of the rest of the world (ROW). It
may be puzzling at first why ROW’s GDP and exports fall despite APEC trade
15
liberalization is nondiscriminatory toward ROW. It is mainly caused by a large decline in
its exports of primary products to Japan and NIEs. UCAN is the leading supplier of
primary products to these regions, and its exports of primary products surge after the
removal of trade barriers. This is because the export price of UCAN relative to that of
ROW falls, resulting from a reduction in the average cost brought about by a fall in the
price of imported intermediate inputs.
The real GDP effect of FDI liberalization depends upon whether a region attracts
or loses foreign capital, which in turn is affected by the magnitude of initial FDI barriers,
the share of output produced by multinational firms in total output, and the initial stock of
inward FDI relative to outward FDI, among many factors. UCAN, NIEs, ASEAN-4, and
China would realize gains in real GDP because the increase in the inward FDI stock is
larger than the increase in the outward FDI stock while the opposite is the case for Japan
and ROW (column 2 of Table 4). 10 In percentage terms the impact on real GDP is
extremely large in ASEAN-4 largely because the share of output produced by
multinational firms in total output is the highest among the APEC regions.11 A large
injection of new foreign capital to the already high initial inward FDI stock relative to the
total capital stock would substantially expand output of multinational firms located in
ASEAN-4.
The results reported in Table 4 suggest that at the aggregate level, trade and FDI
exhibit a complementary relationship. That is, an increase in imports resulting from trade
liberalization leads to an increase in inward FDI (column 4), and a rise in inward FDI
resulting from FDI liberalization induces an expansion of imports (column 5). Home
sourcing of intermediate inputs by foreign subsidiaries can partly explain the latter
causality. We have no strong reason to believe why the removal of trade barriers would
attract foreign capital at the aggregate level, and we postpone our assessment until we
examine the sectoral results.
10 FDI liberalization would raise after-tax rate of return to capital in APEC regions relative to ROW. This induces capital to move from ROW to APEC regions, reducing the capital stock and output produced in ROW. 11 For individual APEC economies, this share is the highest in Singapore, followed by Hong Kong. For the regional aggregation used in this paper, however, the share is significantly higher in ASEAN-4 than the NIEs.
16
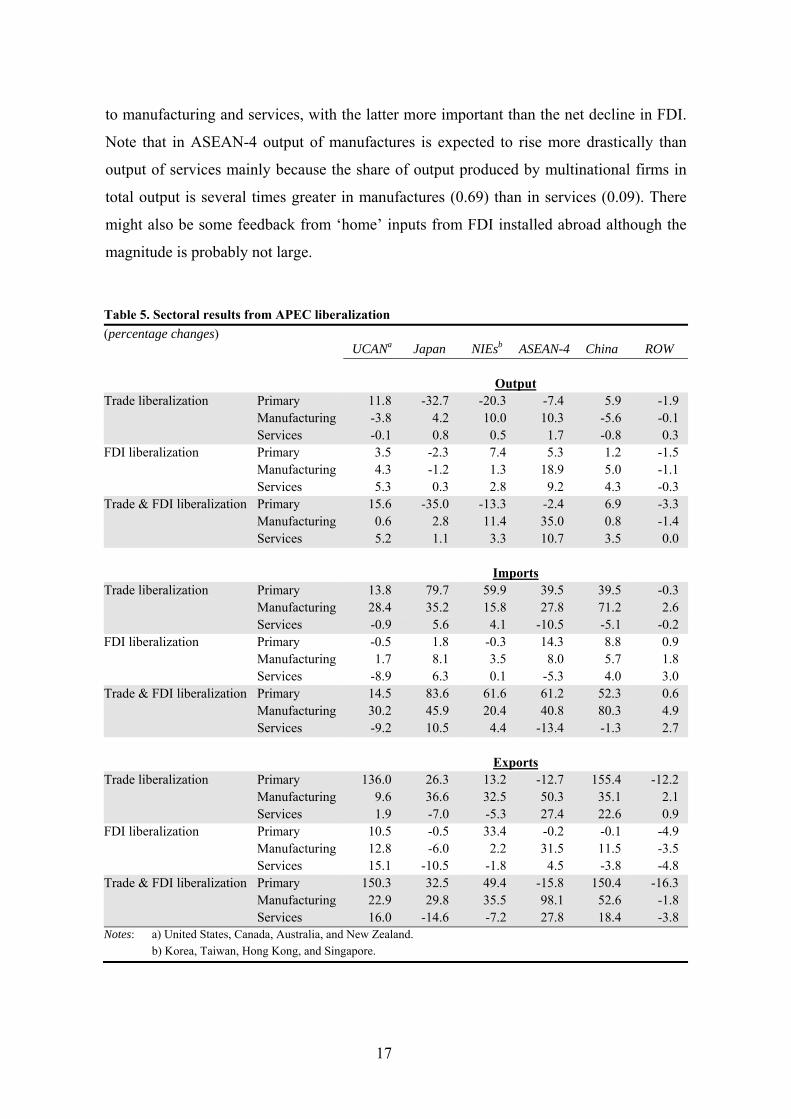
4.2 Sectoral Results
Tables 5 and 6 present each region’s sectoral adjustments in output, trade, and
inward and outward FDI stocks for the three experiments. Not only the magnitude of the
adjustments but the sign often changes with the transition to a more microeconomic
perspective. The removal of trade barriers is expected to lead to large contractions in
output of primary products in Japan and NIEs, resulting from a sharp increase in demand
for imported goods. Since UCAN and China export relatively large shares of their primary
products to Japan and NIEs, export expansion resulting from trade liberalization would
sharply raise domestic output. This appears to cause a strong resource-pull effect in
UCAN and China. As the primary sector expands substantially in these regions, factors of
production would be diverted from the manufacturing and services sectors, causing an
output contraction in these sectors. However, this assumes that labor is homogeneous and
perfectly mobile across sectors. If labor demand was disaggregated by type and skill,
however, limited labor mobility might dampen contraction in non-primary sectors.
The manufacturing output in Japan, NIEs, and ASEAN-4 increases, driven by
export expansion. Had more disaggregated data been available, we would expect that
output of some labor-intensive sectors (such as processed food and apparel) to contract in
Japan and that output of some capital-intensive sectors (such as steel and transportation
equipment) to decline in ASEAN-4.12
FDI liberalization leads to an expansion of output in all three sectors in UCAN,
NIEs, ASEAN-4, and China (Table 5). As already mentioned in section 4.1, the regions
that attract net inward FDI experience a positive output effect. Extremely large percentage
increases in both inward and outward FDI in services are observed (Table 6). This is
because the rates of FDI protection are highest in the services sector in every region.
Although not reported in Table 6, the absolute change in the services sector’s inward FDI
stock is larger than that in its outward FDI stock in every APEC region except Japan.13 An
increase in output of services in Japan may be attributable to inter-sectoral domestic
capital mobility. With primary production declining, capital installed in that sector moves
12 Because of data limitations on FDI, we were not able to disaggregate the manufacturing sector further. See Lee, Roland-Holst, and van der Mensbrugghe (1999) for the sectoral output effects of APEC trade liberalization at a 20-sector level of disaggregation. 13 In Japan the inward FDI in services increases from $0.5 billion to $2.1 billion, whereas the outward FDI in services increases from $10.7 billion to $28.6 billion.
17
to manufacturing and services, with the latter more important than the net decline in FDI.
Note that in ASEAN-4 output of manufactures is expected to rise more drastically than
output of services mainly because the share of output produced by multinational firms in
total output is several times greater in manufactures (0.69) than in services (0.09). There
might also be some feedback from ‘home’ inputs from FDI installed abroad although the
magnitude is probably not large.
Table 5. Sectoral results from APEC liberalization
(percentage changes) UCANa Japan NIEsb ASEAN-4 China ROW Output Trade liberalization Primary 11.8 -32.7 -20.3 -7.4 5.9 -1.9 Manufacturing -3.8 4.2 10.0 10.3 -5.6 -0.1 Services -0.1 0.8 0.5 1.7 -0.8 0.3 FDI liberalization Primary 3.5 -2.3 7.4 5.3 1.2 -1.5 Manufacturing 4.3 -1.2 1.3 18.9 5.0 -1.1 Services 5.3 0.3 2.8 9.2 4.3 -0.3 Trade & FDI liberalization Primary 15.6 -35.0 -13.3 -2.4 6.9 -3.3 Manufacturing 0.6 2.8 11.4 35.0 0.8 -1.4 Services 5.2 1.1 3.3 10.7 3.5 0.0 Imports Trade liberalization Primary 13.8 79.7 59.9 39.5 39.5 -0.3 Manufacturing 28.4 35.2 15.8 27.8 71.2 2.6 Services -0.9 5.6 4.1 -10.5 -5.1 -0.2 FDI liberalization Primary -0.5 1.8 -0.3 14.3 8.8 0.9 Manufacturing 1.7 8.1 3.5 8.0 5.7 1.8 Services -8.9 6.3 0.1 -5.3 4.0 3.0 Trade & FDI liberalization Primary 14.5 83.6 61.6 61.2 52.3 0.6 Manufacturing 30.2 45.9 20.4 40.8 80.3 4.9 Services -9.2 10.5 4.4 -13.4 -1.3 2.7 Exports Trade liberalization Primary 136.0 26.3 13.2 -12.7 155.4 -12.2 Manufacturing 9.6 36.6 32.5 50.3 35.1 2.1 Services 1.9 -7.0 -5.3 27.4 22.6 0.9 FDI liberalization Primary 10.5 -0.5 33.4 -0.2 -0.1 -4.9 Manufacturing 12.8 -6.0 2.2 31.5 11.5 -3.5 Services 15.1 -10.5 -1.8 4.5 -3.8 -4.8 Trade & FDI liberalization Primary 150.3 32.5 49.4 -15.8 150.4 -16.3 Manufacturing 22.9 29.8 35.5 98.1 52.6 -1.8 Services 16.0 -14.6 -7.2 27.8 18.4 -3.8 Notes: a) United States, Canada, Australia, and New Zealand.
b) Korea, Taiwan, Hong Kong, and Singapore.

18
For UCAN and China, expansions of the manufacturing and services sectors under
FDI liberalization are larger than contractions of these sectors under trade liberalization,
resulting in expansions of all three sectors in these regions when both trade and FDI are
liberalized. For Japan, NIEs, and ASEAN-4, the combination of trade and FDI
liberalization leads to expansions of manufacturing and services output.
Table 6. Sectoral FDI impacts results from APEC liberalization
(percentage changes) UCANa Japan NIEsb ASEAN-4 China ROW Inward FDI stock Trade liberalization Primary 10.7 -27.5 -12.4 -9.1 51.7 -4.4 Manufacturing 3.0 8.6 15.6 15.5 8.4 -0.3 Services -1.4 1.8 1.8 -5.0 -5.7 -0.7 FDI liberalization Primary 4.5 57.2 37.9 14.8 16.1 -2.1 Manufacturing 26.2 15.2 9.7 35.3 76.1 -3.1 Services 294.3 291.6 150.0 140.0 200.3 -11.1 Trade & FDI liberalization Primary 15.5 14.4 22.6 4.6 74.4 -6.4 Manufacturing 31.4 24.8 27.3 61.4 103.4 -3.6 Services 291.7 298.0 157.0 133.7 189.6 -11.9 Outward FDI stock Trade liberalization Primary -4.2 31.4 12.2 1.9 -3.4 -0.3 Manufacturing 2.6 6.4 4.9 18.6 19.9 2.4 Services -1.0 -2.7 -4.7 3.1 0.9 0.0 FDI liberalization Primary 12.2 -1.2 8.4 14.3 64.9 1.6 Manufacturing 7.3 16.1 38.8 14.7 10.2 5.4 Services 100.1 168.8 113.9 235.7 329.9 204.9 Trade & FDI liberalization Primary 7.2 31.0 22.5 16.2 65.6 1.3 Manufacturing 10.3 26.8 49.9 37.6 33.6 8.7 Services 98.7 163.8 106.3 246.3 337.3 206.0 Notes: a) United States, Canada, Australia, and New Zealand.
b) Korea, Taiwan, Hong Kong, and Singapore.
Finally, we examine whether trade and FDI are complements at the sectoral level.
Trade liberalization leads to an increase in the inward and outward FDI stocks of the
manufacturing sector in every APEC region, whereas it has an ambiguous effect on the
FDI stocks in the primary and services sectors (Tables 5 and 6). At the same time, FDI
liberalization leads to an increase in imports and exports of manufactures in every APEC
region with the exception of Japanese exports. Again, the effect on the primary and
services sectors is ambiguous.
19
The results are consistent with our a priori expectation that horizontal FDI is the
most prevalent in the manufacturing sector, where trade and FDI linkages are extensive.
Thus the removal of trade barriers in host economies is likely to promote production of
foreign subsidiaries. In the primary sector, motives of FDI might include securing energy
and/or natural resources for the home country, and this type of FDI is expected to be less
sensitive to changes in the height of trade barriers in the host country. In the services
sector, a change in trade regime is unlikely to affect the level of FDI extensively because
FDI is often the only means to provide foreign services to local consumers.
5. Conclusions
Despite a significant economic setback experienced by several East Asian
economies in 1998 and 2001, the Asia-Pacific region has been the fastest growing
multilateral trading area of the world. In this paper, we have evaluated the impact of
APEC trade and investment liberalization using a CGE model that incorporates FDI. The
preliminary results suggest that FDI liberalization would bring about greater benefits to
most of the member economies than trade liberalization. More accurate estimates of FDI
barriers would be helpful in assessing the benefits of APEC liberalization more precisely,
and we hope to refine and update the database.
In the manufacturing sector, trade and FDI are found to be complements in the
APEC regions. Trade liberalization leads to an increase in the inward and outward FDI
stocks, and FDI liberalization leads to an increase in imports and exports of manufactures.
The only exception is that when Japan liberalizes FDI barriers, it leads to an increase in
imports but not in exports. However, this may be treated as a special case because Japan’s
inward FDI stock is extremely small relative to its capital stock. The result on
complementarity suggests that gains from trade liberalization would be amplified in the
presence of FDI. At the same time, FDI liberalization would increase both FDI and trade
flows, which would bring additional gains in the worldwide production.
20
References
Borensztein, E., J. De Gregorio, and J-W. Lee (1998), “How Does Foreign Direct
Investment Affect Economic Growth?” Journal of International Economics, 24:
115-135.
Brown, D. K., A. V. Deardorff, A. K. Fox, and R. M. Stern (1996). “The Liberalization of
Services Trade: Potential Impacts in the Aftermath of the Uruguay Round,” in W.
Martin and L.A. Winters, eds., The Uruguay Round and the Developing Countries,
Cambridge: Cambridge University Press.
Brown, D. K. and R. M. Stern (2001). “Measurement and Modeling of the Economic
Effects of Trade and Investment Barriers in Services,” Review of International
Economics, 9: 262-286.
Chadha, R. (2001). “GATS and Developing Countries: A Case Study of India,” in R. M.
Stern, ed., Services in the International Economy, Ann Arbor: University of
Michigan Press.
Dee, P. and K. Hanslow (2001), “Multilateral Liberalisation of Services Trade,” in R. M.
Stern, ed., Services in the International Economy, Ann Arbor: University of
Michigan Press.
Dee, P., K. Hanslow, and T. Phamduc (2003). “Measuring the Cost of Barriers to Trade in
Services,” in T. Ito and A. O. Krueger, eds., Trade in Services in the Asia-Pacific
Region, Chicago: University of Chicago Press.
Francois, J. (1999). “A Gravity Approach to Measuring Services Protection,” Unpublished
manuscript, Erasmus University, Rotterdam.
Fry, M. J. (1993). Foreign Direct Investment in Southeast Asia: Differential Impacts.
Singapore: Institute of Southeast Asian Studies.
Hanslow, K., T. Phamduc, and G. Verikios (2000). “The Structure of the FTAP Model.”
Research Memorandum MC-58, Productivity Commission, Canberra.
Hanslow, K., T. Phamduc, G. Verikios, and A. Welsh (2000). “Incorporating Barriers to
Services Trade into the FTAP Database.” Research Memorandum MC-59,
Productivity Commission, Canberra.
Hardin, A. and L. Holmes (1997). “Services Trade and Foreign Direct Investment.” Staff
Research Paper, Industry Commission, Canberra.

21
Hertel, T. W., ed. (1997). Global Trade Analysis: Modeling and Applications. Cambridge:
Cambridge University Press.
Hertel, T. W. (2000). “Potential Gains from Reducing Trade Barriers in Manufacturing,
Services and Agriculture,” Federal Reserve Bank of St. Louis Review, 82(4): 77-99.
Hoekman, B. (1995). “Assessing the General Agreement on Trade in Services,” in W.
Martin and L.A. Winters, eds., The Uruguay Round and the Developing Countries,
World Bank Discussion Paper No. 307. Washington, DC: World Bank.
Kaleeswaran, K., G. McGuire, D. Nguyen-Hong, and M. Schuele (2000). “The Price
Impact of Restrictions on Banking Services,” in C. Findlay and T. Warren, eds.,
Impediments to Trade in Services: Measurement and Policy Implications. London:
Routledge.
Kalirajan, K. (2000). “Restrictions on Trade in Distribution Services,” Staff Research
Paper, Productivity Commission, Canberra, August.
Kawai, M. and S. Urata (1998). “Are Trade and Direct Investment Substitutes or Comple-
ment? An Empirical Analysis of Japanese Manufacturing Industries,” in H. Lee
and D.W. Roland-Holst, eds., Economic Development and Cooperation in the
Pacific Basin: Trade, Investment, and Environmental Issues. Cambridge: Cam-
bridge University Press.
Lee, H. and D. Roland-Holst (1998). “Cooperative Approaches to Shifting Comparative
Advantage: The Case of Bilateral Trade between the United States and Japan,” in
H. Lee and D.W. Roland-Holst, eds., Economic Development and Cooperation in
the Pacific Basin: Trade, Investment, and Environmental Issues. Cambridge:
Cambridge University Press.
Lee, Hiro, D. Roland-Holst, and D. van der Mensbrugghe (1999). “Quantitative Analysis
of APEC Liberalization Using Calibrated General Equilibrium Modelling,” in M.E.
Kreinin, M.G. Plummer, and S. Abe, eds., Asia-Pacific Economic Linkages.
Amsterdam: Elsevier.
Low, L., E. D. Ramstetter, and H. W. Yeung (1996). “Accounting for Outward Direct
Investment from Hong Kong and Singapore: Who Controls What?” NBER
Working Paper No. 5858. Cambridge: National Bureau of Economic Research.
Markusen, J. R. (1983). “Factor Movements and Commodity Trade as Complements,”
Journal of International Economics, 14: 341-356.
22
McGuire, G. and M. Schuele (2000), “Restrictiveness of International Trade in Banking
Services,” in C. Findlay and T. Warren, eds., Impediments to Trade in Services:
Measurement and Policy Implications. London: Routledge.
McGuire, G., M. Schuele, and T. Smith (2000). “Restrictiveness of International Trade in
Maritime Services,” in C. Findlay and T. Warren, eds., Impediments to Trade in
Services: Measurement and Policy Implications. London: Routledge.
Mundell, R. A. (1957). “International Trade and Factor Mobility,” American Economic
Review, 47: 321-335.
Naya, S. (1990). “Direct Foreign Investment and Trade in East and Southeast Asia,” in
R.W. Jones and A.O. Krueger, eds., The Political Economy of International Trade:
Essays in Honor of Robert Baldwin. New York: Basil Blackwell.
Neary, J. P., and F. Ruane (1988). “International Capital Mobility, Shadow Prices, and the
Cost of Protection,” International Economic Review, 29: 571-585.
Nguyen-Hong, D. (2000), “Restrictions on Trade in Professional Services,” Staff Research
Paper, Productivity Commission, Canberra, August.
Pacific Economic Cooperation Council (PECC) (1995). Surveys of Impediments to Trade
and Investment in the APEC Region. Singapore: PECC for APEC Secretariat.
Petri, P. A. (1997). “Foreign Direct Investment in a Computable General Equilibrium
Framework,” paper presented at the Brandeis-Keio Conference on “Making APEC
Work: Economic Challenges and Policy Alternatives,” Keio University, Tokyo,
March 13-14.
Ramstetter, E. D. (2000). “Recent Trends in Foreign Direct Investment in Asia: The
Aftermath of the Crisis to Late 1999.” Working Paper 2000-02, International
Centre for the Study of East Asian Development, Kitakyushu.
Robinson, S., Z. Wang, and W. Martin, (1999). “Capturing the Implications of Services
Trade Liberalization.” Paper presented at the Second Annual Conference on Global
Economic Analysis, Ebberuk, Denmark, June 20-22.
UNCTAD (United Nations Conference on Trade and Development) (1996). World
Investment Report 1996: Investment, Trade and International Policy Arrangements.
Geneva and New York: United Nations.
UNCTAD (United Nations Conference on Trade and Development) (2005a). World
Investment Report 2005: Transnational Corporations and the Internationalization
of R&D. Geneva and New York: United Nations.

23
UNCTAD (United Nations Conference on Trade and Development) (2005b). Key Data
from WIR Annex Tables. Downloaded from
http://www.unctad.org/Templates/Page.asp?intItemID=3277&lang=1
van der Mensbrugghe, D. (2000). “A Simple World CGE Model Using GTAP Version
4.0.” Mimeo, Development Prospects Group, The World Bank, September.
Verikios, G. and X-G. Zhang (2001). “Global Gains from Liberalising Trade in
Telecommunications and Financial Services.” Staff Research Paper, Productivity
Commission, Canberra.
Warren, T. (2000a). “The Identification of Impediments to Trade and Investment in
Telecommunications Services,” in C. Findlay and T. Warren, eds., Impediments to
Trade in Services: Measurement and Policy Implications. London: Routledge.
Warren, T. (2000b). “The Impact on Output of Impediments to Trade and Investment in
Telecommunications Services,” in C. Findlay and T. Warren, eds., Impediments to
Trade in Services: Measurement and Policy Implications. London: Routledge.
Wong, K-Y. (1986). “Are International Trade and Factor Mobility Substitutes?” Journal
of International Economics, 21: 25-43.
Wong, K-Y. (1995). International Trade in Goods and Factor Mobility. Cambridge, MA:
MIT Press.
24
Appendix: Model Specification
Indices
i, j Sector indices r, s Regional indices f, d, v Varieties – f represents foreign varieties only, whereas d represents the domestic variety,
i.e. production from home owned and based plants. v represents both f and d (i.e. it is the union of f and d).
Equations
Production
vjrd
vjrd
vjr XPandND ,,,,,, (A.1)
i
ird
vjird
vjr PAadPND ,,,,,, (A.2)
fjrm
fjrp
rdjf XPandWTF ,,,,,,, (A.3)
rdjfm
fjr PMPND ,,,,, (A.4)
vjrvjrvjr XPavaVA ,,,,,, (A.5)
vjrr
vjrlvjr
dvjr VA
W
PVAL
pvjr
,,,,
,,,,
,,
(A.6)
vjrvjr
vjrkvjr
dvjr VA
PK
PVAK
pvjr
,,,,
,,,,,,
,,
(A.7)
p
vjrpvjr
pvjr
vjrk
vjrrl
vjrvjr PKWPVA,,
,,,,1/1
1,,,,
1,,,,
(A.8)
mvjr
mvjr
dvjr
dvjrvjrvjrvjr PNDandPNDandPVAavaVC ,,,,,,,,,,,,,, (A.9)
vjrp
jrvjr VCPP ,,,,, 1 (A.10)
Income Distribution
kr
xr
pr
mr
kr
i v
dvir
nvirvir
i v
dvirrr
InFlowY
TYTYTYTY
KPKLWYH
,,,,,,,, 1
(A.11)
i v
virvirpir
pr XPVCTY ,,,,, (A.12)
25
i v
dvirvir
kvir
kr KPKTY ,,,,,, (A.13)
i s
dris
nrisris
kr KPKInFlowY ,,,,,, (A.14)
i s
dsir
nsirsir
kr KPKOutFlowY ,,,,,, (A.15)
fr
MUVhrrr SPSInvPINV (A.16)
Domestic demand
j
jrjrc
jrrr PAYHY ,,,* 1 (A.17)
irc
ir
riririr
PA
YXAc
,,
*,
,,1
(A.18)
j
jrjrc
jrrhr XAcPAYHS ,,,1 (A.19)
rir
iir
riirir Inv
PA
PINVXAi
ir
,,,,
1 (A.20)
i
rir
iir
iir
iirr PAPINV
1/11
,,, 1 (A.21)
irirv j
dvjr
dvjirir XAiXAcNDadXA ,,,,,,,, (A.22)
i
iriri
iririrc
irx
r XAiPAXAcPATY ,,,,,, (A.23)
Trade
irir
irdirir XA
PDT
PAXDT
mir
,,
,,,
,
(A.24)
irir
irmirir XA
PMT
PAXMT
mir
,,
,,,
,
(A.25)
mirm
irm
ir
irm
irird
irir PMTPDTPA,
,,1/1
1,,
1,,,
(A.26)
irvir
irxdvirvir XDT
PP
PDTXD
dir
,,,
,,,,,
,
(A.27)
26
dir
dir
vvir
xdvirir PPPDT
,
,
1/11
,,,,,
(A.28)
irOwnir
irOwnir
Ownir XMT
PMT
PMTXMT
vir
,,
,,,
,
(A.29)
irForir
irForir
Forir XMT
PMT
PMTXMT
vir
,,
,,,
,
(A.30)
d
irdir
dir For
irFor
irOwnir
Ownirir PMTPMTPMT
,,,
1/11
,,
1
,,,
(A.31)
Ownir
rris
OwnirOwnx
sira
rris XMTPM
PMTWTF
oir
,,,,
,,,,,,
,
(A.32)
Ownir
rdir
OwnirOwnx
dira
rdir XMTPM
PMTWTF
oir
,,,,
,,,,,,
,
(A.33)
o
iro
iro
ir
rdirOwnx
dirs
rrisOwnx
sirOwnir PMPMPMT
,
,,
1/1
1,,,,,
1,,,,,,
(A.34)
rfXMTPFV
PMTFV For
irfir
Forirxf
firfir
fvir
for,
,,
,,,,,
,
(A.35)
fvir
fvir
rffir
xffir
Forir PFVPMT
,
,
1/1
1,,,,,
(A.36)
rfFVPM
PFVWTF fir
rfis
firForxsfir
arfis
ffir
for,,
,,,
,,,,,,,,
,,
(A.37)
rsFVPM
PFVWTF sir
rdis
sirForxsdir
ardis
fsir
for,,
,,,
,,,,,,,,
,,
(A.38)
rfPMPMPFVf
firf
fir
rdifForx
fdirs
rfjsForx
sfirfir
for,,,, 1
,,,,,,1
,,,,,,,, (A.39)
virsirm
sirsvir PPPM ,,,,,,,,, 11 (A.40)
s i v
arvis
prvism
ris
rvism
rismr WTFWTF
PMTY ,,,,,,
,,
,,,,,
1
(A.41)
27
International Trade and Transport Services
PWMWTFWTFPPXWMr i v s
asvir
psvirsirvir /,,,,,,,,,, (A.42)
XWMPMarg
PWMXMarg
t
r
trr
(A.43)
t
t
rr
trPMArgPWM
1/1
1 (A.44)
rmg
irir XMArgXMG ,, (A.45)
i
dirmg
irr PPPMArg ,,, (A.46)
Goods market equilibrium
s
asfir
psfirfirfir WTFWTFXDXP ,,,,,,,,,, (A.47)
irs
asdir
psdirdirdir XMGWTFWTFXDXP ,,,,,,,,,,, (A.48)
Factor market equilibrium
j v
dvjr
sr LL ,, (A.49)
0,rrr WPWW (A.50)
r
r
r
SecirSec
irSec
ir PW
W
PW
PKK
Secr
,
,, (A.51)
Sec
irSec
ir
i
Secir
Secirr PKPW
,
,
1/11
,,
(A.52)
SecirSec
ir
ndirDom
irs
dir KPK
PKK
kxir
,,
,,,,,
,
(A.53)
SecirSec
ir
ForirFor
irFor
ir KPK
PKK
kxir
,,
,,,
,
(A.54)
kx
irkxir
kxir For
irFor
irn
dirSec
irSec
ir PKPKPK,
,,1/1
1
,,
1
,,,,
(A.55)
ForirFor
ir
nrifkf
firs
rifrif KPK
PKK
kfir
,,
,,,,,,,,
,
(A.56)

28
kf
irkf
ir
f
nrif
kffir
Forir PKPK
,
,
1/11
,,,,,
(A.57)
dvir
svir KK ,,,, (A.58)
virk
virn
vir PKPK ,,,,,, 1 (A.59)
Numéraire and closure
OECDr Manui v s
asvir
psvirvir
OECDr Manui v s
asvir
psvirvir
MUV
WTFWTFPP
WTFWTFPPP
0,,,,0,,,,0,,,
0,,,,0,,,,,,
(A.60)
Dropped balance of payments equation
The following equation is deduced as a linear combination of the regional equations:
kr
kr
iirdir
s i v
asvir
psvirvir
s i v
arvis
prvism
ris
rvisfr
MUV
OutFlowYInFlowYXMGPP
WTFWTFPP
WTFWTFPM
SP
,,,
,,,,,,,,
,,,,,,,,
,,,
1
(A.61)
Definition of Variables and Parameters Endogenous Variables Production NDd Aggregate intermediate demand PNDd Price of aggregate intermediate demand WTFp ‘Home’ imports for production by foreign-based investment PNDm Price of ‘home’ imports VA Aggregate value added Ld Labor demand Kd Capital demand PVA Price of value added bundle VC Unit cost of production PP Producer price Income YH Household income TYp Production tax revenues TYk Capital tax revenues TYm Tariff revenues
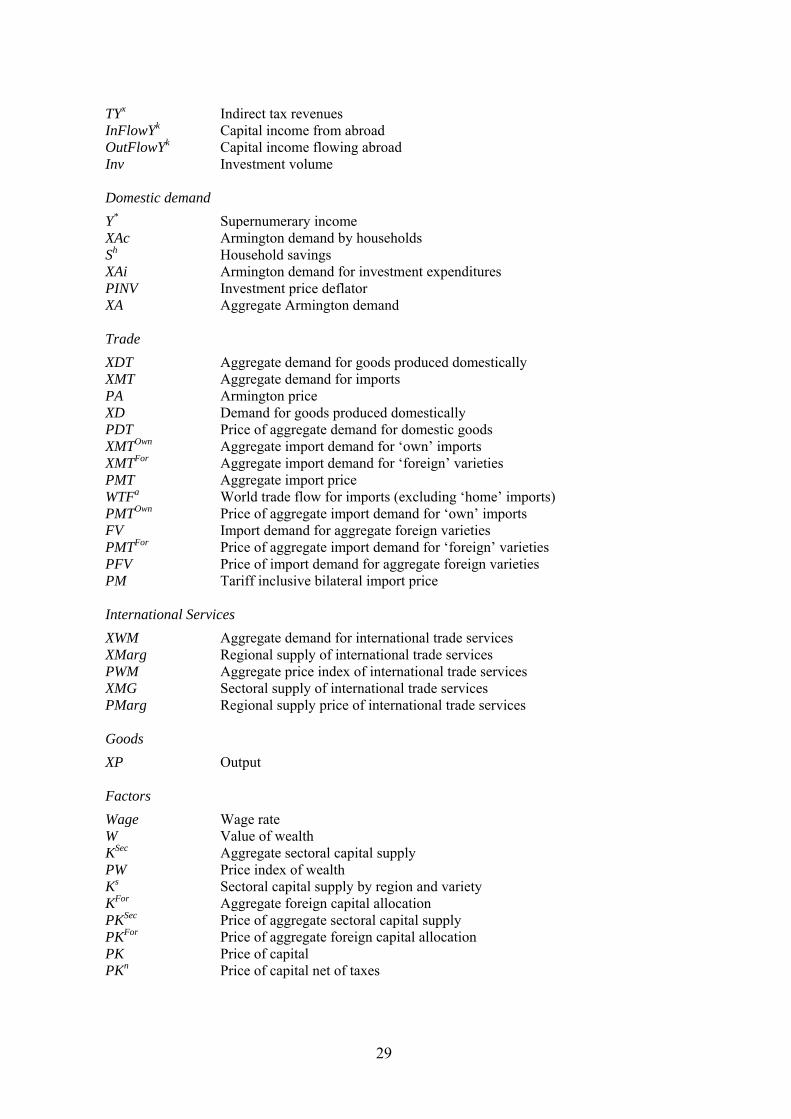
29
TYx Indirect tax revenues InFlowYk Capital income from abroad OutFlowYk Capital income flowing abroad Inv Investment volume Domestic demand Y* Supernumerary income XAc Armington demand by households Sh Household savings XAi Armington demand for investment expenditures PINV Investment price deflator XA Aggregate Armington demand Trade XDT Aggregate demand for goods produced domestically XMT Aggregate demand for imports PA Armington price XD Demand for goods produced domestically PDT Price of aggregate demand for domestic goods XMTOwn Aggregate import demand for ‘own’ imports XMTFor Aggregate import demand for ‘foreign’ varieties PMT Aggregate import price WTFa World trade flow for imports (excluding ‘home’ imports) PMTOwn Price of aggregate import demand for ‘own’ imports FV Import demand for aggregate foreign varieties PMTFor Price of aggregate import demand for ‘foreign’ varieties PFV Price of import demand for aggregate foreign varieties PM Tariff inclusive bilateral import price International Services XWM Aggregate demand for international trade services XMarg Regional supply of international trade services PWM Aggregate price index of international trade services XMG Sectoral supply of international trade services PMarg Regional supply price of international trade services Goods XP Output Factors Wage Wage rate W Value of wealth KSec Aggregate sectoral capital supply PW Price index of wealth Ks Sectoral capital supply by region and variety KFor Aggregate foreign capital allocation PKSec Price of aggregate sectoral capital supply PKFor Price of aggregate foreign capital allocation PK Price of capital PKn Price of capital net of taxes
30
Exogenous Variables
p Output tax k Capital tax m Tariff rate c Indirect tax on consumption i Indirect tax on investment expenditures International trade and transport margin Ls Aggregate labor supply W0 Initial (volume of) wealth Sf Foreign saving PMUV World price index (of industrial countries’ manufacturing exports) Parameters add Share parameter for Armington intermediate demand by sector of input andd Share parameter for aggregate intermediate Armington demand andm Share parameter for aggregate intermediate home demand ava Value added share in production l Labor share parameter in value added k Capital share parameter in value added i Investment expenditure share parameter xd Share parameter for domestic demand of domestically produced goods Own Aggregate share of own variety in aggregate imports For Aggregate share of foreign varieties in aggregate imports Ownx CES share parameters for importing own varieties xf Share parameter for aggregate demand of foreign variety f Forx Share parameters for allocating demand for foreign varieties across regions t CES share parameter for demand of international trade services mg Technical coefficient for supply of international trade and transport services p Capital-labor substitution elasticity across varieties i Investment expenditure substitution elasticity m Substitution elasticity between domestic goods and imports d Substitution elasticity of demand across domestic goods by variety v Substitution elasticity of imports for own versus foreign firms o Substitution elasticity of imports across regions of origin for own products fv Substitution elasticity of imports across varieties for foreign firms f Substitution elasticity of imports across regions of origin for firms of type f t Substitution of demand for international trade and transport services Share of installed FDI owned by foreigners Household subsistence minima Household marginal propensity to consume Sec CET share parameters for top-level CET capital nest Dom Domestic capital share by sector For Foreign capital share by sector kf CET share parameter for allocation of FDI across regions by sector Sec CET transformation elasticity for top-level CET capital nest kx Transformation elasticity between domestic and foreign capital kf Transformation elasticity of FDI across regions of destination
Copyright © 2022 FDOKUMEN