Lateral Vehicle Dynamics Control and Vehicle State Estimation
Upload
khangminh22Category
view
6download
0
Intelligent Real-Time Vehicle Tracking Information System
Vitalii Husak1, Lyubomyr Chyrun2, Yurii Matseliukh1, Aleksandr Gozhyj3, Roman Nanivskyi4
and Mykhailo Luchko5
1 Lviv Polytechnic National University, S. Bandera Street, 12, Lviv, 79013, Ukraine 2 Ivan Franko National University of Lviv, University Street, 1, Lviv, 79000, Ukraine 3 Petro Mohyla Black Sea National University, Desantnykiv Street, 68, Mykolayiv, 54000, Ukraine 4 Hetman Petro Sahaidachnyi National Army Academy, Heroes of Maidan Street, 32, Lviv, 79012, Ukraine 5 West Ukrainian National University, Lvivska Street, 11, Ternopil, 46004, Ukraine
Abstract 1 This project is devoted to developing an intelligent information system for real-time vehicle
tracking using the event streaming platform to achieve high performance. It provides studying
and practical use of real-time data processing in large amounts, building a resilient, fault-
tolerant, and high availability service. The main objective was to design and create the system
to allow its users to operate, observe, and track vehicles in real-time. The real-time tracking
system allows fleet management functions such as fleet tracking, routing, dispatching, on-
board information, and security. It helps users identify and track the location of objects or
people in real-time. It is used everywhere in transport and logistics in various industries. The
postmodern tracking system requires an open architecture and high scalability. An ideal real-
time location system can accurately track, inventory, locate, and manage assets, or people and
help companies make informed decisions based on collected location data.
Research methods are the analysis and comparison of vehicle GPS data flow methods in
transport areas, the construction and building of an application, integrated with certain third-
party services and platforms. One of the goals was to provide the absence of downtime, the
possibility to process a large amount of data, improve scalability, and so on.
The server part of the system that processes the incoming data was built using Java
programming language and Spring Framework. As an event streaming platform, Kafka was
chosen. For storing and processing all the data, there was used Hibernate as a database ORM.
There were selected third-party React libraries on the client-side to interact with the client and
show the GPS data and the vehicle information on a map. During development, IntelliJ IDEA
was used as IDE. The object of the study is the integration mechanisms and functionality of
GPS data in interaction with real-time event streaming. Scope of research – the processes of
development, integration, the exchange of information systems with GPS data flow using the
GUI client. The study aims to demonstrate and analyse the functionality of a real-time vehicle
tracking system that can support high loads.
There were main problems of the GPS data processing investigated. The main advantages and
disadvantages of the created system were determined. During the implementation, there were
analysed few services that have similar functionality, benefits, and weaknesses.
In the analysis process, the system itself was analysed “as is”, which means the external
environment and the design were determined. The plan was decomposed, and the business
processes were found out, that all was shown using notation objects (UML).
The developed system covers all the user’s basic needs to track vehicles in real-time using a
web browser. The proof of concept of the system with the finished lifecycle of IT-project
development results from this diploma project.
MoMLeT+DS 2021: 3rd International Workshop on Modern Machine Learning Technologies and Data Science, June 5, 2021, Lviv-Shatsk,
Ukraine
EMAIL: [email protected] (V. Husak); [email protected] (L. Chyrun); [email protected] (Y. Matseliukh);
[email protected] (A. Gozhyj); [email protected] (R. Nanivskyi); [email protected] (M. Luchko)
ORCID: 0000-0003-1320-8321 (V. Husak); 0000-0002-9448-1751 (L. Chyrun); 0000-0002-1721-7703 (Y. Matseliukh); 0000-0002-3517-
580X (A. Gozhyj); 0000-0001-6504-1178 (R. Nanivskyi); 0000-0001-6499-4188 (M. Luchko)
©️ 2021 Copyright for this paper by its authors.
Use permitted under Creative Commons License Attribution 4.0 International (CC BY 4.0).
CEUR Workshop Proceedings (CEUR-WS.org)
Keywords Tracking system, GPS, real-time, vehicles, process optimisation, real-time data processing,
application program interface, vehicle tracking, information system, artificial intelligence, web
application, machine learning, neural network, rating vector priority, vehicle tracking device,
decision making, system analysis
1. Introduction
Many production processes and supply chains depend on reliable, authentic and up-to-date real-time information. But other innovation scenarios could not exist without real-time object tracking systems
[1-3]. For example, they are driving together, sharing a car or delivering food, etc. The real-time
tracking system allows you to identify and track the location of objects or people in real-time [4-8]. It
is used everywhere in transport and logistics in various industries [9-12]. The postmodern tracking system requires an open architecture and high scalability. An ideal real-time location system can
accurately locate, track, and manage assets, inventory, or people and help companies make informed
decisions based on collected location data. An essential requirement of modern object tracking is the ability to integrate with different technologies. These include location tracking technologies such as
radio frequency (RF), infrared (IR), RFID, beacon, Wi-Fi, Bluetooth, UWB, GPS, GSM, 5G, and more.
It should also be noted that the system must be reliably integrated with the rest of the enterprise in real-
time. These include MES, ERP, APS, CRM, data lakes and many other applications. The program should include [1-12]:
Fleet tracking - vehicle tracking systems allow the company to track the location and speed of
the car, optimise routes, plan tasks, help navigation and analyse driver efficiency;
Navigation - the most basic navigation services contain instructions on moving from point A
to point B. The inclusion of GPS, mapping and mobile cellular technologies will provide more sophisticated navigation services;
Inventory and asset tracking - RFID technologies are widely used for asset and inventory
tracking. RFID tags communicate wirelessly with RFID readers across the enterprise.
The urgency of the work stems from the widespread popularity of the use of GPS data in everyday life by people in their smartphones or large companies to control the fleet. The work aims to demonstrate
and analyse the functionality of the vehicle tracking system in real-time, which can withstand high
loads. It will allow you to explore the business scope of such applications and specific functionality.
To achieve this goal, the following tasks were identified:
Acquaintance and analysis of functions and means of communication that represent existing solutions;
Research and comparison of existing systems that have similar functionality and use similar
technologies to process information or interact with the user;
Building and demonstrating an application that is ready to use and interacts with the necessary
customised services. GPS fleet tracking is commonly used in almost every industry, although usage depends on the
situation in each business.
For example, in the construction industry, fleet tracking is used to ensure the proper use of equipment in the workplace. It is a viable way to manage fuel costs and compliance in retail and manufacturing,
allowing managers to transport and deliver products reliably, efficiently and on time.
It is also often used for services and special auctions, helping to ensure that employees get to work
on time through job applications and make sure they can use all vehicles. The object of the study is an application for vehicle tracking in real-time and its functionality.
The research subject is the processes of development, integration, and interaction of information
systems with GPS data. The research methods are a way to use real-time vehicle tracking systems in logistics, building an existing service integrated with certain third-party services and platforms.
The scientific novelty of this work is to build an information system for processing GPS data in real-
time, with the possibility of integration into existing systems. The practical significance of the work results lies in the popularity of GPS data and their
visualisation in real-time, and the apparent imperfections of existing systems.

2. Related works 2.1. Basic principles of research
In today’s world, it is often just necessary to get up-to-date information. It also applies to vehicles
in areas such as logistics [13-14]. At the moment, there are many tools to solve such a problem as real-
time vehicle tracking [15-21]. Still, in addition, most of them can be attributed to certain shortcomings,
such as long delays in obtaining information, monolith city, patentability, limited scalability, single-purpose decision. GPS vehicle tracking is a sophisticated solution that allows you to locate your vehicle
by connecting to a global positioning system. Typically, this system takes the form of a vehicle tracking
device capable of using GPS technology, real-time tracking and instant data transfer to a connected mobile application [22-25]. Yes, modern vehicle tracking solutions are not only easy to use but also
entirely accurate. Under normal conditions, you can get real-time location information up to three
meters. In addition, the accuracy of data transmitted from vehicle tracking devices depends on satellite signals, which can be worse in large cities due to large buildings. The more open the sky over the object
you want to track, the more accurate the data will be.
The primary functional system is integrated into the tracking and analysing data received from
vehicles using satellite signals. There are two monitoring options:
Online - data is received remotely;
Offline - the information is read when reaching a specific place. The tracking system allows you to control the movement of vehicles and control the amount of fuel
to monitor some techniques and even mechanisms. Thus, you can track which route the car follows, its
mileage, speed and observe the skills of the driver and the condition of the vehicles. The systems use GPS and GSM technologies to provide accurate and consistent telematics for the
individual fleet manager. These systems are usually equipped with monitoring statistics, such as; fuel
consumption, average speed, current driver time and location [26-27]. Demand for this technology has
recently increased as EU regulations impose stricter limits on when a driver can work on a given day. It is currently limited to 9 hours a day. Companies are legally required to install a tachograph in any
vehicle that carries goods [28-29]. This obligation has led many to burn this potentially burdensome
obligation instead of turning it into a benefit. Park management systems use GPS and GSM technologies. Like other trackers, although due to their nature, they are equipped with more specific
diagnostic functions.
2.2. Known means analysis of solving the problem
Let’s consider the following systems in the segment of real-time vehicle tracking: Verizon Networkfleet, Fleetistics, Nextraq, Rhino Fleet Tracking, Teletrac.
Verizon Networkfleet provides cost-effective fleet management solutions for government agencies,
small and medium-sized businesses and businesses. The advantages of this service include a variety of functionality, the ability to track driver behaviour, such as speeding, idling, driving stiffness. It is also
possible to keep statistics on fuel consumption and reduce maintenance costs. The service can improve
the routing and visibility of the fleet. The disadvantages of the system include the complexity of
solutions, which may not always be suitable for small businesses. Fleetisticsis an inexpensive and straightforward GPS tracker with the ability to upgrade and scale
when the fleet increases in size and complexity. Integrated fleet management increases efficiency,
productivity and profitability. Integrated partners provide a modular approach to fleet management. The advantages of this service are its availability for light and medium businesses, a wide range of
features, the ability to view the movement’s history. The system is based on the Cloud solution and is
implemented as Software-as-a-Service, i.e. the only access to it is a browser. Nextraq is a cloud application for service and distribution business to optimise the performance of
vehicles. The service is multifunctional, allows the user to track, report, plan routes and more.
The advantage of this service is it is multiplatform. It can be used in a web browser, desktop
application, mobile phone and more. It is designed for all types of customers - from small businesses to businesses. Disadvantages include the fact that their users receive information about the untimely

update of the status of vehicles, a rather complex interface, which must first be understood. They also have some problems with technical support.
Figure 1: Verizon Networkfleet application view
Figure 2: View of the Fleetistics system
Figure 3: View of the Nextraq system

Rhino Fleet Tracking is a vehicle tracking system of any type based on cloud servers. The software also offers fleet maintenance tools and is compatible with desktop and mobile devices. Rhino Fleet
Tracking uses GPS trackers to monitor vehicle location and display routes in real-time using Google
Maps. The integration of HOS and ELog helps users determine how long drivers have been on the road,
which helps maintain FCMSA requirements. Feedback can also be sent to the driver monitoring device. The strength of this service is a user-friendly, easy-to-use interface, data visualisation using Google
Maps. Sometimes the versions of the card are outdated, which affects the operation of the service itself.
The service itself, from time to time, works with errors.
Figure 4: View of the Rhino Fleet Tracking system
Figure 5: View of the Teletrac system

Teletrac has a wide range of virtually comprehensive features but also customisable, allowing fleet managers to choose which parts they deem necessary. As a result, any fleet can find a version that works
for their specific needs, no matter how small or large the customer’s number of vehicles. Managers can
view their fleet with an aerial satellite view, a list of vehicles that can be clicked, and a GPS map, and
they can even get a street view with instant playback of the DVR (provided the car has it) installed). Among the advantages is communicating with dispatchers and vice versa, vehicle diagnostics, driving
safety warnings and more. The disadvantages include the fact that the service functions are minimal if
the user has a cheap plan limited fuel card integrations. There is no free trial, just a free demo.
2.3. Software system functionality
The functionality of the system that needs to be designed:
1. Filling the system with the necessary information that will be used by the system itself (list of
vehicles, database initialisation); 2. Infrastructure configuration - deployment of a platform for streaming events to ensure the
relevance of GPS data; interactivity - help the user to use the provided functionality of the
service; 3. Providing a wide choice of functionality to meet all user needs;
4. The ability to view the status of vehicles at any time and the relevance of information;
5. Authorisation and authentication - the user can log in to the system, as well as be recognised in
subsequent sessions; 6. Shared architecture for possible further integration of other users, the ability to share
responsibilities between managers and supervisors;
7. Availability in the database of all necessary information for the stable operation of the system; 8. Creating an admin panel to manage the system and change the configuration;
9. Providing an intuitive user interface;
10. Informing the user about events or errors using the notification system; 11. Application software interface (API) for communication with systems;
12. Processing of already available information in databases;
13. Possibility of geo-zoning, creation of event processing, reading of data from the devices
connected to the vehicle, etc.; 14. The ability of the system to process user requests that are not provided.
Table 1 Attributes of functions
Function Status Priority Labour Int. Risk Stability Version
1 Included Critical Average Low Average 0.2 2 Included Critical High Average High 0.2 3 Included Critical High Average Average 0.4 4 Included Critical High Average Average 0.6 5 Approved Important Average Average Average 0.6 6 Included Important High Low Low 1.0 7 Approved Critical Low Low Low 0.4 8 Approved Important Average Average Low 0.6 9 Approved Important High Low Average 1.0
10 Included Useful Average Average Average 1.2 11 Included Useful Average Low Low 1.2 12 Approved Useful Low Low Low 1.2 13 Included Useful High High Average 1.4 14 Included Useful Average Average Average 1.8 15 Approved Useful Average Average Average 2.0

Vehicle tracking systems are top-rated and in high demand. Even considering developing a high-level strategy, we can conclude that the development of its specialised tracking system may require
research and solving quite complex problems.
3. Materials and methods 3.1. System analysis of the object of study and its subject area
The objects of informatisation should include users, developed systems, control of defects. The
purpose of the system is to create a chatbot [30-35] and interactive elements for the information system of forming a list of clothes according to the user’s request. First of all, you need to create a configuration
file for the design, which allows you to flexibly manage the entire service, such as changing the data to
access the database. The next step is to select and connect a system for processing the user’s natural language and select a messenger that will serve as an ecosystem for the chatbot [30-35]. The successful
implementation of any software depends on many factors. An important link is a clear understanding
of the purpose, goals and problems that the system must solve. In addition, you need to have knowledge
and experience of how you can solve problems to achieve goals. The basis of the systems analysis methodology is the choice of alternatives and comparison of
quantitative characteristics during decision-making. To quantify estimates, it is first necessary to meet
the requirements of qualitative evaluation criteria and define them. A “goal tree” is a specific visual representation of the relationship and sequence of goals representing
the division of the mission and the main goal of the task by breaking it down into sub-goals or individual
actions [36-38]. Fig. 6 shows the tree of goals of the system considered in this work, a service designed to operate the vehicle tracking system in real-time. According to the presented tree of purposes, the
service pursues four primary goals ensuring ease of use, the relevance of information, the stability of
the system, the adequacy of the service.
Figure 6: System goal tree
The purpose of information relevance is to provide the service with relevant information and providing the possibility of its processing in real-time. The service must be filled with information and
“trained” to give the user an appropriate result.
Therefore, according to the criteria, the system can have such types as in Fig. 7.
Figure 7: Types of information systems according to criteria
According to the tree of goals built, the primary purpose of the developed system is “Building an intelligent information system for tracking vehicles in real-time”. It is the root of the chart and is
decomposed into three sub-goals: “Event Broadcast Platform”, “Information Flow Processing”, and
“Data Broadcast”. The first goal, which is to create an event broadcasting platform, consists of sub-goals such as “Configuring the event broadcasting platform” and “Input processing”. Thanks to the
event broadcasting platform, the productivity of the service will be high enough to enable users to
receive up-to-date information. The next goal in building an asset management system is “Information
Flow Processing”. It has the following sub-objectives: “Extracting information”, “Designing a database for easy expansion”, and “Choosing the optimal way to store the state of the system”. This task will
create the ability to process all information coming into the system. The productivity of this
functionality will increase many times, allowing users to get relevant information without wasting time. The third and last sub-goal is “Data Broadcasting,” which finds the right ways to display the data
coming into the system. To achieve it, you must perform the following tasks: “Continuous supply of
data to the client part” and “Timely update of the displayed data”. This goal allows you to visualise all the data. Based on the construction of the goal tree for the developed system, the following quality
criteria are defined: stability, easement, the relevance of data, productivity, and scalability.
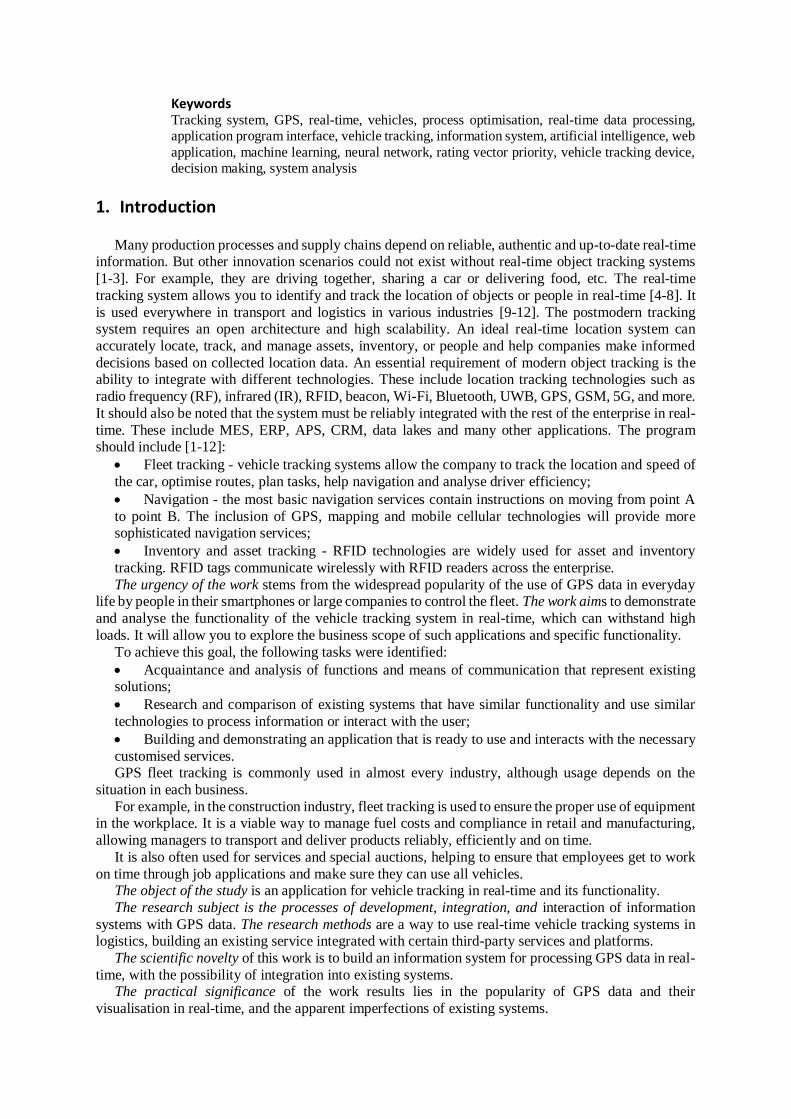
When studying any system, it is advisable to determine its type by the requirements and quality
criteria. The method of analytic hierarchy process (AHP) was used for this purpose. When using it, a matrix of comparisons of the obtained standards is constructed. The results are given in Table 2.
Table 2 Matrix of pairwise comparisons of criteria
No Criteria 1 2 3 4 5 Rating Vector priorities
1 Stability 1 2 0.33 0.5 3 1.37 0.19 2 Easement 1 1 0.33 2 2 1.27 0.17 3 Relevance of Data 3 3 1 1 0.5 1.7 0.23 4 Productivity 2 0.5 1 2 3 1.7 0.23 5 Scalability 0.33 2 2 0.33 1 1.32 0.18
Matrices of pairwise comparisons according to each quality criterion for estimation of types of
information systems are constructed. The comparison data are given in Table 3.
Table 3 Matrices of pairwise comparisons
No Stability 1 2 3 4 Rating Vector priorities
1 Information retrieval 1 0.5 0.5 2 1.0 0.2 2 Information and analytical 2 1 0.33 2 1.33 0.27 3 Information and management 2 3 1 2 2.0 0.4 4 Information and advisory 0.5 0.5 0.5 1 0.63 0.13
No Easement 1 2 3 4 Rating Vector priorities
1 Information retrieval 1 0.5 2 2 1.37 0.35 2 Information and analytical 2 1 0.5 1 0.9 0.23 3 Information and management 0.5 2 1 2 0.9 0.23

4 Information and advisory 0.5 1 0.5 1 0.75 0.19
No Relevance of data 1 2 3 4 Rating Vector priorities
1 Information retrieval 1 2 3 1 1.75 0.36 2 Information and analytical 0.5 1 0.5 2 1.0 0.2 3 Information and management 0.33 2 1 2 1.33 0.28 4 Information and advisory 1 0.5 0.5 1 0.75 0.16
No Productivity 1 2 3 4 Rating Vector priorities
1 Information retrieval 1 1 3 1 1.5 0.29 2 Information and analytical 1 1 0.5 3 1.38 0.27 3 Information and management 0.33 2 1 0.33 0.91 0.18 4 Information and advisory 1 0.33 3 1 1.33 0.26
No Scalability 1 2 3 4 Rating Vector priorities
1 Information retrieval 1 0.5 1 0.5 0.75 0.18 2 Information and analytical 2 1 2 3 1.5 0.36 3 Information and management 1 0.5 1 2 0.88 0.22 4 Information and advisory 2 0.33 0.5 1 0.96 0.23
To calculate the final result and priorities by the quality criteria and determine the type of
information system, a hierarchical synthesis of alternatives with the help of AHP. The results are shown below.
(
0,2 0,350,27 0,23
0,36 0,290,2 0,27
0,4 0,230,13 0,19
0,28 0,180,16 0,26
0,180,360,220,23
)
(
0,190,170,230,230,18)
= (
𝟎, 𝟐𝟖0,2630,260,2
)
According to the final results of applying the method of analysis of hierarchies, it was determined that the type of system for tracking vehicles in real-time - information retrieval system. This type has
the highest priority, equal to 0.28, but the indicator is very close to the information-analytical and
information-management types based NLP methods [39-43]. After determining the type of information system, it is advisable to build its abstract structure using a hierarchy of tasks, each of which can be
performed in parallel or sequentially at the same level of construction. To successfully close the study,
you must wait for all its subtasks. Due to this, the developed system is better perceived because the composition of tasks allows you to understand the information better.
Figure 8: Hierarchy of tasks for the system

3.2. Statement and substantiation of the problem 3.2.1. The purpose of development
To solve any problem, it is necessary to define the main task, goals and form goals. All this includes
the primary purpose, definition of terms, clients, customers, the market, corresponding target systems
and the subjects responsible for the decision.
The main goal of the developed software is to build a web application and software interface that can be used to track vehicles in real-time. The main tasks and functions of the system include:
Addition, modification and removal of vehicles;
Creation of events and the possibility of their processing;
Possibility of integration with third-party services;
Providing up-to-date information;
Localisation;
Database design and construction.
The system allows you to collect data from all GPS sensors that have access to its services and
allows you to automate the fundamental processes involved in monitoring and collecting data on vehicles in the fleet of a particular business. As a result, such solutions have the opportunity to save on
transportation costs significantly. On the other hand, if savings are not possible - the system can provide
greater convenience for doing business in certain areas. The best approaches have been used to facilitate the display of information and the scalability of the system. The built-in platform for broadcasting
events allows you to process large amounts of input data and withstand high loads, allowing the system
to work in almost real-time and always provide the user with up-to-date information. The intelligent
real-time vehicle tracking information system is modelled by a systems analysis approach and should be built using a “client-server” architecture. In the future, all existing services will be transferred to
cloud storage to use a network of remote servers hosted on the Internet for storage, management and
data processing. At the moment, it is envisaged that all processes and services will work locally.
3.2.2. The system purpose description
Automation of the main processes and improvement of the user’s interaction and the business with
the fleet management system is the primary purpose of the developed product. Mechanical work,
mathematical calculations, data translation, data conversion from one type to another are among the tasks of the software. The service is intended for use by both individual users and businesses. Due to
the planned scaling, the system can expand in parallel with how a particular enterprise grows.
3.2.3. Place of application of the system
An intelligent real-time vehicle tracking information system provides for its application in many areas - from fleet control for long-distance transportation to delivery of goods. The user of this system
can be a user or group of users, small or medium business and large enterprises. The system can be used
if its customised version suits the needs of a particular entity. The fact that the design withstands high loads and works in real-time gives it an advantage over analogue systems. The online SaaS service only
requires access to the global Internet and pre-registration and authorisation.
3.2.4. Substantiation, development and implementation of the system
Modern vehicle tracking solutions are easy to use and entirely accurate. However, the improvement of such systems also changes the preferences and desires of users of these services - they become more
demanding on the characteristics and functionality of the system, its features, prices and more. This
situation creates high competition and begins to require more and more research and development costs.
Problems of development and lack of resources are also present in vehicle tracking systems.
In this case, the advantage is given to the service that is the most flexible among analogues. Most companies that have released similar products have already built their activities according to classical
mass production.
Fleet management is a non-trivial and complex process and requires training in geo-data
management and the development of sustainable services. It is almost impossible to perform these processes manually. They are usually slow and complicated, especially if you have many vehicles on
your property, so automation does not save consumers as much money as their time. Almost all
managers and employees of such departments involve additional software and hardware to solve this problem. Usually, specialists have a sufficient understanding of such systems and are happy to cope
with them. Thus, the work solves the main problems of fleet management with the involvement of
available third-party services, which is to increase the number of users and products on the market, improve the quality and optimisation of fundamental processes, and integrate related systems.
3.2.5. Expected effects from the implementation of the system
During the analysis of the developed method for automation and optimisation of general processes
during vehicle tracking, costs, and other mechanical work, the expected effects of this product’s implementation were determined. After that, a scale was developed for their evaluation. Such effects
include:
Functional - is to automate the processes associated with the monitoring of the fleet;
Financial - increase in investment income from intermediaries and stakeholders and increase in
the number of system users, the connection of payment systems;
Economic is the information system that provides reduction of expenses for the management
of vehicles;
Technological - improvement of conditions of tracking of vehicles and development of new approaches for this purpose;
Time - because all information is submitted and processed in real-time, this effect involves
saving such an essential resource as time;
Grocery - increase in the number of vehicle tracking devices;
Public - is the relationship between developers, third-party services and users of the system;
Communication - advertising of third-party resources with which there is integration.
3.3. A conceptual system model development
The conceptual model makes it possible to formally present the input and output data of the
information system at an understandable level and design the data warehouse’s logical structure. It
includes the definition of tasks, goals, objects, and relationships, which are abstract concepts and allow
to generalise the requirements of the developed system. During the infographic conceptual design and modelling of information systems (IS), distinguish the following two methods:
Descending - a method by which entities are formulated and analysed.
Ascending is a method that allows you to synthesise the attributes of objects and entities.
In practice, descending design is often used, which identifies and models the logical structure when
using a general ER diagram. However, before presenting an abstract model of a financial asset management system, it makes sense to conduct research and identify data that comes directly from the
environment and consists of interconnected and original entities.
The result of any system is the initial data that users and administrators can obtain. They are used to
track vehicles and are publicly available. It includes:
The object of the car - all the attributes inherent in the source of its formation;
A list of all vehicles of a specific company;
Current positions of all vehicles;
Data object for integration with third-party services;
Information objects that are sent in the form of notifications when certain conditions of events
are met;

The current state of the map showing the objects;
Information about the user, where there is information about his data and company;
3.3.1. Diagram of usage options
The main external entities of the system include:
User is the leading participant in the interaction with the IP, which can use its capabilities and motivate it to take action;
The administrator is the person who is responsible for updating the system and has access to
most data.
Critical uses include: view vehicle map, create new vehicle labels, connect new ones to the system, add and grant a user or company access, set fields and targets for vehicles, optimise processes to
improve system performance, and more. This type of diagram is given in Fig. 9.
Figure 9: Diagram of usage options
In the diagram of the system of analysis of structural and logical schemes of educational programs, there are the following actors: User, Administrator and System Administrator. The “user” will view all
the information entered into the system using a graphical interface. The “administrator” generates
general information - provides users with access to the design, and connects new vehicles. Finally, the System Administrator is responsible for the system infrastructure.
3.3.2. Class diagram
A UML class diagram is a graphical notation used to build and visualise object-oriented systems.
The primary relationships between classes include the relationship of association (relationship between two classes), the relationship of generalisation (inheritance between classes), the relationship of
aggregation (one class is an attribute type in another; partial case of the relationship of association) and
the relationship of composition (existence of one class is impossible without “Father”, where it is used).
The class diagram of the developed system is given in Fig. 10.

Figure 10: Class diagram
The constructed diagram consists of the following primary classes, each of which has several attributes that do not require further explanation, and methods:
Company- a class for depicting the basic properties and behaviour of the company. It consists
of several attributes and operations that are designed to keep track of existing companies in the
system;
Manager- a class that describes the properties and characteristics of the essence of the manager.
Manager authentication and authorisation are the main methods;
Driver- class to describe the essence of the driver. The main methods are to obtain information about a particular driver and his connection with vehicles;
Vehicle -introductory class describing the car. This entity includes data related to operations on
vehicles and their characteristics;
VehiclePosition is a class to describe the entity that determines the position of a particular
vehicle at a specific point in time, the main task of which is to preserve data about all parts in the past.
3.3.3. State transition diagram
In UML, the state diagram is used to describe the sequences of states and transitions during the life
cycle of the developed system. Simulation of changes in the states of objects is the basis for modelling this type of diagrams. A state is the place of an object in his life at a particular point in time when he is
waiting or taking action. The initial state is when the object is in it from the very beginning of the
operation. This type of state is unique, which still contains the final. Individual states, in particular the initial one, have no actions that can occur internally. The diagram is given in Fig. 11.

Figure 11: State transition diagram
The state in which the user fills in all the necessary data for authorisation in the system is considered
initial in this process. If there are specific errors to check the correctness, the user does not go to the
next state. Instead, when you log in, you go to the state of the main page, i.e. the overview map, which shows all available vehicles. The user can select any available vehicle to obtain additional information
about it or create a specific event related to achieving the transport of a particular position. To log out,
click “Log Out”. After that, there is a transition to the final state, which indicates the end of the process.
3.3.4. Activity chart
For the developed system, the diagram of activity is given in Fig. 12.

Figure 12: Activity chart
The initial state of the system is the input of the necessary input information. If the data transfer is
successful, the user is authenticated and authorised. If any errors occur during user login, the user
returns to the login form until the data is correct. After the user logs in, the system logs in and proceeds to the activity, which involves selecting the following operations. The list of activities of choice
includes:
Activity “Select vehicle” allows you to get all the additional information about a particular
vehicle. After switching to the activity “Display information about the vehicle”, the user can go to the final state or return to the activity “Operation selection”;
The activity “Add a vehicle” allows to perform such works as “Connect the vehicle to the
system” or “Fill in the information about the vehicle”, after their selection and implementation, the
transition to the form of activity selection or the final state of the system;
The “Create event” activity also means that the user can “Describe the event and enter into the
system” activity. It will be able to return to the menu of operations or end the work with the system.

3.3.5. Sequence diagram
A sequence diagram has been constructed for the Add Vehicle option. During this interaction
process, the following objects:
User - an object that is the initiator of all manipulations on the system and can use its functions;
System - the main link of the studied precedent, which is responsible for processing input and
output information and calling functions;
Database - a place where information is stored. The sequence diagram is given in Fig. 13.
Figure 13: Sequence diagram
To add a new vehicle, the user must first log in and authenticate to the system. Then, if he has the
necessary rights, he can initiate a new car using the appropriate command in the menu. As soon as the
user fills in all the information about the object, a request is made to the system. In case of entering the correct information, this data is entered into the database, and the method returns a message about the
successful completion of the operation.
3.3.6. Component diagram
The component scheme divides the existing system being developed into various high levels of functionality. Each component is responsible for one straightforward goal throughout the design and
interacts with other essential elements that it needs to know. Accordingly, the main features such as
React.js, SpringBootApplication and the database were selected to present the software modules of the financial asset management system. The diagram of parts is given in Fig. 14.

Figure 14: Component diagram
The SpringBootApplication file is the main entry point and core of the real-time vehicle tracking system. This component is the REST API, which accepts requests from the client-side. This component
consists of Entities, Services and Controllers packages. The Services package is responsible for all
business logic of the program and is the main functionality. Controllers, in turn, ensures the operation of the application interface for communication between the server and clients. Entities package using
the principle of ORM, i.e. technology for communication between database and system objects.
Examples of server files are SpringBootApplication, VehicleService, KafkaConsumer, GpsService,
VehicleController and more. The component responsible for the client part is called React.js application, which aims to communicate with the server using the REST API and display data to the
user. An example of the files in this component is map. The main entry points are
SpringBootApplication and React.js application. In the second section of the work, during a systematic approach to the analysis of intelligent
information system for vehicle tracking in real-time, its type is determined - information retrieval in
Smart City [44-49]. It is done using the method of calculation of hierarchies after the analysis of system criteria. During the work, a tree of goals was built, a conceptual model was developed, as a result of
which the following types of diagrams were made: use cases, classes, sequences, state transitions,
activity. Each of them is described and as detailed as possible. The system is now detailed, and its
processes are described.
3.4. Software tools for solving the problem
The main goal of the developed system was to provide the user with information about the vehicle,
its position, characteristics and condition in real-time in a convenient way, using the methods of
streaming events. So, the main issues to solve the problems were method:
Data delivery and visualisation;
Reliable and fast data transfer between the service and objects;
The client and server interact. Method of data delivery and visualisation:

The system is offered to the user in the form of a web application that can be opened in a web
browser;
All data on available vehicles of the current user are entered into the system database;
System services communicate with each other, send a request, perform aggregation, and send the result to the client part.
Method of reliable and fast data transfer between service and objects:
The system receives data from vehicles and enters them into the service that is responsible for
the flow of events (event streaming);
The system receives data from the flow of events and updates the status of all available vehicles;
The web client receives the current information using the REST API, sending requests once in a certain period.
How the client and server interact:
The server part implements the REST software interface, which the client can access at any
time to obtain up-to-date information;
Using the API, the system receives messages and sends the necessary data to the next step;
The system gets the processing result and shows the user the updated data.
Having described the main issues for solving system implementation problems, you can start choosing technologies for development.
3.5. Technical characteristics of selected software development tools
Before starting work on the project, the programming language used on the server part fell to
Node.js, C # or Java [50-51]. To finally determine, a comparative table was created.
Table 4 Comparison of programming languages or project development environments
Characteristic Language
Java Node.js C #
Type Object-oriented,
class-based
Runtime library, cross-platform environment for creating JS
applications outside the browser
Object-oriented, component-oriented,
strongly typed
Execution time Java Runtime Environment
Chrome`s V8 JavaScript engine Common Language
Runtime
Project size Complex, large
projects Small projects
Complex, large projects
Scope Interaction with the server part
prevails
Interaction with client and server parts
Web or game applications
Popularity Very high High High
After the comparison, the choice fell on the Java programming language due to its popularity and
knowledge. Also, the reasons include the ability to scale the program to increase functionality or the
number of users. Notable features of Spring Boot:
Automatic configuration: customise your program based on the environment and notifies the
developers;
Autonomy: literally, it is entirely autonomous. Therefore, there is no need to deploy your
program on a web server or in a unique environment. The only task is to press the button or issue the run command, and it will start;
Automatic configuration tries to automatically configure the program based on the
dependencies that have been added. The framework is contextually aware and intelligent.

MySQL is open-source relational database management system based on structured query language (SQL) [54]. Using MySQL Workbench, the developer can design, model, generate and manage
databases. The tool has everything you need to model data and create complex ER models, direct and
reverse design.
Hibernate is a mapping tool between objects and relational structures (ORM) for the Java platform [55]. Hibernate’s goal is to free the developer from the significant typical tasks of database interaction
programming. The developer can use Hibernate both when developing from scratch and for an existing
database. Hibernate takes care of the so-called ‘connection of classes with database tables (and data types of programming language with SQL data types), and provides the means to automatically build
SQL queries and read/write data, and can significantly reduce development time, which is usually spent
manually writing standard SQL and JDBC code. The mapping informs the ORM tool about which store a Java class object in a database table. This section discusses the main tools and technologies used to
write the project. Devices used to develop a web-based real-time vehicle tracking system:
Programming language on the server part - Java using the Spring framework;
Client-side programming language - Javascript, React.js library
Development environment - IntelliJ IDEA;
Event broadcasting platform - Apache Kafka;
Database management system - MySQL using visualisation using MySQL Workbench;
4. Experiments, results and discussion 4.1. The created software description
The created software product purpose is to implement a web application [56] as situational
awareness system [57-58] or recommendation system [59-64], which will be divided into two parts: client and server. Using the REST API will receive the current data from the server and give the user
the desired result. The developed program for real-time vehicle tracking is called VTracker. The system
is built based on client-server architecture and relational database. The program consists of the following three parts:
User communication with the web application and chatbots [30-35] based on NLP [39-43];
Communication of the web application with the server part [56-64];
Contact of devices in vehicles with the server part [1-9].
This program works with only one type of user - the fleet manager of cars. User functionality:
Connects new vehicles;
Reviews the position of available vehicles;
Establishes additional information about vehicles;
Reviews the characteristics of existing vehicles;
Creates events and receives notifications about them;
Obtained result of information analysis based Deep Learning for Statistical Detection Criteria
about vehicles characteristics [65-72]. When creating a web application, the interfaces of the program were separated as shown in Fig. 15
and their implementation for further coverage by Unit-tests.
Because the created project is created using the tool for building Gradle, the following Spring
libraries were connected: Web, AOP, Data JPA. In addition, auxiliary libraries and utilities have also been added: Apache Kafka, Lombok, slf4j-log4j12, the complete list of which can be seen in Fig. 16.
All information intended for the proper functioning of the information system shall be stored in the
data warehouse. A relational MySQL database was used for this purpose. Any database can be presented schematically to logically represent it and describe the data stored there and solve the main problems
of the study area. The scheme of data visualisation is given in Fig. 17. The designed database consists
of five main entities. Let’s describe them. The essence of “Company” is designed to store data about
the company that keeps records and its vehicles tracks in the system. Its attributes include:
id is a unique company key;
name is the name of the company in the system;
phone is contact phone.

Figure 15: System architecture
Figure 16: List of dependencies in the build.gradle file
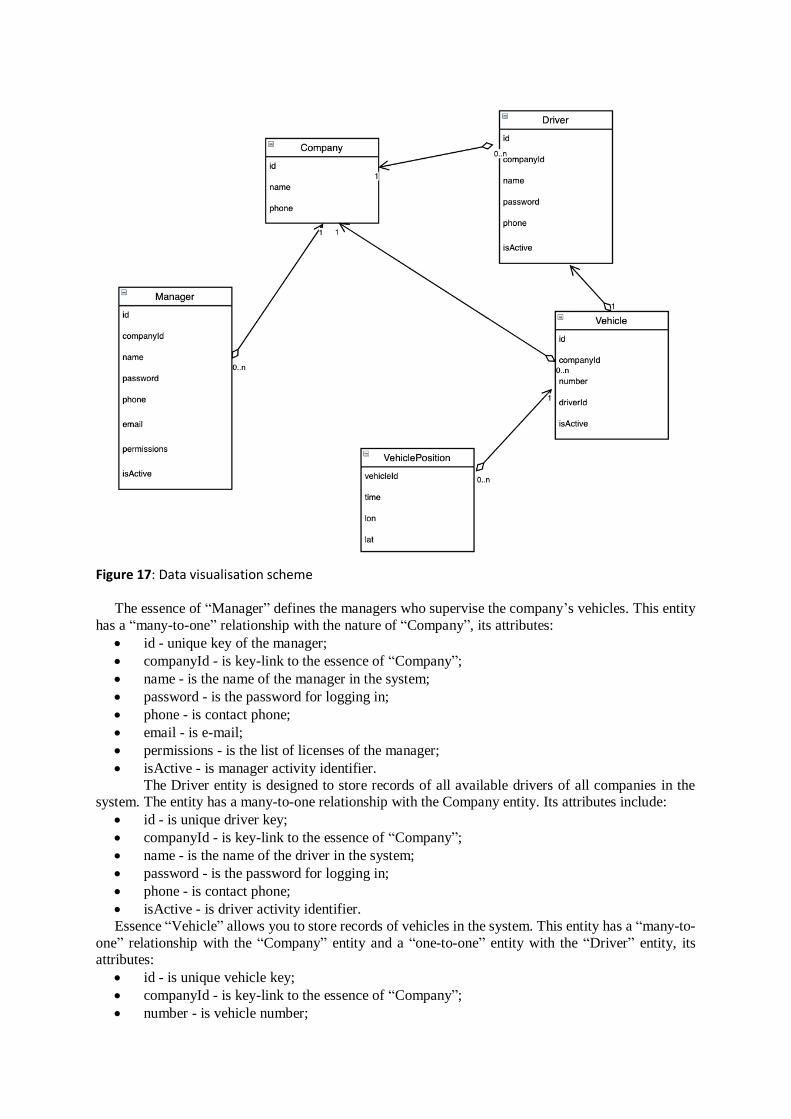
Figure 17: Data visualisation scheme
The essence of “Manager” defines the managers who supervise the company’s vehicles. This entity
has a “many-to-one” relationship with the nature of “Company”, its attributes:
id - unique key of the manager;
companyId - is key-link to the essence of “Company”;
name - is the name of the manager in the system;
password - is the password for logging in;
phone - is contact phone;
email - is e-mail;
permissions - is the list of licenses of the manager;
isActive - is manager activity identifier.
The Driver entity is designed to store records of all available drivers of all companies in the system. The entity has a many-to-one relationship with the Company entity. Its attributes include:
id - is unique driver key;
companyId - is key-link to the essence of “Company”;
name - is the name of the driver in the system;
password - is the password for logging in;
phone - is contact phone;
isActive - is driver activity identifier.
Essence “Vehicle” allows you to store records of vehicles in the system. This entity has a “many-to-
one” relationship with the “Company” entity and a “one-to-one” entity with the “Driver” entity, its attributes:
id - is unique vehicle key;
companyId - is key-link to the essence of “Company”;
number - is vehicle number;
driverId - is key-reference to the nature of “Driver”;
isActive - is vehicle activity identifier.
The essence of “VehiclePosition” is designed to store the history of the position of all vehicles. It has a “many-to-one” relationship with the nature of “Vehicle “. Its attributes include:
vehicleId - is key-reference to the essence of “Vehicle”;
time - is the time at which the vehicle was in this position;
lon - is longitude;
lat - is latitude;
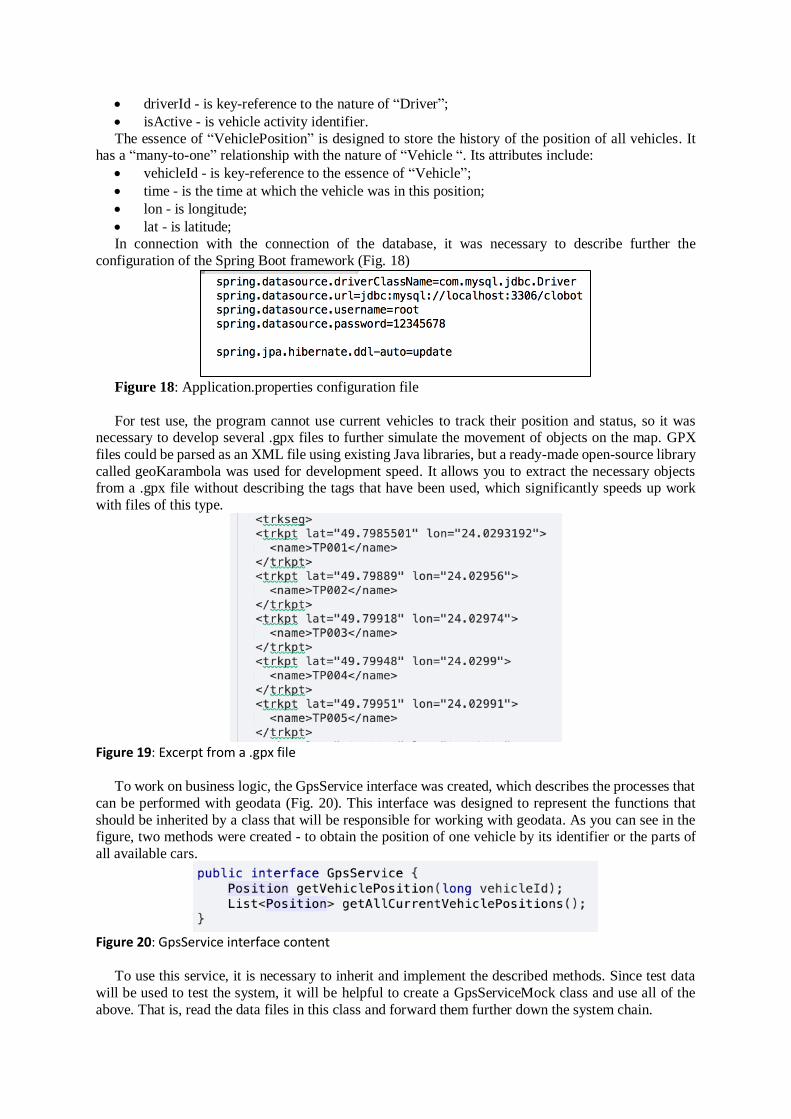
In connection with the connection of the database, it was necessary to describe further the
configuration of the Spring Boot framework (Fig. 18)
Figure 18: Application.properties configuration file
For test use, the program cannot use current vehicles to track their position and status, so it was necessary to develop several .gpx files to further simulate the movement of objects on the map. GPX
files could be parsed as an XML file using existing Java libraries, but a ready-made open-source library
called geoKarambola was used for development speed. It allows you to extract the necessary objects from a .gpx file without describing the tags that have been used, which significantly speeds up work
with files of this type.
Figure 19: Excerpt from a .gpx file
To work on business logic, the GpsService interface was created, which describes the processes that
can be performed with geodata (Fig. 20). This interface was designed to represent the functions that
should be inherited by a class that will be responsible for working with geodata. As you can see in the figure, two methods were created - to obtain the position of one vehicle by its identifier or the parts of
all available cars.
Figure 20: GpsService interface content
To use this service, it is necessary to inherit and implement the described methods. Since test data
will be used to test the system, it will be helpful to create a GpsServiceMock class and use all of the
above. That is, read the data files in this class and forward them further down the system chain.
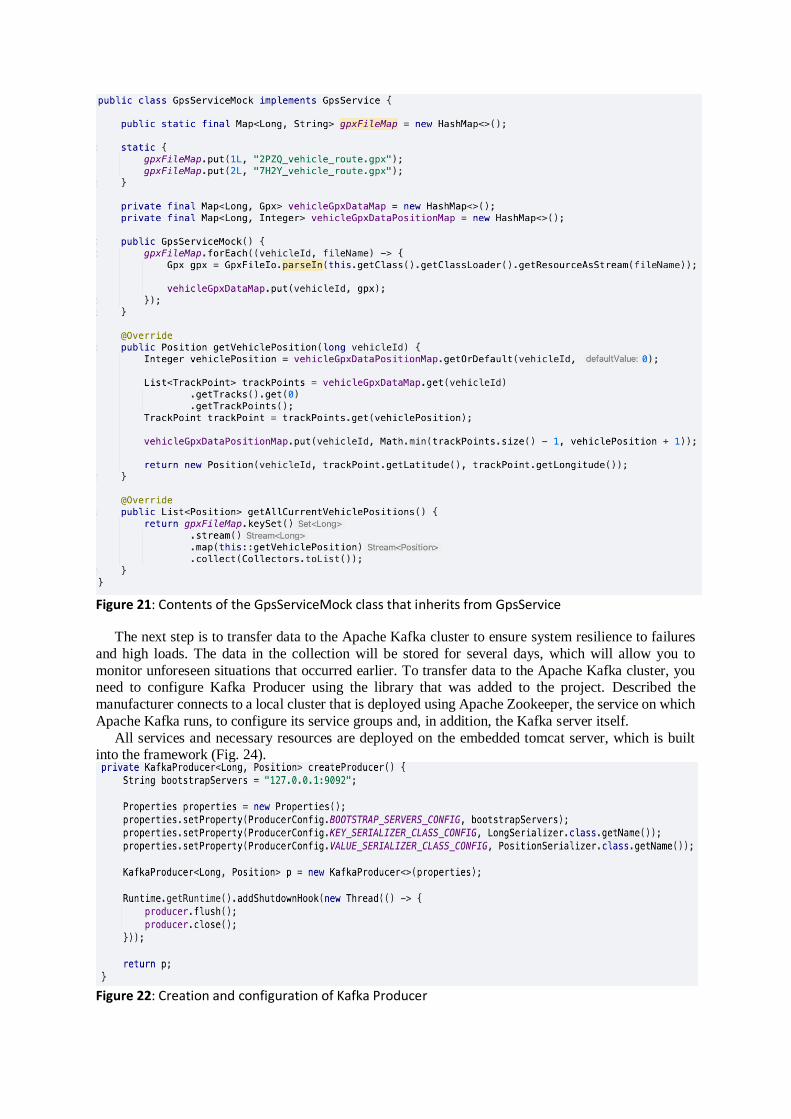
Figure 21: Contents of the GpsServiceMock class that inherits from GpsService
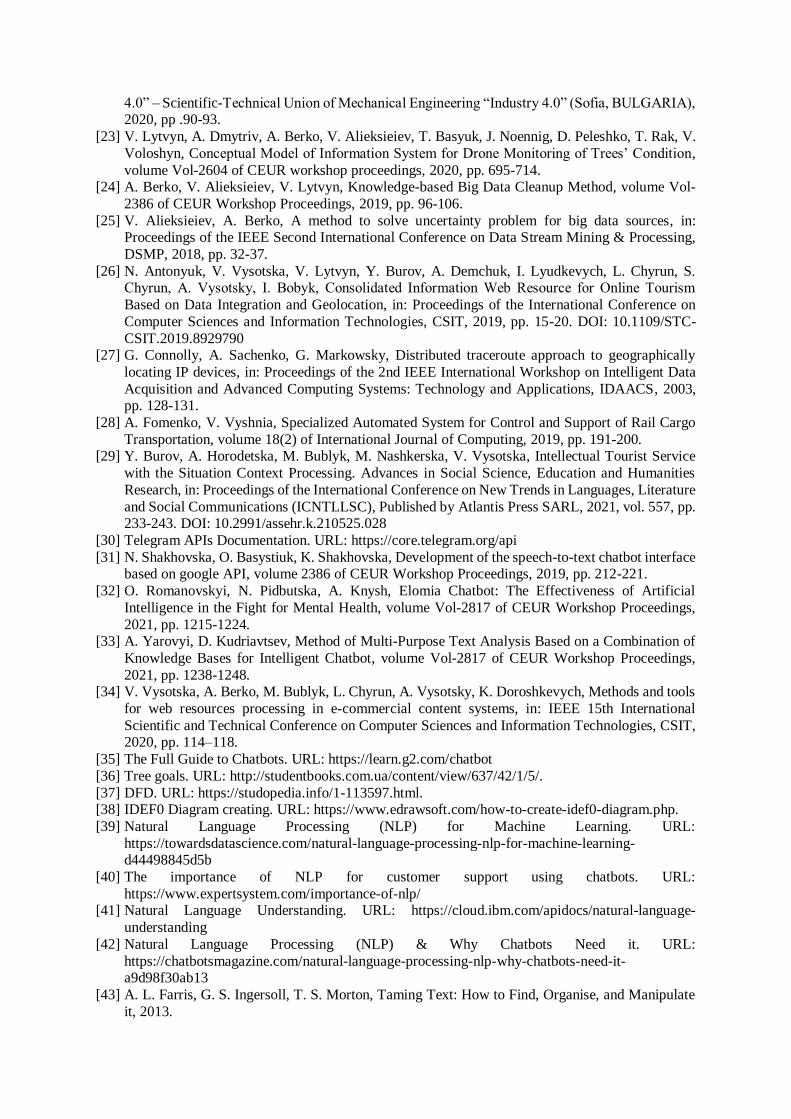
The next step is to transfer data to the Apache Kafka cluster to ensure system resilience to failures
and high loads. The data in the collection will be stored for several days, which will allow you to
monitor unforeseen situations that occurred earlier. To transfer data to the Apache Kafka cluster, you need to configure Kafka Producer using the library that was added to the project. Described the
manufacturer connects to a local cluster that is deployed using Apache Zookeeper, the service on which
Apache Kafka runs, to configure its service groups and, in addition, the Kafka server itself.
All services and necessary resources are deployed on the embedded tomcat server, which is built into the framework (Fig. 24).
Figure 22: Creation and configuration of Kafka Producer

Figure 23: Sending the current positions of all vehicles to the cluster
Figure 24: VTrackerApplication class with main method
Also, for simplicity, Kafka Consumer’s configuration was added to the same class - this is a service
that allows the system to receive all the necessary information using the poll method.
Figure 25: Kafka Consumer configuration
The service on the consumer side will receive up-to-date data at the time of the request, so finally,
you need to configure the API-endpoint, to which the client can send requests.
Figure 26: Contents of the REST Controller by / vehicle
For this purpose, it is necessary to describe the REST Controller (Fig. 26) Using annotations, and in
turn, Spring Boot will do all other work at the program start. Now, suppose you run the program, having

previously configured everything. In that case, you can send a GET request to the link http: // localhost: 8080 / vehicle if the application was run locally and get the current data as in Fig. 27.
Figure 27: Response to a query by /vehicle
The next step is to configure the client part that runs on Javascript using the React.js library. Again,
most of the functionality comes “out of the box”, so you only need to initialise the component that will
receive data from the server and interpret it visually. The API was used to display the maps Google Maps, and the GoogleMapsAPI library for React.js has also been used to make it easier to use. To use
the maps, you need to create a Google Cloud account and generate a token (Fig. 28).
Figure 28: Generating an API key for GoogleMaps
This key will be used to properly function the maps in the web application when it is launched
locally. For commercial development, there are additional conditions for the operation of maps. In the
created component Map.js, which will be the application’s entry point, you must initialise the
component GoogleMapsAPI - MapComponent, as shown in Fig. 29.
Figure 29: Initialise the MapComponent component
Now it is necessary to add an event to request a server to retrieve all vehicle data. Such an event will
be componentWillMount, before there was a delay of 100ms for installing components - this means that the Map component will be updated ten times per second - thus updating the map’s appearance.

Figure 30: ComponentWillMount method
Omitting all the side add-ons for the correct operation of the application and the smooth movement
of all components on the map, the last step is to describe the method render (Fig. 4.16.), adding all parts
to the map the component status is updated.
Figure 31: Initialise the render method
4.2. Analysis of the control example
First of all, you need to check whether the Apache Kafka cluster is configured and working correctly,
so in the terminal window, we connect using the command shown in Figure 4.17. Now the information
in the terminal will be updated every time Kafka Producer sends it.
Figure 32: Consumer connection to the subject

Data comes every second, as expected. The figure shows records with vehicleId equal to 1 and 2 - this is, as mentioned above, the vehicle identifiers, so we expect the customer to receive information
about the position of the two vehicles that we could see in the terminal window.
The next step is to start the REST API for the server and the npm start command to start the client
part, which will be available locally by following the link http: // localhost: 3000. At this link, we get the form for authorisation, as shown in Fig. 33.
Figure 33: Login window
After successful authorisation and authentication, we are redirected to a window with a map, which
initialises the icons in cars moving according to the input data (Fig. 34 and 35).
Figure 34: Initialised web application

Figure 35: Initialised web application
It is also possible to get additional information about a specific vehicle by clicking on it. For
example, in the current version of the system, it is possible to obtain the following data: vehicle number in the design, speed in kilometres per hour (Speed), longitude and latitude at present (Lang and Lat,
respectively). This information window is shown in Fig. 4.21.
Figure 36: Additional information about the condition of the vehicle
4.3. User manual
First of all, the user needs to download Apache Kafka to his personal computer to raise the cluster
with the following commands: ./bin/zookeeper-server-start.sh config/zookeeper.properties./bin/Kafka-
server-start.sh config / server.properties

After that, it is necessary to lift the client and the server locally. To raise the server, the main method of the VTrackerApplication class is started. The client is started with the following command:
npm start
All that remains is to follow the link shown in Fig. 37, after which the user sees all the necessary
information.
Figure 37: The link that the web application is running
In this section, a description of the software product was written, a database schema was created,
and the client-server structure of the software was described. Also, the user manual is related to technical characteristics and step-by-step deployment of this information system analysis of the control
example with graphic functional of the created system results.
5. Conclusions
The paper develops essential functions for an intelligent real-time vehicle tracking information system. The developed software product allows users to monitor the movement of their own fleet and
provides additional opportunities to manage it, keep statistics, history, etc., which in some cases can
help businesses of any size. At the initial stage, the basic concepts used in the creation of a real-time vehicle tracking system were identified. An analysis of the methods used by enterprises to control the
fleet was conducted and identified their key features, properties of their functionalities, identified the
disadvantages and advantages of such systems. After the analysis, it was determined that the topic is relevant for implementation and can be actively used in services where such performance is required.
During the development of the intelligent information system, the type of information system was
also determined using the analysis of hierarchies by qualitative alternatives. A conceptual model has
also been built, which consists of creating UML diagrams, such as the diagram of use cases, classes, sequences, activities, state transitions and components. Characteristics of the created system:
Display of results in real-time;
The application that works around the clock, if it is running on the server;
User-friendly interface based on Google Maps;
The ability of the system to withstand high loads;
The ability to add new functionality and expand existing ones.
The system was created in the Java programming language. Using the platform to broadcast events
has increased the speed of the application and allowed it to withstand heavy loads. The architecture of the system is built so that the developer can expand the functionality and cover the application with test
cases in the future. Expansion methods include displaying more information about a particular vehicle,
adding the ability to create a path for cars and track their performance, connecting managers’ phones to the system to send those SMS about events, and more. It is worth noting that there are already many
such solutions on the market, and the number of analogues continues to grow. Still, there is always the
possibility of developing optimal solutions for specific users - the so-called customisation. Car rental
companies also use it to monitor their fleets. The result of the work is the acquisition of skills in the field of logistics. In addition, improved knowledge for building systems of varying complexity, modern
architectures, and the creation of high-load systems that work in real-time.
6. References
[1] Y. Matseliukh, V. Vysotska, M. Bublyk, Intelligent System of Visual Simulation of Passenger Flows, volume Vol-2604 of CEUR workshop proceedings, 2020, pp. 906-920.
[2] Y. Matseliukh, M. Bublyk, V. Vysotska, Development of intelligent system for visual passenger
flows simulation of public transport in Smart City based on neural network, volume Vol-2870 of CEUR Workshop Proceedings, 2021, pp. 1087-1138.

[3] M. Bublyk, Y. Matseliukh, U. Motorniuk, M. Terebukh, Intelligent System of Passenger Transportation by Autopiloted Electric Buses in Smart City, volume Vol-2604 of CEUR workshop
proceedings, 2020, pp. 1280-1294.
[4] O. Y. Boreiko, V. M. Teslyuk, A. Zelinskyy, О. Berezsky, Development of models and means of
the server part of the system for passenger traffic registration of public transport in the "smart" city, volume 1(2-85) of Eastern-European Journal of Enterprise Technologies, 2017, pp. 40-47.
[5] O. Boreiko, V. Teslyuk, Structural model of passenger counting and public transport tracking
system of smart city, in: Perspective Technologies and Methods in MEMS Design, MEMSTECH, 2016, pp. 124-126. DOI: 10.1109/MEMSTECH.2016.7507533
[6] O. Boreiko, V. Teslyuk, Model of data collection controller of automated processing systems for
passenger traffic public transport smart city based on petri nets, in: 2nd International Conference on Advanced Information and Communication Technologies, AICT, 2017, pp. 62-65. DOI:
10.1109/AIACT.2017.8020066
[7] I. Krislata, A. Katrenko, V. Lytvyn, V. Vysotska, Y. Burov, Traffic flows system development for
smart city, volume Vol-2565 of CEUR Workshop Proceedings, 2020, pp. 280-294. [8] A. Katrenko, I. Krislata, O. Veres, O. Oborska, T. Basyuk, A. Vasyliuk, I. Rishnyak, N.
Demyanovskyi, O.: Meh, Development of Traffic Flows and Smart Parking System for Smart City,
volume Vol-2604 of CEUR workshop proceedings, 2020, pp. 730-745. [9] V. Basto, V. Freitas, A QoS distributed transport service, in: 3rd ACS/IEEE International
Conference on Computer Systems and Applications, 2005, pp. 921-926.
[10] V. Shynkarenko, L. Zhuchyi, Ontological Harmonization of Railway Transport Information Systems, volume Vol-2817 of CEUR Workshop Proceedings, 2021, pp. 541-554.
[11] N. Shpak, O. Mykytiuk, Z. Dvulit, L. Maznyk, N. Horbal, Simulation the Attractiveness of
Transport Services as a Tool for Assessing Consumer Loyalty in the Digital Epoch, volume Vol-
2817 of CEUR Workshop Proceedings, 2021, pp. 1500-1510. [12] L. Mochurad, N. Boyko, M. Bortnikova, Parallel Approach of the Algorithm of Finding the
Optimal Solution of the Transport Problem by the Method of Potentials, volume Vol-2604 of
CEUR workshop proceedings, 2020, pp. 952-963. [13] R. Yurynets, Z. Yurynets, D. Dosyn, Y. Kis, Risk Assessment Technology of Crediting with the
Use of Logistic Regression Model, volume Vol-2362 of CEUR Workshop Proceedings, 2019, pp.
153-162.
[14] Y. Kis, L. Chyrun, T. Tsymbaliak, L. Chyrun, Development of System for Managers Relationship Management with Customers, volume 1020 of Advances in Intelligent Systems and Computing,
2020, pp. 405-421. DOI: 10.1007/978-3-030-26474-1_29
[15] B. Setiyono, D. Sulistyaningrum, S. Soetrisno, D. Wicaksono, Multi Vehicle Speed Detection Using Euclidean Distance Based on Video Processing, volume 18(4) of International Journal of
Computing, 2019, pp. 431-442.
[16] Z. Yang, et al., Dynamic vehicle routing with time windows in theory and practice, volume 16(1) of Natural Computing, 2017, pp. 119-134.
[17] S. Wink, T. Bäck, M. Emmerich, A meta-genetic algorithm for solving the capacitated vehicle
routing problem, in: IEEE Congress on Evolutionary Computation, CEC, 2012.
[18] Z. Yang, M. Emmerich, T. Back, Ant based solver for dynamic vehicle routing problem with time windows and multiple priorities, in: IEEE Congress on Evolutionary Computation, CEC 2015 -
Proceedings, 2015, pp. 2813-2819.
[19] Y. Wang, S. Limmer, M. Olhofer, M.T.M. Emmerich, T. Back, Vehicle Fleet Maintenance Scheduling Optimization by Multi-objective Evolutionary Algorithms, in: IEEE Congress on
Evolutionary Computation, CEC 2019 - Proceedings, 2019, pp. 442-449.
[20] B. van Stein, M. Emmerich, Z. Yang, Fitness landscape analysis of NK landscapes and Vehicle Routing problems by expanded Barrier trees, volume 227 of Advances in Intelligent Systems and
Computing, 2013, pp. 75-89.
[21] Y. Wang, et al., Optimizing the maintenance schedule for a vehicle fleet: a simulation-based case
study, in: Engineering Optimization, 2021. [22] V. Alieksieiev, B. Markovych, Implementation of UAV for environment monitoring of a Smart
City with an airspace regulation by AIXM-format data streaming, volume 5(2/2020) of “Industry
4.0” – Scientific-Technical Union of Mechanical Engineering “Industry 4.0” (Sofia, BULGARIA), 2020, pp .90-93.
[23] V. Lytvyn, A. Dmytriv, A. Berko, V. Alieksieiev, T. Basyuk, J. Noennig, D. Peleshko, T. Rak, V.
Voloshyn, Conceptual Model of Information System for Drone Monitoring of Trees’ Condition,
volume Vol-2604 of CEUR workshop proceedings, 2020, pp. 695-714. [24] A. Berko, V. Alieksieiev, V. Lytvyn, Knowledge-based Big Data Cleanup Method, volume Vol-
2386 of CEUR Workshop Proceedings, 2019, pp. 96-106.
[25] V. Alieksieiev, A. Berko, A method to solve uncertainty problem for big data sources, in: Proceedings of the IEEE Second International Conference on Data Stream Mining & Processing,
DSMP, 2018, pp. 32-37.
[26] N. Antonyuk, V. Vysotska, V. Lytvyn, Y. Burov, A. Demchuk, I. Lyudkevych, L. Chyrun, S. Chyrun, A. Vysotsky, І. Bobyk, Consolidated Information Web Resource for Online Tourism
Based on Data Integration and Geolocation, in: Proceedings of the International Conference on
Computer Sciences and Information Technologies, CSIT, 2019, pp. 15-20. DOI: 10.1109/STC-
CSIT.2019.8929790 [27] G. Connolly, A. Sachenko, G. Markowsky, Distributed traceroute approach to geographically
locating IP devices, in: Proceedings of the 2nd IEEE International Workshop on Intelligent Data
Acquisition and Advanced Computing Systems: Technology and Applications, IDAACS, 2003, pp. 128-131.
[28] A. Fomenko, V. Vyshnia, Specialized Automated System for Control and Support of Rail Cargo
Transportation, volume 18(2) of International Journal of Computing, 2019, pp. 191-200. [29] Y. Burov, A. Horodetska, M. Bublyk, M. Nashkerska, V. Vysotska, Intellectual Tourist Service
with the Situation Context Processing. Advances in Social Science, Education and Humanities
Research, in: Proceedings of the International Conference on New Trends in Languages, Literature
and Social Communications (ICNTLLSC), Published by Atlantis Press SARL, 2021, vol. 557, pp. 233-243. DOI: 10.2991/assehr.k.210525.028
[30] Telegram APIs Documentation. URL: https://core.telegram.org/api
[31] N. Shakhovska, O. Basystiuk, K. Shakhovska, Development of the speech-to-text chatbot interface based on google API, volume 2386 of CEUR Workshop Proceedings, 2019, pp. 212-221.
[32] O. Romanovskyi, N. Pidbutska, A. Knysh, Elomia Chatbot: The Effectiveness of Artificial
Intelligence in the Fight for Mental Health, volume Vol-2817 of CEUR Workshop Proceedings,
2021, pp. 1215-1224. [33] A. Yarovyi, D. Kudriavtsev, Method of Multi-Purpose Text Analysis Based on a Combination of
Knowledge Bases for Intelligent Chatbot, volume Vol-2817 of CEUR Workshop Proceedings,
2021, pp. 1238-1248. [34] V. Vysotska, A. Berko, M. Bublyk, L. Chyrun, A. Vysotsky, K. Doroshkevych, Methods and tools
for web resources processing in e-commercial content systems, in: IEEE 15th International
Scientific and Technical Conference on Computer Sciences and Information Technologies, CSIT, 2020, pp. 114–118.
[35] The Full Guide to Chatbots. URL: https://learn.g2.com/chatbot
[36] Tree goals. URL: http://studentbooks.com.ua/content/view/637/42/1/5/.
[37] DFD. URL: https://studopedia.info/1-113597.html. [38] IDEF0 Diagram creating. URL: https://www.edrawsoft.com/how-to-create-idef0-diagram.php.
[39] Natural Language Processing (NLP) for Machine Learning. URL:
https://towardsdatascience.com/natural-language-processing-nlp-for-machine-learning-d44498845d5b
[40] The importance of NLP for customer support using chatbots. URL:
https://www.expertsystem.com/importance-of-nlp/ [41] Natural Language Understanding. URL: https://cloud.ibm.com/apidocs/natural-language-
understanding
[42] Natural Language Processing (NLP) & Why Chatbots Need it. URL:
https://chatbotsmagazine.com/natural-language-processing-nlp-why-chatbots-need-it-a9d98f30ab13
[43] A. L. Farris, G. S. Ingersoll, T. S. Morton, Taming Text: How to Find, Organise, and Manipulate
it, 2013.

[44] N. Kunanets, H. Matsiuk, Use of the Smart City Ontology for Relevant Information Retrieval, volume Vol-2362 of CEUR Workshop Proceedings, 2019, pp. 322-333.
[45] L. Wieclaw, V. Pasichnyk, N. Kunanets, O. Duda, O. Matsiuk, P. Falat, Cloud computing
technologies in 'smart city' projects, in: Proceedings of the IEEE 9th International Conference on
Intelligent Data Acquisition and Advanced Computing Systems: Technology and Applications, IDAACS, 2017, pp. 339-342. DOI: 10.1109/IDAACS.2017.8095101
[46] K. Nataliia, M. Halyna, Application of Saaty Method While Choosing Thesaurus View Model of
the "Smart city" Subject Domain for the Improvement of Information Retrieval Efficiency, in: IEEE 13th International Scientific and Technical Conference on Computer Sciences and
Information Technologies, CSIT, 2018, pp. 21-25. DOI: 10.1109/STC-CSIT.2018.8526656
[47] K. Nataliia, M. Halyna, Application of the 'Smart City' data domain thesaurus as the tool for representing knowledge while improving the problem-oriented Web search effectiveness, in: IEEE
14th International Scientific and Technical Conference on Computer Sciences and Information
Technologies, CSIT, pp. 31-34. DOI: 10.1109/STC-CSIT.2019.8929868
[48] O. Duda, V. Kochan, N. Kunanets, O. Matsiuk, V. Pasichnyk, A. Sachenko, T. Pytlenko, Data processing in IoT for smart city systems, in: Proceedings of the 10th IEEE International
Conference on Intelligent Data Acquisition and Advanced Computing Systems: Technology and
Applications, IDAACS, 2019, pp. 96-99. DOI: 10.1109/IDAACS.2019.8924262 [49] O. Duda, N. Kunanets, O. Matsiuk, V. Pasichnyk, Cloud-based IT infrastructure for "Smart City"
projects, in: Dependable IoT for Human and Industry: Modeling, Architecting, Implementation,
2018, pp. 389-410. [50] Java. URL: https://docs.oracle.com/javase/8/docs/
[51] Eckel, Bruce. Thinking in Java, 2006.
[52] Spring Boot. URL: https://docs.spring.io/spring-boot/docs/current/reference/htmlsingle/
[53] Craig Walls - Spring in Action, Fourth Edition, 2017. [54] MySQL Connector. URL: https://dev.mysql.com/doc/
[55] Hibernate Documentation. URL: https://hibernate.org/orm/documentation/5.4/
[56] S.S. Shcherbak, Interoperability web application models based on microformats, in: CriMiCo, 21st Int. Crimean Conference: Microwave and Telecommunication Technology, 2011, pp. 57-58.
[57] K. Mykich, Y. Burov, Research of uncertainties in situational awareness systems and methods of
their processing, volume 1(4) of Eastern-European Journal of Enterprise Technologies, 2016, pp.
19-27. [58] K. Mykich, Y. Burov, Algebraic model for knowledge representation in situational awareness
systems, in: Computer Sciences and Information Technologies - Proceedings of the 11th
International Scientific and Technical Conference, CSIT, 2016, pp. 165-167. [59] S. Makara, L. Chyrun, Y. Burov, Z. Rybchak, I. Peleshchak, R. Peleshchak, R. Holoshchuk, S.
Kubinska, A. Dmytriv, An Intelligent System for Generating End-User Symptom
Recommendations Based on Machine Learning Technology, volume Vol-2604 of CEUR workshop proceedings, 2020, pp. 844-883.
[60] V. Lytvyn, V. Vysotska, V. Shatskykh, I. Kohut, O. Petruchenko, L. Dzyubyk, V. Bobrivetc, V.
Panasyuk, S. Sachenko, M. Komar, Design of a recommendation system based on Collaborative
Filtering and machine learning considering personal needs of the user, volume 4(2-100) of Eastern-European Journal of Enterprise Technologies, 2019, pp. 6-28. DOI: 10.15587/1729-
4061.2019.175507
[61] V. Husak, O. Lozynska, I. Karpov, I. Peleshchak, S. Chyrun, A. Vysotskyi, Information System for Recommendation List Formation of Clothes Style Image Selection According to User’s Needs
Based on NLP and Chatbots, volume Vol-2604 of CEUR workshop proceedings, 2020, pp. 788-
818. [62] Y. Meleshko, M. Yakymenko, S. Semenov, A Method of Detecting Bot Networks Based on Graph
Clustering in the Recommendation System of Social Network, volume Vol-2817 of CEUR
Workshop Proceedings, 2021, pp. 1249-1261.
[63] N. Shakhovska, S. Fedushko, ml. M. Greguš, I. Shvorob, Yu Syerov, Development of Mobile System for Medical Recommendations, in: The 15th International Conference on Mobile Systems
and Pervasive Computing (MobiSPC), 2019, 155, pp. 43-50.
[64] N. Boyko, P. Telishevskyi, B. Kushka, Analysis of Recommendation System Methods for Accuracy of Predicted Estimates, volume Vol-2817 of CEUR Workshop Proceedings, 2021, pp.
1878-1888.
[65] B. Rusyn, O. Lutsyk, R. Kosarevych, J. Varetsky, Automated Recognition of Numeric Display
Based on Deep Learning, in: IEEE 3rd International Conference on Advanced Information and Communications Technologies, AICT, 2019, pp.2 44-247.
[66] B.E. Kapustiy, B.P. Rusyn, V.A. Tayanov, Peculiarities of Application of Statistical Detection
Criteria for Problem of Pattern Recognition, volume 37(2) of Journal of Automation and Information Science, 2005, pp. 30-36.
[67] B. Rusyn, V. Korniy, O. Lutsyk, R. Kosarevych, Deep Learning for Atmospheric Cloud Image
Segmentation, in: IEEE 11 th International Conference on Electronics and Information Technologies, ELIT, 2019, pp. 188-191.
[68] B.O. Kapustiy, B.P. Rusyn, V.A. Tayanov, A New Approach to Determination of Correct
Recognition Probability of Set Objects, volume 2 of Upravlyayushchie Sistemy i Mashiny, 2005,
pp. 8-12. [69] B.E. Kapustiy, B.P. Rusyn, V.A. Tayanov, Peculiarities of Application of Statistic Detection
Criteria for Problems of Pattern Recognition, volume 37(2) of Journal of Automation and
Information Science, 2005, pp. 30-36. [70] B. Rusyn, V. Tayanov, O. Lutsyk, Upper-bound Estimates for Classifiers Based on a Dissimilarity
Function, volume 48(4) of Cybernetics and Systems Analysis, 2012, pp. 592-600.
[71] S. Babichev, V. Lytvynenko, J. Skvor, M. Korobchynskyi, M. Voronenko, Information Technology of Gene Expression Profiles Processing for Purpose of Gene Regulatory Networks
Reconstruction, in: Proceedings of the 2018 IEEE 2nd International Conference on Data Stream
Mining and Processing, DSMP, 2018, pp. 336-341.
[72] V. Lytvynenko, N. Savina, J. Krejci, M. Voronenko, M. Yakobchuk, O. Kryvoruchko, Bayesian Networks' Development Based on Noisy-MAX Nodes for Modeling Investment Processes in
Transport, volume Vol-2386 of CEUR Workshop Proceedings, 2019, pp. 1-10.
Copyright © 2022 FDOKUMEN