INTELLIGENT BILLING SYSTEM USING ARTIFICIAL ...
61
Page 1 of 61 INTELLIGENT BILLING SYSTEM USING ARTIFICIAL INTELLIGENCE Supervised by: DM Kamrul Hasan Manager, ICT DPDC Submitted by: Mohammed Saiful Islam( ID: 1947 ) Md. TariqulIslam( ID: 1949 ) Muhammad Mahfuzur Rahman Khan( ID: 1950 ) Mamunoor Rashid( ID: 1951 ) Mohammad MojahidulIslam( ID: 1954 ) Md. Nazmul Hasan( ID: 1956 ) Md. Rajon Hossan( ID: 2158 ) A project submitted to the Bangladesh Power Management Institute (BPMI), Dhaka, in partial fulfillment of the requirements for the completion of 2nd Foundation Training Course BANGLADESH POWER MANAGEMENT INSTITUTE (BPMI) DHAKA, BANGLADESH September, 2020
-
Upload
khangminh22 -
Category
Documents
-
view
3 -
download
0
Transcript of INTELLIGENT BILLING SYSTEM USING ARTIFICIAL ...

Page 1 of 61
INTELLIGENT BILLING SYSTEM USING
ARTIFICIAL INTELLIGENCE
Supervised by:
DM Kamrul Hasan Manager, ICT
DPDC
Submitted by:
Mohammed Saiful Islam( ID: 1947 )
Md. TariqulIslam( ID: 1949 )
Muhammad Mahfuzur Rahman Khan( ID: 1950 )
Mamunoor Rashid( ID: 1951 )
Mohammad MojahidulIslam( ID: 1954 )
Md. Nazmul Hasan( ID: 1956 )
Md. Rajon Hossan( ID: 2158 )
A project submitted to the Bangladesh Power Management Institute (BPMI), Dhaka, in partial
fulfillment of the requirements for the completion of 2nd Foundation Training Course
BANGLADESH POWER MANAGEMENT INSTITUTE (BPMI) DHAKA,
BANGLADESH
September, 2020

Page 2 of 61
DECLARATION
We hereby declare that the research work presented in this study report or any part of it has
not been submitted elsewhere for the fulfillment of any requirement for persuasion of any kind
of degree or similar purpose.
Mohammad Saiful Islam
Md. Tariqul Islam
September, 2020 Muhammad Mahfuzur Rahman Khan
Mamunoor Rashid
Mohammad Mojahidul Islam
Md. Nazmul Hasan
Md. Rajon Hossan

Page 3 of 61
ACKNOWLEDGEMENT
All praise to Almighty Allah, the most Gracious and the most Merciful. We would like to express
our sincere appreciation and heartfelt gratitude to the supervisor, DM Kamrul Hasan, Manager,
ICT, DPDC for his relentless efforts and quintessential guidance without which this work could
not see its light. We are highly delighted to state that Bangladesh Power Management Institute
(BPMI), the pioneer institute in realizing the goals of power sector through imparting
outstanding training and workshop programs to the power sector professionals for the
challenging time ahead, has actually adorned us with this great opportunity to delve into a
pragmatic issue like this as a part of the 2nd Foundation Training Course. Words fall really short
of describing the continuous support of BPMI throughout the project. In this regard, we would
like to thank Dhaka Electric Supply Company Limited (DESCO) for providing us with the
opportunity to participate in the 2nd Foundation Training Course at BPMI. We are immensely
indebted to both BPMI and DESCO. Finally, all others who actively and passively participated or
associated with this work in its different phases, we are conveying our deepest respect to all of
them.
Page 4 of 61
Executive Summary
Electricity is a vital element required for economic growth, poverty reduction and social
development. The Government of Bangladesh, taking into account the vision of 2021 and 2041,
has set a priority for power sector introducing Power Sector Master Plan(PSMP), 2016 to
upgrade the existing utility service of Bangladesh and has been successful to some extent. Prior
this master plan, with the aiding of international agencies, Bangladesh government had first
struck the developmental change in this sector back in 1994 bringing about a total
transparency-based, efficient unbundling scheme which caused significant changes. But there
are still some challenges to work on specially of the distribution segment. Recent COVID-19
pandemic causing anarchy in billing system has given a serious thought on reforms of our
ongoing billing system. Despite the prepaid metering system introduction in case of avoiding
traditional billing and invoicing, forgeries and monitoring still lurk as a burning question in this
regard. Here in this paper, we have made attempts to propose an intelligent billing system
using artificial intelligence since intelligent billing is becoming an active field of research for its
immense potential in efficient power distribution and billing system. We have studied several
related studies which basically focus on advanced metering infrastructure(AMI) which in turns
beckons the smart prepaid metering but don't delineate curbing the chicaneries practiced
through these smart systems. This paper is an exploratory as well as an empirical study with a
combination of quantitative and qualitative method applied for the collection of data through
online survey, case studies and content analysis. It will delineate the application of a machine
learning technique for examining the energy consumption data using artificial neural networks

Page 5 of 61
and smart meter fine-grained data. Due to massive demand of electricity consumption and
recent anarchy or complaints about billing system in our country, there is an urge from
consumers to have a better electricity consumption metering system in power distribution
companies so that the invoiced bill can be accepted spontaneously by them. There is an
attempt, through this paper, to bring complicated machine learning to the billing history of
customers so that abrupt changes in prepaid recharges and postpaid reading can be traced or
forecasted through machine learning models which may lead to finding anomalies in the billing.
The system will also encourage the users to reduce wastage of electricity which is an essential
part of our everyday life. Thus, this automatic monitoring system will reduce human
interference in the entire process.
Page 6 of 61
Table of Contents
Declaration 2
Acknowledgement 3
Executive Summary 4
List of Figures 8
List of Tables 9
1 Chapter 1: Introduction ....................................................................................................................10
1.1 Foreword .................................................................................................................................... 10
1.2 Background ................................................................................................................................. 12
1.3 Statement of problem ................................................................................................................ 13
1.4 Objectives ................................................................................................................................... 13
1.5 Research Questions .................................................................................................................... 14
1.6 Methodologies ........................................................................................................................... 14
1.7 Limitations .................................................................................................................................. 15
1.8 Delimitations .............................................................................................................................. 16
2 Chapter 2: Overview of the present situation ................................................................................... 17
2.1 Postpaid meter ........................................................................................................................... 17
2.1.1 Electromechanical meters .................................................................................................. 17
2.1.2 Electronic meters ................................................................................................................ 18
2.1.3 Billing Using Postpaid meter .............................................................................................. 20
2.1.4 Drawbacks of Postpaid meters .......................................................................................... 20
2.2 Prepayment Metering System ................................................................................................... 21
2.2.1 Determining the energy consumption in Prepaid Meter .................................................. 22
2.2.2 Common Architecture of the Prepaid Metering System .................................................. 23
2.2.3 Most common types of Prepaid Meters ............................................................................ 23
2.2.4 Benefits to utilities ............................................................................................................. 26
2.2.5 Benefits to consumers ........................................................................................................ 27
2.2.6 Advantages of prepayment meters ................................................................................... 28
2.2.7 Disadvantages of prepayment meters .............................................................................. 28
2.3 Findings from a distribution company ....................................................................................... 28
Page 7 of 61
3 Chapter 3: Literature Review ............................................................................................................. 31
3.1 AMR using digital wattmeter and Wi-max[4] ........................................................................... 31
3.2 Automated Electricity Bill Monitoring[5] .................................................................................. 33
3.3 GSM based Automated Electricity Billing System[6] ................................................................ 35
4 Chapter 4: Proposed Intelligent Billing System using AI ................................................................... 38
4.1 Background Knowledge ............................................................................................................. 39
4.1.1 Artificial Neural Networks.................................................................................................. 39
4.1.2 Support Vector Machine .................................................................................................... 40
4.2 Data extraction and preparation ............................................................................................... 41
4.2.1 Data Cleaning ...................................................................................................................... 44
4.2.2 Feature Selection ................................................................................................................ 45
4.2.3 Indexing and compressing ................................................................................................. 45
4.3 Anomaly in consumption pattern detection approach............................................................. 45
4.3.1 Selection of Input/output Parameters for Neural Network Structure ............................. 46
4.3.2 Generation of Training and Validation Datasets ............................................................... 48
4.3.3 Training the Neural Network ............................................................................................. 48
4.3.4 Prediction ............................................................................................................................ 48
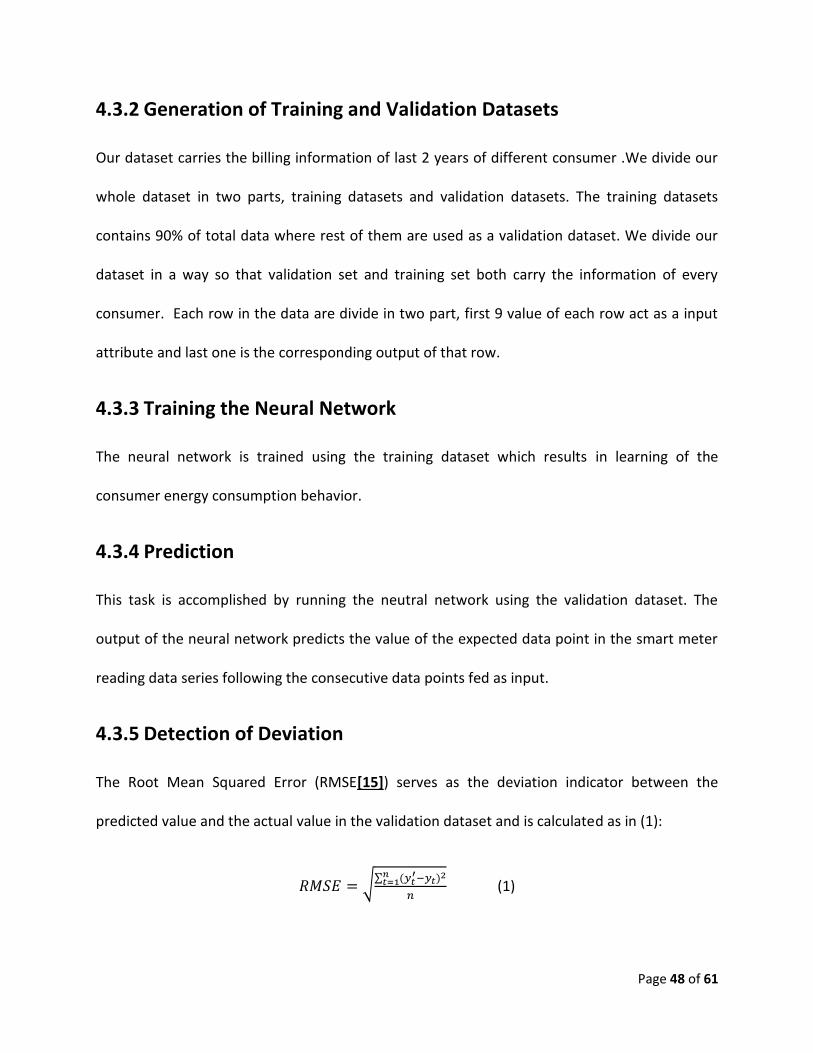
4.3.5 Detection of Deviation ....................................................................................................... 48
5 Chapter 5: Experimental Study .......................................................................................................... 50
5.1 Experimental Data ...................................................................................................................... 50
5.2 Working Procedure .................................................................................................................... 51
5.3 Simulation Result ....................................................................................................................... 53
5.4 Limitations of Experiment .......................................................................................................... 57
6 Chapter 6: Conclusion ........................................................................................................................ 58
7 List of References ............................................................................................................................... 59
Page 8 of 61
List of Figures
Fig 2.1.1Electromechanical meter internal and external picture 18
Fig 2.1.2 Electronic post-paid meter 19
Fig 2.2.1 Topological architecture of prepaid metering system 23
Fig 2.2.2 Smart prepaid meter 24
Fig 2.2.3 Smart card prepaid meter 25
Fig 2.2.4 Keypad prepaid meter 26
Fig 3.1.1 Block diagram of the whole proposed AMR system 32
Fig 3.1.2 Sample flow chart of the reading unit 32
Fig 3.2.1 Flow chart showing the work flow of the proposed system 34
Fig 3.2.2 Difference between the actual reading and reading of the proposed system 35
Fig 3.3.1 GSM network-based system 36
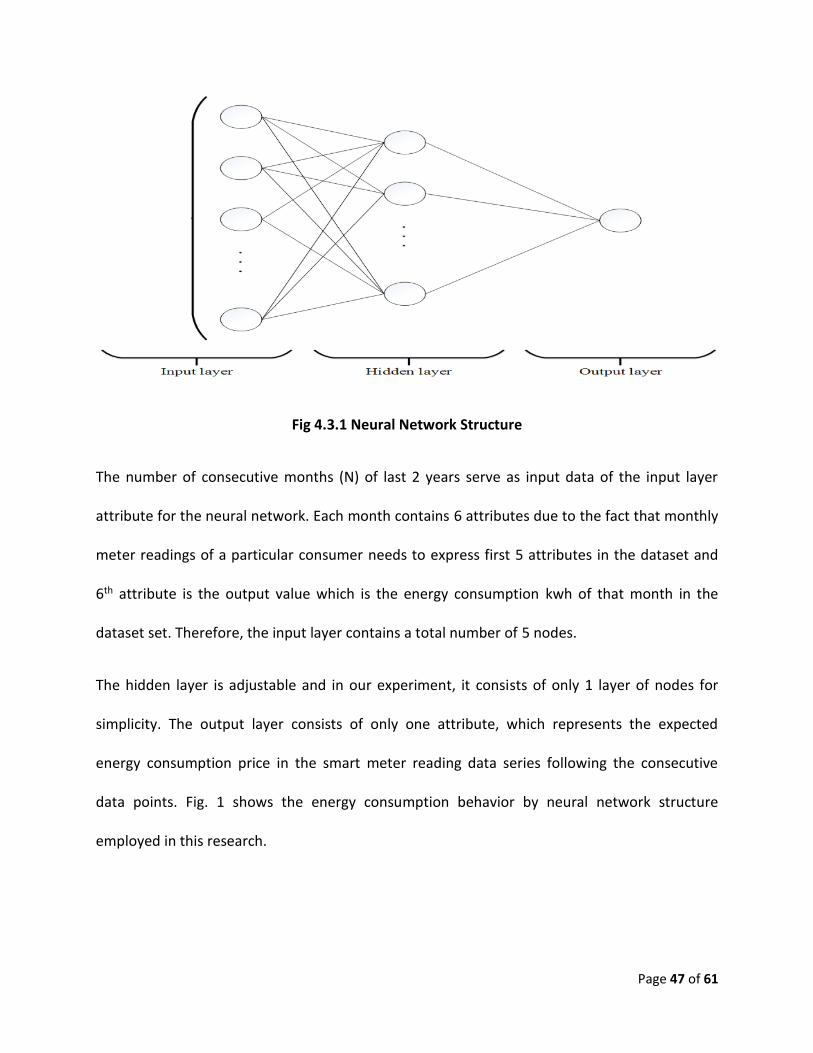
Fig 4.3.1 Neural Network Structure 47
Fig 5.2.1 Neural Network Model 52
Fig 5.3.1 Simulation Result Comparison Actual vs Predicted (4000 of almost 47000 rows) 56
Page 9 of 61
List of Tables
Table 2.3.1 Category wise Complaints from 26.04.19 to 31.08.20 30
Table 4.2.1 Sample Row Data Structure 43
Page 10 of 61
1 Chapter 1: Introduction
1.1 Foreword
Electricity is one of the most vital and phenomenal driving forces of development for any
country. In this current era, we cannot even think of a day without electricity which was almost
a very common scenario in the last decade in Bangladesh. Keeping pace with the advancement
of time and technology, the government has realized that this is the most strategic sector to
focus on. Consequently, to cement the dream of becoming a middle-income and developed
country Bangladesh government has undertaken vision 2021 and 2041 respectively of which
out of all the outlined plans, delineates the emphasis on electricity production, transmission,
distribution and overall management with increasing electricity demand. Within the last decade
only, electricity generation capacity has increased more than 12000 MW.[1] This enormous
success has not come easy rather had to go through many more reformation. In 1994, the
Government of Bangladesh undertook the Power Sector Reforms in Bangladesh (PSRB) policy
paper in consultation with major development partner of which the Asian Development Bank
(ADB) has played the instrumental role.[2]. It proposed the unbundling of the then single agent,
Bangladesh Power Development Board (BPDB) to generation, transmission and distribution.
These tasks ought to be distributed along with corporatization and proper incentivization of
these sectors to rejuvenate the dormant sector. With a cordial supervision and management,
we have come this far. Still there lies problems. The overall service rendering is not up to the
mark and the billing anomalies are a larger portion of this dark side. Despite the boon of
technological advancement, the conventional bill collection and then bill calculation is still at
Page 11 of 61
large in Bangladesh. The meter readers visit house to house, collect meter readings, send those
to the respective collection offices and the bill is calculated. This task is not only conventional
and humongous but also error prone. To reduce and eliminate this problem prepaid metering
and associated ideas have been introduced. But to utilize the prepaid metering facility
throughout the country it takes time and resources. Until then this problem might continue.
The recent billing anarchy has been termed as "Ghostly electricity bill" by the digital and print
media in our country. Moreover, not all the consumers can be brought under the prepaid or
similar metering system specially HT consumers. And with a view to achieving the developed
country government has been leveraging special economic zones and many more facilities
which cannot simply be regulated under the prepaid metering system. The household and
commercial can be brought under prepaid metering but before bringing we need to address the
issue with a proper tuning. In this work, we have proposed different ideas and propositions that
can be incorporated into the electricity billing system especially through wireless network and
communication technology and to buttress the issues regarding those propositions, we have
introduced artificial intelligence with metering and billing system. We have introduced the
issues regarding electricity theft with both prepaid and postpaid metering and billing system.
Among the issues, non-monitoring of prepaid meters and forged meter reading are common.
We have brought the very complicated machine learning to the billing history of customers so
that abrupt changes in prepaid recharges and postpaid reading are well predicted through
machine learning models. Thus, the machine learning models find anomalies in the billing
system so to protect theft in electricity and help in monitoring the metering system.
Page 12 of 61
1.2 Background
Bangladesh, overwhelmed with a large population is facing a large energy demand over the last
couple of years due to taking numerous development projects for becoming a developed
country within 2041. To realize the aforementioned goal, the country needs to excel in
achieving continuous economic growth rate which largely depends upon the industrial
development. Only the availability of energy with a strategic usage can ensure this smooth
transition. Energy is the pivotal socio-economic development input and corner-stone of the
modern industrial economy. And the power sector of this broad energy arena is not only a
success story but also a true focus-oriented sector of the current government from its early
age.[3]Power sector of Bangladesh has gone under many more scissors. The mother
organization BPDB has been adorned many more times. Unbundling has been done for discrete
responsibilities and overall improvement. These techniques have ushered the tremendous
improvement. The rapid demand rate has also been addressed introducing Power Sector
Master Plan(PSMP), 2016. Nonetheless, we cannot still attain the end-users' satisfaction. The
overall service side is still lagging behind. Moreover, billing system frequently arises customers'
grudge. And this grudge actually imparts the ultimate failure. It creates distrust. The traditional
meter reading collection by meter reader is a monotonous and an expensive task. Moreover,
the data can be erroneous. Besides, sometimes meters are installed in a place in the complex
from where reading can't be fetched easily. The fetched reading is then inputted into system.
This means many more loopholes are lurking in these stages. With the rapid increase of
electricity consumption in our country, it is actually inevitable for injecting a better electricity

Page 13 of 61
consumption metering system so that the invoiced bill will be accepted happily by the
countrymen with the least dissatisfaction as well as the best energy management is ensured.
1.3 Statement of problem
Beyond any reasonable doubt, it's true that despite numerous policies, the lack of end
customers' satisfaction produces the bleak outcome of government's achievement in power
sector. Anomalies in electricity billing system is not a new one. It is rather a constant
phenomenon. Besides the recent extra-ordinary billing anomaly, it was there all the time to
some to moderate extent. Unified metering system and associated proposals are in stack and
some are being implemented to address this billing issue. But the matter of fact that, not all
sorts of customers can be brought under this pre-paid metering and also this scheme
implementation over the whole country requires a great deal. Between this phase and onwards
for a targeted audience, we need to devise a sustainable billing system integrated with artificial
intelligence that reduces the issues in great extent. Thus, the artificial system with billing will
help reduce energy theft, forged meter reading and increase customer satisfaction and more
field monitoring.
1.4 Objectives
We broadly focus on addressing the following bullet points:
➢ To go through and understand the present situation regarding the issue thoroughly.
➢ To review the previous studies regarding this issue.
➢ To identify the recommendations/suggestions of the previous studies.

Page 14 of 61
➢ Worldwide best practice assessment in this regard.
➢ To identify the shortcomings/loopholes of the proposed solutions.
➢ To propose a/several remedial suggestions.
➢ To assess the feasibility of the proposed suggestions.
➢ Significantly improve the operational efficiency minimizing cost and resources
➢ Covering maximum area
➢ Assuring the sustainability and as well as effectiveness
➢ Ensuring the re-usage of the proposed system/solution
➢ Enhancing overall customer service and realizing customer satisfaction
1.5 Research Questions
In this conducted research the following questions have been launched to address the
problems and associated issues:
➢ What is the main billing anomaly?
➢ How often does billing anomaly occur?
➢ How energy fraud can be differentiated from regular pattern of usage behavior
➢ When does this anomaly occur most?
➢ Why energy consumption forecast is needed
➢ What is the intensity of billing amount deviation?
➢ Which category users do face this anomaly most?
➢ Has any customer ever felt that the invoiced bill is less than he/she might have thought?
➢ What thing(s) do affect the recent anomaly in case of invoicing bill?
Page 15 of 61
➢ What sorts of difficulties do meter-readers face during data fetching in normal and
abnormal situation?
➢ What are the main reasons behind the anomalies happened in postpaid meter?
➢ How well the idea of using prepaid metering can address these problem?
➢ What are the drawbacks of prepaid metering system?
1.6 Methodologies
The study methodology has been carried out in an exploratory nature and simulated in
software with artificial deep learning model. For the purpose of the study, data have been
collected from distribution agencies, technical persons and from online survey. Beside these
sources, we have collected data from sources like websites, journals, research papers, articles
and similar documents. We also checked the accuracy of study which is illustrated on graph.
1.7 Limitations
Time is one of the main limitations that has hindered a successful realization of the thorough
research on this topic. Because of time constraints, we haven't been able to review all the
possible suggested solutions or recommendations regarding the issue. Besides, because of the
sudden outbreak of COVID-19, field level visits and rigorous data collection, checking and
scrutinizing haven't been possible. As a result, despite depending on the secondary data, less
access and granting data from distribution agencies for several constraints, we to some extent
have lacked to illustrate the real scenario.

Page 16 of 61
1.8 Delimitations
In spite of so many limitations, we can proudly say that the conducted research have brought
about some new avenues. This study tries to find out every possible issue related to meter
reading fetching and further processing. It delineates the challenges along the course which can
be taken into consideration upon different accounts. Moreover, it has made some successful
recommendations upon the software system responsible for invoicing. Some suggested ideas
and proposals can be well utilized in some other cases if it deems not best-fitted for the
targeted reason.
Page 17 of 61
2 Chapter 2: Overview of the present situation
In this chapter we will briefly discuss the working procedures of post-paid and pre-paid
metering systems, bright sides of using pre-paid metering, its types currently working in
Bangladesh and future plan regarding this metering system. At the end of the chapter we will
try to illustrate a tabular information regarding billing and pre-paid metering systems collected
from DPDC.
2.1 Postpaid meter
Postpaid electric meters are the most common ones used for measuring electric units
consumed. They are normally of two types namely: electromechanical and electronic meters.
2.1.1 Electromechanical meters
This is the most common type of electricity measurement meter. In case of a single phase AC
supply, the meter operates through electromagnetic induction by counting revolution of a
metal disc. The disc is nonmagnetic but electrically conductive. The disc rotates at a speed
proportional to the power passing through meter. The meter’s voltage and current coils
consume very low power like 2 watt and this amount is not registered with meter. Below the
disc, there are two sets of induction motor forming a two phase linear induction motor.
Page 18 of 61
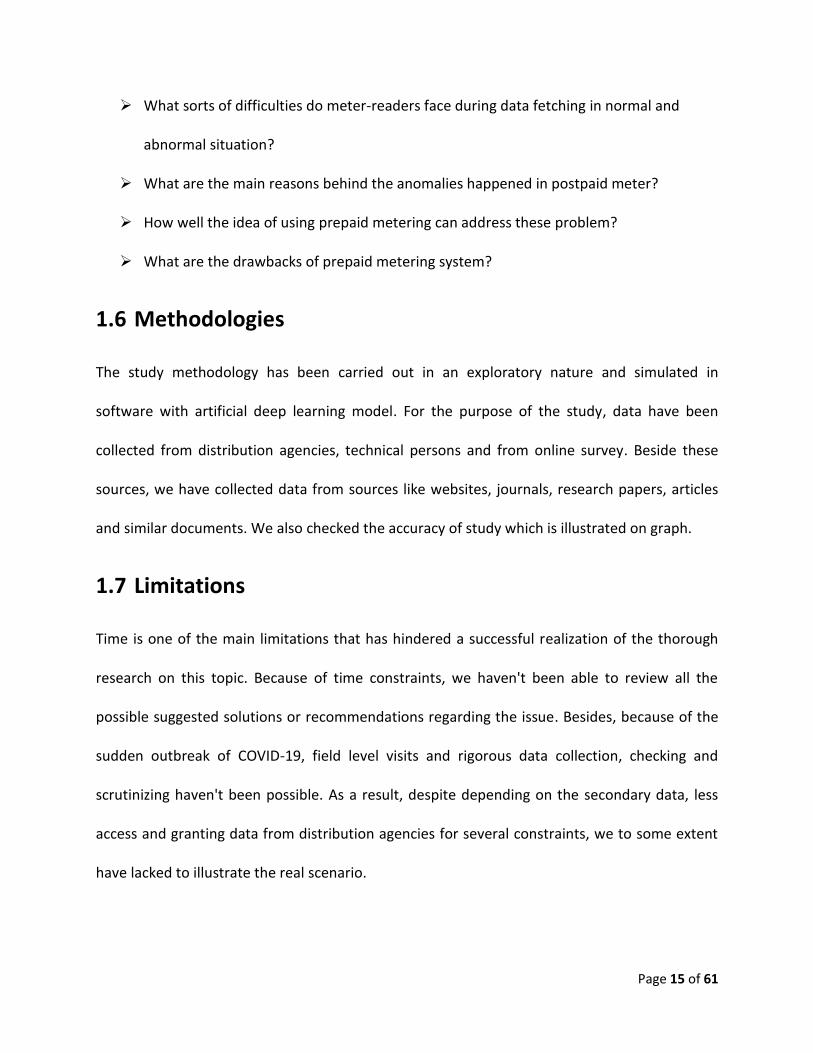
Fig 2.1.1Electromechanical meter internal and external picture
These coils produce magnetic flux in proportion to the voltage and current respectively. Voltage
coil field is 90 degree delayed. It produces eddy currents in the disc and so a force is exerted on
the disc in proportion to the produced current, voltage and power factor/phase angle between
them. A permanent magnet plays a role of eddy current brake. The magnet exerts an opposite
force proportional to the disc’s rotation speed. If the two opposite forces are equal, then we
can say the disc is rotating at same rate of power production. The disc drives count revolutions.
There is a spindle consists of a worm gear which drives the register. The register is a series of
dials. It records amount of energy consumed. This type of meter requires to take read manually
by meter readers.
2.1.2 Electronic meters
These are smarter than electromechanical meters. In addition to energy consumption , they
can calculate demand. These are of interval type meter where they calculate consumption in a

Page 19 of 61
billing cycle interval and thus can calculate maximum demand. But in electromechanical meters
, they are just accumulation type meters and they cannot understand peak / off peak power
consumption and demand. Electronic meters can calculate peak /off peak power consumption.
Fig 2.1.2 Electronic post-paid meter
These meter use LCD/LED display for showing power consumption. The meter has power
supply, metering engine, processing engine, microcontroller, real time clock (RTC), infrared
communication ports/modules. The metering engine takes the voltage and current inputs and
using voltage reference, samplers , quantifiers covert all analogue inputs to digitized
equivalents. These digital inputs are then processed using a digital signal processor to calculate
required metering parameters. Processing and communicating unit calculate various derived
quantities from metering engine derived measurements. It also communicates using various
protocols and interfaces with other connected modules. Then it plays master role and another
module plays role of slave. So RTC and other add on modules are its slave. In modern time all
Page 20 of 61
these modules are integrated in a single chip called microprocessor such as RTC, LCD controller,
temperature sensor, memory and analog to digital converters.
2.1.3 Billing Using Postpaid meter
Currently Postpaid meters store energy information and meter readers go to home/industry
where meters are installed. Then manually read the consumption amount and send information
to distribution company. Distribution company invoices consumption bill processing those
provided data accordingly. In Bangladesh, consumed units of electricity is divided into several
unit slabs for generating bill. Here for lower slabs, unit price is low and higher when the slabs
increase. This way authority not only discourages the wastage of electricity consumption but
also makes it affordable for the lower income people. For HT and MT consumers, meters track
highest energy usage of that meter in each billing period of 30 minute and among these values
highest value is considered for his demand charge. Peak Time is a time when total usage of all
meters is high. So,for cutting peak time demand off , per unit energy price for peak time is high.
For off peak time they offer low per unit energy price. The meter records the amount of
electricity used, and then the meter reader take reading, this information is passed to the
supplier, who bills the consumer for the amount of electricity they consumed. The upside of
this is that a consumer doesn’t have to worry about running out of balance on their meter - it
won’t automatically cut off the supply of electricity due to lack of balance of meter.
2.1.4 Drawbacks of Postpaid meters
➢ Consumers are less concerned about unnecessary electricity consumption. So electricity
misuse is common.

Page 21 of 61
➢ Consumers consume beyond their affordable capability subconsciously.
➢ During pandemic, meter readers are also unable to go consumers' house and take meter
reading . So, distributor companies made an assumption and generated bill on
assumption. As a result, an unprecedented billing incidence occurred.
➢ Sometimes meter readers take bribe from consumers and take false meter reading for
sole benefit. Thus, company faces loss.
➢ Accumulation type postpaid meters cannot decide peak time and off-peak time usage
and it also cannot calculate maximum demand. So, these are not fit for energy price
calculation.
➢ In conventional postpaid meters, meter tampering is easy. Meter readers go to take
reading at a fixed time of month. So dishonest consumers can easily do this bad practice
and due to lack of remote communication of meter , it is not possible to track this
corruption.
2.2 Prepayment Metering System
By definition prepayment electricity system does not use billing in its classical form but collects
the money up front. It rather works most likely recharge based cellular fashion where a
consumer recharges his/her meter and uses until the recharged amount expires. In terms of
money the consumer actually purchases unit of energy which is inserted into the meter through
a special card.

Page 22 of 61
2.2.1 Determining the energy consumption in Prepaid Meter
Present days prepaid meters are a wonder not only in the terms of smart electricity or energy
usage but also keeping a track of the need of and measuring the usage properly. It helps user to
measure how much he or she needs energy for a period of time and what measures might be
taken to adopt the fair usage. In prepaid meters, energy consumption is calculated in kwh.
When a consumer requests to recharge the meter, the request is sent to the due authority’s
vending station. Upon receiving the request, vending station inspects the tariffs associated with
the meter and converts the recharged amount into a digitally produced hash code or some
specified format code. This code actually bears the assigned energy units to be consumed.Some
prepaid meters use STS(Standard Transfer Specification) technology . Through this technology,
meters are only able to accept a specific 16 or 20 digits encrypted code which will be processed
by the meter internally. The internal firmware of the meter is programmed as such which
decrypts this code and converts it into energy in kwh format. This technology successfully bars
any sort of fraudulent activities of recharging the meter. A flash light attached to the meter
indicates whether the meter units are consumed or not. With the usage of energy units the
meter balance lessens and the light flashes. Light flashes more with more consumption.

Page 23 of 61
2.2.2 Common Architecture of the Prepaid Metering System
Fig 2.2.1 Topological architecture of prepaid metering system
2.2.3 Most common types of Prepaid Meters
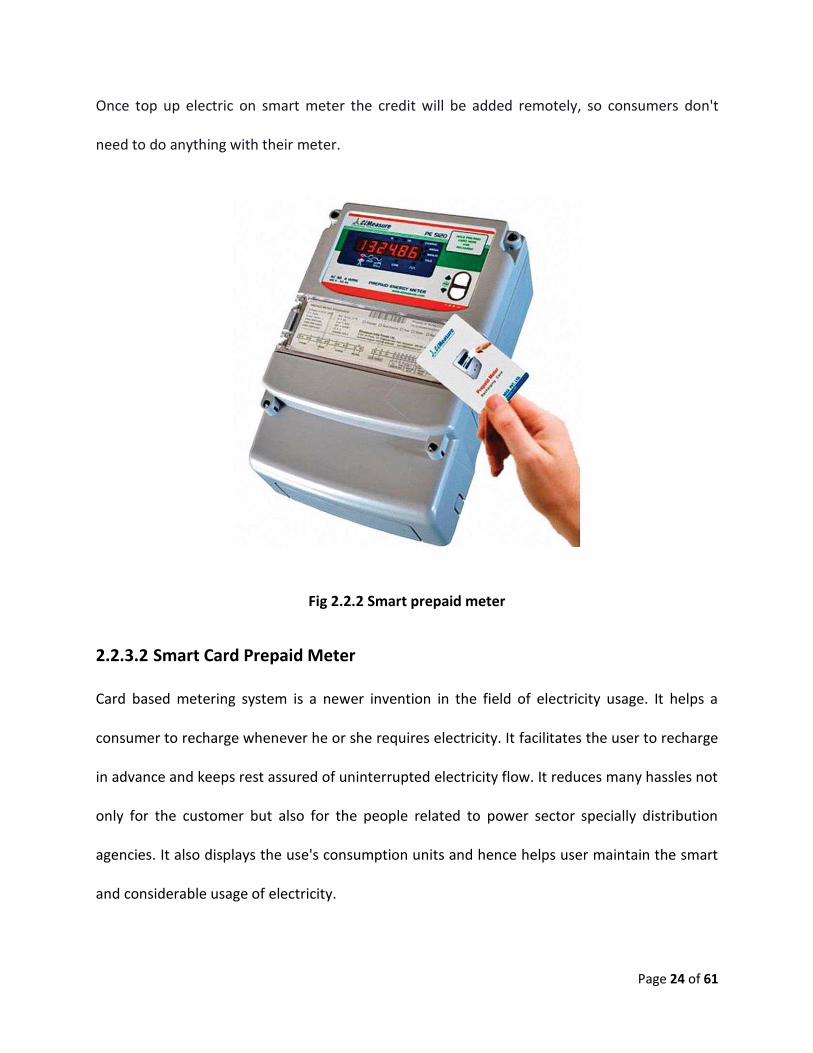
2.2.3.1 Smart prepaid meter
Smart prepayment meters have all the same functionality as standard smart meters, allowing
to view usage information at any time using the in-home display. This can help to manage
electricity usage and find ways to cut down and save on bills.These modern prepayment meters
are also more likely to have smart features to make electricity top ups easier. Consumers can
usually complete a smart meter top up online or via an app to save them leaving the house.
Page 24 of 61
Once top up electric on smart meter the credit will be added remotely, so consumers don't
need to do anything with their meter.
Fig 2.2.2 Smart prepaid meter
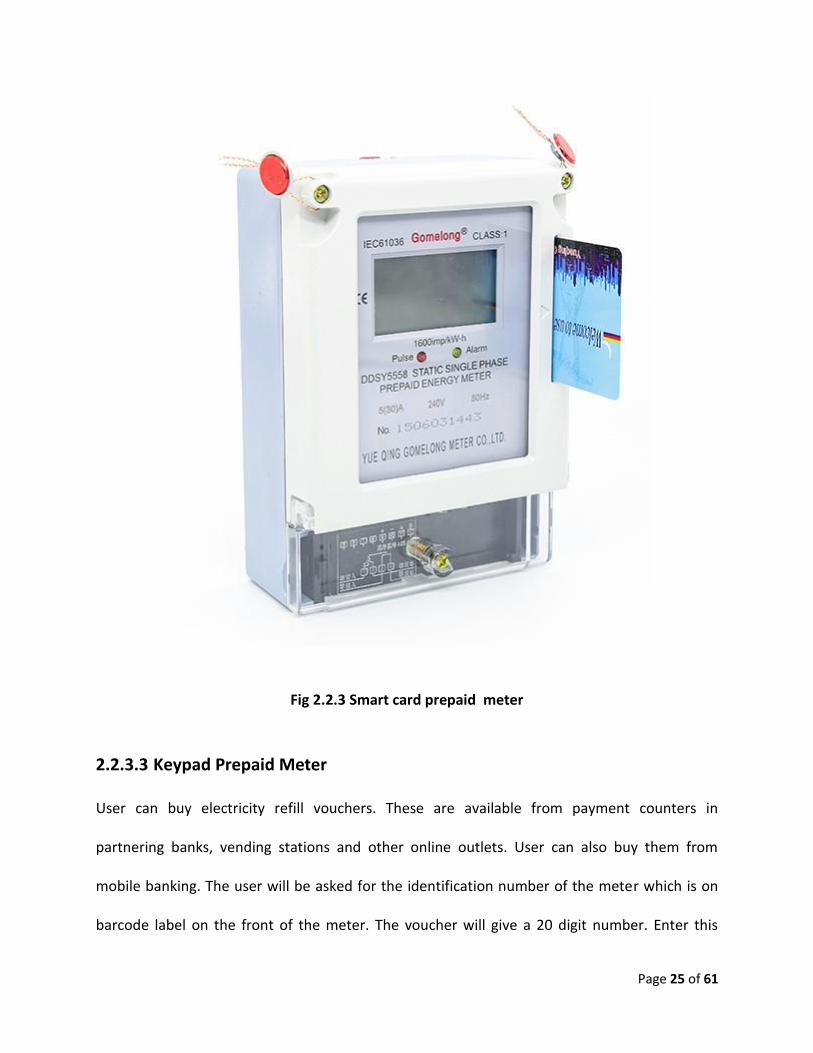
2.2.3.2 Smart Card Prepaid Meter
Card based metering system is a newer invention in the field of electricity usage. It helps a
consumer to recharge whenever he or she requires electricity. It facilitates the user to recharge
in advance and keeps rest assured of uninterrupted electricity flow. It reduces many hassles not
only for the customer but also for the people related to power sector specially distribution
agencies. It also displays the use's consumption units and hence helps user maintain the smart
and considerable usage of electricity.
Page 25 of 61
Fig 2.2.3 Smart card prepaid meter
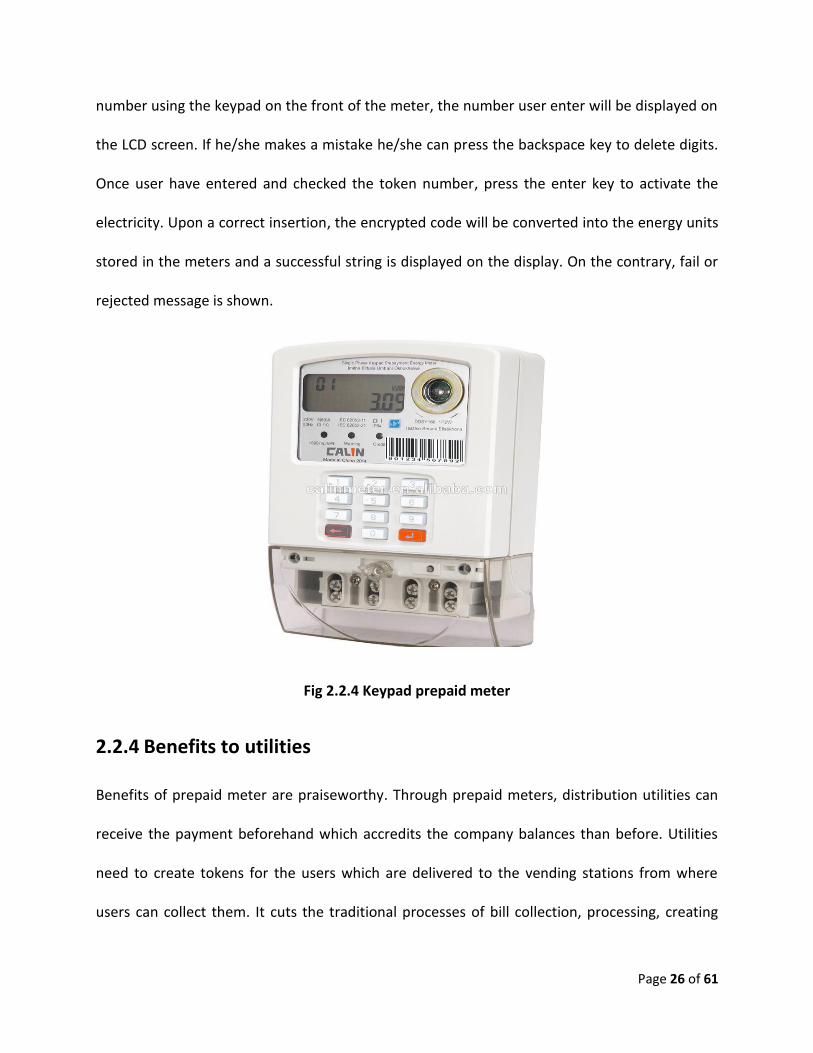
2.2.3.3 Keypad Prepaid Meter
User can buy electricity refill vouchers. These are available from payment counters in
partnering banks, vending stations and other online outlets. User can also buy them from
mobile banking. The user will be asked for the identification number of the meter which is on
barcode label on the front of the meter. The voucher will give a 20 digit number. Enter this
Page 26 of 61
number using the keypad on the front of the meter, the number user enter will be displayed on
the LCD screen. If he/she makes a mistake he/she can press the backspace key to delete digits.
Once user have entered and checked the token number, press the enter key to activate the
electricity. Upon a correct insertion, the encrypted code will be converted into the energy units
stored in the meters and a successful string is displayed on the display. On the contrary, fail or
rejected message is shown.
Fig 2.2.4 Keypad prepaid meter
2.2.4 Benefits to utilities
Benefits of prepaid meter are praiseworthy. Through prepaid meters, distribution utilities can
receive the payment beforehand which accredits the company balances than before. Utilities
need to create tokens for the users which are delivered to the vending stations from where
users can collect them. It cuts the traditional processes of bill collection, processing, creating

Page 27 of 61
and printing the vouchers and emailing to the users. In the case of keypad prepaid meter, the
need of physical token is not required. Through dialing up any vending station necessary
information can be exchanged to receive the encrypted hash code over the phone. Upon a
successful insertion of that code instantly brings the user the required energy units. Described
scenarios in some advanced and smart utilities are handled by IVR(Interactive voice response).
Many features of traditional features are also possible to exercise with prepaid meters. In
addition, modern prepaid meters offer better accuracy and reliability. They offer better
adjustment as well as resilience to environmental incidents. Although prepaid meters negate
the meter reading collection process, it requires the distribution agencies to send staff to
maintain the meters and inspect whether any tampering is made.
2.2.5 Benefits to consumers
Through the use of prepaid meters not only the utilities get benefitted but the same goes with
the consumers. Prepaid meters can bring more control over energy consumption to the user.
User can recharge upon the need. As long as the recharged units are there, there is no worries
regarding the usage. Advance recharging facility is also there which adds an extra benefit.
Hence user can have over control over the electricity usage. User can determine as well as
regulate his or her consumption. It helps user be optimal regarding consumption. It lessens the
traditional invoice receiving and going to the respective offices or bank booth to deposit the
charged money. Thus standing in long queues for depositing the money is vanished with the
population of prepaid metering. Thus money and time both are being saved. Also users are free
from bearing the extra charge in case of failure to deposit the money timely. Additionally

Page 28 of 61
prepaid meter establishes a positive relationship between the utilities and customers. It
reduces hassles for both the consumer and utilities, cuts off theft and forgeries and builds trust
between the consumer and utilities. It makes the distribution services easier and more
maintainable.
2.2.6 Advantages of prepayment meters
➢ Helping customers to manage their debt and energy usage;
➢ Preventing large, unexpected bills.
2.2.7 Disadvantages of prepayment meters
➢ Costing is a bit higher than the average.
➢ Not all categories of consumers can be brought under this scheme e.g industry, plant
➢ If user can't recharge timely or after a specific period electricity will be cut off and things
will get rotten and similar incidents may occur when consumer may leave the residence
for a period of time. This adds an extra botheration for the consumer.
➢ If any issue arises regarding tariff and maintenance, complicacies may arise as these
meters and their maintenance are delicate.
2.3 Findings from a distribution company
As stated earlier, during the pandemic situation it was really a very tough job to collect the
required data let alone conduct a live investigation. It was a hard time for everyone. Despite all
Page 29 of 61
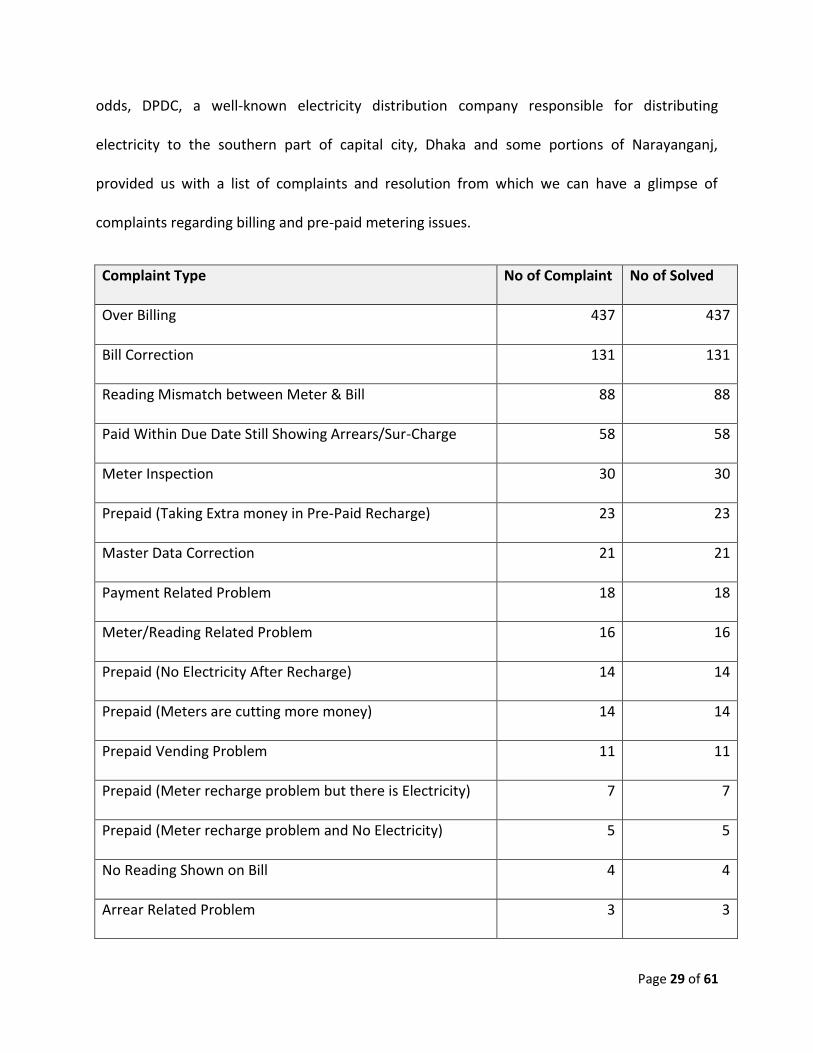
odds, DPDC, a well-known electricity distribution company responsible for distributing
electricity to the southern part of capital city, Dhaka and some portions of Narayanganj,
provided us with a list of complaints and resolution from which we can have a glimpse of
complaints regarding billing and pre-paid metering issues.
Complaint Type No of Complaint No of Solved
Over Billing 437 437
Bill Correction 131 131
Reading Mismatch between Meter & Bill 88 88
Paid Within Due Date Still Showing Arrears/Sur-Charge 58 58
Meter Inspection 30 30
Prepaid (Taking Extra money in Pre-Paid Recharge) 23 23
Master Data Correction 21 21
Payment Related Problem 18 18
Meter/Reading Related Problem 16 16
Prepaid (No Electricity After Recharge) 14 14
Prepaid (Meters are cutting more money) 14 14
Prepaid Vending Problem 11 11
Prepaid (Meter recharge problem but there is Electricity) 7 7
Prepaid (Meter recharge problem and No Electricity) 5 5
No Reading Shown on Bill 4 4
Arrear Related Problem 3 3

Page 30 of 61
Complaint Type No of Complaint No of Solved
Prepaid Recharge 3 3
Prepaid (Customers not understand vending calculation) 2 2
Table 2.3.1 Category wise Complaints from 26.04.19 to 31.08.20
From the above table, we can have a clear picture of how many problems the consumers face
regarding billing and pre-paid metering issues. Although the above table doesn't describe the
whole scenario but still it indicates the severity of this problem. The pre-paid metering involves
some technical and recharging glitches which need to be addressed for its popularity and well
acceptance.

Page 31 of 61
3 Chapter 3: Literature Review
Numerous studies have been found addressing this meter reading and additionally bill
calculation process issues around the world. In Bangladesh, many studies have been carried out
keeping a pace with the world-wide practice and ideas but with some modification, obviously
for the purpose of applicability, availability, implementation hurdles, costing and many more
factors.
3.1 AMR using digital wattmeter and Wi-max[4]
In this paper an 'Automatic Electric Meter Reading (AMR)' system has been proposed. It is a
metering system that in a package not only collects the meter reading data but also processes
the data for billing and further task e.g. decision purposes. This AMR system primarily consists
of four basic units namely reading unit, communication unit, data receiving and processing unit
and billing system. For reading unit, disk rotation of the energy meter is proposed to be
identified and stored the data in microcontroller which eventually keeps the current analog
energy meter unchanged. In this an external module is required to be added to the
conventional meters. For the purpose of communication module, Wi-max technology is used
between the meter end and the server end. This was highly suggested because of its huge
coverage. Data receiving unit processes meter reading data with the help of a micro-controller.
A computer application will perform this task which eventually reduces any sort of risks of
meter tampering or any other forgeries. Despite having many other proposed AMR system the
authors claim their study to be most effective for Bangladesh considering many issues of the

Page 32 of 61
other systems. They also claim their study is innovative in the fashion of implementation idea.
The study was a project of a group of researchers from American International University,
Dhaka, Bangladesh conducted at the Electrical Circuit Laboratory of the university during
October 2009 to November 2010.
Fig 3.1.1 Block diagram of the whole proposed AMR system
Fig 3.1.2 Sample flow chart of the reading unit

Page 33 of 61
3.2 Automated Electricity Bill Monitoring[5]
This study combines the usage of growing ICT dominance with a view to not only measuring the
spent electricity unit but also automate the unit collection, bill processing and create awareness
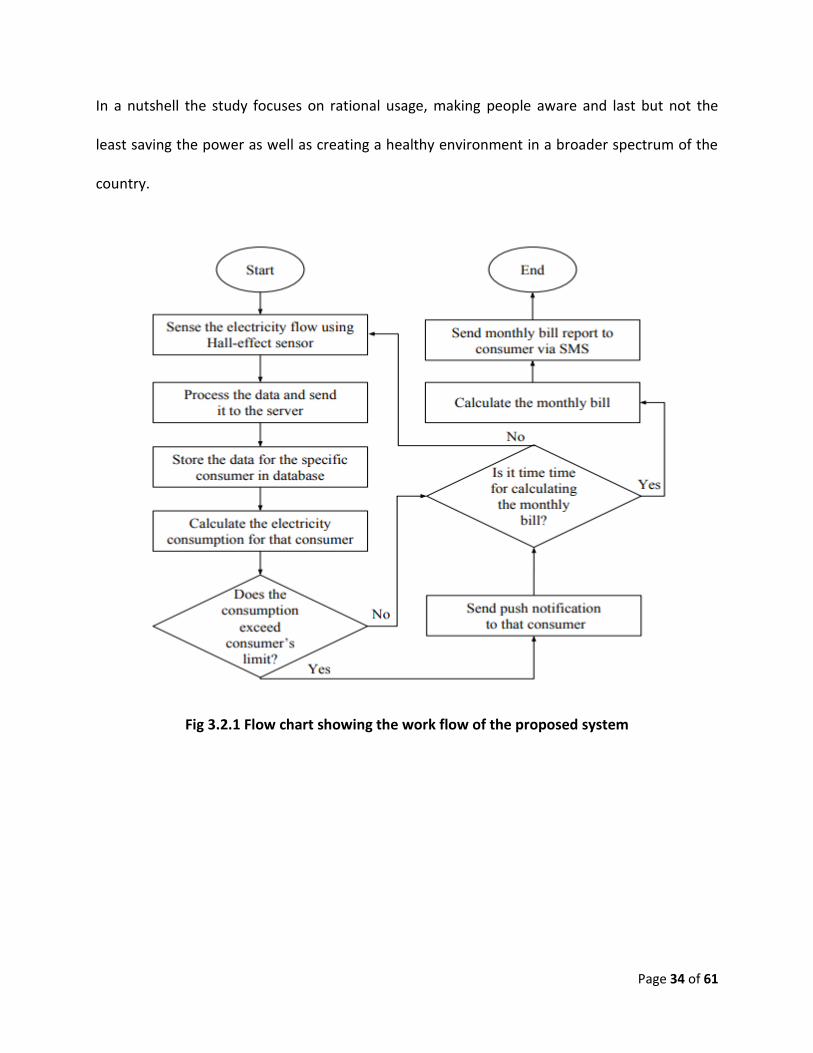
among the people of using electric energy rationally. The following conceptual design of the
proposed system mainly consists of four modules:
A. User Management
User will be registered through a system. Through the respective account user will be contacted
regarding the usage and consumption of electricity and associated bill/invoice.
B. Monitoring Energy Consumption
This module notifies the user about the usage and consumption of electricity unit. This can be
viewed in different manners like daily, monthly or hourly basis. The central admin of the system
can monitor the total consumption of any area or any particular house of an area.
C. Creating Awareness Among Consumers
In this module user can set their usage limit and accordingly user will be notified at the
threshold or if the limit is crossed. This will surely help create awareness among the users.
D. Automatic Bill Generation
In this module the bill generation process is made automated based on the consumption by the
user and will be notified through a SMS.
Page 34 of 61
In a nutshell the study focuses on rational usage, making people aware and last but not the
least saving the power as well as creating a healthy environment in a broader spectrum of the
country.
Fig 3.2.1 Flow chart showing the work flow of the proposed system

Page 35 of 61
Fig 3.2.2 Difference between the actual reading and reading of the proposed system
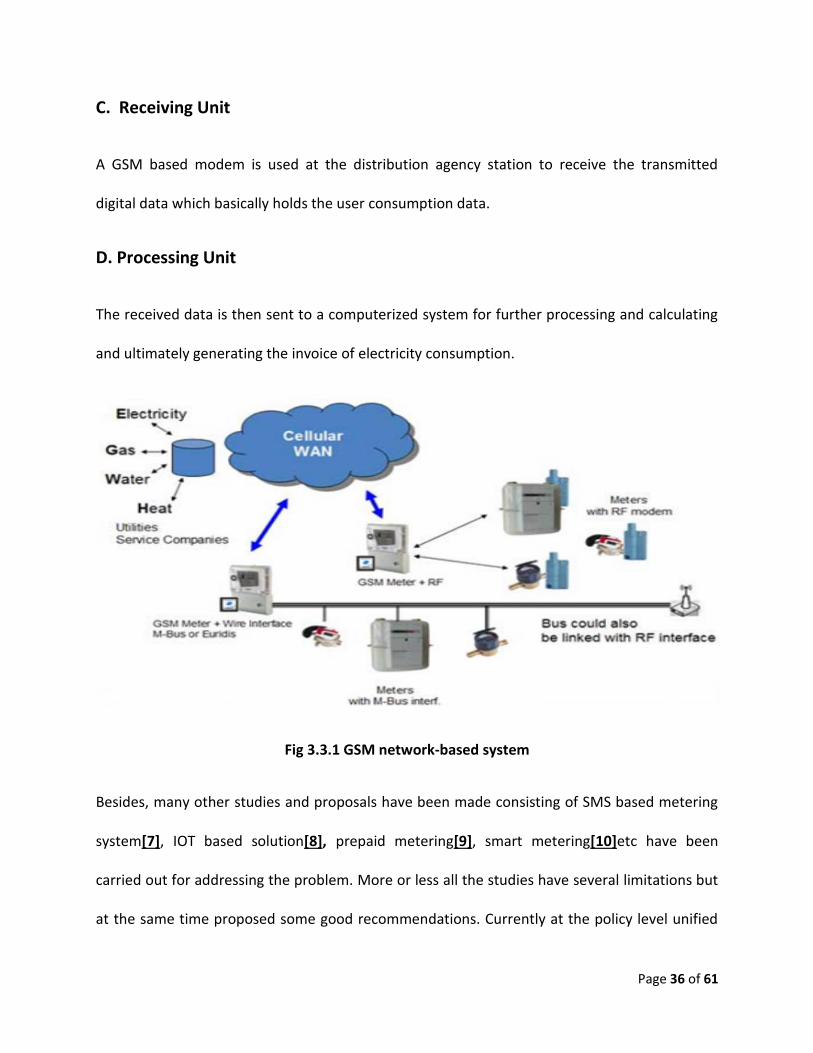
3.3 GSM based Automated Electricity Billing System[6]
In this paper Automated Meter Reading(AMR) system is proposed but using the Global System
for Mobile Communication(GSM) technology. Proposed system has the following four units:
A. Reading Unit
In this module a miniature GSM module will be connected to the existing meters which convert
the analog meter reading into digital data. This module holds a SIM which transmits the
converted digital data to the distribution end.
B. Communication Unit
In this module, a GSM network will be used between the meter and server end for successful
data transmission and receiving. This is widely used communication network of low cost and
reliable as well.
Page 36 of 61
C. Receiving Unit
A GSM based modem is used at the distribution agency station to receive the transmitted
digital data which basically holds the user consumption data.
D. Processing Unit
The received data is then sent to a computerized system for further processing and calculating
and ultimately generating the invoice of electricity consumption.
Fig 3.3.1 GSM network-based system
Besides, many other studies and proposals have been made consisting of SMS based metering
system[7], IOT based solution[8], prepaid metering[9], smart metering[10]etc have been
carried out for addressing the problem. More or less all the studies have several limitations but
at the same time proposed some good recommendations. Currently at the policy level unified

Page 37 of 61
prepaid metering system looking forward to incorporate the smart grid system has been being
implemented which is shedding rays of good hope. Although many issues have been surfaced
from using pre-paid metering[11], [12] authority is trying its best to address and minimize these
issues. Nevertheless, as has been stated earlier, pre-paid metering scheme can't be established
over the whole country, hence existing meter reading and invoice generating system should be
ameliorated.
Page 38 of 61
4 Chapter 4: Proposed Intelligent Billing
System using AI
Energy fraud or anomaly detection is a critical aspect of smart grid security and privacy
preservation. It is also an indispensable part of intelligent billing system. Machine learning and
data mining along with artificial intelligence have been widely used by researchers for extensive
intelligent analysis of data to recognize normal patterns of behavior such that deviations can be
detected as anomalies. In this section, we will discuss a novel application of artificial
intelligence for examining the energy consumption data to report energy fraud and forecast
electricity consumption by using neural network. Our proposed technique is able to pinpoint
successfully different forms of bypassing smart or traditional metering system and adopting
similar means.
This chapter starts with describing the basic concept of background knowledge on artificial
neural networks and support vector machine, so that the ideas proposed in the subsequent
chapters can be easily perceived. Afterwards, we shed a detailed lights on data extraction and
preprocessing, which are the most relevant and important sections for realizing and
experimenting the study. Later, we give an in-depth discussion on energy fraud and anomaly
detection procedure using artificial intelligent and its different components. We also discuss the
major limitation of these procedure. We end this chapter by giving a summary of the topics
discussed.
Page 39 of 61
4.1 Background Knowledge
4.1.1 Artificial Neural Networks
Artificial neural networks (ANN) are computational techniques modeled on the learning
processes of the human cognitive system and the neurological functions of the brain. In recent
times, artificial neural networks have been able to catch attention of its successful application
in solving a variable range of problems of different fields due its wide degree of modularity.
Neural networks are nothing but a distributed information processing system that consists of
different computational nodes communicating through different channels across the network
based on some weights. Inspired by the architecture of the human brain, neural networks
exhibit certain features such as the ability to learn complex patterns of information and
generalize the learned information. Neural networks are simply parameterized non-linear
functions that can be fitted to data for prediction purposes.
The main attractiveness of neural networks is their flexibility in approximating a wide range of
functional relationships between inputs and output. Indeed, advanced neural network
with sufficient data can approximate any discretionary functions. One of the most attention-
grabbing properties of neural networks is their ability to work and forecast even on incomplete,
noisy, and fuzzy data. Moreover, they are doing not need a priori hypothesis and don't impose
any functional form between inputs and output.
For this reason, neural networks are quite practical to use in the cases where knowledge of the
functional form relating inputs and output is lacking, or when a prior assumption about such a
relationship should be avoided.
Page 40 of 61
The success of the NN models depends on properly selected parameters such as the number of
nodes (neurons) and layers, the nonlinear function used in the nodes, learning algorithm, initial
weights of the inputs and layers, and the number of epochs that the model is iterated.
In ANN methodology, the sample data usually is split into 2 categories that are named as
training set and test set. First the neural network learns the relationship between output and
input criteria with the help of training data set, whereas within the validation process, test set is
employed to assess the performance of the model.
4.1.2 Support Vector Machine
Vapnik[14] developed Support Vector Machine (SVM) which constitutes one of the most
robustand accurate methods in data mining algorithms. Its theoretical foundation derived from
statistical learning theory. Statistical methods and machine learning methods are combined
with SPV method. SVM is a supervised learning method that generates input-output mapping
functions from a set of training data.
Observations constitute source of SVM learning process. There is an input space and output
space and a training set. The nature of the output space decides the learning type. Learning
types can be of any kind including type of binary or multiple classification problems. The
standard SVM formulation solves only the binary classification problems.
Predicted value in SPM methodology represents “attribute” where transformed attribute
defines “feature”. Hyperplane is defined by the transformed attribute. The task of selecting the

Page 41 of 61
most appropriate representation is known as “feature selection”. A set features that describe
one case is called a “vector”.
Mapping data to a high dimensional feature space is the working manner of SVM where the
mapping functions can be either classification or regression function. SVM methodology is
among maximal margin classifier types. There are four kernel functions (linear function,
polynomial function, and radial based function, sigmoid function) to be used in classification
problems when the input data is not easily separable.
Optimal hyperplane is found by SVM which separates the clusters of vectors in such a way that
cases with one category of the target variable on one side of the plane and cases with the other
category are on the other side of the plane. Support vectors are the ones near the hyperplane.
A separator which is drawn as a hyperplane is found between the separated classes.
The ultimate aim of SVM is to establish a maximal margin between the separated classes.
Establishing a maximal margin between the separated classes will enable to have a good
classification performance on the training data as well as to provide high predictive accuracy for
the future data from the same distribution. The characteristic of new data after separation can
be used for prediction. SVM’s learning ability is independent of the dimensionality of the future
space and that situation leads to SVM providing good performance[15].
In the support vector machine (SVM) technique presented on top only applies to classification
and output unit is restricted to take binary values. However, the SVM models are extended for
general estimation and prediction problems which is known as support vector regression (SVR)
Page 42 of 61
technique. Usage of support vector regression (SVR) technique eliminates the restriction on
output variable since SVR methodology permits use of nonlinear functions.
4.2 Data extraction and preparation
Before the neural network approach is described, it is imperative to introduce the data to be
analyzed for deriving computational intelligence. The dataset under investigation consists of
smart meter consumption data from approximately 40,000 residential households and 3000
businesses. These representative samples were anonymously collected from the billing history
(2014 — 2019) of Shah Ali S&D database. The raw data are stored in an excel file saving around
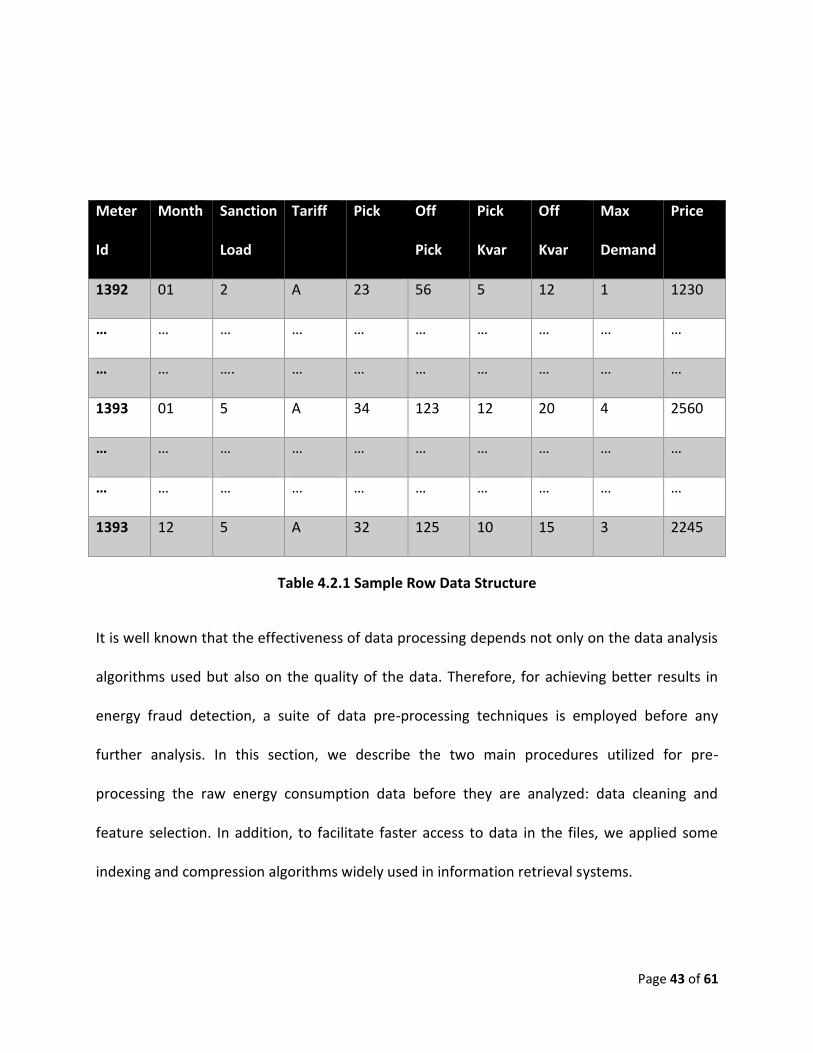
one million entries corresponding to diverse power meter readings. ‘Table 1 represents a small
sample of one of these data files where the data is represented in the columns. The first
column represents the smart meter ID which is linked to a particular consumer. The second
column shows the month (month no. January starting as 1, February 2 and so on)associated
with the meter reading,3th column is sanction load (kilo-watt),4th column is tariff (tariff string
e.g. C2, E, A defined by Bangladesh Energy Regulatory Commission),5th to 9th are peak
consumption (kilo-watt-hour), off peak consumption(kilo-watt-hour), peak kvarh (kilo-volt-
ampere-hour) ,off-peak kvarh(kilo-volt-ampere-hour), kw-reading/maximum demand reading
(kilo-watt)accordinglyand the last column or 10th column is the energy consumption price in
taka.
Page 43 of 61
Meter
Id
Month Sanction
Load
Tariff Pick
Off
Pick
Pick
Kvar
Off
Kvar
Max
Demand
Price
1392 01 2 A 23 56 5 12 1 1230
… … … … … … … … … …
… … …. … … … … … … …
1393 01 5 A 34 123 12 20 4 2560
… … … … … … … … … …
… … … … … … … … … …
1393 12 5 A 32 125 10 15 3 2245
Table 4.2.1 Sample Row Data Structure
It is well known that the effectiveness of data processing depends not only on the data analysis
algorithms used but also on the quality of the data. Therefore, for achieving better results in
energy fraud detection, a suite of data pre-processing techniques is employed before any
further analysis. In this section, we describe the two main procedures utilized for pre-
processing the raw energy consumption data before they are analyzed: data cleaning and
feature selection. In addition, to facilitate faster access to data in the files, we applied some
indexing and compression algorithms widely used in information retrieval systems.
Page 44 of 61
4.2.1 Data Cleaning
Data cleansing/cleaning is a data mining process which focuses on identifying and correcting
inaccurateness, incompleteness, and inconsistency in raw data. It generally involves a few tasks
such as identifying and addressing missing values, reducing noise and inconsistencies, and
detecting outliers[16].
At a first stage, the data are explored for missing values. Since energy consumption data are
time series data, it is quite straightforward to find all missing points as they correspond to
missing time stamps. When such rare missing data points are found for a particular month, it
was replaced with average energy consumption value for that particular year[17].
The second cleaning step involves identifying and eliminating outliers. In this regard, the mean
and standard deviation for each month is computed. After calculation, all measurements that
do not lie within three standard deviation of the mean (we assume that around 1 % of the data
are outliers or noisy/unimportant data) are removed from set. The assumption is that these
outliers should not be considered as fraud and may correspond to peak energy consumption
activities during holidays or special occasions such as birthdays, celebrations.
Lastly, we check the data with respect to real world inconsistencies in date/time stamps. For
example, if we have a time stamp for the 13th month, we either attempt to correct the
inconsistency or remove the entry.
Page 45 of 61
4.2.2 Feature Selection
The experimental smart meter data contain several important parameters such as month, and
some consumer energy consumption values in kwh. We decided to concentrate on all attribute
of the “monthly” data.
The main reason behind this is that we are trying to find anomaly or fraud activity based on
month. We do not consider hourly or weekly data of consumption they cannot significantly
influence the energy consumption measurements, conducting experiments with “weekly or
hourly” feature included did not show any significant improvements in results. Theseare thus
omitted for simplicity.
4.2.3 Indexing and compressing
The data files contain millions of various meter ID entries. In order to efficiently process the
reading of consumer energy, we created an index which maps each meter ID to its own
measurement data. Such an index provides quicker data retrieval from all files for a particular
ID. In addition, the index is compressed by delta encoding widely used in information retrieval
systems to store or transmit data in the form of differences between sequential data rather
than complete files[18].
4.3 Anomaly in consumption pattern detection approach
Machine learning is widely used in many areas of research for deriving computational
intelligence. It allows understanding of the underlying behavior of complex systems. A neural

Page 46 of 61
network is one of the most common machine learning approaches used in fraud detection due
to its noise-robustness and fast response qualities[19, 20].
A neural network consists of three different types of layers[16]. The first layer includes various
features of the dataset under investigation as input. The second layer usually comprises of a
few hidden layers having a varied number of nodes. And the last layer is an output layer
representing the classification result of the neural network. The main goal of applying a neural
network technique in this scenario is to learn consumption behavior per consumer and predict
future energy consumption measurements. We believe that it is possible to detect energy fraud
by comparing neural network predicted values with real measurements and applying statistics
to analyze any deviations.
Our energy consumption anomaly detection approach consists of the following.
4.3.1 Selection of Input/output Parameters for Neural Network Structure
Careful articulation of input/output parameters in a neural network structure is very important
for performance and precision.
Page 47 of 61
Fig 4.3.1 Neural Network Structure
The number of consecutive months (N) of last 2 years serve as input data of the input layer
attribute for the neural network. Each month contains 6 attributes due to the fact that monthly
meter readings of a particular consumer needs to express first 5 attributes in the dataset and
6th attribute is the output value which is the energy consumption kwh of that month in the
dataset set. Therefore, the input layer contains a total number of 5 nodes.
The hidden layer is adjustable and in our experiment, it consists of only 1 layer of nodes for
simplicity. The output layer consists of only one attribute, which represents the expected
energy consumption price in the smart meter reading data series following the consecutive
data points. Fig. 1 shows the energy consumption behavior by neural network structure
employed in this research.
Page 48 of 61
4.3.2 Generation of Training and Validation Datasets
Our dataset carries the billing information of last 2 years of different consumer .We divide our
whole dataset in two parts, training datasets and validation datasets. The training datasets
contains 90% of total data where rest of them are used as a validation dataset. We divide our
dataset in a way so that validation set and training set both carry the information of every
consumer. Each row in the data are divide in two part, first 9 value of each row act as a input
attribute and last one is the corresponding output of that row.
4.3.3 Training the Neural Network
The neural network is trained using the training dataset which results in learning of the
consumer energy consumption behavior.
4.3.4 Prediction
This task is accomplished by running the neutral network using the validation dataset. The
output of the neural network predicts the value of the expected data point in the smart meter
reading data series following the consecutive data points fed as input.
4.3.5 Detection of Deviation
The Root Mean Squared Error (RMSE[15]) serves as the deviation indicator between the
predicted value and the actual value in the validation dataset and is calculated as in (1):
𝑅𝑀𝑆𝐸 = √∑ (𝑦𝑡
′−𝑦𝑡)2𝑛𝑡=1
𝑛 (1)

Page 49 of 61
Where𝑦𝑡′ is a predicted energy reading by the neural network, 𝑦𝑡 , is an actual energy
consumption reading in the validation set, and n is the total number of instances. If the RMSE is
above a certain threshold, then it is inferred that the training set depicts a different behavior
than the validation set and therefore the data in the validation set possibly correspond to an
energy fraud.

Page 50 of 61
5 Chapter 5: Experimental Study
To show our experiment and its result, we will first describe working procedure step by step.
The proposed automated metering system equipped with artificial intelligence to monitor
consumption anomalies and fraudulent activities is run against historical billing data of Shahali
Sales & Distribution Division (a consumer facing division office of Dhaka Electric Supply
Company, Dhaka, Bangladesh).
5.1 Experimental Data
The data consists of two excel files –
1. Training Data.xls – contains monthly consumption of around 50000 consumers/meters
from January, 2018 to December, 2019. The file can be found at
https://drive.google.com/file/d/1vXMqIaGBmWf8AFHa-
Le65FRL0FAGpwMv/view?usp=sharing . The file contains almost 1 million entries of
monthly energy consumption of almost 50000 consumes. On an average, each
consumer has 24 months of consumption data.
2. Test Data.xls – contains monthly consumption of around 50000 consumers/meters of
January, 2020. The file can be found at
https://drive.google.com/file/d/1rMe765dBR7QBIv2m6LcfyQc0k7lS91LT/view?usp=shar
ing. The file contains monthly consumption of same 50000 (approximately) of the
month of January, 2020.
Page 51 of 61
The data mentioned at point 1 will used to train our artificial neural network. The trained neural
network model will be tested to find its accuracy again the data mentioned at point 2.
5.2 Working Procedure
Now with the data mentioned above, we will follow the procedure step by step listed below to
find our desired trained neural network. This neural network is our intelligence for automated
billing/metering system. We will look for continuous deviation of a consumer’s consumption
from the predicted consumption by the neural network model by a certain threshold. Thus, we
can isolate out the consumers with suspicious consumption pattern those may require human
inspection. This way the human inspection can look if the consumer’s consumption is okay or
consumption is bypassed or forged meter reading.
✓ We will remove the columns that are not in line with out experiment. In other words,
we will only keep the following columns that can give insight for desired neural network.
We will keep account no, month, year, sanction tariff, sanction load and total unit
consumed and remove/ignore other data attributes. We will do this both for training
data and test data. These features consist of the input layer, depicted atthe figure5.2.1.
✓ We will use every row of Training data.xls file to be a feature vector for neural network.
We have used python panda library to simulate neural network. We feed the feature
vectors to neural network model and construct the basis for intelligence of our
proposed metering system.
✓ After training is done, we will find the neural network in desired state. Then we will use
the test data to verify how good the neural network is performing. In other words, we

Page 52 of 61
will find the total consumption of the consumers in the test data in January, 2020. Then
we will compare how much the prediction deviates from actual data.
✓ In this step, we will analyze the test result. We will divide the difference of predicted
consumption to actual consumption into 10 slabs namely 0-10%, 10-20%, 20-30%, 30-
40%, 40-50%, 50-60%, 60-70%, 70-80%, 80-90%, 90-100%. How much difference is
anomaly? Finding a reasonable answer is another area of further study. However, for
instance, we take 100% difference as anomaly. Again, the amount that can trigger
anomaly is dependent on the type consumer e.g. residential, commercial and others. If
the anomaly continues for a long period (another area of study) for the same consumer,
this case may be isolated for human inspection.
Fig 5.2.1 Neural Network Model
We have hosted our simulation code in GitHub repository. The code is written in python using
Google’s tensorflow library. We have used python packages e.g. keras, sklearn, panda, numpy.
Page 53 of 61
The code can be found at https://github.com/mujahid1005011/bpmi_thesis. The repository
contains necessary simulation code and cleaned data. The included Readme.txt file contains
necessary instructions about how to run the code.
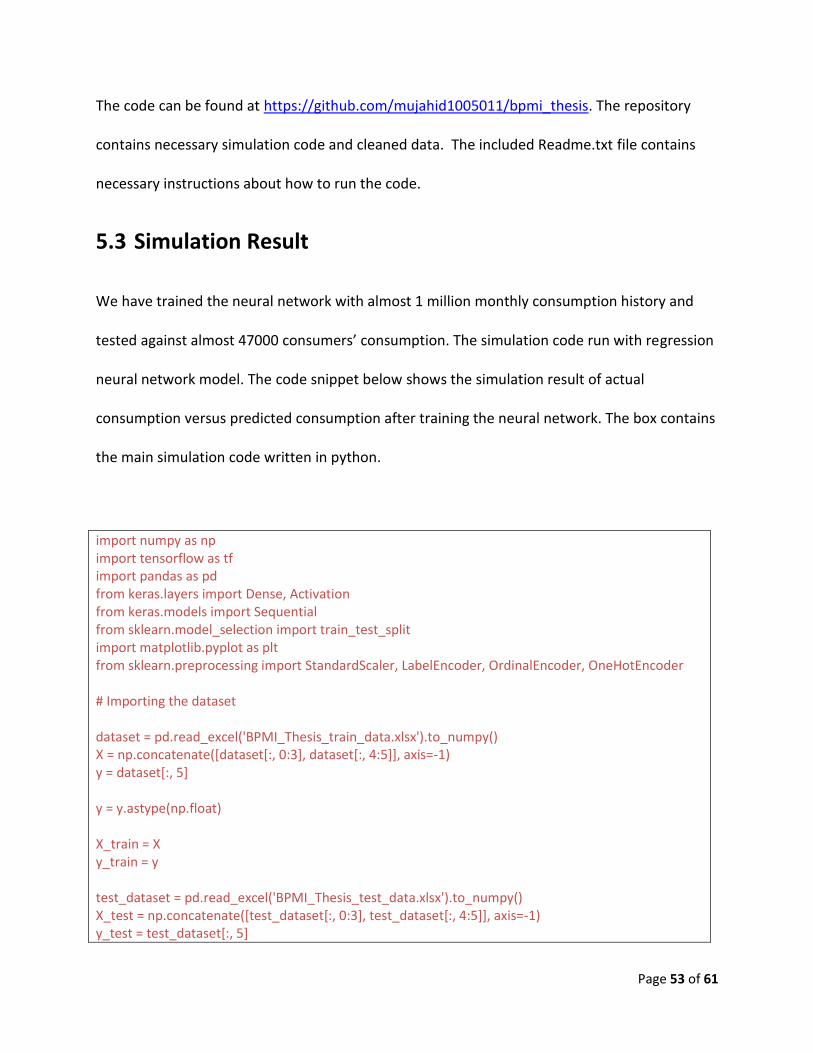
5.3 Simulation Result
We have trained the neural network with almost 1 million monthly consumption history and
tested against almost 47000 consumers’ consumption. The simulation code run with regression
neural network model. The code snippet below shows the simulation result of actual
consumption versus predicted consumption after training the neural network. The box contains
the main simulation code written in python.
import numpy as np import tensorflow as tf import pandas as pd from keras.layers import Dense, Activation from keras.models import Sequential from sklearn.model_selection import train_test_split import matplotlib.pyplot as plt from sklearn.preprocessing import StandardScaler, LabelEncoder, OrdinalEncoder, OneHotEncoder # Importing the dataset dataset = pd.read_excel('BPMI_Thesis_train_data.xlsx').to_numpy() X = np.concatenate([dataset[:, 0:3], dataset[:, 4:5]], axis=-1) y = dataset[:, 5] y = y.astype(np.float) X_train = X y_train = y test_dataset = pd.read_excel('BPMI_Thesis_test_data.xlsx').to_numpy() X_test = np.concatenate([test_dataset[:, 0:3], test_dataset[:, 4:5]], axis=-1) y_test = test_dataset[:, 5]

Page 54 of 61
try: # Feature Scaling sc = StandardScaler() X_train = sc.fit_transform(X_train) X_test = sc.fit_transform(X_test) # Adding the input layer and the first hidden layer model.add(Dense(32, activation='relu', input_dim=4)) # Adding the second hidden layer model.add(Dense(units=32, activation='relu')) # Adding the third hidden layer model.add(Dense(units=32, activation='relu')) # Adding the output layer model.add(Dense(units=1)) model.add(Dense(1)) # Compiling the ANN model.compile(optimizer='adam', loss='mean_squared_error') # Fitting the ANN to the Training set #print(X_train) model.fit(X_train, y_train, batch_size=10, epochs=100) y_pred = model.predict(X_test) slots = { 100: 0, 90: 0, 80: 0, 70: 0, 60: 0, 50: 0, 40: 0, 30: 0, 20: 0, 10: 0 } index = 0 import math for y in y_test: y_p = y_pred[index][0]
Page 55 of 61
diff = 1 if y == 0 else math.sqrt((y - y_p) * (y - y_p) * 100 / y) index += 1 included = False for x in slots.keys(): if diff >= x: slots[x] += 1 included = True break if not included: slots[10] += 1 import copy tests_len = len(y_test) slots_per = copy.deepcopy(slots) for x in slots.keys(): slots_per[x] = (slots[x] * 100.0) / (tests_len * 1.0) print(slots_per) print(slots) plt.plot(y_test, color='red', label='Actual data') plt.plot(y_pred, color='blue', label='Predicted data') plt.title('Prediction') plt.legend() plt.show() except Exception as e: import traceback print(traceback.format_exc())
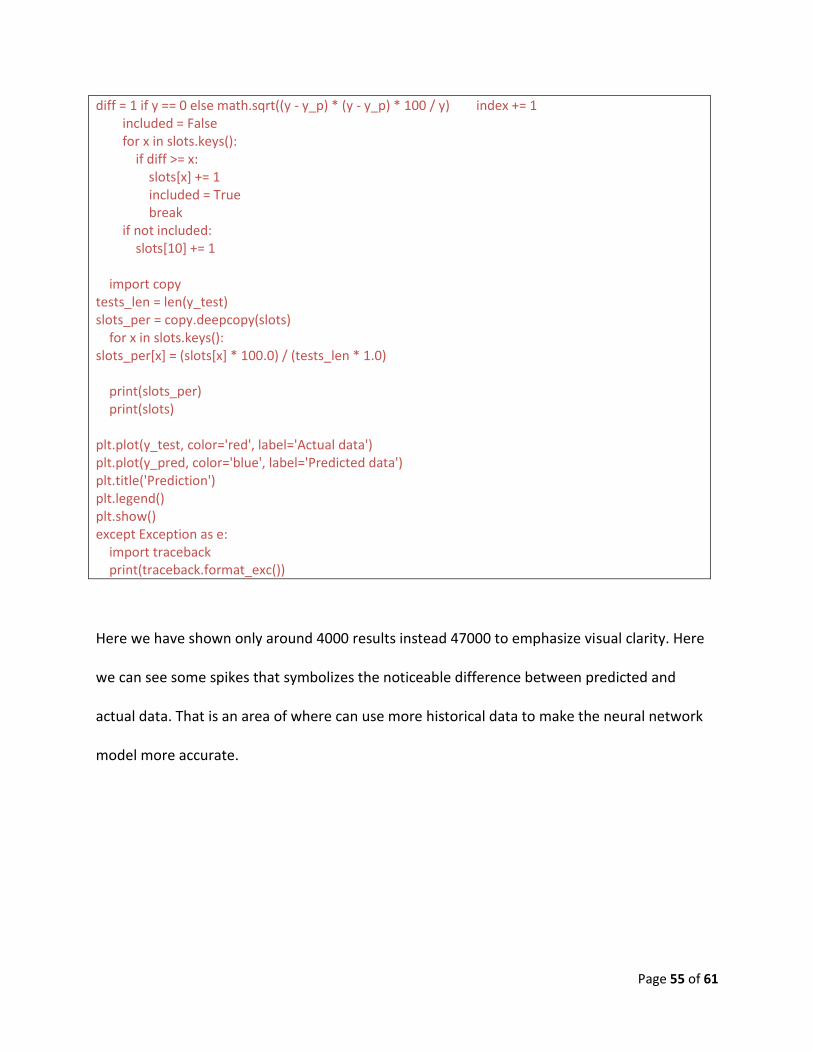
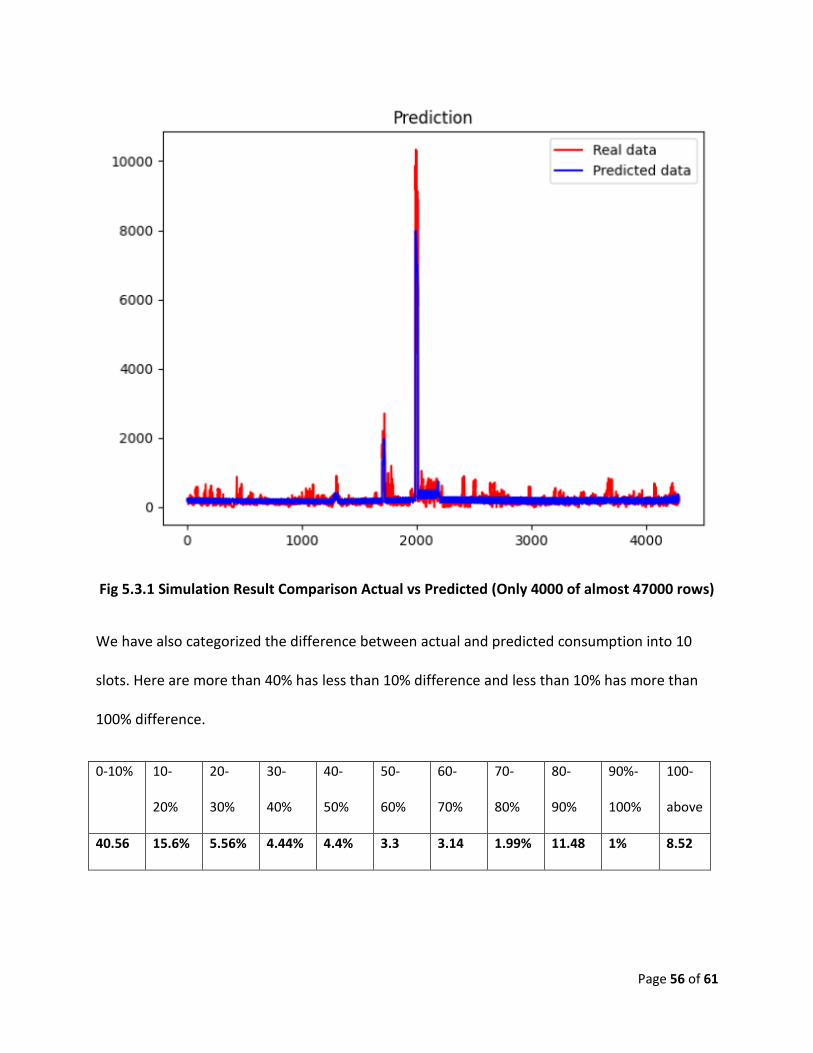
Here we have shown only around 4000 results instead 47000 to emphasize visual clarity. Here
we can see some spikes that symbolizes the noticeable difference between predicted and
actual data. That is an area of where can use more historical data to make the neural network
model more accurate.
Page 56 of 61
Fig 5.3.1 Simulation Result Comparison Actual vs Predicted (Only 4000 of almost 47000 rows)
We have also categorized the difference between actual and predicted consumption into 10
slots. Here are more than 40% has less than 10% difference and less than 10% has more than
100% difference.
0-10% 10-
20%
20-
30%
30-
40%
40-
50%
50-
60%
60-
70%
70-
80%
80-
90%
90%-
100%
100-
above
40.56 15.6% 5.56% 4.44% 4.4% 3.3 3.14 1.99% 11.48 1% 8.52
Page 57 of 61
5.4 Limitations of Experiment
There are enormous areas where we can improve our study and further increase the horizon of
the research topic. Now we will point some pros and cons of our study –
➢ Data Limitation: the data is monthly consumption basis and lack some other features
those could be insightful e.g. consumer age, time temperature etc.
➢ There is scope for determining what percentage in difference can determine the
consumption as anomaly provided the error rate in result.
➢ Our study did not include what distribution of consumption anomaly can be isolated a
energy theft or abnormal consumption.
➢ The data did not include prepaid meter recharges and consumption. But this can be
adapted into current model trivially.

Page 58 of 61
6 Chapter 6: Conclusion
The findings of data and their corresponding analysis with regard to the research questions
and objectives delineate that anomalies in electricity billing system is not a new phenomenon.
Various attempts have already been made to address those vexing problems of non-technical
losses such as contracting out meter reading and billing, pre-paid meters, computerized billing
,cut-offs and legal penalties. But nothing has been proved to be that much successful so
far.With the rapid energy demand as well as service modernization in this present era, itis
almost indispensible for the utility service providers for introducing user friendly service and
invoicing system. This paper has shown several existing smart meters assisted economic
energy consumption schemes for consumers and power outage reduction scheme for
distribution utility companies that has enhanced the quality of service. In this regard, we have
proposed an intelligent billing system using artificial intelligence for a stable and economically
viable electricity distribution system and an effective and trust worthy bill collection system
throughout the country.We believe It will facilitate the newly introduced prepaid metering
service quality as well make this project sustainable. Service with a better management can be
ensured through this proposed scheme.Despite so many limitation we have outreached some
corners which we believe herald some newer scopes to be injected or to be experimented on.
It also entails the challenges along the course which can be taken into consideration. Finally, an
in-depth discussion on energy fraud and anomaly detection procedure using artificial
intelligence and its different components has been given with some considerable
recommendations.

Page 59 of 61
7 List of References
[1]http://powercell.portal.gov.bd/sites/default/files/files/powercell.portal.gov.bd/page/f6e4ea
74_9d6f_4e71_9058_c9c235734bf1/Glimpses%20of%20Bangladesh%20Power%20Sector%20B
ook.pdf
[2] ASIAN DEVELOPMENT BANK, Evaluation Study, Project Number: SAP:BAN 2009-36, Sector
Assistance Program Evaluation: 26194, October 2009
[3]https://cpd.org.bd/wp-content/uploads/2019/03/The-Power-and-Energy-Sector-of-
Bangladesh.pdf
[4]Automatic Electric Meter Reading System: A Cost-Feasible Alternative Approach In Meter
Reading For Bangladesh Perspective Using Low-Cost Digital Wattmeter AndWi-max Technology,
September, 2011International Journal of Engineering and Technology 8(3),
https://www.researchgate.net/publication/258727466
[5] A Proposed System for Automated Electricity Bill Monitoring in Context of Bangladesh,
February 2018, DOI: 10.1109/IC4ME2.2018.8465651, Conference: International Conference on
Computer, Communication, Chemical, Materials and Electronic Engineering (IC4ME2-2018)At:
Rajshahi, Bangladesh, https://www.researchgate.net/publication/324014884
[6] Automated Electricity Billing System for Bangladesh,
http://library.mist.ac.bd:8080/bitstream/handle/123456789/108/LaTeX1.pdf?sequence=1
Page 60 of 61
[7] An Improved SMS Based Metering System, May 2019, DOI: 10.1007/978-981-13-8300-7_16,
In book: Emerging Technologies in Computer Engineering: Microservices in Big Data Analytics
(pp.192-204), https://www.researchgate.net/publication/333165213
[8] Conceptual Design of IoT-based AMR Systems based on IEC 61850 Microgrid Communication
Configuration using Open-Source Hardware/Software IED, November 2019Energies
12(22):4281, DOI: 10.3390/en12224281,
https://www.researchgate.net/publication/337077689
[9] https://powerdivision.gov.bd/site/page/ae49fd24-a37e-4644-a2c1-638bfc3bf537/
[10] A Novel Smart Metering System for Loss Reduction and Efficient Load Management in the
Power Distribution Sector of Bangladesh, December 2013, DOI: 10.1109/ICAEE.2013.6750334,
https://www.researchgate.net/publication/267151669
[11] http://dspace.uiu.ac.bd/bitstream/handle/52243/787/32-
The%20Overall%20Problems%20and%20Prospects%20of%20Prepaid...by%20Jahedul%20Alam
%20Shuvo.docx?sequence=1&isAllowed=y
[12] http://www.dhakacourier.com.bd/news/Technology/users-of-prepaid-meters-in-dilemma-
multiple-problems-surfacing/268
[13] Pankratz, A. (1983), Forecasting with Univariate Box-Jenkins Models: Concepts and Cases,
Wiley, New York.
[14] Vapnik, V.N. (1995), The Nature of Statistical Learning Theory, New York , Springer-Verlag.

Page 61 of 61
[15] Cristianini, N., Shawe, J. (2000), An Introduction to Support Vector Machines and Other
Kernel-based Learning Methods, Cambridge University Press, Cambridge
[16]J. Han, M. Kamber and J. Pei, Data mining: Concepts and techniques, MA, USA:Elsevier,
2012.
[17] J. W. Grzymala-Busse, L. K. Goodwin, W. J. Grzymala-Busse and X. Zheng, "Handling Missing
Attribute Values in preterm birth data sets" in Rough Sets Fuzzy Sets Data Mining and Granular
Computing, Springer-Verlag Berlin Heidelberg, pp. 342-351, 2005
[18] "Binary Delta Compression Technology", download.microsoft.com, 12 May 2014, [online]
Available:http://download.microsoft.com/download/e/1/c/elc654cO-39a6-446d-bdfe-
6d7aI53c67ec/BDCv2.doc.
[19] P. Keung, J. Karel and C. Bright, "Neural Networks for Insurance Fraud
Detection", uwaterloo.ca, 12 May 2014, [online] Available:
https://cs.uwaterloo.ca/~cbright/reports/STAT840-project.pdf
[20] A. M. R. Serrano, J. P. C.L. Da Costa, C. H. Cardonha, A. A. Fernandes and R. T. Sousa
Juniorde, "Neural Network Predictor for Fraud Detection: A Study Case for the Federal
PatrimonyDepartment", icofcs.org, 12 May 2014, [online] Available:
http://www.icofcs.org/2012/ICoFCS201210.pdf