Integration of Social Information by Human Groups
25
Topics in Cognitive Science 7 (2015) 469–493 Copyright © 2015 Cognitive Science Society, Inc. All rights reserved. ISSN:1756-8757 print / 1756-8765 online DOI: 10.1111/tops.12150 Integration of Social Information by Human Groups Boris Granovskiy, a Jason M. Gold, b David J.T. Sumpter, a Robert L. Goldstone b a Department of Mathematics, Uppsala University Institute for Futures Studies, Stockholm b Department of Psychological and Brain Sciences, Indiana University Received 5 July 2012; received in revised form 22 July 2014; accepted 28 October 2014 Abstract We consider a situation in which individuals search for accurate decisions without direct feedback on their accuracy, but with information about the decisions made by peers in their group. The “wisdom of crowds” hypothesis states that the average judgment of many individuals can give a good estimate of, for example, the outcomes of sporting events and the answers to trivia questions. Two conditions for the application of wisdom of crowds are that estimates should be independent and unbiased. Here, we study how individuals integrate social information when answering trivia questions with answers that range between 0% and 100% (e.g., “What percentage of Americans are left-handed?”). We find that, consistent with the wisdom of crowds hypothesis, average performance improves with group size. However, indi- viduals show a consistent bias to produce estimates that are insufficiently extreme. We find that social information provides significant, albeit small, improvement to group performance. Outliers with answers far from the correct answer move toward the position of the group mean. Given that these outliers also tend to be nearer to 50% than do the answers of other group members, this move creates group polariza- tion away from 50%. By looking at individual performance over different questions we find that some people are more likely to be affected by social influence than others. There is also evidence that people differ in their competence in answering questions, but lack of competence is not significantly correlated with willingness to change guesses. We develop a mathematical model based on these results that postu- lates a cognitive process in which people first decide whether to take into account peer guesses, and if so, to move in the direction of these guesses. The size of the move is proportional to the distance between their own guess and the average guess of the group. This model closely approximates the distribution of guess movements and shows how outlying incorrect opinions can be systematically removed from a group resulting, in some situations, in improved group performance. However, improvement is only pre- dicted for cases in which the initial guesses of individuals in the group are biased. Keywords: Wisdom of crowds; Polarization; Social information; Human decision making; Collective behavior Correspondence should be sent to Boris Granovskiy, Institute for Futures Studies, Box 591, 101 31 Stock- holm. E-mail: [email protected]
Transcript of Integration of Social Information by Human Groups

Topics in Cognitive Science 7 (2015) 469–493Copyright © 2015 Cognitive Science Society, Inc. All rights reserved.ISSN:1756-8757 print / 1756-8765 onlineDOI: 10.1111/tops.12150
Integration of Social Information by Human Groups
Boris Granovskiy,a Jason M. Gold,b David J.T. Sumpter,a Robert L.Goldstoneb
aDepartment of Mathematics, Uppsala University Institute for Futures Studies, StockholmbDepartment of Psychological and Brain Sciences, Indiana University
Received 5 July 2012; received in revised form 22 July 2014; accepted 28 October 2014
Abstract
We consider a situation in which individuals search for accurate decisions without direct feedback on
their accuracy, but with information about the decisions made by peers in their group. The “wisdom of
crowds” hypothesis states that the average judgment of many individuals can give a good estimate of, for
example, the outcomes of sporting events and the answers to trivia questions. Two conditions for the
application of wisdom of crowds are that estimates should be independent and unbiased. Here, we study
how individuals integrate social information when answering trivia questions with answers that range
between 0% and 100% (e.g., “What percentage of Americans are left-handed?”). We find that, consistent
with the wisdom of crowds hypothesis, average performance improves with group size. However, indi-
viduals show a consistent bias to produce estimates that are insufficiently extreme. We find that social
information provides significant, albeit small, improvement to group performance. Outliers with answers
far from the correct answer move toward the position of the group mean. Given that these outliers also
tend to be nearer to 50% than do the answers of other group members, this move creates group polariza-
tion away from 50%. By looking at individual performance over different questions we find that some
people are more likely to be affected by social influence than others. There is also evidence that people
differ in their competence in answering questions, but lack of competence is not significantly correlated
with willingness to change guesses. We develop a mathematical model based on these results that postu-
lates a cognitive process in which people first decide whether to take into account peer guesses, and if so,
to move in the direction of these guesses. The size of the move is proportional to the distance between
their own guess and the average guess of the group. This model closely approximates the distribution of
guess movements and shows how outlying incorrect opinions can be systematically removed from a
group resulting, in some situations, in improved group performance. However, improvement is only pre-
dicted for cases in which the initial guesses of individuals in the group are biased.
Keywords: Wisdom of crowds; Polarization; Social information; Human decision making;
Collective behavior
Correspondence should be sent to Boris Granovskiy, Institute for Futures Studies, Box 591, 101 31 Stock-
holm. E-mail: [email protected]

1. Introduction
Early work in social psychology has pointed to an apparently worrisome tendency of
people to conform to the opinions of others even when their original opinions were valid.
For example, in Asch’s (1956) classic experiments on conformity, subjects judged unam-
biguous stimuli after hearing other opinions offering incorrect estimates. In the experi-
ments, 69% of the subjects conformed to the bogus majority. To some degree,
conformity is found because people desire to obtain social approval from others. This has
been indicated by experiments showing that when people give their answers privately,
they are less likely to conform to the group’s opinion than when responding publicly
(Deutsch & Gerard, 1955). The picture that emerged from this early work was that group
outcomes are suboptimal because people are too influenced by one another rather than
standing firm to what they believe (Cialdini & Goldstein, 2004).
More recently, there has been a major shift in thinking about the influence of group
opinion on individuals. In particular, it has often been empirically observed that people
are influenced by their peers too little rather than too much. When people are asked to
estimate uncertain quantities, such as the number of calories that a food possesses, they
fail to adequately take into account others’ estimates when revising their own guesses
(Soll & Larrick, 2009; Yaniv & Choshen-Hillel, 2012). People’s estimates would be more
accurate if they shifted in the direction of others’ estimates in a more pronounced way
than they actually do. This insufficiency of influence is particularly pronounced when
people are given advice from a relatively large number of peers (see Larrick, Mannes, &
Soll, 2012, for a review). This is because people fail to take full advantage of the benefits
of integrating others’ opinions when updating their own opinions.
1.1. The wisdom of crowds
An idea that has recently generated interest both in the popular media and in academic
research on humans and other animals is that of the “wisdom of crowds” (Surowiecki,
2004). The basic premise of the wisdom of crowds idea is that a sufficiently large and
well-mixed group of individuals can often make a better decision than a small panel of
experts. Improved decision making with group size has been investigated for animal
groups, in particular for navigation by bird groups (Benvenuti & Baldaccini, 1985; Berg-
man & Donner, 1964; Biro, Sumpter, Meade, & Guilford, 2006; Simons, 2004; Walraff,
1978) and predator avoidance by fish (Sumpter, Krause, James, Couzin, & Ward, 2008;
Ward, Sumpter, Couzin, Hart, & Krause, 2008). In humans, Faria, Codling, Dyer, Trill-
mich, and Krause (2009) showed that navigational accuracy can be improved by collec-
tive decision making, but only for groups of ten or more, and only when the individuals
had sufficiently high initial directional errors to be improved by social communication.
The functioning of “wisdom of crowds” or “right judgments by integrating many
wrongs” depends upon two key factors: that the members of the group should be indepen-
dent (Conradt & List, 2009; Simons, 2004) and that their judgments are distributed with
a large variance, whereas the measure of central tendency that is used is close to correct.
470 B. Granovskiy et al. / Topics in Cognitive Science 7 (2015)

Under these conditions, increased group size should lead to an improved average guess,
thus producing the wisdom of crowds effect (King, Cheng, Starke, & Myatt, 2011; Stey-
vers, Lee, Miller, & Hemmer, 2009).
A key problem in maintaining independence lies in how to effectively integrate infor-
mation (Sumpter, 2010). For some cognitive tasks, such as recollecting a sequence of
items in order, communication between individuals was shown to improve group perfor-
mance (Janis, 1972; Smith et al., 2009). However, in other tasks, interactions between
individuals can create a feedback that leads to convergence on the wrong decision. The
problems associated with convergence of interacting individuals’ opinions can be allevi-
ated by individuals forming their opinions independently before conferring with fellow
group members (Miller & Steyvers, 2011; Sumpter, 2010). The Delphi group decision-
making technique incorporates an explicit stage of opinion exchange once initial opinions
are independently surveyed (Linstone & Turoff, 1975; Rowe, Wright, & Bolger, 1991).
Much of the theoretical and experimental work carried out on how humans influence the
behavior of their peers supports the hypothesis that positive feedback among decision
makers can produce misleading conformity and overly narrow convergence of opinion.
Asch (1951, 1956) showed that individuals make obviously wrong decisions after seeing
a number of others (planted by the experimenter) make the same incorrect choice. Experi-
ments inspired by Asch’s have replicated his results and quantified the effect that various
factors, such as group size (Gerard, Wilhelmy, & Conolley, 1968; Milgram, Bickman, &
Berkowitz, 1969), degree to which the individual identifies with other group members
(Castelli, Arcuri, & Zogmaister, 2003), the individual’s prior attitude toward the issue in
question (Erb, Bohner, Rank, & Einwiller, 2002), and intensity of stimulus (Latan�e,1981) have on an individual’s behavior and decisions in a group environment.
The second requirement for the functioning of “many wrongs” is that individuals’
guesses are unbiased. King et al. (2011) found that independent guesses of how many
sweets are in a jar were unbiased. However, systematic cognitive biases often occur such
that the members of a group would tend to be influenced in a similar way by framing,
context, instructions, or primes (Kahneman & Frederick, 2002). In the case that a system-
atic bias exists toward a particular answer, the average guess of larger groups will simply
converge on the incorrect, biased answer.
Recent work has discussed the wisdom of crowds and the conditions under which
group decisions are better than decisions made by individuals. King et al. (2011) showed
that group performance deteriorates when individuals share information. Improvement is
only seen when participants are told the best current guess, which gives implicit informa-
tion about the correct answer. Lorenz, Rauhut, Schweitzer, and Helbing (2011) showed a
strong convergence in the answers given to trivia questions when participants saw each
other’s answers, without substantial improvement. They also demonstrated that a self-
assessed measure of confidence reported by the individuals did not correlate strongly with
the individuals’ performance. In fact, participants’ confidence in their estimates was
higher when communication of estimates was present, even though this same communica-
tion led to a lower probability that the range spanned by the group’s estimates would
actually contain the correct answer.
B. Granovskiy et al. / Topics in Cognitive Science 7 (2015) 471

1.2. Collective search with dependencies
Our current approach to exploring the influence of people’s opinions on each other
incorporates both experiments and modeling. We analyze the performance of groups in
decision-making situations and also the process by which individuals integrate social
information in solving problems. We also investigate the factors that affect whether and
in what ways individuals will be influenced by one another’s estimates, and we propose a
mechanism that may explain how individual behavior affects the performance of the
group as a whole. We determine rules used by individuals to change their estimates when
provided with social information and then use a model based on the empirical data to
show that group performance improves with time only if the initial answers are biased.
We find that if no initial bias is present, then the deterioration in group performance
found by Lorenz et al. (2011) is guaranteed.
Our experiment can also be thought of as a collective search problem in an abstract space
(Goldstone, Roberts, Mason, & Gureckis, 2008; Hills, Todd, & Goldstone, 2010). Individu-
als are attempting to find the best answer to a trivia question on a bounded search space of
0–100 where the optimal answer is not known. While they do not receive direct feedback in
terms of the correctness of their guess, the information about where other individuals are
searching can be viewed as indirect feedback that can guide their search process.
More specifically, the individuals in our experiment are participating in a form of parallel
and interactive collective search, where each individual provides his or her own solution to
the problem (parallel), but the solutions of others can influence an individual’s own choices
(interactive) (Goldstone, Wisdom, Roberts, & Frey, 2013). The main complexity associated
with this particular type of search is the interaction between an individual’s private judg-
ment about a particular question and the public information about where others in the group
are searching. An individual may adopt any combination of strategies ranging from com-
plete imitation to predominantly exploration with varying degrees of success in different sit-
uations (Nowak, Szamrej, & Latan�e, 1990; Sumpter, 2010). Here, we are interested in
examining which strategies are adopted by individuals in deciding whether or not to search
where others are searching, and in the resulting group-level patterns.
Our current approach is novel in a number of respects. Unlike much of the work on
“advice taking” (Larrick et al., 2012; Soll & Larrick, 2009; Yaniv, 1997), we let all of
our participants simultaneously influence each other. In most work on conformity or
advice taking, there is only one actual experimental subject per session. The other opin-
ions are provided by accomplices of the experimenter or previously tested participants.
The benefit of this approach is that it allows powerful experimental designs for unambig-
uously determining the influence of the group on the individual’s behavior. The cost of
this approach is that it eliminates the possibility of finding emergent group-level patterns.
For this latter reason, we currently employ a design in which all participants in an experi-
mental group simultaneously influence one another. Other experiments (Latane & Bour-
geois, 2000; Rauhut, Lorenz, Schweitzer, & Helbing, 2011; Wisdom, Song, & Goldstone,
2013) also explore social influence when all participants form and revise their guesses
overtly and in parallel. Our experimental setup is most similar to Rauhut et al. (2011).
472 B. Granovskiy et al. / Topics in Cognitive Science 7 (2015)

However, unlike Rauhut et al. (2011), the opinions we solicit in our experiment are on
questions that are constrained to have answers that fall between 0% and 100%. This
design decision serves to normalize the questions and facilitate an integrated analysis
across questions. It also allows us to measure the extremity of a guess with respect to a
default of 50%, and how extremity varies with social influence. This is particularly perti-
nent for issues related to group polarization and to the issue of groups frequently adopt-
ing more extreme positions after communication (Myers & Bishop, 1970). We return to
the effects of polarization in the General Discussion.
The 0%–100% nature of our participants’ guesses also facilitates the construction and
validation of a computational model of collective influence. We report a model of our
participants’ guesses that assumes that participants first choose whether to be influenced
by others’ guesses, and if an influence occurs, to then move toward the others by an
amount proportional to their distance. This simple model is compared to the distribution
of people’s shifts of opinion, and it also makes predictions for emergent group-level pat-
terns of opinion convergence and extremitization.
2. Methods
2.1. Participants
One hundred and eighty-eight undergraduate students from Indiana University served
as participants to fulfill a course requirement. The students were split into groups of vari-
ous sizes as seen in Table 1. Twenty-two of the participants were assigned to the Solo
condition in which they were not given information about their peers’ estimates, and 166
of the participants were assigned to the Group condition in which they were informed of
their peers’ estimates at the end of every round (observers made multiple successive esti-
mates; see Procedure below for more details on rounds). Participants in the Solo condi-
tion were still run in groups, even though they were not informed of their peers’
estimates after each round.
Table 1
Distribution of group sizes and number of groups of each size in the experiment
Group Size Number of Groups
1 22
2 7
3 5
4 5
5 8
6 5
7 3
8 2
9 0
10 1
B. Granovskiy et al. / Topics in Cognitive Science 7 (2015) 473

2.2. Materials
Participants were given the trivia questions shown in the Appendix. The questions were
selected from the CIA World Fact Book (https://www.cia.gov/library/publications/the-
world-factbook/) for 2008, the year in which the experiment was conducted. All the ques-
tions were chosen to be percentage questions with true answers ranging from 2% to 99%.
The questions were selected so as to widely sample the range of percentages, and so that
participants would generally have a vague idea about the correct answer but would typi-
cally not know the exact answer. Pre-testing eliminated other questions which were judged
to be ambiguous or for which estimates were either too accurate or inaccurate.
2.3. Procedure
Participants in a group were all simultaneously seated in their individual cubicle with
an Internet-connected computer. Participants were instructed not to talk to one another,
and the cubicles prevented visual communication between participants. Participants were
instructed that they would see a series of 36 trivia quiz questions, and that their task was
to make the most accurate estimates possible. Participants made their estimates by mov-
ing the red mark on an “Estimated Percentage” slider from 0% to 100% (see Fig. 1).
Movements of the mark were achieved by using a mouse to drag the red mark that was
initially placed at 50% to its desired location, or by clicking to the left or right of the
mark to move the estimate up or down, respectively, by 1%. Participants registered their
desired estimate by clicking a button titled “Choose.” Once the participant registered his
or her estimate, it showed up in the “Current Choice” box.
The experiment was conducted using the NetLogo 4.1.1 simulation environment (Wilen-
sky, 1999). Using the Hubnet package (Wilensky & Stroup, 1999), NetLogo allows partici-
pants’ computers to send moment-to-moment information to a central server computer,
which then sends information to all other participants’ computers. This centralized architec-
ture allows us to record all participants’ estimates and to keep the computers synchronized.
The ordering of the 36 trivia questions was randomized for each group. Participants were
given three rounds of estimates for the same question, before moving on to the next question.
After each round of estimation, participants in the Group condition were shown the estimates
given by all of the participants in the experiment, including themselves. Participants in the
Solo condition were only shown their own estimate. Pseudonyms were assigned to partici-
pants at the beginning of the experiment, and these pseudonyms were used to identify the par-
ticipant associated with each estimate. Participants were given a visual diagram similar to a
labeled version of Fig. 1 that described how to interpret the display to identify peers’ esti-
mates. Estimates were presented in two forms—symbolically as numeric percentages, and
also by their left-right position on the screen (0% = far left side of screen, 100% = far right
side). They were instructed that they could use the estimates provided to try to improve their
own estimate if they wanted, but that there was no requirement or expectation that they would.
They were reminded to try to use what information they had, whether from themselves or
from their peers’ estimates, to give the most accurate estimate possible.
474 B. Granovskiy et al. / Topics in Cognitive Science 7 (2015)

Peer estimates remained on the screen, whereas the participants made their esti-
mates. When a peer made an estimate, that peer’s icon was turned from a circle to a
star on every participant’s screen, but the peer’s new guess was not shown at that
time. All participants’ estimates were monitored by the experimenter from a computer
in a separate room. When the last estimate was made, the next round or question was
presented. Participants received no feedback on the accuracy of their own, or their
peers’, estimates.
In what follows, we denote by the x1(i, j, q) guess of individual i in group j whenanswering question q; q 2 ½1; 36� in Round 1. Rounds 2 and 3 are denoted with corre-
sponding subscripts. The size of Group j is denoted by s(j). v(q) denotes the correct
answer to question q. We then define �x1ðj; qÞ to be the mean guess over the s(j) members
of Group j when answering question q. Finally, nk is the number of groups of size k. We
define an individual’s pliability to be the number of times she/he changes estimates
between Rounds 1 and 2 over all 36 questions.
Figure 1. Experimental setup. A sample trivia question from the experiment and the information that a par-
ticipant sees on his or her screen.
B. Granovskiy et al. / Topics in Cognitive Science 7 (2015) 475
3. Results
3.1. Round 1 performance
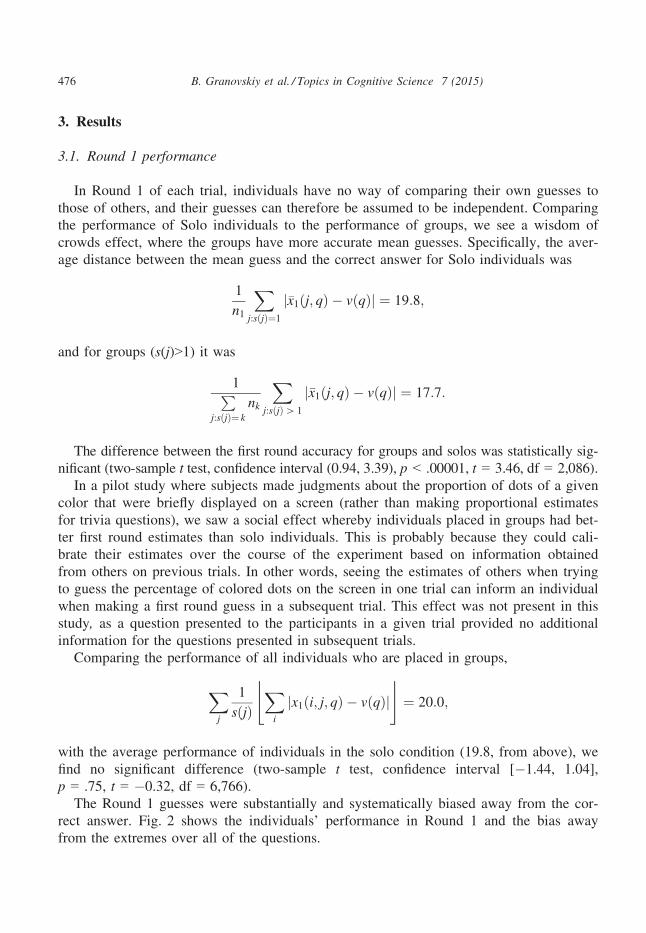
In Round 1 of each trial, individuals have no way of comparing their own guesses to
those of others, and their guesses can therefore be assumed to be independent. Comparing
the performance of Solo individuals to the performance of groups, we see a wisdom of
crowds effect, where the groups have more accurate mean guesses. Specifically, the aver-
age distance between the mean guess and the correct answer for Solo individuals was
1
n1
Xj:sðjÞ¼1
j�x1ðj; qÞ � vðqÞj ¼ 19:8;
and for groups (s(j)>1) it was
1Pj:sðjÞ¼ k
nk
Xj:sðjÞ[ 1
j�x1ðj; qÞ � vðqÞj ¼ 17:7:
The difference between the first round accuracy for groups and solos was statistically sig-
nificant (two-sample t test, confidence interval (0.94, 3.39), p < .00001, t = 3.46, df = 2,086).
In a pilot study where subjects made judgments about the proportion of dots of a given
color that were briefly displayed on a screen (rather than making proportional estimates
for trivia questions), we saw a social effect whereby individuals placed in groups had bet-
ter first round estimates than solo individuals. This is probably because they could cali-
brate their estimates over the course of the experiment based on information obtained
from others on previous trials. In other words, seeing the estimates of others when trying
to guess the percentage of colored dots on the screen in one trial can inform an individual
when making a first round guess in a subsequent trial. This effect was not present in this
study, as a question presented to the participants in a given trial provided no additional
information for the questions presented in subsequent trials.
Comparing the performance of all individuals who are placed in groups,
Xj
1
sðjÞXi
jx1ði; j; qÞ � vðqÞj$ %
¼ 20:0;
with the average performance of individuals in the solo condition (19.8, from above), we
find no significant difference (two-sample t test, confidence interval [�1.44, 1.04],
p = .75, t = �0.32, df = 6,766).
The Round 1 guesses were substantially and systematically biased away from the cor-
rect answer. Fig. 2 shows the individuals’ performance in Round 1 and the bias away
from the extremes over all of the questions.
476 B. Granovskiy et al. / Topics in Cognitive Science 7 (2015)

Individuals significantly overestimated the correct answer when it was below 50% and
underestimated the answer when it was above 50%. Using linear regression, the best fit
between the true value of an answer to a particular question and the average guess made
by the individuals for that question was
bðvðqÞÞ ¼ 0:45vðqÞ þ 26: ð1Þ
Consistent with the wisdom of crowds hypothesis, there was significant improvement
in mean group guess with group size on Round 1. The absolute difference between
(a)
(b)
Figure 2. Round 1 performance. Individual performance over all questions is shown in (a). The average dis-
tance from the correct answer calculated over all the individuals was 20.0 for the initial guesses. A bias
toward the no-information answer of 50% was observed in Round 1 guesses, where individuals were more
likely to overestimate answers less than 50% and underestimate answers greater than 50%. Improvement of
Round 1 mean guesses with group size is computed as the average difference between the group mean and
the correct answer and is shown in (b).
B. Granovskiy et al. / Topics in Cognitive Science 7 (2015) 477

the average guess of group members and the correct value decreased with group size
(correlation coefficient q = �0.68, p = .04). Although this improvement was statistically
significant, the overall improvement for large groups (size 6–10) was only 10%
(Fig. 2b).
3.2. Improvement and aggregation over Rounds 2 and 3
While there was no Round 1 difference between the performance of Solo individuals
and the performance of individuals placed in groups, we find such a difference over the
duration of the experiment. Fig. 3 shows the changes of mean guesses by Solo individu-
als and groups over the course of the experiment. Solo individuals do not show signifi-
cant improvement in the difference between the correct answer and the average guess,
that is, comparing��x2ði; j; qÞ � vðqÞ�� with
��x1ði; j; qÞ � vðqÞ�� (sign test p = .15, z = 1.81;
Fig. 3a). The average of the first two guesses of the Solo individuals was not significantly
better than the first-round guesses (two-sided t test for the accuracy p = .68, 95% confi-
dence interval (�1.26, 1.93), t = 0.41, df = 1,582), nor than the second-round guesses
(two-sided t test for the accuracy p = .67, 95% confidence interval [�1.23, 1.90],
t = 0.42, df = 1,582). However, in only 5.4% of the cases were the first two guesses on
the opposite sides of the correct answer. When the range spanned by guesses includes the
correct answer, the correct answer is said to be “bracketed” by the guesses (Larrick &
Soll, 2006).
Individuals placed in both small (2 ≤ s(j) ≤ 5) and large (6 ≤ s(j) ≤ 10) groups
improve over the three rounds (sign test, small groups: p < .001, z = 4.22, large groups:
p < .001, z = 5.27). Individuals placed in groups improved their performance by 7.1%
from Round 1 to in Round 2 and by 1.9% from Round 2 to Round 3 (Fig. 3b).
The stronger effect was that of convergence around the group’s mean guess. Fig. 3c
shows increasingly close convergence to the group mean over time, with the mean abso-
lute difference between an estimate and the group’s mean decreasing by 25.2% from
Round 1 to Round 2 and 7.8% from Round 2 to Round 3 (one-sided sign test p < .0001
for each pair of rounds, z = 24.3 for Rounds 1 and 2, z = 15.6 for Rounds 2 and 3).
The improvement of individuals over rounds was characterized by polarization (i.e.,
tendency to make more extreme estimates over time). Over the course of the three
Rounds, the systematic bias toward 50% that was seen in Round 1 was reduced. In
Rounds 2 and 3, the mean guesses of individuals in groups moved toward the extremes
(Fig. 3d), increasing for questions with high correct answers (60–100) and decreasing for
those with low correct answers (0–40). This effect was much stronger in individuals
placed in groups than in the solo condition, in particular between rounds 2 and 3 (rank
sum test, p = .020, z = �2.16).
3.3. The mechanism for aggregation and improvement by individuals in groups
The small improvement in accuracy by individuals in groups over the rounds can be
attributed to outliers moving toward the mean of their group. Fig. 4 gives one such exam-
478 B. Granovskiy et al. / Topics in Cognitive Science 7 (2015)

(a)
(c)
(b)
(d)
Figure 3. Movement of mean guesses over the course of the experiment. The improvement of the guesses
made by solo individuals (a) and individuals in groups (b) over the three rounds is shown. For each round,
the distance from correct is calculated by averaging the absolute difference from the correct answer of each
individual over all the groups, or |v � x1(i, j)|. Panel (c) shows convergence to the group mean over the three
rounds. Standard error is shown by error bars. Panel (d) shows the tendency of mean guesses of individuals
in groups to get more extreme over the three rounds. The guesses are represented as changes from Rounds 1
and 2 (circles) and from Rounds 2 and 3 (crosses). Typically, answers become more extreme over the
repeated rounds.
B. Granovskiy et al. / Topics in Cognitive Science 7 (2015) 479

ple. In general, the outliers tend to be on the opposite side of the group mean from the
correct answer. Thus, by moving in toward the mean of the group members’ guesses, the
outliers are typically also moving toward the correct answer. This effect is observed
because outliers are not distributed evenly on both sides of questions with low or high
correct answers. We can see this effect in Fig. 2a by comparing the median, which is
nearer the correct answer, and the mean, which is further away. The movement of outliers
toward the group mean can thus account for both the improvement in accuracy by indi-
viduals in groups and the convergence toward the group mean. In addition, because the
group mean tends to be more extreme than the outliers, this movement is also responsible
for the polarization effect described in the previous section. We now quantify this inter-
pretation of the data.
We constrained the construction of a quantitative model by a combination of certain
aspects of our results, the previous literature on social influence, and plausible cognitive
processes. First, other researchers have noted that people tend to move about 20%–30%of the way from their own original guess toward others’ estimates, being more anchored
to their original guess than is optimal (Harvey & Fischer, 1997; Larrick et al., 2012;
Yaniv, 2004). However, as observed by Soll and Larrick (2009), this average shift is a
poor representation of what individuals are doing. In particular, some participants shift
dramatically toward others’ opinions, whereas other participants do not shift at all. Fig. 5
shows how the distribution of changes between rounds depends on the distance from the
mean guess (Fig. 5a) and the correct answer (Fig. 5b) and highlights that many individu-
als in our experiment do not change their estimates between rounds. This led us to incor-
porate in our model an initial judgment by participants as to whether they will adjust
their original guesses at all.
This assumption proved critical for accommodating the large percentage of Round 2
and Round 3 guesses that are unchanged from Round 1 (68.9% of guesses did not change
Figure 4. Movement of extreme outliers. A representative trial of how individuals change their guesses
between Rounds 1 and 2 and, as a result, improve the group’s mean guess and add to the group’s polarization
over time.
480 B. Granovskiy et al. / Topics in Cognitive Science 7 (2015)

from Round 1 to 2, and even fewer changed from Round 2 to 3). Our assumption is that
participants are more likely to make an adjustment to their guesses as their distance from
others’ estimates increases, consistent with results on conformity suggesting that evidence
of social influence increases as the discrepancy between the individual and their group
increases (Cialdini & Goldstein, 2004). This mechanism may not be applicable in
cases for which the group’s opinion is so far away from the individual that the individ-
ual ignores it as too alien. However, we found no evidence for this effect in our experi-
ments, and given the unemotionally laden nature of our questions, classic social
distinctiveness effects (Leonardelli, Pickett, & Brewer, 2010) are unlikely to be relevant
in this context.
A second model choice that instantiated assumptions of cognitive influence was to
have participants shift their guesses proportionally to the distance of their original guess
to the mean of their peers’ guesses. A plausible alternative model would be to selectively
weight peers’ guesses that are similar to one’s own original guess, dismissing advice that
is too discrepant (Yaniv & Milyavsky, 2007). This alternative model produced results
similar to our model and would be a strong candidate for future testing. However, given
our evidence that outlier guesses are particularly likely to shift markedly, we did not want
to minimize the influence of far removed peer guesses. The assumption that the size of
shift between rounds is linearly proportional to the average distance to peers (assuming
that any shift occurs at all) was compelled by our empirical results, as shown in Fig. 5.
(a)
(b)
Figure 5. Change in guesses between rounds. Frequencies of changes in guesses of different sizes
between Rounds 1 and 2 for all individuals over all questions are plotted in relation to distance from
the group mean (a) and distance from the correct answer (b). Note that the majority of individuals did
not change their guesses between Rounds 1 and 2 (68.9%) and an even greater proportion did not
switch between Rounds 2 and 3 (87.0%). This leads to a bimodal distribution with distinct peaks
along the line of zero change and along the best-fit line for those individuals that did change between
rounds.
B. Granovskiy et al. / Topics in Cognitive Science 7 (2015) 481

Although various non-linear functions could have been plausibly posited, the simple lin-
ear function provides an excellent fit to Fig. 5’s results.
Distance from the group mean had a strong effect on the probability of changing
estimates between rounds. We fit a logistic model for the probability of changing
one’s guess with respect to distance from the group’s mean guess (not including
the focal individual’s own guess) and distance from the correct answer, yielding the
equation
p2ði; jÞ ¼ 1
1þ exp 1:317� 0:037jx1ðiÞ � x1ðiÞj � 0:008jv� x1ðiÞj� �0
where p2(i) is the probability that individual i in group j changes his/her estimate
between Rounds 1 and 2, jx1ðjÞ � x1ðiÞj is the distance from the group mean in
Round 1, and |v � x1(i)| is the distance from the correct answer in Round 1. Both the
distance from correct and the distance from mean were significant factors, but we
note that the distance from the mean was roughly five times more important in deter-
mining the probability of changing. Introducing distance from the correct answer as
an independent variable into a stepwise regression for the probability of changing did
not add significance to that already accounted for by distance from mean. If we only
take into account the distance from the group mean, then the expression for probabil-
ity of changing is as follows:
p2ði; jÞ ¼ 1
1þ exp 1:228� 0:041jx1ðjÞ � x1ðiÞj� � : ð2Þ
The proportion of individuals who changed their guesses between Rounds 2 and 3 was
much smaller than between Rounds 1 and 2 (see Table 2). As such, we concentrated our
analysis on the first two rounds.
For those individuals who did change their guess, there was a strong effect of distance
from group mean on the size and direction of change. Fig. 5 shows that when individuals
adjust their guesses between rounds, the greatest changes appear to be made by the indi-
viduals farthest away from the group mean and the correct answer.
Table 2
Observed and expected (in parentheses) probabilities of changing estimates between rounds, assuming inde-
pendent decisions in Rounds 1 and 2
Changed Between
Rounds 2 and 3
Did Not Change
Between Rounds 2 and 3
Changed between Rounds 1 and 2 0.08 (0.10) 0.23 (0.21)
Did not change between
Rounds 1 and 2
0.05 (0.21) 0.64 (0.48)
482 B. Granovskiy et al. / Topics in Cognitive Science 7 (2015)

Distances from group mean and from the correct answer are correlated (q = 0.56,
p < .0001). To quantify the effects of these factors and to establish which is most impor-
tant, linear regression analysis was carried out on the data. As independent variables for
individual i, we considered the distance between i’s guess and the correct answer,
v � x1(i), and the distance between i’s guess and the mean answer in his/her group,
x1ðjÞ � x1ðiÞ. We also considered two other factors, the distance between i’s guess and
the answer closest to it in her group (we denote this as m), and the variance of the other
guesses in the group besides the guess of the focal individual (var(j/i)). The dependent
variable was the change in i’s guess between Rounds 1 and 2, dx2(i) = x2(i, q) � x1(i, q).When taking all four factors into account, the linear regression model for guess
changes between Rounds 1 and 2 was
dx2ðiÞ ¼ 0:285� 0:051ðv� x1ðiÞÞ � 0:464ðx1ðjÞ � x1ðiÞÞ � 0:190mþ 0:041varðj=iÞ:
We followed the standard procedure for removing non-significant variables from linear
regression models (Rawlings, 1988). The first variable that we removed was group vari-
ance, which was the factor that produced the smallest non-significant (t < 0, a = 0.05)
partial sum of squares. Repeating the process two more times, we eliminated distance
from nearest neighbor and distance from the correct answer, ending up with our final lin-
ear regression model
dx2ðiÞ ¼ 1:118� 0:624jx1ðjÞ � x1ðiÞj: ð3Þ
Equations 2 and 3 capture the idea that individuals farthest away from the mean
contribute most to group improvement, and they increase cohesion and polarization
over rounds. They serve as the basis for the conceptual model that is proposed in the
next section.
3.4. Individual differences
Some individuals changed their guesses more often than others; that is, some individ-
uals were more pliable than others. Individuals who changed guesses between Rounds 1
and 2 were also more likely to change between Rounds 2 and 3 (Table 2). Fig. 6 shows
the distribution of the number of times individuals changed their guesses over all 36
questions. This is different from the expected binomial distribution of changing guesses
with the same average pliability, indicating that individuals differed in pliability more
than would be predicted by chance. Furthermore, an individual’s pliability is only
weakly correlated with her competence, that is, the quality of her guesses
(q = 0.13, p = 0.076).
B. Granovskiy et al. / Topics in Cognitive Science 7 (2015) 483

3.5. Model
Based on our observations, we propose a model of the mechanism by which the indi-
viduals change their guesses over time. Individual i’s guess in Round t + 1 can be mod-
eled as a function of her guess in Round t and of the mean guess of that individual’s
group in Round t. An individual first chooses whether or not to change her guess between
rounds by using the expression for the probability of changing (Equation 2) and then
determines the size of her move (Equation 3). The model can thus be summarized as fol-
lows:
xtþ1ðiÞ ¼ xtðiÞ � aðxiðiÞ � �xtÞ þ etþ1ðiÞ;with probabilitypt
xtðiÞ;with probabilityð1� ptÞ� �
;
where xt(i) is individual i’s guess in round t, �x is the mean guess of all individuals in
individual i’s group. a = 0.624, consistent with Equation 3. pt is the probability of chang-
ing one’s guess between Rounds t and t + 1 and is determined by Equation (2). In the
experiment, probability of changing decreases with the number of rounds, and we model
this with an exponent of t, which is consistent with the decrease over the two rounds.
Finally, ɛ is a normally distributed error term. In the model, it is drawn from a distribu-
tion with mean 0 and a SD based on the SD of the difference between the changes of
individuals’ guesses and the distance from their group means in the experiment. Guesses
outside the range of (0, 100) are discarded, and new ones are generated until they fall
within the desired range. The individuals’ initial guesses, based on Equation (1), are
determined by x1(i) = 26 + 0.45v + ɛ1(i), where v is the correct answer and ɛ1(i) is a nor-
mally distributed random variable with SD equal to that of Round 1 guesses from the
experiment.
Figure 6. Individual differences. The histogram shows the distribution of frequencies of individual pliabilities
of all the participants in the experiment. The curve shows the distribution of frequencies that would be
expected if there were no differences between individual pliabilities.
484 B. Granovskiy et al. / Topics in Cognitive Science 7 (2015)

The model’s behavior accurately reproduces both the improvement of average guesses
(Fig. 7b, compare with Fig. 3b) and the convergence of guesses to the group mean
(Fig. 7c, compare with Fig. 3c) over the three rounds of the experiment. Note that the
average guesses of solo individuals in the model actually get worse over three rounds
(Fig. 7a). This is mainly due to the bias in the initial guesses, the distribution of which is
derived from the corresponding distribution obtained from the experimental data.
We also used the model to predict the effect of the correct answer on group perfor-
mance and convergence over time. Running the model over 10 rounds of possible guess-
(a) (b)
(c)
Figure 7. Movement of guesses in the model. The improvement of the guesses made by solo individuals (a)
and individuals in groups (b) over the three rounds in the model is shown, for comparison with Fig. 3. Panel
(c) shows convergence to the group mean over the three rounds. Standard error is shown by error bars.
B. Granovskiy et al. / Topics in Cognitive Science 7 (2015) 485

ing, we found that groups showed the most improvement on questions which had extreme
correct answers; that is, correct answers between 0–20 and 80–100 (Fig. 8a). Moreover,
instead of improving, group performance got worse over time on questions with moderate
correct answers, 30–70. Convergence toward the group mean over time was observed for
the entire range of correct answers (Fig. 8b). Polarization increased with the extremity of
the correct answers, as was observed in the experiments (Fig. 8c). For the experimental
data, the Pearson correlation between extremity of correct answer and average polariza-
tion was 0.75 (p = 1.7 9 10�6). For the model, the corresponding numbers were 0.62
with a p-value of 0.88 9 10�9.
In the experiment, the distribution of correct answers was such that polarization usually
led to an improvement in group performance. Most of the questions had correct answers
closer to 0% or 100% than to 50%. We used the model to investigate how group
(a)
(b)
(c)
Figure 8. Improvement, convergence, and polarization in the model. The outcome of running the model
100,000 times for 10 rounds for a range of correct answers between 1 and 100. Panel (a) shows group
improvement over time as a function of correct answer. Convergence to the group mean is shown in (b): the
mean distance from the group mean is shown for Rounds 1, 3, and 10 of the simulation as a function of cor-
rect answer. Panel (c) shows the polarization effect over the 10 rounds as a function of correct answer by dis-
playing the difference between the mean Round 1 and Round 10 guesses for questions with different correct
answers.
486 B. Granovskiy et al. / Topics in Cognitive Science 7 (2015)

improvement depends on the location of the correct answer. We found that, for all group
sizes, performance on questions with moderate correct answers became slightly worse
over the rounds, whereas the performance on extreme questions improved considerably
(Fig. 9).
4. Discussion
The most novel aspect of our experiment and modeling was the investigation of group-
level patterns that emerge from individuals’ choices to shift their guesses toward their
peers’ guesses. Although there has been similar empirical work in which all members of
a group are simultaneously influencing each other (Lorenz et al., 2011), our work compli-
ments this work empirically by having questions constrained to a 0%–100% scale and
theoretically by developing a quantitative model of parallel social influences. The 0%–100% scale allowed us to investigate issues related to group polarization. Our groups
(a)
(b)
Figure 9. Model predictions: effects of group size. The group performance over a range of group sizes from
1 to 20 as distance between group mean and the correct answer. The model is run 100,000 times for 10
rounds for a question with correct answers 50 (a) and 10 (b).
B. Granovskiy et al. / Topics in Cognitive Science 7 (2015) 487

became increasingly extreme in their answers with passing rounds of opinion exchange,
and this extremitization was coupled with increasing accuracy for the group.
Individuals placed in groups did not perform better in Round 1 than solo individuals,
showing that there was not a significant socialization effect of people trying harder when
placed in a group setting. The answers of individuals on the first round were biased. Pro-
viding the participants with a “default” answer of 50%, which they then changed by mov-
ing a sliding bar, may partly account for this bias. This could have created a prior value
to weigh any new guess against. The majority of participants (89%) moved the bar away
from the position at 50% where it was set before the first round, but they usually stopped
short of the correct answer. As a result, most first-round answers were located somewhere
between 50% and the correct answer. Such aversion of extremes is not limited to our
experimental setup and occurs in, for example, marketing surveys (Podsakoff, MacKen-
zie, Lee, & Podsakoff, 2003; Pollack, Friedman, & Presby, 1990).
The averaged guesses from the first two rounds of solo individuals were more accurate
than their Round 1 guesses, but not significantly more accurate than their Round 2
guesses. Therefore, Vul and Pashler’s (2008) “crowd within” effect is not really present
here. Such an effect would have been strong if a number of individuals’ second-round
guesses were on the opposite side of the correct answer from the first round, but this only
happened in 5.4% of the cases.
Over the three rounds of the experiment the performance of individuals in groups
improved, whereas that of solo individuals did not. This shows evidence for the effect of
social information being used by individuals in a group setting to improve their guesses
over time. The group improvement in the experiments was achieved through the move-
ment of extreme outliers toward the group mean. This has the effect of different impor-
tance being assigned to different individuals due to within-group communication. In
particular, individuals whose guesses are far from others tend to shift their estimations to
be closer to others. Weighting different individuals’ guesses unequally has been shown to
produce a better collective estimate than an equal weighting for certain group decision
problems (Turner & Steyvers, 2011).
Our model shows that whether a group improves or not depends on the degree of ini-
tial bias. In cases where the initial guesses are unbiased around the correct answer, as is
the case for questions with moderate correct answers, the model predicts that the move-
ment of extreme individuals toward the group mean leads to poorer group performance
(Fig. 8a). This happens because outliers are distributed evenly around the correct answer,
and movement of outliers toward the group mean from both sides does not lead to polari-
zation (Fig. 9b and c). These results are consistent with Lorenz et al.’s (2011) findings
that consultation worsens group performance when there is no initial bias (but see Farrell
[2011] and Rauhut et al. [2011] for further discussion on this issue). In fact, our model
suggests that group improvement is impossible given unbiased initial estimates. When an
initial bias exists (questions with correct answers <40 or >60), then the most biased indi-
viduals are “pulled” by the group mean away from their conservative position toward the
correct answer. In other words, polarization of group opinion over time improves accu-
racy when initial guesses are biased.
488 B. Granovskiy et al. / Topics in Cognitive Science 7 (2015)

These results stand in sharp contrast to the usual view of polarization as a negative
aspect of group behavior. Myers and Bishop (1970) found that groups consisting entirely
of one type of students, either all high-prejudice or all low-prejudice, moved further away
from moderate views as a result of discussion. They showed that individuals can become
more extreme as a result of consultation with those of similar opinion, and that post-con-
sultation opinions can become adopted by the individuals, leading to a permanent “group
polarization.” Evidence for this risky shift was first found by Stoner (1961), and later
confirmed by Kogan and Wallach (1964), Moscovici and Zavalloni (1969), Myers and
Lamm (1976), and Burnstein and Vinokur (1973). In our experiments, polarization pro-
vides the mechanism for improving a group’s decision making. This happens because
individuals start out by being biased away from extreme positions even when those posi-
tions are correct.
An alternative to polarization as a possible explanation for the individuals’ move
toward more extreme guesses over time is that individuals may simply become more
extreme in their guesses as they retrieve increasing amounts of information to move them
away from a default judgment of 50%. However, there is a significant difference between
the polarization effect observed in individuals in the solo and group conditions, in partic-
ular between Rounds 2 and 3. As such, the polarization observed in the group condition
is a true effect of group communication.
There were strong between-individual differences in pliability (Fig. 6). Previous research
has found only weak correlation between asking people how confident they are in their
guesses and how accurate these guesses are (Lorenz et al., 2011). Pliability provides an
additional measurement of confidence that may be more accurate than asking people
directly. We again found only a very weak correlation between competence and pliability.
Our results show that polarization occurs even in the absence of discussion or consulta-
tion, irrespective of competence. Our model also suggests that in some scenarios there is
a positive effect of polarization, that is, overcoming initial biases of individuals toward
incorrect positions and thereby improving group performance. Conversely, when an initial
bias does not exist, polarization cannot occur, and thus group improvement over time
cannot be expected.
In the framework of collective search, we found that in the absence of direct feedback
about the correctness of their answers, most individuals used the public information avail-
able to them to adjust where they were searching. On a group level, this led to conver-
gence of answers. This can be disadvantageous for a group that is trying to broadly cover
a problem search space. Instead of having different individuals explore different parts of
a search space, in extreme forms of group convergence, the entire group may be only
occupying one point in a large problem search space. Although disadvantageous for a
group’s collective ability to explore in parallel different regions of a search space, con-
vergence is useful for achieving consensus (Couzin, Krause, Franks, & Levin, 2005). In
our case, copying behavior by the individuals actually led to group-level improvement in
average distance from the correct answer. This is not inconsistent with Lorenz et al.’s
(2011) findings, as we are using a different measure of group performance, emphasizing
absolute deviation from the correct answer over including the correct answer in the
B. Granovskiy et al. / Topics in Cognitive Science 7 (2015) 489

group’s range of guesses. Our findings show that it is possible to use information about
where others are searching to improve the group’s ability to search in parallel.
Acknowledgments
This research was supported in part by National Science Foundation REESE grant
0910218 and Department of Education IES grant R305A1100060 to R.L.G., National
Institutes of Health Grant EY019265 to J.M.G, and Uppsala University’s Liljewalchs Res-
estipendium to B.G. We thank Takao Sasaki for helpful discussions and suggestions, and
the Summer School on Complex Systems and Social Simulations at the Central European
University for giving us the opportunity to start this collaboration.
References
Asch, S. E. (1951) Effects of group pressure upon the modification and distortion of judgments. In H.
Guetzkow (ed.), Groups, leadership, and men (pp. 222–236). Pittsburgh, PA: Carnegie Press.
Asch, S. E. (1956) Studies of independence and conformity: I. A minority of one against a unanimous
majority. Psychological Monographs, 70.Benvenuti, S., & Baldaccini, N. E. (1985). Pigeon orientation: A comparison between single birds and small
flocks. Ornis Scandinavica, 16, 45–48.Bergman, G., & Donner, K. O. (1964). An analysis of the spring migration of the common scoter and the
long-tailed duck in southern Finland. Acta Zoologica Fennica, 105, 1–59.Biro, D., Sumpter, D. J. T., Meade, J., & Guilford, T. (2006) From compromise to leadership in pigeon
homing. Current Biology, 16, 2123–2128. doi: 10.1016/j.cub.2006.08.087.Burnstein, E., & Vinokur, A. (1973). Testing two classes of theories about group-induced shifts in individual
choice. Journal of Experimental Social Psychology, 9, 123–137.Castelli, L., Arcuri, L., & Zogmaister, C. (2003). Perceiving ingroup members who use stereotypes:
Implicit conformity and similarity. European Journal of Social Psychology, 33, 163–175. doi: 10.1002/ejsp.138.
Cialdini, R. B., & Goldstein, N. J. (2004). Social influence: Compliance and conformity. Annual Review ofPsychology, 55, 591–621.
Conradt, L., & List, C. (2009). Group decisions in humans and animals: A survey. PhilosophicalTransactions of the Royal Society B, 364, 719–742. doi: 10.1098/rstb.2008.0276.
Couzin, I. D., Krause, J., Franks, N. R., & Levin, S. A. (2005). Effective leadership and decision-making in
animal groups on the move. Nature, 433, 513–516.Deutsch, M., & Gerard, H. B. (1955). A study of normative and informative social influences upon individual
judgment. Journal of Abnormal Social Psychology, 51, 629–636.Erb, H.-P., Bohner, G., Rank, S., & Einwiller, S. (2002). Processing minority and majority communications:
The role of conflict and prior attitudes. Personality and Social Psychology Bulletin, 28, 1172–1182. doi:10.1177/01461672022812003.
Faria, J. J., Codling, E. A., Dyer, J. R. G., Trillmich, F., & Krause, J. (2009). Navigation in human crowds;
testing the many-wrongs principle. Animal Behaviour, 78, 587–591.Farrell, S. (2011). Social influence benefits the wisdom of individuals in the crowd. Proceedings of the
National Academy of Sciences of the United States of America, 108, E625. doi: 10.1073/pnas.1109947108.Gerard, H. B., Wilhelmy, R. A., & Conolley, E. S. (1968). Conformity and group size. Journal of
Personality and Social Psychology, 8, 79–82.
490 B. Granovskiy et al. / Topics in Cognitive Science 7 (2015)
Goldstone, R. L., Wisdom, T. N., Roberts, M. E., & Frey, S. (2013). Learning along with others. Psychologyof Learning and Motivation, 58, 1–45.
Goldstone, R. L., Roberts, M. E., Mason, W., & Gureckis, T. (2008). Collective search in concrete and
abstract spaces. In T. Kugler, J. C. Smith, T. Connelly, & Y. Sun (Eds.), Decision modeling and behaviorin complex and uncertain environments (pp. 277–308). New York: Springer.
Harvey, N., & Fischer, I. (1997). Taking advice: Accepting help, improving judgment, and sharing
responsibility. Organizational Behavior and Human Decision Processes, 70, 117–133.Hills, T., Todd, P. M., & Goldstone, R. L. (2010). The central executive as a search process: Priming
exploration and exploitation across domains. Journal of Experimental Psychology: General, 139, 590–609.Janis, I. L. (1972). Victims of groupthink: A psychological study of foreign-policy decisions and fiascoes.
Boston: Houghton Mifflin.
Kahneman, D., & Frederick, S. (2002). Representativeness revisited: Attribute substitution in intuitive
judgment. In T. Gilovich, D. Griffin, & D. Kahneman (Eds.), Heuristics and biases: The psychology ofintuitive judgment (pp. 49–81). New York: Cambridge University Press.
King, A. J., Cheng, L., Starke, S. D., & Myatt, J. P. (2011). Is the true “wisdom of the crowd” to copy
successful individuals? Biology Letters, 8(2), 197–200.Kogan, N., & Wallach, M. A. (1964). Risk taking: A study in cognition and personality. New York: Holt,
Rinehart & Winston.
Larrick, R. P., Mannes, A. E., & Soll, J. B. (2012). The social psychology of the wisdom of crowds. In J. I.
Krueger (Ed.), Frontiers in social psychology: Social judgment and decision making (pp. 227–242). NewYork: Psychology Press.
Larrick, R. P., & Soll, J. B. (2006). Intuitions about combining opinions: Misappreciation of the averaging
principle. Management Science, 52, 111–127. doi: 10.1287/mnsc.1050.0459.
Latan�e, B. (1981). The psychology of social impact. American Psychologist, 36, 343–356.Latane, B., & Bourgeois, M. J. (2000) Dynamic social impact and the consolidation, clustering, correlation,
and continuing diversity of culture. In R. S. Tindale & M. Hogg (Eds.), Handbook of social psychology:Vol. 4. Group processes (pp. 235–258). New York: Blackwell.
Leonardelli, G. J., Pickett, C. L., & Brewer, M. B. (2010). Optimal distinctiveness theory: A framework for
social identity, social cognition and intergroup relations. In M. Zanna & J. Olson (Eds.), Advances inexperimental social psychology (43 (pp. 65–115). New York: Elsevier.
Linstone, H. A., & Turoff, M. (1975). The Delphi method: Techniques and applications. London: Addison-Wesley.
Lorenz, J., Rauhut, H., Schweitzer, F., & Helbing, D. (2011). How social influence can undermine the
wisdom of crowd effect. Proceedings of the National Academy of Sciences of the United States ofAmerica, 108, 9020–9025.
Milgram, S., Bickman, L., & Berkowitz, L. (1969). Note on the drawing power of crowds of different size.
Journal of Personality and Social Psychology, 13, 79–82.Miller, B., & Steyvers, M. (2011). The Wisdom of Crowds with Communication. In L. Carlson, C. H€olscher,
& T. F. Shipley (Eds.), Proceedings of the 33rd Annual Conference of the Cognitive Science Society.Austin, TX: Cognitive Science Society.
Moscovici, S., & Zavalloni, M. (1969). The group as a polarizer of attitudes. Journal of Personality andSocial Psychology, 12, 125–135.
Myers, D. G., & Bishop, G. D. (1970). Discussion effects on racial attitudes. Science, 169, 778–779.Myers, D. G., & Lamm, H. (1976). The group polarization phenomenon. Psychological Bulletin, 83(602),
627.
Nowak, A., Szamrej, J., & Latan�e, B. (1990). From private attitude to public opinion: A dynamic theory of
social impact. Psychological Review, 97(3), 362–376.Podsakoff, P. M., MacKenzie, S. B., Lee, J.-Y., & Podsakoff, N. P. (2003). Common method biases in
behavioral research: A critical review of the literature and recommended remedies. Journal of AppliedPsychology, 88, 879–903.
B. Granovskiy et al. / Topics in Cognitive Science 7 (2015) 491

Pollack, S., Friedman, H. H., & Presby, L. (1990) Two salient factors in the construction of rating scales:
Strength and direction of anchoring adjectives. In International Conference of Measurement Errors inSurveys (p. 57). Tucson, AZ.
Rauhut, H., Lorenz, J., Schweitzer, F., & Helbing, D. (2011). Reply to Farrell: Improved individual
estimation success can imply collective tunnel vision. Proceedings of the National Academy of Sciences ofthe United States of America, 108, E626. doi: 10.1073/pnas.1111007108.
Rawlings, J. O. (1988). Applied regression analysis. Pacific Grove, CA: Wadsworth & Brooks.
Rowe, G., Wright, G., & Bolger, F. (1991). Delphi: A re-evaluation of research and theory. TechnologicalForecasting and Social Change, 39, 235–251.
Simons, A. M. (2004). Many wrongs: The advantage of group navigation. Trends in Ecology & Evolution,19, 453–455.
Smith, M. K., Wood, W. B., Adams, W. K., Wieman, C., Knight, J. K., Guild, N., & Su, T. T. (2009).
Why peer discussion improves student performance on in-class concept questions. Science, 323, 122–124.
Soll, J. B., & Larrick, R. P. (2009). Strategies for revising judgment: How (and how well) people use others’
opinions. Journal of Experimental Psychology. Learning, Memory, and Cognition, 35, 780–805.Steyvers, M., Lee, M., Miller, B., & Hemmer, P. (2009) The wisdom of crowds in the recollection of order
information. In J. Lafferty & C. Williams (Eds.) Advances in Neural Information Processing Systems (pp.
1785–1793). Cambridge, MA: MIT Press.
Stoner, J. A. F. (1961). A comparison of individual and group decisions involving risk. (Unpublished
master’s thesis, Massachusetts Institute of Technology, 1961).
Sumpter, D. J. T., Krause, J., James, R., Couzin, I. D., & Ward, A. J. W. (2008). Consensus decision making
by fish. Current Biology, 18, 1773–1777.Sumpter, D. J. T. (2010). Collective animal behavior. Princeton, NJ: Princeton University Press.
Surowiecki, J. (2004). The wisdom of crowds: Why the many are smarter than the few and how collectivewisdom shapes business, economies, societies and nations. New York: Doubleday.
Turner, B., & Steyvers, M. (2011). A wisdom of the crowd approach to forecasting. 2nd NIPS workshop on
Computational Social Science and the Wisdom of Crowds.
Vul, E., & Pashler, H. (2008). Measuring the crowd within: Probabilistic representations within individuals.
Psychological Science, 19, 645–647.Walraff, H. G. (1978). Social interrelations involved in migratory orientation of birds: Possible contribution
of field studies. Oikos, 30, 401–404.Ward, A. J. W., Sumpter, D. J. T., Couzin, I. D., Hart, P. J. B., & Krause, J. (2008). Quorum decision-
making facilitates information transfer in fish schools. Proceedings of the National Academy of Sciencesof the United States of America, 105, 6948–6953.
Wilensky, U. (1999) NetLogo. http://ccl.northwestern.edu/netlogo/. Center for Connected Learning and
Computer-Based Modeling, Northwestern University. Evanston, IL.
Wilensky, U., & Stroup, W., (1999) HubNet. http://ccl.northwestern.edu/netlogo/hubnet.html. Center for
Connected Learning and Computer-Based Modeling, Northwestern University. Evanston, IL.
Wisdom, T. N., Song, X., & Goldstone, R. L. (2013). Social learning strategies in a networked group.
Cognitive Science, 37, 1383–1425.Yaniv, I. (1997). Weighting and trimming: Heuristics for aggregating judgments under uncertainty.
Organizational Behavior and Human Decision Processes, 69, 237–249.Yaniv, I. (2004). Receiving other people’s advice: Influence and benefit. Organizational Behavior and
Human Decision Processes, 93, 1–13.Yaniv, I., & Choshen-Hillel, S. (2012). Exploiting the wisdom of others to make better decisions: Suspending
judgment reduces egocentrism and increases accuracy. Journal of Behavioral Decision Making, 5, 427–534.
Yaniv, I., & Milyavsky, M. (2007). Using advice from multiple sources to revise and improve judgments.
Organizational Behavior and Human Decision Processes, 103, 104–120.
492 B. Granovskiy et al. / Topics in Cognitive Science 7 (2015)

AppendixTrivia questions asked in the experiments and correct answers
Question
Correct
Answer
What percent of people in the U.S. over the age of 25 have obtained a college degree? 24
What percent of U.S. women age 25 and older have completed high school? 85
What percent of the worldwide use of energy is by the United States? 26
What percent of the worldwide population lives in the United States? 5
What percent of U.S. energy consumption is with fossil fuels? 78
In 2000, the richest 1% of adults owned what percentage of the world’s total assets? 40
What percentage of Americans are age 0–14? 20
What percentage of Americans are Protestant? 51
What percentage of Americans are black? 13
What percentage of Americans over the age of 15 can read and write? 99
What percentage of the American population is below the poverty line? 12
In 2005, what was the U.S. military expenditure as percent of the national income? 4
What percentage of people in the world are age 0–14? 27
What percentage of people in the world are Christian? 33
Across the world, what percentage of people’s first language
is Mandarin (a dialect of Chinese)?
13
Across the world, what percentage of people over the age of 15 can read and write? 82
Across the world, what percentage of the world labor force
is in agriculture (not industry or services)?
40
What percentage of the world’s surface is water (not land)? 71
What percentage of people in the world are aged 65 or over? 8
What percentage of people in the world are Muslim? 21
What percentage of college freshmen have never used a typewriter? 90
What percentage of the U.S. population will eat macaroni and
cheese sometime in the next 2 weeks?
33
What percentage of Americans drink a soda pop nearly every day with breakfast? 17
In the United States, what percentage of households routinely speak a
language other than English?
18
In the United States, what percentage of firms are owned by women? 28
What percentage of American men serve time in prison at some point in their life? 11
What percentage of Americans are regular cigarette smokers? 21
What percentage of Americans have no health insurance? 15
What percentage of children diagnosed with cancer make a full recovery? 70
What percentage of a woman’s body consists of water? 51
What percentage of people grind their teeth while sleeping? 20
What percentage of the earth’s water is fresh (not salt) water? 2
What percentage of people struck by lightning immediately die? 20
What percentage of Americans are left-handed? 10
What percentage of the total number of bones in the human body are in the feet? 27
What percentage of Utah’s population is Mormon? 69
B. Granovskiy et al. / Topics in Cognitive Science 7 (2015) 493