integration of active and passive cool roof system
118
INTEGRATION OF ACTIVE AND PASSIVE COOL ROOF SYSTEM FOR ATTIC TEMPERATURE REDUCTION IN GUARDHOUSE LINGESWARAN A/L SUNDARAMOORTHY A project report submitted in partial fulfilment of the Requirements for the award of Bachelor of Engineering (Honours) Mechanical Engineering Lee Kong Chian Faculty of Engineering and Science University Tunku Abdul Rahman April 2020
-
Upload
khangminh22 -
Category
Documents
-
view
2 -
download
0
Transcript of integration of active and passive cool roof system

INTEGRATION OF ACTIVE AND PASSIVE COOL ROOF SYSTEM
FOR ATTIC TEMPERATURE REDUCTION IN GUARDHOUSE
LINGESWARAN A/L SUNDARAMOORTHY
A project report submitted in partial fulfilment of the
Requirements for the award of Bachelor of Engineering
(Honours) Mechanical Engineering
Lee Kong Chian Faculty of Engineering and Science
University Tunku Abdul Rahman
April 2020

i
DECLARATION
I hereby declare that this project report is based on my original work except for
citations and quotations which have been duly acknowledged. I also declare
that it has not been previously and concurrently submitted for any other degree
or award at UTAR or other institutions.
Signature :
Name : Lingeswaran A/L Sundaramoorthy
ID No. : 1505082
Date : 18/05/2020

ii
APPROVAL FOR SUBMISSION
I certify that this project report entitled “COOL ROOF SYSTEM FOR
GUARDHOUSE” was prepared by LINGESWARAN A/L
SUNDARAMORRTHY has met the required standard for submission in
partial fulfilment of the requirements for the award of Bachelor of Engineering
(Honours) Mechanical Engineering at University Tunku Abdul Rahman.
Approved by,
Signature :
Supervisor : Dr. Yew Ming Chan
Date : 18/05/2020

iii
The copyright of this report belongs to the author under the terms of the
copyright Act 1987 as qualified by Intellectual Property Policy of University
Tunku Abdul Rahman. Due acknowledgement shall always be made of the use
of any material contained in, or derived from, this report.
© 2020, Lingeswaran. All right reserved.

iv
ACKNOWLEDGEMENTS
I would like to take this opportunity to express my utmost gratitude towards
everyone that have been contributory and supportive in the successful
completion of this research. First of all, I would like to express my deep sense
of gratitude to my research supervisor, Dr. Yew Ming Chan his invaluable
advice and guidance throughout the research. His sincere guidance and
enormous patience from scratch were the major factors contributing towards the
completion of this research.
Moreover, I would like to sincerely thank the lab officers for preparing
the appropriate equipment required to carry out this research, despite of their
busy schedules. Without their guidance and assistance, this research would have
not come to a completion.
Furthermore, I would like to express my appreciations and thankfulness
to Dr. Liang Meng Suan and Mr. Cheong Wen Chiet, are my moderators for this
project. They had rectified my mistakes, both in my report and presentation and
they had also given great suggestions during the presentation in order for me to
improve the quality of my thesis.
In addition, I would also like to take this opportunity to express my
gratitude towards my parents and my entire family for the constant
encouragement as well as for financially supporting me throughout the
completion of my degree. Not forgetting, I would like to sincerely thank my
friends who had been constantly helping and guiding me throughout this
research. As a whole, I had managed to complete my final year project on time.
My appreciation also extend to my friends and senior.

v
ABSTRACT
This research project investigates the cooling effect of a roof system which is
designed to enhance the comfort ability of guardhouse occupants with attic
temperature reduction. Malaysia is considered as an equatorial climate country
which having a hot-humid climate all the year. Therefore, an ideal cool roof
system was developed with the implementation of thermal reflection coating
(TRC), vacuumed rockwool insulation, polished aluminium sheet and solar
powered fan for ventilation system as a space cooling device for houses in
Malaysia. The selection of an efficiency cool roof system is carried out with a
total of eight models fabricated and experimented for each aspect of heat
transfer mechanisms (conduction, convection and radiation). The design that
shows the best cooling efficiency is selected and implemented into the main
design which is design X. The model simulation was carried out in a heating
chamber by utilising the halogen lamp as the replacement for solar irradiation
provided by the sun. Two passive cooling method were introduced in this
research project which are vacuumed rockwool insulation and polished
aluminium sheet. For vacuumed insulation, it was able to reduce 1.75 °C
compared to normal insulation. For polished aluminium, sheet it was able to
reduce 1.5 °C compared to unpolished aluminium sheet. Besides that, one active
cooling method was introduced which is solar powered fan. The solar powered
fan is consider as forced convection. Where it was compared to a ventilation
hole which is consider natural convection. Hence from the results forced
convection was able to reduce 1.25 °C more than natural convection. The result
of this eco-friendly cool roof system (design X) has successfully reduced the
attic temperature by 8.5 °C compared to the normal roof model (design A). As
a result, this integrated cool roof design comprises the ability to enhance the
comfort of guardhouse occupants with sustainable renewable energy.

vi
TABLE OF CONTENTS
DECLARATION i
APPROVAL FOR SUBMISSION ii
ACKNOWLEDGEMENTS iv
ABSTRACT v
TABLE OF CONTENTS vi
LIST OF TABLES ix
LIST OF FIGURES x
LIST OF SYMBOLS / ABBREVIATIONS xiv
LIST OF APPENDICES xv
CHAPTER
1 INTRODUCTION 1
1.1 General Introduction 1
1.2 Importance of the Study 4
1.3 Problem Statement 4
1.4 Aim and Objectives 7
1.5 Scope and Limitation of the Study 7
1.6 Contribution of the Study 8
1.7 Outline of the Report 8
2 LITERATURE REVIEW 9
2.1 Introduction 9
2.2 Active cooling systems 9
2.2.1 Solar powered fan and open attic inlet 10
2.3 Passive cooling system 11
2.3.1 Moving air-cavity (MAC) 11
2.3.2 Thermal Insulation 13
2.3.3 Thermal insulation coating (TIC) 15
2.3.4 Radiant heat barriers (RHB) 17
vii
2.4 Evaporative cooling 18
2.4.1 Direct evaporating cooling (DEC) 19
2.4.2 Indirect evaporating cooling (IEC) 20
2.4.3 Building integration of evaporative
cooling 21
3 METHODOLOGY AND WORK PLAN 23
3.1 Introduction 23
3.2 Modal Dimension Analysis 23
3.3 Outer part cooling technology implemented 24
3.3.1 Thermal reflection coating (TRC) 24
3.4 Inner part cooling technologies implemented 25
3.4.1 Conduction heat barrier 25
3.4.2 Convection Heat barrier 29
3.4.3 Radiant heat barrier. (RHB) 32
3.5 Layouts of experiments 34
3.5.1 Normal roof system (Design A) 35
3.5.2 Roof coated with TRC (Design B) 35
3.5.3 Roof coated with TRC and Rockwool
Insulation (Design C) 35
3.5.4 Roof Coated with TRC and Vacuumed
rockwool insulation (Design D) 35
3.5.5 Roof coated with TRC and a ventilation
hole (Design E) 36
3.5.6 Roof coated with TRC and solar powered
Fan (Design F) 36
3.5.7 Roof Coated with TRC and aluminum
sheet (Design G) 36
3.5.8 Roof coated with TRC and polished
aluminum sheet (Design H) 36
3.5.9 Roof coated with TRC, vacuumed
rockwool insulation, polished aluminum
sheet and solar powered fan (Design X) 36
3.6 Set up of experiment 37
3.6.1 Heating chamber 37

viii
3.6.2 Sensor Location and data logger 40
3.7 Procedure (Setup of experiment) 43
4 RESULTS AND DISCUSSION 45
4.1 Introduction 45
4.2 Outer part cooling techniques 45
4.2.1 Normal Roof surface (Design A) 45
4.2.2 Roof Coated with TRC (Design B) 46
4.2.3 Comparison of attic temperature for
Design A and B 47
4.2.4 Comparison of roof surface temperature
for Design A and B 48
4.3 Inner part cooling techniques 49
4.3.1 Conduction heat barrier 49
4.3.2 Convection heat barrier 54
4.3.3 Radiant heat barrier 58
4.4 Summary 63
4.5 Main Design Configuration 63
4.5.1 Main design layout (Design X) 64
4.6 Results for design X 65
4.7 Comparison of attic temperature for all design 65
4.8 Heat transfer mechanism 67
4.9 Comparison of roof surface temperature for all
designs 69
4.10 Comparison of chamber temperature for all designs 71
4.11 Comparison for Active and Passive cooling system 71
4.12 Summary 72
5 CONCLUSIONS AND RECOMMENDATIONS 74
5.1 Conclusions 74
5.2 Recommendation for future work 75
REFERENCES 76
APPENDICES 80

ix
LIST OF TABLES
Table 2:1 Thermal conductivity of material (Jelle, 2011). 14
Table 4:1: Summary of selected design and temperature rise in attic space. 63
Table 4:2: Summary of designs. 73

x
LIST OF FIGURES
Figure 1:1: Shows convection of air (Dehghannya, et al., 2019). 1
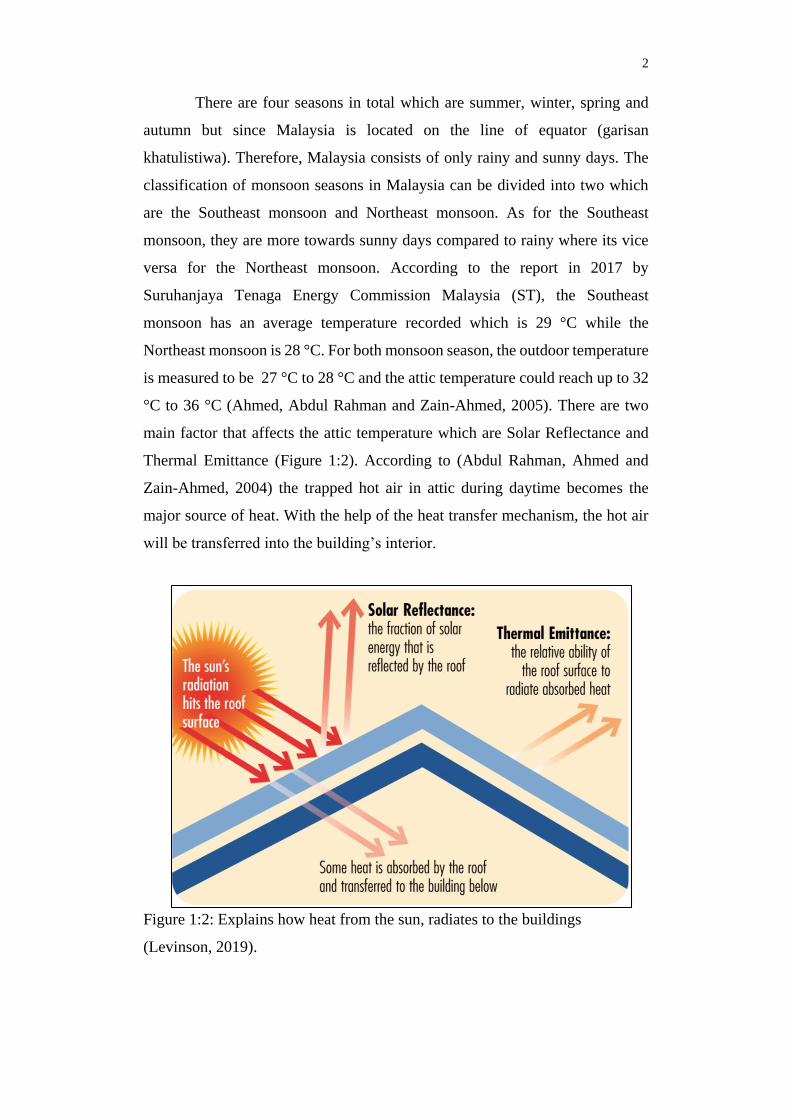
Figure 1:2: Explains how heat from the sun, radiates to the buildings
(Levinson, 2019). 2
Figure 1:3: Analysis of cool roof system (Mishra, 2016). 3
Figure 1:4: Average temperature recorded in Malaysia (Trading Economics,
2018). 5
Figure 1:5: Average electricity consumption in buildings in Malaysia during
2015 (ST, 2017). 5
Figure 1:6: Energy consumption and prediction for each source in Malaysia
(ST, 2017). 6
Figure 2:1: Flow of forced convection (Andrea, 2019). 9
Figure 2:2: The flow of air and label in roofing system (Yew, et al., 2013). 10
Figure 2:3: How air flow in natural convection system (Andrea, 2019). 11
Figure 2:4: Moving air channel aluminium tubes measurements (Yew, et al
., 2013). 12
Figure 2:5: Image of polyurethane (Mahlia, et al., 2007). 14
Figure 2:6: Image of EPS (left) and XPS (right) (Mahlia, et al., 2007). 15
Figure 2:7: Image of Rockwool (left) and Fibreglass (right) (Mahlia, et al.,
2007). 15
Figure 2:8: Roof coated with TIC (b) and uncoated roof (a) (Yew, et al.,
2013). 16
Figure 2:9: Passive solar roof designs (Ong, 2011). 18
Figure 2:10: Evaporative process for DEC (Chan, Riffat and Zhu, 2010). 20
Figure 2:11: Evaporative process for IEC (Chan, Riffat and Zhu, 2010). 20
Figure 2:12: Evaporative cooling results on implementation of roof
materials (Chan, Riffat and Zhu, 2010) . 22
Figure 3:1: Small scale roof model. 23

xi
Figure 3:2: Dimension of attic model (all dimensions in the figure is in
mm). 24
Figure 3:3: Image of titanium dioxide powder. 24
Figure 3:4: Uncoated galvanized roof (left) and Coated galvanized roof
(right). 25
Figure 3:5: Rockwool inside plastic cover. 27
Figure 3:6: The location of Rockwool in attic model (all dimensions in the
figure is in mm). 27
Figure 3:7: Process of vacuuming Rockwool insulation. 29
Figure 3:8: Location of vacuumed Rockwool in attic model (all dimensions
in the figure is in mm). 29
Figure 3:9: Location of ventilation hole in attic model (all dimensions in
the figure is in mm). 31
Figure 3:10: Current divider circuit and calculations. 31
Figure 3:11: Attic fan installed in attic model with double side tape. 32
Figure 3:12: Location of aluminium sheet in attic model (all dimensions in
the figure is in mm). 33
Figure 3:13: Polished (left) and unpolished (right) aluminium sheets. 34
Figure 3:14: 9 layout of attic models (all dimensions in the figure is in
mm). 37
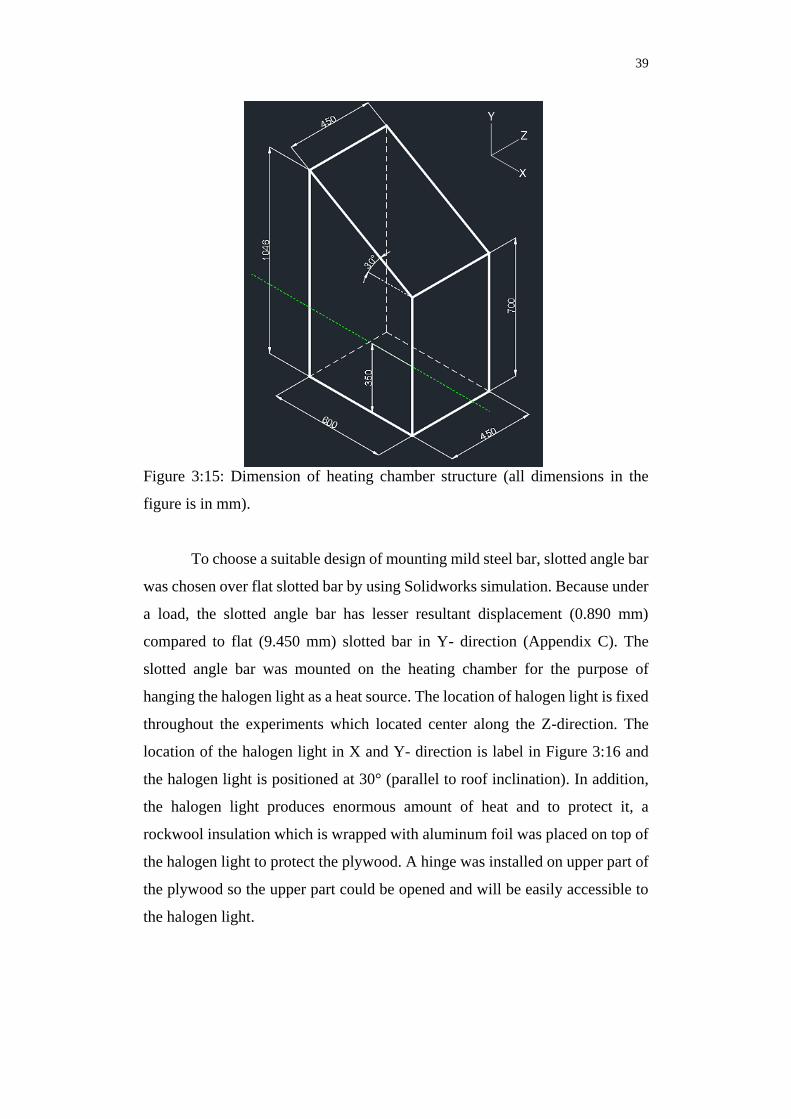
Figure 3:15: Dimension of heating chamber structure (all dimensions in the
figure is in mm). 39
Figure 3:16: Location of halogen light and angle bar in X and Y- direction
(all dimensions in the figure is in mm). 40
Figure 3:17: Roof sensor location in real image (Top view). 42
Figure 3:18: Location of T1 and T2 sensor in drawings, Side view (left)
and front view (right) (all dimensions in the figure is in mm). 42
Figure 3:19: Location and experiment for heating chamber sensor (all
dimensions in the figure is in mm). 43
Figure 3:20: Placement of attic model into heating chamber (all dimensions
in the figure is in mm). 44

xii
Figure 3:21: Real time experiment set up. 44
Figure 4:1: Temperature reading for design A. 46
Figure 4:2: Temperature reading for design B. 47
Figure 4:3 : Comparison of attic temperature for design A and B. 48
Figure 4:4: Comparison of roof surface temperature for design A and B. 49
Figure 4:5: Temperature reading for design C. 50
Figure 4:6: Temperature reading for design D. 51
Figure 4:7: Comparison of attic temperature for design C and D. 51
Figure 4:8: Heat flow through insulation (FluxTeq, 2019). 52
Figure 4:9: Comparison of roof surface temperature for design C and D. 53
Figure 4:10: Heat loss explanation of for roof deck. 54
Figure 4:11: Temperature reading for design E. 55
Figure 4:12: Temperature reading for design F. 56
Figure 4:13: Comparison of attic temperature for design E and F. 57
Figure 4:14: Comparison of roof surface temperature for design E and F. 58
Figure 4:15: Temperature reading for design G. 59
Figure 4:16: Temperature reading for design H. 60
Figure 4:17: Comparison of attic temperature for design G and H. 60
Figure 4:18: Comparison of roof surface temperature for design G and H. 62
Figure 4:19: Specular (left) and diffuse (right) heat reflection (Meola,
Boccasrdi and Carlomagno, 2017). 62
Figure 4:20: Combination of specular and diffuse heat reflection (Oleg,
2010). 63
Figure 4:21: Design X layout (all dimensions in the figure is in mm). 64
Figure 4:22: Temperature reading for design X. 65
Figure 4:23: Comparison of attic temperature for all designs. 66
xiii
Figure 4:24: Designs arranged in worst to best cooling order. 67
Figure 4:25: Heat transfer mechanisms for Passive cooling system. 68
Figure 4:26: Heat transfer mechanisms for Active cooling system. 68
Figure 4:27: Comparison of roof surface temperature for all designs. 70
Figure 4:28: Designs arranged in lowest to largest temperature rise. 70
Figure 4:29: Comparison of chamber temperature of all designs. 71
Figure 4:30: Comparison between Active and Passive cooling system for
all designs. 72
Figure 5:1: Button magnet thermocouple. 75

xiv
LIST OF SYMBOLS / ABBREVIATIONS
cp specific heat capacity, J/(kgK)
h height, m
Kd discharge coefficient
M mass flow rate, kg/s
P pressure, kPa
Pb back pressure, kPa
R mass flow rate ratio
T temperature, K
v specific volume, m3
homogeneous void fraction
pressure ratio
density, kg/m3
compressible flow parameter
ID inner diameter, m
MAP maximum allowable pressure, kPa
MAWP maximum allowable working pressure, kPa
OD outer diameter, m
RV relief valve

xv
LIST OF APPENDICES
APPENDIX A: Temperature tabulated for all designs 80
APPENDIX B: Adruino Data Logging’s Coding 95
APPENDIX C: Solidworks Displacement Simulation 97
APPENDIX D: Material Selection Criteria 99
APPENDIX E: Alternative Cooling System Design 101

1
CHAPTER 1
1 INTRODUCTION
1.1 General Introduction
It is a common scenario in Malaysia where it is essential to have a guardhouse
placed at housing areas. As per norm, guardhouse is found to be placed at the
entrance. A certain criteria that makes a guardhouse is the area needed, number
of floors which is usually one, roof and walls. The roof plays a major role in
preventing the radiated heat from the sun entering the interior of guardhouse.
According to (Dehghannya, et al., 2019), the density of air is being altered
with the change of temperature, pressure and humidity whereby the cool air
becomes denser than warm air. Cool air is proven to be denser than warm air
due to the closely packed molecules. This causes the bond to absorb less energy
that leads to limited movement of the molecules. This causes the warm air to
rise and cool air to sink (Figure 1:1). The main reason the warm air rises is
because the cool air pushes the warm air up as it sinks. This process is called
the convection current. The second law of thermodynamics states that the heat
always flows from hot to cold. For example, ice cube melts (absorb heat) in the
process of changing phase from solid to liquid. It is still possible to make a cool
object remain cool in a warm environment such as refrigerator, but it requires
electrical energy.
Figure 1:1: Shows convection of air (Dehghannya, et al., 2019).
2
There are four seasons in total which are summer, winter, spring and
autumn but since Malaysia is located on the line of equator (garisan
khatulistiwa). Therefore, Malaysia consists of only rainy and sunny days. The
classification of monsoon seasons in Malaysia can be divided into two which
are the Southeast monsoon and Northeast monsoon. As for the Southeast
monsoon, they are more towards sunny days compared to rainy where its vice
versa for the Northeast monsoon. According to the report in 2017 by
Suruhanjaya Tenaga Energy Commission Malaysia (ST), the Southeast
monsoon has an average temperature recorded which is 29 °C while the
Northeast monsoon is 28 °C. For both monsoon season, the outdoor temperature
is measured to be 27 °C to 28 °C and the attic temperature could reach up to 32
°C to 36 °C (Ahmed, Abdul Rahman and Zain-Ahmed, 2005). There are two
main factor that affects the attic temperature which are Solar Reflectance and
Thermal Emittance (Figure 1:2). According to (Abdul Rahman, Ahmed and
Zain-Ahmed, 2004) the trapped hot air in attic during daytime becomes the
major source of heat. With the help of the heat transfer mechanism, the hot air
will be transferred into the building’s interior.
Figure 1:2: Explains how heat from the sun, radiates to the buildings
(Levinson, 2019).
3
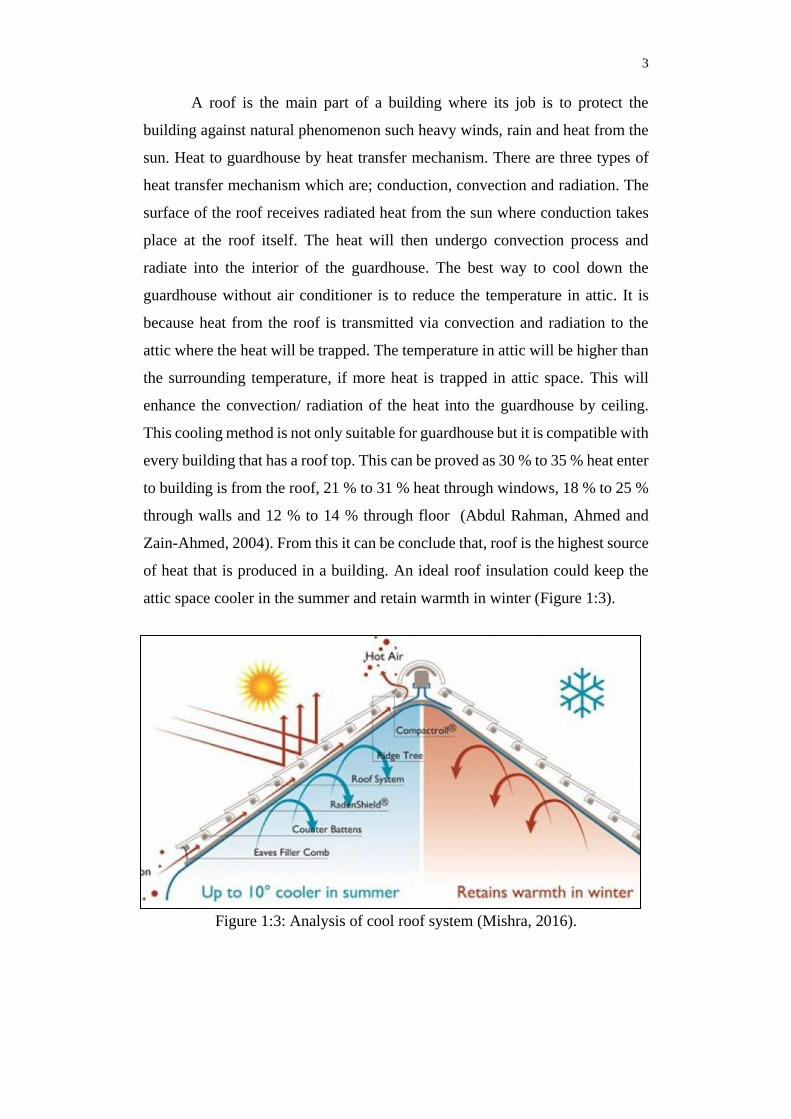
A roof is the main part of a building where its job is to protect the
building against natural phenomenon such heavy winds, rain and heat from the
sun. Heat to guardhouse by heat transfer mechanism. There are three types of
heat transfer mechanism which are; conduction, convection and radiation. The
surface of the roof receives radiated heat from the sun where conduction takes
place at the roof itself. The heat will then undergo convection process and
radiate into the interior of the guardhouse. The best way to cool down the
guardhouse without air conditioner is to reduce the temperature in attic. It is
because heat from the roof is transmitted via convection and radiation to the
attic where the heat will be trapped. The temperature in attic will be higher than
the surrounding temperature, if more heat is trapped in attic space. This will
enhance the convection/ radiation of the heat into the guardhouse by ceiling.
This cooling method is not only suitable for guardhouse but it is compatible with
every building that has a roof top. This can be proved as 30 % to 35 % heat enter
to building is from the roof, 21 % to 31 % heat through windows, 18 % to 25 %
through walls and 12 % to 14 % through floor (Abdul Rahman, Ahmed and
Zain-Ahmed, 2004). From this it can be conclude that, roof is the highest source
of heat that is produced in a building. An ideal roof insulation could keep the
attic space cooler in the summer and retain warmth in winter (Figure 1:3).
Figure 1:3: Analysis of cool roof system (Mishra, 2016).

4
1.2 Importance of the Study
The findings of this study contribute greatly to society and the future. A proper
research is carried out to identify ways to reduce the temperature of a building
by minimizing or using zero non-renewable resources that can preserve the
environment. With the invention of cool roof system, the energy demand will
be reduced drastically and also provide comfortable work space for the people
in the building. As mention in the introduction, this cooling method is not only
suitable for guardhouse but also compatible with every building that has a roof
top.
The main aim of this research is to reduce each aspect of heat transfer
mechanism, in terms of conduction, convection and radiation. As a results,
thermal insulation, attic fan, and radiant heat barrier will be applied to reduce
the temperature in the guardhouse. In addition, the thermal reflection coating
will be applied on the surface to study the effect on the attic temperature.
1.3 Problem Statement
Global warming is becoming a serious issue in the world. The oceans and
atmosphere getting warmer, the snow and ice volumes have decreased, sea
levels has increased, and greenhouse gas concentrations has risen. Nearly the
whole globe has undergone global warming based on the recent changes in
surface temperature. Malaysia is no exception as the temperature over here has
been increasing over the decade. To prove this statement, (Trading Economics,
2018) has recorded the average temperature of Malaysia since 2009 to 2018.
Figure 1:4 shows the recorded average temperature from 2009 to 2018. Based
on Figure 1:4, year 2009 has an average temperature of only 27.8 °C. After 5
years in year 2014, the temperature rises till 30.6 °C and in year 2018 the
average temperature was 32.4 °C. According to data collected, the temperature
is rising exponentially.

5
Figure 1:4: Average temperature recorded in Malaysia (Trading Economics,
2018).
Malaysia faces hot-humid weather all year round and in most towns the
monthly mean air temperature and humidity is almost unchanged. As seen in
Figure 1:5, cooling is the major consumption of electricity in Malaysia building
in year 2015. The reason why cooling need high consumption of electricity is
because the temperature of the building is high and causes discomfort to the
people. In order to solve this issue, air-conditioner (cooling) is used to achieve
their thermal comfort. High usage of air- conditioner leads to consequences
where it causes an increase in global warming. According to ST (2017), stated
that a standard air-conditioner is the largest contributor of electricity
consumption with an average recording of 1,167 kWh of electricity.
Figure 1:5: Average electricity consumption in buildings in Malaysia during
2015 (ST, 2017).

6
Furthermore, based on Figure 1:6, it is stated that energy consumption
has been increasing since year 1990 as well as the consumers. According to
(World Bank, 2018), over the past 50 years, the total population has increased
from 18 million in 1990 to 30.2 million in year 2015. As mention earlier, air-
conditioner consumes a lot of electricity hence, according to ST (2017), states
that a standard air-conditioner need 296 ktoe per year to produce energy. That
is a lot of gas emission to the atmosphere by burning crude oil to produce energy.
According to (Kubota, Jeong and Dorris, 2009), in Malaysia one household will
have at least one unit of air conditioner. Moreover, our three main source of
electricity production is oil, coal and gas. These three are non- renewable source.
The worst part of this scenario is three of these sources produce by-product
when it is burnt, which leads to global warming. In Malaysia, Renewable and
Nuclear energy is utilized less even though they do not produce greenhouse
gases.
Figure 1:6: Energy consumption and prediction for each source in Malaysia
(ST, 2017).
Achieving a thermal comfort without the use of active energy
consumption measures is a major challenge for hot and humid environments.
Studies have shown that these climatic circumstances area requires ventilation
and dehumidification (Abdul Rahman, Ahmed and Zain-Ahmed, 2004).
Humidity concentrations play an important part in the ability of evaporation of
air. When the humidity is high, the increase of vapour pressure prevents
7
evaporation and restricts the cooling impact unless there are greater air
velocities. Moreover, according to (Trading Economics, 2018) has reported the
average humidity in Malaysia is 87 %. Besides that, guardhouse also would
have workers who is responsible for safety of its corresponding housing area.
According to (Nidhi, 2018), the temperature of the workplace affects the
productivity of the workers. High temperature distracts the workers from
concentrating on their work. Therefore, this research identifies the right
temperature to work in which is around 22 °C to 24 °C and it is a major challenge
to achieve this temperature without using an air-conditioner.
1.4 Aim and Objectives
The aim of this research is to analyse the efficiency of reduction in temperature
of the attic spaces in the guardhouse in order to improvise the interior factor of
the building spaces in both hot and humid environment. The findings of this
research can be used for further improvisation of cooling systems of similar
functions that is currently being developed. In order to achieve the aim, the
specific objectives of this study are defined:
1. To design and fabricate the cool roof system models for roof and attic
temperatures measurement.
2. To evaluate the performance of the cool roof system that is implemented
by the integration of thermal insulation coating, insulation material,
radiant heat barrier material and heat removal using convection method.
1.5 Scope and Limitation of the Study
In this research, the scope covers the efficiency to cool the guardhouse and
improvisation of the existing cooling system in order to remove heat more
efficiently along with exploring plenty of new ways or technology to cool the
guardhouse. It also includes the knowledge on how heat transfer mechanism
works and how naturally heat travels in the environment. In this research there
are some limitations;
1. There a lot of types of roof material. The data obtained from the research
might differ for different roof material.

8
2. In Malaysia the weather is not constant throughout the year, considering
the temperature, humidity and wind speed. Hence the data obtained from
this research wouldn’t be very accurate when applied outdoor.
3. For roof building there are many types of structure and different types
of inclination of roof. Moreover, in this research only 30° inclination and
pitched type roof is studied. Hence, the date obtained in this research
varies if applied to different types of roof and inclination.
4. The method in this research is more efficient for cooling system and will
not be suitable for heating system (winter/cold countries).
1.6 Contribution of the Study
The contribution of this study will lead to the ways of cooling method and to
reduce temperature in attic space. Besides that, with less consumption of energy,
thermal comfort for people in the building could be achieved easily.
Furthermore, this study explains how heat flow into the building and how heat
mechanisms works. In addition, in this study only renewable energy powered
cooling system is utilized for sustainable development approaches.
1.7 Outline of the Report
In this report, there are five chapters. Chapter 1 is mainly about introduction of
this research. In chapter 2, literature review will be discussed based on active
and passive cooling system. Chapter 3 shows how this study has been done and
what cooling method is applied. In chapter 4 shows the results obtained from
implementing cooling system and comparison of which cooling system works
efficiently and selecting the best design. Chapter 5 is about how the attic model
reduces the attic temperature when being implemented in the selected design.
Chapter 6 is mainly about recommendation and conclusion of this study.

9
CHAPTER 2
2 LITERATURE REVIEW
2.1 Introduction
In this chapter, a brief explanation of the cooling mechanism system, working
mechanism, different types and designs of cooling system will be discussed.
2.2 Active cooling systems
An active cooling system is a cooling system that depends on an external device
such as electric fan to improve the transfer of heat. In other words, active cooling
means forced convection (Figure 2:1). The rate of liquid flow rises during
convection through active cooling systems, which significantly improves the
rate of thermal removal. Forced air out or in through a fan or blower, and also
forced liquid and thermoelectric coolers (TECs) are active cooling methods that
can be used to enhance thermal management at all levels. Fans are utilized when
there is inadequate natural convection to remove heat. Active cooling system’s
primary limitation is that it involves the use of electricity, resulting in greater
expenses compared to passive cooling.
Figure 2:1: Flow of forced convection (Andrea, 2019).

10
2.2.1 Solar powered fan and open attic inlet
Solar powered fan would not use any electricity and an open attic inlet would
be similar to the Figure 2:2. Solar powered fan would not need any electricity
because it is dependent on sunlight. According to (Yew, et al., 2018), solar
powered fans have been used to improve the airflow rate within the cavity by
pulling out heat before being transferred to the attic. Solar powered fan only
works when there is sunlight available. The disadvantage of solar powered fan
is it does not function without sunlight. The roof needs to be cooled down when
there is sunlight because sunlight is the main cause of increase in the
temperature of attic. During night or cloudy/rainy days, the temperature of the
attic would not be high compared to sunny days. Hence, the solar powered fan
will turn on automatically where there is sunlight and it will extract hot air from
inside to outside of the attic. This will reduce the temperature in the attic, as
well as the energy usage of air conditioner. Even though the solar powered fan
malfunctions, buoyancy in the air still remain whereby when the temperature
rises, the hot air will eventually rise and escape through the open attic (Chong,
et al., 2011). However, it would not be efficient without the solar powered fan
as well as the open attic inlet. With solar fan and open attic inlet the cooling of
the attic will be efficient.
Figure 2:2: The flow of air and label in roofing system (Yew, et al., 2013).

11
2.3 Passive cooling system
Passive cooling is a building design strategy that emphasize on the controlling
of heat gain and heat dissipation in a construction to enhance thermal comfort
with reduced or no power consumption. In other words, passive cooling means
natural convection (Figure 2:3). This strategy operates either by not allowing
heat to enter the interior (prevention of heat gain) or by eliminating heat from
the building (natural cooling). With the combination of the structural design of
building part’s natural cooling make use on-site energy from the atmosphere,
rather than mechanical heat dissipation technologies. Therefore, natural cooling
relies not only on the building's structural design, but also on how the natural
resources of the site are used (i.e. all that absorbs or dissipates heat). Compared
to active cooling methods, passive cooling methods have the benefits of energy
efficiency and reduced economic costs.
Figure 2:3: How air flow in natural convection system (Andrea, 2019).
2.3.1 Moving air-cavity (MAC)
The usage of cavities are equivalent to using an insulating material in the
concept. If an air space in any building is left between two layers in making a
ceiling or a roof, between the two layers the trapped air acts as a heat transfer
boundary. Through a combination of convection, radiation and conduction heat
is transmitted through an air room. Convection primarily relies on the height
and depth of the air space. For radiation heat transfer is relatively independent
of height and thickness but highly dependent on the reflectivity of the inner
surface. Transfer of heat by conduction is inversely proportional to the depth of

12
air space. If natural air flow is overlooked, the mathematical treatment of air
cavity would be equivalent to that of the insulation. The thickness of an air
cavity is a very important design parameter that regulates its efficiency by
regulating the coefficient of heat transfer as in the event of insulation. In the
research of (Yew, et al., 2013), a roof structure is designed where it can support
the aluminium tubes (Figure 2:4) under the roof. Based on Figure 2:4 the
aluminium tube is designed with diameter of 66 mm and 110 mm length for
each aluminium tube. Each aluminium tube was attached using epoxy glue. The
function of the aluminium tube is to act as moving air cavity where it forces the
hot air flow through the cavity and let it exit through the base of the metal roof.
This concept is similar to the studies of (Chong, et al., 2011). This study actually
tells that the presence of the air buoyancy enables the rise of hot air. The moving
air from the outside guides the air to the ridge in the room before it is released
to the outside of the building. By this, the attic would be cooler, and the heat
would not be transferred to living area. Hence, this will reduce the consumption
of air conditioner where it also saves cost of electricity.
Figure 2:4: Moving air channel aluminium tubes measurements (Yew, et al.,
2013).
13
2.3.2 Thermal Insulation
Insulation materials have countless microscopic dead air cells that block air
from moving within the framework of the material. Air immobility inside the
insulation material allows the transfer of heat to be delayed. Consequently, an
insulation material's heat resistance is not obtained by the material itself, but by
the air trapped within the framework of the material. Insulation materials also
block the transfer of heat by splitting heat radiation routes into short distances.
Long-wave infrared radiation is collected and dispersed by the insulation
material's closed framework of microscopic cells. Hence, a material of high
density with lower microscopic cells can be more efficiently prevent heat
transfer by radiation. Contrary to this, lower cells leading to the elevated level
of kinetic energy transfer between tiny cells in touch with each other, do not
stop heat transfer by conduction. The thermal resistance of an insulating
material is hence determined on the basis of its potential to prevent heat transfer
by three types: convection, radiation and conduction (Aditya, et al., 2017).
Thermal insulation has several benefits, one of it is environment. Thermal
insulation can bring advantage to environment by actually reducing the
pollutants. This occurs by adding thermal insulation in the building where it will
block the heat and reduce the air conditioner’s energy consumption. If air
conditioner consumption is reduced hence electricity and pollutants that release
to produce electricity also will be reduced. In addition, it also increases the
comfort of people in the building. Besides that, thermal insulation also provide
protection to the building. Rough climatic circumstances causes elevated
temperature alterations that can harm the structure of the house. High insulation
thermal resistance can reduce changes in temperature. As a result, building’s
durability is maintained and building structures’ lifespan is improved. In
addition, if the proper insulation material is chosen and mounted properly,
insulation materials can stop fire immigration into the construction in the case
of fire. In addition, insulation material can have extremely high melting point,
which makes them an excellent fire barrier. There are few types of heat
insulation that has relatively low thermal conductivity and frequently used are
explain below and listed in Table 2:1.

14
Table 2:1 Thermal conductivity of material (Jelle, 2011).
Material Thermal conductivity
PUR 0.02 to 0.03
XPS 0.03 to 0.04
EPS 0.03 to 0.04
Rockwool 0.03 to 0.04
Fibreglass 0.03 to 0.04
A chemical reaction between isocyanates and polyols, which are
alcohols comprising various hydroxyl groups, which is to create polyurethane
(PUR) (Figure 2:5). With an expansion gas such as HFC, CO2 and C6H12, it is
then extended the PUR.
Figure 2:5: Image of polyurethane (Mahlia, et al., 2007).
Expanded polystyrene (EPS) and extruded polystyrene (XPS) is two
common type of polystyrene (Figure 2:6). EPS consists of tiny polystyrene
spheres made of crude oil comprising of an expansion agent such as pentane
(C6H12) that expand if heated with water vapour. The expansion spheres are
connected together and cast as boards with a partially open pore model. Next,
XPS is produced of melted polystyrene by adding an expansion gas such as HFC,
CO2 and C6H12, where the mass of polystyrene that is extruded through a

15
pressure release nozzle, causing the mass to expand. It is created and sliced after
cooling in constant lengths. It has a pore structure that is closed.
Figure 2:6: Image of EPS (left) and XPS (right) (Mahlia, et al., 2007).
Fibreglass and stone wool (Figure 2:7) are two kinds of mineral wool.
Fibreglass is made of borosilicate glass heated at around 1400 °C and pulled to
produce fibres by rotating nozzles. Rockwool is produced from stone like
diabase or dolerite, which is heated at around 1500 °C until it melts where fibers
were created hurling out of a wheel or disk. For both fibreglass and rockwool,
fibers are bound together to improve their characteristics by adding dust
depletion oil and phenolic resin.
Figure 2:7: Image of Rockwool (left) and Fibreglass (right) (Mahlia, et al., 2007).
2.3.3 Thermal insulation coating (TIC)
Thermal insulation is a barrier for heat transfer. Its main function is to reduce
heat transfer between object in contact (conduction) or in distance of radiate
influence (radiation). More similar to thermal insulator, the only difference can
be found is thermal insulation in solid state and in TIC is in coating state. Figure
2:8 shows the roof was coated with TIC about 0.2 ± 0.05 mm thickness by using

16
gun spray. In the research of TIC, it has great advantage over the environment
where it has potential to reduce heat island phenomena and the release of carbon
dioxide (Yew, et al., 2013). The meaning of heat island is a phenomena where
built-up region (city) is hotter than rural regions. Example a city with a lot of
residence living can have an average annual air temperature 1 °C to 3 °C hotter
than its surrounding.
Figure 2:8: Roof coated with TIC (b) and uncoated roof (a) (Yew, et al., 2013).
According to (Yew, et al., 2013) , thermal insulation coating is not
similar as other insulation such as expanded polystyrene (EPS), glass wool,
extruded polystyrene (XPS) and rockwool. Those insulation required a thicker
or denser insulation to achieve great thermal resistance. TIC is a coating where
it is applied on top of the roof along with white solar reflective paint. TIC is
developed through the use of titanium dioxide pigment and unwanted chicken
eggshell as a bio-filler bounded by a low thermal conductivity polyurethane
resin binder. There is also great impact on environment using this chicken
eggshell where it could reduce wastage of eggshells. In the research of eggshell,
it was found that several tons of eggshell has sent to landfill and landfill are
costly to maintain (Hamideh and Akbar, 2018). From this recycling waste
eggshell into bio-filler, from useless trash into useful coating. The addition of
highly purify titanium dioxide would increase the solar reflective, by this it
would reflect heat radiated from the sun, the result is a cooler attic would
achieve.

17
2.3.4 Radiant heat barriers (RHB)
The term of Radiant heat barriers (RHB) is actually that an aluminium foil which
will be attached to the insulation layer which functions to strengthen the
insulation and to waterproof it. According to research by (Ong, 2011), it stated
that RHB actually helps to reduce the attic temperature by 5.5 °C and this
reduces the heat flow from the attic to the room below. To prove this statement,
he did an experiment of two similar house which is more likely like in the Figure
2:9. Ong (2011) stated that the percentage of heat flow produced by RHB in the
celling is conversely proportional to level of insulation in attic. Heat flows
reduce in ceiling from 26 % to 41 %, based on the insulation thickness.
(Winiarski and O’Neal, 1996) created an attic heat transfer proto-state model
with various radiant barrier configurations and insulation thickness. The
findings of their experiments showed that summer heat flux could be achieved
to reduce from 29 % to 37 %.
Experiment conducted by (Soubdhan, Feuillard and Bade, 2005) shows
that they bring up four similar scale downsize of horizontal roof of corrugated
iron sheets. The reason is to contrast the effect of using various insulating
materials such as RHB, fibreglass and polystyrene and also the impact of the
roof colour (black and white). Besides that, they also investigate the results of
ventilating the air space between both the bare roof top and the roof bottom.
Their findings showed that 86 % of the roof's heat load was due to radiation.
The white galvanized iron roof top achieves much better compared to black
galvanized iron roof. Regardless of the roof heat absorption, the radiation barrier
lowers the radiative heat flux significantly from 32 % to 36 %. As a result,
however, the heat flux that the radiant barrier reflects, raises the temperature of
the roof surface. In addition, the radiant barrier was more effective when the air
space was ventilated compared polystyrene or fibreglass isolation. Although the
air space was not ventilated, a decrease in heat flux was always given by the
radiant barrier. Polystyrene offers better heat transfer resistance compared to
fibreglass when the air space is not ventilated. Theoretical calculations
submitted to demonstrate that a significant reduction in heat load can be
accomplished in warm environments through the use of a bright or reflective
roof colour (Suehrcke, Peterson and Selby, 2008). To prove the statement,

18
(Amer, 2006) conducted an experiment with lab size cabinets with different
colour (black and white) galvanized roof top. For the white cabinet, he found
out that the inside temperature is reduced by 6.5 °C and reduced 7 °C for the
aluminium foil which laminate the 5 cm thick fibreglass. Investigation of
(Khedari, et al., 2000) and (Hirunlabh, et al., 2001) stated that the need for a
solar roof collector to evoke natural ventilation in house similar to Figure 2:9 f
section. Their investigation showed that even though the induced ventilation
rate was adequate to provide sufficient fresh air for ventilation needs, it
was inadequate to provide appropriate cooling for human comfort in the room.
It showed that the roof solar collector could accomplish power savings of more
than 30 % (Ciampi, Leccese and Tuoni, 2005).
Figure 2:9: Passive solar roof designs (Ong, 2011).
2.4 Evaporative cooling
Evaporative cooling is indeed the earliest cooling method and can be used in
both passive and active systems (Cuce and Riffat, 2016). Traditional mechanical
cooling systems requiring large power costs and damages the environment
which led experts to consider the best evaporative method and try to enhance its
performance (Mujahid Rafique, et al., 2015). It was consequently heavily
utilized in the air-conditioning model as an evaporative cooler or heat exchanger.
However, a building evaporative cooling integration is only a limited number

19
and yet to be developed. (Amer, Boukhanouf and Ibrahim, 2015) discovered
that evaporative cooling had the greatest cooling impact among some passive
cooling technologies, first would be solar chimney, which lowered indoor air
temperatures respectively by 9.5 °C and 8.4 °C. For cooling an air stream, the
evaporative cooling method utilizes water evaporation. Basically water absorbs
heat from the environment to evaporate into vapour. This lowers the air or
surrounding temperature. There two kind of evaporative cooling; Indirect and
direct evaporating cooling.
2.4.1 Direct evaporating cooling (DEC)
The fundamental concept of direct evaporative cooling is transformation to
latent heat from sensible heat. When water in the air vapour is evaporated, the
air will be cooled. The water in the air stream is constantly supplied and
recirculated so that the air removes the water and creates the impact of cooling.
According to (Chan, Riffat and Zhu, 2010), the heated air will be transmitted to
the water and became latent heat by evaporation of water and the latent heat
follows the vapour of water and spreads into the atmosphere. After the process,
the content of moisture of the supply air will increase. Figure 2:10 shows the
illustration of this process.
Direct evaporative cooling can give possibilities for power preservation
during advanced seasons in hot dry environments. The efficiency of the cooling
system decreases as the humidity in the air stream rises during the process.
Especially in very humid and hot environment , the cooling result may not be
satisfactory (Chan, Riffat and Zhu, 2010). To enhance the cooling efficiency,
the incoming air will be dehumidified by allowing it through a desiccant. A
mixture of air-drying membrane and evaporative cooling systems was
developed (Joudi and Mehdi, 2000). The membrane is made up of hollow fibers,
such as acetate cellulose and polysulfone. The selective membrane enables the
water vapour to be effectively separated from the air. Before entering the
evaporative cooling unit, the air is pre-treated (dried) by crossing through both
the membrane and operating in a drier air stream.

20
Figure 2:10: Evaporative process for DEC (Chan, Riffat and Zhu, 2010).
2.4.2 Indirect evaporating cooling (IEC)
Figure 2:11 illustrates the indirect evaporating cooling involves exchanging heat
with another flow of air. A heat exchanging wall separates these two air flows,
in which one side of the wall is moist and the other side is dry. According to
(Chan, Riffat and Zhu, 2010), the working air will be passing through the moist
side whereas the outcome air will be passing through the product parched
section and through water evaporation, the moist side absorbs heat from the dry
side as well as cools the dry side. The moist air flow includes latent heat while
sensible heat is involved in the dry air flow. Hence, no extra moisture is
therefore brought into the product air.
Figure 2:11: Evaporative process for IEC (Chan, Riffat and Zhu, 2010).

21
2.4.3 Building integration of evaporative cooling
Some of evaporative cooling's structure integration implementations is porous
roof. During rainy season, through porous layer which the rainwater enters is
kept/stored within the layer. During daytime the substantial quantity of
rainwater that the porous layer maintains will evaporate to the atmosphere.
When evaporation occurs, the surface temperature of the porous layer
reduces owing to the release of latent heat. This will reduce the building room
temperature due to reduce of heat flux from the roof slab. The porous layer tends
to adsorb moisture from the surrounding during the night or on rainy days and
helps to reduce the temperature roof components.
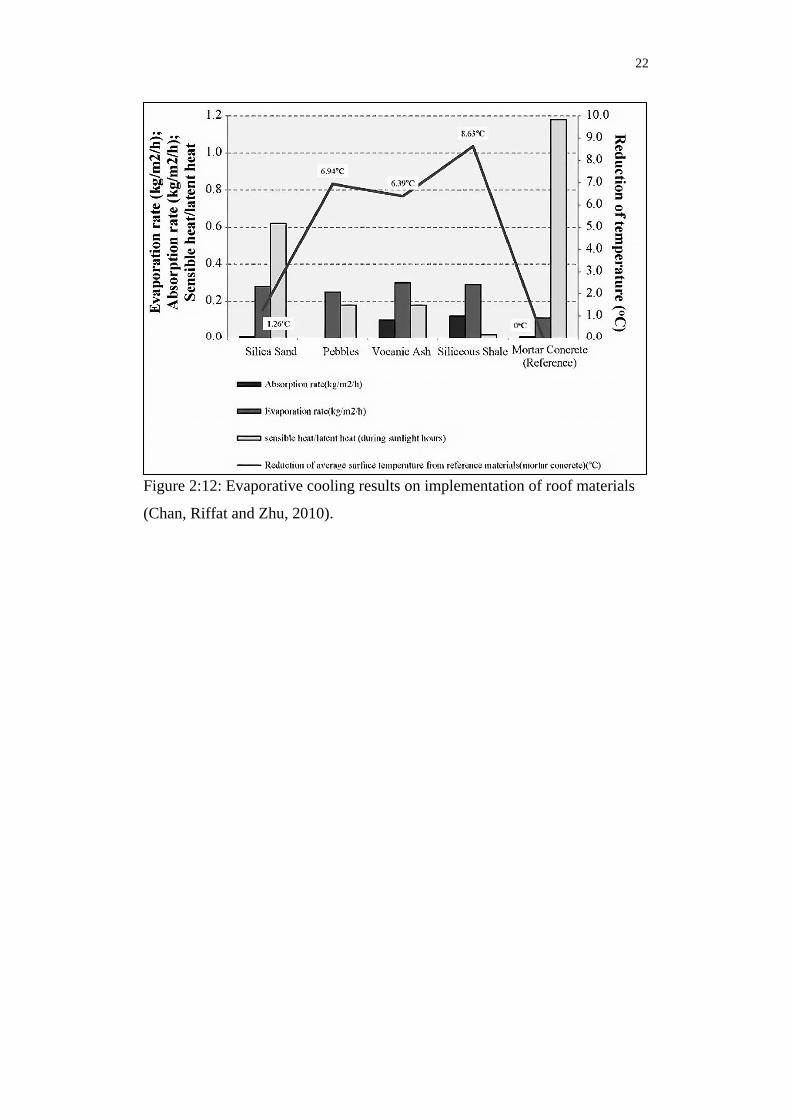
(Wanphen and Nagano, 2009) studied about the efficiency of evaporative
cooling roof materials and summarized the outcomes in Figure 2:12. Among the
materials studied, it is discovered that siliceous shale, consisting of a large
amount of mesopores, efficiently keeps surface moisture from vapour
adsorption and also this material has the highest evaporation performance. This
material can absorb more vapour during the night due to the elevated absorption
rate. Within porous layers of siliceous shale, the stored water from those in the
porous layer evaporates and produces more latent heat to the atmosphere during
light hours, as volcanic ash, rocks and silica sand produce more sensible heat
(smallest sensible heat / latent heat).
In addition, increased evaporation rate makes the surface cooler faster. As
a matter of fact, siliceous shale can lower the temperature of the roof surface to
8.62 °C especially in comparison with mortar concrete.
22
Figure 2:12: Evaporative cooling results on implementation of roof materials
(Chan, Riffat and Zhu, 2010).

23
CHAPTER 3
3 METHODOLOGY AND WORK PLAN
3.1 Introduction
A small scale of roof (Figure 3:1) was setup using plywood, to investigate the
heat transfer and the temperature difference on the surface of the roof and at the
attic. The shape of the roof model is right angle trapezoid. In this project, there
are two section which is the outer part (surface of roof) and inner part cooling
system. For outer part, the cooling technique used is roof coating and for inner
part there are three cooling techniques have been implemented: Conduction heat
barrier, Convection heat barrier and Radiant heat barrier.
Figure 3:1: Small scale roof model.
3.2 Modal Dimension Analysis
Using plywood, a small scale of roof structure was built. The dimension of the
structure is 360 mm long × 360 mm wide × 580 mm height. The thickness of
plywood is 15 mm. For this model, the angle of inclination of the roof was set
30° which measured from the horizontal plane to the perpendicular height of the
modal. Figure 3:2 shows the dimension of the small scale roof structure.

24
Figure 3:2: Dimension of attic model (all dimensions in the figure is in mm).
3.3 Outer part cooling technology implemented
In this section of methodology and work plan, explanation of cooling method
implemented on the surface of roof deck.
3.3.1 Thermal reflection coating (TRC)
TRC was formalize using titanium dioxide pigment and chicken eggshell waste
as a bio-filler. Then it was mixed polyurethane resin binder which has thermal
conductivity of 0.65 W/m.K. Not only that, titanium oxide has low thermal
conductivity (4.8 W/m.K) and it is white in colour, (Figure 3:3) which help
increases the insulating properties. Besides, white colour reflects more sunlight
compare to darker colour, so when most of the heat is reflected, the lesser heat
is radiated into the attic space.
Figure 3:3: Image of titanium dioxide powder.

25
In this experiment two galvanized roof was used, one is coated with TRC
and another is normal roof painted in red similar like in Figure 3:4. Each roof
with 45 cm long × 36 cm wide and with 0.5 mm thickness. The roof is placed
on top of the structure with the inclination of 30°. This is done in order to
compare how much heat is block/reduced with TRC and non-TRC.
Figure 3:4: Uncoated galvanized roof (left) and Coated galvanized roof (right).
3.4 Inner part cooling technologies implemented
In this section of methodology and work plan, explanation of cooling method
implemented in attic space.
3.4.1 Conduction heat barrier
The cooling techniques are emphasize on reducing conduction heat from
entering the attic space. This barrier material will have high heat resistance
which do not conduct heat, in other words it act as heat insulator. Conduction
conducts heat by transferring heat via particles that collides with each other.
This is why solids are better at conducting heat than liquid and gases. Liquid
and gases do conduct heat but not as well solids. This is because for fluids the
particles are wider way from each other for the collision to happen. Furthermore,

26
metals are the best conductor of all solids. This is because inside the metal there
is all these tiny electron whizzing around that are called the free delocalized
electrons. They will collide into all the ions in the metal and they can absorb
heat from the hot end and run straight down and collide into an atom at the cold
end. They’re spreading the heat through metal much quicker than non-metal
objects.
Normally the efficiency of this heat barrier will be in terms of R or U
value. The R-value is a measure of the heat transfer resistance by the thickness
of a given material. The higher the R-value, the higher the heat resistance the
material has and the greater the insulating properties thereof. As for U-value, it
is a measure of how much heat is lost by a given material's thickness which
covers the three main ways in which heat loss occurs – conduction, convection
and radiation. The lower the U-value the better the insulation properties of the
material. Calculating R-value is the most common way, but U-value are far
more accurate because it considering all the various ways in which heat loss
happens, however its more harder to quantify.
In this experiment, rockwool insulation is used as conduction heat
barrier. Rockwool is made of rock based mineral fiber insulation composed of
recycled slag and basalt rock. Basalt is a volcanic rock (abundant on earth), and
slag is a steel and copper by-product. The purpose of choosing this material is,
it is easily available because there is two production company in Malaysia itself.
In addition, rockwool theoretically has high R-value and low U-value. To
increase the thermal resistance of the material, vacuum method is introduced.
The purpose of this experiment is to see how conduction heat barrier affects the
temperature in attic space and how the values of R and U-value affects the
temperature in attic space. A comparison of this both materials will be done and
the material which reduced the attic temperature the most will be selected and
will be implemented on the main design.
3.4.1.1 Normal Rockwool insulation
The rockwool is cut into 41 cm by 31 cm and it was placed inside a plastic cover
(not sealed) as in Figure 3:5. [More information about the plastic cover will be

27
mention in 3.4.1.2 section.] The thickness of the insulation is 5 cm. Then it was
placed into the attic space as in Figure 3:6.
Figure 3:5: Rockwool inside plastic cover.
Figure 3:6: The location of Rockwool in attic model (all dimensions in the
figure is in mm).
3.4.1.2 Vacuumed Rockwool insulation
To vacuum the insulation, a plastic cover is specially designed. The dimension
of the plastic is 45 cm by 35 cm. The thickness is 60 mil and the material of the
plastic cover is Polyethylene (PE). PE was the best thermoplastic choice among
Polypropylene (PP), Polyethylene terephthalate (PET) and Polycarbonate (PC).
The material was selected by the help of CES Edu pack 2005 software. To pass

28
the 1st stage (Appendix D) the material should able to handle at least 70 °C and
0.10 MPa. 0.10 MPa is normal air pressure at sea level, when vacuum is created
inside the container, the force acting outside the container will be approximately
0.10MPa of container surface area. In stage 1, PET material didn’t pass through
even though it would able to sustain the force created by vacuum, but the
maximum service temperature is only 66.85 °C. In 2nd stage (Appendix D) of
material selection emphasis on price and elastic limit. The left 3 material has
passed the elastic limit; however, PC is way more expensive than PE and PP.
Hence, PC is removed from the selection criteria. Comparing PE and PP, PE is
more flexible, durable and tear resistance then PP. This is because PP has a
rougher surface that might create scratches/holes and it is not flexible as PE. To
create a good vacuum, hole must not present and it must flexible enough to adapt
the shape of the rockwool in the vacuum process.
After choosing the material, designing the plastic cover will be next. The
plastic cover is designed to be in 45 cm by 35 cm. As in Figure 3:5, in order to
prevent the atmosphere air enter into the plastic bag, double air lock zipper was
installed instead of one. The reason is to have double protection and to make
sure there is no air enter in while vacuum process. A hole was also designated
to install air valve to vacuum the product. Air valve was installed using hot glue
gun, an excessive amount of hot glue is used to seal the air valve and the hole
together. An excessive amount of hot glue is used to make sure there is no holes
and it is perfectly sealed.
After completing the construction of vacuum plastic cover, the same
rockwool is placed into the plastic bag which is sealed by the air lock zipper and
start vacuuming the bag using the electrical vacuum pump (ROCKER 300) as
in Figure 3:7. It took around 1 minute to complete the vacuum process (-0.8
Bar). Figure 3:7 shows the rockwool after vacuumed process. Then similar to
normal rockwool it was place on the exact same location in attic model (Figure
3:8).

29
Figure 3:7: Process of vacuuming Rockwool insulation.
Figure 3:8: Location of vacuumed Rockwool in attic model (all dimensions in
the figure is in mm).
3.4.2 Convection Heat barrier
In this section, cooling technologies are focused on removing heat using the
convection method. Unlike conduction, convection only occurs in fluids (liquid
and gases). A convection is a combination of advection (fluid motion) and
diffusion (conduction) heat transfer. Advection heat transfer is transfer of heat
through vertical or horizontal direction. For an example, advection commonly
happen here in earth, where the wind blows horizontally which carries hot air
towards cold air region and wind blows cold air towards hot air region. About
diffusion, it is similar like conduction, but it happens in air particle where here
Vacuum pump

30
it is a direct exchange of kinetic energy (heat) of particle through the boundary
between two systems. According to the second law of thermodynamics, such
spontaneous transfer of heat often occurs from a high temperature region to
another lower temperature region. Based on the comparison of air and liquid,
liquid has faster convection heat transfer due to particles are much closer in
distance comparing to air. In this experiment, convection in air will be given
more priority compared to liquid. In short, when there is a source of heat in a
closed space, the air particle will gain energy (hot air) and move faster. This will
make the air particles spacing wider which leads to the reduction of air density
and the particle will rise. It is vice versa for the lower energy particle as it will
start sinking due to the packed spaces and higher density. This process will
continue till the temperature reach equilibrium.
In this experiment, natural convection (hole) and force convection (fan)
is applied. To see how much natural and force convection affects the
temperature in attic space. A comparison of this both techniques will be done
and the method which reduced the attic temperature the most, will be selected
and will be implemented on the main design.
3.4.2.1 Ventilation hole
A hole was created by hole-saw with a diameter of 4.4 cm. The location of the
hole is 9.3 cm from the top as show as in Figure 3:9. The reason the hole is at
high positioned is because using the knowledge of convection of air, where
warm air will be at higher above the ground. The purpose of this experiment is
to see how a ventilation hole will affect the temperature in attic space.

31
Figure 3:9: Location of ventilation hole in attic model (all dimensions in the
figure is in mm).
3.4.2.2 Solar powered fan
Similar to the ventilation hole but this time a solar powered fan is placed in the
hole. This fan has electrical rating of 12 V and 0.07 A, with a power of 0.84 W
(P = I ×V). However, the solar power panel used at this experiment provides
11.5 V and 0.46 A, with the power of 4.9 W. Since in this experiment, only one
piece of fan is used, 4.9 W is too much power for a fan which operate at 0.84
W. However, the fan will be operational at 4.9 W, it is just that the fan will spin
in extreme speed more than it intended too. So, a current divider was construct
as in Figure 3:10 using potentiometer (variable resistor, R1and R2). With the
help of multimeter, each potentiometer was set in desired value as in Figure 3:10.
After completing the circuit, the desire power has achieved that is 0.81 W (0.07
× 11.5). In Figure 3:10 shown the full calculation and current divider full circuit.
Figure 3:10: Current divider circuit and calculations.

32
Furthermore, having an ideal power supply makes the experiment to
proceed to the next step is installation of solar powered fan, the attic fan is
installed in the hole was created before for ventilation. The fan was attached
with double side tape to make sure there is no hole beside the cavity of the fan
as in Figure 3:11. The solar panel is placed outside the heating chamber, with a
500 W halogen lamp is set to face it at distance of 25 cm. The distance between
halogen lamp and solar panel was set in a distance, where the light hits the entire
solar panel. The purpose of this experiment is to see how a solar powered fan
will affect the temperature in attic space.
Figure 3:11: Attic fan installed in attic model with double side tape.
3.4.3 Radiant heat barrier. (RHB)
This cooling techniques focuses on reducing radiation heat from entering the
attic space. Radiation is unlike conduction and convection; both of these
methods need particle to transfer heat. Radiation transfers heat by radiation
wave where it do not need particle to transfer heat. For an example, the heat
from the sun travel through space to reach earth but in space there is no particle
and it known as vacuum state.
The RHB are composed of a highly reflective material that reflects most
of the radiant heat instead of absorbing it. In other words it is called ‘Albedo
Effect’. Higher the albedo means, the ability to reflect more heat more and vice
versa for lower albedo value. Emissivity also play an important role, where
emissivity is the calculation of the capacity of an object to emit thermal radiation.
Emissivity will have a value between 0 (shiny mirror) and 1.0 (black body).

33
In this experiment, aluminum alloy (6061) sheet is used. 6061
Aluminum alloy is a precipitation-hardened alloy that includes magnesium and
silicon as its main alloy components. The reason this material is chosen because
it is easy to be obtained from the market and the low cost of the material. In
addition, aluminum alloy theoretically has lower emissivity and high albedo
effect. The purpose of this experiment is to see how polishing affects the albedo
and emissivity of the material along with how the radiant heat barrier will affect
the temperature in the attic space. A comparison of this both materials will be
done and the material which reduced the attic temperature the most will be
selected and will be implemented on the main design.
3.4.3.1 Unpolished Aluminum sheet
The aluminum was cut into 43 cm by 32 cm and placed as in attic model. The
thickness of the sheet is 0.3 mm. The location where the sheet was placed is 4
cm from the top as in Figure 3:12. Before it was tested, it was cleaned by
ordinary dish washer shop to remove any dust or dirt particle.
Figure 3:12: Location of aluminium sheet in attic model (all dimensions in the
figure is in mm).

34
3.4.3.2 Polished Aluminium sheet
The dimension and the placement of the sheet is similar to unpolished aluminum
sheet. There are several steps need to be done to have a good polished surface.
Firstly, W-40 lubricant oil was sprayed on to the sheet evenly to act as lubricant
for sanding. Secondly, using a 3000-grit sandpaper to sand the sheet uniformly
(less pressure is applied). The purpose of sanding is to remove the small
scratches and make the sheet smoother. Thirdly, the sheet was cleaned by
ordinary dish washer to remove the lubricant, debris of aluminum and dust/dirt
particle. The last step is polishing. Autosol metal polish was used as polishing
agent. A decent amount of polish was applied until it was evenly distributed
around the surface. After it was apply evenly, using microfiber cloth to wipe the
surface in circular motion (moderate pressure is applied) until the surface was
clear, smooth and shiny (Figure 3:13).
Figure 3:13: Polished (left) and unpolished (right) aluminium sheets.
3.5 Layouts of experiments
In this research, there are nine layouts of attic mockup (Figure 3:14), which are
listed from design A to design H and design X. This designs was constructed
and experimented to see the effect of temperature in the attic space.

35
3.5.1 Normal roof system (Design A)
In this design no cooling technologies is applied, the purpose of this design to
see how hot the attic space gets under normal circumstances and how long does
it take. The temperature is taken in interval of one minute until the temperature
became constant for five consecutive minutes. This experiment is done in the
same mock design as in Figure 3:14.
3.5.2 Roof coated with TRC (Design B)
In this design the roof is coated with TRC. The purpose of this to see how TRC
affects the temperature in attic space. This experiment is considered passive
cooling system. The duration of this experiment will be depending on design A,
because then it will be easier to compare which designs will show better
insulating properties. Design B will be compared with design A to see which
type of roof will be better and it will be applied in the rest of the designs and
main design.
3.5.3 Roof coated with TRC and Rockwool Insulation (Design C)
Similar to design B for the roof, however in this design there is a rockwool
insulation was placed below the roof as in Figure 3:14. This experiment is
considered passive cooling system. The purpose of this experiment is to see how
rockwool affects the temperature in attic space. Duration is similar to design B
where it depends on the design A.
3.5.4 Roof Coated with TRC and Vacuumed rockwool insulation
(Design D)
Similar to design C but in this design the rockwool is vacuumed. This vacuumed
rockwool is placed at the same location as design C. This experiment is
considered passive cooling system. The purpose of this experiment is to see how
vacuumed rockwool is going affect the temperature in attic space. Design D will
be compared with design C to see which type of insulation will be better and it
will be applied in the main design.

36
3.5.5 Roof coated with TRC and a ventilation hole (Design E)
In this design the roof is coated with TRC and a hole has been cut in the location
is at the highest point of the attic model as in Figure 3:14. This experiment is
considered passive cooling system. The purpose of this experiment is to see how
a hole can affect the temperature in the attic space. The duration of this
experiment is similar to design B where it depends on design A.
3.5.6 Roof coated with TRC and solar powered Fan (Design F)
Similarly, to design E but this time the hole is occupied with solar powered fan.
This experiment is considered active cooling system. The purpose of it to see
how the solar powered fan is going to affect the temperature in attic space. This
design E will be compared with design F to see which type of cooling system
will be more efficient and it will be implemented in the main design.
3.5.7 Roof Coated with TRC and aluminum sheet (Design G)
The roof is coated with TRC and a shiny aluminum sheet is place under the roof
as in Figure 3:14. This experiment is considered passive cooling system. The
purpose of this experiment is to see how this aluminum sheet is affecting the
temperature of the attic space. The duration will be similar to design B where it
will depend on the design A.
3.5.8 Roof coated with TRC and polished aluminum sheet (Design H)
Similarly to design G but instead, in this design the aluminum is polished. It is
placed at the exact location as design G. This experiment is considered passive
cooling system. The purpose of this experiment is to see how polished aluminum
affect the temperature in attic space. Design H will be compared with design G
to see which type of aluminum will show better cooling properties and it will be
applied in the main design.
3.5.9 Roof coated with TRC, vacuumed rockwool insulation, polished
aluminum sheet and solar powered fan (Design X)
This is the main design (Design X) for this research project. In this design the
roof is coated with TRC as well. The vacuumed rockwool insulation was placed

37
above the polished aluminium sheet. The distance between the insulation and
the roof was set to 4 cm. Both the aluminium sheet and insulation was set in
angle of 30° as in Figure 3:14 (Design X). A solar powered fan was installed,
25.3 cm above the ground. More detail will be further explain in section 4.5.1.
Figure 3:14: 9 layout of attic models (all dimensions in the figure is in mm).
3.6 Set up of experiment
In this section, it shows the equipment and apparatus to set up the experiment
and how the experiment is done.
3.6.1 Heating chamber
The whole experiment was conducted inside the heating chamber. The purpose
of this heating chamber is to create an environment with temperature ranging
from 30 °C to 43 °C by using 200 watts halogen light. The reason is because
highest temperature recorded in Malaysia was 40.1 °C and according to the
(Trading Economics, 2018), in upcoming years there are high chances of
temperature rise about 3 °C if global warming problem does not resolve.

38
The dimension of heating chamber as in Figure 3:15. The material used
to build this heating chamber is 12 mm of plywood. It was designed as same
shape as the attic model. This is because the height of the heat source (Halogen
spotlight) is fixed 66.8 cm from the ground. If it was built as cuboid shape, it
would be challenging to obtain the desired range of temperature as the trapped
heat will be closer to the attic model. In order to save cost and to achieve a
desired range of temperature, right-angled trapezium shape was chosen.
Furthermore, in order prevent loss of heat and to maintain the range of
temperature, the chamber was glue by aluminum foil on the plywood (bright
side facing inwards), nevertheless the type of glue used was construction sealant
(Vital nails), which design to work under high temperature. In addition,
aluminum foil serves another purpose, which is protecting the wood from losing
its strength and being damaged from the heat.
The whole chamber was cut into half as in Figure 3:15 (dotted green line)
so it will be in two pieces (up and bottom), so that it will be easy to store and
also it makes easier to do some changes of the attic model while the attic model
stays in the half of the chamber. When there is cut, then they will be definitely
gaps/holes. So to block the gaps/holes, polystyrene were used to cover the holes.
The purpose of covering the holes is actually to reduce the heat loss to the
atmosphere while maintaining a desire range of temperature inside. In addition,
the lid’s opening will be manipulated until the desire temperature of the chamber
is achieved. Once the desire range of temperature is achieved, opening of the lid
will be fixed throughout the experiment.
39
Figure 3:15: Dimension of heating chamber structure (all dimensions in the
figure is in mm).
To choose a suitable design of mounting mild steel bar, slotted angle bar
was chosen over flat slotted bar by using Solidworks simulation. Because under
a load, the slotted angle bar has lesser resultant displacement (0.890 mm)
compared to flat (9.450 mm) slotted bar in Y- direction (Appendix C). The
slotted angle bar was mounted on the heating chamber for the purpose of
hanging the halogen light as a heat source. The location of halogen light is fixed
throughout the experiments which located center along the Z-direction. The
location of the halogen light in X and Y- direction is label in Figure 3:16 and
the halogen light is positioned at 30° (parallel to roof inclination). In addition,
the halogen light produces enormous amount of heat and to protect it, a
rockwool insulation which is wrapped with aluminum foil was placed on top of
the halogen light to protect the plywood. A hinge was installed on upper part of
the plywood so the upper part could be opened and will be easily accessible to
the halogen light.

40
Figure 3:16: Location of halogen light and angle bar in X and Y- direction (all
dimensions in the figure is in mm).
The halogen lamp light is generated by heating a filament with color
temperature 2700 Kelvin to 2800 Kelvin (similar to outdoor weather). The
halogen lamp emits of its diverse energy in the form of infrared radiation or heat.
In this experiment, 200 Watt halogen light is used and the temperature recorded
from the halogen light was emitting from 53 °C to 65 °C (outside the safety
glass). This is because only roughly 3.5 % of the energy consumed by halogen
lamp is converted to visible radiation or light and the 96.5 % is in term of heat.
Thermodynamics first law states that energy cannot be created or be destroyed
and it only transfers into another form of energy. For usage as light source it
not efficient but as heating agent it is a great source.
3.6.2 Sensor Location and data logger
An arduino data logger was built to monitor the temperature in this experiment
in every 1-minute interval up to 50 minutes. To build an arduino data logger
there are several material and equipment needed. Firstly, Arduino Uno
Compatible, where it act as a motherboard of the system which can receive data

41
from sensor and send to computer/memory card and also it acts as a
programmable device which can be program to a desire function. Secondly is
thermocouple amplifier MAX6675, the purpose of this material is a sensor and
a connector to type- K thermocouple which able to convert the signal from K-
type thermocouple to a digital input. Thirdly, will breadboards and jumper wire
to connect and have a complete circuit. In addition, having arduino software to
code the program and execute the command. Finally, PLX-DAQ is a Microsoft
excel extension is needed, which it is able to tabulate the data recorded in
arduino data logger.
Four type-K thermocouples were used in this experiment. It was
connected to thermocouple amplifier to read the temperature. The first
thermocouple (T1) was attached to surface of the roof with aluminum tape. The
aluminum tape was cut in a square (2 cm × 2 cm) so that the heat will be evenly
distributed and more accurate data could be obtained. The position of it attached
was 14 cm from bottom and 5.5 cm from the right as in Figure 3:17 and Figure
3:18. The position was fixed for the entire experiment so that the result will be
comparable. For the second thermocouple (T2) it was placed inside the attic
space. It was located in the attic space as in Figure 3:18. As this sensor as well,
it was fixed throughout the experiment. The third thermocouple (T3) was place
inside the chamber, where it is located 357 mm above the ground as in Figure
3:19 (cyan). Before choosing T3, a small experiment was conducted to find
which point was the ideal position for T3, four sensors (A1, A2, A3, and A4)
was located at various location as in Figure 3:19 in magenta color. It was
particular placed near the attic model so to know the surround temperature
around the attic model. The temperature recorded for A1 is 45.5 °C, A2 is
41.5 °C, A3 is 44.0 °C and A4 is 42.0 °C. Calculating the average temperature
and distance, position of T3 was selected. Then the opening of the chamber’s
lid is manipulated until T3 reach 43 °C. The fourth thermocouple (T4) was
placed outside the chamber to get the ambient temperature.
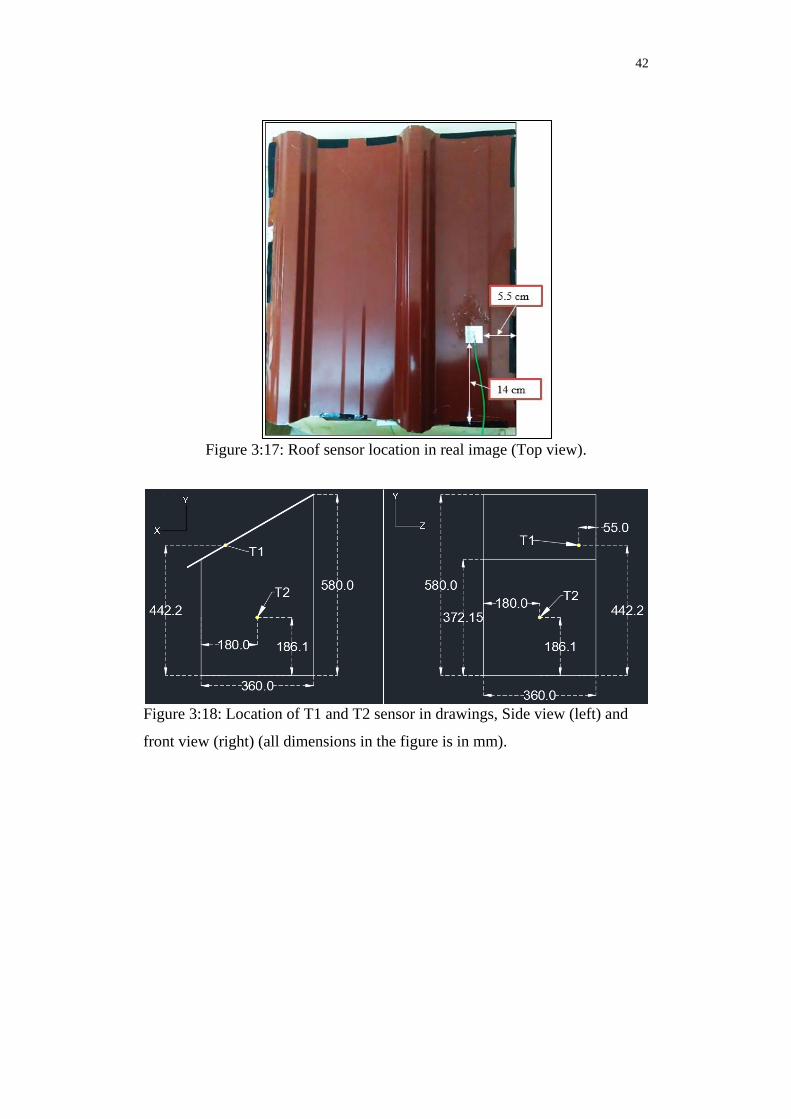
42
Figure 3:17: Roof sensor location in real image (Top view).
Figure 3:18: Location of T1 and T2 sensor in drawings, Side view (left) and
front view (right) (all dimensions in the figure is in mm).

43
Figure 3:19: Location and experiment for heating chamber sensor (all
dimensions in the figure is in mm).
3.7 Procedure (Setup of experiment)
The attic model is placed in heating chamber as in Figure 3:20. The attic model
will be modified with different design/cooling technologies and placed back into
the chamber. The roof is attached with cloth tape (black colour) to the attic
model as in Figure 3:17. If there is any visible hole present, polystyrene will be
used to block the holes. Sensor and data logger will attached to attic model and
heating chamber as mention earlier. The data will recorded by PLX-DAQ
software. The experiment will run under operational halogen light for few
minutes. Once one experiment is over, to continue with another experiment, the
process will have to wait until the attic model and heating chamber to cold down.
The experiment can be proceed when the initial temperature is close to the
ambient temperature. Figure 3:21shows that how this experiment is carry out
(Lid of the chamber is open).

44
Figure 3:20: Placement of attic model into heating chamber (all dimensions in
the figure is in mm).
Figure 3:21: Real time experiment set up.

45
CHAPTER 4
4 RESULTS AND DISCUSSION
4.1 Introduction
This chapter will be discussing more on the outline of the selection process to
determine the best cooling system for each section. There are two section to be
discussed which are the outer part (surface of roof) and inner part cooling system.
For the outer part, cooling techniques was implemented on the roof surface and
for inner part there are three cooling techniques have been implemented in the
attic model: conduction heat barrier, convection heat barrier and radiant heat
barrier.
4.2 Outer part cooling techniques
In this section, cooling techniques will be implemented on the surface of the
roof and the type of cooling techniques that shows greater cooling efficiency
will be selected.
4.2.1 Normal Roof surface (Design A)
In this design no cooling techniques were used or applied, the purpose was to
observe how much heat it is capable of absorbing or reflecting under normal
condition. The recorded results were plotted in Figure 4:1. The ambient
temperature throughout this experiment was 28.75 °C to 30 °C. The initial
temperature of the roof was 29 °C and for the attic was 28.75 °C. This
experiment stopped when the attic temperature was undergoing slight
fluctuation of 0.25 °C every minute for five consecutive minutes, which lasted
for 47 minutes. The final surface temperature increased by 33.5 °C (73.75 °C –
40.25 °C). For the attic final temperature, it was recorded to be 42.25 °C. There
was an increase of 12.75 °C (42.25 °C – 29.5 °C) in the 47 minutes time interval.
For the chamber temperature, the lowest temperature recorded was 32.75 °C and
the highest temperature recorded was 41.25 °C. Based on the Figure 4:1, after
21 minutes, the attic temperature was higher than the chamber temperature and
the attic temperature increases over time. At 47 minutes, the temperature

46
difference between the attic and surrounding (chamber) temperature was 1 °C.
This is similar to our real life scenario where the attic temperature was observed
to be almost similar to the surrounding temperature followed by equal and then
higher than the surrounding temperature. In this roof design, it only protects
other hazards such as rain but does not block heat out of the attic temperature.
Figure 4:1: Temperature reading for design A.
4.2.2 Roof Coated with TRC (Design B)
In this design, TRC was applied on the surface of the roof. The purpose of this
experiment is to investigate how good TRC is against the heat. The recorded
results were plotted in Figure 4:2. During the time when this experiment was
conducted, the ambient temperature was 29 °C to 30.25 °C. The initial
temperature for the roof was 28.75 °C and for the attic was 28.50 °C. Based on
design A, this experiment ended in 47 minutes. In the end of the experiment, the
temperature increased for the surface of the roof was 31 °C (65.5 °C – 34.5 °C).
The final temperature for attic was 39.75 °C and that shows an increase of 11 °C
(39.75 °C – 28.75 °C). For the chamber with the lowest temperature, it was
recorded to be 33 °C and the highest temperature recorded was 41.5 °C. As per
graph, the attic temperature was equal to the chamber temperature after 42
minutes of experiment. Based on Figure 4:2, the temperature difference between
the chamber and attic was decreasing over time. In this design of roof, heat was
reflected, and it delayed the heat transfer to the attic.

47
Figure 4:2: Temperature reading for design B.
4.2.3 Comparison of attic temperature for Design A and B
Figure 4:3 shows the comparison of attic temperature in design A and B. The
temperature increased for design A is 12.75 °C and for design B is 11 °C. From
this data, design B shows reduction of 1.75 °C compared to design A. It is
proven that TRC is able to decrease the attic space temperature by 1.75 °C
compared to the conventional roof.
TRC is a coating applied on the surface of the metal roof. In short, TRC
is a coating made of titanium dioxide pigment and egg shell (chicken) is used
as a bio-filler whereby it is merged together with polyurethane resin binder
which has low thermal conductivity. The addition of mixture with titanium
dioxide gives the coating a shiny white appearance.
TRC has reduced the attic space by reflecting more radiant heat due to
the white appearance of the coating as it has a higher albedo value compared to
red appearance (design A). According to (Jandaghian and Berardi, 2020), white
colour has albedo value of 0.65 and red colour has value of 0.30 [0 - perfect
absorber, 1 - perfect reflector]. Since the white have higher albedo, more heat is
being reflected than being absorbed hence gives out less emissivity of heat from
the roof to the attic space. Besides that, adding TRC coating has decrease the
thermal conductivity and increase the thermal resistance of the roof. This results
in delay of heat transfer to the attic space.

48
Figure 4:3 : Comparison of attic temperature for design A and B.
4.2.4 Comparison of roof surface temperature for Design A and B
Figure 4:4 shows the comparison of roof surface temperature of design A and
design B. Temperature increased for design A is 33.5 °C and for design B is
31 °C. Similarly, comparison between the attic temperature, design B shows
lower roof surface temperature about 2.5 °C compared to design A. Application
of TRC to the roof surface shows that it can reduce the temperature of the roof
surface as well.
TRC will reflect more radiant heat compared to roof surface without
TRC. By reflecting radiant heat, there were less heat transfer to the metal deck
(conduction) and also with the presence of TRC coating, it also acts as heat
thermal resistance. The layer of coating will form resistance layer for heat,
which will be harder to conduct the roof compared to the one without coating.
Since it has reflected the radiant heat, the attic temperature reduces which also
leads to the increase of heat loss at the roof. This is similar to Newton’s cooling
law, where it stated that the heat loss of a material is dependent on the
surrounding temperature.

49
Figure 4:4: Comparison of roof surface temperature for design A and B.
4.3 Inner part cooling techniques
In this section, cooling techniques will be implemented inside the attic model.
The techniques are divided into three sections; conduction heat barrier,
convection heat barrier and radiant heat barrier. A comparison in each section
and the type of cooling techniques which shows greater cooling efficiency will
be selected.
4.3.1 Conduction heat barrier
For this section, a comparison between rockwool and vacuumed rockwool will
be evaluated. Among these two materials, the material that shows the best
cooling efficiency will be selected.
4.3.1.1 Roof coated with TRC and fixed Rockwool insulation (Design C)
In this design TRC and rockwool insulation was used whereby the purpose is to
observe how much heat it was able to delay/block with rockwool insulation.
The recorded results was plotted in Figure 4:5. The ambient temperature
throughout this experiment was at 29 °C to 30 °C. The initial temperature for
the roof was 29.50 °C and for the attic was 29.25 °C. Based on design A, this
experiment ended in 47 minutes. Within 47 minutes, the final surface
temperature increased by 40.25 °C (77 °C – 36.75 °C). For the attic final

50
temperature, it was recorded to be 37.25 °C. There was an increase of 8 °C
(37.25 °C – 29.25 °C) in 47 minutes. For the chamber temperature, the lowest
temperature recorded was 33.75 °C and the highest temperature recorded was
41.5 °C. Based on Figure 4:5, the temperature difference between the chamber
and attic was decreasing over time. In this design of roof, heat was reflected,
and it delayed the heat transfer to the attic.
Figure 4:5: Temperature reading for design C.
4.3.1.2 Roof coated with TRC and fixed vacuumed rockwool (Design D)
Similar to design C, but instead in this design the rockwool is vacuumed. The
purpose is to investigate how much heat it can delay from reaching the attic
space. The recorded results was plotted in Figure 4:6. The ambient temperature
throughout this experiment was 28.75 °C to 29.5 °C. The initial temperature for
the roof was 29 °C and for the attic was 28.75 °C. Based on design A, this
experiment was completed in 47 minutes. Within 47 minutes, the final surface
temperature of roof increased by 41.5 °C (74.25 °C – 32.75° C). For the attic
final temperature, it was recorded to be 35 °C. There was an increase of 6.25 °C
(35 °C – 28.75 °C) in 47 minutes. For the chamber temperature, the lowest
temperature recorded was 32.75 °C and the highest temperature recorded was
42.25 °C. Based on Figure 4:6, the temperature difference between the chamber

51
and attic was decreasing over time. In this design, heat was reflected and it
delayed the heat transfer to the attic.
Figure 4:6: Temperature reading for design D.
4.3.1.3 Comparison of attic temperature for Design C and D
Figure 4:7 shows the comparison of attic temperature for design C and D. The
temperature increase of design C and D are 8 °C and 6.25 °C respectively. From
this it can be concluded that design D is far more efficient in cooling attic space
compared to design C. It was able to reduce 1.75 °C more than design D.
Figure 4:7: Comparison of attic temperature for design C and D.

52
Naturally, normal rockwool is a good heat insulator. Rockwool has R
value of 1.42 and thermal conductivity (k) of 0.035 W/m.K. Rockwool
insulation is packed with small air pocket (R = 1, k = 0.02624). Air is good
thermal insulator and has a low thermal conductivity in room temperature
(25 °C). Hence, having small air pocket in the insulation makes it a better
thermal insulator. The insulation actually slows down the transfer of heat to the
attic space, Figure 4:8 illustrates the heat flow. As mention earlier, this method
focuses on heat transfer via conduction. Hence, most of radiation heat will pass
through the insulation.
Figure 4:8: Heat flow through insulation (FluxTeq, 2019).
According to (Engineering ToolBox, 2019), it is stated that the thermal
conductivity of air will increase along with temperature and pressure. In other
words, thermal conductivity of air will decrease in lower air pressure and
temperature and vice versa for higher temperature and pressure. The scientific
explanation on how thermal conductivity of air changes in pressure is when the
air pressure is lower, the distance between air particles gets larger so the
collision and transfer of energy between particles will become less frequent.
Also, as the distance between particles increases, the R-value for air will
increase too. For temperature, as the temperature of air increases, the molecular
diffusion also increases. Thermal conductivity of air is directly proportional to
the lattice vibration and molecular diffusion. Hence, thermal conductivity of air
increase as the temperature increases.

53
By acquiring knowledge about the behaviour of thermal conductivity of
air, normal rockwool has been vacuumed up to -0.8 bar compared to
atmospheric pressure. By using this technique, it was able to reduce more
temperature compared to the normal rockwool. However, the difference in
temperature between the two designs was only 1.75 °C. Based on the theory of
thermal conductivity of air, this vacuum technique should be able to reduce heat
transfer more than the obtained result. The reason is because in normal rockwool
the insulation is loosely pack and after vacuum the insulation is more closely
pack compared to the normal rockwool. Hence, heat transfer increases in
rockwool insulation and yet decreases through air particle.
4.3.1.4 Comparison of roof surface temperature for Design C and D
Figure 4:9 shows the comparison of roof surface temperature of design C and
design D. For design C the temperature increased is 40.25 °C and for design D
the temperature increased was 41.5 °C. Unlike for attic temperature comparison,
the roof surface temperature for design C is more efficient in cooling roof
surface compared to design D. The temperature difference between two designs
is 1.25 °C.
Figure 4:9: Comparison of roof surface temperature for design C and D.
The reason is because when insulation is placed below the roof it creates
two different region of air as in Figure 4:10. Region 1 gets hotter faster because

54
the heat transferred to region 2 is reduced. This causes more heat to accumulate
at region 1, where it gets hotter in a short period of time due to the small area.
According to Newton’s law of cooling, it is stated that the rate of the body's heat
loss is directly proportional to the difference in temperatures between the body
and its environment. As the temperature of the surrounding increases, the heat
loss of the body decreases. In addition, this also proves that cooling system for
design D reduces the heat transfer more compared to design C.
Figure 4:10: Heat loss explanation of for roof deck.
4.3.2 Convection heat barrier
For this section, a comparison between ventilation hole and attic fan will be
evaluated. Among these two methods, the method that shows the best cooling
efficiency will be selected.
4.3.2.1 Roof coated with TRC and with ventilation hole (Design E)
In this design of experiment, TRC and a ventilation hole were created on the
attic model. The purpose of this experiment is to see how a ventilation hole can
affect the temperature in attic space. The recorded results was plotted in the
Figure 4:11. The ambient temperature throughout this experiment was 28.5 °C
to 29.75 °C. The initial temperature for the roof and attic was 28.5 °C. Based on
design A, this experiment concluded in 47 minutes. Within 47 minutes, the final
surface temperature increased by 30.5 °C (62.25 °C – 31.75 °C). For the attic
final temperature, it was recorded to be 38.75 °C. There was an increase of
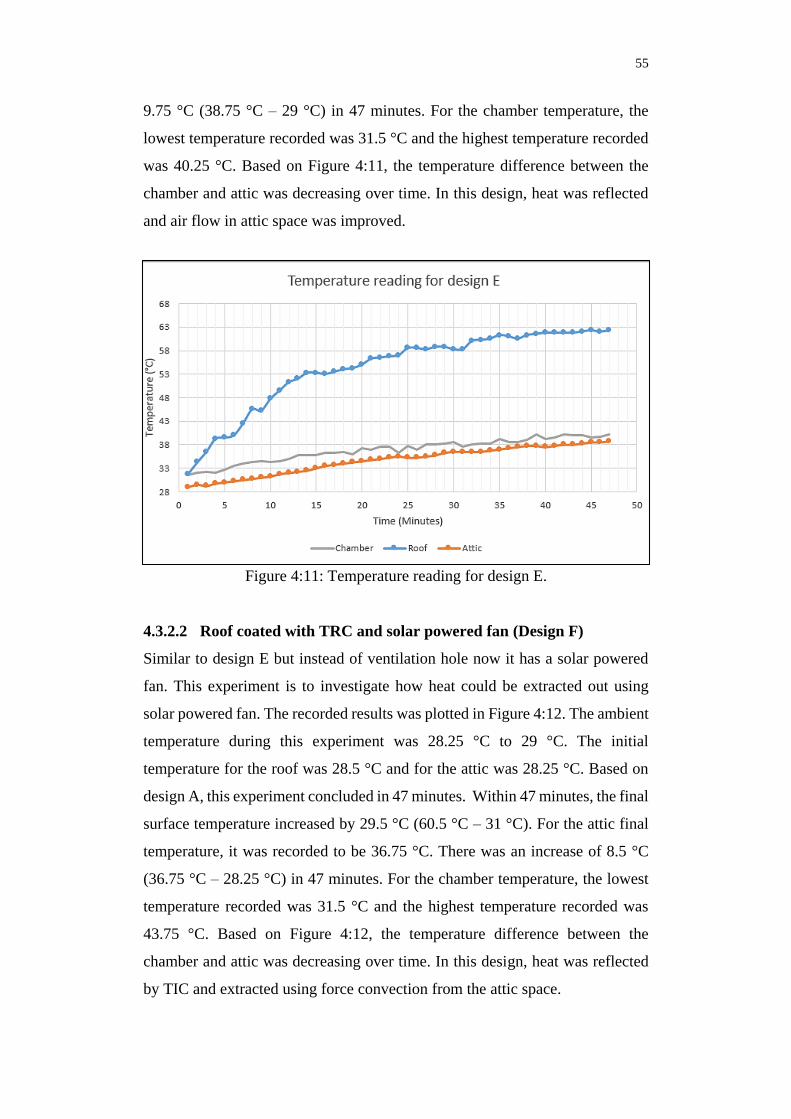
55
9.75 °C (38.75 °C – 29 °C) in 47 minutes. For the chamber temperature, the
lowest temperature recorded was 31.5 °C and the highest temperature recorded
was 40.25 °C. Based on Figure 4:11, the temperature difference between the
chamber and attic was decreasing over time. In this design, heat was reflected
and air flow in attic space was improved.
Figure 4:11: Temperature reading for design E.
4.3.2.2 Roof coated with TRC and solar powered fan (Design F)
Similar to design E but instead of ventilation hole now it has a solar powered
fan. This experiment is to investigate how heat could be extracted out using
solar powered fan. The recorded results was plotted in Figure 4:12. The ambient
temperature during this experiment was 28.25 °C to 29 °C. The initial
temperature for the roof was 28.5 °C and for the attic was 28.25 °C. Based on
design A, this experiment concluded in 47 minutes. Within 47 minutes, the final
surface temperature increased by 29.5 °C (60.5 °C – 31 °C). For the attic final
temperature, it was recorded to be 36.75 °C. There was an increase of 8.5 °C
(36.75 °C – 28.25 °C) in 47 minutes. For the chamber temperature, the lowest
temperature recorded was 31.5 °C and the highest temperature recorded was
43.75 °C. Based on Figure 4:12, the temperature difference between the
chamber and attic was decreasing over time. In this design, heat was reflected
by TIC and extracted using force convection from the attic space.

56
Figure 4:12: Temperature reading for design F.
4.3.2.3 Comparison of attic temperature for Design E and F
Based on Figure 4:13, it shows the comparison of attic temperature for design
E and design F. For design E the temperature increased was 9.75 °C and for
design F was 8.5 °C. From this, design F has greater cooling efficiency, where
it able to reduce 1.25 °C more than design E.
As mentioned earlier, warm air is less dense than cooler air which makes
the warm air to rise at higher location. That was the reason why the ventilation
and hole is located at higher position so it will be suitable to remove the hot air
and reduce the attic temperature.
By adding a ventilation hole, it creates a pressure difference between the
attic space and the surrounding. The heat will transfer between these two
medium until the pressure equalizes. According to (Everts and Meyer, 2018)
when two different temperatures of medium is there, it creates two different
pressures, the heat transfer will occur till both temperature and pressure is equal.
However, by adding an attic fan (suction) it creates a negative pressure
ventilation system where it will extract hot air that accumulates in the attic space.
Hence, it has reduced the pressure and temperature in the attic space. When the
pressure of the medium is low, the distance between particles increases. The
increased distance cause the conduction between air particles to reduce.
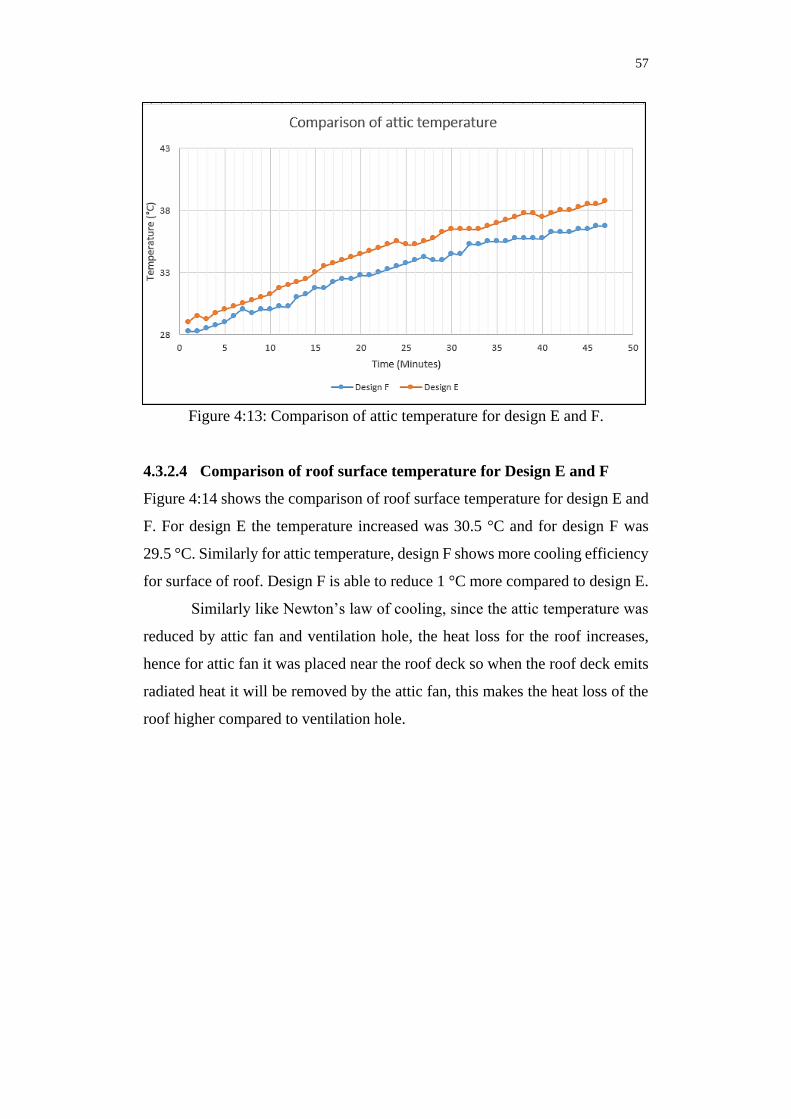
57
Figure 4:13: Comparison of attic temperature for design E and F.
4.3.2.4 Comparison of roof surface temperature for Design E and F
Figure 4:14 shows the comparison of roof surface temperature for design E and
F. For design E the temperature increased was 30.5 °C and for design F was
29.5 °C. Similarly for attic temperature, design F shows more cooling efficiency
for surface of roof. Design F is able to reduce 1 °C more compared to design E.
Similarly like Newton’s law of cooling, since the attic temperature was
reduced by attic fan and ventilation hole, the heat loss for the roof increases,
hence for attic fan it was placed near the roof deck so when the roof deck emits
radiated heat it will be removed by the attic fan, this makes the heat loss of the
roof higher compared to ventilation hole.
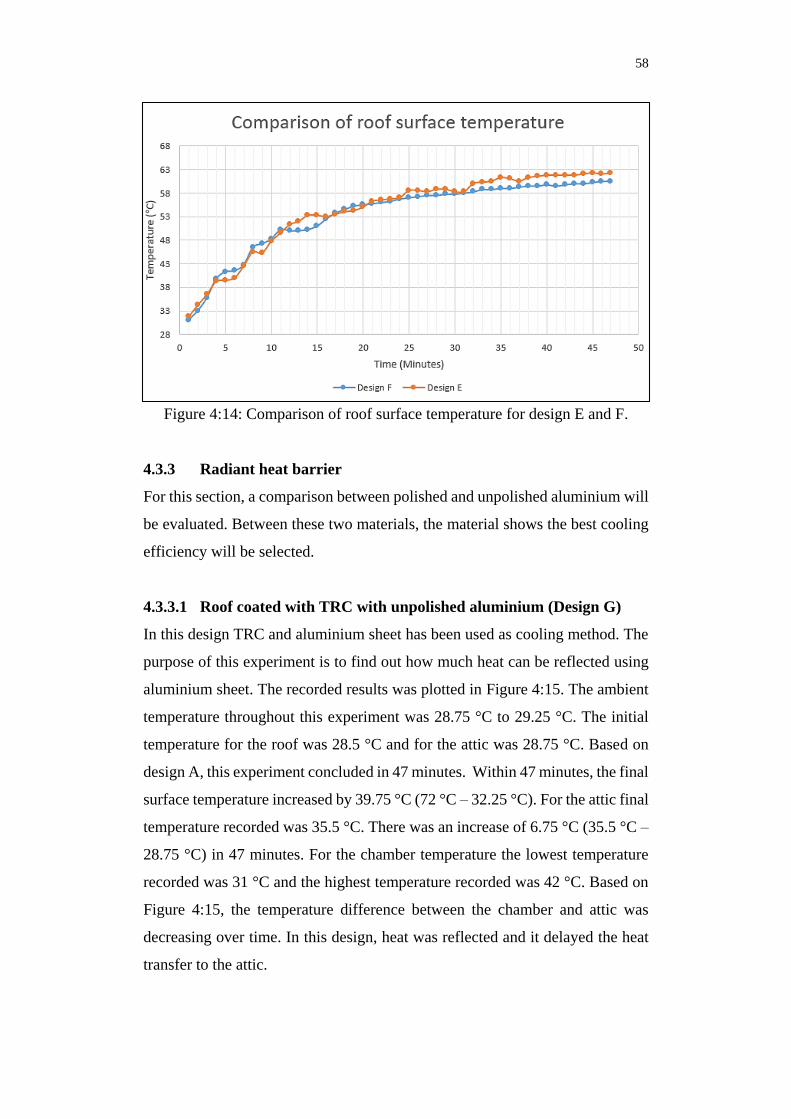
58
Figure 4:14: Comparison of roof surface temperature for design E and F.
4.3.3 Radiant heat barrier
For this section, a comparison between polished and unpolished aluminium will
be evaluated. Between these two materials, the material shows the best cooling
efficiency will be selected.
4.3.3.1 Roof coated with TRC with unpolished aluminium (Design G)
In this design TRC and aluminium sheet has been used as cooling method. The
purpose of this experiment is to find out how much heat can be reflected using
aluminium sheet. The recorded results was plotted in Figure 4:15. The ambient
temperature throughout this experiment was 28.75 °C to 29.25 °C. The initial
temperature for the roof was 28.5 °C and for the attic was 28.75 °C. Based on
design A, this experiment concluded in 47 minutes. Within 47 minutes, the final
surface temperature increased by 39.75 °C (72 °C – 32.25 °C). For the attic final
temperature recorded was 35.5 °C. There was an increase of 6.75 °C (35.5 °C –
28.75 °C) in 47 minutes. For the chamber temperature the lowest temperature
recorded was 31 °C and the highest temperature recorded was 42 °C. Based on
Figure 4:15, the temperature difference between the chamber and attic was
decreasing over time. In this design, heat was reflected and it delayed the heat
transfer to the attic.
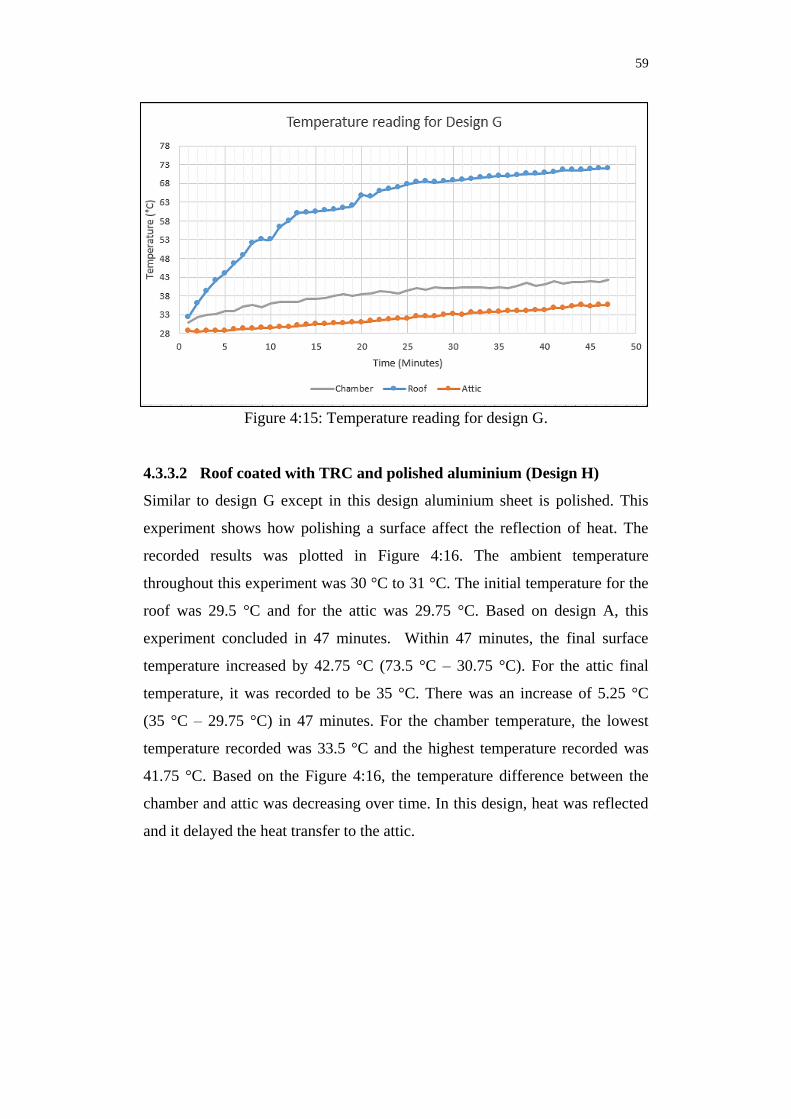
59
Figure 4:15: Temperature reading for design G.
4.3.3.2 Roof coated with TRC and polished aluminium (Design H)
Similar to design G except in this design aluminium sheet is polished. This
experiment shows how polishing a surface affect the reflection of heat. The
recorded results was plotted in Figure 4:16. The ambient temperature
throughout this experiment was 30 °C to 31 °C. The initial temperature for the
roof was 29.5 °C and for the attic was 29.75 °C. Based on design A, this
experiment concluded in 47 minutes. Within 47 minutes, the final surface
temperature increased by 42.75 °C (73.5 °C – 30.75 °C). For the attic final
temperature, it was recorded to be 35 °C. There was an increase of 5.25 °C
(35 °C – 29.75 °C) in 47 minutes. For the chamber temperature, the lowest
temperature recorded was 33.5 °C and the highest temperature recorded was
41.75 °C. Based on the Figure 4:16, the temperature difference between the
chamber and attic was decreasing over time. In this design, heat was reflected
and it delayed the heat transfer to the attic.
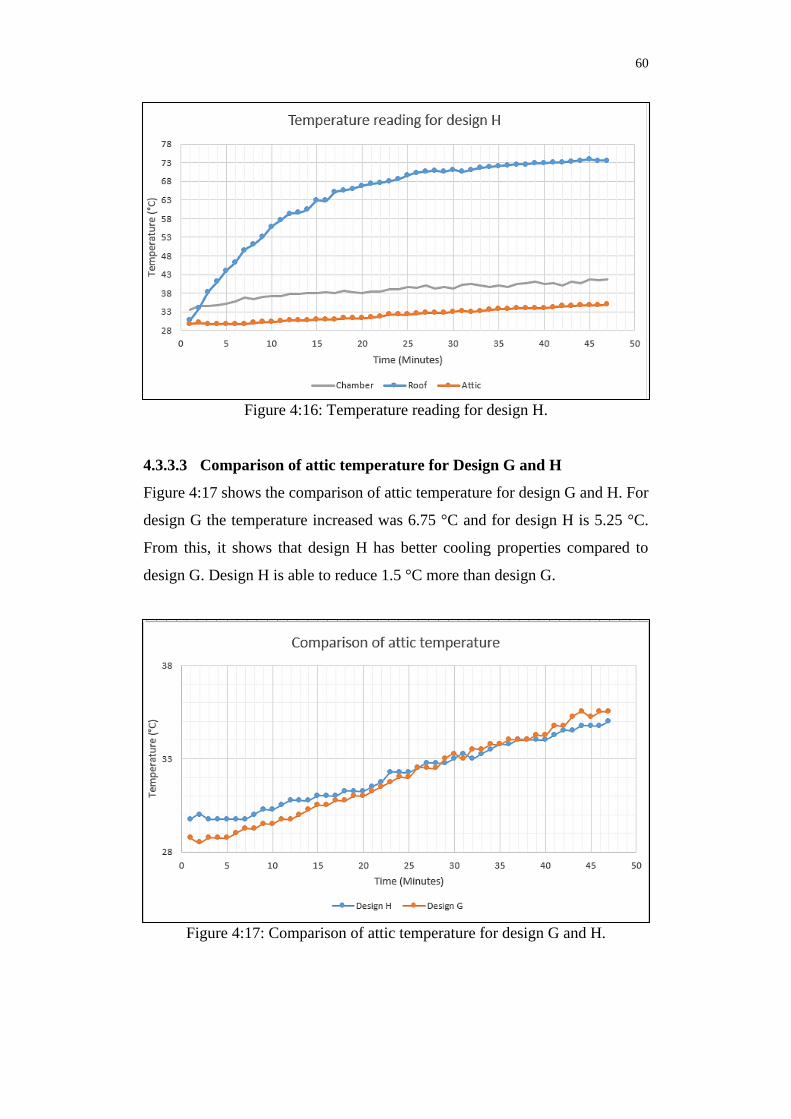
60
Figure 4:16: Temperature reading for design H.
4.3.3.3 Comparison of attic temperature for Design G and H
Figure 4:17 shows the comparison of attic temperature for design G and H. For
design G the temperature increased was 6.75 °C and for design H is 5.25 °C.
From this, it shows that design H has better cooling properties compared to
design G. Design H is able to reduce 1.5 °C more than design G.
Figure 4:17: Comparison of attic temperature for design G and H.
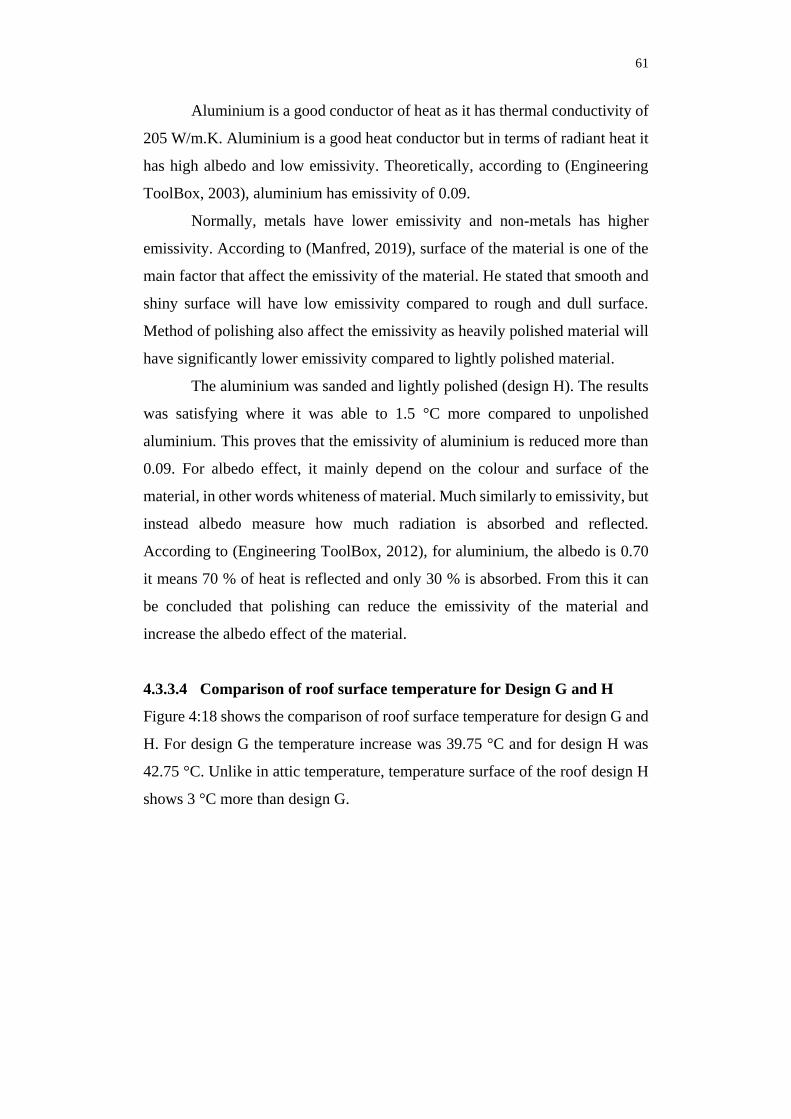
61
Aluminium is a good conductor of heat as it has thermal conductivity of
205 W/m.K. Aluminium is a good heat conductor but in terms of radiant heat it
has high albedo and low emissivity. Theoretically, according to (Engineering
ToolBox, 2003), aluminium has emissivity of 0.09.
Normally, metals have lower emissivity and non-metals has higher
emissivity. According to (Manfred, 2019), surface of the material is one of the
main factor that affect the emissivity of the material. He stated that smooth and
shiny surface will have low emissivity compared to rough and dull surface.
Method of polishing also affect the emissivity as heavily polished material will
have significantly lower emissivity compared to lightly polished material.
The aluminium was sanded and lightly polished (design H). The results
was satisfying where it was able to 1.5 °C more compared to unpolished
aluminium. This proves that the emissivity of aluminium is reduced more than
0.09. For albedo effect, it mainly depend on the colour and surface of the
material, in other words whiteness of material. Much similarly to emissivity, but
instead albedo measure how much radiation is absorbed and reflected.
According to (Engineering ToolBox, 2012), for aluminium, the albedo is 0.70
it means 70 % of heat is reflected and only 30 % is absorbed. From this it can
be concluded that polishing can reduce the emissivity of the material and
increase the albedo effect of the material.
4.3.3.4 Comparison of roof surface temperature for Design G and H
Figure 4:18 shows the comparison of roof surface temperature for design G and
H. For design G the temperature increase was 39.75 °C and for design H was
42.75 °C. Unlike in attic temperature, temperature surface of the roof design H
shows 3 °C more than design G.

62
Figure 4:18: Comparison of roof surface temperature for design G and H.
Unlike in rockwool insulation, in here it is because of the reflected heat
radiation and not because of reduced heat transfer. According to (Meola,
Boccasrdi and Carlomagno, 2017), there are two types of heat reflection which
are specular and diffuse (Figure 4:19). The type of reflection is highly dependent
on surface of material. If the surface is highly polished and smooth, (mirror like
surface) the reflection would be specular but if the surface is rough and dull the
reflection would be diffuse type. For aluminium polished or unpolished, it will
be the combination of diffuse and specular (Figure 4:20). Besides that, for
polished aluminium, it will have more heat ray reflected compared to unpolished
aluminium. This proves the reason why attic space was much cooler for design
C, due to more heat radiation been reflected.
Figure 4:19: Specular (left) and diffuse (right) heat reflection (Meola, Boccasrdi
and Carlomagno, 2017).

63
Figure 4:20: Combination of specular and diffuse heat reflection (Oleg, 2010).
4.4 Summary
From this process selection analysis, Design B, D, F and H is selected. This
selected design will be implemented on the main design and analyse the cooling
efficiency. In Table 4:1 show the selected design in each category and
comparing the attic temperature of each selected design to design A.
Table 4:1: Summary of selected design and temperature rise in attic space.
Category Selected Design Temperature rise in
attic space (°C)
Roof surface (outer) Design B 11
Conduction (inner) Design D 6.25
Convection (inner) Design F 8.5
Radiation (inner) Design H 5.25
4.5 Main Design Configuration
In this section, the final design has been constructed based on selection made in
previous section. The selected cooling designs have been implemented and the
temperature in attic space and roof surface were observed and analysed. The
data has been plotted in the following sections.

64
As mentioned earlier, the main design is built to manage heat from
conduction, convection and radiation. So in each section, a best material/method
is chosen and implemented on the model. For this design the same model is used
but with few modification in the design. In short, this design has combination
of all selected cooling system fixed in.
4.5.1 Main design layout (Design X)
Figure 4:21 shows the layout for design X. TRC was applied on the surface of
the roof as outer part of heat barrier. As for conduction heat barrier, vacuumed
rockwool was installed as per Figure 4:21. For radiant heat barrier, polished
aluminium was placed below the vacuumed rockwool. Finally, for convection,
attic fan was installed 23.5 cm above the ground.
There is a reason why the cooling system is arranged in these manner
(conduction, radiation and convection). According to (Williamson, 2018) the
emissivity of metal material will be affected with increasing temperature. Even
though aluminium is a good radiant heat barrier, it is also a good heat conductor.
In order to make sure the aluminium does not get heated, rockwool insulation is
placed above the aluminium instead of below. The attic fan is placed below the
insulations because when the transfer of heat is reduced, it will be easier to
extract heat more efficiently than placing the attic fan above the insulation. By
using trigonometry knowledge, the hypotenuse will always be the longest in
right angle triangle. Hence placing in inclined will cover more surface. If cover
more surface area it means can reduce more heat transfer to the attic.
Figure 4:21: Design X layout (all dimensions in the figure is in mm).

65
4.6 Results for design X
After comparing all cooling method, the best is chosen and applied in this design.
The purpose is to see how efficient does it remove heat when the best cooling
technique in each heat transfer mechanisms is applied. The recorded results was
plotted in Figure 4:22. The ambient temperature throughout this experiment was
29.75 °C to 30.25 °C. The initial temperature for the roof and the attic was
29.75 °C. Based on design A, this experiment concluded in 47 minutes. Within
47 minutes, the final surface temperature increased by 40.5 °C (72.75 °C –
32.25 °C). For the attic final temperature, it was recorded to be 34 °C. There
was an increase of 4.25 °C (34 °C – 29.75 °C) in 47 minutes. For the chamber
temperature, the lowest temperature recorded was 31.5 °C and the highest
temperature recorded was 41.75°C. With combination of active and passive
cooling system, the temperature in attic space was able to control the
temperature of attic about 34 °C from 42 minute till end of experiment. There is
a slight reduction of 0.25 °C at 44th minute.
Figure 4:22: Temperature reading for design X.
4.7 Comparison of attic temperature for all design
Figure 4:23 shows the comparison of attic temperature of all designs. By
comparing design X and A. For design A the temperature increased was
12.75 °C and for design X it was 4.25 °C. Clearly design X has better cooling
efficiency where it can reduce 8.5 °C more than design A. Not only that, design

66
X shows the lowest increase of temperature compared to the rest of the design.
This is because, each cooling method has been selected to reduce each type of
heat transfer mechanisms (conduction, convection, radiation). However, any
type of insulation applied is better than no insulation. Even by applying TRC, it
was able to reduce 1.75 °C more compared to design A. Figure 4:24 show the
flow of the worst to best cooling method for attic temperature. Besides that,
when conducting experiment based on radiant heat barrier, it shows that
significant amount of temperature is reduced. This prove that most type of heat
transmitted through attic space is radiation heat.
However design X only reduced 1 °C more compared to design H, this
is because some of the heat reflected by aluminium is reflected by the rockwool
and the roof surface, hence allowing more heat to enter the attic space.
According to (Whitwam, 2014) says that the lowest albedo material on earth is
vantablack, it has 0.00035 albedo. Even the lowest albedo material does not
absorb all the radiation light so definitely rockwool and roof surface also will
not absorb all the radiation heat. But taken that rockwool has lower albedo
compared to aluminium, not much heat were reflected. The aluminium will
reflect back some of the reflected heat and some will be absorbed. The process
goes on loop.
Figure 4:23: Comparison of attic temperature for all designs.

67
Figure 4:24: Designs arranged in worst to best cooling order.
4.8 Heat transfer mechanism
The heat transfer mechanism is split into two parts, active and passive cooling
system. The following diagram in Figure 4:25 show how the passive heat
mechanism travels to attic space. From Equation 4.1, the heat source supplied
by halogen lamp in terms of radiation, convection and conduction heat produced
by halogen lamp. Equation 4.2 shows when the radiation heat is exposed to the
coating of the roof. Some of the radiation heat were reflected due to TRC. Q’radin
is the remaining radiant heat transfer towards insulation. Equation 4.3 shows the
heat transfer between the coating and to the roof deck (Qcond1). Equation 4.5
shows the heat transfer between the insulation and aluminium (Qcond2). In
Equation 4.4 Q’’’radin is the remaining heat after been reflected by the insulation
(Q’radout) and aluminium (Q’’rad
out). For active heat transfer mechanism is shown
in Figure 4:26 and Equation 4.6. Qve will extract the hot air from the attic space.
The Equation 4.6 shows how to calculate convection air extracted.

68
Figure 4:25: Heat transfer mechanisms for Passive cooling system.
Figure 4:26: Heat transfer mechanisms for Active cooling system.
QS = Qradin + Qconvout + Qcond (4.1)
Q’radin = Qradin − Qradout (4.2)
Qcond1 = Q’radin + Q’convin (4.3)
Q’’’radin = Q’radin − (Q’radout + Q’’radout) (4.4)
Qcond2 = Q’’’radin + Q’’’convin (4.5)
Qve = M cp (Tout – Tin) (4.6)
Where;
QS = Main heat source from halogen light (W)
Qradin = Radiation heat transfer exposed to roof surface (W)

69
Qconvout = Convection heat transfer from the roof (W)
Qcond = Conduction heat transfer from halogen lamp (W)
Q’radin = Radiation heat transfer exposed to insulation (W)
Qradout = Reflected radiation heat from TRC (W)
Qcond1 = Conduction heat transfer between coating and roof deck (W)
Q’convin = Convection heat transfer into the roof deck (W)
Q’’’radin = Radiation heat transfer exposed to attic (W)
Q’radout = Reflected radiation heat from insulation (W)
Q’’radout = Reflected radiation heat from aluminium (W)
Qcond2 = Conduction heat transfer between insulation and aluminium (W)
Q’’’convin = Convection heat transfer into insulation and aluminium (W)
Qve = Extracted heat out through ventilation (W)
M = Mass flow rate of the removed air (kg/s)
cp = Specific heat capacity of air at atmospheric pressure (J/kg.K)
Tout = Environmental temperature in the chamber (K)
Tin = Attic temperature (K)
Q’’radin = Radiation heat transfer exposed to aluminium (W)
Q’radX = Reflected radiation heat from insulation reflected heat (W)
Q’’radX = Reflected radiation heat from aluminium reflected heat (W)
4.9 Comparison of roof surface temperature for all designs
Unlike attic temperature, for roof surface temperature, design X is not the lowest
temperature rise, design F show the lowest rise of roof surface temperature. Not
only that, design X roof temperature exceeds design A by 7 °C. Based on
Figure 4:27, it shows that the roof temperature increased when rockwool
and aluminium cooling method was implemented. Figure 4:28 shows the flow
of the lowest to highest temperature increased for roof surface temperature.

70
Figure 4:27: Comparison of roof surface temperature for all designs.
Figure 4:28: Designs arranged in lowest to largest temperature rise.
Design X shows higher temperature than design A is because of the
reflected heat by insulators and radiant heat barrier. Based on Figure 4:25, the
reflected heat travels towards the roof became a source of heat. As mentioned
earlier, when having an insulation, it divides attic space into two regions. Due
to surrounding temperature increase, the heat loss of the roof decreases.
However, the roof surface is lower compared to design H and design D. This is
because when attic fan is installed, the surrounding temperature reduced hence
increases the heat loss of the roof surface.

71
4.10 Comparison of chamber temperature for all designs
Figure 4:29 shows the comparison of chamber temperature for all designs. From
the Figure 4:29, it can be seen that the average lowest temperature was 32.36 °C
and the average highest temperature was 41.61 °C. Hence, the average
temperature increased for the chamber is 9.25 °C. However for design F, the
chamber temperature was slightly higher compared to the rest of the design due
to the installation of attic fan. When the hot air was extracted out from the attic
space, it increases the chamber temperature but for design X, even though it has
attic fan installed, the chamber temperature which was in average temperature.
The reason is because due to insulation and radiant heat barrier is installed. It
reduces the heat transfer to the attic space. This makes less heat air extracted
compared to design F. Besides that, for design E, the temperature fluctuates and
it is the lowest temperature compared to all other designs. This is because heat
flow into attic space back and front makes the chamber temperature reduce and
fluctuate.
Figure 4:29: Comparison of chamber temperature of all designs.
4.11 Comparison for Active and Passive cooling system
Figure 4:30 shows the temperature of attic space was collected to compare active
and passive system. For active and passive system, the duration of each
experiment is extended to 50 minutes. For this research, only designs X and F
have active cooling system, the rest of the designs are passive cooling system.

72
As per Figure 4:30, it can be observed that design F (Active) has a constant
temperature over 5 minutes and for other designs (Passive) the temperature is
rising, and for designs G and H the temperature is rising but in slower state.
From this situation, it can be seen that passive cooling system only could reduce
the transfer heat into the attic space but not stop/block the heat from entering.
However, for active cooling system when the heat in and heat out became equal,
there is no further increase of temperature in the attic space.
Besides that, active and passive cooling system has their own advantages
and disadvantages. Advantages for passive cooling system are that they do not
require any power to operate, product life is longer and they do not require any
maintenance. The disadvantage is that they only can reduce the transfer of heat
but not block it, so the heat might increase over a long period. Advantage for
active cooling system is, as mentioned earlier when the heat in and heat out
became equal, there were no further increase of temperature in attic space.
However, the disadvantage is it requires an external power and since fan
involves moving part it might need servicing and maintenance.
Figure 4:30: Comparison between Active and Passive cooling system for all designs.
4.12 Summary
Based on the results, design X shows the best cooling efficiency as it shows the
lowest temperature increased compared to all designs. This shows that by
reducing heat transfer in each category (conduction, convection and radiation)

73
plays an important role to cool a particular medium. Table 4:2 shows the
summary of all designs. For attic temperature comparison to design A is the
calculation for how much the particular design can reduce the temperature in
attic compared to design A. Example calculation for design B shows that, the
temperature rise in attic space is 11 °C and for design A is 12.75 °C. So by
comparison, design B is able to reduce 1.75 °C (12.75 °C – 11 °C) more than
design A.
Table 4:2: Summary of designs.
Layout of attic
model.
Temperature
rise for attic
(°C).
Temperature
rise for roof
surface (°C).
Attic temperature
Comparison to
design A (°C).
Design A 12.75 33.5 -
Design B 11 31 1.75
Design C 8 40.25 4.75
Design D 6.25 41.5 6.5
Design E 9.75 30.5 3
Design F 8.5 29.5 4.25
Design G 6.75 39.75 6
Design H 5.25 42.75 7.5
Design X 4.25 40.5 8.5

74
CHAPTER 5
5 CONCLUSIONS AND RECOMMENDATIONS
5.1 Conclusions
The objective of this research report has been successfully achieved. A small
scale attic model and a heating chamber was able to fabricate using plywood.
Heating chamber is used as a solar radiation/ heat supply to the attic model to
run the experiment. The chamber was designed in a way to simulate a severe
condition of weather in Malaysia. Design A was fabricated in a way where it
simulates normal housing roof (no cooling method is implemented). It was
analysed to see how hot the attic temperature could get in the environment.
There are total of 8 layouts of attic model. Each attic model is
experimented for each category of heat transfer mechanism where the best
cooling efficient was selected and implanted on design X. Design A and B is
compared to select which type of roof shows the best cooling efficiency. Design
B was chosen because it was able to reduce 1.75 °C more compared to design
A. Design C and D was compared to see which design shows the best conduction
heat barrier. Design D was chosen because it was able to reduce 1.75 °C. Design
E and F was compared to see which technique demonstrates more efficiency to
extract hot air using convection method. Design F shows better cooling effect,
it was able to reduce 1.25 °C more than design E. Finally, for radiant heat barrier,
design G and H were compared. Design H shows better cooling of attic space
where it was able to reduce 1.5 °C more than design E.
When all the best design is selected, it was implemented on Design X.
Design X consist of TRC on the surface of roof, a vacuumed rockwool, polished
aluminium and an attic fan was installed. Each of this material is selected to
reduce each heat transfer mechanism (conduction, convection and radiation).
Design X was analysed and it was able to reduce 8.5 °C compared to the normal
roof design (Design A). Combination of active and passive cooling system is
able to remove and reduce the heat transfer to attic space more efficient then
individual cooling system is applied.

75
In conclusion, eco-friendly roof cool roof system was able to reduce the
attic temperature by 8.5 °C and successfully improve the comfort of the
people/guard in the building without or less effect on environment. In addition,
the attic temperature is reduced without any use of non-renewable energy which
also benefits the environment.
5.2 Recommendation for future work
One of the recommendations for future work is using T-type of thermocouple.
It has sensitivity of 43 µV/°C which is more than K-type thermocouple which
is only 41 µV/°C. T-type thermocouple is more accurate compared to K-type
thermocouple in which T-type has an accuracy of ± 1.0 °C and K-type has an
accuracy of ± 2.2 °C. T-type thermocouple is suitable for the use of this research
because T-type thermocouple is designed to handle -270 °C to 300 °C. Besides
that, using a button magnet type thermocouple to measure the roof surface
temperature will give more accurate results. The current thermocouple is in
spherical junction shape. With this shape, not all the surface is in contact with
the roof surface, hence using button type (flat surface) will be accurate to
measure surface temperature (Figure 5:1). In addition, the button magnet is
made of neodymium magnet (SH), which can withstand up to 150 °C and low
as -130 °C.
Besides that, fabricating a building model instead of just attic can
identify how much heat is transferred to a building space. It also can identify
how cooling effect of attic space affects the interior of the building (below attic).
Furthermore, doing experiment based on after heating effect on attic. It means
how fast the attic space cools down after the heating process. With this, it can
identify whether the heat is contained or loss to the environment.
Figure 5:1: Button magnet thermocouple.

76
REFERENCES
Abdul Rahman, S., Ahmed, S. and Zain-Ahmed, A., 2004. A Passive
Ventilation System for Energy Efficiency in Tropical Buildings. A Passive
Ventilation System for Energy Efficiency in Tropical Buildings, SET 2004. In:
3rd International Conference on Sustainable Energy Technologies. Nottingham,
28-30 June 2004.UK.
Aditya, L., Mahlia, T.M.I., Rismanchi, B., Ng, H. M., Hasan, M. H., Metselaar,
H. S.C., Muraza, Oki. and Aditiya, H. B., 2017. A review on insulation materials
for energy conservation in buildings. Renewable and Sustainable Energy
Reviews, [e-journal] 73, pp.1352–1365.
https://doi.org/10.1016/j.rser.2017.02.034.
Ahmed, S., Abdul Rahman, S. and Zain-Ahmed, A., 2005. The ventilation
performance of a solar-powered attic fan in Malaysia Climate. Conference on
Sustainable Building South East Asia, pp. 470-476.
Amer, E.H., 2006. Passive options for solar cooling of buildings in aid areas.
Energy and building, 31, pp. 44 – 1332.
Amer,O., Boukhanouf, R. and Ibrahim, H.G., 2015. A Review of Evaporative
Cooling Technologies. Environmental Science and Development, 6, pp. 111 –
117.
Andrea, Z.,2019. Passive Cooling vs. Active Cooling – What’s the Difference?.
[online] Available at <https://www.simscale.com/blog/2017/01/ active-and-
passive-cooling> [Accessed: 7 April 2020].
Chan, H., Riffat, S.B. and Zhu, J., 2010. Review of passive solar heating and
cooling technologies. Renewable and Sustainable Energy Reviews, 14(2), pp.
781–789.
Chong, W.T., Tiah, C.C., Poh, S.C. and Mahlia, T., 2011. Development of a
multi-layer green roof for integration with an evacuated glass solar water heater.
In: Proceedings World Renewable Energy Congress. Indonesia.
Ciampi, M., Leccese, F. and Tuoni, G., 2005. Energy analysis of ventilated and
microvented roofs. Solar Energy, 79, pp. 92–183.
Cuce, P.M. and Riffat, S., 2016. A state of the art review of evaporative cooling
systems for building applications. Renewable and Sustainable Energy Reviews,
[e-journal] 54, pp.1240–1249. http://dx.doi.org/10.1016/j.rser.2015.10.066.

77
Dehghannya, J., Pourahmad, M., Ghanbarzadeh, B. and Ghaffari, H., 2019. Heat
and mass transfer enhancement during foam-mat drying process of lime juice:
Impact of convective hot air temperature. International Journal of Thermal
Sciences, [e-journal] 135, pp.30–43.
https://doi.org/10.1016/j.ijthermalsci.2018.07.023.
Engineering ToolBox, 2003. Emissivity Coefficients Materials. [Online].
Available at: <https://www.engineeringtoolbox.com/emissivity-coefficients-
d_447.html> [Accessed: 14 April 2020].
Engineering ToolBox, 2012. Materials - Albedo Reflecting Factors. [Online].
Available at: <https://www.engineeringtoolbox.com/light-material-albedo-
factor-d_1842.html> [Accessed: 14 April 2020].
Engineering ToolBox, 2019. Air - Thermal Conductivity. [Online]. Available at:
<https://www.engineeringtoolbox.com/air-properties-viscosity-conductivity-
heat-capacity-d_1509.html> [Accessed: 14 April 2020].
Everts, M. and Meyer, J.P., 2018. Relationship between pressure drop and heat
transfer of developing and fully developed flow in smooth horizontal circular
tubes in the laminar, transitional, quasi-turbulent and turbulent flow regimes.
International Journal of Heat and Mass Transfer, 117, pp.1231–1250.
FluxTeq, 2019, R-Value Measurements and Thermal Conductance. [Online]
Available at: <https://www.azom.com/article.aspx?ArticleID=15387>
[Accessed: 13 April 2020].
Hamideh, F. and Akbar, A., 2018. Application of eggshell wastes as valuable
and utilizable products. Research in Agricultural Engineering, 64(2), pp.104–
114.
Hirunlabh, J., Wachirapuwadon, S., Pratinthong, N. and Khedari, J., 2001. New
configurations of a roof solar collector maximizing natural ventilation. Build
Environment, 36, pp. 91–383.
Jandaghian, Z. and Berardi, U., 2020. Analysis of the cooling effects of higher
albedo surfaces during heat waves coupling the Weather Research and
Forecasting model with building energy models. Energy and Buildings, [e-
journal] 207. https://doi.org/10.1016/j.enbuild.2019.109627.
Jelle, B.P., 2011. Traditional, state-of-the-art and future thermal building
insulation materials and solutions - properties, requirements and possibilities.
Energy and Buildings, 43, pp. 2549-2563.
Joudi, K.A. and Mehdi, S.M., 2000. Application of indirect evaporative cooling
to variable domestic cooling load. Energy Conversion and Management, 41, pp.
51–1931.

78
Khedari, J., Mansirisub, W., Chaima, S., Pratinthong, N. and Hirunlabh, J., 2000.
Field measurement of performance of roof solar collector. Energy and Building,
31, pp. 8–171.
Levinson, R., 2019, Resources - Home & Building OwnersCool Roof Rating
Council. [Online] Available at: <https://coolroofs.org/resources/home-
building-owners> [Accessed: 3 February 2020].
Mahlia, T.M.I., Taufiq, B.N., Ismail and Masjuki, H.H., 2007. Correlation
between thermal conductivity and the thickness of selected insulation materials
for building wall. Energy and Buildings, 39, pp. 182-187.
Manfred, H., 2019, What Factors Influence the Emissivity of a Material?.
[Online] Available at: <https://www.ametek-
land.com/pressreleases/blog/2019/august/whatfactorsinfluencetheemissivityof
amaterial> [Accessed: 14 April 2020].
Meola, C., Boccardi, S. and Carlomagno, G.M., 2017. Infrared Thermography
in the Evaluation of Aerospace Composite Materials. Infrared Thermography
Basics, 72, pp. 195-203.
Mishra, G., 2016. Cool Roof System for Buildings - Types and its Benefits.
[online] Available at: <https://theconstructor.org/building/cool-roof-system-
forbuildings/7033/> [Accessed 22 March 2020].
Mujahid Rafique, M., Gandhidasan, P., Rehman, S. and Al-Hadhrami, L.M.,
2015. A review on desiccant based evaporative cooling systems. Renewable and
Sustainable Energy Reviews, 45, pp.145–159.
Nidhi, Singh., 2018. How Temperature Impacts Workplace Productivity.
[Online] Available at <https://www.entrepreneur.com/article/319479>
[Accessed 30 September 2019].
Oleg, S., 2010. Mixed Heat Reflection is a combination of Specular and Diffuse
Reflection. IEEE International Symposium on Industrial Electronics, [e-journal]
40(2), pp. 1773-1778, https://dx.doi.org/10.1109/ISIE.2010.5637874.
Ong, K.S., 2011. Temperature reduction in attic and ceiling via insulation of
several passive roof designs. Energy Conversion and Management, 52(6), pp.
2405–2411.
Soubdhan, T., Feuillard, T. and Bade, F., 2005. Experimental evaluation of
insulation material in roofing system under tropical climate. Solar Energy, 79,
pp.20– 311.
79
Suehrcke, H., Peterson, E.L. and Selby, N., 2008. Effect of roof solar reflectance
on the building heat gain in a hot climate. Energy and Building, 40, pp. 35–2224.
Suruhanjaya Tenaga Energy Commission Malaysia, 2017. Energy Statistics in
Malaysia. Putrajaya: ST.
Tetsu, K., Jeong, S. and Dorris, H.C.T., 2010. Energy Consumption and Air-
Conditioning Usage in Residential Buildings of Malaysia. In: SENVAR
(Sustainable Environment and Architecture), 11th International Conference on
Sustainable Environmental Architecture. Johor, Malaysia, 14 October 2010.
Toyohama: Japan.
Trading Economics, 2018. Malaysia Average Temperature | 2009-2018 Data |
2019-2022 Forecast | Historical. [Online]. Available at:
<https://tradingeconomics.com/malaysia/temperature> [Accessed: 7 April
2020].
Wanphen, S. and Nagano, K., 2009. Experimental study of the performance of
porous materials to moderate the roof surface temperature by its evaporative
cooling effect. Building and Environment, 44, pp. 51–338.
Whitwam, R., 2014. Carbon nanotubes used to create the blackest black ever.
[Online] Available at: <https://www.geek.com/news/carbon-nanotubes-used-
to-create-the-blackest-black-ever-1599202/> [Accessed: 17 April 2020].
Williamson, 2018. Does Emissivity Change with Temperature?. [Online].
Available at: <https://www.williamsonir.com/blog/does-emissivity-change-
with-temperature/> [Accessed: 20 April 2020].
Winiarski, D.W. and O’Neal, D.L., 1996. A quasi-steady-state model of attic
heat transfer with radiant barriers. Energy and Building, 24, pp. 94–183.
World Bank, 2018. World Development Indicators - Google Public Data
Explorer. [Online]. Available at:
<https://www.google.com/publicdata/explore?ds=d5bncppjof8f9_&met_y=sp
_pop_totl&idim=country:MYS&hl=en&dl=en> [Accessed: 20 April 2020].
Yew, M.C., Ramli Sulong, N.H., Chong, W.T., Poh, S.C., Ang, B.C. and Tan,
K.H., 2013. Integration of thermal insulation coating and moving-air-cavity in
a cool roof system for attic temperature reduction. Energy Convers. Manage,
[e-journal] 75, pp. 241–248.
https://dx.doi.org/10.1016/j.enconman.2013.06.024.
Yew, M.C., Yew, M.K., Saw, L.P., Rajkumar, Durairaj., Ng, T.C., Chen, K.P.
and Beh, J.H., 2018. Experimental analysis on the active and passive cool roof
systems for industrial buildings in Malaysia. J. Build. Eng, [e-journal] 19, pp.
134-141. https://dx.doi.org/10.1016/j.jobe.2018.05.001.

80
APPENDICES
Appendix A : Temperature tabulated for all designs
Table A-1: Results for design A.
Minutes Roof (°C) Attic (°C) Chamber (°C)
1 40.25 29.5 32.75
2 45.75 30.25 33.5
3 47.25 31 34.25
4 51 31.5 34.25
5 51.25 31.75 35
6 52.25 32 35.25
7 55 32.25 35.25
8 59 32.5 35.25
9 58.75 33 36
10 59.25 33.75 35.75
11 62.25 34.5 37
12 62.5 34.75 36.75
13 63.75 35.25 36.5
14 63.5 35.75 37.75
15 63.5 36.25 37.25
16 63.75 36 38
17 64.25 36.25 37.75
18 64.75 36.5 37
19 65.25 36.75 38
20 65.75 37.5 37.75
21 67.75 37.25 38.75
22 68.25 38 38.25
23 68.75 38.25 38.5
24 69.75 38.5 38.75
25 70.25 38.5 39
26 70.25 38.75 38.75
27 70.75 39 39

81
28 71 39.25 39.75
29 71.25 39.25 39.25
30 71.75 40.25 39.5
31 71.5 40.25 39.75
32 71.75 40.25 40.25
33 72 40.5 40
34 72.25 40.75 40
35 72.75 40.75 41
36 72.75 41 40.25
37 73.25 41.25 40.25
38 73.25 41.5 40.25
39 73.25 41.5 40.75
40 73.75 41.5 40.25
41 74 41.75 41
42 74.25 41.75 40.75
43 73.75 42.25 40.25
44 74 42 40.75
45 74 42.25 41.25
46 73.75 42.25 41
47 73.75 42.25 41.25
48 74 42.25 41.25
49 74 42.5 41
50 74.25 42.5 41.25
Table A-2: Results for design B.
Minutes Roof (°C) Attic (°C) Chamber (°C)
1 34.5 28.75 33
2 37.25 29 34
3 38.25 29 34.5
4 40.25 29.25 34.75
5 42.5 29.5 35.5
6 45.25 29.5 35.5

82
7 46.5 29.75 35.75
8 47.5 30 36
9 49 30.25 36.5
10 51.25 30.5 36.25
11 51.75 30.75 37.25
12 52.25 31 37.75
13 54.25 31.25 37.5
14 55.25 31.75 37.5
15 56.25 32.5 37.25
16 56.5 32.25 37.5
17 57 32.75 37.75
18 57.5 33 38.5
19 58.25 33.25 38
20 58.75 33.5 39
21 58.75 33.75 38
22 59 34.25 39
23 60 34.5 38.75
24 60.25 34.75 39.25
25 60.75 35 39.75
26 61.25 35 39.25
27 61.75 35 40
28 61.25 35.25 39.75
29 61.25 36 40.25
30 61.75 36.25 40.5
31 62.25 36.25 40.25
32 63 36.5 39.75
33 63 36.25 40.5
34 63.25 37.25 40.5
35 63.5 37.75 40.5
36 63.75 37.5 41.25
37 64 38 41
38 64.25 38 40.5

83
39 64.25 38.25 40.75
40 64.5 38.25 41
41 64.5 38.5 41.5
42 64.75 38.5 41
43 64.75 39 41
44 64.75 39.25 41.25
45 65 39.25 41.25
46 65 39.25 41
47 65.5 39.75 41.25
48 65.5 40 41.5
49 65.75 40.25 41.25
50 65.75 40.5 41.5
Table A-3: Results for design C.
Minutes Roof (°C) Attic (°C) Chamber (°C)
1 36.75 29.25 33.75
2 38.75 29.25 33.5
3 41.25 29.25 34
4 44.5 29.75 34.75
5 47 30.25 34.5
6 49.75 30.5 34.25
7 53.5 30.5 35.75
8 54.25 31 35.5
9 56 31 35.75
10 58.5 31.25 35.5
11 59.75 31.5 36.5
12 62.25 31.75 36.5
13 63 31.75 37.25
14 63.5 31.75 37.25
15 64 32 37.5
16 65.75 32.25 37.75
17 66.5 32.25 37.25
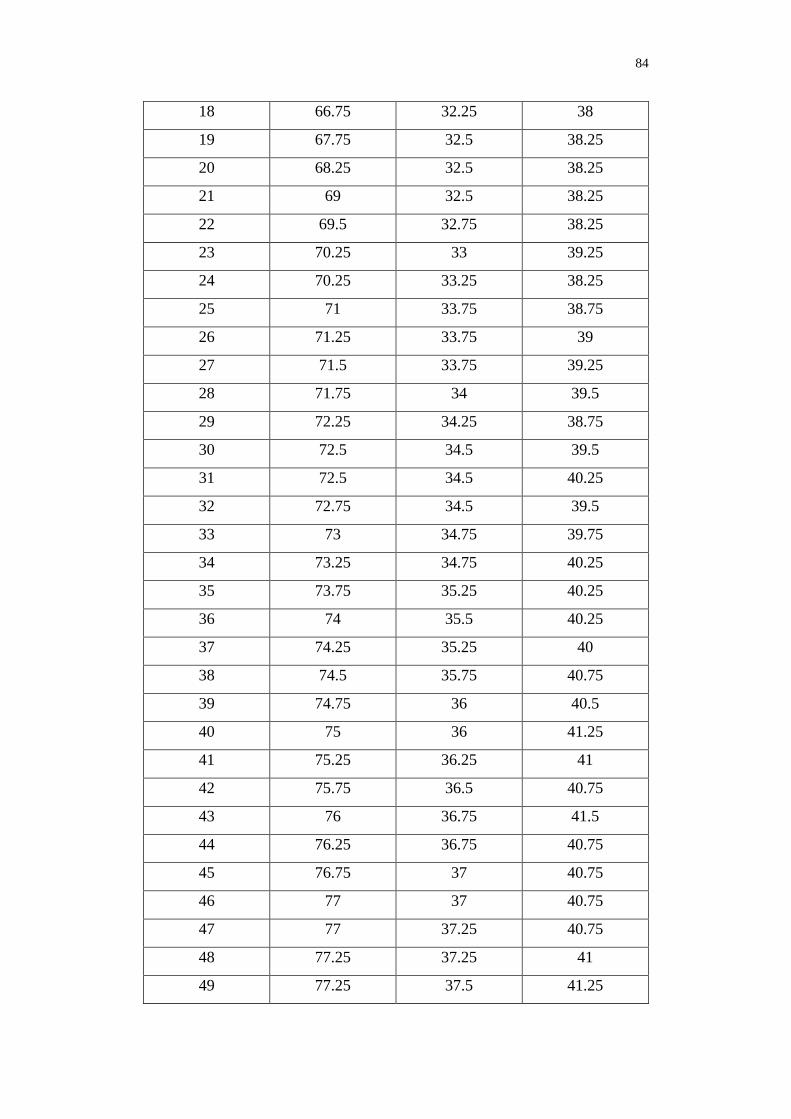
84
18 66.75 32.25 38
19 67.75 32.5 38.25
20 68.25 32.5 38.25
21 69 32.5 38.25
22 69.5 32.75 38.25
23 70.25 33 39.25
24 70.25 33.25 38.25
25 71 33.75 38.75
26 71.25 33.75 39
27 71.5 33.75 39.25
28 71.75 34 39.5
29 72.25 34.25 38.75
30 72.5 34.5 39.5
31 72.5 34.5 40.25
32 72.75 34.5 39.5
33 73 34.75 39.75
34 73.25 34.75 40.25
35 73.75 35.25 40.25
36 74 35.5 40.25
37 74.25 35.25 40
38 74.5 35.75 40.75
39 74.75 36 40.5
40 75 36 41.25
41 75.25 36.25 41
42 75.75 36.5 40.75
43 76 36.75 41.5
44 76.25 36.75 40.75
45 76.75 37 40.75
46 77 37 40.75
47 77 37.25 40.75
48 77.25 37.25 41
49 77.25 37.5 41.25

85
50 77.25 37.75 41.5
Table A-4: Results for design D.
Minutes Roof (°C) Attic (°C) Chamber (°C)
1 32.75 28.75 32.75
2 36.25 28.75 34.25
3 38.75 29 34.5
4 41.75 28.75 35
5 44 29 35.25
6 46.5 29.25 36
7 50 29.25 36.75
8 52 29.5 36.25
9 53.75 29.5 37
10 55 29.75 37.5
11 57.75 30 38
12 57.75 30 38.25
13 60.5 30 38.25
14 62 30.25 38.75
15 63.5 30.25 38.75
16 63.75 30.75 38.5
17 64 30.75 39.25
18 65.5 31 39
19 66 31 39.5
20 66.25 31.25 39
21 66.25 31.5 39.75
22 67.25 31.5 40
23 68.25 31.5 40.25
24 68.5 31.75 39.5
25 70 32 40.5
26 70.25 32 40.5
27 70.5 32 40.5
28 70.75 32.25 40.75

86
29 71 32.5 40.75
30 71.25 32.5 40.25
31 71.5 32.75 41
32 71.5 33 41
33 71.75 33 41
34 71 33.25 41.5
35 71.75 33.25 41.5
36 72.25 33.5 41.5
37 72.25 33.75 41.25
38 72.5 33.75 41.5
39 72.75 34 41.75
40 73 34.25 42.25
41 73 34.25 42.25
42 73.25 34.25 42.25
43 73.5 34.5 42.25
44 73.5 34.75 42.25
45 74 34.75 42.25
46 74.25 35 42.25
47 74.25 35 42
48 74.5 35.25 41.75
49 74.75 35.5 42
50 74.75 35.5 42.25
Table A-5: Results for design E.
Minutes Roof (°C) Attic (°C) Chamber (°C)
1 31.75 29 31.5
2 34.25 29.5 32
3 36.5 29.25 32.25
4 39.25 29.75 32
5 39.5 30 32.75
6 40 30.25 33.5
7 42.5 30.5 34

87
8 45.5 30.75 34.25
9 45.25 31 34.5
10 47.75 31.25 34.25
11 49.5 31.75 34.5
12 51.25 32 35
13 52 32.25 35.75
14 53.25 32.5 35.75
15 53.25 33 35.75
16 53 33.5 36.25
17 53.5 33.75 36.25
18 54 34 36.5
19 54.25 34.25 36
20 55 34.5 37.25
21 56.25 34.75 37
22 56.5 35 37.5
23 56.75 35.25 37.5
24 57 35.5 36.25
25 58.5 35.25 37.75
26 58.5 35.25 37
27 58.25 35.5 38
28 58.75 35.75 38
29 58.75 36.25 38.25
30 58.25 36.5 38.5
31 58.25 36.5 37.5
32 60 36.5 38
33 60.25 36.5 38.25
34 60.5 36.75 38.25
35 61.25 37 39.25
36 61 37.25 38.5
37 60.5 37.5 38.5
38 61.25 37.75 39
39 61.5 37.75 40.25

88
40 61.75 37.5 39.25
41 61.75 37.75 39.5
42 61.75 38 40.25
43 61.75 38 40
44 62 38.25 40
45 62.25 38.5 39.5
46 62 38.5 39.75
47 62.25 38.75 40.25
48 62.5 38.75 40
49 62.5 39 40
50 62.5 39.25 40.25
Table A-6: Results for design F.
Minutes Roof (°C) Attic (°C) Chamber (°C)
1 31 28.25 31.5
2 33 28.25 32.25
3 35.75 28.5 33.5
4 39.75 28.75 34.75
5 41.25 29 35.25
6 41.5 29.5 35.5
7 42.75 30 35.75
8 46.5 29.75 36
9 47.25 30 37.5
10 48.25 30 37.25
11 50.25 30.25 38.25
12 50 30.25 38.25
13 50 31 38.25
14 50.25 31.25 39.25
15 51 31.75 39.25
16 52.5 31.75 39.75
17 53.75 32.25 39.5
18 54.5 32.5 41

89
19 55.25 32.5 40.75
20 55.5 32.75 40.5
21 55.75 32.75 41
22 56 33 41
23 56.25 33.25 41.75
24 56.75 33.5 41
25 57 33.75 42
26 57.25 34 41.75
27 57.5 34.25 42.25
28 57.5 34 43.25
29 57.75 34 43
30 57.75 34.5 42.5
31 58 34.5 43
32 58.25 35.25 43.5
33 58.75 35.25 43
34 58.75 35.5 43.5
35 59 35.5 43.5
36 59 35.5 43
37 59.25 35.75 43.25
38 59.5 35.75 43.5
39 59.5 35.75 43.5
40 59.75 35.75 43.25
41 59.5 36.25 43
42 59.75 36.25 43.5
43 60 36.25 43.75
44 60 36.5 43.5
45 60.25 36.5 43.75
46 60.5 36.75 43
47 60.5 36.75 43.5
48 60.5 36.5 43.5
49 60.75 36.75 43.75
50 60.5 36.75 43.75

90
Table A-7: Results for design G.
Minutes Roof (°C) Attic (°C) Chamber (°C)
1 32.25 28.75 31
2 36 28.5 32.25
3 39.25 28.75 33
4 42 28.75 33.25
5 44 28.75 34
6 46.5 29 34
7 48.75 29.25 35.25
8 52 29.25 35.5
9 53 29.5 35
10 53 29.5 36
11 56.25 29.75 36.5
12 58 29.75 36.5
13 60 30 36.5
14 60.25 30.25 37.25
15 60.5 30.5 37.25
16 60.75 30.5 37.5
17 61 30.75 38
18 61.5 30.75 38.5
19 62 31 38
20 64.75 31 38.5
21 64.5 31.25 38.75
22 66 31.5 39.25
23 66.5 31.75 39
24 67 32 38.75
25 67.75 32 39.5
26 68.25 32.5 40
27 68.5 32.5 39.75
28 68.25 32.5 40.25
29 68.5 33 40
30 68.75 33.25 40
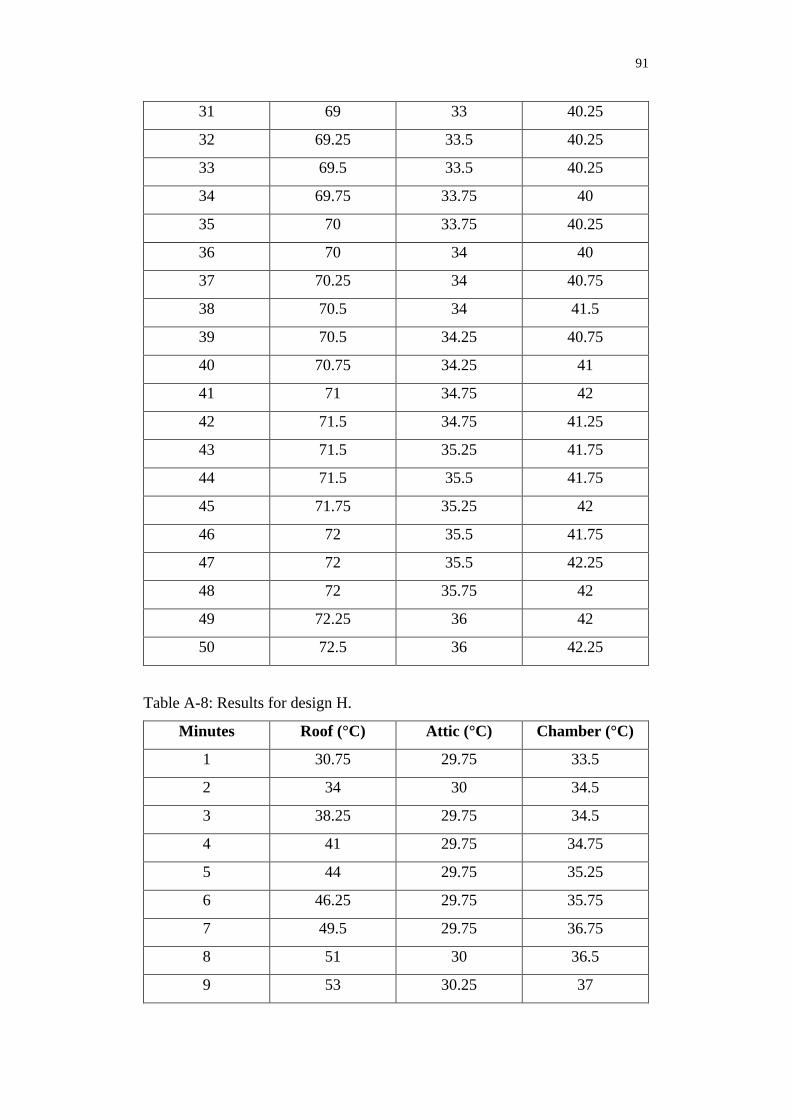
91
31 69 33 40.25
32 69.25 33.5 40.25
33 69.5 33.5 40.25
34 69.75 33.75 40
35 70 33.75 40.25
36 70 34 40
37 70.25 34 40.75
38 70.5 34 41.5
39 70.5 34.25 40.75
40 70.75 34.25 41
41 71 34.75 42
42 71.5 34.75 41.25
43 71.5 35.25 41.75
44 71.5 35.5 41.75
45 71.75 35.25 42
46 72 35.5 41.75
47 72 35.5 42.25
48 72 35.75 42
49 72.25 36 42
50 72.5 36 42.25
Table A-8: Results for design H.
Minutes Roof (°C) Attic (°C) Chamber (°C)
1 30.75 29.75 33.5
2 34 30 34.5
3 38.25 29.75 34.5
4 41 29.75 34.75
5 44 29.75 35.25
6 46.25 29.75 35.75
7 49.5 29.75 36.75
8 51 30 36.5
9 53 30.25 37
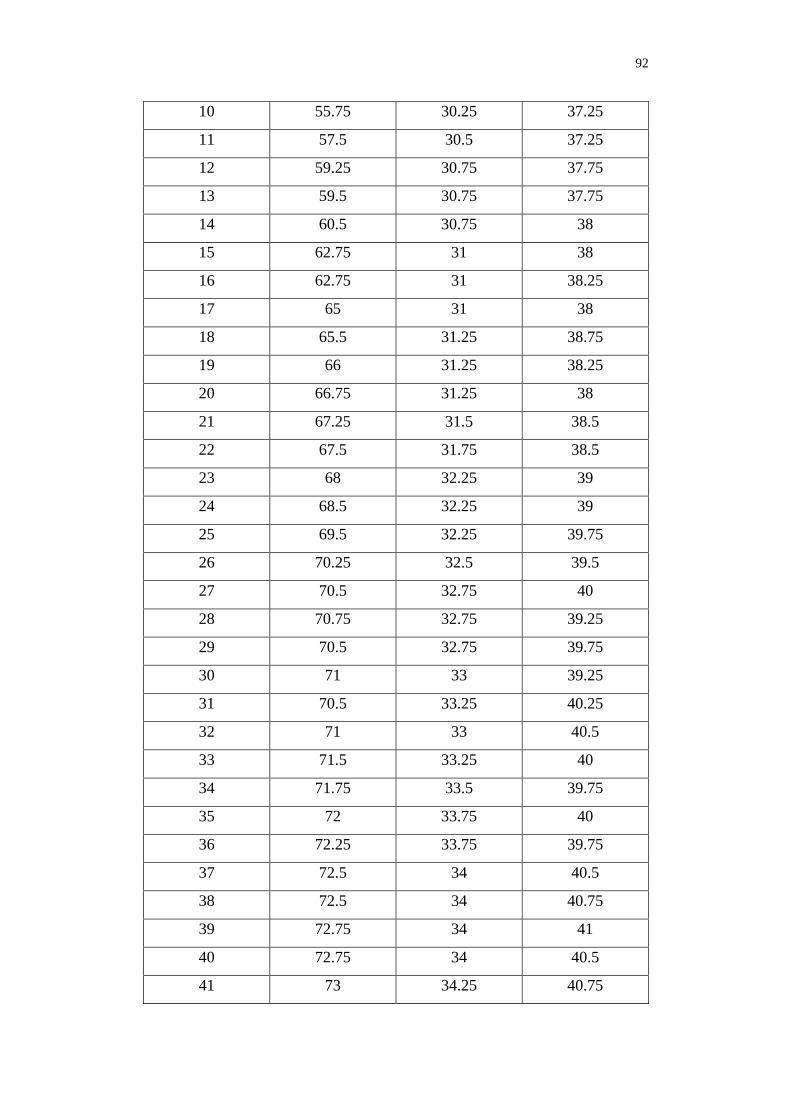
92
10 55.75 30.25 37.25
11 57.5 30.5 37.25
12 59.25 30.75 37.75
13 59.5 30.75 37.75
14 60.5 30.75 38
15 62.75 31 38
16 62.75 31 38.25
17 65 31 38
18 65.5 31.25 38.75
19 66 31.25 38.25
20 66.75 31.25 38
21 67.25 31.5 38.5
22 67.5 31.75 38.5
23 68 32.25 39
24 68.5 32.25 39
25 69.5 32.25 39.75
26 70.25 32.5 39.5
27 70.5 32.75 40
28 70.75 32.75 39.25
29 70.5 32.75 39.75
30 71 33 39.25
31 70.5 33.25 40.25
32 71 33 40.5
33 71.5 33.25 40
34 71.75 33.5 39.75
35 72 33.75 40
36 72.25 33.75 39.75
37 72.5 34 40.5
38 72.5 34 40.75
39 72.75 34 41
40 72.75 34 40.5
41 73 34.25 40.75
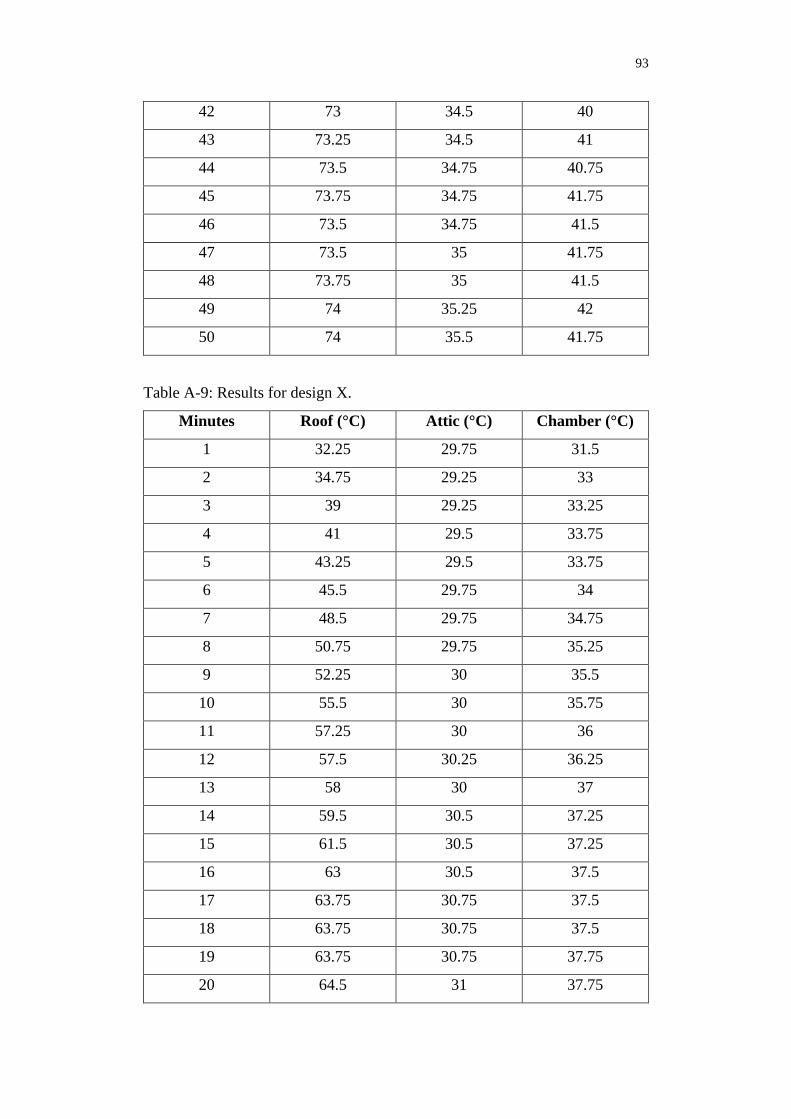
93
42 73 34.5 40
43 73.25 34.5 41
44 73.5 34.75 40.75
45 73.75 34.75 41.75
46 73.5 34.75 41.5
47 73.5 35 41.75
48 73.75 35 41.5
49 74 35.25 42
50 74 35.5 41.75
Table A-9: Results for design X.
Minutes Roof (°C) Attic (°C) Chamber (°C)
1 32.25 29.75 31.5
2 34.75 29.25 33
3 39 29.25 33.25
4 41 29.5 33.75
5 43.25 29.5 33.75
6 45.5 29.75 34
7 48.5 29.75 34.75
8 50.75 29.75 35.25
9 52.25 30 35.5
10 55.5 30 35.75
11 57.25 30 36
12 57.5 30.25 36.25
13 58 30 37
14 59.5 30.5 37.25
15 61.5 30.5 37.25
16 63 30.5 37.5
17 63.75 30.75 37.5
18 63.75 30.75 37.5
19 63.75 30.75 37.75
20 64.5 31 37.75

94
21 64.5 31 38
22 66.5 31.25 38.25
23 66.25 31.5 37.75
24 66.5 31.5 38.25
25 66.75 31.75 38.75
26 67.25 32 39
27 67.25 32 39.25
28 67.5 32.25 39
29 67.75 32.5 39.25
30 68 32.75 39.25
31 68.25 32.25 39.25
32 68.75 32.5 40
33 69 32.5 39.75
34 69.5 32.75 39.75
35 70 33 40
36 70.25 33.25 40.25
37 70.75 33.5 40.5
38 71 33.75 41
39 71.25 33.75 40.5
40 71.5 33.75 40.75
41 71.75 33.75 40.75
42 72 34 40.5
43 72.25 34 40.75
44 72.5 33.75 41.25
45 72.75 34 41.75
46 72.5 34 41.5
47 72.75 34 41.75
48 72.75 33.75 42
49 73 34 41.75
50 73 34.25 42

95
Appendix B : Arduino Data Logging’s Coding
#include "max6675.h"
unsigned long previousTime = millis();
long timeInterval = 60000;
int roofCS = 2;
int roofDO = 3;
int roofCLK = 4;
int atticCS = 5;
int atticDO = 6;
int atticCLK = 7;
int chamberCS = 11;
int chamberDO = 12;
int chamberCLK =13;
int ambientCS = 14;
int ambientDO = 15;
int ambientCLK = 16;
MAX6675 roof(roofCLK, roofCS, roofDO);
MAX6675 attic(atticCLK, atticCS, atticDO);
MAX6675 chamber(chamberCLK, chamberCS, chamberDO);
MAX6675 ambient(ambientCLK, ambientCS, ambientDO);
void setup() {
Serial.begin(9600);
Serial.println("CLEARSHEET");
Serial.println("LABEL,Date,Time,Roof(°C),Attic(°C),Chamber(°C),Ambient(
°C");
Serial.println("MAX6675 test");
// wait for MAX chip to stabilize
delay(500);

96
}
void loop() {
// basic readout test, just print the current temp
unsigned long currentTime = millis();
if (currentTime - previousTime > timeInterval) {
//do action
previousTime = currentTime;
Serial.println((String) "DATA,DATE,TIME," + roof.readCelsius()+ ","
+attic.readCelsius()+"," +chamber.readCelsius() +"," + ambient.readCelsius());
/*Serial.print("roof = ");
Serial.println(roof.readCelsius());
Serial.print("attic = ");
Serial.println(attic.readCelsius());
Serial.print("chamber = ");
Serial.println(chamber.readCelsius());
Serial.print("ambient = ");
Serial.println(ambient.readCelsius());*/
}
delay(1000);
}

97
Appendix C : Solidworks Displacement Simulation
Based on Figure C-1, Solidworks simulation has done to test the maximum deflection of flat bar. The bar was tested under 100 N of force and
80 °C. The end of the bar was set as fixed point (green arrow). The maximum displacement/ deflection of flat bar is 9.450 mm.
Figure C-1: Flat bar displacement simulation.

98
Based on Figure C-2, Solidworks simulation has done to test the maximum deflection of angle bar. The bar was tested under 100 N of force and
80 °C. The end of the bar was set as fixed point (green arrow). The maximum displacement/ deflection of flat bar is 1.038 mm. Compared to flat
bar, angle bar has lesser deflection, hence angle bar has been chosen to support the halogen lamp.
Figure C-2: Angle bar displacement simulation.

99
Appendix D : Material Selection Criteria
Figure D-1: Stage one material selection.

100
Figure D-2: Stage two material selection.

101
Appendix E : Alternative Cooling System Design
The initial design, is to create a vacuum air cavity. In the first design, an
aluminium box was welded together and vacuum pump is being used to suck
the air out. However, during the vacuum process, the aluminium box tends to
bend inwards and the welded joints starts to break. This is because 0.4 mm
aluminium sheet was too thin for this process. To save cost, in the second design
plywood and oak wood was fabricated as in figure E-1. However, in this design
there was air leak in the air valve. The air valve was not designed to withstand
vacuum pressure. As result, this design was replaced by the new design which
is proposed and fabricated in this prototype.
Figure E-1: Fabrication of vacuum cavity box using wood (cover of the box
not installed).

102
Figure E-2: Fabrication of vacuum cavity box using wood (before paint).


![Passive design[1]](https://static.fdokumen.com/doc/165x107/63215c9580403fa2920cb59b/passive-design1.jpg)