Integrating Ontological Knowledge for Iterative Causal Discovery and Visualization
12
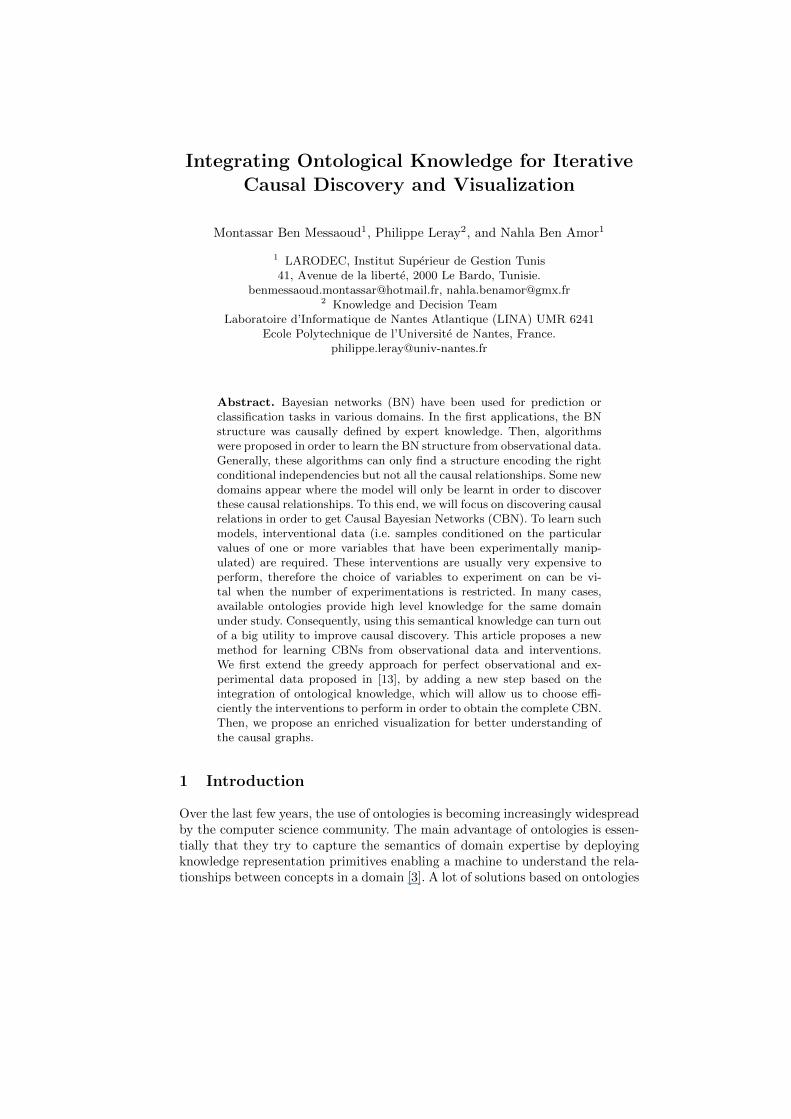
Integrating Ontological Knowledge for Iterative Causal Discovery and Visualization Montassar Ben Messaoud 1 , Philippe Leray 2 , and Nahla Ben Amor 1 1 LARODEC, Institut Sup´ erieur de Gestion Tunis 41, Avenue de la libert´ e, 2000 Le Bardo, Tunisie. [email protected], [email protected] 2 Knowledge and Decision Team Laboratoire d’Informatique de Nantes Atlantique (LINA) UMR 6241 Ecole Polytechnique de l’Universit´ e de Nantes, France. [email protected] Abstract. Bayesian networks (BN) have been used for prediction or classification tasks in various domains. In the first applications, the BN structure was causally defined by expert knowledge. Then, algorithms were proposed in order to learn the BN structure from observational data. Generally, these algorithms can only find a structure encoding the right conditional independencies but not all the causal relationships. Some new domains appear where the model will only be learnt in order to discover these causal relationships. To this end, we will focus on discovering causal relations in order to get Causal Bayesian Networks (CBN). To learn such models, interventional data (i.e. samples conditioned on the particular values of one or more variables that have been experimentally manip- ulated) are required. These interventions are usually very expensive to perform, therefore the choice of variables to experiment on can be vi- tal when the number of experimentations is restricted. In many cases, available ontologies provide high level knowledge for the same domain under study. Consequently, using this semantical knowledge can turn out of a big utility to improve causal discovery. This article proposes a new method for learning CBNs from observational data and interventions. We first extend the greedy approach for perfect observational and ex- perimental data proposed in [13], by adding a new step based on the integration of ontological knowledge, which will allow us to choose effi- ciently the interventions to perform in order to obtain the complete CBN. Then, we propose an enriched visualization for better understanding of the causal graphs. 1 Introduction Over the last few years, the use of ontologies is becoming increasingly widespread by the computer science community. The main advantage of ontologies is essen- tially that they try to capture the semantics of domain expertise by deploying knowledge representation primitives enabling a machine to understand the rela- tionships between concepts in a domain [3]. A lot of solutions based on ontologies
-
Upload
independent -
Category
Documents
-
view
3 -
download
0
Transcript of Integrating Ontological Knowledge for Iterative Causal Discovery and Visualization
Integrating Ontological Knowledge for IterativeCausal Discovery and Visualization
Montassar Ben Messaoud1, Philippe Leray2, and Nahla Ben Amor1
1 LARODEC, Institut Superieur de Gestion Tunis41, Avenue de la liberte, 2000 Le Bardo, Tunisie.
[email protected], [email protected] Knowledge and Decision Team
Laboratoire d’Informatique de Nantes Atlantique (LINA) UMR 6241Ecole Polytechnique de l’Universite de Nantes, France.
Abstract. Bayesian networks (BN) have been used for prediction orclassification tasks in various domains. In the first applications, the BNstructure was causally defined by expert knowledge. Then, algorithmswere proposed in order to learn the BN structure from observational data.Generally, these algorithms can only find a structure encoding the rightconditional independencies but not all the causal relationships. Some newdomains appear where the model will only be learnt in order to discoverthese causal relationships. To this end, we will focus on discovering causalrelations in order to get Causal Bayesian Networks (CBN). To learn suchmodels, interventional data (i.e. samples conditioned on the particularvalues of one or more variables that have been experimentally manip-ulated) are required. These interventions are usually very expensive toperform, therefore the choice of variables to experiment on can be vi-tal when the number of experimentations is restricted. In many cases,available ontologies provide high level knowledge for the same domainunder study. Consequently, using this semantical knowledge can turn outof a big utility to improve causal discovery. This article proposes a newmethod for learning CBNs from observational data and interventions.We first extend the greedy approach for perfect observational and ex-perimental data proposed in [13], by adding a new step based on theintegration of ontological knowledge, which will allow us to choose effi-ciently the interventions to perform in order to obtain the complete CBN.Then, we propose an enriched visualization for better understanding ofthe causal graphs.
1 Introduction
Over the last few years, the use of ontologies is becoming increasingly widespreadby the computer science community. The main advantage of ontologies is essen-tially that they try to capture the semantics of domain expertise by deployingknowledge representation primitives enabling a machine to understand the rela-tionships between concepts in a domain [3]. A lot of solutions based on ontologies
have been implemented in several real applications in different areas as naturallanguage translation, medicine, electronic commerce and bioinformatics.
In the other hand, causal discovery remains a challenging and importanttask [12]. One of the most common techniques for causal modeling are CausalBayesian Networks (CBNs), which are probabilistic graphical models, wherecausal relationships are expressed by directed edges [18]. Like classical BayesianNetworks, CBNs need observational data to learn a partially directed model butalso they require interventional data, i.e. samples conditioned on the particularvalues of one or more variables that have been experimentally manipulated, inorder to fully orient the model.
Several researches have proposed algorithms to learn the structure of a CBNfrom observational and experimental data.
This paper goes farther by integrating ontological knowledge for more ef-ficient causal discovery and proposes, henceforth, an enriched visualization ofcausal graphs based on semantical knowledge.
Less works has been done on this aspect of combining the power of Bayesiannetworks and ontologies. And most of them focus on developing probabilisticframeworks for combining different ontology mapping methods [16, 22].
The remainder of this paper is organized as follows: Section 2 provides somenotations and basic definitions on Bayesian networks, Causal Bayesian Networksas well as ontologies. Section 3 describes the new approach for causal discoverybased on ontological knowledge. Finally, section 5 proposes different tools toobtain an enriched visualization of CBN.
2 Background and notations
This section gives basic definitions on Bayesian networks, causal Bayesian net-works and ontologies. The following notations and syntactical conventions areused: Let X = {X1, X2, ..., XN} be a set of variables. By x we denote any in-stance of X. For any node Xi ∈ X we denote by Pa(Xi) (resp. Ne(Xi)) theparents (resp. neighbors) of the variable Xi. P(Xi) is used to denote the proba-bility distribution over all possible values of variable Xi, while P(Xi=xk) is usedto denote the probability that the variable Xi is equal to xk.
2.1 Bayesian networks
A Bayesian Network (BN) [17] consists of a Directed Acyclic Graph (DAG) anda set of conditional probability tables (CPTs) such that each node in the DAGcorresponds to a variable, and the associated CPT contains the probability ofeach state of the variable given every possible combination of its parents statesi.e. P(Xi|Pa(Xi)). Bayesian networks are very suited for probabilistic inference,since they satisfy an important property known as Markov property, which statesthat each node is independent of its non-descendants given its parents and leadsto a direct factorization of the joint distribution into the product of the condi-tional distribution of each variable Xi given its parents Pa(Xi). Therefore, the
probability distribution relative to X=(X1, X2,..., Xn) can be computed by thefollowing chain rule:
P (X1, X2, ..., Xn) =∏
i=1..n
P (xi | Pa(Xi)). (1)
Note that several BNs can model the same probability distribution. Suchnetworks are called equivalent or Markov equivalent [24].
Definition 1. A Complete Partially Directed Acyclic Graph (CPDAG) isa representation of all equivalent BNs. The CPDAG contains the same skeletonas the original DAG, but possesses both directed and undirected edges. Everydirected edge Xi → Xj of a CPDAG denotes that all DAGs of this class containthis edge, while every undirected edge Xi—Xj in this CPDAG-representationdenotes that some DAGs contain the directed edge Xi → Xj, while others containthe oppositely orientated edge Xi ← Xj.
Under Causal sufficiency assumption (i.e. there are no latent variables thatinfluence the system under study), many structure learning techniques usingperfect observational data are available and can be used to learn CPDAG andthen choose a possible complete instantiation in the space of equivalent graphsdefined by this CPDAG. These techniques can be classified into two groups,namely score-based and constraint-based algorithms.
Score-based algorithms [4, 5] attempt to identify the network that maximizesa scoring function evaluating how well the network fits the data while constraint-based algorithms [12, 21] look for (in)dependencies in the data and try to modelthat information directly into the graphical structure.
2.2 Causal Bayesian Networks
A Causal Bayesian Network (CBN) [18] is a Bayesian network with the addedproperty that all edges connecting variables represent autonomous causal re-lations. Given a CBN, we can go further than probabilistic inference to per-form causal inference. Pearl has introduced the do operator as standard notifi-cation for external intervention on causal models. In fact, the effect of an action”do(Xj=xk)” in a causal model corresponds to a minimal perturbation of theexisting system that forces the variable Xj to the value xk. In other terms, causalinference is the process of calculating the effect of manipulating some set of vari-ables Xi on the probability distribution of some other set of variables Xj , thisis denoted as P(Xi|do(Xj=xk)).
Several researches in the literature have proposed algorithms to learn CBN’sstructure. We can, in particular, mention Tong and Koller [23] and Cooper andYoo [6], which developed a score-based techniques to learn a CBN from a mixtureof experimental and observational data. Eberhardt et al. [9] performed a theo-retical study on the lower bound of the worst case for the number of experimentsto perform to recover the causal structure.
Recently, Meganck et al. [13] proposed a greedy contraint-based learningalgorithm for CBNs using experiments. The MyCaDo (My Causal DiscOvery)algorithm, which represents the main application of their approach, is a structurelearning algorithm able to select appropriate interventions or experiments (i.e.randomly assigning values to a single variable and measuring some other possibleresponse variables) needed to built a CBN. As input, the MyCaDo algorithmneeds a CPDAG. Meganck et al. proposed to use the PC algorithm proposed bySpirtes et al. [21] with modified orientation rules to learn the initial CPDAG,but other structure learning algorithms can be taken into consideration.
When applying PC algorithm, we start with a complete undirected network.Then, we remove edges when independencies are found; we call such step Skele-ton discovery. The edge orientation, in such algorithm, is based on v-structurediscovery and edge propagation. Based on the already oriented edges, an inferrededges step will apply some orientation rules until no more edges can be oriented.
In this step, we need also experimental data to perform interventions on thesystem. To learn a CBN from interventional data, three major parts can bedistinguished in the MyCaDo algorithm:
– First of all, it tries to maximize an utility function based on three variables:gain(exp), cost(exp), cost(meas), respectively, the gained information, thecost of performing an experiment and the cost of measuring other variables,to decide which experiment should be performed and hence also which vari-ables will be measured.If we denote performing an experiment on Xi by AXi
, and measuring theneighboring variables by MXi
, then the utility function will be as follows:
U(AXi) =
αgain(AXi)
βcost(AXi) + γcost(MXi
)(2)
where α, β and γ are measures of importance for every term.
In this formula, gain(AXi) takes into consideration the number of undirected
neighbors NeU (Xi) (e.g. nodes that are connected to Xi by an undirectededge) and the amount of possible inferred edges, after performing an exper-iment on Xi.
Three decision criteria were proposed Maximax, Maximin and Expected Util-ity depending on the type of situation in which to perform the experimentsit might be advantageous to choose a specific criterion.
– Secondly, the selected experiment will be performed.– Finally, the results of this experiment, will be analyzed in order to direct a
number of edges in the CPDAG.
Note that the amount of edges of which the direction can be inferred afterperforming an experiment is entirely based on the instantiation (i.e. assignationof a direction) of the undirected edges connected to the one being experimentedon.
This process will be iterated until we obtain the correct structure of theCBN. Note that we can have a non-complete causal graph (i.e. not all edges areoriented) as final output of MyCaDo algorithm.
Borchani et al. [2] have also described another approach for learning CBNsfrom incomplete observational data and interventions.
Furthermore, other approaches were proposed to learn graphical models thatcan handle latent variables. For this kind of hidden variable modeling, Megancket al. [14, 15] and Maes et al [11] studied which experiments were needed to learnCBN with latent variables under the assumption of faithful distribution (i.e. theobserved samples come from a distribution which independence properties areexactly matched by those present in the causal structure of a CBN). Their solu-tion offers a new representation based on two paradigms that model the latentvariables implicitely, namely Maximal Ancestral Graphs and Semi-MarkovianCausal Models, in order to perform probabilistic as well as causal inference.
2.3 Ontology
An ontology [10] is defined as a formal explicit specification of a shared con-ceptualization. In other terms, it is a formal representation of a set of conceptswithin a domain and the relations between these concepts. The relations in anontology are either taxonomic (e.g. is-a, part-of) or non-taxonomic (i.e. user-defined). The taxonomic ones are the commonly used relations. In the simplecase, the ontology takes the form of a tree or hierarchy representing concepttaxonomy. Formally:
Definition 2. A Concept Taxonomy H = (C,E,Rt) is a directed acyclicgraph where, C = {c1, c2, ..., cn} is the set of all concepts in the hierarchy, E isthe set of all subsumption links (is-a) and Rt is the unique root of this DAG.The primary structuring element of concept taxonomy is the subsumption rela-tionship, which supposed that if the concept ci is a child of concept cj then allproperties of cj are also properties of ci and we say that cj subsumes ci .
Regarding any concept taxonomy hierarchy, we can give the following nota-tions:
– pths(ci, cj): the set of paths between the concepts ci and cj , where i 6= j,– lene(e): the length in number of edges of the path e,– mscs(ci, cj): the most specific common subsumer of ci and cj , where i 6= j.
The major contribution of using concept taxonomies is, essentially, to presentthe domain knowledge in a declarative formalism.
For instance, the Gene Ontology (GO) [25] is one of the principal knowledgeresource repository in the bioinformatic field and represents an important toolfor the representation and processing of information about genes and functions.It provides controlled vocabularies for the designations of cellular components,molecular functions and biological processes.
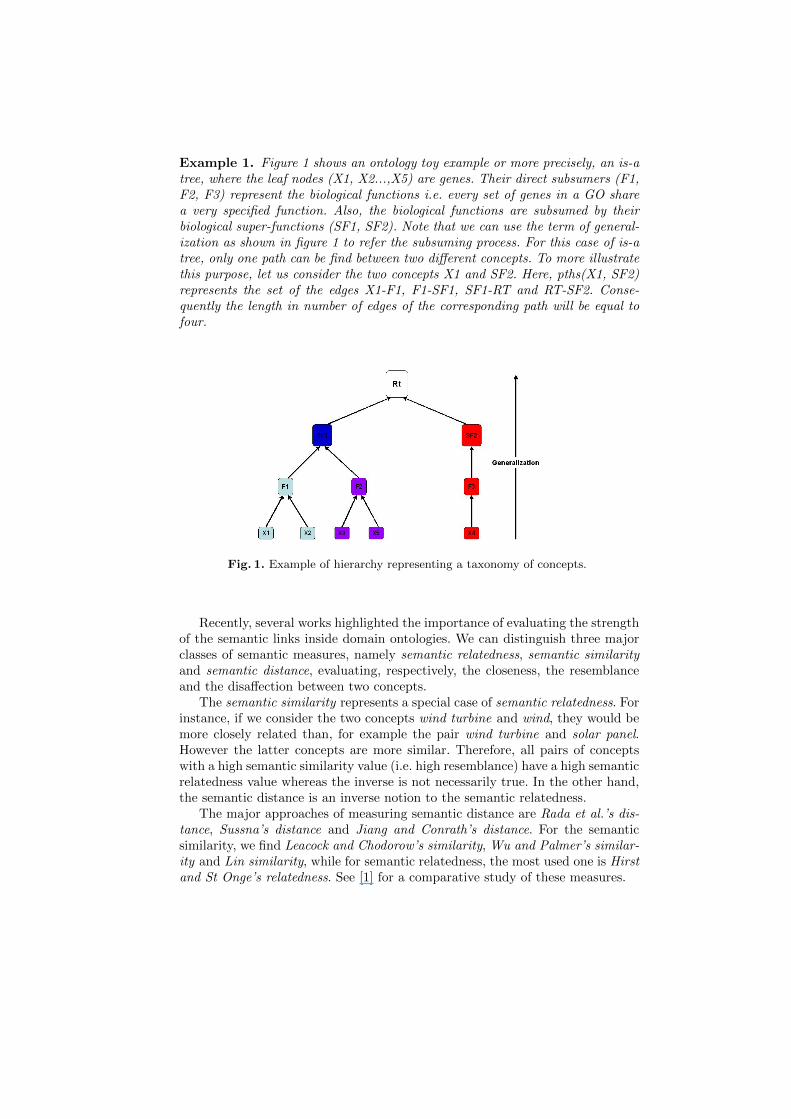
Example 1. Figure 1 shows an ontology toy example or more precisely, an is-atree, where the leaf nodes (X1, X2...,X5) are genes. Their direct subsumers (F1,F2, F3) represent the biological functions i.e. every set of genes in a GO sharea very specified function. Also, the biological functions are subsumed by theirbiological super-functions (SF1, SF2). Note that we can use the term of general-ization as shown in figure 1 to refer the subsuming process. For this case of is-atree, only one path can be find between two different concepts. To more illustratethis purpose, let us consider the two concepts X1 and SF2. Here, pths(X1, SF2)represents the set of the edges X1-F1, F1-SF1, SF1-RT and RT-SF2. Conse-quently the length in number of edges of the corresponding path will be equal tofour.
Fig. 1. Example of hierarchy representing a taxonomy of concepts.
Recently, several works highlighted the importance of evaluating the strengthof the semantic links inside domain ontologies. We can distinguish three majorclasses of semantic measures, namely semantic relatedness, semantic similarityand semantic distance, evaluating, respectively, the closeness, the resemblanceand the disaffection between two concepts.
The semantic similarity represents a special case of semantic relatedness. Forinstance, if we consider the two concepts wind turbine and wind, they would bemore closely related than, for example the pair wind turbine and solar panel.However the latter concepts are more similar. Therefore, all pairs of conceptswith a high semantic similarity value (i.e. high resemblance) have a high semanticrelatedness value whereas the inverse is not necessarily true. In the other hand,the semantic distance is an inverse notion to the semantic relatedness.
The major approaches of measuring semantic distance are Rada et al.’s dis-tance, Sussna’s distance and Jiang and Conrath’s distance. For the semanticsimilarity, we find Leacock and Chodorow’s similarity, Wu and Palmer’s similar-ity and Lin similarity, while for semantic relatedness, the most used one is Hirstand St Onge’s relatedness. See [1] for a comparative study of these measures.
In what follows, we will focus on semantic distances and in particular on theclassical Rada et al.’s distance [19], which can be replaced by any other semanticdistance.
This distance is based on the shortest path between the nodes correspondingto the items being compared such that the shorter the path from one node toanother, the more similar they are. Thus, given multiple paths between twoconcepts, we should take the length of the shortest one. Formally, given twoconcepts ci and cj the Rada et al.’s distance is defined by:
distrmbb(ci, cj) = minp∈pths(ci,cj)
lene(p) (3)
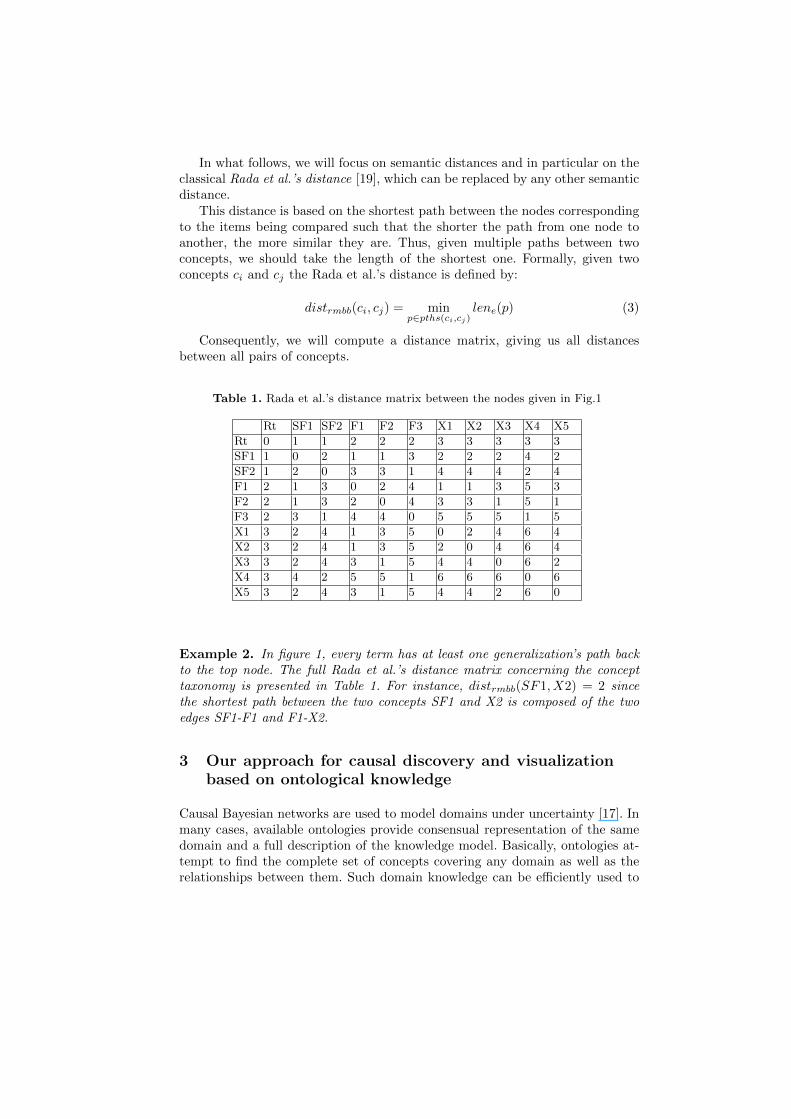
Consequently, we will compute a distance matrix, giving us all distancesbetween all pairs of concepts.
Table 1. Rada et al.’s distance matrix between the nodes given in Fig.1
Rt SF1 SF2 F1 F2 F3 X1 X2 X3 X4 X5
Rt 0 1 1 2 2 2 3 3 3 3 3
SF1 1 0 2 1 1 3 2 2 2 4 2
SF2 1 2 0 3 3 1 4 4 4 2 4
F1 2 1 3 0 2 4 1 1 3 5 3
F2 2 1 3 2 0 4 3 3 1 5 1
F3 2 3 1 4 4 0 5 5 5 1 5
X1 3 2 4 1 3 5 0 2 4 6 4
X2 3 2 4 1 3 5 2 0 4 6 4
X3 3 2 4 3 1 5 4 4 0 6 2
X4 3 4 2 5 5 1 6 6 6 0 6
X5 3 2 4 3 1 5 4 4 2 6 0
Example 2. In figure 1, every term has at least one generalization’s path backto the top node. The full Rada et al.’s distance matrix concerning the concepttaxonomy is presented in Table 1. For instance, distrmbb(SF1, X2) = 2 sincethe shortest path between the two concepts SF1 and X2 is composed of the twoedges SF1-F1 and F1-X2.
3 Our approach for causal discovery and visualizationbased on ontological knowledge
Causal Bayesian networks are used to model domains under uncertainty [17]. Inmany cases, available ontologies provide consensual representation of the samedomain and a full description of the knowledge model. Basically, ontologies at-tempt to find the complete set of concepts covering any domain as well as therelationships between them. Such domain knowledge can be efficiently used to
enrich the learning process of Causal Bayesian networks and optimize the causaldiscovery.
In order, to illustrate this idea we propose to extend the MyCaDo (My CausalDiscOvery) algorithm [13] used to learn causal structures with experiments byintegrating the ontological knowledge, extracted using Rada et al. semantic dis-tance calculation, for causal discovery and visualization.
We make the assumption that we consider a concept taxonomy hierarchy,in which the leaves are also the nodes of the Bayesian network. However, thecausal relations we want to discover and model with our CBN did not exist inthe corresponding ontology, therefore, each model representation complete theother.
3.1 Integrating ontological knowledge for causal discovery
In what follows let us assume that after performing an experiment on a variableXi, we can measure all neighboring variables NeU (Xi).Our utility function U(.) is an extension of the one proposed in [13] (see sub-section 2.2) by generalizing the first term NeU (Xi) and replacing it by thesemantical inertia, denoted by SemIn(NeU (Xi)).
This notion will enable us to integrate our ontological knowledge extractedby calculating semantic distances from ontologies and guide the choice of thebest experiment. In many situations, we can have a node Xi with a high numberof neighbors but all those neighbors are very close semantically. This impliesthat we will have, exactly, two alternatives (i.e. Xi is the direct cause of all hisneighbors or the inverse).
For instance, in bio-informatics, biologists would discover more causal rela-tions between biological functions. Considering a neighborhood which is veryclose semantically will reduce the number of functions under study and con-sequently the informative contribution of the experiment would be very low.However, in the case of distant neighbors, there will be more cause-to-effectrelations between biological functions to find. Such causal discoveries have animportant scientific contribution in the bio-informatic field.
The semantical inertia will be as follows:
SemIn(M) =
∑Xi∈M
minp∈pths(Xi, mscs(M))
(lene(p))
card(M)(4)
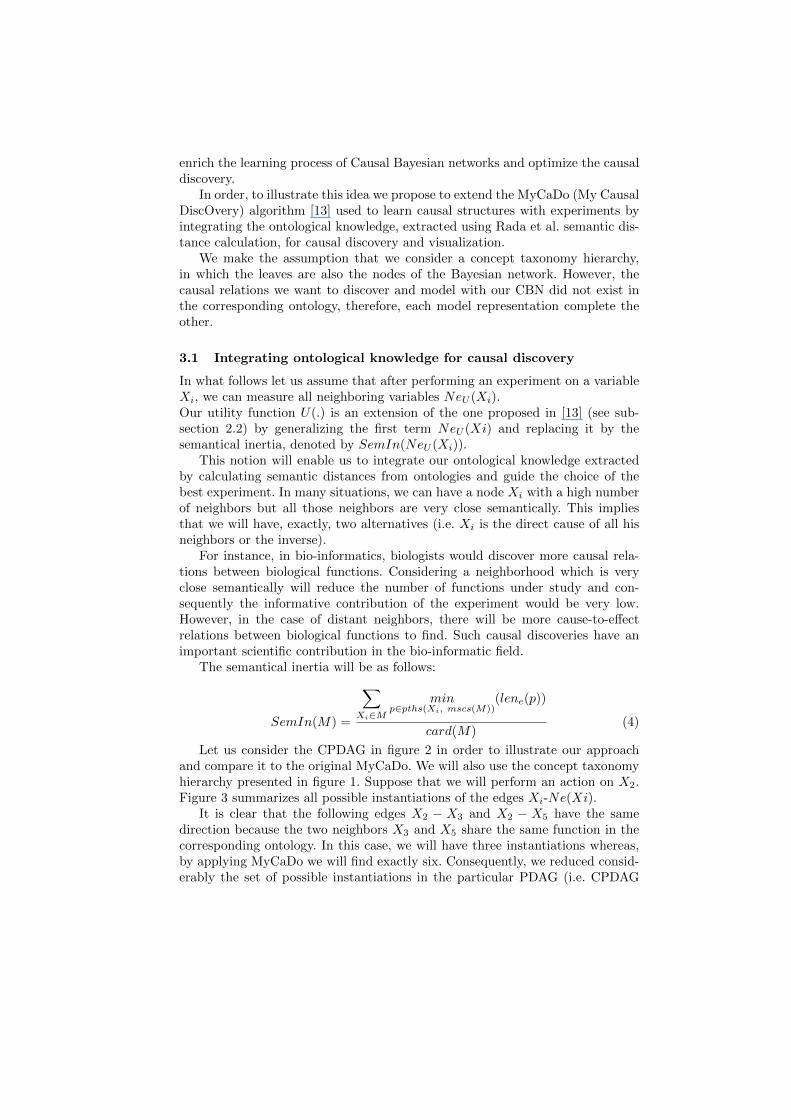
Let us consider the CPDAG in figure 2 in order to illustrate our approachand compare it to the original MyCaDo. We will also use the concept taxonomyhierarchy presented in figure 1. Suppose that we will perform an action on X2.Figure 3 summarizes all possible instantiations of the edges Xi-Ne(Xi).
It is clear that the following edges X2 − X3 and X2 − X5 have the samedirection because the two neighbors X3 and X5 share the same function in thecorresponding ontology. In this case, we will have three instantiations whereas,by applying MyCaDo we will find exactly six. Consequently, we reduced consid-erably the set of possible instantiations in the particular PDAG (i.e. CPDAG
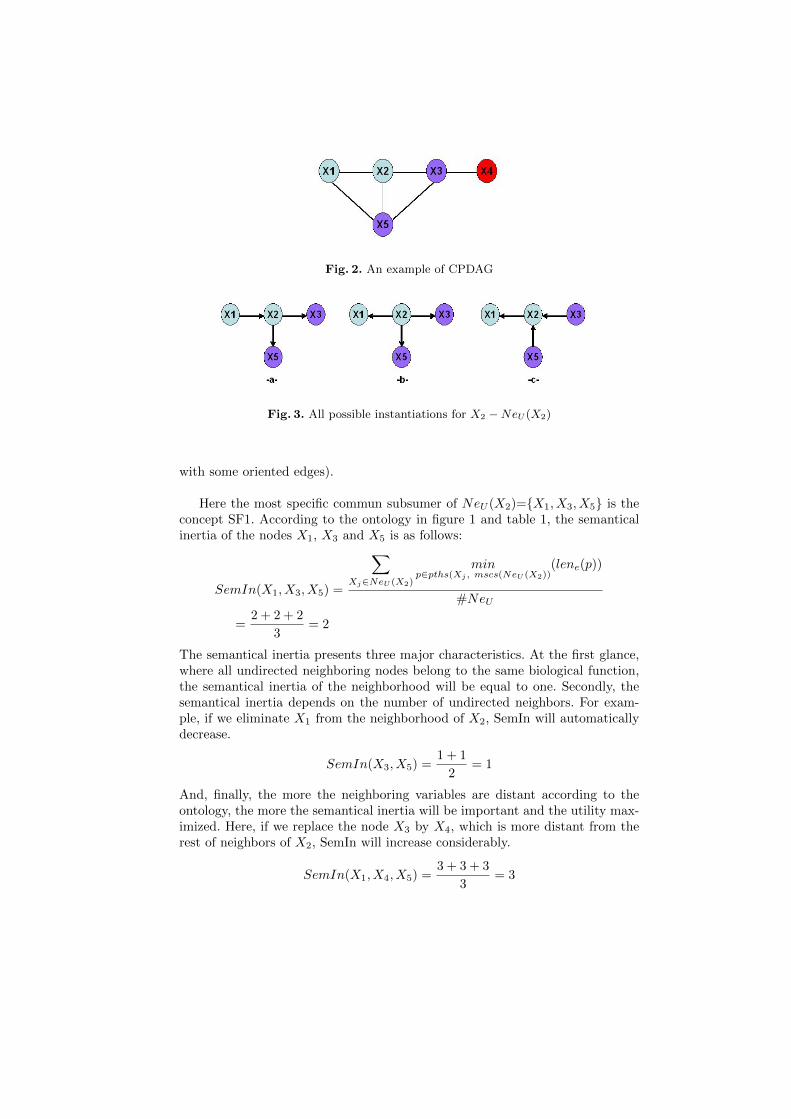
Fig. 2. An example of CPDAG
Fig. 3. All possible instantiations for X2 −NeU (X2)
with some oriented edges).
Here the most specific commun subsumer of NeU (X2)={X1, X3, X5} is theconcept SF1. According to the ontology in figure 1 and table 1, the semanticalinertia of the nodes X1, X3 and X5 is as follows:
SemIn(X1, X3, X5) =
∑Xj∈NeU (X2)
minp∈pths(Xj , mscs(NeU (X2))
(lene(p))
#NeU
=2 + 2 + 2
3= 2
The semantical inertia presents three major characteristics. At the first glance,where all undirected neighboring nodes belong to the same biological function,the semantical inertia of the neighborhood will be equal to one. Secondly, thesemantical inertia depends on the number of undirected neighbors. For exam-ple, if we eliminate X1 from the neighborhood of X2, SemIn will automaticallydecrease.
SemIn(X3, X5) =1 + 1
2= 1
And, finally, the more the neighboring variables are distant according to theontology, the more the semantical inertia will be important and the utility max-imized. Here, if we replace the node X3 by X4, which is more distant from therest of neighbors of X2, SemIn will increase considerably.
SemIn(X1, X4, X5) =3 + 3 + 3
3= 3
It is clear now that the semantical inertia represent a generalization of #NeU (Xi)and introducing it in the utility function will allow a better choice of experiments,based on ontological knowledge. With such method, we can focus the causal dis-covery on relations between distant concepts.
3.2 Integrating ontological knowledge for causal graph visualization
Visualizing large networks of hundreds or thousands nodes is a real challengingtask. It is essentially due to the limitation of the screen, the huge number ofnodes and edges and the limitations of human visual abilities. In this context,our approach can turn out of big utility to improve actual visual tools. The mainpurpose was to propose an enriched visualization of causal models by integrat-ing the power of semantical knowledge. The Rada et al.’s distance matrix canimplement different graph drawing algorithms among which MultiDimentionalScalling (MDS) and Force Directed Placement [7, 8]. More precisely, we will ad-just the node’s position in the screen, referring to the matrix distance calculatedabove. Similarly, in [20], Ranwez et al. used the ontological distance measures topropose an alternative information visualization on conceptual maps.
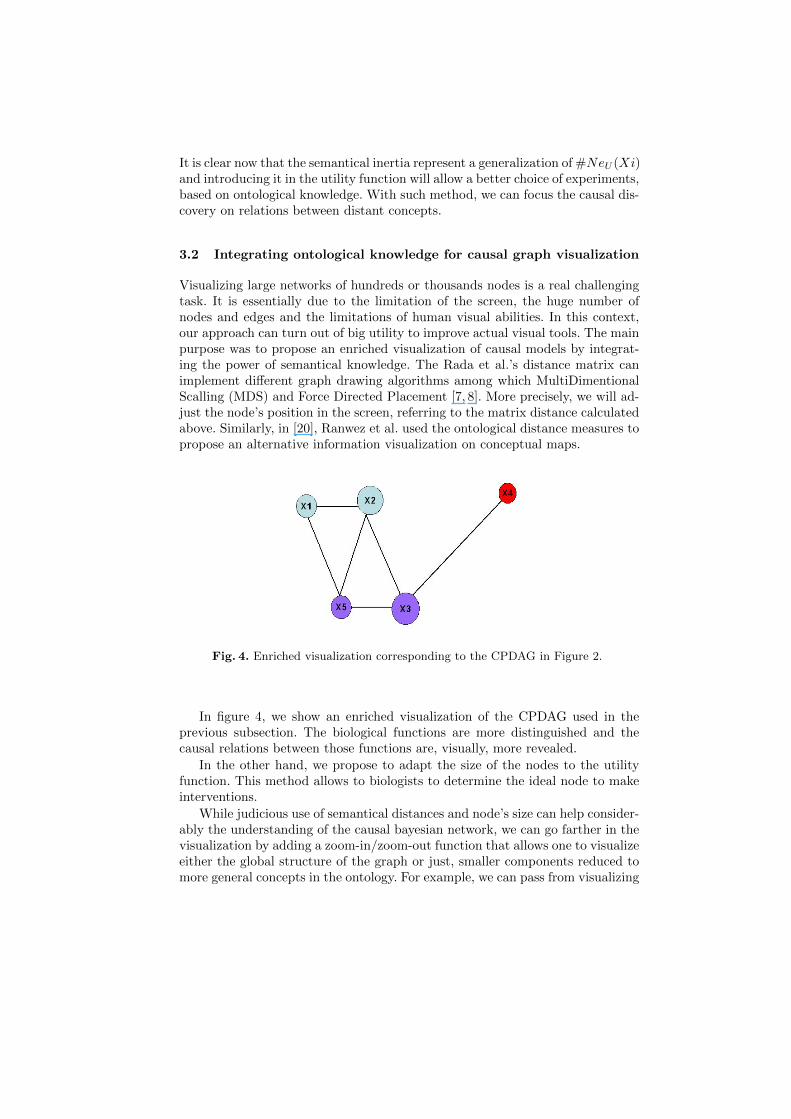
Fig. 4. Enriched visualization corresponding to the CPDAG in Figure 2.
In figure 4, we show an enriched visualization of the CPDAG used in theprevious subsection. The biological functions are more distinguished and thecausal relations between those functions are, visually, more revealed.
In the other hand, we propose to adapt the size of the nodes to the utilityfunction. This method allows to biologists to determine the ideal node to makeinterventions.
While judicious use of semantical distances and node’s size can help consider-ably the understanding of the causal bayesian network, we can go farther in thevisualization by adding a zoom-in/zoom-out function that allows one to visualizeeither the global structure of the graph or just, smaller components reduced tomore general concepts in the ontology. For example, we can pass from visualizing
the genes, in our example, to an abstraction reduced to only biological functionsor even to the biological super-functions.
All those visualization attributes can lead to different valuable informationsabout the causal bayesian network. Moreover, we will be able to investigate fur-ther into the adapted structure of the network. Since the enriched visualizationcan offer assistance to the domain experts, we can change the MyCaDo algo-rithm into semi-automatic method, combining the use of optimal solution ofutility and visualization of causal graph. Consequently, we can ease considerablythe depiction of causality.
4 Conclusion
In this article, we discussed how ontological knowledge can be useful for iterativecausal discovery. More precisely, we extend the MyCaDo algorithm via introduc-ing the notion of the semantical inertia. By supporting the assignment of coststo experiments and measurements, our approach permit us to guide the choiceof the best experiment in order to obtain the complete causal bayesian network.We then proposed an enriched visualization of causal models, using the powerof semantical knowledge extracted from ontologies.
To this end, we considered a toy example ontology as a starting point to de-velop our approach but this choice does not exclude the application of our worksto more realistic ontology’s domains. We emphasize that the work describedhere represents a major step in a longer-term project focusing on the knowledgeintegration for causal bayesian networks learning.
Directions for future work include studying how ontological knowledge canbe integrated to learn causal graphical models with latent variables, or otherlinks between causal bayesian network learning and ontologies construction.
References
1. E. Blanchard, M. Harzallah, H. Briand and P. Kuntz. A typology of ontology-basedsemantic measures. In 2nd INTEROP-EMOI Open Workshop on Enterprise Modelsand Ontologies for Interoperability at the 17th Conference on Advanced InformationSystems Engineering (CAISE’05), volume 160, pages 407-412. CEUR-WS, 2005
2. H. Borchani, M. Chaouachi and N. Ben Amor. Learning causal bayesian networksfrom incomplete observational data and interventions. In Proceedings of Symbolicand Quantitative Approaches to Reasoning with Uncertainty, pages 17-29, 2007.
3. M. Cannataro, A. Massara, P. Veltri. The OnBrowser ontology manager: Managingontologies on the Grid. International Workshop on Semantic Intelligent Middlewarefor the Web and the Grid, Valencia, Spain, 2004.
4. D.M. Chickering. Optimal Structure Identification With Greedy Search. Journal ofMachine Learning Research, pages 507-554, 2002.
5. G.F. Cooper and E. Herskovits. A Bayesian Method for the Induction of Probabilis-tic Networks from Data. Machine Learning, pages 309-347, 1992.
6. G.F. Cooper and C. Yoo. Causal discovery from a mixture of experimental andobservational data. In Proceedings of Uncertainty in Artificial Intelligence, pages116-125, 1999.
7. M. Crampes, S. Ranwez, J. Villerd, F. Velickovski, C. Mooney, A. Emery, N. Mille.Concept Maps for Designing Adaptive Knowledge Maps, in Concept Maps, A SpecialIssue of Information Visualization, Vol. 5, Issue 3, Guest Editors: S.-O. Tergan, T.Keller and R. Burkhard, Palgrave - Macmillan, 2006.
8. M. Crampes, S. Ranwez, F. Velickovski, C. Mooney, N. Mille. An integrated visualapproach for music indexing and dynamic playlist composition, in proceedings of13th Annual Multimedia Computing and Networking (MMCN’06), San Jose, CA,US, 2006.
9. F. Eberhardt, C. Glymour and R. Scheines. N-1 experiments suffice to determine thecausal relations among n variables. Technical report, Carnegie Mellon University,2005.
10. T. R. Gruber. Toward Principles for the Design of Ontologies Used for KnowledgeSharing. International Journal Human-Computer Studies 43 , pages 907-928, 1993.
11. S. Maes, S. Meganck and P. Leray. An integral approach to causal inference withlatent variables. In F. Russo and J. Williamson, Causality and Probability in theSciences (Texts in Philosophy), pages 17-41. College Publications, 2007.
12. S. Mani and G.F. Cooper. Causal discovery using a Bayesian local causal discoveryalgorithm, Proceedings of MedInfo, pages 731-735. IOS Press, 2004.
13. S. Meganck, P. Leray, and B. Manderick. Learning causal bayesian networks fromobservations and experiments: A decision theoritic approach. In Proceedings of theThird International Conference, MDAI 2006, volume 3885 of Lecture Notes in Ar-tificial Intelligence, pages 58-69, Tarragona, Spain. Springer, 2006.
14. S. Meganck, S. Maes, P. Leray and B. Manderick. Learning semi-markovian causalmodels using experiments. In Proceedings of The third European Workshop on Prob-abilistic Graphical Models, PGM 06, pages 195-206, 2006.
15. S. Meganck, P. Leray and B. Manderick. Causal graphical models with latentvariables: Learning and inference. Ninth European Conference on Symbolic andQuantitative Approaches to Reasoning with Uncertainty (ECSQARU 2007), pages5-16, 2007.
16. R. Pan, Z. Ding, Y. Yu and Y. Peng: A Bayesian Network Approach to OntologyMapping. In Proceedings ISWC, pages 563-577, 2005.
17. J. Pearl. Probabilistic reasoning in intelligent systems: networks of plausible infer-ence. Morgan Kaufmann Publishers, San Francisco (California), 1988.
18. J. Pearl. Causality: Models, reasoning and inference, MIT Press, 2000.19. R. Rada, H. Mili, E. Bicknell and M. Blettner. Development and application of a
metric on semantic nets. IEEE Transactions on Systems, Man and Cybernetics, vol.19, pages 17-30, 1989.
20. S. Ranwez, V. Ranwez, J. Villerd and M. Crampes. Ontological Distance Measuresfor Information Visualization on Conceptual Maps. In Proceedings of the OTMWorkshops. LNCS 4278, Springer, pages 1050-1061, 2006.
21. P. Spirtes, C. Glymour and R. Scheines. Causation, Prediction and Search, MITPress, 2000.
22. O. Svab, V. Svatek. Combining Ontology Mapping Methods Using Bayesian Net-works. In Workshop on Ontology Matching at ISWC, 2006.
23. S. Tong and D. Koller. Active learning for structure in bayesian networks. In Pro-ceedings of the Seventeenth International Joint Conference on Artificial Intelligence(IJCAI), pages 863-869, 2001.
24. T.Verma and J.Pearl, Equivalence and Synthesis of Causal Models. In Proceedingsof the Sixth Conference on Uncertainty in Artificial Intelligence, 1990.
25. The Gene Ontology Consortium. Gene Ontology: tool for the unification of biology,Nature Genet, pages 25-29, 2000.