
Integrating functional diversity into tropical forest plantation designs to study ecosystem...
10
Ann. For. Sci. 67 (2010) 303 Available online at: c INRA, EDP Sciences, 2010 www.afs-journal.org DOI: 10.1051/forest/2009110 Original article Integrating functional diversity into tropical forest plantation designs to study ecosystem processes Christopher Baraloto 1 *, Eric Marcon 2 , François Morneau 2 , Sandrine Pavoine 3 , Jean-Christophe Roggy 1 1 INRA, UMR “Ecologie des Forêts de Guyane”, Kourou, French Guiana 2 AgroParisTech, UMR “Ecologie des Forêts de Guyane”, Kourou, French Guiana 3 UMR “Conservation des espèces, restauration et suivi des populations” Muséum National d’Histoire Naturelle, Paris, France (Received 16 May 2009; accepted 15 September 2009) Keywords: complementarity / ecosystem function / functional groups / leaf economics spectrum / nitrogen fixation / quadratic entropy Abstract • The elucidation of relationships between biodiversity and ecosystem processes has been limited by the definition of metrics of biodiversity and their integration into experimental design. Functional trait screening can strengthen the performance of these designs. • We suggest the use of Rao’s quadratic entropy to measure both functional diversity and phyloge- netic diversity of species mixtures proposed for an experimental design, and demonstrate how they can provide complementary information. • We also present an index assessing the statistical performance of these independent variables in different experimental designs. Measurement of independent variables as continuous vs. discrete variables reduces statistical performance, but improves the model by quantifying species differences masked by group assignments. • To illustrate these advances, we present an example from a tropical forest tree community in which we screened 38 species for nine functional traits. The proposed TropiDEP design is based on the relative orthogonality of two multivariate trait axes defined using principal component analysis. • We propose that independent variables describing functional diversity might be grouped to calculate independent variables describing suites of different traits with potentially different effects on partic- ular ecosystem processes. In other systems these axes may differ from those reported here, yet the methods of analysis integrating functional and phylogenetic diversity into experimental design could be universal. Mots-clés : complémentarité / fonctions de l’écosystème / groupes fonctionnels / schéma universel de fonctionnement foliaire des végétaux / fixation biologique du N / entropie quadratique Résumé – Diversité fonctionnelle et processus écosystémiques dans des assemblages synthé- tiques d’espèces d’arbres de forêt tropicale. • La compréhension des relations pouvant exister entre biodiversité et fonctionnement des écosys- tèmes a été longtemps limitée par la définition de méthodes de quantification de la diversité biologique et la mise en œuvre de dispositifs expérimentaux permettant sa mesure. L’identification de syndromes de traits fonctionnels clefs influençant des fonctions écosystémiques particulières peut renforcer la performance de ces dispositifs. • Nous suggérons l’utilisation de l’entropie quadratique de Rao pour mesurer la diversité fonction- nelle et phylogénétique dans des assemblages synthétiques d’espèces, et montrons comment ces me- sures de diversité sont complémentaires. • Nous présentons également un indice permettant de tester la performance statistique de ces variables indépendantes dans différents modèles expérimentaux. L’utilisation de variables indépendantes conti- nues plutôt que discrètes réduit la performance statistique mais améliore le modèle en quantifiant les différences fonctionnelles entre espèces ; différences généralement masquées lors de leur assignation en groupes fonctionnels. * Corresponding author: Institut National de la Recherche Agronomique, BP 709, 97387 Kourou, France, [email protected] Article published by EDP Sciences
-
Upload
univ-antilles -
Category
Documents
-
view
4 -
download
0
Transcript of Integrating functional diversity into tropical forest plantation designs to study ecosystem...

Ann. For. Sci. 67 (2010) 303 Available online at:c© INRA, EDP Sciences, 2010 www.afs-journal.orgDOI: 10.1051/forest/2009110
Original article
Integrating functional diversity into tropical forest plantation designsto study ecosystem processes
Christopher Baraloto1*, Eric Marcon2, François Morneau2, Sandrine Pavoine3,Jean-Christophe Roggy1
1 INRA, UMR “Ecologie des Forêts de Guyane”, Kourou, French Guiana2 AgroParisTech, UMR “Ecologie des Forêts de Guyane”, Kourou, French Guiana
3 UMR “Conservation des espèces, restauration et suivi des populations” Muséum National d’Histoire Naturelle, Paris, France
(Received 16 May 2009; accepted 15 September 2009)
Keywords:complementarity /ecosystem function /functional groups /leaf economics spectrum /nitrogen fixation /quadratic entropy
Abstract• The elucidation of relationships between biodiversity and ecosystem processes has been limitedby the definition of metrics of biodiversity and their integration into experimental design. Functionaltrait screening can strengthen the performance of these designs.• We suggest the use of Rao’s quadratic entropy to measure both functional diversity and phyloge-netic diversity of species mixtures proposed for an experimental design, and demonstrate how theycan provide complementary information.• We also present an index assessing the statistical performance of these independent variables indifferent experimental designs. Measurement of independent variables as continuous vs. discretevariables reduces statistical performance, but improves the model by quantifying species differencesmasked by group assignments.• To illustrate these advances, we present an example from a tropical forest tree community in whichwe screened 38 species for nine functional traits. The proposed TropiDEP design is based on therelative orthogonality of two multivariate trait axes defined using principal component analysis.•We propose that independent variables describing functional diversity might be grouped to calculateindependent variables describing suites of different traits with potentially different effects on partic-ular ecosystem processes. In other systems these axes may differ from those reported here, yet themethods of analysis integrating functional and phylogenetic diversity into experimental design couldbe universal.
Mots-clés :complémentarité /fonctions de l’écosystème /groupes fonctionnels /schéma universel de fonctionnementfoliaire des végétaux /fixation biologique du N /entropie quadratique
Résumé – Diversité fonctionnelle et processus écosystémiques dans des assemblages synthé-tiques d’espèces d’arbres de forêt tropicale.• La compréhension des relations pouvant exister entre biodiversité et fonctionnement des écosys-tèmes a été longtemps limitée par la définition de méthodes de quantification de la diversité biologiqueet la mise en œuvre de dispositifs expérimentaux permettant sa mesure. L’identification de syndromesde traits fonctionnels clefs influençant des fonctions écosystémiques particulières peut renforcer laperformance de ces dispositifs.• Nous suggérons l’utilisation de l’entropie quadratique de Rao pour mesurer la diversité fonction-nelle et phylogénétique dans des assemblages synthétiques d’espèces, et montrons comment ces me-sures de diversité sont complémentaires.•Nous présentons également un indice permettant de tester la performance statistique de ces variablesindépendantes dans différents modèles expérimentaux. L’utilisation de variables indépendantes conti-nues plutôt que discrètes réduit la performance statistique mais améliore le modèle en quantifiant lesdifférences fonctionnelles entre espèces ; différences généralement masquées lors de leur assignationen groupes fonctionnels.
* Corresponding author: Institut National de la Recherche Agronomique, BP 709, 97387 Kourou, France, [email protected]
Article published by EDP Sciences
Ann. For. Sci. 67 (2010) 303 C. Baraloto et al.
• Pour illustrer ces avancées, nous présentons un exemple d’assemblages synthétiques à partir de38 espèces d’arbres de forêt tropicale sélectionnées pour 9 traits fonctionnels (TropiDEP). Le pland’expérience de TropiDEP est basé sur l’orthogonalité relative de deux axes multivariés de traitsfonctionnels définis par analyse en composantes principales.• Nous proposons que les variables décrivant la diversité fonctionnelle soient groupées pour calcu-ler des variables indépendantes, divisées en plusieurs axes décrivant des combinaisons de différentstraits pouvant influencer des processus différents de l’écosystème (e.g. processus du N et du C).Dans d’autres systèmes, ces axes peuvent différer de ceux présentés ici, mais les méthodes d’analysepeuvent être universelles.
1. INTRODUCTION
The rapid and pervasive loss of biodiversity over thepast century has provoked debate about the consequences ofspecies loss for ecosystem function and the stability of biogeo-chemical cycles (e.g., Schwartz et al., 2000). Understandingthe relationship between biodiversity and ecosystem processes(B-EP) has thus become one of the critical issues in contem-porary ecology (Chapin et al., 2000; Loreau et al., 2001). Al-though some experiments have found links between biodiver-sity and ecosystem parameters such as primary productivity ornitrogen retention, other experiments have not found these ef-fects (Hooper et al., 2005). These conflicting results may bedue in part to the means by which the B-EP relationship isinvestigated and analyzed (Diaz and Cabido, 2001; Hooperet al., 2005; Huston et al., 2000; Loreau and Hector, 2001;Wright et al., 2006). Such discussions have moved the cen-tral question from whether biodiversity affects ecosystem pro-cesses, to what mechanisms underly these relationships andhow do they differ between systems (Cardinale et al., 2007;Ewel, 2006; Fargione et al., 2007; Gamfeldt et al., 2008; Hec-tor and Bagchi, 2007; Hillebrand et al., 2008; Hooper andDukes, 2004; Isbell et al., 2009; Naeem and Wright, 2003;Polley et al., 2007; Reich et al., 2004; Roscher et al., 2004;Zhang and Zhang, 2007).
In this paper, we suggest improvements for studying thebiodiversity-ecosystem process relationship (hereafter B-EP)using experiments manipulating species and functional diver-sity. We focus on forest ecosystems, using a tropical tree com-munity as a model system for several reasons. First, tropicalforests are among the most diverse plant communities de-scribed and thus offer a large pool of species, including hun-dreds of nitrogen-fixing legumes that differ widely in func-tional traits related to carbon and water cycling (Bonal et al.,2000; Roggy et al., 1999). Second, tropical forests play a ma-jor role in global biogeochemical cycles; they may accountfor more than a third of global net primary productivity (e.g.,Phillips et al., 1998). Finally, tropical forests are undergoingrapid conversion to deforested areas for livestock, agricultureand mining, and recent attention has focused on how to reha-bilitate converted tropical forests (Lamb et al., 2005; Parrottaand Knowles, 1999). Yet, only a handful of experimental plan-tations manipulating mixtures of forest trees exist, all of whichincorporate some limitations for studying B-EP related to thechoice and number of species tested and the design of experi-mental plots (Ewel, 2006; Scherer-Lorenzen et al., 2005).
In particular, we address two general limitations of currentB-EP research that are particularly lacking in the experimentalapproach used in extant forest plantation studies. First, we fo-cus on how bioviversity is defined and measured in designingand evaluating B-EP experiments (Petchey and Gaston 2006;Wright et al. 2006). Second, we examine the statistical perfor-mance of different experimental designs and propose a com-promise between practical implementation and statistical rigorusing a new performance measure. We illustrate our proposedimprovements using as a case study TropiDEP, an experimen-tal design based on a matrix of traits and phylogenetic infor-mation assembled for French Guianan tree species.
2. DEFINING AND MEASURING BIODIVERSITY
It is now well accepted that the general relationshipsbetween species number and ecosystem processes such asproductivity are the result of functional differences amongspecies. Accordingly, the use of species richness as a proxyfor functional diversity has been criticized as too coarse a mea-sure for predicting ecosystem parameters (Petchey et al., 2004;Petchey and Gaston, 2006; Roscher et al., 2004). Still, the bestmeans to estimate functional diversity for both the design andanalysis of B-EP experiments remains contentious (Petcheyand Gaston, 2006; Ricotta, 2005; Wright et al., 2006). Al-though analyses can be performed using post-hoc attributionsof species to groups or post-hoc measures of diversity, designsgenerally incorporate some a priori designation to maintainbalance and to avoid problems of circularity (Wright et al.,2006).
In general, two approaches have been used to estimatea priori functional diversity in B-EP experiments. Most stud-ies have used a broad designation of species groups basedon key traits such as growth form, photosynthetic pathway,or N-fixing capacity (Ewel, 2006; Hooper and Dukes, 2004;Reich et al., 2004; Tilman et al., 2001). Broad designationsare often easy to employ because they rely on “soft” traits thatare readily distinguished for most species and are easily scoredas categorical variables (Hooper et al., 2005). Broad designa-tions also permit the identification of types of species that haveparticular effects on ecosystem processes or that may comple-ment species from other groups (e.g., Ewel, 2006; Hooper andDukes, 2004; Reich et al., 2004). However, broad designationsmask within-group trait variability, and such fine-scale differ-ences may also be of consequence for ecosystem processes(Craine et al., 2002).
303p2
Functional diversity and ecosystem processes in tropical forests Ann. For. Sci. 67 (2010) 303
A fine-scale approach relies on quantitative differences be-tween species in the values of particular functional traits thatare hypothesized to affect ecosystem processes (Mason et al.,2003; Ricotta, 2005). For example, Petchey and Gaston (2006)proposed a quantitative measure of functional diversity (FD)analogous to a similar measure of phylogenetic diversity (PD;Faith, 1992) that is based on the branch length of the functionaldendrogram of species clustered in trait space. Their indexappears to be a better predictor of aboveground productivitythan species richness or other measures of functional distance(Petchey et al., 2004).
Biodiversity can be represented not only by species andfunctional diversity but also by the diversity in evolutionaryrelationships among taxa (Faith, 1992; Forest et al., 2006). Iftraits are conserved within lineages, then functional diversityshould be tightly correlated with phylogenetic diversity; forexample, among vascular plants nitrogen-fixation occurs al-most exclusively within legumes (Wojciechowski et al., 2005).However, the extent to which other functional traits are evolu-tionarily conserved remains under debate. Wood density ap-pears to be highly conserved within higher taxonomic units(Chave et al., 2006), whereas seed mass shows strong diver-gence within genera (Moles et al., 2005).
A third problem encountered by traditional designs is thateven continuous measures of functional diversity such as FDdo not account for differences in the relative abundances ofspecies in experimental plots. A recently popularized measureof diversity, the quadratic entropy (Rao, 1982), takes into ac-count both species abundances and pairwise distances amongspecies (Botta-Dukát, 2005; Pavoine et al., 2005). When allspecies are considered functionally equivalent, the index isequivalent to the Gini-Simpson index (Pavoine et al., 2005).Botta-Dukát (2005) showed that in addition to accounting forabundance and integrating multiple traits, the Rao index satis-fies a priori criteria proposed by Mason et al. (2003). The Raoindex is thus suitable to contrast diversity in terms of speciesrichness, functional diversity and phylogenetic diversity.
3. DESIGNING EXPERIMENTS ADDRESSINGBIODIVERSITY AND ECOSYSTEM PROCESSES
The classical statistical model used in the literature to as-sess the relationship between diversity and ecosystem pro-cesses is a linear regression (Loreau and Hector, 2001). Byconstructing a sample design of multiple plots, one controlsthe values of a set of variables such as species richness ineach plot. These values are contained in a vector x, wherex′ = (x1, ..., x j, ..., xp). After a period of time, a response yis measured in each plot, for example net primary productivity(NPP), and this response is assumed to be given by y = xθ+ ε,where θ is the vector of parameters to estimate and ε is the er-ror vector of variance σ2. For improved estimates, several (n)plots must be investigated, each of which is submitted to a de-fined sample design. Together, these plots can be described bya matrix X whose rows give the n vectors corresponding to thevalues fixed for the p variables in the n plots and a vector y of nobserved responses. Consequently, the model can be written as
a matrix formula as
y = Xθ + ε. (1)
The precision of the estimation of θ is given by the matrixof variance/covariance (X′X)−1σ2. One can not control for themodel error σ2, due to the unobserved factors, but the matrix(X′X)−1 depends solely on the design. We denote V jk its terms.The variance of the estimator α̂ j is σ2
j = V j jσ2. The optimal de-
sign is characterized by smaller parameter estimation varianceand smaller correlations between parameter estimations. Bydefinition, the simplest factorial experimental design, in whichonly extreme values of the factors are retained and combinedin all possible ways, is statistically optimal (Cochran and Cox,1992).
However, an experimental design must also be able to con-firm the assumed linearity of the statistical model. Linearityof ecosystem processes such as NPP has been shown onlyfor species richness (expressed as a logarithm). Tilman et al.(2001) estimate that the relation is probably asymptotic forfunctional diversity; it would be linear for low diversity only.Intermediate values of the factors that are not included in thebasic factorial design are necessary to describe nonlinear rela-tionships. An alternative is a complete design, which includesall possible combinations of factor levels.
Two other considerations are important to experimental de-sign. First, because functional diversity and the number ofspecies are partly correlated, some designs (e.g., high diver-sity with a single species) are impossible. Second, the effectsof particular species may dominate the response of all plotswhere they are present (Loreau and Hector, 2001). Replicationwith different species is therefore necessary to avoid biases inestimations. For each level of specific and functional diver-sity, several plots with alternative species have been proposed(e.g., Roscher et al., 2004). For biodiversity experiments, a po-tential solution is to replicate the complete design with differ-ent species combinations. However, when the species pool islarge, as is the case in diverse systems, it becomes impracticalto test all possible combinations. Consequently, a strategy forchoosing species combinations is necessary.
The different constraints on experimental design are oftencontradictory, so compromises must be reached. Adding inter-mediate values of factors (e.g., species number) can help todetect non-linearity, but it also decreases factors’ variance andconsequently estimation precision. To allow a rational choice,we define a performance measure for experimental designs in-vestigating diversity effects on ecosystem processes.
Assuming normality and denoting t the Student variable,we know the confidence interval for each parameter: CI(α j) =[α̂ j − t σ j√
n; α̂ j + t σ j√
n
]. We rearrange it so that the confidence
interval of the estimation of the parameter j is the productof four independent terms: σ, the standard deviation of themodel’s error term; n, the number of experimental plots; Sj,a scale factor reflecting the units chosen; and P j, the perfor-mance of the design. We can write:
CI(α j) =
[α̂ j − t
σ√nSjP j
; α̂ j + tσ√
nSjP j
].
303p3
Ann. For. Sci. 67 (2010) 303 C. Baraloto et al.
The number n of plots can be considered as an economic vari-able. Doubling the design divides the estimators’ confidenceinterval by
√2. After choosing the minimum (unit) design, re-
peating it is a matter of finance.
Sj =
√(xmax
j − xminj
)2/2, where xmax
j and xminj are the ex-
treme values of X j. It is a scale factor which only ensures thehomogeneity of the equation.
P j = 1/(Sj√
V j j
)is the performance of the design for vari-
able j1. It is 1 for the factorial design (the one containing ex-treme values only), and less than 1 for other designs. It canbe easily computed for each potential design to evaluate itsrelative efficiency. For example, P j = 50% means that every-thing else equal, the confidence interval will be doubled, orthat twice more plots will be necessary to achieve the sameprecision in the estimation of the parameter as in the facto-rial design. This metric thus allows a comparison of the samemodel with different values of exogenous variables and/or adifferent number of replications.
The other point of interest is the correlation between pa-rameters j and k, given directly by V jk√
V j jVkk. Performances for
different variables and correlations may vary in opposite direc-tions when the design is changed. Yet, we have the necessaryinformation to evaluate the ratio of performance to infrastruc-ture cost. Practically, the factorial design is taken as a referencesince its cost is the lowest; variances are as low as possible (allP j equal 1 by construction), and covariances are null. The realdesigns, which face other constraints, have higher costs andcorrelations.
4. A CASE STUDY EXAMPLE: TROPIDEP
As a case study, we present TropiDEP, an experimental de-sign for B-EP in a tropical forest ecosystem, that differs intwo key ways from other B-EP designs reported to date. It in-corporates the multiple axis approach to functional distances,and it can be modified to strengthen its statistical power us-ing discrete or continuous independent variables, based on thestatistical performance metrics described above. In this way, itrepresents a compromise to multiple replications of the com-plete design.
4.1. Functional trait measurement
We measured a series of traits (see Tab. I) for a set of38 focal species that are common in lowland tropical forestsin French Guiana and that represent the most abundant treefamilies in the Guiana Shield. We made a particular effort toinclude legume species of the subfamily Mimosoideae that areknown to maintain associations with nitrogen fixing Rhizo-bium symbionts (Roggy et al., 1999).
1 The form of Pj is appropriate because in the case of the factorialdesign, Sj is the variance of X j and Vj j = 1/S2
j .Pj is actually a normalized ratio of variances of estimators.
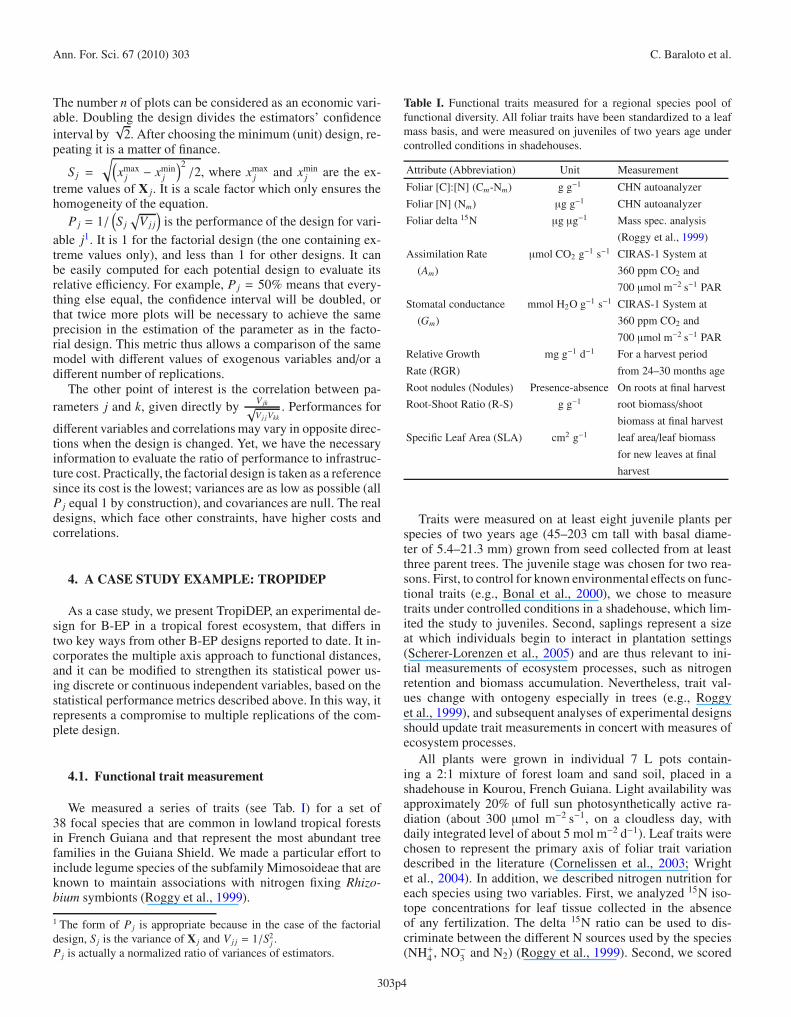
Table I. Functional traits measured for a regional species pool offunctional diversity. All foliar traits have been standardized to a leafmass basis, and were measured on juveniles of two years age undercontrolled conditions in shadehouses.
Attribute (Abbreviation) Unit Measurement
Foliar [C]:[N] (Cm-Nm) g g−1 CHN autoanalyzer
Foliar [N] (Nm) μg g−1 CHN autoanalyzer
Foliar delta 15N μg μg−1 Mass spec. analysis
(Roggy et al., 1999)
Assimilation Rate μmol CO2 g−1 s−1 CIRAS-1 System at
(Am) 360 ppm CO2 and
700 μmol m−2 s−1 PAR
Stomatal conductance mmol H2O g−1 s−1 CIRAS-1 System at
(Gm) 360 ppm CO2 and
700 μmol m−2 s−1 PAR
Relative Growth mg g−1 d−1 For a harvest period
Rate (RGR) from 24–30 months age
Root nodules (Nodules) Presence-absence On roots at final harvest
Root-Shoot Ratio (R-S) g g−1 root biomass/shoot
biomass at final harvest
Specific Leaf Area (SLA) cm2 g−1 leaf area/leaf biomass
for new leaves at final
harvest
Traits were measured on at least eight juvenile plants perspecies of two years age (45–203 cm tall with basal diame-ter of 5.4–21.3 mm) grown from seed collected from at leastthree parent trees. The juvenile stage was chosen for two rea-sons. First, to control for known environmental effects on func-tional traits (e.g., Bonal et al., 2000), we chose to measuretraits under controlled conditions in a shadehouse, which lim-ited the study to juveniles. Second, saplings represent a sizeat which individuals begin to interact in plantation settings(Scherer-Lorenzen et al., 2005) and are thus relevant to ini-tial measurements of ecosystem processes, such as nitrogenretention and biomass accumulation. Nevertheless, trait val-ues change with ontogeny especially in trees (e.g., Roggyet al., 1999), and subsequent analyses of experimental designsshould update trait measurements in concert with measures ofecosystem processes.
All plants were grown in individual 7 L pots contain-ing a 2:1 mixture of forest loam and sand soil, placed in ashadehouse in Kourou, French Guiana. Light availability wasapproximately 20% of full sun photosynthetically active ra-diation (about 300 μmol m−2 s−1, on a cloudless day, withdaily integrated level of about 5 mol m−2 d−1). Leaf traits werechosen to represent the primary axis of foliar trait variationdescribed in the literature (Cornelissen et al., 2003; Wrightet al., 2004). In addition, we described nitrogen nutrition foreach species using two variables. First, we analyzed 15N iso-tope concentrations for leaf tissue collected in the absenceof any fertilization. The delta 15N ratio can be used to dis-criminate between the different N sources used by the species(NH+4 , NO−3 and N2) (Roggy et al., 1999). Second, we scored
303p4

Functional diversity and ecosystem processes in tropical forests Ann. For. Sci. 67 (2010) 303
Figure 1. Results of a principal components analysis for correla-tions among the nine functional traits highlighted in Table I, for the38 species regional pool in French Guiana. Two axes were definedthat explain 67.1% of variation. Along these factors, four putativefunctional groups can be defined representing combinations of ratesof carbon and nitrogen fixation. Abbreviations for variables are ex-plained in Table I. Species positions in trait space are indicated withsquares, except for the 16 focal species focal (four within each func-tional group), to be manipulated in the proposed TropiDEP experi-mental design, for which species codes are given (see Tab. II). Notethat the nitrogen-fixing legumes do not cover the entire gradient ofvariation along the carbon diversity axis comprised by the non-fixingspecies, so for TropiDEP we chose the extreme species with verythick leaves and relatively low photosynthetic capacity within thenon-N-fixing slow-growers.
the presence of Rhizobium-containing root nodules on plantwith negative values of delta 15N ratio in order to distinguishN2-fixing legumes from species using NO−3 (Schimann et al.,2008); when nodules were present, they were abundant andoccurred on all individuals. Table I summarizes the methodsand units of measure for the nine traits.
4.2. Functional trait correlations and focal speciesselection
We used a principal component analysis (PCA) to examinecorrelations among the measured traits, to define interpretablemultivariate trait axes, and to project species differences inmultivariate trait space. All analyses were conducted in theade4 module of the R statistical package (Chessel et al., 2004).
The PCA identified two principal axes explaining 67.1% oftrait variation among the 38 study species (Fig. 1). A rotationof the first axis corresponds with what has been described asa global axis of leaf types among plants (Wright et al., 2004),with strong positive loadings of photosynthetic capacity, stom-atal conductance for water vapor, and specific leaf area; andstrong negative loadings for leaf carbon-nitrogen ratio. A rota-tion of the second axis segregates N-fixing legumes from otherspecies, with strong positive loading for the nodulation vari-
able and a strong negative loading for the 15N isotope values,confirming this pattern.
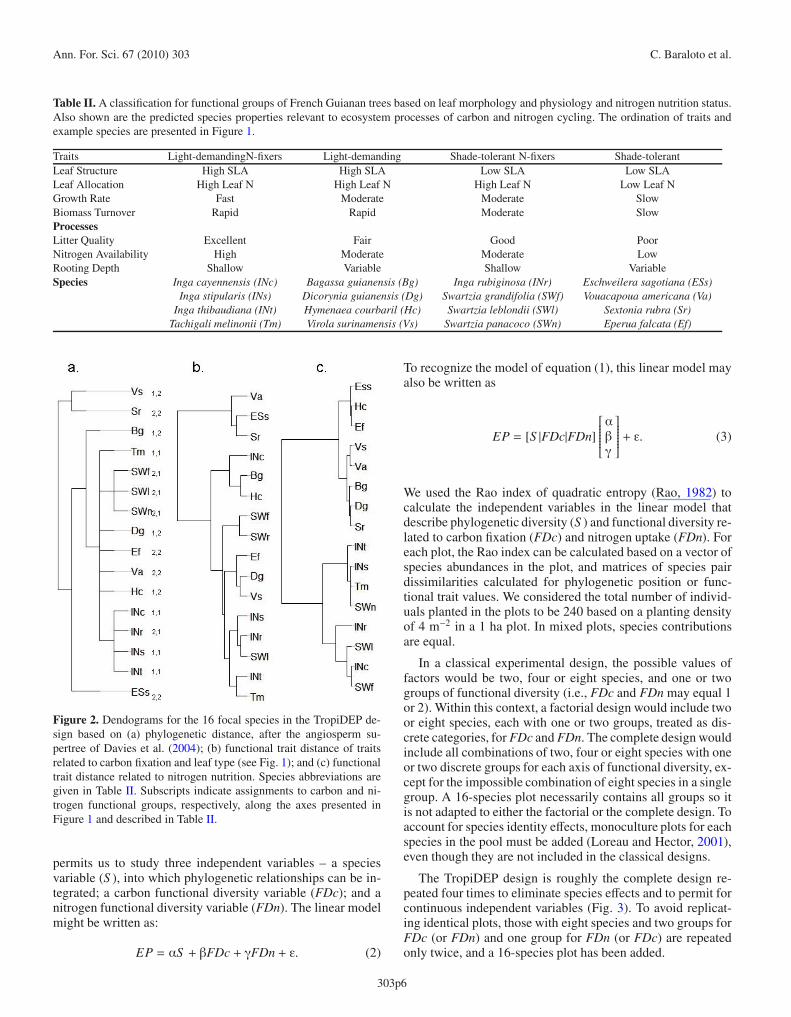
We also examined relationships among the species us-ing hierarchical clustering algorithms with Ward’s minimumvariance method. We calculated Euclidean distances amongspecies pairs derived from three dissimilarity matrices: a phy-logenetic matrix based on the angiosperm supertree (Davieset al., 2004); and matrices of traits related to carbon fixation ornitrogen uptake (Tab. I).
From the 38 study species, we chose 16 species repre-senting four broad “functional groups” that combine the car-bon and nitrogen axes (Tab. II; projected in Fig. 1) for theTropiDEP design. Within our species pool, the nitrogen-fixinglegumes do not cover the entire gradient of variation alongthe carbon diversity axis comprised by the non-fixing species(Fig. 1). We chose to retain the latter diversity by selecting theextreme species with very thick leaves and relatively low pho-tosynthetic capacity within the non-N-fixing slow-growers. Asa result, some species are actually closer in trait space tospecies assigned to a different group.
The chosen focal species also illustrate how measures ofdistances between species can be correlated despite the clearseparation of trait axes. The strong phylogenetic constraint onN-fixation within legumes results in a slight positive corre-lation between phylogenetic distance and functional distancealong the nitrogen axis. This can be seen in dendrograms of thehierarchical cluster analysis performed on the 16 TropiDEPspecies (Fig. 2), with the lower cluster in Figure 2c also be-ing clustered in Figure 2a. However, this correlation is weak-ened because not all legumes in the species pool are N-fixing.A majority of the N-fixing legumes have high foliar nitro-gen contents, and tend to grow quickly and have rapid car-bon assimilation rates, even if they have thicker leaves. As aresult, clusters of species with high values along the carbonaxis (Fig. 2b) also tend to be clustered on the nitrogen axis(Fig. 2c). With further trait screening of N-fixing legumes, wemight be able to identify species with lower values along thecarbon axis to improve the design presented here. However,we can still account for the variability in axis distances for ourindependent variables by calculating measures of diversity foreach experimental plot we create.
4.3. The TropiDEP design
The TropiDEP design is based on the relative orthogonalityof the two multivariate trait axes defined using principal com-ponent analysis (Fig. 1) and their potential effects on particularecosystem processes (Tab. II). We hypothesize that the con-sequences of competition and facilitation for ecosystem pro-cesses will depend at least in part on independent resource-use complementarity along each of these axes, such that aglobal distance measure as proposed by Petchey and Gaston(2002) may mask relationships between functional diversityand ecosystem processes.
To separate these effects, we propose to combine speciesmixtures that independently include variation along each axisof functional diversity for each level of species richness. This
303p5
Ann. For. Sci. 67 (2010) 303 C. Baraloto et al.
Table II. A classification for functional groups of French Guianan trees based on leaf morphology and physiology and nitrogen nutrition status.Also shown are the predicted species properties relevant to ecosystem processes of carbon and nitrogen cycling. The ordination of traits andexample species are presented in Figure 1.
Traits Light-demandingN-fixers Light-demanding Shade-tolerant N-fixers Shade-tolerantLeaf Structure High SLA High SLA Low SLA Low SLALeaf Allocation High Leaf N High Leaf N High Leaf N Low Leaf NGrowth Rate Fast Moderate Moderate SlowBiomass Turnover Rapid Rapid Moderate SlowProcessesLitter Quality Excellent Fair Good PoorNitrogen Availability High Moderate Moderate LowRooting Depth Shallow Variable Shallow VariableSpecies Inga cayennensis (INc) Bagassa guianensis (Bg) Inga rubiginosa (INr) Eschweilera sagotiana (ESs)
Inga stipularis (INs) Dicorynia guianensis (Dg) Swartzia grandifolia (SWf) Vouacapoua americana (Va)Inga thibaudiana (INt) Hymenaea courbaril (Hc) Swartzia leblondii (SWl) Sextonia rubra (Sr)
Tachigali melinonii (Tm) Virola surinamensis (Vs) Swartzia panacoco (SWn) Eperua falcata (Ef)
Figure 2. Dendograms for the 16 focal species in the TropiDEP de-sign based on (a) phylogenetic distance, after the angiosperm su-pertree of Davies et al. (2004); (b) functional trait distance of traitsrelated to carbon fixation and leaf type (see Fig. 1); and (c) functionaltrait distance related to nitrogen nutrition. Species abbreviations aregiven in Table II. Subscripts indicate assignments to carbon and ni-trogen functional groups, respectively, along the axes presented inFigure 1 and described in Table II.
permits us to study three independent variables – a speciesvariable (S ), into which phylogenetic relationships can be in-tegrated; a carbon functional diversity variable (FDc); and anitrogen functional diversity variable (FDn). The linear modelmight be written as:
EP = αS + βFDc + γFDn + ε. (2)
To recognize the model of equation (1), this linear model mayalso be written as
EP = [S |FDc|FDn]
⎡⎢⎢⎢⎢⎢⎢⎢⎣αβγ
⎤⎥⎥⎥⎥⎥⎥⎥⎦ + ε. (3)
We used the Rao index of quadratic entropy (Rao, 1982) tocalculate the independent variables in the linear model thatdescribe phylogenetic diversity (S ) and functional diversity re-lated to carbon fixation (FDc) and nitrogen uptake (FDn). Foreach plot, the Rao index can be calculated based on a vector ofspecies abundances in the plot, and matrices of species pairdissimilarities calculated for phylogenetic position or func-tional trait values. We considered the total number of individ-uals planted in the plots to be 240 based on a planting densityof 4 m−2 in a 1 ha plot. In mixed plots, species contributionsare equal.
In a classical experimental design, the possible values offactors would be two, four or eight species, and one or twogroups of functional diversity (i.e., FDc and FDn may equal 1or 2). Within this context, a factorial design would include twoor eight species, each with one or two groups, treated as dis-crete categories, for FDc and FDn. The complete design wouldinclude all combinations of two, four or eight species with oneor two discrete groups for each axis of functional diversity, ex-cept for the impossible combination of eight species in a singlegroup. A 16-species plot necessarily contains all groups so itis not adapted to either the factorial or the complete design. Toaccount for species identity effects, monoculture plots for eachspecies in the pool must be added (Loreau and Hector, 2001),even though they are not included in the classical designs.
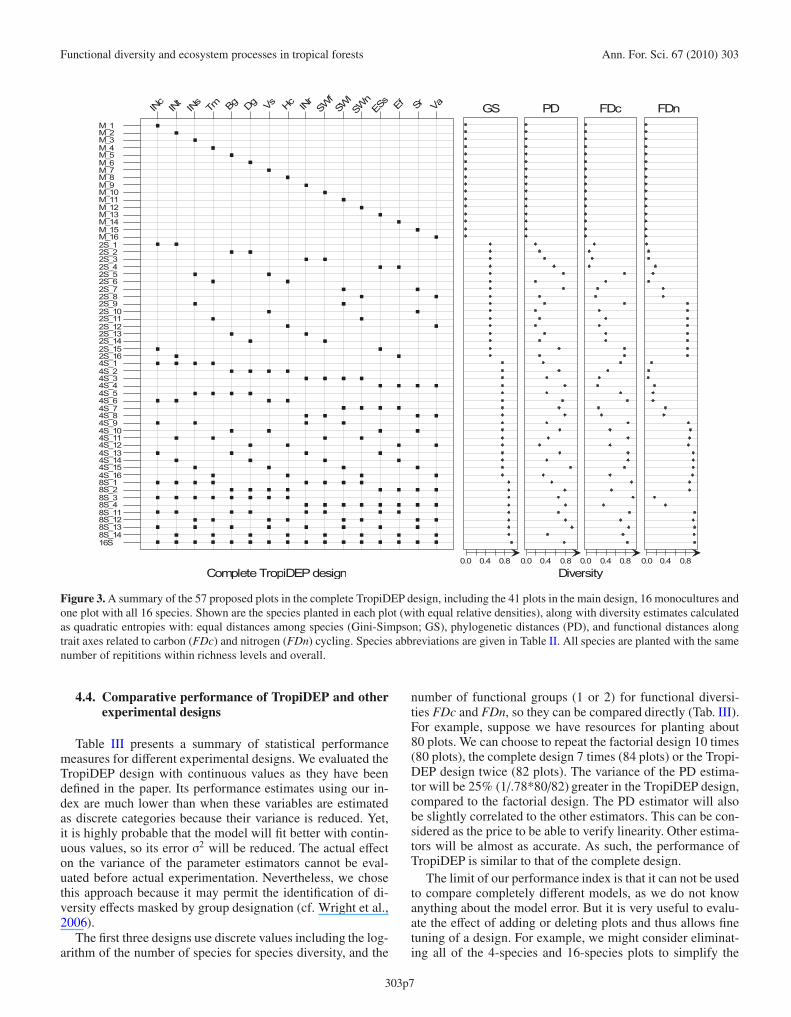
The TropiDEP design is roughly the complete design re-peated four times to eliminate species effects and to permit forcontinuous independent variables (Fig. 3). To avoid replicat-ing identical plots, those with eight species and two groups forFDc (or FDn) and one group for FDn (or FDc) are repeatedonly twice, and a 16-species plot has been added.
303p6
Functional diversity and ecosystem processes in tropical forests Ann. For. Sci. 67 (2010) 303
M_1M_2M_3M_4M_5M_6M_7M_8M_9M_10M_11M_12M_13M_14M_15M_162S_12S_22S_32S_42S_52S_62S_72S_82S_92S_102S_112S_122S_132S_142S_152S_164S_14S_24S_34S_44S_54S_64S_74S_84S_94S_104S_114S_124S_134S_144S_154S_168S_18S_28S_38S_48S_118S_128S_138S_1416S
INcINtINsTm Bg Dg Vs Hc IN
rSWfSWlSWnESs Ef Sr Va
CompleteTropiDEPdesign0.0 0.4 0.8
GS
0.0 0.4 0.8
PD
0.0 0.4 0.8
FDc
0.0 0.4 0.8
FDn
Diversity
Figure 3. A summary of the 57 proposed plots in the complete TropiDEP design, including the 41 plots in the main design, 16 monocultures andone plot with all 16 species. Shown are the species planted in each plot (with equal relative densities), along with diversity estimates calculatedas quadratic entropies with: equal distances among species (Gini-Simpson; GS), phylogenetic distances (PD), and functional distances alongtrait axes related to carbon (FDc) and nitrogen (FDn) cycling. Species abbreviations are given in Table II. All species are planted with the samenumber of repititions within richness levels and overall.
4.4. Comparative performance of TropiDEP and otherexperimental designs
Table III presents a summary of statistical performancemeasures for different experimental designs. We evaluated theTropiDEP design with continuous values as they have beendefined in the paper. Its performance estimates using our in-dex are much lower than when these variables are estimatedas discrete categories because their variance is reduced. Yet,it is highly probable that the model will fit better with contin-uous values, so its error σ2 will be reduced. The actual effecton the variance of the parameter estimators cannot be eval-uated before actual experimentation. Nevertheless, we chosethis approach because it may permit the identification of di-versity effects masked by group designation (cf. Wright et al.,2006).
The first three designs use discrete values including the log-arithm of the number of species for species diversity, and the
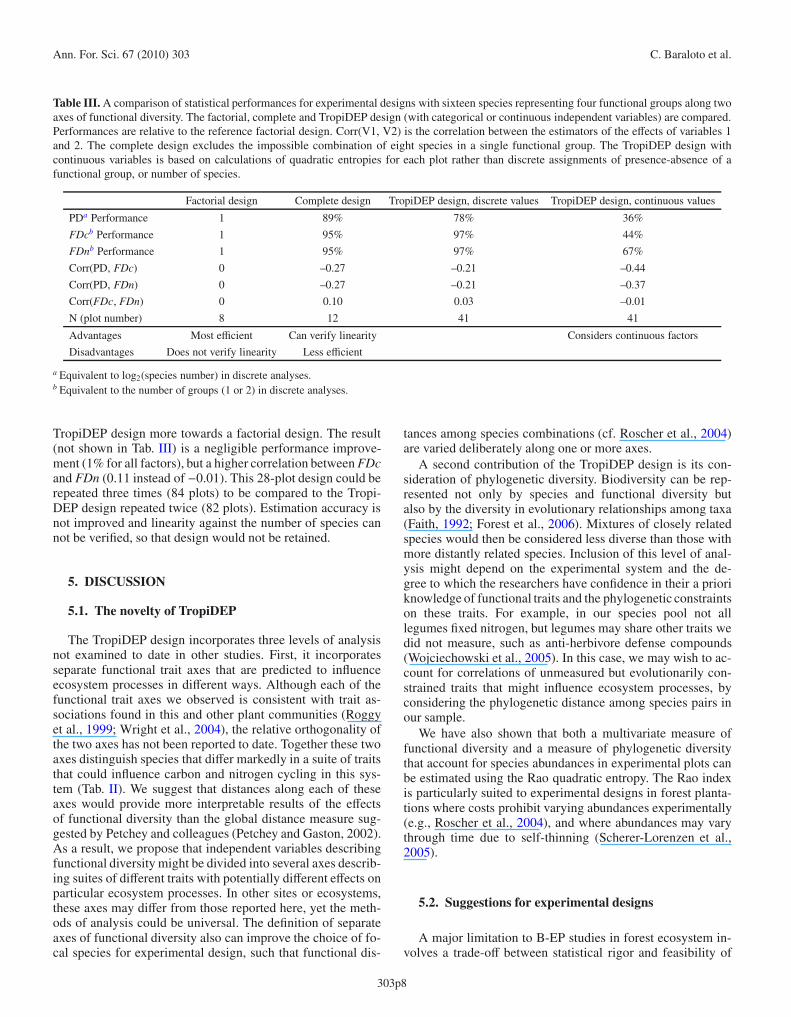
number of functional groups (1 or 2) for functional diversi-ties FDc and FDn, so they can be compared directly (Tab. III).For example, suppose we have resources for planting about80 plots. We can choose to repeat the factorial design 10 times(80 plots), the complete design 7 times (84 plots) or the Tropi-DEP design twice (82 plots). The variance of the PD estima-tor will be 25% (1/.78*80/82) greater in the TropiDEP design,compared to the factorial design. The PD estimator will alsobe slightly correlated to the other estimators. This can be con-sidered as the price to be able to verify linearity. Other estima-tors will be almost as accurate. As such, the performance ofTropiDEP is similar to that of the complete design.
The limit of our performance index is that it can not be usedto compare completely different models, as we do not knowanything about the model error. But it is very useful to evalu-ate the effect of adding or deleting plots and thus allows finetuning of a design. For example, we might consider eliminat-ing all of the 4-species and 16-species plots to simplify the
303p7
Ann. For. Sci. 67 (2010) 303 C. Baraloto et al.
Table III. A comparison of statistical performances for experimental designs with sixteen species representing four functional groups along twoaxes of functional diversity. The factorial, complete and TropiDEP design (with categorical or continuous independent variables) are compared.Performances are relative to the reference factorial design. Corr(V1, V2) is the correlation between the estimators of the effects of variables 1and 2. The complete design excludes the impossible combination of eight species in a single functional group. The TropiDEP design withcontinuous variables is based on calculations of quadratic entropies for each plot rather than discrete assignments of presence-absence of afunctional group, or number of species.
Factorial design Complete design TropiDEP design, discrete values TropiDEP design, continuous values
PDa Performance 1 89% 78% 36%
FDcb Performance 1 95% 97% 44%
FDnb Performance 1 95% 97% 67%
Corr(PD, FDc) 0 –0.27 –0.21 –0.44
Corr(PD, FDn) 0 –0.27 –0.21 –0.37
Corr(FDc, FDn) 0 0.10 0.03 –0.01
N (plot number) 8 12 41 41
Advantages Most efficient Can verify linearity Considers continuous factors
Disadvantages Does not verify linearity Less efficient
a Equivalent to log2(species number) in discrete analyses.b Equivalent to the number of groups (1 or 2) in discrete analyses.
TropiDEP design more towards a factorial design. The result(not shown in Tab. III) is a negligible performance improve-ment (1% for all factors), but a higher correlation between FDcand FDn (0.11 instead of −0.01). This 28-plot design could berepeated three times (84 plots) to be compared to the Tropi-DEP design repeated twice (82 plots). Estimation accuracy isnot improved and linearity against the number of species cannot be verified, so that design would not be retained.
5. DISCUSSION
5.1. The novelty of TropiDEP
The TropiDEP design incorporates three levels of analysisnot examined to date in other studies. First, it incorporatesseparate functional trait axes that are predicted to influenceecosystem processes in different ways. Although each of thefunctional trait axes we observed is consistent with trait as-sociations found in this and other plant communities (Roggyet al., 1999; Wright et al., 2004), the relative orthogonality ofthe two axes has not been reported to date. Together these twoaxes distinguish species that differ markedly in a suite of traitsthat could influence carbon and nitrogen cycling in this sys-tem (Tab. II). We suggest that distances along each of theseaxes would provide more interpretable results of the effectsof functional diversity than the global distance measure sug-gested by Petchey and colleagues (Petchey and Gaston, 2002).As a result, we propose that independent variables describingfunctional diversity might be divided into several axes describ-ing suites of different traits with potentially different effects onparticular ecosystem processes. In other sites or ecosystems,these axes may differ from those reported here, yet the meth-ods of analysis could be universal. The definition of separateaxes of functional diversity also can improve the choice of fo-cal species for experimental design, such that functional dis-
tances among species combinations (cf. Roscher et al., 2004)are varied deliberately along one or more axes.
A second contribution of the TropiDEP design is its con-sideration of phylogenetic diversity. Biodiversity can be rep-resented not only by species and functional diversity butalso by the diversity in evolutionary relationships among taxa(Faith, 1992; Forest et al., 2006). Mixtures of closely relatedspecies would then be considered less diverse than those withmore distantly related species. Inclusion of this level of anal-ysis might depend on the experimental system and the de-gree to which the researchers have confidence in their a prioriknowledge of functional traits and the phylogenetic constraintson these traits. For example, in our species pool not alllegumes fixed nitrogen, but legumes may share other traits wedid not measure, such as anti-herbivore defense compounds(Wojciechowski et al., 2005). In this case, we may wish to ac-count for correlations of unmeasured but evolutionarily con-strained traits that might influence ecosystem processes, byconsidering the phylogenetic distance among species pairs inour sample.
We have also shown that both a multivariate measure offunctional diversity and a measure of phylogenetic diversitythat account for species abundances in experimental plots canbe estimated using the Rao quadratic entropy. The Rao indexis particularly suited to experimental designs in forest planta-tions where costs prohibit varying abundances experimentally(e.g., Roscher et al., 2004), and where abundances may varythrough time due to self-thinning (Scherer-Lorenzen et al.,2005).
5.2. Suggestions for experimental designs
A major limitation to B-EP studies in forest ecosystem in-volves a trade-off between statistical rigor and feasibility of
303p8
Functional diversity and ecosystem processes in tropical forests Ann. For. Sci. 67 (2010) 303
implementation, due to the larger scale and substantial infras-tructure required in tree plantations. Several general lessonscan be drawn from the construction of the TropiDEP modelthat should advance the general field of study of functionaldiversity and ecosystem processes. First, regarding the defini-tion of independent variables using a priori trait measures, re-searchers may want to account for particular functional traits,the results of which can be easily interpreted (Craine et al.,2002). We suggest screening traits for all potential species,from which one or multiple axes of trait variation can be de-fined and along which focal species can be chosen.
Second, regarding the measurement of independent vari-ables, we suggest the relationship between diversity andecosystem processes can only be improved by more precisemeasurement of the independent variables defining diversity(Wright et al., 2006). In particular, we believe that these vari-ables can often be separated (as in our example for FDc andFDn). Moreover, the community composition of plots canbe measured such that replicates for discrete variables areassigned unique calculated values for independent variables.In addition, measures such as Rao’s quadratic entropy (Rao,1982) can be employed to account not only for continuous dis-tances among species in mixtures but also their relative abun-dances in each experimental unit.
A third lesson is perhaps obvious but often ignored, andis based on the wide acceptance that complete designs for alinear model are most appropriate (Gotelli and Graves, 1996).We recommend that statistical rigor should be evaluated priorto design implementation. In particular, designs should incor-porate not only monoculture plots but also intermediate levelsof both species-level diversity and functional diversity alongthe chosen axes. We propose the use of a performance mea-sure such as that described here to compare among potentialdesigns with particular focal species combinations and relativeabundances, to evaluate completely the tradeoffs of particulardesigns and to choose the experimental design that best meetsthe objectives of a particular site and project.
Acknowledgements: This work was conducted with funding toCB from NSF OISE 03-01937. We thank Claude Millier andS. Hattenschwiller for productive discussions during the developmentof this project, and J. Ewel, D. Hibbs, S. Naeem, and F. Putz for con-structive comments on the manuscript.
REFERENCES
Bonal D., Sabatier D., Montpied P., Tremeaux D., and Guehl J.M., 2000.Interspecific variability of δ13C among canopy trees in rainforests ofFrench Guiana: Functional groups and canopy integration. Oecologia124: 454–468.
Botta-Dukát Z., 2005. Rao’s quadratic entropy as a measure of functionaldiversity based on multiple traits. J. Veg. Sci. 16: 533–540.
Cardinale B.J., Wrigh J.P., Cadotte M.W., Carroll I.T., Hector A.,Srivastava D.S. et al., 2007. Impacts of plant diversity on biomassproduction increase through time because of species complementar-ity. Proc. Natl. Acad. Sci., USA, 104: 18123–18128.
Chapin F.S., Zavaleta E.S., Eviner V.T, Naylor R.L., Vitousek P.M.,Reynolds H.L., Hooper D.U., Lavorel S., Sala O.E., Hobbie S.E.,
Mack M.C., and Diaz S., 2000. Consequences of changing biodiver-sity. Nature 405: 234–242.
Chave J., Muller-Landau H.C., Baker T.R., Easdale T.A., Ter Steege, H.,and Webb C.O., 2006. Regional and phylogenetic variation of wooddensity across 2456 neotropical tree species. Ecol. Appl. 16: 2356–2367.
Chessel D., Dufour, A.B., and Thioulouse, J., 2004. The ade4 package-I-One-table methods. R News. 4: 5–10.
Cochran W.G. and Cox G.M., 1992. Experimental Designs, John Wileyand Sons, New York, 428 p.
Cornelissen J.H.C., Lavorel S., Garnier E., Diaz S., BuchmannN., Gurvich D.E., Reich P.B., ter Steege H., Morgan H.D.,van der Heijden M.G.A., Pausas J.G., and Poorter H., 2003. A hand-book of protocols for standardised and easy measurement of plantfunctional traits worldwide. Aust. J. Bot. 51: 335–380.
Craine J.M., Tilman D., Wedin D., Reich P., Tjolker M., and Knops J.,2002. Functional traits, productivity and effects on nitrogen cyclingof 33 grassland species. Funct. Ecol. 16: 563–574.
Davies T.J., Barraclough T.G., Chase M.W., Soltis P.S., Soltis D.E., andSavolainen V., 2004. Darwin’s abominable mystery: Insights from asupertree of the angiosperms. Proc. Natl. Acad. Sci. USA 101: 1904–1909.
Diaz S. and Cabido M., 2001. Vive la difference: plant functional diversitymatters to ecosystem processes. Trends Ecol. Evol. 16: 646–655.
Ewel J.J., 2006. Species and rotation frequency influence soil nitrogen insimplified tropical plant communities. Ecol. Appl. 16: 490–502.
Faith D.P., 1992. Conservation evaluation and phylogenetic diversity.Biol. Conserv. 61: 1–10.
Fargione J., Tilman D., Dybzinski R., Lambers J.H.R., Clark C., HarpoleW.S. et al., 2007. From selection to complementarity: shifts in thecauses of biodiversity-productivity relationships in a long-term bio-diversity experiment. Proc. Roy. Soc. B. 274: 871–876.
Forest F., Grenyer R., Rouget M. et al., 2006. Preserving the evolutionarypotential of floras in biodiversity hotspots. Nature 445: 757–760.
Gamfeldt L., Hillebrand H., and Jonsson P.R., 2008. Multiple functionsincrease the importance of biodiversity for overall ecosystem func-tioning. Ecology 89: 1223–1231.
Gotelli N.J. and Graves G.R., 1996. Null Models in Ecology. SmithsonianInstitution Press, Washington, 368 p.
Grime J.P., Thompson K., Hunt R., Hodgson J.G., Cornelissen J.H.C.,Rorison I.H. et al., 1997. Integrated screening validates primary axesof specialization in plants. Oikos 79: 259–281.
Hector A. and Bagchi R., 2007. Biodiversity and ecosystem multifunc-tionality. Nature 448: 188–190.
Hillebrand H., Bennett D.M., and Cadotte M.W., 2008. Consequences ofdominance: a review of evenness effects on local and regional ecosys-tem processes. Ecology 89: 1510–1520.
Hooper D.U. and Dukes J.S., 2004. Overyielding among plant functionalgroups in a long-term experiment. Ecol. Lett. 7: 95–105.
Hooper D.U., Chapin F.S., Ewel J.J., Hector A., Inchausti P., Lavorel S.,Lawton J.H., Lodge D.M., Loreau M., Naeem S., Schmid B., SetalaH., Symstad A.J., Vandermeer J., and Wardle D.A., 2005. Effects ofbiodiversity on ecosystem functioning: a consensus of current knowl-edge and needs for future research. Ecol. Monogr. 75: 3–36.
Huston M.A., Aarssen L.W., Austin M.P., Cade B.S., Fridley J.D.,Garnier E., Grime J.P., Hodgson J., Lauenroth W.K., Thompson K.,Vandermeer J.H., and Wardle D.A., 2000. No consistent effect ofplant diversity on productivity. Science 289: 1255.
Isbell F.I., Polley H.W., and Wilsey, B.J., 2009. Biodiversity, productiv-ity and the temporal stability of productivity: patterns and processes.Ecol. Lett. doi: 10.1111/j.1461-0248.2009.01299.x.
Lamb D., Erskine P.D., and Parotta J., 2005. Restoration of degraded trop-ical forest landscapes. Science 310: 1628–1632.
303p9
Ann. For. Sci. 67 (2010) 303 C. Baraloto et al.
Loreau M. and Hector A., 2001. Partitioning selection and complemen-tarity in biodiversity experiments. Nature 412: 72–76.
Loreau M., Naeem S., Inchausti P., Bengtsson J., Grime J.P., Hector A.et al., 2001. Biodiversity and ecosystem functioning: current knowl-edge and future challenges. Science 294: 804–808.
Mason N.W.H., MacGillivray K., Steel J.B., and Wilson J.B., 2003. Anindex of functional diversity. J. Veg. Sci. 14: 571–578.
Moles A.T., Ackerly D.D., Webb C.O., Tweddle J.C., Dickie J.B., andWestoby M., 2005. A brief history of seed size. Science 307: 576–580
Naeem S. and Wright J.P., 2003. Disentangling biodiversity effects onecosystem functioning: deriving solutions to a seemingly insur-mountable problem. Ecol. Lett. 6: 567–579.
Parotta J.A. and Knowles O.H., 1999. Restoration of tropical moist foreston bauxite-mined lands in the Brazilian Amazon. Restor. Ecol. 7:103–116.
Pavoine S., Ollier S., and Dufour A.-B., 2005. Is the originality of aspecies measurable? Ecol. Lett. 8: 579–586.
Petchey O.L. and Gaston K.J., 2006. Functional diversity: back to basicsand looking forward. Ecol. Lett. 9: 741–758.
Petchey O.L., Hector A., and Gaston K.J., 2004. How do different mea-sures of functional diversity perform? Ecology 85: 847–857.
Phillips O.L., Malhi Y., Higuchi N., Laurance W.F., Núñez P.V., VásquezR.M., Laurance S.G., Ferreira L.V., Stern M., Brown S., and GraceJ., 1998. Changes in the carbon balance of tropical forests: evidencefrom long-term plots. Science 282: 439–442.
Polley H.W., Wilsey B.J., and Derner J.D., 2007. Dominant species con-strain effects of species diversity on temporal variability in biomassproduction of tallgrass prairie. Oikos 116: 2044–2052.
Rao C.R., 1982. Diversity and dissimilarity coefficients: a unified ap-proach. Theor. Popul. Biol. 21: 24–43.
Reich P., Tilman D., Naeem S., Ellsworth D., Knops J., Craine J. et al.,2004. Species and functional group diversity independently influencebiomass accumulation and its response to CO2 and N. Proc. Natl.Acad. Sci. USA 101: 10101–10106.
Ricotta C., 2005. A note on functional diversity measures. Basic Appl.Ecol. 6: 479–486.
Roggy J.C., Prévost M.F., Gourbière F., Casabianca H., and Garbaye J.,1999. Leaf natural 15N abundance and total N concentration as po-tential indicators of plant N nutrition in legumes and pioneer speciesin a rain forest of French Guiana. Oecologia 120: 171–182.
Roscher C., Schumacher J., Baade J., Wilcke W., Gleixner G., WeisserW.W. et al., 2004. The role of biodiversity for element cycling andtrophic interactions: an experimental approach in a grassland com-munity. Basic Appl. Ecol. 5: 107–121.
Scherer-Lorenzen M., Potvin C., Koricheva J., Schmid B., Hecto, A.,Bornik Z., Reynolds G., and Schulze E.-D., 2005. The design of ex-perimental tree plantations for functional biodiversity research. In:Scherer-Lorenzen M., Korner C, and Schulze E.-D. (Eds.), ForestDiversity and Function: Temperate and Boreal Systems, Springer-Verlag, Berlin, pp. 347–376.
Schimann H., Ponton S., Hattenschwiler S., Ferry B., Lensi R.,Domenach A.M., and Roggy J.C., 2008. Differing nitrogen usestrategies of two tropical rainforest late successional tree species inFrench Guiana: Evidence from 15N natural abundance and microbialactivities. Soil Biol. Biochem. 40: 487–494.
Schwartz M.W., Brigha, C.A., Hoeksema J.D., Lyons K.G., Mills M.H.,and van Mantgem P.J., 2000. Linking biodiversity to ecosystem func-tion: implications for conservation ecology. Oecologia 122: 297–305.
Simpson E.H., 1949. Measurement of diversity. Nature 163: 688.Tilman D., Reich P.B., Knops J., Wedin D., Mielke T., and Lehman C.,
2001. Diversity and productivity in a long-term grassland experi-ment. Science 294: 843–845.
Wojciechowski M.F., Lavin M., and Sanderson M.J., 2005. A phylogenyof legumes (Leguminosae) based on analysis of the plastid matK generesolves many well-supported subclades within the family. Am. J.Bot. 91: 1846–1862.
Wright I.J., Reich P.B., Westoby M., Ackerly D.D., Baruch Z., BongersF. et al., 2004. The worldwide leaf economics spectrum. Nature 428:821–827.
Wright J.P., Naeem S., Hector A., Lehma, C., Reich P.B., Schmid B., andTilman D., 2006. Conventional functional classification schemes un-derestimate the relationship with ecosystem functioning. Ecol. Lett.9: 111–120.
Zhang Q.G. and Zhang D.Y., 2007. Colonization sequence influences se-lection and complementarity effects on biomass production in exper-imental algal microcosms. Oikos 116: 1748–1758.
303p10