integrated disease surveillance project (idsp) - Indian Council ...
88
Ministry of Health & Family Welfare Government of India INTEGRATED DISEASE SURVEILLANCE PROJECT (IDSP) NON-COMMUNICABLE DISEASE RISK FACTORS SURVEY 2007-08 Madhya Pradesh Government Medical College Regional Medical Research Centre Nagpur for Tribals, Jabalpur (State Survey Agency) (Regional Resource Centre) National Institute of Medical Statistics New Delhi (National Nodal Agency) National Institute of Communicable Diseases Indian Council of Medical Research New Delhi New Delhi (IDSP Central Surveillance Unit) (National Implementing Agency) Funded by the World Bank 2009
-
Upload
khangminh22 -
Category
Documents
-
view
1 -
download
0
Transcript of integrated disease surveillance project (idsp) - Indian Council ...

Ministry of Health & Family Welfare
Government of India
INTEGRATED DISEASE SURVEILLANCE PROJECT(IDSP)
NON-COMMUNICABLE DISEASE RISK FACTORS SURVEY
2007-08
Madhya Pradesh
Government Medical College Regional Medical Research Centre
Nagpur for Tribals, Jabalpur
(State Survey Agency) (Regional Resource Centre)
National Institute of Medical Statistics
New Delhi
(National Nodal Agency)
National Institute of Communicable Diseases Indian Council of Medical Research
New Delhi New Delhi
(IDSP Central Surveillance Unit) (National Implementing Agency)
Funded by the World Bank
2009

Integrated Disease Surveillance Project (IDSP)
ii
Printed at: M/s Royal Offset Printers, A-89/1, Naraina Industrial Area, Phase-I, New Delhi-110 028 Ph.: 011-25797524
Suggested Citation
National Institute of Medical Statistics, Indian Council of Medical Research (ICMR), 2009,
IDSP Non-Communicable Disease Risk Factors Survey, Madhya Pradesh, 2007-08. National
Institute of Medical Statistics and Division of Non-Communicable Diseases, Indian Council
of Medical Research, New Delhi, India.

Non-Communicable Disease Risk Factor Survey, 2007-08, Madhya Pradesh
iii
Contents
Page No
Foreword .................................................................................................................... v
Preface ...................................................................................................................vii
Acknowledgements ........................................................................................................... ix
Definitions ................................................................................................................... xi
Acronyms .................................................................................................................. xiii
Tables ................................................................................................................... xv
Figures ................................................................................................................. xvii
Fact Sheet .................................................................................................................. xix
Executive Summary .......................................................................................................... xxi
1. Introduction 1
1.1 Background of the Survey ..................................................................................... 1
1.2 Objectives....................................................................................................... 1
1.3 Non communicable Disease (NCD) Risk Factors ........................................................... 1
1.4 Health Profile of the State .................................................................................... 2
1.5 Survey Design and Implementation.......................................................................... 3
1.6 Survey Instruments ............................................................................................ 5
1.7 Training .......................................................................................................... 6
1.8 Data Processing and Analysis ................................................................................. 7
1.9 Quality Control Measures ..................................................................................... 7
2. Background Characteristics of the Respondents and Households 9
2.1 Household Characteristics .................................................................................... 9
2.2 Age and Sex Composition .................................................................................... 10
2.3 Education Level ................................................................................................ 10
2.4 Marital Status .................................................................................................. 10
2.5 Occupation ..................................................................................................... 11
3. Behavioural Risk Factors 13
3.1 Tobacco Smoking and Chewing .............................................................................. 13
3.2 Alcohol Consumption .......................................................................................... 17
3.3 Fruits and Vegetables Consumption ........................................................................ 19
3.4 Physical Activity ............................................................................................... 21
3.5 Socio-Demographic Pattern .................................................................................. 23

Integrated Disease Surveillance Project (IDSP)
iv
4. Hypertension and Diabetes 29
4.1 Hypertension ................................................................................................... 29
4.2 Socio-Demographic Pattern of Hypertension .............................................................. 31
4.3 Diabetes ........................................................................................................ 32
5. Physical Measurements 33
5.1 Weight .......................................................................................................... 33
5.2 Height ........................................................................................................... 33
5.3 Body Mass Index (BMI) ........................................................................................ 33
5.4 Waist Circumference ......................................................................................... 33
5.5 Socio-Demographic Pattern of Overwight ................................................................. 35
6. Summary and Conclusions 37
Reference .............................................................................................................. 39
Appendix A Sample Weights ........................................................................................ 41
Appendix B Household/Individual Questionnaire ................................................................ 44
Appendix C Technical Support and Human Resource............................................................. 58

Non-Communicable Disease Risk Factor Survey, 2007-08, Madhya Pradesh
v
Foreword
Globally, non-communicable diseases (NCDs) are the major cause of morbidity and mortality.
According to WHO Report 2004, they account for almost 60% of deaths and 47% of the global
burden of disease. In India, estimated deaths due to non-communicable diseases were double
than those from communicable diseases. A progressive rise in the disease pattern of NCD
foretells a serious public health issue. The major risk factors for non-communicable diseases
are tobacco and alcohol abuse, a sedentary lifestyle, and an unhealthy diet. It is believed that
about half of non-communicable disease-related premature deaths could be prevented through
healthy diet, regular physical activity and by avoiding tobacco and alcohol.
Envisaging the magnitude of the public health problem of chronic diseases, the Government
of India through National Institute of Communicable Disease, MoHFW and Indian Council of
Medical Research initiated NCD risk factors survey, phase-I in seven states of India. It is a well
planned large community based survey providing state wise estimates of major NCD risk factors
in different strata of population. It is needless to mention that the estimated NCD risk factors
are important input for targeted prevention of NCD and effective health care planning. The
National Technical Advisory Committee (NTAC) and National Monitoring Committee constituted
by MoHFW, provided valuable technical guidance and support to complete the study.
The Indian Council of Medical Research through its Division of Non-communicable Diseases
has implemented the study with all the partners including the National Institute of Medical
Statistics as a National Nodal Agency, Regional Resource Centers and State Survey Agencies.
I congratulate the Team for successfully completing the survey and bringing out Phase-I
report of NCD Risk Factors which would be of immense use for prevention and control of non-
communicable diseases.
(Dr. V.M. Katoch)

Integrated Disease Surveillance Project (IDSP)
vi

Non-Communicable Disease Risk Factor Survey, 2007-08, Madhya Pradesh
vii
Preface
Non-Communicable Diseases (NCD) account for a large proportion of morbidity and mortality
amongst the adult population of our country. The high prevalence of major risk factors viz.
tobacco and alcohol consumption, inappropriate diet, physical inactivity, high blood pressure,
high blood glucose and dyslipidemias are driving the epidemic of NCDs. The Division of Non-
Communicable Diseases at ICMR was identified as the nodal point for surveillance of NCDs and
their risk factors by the World Health Organization, and multi-site studies helped us in developing
a sound strategy for NCD risk factor surveys at the national level under IDSP. The survey
methodology developed by ICMR was incorporated by IDSP into the overall survey protocol
provided to ICMR for implementation.
The Indian Council of Medical Research signed a Memorandum of Understanding (MOU)
with IDSP for the standardization and quality assurance of the NCD risk factor surveys under
the World Bank funded IDSP on behalf of Ministry of Health, Govt. of India. As per IDSP plan,
these surveys were to be carried out in three phases so as to cover all States and UTs of the
country. In the present Phase I, the State based estimates of the risk factors in seven States
(Andhra Pradesh, Kerala, Madhya Pradesh, Maharashtra, Mizoram, Tamil Nadu and Uttarakhand)
were arrived at through the IDSP identified seven State Survey Agencies, five Regional Research
Centers and a National Nodal Agency under the overall guidance and supervision of ICMR
Headquarters through the National Technical Advisory Committee. I am grateful to the Director
General, ICMR for supporting the Division of Noncommunicable Diseases ICMR to implement
the surveys. The untiring effort of our partner agencies is commendable and is duly acknowledged.
This report marks an important milestone in surveillance activities for NCDs in the country.
The results would be useful for planning and monitoring an effective response in a coordinated
manner by the Government. It should also stimulate further analysis and research in the area.
(Dr. Bela Shah)
MkW csyk ’kkg ,e-Mh-oSKkfud ^th* ,oa izeq[kvlapkjh jksx izHkkx
Dr. Bela Shah MD
Scientist ‘G’ & Head
Division of Non-Communicable Diseases
Hkkjrh; vk;qfoZKku vuqla/kku ifj"knLokLF; vuqla/kku foHkkxLokLF; ,oa ifjokj dY;k.k ea=kky;oh- jkefyaxLokeh] valkjh uxjubZ fnYyh& ¼Hkkjr½110 029
Indian Council of Medical Research
Department of Health Research
Ministry of Health & Family Welfare
V. Ramalingaswamy Bhawan
Ansari Nagar, New Delhi - 110 029 (INDIA)

Integrated Disease Surveillance Project (IDSP)
viii

Non-Communicable Disease Risk Factor Survey, 2007-08, Madhya Pradesh
ix
Acknowledgements
The National Institute of Medical Statistics was identified as National Nodal Agency
(NNA) to conduct the IDSP-NCD Risk Factors Survey Phase-I in India. The survey was carried
out with the joint efforts of all partner organizations including Division of Non-Communicable
Diseases of Indian Council of Medical Research as the implementing agency; and Center for
Community Medicine, All India Institute of Medical Sciences, New Delhi; Regional Medical
Research Centre for Tribal, Jabalpur; National Institute of Epidemiology, Chennai; Sri Chitra
Tirunal Institute of Medical Sciences and Technology, Thiruvanathapuram; Regional Medical
Research Centre, Dibrugarh as Regional Resource Centers; Department of Community
Medicine of Chhatrapati Shahuji Maharaj Medical University, Lucknow; Government Medical
College, Nagpur; Pune Health Care Management and Research Centre, Pune; Indian Institute
of Health and Family Welfare, Hyderabad; Madras Diabetes Research Foundation, Chennai;
Clinical Epidemiology Unit, Medical College, Thiruvanathapuram; Regional Institute of Medical
Sciences, Imphal, Manipur as State Survey Agencies respectively.
We sincerely acknowledge the Ministry of Health and Family Welfare (MoHFW),
Government of India for granting us responsibility of conducting the IDSP NCD Risk Factors
Survey Phase-I in India. We acknowledge the World Bank for providing financial support to
conduct the Phase-I survey in seven states. We gratefully acknowledge the technical support
and valuable guidance provided by Dr. N.K. Ganguly, Chairman and all members of National
Technical Advisory Committee (NTAC) and Dr. Shiv Lal, Special Director General Health
Services, Director NICD and all the members of National Monitoring Committee. Thanks go
to Dr. G. Ramana and J. Gowrinath Sastry from World Bank; Dr. Cherian Varghese, WHO; Dr.
D. Bachani, Dr. R.L. Ichhpujani, Dr. A.C. Dhariwal, Dr. Shah Hossain and Dr. Pradeep Khasnobis
from IDSP Central Surveillance Unit, NICD for their support in undertaking the survey. We
are grateful to Dr. L.M. Nath and Dr. K. Anand, AIIMS, New Delhi and Dr. B.N. Bhattacharya,
Indian Statistical Institute, Kolkatta for their technical guidance and review of the reports.
We are extremely thankful to Dr. Bela Shah and her colleagues Dr. D.K. Shukla and Dr.
Prashant Mathur at ICMR for providing leadership to implement the survey.
The team of NIMS including Dr. H.K. Chaturvedi, Dr. D. Sahu, Dr. Tulsi Adhikari, Dr. Atul
Juneja, Mr. Jiten Kumar Singh and all other supporting staff involved in the study deserve
appreciation and acknowledgement. We are grateful to Regional Medical Research Centre
for Tribal, Jabalpur being the Regional Resource Center for Madhya Pradesh and Government
Medical College, Nagpur involved as State Survey Agency for supervising, data collection
and data entry of survey in Madhya Pradesh.
The hard work of all the field investigators, field supervisors and data entry operators
are highly appreciable and acknowledged. Last but not the least, I express my heartiest
thanks to all the respondents and other peoples including local health administrators of
districts and state who helped in completing the survey.
National Institute of Medical Statistics (Arvind Pandey)
ICMR, New Delhi Director

Integrated Disease Surveillance Project (IDSP)
x

Non-Communicable Disease Risk Factor Survey, 2007-08, Madhya Pradesh
xi
Definitions
Current Smoker / Smokeless Tobacco User: Some one
who at the time of the survey, smokes / uses tobacco in
any form either daily or occasionally.
Current Daily Smoker / Smokeless Tobacco User: Some
one who smokes / uses tobacco everyday with rare
exceptions such as not on days of religious fasting or
during acute illness.
Past- Daily Smokers / Smokeless Tobacco User: These
are those individuals who were smoking daily in past,
but have not smoked ever in one year preceding the
survey.
Non-Smoker / Never Used Smokeless Tobacco: These
are those individuals who have never smoked / used
smokeless tobacco in the lifetime.
Current Drinker: Those who consumed one or more
than one drink of any alcohol in the year preceding the
survey.
Former Drinker: Those who have consumed alcohol but
those who did not consume one or more drink during
the year preceding the survey.
Lifetime Abstainer: Those who have never consumed
one or more drink of any type of alcohol in lifetime.
High Risk Drinker (Binge Drinker): Those who drink
more than 5 (for women 4) standard drinks on any single
day.
Standard Drink: It is defined as any standard drink with
net alcohol content of 10 gm ethanol.
Standard Serving: One standard serving of fruits and
vegetables is equivalent to 80 grams, translated into
different units of cups depending on type of vegetables
and fruits.
Metabolic Equivalent (MET): MET is the ratio of a
person’s working metabolic rate relative to the resting
metabolic rate. One MET is defined as the energy cost
of sitting quietly, and is equivalent to a caloric
consumption of 1 kcal/kg/hour. It is estimated that,
compared to sitting quietly, a person’s caloric
consumption is four times as high when being moderately
active, and eight times as high when being vigorously
active.
Central Obesity: Central obesity (measured as waist
circumference or waist to hip ratio) is more strongly
associated with coronary heart disease than BMI. Waist
measurement is taken at the level of mid point between
the inferior margin of the rib and crest of the ileum in
the mid-auxiliary plane, using a non-stretchable tape,
without clothing, that is, directly over the skin (or over
light clothing). A cut-off level of 102 cms. in males and
88 cms. in females, have been recommended for
developed countries (ATP 3 Guidelines), however, much
lower cut-off levels are appropriate for Indians of 90
cms. in males and 80 cms. in females (South Asia Pacific
Guidelines).
Hypertensive Stage I: The upper and lower limit of the
systolic and diastolic blood pressure for hypertensive
stage I is 140-159 mm Hg systolic or 90-99 mm Hg for
diastolic.
Hypertensive Stage II: The upper and lower limit of the
systolic and diastolic blood pressure for hypertensive
stage II is >160 mm Hg systolic or >100 mm Hg for
diastolic.
Under Weight: The person with BMI less than 18.5 kg/
m2 is categorized as under weight.
Normal Weight: The person whose BMI is between 18.5
to 24.9 kg/m2 is categorized as normal weight.
Over Weight: The person whose BMI is 25 kg/m2 or more
is categorized as over weight.

Integrated Disease Surveillance Project (IDSP)
xii

Non-Communicable Disease Risk Factor Survey, 2007-08, Madhya Pradesh
xiii
Acronyms
AYUSH Ayurveda, Unani Shidha, and Homeopathy
BMI Body Mass Index
BP Blood Pressure
CEB Census Enumeration Block
DHO District Health Officer
ICMR Indian Council of Medical Research
GMC Government Medical College
IDSP Integrated Disease Surveillance Project
LPG Liquid Petroleum Gas
MET Metabolic Equivalent
NCD Non-communicable Diseases
NICD National Institute of Communicable Diseases
NIMS National Institute of Medical Statistics
NMC National Monitoring Committee
NNA National Nodal Agency
NTAC National Technical Advisory Committee
PSU Primary Sampling Unit
RMRCT Regional Medical Research Center for Tribals
RRC Regional Resource Centre
SSA State Survey Agency
WC Waist Circumference
WHO World Health Organization

Integrated Disease Surveillance Project (IDSP)
xiv
Non-Communicable Disease Risk Factor Survey, 2007-08, Madhya Pradesh
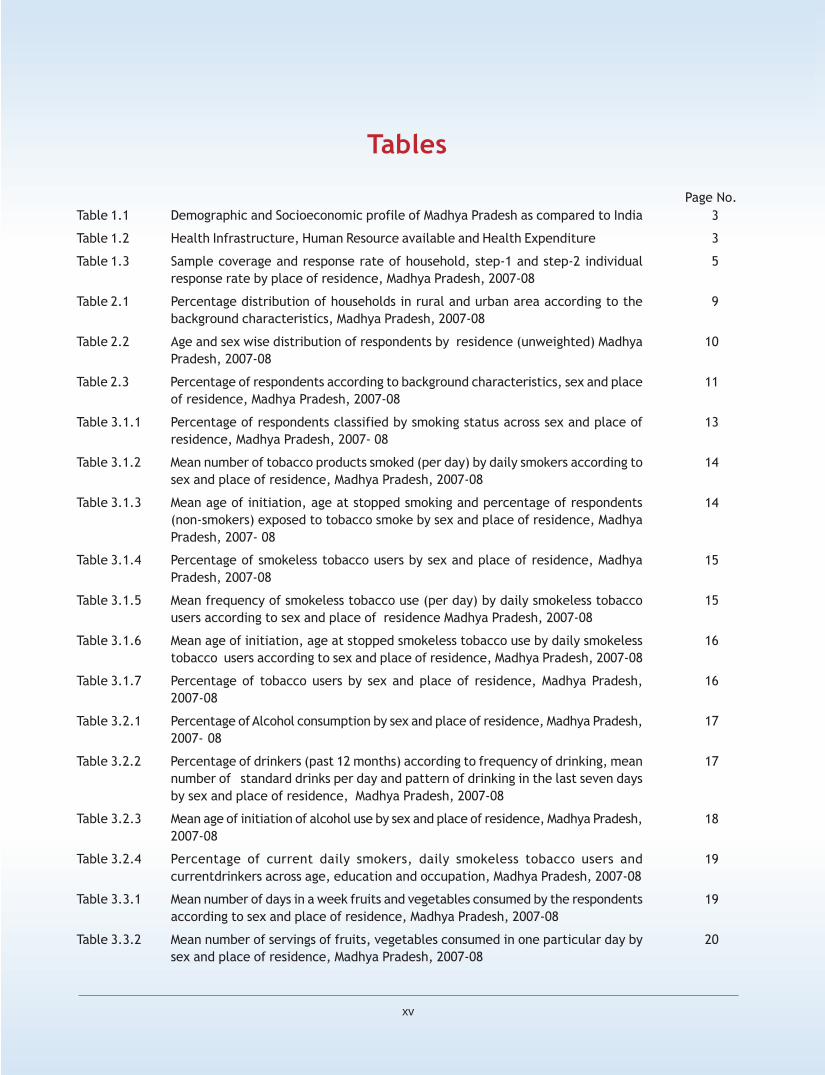
xv
Table 1.1 Demographic and Socioeconomic profile of Madhya Pradesh as compared to India
Table 1.2 Health Infrastructure, Human Resource available and Health Expenditure
Table 1.3 Sample coverage and response rate of household, step-1 and step-2 individual
response rate by place of residence, Madhya Pradesh, 2007-08
Table 2.1 Percentage distribution of households in rural and urban area according to the
background characteristics, Madhya Pradesh, 2007-08
Table 2.2 Age and sex wise distribution of respondents by residence (unweighted) Madhya
Pradesh, 2007-08
Table 2.3 Percentage of respondents according to background characteristics, sex and place
of residence, Madhya Pradesh, 2007-08
Table 3.1.1 Percentage of respondents classified by smoking status across sex and place of
residence, Madhya Pradesh, 2007- 08
Table 3.1.2 Mean number of tobacco products smoked (per day) by daily smokers according to
sex and place of residence, Madhya Pradesh, 2007-08
Table 3.1.3 Mean age of initiation, age at stopped smoking and percentage of respondents
(non-smokers) exposed to tobacco smoke by sex and place of residence, Madhya
Pradesh, 2007- 08
Table 3.1.4 Percentage of smokeless tobacco users by sex and place of residence, Madhya
Pradesh, 2007-08
Table 3.1.5 Mean frequency of smokeless tobacco use (per day) by daily smokeless tobacco
users according to sex and place of residence Madhya Pradesh, 2007-08
Table 3.1.6 Mean age of initiation, age at stopped smokeless tobacco use by daily smokeless
tobacco users according to sex and place of residence, Madhya Pradesh, 2007-08
Table 3.1.7 Percentage of tobacco users by sex and place of residence, Madhya Pradesh,
2007-08
Table 3.2.1 Percentage of Alcohol consumption by sex and place of residence, Madhya Pradesh,
2007- 08
Table 3.2.2 Percentage of drinkers (past 12 months) according to frequency of drinking, mean
number of standard drinks per day and pattern of drinking in the last seven days
by sex and place of residence, Madhya Pradesh, 2007-08
Table 3.2.3 Mean age of initiation of alcohol use by sex and place of residence, Madhya Pradesh,
2007-08
Table 3.2.4 Percentage of current daily smokers, daily smokeless tobacco users and
currentdrinkers across age, education and occupation, Madhya Pradesh, 2007-08
Table 3.3.1 Mean number of days in a week fruits and vegetables consumed by the respondents
according to sex and place of residence, Madhya Pradesh, 2007-08
Table 3.3.2 Mean number of servings of fruits, vegetables consumed in one particular day by
sex and place of residence, Madhya Pradesh, 2007-08
Tables
Page No.
3
3
5
9
10
11
13
14
14
15
15
16
16
17
17
18
19
19
20

Integrated Disease Surveillance Project (IDSP)
xvi
Table 3.3.3 Percentage of respondents according to the intake of specific food items by sex
and place of residence, Madhya Pradesh, 2007-08
Table 3.3.4 Percentage of households according to type of oil consumption, Madhya Pradesh,
2007-08
Table 3.4.1 Mean time spent (in minutes) on physical activity per day by sex and residence,
Madhya Pradesh, 2007-08
Table 3.4.2 Percentage of respondents classified in three categories of total physical activity
per day (P & 95% CI) by sex and place of residence, Madhya Pradesh, 2007-08
Table 3.4.3 Percentage of respondents (with 95% Confidence Interval) according to
threecategories of total physical activity by age group and sex, Madhya Pradesh,
2007-08
Table 3.4.4 Sex wise percentage of respondents classified according to total time spent in
sedentary activity per day by residence, Madhya Pradesh, 2007-08
Table 3.5.1 Percentage of respondents in the category of some high risk factors of NCD (current
daily smokers, daily smokeless tobacco user, current drinkers, low fruits and vegetables
intake and low physical activity) across age, education, occupation and sex, urban, Madhya
Pradesh, 2007- 08
Table 3.5.2 Percentage of respondents in the category of some high risk factors of NCD (current
daily smokers, daily smokeless tobacco user, current drinkers, low fruits and vegetables
intake and low physical activity) across age, education, occupation and sex, rural,
Madhya Pradesh, 2007- 08
Table 3.5.3 Percentage of respondents in the category of some high risk factors of NCD (current
daily smokers, daily smokeless tobacco user, current drinkers, low fruits and
vegetables intake and low physical activity) across age, education, occupation and
sex, combined, Kerala, 2007- 08
Table 4.1.1 Percentage of respondents with history of raised blood pressure, treatment and
life style modification advised, seeking consultation and treatment from an AYSUH
practitioner by sex and place of residence, Madhya Pradesh, 2007-08
Table 4.1.2 Mean Systolic and Diastolic blood pressure by sex and place of residence, Madhya
Pradesh, 2007-08
Table 4.1.3 Categories of Hypertension
Table 4.1.4 Percentage of respondents according to category of hypertension by sex and place
of residence, Madhya Pradesh, 2007-08
Table 4.2 Percentage of respondents in the category of stage I & stage II hypertension
across age, education, occupation and by sex and residence, Madhya Pradesh,
2007- 08
Table 4.3 Percentage of respondents with history of raised blood sugar, treatment and life
style modification advised, seeking consultation and treatment from an AYSUH
practitioner by sex and place of residence, Madhya Pradesh, 2007-08
Table 5.1 Categories of BMI
Table 5.2 Mean value for body mass index (BMI), height, weight and waist circumference by
sex and place of residence, Madhya Pradesh, 2007-08
Table 5.3 Percentage of respondents according to BMI categories by sex and place of residence,
Madhya Pradesh, 2007-08
Table 5.4 Percentage of respondents in the category of overweight (Grade I, II & III) across
age, education, occupation and by sex and residence, Madhya Pradesh, 2007- 08
20
21
21
22
22
23
24
26
27
29
30
30
30
31
32
33
34
34
35

Non-Communicable Disease Risk Factor Survey, 2007-08, Madhya Pradesh
xvii
Figures
Page No.
Figure 1 Current smokers (%) by sex and residence xxii
Figure 2 Current daily smokeless tobacco users (%) by sex and residence xxii
Figure 3 Alcohol consumption (%) by sex and residence xxii
Figure 4 Less than five servings of fruits & vegetables consumption (%) by sex and residence xxiii
Figure 5 Major oil consumption among households (%) by residence xxiii
Figure 6 Mean time spent on physical activity per day (minutes) by sex and residence xxiii
Figure 7 Low physical activity of respondants (%) by sex and residence xxiii
Figure 8 Stage I & II hypertension (%) by sex and residence xxiv
Figure 9 History of raised blood sugar (%) by sex and residence xxiv
Figure10 Overweight respondents(%) by sex and residence in Madhya Pradesh xxv

Integrated Disease Surveillance Project (IDSP)
xviii

Non-Communicable Disease Risk Factor Survey, 2007-08, Madhya Pradesh
xix
IDSP-NCD Risk Factor SurveyFact Sheet - Madhya Pradesh
Population Any form of Tobacco use 47
Household covered 4998 Male 68
Individual covered 5853 Female 23
Household Characteristics(%) Mean age of Initiation (in years)
Religion Smoking 19
Hindu 92 Male *
Muslim 6 Female 19
Access to piped drinking water 26 Smokeless tobacco 20
Urban 69 Male 20
Rural 10 Female 15
Sanitation Alcohol Consumption
Flush Toilet 15 Consumed Alcohol (last 30 days) 14
Urban 48 Male 24
Rural 2 Female 3
Source of Lighting Consumed Alcohol (last 12 Months) 19
Electricity 68 Male 33
Urban 97 Female 4
Rural 57 Consumed alcohol (in last 7 days)
Type of House Binge Drinkers 13
Pucca House 23 Male 14
Urban 60 Female 4
Rural 10 Mean age of Initiation Alcohol (in years) 20
Kachha House 52 Male 20
Urban 18 Female 18
Rural 64 Fruits and Vegetables consumed
Fuel use for Cooking Less than five servings per day 83
LPG/Gas 19 Urban 71
Urban 59 Rural 88
Rural 4 Physical Activity
Separate Kitchen Low Physical Activity 42
Urban 56 Urban 68
Rural 26 Rural 32
Own Agricultural land Hypertension
Urban 16 Pre Hypertension 46
Rural 62 Urban 46
Individual Characteristics(%) Rural 46
Education -Illiterate 44 Stage I and II Hypertension 21
Urban (Male) 12 Urban 24
Urban (Female) 32 Rural 20
Rural (Male) 37 Physical Measurement - BMI
Rural (Female) 71 Under weight 39
Behavioural Information(%) Urban 27
Current Tobacco users Rural 44
Smokers 22 Over weight (grade I,II,III) 8
Male 41 Urban 20
Female 1 Rural 4
Smokeless tobacco users 39 Central Obesity 11
Male 54 Urban 22
Female 23 Rural 7
*figure not shown, based on fewer than 25 unweighted cases

Integrated Disease Surveillance Project (IDSP)
xx
Non-Communicable Disease Risk Factor Survey, 2007-08, Madhya Pradesh
xxi
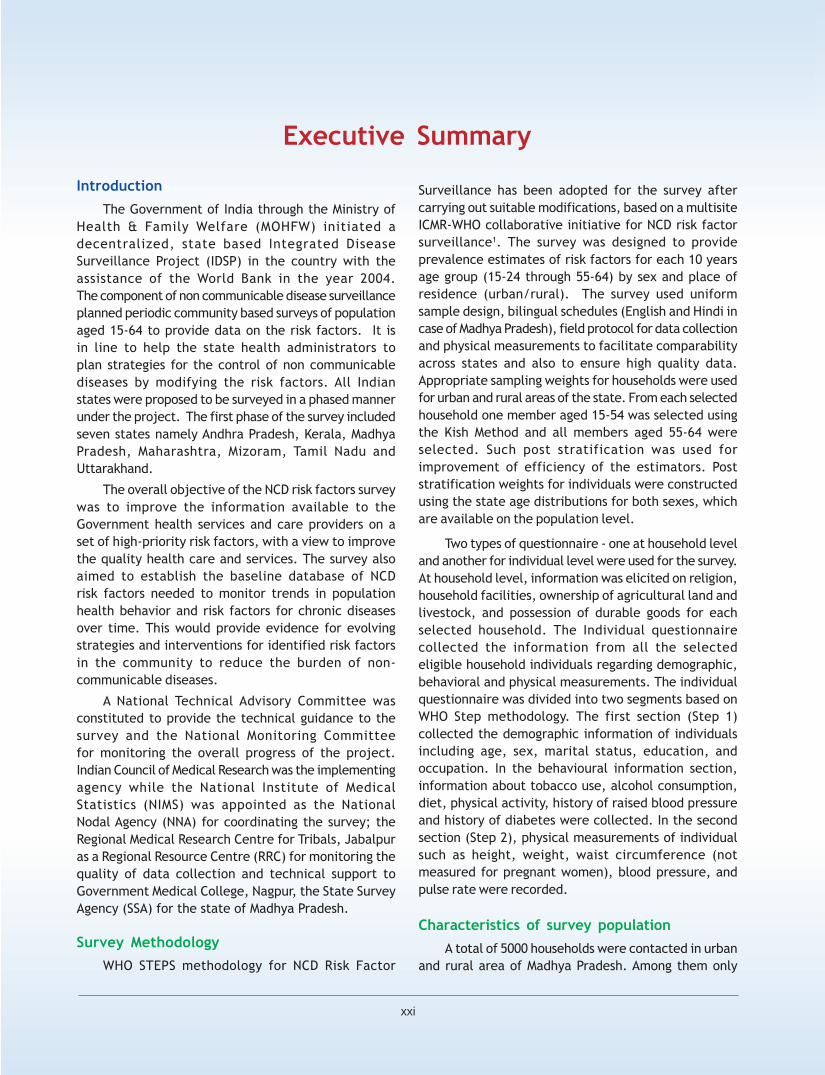
Executive Summary
Introduction
The Government of India through the Ministry of
Health & Family Welfare (MOHFW) initiated a
decentralized, state based Integrated Disease
Surveillance Project (IDSP) in the country with the
assistance of the World Bank in the year 2004.
The component of non communicable disease surveillance
planned periodic community based surveys of population
aged 15-64 to provide data on the risk factors. It is
in line to help the state health administrators to
plan strategies for the control of non communicable
diseases by modifying the risk factors. All Indian
states were proposed to be surveyed in a phased manner
under the project. The first phase of the survey included
seven states namely Andhra Pradesh, Kerala, Madhya
Pradesh, Maharashtra, Mizoram, Tamil Nadu and
Uttarakhand.
The overall objective of the NCD risk factors survey
was to improve the information available to the
Government health services and care providers on a
set of high-priority risk factors, with a view to improve
the quality health care and services. The survey also
aimed to establish the baseline database of NCD
risk factors needed to monitor trends in population
health behavior and risk factors for chronic diseases
over time. This would provide evidence for evolving
strategies and interventions for identified risk factors
in the community to reduce the burden of non-
communicable diseases.
A National Technical Advisory Committee was
constituted to provide the technical guidance to the
survey and the National Monitoring Committee
for monitoring the overall progress of the project.
Indian Council of Medical Research was the implementing
agency while the National Institute of Medical
Statistics (NIMS) was appointed as the National
Nodal Agency (NNA) for coordinating the survey; the
Regional Medical Research Centre for Tribals, Jabalpur
as a Regional Resource Centre (RRC) for monitoring the
quality of data collection and technical support to
Government Medical College, Nagpur, the State Survey
Agency (SSA) for the state of Madhya Pradesh.
Survey Methodology
WHO STEPS methodology for NCD Risk Factor
Surveillance has been adopted for the survey after
carrying out suitable modifications, based on a multisite
ICMR-WHO collaborative initiative for NCD risk factor
surveillance1. The survey was designed to provide
prevalence estimates of risk factors for each 10 years
age group (15-24 through 55-64) by sex and place of
residence (urban/rural). The survey used uniform
sample design, bilingual schedules (English and Hindi in
case of Madhya Pradesh), field protocol for data collection
and physical measurements to facilitate comparability
across states and also to ensure high quality data.
Appropriate sampling weights for households were used
for urban and rural areas of the state. From each selected
household one member aged 15-54 was selected using
the Kish Method and all members aged 55-64 were
selected. Such post stratification was used for
improvement of efficiency of the estimators. Post
stratification weights for individuals were constructed
using the state age distributions for both sexes, which
are available on the population level.
Two types of questionnaire - one at household level
and another for individual level were used for the survey.
At household level, information was elicited on religion,
household facilities, ownership of agricultural land and
livestock, and possession of durable goods for each
selected household. The Individual questionnaire
collected the information from all the selected
eligible household individuals regarding demographic,
behavioral and physical measurements. The individual
questionnaire was divided into two segments based on
WHO Step methodology. The first section (Step 1)
collected the demographic information of individuals
including age, sex, marital status, education, and
occupation. In the behavioural information section,
information about tobacco use, alcohol consumption,
diet, physical activity, history of raised blood pressure
and history of diabetes were collected. In the second
section (Step 2), physical measurements of individual
such as height, weight, waist circumference (not
measured for pregnant women), blood pressure, and
pulse rate were recorded.
Characteristics of survey population
A total of 5000 households were contacted in urban
and rural area of Madhya Pradesh. Among them only
Integrated Disease Surveillance Project (IDSP)
xxii
one household refused to participate in the survey. The
overall individual response rate for the survey was 99
percent. Of the surveyed households, more than 90%
of the households were Hindu and about 6% were Muslim.
Seventy-three percent of the households used drinking
water from a piped or hand pump. Almost all households
had flush or pit toilet facility. Sixty eight percent of
households had electricity. LPG was a major source of
cooking fuel in urban area and wood was main source of
fuel in rural area. Overall 50% of the households
possessed agricultural land, which was only 16% in case
of urban area.
About 44% of the respondents were illiterate. It was
pronounced in rural area where almost half of surveyed
population was illiterate. The results emphasize the
need of taking female literacy program of the
Government more emphatically. About three-quarter of
respondents were currently married. Majority of the
respondents in rural area were engaged in agricultural
work. More than 50% of females in urban area were
looking after domestic work; the males were engaged
in manual work (35%) followed by executive and business
positions (11%).
BEHAVIOURAL RISK FACTORS FOR NCD
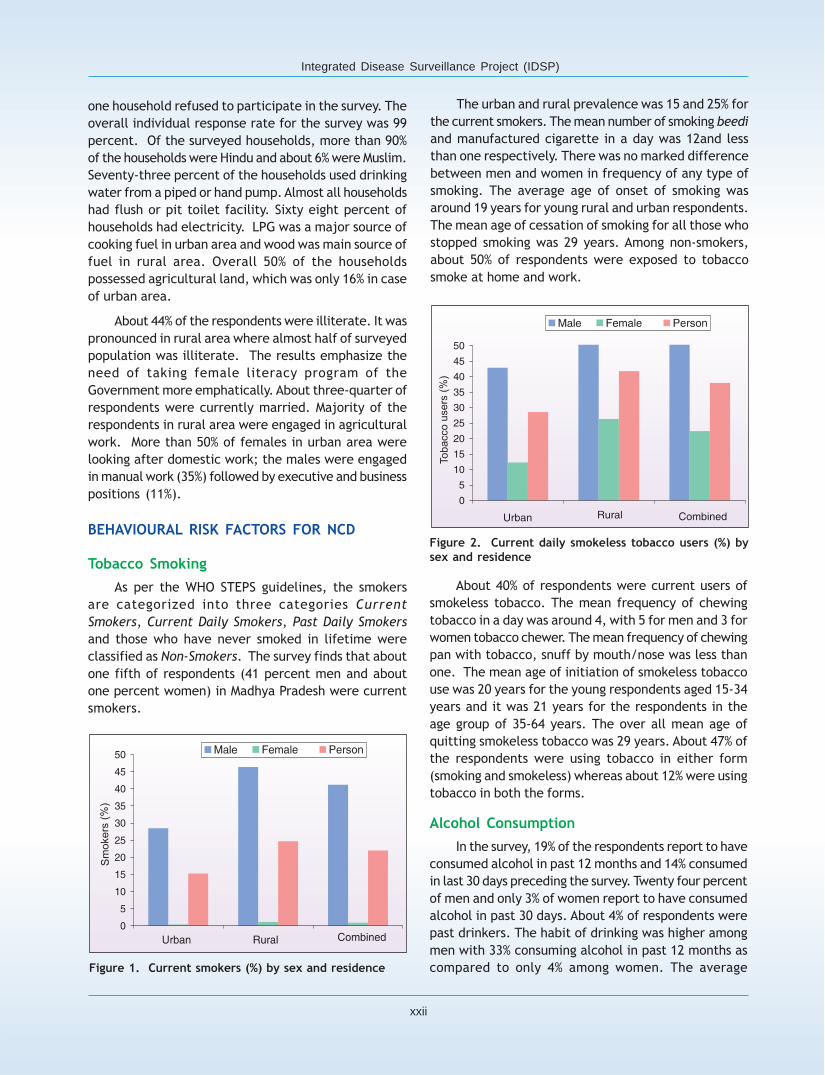
Tobacco Smoking
As per the WHO STEPS guidelines, the smokers
are categorized into three categories Current
Smokers, Current Daily Smokers, Past Daily Smokers
and those who have never smoked in lifetime were
classified as Non-Smokers. The survey finds that about
one fifth of respondents (41 percent men and about
one percent women) in Madhya Pradesh were current
smokers.
The urban and rural prevalence was 15 and 25% for
the current smokers. The mean number of smoking beedi
and manufactured cigarette in a day was 12and less
than one respectively. There was no marked difference
between men and women in frequency of any type of
smoking. The average age of onset of smoking was
around 19 years for young rural and urban respondents.
The mean age of cessation of smoking for all those who
stopped smoking was 29 years. Among non-smokers,
about 50% of respondents were exposed to tobacco
smoke at home and work.
About 40% of respondents were current users of
smokeless tobacco. The mean frequency of chewing
tobacco in a day was around 4, with 5 for men and 3 for
women tobacco chewer. The mean frequency of chewing
pan with tobacco, snuff by mouth/nose was less than
one. The mean age of initiation of smokeless tobacco
use was 20 years for the young respondents aged 15-34
years and it was 21 years for the respondents in the
age group of 35-64 years. The over all mean age of
quitting smokeless tobacco was 29 years. About 47% of
the respondents were using tobacco in either form
(smoking and smokeless) whereas about 12% were using
tobacco in both the forms.
Alcohol Consumption
In the survey, 19% of the respondents report to have
consumed alcohol in past 12 months and 14% consumed
in last 30 days preceding the survey. Twenty four percent
of men and only 3% of women report to have consumed
alcohol in past 30 days. About 4% of respondents were
past drinkers. The habit of drinking was higher among
men with 33% consuming alcohol in past 12 months as
compared to only 4% among women. The average
Figure 2. Current daily smokeless tobacco users (%) bysex and residence
Figure 1. Current smokers (%) by sex and residence

Non-Communicable Disease Risk Factor Survey, 2007-08, Madhya Pradesh
xxiii
Fruits and Vegetables Consumption
In a week, people in Madhya Pradesh consumed
vegetables 5 days and fruits on an average 2 days. The
mean number of days when fruits were consumed was
higher for urban population (2 days) as compared to
that for rural population (1 day). Only 17% of population
consumed five or more servings of fruits and vegetables
per day.
In respect of consumption of specific food habits,
17% population consumed eggs, 10% consumed fish, and
13% consumed red meat and (20%)fried local food at
least once a week. Cheese/butter was consumed daily
by 9% of the population. Cake pastries or other bakery
items including chips/namkeen are consumed daily by
6% of population.
The most common oil used for cooking among the
households in Madhya Pradesh was soyabean oil (60%),
followed by mustard oil (36%) and groundnut oil (4%).
Physical Activity
The lack of physical activity leads to obesity,
hyperlipidemia, diabetes mellitus, hypertension, and
coronary heart disease. In this respect survey finds that
in Madhya Pradesh, the mean time spent in different
sub groups on work related physical activity range
between 191-332 minutes per day. The mean duration
of total physical activity was 2106 MET minutes per day.
Most of the time spent related to work and travel (walks
and bicycle). Around 67 minutes and 12 minutes were
spent per day for travel and recreational activities
respectively.
number of drinks consumed on a drinking day was two
drinks. About one tenth of current drinkers were binge
drinkers (high drinking). The mean age of initiation of
alcohol consumption regularly was 20 years for the
respondents in the age group 15-34 years and 25 years
for the respondents in the age group of 35-64 years.
The percentage of current drinkers was highest for
respondents whose main occupation was manual work
& agriculture.
Figure 3. Alcohol consumption (%) by sex and residence
Figure 4. Less than five servings of fruits & vegetablesconsumption (%) by sex and residence
Figure 5. Major oil consumption among households/nut(%) by residence
Figure 6. Mean time spent on physical activity per day(minutes) by sex and residence
As per the WHO guidelines, the total physical

Integrated Disease Surveillance Project (IDSP)
xxiv
activity of the individual has been categorized as low,
medium and high. About 42% of respondents recorded
low level of physical activity, while 20% and 38% of
respondents recorded medium and high level of activity,
respectively. Majority of respondents spent 1-3 hours in
sedentary activities (60%). About 20% spent more than
4 hours in sedentary activity.
HYPERTENSION AND DIABETES
Hypertension
The blood pressure is an important determinant of
risk of cardiovascular and ischemic heart diseases,
congestive cardiac failure and renal failure. In the survey,
2% respondents report to have been diagnosed as
hypertensive by health professionals (2% for males and
3% for females; 6% for urban and 1% for rural population).
Among these who were diagnosed for hypertension, 60%
were on prescribed drugs, 67% were advised dietary
modification, and 1% consulted AYUSH practitioner of
which one-fourth were taking treatment from them. The
survey also carried out measurement of blood pressure
as a part of step-2 of individual questionnaire. The mean
systolic blood pressure in the population was around 126
mm Hg and mean diastolic blood pressure was 78 mm
Hg. By categories of hypertension, 33% recorded to be
normal, 46% in pre hypertension, 16% in stage-I
hypertension and 5% in stage-II hypertension. Stage I
&II hypertension was more pronounced in men (24%) as
compared to women (18%).
Diabetes
Diabetes mellitus is an important marker of risk
for the arterial disease of the coronary, cerebral and
peripheral arterial trees, and for micro vascular disease
leading to blindness and renal failure. The survey also
included information on history of diabetes. Around 1%
of the respondents reported to have history of raised
blood sugar of which 17% were taking insulin and 77%
were on oral drugs. A large proportion of them were
advised life style modification such as diet modification,
reducing weight and increasing physical activity. About
20% (of the diagnosed) had consulted AYUSH
practitioners for the elevated blood sugar levels and
majority of them were taking the treatment from the
system.
PHYSICAL MEASUREMENTS
Body Mass Index (BMI)
Worldwide researches have shown that there is a
strong association between BMI and health risk. On the
other hand, low BMI is an indicator of risk to health,
often being associated with tobacco, alcohol use and
drug addiction. The survey recorded height, weight and
waist circumference. The mean BMI was around 20 kg/
Figure 7. Low of physical activity of respondents (%) bysex and residence
Figure 8. Stage I & II hypertension (%) by sex & residence
Figure 9. History of raised blood sugar (%) by sex andresidence
Re
sp
on
de
ts(%
)

Non-Communicable Disease Risk Factor Survey, 2007-08, Madhya Pradesh
xxv
physical activity reduce the risk of non-communicable
diseases. But, the study indicates high proportion of
population taking inadequate amount of fruits and
vegetables (less than five servings of fruits and
vegetables per day). Prevalence of low consumption was
high in all the age groups, level of education and
occupation by sex and residence with marginal
differences in between some of the groups. Besides
that, about half of the population was found in the
category of doing low physical activity. The differences
in the pattern of low physical activity by age, sex,
education, occupation and residence were also observed.
Among the older (55-64) and younger age groups (15-
24), the people were doing less physical activity as
compare with other age groups. Female respondents
were more in low physical activity compare with males
across all the age groups. However, rural people were
doing more physical work than urban, but the pattern
was similar across all age groups and sex. The physical
activity by education was observed low among higher
level education whereas it was comparatively high among
lower level education people. Occupational difference
in physical work activity was also observed across all
the categories. The people whose occupation was
agriculture or manual work were doing more physical
work compare with other occupational categories. Low
physical activity was high among the occupation of
domestic work.
Hypertension is a major non-communicable disease
risk factor especially related to cardiovascular disease.
The increasing pattern of prevalence of hypertension
(stage I & II) was recorded with increasing age group of
people across all the subgroups of population (sex and
urban-rural). It was prevalent in all the level of education
with marginal differences with one another.
Hypertension was prevalent in all the occupational
categories across residence and sex with some
differences between the subgroups.
Overweight (obesity) is a major risk factor of Non-
communicable diseases. High prevalence of overweight
was recorded in all the age groups except the younger
age (15-24). Prevalence of overweight was higher among
females compare with males across all the age groups.
The prevalence of overweight among urban population
was higher comparing with rural. However, prevalence
of overweight was low among illiterate whereas it was
high among higher level of education. Similarly,
prevalence was also recorded low among the people
whose occupation was agriculture or manual work
whereas it was high in other categories of occupation.
Figure 10. Overweight respondents (%) by sexand residence in Madhya Pradesh
m2 with mean height 158 cm (165 cm for men, 152 cm
for women) and mean weight 50 kg (53 kg for men and
47 kg for women). According to the survey, 39% of the
respondents were under weight and about 8% were
overweight, which was 20% of urban and 4% of rural
population. Overall 53% of the respondents were in the
normal category of BMI.
SOCIO-DEMOGRAPHIC DIFFRENTIALS
Tobacco is mainly used either in the form of
smoking or smokeless (chewing with lime or Pan) in
Madhya Pradesh. The prevalence of smoking was high
among urban as well as rural male population. The
increasing pattern of prevalence of smoking was
recorded with increasing age group of respondents. But,
it was declining with increasing level of education.
Prevalence of smoking among female respondents was
very low compare with males across all the socio-
demographic categories, which shows gender
differentials. Occupation is an important socioeconomic
indicator. The differences in prevalence of smoking were
higher form one category of occupation to another.
Prevalence of smoking in the occupational categories
of agriculture and manual work was high compare with
other categories . A similar pattern of increasing in
prevalence with age and decreasing with level of
education was also observed with smokeless tobacco
users. The prevalence of current alcohol drinkers was
also showing an increasing pattern with age groups.
But, the pattern of prevalence was decreasing with
increasing level of education. The habits of tobacco
and alcohol use starts at early young age which
contributes to the high risk of NCD at productive stage
of life or as grown older with such habits.
The fruits and vegetable consumption and regular

Integrated Disease Surveillance Project (IDSP)
xxvi
Overall, NCD risk factors were prevalent across all
the socioeconomic and demographic categories of
population in Madhya Pradesh.
The results generated through this IDSP-NCD
survey would certainly focus on major issues in
bringing about changes or initiate various
programmes related to control of non-communicable
diseases.

Non-Communicable Disease Risk Factor Survey, 2007-08, Madhya Pradesh
1
1.1 BACKGROUND OF SURVEY
In response to a long felt need expressed by various
expert committees, the Government of India through
the Ministry of Health & Family Welfare initiated a
decentralized, state based Integrated Disease
Surveillance Project (IDSP) in the country with the
assistance of the World Bank in the year 2004. The
project envisaged detecting early warning signals of
impending outbreaks; initiate an effective response in
a timely manner. Unlike communicable diseases, most
non-communicable diseases are latent type and they
occur after a prolonged exposure to life style risk factors
like smoking, raised blood sugar, raised blood pressure
and hyper-cholestremia. Public health action would be
primarily directed against preventive strategies for the
disease and hence the priority was to monitor risk
factors rather than non-communicable diseases
themselves.
Periodic community based surveys covering
representative adult population were planned under the
IDSP to provide data on NCD risk factors at state level
enabling states to develop strategies and activities to
prevent and control the non-communicable diseases. It
was taken up as a collaborative project of the Ministry
of Health & Family Welfare, Govt. of India’s National
Institute of Communicable Diseases and the Indian
Council of Medical Research with National Institute of
Medical Statistics (NIMS) as the National Nodal Agency
(NNA) and Regional Medical Research Center for Tribal,
Jabalpur as the Regional Resource Centres (RRCs).
Government Medical College, Nagpur was identified as
the State Survey Agencies (SSAs) based on their
experience and knowledge about the local conditions.
The division of non communicable diseases at ICMR
coordinated the overall activities and guided in the
project development, implementation, monitoring and
evaluation.
The NIMS provided the technical assistance at all
stages of the survey including development of survey
protocol, sampling methodology, survey questionnaire
etc. with the approval of the National Technical Advisory
Introduction
CHAPTER 1
Committee (NTAC). The survey was supervised and
monitored by the RRCs for quality assurance. The RRCs
were identified in order to provide training to the field
investigators, monitoring of data collection and technical
support to the field agencies particularly for the
anthropometrical and blood pressure measurements. All
states were proposed to be covered in a phased manner.
The first phase states included Andhra Pradesh, Kerala,
Madhya Pradesh, Maharashtra, Mizoram, Tamil Nadu and
Uttarakhand. The present treatise is the survey report
of the state of Madhya Pradesh. Government Medical
Collage, Nagpur was the State Survey Agency (SSA) in
the state while Regional Medical Research Centre for
Tribals (RMRCT), Jabalpur was the Regional Resource
Centre (RRC).
1.2 OBJECTIVES
The overall objective of the NCD-risk factors survey
was to improve the information available to the
Government health services and care providers on a
set of high-priority risk factors, with a view to improve
on-the-ground responses to such risk factors. It also
aimed to provide essential data to monitor progress of
on going disease control programs and reallocate health
resources more optimally. The specific objectives of the
survey were to:
1. Assess the prevalence of NCD risk factors in
different strata of population in the states;
2. Establish a baseline database of NCD risk factors
needed to monitor trends in population health
behavior and risk factors for chronic diseases over
a period of time in the states ; and
3. Provide evidence for evolving strategies and
interventions for identified risk factors in the
community to reduce the burden of Non-
Communicable Diseases in the population
1.3 NON-COMMUNICABLE DISEASE (NCD) RISKFACTORS
A “risk factor” refers to any attribute,

Integrated Disease Surveillance Project (IDSP)
2
characteristic, or exposure of an individual, which
increases the likelihood of developing a non-
communicable disease. The major (modifiable)
behavioural risk factors identified in the World Health
Report 20022 are tobacco use, harmful alcohol use,
unhealthy diet (low fruit and vegetable consumption)
and physical inactivity. On the other hand, the major
biological risk factors identified are overweight and
obesity, raised blood pressure, raised blood glucose and
raised total cholesterol. These major behavioural and
biological risk factors were included in non-
communicable disease risk factors survey except raised
blood sugar and total cholesterol, because they have
the greatest impact on non-communicable disease
mortality and morbidity, and modification is possible
through effective prevention.
Tobacco use is a known or probable cause of about
25 diseases including heart disease; cancer, stroke,
chronic obstructive pulmonary disease and digestive
tract disease, as well as, has significant adverse effects
on pregnancy. Smokeless tobacco use causes oral cancer
in the lip, tongue, mouth, and throat areas and digestive
system cancers. The relationship between alcohol
consumption and health and social outcomes is complex
and multi-dimensional. Alcohol consumption is linked
to more than 60 disease conditions including liver
cirrhosis, several cancers (liver, laryngeal, esophageal
and oropharyngeal cancers), injuries and hemorrhagic
strokes.
Consumption of fruits and vegetables reduces the
risk of NCDs, like cancers and cardiovascular diseases.
Dietary patterns that include higher intakes of fruits
and vegetables are associated with several health
benefits, including a decreased risk for some types
of cancer. Low consumption of fruit and vegetables
has been identified as a risk factor in the development
of a range of chronic diseases, including coronary
heart disease, stroke and many forms of cancer.
Research has indicated that the required intake of fruit
for optimal health benefits is five daily servings of fruit
and vegetable.
Lack of physical activity leads to obesity,
dyslipidemia (lower high-density lipoprotein levels),
insulin resistance, diabetes mellitus and high blood
pressure levels. Physical inactivity is a well-established
risk factor for coronary heart disease (CHD) and is
associated with about a twofold increase in risk of CHD.
1.4 HEALTH PROFILE OF THE STATE
The state of Madhya Pradesh is located in the
central part of India. It is the largest state in India
both in terms of area and population. It is bounded
by the states of Rajasthan to the north-west, Uttar
Pradesh to the north, Chhattisgarh to the east,
Maharashtra to south and Gujarat to the west. It has an
area of 308,144 sq. km. and a population of 67569 people
(in thousand).2 There are 48 districts, 313 blocks and
55393 villages in the state. The population density was
196 per sq. km. (as against the national average of
325). The population of the state has been growing
faster with the decadal growth rate of 24.3% against
21.5% for the country. The key population and health
indicators for Madhya Pradesh are presented in Table
1.1 and Table 1.2.
RISK FACTORS COMMON TO MAJOR NCD’S
Risk factor Non-communicable Disease
CVD Diabetes Cancer Respiratory
Smoking/tobacco + + + +
Alcohol + +
Nutrition + + + +
Physical Inactivity + + + +
Raised BP + + +
Raised blood Sugar + +
Obesity + + + +
Blood lipids* + + +
+ Corresponds to Risk Factor;
* Not being included in Phase I; CVD – Cardiovascular Disease

Non-Communicable Disease Risk Factor Survey, 2007-08, Madhya Pradesh
3
Table 1.1. Demographic and Socioeconomic profile of Madhya Pradesh as compared to India
S. No Indicator Madhya Pradesh India
1 Total Population(in thousand)* 67569 1128521
2 Decadal Growth Rate* 24.26 21.52
3 Population ratio (Urban/ 1000 Rural)** 360 385
4 Crude Birth Rate (Per 1000 Population)** 29.1 23.5
5 Crude Death Rate (Per 1000 Population)** 6.3 7.5
6 Life Expectancy at Birth** 57.8(M) 62.3(M)
57.5(F) 63.9(F)
7 Total Fertility Rate*** 4.0 2.9
8 Infant Mortality Rate (Per 1000 Live Births)** 74 57
9 Maternal Mortality Ratio (Per 100000 Live Births)† 379 301
10 Sex Ratio (Females/1000 Males)* 919 933
11 Mean Age Of Marriage (Female)†† 20.5 20.2
12 Population Below Poverty Line††† 38.3 27.5%
13 Literacy Rate* 63.7 64.8
Source: National Health Profile 2007, Central Bureau of Health Intelligence4 (*Registrar General, India; **SRS Bulletin, October 2007;†Statistical Report, RGI 2004; ††Statistical Report RGI, 2005; RGI; PCA; †††Planning Commission of India)
Table 1.2. Health Infrastructure, Human Resource available and Health Expenditure
S. No Indicator Madhya Pradesh India
1 Number of Allopathic Doctors with recognized medical - 696747
qualifications and registered with State Medical Council*
2 Dental Surgeons Registered** 1643 72497
3 Number of Government Allopathic Doctors*** 3662 76542
4 Average Population served/Doctor*** 18451 -
5 Number of Registered AYUSH Doctors† 57593 725338
6 Total Number of Registered Nurses†† 121316 1509196
7 Number of Doctors at the PHCs††† 839 22273
8 Total CHCs Specialists at CHCs††† 49 3979
9 Health Assistant (Male & Female)††† 2242 35330
10 Health Worker (Male & Female)††† 16643 215206
Source: National Health Profile 2007, Central Bureau of Health Intelligence, MOHFW,
(* Medical Council of India; ** Dental Council of India; *** Directorate of state health services; † Department of AYUSH, MOH&FW/
GOI; †† Indian Nursing Council, Pharmacy Council of India; ††† Bulletin on Rural Health Statistics in India, 2006 – Special Revised
Edition, MOHFW )
1.5 SURVEY DESIGN AND IMPLEMENTATION
Sample Size
In order to achieve the aforesaid objectives, it was
assumed that we should be able to estimate a parameter
that has a level of 15% in a subgroup of population, with
a relative precision of 30%, design effect as 1.25 and
we would be able to achieve a response rate of 90%.
Assuming that NCD risk factors are concentrated in 15-
64 years for both males and females, the required
sample size for each sex in 10-years age groups was
estimated to be about 280. It is a known fact that the
proportion of population in the 10 year age groups
decrease with increase in age. In any population, the
proportion of population in the age-group 55-64 is lowest
and varies in the range of 5-7 percent depending upon
the fertility level (it is at the lower end, i.e., 5% in high
fertility states, e.g. Uttar Pradesh, Madhya Pradesh,
Bihar and Rajasthan, in the middle, i.e. 6% in moderate
fertility states and at the upper end, i.e. 7% in low fertility
states). Keeping such scenario of population composition
in view and in order to have targeted 280 females
and 280 males in age group 55-64, a sample of
5000 households was considered to be adequate for
the survey.
Sample Design
A uniform sample design with equal allocation in
urban and rural area was adopted and same was followed

Integrated Disease Surveillance Project (IDSP)
4
in Madhya Pradesh. In the state, the rural sample was
selected in two stages: the selection of Primary Sampling
Units (PSUs), which are villages with probability
proportional to population size (PPS) at the first stage,
followed by the random selection of households within
each PSUs at second stage using systematic random
sampling. In urban areas, a three-stage procedure was
followed. In the first stage, wards were selected with
PPS sampling. In the second stage, one Census
Enumeration Block (CEB) was randomly selected from
each sample ward. In the final stage households were
randomly selected within each CEB using the systematic
random sampling procedure. From each selected PSU in
rural area and from each selected Census Enumeration
Block (CEB) in urban area, 50 households were selected.
From each selected household, one individual was
selected from those who fall in the 15-54 age range by
using KISH method5 whereas all who fall in the age group
55-64 were included in the sample.
Sample Selection in Rural Areas
In rural area, the 2001 Census list of villages served
as the sampling frame3. The list was stratified by a
number of variables. The first level of stratification was
geographic with villages classified into five contiguous
regions. In each region, villages were further stratified
by village size and the percentage of the population
belonging to scheduled castes or scheduled tribes. The
final level of stratification was implicit for all strata
consisting of an ordering of villages within each stratum
in ascending and descending order alternatively by the
level of female literacy. From the list of villages so
arranged, villages were selected systematically with
probability proportional to the population of the village.
Small villages with <75 households were linked with one
or more adjoining villages to form PSUs. Villages with
fewer than 5 households were excluded from the
sampling frame.
In each selected sample PSU, a mapping and
household listing was carried out prior to the data
collection that provided the necessary frame for selecting
households at the second stage. The household listing
operation involved preparing up-to-date location map
and layout sketch maps of each selected PSU, assigning
numbers to structures, recording addresses or the
location of these structures, identifying residential
structures, and listing the names of the heads of all the
households in residential structures in selected PSUs.
The household listing operation was carried out by
independent teams.
A complete listing of households was carried out in
the villages with households up to 400 households. In
case of villages with more than 400 households were
divided into at least three segments of 150-300
households as average size of each segment and two
segments were randomly selected for household listing.
In each selected PSU, 50 households were selected from
the household list using systematic random sampling.
Sample Selection in Urban Areas
The 2001 Census list of wards was used as the
sampling frame. All wards were stratified by geographic
regions, size of ward and percentage of SC/ST
population. Female literacy was used for implicit
stratification. A sample of wards was selected
systematically with probability proportional of ward. One
Census Enumeration Block (CEB), consisting of
approximately 150-200 households, was selected from
each selected ward using the PPS sampling method. The
household listing operation was carried out in each
selected census enumeration block similarly as in the
village in rural area, which provided the necessary frame
for selecting 50 households from the CEB.
Sample Weights
Appropriate sampling weights for households
were used for urban and rural areas of the state.
In urban sector it consisted of factors reflecting
ward selection probabilities, census enumeration
block (CEB) selection probabilities within wards;
and household selection probabilities within CEB; and
household non-response adjustments. In rural sector,
the element of weight consisted of factors reflecting
probability of selection of PSU, household selection
probability within the PSU, and household non-response
adjustments.
From each selected household one member
aged 15-54 was selected using the KISH method and
all members aged 55-64 were selected. Since objective
of the study was to obtain estimates for each age
group (15-24 through 55-64) and by sex, post
stratification was used for improvement of efficiency
of the estimators. Post stratification weights
for individuals were constructed using the state
age distributions for both sexes of the urban and rural
sector, which are available on the population level
(Appendix-A)6.
Sample Implementation
During the survey, information collected from a

Non-Communicable Disease Risk Factor Survey, 2007-08, Madhya Pradesh
5
Table 1.3 Sample coverage and response rate of household, step-1 and step-2 individual response rate by place
of residence, Madhya Predesh, 2007- 08
Residence
Response Urban Rural Combined
Households interview
Households contacted 2500 2500 5000
Households interviewed 2498 2500 4998
Households response rate (%) 99.9 100.0 99.9
Eligible Participants Step-1
Individual contacted 3004 2918 5922
Individual interviewed 2992 2882 5874
Response rate (%) 99.6 98.8 99.2
Eligible Participants Step-2
Step-2 completed 2980 2873 5853
Overall Individual response rate (%) 99.2 98.4 98.8
Against the target sample size of 280, there is low
turnout in certain age groups and high turn out in other
(it may be seen in the subsequent table 2.2). It might
be due to either misreporting of age or replacement of
the individual who was selected but not available at the
time of interview affecting the use of Kish method to
give the required sample size. In fact, the Kish method
was used in each selected household to select one
respondent amongst those who were aged 15-54. It was
done by the field investigator after listing of members
of the household and arranging them according to age,
sex and then selecting one respondent for the interview.
There is possibility that some respondents in the age
group15-54 particularly males were not available at home
during the survey (10AM to 5 PM) and thereby might
have been replaced by those household members who
were present at the time of survey.
1.6 SURVEY INSTRUMENTS
The survey used two types of questionnaire,
the Household Questionnaire and the Individual
Questionnaire (Appendix-B). The overall content and
format of the questionnaires were determined
through a series of workshops and meetings held in
2006-07. The questionnaires for each state were
bilingual with questions in both the English and principal
language of the state which was Hindi in the present
above information was used to identify the eligible
individual for the survey in the age group 15-64 years,
for administering individual questionnaire. The
Household Questionnaire also collected information on
religion, ownership of a house, type of house with
number of rooms, main source of drinking water, type
of toilet facility, main source of lighting, types of cooking
fuel, type of oil/cooking medium, ownership of
agricultural land, ownership of livestock and possession
of durable goods.
The Individual Questionnaire included questions
seeking information from all the selected individuals
(men and women) in the age group 15-64. The Individual
Questionnaire covered information on demographic,
behavioural and physical measurements under Step-1
and Step-2 with a number of sections into them. The
first section of Step-1 included questions regarding the
demographic information of individuals, viz., age, sex,
marital status, education, and occupation. The
behavioural information section included questions on
tobacco use, alcohol consumption, diet, and physical
activity, history of raised blood pressure and history of
diabetes.
Tobacco Use (Smoking & Smokeless): Questionnaire
was used to elicit information on current and past use
of tobacco (smoking & smokeless), age when used
random sample of 4998 households covering 2500
households from rural and 2498 from urban areas. From
these households, a total of 5922 respondents were
contacted out of which 5874 completed the Step-1, and
5853 completed the Step-2 survey. The overall individual
non-response for the survey was 1.2% (Table 1.3).
case. It first listed all usual residents age 12 years and
above, in each sample household. For each listed
members, survey collected basic information on age,
sex and relationship to the head of the household. The
residential status (whether present in the household or
temporary away from household) was gathered. The

Integrated Disease Surveillance Project (IDSP)
6
tobacco for first time, past history of tobacco use, and
age when stopped using tobacco.
Alcohol use: Questionnaire collected information on
whether the individual was currently consuming alcohol,
use of alcohol in past 12 months, frequency of drinks in
past 12 months, average number of drinks consumed in
one day, alcohol consumed within past 30 days, number
of standard alcoholic drinks consumed per day in past 7
days, past history of alcohol consumption, and age when
started consuming alcohol regularly.
The contents and format of these questionnaires
were though largely governed by the WHO STEPS
guidelines but they were finalized through a series of
consultative meetings held at the Indian Council of
Medical Research.
Diet: Questions were asked to collect information on
number of days in a week when fruits were consumed,
number of serving of fruits consumed in a day, number
of days in a week when vegetables were consumed,
number of serving of vegetables consumed in a day,
frequency of consumption of cheese and butter, fried
local food, red meat, eggs, chicken, fish, aerated soda,
sweetened drinks, pizza/burger/French fries, cakes/
pastries or other bakery items, chips/namkeen.
Physical Activity: Questions were asked about the
intensity of physical activity in the daily work, frequency
of doing physical activity of varying intensity, time spent
in doing physical activity of varying intensity per day,
mode of travel to and from places, time spent walking
or bicycling, type of vigorous/moderate intensity sports
for recreation being practiced, frequency of doing such
vigorous/moderate intensity sports in a week, time
spent doing vigorous/moderate intensity sports per day,
practice of yoga, frequency of practicing yoga, duration
of time spent per day in yoga, time spent sitting or
reclining etc.
History of Raised Blood Pressure: Questions were
asked on history of hypertension, medicines prescribed
by a doctor and the advice given regarding diet, weight
lose, smoking and nature of physical activity
undertaken.
History of Diabetes: Questions covering history of
diabetes, medicines prescribed by a doctor and advice
given regarding diet, weight loss, smoking and physical
activities were asked.
Individual questionnaire included several biomarker
measurements in Step-II. The height of the eligible
individual participant was taken in centimeter by using
a portable height measuring board and also measured
weight in kilogram using a portable electronic weighting
scale. Waist circumference (not measured for pregnant
women) was taken two times to provide additional
information on overweight and obesity. Constant tension
tape (Figure finder tape) measure was used for waist
circumference measurements. The measurement was
taken without clothing, that is, directly over the skin or
over light clothing. The privacy area was maintained
for this measurement.
Blood pressure of the individual participants was
taken three times using automated blood pressure
measuring instrument (OMRON®) and pulse rate was
also measured three times using an automated blood
pressure device.
1.7 TRAINING
In order to maintain uniform survey procedure
across the country, a manual dealing with various aspects
of the survey were prepared by NIMS, ICMR. There are
five sections: (1) Project Protocol, (2) Survey
Methodology, (3) Coordinator’s Guide, (4) Trainers Guide
and (5) Interviewer’s Guide. The Interviewer’s Guide
consists of guidelines to the interviewers regarding
interviewing procedure, field procedures and method
on asking each question and recording answers. The
Coordinator’s Guide contains a detail description of the
role and responsibilities of the state coordinators. The
Trainer’s Guide include training guidelines for the
training of the field staff including survey methodology,
survey instruments, mapping and list of households,
preparation and collection of data.
The representatives of State Survey Agencies (SSAs)
and Regional Resource Centres (RRCs) were trained in
the Training of Trainers workshop and Data Entry &
Management Workshop organized by NIMS at the
beginning of the data collection (18-20 July 2007). The
purpose of the former workshop was to explain the
objective of the NCD Risk Factors Survey and ensure
uniform application of survey material to collect good
quality of data. The survey documents such as training
manuals, survey instruments, list of selected rural and
urban PSUs etc. was provided to them for conducting
the survey. The equipments required for survey was
procured centrally by ICMR and distributed to the SSAs
and RRCs. The personnel trained in these workshops
subsequently trained the field staff in their respective
states.
Training of Field Staff
As mentioned, the field staff recruited for the

Non-Communicable Disease Risk Factor Survey, 2007-08, Madhya Pradesh
7
survey in Madhya Pradesh was trained at the Department
of PSM, Government Medical College, Nagpur, and the
officials of RMRCT, Jabalpur, supervised the training
process. The training was conducted from 8-10
December 2007. The training consisted of lectures,
classroom training, demonstration, practice interviews
and field based training. A total of 23 participants were
trained, of these 23 trainees, 10 were part of the 5
survey teams and 5 were the supervisors for the survey
teams. It was ensured that each survey team comprised
of one male and one female member.
Each trainee was given a training kit at the
beginning of training, the training kit comprised of an
interviewers guide, household and individual schedules
in Hindi, consent form, IEC message, set of show cards
(e.g. diet chart, alcohol chart) and reference forms (e.g.
Kish table, table of random numbers), flow chart of
activities in field, identity card and supporting letters
from Government mentioning purpose of visit. A field
visit was also arranged as part of practical training of
investigators in field activities and procedure for
conducting a survey and as part of pre-test. After the
completion of training, letters were issued through
Directorate of Health Services to DHOs, Municipal
corporations and Municipalities across the state, and
Deputy Director of Health Services requesting their
cooperation in smooth conduction of the survey.
Data Entry Training
Data entry software in Epi-Info with its manual was
developed by the NIMS, ICMR. A two-day data entry
workshop cum hands on training was organized by NIMS,
ICMR during 10-11 December 2007 for the statisticians
and date entry personnel of the state survey agencies
(SSAs). The purpose of the workshop was to familiarize
the participants with the software. Emphasis was made
on double data entry in order to ensure high accuracy in
data entry and to minimize data entry errors. All the
participants were provided with the Data Entry Software
and its manual.
1.8 DATA PROCESSING AND ANALYSIS
Following the data entry by the state survey agency
(SSA), the validity and consistency check was carried
out by the NIMS, ICMR for final analysis. Analysis plan
in terms of dummy tables was finalized in consultation
with ICMR Review Group.
Prevalence of current smokers, current daily
smokers and past daily smokers was calculated among
the respondents by sex and place of residence. Those
who smoke tobacco daily, the mean number of tobacco
products (biddies, cigarettes, pipes, cigars, etc.,) used
daily was calculated taking denominator as all daily
smokers. Though the age of initiation of smoking was
collected from all daily smokers in completed years but
for the past smokers it was calculated by imputation
because it was not recorded. Finally average age of
initiation of smoking was calculated in two age groups
of smokers, 15-34 years and 35-64 years. The same
procedure was followed for the calculation of average
age of initiation of smokeless tobacco. Prevalence of
alcohol consumption was calculated for last twelve
month, last thirty days and last seven days and presented
as percentage. The mean age of initiation of alcohol
consumption was also calculated. Mean number of
servings fruit, vegetables, and combined (fruit and
vegetables) consumed per day was computed.
Mean physical activity per day was computed
by combining all types of physical activity (vigorous,
moderate-intensity, travel and recreational) using
METs (Metabolic Equivalent) score. Prevalence
of reported cases of blood pressure and diabetes
were also calculated. Measurement of height, weight
and waist circumference of individual respondent
was used to compute BMI (body mass index) and central
obesity.
1.9 QUALITY CONTROL MEASURES
A uniform project protocol, survey methodology,
training manuals, survey instruments and data-
management modules were developed and adopted
across all the states including Madhya Pradesh. It was
executed by the Government Medical College, Nagpur
(SSA) and was monitored by regular visits by the Regional
Medical Research Centre for Tribals, Jabalpur (RRC).
The Division of Non-Communicable Diseases, Indian
Council of Medical Research with its National Institute
of Medical Statistics coordinated and supervised the
survey in the state along with other states. In addition,
an independent check by collecting data in randomly
drawn sample of 10% of PSUs was carried out by RRC.
High concordance was recorded between the survey by
SSA and independent checked by RRC on some key
indicators like smoking, alcohol consumption and
physical activity with an overlapping of 95% confidence
intervals. Various activities hitherto were to maintain
the highest level of the quality of data.

Integrated Disease Surveillance Project (IDSP)
8
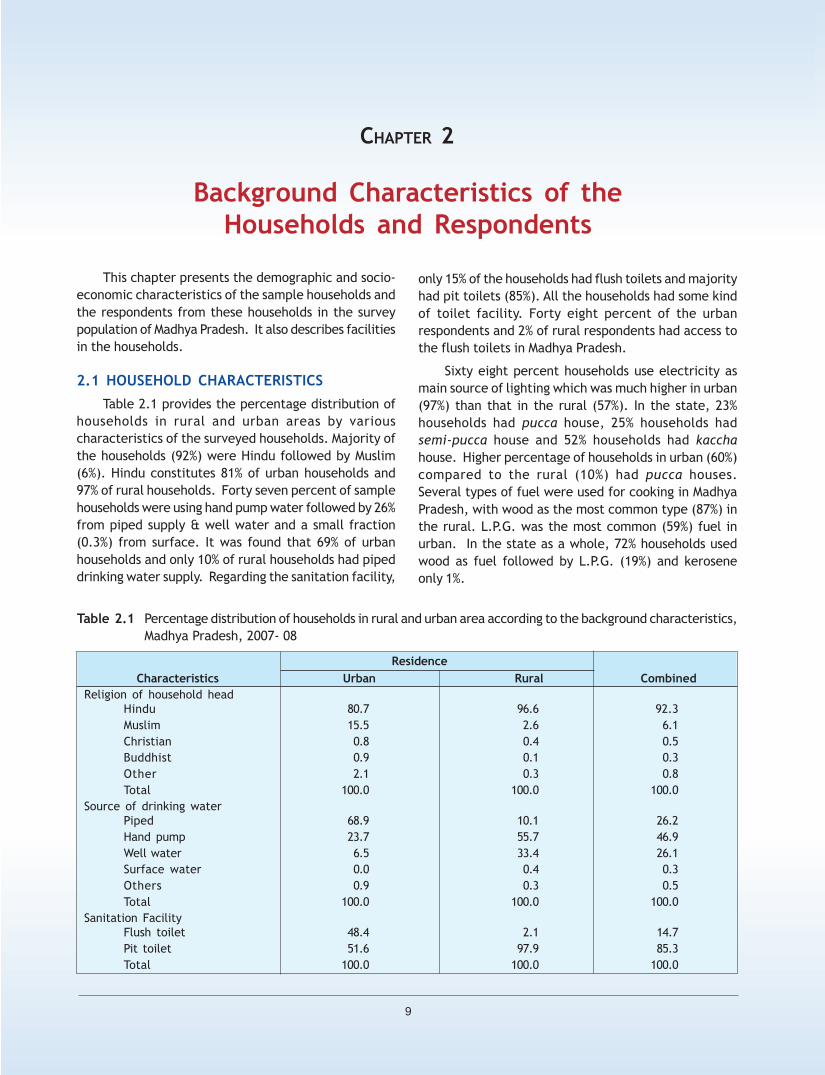
Non-Communicable Disease Risk Factor Survey, 2007-08, Madhya Pradesh
9
This chapter presents the demographic and socio-
economic characteristics of the sample households and
the respondents from these households in the survey
population of Madhya Pradesh. It also describes facilities
in the households.
2.1 HOUSEHOLD CHARACTERISTICS
Table 2.1 provides the percentage distribution of
households in rural and urban areas by various
characteristics of the surveyed households. Majority of
the households (92%) were Hindu followed by Muslim
(6%). Hindu constitutes 81% of urban households and
97% of rural households. Forty seven percent of sample
households were using hand pump water followed by 26%
from piped supply & well water and a small fraction
(0.3%) from surface. It was found that 69% of urban
households and only 10% of rural households had piped
drinking water supply. Regarding the sanitation facility,
Background Characteristics of the
Households and Respondents
CHAPTER 2
Table 2.1 Percentage distribution of households in rural and urban area according to the background characteristics,
Madhya Pradesh, 2007- 08
Residence
Characteristics Urban Rural Combined
Religion of household head
Hindu 80.7 96.6 92.3
Muslim 15.5 2.6 6.1
Christian 0.8 0.4 0.5
Buddhist 0.9 0.1 0.3
Other 2.1 0.3 0.8
Total 100.0 100.0 100.0
Source of drinking water
Piped 68.9 10.1 26.2
Hand pump 23.7 55.7 46.9
Well water 6.5 33.4 26.1
Surface water 0.0 0.4 0.3
Others 0.9 0.3 0.5
Total 100.0 100.0 100.0
Sanitation Facility
Flush toilet 48.4 2.1 14.7
Pit toilet 51.6 97.9 85.3
Total 100.0 100.0 100.0
only 15% of the households had flush toilets and majority
had pit toilets (85%). All the households had some kind
of toilet facility. Forty eight percent of the urban
respondents and 2% of rural respondents had access to
the flush toilets in Madhya Pradesh.
Sixty eight percent households use electricity as
main source of lighting which was much higher in urban
(97%) than that in the rural (57%). In the state, 23%
households had pucca house, 25% households had
semi-pucca house and 52% households had kaccha
house. Higher percentage of households in urban (60%)
compared to the rural (10%) had pucca houses.
Several types of fuel were used for cooking in Madhya
Pradesh, with wood as the most common type (87%) in
the rural. L.P.G. was the most common (59%) fuel in
urban. In the state as a whole, 72% households used
wood as fuel followed by L.P.G. (19%) and kerosene
only 1%.

Integrated Disease Surveillance Project (IDSP)
10
Table 2.2 Age and sex-wise distribution of respondents by type of residence (unweighted), Madhya Pradesh
2007- 08
Residence
Urban Rural Combined
Age Male Female Total Male Female Total Male Female Total
15 – 24 378 309 687 312 266 578 690 575 1265
25 – 34 311 413 724 377 371 748 688 784 1472
35 – 44 300 334 634 321 275 596 621 609 1230
45 – 54 159 213 372 175 218 393 334 431 765
55 – 64 250 313 563 274 284 558 524 597 1121
15 - 64 1398 1582 2980 1459 1414 2873 2857 2996 5853
Main source of lighting
Electricity 96.7 57.2 67.9
Kerosene 3.1 42.7 32.0
Gas/Oil 0.2 0.1 0.1
Total 100.0 100.0 100.0
Type of House
Pucca 59.9 9.6 23.3
Semi-Pucca 21.9 26.0 24.9
Kachha 18.2 64.4 51.8
Total 100.0 100.0 100.0
Cooking fuel
LPG 59.0 3.9 18.9
Wood 32.5 86.6 71.9
Kerosene 3.2 0.2 1.0
Others 5.3 9.3 8.2
Total 100.0 100.0 100.0
Separate kitchen room
Yes 56.1 26.0 34.2
No 43.9 74.0 65.8
Total 100.0 100.0 100.0
Agriculture land
Own agriculture land (%) 16.2 61.8 49.4
Number 2498 2500 4998
About half of surveyed population own agricultural
land in Madhya Pradesh, which was 62% for rural as
compared to 16% for urban households. The proportion
of households having separate kitchen was 34%. This
percentage was 56 for urban against 26 for rural
households.
2.2 AGE AND SEX COMPOSITION
A total of 5833 individuals with 2857 males and
2996 females from urban and rural areas were contacted
and interviewed in the survey. They are presented in 10
years age groups 15-24, 25-34, 35-44, 45-54 and 55-
64. The distribution of the number of respondents across
the five age groups is depicted for both males and
females as well as for both sex together, separately for
urban and rural areas and combined in Table 2.2. The
number of respondents was least, i.e. 765, in the age
group 45-54 and maximum, i.e., 1472 in age group 25-
34 years.
2.3 EDUCATION LEVEL
Table 2.3 presents the percentage of the
respondents according to their literacy levels by sex and
place of residence. Forty four percent of the total
respondents were illiterate whereas 30% were with
primary or middle, 18% were secondary or in higher
secondary, while 8% were educated up to college and
above. In the sample, 60% females and 30% males were

Non-Communicable Disease Risk Factor Survey, 2007-08, Madhya Pradesh
11
Table 2.3 Percentage of respondents according to background characteristics, sex and place of residence,
Madhya Pradesh, 2007- 08
Residence
Urban Rural Combined
Characteristic Male Female Total Male Female Total Male Female Total
EducationIlliterate 11.9 31.7 21.2 37.0 71.0 53.3 29.7 59.9 44.1
Primary 9.3 9.1 9.2 13.9 9.4 11.7 12.5 9.3 11.0
Middle 18.5 17.7 18.1 25.2 12.1 18.9 23.3 13.7 18.7
Secondary 16.9 13.9 15.5 13.9 4.9 9.6 14.8 7.4 11.3
Higher Secondary 14.7 9.1 12.1 6.4 2.0 4.3 8.4 4.0 6.5
College & above 28.7 18.5 23.9 3.6 0.6 2.2 10.9 5.7 8.4
Total 100.0 100.0 100.0 100.0 100.0 100.0 100.0 100.0 100.0
Marital statusNever married 36.0 18.9 28.0 26.6 11.9 19.6 29.4 13.9 22.0
Married 62.8 75.4 68.7 70.5 81.2 75.6 68.2 79.6 73.6
Widowed/Divorced/ 1.2 5.7 3.3 2.9 6.9 4.8 2.4 6.5 4.4
Separated
Total 100.0 100.0 100.0 100.0 100.0 100.0 100.0 100.0 100.0
OccupationExecutive/Business 18.5 2.0 10.8 7.3 3.4 5.5 10.6 3.0 7.0
Agriculture 13.2 7.3 10.5 41.2 22.3 32.1 33.0 18.1 25.9
Domestic work 0.5 55.5 26.2 0.3 30.6 14.9 0.4 37.7 18.1
Services/Sales 15.0 4.1 9.9 1.9 1.0 1.5 5.7 1.9 3.9
Manual worker 28.9 11.3 20.6 37.6 29.6 33.8 35.0 24.4 30.0
Other 23.9 19.8 22.0 11.7 13.1 12.2 15.3 14.9 15.1
Total 100.0 100.0 100.0 100.0 100.0 100.0 100.0 100.0 100.0
Number 1398 1582 2980 1459 1414 2873 2857 2996 5853
illiterate. The proportion of illiterate respondents
among rural females was as about the twice as
high than that among urban females. A higher
percentage of males than of females had completed
almost each level of schooling. Education levels were
much higher for urban respondents than rural
respondents.
2.4 MARITAL STATUS
The second panel of Table 2.3 shows the percentage
of respondents according to the three marital categories
by sex and place of residence. Three quarter of the
respondents, both male and female were currently
married, 26% were never married and 4% were widowed,
divorced or separated. The proportion of respondents
who were currently married was 69% in urban and 76%
in rural residents.
2.5 OCCUPATION
Table 2.3 provides information on the current
occupation of the respondents. In the sample about 38%
women were currently engaged in domestic work. It was
closely followed by individuals involved in manual
work, which were about 35% in case of males and 24%
in case of females. About 4% individuals were engaged
in work related to sales and services and only 7% of
the total respondents were engaged executive/business
set-ups.

Integrated Disease Surveillance Project (IDSP)
12

Non-Communicable Disease Risk Factor Survey, 2007-08, Madhya Pradesh
13
This chapter presents the prevalence of certain
behavioural risk factors for the non-communicable
diseases in the survey population. The survey
questionnaire asked questions about certain life
style of respondents which could be considered as
the behavioural risk factors for non-communicable
diseases.
3.1 TOBACCO SMOKING AND CHEWING
As per the WHO STEPS guidelines to measure the
prevalence of smoking habit among the respondents,
the smokers are grouped into three categories current
smokers, current daily smokers, past daily smokers and
those who have never smoked in lifetime are classified
as non-smokers.
Table 3.1.1 presents the percentage of respondents,
both males and females as well as combined in various
categories of smokers and non-smokers according to
the place of residence (rural or urban). About one in
every five respondents in the survey was a current
smoker. They were mostly current daily smokers. The
Behavioural Risk Factors
CHAPTER 3
Table 3.1.1 Percentage of respondents classified by smoking status across sex and place of residence,
Madhya Pradesh, 2007- 08
Smoking Status
Residence/ Current smokers Current daily smokers Past daily smokers Never smoked
Sex P (%) 95% CI P (%) 95% CI P (%) 95% CI P (%) 95% CI
Urban
Male 28.5 (24.5, 32.8) 25.2 (21.5, 29.3) 5.1 (3.6, 7.1) 69.7 (65.9, 73.3)
Female 0.4 (0.2, 0.8) 0.3 (0.1, 0.8) 0.1 (0.0, 0.4) 99.6 (99.0, 99.8)
Total 15.3 (13.2, 17.7) 13.5 (11.6, 15.8) 2.7 (1.9, 3.8) 83.7 (81.6, 85.6)
Rural
Male 46.4 (41.7, 51.2) 43.7 (38.6, 48.9) 3.9 (2.7, 5.6) 52.4 (47.2, 57.6)
Female 1.1 (0.6, 2.0) 0.8 (0.5, 1.5) 0.2 (0.1, 0.6) 98.9 (98.1, 99.4)
Total 24.7 (22.0, 27.7) 23.1 (20.2, 26.3) 2.2 (1.5, 3.1) 74.7 (71.4, 77.7)
Combined
Male 41.2 (37.6, 44.9) 38.3 (34.5, 42.2) 4.2 (3.3, 5.5) 54.6 (53.5, 61.3)
Female 0.9 (0.5, 1.5) 0.7 (0.4, 1.2) 0.2 (0.1, 0.5) 98.9 (98.6, 99.4)
Total 22.0 (20.0, 24.2) 20.4 (18.2, 22.7) 2.3 (1.8, 3.0) 75.7 (74.9, 79.5)
prevalence of smoking was more among men (41%) than
among women (1%). By place of residence, 14% of urban
respondents and 23% of rural respondents were current
daily smokers. Only 2% of respondents were past daily
smokers.
Table 3.1.2 presents the mean number of tobaco
products smoked daily among those respondents
who were current daily smokers of any form of
tobacco.
Among those who were current daily smokers of
different products of tobacco, the mean number of
smoking per day was 12 in case of bidis, and less than
one for manufactured cigarettes. There was marked
difference between male and female respondents in the
frequency of smoking being bidi i.e. 12 per day for male
and 8 for female. The mean number of smoking bidi
was marginally higher among rural respondents (13 per
day) as compared to urban respondents (10 per day). In
case of manufactured cigarettes however, the mean
number of smoking was higher among urban respondents
(2 per day) as compared to rural respondents (<1 per day).

Integrated Disease Surveillance Project (IDSP)
14
Table 3.1.3 Mean age of initiation, age at stopped smoking and percentage of respondents (non-smokers) exposed
to tobacco smoke by sex and place of residence, Madhya Pradesh, 2007- 08
Smokers Non-smokers
Age of Initiation Age of Initiation Age at Stopped Exposed to tobacco Residence/ (15-34 years) (35-64 years) smoke at Home or Work
Sex Mean 95% CI Mean 95% CI Mean 95% CI P (%) 95% CI
Urban
Male 19 (18.5, 20.5) 20 (19.5,22.5) 29 (26.9, 32.1) 56 (48.3, 63.0)
Female * * 31 (25.5,38.5) 23 (22.4, 24.8) 30 (24.3, 37.1)
Total 19 (18.5, 20.5) 21 (20,22.5) 29 (26.8, 32.0) 42 (36.2, 48.0)
Rural
Male 18 (17.5, 20.5) 20 (19.0,20.5) 29 (26.0, 31.9) 58 (50.2, 65.8)
Female * * 20 (12.5,30.5) 28 (12.8, 44.1) 49 (41.1, 56.8)
Total 19 (18.5, 20.5) 20 (19.5,20.5) 28 (26.2, 31.7) 53 (45.4, 59.5)
Combined
Male 19 (18.5, 20.5) 20 (19.5,22.5) 29 (27.1, 31.2) 57 (51.7,62.9)
Female * * 25 (16.5,32.5) 27 (15.2, 39.7) 44 (37.9,49.7)
Total 19 (18.5, 20.5) 20 (19.5,21.5) 29 (27.1, 31.0) 49 (44.1,54.4)
* no observation
Table 3.1.2 Mean number of tobacco products smoked (per day) by daily smokers age 15-64 according to sex and
place of residence, Madhya Pradesh, 2007- 08
Type of smoking
Residence/ Bidi Manufactured Cigarettes
Sex Mean 95% CI Mean 95% CI
Urban
Male 10.5 (9.0, 11.9) 1.7 (0.7, 2.7)
Female 4.6 (2.9, 6.3) * *
Total 10.4 (8.9, 11.8) 1.7 (0.7, 2.7)
Rural
Male 12.8 (10.9,14.6) 0.1 (0.0, 0.1)
Female 8.9 (3.6, 14.3) * *
Total 12.7 (10.9,14.6) 0.1 (0.0, 0.1)
Combined
Male 12.4 (10.8,13.8) 0.4 (0.2, 0.6)
Female 8.4 (3.8, 12.9) * *
Total 12.2 (10.8,13.8) 0.4 (0.2, 0.6)
* no observation
Table 3.1.3 presents the mean age of initiation,
age at stopped smoking and the percentage of non-
smoker respondents exposed to tobacco smoke by sex
and the place of residence.
The mean age for initiation of smoking among
respondents aged 15-34 as well among 35-69 yrs was 19
and 20 years respectively. The mean age of cessation
of smoking for all those who stopped smoking was 29
years. On an average, rural resident in Madhya Pradesh
whose current age was 35-64 years, initiated smoking
at the age of 20 years as compared to urban counterpart
who initiated it at the age of 21 years. The mean age of
initiating smoking for urban and rural males in the age
group 15-34 years was 19 and 18 years respectively.
There were no women smokers among surveyed
population in 15-34 years. The age of initiation of
smoking in the age group 35-64 years was 20 years for
rural male and female whereas among the urban smokers
the mean age of initiation for males was 20 years and
31 years for females. The mean age of cessation of
smoking for rural and urban male was 29 years.
About half of respondents of those who never
smoked were exposed to tobacco smoke at home or
work place. It wast 57% in case of men against 44% in

Non-Communicable Disease Risk Factor Survey, 2007-08, Madhya Pradesh
15
Table 3.1.4 Percentage of smokeless tobacco users by sex and place of residence, Madhya Pradesh, 2007- 08
Smokeless tobacco user
Residence/ Current users Current daily users Past daily users Never used
Sex P (%) 95% CI P (%) 95% CI P (%) 95% CI P (%) 95% CI
Urban
Male 43.7 (38.4,49.1) 42.9 (37.4,48.5) 2.9 (1.9,4.5) 53.4 (48.9,59.4)
Female 12.4 (9.4,16.3) 12.3 (9.3,16.2) 0.7 (0.4,1.4) 86.9 (82.9,90.2)
Total 29.0 (25.1,33.3) 28.6 (24.6,32.9) 1.9 (1.3,2.7) 69.1 (65.3,73.5)
Rural
Male 58.0 (52.5,63.3) 56.1 (50.3,61.7) 2.4 (1.6,3.7) 39.6 (36.3,47.0)
Female 26.6 (21.7,32.2) 26.3 (21.4,31.9) 0.5 (0.2,1.2) 72.9 (67.6,78.2)
Total 43.0 (38.6,47.4) 41.8 (37.3,46.4) 1.5 (1.0,2.2) 55.5 (52.3,61.0)
Combined
Male 53.8 (49.7,57.9) 52.2 (47.9,56.6) 2.6 (1.9,3.5) 43.6 (41.2,49.3)
Female 22.6 (18.9,26.8) 22.4 (18.7,26.5) 0.5 (0.3,1.0) 76.9 (72.9,80.8)
Total 39.0 (35.7,42.4) 38.0 (34.6,41.6) 1.6 (1.2,2.2) 59.4 (57.0,63.7)
Table 3.1.5 Mean frequency of smokeless tobacco use (per day) by the daily smokeless tobacco users according to
sex and place of residence, Madhya Pradesh, 2007- 08
Type of smokless tobacco
Residence/ Chewing tobacco Pan with tobacco Snuff by mouth* Others
Sex Mean 95% CI Mean 95% CI Mean 95% CI Mean 95% CI
Urban
Male 4.3 (3.8, 4.8) 0.6 (0.2, 0.9) 0.1 (0.0, 0.1) 1.7 (0.9, 2.5)
Female 2.7 (2.1, 3.3) 0.6 (0.3, 0.9) 0.6 (0.3, 0.8) 0.6 (0.2, 0.9)
Total 4.0 (3.5, 4.5) 0.6 (0.3, 0.8) 0.2 (0.1, 0.3) 1.4 (0.8, 2.1)
Rural
Male 5.1 (4.7, 5.5) 0.4 (0.2, 0.7) 0.1 (0.0, 0.2) 0.4 (0.2, 0.5)
Female 3.6 (3.1, 4.1) 0.2 (0.1, 0.3) 0.6 (0.4, 0.8) 0.1 (0.0, 0.2)
Total 4.6 (4.2, 5.0) 0.4 (0.2, 0.6) 0.2 (0.1, 0.4) 0.3 (0.1, 0.4)
Combined
Male 4.9 (4.6, 5.2) 0.5 (0.3, 0.7) 0.1 (0.0, 0.2) 0.7 (0.4, 0.9)
Female 3.4 (3.0, 3.9) 0.3 (0.2, 0.4) 0.6 (0.4, 0.7) 0.2 (0.1, 0.3)
Total 4.5 (4.2, 4.8) 0.4 (0.2, 0.6) 0.2 (0.1, 0.3) 0.5 (0.3, 0.7)
* Tooth powder or tooth paste prepared using tobacco
case of women. Over 42% of the urban respondents and
53% of the rural respondents were exposed to tobacco
smoke at home or work place.
Table 3.1.4 provides percentage of smokeless
tobacco users by sex and place of residence of the
respondents.
frequency of chewing tobacco was 5 for men whereas it
was 3 for women. It did not vary much by place of
residence. The mean number of times chewing tobacco
per day was 3 for urban women and 4 for rural women.
For those who chew pan with tobacco, snuff by mouth,
snuff by nose or others of such kind, the average daily
frequency of such consumption was quite less.
The mean age of initiation and age at stopped using
smokeless tobacco by sex and place of residence of
About 39% of the respondents were current user of
smokeless tobacco with 54% among men and 23% among
women. A small percentage of men and women (1.6%)
were found to be past daily users. The prevalence of
smokeless tobacco use was higher among rural
respondents (42%) as against urban respondents (29%).
More men (56% of rural and 43% of urban men) than
women (26% of rural and 12% of urban women) were
current daily users of smokeless tobacco.
The mean number of consumptions per day of
various smokeless tobacco products such as tobacco
chewing, pan with tobacco, snuff by mouth, snuff by
nose and others are provided in Table 3.1.5. The mean
number of times chewing tobacco per day in Madhya
Pradesh was about 4 (5 for men and 3 for women). The

Integrated Disease Surveillance Project (IDSP)
16
Table 3.1.7 Percentage of tobacco users by sex and place of residence, Madhya Pradesh, 2007- 08
Tobacco Use
Smokeless tobacco Smokers only Both (Smoking Any form (Smoking Residence/ users only and smokeless) or smokeless)
Sex P (%) 95% CI P(%) 95% CI P (%) 95% CI P (%) 95% CI
Urban
Male 29.2 (25.5,33.1) 11.5 (9.4,14.1) 13.7 (10.4,17.8) 54.4 (49.2,59.5)
Female 12.3 (9.2,16.1) 0.3 (0.1,0.7) 0.1 (0.0,0.3) 12.6 (9.5,16.5)
Total 21.3 (18.3,24.5) 6.2 (5.1,7.6) 7.3 (5.5,9.6) 34.8 (30.8,39.0)
Rural
Male 30.1 (26.1,34.3) 17.7 (14.2,21.8) 26.0 (21.3,31.3) 73.7 (69.7,77.5)
Female 26.1 (21.2,31.7) 0.6 (0.3,1.2) 0.2 (0.1,0.7) 26.9 (22.1,32.4)
Total 28.2 (24.5,32.2) 9.5 (7.6,11.8) 13.6 (11.1,16.6) 51.3 (47.5,55.1)
Combined
Male 29.8 (26.8,33.0) 15.9 (13.3,18.9) 22.4 (18.9,26.3) 68.1 (64.8,71.2)
Female 22.2 (18.5,26.3) 0.5 (0.3,1.0) 0.2 (0.1,0.5) 22.9 (19.3,27.0)
Total 26.2 (23.4,29.2) 8.6 (7.2,10.2) 11.8 (10.0,14.0) 46.6 (43.6,49.6)
Table 3.1.6 Mean age of initiation, age at stopped smokeless tobacco use by daily smokeless tobacco user
according to sex and place of residence, Madhya Pradesh, 2007- 08
Smokeless tobacco users Age of Initiation Age of Initiation Age at Stopped
Residence/ (15-34 years) (35-64 years ) Sex Mean 95% CI Mean 95% CI Mean 95% CIUrban
Male 20 (19.5, 21.5) 25 (22.5,25.5) 31 (27.5, 35.7)
Female 15 (14.5, 18.5) 30 (25.5,30.5) 32 (27.4, 37.1)
Total 20 (19.5, 21.5) 25 (23.0,26.5) 31 (28.5, 34.9)
Rural
Male 20 (19.5, 19.5) 20 (19.0,20.5) 27 (23.9, 31.5)
Female 13 (11.5, 20.5) 21 (20.5,25.5) 28 (19.1, 37.3)
Total 20 (18.5, 22.5) 20 (17.0,22.5) 27 (24.3, 31.2)
Combined
Male 20 (18.5, 21.5) 21 (20.5,21.5) 29 (26.2, 31.8)
Female 15 (14.5, 18.5) 25 (23.5,25.5) 29 (24.0, 35.6)
Total 20 (18.5, 22.5) 21 (20.5,22.5) 29 (26.6, 31.6)
respondents is provided in Table 3.1.6. The mean age
of initiation of smokeless tobacco use among those who
use smokeless tobacco and were aged 15-34 years was
20 years for males and 15 years for females where as
there was no residential differential in mean age of
initiation of smokeless tobacco use. For respondent
aged 35-64 years, the mean age of initiation of
smokeless tobacco use was 21 years (21 years for males
and 25 years for females). It was 25 years for urban
population as compared to 20 year for rural. The mean
age of quitting smokeless tobacco use among those who
did so was 29 years; it was 29 years for both men and
women. The mean age of quitting smokeless tobacco
use for urban respondents was 31 years against 27 years
for rural respondents.
Table 3.1.7 presents the percentage of smokers
and smokeless tobacco users by sex and the place of
residence. It shows that 47% of respondents were either
smoking or using smokeless tobacco whereas 12% of
the respondents were using both forms of tobacco, i.e.
smoking and also smokeless tobacco. The use of either
smoking or smokeless tobacco was 35% in urban area
as compared to 51% in rural area. The use of both the
forms of tobacco (smoking as well as smokeless tobacco)
was 7% for urban and 13% for rural respondents. The
percentage of either smoking or using smokeless tobacco
among men (68%) was as high as the thrice of that
among women (23%).
Tobacco is one of the major risk factors of non-
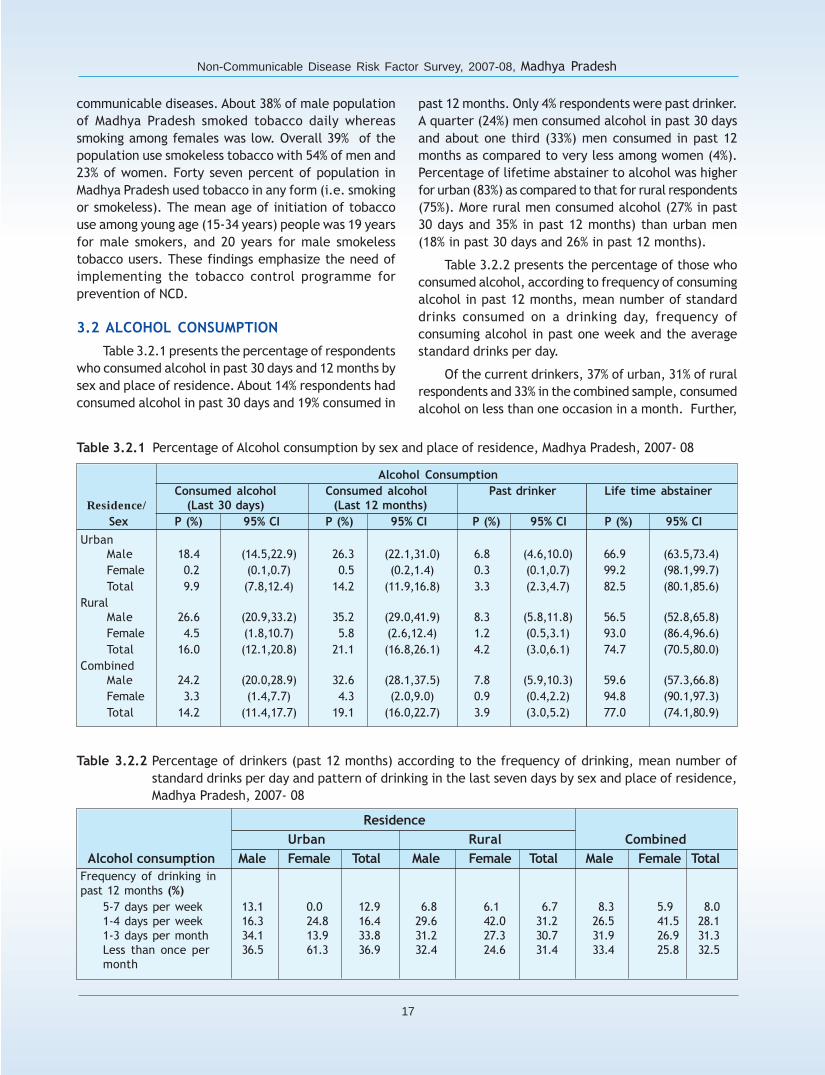
Non-Communicable Disease Risk Factor Survey, 2007-08, Madhya Pradesh
17
Table 3.2.1 Percentage of Alcohol consumption by sex and place of residence, Madhya Pradesh, 2007- 08
Alcohol Consumption
Consumed alcohol Consumed alcohol Past drinker Life time abstainer Residence/ (Last 30 days) (Last 12 months)
Sex P (%) 95% CI P (%) 95% CI P (%) 95% CI P (%) 95% CI
Urban
Male 18.4 (14.5,22.9) 26.3 (22.1,31.0) 6.8 (4.6,10.0) 66.9 (63.5,73.4)
Female 0.2 (0.1,0.7) 0.5 (0.2,1.4) 0.3 (0.1,0.7) 99.2 (98.1,99.7)
Total 9.9 (7.8,12.4) 14.2 (11.9,16.8) 3.3 (2.3,4.7) 82.5 (80.1,85.6)
Rural
Male 26.6 (20.9,33.2) 35.2 (29.0,41.9) 8.3 (5.8,11.8) 56.5 (52.8,65.8)
Female 4.5 (1.8,10.7) 5.8 (2.6,12.4) 1.2 (0.5,3.1) 93.0 (86.4,96.6)
Total 16.0 (12.1,20.8) 21.1 (16.8,26.1) 4.2 (3.0,6.1) 74.7 (70.5,80.0)
Combined
Male 24.2 (20.0,28.9) 32.6 (28.1,37.5) 7.8 (5.9,10.3) 59.6 (57.3,66.8)
Female 3.3 (1.4,7.7) 4.3 (2.0,9.0) 0.9 (0.4,2.2) 94.8 (90.1,97.3)
Total 14.2 (11.4,17.7) 19.1 (16.0,22.7) 3.9 (3.0,5.2) 77.0 (74.1,80.9)
Table 3.2.2 Percentage of drinkers (past 12 months) according to the frequency of drinking, mean number of
standard drinks per day and pattern of drinking in the last seven days by sex and place of residence,
Madhya Pradesh, 2007- 08
Residence
Urban Rural Combined
Alcohol consumption Male Female Total Male Female Total Male Female Total
Frequency of drinking in
past 12 months (%)
5-7 days per week 13.1 0.0 12.9 6.8 6.1 6.7 8.3 5.9 8.0
1-4 days per week 16.3 24.8 16.4 29.6 42.0 31.2 26.5 41.5 28.1
1-3 days per month 34.1 13.9 33.8 31.2 27.3 30.7 31.9 26.9 31.3
Less than once per 36.5 61.3 36.9 32.4 24.6 31.4 33.4 25.8 32.5
month
communicable diseases. About 38% of male population
of Madhya Pradesh smoked tobacco daily whereas
smoking among females was low. Overall 39% of the
population use smokeless tobacco with 54% of men and
23% of women. Forty seven percent of population in
Madhya Pradesh used tobacco in any form (i.e. smoking
or smokeless). The mean age of initiation of tobacco
use among young age (15-34 years) people was 19 years
for male smokers, and 20 years for male smokeless
tobacco users. These findings emphasize the need of
implementing the tobacco control programme for
prevention of NCD.
3.2 ALCOHOL CONSUMPTION
Table 3.2.1 presents the percentage of respondents
who consumed alcohol in past 30 days and 12 months by
sex and place of residence. About 14% respondents had
consumed alcohol in past 30 days and 19% consumed in
past 12 months. Only 4% respondents were past drinker.
A quarter (24%) men consumed alcohol in past 30 days
and about one third (33%) men consumed in past 12
months as compared to very less among women (4%).
Percentage of lifetime abstainer to alcohol was higher
for urban (83%) as compared to that for rural respondents
(75%). More rural men consumed alcohol (27% in past
30 days and 35% in past 12 months) than urban men
(18% in past 30 days and 26% in past 12 months).
Table 3.2.2 presents the percentage of those who
consumed alcohol, according to frequency of consuming
alcohol in past 12 months, mean number of standard
drinks consumed on a drinking day, frequency of
consuming alcohol in past one week and the average
standard drinks per day.
Of the current drinkers, 37% of urban, 31% of rural
respondents and 33% in the combined sample, consumed
alcohol on less than one occasion in a month. Further,

Integrated Disease Surveillance Project (IDSP)
18
Table 3.2.3 Mean age of initiation of alcohol use by sex and place of residence, Madhya Pradesh, 2007-08
Alcohol users
Residence/ Age of Initiation (15-34 years) Age of Initiation (35-64 years)
Sex Mean 95% CI Mean 95% CI
Urban
Male 20 (19.5, 21.5) 25 (24.0,25.5)
Female * * 30 (15.5,37.5)
Total 20 (19.5, 21.5) 25 (24.0,26.5)
Rural
Male 20 (18.5, 22.5) 21 (20.5,25.5)
Female 18 (16.5, 22.5) 25 (20.5,30.5)
Total 20 (17.5, 23.5) 22 (21.5,25.5)
Combined
Male 20 (17.0, 21.5) 25 (22.5,25.5)
Female 18 (16.5, 22.5) 26 (21.5,30.5)
Total 20 (17.0, 22.5) 25 (23.5,25.5)
* no observation
34% respondents of urban and 31% respondents of rural
consumed alcohol 1-3 days per month in past one year.
Twenty eight percent of current drinkers consumed
alcohol 1-4 days every week and 8 percent current
drinkers consumed alcohol 5-7 days per week in the past
one-year in both rural and urban. The average numbers
of drinks consumed on a drinking day was 2 drinks.
The respondents who were current drinker were also
asked about their behaviour in terms of the number of
days and number of drinks per day they took in the past
7 days preceding the survey. The survey found that 13%
respondents of urban, 11% respondents of rural and 11%
in combined sample respondents consumed alcohol at
least 4 days a week. About one-tenth of current drinkers
were in high risk drinking (binge drinking); it was about
14% in rural area against 9% in urban area and
concentrated among men. The average standard drink
consumed per day was calculated using the data collected
for alcohol consumption by current drinkers in the week
preceding the survey, which was about one drink.
Table 3.2.3 presents the mean age of alcohol use
by sex and the place of residence among current drinkers
and past drinkers in the age group 15-34 year and 35-
64 years. The mean age of initiation of alcohol
consumption regularly in the age group of 15-34 years
was 20 years irrespective of the place of residence. The
mean age of initiation in the age group 35-64 years was
around 25 years. The age of initiation among rural
women (15-34) was 18 years. There was no urban woman
reported to be consuming alcohol.
Table 3.2.4 presents the percentage of current daily
smokers and smokeless tobacco users and current
drinkers by age, education and occupation. The
percentage of daily smokers was high in the age group
35-44 years (26%), among illiterate (41%) and
agriculturist (42%). Similarly, percentage of smokeless
tobacco users was highest in the age group 25-34 years
(27%), among illiterate (47%) and manual workers (43%).
The percentage of current drinkers was high (27%) in
the age group 25-34 and 35-44, among illiterate (47%)
and those who report their occupation as manual
worker (46%).
Interesting observations of alcohol consumption
was that about 33% of men consumed alcohol at least
Mean number of drinks on 2.0 1.1 2.0 2.0 1.6 1.9 2.0 1.6 2.0a drinking day
Drinks during last 7 days
Alcohol consumed on 13.2 * 13.0 10.4 12.0 10.6 11.0 11.8 11.14+days (%)
**Binge drinking on 8.7 * 8.6 15.1 3.6 13.6 13.7 3.6 12.6any day (%)
20+ drinks in 7 days(%) 6.0 0.0 6.0 5.0 1.7 4.6 5.2 1.7 4.9
Average standard drinks1.0 0.4 1.0 1.1 0.5 1.1 1.1 0.5 1.0
per day
* no observation **5+ drinks on any day for male; and 4+ drinks on any day for female

Non-Communicable Disease Risk Factor Survey, 2007-08, Madhya Pradesh
19
Table 3.2.4 Percentage of current daily smokers, daily smokeless tobacco users and current drinkers across age,
education and occupation, Madhya Pradesh, 2007- 08
Characteristic Smoker Smokeless tobacco user Current drinkers
Age group
15-24 17.9 24.5 16.8
25-34 25.3 27.1 26.6
35-44 26.4 22.4 26.6
45-54 18.9 14.6 19.2
55-64 11.5 11.4 10.8
Total 100.0 100.0 100.0
Education
Illiterate 40.5 46.9 46.8
Primary 20.5 14.3 16.6
Middle 20.7 19.6 18.5
Secondary 9.7 9.2 8.1
Higher Secondary 4.4 5.3 5.2
College & above 4.2 4.7 4.8
Total 100.0 100.0 100.0
Occupation
Executive/Business 9.8 9.4 14.0
Agriculture 41.8 28.7 32.6
Domestic Work 0.3 7.4 0.7
Services/Sales 2.8 2.9 3.7
Manual Worker 40.6 42.9 45.9
Other 4.7 8.7 3.1
Total 100.0 100.0 100.0
Number 1175 2087 750
once in last one year whereas 24% of men in last one
month. The alcohol consumption among females was
low. Those who consumed alcohol in last seven days,
13% of them were binge drinkers. The mean age of
initiation of alcohol consumption by young age (15-34
years) men was 20 years.
3.3 FRUITS AND VEGETABLES CONSUMPTION
Survey asked questions about the number of days
in a typical week on which fruits and vegetables
were consumed by the respondents and the number
of servings of fruits and vegetables consumed on one
of those days. Table 3.3.1 presente mean number
of days of such consumptions by sex and place of
residence.
In Madhya Pradesh, mean number of days people
consumed vegetables was 5 days and fruits 2 days a
week. The mean number of days when fruits consumed
was higher for urban (2.4 days) as compared to that of
rural (1.3 days).
Table 3.3.1 Mean number of days in a week fruit and vegetable consumed by the respondents according to sex and
place of residence, Madhya Pradesh, 2007- 08
Residence
Fruits and vegetables Urban Rural Combined
consumption per week Male Female Total Male Female Total Male Female Total
Mean number of days 2.4 2.4 2.4 1.3 1.3 1.3 1.6 1.6 1.6
fruits consumed
Mean number of days 5.3 5.2 5.3 4.4 4.2 4.3 4.7 4.5 4.6
vegetables consumed
Less than five servings of 69.3 71.8 70.5 86.9 89.3 88.0 81.8 84.3 83.0
fruits & vegetables
consumed per day

Integrated Disease Surveillance Project (IDSP)
20
More than three-quarter of respondents report that
they had less than five servings of fruits and vegetables
per day on those days when they consumed it. It was
70% in urban and 88% in rural areas. From Table 3.3.2,
it can be seen that the mean number of servings of
fruits and vegetables each in one particular day was
about 1 and 2 respectively. The mean number of
servings fruits and vegetables was 3 for urban and 2 for
rural respondents.
Nutritional inadequacy is the major risk factor of
many non-communicable diseases. Overall, 83% of
population in Madhya Pradesh consumed less than five
servings of fruits and vegetables per day, which was
inadequate as per WHO recommended standards. On
an average only two days in a week people consumed
fruits against vegetables consumed on 5 days. This is
an important health issues and needs to be address with
more emphatically.
Food and Oil Consumption
The percentage of respondents according to
the intake of specific food items at least once a week
by sex and place of residence is provided in Table 3.3.3.
The specific food items include cheese/butter, fried
local foods, red meat, eggs, chicken, aerated soda,
sweetened drinks, pizza/burger/French fries, cakes/
pastries or other bakery items, chips/namkeen etc.
Over 17% population consumed eggs, 10% consumed
fish, 6% consumed cakes/pastries or other bakery items,
13% consumed red meat and 20% fried local
foods and 15% consumed chicken at least once a week.
Cheese/butter was consumed daily only by 9%
population. Fried local food, cakes/pastries or
other bakery items, chips, namkeen etc. each, were
consumed daily by around 3% of the population.
Table 3.3.4 presents the type of edible oil used
for cooking by the sample households in the rural
Table 3.3.2 Mean number of servings of fruits, vegetables consumed in on a typical day by sex and place of
residence, Madhya Pradesh, 2007- 08
Number of servings of Residence
fruits/vegetables/both Urban Rural Combined
per day Male Female Total Male Female Total Male Female Total
Servings of fruit 0.8 0.7 0.7 0.5 0.4 0.4 0.6 0.5 0.5
Servings of vegetable 2.0 1.8 1.9 1.4 1.3 1.4 1.6 1.5 1.5
Daily no. of serving of 2.8 2.6 2.7 2.0 1.8 1.9 2.3 2.1 2.2
fruits and vegetable
Table 3.3.3 Percentage of respondents according to the intake of specific food items by sex and place of residence,
Madhya Pradesh, 2007- 08
Residence
Urban Rural Combined
Daily At least once Daily At least once Daily At least once Specific Food Items in a week in a week in a week
Cheese/ Butter 10.4 14.0 8.5 9.0 9.1 10.5
Fried local foods 6.5 30.7 1.3 16.1 2.8 20.3
Red Meat 0.9 18.3 0.1 10.7 0.4 12.9
Eggs 1.5 21.8 0.3 15.3 0.6 17.1
Chicken 0.3 17.4 0.1 13.6 0.2 14.7
Fish 0.3 12.7 0.2 8.8 0.2 9.9
Aerated Soda 0.2 8.3 0.1 9.9 0.1 9.4
Sweetened drinks 0.6 1.8 0.1 0.2 0.2 0.7
Pizza/ burgers/ French fries 0.2 2.4 0.2 1.1 0.1 0.9
etc.
Cakes, Pastries or other 6.6 12.8 0.7 3.1 2.4 5.9
bakery items
Chips, Namkeen etc. 6.2 29.3 2.0 16.4 3.2 20.1

Non-Communicable Disease Risk Factor Survey, 2007-08, Madhya Pradesh
21
Table 3.3.4Percentage of households according to type of
oil consumption, Madhya Pradesh, 2007- 08
Residence
Type of oil Urban Rural Combined
Mustard oil 24.7 40.2 36.0
Coconut oil 0.0 0.1 0.1
Groundnut oil 7.3 2.5 3.8
Sunflower oil 1.5 0.0 0.4
Soyabean oil 65.7 56.9 59.3
Others 0.7 0.2 0.4
Total 100.0 100.0 100.0
Table 3.4.1 Mean time spent (in minutes) on physical activity per day by sex and residence, Madhya Pradesh,
2007- 08
Residence
Urban Rural Combined
Physical Activity Male Female Total Male Female Total Male Female Total
Total Physical
Activity (MET)
Mean 1463.5 1136.4 1310.3 2698.5 2131.9 2427.0 2388.7 1850.6 2106.3
95% CI Lower 1268.9 1026.9 1171.6 2528.4 1944.8 2273.0 2202.4 1713.4 1988.0
Upper 1658.2 1245.9 1449.0 2868.6 2319.1 2581.1 2474.9 1987.8 2224.5
Work Related Activity
Mean 191.1 218.9 204.1 331.7 325.7 328.9 290.8 295.5 293.0
95% CI Lower 156.9 199.4 180.3 306.9 303.4 308.1 270.2 278.5 279.4
Upper 225.4 238.4 228.0 356.6 348.1 349.6 311.3 312.5 309.7
Travel Related Activity
Mean 65.0 37.0 51.9 85.9 59.9 73.4 79.8 53.4 67.2
95% CI Lower 56.7 31.0 45.3 75.3 52.1 64.9 72.0 47.7 60.9
Upper 73.4 43.0 58.4 96.5 67.6 81.9 87.6 59.1 73.5
Recreational Activity
Mean 19.1 2.1 11.1 21.4 3.2 12.7 20.7 2.9 12.2
95% CI Lower 15.8 1.0 9.2 14.6 0.8 8.1 15.9 1.2 8.9
Upper 22.3 3.1 13.0 28.2 5.6 17.3 25.6 4.6 15.6
Number 1398 1582 2980 1459 1414 2873 2857 2996 5853
while traveling for work and recreation by sex and the
place of residence, is provided in Table 3.4.1. On an
average, people in Madhya Pradesh, used to do some
physical activity for duration of 2106 MET minutes per
day, 1310 MET minutes per day for urban and 2427 MET
minutes per day for rural. Men, on an average, spent
2339 MET minutes a day while women spent 1851 MET
minutes a day on physical activity. The mean time spent
in work related physical activity was 293 minutes per
day and it was 204 minutes per day for urban and 329
minutes per day for rural. The time spent in work related
physical activity was more among women (296 minutes
per day) than men (291 minutes per day).
The mean time spent in travel related activity
(cycling/walking) was found to be 52 and 73 minutes
per day for urban and rural respondents respectively. It
was more among men (80 minutes per day) as compared
to women (53 minutes per day). The survey also report
that the mean time spent in recreational activities was
12 minutes per day, with 11 minutes per day for urban
and 13 minutes per day for rural respondents. Men spent
more time (21 minutes per day) than women (3 minutes
per day) in recreational activities.
According to the WHO Global Physical Activity
Questionnaire Analysis Guidelines7, the total physical
activity of the respondents is classified under three
categories low, medium and high on the basis of
and urban area. It shows that the use of soybean oil
for cooking was highest (60% households with 66% of
urban and 58% of rural) followed by mustard oil (36%
households with 25% of urban and 40% of rural),
groundnut oil (4% households with 7% of urban and 3%
of rural). Sunflower oil was being used by less than 1%
of the households population.
3.4 PHYSICAL ACTIVITY
It is well known that lack of physical activity leads
to obesity, hyperlipidemia, diabetes mellitus,
hypertension and coronary heart disease. An account of
physical activities of respondents in terms mean time
spent (in minutes) in doing physical activity at work,
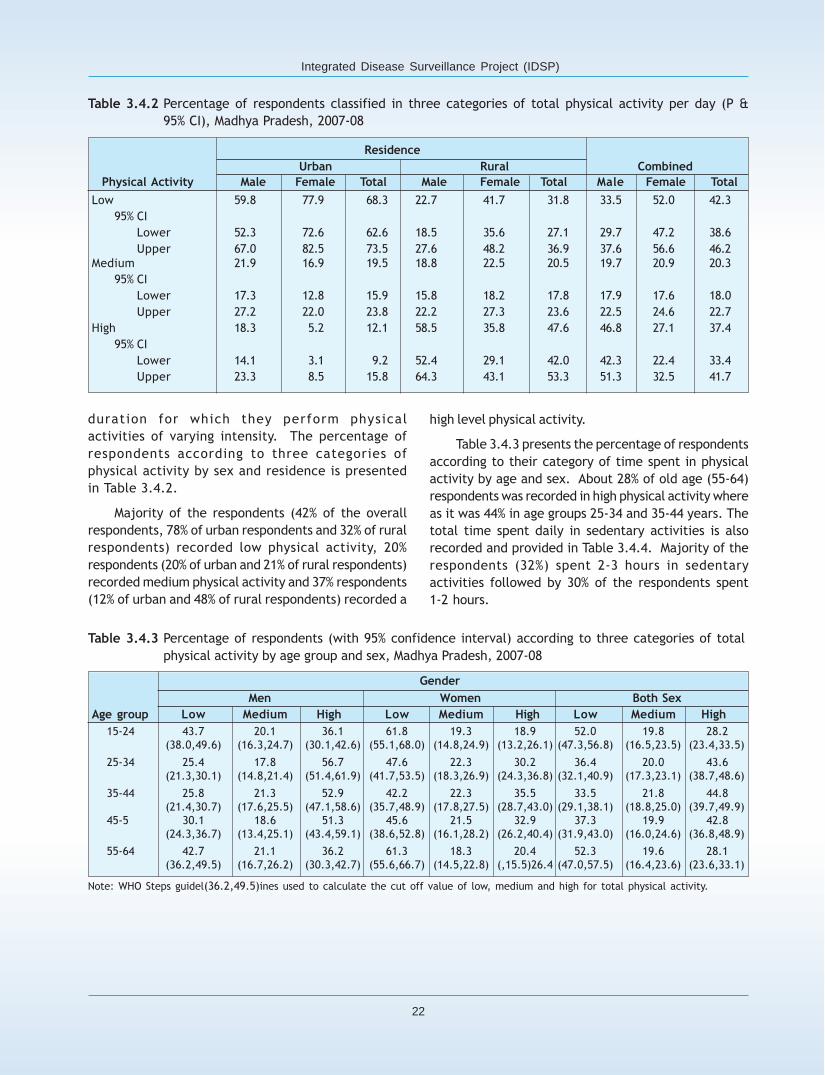
Integrated Disease Surveillance Project (IDSP)
22
Table 3.4.2 Percentage of respondents classified in three categories of total physical activity per day (P &
95% CI), Madhya Pradesh, 2007-08
Residence
Urban Rural Combined
Physical Activity Male Female Total Male Female Total Male Female Total
Low 59.8 77.9 68.3 22.7 41.7 31.8 33.5 52.0 42.3
95% CI
Lower 52.3 72.6 62.6 18.5 35.6 27.1 29.7 47.2 38.6
Upper 67.0 82.5 73.5 27.6 48.2 36.9 37.6 56.6 46.2
Medium 21.9 16.9 19.5 18.8 22.5 20.5 19.7 20.9 20.3
95% CI
Lower 17.3 12.8 15.9 15.8 18.2 17.8 17.9 17.6 18.0
Upper 27.2 22.0 23.8 22.2 27.3 23.6 22.5 24.6 22.7
High 18.3 5.2 12.1 58.5 35.8 47.6 46.8 27.1 37.4
95% CI
Lower 14.1 3.1 9.2 52.4 29.1 42.0 42.3 22.4 33.4
Upper 23.3 8.5 15.8 64.3 43.1 53.3 51.3 32.5 41.7
duration for which they perform physical
activities of varying intensity. The percentage of
respondents according to three categories of
physical activity by sex and residence is presented
in Table 3.4.2.
Majority of the respondents (42% of the overall
respondents, 78% of urban respondents and 32% of rural
respondents) recorded low physical activity, 20%
respondents (20% of urban and 21% of rural respondents)
recorded medium physical activity and 37% respondents
(12% of urban and 48% of rural respondents) recorded a
high level physical activity.
Table 3.4.3 presents the percentage of respondents
according to their category of time spent in physical
activity by age and sex. About 28% of old age (55-64)
respondents was recorded in high physical activity where
as it was 44% in age groups 25-34 and 35-44 years. The
total time spent daily in sedentary activities is also
recorded and provided in Table 3.4.4. Majority of the
respondents (32%) spent 2-3 hours in sedentary
activities followed by 30% of the respondents spent
1-2 hours.
Table 3.4.3 Percentage of respondents (with 95% confidence interval) according to three categories of total
physical activity by age group and sex, Madhya Pradesh, 2007-08
Gender
Men Women Both Sex
Age group Low Medium High Low Medium High Low Medium High
15-24 43.7 20.1 36.1 61.8 19.3 18.9 52.0 19.8 28.2
(38.0,49.6) (16.3,24.7) (30.1,42.6) (55.1,68.0) (14.8,24.9) (13.2,26.1) (47.3,56.8) (16.5,23.5) (23.4,33.5)
25-34 25.4 17.8 56.7 47.6 22.3 30.2 36.4 20.0 43.6
(21.3,30.1) (14.8,21.4) (51.4,61.9) (41.7,53.5) (18.3,26.9) (24.3,36.8) (32.1,40.9) (17.3,23.1) (38.7,48.6)
35-44 25.8 21.3 52.9 42.2 22.3 35.5 33.5 21.8 44.8
(21.4,30.7) (17.6,25.5) (47.1,58.6) (35.7,48.9) (17.8,27.5) (28.7,43.0) (29.1,38.1) (18.8,25.0) (39.7,49.9)
45-5 30.1 18.6 51.3 45.6 21.5 32.9 37.3 19.9 42.8
(24.3,36.7) (13.4,25.1) (43.4,59.1) (38.6,52.8) (16.1,28.2) (26.2,40.4) (31.9,43.0) (16.0,24.6) (36.8,48.9)
55-64 42.7 21.1 36.2 61.3 18.3 20.4 52.3 19.6 28.1
(36.2,49.5) (16.7,26.2) (30.3,42.7) (55.6,66.7) (14.5,22.8) (,15.5)26.4 (47.0,57.5) (16.4,23.6) (23.6,33.1)
Note: WHO Steps guidel(36.2,49.5)ines used to calculate the cut off value of low, medium and high for total physical activity.

Non-Communicable Disease Risk Factor Survey, 2007-08, Madhya Pradesh
23
3.5 SOCIO-DEMOGRAPHIC PATTERN
The socio-demographic patterns of behavioural risk
factors of NCD (tobacco, alcohol, fruits and vegetable
consumption, and physical activity) by residence are
presented in Table 3.5.1, Table 3.5.2, and Table 3.5.3.
Tobacco
Tobacco is mainly used as smoking and other forms
of smokeless tobacco use among urban and rural
residents of Madhya Pradesh. The prevalence and
pattern of smoking among urban male respondents was
increasing with age from 14% in 15-24 to 41% in 35-44
and than declining to 35% among older age group (45-
64). But, it was decreasing with increasing level of
education (54% among illiterate to 16% among college &
above). Prevalence of smoking among female
respondents was very low compare with males across
all the categories. Occupation is an important
socioeconomic indicator and differences in prevalence
of smoking tobacco were observed form one category
of occupation to another. Prevalence of smoking among
occupational categories of manual worker (40%) and
agriculture (39%) was high compare with other
categories of occupation. A similar pattern of increasing
in prevalence with age and decreasing with level of
education was also observed with smokeless tobacco
users. The prevalence of smokeless tobacco users among
urban respondents was also increasing with age (20% in
15-24 to 35% in 55-64 aged respondents). Prevalence
of smokeless tobacco users among females was recorded
low (12%), but the pattern was increasing with age. By
education, the prevalence among urban male
respondents was showing a declining pattern with
increasing level of education (61% among illiterate to
28% among college and above education. In the
occupational categories, prevalence of smokeless
tobacco users was high among the occupation of manual
work (55%) and agriculture (39%). Among urban male
Table 3.4.4 Sex wise percentage of respondents classified according to total time spent in sedentary activity per
day by type of residence, Madhya Pradesh, 2007-08
Residence
Time spent sitting/ Urban Rural Combined
reclining Male Female Total Male Female Total Male Female Total
Less than 1 hours 8.8 5.1 7.1 8.6 7.9 8.3 8.7 7.1 7.9
1-2 hours 27.6 19.6 23.9 32.8 30.9 31.9 31.3 27.7 29.6
2-3 hours 29.0 29.7 29.3 33.7 32.7 33.2 32.3 31.9 32.1
3-4 hours 11.1 15.5 13.2 8.5 10.2 9.3 9.2 11.7 10.4
More than 4 hours 23.5 30.0 26.6 16.4 18.3 17.3 18.5 21.6 20.0
respondents, smokeless tobacco users were higher (44%)
than smokers (29%), but the pattern was similar in both.
Rural-urban differences in the prevalence of
smoking and smokeless tobacco users were observed
across all the socio-demographic categories. Prevalence
of smoking among rural male respondents was high (46%)
compare with urban males (29%). Overall, pattern of
smoking and smokeless tobacco users in urban and rural
subgroups of population remain similar across age,
education and occupation. The prevalence of smoking
among rural male respondents shows the increasing
pattern with age (28% in 15-24 to 65% in 45-54).
Prevalence of smoking among occupational categories
of agriculture (54%) and manual worker (51%) of rural
male respondents was high compare with other. Similar
pattern of smoking and smokeless tobacco users was
observed in the combined population (Table 3.5.3).
Alcohol
The prevalence of current alcohol drinkers among
urban male respondents was high among the adults (32%
in 25-34, 33% in 35-44, 35% in 45-54 and 24% in 55-64
age groups). It was comparatively low among younger
age (16% in 15-24). An increasing pattern of prevalence
with age was observed up to age group of 45-54 among
urban males, than the pattern declined with increasing
age (older age groups). Prevalence of drinking alcohol
among male respondents was recorded high in lower
level of education such as illiterate (43%), Primary (37%)
and Middle (33%). The pattern of prevalence was
declining with increasing level of education (18% among
collage and above). Prevalence of drinking alcohol in
occupational categories of male urban respondents was
high among manual worker (38%) and agriculture (30%).
Prevalence of drinking alcohol was very low among the
female urban respondents (Table 3.5.1). Among the
rural male respondents, current alcohol users were high
in the adult age groups (39% in 25-34, 43% in 35-44,

Integrated Disease Surveillance Project (IDSP)
24
Table
3.5
.1Perc
enta
ge o
f r
esp
ondents
in t
he c
ate
gory
of
som
e h
igh r
isk f
acto
rs o
f N
CD
(curr
ent
daily s
mokers
, daily s
mokele
ss t
obacco u
ser,
curr
ent
drinke
rs, lo
w fru
its
and v
ege
table
s in
take
and low
phys
ical act
ivity)
acr
oss
age
, educa
tion, occ
upation a
nd s
ex,
urb
an, M
adhya
Pr
adesh
, 2007- 08
C
hara
cte
rist
icSm
oker
S
mokele
ss t
obacco
Curr
ent
dri
nkers
Less
than f
ive s
erv
ings
L
ow
physi
cal
acti
vit
yuse
rof
fruit
s &
vegeta
ble
s
consu
med p
er
day
Male
Fem
ale
Tota
lM
ale
Fem
ale
Tota
lM
ale
Fem
ale
Tota
lM
ale
Fem
ale
Tota
lM
ale
Fem
ale
Tota
l
Age g
roup
15-2
414.2
0.0
7.8
33.6
3.9
20.1
15.5
0.0
8.5
57.4
71.1
69.1
67.1
84.7
75.1
25-3
432.2
0.0
16.4
54.6
10.3
32.9
31.6
0.5
16.4
70.7
73.3
72.0
54.7
73.4
63.9
35-4
440.7
0.6
22.0
47.1
18.1
33.6
33.1
0.6
18.0
70.5
70.7
70.6
49.2
70.2
58.9
45-5
435.1
1.3
19.9
43.7
20.8
33.4
34.8
1.0
19.6
68.0
68.9
68.4
61.1
76.1
67.8
55-6
435.2
1.0
18.1
43.9
26.4
35.1
23.6
1.4
12.5
72.5
76.3
74.4
72.3
88.4
80.4
Tota
l28.5
0.4
15.3
43.7
12.4
29.0
26.3
0.5
14.2
69.3
71.8
70.5
59.8
77.9
68.3
Educati
on
Illite
rate
53.5
0.9
16.2
61.4
23.6
34.6
42.5
1.1
13.2
81.9
74.8
76.9
25.9
61.4
51.0
Pri
mary
46.6
0.3
25.1
58.6
19.1
40.2
37.0
0.3
19.9
74.1
80.7
77.1
41.6
74.6
57.0
Mid
dle
36.9
0.0
20.0
57.2
11.9
36.5
33.8
0.3
18.5
76.5
76.7
76.6
42.9
79.4
59.6
Secondary
23.5
0.3
13.8
43.9
3.2
26.8
20.9
0.0
12.1
69.4
73.8
71.3
64.3
87.7
74.1
Hig
her
Secondary
17.2
0.0
11.1
33.7
3.7
23.0
20.4
0.0
13.1
62.2
58.4
60.9
78.2
87.3
81.5
College &
above
15.6
0.0
10.0
27.9
1.8
18.5
17.6
0.3
11.3
61.7
62.2
61.9
78.4
94.1
84.1
Tota
l28.5
0.4
15.3
43.7
12.4
29.0
26.3
0.5
14.2
69.3
71.8
70.5
59.8
77.9
68.3
Occupati
on
Executi
ve/Busi
ness
26.8
0.0
24.4
43.4
5.6
40.0
24.6
0.0
22.1
61.6
46.5
60.3
77.9
97.6
79.6
Agri
cult
ure
39.2
1.3
26.8
51.2
15.2
39.4
30.0
0.4
20.3
67.5
67.1
67.3
27.6
25.9
27.1
Dom
est
ic W
ork
**0.4
0.4
**10.9
11.0
**0.4
0.3
**68.1
67.9
**83.5
83.7
Serv
ices/
Sale
s25.5
0.0
20.5
34.2
7.5
29.0
27.6
2.8
22.8
66.0
67.2
66.3
71.2
74.9
72.0
Manual
Work
er
39.7
0.3
29.7
63.8
27.1
54.5
38.4
1.3
29.0
80.7
94.4
84.2
34.5
47.1
37.7
Oth
er
12.6
0.0
7.3
21.9
9.0
16.4
10.9
0.0
6.3
65.2
74.4
69.1
86.5
97.5
91.1
Tota
l28.5
0.4
15.3
43.7
12.4
29.0
26.3
0.5
14.2
69.3
71.8
70.5
59.8
77.9
68.3
Num
ber
(n)
1398
1582
2980
1398
1582
2980
1398
1582
2980
1398
1582
2980
1398
1582
2980
** F
igure
not
show
n;
base
d o
n f
ew
er
than 1
5 u
nw
eig
hte
d c
ase
s

Non-Communicable Disease Risk Factor Survey, 2007-08, Madhya Pradesh
25
49% in 45-54 and 39% in 55-64). By education, the
pattern prevalence was decreasing with increasing level
of education (47% among illiterate to 16% among college
and above) in rural male population. However, prevalence
in the occupation categories of executive and business
(44%), and manual work (29%) was high compare with
others (Table 3.5.2). A similar pattern of prevalence of
alcohol use was observed in the combined (rural and
urban) population across age, education and occupation
(Table 3.5.2 & 3.5.3).
Fruits and Vegetables
Though fruits and vegetable consumption reduces
the risk of non-communicable diseases, but the survey
showed larger proportion of population consumed
inadequate amount of fruits and vegetables (i.e. less
than five servings of fruits and vegetables per day).
Prevalence of low (inadequate) consumption was
recorded high (71%) among urban population with
marginal differences between age groups (69% in 15-24
to 74% in 55-64). Inadequate consumption of fruits and
vegetables was also high in all the education level (77%
among illiterate to 62% among college and above).
Prevalence of low consumption was high (84%) among
manual worker whereas it was varying from 60% to 68%
in rest of the occupation categories (Table 3.5.1). A
similar pattern of inadequate consumption of fruits and
vegetables was observed among rural population.
Prevalence of inadequate consumption was high among
all the age groups (88% in 15-24 to 92% in 55-64).
Prevalence by education was varying between 79%in
higher secondary to 92% in secondary with marginal
differences. The low (inadequate) consumption of fruits
and vegetables was high among the occupational
categories of manual work (96%). It was comparatively
low (79%) among agriculture category (Table 3.5.2).
Overall, prevalence and pattern of consumption of fruits
and vegetables by age, education and occupation was
high with similar pattern as recoded in rural and urban
population of Madhya Pradesh (Table 3.5.3).
Physical Activity
The differences in the prevalence of low physical
activity were recorded across age, sex, education and
occupation in urban population (Table3.5.1). Large
proportion of urban respondents were recorded in the
category of low physical activity (68%) and it was varying
with age groups (75% in 15-24, 64% in 25-34, 59% in 35-
44, 68% in 45-54 and 80% in 55-64). Prevalence of low
physical activity was high among old and young age
respondents. Low physical activity by sex was recorded
high (78%) among female respondents compare with
males (60%), and such differences remain across all the
age groups (Table 3.5.1). The pattern of low physical
activity was increasing with level of education (51% of
illiterate to 84% of higher level). Accordingly, low physical
activity was recorded high among the domestic work
(84%), executive and business (80%), and service (72%)
categories of occupation. Those working in agriculture
and doing manual work were doing more physical work
activity (Table 3.5.1).
Urban-rural comparison of low physical activity
demonstrated that rural people (32%) were doing more
physical work than urban (68%) and such differences
observed across all age groups and sex (Table 3.5.2).
Low physical activity by education was observed more
among higher level of education (58% in college) compare
with lower level (27% among illiterate) in rural
population. Similarly, occupational differences in low
physical activity were also observed across all the
categories. The occupational categories of agriculture
and manual worker people were doing more physical work
compare with others. Overall, low physical activity was
high among domestic worker (77%) in the rural and urban
population (Table 3.5.3).
Physical inactivity is one of the important risk factors
of NCD. Most important point to be noted that four out
of ten individual adult population was categorized into
low level of physical activity. This invites special
attention to health planner.
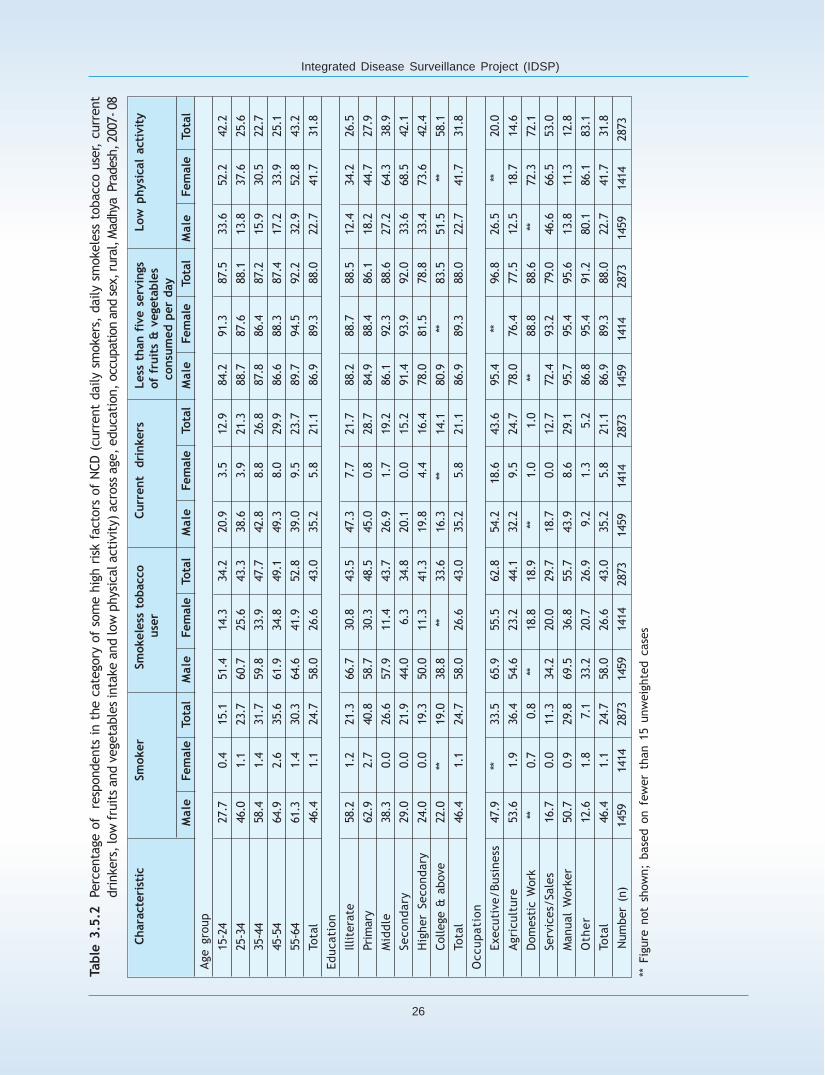
Integrated Disease Surveillance Project (IDSP)
26
Table
3.5
.2Perc
enta
ge o
f r
esp
ondents
in t
he c
ate
gory
of
som
e h
igh r
isk f
acto
rs o
f N
CD (
curr
ent
daily
smokers
, daily
smokele
ss t
obacco u
ser, c
urr
ent
dri
nkers
, lo
w fru
its
and v
egeta
ble
s in
take a
nd low
phys
ical acti
vity
) acro
ss a
ge, educati
on,
occ
upation a
nd sex,
rura
l, M
adhya
Pra
desh
, 2007- 08
C
hara
cte
rist
icSm
oker
S
mokele
ss t
obacco
Curr
ent
dri
nkers
Less
than f
ive s
erv
ings
Low
physi
cal
acti
vit
yuse
rof
fruit
s &
vegeta
ble
s
consu
med p
er
day
Male
Fem
ale
Tota
lM
ale
Fem
ale
Tota
lM
ale
Fem
ale
Tota
lM
ale
Fem
ale
Tota
lM
ale
Fem
ale
Tota
l
Age g
roup
15-2
427.7
0.4
15.1
51.4
14.3
34.2
20.9
3.5
12.9
84.2
91.3
87.5
33.6
52.2
42.2
25-3
446.0
1.1
23.7
60.7
25.6
43.3
38.6
3.9
21.3
88.7
87.6
88.1
13.8
37.6
25.6
35-4
458.4
1.4
31.7
59.8
33.9
47.7
42.8
8.8
26.8
87.8
86.4
87.2
15.9
30.5
22.7
45-5
464.9
2.6
35.6
61.9
34.8
49.1
49.3
8.0
29.9
86.6
88.3
87.4
17.2
33.9
25.1
55-6
461.3
1.4
30.3
64.6
41.9
52.8
39.0
9.5
23.7
89.7
94.5
92.2
32.9
52.8
43.2
Tota
l46.4
1.1
24.7
58.0
26.6
43.0
35.2
5.8
21.1
86.9
89.3
88.0
22.7
41.7
31.8
Educati
on
Illite
rate
58.2
1.2
21.3
66.7
30.8
43.5
47.3
7.7
21.7
88.2
88.7
88.5
12.4
34.2
26.5
Pri
mary
62.9
2.7
40.8
58.7
30.3
48.5
45.0
0.8
28.7
84.9
88.4
86.1
18.2
44.7
27.9
Mid
dle
38.3
0.0
26.6
57.9
11.4
43.7
26.9
1.7
19.2
86.1
92.3
88.6
27.2
64.3
38.9
Secondary
29.0
0.0
21.9
44.0
6.3
34.8
20.1
0.0
15.2
91.4
93.9
92.0
33.6
68.5
42.1
Hig
her
Secondary
24.0
0.0
19.3
50.0
11.3
41.3
19.8
4.4
16.4
78.0
81.5
78.8
33.4
73.6
42.4
College &
above
22.0
**19.0
38.8
**33.6
16.3
**14.1
80.9
**83.5
51.5
**58.1
Tota
l46.4
1.1
24.7
58.0
26.6
43.0
35.2
5.8
21.1
86.9
89.3
88.0
22.7
41.7
31.8
Occupati
on
Executi
ve/Busi
ness
47.9
**33.5
65.9
55.5
62.8
54.2
18.6
43.6
95.4
**96.8
26.5
**20.0
Agri
cult
ure
53.6
1.9
36.4
54.6
23.2
44.1
32.2
9.5
24.7
78.0
76.4
77.5
12.5
18.7
14.6
Dom
est
ic W
ork
**0.7
0.8
**18.8
18.9
**1.0
1.0
**88.8
88.6
**72.3
72.1
Serv
ices/
Sale
s16.7
0.0
11.3
34.2
20.0
29.7
18.7
0.0
12.7
72.4
93.2
79.0
46.6
66.5
53.0
Manual
Work
er
50.7
0.9
29.8
69.5
36.8
55.7
43.9
8.6
29.1
95.7
95.4
95.6
13.8
11.3
12.8
Oth
er
12.6
1.8
7.1
33.2
20.7
26.9
9.2
1.3
5.2
86.8
95.4
91.2
80.1
86.1
83.1
Tota
l46.4
1.1
24.7
58.0
26.6
43.0
35.2
5.8
21.1
86.9
89.3
88.0
22.7
41.7
31.8
Num
ber
(n)
1459
1414
2873
1459
1414
2873
1459
1414
2873
1459
1414
2873
1459
1414
2873
** F
igure
not
show
n;
base
d o
n f
ew
er
than 1
5 u
nw
eig
hte
d c
ase
s

Non-Communicable Disease Risk Factor Survey, 2007-08, Madhya Pradesh
27
Table
3.5
.3Perc
enta
ge o
f r
esp
ondents
in t
he c
ate
gory
of
som
e h
igh r
isk f
acto
rs o
f N
CD
(curr
ent
daily s
mokers
, daily s
mokele
ss t
obacco u
ser,
curr
ent
dri
nkers
, lo
w f
ruit
s and v
egeta
ble
s in
take a
nd low
phys
ical acti
vity
) a
cro
ss a
ge,
educati
on,
occupati
on a
nd s
ex,
com
bin
ed,
Kera
la,
2007-
08
C
hara
cte
rist
icSm
oker
S
mokele
ss t
obacco
Curr
ent
dri
nkers
Less
than f
ive s
erv
ings
Low
physi
cal
acti
vit
yuse
rof
fruit
s &
vegeta
ble
s
consu
med p
er
day
Male
Fem
ale
Tota
lM
ale
Fem
ale
Tota
lM
ale
Fem
ale
Tota
lM
ale
Fem
ale
Tota
lM
ale
Fem
ale
Tota
l
Age g
roup
15-2
423.6
0.3
12.9
46.0
11.2
30.0
19.3
2.5
11.5
79.1
85.3
82.0
43.7
61.8
52.0
25-3
442.1
0.8
21.7
59.0
21.3
40.3
36.6
2.9
19.9
83.6
83.6
83.6
25.4
47.6
36.4
35-4
453.1
1.1
28.8
56.1
29.3
43.5
39.9
6.3
24.2
82.7
81.8
82.2
25.8
42.2
33.5
45-5
456.2
2.3
31.1
56.5
30.9
44.6
45.0
6.1
26.9
81.1
83.0
82.0
30.1
45.6
37.3
55-6
454.6
1.3
27.3
59.4
38.2
48.5
35.1
7.6
21.0
85.4
90.2
87.9
42.7
61.3
52.3
Tota
l41.2
0.9
22.0
53.8
22.6
39.0
32.6
4.3
19.1
81.8
84.3
83.0
33.5
52.0
42.3
Educati
on
Illite
rate
57.7
1.2
20.6
66.1
29.7
42.3
46.8
6.7
20.5
87.4
86.7
86.9
14.0
38.2
29.9
Pri
mary
59.5
2.0
37.0
58.7
27.1
46.3
43.3
0.7
26.6
82.6
86.2
84.0
23.1
53.1
34.8
Mid
dle
38.0
0.0
24.8
57.8
11.6
41.7
28.5
1.2
19.0
84.5
86.6
85.2
30.8
69.8
44.4
Secondary
27.2
0.2
18.7
43.9
4.6
31.6
20.4
0.0
14.0
84.1
83.3
83.8
43.8
78.6
54.7
Hig
her
Secondary
21.2
0.0
15.0
42.1
6.4
31.6
20.1
1.6
14.7
70.4
66.7
69.3
55.2
82.4
63.2
College &
above
17.1
0.0
11.6
30.5
1.6
21.3
17.3
0.3
11.9
66.2
65.2
65.9
72.1
94.6
79.3
Tota
l41.2
0.9
22.0
53.8
22.6
39.0
32.6
4.3
19.1
81.8
84.3
83.0
33.5
52.0
42.3
Occupati
on
Executi
ve/Busi
ness
37.2
0.0
29.5
54.5
45.9
52.7
39.0
15.1
34.1
78.2
89.8
80.6
52.6
22.5
46.4
Agri
cult
ure
51.9
1.9
35.3
54.2
22.3
43.6
32.0
8.5
24.2
76.8
75.3
76.3
14.3
19.6
16.0
Dom
est
ic W
ork
**0.6
0.6
**15.5
15.6
**0.7
0.7
**80.2
80.0
**77.0
76.9
Serv
ices/
Sale
s23.4
0.0
18.1
34.2
12.2
29.2
25.5
1.8
20.1
67.5
77.0
69.7
65.4
71.8
66.9
Manual
Work
er
48.1
0.8
29.7
68.1
35.5
55.5
42.6
7.7
29.0
92.1
95.3
93.4
18.8
16.0
17.7
Oth
er
12.6
1.1
7.2
28.0
16.3
22.5
10.0
0.8
5.7
76.9
87.6
81.9
83.0
90.3
86.5
Tota
l41.2
0.9
22.0
53.8
22.6
39.0
32.6
4.3
19.1
81.8
84.3
83.0
33.5
52.0
42.3
Num
ber
(n)
2857
2996
5853
2857
2996
5853
2857
2996
5853
2857
2996
5853
2857
2996
5853
** F
igure
not
show
n;
base
d o
n f
ew
er
than 1
5 u
nw
eig
hte
d c
ase
s

Integrated Disease Surveillance Project (IDSP)
28

Non-Communicable Disease Risk Factor Survey, 2007-08, Madhya Pradesh
29
This chapter focuses on the prevalence of
hypertension and diabetes in the study population along
with the information regarding history of hypertension
and diabetes and the nature of treatment advised by
the treating physician.
4.1 HYPERTENSION
The blood pressure is an important determinant of
the risk of cardiovascular diseases, ischemic heart
disease, congestive cardiac failure and renal failure. In
the survey the blood pressure of the respondents was
measured using automated blood pressure measuring
instrument (OMRON®). Table 4.1.1 provides percentage
of respondents with history of raised blood pressure,
treatment and life style modification advised, seeking
consultation and treatment from AYUSH by sex and place
of residence. Over all 2% respondents (2% among men,
3% among women) were found to have been diagnosed
for hypertension by the health professional. In the urban
area, the prevalence of hypertension was 6% with 4%
among men and 7% among women.
Hypertension and Diabetes
CHAPTER 4
Table 4.1.1 Percentage of respondents with history of raised blood pressure, treatment and lifestyle modification
advised, seeking consultation and treatment from an AYUSH practitioner by sex and place of residence,
Madhya Pradesh, 2007- 08.
Residence
Urban Rural Combined
Hypertension Male Female Total Male Female Total Male Female Total
Hypertension diagnosed by 3.9 7.3 5.5 0.8 1.6 1.2 1.7 3.2 2.4
health professional
(all respondents)
Diagnosed hypertensive
Currently taking drugs 62.3 61.4 61.7 55.8 54.0 54.6 60.1 58.8 59.3
Advised dietary 71.5 63.3 66.4 68.3 68.8 68.7 70.5 65.3 67.2
modifications
Advised to lose weight 45.5 42.1 43.4 31.4 21.1 24.7 40.8 34.6 36.9
Advised to quit smoking 42.2 8.0 20.8 51.8 9.4 24.3 45.4 8.5 22.0
Advised to increase 64.0 52.7 56.9 59.9 31.1 41.2 62.6 45.0 51.5
physical activity
Consulted AYUSH 2.4 3.5 2.9 0.3 0.3 0.3 0.9 1.2 1.1
practitioner
Taking treatment from 23.9 20.3 21.9 25.2 35.9 30.2 24.2 23.0 23.5
AYUSH practitioner
Of those who were diagnosed for hypertension (1%
among both male and female), majority of them (60%)
were taking the prescribed medicine. About 62% of
the urban respondents and 55% of the rural respondents
were taking prescribed medicine after they
were diagnosed with hypertension and there was no
sex differential. More than 60% of those who were
diagnosed with hypertension were advised
dietary modification including low salt intake; 37% were
advised to lose weight and 52% were advised
to increase physical activity. Twenty two percent, who
were smokers, were advised to quit smoking. The
percentage of those who received dietary advice
including low salt intake was slightly higher for men (71%)
than for women (65%); more for rural (69%) than urban
(66%) respondents.
Only 1% (both in men & women) of the respondents,
who were diagnosed for hypertension had consulted
AYUSH with 3% for urban and less than 1% for rural.
Among those respondents who had consulted AYUSH,
about one quarter were taking the treatment from the

Integrated Disease Surveillance Project (IDSP)
30
AYUSH practitioner, which was 30% in case of rural and
22% in case of urban.
Table 4.1.2 presents the mean systolic and diastolic
blood pressure by sex and place of residence. In the
survey population the mean systolic blood pressure was
126 mm Hg, mean diastolic blood pressure was 78 mm
Hg. These averages were same for rural and urban, both
among males and females.
According to WHO STEPS guideline, the population
is categorized into four categories namely, normal, pre-
hypertensive, Stage-I hypertensive and Stage-II
hypertensive on the basis of their blood pressure level8.
In the present survey, this categorization was done after
recording the resting blood pressure for each study
subject. The upper and the lower limit of the systolic
and diastolic blood pressure for each category has been
given in Table 4.1.3.
Table 4.1.4 gives the percentage of respondents
Table 4.1.3 Categories of Hypertension
Category Systolic Blood Pressure Diastolic Blood Pressure
(mm Hg) (mm Hg)
Normal <120 and <80
Pre-hypertension 120-139 or 80-89
Stage-I hypertension 140-159 or 90-99
Stage-II hypertension > 160 or > 100
Table 4.1.2 Mean Systolic and Diastolic blood pressure by sex and place of residence, Madhya Pradesh, 2007- 08
Residence
Urban Rural Combined
Blood Pressure Male Female Total Male Female Total Male Female Total
Systolic blood pressure 130.1 123.7 127.1 127.1 124.3 125.8 127.9 124.1 126.1
95% CI
Lower 129.1 122.5 126.2 125.8 123.1 124.7 127.0 123.2 125.4
Upper 131.0 124.9 128.0 128.3 125.6 126.8 128.9 125.1 126.9
Diastolic blood pressure 80.7 77.7 79.3 77.9 77.4 77.7 78.7 77.5 78.1
95% CI
Lower 79.9 76.8 78.6 77.0 76.3 76.8 78.0 76.7 77.5
Upper 81.5 78.7 80.1 78.8 78.6 78.6 79.3 78.4 78.8
Table 4.1.4 Percentage of respondents according to category of hypertension by gender and place of residence
(P & 95% CI), Madhya Pradesh, 2007- 08
Residence
Category of Urban Rural Combined
hypertension Male Female Total Male Female Total Male Female Total
Normal 21.3 40.5 30.2 28.1 39.6 33.6 26.2 39.8 32.6
95% CI
Lower 18.6 36.7 27.5 24.9 35.5 30.9 23.7 36.7 30.6
Upper 24.3 44.4 33.0 31.6 43.9 36.4 28.8 43.1 34.8
Pre – hypertension 50.0 41.5 46.0 50.1 42.2 46.3 50.0 42.0 46.2
95% CI
Lower 47.0 38.2 43.7 46.2 39.2 43.7 47.2 39.7 44.3
Upper 53.0 44.8 48.4 53.9 45.3 48.9 52.9 44.4 48.2
Stage-I hypertension 21.6 14.0 18.1 16.9 13.5 15.3 18.3 13.7 16.1
95% CI
Lower 19.3 11.6 16.1 14.4 11.4 13.3 16.3 12.0 14.5
Upper 24.2 16.9 20.2 19.9 15.9 17.5 20.5 15.5 17.8
Stage-II hypertension 7.1 4.0 5.7 4.8 4.7 4.8 5.5 4.5 5.0
95% CI
Lower 5.8 3.0 4.8 3.5 3.5 3.7 4.4 3.6 4.2
Upper 8.7 5.3 6.7 6.7 6.1 6.1 6.8 5.6 6.0

Non-Communicable Disease Risk Factor Survey, 2007-08, Madhya Pradesh
31
according to categories of hypertension by sex and place
and residence. Over all, 33% respondents were normal,
46% were in the category of pre-hypertension, 16% in
stage I hypertension and only 5% were in stage-II
hypertension. Among males, 26% were normal, 50% were
in the category of pre-hypertension, 18% were in stage
I hypertension and only 6% were in stage-II hypertension
against females having 40% normal, 42% pre-
hypertension, 14% stage I hypertension and 5% stage-II
hypertension. The composition appears to be similar
for urban and rural.
4.2 SOCIO-DEMOGRAPHIC PATTERN OFHYPERTENSION
Hypertension is a major NCD risk factors especially
related to cardiovascular disease. The socio-
demographic patterns of respondents in the category
of hypertension (stage I & II) are presented in Table
4.2. Among the urban population, the prevalence of
hypertension was 24% and pattern of prevalence was
recorded as increasing with age (14% in 15-24, 19% in
25-34, 27% in 35-44, 42% in 45-54 and 53% in 55-64).
The prevalence among male respondents was high (29%)
compare with females (18%), but the increasing pattern
with age was observed in both sexes (Table 4.2).
Prevalence of hypertension by education was 24% among
illiterate and 28% among higher level. However, the
prevalence was high among occupational categories of
service (33%), executive (30%) and agriculture (25%).
Low prevalence of hypertension was recorded among
the domestic workers (20%). Overall, prevalence among
rural population was 20% and the pattern was increasing
with age (11% in 15-24 to 43% in 55-64). Similarly, high
prevalence was observed among illiterate (23%) and
college (26%), whereas it was low (14%) among secondary
level. Among the occupational categories, the prevalence
Table 4.2 Percentage of respondents in the category of stage I & stage II hypertension across age, education,
occupation and by sex and residence, Madhya Pradesh, 2007- 08
Characteristic Stage I & II hypertensive
Urban Rural Combined
Male Female Total Male Female Total Male Female Total
Age group
15-24 18.8 7.8 13.8 14.7 7.2 11.2 15.9 7.4 12.0
25-34 26.3 10.9 18.8 21.6 13.6 17.6 22.9 12.9 18.0
35-44 29.7 24.3 27.2 22.6 21.8 22.2 24.6 22.5 23.7
45-54 46.8 35.4 41.9 27.5 26.2 26.9 33.0 28.5 30.9
55-64 54.0 51.6 52.8 38.7 46.8 42.9 42.2 47.8 45.0
Total 28.7 18.0 23.8 21.8 18.2 20.1 23.8 18.1 21.1
Education
Illiterate 30.7 21.0 23.9 25.4 21.5 22.9 26.0 21.4 23.0
Primary 26.4 19.0 23.0 17.9 18.5 18.1 19.6 18.6 19.3
Middle 23.7 16.7 20.6 19.6 7.0 15.8 20.6 10.5 17.1
Secondary 26.2 14.3 21.3 17.3 3.4 13.9 20.2 9.1 16.8
Higher Secondary 28.8 14.5 23.9 24.9 9.6 21.6 26.8 12.8 22.8
College & above 33.6 18.3 28.1 30.2 0.0 26.0 32.8 16.8 27.7
Total 28.7 18.0 23.8 21.8 18.2 20.1 23.8 18.1 21.1
Occupation
Executive/Business 32.0 ** 30.3 32.2 15.7 27.2 32.1 14.9 28.5
Agriculture 30.9 13.9 25.4 20.4 19.9 20.2 21.6 19.3 20.8
Domestic Work ** 20.3 20.2 ** 15.9 15.8 11.1 17.7 17.6
Services/Sales 36.8 17.2 33.1 38.7 9.4 30.3 37.2 14.4 32.4
Manual Worker 26.9 17.4 24.5 21.9 18.9 20.7 23.1 18.7 21.4
Other 22.6 14.5 19.3 17.4 20.0 18.7 19.8 18.0 19.0
Total 28.7 18.0 23.8 21.8 18.2 20.1 23.8 18.1 21.1
Number (n) 1343 1468 2811 1449 1398 2847 2792 2866 5658
** Figure not shown; based on fewer than 15 unweighted cases

Integrated Disease Surveillance Project (IDSP)
32
Table 4.3. Percentage of respondents with history of raised blood sugar, treatment and lifestyle modification
advised, seeking consultation and treatment from an AYUSH practitioner by sex and place of residence,
Madhya Pradesh, 2007- 08
Residence
Urban Rural Combined
Blood sugar Male Female Total Male Female Total Male Female Total
Raised blood sugar diagnosed 1.7 1.7 1.7 0.1 0.2 0.2 0.6 0.6 0.6
(All respondents)
Diagnosed diabetics
Currently taking insulin 13.1 26.3 19.2 22.9 0.0 9.6 14.7 20.0 17.3
Currently taking oral drugs 81.6 77.5 79.7 100.0 41.0 65.7 84.6 68.9 76.9
Advised dietary modifications 92.8 85.1 89.2 0.0 0.0 0.0 94.0 88.6 91.4
Advised to lose weight 49.2 47.5 48.4 0.0 83.1 48.3 41.2 55.9 48.4
Advised to increase physical 71.3 67.1 69.3 78.4 65.3 70.8 72.5 66.7 69.6
activity
Consulted AYUSH practitioner 18.1 18.1 18.1 55.5 * 53.3 24.3 13.8 19.1
Taking treatment from AYUSH 60.0 63.0 61.0 100.0 * 100.0 75.0 63.0 70.7
practitioner
*no observation
was high among service (30%), executive and business
class (27%). But, it was low among occupation of
domestic work (16%). Overall, prevalence of hypertension
was 21% in Madhya Pradesh and pattern of prevalence
was increasing with age (Table 4.2).
Most striking observations of blood pressure
measurements was that only around a third of the adult
population surveyed had normal blood pressure. While
half of the adult population was categorized into pre-
hypertension group, another 16% were found in stage-I
hypertension with the remaining 5% in stage-II. On the
contrary, only 2% of population reported history of
hypertension, which requires urgent attention for
intervention.
4.3 DIABETES
Diabetes mellitus is an important marker of risk
for the arterial disease of the coronary, cerebral and
peripheral arterial trees, and for micro vascular disease
leading to blindness and renal failure. In the survey, the
history pertaining to diabetes was elicited from the
respondents. Table 4.3 deals with the percentage of
respondents with history of raised blood sugar, a
treatment and life style modification advises by sex and
place of residence. Over all less than 1% of respondents
(2% of urban and 0.2% of rural) had reported having
raised blood sugar level in past 12 months. This
percentage was same for males and females. Amongst
those who were diagnosed with diabetes, 17% of the
respondents (19% for urban and 10% for rural) were
currently taking insulin; three-quarter (80% of urban and
66% of rural respondents) were taking oral hypoglycemic
drugs. A good proportion of respondents reported to have
received advice from the treating physicians on their
life style modification, 91% for dietary advice, 48% to
reduce weight and 70 to increase physical activity.

Non-Communicable Disease Risk Factor Survey, 2007-08, Madhya Pradesh
33
This chapter describes various physical
measurements such as height, weight, waist
circumference and body mass index (BMI), which are
key indicators for surveillance of non-communicable
diseases. Weight of an individual is directly related to
the Body Mass Index (BMI), waist circumference, blood
pressure and probability of developing diabetes
mellitus-2.
5.1 WEIGHT
Having weight more than the ideal weight for age
and height is a risk factor for development of colorectal
cancer, uterine cancer, coronary artery disease and it
would also exacerbate the symptoms of osteoarthritis.
The weight is a continuous variable, reflecting the body
mass of an individual in light clothing; it is used for
calculating BMI.
5.2 HEIGHT
Height is another key variable required for
calculation of body mass index (BMI). Height is a
continuous variable measured with the individual
standing on a firm leveled surface, without wearing any
foot wear, and stand with feet together, with heels,
calves, buttocks, dorsal spine and head in same plane.
5.3 BODY MASS INDEX (BMI)
BMI (Body mass Index) is a valid indicator for finding
out whether the body weight of an individual is
appropriate for the height of the individual. It is
calculated from height and weight measurements as body
weight per meter2. Worldwide researches have shown
Physical Measurements
CHAPTER 5
that there is a strong association between BMI and health
risk. The excess of adipose tissue in the adults is
associated with excess morbidity and mortality from a
large number of health conditions like diabetes,
hypertension, hypercholesterolemia, carcinomas of colon
and breast, gall bladder stones and osteoarthritis. On
the other hand low BMI is an indicator of risk to health,
often being associated with tobacco, alcohol use and
drug addiction (Table 5.1).
5.4 WAIST CIRCUMFERENCE (WC)
The waist circumference is one of the sensitive
indicators for abdominal obesity. Abdominal obesity has
got a stronger association with coronary heart diseases
as compared to BMI. The waist measurement is taken
at the level of mid point between the inferior margin of
the rib and crest of ileum in the mid auxiliary plane,
using a non-stretchable measuring tape, without
clothing. A cut-off level of 102 cm in males and 88 cm.
in females have been recommended for developed
countries (ATP3 Guidelines), however lower cut-off levels
are appropriate for Indians- 90 cm in males and 80 cm
in females (The Asia Pacific Guidelines) 9.
Table 5.2 presents the mean BMI, height, weight
and waist circumference by sex and the place of
residence. The mean BMI in Madhya Pradesh was 20
kg/m2 (22 for urban, 19.4 for rural respondents, 19.9
for males and 20.3 for females). The mean height in
the survey population was 158 cm (159 cm for urban,
158 cm for rural, 164 cm among males and 152 cm for
females). The mean weight was 50 kg with 55 kg for
urban, 48 kg for rural. The mean weight was 53.3 kg
Table: 5.1 Categories of BMI
Body Mass Index (BMI) Category of Relative Weight
<18.5 Under Weight
18.5- 24.9 Normal Weight
25.0- 29.9 Grade-1 Over Weight
30-39.9 Grade-2 Over Weight
> 40 Grade-3 Over Weight
Source: WHO Step-wise approach to NCD surveillance

Integrated Disease Surveillance Project (IDSP)
34
Table 5.2 Mean value for body mass index (BMI), height, weight and waist circumference by sex and place of
residence, Madhya Pradesh, 2007- 08
Residence
Physical Urban Rural Combined
Measurement Male Female Total Male Female Total Male Female Total
BMI (kg/m2 ) 21.7 22.4 22.0 19.2 19.4 19.4 19.9 20.3 20.1
95% CI
Lower 20.8 21.2 21.2 18.8 19.2 19.1 19.6 19.9 19.8
Upper 22.6 23.7 22.8 19.6 19.8 19.6 20.3 20.7 20.4
Height 165.4 151.9 159.1 163.5 151.4 157.7 164.0 151.5 158.1
95% CI
Lower 164.7 151.3 158.5 162.8 150.9 157.0 163.5 151.2 157.6
Upper 166.0 152.5 159.7 164.2 151.9 158.3 164.5 151.9 158.6
Weight 58.8 50.6 55.0 51.1 44.7 48.0 53.3 46.4 50.0
95% CI
Lower 56.7 49.3 53.4 50.4 44.1 47.4 52.6 45.8 49.4
Upper 60.9 51.9 56.6 51.7 45.2 48.6 54.1 46.9 50.6
Waist circum. 78.3 71.0 74.9 72.4 65.4 69.1 74.1 67.0 70.7
95% CI
Lower 76.9 69.2 73.4 71.6 64.1 68.2 73.4 65.9 70.0
Upper 79.7 72.7 76.3 73.3 66.7 69.9 74.9 68.0 71.4
Table 5.3 Percentage of respondents according to BMI categories by sex and place of residence, Madhya Pradesh,
2007- 08
Residence
Urban Rural Combined
Category of BMI Male Female Total Male Female Total Male Female Total
Under weight(<18.5) 28.8 25.2 27.2 43.8 43.2 43.5 39.4 38.1 38.895% CI
Lower 25.1 21.7 24.0 39.5 39.9 40.4 36.2 35.5 36.4
Upper 32.9 29.0 30.6 48.1 46.6 46.7 42.7 40.7 41.2
Normal weight53.4 52.5 53.0 53.8 52.0 53.0 53.6 52.2 53.0
(18.5-24.9)
95% CI
Lower 49.8 49.8 50.6 49.7 48.9 49.9 50.6 49.8 50.7
Upper 56.8 55.2 55.3 57.8 55.2 56.0 56.7 54.5 55.2
Grade-1 over weight14.3 16.3 15.2 2.4 3.8 3.0 5.9 7.4 6.6
(25.0-29.9)
95% CI
Lower 11.3 13.9 12.8 1.7 2.7 2.4 4.8 6.3 5.7
Upper 18.0 19.0 18.0 3.3 5.2 3.9 7.1 8.6 7.5
Grade-2 over weight3.3 5.7 4.4 0.1 0.9 0.4 1.0 2.3 1.6
(30.0-39.9)
95% CI
Lower 2.5 4.3 3.5 0.0 0.5 0.2 0.8 1.7 1.3
Upper 4.4 7.7 5.6 0.3 1.6 0.8 1.3 3.0 2.0
for males and 46.4 kg for females. The average waist
circumference was 71 centimeters with 75 centimeter
for urban and 69 centimeters for rural. The waist
circumference for male and female was 74 centimeters
and 67 centimeters respectively.
Table 5.3 presents the percentage of respondents
according to their BMI category and central obesity
by sex and the place of residence. In the survey, we
found that 39% respondents were under-weight, which
was 27% of urban and 44% of rural respondents. By sex,

Non-Communicable Disease Risk Factor Survey, 2007-08, Madhya Pradesh
35
Grade-3 over weight0.2 0.2 0.2 0.0 0.1 0.1 0.1 0.1 0.1
(> 40.0)
95% CI
Lower 0.0 0.1 0.1 0.0 0.0 0.0 0.0 0.0 0.0
Upper 0.6 0.6 0.4 0.2 0.6 0.2 0.2 0.3 0.2
Central Obesity19.0 24.9 21.8 3.6 10.0 6.6 8.1 14.2 11.0
WC > K*
95% CI
Lower 15.4 21.3 18.5 2.6 8.1 5.5 6.8 12.5 9.7
Upper 23.2 29.0 25.5 4.8 12.2 8.0 9.5 16.1 12.4
* K=90 cm for male and K=80 cm for female
Table 5.4 Percentage of respondents in the category of overweight (Grade I, II & III) across age, education,
occupation and by sex and residence, Madhya Pradesh, 2007- 08
Characteristic Overweight ( Grade I, II & III)
Urban Rural Combined
Male Female Total Male Female Total Male Female Total
Age group
15-24 7.1 5.3 6.3 0.5 0.4 0.5 2.5 1.9 2.2
25-34 15.2 18.7 16.4 1.9 2.8 2.3 5.7 7.3 6.5
35-44 26.9 35.6 30.9 3.6 7.7 5.5 10.6 15.9 13.1
45-54 30.0 35.5 32.5 2.9 11.0 6.7 10.8 17.7 14.1
55-64 28.6 41.6 35.1 8.0 7.8 7.9 13.1 15.8 14.5
Total 17.8 22.2 19.8 2.5 4.7 3.5 6.9 9.7 8.2
Education
Illiterate 8.9 16.5 14.2 1.6 5.1 3.8 2.5 6.7 5.2
Primary 10.6 19.8 14.8 1.9 5.1 3.0 3.7 9.4 5.8
Middle 9.5 18.0 13.3 2.5 3.0 2.6 4.1 8.6 5.6
Secondary 13.3 18.9 15.6 0.6 0.0 0.5 4.8 10.5 6.5
Higher Secondary 22.1 27.7 24.1 5.6 10.9 6.8 13.6 21.6 16.0
College & above 29.7 36.7 32.2 15.1 0.0 13.3 26.2 34.2 28.5
Total 17.8 22.2 19.8 2.5 4.7 3.5 6.9 9.7 8.2
Occupation
Executive/Business 30.9 33.4 31.1 5.2 0.8 3.9 18.3 7.2 16.1
Agriculture 15.9 7.1 13.2 2.8 3.4 3.0 4.3 3.8 4.2
Domestic Work ** 25.2 25.1 ** 5.7 5.6 ** 13.9 13.8
Services/Sales 29.4 36.0 30.7 10.2 16.0 12.1 24.8 28.5 25.7
Manual Worker 9.1 17.0 11.0 1.7 3.9 2.6 3.5 5.6 4.3
Other 12.1 18.5 14.8 0.8 6.4 3.6 6.0 11.0 8.3
Total 17.8 22.2 19.8 2.5 4.7 3.5 6.9 9.7 8.2
Number (n) 1398 1536 2934 1459 1357 2816 2857 2893 5750
** Figure not shown; based on fewer than 15 unweighted cases.
39% males and 38% females were underweight. Over 8%
people were over weight (20% among urban and 4%
among rural population). Overall the central obesity was
11% (19% among urban males, 25% among urban females;
4% among rural males, 10% among rural females).
5.5 SOCIO-DEMOGRAPHIC PATTERN OFOVERWIGHT
Overweight (obesity) is a major risk factor of NCD.
The socio-demographic pattern of respondents in the
category of overweight (grade I, II & III) across age,

Integrated Disease Surveillance Project (IDSP)
36
education, occupation and sex are presented in Table
5.4. The prevalence of overweight among the urban
population was 20% and its pattern was found increasing
with age (6% in 15-24, 17% in 25-34, 31% in 35-44, 33%
in 45-54 and 35% in 55-64). The prevalence among
female respondents was high (22%) compare with males
(18%), but the increasing pattern with age was observed
in both sexes (Table 5.4). In educational categories,
the prevalence was varying with 14% among illiterate to
32% among higher level (College). Occupational
categories, the prevalence was high among executive
and business class (31%), and service (31%). Low
prevalence of overweight was recorded among
occupation of manual work (11%) and agriculture (13%).
Overall, prevalence among rural population was 4% and
it was varying with age (1% in 15-24 to 8% in 55-64).
Similarly, prevalence in the educational categories was
varying from 4% among illiterate to 13% among higher
level of education. In the occupational category, the
prevalence was high among service (12%) and domestic
work (6%) and it was low among the occupation of
agriculture (3%) and manual worker (3%). Overall,
prevalence of overweight was 8% among the combined
population and the pattern of prevalence was increasing
with age. Except the younger age group, the overweight
peoples were prevalent in all age groups across
educational levels and occupation (Table 5.4).
In the category of BMI and central obesity, one out
of ten of adult population surveyed was overweight or
categorized into central obesity, constituting a high-risk
group for NCD. It is also to be noted that 39% of adult
population was recorded as under weight which is also
an important issue for health planner.

Non-Communicable Disease Risk Factor Survey, 2007-08, Madhya Pradesh
37
The NCD risk factors survey in Madhya Pradesh
collected information from a random sample of 4998
households covering 2500 households from rural and
2498 from urban areas. From these households, 5853
individuals selected randomly were interviewed to collect
behavioural information and also to carry out physical
measurements. The analysis of the survey data have
been presented and discussed in the present report
providing information about the proportion of population
or subgroup of population under the risk of Non-
communicable diseases.
In Madhya Pradesh, majority households (92%) are
Hindu followed by Muslim (6%). Forty seven percent of
households were using hand pump with 24% in urban
and 56% in rural households. One-fourth of households
had access to piped drinking water with 69% in urban
and 10% in rural households. About half of the urban
households had flush toilet facility whereas 98% of rural
household had pit toilet facility. Overall 68% households
used electricity as main source of lighting with 97% in
urban and 57% in rural households. Eighty seven percent
of rural households were still using wood as a main source
of cooking fuel and 59% of urban households were using
LPG. Sixty four percent of rural households resided in
kachha houses. About 56% population of Madhya Pradesh
was literate, but there existed sex and rural-urban
differentials in educational attainment.
Tobacco is one of the major risk factors of non-
communicable diseases. About 38% of male population
smoked tobacco daily whereas smoking among females
was low. Overall 39% of the population uses smokeless
tobacco whereas 54% of men and 23% of women use
smokeless tobacco. Forty seven percent of population
in Madhya Pradesh used tobacco in any form (i.e.
smoking or smokeless). This prevalence was 68% among
males and 23% among females. The mean age of
initiation of tobacco use among young age (15-34 years)
people was 19 years for male smokers, and 20 years for
male smokeless tobacco users.
The alcohol consumption is a known risk factors of
many non-communicable diseases. About 33% of men
Summary and Conclusions
CHAPTER 6
consumed alcohol at least once in last one year whereas
24% of men in last one month. The alcohol consumption
among females was low. Those who consumed alcohol
in last seven days, 13% of them were binge drinkers.
The mean age of initiation of alcohol consumption by
young age (15-34 years) men was 20 years.
Nutritional inadequacy is the major risk factors of
many non-communicable diseases. Overall, 83% of
population in Madhya Pradesh consumed less than five
servings of fruits and vegetables per day, which was
inadequate as per WHO recommended standards. On
an average only two days in a week people consumed
fruits against vegetables consumed on 5 days.
Physical inactivity is the leading cause of diabetes,
hypertension and coronary heart disease. Overall, 42%
of population in Madhya Pradesh with 68% of urban and
32% of rural population was in low category of physical
activity. About 46% of the population was detected with
pre hypertension stage and one-fourth was in stage I
and stage II hypertension. According to BMI, 8% of
population was in the category of over weight and 39%
of population was recorded as under weight. However,
11% of population in Madhya Pradesh was in the category
of central obesity with 14% among females and 8% among
males.
Overall, prevalence of smoking and smokeless
tobacco users among female population was low compare
with males. The increasing pattern of prevalence was
recorded with increasing age of people. A declining
pattern of prevalence was observed with increasing level
of education. Prevalence among the occupation of
agriculture and manual work was high compare with
others. A similar pattern of increasing prevalence with
age and decreasing with level of education was also
observed with current alcohol drinkers. The habits of
tobacco and alcohol use starts at early young age which
contributes to the high risk of NCD at later age. High
proportion of population was taking inadequate amount
of fruits and vegetables which increases the risk of NCD.
Its distribution across all age groups, education and
occupation by sex and residence was found very high

Integrated Disease Surveillance Project (IDSP)
38
with marginal differences. Besides that, about half of
the population was found in the category of low physical
activity. More female respondents were in the category
of low physical activity as compare with males across
all the age groups. Rural population was doing more
physical work than urban. The increasing pattern of
prevalence of hypertension was recorded with increasing
age of people. It was prevalent in all education levels
and occupational categories. High prevalence of
overweight was recorded in all the age groups except
the younger age. It was prevalent in both sexes, but
higher in urban population compare with rural. Low
prevalence of overweight was recorded among illiterates
as well as among the people working in agriculture or
manual worker. Overall, NCD risk factors were prevalent
across all the socioeconomic and demographic categories
of population in Madhya Pradesh.
These are the major health issues related to Non-
communicable diseases of people in Madhya Pradesh.

Non-Communicable Disease Risk Factor Survey, 2007-08, Madhya Pradesh
39
1. Risk factor surveillance for non communicable
diseases (NCDs): the multi-site ICMR-WHO
collaborative initiative, presented in Forum 9,
Mumbai, 12-16 September 2005.
2. The World Health Report 2002; Reducing Risks,
Promoting Healthy Life, WHO.
3. Primary Census Abstract: Census of India, 2001,
Office of the Registrar General, India, Ministry of
Home Affairs, Govt. of India.
4. National Health Profile, Central Bureau of Health
Intelligence, Director General Health Services,
Ministry of Health & Family Welfare, Govt. of India.
5. Lisley Kish: A procedure for objective respondent
selection within the household. Am Stat Assoc
References
Journal, 1949; 44: 380-387.
6. Lehtonen R. and Pahkinen E. 2004. Practical Methods
for Design and Analysis of Complex Surveys. John
Wiley & Sons, Ltd.: England.
7. Global Physical Activity Questionnaire (GPAQ),
Analysis Guide, www.who.int/chp/steps.
8. The Seventh Report of the Joint National Committee
on Prevention, Detection, Evaluation, and
Treatment of High Blood Pressure. JAMA
2003;289:2560–71.
9. WHO/IASO/IOTF: The Asia-Pacific perspective:
redefining obesity and its treatment [article online].
Available from http://www.idi.org.au/home.htm.
Accessed 21August 2003.

Integrated Disease Surveillance Project (IDSP)
40
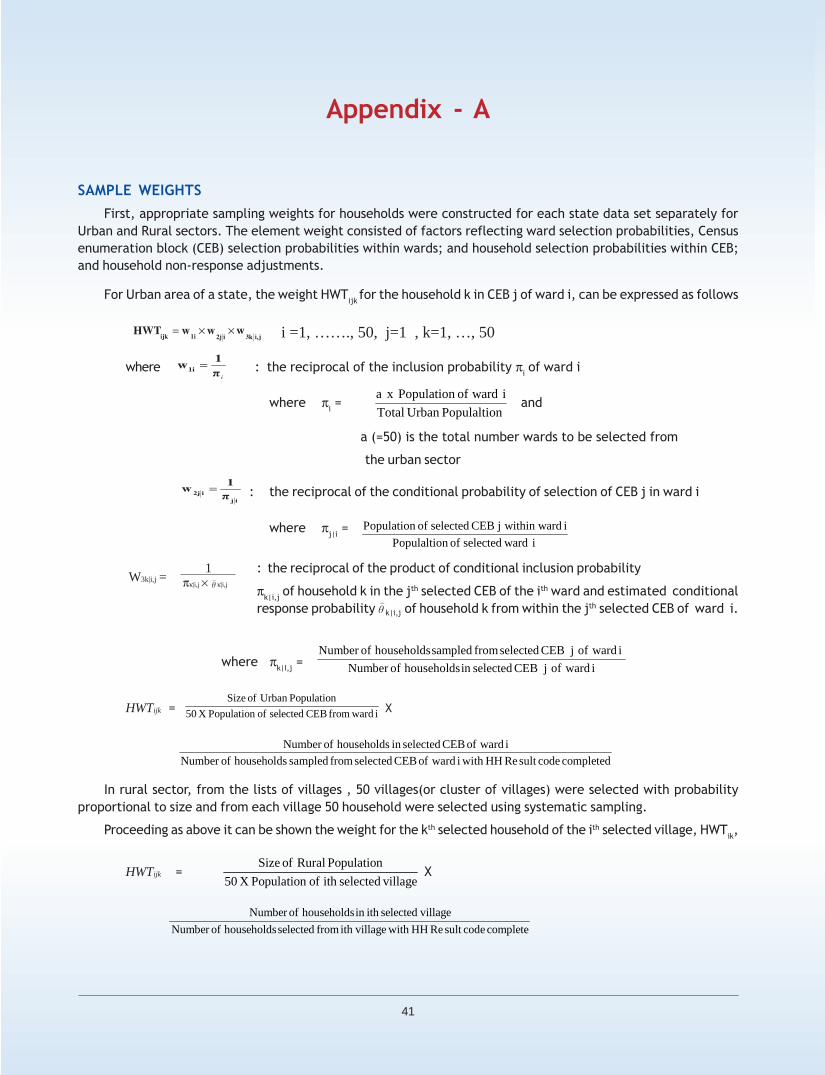
Non-Communicable Disease Risk Factor Survey, 2007-08, Madhya Pradesh
41
Appendix - A
SAMPLE WEIGHTS
First, appropriate sampling weights for households were constructed for each state data set separately for
Urban and Rural sectors. The element weight consisted of factors reflecting ward selection probabilities, Census
enumeration block (CEB) selection probabilities within wards; and household selection probabilities within CEB;
and household non-response adjustments.
For Urban area of a state, the weight HWTijk
for the household k in CEB j of ward i, can be expressed as follows
i =1, ……., 50, j=1 , k=1, …, 50
where : the reciprocal of the inclusion probability πi of ward i
where πi =
nPopulaltioUrbanTotal
iwardofPopulationxa and
a (=50) is the total number wards to be selected from
the urban sector
: the reciprocal of the conditional probability of selection of CEB j in ward i
where πj|i
= iwardselectedofnPopulaltio
iwardwithinjCEBselectedofPopulation
: the reciprocal of the product of conditional inclusion probability
πk|i,j
of household k in the jth selected CEB of the ith ward and estimated conditional
response probability k|i,j of household k from within the jth selected CEB of ward i.
where πk|I,j
= iwardofjCEBselectedinhouseholdsofNumber
iwardofjCEBselectedfromsampledhouseholdsofNumber
HWTijk = iwardfromCEBselectedofPopulationX50
PopulationUrbanofSize X
completedcodesultReHHwithiwardofCEBselectedfromsampledhouseholdsofNumber
iwardofCEBselectedinhouseholdsofNumber
In rural sector, from the lists of villages , 50 villages(or cluster of villages) were selected with probability
proportional to size and from each village 50 household were selected using systematic sampling.
Proceeding as above it can be shown the weight for the kth selected household of the ith selected village, HWTik,
HWTijk =villageselectedithofPopulationX50
PopulationRuralofSize X
completecodesultReHHwithvillageithfromselectedhouseholdsofNumber
villageselectedithinhouseholdsofNumber
W3k|i,j = πκ|i,j × κ|i,j
1

Integrated Disease Surveillance Project (IDSP)
42
INDIVIDUAL WEIGHTS
From each selected household one member aged 15-54 is selected using the Kish Method and all usual members
aged 55-64 were selected. Since objective of the study is to obtain estimates for each age group (15-24 through
55-64) and sex groups, post stratification is used for improvement of efficiency of the estimators.
Post stratification weights for individuals were constructed using the state age distributions for both sexes of
the urban sector which are available on the population level. We first divide the target population of persons age
15-64 in 10 age – sex post strata with five age group (15-24 through 55-64) and two sex groups ( male and female).
In the subsequent lines the symbol l is used to denote the age group [ 15 + (l – 1)*10, 15 +10*l], l = 1,2, …, 5
and m for sex, m = 1 if sex is male and m=2 if sex is female.
For Urban,
Define :
1 if nth selected respondent of the kth household of the jth CEB of the ith
δijknlm
= ward belongs to age group l and of sex m.
0 otherwise
estimated number of persons of age group l and sex m if one person from the list of persons age
15-54 is selected from household of the population (l =1,2,3,4, m=1,2)
estimated number of the persons belonging to the age group l and sex group m (l =5, m=1,2)
is obtained as
where is the estimated group response rate.
Calibrated Individual weight
IWTijklm
= x HWTijk
Denoted by
Nlm
= Number of person of sex m belonging to age group l in the urban sector of the population
( l = 1,2 ,3,4,5 and sex m =1,2 )
yijkn
, = the observed value of the study variable for the respondent n belonging to household k,
CEB j and ward i.
Estimate of the population total of sex group m and age group l is

Non-Communicable Disease Risk Factor Survey, 2007-08, Madhya Pradesh
43
Estimate of the mean of the study variable for sex group m and age group l, and for and overall
are , respectively.
For Rural,
Define :
1 if nth selected respondent of the kth household of the ith village
δiknlm = belongs to age group l and of sex m.
0 otherwise
estimated number of persons of age group l and sex m if one person from the list of
persons age 15-54 is selected from household of the population (l =1,2,3,4, m=1,2)
estimated number of the persons belonging to the age group l and sex group m (l =5, m=1,2)
is obtained as
where is the estimated group response rate.
Calibrated Individual weight
IWTiklm
= x HWTik
Denoted by
Nlm
= Number of person of sex m belonging to age group l in the rural sector of the population
( l = 1,2 ,3,4,5 and sex m =1,2 )
yikn
, = the observed value of the study variable for the respondent n belonging to household k of
village i.
Estimate of the population total of sex group m and age group l is
Estimate of the mean of the study variable for age-sex group l and m, sex group m, age group l and overall
mean can be obtained.

Integrated Disease Surveillance Project (IDSP)
44
Appendix - B
INTEGRATED DISEASE SURVEILLANCE PROJECT (IDSP)
NCD RISK FACTORS SURVEY (PHASE –I), INDIA
(Name of State Year –2007)
HOUSEHOLD QUESTIONNAIRE
IDENTIFICATION
STATE :
DISTRICT :
TEHSIL/TALUK
CITY/TOWN/VILLAGE:
URBAN/RURAL (URBAN=1, RURAL =2, URBAN SLUM -3)
PSU NUMBER …………………………………….
SEGMENT NUMBER:
Household Number
Name of Household Head:
Address oF HOUSEHOLD:
INTERVIEWER VISITS
1 2 3 FINAL VISIT
Date Day
____________ ___________ ____________ Month
Interviewer’s____________ ___________ ____________
Year
2 0
Name Interviewer Code
Result ____________ ___________ ____________
Result*
Next Visit:
____________ ___________
Total Number of Visits
Date
Time
*RESULT CODES: 1. COMPLETED 6. DWELLING VACANT OR
2. NO HOUSEHOLD MEMBER/ NO COMPETENT RESPONDENT ADDRESS NOT A DWELLING
AT HOME AT THE TIME OF VISIT 7. DWELLING DESTROYED
3. ENTIRE HOUSEHOLD ABSENT FOR EXTENDED PERIOD 8. DWELLING NOT FOUND
4. POSTPONED 9. OTHER _______________________
5. REFUSED (SPECIFY)
NAME SUPERVISOR EDITED & CHECKED BY KEYED BY
DATE
……………… ……………… ………………
CONFIDENTIAL
For Research
Purpose Only

Non-Communicable Disease Risk Factor Survey, 2007-08, Madhya Pradesh
45
HOUSEHOLD STRUCTURE (HS)
List of all household members who usually live in your household aged 12 years and above
LINE NAME RELATION- SEX AGE IN RESIDENTIAL RECRUITED FOR SURVEYNO. SHIP COMPLETED STATUS
YEARS Please give me names (Present-1; Put a tick mark of the persons who temporarily against one member usually live in your away from age 15-54 selected household (may be home-2) below by kish method temporarily away and all members from home) age 55-64
(1) (2) (3) (4) (5) (6) (7)
01
02
03
04
05
06
07
08
09
10
11
12
Codes for Q.3 01 – HEAD, 08 – BROTHER OR SISTER
Relationship to Head of Household: 02 – WIFE OR HUSBAND, 09 – BROTHER IN LAW OR SISTER IN
03 – SON OR DAUGHTER LAW
04 – SON IN LAW OR DAUGHTER 10 – NIECE OR NEPHEW
IN LAW 11 – OTHER RELATIVE
05 - GRANDCHILD 12 – ADOPTED OR FOSTER CHILD
06 - PARENT 13 – NOT RELATED
07 – PARENT IN LAW
LIST ALL USUAL MEMBERS OF THE HOUSEHOLD AGE 15 – 54 IN THE HOUSEHOLD*.
Line No. Sex Age Adult Number Select one member (R) Enter a specific Kish Table used forby using Kish Table selection of one member below.
(A or B1 or B2 or C……. as assigned
for each randomly selected household
1 to 50)
*Arrange all the members aged 15-54 in the following order - oldest male, next oldest male, and so on for all males
followed by oldest female, next oldest female, etc. Then use selection table assigned to the household to choose R
individual RESPONDENT.
(Wit
h h
ead o
fh
ouse
hold
)
Male
-1Fem
ale
-2

Integrated Disease Surveillance Project (IDSP)
46
GENERAL HOUSEHOLD INFORMATION
Questions RESPONSE SKIP
1. Number of members who usually
live in the household
2. Religion of the head of the
household: Hindu ......................................... 01
Muslim........................................ 02
Christian ..................................... 03
Sikh ........................................... 04
Buddhist/neo buddhist ................... 05
Jain ........................................... 06
Jewish........................................ 07
Parsi .......................................... 08
No religion .................................. 09
Other ........................................ 96
(Specify)
3. What is the main source of drinking PIPED WATER
water? Piped into
Residence .......................... 11
Public Tap .......................... 12
GROUND WATER:
Hand Pump in Residence ....... 21
Public Hand Pump ................ 22
WELL WATER
Well in Residence
Covered well ....................... 31
Open well .......................... 32
Public Well
Covered well ........................... 33
Open well ............................... 34
SURFACE WATER:
Spring .................................... 41
River/Stream ........................... 42
Pond ..................................... 43
Dam ....................................... 44
Rainwater ............................... 51
Tanker Truck ........................... 61
Any other ............................... 96
(specify)
4. What kind of toilet facilities do you have? Flush Toilet
Own Flush Toilet ...................... 11
Shared Flush Toilet ................... 12
Public Flush Toilet .................... 13
Pit Toilet/Latrine
Own Pit Toilet ......................... 21
Shared Pit Toilet ...................... 22
Public Pit Toilet ....................... 23
No facility/Bush/Field ................ 31
Other .................................... 96
(Specify)

Non-Communicable Disease Risk Factor Survey, 2007-08, Madhya Pradesh
47
5. What is the main source of lighting for Electricity ............................... 1
your household? Kerosene ................................ 2
Gas ........................................ 3
Oil ........................................ 4
Other ..................................... 6
(Specify)
6. What is the type of house? Pucca ..................................... 1
Semi-Pucca .............................. 2
Kachha ................................... 3
7. How many rooms are there in your
household? Rooms .....................
8. Do you have a separate room, which is Yes ........................................ 1
used as kitchen? No ........................................ 2
9. What type of fuel does your household Wood ..................................... 01
mainly use for cooking? Crop Residue ........................... 02
Dung Cakes ............................. 03
Coal/Coke/Lignite .................... 04
Charcoal ................................ 05
Kerosene ............................... 06
Electricity .............................. 07
Liquid Petroleum Gas (LPG) ......... 08
Bio-Gas .................................. 09
Others ................................... 96
(Specify)
10. Does this household own this house or Yes ........................................ 1
any other house? No ........................................ 2
11. Does this household own any agricultureland? Yes ........................................ 1 If No, go to
No ........................................ 2 14
12. How much agriculture land does this Acres
household own? None .
13. Out of this land, how much is irrigated? Acres
None .
14. Does the household own any livestock? Yes ........................................ 1
No ........................................ 2
15. Does the household own any of the following: Yes No
A mattress? 1 2
(READ ALL THE OPTIONS AND RECORD A pressure cooker? 1 2
THE RESPONSE) A chair? 1 2
A cot or bed? 1 2
A table? 1 2
A clock or Watch? 1 2
An electric fan? 1 2
A bicycle? 1 2
A radio or transistor? 1 2
A sewing machine? 1 2
A telephone or Mobile? 1 2
A refrigerator? 1 2
A television? 1 2
A moped, scooter, or motorcycle? 1 2
A car? 1 2
A water pump? 1 2
A bullock cart? 1 2
A thresher? 1 2
A tractor? 1 2

Integrated Disease Surveillance Project (IDSP)
48
16. What is the type of oil/cooking medium Cooking Oil
most commonly used in the house? Mustard oil ............................. 01
Coconut oil ............................. 02
(CHOOSE ONLY ONE IDENTIFIED BY Groundnut oil .......................... 03
MAXIMUM CONSUMPTION) Sunflower oil ........................... 04
Soyabean oil ............................ 05
Palm oil .................................. 06
Vanaspati oil ............................ 07
Pure Ghee .............................. 08
Butter ................................... 09
Others ................................... 96
(Specify)

Non-Communicable Disease Risk Factor Survey, 2007-08, Madhya Pradesh
49
INTEGRATED DISEASE SURVEILLANCE PROJECT (IDSP)NCD RISK FACTORS SURVEY (PHASE –I), INDIA
(Name of State Year –2007)
INDIVIDUAL QUESTIONNAIRE
IDENTIFICATION
STATE CODE:
DISTRICT CODE
TEHSIL/TALUK
CITY/TOWN/VILLAGE
SEGMENT NUMBER:
URBAN/RURAL (URBAN=1, RURAL =2, URBAN SLUM = 3)
PSU NUMBER
HOUSEHOLD NUMBER
LINE NUMBER OF PARTICIPANT
NAME: _______________________________________
CONSENT RESPONSE
CONSENT HAS BEEN READ OUT TO PARTICIPANT YES ........................1
NO ........................2 IF NO, READ
CONSENT
CONSENT HAS BEEN OBTAINED YES ........................1
NO ........................2 IF NO, END
1 2 3 FINAL VISIT
Date
Interviewer’s ___________ ___________ ___________ Day
Name & Code ___________ ___________ ___________ Month
(Step 1 & Step 2) Year 2 0
Technician’s Interviewer’s Code
Name & Code ___________ ___________ ___________ Result* (Step-1)
(Step 3) Result* (Step- 2)
Result* (Step- 3)
Next Visit ___________ ___________ Total Number
Date/ Time of Visits
*RESULT CODES: 1. COMPLETED 2. NOT AT HOME 3. POSTPONED 4. REFUSED 5. PARTLY COMPLETED 6. NOT ELIGIBLE
9. OTHER (SPECIFY) _____________________________
NAME SUPERVISOR EDITED & CHECKED BY KEYED BY
DATE
……………… …………………. ………………….
CONFIDENTIAL
For Research
Purpose Only

Integrated Disease Surveillance Project (IDSP)
50
STEP- I DEMOGRAPHIC INFORMATION
QUESTIONS AND FILTERS Response Skip
101. Sex Male ............................................... 1
Female ............................................. 2
102. Age Age in completed
Years
Never married ................................... 1
Currently ...........................................
103. What is your current marital Married ........................................... 2
status? Married but gauna not performed .......... 3
Widowed/Divorced/Separated ............... 4
104. Have you ever attended school? Yes ................................................. 1 If no, go
No .................................................. 2 to 107
105. if yes, what is the highest grade Grade*…….…..
of education you completed?
Check 105
106. Grade 0-5 Grade 6 & above Go to 108
107. Can you read and write? Yes ................................................. 1
No .................................................. 2
Professional/Executive/Manager/
108. What is your main work/ Big business ...................................... 1
occupation? Clerical/Medium business ..................... 2
Sales ............................................... 3
Agriculture/Self-employed ................... 4
Agriculture employer .......................... 5
Household and domestic work .............. 6
Services ........................................... 7
Skilled manual ................................... 8
Unskilled manual ................................ 9
Other (Specify) ................................. 10
Do not work .................................... 11
*GRADE FOR DIFFERENT LEVEL OF EDUCATION LEVEL GRADE
COMPLETED EDUCATION CLASS I TO XII : 1 TO 12 YEARS = 1 TO 12 GRADE
BACHELOR’S DEGREE : 15 YEARS (12+3) = 15 GRADE
MASTER’S DEGREE : 17 YEARS (12+3+2) = 17 GRADE
ENGINEERING : 16 YEARS (12+4) = 16 GRADE
MBBS : 17 YEARS (12+5) = 17 GRADE
POLYTECHNIC : 13 YEARS (10+3) = 13 GRADE
ITI : 11 YEARS (10 +1) = 11 GRADE
PH. D. : 20 YEARS (12+3+2+3) = 20 GRADE
↑ ↑

Non-Communicable Disease Risk Factor Survey, 2007-08, Madhya Pradesh
51
STEP- I BEHAVIOURAL INFORMATION
Now I am going to ask you some questions about various health behaviours. This includes things like smoking, drinking
alcohol, eating fruits and vegetables and physical activity. Let’s start with tobacco
Smoking Tobacco use
Questions Response Skip
201. Do you currently smoke any tobacco Yes ............................................. 1
products, such as bidis, cigarettes, cigars No.............................................. 2 If No,
or pipes, hookah or any other local go to 205
tobacco products?
202. If Yes, do you smoke daily? Yes ............................................. 1
No.............................................. 2 if No,
go to 205
203. On an average, how many (number oftimes in case of hookah) of the following Number
do you smoke each day? Bidis
(RECORD FOR EACH TYPE) Manufactured Cigarettes
RECORD 88, IF ANY PRODUCT IS NOT Hand-rolled Cigarettes
USED INSTEAD OF LEAVING BLANK IN
THE PRODUCT CATEGORIES). Pipes
Cigars, Cheroots
Hookah
(RECORD FOR ANY NEW FORM OF
TOBACCO USE REPORTED BY THE Other local smoked tobacco
RESPONDENT e.g. REVERSE SMOKING etc.) products…..…………………
(SPECIFY)
204. How old were you at that time when you Go to 208
first started using the tobacco product(s) Age in completed years
daily? Don’t remember 7 7
205. In the past, did you ever smoke tobacco Yes ............................................. 1
products such as bidis, cigarettes, cigars No ............................................. 2 If No, go
or pipes daily? to 207
206. How old were you when you stoppedsmoking daily? Age in completed years
Don’t remember 7 7
207. Are you currently exposed to tobacco
smoke at your home or workplace daily? Yes ............................................. 1
No ............................................. 2

Integrated Disease Surveillance Project (IDSP)
52
Smokeless Tobacco use
Questions Response Skip
208. Do you currently use any smokeless tobacco, Yes ......................................... 1
such as (chewing tobacco, tuibu snuff, betel, No .......................................... 2 if No,
gutka, pan masala, etc.)? go to 212
209. If yes, Do you currently use smokeless tobacco Ye .......................................... 1
products daily? No .......................................... 2 if No, go
to 212
210. On average, how many times a day do you use...
Chewing tobacco
(RECORD FOR EACH TYPE) Pan with tobacco
SPECIFY 77 IF NO PRODUCTS WERE USED IN
EACH CATEGORY INSTEAD OF LEAVING Tuibu, Tobacco Snuff, by
CATEGORIES BLANK. mouth
Snuff, by nose
Other
Other (specify)…………………….
211. How old were you at that time when you firststarted using smokeless tobacco daily? Age in completed years Go to 214
212. If you are not using currently, in the past did Yes …………………...1
you ever use smokeless tobacco products No ……………….…..2 if No, go
daily such as chewing tobacco, tuibu, snuff, to 214
betel, gutka, etc.?
213. How old were you when you stopped using
smokeless tobacco products daily? Age in completed years
Alcohol Consumption
The next questions ask about the consumption of alcohol.
Questions Response Skip
214. Have you consumed any alcoholic products Yes ......................................... 1
(such as beer, wine, whisky, locally prepared No .......................................... 2 if No, go to
alcohol, etc.) within the past 12 months? 219
215 In the past 12 months, how frequently have 5-7 days per week ...................... 1
you had at least one drink? 1-4 days per week ...................... 2
1-3 days per month .................... 3
Less than once per month ........... 4
216. When you drink alcohol, on average, how
many standard drinks do you have during Number
one day? (USE SHOWCARD)
217. Have you consumed alcohol (such as beer, Yes ......................................... 1
wine, spirits, or any locally prepared wine, No .......................................... 2 If No go to
etc.) within the past 30 days? 220
218. During each of the past 7 days, how many
standard drinks of any alcoholic drink did Monday
you have each day?
Tuesday Go to 220
(USE SHOWCARD) Wednesday

Non-Communicable Disease Risk Factor Survey, 2007-08, Madhya Pradesh
53
Thursday
Friday
Saturday
Sunday
219. If answer to Question 214 is No, then Have you Yes ......................................... 1
ever (past user) consumed alcohol (such as beer, No .......................................... 2 if No, go to
wine, spirits, or any local wine product)? 221
220. How old were you when you started Age in years
consuming alcohol regularly?Don’t Remember 7 7
Diet
The next questions ask about the fruits and vegetables that you usually eat. I have a nutrition card here that shows
you some examples of local fruits and vegetables. Each picture represents the size of a serving. As you answer these
questions please think of a ‘typical’ or a ‘usual’ week.
Questions Response Skip
221. In a typical week, on how many days do you If zero days,
eat fruit? Number of days go to 223
222. How many servings of fruit do you eat on oneof those days? Number of servings
(USE SHOWCARD)
223. In a typical week, how many days do you eat If zero days,
vegetables? Number of days go to 225
(USE SHOWCARD)
224. How many servings of vegetables do you eat on Number of servings
one of those days?
(USE SHOWCARD)
225. How often do you consume each of the Butter/Ghee
following ?
Fried local foods (Samosa,
Kachori, etc.)
(USE CODE: DAILY – 1;
AT LEAST ONCE IN A WEEK – 2; Red meat
ONCE IN A MONTH –3;
OCCASIONALY OR RARELY - 4; Eggs
NEVER – 5)
Chicken
Fish
Aerated drinks
Sweetened drinks
Pizza/burgers/French fries etc
Cakes, Pastries or other
bakery items
Chips, Namkeen etc

Integrated Disease Surveillance Project (IDSP)
54
Physical Activity
Next I am going to ask you about the time you spend doing different types of physical activity in a typical week.Please answer these questions even if you do not consider yourself to be a physically active person.
Think first about the time you spend doing work. Work includes things that you have to do such as paid or unpaid
work, study/training, household chores, harvesting food/crops, fishing or hunting for food, seeking employment.
In answering the following questions ‘Vigorous –Intensity activities’ are activities that require hard physical effort
and cause large increase in breathing or heart rate, ‘Moderate-Intensity activities’ are activities that require effort
and cause small increases in breathing or heart rate.
Questions Response Skip
226. Does your work involve vigorous-intensity activity
that causes large increases in breathing or heart rate Yes .............................. 1
like (carrying or lifting heavy loads, digging or No ............................... 2 If No, go to
construction work etc.) for at least 10 minutes 229
continuously?
227. In a typical week, on how many days do you do Number of days
vigorous-intensity activities as part of your work?
228. How much time do you spend doing vigorous- Hours : minutes
intensity activity at home/work on a typical day? :
Hours minutes
229. Does your work involve moderate -intensityactivity that causes small increases in breathing Yes .............................. 1
or heart rate for at least 10 minutes continuously No ............................... 2 If No,go to
(such as brisk walking or carrying loads, manual 232
washing of clothes, dry sweeping of floor, wet
mopping of floor, drawing water from well, carrying
water from tap, carrying water from river or well,
manual grinding or pounding of cereals,
gardening at home, carrying groceries from
market, etc.) ?
230. In a typical week, on how many days do you do
moderate-intensity activities as part of your work? Number of days
231. How much time do you spend doing moderate- Hours : minutes
intensity activity at work on a typical day? :
Hours minutes
Travel (related to Physical Activity) to and from places
The next questions exclude the physical activities at work that you have already mentioned. Now I would like to ask
you about the usual way you travel to and from places. For example to work, for shopping, to market, to place of
worship etc.
232. Do you walk or use a bicycle (pedal cycle) for Yes .............................. 1
at least 10 minutes continuously to get to and No ............................... 2 If No, go to
from places? 235
233. In a typical week, on how many days do you
walk or bicycle for at least 10 minutes Number of days
continuously to get to and from places?
234. How much time do you spend walking or Hours : minutes
bicycling for travel on a typical day? :
Hours minutes

Non-Communicable Disease Risk Factor Survey, 2007-08, Madhya Pradesh
55
Recreational Activity
235. Do you do any vigorous-intensity sports, fitness
or recreational (leisure) activities that cause large Yes ................................... 1
increases in breathing or heart rate like (running No.................................... 2 If No, go to
or football,…) for at least 10 minutes continuously? 238
236. In a typical week, on how many days do you do
vigorous-intensity sports, fitness, or recreational Number of days
activity?
237. How much time do you spend doing vigorous- Hours : minutes
intensity sports, fitness or recreational (leisure) :
activities on a typical day?Hours minutes
238. Do you do any moderate-intensity sports, fitness
or recreational (leisure) activities that cause small Yes ................................... 1
increases in breathing or heart rate such as brisk No.................................... 2 If No, go to
walking (cycling, swimming, volleyball etc.) for 241
at least 10 minutes continuously?
239. In atypical week, on how many days do you do
moderate-intensity sports, fitness, or recreational
activity? Number of days
240. How much time do you spend doing moderate- Hours : minutes
intensity sports, fitness, or recreational activities on :
a typical day?
Hours minutes
Yoga Activity
241. Do you regularly practice Yogic Exercise /Yogasan? Yes ................................... 1
No.................................... 2 If No, go to
244
242. If yes, how many days in a week?Number of days
243. How much time do you spend doing Yoga in a Hours : minutes
typical day? :
Hours minutes
Sedentary Behaviour
The following question is about sitting or reclining at work, at home, getting to and from places, or with friends
including time spent [sitting at a desk, sitting with friends, traveling in car, bus, train, reading, playing cards or
watching television], but do not include time spent sleeping.
244. How much time do you usually spend sitting or Hours : minutes
reclining on a typical day? :
Hours minutes

Integrated Disease Surveillance Project (IDSP)
56
History of Raised Blood Pressure
Questions Response Skip
245. When was your blood pressure last measured by Within past 12 months .............. 1
a health professional? 1-5 years ago .......................... 2
More than 5 years ago ............. 3
Never ................................... 4
246. Have you ever been told by a doctor or other Yes ...................................... 1
health worker that you have raised (high) blood No ....................................... 2 If No, go to
pressure or hypertension? 248
247. Are you currently receiving any of the following treatments/advice for raised (high) blood pressure prescribed
by a doctor or other health worker as well as any advice?
Drugs (medication) that you have taken in the Yes ...................................... 1
last 2 weeks No ....................................... 2
Special prescribed diet Yes ...................................... 1
No ....................................... 2
Advice or treatment to lose weight Yes ...................................... 1
No ....................................... 2
Advice or treatment to stop smoking Yes ...................................... 1
No ....................................... 2
Not Applicable ........................ 8
Advice to start or do more physical activity Yes ...................................... 1
No ....................................... 2
248. During the past 12 months have you visited to an Yes ...................................... 1
AYUSH Practitioner for high blood pressure or No ....................................... 2 If No, go to
hypertension? 250
249. Are you currently taking any treatment/medicine Yes ...................................... 1
from an AYUSH Practitioner for your high blood No ....................................... 2
pressure?
History of Diabetes
250. Has your blood sugar been measured in the last Yes ...................................... 1
12 months? No ....................................... 2
251. Have you ever been told by a doctor or health Yes ...................................... 1
worker that you have diabetes? No ....................................... 2 If No, go to
253
252. Are you currently receiving any of the following treatments/advice for diabetes prescribed by a doctor or
other health worker as well as any advice?
Insulin Yes ...................................... 1
No ....................................... 2
Oral drug (medication that you have taken in the Yes ...................................... 1
last 2 weeks). No ....................................... 2
Special Prescribed diet Yes ...................................... 1
No ....................................... 2
Advice or treatment to lose weight Yes ...................................... 1
No ....................................... 2
Advise to start or do more exercise Yes ...................................... 1
No ....................................... 2
253. During the past 12 months have you visited/ seen Yes ...................................... 1
an AYUSH Practitioner for diabetes? No ....................................... 2 If No, go to
301
254. Are you currently taking any treatment/medicine Yes ...................................... 1
from an AYUSH Practitioner for your diabetes? No ....................................... 2
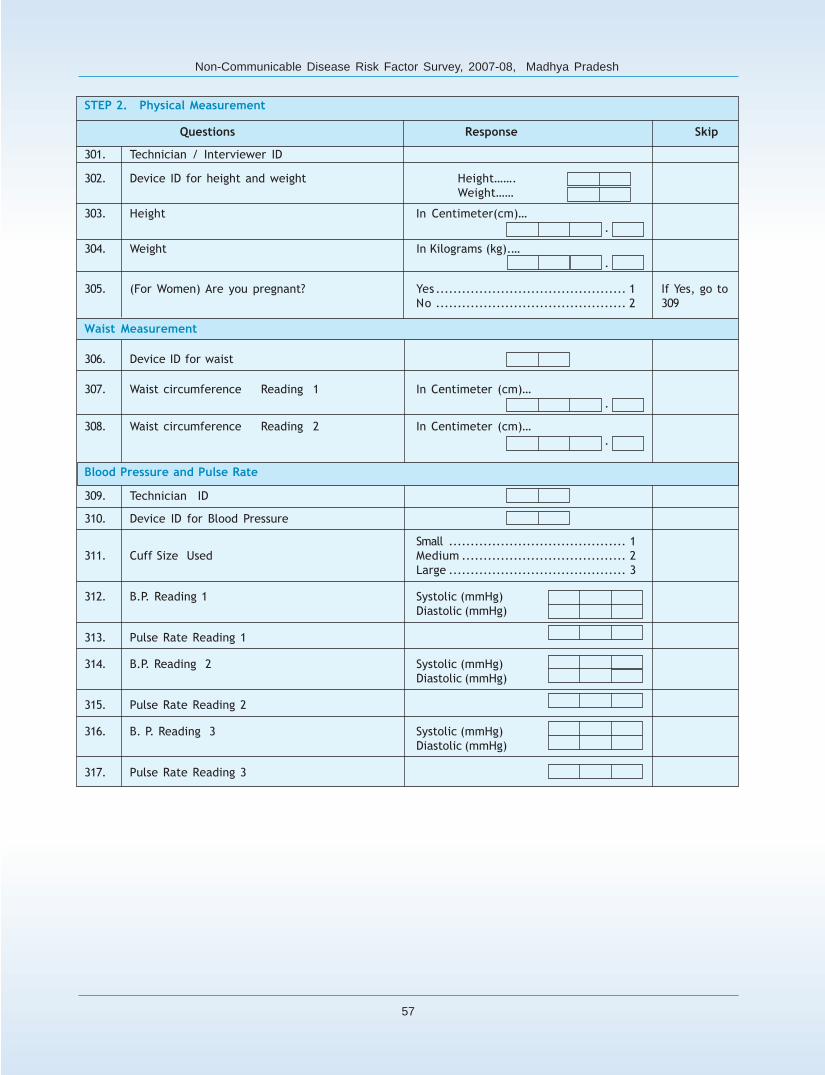
Non-Communicable Disease Risk Factor Survey, 2007-08, Madhya Pradesh
57
STEP 2. Physical Measurement
Questions Response Skip
301. Technician / Interviewer ID
302. Device ID for height and weight Height…….
Weight……
303. Height In Centimeter(cm)…
.
304. Weight In Kilograms (kg).…
.
305. (For Women) Are you pregnant? Yes ............................................ 1 If Yes, go to
No ............................................ 2 309
Waist Measurement
306. Device ID for waist
307. Waist circumference Reading 1 In Centimeter (cm)…
.
308. Waist circumference Reading 2 In Centimeter (cm)…
.
Blood Pressure and Pulse Rate
309. Technician ID
310. Device ID for Blood Pressure
Small ......................................... 1
311. Cuff Size Used Medium ...................................... 2
Large ......................................... 3
312. B.P. Reading 1 Systolic (mmHg)
Diastolic (mmHg)
313. Pulse Rate Reading 1
314. B.P. Reading 2 Systolic (mmHg)
Diastolic (mmHg)
315. Pulse Rate Reading 2
316. B. P. Reading 3 Systolic (mmHg)
Diastolic (mmHg)
317. Pulse Rate Reading 3
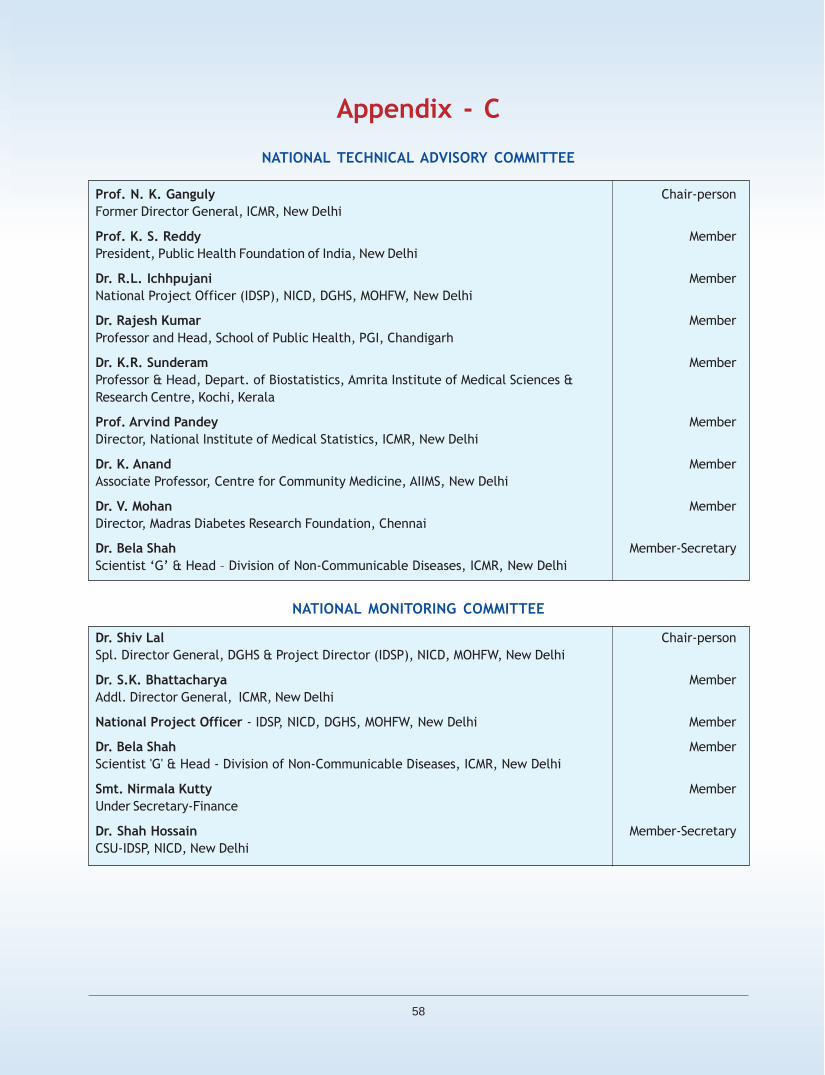
Integrated Disease Surveillance Project (IDSP)
58
Appendix - C
NATIONAL TECHNICAL ADVISORY COMMITTEE
Prof. N. K. Ganguly Chair-person
Former Director General, ICMR, New Delhi
Prof. K. S. Reddy Member
President, Public Health Foundation of India, New Delhi
Dr. R.L. Ichhpujani Member
National Project Officer (IDSP), NICD, DGHS, MOHFW, New Delhi
Dr. Rajesh Kumar Member
Professor and Head, School of Public Health, PGI, Chandigarh
Dr. K.R. Sunderam Member
Professor & Head, Depart. of Biostatistics, Amrita Institute of Medical Sciences &
Research Centre, Kochi, Kerala
Prof. Arvind Pandey Member
Director, National Institute of Medical Statistics, ICMR, New Delhi
Dr. K. Anand Member
Associate Professor, Centre for Community Medicine, AIIMS, New Delhi
Dr. V. Mohan Member
Director, Madras Diabetes Research Foundation, Chennai
Dr. Bela Shah Member-Secretary
Scientist ‘G’ & Head – Division of Non-Communicable Diseases, ICMR, New Delhi
NATIONAL MONITORING COMMITTEE
Dr. Shiv Lal Chair-person
Spl. Director General, DGHS & Project Director (IDSP), NICD, MOHFW, New Delhi
Dr. S.K. Bhattacharya Member
Addl. Director General, ICMR, New Delhi
National Project Officer - IDSP, NICD, DGHS, MOHFW, New Delhi Member
Dr. Bela Shah Member
Scientist 'G' & Head - Division of Non-Communicable Diseases, ICMR, New Delhi
Smt. Nirmala Kutty Member
Under Secretary-Finance
Dr. Shah Hossain Member-Secretary
CSU-IDSP, NICD, New Delhi

Non-Communicable Disease Risk Factor Survey, 2007-08, Madhya Pradesh
59
ICMR-PROJECT REVIEW GROUP
Dr. L.M. Nath Chair-person
Consultant, New Delhi
Dr. Bela Shah Member
Scientist 'G' & Head-Division of NCD, ICMR, New Delhi
Prof. Arvind Pandey Member
Director, NIMS, ICMR, New Delhi
Dr. K. Anand Member
Associate Professor, Centre for Community Medicine, AIIMS, New Delhi
Dr. D. K. Shukla Member
Scientist 'F', ICMR, New Delhi
Dr. Prashant Mathur Member
Scientist 'D', ICMR, New Delhi
Dr. H. K. Chaturvedi Member
Scientist 'E', NIMS, ICMR, New Delhi
Integrated Disease Surveillance Project (IDSP)
60
WORLD BANK
(IDSP –NCD RISK FACTOR SURVEY)
Dr. G. Ramana
Mr. G.J. Sastry, Consultant
NATIONAL INSTITUTE OF COMMUNICABLE DISEASES, NEW DELHI
(CENTRAL SURVEILLANCE UNIT)
Dr. Shiv Lal Dr. D. Bachani
Spl. Director General, DGHS & Dr. R.L. Ichhpujani
Project Director (IDSP) Dr. A. C. Dhariwal,
Dr. Shah Hossain
Dr. Pradeep Khasnobis
DIVISION OF NON-COMMUNICABLE DISEASES
INDIAN COUNCIL OF MEDICAL RESEARCH, NEW DELHI
PROJECT IMPLEMENTING AGENCY
Dr. Bela Shah, Scientist ‘G’ & Head Dr. D. K. Shukla, Scientist ‘F’
Dr. Prashant Mathur, Scientist ‘D’
NATIONAL INSTITUTE OF MEDICAL STATISTICS, ICMR, NEW DELHI
NATIONAL NODAL AGENCY (NNA)
Prof. Arvind Pandey, Director Dr. B. N. Bhattacharya
Dr. H. K. Chaturvedi, Scientist 'E' Dr. Vinod K. Patro
Dr. Damodar Sahu, Scientist 'D' Dr. Aikant Bhatti
Dr. Tulsi Adhikari, Scientist 'C' Mr. Chandan Bandopadhyay
Dr. Atul Juneja, Scientist 'C' Dr. Vinod K. Upadhyay
Mr. Kh. Jiten Kumar Singh, Scientist 'B' Mr. Ashish Yadav
Mr. Sarad Mathur
Mr. Jeetendra Yadav
Mrs. Madhu Mehra
Mr. Charan Singh

Non-Communicable Disease Risk Factor Survey, 2007-08, Madhya Pradesh
61
REGIONAL MEDICAL RESEARCH CENTRE FOR TRIBALS, JABALPUR, MP
Regional Resource Centre
Dr. Neeru Singh, Director Dr. Tapas Chakma, Scientist ‘E’
STATE SURVEY AGENCY (SSA)
Government Medical College, Nagpur
Dr J R Biranjan, Principal Investigator Mr Rupendra Gour, Project Coordinator
Dr P R Bhatkule, Associate Project Coordinator
Dr D Parmar, Associate Project Coordinator
Supervisor Statistical Assistant
Mr Shailendra Singh Ku Kalindi Soni
Ku Ratnamala Wakhare
Ku Ashwini Yelekar Investigator
Mr Mahendra Bhagwatkar Ku Sushma Newal
Mr Manish Kawade Ku Nita Fulzele
Ku Sunanda Bamburde
Data Entry Operator Ku Reeta Somkuwar
Mr Vinod Wankhede Ku Pradnya Patil
Mr Bharat Wankhede Mr Anil Chatap
Ku Yogita Fulzele Mr Naresh Devikar
Mr Sandip Wankhede Mr Suresh Dongre
Ku Jyoti Jambhulkar
Mr Simendra Awle

Integrated Disease Surveillance Project (IDSP)
62