Integrated Biological and Behavioral Surveillance Survey ...
121
July 2009 Integrated Biological and Behavioral Surveillance Survey (IBBS) among Men who have Sex with Men (MSM)) in the Kathmandu Valley Round III – 2009 ASHA Project Family Health International /Nepal Baluwatar P.O. Box 8803 Kathmandu, Nepal
-
Upload
khangminh22 -
Category
Documents
-
view
3 -
download
0
Transcript of Integrated Biological and Behavioral Surveillance Survey ...

July 2009
Integrated Biological and Behavioral Surveillance Survey (IBBS) among Men who have Sex with Men (MSM)) in the Kathmandu
Valley
Round III – 2009
ASHA Project Family Health International /Nepal
Baluwatar P.O. Box 8803
Kathmandu, Nepal
IBBS MSM Kathmandu Valley Report - 2009 ii
Submitted by:
New ERA
P.O. Box 722 Rudramati Marga, Kalopul
Kathmandu, Nepal
In Collaboration with
STD/AIDS Counseling and Training Services
P.O. Box 7314 Pyukha, Kathmandu, Nepal
Family Health International/Nepal USAID Cooperative Agreement #367-A-00-06-00067-00
Strategic Objective No. 9 & 11
IBBS MSM Kathmandu Valley Report - 2009 i
ACKNOWLEDGMENTS
The study team would like to gratefully acknowledge Family Health International/Nepal (FHI/Nepal) for funding this study. Special thanks go to Ms. Jacqueline McPherson, Country Director, FHI/Nepal and to Mr. Satish Raj Pandey, Deputy Director, FHI/Nepal, for their valuable inputs. We are indebted to Dr. Laxmi Bilas Acharya, Team Leader, Strategic Information (SI) Unit, FHI/Nepal, for his technical inputs and guidance. The team would also like to acknowledge the cooperation received from the Blue Diamond Society (BDS) for facilitating the fieldwork. Mr. Sunil Babu Pant, Member, the Constituent Assembly Nepal deserves special thanks for his continuous support and guidance to the team. We are indebted to Cruiseaids and Parichaya Samaj for providing the space and counselors for post-test counseling and dissemination of test results to the study participants. We also acknowledge cooperation extended to the team by Mr. Sanjiv Gurung (Cruiseaids) and Mr. Umesh Shrestha (Parichaya Samaj) throughout the study period The study team would also like to express its heartfelt thanks to all the participants, without whom this survey would have not been possible. Last but not least, the effort made by each and every member of the field team, as well as the coders and data analysts have all contributed to accomplishing this survey. We sincerely acknowledge their contribution.
~ New ERA Study Team ~
IBBS MSM Kathmandu Valley Report - 2009 ii
STUDY TEAM MEMBERS Key Team Members Mr. Sidhartha Man Tuladhar Team Leader Mr. Niranjan Dhungel Project Coordinator Ms. Pranita Thapa Research Officer Ms. Nira Joshi Assistant Research Officer Mr. Ramesh Dangi Senior Research Assistant Mr. Sachin Shrestha Senior Research Assistant Mr. Laxmi Datta Sapkota Senior Counselor Mr. Sanjeev Dhungel Database Analyst (RDS) Ms. Sharmila Prasai Senior Computer Programmer Field Study Team Members Mr. Deepak Dhungel Field Research Assistant Mr. Santi Ram Dahal Field Research Assistant Mr. Manish Khadka Field Supervisor Mr. Bishnu Rijal Field Supervisor Mr. Gopal Prasad Regmi Field Supervisor Mr. Dev Bahadur Dangi Field Supervisor Mr. Shree Dhar Pandey Field Supervisor Mr. Anuj Kunwar Field Supervisor Mr. Manoj Bikram Kathet Field Supervisor Mr. Ganesh Wagle Field Supervisor Mr. Lalan Prasad Shah Senior Health Assistant Mr. Bikash Bade Health Assistant Mr. Badri Pandey Counselor (Parichaya Samaj) Mr. Mani Khadka Counselor (Cruisaids) Ms. Shanti Thing Counselor (SACTS) Mr. Sita Ram Rijal Runner Mr. Kabiram Chaudhary Runner Data Entry/Tabulation /Coding Mr. Babu Raja Dangol Coder Ms. Sujaya Dhungel Coder Mr. Birochan Upreti Coder Mr. Himal Awosthi Coder Ms. Sanu Maiya Shrestha Data Entry Person Ms. Dejeena Amatya Data Entry Person Administration Support Ms. Geeta Shrestha (Amatya) Senior Word Processor Mr. Rajendra Kumar Shrestha Office Assistant
IBBS MSM Kathmandu Valley Report - 2009 iii
Laboratory Team (SACTS) Dr. Vijaya Lal Gurubacharya Consultant Pathologist Mr. Janardan Kuinkel Senior Lab Technician Mrs. Kalpana Neupane Lab Technician Mr. Rajan Rajthala Lab Technician Team from Blue Diamond Society, Parichaya Samaj and CruiseAids Key Team Members Sunil Babu Panta Co-investigator Sanjeev Gurung Facilitator Umesh Shrestha Facilitator Fieldwork Facilitators Ajaya Pradhan Amber Maji Amrit Adhikari Anil Basnet Anil Sherpa Bal Bd. Chaudhary Buddha Lama Chandra Gurung Chari Shrestha Dependra Bd Chaudhary Dharma Raj Sharma Dinesh Maharjan Garima Sapkota Gauthali Gube Lama Honney Indrawati Thakuri Jyoti Thapa Kanchan KC Karan Bhatta Keshab Paudel Krishana Pudasaine Krishna Rana Magar Kumar Bhattarai Kumari Baidha Kumari Magar Laxman Lama Madav Khadka Malina Rijal Man Bd. Maji Manar Deula Nabin Chaudhary Mani Raj Pradeep Adhikari Om Prd.Chaudhary Prem GC Prameshwor Bhattarai Prerana Shrestha Prem Pakhrin Puspa Tamang Puspa Khadka Raju Ghale Rajesh Maharjan Rupa Subba Roja Amatya Sandesh Pun Samir Magar Sanu Babu KC Santan Adhikari Satis Shrestha Sanu KC Shree Maharjan Shekhar Sharma Subash Mali Siddhi Sada Suku Tamang Sudeep Lama Suraj Tamang Suman Maharjan Surya Gurung Surendra Maharjan Tanka Bd Raut Swastika KC Umesh Pandey Tina Rai Yuba Raj Koirala Yanjan Raj Shrestha
IBBS MSM Kathmandu Valley Report - 2009 iv
TABLE OF CONTENTS ACKNOWLEDGMENTS................................................................................................... i STUDY TEAM MEMBERS ...............................................................................................ii TABLE OF CONTENTS ..................................................................................................iv LIST OF TABLES............................................................................................................vi LIST OF ANNEXES........................................................................................................vii LIST OF FIGURES........................................................................................................ viii ABBREVIATIONS ...........................................................................................................ix EXECUTIVE SUMMARY.................................................................................................xi CHAPTER -1.0: INTRODUCTION.................................................................................. 1
1.1 Background....................................................................................................... 1 1.2 Objectives ......................................................................................................... 1
CHAPTER -2.0: DESIGN AND METHODOLOGY........................................................... 3
2.1 Study Population............................................................................................... 3 2.1.1 Sample Size and Sampling Design ........................................................ 2 2.1.2 Seeds and Recruitment.......................................................................... 4
2.2 Study Process................................................................................................... 4
2.2.1 Recruitment and Training of Research Team ........................................ 5 2.2.2 Ethical Review ....................................................................................... 5 2.2.3 Clinical and Laboratory Procedures ....................................................... 6
2.3 Study Management........................................................................................... 8 2.4 Constrains to the fieldwork................................................................................ 9 2.5 Quality Control .................................................................................................. 9 2.6 Post-Test Counseling and Test Results Distribution ......................................... 9 2.7 Data Management and Analysis ....................................................................... 9
CHAPTER - 3.0: HIV/STI PREVALENCE ..................................................................... 11
3.1 HIV/STI Prevalence ........................................................................................ 11 3.2 Relationship Between Socio-Demographic Characteristics and HIV/STIs ...... 11 3.3 Relationship between Sexual Behavior and HIV/STI Prevalence ................... 12 3.4 Relationship Between STIs and HIV ............................................................... 14
CHAPTER – 4.0: SOCIO-DEMOGRAPHIC CHARACTERISTICS OF MSM ............... 15
4.1 Socio-Demographic Characteristics................................................................ 15 4.2 Monthly Income of the MSM and Sources of Income...................................... 17
CHAPTER - 5.0: USE OF ALCOHOL AND DRUGS ..................................................... 20
5.1 Use of Alcohol................................................................................................. 20 5.2 Use of Drugs ................................................................................................... 20
IBBS MSM Kathmandu Valley Report - 2009 v
CHAPTER - 6.0: SEXUAL BEHAVIOR, TYPE OF PARTNER AND CONDOM USE.... 21 6.1 First Sexual Contact........................................................................................ 21 6.2 Sex Partners of MSM..................................................................................... 22 6.3 Anal and Oral Sex Partners ............................................................................ 24 6.4 Types of Sex Role with Sex Partners.............................................................. 25 6.5 Type of Different Partners at First Sex and Last Sex Acts .............................. 26 6.6 Condom Use Behavior of MSM....................................................................... 26
6.6.1 Consistent Condom Use with Different Type of Sex Partners.............. 29 6.6.2 Availability of Condoms and Brand Names .......................................... 29
6.7 Use of Lubricant.............................................................................................. 31 6.8 Problems in Using Condom and Lubricant...................................................... 33
CHAPTER -7.0: KNOWLEDGE OF STIs AND HIV/AIDS.............................................. 35
7.1 Level of Knowledge of STIs ............................................................................ 35 7.2 Knowledge about HIV/AIDS............................................................................ 37 7.3 Knowledge about HIV Testing Facilities.......................................................... 40 7.4 Attitudes towards HIV/AIDS ............................................................................ 40 7.5 Perceived Risk of HIV ..................................................................................... 41 7.6 Physical/Sexual Violence against MSM .......................................................... 44
CHAPTER - 8.0: EXPOSURE TO HIV/AIDS AWARENESS PROGRAMS ................... 46
8.1 Peer/Outreach Education................................................................................ 46 8.2 Drop-in Centers............................................................................................... 47 8.3 STI Clinics....................................................................................................... 48 8.4 VCT Centers ................................................................................................... 49 8.5 Participation in HIV/AIDS Awareness Programs ............................................. 43
CHAPTER - 9.0: A COMPARATIVE ANALYSIS OF SELECTED VARIABLES ............ 53
9.1 Socio Demographic Characteristic.................................................................. 53 9.2 Drug Injecting Practices .................................................................................. 54 9.3 Sexual Behavior.............................................................................................. 54 9.4 Condom Use with Different Partners............................................................... 55 9.5 HIV and STI Prevalence ................................................................................. 57
CHAPTER – 10: SUMMARY OF MAJOR FINDINGS AND RECOMMENDATIONS..... 58
10.1 General Findings............................................................................................. 58 10.2 Group Specific Findings on MSWs and Non-MSWs ....................................... 59 10.3 Recommendations .......................................................................................... 61
REFERENCES.............................................................................................................. 63
IBBS MSM Kathmandu Valley Report - 2009 vi
LIST OF TABLES
Table 3.1: HIV and STI Prevalence among MSM ......................................................... 11 Table 3.2: Relationship between Socio-Demographic Characteristics and HIV and STI
Prevalence................................................................................................ 12 Table 3.3: Relationship between Sexual Behavior and HIV and STI Prevalence............ 14 Table 3.4: Relationship between HIV and STI Prevalence ............................................ 14 Table 4.1: Self-categorization ...................................................................................... 15 Table 4.2: Birthplace and Currently Living District ........................................................ 15 Table 4.3: Demographic Characteristic ........................................................................ 16 Table 4.4: Social Characteristics.................................................................................. 17 Table 4.5: Occupational Background ........................................................................... 17 Table 4.6 : Source of Income and Number of Dependents............................................. 18 Table 5.1: Alcohol Consumption .................................................................................. 20 Table 5.2: Use of Drugs .............................................................................................. 20 Table 6.1: Sexual Behavior & Sex Partners.................................................................. 21 Table 6.2: Number of Different Types of Sex Partners in the Past Month ...................... 23 Table 6.3: Type of Sexual Contact with Male Partners in the Past Month ...................... 24 Table 6.4: Number of Different Types of Anal Sex Partners in the Past Month .............. 24 Table 6.5: Oral Sex with Different Paying Partners in the Past Month ........................... 25 Table 6.6: Sexual Role in the Past Month .................................................................... 25 Table 6.7: First and Last Sex Partners ......................................................................... 26 Table 6.8: Condom Use with First and Last Sex Partners ............................................. 27 Table 6.9: Use of Condom in the Last Sex with Different Sex Partners ......................... 28 Table 6.10: Consistent Use of Condom with Different Sex Partners in Past Month .......... 29 Table 6.11: Condom Possession and its Availability ....................................................... 30 Table 6.12: Use of Lubricant.......................................................................................... 33 Table 6.13: Problem Encountered in Using Lubricant with Condom ................................ 34 Table 7.1: Awareness of STI and Reported STI Symptoms in the Past Year ................. 35 Table 7.2: Knowledge of Symptoms of STIs................................................................ 35 Table 7.3: Reported STI Symptom and Treatment in the Past 12 Months ..................... 36 Table 7.4: Knowledge about Preventing HIV/AIDS ....................................................... 37 Table 7.5: Knowledge on Ways of HIV/AIDS Transmission........................................... 39 Table 7.6: Perception on HIV Testing .......................................................................... 40 Table 7.7: Attitudes towards HIV/AIDS......................................................................... 41 Table 7.8: Risk Perception and Reason for Such Perception................................... 43 Table 7.9: Personal Experience of Violence and Discrimination in the Past 12 Months.. 44 Table 8.1: Meeting/Interaction with Peer /Outreach Educator/Community
Mobilizer/Community Educator .................................................................. 46 Table 8.2: Outreach Center Visiting Practices .............................................................. 47 Table 8.3: STI Clinic Visiting Practices......................................................................... 48 Table 8.4: VCT Visiting Practices................................................................................. 49 Table 8.5: Participation in STI/HIV/AIDS Awareness Program ...................................... 51 Table 9.1: Socio-Demographic Characteristics of MSM by Surveyed Years .................. 53 Table 9.2: Drug Injecting Practices of MSM by Surveyed Years...................................... 46 Table 9.3: Sexual Behavior of MSM by Surveyed Years ............................................... 54 Table 9.4: Consistent Use of Condom with Different Sex Partners in the Past month by
Surveyed Years ........................................................................................ 55 Table 9.5: HIV and STI Prevalence among MSM by Surveyed Years ........................... 57
IBBS MSM Kathmandu Valley Report - 2009 vii
LIST OF ANNEXES ANNEX - 1: Indicators for Monitoring and Evaluation Framework for HIV .......... 54 ANNEX – 2: Questionnaire ................................................................................. 55 ANNEX – 3: Sample Size Formula ...................................................................... 80 ANNEX – 4: Respondent Driven Sampling Tree ................................................ 81 ANNEX – 5: Clinical/Lab Checklist ..................................................................... 83 ANNEX – 6: Oral Informed Consent Form .......................................................... 85 ANNEX – 7: Participation in Post Test Counseling.............................................. 88 ANNEX – 8: Self Categorization by “Third Gender” on the Basis of Their Sexual
Orientation/Behavior ....................................................................... 88 ANNEX – 9: Common Professional Background of Paying Partners................... 88 ANNEX –10: Sites Visited to Meet Sex Partners in Past Six Months ................... 89

IBBS MSM Kathmandu Valley Report - 2009 viii
LIST OF FIGURES
Figure 1: Had Sex with Female Sex Partner/s in Past 12 Month .............................. 18 Figure 2: Condom Use in Last Sex........................................................................... 24 Figure 3: STI Symptom Expereienced in the Past Year and Treatment Status ........ 32 Figure 4: Knowledge of ABC and BCDEF ................................................................ 33 Figure 5: Program Coverage/Exposure .................................................................... 44
IBBS MSM Kathmandu Valley Report - 2009 ix
ABBREVIATIONS AIDS - Acquired Immuno-Deficiency Syndrome BDS - Blue Diamond Society CC - Counseling Center CCST - Community Care Support and Treatment CE - mmunity Educator CHBC - Community Home Based Care CI - Confidence Interval CM - Community Mobilizer CREHPA - Center for Research on Environment Health and Population Activities CT - Chlamydia Trachomatis DIC - Drop-in-Center DNA - Deoxyribonucleic Acid ELISA - Enzyme Linked Immuno Assays EPP - Estimated Population Proportion EQA - External Quality Assessment FHI - Family Health International FSW - Female Sex Worker HIV - Human Immuno-Deficiency Virus IBBS - Integrated Biological and Behavioral Surveillance Survey IC - Information Centre ID - Identification Number IDU - Injecting Drug User IEC - Information, Education and Communication MARP - Most-at-Risk Population MSM - Men who have Sex with Men MSW - Male Sex Worker NCASC - National Center for AIDS and STD Control NG - Neisseria Gonorrhoea NGO - Non-Governmental Organization NHRC - Nepal Health Research Council NPHL - National Public Health Laboratory NRL - National Reference Laboratory OE - Outreach Educator PE - Peer Educator PHSC - Protection of Human Subjects Committee RDS - Respondent Driven Sampling RDSAT - Respondent Driven Sampling Analysis Tools RPR - Rapid Plasma Reagin SACTS - STD/AIDS Counseling and Training Services SLC - School Leaving Certificate SPSS - Statistical Package for the Social Sciences STD - Sexually Transmitted Disease STI - Sexually Transmitted Infection TPPA - Treponema Pallidum Particle Agglutination USAID - United States Agency for International Development VCT - Voluntary Counseling and Testing

IBBS MSM Kathmandu Valley Report - 2009 x
IBBS MSM Kathmandu Valley Report - 2009 xi
EXECUTIVE SUMMARY Under the National Surveillance Plan for HIV and AIDS, the National Center for AIDS and STD Control (NCASC) has been conducting Integrated Biological and Behavioral Surveillance Surveys (IBBS) among the most at-risk populations (MARPs) at regular intervals. These surveillance studies are aimed at measuring the prevalence of HIV and sexually transmitted infections (STIs) among MARPs and assessing their health risk behaviors as well as monitoring epidemic and behavioral trends to inform the HIV response in Nepal. This report documents the findings of the third round of the IBBS conducted among 400 men who have sex with men (MSM) in the Kathmandu Valley. As in the previous round of the IBBS among the same group, the respondent-driven sampling (RDS) methodology was adopted to recruit the respondents for the study. RDS, which is one of the most effective methodologies to reach ‘hard to reach groups’, is a relatively new adaptation of chain referral sampling, where subsequent respondents are recruited by previous respondents through their network of acquaintances. This survey was conducted primarily to determine the prevalence of HIV and STIs (syphilis, chlamydia trachomatis (CT) and neisseria gonorrhoea (NG)) among MSM in the Kathmandu Valley and to assess their HIV/STI-related risk behaviors, including their sexual practices. The survey also aimed to measure their exposure to the intervention programs targeted at MSM in the valley. At the same time, it has sought to analyze trends through the comparison of data on selected variables obtained from the first, the second and the third rounds of the IBBS. A structured questionnaire (Annex 2) was used to collect information on sexual behavior, HIV/AIDS awareness, as well as the socio-demographics of the respondents. Randomly selected study participants were enrolled in the study only after getting oral informed and witnessed consent. Interview using the structured questionnaire was followed by a clinical examination by a health assistant and the collection of blood, urine and anal swab samples for biological testing of HIV, syphilis, CT and NG. The survey was carried out through one centrally-located study center at Jamal in the Kathmandu Valley. Biological samples were collected only after a pre-test counseling session and the study participants were provided syndromic treatment for STI- related problems after being examined by a health assistant. HIV and syphilis test results were provided later at STD/AIDS and Training Services (SACTS), Cruiseaids and Parichaya Samaj Voluntary Counseling and Testing (VCT) Centers along with post-test counseling delivered by experienced counselors. For the purpose of analysis, MSWs (male sex workers) and non-MSWs (non-sex workers) have been collectively defined as MSM. These two categories have been presented separately and the variables which showed marked differences between these two groups have been commented on. Finally, in this round of IBBS, although the sample was drawn using RDS method, data analysis is not done using the Respondent Driven Sampling Analysis Tools (RDAST) software. The study team analyzed the data on the network size reported in the survey, which is one of the key data needed for adjusting the sample proportions, and decided
IBBS MSM Kathmandu Valley Report - 2009 xii
not to go for RDSAT analysis. The network size was asked twice in the questionnaire, which leads to substantial difference in reported network size that could not be reconciled and lead to substantial differences in prevalence estimates. Technical experts from FHI/Nepal and FHI Asia Pacific Regional Office (APRO) also were consulted while making this decision. In this perspective the sampling methodology used in the survey may be considered as "convenient sample obtained using RDS methodology". Below is a short summary of the findings of this study: STI/HIV/AIDS Prevalence HIV prevalence among MSM in the Kathmandu Valley in 2009 is 3.8 percent. Seven of the 135 MSWs (5.2%) and eight out of 265 non-MSWs (3%) had HIV. The overall prevalence of at least one STI was 21.5 percent among MSM in the valley. MSWs (31.9%) had significantly high prevalence of at least one STI than non-MSWs (16.2%). Moreover 1.5 percent of MSM had active syphilis, while 2.5 percent had a history of syphilis. Overall, 12.5 percent of MSM had anal NG with a relatively high prevalence among MSWs (18.5%) than non-MSWs (9.4%). In the same way, anal CT was also high among MSWs (11.1%) than non-MSWs (1.9%).The prevalence of urethral CT and urethral NG was comparatively lower than other STIs (2.5% and 0.8% respectively). Socio-demographic Characteristics MSM in the Kathmandu Valley are mostly young. The majority of respondents were below the age of 30 years (79.3% MSWs and 78.9% non-MSWs) with one in ten (12.5%) below 20 years of age (8.9% MSWs and 14.3% non-MSWs). Twenty-five percent of MSM were currently married. Not much difference was noticed in the marital status of MSWs and non-MSWs (77.8% of MSWs and 73.6% non-MSWs were unmarried). However, of those who were currently married, more MSWs (23.3%) than non-MSWs (2.9%) were married to a male partner. A relatively low proportion of MSM (22.5%) reported living with a regular partner. Among those living with a regular partner, most non-MSWs lived with female partners (69.8%), whereas the majority of the MSWs’ regular partners were male (64.9%). Almost 43 percent of MSM had attended School Leaving Certificate (SLC) or a higher level of studies. Around four percent of MSM were illiterate, while 6.8 percent could read and write but had no formal schooling. Six in ten MSM (65.3%) had lived away from home in the past 12 months. While 25.9 percent of MSWs relied on exchanging sex with a male partner for money as their main source of income, 24.9 percent of non-MSWs relied on wage labor. Use of Alcohol and Drugs The majority of MSM (80.9%) had consumed alcohol in the last month. At the same time, 38.8 percent of MSM also had used drugs in the past year. More non-MSWs
IBBS MSM Kathmandu Valley Report - 2009 xiii
(44.9%) than MSWs (26.7%) had done drugs in the year preceding the survey and the most common drugs used by them (98.7%) was marijuana, locally called ganja. Sexual Behavior, Type of Partner and Condom Use MSM reported having their first sexual encounter at a fairly young age. Six in ten (61.3%) had sex before the age of 17. More MSM (59.3%) had their first sexual experience with a male partner than with a female partner (40.8%). More MSWs than non-MSWs had their sexual debut both before the age of 17 (82.2% MSWs and 50.6% non-MSWs) and with a male partner (89.6% MSWs and 43.8% non MSWs). All the MSM had sexual contact with a male in the year preceding the survey, 49 percent of them had also maintained sexual relations with a female partner in the same period. Overall, 35.5 percent of MSM had sold sex at least once before the survey. The average age of respondents when they sold sex for the first time was 19 years. The predominant sex practice among MSM was anal sex followed by oral sex. Overall, 85.8 percent had practiced anal sex in the past month; while 71.8 percent had oral as well as anal sex in the past month. Mostly MSWs had performed receptive roles while non-MSWs had mostly performed insertive role in anal as well as oral sex in the past month. Overall, consistent condom use was highest with a paid female sex partner (78.8%) and lowest with a non-paying female sex partner (40%) in the month preceding the survey. The majority of the respondents (94.8%) could get condoms whenever necessary, and 76.6 percent of those who had obtained their last condom from various sources had got it free of cost. Almost nine in ten MSM (86.8%) had used lubricants before the survey, while 53.3 percent of those who had heard of branded/specially made lubricants had used it consistently in the past month. STI and HIV/AIDS Awareness Overall, 9.3 percent of MSM could not correctly name any symptom of STIs in men. Reportedly 22.5 percent had experienced at least one symptom of STI in the past year. Eighty-three percent of MSM (84.4% MSW and 82.7% non-MSWs) had knowledge of all three major HIV/AIDS preventive measures, such as abstinence from sexual contact , ‘A’; being faithful to one partner, ‘B’; and condom use during each incidence of sexual contact, ‘C’. Meanwhile, 64.3 percent of MSM were aware of ‘B,C,D,E,F’ (a healthy looking person can be infected with HIV, ‘D’; a person cannot get the HIV virus from a mosquito bite, ‘E’; and sharing meal with an HIV-infected person does not transmit the HIV virus, ‘F’). Eighty-three percent of the respondents were aware of a confidential HIV test facility. Moreover, 62.8 percent of MSM had taken an HIV test before the survey. Among them, 67.7 percent had taken the test within the year preceding the survey. A higher proportion of MSWs (83.7%) than non-MSWs (52.1%) had taken up HIV testing. Around two-thirds of both MSWs (65.9%) and three-fourths of non-MSWs (75.5%) perceived themselves to be at little or no risk of contacting HIV. At the same time, 34.1 percent of

IBBS MSM Kathmandu Valley Report - 2009 xiv
MSWs and 23.8 percent non-MSWs perceived that they had a high or medium risk of getting HIV. Exposure to HIV/AIDS Related Programs In the past year, seventy-eight percent of MSM had met peer/outreach educators, 54.5 percent had visited a drop-in center (DIC), and 47.5 percent had participated in at least one HIV/STI awareness program/community event. VCT centers had been visited by 43.8 percent at least once. A relatively smaller proportion of them (24.8%) had visited an STI clinic in the year preceding the survey. More MSWs than non-MSWs were exposed to or had participated in these activities.

IBBS MSM Kathmandu Valley Report - 2009 1
CHAPTER -1.0: INTRODUCTION 1.1 Background The HIV situation in Nepal is categorized as a concentrated epidemic with the estimated prevalence among the general population being below one percent, and more than 30 percent among some groups identified as ‘most at-risk populations’ (MARPs). According to the National Center for AIDS and STD Control (NCASC) estimates, there were about 70,000 people, including children and adults, infected by HIV in Nepal in 2007. As of May 2009, a cumulative total of 13,885 HIV infections, including 2,384 cases of AIDS, have been reported in the country (NCASC, May 14, 2009). Although the reporting system of HIV/AIDS cannot actually measure the prevalence rate of infection because of under-reporting and reporting delays, it does indicate which sub-groups of the population are most affected. The National HIV/AIDS Strategy 2006/2011 has identified several MARPs and proposes effective strategies and targeted intervention programs for these groups. The Integrated Biological and Behavioral Surveillance Survey (IBBS) among these MARPs is conducted regularly as a part of the National Surveillance Plan to inform the development of the strategy and the National HIV/AIDS Action Plan. ‘Men who have Sex with Men’ (MSM) have been identified as a core risk group because of their high-risk sexual behavior with low levels of condom use and a high turnover of both male and female partners. According to Blue Diamond Society, a non-government organization (NGO) working with MSM in Nepal, the number of MSM in the country is on the rise (CREHPA/SACTS/FHI 2005) and low levels of awareness about HIV increases exposure to the disease whilst preventing those who are living with the virus from seeking treatment. A number of intervention strategies are underway to promote HIV/AIDS awareness at a larger scale among the MSM population. The first round of the IBBS among MSM in Kathmandu Valley was conducted in 2004 and showed a 4.8 percent HIV prevalence among MSWs and 3.6 percent among MSM (CREHPA/SACTS/FHI 2005). The survey also indicated that over half of the MSWs (54%) and one in five (19%) MSM were exposed to at least one form of STI. The second round of the IBBS conducted in 2007 showed a 3.3 percent HIV prevalence among MSM in the Kathmandu Valley, with 3.4 percent among non-MSWs and 2.9 percent among MSWs. Additionally, it was found that 19.4 percent of MSWs and 16.4 percent of non-MSWs were exposed to at least one form of STI. This report outlines the findings of the third round of the IBBS among MSM in the Kathmandu Valley. 1.2 Objectives In line with the objectives of the previous rounds of the IBBS, this third round of the survey was also undertaken primarily to determine the prevalence of HIV and STIs (syphilis, chlamydia trachomatis (CT) and neisseria gonorrhoea (NG)) among MSM in the Kathmandu Valley and to assess their HIV/STI-related risk behavior, including their sexual practices. The survey also aimed to measure their exposure to the intervention programs targeted at MSM in the valley. At the same time, the survey

IBBS MSM Kathmandu Valley Report - 2009 2
sought to analyze trends through the comparison of data on selected variables obtained from the first, the second and the third rounds of the IBBS. The information in this report is aimed at helping to design timely intervention strategies and monitor HIV prevalence among the target population.
IBBS MSM Kathmandu Valley Report - 2009 3
CHAPTER -2.0: DESIGN AND METHODOLOGY 2.1 Study Population This study was conducted among MSM who are considered one of the core groups for the transmission of HIV/STI infection. MSM from the three districts of Kathmandu, Lalitpur and Bhaktapur were eligible for inclusion in the study. For the purposes of this study the participants were divided into two sug-groups: MSWs and non-MSWs. MSWs were defined as :‘Those males aged 16 years or above who have had sexual relations, (either oral or anal) with another male in the 12 months preceding the survey in exchange for money or other commodities.’ Non-MSWs were defined as: ‘Those males aged 16 years or above who have had sexual relations (either oral or anal) with another male in the 12 months preceding the survey without receiving cash payment or other commodities.’ All randomly selected participants were screened to make sure they met the criteria for the study. 2.1.1 Sample Size and Sampling Design As in the previous rounds a total of 400 MSM (135 MSWs and 265 non-MSWs) from the three districts of Kathmandu, Lalitpur and Bhaktapur were included in the study. The respondent-driven sampling (RDS) methodology, which is a relatively new adaptation of the chain-referral sampling, was used to recruit participants to the study. In RDS the sampling process begins with the selection of a set of people in the target population who serve as ‘seeds’. After participating in the study, each seed was provided with three recruitment coupons, which they use to recruit other people they know in their networks. The RDS, unlike the ‘snowball’ method, attempts to overcome biases such as masking, volunteerism and over-sampling of groups with large networks and thus gives unbiased estimates of population parameters (Heckathorn, 1997) hence providing more representative samples. Since it relies on social networks, RDS has the potential to reach individuals who are not easily accessible such as MSM, injecting drug users (IDUs), male sex workers (MSWs) and female sex workers (FSWs). In RDS, the sampling frame is created based on information collected from the participants during the sampling process itself. This information includes (1) who recruited whom; (2) the relationship of the participant to the recruiter (RDS population estimates are based on an assumption that the recruiter and the participant know each other); (3) the participants’ personal network sizes (network size is used to estimate the average network size by different sample characteristics such as gender, race/ethnicity and age). Since RDS population estimates are based on the recruiter and recruit knowing one another, the RDS design includes the means to encourage participants to recruit
IBBS MSM Kathmandu Valley Report - 2009 4
those they already know. This involves offering rewards for recruiters and making recruitment rights scarce through quotas, so that recruitment is not wasted on strangers (Ramirez-Valles et. al., 2005). 2.1.2 Seeds and Recruitment In line with the RDS methodology, the study team, in consultation with facilitators from Paricyaya Samaj and Cruiseaids, first recruited a total of four MSM as ‘seeds’. It was decided that seeds selected to initiate the recruitment process should be as diverse as possible; seeds were heterogeneous in age, ethnicity and MSM type. These seeds were informed about study protocol and procedures and were encouraged to recruit other eligible individuals from their social networks randomly to participate in the study. Thus the first wave of participants recruited for the study was brought in by seeds. After their recruitment in the survey, each seed received three recruitment coupons which they passed to their peers. These peers who were eligible to take part in the study were given three coupons each. In this way the recruitment process continued until 400 MSM were recruited. Each coupon was uniquely coded in order to link recruiters and recruits. The coupon ID numbers were carefully recorded in each questionnaire. Of the four seeds, one completed 10 waves, one 12, one seven, and one seed generated eight waves (Annex - 4). RDS theory requires a minimum of six waves of recruitment for equilibrium, which implies that in this survey, respondents sufficiently represented the population being sampled. Since RDS allows for a dual incentive system to induce recruitment, each participant received NRs. 100 (equivalent to $1.30) for the participation into the study and another NRs. 50 (equivalent to $0.60) for each individual they recruited. A participant could have received up to NRs. 250 (equivalent to $3.30) for successfully recruiting three peers into the study. Failure to meet the study criteria resulted in 45 MSM being turned down. Among them, 24 did not meet the study criteria, six refused to give anal swabs, one was too afraid of the blood test, and one was not feeling well. There were four MSM who did not have enough time to take part in the interview, while nine came with the card but said they were not MSM. 2.2 Study Process A quantitative research approach was adopted for the study. Structured questionnaires were used to collect behavioral data relating to sexual behavior, sex partners, and use of condoms among MSM as well as demographic and social characteristics. In order to draw up a comparative analysis of behavioral changes over the years, the same questions asked during the previous rounds were repeated. Initially, the questionnaires were developed based on the Guidelines for Repeated Behavioral
IBBS MSM Kathmandu Valley Report - 2009 5
Surveys in Populations at Risk of HIV (FHI, 2000). In each round few new questions are added as per the national need. Before starting the interview, all those coming with the referral cards were informally asked certain screening questions relating to the general behavior of MSM, and their sexual partners to ensure that they meet the definitions of MSW or non-MSW. The questions were asked as a part of rapport building process and the facilitators from Parichaya Samaj and Cruiseaids assisted the study team in the screening process. A centrally-located study center was established at Jamal in Kathmandu. In the previous round of IBBS conducted among MSM also one study centers was in the same location. There were separate rooms for each activity, such as receiving the respondents, individual interviews, clinical examinations and blood, urine and anal swab sample collection. Two facilitators from Parchaya Samaj and Cruiseaids were present at the study site to facilitate the study process. Since the study was conducted at one centre, there was hardly any possibility for duplication or repeated interviews of the same MSM. Nevertheless, the study team asked each participant several questions to make sure this was the first time they had participated in the study. Such questions included queries relating to their experience of having undergone any blood tests, the part of the body from where the blood was taken, their experience of HIV testing or testing for other diseases, meeting with New ERA staff and peer educators, and possession of an ID card with the study number. The fieldwork started on March 12, 2009 and was completed on April 21, 2009. 2.2.1 Recruitment and Training of Research Team When selecting field researchers, priority was given to those who had been involved in similar studies of HIV prevalence in the past. Their commitment to respect respondents' privacy was also considered important. Before data collection started, a one-week intensive training program was organized for the study team. The training session familiarized the team with the study objectives, the characteristics of the target groups, rapport-building techniques, the contents of the questionnaire, consent form, oral informed & witnessed consent taking process and the overall study process. The training session also included theory and practical classes on pre-test counseling and questionnaire administration. Role plays that attempted to be as true to the actual field situation as possible were carried out. This allowed for the discussion of potential problems that could be faced while approaching MSM, and possible ways for overcoming such problems. Representatives from Parichaya Samaj and Cruiseaids trained the study team on the general attitudes of MSM and the best approaches to take when working with them. The training also explained and clarified the definition of informed consent. 2.2.2 Ethical Review
IBBS MSM Kathmandu Valley Report - 2009 6
The research was conducted in compliance with both ethical and human rights standards. These standards included participants’ anonymity as well as pre- and post-test counseling. As this study was done with individuals who are often stigmatized, ethical as well as technical approvals was obtained from Family Health International’s ethical review body, the Protection of Human Subjects Committee (PHSC) and the Nepal Health Research Council (NHRC) prior to the fieldwork. The study protocols were carefully reviewed and approved by these organizations. Verbal consent was obtained from all the participants in a private setting and was witnessed by a third person before the interview and clinical tests were performed (Annex – 6). No personal identifiers were collected. All the respondents were provided with a unique identification (ID) number written on a plastic-coated card. The same number was marked on the questionnaire, the medical records, and on all biological specimens collected from that particular respondent. This card was also used for the distribution of the test results. Only those participants who produced the card were provided test results of HIV and Syphilis with post-test counseling by a qualified counselor. The study team maintained the confidentiality of the data collected throughout the survey. The interviewer regularly submitted the completed questionnaires to the field supervisor on the day of each interview. The supervisor kept these questionnaires in separate locked cabinets where no one except the supervisor had access to the information collected. The supervisor then transported the questionnaires to New ERA at regular intervals. In the New ERA office at Kathmandu, the questionnaires were kept in a locked coding room where only authorized data coding and data entry staff had access to individual questionnaires. 2.2.3 Clinical and Laboratory Procedures Clinical Procedures The study participants were clinically checked for STI-related symptoms by a health assistant who also filled in a checklist with the information provided by the respondents (Annex - 5). They provided symptomatic treatment to the respondents in accordance with the National STI Case Management Guidelines. Over-the-counter medicines such as paracetamol, alkalysing agents and vitamins were given as necessary. Collection, Storage and Transportation of Samples I) Blood Sample After pre-test counseling, the lab technician briefed the respondents about the HIV/STI testing process and sought their consent to take blood. Blood samples for testing HIV/syphilis were drawn from a vein from each of the study participants using a 5ml disposable syringe and were stored in a sterile glass tube labeled with the respondent’s ID number. The blood sample was placed in a centrifuge to separate the blood cells from the serum. Serum samples were stored in the deep fridge compartment of the refrigerator at the study site at 2°C to 8°C. The survey period witnessed long hours of power cuts. However, sufficient numbers of ice packs were
IBBS MSM Kathmandu Valley Report - 2009 7
stored in the deep fridge compartment to ensure that proper temperature was maintained for storing the samples. The health assistant as well as the team leader constantly monitored the temperature in the thermometer kept in the compartment and recorded them in the log book. Each sample was labeled with the ID number of the study participant. The specimens were transported to the SACTS laboratories in Kathmandu in a cold box every day. The serum samples were stored at a temperature of -12°C to -20°C at the SACTS laboratory. II) Urine and Swab Samples For DNA amplification testing for gonorrhea and chlamydia, 20 ml of first catch urine taken at least two hours since the last void was collected. The participant collected urine in a sterile plastic universal urine container, a 20 ml screw cap tube. The urine container was stored at room temperature and sent to National Reference laboratory (NRL) on the same day where it was stored in two different aliquots at minus 86°C. Anal swabs were also collected from all MSM by the health assistant. The anal swab was collected by inserting the swab stick about 2.5 cm into the anal canal. All the swabs were rotated and moved gently from side to side for 3-5 seconds before removing them. The swab was placed in the Amplicor STM tube. The health assistant vigorously swirled the swab in the liquid for 15 seconds. The contamination from the surface of the liquid was removed by the swab tip then liquid was expressed from the swab by pressing it against the side of the tube. The swab stick was discarded, the transport tube was recapped tightly and labeled with ID number of the respondent, collection date and time. The tube was stored at room temperature in the tube stand and sent to NRL in an upright position every day. Laboratory Methods Syphilis was tested using BD. Micro-Vue Rapid Plasma Regain (RPR) card test. All the samples negative for RPR were recorded as negative. All positive samples for RPR were further tested with serial serum dilution up to 64 times and the test record was recorded with dilution factor. All the RPR positive serums were also tested by Treponema Pallidum Particle Agglutination (TPPA) test using Serodia TPPA as a confirmatory test. On the basis of titre of RPR, all the specimens with RPR/TPPA-positive results were divided into two categories.
• TPPA-positive with RPR-negative or RPR-positive with titre < 1:8 were classified as showing a history of syphilis
• TPPA-positive with RPR titre of 1:8 or greater were classified as showing a current syphilis requiring immediate treatment
HIV antibody screening was performed using serial testing approach. All the serum samples were tested using Determine HIV 1/2 (Abbott Japan Co. Ltd.) as a first test to detect antibodies against HIV. If the first test was negative, no further test was conducted, but if the first test was positive, a second test was performed using Uni-
IBBS MSM Kathmandu Valley Report - 2009 8
Gold (Trinity Biotech, Dublin, Ireland). In case of a tie between the first two tests, a third test was performed using SD Bioline HIV 1/2 (Standard Diagnostics, Inc., Kyonggi-do, South Korea) as a tie-breaker test. The testing protocol is based on the National VCT Guidelines of Nepal revised by NCASC in 2007. The interpretation of the test results was as follows:
• First test negative = negative • First + second test positive = positive • First test positive + second test negative + third test positive = positive • First test positive + second test negative + third test negative = negative
Roche Amplicor kit was used for processing and extraction of usable specimen for detection of NG and CT. The extracted specimen was divided in three aliquots (one for further analysis, one for back up and the last one for external quality control). The specimen was then amplified (PCR) using Roche Amplicor Amplification kit to make the replication of NG/CT DNA. After amplification the ELISA detection procedure was followed separately for NG and CT using Roche Amplicor Detection Kit NG and Roche Amplicor Detection kit CT separately. The detection method went along with internal control kit of NG and CT which contributed substantially for validation of test performed and interpretation. 2.3 Study Management The study was conducted under the leadership of NCASC, Ministry of Health and Population, Government of Nepal. The NHRC reviewed the study protocols and the study instruments and provided its approval to the study. The overall management of the study was carried out by New ERA in collaboration with STD/AIDS Counseling and Training Services (SACTS) while FHI/USAID Nepal provided technical support. SACTS was responsible for setting up the laboratory in the field site, providing training to the lab technician, supervising and collecting specimen samples, maintaining cold chain, conducting HIV and syphilis testing at their laboratory and also ensuring that EQA (External Quality Assessment) tests were performed using prescribed test kits and testing approach at National Public Health Laboratory (NPHL). New ERA’s responsibility was to design the research methodology (including the sampling method), prepare the questionnaire, recruit and train survey team, collect data, transport the samples to the laboratories maintaining a proper temperature, analyze the collected information and coordinate and monitor the distribution the test results to the study participants with post-test counseling. National Reference Laboratory provided training on collection of urine and anal swabs and carried out NG and CT testing on these samples while NPHL performed EQA test on 10 percent sample of the total serum collected for HIV and Syphilis. The New ERA study team was made up of a team leader, a research coordinator, two research officers, two research assistants, a senior counselor and the field teams. The field team consisted of two research assistants, eight supervisors/interviewers, two health assistants, two lab technicians, and two runners. One facilitator from Cruiseaids and one from Parichaya Samaj were also part of the field team.
IBBS MSM Kathmandu Valley Report - 2009 9
2.4 Constrains to the fieldwork The long hours of load shedding scheduled during fieldwork posed some problem in using the electronic centrifuge machine to separate the serum from the blood sample in the lab. To overcome the problem, both auto and manual centrifuge machines were installed at the study site. Icepacks were also stored in the fridge to maintain the required temperature for storing the samples. 2.5 Quality Control Quality control was strictly maintained throughout the process of specimen collection, handling and testing. All the tests were performed using internal controls. These controls were recorded with all the laboratory data. For quality control assurance, a 10 percent sample of the total serum collected (all positive samples and randomly selected negative samples to make 10% of total sample) was submitted to the NPHL to test for HIV and syphilis. The same test kit and testing protocols were used in NPHL for quality assurance. At the same time 10 percent of urine and swab samples were sent to Y R Gaitonde Centre for AIDS Research and Education (YRG CARE), Chennai, India for EQA test for CT and NG. The center is a FDA, NABL, ISO accredited laboratory for infectious diseases in India. To ensure the quality of data, New ERA and FHI officials supervised the fieldwork regularly. Research Assistants and Field Supervisors were responsible for ensuring that the project was carried out according to protocol on a day-to-day basis. Field supervisors reviewed all the completed questionnaires. Any inconsistencies in the responses were clarified through discussions with the concerned interviewer later the same day. 2.6 Post-Test Counseling and Test Results Distribution Once the clinical tests were over, the participants were informed about the location and operating hours of the nearest site where they could collect the test results. Those who displayed their ID cards were provided HIV and syphilis test results with post-test counseling by a trained counselor at Parichaya Samaj, Cruiseaids or the SACTS VCT centers. Trained counselors delivered the results to the participants in a private setting followed by a counseling session which focused on high-risk behavior and other aspects of STIs and HIV. The counselors read the test results by opening the sealed envelope in front of the respondents. However, the written copy of the test result was also provided to those MSM who asked for it. Post-test counseling and individual report dissemination was completed between March 27- May 08, 2009 at the above VCT centers. Out of 400 MSM who tested for HIV, 179 (44.8%) came to collect the test results (Annex 7). A small provision for reimbursement of transportation costs might have persuaded more MSM to visit the VCT centers to collect the test results. 2.7 Data Management and Analysis The completed questionnaires were thoroughly checked for any inconsistencies before the data was entered into a computer using FoxPro software. A double-entry
IBBS MSM Kathmandu Valley Report - 2009 10
approach was used to minimize errors during the data entry. Finally, in this round of IBBS, although the sample was drawn using RDS method, data analysis is not done using the RDAST software. The study team analyzed the data on the network size reported in the survey, which is one of the key data needed for adjusting the sample proportions, and decided not to go for RDSAT analysis. The network size was asked twice in the questionnaire, which leads to substantial difference in reported network size that could not be reconciled and lead to substantial differences in prevalence estimates. Technical experts from FHI/Nepal and FHI APRO also were consulted while making this decision. In this perspective the sampling methodology used in the survey may be considered as "convenient sample obtained using RDS methodology". Simple statistical tools, such as frequency distribution, percentages, range, proportion and mean and median were used to analyze the results of the survey. Epi Info 6 software was used to measure the statistical significance of the relationship between HIV and STI infection and some of the selected explanatory variables. Clinical and behavioral data were merged in order to examine the relationship between the participants' HIV status, socio-demographic characteristics, injecting practices and sexual behaviors. As in the previous rounds of survey reports, for the purposes of analysis, MSWs and non-MSWs collectively have been defined as ‘MSM’. Both of these categories have been presented separately throughout the report but only variables which showed marked differences between these two groups have been commented on. For the key selected variables trend analysis also is done using the data from previous rounds of IBBS.

IBBS MSM Kathmandu Valley Report - 2009 11
CHAPTER - 3.0: HIV/STI PREVALENCE
This chapter deals with the prevalence of HIV/STI among MSM in the Kathmandu Valley. It also describes the relationship between HIV and STI prevalence with some of the selected variables. 3.1 HIV/STI Prevalence Of the 400 MSM, 3.8 percent were HIV positive. MSWs had a slightly higher prevalence of HIV than non-MSWs — 5.2 percent (7 out of 135) MSWs and three percent (8 out of 265) non-MSWs were tested HIV positive. The percentage of respondents who had at least one of the following infections: HIV, active syphilis, anal and urethral neisseria gonorrhoea (NG) or anal and urethral chlamydia trachomatis (CT)) in the Kathmandu Valley was 21.5 , with a significantly high percentage among MSWs (31.9%) than non-MSWs (16.2%). Table 3.1: HIV and STI Prevalence among MSM
MSW Non-MSW MSM STI infection N=135 % N=265 % N=400 %
HIV 7 5.2 8 3.0 15 3.8 Active syphilis 4 3.0 2 0.8 6 1.5 Syphilis history 6 4.4 4 1.5 10 2.5 Anal-CT 15 11.1 5 1.9 20 5.0 Anal-NG 25 18.5 25 9.4 50 12.5 Urethral-CT 1 0.7 9 3.4 10 2.5 Urethral-NG 1 0.7 2 0.8 3 0.8 Any One STI* 43 31.9 43 16.2 86 21.5
*Note: Any one STI include HIV, Current Syphilis, Anal CT & NG and urethral CT & NG. Anal CT means CT Test based on anal swab samples. Similarly anal-NG means NG test based on anal swab sample The prevalence of active syphilis was three percent among MSWs and 0.8 percent among non-MSWs. Likewise, more MSWs had a history of syphilis (4.4%) compared to non-MSWs (1.5%). Five percent of MSM had anal CT, with a relatively higher prevalence among MSWs than non-MSWs (11.1 percent and 1.9 percent respectively). Nearly 13 percent of MSM in the Kathmandu Valley had anal NG, with a 9.4 percent prevalence among non-MSWs and 18.5 percent among MSWs. Urethral CT and urethral NG were detected in 2.5 percent and 0.8 percent among MSM respectively. The difference in prevalence of NG between MSWs and Non-MSWs is not large and significant, but in urethral CT non-MSWs have higher prevalence (3.4%) compared to MSWs (0.7%). 3.2 Relationship Between Socio-Demographic Characteristics and HIV/STIs This section examines the relationship between socio-economic characteristics and HIV as well as the prevalence of at least one STI.
IBBS MSM Kathmandu Valley Report - 2009 12
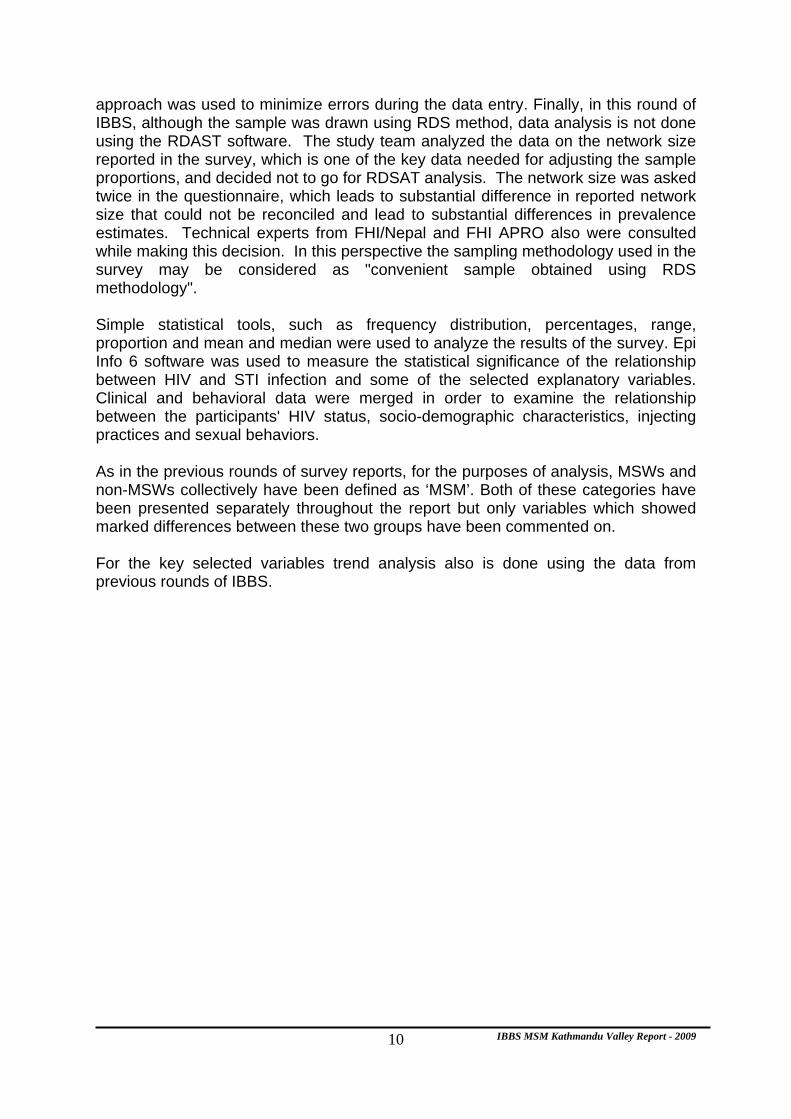
HIV and STIs follow a similar pattern: MSM who were more than 25 years had a significantly higher prevalence of HIV than younger MSM (6.8% compared with 1.3%). Similarly, the prevalence of at least one STI was also higher among MSM over 25 years of age than their younger counterparts (22.2 compared with 15.6). The difference in STI, however, is not statistically significant. Table 3.2: Relationship between Socio-Demographic Characteristics and HIV and STI Prevalence
HIV STI Socio-demographic characteristics N % P Value N % P Value
Age Below 25 years (n=224) 3 1.3 35 15.6 25 years and above (n=176) 12 6.8 <0.01 39 22.2 >0.05
Currently married Yes (n=100) 5 5.0 25 25.0 No (n=300) 10 3.3 >0.05 49 16.3 >0.05
Literacy status Illiterate/literate/no schooling (n=42) 2 4.8 13 31.0 Formal schooling (n=358) 13 3.6 >0.05 61 17.0 <0.05
Total (N = 400) 15 3.8 - 74 18.5 -
Although HIV prevalence also differs slightly with the marital and literacy status of the respondents, the relation is not statistically significant. Moreover, the prevalence rate of at least one STIs is significantly higher among illiterate MSM and those who had not attended school (31%) than those who had received formal schooling (17%). 3.3 Relationship between Sexual Behavior and HIV/STI Prevalence Table 3.3 examines the relationship between sexual behavior and the prevalence of HIV/STIs among MSM. The association between HIV and STI infection and risk behavior needs to be examined with caution. Current sexual behaviors may not necessarily be related to the HIV/STI status of the MSM as they could have changed their behavior recently, or after being diagnosed with HIV/STI. Their current sexual behavior may not be responsible for their present HIV/STI status. No significant association was noticed between the sexual behavior of MSM and HIV prevalence. However, a slightly higher proportion of older MSM, those who had sold sex to a male partner at least once, and those who had oral as well as anal sex with a male partner in the past month were HIV-positive than their other counterparts (Table 3.3). On the other hand, there are some sexual behavior of MSM which reveals a significant association with the prevalence of other STIs. MSM who had sold sex before had a significantly higher prevalence of other STI (26.8%) than those who had never had sex in exchange for money (14%). On the contrary, MSM who had followed unsafe sexual practices such as buying sex with a paid male sex partner and a female sex partner, selling anal sex to male clients, having oral and anal sex with a male partner in the past month had a significantly lower prevalence of STIs than other MSM who had not followed such sexual behavior (Table 3.3). As mentioned above, it is important to note here that this trend reflects the current
IBBS MSM Kathmandu Valley Report - 2009 13
sexual behavior of MSM, which may have been different before and changed recently.

IBBS MSM Kathmandu Valley Report - 2009 14
Table 3.3: Relationship between Sexual Behavior and HIV and STI Prevalence HIV STI
Sexual behavior N % P
Value N % P Value
Age at first sex 8 – 16 (n=245) 11 4.5 52 21.2 17 – 20 (n=132) 4 3.0 17 12.9 21 – 32 (n=23) 0 0.0
>0.05 5 21.7
>0.05
Ever had sex with a male in exchange for money Yes (n=142) 7 4.9 38 26.8 No (n=258) 8 3.1 >0.05 36 14.0 <0.01
Vaginal /anal/oral sex with women and anal/oral sex with male in the past year
Any type of sex with female in past year (n=196) 7 3.6 29 14.8 Anal/oral sex with only male partner in the past year (n=204) 8 3.9
>0.05 45 22.1
>0.05
Bought sex from male in the past month Yes (n=76) 1 1.3 >0.05 6 7.9 <0.01 No (n=324) 14 4.3 68 21.0 Bought sex from female in the past month Yes (n=33) 0 0.0 1 3.0 No (n=367) 15 4.1 >0.05 73 19.9 <0.01
Sold anal sex to male in the past month Yes (n=107) 5 4.7 32 29.9 No (n=293) 10 3.4 >0.05 42 14.3 <0.01
Oral and anal sex with male in the past month Yes (n=287) 11 3.8 65 22.6 No (n=113) 4 3.5 >0.05 9 8.0 <0.01
Oral or anal sex with male in the past month Yes (n=349) 14 4.0 68 19.5 No (n=51) 1 2.0 >0.05 6 11.8 >0.05
Oral sex with one time or regular client in the past month Yes (n=97) 5 5.2 31 32.0 No (n=303) 10 3.3 >0.05 43 14.2 <0.01
Total (N=400) 15 3.8 - 74 18.5 -
3.4 Relationship Between STIs and HIV
Table 3.4 explores the relationship between the prevalence of STIs and HIV. MSM with STIs were slightly more likely to be HIV-positive (4.1%) than those who did not have an STI (3.7%) although the difference is not statistically significant. Table 3.4: Relationship between HIV and STI Prevalence
Total Sample HIV- positive STI prevalence N N %
HIV Any STI 74 3 4.1 No STI 326 12 3.7 Untreated Syphilis 6 1 16.7 Anal Gonorrhea 50 2 4.0 Anal Chlamydia 20 1 5.0 Urethral Gonorrhea 3 2 66.7 Urethral Chlamydia 10 2 20.0
Notably, two out of three MSM (66.7%) who were diagnosed with urethral gonorrhea were HIV-positive. At the same time, two out of 10 MSM (20%) with urethral chlamydia and one of the six MSM (16.7%) with untreated syphilis were HIV-positive, indicating a potential relationship between such STIs and HIV.
IBBS MSM Kathmandu Valley Report - 2009 15
CHAPTER – 4.0: SOCIO-DEMOGRAPHIC CHARACTERISTICS OF MSM
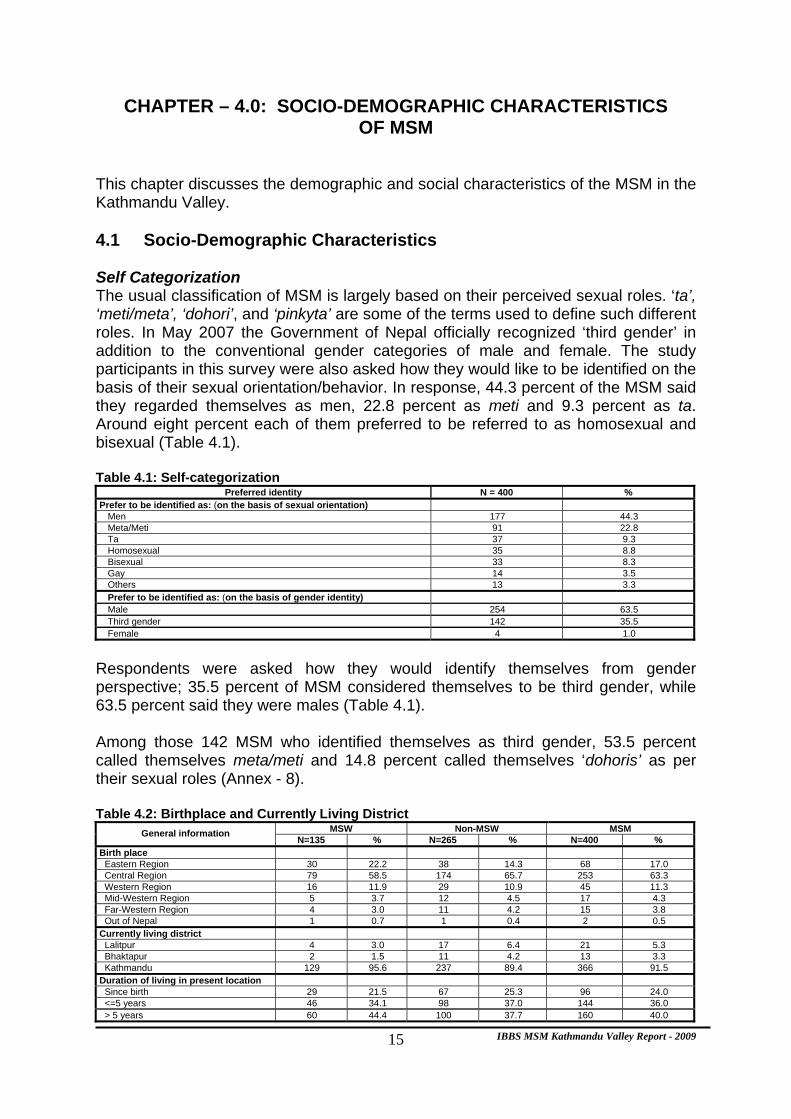
This chapter discusses the demographic and social characteristics of the MSM in the Kathmandu Valley. 4.1 Socio-Demographic Characteristics Self Categorization The usual classification of MSM is largely based on their perceived sexual roles. ‘ta’, ‘meti/meta’, ‘dohori’, and ‘pinkyta’ are some of the terms used to define such different roles. In May 2007 the Government of Nepal officially recognized ‘third gender’ in addition to the conventional gender categories of male and female. The study participants in this survey were also asked how they would like to be identified on the basis of their sexual orientation/behavior. In response, 44.3 percent of the MSM said they regarded themselves as men, 22.8 percent as meti and 9.3 percent as ta. Around eight percent each of them preferred to be referred to as homosexual and bisexual (Table 4.1). Table 4.1: Self-categorization
Preferred identity N = 400 % Prefer to be identified as: (on the basis of sexual orientation)
Men 177 44.3 Meta/Meti 91 22.8 Ta 37 9.3 Homosexual 35 8.8 Bisexual 33 8.3 Gay 14 3.5 Others 13 3.3 Prefer to be identified as: (on the basis of gender identity) Male 254 63.5 Third gender 142 35.5 Female 4 1.0
Respondents were asked how they would identify themselves from gender perspective; 35.5 percent of MSM considered themselves to be third gender, while 63.5 percent said they were males (Table 4.1). Among those 142 MSM who identified themselves as third gender, 53.5 percent called themselves meta/meti and 14.8 percent called themselves ‘dohoris’ as per their sexual roles (Annex - 8). Table 4.2: Birthplace and Currently Living District
MSW Non-MSW MSM General information N=135 % N=265 % N=400 %
Birth place Eastern Region 30 22.2 38 14.3 68 17.0 Central Region 79 58.5 174 65.7 253 63.3 Western Region 16 11.9 29 10.9 45 11.3 Mid-Western Region 5 3.7 12 4.5 17 4.3 Far-Western Region 4 3.0 11 4.2 15 3.8 Out of Nepal 1 0.7 1 0.4 2 0.5 Currently living district Lalitpur 4 3.0 17 6.4 21 5.3 Bhaktapur 2 1.5 11 4.2 13 3.3 Kathmandu 129 95.6 237 89.4 366 91.5 Duration of living in present location Since birth 29 21.5 67 25.3 96 24.0 <=5 years 46 34.1 98 37.0 144 36.0 > 5 years 60 44.4 100 37.7 160 40.0
IBBS MSM Kathmandu Valley Report - 2009 16
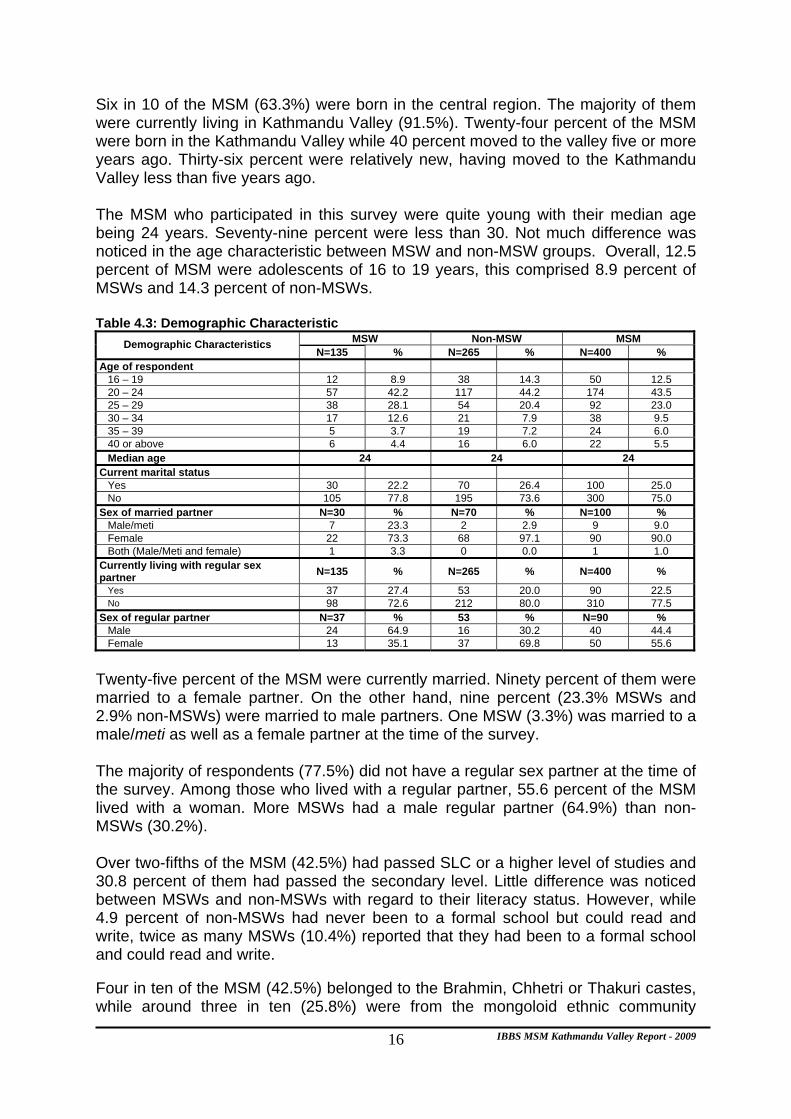
Six in 10 of the MSM (63.3%) were born in the central region. The majority of them were currently living in Kathmandu Valley (91.5%). Twenty-four percent of the MSM were born in the Kathmandu Valley while 40 percent moved to the valley five or more years ago. Thirty-six percent were relatively new, having moved to the Kathmandu Valley less than five years ago. The MSM who participated in this survey were quite young with their median age being 24 years. Seventy-nine percent were less than 30. Not much difference was noticed in the age characteristic between MSW and non-MSW groups. Overall, 12.5 percent of MSM were adolescents of 16 to 19 years, this comprised 8.9 percent of MSWs and 14.3 percent of non-MSWs. Table 4.3: Demographic Characteristic
MSW Non-MSW MSM Demographic Characteristics N=135 % N=265 % N=400 %
Age of respondent 16 – 19 12 8.9 38 14.3 50 12.5 20 – 24 57 42.2 117 44.2 174 43.5 25 – 29 38 28.1 54 20.4 92 23.0 30 – 34 17 12.6 21 7.9 38 9.5 35 – 39 5 3.7 19 7.2 24 6.0 40 or above 6 4.4 16 6.0 22 5.5 Median age 24 24 24
Current marital status Yes 30 22.2 70 26.4 100 25.0 No 105 77.8 195 73.6 300 75.0 Sex of married partner N=30 % N=70 % N=100 %
Male/meti 7 23.3 2 2.9 9 9.0 Female 22 73.3 68 97.1 90 90.0 Both (Male/Meti and female) 1 3.3 0 0.0 1 1.0
Currently living with regular sex partner N=135 % N=265 % N=400 %
Yes 37 27.4 53 20.0 90 22.5 No 98 72.6 212 80.0 310 77.5
Sex of regular partner N=37 % 53 % N=90 % Male 24 64.9 16 30.2 40 44.4 Female 13 35.1 37 69.8 50 55.6
Twenty-five percent of the MSM were currently married. Ninety percent of them were married to a female partner. On the other hand, nine percent (23.3% MSWs and 2.9% non-MSWs) were married to male partners. One MSW (3.3%) was married to a male/meti as well as a female partner at the time of the survey. The majority of respondents (77.5%) did not have a regular sex partner at the time of the survey. Among those who lived with a regular partner, 55.6 percent of the MSM lived with a woman. More MSWs had a male regular partner (64.9%) than non-MSWs (30.2%). Over two-fifths of the MSM (42.5%) had passed SLC or a higher level of studies and 30.8 percent of them had passed the secondary level. Little difference was noticed between MSWs and non-MSWs with regard to their literacy status. However, while 4.9 percent of non-MSWs had never been to a formal school but could read and write, twice as many MSWs (10.4%) reported that they had been to a formal school and could read and write. Four in ten of the MSM (42.5%) belonged to the Brahmin, Chhetri or Thakuri castes, while around three in ten (25.8%) were from the mongoloid ethnic community

IBBS MSM Kathmandu Valley Report - 2009 17
(Rai/Limbu/Gurung/Tamang/Magar). Sixteen percent belonged to the Newar community. While not much difference was noticed in the caste/ethnicity composition between MSWs and non-MSWs, a relatively larger proportion of MSWs (18.5%) represented different Terai castes compared to non-MSWs (6.4%). Table 4.4: Social Characteristics
MSW Non-MSW MSM Social characteristics N=135 % N=265 % N=400 %
Education Illiterate 7 5.2 8 3.0 15 3.8 Literate, no schooling 14 10.4 13 4.9 27 6.8 Primary 21 15.6 44 16.6 65 16.3 Secondary 42 31.1 81 30.6 123 30.8 SLC and Above 51 37.8 119 44.9 170 42.5
Ethnic/caste group Brahmin /Chhetri/Thakuri 45 33.3 125 47.2 170 42.5 Rai/Limbu/ Gurung/ Tamang /Magar 37 27.4 66 24.9 103 25.8
Newar 22 16.3 42 15.8 64 16.0 Terai Caste 25 18.5 17 6.4 42 10.5
Other hill caste 6 4.4 15 5.7 21 5.3 Religion Hindu 105 77.8 223 84.2 328 82.0 Buddhist 20 14.8 24 9.1 44 11.0 Christian 8 5.9 14 5.3 22 5.5 Others 2 1.5 4 1.5 6 1.5 Lived away from home in the past 12 months
Yes 94 69.6 167 63.0 261 65.3 No 41 30.4 98 37.0 139 34.8
Eighty-two percent of the MSM were Hindus, 11 percent were Buddhists while 5.5 percent were Christians. Overall, 65.3 percent of the MSM (63% non-MSWs and 69.6 percent MSWs ) had lived away from home for one month or longer in the past year. 4.2 Monthly Income of the MSM and Sources of Income Respondents came from a variety of occupational backgrounds, ranging from farmers to civil servants. In total, 21.8 percent of the MSM relied on wage labor as their main source of income, whilst 17.5 percent were employed by private companies. One in ten of the MSM were students (12.8%), were employed as peer/outreach educators (PEs/OEs) (12%), or ran their own business (12%). Table 4.5: Occupational Background
MSW Non-MSW MSM Type of major occupation N=135 % N=265 % N=400 %
Occupation type Labor/Wage labor 21 15.6 66 24.9 87 21.8 Private company staff 22 16.3 48 18.1 70 17.5 Student 9 6.7 42 15.8 51 12.8 PE/OE 34 25.2 14 5.3 48 12.0 Businessman 4 3.0 44 16.6 48 12.0 Sex worker 35 25.9 0 0.0 35 8.8 Unemployed 3 2.2 18 6.8 21 5.3 Driver 2 1.5 10 3.8 12 3.0 Police 2 1.5 7 2.6 9 2.3 Restaurant employee 1 0.7 5 1.9 6 1.5 Other civil servant 0 0.0 4 1.5 4 1.0 Military 0 0.0 3 1.1 3 0.8 Farmer 1 0.7 1 0.4 2 0.5
IBBS MSM Kathmandu Valley Report - 2009 18
Others 1 0.7 3 1.1 4 1.0
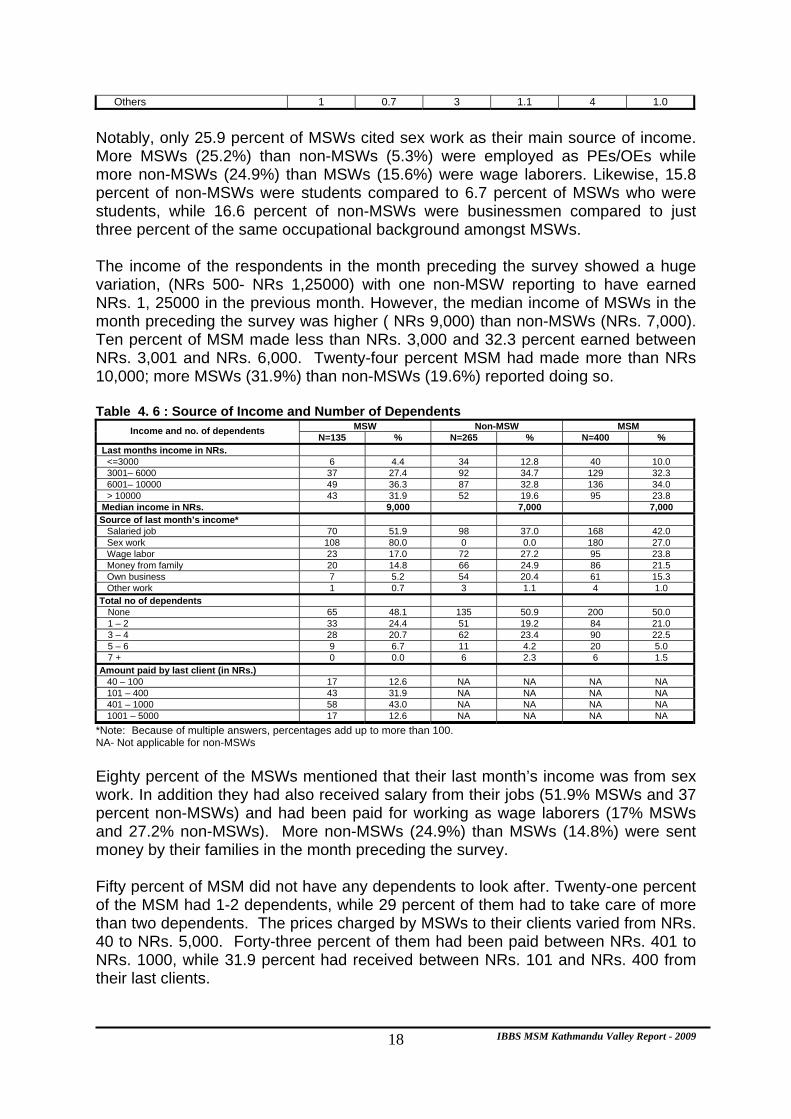
Notably, only 25.9 percent of MSWs cited sex work as their main source of income. More MSWs (25.2%) than non-MSWs (5.3%) were employed as PEs/OEs while more non-MSWs (24.9%) than MSWs (15.6%) were wage laborers. Likewise, 15.8 percent of non-MSWs were students compared to 6.7 percent of MSWs who were students, while 16.6 percent of non-MSWs were businessmen compared to just three percent of the same occupational background amongst MSWs. The income of the respondents in the month preceding the survey showed a huge variation, (NRs 500- NRs 1,25000) with one non-MSW reporting to have earned NRs. 1, 25000 in the previous month. However, the median income of MSWs in the month preceding the survey was higher ( NRs 9,000) than non-MSWs (NRs. 7,000). Ten percent of MSM made less than NRs. 3,000 and 32.3 percent earned between NRs. 3,001 and NRs. 6,000. Twenty-four percent MSM had made more than NRs 10,000; more MSWs (31.9%) than non-MSWs (19.6%) reported doing so. Table 4. 6 : Source of Income and Number of Dependents
MSW Non-MSW MSM Income and no. of dependents N=135 % N=265 % N=400 %
Last months income in NRs. <=3000 6 4.4 34 12.8 40 10.0 3001– 6000 37 27.4 92 34.7 129 32.3 6001– 10000 49 36.3 87 32.8 136 34.0 > 10000 43 31.9 52 19.6 95 23.8 Median income in NRs. 9,000 7,000 7,000 Source of last month’s income* Salaried job 70 51.9 98 37.0 168 42.0 Sex work 108 80.0 0 0.0 180 27.0 Wage labor 23 17.0 72 27.2 95 23.8 Money from family 20 14.8 66 24.9 86 21.5 Own business 7 5.2 54 20.4 61 15.3 Other work 1 0.7 3 1.1 4 1.0 Total no of dependents
None 65 48.1 135 50.9 200 50.0 1 – 2 33 24.4 51 19.2 84 21.0 3 – 4 28 20.7 62 23.4 90 22.5 5 – 6 9 6.7 11 4.2 20 5.0 7 + 0 0.0 6 2.3 6 1.5
Amount paid by last client (in NRs.) 40 – 100 17 12.6 NA NA NA NA 101 – 400 43 31.9 NA NA NA NA 401 – 1000 58 43.0 NA NA NA NA 1001 – 5000 17 12.6 NA NA NA NA
*Note: Because of multiple answers, percentages add up to more than 100. NA- Not applicable for non-MSWs Eighty percent of the MSWs mentioned that their last month’s income was from sex work. In addition they had also received salary from their jobs (51.9% MSWs and 37 percent non-MSWs) and had been paid for working as wage laborers (17% MSWs and 27.2% non-MSWs). More non-MSWs (24.9%) than MSWs (14.8%) were sent money by their families in the month preceding the survey. Fifty percent of MSM did not have any dependents to look after. Twenty-one percent of the MSM had 1-2 dependents, while 29 percent of them had to take care of more than two dependents. The prices charged by MSWs to their clients varied from NRs. 40 to NRs. 5,000. Forty-three percent of them had been paid between NRs. 401 to NRs. 1000, while 31.9 percent had received between NRs. 101 and NRs. 400 from their last clients.

IBBS MSM Kathmandu Valley Report - 2009 19
MSWs’ paying partners were from different professional backgrounds. Forty-three percent of MSWs reported that their clients were mostly police/military men, while 38.5 percent and 36.3 percent said that their clients were mostly students and businessmen (Annex - 9).
IBBS MSM Kathmandu Valley Report - 2009 20
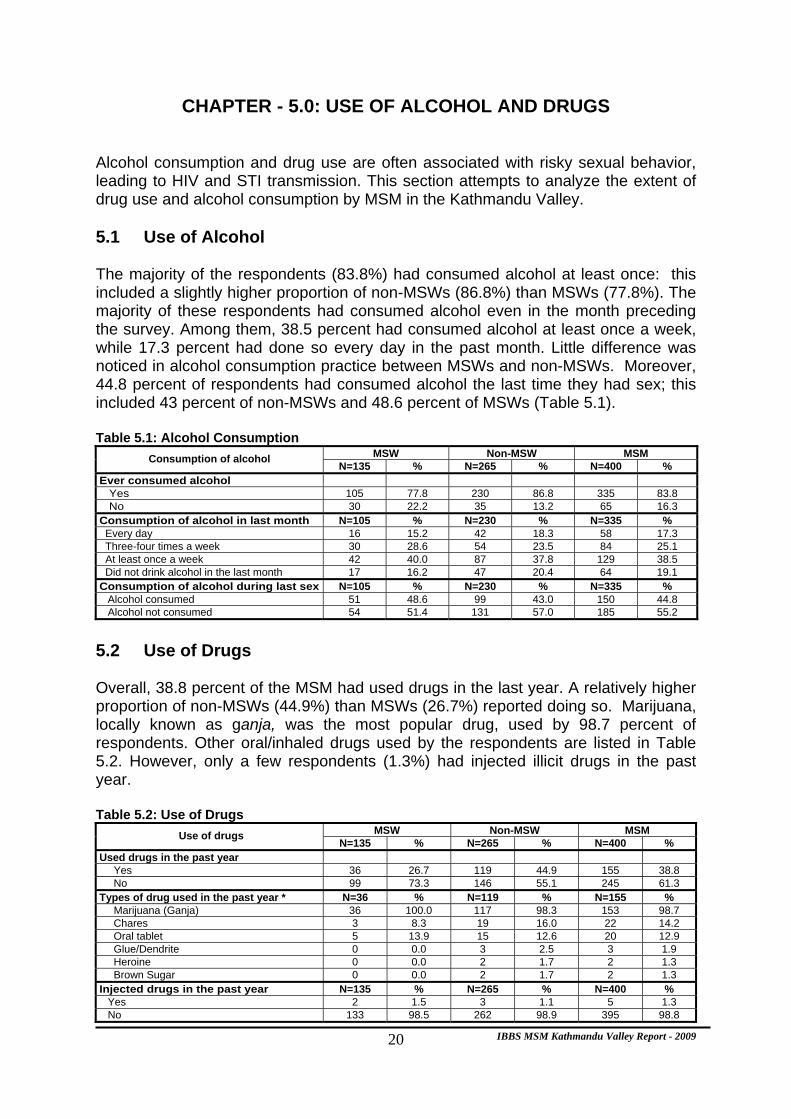
CHAPTER - 5.0: USE OF ALCOHOL AND DRUGS Alcohol consumption and drug use are often associated with risky sexual behavior, leading to HIV and STI transmission. This section attempts to analyze the extent of drug use and alcohol consumption by MSM in the Kathmandu Valley. 5.1 Use of Alcohol The majority of the respondents (83.8%) had consumed alcohol at least once: this included a slightly higher proportion of non-MSWs (86.8%) than MSWs (77.8%). The majority of these respondents had consumed alcohol even in the month preceding the survey. Among them, 38.5 percent had consumed alcohol at least once a week, while 17.3 percent had done so every day in the past month. Little difference was noticed in alcohol consumption practice between MSWs and non-MSWs. Moreover, 44.8 percent of respondents had consumed alcohol the last time they had sex; this included 43 percent of non-MSWs and 48.6 percent of MSWs (Table 5.1). Table 5.1: Alcohol Consumption
MSW Non-MSW MSM Consumption of alcohol N=135 % N=265 % N=400 %
Ever consumed alcohol Yes 105 77.8 230 86.8 335 83.8 No 30 22.2 35 13.2 65 16.3 Consumption of alcohol in last month N=105 % N=230 % N=335 % Every day 16 15.2 42 18.3 58 17.3 Three-four times a week 30 28.6 54 23.5 84 25.1 At least once a week 42 40.0 87 37.8 129 38.5 Did not drink alcohol in the last month 17 16.2 47 20.4 64 19.1 Consumption of alcohol during last sex N=105 % N=230 % N=335 %
Alcohol consumed 51 48.6 99 43.0 150 44.8 Alcohol not consumed 54 51.4 131 57.0 185 55.2
5.2 Use of Drugs Overall, 38.8 percent of the MSM had used drugs in the last year. A relatively higher proportion of non-MSWs (44.9%) than MSWs (26.7%) reported doing so. Marijuana, locally known as ganja, was the most popular drug, used by 98.7 percent of respondents. Other oral/inhaled drugs used by the respondents are listed in Table 5.2. However, only a few respondents (1.3%) had injected illicit drugs in the past year. Table 5.2: Use of Drugs
MSW Non-MSW MSM Use of drugs N=135 % N=265 % N=400 %
Used drugs in the past year Yes 36 26.7 119 44.9 155 38.8 No 99 73.3 146 55.1 245 61.3
Types of drug used in the past year * N=36 % N=119 % N=155 % Marijuana (Ganja) 36 100.0 117 98.3 153 98.7
Chares 3 8.3 19 16.0 22 14.2 Oral tablet 5 13.9 15 12.6 20 12.9 Glue/Dendrite 0 0.0 3 2.5 3 1.9 Heroine 0 0.0 2 1.7 2 1.3 Brown Sugar 0 0.0 2 1.7 2 1.3
Injected drugs in the past year N=135 % N=265 % N=400 % Yes 2 1.5 3 1.1 5 1.3 No 133 98.5 262 98.9 395 98.8

IBBS MSM Kathmandu Valley Report - 2009 21
*Note: Because of multiple answers, percentages add up to more than 100.
CHAPTER - 6.0: SEXUAL BEHAVIOR, TYPE OF PARTNER AND CONDOM USE
This chapter deals with the sexual behavior of MSM. It focuses particularly on risky sexual behavior, type and number of partners, as well as the use of condoms and lubricants in different sexual acts. 6.1 First Sexual Contact Six in ten MSM (61.3%) first had sex between the ages of 8-16 years. Notably, 82.2 percent of MSWs had their first sexual contact at the age of 8-16 years compared to 50.6 percent of non-MSWs. It is also important to note that a relatively high proportion of MSWs (89.6%) had their first sexual experience with a male partner than non-MSWs (43.8%). Overall, 35.5 percent of MSM reported ever having sex with a male partner in exchange for money. Not all of these were MSWs: seven non-MSWs (2.6%) also had at least one sexual contact in return for money until the date of the survey, but had stopped doing so more than one year before. Table 6.1: Sexual Behavior & Sex Partners
MSW Non-MSW MSM Sexual behavior N=135 % N=265 % N=400 %
Age at first sexual intercourse 8 – 16 111 82.2 134 50.6 245 61.3 17 – 20 23 17.0 109 41.1 132 33.0 21 – 30 1 0.7 22 8.3 23 5.8
Median - 14.0 - 16.0 - 16.0 Mean - 14.2 - 16.7 - 15.9
First sex partner Male 121 89.6 116 43.8 237 59.3 Female 14 10.4 149 56.2 163 40.8
Ever had sex with a male in exchange for money
Yes 135 100.0 7 2.6 142 35.5 No 0 0.0 258 97.4 258 64.5 Age at first sex with a male in exchange for money
N=135 % N=7 % N=142 %
8 – 16 35 25.9 1 14.3 36 25.4 17 – 20 63 46.7 3 42.9 66 46.5 > 20 (21 – 55) 37 27.4 3 42.9 40 28.2
Mean - 19.5 - 23.6 - 19.7 Median - 19.0 - 20.0 - 19.0
Time of last sex with male/in exchange for money
N=135 % N=7 % N=142 %
Within last 7 days 88 65.2 0 0.0 88 62.0 8 – 15 days before 15 11.1 0 0.0 15 10.6 16 – 30 days before 3 2.2 0 0.0 3 2.1 31 – 60 days before 12 8.9 0 0.0 12 8.5 60 days – 1year before 17 12.6 0 0.0 17 12.0 > 1year before 0 0.0 7 100.0 7 4.9
Around one-fourth of the MSM (25.4%) had sold sex for the first time between the ages of 8-16 years. The median age for starting to exchange sex for money was 19 years among MSWs and 20 years among non-MSWs. Around 47 percent of those

IBBS MSM Kathmandu Valley Report - 2009 22
who had sex with a male partner in exchange for money were 17 to 20 years old at the time of their first such sexual contact. A total of 78.5 percent of MSWs had last exchanged sex for money in the month preceding the survey. Among them, 65.2 percent had sold sex in the past week. While 8.9 percent of MSWs had had sex in exchange for money 1-2 months before the survey, 12.6 percent of them had done so over 2 months prior to the survey. 6.2 Sex Partners of MSM This study made efforts to cover as many different types of sex partners of MSM as possible. Six types of sex partners were cited by MSM. These are (1) non-paying male, (2) non-paying female, (3) one-time paying male, (4) regular paying male, (5) paid male and (6) paid female partners. This section deals with information on number of different types of sex partners respondents had in the month preceding the interview. While all of the study participants had had sex with a male partner in the past year, 49 percent of them had sexual contact with female partners too. A larger proportion of non-MSWs (57.7%) than MSWs (31.9%) have had sexual contact with female partner in the past year (Figure 1). Sex Partners in the Past Month Non-paying Partners The survey made an effort to assess the sexual practices of the respondents in the month preceding the survey. Seventy-five percent of the MSM who participated in the survey had had sex with a non-paying male partner in the last month, while 22.5 percent had also sex with a non-paying female sex partner in the last month. The mean number of non-paying male sex partners was 5.5 compared to the mean of 0.4 non-paying female sex partners in the past month (Table 6.2). It is interesting to note that there is little difference between MSWs and non-MSWs in terms of the number of non-paying male partners. On average, both groups had about five male non-paying partners in the last month. Paying Partners The paying partners of MSWs were categorized as one-time paying partners and regular paying partners. On average, the MSWs had 9 one-time paying and 11.1 regular paying male sex partners in the past month. While 29.6 percent of MSWs did not have a one-time paying sexual partner, 26.7 percent of MSWs did not have a regular paying male sex partner in the past month. On the other hand, 33.3 percent had more than five one-time paying male sex partners while 40.7 percent of them had more than five regular paying sex partners in the month preceding the survey (Table 6.2).
Figure 1: Had Sex with Female Sex Partner/s in Past 12 Month
31.9
57.7
0
10
20
30
40
50
60
70
MSW (N=135) Non-MSW (N=265)
Perc
ent
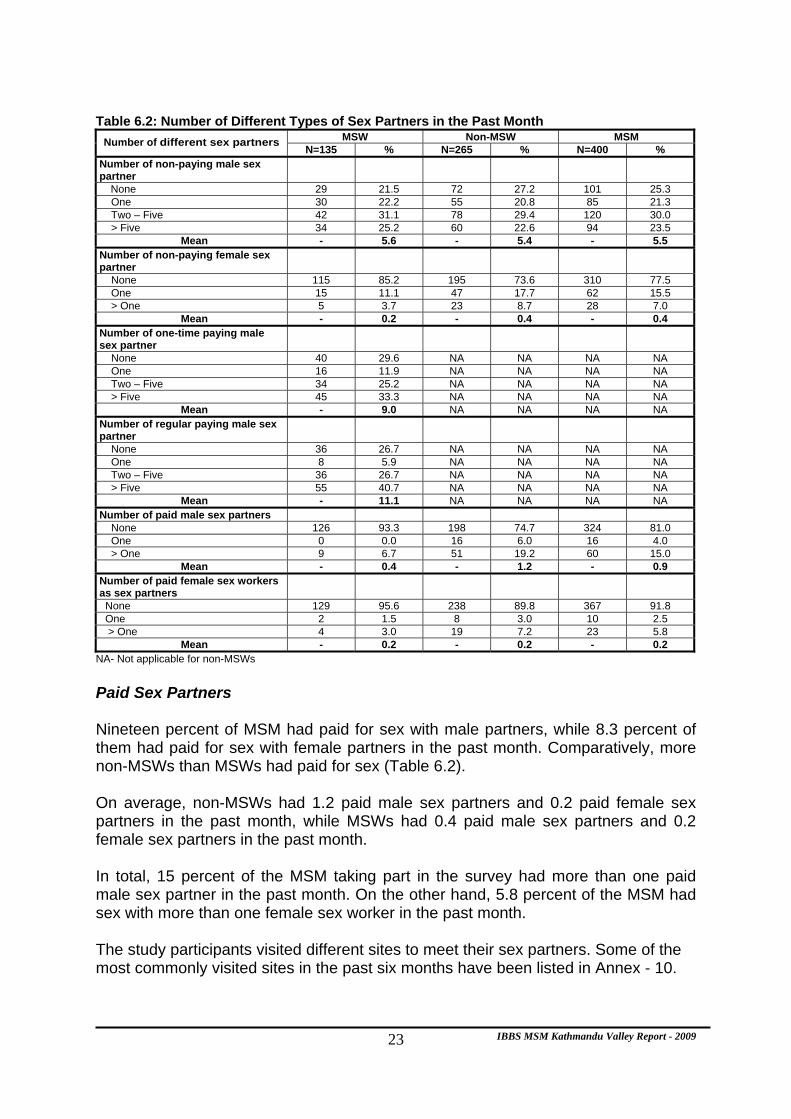
IBBS MSM Kathmandu Valley Report - 2009 23
Table 6.2: Number of Different Types of Sex Partners in the Past Month
MSW Non-MSW MSM Number of different sex partners N=135 % N=265 % N=400 %
Number of non-paying male sex partner
None 29 21.5 72 27.2 101 25.3 One 30 22.2 55 20.8 85 21.3 Two – Five 42 31.1 78 29.4 120 30.0 > Five 34 25.2 60 22.6 94 23.5
Mean - 5.6 - 5.4 - 5.5 Number of non-paying female sex partner
None 115 85.2 195 73.6 310 77.5 One 15 11.1 47 17.7 62 15.5 > One 5 3.7 23 8.7 28 7.0
Mean - 0.2 - 0.4 - 0.4 Number of one-time paying male sex partner
None 40 29.6 NA NA NA NA One 16 11.9 NA NA NA NA Two – Five 34 25.2 NA NA NA NA > Five 45 33.3 NA NA NA NA
Mean - 9.0 NA NA NA NA Number of regular paying male sex partner
None 36 26.7 NA NA NA NA One 8 5.9 NA NA NA NA Two – Five 36 26.7 NA NA NA NA > Five 55 40.7 NA NA NA NA
Mean - 11.1 NA NA NA NA Number of paid male sex partners None 126 93.3 198 74.7 324 81.0 One 0 0.0 16 6.0 16 4.0 > One 9 6.7 51 19.2 60 15.0
Mean - 0.4 - 1.2 - 0.9 Number of paid female sex workers as sex partners
None 129 95.6 238 89.8 367 91.8 One 2 1.5 8 3.0 10 2.5 > One 4 3.0 19 7.2 23 5.8
Mean - 0.2 - 0.2 - 0.2 NA- Not applicable for non-MSWs Paid Sex Partners Nineteen percent of MSM had paid for sex with male partners, while 8.3 percent of them had paid for sex with female partners in the past month. Comparatively, more non-MSWs than MSWs had paid for sex (Table 6.2). On average, non-MSWs had 1.2 paid male sex partners and 0.2 paid female sex partners in the past month, while MSWs had 0.4 paid male sex partners and 0.2 female sex partners in the past month. In total, 15 percent of the MSM taking part in the survey had more than one paid male sex partner in the past month. On the other hand, 5.8 percent of the MSM had sex with more than one female sex worker in the past month. The study participants visited different sites to meet their sex partners. Some of the most commonly visited sites in the past six months have been listed in Annex - 10.
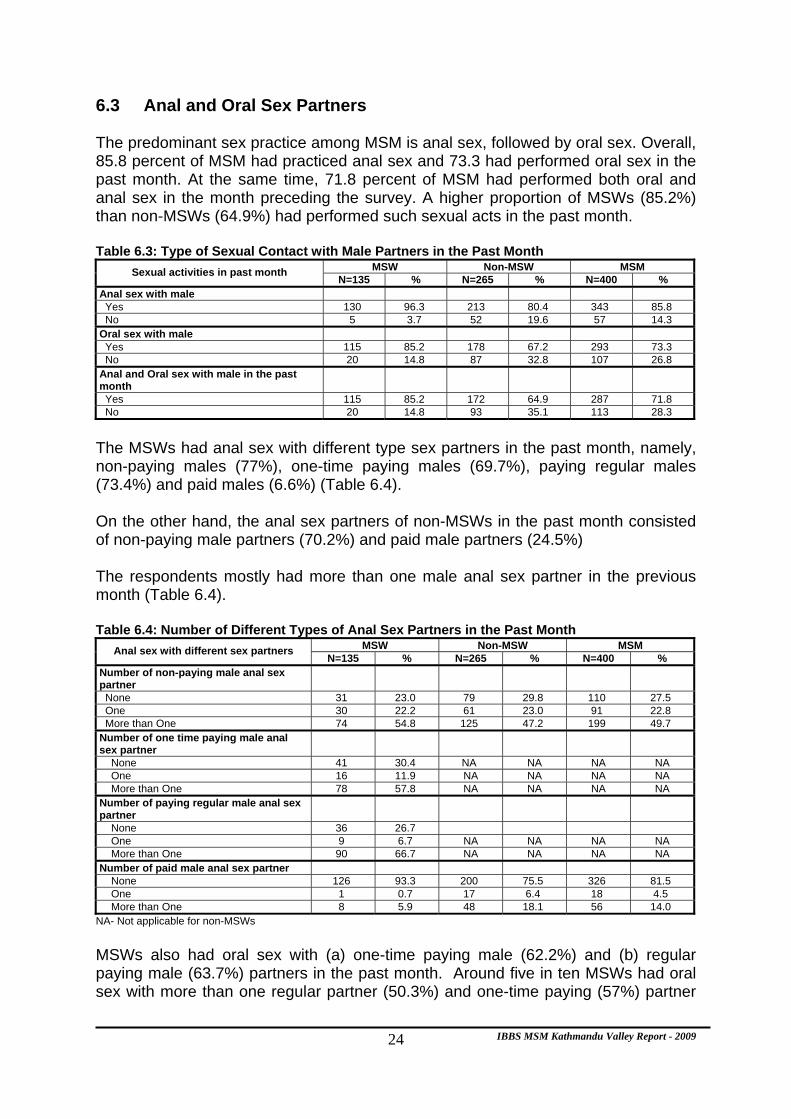
IBBS MSM Kathmandu Valley Report - 2009 24
6.3 Anal and Oral Sex Partners The predominant sex practice among MSM is anal sex, followed by oral sex. Overall, 85.8 percent of MSM had practiced anal sex and 73.3 had performed oral sex in the past month. At the same time, 71.8 percent of MSM had performed both oral and anal sex in the month preceding the survey. A higher proportion of MSWs (85.2%) than non-MSWs (64.9%) had performed such sexual acts in the past month. Table 6.3: Type of Sexual Contact with Male Partners in the Past Month
MSW Non-MSW MSM Sexual activities in past month N=135 % N=265 % N=400 %
Anal sex with male Yes 130 96.3 213 80.4 343 85.8 No 5 3.7 52 19.6 57 14.3
Oral sex with male Yes 115 85.2 178 67.2 293 73.3 No 20 14.8 87 32.8 107 26.8
Anal and Oral sex with male in the past month
Yes 115 85.2 172 64.9 287 71.8 No 20 14.8 93 35.1 113 28.3
The MSWs had anal sex with different type sex partners in the past month, namely, non-paying males (77%), one-time paying males (69.7%), paying regular males (73.4%) and paid males (6.6%) (Table 6.4). On the other hand, the anal sex partners of non-MSWs in the past month consisted of non-paying male partners (70.2%) and paid male partners (24.5%) The respondents mostly had more than one male anal sex partner in the previous month (Table 6.4). Table 6.4: Number of Different Types of Anal Sex Partners in the Past Month
MSW Non-MSW MSM Anal sex with different sex partners N=135 % N=265 % N=400 %
Number of non-paying male anal sex partner
None 31 23.0 79 29.8 110 27.5 One 30 22.2 61 23.0 91 22.8 More than One 74 54.8 125 47.2 199 49.7
Number of one time paying male anal sex partner
None 41 30.4 NA NA NA NA One 16 11.9 NA NA NA NA More than One 78 57.8 NA NA NA NA
Number of paying regular male anal sex partner
None 36 26.7 One 9 6.7 NA NA NA NA More than One 90 66.7 NA NA NA NA
Number of paid male anal sex partner None 126 93.3 200 75.5 326 81.5 One 1 0.7 17 6.4 18 4.5 More than One 8 5.9 48 18.1 56 14.0
NA- Not applicable for non-MSWs MSWs also had oral sex with (a) one-time paying male (62.2%) and (b) regular paying male (63.7%) partners in the past month. Around five in ten MSWs had oral sex with more than one regular partner (50.3%) and one-time paying (57%) partner
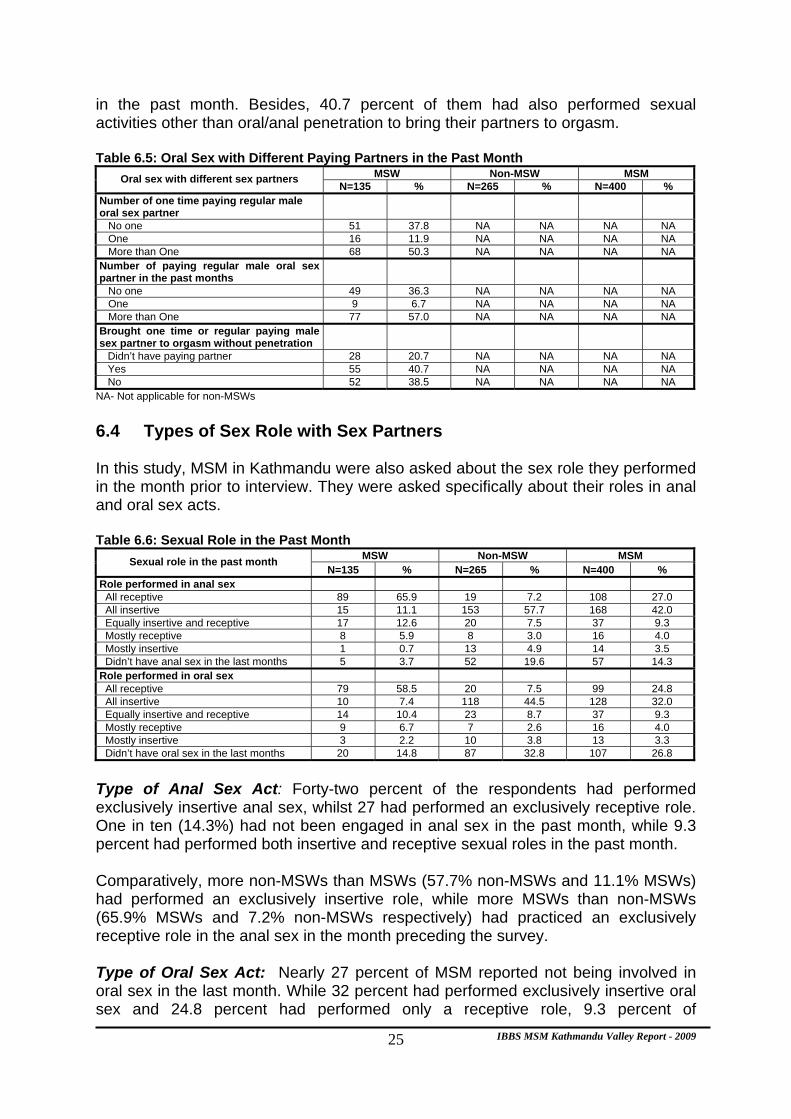
IBBS MSM Kathmandu Valley Report - 2009 25
in the past month. Besides, 40.7 percent of them had also performed sexual activities other than oral/anal penetration to bring their partners to orgasm. Table 6.5: Oral Sex with Different Paying Partners in the Past Month
MSW Non-MSW MSM Oral sex with different sex partners N=135 % N=265 % N=400 %
Number of one time paying regular male oral sex partner
No one 51 37.8 NA NA NA NA One 16 11.9 NA NA NA NA More than One 68 50.3 NA NA NA NA Number of paying regular male oral sex partner in the past months
No one 49 36.3 NA NA NA NA One 9 6.7 NA NA NA NA More than One 77 57.0 NA NA NA NA Brought one time or regular paying male sex partner to orgasm without penetration
Didn’t have paying partner 28 20.7 NA NA NA NA Yes 55 40.7 NA NA NA NA No 52 38.5 NA NA NA NA
NA- Not applicable for non-MSWs 6.4 Types of Sex Role with Sex Partners In this study, MSM in Kathmandu were also asked about the sex role they performed in the month prior to interview. They were asked specifically about their roles in anal and oral sex acts. Table 6.6: Sexual Role in the Past Month
MSW Non-MSW MSM Sexual role in the past month N=135 % N=265 % N=400 %
Role performed in anal sex All receptive 89 65.9 19 7.2 108 27.0 All insertive 15 11.1 153 57.7 168 42.0 Equally insertive and receptive 17 12.6 20 7.5 37 9.3 Mostly receptive 8 5.9 8 3.0 16 4.0 Mostly insertive 1 0.7 13 4.9 14 3.5 Didn’t have anal sex in the last months 5 3.7 52 19.6 57 14.3 Role performed in oral sex All receptive 79 58.5 20 7.5 99 24.8 All insertive 10 7.4 118 44.5 128 32.0 Equally insertive and receptive 14 10.4 23 8.7 37 9.3 Mostly receptive 9 6.7 7 2.6 16 4.0 Mostly insertive 3 2.2 10 3.8 13 3.3 Didn’t have oral sex in the last months 20 14.8 87 32.8 107 26.8
Type of Anal Sex Act: Forty-two percent of the respondents had performed exclusively insertive anal sex, whilst 27 had performed an exclusively receptive role. One in ten (14.3%) had not been engaged in anal sex in the past month, while 9.3 percent had performed both insertive and receptive sexual roles in the past month. Comparatively, more non-MSWs than MSWs (57.7% non-MSWs and 11.1% MSWs) had performed an exclusively insertive role, while more MSWs than non-MSWs (65.9% MSWs and 7.2% non-MSWs respectively) had practiced an exclusively receptive role in the anal sex in the month preceding the survey. Type of Oral Sex Act: Nearly 27 percent of MSM reported not being involved in oral sex in the last month. While 32 percent had performed exclusively insertive oral sex and 24.8 percent had performed only a receptive role, 9.3 percent of
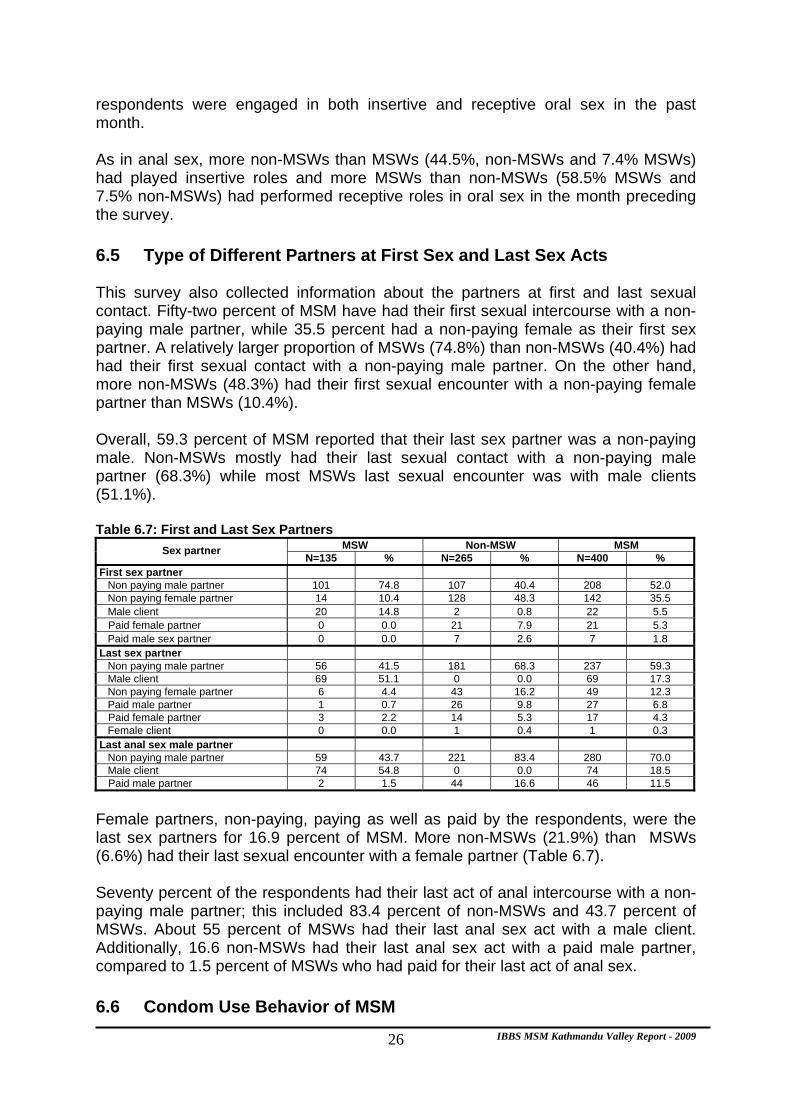
IBBS MSM Kathmandu Valley Report - 2009 26
respondents were engaged in both insertive and receptive oral sex in the past month. As in anal sex, more non-MSWs than MSWs (44.5%, non-MSWs and 7.4% MSWs) had played insertive roles and more MSWs than non-MSWs (58.5% MSWs and 7.5% non-MSWs) had performed receptive roles in oral sex in the month preceding the survey. 6.5 Type of Different Partners at First Sex and Last Sex Acts This survey also collected information about the partners at first and last sexual contact. Fifty-two percent of MSM have had their first sexual intercourse with a non-paying male partner, while 35.5 percent had a non-paying female as their first sex partner. A relatively larger proportion of MSWs (74.8%) than non-MSWs (40.4%) had had their first sexual contact with a non-paying male partner. On the other hand, more non-MSWs (48.3%) had their first sexual encounter with a non-paying female partner than MSWs (10.4%). Overall, 59.3 percent of MSM reported that their last sex partner was a non-paying male. Non-MSWs mostly had their last sexual contact with a non-paying male partner (68.3%) while most MSWs last sexual encounter was with male clients (51.1%). Table 6.7: First and Last Sex Partners
MSW Non-MSW MSM Sex partner N=135 % N=265 % N=400 %
First sex partner Non paying male partner 101 74.8 107 40.4 208 52.0 Non paying female partner 14 10.4 128 48.3 142 35.5 Male client 20 14.8 2 0.8 22 5.5
Paid female partner 0 0.0 21 7.9 21 5.3 Paid male sex partner 0 0.0 7 2.6 7 1.8
Last sex partner Non paying male partner 56 41.5 181 68.3 237 59.3 Male client 69 51.1 0 0.0 69 17.3 Non paying female partner 6 4.4 43 16.2 49 12.3 Paid male partner 1 0.7 26 9.8 27 6.8
Paid female partner 3 2.2 14 5.3 17 4.3 Female client 0 0.0 1 0.4 1 0.3
Last anal sex male partner Non paying male partner 59 43.7 221 83.4 280 70.0 Male client 74 54.8 0 0.0 74 18.5
Paid male partner 2 1.5 44 16.6 46 11.5
Female partners, non-paying, paying as well as paid by the respondents, were the last sex partners for 16.9 percent of MSM. More non-MSWs (21.9%) than MSWs (6.6%) had their last sexual encounter with a female partner (Table 6.7). Seventy percent of the respondents had their last act of anal intercourse with a non-paying male partner; this included 83.4 percent of non-MSWs and 43.7 percent of MSWs. About 55 percent of MSWs had their last anal sex act with a male client. Additionally, 16.6 non-MSWs had their last anal sex act with a paid male partner, compared to 1.5 percent of MSWs who had paid for their last act of anal sex. 6.6 Condom Use Behavior of MSM

IBBS MSM Kathmandu Valley Report - 2009 27
This section deals with condom using behavior among MSM. Six of the 400 (1.5%) MSM had never used condom, this included one MSW and 5 non-MSWs. Table 6.8 shows condom use at sexual debut and during the last sex act with either a male or female partner. Twenty-three percent of MSM had used condom at their first sexual debut. However, more MSM (71.3%) had used condom in their last sexual contact. About 75 percent MSWs had used condoms during last sex compared to 69.4 percent non-MSWs reporting so. Table 6.8: Condom Use with First and Last Sex Partners
MSW Non-MSW MSM Use of condom N=135 % N=265 % N=400 %
Used condom in first sex Yes 14 10.4 78 29.4 92 23.0 No 120 88.9 187 70.6 307 76.8 Don’t know/Can’t recall 1 0.7 0 0.0 1 0.3
Used condom in last sex Yes 101 74.8 184 69.4 285 71.3 No 34 25.2 81 30.6 115 28.7
Used condom in last anal sex with male Yes 103 76.3 198 74.7 301 75.3 No 32 23.7 67 25.3 99 24.7
Three types of sex practices anal, oral and vaginal, with different partners were reported by the respondents. Table 6.9 depicts the condom use behavior of MSM during their last act of sex with different type sex partners. Since MSWs and non-MSWs have different type of sex partners, their condom using practices have been discussed in separate sections. MSWs and Condom Use in the Last Act of Sex Of the four types of different male sex partners of MSWs; (1) non-paying (2) one-time paying (3) regular paying and (4) paid partner; the highest percent of condom use during the last act of anal sex was with paid male sex partners (100%) and the lowest was during sex with non-paying male sex partners (75.5% each). The majority of MSWs had also used a condom the last time they had anal sex with one-time paying male sex partners (90.4%) and regular paying male sex partners (86.9%). Overall, 75.5 percent of MSWs had used a condom with their last non-paying male anal sex partner in the month preceding the survey. Of the 20 MSWs who had had sex with non-paying female sex partners, 10 (50 %) had used a condom the last time they had sex with them. At the same time, three of the six MSWs (50%) who had sex with paid female sex partners in last month had used condoms.
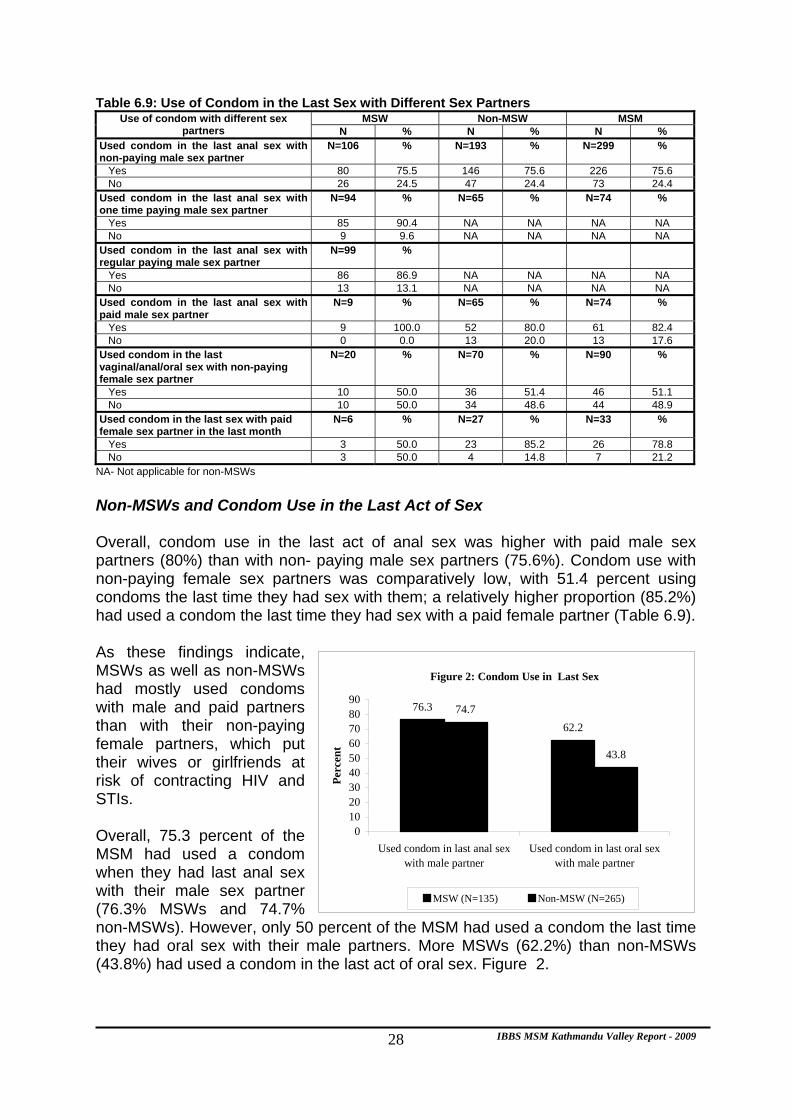
IBBS MSM Kathmandu Valley Report - 2009 28
Table 6.9: Use of Condom in the Last Sex with Different Sex Partners MSW Non-MSW MSM Use of condom with different sex
partners N % N % N % Used condom in the last anal sex with non-paying male sex partner
N=106 % N=193 % N=299 %
Yes 80 75.5 146 75.6 226 75.6 No 26 24.5 47 24.4 73 24.4 Used condom in the last anal sex with one time paying male sex partner
N=94 % N=65 % N=74 %
Yes 85 90.4 NA NA NA NA No 9 9.6 NA NA NA NA Used condom in the last anal sex with regular paying male sex partner
N=99 %
Yes 86 86.9 NA NA NA NA No 13 13.1 NA NA NA NA Used condom in the last anal sex with paid male sex partner
N=9 % N=65 % N=74 %
Yes 9 100.0 52 80.0 61 82.4 No 0 0.0 13 20.0 13 17.6 Used condom in the last vaginal/anal/oral sex with non-paying female sex partner
N=20 % N=70 % N=90 %
Yes 10 50.0 36 51.4 46 51.1 No 10 50.0 34 48.6 44 48.9 Used condom in the last sex with paid female sex partner in the last month
N=6 % N=27 % N=33 %
Yes 3 50.0 23 85.2 26 78.8 No 3 50.0 4 14.8 7 21.2
NA- Not applicable for non-MSWs Non-MSWs and Condom Use in the Last Act of Sex Overall, condom use in the last act of anal sex was higher with paid male sex partners (80%) than with non- paying male sex partners (75.6%). Condom use with non-paying female sex partners was comparatively low, with 51.4 percent using condoms the last time they had sex with them; a relatively higher proportion (85.2%) had used a condom the last time they had sex with a paid female partner (Table 6.9). As these findings indicate, MSWs as well as non-MSWs had mostly used condoms with male and paid partners than with their non-paying female partners, which put their wives or girlfriends at risk of contracting HIV and STIs. Overall, 75.3 percent of the MSM had used a condom when they had last anal sex with their male sex partner (76.3% MSWs and 74.7% non-MSWs). However, only 50 percent of the MSM had used a condom the last time they had oral sex with their male partners. More MSWs (62.2%) than non-MSWs (43.8%) had used a condom in the last act of oral sex. Figure 2.
Figure 2: Condom Use in Last Sex
76.3
62.274.7
43.8
0102030405060708090
Used condom in last anal sexwith male partner
Used condom in last oral sexwith male partner
Perc
ent
MSW (N=135) Non-MSW (N=265)
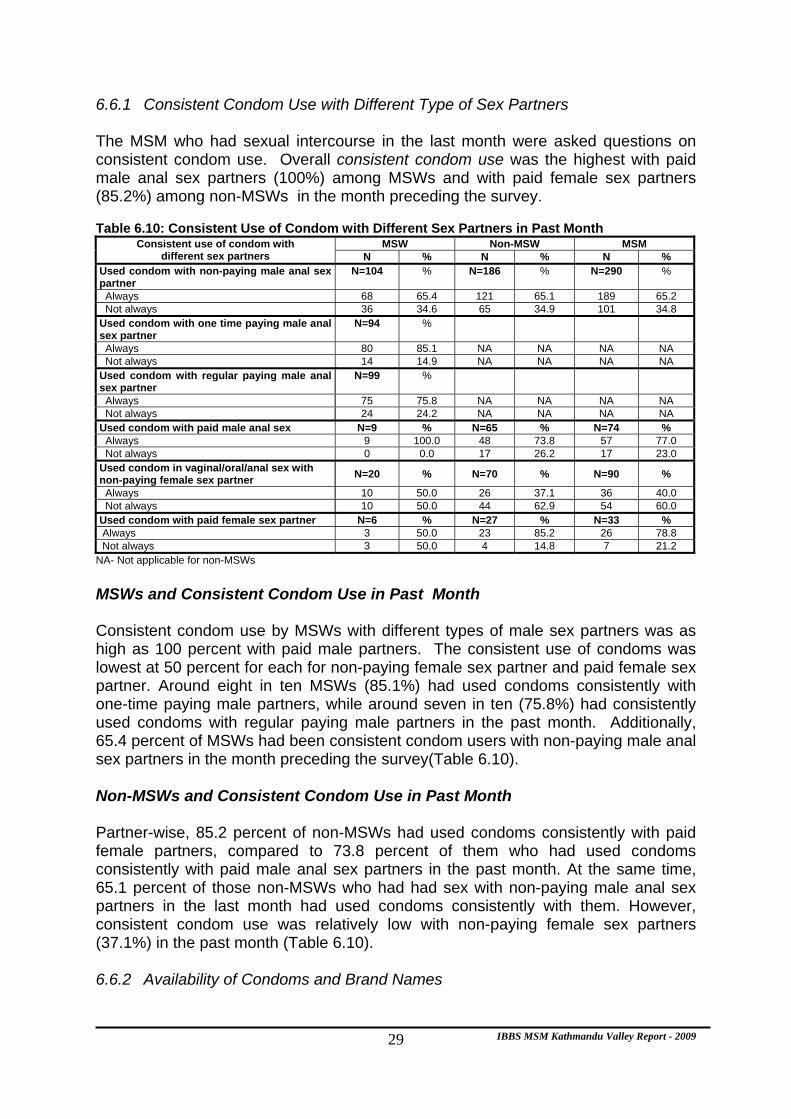
IBBS MSM Kathmandu Valley Report - 2009 29
6.6.1 Consistent Condom Use with Different Type of Sex Partners The MSM who had sexual intercourse in the last month were asked questions on consistent condom use. Overall consistent condom use was the highest with paid male anal sex partners (100%) among MSWs and with paid female sex partners (85.2%) among non-MSWs in the month preceding the survey. Table 6.10: Consistent Use of Condom with Different Sex Partners in Past Month
MSW Non-MSW MSM Consistent use of condom with different sex partners N % N % N %
Used condom with non-paying male anal sex partner
N=104 % N=186 % N=290 %
Always 68 65.4 121 65.1 189 65.2 Not always 36 34.6 65 34.9 101 34.8 Used condom with one time paying male anal sex partner
N=94 %
Always 80 85.1 NA NA NA NA Not always 14 14.9 NA NA NA NA Used condom with regular paying male anal sex partner
N=99 %
Always 75 75.8 NA NA NA NA Not always 24 24.2 NA NA NA NA Used condom with paid male anal sex N=9 % N=65 % N=74 % Always 9 100.0 48 73.8 57 77.0 Not always 0 0.0 17 26.2 17 23.0 Used condom in vaginal/oral/anal sex with non-paying female sex partner N=20 % N=70 % N=90 %
Always 10 50.0 26 37.1 36 40.0 Not always 10 50.0 44 62.9 54 60.0 Used condom with paid female sex partner N=6 % N=27 % N=33 % Always 3 50.0 23 85.2 26 78.8 Not always 3 50.0 4 14.8 7 21.2
NA- Not applicable for non-MSWs MSWs and Consistent Condom Use in Past Month Consistent condom use by MSWs with different types of male sex partners was as high as 100 percent with paid male partners. The consistent use of condoms was lowest at 50 percent for each for non-paying female sex partner and paid female sex partner. Around eight in ten MSWs (85.1%) had used condoms consistently with one-time paying male partners, while around seven in ten (75.8%) had consistently used condoms with regular paying male partners in the past month. Additionally, 65.4 percent of MSWs had been consistent condom users with non-paying male anal sex partners in the month preceding the survey(Table 6.10). Non-MSWs and Consistent Condom Use in Past Month Partner-wise, 85.2 percent of non-MSWs had used condoms consistently with paid female partners, compared to 73.8 percent of them who had used condoms consistently with paid male anal sex partners in the past month. At the same time, 65.1 percent of those non-MSWs who had had sex with non-paying male anal sex partners in the last month had used condoms consistently with them. However, consistent condom use was relatively low with non-paying female sex partners (37.1%) in the past month (Table 6.10). 6.6.2 Availability of Condoms and Brand Names
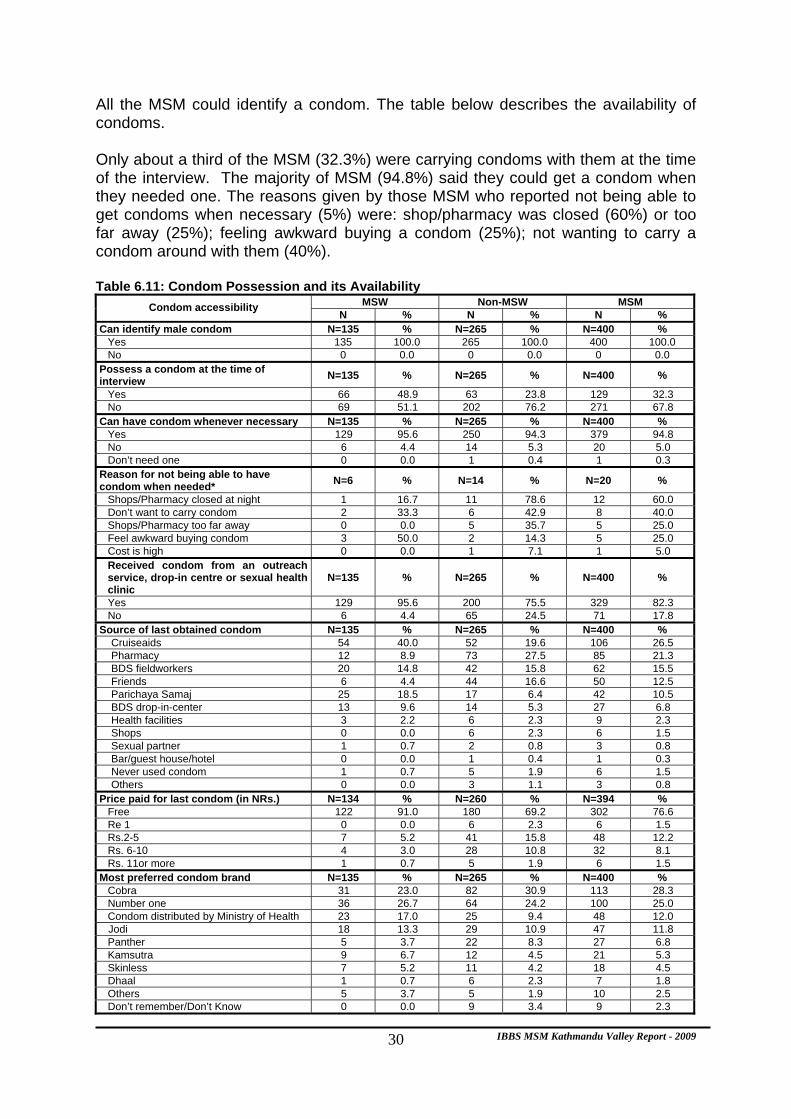
IBBS MSM Kathmandu Valley Report - 2009 30
All the MSM could identify a condom. The table below describes the availability of condoms. Only about a third of the MSM (32.3%) were carrying condoms with them at the time of the interview. The majority of MSM (94.8%) said they could get a condom when they needed one. The reasons given by those MSM who reported not being able to get condoms when necessary (5%) were: shop/pharmacy was closed (60%) or too far away (25%); feeling awkward buying a condom (25%); not wanting to carry a condom around with them (40%). Table 6.11: Condom Possession and its Availability
MSW Non-MSW MSM Condom accessibility N % N % N %
Can identify male condom N=135 % N=265 % N=400 % Yes 135 100.0 265 100.0 400 100.0 No 0 0.0 0 0.0 0 0.0
Possess a condom at the time of interview N=135 % N=265 % N=400 %
Yes 66 48.9 63 23.8 129 32.3 No 69 51.1 202 76.2 271 67.8
Can have condom whenever necessary N=135 % N=265 % N=400 % Yes 129 95.6 250 94.3 379 94.8 No 6 4.4 14 5.3 20 5.0 Don’t need one 0 0.0 1 0.4 1 0.3
Reason for not being able to have condom when needed* N=6 % N=14 % N=20 %
Shops/Pharmacy closed at night 1 16.7 11 78.6 12 60.0 Don’t want to carry condom 2 33.3 6 42.9 8 40.0 Shops/Pharmacy too far away 0 0.0 5 35.7 5 25.0 Feel awkward buying condom 3 50.0 2 14.3 5 25.0 Cost is high 0 0.0 1 7.1 1 5.0 Received condom from an outreach service, drop-in centre or sexual health clinic
N=135 % N=265 % N=400 %
Yes 129 95.6 200 75.5 329 82.3 No 6 4.4 65 24.5 71 17.8
Source of last obtained condom N=135 % N=265 % N=400 % Cruiseaids 54 40.0 52 19.6 106 26.5 Pharmacy 12 8.9 73 27.5 85 21.3 BDS fieldworkers 20 14.8 42 15.8 62 15.5 Friends 6 4.4 44 16.6 50 12.5 Parichaya Samaj 25 18.5 17 6.4 42 10.5 BDS drop-in-center 13 9.6 14 5.3 27 6.8 Health facilities 3 2.2 6 2.3 9 2.3 Shops 0 0.0 6 2.3 6 1.5 Sexual partner 1 0.7 2 0.8 3 0.8 Bar/guest house/hotel 0 0.0 1 0.4 1 0.3 Never used condom 1 0.7 5 1.9 6 1.5 Others 0 0.0 3 1.1 3 0.8 Price paid for last condom (in NRs.) N=134 % N=260 % N=394 %
Free 122 91.0 180 69.2 302 76.6 Re 1 0 0.0 6 2.3 6 1.5 Rs.2-5 7 5.2 41 15.8 48 12.2 Rs. 6-10 4 3.0 28 10.8 32 8.1 Rs. 11or more 1 0.7 5 1.9 6 1.5
Most preferred condom brand N=135 % N=265 % N=400 % Cobra 31 23.0 82 30.9 113 28.3 Number one 36 26.7 64 24.2 100 25.0 Condom distributed by Ministry of Health 23 17.0 25 9.4 48 12.0
Jodi 18 13.3 29 10.9 47 11.8 Panther 5 3.7 22 8.3 27 6.8 Kamsutra 9 6.7 12 4.5 21 5.3 Skinless 7 5.2 11 4.2 18 4.5 Dhaal 1 0.7 6 2.3 7 1.8 Others 5 3.7 5 1.9 10 2.5 Don’t remember/Don’t Know 0 0.0 9 3.4 9 2.3
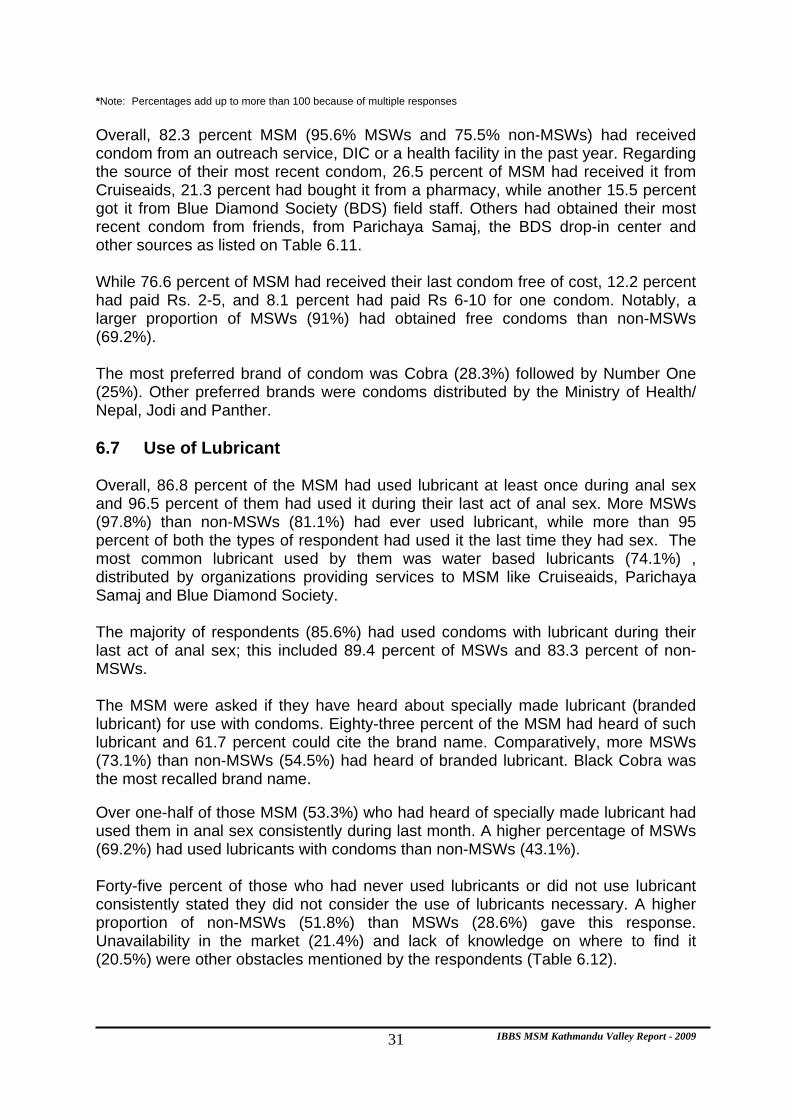
IBBS MSM Kathmandu Valley Report - 2009 31
*Note: Percentages add up to more than 100 because of multiple responses Overall, 82.3 percent MSM (95.6% MSWs and 75.5% non-MSWs) had received condom from an outreach service, DIC or a health facility in the past year. Regarding the source of their most recent condom, 26.5 percent of MSM had received it from Cruiseaids, 21.3 percent had bought it from a pharmacy, while another 15.5 percent got it from Blue Diamond Society (BDS) field staff. Others had obtained their most recent condom from friends, from Parichaya Samaj, the BDS drop-in center and other sources as listed on Table 6.11. While 76.6 percent of MSM had received their last condom free of cost, 12.2 percent had paid Rs. 2-5, and 8.1 percent had paid Rs 6-10 for one condom. Notably, a larger proportion of MSWs (91%) had obtained free condoms than non-MSWs (69.2%). The most preferred brand of condom was Cobra (28.3%) followed by Number One (25%). Other preferred brands were condoms distributed by the Ministry of Health/ Nepal, Jodi and Panther. 6.7 Use of Lubricant Overall, 86.8 percent of the MSM had used lubricant at least once during anal sex and 96.5 percent of them had used it during their last act of anal sex. More MSWs (97.8%) than non-MSWs (81.1%) had ever used lubricant, while more than 95 percent of both the types of respondent had used it the last time they had sex. The most common lubricant used by them was water based lubricants (74.1%) , distributed by organizations providing services to MSM like Cruiseaids, Parichaya Samaj and Blue Diamond Society. The majority of respondents (85.6%) had used condoms with lubricant during their last act of anal sex; this included 89.4 percent of MSWs and 83.3 percent of non-MSWs. The MSM were asked if they have heard about specially made lubricant (branded lubricant) for use with condoms. Eighty-three percent of the MSM had heard of such lubricant and 61.7 percent could cite the brand name. Comparatively, more MSWs (73.1%) than non-MSWs (54.5%) had heard of branded lubricant. Black Cobra was the most recalled brand name. Over one-half of those MSM (53.3%) who had heard of specially made lubricant had used them in anal sex consistently during last month. A higher percentage of MSWs (69.2%) had used lubricants with condoms than non-MSWs (43.1%). Forty-five percent of those who had never used lubricants or did not use lubricant consistently stated they did not consider the use of lubricants necessary. A higher proportion of non-MSWs (51.8%) than MSWs (28.6%) gave this response. Unavailability in the market (21.4%) and lack of knowledge on where to find it (20.5%) were other obstacles mentioned by the respondents (Table 6.12).

IBBS MSM Kathmandu Valley Report - 2009 32
The majority of MSM (91.7%) who used lubricant reported that it decreased pain/inflammation during sexual contact. At the same time, 70.4 percent also perceived that use of lubricant decreased the risk of condom breakage while 31.6 percent mentioned that they could avoid HIV transmission with the use of lubricant.

IBBS MSM Kathmandu Valley Report - 2009 33
Table 6.12: Use of Lubricant MSW Non-MSW MSM Use of lubricant
N % N % N % Ever used lubricant in anal sex N=135 % N=265 % N=400 %
Yes 132 97.8 215 81.1 347 86.8 No 3 2.2 50 18.9 53 13.3
Types of lubricant used in the last anal sex N=132 % N=215 % N=347 %
Water based lubricant ** 112 84.8 145 67.4 257 74.1 Saliva 11 8.3 35 16.3 46 13.3 Oil 4 3.0 20 9.3 24 6.9 Cream/lotion 1 0.8 3 1.4 4 1.2 Antiseptic/antibiotic cream 1 0.8 2 0.9 3 0.9 Others 0 0.0 1 0.5 1 0.3 Did not used lubricant in the last sex 3 2.3 9 4.2 12 3.5
Used condom with lubricant in the last anal sex N=132 % N=215 % N=347 %
Yes 118 89.4 179 83.3 297 85.6 No 14 10.6 36 16.7 50 14.4
Heard of lubricant that is specially used with condom N=135 % N=265 % N=400 %
Yes 130 96.3 202 76.2 332 83.0 No 5 3.7 63 23.8 68 17.0
Know brand name of lubricant N=130 % N=202 % N=332 % Yes, can say the brand name 95 73.1 110 54.5 205 61.7 No, can’t say the brand name 35 26.9 92 45.5 127 38.3
Brand Name of lubricant* N=95 % N=110 % N=205 % Black Cobra 61 64.2 72 65.5 133 64.9 Water Based lubricant** 16 16.8 26 23.6 42 20.5 Number One 14 14.7 5 4.5 19 9.3 KY Jelly 5 5.3 5 4.5 10 4.9 Zycolin 3 3.2 1 0.9 4 2.0 Johnson & Johnson 1 0.7 2 0.8 3 0.8 Others 1 1.1 1 0.9 2 1.0
Frequency of use of special lubricant with condom in anal sex in the past month
N=130 % N=202 % N=332 %
Every time 90 69.2 87 43.1 177 53.3 Sometimes or Never 35 26.9 82 40.6 117 35.3 Did not have anal sex in the past month 5 3.8 33 16.3 38 11.4
Reasons for occasional or no use of lubricant* N=35 % N=82 % N=117 %
Did not consider it necessary 10 28.6 43 51.8 53 44.9 Unavailability in the market 13 37.1 12 14.6 25 21.4 Did not know where to obtain it 5 14.3 19 23.2 24 20.5 Used other cream 6 16.7 7 8.5 13 11.0 Felt awkward to purchase 1 2.9 9 11.0 10 8.5 Enough lubricant in condom 2 5.7 6 7.2 8 6.8 High price 1 2.9 4 4.9 5 4.3 Not aware of such product 0 0.0 1 1.2 1 0.9 Others 9 25.7 9 11.0 18 15.4
Purpose of using lubricant* N=120 % N=133 % N=253 % To decrease pain/inflammation 119 99.2 113 85.0 232 91.7 To decrease the risk of condom breakage 92 76.7 86 64.7 178 70.4 To avoid HIV/AIDS infection 46 38.3 34 25.6 80 31.6 To increase sexual drive 21 17.5 31 23.3 52 20.6 Others 2 1.7 2 1.5 4 1.6
*Note: Percentages add up to more than 100 because of multiple responses ** Water based lubricants are those that are distributed by organizations providing services to MSM, they come in
sealed packs with water based lubricant written on it. 6.8 Problems in Using Condom and Lubricant While the majority of condom users (80.7%) did not face any problem while using lubricant with condoms, some MSM mentioned that they encountered certain problems like irritation/burning sensation (15.3%), condom slippage (1.7%) and condom breakage (1.4%) while using lubricant with condoms (Table 6.13).
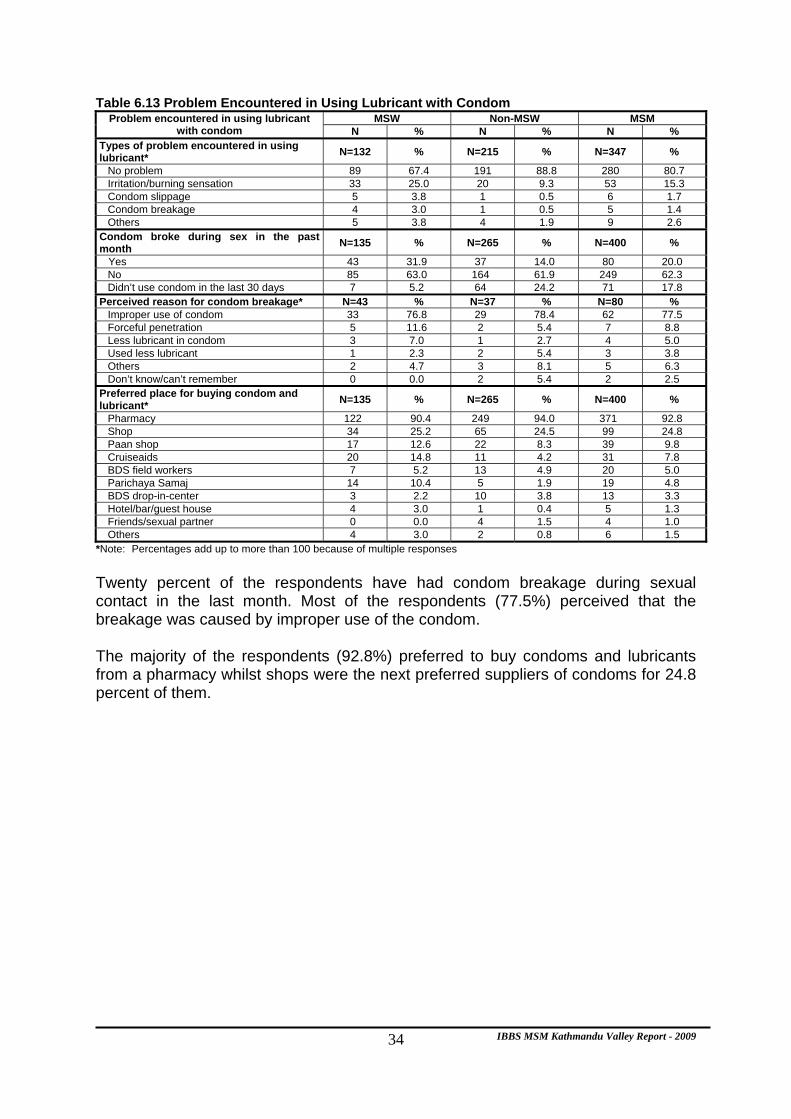
IBBS MSM Kathmandu Valley Report - 2009 34
Table 6.13 Problem Encountered in Using Lubricant with Condom MSW Non-MSW MSM Problem encountered in using lubricant
with condom N % N % N % Types of problem encountered in using lubricant* N=132 % N=215 % N=347 %
No problem 89 67.4 191 88.8 280 80.7 Irritation/burning sensation 33 25.0 20 9.3 53 15.3 Condom slippage 5 3.8 1 0.5 6 1.7 Condom breakage 4 3.0 1 0.5 5 1.4 Others 5 3.8 4 1.9 9 2.6
Condom broke during sex in the past month N=135 % N=265 % N=400 %
Yes 43 31.9 37 14.0 80 20.0 No 85 63.0 164 61.9 249 62.3 Didn’t use condom in the last 30 days 7 5.2 64 24.2 71 17.8
Perceived reason for condom breakage* N=43 % N=37 % N=80 % Improper use of condom 33 76.8 29 78.4 62 77.5 Forceful penetration 5 11.6 2 5.4 7 8.8 Less lubricant in condom 3 7.0 1 2.7 4 5.0 Used less lubricant 1 2.3 2 5.4 3 3.8 Others 2 4.7 3 8.1 5 6.3 Don’t know/can’t remember 0 0.0 2 5.4 2 2.5
Preferred place for buying condom and lubricant* N=135 % N=265 % N=400 %
Pharmacy 122 90.4 249 94.0 371 92.8 Shop 34 25.2 65 24.5 99 24.8 Paan shop 17 12.6 22 8.3 39 9.8 Cruiseaids 20 14.8 11 4.2 31 7.8 BDS field workers 7 5.2 13 4.9 20 5.0 Parichaya Samaj 14 10.4 5 1.9 19 4.8 BDS drop-in-center 3 2.2 10 3.8 13 3.3 Hotel/bar/guest house 4 3.0 1 0.4 5 1.3 Friends/sexual partner 0 0.0 4 1.5 4 1.0 Others 4 3.0 2 0.8 6 1.5
*Note: Percentages add up to more than 100 because of multiple responses Twenty percent of the respondents have had condom breakage during sexual contact in the last month. Most of the respondents (77.5%) perceived that the breakage was caused by improper use of the condom. The majority of the respondents (92.8%) preferred to buy condoms and lubricants from a pharmacy whilst shops were the next preferred suppliers of condoms for 24.8 percent of them.

IBBS MSM Kathmandu Valley Report - 2009 35
CHAPTER -7.0: KNOWLEDGE OF STIs AND HIV/AIDS
This chapter deals with the level of knowledge among MSM regarding STIs. Along with HIV/AIDS awareness, knowledge about STIs is also crucial to reducing the risk of HIV transmission. 7.1 Level of Knowledge of STIs The majority of the MSM (90.8%) mentioned that they were aware of at least one of the STI symptoms. However, 9.3 of them said that they could not mention any symptoms. The proportion of respondents reporting to be unaware of any symptoms of STIs was higher among non-MSWs (12.5%) than MSWs (3%). Table 7.1: Awareness of STI and Reported STI Symptoms in the Past Year
MSW Non-MSW MSM Knowledge of STI N=135 % N=265 % N=400 %
Aware of at least one male STI symptoms Yes 131 97.0 232 87.5 363 90.8 No 4 3.0 33 12.5 37 9.3
Most of the MSM (86.8%) cited genital ulcers as an STI symptom. The other most commonly cited symptoms were genital discharge (73.5%), burning during urination (51%), and itching in genital area (34.3%).
More MSWs than non-MSWs could name STI symptoms in males. For instance, a larger proportion of MSWs cited genital discharge (94.1% MSWs and 83% non-MSWs), genital ulcers/sores (88.1% MSWs 66% and non-MSWs) and burning while urinating (65.2 MSWs and 43.8 non-MSWs) as a STI symptoms. Other symptoms were also cited by more MSWs than non-MSWs (Table 7.2). Table 7.2: Knowledge of Symptoms of STIs
Perceived symptoms of male STIs MSW Non-MSW MSM STI symptom N=135 % N=265 % N=400 % Genital Ulcers/Sore 127 94.1 220 83.0 347 86.8 White discharge/discharge of pus/Dhatu
flow from penis 119 88.1 175 66.0 294 73.5
Burning while urinating 88 65.2 116 43.8 204 51.0 Itching in genital areas 52 38.5 85 32.1 137 34.3 Anal ulcer/sore 40 29.6 29 10.9 69 17.3 Swelling in groin areas 25 18.5 28 10.6 53 13.3 Anal discharge 14 10.4 8 3.0 22 5.5 Weakness/weight loss 5 3.7 11 4.2 16 4.0 High temperature/fever 4 3.0 9 3.4 13 3.3 Mouth ulcer/sore 4 3.0 3 1.1 7 1.8 Others 7 5.2 11 4.2 18 4.5 STI symptoms not known 4 3.0 33 12.5 37 9.3 Number of known male STI symptoms None 4 3.0 33 12.5 37 9.3 One symptom 3 2.2 14 5.3 17 4.3 Two symptoms 23 17.0 64 24.2 87 21.8 Three symptoms 28 20.7 88 33.2 116 29.0 Four symptoms 42 31.1 45 17.0 87 21.8 Five symptoms 26 19.3 17 6.4 43 10.8 Six symptoms 9 6.7 4 1.5 13 3.3
*Note: Percentages add up to more than 100 because of multiple responses
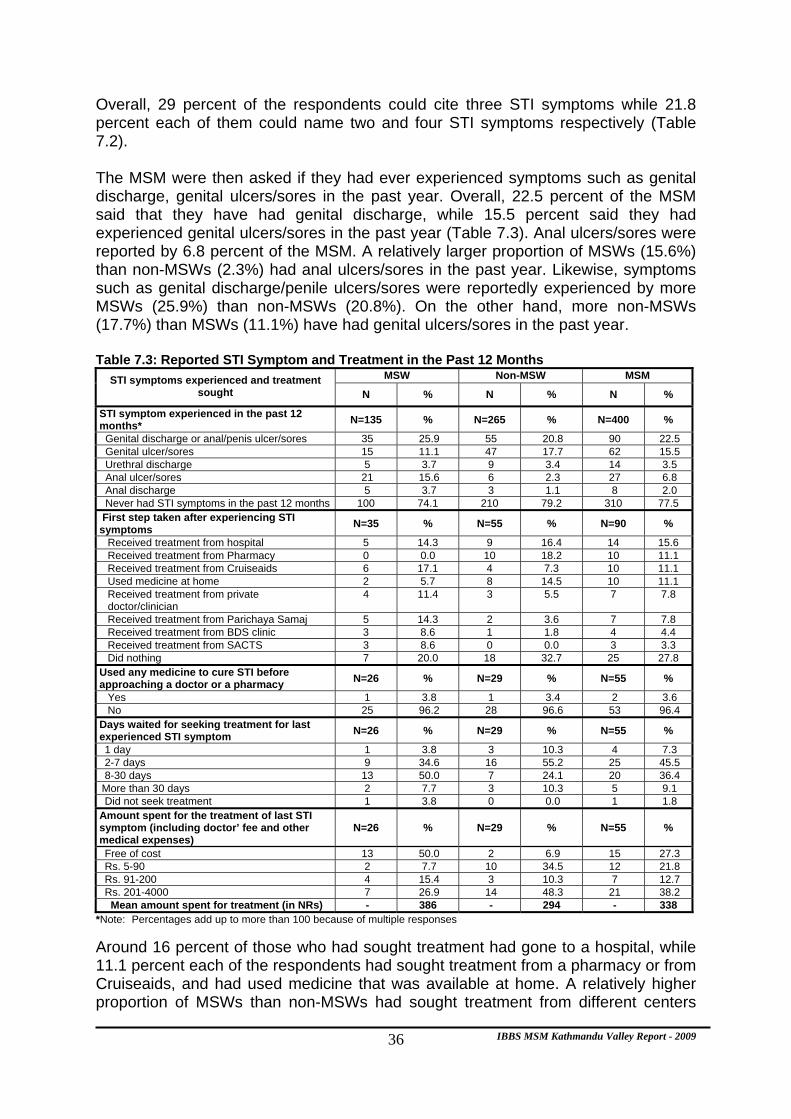
IBBS MSM Kathmandu Valley Report - 2009 36
Overall, 29 percent of the respondents could cite three STI symptoms while 21.8 percent each of them could name two and four STI symptoms respectively (Table 7.2). The MSM were then asked if they had ever experienced symptoms such as genital discharge, genital ulcers/sores in the past year. Overall, 22.5 percent of the MSM said that they have had genital discharge, while 15.5 percent said they had experienced genital ulcers/sores in the past year (Table 7.3). Anal ulcers/sores were reported by 6.8 percent of the MSM. A relatively larger proportion of MSWs (15.6%) than non-MSWs (2.3%) had anal ulcers/sores in the past year. Likewise, symptoms such as genital discharge/penile ulcers/sores were reportedly experienced by more MSWs (25.9%) than non-MSWs (20.8%). On the other hand, more non-MSWs (17.7%) than MSWs (11.1%) have had genital ulcers/sores in the past year. Table 7.3: Reported STI Symptom and Treatment in the Past 12 Months
MSW Non-MSW MSM STI symptoms experienced and treatment sought N % N % N %
STI symptom experienced in the past 12 months* N=135 % N=265 % N=400 %
Genital discharge or anal/penis ulcer/sores 35 25.9 55 20.8 90 22.5 Genital ulcer/sores 15 11.1 47 17.7 62 15.5 Urethral discharge 5 3.7 9 3.4 14 3.5 Anal ulcer/sores 21 15.6 6 2.3 27 6.8 Anal discharge 5 3.7 3 1.1 8 2.0 Never had STI symptoms in the past 12 months 100 74.1 210 79.2 310 77.5 First step taken after experiencing STI symptoms N=35 % N=55 % N=90 %
Received treatment from hospital 5 14.3 9 16.4 14 15.6 Received treatment from Pharmacy 0 0.0 10 18.2 10 11.1 Received treatment from Cruiseaids 6 17.1 4 7.3 10 11.1 Used medicine at home 2 5.7 8 14.5 10 11.1 Received treatment from private
doctor/clinician 4 11.4 3 5.5 7 7.8
Received treatment from Parichaya Samaj 5 14.3 2 3.6 7 7.8 Received treatment from BDS clinic 3 8.6 1 1.8 4 4.4 Received treatment from SACTS 3 8.6 0 0.0 3 3.3 Did nothing 7 20.0 18 32.7 25 27.8 Used any medicine to cure STI before approaching a doctor or a pharmacy N=26 % N=29 % N=55 %
Yes 1 3.8 1 3.4 2 3.6 No 25 96.2 28 96.6 53 96.4 Days waited for seeking treatment for last experienced STI symptom N=26 % N=29 % N=55 %
1 day 1 3.8 3 10.3 4 7.3 2-7 days 9 34.6 16 55.2 25 45.5 8-30 days 13 50.0 7 24.1 20 36.4 More than 30 days 2 7.7 3 10.3 5 9.1 Did not seek treatment 1 3.8 0 0.0 1 1.8 Amount spent for the treatment of last STI symptom (including doctor’ fee and other medical expenses)
N=26 % N=29 % N=55 %
Free of cost 13 50.0 2 6.9 15 27.3 Rs. 5-90 2 7.7 10 34.5 12 21.8 Rs. 91-200 4 15.4 3 10.3 7 12.7 Rs. 201-4000 7 26.9 14 48.3 21 38.2
Mean amount spent for treatment (in NRs) - 386 - 294 - 338 *Note: Percentages add up to more than 100 because of multiple responses Around 16 percent of those who had sought treatment had gone to a hospital, while 11.1 percent each of the respondents had sought treatment from a pharmacy or from Cruiseaids, and had used medicine that was available at home. A relatively higher proportion of MSWs than non-MSWs had sought treatment from different centers
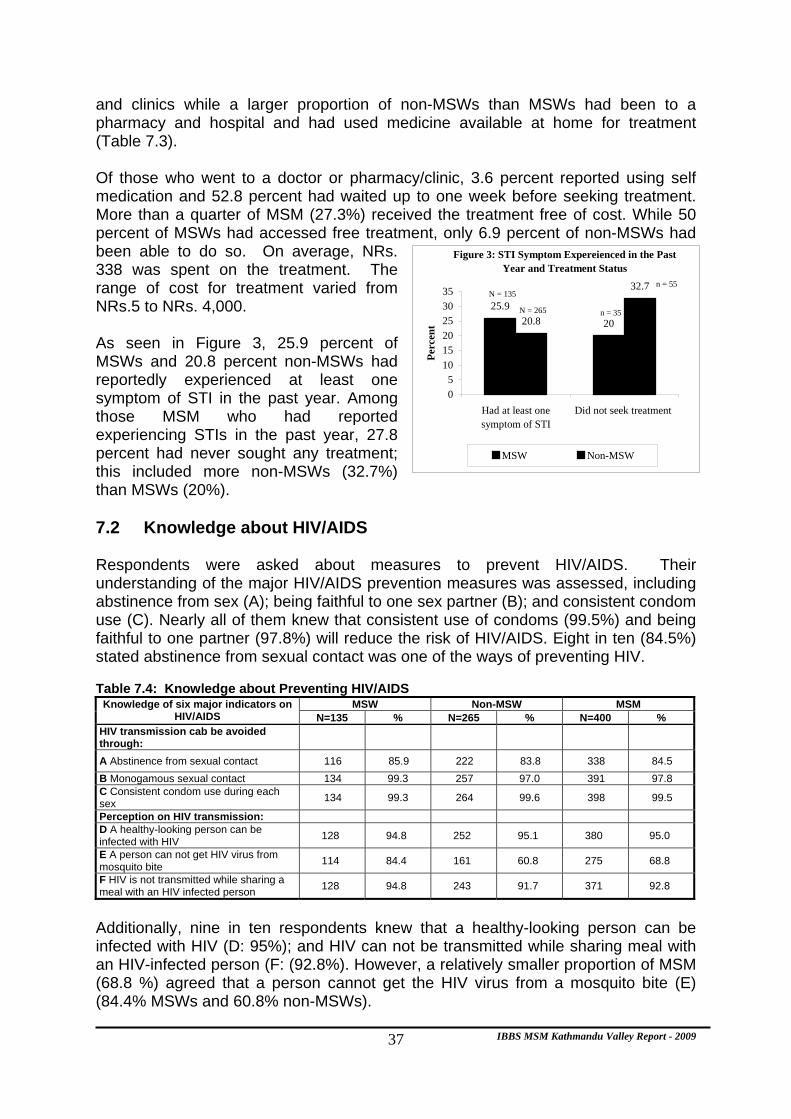
IBBS MSM Kathmandu Valley Report - 2009 37
and clinics while a larger proportion of non-MSWs than MSWs had been to a pharmacy and hospital and had used medicine available at home for treatment (Table 7.3). Of those who went to a doctor or pharmacy/clinic, 3.6 percent reported using self medication and 52.8 percent had waited up to one week before seeking treatment. More than a quarter of MSM (27.3%) received the treatment free of cost. While 50 percent of MSWs had accessed free treatment, only 6.9 percent of non-MSWs had been able to do so. On average, NRs. 338 was spent on the treatment. The range of cost for treatment varied from NRs.5 to NRs. 4,000. As seen in Figure 3, 25.9 percent of MSWs and 20.8 percent non-MSWs had reportedly experienced at least one symptom of STI in the past year. Among those MSM who had reported experiencing STIs in the past year, 27.8 percent had never sought any treatment; this included more non-MSWs (32.7%) than MSWs (20%). 7.2 Knowledge about HIV/AIDS Respondents were asked about measures to prevent HIV/AIDS. Their understanding of the major HIV/AIDS prevention measures was assessed, including abstinence from sex (A); being faithful to one sex partner (B); and consistent condom use (C). Nearly all of them knew that consistent use of condoms (99.5%) and being faithful to one partner (97.8%) will reduce the risk of HIV/AIDS. Eight in ten (84.5%) stated abstinence from sexual contact was one of the ways of preventing HIV. Table 7.4: Knowledge about Preventing HIV/AIDS
MSW Non-MSW MSM Knowledge of six major indicators on HIV/AIDS N=135 % N=265 % N=400 %
HIV transmission cab be avoided through:
A Abstinence from sexual contact 116 85.9 222 83.8 338 84.5 B Monogamous sexual contact 134 99.3 257 97.0 391 97.8 C Consistent condom use during each sex 134 99.3 264 99.6 398 99.5
Perception on HIV transmission: D A healthy-looking person can be infected with HIV 128 94.8 252 95.1 380 95.0
E A person can not get HIV virus from mosquito bite 114 84.4 161 60.8 275 68.8
F HIV is not transmitted while sharing a meal with an HIV infected person 128 94.8 243 91.7 371 92.8
Additionally, nine in ten respondents knew that a healthy-looking person can be infected with HIV (D: 95%); and HIV can not be transmitted while sharing meal with an HIV-infected person (F: (92.8%). However, a relatively smaller proportion of MSM (68.8 %) agreed that a person cannot get the HIV virus from a mosquito bite (E) (84.4% MSWs and 60.8% non-MSWs).
Figure 3: STI Symptom Expereienced in the Past Year and Treatment Status
25.9
2020.8
32.7
05
101520253035
Had at least onesymptom of STI
Did not seek treatment
Perc
ent
MSW Non-MSW
n = 35
n = 55N = 135
N = 265

IBBS MSM Kathmandu Valley Report - 2009 38

IBBS MSM Kathmandu Valley Report - 2009 39
Overall, 83.3 percent of MSM were aware of all three major modes of transmission, i.e. ‘ABC’(84.4% MSWs and 82.7% non-MSWs ). On the other hand, 64.3 percent of them were aware of all of the five ways –BCDEF- by which one can protect oneself against HIV and ways in which it cannot be transmitted (80.7% MSWs and 55.8% non-MSWs ) (Figure 4). More MSWs (70.4%) than non-MSWs (51.3%) knew someone living with HIV/AIDS or who had died of an AIDS-related illness. When asked about the type of relationship they shared with such individuals, 47.4 percent of MSWs and 25 percent non-MSWs said they were close friends and 8.4 percent of MSWs and 19.9 percent of non-MSWs said they were relatives. One half of the MSM (50.6%) had heard/seen such people but did not have any relationship with them (Table 7.5). Table 7.5: Knowledge on Ways of HIV/AIDS Transmission
MSW Non-MSW MSM Statements related to HIV/AIDS N=135 % N=265 % N=400 %
Know a person who is infected with HIV or who has died of AIDS
95 70.4 136 51.3 231 57.8
Relation shared with the person who is infected with HIV or has died of AIDS N=95 % N=136 % N=231 %
Close relative 8 8.4 27 19.9 35 15.2 Close friend 45 47.4 34 25.0 79 34.2 No relation 42 44.2 75 55.1 117 50.6
Awareness on HIV/AIDS N=135 % N=265 % N=400 % Can reduce the risk of HIV by using condom correctly in every time of anal sex 135 100.0 263 99.3 398 99.5
Using a previously used needle/syringe may transmit HIV 134 99.3 264 99.6 398 99.5
Blood transfusion from an infected person to the other transmit HIV 134 99.3 263 99.3 397 99.3
Holding an HIV infected person’s hand does not transmit HIV 133 98.5 255 96.2 388 97.0
HIV may be transmitted from a pregnant woman infected with HIV/AIDS to her unborn child
121 89.6 235 88.7 356 89.0
A woman with HIV/AIDS can transmit the virus to her new-born child through breastfeeding
113 83.7 168 63.4 281 70.3
A pregnant woman can reduce the risk of transmission of HIV to her unborn child by:
N=121 % N=235 % N=356 %
Taking medicine (ART therapy) 55 45.5 90 38.3 145 40.7 Taking advice from doctor/health personnel 32 26.4 47 20.0 79 22.2
Cannot do anything 0 0.0 5 2.1 5 1.4 Others 1 0.8 3 1.3 4 1.0 Don't know 33 27.3 90 38.3 123 34.6
The respondents’ perception on HIV/AIDS and its different modes of transmission were further tested with the help of certain probing questions. Almost all of the respondents knew the correct condom usage for each act of anal sex reduces the risk of HIV transmission (99.5%) and that injecting with a previously used needle (99.5%) and having a blood transfusion from an HIV-positive person (99.3%) will transmit the virus. They also knew that holding an HIV infected person’s hand does
Figure 4: Knowledge of ABC and BCDEF
84.4 80.782.7
55.8
83.3
64.3
0
20
40
60
80
100
Knowledge of all of ABC Knowledge of all ofBCDEF
Perc
ent
MSWs (N=135) Non-MSWs (N=265) MSM (N=400)
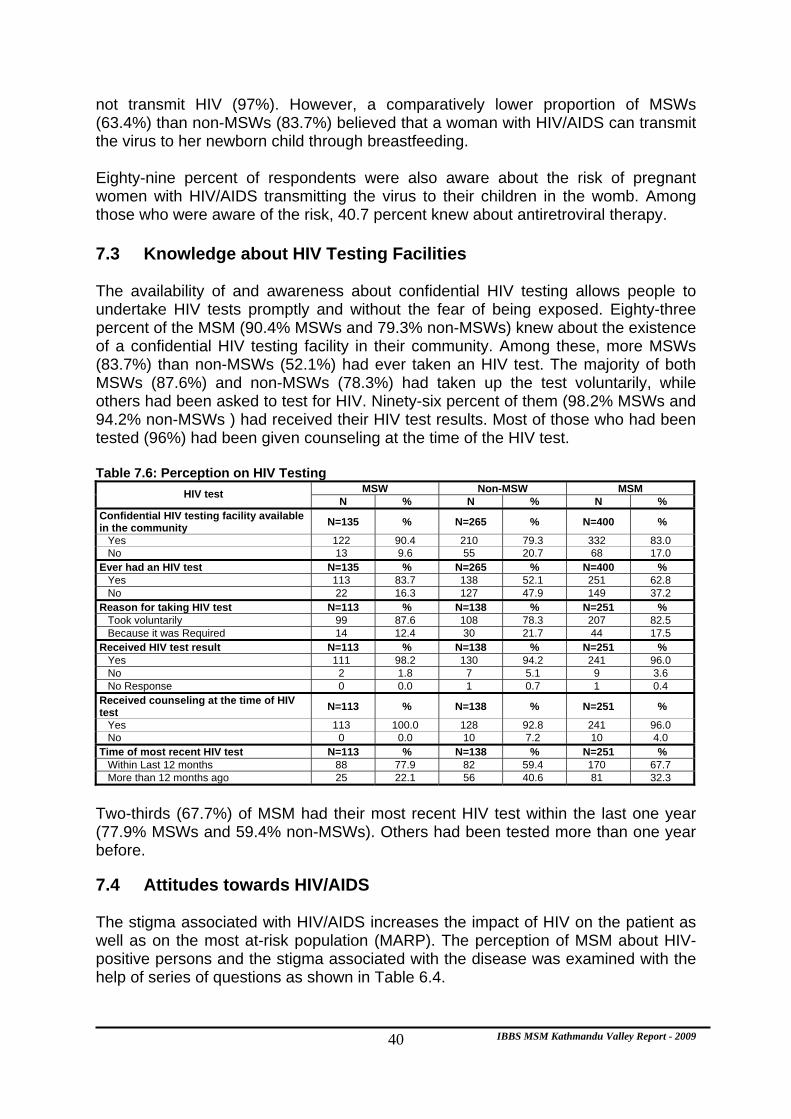
IBBS MSM Kathmandu Valley Report - 2009 40
not transmit HIV (97%). However, a comparatively lower proportion of MSWs (63.4%) than non-MSWs (83.7%) believed that a woman with HIV/AIDS can transmit the virus to her newborn child through breastfeeding. Eighty-nine percent of respondents were also aware about the risk of pregnant women with HIV/AIDS transmitting the virus to their children in the womb. Among those who were aware of the risk, 40.7 percent knew about antiretroviral therapy. 7.3 Knowledge about HIV Testing Facilities The availability of and awareness about confidential HIV testing allows people to undertake HIV tests promptly and without the fear of being exposed. Eighty-three percent of the MSM (90.4% MSWs and 79.3% non-MSWs) knew about the existence of a confidential HIV testing facility in their community. Among these, more MSWs (83.7%) than non-MSWs (52.1%) had ever taken an HIV test. The majority of both MSWs (87.6%) and non-MSWs (78.3%) had taken up the test voluntarily, while others had been asked to test for HIV. Ninety-six percent of them (98.2% MSWs and 94.2% non-MSWs ) had received their HIV test results. Most of those who had been tested (96%) had been given counseling at the time of the HIV test. Table 7.6: Perception on HIV Testing
MSW Non-MSW MSM HIV test N % N % N %
Confidential HIV testing facility available in the community N=135 % N=265 % N=400 %
Yes 122 90.4 210 79.3 332 83.0 No 13 9.6 55 20.7 68 17.0
Ever had an HIV test N=135 % N=265 % N=400 % Yes 113 83.7 138 52.1 251 62.8 No 22 16.3 127 47.9 149 37.2
Reason for taking HIV test N=113 % N=138 % N=251 % Took voluntarily 99 87.6 108 78.3 207 82.5 Because it was Required 14 12.4 30 21.7 44 17.5
Received HIV test result N=113 % N=138 % N=251 % Yes 111 98.2 130 94.2 241 96.0 No 2 1.8 7 5.1 9 3.6 No Response 0 0.0 1 0.7 1 0.4
Received counseling at the time of HIV test N=113 % N=138 % N=251 %
Yes 113 100.0 128 92.8 241 96.0 No 0 0.0 10 7.2 10 4.0
Time of most recent HIV test N=113 % N=138 % N=251 % Within Last 12 months 88 77.9 82 59.4 170 67.7 More than 12 months ago 25 22.1 56 40.6 81 32.3
Two-thirds (67.7%) of MSM had their most recent HIV test within the last one year (77.9% MSWs and 59.4% non-MSWs). Others had been tested more than one year before.
7.4 Attitudes towards HIV/AIDS The stigma associated with HIV/AIDS increases the impact of HIV on the patient as well as on the most at-risk population (MARP). The perception of MSM about HIV-positive persons and the stigma associated with the disease was examined with the help of series of questions as shown in Table 6.4.
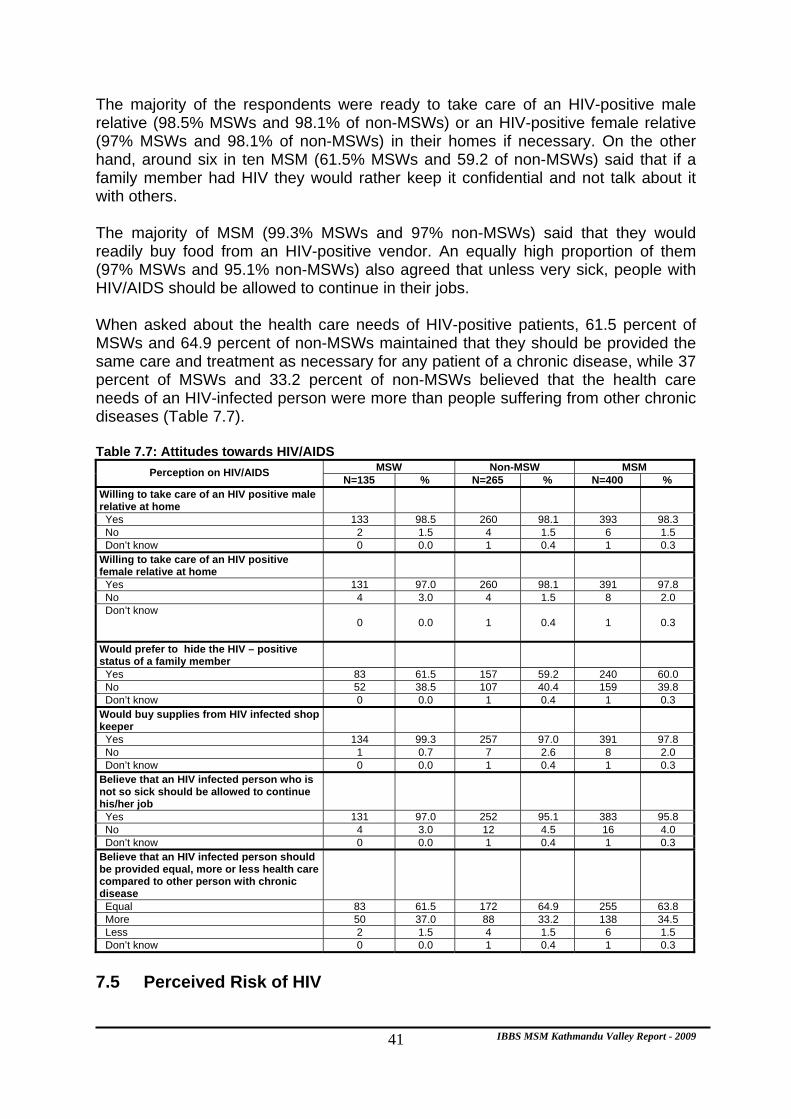
IBBS MSM Kathmandu Valley Report - 2009 41
The majority of the respondents were ready to take care of an HIV-positive male relative (98.5% MSWs and 98.1% of non-MSWs) or an HIV-positive female relative (97% MSWs and 98.1% of non-MSWs) in their homes if necessary. On the other hand, around six in ten MSM (61.5% MSWs and 59.2 of non-MSWs) said that if a family member had HIV they would rather keep it confidential and not talk about it with others. The majority of MSM (99.3% MSWs and 97% non-MSWs) said that they would readily buy food from an HIV-positive vendor. An equally high proportion of them (97% MSWs and 95.1% non-MSWs) also agreed that unless very sick, people with HIV/AIDS should be allowed to continue in their jobs. When asked about the health care needs of HIV-positive patients, 61.5 percent of MSWs and 64.9 percent of non-MSWs maintained that they should be provided the same care and treatment as necessary for any patient of a chronic disease, while 37 percent of MSWs and 33.2 percent of non-MSWs believed that the health care needs of an HIV-infected person were more than people suffering from other chronic diseases (Table 7.7). Table 7.7: Attitudes towards HIV/AIDS
MSW Non-MSW MSM Perception on HIV/AIDS N=135 % N=265 % N=400 %
Willing to take care of an HIV positive male relative at home
Yes 133 98.5 260 98.1 393 98.3 No 2 1.5 4 1.5 6 1.5 Don’t know 0 0.0 1 0.4 1 0.3 Willing to take care of an HIV positive female relative at home
Yes 131 97.0 260 98.1 391 97.8 No 4 3.0 4 1.5 8 2.0 Don’t know
0 0.0 1 0.4 1 0.3
Would prefer to hide the HIV – positive status of a family member
Yes 83 61.5 157 59.2 240 60.0 No 52 38.5 107 40.4 159 39.8 Don’t know 0 0.0 1 0.4 1 0.3 Would buy supplies from HIV infected shop keeper
Yes 134 99.3 257 97.0 391 97.8 No 1 0.7 7 2.6 8 2.0 Don’t know 0 0.0 1 0.4 1 0.3 Believe that an HIV infected person who is not so sick should be allowed to continue his/her job
Yes 131 97.0 252 95.1 383 95.8 No 4 3.0 12 4.5 16 4.0 Don’t know 0 0.0 1 0.4 1 0.3 Believe that an HIV infected person should be provided equal, more or less health care compared to other person with chronic disease
Equal 83 61.5 172 64.9 255 63.8 More 50 37.0 88 33.2 138 34.5 Less 2 1.5 4 1.5 6 1.5 Don’t know 0 0.0 1 0.4 1 0.3
7.5 Perceived Risk of HIV

IBBS MSM Kathmandu Valley Report - 2009 42
After assessing their awareness about HIV/AIDs, the respondents were asked what measures they had adopted to avoid getting HIV. In response, 83 percent of MSWs and 66.8 percent of non-MSWs mentioned that they have been consistently using condoms. A smaller proportion of them also pointed out that they had not shared needles (18.8%), had taken no precautionary measures (11.5%) and had sex only with faithful partners (10.3%).
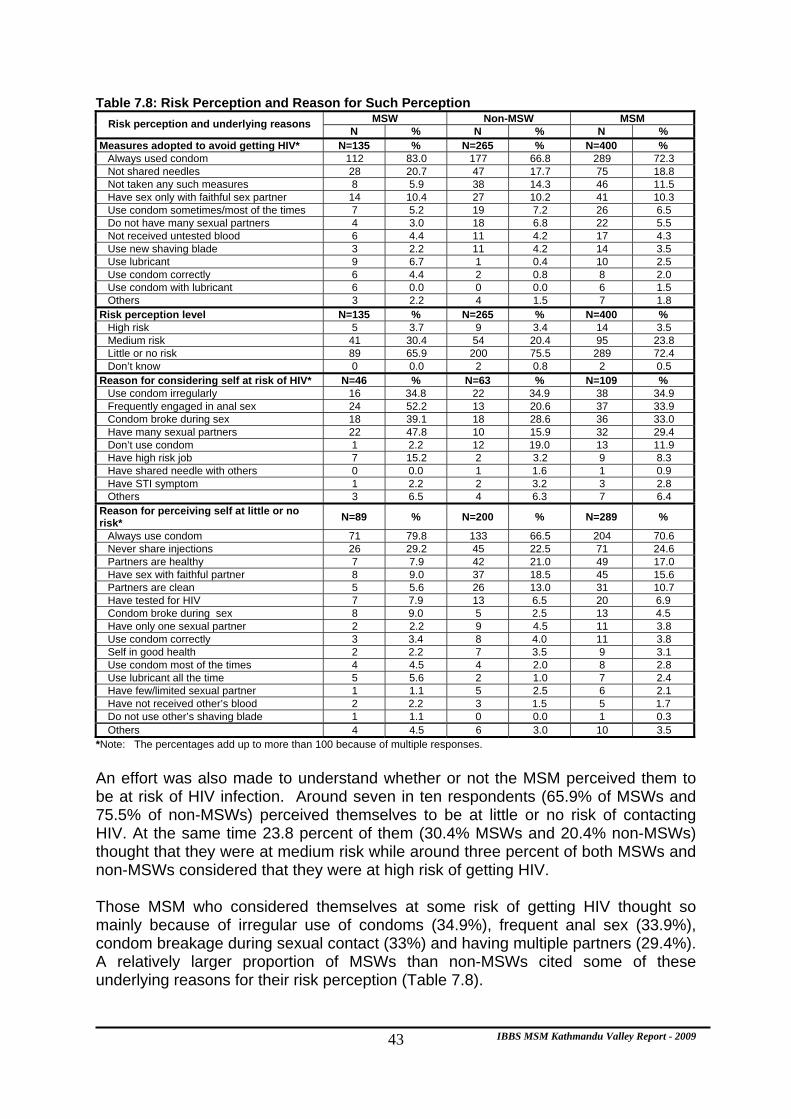
IBBS MSM Kathmandu Valley Report - 2009 43
Table 7.8: Risk Perception and Reason for Such Perception MSW Non-MSW MSM Risk perception and underlying reasons
N % N % N % Measures adopted to avoid getting HIV* N=135 % N=265 % N=400 %
Always used condom 112 83.0 177 66.8 289 72.3 Not shared needles 28 20.7 47 17.7 75 18.8 Not taken any such measures 8 5.9 38 14.3 46 11.5 Have sex only with faithful sex partner 14 10.4 27 10.2 41 10.3 Use condom sometimes/most of the times 7 5.2 19 7.2 26 6.5 Do not have many sexual partners 4 3.0 18 6.8 22 5.5 Not received untested blood 6 4.4 11 4.2 17 4.3 Use new shaving blade 3 2.2 11 4.2 14 3.5 Use lubricant 9 6.7 1 0.4 10 2.5 Use condom correctly 6 4.4 2 0.8 8 2.0 Use condom with lubricant 6 0.0 0 0.0 6 1.5 Others 3 2.2 4 1.5 7 1.8
Risk perception level N=135 % N=265 % N=400 % High risk 5 3.7 9 3.4 14 3.5 Medium risk 41 30.4 54 20.4 95 23.8 Little or no risk 89 65.9 200 75.5 289 72.4 Don’t know 0 0.0 2 0.8 2 0.5
Reason for considering self at risk of HIV* N=46 % N=63 % N=109 % Use condom irregularly 16 34.8 22 34.9 38 34.9 Frequently engaged in anal sex 24 52.2 13 20.6 37 33.9 Condom broke during sex 18 39.1 18 28.6 36 33.0 Have many sexual partners 22 47.8 10 15.9 32 29.4 Don’t use condom 1 2.2 12 19.0 13 11.9 Have high risk job 7 15.2 2 3.2 9 8.3 Have shared needle with others 0 0.0 1 1.6 1 0.9 Have STI symptom 1 2.2 2 3.2 3 2.8 Others 3 6.5 4 6.3 7 6.4
Reason for perceiving self at little or no risk* N=89 % N=200 % N=289 %
Always use condom 71 79.8 133 66.5 204 70.6 Never share injections 26 29.2 45 22.5 71 24.6 Partners are healthy 7 7.9 42 21.0 49 17.0 Have sex with faithful partner 8 9.0 37 18.5 45 15.6 Partners are clean 5 5.6 26 13.0 31 10.7 Have tested for HIV 7 7.9 13 6.5 20 6.9 Condom broke during sex 8 9.0 5 2.5 13 4.5 Have only one sexual partner 2 2.2 9 4.5 11 3.8 Use condom correctly 3 3.4 8 4.0 11 3.8 Self in good health 2 2.2 7 3.5 9 3.1 Use condom most of the times 4 4.5 4 2.0 8 2.8 Use lubricant all the time 5 5.6 2 1.0 7 2.4 Have few/limited sexual partner 1 1.1 5 2.5 6 2.1 Have not received other’s blood 2 2.2 3 1.5 5 1.7 Do not use other’s shaving blade 1 1.1 0 0.0 1 0.3 Others 4 4.5 6 3.0 10 3.5
*Note: The percentages add up to more than 100 because of multiple responses. An effort was also made to understand whether or not the MSM perceived them to be at risk of HIV infection. Around seven in ten respondents (65.9% of MSWs and 75.5% of non-MSWs) perceived themselves to be at little or no risk of contacting HIV. At the same time 23.8 percent of them (30.4% MSWs and 20.4% non-MSWs) thought that they were at medium risk while around three percent of both MSWs and non-MSWs considered that they were at high risk of getting HIV. Those MSM who considered themselves at some risk of getting HIV thought so mainly because of irregular use of condoms (34.9%), frequent anal sex (33.9%), condom breakage during sexual contact (33%) and having multiple partners (29.4%). A relatively larger proportion of MSWs than non-MSWs cited some of these underlying reasons for their risk perception (Table 7.8).

IBBS MSM Kathmandu Valley Report - 2009 44
On the other hand, those MSM who saw themselves at little or no risk of getting HIV thought so mainly because they used a condom consistently (79.8% MSWs and 66.5% non-MSWs). However, there were some respondents (7.9% MSWs and 21% non-MSWs) who assumed that they could not get HIV because they had healthy partners , and some who said that they could not have the disease since their partners are clean (5.6% MSWs and 13% non-MSWs). 7.6 Physical/Sexual Violence against MSM Many studies have shown that MSM are also subjected to discrimination and physical violence because of their sexual orientation. This study tried to find out if any of the study participants had been subjected to violence and discrimination in the past year. Overall, ten percent of the MSM had been beaten up, 16.3 percent had been forced to have sex, 21.3 percent had been blackmailed, and 21 percent faced discrimination at work in the past year. More vulnerable are dohoris/metis whose feminine personality and behavior distinguish them from other MSM. Overall, 47.4 percent of them had ever faced different problems because of their sexual identity (54.9% MSWs and 27.9% non-MSWs). Table 7.9: Personal Experience of Violence and Discrimination in the Past 12 Months
MSW Non-MSW MSM Subjected to Violence/Discrimination N % N % N %
Was beaten up in the past 12 months N=135 % N=265 % N=400 % Yes 35 25.9 5 1.9 40 10.0 No 100 74.1 260 98.1 360 90.0 Was beaten up by* N=35 % N=5 % N=40 % Police 24 68.6 2 40.0 26 65.0 Hooligans 10 28.6 3 60.0 13 32.5 Sex partner 5 14.3 1 20.0 6 15.0 Military 2 5.7 0 0.0 2 5.0 Client 1 2.9 0 0.0 1 2.5 Others 4 11.4 0 0.0 4 10.0 Was forced to have sex in the past 12 months N=135 % N=265 % N=400 %
Yes 44 32.6 21 7.9 65 16.3 No 91 67.4 244 92.1 335 83.8 People who forcefully had sex* N=44 % N=21 % N=65 % Sexual partner 9 20.5 17 81.0 26 40.0 Police 17 38.6 0 0.0 17 26.2 Hooligans 12 27.3 4 19.0 16 24.6 Client 5 11.4 0 0.0 5 7.7 Military 2 4.5 0 0.0 2 3.1 Others 5 11.4 0 0.0 5 7.7 Was blackmailed in the past 12 months N=135 % N=265 % N=400 % Yes 68 50.4 17 6.4 85 21.3 No 67 49.6 248 93.6 315 78.8 Faced discrimination at job or every day life in the past 12 months N=135 % N=265 % N=400 %
Yes 60 44.4 24 9.1 84 21.0 No 75 55.6 241 90.9 316 79.0 Ever experienced any kind of problems due to sexual orientation (asked only to metis/dohoris)
N=113 % N=43 % N=156 %
Yes 62 54.9 12 27.9 74 47.4 No 45 39.8 23 53.5 68 43.6 No Response 6 5.3 8 18.6 14 9.0
*Note: The percentages add up to more than 100 because of multiple responses.

IBBS MSM Kathmandu Valley Report - 2009 45
MSWs reported to be more vulnerable to the social stigma associated with their sexual preference than non-MSWs. More MSWs than non-MSWs had been subjected to physical/sexual violence such as beatings (25.9% of MSWs and 1.9% of non-MSWs), forced sex (32.6% of MSWs and 7.9% of non-MSWs), blackmailing (50.4% of MSWs and 6.4% of non-MSWs) and discrimination at job or daily life (44.4% of MSWs and 9.1% of non-MSWs) in the past year (Table 7.9). The police, sexual partners and hooligans are the main offenders. Two-thirds of the MSM (65%) who were beaten up in the last 12 months, were beaten up by the police, and one-third (32.5%) by hooligans. MSWs were particularly vulnerable to forced sex by police (38.6%) and hooligans (27.3%), whereas non-MSWs were more likely to be assaulted by their sex partners (81%).
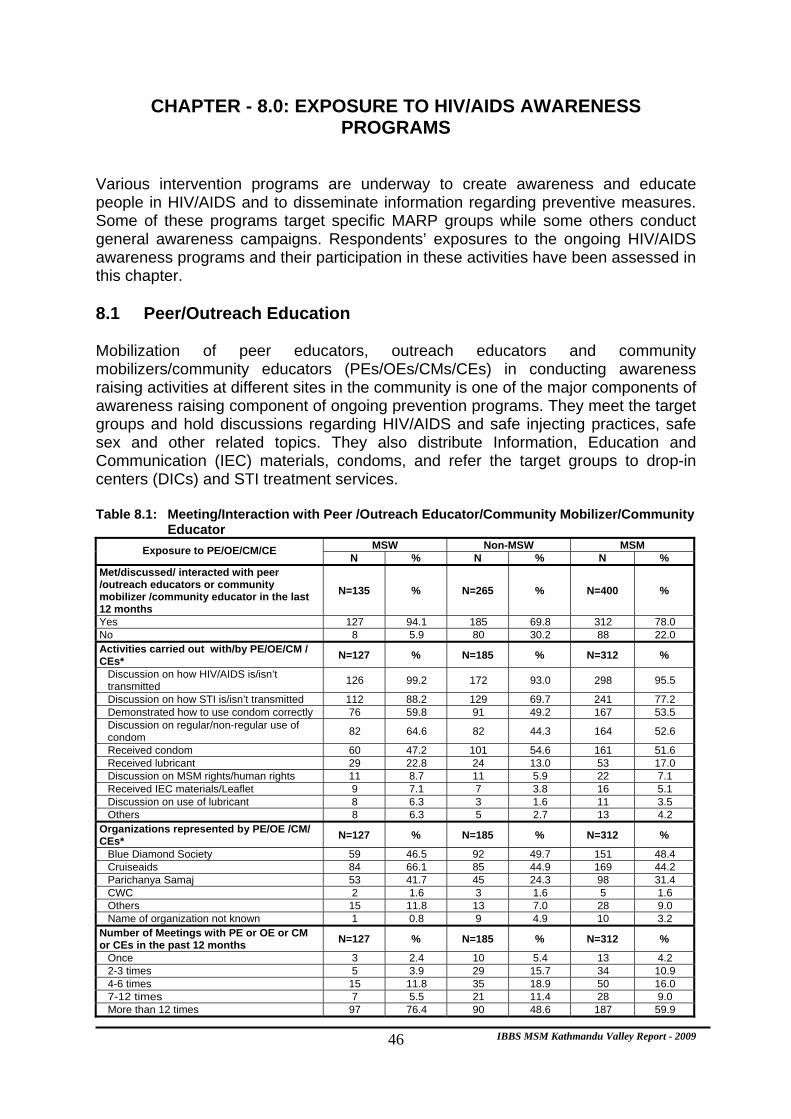
IBBS MSM Kathmandu Valley Report - 2009 46
CHAPTER - 8.0: EXPOSURE TO HIV/AIDS AWARENESS PROGRAMS
Various intervention programs are underway to create awareness and educate people in HIV/AIDS and to disseminate information regarding preventive measures. Some of these programs target specific MARP groups while some others conduct general awareness campaigns. Respondents’ exposures to the ongoing HIV/AIDS awareness programs and their participation in these activities have been assessed in this chapter. 8.1 Peer/Outreach Education Mobilization of peer educators, outreach educators and community mobilizers/community educators (PEs/OEs/CMs/CEs) in conducting awareness raising activities at different sites in the community is one of the major components of awareness raising component of ongoing prevention programs. They meet the target groups and hold discussions regarding HIV/AIDS and safe injecting practices, safe sex and other related topics. They also distribute Information, Education and Communication (IEC) materials, condoms, and refer the target groups to drop-in centers (DICs) and STI treatment services. Table 8.1: Meeting/Interaction with Peer /Outreach Educator/Community Mobilizer/Community
Educator MSW Non-MSW MSM Exposure to PE/OE/CM/CE
N % N % N % Met/discussed/ interacted with peer /outreach educators or community mobilizer /community educator in the last 12 months
N=135 % N=265 % N=400 %
Yes 127 94.1 185 69.8 312 78.0 No 8 5.9 80 30.2 88 22.0 Activities carried out with/by PE/OE/CM / CEs* N=127 % N=185 % N=312 %
Discussion on how HIV/AIDS is/isn’t transmitted 126 99.2 172 93.0 298 95.5
Discussion on how STI is/isn’t transmitted 112 88.2 129 69.7 241 77.2 Demonstrated how to use condom correctly 76 59.8 91 49.2 167 53.5 Discussion on regular/non-regular use of condom 82 64.6 82 44.3 164 52.6
Received condom 60 47.2 101 54.6 161 51.6 Received lubricant 29 22.8 24 13.0 53 17.0 Discussion on MSM rights/human rights 11 8.7 11 5.9 22 7.1 Received IEC materials/Leaflet 9 7.1 7 3.8 16 5.1 Discussion on use of lubricant 8 6.3 3 1.6 11 3.5 Others 8 6.3 5 2.7 13 4.2
Organizations represented by PE/OE /CM/ CEs* N=127 % N=185 % N=312 %
Blue Diamond Society 59 46.5 92 49.7 151 48.4 Cruiseaids 84 66.1 85 44.9 169 44.2 Parichanya Samaj 53 41.7 45 24.3 98 31.4 CWC 2 1.6 3 1.6 5 1.6 Others 15 11.8 13 7.0 28 9.0 Name of organization not known 1 0.8 9 4.9 10 3.2
Number of Meetings with PE or OE or CM or CEs in the past 12 months N=127 % N=185 % N=312 %
Once 3 2.4 10 5.4 13 4.2 2-3 times 5 3.9 29 15.7 34 10.9 4-6 times 15 11.8 35 18.9 50 16.0 7-12 times 7 5.5 21 11.4 28 9.0 More than 12 times 97 76.4 90 48.6 187 59.9
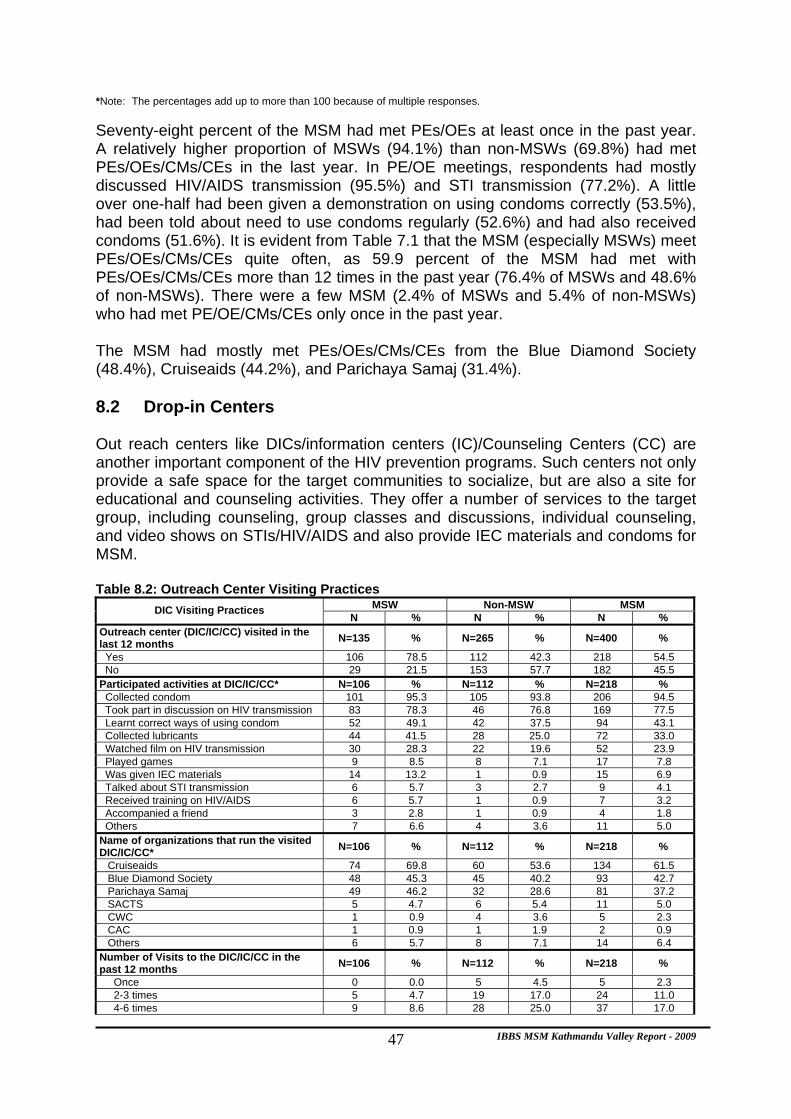
IBBS MSM Kathmandu Valley Report - 2009 47
*Note: The percentages add up to more than 100 because of multiple responses. Seventy-eight percent of the MSM had met PEs/OEs at least once in the past year. A relatively higher proportion of MSWs (94.1%) than non-MSWs (69.8%) had met PEs/OEs/CMs/CEs in the last year. In PE/OE meetings, respondents had mostly discussed HIV/AIDS transmission (95.5%) and STI transmission (77.2%). A little over one-half had been given a demonstration on using condoms correctly (53.5%), had been told about need to use condoms regularly (52.6%) and had also received condoms (51.6%). It is evident from Table 7.1 that the MSM (especially MSWs) meet PEs/OEs/CMs/CEs quite often, as 59.9 percent of the MSM had met with PEs/OEs/CMs/CEs more than 12 times in the past year (76.4% of MSWs and 48.6% of non-MSWs). There were a few MSM (2.4% of MSWs and 5.4% of non-MSWs) who had met PE/OE/CMs/CEs only once in the past year. The MSM had mostly met PEs/OEs/CMs/CEs from the Blue Diamond Society (48.4%), Cruiseaids (44.2%), and Parichaya Samaj (31.4%). 8.2 Drop-in Centers Out reach centers like DICs/information centers (IC)/Counseling Centers (CC) are another important component of the HIV prevention programs. Such centers not only provide a safe space for the target communities to socialize, but are also a site for educational and counseling activities. They offer a number of services to the target group, including counseling, group classes and discussions, individual counseling, and video shows on STIs/HIV/AIDS and also provide IEC materials and condoms for MSM. Table 8.2: Outreach Center Visiting Practices
MSW Non-MSW MSM DIC Visiting Practices N % N % N %
Outreach center (DIC/IC/CC) visited in the last 12 months N=135 % N=265 % N=400 %
Yes 106 78.5 112 42.3 218 54.5 No 29 21.5 153 57.7 182 45.5 Participated activities at DIC/IC/CC* N=106 % N=112 % N=218 % Collected condom 101 95.3 105 93.8 206 94.5 Took part in discussion on HIV transmission 83 78.3 46 76.8 169 77.5 Learnt correct ways of using condom 52 49.1 42 37.5 94 43.1 Collected lubricants 44 41.5 28 25.0 72 33.0 Watched film on HIV transmission 30 28.3 22 19.6 52 23.9 Played games 9 8.5 8 7.1 17 7.8 Was given IEC materials 14 13.2 1 0.9 15 6.9 Talked about STI transmission 6 5.7 3 2.7 9 4.1 Received training on HIV/AIDS 6 5.7 1 0.9 7 3.2 Accompanied a friend 3 2.8 1 0.9 4 1.8 Others 7 6.6 4 3.6 11 5.0 Name of organizations that run the visited DIC/IC/CC* N=106 % N=112 % N=218 %
Cruiseaids 74 69.8 60 53.6 134 61.5 Blue Diamond Society 48 45.3 45 40.2 93 42.7 Parichaya Samaj 49 46.2 32 28.6 81 37.2 SACTS 5 4.7 6 5.4 11 5.0 CWC 1 0.9 4 3.6 5 2.3 CAC 1 0.9 1 1.9 2 0.9 Others 6 5.7 8 7.1 14 6.4
Number of Visits to the DIC/IC/CC in the past 12 months N=106 % N=112 % N=218 %
Once 0 0.0 5 4.5 5 2.3 2-3 times 5 4.7 19 17.0 24 11.0 4-6 times 9 8.6 28 25.0 37 17.0

IBBS MSM Kathmandu Valley Report - 2009 48
7-12 times 13 12.3 13 11.6 26 11.9 More than 12 times 79 74.5 47 42.0 126 57.8
*Note: The percentages add up to more than 100 because of multiple responses. Around 55 percent of the MSM had visited a DIC/IC/CC in the past year; this included a larger proportion of MSWs than non-MSWs (78.5% MSWs and 42.3% non-MSWs). The majority (94.5%) of those who visited a DIC/IC/CC in the last year had collected condoms from there, while 77.5 percent had taken part in discussions relating to HIV transmission at DICs. Moreover, 43.1 percent of them had learnt the correct way of using a condom and 33 percent had watched a film on HIV transmission. Overall, DICs run by Cruiseaids were the most frequently visited DICs by the respondents participating in this survey (69.8% MSWs and 53.6% non-MSWs); followed by the Blue Diamond Society and Parichaya Samaj. MSWs were more likely to visit DICs than non-MSWs. MSWs also tend to visit DICs more often than non-MSWs. Nearly 75 percent of MSWs had visited a DIC more than 12 times in the past year, while among non-MSWs 42 percent had reported doing so. 8.3 STI Clinics MSM who are engaged in unsafe sexual encounters are at high risk of STIs. Timely detection of STIs may prevent them from serious health problems. There are different clinics being run by various government as well as non-government organizations for providing STI testing and treatment. About one-fourth (24.8%) of respondents had visited an STI clinic in the past year. Most of those who visited an STI clinic were physically examined (61.6%), had accompanied a friend (51.5%) and had given their blood sample for STI detection (30.3%). They were also informed about STI transmission, and use of condoms at the clinic. Table 8.3: STI Clinic Visiting Practices
MSW Non-MSW MSM STI Clinic Visiting Practices N % N % N %
Visited any STI clinic in the past 12 months N=135 % N=265 % N=400 % Yes 60 44.4 39 14.7 99 24.8 No 75 55.6 226 85.3 301 75.3 Participated activities at STI Clinic* N=60 % N=39 % N=99 %
Physical examination conducted for STI detection 33 55.0 28 71.8 61 61.6
Accompanied a friend 40 66.7 11 28.2 51 51.5 Blood tested for STI detection 20 33.3 10 25.6 30 30.3 Discussed on how STI is/is not transmitted 14 23.3 8 20.5 22 22.2 Discussed on regular/non-regular use of condom 9 15.0 4 10.3 13 13.1
Others 2 3.3 2 5.1 4 4.0 Name of organization that run the visited STI Clinic N=60 % N=39 % N=99 %
Cruiseaids 25 41.7 14 35.9 39 39.4 Parichaya Samaj 16 26.7 5 12.8 21 21.2 SACTS 10 16.7 5 12.8 15 15.2 Hospital 6 10.0 8 20.5 14 14.1 Blue Diamond Society 9 15.0 4 10.3 13 13.1 Pharmacy 0 0.0 8 20.5 8 8.1 Others 3 5.0 4 10.3 7 7.1
Number of visits to STI clinics in the past 12 months N=60 % N=39 % N=99 %
Once 7 11.7 16 41.0 23 23.2

IBBS MSM Kathmandu Valley Report - 2009 49
2-3 times 14 23.3 13 33.3 27 27.3 4-6 times 3 5.0 0 0.0 3 3.0 7-12 times 4 6.7 1 2.6 5 5.1 More than 12 times 32 53.3 9 23.1 41 41.4
*Note: The percentages add up to more than 100 because of multiple responses. The most visited STI clinics were run by Cruiseaids (39.4%). Some had also visited STI clinics run by Parichays Samaj (21.2%) and SACTS (15.2%). While 27.3 percent had visited an STI clinic 2 to 3 times in the past year, 23.2 percent of the MSM had visited such a clinic once. Moreover, 41.4 percent MSM had been to an STI clinic more than 12 times in the last year (Table 8.3). However percentage of MSWs visiting STI clinics more than 12 times in the past year (53.3%) was much higher compared to non-MSWs (23.1%). 8.4 VCT Centers VCT centers provide HIV/AIDS/STI tests along with pre- and post-test counseling. Information related to safe injecting practices, HIV/AIDS/STI transmission, and treatment facilities are also disseminated from these centers. VCT centers form an integral part of the HIV/AIDS prevention program. Overall, 43.8 percent of the MSM had visited a VCT center in the past year, with more MSWs (68.1%) than non-MSWs (31.3%). The majority of those who had been to a VCT center had received pre-HIV test counseling (94.3%), had given a blood sample for HIV testing (93.7%), had received the HIV test result (92.6%) and had received post-HIV test counseling (88%) here. Table 8.4: VCT Visiting Practices
MSW Non-MSW MSM VCT Visiting Practices N % N % N %
Visited VCT center in the past 12 months N=135 % N=265 % N=400 % Yes 92 68.1 83 31.3 175 43.8 No 43 31.9 182 68.7 225 56.3
Activities participated in at VCT Center* N=92 % N=83 % N=175 % Received pre HIV test counseling 87 94.6 78 94.0 165 94.3 Blood tested for HIV detection 87 94.6 77 92.8 164 93.7 Received HIV test result 87 94.6 75 90.4 162 92.6 Received post HIV test counseling 85 92.4 69 83.1 154 88.0 Received counseling on correct and consistent use of condom 60 65.2 44 53.0 104 59.4
Accompanied a friend 37 40.2 32 38.6 69 39.4 Received information on HIV/AIDS window period 50 54.3 18 21.7 68 38.9
Received condom/IEC materials 0 0.0 2 2.4 2 1.1 Name of the organization that run the visited VCT * N=92 % N=83 % N=175 %
Cruiseaids 50 54.3 39 47.0 89 50.9 Parichaya Samaj 38 41.3 13 15.7 51 29.1 Blue Diamond Society 20 21.7 24 28.9 44 25.1 SACTS 17 18.5 13 15.7 30 17.1 Hospital 0 0.0 6 7.2 6 3.4 Others 1 1.1 5 6.0 6 3.4
Number of visit s to VCT in the past 12 months N=92 % N=83 % N=175 %
Once 10 10.9 27 32.5 37 21.1 2-3 times 23 25.0 30 36.1 53 30.3 4-6 times 10 10.9 5 6.0 15 8.6 7-12 times 0 0.0 3 3.6 3 1.7 More than 12 times 49 53.3 18 21.7 67 38.3
*Note: The percentages add up to more than 100 because of multiple responses.
IBBS MSM Kathmandu Valley Report - 2009 50
About one half of the MSM (50.9%) had visited a Cruiseaids VCT center, while 29.1 percent had been to Parichaya Samaj and 25.1 to the Blue Diamond Society VCT centers. While 21.1 percent of the MSM had visited a VCT center once in the past year, 38.3 of them had visited such center more than 12 times. More MSWs (53.3%) than non-MSWs (21.7%) had been such frequent visitors (Table 8.4)
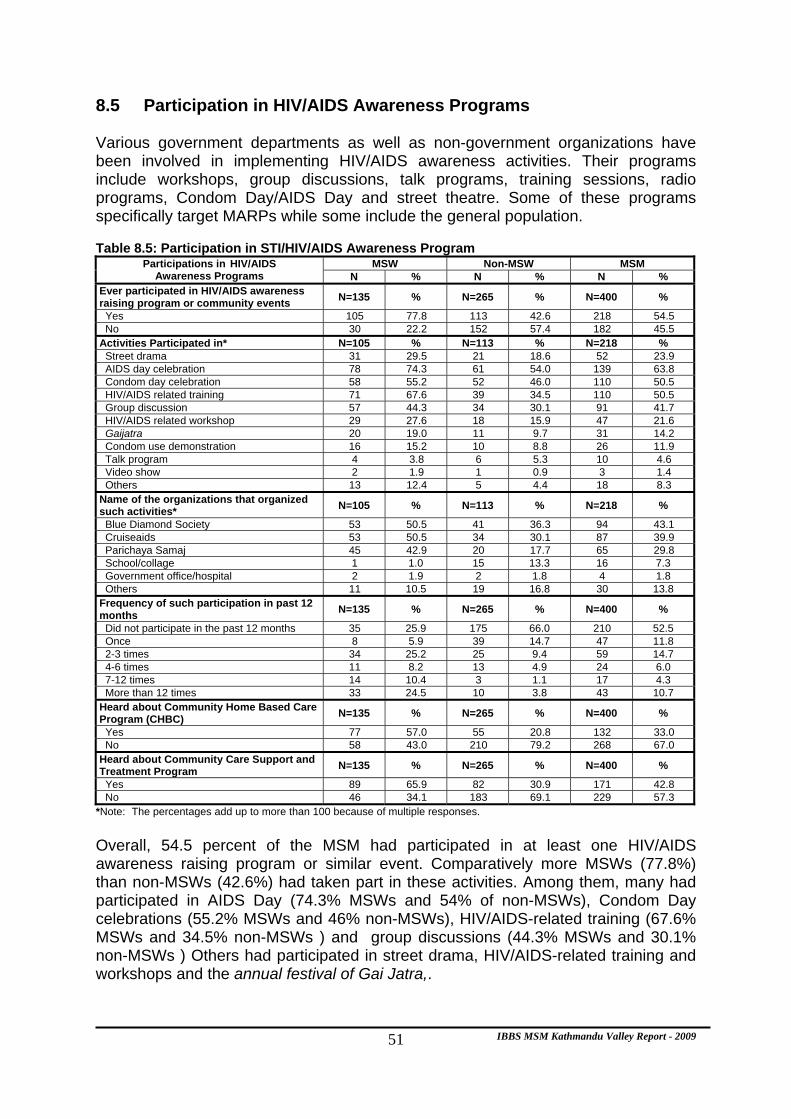
IBBS MSM Kathmandu Valley Report - 2009 51
8.5 Participation in HIV/AIDS Awareness Programs Various government departments as well as non-government organizations have been involved in implementing HIV/AIDS awareness activities. Their programs include workshops, group discussions, talk programs, training sessions, radio programs, Condom Day/AIDS Day and street theatre. Some of these programs specifically target MARPs while some include the general population. Table 8.5: Participation in STI/HIV/AIDS Awareness Program
MSW Non-MSW MSM Participations in HIV/AIDS Awareness Programs N % N % N %
Ever participated in HIV/AIDS awareness raising program or community events N=135 % N=265 % N=400 %
Yes 105 77.8 113 42.6 218 54.5 No 30 22.2 152 57.4 182 45.5 Activities Participated in* N=105 % N=113 % N=218 % Street drama 31 29.5 21 18.6 52 23.9 AIDS day celebration 78 74.3 61 54.0 139 63.8 Condom day celebration 58 55.2 52 46.0 110 50.5 HIV/AIDS related training 71 67.6 39 34.5 110 50.5 Group discussion 57 44.3 34 30.1 91 41.7 HIV/AIDS related workshop 29 27.6 18 15.9 47 21.6 Gaijatra 20 19.0 11 9.7 31 14.2 Condom use demonstration 16 15.2 10 8.8 26 11.9 Talk program 4 3.8 6 5.3 10 4.6 Video show 2 1.9 1 0.9 3 1.4 Others 13 12.4 5 4.4 18 8.3 Name of the organizations that organized such activities* N=105 % N=113 % N=218 %
Blue Diamond Society 53 50.5 41 36.3 94 43.1 Cruiseaids 53 50.5 34 30.1 87 39.9 Parichaya Samaj 45 42.9 20 17.7 65 29.8 School/collage 1 1.0 15 13.3 16 7.3 Government office/hospital 2 1.9 2 1.8 4 1.8 Others 11 10.5 19 16.8 30 13.8 Frequency of such participation in past 12 months N=135 % N=265 % N=400 %
Did not participate in the past 12 months 35 25.9 175 66.0 210 52.5 Once 8 5.9 39 14.7 47 11.8 2-3 times 34 25.2 25 9.4 59 14.7 4-6 times 11 8.2 13 4.9 24 6.0 7-12 times 14 10.4 3 1.1 17 4.3 More than 12 times 33 24.5 10 3.8 43 10.7 Heard about Community Home Based Care Program (CHBC) N=135 % N=265 % N=400 %
Yes 77 57.0 55 20.8 132 33.0 No 58 43.0 210 79.2 268 67.0 Heard about Community Care Support and Treatment Program N=135 % N=265 % N=400 %
Yes 89 65.9 82 30.9 171 42.8 No 46 34.1 183 69.1 229 57.3
*Note: The percentages add up to more than 100 because of multiple responses. Overall, 54.5 percent of the MSM had participated in at least one HIV/AIDS awareness raising program or similar event. Comparatively more MSWs (77.8%) than non-MSWs (42.6%) had taken part in these activities. Among them, many had participated in AIDS Day (74.3% MSWs and 54% of non-MSWs), Condom Day celebrations (55.2% MSWs and 46% non-MSWs), HIV/AIDS-related training (67.6% MSWs and 34.5% non-MSWs ) and group discussions (44.3% MSWs and 30.1% non-MSWs ) Others had participated in street drama, HIV/AIDS-related training and workshops and the annual festival of Gai Jatra,.

IBBS MSM Kathmandu Valley Report - 2009 52
Around four in ten MSM reported taking part in events organized by the Blue Diamond Society (43.1%) and Cruiseaids (39.9%). Almost 30 percent had also been part of Parichaya Samaj activities. Fifteen percent of the MSM had taken part in such programs 2 to 3 times, while 11.8 percent had taken part just once in the past year. More than half of the MSM (52.5%) had not taken part in any of such activities/programs in the past year (25.9% MSWs and 66% non-MSWs). (Table 8.5) Figure five further shows the exposure of the MSM to other program components. Overall, 90.3 percent knew of a facility where they could go for an HIV test whenever necessary, while 82.3 percent had received condoms from an outreach service, drop-in centre or sexual health clinic in the past year. In addition to this, the MSM were also asked if they were aware of Community Home Based Care Program (CHBC) and Community Care Support and Treatment (CCST) program. Thirty-three percent of the MSM had heard about CHBC services provided to HIV-positive people, while 42.8 percent of them had heard of the CCST program.
Figure 5: Program Coverage/Exposure
90.382.3
42.833
0102030405060708090
100
Know an HIVtesting facility
Receivedcondom in past
12 month
Heard of CCSTprogram
Heard of CHBCservice
Perc
ent
N = 400
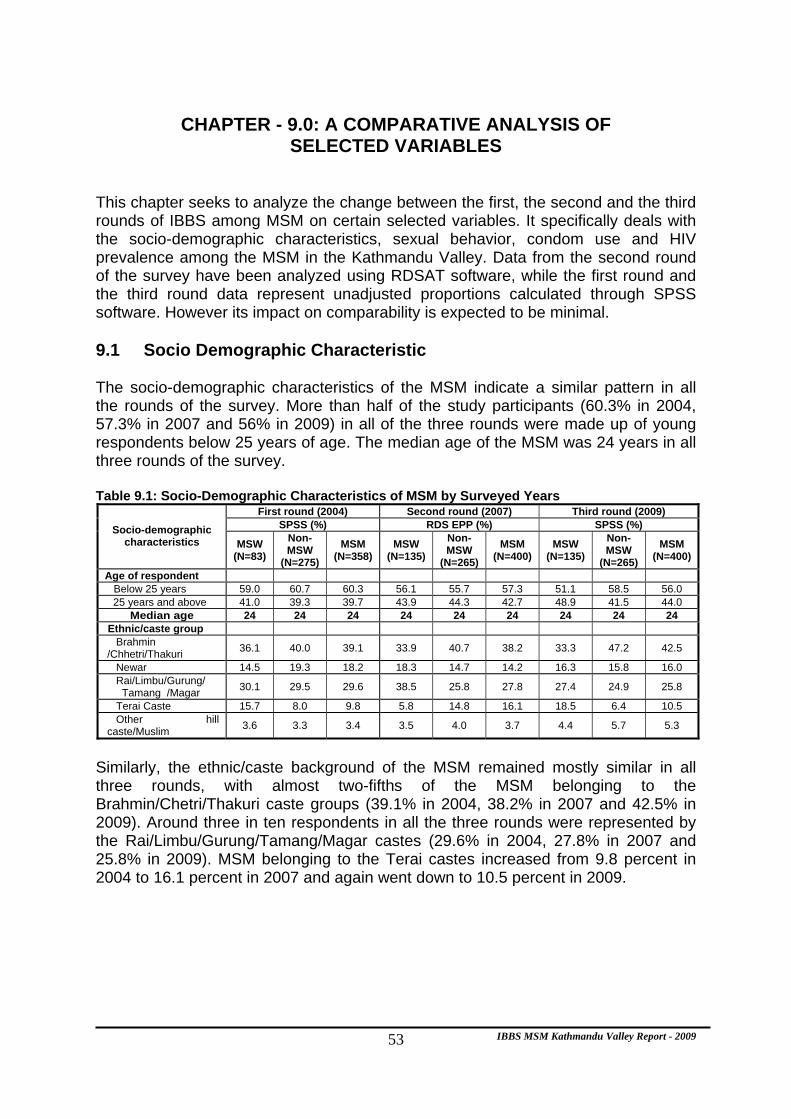
IBBS MSM Kathmandu Valley Report - 2009 53
CHAPTER - 9.0: A COMPARATIVE ANALYSIS OF
SELECTED VARIABLES This chapter seeks to analyze the change between the first, the second and the third rounds of IBBS among MSM on certain selected variables. It specifically deals with the socio-demographic characteristics, sexual behavior, condom use and HIV prevalence among the MSM in the Kathmandu Valley. Data from the second round of the survey have been analyzed using RDSAT software, while the first round and the third round data represent unadjusted proportions calculated through SPSS software. However its impact on comparability is expected to be minimal. 9.1 Socio Demographic Characteristic The socio-demographic characteristics of the MSM indicate a similar pattern in all the rounds of the survey. More than half of the study participants (60.3% in 2004, 57.3% in 2007 and 56% in 2009) in all of the three rounds were made up of young respondents below 25 years of age. The median age of the MSM was 24 years in all three rounds of the survey. Table 9.1: Socio-Demographic Characteristics of MSM by Surveyed Years
First round (2004) Second round (2007) Third round (2009) SPSS (%) RDS EPP (%) SPSS (%) Socio-demographic
characteristics MSW (N=83)
Non-MSW
(N=275)
MSM (N=358)
MSW (N=135)
Non-MSW
(N=265)
MSM (N=400)
MSW (N=135)
Non-MSW
(N=265)
MSM (N=400)
Age of respondent Below 25 years 59.0 60.7 60.3 56.1 55.7 57.3 51.1 58.5 56.0
25 years and above 41.0 39.3 39.7 43.9 44.3 42.7 48.9 41.5 44.0 Median age 24 24 24 24 24 24 24 24 24
Ethnic/caste group Brahmin /Chhetri/Thakuri 36.1 40.0 39.1 33.9 40.7 38.2 33.3 47.2 42.5
Newar 14.5 19.3 18.2 18.3 14.7 14.2 16.3 15.8 16.0 Rai/Limbu/Gurung/ Tamang /Magar 30.1 29.5 29.6 38.5 25.8 27.8 27.4 24.9 25.8
Terai Caste 15.7 8.0 9.8 5.8 14.8 16.1 18.5 6.4 10.5 Other hill caste/Muslim 3.6 3.3 3.4 3.5 4.0 3.7 4.4 5.7 5.3
Similarly, the ethnic/caste background of the MSM remained mostly similar in all three rounds, with almost two-fifths of the MSM belonging to the Brahmin/Chetri/Thakuri caste groups (39.1% in 2004, 38.2% in 2007 and 42.5% in 2009). Around three in ten respondents in all the three rounds were represented by the Rai/Limbu/Gurung/Tamang/Magar castes (29.6% in 2004, 27.8% in 2007 and 25.8% in 2009). MSM belonging to the Terai castes increased from 9.8 percent in 2004 to 16.1 percent in 2007 and again went down to 10.5 percent in 2009.

IBBS MSM Kathmandu Valley Report - 2009 54
9.2 Drug Injecting Practices The percentage of MSM injecting drugs nearly halved in second round (1.8%) since the first round (3.4%) and further decreased to 1.3 percent in the third round. As in the previous two rounds most MSM (98.8%) had not injected even once in the past year. Table 9.2: Drug Injecting Practices of MSM by Surveyed Years
First round (2004) Second round (2007) First round (2009) SPSS (%) RDS EPP (%) SPSS (%) Drug injecting
practice MSW (N=83
)
Non-MSW
(N=275)
MSM (N=1358)
MSW (N=135)
Non-MSW (N=265)
MSM (N=400
)
MSW(N=135)
Non-MSW
(N=265)
MSM (N=400
) Injected drug during past year
Yes 0.0 4.4 3.4 4.2 1.6 1.8 1.5 1.1 1.3 No 92.8 95.6 95.0 95.8 98.4 98.2 98.5 98.9 98.8 Don’t remember 7.2 0.0 1.7 0.0 0.0 0.0 0.0 0.0 0.0
9.3 Sexual Behavior The sexual behavior of the MSM did not change much from the first round of the survey. The majority of the respondents had their first sexual contact before the age of 21 (90.8% in 2004 89% in 2007 and 94.3% in 2009). Table 9.3: Sexual Behavior of MSM by Surveyed Years
First round (2004) Second round (2007) Third round (2009) SPSS (%) RDS EPP (%) SPSS (%)
Sexual behavior MSW
(N=83) Non-MSW
(N=275) MSM
(N=358) MSW
(N=135) Non-MSW
(N=265) MSM
(N=400) MSW
(N=135) Non-MSW
(N=265) MSM
(N=400)
Age at first sexual intercourse Up to 16 years 79.5 52.0 58.4 62.8 48.2 51.5 82.2 50.6 61.3 17 – 20 years 14.5 37.8 32.4 31.0 39.7 37.5 17.0 41.1 33.0 21 and above 4.8 9.8 8.7 6.2 12.1 11.0 0.7 8.3 5.8 Can’t remember 1.2 0.4 0.6 0.0 0.0 0.0 0.0 0.0 0.0 Mean age at first sex 14.2 16.4 15.9 14.8 16.6 16.0 14.2 16.7 15.9 First sexual contact person male or female
Male 21.7 58.5 50.0 68.5 31.5 36.1 89.6 43.8 59.3 Female 78.3 41.5 50.0 31.5 68.5 63.9 10.4 56.2 40.8 Bought sex from male in the past month
Yes 14.5 12.7 13.1 20.0 15.5 17.4 6.7 25.3 19.0 No 85.5 87.3 86.9 80.0 84.5 82.6 93.3 74.7 81.0 Bought sex from female in the past month
Yes 3.6 12.4 10.3 15.0 10.3 11.3 4.4 10.2 8.3 No 96.4 87.6 89.7 85.0 89.7 88.7 95.6 89.8 91.8 Sold anal sex to male in the past month
Yes 71.1 NA NA 82.2** NA NA 79.3 NA NA No 28.9 NA NA 17.8** NA NA 20.7 NA NA
Note: Estimated population proportion (%) of the variables with double asterisks (**) did not meet the required numerator to be calculated with RDSAT and therefore represents unadjusted proportion NA- Not applicable for non-MSWs
Fifty percent of the MSM in 2004 had sex with a female partner, while 63.9 percent of respondents reported the same in 2007, followed by 40.8 percent in 2009.

IBBS MSM Kathmandu Valley Report - 2009 55
Likewise, about the same proportion of the MSM in the first two rounds (10.3% in 2004 and 11.3% in 2007) had paid a female partner for sex in the past month, while in 2009 the proportion of MSM reporting so went down to 8.3 percent. While in 2007, 82.2 percent of MSWs had sold sex to a male partner in the month preceding the survey compared to 71.1 percent of MSWs reporting so in 2004, in 2009 again a slightly lower proportion of MSWs (79.3 %) had sold sex in the month preceding the survey. 9.4 Condom Use with Different Partners The trend of consistent condom use with different type of partners showed some changes over the three rounds of the survey. The proportion of MSM reporting consistent condom use with a non-paying male partner increased from 44.3 percent in 2004 to 70.1 percent in 2007, but again went down to 65.2 percent in 2009. This is still a significant increase since the first round. Likewise, reported consistent condom use with a paid male anal sex partner in the month preceding the survey increased from 50 percent in 2004 to 89.3 percent in 2007 but went down to 77 percent in 2009. However, this too is a significant increase since the first round. The consistent use of condom with non-paying female sex partners, however improved all through the three rounds of the study (19.2% in 2004, 33% in 2007 and 40% in 2009); statistically too this is a highly significant change since the first round. Table 9.4: Consistent Use of Condom with Different Sex Partners in the Past month by Surveyed Years
First round (2004) Second round (2007) Third round (2009)) SPSS (%) RDS EPP (%) SPSS (%) Consistent use of condom
MSW Non-MSW MSM MSW Non-
MSW MSM MSW Non-MSW MSM
With non-paying male anal sex partner N=54 N=140 N=194 N=108 N=193 N=301 N=104 N=186 N=290
Always 57.4 39.3 44.3 71.8 70.9 70.1 65.4 65.1 65.2 Not always 42.6 60.7 55.7 28.2 29.1 29.9 34.6 34.9 34.8 With one time paying male anal sex partner N=48 N=92 N=94
Always 68.8 NA NA 94.6** NA NA 85.1 NA NA Not always 31.2 NA NA 5.4** NA NA 14.9 NA NA With regular paying male anal sex partner N=36 NA NA N=101 N=99 NA NA Always 50.0 NA NA 97.2 NA NA 75.8 NA NA Not always 50.0 NA NA 2.8 NA NA 24.2 NA NA With paid male anal sex partner N=12 N=34 N=46 N=21 N=35 N=56 N=9 N=65 N=74
Always 58.3 47.1 50.0 100.0** 82.9** 89.3 100.0 73.8 77.0 Not always 41.7 52.9 50.0 0.0** 17.1** 10.7 0.0 26.2 23.0 With non-paying female sex partner N=15 N=63 N=78 N=28 N=86 N=114 N=20 N=70 N=90
Always 40.0 14.3 19.2 69.2 33.8 33.0 50.0 37.1 40.0 Not always 60.0 85.7 80.8 30.8 66.2 67.0 50.0 62.9 60.0
Note: Estimated population proportion (%) of the variables with double asterisks (**) did not meet the required numerator to be calculated with RDSAT and therefore represents unadjusted proportion NA- Not applicable for non-MSWs
Although the trend of consistent condom use among MSWs with one time paying and regular paying male anal sex partner has improved over the years, it did not show significant changes since the first round of the study. Consistent condom use with one-time paying male anal sex partners among MSWs was reported by 68.8
IBBS MSM Kathmandu Valley Report - 2009 56
percent of them in the first round, 94.6 percent in the second round and 85.1 percent in the third round. Similarly, consistent condom use with regular paying male anal sex partners went up from 50 percent in 2004 to 97.2 percent in 2007, but again decreased to 75.8 percent in 2009.

IBBS MSM Kathmandu Valley Report - 2009 57
9.5 HIV and STI Prevalence HIV prevalence among the MSM has not changed significantly throughout the three rounds of the survey. As seen in Table 8.5, the first round of IBBS showed that the HIV prevalence among MSM was 3.9 percent, 3.3 percent in the second round which again increased to 3.8 percent in the third round. Unlike in 2007 when the prevalence was slightly higher among non-MSWs (3.4%) than among MSWs (2.9%), in 2004 and 2009 more MSWs had HIV than non-MSWs (4.8% MSWs and 3.6% non-MSWs in 2004, 5.2% MSWs and 3% non-MSWs in 2009). Table 9.5: HIV and STI Prevalence among MSM by Surveyed Years
First round (2004) Second round (2007) Third round (2009) SPSS (%) RDS EPP (%) SPSS (%)
HIV prevalence MSW
(N=83) Non-MSW
(N=275) MSM
(N=358) MSW
(N=135) Non-MSW
(N=265) MSM
(N=400) MSW
(N=135) Non-MSW
(N=265) MSM
(N=400)
HIV 4.8 3.6 3.9 2.9 3.4 3.3 5.2 3.0 3.8 Active Syphilis 2.4 1.5 1.7 1.5** 2.3** 2.4 3.0 0.8 1.5 Syphilis History 14.5 7.3 8.9 3.0** 2.6** 2.8 4.4 1.5 2.5 Anal-CT 20.5 1.5 5.9 11.6 2.6 3.6 11.1 1.9 5.0 Anal-NG 12.0 3.6 5.6 8.3 8.1 8.1 18.5 9.4 12.5 Urethral-CT 1.2 2.2 2.0 0.7** 1.1** 0.5 0.7 3.4 2.5 Urethral-NG 1.2 2.2 2.0 0.0** 0.8** 0.3 0.7 0.8 0.8
Note: Estimated population proportion (%) of the variables with double asterisks (**) did not meet the required numerator to be calculated with RDSAT and therefore represents unadjusted proportion
Overall, syphilis prevalence among MSM was 2.4 percent in second round compared to 1.7 percent in first round; and 1.5 percent in the third round. Syphilis history however had decreased from 8.9 percent in the first round to 2.8 in the second round and further to 2.5 percent in the third round. On the other hand, the prevalence of anal NG increased from 5.6 percent in the first round in 2007, to 8.1 percent in the second round and further to 12.5 percent in the third round. The difference is statistically significant. The anal CT infection rate had decreased from 5.9 percent in the first round to 3.6 percent in the second round but had again increased to 5 percent in the third round. The prevalence of anal CT and anal NG was noticeably higher among MSWs than non-MSWs in all the three rounds. Urethral NG and urethral CT among the MSM were two percent each in the first round, which decreased to 0.3 percent and 0.5 percent respectively in the second round, before increasing to 0.8 percent and 2.5 percent respectively in the third round.
IBBS MSM Kathmandu Valley Report - 2009 58
CHAPTER – 10: SUMMARY OF MAJOR FINDINGS AND RECOMMENDATIONS
10.1 General Findings HIV prevalence among MSM in the Kathmandu Valley is 3.8 percent, while the overall prevalence rate of at least one STI is 21.5 percent (i.e. percentage of respondents who have at least one of the following infections: HIV, active syphilis, anal and urethral neisseria gonorrhoea and anal and urethral chlamydia trachomatis). The MSM group was mostly young, with 79 percent being below the age of 30. Overall, 22.5 percent were living with a regular sex partner at the time of the survey. Of these 44.4 percent were living with a male partner while 55.6 percent with a female partner. The predominant sex practice among MSM was anal sex, followed by oral sex. The majority of them (85.8%) had practiced anal sex in the past month while 71.8 percent had oral as well as anal sex in the past month. All of the study participants had sexual contact with a male in the past year while 49 percent of them had sex with a female partner too. The MSM group tends to not use condoms consistently with their regular female partners. The past month’s sexual encounters showed that overall consistent condom use was low with non-paying female sex partners (40%). Ninety-five percent of MSM could get condoms whenever necessary. Eighty-three percent of MSM had heard of lubricants that are made specially to be used with condoms. Among them, 53.3 percent had used such lubricants consistently during anal sex in the month preceding the survey. Twenty percent of the MSM group had experienced condom breakage during sex in the past month. More than three-fourths (77.5%) of them knew that such breakage had been caused due to the improper use of condoms. Overall, 9.3 percent of MSM could not correctly name any symptom of STIs in men. On the other hand, 22.5 percent had experienced at least one symptom of STI in the past 12 months. While 83.3 percent of MSM knew about ‘ABC’, 64.3 percent were aware of all of ‘BCDEF’ (A: abstinence, B: being faithful to one partner, C: consistent condom use prevent HIV transmission, D: a healthy looking person can be infected with HIV, E: a person can not get HIV from a mosquito bite and F: HIV is not transmitted while sharing meal with an HIV infected person). Eighty-three percent of MSM knew about a confidential HIV testing facility in their community. However, only 62.8 percent had ever taken an HIV test. Among them, 67.7 percent had taken the test within the past year.
IBBS MSM Kathmandu Valley Report - 2009 59
While 27.3 percent of MSM perceived themselves to be at medium or high risk of contacting HIV, 72.4 percent saw little or no such risk for themselves. Seventy-eight percent of MSM had met peer/outreach educators while 54.5 percent had visited a drop-in center (DIC), 47.5 percent had participated in at least one HIV/STI awareness program/community event and 43.8 had visited a VCT center at least once in the past year. A relatively smaller proportion of them (24.8%) had visited an STI clinic in the year preceding the survey. MSM had mostly participated or visited programs run by Cruiseaids, the Blue Diamond Society and Parichaya Samaj. 10.2 Group Specific Findings on MSWs and Non-MSWs MSWs had a slightly higher prevalence of HIV than non-MSWs, as 5.2 percent of 135 MSWs and three percent of 265 non-MSWs tested HIV-positive. The prevalence of at least one STI, i.e., HIV, current syphilis, anal CT and NG and urethral CT and NG was also higher (31.9%) among MSWs than non-MSWs (16.2%). Twenty-five percent of MSM were currently married. While 23.3 percent MSWs were married to male partners, 2.9 percent of non-MSWs had been married to males. While 4.9 percent of non-MSWs had never been to a formal school but could read and write, twice as many MSWs (10.4%) reported so. A relatively larger proportion of MSWs (18.5%) represented different Terai castes compared to non-MSWs (6.4%). MSWs were found to engage in sexual encounters at an earlier age than non-MSWs, as 82.2 percent of MSWs had their first sexual contact at the age of between 8-16 years compared to 50.6 percent of non-MSWs reporting so. At the same time, a relatively higher proportion of MSWs (89.6%) had their first sexual experience with a male partner than non-MSWs (43.8%). More non-MSWs (57.7%) than MSWs (31.9%) had sexual contact with female partners in the past year. At the same time, non-MSWs had mostly performed the insertive role (57.7%) while MSWs had mostly performed the role of receptive partner (65.9%) during anal sex in the month preceding the survey. Overall consistent condom use was the highest with paid male anal sex partners (100%) among MSWs and with paid female sex partners (85.2%) among non-MSWs in the month preceding the survey. More MSWs (96.3%) than non-MSWs (76.2%) had heard of branded lubricants. Likewise, a higher percentage of MSWs (69.2%) than non-MSWs (43.1%) had used lubricants with condoms in each anal sex in the past month. A higher proportion of non-MSWs (12.5%) than MSWs (3%) were unaware of any symptoms of male STIs. Among the different symptoms of STIs, a relatively larger proportion of MSWs (15.6%) than non-MSWs (2.3%) had anal ulcers/sores in the

IBBS MSM Kathmandu Valley Report - 2009 60
past year. On the other hand, more non-MSWs (17.7%) than MSWs (11.1%) have had genital ulcers/sores in the past year.

IBBS MSM Kathmandu Valley Report - 2009 61
More non-MSWs (32.7%) than MSWs (20%) had not sought treatment for the symptoms of STI/S experienced by them in the past year. A relatively higher proportion of MSWs than non-MSWs had sought treatment from Cruiseaids (17.1% MSWs and 7.3% non-MSWs), Parichaya Samaj (14.3% MSws and 3.6% non-MSWs), and private doctor/clinician (11.4% MSWs and 5.5% non-MSWs) while a larger proportion of non-MSWs than MSWs had been to a pharmacy (18.2% non-MSWs and none of the MSWs (0%) ) and had used medicine available at home for treatment (14.5% non-MSWs and 5.7% MSWs). While 90.4 percent of MSWs knew about the existence of a confidential HIV testing facility in their community, 79.3 percentage of non-MSWs knew about it. Among them more MSWs (83.7%) than non-MSWs (52.1%) had ever taken an HIV test. More MSWs than non-MSWs had been subjected to physical/sexual violence such as beating (25.9% MSWs and 1.9% non-MSWs), forced sex (32.6% MSWs and 7.9% non-MSWs), blackmailing (50.4% MSWs and 6.4% non-MSWs) and discrimination at their job or in daily life (44.4% MSWs and 9.1% non-MSWs) in the past one year. More MSWs than non-MSWs had been exposed to ongoing HIV/AIDS awareness programs and activities including exposure to PEs/OEs/CMs/CEs, visit to DICs, STI clinics, VCT centers or participation in any program/event. 10.3 Recommendations Based on the findings of this study, some specific recommendations are as follows: The prevalence of anal NG and urethral CT has increased over the years, suggesting unsafe/unprotected sexual practices among MSM. Consistent condom use was relatively low with non-paying female partners both among MSWs (50%) and non-MSWs (37.1%) in the past month. Condom use was inconsistent with other partners too. Comprehensive program catering to MSM and their sexual networks (that consist of female partners too), should be designed. Advocacy, behavioral change programs, and health promotion intervention should be further scaled up. The contents of the messages should be improved further and disseminated widely. The study findings indicated that interventions can target locations like bus parks, cinema halls, temples and their surrounding areas, dance restaurants, discotheques which are frequented by the study groups. Data from the study indicate that a considerable proportion of MSM have their first sexual encounter at quite a young age (82.2% MSWs and 50.6% non-MSWs were less than 17 at time of their first sexual contact). Specific education program activities that target school children, college students, youth, and adolescents should be designed to impart HIV/AIDS awareness and sex education. Information can be disseminated through printed as well as on line education materials. Seventeen percent of MSM were not aware of a confidential HIV testing facility being available in the valley. At the same time, 37.2 percent of the respondents had never tested themselves for HIV so far. Client-friendly HIV counseling and testing facilities
IBBS MSM Kathmandu Valley Report - 2009 62
should be expanded further to cover more of the MSM population and they should also be made aware of the location and of the availability of such services. PEs/OE/CM/CEs are good contact points to disseminate the necessary information and IEC materials to the target population, especially to MSWs. Seventy-eight percent of the respondents had met them at least once in the past year. Outreach education programs should be continued and geographically expanded to cover more of the target population. Ongoing programs should be expanded geographically and capacity building of local NGOs should be focused on to increase access to more of target population. Some MSM were subjected to physical violence such as beating and forced sex, blackmailing and discrimination on the basis of their sexuality. Necessary information related to sexuality and to the rights of sexual minorities should be provided at a larger scale through awareness campaigns such as street drama and radio and television programs to change the negative attitude of the society. Emphasis should be put on the availability of health services to MSM who are subjected to sexual violence. The group-specific findings suggest that a relatively smaller proportion of non-MSWs than MSWs have participated in different programs/services related to the MSM community and HIV/AIDS. New strategies need to be considered to cover unexposed MSM including clients of MSWs and non-MSWs. Different mediums of communications such as hotlines, websites, PEs/OEs, pamphlets, posters and radio/television could be used to reach these groups.
IBBS MSM Kathmandu Valley Report - 2009 63
REFERENCES FHI, 2000. "Behavioral Surveillance Surveys: Guidelines for Repeated
Behavioral Surveys in Populations at Risk of HIV". FHI Implementing AIDS Prevention and Care Project. USA.
FHI. 2000."Behavioral Surveillance Surveys: Guidelines for Repeated
Behavioral Surveys in Populations at Risk of HIV". Arlington, VA Family Health International.
CREHPA/ FHI, December 2005. Integrated Bio-behavioral Survey (IBBS) among
MSM Populations in Kathmandu Valley Heckathorn DD, 2002a. "Respondent Driven Sampling II: Deriving Valid
Population Estimates from Chain-referral Samples of Hidden Populations". Social Problem 49 (1): 11-34.
Heckathorn DD. 1997. "Respondent Driven Sampling: A New Approach to the
Study of Hidden Populations." Social problem 44(2): 174-199. Heckathron, DD, Updated July 2003. "Snowball and Respondent-Driven-
Sampling An Overview". National Center for AIDS and STD Control. 2007. "Cumulative HIV/AIDS Situation
of Nepal" As of May 14, 2009. New ERA/FHI, January 2008. “Integrated Bio-behavioral Survey (IBBS) among
Men who have Sex with Men in the Kathmandu Valley”- 2007. November 2006/ Supplement. "Journal of Urban Health - Bulletin of the New
York Academy of Medicine". Volume 83 Number 6. Ramirez- Valles J, Heckathorn DD, Vasquez R, Diaz RM, Campbell RT. 2005. "The
Fit between Theory and Data in Respondent-driven Sampling: Response to Heimer" AIDS behav. 9(4): 409-414.
Ramirez- Valles J, Heckathorn DD, Vasquez R, Diaz RM, Campbell RT. 2005.
"From Networks to Populations: The Development and Application of Respondent-driven Sampling among IDUs and Latino Gay Men". AIDS behav. 9(4): 387-402.
Salganik MJ, Heckathorn DD, 2004. "Sampling and Estimation in Hidden
Populations Using Respondent-driven Sampling". Social Method. 34:193-239.
Salganik, Matthew J. and Douglas D. Heckathorn. 2004. “Sampling and Estimation
in Hidden Populations Using Respondent Driven Sampling”. Sociological Method. 34(1):193-240.
ANNEXES
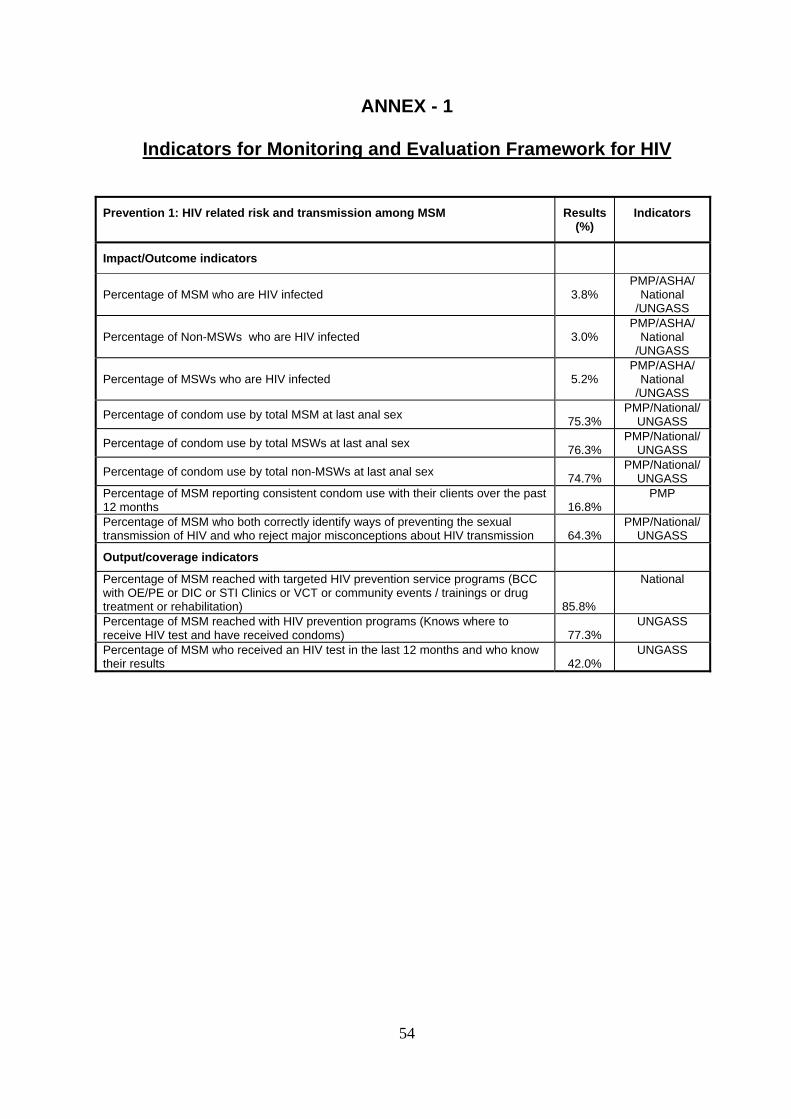
54
ANNEX - 1
Indicators for Monitoring and Evaluation Framework for HIV
Prevention 1: HIV related risk and transmission among MSM Results (%)
Indicators
Impact/Outcome indicators
Percentage of MSM who are HIV infected 3.8% PMP/ASHA/
National /UNGASS
Percentage of Non-MSWs who are HIV infected 3.0% PMP/ASHA/
National /UNGASS
Percentage of MSWs who are HIV infected 5.2% PMP/ASHA/
National /UNGASS
Percentage of condom use by total MSM at last anal sex 75.3% PMP/National/
UNGASS
Percentage of condom use by total MSWs at last anal sex 76.3% PMP/National/
UNGASS
Percentage of condom use by total non-MSWs at last anal sex 74.7% PMP/National/
UNGASS Percentage of MSM reporting consistent condom use with their clients over the past 12 months 16.8%
PMP
Percentage of MSM who both correctly identify ways of preventing the sexual transmission of HIV and who reject major misconceptions about HIV transmission 64.3%
PMP/National/ UNGASS
Output/coverage indicators
Percentage of MSM reached with targeted HIV prevention service programs (BCC with OE/PE or DIC or STI Clinics or VCT or community events / trainings or drug treatment or rehabilitation) 85.8%
National
Percentage of MSM reached with HIV prevention programs (Knows where to receive HIV test and have received condoms) 77.3%
UNGASS
Percentage of MSM who received an HIV test in the last 12 months and who know their results 42.0%
UNGASS
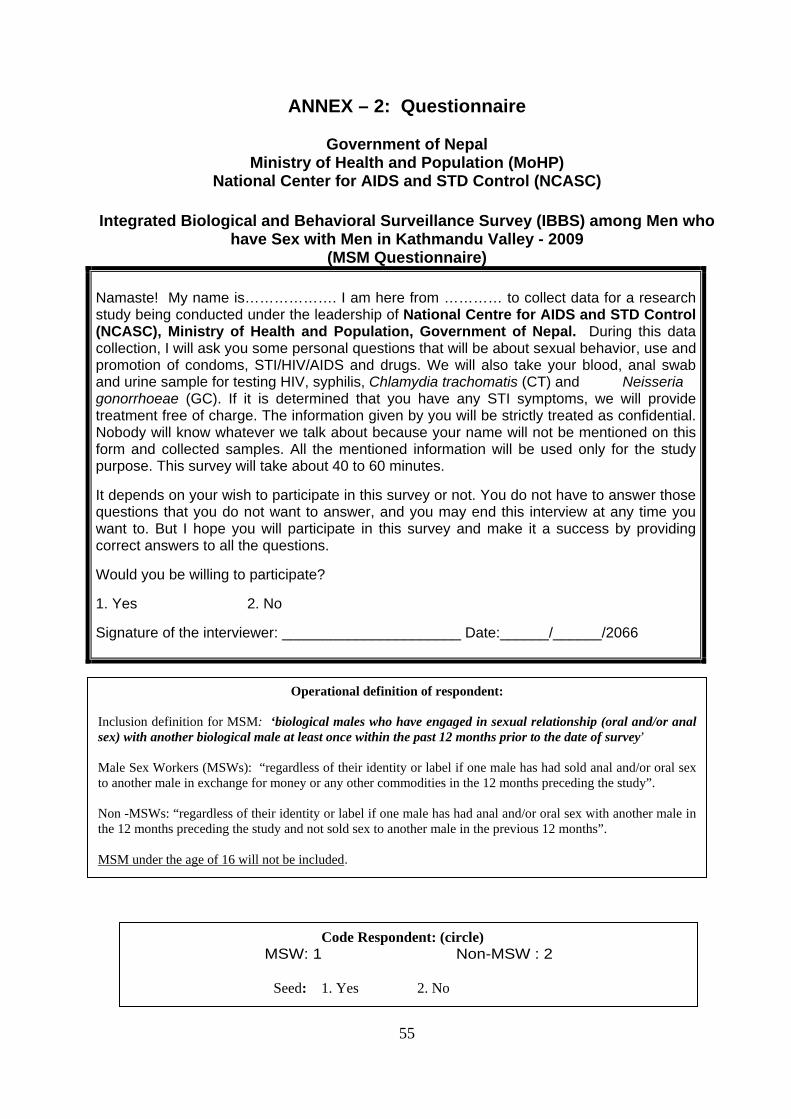
55
ANNEX – 2: Questionnaire
Government of Nepal Ministry of Health and Population (MoHP)
National Center for AIDS and STD Control (NCASC)
Integrated Biological and Behavioral Surveillance Survey (IBBS) among Men who have Sex with Men in Kathmandu Valley - 2009
(MSM Questionnaire) Namaste! My name is………………. I am here from ………… to collect data for a research study being conducted under the leadership of National Centre for AIDS and STD Control (NCASC), Ministry of Health and Population, Government of Nepal. During this data collection, I will ask you some personal questions that will be about sexual behavior, use and promotion of condoms, STI/HIV/AIDS and drugs. We will also take your blood, anal swab and urine sample for testing HIV, syphilis, Chlamydia trachomatis (CT) and Neisseria gonorrhoeae (GC). If it is determined that you have any STI symptoms, we will provide treatment free of charge. The information given by you will be strictly treated as confidential. Nobody will know whatever we talk about because your name will not be mentioned on this form and collected samples. All the mentioned information will be used only for the study purpose. This survey will take about 40 to 60 minutes. It depends on your wish to participate in this survey or not. You do not have to answer those questions that you do not want to answer, and you may end this interview at any time you want to. But I hope you will participate in this survey and make it a success by providing correct answers to all the questions. Would you be willing to participate? 1. Yes 2. No Signature of the interviewer: ______________________ Date:______/______/2066
Operational definition of respondent: Inclusion definition for MSM: ‘biological males who have engaged in sexual relationship (oral and/or anal sex) with another biological male at least once within the past 12 months prior to the date of survey’ Male Sex Workers (MSWs): “regardless of their identity or label if one male has had sold anal and/or oral sex to another male in exchange for money or any other commodities in the 12 months preceding the study”. Non -MSWs: “regardless of their identity or label if one male has had anal and/or oral sex with another male in the 12 months preceding the study and not sold sex to another male in the previous 12 months”. MSM under the age of 16 will not be included.
Code Respondent: (circle) MSW: 1 Non-MSW : 2
Seed: 1. Yes 2. No
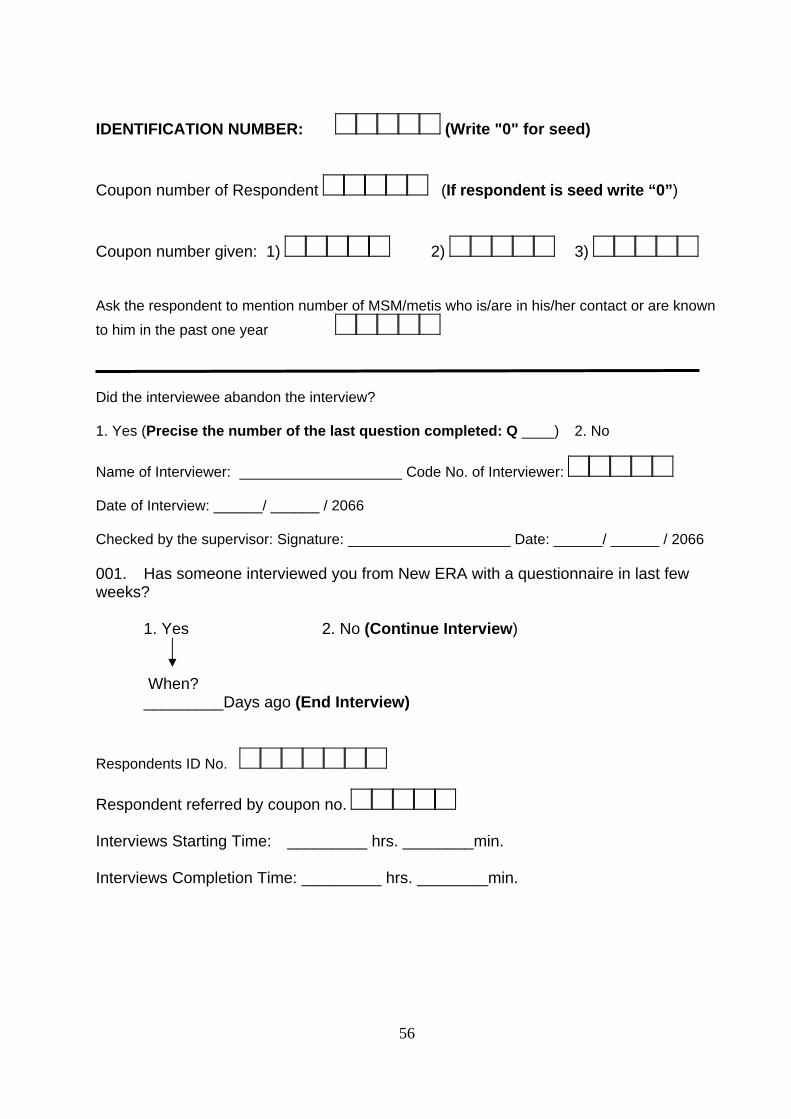
56
IDENTIFICATION NUMBER: (Write "0" for seed) Coupon number of Respondent (If respondent is seed write “0”) Coupon number given: 1) 2) 3) Ask the respondent to mention number of MSM/metis who is/are in his/her contact or are known to him in the past one year Did the interviewee abandon the interview? 1. Yes (Precise the number of the last question completed: Q ____) 2. No Name of Interviewer: ____________________ Code No. of Interviewer: Date of Interview: ______/ ______ / 2066 Checked by the supervisor: Signature: ____________________ Date: ______/ ______ / 2066 001. Has someone interviewed you from New ERA with a questionnaire in last few weeks?
1. Yes 2. No (Continue Interview)
When? _________Days ago (End Interview)
Respondents ID No. Respondent referred by coupon no. Interviews Starting Time: _________ hrs. ________min. Interviews Completion Time: _________ hrs. ________min.
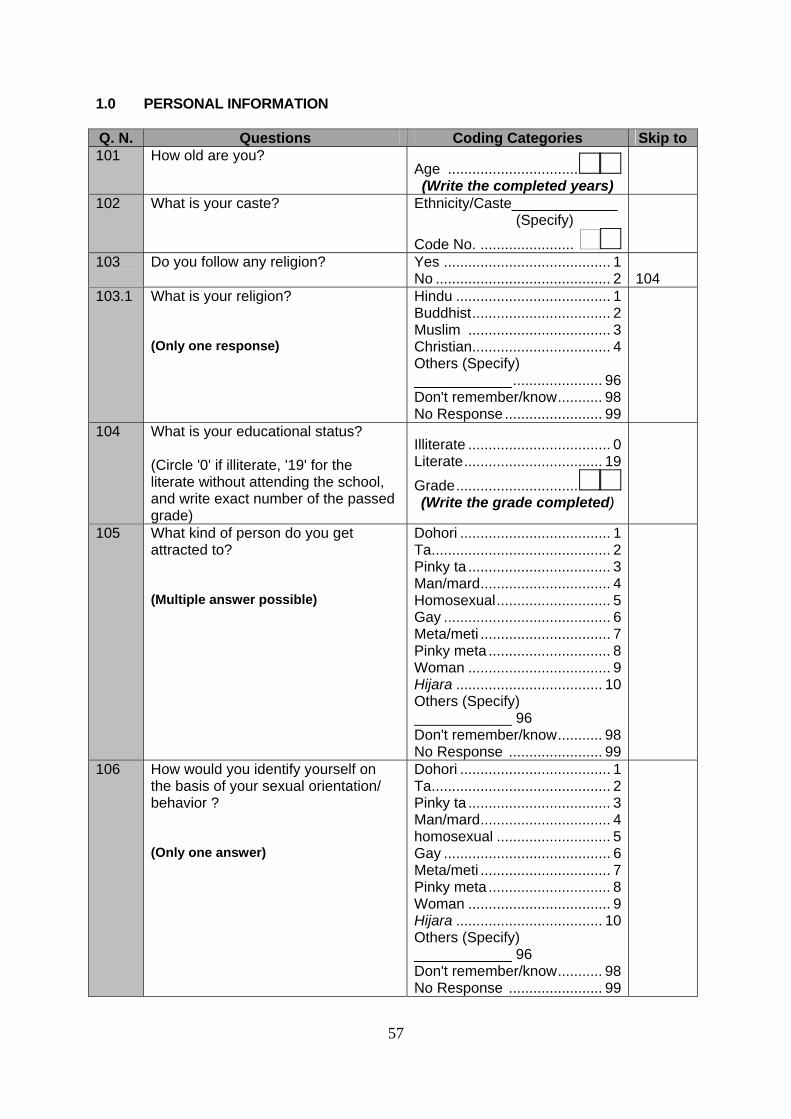
57
1.0 PERSONAL INFORMATION Q. N. Questions Coding Categories Skip to 101 How old are you?
Age ................................ (Write the completed years)
102 What is your caste?
Ethnicity/Caste_____________ (Specify) Code No. .......................
103 Do you follow any religion? Yes ......................................... 1 No ........................................... 2
104
103.1 What is your religion? (Only one response)
Hindu ...................................... 1 Buddhist.................................. 2 Muslim ................................... 3 Christian.................................. 4 Others (Specify) ____________...................... 96 Don't remember/know........... 98 No Response ........................ 99
104 What is your educational status? (Circle '0' if illiterate, '19' for the literate without attending the school, and write exact number of the passed grade)
Illiterate ................................... 0 Literate.................................. 19 Grade.............................. (Write the grade completed)
105 What kind of person do you get attracted to? (Multiple answer possible)
Dohori ..................................... 1 Ta............................................ 2 Pinky ta ................................... 3 Man/mard................................ 4 Homosexual............................ 5 Gay ......................................... 6 Meta/meti ................................ 7 Pinky meta .............................. 8 Woman ................................... 9 Hijara .................................... 10 Others (Specify) ____________ 96 Don't remember/know........... 98 No Response ....................... 99
106 How would you identify yourself on the basis of your sexual orientation/ behavior ? (Only one answer)
Dohori ..................................... 1 Ta............................................ 2 Pinky ta ................................... 3 Man/mard................................ 4 homosexual ............................ 5 Gay ......................................... 6 Meta/meti ................................ 7 Pinky meta .............................. 8 Woman ................................... 9 Hijara .................................... 10 Others (Specify) ____________ 96 Don't remember/know........... 98 No Response ....................... 99
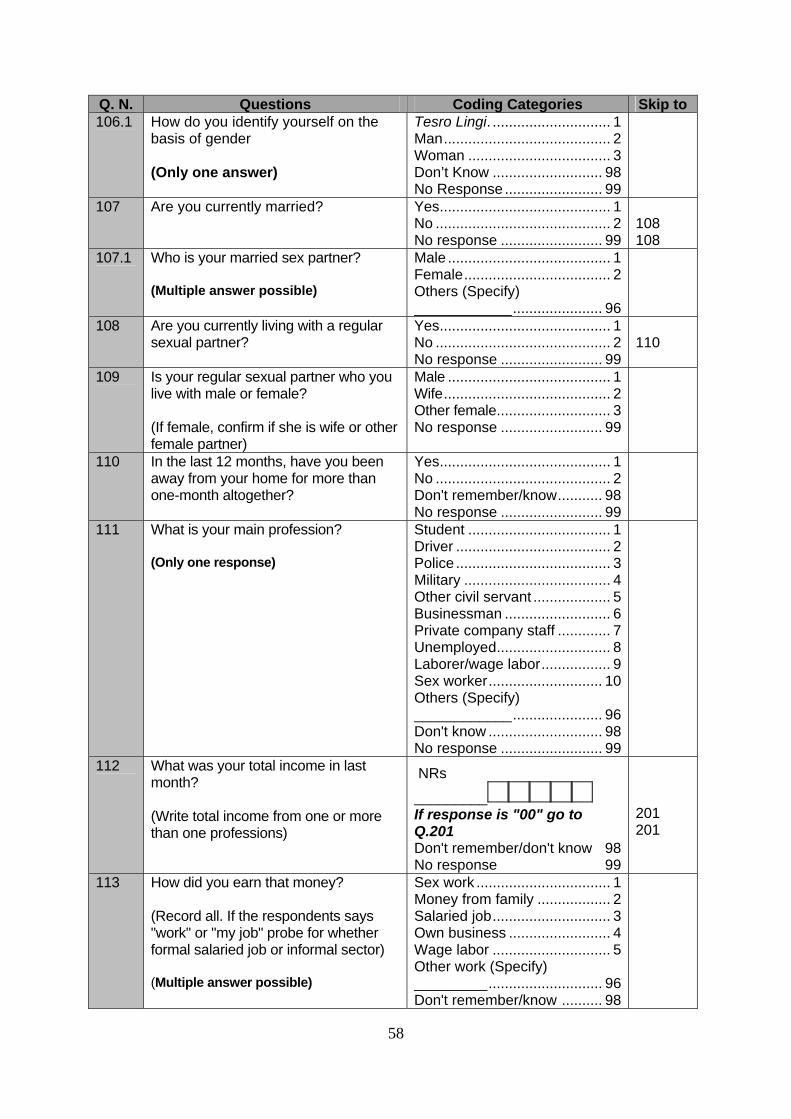
58
Q. N. Questions Coding Categories Skip to 106.1 How do you identify yourself on the
basis of gender (Only one answer)
Tesro Lingi. ............................. 1 Man......................................... 2 Woman ................................... 3 Don’t Know ........................... 98 No Response ........................ 99
107 Are you currently married?
Yes.......................................... 1 No ........................................... 2 No response ......................... 99
108 108
107.1 Who is your married sex partner? (Multiple answer possible)
Male ........................................ 1 Female.................................... 2 Others (Specify) ____________...................... 96
108 Are you currently living with a regular sexual partner?
Yes.......................................... 1 No ........................................... 2 No response ......................... 99
110
109 Is your regular sexual partner who you live with male or female? (If female, confirm if she is wife or other female partner)
Male ........................................ 1 Wife......................................... 2 Other female............................ 3 No response ......................... 99
110 In the last 12 months, have you been away from your home for more than one-month altogether?
Yes.......................................... 1 No ........................................... 2 Don't remember/know........... 98 No response ......................... 99
111 What is your main profession? (Only one response)
Student ................................... 1 Driver ...................................... 2 Police ...................................... 3 Military .................................... 4 Other civil servant ................... 5 Businessman .......................... 6 Private company staff ............. 7 Unemployed............................ 8 Laborer/wage labor................. 9 Sex worker............................ 10 Others (Specify) ____________...................... 96 Don't know ............................ 98 No response ......................... 99
112 What was your total income in last month? (Write total income from one or more than one professions)
NRs _________ If response is "00" go to Q.201 Don't remember/don't know 98 No response 99
201 201
113 How did you earn that money? (Record all. If the respondents says "work" or "my job" probe for whether formal salaried job or informal sector) (Multiple answer possible)
Sex work ................................. 1 Money from family .................. 2 Salaried job............................. 3 Own business ......................... 4 Wage labor ............................. 5 Other work (Specify) _________............................ 96 Don't remember/know .......... 98
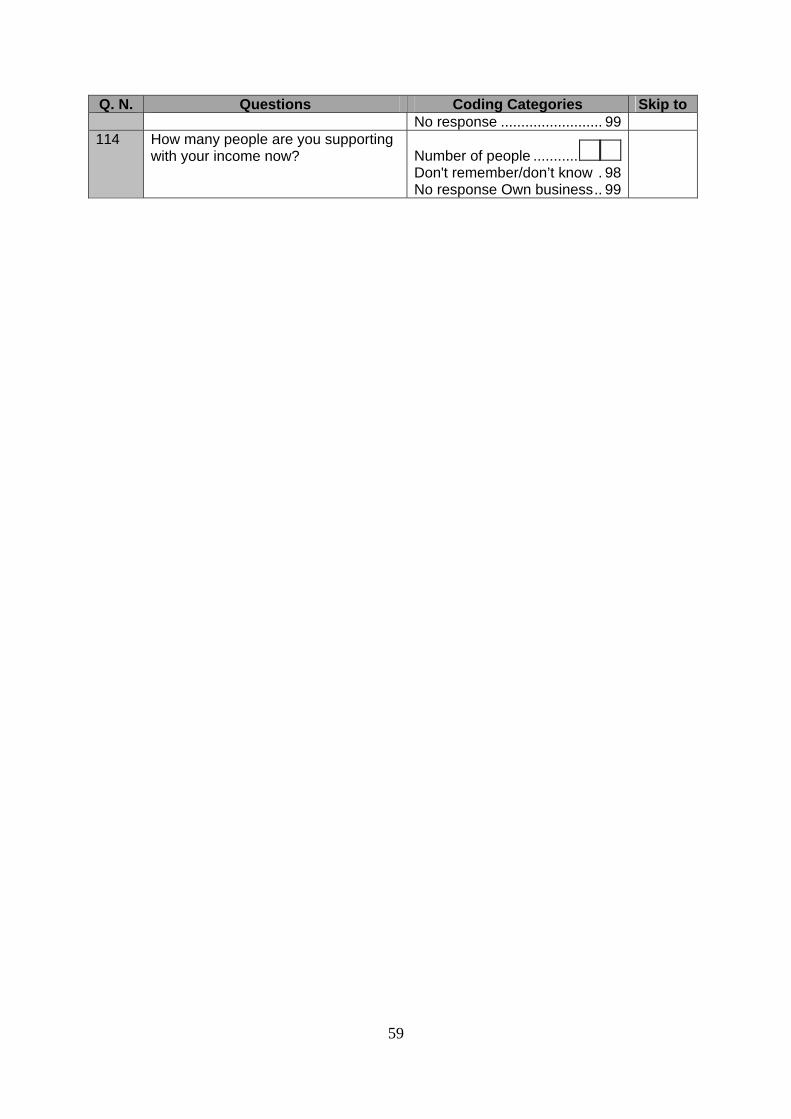
59
Q. N. Questions Coding Categories Skip to No response ......................... 99
114 How many people are you supporting with your income now?
Number of people ........... Don't remember/don’t know . 98 No response Own business.. 99
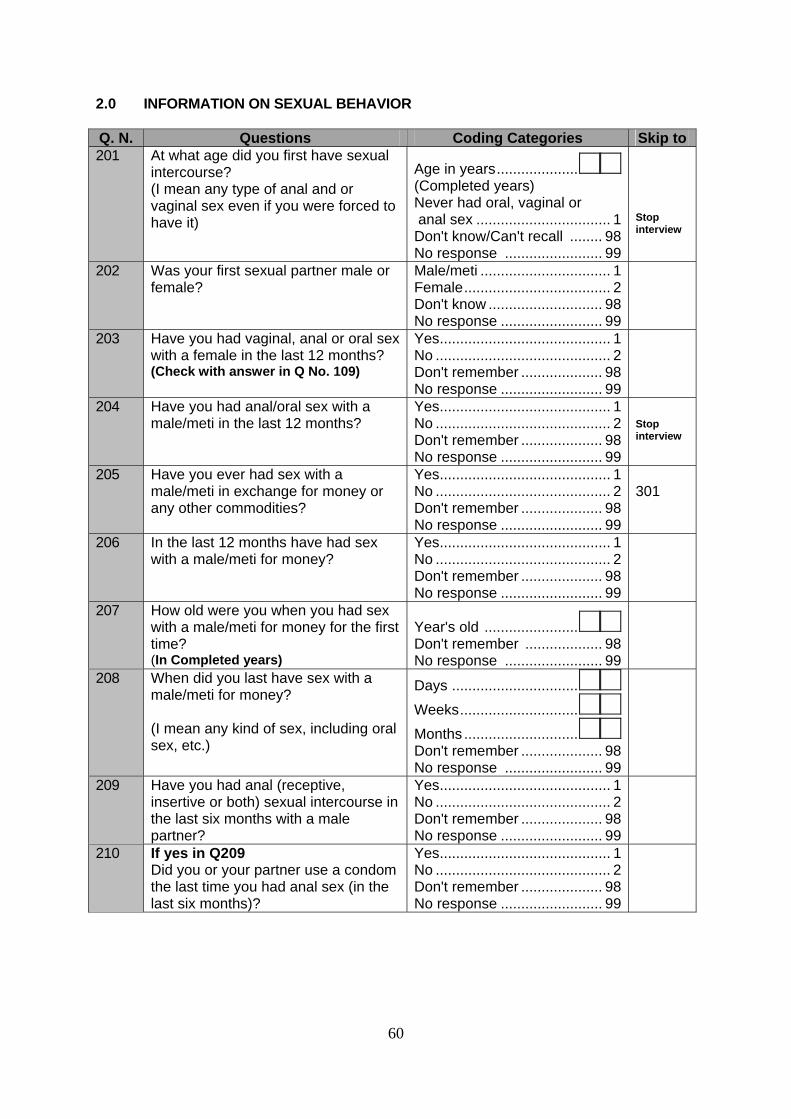
60
2.0 INFORMATION ON SEXUAL BEHAVIOR Q. N. Questions Coding Categories Skip to 201 At what age did you first have sexual
intercourse? (I mean any type of anal and or vaginal sex even if you were forced to have it)
Age in years.................... (Completed years) Never had oral, vaginal or anal sex ................................. 1 Don't know/Can't recall ........ 98 No response ........................ 99
Stop interview
202 Was your first sexual partner male or female?
Male/meti ................................ 1 Female.................................... 2 Don't know ............................ 98 No response ......................... 99
203 Have you had vaginal, anal or oral sex with a female in the last 12 months? (Check with answer in Q No. 109)
Yes.......................................... 1 No ........................................... 2 Don't remember .................... 98 No response ......................... 99
204 Have you had anal/oral sex with a male/meti in the last 12 months?
Yes.......................................... 1 No ........................................... 2 Don't remember .................... 98 No response ......................... 99
Stop interview
205 Have you ever had sex with a male/meti in exchange for money or any other commodities?
Yes.......................................... 1 No ........................................... 2 Don't remember .................... 98 No response ......................... 99
301
206 In the last 12 months have had sex with a male/meti for money?
Yes.......................................... 1 No ........................................... 2 Don't remember .................... 98 No response ......................... 99
207 How old were you when you had sex with a male/meti for money for the first time? (In Completed years)
Year's old ....................... Don't remember ................... 98 No response ........................ 99
208 When did you last have sex with a male/meti for money? (I mean any kind of sex, including oral sex, etc.)
Days ............................... Weeks............................. Months ............................ Don't remember .................... 98 No response ........................ 99
209 Have you had anal (receptive, insertive or both) sexual intercourse in the last six months with a male partner?
Yes.......................................... 1 No ........................................... 2 Don't remember .................... 98 No response ......................... 99
210 If yes in Q209 Did you or your partner use a condom the last time you had anal sex (in the last six months)?
Yes.......................................... 1 No ........................................... 2 Don't remember .................... 98 No response ......................... 99
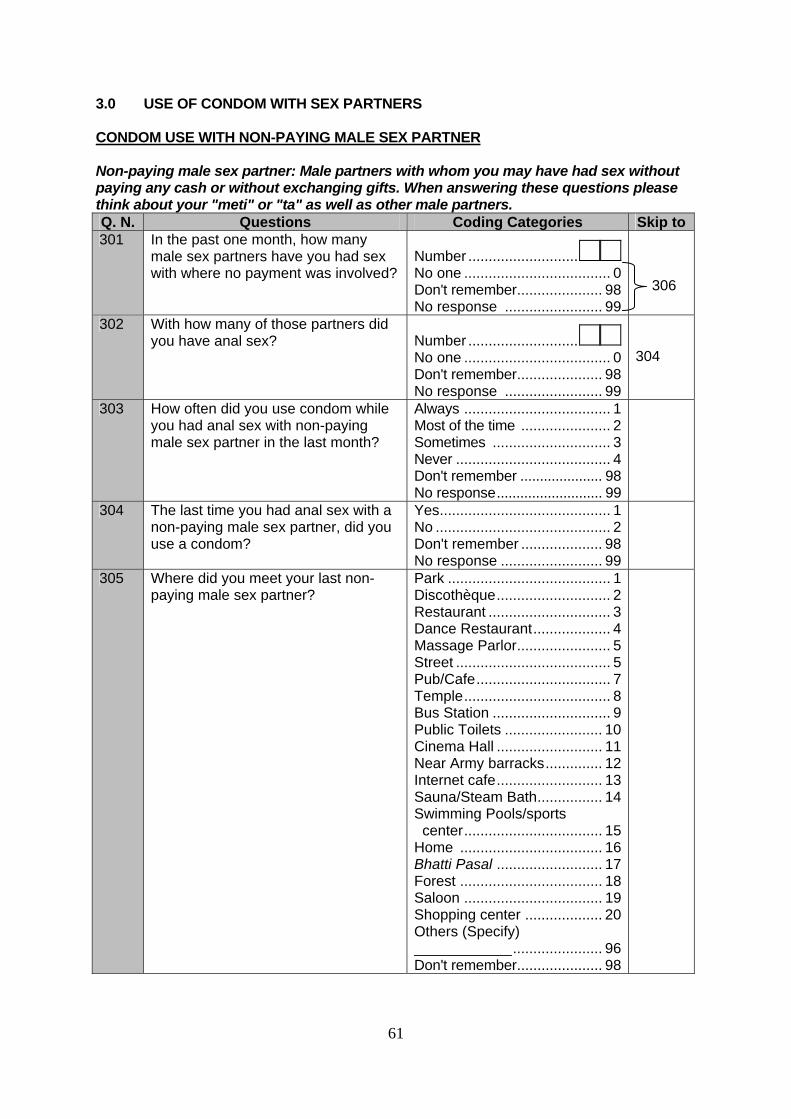
61
3.0 USE OF CONDOM WITH SEX PARTNERS CONDOM USE WITH NON-PAYING MALE SEX PARTNER Non-paying male sex partner: Male partners with whom you may have had sex without paying any cash or without exchanging gifts. When answering these questions please think about your "meti" or "ta" as well as other male partners. Q. N. Questions Coding Categories Skip to 301 In the past one month, how many
male sex partners have you had sex with where no payment was involved?
Number ........................... No one .................................... 0 Don't remember..................... 98 No response ........................ 99
306
302 With how many of those partners did you have anal sex?
Number ........................... No one .................................... 0 Don't remember..................... 98 No response ........................ 99
304
303 How often did you use condom while you had anal sex with non-paying male sex partner in the last month?
Always .................................... 1 Most of the time ...................... 2 Sometimes ............................. 3 Never ...................................... 4 Don't remember ..................... 98 No response........................... 99
304 The last time you had anal sex with a non-paying male sex partner, did you use a condom?
Yes.......................................... 1 No ........................................... 2 Don't remember .................... 98 No response ......................... 99
305 Where did you meet your last non-paying male sex partner?
Park ........................................ 1 Discothèque............................ 2 Restaurant .............................. 3 Dance Restaurant................... 4 Massage Parlor....................... 5 Street ...................................... 5 Pub/Cafe................................. 7 Temple.................................... 8 Bus Station ............................. 9 Public Toilets ........................ 10 Cinema Hall .......................... 11 Near Army barracks.............. 12 Internet cafe.......................... 13 Sauna/Steam Bath................ 14 Swimming Pools/sports center.................................. 15 Home ................................... 16 Bhatti Pasal .......................... 17 Forest ................................... 18 Saloon .................................. 19 Shopping center ................... 20 Others (Specify) ____________...................... 96 Don't remember..................... 98
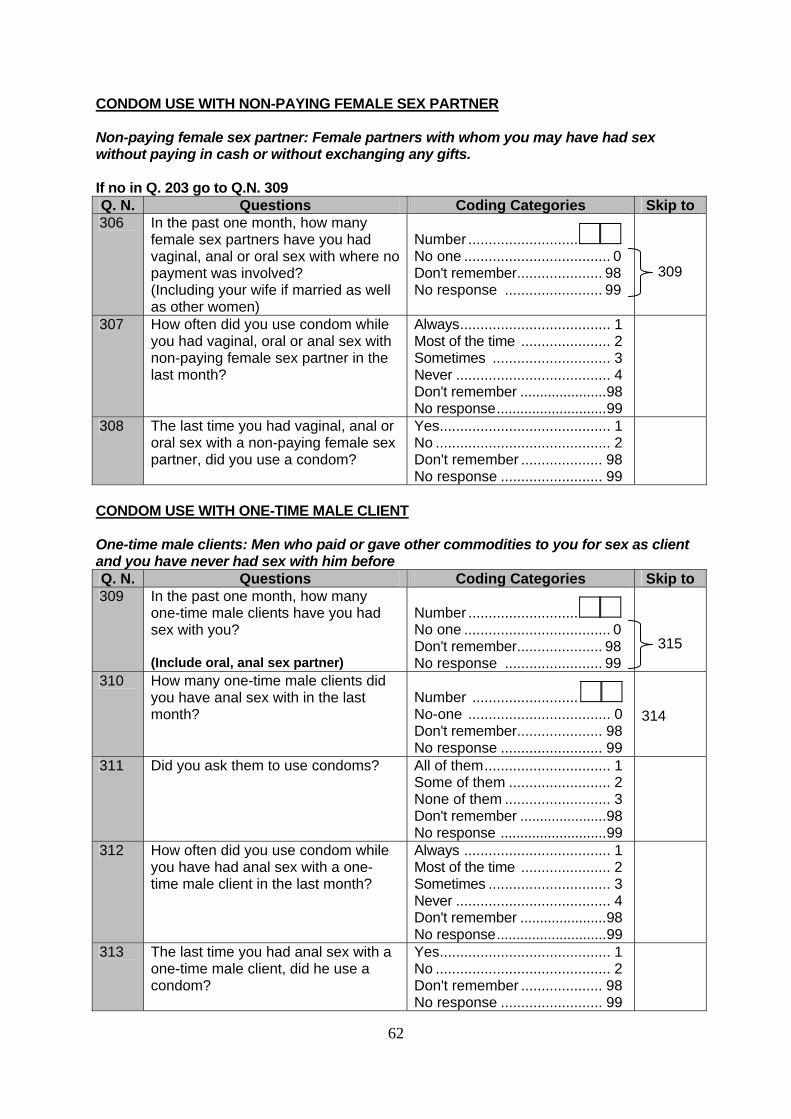
62
CONDOM USE WITH NON-PAYING FEMALE SEX PARTNER Non-paying female sex partner: Female partners with whom you may have had sex without paying in cash or without exchanging any gifts. If no in Q. 203 go to Q.N. 309 Q. N. Questions Coding Categories Skip to 306 In the past one month, how many
female sex partners have you had vaginal, anal or oral sex with where no payment was involved? (Including your wife if married as well as other women)
Number ........................... No one .................................... 0 Don't remember..................... 98 No response ........................ 99
309
307 How often did you use condom while you had vaginal, oral or anal sex with non-paying female sex partner in the last month?
Always..................................... 1 Most of the time ...................... 2 Sometimes ............................. 3 Never ...................................... 4 Don't remember ......................98 No response............................99
308 The last time you had vaginal, anal or oral sex with a non-paying female sex partner, did you use a condom?
Yes.......................................... 1 No ........................................... 2 Don't remember .................... 98 No response ......................... 99
CONDOM USE WITH ONE-TIME MALE CLIENT One-time male clients: Men who paid or gave other commodities to you for sex as client and you have never had sex with him before Q. N. Questions Coding Categories Skip to 309 In the past one month, how many
one-time male clients have you had sex with you? (Include oral, anal sex partner)
Number ........................... No one .................................... 0 Don't remember..................... 98 No response ........................ 99
315
310 How many one-time male clients did you have anal sex with in the last month?
Number .......................... No-one ................................... 0 Don't remember..................... 98 No response ......................... 99
314
311 Did you ask them to use condoms? All of them............................... 1 Some of them ......................... 2 None of them .......................... 3 Don't remember ......................98 No response ...........................99
312 How often did you use condom while you have had anal sex with a one-time male client in the last month?
Always .................................... 1 Most of the time ...................... 2 Sometimes .............................. 3 Never ...................................... 4 Don't remember ......................98 No response............................99
313 The last time you had anal sex with a one-time male client, did he use a condom?
Yes.......................................... 1 No ........................................... 2 Don't remember .................... 98 No response ......................... 99
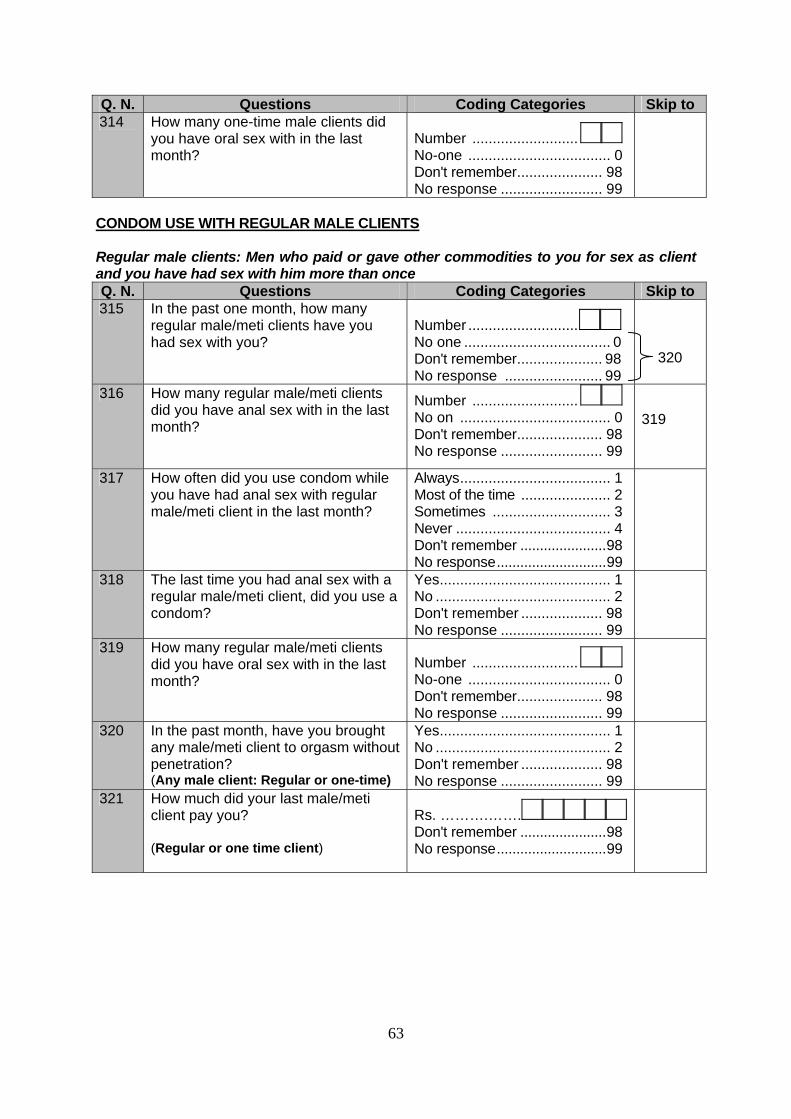
63
Q. N. Questions Coding Categories Skip to 314 How many one-time male clients did
you have oral sex with in the last month?
Number .......................... No-one ................................... 0 Don't remember..................... 98 No response ......................... 99
CONDOM USE WITH REGULAR MALE CLIENTS Regular male clients: Men who paid or gave other commodities to you for sex as client and you have had sex with him more than once Q. N. Questions Coding Categories Skip to 315 In the past one month, how many
regular male/meti clients have you had sex with you?
Number ........................... No one .................................... 0 Don't remember..................... 98 No response ........................ 99
320
316 How many regular male/meti clients did you have anal sex with in the last month?
Number .......................... No on ..................................... 0 Don't remember..................... 98 No response ......................... 99
319
317 How often did you use condom while you have had anal sex with regular male/meti client in the last month?
Always..................................... 1 Most of the time ...................... 2 Sometimes ............................. 3 Never ...................................... 4 Don't remember ......................98 No response............................99
318 The last time you had anal sex with a regular male/meti client, did you use a condom?
Yes.......................................... 1 No ........................................... 2 Don't remember .................... 98 No response ......................... 99
319 How many regular male/meti clients did you have oral sex with in the last month?
Number .......................... No-one ................................... 0 Don't remember..................... 98 No response ......................... 99
320 In the past month, have you brought any male/meti client to orgasm without penetration? (Any male client: Regular or one-time)
Yes.......................................... 1 No ........................................... 2 Don't remember .................... 98 No response ......................... 99
321 How much did your last male/meti client pay you? (Regular or one time client)
Rs. ……….……. Don't remember ......................98 No response............................99

64
Q. N. Questions Coding Categories Skip to 322 Where did you meet your last
male/meti client? (Regular or one time client)
Park ........................................ 1 Discotheque............................ 2 Restaurant .............................. 3 Dance Restaurant................... 4 Massage Parlor....................... 5 Street ...................................... 5 Pub/Cafe................................. 7 Temple.................................... 8 Bus Station ............................. 9 Public Toilets ........................ 10 Cinema Hall .......................... 11 Near Army barracks.............. 12 Internet /cafe ........................ 13 Sauna/Steam Bath................ 14 Swimming Pools ................... 15 Home ................................... 16 Bhatti Pasal .......................... 17 Forest ................................... 18 Saloon .................................. 19 Shopping center ................... 20 Others (Specify) _____________.................... 96 Don't remember..................... 98 No response ........................ 99
323 What are the most common occupations among your clients? (Do not read options. Probe for up to three)
Student ................................... 1 Police/Military.......................... 2 Civil servant ............................ 3 Businessman .......................... 4 Laborer ................................... 5 Unemployed............................ 6 Driver ...................................... 7 Private office staff ................... 8 Others (Specify) ____________.............................................. 96 Don't know...............................98 No response............................99
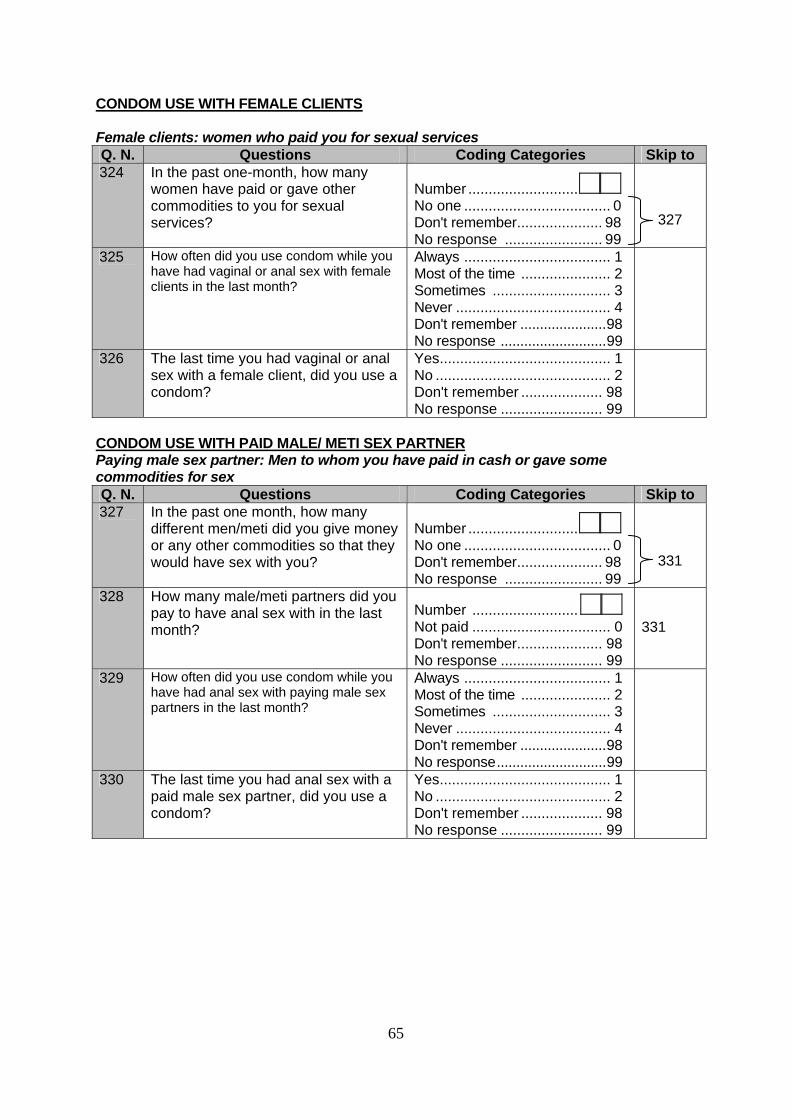
65
CONDOM USE WITH FEMALE CLIENTS Female clients: women who paid you for sexual services Q. N. Questions Coding Categories Skip to 324 In the past one-month, how many
women have paid or gave other commodities to you for sexual services?
Number ........................... No one .................................... 0 Don't remember..................... 98 No response ........................ 99
327
325 How often did you use condom while you have had vaginal or anal sex with female clients in the last month?
Always .................................... 1 Most of the time ...................... 2 Sometimes ............................. 3 Never ...................................... 4 Don't remember ......................98 No response ...........................99
326 The last time you had vaginal or anal sex with a female client, did you use a condom?
Yes.......................................... 1 No ........................................... 2 Don't remember .................... 98 No response ......................... 99
CONDOM USE WITH PAID MALE/ METI SEX PARTNER Paying male sex partner: Men to whom you have paid in cash or gave some commodities for sex Q. N. Questions Coding Categories Skip to 327 In the past one month, how many
different men/meti did you give money or any other commodities so that they would have sex with you?
Number ........................... No one .................................... 0 Don't remember..................... 98 No response ........................ 99
331
328 How many male/meti partners did you pay to have anal sex with in the last month?
Number .......................... Not paid .................................. 0 Don't remember..................... 98 No response ......................... 99
331
329 How often did you use condom while you have had anal sex with paying male sex partners in the last month?
Always .................................... 1 Most of the time ...................... 2 Sometimes ............................. 3 Never ...................................... 4 Don't remember ......................98 No response............................99
330 The last time you had anal sex with a paid male sex partner, did you use a condom?
Yes.......................................... 1 No ........................................... 2 Don't remember .................... 98 No response ......................... 99
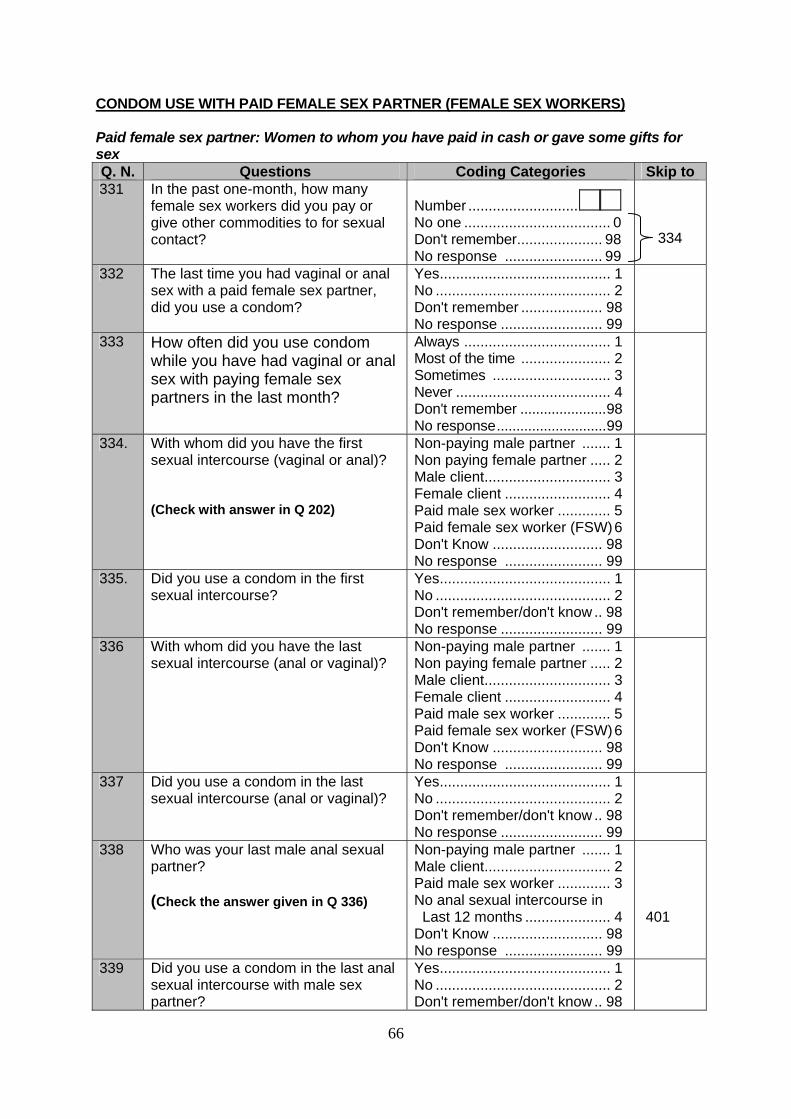
66
CONDOM USE WITH PAID FEMALE SEX PARTNER (FEMALE SEX WORKERS) Paid female sex partner: Women to whom you have paid in cash or gave some gifts for sex Q. N. Questions Coding Categories Skip to 331 In the past one-month, how many
female sex workers did you pay or give other commodities to for sexual contact?
Number ........................... No one .................................... 0 Don't remember..................... 98 No response ........................ 99
334
332 The last time you had vaginal or anal sex with a paid female sex partner, did you use a condom?
Yes.......................................... 1 No ........................................... 2 Don't remember .................... 98 No response ......................... 99
333 How often did you use condom while you have had vaginal or anal sex with paying female sex partners in the last month?
Always .................................... 1 Most of the time ...................... 2 Sometimes ............................. 3 Never ...................................... 4 Don't remember ......................98 No response............................99
334. With whom did you have the first sexual intercourse (vaginal or anal)? (Check with answer in Q 202)
Non-paying male partner ....... 1 Non paying female partner ..... 2 Male client............................... 3 Female client .......................... 4 Paid male sex worker ............. 5 Paid female sex worker (FSW)6 Don't Know ........................... 98 No response ........................ 99
335. Did you use a condom in the first sexual intercourse?
Yes.......................................... 1 No ........................................... 2 Don't remember/don't know .. 98 No response ......................... 99
336 With whom did you have the last sexual intercourse (anal or vaginal)?
Non-paying male partner ....... 1 Non paying female partner ..... 2 Male client............................... 3 Female client .......................... 4 Paid male sex worker ............. 5 Paid female sex worker (FSW)6 Don't Know ........................... 98 No response ........................ 99
337 Did you use a condom in the last sexual intercourse (anal or vaginal)?
Yes.......................................... 1 No ........................................... 2 Don't remember/don't know .. 98 No response ......................... 99
338 Who was your last male anal sexual partner? (Check the answer given in Q 336)
Non-paying male partner ....... 1 Male client............................... 2 Paid male sex worker ............. 3 No anal sexual intercourse in Last 12 months ..................... 4 Don't Know ........................... 98 No response ........................ 99
401
339 Did you use a condom in the last anal sexual intercourse with male sex partner?
Yes.......................................... 1 No ........................................... 2 Don't remember/don't know .. 98
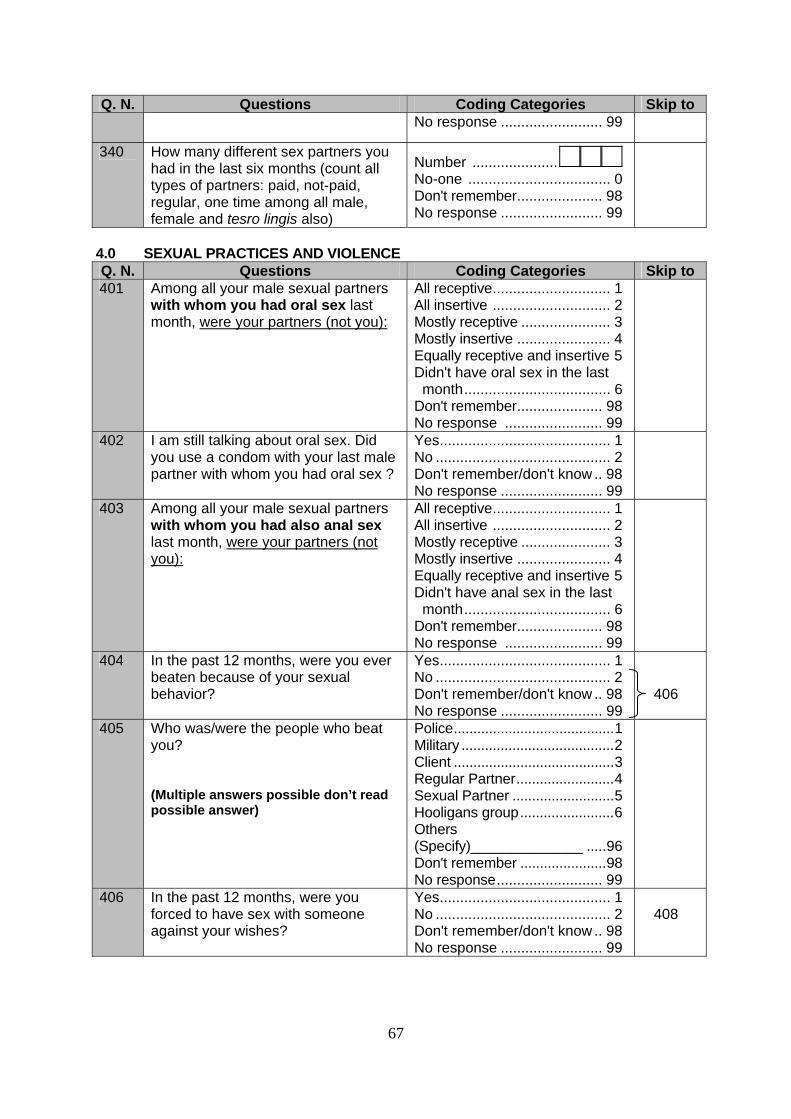
67
Q. N. Questions Coding Categories Skip to No response ......................... 99
340 How many different sex partners you had in the last six months (count all types of partners: paid, not-paid, regular, one time among all male, female and tesro lingis also)
Number ..................... No-one ................................... 0 Don't remember..................... 98 No response ......................... 99
4.0 SEXUAL PRACTICES AND VIOLENCE Q. N. Questions Coding Categories Skip to 401 Among all your male sexual partners
with whom you had oral sex last month, were your partners (not you):
All receptive............................. 1 All insertive ............................. 2 Mostly receptive ...................... 3 Mostly insertive ....................... 4 Equally receptive and insertive 5 Didn't have oral sex in the last month.................................... 6 Don't remember..................... 98 No response ........................ 99
402 I am still talking about oral sex. Did you use a condom with your last male partner with whom you had oral sex ?
Yes.......................................... 1 No ........................................... 2 Don't remember/don't know .. 98 No response ......................... 99
403 Among all your male sexual partners with whom you had also anal sex last month, were your partners (not you):
All receptive............................. 1 All insertive ............................. 2 Mostly receptive ...................... 3 Mostly insertive ....................... 4 Equally receptive and insertive 5 Didn't have anal sex in the last month.................................... 6 Don't remember..................... 98 No response ........................ 99
404 In the past 12 months, were you ever beaten because of your sexual behavior?
Yes.......................................... 1 No ........................................... 2 Don't remember/don't know .. 98 No response ......................... 99
406
405 Who was/were the people who beat you? (Multiple answers possible don’t read possible answer)
Police.........................................1 Military .......................................2 Client .........................................3 Regular Partner.........................4 Sexual Partner ..........................5 Hooligans group........................6 Others (Specify)______________ .....96 Don't remember ......................98 No response.......................... 99
406 In the past 12 months, were you forced to have sex with someone against your wishes?
Yes.......................................... 1 No ........................................... 2 Don't remember/don't know .. 98 No response ......................... 99
408

68
Q. N. Questions Coding Categories Skip to 407 Who were these people who forced
you to have sex against your will? (Multiple answer possible)
Police.........................................1 Military .......................................2 Client .........................................3 Regular Partner.........................4 Sexual Partner ..........................5 Hooligans group........................6 Others (Specify)______________ .....96 Don't remember ......................98 No response............................99
408 In the past 12 months, have you been cheated /threatened because of your sexual behavior?
Yes.......................................... 1 No ........................................... 2 Don't remember ......................98 No response............................99
409 In the past 12 months, have you faced any kind of discrimination in your job or every day activities because of your sexual behavior?
Yes.......................................... 1 No ........................................... 2 Don't remember .................... 98 No response ......................... 99
410
Ask Metis only: Have you ever faced any problems because of your sexual identity?
Yes.......................................... 1 No ........................................... 2 Don't remember .................... 98 No response ......................... 99
5.0 ACCESSIBILITY OF CONDOM AND LUBRICANT Q. N. Questions Coding Categories Skip to 501 SHOW CONDOM
Can you tell me what this is? Can identify as condom .......... 1 Cannot identify as condom .... 2 No response ......................... 99
502 Do you have condoms with you at this moment? Please show me
Can show condoms ................ 1 Cannot show a condom.......... 2 No response ......................... 99
502.1 In the last 12 months have you been given condoms? (e.g. through an outreach service, drop-in centre or sexual health clinic)
Yes.......................................... 1 No ........................................... 2 Don't remember .................... 98 No response ......................... 99
503 Last time, from where did you get condom? (Multiple answers. DO NOT READ the possible answers)
Shop........................................ 1 Pharmacy................................ 2 Health facility ........................... 3 Bar/Guest House/Hotel............ 4 Friends .................................... 5 Clients ..................................... 6 BDS drop-in center .................. 7 BDS field workers .................... 8 Parchaya Samaj ...................... 9 Cruiseaids ............................ 10 Never received condom ........ 11 Other (Specify) ______________.................................................96 Don't know ............................ 98 No response ............................99
505 505

69
Q. N. Questions Coding Categories Skip to 504 How much did you pay for one piece
of condom the last time you got one?
NRS ............................... . Free ........................................ 1 Don't know ............................ 98 No response ......................... 99
505 Can you obtain a condom every time you need it ?
Yes.......................................... 1 No ........................................... 2 Don't need one........................ 3 Don't remember .................... 98 No response ......................... 99
507 507
506 Why can't you get a condom every time you need it? (Multiple answers. DO NOT READ the possible answers)
Cost too much ......................... 1 Shop/pharmacy too far away ... 2 Shops/pharmacies closed........ 3 Shy to buy condom.................. 4 Don't know where to obtain...... 5 Don't want to carry condom ..... 6 Other (Specify) ______________.................................................96 Don't know ............................ 98 No response.......................... 99
507 Which is your most preferred condom brand?
Dhal......................................... 1 Panther ................................... 2 Number one ............................ 3 Jodi ......................................... 4 Kamasutra............................... 5 Other (Specify) ______________.................................................96 Don't know ............................ 98 No response.......................... 99
508 Some people use a lubricant product made especially for using with condom. Have you heard of such a product?
Yes.......................................... 1 No ........................................... 2 Don't remember .................... 98 No response ......................... 99
513 513
509 Could you tell me the brand name of such a product?
Yes, (Name)_________________.. 1 No ........................................... 2 Don't remember ......................98 No response............................99
510 In the past 30 days, how often have you used a special lubricant for condoms together with a condom during anal sex?
Always .................................... 1 Most of the time ...................... 2 Sometimes ............................. 3 Never ...................................... 4 Don't remember ......................98 No response............................99
512
511 Why do you sometimes not use or never use such special condom lubricant?
Cost too much ......................... 1 Shy to buy lubricant ................. 2 Don't know where to obtain...... 3 I do not need to use................. 4 I use other cream..................... 5 Not aware of such products ..... 6 Other (Specify) ______________.................................................96

70
Q. N. Questions Coding Categories Skip to Don't remember .................... 98 No response ............................99
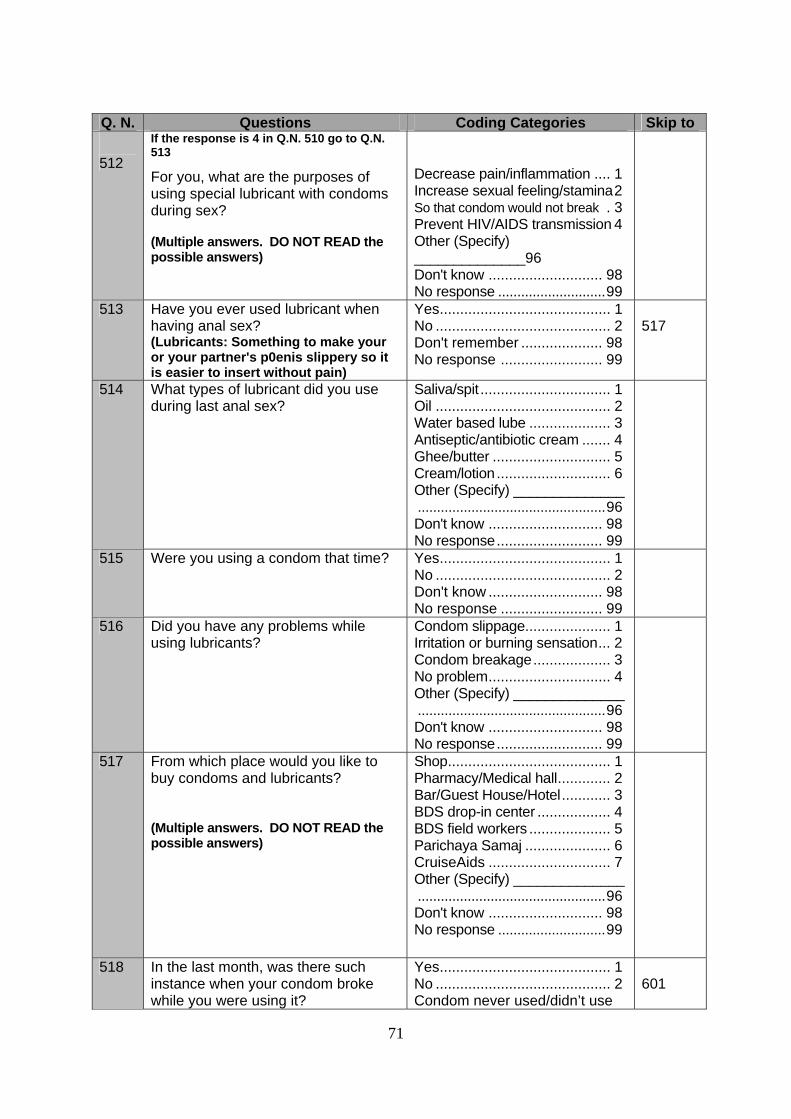
71
Q. N. Questions Coding Categories Skip to 512
If the response is 4 in Q.N. 510 go to Q.N. 513
For you, what are the purposes of using special lubricant with condoms during sex? (Multiple answers. DO NOT READ the possible answers)
Decrease pain/inflammation .... 1 Increase sexual feeling/stamina2 So that condom would not break . 3 Prevent HIV/AIDS transmission 4 Other (Specify) ______________96 Don't know ............................ 98 No response ............................99
513 Have you ever used lubricant when having anal sex? (Lubricants: Something to make your or your partner's p0enis slippery so it is easier to insert without pain)
Yes.......................................... 1 No ........................................... 2 Don't remember .................... 98 No response ......................... 99
517
514 What types of lubricant did you use during last anal sex?
Saliva/spit ................................ 1 Oil ........................................... 2 Water based lube .................... 3 Antiseptic/antibiotic cream ....... 4 Ghee/butter ............................. 5 Cream/lotion ............................ 6 Other (Specify) ______________.................................................96 Don't know ............................ 98 No response.......................... 99
515 Were you using a condom that time? Yes.......................................... 1 No ........................................... 2 Don't know ............................ 98 No response ......................... 99
516 Did you have any problems while using lubricants?
Condom slippage..................... 1 Irritation or burning sensation... 2 Condom breakage................... 3 No problem.............................. 4 Other (Specify) ______________.................................................96 Don't know ............................ 98 No response.......................... 99
517 From which place would you like to buy condoms and lubricants? (Multiple answers. DO NOT READ the possible answers)
Shop........................................ 1 Pharmacy/Medical hall............. 2 Bar/Guest House/Hotel............ 3 BDS drop-in center .................. 4 BDS field workers .................... 5 Parichaya Samaj ..................... 6 CruiseAids .............................. 7 Other (Specify) ______________.................................................96 Don't know ............................ 98 No response ............................99
518 In the last month, was there such instance when your condom broke while you were using it?
Yes.......................................... 1 No ........................................... 2 Condom never used/didn’t use
601

72
Q. N. Questions Coding Categories Skip to last month ............................. 3 Don't know ............................ 98 No response ......................... 99
601
519 If you have experienced condom breakage, what do you think caused such breakage?
Use of oil based lubricant......... 1 Improper use of condom.......... 2 Other (Specify) ______________.................................................96 Don't know ............................ 98 No response ......................... 99
6.0 USE OF ALCOHOL AND DRUGS Q. N. Questions Coding Categories Skip to 601 Have you ever had any drinks
containing alcohol? Yes.......................................... 1 No ........................................... 2 No response ......................... 99
604
601.1 During the last 4 weeks how often have you had drinks containing alcohol?
Every day................................ 1 3-4 days a week...................... 2 At least once a week............... 3 Did not drink alcohol in the last week .................................... 4 Don't know / remember ........ 98 No response ......................... 99
602 Normally what type of drinks do you take?
Local raksi ............................... 1 Beer ........................................ 2 Jand ....................................... 3 Whisky .................................... 4 Other (Specify) ______________.................................................96 Don't know / remember ........ 98 No response ......................... 99
603 Last time you had sex, how much alcohol did you drink? (Only one response)
A lot (more than 6 small beers or 3 glass of local raw whisky) ................................. 1 Some (3-4 small beers or 1-3 glasses of wine) ................... 2 A little (1-3 small beers or 1 glass of wine) ......................... 3 No alcohol............................... 4 Don’t know / remember......... 98 No response ......................... 99
604 Some people have tried different types of drugs. Which of the following have you ever tried in the last 12 months? READ OUT ANSWERS
Yes No Ganja ............................ 1 2 Chares .......................... 1 2 Tablets .......................... 1 2 Glue/dendrite ................ 1 2 Heroine ......................... 1 2 Other (Specify)___________ 96
605 Some people try injecting drugs using a syringe. Have you injected such drugs in the last 12 months
Yes.......................................... 1 No ........................................... 2 Don't remember/don't know .. 98 No response ......................... 99
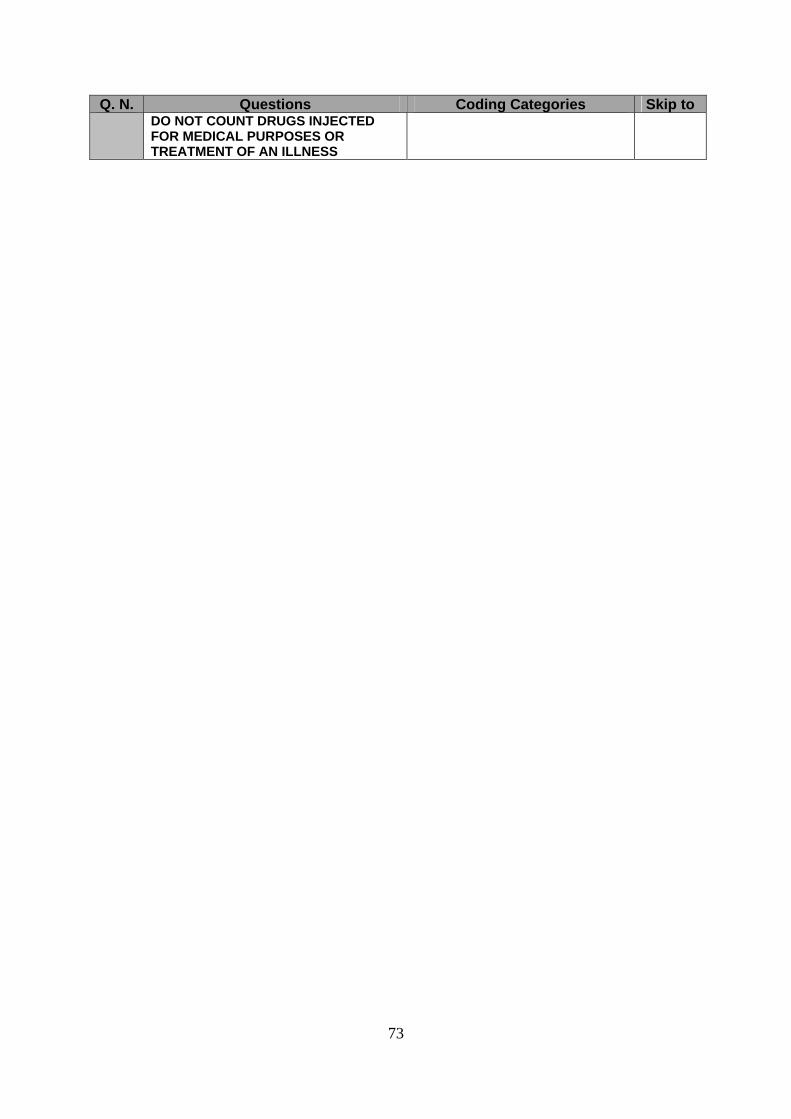
73
Q. N. Questions Coding Categories Skip to DO NOT COUNT DRUGS INJECTED FOR MEDICAL PURPOSES OR TREATMENT OF AN ILLNESS
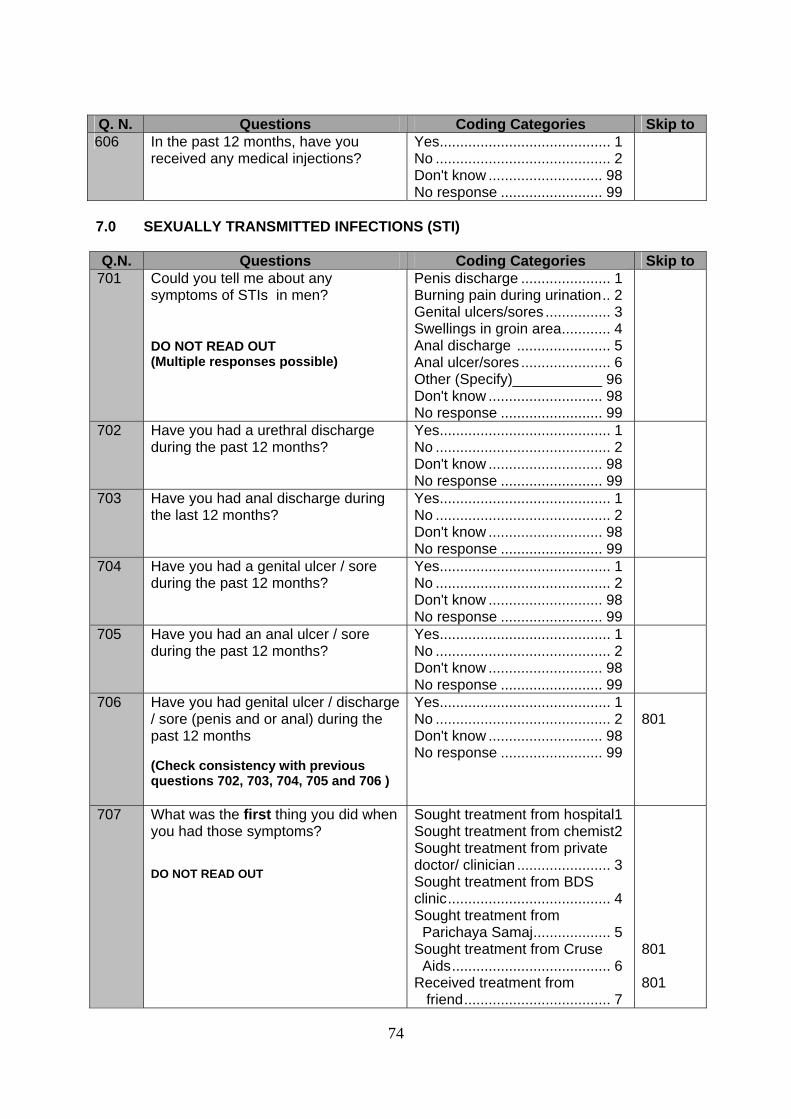
74
Q. N. Questions Coding Categories Skip to 606 In the past 12 months, have you
received any medical injections? Yes.......................................... 1 No ........................................... 2 Don't know ............................ 98 No response ......................... 99
7.0 SEXUALLY TRANSMITTED INFECTIONS (STI) Q.N. Questions Coding Categories Skip to
701 Could you tell me about any symptoms of STIs in men? DO NOT READ OUT (Multiple responses possible)
Penis discharge ...................... 1 Burning pain during urination.. 2 Genital ulcers/sores ................ 3 Swellings in groin area............ 4 Anal discharge ....................... 5 Anal ulcer/sores ...................... 6 Other (Specify)___________ 96 Don't know ............................ 98 No response ......................... 99
702 Have you had a urethral discharge during the past 12 months?
Yes.......................................... 1 No ........................................... 2 Don't know ............................ 98 No response ......................... 99
703 Have you had anal discharge during the last 12 months?
Yes.......................................... 1 No ........................................... 2 Don't know ............................ 98 No response ......................... 99
704 Have you had a genital ulcer / sore during the past 12 months?
Yes.......................................... 1 No ........................................... 2 Don't know ............................ 98 No response ......................... 99
705 Have you had an anal ulcer / sore during the past 12 months?
Yes.......................................... 1 No ........................................... 2 Don't know ............................ 98 No response ......................... 99
706 Have you had genital ulcer / discharge / sore (penis and or anal) during the past 12 months (Check consistency with previous questions 702, 703, 704, 705 and 706 )
Yes.......................................... 1 No ........................................... 2 Don't know ............................ 98 No response ......................... 99
801
707 What was the first thing you did when you had those symptoms? DO NOT READ OUT
Sought treatment from hospital1 Sought treatment from chemist2 Sought treatment from private doctor/ clinician ....................... 3 Sought treatment from BDS clinic........................................ 4 Sought treatment from Parichaya Samaj................... 5 Sought treatment from Cruse Aids....................................... 6 Received treatment from friend.................................... 7
801 801
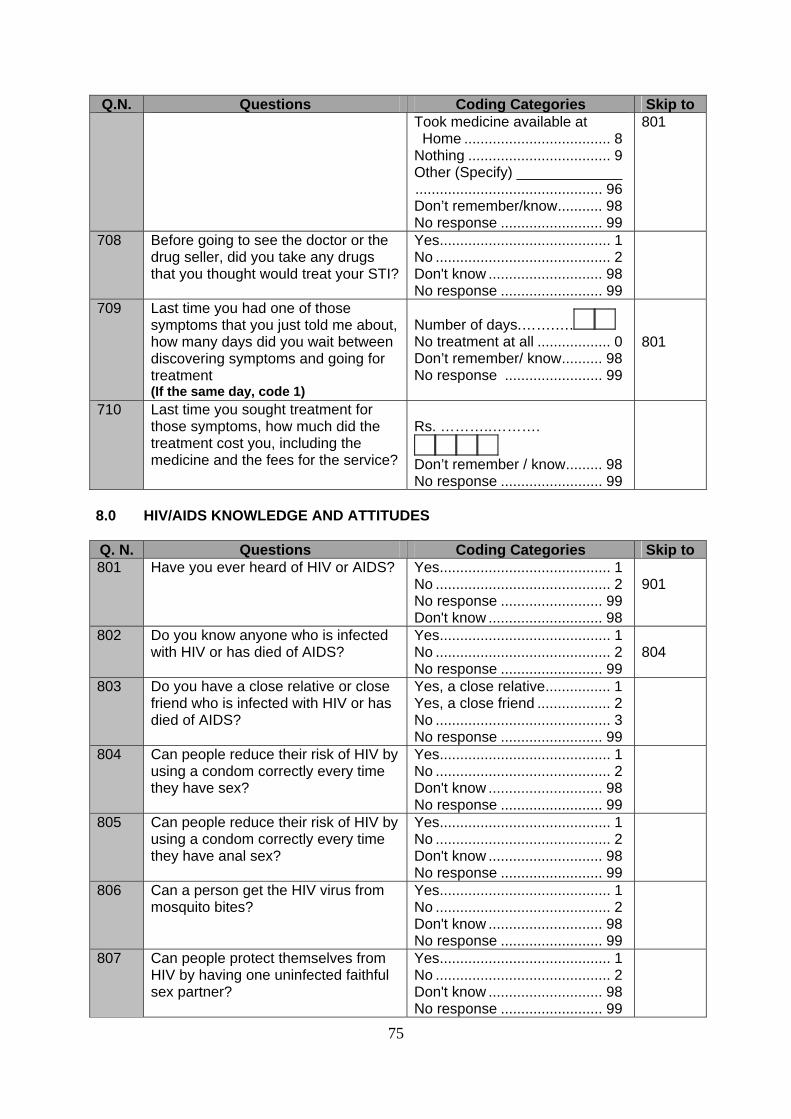
75
Q.N. Questions Coding Categories Skip to Took medicine available at Home .................................... 8 Nothing ................................... 9 Other (Specify) _____________.............................................. 96 Don’t remember/know........... 98 No response ......................... 99
801
708 Before going to see the doctor or the drug seller, did you take any drugs that you thought would treat your STI?
Yes.......................................... 1 No ........................................... 2 Don't know ............................ 98 No response ......................... 99
709 Last time you had one of those symptoms that you just told me about, how many days did you wait between discovering symptoms and going for treatment (If the same day, code 1)
Number of days.…….…. No treatment at all .................. 0 Don’t remember/ know.......... 98 No response ........................ 99
801
710 Last time you sought treatment for those symptoms, how much did the treatment cost you, including the medicine and the fees for the service?
Rs. ………..……….
Don’t remember / know......... 98 No response ......................... 99
8.0 HIV/AIDS KNOWLEDGE AND ATTITUDES Q. N. Questions Coding Categories Skip to 801 Have you ever heard of HIV or AIDS?
Yes.......................................... 1 No ........................................... 2 No response ......................... 99 Don't know ............................ 98
901
802 Do you know anyone who is infected with HIV or has died of AIDS?
Yes.......................................... 1 No ........................................... 2 No response ......................... 99
804
803 Do you have a close relative or close friend who is infected with HIV or has died of AIDS?
Yes, a close relative................ 1 Yes, a close friend .................. 2 No ........................................... 3 No response ......................... 99
804 Can people reduce their risk of HIV by using a condom correctly every time they have sex?
Yes.......................................... 1 No ........................................... 2 Don't know ............................ 98 No response ......................... 99
805 Can people reduce their risk of HIV by using a condom correctly every time they have anal sex?
Yes.......................................... 1 No ........................................... 2 Don't know ............................ 98 No response ......................... 99
806 Can a person get the HIV virus from mosquito bites?
Yes.......................................... 1 No ........................................... 2 Don't know ............................ 98 No response ......................... 99
807 Can people protect themselves from HIV by having one uninfected faithful sex partner?
Yes.......................................... 1 No ........................................... 2 Don't know ............................ 98 No response ......................... 99
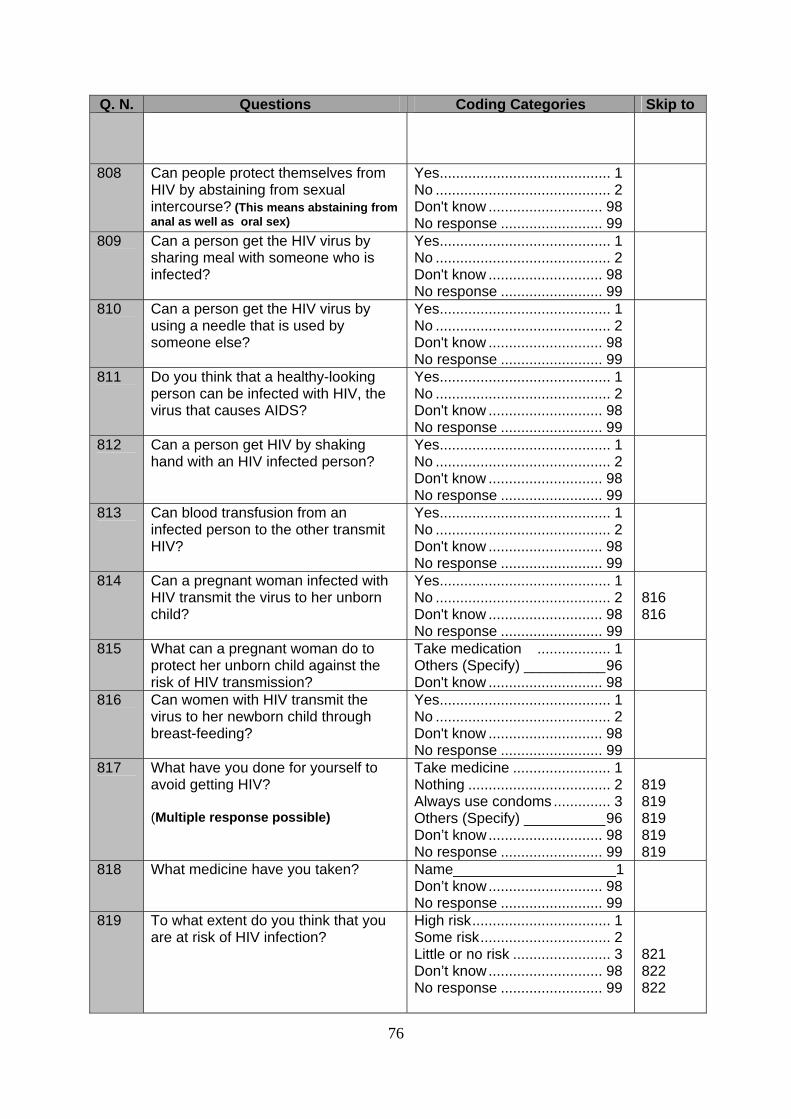
76
Q. N. Questions Coding Categories Skip to
808 Can people protect themselves from HIV by abstaining from sexual intercourse? (This means abstaining from anal as well as oral sex)
Yes.......................................... 1 No ........................................... 2 Don't know ............................ 98 No response ......................... 99
809 Can a person get the HIV virus by sharing meal with someone who is infected?
Yes.......................................... 1 No ........................................... 2 Don't know ............................ 98 No response ......................... 99
810 Can a person get the HIV virus by using a needle that is used by someone else?
Yes.......................................... 1 No ........................................... 2 Don't know ............................ 98 No response ......................... 99
811 Do you think that a healthy-looking person can be infected with HIV, the virus that causes AIDS?
Yes.......................................... 1 No ........................................... 2 Don't know ............................ 98 No response ......................... 99
812 Can a person get HIV by shaking hand with an HIV infected person?
Yes.......................................... 1 No ........................................... 2 Don't know ............................ 98 No response ......................... 99
813 Can blood transfusion from an infected person to the other transmit HIV?
Yes.......................................... 1 No ........................................... 2 Don't know ............................ 98 No response ......................... 99
814 Can a pregnant woman infected with HIV transmit the virus to her unborn child?
Yes.......................................... 1 No ........................................... 2 Don't know ............................ 98 No response ......................... 99
816 816
815 What can a pregnant woman do to protect her unborn child against the risk of HIV transmission?
Take medication .................. 1 Others (Specify) __________96 Don't know ............................ 98
816 Can women with HIV transmit the virus to her newborn child through breast-feeding?
Yes.......................................... 1 No ........................................... 2 Don't know ............................ 98 No response ......................... 99
817 What have you done for yourself to avoid getting HIV? (Multiple response possible)
Take medicine ........................ 1 Nothing ................................... 2 Always use condoms .............. 3 Others (Specify) __________96 Don’t know............................ 98 No response ......................... 99
819 819 819 819 819
818 What medicine have you taken?
Name____________________1 Don’t know............................ 98 No response ......................... 99
819 To what extent do you think that you are at risk of HIV infection?
High risk.................................. 1 Some risk................................ 2 Little or no risk ........................ 3 Don’t know............................ 98 No response ......................... 99
821 822 822
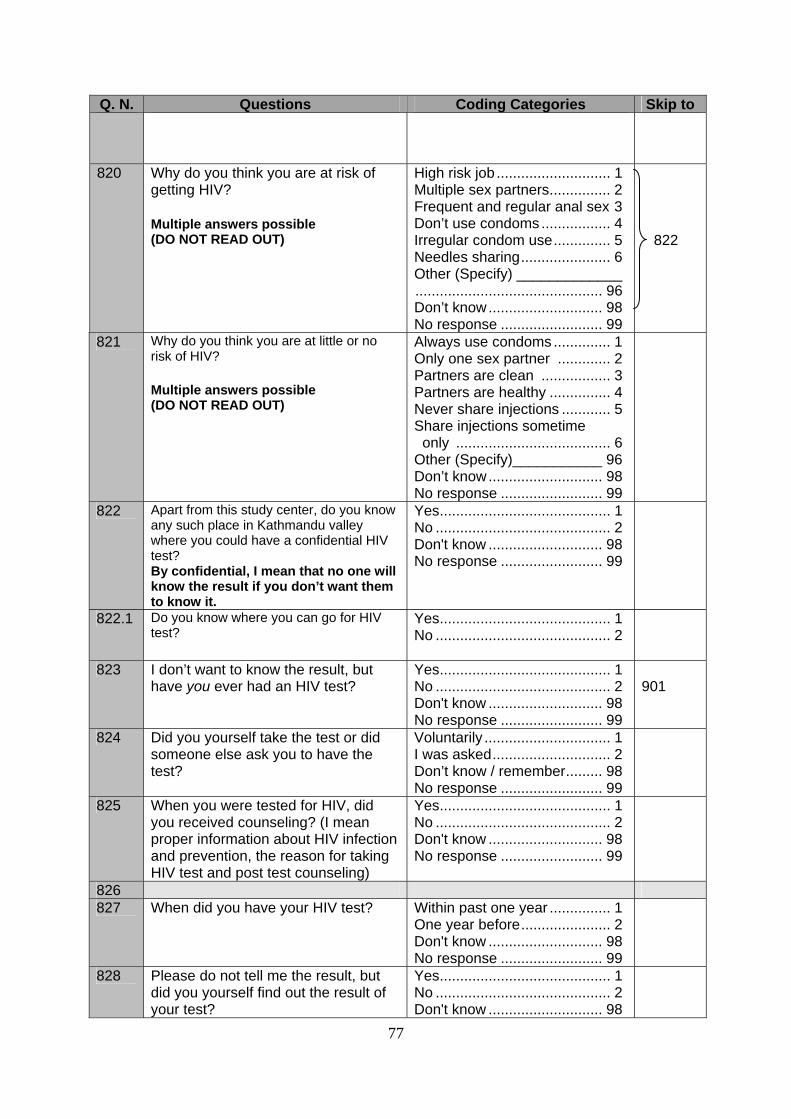
77
Q. N. Questions Coding Categories Skip to
820 Why do you think you are at risk of getting HIV? Multiple answers possible (DO NOT READ OUT)
High risk job ............................ 1 Multiple sex partners............... 2 Frequent and regular anal sex 3 Don’t use condoms ................. 4 Irregular condom use.............. 5 Needles sharing...................... 6 Other (Specify) _____________.............................................. 96 Don’t know............................ 98 No response ......................... 99
822
821 Why do you think you are at little or no risk of HIV? Multiple answers possible (DO NOT READ OUT)
Always use condoms .............. 1 Only one sex partner ............. 2 Partners are clean ................. 3 Partners are healthy ............... 4 Never share injections ............ 5 Share injections sometime only ...................................... 6 Other (Specify)___________ 96 Don’t know............................ 98 No response ......................... 99
822 Apart from this study center, do you know any such place in Kathmandu valley where you could have a confidential HIV test? By confidential, I mean that no one will know the result if you don’t want them to know it.
Yes.......................................... 1 No ........................................... 2 Don't know ............................ 98 No response ......................... 99
822.1 Do you know where you can go for HIV test?
Yes.......................................... 1 No ........................................... 2
823 I don’t want to know the result, but have you ever had an HIV test?
Yes.......................................... 1 No ........................................... 2 Don't know ............................ 98 No response ......................... 99
901
824 Did you yourself take the test or did someone else ask you to have the test?
Voluntarily ............................... 1 I was asked............................. 2 Don’t know / remember......... 98 No response ......................... 99
825 When you were tested for HIV, did you received counseling? (I mean proper information about HIV infection and prevention, the reason for taking HIV test and post test counseling)
Yes.......................................... 1 No ........................................... 2 Don't know ............................ 98 No response ......................... 99
826 827 When did you have your HIV test? Within past one year ............... 1
One year before...................... 2 Don't know ............................ 98 No response ......................... 99
828 Please do not tell me the result, but did you yourself find out the result of your test?
Yes.......................................... 1 No ........................................... 2 Don't know ............................ 98
78
Q. N. Questions Coding Categories Skip to No response ......................... 99
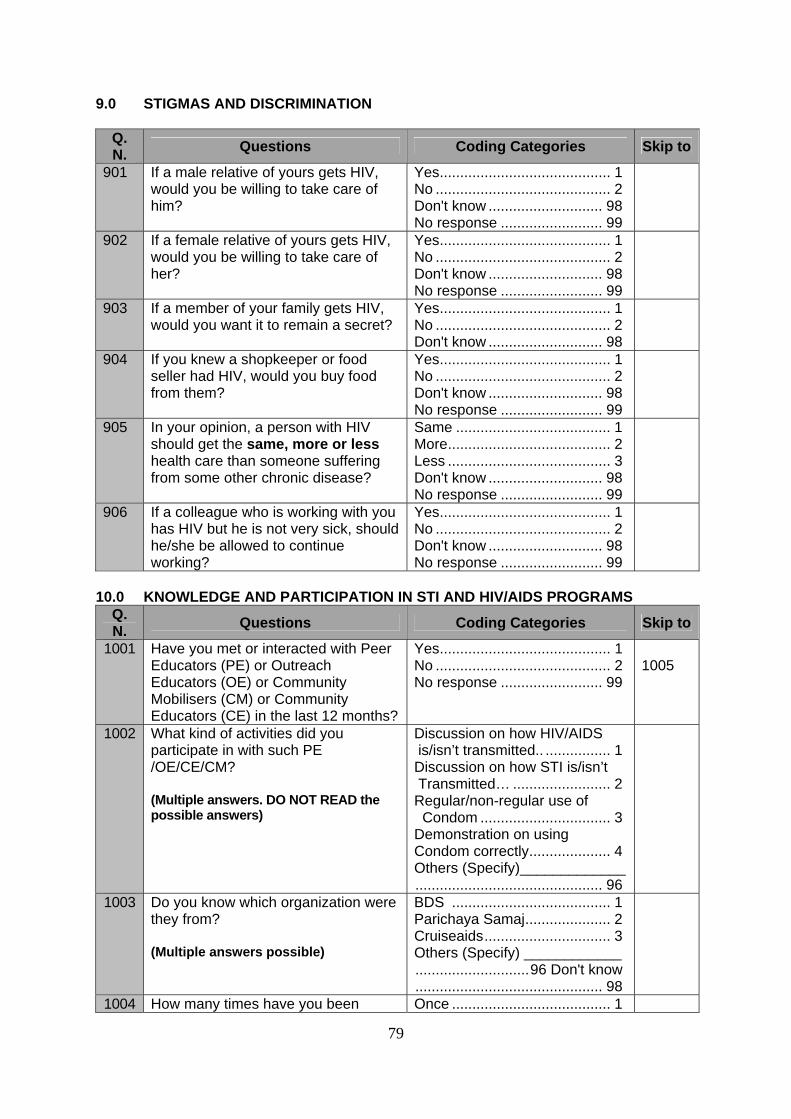
79
9.0 STIGMAS AND DISCRIMINATION
Q. N. Questions Coding Categories Skip to
901 If a male relative of yours gets HIV, would you be willing to take care of him?
Yes.......................................... 1 No ........................................... 2 Don't know ............................ 98 No response ......................... 99
902 If a female relative of yours gets HIV, would you be willing to take care of her?
Yes.......................................... 1 No ........................................... 2 Don't know ............................ 98 No response ......................... 99
903 If a member of your family gets HIV, would you want it to remain a secret?
Yes.......................................... 1 No ........................................... 2 Don't know ............................ 98
904 If you knew a shopkeeper or food seller had HIV, would you buy food from them?
Yes.......................................... 1 No ........................................... 2 Don't know ............................ 98 No response ......................... 99
905 In your opinion, a person with HIV should get the same, more or less health care than someone suffering from some other chronic disease?
Same ...................................... 1 More........................................ 2 Less ........................................ 3 Don't know ............................ 98 No response ......................... 99
906 If a colleague who is working with you has HIV but he is not very sick, should he/she be allowed to continue working?
Yes.......................................... 1 No ........................................... 2 Don't know ............................ 98 No response ......................... 99
10.0 KNOWLEDGE AND PARTICIPATION IN STI AND HIV/AIDS PROGRAMS
Q. N. Questions Coding Categories Skip to
1001 Have you met or interacted with Peer Educators (PE) or Outreach Educators (OE) or Community Mobilisers (CM) or Community Educators (CE) in the last 12 months?
Yes.......................................... 1 No ........................................... 2 No response ......................... 99
1005
1002 What kind of activities did you participate in with such PE /OE/CE/CM? (Multiple answers. DO NOT READ the possible answers)
Discussion on how HIV/AIDS is/isn’t transmitted.. ................ 1 Discussion on how STI is/isn’t Transmitted… ........................ 2 Regular/non-regular use of Condom ................................ 3 Demonstration on using Condom correctly.................... 4 Others (Specify)_____________.............................................. 96
1003 Do you know which organization were they from? (Multiple answers possible)
BDS ....................................... 1 Parichaya Samaj..................... 2 Cruiseaids............................... 3 Others (Specify) ____________............................96 Don't know .............................................. 98
1004 How many times have you been Once ....................................... 1

80
Q. N. Questions Coding Categories Skip to
visited by PE, OE, CM and/or CE in the last 12 months?
2-3 times ................................. 2 4-6 times ................................ 3 7-12 times ............................... 4 More than 12 times ................. 5
1005 Have you visited or been to any out reach center (DIC, IC or CC) in the last 12 months? Drop-In Center (DIC), Information Center (IC), Counseling Center (CC)
Yes.......................................... 1 No ........................................... 2
1009
1006 When you went to the out reach center (DIC,IC or CC), which activities did you take part in? (Multiple answers. DO NOT READ the possible answers)
Went to collect condoms......... 1 Went to learn the correct way of using condom. .................. 2 Went to watch film on HIV/AIDS................................................. 3 Participated in discussion on HIV transmission…................ 4 Other (Specify)______________.............................................. 96
1007 Do you know which organizations run those out reach center (DIC,IC or CC)? (Multiple answers possible)
BDS ....................................... 1 Parichaya Samaj..................... 2 Cruiseaids............................... 3 SACTs .................................... 4 NFCC...................................... 5 CAC ........................................ 6 Others (Specify) _____________..96 Don't know .............................................. 98
1008 How many times have you visited out reach centers (DIC, IC or CC) in the last 12 months?
Once ....................................... 1 2-3 times ................................. 2 4-6 times ................................ 3 7-12 times ............................... 4 More than 12 times ................. 5
1009 Have you visited any STI clinic in the last 12 months?
Yes.......................................... 1 No ........................................... 2
1013
1010 When you visited such STI clinic in what activities were you involved? (Multiple answers. DO NOT READ the possible answers given below)
Blood tested for STI ................ 1 Physical examination conducted for STI identification. ............... 2 Discussed on how STI is/isn’t transmitted .............................. 3 Discussed on regular/non-regular use of condom ........... 4 Took a friend with me ............. 5 Other (Specify)______________.............................................. 96
1011 Do you know which organizations run those STI clinics? (Multiple answers possible)
BDS ....................................... 1 Parichaya Samaj..................... 2 Cruiseaids............................... 3 SACTs .................................... 4 NFCC...................................... 5 CAC ........................................ 6 Others (Specify)
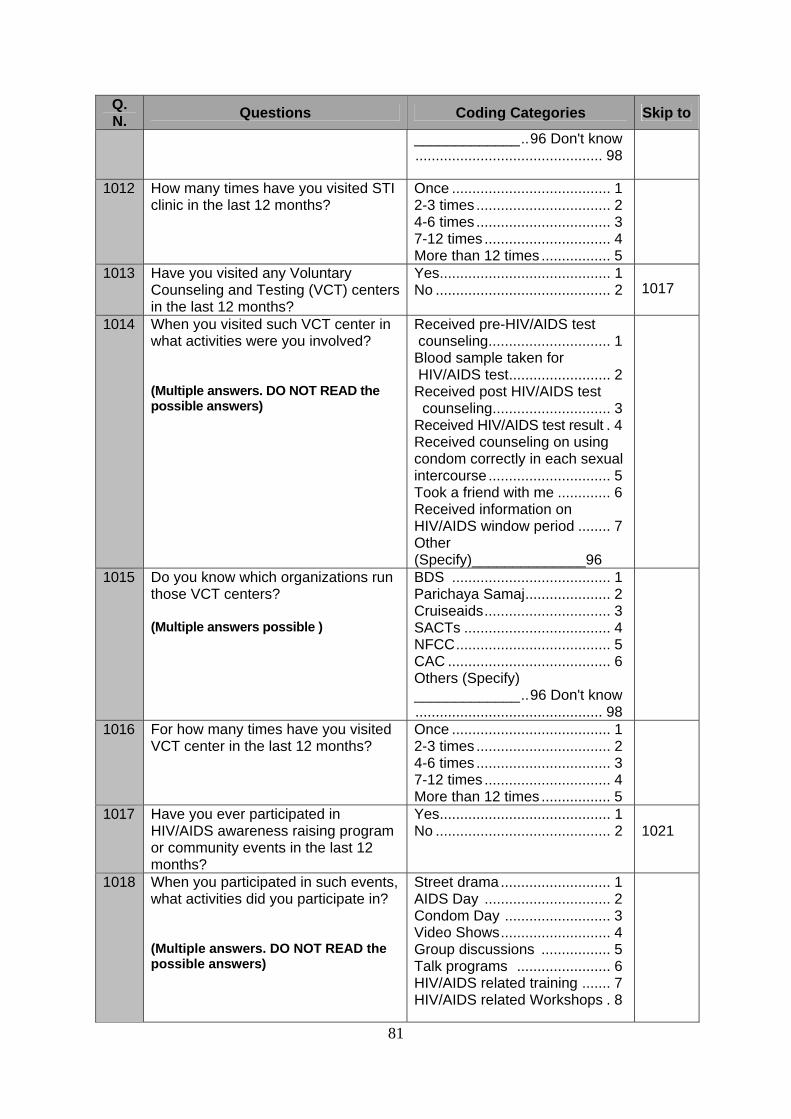
81
Q. N. Questions Coding Categories Skip to
_____________..96 Don't know .............................................. 98
1012 How many times have you visited STI clinic in the last 12 months?
Once ....................................... 1 2-3 times ................................. 2 4-6 times ................................. 3 7-12 times ............................... 4 More than 12 times ................. 5
1013 Have you visited any Voluntary Counseling and Testing (VCT) centers in the last 12 months?
Yes.......................................... 1 No ........................................... 2
1017
1014 When you visited such VCT center in what activities were you involved? (Multiple answers. DO NOT READ the possible answers)
Received pre-HIV/AIDS test counseling.............................. 1 Blood sample taken for HIV/AIDS test......................... 2 Received post HIV/AIDS test counseling............................. 3 Received HIV/AIDS test result . 4 Received counseling on using condom correctly in each sexual intercourse .............................. 5 Took a friend with me ............. 6 Received information on HIV/AIDS window period ........ 7 Other (Specify)______________96
1015 Do you know which organizations run those VCT centers? (Multiple answers possible )
BDS ....................................... 1 Parichaya Samaj..................... 2 Cruiseaids............................... 3 SACTs .................................... 4 NFCC...................................... 5 CAC ........................................ 6 Others (Specify) _____________..96 Don't know .............................................. 98
1016 For how many times have you visited VCT center in the last 12 months?
Once ....................................... 1 2-3 times ................................. 2 4-6 times ................................. 3 7-12 times ............................... 4 More than 12 times ................. 5
1017 Have you ever participated in HIV/AIDS awareness raising program or community events in the last 12 months?
Yes.......................................... 1 No ........................................... 2
1021
1018 When you participated in such events, what activities did you participate in? (Multiple answers. DO NOT READ the possible answers)
Street drama........................... 1 AIDS Day ............................... 2 Condom Day .......................... 3 Video Shows........................... 4 Group discussions ................. 5 Talk programs ....................... 6 HIV/AIDS related training ....... 7 HIV/AIDS related Workshops . 8

82
Q. N. Questions Coding Categories Skip to
Condom use demonstrations.. 9 Others (Specify) ______________96
1019 Do you know which organizations organized those activities? (Multiple answers. DO NOT READ the possible answers given below)
BDS ....................................... 1 Parichaya Samaj..................... 2 Cruiseaids............................... 3 Others (Specify) _____________..96 Don't know .............................................. 98
1020 How many times have you participated in such activities in the last 12 months?
Did not participate in last 12 months .................................. 0 Once ....................................... 1 2-3 times ................................. 2 4-6 times ................................. 3 7-12 times ............................... 4 More than 12 times ................. 5
1021 Have you heard about Community Home Based Care (CHBC) services that are provided to people with HIV?
Yes.......................................... 1 No ........................................... 2
1022 Have you heard about programs that provide essential services for people with HIV, ART services and that which gives information on ART (Community Care Support Treatment Program)?
Yes.......................................... 1 No ........................................... 2
11.0 GENERAL INFORMATION
Q. N. Questions Coding Categories Skip to
1101 Where were you born?
District______________________ VDC/Municipality_____________
1102 Where do you live now? (Do not ask the exact address)
Districts: _____________________ VDC/Municipality: ____________ Don't remember/know........... 98 No response ........................ 99
1103 For how long have you been living in this district?
Number of Months …….. (Record "00" if less than 1Month) Since Birth ............................ 95 Don't remember/know........... 98 No response ........................ 99
1201
1104 Before you moved here, where did you live?
Districts: _____________________ VDC/Municipality: ____________ Don't remember/know........... 98 No response ........................ 99
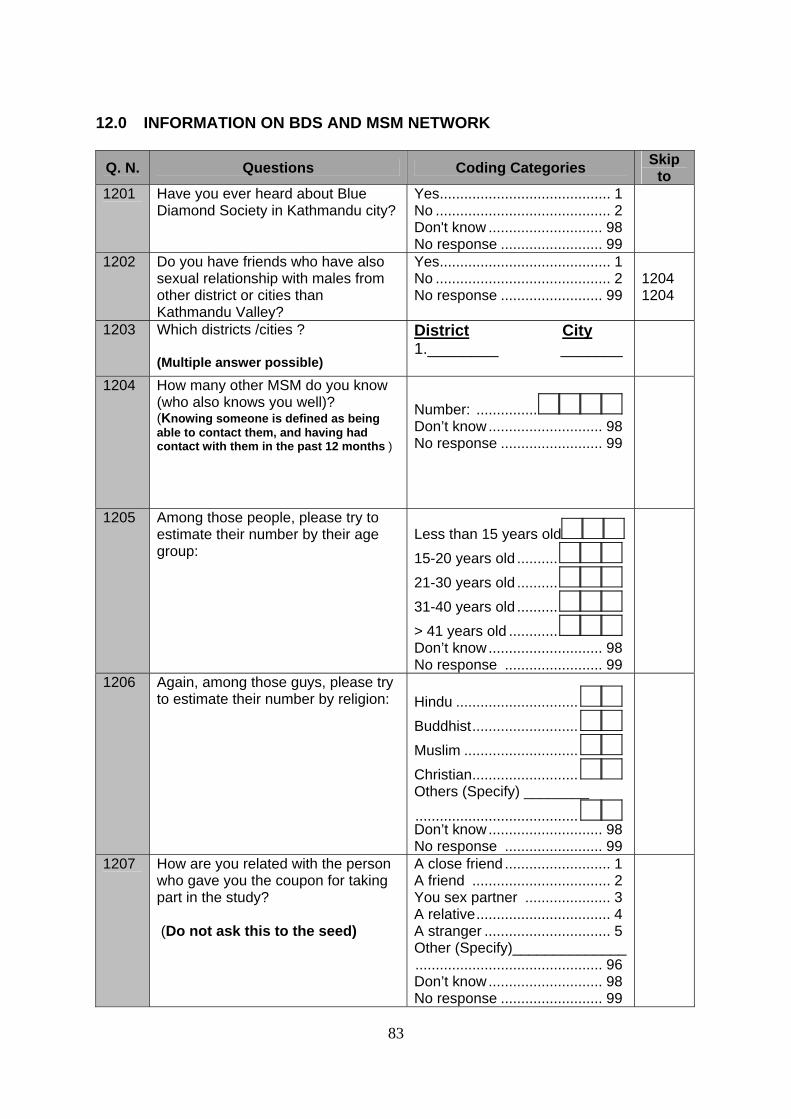
83
12.0 INFORMATION ON BDS AND MSM NETWORK
Q. N. Questions Coding Categories Skip to
1201 Have you ever heard about Blue Diamond Society in Kathmandu city?
Yes.......................................... 1 No ........................................... 2 Don't know ............................ 98 No response ......................... 99
1202 Do you have friends who have also sexual relationship with males from other district or cities than Kathmandu Valley?
Yes.......................................... 1 No ........................................... 2 No response ......................... 99
1204 1204
1203 Which districts /cities ? (Multiple answer possible)
District City 1.________ _______
1204 How many other MSM do you know (who also knows you well)? (Knowing someone is defined as being able to contact them, and having had contact with them in the past 12 months )
Number: ............... Don’t know............................ 98 No response ......................... 99
1205 Among those people, please try to estimate their number by their age group:
Less than 15 years old
15-20 years old ..........
21-30 years old .......... 31-40 years old .......... > 41 years old ............ Don’t know............................ 98 No response ........................ 99
1206 Again, among those guys, please try to estimate their number by religion:
Hindu .............................. Buddhist.......................... Muslim ............................ Christian.......................... Others (Specify) ________
........................................ Don’t know............................ 98 No response ........................ 99
1207 How are you related with the person who gave you the coupon for taking part in the study? (Do not ask this to the seed)
A close friend .......................... 1 A friend .................................. 2 You sex partner ..................... 3 A relative................................. 4 A stranger ............................... 5 Other (Specify)______________.............................................. 96 Don’t know............................ 98 No response ......................... 99

84
Q. N. Questions Coding Categories Skip to
Very Often Often
Some-
time Never
1208 In the past 6 months, how often have you been to the following locations to meet male sexual partners: (Ask for all the items proposed and probe for other locations, as well)
Park Discotheque Dance Restaurant Massage parlor Street Pub/Cafe Temple Bus Station Public Toilets Cinema Hall Near Army barracks Internet (chat room) Personal Add (web site) Personal Add (magazine or other) Sauna/Steam bath Swimming Pools Home Telephone Other (Specify) _______
1 1 1 1 1 1 1 1 1 1 1 1 1 1
1 1 1 1 1
2 2 2 2 2 2 2 2 2 2 2 2 2 2
2 2 2 2 2
3 3 3 3 3 3 3 3 3 3 3 3 3 3
3 3 3 3 3
4 4 4 4 4 4 4 4 4 4 4 4 4 4
4 4 4 4 4
1209 Please give me the names of the 3 mostly visited locations in Kathmandu Valley where you have been to contact male sexual partners in the past 6 months:
_______________________1 _______________________2 _______________________3 Don’t know..............................98 No response ...........................99
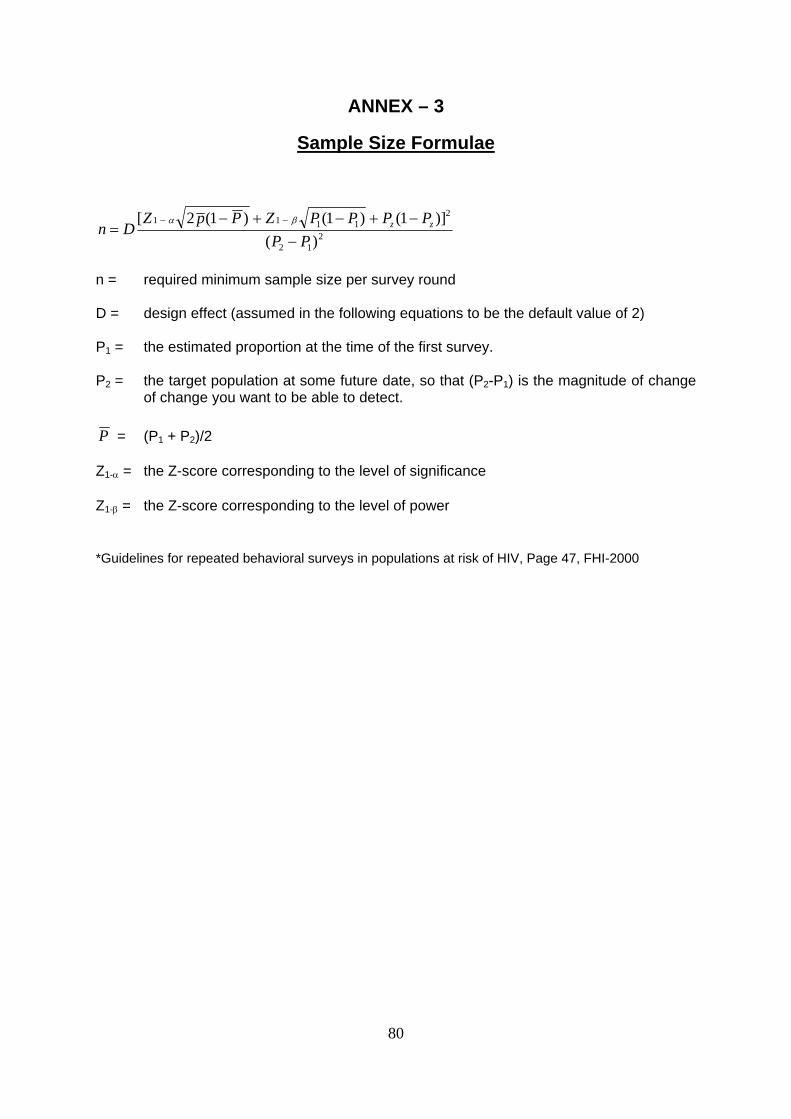
80
ANNEX – 3
Sample Size Formulae
212
21111
)()]1()1()1(2[
PPPPPPZPpZ
Dn zz
−−+−+−
=−− βα
n = required minimum sample size per survey round D = design effect (assumed in the following equations to be the default value of 2) P1 = the estimated proportion at the time of the first survey. P2 = the target population at some future date, so that (P2-P1) is the magnitude of change
of change you want to be able to detect. P = (P1 + P2)/2 Z1-α = the Z-score corresponding to the level of significance
Z1-β = the Z-score corresponding to the level of power *Guidelines for repeated behavioral surveys in populations at risk of HIV, Page 47, FHI-2000
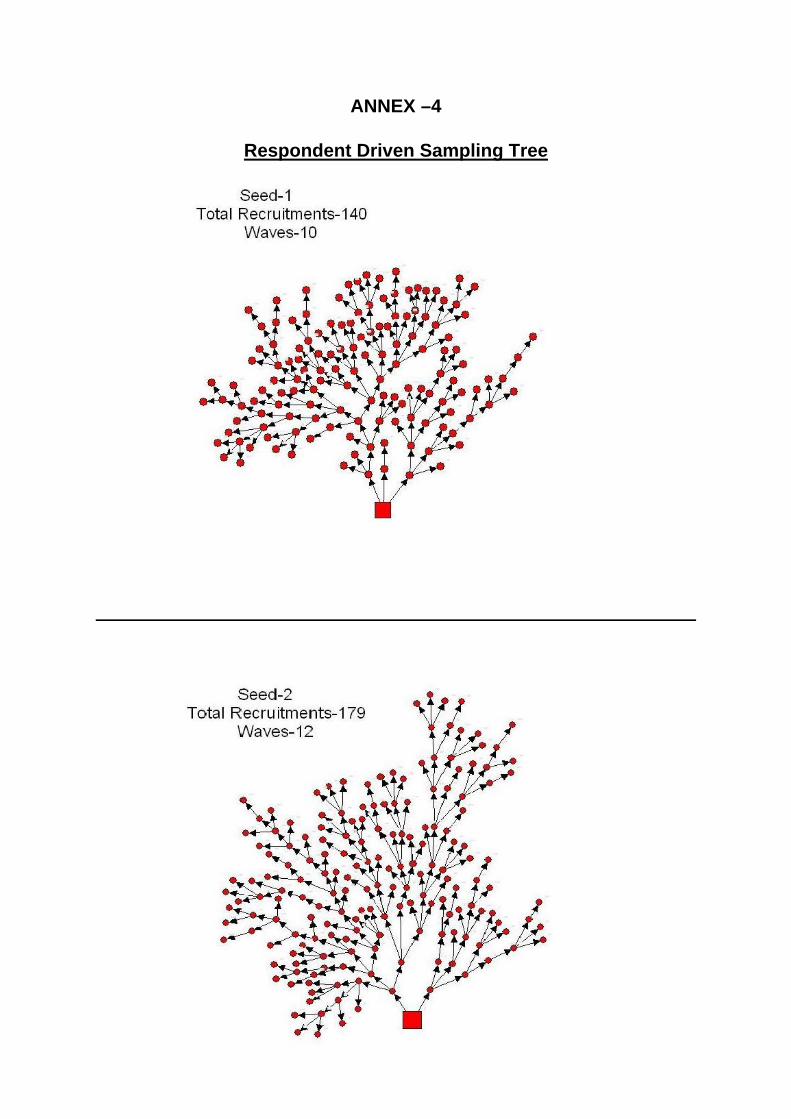
81
ANNEX –4
Respondent Driven Sampling Tree
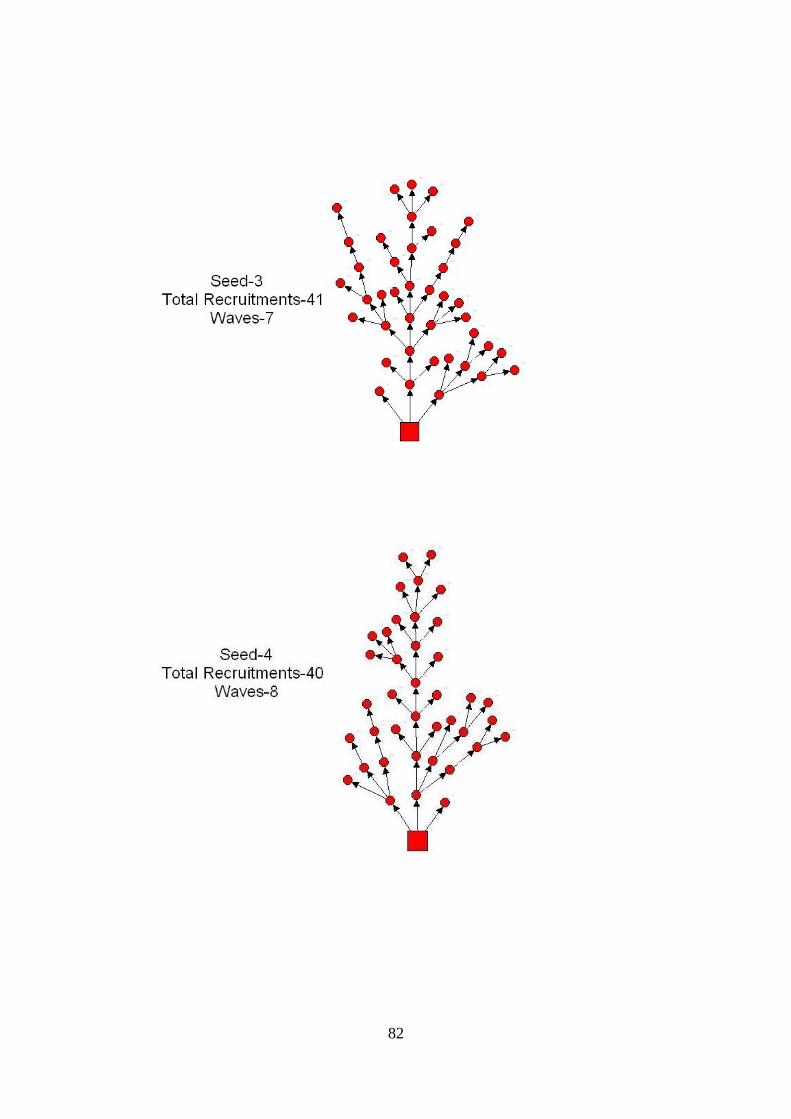
82
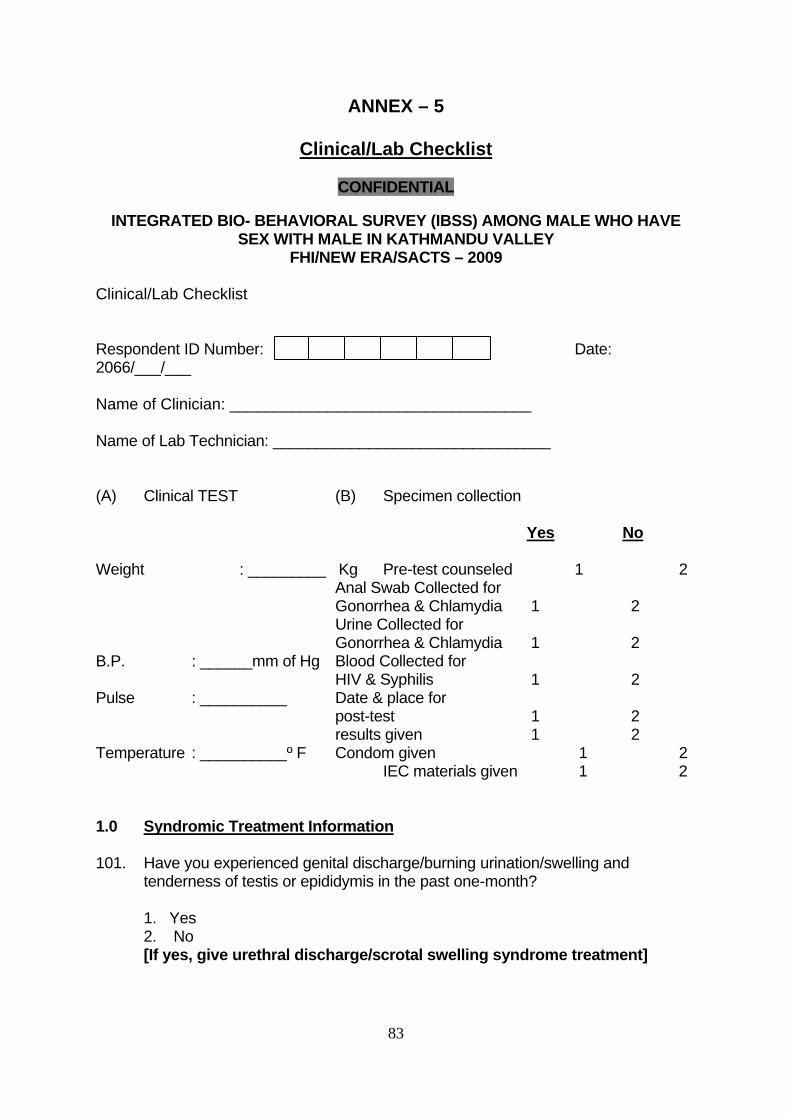
83
ANNEX – 5
Clinical/Lab Checklist
CONFIDENTIAL
INTEGRATED BIO- BEHAVIORAL SURVEY (IBSS) AMONG MALE WHO HAVE SEX WITH MALE IN KATHMANDU VALLEY
FHI/NEW ERA/SACTS – 2009 Clinical/Lab Checklist Respondent ID Number: Date: 2066/___/___ Name of Clinician: __________________________________ Name of Lab Technician: ________________________________ (A) Clinical TEST (B) Specimen collection Yes No Weight : _________ Kg Pre-test counseled 1 2 Anal Swab Collected for Gonorrhea & Chlamydia 1 2 Urine Collected for Gonorrhea & Chlamydia 1 2 B.P. : ______mm of Hg Blood Collected for HIV & Syphilis 1 2 Pulse : __________ Date & place for post-test 1 2 results given 1 2 Temperature : __________º F Condom given 1 2 IEC materials given 1 2 1.0 Syndromic Treatment Information 101. Have you experienced genital discharge/burning urination/swelling and
tenderness of testis or epididymis in the past one-month? 1. Yes 2. No [If yes, give urethral discharge/scrotal swelling syndrome treatment]
84
102. Have you had genital ulcer/sore blister in the past one-month? 1. Yes 2. No
[If yes, give genital ulcer syndrome treatment and time for follow-up] 103. Have you had a tender or non-tender/solid or fluctuant swelling in the groin area
in the past one month?
1 Yes 2. No
[If yes, give inguinal swelling (bubo) syndrome treatment and time for follow-
up]
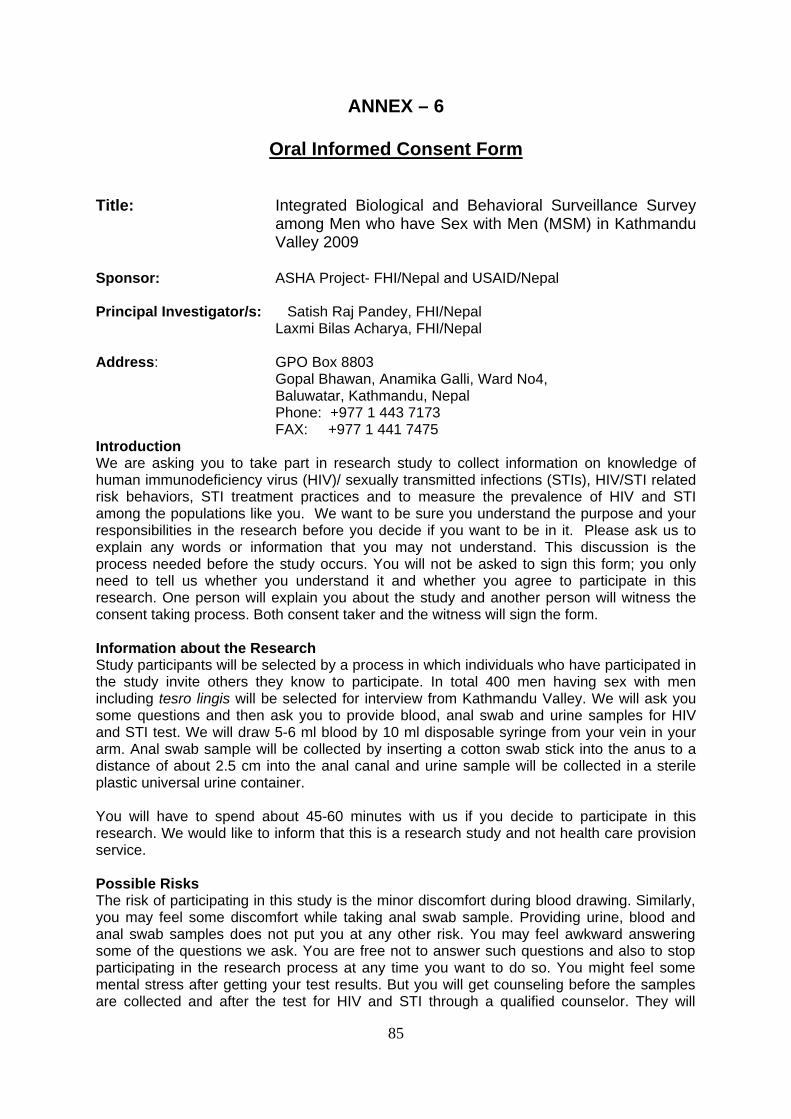
85
ANNEX – 6
Oral Informed Consent Form Title: Integrated Biological and Behavioral Surveillance Survey
among Men who have Sex with Men (MSM) in Kathmandu Valley 2009
Sponsor: ASHA Project- FHI/Nepal and USAID/Nepal Principal Investigator/s: Satish Raj Pandey, FHI/Nepal Laxmi Bilas Acharya, FHI/Nepal Address: GPO Box 8803 Gopal Bhawan, Anamika Galli, Ward No4, Baluwatar, Kathmandu, Nepal Phone: +977 1 443 7173 FAX: +977 1 441 7475 Introduction We are asking you to take part in research study to collect information on knowledge of human immunodeficiency virus (HIV)/ sexually transmitted infections (STIs), HIV/STI related risk behaviors, STI treatment practices and to measure the prevalence of HIV and STI among the populations like you. We want to be sure you understand the purpose and your responsibilities in the research before you decide if you want to be in it. Please ask us to explain any words or information that you may not understand. This discussion is the process needed before the study occurs. You will not be asked to sign this form; you only need to tell us whether you understand it and whether you agree to participate in this research. One person will explain you about the study and another person will witness the consent taking process. Both consent taker and the witness will sign the form. Information about the Research Study participants will be selected by a process in which individuals who have participated in the study invite others they know to participate. In total 400 men having sex with men including tesro lingis will be selected for interview from Kathmandu Valley. We will ask you some questions and then ask you to provide blood, anal swab and urine samples for HIV and STI test. We will draw 5-6 ml blood by 10 ml disposable syringe from your vein in your arm. Anal swab sample will be collected by inserting a cotton swab stick into the anus to a distance of about 2.5 cm into the anal canal and urine sample will be collected in a sterile plastic universal urine container. You will have to spend about 45-60 minutes with us if you decide to participate in this research. We would like to inform that this is a research study and not health care provision service. Possible Risks The risk of participating in this study is the minor discomfort during blood drawing. Similarly, you may feel some discomfort while taking anal swab sample. Providing urine, blood and anal swab samples does not put you at any other risk. You may feel awkward answering some of the questions we ask. You are free not to answer such questions and also to stop participating in the research process at any time you want to do so. You might feel some mental stress after getting your test results. But you will get counseling before the samples are collected and after the test for HIV and STI through a qualified counselor. They will

86
provide information about STIs too and will also provide counseling for any mental stress you may have. There may be some risk that people may see you associated with the study, either now or when you return for your test results. If you know the status of your HIV and other STI tests you may have some mental stress related to the treatment of STI and other related issues. Possible Benefits You will be provided with free treatment, if currently you have any STI symptoms. You will be given lab test results and made aware of how STI/HIV is transmitted and how it can be prevented and controlled. If your STI tests are positive for the curable sexual infection such as syphilis and you have not been already treated for this, you will be offered free treatment. Although we do not provide HIV treatments service, we will give you information about HIV treatment service providers and refer you to them if necessary. If you go to the government ART sites/hospitals, they provide free services. You will also be provided with information on safer sex with the help of which you may reduce the risk of being infected by or infecting your sexual partners. The information we obtain from this research will help to plan strategies to control and prevent further spread of HIV/AIDS and other sexually transmitted diseases. At the time of sample collection the study team members will give you the detailed address of the place and the dates where you can hear your test results of STI and HIV. Test result will be given by a qualified counselor with pre and post test counseling. Test results can only be obtained by presenting the study ID card with your code number on it. If you do not have the ID card when you return for the test results we cannot give you the results because we will not be able to recognize you without the study ID card. If You Decide Not to Be in the Research You are free to decide whether or not to take part in this research. Your decision will not affect in any way in the health services you are seeking now and you would normally receive. Confidentiality We will protect information collected about you and your taking part in this study to the best of our ability. We will not ask your name or any other identifiers. A court of law could order medical records shown to other people, but that is unlikely. We will not ask you to put your name on this form, but only ask you mention verbally (with spoken words) whether or not you want to participate in this study. Payment We will not give you anything for your participation but you will be given, condom and reading materials about STI/HIV/AIDS as compensation for your participation in the research. Moreover, we will provide you a fixed amount of Nepalese Rupees (NRs.) 100.00 (approximately, US$1.50) after completing the study requirements to cover the local transportation you may use to come to the study center for interview and for providing biological sample and an additional NRs. 50.0 (US$ 0.70) for each successful referral of peers for the study. You may refer up to three peers or friend. Leaving the Research You may leave the research at any time. If you do, it will not change the healthcare you normally receive from the study clinic.

87
If you have a questions about the study If you have any questions about the research, call: Satish Raj Pandey, ASHA project - FHI/Nepal, Baluwatar, Kathmandu, Phone: 01-4437173; OR Siddhartha Man Tuladhar, New ERA, Kalopool, Kathmandu, Phone: 01-4413603; OR Laxmi Bilas Acharya, ASHA project - FHI/Nepal, Baluwatar, Kathmandu, Phone: 01-4437173 We will not be able to pay for care for injuries that occur as a result of the study. Your Rights as a Participant This research has been reviewed and approved by the Institutional Review Board of Family Health International and Nepal Health Research Council (NHRC). If you have any questions about how you are being treated by the study or your rights as a participant you may contact Satish Raj Pandey, Family Health International (FHI), Baluwatar, Kathmandu, Phone: 01-4437173 and/or Mr. David Borasky, Protection of Human Subjects Committee, PO Box 13950, Research Triangle Park, NC 27709, USA, phone number: [International Access Code]-1-919-405-1445, e-mail: [email protected]. ] VOLUNTEER AGREEMENT I was present while the benefits, risks and procedures were read to the volunteer. All questions were answered and the volunteer has agreed to take part in the research. __________________________________________________ ______________________________ Signature of witness Date I certify that the nature and purpose, the potential benefits, and possible risks associated with participating in this research have been explained to the above individual. _________________________________________________ _______________________________ Signature of Person Who Obtained Consent Date

88
ANNEX - 7
Participation in Post Test Counseling
Client counseled Client with HIV+ Client with HIV- Date Counseling
center Expected
client N % N % N %
27March -08 May, 2009 CruiseAids 250 96 38.4 1 1.0 95 99.0
27March -08 May, 2009 SACTS 81 19 23.5 0 0.0 19 100.0
27March - 08 May, 2009 Parichaya Samaj 69 23 33.3 1 4.4 22 95.6
Total 400 138 34.5 2 1.5 136 98.5
ANNEX – 8
Self Categorization by 'Third Gender' on the Basis of Their Sexual Orientation/Behavior
Self categorization N=142 % Meta/meti 76 53.5 Bisexual 21 14.8 Homosexual 14 9.9 Third Gender 13 9.2 Ta 10 7.0 Men 6 4.2 Gay 2 1.4
ANNEX – 9
Common Professional Background of Paying Partners
MSW Professional background of clients N=135 %
Police/military 58 43.0 Student 52 38.5 Business 49 36.3 Labor 41 30.4 NGOs/private office staff 30 22.2 Civil servant 27 20.0 Driver 24 17.8 Unemployed 15 11.1 Sex work 6 4.4 Others 6 4.4 Don’t know 2 1.5
*Note: The percentages add up to more than 100 because of multiple responses.
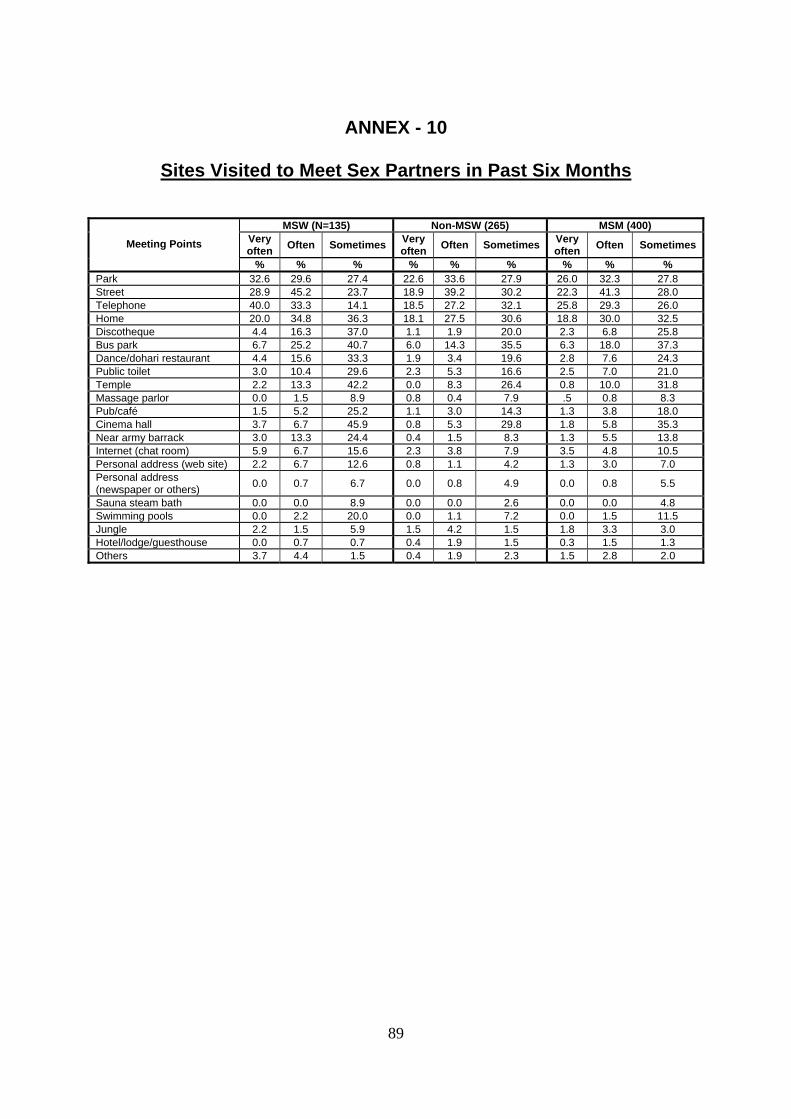
89
ANNEX - 10
Sites Visited to Meet Sex Partners in Past Six Months
MSW (N=135) Non-MSW (265) MSM (400) Very often Often Sometimes Very
often Often Sometimes Very often Often Sometimes Meeting Points
% % % % % % % % % Park 32.6 29.6 27.4 22.6 33.6 27.9 26.0 32.3 27.8 Street 28.9 45.2 23.7 18.9 39.2 30.2 22.3 41.3 28.0 Telephone 40.0 33.3 14.1 18.5 27.2 32.1 25.8 29.3 26.0 Home 20.0 34.8 36.3 18.1 27.5 30.6 18.8 30.0 32.5 Discotheque 4.4 16.3 37.0 1.1 1.9 20.0 2.3 6.8 25.8 Bus park 6.7 25.2 40.7 6.0 14.3 35.5 6.3 18.0 37.3 Dance/dohari restaurant 4.4 15.6 33.3 1.9 3.4 19.6 2.8 7.6 24.3 Public toilet 3.0 10.4 29.6 2.3 5.3 16.6 2.5 7.0 21.0 Temple 2.2 13.3 42.2 0.0 8.3 26.4 0.8 10.0 31.8 Massage parlor 0.0 1.5 8.9 0.8 0.4 7.9 .5 0.8 8.3 Pub/café 1.5 5.2 25.2 1.1 3.0 14.3 1.3 3.8 18.0 Cinema hall 3.7 6.7 45.9 0.8 5.3 29.8 1.8 5.8 35.3 Near army barrack 3.0 13.3 24.4 0.4 1.5 8.3 1.3 5.5 13.8 Internet (chat room) 5.9 6.7 15.6 2.3 3.8 7.9 3.5 4.8 10.5 Personal address (web site) 2.2 6.7 12.6 0.8 1.1 4.2 1.3 3.0 7.0 Personal address (newspaper or others) 0.0 0.7 6.7 0.0 0.8 4.9 0.0 0.8 5.5
Sauna steam bath 0.0 0.0 8.9 0.0 0.0 2.6 0.0 0.0 4.8 Swimming pools 0.0 2.2 20.0 0.0 1.1 7.2 0.0 1.5 11.5 Jungle 2.2 1.5 5.9 1.5 4.2 1.5 1.8 3.3 3.0 Hotel/lodge/guesthouse 0.0 0.7 0.7 0.4 1.9 1.5 0.3 1.5 1.3 Others 3.7 4.4 1.5 0.4 1.9 2.3 1.5 2.8 2.0