Chronic Cholecystitis of Dogs: Clinicopathologic Features and ...
Upload
independentCategory
view
1download
0
Research article
TheJournalofClinicalInvestigation http://www.jci.org Volume 120 Number 12 December 2010 4425
Insulin-induced hypoglycemia increases hepatic sensitivity to glucagon in dogs
Noelia Rivera,1 Christopher J. Ramnanan,1 Zhibo An,1 Tiffany Farmer,1 Marta Smith,1 Ben Farmer,1 Jose M. Irimia,2 Wanda Snead,1 Margaret Lautz,1 Peter J. Roach,2 and Alan D. Cherrington1
1Department of Molecular Physiology, Vanderbilt University School of Medicine, Nashville, Tennessee, USA. 2Department of Biochemistry and Molecular Biology, Indiana University School of Medicine, Indianapolis, Indiana, USA.
Inindividualswithtype1diabetes,hypoglycemiaisacommonconsequenceofoverinsulinization.Underconditionsofinsulin-inducedhypoglycemia,glucagonisthemostimportantstimulusforhepaticglucoseproduction.Incontrast,duringeuglycemia,insulinpotentlyinhibitsglucagon’seffectontheliver.Thefirstaimofthepresentstudywastodeterminewhetherlowbloodsugaraugmentsglucagon’sabilitytoincreaseglu-coseproduction.Usingaconsciouscatheterizeddogmodel,wefoundthathypoglycemiaincreasedglucagon’sabilitytoovercometheinhibitoryeffectofinsulinonhepaticglucoseproductionbyalmost3-fold,aneffectexclusivelyattributabletomarkedenhancementoftheeffectofglucagononnetglycogenbreakdown.Toinves-tigatethemolecularmechanismbywhichthiseffectcomesabout,weanalyzedhepaticbiopsiesfromthesameanimals,andfoundthathypoglycemiaresultedinadecreaseininsulinsignaling.Furthermore,hypoglycemiaandglucagonhadanadditiveeffectontheactivationofAMPK,whichwasassociatedwithalteredactivityoftheenzymesofglycogenmetabolism.
IntroductionIn individuals with type 1 diabetes, hypoglycemia is a common consequence of overinsulinization. The incidence of hypoglyce-mia is less frequent in individuals with type 2 diabetes, but as the disease progresses and patients begin to use insulin, it once again becomes a limiting factor in glycemic control (1). The counterregu-latory response to hypoglycemia in the normal individual involves the release of glucagon, epinephrine, norepinephrine, cortisol, and growth hormone, which together increase glucose production and limit glucose utilization (2). Glucagon has been shown to provide the primary stimulus for the counterregulatory increase in glucose production in response to insulin-induced hypoglycemia in the normal individual (2). Furthermore, abnormalities in the response of the α cell to hypoglycemia make individuals with diabetes more prone to low blood sugar (1, 2).
We have previously examined the interaction between insulin and glucagon in controlling glucose production in the conscious dog (3). Intraportal replacement of basal amounts of insulin and glucagon in the presence of somatostatin infusion was associ-ated with sustained basal glucose production. A selective 4-fold rise in glucagon resulted in an increment in glucose production of approximately 4.5 mg/kg/min at 30 minutes. In contrast, a selective 4-fold rise in insulin resulted in a decrement in glucose production of approximately 1.3 mg/kg/min at 30 minutes. When both hormones were simultaneously increased 4-fold, the decre-ment in glucose production at 30 minutes was only approximately 0.6 mg/kg/min. Therefore, glucagon’s effect was 4.5 mg/kg/min in the presence of basal insulin — despite the accompanying hyperglycemia — and only 0.7 mg/kg/min in the presence of high insulin and euglycemia, a reduction of almost 85%. These data indicate that, in the absence of hypoglycemia, insulin dominates glucagon’s action on the liver even when equimolar increments in the 2 hormones are bought about (3). In another previous study
from our laboratory (4), a physiologic rise in glucagon significant-ly increased glucose production (4.5 mg/kg/min increase) in the presence of hypoglycemia, despite an arterial insulin level that was increased 40-fold (328 μU/ml increase). This suggests that under hypoglycemic conditions, glucagon must be able to overcome insulin’s potent inhibitory effect on the liver, an action that would appear critical to its role in glucose counterregulation.
To our knowledge, a direct comparison of the ability of a con-trolled rise in glucagon to overcome insulin’s inhibitory effect on glucose production in the presence of euglycemia versus hypoglyce-mia has never been carried out. Therefore, the first aim of the pres-ent study was to determine the extent to which glucagon’s ability to overcome the inhibitory effect of insulin on glucose production is enhanced by hypoglycemia. The second aim was to shed light on the cellular mechanisms by which this effect comes about.
ResultsWe studied 4 groups of 18-hour fasted conscious dogs: saline-eug-lycemic (SE), saline-hypoglycemic (SH), glucagon-euglycemic (GE), and glucagon-hypoglycemic (GH). Each experiment consisted of an equilibration period (–140 to –40 minutes), a basal control period (–40 to 0 minutes), experimental period 1 (0 to 60 minutes), and experimental period 2 (60 to 180 minutes). See Methods for details.
Hormone concentrations. Hepatic sinusoidal insulin rose from baseline to approximately 450 μU/ml in response to insulin infusion (Figure 1A). Hepatic sinusoidal glucagon levels were similar in all groups during the control period (48 ± 2 pg/ml) and experimental period 1, although they fell to approximately 32 ± 2 pg/ml during the latter as a result of somatostatin infu-sion (Figure 1B). These levels remained low in experimental period 2 in the saline-infused groups (SE, 24 ± 5 pg/ml; SH, 26 ± 5 pg/ml; last 30 minutes), but rose to 174 ± 22 and 175 ± 15 pg/ml (last 30 minutes) in response to intraportal glucagon infusion in the GE and GH groups, respectively (Figure 1B). Arterial plasma cortisol was approximately 3.3 ± 0.2 μg/dl in all groups during the control period and experimental period 1 (Figure 2A). It
Conflictofinterest: The authors have declared that no conflict of interest exists.
Citationforthisarticle: J Clin Invest. 2010;120(12):4425–4435. doi:10.1172/JCI40919.

research article
4426 TheJournalofClinicalInvestigation http://www.jci.org Volume 120 Number 12 December 2010
remained low during experimental period 2 in the euglycemic groups (SE, 4.0 ± 0.9 μg/dl; GE, 4.0 ± 0.8 μg/dl; last 30 minutes) but rose to 14 ± 1 and 16 ± 1 μg/dl (last 30 minutes) in response to hypoglycemia in the SH and GH groups, respectively (both P < 0.05 vs. corresponding euglycemic group). The arterial plasma epinephrine level was basal (~127 ± 19 pg/ml) during the control period and experimental period 1 in all groups (Figure 2B). During experimental period 2, it was 101 ± 29 and 123 ± 48 pg/ml in the SE and GE groups, but rose to 1,982 ± 325 and 1,866 ± 251 pg/ml (last 30 minutes) in the SH and GH groups, respectively (both P < 0.05 vs. corresponding euglycemic group). Likewise, arterial plasma norepinephrine was basal in all groups (155 ± 15 pg/ml) during the control period and experimental period 1 (Figure 2C). During experimental period 2, it remained unchanged in the euglycemic groups (SE, 202 ± 23 pg/ml; GE, 156 ± 27 pg/ml; last 30 minutes), but increased to 395 ± 70 and 346 ± 57 pg/ml (last 30 minutes) in the SH and GH groups, respectively (both P < 0.05 vs. corresponding euglycemic group).
Blood glucose levels and net hepatic glucose balance. Euglycemia was maintained during experimental period 1 in each group and dur-ing experimental period 2 in the SE and GE groups (Figure 3A). In the latter groups, glucose infusion rates averaged 16.4 ± 1.6 and 14.6 ± 1.6 mg/kg/min, respectively, from 60 to 180 min-utes (Table 1). On the other hand, the glucose infusion rates required to maintain hypoglycemia (49 mg/dl) in the SH and GH groups were 6.3 ± 1.2 and 5.1 ± 1.6 mg/kg/min, respec-tively. Net hepatic glucose output (NHGO) was approximately 1.6 ± 0.03 mg/kg/min in all groups during the control period (Figure 3B). In response to intraportal insulin infusion in the presence of euglycemia and a fall in plasma glucagon, the liver
switched to slight net hepatic glucose uptake (NHGU) in all groups (~0.9 mg/kg/min; Figure 3B). During experimental peri-od 2, NHGU increased slightly over time (to 1.5 ± 0.3 mg/kg/min) in the SE group, whereas in the GE group, the liver temporarily switched to NHGO (~0.3 ± 0.4 mg/kg/min) but then reverted to NHGU (0.7 ± 0.4 mg/kg/min). In the 2 hypoglycemic groups, the liver quickly switched to NHGO and remained in a production mode until the end of the study (SH, 1.2 ± 0.3 mg/kg/min; GH, 2.9 ± 0.4 mg/kg/min; last 30 minutes; P < 0.05). The ΔAUC for the increase in net hepatic glucose balance (NHGB; 60 to 180 minutes) caused by glucagon was almost 3-fold greater (P < 0.03) in the presence of hypoglycemia (NHGB ΔAUC between SH and GH,
Figure 1Hepatic sinusoidal concentrations of pancreatic hormones in 18-hour fasted conscious dogs exposed to a controlled rise of glucagon in the presence of hyperinsulinemia and euglycemia or hypoglycemia. Hepatic sinusoidal (A) insulin and (B) glucagon. Experimental protocols are illus-trated below the graphs (see Methods). During experimental period 1, somatostatin (0.8 μg/kg/min) and intraportal insulin (5.0 mU/kg/min) were infused, and euglycemia (EU) was maintained by infusing glucose as required. During experimental period 2, somatostatin and insulin infusions continued and either glucagon (2.3 ng/kg/min) or saline (0.9% NaCl) was infused intraportally; moreover, glucose was infused as required to maintain euglycemia or establish hypogly-cemia (HYPO). Values are mean ± SEM; n = 7 per group. †P < 0.05, GH vs. SH; #P < 0.05, GE vs. SE.
Figure 2Arterial plasma concentrations of counterregulatory hormones. Arterial plasma (A) cortisol, (B) epinephrine, and (C) norepinephrine. Experi-mental protocols are illustrated as in Figure 1. Values are mean ± SEM; n = 7 per group. *P < 0.05 vs. corresponding euglycemic group; †P < 0.05, GH vs. SH.

research article
TheJournalofClinicalInvestigation http://www.jci.org Volume 120 Number 12 December 2010 4427
251 ± 84 mg/kg/120 minutes) than in the presence of euglycemia (NHGB ΔAUC between SE and GE, 85 ± 25 mg/kg/120 minutes; Figure 3C). Changes in tracer-determined endogenous glucose production paralleled the changes in NHGO (Table 1).
Tracer-determined glucose utilization increased in response to intraportal insulin infusion in all groups during experimental peri-od 1 (15.0 ± 1.5, 14.8 ± 1.1, 12.5 ± 1.2, and 10.7 ± 1.2 mg/kg/min, 60-minute time point; Table 1). Tracer-determined glucose utiliza-tion continued to increase over time in the SE and GE groups (reach-ing 19.6 ± 2.2 and 18.6 ± 1.3 mg/kg/min, respectively, by the end of the study), but it decreased in the SH and GH groups (6.2 ± 0.9 and 5.3 ± 0.7 mg/kg/min, respectively; P < 0.05). Glucose clearance increased in all groups during experimental period 1 (Table 1) and rose to a greater extent during experimental period 2 in the eugly-cemic groups than in the hypoglycemic groups.
Metabolites. Arterial blood alanine levels decreased in response to the rise in insulin in all groups. There was no significant change in net hepatic alanine balance over time and no difference between groups (Table 2). Conversely, fractional extraction of alanine by the liver doubled, although this change did not reach significance in any individual group. Arterial blood lactate levels were basal during the control period and rose slightly in experimental peri-od 1, regardless of group (Table 2). During experimental period 2, the blood lactate level changed minimally in both euglycemic groups, but increased markedly in response to hypoglycemia with or without glucagon (Table 2). The liver produced lactate during experimental period 1 in all groups. By the end of the study, all
groups had switched to net hepatic lactate uptake, but the hypo-glycemic groups were taking up more than 5 times as much lac-tate as the euglycemic groups. The rise in glucagon was associated with increased net hepatic lactate output for approximately 1 hour under both hypoglycemic and euglycemic conditions. By the end of the study, however, glucagon’s presence made no difference with regard to net hepatic lactate balance.
Arterial plasma glycerol levels, which reflect the lipolytic rate, fell in all groups when insulin rose (Table 3). They remained sup-pressed during experimental period 2 in both euglycemic groups, but increased markedly in response to hypoglycemia. Net hepatic glycerol uptake paralleled the changes in the blood glycerol level and was more than 10-fold greater in the presence of hypoglyce-mia. Glucagon had no effect on glycerol metabolism, regardless of the glycemic condition.
Arterial plasma FFAs and β-hydroxybutyrate. Arterial plasma FFA levels were basal in all groups during the control period and fell markedly in response to hyperinsulinemia in experimental period 1 (Table 3). During experimental period 2, they fell to less than 50 μmol/l in both euglycemic groups, whereas they increased mark-edly in the SH and GH groups (to 538 ± 82 and 351 ± 99 μmol/l, respectively). Net hepatic FFA uptake paralleled the changes in plas-ma FFA levels (Table 3). Arterial blood β-hydroxybutyrate (BOHB) levels and net hepatic BOHB output fell in response to the eleva-tion in insulin, but the decline was attenuated in the presence of hypoglycemia with or without glucagon. The presence of glucagon had no discernible effect on FFA or BOHB metabolism (Table 3).
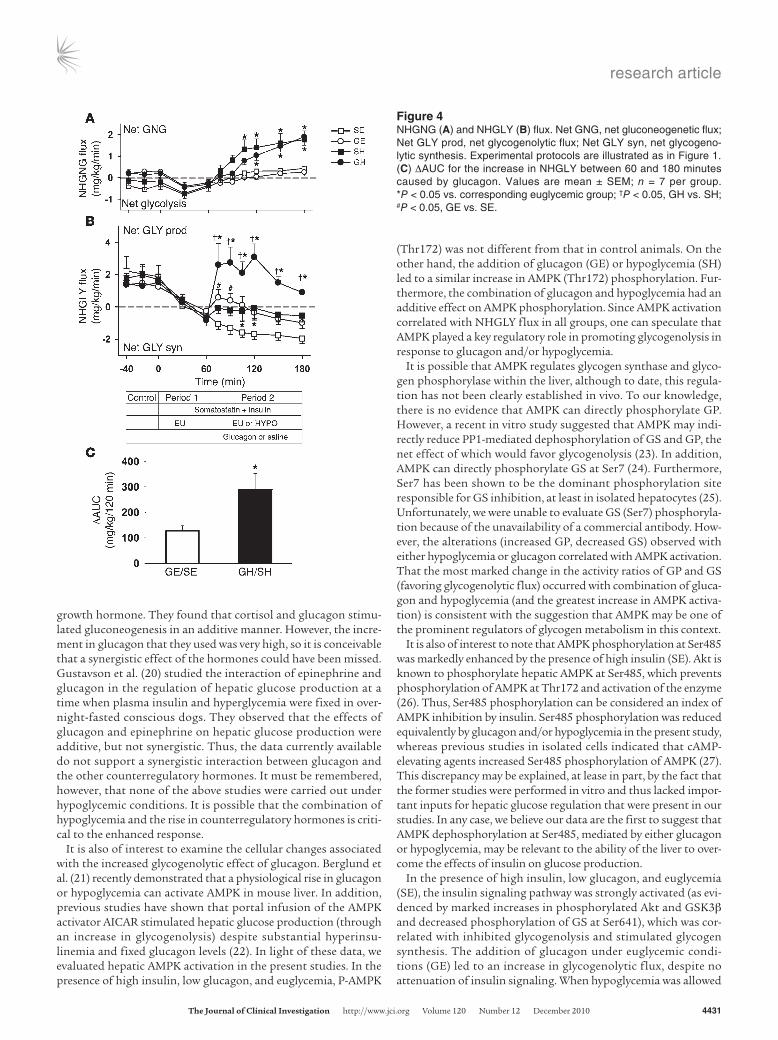
Net hepatic gluconeogenic and glycogenolytic flux. Net hepatic gluco-neogenic (NHGNG) flux was approximately 0.0 ± 0.2 mg/kg/min during the control period (Figure 4A) and decreased to approxi-mately –0.4 ± 0.1 mg/kg/min in all groups during experimental period 1, indicating net glycolysis. It remained close to 0 in the SE and GE groups during experimental period 2, but increased significantly in response to hypoglycemia (SH and GH). Since the increase was identical in the 2 hypoglycemic groups (1.7 ± 0.4 and 1.7 ± 0.3 mg/kg/min increases, respectively; P < 0.05), the drive for gluconeogenesis was not attributable to glucagon.
Net hepatic glycogenolytic (NHGLY) flux was approximately 1.7 ± 0.2 mg/kg/min in all groups at the end of the control period (Figure 4B). During experimental period 1, NHGLY flux fell to –0.5 ± 0.2, –0.7 ± 0.2, –0.3 ± 0.3, and –0.8 ± 0.4 mg/kg/min in the SE, SH, GE, and GH groups, respectively. During experimental period 2, the SE group continued to exhibit net glycogen synthesis (–1.6 ± 0.3 mg/kg/min). Addition of glucagon (GE) caused a small glycogenolytic response followed by a return to net glycogen synthe-sis, but at a much lower rate than in the SE group. During hypogly-cemia in the absence of glucagon (SH), net glycogen synthesis was evident at a very low rate for the entirety of experimental period 2. On the other hand, in the presence of hypoglycemia and an increase in glucagon (GH), NHGLY flux increased to 2.6 ± 1.0 mg/kg/min at 75 minutes and remained elevated throughout the study. The NHGLY flux ΔAUC between 60 and 180 minutes caused by glucagon was greater in the presence of hypoglycemia (289 ± 63 mg/kg/120 min;
Figure 3Blood glucose levels and NHGB. (A) Arterial plasma glucose. (B) NHGB. Experimental protocols are illustrated as in Figure 1. (C) ΔAUC for the increase in NHGO between 60 and 180 minutes caused by glucagon. Values are mean ± SEM; n = 7 per group. *P < 0.05 vs. corresponding euglycemic group; †P < 0.05, GH vs. SH; #P < 0.05, GE vs. SE.

research article
4428 TheJournalofClinicalInvestigation http://www.jci.org Volume 120 Number 12 December 2010
P < 0.01) than in the presence of euglycemia (127 ± 20 mg/kg/120 min; P < 0.05). Hypoglycemia thus caused a 2.3-fold increase in the gly-cogenolytic response to glucagon (Figure 4C).
Molecular changes. Molecular indices in hepatic biopsies from 3–4 dogs in each group were compared with those in hepatic biopsies taken from 3 control animals (overnight-fasted dogs in which somatostatin was given and the levels of insulin, glu-cagon, and glucose were maintained at basal values). The lat-ter animals were part of another study (5) and are included here for reference purposes only. Levels of phosphorylated Akt (Ser473), GSK3β (Ser9), and glycogen synthase (GS) (Ser641) were assayed as indices of hepatic insulin signaling and glyco-gen metabolism (Figure 5 and Supplemental Figure 1; supple-mental material available online with this article; doi:10.1172/JCI40919DS1). Animals in the SE and GE groups exhibited similar, marked increases (~5-fold) in P-Akt and P-GSK3β, and similar decreases (42% and 59%) in P-GS (Ser641), relative to the basal control animals (Figure 5, A–C). However, the pres-ence of hypoglycemia with or without glucagon (SH and GH) blunted Akt and GSK3β phosphorylation and prevented insu-lin-mediated Ser641 dephosphorylation (and activation) of GS (Figure 5C). The GS activity ratio increased 4-fold in the SE group, but this activity was lessened by either glucagon (GE) or hypoglycemia (SH) treatment and was further suppressed by the combination of the 2 stimuli (GH; Figure 5D). On the other hand, the glycogen phosphorylase (GP) activity ratio was sup-pressed (~50%) in SE animals, but this suppression was largely negated in both GE and SH groups (Figure 5E). The combination of glucagon and hypoglycemia (GH) led to a marked 3-fold eleva-tion of GP activity relative to SE. When the activity ratios of the
glycogen-metabolizing enzymes were themselves expressed as a ratio (i.e., GP/GS), levels were 15%, 85%, 40%, and 200% of basal in the SE, GE, SH, and GH groups, respectively (Figure 5F).
To assess markers of glucagon action and the gluconeogenic pro-gram, we assayed levels of phosphorylated CREB (Ser133), FOXO1 (Ser256), CRTC2 (Ser171), and STAT3 (Tyr705) as well as protein lev-els of PCK and PGC1α and mRNA levels of G6PC and PCK1 (Figure 6, A–F, and Supplemental Figure 2). P-CREB was reduced by 65% in the presence of increased insulin, decreased glucagon, and euglycemia, but this decrease was markedly reduced in the presence of glucagon, hypoglycemia, and both combined (GE, SH, and GH; Figure 6A). FOXO1 phosphorylation was markedly increased (4.4-fold) in the SE group relative to control animals, but only a 1.6-fold rise was observed when glucagon was elevated in the absence of hypoglyce-mia. Furthermore, the effect of insulin on FOXO1 phosphorylation was completely prevented in both hypoglycemic groups (Figure 6B). Phosphorylation of CRTC2 and STAT3 was increased approximately 2-fold in all groups compared with basal control animals (Figure 6, C and D). Analysis of gene transcription revealed that PCK1 and G6PC mRNA levels were decreased by 84% and 86%, respectively, in the SE group. This strong repression was modestly lessened by increased glucagon or hypoglycemia, as well as both in combination, but inter-estingly, transcription remained markedly suppressed relative to that in basal control animals (Figure 6E). PGC1α and PCK protein levels were reduced by 55% and 41%, respectively, in the hyperinsulinemic euglycemic group. Their levels failed to change significantly from basal in the presence of glucagon, hypoglycemia, or both combined (Figure 6F), presumably because there was less of a fall in gene expres-sion and there was only a limited time for alteration in mRNA to bring about changes in protein levels.
Table 1Tracer-determined endogenous glucose production and utilization, glucose clearance, and glucose infusion rate
Control Experimental Experimental period period1 period2 30–60min 75min 90min 120min 180minTracer-determinedglucoseproduction(mg/kg/min)SE 2.9 ± 0.3 0.7 ± 0.5 –0.7 ± 0.9 –0.1 ± 0.7 0.4 ± 0.6 1.0 ± 0.3GE 2.2 ± 0.2 0.6 ± 0.9 0.6 ± 0.8 –0.5 ± 1.2 0.1 ± 1.0 0.8 ± 1.0SH 2.5 ± 0.2 0.9 ± 0.8 –0.6 ± 1.4 –0.1 ± 0.9 1.9 ± 0.6A 1.8 ± 0.6GH 2.4 ± 0.1 0.6 ± 0.9 2.3 ± 0.4B 2.0 ± 0.5A,B 3.5 ± 0.6A 3.3 ± 0.5A
Tracer-determinedglucoseutilization(mg/kg/min)SE 2.8 ± 0.3 11.9 ± 1.8 15.0 ± 1.8 16.5 ± 1.9 18.2 ± 2.0 19.6 ± 2.2GE 2.2 ± 0.2 11.6 ± 1.7 13.2 ± 0.5 14.2 ± 0.6 15.8 ± 0.8 18.6 ± 1.3SH 2.5 ± 0.2 10.6 ± 1.3 8.2 ± 1.5A 7.3 ± 1.1A 6.3 ± 0.8A 6.2 ± 0.9A
GH 2.4 ± 0.2 9.2 ± 1.7 8.1 ± 1.1A 7.0 ± 1.0A 5.8 ± 0.9A 5.3 ± 0.7A
Glucoseclearance(ml/kg/min)SE 2.5 ± 0.3 11.4 ± 1.7 14.2 ± 1.8 15.4 ± 1.7 16.8 ± 1.8 18.3 ± 2.3GE 2.0 ± 0.2 11.1 ± 1.6 12.7 ± 0.7 13.9 ± 0.9 15.7 ± 1.3 18.2 ± 1.2SH 2.2 ± 0.2 11.0 ± 1.4 12.7 ± 2.0 13.1 ± 1.9 13.4 ± 1.6 13.6 ± 1.8A
GH 2.2 ± 0.1 9.3 ± 1.8 13.1 ± 2.0 13.2 ± 2.0 12.6 ± 2.0 11.8 ± 1.6A
Glucoseinfusionrate(mg/kg/min)SE NA 6.6 ± 1.7 14.7 ± 1.1 16.4 ± 1.5 18.4 ± 1.0 18.5 ± 1.1GE NA 6.4 ± 1.6 12.5 ± 1.4 14.8 ± 0.9 15.0 ± 1.7 18.0 ± 1.6SH NA 6.7 ± 1.8 8.8 ± 1.0A 5.7 ± 0.7A 4.5 ± 0.6A,C 4.6 ± 0.6A
GH NA 7.1 ± 2.2 7.3 ± 1.3A 4.0 ± 0.9A 3.3 ± 1.0A 3.1 ± 0.9A
Values are mean ± SEM; n = 7 per group. AP < 0.05 vs. corresponding euglycemic group. BP < 0.05 vs. SH.

research article
TheJournalofClinicalInvestigation http://www.jci.org Volume 120 Number 12 December 2010 4429
AMPK phosphorylation at the Thr172 site did not change in the SE animals. On the other hand, both glucagon and hypoglycemia (GE and SH) caused a 2.5-fold increase in P-AMPK, and the com-bination (GH) led to a nearly 4-fold rise (Figure 7A). AMPK phos-phorylation at Ser485 was 2.5-fold higher in the SE group than in basal control animals. This increase was prevented by glucagon, hypoglycemia, or the combination (Figure 7B). Finally, P-ACC1, a downstream marker of AMPK activity, confirmed the results obtained with AMPK at the Thr172 site (Figure 7C).
DiscussionPrevious studies have shown that the α cell is critical for a nor-mal counterregulatory response to insulin-induced hypoglycemia (4, 6–9). In fact, glucagon is widely thought to provide the primary defense against a low blood glucose level. On the other hand, insu-lin is known to exert a powerful restraining effect on glucagon’s action (3). This raises the question of how glucagon can have such a prominent role in counterregulation if it is so easily subject to insulin’s inhibitory action. The aim of the present study, there-fore, was to determine the extent to which hypoglycemia enhances
glucagon’s ability to overcome insulin’s inhibitory action on the liver and to shed light on the mechanism by which this occurs. The present results indicate that hypoglycemia (~50 mg/dl), or some factor associated with it, enhanced glucagon’s ability to increase glucose production almost 3-fold, even in the presence of extreme-ly high insulin levels. Furthermore, they showed that this change reflected a marked increase in glycogenolysis, which was associ-ated with hypoglycemia-induced inhibition of insulin signaling and increased AMPK activity caused by the combined effects of the fall in glucose and the rise in glucagon.
In the current study, in the presence of hyperinsulinemia and euglycemia, a physiologic rise in glucagon mimicking that occurs in response to insulin-induced hypoglycemia, caused an increase in NHGO that had a ΔAUC of 85 mg/kg/120 min. When the same rise in glucagon was brought about under hypoglycemic conditions, it produced a 3-fold greater increase (251 mg/kg/120 min) in NHGO. This correlated with a 2.3-fold greater increase in glycogenolysis and little or no difference in gluconeogenesis. It should be noted that the changes in plasma epinephrine, norepinephrine, and cortisol that occurred in response to hypoglycemia were the same whether gluca-
Table 2Lactate and alanine arterial blood levels and net hepatic balance
Control Experimental Experimental period period1 period2 30–60min 75min 90min 120min 180minArteriallactatebloodlevel(μmol/ml)SE 722 ± 109 817 ± 66 763 ± 101 764 ± 92 701 ± 89 651 ± 85GE 552 ± 119 688 ± 67 748 ± 86 791 ± 77 766 ± 80 768 ± 79SH 773 ± 137 845 ± 82 591 ± 83 524 ± 95 1200 ± 337 1532 ± 369A
GH 600 ± 106 662 ± 89 632 ± 102 787 ± 214 1279 ± 347 1545 ± 314A
Nethepaticlactatebalance(μmol/kg/min)SE 8.6 ± 6.4 10 ± 2.9 5.4 ± 2.9 2.6 ± 2.6 0.0 ± 2.6 –1.9 ± 1.4GE 1.4 ± 2.9 7.3 ± 2.3 6.5 ± 1.8 5.3 ± 1.8 2.3 ± 1.4 –1.2 ± 2.8SH 6.2 ± 2.9 10 ± 2.6 0.6 ± 1.9 –4.1 ± 1.6 –9.3 ± 2.6 –11.3 ± 3.0A
GH 3.0 ± 3.2 8.6 ± 1.9 5.8 ± 2.3 3.1 ± 3.0 –4.0 ± 2.6 –11.9 ± 3.6A
LactatefractionalextractionSE 0.3 ± 0.27 0.6 ± 0.16 0.3 ± 0.19 0.2 ± 0.17 0.04 ± 0.14 –0.1 ± 0.10GE 0.1 ± 0.16 0.5 ± 0.14 0.3 ± 0.06 0.2 ± 0.06 0.1 ± 0.08 0.0 ± 0.10SH 0.2 ± 0.01 0.5 ± 0.12 0.1 ± 0.14 –0.3 ± 0.15A –0.3 ± 0.11 –0.2 ± 0.06GH 0.0 ± 0.14 0.5 ± 0.11 0.4 ± 0.21 0.2 ± 0.16B –0.1 ± 0.09 –0.2 ± 0.06
Arterialalaninebloodlevel(μmol/ml)SE 401 ± 31 336 ± 34 259 ± 15 223 ± 13 191 ± 12 151 ± 12GE 323 ± 36 267 ± 27 215 ± 20 207 ± 24 182 ± 19 151 ± 15SH 381 ± 36 319 ± 36 237 ± 23 204 ± 15 188 ± 15 168 ± 12GH 353 ± 52 344 ± 39 234 ± 22 206 ± 19 192 ± 20 164 ± 18
Nethepaticalaninebalance(μmol/kg/min)SE –2.3 ± 0.3 –2.6 ± 0.2 –2.6 ± 0.5 –2.3 ± 0.4 –2.6 ± 0.2 –2.3 ± 0.2GE –2.3 ± 0.3 –2.3 ± 0.4 –2.4 ± 0.3 –2.2 ± 0.3 –2.3 ± 0.3 –2.4 ± 0.4SH –2.3 ± 0.4 –2.3 ± 0.5 –2.1 ± 0.4 –2.2 ± 0.2 –2.2 ± 0.3 –2.8 ± 0.3GH –2.6 ± 0.5 –2.2 ± 0.3 –2.8 ± 0.4 –2.2 ± 0.3 –2.3 ± 0.4 –2.9 ± 0.4
AlaninefractionalextractionSE –0.2 ± 0.03 –0.3 ± 0.02 –0.3 ± 0.05 –0.4 ± 0.05 –0.4 ± 0.04 –0.5 ± 0.02GE –0.2 ± 0.02 –0.3 ± 0.02 –0.3 ± 0.02 –0.3 ± 0.02 –0.4 ± 0.03 –0.4 ± 0.03SH –0.2 ± 0.03 –0.3 ± 0.05 –0.3 ± 0.04 –0.3 ± 0.03 –0.3 ± 0.04 –0.4 ± 0.03GH –0.2 ± 0.05 –0.3 ± 0.06 –0.4 ± 0.04 –0.3 ± 0.05 –0.3 ± 0.05 –0.4 ± 0.05
Values are mean ± SEM; n = 7 per group. AP < 0.05 vs. corresponding euglycemic group. BP < 0.05 vs. SH. Negative balance is indicative of uptake.

research article
4430 TheJournalofClinicalInvestigation http://www.jci.org Volume 120 Number 12 December 2010
gon was increased or not; thus, a differential response in their secre-tion or subsequent effects on the liver cannot explain the difference in glucose production in the 2 hypoglycemic groups.
Although differences in gluconeogenesis were not part of the explanation for the increase in glucagon action, hypoglycemia with or without glucagon (SH and GH) caused a marked 1.7-mg/kg/min increase in NHGNG flux. This leads to the question of how the increase in gluconeogenesis came about, since the cellular indices of the gluconeogenic program were either at or below values evi-dent in the control animals. The answer lies in the fact that hypo-glycemia caused marked increases in the release of lactate from muscle and glycerol from fat. This resulted in large increments in their delivery to and uptake by the liver, which in turn caused a substrate-driven increase in gluconeogenic flux. The increase in muscle glycogenolysis undoubtedly resulted from the hypogly-cemia-driven rise in plasma epinephrine, whereas the increase in lipolysis probably resulted from the hypoglycemia-driven increase in neural input (norepinephrine) to fat (10, 11).
The question then arises as to the mechanism by which the liv-er’s glycogenolytic responsiveness to glucagon was enhanced by
hypoglycemia. It is unclear which physiologic signal — increased cortisol; increased epinephrine; increased norepinephrine; increased neural input to the liver, fat, and muscle; hypoglycemia per se; or some combination of these — explains this important adaptive response. It is clear that the liver is capable of adjusting its glucose output in response to variations in the blood glucose concentration, independent of hormonal changes (12–16). This phenomenon of hepatic autoregulation has been demonstrated to occur in various in vitro preparations (14–16) and in vivo (12, 13). It is therefore possible that hypoglycemia per se sensi-tized the liver to glucagon.
Another possibility is that the enhanced response of the liver to glucagon during insulin-induced hypoglycemia is related to the interaction of glucagon with one or other of the counterregulato-ry hormones. Several studies have looked at the acute interaction of the counterregulatory hormones (17–20). Lecavalier et al. (19) performed studies in humans to assess the interaction between glucagon and cortisol on gluconeogenesis from 14C lactate. In their studies, glucose was clamped, and they used a pancreatic pituitary clamp to control for changes in insulin, glucagon, and
Table 3Arterial plasma FFA levels, glycerol and BOHB blood levels, and net hepatic balance
Control Experimental Experimental period period1 period2 30–60min 75min 90min 120min 180minArterialplasmaFFAlevel(μmol/l)SE 756 ± 124 124 ± 23 79 ± 9 66 ± 6 54 ± 6 38 ± 5GE 840 ± 109 109 ± 22 91 ± 21 67 ± 16 49 ± 13 43 ± 11SH 816 ± 79 120 ± 15 233 ± 132 587 ± 162A 607 ± 112A 513 ± 73A
GH 829 ± 112 95 ± 28 155 ± 44 267 ± 50B 535 ± 137A 338 ± 105A
NethepaticFFAbalance(μmol/kg/min)SE –2.8 ± 0.6 –0.1 ± 0.2 0.0 ± 0.1 0.0 ± 0.1 –0.1 ± 0.1 0.0 ± 0.1GE –2.9 ± 0.4 –0.2 ± 0.1 –0.2 ± 0.1 –0.2 ± 0.1 0.0 ± 0.1 –0.1 ± 0.1SH –2.7 ± 0.4 0.0 ± 0.1 –0.6 ± 0.5 –2.2 ± 0.7A –2.6 ± 0.5A –2.0 ± 0.5A
GH –3.0 ± 0.6 0.0 ± 0.1 –0.2 ± 0.2 –0.6 ± 0.2B –1.8 ± 0.7A –1.2 ± 0.6
Arterialglycerolbloodlevel(μmol/ml)SE 78 ± 17 33 ± 12 26 ± 6 24 ± 8 22 ± 8 22 ± 5GE 86 ± 15 38 ± 11 26 ± 6 28 ± 7 22 ± 4 28 ± 6SH 80 ± 10 38 ± 8 73 ± 29 163 ± 26A 235 ± 35A 257 ± 36A
GH 85 ± 15 42 ± 13 104 ± 45A 125 ± 27A 212 ± 26A 199 ± 27A,B
Nethepaticglycerolbalance(μmol/kg/min)SE –1.6 ± 0.4 –0.5 ± 0.2 –0.5 ± 0.1 –0.4 ± 0.1 –0.4 ± 0.1 –0.5 ± 0.1GE –1.7 ± 0.3 –0.7 ± 0.2 –0.7 ± 0.4 –0.4 ± 0.2 –0.4 ± 0.1 –0.7 ± 0.2SH –1.7 ± 0.2 –0.8 ± 0.2 –2.0 ± 1.0 –3.9 ± 0.8A –5.5 ± 1.2A –7.2 ± 1.4A
GH –2.2 ± 0.5 –1.0 ± 0.4 –2.8 ± 1.0A –3.1 ± 0.5A –5.1 ± 0.7A –5.6 ± 0.6A,B
ArterialBOHBbloodlevel(μmol/ml)SE 29 ± 5 21 ± 4 21 ± 4 17 ± 4 18 ± 5 20 ± 5GE 38 ± 9 13 ± 1 10 ± 1 10 ± 1 9 ± 1 10 ± 1SH 28 ± 3 20 ± 6 17 ± 5 30 ± 5 33 ± 10 30 ± 12GH 31 ± 6 14 ± 1 13 ± 2 14 ± 1B 18 ± 2 16 ± 2
NethepaticBOHBbalance(μmol/kg/min)SE 0.5 ± 0.1 0.2 ± 0.1 0.1 ± 0.0 0.1 ± 0.0 0.0 ± 0.1 0.0 ± 0.0GE 1.1 ± 0.3 0.2 ± 0.1 0.2 ± 0.1 0.1 ± 0.1 0.1 ± 0.0 0.1 ± 0.0SH 0.5 ± 0.2 0.3 ± 0.1 0.3 ± 0.1 0.8 ± 0.4 0.3 ± 0.2 0.3 ± 0.2GH 0.9 ± 0.3 0.2 ± 0.1 0.2 ± 0.1 0.2 ± 0.1 0.3 ± 0.1 0.2 ± 0.1
Values are mean ± SEM; n = 7 per group. AP < 0.05 vs. corresponding euglycemic group. BP < 0.05 vs. SH. Negative balance is indicative of uptake.
research article
TheJournalofClinicalInvestigation http://www.jci.org Volume 120 Number 12 December 2010 4431
growth hormone. They found that cortisol and glucagon stimu-lated gluconeogenesis in an additive manner. However, the incre-ment in glucagon that they used was very high, so it is conceivable that a synergistic effect of the hormones could have been missed. Gustavson et al. (20) studied the interaction of epinephrine and glucagon in the regulation of hepatic glucose production at a time when plasma insulin and hyperglycemia were fixed in over-night-fasted conscious dogs. They observed that the effects of glucagon and epinephrine on hepatic glucose production were additive, but not synergistic. Thus, the data currently available do not support a synergistic interaction between glucagon and the other counterregulatory hormones. It must be remembered, however, that none of the above studies were carried out under hypoglycemic conditions. It is possible that the combination of hypoglycemia and the rise in counterregulatory hormones is criti-cal to the enhanced response.
It is also of interest to examine the cellular changes associated with the increased glycogenolytic effect of glucagon. Berglund et al. (21) recently demonstrated that a physiological rise in glucagon or hypoglycemia can activate AMPK in mouse liver. In addition, previous studies have shown that portal infusion of the AMPK activator AICAR stimulated hepatic glucose production (through an increase in glycogenolysis) despite substantial hyperinsu-linemia and fixed glucagon levels (22). In light of these data, we evaluated hepatic AMPK activation in the present studies. In the presence of high insulin, low glucagon, and euglycemia, P-AMPK
(Thr172) was not different from that in control animals. On the other hand, the addition of glucagon (GE) or hypoglycemia (SH) led to a similar increase in AMPK (Thr172) phosphorylation. Fur-thermore, the combination of glucagon and hypoglycemia had an additive effect on AMPK phosphorylation. Since AMPK activation correlated with NHGLY flux in all groups, one can speculate that AMPK played a key regulatory role in promoting glycogenolysis in response to glucagon and/or hypoglycemia.
It is possible that AMPK regulates glycogen synthase and glyco-gen phosphorylase within the liver, although to date, this regula-tion has not been clearly established in vivo. To our knowledge, there is no evidence that AMPK can directly phosphorylate GP. However, a recent in vitro study suggested that AMPK may indi-rectly reduce PP1-mediated dephosphorylation of GS and GP, the net effect of which would favor glycogenolysis (23). In addition, AMPK can directly phosphorylate GS at Ser7 (24). Furthermore, Ser7 has been shown to be the dominant phosphorylation site responsible for GS inhibition, at least in isolated hepatocytes (25). Unfortunately, we were unable to evaluate GS (Ser7) phosphoryla-tion because of the unavailability of a commercial antibody. How-ever, the alterations (increased GP, decreased GS) observed with either hypoglycemia or glucagon correlated with AMPK activation. That the most marked change in the activity ratios of GP and GS (favoring glycogenolytic flux) occurred with combination of gluca-gon and hypoglycemia (and the greatest increase in AMPK activa-tion) is consistent with the suggestion that AMPK may be one of the prominent regulators of glycogen metabolism in this context.
It is also of interest to note that AMPK phosphorylation at Ser485 was markedly enhanced by the presence of high insulin (SE). Akt is known to phosphorylate hepatic AMPK at Ser485, which prevents phosphorylation of AMPK at Thr172 and activation of the enzyme (26). Thus, Ser485 phosphorylation can be considered an index of AMPK inhibition by insulin. Ser485 phosphorylation was reduced equivalently by glucagon and/or hypoglycemia in the present study, whereas previous studies in isolated cells indicated that cAMP-elevating agents increased Ser485 phosphorylation of AMPK (27). This discrepancy may be explained, at lease in part, by the fact that the former studies were performed in vitro and thus lacked impor-tant inputs for hepatic glucose regulation that were present in our studies. In any case, we believe our data are the first to suggest that AMPK dephosphorylation at Ser485, mediated by either glucagon or hypoglycemia, may be relevant to the ability of the liver to over-come the effects of insulin on glucose production.
In the presence of high insulin, low glucagon, and euglycemia (SE), the insulin signaling pathway was strongly activated (as evi-denced by marked increases in phosphorylated Akt and GSK3β and decreased phosphorylation of GS at Ser641), which was cor-related with inhibited glycogenolysis and stimulated glycogen synthesis. The addition of glucagon under euglycemic condi-tions (GE) led to an increase in glycogenolytic flux, despite no attenuation of insulin signaling. When hypoglycemia was allowed
Figure 4NHGNG (A) and NHGLY (B) flux. Net GNG, net gluconeogenetic flux; Net GLY prod, net glycogenolytic flux; Net GLY syn, net glycogeno-lytic synthesis. Experimental protocols are illustrated as in Figure 1. (C) ΔAUC for the increase in NHGLY between 60 and 180 minutes caused by glucagon. Values are mean ± SEM; n = 7 per group. *P < 0.05 vs. corresponding euglycemic group; †P < 0.05, GH vs. SH; #P < 0.05, GE vs. SE.

research article
4432 TheJournalofClinicalInvestigation http://www.jci.org Volume 120 Number 12 December 2010
to occur in the absence of glucagon (SH), insulin signaling was blunted (decreased phosphorylation of Akt, GSK3β, and increased Ser641 phosphorylation of GS), and this resulted in increased gly-cogenolysis. The addition of glucagon to hypoglycemia (GH) did not cause a further reduction in insulin signaling, yet it caused the greatest increase in the glycogenolytic rate. Thus, our data suggest that hypoglycemia, or some aspect associated with it, can interfere with insulin-mediated regulation of Akt, GSK3β, and GS (Ser641), which undoubtedly facilitates hepatic glycogenoly-sis. Moreover, we posit that the addition of glucagon (which does not impair insulin signaling) stimulated glycogenolysis, possi-bly through AMPK-mediated alteration of GS and GP activities. Finally, this glycogenolytic effect was magnified when glucagon and hypoglycemia were combined, leading to an additive effect on AMPK activation, in the presence of hypoglycemia-mediated impairment of insulin signaling.
Although gluconeogenic f lux was not a major factor in increased glucose production in the acute response to glucagon and/or hypoglycemia, it is interesting to note that the substan-
tial suppression of the gluconeogenic program at the genetic level was only modestly lessened by addition of glucagon and/or the hypoglycemic condition. Insulin (SE) predictably led to increased FOXO1, STAT3, and CRTC2 phosphorylation and decreased CREB phosphorylation, all of which likely factored into the substantial decrease observed in gluconeogenic gene expression. Addition of glucagon and/or hypoglycemia (GE, SH, and GH) led to slight increases in gluconeogenic mRNA that cor-related with alterations in CREB and FOXO1 phosphorylation. However, STAT3 and CRTC2 phosphorylation were maintained at elevated levels, and since gluconeogenic gene expression was still largely suppressed, it appears that these factors may domi-nate the control of PCK1 and G6PC gene expression, at least dur-ing hyperinsulinemia. In addition, AMPK, much like insulin, can phosphorylate CRTC2, resulting in the cytoplasmic sequestra-tion of this protein and a consequent reduction in gluconeogenic gene expression (28). However, our results indicate that the level of CRTC2 phosphorylation in response to insulin (SE) was not further increased in the GE, SH or GH groups despite the activa-
Figure 5Markers of insulin signaling and glycogen metabolism. Phosphorylation of (A) Akt (Ser473), (B) GSK3β (Ser9), and (C) GS (Ser641) relative to levels observed in basal control animals. Activity ratios of (D) GS, (E) GP, and (F) GP/GS. Values are means ± SEM; n = 3–4 per group. §P < 0.05 vs. basal; *P < 0.05 vs. corresponding euglycemic group; †P < 0.05, GH vs. SH; #P < 0.05, GE vs. SE.

research article
TheJournalofClinicalInvestigation http://www.jci.org Volume 120 Number 12 December 2010 4433
tion of AMPK. It therefore appears that in the presence of marked hyperinsulinemia, AMPK activation by glucagon and/or hypogly-cemia does not cause further CRTC2 phosphorylation.
In summary, hypoglycemia increased glucagon’s ability to overcome insulin’s inhibitory effect on hepatic glucose production. This effect was attributable to marked enhancement of net glycogen breakdown with no effect on gluconeogenesis. At the cellular level, it was associ-ated with reduced insulin signaling caused by some aspect of hypogly-cemia and by activation of AMPK resulting from the combination of increased glucagon and hypoglycemia. Which aspect of hypoglycemia causes these changes (hypoglycemia per se, or some other component of the counterregulatory response) remains to be determined.
MethodsAnimal care and surgical procedures. Experiments were performed on 18-hour overnight-fasted, conscious mongrel dogs of either sex (19–25 kg). The surgical facility met the standards published by the American Associa-
tion for the Accreditation of Laboratory Animal Care guidelines, and the protocol was approved by the Vanderbilt University Medical Center Animal Care Committee.
At 2 weeks prior to the study, a laparotomy was performed for placement of silastic catheters in the jejunal and splenic veins for intraportal infusion of insulin (Lilly) and glucagon (Lilly), and sampling catheters in the femoral artery as well as the portal vein and left common hepatic vein, as previously described (29). Ultrasonic flow probes (Transonic Systems) were positioned around the hepatic artery and portal vein, as described previously (30). All the animals studied met the established criteria for good health: (a) leukocyte count less than 18,000/mm3, (b) hematocrit greater than 35%, (c) good appetite, and (d) normal stools. On the day of the study, catheters were placed in leg veins for [3-3H] glucose (Du Pont NEN), indocyanine green (Sigma-Aldrich), peripheral glucose (20% dextrose; Baxter Healthcare), and somatostatin infusion.
Experimental design. 4 groups of animals were studied: SE, SH, GE, and GH. Each experiment consisted of equilibration (–140 to –40 minutes), basal (–40 to 0 minutes), and experimental (0 to 180 minutes) periods.
Figure 6Markers of glucagon action and the gluconeogenic program. Phosphorylation of (A) CREB (Ser133), (B) FOXO1 (Ser256), (C) CRTC2 (Ser171), and (D) STAT3 (Tyr705) and levels of (E) gluconeogenic mRNA (PCK1 and G6PC) and (F) gluconeogenic protein (PCK and PGC1α) expression, relative to levels observed in basal control animals. Values are mean ± SEM; n = 3–4 per group. §P < 0.05 vs. basal; *P < 0.05 vs. corresponding euglycemic group; †P < 0.05, GH vs. SH; #P < 0.05, GE vs. SE.

research article
4434 TheJournalofClinicalInvestigation http://www.jci.org Volume 120 Number 12 December 2010
At –140 minutes, a priming dose of [3-3H] glucose (33 μCi) was given, fol-lowed by a constant infusion of [3-3H] glucose (0.35 μCi/min) and indocya-nine green (0.07 mg/min). The equilibration period was followed by a con-trol period and an experimental period, which was divided into period 1 (0–60 minutes) and period 2 (60–180 minutes). In experimental period 1, somatostatin (0.8 μg/kg/min) and intraportal insulin (5.0 mU/kg/min) were infused, and glucose was monitored every 5 minutes in order to maintain euglycemia by infusing glucose through the saphenous vein as required (20% dextrose). In experimental period 2, the somatostatin and insulin infusions were continued, and either glucagon (2.3 ng/kg/min) or saline (0.9% NaCl) were infused intraportally. Glucose was infused as required to maintain euglycemia (~100 mg/dl) or to establish hypoglyce-mia of approximately 50 mg/dl. All animals were euthanized at the end of the experiment, and hepatic biopsies were taken and frozen at –70°C. The correct positions of the catheters’ tips were also confirmed at autopsy.
Real-time PCR and Western blot analysis. Biopsies from hepatic liver lobes 2, 3, and 7 were obtained within 2 minutes of the final sampling time point. In each case, the dog was anesthetized with sodium pentobarbital, a lapa-rotomy was used to expose the liver, and approximately 5 g of each liver lobe was freeze-clamped with tongs cooled in liquid nitrogen. The frozen liver samples were stored at –70°C until subsequent analysis for protein (via Western blotting) and mRNA (via real-time PCR) levels.
Total RNA was extracted by homogenizing 50 mg of frozen canine liver in Tri-reagent (Sigma-Aldrich) following the manufacturer’s instructions, and RNA was further purified using the Qiagen RNEasy kit (Qiagen). First-
strand cDNA was synthesized from total RNA using the High Capacity reverse transcription kit (Applied Biosystems). Primer pairs were as follows: PCK1, 5′-AGCTTTCAATGCCCGATTTCCAGG-3′ and 5′-TCAGCTCGAT-GCCGATCTTTGACA-3′; G6PC, 5′-ATGCCTTCTATGTCCTCTTTCC-3′ and 5′-GCCAGTCTCCAATCACAGC-3′; hypoxanthine phosphoribo-syl transferase 1 (HPRT1), 5′-AGCTTGCTGGTGAAAAGGAC-3′ and 5′-TTATAGTCAAGGGCATATCC-3′. Real-time PCR analysis was per-formed using iQ Supermix reagent (Bio-Rad). Test genes were normalized to the housekeeping gene HPRT1 using the Livak method (31).
For Western blotting, sample preparation (in conditions that inhibited endogenous protease, kinase, and phosphatase activities), electrophoretic sep-aration, blotting, normalization, and immunodetection of proteins was per-formed essentially as described previously (32). Antibodies specific for total and phosphorylated Akt, GSK3β, GS, FOXO1, AMPK, ACC, CREB, STAT, and CRTC2 were purchased from Cell Signaling, while the actin (loading control) and PGC1α antibodies were purchased from Santa Cruz Biotechnology. The PCK antibody was a gift from D.K. Granner (Vanderbilt University School of Medicine). Test protein bands in the linear signal range were quantified using ImageJ software (http://rsb.info.nih.gov/ij/). Antibody incubation, washing, and exposure conditions were optimized for each antibody individually, as done previously (33). Actin was used as a loading control for all test proteins. Each antibody cross-reacted with 1 canine protein at the appropriate molecu-lar weight. Blots probed with phosphospecific antibodies were stripped and reprobed with antibodies against the respective total protein. Thus, data for phosphoproteins are corrected for the respective total proteins. In the case of PCK and PGC1α, protein levels were normalized against actin.
GS and GP activity determination. GS and GP activity ratios were assessed using standard, established enzyme assays (34, 35).
Analytical procedures. Immediately after samples were drawn, 4 10-μl aliquots of plasma were analyzed for glucose using the glucose oxidase method in a glu-cose analyzer (Beckman Instruments). [3-3H] glucose, lactate, alanine, glycerol, β-hydroxybutyrate, indocyanine green, insulin, glucagon, catecholamines, cor-tisol, and nonesterified FFAs were determined as previously described (36, 37). All samples were placed at –70°C until the assays were completed.
General calculations. Hepatic blood flow was determined by 2 methods: transonic flow probes and indocyanine green. The data shown were calcu-lated using transonic flows, since no assumptions regarding the distribu-tion of flow in the portal vein and hepatic artery were then required. Plas-ma glucose values were converted to blood glucose values using previously established correction factors (38). Net hepatic balance was determined as previously described (36). Net fractional extraction was calculated as net hepatic balance/loadin. Tracer-determined whole-body glucose produc-tion and utilization were measured using a primed, constant infusion of [3-3H] glucose. Data calculation was carried out using the 2-compartment model described by Mari (39) and canine parameters reported by Dobbins (40). The approximate plasma insulin and glucagon concentrations in the hepatic sinusoidal bed were calculated as previously described (38).
AUC calculations. The changes caused by saline or glucagon under eugly-cemic or hypoglycemic conditions were calculated as difference relative to the 60-minute time point (i.e., 60–180 minutes). Therefore, the effect of glucagon in the presence of hyperinsulinemia/euglycemia (GE vs. SE) or hyperinsulinemia/hypoglycemia (GH vs. SH) could be compared.
Figure 7AMPK signaling. AMPK phosphorylation at (A) Thr172 (index of acti-vation) and (B) Ser485 (index of inhibition by insulin) and (C) ACC (Ser79) phosphorylation, relative to levels observed in basal control animals. Values are mean ± SEM; n = 3–4 per group. §P < 0.05 vs. basal; *P < 0.05 vs. corresponding euglycemic group; †P < 0.05, GH vs. SH; #P < 0.05, GE vs. SE.

research article
TheJournalofClinicalInvestigation http://www.jci.org Volume 120 Number 12 December 2010 4435
NHGNG flux and NHGLY flux calculations. Gluconeogenesis is the syn-thesis and release of glucose formed from noncarbohydrate precursors. Glucose-6-phosphate produced from flux through the gluconeogenic pathway is not only released as glucose, it can also be stored as glycogen, oxidized, or released as lactate. Therefore, there is a distinction between gluconeogenic flux to glucose-6-phosphate, which is the conversion of pre-cursors to glucose-6-phosphate, and gluconeogenesis per se, which is the release of glucose derived from gluconeogenic flux into the blood. In the present study, we estimated NHGNG flux relative to glucose-6-phosphate and NHGLY flux as described previously (38).
Statistics. Data were analyzed for differences between SE and GE and between SH and GH groups. Statistical comparisons were carried out using 2-way repeated-measures ANOVA and 2-way ANOVA with post-hoc data analysis determined by Student-Newman-Keuls method (Sigma Stat, SPSS Inc.). A P value less than 0.05 was considered significant.
AcknowledgmentsThe authors thank Margaret Lautz, Jon Hastings, Susan Hajizadeh, Wanda Snead, Eric Allen, and Patrick Donahue for their excellent
technical support and Dale Edgerton and Mary Courtney Moore for their assistance with the manuscript. This work was supported by NIH grants R37 DK18243, R37 DK18243S, and P60 DK020593 to A.D. Cherrington and R37 DK27221 to P.J. Roach. A.D. Cher-rington holds The Jacquelyn A. Turner and Dr. Dorothy J. Turner Chair in Diabetes Research, Vanderbilt University Medical School.
Received for publication September 3, 2010, and accepted Septem-ber 29, 2010.
Address correspondence to: Alan D. Cherrington, Molecular Physiology and Biophysics, Vanderbilt University Medical Center, 702 Light Hall, Nashville, Tennessee 37232-0615, USA. Phone: 615.322.7013; Fax: 615.343.0490; E-mail: alan.cherrington@ vanderbilt.edu.
This work was presented in part at the American Diabetes Asso-ciation 66th Scientific Sessions, Washington, DC, USA, on June 9–13, 2006.
1. Cryer PE, Davis SN, Shamoon H. Hypoglycemia in diabetes. Diabetes Care. 2003;26(6):1902–1912.
2. Cryer PE. The prevention and correction of hypo-glycemia. In: Jefferson L, ed. Handbook of Physiology: The Endocrine Pancreas and Regulation of Metabolism. New York, New York, USA: Oxford University Press; 2001:1057–1092.
3. Steiner KE, Williams PE, Lacy WW, Cherrington AD. Effects of insulin on glucagon-stimulated glu-cose production in the conscious dog. Metabolism. 1990;39(12):1325–1333.
4. Dobbins RL, Connolly CC, Neal DW, Palladino LJ, Parlow AF, Cherrington AD. Role of glucagon in countering hypoglycemia induced by insulin infusion in dogs. Am J Physiol. 1991;261(6 pt 1):E773–E781.
5. Ramnanan CJ, et al. Molecular characterization of insulin-mediated suppression of hepatic glucose production in vivo. Diabetes. 2010;59(6):1302–1311.
6. Gerich J, et al. Hormonal mechanisms of recovery from insulin-induced hypoglycemia in man. Am J Physiol. 1979;236(4):E380–E385.
7. Cryer PE, Tse TF, Clutter WE, Shah SD. Roles of glucagon and epinephrine in hypoglycemic and nonhypoglycemic glucose counterregulation in humans. Am J Physiol. 1984;247(2 pt 1):E198–E205.
8. Taborsky GJ Jr, Ahren B, Havel PJ. Autonomic mediation of glucagon secretion during hypoglyce-mia: implications for impaired alpha-cell responses in type 1 diabetes. Diabetes. 1998;47(7):995–1005.
9. Havel PJ, et al. Redundant parasympathetic and sympathoadrenal mediation of increased glucagon secretion during insulin-induced hypoglycemia in conscious rats. Metabolism. 1994;43(7):860–866.
10. Connolly CC, et al. Regulation of lipolysis and ketogenesis by norepinephrine in conscious dogs. Am J Physiol. 1991;261(4 pt 1):E466–E472.
11. Steiner KE, Fuchs H, Williams PE, Stevenson RW, Cherrington AD, Alberti KG. Regulation of ketogenesis by epinephrine and norepinephrine in the overnight-fasted, conscious dog. Diabetes. 1985;34(5):425–432.
12. Sacca L, Cryer PE, Sherwin RS. Blood glucose regu-lates the effects of insulin and counterregulatory hormones on glucose production in vivo. Diabetes. 1979;28(6):533–536.
13. Bolli G, et al. Role of hepatic autoregulation in defense against hypoglycemia in humans. J Clin Invest. 1985;75(5):1623–1631.
14. Ruderman NB, Herrera MG. Glucose regulation of hepatic gluconeogenesis. Am J Physiol. 1968; 214(6):1346–1351.
15. Glinsmann WH, Hern EP, Lynch A. Intrinsic regu-
lation of glucose output by rat liver. Am J Physiol. 1969;216(4):698–703.
16. McCraw EF, Peterson MJ, Ashmore J. Autoregula-tion of glucose metabolism in the isolated perfused rat liver. Proc Soc Exp Biol Med. 1967;126(1):232–236.
17. Eigler N, Sacca L, Sherwin RS. Synergistic inter-actions of physiologic increments of glucagon, epinephrine, and cortisol in the dog: a model for stress-induced hyperglycemia. J Clin Invest. 1979;63(1):114–123.
18. Shamoon H, Hendler R, Sherwin RS. Synergistic interactions among antiinsulin hormones in the pathogenesis of stress hyperglycemia in humans. J Clin Endocrinol Metab. 1981;52(6):1235–1241.
19. Lecavalier L, Bolli G, Gerich J. Glucagon-corti-sol interactions on glucose turnover and lactate gluconeogenesis in normal humans. Am J Physiol. 1990;258(4 pt 1):E569–E575.
20. Gustavson SM, et al. Interaction of glucagon and epinephrine in the control of hepatic glucose pro-duction in the conscious dog. Am J Physiol Endocri-nol Metab. 2003;284(4):E695–E707.
21. Berglund ED, et al. Hepatic energy state is regu-lated by glucagon receptor signaling in mice. J Clin Invest. 2009;119(8):2412–2422.
22. Camacho RC, Lacy DB, James FD, Donahue EP, Wasserman DH. 5-Aminoimidazole-4-carbox-amide-1-beta-D-ribofuranoside renders glucose output by the liver of the dog insensitive to a phar-macological increment in insulin. Am J Physiol Endo-crinol Metab. 2005;289(6):E1039–E1043.
23. Vernia S, et al. AMP-activated protein kinase phosphorylates R5/PTG, the glycogen targeting subunit of the R5/PTG-protein phosphatase 1 holoenzyme, and accelerates its down-regulation by the laforin-malin complex. J Biol Chem. 2009; 284(13):8247–8255.
24. Carling D, Hardie DG. The substrate and sequence specificity of the AMP-activated protein kinase. Phosphorylation of glycogen synthase and phosphorylase kinase. Biochim Biophys Acta. 1989;1012(1):81–86.
25. Ros S, Garcia-Rocha M, Dominguez J, Ferrer JC, Guinovart JJ. Control of liver glycogen synthase activity and intracellular distribution by phos-phorylation. J Biol Chem. 2009;284(10):6370–6378.
26. Mankouri J, et al. Enhanced hepatitis C virus genome replication and lipid accumulation medi-ated by inhibition of AMP-activated protein kinase. Proc Natl Acad Sci U S A. 2010;107(25):11549–11554.
27. Hurley RL, et al. Regulation of AMP-activated protein kinase by multisite phosphorylation in
response to agents that elevate cellular cAMP. J Biol Chem. 2006;281(48):36662–36672.
28. Koo SH, et al. The CREB coactivator TORC2 is a key regulator of fasting glucose metabolism. Nature. 2005;437(7062):1109–1111.
29. Dobbins RL, Davis SN, Neal DW, Cobelli C, Jaspan J, Cherrington AD. Compartmental modeling of glucagon kinetics in the conscious dog. Metabolism. 1995;44(4):452–459.
30. Myers SR, McGuinness OP, Neal DW, Cherrington AD. Intraportal glucose delivery alters the relation-ship between net hepatic glucose uptake and the insu-lin concentration. J Clin Invest. 1991;87(3):930–939.
31. Livak KJ, Schmittgen TD. Analysis of relative gene expression data using real-time quantitative PCR and the 2(-Delta Delta C(T)) Method. Methods. 2001;25(4):402–408.
32. Ramnanan CJ, Storey KB. Glucose-6-phosphate dehydrogenase regulation during hypometabolism. Biochem Biophys Res Commun. 2006;339(1):7–16.
33. Edgerton DS, et al. Effects of insulin on the meta-bolic control of hepatic gluconeogenesis in vivo. Diabetes. 2009;58(12):2766–2775.
34. Thomas JA, Schlender KK, Larner J. A rapid filter paper assay for UDPglucose-glycogen glucos-yltransferase, including an improved biosyn-thesis of UDP-14C-glucose. Anal Biochem. 1968; 25(1):486–499.
35. Guinovart JJ, Salavert A, Massague J, Ciudad CJ, Salsas E, Itarte E. Glycogen synthase: a new activity ratio assay expressing a high sensitivity to the phos-phorylation state. FEBS Lett. 1979;106(2):284–288.
36. Rivera N, et al. A novel glucagon receptor antago-nist, NNC 25-0926, blunts hepatic glucose pro-duction in the conscious dog. J Pharmacol Exp Ther. 2007;321(2):743–752.
37. Edgerton DS, et al. Small increases in insulin inhibit hepatic glucose production solely caused by an effect on glycogen metabolism. Diabetes. 2001;50(8):1872–1882.
38. Edgerton DS, et al. Effects of hyperglycemia on hepatic gluconeogenic flux during glycogen phos-phorylase inhibition in the conscious dog. Am J Physiol Endocrinol Metab. 2004;286(4):E510–E522.
39. Mari A. Estimation of the rate of appearance in the non-steady state with a two-compartment model. Am J Physiol. 1992;263(2 pt 1):E400–E415.
40. Dobbins RL, Davis SN, Neal DW, Cobelli C, Cherrington AD. Pulsatility does not alter the response to a physiological increment in glu-cagon in the conscious dog. Am J Physiol. 1994; 266(3 pt 1):E467–E478.
Copyright © 2022 FDOKUMEN