Tecnológico de Estudios Superiores de Jocotitlán. Valoración ...
Upload
khangminh22Category
view
8download
0
Instituto Tecnológico y de Estudios Superiores de Monterrey
Campus Monterrey
School of Engineering and Sciences
Self-Assembly Behavior of Amphiphilic Janus Dendrimers in Water: A Combined Experimental and Coarse-Grained Molecular Dynamics
Simulation Approach
A dissertation presented by
Mariana Estefanía Elizondo García
Submitted to the School of Engineering and Sciences
in partial fulfillment of the requirements for the degree of
Doctor
in
Biotechnology
Monterrey Nuevo León, May 14th, 2018

iii
Dedication
Dedicated to my parents. Thank you for your love, patience and unconditional support. This work could not have been possible without you.

iv
Acknowledgments
To my principal advisor, Dr. Jesús Ángel Valencia Gallegos, for trust in me for the
development of this work. The freedom that he gave me to carry out the research made
me grow as a student and a researcher.
To my co-advisor, Dr. Marcelo Videa Vargas, for accepting to collaborate on this project
and for your help and advice during the thermal analysis studies.
To the dissertation committee members, Dr. Janet Gutierrez Uribe and Dr. Jorge Cortés
Ramirez, for their guidance, suggestions, and comments, which helped in the
improvement of this thesis work. Also, for the patience and availability, they always had
with me.
To Dr. Fernando Danilo González Nilo for his support in advising, reviewing and
improving this project. Also, for giving me the opportunity to make a research stay at the
Center for Bioinformatics and Integrative Biology (CBIB) and allowing me to meet his
great group and learn from them. To all the CBIB community for their kindness and
hospitality during my stay in Chile. To Ingrid Araya, Camila Navas, and Valeria Marquez,
for their support and guidance in the molecular dynamics simulations.
I would like to express my gratitude to Dr. Luis Elizalde Herrera from Centro de
Investigación en Química Aplicada, for his help running the NMR spectra; MSc. Gloria
Macedo Raygoza and Dr. Miguel J. Beltrán García from Universidad Autónoma de
Guadalajara, for their help in the measuring of MALDI-TOF mass spectra; MSc. Luis
Montes de Oca, MSc. Maricela Rodríguez Nieto and Jorge Luis Menchaca from
Universidad Michoacana de San Nicolás de Hidalgo and Universidad Autónoma de
Nuevo León, for their collaboration in microfluidics experiments and their help with the

v
AFM measurements. I would also thank the following people from Tecnológico de
Monterrey: LCQ. Regina Elizabeth Vargas Mejía, for allowing me to use the DLS
equipment; Dr. Perla Pérez Treviño and Dr. Julio Altamirano, for their help in confocal
microscopy measurements; MSc. Elda Gómez López for her help running IR spectra;
and Dr. Luz Maria Martínez Calderon and her group, for allowing me to use the DSC
equipment and their help in the use of this equipment. Without your support to have
access to this specialized equipment and techniques, this thesis work would not have
been possible.
To Consejo de Ciencia y Tecnología (CONACyT) and Tecnológico de Monterrey for the
financial support provided during my postgraduate studies.
Last but not least, I would like to thank my family and friends, for their advice, motivation,
and support.

vi
Self-Assembly Behavior of Amphiphilic Janus Dendrimers in Water: A Combined Experimental and Coarse-Grained Molecular Dynamics
Simulation Approach
by
Mariana Estefanía Elizondo García
Abstract
Amphiphilic Janus dendrimers (JDs) are repetitively branched molecules with
hydrophilic and hydrophobic components that self-assemble in water to form a variety of
morphologies, including vesicles analogous to liposomes with potential pharmaceutical
and medical application. To date, the self-assembly of JDs has not been fully
investigated thus it is important to gain insight into its mechanism and dependence on
JDs’ molecular structure. In this study, a series of amphiphilic JDs with variations in their
core and branching pattern was synthesized and its aggregation behavior in water was
evaluated using experimental and computational methods. JDs were obtained from 2,2-
bis(hydroxymethyl)propionic acid, myristic acid and different glycols. Dispersions of JDs
in water were carried out using the thin-film hydration, solvent injection methods and by
microfluidics, using double emulsion drops with ultrathin shells as templates.
Furthermore, a coarse-grained molecular dynamics (CG-MD) simulation was performed
to study the mechanism of JDs aggregation. The resulting assemblies were
characterized by optical microscopy, dynamic light scattering, confocal microscopy, and
atomic force microscopy. The obtaining of assemblies in water with no interdigitated
bilayers was confirmed by the experimental characterization and CG-MD simulation for
one of the dendrimers. Assemblies with dendrimersome characteristics were obtained
using the solvent injection method. Also, monodisperse nanometric assemblies were
obtained by this method. The use of microfluidics enables the production of giant
dendrimersomes from highly hydrophobic JDs, even when the dendrimers did not form
vesicles using the thin-film hydration method. The results of this study establish a
relationship between the molecular structure of the JDs and the properties of its
aggregates in water. These results could be relevant for the design of novel JDs with
tailored assemblies suitable for drug delivery systems. In addition, this study offers an
approach to produce dendrimersomes in a more controlled way.
Keywords: Janus dendrimers; amphiphilic; self-assembly; dendrimersome; coarse-grained molecular dynamics; microfluidics; thin-film hydration method; solvent injection method.
vii
Contents
Abstract vi
List of Figures ix
List of Tables xiii
List of Equations xiv
List of Abbreviations and Units of Measurement xv
Introduction ..................................................................................................................... 1
Theoretical Framework .................................................................................................... 3
2.1 Dendrimers ............................................................................................................ 3
2.2 Amphiphilic Janus Dendrimers ............................................................................... 5
2.2.1 Structure .......................................................................................................... 5
2.2.2 Synthesis ......................................................................................................... 6
2.2.3 Applications ................................................................................................... 10
2.2.4 Self-Assembly of JDs ..................................................................................... 10
Materials and Methods .................................................................................................. 20
3.1 General Information ............................................................................................. 20
3.2 Instruments for Dendrimers Characterization ....................................................... 21
3.2.1 Nuclear Magnetic Resonance (NMR) ............................................................ 21
3.2.2 Mass Spectra ................................................................................................. 21
3.2.3 Differential Scanning Calorimetry (DSC)........................................................ 21
3.3 Synthesis of Amphiphilic Janus Dendrimers ........................................................ 22
Dendron 1 and General Esterification Procedure ................................................... 22
Dendron 2 and General Procedure for Removal of Benzyl Ester Group ................. 23
Dendron 3A ............................................................................................................ 23
Dendron 3B ............................................................................................................ 23
Dendron 3C ............................................................................................................ 24
Dendrimer 5A and General Procedure for Removal of the Acetonide Protective Group ...................................................................................................................... 24
Dendrimer 5B.......................................................................................................... 24
Dendrimer 5C ......................................................................................................... 25
Dendron 6 ............................................................................................................... 25

viii
Dendron 7 ............................................................................................................... 25
Dendron 8A ............................................................................................................ 26
Dendron 8B ............................................................................................................ 26
Dendron 8C ............................................................................................................ 26
Dendrimer 10A........................................................................................................ 26
Dendrimer 10B........................................................................................................ 27
Dendrimer 10C ....................................................................................................... 27
3.4 Formation and Characterization of Assemblies (Experimental Method) .............. 27
3.4.1 Thin-Film Hydration Method ........................................................................... 28
3.4.2 Microfluidics ................................................................................................... 29
3.4.3 Solvent Injection Method ............................................................................... 32
3.5 Coarse-Grained Molecular Dynamic Simulation .................................................. 32
3.6 Statistical Analysis ............................................................................................... 35
Results and Discussion ................................................................................................. 36
4.1 Synthesis and Characterization of Amphiphilic JDs ............................................. 36
4.1.1 First Generation Dendrimers .......................................................................... 36
4.1.2 Second Generation Dendrimers .................................................................... 40
4.2 Thermal Behavior of Amphiphilic JDs .................................................................. 45
4.3 Self-Assembly of JDs in Water ............................................................................. 48
4.3.1 Formation and Characterization of Giant Assemblies .................................... 48
4.3.2 Formation and Characterization of Small Assemblies ................................... 56
4.3.3 Coarse-grained Molecular Dynamic Simulation of Dendrimer 10A ................ 64
Conclusions ................................................................................................................... 70
Appendix A .................................................................................................................... 72 1H NMR, 13C NMR, and MALDI-TOF MS Data of Dendrons and Dendrimers............ 72
Appendix B .................................................................................................................... 80
General Linear Model: Z-AVE vs. Gen, Core ............................................................. 80
Appendix C .................................................................................................................... 82
General Linear Model: PDI vs. Gen, Core.................................................................. 82
Appendix D .................................................................................................................... 84
Solvent Accessible Surface Area (SASA) of the Dendrimers During the Simulation .. 84
References .................................................................................................................... 85
Published papers .......................................................................................................... 95
Curriculum Vitae ............................................................................................................ 96
ix
List of Figures
Figure 2.1 Second generation polyamidoamine (PAMAM) dendrimer. ........................... 3
Figure 2.2 Different dendrimer synthesis approaches: (a) divergent and (b) convergent
growth. ............................................................................................................................ 5
Figure 2.3 Structure of an amphiphilic Janus dendrimer. ................................................ 5
Figure 2.4 Main methods for Janus dendrimers synthesis. (a) Chemoselective coupling.
(b) Heterogeneous double exponential growth. (c) Mixed modular approach.
Modified from Ref. [21]. ................................................................................................... 6
Figure 2.5 Components of amphiphilic Janus dendrimers obtained by the
chemoselective method. Dendrimers synthesized by (a) Fedeli et al. [3] and
(b) Nummelin et al. [12]. .................................................................................................. 8
Figure 2.6 Components of amphiphilic Janus dendrimers obtained by the
heterogeneous double exponential growth. Dendrimers synthesized by Pan et al. [22]…
........................................................................................................................................ 9
Figure 2.7 Components of amphiphilic Janus dendrimers obtained by the mixed
modular approach. Dendrimers synthesized by Ropponen et al. [24]. .......................... 10
Figure 2.8 Libraries of Percec-type Janus dendrimers. Reproduced from Ref. [4]. ....... 11
Figure 2.9 Comparison between Percec-type dendrimers and single-single dendrimers.
Reproduced from Ref. [13]. ........................................................................................... 13
Figure 2.10 Schematic of the self-assembly of Percec-type dendrimers into vesicles.
The substitution pattern of hydrophobic block controls the size and mechanical
properties of dendrimersomes. Reproduced from Ref. [25]. .......................................... 14
Figure 2.11 Differences in lattice parameter due to the formation of hydrogen bonds
between the cores. Modified from Ref. [13]. .................................................................. 16
Figure 3.1 Schematic illustration of the microfluidic device for preparation of
monodisperse double-emulsion drops........................................................................... 30
x
Figure 3.2. Mapping between the molecular structure and coarse-grained (CG) model
for the amphiphilic Janus dendrimer. (a) Dendrimer molecular structure (full-atom); (b)
The simplified structure using CG beads. Bis-MPA methyl substituents were not
considered. .................................................................................................................... 33
Figure 4.1. Synthesis of hydrophobic building block of [G-1] dendrimers. Reagents and
conditions: i) Myristic acid, DCC, DPTS, DCM; ii) Pd/C, H2 (40 psi), EtOAc: DCM. ...... 36
Figure 4.2 Synthesis of hydrophobic building block of [G-1] dendrimers. Reagents and
conditions: i) Ethylene glycol, triethylene glycol or 1,10-decanediol, DCC, DPTS, DCM;
ii) isopropylidene-2,2-bis(methoxy)propionic acid, DCC, DPTS, DCM; iii) DOWEX® H,
MeOH: DCM, 55°C. ....................................................................................................... 37
Figure 4.3 1H-NMR spectra (500 MHz, CDCl3) of 5A, integrals and peak assignments..
...................................................................................................................................... 39
Figure 4.4 1H-NMR spectra (500 MHz, CDCl3) of 5B, integrals and peak assignments..
...................................................................................................................................... 39
Figure 4.5 1H-NMR spectra (500 MHz, CDCl3) of 5C, integrals and peak assignments..
...................................................................................................................................... 40
Figure 4.6 Synthesis of hydrophobic building block of [G-2] dendrimers. Reagents and
conditions: i) Myristic acid, DCC, DPTS, DCM; ii) Pd/C, H2 (40 psi), EtOAc: DCM. ...... 41
Figure 4.7 Synthesis of hydrophobic building block of [G-1] dendrimers. Reagents and
conditions: i) Ethylene glycol, triethylene glycol or 1,10-decanediol, DCC, DPTS, DCM;
ii) (isopropylidene)4-[G-2]-COOH, DCC, DPTS, DCM; iii) DOWEX® H,
MeOH: DCM, 55°C. ....................................................................................................... 42
Figure 4.8 1H-NMR spectra (500 MHz, CDCl3) of 10A, integrals and peak assignments.
...................................................................................................................................... 44
Figure 4.9 1H-NMR spectra (500 MHz, CDCl3) of 10B, integrals and peak assignments.
...................................................................................................................................... 44
Figure 4.10 1H-NMR spectra (500 MHz, CDCl3) of 10C, integrals and peak assignments.
...................................................................................................................................... 45
xi
Figure 4.11 First heating DSC curves of amphiphilic Janus dendrimers. ...................... 47
Figure 4.12 Second heating DSC curves of amphiphilic Janus dendrimers. ................. 48
Figure 4.13 Production of assemblies using the thin-film hydration method. (a) Residual
dendrimer/Nile Red films after 12 h of hydration. (b) Optical micrograph showing
assemblies obtained by procedure 1. (c) Optical micrograph showing assemblies
obtained by procedure 2. ............................................................................................... 49
Figure 4.14 (a) Confocal microscopy images of dendrimer 10A assemblies formed by
the thin-film hydration method and encapsulating Nile Red (hydrophobic dye).
Optical sections of individual assemblies of (a) 10A and (b) 5A, taken from the center of
their structure. ............................................................................................................... 50
Figure 4.15 Optical micrograph showing a typical production of monodisperse double
emulsion drops containing dendrimers in the oil phase. ................................................ 51
Figure 4.16 (a) Optical micrograph of a population of double emulsion drops containing
dendrimer B. The inset shows a single emulsion drop formed by the destabilization of a
double emulsion drop (white circle). (b) Radius distribution of double emulsion drops.
The mean radius is 30 ± 3 µm. ...................................................................................... 52
Figure 4.17 Bright field microscopy images showing the samples resulting from double
emulsion drops made with: (a) dendrimer 10A, image was taken 4 days after production,
polydisperse vesicle-like structures are observed; (b) dendrimer 10B, image was taken
12 days after production, monodisperse double emulsion drops continue presently. ... 54
Figure 4.18 (a) Optical micrograph showing the population of double emulsion drops
after their transition to dendrimersomes. (b) Scheme showing the formation of dendritic
reservoirs. (c) Dendrimersome formed after solvent evaporation. ................................. 56
Figure 4.19 Cloudy dispersions of dendrimers with (a) ethylene glycol core (5A and
10A), (b) triethylene glycol core (5B and 10B), and (c) 1,10-decanediol core (5C and
10C), indicative of the formation of assemblies in water. .............................................. 57
Figure 4.20 Schematic representation of the possible arrangement of dendrimers in the
membrane of formed assemblies. Dendrimers with (a) ethylene glycol, (b) triethylene

xii
glycol and (c) 1,10-decanediol. Color code: yellow, hydrophobic part of the membrane;
blue, hydrophilic part of the membrane. ........................................................................ 59
Figure 4.21 Time stability of small assemblies. (a) Z-Average and (b) PDI variation (by
DLS). *significant difference by paired t-test at p-value ≤ 0.05. Dendrimers
nomenclature: 5, [G-1] dendrimers; 10, [G-2] dendrimers; A, ethylene glycol as the core;
B, triethylene glycol as the core; and C, 1,10-decanediol as the core. .......................... 61
Figure 4.22 Temperature stability of the assemblies reported as a change (%) in
Z-average. Dendrimers nomenclature: 5, [G-1] dendrimers; 10, [G-2] dendrimers; A,
ethylene glycol as the core; B, triethylene glycol as the core; and C, 1,10-decanediol as
the core. ........................................................................................................................ 61
Figure 4.23 Atomic force microscopy (AFM) images of air-dried small assemblies
obtained using ethanol injection method. (a) AFM height image and (b) cross-section
profile determined from line 1. (c) AFM phase image. ................................................... 63
Figure 4.24 Representative images of the self-assembly process of JDs in water at
different stages of the coarse-grained molecular dynamics (CG-MD) simulation. Color
code: polar head group, red; hydrophobic tails, green; and hydrophilic groups, gray.
Water is not shown. ....................................................................................................... 64
Figure 4.25 Snapshot of fusion mechanism of a disk-like bilayer and a major size
nanostructure. Color code: polar head group, red; hydrophobic tails, green; and
hydrophilic groups, gray. Water is not shown. ............................................................... 65
Figure 4.26 (a) Final assembly obtained by coarse-grained molecular dynamics (CG-
MD) simulation. (b) A cross-sectional view of the nanostructure. Time of simulation:
13 µs. Color code: polar head group, red; hydrophobic tails, green; and hydrophilic
groups, gray. Water is not shown. ................................................................................. 66
Figure 4.27 Density profile analysis of a selected patch from the final nanostructure.
Size of selected patch considered: 6.5 × 5.4 × 7.4 nm3. ............................................... 68

xiii
List of Tables
Table 4.1 Thermal properties of amphiphilic Janus dendrimers. ................................... 46
Table 4.2 Small assemblies size and PDI (by DLS) obtained by the injection of ethanol.
...................................................................................................................................... 58

xiv
List of Equations
VT = Vaq + Vo Equation 1................................................................................ 53
t = RTRT-√RT3 -Ro
33Equation 2 ................................................................................ 53
xv
List of Abbreviations and Units of Measurement
[G-1] First generation
[G-2] Second generation
[G-3] Third generation
°C Celsius
13C-NMR Carbon nuclear magnetic resonance
1H-NMR Proton nuclear magnetic resonance
AFM Atomic force microscopy
ANOVA Analysis of variance
Bis-MPA 2,2-bis(hydroxymethyl)propionic acid
CDCl3 Deuterated chloroform
CG-MD Coarse-grained molecular dynamics
cm2 Square centimeters
CuAAc Copper-catalyzed alkyne-azide cycloaddition
DCC N,N’-dicyclohexylcarbodiimide
DCM Dichloromethane
DD 1,10-decanediol
DLS Dynamic light scattering
DPTS 4-(dimethylamino)pyridinium p-toluenesulfonate
DSC Differential scanning calorimetry
EG Ethylene glycol
ESEM Environmental scanning electron microscopy
EtOAc Ethyl acetate
fs Femtoseconds
g Grams
Gly Glycine
h Hours
HLB Hydrophilic-lipophilic balance
JDs Janus dendrimers
K Kelvins

xvi
kDa Kilodaltons
kJ/mol Kilojoules per mole
kJ/mol°C Kilojoules per mole celsius
kJ/(mol nm) Kilojoules per mole per nanometer
L-Ala L-Alanine
L-Asp L-Aspartate
L-Glu L-Glutamate
LCTEM Liquid-cell transmission electron microscopy
MALDI-TOF Matrix assisted laser desorption/ionization time-of-flight
MeOH Methanol
mg/mL Milligram per milliliter
MHz Megahertz
mL Milliliters
mM Millimolar
mmol Millimole
mV Millivolts
MS Mass spectrometry
MW Molecular weight
MΩ.cm Megaohms centimeter
N Newtons
nm Nanometer
Pd/C Palladium on carbon
PAMAM Polyamidoamine
PDI Polydispersity index
PEG Poly(ethylene glycol)
ppm Parts per million
PVA Poly(vinyl alcohol)
Ref. Reference
s Seconds
SASA Solvent accessible surface area
xvii
TEG Triethylene glycol
TEM Transmission Electron Microscopy
Tg Glass transition temperature
THF Tetrahydrofuran
TLC Thin Layer Chromatography
Tm Melting temperature
v/v Volume by volume
w/w Weight by weight
W/O/W Water-in-oil-in-water
µL Microliters
µL/h Microliters per hour
µm Micrometers
µs Microseconds
Chapter 1
Introduction
In recent years, interest in the development of new materials for drug delivery, and other
therapeutic and diagnostic applications has been increased. This interest is motivated
mainly by the problematic properties of potentially useful low-weight drug candidates,
such as low solubility in water and bioavailability, rapid elimination, high toxicity and side
effects [1]. Drug delivery systems offer an alternative to optimize the pharmacokinetics
and pharmacodynamics of these kinds of compounds.
Amphiphilic Janus dendrimers (JDs) are molecules composed of polar (hydrophilic) and
non-polar (hydrophobic) dendritic blocks [2]. This characteristic is the key factor that
favors the spontaneous self-assembly of JDs in water into complex supramolecular
structures [3]. Variations in the molecular structure of JDs allows achieving a rich palette
of morphologies in water, among which are bilayered vesicles termed as
dendrimersomes [4].
Dendrimersomes possess characteristics that make them ideal vehicles for drug
delivery and as diagnostic or theranostic agents. They are monodisperse, stable up to
one year in various media and can encapsulate both hydrophilic and/or hydrophobic
species [5–9]. In addition, they exhibit mechanical properties as good as their
analogous polymersomes and cholesterol stabilized liposomes [10].
Despite these advantages, the information about dendrimersomes is still limited and is
mainly focused on one type of JDs (Percec-type). Recent alternatives to Percec-type
structures involve dendrimers obtained from click chemistry reactions, which incorporate
more complex, and in some cases, more flexible molecules as cores, in comparison
Chapter 1. Introduction 2
with Percec-type dendrimers [3,11,12]. Thus, it is important to evaluate if these
variations in the core of the amphiphilic JDs influences in their self-assembly ability in
aqueous media, as well as in the generation of stable vesicles; and if this core effect
has an interaction with the branching pattern of the hydrophobic and hydrophilic blocks
of the dendrimer. Previous studies reported that the incorporation of molecules that can
form hydrogen bonds (amino acids) to the core of the JDs generate changes in bilayer
thickness, size, and lamellarity of the assemblies [13,14]. Nevertheless, the effect of the
core length and its polarity has not been studied. This information could be relevant for
the design of novel JDs with tailored assemblies suitable for drug delivery systems.
Therefore, the aim of this work was to establish a relationship between the molecular
structure of JDs and the properties of their assemblies in water. In order to study the
impact of the molecular structure of the JDs in the self-assembly structures, a series of
dendrimers with variations in the core and the number of generation were synthesized
and characterized. These dendrimers were obtained from 2,2-
bis(hydroxymethyl)propionic acid (bis-MPA), myristic acid, and different glycols. The
self-assembly behavior of JDs in water was evaluated using experimental and computer
simulation methods. In addition, the morphology, physical properties, and stability as a
function of time and temperature of the self-assembly structures were evaluated.

Chapter 2
Theoretical Framework
2.1 Dendrimers
Dendrimers (Figure 2.1) are geometric polymeric structures that are prepared through
the consecutive addition of monomeric multifunctional units around a central core with
the aim to form tree-like structures (dendrimer from the Greek dendron that means tree).
The core can be formed by any functional monomer and by at least two functional
groups that allow the union of additional layers or generations, which constitute the
majority of the dendrimer. The step-wise synthesis of dendrimers affords a high degree
of control over the positioning of chemical functionalities at the nanoscale [9].
Figure 2.1 Second generation polyamidoamine (PAMAM) dendrimer.
Chapter 2. Theoretical Framework 4
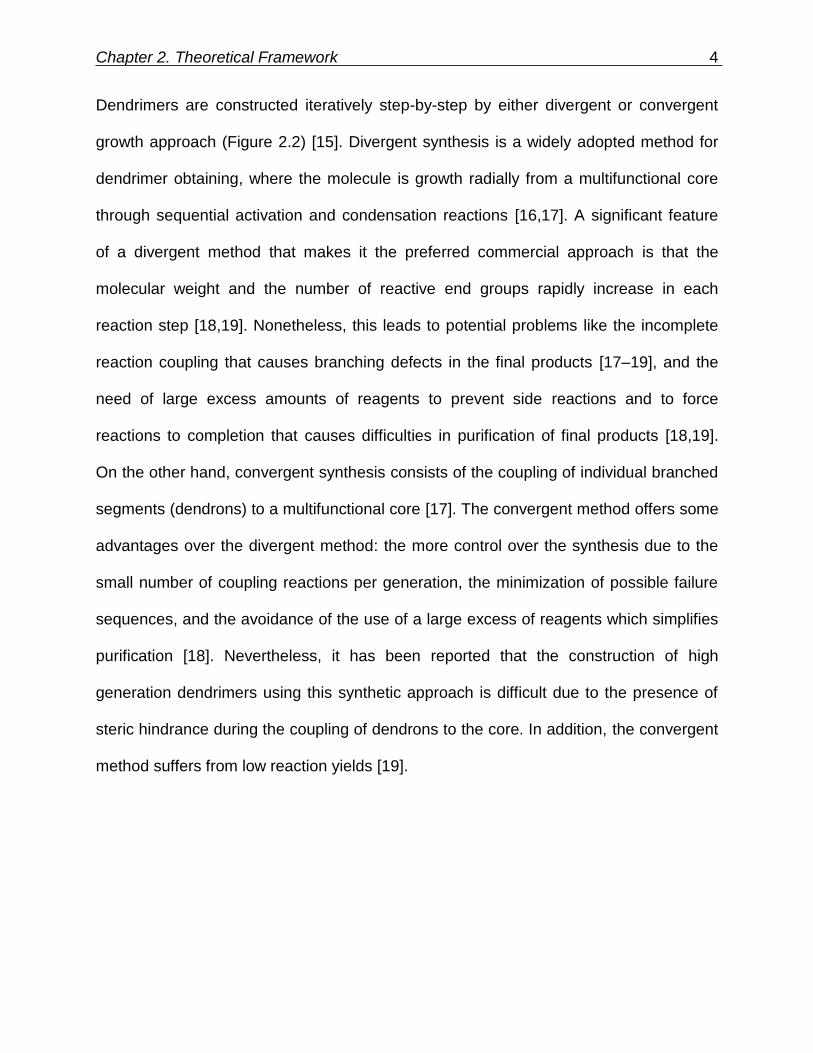
Dendrimers are constructed iteratively step-by-step by either divergent or convergent
growth approach (Figure 2.2) [15]. Divergent synthesis is a widely adopted method for
dendrimer obtaining, where the molecule is growth radially from a multifunctional core
through sequential activation and condensation reactions [16,17]. A significant feature
of a divergent method that makes it the preferred commercial approach is that the
molecular weight and the number of reactive end groups rapidly increase in each
reaction step [18,19]. Nonetheless, this leads to potential problems like the incomplete
reaction coupling that causes branching defects in the final products [17–19], and the
need of large excess amounts of reagents to prevent side reactions and to force
reactions to completion that causes difficulties in purification of final products [18,19].
On the other hand, convergent synthesis consists of the coupling of individual branched
segments (dendrons) to a multifunctional core [17]. The convergent method offers some
advantages over the divergent method: the more control over the synthesis due to the
small number of coupling reactions per generation, the minimization of possible failure
sequences, and the avoidance of the use of a large excess of reagents which simplifies
purification [18]. Nevertheless, it has been reported that the construction of high
generation dendrimers using this synthetic approach is difficult due to the presence of
steric hindrance during the coupling of dendrons to the core. In addition, the convergent
method suffers from low reaction yields [19].
Chapter 2. Theoretical Framework 5
Figure 2.2 Different dendrimer synthesis approaches: (a) divergent and (b) convergent
growth.
2.2 Amphiphilic Janus Dendrimers
2.2.1 Structure
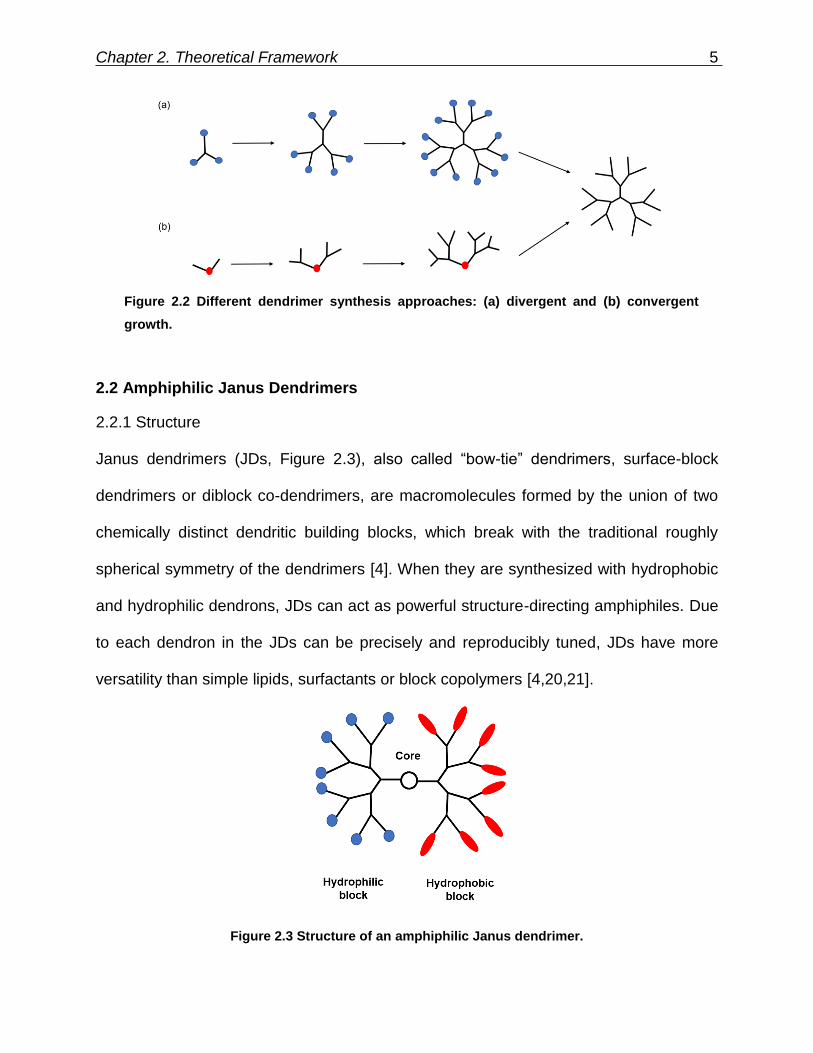
Janus dendrimers (JDs, Figure 2.3), also called “bow-tie” dendrimers, surface-block
dendrimers or diblock co-dendrimers, are macromolecules formed by the union of two
chemically distinct dendritic building blocks, which break with the traditional roughly
spherical symmetry of the dendrimers [4]. When they are synthesized with hydrophobic
and hydrophilic dendrons, JDs can act as powerful structure-directing amphiphiles. Due
to each dendron in the JDs can be precisely and reproducibly tuned, JDs have more
versatility than simple lipids, surfactants or block copolymers [4,20,21].
Figure 2.3 Structure of an amphiphilic Janus dendrimer.
Chapter 2. Theoretical Framework 6
2.2.2 Synthesis
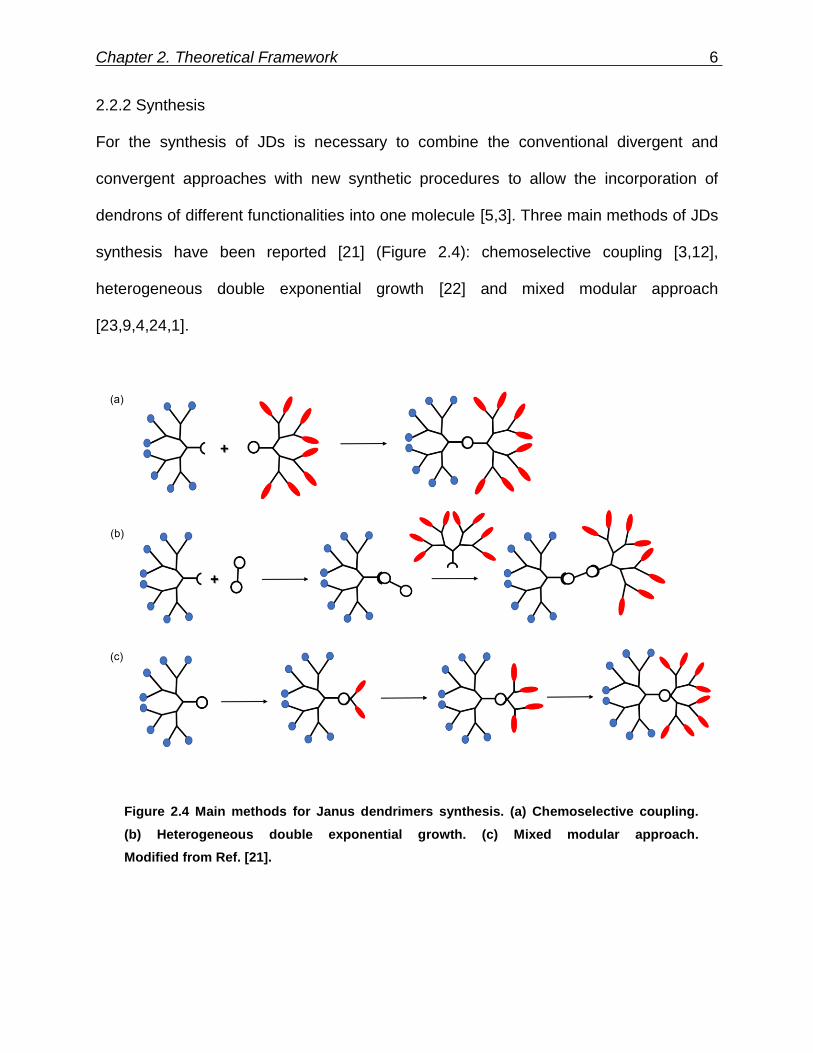
For the synthesis of JDs is necessary to combine the conventional divergent and
convergent approaches with new synthetic procedures to allow the incorporation of
dendrons of different functionalities into one molecule [5,3]. Three main methods of JDs
synthesis have been reported [21] (Figure 2.4): chemoselective coupling [3,12],
heterogeneous double exponential growth [22] and mixed modular approach
[23,9,4,24,1].
Figure 2.4 Main methods for Janus dendrimers synthesis. (a) Chemoselective coupling.
(b) Heterogeneous double exponential growth. (c) Mixed modular approach.
Modified from Ref. [21].

Chapter 2. Theoretical Framework 7
2.2.2.1 Chemoselective Coupling
The chemoselective method consists in reacting two dendrons, synthesized by the
convergent approach, with complementary functions as the core. This is the simplest
method to obtain JDs, and mainly involve the use of click chemistry [5,21]. The click
chemistry reaction most widely used is the Cu(I)-catalyzed 1,3-dipolar cycloaddition
between an alkyne and azide groups (CuAAC). Although this reaction is an efficient and
high yielding method for the synthesis of JDs, the complete removal of Cu from the final
products can be difficult and can interfere with their subsequent applications [5].
Fedeli et al. [3] employed click chemistry for the synthesis of amphiphilic JDs derived
from 2,2-bis(hydroxymethyl)propionic acid (bis-MPA) and stearic acid (Figure 2.5a). The
hydrophilic block of these dendrimers consisted of bis-MPA dendrons with free terminal
hydroxyl groups. The hydrophobic block also consisted in bis-MPA dendrons, in this
case, functionalized with the stearic acid. The hydrophilic and hydrophobic blocks were
functionalized in their focal point with a hexamethyl azide group and alkyne group,
respectively. Dendrons were obtained by the divergent method, using Steglich
esterification and protection/deprotection of acetonide protecting groups. Final
dendrimers were obtained by the combination of equal or different generations of
hydrophilic/hydrophobic blocks ([G-1] to [G-3]), which were linked together via CuAAC.
Nummelin et al. [12] synthesized six amphiphilic JDs from gallate ether-type [G-1]
dendrons with two generation ([G-1] and [G-2]) of hydrophilic blocks consisted in bis-
MPA dendrons with free hydroxyl groups (Figure 2.5b). The hydrophilic block was
functionalized with a propargyl moiety, while the hydrophobic block with an azide moiety.
No spacer between the construction blocks was used. The growth of hydrophilic
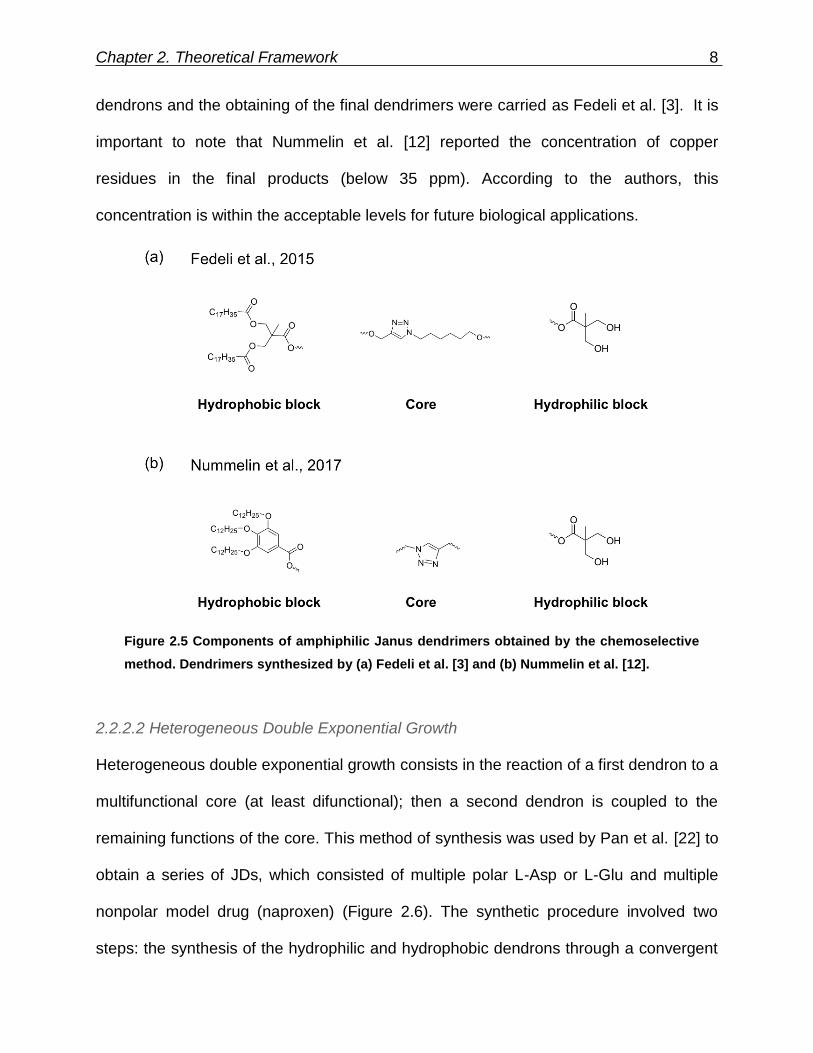
Chapter 2. Theoretical Framework 8
dendrons and the obtaining of the final dendrimers were carried as Fedeli et al. [3]. It is
important to note that Nummelin et al. [12] reported the concentration of copper
residues in the final products (below 35 ppm). According to the authors, this
concentration is within the acceptable levels for future biological applications.
Figure 2.5 Components of amphiphilic Janus dendrimers obtained by the chemoselective
method. Dendrimers synthesized by (a) Fedeli et al. [3] and (b) Nummelin et al. [12].
2.2.2.2 Heterogeneous Double Exponential Growth
Heterogeneous double exponential growth consists in the reaction of a first dendron to a
multifunctional core (at least difunctional); then a second dendron is coupled to the
remaining functions of the core. This method of synthesis was used by Pan et al. [22] to
obtain a series of JDs, which consisted of multiple polar L-Asp or L-Glu and multiple
nonpolar model drug (naproxen) (Figure 2.6). The synthetic procedure involved two
steps: the synthesis of the hydrophilic and hydrophobic dendrons through a convergent
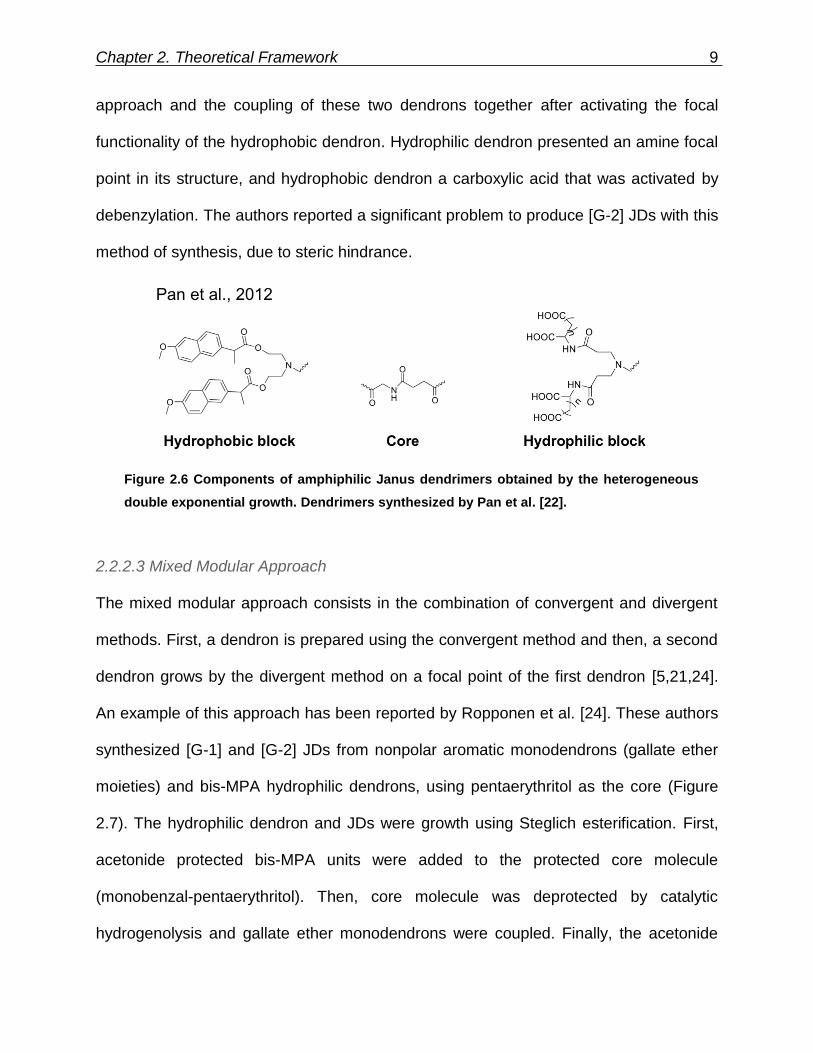
Chapter 2. Theoretical Framework 9
approach and the coupling of these two dendrons together after activating the focal
functionality of the hydrophobic dendron. Hydrophilic dendron presented an amine focal
point in its structure, and hydrophobic dendron a carboxylic acid that was activated by
debenzylation. The authors reported a significant problem to produce [G-2] JDs with this
method of synthesis, due to steric hindrance.
Figure 2.6 Components of amphiphilic Janus dendrimers obtained by the heterogeneous
double exponential growth. Dendrimers synthesized by Pan et al. [22].
2.2.2.3 Mixed Modular Approach
The mixed modular approach consists in the combination of convergent and divergent
methods. First, a dendron is prepared using the convergent method and then, a second
dendron grows by the divergent method on a focal point of the first dendron [5,21,24].
An example of this approach has been reported by Ropponen et al. [24]. These authors
synthesized [G-1] and [G-2] JDs from nonpolar aromatic monodendrons (gallate ether
moieties) and bis-MPA hydrophilic dendrons, using pentaerythritol as the core (Figure
2.7). The hydrophilic dendron and JDs were growth using Steglich esterification. First,
acetonide protected bis-MPA units were added to the protected core molecule
(monobenzal-pentaerythritol). Then, core molecule was deprotected by catalytic
hydrogenolysis and gallate ether monodendrons were coupled. Finally, the acetonide

Chapter 2. Theoretical Framework 10
protecting groups were removed in acid media from the compounds to generate [G-1]
dendrimers. [G-2] dendrimers were obtained after the esterification of [G-1] dendrimers
with acetonide protected bis-MPA units and their posterior deprotection in acid media.
All the involved reactions were reported with high yields.
Figure 2.7 Components of amphiphilic Janus dendrimers obtained by the mixed modular
approach. Dendrimers synthesized by Ropponen et al. [24].
2.2.3 Applications
The self-assembly properties of amphiphilic molecules have allowed them to be applied
in technological applications ranging from nanomedicine to its use in cosmetics, food,
and agriculture [25]. In recent years, a variety of amphiphilic JDs backbones have been
investigated, including poly(propyl ether imine) [26], polyester [23,6–
8,4,3,12,24,1,25,27–31], poly(alkyl ether) [32], polyamidoamine [11,33] and polyamide
[22]. Their potential applications are mainly focused on the pharmaceutical and
biomedical areas and can be divided into two major approaches, conjugation and
vesicular formation [5].
2.2.4 Self-Assembly of JDs
Percec et al. [4] synthesized a wide variety of amphiphilic JDs (Figure 2.8) and studied
their self-assembly in aqueous media. They found that through structural modifications
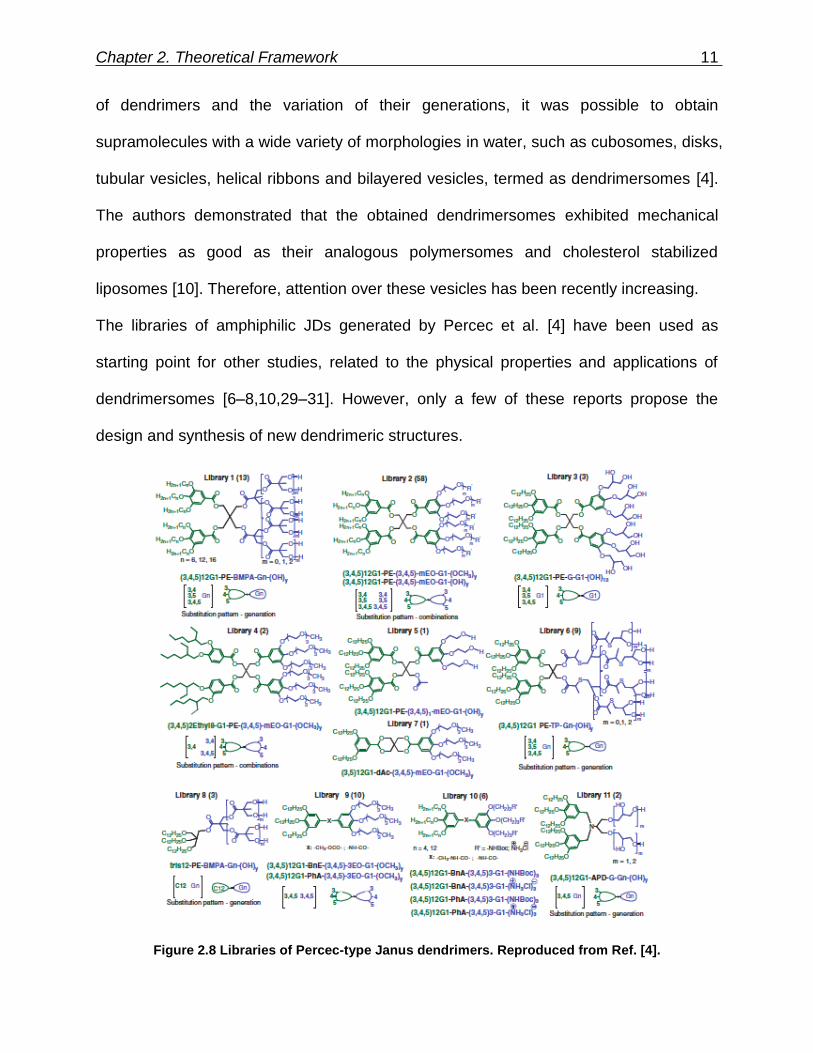
Chapter 2. Theoretical Framework 11
of dendrimers and the variation of their generations, it was possible to obtain
supramolecules with a wide variety of morphologies in water, such as cubosomes, disks,
tubular vesicles, helical ribbons and bilayered vesicles, termed as dendrimersomes [4].
The authors demonstrated that the obtained dendrimersomes exhibited mechanical
properties as good as their analogous polymersomes and cholesterol stabilized
liposomes [10]. Therefore, attention over these vesicles has been recently increasing.
The libraries of amphiphilic JDs generated by Percec et al. [4] have been used as
starting point for other studies, related to the physical properties and applications of
dendrimersomes [6–8,10,29–31]. However, only a few of these reports propose the
design and synthesis of new dendrimeric structures.
Figure 2.8 Libraries of Percec-type Janus dendrimers. Reproduced from Ref. [4].
Chapter 2. Theoretical Framework 12
Fedeli et al. [3] synthesized and evaluated the self-assembly of six symmetric and
asymmetric bis-MPA JDs (described in section 2.2.2.1). They found that all dendrimers
(excluding the lowest generation [G-1] dendrimer) formed supramolecular architectures
in water. [G-3]-[G-3] (hydrophobic-hydrophilic block generation) dendrimer generated
dendrimersomes; [G-2]-[G-2] dendrimer generated aggregates; and [G-2]-[G-3], [G-1]-
[G-2] and [G-1]-[G-3] dendrimers generated elongated micelles. All aggregates showed
the ability to encapsulate a hydrophobic drug.
Nummelin et al. [12] presented the synthesis of six JD composed by bis-MPA moieties
and Percec-type hydrophobic dendrons (described in section 2.2.2.1). These low
generation dendrimers generated unilamellar and multilamellar dendrimersomes with
narrow size distribution. Dendrimers encapsulated the hydrophobic dye Nile red and the
small-molecule drug propranolol. Dendrimers with (3,5) and (3,4,5)-hydrophobic pattern
presented a robust shelf-life (> 4 months).
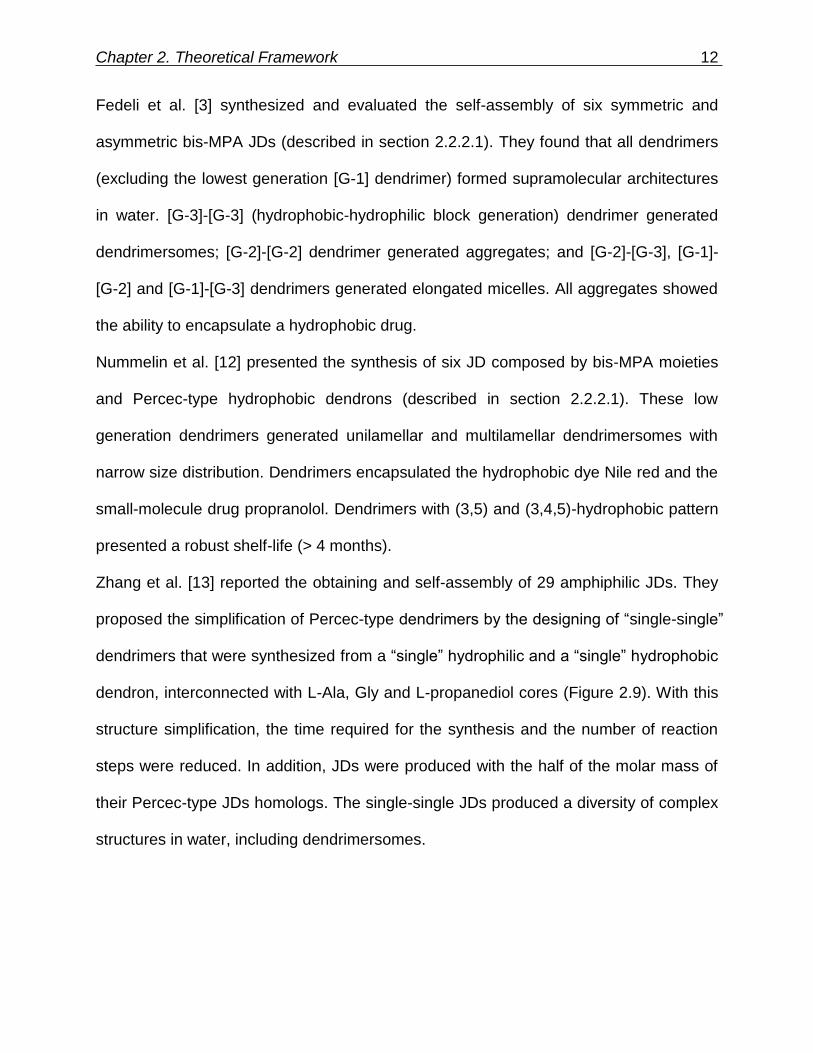
Zhang et al. [13] reported the obtaining and self-assembly of 29 amphiphilic JDs. They
proposed the simplification of Percec-type dendrimers by the designing of “single-single”
dendrimers that were synthesized from a “single” hydrophilic and a “single” hydrophobic
dendron, interconnected with L-Ala, Gly and L-propanediol cores (Figure 2.9). With this
structure simplification, the time required for the synthesis and the number of reaction
steps were reduced. In addition, JDs were produced with the half of the molar mass of
their Percec-type JDs homologs. The single-single JDs produced a diversity of complex
structures in water, including dendrimersomes.

Chapter 2. Theoretical Framework 13
Figure 2.9 Comparison between Percec-type dendrimers and single-single dendrimers.
Reproduced from Ref. [13].
Zhang et al. [14] generated six new single-single JD structures that self-assemble into
onion-like dendrimersomes (multilamellar vesicles) in water. The structures of these JDs
were designed from previous dendrimer libraries [13,34] with variations in their cores.
As mentioned above, Percec-type dendrons have been modified to obtain JDs and
therefore dendrimersomes tailored to specific applications. Recent reports include
dendrimersomes with photodegradable membranes [9], glycodendrimersomes [34] and
gadoteridol dendrimersomes [6–8] for biomedical applications.
2.2.4.1 Relationship Between JD Structure and Dendrimersome Properties
The mechanism of vesicle formation, including dendrimersomes, is not completely
elucidated. Therefore, any methodology that can predict the size, physical properties
and polydispersity of vesicles from the primary structure of their precursors, even using
empirical rules, would provide an advance in this field [25].
Some reports [3] apply the critical packing parameter p, that is commonly used to
predict the self-assembly morphologies of lipids, to JDs. However, the molecular
complexity of JDs makes difficult to apply conventional geometric models for predicting
their self-assembly into dendrimersomes and other structures [4].
Peterca et al. [25] reported the first attempt to correlate the size and physical properties
of monodispersed dendrimersomes, with the molecular structure of the JDs and with the
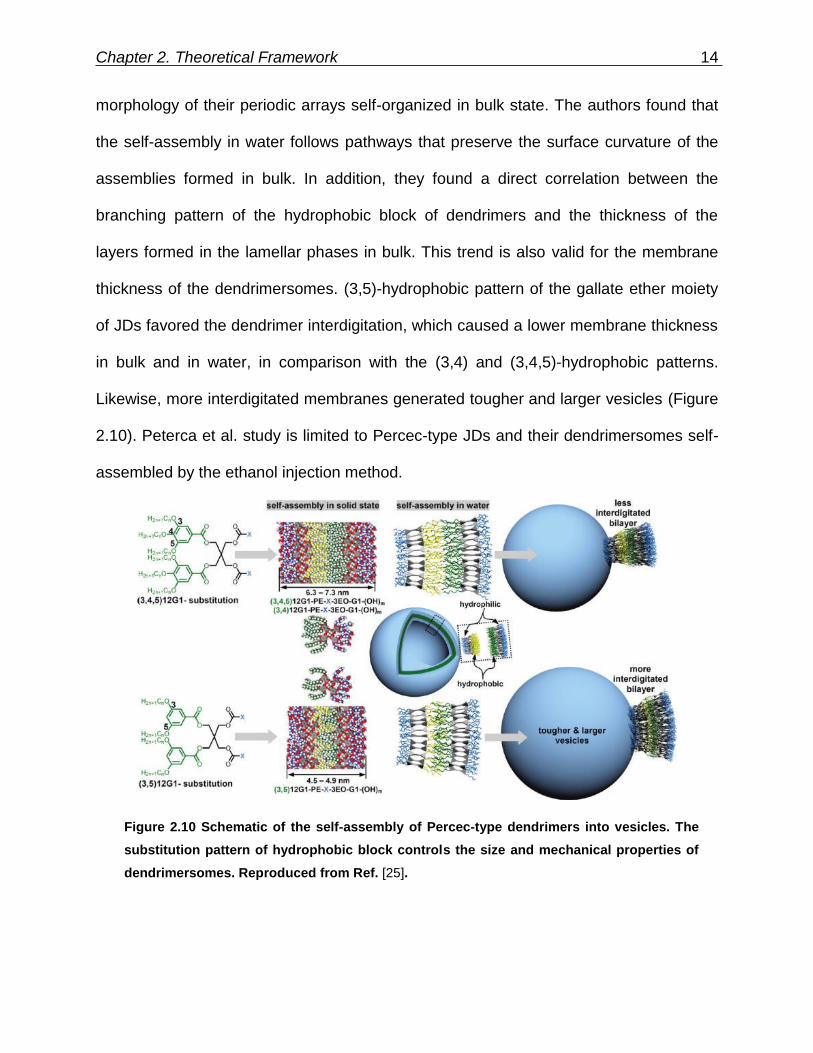
Chapter 2. Theoretical Framework 14
morphology of their periodic arrays self-organized in bulk state. The authors found that
the self-assembly in water follows pathways that preserve the surface curvature of the
assemblies formed in bulk. In addition, they found a direct correlation between the
branching pattern of the hydrophobic block of dendrimers and the thickness of the
layers formed in the lamellar phases in bulk. This trend is also valid for the membrane
thickness of the dendrimersomes. (3,5)-hydrophobic pattern of the gallate ether moiety
of JDs favored the dendrimer interdigitation, which caused a lower membrane thickness
in bulk and in water, in comparison with the (3,4) and (3,4,5)-hydrophobic patterns.
Likewise, more interdigitated membranes generated tougher and larger vesicles (Figure
2.10). Peterca et al. study is limited to Percec-type JDs and their dendrimersomes self-
assembled by the ethanol injection method.
Figure 2.10 Schematic of the self-assembly of Percec-type dendrimers into vesicles. The
substitution pattern of hydrophobic block controls the size and mechanical properties of
dendrimersomes. Reproduced from Ref. [25].
Chapter 2. Theoretical Framework 15
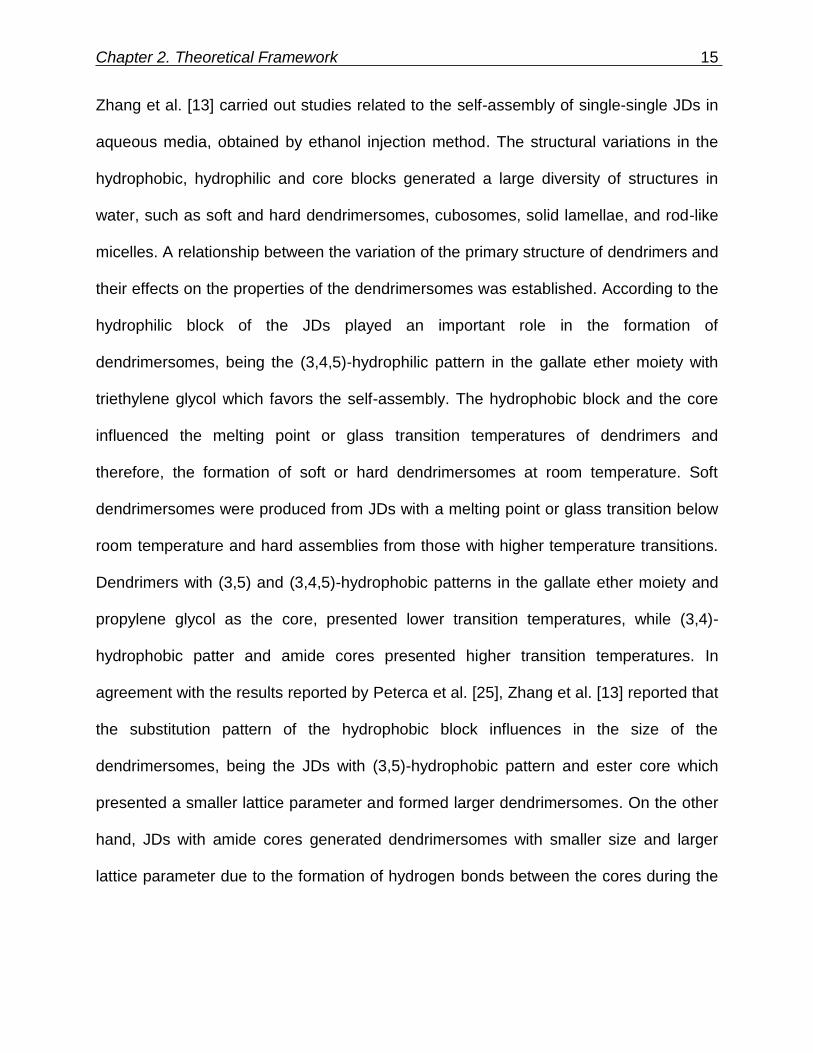
Zhang et al. [13] carried out studies related to the self-assembly of single-single JDs in
aqueous media, obtained by ethanol injection method. The structural variations in the
hydrophobic, hydrophilic and core blocks generated a large diversity of structures in
water, such as soft and hard dendrimersomes, cubosomes, solid lamellae, and rod-like
micelles. A relationship between the variation of the primary structure of dendrimers and
their effects on the properties of the dendrimersomes was established. According to the
hydrophilic block of the JDs played an important role in the formation of
dendrimersomes, being the (3,4,5)-hydrophilic pattern in the gallate ether moiety with
triethylene glycol which favors the self-assembly. The hydrophobic block and the core
influenced the melting point or glass transition temperatures of dendrimers and
therefore, the formation of soft or hard dendrimersomes at room temperature. Soft
dendrimersomes were produced from JDs with a melting point or glass transition below
room temperature and hard assemblies from those with higher temperature transitions.
Dendrimers with (3,5) and (3,4,5)-hydrophobic patterns in the gallate ether moiety and
propylene glycol as the core, presented lower transition temperatures, while (3,4)-
hydrophobic patter and amide cores presented higher transition temperatures. In
agreement with the results reported by Peterca et al. [25], Zhang et al. [13] reported that
the substitution pattern of the hydrophobic block influences in the size of the
dendrimersomes, being the JDs with (3,5)-hydrophobic pattern and ester core which
presented a smaller lattice parameter and formed larger dendrimersomes. On the other
hand, JDs with amide cores generated dendrimersomes with smaller size and larger
lattice parameter due to the formation of hydrogen bonds between the cores during the
Chapter 2. Theoretical Framework 16
formation of JDs monolayer. These hydrogen bonds align and prevent the interdigitation
of dendrimers (Figure 2.11).
Figure 2.11 Differences in lattice parameter due to the formation of hydrogen bonds
between the cores. Modified from Ref. [13].
Both, Peterca et al. [25] and Zhang et al. [13] studies established a methodology to
predict the size of dendrimersomes from JD concentration and parameters taken from a
reference JD structure. Furthermore, Zhang et al. [14] related the concentration of JDs
with the distance between bilayers in multilamellar onion-like dendrimersomes.
Most of the reported studies focus on the prediction of dendrimersomes size, shape,
and stability using experimental methods. Moreover, these studies are based on a
single type of JDs (Percec-type with gallate ether moieties) and require the full
characterization of a reference structure [10,13,14]. A deep exploration of other JD
structures using theoretical tools is required to understand the role of the molecular
architecture in the assembly formation and molecular properties [5]. Molecular
simulation can be a useful tool to gain insight into JDs self-assembly mechanism. Also,
Chapter 2. Theoretical Framework 17
other important properties of their aggregates, difficult to evaluate via experimental
methods, could be studied.
Mesoscopic molecular dynamics technologies, such as coarse-grained molecular
dynamics (CG-MD), are popular alternatives to study the self-assembly of amphiphilic
molecules since they reduce the computational costs when handling with large
molecules and long timescales of simulation [35]. CG modeling consists of the
simplification of molecular structure by mapping several atoms as single interactions
sites reducing the number of degrees of freedom and maintaining the essential
molecular features [36,37]. CG-MD simulation has already been applied to Percec-type
JDs that formed dendrimersomes [4] and to other amphiphilic dendrimers [38].
2.2.4.2 Methods for Dendrimersomes Preparation
The preparation procedure of assemblies with complex geometries, such as
dendrimersomes, plays an important role in the final morphology. Usually, the
preparation of self-assembled molecules follows two different kinds of approaches:
bottom-up, when the molecule is dissolved in a good solvent and forced to assemble by
a solvent switch; and the top-down, where a precursor phase is induced to rearrange in
solution [39]. The top-down approach is generally used for the preparation of giant
vesicles (size > 1 μm) through the thin-film hydration method [40]. On the other hand
bottom-up approach is applied to the production of nanovesicles [41], for example using
the method of solvent injection.
Thin-film hydration and solvent injection methods have been widely applied for the
obtaining of dendrimersomes [9,4,14,42]. The solvent injection method represents the
simplest method to produce dendrimersomes. In this technique, JDs are first dissolved
Chapter 2. Theoretical Framework 18
in an organic solvent, such as diethyl ether or ethanol, and then injected through a thin
needle into an excess aqueous medium [41,43]. When ethanol is used,
dendrimersomes are formed spontaneously as soon as the organic solution is in contact
with the aqueous phase, but vigorous agitation is needed to obtain narrow size
distribution [10]. This method generally allows the formation of unilamellar vesicles with
diameters below 300 nm [43]. The production of unilamellar and multilamellar
dendrimersomes with narrow size distribution by the solvent injection method, have
been reported [4,12].
Other reported procedure for the formation of dendrimersomes is the oil-in-water
method applied by Fedeli et al. [3] and Nazemi et al. [28]. In this method, JDs are
dissolved in a volatile non-water-miscible solvent and then aqueous media is added and
the mixture stirred rapidly until the complete evaporation of the organic fraction.
A common problem, which arises with the previously mentioned methods, is the
difficulty of upscaling toward their production in large quantities with high reproducibility,
a necessary condition for drug delivery applications in the biomedical field.
The use of microfluidic techniques for the formation of vesicles and microcapsules, and
for the encapsulation of drugs, offer several advantages over the traditional techniques,
such as the ability to produce large amounts of highly monodisperse microcapsules and
to achieve control of the concentrations and molecular composition into the cores and
shells of these microcapsules. An advantageous use of microfluidics in the
pharmaceutical industry is the capability to reduce the waste of precious material during
encapsulation, and the consequent reduction of costs in the elaboration process [44–46].

Chapter 2. Theoretical Framework 19
Thin-film hydration method consists in the hydration of stacked dendrimer bilayers that
separate and self-close, forming the assemblies [47]. The solvent injection method is
performed by the injection of a solution of dendrimers in a water-miscible organic
solvent through a thin needle, into an aqueous solution while stirring [48]. Assemblies
are formed instantaneously [49] with particle sizes smaller than the obtained by thin-film
hydration method.

Chapter 3
Materials and Methods
3.1 General Information
All chemicals were purchased from Sigma-Aldrich (St. Louis, MO, USA) and used
without any further purification except where noted otherwise. Ethyl acetate (EtOAc),
dichloromethane (DCM), and hexane (all reagent grade) were purchased from CTR
scientific (Monterrey, Mexico) and distilled prior to use. Ultrapure water (18.2 MΩ.cm)
was obtained from a Milli-Q system from Millipore (Billerica, MA, USA). The catalyst 4-
(dimethylamino)pyridinium p-toluenesulfonate (DPTS) was synthesized according to
Moore et al. [50]. Isopropylidene-2,2-bis(methoxy)propionic acid and benzyl-2,2-
bis(methylol)propionate were obtained following the procedure reported by Ihre et al.
[15]. Isopropylidene-[G-2]-benzyl ester and its deprotected product OH-[G-2]-benzyl
ester were obtained according to the procedure reported by Appel et al. [51].
Isopropylidene-[G-2]-COOH was obtained from isopropylidene-[G-2]-benzyl ester
hydrogenolysis, following the procedure reported by Ihre et al. [15]. Preparative flash
column chromatographies were carried out using silica-gel with a particle size of 40–63
μm (SiliaFlash® P60, SiliCycle, Quebec City, Canada). Analytical thin layer
chromatographies (TLC) were performed on silica gel plastic plates (TLC Silica gel 60
F254, Merck, Darmstadt, Germany).
Chapter 3. Materials and Methods 21
3.2 Instruments for Dendrimers Characterization
3.2.1 Nuclear Magnetic Resonance (NMR)
1H- and 13C-NMR spectra were recorded at 500.13 and 125.76 MHz, respectively, on a
Bruker Advance III spectrometer (Billerica, MA, USA), using d-chloroform (CDCl3) as a
solvent. The solvent signal was used as an internal standard.
3.2.2 Mass Spectra
Mass spectra were obtained using an Autoflex II MALDI-TOF mass spectrometer
(Bruker Daltonics, Bremen, Germany). Measures were performed in linear positive
mode, using a nitrogen laser (337 μm) at 50 Hz frequency. The acceleration voltage
was 19.50 kV, with delay time acquisition. The analytical samples were obtained by the
dry-droplet method. Briefly, 1 μL of an analyte solution in methanol (1 mg/mL) was
loaded on the MALDI plate (MTP 384 target plate polished steel BC, Bruker Daltonics,
Bremen, Germany) and allowed to dry at 23 °C. Each sample was covered with 2 μL of
matrix (α-cyano-4-hydroxycinnamic acid) solution (10 mg/mL, 50% acetonitrile, water
47.5% and 2.5% trifluoroacetic acid) and allowed to dry at 23 °C before the plate was
inserted into the vacuum chamber of the MALDI instrument. Data analysis was carried
in FlexAnalysis 3.0 software (Bruker Daltonics, Bremen, Germany).
3.2.3 Differential Scanning Calorimetry (DSC)
Thermal behavior of dendrimers 5A-C and 10A-C was determined using a Diamond
DSC (PerkinElmer, Shelton, USA) equipped with an intra-cooling system. The
measures were carried out under a constant dry nitrogen flow. The samples were
analyzed using 50 μL sealed aluminum pans (PerkinElmer, Shelton, USA). An empty
pan was used as a reference in all cases. Sample weights of 3-6mg were used on the

Chapter 3. Materials and Methods 22
measurements. Typically, the following temperature profile was used for each sample:
(1) Heat from 30 °C to 60 °C at 10 °C/min; (2) Cool from 60 °C to -45 °C at 70 °C/min;
(3) Hold for 3 minutes at -45 °C; (4) Heat from -45 °C to 60 °C at 10 °C/min; (5) Cool
from 60 °C to -20 °C at 10 °C/min and (6) Heat from -20 °C to 60 °C at 10 °C/min. DSC
curves were analyzed using OriginPro Evaluation 2018b b9.5.5.409 (Northampton, MA,
USA). The melting transition temperatures were taken at the onset of the peaks. The
glass transition temperature was taken as half ΔCp extrapolated.
3.3 Synthesis of Amphiphilic Janus Dendrimers
In general, the growth of dendrimers was performed via Steglich esterifications, which
involve the use of N,N’-dicyclohexylcarbodiimide (DCC) and DPTS as activating agents.
The reaction schemes are presented in Figures 4.1, 4.2, 4.6 and 4.7.
Dendron 1 and General Esterification Procedure
Benzyl-2,2-bis(methylol)propionate (0.5 g, 2.32 mmol), myristic acid (1.6 g, 6.96 mmol)
and DPTS (0.41 g, 0.139 mmol) were dissolved in dichloromethane (15 mL). To this, a
solution of N,N’-dicyclohexylcarbodiimide (DCC, 1.66 g, 8.04 mmol) in dichloromethane
(3 mL) was added dropwise. The reaction mixture was stirred for 24 h at 23 °C. Once
the reaction was complete, the white precipitate (N,N’-dicyclohexylurea, DCU) was
filtered off using a glass filter and washed with dichloromethane (5 mL). The organic
solvent was removed with a rotary evaporator. The crude product was precipitated in
ethanol (68 mL) at 4 °C.
Chapter 3. Materials and Methods 23
Dendron 2 and General Procedure for Removal of Benzyl Ester Group
Pd/C (10%, 0.42 g), was added to a solution of dendron 1 (4 g, 6.02 mmol) in a mixture
of EtOAc and dichloromethane (5:1, 30 mL). The apparatus for catalytic hydrogenolysis
was evacuated of air and filled with H2 (40 psi). After 5 h of shaking at 23 °C, the
reaction was complete. The catalyst was filtered off and carefully washed with EtOAc
(5 mL). The solvent of the filtrate was eliminated with a rotary evaporator. This product
was used without further purification.
Dendron 3A
Dendron 2 (1.02 g, 1.8 mmol), ethylene glycol (0.569 g, 9.17 mmol), DPTS (0.116 g,
0.394 mmol), and DCC (0.450 g, 2.18 mmol) were allowed to react for 24 h in DCM
(10 mL) following the general esterification procedure. The crude product was purified
by flash column chromatography using a mixture of 20:80 EtOAc/hexane, increasing to
100% EtOAc, to give compound 3A.
Dendron 3B
Compound 2, 1.03 g (1.9mmol), and 1.36 g (9.06 mmol) of triethylene glycol, 0.122 g
(0.414 mmol) of DPTS, and 0.472 g (2.29 mmol) of DCC were allowed to react following
the general esterification procedure in 12 mL of DCM for 24 h. The crude product was
purified by flash column chromatography using a mixture of 20:80 EtOAc/hexane,
increasing to 100% EtOAc, to give compound 3B.
Chapter 3. Materials and Methods 24
Dendron 3C
Compound 2, 1.04 g (1.87 mmol), and 0.677 g (3.88 mmol) of 1,10-decanediol, 0.106 g
(0.36 mmol) of DPTS, and 0.456 g (2.21 mmol) of DCC were allowed to react following
the general esterification procedure in 10 mL of DCM for 24 h. The crude product was
purified by flash column chromatography using a mixture of 20:80 EtOAc/hexane, to
give compound 3C.
Dendrimer 5A and General Procedure for Removal of the Acetonide
Protective Group
Dendron 3A (0.900 g, 1.5 mmol), isopropylidene-2,2-bis(methoxy)propionic acid
(0.530 g, 3.04 mmol), DPTS (0.185 g, 6.28 mmol), and DCC (0.748 g, 3.63 mmol) were
allowed to react for 24 h in DCM (15 mL) following the general esterification procedure.
The crude product was purified by flash column chromatography using a mixture of
30:70 EtOAc/hexane. Deprotected dendrimer was obtained following the procedure
described by Tuutila et al. [30]. Briefly, a fraction of the purified solid (0.200 g, 0.265
mmol) was solubilized in DCM (5 mL) and diluted with methanol (5 mL). One teaspoon
of Dowex® 50WX8 resin was added, and the reaction mixture was stirred at 55 °C for 24
h. After this time, the resin was filtered off and washed with dichloromethane (5 mL).
The organic solvent was removed with a rotary evaporator to give the compound 5A.
Dendrimer 5B
Compound 3B, 0.973 g (1.4 mmol), and 0.494 g (2.83 mmol) of isopropylidene-2,2-
bis(methoxy)propionic, 0.168 g (0.57 mmol) of DPTS, and 0.707 g (3.43 mmol) of DCC
were allowed to react following the general esterification procedure in 15 mL of DCM for
Chapter 3. Materials and Methods 25
24 h. The crude product was purified by flash column chromatography using a mixture
of 50:70 EtOAc/hexane. Purified solid, 0.206 g (0.244 mmol) was deprotected following
the general procedure for the acetonide protective group.
Dendrimer 5C
Compound 3C, 0.694 g (0.98 mmol), and 0.342 g (1.96 mmol) of isopropylidene-2,2-
bis(methoxy)propionic, 0.117 g (0.397 mmol) of DPTS, and 0.483 g (2.34 mmol) of DCC
were allowed to react following the general esterification procedure in 15 mL of DCM for
24 h. The crude product was purified by flash column chromatography using a mixture
of 20:80 EtOAc/hexane. The purified compound, 0.200 g (0.231 mmol) was deprotected
following the general procedure for the acetonide protective group.
Dendron 6
Isopropylidene-[G-2]-benzyl ester (0.409 g, 0.896 mmol), myristic acid (1 g, 4.38 mmol)
and DPTS (0.113 g, 0.384 mmol) were allowed to react for 24 h in DCM (12 mL)
following the general esterification procedure. The crude product was precipitated in
ethanol (68 mL) at 4 °C.
Dendron 7
Dendron 6 (2.88 g, 2.22 mmol) was dissolved in a mixture of EtOAc and
dichloromethane (5:1, 30 mL) and Pd/C (10%, 0.29 g) was added. Dendron 7 was
deprotected according to the general procedure for removal of benzyl ester group. This
product was used without further purification.

Chapter 3. Materials and Methods 26
Dendron 8A
Dendron 7 (1.022 g, 0.846 mmol), ethylene glycol (0.269 g, 4.33 mmol), DPTS (0.049 g,
0.166 mmol), and DCC (0.209 g, 1.01 mmol) were allowed to react for 24 h in DCM
(12 mL) following the general esterification procedure. The crude product was purified
by flash column chromatography using a mixture of 20:80 EtOAc/hexane, increasing to
100% EtOAc, to give compound 8A.
Dendron 8B
Compound 7, 1.007 g (mmol), and 0.642 g (mmol) of triethylene glycol, 0.054 g (mmol)
of DPTS, and 0.268 g (mmol) of DCC were allowed to react following the general
esterification procedure in 12 mL of DCM for 24 h. The crude product was purified by
flash column chromatography using a mixture of 20:80 EtOAc/hexane, increasing to
100% EtOAc, to give compound 8B.
Dendron 8C
Compound 7, 1.009 g (0.836 mmol), and 0.291 g (1.67 mmol) of 1,10-decanediol, 0.050
g (0.170 mmol) of DPTS, and 0.218 g (1.06 mmol) of DCC were allowed to react
following the general esterification procedure in 12 mL of DCM for 24 h. The crude
product was purified by flash column chromatography using a mixture of 20:80
EtOAc/hexane, to give compound 8C.
Dendrimer 10A
Dendron 8A (0.781 g, 0.624 mmol), isopropylidene-[G-2]-COOH (0.563 g, 1.26 mmol),
DPTS (0.076 g, 0.258 mmol), and DCC (0.335 g, 1.62 mmol) were allowed to react for
24 h in DCM (18 mL) following the general esterification procedure. The crude product

Chapter 3. Materials and Methods 27
was purified by flash column chromatography using a mixture of 30:70 EtOAc/hexane.
The purified solid (0.210 g, 0.124 mmol) was deprotected following the general
procedure for the acetonide protective group.
Dendrimer 10B
Compound 8B, 0.624 g (0.353 mmol), and 0.710 g (1.59 mmol) of Isopropylidene-[G-2]-
COOH, 0.063 g (0.214 mmol) of DPTS, and 0.261 g (1.26 mmol) of DCC were allowed
to react following the general esterification procedure in 20 mL of DCM for 24 h. The
crude product was purified by flash column chromatography using a mixture of 50:70
EtOAc/hexane. The purified solid [0.111 g (0.062 mmol)] was deprotected following the
general procedure for the acetonide protective group.
Dendrimer 10C
Compound 8C, 0.544 g (0.400 mmol), and 0.356 g (0.798 mmol) of Isopropylidene-[G-
2]-COOH, 0.080 g (0.272 mmol) of DPTS, and 0.206 g (0.998 mmol) of DCC were
allowed to react following the general esterification procedure in 20 mL of DCM for 24 h.
The crude product was purified by flash column chromatography using a mixture of
30:70 EtOAc/hexane. The purified compound [0.212 g (0.118mmol)] was deprotected
following the general procedure for the acetonide protective group.
3.4 Formation and Characterization of Assemblies (Experimental Method)
To assess different properties of aggregation behavior in water, two sizes of assemblies
were created through different methods. Giant assemblies (size ≥ 1 μm) were used to
evaluate the morphology of the assemblies and to identify hydrophobic and hydrophilic
domains in their structure. While small assemblies (size ≤ 100 nm) were produced to
Chapter 3. Materials and Methods 28
evaluate the size, polydispersity index (PDI), ζ-potential, stability and morphology of the
assemblies. Aqueous dispersions of JDs were carried out using the dendrimersomes
preparation protocols of thin-film hydration (for giant assemblies), and solvent injection
(for small assemblies) previously reported by Percec et al. [4]. In addition, microfluidics
was used as an alternative to the thin-film hydration method to produce giant
dendrimersomes, using double emulsion drops with ultrathin shells as templates.
3.4.1 Thin-Film Hydration Method
Procedure 1: A 10 mg/mL solution of dendrimer in chloroform (200 µL) and a 3 mg/mL
solution of Nile Red (10 µL) in the same solvent were mixed and deposited on a 2 cm2
roughened Teflon plate. After solvent evaporation, the Teflon plate was placed in a vial
and continued drying under reduced pressure for 2 h. Addition of 4 mL of ultrapure
water and subsequent hydration at 60 °C for 1 h followed by hydration at 23 °C for 12 h,
led to the formation of the aggregates.
Procedure 2: The solution of dendrimer and Nile Red in chloroform was deposited on a
glass vial. The solvent was evaporated at 80 °C under reduced pressure for 2 h.
Addition of 2 mL of ultrapure water and subsequent hydration at 80 °C for 1 h followed
by hydration at 23 °C for 12 h, led to the formation of the aggregates.
Assemblies were characterized by confocal microscopy using a Leica TCS SP5
confocal microscope (Leica Microsystems, Wetzlar, Germany), equipped with an HCX
PL APO CS 20.0/0.70 IMM UV objective (Leica Microsystems, Wetzlar, Germany).
Nile Red was excited at 488 nm with an argon laser and emission spectra collected at
600–700 nm. Confocal images of 512 × 512 pixels were acquired in the XYZ scan mode
at a scan speed of 400 Hz. Optical sections were taken at 1.98 µm intervals. Images
Chapter 3. Materials and Methods 29
were digitalized at a resolution of 8 bits. The digital images of the confocal stacks were
processed using Fiji software (ImageJ, National Institutes of Health, Bethesda, MD,
USA) [52].
3.4.2 Microfluidics
3.4.2.1 Fabrication of the Microfluidic Device.
Monodisperse water-in-oil-in-water (W/O/W) double emulsion drops with ultra-thin shells
were produced using a glass capillary microfluidic device, following a procedure similar
to that reported by Kim et al. [53]. These drops were utilized as templates to form the
dendrimersomes. The microfluidic device consisted of two tapered cylindrical capillaries
of the outer diameter of 1.00 mm. These cylindrical capillaries were inserted oppositely
into each end of a cylindrical capillary, whose inner diameter was slightly larger (1.05
mm) than the outer diameter of the inner capillaries; this configuration enabled to
accurately align the axes of the cylindrical capillaries under the microscope, as
illustrated schematically in Figure 3.1. The tip of the capillary on the left (injector
capillary) was about 50-80 μm in diameter, and the tip of the capillary on the right
(collection capillary) was about 120-160 μm. The separation distance between them
was the same as the tip size of the injection capillary. These cylindrical capillaries were
tapered to a diameter of 20 μm with a micropipette puller (P-30, Sutter Instrument,
Novato, CA, USA) and then were carefully sanded to the desired final diameter. The
middle injection capillary was coated with n-octadecyl-trimethoxysilane to render its
surface hydrophobic; to prevent wetting of the aqueous phase on the external capillary
wall and enhance the formation of a water-in-oil emulsion. Also, the collector capillary
was coated with (3-mercaptopropyl)trimethoxysilane for rendering its surface hydrophilic,
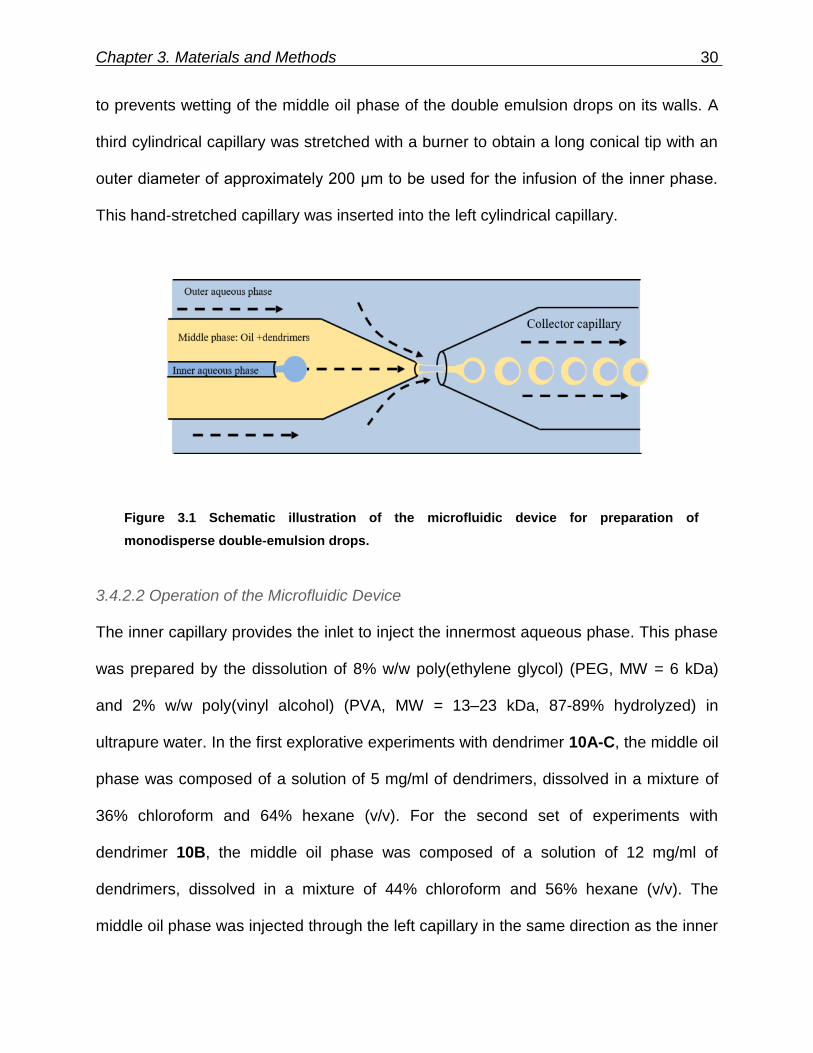
Chapter 3. Materials and Methods 30
to prevents wetting of the middle oil phase of the double emulsion drops on its walls. A
third cylindrical capillary was stretched with a burner to obtain a long conical tip with an
outer diameter of approximately 200 μm to be used for the infusion of the inner phase.
This hand-stretched capillary was inserted into the left cylindrical capillary.
Figure 3.1 Schematic illustration of the microfluidic device for preparation of
monodisperse double-emulsion drops.
3.4.2.2 Operation of the Microfluidic Device
The inner capillary provides the inlet to inject the innermost aqueous phase. This phase
was prepared by the dissolution of 8% w/w poly(ethylene glycol) (PEG, MW = 6 kDa)
and 2% w/w poly(vinyl alcohol) (PVA, MW = 13–23 kDa, 87-89% hydrolyzed) in
ultrapure water. In the first explorative experiments with dendrimer 10A-C, the middle oil
phase was composed of a solution of 5 mg/ml of dendrimers, dissolved in a mixture of
36% chloroform and 64% hexane (v/v). For the second set of experiments with
dendrimer 10B, the middle oil phase was composed of a solution of 12 mg/ml of
dendrimers, dissolved in a mixture of 44% chloroform and 56% hexane (v/v). The
middle oil phase was injected through the left capillary in the same direction as the inner
Chapter 3. Materials and Methods 31
aqueous phase. The outer aqueous phase, composed of 10% w/w PVA solution was
injected through the interstices between the left capillary and the outer capillary, and it
flows in the same direction on the inner and middle phases. The PVA in the outer phase
enhanced this phase viscosity and the stability of double emulsion drops. With this
device, a water drop is forced to be re-emulsified into the oil phase forming a W/O/W
double emulsion drops, pulled downstream into the collection capillary, as shown in
Figure 3.1. The innermost aqueous phase and the middle oil phase were injected at a
flow rate of 498 μL/h and the outer phase at a flow rate of 3000 μL/h.
The double emulsion drops were produced as templates for the formation of
dendrimersomes in the dripping regime which enhance the monodispersity of the
samples [54]. The resultant double emulsion drops were collected in a glass vial
containing a solution of 100 mM sucrose water, having the same osmolarity of the inner
aqueous cores to prevent osmotic stresses. Once in the vial, the solvents contained in
the middle oil phase of the double emulsions start to diffuse to the outer continuous
aqueous phase [54]. The collector vial was maintained uncovered for 1 h, during the
collection process, to allow the solvents in the outer aqueous phase to evaporate. All
experiments were performed at room temperature. The production of double emulsion
drops in the microfluidic device was recorded using a 10x objective on an inverted
microscope (Axio Observer Z1, Zeiss, Göttingen, Germany) equipped with a high-speed
camera (Phantom Miro EX2-2048MM, Vision Research, Wayne, NJ, USA). The time of
collection was 1 h in all experiments. The values reported on the shell thickness and
radius of the dendrimersomes were measured from bright field images with the use of
ImageJ (NIH) software [55] in combination with MATLAB codes for their posterior
Chapter 3. Materials and Methods 32
analysis. Hydrophilic-lipophilic balance (HLB) value was calculated with the
MarvinSketch 17.27 program (ChemAxon Ltd., Cambridge, MA, USA), using the Griffin
method [56,57].
3.4.3 Solvent Injection Method
A dendrimer solution (10 mg/mL, 100 µL) in absolute ethanol, acetone or
tetrahydrofuran (THF), was injected into ultrapure water (1.9 mL) and vortex mixed for
5 s to obtain a final dendrimer concentration of 0.5 mg/mL. The size, PDI, and ζ-
potential of the assemblies were determined by triplicate (independent samples from
each treatment) at 23 °C, using dynamic light scattering (DLS) with a Malvern Zetasizer
ZS ZEN3600 (Malvern Instruments Ltd., Malvern, UK) following the procedure
described by Percec et al. [4]. Morphology of the assemblies was evaluated using
atomic force microscopy (AFM). For this analysis, samples obtained from ethanol
injection experiments were diluted 1:2 with ultrapure water. 10 μL of the sample were
placed on a glass coverslip and then allowed to air dry for approximately 15 h. Samples
were observed in a NT-MDT NTEGRA Prima AFM (Moscow, Russia) at 23 °C, with a
RTESPA probe (Bruker, Billerica, MA, USA) of spring constant k = 40 N/m in
semicontact mode. Height and phase images were simultaneously obtained with a scan
rate of 1.61 μm/s over a selected area of 1 × 1 μm. Images were processed and
analyzed using NOVA 3.1. (NT-MDT). The height and diameter of assemblies were
measured from the profile section of AFM line scans analyzing height images.
3.5 Coarse-Grained Molecular Dynamic Simulation
CG-MD simulation was made using the MARTINI CG model [58]. The parameters of
this model were adapted to use with the dendrimer composed of 2 [G-2] bis-MPA
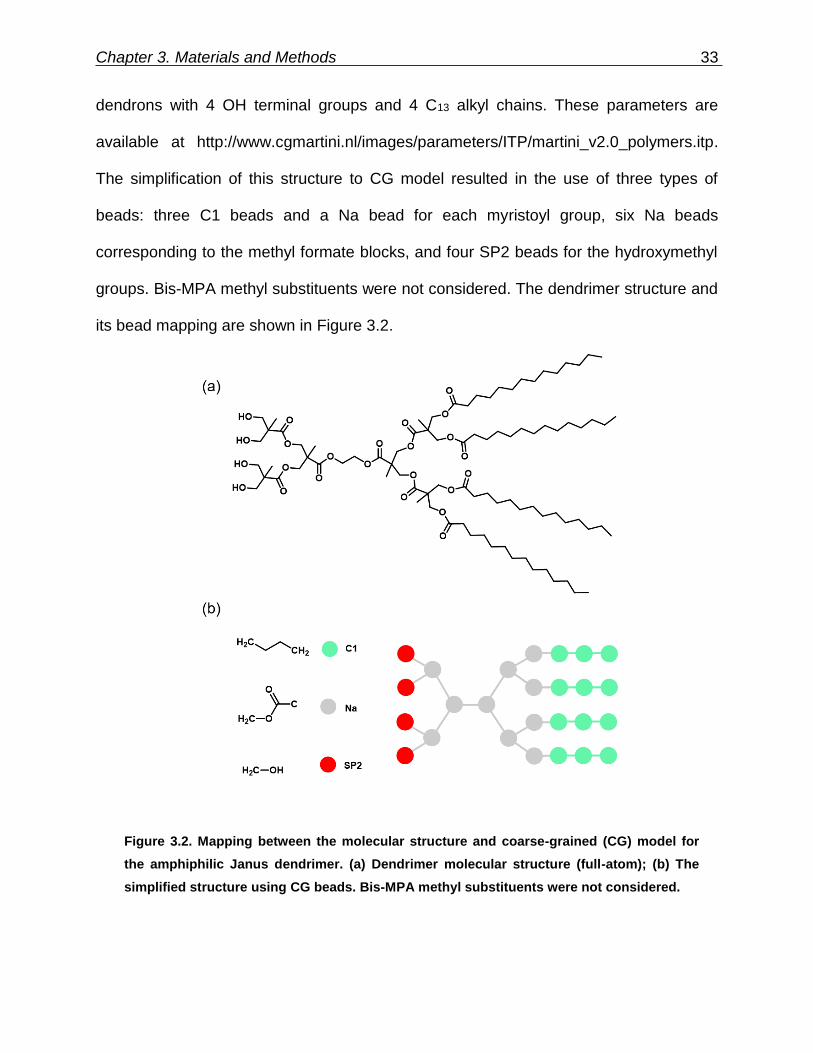
Chapter 3. Materials and Methods 33
dendrons with 4 OH terminal groups and 4 C13 alkyl chains. These parameters are
available at http://www.cgmartini.nl/images/parameters/ITP/martini_v2.0_polymers.itp.
The simplification of this structure to CG model resulted in the use of three types of
beads: three C1 beads and a Na bead for each myristoyl group, six Na beads
corresponding to the methyl formate blocks, and four SP2 beads for the hydroxymethyl
groups. Bis-MPA methyl substituents were not considered. The dendrimer structure and
its bead mapping are shown in Figure 3.2.
Figure 3.2. Mapping between the molecular structure and coarse-grained (CG) model for
the amphiphilic Janus dendrimer. (a) Dendrimer molecular structure (full-atom); (b) The
simplified structure using CG beads. Bis-MPA methyl substituents were not considered.
Chapter 3. Materials and Methods 34
Angle and bond parameters for CG model were obtained from a full atomistic simulation
of a single molecule of dendrimer in explicit water and transformed to CG resolution
using the mapping technique described previously and following the procedure
described by Marquez-Miranda et al. [38], and following Marrink et al. [59,60] criteria to
obtain parameters for known bead types. Furthermore, radii of gyration for the full
atomistic model was similar to CG model.
Simulation system was built with 1700 CG-dendrimers placed randomly into a 37.6 nm
× 37.4 nm × 37 nm non-polarized MARTINI water box, representing a dendrimer
concentration of 76 mM.
The CG simulation was performed using GROMACS simulation package 5.0.3
(SciLifeLab, Stockholm, Sweden). Steepest descent method was used for energy
minimization with a force tolerance of 10 kJ/(mol nm). After, a molecular dynamics
simulation in the isobaric-isothermal ensemble was performed under periodic boundary
conditions with a temperature of 310 K and pressure of 1 bar. The temperature was
maintained by the velocity rescaling thermostat (modifies Berendsen) [61] and pressure
by the Parrinello-Rahman scheme. Lennard-Jones potentials and short-range
electrostatics were shifted from 0.9 and 0.0 nm, respectively, to the cut-off distance (1.2
nm) using the standard shift function in GROMACS [62]. Long-range electrostatics were
calculated using particle mesh Ewald summation [63]. An integration time step of 30 fs
and Verlet algorithm were considered. The total simulation length was 13 μs. Analysis
and visualization of simulation results were performed using Tcl homemade-scripts,
VMD 1.9.3 (University of Illinois, Urbana, IL, USA) [64] and GROMACS programs.
Chapter 3. Materials and Methods 35
3.6 Statistical Analysis
Data were expressed as a mean ± standard deviation. Data were analyzed using
analysis of variance (ANOVA), followed by Tukey’s honestly significantly different test.
Mean differences were evaluated by paired Student’s t-test or when appropriate
unpaired t-test. The accepted level of significance was p-value ≤ 0.05. Statistical
analysis was performed with MINITAB 15 (Minitab Inc., Champaign, IL, USA).

Chapter 4
Results and Discussion
4.1 Synthesis and Characterization of Amphiphilic JDs
4.1.1 First Generation Dendrimers
The hydrophobic building block of [G-1] dendrimers (Figure 4.1), (myristoyl)2-[G-1]-
benzyl ester (dendron 1) was synthesized in 82% yield by the condensation of benzyl-
2,2-bis(methylol)propionate (EB) and myristic acid, in a 1:3 molar ratio. Taking
advantage of the differences in solubility of the reactants and the product of interest,
dendron 1 was obtained by precipitation in ethanol at 4 °C, without the need of column
chromatography for its isolation. Then, dendron 1 was deprotected from the benzyl
group by low pressure (40 psi) catalytic hydrogenolysis with palladium on carbon, to
give dendron 2 with a reaction yield of 98%.
Figure 4.1. Synthesis of hydrophobic building block of [G-1] dendrimers. Reagents and
conditions: i) Myristic acid, DCC, DPTS, DCM; ii) Pd/C, H2 (40 psi), EtOAc: DCM.
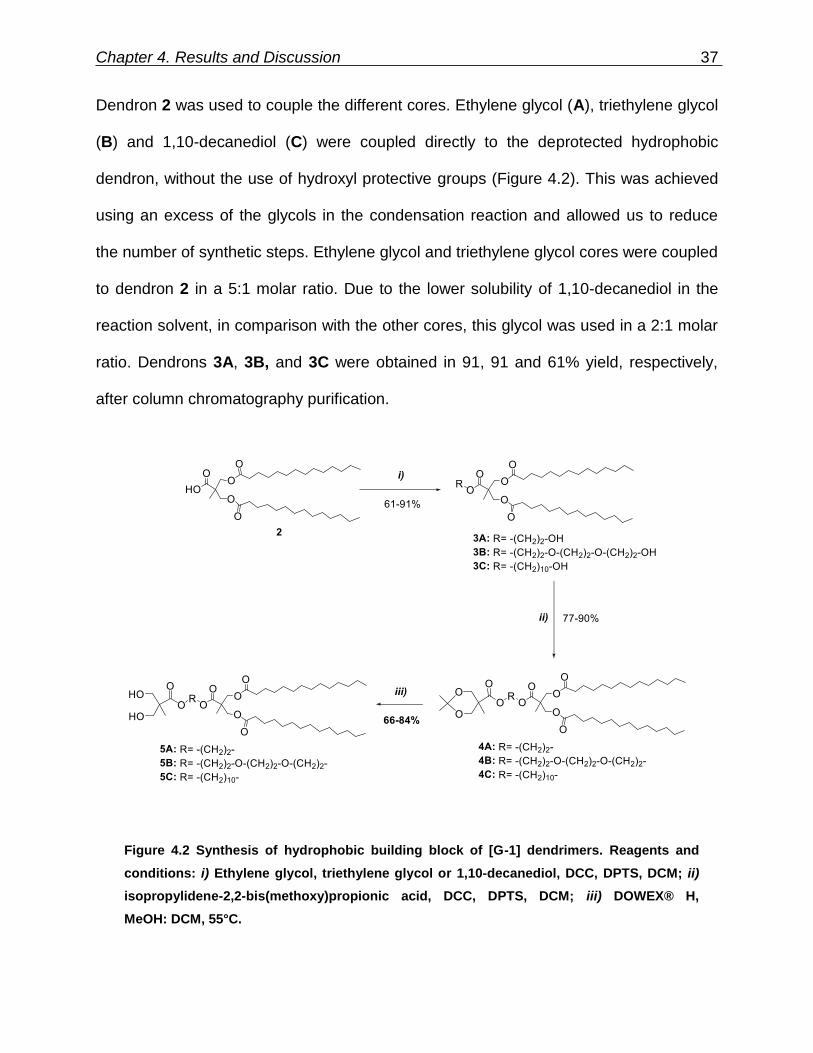
Chapter 4. Results and Discussion 37
Dendron 2 was used to couple the different cores. Ethylene glycol (A), triethylene glycol
(B) and 1,10-decanediol (C) were coupled directly to the deprotected hydrophobic
dendron, without the use of hydroxyl protective groups (Figure 4.2). This was achieved
using an excess of the glycols in the condensation reaction and allowed us to reduce
the number of synthetic steps. Ethylene glycol and triethylene glycol cores were coupled
to dendron 2 in a 5:1 molar ratio. Due to the lower solubility of 1,10-decanediol in the
reaction solvent, in comparison with the other cores, this glycol was used in a 2:1 molar
ratio. Dendrons 3A, 3B, and 3C were obtained in 91, 91 and 61% yield, respectively,
after column chromatography purification.
Figure 4.2 Synthesis of hydrophobic building block of [G-1] dendrimers. Reagents and
conditions: i) Ethylene glycol, triethylene glycol or 1,10-decanediol, DCC, DPTS, DCM; ii)
isopropylidene-2,2-bis(methoxy)propionic acid, DCC, DPTS, DCM; iii) DOWEX® H,
MeOH: DCM, 55°C.
Chapter 4. Results and Discussion 38
To obtain the [G-1] dendrimers 4A-C (Figure 4.2) compounds 3A-C were coupled to the
hydrophilic dendron isopropylidene-2,2-bis(methoxy)propionic acid in a 1:2 molar ratio,
and purified by column chromatography, in 84 (4A), 77 (4B) and 90% (4C) yield.
Afterward, the acetonide protective group was effectively removed in presence of an
acidic Dowex 50WX8 resin at 55 °C, as described by Tuuttila et al. [30], obtaining
dendrimers 5A-B in 84 (5A), 66 (5B) and 70% (5C) yields. We tried other unsuccessful
approaches to remove acetonide group. First, we used the ion-exchange resin at room
temperature, but the reaction was incomplete probably due to too mild conditions. We
also tried the procedure described by Ropponen et al. [24] that involves the use of HCl
6 N but was ineffective leading to the formation of byproducts probably due to the ester
hydrolysis.
The structures of the [G-1] dendrimers and their precursors were fully characterized by
1H NMR, 13C NMR, and MALDI-TOF MS, and the detailed information is described in
the Appendix A. Particularly, 1H NMR and 13C NMR were very useful to monitoring the
coupling and deprotection reactions to obtain the final dendrimers. Examination of the
1H NMR spectra of reveals signals attributed to the bis-MPA units in the hydrophilic and
hydrophobic building blocks around 1.1, 3.6-3.9, 4.0-4.3 and 4.4 ppm, and the signals of
the myristic chains in the hydrophobic block at 0.88, 1.2-1.4, 1.5-1.6 and 2.3 ppm, as
shown in the 1H NMR spectra of dendrimers (Figures 4.3-4.5). In addition, signals
around 4.2-4.3 ppm for 5A (Figure 4.3); 3.5-3.7 and 4.2-4.3 ppm for 5B (Figure 4.4);
and 1.2-1.4, 1.4-1.7 and 4.1-4.3 ppm for 5C (Figure 4.5), revealed the coupling of
dendrons to the respective core molecule. The 1H NMR spectra integration of all
dendrimer was consistent with the expected results. 13C NMR spectra of the final
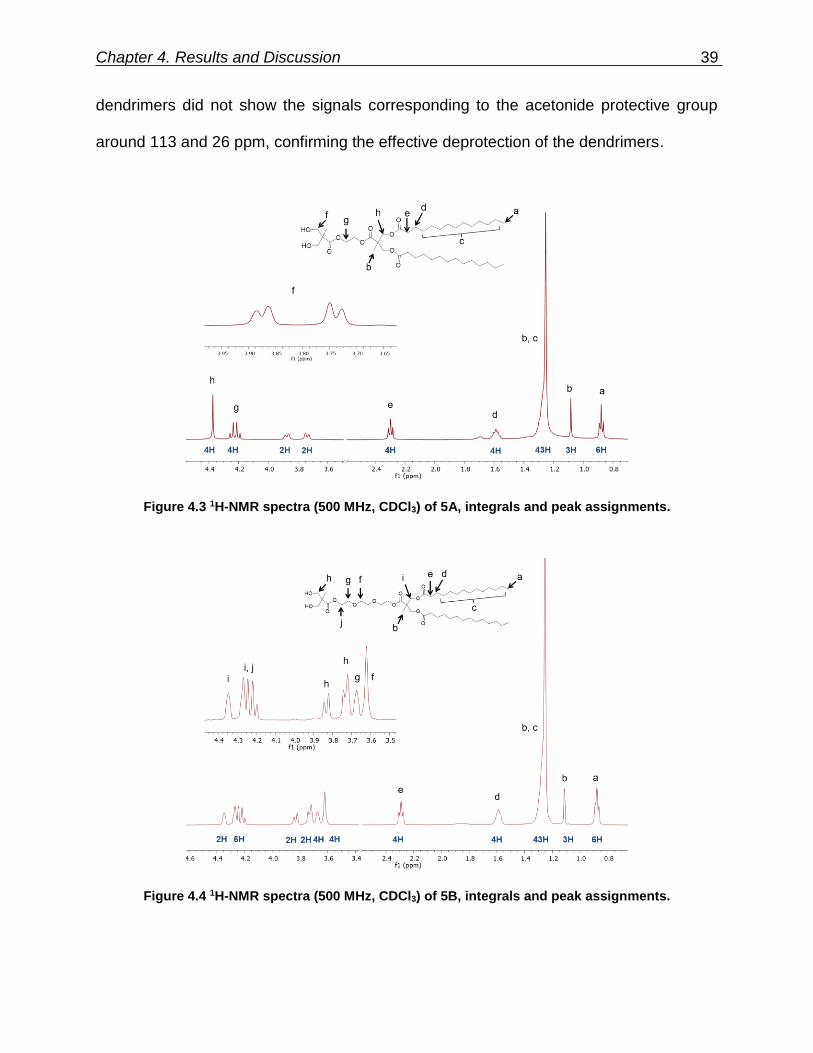
Chapter 4. Results and Discussion 39
dendrimers did not show the signals corresponding to the acetonide protective group
around 113 and 26 ppm, confirming the effective deprotection of the dendrimers.
Figure 4.3 1H-NMR spectra (500 MHz, CDCl3) of 5A, integrals and peak assignments.
Figure 4.4 1H-NMR spectra (500 MHz, CDCl3) of 5B, integrals and peak assignments.
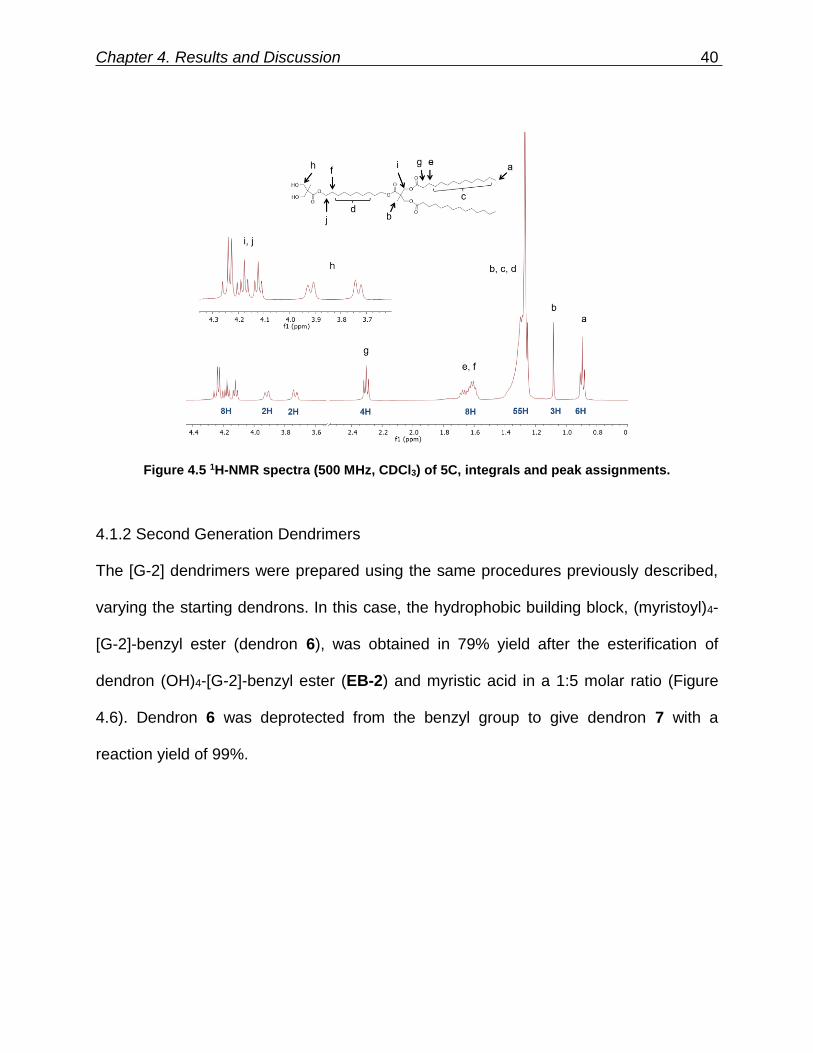
Chapter 4. Results and Discussion 40
Figure 4.5 1H-NMR spectra (500 MHz, CDCl3) of 5C, integrals and peak assignments.
4.1.2 Second Generation Dendrimers
The [G-2] dendrimers were prepared using the same procedures previously described,
varying the starting dendrons. In this case, the hydrophobic building block, (myristoyl)4-
[G-2]-benzyl ester (dendron 6), was obtained in 79% yield after the esterification of
dendron (OH)4-[G-2]-benzyl ester (EB-2) and myristic acid in a 1:5 molar ratio (Figure
4.6). Dendron 6 was deprotected from the benzyl group to give dendron 7 with a
reaction yield of 99%.

Chapter 4. Results and Discussion 41
Figure 4.6 Synthesis of hydrophobic building block of [G-2] dendrimers. Reagents and
conditions: i) Myristic acid, DCC, DPTS, DCM; ii) Pd/C, H2 (40 psi), EtOAc: DCM.
The hydrophilic building block was obtained from (isopropylidene)4-[G-2]-COOH.
Coupling reactions between the hydrophobic building group and the different cores in a
1:5 molar ratio (except for 1,10-decanediol where a 1:2 molar ratio was used),
generated dendrons 8A-C in 75 (8A), 75 (8B) and 45% (8C) yield (Figure 4.7). These
dendrons were attached to the hydrophilic block in a 1:2 molar ratio, to produce
dendrimers 9A-C in 81 (9A), 44 (9B) and 68% (9C) yield. Finally, dendrimers 10A-C
were obtained in 78 (10A), 79 (10B) and 31% (10C) yield, after the elimination of
isopropylidene protecting group from dendrimers 9A-C.
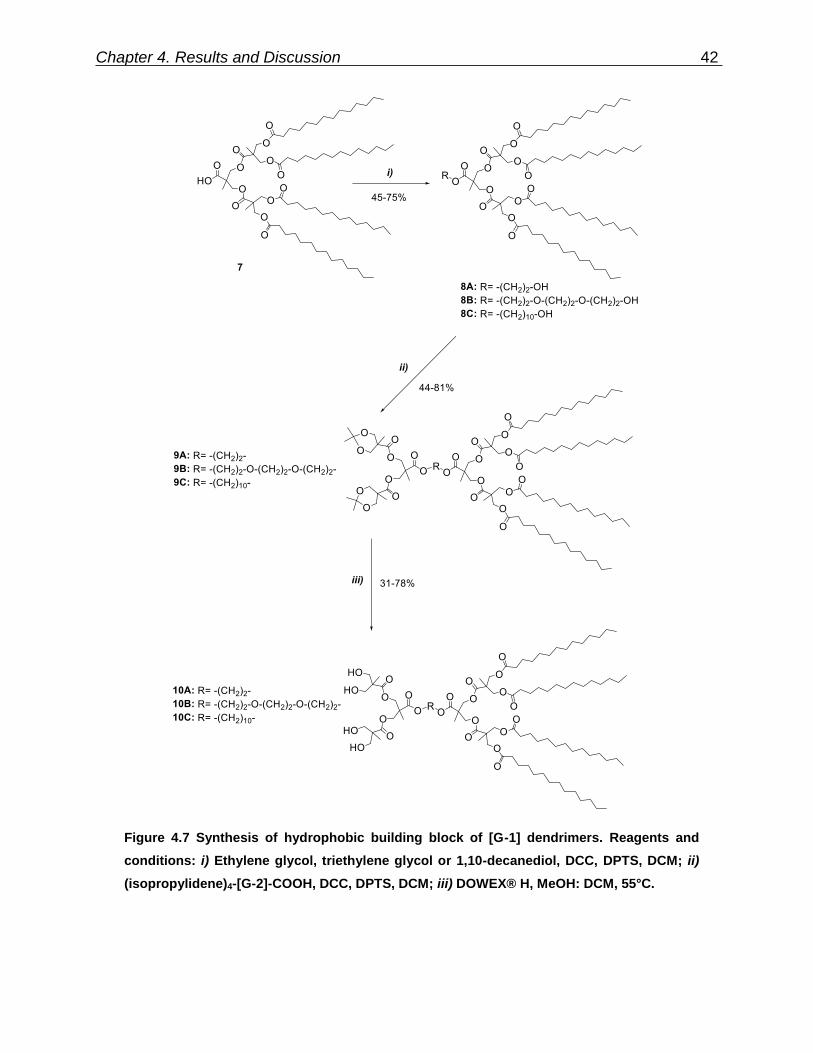
Chapter 4. Results and Discussion 42
Figure 4.7 Synthesis of hydrophobic building block of [G-1] dendrimers. Reagents and
conditions: i) Ethylene glycol, triethylene glycol or 1,10-decanediol, DCC, DPTS, DCM; ii)
(isopropylidene)4-[G-2]-COOH, DCC, DPTS, DCM; iii) DOWEX® H, MeOH: DCM, 55°C.
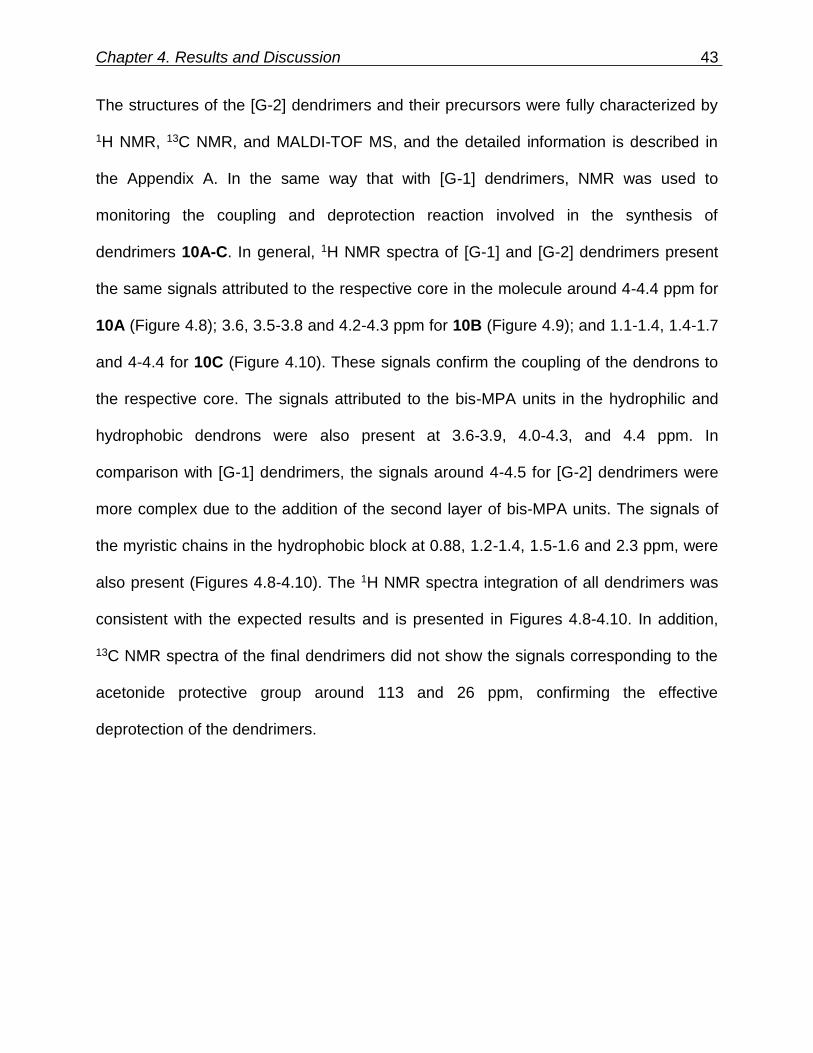
Chapter 4. Results and Discussion 43
The structures of the [G-2] dendrimers and their precursors were fully characterized by
1H NMR, 13C NMR, and MALDI-TOF MS, and the detailed information is described in
the Appendix A. In the same way that with [G-1] dendrimers, NMR was used to
monitoring the coupling and deprotection reaction involved in the synthesis of
dendrimers 10A-C. In general, 1H NMR spectra of [G-1] and [G-2] dendrimers present
the same signals attributed to the respective core in the molecule around 4-4.4 ppm for
10A (Figure 4.8); 3.6, 3.5-3.8 and 4.2-4.3 ppm for 10B (Figure 4.9); and 1.1-1.4, 1.4-1.7
and 4-4.4 for 10C (Figure 4.10). These signals confirm the coupling of the dendrons to
the respective core. The signals attributed to the bis-MPA units in the hydrophilic and
hydrophobic dendrons were also present at 3.6-3.9, 4.0-4.3, and 4.4 ppm. In
comparison with [G-1] dendrimers, the signals around 4-4.5 for [G-2] dendrimers were
more complex due to the addition of the second layer of bis-MPA units. The signals of
the myristic chains in the hydrophobic block at 0.88, 1.2-1.4, 1.5-1.6 and 2.3 ppm, were
also present (Figures 4.8-4.10). The 1H NMR spectra integration of all dendrimers was
consistent with the expected results and is presented in Figures 4.8-4.10. In addition,
13C NMR spectra of the final dendrimers did not show the signals corresponding to the
acetonide protective group around 113 and 26 ppm, confirming the effective
deprotection of the dendrimers.
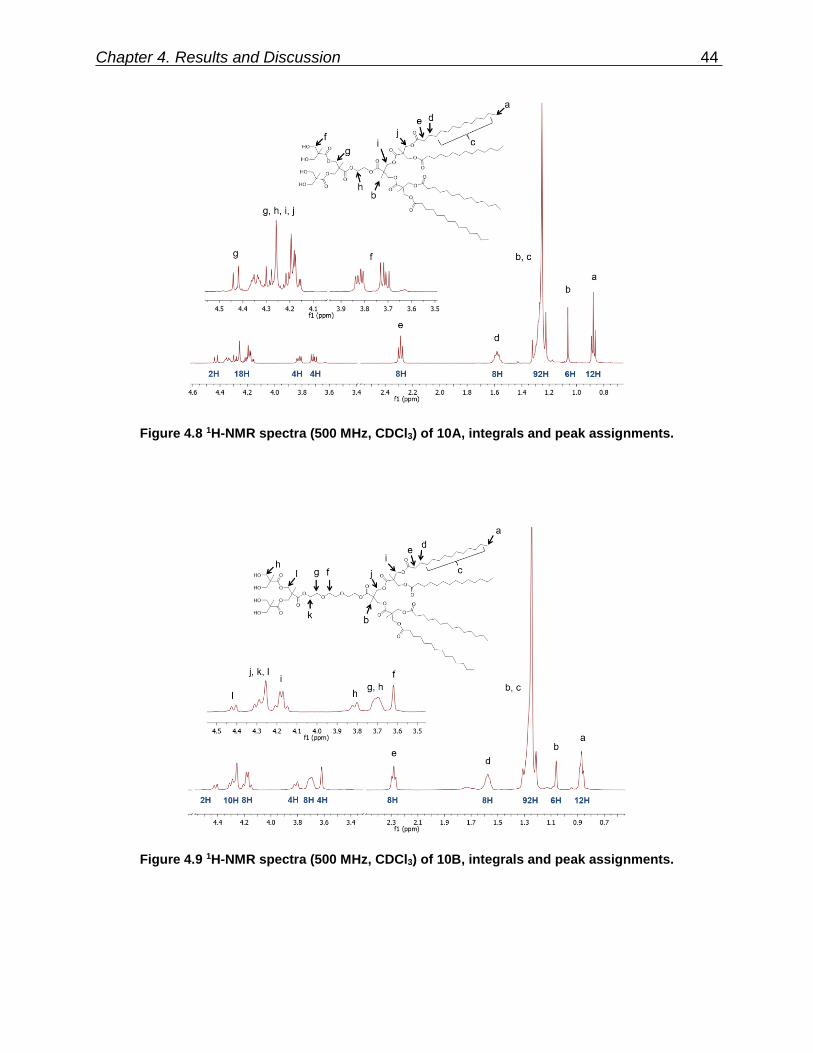
Chapter 4. Results and Discussion 44
Figure 4.8 1H-NMR spectra (500 MHz, CDCl3) of 10A, integrals and peak assignments.
Figure 4.9 1H-NMR spectra (500 MHz, CDCl3) of 10B, integrals and peak assignments.

Chapter 4. Results and Discussion 45
Figure 4.10 1H-NMR spectra (500 MHz, CDCl3) of 10C, integrals and peak assignments.
4.2 Thermal Behavior of Amphiphilic JDs
The thermal behavior of the dendrimers was determined using differential scanning
calorimetry (DSC). Results of DSC measurements are summarized in Table 4.1, and
the DSC curves are presented in Figures 4.11 and 4.12.
Due to the waxy consistency of the dendrimers, an initial heating scan from 30 to 60 °C
was applied to increase the contact surface between the samples and the bottom of the
aluminum pans where the measures were conducted. In this range of temperatures only
melting transitions (Tm) were observed for all dendrimers. In general, the shape of
these melting transitions peaks was broad and presented high enthalpy values (66-230
kJ/mol) (Figure 4.11). These values were in the order of magnitude of melting process
enthalpies of similar dendrimers [3]. The [G-2] dendrimer with ethylene glycol core
(compound 10A) presented the highest melting temperature. On the other hand, [G-2]
dendrimer with 1,10-decanediol as core (compound 10C) presented the highest
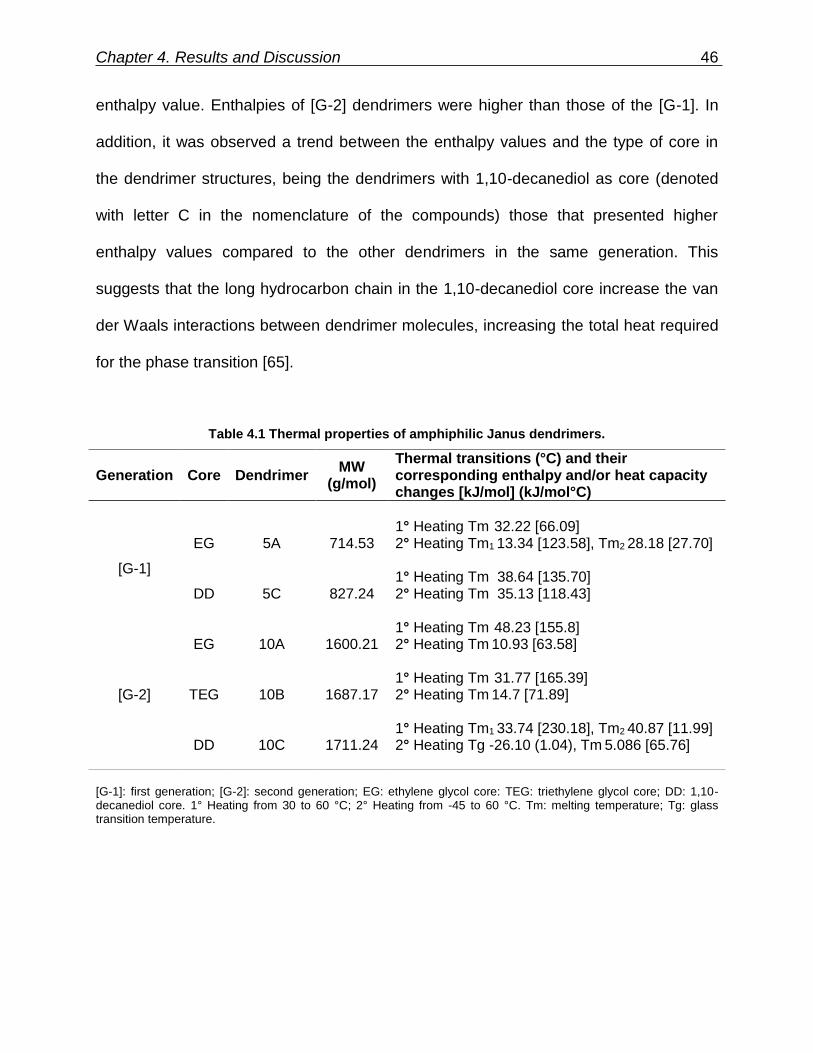
Chapter 4. Results and Discussion 46
enthalpy value. Enthalpies of [G-2] dendrimers were higher than those of the [G-1]. In
addition, it was observed a trend between the enthalpy values and the type of core in
the dendrimer structures, being the dendrimers with 1,10-decanediol as core (denoted
with letter C in the nomenclature of the compounds) those that presented higher
enthalpy values compared to the other dendrimers in the same generation. This
suggests that the long hydrocarbon chain in the 1,10-decanediol core increase the van
der Waals interactions between dendrimer molecules, increasing the total heat required
for the phase transition [65].
Table 4.1 Thermal properties of amphiphilic Janus dendrimers.
[G-1]: first generation; [G-2]: second generation; EG: ethylene glycol core: TEG: triethylene glycol core; DD: 1,10-decanediol core. 1° Heating from 30 to 60 °C; 2° Heating from -45 to 60 °C. Tm: melting temperature; Tg: glass transition temperature.
Generation Core Dendrimer MW
(g/mol)
Thermal transitions (°C) and their corresponding enthalpy and/or heat capacity changes [kJ/mol] (kJ/mol°C)
[G-1]
EG 5A 714.53 1° Heating Tm 32.22 [66.09] 2° Heating Tm1 13.34 [123.58], Tm2 28.18 [27.70]
DD 5C 827.24 1° Heating Tm 38.64 [135.70] 2° Heating Tm 35.13 [118.43]
[G-2]
EG 10A 1600.21 1° Heating Tm 48.23 [155.8] 2° Heating Tm 10.93 [63.58]
TEG 10B 1687.17 1° Heating Tm 31.77 [165.39] 2° Heating Tm 14.7 [71.89]
DD 10C 1711.24 1° Heating Tm1 33.74 [230.18], Tm2 40.87 [11.99] 2° Heating Tg -26.10 (1.04), Tm 5.086 [65.76]
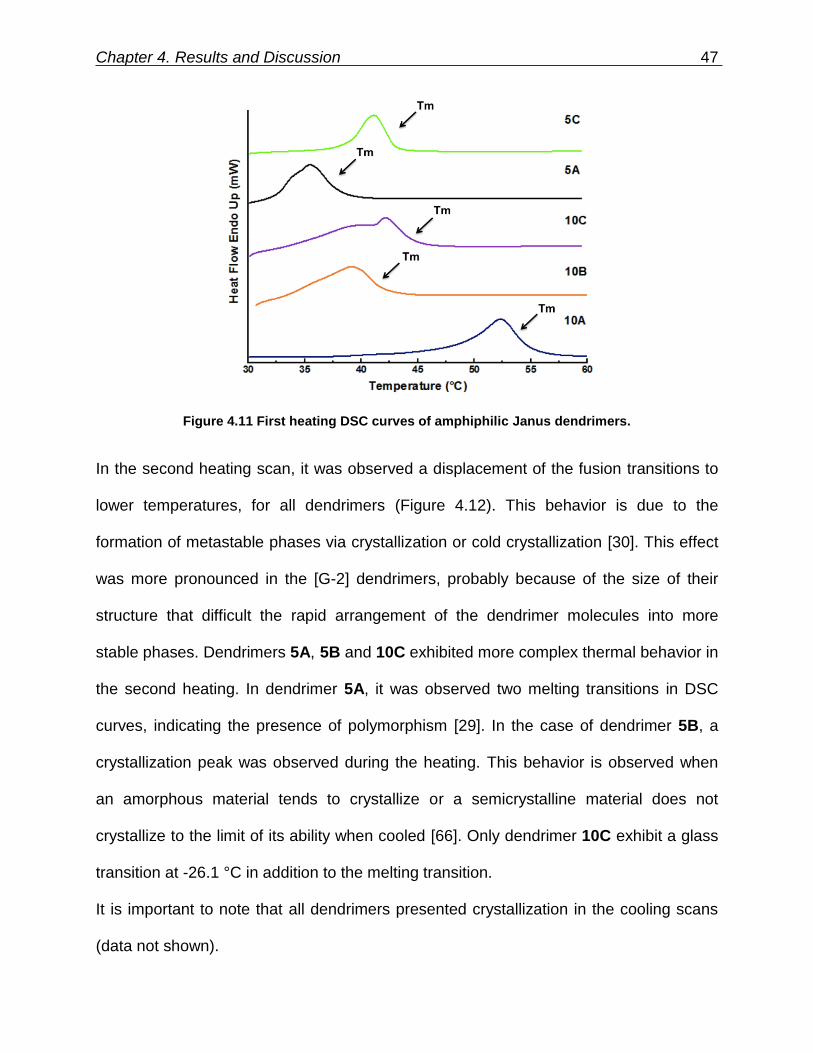
Chapter 4. Results and Discussion 47
Figure 4.11 First heating DSC curves of amphiphilic Janus dendrimers.
In the second heating scan, it was observed a displacement of the fusion transitions to
lower temperatures, for all dendrimers (Figure 4.12). This behavior is due to the
formation of metastable phases via crystallization or cold crystallization [30]. This effect
was more pronounced in the [G-2] dendrimers, probably because of the size of their
structure that difficult the rapid arrangement of the dendrimer molecules into more
stable phases. Dendrimers 5A, 5B and 10C exhibited more complex thermal behavior in
the second heating. In dendrimer 5A, it was observed two melting transitions in DSC
curves, indicating the presence of polymorphism [29]. In the case of dendrimer 5B, a
crystallization peak was observed during the heating. This behavior is observed when
an amorphous material tends to crystallize or a semicrystalline material does not
crystallize to the limit of its ability when cooled [66]. Only dendrimer 10C exhibit a glass
transition at -26.1 °C in addition to the melting transition.
It is important to note that all dendrimers presented crystallization in the cooling scans
(data not shown).
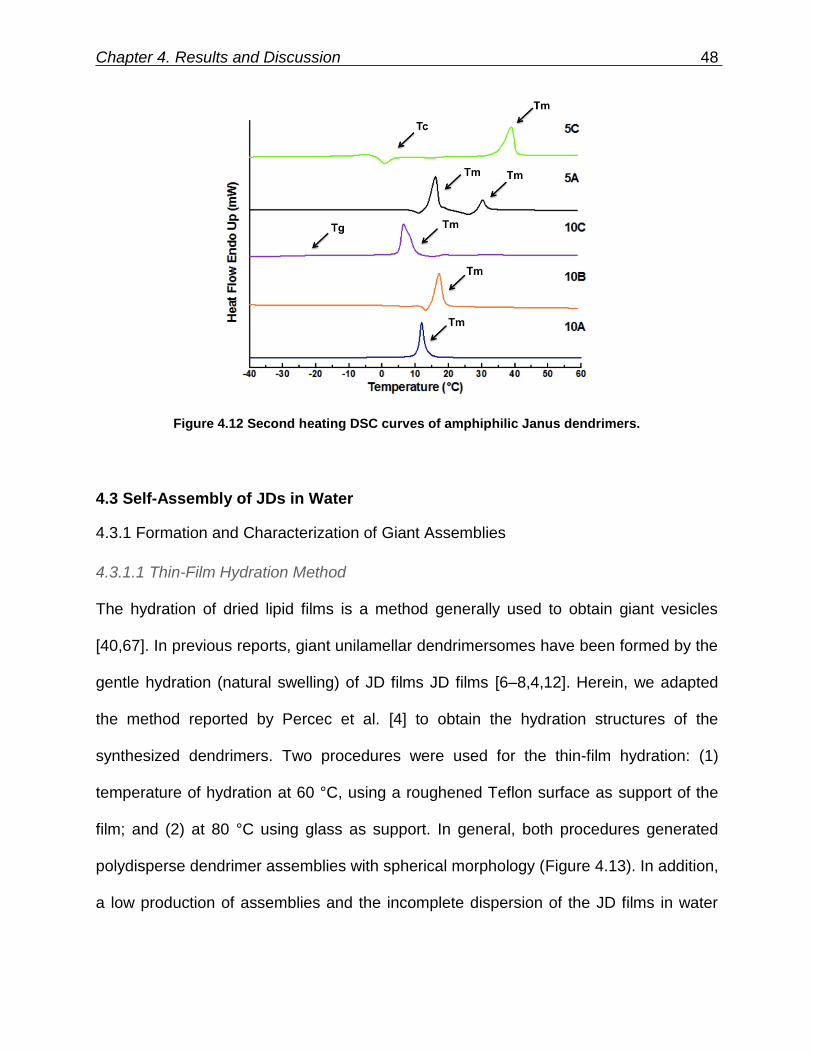
Chapter 4. Results and Discussion 48
Figure 4.12 Second heating DSC curves of amphiphilic Janus dendrimers.
4.3 Self-Assembly of JDs in Water
4.3.1 Formation and Characterization of Giant Assemblies
4.3.1.1 Thin-Film Hydration Method
The hydration of dried lipid films is a method generally used to obtain giant vesicles
[40,67]. In previous reports, giant unilamellar dendrimersomes have been formed by the
gentle hydration (natural swelling) of JD films JD films [6–8,4,12]. Herein, we adapted
the method reported by Percec et al. [4] to obtain the hydration structures of the
synthesized dendrimers. Two procedures were used for the thin-film hydration: (1)
temperature of hydration at 60 °C, using a roughened Teflon surface as support of the
film; and (2) at 80 °C using glass as support. In general, both procedures generated
polydisperse dendrimer assemblies with spherical morphology (Figure 4.13). In addition,
a low production of assemblies and the incomplete dispersion of the JD films in water
Chapter 4. Results and Discussion 49
were observed for all dendrimers (Figure 4.13a). The procedure 1 generated fewer
assemblies than procedure 2. Also, this procedure generated assemblies of smaller size.
Figure 4.13 Production of assemblies using the thin-film hydration method. (a) Residual
dendrimer/Nile Red films after 12 h of hydration. (b) Optical micrograph showing
assemblies obtained by procedure 1. (c) Optical micrograph showing assemblies obtained
by procedure 2.
The JDs were able to encapsulate the hydrophobic dye Nile Red as confirmed by
confocal microscopy (Figure 4.14). Optical sections of assemblies showed the
accumulation of the dye within the whole structure of the assemblies. No presence of
water inside the structures was observed, except for some of the assemblies of
dendrimer 5A that presented solvent sections. However, these sections represent a
small proportion of the assemblies. Figure 4.14 shows optical sections of dendrimers
assemblies, taken from the center of their structures. The results of dye encapsulation
experiments indicate that the dendrimer assemblies are mainly composed of
hydrophobic domains, without water entrapped inside, discarding the presence of
dendrimersomes (vesicle-like morphology). Multiple layers of dendrimers could form the
Chapter 4. Results and Discussion 50
obtained assemblies. No formation of dendrimersomes can be attributed to the poorly
hydration of the dendrimer film caused by the insufficient electrostatic repulsion
between the adjacent lamellae, as seen in neutral phospholipids [40,67]. Moreover, the
preparation methodology adopted used heat to promote the lamellae hydration.
According to Ianiro et al. [39], this condition causes the loss of the hydrogen bonds
between the water and hydrophilic domains, reducing the overall solubility of the
amphiphile. It is necessary to explore other preparation procedures, varying the
temperature of thin-films rehydration or using other production techniques for giant
vesicles, such as microfluidics.
Figure 4.14 (a) Confocal microscopy images of dendrimer 10A assemblies formed by the
thin-film hydration method and encapsulating Nile Red (hydrophobic dye).
Optical sections of individual assemblies of (a) 10A and (b) 5A, taken from the center of
their structure.
Chapter 4. Results and Discussion 51
4.3.1.2 Microfluidics
Due to the low efficiency for dendrimersomes formation using the thin-film hydration
method, the microfluidic approach was employed as an alternative for vesicle
production. Monodisperse double emulsion drops with ultrathin shells were used as
templates for the fabrication of dendrimersomes from [G-2] JDs (compounds 10A-C).
The election of these dendrimers was arbitrary. However, the molecular structure of
[G-2] dendrimers could be interesting for further applications due to the higher number
of functionalizable hydroxyl groups. Figure 4.15 shows a typical image of the double
emulsion production in the glass microfluidic devices employed.
Figure 4.15 Optical micrograph showing a typical production of monodisperse double
emulsion drops containing dendrimers in the oil phase.
First explorative experiments were conducted using the conditions described by Arriaga
et al. [54]. The oil phase for these experiments was composed of a mixture of 36%
chloroform and 64% hexane (v/v), and a JD concentration of 5 mg/mL. With the addition
of dendrimers in the oil middle phase in the microfluidic devices, two different flow

Chapter 4. Results and Discussion 52
behaviors were observed. For dendrimers 10A and 10C, the flow followed a
discontinuous regime, in which single-emulsion drops and double-emulsion drops were
produced intermittently [54]. For dendrimer 10B, double-emulsion drops were obtained
in a stable continuous regime during 1 h of sample collection. It is known that surfactant
molecules do not affect the surface tension during the drop production in microchannels
when their diffusion times are higher than the time of drop formation [68]. This is an
evidence that dendrimer 10B must have a low diffusion time.
Due to the precise control over the flow ratios in the microfluidic device, in experiments
with dendrimer 10B, the resultant double emulsion drops were highly monodispersed,
with radius 30 ± 3 μm, as shown in Figure 4.16. The small drop with high optical
contrast (indicated in a circle) in Figure 4.16a was an oil-in-water single emulsion drop.
Since the double emulsion drops with dendrimer 10B were obtained in the continuous
regime, these single emulsion drops must come from destabilized double-emulsion
drops and represent 14% of the total sample.
Figure 4.16 (a) Optical micrograph of a population of double emulsion drops containing
dendrimer B. The inset shows a single emulsion drop formed by the destabilization of a
double emulsion drop (white circle). (b) Radius distribution of double emulsion drops.
The mean radius is 30 ± 3 µm.

Chapter 4. Results and Discussion 53
The mean value of the radii Ro of these single emulsion drops was used to determine
the thickness of the middle oil phase of the double emulsion drops: since the total
volume of the double emulsion drop (VT) must be equal to the sum of the volume of the
aqueous phase (Vaq) plus the volume of the oil phase (Vo) (Equation 1), the expression
for the thickness (t) of the double emulsion drops can be formulated as Equation 2,
where RT is the external radius of the double emulsion drop and Ro is the radius of the
single emulsion [53].
𝑉𝑇 = 𝑉𝑎𝑞 + 𝑉𝑜 Equation 1
𝑡 = 𝑅𝑇 − √𝑅𝑇3 − 𝑅𝑜
33 Equation 2
By this calculation, the shell thickness was 140 nm, considering an uncertainty of 6%
from the optical resolution limit of microscopy images. This value was similar to
previously reported works with this method, being around 200-600 nm for double
emulsion drops made with SPAN 80 surfactant in hexadecane [53,69]. In fact, the oily
shell of the double emulsion drops made with this method was less than a micron thick,
smaller than in double emulsion templates obtained with other methods. This feature is
important in double emulsion drops because under the appropriate conditions enables
the formation of vesicles after the oil phase evaporation [54], due to the minimal amount
of residual solvent within their shells. However, double emulsions obtained with this
experiment did not precipitate into bilayered structures.
As mentioned above, double emulsions made with dendrimers 10A and 10C were
obtained with a discontinuous regime. The resulting double emulsions made with these
dendrimers destabilize in some minutes after their production. Even though, in the case
Chapter 4. Results and Discussion 54
of dendrimer 10A, the presence of polydisperse vesicle-like structures was observed
among several drops of oil in water (Figure 4.17a). In the case of the sample made with
dendrimer 10C, no evidence of stable double emulsion drops was observed (data not
shown).
The different behavior of the JD assembly could be attributed to the difference in the
hydrophilicity of each dendrimer. Following this idea, the HLB balance for dendrimers
was calculated. The resulting values were 6.36 for dendrimer 10A, 7.07 for 10B, and
5.94 for 10C; being the dendrimer 10C the less hydrophilic. Samples of double
emulsions obtained from dendrimers 10B were stable at least for 20 days, stored at
room temperature. It was considered that the polydisperse vesicle-like structures
observed in the dendrimer 10A sample were driven by the self-assembly of this
dendrimer into vesicles next to destabilization of the double emulsion drops.
Figure 4.17 Bright field microscopy images showing the samples resulting from double
emulsion drops made with: (a) dendrimer 10A, image was taken 4 days after production,
polydisperse vesicle-like structures are observed; (b) dendrimer 10B, image was taken 12
days after production, monodisperse double emulsion drops continue presently.

Chapter 4. Results and Discussion 55
Since dendrimer 10B was the only dendrimer that formed stable double emulsions
suitable for dendrimersomes production, this dendrimer was used in a second
experiment. For the second experiment, dendrimer concentration was increased to
12 mg/mL and the oil phase mixture was modified 44% chloroform and 56% hexane
(v/v). With the flow ratios and the solvent mixture used in this experiment, the
microfluidic device worked in a discontinuous regime. In addition, with the solvent
mixture and dendrimer concentration employed, the double emulsion drops produced
precipitated into dendrimersomes, as shown in Figure 4.18. In the obtained
dendrimersomes, it was observed the formation of the small dendritic reservoirs (Figure
4.18b). This reservoirs of surfactant molecules had been observed previously in
liposomes obtained with this method [54], in which, the formation of vesicle-like
structures was promoted by the ultrathin oily shell of the double emulsion templates
made in the microfluidic devices used. A careful selection of the oil mixture in the middle
phase, with a volatile solvent (chloroform) capable of a fast evaporation and a less
volatile solvent that promotes the precipitation of dendrimers (hexane), lead the
formation of bilayers through a hydrodynamic fluctuation after the evaporation of
solvents, in a process known as dewetting [54,70,71]. Nevertheless, the samples of
dendrimersomes produced were polydisperse due to difficulties related to the control of
the dripping regime in the double emulsion formation. The formed dendrimersomes
(Figure 4.18c) started to destabilize upon three days after their production. In spite of
the short time of stability of the dendrimersomes, the results show the ability of the
microfluidic method to assemble these JDs into vesicle structures.
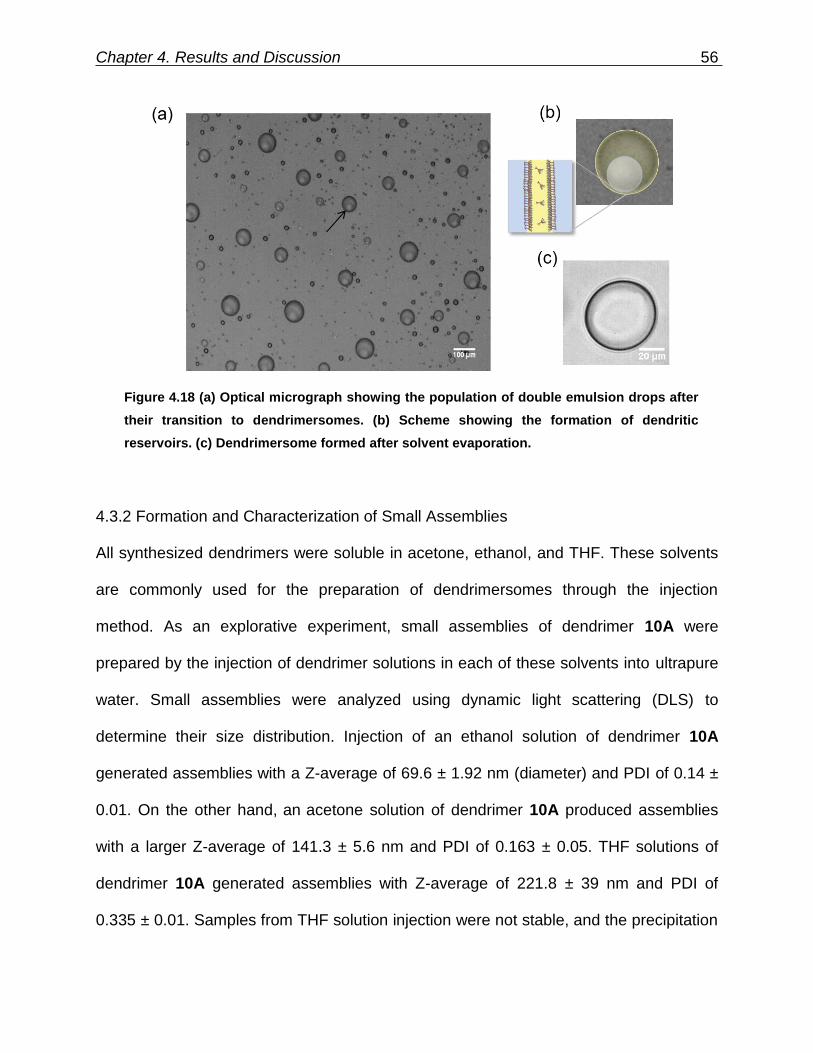
Chapter 4. Results and Discussion 56
Figure 4.18 (a) Optical micrograph showing the population of double emulsion drops after
their transition to dendrimersomes. (b) Scheme showing the formation of dendritic
reservoirs. (c) Dendrimersome formed after solvent evaporation.
4.3.2 Formation and Characterization of Small Assemblies
All synthesized dendrimers were soluble in acetone, ethanol, and THF. These solvents
are commonly used for the preparation of dendrimersomes through the injection
method. As an explorative experiment, small assemblies of dendrimer 10A were
prepared by the injection of dendrimer solutions in each of these solvents into ultrapure
water. Small assemblies were analyzed using dynamic light scattering (DLS) to
determine their size distribution. Injection of an ethanol solution of dendrimer 10A
generated assemblies with a Z-average of 69.6 ± 1.92 nm (diameter) and PDI of 0.14 ±
0.01. On the other hand, an acetone solution of dendrimer 10A produced assemblies
with a larger Z-average of 141.3 ± 5.6 nm and PDI of 0.163 ± 0.05. THF solutions of
dendrimer 10A generated assemblies with Z-average of 221.8 ± 39 nm and PDI of
0.335 ± 0.01. Samples from THF solution injection were not stable, and the precipitation
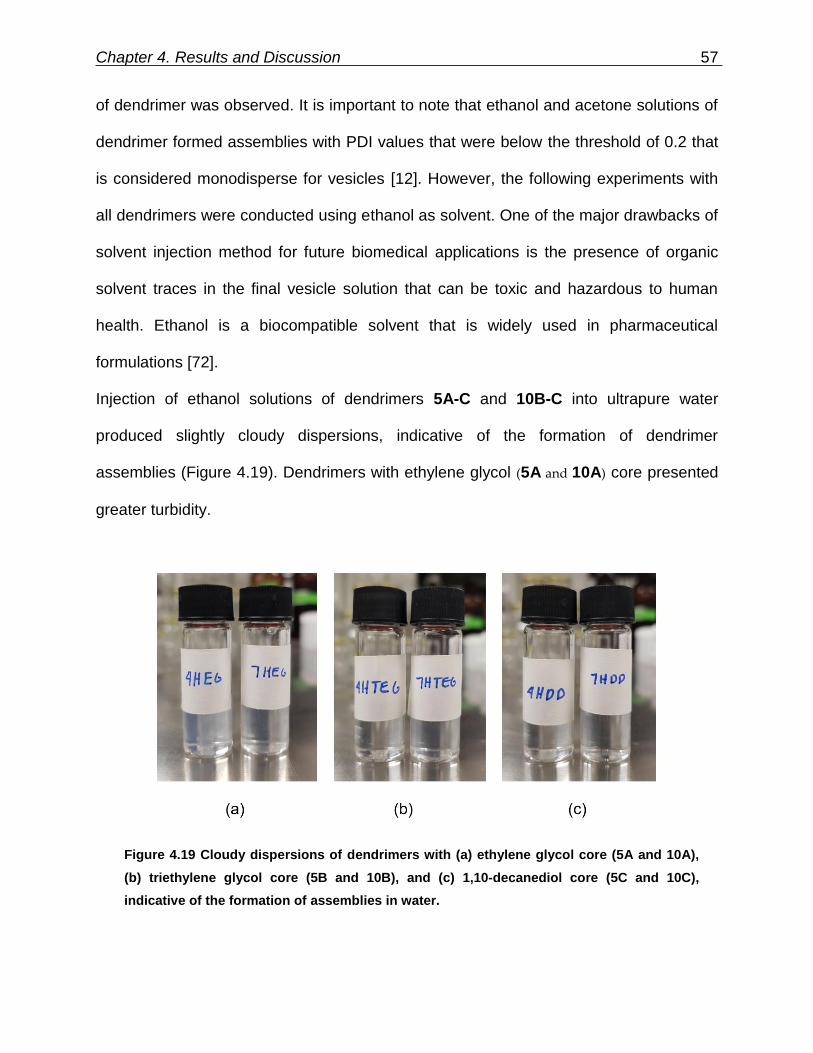
Chapter 4. Results and Discussion 57
of dendrimer was observed. It is important to note that ethanol and acetone solutions of
dendrimer formed assemblies with PDI values that were below the threshold of 0.2 that
is considered monodisperse for vesicles [12]. However, the following experiments with
all dendrimers were conducted using ethanol as solvent. One of the major drawbacks of
solvent injection method for future biomedical applications is the presence of organic
solvent traces in the final vesicle solution that can be toxic and hazardous to human
health. Ethanol is a biocompatible solvent that is widely used in pharmaceutical
formulations [72].
Injection of ethanol solutions of dendrimers 5A-C and 10B-C into ultrapure water
produced slightly cloudy dispersions, indicative of the formation of dendrimer
assemblies (Figure 4.19). Dendrimers with ethylene glycol (5A and 10A) core presented
greater turbidity.
Figure 4.19 Cloudy dispersions of dendrimers with (a) ethylene glycol core (5A and 10A),
(b) triethylene glycol core (5B and 10B), and (c) 1,10-decanediol core (5C and 10C),
indicative of the formation of assemblies in water.
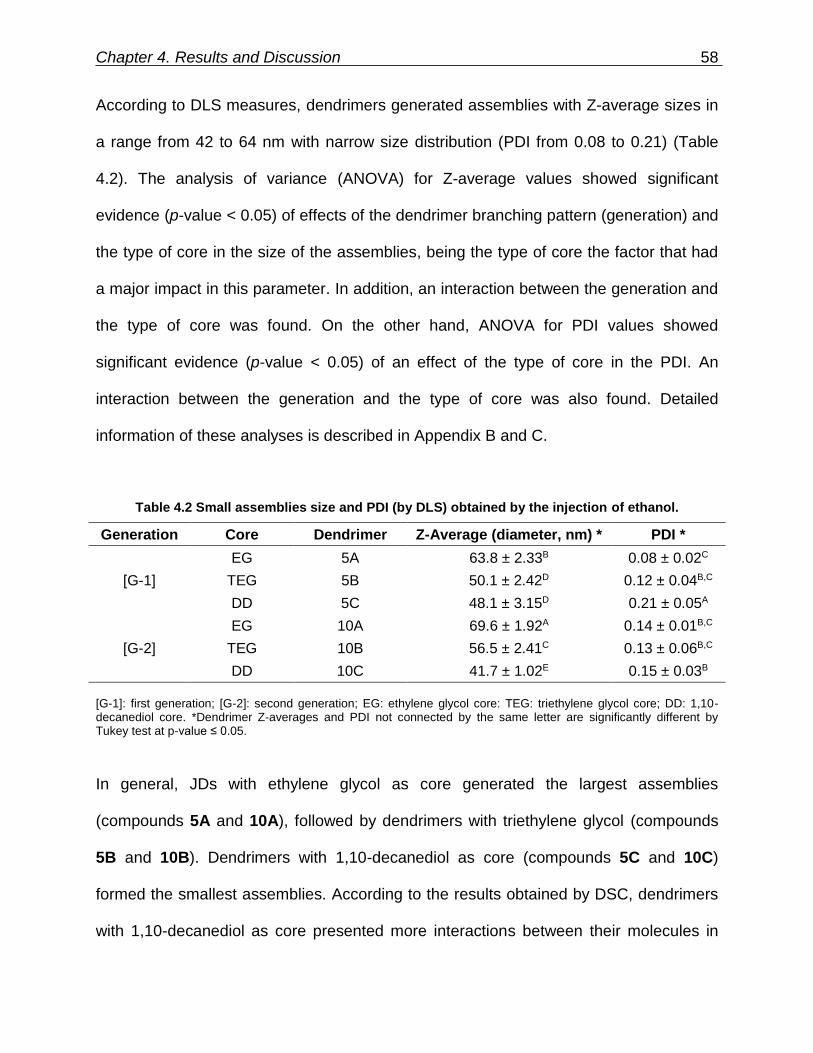
Chapter 4. Results and Discussion 58
According to DLS measures, dendrimers generated assemblies with Z-average sizes in
a range from 42 to 64 nm with narrow size distribution (PDI from 0.08 to 0.21) (Table
4.2). The analysis of variance (ANOVA) for Z-average values showed significant
evidence (p-value < 0.05) of effects of the dendrimer branching pattern (generation) and
the type of core in the size of the assemblies, being the type of core the factor that had
a major impact in this parameter. In addition, an interaction between the generation and
the type of core was found. On the other hand, ANOVA for PDI values showed
significant evidence (p-value < 0.05) of an effect of the type of core in the PDI. An
interaction between the generation and the type of core was also found. Detailed
information of these analyses is described in Appendix B and C.
Table 4.2 Small assemblies size and PDI (by DLS) obtained by the injection of ethanol.
Generation Core Dendrimer Z-Average (diameter, nm) * PDI *
[G-1]
EG 5A 63.8 ± 2.33B 0.08 ± 0.02C
TEG 5B 50.1 ± 2.42D 0.12 ± 0.04B,C
DD 5C 48.1 ± 3.15D 0.21 ± 0.05A
[G-2]
EG 10A 69.6 ± 1.92A 0.14 ± 0.01B,C
TEG 10B 56.5 ± 2.41C 0.13 ± 0.06B,C
DD 10C 41.7 ± 1.02E 0.15 ± 0.03B
[G-1]: first generation; [G-2]: second generation; EG: ethylene glycol core: TEG: triethylene glycol core; DD: 1,10-decanediol core. *Dendrimer Z-averages and PDI not connected by the same letter are significantly different by Tukey test at p-value ≤ 0.05.
In general, JDs with ethylene glycol as core generated the largest assemblies
(compounds 5A and 10A), followed by dendrimers with triethylene glycol (compounds
5B and 10B). Dendrimers with 1,10-decanediol as core (compounds 5C and 10C)
formed the smallest assemblies. According to the results obtained by DSC, dendrimers
with 1,10-decanediol as core presented more interactions between their molecules in
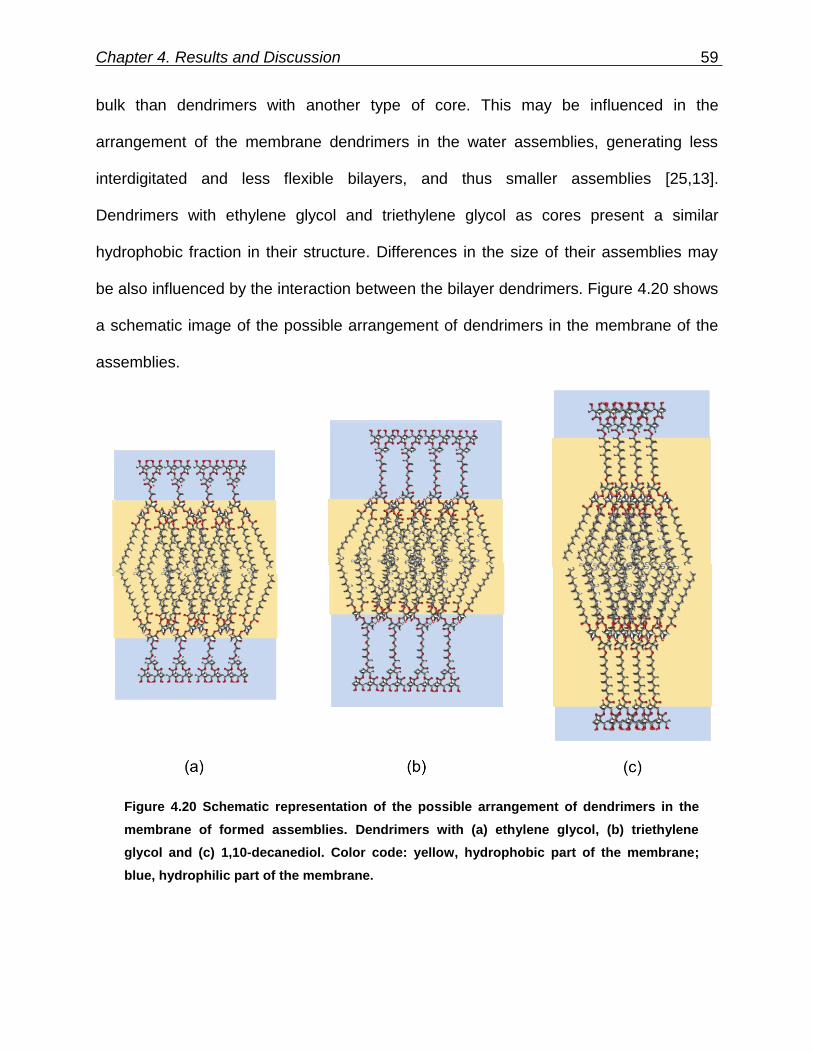
Chapter 4. Results and Discussion 59
bulk than dendrimers with another type of core. This may be influenced in the
arrangement of the membrane dendrimers in the water assemblies, generating less
interdigitated and less flexible bilayers, and thus smaller assemblies [25,13].
Dendrimers with ethylene glycol and triethylene glycol as cores present a similar
hydrophobic fraction in their structure. Differences in the size of their assemblies may
be also influenced by the interaction between the bilayer dendrimers. Figure 4.20 shows
a schematic image of the possible arrangement of dendrimers in the membrane of the
assemblies.
Figure 4.20 Schematic representation of the possible arrangement of dendrimers in the
membrane of formed assemblies. Dendrimers with (a) ethylene glycol, (b) triethylene
glycol and (c) 1,10-decanediol. Color code: yellow, hydrophobic part of the membrane;
blue, hydrophilic part of the membrane.
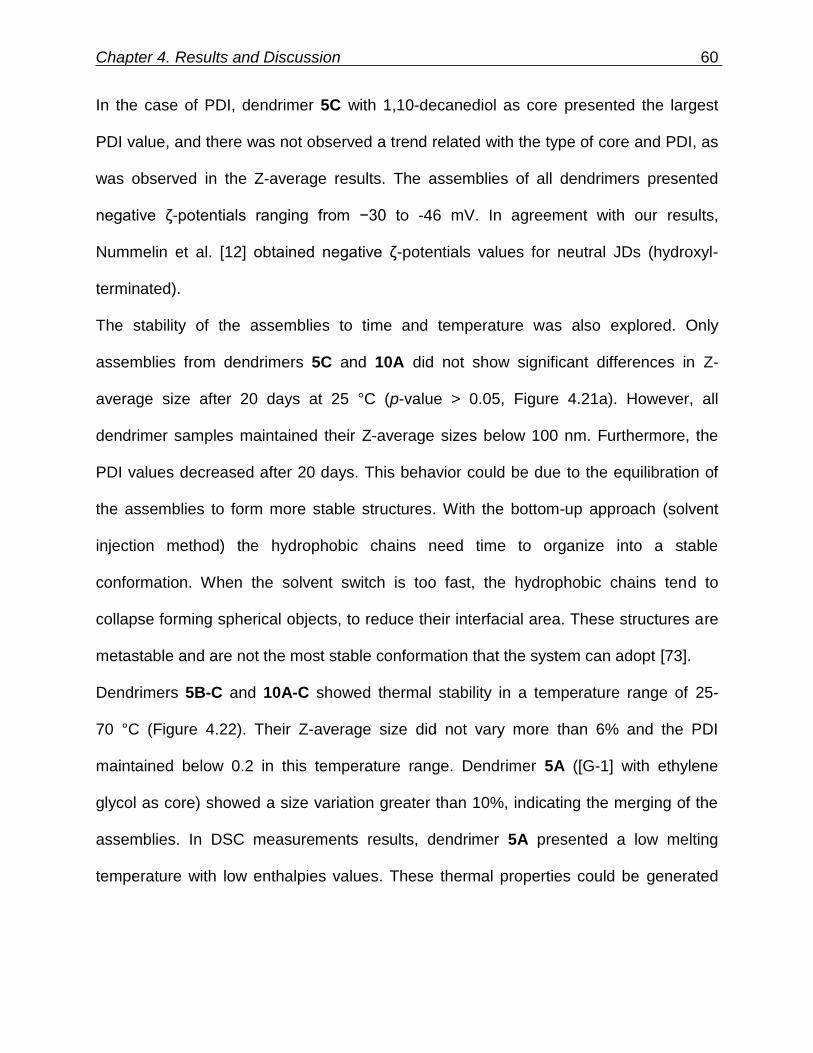
Chapter 4. Results and Discussion 60
In the case of PDI, dendrimer 5C with 1,10-decanediol as core presented the largest
PDI value, and there was not observed a trend related with the type of core and PDI, as
was observed in the Z-average results. The assemblies of all dendrimers presented
negative ζ-potentials ranging from −30 to -46 mV. In agreement with our results,
Nummelin et al. [12] obtained negative ζ-potentials values for neutral JDs (hydroxyl-
terminated).
The stability of the assemblies to time and temperature was also explored. Only
assemblies from dendrimers 5C and 10A did not show significant differences in Z-
average size after 20 days at 25 °C (p-value > 0.05, Figure 4.21a). However, all
dendrimer samples maintained their Z-average sizes below 100 nm. Furthermore, the
PDI values decreased after 20 days. This behavior could be due to the equilibration of
the assemblies to form more stable structures. With the bottom-up approach (solvent
injection method) the hydrophobic chains need time to organize into a stable
conformation. When the solvent switch is too fast, the hydrophobic chains tend to
collapse forming spherical objects, to reduce their interfacial area. These structures are
metastable and are not the most stable conformation that the system can adopt [73].
Dendrimers 5B-C and 10A-C showed thermal stability in a temperature range of 25-
70 °C (Figure 4.22). Their Z-average size did not vary more than 6% and the PDI
maintained below 0.2 in this temperature range. Dendrimer 5A ([G-1] with ethylene
glycol as core) showed a size variation greater than 10%, indicating the merging of the
assemblies. In DSC measurements results, dendrimer 5A presented a low melting
temperature with low enthalpies values. These thermal properties could be generated
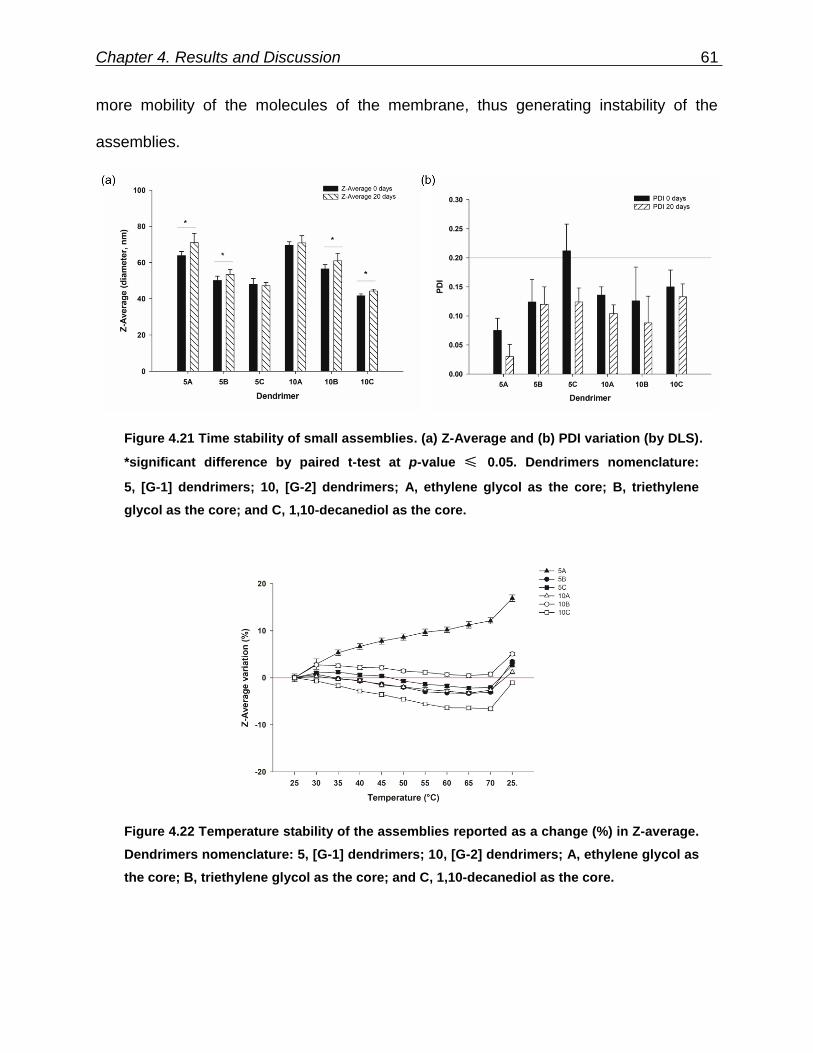
Chapter 4. Results and Discussion 61
more mobility of the molecules of the membrane, thus generating instability of the
assemblies.
Figure 4.21 Time stability of small assemblies. (a) Z-Average and (b) PDI variation (by DLS).
*significant difference by paired t-test at p-value ≤ 0.05. Dendrimers nomenclature:
5, [G-1] dendrimers; 10, [G-2] dendrimers; A, ethylene glycol as the core; B, triethylene
glycol as the core; and C, 1,10-decanediol as the core.
Figure 4.22 Temperature stability of the assemblies reported as a change (%) in Z-average.
Dendrimers nomenclature: 5, [G-1] dendrimers; 10, [G-2] dendrimers; A, ethylene glycol as
the core; B, triethylene glycol as the core; and C, 1,10-decanediol as the core.
Chapter 4. Results and Discussion 62
Small assemblies of dendrimer 10A were also analyzed by atomic force microscopy
(AFM), which allowed the observation of isolated structures with concave and convex
morphologies in the AFM height images (Figure 4.23a). Profile analysis of an AFM
height image is presented in Figure 4.23b. Convex structures with larger dimensions
product of assemblies’ fusion were observed. All structures presented larger diameters
(144.0 ± 21.6 nm) than related heights (4.30 ± 0.91 nm). The diameter values were
higher than those calculated by DLS. This morphological characteristic has been
previously reported in dried liposomes and it has been attributed to a structural collapse
due to the evaporation of water from vesicle interior and the adsorption on the
substrate, which leaves a circular shape with a rim similar to a deflated soccer ball
[74,75]. This characteristic was also observed in dendrimersomes, as reported by
Giustini et al. [31]. Considering the apparent height of the higher outline of the
structures (4.30 ± 0.91 nm) that compares with the typical dendrimersome bilayer
thickness (5 to 8 nm) [3,31,76], it can be deduced that this value corresponds to the
membrane thickness of the assemblies. The AFM phase images (Figure 4.23c) showed
a dark area in the center of the assemblies (negative phase shift) and a bright area in
their contour (positive phase shift), indicating differences in the surface properties of the
samples. Ruozi et al. [74] reported that this variation could be affected by the hydration
degree of the bilayer and consequently by the local surface properties of vesicles. The
negative phase shift, identified in the depressed central portion of the structure, can be
related to a flattened layer of lipids with high viscosity. On the other hand, the positive
phase shift observed in the higher outline of the structure suggests that the lipids were
still hydrated with a relatively low viscosity environment [74,77]. Although AFM images

Chapter 4. Results and Discussion 63
allowed the identification of dendrimersomes, one limitation of this study is that
assemblies were analyzed as dried samples. Other techniques, including environmental
scanning electron microscopy (ESEM) [74,78] and liquid-cell transmission electron
microscopy (LCTEM) [73], can be used for the visualization of small assemblies in the
hydrated state. Nonetheless, unlike AFM, the resolution of ESEM do not provide
detailed information related to the surface and architecture of the small vesicles [74],
and LCTEM has to be improved and it may not be accessible to researchers due to its
short time development [79].
Figure 4.23 Atomic force microscopy (AFM) images of air-dried small assemblies obtained
using ethanol injection method. (a) AFM height image and (b) cross-section profile
determined from line 1. (c) AFM phase image.
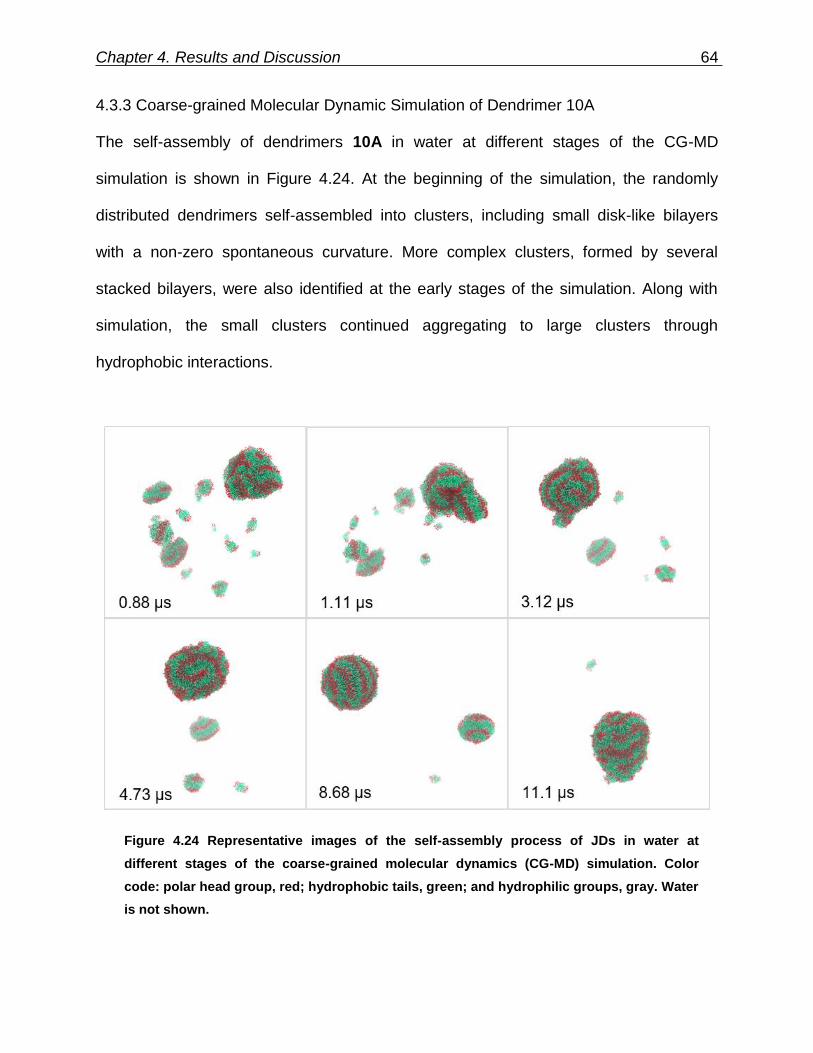
Chapter 4. Results and Discussion 64
4.3.3 Coarse-grained Molecular Dynamic Simulation of Dendrimer 10A
The self-assembly of dendrimers 10A in water at different stages of the CG-MD
simulation is shown in Figure 4.24. At the beginning of the simulation, the randomly
distributed dendrimers self-assembled into clusters, including small disk-like bilayers
with a non-zero spontaneous curvature. More complex clusters, formed by several
stacked bilayers, were also identified at the early stages of the simulation. Along with
simulation, the small clusters continued aggregating to large clusters through
hydrophobic interactions.
Figure 4.24 Representative images of the self-assembly process of JDs in water at
different stages of the coarse-grained molecular dynamics (CG-MD) simulation. Color
code: polar head group, red; hydrophobic tails, green; and hydrophilic groups, gray. Water
is not shown.

Chapter 4. Results and Discussion 65
Figure 4.25 presents images taken from the simulation, in which a fusion event between
a nanostructure and a disk-like bilayer was observed. At the end of the simulation, the
majority of the bilayered assemblies clustered together. The reaching of the equilibrium
stage of the system was confirmed by the calculation of solvent accessible surface area
(SASA) of the dendrimers during the simulation (Appendix D). After 10 μs of simulation,
this parameter remained constant.
At the 13 μs of simulation, a quasi-spherical nanostructure with an average volume of
12.9 nm3, diameter around 20 nm and aggregation number of 1689 JDs, was obtained
(Figure 4.26a). This final structure was constituted by entangled dendrimer bilayers,
with hydrophobic sites exposed to aqueous media and did not present dendrimersome
morphology as seen in the cross-sectional view of the final structure (Figure 4.27b).
Figure 4.25 Snapshot of fusion mechanism of a disk-like bilayer and a major size
nanostructure. Color code: polar head group, red; hydrophobic tails, green; and
hydrophilic groups, gray. Water is not shown.

Chapter 4. Results and Discussion 66
Figure 4.26 (a) Final assembly obtained by coarse-grained molecular dynamics (CG-MD)
simulation. (b) A cross-sectional view of the nanostructure. Time of simulation: 13 µs.
Color code: polar head group, red; hydrophobic tails, green; and hydrophilic groups, gray.
Water is not shown.
The self-assembly behavior of the JDs and its aggregation nanostructure does not
coincide with the reported mechanisms for vesicle formation. Reported mechanisms,
using computer simulation and macromolecules different to dendrimers (polymers
[80,81], cationic-anionic surfactants [35], and phospholipids [82,83]) describe three
stages in this process: the nucleating, fusion and curling stages. In the nucleating stage,
small clusters of amphiphilic molecules are formed; during the fusion stage, small
micelles fuse to form disk-like aggregates; and finally, in the curling stage these disk-like
aggregates curl up and close to form vesicles [35]. In contrast, JDs presented
aggregation into bilayers rather than micelles, this behavior could be due to the lack of
molecules that being able to form the lateral edges of the micelles. The geometrical
condition in the molecular structure of the amphiphiles to form that edges in micelles is
that their packing parameter factor accomplish v/aolc < 1/3, where v is the volume of
their hydrocarbon chains, ao is their optimal area per head group that minimize the free
energy and lc is roughly the length of the hydrocarbon chain [84]. According to this, the
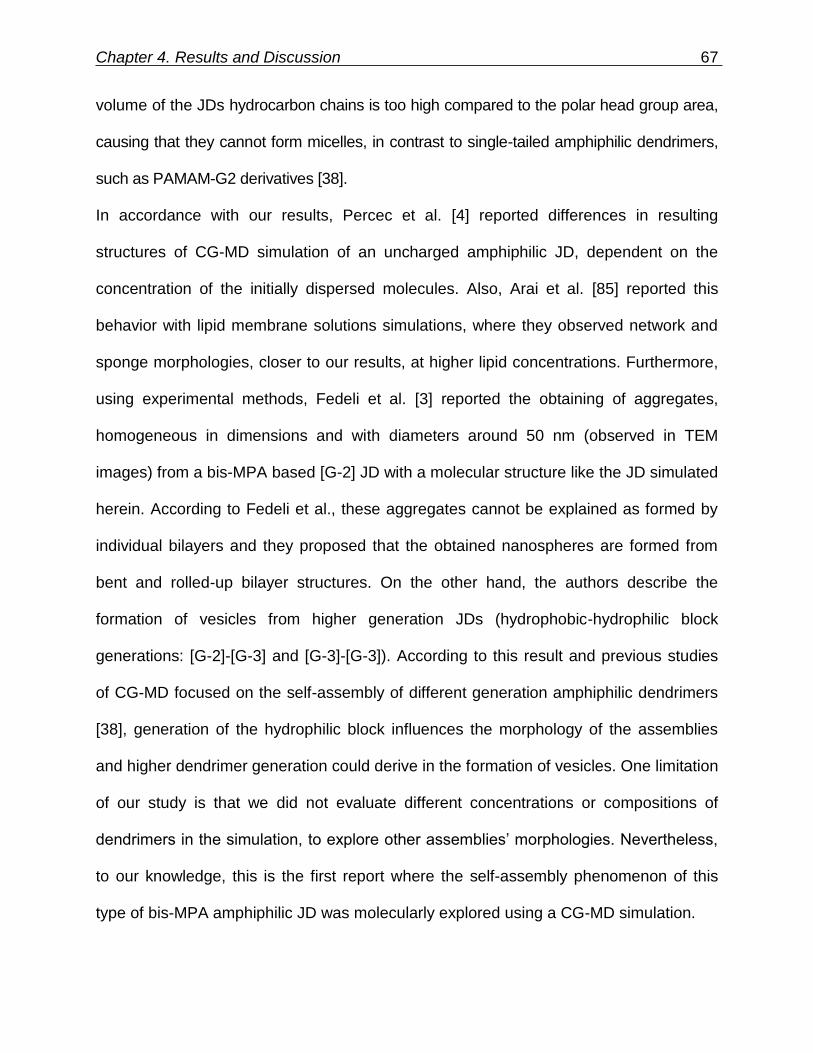
Chapter 4. Results and Discussion 67
volume of the JDs hydrocarbon chains is too high compared to the polar head group area,
causing that they cannot form micelles, in contrast to single-tailed amphiphilic dendrimers,
such as PAMAM-G2 derivatives [38].
In accordance with our results, Percec et al. [4] reported differences in resulting
structures of CG-MD simulation of an uncharged amphiphilic JD, dependent on the
concentration of the initially dispersed molecules. Also, Arai et al. [85] reported this
behavior with lipid membrane solutions simulations, where they observed network and
sponge morphologies, closer to our results, at higher lipid concentrations. Furthermore,
using experimental methods, Fedeli et al. [3] reported the obtaining of aggregates,
homogeneous in dimensions and with diameters around 50 nm (observed in TEM
images) from a bis-MPA based [G-2] JD with a molecular structure like the JD simulated
herein. According to Fedeli et al., these aggregates cannot be explained as formed by
individual bilayers and they proposed that the obtained nanospheres are formed from
bent and rolled-up bilayer structures. On the other hand, the authors describe the
formation of vesicles from higher generation JDs (hydrophobic-hydrophilic block
generations: [G-2]-[G-3] and [G-3]-[G-3]). According to this result and previous studies
of CG-MD focused on the self-assembly of different generation amphiphilic dendrimers
[38], generation of the hydrophilic block influences the morphology of the assemblies
and higher dendrimer generation could derive in the formation of vesicles. One limitation
of our study is that we did not evaluate different concentrations or compositions of
dendrimers in the simulation, to explore other assemblies’ morphologies. Nevertheless,
to our knowledge, this is the first report where the self-assembly phenomenon of this
type of bis-MPA amphiphilic JD was molecularly explored using a CG-MD simulation.
Chapter 4. Results and Discussion 68
A patch was selected from the final simulation nanostructure. The density profile
analysis of the components of this patch (Figure 4.27) displays the decrease of polar
head groups and total hydrophilic groups density, as the measured distance
approaches the center of the selection. On the contrary, the density of tail end groups
and total hydrophobic groups increased in this zone and decreases as the measured
distance moves away from the center of the selection. This data confirms that
dendrimers tend to arrange into bilayers that are forming the final nanostructure.
Figure 4.27 Density profile analysis of a selected patch from the final nanostructure. Size
of selected patch considered: 6.5 × 5.4 × 7.4 nm3.
A bilayer thickness of 4.1 nm with a hydrophobic part length of 1.8 nm was determined
from the selected patch. In addition, a dendrimer length of 2.0 nm with a hydrophobic
tail length of 0.7 nm was determined. It is important to note that bilayer thickness and its
hydrophobic part length were more than twice as large as the dendrimer and its
hydrophobic tail length, respectively. Hence, there was no interdigitation among bilayer
components. Interdigitation degree in bilayers is related to the size, hardness, and
Chapter 4. Results and Discussion 69
stability of aggregates [10]. This parameter is influenced by the length of hydrophobic
tails [38] and other factors, such as the formation of hydrogen bonds between the
hydrophilic segments of the membrane dendrimers, which prevent the interdigitation
[13]. The dendrimer studied here was composed of bis-MPA moieties with hydroxyl
groups that form this type of interactions and may be influencing the arrangement of the
dendrimers in the bilayers.
Comparing the bilayer thickness determined from the final simulation structure versus
the value deducted from AFM height images of small assemblies, a non-significant
difference was found (p-value > 0.05). However, CG-MD simulation did not represent in
totality the results obtained by the experimental methods. In comparison with small
assemblies obtained by ethanol injection method, CG-MD simulation assembly
presented smaller particle size and different morphology. These differences may be due
to experimental variables involved in the method applied for assemblies’ formation, such
as: stirring speed, injection flow and ethanol concentration [41,86]. These variables
were unable to be reproduced by simulation and have an impact on the properties of the
assemblies. In addition, the size of experimental results corresponds to the
hydrodynamic diameter calculated by DLS. This diameter is indicative of the apparent
size of the solvated particle and is greater than the size calculated by other techniques.
Furthermore, the initial concentration of the dendrimer and spatial disposition in the
simulated system may also influence the morphology of the assemblies. Simulation
environment with a high concentration of JD favors the interaction between polar heads
of the dendrimers, preventing the formation of disk-like aggregates with larger
dimensions and with the ability to curl up to form a vesicle.

Chapter 5
Conclusions
A series of myristylated bis-MPA Janus dendrimers with structural variations in the core
and branching pattern were synthesized, and their self-assembly behavior in aqueous
media was evaluated using experimental methods and CG-MD simulation.
A relationship between the chemical structure of the synthesized dendrimers and the
properties of their assemblies in water was established. The generation number and the
core type play a key role in the formation of assemblies and have an effect in the
melting transition temperatures of the dendrimers, and in the size and polydispersity
index of their assemblies in water.
Dendrimersomes with sizes in nanometric and micrometer scale were obtained by the
solvent injection method and microfluidics, respectively. Solvent injection method
generated dendrimersomes with sizes below 100 nm and narrow size distribution. With
the use of microfluidic techniques, dendrimersomes with a minimal amount of residual
solvent within their membranes were produced. In addition, the microfluidic technique
enabled the production of large quantities of dendrimersomes with controlled size and
composition, in contrast with the thin-film hydration method. Moreover, we showed the
possibility to form dendrimersomes with microfluidics, using highly hydrophobic JDs.
The CG-MD simulation allowed us to gain a molecular insight into the mechanism of
self-assembly of the dendrimer, in which disk-like bilayers were important intermediates
of the assembly obtained at the end of the simulation. This is the first report where a CG
Chapter 5. Conclusions 71
model for the studied bis-MPA dendrimers was developed and the self-assembly
phenomenon was explored.
Further research will be focused on the mechanical behavior of dendrimers at interfaces
to find the optimal conditions to prepare dendrimersomes. Also, further research on the
developing of smart dendrimersomes for controlled drug release should be conducted;
taking advantage of the high versatility that gives the use of dendrimers, and the
possibility to control the composition of dendrimersomes given by the microfluidic
technique.

Appendix A 72
Appendix A
1H NMR, 13C NMR, and MALDI-TOF MS Data of Dendrons and Dendrimers
Dendron 1
1H NMR (500 MHz, CDCl3) δ 7.40–7.17 (m, 5H, -CH=), 5.14 (s, 2H, -O-CO-CH2-C-),
4.31 – 4.11 (m, 4H, -CHH'-O-CO- [G-1] non-polar block), 2.21 (t, J = 7.6 Hz, 4H, -O-CO-
CH2-CH2-(CH2)10-), 1.57–1.47 (m, 4H, -O-CO-CH2-CH2-(CH2)10-), 1.36–1.05 (m, ~43H, -
C-CH3 and -O-CO-CH2-CH2-(CH2)10-), 0.86 (t, J = 7.0 Hz, 6H, -(CH2)10-CH3).13C NMR
(126 MHz, CDCl3) δ 173.24, 172.65, 135.64, 128.55, 128.30, 128.05, 66.75, 65.33,
46.41, 34.07, 31.91, 29.67, 29.64, 29.60, 29.46, 29.34, 29.24, 29.11, 24.84, 22.67,
17.79, 14.08. MALDI-TOF MS (m/z) [M+Na]+ calcd. for C40H68NaO6: 667.95; found:
669.90.
Dendron 2
1H NMR (500 MHz, CDCl3) δ 4.36–4.12 (m, 4H, -CHH'-O-CO- [G-1] non-polar block),
2.31 (t, J = 7.6 Hz, 4H, -O-CO-CH2-CH2-(CH2)10-), 1.69–1.47 (m, 4H, -O-CO-CH2-CH2-
(CH2)10-), 1.35–1.15 (m, 43H, -C-CH3 and -O-CO-CH2-CH2-(CH2)10-), 0.88 (t, J = 7.0 Hz,
6H, -(CH2)10-CH3). 13C NMR (126 MHz, CDCl3) δ 178.37, 173.31, 65.00, 46.19, 34.13,
31.94, 29.70, 29.67, 29.63, 29.49, 29.37, 29.27, 29.14, 24.89, 22.70, 17.78, 14.10.
MALDI-TOF MS (m/z) [M+Na]+ calcd. for C33H62NaO6: 577.83; found: 578.82.
Dendron 3A
1H NMR (500 MHz, CDCl3) δ 4.35–4.18 (m, 6H, -CHH'-O-CO- [G-1] non-polar block and
-CO-O-CH2-CH2-OH), 3.79 (s, 2H, -CO-O-CH2-CH2-OH), 2.30 (t, J = 7.6 Hz, 4H, -O-CO-

Appendix A 73
CH2-CH2-(CH2)10-), 1.66–1.52 (m, 4H, -O-CO-CH2-CH2-(CH2)10-), 1.38–1.16 (m, 43H, -
C-CH3 and -O-CO-CH2-CH2-(CH2)10-), 0.88 (t, J = 6.9 Hz, 6H, -(CH2)10-CH3). 13C NMR
(126 MHz, CDCl3) δ 173.46, 173.00, 66.95, 65.34, 60.96, 46.72, 34.19, 31.94, 29.69,
29.66, 29.62, 29.49, 29.37, 29.26, 29.15, 24.92, 22.70, 17.82, 14.10. MALDI-TOF MS
(m/z) [M+Na]+ calcd. for C35H66NaO7: 621.88; found: 623.51.
Dendron 3B
1H NMR (500 MHz, CDCl3) δ 4.34–4.05 (m, 6H, -O-CO-CH2-CH2-O- and -CHH'-O-CO-
[G-1] non-polar block), 3.74–3.69 (m, 2H, -O-CH2-CH2-OH), 3.69–3.57 (m, 8H, -CO-O-
CH2-CH2-, -O-CH2-CH2-O-CH2- ), 2.27 (t, J = 7.6 Hz, 4H, -O-CO-CH2-CH2-(CH2)10-),
1.64–1.47 (m, 4H, -O-CO-CH2-CH2-(CH2)10-), 1.39–1.11 (m, 43H, -C-CH3 and -O-CO-
CH2-CH2-(CH2)10-), 0.86 (t, J = 7.0 Hz, 6H, -(CH2)10-CH3). 13C NMR (126 MHz, CDCl3) δ
173.31, 172.74, 72.56, 70.67, 70.40, 68.92, 65.21, 64.06, 61.80, 46.35, 34.13, 33.95,
31.91, 29.67, 29.63, 29.60, 29.47, 29.34, 29.25, 29.13, 24.88, 22.67, 17.76, 14.08.
MALDI-TOF MS (m/z) [M+K]+ calcd. for C39H74KO9: 726.09; found: 728.07.
Dendron 3C
1H NMR (500 MHz, CDCl3) δ 4.27–4.17 (m, 4H, -CHH'-O-CO- [G-1] non-polar block),
4.11 (t, J = 6.7 Hz, 2H, -CO-O-CH2-(CH2)9-), 3.64 (t, J = 6.6 Hz, 2H, -CO-O-(CH2)9-CH2-
OH ), 2.29 (t, J = 7.6 Hz, 4H, -O-CO-CH2-CH2-(CH2)10-), 1.66–1.53 (m, 8H, -O-CO-CH2-
CH2-(CH2)10-, -CO-O-CH2-CH2-(CH2)8- and -CO-O-(CH2)8-CH2-CH2-OH), 1.42–1.11 (m,
~55H, -C-CH3, -O-CO-CH2- CH2-(CH2)10- and -CO-O-CH2-CH2-(CH2)6-CH2-CH2-OH),
0.88 (t, J = 7.0 Hz, 6H, -(CH2)10-CH3). 13C NMR (126 MHz, CDCl3) δ 173.28, 172.86,
65.34, 65.26, 63.02, 46.30, 34.15, 32.79, 31.91, 29.67, 29.64, 29.60, 29.47, 29.40,
Appendix A 74
29.36, 29.34, 29.25, 29.16, 29.13, 28.52, 25.81, 25.71, 24.90, 22.67, 17.85, 14.08.
MALDI-TOF MS (m/z) [M+Na]+ calcd. for C43H82NaO7: 734.10; found: 736.72.
Dendron 5A
1H NMR (500 MHz, CDCl3): δ 4.37 (s, 4H, -CH2-O-CO- [G-1] non-polar block), 4.22 (q,
J = 11.1 Hz, 4H, -O-CO-CH2-CH2-O-CO-), 3.87 (d, J = 11.2 Hz, 2H, -CHH'-OH), 3.74 (d,
J = 11.3 Hz, 2H, -CHH'-OH), 2.30 (t, J = 7.6, 4H, -O-CO-CH2-CH2-(CH2)10-), 1.62–1.49
(m, 4H, -O-CO-CH2-CH2-(CH2)10-), 1.44–1.14 (m, 43H, -C-CH3 and -O-CO-CH2-CH2-
(CH2)10-), 1.08 (s, 3H, -C-CH3), 0.88 (t, J = 6.8, 6H, -(CH2)10-CH3). 13C NMR (126 MHz,
CDCl3): δ 175.51, 173.45, 172.72, 68.14, 68.12, 65.18, 62.80, 62.54, 49.43, 46.43,
34.13, 31.93, 29.69, 29.66, 29.62, 29.49, 29.36, 29.27, 29.14, 24.88, 22.69, 17.71,
17.17, 14.12. MALDI-TOF MS (m/z) [M+Na]+ calcd. for C40H74NaO10: 738.00; found
740.78.
Dendron 5B
1H NMR (500 MHz, CDCl3): δ 4.38 – 4.32 (m, 2H, -CHH'-O-CO- [G-1] non-polar block),
4.31 – 4.17 (m, 6H, -CHH'-O-CO- [G-1] non-polar block and -CO-O-CH2-CH2-O-), 3.83
(d, J = 11.4 Hz, 2H, -CHH'-OH), 3.73 (d, J = 11.5 Hz, 2H, -CHH'-OH), 3.70 – 3.65 (m,
4H, -CO-O-CH2-CH2-O-CH2-), 3.62 (s, 4H, -O-CH2-CH2-O-), 2.29 (t, J = 7.6, 4H, -O-CO-
CH2-CH2-(CH2)10-), 1.64 – 1.53 (m, 4H, -O-CO-CH2-CH2-(CH2)10-), 1.34 – 1.19 (m, 43H,
-C-CH3 and -O-CO-CH2-CH2-(CH2)10-), 1.11 (s, 3H, -C-CH3), 0.88 (t, J = 6.9, 6H, -
(CH2)10-CH3). 13C NMR (126 MHz, CDCl3): δ 175.62, 173.31, 172.72, 70.51, 70.34,
68.94, 68.83, 67.76, 65.16, 64.02, 63.31, 49.67, 46.31, 34.12, 31.91, 29.67, 29.64,

Appendix A 75
29.60, 29.47, 29.34, 29.26, 29.12, 26.22, 25.13, 24.89, 22.67, 17.78, 17.07, 14.10.
MALDI-TOF MS (m/z) [M+Na]+ calcd. for C44H82NaO12: 826.10; found 829.67.
Dendron 5C
1H NMR (500 MHz, CDCl3) δ 4.28–4.09 (m, 8H, -CHH'-O-CO- [G-1] non-polar block and
-CO-O-CH2-(CH2)8-), 3.92 (d, J = 11.3 Hz, 2H, -CHH'-OH), 3.73 (d, J = 11.3 Hz, 2H, -
CHH'-OH), 2.30 (t, J = 7.6 Hz, 4H, -O-CO-CH2-CH2-(CH2)10-), 1.71–1.58 (m, 8H, -O-CO-
CH2-CH2-(CH2)10- and -CO-O-CH2-CH2-(CH2)8-), 1.47–1.21 (m,~ 55H, -C-CH3, -O-CO-
CH2-CH2-(CH2)10- and -O-CH2-CH2-(CH2)6-), 1.08 (s, 3H, -C-CH3), 0.89 (t, J = 6.8 Hz,
6H, -(CH2)10-CH3). 13C NMR (126 MHz, CDCl3): δ 176.02, 173.31, 172.88, 68.54, 65.34,
65.27, 65.19, 49.10, 46.30, 34.18, 31.93, 29.69, 29.66, 29.63, 29.49, 29.42, 29.36,
29.28, 29.19, 29.18, 29.15, 28.55, 25.85, 25.84, 24.92, 22.70, 17.88, 17.15, 14.12.
MALDI-TOF MS (m/z) [M+K]+ calcd. for C48H90KO10: 866.32; found 869.61.
Dendron 6
1H-NMR (500 MHz, CDCl3) δ 7.45–7.28 (m, ~5H, -CH=), 5.15 (s, 2H, -O-CO-CH2-C-),
4.30–4.23 (m, 4H, -CHH’-O-CO- [G-1] non-polar block), 4.18–4.10 (m, ~8H, -CHH’-O-
CO- [G-2] non-polar block), 2.27 (t, J = 7.6 Hz, 8H, -O-CO-CH2-CH2-(CH2)10-), 1.64–
1.42 (m, 8H, -O-CO-CH2-CH2-(CH2)10-), 1.35–1.20 (m, ~83H, -C-CH3 and -O-CO-CH2-
CH2-(CH2)10-), 1.16 (s, 6H, -C-CH3), 0.88 (t, J = 6.9 Hz, 12H, -(CH2)10-CH3). 13C-NMR
(126 MHz, CDCl3) δ 173.17, 172.10, 172.00, 135.42, 128.69, 128.50, 128.36, 67.13,
65.76, 65.03, 46.75, 46.44, 34.17, 34.06, 31.94, 29.71, 29.68, 29.67, 29.65, 29.51,
29.37, 29.31, 29.16, 24.89, 22.70, 17.72, 17.58, 14.11. MALDI-TOF MS (m/z) [M-
H+2Na]+ calcd. for C78H135Na2O14: 1342.88; found 1342.29.
Appendix A 76
Dendron 7
1H-NMR (500 MHz, CDCl3) δ 4.30–4.15 (m, 12H, -CHH’-O-CO- [G-1] non-polar block, -
CHH’-O-CO- [G-2] non-polar block), 2.29 (t, J = 7.6 Hz, 8H, -O-CO-CH2-CH2-(CH2)10-),
1.66–1.52 (m, 8H, -O-CO-CH2-CH2-(CH2)10-), 1.35–1.17 (m, 89H, -C-CH3 and -O-CO-
CH2-CH2-(CH2)10-), 0.88 (t, J = 6.9 Hz, 12H, -(CH2)10-CH3).13C-NMR (126 MHz, CDCl3)
δ 175.33, 173.33, 173.31, 172.04, 65.67, 65.14, 65.11, 46.47, 46.35, 34.08, 31.94,
29.71, 29.69, 29.67, 29.66, 29.52, 29.37, 29.31, 29.17, 24.89, 22.70, 17.77, 17.54,
14.11. MALDI-TOF MS (m/z) [M-H+2Na]+ calcd. for C71H129Na2O14: 1252.76; found
1251.96.
Dendron 8A
1H-NMR (500 MHz, CDCl3) δ 4.40–4.08 (m, 14H, -CHH’-O-CO- [G-1] non-polar block, -
CHH’-O-CO- [G-2] non-polar block and -CO-O-CH2-CH2-OH), 3.89–3.76 (m, 2H, -CO-
O-CH2-CH2-OH), 2.29 (t, J = 7.6 Hz, 8H, -O-CO-CH2-CH2-(CH2)10-), 1.62–1.54 (m, 8H, -
O-CO-CH2-CH2-(CH2)10-), 1.34–1.20 (m, 89H, -C-CH3 and -O-CO-CH2-CH2-(CH2)10-),
0.88 (t, J = 6.8, 12H, -(CH2)10-CH3). 13C-NMR (126 MHz, CDCl3) δ 173.32, 172.46,
172.18, 67.09, 65.92, 65.04, 60.77, 46.77, 46.47, 34.05, 33.93, 31.91, 29.68, 29.65,
29.62, 29.48, 29.34, 29.27, 29.13, 24.85, 22.67, 17.77, 17.61, 14.08. MALDI-TOF MS
(m/z) [M-H+2Na]+ calcd. for C73H133Na2O15: 1296.81; found: 1296.75.
Dendron 8B
1H NMR (500 MHz, CDCl3) δ 4.31–4.25 (m, 6H, -CO-O-CH2-CH2-O- and -CHH'-O-CO-
[G-1] non-polar block), 4.25–4.16 (m, 8H, -CHH'-O-CO- [G-2] non-polar block), 3.76–
3.58 (m, 10H, -O-CH2-CH2-OH, -CO-O-CH2-CH2- and -O-CH2-CH2-O-CH2-), 2.30 (t,

Appendix A 77
J = 7.6 Hz, 8H, -O-CO-CH2-CH2-(CH2)10-), 1.64–1.53 (m, 8H, -O-CO-CH2-CH2-(CH2)10-),
1.41–1.16 (m, ~89H, -C-CH3 and -O-CO-CH2-CH2-(CH2)10-), 0.89 (t, J = 6.9 Hz, 12H,
-(CH2)10-CH3). 13C NMR (126 MHz, CDCl3) δ 173.17, 172.10, 172.07, 72.50, 70.58,
70.38, 68.82, 65.68, 65.00, 64.24, 61.76, 46.64, 46.42, 34.03, 33.96, 31.91, 29.68,
29.64, 29.62, 29.48, 29.34, 29.28, 29.14, 24.86, 22.66, 17.77, 17.52, 14.07. MALDI-
TOF MS (m/z) [M+2Na]+ calcd. for C77H142Na2O17: 1385.92; found: 1385.50.
Dendron 8C
1H NMR (500 MHz, CDCl3) δ 4.29–4.14 (m, 12H, -CHH’-O-CO- [G-1] non-polar block,
-CHH’-O-CO-[G-2] non-polar block), 4.10 (t, J = 6.8 Hz, 2H, -CO-O-CH2-(CH2)9-OH),
3.63 (t, J = 6.6 Hz, 2H, -CO-O-(CH2)9-CH2-OH), 2.29 (t, J = 7.6 Hz, 8H, -O-CO-CH2-
CH2-(CH2)10-), 1.62–1.53 (m, 12H, -O-CO-CH2-CH2-(CH2)10-, -CO-O-CH2-CH2-(CH2)8-
and -CO-O-(CH2)8-CH2-CH2-OH), 1.35–1.20 (m, 101H, -C-CH3, -O-CO-CH2-CH2-
(CH2)10- and -CO-O-CH2-CH2-(CH2)6-CH2-CH2-OH), 0.88 (t, J = 6.9 Hz, 12H, -(CH2)10-
CH3). 13C NMR (126 MHz, CDCl3) δ 173.32, 172.29, 172.24, 65.91, 65.73, 65.18, 63.17,
46.76, 46.59, 34.20, 32.96, 32.08, 29.85, 29.83, 29.81, 29.79, 29.66, 29.53, 29.51,
29.45, 29.33, 29.31, 28.68, 26.00, 25.88, 25.03, 22.84, 17.95, 14.25. MALDI-TOF MS
(m/z) [M-H+2Na]+ calcd. for C81H149Na2O15: 1409.02; found: 1409.26.
Dendrimer 10A
1H-NMR (500 MHz, CDCl3) 4.43 (d, J = 11.1 Hz, 2H, -CHH’-O-[G-1] polar block), 4.39–
4.09 (m, 18H, -O-CO-CH2-CH2-O-CO-, -CHH’-O-[G-1] polar block, -CHH’-O-[G-1] non-
polar block and -CHH’-O-CO-[G-2] non-polar block), 3.87–3.77 (m, 4H, -CHH’-OH),
3.76–3.64 (m, 4H, -CHH’-OH), 2.29 (t, J = 7.6 Hz, 8H, -O-CO-CH2-CH2-(CH2)10-), 1.64–
Appendix A 78
1.51 (m, 8H, -O-CO-CH2-CH2-(CH2)10-), 1.34–1.20 (m, 92H, -C-CH3 and -O-CO-CH2-
CH2-(CH2)10-), 1.06 (s, 6H, -C-CH3), 0.88 (t, J = 6.9 Hz, 12H, -(CH2)10-CH3). 13C-NMR
(126 MHz, CDCl3) δ 175.18, 173.42, 173.41, 172.79, 172.27, 172.08, 68.25, 68.19,
66.09, 65.78, 65.22, 65.17, 65.00, 62.99, 62.95, 49.94, 46.87, 46.70, 46.66, 46.62,
34.20, 32.07, 29.84, 29.81, 29.80, 29.78, 29.65, 29.50, 29.44, 29.42, 29.30, 25.02,
22.82, 18.13, 17.92, 17.77, 17.63, 17.25, 14.23. MALDI-TOF MS (m/z) [M+2Na]+ calcd.
for C88H158Na2O24: 1646.16; found 1648.92.
Dendrimer 10B
1H NMR (500 MHz, CDCl3) δ 4.41 (d, J = 11.0 Hz, 2H, -CHH'-O-CO- [G-1] polar block),
4.34 - 4.23 (m, 10H, -CO-O-CH2-CH2-O-, -CHH'-O-CO- [G-1] polar block and -CHH'-O-
CO- [G-1] non-polar block), 4.18 (q, J = 11.3 Hz, 8H, -CHH'-O-CO- [G-2] non-polar
block), 3.81 (d, J = 11.5 Hz, 4H, -CHH'-OH), 3.77 - 3.65 (m, 8H, -CHH'-OH and -CO-O-
CH2-CH2-O-CH2-), 3.62 (s, 4H, -O-CH2-CH2-O), 2.28 (t, J = 7.6 Hz, 8H, -O-CO-CH2-
CH2-(CH2)10-), 1.64 – 1.52 (m, 8H, -O-CO-CH2-CH2-(CH2)10-), 1.36- 1.17 (m, 92H, -C-
CH3 and -O-CO-CH2-CH2-(CH2)10-), 1.06 (s, 6H, -C-CH3), 0.87 (t, J = 6.7 Hz, 12H, -
(CH2)10-CH3). 13C NMR (126 MHz, CDCl3) δ 175.07, 173.23, 173.20, 172.10, 172.08,
70.43, 68.91, 68.82, 67.96, 67.88, 65.60, 64.98, 64.95, 64.31, 64.21, 49.78, 46.62,
46.49, 46.40, 34.04, 31.92, 29.69, 29.67, 29.65, 29.63, 29.50, 29.35, 29.29, 29.15,
24.86, 22.68, 18.04, 17.79, 17.54, 17.13, 14.10. MALDI-TOF MS (m/z) [M+2Na]+ calcd.
for C92H166Na2O26: 1734.27; found: 1737.63.
Appendix A 79
Dendrimer 10C
1H NMR (500 MHz, CDCl3) δ 4.44 (d, J = 11.1 Hz, 2H, -CHH'-O-CO- [G-1] polar block),
4.32 – 4.06 (m, 18H, -CO-O-CH2-(CH2)8-, -CHH'-O-CO- [G-1] polar block, -CHH'-O-CO-
[G-1] non-polar block and -CHH'-O-CO- [G-2] non-polar block), 3.88 – 3.77 (m, ~4H, -
CHH'-OH), 3.74 – 3.59 (m, 4H, -CHH'-OH), 2.28 (t, J = 7.6 Hz, 8H, -O-CO-CH2-CH2-
(CH2)10-), 1.67 – 1.53 (m, 12H, -O-CO-CH2-CH2-(CH2)10- and CO-O-CH2-CH2-(CH2)6-),
1.39 – 1.12 (m, 109H, -O-CH2-CH2-(CH2)6- and -C-CH3 and -O-CO-CH2-CH2-(CH2)10-),
1.05 (s, ~6H, -C-CH3 ), 0.87 (t, J = 6.8 Hz, 12H, -(CH2)10-CH3). 13C NMR (126 MHz,
CDCl3) δ 175.27, 173.34, 173.14, 172.29, 172.23, 68.23, 65.85, 65.79, 65.71, 65.16,
65.04, 63.14, 49.84, 48.80, 46.72, 46.62, 46.55, 46.52, 34.27, 34.18, 32.92, 32.06,
29.83, 29.81, 29.80, 29.78, 29.64, 29.59, 29.50, 29.43, 29.35, 29.34, 29.29, 28.68,
28.66, 25.99, 25.86, 25.01, 22.83, 18.28, 17.93, 17.90, 17.76, 17.53, 17.25, 14.25.
MALDI-TOF MS (m/z) [M+2Na]+ calcd. for C96H174Na2O24: 1758.38; found: 1762.01.

Appendix A 80
Appendix B
General Linear Model: Z-AVE vs. Gen, Core
Factor Type Levels Values
Gen Fixed 2 1, 2
Core Fixed 3 A, B, C
Analysis of Variance for Z-AVE, using Adjusted SS for Tests
Source DF SS Adj SS Adj MS F-Value P-Value
Gen 1 132.06 46.54 46.54 8.78 0.005
Core 2 4046.31 3835.08 1917.54 361.89 0.000
Gen*Core 2 461.12 461.12 230.56 43.51 0.000
Error 47 249.04 249.04 5.30
Total 52 4888.53
S = 2.30190 R-sq = 94.91% R-sq(adj) = 94.36%
Assumptions for ANOVA
N 53 AD 0.709 P-Value 0.060
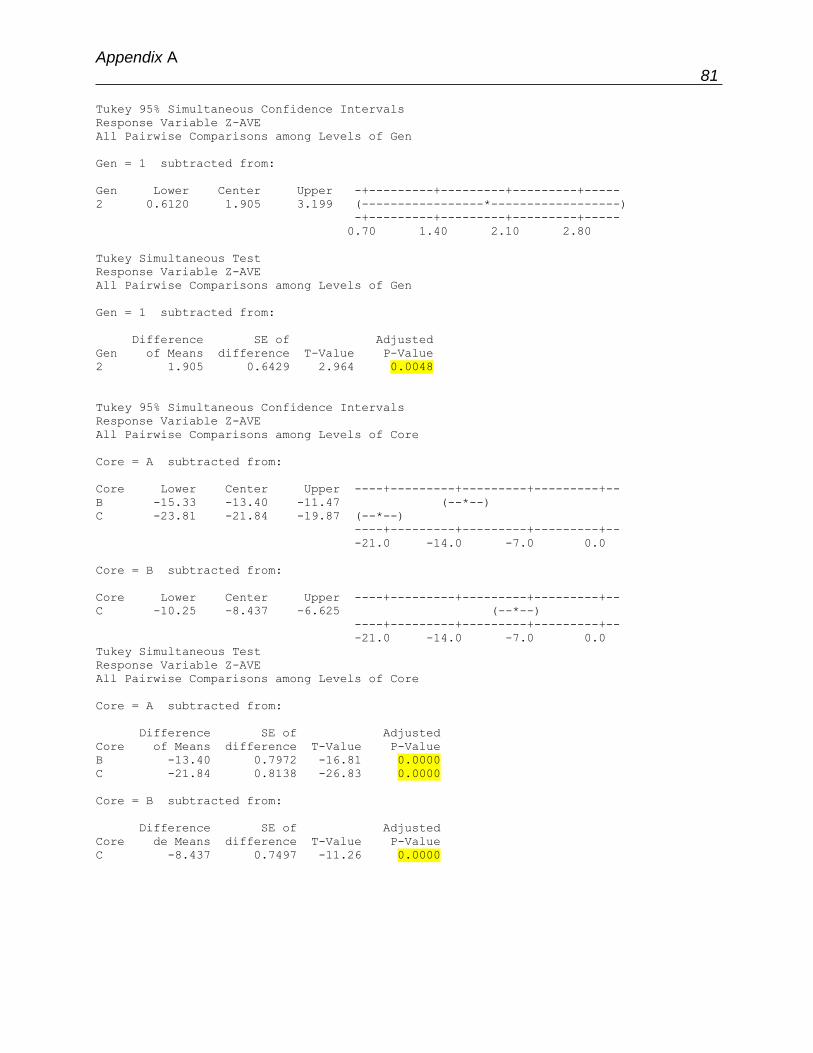
Appendix A 81
Tukey 95% Simultaneous Confidence Intervals
Response Variable Z-AVE
All Pairwise Comparisons among Levels of Gen
Gen = 1 subtracted from:
Gen Lower Center Upper -+---------+---------+---------+-----
2 0.6120 1.905 3.199 (-----------------*------------------)
-+---------+---------+---------+-----
0.70 1.40 2.10 2.80
Tukey Simultaneous Test
Response Variable Z-AVE
All Pairwise Comparisons among Levels of Gen
Gen = 1 subtracted from:
Difference SE of Adjusted
Gen of Means difference T-Value P-Value
2 1.905 0.6429 2.964 0.0048
Tukey 95% Simultaneous Confidence Intervals
Response Variable Z-AVE
All Pairwise Comparisons among Levels of Core
Core = A subtracted from:
Core Lower Center Upper ----+---------+---------+---------+--
B -15.33 -13.40 -11.47 (--*--)
C -23.81 -21.84 -19.87 (--*--)
----+---------+---------+---------+--
-21.0 -14.0 -7.0 0.0
Core = B subtracted from:
Core Lower Center Upper ----+---------+---------+---------+--
C -10.25 -8.437 -6.625 (--*--)
----+---------+---------+---------+--
-21.0 -14.0 -7.0 0.0
Tukey Simultaneous Test
Response Variable Z-AVE
All Pairwise Comparisons among Levels of Core
Core = A subtracted from:
Difference SE of Adjusted
Core of Means difference T-Value P-Value
B -13.40 0.7972 -16.81 0.0000
C -21.84 0.8138 -26.83 0.0000
Core = B subtracted from:
Difference SE of Adjusted
Core de Means difference T-Value P-Value
C -8.437 0.7497 -11.26 0.0000
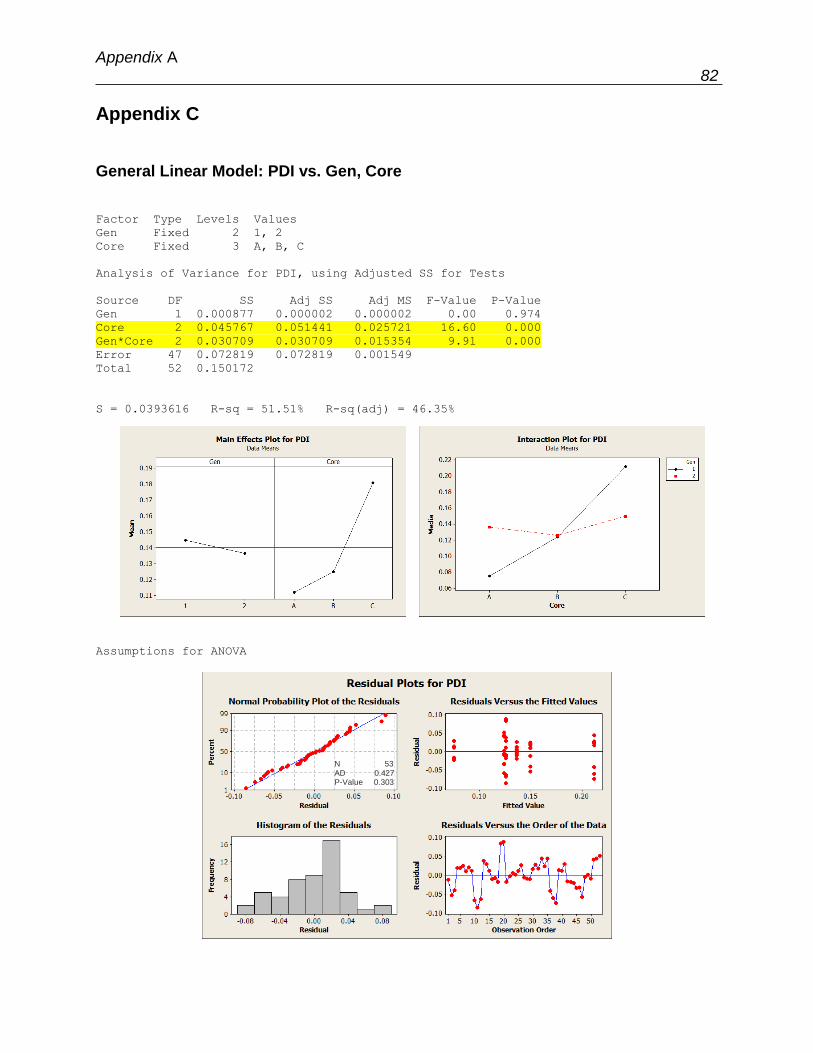
Appendix A 82
Appendix C
General Linear Model: PDI vs. Gen, Core
Factor Type Levels Values
Gen Fixed 2 1, 2
Core Fixed 3 A, B, C
Analysis of Variance for PDI, using Adjusted SS for Tests
Source DF SS Adj SS Adj MS F-Value P-Value
Gen 1 0.000877 0.000002 0.000002 0.00 0.974
Core 2 0.045767 0.051441 0.025721 16.60 0.000
Gen*Core 2 0.030709 0.030709 0.015354 9.91 0.000
Error 47 0.072819 0.072819 0.001549
Total 52 0.150172
S = 0.0393616 R-sq = 51.51% R-sq(adj) = 46.35%
Assumptions for ANOVA
N 53 AD 0.427 P-Value 0.303
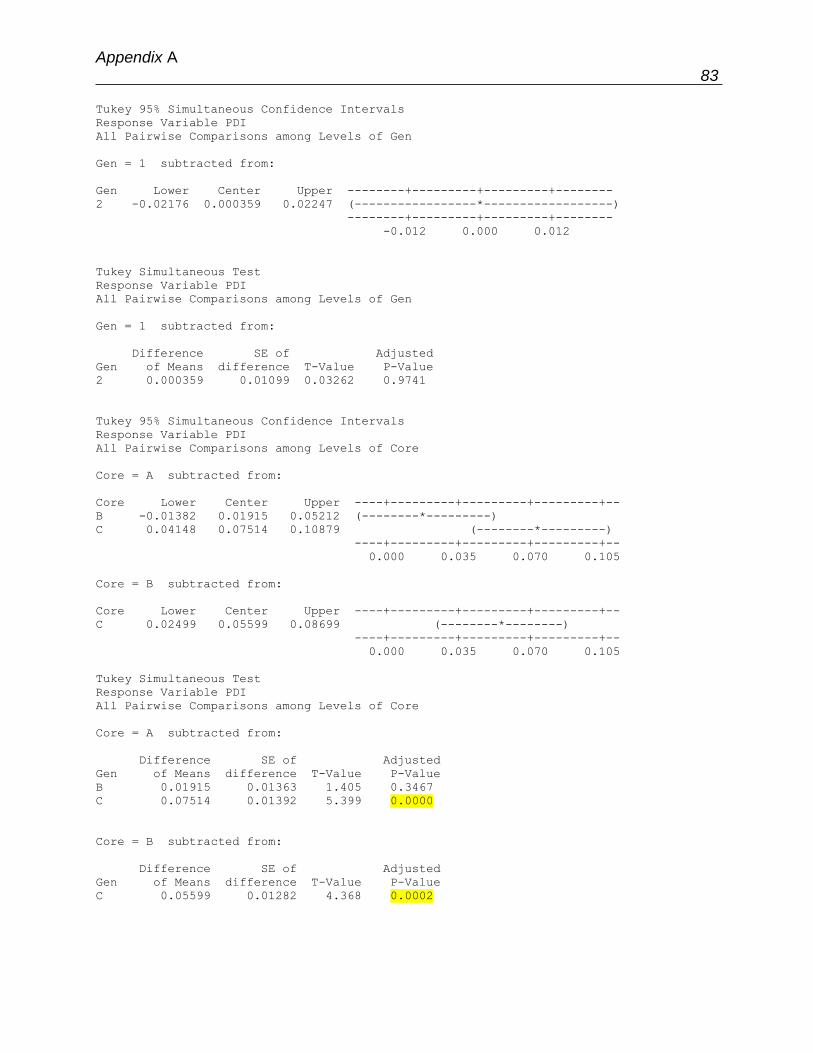
Appendix A 83
Tukey 95% Simultaneous Confidence Intervals
Response Variable PDI
All Pairwise Comparisons among Levels of Gen
Gen = 1 subtracted from:
Gen Lower Center Upper --------+---------+---------+--------
2 -0.02176 0.000359 0.02247 (-----------------*------------------)
--------+---------+---------+--------
-0.012 0.000 0.012
Tukey Simultaneous Test
Response Variable PDI
All Pairwise Comparisons among Levels of Gen
Gen = 1 subtracted from:
Difference SE of Adjusted
Gen of Means difference T-Value P-Value
2 0.000359 0.01099 0.03262 0.9741
Tukey 95% Simultaneous Confidence Intervals
Response Variable PDI
All Pairwise Comparisons among Levels of Core
Core = A subtracted from:
Core Lower Center Upper ----+---------+---------+---------+--
B -0.01382 0.01915 0.05212 (--------*---------)
C 0.04148 0.07514 0.10879 (--------*---------)
----+---------+---------+---------+--
0.000 0.035 0.070 0.105
Core = B subtracted from:
Core Lower Center Upper ----+---------+---------+---------+--
C 0.02499 0.05599 0.08699 (--------*--------)
----+---------+---------+---------+--
0.000 0.035 0.070 0.105
Tukey Simultaneous Test
Response Variable PDI
All Pairwise Comparisons among Levels of Core
Core = A subtracted from:
Difference SE of Adjusted
Gen of Means difference T-Value P-Value
B 0.01915 0.01363 1.405 0.3467
C 0.07514 0.01392 5.399 0.0000
Core = B subtracted from:
Difference SE of Adjusted
Gen of Means difference T-Value P-Value
C 0.05599 0.01282 4.368 0.0002

Appendix A 84
Appendix D
Solvent Accessible Surface Area (SASA) of the Dendrimers During the Simulation

References
1. Gillies, E. R.; Fre, J. M. J. Synthesis and Self-Assembly of Supramolecular
Dendritic “ Bow-Ties ”: Effect of Peripheral Functionality on Association Constants.
2004, 46–53.
2. Kalhapure, R. S.; Kathiravan, M. K.; Akamanchi, K. G.; Govender, T. Dendrimers
- from organic synthesis to pharmaceutical applications: an update. Pharm. Dev.
Technol. 2013, 20, 22–40, doi:10.3109/10837450.2013.862264.
3. Fedeli, E.; Lancelot, A.; Serrano, J. L.; Calvo, P.; Sierra, T. Self-assembling
amphiphilic Janus dendrimers: mesomorphic properties and aggregation in water.
New J. Chem. 2015, 39, 1960–1967, doi:10.1039/c4nj02071e.
4. Percec, V.; Wilson, D. A.; Leowanawat, P.; Wilson, C. J.; Hughes, A. D.; Kaucher,
M. S.; Hammer, D. A.; Levine, D. H.; Kim, A. J.; Bates, F. S.; Davis, K. P.; Lodge,
T. P.; Klein, M. L.; DeVane, R. H.; Aqad, E.; Rosen, B. M.; Argintaru, A. O.;
Sienkowska, M. J.; Rissanen, K.; Nummelin, S.; Ropponen, J. Self-assembly of
Janus dendrimers into uniform dendrimersomes and other complex architectures.
Science 2010, 328, 1009–14, doi:10.1126/science.1185547.
5. Sikwal, D. R.; Kalhapure, R. S.; Govender, T. An emerging class of amphiphilic
dendrimers for pharmaceutical and biomedical applications: Janus amphiphilic
dendrimers. Eur. J. Pharm. Sci. 2017, 97, 113–134,
doi:10.1016/j.ejps.2016.11.013.
6. Filippi, M.; Patrucco, D.; Martinelli, J.; Botta, M.; Castro-Hartmann, P.; Tei, L.;
Terreno, E. Novel stable dendrimersome formulation for safe bioimaging
applications. Nanoscale 2015, 7, 12943–12954, doi:10.1039/c5nr02695d.
7. Filippi, M.; Martinelli, J.; Mulas, G.; Ferraretto, M.; Teirlinck, E.; Botta, M.; Tei, L.;
Terreno, E. Dendrimersomes: a new vesicular nano-platform for MR-molecular
imaging applications. Chem. Commun. (Camb). 2014, 50, 3453–6,
doi:10.1039/c3cc49584a.
8. Filippi, M.; Catanzaro, V.; Patrucco, D.; Botta, M.; Tei, L.; Terreno, E. First in vivo
MRI study on theranostic dendrimersomes. J. Control. Release 2017, 248, 45–52,
doi:10.1016/j.jconrel.2017.01.010.
References 86
9. Nazemi, A.; Gillies, E. R. Dendrimersomes with photodegradable membranes for
triggered release of hydrophilic and hydrophobic cargo. Chem. Commun. (Camb).
2014, 50, 11122–5, doi:10.1039/c4cc05161k.
10. Peterca, M.; Percec, V.; Leowanawat, P.; Bertin, A. Predicting the size and
properties of dendrimersomes from the lamellar structure of their amphiphilic
Janus dendrimers. J. Am. Chem. Soc. 2011, 133, 20507–20,
doi:10.1021/ja208762u.
11. Liu, X.; Zhou, J.; Yu, T.; Chen, C.; Cheng, Q.; Sengupta, K.; Huang, Y.; Li, H.; Liu,
C.; Wang, Y.; Posocco, P.; Wang, M.; Cui, Q.; Giorgio, S.; Fermeglia, M.; Qu, F.;
Pricl, S.; Shi, Y.; Liang, Z.; Rocchi, P.; Rossi, J. J.; Peng, L. Adaptive amphiphilic
dendrimer-based nanoassemblies as robust and versatile siRNA delivery systems.
Angew. Chemie - Int. Ed. 2014, 53, 11822–11827, doi:10.1002/anie.201406764.
12. Nummelin, S.; Selin, M.; Legrand, S.; Ropponen, J.; Seitsonen, J.; Nykänen, A.;
Koivisto, J.; Hirvonen, J.; Kostiainen, M. A.; Bimbo, L. M. Modular synthesis of
self-assembling Janus-dendrimers and facile preparation of drug-loaded
dendrimersomes. Nanoscale 2017, 9, 7189–7198, doi:10.1039/C6NR08102A.
13. Zhang, S.; Sun, H. J.; Hughes, A. D.; Draghici, B.; Lejnieks, J.; Leowanawat, P.;
Bertin, A.; Otero De Leon, L.; Kulikov, O. V.; Chen, Y.; Pochan, D. J.; Heiney, P.
A.; Percec, V. “Single-Single” Amphiphilic Janus Dendrimers Self-Assemble into
Uniform Dendrimersomes with Predictable Size. ACS Nano 2014, 8, 1554–1565.
14. Zhang, S.; Sun, H. J.; Hughes, A. D.; Moussodia, R. O.; Bertin, A.; Chen, Y.;
Pochan, D. J.; Heiney, P. A.; Klein, M. L.; Percec, V. Self-assembly of amphiphilic
Janus dendrimers into uniform onion-like dendrimersomes with predictable size
and number of bilayers. Proc. Natl. Acad. Sci. U. S. A. 2014, 111, 9058–63,
doi:10.1073/pnas.1402858111.
15. Ihre, H.; Hult, A.; Fréchet, J. M. J.; Gitsov, I. Double-Stage Convergent Approach
for the Synthesis of Functionalized Dendritic Aliphatic Polyesters Based on 2,2-
Bis(hydroxymethyl)propionic Acid. Macromolecules 1998, 31, 4061–4068,
doi:10.1021/ma9718762.
16. Caminade, A.; Yan, D.; Smith, D. K.; Buhleier, E.; Wehner, W.; Vögtle, F.;
Tomalia, D. A.; Baker, H.; Dewald, J.; Hall, M.; Kallos, G.; Martin, S.; Roeck, J.;
References 87
Ryder, J.; Smith, P.; Newkome, G. R.; Yao, Z.; Baker, G. R.; Gupta, V. K.; Flory,
P. J. Dendrimers and hyperbranched polymers. Chem. Soc. Rev. 2015, 44, 3870–
3873, doi:10.1039/C5CS90049B.
17. Bugno, J.; Hsu, H.-J.; Hong, S. Recent advances in targeted drug delivery
approaches using dendritic polymers. Biomater. Sci. 2015, 3, 1025–1034,
doi:10.1039/C4BM00351A.
18. Hawker, C. J.; Fréchet, J. M. J. Preparation of Polymers with Controlled Molecular
Architecture. A New Convergent Approach to Dendritic Macromolecules. J. Am.
Chem. Soc. 1990, 112, 7638–7647, doi:10.1021/ja00177a027.
19. Venkataraman, S.; Hedrick, J. L.; Ong, Z. Y.; Yang, C.; Ee, P. L. R.; Hammond, P.
T.; Yang, Y. Y. The effects of polymeric nanostructure shape on drug delivery.
Adv. Drug Deliv. Rev. 2011, 63, 1228–1246, doi:10.1016/j.addr.2011.06.016.
20. Park, C.; Lee, J.; Kim, C. Functional supramolecular assemblies derived from
dendritic building blocks. Chem. Commun. 2011, 47, 12042,
doi:10.1039/c1cc11531f.
21. Caminade, A.-M.; Laurent, R.; Delavaux-Nicot, B.; Majoral, J.-P. “Janus”
dendrimers: syntheses and properties. New J. Chem. 2012, 36, 217,
doi:10.1039/c1nj20458k.
22. Pan, J.; Wen, M.; Yin, D.; Jiang, B.; He, D.; Guo, L. Design and synthesis of novel
amphiphilic Janus dendrimers for bone-targeted drug delivery. Tetrahedron 2012,
68, 2943–2949, doi:10.1016/j.tet.2012.02.040.
23. Gillies, E. R.; Fréchet, J. M. J. Designing macromolecules for therapeutic
applications: polyester dendrimer-poly(ethylene oxide) “bow-tie” hybrids with
tunable molecular weight and architecture. J. Am. Chem. Soc. 2002, 124, 14137–
46.
24. Ropponen, J.; Nummelin, S.; Rissanen, K. Bisfunctionalized Janus molecules.
Org. Lett. 2004, 6, 2495–7, doi:10.1021/ol049555f.
25. Peterca, M.; Percec, V.; Leowanawat, P.; Bertin, A. Predicting the size and
properties of dendrimersomes from the lamellar structure of their amphiphilic
janus dendrimers. J. Am. Chem. Soc. 2011, 133, 20507–20,
doi:10.1021/ja208762u.
References 88
26. Kalhapure, R. S.; Akamanchi, K. G. Oleodendrimers: a novel class of
multicephalous heterolipids as chemical penetration enhancers for transdermal
drug delivery. Int. J. Pharm. 2013, 454, 158–66,
doi:10.1016/j.ijpharm.2013.07.028.
27. Shao, S.; Si, J.; Tang, J.; Sui, M.; Shen, Y. Jelly fish-Shaped Amphiphilic
Dendrimers: Synthesis and Formation of Extremely Uniform Aggregates. 2014.
28. Nazemi, A.; Schon, T. B.; Gillies, E. R. Synthesis and Degradation of Backbone
Photodegradable Polyester Dendrimers. 2013, 12–15.
29. Tuuttila, T.; Lahtinen, M.; Kuuloja, N.; Huuskonen, J.; Rissanen, K. Synthesis and
thermal behavior of Janus dendrimers, part 1. Thermochim. Acta 2010, 497, 101–
108, doi:10.1016/j.tca.2009.08.018.
30. Tuuttila, T.; Lahtinen, M.; Huuskonen, J.; Rissanen, K. Synthesis and thermal
behavior of Janus dendrimers, part 2. Thermochim. Acta 2010, 497, 109–116,
doi:10.1016/j.tca.2009.08.019.
31. Giustini, M.; Bellinazzo, C.; Galantini, L.; Mallardi, A.; Palazzo, G.; Sennato, S.;
Bordi, F.; Rissanen, K. Incorporation of the bacterial reaction centre into
dendrimersomes. Colloids Surfaces A Physicochem. Eng. Asp. 2012, 413, 38–43,
doi:10.1016/j.colsurfa.2012.01.040.
32. Grayson, S. M.; Frechet, J. M. J. Synthesis and surface functionalization of
aliphatic polyether dendrons. J. Am. Chem. Soc. 2000, 122, 10335–10344,
doi:10.1021/ja001903v.
33. Prabakaran, P.; Prasad, E. Janus Dendrimer from Poly(Aryl Ether) Linked
PAMAM for Supergelation and Guest Release. ChemistrySelect 2016, 1, 5561–
5568, doi:10.1002/slct.201601335.
34. Modular Synthesis of Amphiphilic Janus Glycodendrimers and Their Self
Assembly into Glycodendrimersomes and Other Complex Architectures with
Bioactivity to Biomedically Relevant Lectins 2014.
35. Wang, P.; Ma, Y.; Liu, Z.; Yan, Y.; Sun, X.; Zhang, J. Vesicle formation of
catanionic mixtures of CTAC/SDS induced by ratio: a coarse-grained molecular
dynamic simulation study. RSC Adv. 2016, 6, 13442–13449,
doi:10.1039/C5RA26051E.
References 89
36. Marrink, S. J.; de Vries, A. H.; Mark, A. E. Coarse Grained Model for
Semiquantitative Lipid Simulations. J. Phys. Chem. B 2004, 108, 750–760,
doi:10.1021/jp036508g.
37. Thota, N.; Luo, Z.; Hu, Z.; Jiang, J. Self-Assembly of Amphiphilic Peptide
(AF)6H5K15 : Coarse-Grained Molecular Dynamics Simulation. J Phys Chem B
2013, 117, 9690–8, doi:10.1021/jp4059752.
38. Márquez-Miranda, V.; Araya-Durán, I.; Camarada, M. B.; Comer, J.; Valencia-
Gallegos, J. A.; González-Nilo, F. D. Self-Assembly of Amphiphilic Dendrimers:
The Role of Generation and Alkyl Chain Length in siRNA Interaction. Sci. Rep.
2016, 6, 29436, doi:10.1038/srep29436.
39. Ianiro, A.; Patterson, J.; González García, A.; van Rijt, M. M. J.; Hendrix, M. M. R.
M.; Sommerdijk, N. A. J. M.; Voets, I. K.; Esteves, A. C. C.; Tuinier, R. A roadmap
for poly(ethylene oxide)-block-poly-ε-caprolactone self-assembly in water:
Prediction, synthesis, and characterization. J. Polym. Sci. Part B Polym. Phys.
2018, 56, 330–339, doi:10.1002/polb.24545.
40. Rodriguez, N.; Pincet, F.; Cribier, S. Giant vesicles formed by gentle hydration
and electroformation: A comparison by fluorescence microscopy. Colloids
Surfaces B Biointerfaces 2005, 42, 125–130, doi:10.1016/j.colsurfb.2005.01.010.
41. Garcia-Manrique, P.; Matos, M.; Gutierrez, G.; Estupiñan, O. R.; Blanco-Lopez, M.
C.; Pazos, C. Using Factorial Experimental Design to Prepare Size-Tuned
Nanovesicles. Ind. Eng. Chem. Res. 2016, 55, 9164–9175,
doi:10.1021/acs.iecr.6b01552.
42. Xiao, Q.; Rubien, J. D.; Wang, Z.; Reed, E. H.; Hammer, D. A.; Sahoo, D.; Heiney,
P. A.; Yadavalli, S. S.; Goulian, M.; Wilner, S. E.; Baumgart, T.; Vinogradov, S. A.;
Klein, M. L.; Percec, V. Self-sorting and coassembly of fluorinated, hydrogenated,
and hybrid Janus dendrimers into dendrimersomes. J. Am. Chem. Soc. 2016, 138,
12655–12663, doi:10.1021/jacs.6b08069.
43. Gentine, P.; Bubel, A.; Crucifix, C.; Bourel-Bonnet, L.; Frisch, B. Manufacture of
liposomes by isopropanol injection: characterization of the method. J. Liposome
Res. 2012, 22, 18–30, doi:10.3109/08982104.2011.584318.
44. Kaminski, T. S.; Scheler, O.; Garstecki, P. Droplet microfluidics for microbiology:

References 90
techniques, applications and challenges. Lab Chip 2016, 16, 2168–2187,
doi:10.1039/C6LC00367B.
45. Zhao, C.-X. Multiphase flow microfluidics for the production of single or multiple
emulsions for drug delivery. Adv. Drug Deliv. Rev. 2013, 65, 1420–1446,
doi:10.1016/j.addr.2013.05.009.
46. Baroud, C. N.; Gallaire, F.; Dangla, R. Dynamics of microfluidic droplets. Lab Chip
2010, 10, 2032–2045, doi:10.1039/c001191f.
47. Walde, P.; Cosentino, K.; Engel, H.; Stano, P. Giant vesicles: preparations and
applications. Chembiochem 2010, 11, 848–65, doi:10.1002/cbic.201000010.
48. Meure, L. A.; Foster, N. R.; Dehghani, F. Conventional and dense gas techniques
for the production of liposomes: a review. AAPS PharmSciTech 2008, 9, 798–809,
doi:10.1208/s12249-008-9097-x.
49. Gentine, P.; Bourel-Bonnet, L.; Frisch, B. Modified and derived ethanol injection
toward liposomes: development of the process. J. Liposome Res. 2013, 23, 11–9,
doi:10.3109/08982104.2012.717298.
50. Moore, J. S.; Stupp, S. I. Room Temperature Polyesterification. Macromolecules
1990, 23, 65–70.
51. Appel, R.; Fuchs, J.; Tyrrell, S. M.; Korevaar, P. A.; Stuart, M. C. A.; Voets, I. K.;
Schönhoff, M.; Besenius, P. Steric Constraints Induced Frustrated Growth of
Supramolecular Nanorods in Water. Chem. - A Eur. J. 2015, 21, 19257–19264,
doi:10.1002/chem.201503616.
52. Schindelin, J.; Arganda-Carreras, I.; Frise, E.; Kaynig, V.; Longair, M.; Pietzsch,
T.; Preibisch, S.; Rueden, C.; Saalfeld, S.; Schmid, B.; Tinevez, J.-Y.; White, D.
J.; Hartenstein, V.; Eliceiri, K.; Tomancak, P.; Cardona, A. Fiji: an open-source
platform for biological-image analysis. Nat Meth 2012, 9, 676–682.
53. Kim, S.-H.; Kim, J. W.; Cho, J.-C.; Weitz, D. A. Double-emulsion drops with ultra-
thin shells for capsule templates. Lab Chip 2011, 11, 3162–3166,
doi:10.1039/c1lc20434c.
54. Arriaga, L. R.; Datta, S. S.; Kim, S. H.; Amstad, E.; Kodger, T. E.; Monroy, F.;
Weitz, D. A. Ultrathin shell double emulsion templated giant unilamellar lipid
vesicles with controlled microdomain formation. Small 2014, 10, 950–956,
References 91
doi:10.1002/smll.201301904.
55. Abràmoff, M. D.; Magalhães, P. J.; Ram, S. J. Image processing with ImageJ.
Biophotonics Int. 2004, 11, 36–41, doi:10.1117/1.3589100.
56. Griffin, W. C. Calculation of HLB values of non-ionic surfactants. J. Soc. Cosmet.
Chem. 1954, 5, 249–256.
57. Griffin, W. C. Classification of surface-active agents by “HLB.” J. Soc. Cosmet.
Chem. 1949, 1, 311–326.
58. Marrink, S. J.; Risselada, H. J.; Yefimov, S.; Tieleman, D. P.; de Vries, A. H. The
MARTINI Force Field : Coarse Grained Model for Biomolecular Simulations. J.
Phys. Chem. B 2007, 111, 7812–7824, doi:10.1021/jp071097f.
59. Periole, X.; Marrink, S.-J. The Martini Coarse-Grained Force Field. In
Biomolecular Simulations. Methods in Molecular Biology (Methods and Protocols);
Monticelli, L., Salonen, E., Eds.; Humana Press: Totowa, NJ, 2013; Vol. 924, pp.
533–565 ISBN 978-1-62703-016-8.
60. Bradley, R.; Radhakrishnan, R. Coarse-grained models for protein-cell membrane
interactions. Polymers (Basel). 2013, 5, 890–936, doi:10.3390/polym5030890.
61. Bussi, G.; Donadio, D.; Parrinello, M. Canonical sampling through velocity
rescaling. J. Chem. Phys. 2007, 126, 14101, doi:10.1063/1.2408420.
62. Thota, N.; Jiang, J. Self-assembly of amphiphilic peptide (AF)6H5K 15
derivatives: Roles of hydrophilic and hydrophobic residues. J. Phys. Chem. B
2014, 118, 2683–2692, doi:10.1021/jp500406p.
63. Essmann, U.; Perera, L.; Berkowitz, M. L.; Darden, T.; Lee, H.; Pedersen, L. G. A
smooth particle mesh Ewald method. J Chem Phys 1995, 103, 8577–8593,
doi:10.1063/1.470117.
64. Humphrey, W.; Dalke, A.; Schulten, K. VMD: Visual molecular dynamics. J. Mol.
Graph. 1996, 14, 33–38, doi:10.1016/0263-7855(96)00018-5.
65. Ali, S.; Minchey, S.; Janoff, A.; Mayhew, E. A differential scanning calorimetry
study of phosphocholines mixed with paclitaxel and its bromoacylated taxanes.
Biophys. J. 2000, 78, 246–256, doi:10.1016/S0006-3495(00)76588-X.
66. Demetzos, C. Differential Scanning Calorimetry (DSC): A tool to study the thermal
behavior of lipid bilayers and liposomal stability. J. Liposome Res. 2008, 18, 159–

References 92
173, doi:10.1080/08982100802310261.
67. Tsumoto, K.; Matsuo, H.; Tomita, M.; Yoshimura, T. Efficient formation of giant
liposomes through the gentle hydration of phosphatidylcholine films doped with
sugar. Colloids Surfaces B Biointerfaces 2009, 68, 98–105,
doi:10.1016/j.colsurfb.2008.09.023.
68. Erb, R. M.; Obrist, D.; Chen, P. W.; Studer, J.; Studart, A. R. Predicting sizes of
droplets made by microfluidic flow-induced dripping. Soft Matter 2011, 7, 8757–
8761, doi:10.1039/c1sm06231j.
69. Zhao, C. X.; Chen, D.; Hui, Y.; Weitz, D. A.; Middelberg, A. P. J. Controlled
generation of ultrathin-shell double emulsions and studies on their stability.
ChemPhysChem 2017, 18, 1393–1399, doi:10.1002/cphc.201601334.
70. Hayward, R. C.; Utada, A. S.; Dan, N.; Weitz, D. A. Dewetting instability during
the formation of polymersomes from block-copolymer-stabilized double emulsions.
Langmuir 2006, 22, 4457–4461, doi:10.1021/la060094b.
71. do Nascimento, D. F.; Arriaga, L. R.; Eggersdorfer, M.; Ziblat, R.; Marques, M. de
F. V.; Reynaud, F.; Koehler, S. A.; Weitz, D. A. Microfluidic fabrication of pluronic
vesicles with controlled permeability. Langmuir 2016, 32, 5350–5355,
doi:10.1021/acs.langmuir.6b01399.
72. Taabache, S.; Bertin, A. Vesicles from amphiphilic dumbbells and Janus
dendrimers: Bioinspired self-assembled structures for biomedical applications.
Polymers (Basel). 2017, 9, 280.
73. Parent, L. R.; Bakalis, E.; Ramírez-Hernández, A.; Kammeyer, J. K.; Park, C.; De
Pablo, J.; Zerbetto, F.; Patterson, J. P.; Gianneschi, N. C. Directly Observing
Micelle Fusion and Growth in Solution by Liquid-Cell Transmission Electron
Microscopy. J. Am. Chem. Soc. 2017, 139, 17140–17151,
doi:10.1021/jacs.7b09060.
74. Ruozi, B.; Belletti, D.; Tombesi, A.; Tosi, G.; Bondioli, L.; Forni, F.; Vandelli, M. A.
AFM, ESEM, TEM, and CLSM in liposomal characterization: a comparative study.
Int. J. Nanomedicine 2011, 6, 557–563, doi:10.2147/IJN.S14615.
75. Antonietti, M.; Förster, S. Vesicles and Liposomes: A Self-Assembly Principle
Beyond Lipids. Adv. Mater. 2003, 15, 1323–1333, doi:10.1002/adma.200300010.
References 93
76. Luman, N. R.; Grinstaff, M. W. Synthesis and aqueous aggregation properties of
amphiphilic surface-block dendrimers. Org. Lett. 2005, 7, 4863–6,
doi:10.1021/ol051583q.
77. Ruozi, B.; Tosi, G.; Tonelli, M.; Bondioli, L.; Mucci, A.; Forni, F.; Vandelli, M. A.
AFM phase imaging of soft-hydrated samples: A versatile tool to complete the
chemical-physical study of liposomes. J. Liposome Res. 2009, 19, 59–67,
doi:10.1080/08982100802584071.
78. Bibi, S.; Kaur, R.; Henriksen-Lacey, M.; McNeil, S. E.; Wilkhu, J.; Lattmann, E.;
Christensen, D.; Mohammed, A. R.; Perrie, Y. Microscopy imaging of liposomes:
From coverslips to environmental SEM. Int. J. Pharm. 2011, 417, 138–150,
doi:10.1016/j.ijpharm.2010.12.021.
79. Liao, H.-G.; Zheng, H. Liquid Cell Transmission Electron Microscopy. Annu. Rev.
Phys. Chem. 2016, 67, 719–747, doi:10.1146/annurev-physchem-040215-112501.
80. Han, M.; Hong, M.; Sim, E. Influence of the block hydrophilicity of AB2 miktoarm
star copolymers on cluster formation in solutions. J. Chem. Phys. 2011, 134,
204901, doi:10.1063/1.3586804.
81. Yamamoto, S.; Maruyama, Y.; Hyodo, S. Dissipative particle dynamics study of
spontaneous vesicle formation of amphiphilic molecules. J. Chem. Phys. 2002,
116, 5842, doi:10.1063/1.1456031.
82. Wang, Z.; He, X. Dynamics of vesicle formation from lipid droplets: Mechanism
and controllability. J. Chem. Phys. 2009, 130, 94905, doi:10.1063/1.3079097.
83. Shinoda, W.; Devane, R.; Klein, M. L. Zwitterionic lipid assemblies: Molecular
dynamics studies of monolayers, bilayers, and vesicles using a new coarse grain
force field. J. Phys. Chem. B 2010, 114, 6836–6849, doi:10.1021/jp9107206.
84. Israelachvili, J. N.; Mitchell, D. J.; Ninham, B. W. Theory of self-assembly of
hydrocarbon amphiphiles into micelles and bilayers. J. Chem. Soc. Faraday Trans.
2 1976, 72, 1525, doi:10.1039/f29767201525.
85. Arai, N.; Yoshimoto, Y.; Yasuoka, K.; Ebisuzaki, T. Self-assembly behaviours of
primitive and modern lipid membrane solutions: a coarse-grained molecular
simulation study. Phys. Chem. Chem. Phys. 2016, 18, 19426–19432,
doi:10.1039/C6CP02380K.
References 94
86. Kremer, J. M.; Esker, M. W.; Pathmamanoharan, C.; Wiersema, P. H. Vesicles of
Variable Diameter Prepared by a Modified Injection Method. Biochemistry 1977,
16, 3932–3935, doi:10.1021/bi00636a033.
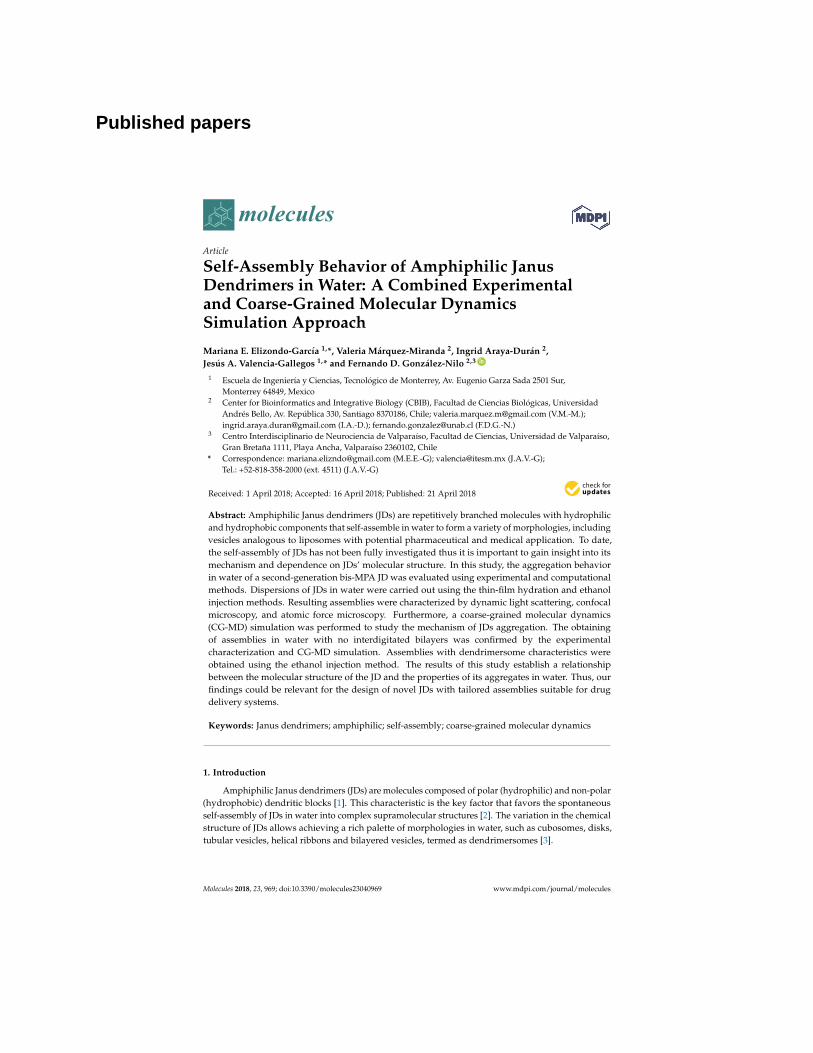
Published papers

Curriculum Vitae
Mariana Estefanía Elizondo García was born in Monterrey, México, on September 9, 1988. She earned her BSc in Industrial Chemistry from the Universidad Autónoma de Nuevo León in December 2009 and her MSc in Biotechnology from the Instituto Tecnológico y de Estudios Superiores de Monterrey, Monterrey Campus in May 2012. She was accepted in the graduate program in Biotechnology in January 2014, working under the supervision of Dr. Jesús A. Valencia Gallegos. This thesis represents the termination of her Doctoral studies.

This document was typed in using Microsoft Word by Mariana E. Elizondo García
Copyright © 2022 FDOKUMEN