Institute of Aquaculture, University of Stirling, Stirling FK9 4LA ...
323
37721 A design and management approach for hon*zontally integrated aquaculturesystems Stuart W Bunting October 2001 Institute of Aquaculture, University of Stirling, Stirling FK9 4LA, Scotland A thesis presented for the degree of Doctor of Philosophy to the University of Stirling.
-
Upload
khangminh22 -
Category
Documents
-
view
1 -
download
0
Transcript of Institute of Aquaculture, University of Stirling, Stirling FK9 4LA ...

37721
A design and management approach for hon*zontally integrated aquaculture systems
Stuart W Bunting
October 2001
Institute of Aquaculture, University of Stirling, Stirling FK9 4LA, Scotland
A thesis presented for the degree of Doctor of Philosophy to the University of Stirling.

Acknowledgments
I would like to express my sincere thanks to the management and staff at the commercial smolt unit surveyed, to the owners and manager of the trout fishery monitored and to the Wildfowl and Wetlands Trust, Slimbridge for their interest and co-operation in this research. Thanks also to everybody who gave their time to participate in the Delphi investigation, particularly to Dr Caffey whose correspondence and advice was valued. The assistance from Mr W Struthers and Mrs N Pollock, Water Quality Laboratory, Institute of Aquaculture was greatly appreciated. I am extremely grateful for the guidance I received from Professor James Muir and Dr Malcolm Beveridge throughout the course of this study. Finally, thank you to Caroline for her support and encouragement.
I

Contents
Page
Introduction 1
Introduction 2
1.2 Aquaculture and its ecological footprint 3
1.3 Environmental impacts of aquaculture wastewater 6
1.3.1 Physio-chemical impacts 7 1.3.2 Eutrophication 14 1.3.3 Shifting trophic status and interactions 17 1.3.4 Escapees 20 1.3.5 Summary of ecological impacts 20
1.4 Resource-use conflicts 21
1.4.1 Self-pollution 21 1.4.2 Restricted amenity 24 1.4.3 Reduced functionality 25 1.4.4 Impacts on option and non-use values 26 1.4.5 The cost of discharging aquaculture wastewater 27
1.5 Strategies for managing aquaculture wastewater 27
1.5.1 Feed technology and management 29 1.5.2 Facility design and operation 32 1.5.3 Wastewater treatment at land-based farms 33 1.5.4 Wastewater treatment at cage farms 39 1.5.5 Water reuse in aquaculture 40
1.6 Future Directions 41
2 Horizontally integrated aquaculture systems 46
2.1 Introduction 46
2.2 Productive reuse and treatment of waste through aquaculture 46
2.2.1 Manure 47 2.2.2 Human waste 49 2.2.3 Intermediaries in integrated aquaculture 52
2.3 Opportunities for horizontally integrated aquaculture 53
2.4 Defining horizontally integrated aquaculture 55
2.5 Developing a systems perspective 57
11

2.6 Management strategies facilitating horizontally integrated aquaculture 59
2.6.1 Polyculture 61 2.6.2 Inter-cropping 64 2.6.3 Horizontal integration in aquaculture systems employing water reuse 65 2.6.4 Flow-through horizontally integrated aquaculture 68 2.6.5 Open horizontally integrated aquaculture 91
2.7 Evaluating the potential of horizontally integrated aquaculture 97
3 Modelling horizontally integrated aquaculture: a smolt farm, constructed wetland and trout fishery 99
3.1 Introduction 99
3.2 Formulating the bioeconomic model 101
3.3 Case study development 105
3.4 Simulated commercial smolt production 106
3.4.1 Stock model 107 3.4.2 Wastewater characteristics 109 3.4.3 Predicted wastewater composition ill.
3.5 Modelling and testing outputs from the treatment scenarios 114
3.5.1 Scenario 1: wastewater treatment with a drumfilter 115 3.5.2 Scenario 2: treatment with a reedbed 118 3.5.3 Scenario 3: treatment with a trout fishery and reedbed 124
3.6 Financial implications 128
3.6.1 Scenario 1: drumfilter 130 3.6.2 Scenario 2: constructed wetland 130 3.6.3 Scenario 3: a trout fishery and constructed wetland 132
3.7 Sensitivity analysis 133
3.8 Conclusions 134
3.9 Summary 143
4 Constructed mangrove wetlands for intensively managed shrimp pond wastewater 145
4.1 Introduction 145
4.2 Method 147
III

4.2.1 Pond management 147 4.2.2 Dimensioning the mangrove wetland 148 4.2.3 Treatment performance 150 4.2.4 Financial and economic implications 150
4.3 Results 152
4.3.1 Biomass production and waste outputs 152 4.3.2 Dimensioning the mangrove wetland 152 4.3.3 Wastewater composition and volume 154 4.3.4 Wastewater treatment 157 4.3.5 Financial implications 159 4.3.6 Sensitivity analysis 161
4.4 Discussion 162
4.4.1 Wastewater characteristics 162 4.4.2 Nutrient retention 164 4.4.3 Environmental goods and services associated with mangroves 165 4.4.4 Management issues 166 4.4.5 Practical constraints 168 4.4.6 Social and economic issues 169 4.4.7 Financial viability 171
4.5 Conclu sions 174
5 Comparison of conventional, rational and traditional strategies for lagoon-based wastewater treatment and reuse 177
5.1 Introduction 177
5.1.1 Study aims 178
5.2 Method 179
5.2.1. Wastewater characteristics 179 5.2.2. Conventional and rational design approaches 180 5.2.3 Aquatic production and nutrient retention 184 5.2.4 Financial inputs and implications 184
5.3 Results 186
5.3.1 Physical characteristics 186 5.3.2 Water flow and evaporation 187 5.3.3 Nitrogen dynamics 188 5.3.4 Aquatic production and nutrient assimilation 189 5.3.5 Faecal colifom-1 levels 189 5.3.6 Financial indicators 190 5.3.7 Sensitivity analysis 192
5.4. Discussion 193
IV

5.4.1 Physical characteristics 193 5.4.2 Water conservation 195 5.4.3 Nutrient retention and reuse 195 5.4.4 Financial indicators and productivity 197 5.4.5 Social and economic issues 200
5.5 Summary 204
6 Development options: a Delphi investigation 206
6.1 Introduction 206
6.2 Method 207
6.2.1 Research questions and hypotheses 208 6.2.2 Questionnaire formulation 208 6.2.3 Participant selection and instruction 209 6.2.4 Round 1 211 6.2.5 Round 2 212 6.2.6 Round 3 212
6.3 Analysis 212
6.4 Results 214
6.4.1 Survey participation 214 6.4.2 Constraints 214 6.4.3 Opportunities 216 6.4.4 Alternative strategies for limiting impacts of aquaculture wastewater 218 6.4.5 Confidence and convergence in rank patterns after round 2 219 6.4.6 Confidence and convergence in rank patterns after round 3 220 6.4.7 Rank patterns and consensus within categories 221
6.5 Discussion 223
7 Discussion 233
7.1 Overview 233
7.2 Discussion of methodology 234
7.3 Implications of findings 238
7.4 Conclusions and recommendations 242
References 244
Appendices
V

Contents List of Tables
Table Page
1.1 Ecological impacts associated with wastewater discharges from commercial 22 aquaculture,
1.2 Negative impacts associated with aquaculture wastewater 28
1.3 Strategies for reducing waste loadings from commercial aquaculture 42
2.1 Wastewater treatment functions of constructed wetlands 87
2.2 Appropriate horizontally integrated systems for the aquaculture units described 98 together with constraints and opportunities
3.1 Physical parameters and management details for a commercial smolt unit 107
3.2 Approaches supported by the ADEPT model for simulating discharges from smolt 110 units
3.3 Mean waste concentrations (mgl-') observed in abstracted water and predicted for 112 untreated wastewater and water treated using strategies shown, percentage change after treatment is given in parenthesis
3.4 Observed and predicted means and ranges for waste concentrations (mg 1-1) in 114 untreated wastewater, z scores and probability level (p) at which these differ using the Wilcoxon test, and correlation coefficients between observed and predicted concentrations
3.5 Observed and predicted means and ranges for waste concentrations (mg 1-1) for 117 druinfilter filtrate, z scores and probability level (p) at which these differ using the Wilcoxon test, and correlation coefficients between observed and predicted concentrations
3.6 Design parameters for constructed wetlands 120
3.7 Observed and predicted means and ranges for waste concentrations (mg 1-1) for 123 wastewater treated in a reedbed, z scores and probability level (P) at which these differ using the Wilcoxon test, and correlation coefficients between observed and predicted concentrations
3.8 Observed and predicted means and ranges for waste concentrations (ing 1-1) for 127 water having passed through a trout fishery, z scores and probability level (P) at which these differ using the Wilcoxon test, and correlation coefficients between observed and predicted concentrations
3.9 Financial parameters and baseline assumptions employed 129
3.10 Financial implications and key indicators of performance for the treatment 131 strategies indicated
3.11 Sensitivity of ten year IRR (%) to changing input parameters 133
4.1 Operating parameters for intensively managed ponds *in Thailand stocked at low 148 and high densities
4.2 Physical characteristics of mangrove wetlands treating wastewater from I ha of 153 shrimp ponds stocked at low and high densities
4.3 Predicted mean changes in waste concentrations (mg 1-1) in treated and abstracted 154 water for low and high density shrimp culture
vi

4.4 Financial indicators associated with developing constructed mangrove wetlands to 160 treat wastewater from 1 ha of shrimp ponds stocked at low and high densities
4.5 Sensitivity of ten year IRR (%) to changing input parameters at low and high 161 stocking densities
5.1 Design parameters for lagoon-based wastewater treatment and aquaculture reuse 182
5.2 Financial parameters assumed for the two scenarios 186
5.3 Physical characteristics of lagoon-based treatment systems dimensioned using 188 conventional and rational design approaches
5.4 Production, nutrient assimilation and faecal coliform levels in fishponds 190
5.5 Financial indicators for conventional and rational designs 191
5.6 Sensitivity analysis of ten year IRRs associated with conventional and rational 193 designs
6.1 Guidelines for interpreting the degree of agreement and confidence in ranks 213 associated with discreet values for Kendall's coefficient of concordance (ffý
6.2 Constraints participants associate with horizontally integrated aquaculture, the 215 frequency of occurrence in round I (n) and both mean score (x) and mean ordinal rank following round 3
6.3 Opportunities participants associate with horizontally integrated aquaculture, the 217 frequency of occurrence in round I (n) and both mean score (x) and mean ordinal rank following round 3
6.4 Strategies proposed by participants to reduce negative impacts associated with 219 aquaculture wastewater, the frequency of occurrence in round I (n) and both mean score (x) and mean ordinal rank following round 3
6.5 Values for Friedman's X2Fat probability levels (p) indicated and Kendall's W for 220 weights assigned to factors during round 2
6.6 Values for Friedman's -X2F at probability levels (p) *indicated and Kendall's W for 221
weights assigned to factors during round 3
6.7 Friedman's -X2Fat probability levels (p) indicated and Kendall's W for rank patterns 222
in weights assigned to constraints following round 3
6.8 Friedman's -Y2Fat probability levels (p) indicated and Kendall's W for rank patterns 223 in weights assigned to opportunities following round 3
6.9 Friedman's -'y2Fat probability levels (p) indicated and Kendall's W for rank patterns 223 in weights assigned to alternative strategies following round 3
vii

Contents List of Figures
Figure Page
2.1 Aquaculture systems facilitating horizontal integration 60
3.1 Conceptual framework and user-friendly front page for the ADEPT bloeconormc 103 model
3.2 Stock model (kg) and mean temperature ('C) of abstracted water 108
3.3 Mean change in concentration (mg/1) of SS, BOD and DO in smolt unit wastewater 112
3.4 Mean change in concentration (mg/1) of TAN and TP in smolt unit wastewater 113
3.5 Mean SS, BOD and DO concentrations (mg/1) in water treated using a drumfilter 116 (minus background levels)
3.6 Mean TAN and TP concentrations (mg/1) in water treated using a drumfilter (minus 116 background levels)
3.7 Mean SS, BOD and DO concentrations in water treated using a reedbed (minus 121 background levels)
3.8 Mean TAN and TP concentrations (mg/1) in water treated using a reedbed (niinus 122 background levels)
3.9 Mean SS, BOD and DO concentrations (mg/1) in water treated using a trout fishery 125 and reedbed (minus background levels)
3.10 Mean TAN and TP concentrations (mg/1) in water treated using a trout fishery and 126 reedbed (MInus background levels)
4.1 Mean predicted concentration (mg/1) change for SS, BOD and DO in wastewater 155 from shrimp ponds stocked at low densities
4.2 Mean predicted concentration (mg/1) change for TAN, TN and TP in wastewater from 155 shrimp ponds stocked at low densities
4.3 Mean predicted concentration (mg/1) change for SS, BOD and DO in wastewater 155 from shrimp ponds stocked at high densities
4.4 Mean predicted concentration (mg/1) change for TAN, TN and TP in wastewater from 156 shrimp ponds stocked at high densities
4.5 Mean predicted SS, BOD and DO concentrations (mg/1) in water from low density 157 ponds treated using a mangrove wetland (minus background levels)
4.6 Mean predicted TAN, TN and TP concentrations (mg/1) in water from low density 158 ponds treated using a mangrove wetland (mmus background levels)
4.7 Mean predicted SS, BOD and DO concentrations (mg/1) in water from high density 158 ponds treated using a mangrove wetland (minus background levels)
4.8 Mean predicted TAN, TN and TP concentrations (mg/1) in water from high density 159 ponds treated using a mangrove wetland (mmus background levels)
6.1 Flow-chart for data collection and feedback to participants during the iterative rounds 210 of the Delphi investigation
Vill

Abstract
This thesis presents an assessment concerning the potential of horizontally integrated
aquaculture, with outcomes assessed from a systems-based perspective. A literature review
concerning the negative impacts and the limitations of current wastewater management
, approaches demonstrated that improved strategies are required. Horizontally integrated r,
aquaculture was proposed, where the productive reuse of aquaculture wastewater
ameliorates associated negative impacts. A definition for horizontally integrated
aquaculture is presented and management strategies that conform to this definition
reviewed.
The development and application of the ADEPT bioeconornic model to assess the
potential of a constructed wetland and trout fishery to treat wastewater from a commercial
smolt unit in Scotland is described. The model outputs were tested against observations
from commercial facilities operating under comparable conditions to those envisaged for
horizontally integrated systems. Findings demonstrated that the modelling approach
adopted was generally effective in predicting the composition of wastewater outputs from
the farm and the effect of the selected treatment strategies. The model was applied to two
further case studies. One assessed the potential of treating wastewater from shrimp farms
in Thailand using a constructed mangrove wetland; the second evaluated the possible
advantages of a rational design approach to lagoon-based wastewater treatment and reuse,
as opposed to a conventional design and traditional practices developed in peri-urban
Calcutta.
ix

Chapter One
Introduction
Overview
Rapid expansion of the aquaculture sector in many countries has often outpaced the
introduction of legislation and monitoring programmes to regulate wastewater discharges,
and such a pattern of development has frequently been linked with negative environmental
impacts. When regulatory controls are implemented, producers may consider them rigid
and draconian, whilst environmental activists and advocates of the precautionary principle
may find them lenient and poorly policed. Practical aspects of managing and treating
aquaculture wastewater make compliance with discharge standards problematic, time
consuming and expensive, whilst the prospect of more stringent standards threatens to
exceed developments in waste management and conventional treatment approaches.
Therefore, a proactive strategy for wastewater management, in both emerging aquaculture
sectors and established industries, that exploits the waste resource in complementary
production systems, whilst ameliorating negative environmental, economic and social
impacts is desirable. This thesis proposes that the strategy of horizontally integrated
aquaculture embodies this concept. By invoking a systems-based approach, the potential of
this strategy to ameliorate negative impacts of aquaculture wastewater and produce
products with value, whilst allaying the concerns of stakeholders, especially consumers
and regulators is assessed.
As a background to discussing horizontally integrated aquaculture, the range of
negative environmental, economic and social impacts associated with aquaculture
I

wastewater, together with the strategies that have been employed to mitigate these impacts
are discussed in Chapter 1. In Chapter 2a definition for horizontally integrated aquaculture
is derived and studies of the systems meeting the proposed criteria reviewed. Chapter 3
outlines the formulation, development and application of a bioeconomic model for
horizontally integrated aquaculture systems; a case study concerning the integration of a
smolt unit, constructed wetland and trout fishery is used to evaluate the model. Chapters 4
and 5 present further case studies assessing an integrated shrimp farm-mangrove system
and a rational design approach to wastewater aquaculture, respectively. Although not
falling within the proposed definition of horizontally integrated aquaculture, the case-study
concerning wastewater aquaculture in pen-urban Calcutta was selected as this system
constitutes one of the few large-scale ecologically based wastewater production and reuse
systems from which it was thought insights concerning the management demands, social
and economic implications and real world constraints to such systems could be gained. It
was also hoped to test the generality of the modelling approach adopted. A Delphi
investigation concerning future prospects for horizontally integrated aquaculture is
described in Chapter 6. Findings from the review process, modelling exercises and Delphi
investigation are drawn together in Chapter 7; recommendations to guide the sustainable
development of horizontally integrated aquaculture systems are proposed and constraints
requiring further investigation identified.
1.1. Introduction
This chapter introduces the concept that aquaculture appropriates a range of envirom-nental
goods and services from an ecosystem support area, or ecological footprint, and that the
demand for these goods and services can exceed the carrying capacity of the ecosystem.
Environmental, social and economic impacts associated with aquaculture wastewater
discharges that exceed this carrying capacity are reviewed. The current status of
2

wastewater treatment and management is discussed and constraints to developing more
efficient and reliable approaches identified.
1.2. Aquaculture and its ecological footprint
Aquaculture appropriates a range of enviromnental goods and services (Beveridge, Phillips
and Macintosh, 1997). The area of natural environment required to sustain the supply of
these goods and services has been referred to as both the ecosystem support area and the
ecological footprint (Kautsky, Berg, Folke, Larsson and Troell, 1997). Appropriated
environmental goods include the physical area of land or water for site development;
construction materials e. g. timber, stone, soil; water (containing oxygen) for filling ponds
and replenishing that lost through evaporation or exchange; broodstock, seed and juveniles
for stocking; areas of land or water to produce feed. Enviromnental services required by
aquaculture consist mainly of processes metabolising and assimilating waste fractions and
replenishing dissolved oxygen concentrations.
Ecological footprints associated with intensive aquaculture indicate that
enviromnental goods and services are appropriated from relatively large areas (Folke and
Kautsky, 1989; Larsson, Folke and Kautsky, 1994; Robertson and Phillips, 1995; Berg,
Michelsen, Troell, Folke and Kautsky, 1996; Kautsky et al., 1997; Folke, Kautsky, Berg,
Jansson and Troell, 1998). Shrimp (Penaeus stylirostris and Penaeus vannamei)
production in semi-intensive ponds along the Caribbean coast of Colombia was estimated
to require an ecosystem support area 35-190 times the surface area of the farm (Larsson et
al., 1994). The mangrove nursery area required to supply postlarvae to I ha of shrimp
ponds was estimated to be the largest component of the ecological footprint at 160 ha.
Describing small-scale semi-intensive pond farming of tilapia (Tilapia rendalli,
Oreochromis mossambicus and Oreochromis niloticus) in Zimbabwe, Berg et al. (1996)
estimated that the area for phosphorus assi imilation and oxygen production to support I M2
3

of this culture system was 0.9 and 0.5 M2 , respectively, and could therefore be
accommodated within the pond area. By comparison, it was estimated that tilapia
production in Im2 of intensively managed cages situated in Lake Kariba required an
2 ecosystem area of 115 and 160 m for phosphorus assimilation and oxygen production,
respectively. At a further extreme, the intensive production of salmon in cages is largely
dependent upon the supply of concentrated feed containing fishmeal and oils derived from
marine capture fisheries. Folke (1988) estimated that the ecosystem area needed to sustain
the supporting capture fisheries ranged between 40,000 and 50,000 times the cage area.
A key factor to be considered when invoking the principle of ecological footprints
is the degree of connectivity that exists between the activity appropriating environmental
goods and services and the supporting ecosystem area. Traded goods and services e. g. feed
and fry, derived from other ecosystems can be purchased to augment inadequate local
supplies. Envirom-nental goods and services that cannot be supplemented i. e. the
assimilation of nutrients, will therefore define the capacity of the localised ecosystem to
sustain production in the aquaculture facility. Balancing the demand for these goods and
services with supply is essential to avoid undesirable environmental impacts.
The supposition that increasing material and energy inputs to aquaculture leads to
increased risk from negative environmental impacts has been presented (Folke, 1988;
Kautsky and Folke, 1990). However, pond-based integrated agriculture- aquaculture and
dike-pond systems receive comparatively large inputs of organic material, yet have little
impact on the external environment (Edwards, 1993). Inputs of duck, pig and cattle manure
to traditional dike-pond farms in the Zhujiang Delta, China are typically 75,454 and 550 t
ha-' y-1, resulting in fish yields of 7-10 t ha-1 Y-1 (Kom, 1996). However, integrated
production of sugarcane, mulberry, silk worms, vegetables and bananas, fertilized with
mud and water from the fishpond, may increase production to 20-40 t ha-1 y-1. Physically,
this integrated system is relatively closed, wi I ith little discharge of pond water or by-
4

products to the external environment, instead relying on in situ processes to assimilate
waste and supply other enviromnental services; therefore, the openness of aquaculture
systems is important when considering possible environmental impacts.
Production in semi-intensive and intensive aquaculture requires that natural
supplies of envirom-nental goods, particularly feed, be supplemented. However, as
production intensifies beyond the productive and assimilative capacity of the standing
water body, the exchange of water and therefore the volume of wastewater discharged
tends to increase (Phillips, Beveridge and Clark, 1991). This leads to the appropriation of
increased levels of enviromuental goods and the export of waste to the receiving
environment. Large wastewater volumes discharged from intensive aquaculture typically
contain low concentrations of waste compounds as compared with effluents from other
industrial processes (Cripps and Kelly, 1996), and in overall mass flow terms, nutrients
discharged from aquaculture make a relatively small contribution to the overall
anthropological input to most aquatic ecosystems (Ackefors and Enell, 1990; Kronvang,
ýErtebjerg, Grant, Kristensen, Hovmand and Kirkegaard, 1993). However, aquaculture
wastewater may contain significantly higher concentrations of pollutants than would be
expected in the receiving envirom-nent (Robertson and Phillips, 1995).
To appreciate the likely impact of aquaculture wastewater on an ecosystem key
factors must be considered: the connectivity between the aquaculture system and
ecosystem; the wastewater volume and quality; the hydrology of the receiving environment
and the carrying capacity of the ecosystem. Hydrological characteristics of the receiving
environment largely dictate the carrying capacity of the ecosystem, with open systems
situated in dynamic high-energy sites that promote mixing and dispersion being less likely
to exceed the carrying capacity of the ecosystem. However, continuous point source
discharge of dilute aquaculture wastewater to low energy systems over an extended period
5

may exceed the assimilative capacity of the enviromnent close to the culture facility, thus
producing localised environmental impacts.
Invoking the ecological footprint concept demonstrates that even wastewater
discharged from well-planned and managed aquaculture operations appropriates a range of
environmental goods and services, disrupting natural functioning of the system. Over time
this may lead to shifts in the species assemblage of the receiving environment or may
compromise the ecosystems resilience to natural shocks and perturbations. Therefore,
unless a comprehensive and precise long-term monitoring programme is in place, such
subtle changes will not be recorded. However, where carrying capacities of ecosystems
have been exceeded by aquaculture wastewater discharges, negative impacts have been
observed and pertinent examples are presented in the following sections.
Environmental impacts of aquaculture wastewater
Recent articles have focused public attention on the potential negative envirom-nental
impact of aquaculture, particularly the intensive production of salmon and shrimp
(Holmes, 1996; Anon, 1997; Hecht, 1998; Naylor, Goldburg, Mooney, Beveridge, Clay,
Folke, Kautsky, Lubchenco, Primavera and Williams, 1998; Naylor, Goldburg, Primavera,
Kautsky, Beveridge, Clay, Folke, Lubchenco, Mooney and Troell, 2000). However, when
assessing the impact of aquaculture a rational appraisal, based on the best available data,
must be established to prevent the debate becoming distorted by stakeholder groups with
markedly different agendas (Boyd, 1999).
Environmental impacts associated with aquaculture wastewater discharges include
the alteration of physio-chemical parameters in the receiving environment, eutrophication,
shifting trophic status and interactions, problems associated with the escape of culture
organisms and the impact of pathogens released from the aquaculture facility on native
6

species. The cause and effect of these environmental impacts are discussed in the
following sections.
1.3.1. Physlo-chemical impacts
The appropriation of water for aquaculture and the subsequent discharge of wastewater can
have a significant impact on the local hydrology and chemical composition of water and
sediments in the receiving environment. Major physical impacts described here include the
modification of flow regimes and hydrological conditions in the receiving environment and
the effect of sedimentation. Changes in the chemistry of the receiving environment are
largely related to the release of nutrients and chemical agents used to treat disease.
However, respiration within the aquaculture facility and biological and chemical oxygen
demand associated with discharged waste also impact upon the water quality.
Appropriation of water resources
Beveridge and Phillips (1993) reviewed environmental impacts associated with tropical
inland aquaculture and noted that water resource appropriation may have several adverse
consequences: altering channel morphology and sedimentation patterns, reducing access to
spawning and nursery areas, creating barriers to migratory fish, changing thermal regimes
and modifying biological communities in the receiving environment. Groundwater
nlý abstraction for tropical coastal aquaculture has been implicated in causing subsidence and
saline intrusion, whilst the discharge of saline wastewater has caused the salinisation of
surface water and land resources (Phillips, Kwel Lin and Beveridge, 1993; Tran, Le and
Brennan, 1999). Water resource appropriation for sub-tropical and temperate freshwater
aquaculture is likely to have impacts similar to those outlined by Beveridge and Phillips
(1993), although water requirements for pond aquaculture are likely to be higher in more
and climates (Boyd and Gross, 2000). These authors also proposed some practical water
7

conservation measures for pond aquaculture that included seepage control through
employing good construction practices, limiting water exchange and providing storage for
rain and runoff water. Jones (1990) noted that water abstraction for flow-through trout
fanns reduced flows in river stretches between the faryn intake and outflow to such an
extent that the movement of migratory fish could be hampered. Situations such as this
could be avoided through improved site selection and restricting abstraction to well below
the minimum recorded flow; supplementary aeration and water reuse also have potential
for improving the efficiency of water use in aquaculture.
Sedimentation
Deposition of particulate matter entrained in aquaculture wastewater can be unsightly, but
also causes additional problems. Siltation can smother invertebrates and macrophytes, and
increase substrate embeddedness, reducing interstitial water flow and restricting the access
of certain fish species to substrates suitable for spawning. Sedimentation is more likely
where the dilution capacity of the receiving envirom-nent is limited (Jones, 1990). Within
the receiving environment, particular habitats are more vulnerable to siltation i. e. the
deeper reaches of rivers and streams downstream of commercial aquaculture operations
and directly beneath cage farms. Excessive sedimentation can inundate the habitat, altering
the sediment composition, restricting colonisation and eventually leading to anoxia that
may contribute to eliminating pollution tolerant species.
Pollutants
In addition to the physical impacts outlined above, several potential pollutants are
discharged to the receiving enviromnent entrained in aquaculture wastewater (Beveridge,
Phillips and Clarke, 1991). Primarily, these waste fractions arise from uneaten feed,
8

excreta and faecal material and chemical treatments used to maintain water quality and
eradicate disease (Beveridge and Phillips, 1993).
Ammonia discharged from fish farms and released during the degradation of
protematious waste can be toxic to invertebrates, particularly in lentic habitats. Streams
and rivers in Scotland are particularly vulnerable as they generally have high water quality,
characterised by diverse communities of benthic invertebrates, many of which are
intolerant of pollution (NCC, 1990). However, several studies show that nutrients released
from aquaculture contribute only a small proportion to the overall anthropogenic input to
aquatic ecosystems (Ackefors and Enell, 1990; Foy and Rosell, 1991; Kronvang et al.
1993; Paez-Osuna, Guerrero-Galvan and Ruiz-Femandez, 1998). Compared with other
nutrient sources, shrimp aquaculture in the coastal states of Mexico contributes only 1.5%
to total nitrogen, and 0.9% to total phosphorus inputs to the marine environment (Paez-
Osuna et al.,, 1998). However, these relatively small inputs have been implicated in causing
adverse local environmental impacts. Reports of eutrophication and shifts in species
assemblages and interactions associated with wastewater discharged from aquaculture are
reviewed later.
Organic and inorganic fertiliser employed in semi-intensive pond aquaculture may
significantly increase nutrient levels in the culture water. However, the minimal exchange
of water in these systems limits the release of nutrients to the receiving environment. The
use of chemicals in aquaculture, including inorganic fertiliser, has been reviewed in a
number of studies (Beveridge et al., 1991; Beveridge and Phillips, 1993; Phillips et al.,
1993; Bergheini and Asgard, 1996). Lime is used extensively to condition pond sediments
between production cycles, but impacts on the external environment are likely to be
limited. More problematic may be the use of highly toxic and persistent chemicals such as
chlorinated hydrocarbons and organotins to eradicate predators, competitors and disease
vectors (Phillips et al., 1993). Piscicides and molluscicides derived from plant extracts e. g.
9

rotenone, saponin and nicotine are widely used in tropical aquaculture (Baird, 1994) and
Phillips et al. (1993) suggest that the environmental impact of using these products is
expected to be limited as they readily biodegrade. However, the non-specific nature of
these compounds and their possible impact on the health of workers during preparation and
application represent serious concerns (Baird, 1994).
Disinfectants, e. g. sodium hypochlorite, forn-ialin and benzalkonium chlonde, used
in production facilities, particularly hatcheries, may be discharged in aquaculture
wastewater; however, the consequences of this practice have not been investigated
(Phillips et al., 1993). Environmental impacts associated with using algicides such as
copper sulphate in shrimp ponds have not been studied, but impacts are likely to depend on
the application rate and degree to which water is exchanged between the culture facility
and receiving environment. Copper-based antifoulants used to treat nets on salmon cages
have been associated with elevated concentrations of copper in sediments close to culture
I.. facilities, although, no han-nful impacts were reported (Bergheim and Asgard, 1996).
The majority of other chemicals employed in aquaculture are used to treat disease
and combat parasites i. e. antibiotics, parasiticides and fungicides. However, despite
widespread use in tropical aquaculture, information concerning the extent and impact of
these chemicals is limited. Burka, Hammell, Horsberg, Johnson, Rainnie and Speare
(1997) presented a comprehensive review of the current status of chemotherapeutant use in
salmonid aquaculture; compared with mammalian therapeutants the range of treatments is
limited, and application is restricted to anaesthesia and anti-infective agents preventing
parasitic and microbial diseases.
In many cases a large proportion of the medication is not absorbed and retained by
the culture organisms, but passes out of the aquaculture system to the receiving
environment (Weston, 1996). Antibacterial medications are often delivered as feed
additives, however, diseased fish generally have a suppressed appetite, decreasing the
10

proportion of medicated feed consumed. The discharge of therapeutants from fish fanning
operations is increased further as the majority of active agents ingested are not absorbed in
the gut but expelled, unmodified, in faeces. It has been estimated that due to the factors
outlined above, 62-95% of antibacterial agents such as oxytetracycline and oxolinic acid
may be discharged from culture facilities (Weston, 1996).
The fate and potential impact of therapeutants entrained in aquaculture wastewater
from commercial facilities has been investigated in a number of studies (Pouliquen, Le
Bris and Pinault, 1993; Smith, Donlon, Coyne and Cazabon, 1994; Davies, McHenery and
Rae, 1997). Residues from therapeutants used in aquaculture may pose a serious threat to
non-target invertebrate communities in the receiving environment as many chemical
treatments used in aquaculture are designed to eradicate invertebrate pathogens. Ivermectin
(22,23-dihydroavennectin BI) used to treat sea-lice (Caligus elongatus and
Lepeophtheirus salmonis) infestations at salmon cage sites has been implicated in
eradicating communities of benthic invertebrates and damaging shellfish fisheries.
However, research suggests that using this agent in aquaculture is unlikely to cause acute
direct toxic effects in invertebrates and that bivalves in the receiving enviromnent will not
bioaccumulate detectable concentrations (Davies et al., 1997).
Several studies have recorded an increase in the occurrence of antibiotic-resistant
bacteria following the widespread introduction of antibacterial agents in aquaculture.
Weston (1996) provides a comprehensive review regarding the stimulation of antibacterial
resistance through antibiotic use in aquaculture. Treatment using oxolinic acid,
oxytetracycline and potentiated sulphonamide on rainbow trout (Oncorhyncchus mykiss)
farms resulted in elevated numbers of bacteria resistant to these agents being released to
the receiving environment (Austin, 1985). Oxytetracycline use at cage farms culturing
salmonids was associated with an increased abundance of resistant bacteria in sediments
underlying the fanns (see Weston, 1996) and cro ss-resi stance between oxytetracycline and
II

potentiated sulphonamide in sedimentary bacteria (Gray, Weston and Herwig, 1994; cited
in Weston, 1996). Microcosm studies confirmed that adding oxytetracycline-medicated
feed increased both the number of oxytetracycline-resistant bacteria and bacteria resistant
to potentiated sulphonomide (Gray and Herwig, 1994; cited in Weston, 1996).
Brown (1989) highlighted the potential problem regarding the prophylactic use of
antibiotics in aquaculture, and suggested that their unregulated low-level application in
penaeid shrimp hatcheries in Ecuador may have contributed to the development of
antibiotic-resistant bacteria. Of particular importance from a human perspective is that this
practice may lead to the development of antibiotic-resistance in aquatic bacteria i. e. Vibrio
cholerae, Vibrio parahaemol ticus, Vibrio vulnificus and Vibrio alginolyticus, which have y
been identified as human pathogens.
In general, the use of chemicals in temperate aquaculture is closely regulated to
ensure operator safety, protect the envirom-nent and safeguard the quality of the product. In
tropical developing countries where aquaculture production has increased dramatically, the
rate of expansion in the industry has frequently overwhelmed attempts to regulate and
monitor the industry. Consequently, problems associated with chemical use in aquaculture
may be more acute in developing countries with poorly defined regulatory frameworks.
However, as institutional arrangements evolve, the operators of aquaculture facilities are
likely to require appropriate management strategies and treatment technologies to limit the
release of chemicals in wastewater.
Dissolved oxygen
Aquaculture wastewater has elevated biological and chemical oxygen demands (Kelly and
Karpinski, 1994), therefore directly following discharge, dissolved oxygen (DO) levels,
already depressed by respiration within farins, can be reduced further. Boaventura, Pedro,
Coimbra and Lencastre (1997) reported that mean DO concentration in the Coura River,
12

250 in downstream of a rainbow trout farm in northern Portugal producing 500 t y-1, were
9.6 mg 1 1-1 , as compared with 10.7 mg 1-1 upstream of the farm. However, mean
biochemical oxygen demand (BOD) levels in the river were 5.6 mg 1-1 at distances of 250
m and 1000 m downstream of the farm, as compared with 1.6 mg 1-1 upstream.
Furthermore, BOD levels only returned to background levels 12 km downstream of the
farm and the maximum recommended BOD level for salmonid waters (3 mg 1-1; EEC,
1978; cited by these authors) was exceeded in aI km stretch of the river. Comel and
Whonskey (1993) noted oxygen depletion in the water column (0-9 m depth) close to
rainbow trout cages in Lac du Passage, Quebec. Typical monitoring data show that at a
control site -400 m from the farm, DO levels of -12 mg 1 -1 were recorded at 4 m, however,
adjacent to the cages DO levels were -6 mg 1-1 at this depth. Direct impacts of decreased
oxygen levels on the native biota were not recorded; the authors raised concern that the
stock may have been stressed, although no supporting evidence was presented.
Compared with oxygen depletion rates in other sea lochs, Gillibrand, Turrell,
Moore and Adams (1996) attributed elevated levels in the bottom waters of Loch Ailort, a
sea loch on the west coast of Scotland, to the microbial breakdown of organic matter.
These authors estimated that 50% of the total particulate organic carbon supply to the loch
could be ascribed to two cage-based salmon farms. Increased sediment oxygen
consumption was also observed under salmon cages in the Bay of Fundy, Canada
(Hargrave, Phillips, Doucette, White, Milligan, Wildish and Cranston, 1997) and beneath
tilapia cages in Lake Kariba, Zimbabwe (Troell and Berg, 1997).
Problems associated with oxygen consumption within aquaculture facilities, and
the subsequent compensation for biological and chemical oxygen demand, can be
compounded by secondary oxygen consumption (Bailey-Watts, 1994). Decomposition of I
g of fish feed has been estimated to consume 1.65 9 of oxygen. However, phosphorus
contained in the feed can sustain 10-40 g of plant production, which will consume 2-6 g of
13

oxygen when decomposed. Despite the negative implications, nutrients released from
aquaculture generally represent a small proportion of the overall input to aquatic
ecosystems. Depressed oxygen levels associated both directly and indirectly with
aquaculture wastewater would be detrimental to native species assemblages, however the
magnitude of impact would be influenced by the sensitivity of organisms to reduced DO
concentrations, prevailing seasonal and diurnal oxygen regimes, and the re-aeration
capacity of the receiving envirom-nent.
1.3.2. Eutrophication
The Council of the European Communities (1991) defines eutrophication as "the
enrichment of water by nutrients, especially compounds of nitrogen and/or phosphorus,
causing an accelerated growth of algae and higher fornis of plant life to produce an
undesirable disturbance to the balance of organisms present in the water and to the quality
of the water concerned. " Aquaculture wastewater may contribute to eutrophication; the
discharge of organic and inorganic matter from commercial aquaculture has been
implicated in stimulating the production of phytoplankton adjacent to cage farms
(Bonsdorff, Blomqvist, Mattila and Norkko, 1997). Increased phytoplankton abundance
and biomass are frequently the first evidence of eutrophication, making phytoplankton
communities important indicators for monitoring environmental impacts associ 1 iated with
aquaculture.
Arzul, Clement and Pinier (1996) demonstrated that seawater used to rear turbot
(Psetta maxima) in tanks enhanced the growth of the marine diatom, Chaetoceros gracile
and dinoflagellate, Gymnodinium cf Nagasakiense, during in vitro studies. However,
dinoflagellate (Alexandrium minutum) production was inhibited, suggesting that
wastewater from turbot fanns may significantly change the assemblage of phytoplankton
in the receiving environment. The response of phytoplankton populations to discharges
14

from aquaculture depends on factors such as wastewater composition, initial phytoplankton
community, ambient conditions and nutrient status of the receiving environment.
Phytoplankton bioassays conducted with Selenastrum capricornutum and
/, -I - uscillatoria redekei revealed that bioavailable phosphorus concentrations in water passing
through six land-based rainbow trout and Atlantic salmon (Salmo salar) farms increased
significantly (Massik and Costello, 1995). This implies that the wastewater discharged is
likely to enhance phytoplankton production in receiving environments. However, in some
freshwaters there will be little enhanced phytoplankton growth, even in response to large
wastewater inputs, as other growth factors such as dissolved humic matter, carbon, trace
elements and vitamins, will limit production (NCC, 1990).
Concern in the United Kingdom is growing over the rising incidence of toxic algal
blooms (Pearce, 1996) and the possible association, in some instances, with aquaculture
wastewater (Anon, 1999). This association was debated following suggestions by Folke,
Kautsky and Troell (1994) that modifying the composition of commercial fish feed may
stimulate the production of toxic algal species (Black, Gowen, Rosenthal, Roth, Stechy and
Taylor, 1997; Folke, Kautsky and Troell, 1997). The discussion focused on the fact that
lowering the phosphorus content of feed may increase the ratio of nitrogen to phosphorus
in the wastewater, contributing to the selection of toxic species.
Carr (1988, cited in NCC, 1990) found that below a rainbow trout farm on the
River Hull in England, the growth potential for algae (measured by a Selenastrum
bioassay) and growth of periphyton on polyethylene sheets increased when compared with
upstream controls. In streams directly below three trout farms, Selong and Helfrich (1998)
recorded a significantly higher standing crop of periphyton on rocks. The downstream
standing crop of periphyton also showed a positive correlation with feed loading rates at
the farms and a negative correlation with overhead cover.
15

Whilst monitoring natural populations of periphyton (Cladophora glomerata) in the
sheltered bays of south-west Aland in the northern Baltic Sea, Ruokolahti (1988) recorded
a significantly higher biomass at sites close to cage farrns culturing rainbow trout as
compared to reference sites. However, Stirling and Dey (1990) compared the development
of periphyton communities on artificial substrates positioned below 75 floating cages
containing 135 t of rainbow trout, and at a control site 1.61 km south-west of the cage site
in Loch Fad. Of twenty-two periphyton species recorded, only one species had a
significantly different annual geometric mean abundance between the two sites. The
absence of demonstrable differences between the farm and control site were attributed to
the high nutrient status of the loch causing phytoplankton and periphyton production to be
light, not nutrient limited. The situation was compounded by high turbidity levels
associated with fann waste; wind induced turbulence was also believed to regulate algae
growth within the loch.
Increased growth of epiphytes below trout farms was implicated in smothering
Ranunculus penicillatus, causing growth to be retarded (Carr, 1988; cited in NCC, 1990).
In addition, the possible decline of the rarest plant in Britain (Crassula aquatica) in Loch
Shiel has been attributed to increased rural development and possibly the effects of cage
fish fan-ns (NCC, 1990). It is hypothesised that an increase in available nutrients leads to
the selection of macrophyte species with the largest assimilative capacity, causing diversity
to decline, whilst weedy species capable of rapid seasonal growth and producing large
numbers of propogules become dominant. Changes in the composition, abundance and
distribution of macrophyte communities can also result in the movement of sediments
previously consolidated by the vegetation, altering the hydrology of the stream or river.
Nutrients released from aquaculture have been associated with increased primary
production in the receiving environment and Table 1.1 presents a review of the accounts
described above. However, studies regarding the extent of the problem are limited. The
16

role of aquaculture wastewater in eutrophication will depend upon the nature of the
receiving envirom-nent, including background nutrient status and water chemistry,
hydrology and carrying capacity. However, when nutrients are limiting primary
production, hydrological conditions restrict water exchange and the capacity for nutrient
assimilation in the receiving environment is low, nutrients released from aquaculture may
make a significant contribution to the process of eutrophication.
1.3.3. Shifting trophic status and interactions
Enrichment of a water body may cause a shift in trophic status resulting in an increased
, 4, abundance of pollutant tolerant species, whilst overall diversity decreases. The impact of
aquaculture wastewater on benthic invertebrate communities, zooplankton assemblages
and resident fish populations is described in the following sections and summarised in
Table I. I.
Benthic invertebrates
Loch, West and Perlmutter (1996) and Selong and Helfrich (1998) monitored the impact of
trout fanning in North America on communities of macro-invertebrates. Loch et al. (1996)
recorded a significantly lower diversity of pollution intolerant taxa i. e. Epherneroptera,
Plecoptera and Trichoptera (EPT) in a stream below three trout farms in western North
Carolina, as compared with upstream control stations. Taxa richness 1.5 km downstream
had increased compared with that recorded at the farms, however, it remained signlificantly
below that observed at upstream controls. Selong and Helfrich (1998) recorded similar
observations in streams receiving wastewater from five commercial trout farms in
Virginia: the abundance and diversity of sensitive taxa decreasing downstream, whilst
pollution tolerant taxa increased.
17

Beneath salmon cages in Bliss Harbour, Bay of Fundy, Canada, a decrease in the
sediment meiobenthic taxa diversity was recorded and found to be associated with
increasing levels of organic enrichment (Duplisea and Hargrave, 1996). Similar
modifications in the assemblage of benthic species beneath other cage farms and mussel
rafts have been recorded (Karakassis, Hatziyanni, Tsapakis and Plaiti, 1999; Stenton-
Dozey, Jackson and Busby, 1999), however, observable impacts commonly extend little
beyond 100 in from the culture facility (Costa-Pierce, 1996). The extent of environmental
impacts from organic enrichment caused by aquaculture is dependent on hydrological
factors e. g. flushing, resuspension and dispersion. De Grave, Moore and Bumell (1998)
suggest that the highly dissipative nature of a site in Dungarvan Bay, Ireland, used to
culture oysters (Crassostrea gigas) on trestles meant that no evidence of organic
enrichment or changes in the benthic community was found.
Zooplankton communities
Eutrophication frequently changes the abundance, species composition and size structure
of natural zooplankton communities (Blancher, 1984; cited in NCC, 1990). Several
zooplankton species have specific food requirements; therefore changes in phytoplankton
communities may induce a trophic cascade. Eutrophication may lead to oligotrophic
communities characterised by copepods being replaced with communities dominated by
large numbers of small herbivorous zooplankton (Allan, 1976), leading in turn to changes
iii the phytoplankton community. The grazing pressure exerted on phytoplankton
populations may be altered, resulting in the selection of certain species types or size
ranges, ultimately changing the standing biomass and structure of the phytoplankton
community. Furthermore, the proliferation of small herbivorous zooplankton may result in
phytoplankton species resistant to grazing e. g. cyanobacteria, becoming dominant and
forining dense standing crops.
18

Zooplanktivorous copepods and fish will be influenced by changes in the
composition of zooplankton assemblages. Fish populations may depend on the availability
of a specific food source at a specific time of year; larval fish are particularly vulnerable.
Recruitment can be severely limited if suitable zooplankton species or size classes are
unavailable for periods as short as two weeks, especially soon after hatching (Hommer,
1985; cited in NCC, 1990). The availability of zooplankton can be an ultimate factor for
bringing fish into breeding condition e. g. Arctic charr (Salvelius alpinus).
The migration of zooplankton and deposition of faecal pellets can play a significant
role in the movement and fate of nutrients in the water column (Anderson et al., 1988;
cited in NCC, 1990; Ferrante and Parker, 1977). Reducing the abundance of copepods can
decrease the rate of nutrient transfer to sediments in faecal pellets, while increased
numbers of small cladocerans that recycle faecal material can maintain nutrient levels in
the water column, increasing the possibility of eutrophication (Lehman, 1980).
Fish assemblages
Oberdorff and Porcher (1994) investigated the impact of wastewater from farms in
Brittany, France using the Index of Biotic Integrity (IBI), a fish-based index that relies on
the assemblage of fish communities changing in a characteristic manner, dependent upon
stream quality. Compared with upstream communities, the abundance and biomass of fish
species downstream from nine fish farms generally increased, with pollution tolerant rudd
(Rutilus rutilus) and exotic rainbow trout appearing; however, the pollution sensitive goby
(Cottus gobio) was no longer present.
Selong and Helfrich (1998) employed a modified IBI, accounting for the
characteristically low diversity of fish species in Appalachian headwater streams, to assess
the impact of wastewater from fish farms in Virginia on the assemblage of fish species in
receiving streams. Species diversity consistently increased downstream of the farms, with
19

increasing primary production downstream implicated in expanding the trophic base and
encouraging diversity in the fish species present (Selong and Helfrich, 1998). Oligotrophic
rivers and lochs in temperate environments, such as those found in Scotland, frequently
play host to communities of salmonids. However, application of the IBI in assessing the
impact of wastewater from aquaculture in these environments may be limited. The general
lack of species diversity in oligotrophic streams requires a modified version of the IBI to
be employed, otherwise a disproportionate influence to the abundance of particular taxa is
given (Selong and Helfrich, 1998).
1.3.4. Escapees
With all animal production systems there is the potential for escapees, and when
considering aquaculture it is likely that the majority of escapees will be entrained in
discharged wastewater. Environmental impacts associated with the unintentional
introduction of non-native species from aquaculture facilities have been reviewed
extensively (Welcomme, 1988; Beveridge, Ross and Kelly, 1994; Arthington and
Bluhdom, 1996; Bardach, 1997; Beardmore, Mair and Lewis, 1997). Beveridge and
Phillips (1993) proposed five distinct impacts associated with introductions from
aquaculture: direct disruption to the receiving envirom-nent; disruption to the host
community, through predation or competition; genetic degradation of local stocks; the
introduction of diseases and pathogens; socioeconomic impacts. A more detailed
assessment of these impacts is beyond the scope of the current thesis, although the
references quoted should provide useful further information where required.
1.3.5. Summary of ecological impacts
Negative ecological impacts associated with commercial aquaculture wastewater are
surnmarised in Table I. I. Despite the widespread nature of aquaculture, the cost and
20

difficulty in monitoring environmental impacts means there are relatively few accounts
describing the frequency with which aquaculture operations cause negative environmental
impacts. However, where the carrying capacity of the receiving environment is exceeded it
may be anticipated that one or more of the impacts described above will be evident.
Resource-use conflicts
Despite envirom-nental impacts associated with aquaculture operations, the lack of value
ascribed to environmental goods and services means costs associated with discharging
aquaculture wastewater are usually only considered when functions serving society are
effected, or other users of the aquatic resource inconvenienced. Therefore, to evaluate the
costs of discharging aquaculture wastewater more comprehensively, the following sections
assess the risk of self-pollution, impacts on other aquatic resource users, disruptions to
ecosystem functionality and impacts on non-use values.
1.4.1. Self-pollution
Wastewater from land-based aquaculture is frequently discharged to streams and rivers
supplying downstream commercial aquaculture operations, whilst waste discharged from
cage fanns may be conveyed to other facilities by currents and tides. However, in the case
of cage aquaculture and pump-ashore facilities there is a danger that wastewater
discharged to the receiving environment may contaminate water subsequently used to
supply the culture facility.
Problems of self-pollution have been associated with shrimp farming in the inter-
tidal area surrounding the Mundel-Dutch Canal lagoon system in the northwestern
province of Sri Lanka. Farms were discharging wastewater containing high concentrations
of ammonia, nitrite, nitrate and metals to the same areas used to supply their own, or
neighbouring culture systems. The problem was compounded as mix1ng in the lagoon
21

03
03
0 (Iti to ý-4 cd
En
C13
V
m
U
cl
(4
ra,
cl
0
b-
v U
14ý V
P4
b-0
I. U
ct
I. -N /111, 110 IT Cý CN kn 00 00 CN Cý 00
Cý Cý CIN u Cý CN CN Cý cl, u I--(
u lu zz>Q. )
,2 14 I= M
JZ 4ý "o 00 \ýc 00 (-Iý cl ON - V
66 C;
6
03 0 00 r-, :ý 00 C7ý - Cd Cýl as cl C\ cz cl cz bj)
-4 0 C) U
C13 5" ý C7\ uu m a) CTS C. \ 0Q -0 a)
uU
Cd to V
En 0 Q. ) C's 0 7ý 0UC, 3 -ý (1) u Cd (U 1-4
+ý 4- ýa uV En Cd 0 (A m cl 0 64 lb C, 3
, ij +, U9v,
ý41 E --Cý *> ; 1.4
uý cz 4Vg= +-q I. J 9
Cd t 010 cl (D >N C) 4-4
M En cd u
Q 03 C) cn cl 64
'o Cýs Cd
tj a) "
cd C13 cl u 1: ý u
cn C's
-4. - V) cis 0 w <ý c=4 cl (D 4-( ýn En W
421 4-4 aj 4-
00
cl C13 cl r2 u0 cl --Cj
(" cd "Ci C, om
tj (n ý-4 = cl O'D 4-4 0
+Z 0E.. a) '.. - ýg col, .- +-, U-E0 a4 > (-tý 4EuW t), O 41. ý: s ý, ;; 4
00v ýl c) (4ý ý-4 cl V0 "0 --4^ C) >. ý tý "o
1"^ 0 V
-4 Q)
m ;, m -':: i -cj ý 'V (D ý-4 A- Ici cl U. cl
tl En Cd I> rn
9 a) 'D
1u
cl 0 vs C) u>. -
V) En 00 -4 'o cd
ý: ý: bm cl "Z: J "0 'A =0ý: ý. > ýc -`ý i: ý,
o 'C's (d
" -8 ;: ý cv
cu >
CU
44
ýlo 1) 4- ý, ý u
CU
cu ul 5 "C ci
ýc P. 4
Cd
-2
U
"o
Zi
to
Cd
>1
C's
b, O
g: 4
u Z. --4 +-
lci
4--4
Cd z (L)
.5 Q-, -0
, --:, j F- (1) > V) u
., q .
cu 7ý --4 0 (D
V) 0
0 Cd rA
(4-4
cd
od
En as
cl
C13 ct3 --4
o 0 C's
'
Cd
Cd cts cd a)
C's ýý U
Cý3
":: ý - nzý o
+ (U
C13 C13
cl
tb cn
cq
cq C'3 Q)
ro 3
r-14 Q) ,3 ýý
A b C a l
rl' to .I- : P- ý 1=1 Cis
to
cd
M U 'o u
0
Cl crj
C, 3
7j ;t0 rA >%
ýc cl
-ý --4 0
(1) .,
Z2
"
Cn 64 P4
cl cl C, 3
u
I u 64
cJ
22

is limited due to the shallow bathymetry and a sandbar that prevents exchange with the
marine environment. Furthermore, destruction of mangroves and salt marshes to
accommodate new shrimp farms created elevated sediment loads and decreased the
capacity of the environment to buffer floods. These factors resulted in the shrimp farms
extracting water from the lagoon, which had a high biochemical oxygen demand and
contained concentrations of ammonia, nitrite, nitrate, sulphides and suspended solids
considered unacceptable for shrimp fanning. This caused disease outbreaks, encouraged
parasite infestations, increased the fouling of gill structures with suspended solids, retarded
growth rates and resulted in the production of poor quality shrimp (Corea, Johnstone,
Jayasinghe, Ekaratne and Jayawardene, 1998). Similarly, wastewater discharged from
large shrimp farms in Indonesia caused water quality problems in ad acent small-scale i
tambak shrimp farms that were unable to regulate the exchange of water between ponds
(Muluk and Bailey, 1996).
Increased oxygen consumption by microbial communities in sediments below cage
farms may lead to anoxic conditions and the evolution of methane and hydrogen sulphide.
The release of gaseous methane and hydrogen sulphide has been implicated in causing gill
disease at salmon farms (Black, Ezzi, Kiemer and Wallace, 1994). Furthermore, respiration
by benthic invertebrates and microbial communities in sediments receiving organic inputs
from cage farms may depress oxygen concentrations in the water column. Reduced oxygen
concentrations in the water column have been observed beneath salmon cages in Scotland
(Lumb, 1989; Gillibrand et al., 1996) and upwelling of this anoxic bottom water poses a
serious threat to the health of cultured fish and has been implicated in causing fish kills
(Beveridge, 1996).
Fishermen and environmentalists have hypothesised that nutrient discharges from
salmon aquaculture have stimulated toxic algae blooms, which have disrupted shellfish
fisheries on the west coast of Scotland. However, the regulatory authorities that impose
23

restrictions on the fisheries attributed the blooms to natural phenomenon (Anon, 1999).
Consumption of shellfish that have accumulated toxins from algae has caused Paralytic
Shellfish Poisoning, which can be fatal. Toxins excreted by cyanobacteria may also
damage the liver and nervous system of animals consuming the water; dogs and cattle have
died after drinking contaminated water or licking toxic scum from their coats, and birds
and fish have been killed. Although the blooms often collapse suddenly, the toxins can
persist in the enviromnent, possibly entering the aquatic food web, bioaccumulating in
herbivorous water fleas and potentially biomagnifying in secondary consumers.
1.4.2. Restricted amenity
Discharging aquaculture wastewater can affect users of the aquatic resource, other than
aquaculture operators. Deteriorating water quality in the Mundel-Dutch Canal lagoon
system, which has been attributed to the increase in shrimp farming, has been blamed for
the observed decline in the capture fisheries of the lagoon. This has caused resentment in
local fishing communities, which has manifested itself as poaching (Corea et al., 1998). A
survey of local community members revealed that a number of people complained of skin
diseases attributed to poor water quality. Although no direct link has been established,
concerns of this type may strengthen opposition to shrimp farming in the local population.
Saline wastewater discharged from shrimp farms in Songkhla, Thailand has been
implicated in causing the death of livestock drinking from canals (Primavera, 1997). The
author further reports that following the salinisation of surface water caused by the
discharge of wastewater from shrimp farms in Nellore district, India, women were forced
to spend longer collecting drinking water from distant sources. Yields on farms cultivating
rice have also been affected by saline water released from neighbouring shrimp farms
(Tran et al., 1999); however, it appears that this situation has arisen from leaching during
the dry season and bunds being breached during the growing season. Tran et al. (1999)
24

noted that shrimp fanning may increase the sediment load to local canals and rivers and
Phillips et al. (1993) also reported that sediment in wastewater from shrimp farms in
Thailand and Sri Lanka caused irrigation canals to become silted.
Aquaculture wastewater may encourage nuisance growths of macrophytes that
interfere with recreational activities, for example, angling, swimming and boating. In
Scotland, possible disease transmission from cage farms to native fish stocks has been
blamed for causing a decline in the number of Atlantic salmon returning to recreational
capture fisheries (NCC, 1990). Estimates have demonstrated that declines in recreational
fisheries may have severe implications for rural economies that receive income from
visiting anglers. The introduction of disease with the signal crayfish (Pacifasticus
leniusculus) reduced native crayfish (Austropotamobius pallipes) populations in Europe
and caused the wild crayfish capture fishery to decline. Furthen-nore, reduced indigenous
crayfish populations allowed aquatic macrophytes to proliferate, resulting in the
elimination of habitat for game fish (Thompson, 1990).
1.4.3. Reduced functionality
Burbridge (1994) described natural wetland functions that produce a wide array of
envirom-nental goods and services that sustain economic activities and societal systems.
However, wastewater discharged ftom commercial aquaculture operations may have a
detrimental effect on the functional integrity of wetlands, disrupting the supply of
environmental good and services. Considering the discharge of wastewater from shrimp
farms, Robertson and Phillips (1995) suggested that the assimilative capacity of a
mangrove ecosystem may be exceeded and that excessive loads of ammonia and organic
matter could lead to anaerobic sediments, resulting in tree mortality.
Elimination of mangrove trees may result in the loss of a number of functions.
Reduced production of mangrove biomass will be accompanied by a decrease in the
25

assimilation and cycling of nutrients, potentially leading to nutrient export from the
mangrove ecosystem, and, consequently, adverse impacts on the receiving environment.
Decline of the mangrove root system could decrease sediment stability, leading to erosion,
which could increase the risk of saline water intruding inland. The loss of mangrove
habitat may also represent a reduction in the extent of nursery areas for juvenile fish and
shrimp, and contribute to a general decrease in biodiversity.
1.4.4. Impacts on option and non-use values
Reduction in quality of the aquatic enviromnent can influence the value an individual
attributes to preserving the resource to allow the individual, other individuals and ftiture
generations the option of using the resource at a later date (Muir, Brugere, Young and
Stewart, 1999). The impact of an activity on this option value may be estimated by
assessing the willingness-to-pay (WTP) of an individual to preserve the environment.
Folke et al. (1994) extrapolated marginal costs of 1SEK 50-100 and SEK 20-30 kg- I for
nitrogen and phosphorus removal, respectively, from sewage in Sweden, to represent the
WTP of Swedish society to limit nutrient discharges from salmon aquaculture. Based on a
comparison of waste production presented as person equivalents, it was estimated in 1994
that the cost to society of eliminating nitrogen and phosphorus discharges originating from
salmon aquaculture equated to SEK 4-4.5 kg-I of production. These authors also calculated
that intemalising this cost increased production costs for salmon to SEK 31-31.5 kg-1, and
although the 1994 farm gate price for salmon was not given, such a cost increase would
severely reduce profits and possibly threaten the viability of salmon farming.
Enviromnents also have non-use values. The intrinsic or existence value of
environments is unrelated to humans and their present, or potential, direct or indirect use of
the resource (Turner, 1991; Muir et al., 1999). For example, people that are unlikely ever
11 US$ =-6 SEK. Folke et al. (1994).
26

to visit a region may attribute value to its existence and feel a sense of loss were the
ecosystem to be degraded through the discharge of aquaculture wastewater. Degradation of
the environment would also reduce the value ascribed to passing the asset onto future
generations, tenned the bequest value. Therefore, although changes in non-use values of
environments due to aquaculture wastewater discharges have not been described, they may
be expected to be negative.
1.4.5. The cost of discharging aquaculture wastewater
The previous sections present a review of the environmental impacts, cases of self-
pollution, restricted amenity and functionality and decreased non-use values associated
with discharging aquaculture wastewater. Table 1.2 summanses the range of
environmental impacts and stakeholder conflicts identified.
Growing recognition that aquaculture wastewater may be responsible for a wide
range of environmental costs and stakeholder conflicts has lead to increased legislation and
discharge monitoring in many countries. Therefore, unless managers of aquaculture
facilities adopt new strategies to reduce the volume and concentration of wastewater
produced, they may find themselves liable to taxes, fines and ultimately closure. The
perception of consumers is also important, and where concern exists over the impacts
associated with aquaculture, the demand, and subsequently value, of products from the
aquaculture sector may decline.
Strategies for managing aquaculture wastewater
Operators of aquaculture facilities have been presented with a range of strategies for
reducing pollutant concentrations in discharges from their facilities (NCC, 1990; Cripps
and Kelly, 1995). Phillips et al. (1993) suggest that appropriate site selection, improved
27

ce
ce
ce
Z
ýc m E-
00
Cý lcý -C$ 0 -. 4 ..... (7ý, Cý -4 cl 9u ý-4 =0 C*ý ýc z CIN clý 11-11 0 Cý
C) C'% C*ý
ý ON C-ý (L) (Jý, (tý to - (7N -ý C13 0 CN
o -q cl U as cl cý ;. l
i 04 Ln V Z) ýM ý-4 n: ý -'4 u cl -C Cl\ t)z .m
V) ý-4 0 > k-J. 0. E-4
CIN P4
r-14 = Cý - 64 OC)
Ici -., U b-0 00
Mr P-4
; --4 4-. Zt a) .4
C)C)
gL, --, -;; qý ý11 9Lý 0 c-, ýc 4 C7., all 110 C/) Z: ý ý, a, \ ltý "a P.. 4 (0ý CN 0 Cý --r. rý ; -ý -1 CIN V) "LZ
+ý , , -, Q
--- cý 1ý ý cl
. L:, c-,
a) IC14 cl cd C7ý ý--
-, C, C, 3
C/) -4 r1r)
0 Cý 5ý
(D ý-4
Q) v C', C7ý --4 7ý ýýl CIN ýý :..: z 9 (ZAý cl CN cz (L) -. 4 C',
_4 cl cn Q) cn Cý Ojo
0c) u 4- n0 U
-..; CA rý 4 (: ) -4 (=. ý 1ý --4 uU
-4 > U Cj c
Iu co $: l ct E Q) C) 0 CIS
(1) 0 9'. C, 3 Cd Aý U > cl U> ct as M
cn C13 cl cl cl mW
cn 1 ; -4 rA b4 rcj
-0 s
us , tb
ý2 mI
m0& Q) -
v (L) M (1) :: 1 u-w0 cl cl lcý 0 clj u C) rj) t) rn V
0 C) > ; --q 0 . 4- V cl) bj) +ý a) w 75 C13 tj
ýc 94 C'3 Lo
u CIS
C13 u C-)
,uUý, Ln '0 cq 4-. 1 ncý o (A Q) Cl c)
C, 3 V) M 7ý =>
CIS m Cd 0 CU v ; --o v Cd ol r4 C) CIS C)
. I=! C) ---1 0 C, 3 to u ;ý ýJ Q -4- V) -4-- Q
C, 3 v :ýu C's it r. ýc V) C13 C) 0
-4 cid
cl C) cn as
g cd cd 0 cl "t:; ýý a) (p 02 (1) cl :: I -4-
", IZ4 0 ý--) En 00 >oC, 3 M 4ý cl 0 'C44
0u0 cl V) :z C) cl u -,; --
u cn U
U a) b 4) (L) Cl CJ)
C13 ,:: I to ri to tw
C, 3 p C, cl
10 cl 0V a) 0 00 'u,
Q) M-ý a) 0"u bi) , cl -ý llcý ; --4 +ý 1-0 (4z; Ln
CG C's C, 3 C, 3 ; -4 v En > -Zý ;ý bdo
"Tý (D - 1ý- 40
5E>C, 3 0, C's cl m a) to C13 0
>z US xt m ýA ncý
;z Ln 44 C)
C's a) 45 ;2 CX)
P.
7ý uu cl U od ct (L) C) Ln W
cl X Q) UV "o 45 C', C) cis
03 1-4 r. ýc -, -q cl U (+
ctj -4
cl En >
cd cl
CIS cd (1) rU cl ncý C-)
V C, 3
Jý C, C', C's 0 a)
0 -4= u
Lt M00 'n
ý: U
I cl En --c Cis -ý40 En C's 71 m0
64 cl (1) cn cl r" cq cl
rn 'cl 4
u Cd
-4
0 7: 1 -4-
v
."", U)
C, 3 4- 54 CA
m0 C13
71' m- C) (t C13 C) "Cý c)
v to C, 3 bi) u
C, 3 -4 a) :: I
a) C's
4ý
1 ý: s 5 ýj ; -4 a) *4
(U
CIS Cý u -cj u" CIS
> ; -4
:Z
cl cr 7: ý
as tv ý3
to
cd
cl V) cz uM cl cd C'j
ýcj += cl UU
4ý I, cd 0UU
as
C; - ý 'o uý 10 u ; -4 -,:: ý ', ý - (L) -4 00
V) Vý
'o (1) 0 rA Q. ) 0o
(1) 00u0 Pý 0
Or)
>
rA cl V) Cd
cl V tri
V) tu up)
cn u. 0
cl 0
tj ý. ' 4Eý cl , C-13 P. - uu
J-- ý: 3 C93
)--. 4 cl
28

pond management, wastewater treatment and adopting effective planning and monitoring
may reduce the environmental impact associated with shrimp farm wastewater. However,
strategies proposed by researchers and commercial enterprises with a vested interest in
uptake are sometimes constrained by concerns regarding reliability, practical limitations,
possible risks and financial demands. The following sections present a review of strategies
to limit pollutant discharges. Potential advantages and constraints are described; findings
are summanse in Ta e 1.3.
1.5.1. Feed technology and management
The development of new feed types has played a significant role in reducing pollution
associated with aquaculture (Cho and Bureau, 1997). Unlike traditional milled pellets that
are pressed together, extruded pellets are expanded and fused together, fully gelatinising
the starch component to form a matrix. This makes the pellet more digestible and reduces
the amount of faeces produced. Seymour and Johnsen (1990; cited in Seymour and
Bergheim, 1991) found extruded feed gave a food conversion ratio of 1.05 as compared
with 1.12-1.25 for pressed pellets. Furthermore, it was estimated that for every tonne of
fish produced, solid waste levels between 320-450 kg for pressed pellets could be reduced
to 250 kg with extruded pellets.
In addition to increasing digestibility, extrusion results in a decreased surface area
liable to attack when immersed, making extruded pellets more water-stable than milled
pellets. Seymour and Johnsen (1990; cited in Seymour and Bergheim, 1991) found that
commercial extruded pellets immersed for 24 hours remained 84% intact with respect to
dry weight, whilst two types of commercial pressed pellets of the same size remained only
50% intact after 17 and 53 minutes. Extruded pellets can contain increased lipid levels,
giving them a higher energy density. Energy dense diets reduce the feed required per unit
production as increasing lipid concentration leads to protein sparing. This reduces nutrient
29

discharges as the major source of phosphorus and nitrogen pollution from fish farms is
protein catabolism (Henriksson, 1989 and Bergheim et al., 1990; cited in Seymour and
Bergheim, 1991).
Crampton (1987) noted that "phosphorus outputs from fish fanns are determined by
the level of phosphorus in the feed and by the feed conversion ratios achieved". Therefore,
reducing the concentration contained in feed represents another strategy to limit
phosphorus discharges. Wiesmann, Scheid and Pfeffer (1988) found that reducing the
phosphorus content of semi-purified trout diets from 10 g kg- I to 4g kg-1 caused no
significant reduction in growth rate or feed conversion.
Stuart (1953) and Rimen and Power (1978) (cited in Jorgensen and Jobling, 1992)
observed that cultured brown trout and Atlantic salmon only attack moving particles,
ignoring those coming to rest on the bottom. The extrusion process can be employed to
produce pellets that float or sink slowly, giving fish an extended period to ingest the pellet
before it comes to rest on the base of the culture vessel, or in cage culture, passes out of the
enclosure. In cages, however, increased buoyancy may result in greater feed loss through
the sides. Beveridge (1996) notes that fine mesh screens around the tops of cages can
minimise feed losses due to wind and wave action, but increased fouling and reduced water
exchange may constrain the uptake of this approach. Ensuring feed is introduced at the
cage centre would also limit losses through the cage sides. However, restricting feed
delivery to part of the cage may increase competition, causing reduced and uneven growth.
The feeding regime adopted at a farm is the approach with the greatest potential to
maximise feed utilisation. Seymour (1985 and 1989a; cited in Seymour and Bergheim,
1991) found that fish experience cycles of appetite associated with emptying and filling of
the stomach. Employing video equipment, Kadri, Metcalfe, Huntingford and Thorpe
(1991) observed that salmon in cages feed actively early in the morning and again in the
afternoon; feed presented between these times was largely wasted. Therefore, two feeding
30

events during these active periods were proposed to maximise the assimilation of feed and
limit pollution. Fixed feeding times also promote behavioural responses that contribute to
improved feed intake and conversion ratios (Seymour, 1989b; cited in Seymour and
Bergheim, 1991). The efficiency of feed utilisation during the proposed feeding periods
may be optimised through the use of demand feeders (Alandrd, 1992).
Rough handling and transport creates dust in feed bags and it has been estimated
that the production of feed dust could amount to 10 t y-1 of dry waste on an average size
cage farm using pressed pellets (Bergheim et al., 1990; cited in Seymour and Bergheim,
1991). The superior structure of extruded pellets as compared to pressed pellets means that
lower quantities of dust are produced. Careful handling may contribute to reducing the
production of dust and the operator could sieve the pellets prior to feeding to reduce the
level of dust introduced to the water. Where feed dust remains a problem, machines are
available that produce new pellets from dust and crushed pellets at the farm site (Seymour
and Bergheim, 199 1).
Henderson and Bromage (1987) proposed the use of low pollution diets as a highly
effective strategy for reducing the environmental impact of aquaculture wastewater.
However, limitations to feed constituents and the efficiency of biological production
systems indicate that in addition to advancements in feed formulation and delivery,
strategies designed to minimise the impact of faecal material and excreted byproducts
derived from metabolic processes will also need to be developed. The following sections
outline strategies for the design and management of aquaculture facilities aimed at
minimising the production of waste products and optimising the perfonnance of
wastewater treatment.
31

1.5.2. Facility design and operation
Improving the design of farms e. g. pipe layout, reducing the length of pipe and number of
bends, may reduce the break-up of particulate matter, enabling a larger proportion to be
retained during wastewater treatment. Within certain culture facilities, such as ponds,
remedial measures to reduce waste discharges may be integrated into the general
management of the farm. Permitting macrophytes to colonise channels between ponds
could encourage nutrient removal, whilst promoting vegetated pond margins will facilitate
nutrient uptake and stabilise embankments, reducing erosion and eliminating scour which
can be an important source of suspended solids in pond-based aquaculture (Funge-Smith
and Briggs, 1998). Modification of the receiving environment may ameliorate the negative
effects of aquaculture wastewater; altering the river or stream morphology could promote
mixing and aeration, reducing sediment deposition and compensating for depressed oxygen
levels. Such modifications are already undertaken to disrupt the lifecycle of intermediate
parasite hosts e. g. weed removal to eradicate the intermediate snail (Lymnaea spp. ) host of
digenean (Diplostomum spp. ) eye flukes; steps to reduce enviromnental impacts of
wastewater could be incorporated with this work. Furthermore, where appropriate,
adopting more proactive strategies, such as building weirs, constructing upstream groynes
and installing gravel riffles could enhance the habitat value of the receiving enviromnent.
Wastewater discharged during and directly following feeding, water used to flush
culture units and clean screens, and water released after grading and harvesting frequently
contain a significant proportion of waste discharged from aquaculture (Briggs and Funge-
Smith, 1994; Shireman and Cichra, 1994; Schwartz and Boyd, 1994). Preferential
treatment of wastewater released at these times may significantly increase the efficiency of
treatment. Lystad and Selvik (1991) and Selvik and Lystad (1991) investigated the
potential of in situ sludge separation in culture units. Particulate waste produced during
salmon fanning was concentrated using a circular current in the culture tank, with particles
32

transported to a central sludge cone located in the base of the vessel. The collection of
particulate matter using this technique accounted for the retention of 18% of nitrogen and
81% of phosphorus discharged. The greater retention of phosphorus was explaine as it is
largely bound to faeces, whereas most nitrogenous waste is excreted as soluble ammonia.
Employing oxygenation in aquaculture facilities can reduce the volume of water
required, thus improving the efficiency of existing treatment processes or permitting the
use of treatment techniques with a limited hydraulic capacity. During an extensive review
of the envirom-nental impact of aquaculture in Scotland, the potential of using aeration to
reduce water consumption and improve the efficiency of filtration, whilst increasing the
capacity of the receiving enviromnent to dilute discharged wastewater, was identified
(NCC, 1990). However, as the majority of aquaculture facilities are able to meet existing
discharge standards and further intensification of sites is constrained by limitations in
disease management and wastewater treatment, the adoption of this technology remains
limited.
1.5.3. Wastewater treatment at land-based farms
Settlement
Traditionally, settlement ponds have been employed to reduce concentrations of suspended
solids (SS) in aquaculture wastewater discharged from fish farms in the United Kingdom.
Solbe (1982) reported that in 1980,24 of the 141 freshwater farms surveyed in the United
Kingdom reported treating wastewater prior to discharge, with all strategies incorporating
settlement. A more recent survey of 150 land-based freshwater fish farms in Scotland
revealed that 55 were using settlement, whilst 7 were using filtration devices (Allcock and
Buchanan. ) 1994).
Hennessy (1991) assessed the efficiency of earthen settlement ponds in treating
wastewater from two freshwater Atlantic salmon farms. Following treatment, the author
33

found that total phosphorus (TP) concentrations increased by 24-170% and total ammonia
nitrogen (TAN) concentrations increased by 22-193% as compared with untreated
wastewater. Increased TP concentrations were ascribed to the degradation of accumulated
sediments within the settlement ponds, while increased TAN concentrations indicated that
processes in the ponds were contributing to ammonification. The removal of SS and BOD
was variable and limited.
Settlement ponds are poor at controlling the discharge of BOD from temperate
aquaculture as -60% is associated with soluble waste fractions and pond retention times,
and water temperatures are too low to facilitate biodegradation. In addition, TAN in
aquaculture wastewater is water-soluble, making removal in settlement ponds ineffective.
Hennessy (199 1) concluded that sludge accumulation was the primary cause of ineffective
settlement ponds, emphasising the importance of frequent sludge removal to maintain
optimal performance.
Teichert-Coddington, Rouse, Potts and Boyd (1999) demonstrated that settlement
could be applied successfully to treating water discharged from shrimp farms dunng
harvest. However, this was only used to treat the final 20 cm of water discharged from the
pond during harvesting; this strategy was adopted as the proportion of nutrients and solids
is greatest in the final 10-20% of water discharged. Following a retention period of 6
hours, the concentration of SS decreased by 88%, BOD was reduced by 63% and TP and
total nitrogen (TN) decreased by 55% and 31%, respectively. Allcock and Buchanan
(1994) outlined constraints limiting the effectiveness of settlement ponds in typical
situations:
infrequent removal of deposited sludge, leading to in situ decompositlon resulting in
deterioration in wastewater quality through the release of soluble pollutants;
inadequate sludge treatment and inappropriate methods of disposal following removal;
34

- the omission of duplicate ponds to which wastewater may be diverted during
maintenance and sludge removal;
poorly designed and constructed influent structures, resulting in uneven wastewater
distribution and increased turbulence, reducing the efficiency of settling and promoting
the resuspension of solids;
incorrectly designed and constructed outflow structures, resulting in resuspension
causing deterioration in wastewater quality.
Limiting flow velocities in settlement ponds is considered the most important factor in
increasing treatment efficiency (Henderson and Bromage, 1988). Reviewing the
performance of 16 settlement ponds for aquaculture wastewater, these authors found that
where inlet concentrations are below 10 mg 1-1, resuspension of settled solids through
turbulent scouring and effective solids removal are problematic. In addition, reducing the
concentration of solids below -6 mg 1-1 is difficult. The removal efficiency for SS was
related to the inlet concentration thus:
SSi - SS,, = 0.975SSi - 6.26
where, SSi'O SS concentration (mg 1-1) in inflow and outflow, respectively.
Employing good design practice may optimise settlement efficiency and avoid
resuspension. Henderson and Bromage (1988) recommend that the hydrology of the
settlement pond should be engineered to produce flow rates below 4 in min-' with
increasing hydraulic loading up to, and including, the maximum permitted discharge of the
site. These authors found that resuspension in aquaculture settlement ponds was correlated
with a function of mean fluid velocity, and that a flow rate of 4 in min-' limited
35

resuspension whilst maintaining a relatively high loading rate. To further enhance SS
removal the authors recommend maintaining flow rates <1 in min-', however, practical
constraints may limit this.
Inflow and outflow channels should be wide enough to avoid rapid flows, thereby
ensuring the even distribution of flow throughout the settlement chamber, maximising
settlement, preventing short-circuiting and avoiding channelisation which leads to
resuspension. Sloping sides and the inclusion of a slight slope towards the outflow promote
settlement and including a drain at the lowest point enables the use of a sludge pump for
the frequent removal of settled solids. Finally, adequate provision for the removal and de-
watering of accumulated sludge should be made based on average SS concentrations and
removal efficiency.
Mechanicalfiltration
Filtration can be an effective treatment strategy for aquaculture wastewater as a significant
proportion of phosphorus, organic matter and BOD are associated with suspended particles
(Cripps, 1991). Several commercial filters are available, with the simplest devices
containing stationary screens, for example, the Triangel Filter 2 (Mdkinen, Lindgren and
Eskelinen, 1988). Reviewing performance figures for this filter type from various studies
indicates removal efficiencies ranging from 27-40% for TN, 18-83% for TP, 4-90% for SS
and 17-85% for BOD (see NCC, 1990 and Hennessy, 1991). Triangel Filter perfonuance
may be adversely affected by the breakup of solids prior to filtration or algal growths
clogging the screens (NCC, 1990).
Self-cleaning axial flow rotary screens such as the Unik Filter 3 offer an advantage
over stationary screens where fouling is a problem (Cripps and Kelly, 1996). Treating
wastewater from Atlantic salmon tanks using a Unik Filter fitted with two submersible
2 Triangel Filters manufactured by Hydrotech AB, Industrigatan 1,235 32 Vellinge, Sweden 'Unik Filters manufactured by Urak Filtersystern A/S, N-5200 Os, Norway
36

microsieves, with mesh sizes of 60 ýtm and either 150 or 350 gm, resulted in mean removal
rates for SS, TP and TN of 68,63 and 17 per cent, respectively. TAN concentrations were
unchanged (Bergheim, Sanni, Indrevik and Holland, 1993). The soluble nature of TAN
makes removal by filtration impractical, therefore, the removal performance of mechanical
filters for other dissolved complexes may also be limited. Despite this, Unik Filters have
been used extensively in Norway to treat wastewater from smolt units, and several
hatchenes were reported to filter both influent and effluent water (Bergheim, Tyvold and
Seymour, 1991).
Radial flow rotary screens are drum shaped and wastewater entering the open end
is filtered through a cylindrical mesh screen. Matter retained on the inner surface of the
drum is then washed intermittently into a trough and the resulting backwash water flows to
a settlement chamber for de-watering (Cripps and Kelly, 1996). Hydrotech 4 produce a
range of commercially available drum-shaped filters that have found widespread
application and studies have demonstrated that this type of filter, fitted with a 60 ýtm pore
size screen, may remove between 67-97% of SS, 21-86% of TP and 4-89% of TN
(Ulgenes, 1992b, cited in Cripps and Kelly, 1996). Other types of mechanical filter for
treating aquaculture wastewater include chain type rotary screens and vibratory screens
(Cripps, 1991), although these are not commonly used. Belt filters have been installed at a
number of aquaculture sites in the past 3-4 years (Muir, personal communication 2001),
but performance data are absent from the literature.
The potential of mechanical filtration as a treatment option depends largely on the
proportion of waste compounds contained in the particulate fraction, and the characteristics
of the particles. Cripps (1995) describes the distribution of particles in wastewater from a
salmonid hatchery. Analysis of particles in the wastewater divided into seven size fractions
using membranes with pore sizes of 200,100,85,65,47,25 and 5 gm, revealed that no
'Hydrotech Drumfilters manufactured by Hydrotech AB, Industrigatan 1,235 32 Vellinge, Sweden
37

single size group contained a disproportionate concentration of phosphorus, nitrogen or
particulate volume or number. This suggested that mechanical filters fitted with 60 gm
screens may retain only approximately half the particulate matter discharged. However,
using screens with a smaller pore size would restrict the volume of wastewater filtered for
equivalent surface areas.
The performance of mechanical filters also depends on the configuration of
screens employed and wastewater characteristics; Cripps and Kelly (1996) recommend in
situ testing during the commissioning phase to select the most appropriate screen
configuration. Varying operating conditions, wastewater characteristics and screen
configurations used in studies reviewed here makes drawing comparisons between
different filter makes and models unwise. This review suggests that mechanical filters are
effective for the removal of SS, BOD and TP, however, performance is limited by
particle breakup prior to filtration, clogging and an inability to remove dissolved
substances and fine particles. Mechanical filters usually produce small volumes of
backwash water in relation to the wastewater volume treated (Seymour and Bergheim,
1991; Cripps, 1994), and de-watering backwash water to produce a manageable volume
of concentrated sludge requires investment in equipment and constant monitoring.
Bergheim, Ronhovde and Mundal (1997) reported that the average volume of
backwash water required by 4 Hydrotech drumfilters receiving 30-35 m3 min-' of
3- wastewater from a Norwegian smolt farm equated to less than II in- i. e. <0. I% of treated
water. The sludge was made more manageable by filtering the backwash water through a
single Hydrotech filter, and the resulting sludge settled using a conical tank. It was
subsequently decanted to a second tank where lime was used to raise the pH to 12,
eliminating odour, arresting putrefaction and killing pathogens. Stabilised sludge was
transferred to a third tank for 2-4 weeks storage before being removed by local farmers,
mixed with livestock manure and stored prior to land application. The proportion of solids,
38

nitrogen and phosphorus in wastewater discharged from the smolt unit and applied to the
land was 50,20 and 50 per cent, respectively, suggesting that efficiency could be
improved. The negligible potassium content of the sludge would limit its value as a
fertilizer. Fixed costs associated with developing the system were considered high,
however, this was because drumfilters with additional capacity to meet future farm
expansion were installed. Annual costs amounted to 5% of total production costs, although
this was expected to decrease as the fann expanded.
1.5.4. Wastewater treatment at cage farms
The potential of sludge collection systems suspended below fish cages has been reported
by a number of authors (Beveridge, 1996; Costa-Pierce, 1996; Cripps and Kelly, 1996).
Garmann et al. (1984; cited in Seymour and Bergheim, 1991) placed a trap below rainbow
trout cages; the trap had an effective horizontal surface area of 50 in 2, equating to
2pproximately 40% of the surface area of the cages. Over a four-month period the trap r-
collected 75-80% of particles released from the cages, appearing to represent an effective
treatment strategy; however, limitations had been identified. The sludge collection system
worked well in lakes and sheltered coastal areas, but was vulnerable in more exposed
conditions (Cripps and Kelly, 1996). Kasper et al. (1988; cited in Seymour and Bergheimý
1991) estimated that 10% of phosphorus and 65% of nitrogen in feed pass into the
receiving aquatic environment as soluble compounds, and so these fractions are not
removed by particle collection.
Dispersal of waste that settles under cage facilities has been attempted using
mechanical mixers (Beveridge, 1996). Used at a cage site to re-suspend and disperse
settled material this method resulted in a reduction of 60-75% of the 40 cm thick layer of
accumulated waste (Braaten, Ervik and Boje, 1983; cited in Beveridge, 1996). This may be
a beneficial management strategy, but although dispersal can limit localised impacts, the
39

problems may only have been relocated. An alternative strategy is to fallow cage sites, this
allows recovery of impacted benthic environments and may assist In limItIng the
proliferation of disease organisms (Beveridge, 1996). However, recovery of sediments may
take several years and the limited availability of suitable sites for cage aquaculture restricts
the practicality of this option.
The development of offshore sea cages at sites exposed to strong waves and
currents appears promising as these conditions promote water exchange and the dispersion
and dilution of waste products. An increased distance from other farms is also attractive,
reducing the risk of local nutrient enrichment and disease transfer between sites. However,
the development of offshore cage farms is restricted by the availability of suitable
technologies to cope with extreme hydrological conditions, and by the practical constraints
of servicing exposed locations.
1.5.5. Water reuse in aquaculture
Water reuse in aquaculture depends on the use of advanced treatment techniques, such as
biofiltration, ultraviolet steralisation and ozonation, so that the culture water may be
recycled (Muir, 1994). Frequently, water reuse is employed in an attempt to retain heat
energy, enabling the maintenance of the optimal culture temperature, leading to increased
gTowth rates and improved feed conversion ratios (Seymour and Bergheim, 1991). Farins
employing water reuse are effective at limiting pollution, although several constraints to
managing water quality and disposing of wastewater produced in water reuse systems have
been identified.
The effectiveness of wastewater treatment in these systems is constrained by a
number of factors; the accumulation of TAN, Phosphorus and small particles in the culture
water represent particular areas of concern. Chen, Timmons, Aneshansley and Bisogni
(1993) recorded the size profile of particles in water reuse facilities and found that over
40

95% of particles had a diameter below 20 ýtm and that this fraction accounted for 40-70%
of SS by weight. The implication is that conventional mechanical filters will be unable to
remove a large proportion of these smaller particles, leading to the deterioration of water
quality. Employing advanced wastewater treatment techniques such as contact media
filters may facilitate the removal of small particles, but may lead to increased management
demands associated with maintaining and monitoring the treatment unit. Irrespective of
which treatment strategy is employed, removal of solid waste from the culture water will
produce sludge that will require the provision of de-watering and storage facilities and
ultimately need disposal. On-site sludge management options are limited because nutnents
could leach to local watercourses; sludge containing pathogens would represent a health
hazard; odour or flies could cause a nuisance; the cost and physical area required to
establish de-watering and drying beds may be prohibitive. Sludge disposal is frequently
contracted out, however, this results in risks associated with nutrient and pathogen
management being transferred off-site. Furthermore, the large capital investment required
to establish aquaculture facilities employing water reuse has restricted its adoption.
Future directions
Concern regarding the impact of wastewater from aquaculture, including nutrient
enrichment and alterations in the biotic community in the receiving water, has been
addressed in several fundamental ways (NCC, 1990). Effluent loading rates have been
significantly reduced through careful feed management, the formulation of energy-dense
and low pollution diets, and through more efficient sludge collectors and mechanical
filters. In addition, fish fann managers have developed best management practices, e. g. the
environmental management system proposed by Gavine, Rennis and Windmill (1996).
In the UK, the range of developments and initiatives mentioned above has resulted
in discharge-consents for freshwater aquaculture being attained more frequently. However,
41

"Cý cz > cl 00 V) . _ý It oc Cd 4)
cl 1 0. c-, 0, C"ý (: 7N (D o Oý a\ -r (7ý - C/) Z C13
00 u
rcý Q) u C, 3 Q ()C) m
1 (Z.,, -4 C/) __4 C/) ý= a) Cý 00 (7., 4- a) F- 00
Cý Co
I C, 3 , (7ý, c-, ý (Z., "I:: ý (0ý Cý . 4-
U, -Z C'ý
1-. 'as g. - to _ to cl I a) Cý
_-, ý-. - (:: )
. (: ) Iýt ý-, 9
-4., ý_4 (D ý-4
a) 2,1-. ,mE C'\ 71 drý 0 _ý V
_4 rý ', go>, go" 11) u bio __ý C) tv +- C'n on M -M 04. E= C's 64 . 4- . _q E5
--c -15 ": j cl C\ crý
cu C) M Cý 0 a. ) Q) =s 'r!
cl co (D V cq 4- Iu V) cl b. 0 Cd I: $ v0
cz Q) lcý
u cl Cd as >>t. 0 cn U Cd
C13 P.
4 Cd bo 'I) v -(:: ) ý c)
to 9
cl cn in En 0 bi) 4- ýý 4- rA Cd 4- C) ;. U u C) 0
to CJ
1 ; _4 ux C) 41 -4 V
'o cri C'3 cl
w, ý4, ýc 0 > t: j 4- .
'n ýo ý-4 v Cd a. ) ý-4-u.,; v0 ýJ: j V)
"', C, 3 (: )
p021: 1ý 'ýi
0 0 8) cl 71
cl , ý_j Jý 7j U Q) ý_4 (D C13 cl 0> (D _4 0
C) v 1
ý_4
0U-U *i. ý
C13 0U Eon C) 9b ýj C) C, 3 C'3 0 ,. CJ > ,ýM0p, ýz cl CF. cl a) I
:ýwV C74 uc (1) ý-4 u C) 5j to ti -Cý C)
o Cd cn 4- " '. - -4 C) C, 3 Cd
ým
4: ý C13 Cd En 0
cd >_. cd cl V) En (L) V) V, En
C, 3 v a)
C. ) cj C, 3 4cý :n 71
cl to
tv >
as
C, 3 (4-4
C, 3 I a) (L) cd U "(: ý 0 to ým 'ril r. C4.. 4 U ý_4 U
0 cl C13 .4 1 C: ) c "Z: ý ý. _ý >, 0 u Cd cn ct
cl p" cz ýý +- ý-4 .ý., _4 U cz to 0 r-I uu0s., C)ý -ý>u cis t4; +1 . 4. j M cl u rA c) ýu0 ýs 0 'cl
U0 $ý 4ý U0 03
IR u .- ;ý 10 ; ý' h_ Ln .m 4ý C's ct 4- Cd cd 71
0 Cd V) ý) C', I
o (1) C, 3
C, 3 as ý. 4 (D ý. 4 C13 tg >
lb .,.,
>u 1421 U Cl 4- uu ý_4 ý_4 CIS ; -. u 4-4 to -0 -,, k ce 0 ID
"oil 7ý Cd ýU(: I Cl (L) i" 1=1 -ý . _4 C) ,=0000 cu -ý ro rA ý: 'o Q) cn UV tý ý=
C13 (L) (L) u cl Q el I
4- 10 IDJD Cd
cri ll:: ý 9
cd o En 'A U) ý cl cl 'ICJ
cl M C's C, 3 >
cis cl cl C) as CT3 > 0 u
En (D a) cts
;>
UU cd UuU V) 7ý
4ý g, Uý0 It r. -
.5- ctý C's a, . Cý ý: s
g 4-ý - "10: 1 E_ r
cl 0 cd M Cd 0 Cd r cl
ci C) CJ
ct uM cu a)
(:: ) U-
ct3 ; -4
C,
uu 64 ; -4
Mu
ti
Q) *0
03 4-4 0 u ; _4
1.0 to
4ý 0. ý. 4 M
C) V > cz C13 c) 4- 0
C13 U M
Cd u 5 Cd V cu
cz U
m C) cl cl -0 t (1) a. ) m a) u
z 4.4 4-4 F_ I
42

Doughty and McPhail (1995) caution that this compliance should "be considered in
context of the low sampling frequency employed: large daily variations in losses of total
phosphorus and total nitrogen (of which ammonia is the largest fraction) from fish farms
have been noted". In many situations, nutrient discharges, particularly nitrogen and
phosphorus, from freshwater aquaculture are unregulated and represent a potential cause
for concern. Nutrient discharges from industry, including agriculture and aquaculture, are
increasingly controlled by guidelines and legislation, with non-compliance leading to fines
and the imposition of pollution taxes.
Management strategies with high potential to minimise aquaculture waste
discharges can be identified by adopting a systematic approach to assessing each element
of the production process which influences the efficiency of feed utilisation and/or the
effectiveness of managing the waste produced. One such approach is Life cycle analysis,
which has been widely applied in developing envirom-nental impact management strategies
for industrial processes. As part of an integrated approach to aquaculture wastewater
management, Alandrd, Bergheim, Cripps, Eliassen and Kristiansen. (1994) applied a similar
assessment to Atlantic salmon culture. The proposed strategy included demand feeders to
optimise feed utilisation, wastewater treatment using rotary filters with screen sizes
tailored to particle size distribution, and sludge disposal to infiltration basins. However,
constraints to current practices employed in managing aquaculture wastewater, such as
those described in Table 1.3, suggest that improving, or 'fine-tuning' existing management
strategies may be insufficient to meet more stringent discharge standards.
Where treatment is employed, the effectiveness of settlement ponds and mechanical
filtration in removing dissolved nutrients and fine particulate matter is limited (Hennessy,
1991; Cripps and Kelly, 1996). Mechanical filters represent a significant burden upon the
time of the operator as they are susceptible to shock loadings, mechanical failure, wear and
tear and interruptions to the supply of electricity, and therefore require constant monitoring
43

and regular maintenance. Settlement ponds and mechanical filters produce concentrated
sludge that requires regular disposal, an activity that may represent a significant cost to the
operator and may lead to the formation of "hampered effluent accumulation processes
(HEAP) traps, where former point source pollution is ultimately converted into non-point
source pollution" (Giinther, 1997). Furthermore, even aquaculture facilities employing
water reuse continue to produce backwash water and sludge requiring disposal. The
nil ausence of economically viable techniques capable of removing the dissolved nitrogen and
phosphorus from the large volumes of wastewater that characterise discharges from
aquaculture represents a significant constraint to achieving stricter discharge standards.
In addition to meeting the requirements of regulatory bodies, aquaculture producers
must be aware of concerns expressed by the public regarding the origins of products they
consume and their environmental credentials. Wasteful producers could find themselves at
a disadvantage while operators employing environmentally friendly options may be able to
obtain a premium for their products. Young, Brugere and Muir (1999) suggest that market
perceptions and environmental attributes will increasingly drive ftiture growth within the
aquaculture industry. A proactive approach to managing problems associated with
discharging aquaculture wastewater could therefore confer a significant advantage on
operators.
The prospect of stricter discharge consents, pollution taxes and increased
preference of consumers for environmentally friendly goods justifies research into
improved treatment methods. In addition to public concern regarding the appropriation of
environmental goods and services by aquaculture, there is a growing recognition that
nutrients entrained in aquaculture wastewater represent a potentially valuable resource. In
developing countries where discharge standards have yet to be implemented for rapidly
expanding aquaculture sectors, there may be little incentive to treat aquaculture
wastewater, even with simple strategies such as settlement, despite the risk of negative
44

environmental impacts. However, where tangible benefits from increased production are
achieved through the productive reuse of aquaculture wastewater, operators in developing
countries would be more willing to adopt such strategies. Treatment options that facilitate
the reuse of wastewater to culture aquatic species could be attractive to both consumers
and operators in developed and developing countries. This rationale fom-is the basis from
which horizontally integrated aquaculture has developed.
45

Chapter Two
Horizontally integrated aquaculture systems
1. Introduction
This chapter describes the origins of using waste-flows as production enhancing inputs for
aquaculture and develops the concept of generating valuable products whilst facilitating
processes to improve water quality. A definition for the practice of horizontally integrated
aquaculture is proposed and the potential of employing unexploited resources and assets
from primary aquaculture activities to integrate aquatic organisms in one or more
secondary production units is described. Such a strategy would capitalise on existing
knowledge, management structures, infrastructure and markets. Aquaculture practices that
fit the definition are characterised, and experiences of constraints and benefits with each
are described. It is shown that despite apparent technical viability, extensive research and
trials concerning horizontally integrated aquaculture, few commercial enterprises have
been established. Therefore, a systems perspective is proposed to assess the potential of
horizontally integrated aquaculture in commercial settings.
2.2. Productive reuse and treatment of waste through aquaculture
Limited access to nutrient sources and the expense of inorganic fertiliser and feed has led
to food processing by-products, animal manure and human waste being used to stimulate
production in fishponds (Edwards, 1980; Little and Muir, 1987; Wohlfarth and Hulata
1987; De Pauw and Salomoni, 1991; Lin, Teichert-Coddington, Green and Vevenca,
1997). Employing unexploited resources derived from within farming systems or from the
46

immediate area to intensify production in fishponds has been termed integrated
aquaculture (Little and Muir, 1987). Examples of these practices are described in the
remainder of this section.
2.2.1. Manure
The poor resource base of most small-scale farms in developing countries means that
unexploited nutrient sources e. g. crop by-products, terrestrial weeds, aquatic plants and
manure represent important production enhancing inputs to fishponds (Edwards, Dername,
Innes-Taylor and Turongruang, 1996). Little and Edwards (1999) reviewed the altemative
strategies that have evolved to integrate the production of livestock and aquaculture.
Manure from cattle, buffalo, sheep, pigs and poultry has been employed to enhance
production in aquaculture systems (Teichert-Coddington, Behrends and Smitherman, 1990;
Edwards, Pacharaprakiti and Yomjinda, 1994; Maclean, Brown, Ang and Jauncey, 1994;
Garg, 1996). Zhu, Yang, Wan, Hua and Mathias (1990) studied the response of ponds
stocked with silver carp (Hypophthalmichthys molitrix), bighead carp (Aristichthys
nobilis), common carp and crucian carp (Carassius carassius) to various applications of
fermented pig manure. Manure rates of 31-48 kg ha-1 d-1 produced a net fish yield of 10.2
kg ha-1 d-1; control ponds receiving equivalent inputs of inorganic fertiliser produced 4.3 kg
ha-1 d-1. These authors proposed that higher fish production observed in manured ponds, as
compared to ponds receiving equivalent nutrient inputs in the form of inorganic fertiliser,
was attributable to increased heterotrophic production. This demonstrates that both
autotrophic and heterotrophic pathways are important in optimising fish production in
ponds.
The integrated rearing of poultry above fishponds has been widely advocated
(Johnson and Avault, 1982; Msiska and Cantrell, 1985; Knud-Hansen, Batterson. and
McNabb, 1993; Christensen, 1993; Christensen, 1994; Njoku and Ejlogu, 1999). It has
47

been practised in Asia for several centuries, and has been shown to confer several
advantages. Fermentation, evaporation and coagulation are reduced, preserving the
nutritional quality of faeces; feed residues are consumed directly by fish; costs associated
with collecting, storing and transporting manure are eliminated, and as compared with
separate culture units, less land is required (Barash, Plavnik and Moav, 1982). These
authors found that production in fishponds receiving direct inputs of excreta from ducks
was equivalent to that in ponds receiving equivalent inputs of dry poultry manure and
supplementary feed. However, despite the apparent benefits of integrating poultry farming
with aquaculture, constraints have been identified (Little, 1995). These include limited
access to inputs e. g. capital, labour and feed, and lack of skills amongst potential operators
to successfully manage such systems. Small-scale farmers integrating the production of
fish and ducks may also encounter problems obtaining inputs and selling products,
especially if competing with large-scale producers (Edwards, 1998).
Within the dike-pond farming system that evolved over several hundred years in
the Zhujiang Delta, Guangdong Province, South China, excreta from pigs was used
extensively to fertilise ponds (Ruddle and Christensen, 1993). Ruddle and Zhong (1988)
suggested that in many cases, manure production was the primary reason for keeping pigs.
However , in recent years the extent of land under dike-pond cultivation has declined and
fan-ners have removed dikes to increase available pond area for stocking intensive market-
orientated monocultures, producing high-value products such as eels, prawns and terrapins
destined for export markets (Wong Chor Yee, 1999). Factors leading to these changes have
been the prospect of greater economic returns, and the decline in the value of silk, an
important output of the traditional dike-pond system.
Concern has also been expressed regarding the role that pigs may play in
facilitating contact between avian and human influenza viruses, possibly leading to
influenza pandemics. It has therefore been recommended that co-location. of pigs and
48

poultry in integrated farming systems should be avoided, and that the promotion of this
management strategy should be discontinued (Scholtissek and Naylor 1988). Replying to
this commentary, Edwards, Kwei Lin, Macintosh, Leong Wee, Little and Innes-Taylor
(1988) stated that pigs and ducks had been raised together in traditional Asian fanning
systems for centuries without apparent risks, and that promoting integrated aquaculture
would be unlikely to increase the risk posed by new influenza strains. Furthennore,
problems with management and marketing had constrained the integration of more than
one species of livestock or poultry making the dangers of wider multi-species transfers less
likely. In response, Naylor and Scholtissek (1988) called for a proposal from the
Consultative Group on International Agricultural Research advocating "fully integrated
crop/livestock/fish fanning" to be qualified. Skladany (1996) chronicles the evolution of
the resulting debate and highlights the potential of following the research, publications,
projects and controversies of innovators to inforin sociologists studying aquaculture
development. The discourse described is based largely on a hypothetical risk, however,
Muratori, de Oliveira, Ribeiro, Leite, Costa and da Silva (2000) showed that 11.2% of fish
sampled (n = 540) from ponds fertilised with pig manure harboured Edwardsiella tarda.
This causes tropical fish septicaemic disease and is considered an emergent foodborne
health hazard for humans. Therefore, risks associated with using animal manure in
aquaculture require consideration, and precautionary measures such as pre-treatment to kill
pathogens and depuration may be advisable.
2.2.2. Human waste
A comprehensive review of domestic waste-based aquaculture is presented elsewhere
(Edwards, 1992). Practices from 21 countries were reviewed and classified according to
the approach used to introduce faecal material to the aquaculture system i. e. overhung
latrines, cartage of urban nightsoil, faecally polluted surface water and sewage water.
49

Informal wastewater aquaculture systems receiving faecally polluted surface water were
described from five Asian countries: Indonesia, Japan, China, Sri Lanka and Taiwan.
Surface water containing human waste is commonly used in Indonesia to culture fish;
around Bogor, grey water from drains that also received human excreta was used to culture
tilapia. Indonesian aquaculturists developed the culture of common carp in bamboo cages
positioned in canals containing faecally polluted surface water. Traditionally, no
supplementary feed was given to carp cultured in these cages as benthic organisms e. g.
chimomids, proliferated in the nutrient rich water. However, intensification has resulted in
supplementary feeds being applied to enhance production.
In addition to infonnal practices in Asia where aquaculture is undertaken in
faecally polluted surface water, Edwards (1992) described the deliberate use of sewage
water in formal systems to produce fish in four Asian countries: China, Indonesia, Israel
and India. Kundu (1994) described the origins and current status of wastewater aquaculture
in peri-urban Calcutta, India. Ponds managed for wastewater aquaculture covered an area
of 3,000 ha, consisting of -154 fisheries or bheries. The extent of the fisheries had
developed to receive 550,000 in 3 d-1 of untreated Calcutta wastewater. Wastewater from
the city was pumped into a series of secondary canals that conveyed it to the reuse system
that, in addition to facilitating wastewater aquaculture, supported an area of wastewater
agriculture. Production from the Calcutta system was estimated at 13,000 t y-1 of Indian
major carp and tilapia; harvested fish sold in nearby urban markets represented -16% of
total fish sales in the municipality (Mara, Edwards, Clark and Mills, 1993).
Wastewater aquaculture has been extensively practiced in the Thanh Tri District of
Vietnam. During the 1960's a canal was constructed to transport wastewater away from
urban areas; fishponds were subsequently constructed adjacent to the canal and wastewater
from the canal pumped into them. The reticulated nature of the canal network means that
fishponds further from the urban centre do not receive nutrient rich wastewater. However,
50

water entering these ponds is rich in biota. Fish species cultured include silver carp, rohu
(Labeo rohita) and tilapia and yields ranged from 5-8 t ha-1 y-1. Production from fishponds
receiving wastewater represented an important source of relatively cheap food for poor
communities; the annual production of 4,500 t was equivalent to 40-50% of the total
supply of fish to Hanoi (Edwards, 1996).
Aquaculture can play an important role in converting unexploited nutrient resources
in wastewater to valuable products. However, concerns about the capacity of aquatic
ecosystems to attenuate pathogen numbers, compensate for biological oxygen demand and
assimilate nutrients has favoured the use of conventional treatment ponds and lagoons to
treat domestic, agricultural and industrial wastewater (Mara, 1997). Based on conventional
treatment approaches, a rational design had been proposed by Mara et al. (1993) predicting
that following retention in an anaerobic lagoon for 1 day and a facultative lagoon for 5
days, discharged wastewater may be used in fishponds to produce fish that are
microbiologically safe for human consumption. The authors estimated that fish production
in treated wastewater would average 13 t ha- Iy -1 and a financial assessment of the
proposed system indicated commercial viability.
Despite the apparent benefits of traditional wastewater aquaculture practices and
the potential of integrating aquaculture with formal lagoon based treatment facilities,
research has tended to focus on the engineering of experimental and pilot scale wastewater
aquaculture systems with the aim of maximising production (Edwards, 1992). Edwards and
Sinchumpasak (1981) described culturing tilapia (0. niloticus) fed with microalgae from
high rate stabilisation ponds used to treat sewage. Following a retention period of three
days, wastewater from the 200 in 3 stabilisation pond, with a mean phytoplankton
concentration of 94 mg I- was transferred to 4 M3 concrete fishponds. Edwards,
Sinchumpasak and Tabucanon (1981b) estimated that tilapia yields from this system could
approach 20 t ha- I y- I, although production was dependent on large inputs of phytoplankton
51

from the stabilisation pond. Phytoplankton production in the stabilisation pond was 15.7 g
M-2 d-1, from which an annual production rate of 57 t ha-1 was extrapolated. However,
despite the promise of this system, samples from fishponds contravened WHO standards
for faecal coliform concentrations in wastewater for use in aquaculture or irrigating crops
to be eaten after cooking (Edwards, Sinchumpasak, Labhsetwar and Tabucanon, 1981a).
The experience of these authors demonstrated that even where highly productive waste-
reuse systems are developed, other factors such as possible health risks from pathogens and
pollutants, and consumer acceptance, must be considered.
2.2.3. Intermediaries in integrated aquaculture
When undertaking aquaculture in domestic wastewater, the presence of faecal coliforms
and other pathogens e. g. protazoa, trematodes, helminths and viruses, and the threat of
contamination with heavy metals, detergents and carcinogens severely restrict consumer
acceptance. Depuration offers a potential solution, but requires that the cultured species be
held in clean water for several days, which may be costly and difficult to manage and
control. The potential of culturing organisms using waste and then feeding these as
intermediate products to species destined for human consumption has also received
attention (Edwards, 1990). Such intermediaries could prevent the transmission of disease
agents and allay fears of potential consumers.
Numerous species have been investigated as intermediaries in integrated fanning
systems e. g. microalgae, aquatic macrophytes, zooplankton, invertebrates and fish
(Groeneweg and Schluter, 1981; Schluter and Groeneweg, 1981; Gnudi, Caputo and
Salomoni, 1991). In addition to assimilating nutrients, organisms produced in integrated
systems may contribute significantly to the nutrition of animals to which they are fed.
Chironomid larvae cultured using waste organic matter i. e. palm oil mill effluent, were
shown to possess high levels of essential amino acids and polyunsaturated fatty acids as
52

compared with larvae grown in algae cultures (Habib, Yusoff, Phang, Ang and Mohamed,
1997). The cultivation of chironomid larvae in Hong Kong using chicken manure was
reported to have been an important source of live-feed for aquarium fish and fry of
camivorous species e. g. Clariasfuscus and Ophiocephalus spp. (Shaw and Mark, 1980).
Tumer, Sibbald and Hemens (1986a) investigated the possibility of cultunng tilapia
in marine ponds fertilised with domestic wastewater. It was proposed that fish biomass
produced could be used as a protein supplement in diets for shrimp (Turner, Sibbald and
Hemens, 1986b). Despite appearing relatively inefficient, with 10 t of fish biomass being
converted to 1.05 t of shrimp, the economics of the system were favourable, and although
wastewater entering the ponds contained Escherichia coli, none were detected in the flesh
of either tilapia or prawns. Heavy metal accumulation was not significant and levels of
chlorinated hydrocarbons were within permissible levels (Turner, Sibbald and Hemens,
1986c).
2.3. Opportunities for horizontally integrated aquaculture
The culture of aquatic species is accompanied by the generation of waste products
(Beveridge et al., 1997). Depending on the perspective from which these waste products
are viewed, they could represent a constraint to sustainability, degrading the external
environment and leading to negative feedback mechanisms. However, they may also
represent an opportunity, as an unexploited resource for input to integrated production
systems, assimilating waste nutrients and reducing discharges to the receiving
environment. Furthermore, products from the integrated culture unit could be marketed to
generate additional income. A wider range of benefits may also be conferred on the
environinent, stakeholders and operators of aquaculture facilities. These aspects constitute
the central tenet underpinning horizontally integrated aquaculture.
53

Reducing waste discharges through horizontal integration will contribute to
environmental protection and reduce the risk of negative feedback mechanisms, which
could disrupt the supply of environmental goods and services upon which commercial
aquaculture ultimately depends (Beveridge et al., 1997). Assimilating nutrients into
marketable products, as opposed to removing them using conventional treatment
techniques, avoids the production of sludge, the inappropriate disposal of which could
transform a point source of pollution to a diffuse source (Gunther, 1997). The assimilation
of nutrients using horizontally integrated aquaculture will reduce the loss of non-renewable
resources e. g. phosphorus, in the unidirectional flow of matter entrained within the
hydrological cycle.
Technical innovation and husbandry techniques e. g. low pollution feed, automated
and demand-driven feed delivery units, reduced stocking densities, vaccines and
wastewater treatment, may be employed to reduce the demand for environmental goods
and services that aquaculture places upon the environment (Beveridge et al., 1997).
However, adoption of modified management strategies is usually limited due to financial
demands. Maddox and Kingsley (1989) state: "if any new activity such as waste treatment,
does not reduce costs and/or increase income, it is unlikely to gain acceptance". The
cultivation of valuable species in integrated units may address this constraint.
Culturing aquatic species in wastewater from aquaculture operations has been
proposed previously and the associated treatment effect, productivity and technical
demands, based on results from laboratory investigations and pilot-scale studies, have been
described. Costa-Pierce (1996) describes using wastewater from shrimp ponds and cage
facilities to rear bivalves and diverting waste from settling ponds and cage collectors to
assist in creating wetlands as ecological aquaculture. Buschmann (1996) refers to
cultivating seaweed in wastewater from commercial offshore aquaculture facilities as
1. ntegrated farming, although this latter phrase has close associations with integrating
54

agricultural activities, especially livestock production, with aquaculture. However, no
formal definition has been derived to describe adequately the wide array of systems that
have evolved from traditional practices and developed through scientific investigation. In
the following section, existing descriptions of key components of horizontally integrated
aquaculture are presented and used to formulate a tentative definition.
2.4. Defining horizontally integrated aquaculture
As outlined in Section 2.1, the practice of employing unexploited resources to intensify
production in fishponds has been tenned integrated aquaculture (Little and Muir, 1987).
However, the definition proposed here aims specifically to describe the use of unexploited
resources derived from aquaculture activities as production enhancing inputs to secondary
aquaculture activities. Aquaculture is defined by FAO (1995) as "the fanning of aquatic
organisms, including fish, molluscs, crustaceans and aquatic plants. Farming implies some
forni of intervention in the rearing process to enhance production, such as the regular
stocking, feeding, protection from predators, etc. Farming also implies individual or
corporate ownership of the stock being cultivated. For statistical purposes, aquatic
organisms that are harvested by an individual or corporate body that has owned them
throughout their rearing period contribute to aquaculture, whilst aquatic organisms that are
exploitable by the public as common property resources, with or without appropriate
licenses, are the harvest of fisheries". Defining aquaculture is important for two reasons:
firstly it identifies those activities from which unexploited resources may be derived and
secondly it defines those culture practices that may be considered for integration. The FAO
definition also appears to exclude groups other than individuals and corporate bodies from
engaging in aquaculture, however, households, families, communities, cooperatives and
governments may have ownership over cultured stock. This is of particular importance
where horizontally integrated aquaculture is proposed as a suitable mechanism for
55

empowering local communities, permitting them renewed access to productive coastal
resources, but where equitable management is likely to depend upon community-based
organisations that retain ownership or at least the right to exploit aquatic plants and
animals cultured in integrated systems. Implications of allowing local communities access
to extensive horizontally integrated aquaculture systems are discussed further in Chapter 4.
From a business perspective, Thompson (1993b) states that "horizontal integration
occurs when a firm acquires or merges with a major competitor, or at least another firm
operating at the same stage in the added value chain". However, horizontal integration is
used here to describe using unexploited resources and assets from existing aquaculture
operations to culture products at a similar stage in the added value chain. It implies parity
between the aquaculture activities undertaken, although in most cases, horizontally
integrated systems will consist of a primary activity receiving the majority of external
inputs and generating a substantial part of the output value. Therefore, horizontally
integrated aquaculture may be defined as:
"the use of unexploited resources derived from primary aquaculture act'vities to
facilitate the integration of secondary aquaculture practices. "
A distinction may also be drawn between culture practices that are undertaken in
conjunction with an aquaculture activity primarily to supply inputs (vertieal integration)
and culture systems that develop to exploit surplus resources (horizontal integration).
However, situations may arise where products from horizontally integrated aquaculture
systems facilitate vertical integration.
56

2.5. Developing a systems perspective
Research studies commonly focus on technical aspects of horizontally integrated
aquaculture such as wastewater treatment performance, production rates, management
demands and design parameters. However, operators of commercial aquaculture units
deciding whether to adopt such strategies will need to consider a much wider range of
issues'. Financial viability is likely to be foremost, and will depend on factors such as input
costs, market demand for integrated products and the cost to benefit ratio of alternative
wastewater treatment strategies. Regulatory controls may also hold sway, for example,
planning restrictions and legislation against co-culturing species or outlawing the
introduction of species suitable for integration may constrain development. Consumer
acceptance and perceived public health risks will be influential, as will potential benefits
such as increased enviromnental protection, enhanced resource-use efficiency and reduced
stakeholder conflicts. Such factors also interact, operate at a range of scales and change
with time, resulting in a complex setting in which operators must make decisions.
The "systems approach to management" for aquaculture proposed by Muir (1996)
provides an overview of the essential elements requiring consideration and is used to guide
the assessment of horizontally integrated aquaculture in this thesis. In the remainder of this
chapter, to build on the definition of horizontally integrated aquaculture presented, studies
investigating the practical application of this strategy are reviewed. A bioeconomic model
is developed in Chapter 3 to further investigate technical and financial aspects of
horizontal integration, and a case study concerning the integration of a constructed wetland
and trout fishery with a smolt unit is presented. Chapters 4 and 5 present additional case
studies developed to test the generality of the model, whilst in Chapter 6 the results of a
Delphi investigation elicit constraints and opportunities to horizontally integrated
aquaculture from stakeholders. Chapter 7 presents a synthesis of findings from this work;
57

prominent systems features are described and areas requiring future investigation, to
develop the systems approach more fully, identified. However, before progressing further,
the boundaries of the systems to be investigated must be delineated.
The FAO definition of aquaculture given earlier provides the basis for delineating
both primary 'waste generating' and secondary 'waste processing' aquaculture activities.
Horizontally integrated aquaculture therefore excludes using waste from aquaculture to
enhance production in terrestrial agriculture. Furthennore, the FAO definition
distinguishes between aquaculture and fisheries by ownership. Thus excluding the
enhancement of capture fisheries from this discussion. However, employing unexploited
resources to facilitate ranching may be included. Prospects for ranching are discussed in
Section 2.5.6.
In addition to identifying farming practices and management structures that
constitute aquaculture, assessment from a systems perspective requires the definition to be
expanded. Spedding (1988) describes a system as "a group of interacting components,
operating together for a common purpose, capable of reacting as a whole to external
stimuli: it is unaffected directly by its own outputs and has a specified boundary based on
the inclusion of all significant feedback". Muir (1996) presented a summary of
components, or systems features, that interact within aquaculture systems; these included
ethical, cultural, socio-political, economic, climatic, ago-ecological, production, farming,
resource-use, mass-balance, ecological and biological factors. Furthermore, Muir (1996)
described aquaculture systems as:
"the interdependent elements of enviromnent, physical structure, rearing process,
resource use and socio-economic context which form the entity from which fanned
119
aquatic organisms are produced .
I An assessment of influential constraints and benefits that stakeholders, including operators of commercial aquaculture units, associated with horizontally integrated aquaculture is presented in Chapter 6
58

Within this definition, primary and secondary aquaculture activities that constitute
horizontal integration may be considered sub-systems.
Having defined which fanning activities constitute horizontally integrated
aquaculture, the following section presents a summary of management strategles that meet
the criteria; this may be considered the first step in developing a systems perspective.
Subsequent steps include exploring the relationships between intra-system elements,
leading to context and explanation, assessing functions and controls that govern systems
behaviour, and describing implications and impacts of outcomes (Muir, 1996). The
synthesis of these elements leads to the comprehension of a complete systems context,
allowing areas for prioritisation and choice to be identified, and associated outcomes
predicted.
2.6. Management strategies facilitating horizontal integration
Following the definition in the previous section, Figure 2.1 presents a framework in which
culture systems that fulfil the criteria for horizontally integrated aquaculture are
summarised. Primary aquaculture activities are divided into four types based upon the
degree of connectivity existing between the culture system and the environment: static,
water reuse, flow-through and open. Specific culture strategies that may be considered for
integration with each of the primary aquaculture activities are presented and experiences
with each are reviewed below. The framework in Figure 2.1 includes an indication of
distance from the primary aquaculture activity and a notional boundary to the system in an
attempt to facilitate the development of a spatial context in which to consider horizontally
integrated aquaculture.
59

>1
:5 a, cl
W
0
_c to
V
0
C,, C,,
cd :3 a- ct
V
U
0
öü C.,
.a
cn ci
"Zi
U
F-
"Ci
-0
Z s-
, r. -0
Cý 4-
Z
- Cd =3 -3 C. ) cr cl 03 =s
E 0
rZ 'r -I
60

2.6.1. Polyculture
Polyculture, the practice of stocking multiple species exhibiting different feeding
preferences to exploit all niches within the pond, may be considered the most basic
strategy facilitating horizontally integrated aquaculture. Polyculture practices employing
indigenous fish species have developed predominantly in China and India, to optimise
yields in static ponds where the production of diverse biota may be stimulated through
introducing fertiliser, particularly organic waste. Traditional Chinese approaches are based
on stocking 4-5 species with diverse feeding behaviours to exploit the various nutritional
resources found in managed ponds. Typically these include species that feed preferentially
on phytoplankton (silver carp), zooplankton (bighead carp), macrophytes (grass carp,
Ctenopharyngodon idella), detritus (common carp and mud carp, Cirrhina molitorella) and
snails (black carp, Mylopharyngodon piceus) (Ruddle and Zhong, 1988). There may also
be synergistic effects of stocking different species together, for example, common carp
consuming silver carp faeces, rich in partially digested phytoplankton, may attain a higher
yield than in monoculture, whilst nutrient rich sediments put into suspension by foraging
common carp suppress the development of filamentous algae and higher plants, and
stimulate the production of phytoplankton, upon which the silver carp feed (Milstein,
1992). This author also noted that polyculture may contribute to improved water quality,
with appropriate species used to regulate phytoplankton and macrophyte populations,
contributing to more stable dissolved oxygen regimes, whilst benthic feeders prevent the
accumulation of organic sediments, reducing oxygen consumption and ammonia
production. However, despite the potential benefits, poorly managed or inappropriate
polyculture practices could result in unstable phytoplankton populations, leading to oxygen
depletion, blooms of undesirable algae or competition amongst species for food.
Production rates of 5-10 t ha-1 y-1 have been reported for ponds managed for
polyculture in China (Ruddle and Zhong, 1988; Kom, 1996). However, accounts of recent
61

initiatives, where bream (Megalobrama bramula) and tilapia (Oreochromis spp. ) were
stocked with 6 carp species to enhance production, reported yields of 7t ha-' y-1 (Ruddle
and Christensen, 1993); this is still within the range given for traditional carp polycultures.
When compared to the Chinese system, the greater plasticity in feeding behaviour
exhibited by fish used in Indian polycultures appears to have constrained productivity
(Little and Muir, 1987). The feeding preferences of fish in the Chinese system tend to
mean that particular species forage in different spatial zones, minimising competition for
nutritional resources, facilitating optimal foraging and limiting energy expenditure during
behavioural interactions. Furtherniore, the diversity of fish species stocked in polycultures
may introduce a degree of resilience to disease and market pressures. However, these
potential benefits must be considered with respect to possible constraints, including
restricted access to the required quantity and species of fry for stocking, extra handling
costs during harvest, and poor market value and acceptability of some species (Little and
Muir, 1987).
In geographical locations outside Asia, traditional polyculture practices have not
developed, possibly due to the limited selection of indigenous fish that are cultured.
However, in a number of situations, recent innovations have included culturing chinook
salmon (Oncorhynchus tshawyacha) with Pacific oysters (Jones and Iwama, 1991), shrimp
(P. vannamei) with clams (Mercenaria mercenaria) and oysters (Crassostrea virginica)
(Hopkins, Hamilton, Sandifer and Browdy, 1993), and shimp (Penaeus chinensis) with
hybrid tilapia (Wang, Li, Dong, Wang and Tian, 1998). Culturing bivalves In static water
ponds may contribute to maintaining water quality, particularly in shrimp culture ponds
where the inefficient feeding of shrimp frequently results in dense phytoplankton blooms.
Hopkins et al. (1993) found that DO concentrations in polyculture ponds were
consistently higher than in a control pond stocked only with shrimp. Furthermore, shrimp
production in polyculture and control ponds was similar at 10.6 and 11.5 t ha-1,
62

respectively; however, overall production in polyculture ponds, including bivalves, was
24.7 t ha- I. High mortality rates for clams were associated with seeding juveniles directly
into pond sediments; in contrast, the survival of oysters supported above the bottom of the
pond was significantly higher, although the authors noted that the trays used might
interfere with management procedures on commercial fan-ns. Wang et al. (1998)
investigated using tilapia to regulate the development of phytoplankton blooms in marine
shrimp ponds and optimal stocking densities for shrimp (60,000 ha-) and tilapia (400 kg
ha-1) were reported. A possible problem with this strategy would be the unregulated
reproduction of tilapia; regular netting could be employed to maintain the optimal biomass
or a predatory species could be stocked to control the population (Little and Muir, 1987);
however, the impact of a predator on shrimp culture must also be considered.
Within the definition of horizontally integrated aquaculture, aquatic plants may be
considered as potential candidates for polyculture. Their capacity to assimilate inorganic
nutrients also makes them potentially important as in situ biological filters. McCord and
Loyacano (1978) reported that Chinese water chestnut (Eleocharis dulds) cultivated on
ponds stocked with channel catfish (Ictalurus punctatus), produced -4,660 kg ha-1 of
coryns. The presence of water chestnuts was associated with significantly lower
concentrations of phytoplankton, TAN and nitrate; nutrient removal during the growing
season averaged 53.8,3.4 and 18.6 Mg M-2 d-I for nitrogen, calcium and magnesium,
respectively. The authors proposed that adopting this strategy could allow supplementary
feed levels to be increased, enhancing fish production. However, despite its promise,
possible disadvantages associated with the polyculture of macrophytes and fish include
reduced light penetration into the pond restricting primary production in the water column,
which could limit fish growth and restrict dissolved oxygen levels. Other problems include
potential interference with routine pond management and the possibility that the
macrophytes could harbour fish pathogens or their hosts.
63

An alternative strategy for integrating the production of plants in static water ponds
has developed in association with traditional chinampas fanning systems from
Xochimilco-Chalco, Mexico, where 6-9 m long floating rafts of reed and cattail were
covered with mud and used as nurseries for vegetables (Armillas, 1971). Recent studies
have used rafts made from artificial materials e. g. polystyrene sheets to grow rice, flowers,
vegetables, wheat and fibre producing plants. Preliminary results have demonstrated that
this strategy is technically viable (Song, Ying, Wu, Jin, Zou, Zhu, Zhu, Li, and Li, 2000),
however, the cost of construction materials may constrain development, and the physical
presence of the planted beds may interfere with pond management activities. Fish culture
in rice fields is a widespread and successful example of integrating the cultivation of
aquatic plants with fish. Reviewing the evolution of this practice in Thailand, Little,
Surintaraseree and Innes-Taylor (1996) provide a valuable account of stimuli affecting
development, systems facilitating rice-fish culture and constraints and opportunities for
wider adoption.
2.6.2. Inter-cropping
Polyculture may be used to optimise the use of space and feeding niches in aquaculture
systems, however, inter-cropping facilitates the optimal temporal use of an area (Wenhua
and Qingwen, 1999). The seasonal availability of water in many situations leads to
activities such as fish production being suspended during the dry season, however, during
this period alternative crops such as rice and vegetables may be grown in the bottom of
ponds (Little and Muir, 1987). These strategies do not meet the definition of horizontally
integrated aquaculture; however, valid strategies include culturing air-breathing catfish in
ponds with decreasing water levels following the harvest of the main crop and maintaining
and spawning broodstock in refugia prior to stocking the pond.
64

2.6.3. Horizontal integration in aquaculture systems employing water reuse
Adopting water reuse increases the carrying capacity of an aquaculture facility, reducing
the volume of wastewater discharged and limiting environmental impacts. It also restricts
the transmission of disease between farms, prevents stock escaping, increases the degree of
stock control and facilitates feeding strategies that optimise feed conversion (Muir, 1996;
Blancheton and Coves, 1993). Water reuse systems also conserve thermal energy in the
process water, an important consideration in temperate climates where the cost of heating
water is considerable. However, despite the potential benefits of water reuse in
aquaculture, organic matter, inorganic nitrogen (especially TAN) and carbon dioxide tend
to accumulate in the process water (Muir, 1982) and a lack of effective and economic
treatment options has constrained adoption.
According to van Rijn (1996), incorporating biological processes in process water
treatment, such as those that maintain water quality in fishponds, has considerable
potential. However, earlier studies investigating this strategy, employing ponds and
lagoons as biofilters to treat water for reuse in intensive aquaculture facilities, have not
been successful. Mires and Amit (1992) employed an earthen reservoir stocked with
common carp and tilapia to treat water for reuse in four concrete ponds being used to
intensively culture tilapia; production in these ponds averaged 17 kg M-2 y-1. High
mortalities during the first year were attributed to the proliferation of bacteria
(Streptococcus spp. ). TAN and nitrite occasionally reached undesirable concentrations,
possibly indicating that the 1: 6 ratio of pond to reservoir volume was too low. However,
reporting on the nitrogen dynamics in this combined intensive-extensive system, Diab,
Kochba, Mires and Avnimelech (1992) conclude that although the ponds provided optimal
conditions for nitrification, rapid flushing rates meant anoxic conditions in the reservoir
inhibited the growth of nitrifying bacteria.
65

Neori, Krom, Ellner, Boyd, Popper, Rabinovitch, Davison, Dvir, Zuber, Ucko,
Angel and Gordin (1996) cultivated seaweed (Ulva lactuca) to regulate water quality in an
aquaculture system stocked with gilthead seabream (Sparus aurata) and employing water
reuse; during the two year study, water quality parameters remained stable and within safe
limits. Describing nutrient dynamics in the system, Krom, Ellner, van Rijn and Neori
(1995) report that only 20-27% of nitrogen supplied as feed was present in wastewater
discharged from the culture unit, reportedly less than half the nitrogen discharged from
conventional marine aquaculture facilities. Despite the potential benefits, performance of
the biofilter may be susceptible to variations in temperature, pH and oxygen concentrations
(Dvir, van Rijn and Neori, 1999). Seaweed biomass harvested from the biofilter may be
considered a valuable by-product, however, the capital required to establish the system and
operating costs associated with intensive management and monitoring may constrain
development.
Horizontal integration in freshwater systems employing water reuse is constrained
to a large extent by the market value and demand for species that may be cultured.
Freshwater bivalves and filter-feeding fish have a limited value in most countries where
freshwater aquaculture is undertaken in systems employing water reuse. However, pilot-
scale studies have been conducted regarding the technical viability and treatment
perfonnance of integrating the production of freshwater fish with the cultivation of aquatic
plants, which may be valued for their ornamental or edible nature. Ng, Sim, Ong, Kho, Ho,
Tay and Goh (1990) used giant pondweed (Elodea densa) to remove nitrogenous
compounds from water being reused for aquaculture. Planted tanks reduced concentrations
of nitrate, nitrite and TAN and removed 25% of total nitrogen (TN) from the influent
water. During normal operation, turbidity also decreased. Combining the production of
plants and fish represents a potential strategy for nitrogen removal, facilitating water reuse;
however, the harvest of plants for sale disrupted the perforniance of the filter for 3-4 days
66

(Ng et al., 1990). Cropping plant culture tanks alternately would reduce the possibility of
water quality problems. Redding, Todd and Midlen (1997) examined the effectiveness of
three aquatic macrophytes, emergent watercress (Rorippa nasturtium -aquaticum), free-
floating waterfem (Azolla filiculoiides) and submersed Canadian pondweed (Elodea
nuttallii) to treat water for reuse in culturing tilapia (0. niloticus). Removal rates for TAN,
nitrate and phosphorus were highest in tanks planted with watercress; however, rates of
nitrate removal decreased throughout the study. The authors suggest periodic cropping may
maintain growth rates, enhancing nutrient assimilation. Where watercress is harvested for
sale on a regular basis this would stimulate nutrient uptake, whilst the revenue generated
could offset any associated increase in management costs, although this would depend on
the value of watercress harvested and the cost of labour employed.
L T.. hydroponics
The hydroponic cultivation of macrophytes to treat water in aquaculture facilities
employing water reuse, commonly referred to as aquaponics, has been proposed. Adler
(1998) cultivated lettuce and basil in water being reused to culture rainbow trout; based on
a feed conversion ratio of 1.2 it was estimated that 13-18 heads of lettuce could be
cultivated on waste nutrients released ftom 1 kg of feed. Although Adler (1998) and others
have demonstrated the apparent technical viability of aquaponics, constraints have been
identified i. e. balancing nutrient levels in the system with the nutritional requirements of
plants, preventing the accumulation of salts and controlling disease and pests of both plants
and fish (van Rijn, 1996). Furthermore, waste-flows generated by mechanical and
biological filters in aquaculture facilities employing water reuse require treatment.
Jungersen (1991) found wastewater discharged from fish breeding facilities using water
reuse contained high levels of nitrogen and phosphorus, and most micronutrients required
by greenhouse crops. Based on a pilot-study, it was estimated that nitrogen discharged
67

from a culture unit producing 100 t of eel (Anguilla anguilla) annually, could sustain the
production of 690 t of tomatoes. Despite the potential of aquaponics in assimilating
nutrients from the process water and wastewater from aquaculture systems employing
water reuse into valuable by-products, this strategy does not meet the criteria for
horizontally integrated aquaculture. Plants cultured in the studies described above are not
truly aquatic and therefore their production does not fit with the definition of aquaculture;
furthermore, producing edible and ornamental plants does not capitalise on existing
management skills, infrastructure and markets: the wider objectives of horizontally
integrated aquaculture. However, insights gained from studies involving aquaponics may
assist in designing and managing systems facilitating horizontal integration.
2.6.4. Flow-through horizontally integrated aquaculture
Several authors have described the potential of developing horizontally integrated
production units in wastewater discharged from flow-through aquaculture facilities. The
most widely investigated species group for integration with marine aquaculture are
macroalgae and filter-feeding bivalve molluscs, experiences with each are described below
and the possibility of integrating both is discussed. Other species groups with potential for
horizontal integration with both marine and freshwater aquaculture facilities are discussed
in the following sections.
Macroalgae
Macroalgae has been proposed as a suitable species group for horizontally integration
because they sequester dissolved nutrients, particularly TAN (Vandenneulen and Gordin,
1990; Subandar, Petrell and Hamson, 1993; Neori and Shpigel, 1999). Jimenez del Rio,
Ramazanov and Garcia-Rema (1996) cultured Ova rigida in wastewater from land-based
seabream (S. aurata) culture units and results indicated that 153 in 2 of seaweed cultivation
68

tanks would be required to assimilate discharged nitrogen whilst producing It of fish.
Furthermore, seaweed production, and concomitantly treatment efficiency, decreased
during winter, whilst susceptibility to infections increased. Buschmann, Mora, Gomez,
B6ttger, Buitano, Retamales, Vergara and Gutierrez (1994) investigated using wastewater
from an on-shore facility stocked with Pacific salmon (Oncorhynchus kisutch) and rainbow
trout to cultivate the agarophytic red algae (G. chilensis) in raceways. The authors consider
using wastewater from intensively managed salmonids to cultivate seaweed as an effective
strategy in southern Chile. Seaweed production rates (48.9 kg M-2 y-) were reportedly
higher than those recorded in traditional open systems or tank cultures in central and
northern Chile and epiphytism did not constitute a major constraint; however, the agar
content of the G. chilensis decreased during periods of high growth. Martinez and
Buschmann (1996) found the agar content of G. chilensis cultured in aquaculture
wastewater was lower than plants cultured in fresh seawater. These findings may have
serious consequences for the financial viability of aquaculture operations that integrate the
culture of fish and macroalgae as the value of seaweed is largely dependent on agar content
(Anon, 1996). However, if macroalgae produced in integrated systems are used in the
formulation of feed for herbivorous species e. g. abalone, the nutritional content, as
opposed to the agar content, would also influence the market value.
There are constraints, both financial and practical, that could limit the application
of macroalgae in removing nutrients from wastewater discharged from commercial
aquaculture. Fouling with particulate matter and biofouling with colonising epiphytes has
been reported widely as restricting the production of macroalgae in horizontally integrated
units. Phang, Shaharuddin, Noraishah and Sasekumar (1996) found that production of
Gracilaria changii cultivated in shrimp ponds and an irrigation canal at Morib, on the west
coast of peninsular Malaysia, was severely effected as a result of being heavily infested
69

with epiphytes (Hypnea sp. ). These authors also reported that siltation, wave action and
predation by rabbit-fish (Siganus spp. ) adversely affected the productlon of G. changii.
The turbid nature of wastewater can restrict light penetration into the water column,
thereby limiting primary production. Phang et al. (1996) suggested that turbidity in shrimp
ponds and an irrigation canal restricted the production of G. changli. Faced with this
problem, Briggs and Funge-Smith (1996) recommended pre-treatment of shrimp farm
effluent using either settlement, or bio-filtration using bivalves, as a primary stage for
integrated macroalgae cultivation. Light entering the water column is also rapidly
attenuated in productive cultures as excessive plant growth causes self-shading. Problems
of self-shading and bio-fouling can be limited through intensive management, for example
by frequent harvesting and/or agitation by aeration (Briggs and Funge-Smith, 1996).
However, the cost of labour required to manage horizontally integrated seaweed culture
may represent a substantial burden to the operator, although recent developments e. g.
culturing seaweed in net tubes, as opposed to attaching individual plants to a substrate,
may reduce labour demands (Zertuche-Gonzalez, Garcia-Lepe, Pacheco-Ruiz, Chee-
Barragan and Gendrop-Funes, 1999). Despite additional costs associated with the
integrated cultivation of seaweed, a financial analysis undertaken by Buschmann, Troell,
Kautsky and Kautsky (I 996b) suggested that income generated through sales of G.
chilensis may be significant, making such a venture profitable.
Filter-feeding bivalve molluscs
Turbidity, negatively affecting the growth of macroalgae, may be prevented using a
settlement pond or lagoon to remove particulate matter before it passes into the macroalgae
culture unit. An alternative approach, that develops the concept of horizontal integration a
stage further, is to use filter-feeding organisms such as bivalves to remove suspended
solids whilst at the same time assimilating nutrients contained within the particulate waste
70

(Helfrich, Zimmennan and Weigmann, 1995; Soto and Mena, 1999). However, Briggs and
Funge-Smith (1996) recommend that the wastewater should be pre-settled prior to entering
the integrated bivalve culture to reduce fouling with particulate matter.
Pilot-scale experiments conducted by Lin, Ruamthaveesub and Wanuchsoontorn
(1993) investigated culturing the green mussel (Perna viridis) stocked on bamboo sticks at
a rate of 200-250 and positioned 40-50 cm below the water surface in a drainage canal
carrying wastewater from a commercial shrimp farm in the Upper Gulf of Thailand.
Survival to harvest was 85%, mean individual mussel weight increased from 12 to 42 g and
mean meat weight increased from 7 to 28 g during the 113 day grow-out period. The
potential of another bivalve, the Sydney rock oyster (Saccostrea commercialis), to remove
nutrients and SS from shrimp (Penaeus japonicus) culture wastewater was tested in
Moreton Bay, Australia (Jones and Preston, 1999). Pumping wastewater through tanks
containing oysters (mean individual wet weight 55g) at a density of 0.7 per litre, resulted in
mean inflow concentrations of SS (130 mg 1-1), TN (1.4 mg 1-1) and TP (0.15 mg 1-1) being
reduced by 51,20 and 33 per cent, respectively. Oysters stocked at a density of 0.5 1-1
removed only 36,12 and 17 per cent of SS, TN and TP, respectively. However, the flow-
rate employed is not reported, therefore, potentially useful indicators such as removal rates
per unit time may not be calculated.
Guerrero and Gonzalez (1991) investigated culturing the palourde clam (Ruditapes
decussatus) in wastewater from a turbot farm in Ria de Arosa, Spain. During a6 month
trial, two groups of fifty clams with a total biomass of 1.9 and 6.4 g suspended in
wastewater discharged from the farm increased in weight to 512 and 1,200 g, respectively.
The authors suggested that as only -20-30% of nitrogen and phosphorus added as feed is
assimilated in intensively managed farms, unassimilated nutrients and fish metabolites may
stimulate phytoplankton blooms, contributing to good growth and survival; mortality rates
were below 10%.
71

Shpigel, Gasith and Kimmel (1997) studied the particulate removal efficiency of
equivalently sized (mean wet weight 5 9) oysters (Crassostrea gigas) and clams (Ruditapes
philippinarium) stocked in 14.4 litre troughs receiving 40 1 h-1 of settled wastewater from
ponds stocked with seabream (S. aurata). At densities of 7 1-1, the treatment efficiency for
oysters measured against influent turbidity levels of 47 NTU and chlorophyll a
concentrations of 42 ýt g 1-1, was 87% and 93%, respectively; clams reduced turbidity and
chlorophyll a by 68% and 83%, respectively. With the same total biomass and mean
individual weights, these authors noted that particulate removal by oysters was consistently
more efficient than by clams, and that this was consistent with findings from other studies.
Clam seed (R. decussatus) (mean live weight 0.16 g) stocked at a density of 2.5 kg
M-3 in 560 1 tanks receiving 1,120 1 h-1 of wastewater from a turbot farm in Galicia, Spain,
displayed instantaneous growth rates of 0.036 over 60 days, as compared with 0.001 in a
control tank receiving the same volume of fresh seawater (Jara-Jara, Pazos, Abad, Garcia-
Martin and Sanchez, 1997). During the study, the Condition Index (CI) of seed in the
control tank was lower with a range of 9-12, while that of wastewater grown clams ranged
between 13-19. The levels of all biochemical components measured e. g. total
carbohydrates, total lipids and protein, were higher in wastewater grown clams, as was the
energy content. The CI, biochemical component levels, energy content and survival of seed
cultured in wastewater were also higher than that of seed reared under natural conditions.
The authors attributed better performance using wastewater to continuous
submergence, permitting uninterrupted feeding, as compared with the diurnal tidal rhythm
and fluctuating food supply in natural systems. However, integrating bivalve culture into a
continuous stream of aquaculture wastewater may cause biochemical changes within the
organisms, such as the accumulation of lipids (Jara-Jara et al., 1997), which may affect
processing or consumer acceptance. Continuous submergence may also be accompanied by
increased fouling with solids and colonising species. Therefore, integrati of filter- "on
72

feeding molluscs may be most appropriate for systems with a variable discharge of
wastewater, allowing periodic exposure to the atmosphere, thereby limiting fouling and
predation. However, in culture systems where water exchange is sometimes restricted, such
as shrimp farms at night, it may be necessary to ci in irculate and aerate the water separately i
the integrated culture unit to provide DO and limit fouling (Briggs and Funge-Smith,
1996).
The possibility that shellfish may harbour bacteria and toxic algae, or accumulate
chemicals used to treat diseases and remedy water quality problems, must be regarded as a
potential human health hazard. This may require operators of integrated systems to avoid
chemical treatments in favour of alternative management options and ensure that a period
of depuration is observed. Shpigel and Blaylock (1991) raised concerns that horizontally
integrated bivalve culture could increase dissolved nutrient loadings due to the excretion of
waste products, although in terms of overall mass balance a net reduction in nutrient
loadings would be expected. Therefore, where further reductions in nutrient loadings are
desirable, macroalgae or plant cultivation provides a logical step in developing the
integrated system, examples of which are given in the following section.
Combined bivalve mollusc-macroalgae
Based on a series of pilot studies, Shpigel, Neori, Popper and Gordin (1993) modelled the
perfon-nance of a settlement pond and culture units containing bivalves (C. gigas,
Ruditapes semidecussatus) and seaweed (U. lactuca) in removing particulate matter and
dissolved nutrients from wastewater from a land-based seabream (S. aurata) culture unit.
Fish, seaweed and bivalves were found to assimilate 63% of nitrogen introduced to the
system as feed, deposition in faeces accounted for a further 33 % and 4% was discharged
to the marine environment. Based on nitrogen modelling alone, 3 kg of bivalves and 7.8 kg
of seaweed could be produced through the assimilation of nitrogen released while
73

producing I kg of fish. Although bivalve and seaweed sales could generate income,
viability may be limited by the cost of developing the area required. Prior to applying these
research findings it would be desirable to evaluate the model further, considering the
dynamics of other critical nutrients.
Cultivating hairy cockle (Scapharca inaequivalvis) and seaweed (Gracilaria spp. )
in wastewater from a commercial shrimp farm in Kota Bharu, Malaysia reduced the
concentration of ammonium, TN and TP by 61,72 and 61 per cent, respectively (Enander
and Hasselstrom, 1994). Wastewater was passed through two ponds in series, one (12 in
long, 2.5 in wide, 0.3 m deep) stocked with 60 kg of cockles and one (12 m long, 1.5 in
wide, 0.7 m deep) containing 5 kg of seaweed. Two sets of ponds were operated in parallel
and each received 5.5 in 3 d- I of wastewater. Mean TN and TP concentrations in bivalve
ponds were reduced by 55% and 67%, respectively, whilst seaweed ponds reduced mean
TN and TP concentrations by 36% and 10%, respectively. A mass balance model predicted
that during one month, bivalve production (30 kg) would sequester 260 g of nitrogen and 9
g of phosphorus, whilst seaweed production (60 kg) would assimilate 5g of nitrogen and 7
g of phosphorus. The authors noted that bivalves and seaweed are both potentially useful
products for shrimp farmers, as they may either be recycled for shrimp feed or sold for
supplementary income. Another suggested advantage is that diversifying species may
disperse financial risks associated with fanning shrimp.
Based on previous studies, Shpigel and Neori (1996) proposed integrating the
production of abalone (Haliotis tuberculata), macroalgae (U. lactuca, Gracilaria spp. ),
Manila clam (T. tuberculata) and seabream (S. aurata). A modular design was proposed to
allow operators to focus on particular components depending on the availability of labour
and seed, environmental conditions, market prices and the status of individual components.
Commenting on possible operational demands the authors note that greater flexibility may
74

be accompanied by greater complexity, requiring more skilled labour and sophistIcated
management.
Neori, Ragg and Shpigel (1998) conducted a pilot-scale study investigating one
such modular culture unit. Seaweed (U. lactuca or Gracilaria conferta) was cultivated in
1ý500 1 tanks receiving wastewater from one of two 600 1 abalone (H. tuberculata) culture
units. Seaweed biomass produced was used to formulate a mixed feed for the abalone.
Nitrogen input to the abalone tanks, each stocked with 235 abalone with a total biomass of
2.2 kg, averaged 494 ing per month, of which 62 mg (14%) was assimilated in biomass, at
an areal rate of 105 Mg M-2 d-1,284 mg (59%) was discharged in the effluent, the
remainder was unaccounted for. Production of U. lactuca (initial standing crop 1.5 kg M-2)
averaged 230 g fresh weight d-1, with maximum and minimum values of 412 and 52 g d-1
occurring in summer and winter, respectively. Seaweed harvested from the system
removed 1,621 mg N M-2 d-I , accounting for 34% of that entering the system. Mean annual
specific growth rates for abalone ranged from 0.25-0.26% d-1, compared with 1.16% d-1
reported by Mai, Mercer and Donlon (1996) for H. tuberculata fed with U. lactuca. Poor
growth periods were attributed to competition and high feed conversion ratios associated
with high summer temperatures, perhaps suggesting that the abalone species cultured was
not suitable for the environment. Cumulative annual mortality rates for abalone of 32-39%
were attributed partly to smothering and cannibalism, while handling stress following
stocking and rapidly declining water temperatures during autumn were considered
responsible for periods of high mortality. Growth, and therefore treatment capacity, of G.
conferta was also affected by variable water temperatures, again indicating a lack of
suitability for integration. Although practical management constraints were identified, the
authors note that where integration is not practiced, double the water volume would be
required to supply the separate culture units, nitrogen from abalone culture units would be
discharged to the sea, whilst seaweed cultivation would require nitrogen fertiliser.
75

Despite the apparent benefits of culturing several species in horizontally integrated
systems, prior to commercialisation the conclusions drawn from the pilot studies presented
above will require additional validation and testing under a wider range of environmental
and operating conditions. Horizontally integrated units producing inputs for primary
aquaculture activities e. g. feed or seed, have considerable appeal as they potentially
increase resi ience to external factors. However, management will be subject to similar
constraints to those identified for integrating single secondary aquaculture activities, and a
higher degree of dependence on 'feedback loop' inputs will increase the need for control.
Furthermore, the risk of disease transmission between culture units, both to the primary
culture system from feed cultivated downstream and to seed from the on-growing unit
should be carefully assessed, and where necessary, suitable precautions such as
monitoring, depuration or processing should be introduced to avoid such problems.
Other candidate speciesfor integration
Species other than macroalgae and molluscs, such as microalgae, zooplankton, marine
diatoms, periphyton, aquatic macrophytes and fish may also be considered for integration.
Microalgae
Dumas, Laliberte, Lessard and de la Noft (1998) investigated using a non-toxic
cyanobacterium (Phormidium bohneri) cultured in completely mixed 70 1 photobioreactors
with retention times of 8,12 and 24 h, to remove dissolved inorganic nutrients from
wastewater discharged from two 260 1 tanks stocked with 19 rainbow trout (mean weight
568 g). During a one month period, an average of 82% of TAN and 85% of soluble
orthophosphate at mean influent concentrations of I and 0.12 mg 1-1, respectively, was
removed. However, instantaneous growth rates for P. bohneri of 0.03-0.06 d-1 were only
one tenth of those recorded in cultures receiving cheese factory effluent; this was attributed
76

to higher concentrations of TAN (22 mg 1-1) and phosphorus (15 mg 1-1) in the cheese
factory waste.
Lefebvre, Hussenot and Brossard (1996) batch cultured diatoms in outdoor 16 1
tanks filled with wastewater from land-based marine fish farms. Over 3-5 days -90% of
inorganic matter was removed from the culture water. Diatom growth was limited by
wastewater silicate concentrations, and supplementary silicate (Na2S'03) inputs
significantly enhanced both production and nutrient removal rates. Depending upon the
nutrients present in the wastewater either Skeletonema costatum or Chaetoceros spp.
dominated the batch cultures.
In the study by Dumas et al. (1998) treatment efficiency of P. bohneri was
significantly reduced below 15T, therefore the cost of maintaining a suitable temperature
in the photobioreactor could represent a considerable limitation to this treatment technique
in temperate climates. These authors also found that competition between nitrifying
bacteria and P. bohneri could limit effectiveness. However, it is difficult to assess the
potential effects of grazing and contamination with other algae species on the dominance
and effectiveness of P. bohneri as the investigation only lasted for one month. The
potential affect of chemotheraputants used in the aquaculture facility on microalgae
cultures represents another constraint. Furthennore, retention times employed by Dumas et
al. (1998) and Lefebvre et al. (1996) indicate that development of such approaches for
commercial aquaculture operations will only be feasible where pond-based culture
strategies are developed, similar to those used to culture microalgae commercially in
Australia, America and Israel (Borowitzka, 1993).
Zooplankton
Zooplankton play an important role in the nutrition of various fish and prawn species
(Kibria, Nugegoda, Fairclough, Lam and Bradly, 1997 and 1999). The integrated
77

production of cladocerans, copepods, rotifers or euphausids in aquaculture wastewater
could represent an important source of zooplankton for use as either a live feed for
crustaceans and fish larvae or as a component in a formulated diet. Kibria et al. (1997 and
1999) described the harvest of zooplankton from wastewater treatment lagoons at Werribee
sewage treatment plant, the largest in Australia. Zooplankton (Daphnia carinata and
Moina australiensis) proliferate in the final treatment lagoons and are harvested at a rate of
40-84 kg h-I by filtering the water through screens mounted on a floating platform. The
harvest of 100 kg of fresh zooplankton removes approximately 0.1 kg of phosphorus and I
kg of nitrogen. Furthermore, these zooplankton were found to be rich in protein, essential
amino acids, lipids and phosphorus, and the specific growth rate (2.97), feed conversion
ratio (1.18) and protein efficiency ratio (1.57) for silver perch (Bidyanus bidyanus) fed
frozen D. carinata were not significantly different to those of fish receiving a commercial
diet (Kibria et al., 1999).
Combined algae-zooplankton
Gnudi et al. (1991) cultivated zooplankton (Daphnia spp. ) in sixteen Im deep ponds
(1,200 m2) that received microalgae from cultures produced in four 0.5 m deep basins
(2,000 M2) . The microalgae culture was fertilised with 1.5-6 1 M-2 d-1 of pig manure,
depending on climatic conditions. The dry weight microalgae standing crop decreased
during the 4 month study from 62 mg 1-1 in October to 41 mg 1-1 in January; this was
attributed to lower solar radiation, 940 cal CM-2 d-1 in October as compared with 615 cal
CM-2 d-1 in January, and reduced mean daily temperatures, 12'C in October and 3'C in
January. The dry weight of microalgae transferred to the zooplankton cultures also
declined during the study from 4.4 to 1.6 g in -3 d-1, and in combination with declining
temperatures resulted in mean weekly wet weight zooplankton harvests (40% of standing
biomass) falling from 80 to 28 g M-3 - Groeneweg and SchRiter (1981) fed rotifer
78

(Brachionus rubens) cultures in 50 1 indoor tanks on algae diets produced in shallow 9.7
m2 raceways fertilised with diluted pig manure. Each day 12.5 1 of pond water was
introduced to the rotifer culture, giving a retention time of 4 days. Cultures were produced
containing 200-580 rotifers per ml, depending on the concentration of algal-bacterial
biomass in the pond water, thus:
1.54X - 226.86
where, y rotifers (ml-)
x total SS (mg 1-1)
Schliiter and Groeneweg (1981) described the environmental requirements e. g.
nitrite, salinity, DO and pH for culturing B. rubens; DO levels were considered especially
important, with minimum concentrations of 1.15 mg 1-1 being recommended; below this
reproduction and survival decreased. Although other food sources have been successfully
used for culturing rotifers, those produced with algae diets had a higher nutritive value for
juvenile fish.
Combined algae-bivalves
Hussenot, Lefebvre and Brossard (1998) jnvestigated culturing bivalves (C. gigas) on
microalgal cultures grown in a 1.2 m deep reactor receiving wastewater from an intensive
seabass (Dicentrarchus labrax) farni. A mean dilution rate of 70% was maintained in the
48 m3 reactor. Concentrations of TAN (1.85 mg 1-1) and phosphorus (1.1 mg 1-1) in
wastewater passing through the microalgal reactor were reduced by 67% and 47%,
respectively, however, total pigment concentrations (0.02 [tg 1-1) increased by 1,139%.
Adding sodium silicate to achieve an optimal SIT ratio of 4: 1, ensured that a native diatom
79

(Skeletonema costatum) that had shown good growth in a previous study (Lefebvre et al.,
1996) proliferated, dominating the algal species leaving the reactor to the bivalve culture
unit. Bivalves cultured in 1m3 tanks, receiving 1.2 in 3 d-1 of wastewater and stocked at a
biomass of 424 mg 1-1, removed 50% of total pigments; however, during gametogenesis the
treatment efficiency was lower as food availability was reduced to avoid mortalities.
Although promising, the cost of sodium silicate and a system to regulate and monitor its
levels in the microalgae reactor may prohibit commercial development, and reduced
treatment capacity dunng gametogensis may represent a further practical constraint.
Combined periphyton-fish
The cultivation of bivalves using microalgae suspensions grown on wastewater appears
feasible, however, few freshwater bivalves are commercially important. Edwards and
Sinchumpasak (1981) predicted that culturing tilapia (0. niloticus) in ponds receiving
microalgae entrained in high rate stabilization pond effluent could achieve yields of -20 t
ha-1 y-1; however, fish production in the optimised system proposed by the authors was
subsidised by an area of stabilisation ponds -1.9 times larger than the fishponds.
Furthennore, no trials were undertaken to validate an extrapolated yield of 20 t ha -1 y -1 ,
based on a three month trial, whilst collapses in the stabilisation pond algal population and
early morning oxygen depletion by algal populations in the fishpond were also identified
as possible constraints. Dempster, Baird and Beveridge (1995) reviewed ingestion rates for
tilapia feeding on algae suspensions in laboratory studies and, despite the good growth
reported by Edwards and Sinchumpasak (1981), found the efficiency of this feeding
strategy unable to account for algae volumes in tilapia guts reported in the literature.
Furthennore, a bio-energetic model developed by the authors suggested that tilapia feeding
on only algae suspensions were unable to fulfill basic nutritional demands. It was
concluded that high algae ingestion rates must be achieved by additional feeding on algae
80

aggregates in the water column, gTazing on algae-based detritus, particles covered in
cyanobacteria and periphyton. Trials undertaken by Shrestha and Knud-Hansen (1994)
confinned that 20 g tilapia (0. niloticus) stocked at a rate of 3 M-2 in concrete tanks (2.5 x
2x1.1 m) with five vertical plastic baffles (1.26 x 0.6 in) gazed extensively on attached
microorganisms and detrital biomass. However, comparing average fish production under
these conditions (0.88 g M-2 d-1) with that in tanks stocked at similar rates without baffles
-2 -1 (1.05 gMd) showed no statistical difference. Consequently, these authors concluded
that there was a trade-off between phytoplankton versus attached algae growth, which
accounted for the similarities in net fish yields.
Drenner, Day, Basham, Smith and Jensen (1997) investigated the use of stoneroller
minnows (Campostoma anomalum) and tilapia (Tilapia mossambica) to graze periphyton
growing on porous screens in order to remove nitrogen and phosphorus from wastewater. It
was expected that fish feeding on periphyton would either assimilate nutrients or expel
them in faeces, resulting in the nutrients being permanently removed from the system by
harvesting fish and removing faeces collected in sediment traps. However, TP removal in
tanks stocked with fish (-48 Mg M-2 d-) was considerably lower than that reported in
studies where periphyton was harvested by vacuuming (104-139 Mg M-2 d-1). Three factors
were suggested to account for the observed differences:
fish may be less efficient as they excrete excess phosphorus back into the water;
the low nitrogen to phosphorus ratio in the water used in the investigation, although
equivalent to that in domestic wastewater, may have caused periphyton production to
be limited by the availability of nitrogen and not phosphorus, hence reducing the rate
of phosphorus removal in periphyton biomass;
81

the design of the tanks used in the investigation and the configuration of the screens
within the tanks had not been optimally designed for periphyon growth and nutrient
uptake.
High mortality rates for fish during the trial, which Drenner et al. (1997) attributed to low
temperatures, indicated restricted potential in temperate climates by the limited choice of
cold tolerant fish that consume periphyton. Although the system could be enclosed, or heat
recovery applied to regulate the temperature, this may not be cost effective.
The bamboo-acadja operated in Benin represents an alternative approach for
enhancing primary production in nutrient rich water through the introduction of a substrate
that can be colonised by periphyton (Hem, Avit and Cisse, 1995). In the traditional acadja,
fish are attracted to bundles of twigs placed in coastal lagoons, as they offer protection and
shelter and provide a substrate suitable for the growth of microfauna and periphyton. This
concept has also been developed as a sustainable aquaculture system capable of enhancing
fish production from freshwater ponds in West Africa (Hem et al., 1995). The traditional
acadja resulted in local forests being overexploited, and therefore bamboo has been
introduced as an alternative substrate. When tested in the traditional setting of coastal
lagoons the bamboo-acadja resulted in fish production of between 4-8 t ha-1 y-1 (Hem et al.,
1995). When transferred to freshwater ponds, an annual production of 3.6 t ha-1 was
obtained, a significant improvement over traditionally managed rural ponds -
A similar pattern of development has been observed in Bangladesh where the
principles of the traditional katha fisheries, like the acadja of West Africa, have been
applied to pond-based culture systems (Wahab, Azim, Ali, Beveridge and Khan, 1999a;
Wahab, Mannan, Huda, Azim, Tollervey and Beveridge, 1999b). In ponds containing
bamboo poles at a rate -93,000 ha-1 and stocked with calbaush (Labeo calbasu) at densities
of 10,000 fingerlings ha-1, production over 120 days was 713 kg ha-1, significantly higher
82

than in ponds without substrate (399 kg ha-1) (Wahab et al., 1999a). However, Wahab et al.
(1999b) found that similar densities of bamboo poles (90,000 ha-') in ponds stocked with
rohu at densities of 10,000 fingerlings ha-1, resulted in production dunng a four month
period of 1,899 kg ha-1, compared with 1,089 kg ha-I in control ponds. Despite significant
increases in production in both studies the authors note the need to conduct a financial
analysis to test the appropriateness of the system for rural pond operators in Bangladesh.
Furthennore, Shrestha and Knud-Hansen (1994) suggested that in ponds receiving low
fertillser inputs and where primary production in the water column was limited, the
addition of substrate may facilitate more efficient feeding by tilapia. However, with greater
fertilisation and primary production, fish yields may be as high without using substrates.
Consequently, to fully assess the potential of periphyton-based aquaculture, further
investigation is required concerning the relative trade-off between attached and free-
floating algae biomass in feitilised ponds.
The potential value of periphyton in other production systems, such as pond-based
prawn (Macrobrachium rosenbergii) grow-out, cage-based tilapia (Oreochromis
mortimeri; 0. niloticus; Tilapia rendalli) culture and in rearing catfish (Clarias gariepinus)
fry, has also been reported (Norberg, 1999; Nwachukwu, 1999; Tidwell, Coyle, Van
Arnum and Weibel, 2000). The acadja described by Hem et al. (1995) received organic
inputs as chicken droppings inserted into the top sections of the bamboo poles pushed into
the bottom of the pond. However, nutrient enrichment with wastewater from commercial
aquaculture could be used to stimulate production within a similar system.
Aquatic macrophytes
A number of aquatic macrophytes may have roles in horizontally integrated units for
aquaculture wastewater. Studies have described using aquatic macrophytes to treat
discharges of industrial, agricultural and domestic wastewater (Nelson, Smith and Best,
83

1981; Ghobrial and Siam, 1998; Sun, Gray and Biddlestone, 1998; Griffin and Upton,
1999). Floating aquatic macrophytes such as duckweed (Lemna spp., Spirodela spp.,
Woýffla spp., Wo4fflella spp. ), water hyacinth (Eichhornia cassipes), water fern (Azolla
spp. ) and water lettuce (Pistia spp. ) have received considerable attention due to their high
productivity and ability to grow on turbid waters that would exclude most submerged and
emergent aquatic macrophyes.
Alaerts, Mahbubar and Kelderman (1996) described the treatment performance of a
duckweed-covered lagoon receiving wastewater from Kurnidini Hospital, Mirzapur,
Bangladesh. The 0.6 ha duckweed lagoon was 500 m long, -13 m wide and increased in
depth from 0.4 in at the inflow to 0.9 in at the outflow. On a weekly basis, the lagoon
received -2,000 m3 of pre-settled wastewater, surface BOD loads ranged from 48 to 60 kg
ha-1 d-1, and the retention time was estimated at 20.4 d. Monitoring work over four weeks
in the dry season showed that the lagoon removed 95-99% of BOD and 74-77% of both
TN and TP; during this period duckweed production range from 58-105 kg (dw) ha-1 d-I -
Based on these production data, nitrogen and phosphorus removal in harvested duckweed
biomass was estimated at 0.26 and 0.05 g M-2 d-1, respectively. Annual duckweed yields of
21.2-38 t (dw) ha-1 were extrapolated, equivalent to 261-438 t ha-1 y-1 of fresh duckweed
biomass. Further studies concerning duckweed cultivation employing wastewater resources
described by Edwards, Hassan, Chao and Pacharaprakiti (1992), Oron (1994) and van der
Steen, Brenner and Oron (1998) have confinned the effectiveness of this approach and
suggested that biomass production levels similar to those reported by Alaerts et al. (1996)
may be expected.
Constructed wetlands
The tenu 'constructed wetland' refers to wetlands that are established specifically to treat
wastewater; the majority are planted with either the common reed (Phragmites australis),
84

bulrush (Scirpus spp. ) or cattail (Typha spp. ), and they have been used to treat domestic
and industrial wastewater (Butler, Loveridge, Ford, Bone and Ashworth, 1990; Kadlec and
Knight, 1996). Two hydrological regimes prevail in constructed wetlands, subsurface and
surface-flow. In the former, wastewater percolates either horizontally or vertically through
the substrate-root matrix, whilst in the latter, overland flow dominates. Based on the
assessment of empirical data from a wide range of systems, design parameters for
subsurface and surface-flow wetlands have been proposed (see Kadlec and Knight, 1996).
Constructed wetlands facilitate a range of physical, chemical and biological processes that
remove pollutants from wastewater; these are summarised in Table 2.1. The possibility of
using constructed wetlands to treat aquaculture wastewater has been reviewed (Baldwin,
2000) and studies have been conducted in various settings. Conventional constructed
wetlands have been developed primarily to receive freshwater. However, the saline water
used to culture shrimp has meant that species from mangrove ecosystems have been
incorporated into constructed wetlands (Samocha and Lawrence, 1997; Wilson, 1999).
A subsurface-flow constructed wetland planted with mangrove fern (Acrostchum
aureum) was used at the pilot-scale to treat wastewater from commercial shrimp farms in
Thailand (Sansanayuth, Phadungchep, Ngammontha, Ngdngam, Sukasem, Hoshino and
Ttabucanon, 1996). Results indicated that the wetland. reduced concentrations of SS by
84%, BOD by 91%, total organic carbon by 46% and TN and TP by 48% and 31%,
respectively. Robertson and Phillips (1995) studied the potential of mangroves as filters for
wastewater from shrimp ponds in Thailand. Employing a mass balance analysis they
II excess estimated that the area of Rhizophora-dominated mangrove required to assimilate
nitrogen and phosphorus from 1 ha of semi-intensive (4 PL M-2 ) and intensive (52 PL M-2)
culture ponds yielding 1 and 13.8 t ha-1 y-1, would be 3 and 22 ha, respectively.
Furthermore, the authors report a production rate for mangrove wood of 20 t ha-1 Y- II
therefore, it may be estimated that shrimp production in I ha of semi-intensive and
85

intensive ponds could sustain the production of 60 and 440 t y-1, respectively, of
marketable wood.
Rivera-Monroy, Torres, Bahamon, Newmark and Twilley (1999) estimated that the
potential of a mangrove forest to reduce dissolved inorganic nitrogen in shrimp pond
wastewater was _190 Mg M-2 d-1. Considering typical concentrations of TAN (67 ýtg 1-1)
and nitrate and nitrite combined (34 ýtg 1-1) for wastewater discharged from semi-intensive
(13-24 PL M-2) shrimp ponds on the Caribbean coast of Colombia, the authors predicted
that 0.04-0.12 ha of mangrove would be required to remove the dissolved inorganic
nitrogen discharged from I ha of shrimp ponds.
Robertson and Phillips (1995) noted several practical constraints regarding the
management of mangroves as filters for wastewater from shrimp farms. Mangroves are not
homogenous; their hydrology depends on a number of topographical and other factors e. g.
sediment characteristics, root architecture, canopy thickness and the activity of burrowing
animals. Consequently, it is unlikely that wastewater will be evenly dispersed throughout
the mangrove, potentially causing short-circuiting, and resulting in the assimilative
capacity of certain areas being overwhelmed. Excessive loads of TAN, particulate organic
matter and dissolved organic matter could lead to anaerobiosis within the mangrove
sediments, resulting in tree mortality and negative impacts on benthic fauna, including the
loss of burrowing animals. These authors also discuss the long term assimilative capacity
of mangrove sediments for phosphorus, the influence of different sediment types on the
retention and transfon-nation of nitrogen, and the silviculture practices resulting in the
optimal combination of forest growth and nutrient uptake. They note the need for such
issues to be fully considered.
Brown, Glenn, Fitzsimmons and Smith (1999) investigated using halophytic
species with potential as forage crops (Suaeda esteroa) and oil seed production (Salicornia
bigeloivi and Atriplex barclayana) to remove nutrients from saline aquaculture wastewater.
86

r
ý-4
l--q 03
ti a)
ýl m "Ci
u cn
cl
Z C
C-)
; -T-4
ce
2 cn cli cu ýc zi cli cu "Z =u
ýd- mt 0
0 > "Ci 4ý
rA >
-0 r. -- ýc ý. öü 3 rA Lr, CU rA 0 p. 0 u '
u jý "Z 4 cu
>
ll e -
C)
4-4 Gn (Z cu
"C cn u cu -- 44
u M &) --i
u 2) tu .,.. 4
"C r. m
= Z 0 C -
tu 4 Z g2, Z CD
ce = +ý U > u 4.1 4 ýn 0 0 "C --0
=
cn Cj ce -
0 "Ci 4- cli A
0 u ýc ;j
44 0 n
c
;m ýý 0
-2 ýc ce ýc "a tn Ln
u
4 tu
b :
Co 44 0
ýn r. 4 (D 44 >,
u - ýý . u tr. CD
, m "- u >, =
,Z Z 1 -0 U
4--d 0 Co
r - .ý
Z In .,
2 4
'x ; -Z; ' w Lz r. CU -f 0 "C ,4
C, 3 4-4 ru,
cu N-d 4-1
CKJ " i
ce C -6-,
jo s. 0 u tu "C
CD X u0
ce rA 0 -
ce 0
>Z ce
cu
(D = u cu -q 0
"C 10
ce ce
cli cu ce
ce cu "C CD Q) CD
CD
u u (D M Ln cn
u Cd cu (C
t Cli
> > ce cu
421
cn PZ pý 24
u -0
ýd- 0
C cu ým euý
rn
5 m 0 (Z 0 u
Cý 00
cl
87

Wastewater with salinities of 0.5%o, 10%o and 35%o was used to irrigate lysimeters planted
with monocultures of these species. Hydraulic loading rates were modified in each of the
treatments to meet the demands of evapotranspiration and to ensure that 30% of the
applied wastewater leached from the container. Irrespective of plant species and salinity,
the plant-soil systems consistently sequestered TN and phosphorus at rates of 98% and
99%, respectively, during a4 month trial period. Rates of inorganic nitrogen and
phosphorus removal were slightly lower at 94% and 97%, respectively.
Examining the fate of nutrients applied in 0.5%o and 10%o salinity treatments, only
21% of nitrogen and 15% of phosphorus, were sequestered in plant shoots; the majority of
nitrogen (76%) and phosphorus (84%) was retained within the root-soil matrix or released
as gaseous products of bacterial degradation. Longer-tenn trials could detennine the
ultimate fate of nutrients applied in wastewater as the root-soil matrix may eventually
become saturated, leading to nutrient leaching.
Brown and Glenn (1999) investigated reusing saline (31%o) tilapia culture
wastewater to cultivate S. esteroa, a halophyte shrub with potential as a forage crop. Over
four months, shrubs planted in 0.78 m3 lysimeters (0.76 in deep, 1.02 M2 surface area)
were irrigated with wastewater three times per week at rates ranging from 50 to 250% of
the pan evaporation rate (Epan). Plant biomass increased significantly with higher
application rates: with irrigation volumes of 212 1 (50% Epan) and 1,060 1 (250% Ep,, n)
mean net plant dry weights after four months were 385 g and 694 g per lysimeter,
respectively. However, water use efficiency was lower at 1.7 g 1-1 with an application rate
of 250% Epang as compared with 2g 1-1 at 50%Epan. Nitrogen leaching from the lysimeters
decreased with time and increasing irrigation rates, in contrast leachate phosphorus
concentrations increased with time and higher irrigation rates. Mean nitrate and soluble
reactive phosphorus (SRP) concentration in composite irrigation water samples were 8.8
and 14.6 mg 1-1, respectively. During week 14, with an application rate of 100% Epan the
88

leachate nitrate concentration was 27 mg 1-1, whilst at 250% F-pa,, it was 0.8 mg 1-1; at 100%
Epa,, the leachate SRP concentration was 1.2 mg 1-1, whilst at 250% Epan it was 3.7 mg 1-1.
The authors concluded that where phosphorus is not a limit'ng factor in the receiving
environment, using saline aquaculture wastewater to irrigate halophyte crops is an
appropriate treatment strategy. It was estimated that wastewater from aI ha shrimp pond
(I m deep) with exchange rates of 20% and 70% per week could be used to grow -2.5 and
13 ha of S. esteroa, respectively, at irrigation rates of 250% Ep,,,,. Furthen-nore, these
authors reported that production of S. esteroa (6.9 g m-' d-') irrigated with 1.04 m of water
over 98 days (250% Ep,,,, ) was greater than that of Sudan grass (6.1 g M-2 d-) irrigated with
1.2 m of water.
Aquaculture wastewater treatment and reuse through irrigation could be regarded
as challenging to the definition of horizontally integrated aquaculture; based on the
definition, horizontal integration would only occur if the plants being irrigated were
aquatic in nature. Drawing a distinction between aquatic plants that tolerate drying and
terrestrial plants that tolerate flooding may be difficult; the concept of aquaponics,
cultivating terrestrial plants using aquaculture wastewater in the absence of soil further
tests the definition. However, despite possible problems concerning the delineation of
production strategies that constitute valid approaches to horizontally integrated aquaculture
it was considered important to propose a tentative definition to assist in focusing the
present study on a diverse range of emerging production strategies which have been
developed to address common problems and meet specific objectives. Furthermore,
although the definition appears to exclude apparently closely allied practices, this
demonstrates that the definition may be applied rigorously, contributing to the focus of the
study and consequently the validity of resulting conclusions and recommendations.
Schwartz and Boyd (1995) used reedbeds to treat water from a channel catfish
pond. Two cells, measuring 84 m long and 14 in wide, were constructed in series; the first
89

was planted with California bulrush (Scripus californicus) and giant cutgrass (Zizaniopsis
miliacea); the second with Halifax maidencane (Panicum hemitomon). Hydraulic residence
times (HRTs) of 1-4 days and hydraulic loading rates from 77-91 1 m-' d-1 were tested.
Reductions in waste concentrations ranged from 1-81% for TAN, 43-98% for nitrite, 51-
75% for nitrate, 45-61% for TN, 59-84% for TP, 37-67% for BOD and 75-87% for SS.
The best overall perfori-nance figures were obtained in vegetated cells with a HRT of 4
days; SS, TN and TP mass loadings of 34.6,4.8 and 0.16 kg ha-1 were reduced by 31.4,3.1
and 0.14 kg ha-1, respectively. However, good pollutant removal rates were also recorded
with shorter retention times and when the vegetation was dormant. The authors recognised
that the large area of land required to treat wastewater discharged from aquaculture can be
a limitation. However, using large wetland areas could be justified through the semi-
intensive production of additional crops; for example, fish, plants or crustacea.
Some forms of valliculture in the northern Adriatic, described by Melotti,
Colombo, Roncarati and Garella (1991), utilised wastewater Erom the intensive culture of
seabass (D. labrex) and seabream (S. aurata) to fertilise areas for the extensive culture of
seabass, seabream, mullet (Mugil spp. ) and eel (A. anguilla). The authors noted that the
mean harvest weight for mullet increased significantly following wastewater reuse from
302 g in 1987, to 375 g in 1990; however, at the same farm, mean harvest weights for
seabass declined significantly, from 525 g to 422 g. It was also proposed that wastewater
reuse in extensive culture systems could reduce coastal zone pollution, although no change
was recorded in nutrient levels in neighbouring coastal waters.
Where constructed wetlands for primary aquaculture wastewater treatment are
prohibited by physical or hydrological constraints, development of smaller constructed
wetlands could assist in managing sludge produced following treatment using conventional
approaches. Nielson (1990) incorporated common reed (P. australis) in a conventional
unplanted drying bed for concentrated domestic sludge and concluded that this increased
90

the rate of de-watering and mineralisation. The potential of using vertical and horizontal
flow wetlands planted with vetiver grass (Vetiveria zizanioides) to treat backwash water
from filters in an aquaculture system stocked with trout and employing water reuse has
been described (Summerfelt, Adler, Glenn and Kretschmann, 1999). Sludge was applied to
the wetlands at a rate of - 13.5 1 M-2 d-1 or 30 kg dry solids M-2 Y- 1. Vertical and horizontal
flow wetlands removed 98% and 96% of SS and 91% and 72% of COD, respectively.
Concentrations of TN, TP and dissolved phosphate were reduced by 82-93% in both
wetland types. Mineralisation in the wetlands was also significant, with total volatile solids
in the sludge reduced by 50%.
Aquaculture sludge reuse in agriculture
The use of sludge, produced dunng the treatment of aquaculture wastewater, to fertilise
agricultural crops has been proposed (Bergheim, Cripps and Liltved, 1998; Chen, 1998).
However, this strategy fails to meet the proposed definition of horizontally integrated
aquaculture. Reuse of sludge and wastewater from aquaculture facilities as production
enhancing inputs to other aquatic systems would meet the definition, and the use of
enriched pond water to irrigate rice fields that may be used to raise fish has been described
(Little and Muir, 1987).
2.6.5. Open horizontally integrated aquaculture
The potential for self-pollution in aquaculture is greatest in open production units e. g. cage
and pen systems, situated within the ecosystem to which they discharge waste. Costa-
Pierce (1996) describes how waste collected under lake-based trout cages could be pumped
on to the land to facilitate environmental enhancement through the creation of wetlands
and the rehabilitation of eroded hillsides. This may be suitable for cages in lakes or
sheltered coastal locations close to land, where topographic and nutrient load conditions
91

are suitable, but is unlikely to work for cages in exposed or offshore settings or where the
additional nutrients may overload terrestrial systems. In addition to regular maintenance,
the pump-ashore facility would require a localised energy source, a possible constraint at
isolated sites. Furthermore, capital costs of infrastructure for collecting and transferring
waste matter and constructing the wetland may deter commercial development. As a
complementary approach to this system Costa-Pierce (1996) suggested that a secondary
enclosure stocked with unfed baitfish could be positioned around the grow-out cages, and
that this ecosystem enclosure would capture fine particles and dissolved phosphorus
released from the grow-out cage. Fish produced could then be either sold or released to
enhance capture fisheries.
Troell, Halling, Nilsson, Buschmann, Kautsky and Kautsky (1997) integrated
cultivation of G. chilensis on ropes close to cages producing salmonids (0. mykiss and 0.
kisutch) in Chile. Extrapolated yields indicated that I ha of G. chilensis cultivated in this
way had the potential to remove 5% of the dissolved nitrogen and 27% of the phosphorus
released from the cages. However, an economic analysis of the proposed system was not
undertaken, leaving its commercial viability uncertain. Petrell, Mazhari Tabrizi, Harrison
and Druehl (1993) developed a bioeconomic model for the integrated culture of kelp
(Laminaria saccharina) in coastal waters close to a 12 cage salmon farm producing 250 t
Y-1. It was predicted that a kelp farm consisting of ten 60 m long ropes would produce 1.6 t
Y-1 of dried seaweed, furthermore, based on an initial investment of -61,000 Canadian
dollars 2a pay-back period of 6 years was estimated and the net present value of the
enterprise was positive at rates of return up to 25%. The authors also estimated that with
typical current velocities on salmon fanns of 0.1 in s-1 and critical oxygen concentrations
of 5 mg 1-1, oxygen consumption in the kelp farm (0.026 mg g-1 h-) would account for less
than 1% of the available oxygen.
1 Canadian dollar = US$1.19; May 1992 (Petrell et al., 1993)
92

Stirling and Okumus (1995) studied the growth of mussels (Mytilus edulis)
suspended from sea cages containing Atlantic salmon in a loch on the west coast of
Scotland. The growth of mussels was related to temperature and food availability and
consequently showed a clear seasonal trend, being relatively rapid from May to October
but significantly slower during the rest of the year. Mussel growth near to salmon cages
was better than that at a neighbouring shellfish fann, probably due to the higher
concentration of suspended organic matter at the cage site. However, in temperate
climates, the seasonal growth of shellfish may limit their effectiveness as bio-filters.
Despite the apparent benefits of integrating the culture of both seaweed and shellfish with
open aquaculture systems, little empirical evidence is available to confirm practical
application and economic performance (Buschmann, Lopez and Medina, 1996a).
Ranching
Thorpe (1980) stated that salmon ranching may be defined as: "an aquaculture system in
which juvenile fish are released to grow, unprotected, on natural foods in marine waters
from which they are harvested at marketable size". In addition to feeding on natural biota,
fish stocked as part of a ranching programme could feed directly on waste feed and faeces
discharged from aquaculture facilities. Johansson, Hakanson, Borum and Persson (1998)
studied the fate of indicator particles contained in commercial feeds given to rainbow trout
cultured in a commercial farm in Lake Southern Bullaren, Sweden. Results indicated that
wild fish consume a significant proportion of faeces expelled by cultured fish. Therefore,
fish stocked close to a cage facility as part of a ranching programme may be expected to
exploit this source of nutrition, assimilating nutrients and reducing the impact on
underlying sediments. The foraging behaviour of grey mullet (Mugil cephalus), stocked
into open-bottom cages on the seabed, significantly improved the quality of sediments
below a commercial cage farm in the northern Gulf of Aqaba, Eilat (Porter, Krost, Gordin
93

and Angel, 1996). After a period of seven weeks, the proportion of organic matter and
redox potentials in sediments below the farm returned to levels comparable to an
undisturbed reference site. Furthermore, despite the foraging of the mullet, the invertebrate
assemblage in sediments below the cage shifted from a mono-specific population of small
nematodes to a mixed community of nematodes and polychaetes; a diverse macrofauna
assemblage consisting of nematodes and polychaetes was observed at the reference site.
Several factors could constrain the adoption of ranching; unrestricted movement
may lead to the species stocked avoiding heavily impacted sites, and therefore potential
benefits, such as those reported by Porter et al. (1996) may not be realised. Species being
ranched may also range widely, however, optimal foraging theory suggests that this
freedom-of-movement may assist in optimising the assimilation of nutrients from the
receiving enviromnent. Containinent strategies, such as bubble curtains and behavioural
conditioning, could be employed to prevent animals being ranched from leaving the
immediate vicinity of the fann site. However, such approaches are likely to be expensive
and difficult to manage. Problems with retaining stocked species close to aquaculture
facilities indicates that organisms which are largely sessile in nature, e. g. scallops, have the
greatest potential as candidate species for horizontal integration through ranching.
Deliberately stocking species in aquatic ecosystems to induce changes in ecological
processes, ameliorating negative environmental impacts, is a key element to
biomanipulation. Approaches to biomanipulation include: introducing predatory fish, or
suppressing zooplanktivores to increase phytoplankton grazing by zooplankton;
encouraging filter-feeders, reducing the seston. concentration; introducing herbivores to
increase the conversion efficiency of primary production and promoting populations of
organisms which are readily consumed by fish (Mapper, 1991). Despite several examples
where the biornampulation of fish populations has produced significant improvements in
water quality, several constraints to this approach have been identified. Suppressing
94

populations of fish, particularly small species and juveniles, is labour intensive and
difficult to maintain (Moss, 1992) and grazing pressure from the increased population of
zooplankton may lead to the selection of undesirable phytoplankton species. Furthennore,
unless nutrient levels in the water-body are permanently reduced, any improvement in
water quality will be unsustainable and the ecosystem will tend to revert to its original
trophic state. The removal of nutrients by harvesting species stocked in aquatic ecosystems
has been considered to a limited extent. Fichtner (1983; cited in Klapper, 1991) described
how harvesting grass carp stocked in a weed-infested lake removed 5-10% of the
phosphorus from the water-body. Beveridge (1984) reported that operators of a Scottish
cage farm producing 200 t y-1 of rainbow trout recovered 10 t of escaped fish using nets,
whilst anglers caught a further 2.5 t; this generated income for the farm through increased
sales and angling revenue and reduced the annual phosphorus load to the lake by 1.3%.
To be considered within the definition of aquaculture (FAO, 1995) operators
engaging in ranching must retain ownership of organisms being cultured. Ownership may
be difficult to establish unless the stocked species can be identified e. g. by using tagging to
identify populations of scallops, lobsters and fish. Previous studies concerning ranching
can be used to identify high potential management strategies and suitable species for
ranching. However, concerns regarding the impact of introducing non-indigenous species
may restrict ranching operations to using native species or organisms originating from
local populations. Harvesting may also require operators to invest in suitable equipment
and develop new skills. Furthermore, operators may face problems in obtaining exclusive
rights to harvest the ranched species. Exclusion of other actors from the fishery may be
difficult, especially where commercial fishing operations are established. Although
ranching has the potential to enhance commercial fisheries, there may be little incentive to
invest unless mechanisms are developed that allow operators to benefit from increased
catches. A potential strategy might be to transfer revenue generated through the sale of
95

rights to enhanced fisheries to aquaculture operators engaged in ranching. However, this
would cause conflicts where access to the fishery changed. An alternative strategy would
be for the operator to trade-off enhanced nutrient assimilation through ranching against a
permit to discharge nutrients, with any surplus being traded with other operators.
Artificial reefs
Employing artificial reefs to remove nutrients from aquatic ecosystems is closely related to
ranching as a strategy facilitating horizontal integTation in association with open culture
facilities. Laihonen, Hdnninen, Chojnacki and Vuorinen (1997) outlined the theory of
removing nutrients from aquatic ecosystems using artificial reefs. These represent an
increased area capable of supporting colonial organisms and other assembelages e. g.
grazers and predators. The growth of these assimilates nutrients in biomass that may be
harvested, resulting in a net removal of nutrients and output of value from the ecosystem.
Laihonen et al. (1997) reported the effectiveness of using a variety of artificial reefs to
remove nutrients from the Baltic Sea, proposing that sessile filter-feeding organisms and
aquatic plants that are capable of efficient and rapid assimilation of dissolved nutrients are
likely to be most promising. These authors used concrete pipes (0.6 m diameter, Im long)
to construct star, tube and pyramid shaped artificial reefs at depths of 9-12 in in both
inshore and offshore locations in Pornerian Bay, Poland. Offshore, colonisation of the star
shaped reef was highest at 216,030 individuals M-2 ; inshore the highest settlement level
(112,500 individuals M-2) was observed on the pyramid reef Mussels (M. edulis) and
barnacles (Balanus improvisus) dominated both reefs. The filtration rate of the organisms
colonising the reef was estimated at 5,500 m3 m-2 y-1. The authors linked colonisation. of
the artificial reefs in Pomenan Bay with increased visibility, rising from 2-5 in in June
1991, to 5.5-7 in in October 1993, and decreased nitrate concentrations, falling from 0.5-2
mg 1-1 to <0.5 mg 1-1 during the same period. However, data from control sites and
96

monitoring prior to establishing the reefs was not presented, making it impossible to assess
the influence of the reefs with respect to regional water quality trends.
Several factors require to be addressed when considering artificial reefs (Lalhonen
et al., 1997). The physical, chemical and biological conditions at the site must be assessedq
temperatures should be high enough to allow a reasonable level of biological activity, light
penetration into the water colurnn should be sufficient to allow photosynthesis and
nutrients circulating around the reef should be readily bio-available. The reef should also
be positioned as close as possible to the nutrient source as the dilution of nutrients will
reduce the removal efficiency of the reef system.
The dispersal of waste discharged from open culture systems e. g. cages and pens, is
a dynamic process and depends upon a range of factors. The physical properties of the
waste, the topography and composition of the substrate underlying the site, tides and
currents that affect the hydrology of the site, and the interaction of natural biota all
influence the ultimate dispersion pattern. Detailed information is therefore required to
produce a reliable model of expected dispersion, thereby allowing the horizontally
integrated culture unit or artificial reef to be positioned correctly.
2.7. Evaluating the potential of horizontally integrated aquaculture
Table 2.2 presents a summary of information concerning the range of strategies
investigated or demonstrating potential for horizontal integration with semi-intensive and
intensive aquaculture. However, there are few examples of full-scale systems associated
with commercial aquaculture. Therefore, in addition to the technical constraints, financial,
economic, managerial, social, institutional and environmental factors also require
consideration. These issues are discussed further in subsequent chapters.
97

0
Cd
a) cl cd (1) 4) >
p 1) tQ ý ýEý ý -S a) ýz 7ý 0
p 64 0V C13 Cd >v 0 Cd co cd as 0 4Eý ; -4 cl V) ý-4 a) Ln
cd ti) cd
v '5 0u ý-4 rA a) cn r. cd
(U 0W Cd iý
oh (L) +ý (-r-4 En rA
4- V) 1-4 4- En V) 4-4 C) ý Q) 0
s. 4 0 cl uU 03 (4; ý 0
ýý : Ll 4ý ý-4
10
A -,:: ý -2 0u cn
ýc . 4- V cl (D r. ýý -ý U 0fr.
4.0 rA (:: ) 1-4 0ý00
to 9 Z
r, 4.0) 'Cý --4 a) (4; > 0 4.1 ;3
cd v cd Cull
40 uVV
vU C13
m Cd 0
I. - to
u CA C, 3
u vu0u
u a) cl cd U-vr.
1-5
VV ýj (D -0 > C, 3 in. > +-j 41 u0C,
3 rA 64 4-
ja4 v>0 4-04 rCý. l
v
0 cd
u 4.1
-4 0 cn 0v V) 4- Cd 9: 14 V
i ýý '0 r. 14 4)
0 (n m (1) u lci 1v0 (A .ý -Q u C, 3 cl tn
1m Pý
cii u U)
V) C) -4- ý3 bj) C, 3
0
Cd CA
!ýP. 42,0. ) . tý ýa -z! vs r. b C, 3 ý: s I.. ý: 2 C's Cl 4. ) r-., q u ':: ý cy, tv (1)
V +ý -4
cu C's u cd C-) C13 ýs 0 t4; 74 -- (1) cl
0 -15 (1. ) C-/)
-" i t.;,, u -0>, ý: s c -0 (n 'r., 03)
,0-, Uj ýL ZR
0 "') 0U, - 'D
.30v0 -tp 0 to 9-mo
$5. -
rý t4;; 0
Cd C, 3 C, 3 >,. o
r0 i-, c0u.. C) cl, 4- " -ý 'cj
ý, 3 C, 3
Cd C, 73 03
64 cl Cd 7ý ---4 (1) ý: Ln
I
"Cý -R4:
1 te b -0 C, 0tpý: v
bo Q) -4 0
1ý &u,
-ý v. "0
404 0 Cd 404 u Cd Cd
Cd 0
0 1, ý, m 'a to
> 1-4 Cd Ici
64 ? 48 0
46
ý01ý bD EMmý "I I P. 0>> U3 V) 00 Cd 0 +ý
(1) u cd N)
Cd cl -4 Cýd !ýý:
""0>> Cd
i r4 00 V) bi)
-4
>CU P4
; -4 L) Cd v) --4
-CJ 0 u
C's as > cl >
as U cis ; -4 M 03 o 64
a) Cd cl C) cd cd
cl P-4 u.: 10 Pý rA
41
ý3 46
>N 'o 1v :3 (D 0u V) ýs z as "
C) P, 0 cl
03 V
M-
C', 4- Q. ) 4ý
cz u
98

Chapter Three
Modelling horizontally integrated aquaculture: a smolt farm,
constructed wetland and trout fishery
1. Introduction
This chapter describes the development of the 'ADEPT' (Aquatic Downstream Ecological
Production and Treatment) model that was employed to assess the treatment effect,
management demands and financial implications of conventional aquaculture wastewater
treatment strategies and horizontally integrated systems. The rationale behind the adoption
of a modelling approach is explained and the methodologies used in constructing the
model are presented. The majority of studies reviewed in Chapter 2 were conducted as
pilot studies and assessed only the fundamental aspects of horizontally integrated
aquaculture i. e. nutrient retention, treatment effect, species specific performance and
production. Few studies have attempted to evaluate these physical parameters in
association with managerial and financial indicators. Studies assessing strategies for
horizontal integration employing models have, however, provided an insight to the
functioning of different strategies under various operating conditions.
Bodvin, Indergaard, Norgaard, Jensen and Skaar (1996) present a linear model
based on mass-balances of N and P in a hypothetical system that integrated the production
of salmon, seaweed and mussels. Employing data ftom field trials, laboratory studies and
the literature it was estimated that 112.5 t of mussels would be required to adequately filter
60 111 1 min-' of water used to produce 300 t y-1 of salmon; it was estimated that the salmon
99

culture wastewater contained 15 t of N and 2.4 t of P. Considering nutrient dynamics in the
mussel culture unit it was predicted that 0.5 t of N would be assimilated and 0.6 t removed
through sedimentation; the removal of P via these processes was estimated at 1.2 t. It was
estimated that a standing stock of 45 t of seaweed would be required in the final integrated
unit to sequester the remaining 13.1 t of N from the mussel culture wastewater, however, at
this standing stock only 0.68 t or 57% of the remaining P would be assimilated. Although
this approach provides guidance for potential operators of such systems, the sensitivity of
the modelled system to different operating conditions was not tested and the model
remains to be validated.
Ellner, Neori, Krom, Tsai and Easterling (1996) developed a model using
FORTRAN to simulate TAN and total oxidised nitrogen dynamics in a seaweed (U.
lactuca) biofilter treating water from a recirculating seabream (S. aurata) culture unit.
These authors found the model able to predict the response of an experimental system (see
description of Krom et al, 1995 and Neori et al. 1996, Chapter 2) to changing hydraulic
loading rates and feed inputs. Troell and Norberg (1998) constructed a model employing
STELLA to simulate the retention by mussels of particles discharged from 68 salmon
cages producing 136 t y-1. Based on production data from Chilean salmon farms, values
from the literature for the output of particles from cages and an equation for particulate
uptake by blue mussels (M. edulis), the model predicted the effect of changing fish size
(after 92,183,274 and 365 days of cultivation), feeding regime (demand or pulsed
feeding), and current speeds (0.03,0.05,0.1 and 0.15 in s-) on particulate retention by
mussels with a mean individual weight of 25 g, stocked on ropes at a density of 0.5 1-1 in a
50 m long culture area. From the various simulations these authors concluded that
particulate output from salmon cages would only stimulate mussel growth when ambient
seston concentrations were low. However, no fieldwork was undertaken to validate the
model.
100

Findings from a modelling exercise, conducted by Petrell et al. (1993) using a
programme written in Turbo-C, to assess the potential of integrating kelp with salmon
culture in coastal waters were described in Chapter 2. However, subsequent to this study
Petrell and Alle (1996) produced a Quattro Pro spreadsheet-based bioeconomic model for
the system, permitting the inclusion of biological, physical and financial variables, which
facilitated a simultaneous assessment of productivity, nutrient assimilation and technical
and financial viability. Following a comprehensive review of the role of modelling in
managing and planning aquaculture systems, Leung and EI-Gayar (1997) concluded, that
of the approaches considered, "bioeconomic modeling ... offers the greatest potential for
the development and planning of sustainable aquaculture. "
3.2. Formulating the bioeconomic model
The ADEPT bioeconomic model was developed using 'Excel, a widely available
proprietary spreadsheet package. This application offers a range of facilities such as
Boolean logic functions, financial accounting, macros and graphical presentation options
that were considered useful in formulating the model and presenting outputs. The first
stage was to develop a conceptual framework that outlined the relationship between inputs,
stock dynamics, wastewater outputs, treatment, downstream production, costs, returns and
financial indicators. This framework was employed as the front page to the model,
providing an accessible user interface (Figure 3.1). A flowchart on the front page contains
information concerning the function of the main pages in the model; macros associated
with each enable navigation to the other pages, printing of selected pages or access to
graphs showing model outputs.
Within the Inputs page, the user is required to enter basic managerial and financial
infori-nation that should be readily accessible. Other arrays within the page pen-nit the
'Microsoft Excel Office'97 version of the ADEPT model for this case study provided on the disk included. 101

selection of methodologies for simulating waste outputs, and allow the user to configure
the treatment system using any combination of the strategies supported. Input variables
concerning the stocking regime, feeding rate and expected FCR's are then imported to the
Stock model page pennitting the mean monthly smolt biomass to be estimated. The stock
model, together with data on water temperatures, flow rates and information on the feeding
regime and feed composition is used in the Waste output page to simulate mean monthly
waste discharge concentrations of SS, TAN, BOD, DO and TP in water passing through
the culture unit. These waste fractions were selected as they are commonly stipulated for
aquaculture discharge consents. The mass balance of TN in the smolt unit and horizontally
integrated units was simulated to assess the possibill 1 ion. ity that it may I'mit P sequestrati
Mean monthly waste concentrations from the Waste output page are imported to the
Treatment page where, based on the expected flow rate and wastewater composition, the
selected treatment strategies are dimensioned. Depending upon the type and order of
treatment strategies selected in the Inputs page, the model uses a simple sub-routine to
configure the required treatment system. The expected performance of these treatment
strategies is used to estimate changes in the mean monthly waste concentrations. Where
downstream production systems are selected, the Horizontal integration page uses either
values inputted by the user or pre-defined rates to estimate the productivity or amenity
level generated. Using values from the Inputs page and, where appropriate, quotes from the
literature or key informants, the Costs page estimates the financial implications of
developing and running the proposed treatment system. Cost estimates are imported to the
Cost return page and together with estimates of the income generated by activities outlined
in the Horizontal integration page, are used to calculate key financial indicators such as
profit, rate of return on capital and operating costs and payback period. Cost and return
data, together with user defined depreciation periods for equipment and infrastructure, are
imported into the Cash flow page. Where the Net Present Value (NPV) of the investment
102

and Internal Rate of Return (IRR) are calculated. Finally, key indicators from each of the
pages are summarised in the Outputs page. Further details of the methods and approaches
employed in constructing the ADEPT model are described in the following sections.
Microsoft Excel - ADEPTAS
Eile Ldtt View Insert Format Tools Data Window Help
Aý Z a og 69%
SM Times New Roman -10- 111 u KEMWýfflw%, +. 00 PZ"17 . 00 ;. "S =. ý =ý. . 00 ,&ý,
Inputs Summafises input variable reqUiFed:
input information required by the ADEPT model
Wastewater treatment Calculates the percentage reduction in waste
fractions achieved by the ADEPT system:
the performance criterion for the user defined system should be entered here.
JIL Is
43
JI JIL
Stock model DeSCFibes the stocks biomass ovei one year
if known, the exact biomass held on the farm can be entered on a monthly basis
J; Wastewater output
Calculate* the concentrations of waste fractions in the wastewater from the *molt unit:
if known, exact concentrations can be entered
Horizontal integration Financial considerations Estimates the biomass and value of PFoducts hom Calculates the capital costs and operafing costs of
the ADEPT system: adopting the ADEPT system:
the cost of seed, fates of production OF the value of products the majority of these costs are based on information provided and angling can be entered if known -(-3--1 in sections 6 and 8 of the Inputs page Z
Cost return Presents an outline of the initial costs. annual operating costs, income generated and some
general financial indicators:
no inputs are required here
Cash flow Displays the projected cash flow during the first ten
years of operation:
discounted cash flow is used to calculate the Net Present Value (NPV) and Internal Rate of Return (IRR) M
Z 190
Outputs Presents a summary of outputs from the scenario
modelled:
outputs include treatment effect, physical characteristics and financial and economic indicators IM
SO
44ý ýj \Front page ý Inputs ý Outputs / Stock model / Waste output / Treatment / Horizontal integration Ready NUM
Figure 3.1. Conceptual framework and user-friendly front page for the ADEPT bioeconomic model.
103

With a suitable level of validation for discharge loads expected under normal operating
conditions, it was proposed that the model would constitute a useftil tool for simulating the
performance of a variety of treatment systems required by the user. Therefore, to test the
model, the simulated composition of the smolt unit wastewater and predicted treatment
effect of a drumfilter, were compared with samples collected from a commercial culture
unit in central Scotland. The simulated reedbed treatment performance was compared with
monitoring data from the treatment wetland run by the Wildfowl and Wetlands Trust,
Slimbridge; this system operates under similar conditions to those envisaged for a reedbed
receiving aquaculture wastewater. The treatment performance of the recreational trout
fishery was compared with observations made at a commercial system. It was also
anticipated that bioeconomic modelling would enable the assessment of the sensitivity of
predicted outcomes to changes in selected input variables, giving insight to the likely
impact of revised design, management, environmental, financial or regulatory parameters.
The outcomes of this analysis undertaken using the ADEPT model are presented in Section
3.7.
In addition to assessing the treatment performance of the proposed wastewater
management strategies, key financial indicators such as profit, annual rate of return on
capital and operating costs and payback period were calculated for each strategy. A
discounted cash flow approach following conventional procedures was used to calculate
the NPV of the investment at discount rates of 5,10,15 and 20 per cent and ERR over 10,
20 and 50 years. Other key indicators, such as the physical area required for the treatment
system per unit production (M2 kg-') and the nutrient assimilation capacity of the integrated
production units, were also used to assess the overall performance of the selected treatment
strategies. Social, economic and envirom-nental benefits that may be associated with each
of the treatment strategies are discussed and potential constraints to development
identified.
104

3.3. Case study development
The ADEPT model was used in this case study to assess the treatment performance,
productivity, income generating potential and financial implications of horizontal
integration for a smolt farm in Scotland. Three scenarios in which the wastewater stream
was derived from a commercial unit producing 100,000 smolts y-1 were used:
-a conventional approach to treatment employing a propriety drumfilter,
- treatment with a surface-flow reedbed planted with the common reed (P. australis),
- treatment including a recreational trout fishery followed by a reedbed.
The first scenario was selected to establish a baseline as drumfilters are employed on a
number commercial smolt farms in Scotland 2. However, as discussed in Chapter 1,
although conventional treatment technologies can remove specific waste fractions,
settlement and mechanical filtration are inefficient in removing small particles and
dissolved substances, i. e. TAN and ortho-phosphate, from the large volumes of wastewater
generated by commercial aquaculture. Therefore, the second scenario was proposed as
reedbeds have proved effective for the tertiary treatment and "nutrient polishing" of
domestic wastewater. Several studies have focused on exploiting natural processes
occurring in aquatic ecosystems such as lagoons, ponds and constructed wetlands to treat
these waste fractions. Constructed wetlands planted with common reed have been used for
the tertiary treatment of wastewater ftom several rural sewage works in Scotland and
England (Bayes, Bache and Dickson, 1989; Chalk and Wheale, 1989; Upton, Green and
Findlay, 1995; Clelland, 1998). Furthermore, constructed wetlands employed by
Sansanayuth et al. (1996) and Schwartz and Boyd (1995) to treat wastewater from
aquaculture facilities have been described in Chapter 2. Although it was assumed that reed
2A hard copy of the ADEPT model outputs for this scenario is given in Appendix 1. 105

biomass produced in the wetland would have value as an energy crop, it was anticipated
that financial returns from this activity would not be sufficient to offset development costs.
Therefore , in the third scenario a recreational trout fishery was included to facilitate further
cost recovery; diversification in such a way would capitalise on the knowledge and
experience of smolt farm managers concerning fish husbandry and water quality
management.
Although, lagoons and settlement ponds have been employed to treat wastewater
and sludge from a number of commercial aquaculture units (Henderson, Bromage and
Watret, 1989; Hennessy, 1991; Chen, Ning and Malone, 1996; Teichert-Coddington et al.,
1999), validated design equations based on treatment performance for aquaculture
wastewater have not been defined. Therefore, for both the reedbed and trout fishery
expected treatment performance levels are estimated using a series of empirical models
proposed by Kadlec and Knight (1996) for surface-flow constructed wetlands.
3.4. Simulated commercial smolt production
The first step in applying the model was to establish basic operating parameters for a
representative culture facility, including current stocking and feeding regimes, expected
FCR's, feed composition data, flow rates and temperatures for abstracted water and
baseline financial data. This was achieved through a series of consultations with managers
of a farm in central Scotland, as shown in Table 3.1. The model farm produces 100,000
salmon smolts (S. salar) annually; process water for the smolt unit is abstracted from a
stream at an average rate of 3,400 rn 3 d-1 and following treatment, wastewater is discharged
downstream. This baseline was used in all three scenarios to simulate a realistic stock
model and estimate waste concentrations in the used culture water.
106

3.4.1. Stock model
The stock model estimates the mean weight of fish held at the unit on a monthly basis,
enabling the model to simulate the relationship between changing stock biomass and waste
output. Information was obtained in preliminary interviews on anticipated biomass at
harvest, feeding regimes, feed composition and expected FCR's (Table 3.1).
Table 3.1: Physical parameters and management details for a commercial smolt unit.
Parameter .................................... ........... ................................. ............. . ..................... -................................ ..........................................................
Value .............................................. ........... ............. . ............ .-.........
Units .......................................... ............................
Stocking date April
Culture period 12 Months
Number of fish at harvest (May) 100,000
Mean weight of individual fish at harvest 70 9
FCR 1.2
Maximum feed input 4 % body weight d-1
P content of feed 12 g kg-1
N content of feed 72 g kg- I
Dry matter content of feed 950 g kg-1
Average flow rate through the culture facility 3,400 m3 d-1
Based on the weight of fish at harvest, feeding rates and FCR, the model predicts the
biomass on the farm during the culture cycle, thus:
b(, ) = [(FCR-1 xfx n)/ b(e) + b(e)-11-1
where, b(, ) biomass at start of month (kg)
b(e) biomass at end of month (kg)
FCR = Feed Conversion Ratio
f feed input (% body weight d-)
n number of days in month.
107
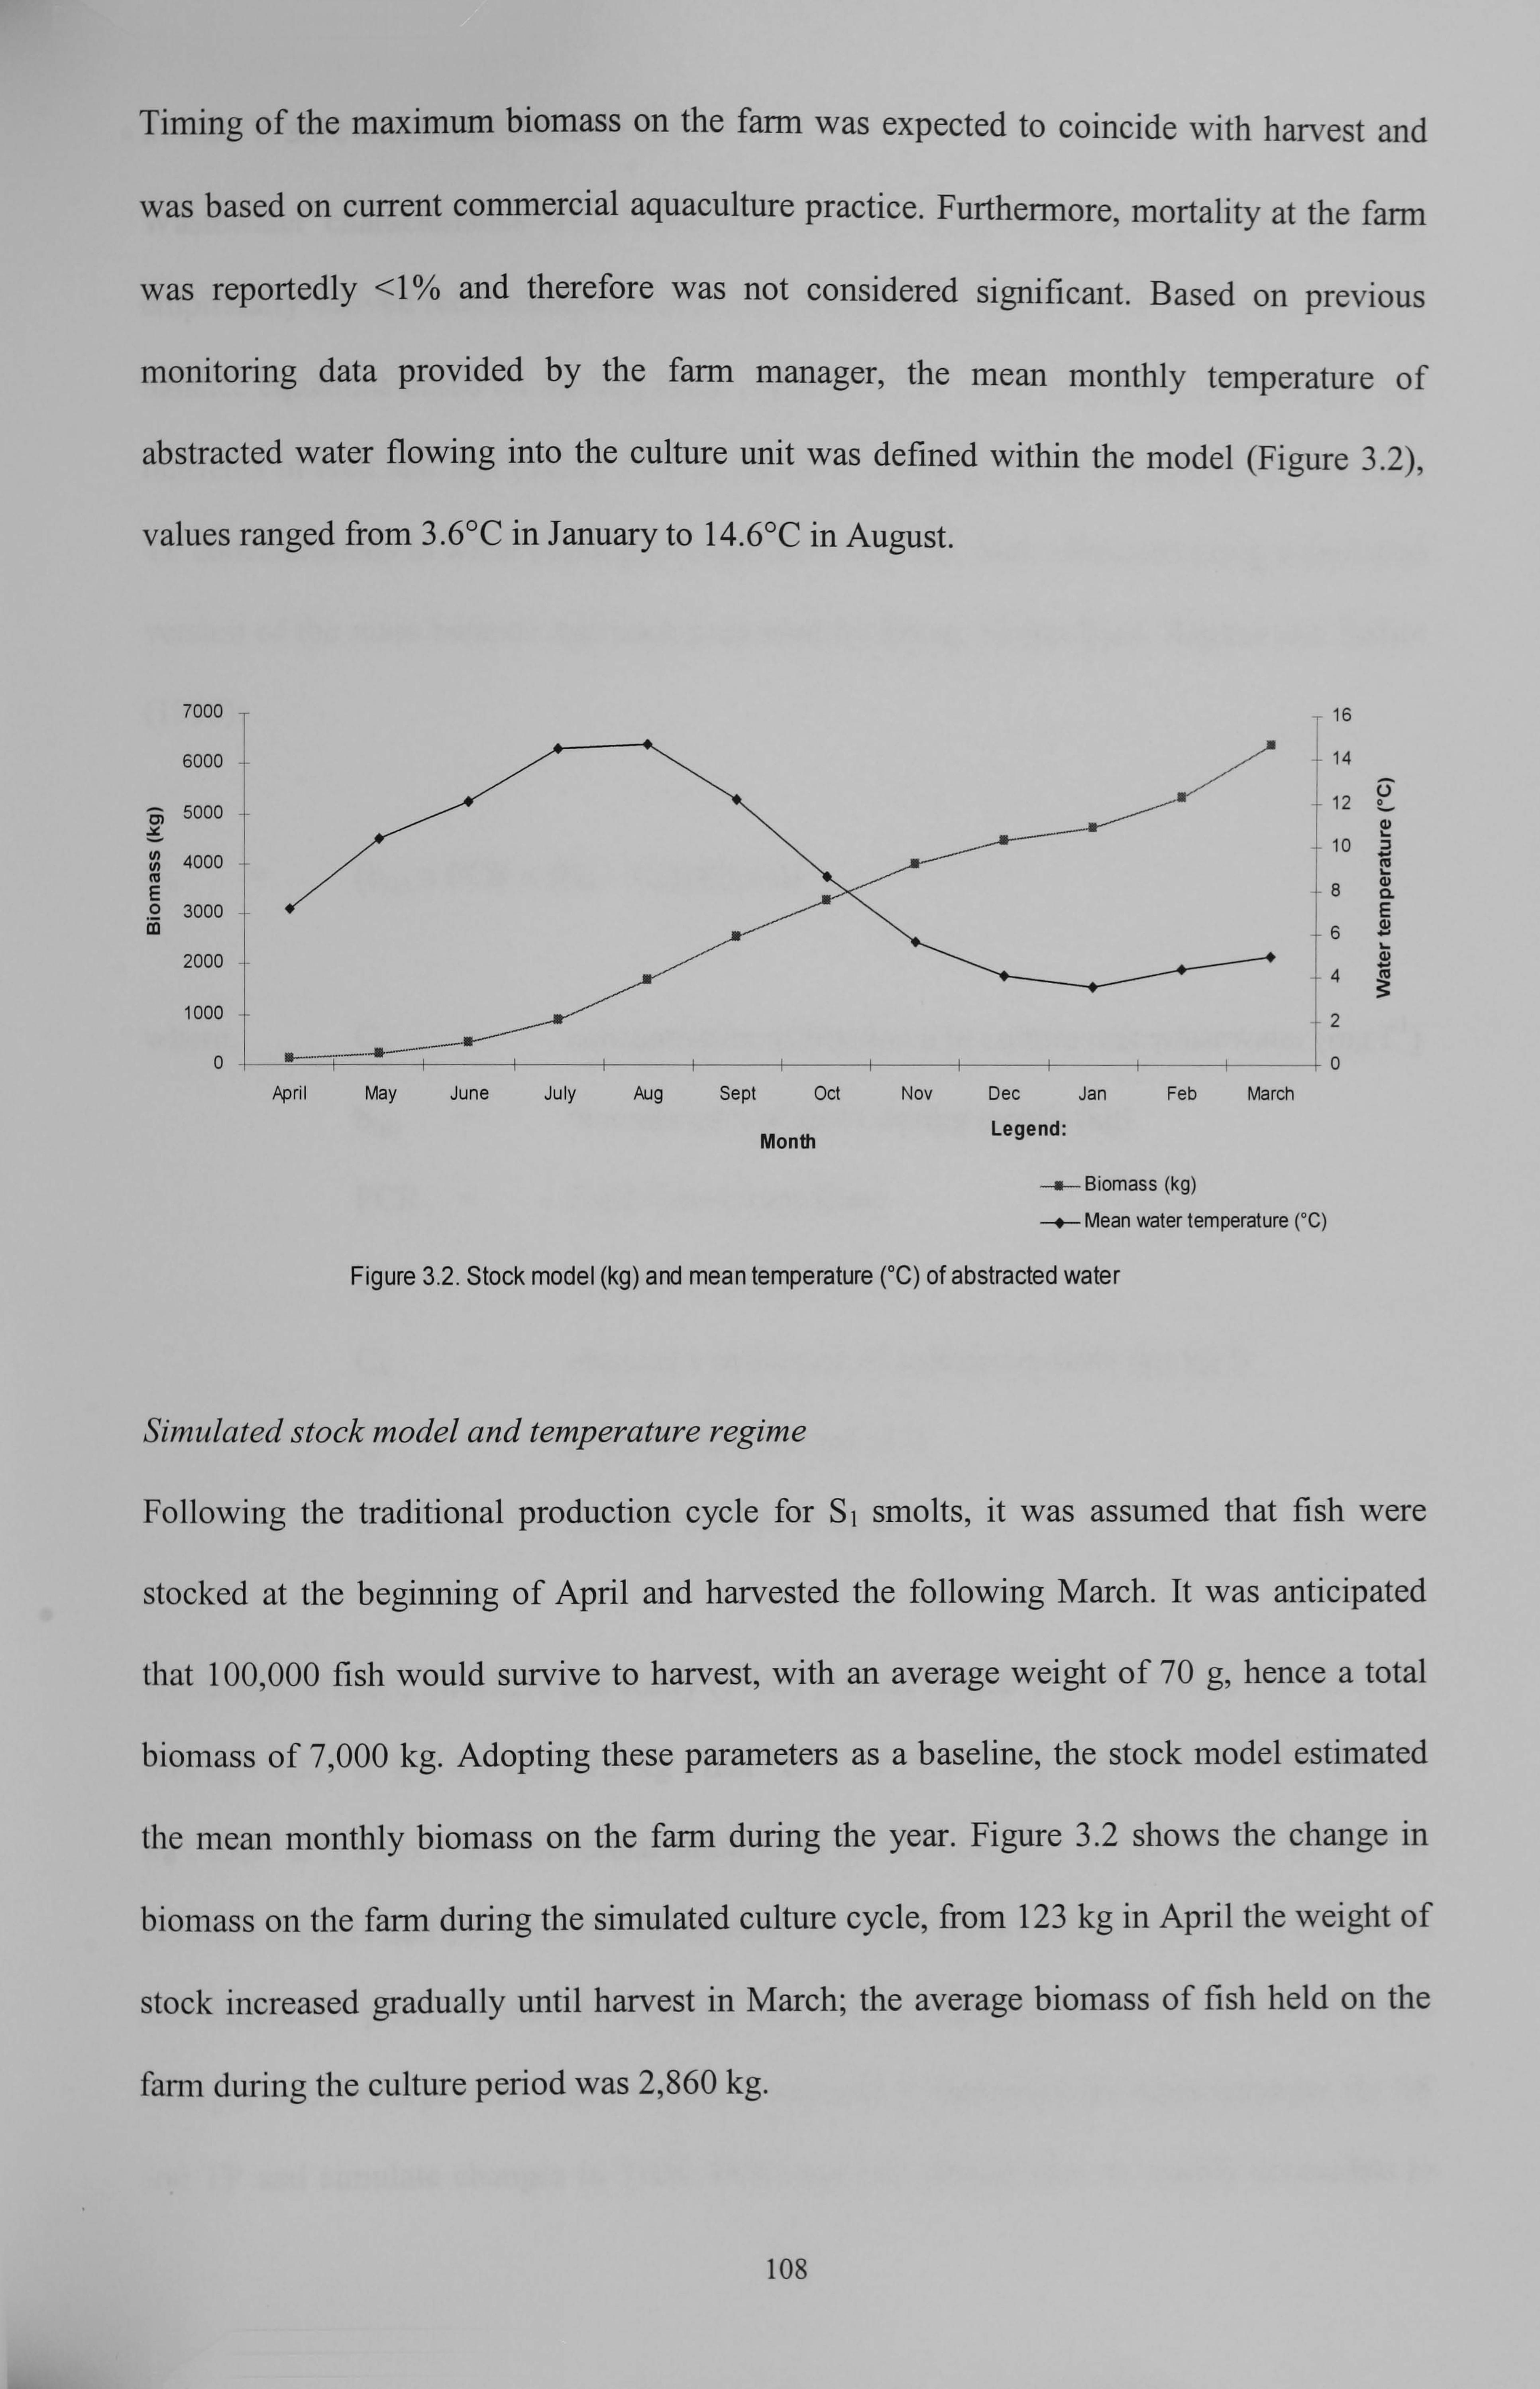
Timing of the maximum biomass on the farm was expected to coincide with harvest and
was based on current commercial aquaculture practice. Furthermore, mortality at the farm
was reportedly <1% and therefore was not considered significant. Based on previous
monitonng data provided by the farm manager, the mean monthly temperature of
nlý 1111 austracted water flowing into the culture unit was defined within the model (Figure 3.2),
values ranged from 3.6'C in January to 14.60C in August.
7000
6000
5000
4000
3000
2000
16
14
12 I-
10
8 CL E
6
4c
1000
0
2
0 Ma rch
m Biomass (kg)
s Mean water temperature ('C)
Figure 3.2. Stock model (kg) and mean temperature (OC) of abstracted water
Simulated stock model and temperature regime
Following the traditional production cycle for S, smolts, it was assumed that fish were
stocked at the beginning of April and harvested the following March. It was anticipated
that 100,000 fish would survive to harvest, with an average weight of 70 g, hence a total
biomass of 7,000 kg. Adopting these parameters as a baseline, the stock model estimated
the mean monthly biomass on the farm during the year. Figure 3.2 shows the change in
biomass on the farm during the simulated culture cycle, from 123 kg in Apnl the weight of
stock increased gradually until harvest in March; the average biomass of fish held on the
farn-i during the culture period was 2,860 kg.
108
April May June July Aug Sept Oct Nov Dec Jan Feb
Month Legend:

3.4.2. Wastewater characteristics
Wastewater characteristics were simulated using a range of methodologies, including
empirically derived relationships from previous studies, values from the literature and mass
balance equations based on feeding rates, expected FCR's and the proportion of solids and
nutrients in feed and fish (Table 3.2). In scenarios presented here, changes in SS, TN and
TP concentrations in water passing through the smolt unit were estimated using a modified
version of the mass balance approach presented by Einen, Holmefjord, Asgard and Talbot
(1995):
CO (b(g) x FCR x (D, - C, ))/(Q x d)
where, CO concentration of fraction n in culture unit wastewater (mg
b(g) biomass gain of stock during month (kg)
FCR Feed Conversion Ratio
Dn element n in diet (kg kg-1)
Cn element n in carcass of cultured species (kg kg-1)
Q average flow rate (m 3 d-)
d number of days in month.
Hennessy, Wilson, Struthers and Kelly (1996) present typical discharge rates for SS (191-
606 kg t fish-' d-1), TAN (20-39.3 kg t fish-' d-1), TP (9.1-10 kg t fish-' d-1) and BOD (410
kg t fish-' d-) from two commercial smolt units in Scotland. These authors also noted that
previous studies had not been able to account for more recent changes in feed formulation
and husbandry practices such as stocking and feeding regimes. Mass balances allow such
changes to be incorporated. Input variables required to formulate the mass balances for SS
and TP and simulate changes in TAN, BOD and DO should also be readily accessible to
109

commercial managers. However, where such data are not available, the option exists in the
ADEPT model to use stored data from studies published conceming comparable systems
(Table 3.2) or for the user to insert data from previous monitoring work.
Table 3.2: Approaches supported by the ADEPT model for simulating discharges from smolt units.
Waste fraction Literature Stock biomass Feedinput Other (mg 1-) (g kg-' d-1) (g kg-' d-1) (mg kg-' rMn-1)
SS * 14 tlo. 8 +Mass balance
TAN 10.91 A (Nfeed-Nfish) X 0-8 X 0.8 10.03 + 0.08 xG
TP 0.125 ý0.43 +Mass balance
TN +Mass balance
BOD *8 t17.85 A
0.15A
DO consumption 10.66 x 10(0.063 x T)
(1989)
The approach proposed by Petit (1989) for determining the output of TAN from salmonid
aquaculture was used in this case study, where, of N supplied in feed, but not assimilated
by the fish, -20% is bound in faeces and the remainder excreted in urine or across the gills.
TAN constitutes -80% of this soluble fraction. This author presents a further relationship
for BOD output from salmonid culture:
BOD = 0.15A
where, A weight of feed given.
The consumption of DO in meeting the respiratory demand of the stock was simulated
using the relationship established by Bergheim, Seymour, Sanni, Tyvold and Fivelstad
110

(199 1) which predicted oxygen consumption for first year smolts based on the ambient
water temperature:
02= 0.66 x, 00.063T
where, 02 oxygen consumption rate (mg kg-1 min-)
water temperature
Based on data from the farm managers regarding the mean monthly water temperature in
the smolt unit, the DO concentration in water abstracted for the culture system was
estimated using the formula given by Elmore and Hayes (1960, cited in Kadlec and Knight,
1996):
DOsat " 14.652 - 0.41022T + 0.007991T 2-0.00007777T 3
where, DOsat "::: ý concentration of oxygen in saturated water at I atin
water temperature (OC).
3.4.3. Predicted wastewater composition
Based on the approaches presented above, the ADEPT model simulated the mean monthly
concentrations (mg I ractions I -1) of five waste f in the 3,400 M3 d-1 of discharged water, the
results of which are summarised in Table 3.3, profiles for SS, BOD and DO are presented
in Figure 3.3, and those for TAN and TP are shown in Figure 3.4. Kadlec and Knight
(1996) described how treatment wetlands have a limited power to remove waste fractions
below a certain threshold, commonly referred to as the background concentration (C*);
examples are give in Table 3.6. Therefore, to assess the treatment performance of a
III

wetland receiving aquaculture wastewater it is important to consider waste concentrations
present in water abstracted for culture purposes. Data from previous monitoring work at
the site (Hennessy et al., 1996) was used to simulate background SS, TAN, TP and BOD
concentrations, while the expected DO concentrations was estimated using the fon-nula
given by Elmore and Hayes (1960, cited in Kadlec and Knight, 1996).
Table 3.3: Mean waste concentrations (mg I-) observed in abstracted water and predicted for untreated
wastewater and water treated using strategies shown; percentage change after treatment is given in
parenthesis.
Waste Abstracted Untreated Drumfilter fraction water
.............. .. I.., - .......... - wastewater
........................................................... SS 1.75* 6.55 1.18 (-112)
TAN 0.07* 0.25 0.25 (0)
TP 0.00* 0.05 0.02 (-54)
BOD 1.25* 2.42 2.3 (-10)
Reedbed Reedbed and trout fishery
3.08 (-72)
0.09 (-91) 0.02 (-58)
3.63 (+104)
3.03 (-73)
0.09 (-91)
0.02 (-58)
3.7 (+110)
DO 11.7t 9.46 9.46 (0) 3.7 (-246) 3 (-277)
alues from previous monitoring work undertaken at the site (Hennessy et al., 1996) tBased on 100% saturation at I atm. and ambient temperatures given by the farm manager
C) E 0
I 0
12
10
8
6
4
2
o
-2 April
-4
-6
May June ... _Jyly Alig Sept Oct Nov Dec Jan Feb March
Legend:
s SS - BOD
Figure 3.3. Mean change in concentration (mg/1) of SS, BOD and DO in smolt unit wastewater
DO
112

0.4
0.4 Z c31 0.3 E c 0.3 0
0.2
c 0.2
c 0.1 0 u
0.1
0.0
April May June July Aug Sept Oct Nov Dec Jan
Month
Feb March
Legend:
* TAN
Figure 3.4. Mean change in concentration (mg/1) of TAN and TP in smolt unit wastewater
Model testing: wastewater composition
* -- TP
The composition of wastewater discharged from a commercial smolt unit was assessed
with a monitoring programme undertaken between May and October 1998; the results are
summarised in Table 3.4. On each occasion 1 litre samples were taken for analysis from
the filtered site inflow, smolt tank discharge, drunifilter sump and filtered site outflow. DO
and temperature readings were taken in situ with a YSI meter. Samples were collected
between 10: 00 and 12: 00 hours, stored in darkness and returned immediately to the
laboratory for analysis of SS, BOD, TAN and TP levels, following standard procedures.
Accounting for background concentrations present in abstracted water, the mean
untreated discharge concentrations of SS, TAN, TP and BOD were 7.2,0.3,0.09 and 2.9
mg 1-1 higher, respectively. The mean concentration of DO in untreated wastewater (9.9 mg
1-1) was -0.9 mg 1-1 below that recorded in abstracted water.
Comparing predicted and observed concentrations using the Wilcoxon paired-
sample signed-rank test showed no significant differences atp=0.05, for SS, TAN or TP or
DO. However, BOD concentrations predicted by the model were significantly less than
those observed during sampling (z = -2.197, p<0.05, two-tailed). Correlation coefficients of
0.74-0.77 between observed and predicted concentrations for TAN, TP and BOD
demonstrated that trends in the discharge concentrations simulated by the ADEPT model
113

(Figures 3.3 and 3.4) were in agreement with those recorded at the farm. A correlation
coefficient of 0.39 between observed and predicted SS concentrations indicated only a
slight agreement, whilst a coefficient of -0.53 for DO suggested an inverse relationshiP.
Table 3.4: Observed and predicted means and ranges for waste concentrations (mg I-) in untreated
wastewater, z scores and probability level (p) at which these differ using the Wilcoxon test, and correlation
coefficients between observed and predicted concentrations.
Waste fraction n Observed Predicted Wilcoxon test Correlation
Mean Range Mean Range z p R
SS 9 7.2 0-43.5 5.2 1.2-8 -0.652 . 515 0.39
TAN 5 0.3 0.09-0.52 0.17 0.05-0.3 -1.753 . 080 0.77
TP 9 0.09 0.02-0.22 0.05 0.01-0.08 -1.599 . 110 0.75
BOD 7 2.9 1-7 1.6 0.8-2.3 -2.197 . 028 0.74
DO deficit 9 0.86 0.2-1.6 2.55 0.26-4.13 -1.955 . 051 -0.53
Poor correlation between observed and predicted SS and DO concentration changes could
be explained by the sampling regime adopted. Daily variations in husbandry practices e. g.
feeding and cleaning, would cause fluctuations in the discharge of solids and respiratory
demands of the stock; this may have masked seasonal trends. Consistently higher observed
BOD concentrations, as compared to those predicted, suggest that the approach to
modelling BOD output taken from Petit (1989) may not be appropriate. However, this
finding could also be a consequence of designing the ADEPT model to calculate average
waste flows, whilst sampling was undertaken at discrete intervals and during the day, when
waste loads are likely to be higher than average.
3.5. Modelling and testing outputs from the treatment scenarios
Approaches used to simulate the perfon-nance of the various treatment strategies are
descnbed below and the effect of employing each on the composition of smolt unit
114

wastewater was assessed using the ADEPT model. The predicted treatment performance of
each strategy was then tested against observations from systems operating under
comparable conditions.
3.5.1. Scenario 1: wastewater treatment with a drumfilter
Predicted treatment performance
Ulgenes (I 992b, cited in Cripps and Kelly, 1996) described the treatment performance of a
drumfilter; SS removal ranged from 67-97% and TP removal ranged from 21-86%. The
mid-point of these ranges was used to estimate treatment performance. Infon-nation on
removal of TAN and BOD is absent from the literature; however, Bergheim and Asgard
(1996) reported that -72% of BOD from Atlantic salmon cage farms was associated with
particulate matter. Assuming a removal rate for SS of 82%, a BOD treatment efficiency of
59% may be estimated. Furthermore these authors reported that the majority of TAN in
aquaculture wastewater is dissolved and therefore, the effect of mechanical filtration is
likely to be negligible; it was also assumed that the drumfilter would not affect the DO
concentration.
Wastewater treatment with a drumfillter
Average mean monthly concentrations predicted by the model for drumfilter treated
wastewater are presented in Table 3.3; profiles for SS, BOD and DO are presented in
Figure 3.5, and those for TAN and TP are shown in Figure 3.6. The assumption that the
drumfilter removes a fixed proportion of waste fractions regardless of the concentration
resulted in post-treatment waste concentrations having similar trends to those of untreated
wastewater. Mean concentrations of SS, TP and BOD in filtered wastewater were expected
to be 1.18,0.02, and 2.3 mg 1-1, respectively. Concentrations of TAN and DO following
treatment were not expected to change.
115

3.0
2.0
1.0 Z m E 0.0 1----
April 1.0
-2.0
-3.0
-4.0
-5.0
May J4ne AU97- ýSepTt OcýýýD y ), ec--ýý,,, ýFeb --March-
Month
Legend:
s SS - BOD DO
Figure 3.5. Mean SS, BOD and DO concentrations (mg/1) in water treated using a drumfilter (minus background levels)
0.4
0.4
0.3 m
03
0.2 ý
0.2
0.1
0.1
0.0
April May June July Aji g Sept Oct Nov Dec
Month
Legend:
s TAN
T
Jan Feb March
a TP
Figure 3.6. Wan TAN and TP concentrations (mg/1) in water treated using a drumfilter (minus background levels)
Model testing: treatment with a drumfilter
The mean and range of waste concentrations recorded in samples of drumfilter filtrate
collected during monitoring at the commercial smolt farrn are presented in Table 3.5. Mean
concentrations of SS, TP and BOD in filtered wastewater were 6.4,0.17 and 4.5 mg
respectively, 74.3,44.1 and 25.9 per cent less as compared with untreated wastewater.
Mean TAN concentrations were 8.3% lower at 0.23 mg 1-1, whilst mean DO levels were
1.7% higher at 10.1 mg 1- 1. Based on concentrations observed in untreated wastewater, and
116

using the treatment efficiencies used by the ADEPT model, expected post-treatment
concentrations were predicted (Table 3.5).
EmploYing the Wilcoxon test, predicted concentrations of SS, TAN, TP and BOD
were not significantly different from those observed (p = 0.05). However, predicted DO
concentrations were consistently lower than those observed (z = -2.327, p<0.05, two-
tailed). Correlation coefficients for observed and predicted concentrations of SS, TAN, TP
and DO were >0.89, demonstrating a good degree of agreement. However, a coefficient of
0.07 between the observed and predicted BOD concentrations suggests there was no
relationship.
Table 3.5: Observed and predicted means and ranges for waste concentrations (mg 1-1) for drumfilter filtrate',
z scores and probability level (p) at which these differ using the Wilcoxon test, and correlation coefficients
between observed and predicted concentrations.
Waste n Observed Predicted Wilcoxon test Correlation fraction
I ......................................................................... ..................................... . .................... . ................. ................. .... . ............... . .................. ... . ........................................................... ............................................................... .......... Mean Range Mean Range z p R
ss 9 6.4 0-41 4.5 0.4-21.2 -1.260 . 208 0.89
TAN 7 0.23 0.07-0.58 0.25 0.08-0.56 -1.521 . 128 0.99
TP 10 0.17 0.04-1.03 0.18 0.04-0.95 -0.051 . 959 0.98
BOD 8 4.5 1.6-9.6 2.3 1.4-3.7 -1.680 . 093 0.07
DO 9 10.1 9.2-11.2 9.9 8.9-11 -2.327 . 020 0.98
rrected for background concentrations in abstracted water
According to the Wilcoxon statistic, observed DO concentrations were higher than those
predicted; this could have been a result of reaeration due to turbulence caused by the action
of the drumfilter. However, as the range of observed and predicted concentrations was
similar, and the correlation coefficient shows a very high degree of agreement, the effect of
reaeration appears limited. The absence of correlation between observed and predicted
117

BOD concentrations may be due to the manner in which the treatment effect was
estimated; further work is required to evaluate the capacity of a drumfilter to remove BOD
under a range of operating conditions.
3.5.2. Scenario 2: treatment with a reedbed
Wastewater treatment in reedbeds involves several processes, e. g. sedimentation,
entrapment by plant material, uptake of nutrients by plants and bacteria, decomposition of
organic matter, nitrification and the adsorption of ions on soil particles. Watson et al.
(1989) reviewed the physical, chemical, biochemical and biological treatment processes
acting in wetlands and described the perfonuance of reedbeds operating in a variety of
settings (Chapter 2; Table 2.1). Following a comprehensive review of the treatment
perfort-nance of constructed wetlands, Kadlec and Knight (1996) proposed a general design
equation for constructed wetlands relating the area required to reduce a waste fraction to a
desired concentration to the flow rate, waste concentration in untreated water, background
limit and areal rate constant:
A= [0.0365xQ]/k x ln[Ci-C*]/C, -C*
where,, A area required (ha)
flow rate (M3 d-)
k areal rate constant (m Y-1)
Ci concentration of fraction in water entering wetland (mg 1-1)
Ce concentration of fraction in water exiting wetland (mg 1-1)
C* background limit (mg 1-1).
118

Expected background limits (C*), the lowest concentration to which the constructed
wetland is expected to reduce waste fractions, and areal rate constants are presented in
Table 3.6.
Concentrations for SS, TAN and BOD stated in the discharge consent standards of
the site at 5,0.1 and 4 mg 1-1 respectively, are substituted for C, to dimension the wetland.
This estimated the wetland area required to reduce the highest mean monthly discharge
concentrations of these waste fractions to discharge consent levels.
Simulated treatment performance
The predicted change in concentration of SS, TAN and BOD is based on k-C* models
developed by Kadlec and Knight (1996) for surface flow wetlands. The models have a
similar derivation, though the areal rate constant (k) and wetland background limit (C*)
vary with the waste fraction concerned (Table 3.6). The general model is:
Q, = C* + (Ci - C*)exp-[kA]/0.0365Q
where, CO concentration of fraction in water exiting wetland (mg 1-1)
Ci concentration of fraction in water entering wetland (mg 1-1)
background limit (mg 1-1)
areal rate constant (m
A wetland area (ha)
flow rate (M3 d-1).
119

Table 3.6: Design parameters for constructed wetlands.
Waste fraction C* 20 C* k20 kT 0
ss 5.1 + 0.16Ci C* 20
O(T-20) 1000 1.065
TAN 0 18 kT = k2oo(T-20) 1.04
TP 0.02 12
BOD 3.5 + 0.053Ci 34 kT = k200 (T-20) 1.06
ýTN 1.5 22 kT= k2oo(T-20) 1.05
(compiled from Kadlec and Knight, 1996) fpararneters for TN are used in Chapters 4
The expected change in phosphorus concentration is also taken from Kadlec and Knight
(1996) and has the form:
Ci exp(-k/q)
where, CO phosphorus concentration in water exiting wetland (mg 1-1)
Ci phosphorus concentration in water entering wetland (mg 1-1)
k areal rate constant (m y-1)
q hydraulic loading rate (cm d-1).
The wetland background limit is expected to be negligible.
DO concentration changes in surface-flow wetlands have been found to depend on
levels in water entering the wetland and the areal loading of TAN; Kadlec and Knight
(1996) presented the following relationship:
CDO, out= 2.52 + 0.126CDO, in- 2.41 qCNH4-N, in
where, CDO, out DO concentration in water exiting wetland (mg 1-1)
CDO, in DO concentration in water entering wetland (mg
qCNH4-N, in areal loading rate for TAN (g M-2 d-1).
120

In addition to estimating treatment performance using the k-C* models proposed by
Kadlec and Knight (1996), the ADEPT model uses a mass-balance equation to assess the
capacity of the wetland to assimilate P discharged from the culture uni I it in aboveground
macrophyte biomass. Based on observations from comparable systems in temperate
environments and planted with the same reed species, the production rate for aboveground
biomass was set at 29 t ha-1 y-1 (Li, Ding and Wang, 1995) and assumed to contain 11.65
and 2.5 g kg-1 of N and P, respectively (Vyinazal, 1995).
Wastewater treatment with a reedbed
Based on wastewater discharge concentrations of SS, TAN and BOD from the smolt unit,
and existing discharge consent standards, the model estimated that a 5.8 ha constructed
wetland would be required, equivalent to 8.3 M2 kg-1 of smolts produced. The reedbed was
estimated to have a hydraulic retention time of 4.4 days.
4.0
2.0
0.0 ZZ 0)
E April May June July Aug Sept c 2.0
-4.0
-6.0
-8.0
-10.0
Oct
Month
-- - -- --- -- ---, - -l Nov Dec Jan Feb March
Legend:
s SS BOD DO
Figure 3.7. Mean SS, BOD and DO concentrations (mg/1) in water treated using a reedbed (minus background levels)
121

0.1
0.1
0.1
0.1
0.0 , 0.0
0 0 .
0.0 Apdl May
0.0
-0.1
July Aug Sept Oct Nov \Dt
`F---ýJ an Feb Nbrch
Month
Legend:
s TAN TP
Figure 3.8. Mean TAN and TIP concentrations (mg/1) in water treated using a reebed (minus background levels)
The model predicted that the reedbed would reduce mean discharge concentrations of SS,
TAN and TP in smolt unit wastewater by 72,91 and 58 per cent, respectively (Table 3.3),
whilst BOD was expected to increase by 104%. The mean DO concentration was predicted
to decrease from 9.3 to 3.7 mg 1-1; combined with oxygen consumption predicted in the
smolt unit (2.4 mg 1-1) this represents a 70% reduction as compared with levels in
abstracted water. Profiles for SS, BOD and DO following treatment are presented in Figure
3.7, whilst those for TAN and TP are shown in Figure 3.8. The assimilation capacity for N
and P in aboveground reed biomass was estimated at 2,652 and 569 kg y-1, respectively,
equivalent to 769% of the N and 957% of the P released as a consequence of culturing
smolts.
Model testing: treatment with a reedbed
The predicted treatment effect of the constructed wetland was validated through
comparison with the performance of a reedbed planted with common reed operated by the
Wildfowl & Wetlands Trust, Slimbridge. The reedbed. occupies 0.13 ha and receives 1,000
in 3 d-1 of wastewater (Millett, 1997), a hydraulic loading rate of -0.8 M3 in-' d-'. Over the
period from February 1995 to March 1997 water quality parameters were measured
122

fortnightly, with all analyses following standard procedures (Millett, personal
communication, 1999). Mean waste concentrations in pre and post-treatment wastewater
recorded are presented in Table 3.7. The mean SS concentration of 12.8 mg 1-1 in water
exiting the wetland was 19% less than that observed in the inflow; TAN was 7% less at
1.95 mg 1-1, TP was 10% less at 1.17 mg 1-1 and BOD was 3% less at 3.63 mg 1-1.
Employing the Wilcoxon paired-sample signed-rank test, observed waste concentrations
following treatment were compared with those predicted using the k-C* models; this
showed that predicted concentrations of TAN, TP and BOD did not differ significantly
from those observed at a level of p<0.05. However, predicted SS concentrations following
treatment were significantly lower than that observed (z = -3.779, p<0.05, two-tailed). It
was not possible to validate the predicted change in DO concentrations, as data from a
reedbed operating under comparable conditions were not available. Correlation coefficients
between 0.95-0.99 for observed and predicted concentrations of TAN, TP and BOD
demonstrated a good degree of agreement. However, a coefficient of 0.12 between the
observed and predicted SS concentrations suggested no relationship.
Table 3.7: Observed and predicted means and ranges for waste concentrations (mg 1-1) for wastewater treated
in a reedbed, z scores and probability level (p) at which these differ using the Wilcoxon test, and correlation
coefficients between observed and predicted concentrations.
Waste n Observed Predicted Wilcoxon test Correlation fraction
Mean Range Mean Range z p R
ss 43 12.8 (3.1-42.9) 6.2 (2.4-14.3) -3.779 <. 001 0.12
TAN 33 1.95 (0.04-3.9) 1.97 (0.04-3.7) -0.853 . 394 0.99
TP 22 1.17 (0.02-3.5) 1.23 (0.02-2.8) -0.800 . 424 0.95
BOD 40 3.63 (1.3-14.8) 3.72 (1.9-13.9) -1.734 . 083 0.96
Note: Limited access meant it was not possible to monitor DO concentrations within the wetland.
123

There was a generally good agreement between observed and predicted concentrations
following treatment. However, observed SS concentrations were higher than those
predicted and no trend between the two was apparent. This suggests that SS dynamics in
the reedbed studied do not conform to the k-C* model proposed by Kadlec and Knight
(1996). Potential explanations could include short-circuiting or non-ideal flow regimes
causing turbulent resuspension or internal loading due to phytoplankton growth. Also,
considering the location of the reedbed, the activity of waterfowl in the wetland could
provide another explanation for the higher than expected SS concentrations.
3.5.3. Scenario 3: treatment with a trout fishery and reedbed
Recreational trout fisheries commonly have depths ranging from 1.5-2 m, hydraulic
loading rates above -0.05 m3 M-2 d-I and extend to several hectares (Anderson, personal
communication, 1999). With data for the removal of waste fractions in such extensive
fisheries absent from the literature, treatment performance rates for surface-flow
constructed wetlands described above were employed. Such constructed wetlands
commonly have depths <0.6 m, but irrespective of depth it is expected that a similar range
of treatment processes would occur in a trout fishery. However, the treatment efficiency
and power of the fishery may vary due to rate limiting factors which are a function of
depth such as light penetration, diffusion and mixing.
Reviewing design parameters used to engineer constructed wetlands, Watson et al.
(1989) recommend hydraulic loading rates of 0.02-0.1 m3 M-2 d-1 for surface-flow wetlands
used to polish municipal wastewater, comparable to those reported for recreational
fisheries. Furthermore, the semi-natural conditions that prevail in many fisheries mean that
emergent macrophytes are common around the periphery and on shoals and bars within the
water body, and this vegetation may facilitate a number of the treatment processes
associated with constructed wetlands (Chapter 2; Table 2.1). Therefore, a secondary
124

objective of this study was to test the validity of the k-C* models proposed by Kadlec and
Knight (1996) for surface-flow constructed wetlands in predicting waste removal rates in
extensive trout fisheries, and highlight opportunities to develop these models to describe
the treatment potential of such systems.
Wastewater treatment with a troutfishery and reedbed
Based on the expected wastewater flow of 3,400 m3 d-1, the model calculated that a 6.8 ha
trout fishery was required to achieve the desired hydraulic loading rate (0.05 M3 M-2 d-1).
Furthermore, assuming the treatment effect of the trout fishery conforms to the k-C*
models for surface-flow wetlands, a 9.2 ha reedbed would be needed to reduce SS, TAN
and BOD concentrations to discharge consent levels. The total surface area of the trout
fishery and reedbed would be 16 ha, equivalent to 22.9 m2 kg-1 of smolts produced. The
hydraulic retention time of the system was estimated at 47 days.
4.0
2.0
0.0
April May June JU ly Aug Sept Oct Nov -2.0
0 4.0 Month
-6.0
U -8.0 N ....... 0
-10.0
-12.0 Legend:
s SS
Dec Jan Feb March
..........
a--- BOD DO
Figure 3.9. Mean SS, BOD and DO concentrations (mg/1) in water treated using a trout fishery and reedbed (minus background levels)
The model predicted this treatment strategy would reduce mean SS, TAN and TP
concentrations by 73,91 and 58 per cent, respectively (Table 3.3), with BOD increasing by
I 10%. The mean DO concentration would be reduced from 9.3 to 3 mg 1-1, only 26% of the
125

predicted level in abstracted water. Profiles for SS, BOD and DO following treatment are
presented in Figure 3.9, whilst those for TAN and TP are shown in Figure 3.10. The
capacity for N and P retention in aboveground reed biomass was estimated at 2,147 and
461 kg y- I, equivalent to 623% and 775%, respectively, of the output from the smolt unit.
0.1
0.1
0.1
0.1
0.0
0.0
0.0
0.0
0.0 ý
-0.1
April May Jun_ýý July Aug Sept Oct Nov c Jan Feb March
Month
Legend:
s TAN ý TP
Figure 3.10. Mean TAN and TIP concentrations (mg/1) in water treated using a trout fishery and reedbed (minus background levels)
Model testing: treatment with a troutfishery and reedbed
The treatment effect of passing wastewater through a recreational fishery was validated
through comparison with the perforinance of a 2.4 ha trout fishery situated -10 km north
east of Dundee. Dunng a monitonng programme undertaken between 1997 and 1999,
samples for analysis were collected at two month intervals from the site inflow and outflow
and analysed following standard procedures. During the sampling period the mean volume
of water passing through the fishery was estimated at 2,500 in 3 d-1 (Anderson, personal
3 -2 -1 communication, 1999), equating to a hydraulic loading rate of -0.1 in Md
Mean waste concentrations observed in the fishery discharge are presented in Table
3.8; TAN was 52% lower at 0.04 mg 1-1 and TP was 40% less at 0.34 mg I- I. Mean SS and
BOD concentrations increased by 170% and 44% to 6.75 and 2.86 mg 1-1, respectively,
whilst DO concentrations were on average 12% lower at 9.63 mg I- I.
126

Table 3.8: Observed and predicted means and ranges for waste concentrations (mg 1-1) for water having
passed through a trout fishery, z scores and probability level (p) at which these differ using the Wilcoxon test,
and correlation coefficients between observed and predicted concentrations.
Waste n Observed Predicted Wilcoxon test Correlation fraction
Mean Range Mean Range z p R
ss 10 6.8 (0-32) 3.2 (2.1-4.6) -. 764 0.445 0.06
TAN 7 0.04 (0-0.17) 0.06 (0.01-0.27) . 000 1.000 -0.14
TP 5 0.34 (0.19-0.45) 0.18 (0.08-0.3) -2.023 0.043 0.95
BOD 9 2.9 (1.35-5.95) 2.7 (1.3-3.9) -0.296 0.767 0.73
DO to 9.6 (7.9-12) 3.9 (3.6-4.1) -2.803 0.005 0.60
Analysis using the Wilcoxon paired-sample signed-rank test showed that recorded
concentrations of SS, TAN and BOD were not significantly different from those predicted
using the k-C* models for surface-flow wetlands. However, predicted TP concentrations
were significantly lower than those observed (z = -2.023, p<0.05, two-tailed) as were DO
concentrations (z = -2.803, p<0.05, two-tailed). A correlation coefficient of 0.95 between
observed and predicted TP concentrations demonstrated a good degree of agreement,
whilst coefficients of 0.73 and 0.6 for BOD and DO indicated a reasonable level of
agreement. Coefficients of 0.06 and -0.14 for observed and predicted SS and TAN
concentrations suggested no definable relationship.
Generally, agreement between observed and predicted concentrations was poor,
suggesting that with the exception of BOD, the k-C* models for surface-flow wetlands
were not appropriate in this context. Poor correlation between observed and predicted SS
concentrations may be due to Internal loading by phytoplankton, and although the k-C*
model accounts for this phenomena to an extent, it is likely to be more significant in an
open-water system. TAN concentrations also showed poor correlation, suggesting the need
127

to develop a refined k-C* model for open water wetlands, or to investigate alternative
approaches. Relationships established for sewage oxidation ponds and wastewater
treatment lagoons may be useful (for example see Benfield and Randall, 1980; Mara,
1997). However, the more concentrated nature of effluents treated in such systems may
mean that design equations and expected treatment performance levels may not be valid
when considering the relatively dilute discharges that charactense aquaculture wastewater.
Although trends were evident in the observed and predicted TP and DO concentrations, the
magnitude of change differed, again suggesting the need to refine the k-C* models
employed. Refining these models will require data from further comparable systems to
ensure robust outputs and facilitate validation.
3.6. Financial implications
Cash flows associated with the various treatment strategies were assessed using
conventional financial appraisal methods. Financial requirements and income levels
associated with horizontally integrated aquaculture are difficult to predict and published
accounts are limited, therefore, where examples from the literature were unavailable,
estimates were derived from consultations with the managers of comparable systems
(Table 3.9). Expected variable construction costs included the value of land required, site
development and infrastructure, variable operating costs were associated with electricity
and contracted labour requirements, whilst wages paid to full-time staff and managers
constituted the fixed operating costs. The depreciation period for infrastructure and
equipment was assumed at 15 and 10 years, respectively; the salvage value of equipment
and infrastructure was assumed to be zero. In the baseline scenario land was also assigned
a salvage value of zero as the cost of wetland reclamation could prohibit future uses; the
influence of this decision was tested in the sensitivity analysis. The annual cost of
maintaining the site and infTastiructure was estimated at 1% of initial capital costs.
128

Income from the reedbed was estimated from the value of aboveground biomass
produced as a biofuel, and a representative production level of 29 t ha-1 y-1 (Li et al., 1995).
The value of reed biomass was estimated from preliminary data presented by Bj6rk and
Graneli (1978), with 2t of reed biomass energetically equivalent to I in 3 of commercial
heating oil. Assuming heating oil costs floo m-1 (Butler Fuels, personal communication,
2000) and disregarding handling and processing costs, the value of reed biomass is
equivalent to f 50 t-1. The cost of harvesting the reed biomass, f-41 ha-1 y-' (f 1 equivalent to
C1.5) was based on engaging a contractor with a single-phase self-propelled forage maize
harvester (Walsh, 1999). This strategy has been recommended for harvesting Miscanthus
spp. grown as an energy crop.
Table 3.9: Financial parameters and baseline assumptions employed.
Parameter .....................
Value Units Source
Land 7,400 f ha- Millet (pers. comm. 1999)
Development cost for wetlands 49,500 f ha-1 Millet (pers. comm. 1999)
Drumfilter (167 rrO h-) running costs 500 f filter-' y-1 Murray (pers. comm. 1999)
Reed biomass harvesting 41 f ha-1 y-1 Walsh (1999)
Workers labour 10 f h-1 Millet (pers. comm. 1999)
Managers labour 20 f h-1 Millet (pers. comm. 1999)
Reed production 29 t ha-' y-' Li et al. (1995)
Energy content of reed biomass 5 MWh t-1 Bj6rk and Gran6li (1978)
Heating oil 100 f ff 3 Butler Fuels (pers. comm. 1999)
Financial aspects of developing and operating the recreational trout fishery were obtained
by consulting with the managers of a commercial operation; details are presented in Table
3.9. The fishery is initially stocked with trout costing U each, at a rate of 0.1 M-2 ; it was
anticipated that 1 ha. of trout fishery would attract 2 anglers a day, and that each angler
would remove two fish that must be replaced. The value of angling provided was estimated
at f25 per day. As described above, conventional financial indicators were employed to
129

evaluate the management strategies selected here for a commercial smolt fan-n; the results
of this analysis are presented in Table 3.10.
3.6.1. Scenario 1: drumfilter
Based on fixed and variable construction and operating costs assumed for the scenano
(Table 3.9) a capital cost of L16,000 is incurred for a drunifilter and associated
infrastructure, details are presented in Table 3.10. The largest cost incurred is f 10,000 for
2 the drumfilter, the instillation of which requires an area of 50 m. Other costs incurred
include site development at E260, electricity supply at E500, a settling tank and sludge
storage tank at fl, 500 each, a sludge pump at E200, hydrological control structure at
f2, OOO and f40 for the land.
Operation of a drumfilter was estimated to require 91 h y-1 for maintenance and
generate 13 h y-1 of administrative work. Variable operating costs included f250 y-1 for
electricity, E910 y-1 for labour and f 160 y-1 for site and infrastructure maintenance; the
only fixed operating cost was f260 y- I for administration. Total annual operating costs
were f 3,070 y-1 or f1 ý5 80 y-1 excluding depreciation. As no income would be generated,
I the net benefit associated with running the drumfilter was negative at 42,080 y-
Employing a discounted cash flow approach and following conventional procedures, 10
year NPV's at discount rates of 5.10,15 and 20 per cent, are 426,900,423,100,420,400
and 418,200, respectively. The IRR is negative over ten, twenty and fifty years of
operation.
3.6.2. Scenario 2: constructed wetland
Capital costs associated with developing the reedbed were established through consultation
with the manager of a recently commissioned system (Millet, personal communication,
1999). Typical costs included land acquisition, basin construction, purchasing and planting
130

reeds and hydrological control structures. Total capital costs for the 11.4 ha reedbed were
estimated at f681,940; individual costs are presented in Table 3.10. Variable operating
costs were f 6,820 for site maintenance and F-470 for a contractor to harvest the reeds.
Fixed operating costs were restricted to f260 for administration time required by a
manager.
3.10: Financial implications and key indicators of performance for the treatment strategies indicated.
Trout fishery
Cost Drumfilter Constructed and wetland constructed
wetland
Capital costs
Land f40 E88,400 f 124,400
Site development f 260 E591,510 f 832,400
Infrastructure and equipment f 15,700 f 2,000 f4,500
Stocking f 13,600
Total E16,000 E681,940 f 974,940
Operating costs
Electricity E250
Labour E910
Contractor f470 080
Stock E38,950
Maintenance f160 f 6,820 f9,750
Fixed labour costs E260 E260 E19,260
Total f 1,580 E7,550 68,340
Income
Reed biomass f 10,240 E8,290
Angling E243,440
Profit excluding depreciation -f 1,600 f 2,700 f 183,400
Rate of return on capital costs (%) -9.9 0.4 18.8
Rate of return on operating costs -100 36 268
Payback period (y) na. 253 5.3
NPV at: 5% 425,900 4631,200 013,000
10% 422,800 -f 605,800 f 73,900
15% 420,500 -f 581,800 -f 86,800
20% -f 18,600 4559,200 -f 196,400
IRR (%) over: 10 years na. na. 12.1
20 years na. na. 18 50 years na. na. 18.8
131

The value of 228 t of reed biomass produced annually was estimated at f 10,240 y-1 5
resulting in a net benefit excluding deprecation of f2,700 y-1 or f 227 ha-1 y-1, and an
annual rate of return of 0.4% on initial capital costs and of 36% on operating costs. The
payback period was calculated at 253 years. At discount rates of 5,10,15 and 20 per cent,
ten year NPV's were 4631,200,4605,800,4581,800 and 4559,200, respectively, whilst
the ERR over ten, twenty and fifty years was negative (Table 3.10).
3.6.3. Scenario 3: a trout fishery and constructed wetland
Development of the combined reedbed and trout fishery was estimated to incur a capital
cost of E974,940, including E124,400 for land, f832,400 for site preparation and
construction, f 3,000 for water control structures, f 13,600 for initial stocking and f 1,500
for fish handling equipment. With an area >3 ha, no variable labour costs are incurred as
all necessary work was included in the duties of the full-time fisheries manager, who
would also undertake all administrative work. Operating costs were therefore estimated at
f 689340 y- I; variable operating costs included f9,750 y-1 for site maintenance, E380 y-1 for
a contract reed harvester and 08,950 y -1 to purchase fish. The only fixed operating cost
was f 19,260 y-1 for a fishery manager.
An income of f251,730 y-1 was estimated, with f 8,290 y-1 and E243,440 y-1
reallsed through the sale of 184 t of reed biomass and provision of 9,737 angling days,
respectively. The estimated net profit, excluding depreciation, was f 183,400 y-1 or f 10,900
ha-1 y-1 from the land occupied by the system, representing a rate of return of 18.8% on
capital costs, 268% on operating costs and a payback period of 5.3 years. The ten-year
NPV remained negative at discount rates of 15 and 20 per cent, but was 03,900 at 10%
and 013,000 at 5%. The MR over ten, twenty and fifty years was 12.1,18 and 18.8 per
cent, respectively.
132

3.7. Sensitivity analysis
The sensitivity analysis was achieved by modifying key input parameters in turn and
assessing the impact on the ten year H?, R of the system in question; results are summansed
in Table 3.11. The drumfilter was excluded from this analysis, as it was clear that this
strategy was unable to generate a positive IRR. Considering the reedbed scenario, 10%
changes in the range of selected input variables failed to generate a positive rate of return;
only when it was assumed that the land and earthworks would retain their value was an
IRR of 0.4% calculated.
Table 3.11. Sensitivity of ten year IRR (%) to changing input parameters.
Parameter Reedbed Trout fishery and
.......... I ............................................................ ..... ............. -. - ............................................................. reedbed
...................................................................................................................... ................................................. ................. Baseline - 12.1
Land cost (-10%) - 12.4
Land cost (+10%) - 11.7
Land retains its value over ten years - 13.2
Land and earthworks retain value over ten years 0.4 18.7
Land cost assumed at EO ha-1 - 16
Site development cost (-10%) - 14.6
Site development cost (+10%) - 9.8
Value of reed biomass (-10%) - 11.9
Value of reed biomass (+10%) - 12.2
Value of angling (-10%) - 8.5
Value of angling (+10%) - 15.5
Smolt numbers increased by 50% - 6.4
Smolt number decreased by 50% - 28.3
Water used decreased by 50% - 0.9
Water used increased by 50% - 21.3
A 10% change in land or reed biomass values had a minimal effect on the MR generated
by the trout fishery and reedbed combined. A 10% fall in site development costs or 10%
133

rise in the value of angling had a positive effect, raising the IRR to 14.6% and 15.5%,
respectively. Assuming land retains its value generated a slight increase in the IRR to
13.2%, whilst assuming the initial land cost was zero increased this to 16%. Assuming
both the land and earthworks retained their value resulted in a ten year IRR of 18.7%.
However, the most notable change occurred when significant modifications to the
operation of the smolt unit were assumed. A 50% increase in water use resulted in an IRR
of 21.3% whilst a comparable fall resulted in an IRR of 0.9%. Increasing smolt numbers by
50% resulted in an IRR of 6.4%, whilst a fall of 50% resulted in an HZR of 28.3%.
3.8. Conclusions
The managers of a commercial farm (Murray, personal communication, 1999) considered
the stock data predicted by the ADEPT model to be realistic. Average mean discharge
concentrations (mg 1-1) of the various waste fractions estimated by the model for the smolt
unit are comparable to those in the literature (Cripps, 1994). Furthermore, excluding BOD,
ADEPT model estimates of mean monthly concentrations showed no significant
differences from levels observed in wastewater samples taken from a commercial smolt
farm. This demonstrated that the model was suitable for simulating waste concentrations
discharge from smolt farins. Similar approaches to modelling wastewater discharged from
commercial aquaculture operations have been described (Beveridge et al., 1991; Foy and
Rosell, 1991; Einen et al., 1995; Eikebrokk, Piedrahita and Ulgenes, 1995). Foy and Rosell
(1991) modelled the expected discharges from a trout farm in Ireland and found that
employing a mass-balance approach it was possible to account for 89% and 103% of the
observed discharges of N and P, respectively.
Concentrations of waste discharged from commercial aquaculture sites have been
found to follow diumal trends (Bergheim et al., 1991; Kelly and Karpinski, 1994;
Hennessy et al., 1996) and exhibit peaks associated with feeding and cleaning, representing
134

a possible limitation for the ADEPT model. However, when modelling large engineered
systems such as constructed wetlands and trout fisheries, diurnal trends are likely to
become less distinct due to mixing and the long residence times introduced. Problems may
arise in modelling treatment systems that retain wastewater for limited periods e. g.
drumfilters and settlement ponds. Higher waste concentration pulses following feeding,
cleaning tanks or handling fish may adversely affect the perforinance of drumfilters as
screens may become blocked, causing untreated wastewater to bypass the filter. Although
the model does not simulate variations in treatment efficiency due to changes in waste
loading, predicted concentrations of SS, TAN, TP and BOD treated using a drumfilter did
not differ significantly from those observed. It was assumed that the drumfilter would have
no effect on DO concentrations in filtered wastewater, but comparative results showed
there was a consistent increase, thus suggesting the need to refine the ADEPT model.
The design strategy adopted for surface flow reedbeds in the integrated systems
was intended to ensure that discharge achieved 100% compliance with discharge consent
standards. However, compared with wastewater treated in the majority of constructed
wetlands, aquaculture wastewater is relatively dilute. This may be an important factor as
where waste concentrations are below the background concentration (C*), the use of
reedbeds for treatment may be constrained. Furthermore, the k-C* models predicted that
constructed wetlands may contribute to the waste load discharged to the receiving
environment during periods when waste concentrations from the smolt unit are low.
Despite these possible limitations, the model predicts that concentrations of SS,
TAN and BOD in discharges in the two scenarios incorporating wetlands achieve a 100%
level of consent compliance, avoiding fines or legal action, or reducing tax liabilities were
a pollution tax to be levied on waste discharges. Operators of the farin could also promote
an environmentally friendly image, possibly leading to a premium for fish produced. The
mean DO concentration (3.7 mg 1-1) predicted for the reedbed discharge in the baseline
135
modelling exercise may represent a cause for concern, however, it was not possible to
validate this output. Further work is required to address this potentially serious constraint
to using constructed wetlands for aquaculture wastewater treatment. One potential solution
could be to position the trout fishery after the reedbed, as DO levels observed at the fishery
were significantly above those expected based on the k-C* model for surface-flow
wetlands. However, problems with elevated SS concentrations have constrained using open
water systems in the final stages of ecologically based treatment systems (Kadlec and
Knight, 1996). Furthen-nore, due to the poor association between the observed treatment
efficiency and that predicted using the k-C* models for surface flow wetlands, additional
work is required to assess the potential of trout fisheries as a viable treatment option. Such
a study should consider the treatment performance of other fisheries and comparable
systems, functioning under a range of operating conditions, to develop appropriate and
robust models.
Constructed wetlands have proved effective at treating wastewater from a wide
range of sources (Kadlec and Knight, 1996). However, the long-term storage of nutrients
and other pollutants has not been studied widely. Phosphorus entering a constructed
wetland is removed initially through adsorption on substrate particles and assimilation in
plant and microbial biomass (Watson et al., 1989). However, Richardson (1985) noted,
"wetlands tested as wastewater filtration systems became phosphorus-saturated in a few
years, with the export of excessive quantities of phosphate". Furthermore, plant
communities that are not harvested, naturally senesce, releasmg sIgnificant amounts of
both nitrogen and phosphorus (Landers, 1982). The accumulation of litter may provide
additional binding sites, prolonging the effective life of a wetland. Eventually, however,
accumulated sediments will require removal to maintain the hydraulic characteristics of the
wetland, and there is a risk that the inappropriate disposal of these sediments may create a
diffuse pollution source. In contrast, horizontal integration leads to pollutants assimilated
136

in biomass produced in the system being removed during harvest, avoiding problems
associated with the development of HEAP traps (Gunther, 1997) and the release of
nutrients when the macrophytes senesce. Harvesting reeds for use as a 'green fuel'
represents an important innovation in the management of constructed wetlands, in which
nutrients sequestered from the unidirectional flow of matter in the hydrological cycle are
permanently removed from the ecosystem and a renewable energy source is created.
Despite such potential there may be practical constraints. During harvest the
wetland will not be available for wastewater treatment, although a possible solution would
be to harvest the reedbed between culture cycles, when the smolt unit is empty. However,
at this time, commonly between March and April, the reeds will have started to grow, a
less optimal harvest time than the dormant winter period. An alternative strategy would be
to construct the wetland in two separate basins, permitting one basin to remain functional
whilst the other was harvested. Although engineering a wetland with multiple basins may
increase the area of land required and add to capital costs, increased opportunities to adopt
cut and fill could reduce earthmoving costs. This also presents opportunities for
diversifying the macrophyte species cultivated. The proposition to plant only with the
common reed was used to simplify management, but, harvesting and processing, risks from
disease , infestations and grazing by waterfowl must be considered. Planting species that
are donnant during different periods could spread the workload associated with harvesting
extensive wetland areas, an important consideration if for instance employees from the
smolt unit were to meet this labour demand.
In the second scenario, it is estimated that the reed biomass produced in the
constructed wetland could assimilate considerably more N (769%) and P (957%) than is
discharged from the smolt unit. This indicates that the capacity of the reedbed to retain
imtrients is not fully exploited. The extra capacity of constructed wetlands for nutrient
retention could potentially be exploited (and costs shared) by assimilating nutrients
137

discharged from septic tanks, small sewage treatment works or runoff from agricultural
land. However, such an integrated approach would only be possible where the hydraulic
loading rate for the reedbed could be maintained, e. g. by reducing the volume of water
used in the culture facility during periods when the oxygen requirement and production of
waste is low. This contrasts to the situation at many commercial culture facilities where a
constant volume of water is abstracted throughout the year. The additional capacity of the
wetland to retain nutrients may also reduce the nutrient concentrations In discharges from
the smolt unit to below those in its supply.
Using constructed wetlands to control nutrient flows at the local and regional scale
may make a significant contribution to catchment-scale management initiatives.
Furthennore, where the cost of nutrient discharge and value of nutrient retention is realised
in the fon-n of tradable permits, the operators of the constructed wetland may be in a
position to benefit financially from the sale of this extra capacity. Although no such
arrangements currently exist in Scotland, the ADEPT model could be further developed to
facilitate an assessment of these likely financial impacts. Other possible areas of
investigation would be the potential impact of introducing charges for water use or a
pollution tax on nutrient discharges.
Consistent performance throughout the year is a basic requirement for treatment in
meeting discharge standards. The capacity of constructed wetlands to maintain removal
rates during winter when the plants are dormant is primarily due to non-biological
processes such as sedimentation, filtration and soil adsorption. Describing the treatment
effect of reedbeds receiving municipal and industrial wastewater in Beijing, China, Li et al.
(1995) noted that performance did not deteriorate significantly during the winter months
when the air temperature regularly dropped below zero- Furthermore, Schwartz and Boyd
(1995) reported good pollutant removal rates during periods when vegetation in the
reedbeds was dormant. Non-biological processes e. g. sedimentation and adsorption, are
138

particularly important in temperate environments during winter when temperatures retard
microbial activity and assimilation of nutrients by vegetation may cease.
Retaining water abstracted from a lotic environment in a trout fishery for several
days may cause a change in the species assemblage present. Phytoplankton blooms and
macrophyte communities proliferate in lentic environments receiving nutrient inputs and
sustain complex food webs that may include species of zooplankton, herbivorous
invertebrates and fish. The discharge of this water with its entrained lentic species
assemblage could potentially disrupt the biotic community in a receiving lotic water body.
In the present scenario water discharged from the trout fishery passes through a reedbed
before being discharged from the site, preventing the majority of biota from the fishery
passing to the receiving environment.
Detaining lotic waters in lakes and lochs is a natural process that can confer
benefits on downstream envirom-nents. Water bodies retain significant amounts of
sediment (White, Labadz and Butcher, 1996) and nutrients (Berge, Fjeld, Hindar and
Kaste, 1997) that might otherwise degrade downstream ecosystems. Wetlands also
facilitate the assimilation of nutrients into complex organic material, which if discharged,
may cause receiving environments to shift back to being driven by externally derived
detritus, as opposed to in situ primary production i. e. eutrophication. Consequently,
fisheries and constructed wetlands may be viewed as ecosystems suitable for interrialising
the potentially negative environmental impact associated with discharging wastewater
from smolt farms.
In addition to retaining nutrients, constructed wetlands, particularly reedbeds, have
been cited as capable of reducing the level of pathogenic bacteria and viruses e. g.
SaInionella sp. (Gersberg, Gearheart and Ives, 1989), chemicals e. g. refactory organics
(Watson et al., 1989) and trace elements, including heavy metals (Goodrich-Mahoney,
1996) in wastewater. This is significant as the consent to discharge granted to aquaculture
139

facilities "does not authorise the presence in the effluent discharged to the watercourse of
any substance or other matter not mentioned in the consent or the conditions" (SEPA,
1996).
Horizontally integrated aquaculture has been proposed as a strategy capable of
making a positive contribution to environmental protecti III ion, maximising production with
respect to inputs and potentially reducing financial risks (Enander and Hasselstrom, 1994).
Furthen-nore, Schwartz and Boyd (1995) considered constructed wetlands as inexpensive
to build and operate compared with conventional treatment strategies. However, in these
examples developing a constructed wetland for wastewater treatment results in a
significant capital cost (f681,940) and the small profit generated (f2,700 y-) means that
the ERR over ten, twenty and fifty years is negative.
In the baseline scenarios, depreciation on land and earthwork structures for
extensive aquaculture were assigned a salvage value of zero, as alternative activities at the
site may be limited, and redevelopment may represent a substantial cost. However,
facilities that receive adequate maintenance and continue to be used for similar purposes,
may be expected to retain a proportion of their initial value. Therefore, at the end of the
financial assessment period used, the wetland could potentially be sold for an amount
equivalent to the initial capital cost of the land, and possibly earthworks. However, this
would depend on the proposed use of the site by the prospective buyer. The sensitivity
analysis demonstrated that if the land and earthworks do retain their value, that the
combined fishery and reedbed becomes a more attractive investment. However, the effect
on the returns generated by the reedbed demonstrated that even in a favourable setting this
strategy, with its high initial capital cost, remains financially unattractive.
In the baseline scenario, employing a trout fishery and reedbed for wastewater
treatment generated a modest IRR (12.1%) over ten years. In most analyses, an ERR from
10-20% is considered desirable, although where a social benefit can be identified, BOJ6
140

(1991) suggested that a lower rate of -5% may be acceptable. However, managers of
commercial aquaculture operations are unlikely to factor in such social benefits to any
financial assessment. Furthermore, a relatively small IRR requires a greater weight to be
attached to long-term effects, increasing the significance of financial risks. It could be
argued that where there is an appropriate level of investment, structural integrity and
functionality of ecologically based wastewater treatment systems may be maintained
indefinitely, and a medium to long-term time horizon of 30-50 years may be considered.
However,, from the scenarios presented here it is apparent that returns generated over
twenty and fifty years are not markedly different, whilst the risk attached to the longer time
horizon increase significantly.
For a twenty-year period an integrated trout fishery and reedbed returns a
reasonable IRR (18%), however, as the time horizon increases it becomes difficult to
predict the future setting in which the system will function. For example, demand for
fishing may decline or the effectiveness of the treatment strategy may decrease,
particularly if stricter discharge regulations are introduced. The viability of the primary
aquaculture activity may change. However, it should also be considered that the conditions
for such a treatment approach might improve. As the fishery becomes more established
greater numbers of anglers may be attracted, especially as productive fisheries receiving
i ion nutrient rich water from smolt units may be expected to enhance the growth and conditi
of stocked trout, or policies may develop that recognise the wider values of ecological
based wastewater treatment, exempting the operator from pollution taxes or more stringent
discharge standards. This suggests a need to develop a more wide ranging sensitivity or
cost benefit analysis to consider the likely impact of such developments; the ADEPT
model represents an important starting point. Furthennore, considering potential
improvements in wastewater treatment, the adoption of constructed wetlands could
potentially open up new sites demanding more stringent discharge standards or permit the
141

expansion of existing farrns. These are both attractive propositions where site availability
constrains expansion in the aquaculture sector.
criticism of commercial aquaculture is that increased efficiency and
mechanisation leads to a decrease in employment; potentially causing resentment in local
communities, and in some cases, actually reducing their viability. Employment
opportunities associated with developing recreational fisheries in rural locatlons where
smolt farms frequently occur could potentially improve the perceptions held by
stakeholders conceming commercial aquaculture.
It is significant that the integrated trout fishery and reedbed creates a position for a
manager, who in addition to duties connected directly with the trout fishery, would be
responsible for general site maintenance, harvesting the reedbed and dealing with
administration relating to wastewater management. In contrast, it is assumed that work
associated with using a drumfilter or constructed wetland to treat wastewater will be
undertaken by contract labours or staff employed to operate the primary culture facility.
Employees at the smolt farm considered in this case study are frequently engaged in
activities related to wastewater management. The operation of the drumfilter is monitored
on a daily basis and maintenance e. g. greasing of gears and pressure washing screens, is
carried out on a monthly basis; furthermore, accumulated sludge requires disposal once or
twice a year and screens must be replaced at 2-3 year intervals.
An important constraint to using constructed wetlands could be the extensive land
area required. Irrespective of local land values, suitable land may not be available adjacent
to an existing aquaculture facility, whether due to inapproPriate physical characteristics or
prohibited by legislation. Where suitable land is identified but unavailable for sale, the
proposed wetland may represent an interesting diversification for the landowner
concerned, based on a revenue contract.
In the third scenario, the model predicted that land occupied by the integrated
142

wetland generates a considerable annual income (f 10,900 ha-1) as compared with the return
from agriculture. Should it prove possible to subsidise this income with grants for habitat
creation, waste reduction or business development, then the economic viability of these
systems would be improved. However, the risk associated with the initial capital costs
must be considered. A landowner engaged in activities other than aquaculture e. g. fanning,
may also be in a position to engage their own labour and machinery to develop the site,
reducing site development costs.
3.9. Summary
The ADEPT model was developed to facilitate an evaluation of the treatment effect,
management demands and economic implications for conventional aquaculture wastewater
treatment strategies and horizontally integrated systems. The model provides a framework
in which to assess several of the parameters that managers of commercial aquaculture
operations must evaluate when considering alternative waste management strategies. These
parameters include treatment capacity and performance, financial requirements and
economic implications. This study has demonstrated that the modelling approach adopted
is appropriate to simulate the composition of wastewater discharged from a commercial
smolt farm and the treatment effect of a drumfilter and horizontally integrated wetlands
and recreational trout fishery. It is concluded that horizontally integrated systems may have
a role to play in facilitating the reuse of nutrients in aquaculture wastewater, achieving
higher treatment standards, generating additional income, creating employment
opportunities and possibly assisting commercial aquaculture in becoming more sustainable.
Although horizontally integrated aquaculture may offer several advantages, two
major constraints identified in the current scenarios are the land required and the initial
capital expenditure. However, where land and capital are available for development for the
proposed integrated trout fishery and reedbed system, the positive but relatively small
143

economic returns could be subsidised by other potential benefits.
The conceptual model (Figure 3.1) elucidated a range of factors that must be
evaluated when considering alternative wastewater management strategies. However,
despite the apparent detail of the ADEPT model, it is important to reflect on a sentiment
expressed by Thompson (1993a) that "the major follies of our time are rarely due to
miscalculation of the detail, but more often the lack of appreciation of the totality of the
effect". In addition to the treatment efficiency and financial demands, the decision whether
to adopt horizontal integration depends on a number of additional factors, as demonstrated
through the use of a stakeholder Delphi, the results of which are presented in Chapter 6.
The next two chapters describe the use of the ADEPT model to explore alternative
approaches to horizontally integrated aquaculture; resource recovery from wastewater,
trends observed and possible constraints and opportunities are described. Chapter 4
assesses the potential of using constructed mangrove wetlands to treat wastewater from
commercial shrimp farms.
Acknowledgement
Sincere thanks to the management and staff at the commercial smolt unit surveyed, the
owners and manager of the trout fishery monitored and the Wildfowl and Wetlands Trust,
Slimbridge for their cooperation. The guidance of Mr W Struthers and Mrs N Pollock,
Water Quality Laboratory, Institute of Aquaculture, was also greatly appreciated.
144

Chapter Four
Constructed mangrove wetlands for intensively managed
shrimp pond wastewater
1. Introduction
Domestic and industrial water pollution, including that from aquaculture, has made it
increasingly difficult for shrimp farms to appropriate supplies of good quality water
(Beveridge et al., 1997). Wastewater treatment processes facilitated by mangroves have the
potential to improve the quality of run-off flowing into coastal lagoons, estuaries and near-
shore areas. Mangroves have been used to treat sewage and wastewater discharged from
societal systems, with the majority demonstrating a high capacity for retaining nutrients
and degrading organic matter (Clough, Boto and Attiwill, 1983; Dwivedi and
Padmakumar, 1983; Tam and Wong, 1995; Wong, Lan, Chen, Li, Chen, Llu and Tam,
1995; Machiwa, 1998). hnproving water quality in coastal areas would increase the
availability of good quality water for shrimp culture and contribute to the maintenance of
the trophic status of receiving habitats, ensuring that ecosystem support functions provided
by the coastal enviromnent persist and the utility of the resource is preserved.
The potential to exploit mangroves to condition water for use in shrimp aquaculture
and to treat wastewater from shrimp farms has been considered by a number of authors
(e. g. Robertson and Phillips, 1995; Rajendran and Kathiresan, 1996; Fredenksen,
Sorensen, Finster and Macintosh, 1998; Wolanski, Spagnol, Thomas, Moore, Alongi, Trott
145

and Davidson, 2000). Robertson and Phillips (1995) employed a mass-balance approach to
estimate the mangrove area needed to assimilate nutrients present in wastewater and
sediments from a semi-intensively managed shrimp pond in Tra Vinh Province, Vietnam
and an intensively managed pond in Chantabun Province, Thailand. They estimated that
excess nitrogen and phosphorus from 1 ha of semi-intensive shrimp ponds could be
assimilated by 2.5 ha and 3.4 ha of mangrove, respectively; assimilation of excess nitrogen
and phosphorus from I ha of intensive shrimp ponds could occur with 7.2 ha and 21.7 ha
of mangrove, respectively. However, the treatment effect of mangroves with respect to the
concentration of waste fractions present in water discharged from shrimp farms, and the
financial and economic implications of developing and managing constructed mangrove
wetlands have not been investigated.
Scenarios developed in the second case study using the ADEPT model examine the
potential of using constructed mangrove wetlands to treat wastewater from intensively
managed shrimp ponds stocked at low and high densities. Employing the ADEPT model,
the composition of wastewater discharged from intensively managed shrimp ponds stocked
at low and high densities was simulated. The mangrove area required for nutrient
assimilation was used to dimension the wetland and the expected treatment effect was
simulated emploYing the k-C* models described in Chapter 3.
The rationale for employing a mangrove wetland for wastewater treatment was that
such systems, in addition to facilitating a range of treatment processes, have the potential
to generate a variety of both marketed and non-marketed goods. Marketed goods could
include timber, thatch, charcoal, fish and shellfish; the provision of habitat and nursery
areas, shoreline protection and the regulation of the local hydrology may be considered as
non-marketed goods. In this case study it was assumed that wood harvested from the
mangrove would represent a marketable good for sale by the shrimp farmer. Costs
associated with developing the constructed wetland were assessed, income generated ftom
146

selling wood produced in the horizontally integrated mangrove plantation was estimated
and potential benefits associated with integrating further aquaculture activities are
discussed.
4.2. Method
Scenarios developed here employ background information on environmental conditions
and management practices for intensive shrimp culture, recorded at commercial farms in
Thailand; this data is summarised in Table 4.1. Mean temperatures reported by Cowan,
Lorenzen and Funge-Smith (1999) of 28'C during the wet season and 30'C during the dry
season, were assumed. These authors also reported that intensively managed shrimp ponds
stocked at low and high densities have similar mean depths of 1.6 in and that 0.4,4,6 and
8% of the water in these ponds was exchanged daily during the first, second, third and
fourth months of culture, respectively. Information relating to the management of shrimp
ponds stocked at low and high densities, methods employed to determine the composition
of wastewater and predict the treatment effect of a constructed mangrove wetland and
approaches used to assess financial and economic implications associated with
development are presented in the following sections.
4.2.1. Pond management
Operating parameters reported by Briggs and Funge-Smith (1994) and Cowan et al. (1999)
for intensively managed shrimp ponds in Thailand, stocked during the first year of
production at low and high densities were employed to develop two scenarios (Table 4.1).
Briggs and Funge-Smith (1994) reported that grow-out periods in intensively managed
ponds average 124 days, culture periods are assumed to last 4 months, with fallow periods
between each set at two months. Post larval (PL15-30) shrimp (Penaeus monodon) are
147

introduced at mean densities of 52.5 and 94.8 M-2 to intensively managed ponds to achieve
low and high stocking densities, respectively.
Table 4.1. Operating parameters for intensively managed ponds in Thailand stocked at low and high densities
Operating parameter ___- ...... ............. ...... . ............... --------
Low High
Pond depth (in) 1.6 1.6
Stocking density (no. nf2) 52.5 94.8
Survival (%) 40.6 44.8
Mean shrimp harvest weight (g) 21.7 21.5
FCR 2.13 1.93
Feed input (% body weight d-') 5.2 10.6
Feed input (kg ha-' cycle-) 8,800 17,280
4.2.2. Dimensioning the mangrove wetland
A simple stock model was developed to account for the stocking density (M-2) , anticipated
FCR and feed input (% body weight d-1); this, together with assumptions concerning the
proximate composition of feed and shrimp, was used to estimate the proportion of nutrients
and solids introduced as feed that are not assimilated in shrimp biomass. Feed pellets
introduced to culture ponds stocked at high and low densities equate to 34.6 and 17.6 t ha-I
-I y, respectively. Robertson and Phillips (1995) report that shrimp feed contains 7.1% of N
and 1.6% of P, and that shrimp contain 2.94% of N and 0.19% of P. The solids content of
commercial shrimp feed is assumed at 90.3% and that of shrimp at 24.6% (Funge-Smith
and Briggs, 1998).
The estimated mass of N, P and solids introduced as feed on a monthly basis, but
not assimilated in shrimp biomass, was divided by the volume of water discharged from
the culture pond to simulate the concentration of these waste fractions in wastewater
entering the constructed wetland. Representative concentrations for TAN, BOD and DO in
148

wastewater from tropical shrimp ponds reported by Briggs and Funge-Smith (1994) were
used in both scenarios.
A mass balance approach was employed to dimension the mangrove area required
to assimilate excess N and P; the difference in N and P introduced as feed and assimilated
in shrimp biomass was used to estimate the mass of nutrients that the mangrove would be
required to assimilate. Robertson and Phillips (1995) reported that the production of litter9
wood and roots in a tropical Rhizophora-dominated mangrove forest averages 8,20 and 28
t ha-1 y- I, respectively; these values are used in the scenarios presented here. However, the
species assemblage in a mangrove forest is likely to depend on local environmental and
hydrological conditions and prior to using the ADEPT model to assess the potential of
horizontal integration in specific settings, the likely productivity of the prevailing
mangrove type should be evaluated. The value for wood accumulation in a Rhizophora-
dominated mangrove employed in this case study, represents a mean value derived from a
comprehensive review of biomass accumulation rates in such mangrove stands by Clough
(1992; cited in Robertson and Phillips, 1995). In this review estimated accumulation rates
for wood in natural and managed mangrove stands ranged from 6 to 45 t ha-I y-1, however,
Robertson and Phillips (1995) considered 20 t ha-1 Y-1 a conservative estimate for wood
accumulation in managed mangroves fertilised with aquaculture wastewater. Furthermore,
fertilisation of Rhizophora trees has been shown to increase tissue nutrient concentrations
(Clough et al., 1983). Ideally, therefore, further to considering the productivity of the
prevailing mangrove type, the response of such a mangrove stand to varying cropping
patterns and fertilisation rates should be assessed when considering the potential of
constructed mangrove wetlands for aquaculture wastewater treatment.
However, in the absence of data for mangrove stands managed for aquaculture
wastewater treatment, Robertson and Phillips (1995) noted that the N content Of litter,
wood and roots was 1,0.12 and 0.41 per cent, respectively, and it was estimated that 219
149

kg ha-1 y-1 of N was required to sustain mangrove production. Employing a similar
approach, and assuming the P content of litter, wood and roots is 0.1,0.03 and 0.02 per
cent, respectively, it was estimated that 20 kg ha-I Y- I of P is required to sustain mangrove
production. As the mangrove areas required to assimilate N and P differed, the larger area
was used to dimension the constructed wetland.
4.2.3. Treatment performance
The treatment effect of constructed mangrove wetlands was based on k-C* models for
surface-flow constructed wetlands given by Kadlec and Knight (1996) and described in
Chapter 3. Concentrations expected in water abstracted for culture purposes were taken
from Briggs and Funge-Smith (1994). These authors reported that in water abstracted for
use in shrimp ponds in Thailand mean concentrations of SS were 108 mg 1-1, TAN 0.08 mg
rlý TN 0.69 mg 1-1, TP 0.12 mg 1-1 and BOD 1.9 mg 1-1. As in Chapter 3, background DO
levels were estimated based on 100% saturation levels. Permanent nutrient removal by the
constructed wetland was based on the harvest of mangrove wood; assuming wood
accumulates 20 t ha-1 y-1, N and P removal rates equate to 24 and 6 kg ha-1 y -1 1
respectively.
4.2.4. Financial and economic implications
Costs associated with developing the site were based on values presented by Mara et al.
(1993) and Mukheýee (personal communication, 1998) for constructing large-scale
ecologically based wastewater treatment facilities in Asia. The cost of land for construction
was assumed at f2,060 ha-1 and the cost of developing this area based on the cost of
digging I in deep ponds and transferring earth manually to trucks, estimated at E3,960 a- I.
However, by employing machinery on large-scale developments and optimising
150

arrangements for cut-and-fill it may be possible to reduce site development costs. An
additional 5% land area was included for access and infrastructure. It was assumed that one
control structure was required to regulate the flow of water entering the constructed
wetland, and a second to regulate the discharge of treated water to the receiving
environment. The cost of the control structures was estimated at f290 per installation and it
was anticipated that miscellaneous equipment costing f5 per employee would be required.
Operating costs included wages to pay managers and workers and money to
purchase materials and equipment to maintain the wetland and associated infrastructure.
Based on prevailing rates in India, it was assumed that a manager is required when the
constructed wetland exceeds 10 ha, and that the salary would be E825 y-1; workers are
employed at a rate of one every 5 ha, each receiving f410 y-1 (Mukheýee, personal
communication, 1998). The cost of materials and equipment to maintain infrastructure was
set at 1% of initial capital cost. Income would be generated through the sale of mangrove
wood, and based on information given by 'Primavera (1995), a market value of fO. 05 kg-1
was assumed. Accounting for the costs and potential returns described above, key financial
indicators were calculated as in Chapter 3. Furthennore, the same discounted cash flow
approach was used to calculate the NPV over ten years at discount rates of 5,10,15 and 20
per cent and the H?, R over ten, twenty and fifty years. Salvage values and replacement costs
were also treated as in Chapter 3.
'Primavera (1995) reported values for goods from mangroves of $30-2,000; assuming an exchange rate of fI
to $1.5 and that 20 t of marketable wood is produced annually, the value of this wood is estimated to range between fO. 001-0.067 kg-'. Although the upper quartile of the range, EO. 05 kg- 1, is used here, this author noted that the sustained harvest of wood products in Malaysia could realise a return of $11,561 ha-1 y-1.
151

4.3. Results
Physical characteristics of the constructed mangrove wetlands required to treat wastewater
from intensively managed shrimp ponds stocked at low and high densities are summarised
in Table 4.2. Other key indicators regarding the potential of employing mangrove wetlands
to treat shrimp culture wastewater are presented below.
4.3.1. Biomass production and waste outputs
The stock model predicted that intensively managed ponds stocked at high densities
produce 18.2 t ha-1 y-1 of shrimp, with 9.1 t produced from each culture cycle. For ponds
stocked at low densities, 9.3 t ha7l Y-1 of shrimp biomass is produced, each culture cycle
producing -4.6 t. The model estimated that the weight of solids contained in feed entering
ponds stocked at high densities was 32.9 t ha-1 y-1. Furthermore, based on the assumed
FCR and proximate analysis values for shrimp and feed, it was estimated that 22.7 t ha-1 y-1
of solids would not be assimilated and would be released to the receiving environment.
Based on the assumptions in Section 4.2.2, it was estimated that on an annual basis, 1,427
kg of N and 501 kg of P would be released from I ha of culture ponds stocked at a high
density. It was estimated that of 15.9 t ha-i y-i of solids delivered in feed to ponds stocked
at low densities, 11.6 t ha-1 y-1 would not be assimilated; the mass of N and P introduced as
feed but not assimilated was estimated at 727 kg and 255 kg, respectively.
4.3.2. Dimensioning the mangrove wetland
Assuming mangroves assimilate 20 kg P ha-1 y-1, it was estimated that -12.8 and 25 ha of
mangrove would be required to assimilate the 255 and 501 kg of excess P released from 1
ha of ponds stocked at low and high densities, respectively. An additional land area of 5%
152

required for embankments, access roads and supporting infrastructure increases the total
area needed to 13.4 and 26.3 ha for ponds stocked at low and high densities, respectively.
Based on mean growth rates, the production of litter, wood and roots in 12.8 ha of
mangrove equates to 102,256 and 358 t, respectively. The potential for N assimilation in
this area was estimated at 2,803 kg y-1, however, the estimated release of N from ponds
stocked at low densities was 727 kg y-1, indicating that only 26% of the N assimilation
capacity of the mangrove would be exploited. The mangrove area (25 ha) required to
assimilate excess P from 1 ha of ponds stocked at high densities was estimated to produce
200 t of litter, 501 t of wood and 700 t of roots annually. Excess N released from these
ponds was estimated at 1,427 kg y-1, however, the mass of N required to sustain production
in this mangrove area equates to 5,475 kg y-1. again indicating that only 26% of the N
assimilation capacity of the mangrove stand would be utilised.
Table 4.2. Physical characteristics of mangrove wetlands treating wastewater from I ha of shrimp ponds
stocked at low and high densities.
Characteristic Low High
Shrimp production (kg ha-1 y-1) 9.3 18.2
N not assimilated 727 1,427
P not assirMlated 255 501
Mangrove area required for P assimilation (ha) 12.8 25
Total area required (ha) 13.4 26.3
Production (t y-'): litter 102 200
wood 256 500
roots 358 700
Permanent removal through harvesting wood (kg y-1): N 306 601
P 77 150
Permanent nutrient removal from the horizontally integrated mangrove system is predicted
to occur primarily through the harvest of accumulated wood. Harvesting 256 t of wood
153

produced annually in the mangrove receiving wastewater from low density ponds would
remove 306 kg of N and 77 kg of P, equivalent to 42 and 30%, respectively, of the excess
nutrients entering the culture system. Wood harvested annually in the 27 ha wetland
treating wastewater from high density ponds would contain 601 kg of N and 150 kg of P,
equivalent to 42 and 30%, respectively of excess nutrients discharge from the ponds.
4.3.3. Wastewater composition and volume
Means and ranges predicted by the ADEPT model for waste concentration changes in
water used in shrimp ponds stocked at low and high densities are presented in Table 4.3.
For the low stocking density scenario, profiles for the predicted discharges of SS, BOD
and DO are presented in Figure 4.1, those for TAN, TN and TP are given in Figure 4.2.
Profiles for SS, BOD and DO for the high stocking density scenario are presented in
Figure 4.3, those for TAN, TN and TP are given in Figure 4.4.
Table 4.3. Predicted mean changes in waste concentrations (mg 1-1) in treated and abstracted water for low
and high density shrimp culture (where appropriate, ranges given in parenthesis).
Waste fraction Low density High density
Pond discharge Treated water
SS 109(46-265) -38 (-59-14)
TAN 0.31 -0.08
TN 6.8 (2.9-16.7) 0.8
TP 2.4(1-5.9) -0.1
BOD 5.3 2
DO 0.9 -4.2 (-4.1--4.3)
Pond discharge
130(52-195)
0.84
8.2 (3.2-12.3)
2.9 (1.1-4.3)
6.5
1.7
Treated water
-32 (-7--57)
-0.08
0.8
-0.1
2.1
-4.3 (-4.2--4.4)
154

300
250
200 E C 150 0
100 C
C 50 0 U 0
-50 April May June July
18.0 16.0
0 14.0 E
11 W-
Aug Sept Oct
Month
Nov Dec
Legend:
s SS
Jan . 1: 6 #1- -
Feb Nbrch
u BOD DO
Figure 4.1. Mean predicted concentration (mg/1) change for SS, BOD and DO in wastewater from shrimp ponds stocked at low densities
12.0 - 10.0 8.0 6.0 4.0 2.0 0.0
250
200
April May June July Aug Sept Oct Nov Dec Jan Feb March
Month Legend:
* TAN TP TN
Figure 4.2. Mean predicted concentration (mg/1) change for TAN, TN and TP in wastewater from shrimp ponds stocked at low densities
E 150 0
loo 50
UoII! - -a M-
April May June July -50
ý Aug Sept Oct Nov Dec Jan Feb March
Month Legend:
0 ss BOD DO
Figure 4.3. Mean predicted concentration (mg/1) change for SS, BOD and DO in wastewater from shrimp ponds stocked at high densities.
155

14.0 ,
12.0
10.0
8.0 - 6.0 - 4.0
2.0
0.0 Apdl May June July Aug S ept Oct Nov Dec Jan Feb March
Month Legend:
s TAN Ali TP TN
Figure 4.4. Mean predicted concentration (mgý) change for TAN, TN and TP in wastewater from shrimp ponds stocked at high densities.
Mean concentration changes for SS, TN and TP in wastewater from low density culture
were 109,6.8 and 2.4 mg 1-1, respectively, whilst for high density ponds changes for SS,
TN and TP were estimated at 130,8.2 and 2.9 mg 1-1, respectively. Predicted changes in
TAN, BOD and DO in water used to culture shrimp stocked at low and high densities were
given by Briggs and Funge-Smith (1994). As compared with abstracted water,
concentrations of TAN, BOD and DO in wastewater from intensively managed shrimp
ponds stocked at low densities were expected to increase by 0.31,5.3 and 0.9 ing 1-1,
respectively. Concentrations of TAN, BOD and DO in wastewater ftom ponds stocked at
high densities were expected to increase by 0.81,6.5 and 1.7 mg FI, respectively.
It is important to note here that, unlike the situation with the commercial smolt unit
considered in Chapter 3, the volume of wastewater discharged from intensively managed
shrimp ponds increases during the production cycle. Irrespective of the stocking density,
the discharge volume was expected to increase from 64 m3 d-1 in the first month to 640 M3
d-1 in the second, 960 m3 d-I in the third, reaching a maximum of 1,280 m3 d-1 in the fourth.
It was assumed that dunng the fallow penods the ponds are left to dry.
156

4.3.4. Wastewater treatment
Changes predicted by the ADEPT model for waste concentrations following treatment of
the process water in a constructed mangrove wetland are given in Table 4.2; values
presented refer to changes in mean monthly concentrations with respect to background
levels in abstracted water.
Low stocking density
Profiles for the predicted discharges of SS, BOD and DO following treatment are
presented in Figure 4.5, those for TAN, TN and TP are given in Figure 4.6. Predicted mean
concentrations of SS, TAN and TP following treatment are on average below background
levels expected in abstracted water by 38,0.08 and 0.1 mg 1-1, respectively representing
reductions of 135,126 and 104 per cent. However, mean TN and BOD concentrations
were predicted to remain above concentrations in abstracted water by 0.8 and 2 mg 1-1,
respectively, indicating that only 88% and 63% of the TN and BOD released from the
culture ponds would be removed.
20.0
10.0
0.0
E- 10.0 c .2 -20.0
-30.0
r 40.0 0 0
- 50.0
-60.0 i
-70.0
March
Legend:
0 SS BOD DO
Figure 4.5. Mean predicted SS, BOD and DO concentrations (mg/1) in wastewater from low density ponds treated using a mangrove wetland (minus background levels)
157

0.8
ol E 0.6
c 0,4
0.2
0.0
-0.2
A O; t ------------ --- Mklq ics Aug Sept
Month
Legend:
s TAN TP
Figure 4.6. Mean predicted TAN, TN and TIP concentrations (mg/1) in wastewater from low density ponds treated using a mangrove wetland (minus background levels)
High stocking density
F%.
March
TN
Profiles for the predicted discharges of SS, BOD and DO following treatment are
presented in Figure 4.7, whilst those for TAN, TN and TP are given in Figure 4.8.
Treatment in the constructed wetland was expected to reduce mean SS, TAN and TP
concentrations to below background levels in abstracted water by 32,0.08 and 0.1 mg 1-1,
respectively, representing reductions of 124,109 and 104 per cent, as compared with
outputs from the culture unit. Mean concentrations of TN and BOD were predicted to
remain above those expected in abstracted water by 0.8 and 2.1 mg 1-1, respectively,
indicating that treatment removes on average 90% of TN and 69% of BOD. As with
wastewater from ponds stocked at low densities, DO concentrations following treatment
10.0 0.0
A ril zz -10.0 cn E- 20.0 0
-30.0
-40.0
- 50.0
-60.0
-70.0
............
Aug Sept Nv A'n' /F"
eb March
Month
Legend:
s SS m BOD -, DO
Figure 4.7. Mean predicted SS, BOD and DO concentrations (mg/1) in water from high density ponds treated using a mangrove wetland (minus background levels)
158

1.0
0.8
0.6
0.4
0.2
0.0
AM MN5 ---=jeg --- =ý=269: 7--ýAug Se P7ýýý bM ar>C h
-0.2 ,
Month
Legend:
s TAN ----4F- TP TN
Figure 4.8. Mean predicted TAN, TN and TIP concentrations (mg/1) in water from high density ponds treated using a mangrove wetland (minus background levels)
4.3.5. Financial implications
The financial demands, including expected capital and operating costs, for constructed
mangrove wetlands treating wastewater from ponds stocked at high and low densities are
surnmarised in Table 4.4.
Low stocking density
Major capital costs associated with developing an area of 13.4 ha for the mangrove
wetland in this scenario were estimated at f27,600 to purchase land and f53,100 to
develop the site. Additional capital costs were f 580 for control structures and f 15 for
miscellaneous equipment. Total capital costs were estimated at f 81,320, or f 6,070 ha- I of
land developed. Operating costs of f8 10 y- I were associated with purchasing materials and
equipment to maintain the site and f2,060 y- I with wages for management and employees.
Selling 255 t of mangrove wood results in a gross income of f 12,770 y- I, equivalent to
-f950 ha-1 Y- 1. Profits excluding depreciation were estimated at f 9,900 y- 1, suggesting rates
of return on initial capital and annual operating costs of 12.2% and 345%, respectively, and
a payback period of 8.2 years. During the first ten years, cash flows generated by the
horizontally integrated mangrove plantation result in negative NPV's at discount rates 159

albove 5%; the IRR was 1.9% during this period. However, over twenty and fifty years the
predicted IRR increased to 10.3% and 12.1 %, respectively.
Table 4.4. Financial indicators associated with developing constructed mangrove wetlands to treat
wastewater from 1 ha, of shrimp ponds stocked at low and high densities
Characteristic Low High .......... . ............ ............. . ... . ..... . ....... ....... ... ......... ........ ..... ............ ...........
Capital costs
Land E27,600 f 54,200
Site development f53,100 f 104,180
Miscellaneous f 595 f 605
Total f 81,320 f 158,980
Operating costs
Maintenance f8lo fl, 590
Labour f2,060 E2,880
Total E2,870 E4,470
Profit excluding depreciation E9,900 f20,600
Pay-back period (y) 8.2 7.7
Return on capital costs 12.2% 13%
Return on operating costs 345% 461%
Ten year NPV at: 5% -f 10,400 -f 12,000 10% 422,100 436,700 15% 429,600 452,800 20% 434,500 463,300
IRR (%) over: loy 1.9 3.2 20 y 10.3 11.2 50y 12.1 12.9
High stocking density
Major capital costs associated with developing 26.3 ha for the mangrove wetland were
estimated at f 54,200 to purchase land and f 104,180 to develop the site. Other capital costs
were E580 for control structures and f25 for miscellaneous equipment. Total capital costs
were estimated at f 158,980, or E6,045 ha-1 of area developed, slightly less than In the low
stocking density scenario. Operating costs of f 1,590 y- I and f2,880 y-1 are associated with 160

site maintenance and wages, respectively. Selling 501 t of mangrove wood resulted in an
estimated income of f25,050 y-1, equivalent to E952 ha-I y -1. Profits excluding depreciation
were estimated at f20,600 y-1; suggesting rates of return on initial capital and annual
operating costs of 13% and 461%, respectively and a payback period of 7.7 years. During
the first ten years, cash flows generated result in negative NPV's at discount rates above
5%; the IRR is 3.2% during this period. However, over twenty and fifty years the
estimated MR increased to 11.2% and 12.9%, respectively.
4.3.6. Sensitivity analysis
As in Chapter 3, the sensitivity analysis was achieved by modifying key input parameters
in turn and assessing the impact on the ten year IRR. Outputs are summarised in Table 4.5,
and it is apparent that changing costs produce a similar response in both scenarios. A 20%
decrease in land or site development costs had a minimal effect on the ERR, which remains
below -7% in both scenarios.
Table 4.5. Sensitivity of ten year IRR (%) to changing input parameters at low and high stocking densities.
Parameter ................................................ .................................................. ................... .......................................... ............... . ................ ......................................................
Low .......................... ................ . ..... . ..... ..... ............................... .............
High .......... . ....................................... .......................................
Baseline 1.9 3.2
Land cost (-20%) 3.5 4.8
Land cost (+20%) 0.4 1.7
Site development cost (-20%) 5.1 6.6
Site development cost (+20%) - 0.4
Value of mangrove biomass (-20%) -
Value of mangrove biomass (+20%) 7 8.1
Land retains its value over ten years 6.6 7.6
Land and earthworks retain value over ten years 12.1 12.9
Land cost assumed at EO ha-1 12.3 13.9
Stocking density increased by 50% 3.2 3.4
Stocking density decreased by 50% 0.8 1.8
161

Assuming the value of mangrove wood produced was 20% higher generates IRRs of 7%
and 8.1 % at low and high stocking densities, however, accounting for a 20% decrease
results in negative MRs in both cases. Assuming land retains its value over ten years
results in higher IRRs of -7% in both cases, however, assuming both land and earthworks
retain their value results in an ERR of 12.1 % in the low stocking density case and 12.9% at
a high density. The greatest increase in ERR to 12.3% and 13.9% at low and high stocking
densities, respectively, occurred when the land cost was assumed as zero. A 50% increase
or decrease in shrimp stocking density results in only marginal changes as compared with
the baseline IRR.
4.4. Discussion
4.4.1. Wastewater characteristics
Briggs and Funge-Smith (1994) report that mean concentrations of SS, TN and TP in water
passing t ough recently constructed, intensively managed shrimp ponds stocked at high
densities were 31,2.1 and 0.17 mg 1-1 higher, than abstracted water. However, mean
concentration increases for SS (109 and 130 mg 1-1), TN (6.8 and 8.2 mg 1-1) and TP (2-4
and 2.9 mg 1-1), predicted using the ADEPT model, for ponds stocked at both low and high
densities, are higher than those reported by these authors. Budgets for solids and nutrients
proposed by Briggs and Funge-Smith (1994) account for a range of inputs including lime,
fertillser, juvenile shrimp and inlet water, and consider dynamic processes occurring in
culture ponds i. e. erosion, denitrification and sediment accumulation. In contrast, the
inputs -L'r ADEPT model treats the shrimp pond as a black box, only accounting for major
(feed) and outputs (wastewater and shrimp biomass). Consequently, the model simulates a
culture system that may be a closer approximation to a lined pond, relying on commercial
feed to sustain production, as opposed to the conventional earthen pond culture system
162

described by Briggs and Funge-Smith (1994). Nitrogen and phosphorus may be retained in
sediments that accumulate in shrimp culture ponds and nitrogen may be lost from the
system through denitrification and volatilisation (Funge-Smith and Briggs, 1998).
The ADEPT model could be modified to account for the dynamics of waste
fractions in the culture ponds, however, solids and nutrients that accumulate in sediments
still require disposal and may ultimately be released to the receiving environment where
they will require degradation and assimilation. Accounting for processes such as
denitrification and volatilisation, where compounds are lost from the system, may be
appropriate, although the extent and magnitude of these processes is likely to vary
depending on management regimes, environmental conditions and climate.
The volume of water discharged from the shrimp ponds remains at low levels (0.4-
8% d-1) during the culture cycle, however, the ADEPT model assumes that the total waste
loading from the culture system becomes entrained in water discharged from the culture
facility. This may represent a reasonable assumption in flow-through systems where
exchange rates exceed 100% d-1, however, in the scenarios presented here, it may have
been useful to adopt a modified approach. This could have simulated the composition of
wastewater from the shrimp ponds to account for initial dilution and gradual accumulation
of waste products in the culture system. However, unless the dynamic physical, chemical
and biological processes that occur in shrimp ponds were considered, this approach may
not have resulted in predictions that were more accurate. Furthermore, accounting for
processes of dilution and accumulation in the process water would not change the total
loading of excess nutrients and other waste fractions generated by the culture facility that
may ultimately be discharged to the receiving envirom-nent.
163

4.4.2. Nutrient retention
Design criteria employed in this study meant that the capacity of the constructed wetland
was sufficient to assimilate the total loading of N and P released from the culture system.
However, Li (1997) demonstrated that in established mangrove forests in Shenzhen, south
China, the assimilation of N and P by mangrove trees is in equilibrium with the return of
nutrients to the ecosystem as litter. This finding indicates that established mangrove forests
may not retain a significant proportion of the nutrients assimilated during primary
production. However, the capacity of forests to permanently sequester nutrients from the
ecosystem may be enhanced through regular cropping of accumulated wood; a simple
mass-balance approach was employed here to demonstrate the potential of this
management strategy.
The ADEPT model estimated that the proportion of N (42%) and P (30%) from
wastewater discharged from intensively managed shrimp ponds, stocked both at high and
low densities, and removed from the mangrove ecosystem through harvesting accumulated
wood was significantly less than that assimilated in the mangrove plantation. The need to
permanently remove accumulated biomass, and concomitantly nutrients from mangrove
forests, was noted by Robertson and Phillips (1995) as being a condition of using
mangroves as nutrient filters for shrimp pond wastewater. This investigation demonstrated
that the actual area of mangrove required to assimilate the nutrients discharged from
shrimp aquaculture is greater than the mangrove area required to assimilate the nutrients
per se. The wetland design could be modified so that theoretically all nutrients released
from the shrimp ponds could be assimilated into wood that could be harvested and
removed from the system. However, such a strategy would most likely result in mangrove
production further from the wastewater inlet becoming both P and N limited. With the
design approach presented here, only 26% of the N that would usually be assimilated in the
area of mangrove required to assimilate excess P was available, suggesting that N 164

availability would limit overall production, and consequently P assimilation. Another N
source may therefore be required to ensure that production in the mangrove does not
become limited by this nutrient. Further work would be required to assess the possibility
for other nutnents to limit mangrove production.
Mangrove ecosystems are capable of storing nutrients; Robertson and Phillips
(1995) suggested that the retention and recycling of matter in sediments underlying
mangrove forests represents a sink for nutrients. The ADEPT model could be modified to
account for nutrient retention in mangrove sediments; however, the capacity of such
sediments to retain nutrients is likely to be site specific, varying with the hydraulic regime,
nutrient loading rate and age of the mangrove forest. Furthermore, the accumulation of
nutrients in mangrove sediments does not represent an appropriate strategy for reusing
nutrients isc arge ins mp culture wastewater.
4.4.3. Environmental goods and services associated with mangroves
Although the retention of assimilated nutrients in established mangrove communities may
be limited (Li, 1997), the assimilation of nitrogen and phosphorus in complex organic
matter such as leaf litter and fine root production may alleviate the problems of nutrient
enrichment associated with shrimp aquaculture. Corea et al. (1995) provides an account
regarding the degradation of water quality in the Dutch canal, Sri Lanka, due to the release
of wastewater from shrimp farms. Establishing mangrove communities to assimilate
bioavailable nutrients present in the wastewater may represent an important strategy in
ameliorating the observed negative environmental and social impacts. Litter from the
forest would represent an important source of detritus, the basis for a number of food
chains in coastal enviromnents. Sheridan (1997) reported that the abundance of benthic
fauna in sediments underlying red mangrove (Rhizophora mangle) stands in Rookery Bay,
Florida exceeded that in neighbouring seagrass and non-vegetated mud habitats. Sheridan 165

(1997) observed that surface deposit feeders and carnivores dominated the benthic fauna in
sediment underlying the red mangrove, and that this habitat provided high densities of
small prey items for consumers that exploit the inter-tidal zone during high tide.
Furthermore, Larsson et al. (1994) estimated that 4 ha of mangrove forest is required to
supply detritus to supplement feed inputs to 1 ha of semi-intensively managed shrimp
culture ponds. Detritus production in mangroves established to treat wastewater from
shrimp fanning may compensate for the appropriation of detritus in the culture system.
The abundance of detritus and prey items in mangrove communities combined with
the complex architecture of aerial roots and branches make mangroves ideal nursery areas
for juvenile fish and shrimp. Primavera (1998) found that riverine mangroves in Guimaras,
the Philippines played an important role as nursery areas for penaeid shrimp. Kautsky et al.
(1997) estimated that 9.6-160 M2 of coastal mangrove is required to supply shrimp post-
2 larvae to stock Im of a semi-intensively managed shrimp pond. Therefore, the mangrove
forest required for nutrient assimilation in this study (12.8-25 ha) may represent an
important nursery area for juvenile shrimp, producing a significant proportion of the post-
larvae required from restocking and supplementing the supply of juvenile shrimp produced
in natural mangrove ecosystems. In addition to assimilating nutrients, producing detritus
and providing nursery areas, mangrove forests sequester carbon released during processes
associated directly and indirectly with semi-intensive shrimp aquaculture. Kautsky et al.
(1997) estimated that 0.8-2.5 M2 of forest is required to sequester carbon emitted as a
consequence of culturing shrimp in Im2 of a semi-intensively managed ponds.
4.4.4. Management issues
Constraints and opportunities associated with the development of the mangrove production
system extend further than financial and economic considerations; integrating mangrove
production with commercial shrimp fanning poses several practical problems. The 166

capacity of shrimp farm operators may need strengthening as managing the constructed
wetland may demand skills more closely allied to forestry, a discipline that has different
demands to that of aquaculture. Although cultivating mangrove trees may not capitalise on
existing knowledge to the same extent as culturing shellfish and seaweed, mangroves are
aquatic habitats and knowledge of hydrology, water quality and aquatic ecosystems
possessed by shrimp farmers may contribute to formulating appropriate management
strategies.
Traditional management strategies for mangrove plantations are based on rotations
of 20-30 years in which a single age class of plants is cultivated; plantations are thinned at
5-10 year intervals during the rotation and finally clear felled when the trees reach maturity
(Ong, 1982; Johnston, Clough, Xuan and Phillips, 1999). Ong (1982) reports that in
traditional management regimes for mangrove plantations in Malaysia, the stand is thinned
after 15 years, again at 20-25 years and clear-felled at 30 years. Proposing a similar
regime, with irregular intervals between planting, thinning and felling, would have serious
implications for the management and economics of horizontally integrated mangrove
plantations. Should substantial quantities of marketable wood only be produced after 15-30
years, the relatively long period preceding a financial return may dissuade potential
developers.
The cropping pattern for mangroves used to develop the ADEPT model was based
on extracting wood products from the mangrove plantation on an annual basis. Johnston et
al. (1999) proposed that harvesting a proportion of mangrove plantations equal to the
reciprocal of the rotation length from mixed aquaculture- silviculture fanning systems
annually would provide farmers with a regular annual income. Although this may be
feasible when harvesting large established mangrove stands, when considering relatively
small, newly established plantations, this may not represent the best management strategy.
Possible problems may be associated with the fact that it is generally more difficult to 167

manage numerous cohorts in small plantations compared with a single age class; that
stands of mangrove trees in particular areas are likely to be of similar ages and that the
length of time to establish such a rotation is twice that of traditional systems.
A possible solution that addresses problems associated with both traditional and
modified harvesting strategies proposed in scenarios developed in this study would be the
establishment of a regional management strategy. This would encompass mangrove stands
of varying ages on different farms and permit the optimal management of single age class
plantations on individual farms, whilst cash-flows generated from the harvest of mature
trees would be distributed amongst those farmers managing their plantations cooperatively.
This strategy would help disperse risks associated with long-term investment required for
forestry and facilitate the establishment of reciprocal arrangements for labour demands
associated with planting, thinning and harvesting. It would also provide the collective of
operators greater negotiating power when sourcing inputs and trying to access markets
demanding regular supplies of timber and wood products. However, a range of factors may
constrain the development of cooperative agreements; operators may be reluctant to form
cooperatives, especially where the agreement would last for 20-30 years; the capacity of
local institutions may not be sufficient to support the formal implementation of agreements
and insecurity of tenure may prevent operators from entering into such contracts.
4.4.5. Practical constraints
Robertson and Phillips (1995) noted several constraints regarding the management of
mangroves treating wastewater from shrimp farms. Mangroves are not homogenous and
hydrological conditions depend on a number of physical and environmental features e. g.
sediment characteristics, root architecture, canopy thickness and the activity of burrowing
animals. Consequently, it is unlikely that wastewater will be dispersed evenly throughout
the mangrove wetland. Uneven wastewater dispersion in the mangrove may cause short- 168

circuiting, reducing the treatment efficiency of the constructed wetland, while some areas
of the wetland may receive excessive wastewater loadings, resulting in the assimilative
capacity of certain areas being exceeded.
Robertson and Phillips (1995) raise questions regarding the feasibility of using
mangroves to treat aquaculture wastewater. Continuous flooding of mangroves with
wastewater contrasts with the intermittent flooding caused by tides and terrestrial run-off
that characterises the hydrology of natural mangroves. Furthermore, these authors question
the long-term assimilative capacity of mangrove sediments for phosphorus, the influence
of sediment type on nitrogen retention and transformation, and which silviculture practices
optimise forest growth and nutrient uptake. Excessive loadings of TAN, particulate organic
matter and dissolved organic matter may lead to anaerobiosis in the mangrove sediments.
This could result in tree mortality and negative impacts on benthic fauna, including the loss
of burrowing animals, which could have a severe impact upon the functioning of the
ecosystem. Evidently before mangroves are promoted for treating wastewater from
commercial aquaculture, the queries presented here require consideration.
4.4.6. Social and economic issues
As noted above, mangrove ecosystems are important habitats for juvenile shrimp.
Furthermore, studies have shown that mangroves act as nursery areas for a number of other
aquatic species, including several that are economically important in near-shore and
offshore fisheries (Collette, 1983; Louis, Bouchon and Bouchon-Navaro, 1995; Kenyon,
Loneragan, Hughs and Staples, 1997; Ronnback, Troell, Kautsky and Pnmavera, 1999).
Therefore, mangrove areas created to treat aquaculture wastewater could potentially
harbour the juveniles of species, that on emerging from the mangrove supplement
populations may be exploited by local fishennen. This would constitute an important social
benefit, especially in areas where mangrove forests that once fringed the coast have 169

disappeared through development or over-exploitation. Supplementing stocks in near-shore
and offshore fisheries could benefit local fishermen, but this resource may be open to
exploitation by commercial fisheries, in which case the benefits may not be reallsed by the
local community. Ensuring that local communities benefit from the creation of mangrove
areas to treat aquaculture wastewater could assist shrimp farming to become more
acceptable, alleviating feelings of disenfranchisement in the local community and reducing
antagonism between shrimp farmers and other stakeholder groups.
According to Primavera (1995), artisanal fishing communities obtain a range of
food items from mangrove forests. In the Philippines, extensive aquaculture i. e.
introducing rock mounds known as amatong to encourage the aggregation of fish, fish
cage culture, crab fattening in cages, seaweed culture and mollusc culture on stakes, may
be employed to increase the incomes of coastal communities. Permitting coastal
communities access to constructed mangrove wetlands, to culture food species and collect
medicine and construction materials, must be balanced against the need to manage the
forest correctly, thereby securing the predicted financial returns required for the economic
sustainability of the enterprise. Extensive aquaculture production systems that may be
integrated with the mangrove plantation could include cultivating seaweed, shellfish or
crabs, although the impact of these culture practices on water quality should be considered.
Studies have demonstrated that cultivating seaweed is an economically attractive
livelihood strategy for members of coastal communities in Southeast Asia (Padilla and
Lampe, 1989; Firdausy and Tisdell, 1991). Siar, Samonte and Espada (1995) described
how small-scale enterprises culturing the slipper oyster (Crassostrea iredalei) represented
a significant source of employment for women in Western Visayas, the Philippines.
Opportunities for employing women in extensive aquaculture practices associated with
mangrove plantations may represent an important social benefit of using constructed
wetlands to treat wastewater from shrimp farms. 170

The constructed wetlands proposed here for integration with I ha of shrimp ponds,
create work for 4-6 people; the provision of employment is an important benefit of
aquaculture in less developed countries. For communities close to shrimp farms in, for
example, India, Bangladesh, Indonesia and the Philippines, the development of constructed
mangrove wetlands may confer significant social benefits on the local community. Where
rice fields have been converted to aquaculture, the need to generate employment
opportunities may e great; Shiva (1995; source Primavera, 1997) states that a shrimp farm
covering 40 ha requires only 5 employees as opposed to an equivalently si I ized rice farm
that would employ 50 workers. With the advent of commercial aquaculture in coastal
regions, particularly in the tropics, local communities have frequently been denied access
to natural resources upon which they depended and deprived of tenure over productive
costal areas. Permitting access to mangroves established primarily for wastewater
treatment could therefore have a significant positive impact on local coastal communities
that are often vulnerable, and sometimes resentful of previous aquaculture developments.
4.4.7. Financial viability
In addition to generating employment for poor people from the local community, the
integration of extensive aquaculture practices, such as those described by Primavera
(1995), amongst mangrove trees in constructed wetlands may have a positive impact on
economic returns generated by the enterprise. Enander and Hasselstrom (1994) suggest
that economic loss associated with low shrimp yields could be offset by horizontally
integrated production of shellfish. However, findings from this study suggest that the
financial demands associated with establishing horizontally integrated mangrove
plantations to treat wastewater from intensively managed shrimp ponds may constrain
development by operators of small-scale farming enterprises. Financial indicators
developed in scenarios presented here do not fully support this hypothesis. Employing 171

conventional financial measures of success, the IRR's generated over the first ten years of
operation (1.9% and 3.2%) would not be considered sufficient to justify investment in this
innovative management strategy.
Considering the financial performance of the horizontally integrated mangrove
plantations over twenty years, the IRRs generated Increased (10.3% and 11.2%), however,
returns at the levels predicted are unlikely to persuade operators to invest in this treatment
strategy, especially where the opportunity cost for financial assets may be significantly
higher and risks over the medium to long-term become less predictable. Despite apparent
conclusions that may be drawn from these findings, a number of mitigating circumstances
may be proposed that would increase the economic viability and attractiveness of this
wastewater treatment strategy to shrimp farm operators. The sensitivity analysis
demonstrated that returns over ten years were relatively insensitive to a 20% change in key
input variables. However, where land and earthworks retain their value over the
assessment period, or land costs are close to zero, investment in such treatment systems
generates more favourable returns (12-14%).
Scenarios developed in this investigation are based on commissioning a constructed
mangrove wetland; potential sites for establishing mangrove plantations include land that
is currently used for agricultural production, abandoned shrimp ponds and marginal areas.
The cost of establishing the mangrove plantation is based on the acquisition of agricultural
land at the full market value, ensuring that the viability of the proposed strategy does not
depend on appropriating marginal land that local communities may consider a common
resource. In contrast, developing derelict shrimp ponds that are unable to support other
aquaculture activities may assist in regenerating coastal areas that have been degraded
through the development of unsustainable aquaculture practices. Furthermore, reclaiming
derelict ponds for use as constructed wetlands for aquaculture wastewater treatment would
require less capital investment. 172

Acquisition of agricultural land is likely to be considerably more expensive than
developing derelict and marginal land, and may have serious consequences for the
financial viability of the proposed wastewater treatment strategy. Assessing the financial
performance of constructed mangrove wetlands, as outlined in this study, demonstrates that
this strategy for managing shrimp culture wastewater generates relatively small IRR during
the first ten years of operation, and increases to only relatively modest levels over twenty
years.
However, financial returns generated could be enhanced significantly if it were
possible to capitalise on other values attributable to mangroves, and not depend solely on
income generation through wood sales. Ruitenbeek (1994) outlines a wide range of
sustainable production uses of mangroves; other wood based products include timber,
firewood and charcoal. The extensive culture of fish, shellfish and crustaceans represents
another important sustainable production function of mangroves. Traditional practices of
hunting, fishing and gathering in mangroves yield greater benefits than might be expected;
in addition to capturing fish, shellfish and crustaceans from natural populations, other
products include tannins, nipa, medicines and honey (Ruitenbeek, 1994; Ronnback, 1999).
Furthermore, the mangrove ecosystem acts as a repository for genetic resources, a functlon
that still requires evaluation.
Production functions of mangrove ecosystems represent tangible benefits, however,
benefits attributable to mangroves can be extended to include regulatory, carrier and
information functions (Ruitenbeek, 1994; Gilbert and Janssen, 1998). Evaluating both
marketed and non-marketed goods supplied by mangroves resulted in estimates ranging
between $30-11,561 ha-1 y-1; the maximum value reported was attributed to sustained
production of wood products in a Malaysian mangrove (Primavera, 1995). If the developer
of a mangrove plantation were able to capitalise on marketed and non-marketed goods
supplied by this habitat, the development of constructed mangrove wetland to treat 173

wastewater from shrimp culture may become a financially viable proposition. However, it
is unlikely that the value of both marketed and non-marketed goods will be transferred to
operators of shrimp farms that establish new mangrove areas, although it may be argued
that these shrimp farms are currently subsidised by existing mangrove ecosystems.
4.5. Conclusions
This study demonstrates that the stock model developed for the ADEPT model, based on
anticipated feed inputs and expected feed conversion ratios, may be applied readily to
simulate the growth of shrimp stocked at low and high densities in intensively managed
ponds. Predictions using the ADEPT model for waste concentrations present in water
discharged from intensively managed shrimp ponds stocked at low and high densities are
within the range reported in the literature. The ADEPT model could be refined further to
account for the internal dýmamics of nutrients and waste fractions in culture ponds and
variable water exchange rates, however, potential benefits associated with these
developments are not clear. It is argued that those waste fractions not discharged, entrained
in the process water during routine water exchange, may ultimately be released from the
culture system and appropriate environmental services from receiving ecosystem areas.
Regarding the treatment efficiency of constructed mangrove wetlands, the k-C*
models employed here are based on relationships derived largely from freshwater wetlands
in temperate environments. Therefore, without validation it is difficult to define the level
of confidence with which the findings may be considered. Information collected from
existing mangrove stands receiving wastewater with a comparable composition may be
employed to formulate k-C* models that relate directly to the dynamics of waste fractions
in marine and brackish-water forested wetlands dominated by mangrove. Before proposing
constructed mangrove wetlands as appropriate treatment systems for wastewater from
174

shrimp ponds, monitoring of the treatment performance of pilot-scale systems would be
advisable. Information collected regarding the wastewater composition, treatment
performance, management demands and financial costs would enable the validation of
scenarios developed in this study and permit the refinement of the ADEPT model
Employing a nutrient mass balance approach to dimension the constructed wetland
results in an excessive capacity of the mangrove plantation to assimilate nitrogen.
However, as nitrogen usually limits primary production in marine and brackish-water
environments it may be desirable to refine the ADEPT model, dimensioning the wetland
with respect to nitrogen loadings, ensuring that this limiting nutrient does not reach the
receiving environment whilst permitting the discharge of potentially less damaging
phosphorus. This refined procedure may assist in developing optimally designed
horizontally integrated mangrove plantations that minimise costs whilst ensuring the
achievement of a significant degree of environmental protection.
Financial indicators considered here i. e. ten and twenty year IRR's, suggest that the
horizontal integration of mangrove plantations for wastewater treatment may not represent
an attractive investment opportunity for operators of intensively managed shrimp ponds.
Over ten years returns may be considered insufficient, whilst over twenty years returns
increase to modest levels; however, uncertainty due to risks may be assumed to increase
with time. Despite these economic indicators, the management of small-scale mangrove
plantations continues in many coastal regions in Southeast Asia (Binh, Phillips and
Demaine, 1997, Johnston et al., 1999).
Integration of mangroves with aquaculture ponds was once practised in Indonesia;
dikes and tidal flats surrounding the ponds or tambak were planted with Rhizophora spp.,
Avicennia spp. and other mangrove species to provide firewood, fertiliser (decaying
leaves) and protection against erosion (Schuster, 1952, cited in Primavera, 1995).
Similarly, at the turn of the century, the embankments of aquaculture ponds in the 175

Philippines were planted with rows of Rhizophora sp., Sonneratia sp. and nipa pahn to
protect against soil erosion induced through wind and wave action (Adams, Montalban and
Martin, 1932, cited in Primavera, 1995). Recent initiatives have attempted to
systematically investigate the benefits and opportunities associated with these integrated
shrimp aquaculture-mangrove silviculture systems (Fitzgerald, 1999; Johnston et al.,
1999). However, earlier recognition by operators and managers of the benefits associated
with these traditional practices may have averted some of the environmental degradation
that has accompanied the emergence of commercial shrimp culture.
Further investigation of investment and labour demands, cropping strategies and
financial returns associated with existing aquaculture-silviculture farming systems is
required to ensure design criteria and management regimes proposed for horizontally
integrated mangrove plantations meet the demands and expectations of potential operators.
Horizontally integrated mangrove plantations that incorporate secondary extensive or
semi-intensive production systems (e. g. seaweed, shellfish or crustacean culture) that
contribute to financial returns generated by the farming enterprise and provide employment
opportunities for members of poor coastal communities appear to have the greatest
potential. However, the assessment of these systems will require the development of
refined modelling scenarios and an increased understanding of the biological, managerial
and financial demands associated with these diverse fanning enterprises. Finally,
developing horizontally integrated mangrove plantations removes the reliance of shrimp
fanns on environmental goods and services appropriated from supporting ecosystem areas,
intemalising costs associated with discharging waste to the receiving environment, whilst
addressing concerns raised by enviromnentalists and stakeholder groups regarding the
externalities associated with intensive shrimp culture.
176

Chapter Five
Comparison of conventional, rational and traditional
strategies for lagoon-based wastewater treatment and reuse
Introduction
Lagoon-based wastewater treatment systems are commonly designed to produce discharge
water that attains the recommended reduction in pathogens prior to reuse. However, a
rational design approach proposed by Mara et al. (1993)1 represents an attempt to
simultaneously optimise wastewater treatment and fish production in lagoon-based
systems. Here, the treatment lagoons are configured so that N is retained in the discharge
water , increasing its value as a fertilizer, while dilution in the fishpond results in
microbiologically safe culture conditions. These authors recommend that wastewater
should be treated and retained for one day in a2m deep anaerobic lagoon, followed by a
five day retention time in a 1.5 m deep facultative pond, before being discharged to
fishponds. The main difference between the rational design and the conventional approach
is the absence of maturation ponds. In conventional treatment, maturation ponds serve to
lower the faecal colifonn count to levels considered microbiologically safe prior to reuse.
However, Mara et al. (1993) assert that an initial 99% reduction in pathogen numbers
I aecal coliforms occurs in the fishpond through dilution, followed by a rapid die-off of E
over the next 30 hours, accounting for a further 99% reduction. Therefore, the risk of fish
Mara (1997) subsequently suggested a modified version of the model incorporating a verification step to assess the concentration of ammonia entering the fishpond.
177

being contaminated with pathogens and compromising the safety of cultured products is
significantly reduced.
Traditional wastewater aquaculture practices at the Calcutta pen-urban interface
have been described by a number of authors (Oldh, Sharangi and Datta, 1986; Ghosh,
1990; Kundu, 1994; Muir, Walker and Goodwin, 1994; Mukheýee, 1996; Jana, 1998). An
account of the origins and evolution of these practices, together with an extensive review
of their current status, including culture methods, production figures and management
strategies is given by Kundu (1994). Fishponds managed for wastewater aquaculture at the
Calcutta peri-urban interface cover 3,000 ha, with individual fisheries ranging in size from
0.4-162 ha (Mukheýee, 1996). It has been estimated that these ponds receive 550,000 M3
-1 o wastewater and produce an annual yield of 13,000 t of fish (Mara et al, 1993).
However, despite its long history and continued operation, a number of problems have
been reported with this system, including declining productivity and diminishing financial
retums (Kundu, 1994; Mukheigee, 1996). Therefore, it was decided to develop a modified
version of the ADEPT model suitable for assessing the treatment and financial
performance of lagoon-based wastewater treatment approaches. The objective was to
identify possible areas for improving current design and management approaches used in
the Calcutta peri-urban system, and to highlight opportunities for improving engineering
designs for lagoon-based wastewater treatment and reuse.
1.1. Study alms
Within the framework of the ADEPT model, this case study aims to compare the physical,
financial, practical, economic and socIal consequences of adoptlng a ratIonal des, ign for
lagoon-based wastewater treatment and aquaculture production, with the conventional
design approach, and traditional reuse system operating in peri-urban Calcutta. Results are
viewed from a systems perspective, considering implications for health, employment,
178

environmental protection and nutrient recovery. Potential outcomes associated with
adopting the rational design criteria are described with respect to the needs and
expectations of stakeholders, while strategies with potential to facilitate appropriate
modifications to existing practices to enhance benefits are discussed.
5.2. Method
Using the modified framework of the ADEPT model, rational design criteria proposed by
Mara et al. (1993) were used in the first scenario to dimension anaerobic lagoons and
facultative ponds with the capacity to treat 550,000 m' d-' of wastewater, equal to the
volume flowing to peri-urban fishponds in Calcutta. In the second, design criteria
presented by Mara (1997) for a conventional lagoon-based treatment system were used. In
both scenarios the predicted N concentrations following treatment were used to dimension
the fishpond area. Levels of fish production were extrapolated from expected yields
reported by Mara et al. (1993) and faecal coliform numbers in water entering the fishpond
were used to assess public health risks. Financial indicators were estimated using the
approaches described in previous chapters and systems designed using the rational and
conventional design approaches were compared with those in pen-urban Calcutta.
5.2.1. Wastewater characteristics
The two modelling scenarios were developed using baseline data presented by Mara et al.
(1993); these data were suggested as being representative of typical conditions encountered
in West Bengal, India. These authors reported typical BOD and N concentrations for
wastewater of 200 mg 1-1 and 50 mg 1-1, respectively; faecal coliform numbers were 5x 10⁷
100 ml-', the pH was 8, and the mean temperature and net evaporation were 25'C and 5
mm d- 1, respectively.
179

5.2.2. Conventional and rational design approaches
In both scenarios, following the design criteria presented by Mara et al. (1993) an
additional land area, equivalent to 55% of that required to accommodate the treatment
lagoons and fishponds, was included to accommodate pond embankments, access roads
and associated infrastructure.
Rational design approach
Detailed infonnation on the rational design approach was given by Mara et al. (1993) and
key design features are presented in Table 5.1. The mid-depth area of the anaerobic lagoon
is found by multiplying the flow volume (in 3) by the retention time (I day) and dividing
the product by the depth of the pond (2 in). The volumetric BOD loading (/kv, g M-3 d-1) is
used to validate the anaerobic lagoon design and may be calculated using the equation
given by Mara (1997):
kv == LiQlVa
where, Li influent BOD concentration (g M-3)
Q flow rate (M3 d-1)
Va anaerobic lagoon volume (in 3).
At 250C the maximum permissible design load for BOD is 300 g M-3 d-1 (Mara and
Pearson, 1986; cited in Mara et al., 1993); the estimated loading on the pond in this case
was 200 g M-3 d-1 and considered satisfactory.
The mid-depth area of the facultative lagoon is found by multiplying the flow
volume (in 3) by the retention time (5 d) and dividing the product by the depth of the pond
(1.5 in). As with the anaerobic pond, the design was validated using the surface BOD
180

loading; at 25'C the maximum permissible loading for the facultative lagoon is 350 kg ha-I
d-1 (Mara, 1987; cited in Mara et al., 1993), here the estimated loading was 180 kg ha-1 d-1
and considered satisfactory.
Mara et al. (1993) discounted evaporation from the facultative lagoon due to a
relatively short retention time, however, it is considered here as the ADEPT model could
dimension large treatment systems with Significant evaporation. Evaporation from the
anaerobic lagoon is not considered because under normal operating conditions surface
scum significantly reduces the rate of evaporation (Mara, 1997).
The fishpond was designed using an optimal N loading rate of -4 kg ha-1 d-'
(Edwards, 1992), therefore, prior to dimensioning this component, the effects of the
preceding treatment lagoons on the N concentration were estimated. Following the
example of Mara et al. (1993) it was assumed that no N removal occurs in the anaerobic
pond; however, N removal by the facultative pond is significant and was estimated using
the relationship established by Reed (1985; cited in Mara et al., 1993):
C, = Ciexpf-[0.0064(l. 03 9)T-20] [0+60.6(pH-6.6)]l
where, Ce facultative pond effluent TN concentration (mg 1-1)
Ci facultative pond influent TN concentration (mg I-)
temperature
retention time (d)
Assuming the TN concentration in the in-flowing water (Q is 50 mg 1-1, at pH 8, the
resulting concentration in the facultative pond effluent (C) is 24.9 mg 1-1. Therefore, with a
discharge volume from the facultative lagoon of 540,900 m3 the mass flow of N was
181

estimated at 13,480 kg d-1, sufficient to meet the desired N loading rate in 3,370 ha of
fishponds.
The expected concentration of faecal coliforms in water used to culture fish was
estimated using the relationship established by Marais (1974; cited in Mara et al., 1993):
Np ::::::::: NAl +kTOa)(1 +kTOf)(1 +kTOp)
where, Np faecal. coliforms number (100 ml-1) in fishpond
Ni faecal coliforms number (100 ml-1) in untreated wastewater
kT rate constant for faecal. coliforn-is removal d-1 (2.6(l .I
9)T-20)
Oa anaerobic lagoon retention time (d)
Of facultative lagoon retention time (d)
OP fishpond retention time (d)
Table 5.1: Design parameters for lagoon-based wastewater treatment and aquaculture reuse.
Component Design criteria Conventional
-- -----------
Rational
-- Anaerobic pond Retention time (d)
Depth (in) 4 2 Volumetric BOD loading for validation <300 g m7' d-' -3 1
<300 gMd
Facultative pond Retention time (d) 4 5 Depth (in) 1.5 1.5 Aereal BOD loading for validation <350 kg ha-1 d-' <350 kg ha-' d-'
Maturation ponds Depth (in) 1.5 Number of ponds (n) where: faecal coliform. count (100 ml-1) required N, = Ni(l+kTO,,, ) n
in the maturation pond effluent is N,. Minimum retention time (d) 3 Aereal BOD loading for validation < 350 kg ha-1 d-1
Fishpond Depth (in) 1 1 Optimal N loading rate 4 kg ha-1 d-1 4 kg ha-' d- 1
Refers to the rational design proposed by Mara et al. (1993) 2 Ne for unrestricted irrigation reconunended by WHO (1989) i. e. IX 103 100 MI-I
182

Conventional design approach
Although the same general design criteria used in the rational design approach were
employed to dimension the anaerobic lagoons and facultative ponds required for the
conventional treatment systems, slight modifications were performed to replicate the
design criteria proposed by Mara (1997). The depth of the anaerobic lagoon was increased
to 4 in and the target retention time in the facultative lagoon reduced to 4 days. Excluding
these minor alterations and the presence of maturation ponds, all other input variables were
constant between the two simulations.
Design criteria for dimensioning the maturation ponds and predicting the treatment
effect of these additional components was taken from Mara (1997). However, prior to
dimensioning the maturation ponds, the required level of wastewater treatment was
selected using the ADEPT model. The available options permitted the calculation of the
optimum number of maturation ponds needed to reduce faecal coliform levels to <1 X 10³
and <1 x 10² per 100 ml, guideline levels proposed by the World Health Organization for
unrestricted and restricted irrigation, respectively (WHO, 1989). The number of maturation
ponds required to achieve the desired treatment levels for the second and third options was
derived from a modified version of the equation presented by Mara (1997) for increasing
values of n (the number of maturation ponds):
N =NI(I+kom)n ,eiT
where, Ni faecal coliforms in untreated wastewater (100 ml-)
N, faecal coliforms in maturation pond discharge (100 ml-1)
OM retention time (d) in single maturation pond in series (>3 d)
kT areal rate constant for faecal coliform removal
183

Following the recommendation by Mara (1997) a sub-routine was developed In the
ADEPT model to verify that the BOD loading on the first maturation pond was below that
on the preceding facultative lagoon.
As with N removal in the facultative lagoon, the relationship established by Reed
(1985; cited in Mara et al., 1993) was used to estimate the effect of the maturation ponds;
removal in each was estimated sequentially. Having estimated N removal in the maturation
ponds, the recommended N loading rate given above was used to dimension the fishponds.
5.2.3. Aquatic production and nutrient retention
Production in the fishponds was based on the cropping pattern proposed by Mara et al.
(1993) where tilapia were cultured in ponds with an average size of I ha. It is possible to
drain ponds of this size, permitting a complete harvest and enabling them to be quickly
restocked (Mara et al., 1993). Adopting such a culture system, employing a relatively short
-2 9 grow-out phase of 4 months and stocking 20 g fingerlings at a rate of 3M - it should be
possible to produce three crops of 200 g fish annually. Allowing for a 25% loss of fish
through poaching, predation and mortality, an overall production rate of 13 t ha-1 y-1 was
extrapolated. N and P retention in the fish biomass harvested from the ponds managed for
wastewater aquaculture was calculated using a mass-balance equation. Average
concentrations for N (14 g kg-1) and P (5 g kg-1) found in carcasses of freshwater fish were
used to estimate nutrient retention through assimilation in fish biomass. Net production
was used to account for N and P inputs in the fonn of fingerlings.
5.2.4. Financial inputs and implications
Although Mara et al. (1993) provided financial data for the development and operation of
lagoon-based wastewater treatment systems in West Bengal, more recent information on
financial costs and benefits was taken from sources that refer specifically to pen-urban
184

Calcutta (Kundu, 1994; Mukheýee, 1996 and Mukherjee, personal communication, 1998);
these costs are surnmarised in Table 5.2.
The cost of land was assumed at f2,060 ha-1 and lagoon and fishpond construction
was expected to cost f3,960 ha-1 (assuming a worker requires 30 days to develop I katha
(720 ft2) of land, and receives a wage of f-0.88 d-1; Mukherjee, personal commun1cation,
1998). Control structures for regulating the flow of wastewater between treatment lagoons
and fishponds were the only infrastructure costs included in the scenarios. Considering the
likely scale of development it was assumed that one control structure would be required for
each hectare of lagoons and fishponds; the cost of control structures was estimated at f 50
per instillation (Mukherjee, personal communication, 1998).
Mara et al. (1993) include nets, boats, vans and bicycles as financial costs
associated with the rational design approach, however, operators of fisheries at the Calcutta
peri-urban interface do not provide vans and bicycles. Expenditure on boats and nets was
expected to equate to f295 and f 75 per employee, respectively; miscellaneous equipment
required by the fisheries personnel was estimated to cost -f5 per employee (Mukheijee,
personal communication, 1998). Variable operating costs included the purchase of
fingerlings at fO. 01 each (Mukherjee, personal communication, 1998) and materials to
maintain the system, assumed at 1% of initial costs. Fixed operating costs included wages
to pay employees and a manager to coordinate the operation. Following the labour
requirements outlined by Mara et al. (1993), it was assumed that 1 employee would be
required for each hectare developed, whilst I manager would be required for every ten
hectares. The cost of engaging an employee and manager was assumed at f410 Y-1 and
f 825 y-1, respectively (Mara et al., 1993). Income would be generated through the sale of
fish and the expected market value was f 0.37 kg-1 (Momce, Chowdhury and Little, 1998).
185

Table 5.2: Financial parameters assumed for the two scenarios.
Parameter Value Units
Capital costs (CC)
Land 2,060 f ha- 1
Site development 3,960 f ha-'
Control structures 50 f ha-1
Boats, nets and miscellaneous equipment 375 f ha- 1
Operating costs
Maintenance 1% cc
Employees 410 f ha-'
Management 825 f 10 ha-1
Fingerlings 0.01 f each
Returns
Fish sales 0.37 f kg-1
As in the previous two chapters, the financial implications of investing in each of the
scenarios described above was assessed using a conventional discounted cash flow
approach. The ten year NPV was calculated at discount rates of 5,10,15 and 20 per cent,
whilst the ERR was calculated over ten years. The salvage value of materials and
equipment was calculated as in the previous case studies, and cash flows during the
financial assessment period included the replacement of infrastructure and equipment that
has exceeded its economic life.
5.3. Results
5.3.1. Physical characteristics
Physical characteristics of the lagoon-based treatment and production systems designed
using the conventional and rational design approaches are presented in Table 5.3. The
depth of anaerobic ponds in the rational (2 in) and conventional (4 in) designs caused the
area required for a retention time of I day, to be reduced from 27.5 ha in the rational
design to 13.8 ha in the conventional. The area occupied by the facultative lagoon In the
186

rational system was 182 ha, whilst in the conventional system the facultative lagoon
occupied 146 ha. This results from the lower hydraulic retention time employed when
designing conventional facultative lagoons.
Two maturation ponds required to produce an effluent suitable for unrestricted
irrigation in the conventional system had an area of 215 ha and retention time of 6 days. In
total the treatment basins required for the conventional system had an area of 374 ha,
whilst in the rational system the area was 209 ha. The fishpond area under the conventional
design was estimated at 856 ha, significantly less than the 3,370 ha required for the rational
design. This difference in fishpond area arises from the N removal facilitated by
maturation ponds in the conventional system. Land required for access roads and
supporting infrastructure meant the total area required for the rational design system was
-5,550 ha, almost three times that required for the conventional design at 1,907 ha.
5.3.2. Water flow and evaporation
The greater area required for the rational design, as compared with conventional design, is
a consequence of the greater fishpond area that could be supplied with optimal N loading.
Fishponds in the conventional system generate a hydraulic retention time of 16 days, as
compared with 62 days in the rational system. Overall, water passing through the
conventional system was retained for 27 days, while in the rational system the retention
period was 68 days. Variation in the surface area of the basins in the two scenarios results
in the predicted difference in water loss through evaporation. Evaporation from the
conventional and rational systems was estimated at 60,840 and 177,600 m3 d-11
respectively. Consequently the volume of water discharged to downstream users or the
receiving environment from the conventional system (489,160 M3 d-) would be
considerably larger than that from the rational design system (372,40OM3 d-1).
187

Table 5.3. Physical characteristics of lagoon-based treatment systems dimensioned using conventional and
rational design approaches.
Systems characteristics Conventional Rational
Anaerobic lagoon area (ha) 13.8 27.5 Facultative lagoon area (ha) 146 182 Maturation pond area (ha) 215
Fishpond area (ha) 856 3,370 Additional area required (%) 55% 55% Total area required (ha) 1,907 5,550 Total hydraulic retention time (d) 27 68 Discharge volume (mý d-1) 489,160 372,400
5.3.3. NitTogen dynamics
It was estimated that water discharged from the maturation ponds in the conventional
system would contain -6.4 mg 1-1 of N, as compared with 25 mg 1-1 in water discharged
from the facultative lagoon. N removal in the treatment components of the conventional
system was calculated at 87%, as compared to 50% in the rational design system. N
removal by the facultative lagoon in the conventional and rational systems was comparable
at 49.8% and 50.2%, respectively. However, the maturation ponds facilitated greater N
removal in the conventional system; the influent concentration was reduced by -50% in
each pond.
Treated water discharged from facultative lagoons in the rational design system
contains -25 mg 1-1 of N, equivalent to a mass loading of 13,480 kg d-1, and sufficient to
meet the optimal N loading rate for 3,370 ha of fishponds. Water discharged to the
fishponds from the maturation ponds in the conventional system contains -6 mg 1-1, -26%
of the N present in water from the facultative lagoons in the rational system. Accounting
for evaporation from the maturation ponds, 532,000 in 3 d-1 of water flowing to fishponds in
188

the conventional system contains 3,420 kg of N, sufficient to meet the optimal loading rate
for 856 ha of fishponds.
5.3.4. Aquatic production and nutrient assimilation
Fish production and nutrient assimilation in the two systems are summansed in Table 5.4.
Based on the predicted yield from fishponds managed for wastewater aquaculture of 13 t
ha- I y-1 (Mara et al., 1993), fish production in the two scenarios considered here is directly
proportional to fishpond area. Consequently, gross fish production from the conventional
and rational systems was estimated at 11,560 and 45,500 t y-1, respectively. Net fish
production from the conventional and rational systems was estimated at 10,400 and 40,950
t Y-1 , respectively. Employing these production values the ADEPT model calculated that of
10,040 t y-1 of N discharged to the treatment system, 573 t y- I or 5.7% was recovered in
fish produced in the rational design system and 146 t y-1 or 1.5% was recovered in fish
from the conventional system. The areal rate of N assimilation in fish biomass equates to
0.5 kg ha-1 d-1 in both systems. On a daily basis -37 t of P was discharged to the treatment
system, equating to a mass flow of 13,530 t y- I. Fish biomass produced in the rational
design system retains 197 t of P, equivalent to 1.5% of the annual mass flow, fish produced
in the conventional system retain 49 t of P, or 0.4% of the annual mass flow. P assimilation
in fish biomass equates to 0.16 kg ha-1 d-1 in both systems.
5.3.5. Faecal coliform levels
Faecal coliform levels in water flowing to the fishponds in the conventional and rational
design scenarios were 7x 10 2 and 2.2 x 10⁵ 100 ml-1, respectively. The predicted removal
of faecal coliform bacteria in fishponds results in water discharged to downstream users or
the receiving environment from the conventional and rational systems containing levels of
-7 and 6x 10² 100 MI-I , respectively.
189

Table 5.4. Production, nutrient assirmlation and faecal coliform levels in fishponds.
Systems characteristics Conventional Rational
Gross fish production (t y-') 11,560 45,500
Net fish production (t y-) 10,400 40,950
" retention in fish biomass (t y-1) 146 573
" recovered from wastewater (%) 1.5 5.7
Areal rate of N recovery (kg ha-1 d-1) 0.5 0.5
P retention in fish biomass (kg y-) 49 197
P recovered from wastewater (%) 0.4 1.5
Areal rate of P recovery (kg ha-1 d-) 0.16 0.16
Faecal coliform. level: entering fishpond (100 ml-') 7x 10² 2.2 x 10⁵
in final site discharge (100 ml-) 7 6x 10²
5.3.6. Financial indicators
Rational design approach
Capital costs of f 35.67 million associated with adopting the rational design are due mainly
to the expense of developing the basin area, estimated at f2l. 97 million; a further f 11.43
million was required to purchase the land required; costs associated with the development
are detailed in Table 5.5. Additional capital costs of E2.27 million were associated with
developing infrastructure at the site, purchasing nets, bicycles, boats and miscellaneous
equipment. Operating costs associated with the rational design were f6.2 million y-1;
variable costs included E3.13 million to purchase fingerlings and EO. 36 million y-I for
maintenance; fixed costs consisted of f2.28 million y-1 for full-time workers and LO. 46
million y-1 for a manager.
Conventional design approach
Capital costs of f 12.3 million associated with the conventional system are significantly
lower (f23.4 million) as compared to adopting the rational design; land for the
190

development was expected to cost E3.9 million and f 7.6 million was estimated for basin
construction. An additional fO. 8 million would be required to purchase nets, bicycles and
miscellaneous equipment and develop infrastructure. Operating costs for the conventional
system amounted to f 1.9 million y-1; including f 0.79 million to purchase fingerlings and
fO. 12 million for maintenance; employment of -1,900 full-time employees represented a
fixed cost of f 0.78 million
Table 5.5: Financial indicators for conventional and rational designs.
Systems characteristics ---- -- - ---- ------
Conventional Rational
Capital costs (f million) 12.3 35.67
Operating costs (f million y-) 1.9 6.2
Profit excluding depreciation (f million y-) 2.4 10.6
Rate of return on initial capital cost (% y-1) 19.7 29.7
Rate of return on operating costs (% y-1) 130 171
Payback period 5 3.4
NPV (f million) at: 5% 2.8 31.7 10% -0.3 17.2 15% -2.3 7.4 20% -3.7 0.6
IRR (%) over 10 years 9.5 20.1
Comparative performance
Accounting for capital costs, operating costs and income, general financial indicators were
calculated. Excluding depreciation, the annual profits generated by the rational and
conventional systems were estimated at f 10.6 and f2.4 million, respectively. The rate of
return on capital and operating cots for the rational design was 29.7% and 171%,
I ing respectively, whilst for the conventional design the rate of return on capital and operati
costs was 19.7% and 130%, respectively. A payback period of 3.4 years was estimated for
the rational design; for the conventional systems the estimated payback periods was higher
191

at 5 years. The gross value of fish produced in the rational and conventional systems was
estimated at f 16.8 and f 4.3 million, respectively.
The ten year NPV of the cash flow for the rational design system was estimated at
01.7ý E17.2, E7.4 and EO. 6 million at discount rates of 5,10,15 and 20 per cent,
respectively. The IRR over ten years was estimated at 20.1%. The cash flow generated by
the conventional system resulted in ten year NPV's of f2.8, -f 0.3,42.3 and -f 3.7 million
at discount rates of 5,10ý 15 and 20 per cent, respectively. The IRR was estimated at 9.5%,
over ten years.
5.3.7. Sensitivity analysis
As with previous chapters a sensitivity analysis was undertaken, investigating the impact
of key variables on the ten year IRR generated by the different treatment approaches;
findings are summarised in Table 5.6.
Increases and reductions of 20% in land, site development and labour costs had
little impact on the returns generated, <5% for both the conventional and rational designs.
However , in both cases,, a 20% change in the value of fish resulted in a corresponding rise
or fall in the ERR of -10%; a 20% fall in the value of fish meant the conventional system
was unable to generate a positive MR. Assuming either that the land cost was zero or that
it retained its value resulted in a slight increase in the IRR; assuming both the land and
earthworks retained their value resulted in the second highest returns of 19% and 32.4%
for the conventional and rational systems, respectively. However the best returns predicted
resulted from decreasing the land area required for access and infrastructure to 6.5%.
192

Table 5.6. Sensitivity analysis of ten year IRR's associated with conventional and rational designs.
Sensitivity 11.11-1 . ............................ . ....... ..... ------ ---------- ------
Conventional ... ..........
Rational
Baseline 9.5 20.6 Land cost (+20%) 8 18.8 Land cost (-20%) 11 22.5 Site development (+20%) 6.9 17.3 Site development (-20%) 12.6 24.4 Cost of labour (+20%) 7.6 18.8
Cost of labour (-20%) 11.4 22.3
Value of fish (-20%) - 9.8
Value of fish (+20%) 17.8 30.2
Land retains its value 12.2 22
Land and earthworks retain their value 15.9 24.5
Land has a cost of zero 19 32.4
Additional land requirement reduced to 6.5% 23.3 36.4
5.4. Discussion
5.4.1. Physical characteristics
The area of fishponds required for the conventional (856 ha) and rational (3,370 ha)
designs represent a significant difference between the two options. This variation is a
consequence of N removal facilitated by the maturation ponds in the conventional system,
and the fact that the fishponds in both scenarios are dimensioned using a fixed loading rate
for N.
The provision of additional land for access roads and supporting infrastructure in
the base case scenarios means the total area required for the rational design (5,550 ha) is
-3 times that required by the conventional design (1,907 ha). However, this added demand
for land may be difficult to justify in peri-urban areas where pressure on land resources is
likely to be considerable. Reducing the area allocated for supporting infrastructure from an
additional 55% to 6.5%, the proportion of land not occupied by ponds in the functional
193

systems at the Calcutta peri-urban interface, may become more appropriate. The sensitivity
analysis demonstrated that such a reduction has a beneficial impact on the ten year IRR
generated by both systems. However, despite this, where land is available at a reasonable
cost, the inclusion of an additional land area in the design would pen-nit the future
expansion of the treatment system if extra capacity were required.
When proposing the modification of the existing wastewater aquaculture system at
the Calcutta peri-urban interface, the area required to implement the rational design would
represent an important constraint, as suitable land for development may be limited. The
land area required to accommodate the treatment lagoons and fishponds required for the
rational design (5,550 ha) is greater than the existing 3,000 ha of fishponds managed for
wastewater aquaculture (Kundu, 1994), without the addition of extra land for access roads
and supporting infrastructure. Acquisition of suitable land at the urban fringe represents a
major constraint to ecologically based wastewater reuse systems. Minimising the area
required would help limit conflicts with other stakeholder groups; however, it should be
ensured that design criteria are not compromised as this could lead to a systems failure.
Implementation of the rational design criteria would require formal arrangements
for lagoon-based wastewater treatment. This would either require the construction of new
lagoons at the urban fringe or conversion of existing fishponds to treatment lagoons. The
availability of land close to the urban fringe may prevent construction of new lagoons
specifically for treatment; operators of existing fisheries may be unwilling to convert their
fishponds to treatment lagoons unless adequately compensated, although this could place
unacceptable demands on public finances. it may be possible to raise sufficient funds by
taxing other users of the wastewater resource or selling part of the land to a developer;
revenue raised could also be used to subsidise the operation of the treatment lagoons.
Irrespective of the strategy selected, appropriate institutional processes and structures
would be required to ensure the equitable distribution of benefits.
194

5.4.2. Water conservation
Results of the modelling exercise presented here indicate that water conservation is more
efficient in a conventional system than when the rational design criteria are used. The
restricted loss of water from the conventional system (11%), as compared with the rational
design system (32%), is a consequence of the lower surface area in the conventional
system. The additional volume of water discharged from the conventional system may
represent a significant advantage over the rational design when considering possible
environmental requirements and the needs of downstream users. Water from fishponds
could be used to irrigate agricultural crops and recreational areas, or to revive degraded
watercourses; water discharged from the existing ponds managed for wastewater
aquaculture at the Calcutta peri-urban interface is used downstream to irrigate rice fields
(Mara, 1997). Creating wetland areas using the treated wastewater could confer a range of
benefits to society and the enviromnent e. g. flood protection, ground water recharge and
wildlife habitat (Burbridge, 1994). However, to effectively plan and manage the
distribution and exploitation of the wastewater resource the relative merits of the different
reuse practices should be considered; to evaluate this, the ADEPT model could be
developed further to evaluate the various reuse options.
5.4.3. Nutrient retention and reuse
As mentioned previously, N dynamics in the treatment lagoons have a significant influence
on treatment system design; however, N recovery in fish biomass accounts for only a small
proportion of the total mass flow entering the systems (1.5% with the conventional design
and 5.7% with the rational design). P retention in the conventional and rational systems is
less efficient (0.4% and 1.5%, respectively). Although N and P recovery in the rational
design system is significantly higher than that in the conventional system, it is apparent
that the efficiency of nutrient recovery through fish culture in ponds managed for
195

wastewater aquaculture is still limited. Therefore, promoting wastewater aquaculture as an
effective approach to the recovery of nutrients from wastewater may be inappropriate.
The recommended N loading for fishponds (4 kg ha-1 d-) is significantly higher
than the rate at which N is assimilated in fish biomass (0.5 kg ha-1 d-1). This difference
between recommended nutrient loading and efficiency of resource recovery demonstrates
the need for a shift in the way pond-based wastewater aquaculture systems are viewed.
Intensification of nutrient flows within aquatic systems through the integration of
additional culture practices may be a potential strategy. Linking the flow of nutrients
within aquatic systems to terrestrial production offers another. The model system that may
be considered is dike-pond farming, developed and refined in China over the past two
thousand years.
N and P dynamics could be investigated using a range of approaches including field
trials, pilot scale studies, laboratory experiments and mathematical modelling. Ruddle and
Christensen (1993) employed the Ecopath 11 model to develop an energy flow model for
mulberry dike-carp ponds in the Zhujiang Delta, Guangdong Province, China. Applying a
similar approach to explore nutrient dynamics in wastewater aquaculture systems
incorporating integrated production practices may assist in developing more efficient
resource recovery strategies. Further development of the ADEPT model to account for
production in integrated production systems i. e. dike-cropping, could have potential to
increase the financial returns generated. However, the integration of further production
practices may be constrained through increased management demands and requirement f io r
greater support from local institutions and development agencies.
Currently there is no formal strategy for treating wastewater prior to reuse in
fishponds at the Calcutta peri-urban interface. Operators rely on processes in feeder canals
for passive treatment; however, the treatment effect has not been described. The hydraulic
retention time in these canals has been estimated at -0.5 days and it is assumed that there is
196

no N removal (Edwards, personal communication, 1997). Kundu (1994) reported that
3,000 ha of ponds were managed for wastewater aquaculture in pen-urban Calcutta. Based
on the predicted mass flow of N in untreated wastewater (27.5 t d-1), it is estimated that
these ponds are loaded with 9.2 kg N ha-1 d-1' over twice the recommended rate (4 kg ha-1
d-1). Excessive N loading in fishponds at the Calcutta peri-urban interface may be
responsible for recent management problems encountered, in particular blue-green algae
blooms (Ghosh, personal communication, 1998). Such blooms are often associated with
off-flavours in fish and the production of toxic substances that can harm fish and pose a
threat to consumers; this represents a potential constraint to the sustainability of the culture
system. However, despite the model outputs and corroboratory evidence concerning algal
blooms, more recent interviews with pond operators revealed a widespread perception that
limited wastewater availability was restricting primary production and constraining fish
growth (Kundu, personal communication, 2000). A likely explanation for these differing
observations is a variation in the distribution and availability of wastewater to different
fisheries, although further work is required to resolve these contradictions.
5.4.4. Financial indicators and productivity
Due to the difference in land and development costs, the conventional design requires
significantly less capital investment, as compared with the rational design approach. This
could be important, as implementing agencies may be more willing to invest in systems
with lower initial start-up costs. Furthermore, comparing capital costs of the two systems
raises questions regarding relative financial risks, the lower costs associated with the
conventional system appear to represent a reduced risk. However, the higher rate of return
on initial capital costs associated with the rational design (29.8%), as compared with the
conventional design (19.7%), indicates that the performance of the rational design system
is more resilient to increasing costs and decreasing financial returns.
197

During the first ten years of operation, implementation of the rational design
generates an IRR (20.6%) that indicates financial viability, and could attract entrepreneurs
from the private sector. The lower H? -R generated by the conventional system during the
same period (9.5%) indicates that this system may be less attractive to investors. As
mentioned previously, from a public sector perspective, an IRR of 5% can be considered
viable for projects that confer social benefits (Bojo, 1991). Furthennore, when evaluating
wastewater treatment options it is important to consider the cost associated with
alternatives to lagoon-based systems. Considering some of the alternatives i. e. aerated
lagoons, oxidation ditches and conventional biofilter treatment, Mara (1997) estimated that
ponds were the cheapest option when land costs were low.
The higher rate of return on capital invested in the rational design is a consequence
of the larger proportion of the system being devoted to producing fish. Income generated
through the sale of fish effectively subsidises capital and operating costs associated with
constructing treatment components. The level of subsidy could be enhanced through the
integration of additional production practices; however, suitable approaches to evaluating
benefits generated in complex integrated systems are poorly developed. Therefore,
modification of the ADEPT model to account for financial returns from integrated systems
may represent an important area for future research. Enhancing the financial returns
generated could increase the level of private sector interest in wastewater treatment
combined with reuse, an important consideration in developing countries where authorities
may be unable to implement wastewater treatment projects due to limited financial
resources and inadequate institutional capacity.
Comparing the performance of the conventional and rational design approaches to
the existing system in pen-urban Calcutta, a key difference is the achieved level of fish
production. In the simulations it was assumed at 13 t ha-1 y-1, however, Yields reported for
the Calcutta system may be estimated at -4.3 t ha-1 y-I (13,000 t y-1 from 3,000 ha of
198

ponds). Providing the means to regulate the level of water in the existing system would
allow ponds to be drained easily, permitting an efficient harvest at regular intervals.
Draining ponds frequently would also allow the removal of predatory and small wild fish
that can constrain production. Adapting existing management practices relating to stocking
and harvesting strategies may represent the most promising approach to improving the
finances of the existing system. Adopting management practices utilised in other large-
scale fisheries e. g. the culture of tilapia in Israeli reservoirs (Fischer, 1997), may also
represent a significant opportunity.
Establishing harvest strategies based around three distinct grow-out periods, as
recommended by Mara et al. (1993), may improve the efficiency of fish production,
however, fish are currently supplied to local markets on a daily basis, ensuring a
continuous supply of fresh fish. Adopting the proposed three-harvest strategy could result
in supplies of perishable fish exceeding demand in local markets. Operators would also
require access to supplies of tilapia seed throughout the year to enable stocking in three
distinct grow-out periods. Such a strategy is unlikely to be feasible unless facilities
including hatcheries and holding ponds are developed, a process that may require support
from local institutions. Furthermore, a fundamental question remains as to whether the
expected production of 13 t ha-1 Y-1 for tilapia in extensive ponds managed from
wastewater aquaculture is feasible. Production from well managed systems such as those in
eed and aeration are also provided, commonly average -10 Israel in which supplementary fI
t ha-1 y-1 (Fischer, 1997). The effect of lower than predicted fish yields on the financial
returns generated could be assessed through an extension of the sensitivity analysis
presented, however, the sensitivity of financial returns to a decrease in fish values of 20%,
with a fall in the IRR to 9.8%, suggests that lower productivity could have a significant
negative influence on financial viability.
199

5.4.5. Social and econorMc issues
Employment represents a tangible benefit associated with wastewater reuse through
aquaculture; Kundu (1994) reported that 8,000 workers were engaged in managing and
operating ponds managed for wastewater aquaculture 1n The estimated in pe '-urban Calcutta.
number of employees required to operate the treatment and production system
dimensioned using the rational design criteria (-5,550) is significantly lower than the
number currently employed. Therefore, should employment be considered an important
benefit of lagoon-based wastewater reuse, then the continued operation of the existing
system appears to represent the most attractive option. However, Mukherjee (1996) noted
that only -25% of the fishery workers in pen-urban Calcutta are engaged in full-time
employment, the remainder being temporary employees. Furthermore, based on interviews
Mukherjee (1996) reported that with average wages of Rsl, 090 Y-1 and Rs795 y- I fo r
unskilled pen-nanent workers and temporary labourers, respectively, employees in the
existing system found it difficult to cope. Therefore, the annual wage levels included in the
scenarios presented here (f4l. 0 or Rs28,290 at an exchange rate of fI to Rs69) would
represent a significant improvement. Social benefits commonly attributed to waste reuse
practices should be measured against the actual benefit derived by employees.
Access to income generating activities at the peri-urban interface of many towns
and cities in developing countries is limited; therefore, jobs associated with operating
lagoon-based wastewater treatment and aquaculture production systems may significantly
enhance the livelihoods of poor people and marginalised individuals. Increased labour
demands associated with managing and maintaining integrated production systems e. g.
dike-cropping, may be viewed as a potential benefit, depending on the context within
which the development is undertaken. The additional land area (55%) included when
developing the base case scenarios could represent an important opportunity for integrating
the production of vegetables, fruit trees and livestock. However, similar opportunities may
200

be limited in the existing system as only a relatively small area of land (-6.5%) would be
suitable for such production.
Viewing wastewater aquaculture from a social perspective, it is important to note
that fish production achieved using the conventional design (11,560 t y-1) is significantly
lower than when employing the rational design (45,500 t y-1). Fish production in ponds
managed for wastewater aquaculture represents a source of small fish (I 00-200g) that
command a relatively low price (fO. 37 kg-1) in the markets of metropolitan Calcutta, and
therefore appeal to the poor (Morrice et al., 1998). Furthen-nore, the perennial supply of
low cost fish from these systems may represent an important constituent in the diets of
poor households. The estimated level of production based on the rational design approach
is significantly higher than the estimated 13,000 t y- I of fish produced in the existing
system, and this increased production could contribute significantly to the availability of
low cost fish in local markets servicing the poor. Assuming nutritional demands in West
Bengal conform to those of typical households in South East Asia where households with 5
members consume on average 100 kg of fish annually (Edwards, Little and Yakupitiyage,
1997), production in the conventional system is sufficient to meet the demand for fish from
115,600 households. However, with the rational design the demand for fish from 455,000
households, a total of 2.28 million individuals, may be met. The population served by the
drainage system supplying wastewater to fishponds managed for wastewater aquaculture
was estimated at 4 million (Mara et al., 1993). Therefore, it can be estimated that
production from the existing system and one developed using the rational design criteria
would meet the demand for fish from 0.65 and 2.28 million people, respectively, or 16%
and 57% of demand for fish from those served.
Lower faccal coliform numbers in water entering fishponds in the conventional
system are largely due to die-off in the maturation ponds. Numbers of faecal coliform
bacteria in water flowing to the fishponds in the rational design system (2.2 x 10⁵ 100 MI-1)
201

exceed WHO guidelines for the acceptable number of faecal coliforms in wastewater for
use in aquaculture (1 x 10⁴ 1 OOMI-I; VýHo' 1989). However, mitigating circumstances
were suggested to justify the design criteria used i. e. the dilution and rapid die-off of
pathogenic bacteria and viruses (Mara et al., 1993). In certain situations the optimal design
criteria may be acceptable i. e. in well-mixed water bodies that are infrequently loaded with
wastewater, and Mara et al. (1993) specify in their design criteria that ponds used to
culture fish should be between 0.5 and I ha. Adopting these design criteria would increase
the expected level of mixing, ensuring that the numbers of faecal coliform bacteria in the
water column are rapidly attenuated. However, reducing the size of existing fishponds
managed for wastewater aquaculture at the Calcutta peri-urban interface from tens of
hectares to between 0.5 and I hectares, may be impractical.
If an attempt were made to transpose the design criteria proposed by Mara et al.
(1993) to the wastewater aquaculture practices at the Calcutta peri-urban interface, the
simple wastewater delivery and distribution system may result in pools of relatively
concentrated wastewater close to the inlet. The constant introduction of wastewater
containing excessive numbers of faecal coliform bacteria to fishponds may result in fish
being continuously exposed to levels of faecal colifon-n bactena in excess of the WHO
guidelines. The problem could be exacerbated if fish congregate around the inlet to forage
for food, such as particulate matter form the influent water or benthic organisms that
proliferate in sediments receiving high organic inputs.
The concentration of faecal coliforni bacteria in water entering fishponds following
treatment according to the rational design approach exceeds guideline levels (WHO, 1989)
and is a potential cause for concern. However, Pal and Das Gupta (1992) reported that
water in fishponds at the Calcutta peri-urban interface contained E. coli bacteria at levels
of -1 x 10 5 100 ml-1. Comparing this level with the number of faecal coliforms predicted
when simulating the rational design approach, it is apparent that adopting such a design
202

would represent an improvement on the current situation. Epidemiological evidence of
negative health impacts associated with eating fish cultured 1 in ponds managed for
wastewater aquaculture at the Calcutta peri-urban interface is lacking. Local practIces of
thoroughly cooking fish may explain why consuming fish cultured in water containing
numbers of faecal coliform. bacteria exceeding the recommended safe levels does not result
in elevated levels of illness in consumer groups. However, the potential for contamination
with faecal coliform bacteria, other pathogens and persistent chemicals indicates that
wastewater reuse systems require monitoring to ensure the safety of products destined for
human consumption.
The need for monitoring is ftirther illustrated when it is considered that wastewater
aquaculture systems are open to contamination by pathogenic organisms that are more
resilient to control measures such as cooking i. e. viruses and helminth eggs. Contamination
of fish produced in the reuse system by persistent chemicals e. g. heavy metals and organic
compounds, that are not removed by processing and cooking would represent a serious
health hazard. Monitoring would need to consider the final product and should aim to
ensure that the entire culture system is safeguar e against contamination. Adoption of a
HACCP (Hazard Analysis Critical Control Point) framework could represent a significant
contribution to safeguarding the quality of products from the existing system, however, the
safety of producers must also be considered within whichever framework is adopted.
Despite the potential benefits of monitoring, the adoption of such a programme would
demand additional resources, require a local agency to take responsibility for
implementation and could possibly lead to increased concerns being expressed by
consumers.
203

5.5. Summary
The merits of comparing the performance of traditional waste reuse practices against
highly engineered and designed systems may be debatable, especially as such traditional
practices have evolved within, and been adapted to, local settings, including social,
institutional, political, environmental and cultural facets. However, key indicators
developed in this study have identified possible adaptations to current management
strategies that have potential benefits for a range of stakeholders including operators,
employees and consumers.
Relative merits associated with conventional and rational design approaches for
lagoon-based wastewater treatment and aquaculture production have been discussed.
However, the two approaches must be considered with respect to site-specific variables,
including physical, social, institutional, financial and envirom-nental factors. Outcomes
associated with both should be considered with respect to the demands and expectations of
potential operators, employees, stakeholders and consumers. Where social benefits
associated with waste reuse practices are important, priority should be given to projects
that create employment opportunities and supply low cost products to local markets.
Implementing the rational design criteria proposed by Mara et al. (1993) in place of
existing wastewater aquaculture practices at the Calcutta peri-urban interface, would
require extensive physical redevelopment and modifications to current management
strategies. Conversion of the large fishponds that characterise the existing system to more
manageable culture ponds of between 0.5 and I ha represents a considerable constraint.
Furthermore, the area needed to accommodate the system would necessitate the acquisition
of extra land.
Developing marginal land or converting existing wetlands to wastewater
aquaculture may exclude poor people that previously had access to such areas as common
property resources. Should such community resources become contaminated, this would
204

prohibit their use for social purposes such as laundering clothes, bathing and washing
utensils; people without access to alternative water sources would be severely affected.
Land at the periphery of the existing wastewater aquaculture systems may already be under
cultivation. Therefore, before converting already productive land to wastewater
aquaculture, it would be prudent to conduct a comprehensive cost-benefit analysis,
assessing whether conversion would generate greater net benefits.
Should sufficient land be available to develop the entire optimised system in a new
location, this would permit reclamation of the existing system for development. Operators
of the existing system could be compensated and relocated to manage the new system, as
could employees currently engaged in activities associated with wastewater aquaculture.
Although this scenario may be difficult to implement, provision for relocating wastewater
reuse systems to locations further from the urban fringe may confer two distinct benefits.
Firstly, reclaiming land occupied by the existing system would permit urbanisation to
proceed, removing conflicts between developers and stakeholder groups intent on
preserving the system. Secondly, revenue generated through the sale of land previously
managed for wastewater aquaculture could be used to subsidise development of a new
wastewater aquaculture system and relocate poor people displaced by urbanisation. The
managed retreat of waste reuse practices from the peri-urban interface, and the transfer of
benefits associated with urbanisation to displaced communities must be considered if
development at the peri-urban interface is to be equitable.
205

Chapter Six
Development options: a Delphi investigation
1. Introduction
Despite numerous theoretical propositions, exploratory models and pilot-scale studies
suggesting the potential technical and financial viability of horizontally integrated
aquaculture, there are few operational systems developed in association with commercial
aquaculture practices. This suggests that additional constraints may exist, therefore this
chapter explores possible constraints and opportunities for horizontal integration identified
through consultation with a stakeholder panel. The relative importance ascribed to
alternative strategies for minimising negative impacts associated with discharging
aquaculture wastewater is also investigated.
The Delphi technique has been developed to elicit expert opinion on a wide range
of subjects (Rowe, Wright and Bolger, 1991; Woudenberg, 1991; Gupta and Clarke, 1996).
Investigations relevant to aquatic systems include assessments regarding the recreational
diver catch of spiny lobsters from waters off Florida (Zuboy, 1981), habitat impairments
that impact on aquatic resources in lake Ontario (Busch and Lary, 1996), water resource
planning in the Grand River basin, Ontario with respect to climate change (de Loe, 1995),
the impacts of an improper effluent control system in Jeddah, Saudi Arabia (Mohoýy and
Aburizaiza, 1997), the selection of treatment and discharge options for domestic
wastewater in the Great Lakes basin (Ludlow, 1975) and the development of sustainability
indicators for aquaculture (Caffey, 1998; Caffey and Kazmierczak, 1998).
206

Delphi investigations capitalise on the knowledge, analytical ability and predictive
powers of experts in a specific subject area to produce consensus about possible future
events. Unlike group discussion methods for reaching consensus e. g. committee meetings,
the Delphi technique is conducted through an iterative series of questionnaires sent to
individual participants or panelists. Caffey (1998) noted that the Delphi techni is
founded on four key assumptions:
expert opinion is a valid input to inexact research areas
- consensus amongst experts is more valid than the opinion of an individual
- joint meetings of experts induce a follow-the-leader bias
ensuring the anonymity of participants compensates for inherent opinion biases.
The Delphi methodology was therefore chosen as a means of eliciting a more complete
range of possible constraints and opportunities than the financial assessment developed in
Chapters 3 and 4. Employing this approach it was also possible to reach a consensus
amongst a stakeholder panel concerning the relative importance of the proposed factors.
The commitment of participants in responding to the iterative rounds of this Delphi
investigation is appreciated greatly and correspondence with Dr Caffey contributed
significantly to conducting the study.
6.2. Method
This study aimed to elicit responses from an expert stakeholder panel to identify factors
having the greatest potential to influence decision-making in adopting horizontally
integrated aquaculture. The panel proposed a range of factors, and then the relative
importance of each was investigated and weighted. The importance of alternative strategies
207

for limiting negative impacts associated with the discharge of aquaculture wastewater was
also assessed.
6.2.1. Research questions and hypotheses
Research questions were fon-nulated to guide the Delphi investigation:
- given the potential for horizontal integration in commercial aquaculture, which
factor(s) are identified by a panel of experts as possible constraints and opportunities?
- which alternative management strategies do the panel believe could limit negative
impacts associated with aquaculture wastewater?
Hypotheses were formulated to assist in analysing the generated data. It was postulated
that participants would reach a consensus concerning the prionty of various factors in
influencing decision-making. It was further proposed that, due to the commercial nature of
the aquaculture systems being considered, economic factors would represent the most
important constraints, whilst due to growing concern over the negative impacts of
discharging aquaculture wastewater, enviromnental attributes would present the greatest
opportunities. Finally, it was expected that improved treatment technologies would
represent the most promising alternative strategy for reducing negative impacts of
wastewater.
6.2.2. Questionnaire formulation
The first-round questionnaire was written specifically for this Delphi investigation
(Appendix 2a), and questions formulated to address the aims of the investigation. Prior to
distributing the questionnaire a small number of aquaculture researchers were asked to
provide feedback on the content and presentation. This demonstrated that asking for
208

general constraints and opportunities elicited responses such as "environmental" and
"financial". Therefore, six sub-category headings i. e. physical, environmental, managerial,
institutional, economic and social were incorporated into the questionnal I ire to elicit
responses that were more specific. These sub-category headings were invoked as they were
found adequate to describe the responses from participants in the pilot-study. With respect
to altemative strategies for minimising the impact of aquaculture wastewater, four sub-
categories were adequate to describe the responses: institutional, managerial, socio-
economic and technological.
6.2.3. Participant selection and instruction
The first-round questionnaire and the specific research aims associated with this Delphi
investigation were presented to prospective panel members, allowing them to assess their
own competence to answer the study questions. Furthermore, a statement outlining the
aims and likely outputs of the study allowed potential panel members to judge possible
benefits they may receive from participation. Stakeholders were approached using two
strategies:
- individuals who had published work in the past ten years relating to horizontally
integrated aquaculture were invited to participate in the study
the first-round questionnaire was distributed to several electronic discussion groups;
members who considered themselves sufficiently expert to engage in the process were
asked to respond.
Although the statistical tests selected to assess the outcomes of this Delphi investigation
require a minimum of three paired samples i. e. three panel members, previous studies
employing this approach have commonly elicited the opinion of panels with 15-60
209

members (Hasson, Keeney and McKenna, 2000). It was anticipated that a similar number
of participants would respond to this study.
To avoid leader bias, the identity of those responding was concealed from other
panel members. The flow-chart presented in Figure 6.1 outlines the major steps in
conducting the investigation; three rounds were found necessary to elicit consensus
amongst the participants.
Round 1 questionnaire prepared and pre-tested
Round 1 data analysed and similar factors grouped under representative headings
Round 2 data analysed and means and inter-quartile ranges summarised in Round 3 questionnaire
Responses to Round 3 analysed using Friedman's randomised block analysis and Kendall's coefficient of concordance (9)
Round 1 questionnaire administered through contact with individuals and distribution to electronic discussion groups
Round 2 questionnaire with summary of responses from Round 1 sent to participants
Round 3 questionnaire with summary of responses from Round 2 sent to participants who responded to Round 2
Summary of findings from the Delphi investigation disseminated to all participants
Figure 6.1. Flow-chart for data collection and feedback to participants during the iterative rounds of the
Delphi investigation.
210

6.2.4. Round I
Within the first-round questionnaire, panel members were presented with a brief
explanation of the term horizontally integrated aquaculture, thus:
'the culture of aquatic species in wastewater from commercial aquaculture, reducing the
concentration of pollutants and potentially conferring benefits to the operator, enviromnent
and stakeholder groups. "
Examples were presented, including the culture of seaweed and shellfish in
wastewater from shrimp ponds and marine cage facilities, and the use of constructed
wetlands planted with reeds or mangrove to treat wastewater from land-based freshwater
and marine or brackish aquaculture, respectively. The purpose of providing a definition
and examples was to focus the expertise of individual panel members on issues specifically
relating to such systems.
When answering the questionnaire, panel members were required to consider
factors they believed represented either constraints or opportunities and to list these factors
under the six sub-category headings proposed following the pilot-study. The second
section of the questionnaire requested panel members to suggest alternative strategies for
limiting negative impacts associated with discharging aquaculture wastewater.
Once questionnaires were completed and returned, factors suggested as constraints,
opportunities and alternative strategies during the first-round were grouped under
representative headings; where possible wording used by participants was employed. In
previous studies factors suggested by less than a specified proportion of the panel
members, for example 20% of each stakeholder group (Caffey and Kazmlerczak, 1998)
were discarded. However, in this study no responses elicited during the first round were
rejected. This approach was adopted to avoid biasing the study towards majority held
211

beliefs and conceptions, and pennitted individual participants to express unique points of
view for evaluation by the other members of the stakeholder panel during subsequent
rounds.
6.2.5. Round 2
The second-round questionnaire (presented in Appendix 2b), summarizing factors
suggested by participants during the first-round, was sent to all respondents. Factors were
listed under the respective category headings with the ftequency with which they occurred.
Participants were asked to assign a score between 1 and 10 for the importance ascribed to
each factor, I being least and 10 being most important. Responses for the second round
were collated and mean values and inter-quartile ranges for factor weights were calculated.
6.2.6. Round 3
Second-round responses were summarized in tables and sent to participants that replied
during round 2 (Appendix 2c). Mean weights and inter-quartile ranges were given for the
factors, together with their original narrative description. Participants were required to
either accept the mean score or suggest an alternative score based on their own perception.
Where participants wished to assign a weight outside the inter-quartile range, they were
requested to provide a statement justifying their decision.
6.3. Analysis
Following the rationale presented by Caffey (1998), Friedman's randomized block analysis
was employed to investigate the distribution of weights assigned to factors by participants
in rounds 2 and 3. This nonparametric test is appropriate for identifying the presence of
rank patterns in survey data generated by Delphi investigations where the non-random
nature of participant selection excludes the use of parametric statistical tests. Friedman's
212

null hypothesis (Ho) states that each ranking of random variables within a block is equally
likely. However, the nature of the Friedman's test statistic means that the null hypothesis
tends to be rejected in the presence of slight rank correlation, and the test provides no
indication of the degree of agreement between the ranks assigned by partl icipants (Caffey,
1998). Confidence in the degree of agreement within identified rank patterns was therefore
elicited using Kendall's coefficient of concordance (9). This measure of rank
convergence, or agreement, ranging from 0 to 1, has been recommended for interpreting
data generated by Delphi investigations to provide inforination on the degree of consensus
achieved and the level of confidence with which the mean ordinal ranks may be considered
(Schmidt, 1997). Guidelines for interpreting the degree of agreement and confidence in
ranks associated with values for Kendall's W are given in Table 6.1.
Table 6.1. Guidelines for interpreting the degree of agreement and confidence in ranks associated with
discreet values for Kendall's coefficient of concordance (R).
Kendall's W Interpretation Confidence in ranks
0.1 Very weak agreement None
0.3 Weak agreement Low
0.5 Moderate agreement Fair
0.7 Strong agreement High
0.9 Unusually strong agreement Very high
Adapted from Schmidt (1997)
Although it provides an indication of the degree of convergence observed in Delphi survey
data, and the level of confidence with which ranks may be regarded, Kendall's W fails to
provide any indication of the relative importance that participants ascribe to individual
factors. Caffey (1998) employed a distance function approach to assess the actual
consensus order of ranked preferences and indicators. However, his comparison with mean
ranks calculated from cardinal weights of individual indicators showed only slight
213

differences. In the light of this it was considered acceptable to use mean ranks to describe
the relative importance attached to individual factors by participants.
6.4. Results
Results show the number of participants contributing to each round, the nature and
distribution of constraints, opportunities and alternative strategies submitted in round 1, the
mean weights assigned to factors following round 3 and the associated mean ranks of
separate constraints, opportunities and alternative strategies. Patterns in rank distribution
are identified and the degree of convergence in rank patterns following rounds 2 and 3
evaluated and discussed.
6.4.1. Survey participation
Due to the panel selection methods employed it is not known how many potential
respondents viewed the initial questionnaire. However, approximately 40 individuals were
contacted directly and a total of 24 individuals responded to the first-round questionnaire.
During the second round 19 replies were elicited from those that had participated in the
first round, a response rate of 79%; during the third round the response rate remained
stable at 79%, with replies received from 15 participants. Of the initial respondents, 71%
were researchers, 13% managed production facilities, 8% worked for regulatory bodies and
8% were consultants. In the geographical distribution, 7 were from the United States, 6
from Scotland, 2 from Brazil, with single representatives from Australia, Canada, Chile,
Korea, Malaysia, New Zealand, Nicaragua, Singapore and Taiwan.
6.4.2. Constraints
First round participants responded with 84 short statements outlining possible constraining
factors. A number of these were sufficiently similar to be aggregated into 29 distinct
214

factors. Table 6.2 summarises the range of constraints suggested; eleven were mentioned
by only I participant while one, "the availability of suitable land or water", was suggested
Table 6.2: Constraints participants associate with horizontally integrated aquaculture, the frequency of
occurrence in round 1 (n) and both mean score (x) and mean ordinal rank following round 3.
Systems feature n x Rank
Physical Facility designed primarily for original aquaculture species 1 4.7 28 Availability of suitable land or water 11 7.4 2 Wastewater supply e. g. nutrient flows not optimal or presence of chemicals, antibiotics or pathogens 4 7.1 6
Engineering of wastewater flows difficult e. g. high volumes and distance 2 5.4 22 Biological treatment inconsistent at removing nutrients throughout the growing season 1 5.8 16
Envirom-nental Site specific design required e. g. climate vulnerability 4 5.7 14.5 Discharge requirements; by-products from integrated systems may not comply with 2 6.5 7 regulations Translocation of organisms suitable for integrated production restricted 1 4.3 29 External pollution could affect the integrated system 1 5.4 20
Managerial Lack of skills and training for existing managers and workers 4 6.0 14 Managers lack leadership, resist change and adopt a non-systematic approach 5 6.4 9 Decisions based on short-term financial appraisal 1 7.2 3 Limited knowledge-base regarding design and management e. g. optimal loading rates, 6 7.0 5 harvesting strategies, disease management Inadequate supplies of seed and inputs for integrated system 1 4.9 26
Institutional Absence of instruction and training support 1 5.9 18 Inertia i. e. a lack of research and development 1 6.0 11 Constrained by existing paradigms of food production i. e. no structures exist to facilitate systems thinking
2 5.8 17
Environmental laws and planning restrictions constrain integration 3 5.8 14.5 Lack of structures for monitoring and auditing integrated systems 1 5.6 19
Economic Market analysis and stimulation required 3 6.5 8 Limited revenue generated by the integrated system 4 5.0 25 Insufficient techniques for analysis of operating costs and accounting for broader issues
such as opportunity costs 2 4.9 27
Holders of economic power not interested 1 5.3 21 Financial costs associated with development 8 7.3 1
Lack of funding, access to venture capital 2 6.9 4 Costs associated with management and operation 3 5.9 10
Social Public acceptance of produce, the perception of 'dirty' food 4 5.8 13 Conflicts with stakeholder groups e. g. user groups or environmentalists 4 5.3 23 Limited systems thinking education and information exchange 1 5.2 24
215

by II participants. Only 3 factors were submitted as possible social limitations, 4 factors
identified as envirom-nental constraints, 5 factors each as physical, managerial and
institutional constraints and 7 submitted as economic constraints.
Results presented in Table 6.2 showed a wide variation in mean weightings
following round 3, ranging from 4.3 for the "restricted translocation of organisms suitable
for integrated production" to 7.4 for "the availability of suitable land or water". Lower
mean weights represented lower ascribed importance. Mean ordinal ranks for each
constraint are also presented in Table 6.2. These demonstrate that the 4 most important
constraints were: "financial costs associated with development", "the availability of
suitable land or water", "decisions based on short-term financial appraisal" and "lack of
funding and access to venture capital".
6.4.3. Opportunities
Participants responded with 94 short statements concerning potential opportunities; as with
constraining factors, a number were sufficiently similar to be aggregated, resulting in 27
distinct factors. Table 6.3 surnmarises the range of opportunities suggested; eight were
mentioned by only I participant while one, "increased income generated from additional
crops based on same inputs", was suggested by 12 participants. Only 3 factors were
submitted as potential physical benefits; 4 factors identified as environmental opportunities
and 5 factors each proposed as managerial, institutional, economic and social
opportunities.
Mean weightings assigned to possible opportunities after round 3 ranged from 3.7
for "better transport around remote areas" to 8.5 for both "Improved efficiency of resource
use e. g. nutrients and water" in the physical category and "reduced impact on the
environment and downstream users e. g. other farms" in the environmental category. These
both received a mean rank of 1.5, indicating their equal importance to participants. Mean
216

ranks presented in Table 6.3 show that the third and fourth most important opportunities,
both with a mean weighting of 8.3, were "reduced sediment and nutrient concentration in
wastewater" and "less energy consumed and waste generated in food production"; both
factors occurred in the enviromnental category.
Table 6.3: Opportunities participants associate with horizontally integrated aquaculture, the frequency of
occurrence in round 1 (n) and both mean score (x) and mean ordinal rank following round 3.
Systems feature nx Rank
Physical Better transport around remote areas 1 3.7 27 Improved efficiency of resource use e. g. nutrients and water 7 8.5 1.5 More attractive in the landscape than conventional treatment systems 2 6.4 16
Envirom-nental Reduced sediment and nutrient concentration in the wastewater 8 8.3 3 Less energy consumed and waste generated in food production 1 8.3 4 Increased habitat diversity, providing shelter to endemic species 3 6.5 17 Reduced impact on the envirom-nent and downstream users e. g. other farms 8 8.5 1.5
Managerial Meet expectations of managers regarding environmental protection and waste 2 7.0 8 management Increase opportunities for recirculation 1 7.0 11 Facilitate the development of a new paradigm for aquaculture and other agricultural 2 6.6 13 sectors Contribute to the skill base of managers 1 5.6 24 Reduce the potential for farms to self-pollute 2 7.2 6
Institutional Improved discharge standards that reduce penalties e. g. court action or closure 2 6.1 23 New opportunities to develop commercial partnerships 2 6.2 21 Potential site for research and development 2 6.5 18 Enabling more stringent discharge standards to be satisfied in the future 6 6.8 12 Help meet the standards for quality assurance or organic certification 1 7.2 10
Economic Reduce wastewater treatment costs 1 7.0 9 Increased income generated from additional crops based on same inputs 12 7.2 7
Represents a diversification reducing economic risks 5 6.5 14
Reduce the level of any potential pollution tax 6 6.1 22
Contribute to the regional economy, adding to tax base 2 5.2 25
Social Improved public perception; reconciling environmental and economic goals of different 6 7.6 5 groups Represents a good educational resource 1 6.3 20
Increased employment opportunities 5 6.5 15
Enhanced appeal of the primary aquaculture product to consumers 5 6.4 19
Better places to live 1 5.2 26
217

With the exception of institutional opportunities, each of the 5 remaining categories has a
factor with a mean ranking equal to or above 7; the most important institutional factor Nvith
a mean rank of 10 was, associated with "helping meet the standards for quality assurance or
organic certification"
6.4.4. Alternative strategies for limiting impacts of aquaculture wastewater
First round participants responded with 51 short statements describing alternative
strategies for limiting negative impacts associ I "ated with aquaculture wastew-ater. These
factors were aggregated under 18 distinct headings and are suniniarized in Table 6.4. Five
,. vere mentioned by single panel members, whilst two proposed in the technological
category "increased research and development into improved treatment technologies" and
"develop systems for water reuse" were mentioned by 7 and 6 participants, respectively.
The distribution of responses amongst the four strategy types sho,, ved that 4 factors were
submitted in both the managenal and technological categories whilst 5 Nvere submitted in
both the institutional and socioeconomic categories.
Mean weightings assigned to the alternative strategies after round 3 ranged from
3.8 to 8.1. The lowest mean weight was associated with the "adoption of extensive as
opposed to intensive management practices", the highest Nvith two factors submitted In the
management category: "management procedures that improve water quality e. g. careful
feed management, de-sludging lagoons, aeration and harvestIng strategies that minimise
discharges" and "good planning prior to developing aquaculture facilities and improved
site selection". The two management factors with mean weights of 8.1 received a mean
rank of 1.5. indicating their equal importance to participants. The most important factors in
the institutional. socioeconomic and technological categories received mean ranks of 3,8
and 4, respectivelv, and vvere: "encourage collaboration between researchers and
commercial enterprises"; "improved evaluation of benefits associated , vith management
218

practices that reduce environmental impact" and "increased research and development into
improved treatment technologies".
Table 6.4: Strategies proposed by participants to reduce negative impacts associated with aquaculture
wastewater, the frequency of occurrence in round I (n) and both mean score (x) and mean ordinal rank
following round 3.
Factor nx Rank
Institutional Better education of farmers regarding water quality and environmental management 3 7.1 6 Increase and enforce discharge standards for wastewater or implement a pollution tax 3 6.9 10 Open some commercial operations for public tours 1 6.1 15 Encourage collaboration between researchers and commercial enterprises 3 7.9 3 Provide information and direction to government regarding opportunities for the
2 7.1 7 innovative management of aquaculture wastewater
Managerial Adoption of a more holistic/systematic paradigm for aquaculture 2 6.7 12 Good planning prior to developing aquaculture facilities, improved site selection 3 8.1 1.5 Management procedures that improve water quality e. g. careful feed management, de-
5 8.1 1.5 sludging lagoons, aeration and harvesting strategies that minimise discharges Adopt extensive as opposed to intensive management practices 1 3.8 18
Socioeconomic Educate the public and managers regarding recycling systems 1 6.5 14 Look at the energy costs of typical intensive production systems 1 6.6 11 Government funding e. g. subsidies, grants and tax relief to encourage research and 2 6.1 16 development Improved evaluation of benefits associated with management practices that reduce 2 7.0 8 environmental impact The need to portray a positive image will necessitate improved waste management 1 6.9 9
Technological Increase research and development into improved treatment technologies 7 7.5 4 Develop systems for water reuse 6 6.6 13 Improved feed quality e. g. lower feed conversion ratios 5 7.3 5 Develop new vaccines and improve disease control 3 5.2 17
6.4.5. Confidence and convergence in rank patterns after round 2
Application of Friedman Is test in assessing the distribution of factor weightings assigned
by each participant identified similar rank patterns for constraints, opportunities and
alternative strategies following round 2 of the investigation (p<0.000, two-tailed) (Table
219

6.5). However, despite the presence of rank patterns, Kendall's W calculated for ranks
assigned to factors within each research area i. e. constraints, opportunities and alternative
strategies at 0.143,0.267 and 0.205, respectively, indicated that agreement in assigned
ranks ranged from "very weak" to "weak" and that the confidence of defining rank patterns
ranged from "none" to "low"; Table 6.5 presents a summary of results.
Table 6.5: Values for Friedrnan'sly2Fat probability levels (p) indicated and Kendall's W for weights assigned
to factors during round 2.
Research area .................... .......................... . ...
Friedman's 7F ............ .......... . ........ ...... . ......... ............... . .... . ......
(P) ...... . .............. . ...................
Kendall's W ...... -- ........................................ . ........ ...
Agreement ....................................................................... ................... ....
Confidence .................................................... ............................
Constraints 59.9 < 0.000 0.143 Very weak None
Opportunities 111.2 < 0.000 0.267 Weak Low
Alternatives 59.2 < 0.000 0.205 Weak-Very weak Low-None
6.4.6. Confidence and convergence in rank patterns after round 3
Friedman's test on the distribution of factor weights following round 3 indicated rank
patterns in all three areas of investigation (p<0.000, two-tailed). Application of Kendall's
W indicated that the level of agreement in rank patterns was significantly higher than in
round 2, and that the level of confidence in ranking had also increased (Table 6.6). A value
for Kendall's W of 0.673 for ranking constraints, indicates "strong" agreement and a
"high" level of confidence; a value of 0.837 for ranking opportunities in icates a ((very
strong" level of agreement and implies a "high" to "unusually high" level of confidence; a
value of 0.733 for alternative strategies again implies a "strong" agreement amongst
participants and a "high" level of confidence.
220

6.4.7. Rank patterns and consensus within categories
More detailed analyses of rank patterns in each of the sub-categories in the three research
areas employing Friedman's test and Kendall's W are presented here. Friedman's test
indicates the presence of similar rank patterns for responses from individual pII in articipants i
all categories investigated (p<0.000, two-tailed).
2 Table 6.6: Values for Friedman's ý'F at probability levels (p) indicated and Kendall's W for weights assigned
to factors during round 3.
Research area Friedman's FP Kendall's W ment Confidence
Constraints 263.7 < 0.000 0.673 Strong High
Opportunities 304.6 < 0.000 0.837 Unusually strong- Very high-High Strong
Alternatives 174.4 < 0.000 0.733 Strong High
Constraints
Rank patterns observed in the physical and enviromnental categories result in values for
Kendall's W of 0.87 and 0.884, respectively, indicating an "unusually strong" level of
agreement and "very high" level of confidence (Table 6.7). Agreement in rank patterns
observed in weights assigned to factors submitted as managerial and economic factors is
44 strong" and confidence is "high". Values for Kendall's W of 0.442 and 0.545 for rank
patterns observed in institutional and social categories, respectively, indicate "moderate"
agreement and that confidence is "fair".
Opportunities
Values for Kendall's W of I and 0.878 for rank patterns observed in physical and
environmental categories, respectively, indicate an "unusually strong" level of agreement
and that confidence in these findings is "very high" (Table 6.8). Rank patterns for weight
221

assigned to factors in the managerial category result in a value for Kendall's W of 0.774
indicating a "strong" to "unusually strong" level of agreement and a "high" to "very high"
level of confidence; Kendall's W for rank patterns relating to social factors is similar at
0.802 indicating an "unusually strong" to "strong" level of agreement and a "very high" to
"high" level of confidence. Agreement in rank patterns observed in weights assigned to
factors submitted as institutional and economic opportunities is "strong" and confidence is
"high".
Table 6.7: Friedman's -'y2Fat probability levels (p) indicated and Kendall's W for rank patterns in weights
assigned to constraints following round 3.
Category for Friedman's XF (P) Kendall's W Agreement Confidence constraints
Physical 48.7 <0.000 0.87 Unusually strong Very high
Enviromnental 37.1 <0.000 0.884 Unusually strong Very high
Managerial 35.9 <0.000 0.641 Strong High
Institutional 24.8 <0.000 0.442 Moderate Fair
Econornic 57.4 <0.000 0.684 Strong High
Social 15.3 <0.000 0.545 Moderate Fair
Alternative strategies
Rank patterns observed in the institutional and managerial categories for alternative
management strategies result in values for Kendall's W of 0.697 and 0.765, respectively,
indicating a "strong" agreement amongst participants and a "high" level of confidence
(Table 6.9). Kendall's W for rank patterns observed in the technological category is
slightly higher than that for the managerial category at 0.786, indicating a "strong" to
"unusually strong" agreement amongst participants and signifying "high" to "very high"
confidence. A value for Kendall's W of 0.579 for rank patterns in the socioeconomic
222

category indicates that agreement between participants is moderate to 44strong" and that
confidence is "fair" to "high"
2 Table 6.8: Friedman'sXF at probability levels (p) indicated and Kendall's W for rank patterns in weights
assigned to opportunities following round 3.
Category for Friedman'sYý- (p) Kendall's W Agreement Confidence opportunities
Physical 28 <0.000 I Unusually strong Very high
Environmental 36.9 <0.000 0.878 Unusually strong Very high
Managerial 43.3 <0.000 0.774 Strong-Unusually High-Very high strong
Institutional 38.8 <0.000 0.692 Strong High
Economic 41.9 <0.000 0.749 Strong High
Social 44.9 <0.000 0.802 Unusually strong- Very high-High Strong
Table 6.9: Friedman's -Y2Fat probability levels (p) indicated and Kendall's W for rank patterns in weights
assigned to alternatiVe strategies following round 3.
Category for Friedman's (P) Kendall's W Agreement Confidence alternative strategies -'y2F
Institutional 39.1 <0.000
Managerial 32.1 <0.000
Socioeconomic 32.4 <0.000
0.697 Strong
0.765 Strong High
0.579 Moderate-Strong Fair-High
High
Technological 33 <0.000 0.786 Strong-Unusually High-Very high strong
6.5. Discussion
An important aspect of the Delphi methodology is the contribution of participants to
selecting factors for investigation. Open questions employed during the first round of
enquiry provided respondents with an opportunity to suggest factors based on their unique
223

understanding of the situation and their personal agendas. This may be in contrast to group
discussions or workshops where opinionated individuals may have a forum to impose their
ideas on others or the views and feelings of less vocal groups are ignored. In this study,
where all factors proposed in the first round were put forward into the second round, all
perspectives were given equal consideration. There are two distinct advantages over other
consensus building strategies, firstly, permitting participants to select areas for
investigation helps engender ownership of the process and secondly, requesting a variety
of stakeholders to contribute results in a multidisciplinary assessment giving greater scope
and depth than studies engaging only with sectoral experts. The wide range of factors
submitted by participants in the first round confirms the advantage over employing a
predefined questionnaire.
Previous studies have emphasised the importance of selecting a panel of experts for
Delphi investigations. However, as this study dealt with an innovative management
strategy it was difficult to identify sufficient experts in the field. It was therefore decided to
try and identify stakeholders with experience or expertise in policy making, regulation,
environmental protection, commercial aquaculture production, research and development.
This widened the debate, elicited a more diverse range of factors for consideration and
tested the Delphi methodology in generating consensus amongst diverse stakeholder
groups. Hasson et al. (2000) discuss the validity of the tenn "expert" as applied to
participants in Delphi investigations and instead suggest using "a panel of informed
individuals", a term used by McKenna (1994) to describe participants in a Delphi
investigation regarding nursing practices. In addition to obtaining a broader perspective of
the subject matter through engaging stakeholders as opposed to experts, it should also be
noted that stakeholders who may not consider themselves experts can nevertheless be
highly influential, or have agendas in which aquaculture is not of prime importance, but
which may constrain or enhance prospects for aquaculture development.
224

Considering the diverse backgrounds and specialisations of participants in this
study, prospects for reaching a consensus may have been considered poor. However,
following the third round, rank patterns had emerged in each of the three research areas
with a level of agreement ranging from "strong" to "unusually strong", and confidence in
this finding considered "high" to "very high".
At the start of the study it was hypothesised that economic factors would constitute
the most important constraints to development; that the greatest opportunities would relate
to environmental concerns and that improved treatment technologies would represent the
most promising strategy for reducing negative impacts associated with aquaculture
wastewater. Mean rankings following round 3 indicated that the most important constraint
was indeed submitted in the economic category. Assigning the greatest importance to the
"financial costs associated with development" may have been expected considering the
focus on commercial production systems in this study. However, when considering
potential opportunities the prospect of "increased income generated from additional crops
based on same inputs 55 , which could offset the costs associated with development, was only
considered the 7'h most important factor. This suggests perhaps that the participants are
pessimistic concerning the likely financial returns from horizontal integration or that
opportunities such as the "improved efficiency of resource use... ", "reduced impact on the
environment and downstream users... ", "reduced sediment and nutrient concentrations in
wastewater" and "less energy consumed and waste generated... ", although not generating
a direct income, are of more value than the financial returns from integration. However, the
question remains whether commercial producers are in a position to capture these benefits,
especially when opportunities such as "help[ing] meet the standards of quality assurance or
organic certification" and "enhanced appeal of the primary aquaculture product to
consumers" were ranked 10 th and I gth most important, respectively.
225

The second most important constraint, "the availability of land or water" appears to
be a decisive limiting factor, although presumably this would depend on the setting of the
primary culture facility. However, it may be possible to tailor the design, type and
management of the secondary culture facility to permit effective horizontal integration.
The 3d and 4 Ih most important constraints "decisions based on short term financial
appraisal" and a "lack of funding, access to venture capital" may reflect a perception that
horizontal integration is costly, whilst generating low returns. This may make financial
assessments based on conventional approaches unfavourable, dissuading prospective
financial backers. Other constraints, e. g. "envirom-nental laws and planning restrictions
constrain integration" or the negative "public acceptance of produce, the perception of
'dirty' food", although not discussed in depth, may demand detailed consideration as in
particular locations they could represent insun-nountable obstacles to horizontal
integration.
Although one of the two most important opportunities, a "reduced impact on the
environment and downstream users e. g. other farms" occurred in the envirom-nental
section, the second, "improved efficiency of resource use e. g. nutrients and water" was
proposed as a physical benefit, so only partially satisfying the initial hypothesis. Limiting
the environmental impact of aquaculture is undoubtedly desirable and avoiding conflicts
with downstream users could represent a tangible benefit to operators. However, the
importance of horizontal integration in achieving "improved discharge standards that
reduce penalties e. g. court action or closure" and to "reduce the level of any potential
pollution tax" with ranks of 23 and 22, respectively, suggests that enviromnental protection
and altruistic motives are more influential than possible future cost-savings. Potentially
influential and beneficial opportunities from the perspective of a production system
manager are "improved public perception ... " and "reduced potential for farins to self-
pollute", ranked 5 th and 6 th MoSt important. Enhanced public perception may add value to
226

products from the primary aquaculture facility, although potential benefits from quality
assurance and organic certification were given less importance. Avoiding the problems of
self-pollution outlined in Chapter I could have a direct and positive impact on both
production and financial returns.
It may be argued that the 3d and 4 th mOst imPortant opportunltles, "reduced
sediment and nutrient concentrations in wastewater" and "less energy consumed and waste
generated... " could have been brought together following the first round. However,
interpreting these statements as alluding to waste reduction and waste avoidance,
respectively, suggests that participants considered these two fundamentally different
approaches to waste management to be equally important, which has significant f'
implications for production system management.
The hypothesis that improved wastewater treatment technologies would represent
the most promising alternative approach was rejected, the greatest importance being
associated with management factors. "Good planning prior to developing aquaculture
facilities... " and the adoption of "management procedures that improve water quality. --"
were regarded as the most important strategies. Effective planning and appropriate site
selection for aquaculture, developments is widely regarded as a prerequisite for financial
and ecological sustainability, and it has been demonstrated that refined management
practices can represent an efficient and cost effective approach to waste reduction and
improved resource-use efficiency. However, as access to suitable sites for aquaculture
declines and the returns from improved management strategies begin to diminish, the
prospects for improved wastewater management may improve. The perception of
horizontal integration may therefore be modified by future trends, which suggests the need
for a continued reassessment of its potential. Furthermore, it has been shown that for both
constraints and opportunities for horizontal integration, the most important 3-4 factors
were distributed in more than one category, reconfirming the need to consider the
227

development of innovative management strategies and technological development
employing a systems approach.
This investigation demonstrates that the practical application of outputs from the
modelling scenarios in the preceding chapters may demand greater attention to other
factors not explicitly stated or evaluated. Thus, possible constraints such as the
'(availability of land or water" or potential opportunities e. g. "reduced impact on the
environment and downstream users e. g. other farms" may need to be more explicitly
evaluated. To assess the full range of possible limitations and potential benefits,
researchers and commercial managers may need to develop case studies or site specific
assessments involving a range of factors, perhaps suggested by a stakeholder panel with a
particular interest in the sector or proposed location e. g. local planners or envirom-nental
groups. Engaging local stakeholders may elicit factors that were only ranked as moderately
important here but may require greater attention in a particular setting e. g. "envirom-nental
laws and planning restrictions constrain integration" or "attractiveness in landscape
compared to conventional treatment systems". The need to consider agriculture and
aquaculture development within a systems perspective has been recognised (Spedding,
1988; Muir, 1996), and Delphi investigations conducted with local stakeholder groups may
represent a promising approach to achieving this objective.
Although the range of factors considered in this study is diverse, the ADEPT model
has the capacity to enable a number of the most important constraints identified to be
investigated e. g. costs associated with development, the area of land or water required, the
effect of varying the time horizon for financial appraisal and optimal design strategies and
management regimes. Furthermore, some of the most important opportunities associated
with horizontally integrated aquaculture may be investigated e. g. exploring the efficiency
of resource use in the integrated culture system and assessing changes in the concentration
of solids and nutrients in treated wastewater. Therefore, despite the limitations described
228

-Ilk aDove, ADEPT model scenarios could be a valuable resource from which more
comprehensive situation analyses could be developed. Modelling outputs should be used to
identify high potential systems and focus resources on developing more comprehensive
case studies that address the needs, priorities and expectations of operators and
stakeholders.
Although good agreement was identified in rank patterns observed in all three
research areas and the majority of categories within these , it was notable that the
"moderate" agreement and "fair" confidence regarding constraints from institutional and
social factors was less defined than in the other categories. This may reflect differing social
settings and institutional arrangements encountered by participants from different
countries, and it could be argued that a more focused study would be required to consider
these categories more fully in constraining prospects of horizontally integrated
aquaculture. Areas of ambiguity identified during a Delphi process are likely to require
further investigation; possible tools for achieving a better understanding of the social
setting may include focus groups, consumer acceptance and market surveys or the
development of a more refined Delphi investigation. Institutional arrangements may be
investigated further through reviewing appropriate policy and regulatory documents and
undertaking an institutional analysis.
The preparation and facilitation of a stakeholder Delphi investigation represents a
resource demanding exercise that is unlikely to be feasible in the majority of cases where
small-scale innovations are being proposed on individual fan-ns. However, where issues
with potentially wide-reaching impacts are being addressed, such as the formulation of
policy or regulation or the preparation of an Environmental Impact Assessment for a large-
scale development, the Delphi method may provide a suitable approach to encourage a
constructive dialogue between diverse stakeholder groups.
229

The initial focus of this Delphi investigation, both with respect to the area of
research and selection of participants, has useful implications for interpreting the results. It
could be argued that selecting participants from a particular geographical region or having
experience with a certain culture system may have improved the focus of this study. The
limited extent of knowledge and experience regarding horizontally integrated aquaculture
necessitated the inclusion of participants from a wide range of countries and experience
with a diverse array of culture systems. However, it was still possible to reach a general
consensus regarding the importance of factors proposed by all participants. As knowledge
and experience of these systems develops it may be possible to undertake more focused
studies, but this investigation has provided a valuable insight into the nature and diversity
of factors that may influence decision-making.
As investigations become more focused, the demands and expectations of
participants are also likely to become more personal and value-laden. A criticism of other
traditional methods for consensus building, which the Delphi methodology is designed to
avoid, is the fact that open debates regarding emotive issues may become distorted by the
opinions of participants with markedly different agendas. Investigations involving
stakeholders with differing agendas may cause concerns and grievances to become
explicit, leading to conflict. The Delphi technique aims to avoid this issue as the quasi-
anonymity of participants is ensured (McKenna, 1994) and emotive language is tempered
through the aggregation of statements submitted in the first round, although, value-laden
statements are not excluded. Eliminating conflict using the Delphi technique and avoiding
confounding influences such as leader-bias helps develop a constructive dialogue amongst
participants with differing perspectives and assists in formulating mutually acceptable
outcomes.
A potential constraint to invoking the Delphi methodology is the problem of
attrition; participants contributing value-laden statements and weights in the initial rounds
230

may decide not to contribute in subsequent rounds. To avoid this problem it is
recommended to engage sufficient participants to reduce the influence of any one
individual; efforts should also be made to ensure that as few parti I ire as possible, icipants ret'
possibly meaning extra correspondence and time allocated to following up queries and
unreturned questionnaires. Sumsion (1998) suggests that a response rate of 70% is
desirable in each round to ensure the rigour of the investigation; this criterion was met in
this investigation.
A key factor governing response rates in Delphi investigations is the commitment
of participants, which has been related to their interest and involvement with the question
under investigation (Hasson et al., 2000). As mentioned previously, the purposive
sampling methodology that permitted panel members to submit factors ensured that issues
of interest to individual participants were evaluated. Furthermore, making the objectives of
the study explicit to potential participants in the introductory text that accompanied the
first-round questionnaire ensured that only those with an interest in the outcome of the
research would respond. The success of this approach is shown by response rates greater
than 70% in both the second and third rounds. Having demonstrated a commitment to the
research being undertaken, it is hoped that participants that contributed to this study gained
an insight to the perceptions of others regarding horizontally integrated aquaculture, and
that agreement on possible constraints and potential opportunities has provided an
indication of the most significant factors that require further consideration, or hold the
greatest promise for realising the benefits associated with horizontally integrated
aquaculture.
Findings from this study indicate that rank patterns were identifiable following
round two. However, agreement and confidence in the distribution of these ranks was only
regarded as reliable after round 3. Despite the diverse backgrounds and experiences of
participants it was possible to reach consensus on the nature and importance of key
231

constraints and opportunities. The findings of this research also indicate where the
priorities for subsequent research and development lie, and may contribute to focusing
resources on formulating design and management plans that meet the demands and
expectations of the diverse stakeholder groups that exert an influence on the decision-
making process. This post hoc research may be best facilitated through invoking
methodologies such as focus groups and structured questionnaires. However, the role of
the Delphi investigation in providing guidance on the nature and diversity of factors
requiring further consideration may be critical.
232

Chapter Seven
Discussion
Overview
This thesis has assessed the potential of horizontally integrated aquaculture from a systems
perspective. Problems associated with the discharge of wastewater from commercial
aquaculture operations and limitations to current waste management strategies were
described in Chapter 1. In Chapter 2 the potential role of horizontally integration in
ameliorating negative impacts associated with aquaculture wastewater was discussed. A
definition for these production systems was developed and management strategies that
facilitate horizontal integration reviewed. The development and application of a
bioeconomic model suitable for assessing the potential of a constructed wetland and
recreational fishery as horizontally integrated production systems was presented in Chapter
3. Outputs generated by the ADEPT model were then validated against observations from
a commercial aquaculture facility and a constructed wetland with a recreational fishery,
functioning under comparable operating conditions to those envisaged for horizontally
integrated systems. The model and approach developed though this case study was applied
in Chapter 4 to assess the potential of using constructed mangrove wetlands to treat shrimp
culture wastewater. The same strategy was used in Chapter 5 to evaluate a rational design
approach to lagoon-based wastewater treatment and reuse through aquaculture, as
compared to conventional and traditional practices. Finally, Chapter 6 presented the
findings of a Delphi investigation that explored the nature and importance of key factors
that stakeholders perceive as having a significant role in influencing the decision-making
233

process when considering horizontal integration. This chapter presents an assessment of
the appropriateness of the methodologies adopted in this study, together with a review of
the major findings from the preceding chapters. Based on this review , important emerging
thematic issues are discussed and appropriate recommendations forinulated to guide future
research and development work regarding horizontally integrated aquaculture.
7.2. Discussion of methodology
Bioeconomic modelling
Adoption of a bioeconomic modelling approach enabled key physical, managerial and
financial aspects of the proposed horizontally integrated systems to be assessed
simultaneously. From the review presented in Chapter 2 it was apparent that the majority
of studies dealing with horizontally integrated aquaculture had focused on addressing key
technical constraints or optimising the treatment performance or productivity of the
integrated components. Few studies had, however, considered the practical and financial
implications for the operator of the primary aquaculture activity.
Through consultation with the managers of a commercial aquaculture facility it was
possible to identify some of the key issues that determine the wastewater management
strategy employed. Primarily, these factors related to cost, reliability and the required
treatment standard as stipulated by the regulatory authorities. These issues required
consideration when developing the proposed bioeconomic model to ensure that the
resulting outputs were practical, and of use to commercial producers. Ease of operation
was a key requirement for the model; therefore, the input variables required by the model
relate to information that should be readily available to managers. It was envisaged that
using a proprietary spreadsheet package to develop the model would increase the prospects
for the use of the product. It was anticipated that using the ADEPT model to simulate
waste outputs and treatment performance of conventional treatment strategies could assist
234

managers of commercial operations to identify periods in the culture cycle when there is a
risk of the farm discharge contravening discharge consent standards. Refined management
strategies e. g. restricted feeding, increasing wastewater treatment capacity at the site or
partial harvesting, could then be adopted during high-risk periods.
Although developing the model in consultation with commercial operators helped
inform the modelling process, there were constraints to formulation and testing of the
model. Relationships and assumptions used to develop the model did not always relate
specifically to the production or treatment system under consideration, however, where
possible, only information relating to comparable systems was used. A major constraint
was the absence of information relating to the likely treatment effect of a trout fishery. The
k-C* models for surface-flow wetlands proposed by Kadlec and Knight (1996) were
therefore tested in this context. Although the model outputs were tested, and deficiencies
identified, there is a need to further refine and calibrate the model in order that reliable and
robust outcomes are assured. However, despite its limitations, the ADEPT model provides
an initial step for assessing the potential of horizontal integration for commercial
aquaculture and identifying high potential strategies worthy of further and more intensive
study.
The next phase in such an assessment would probably involve the development of a
pilot-scale system, although, as was evident from the literature review, these are often
developed outside the context of commercial aquaculture. However, if the
commercialisation of horizontally integrated approaches to aquaculture wastewater is to be
an objective of such studies, they must be undertaken in close association with commercial
partners. Otherwise, potentially useful findings may be only narrowly disseminated and
consequently have a limited impact.
Testing the predicted performance of selected approaches to horizontal integration
against observations from comparable commercial systems demonstrated the potential of
235

the chosen strategies, but there were also limitations to this approach. The systems
monitored were large in scale and it was not possible to control the prevailing operating
conditions. As these systems were open to a range of external variables, it was often not
possible to know which were the most influential in dictating the behaviour of the system.
Testing the model outputs against pilot-scale systems, where more variables could be
regulated could help clarify this. An alternative approach would be to test the findings
from this study with observations from a wider range of comparable systems. This would
be the first step in developing robust, generalised models for key variables, such as the
treatment performance of extensive open-water systems.
The outputs of the modelling exercises presented here require consideration from a
more general perspective. Although proposed as an approach that would assess a range of
issues such as treatment performance, productivity and financial returns, these represent
only a part of the systems context for developments in the aquaculture industry. Other
facets of the systems in which aquaculture functions e. g. social, economic, environmental
and legislative aspects, also require consideration.
Delphi investigation
To better understand the nature and importance of factors that could influence the adoption
of horizontally integrated aquaculture, a Delphi investigation with stakeholders was
undertaken. This approach elicited a wide range of factors considered by the participants to
represent key benefits and constraints associated with horizontally integrated aquaculture.
However, due to the relatively small number of participants involved and the limited focus
of the study, the findings should only be regarded as general indicators.
Ideally, variations in the perceptions of respondents would have been assessed with
respect to their background and area of interest, as demonstrated by Caffey (1998). The
priority different groups gave to the various constraints and opportunities based on
236

whether they were researchers, operators, regulators or environmentalists, and which
production systems they were involved with would have provided useful information.
Although the Delphi investigation was used here to facilitate an assessment of the systems
features affecting the prospects for horizontally integrated aquaculture, key areas of
potential or conflict in particular settings may have been lost.
A more informative approach could have been to specify a particular aquaculture
practice, such as smolt production, with which to consider the prospects for horizontal
integration. However, such a targeted approach would limit the numbers of potential
participants considering themselves adequately qualified to engage in the process. Where
time and resources are available it may be beneficial to identify and engage with selected
groups; the outputs from such studies could highlight key areas of opportunity or conflict
with respect to particular settings. However, caution must be exercised so as not to restrict
too tightly the views and experience of participants, as this risks losing the general
perspective gained through the Delphi investigation.
The Delphi investigation provided the opportunity for the assessment of
stakeholders' perceptions of the relative merits of wastewater management strategies other
than horizontal integration. In this investigation it was evident that approaches other than
treating wastewater were given priority, e. g. improved feed management and husbandry
practices. It would not have been possible to obtain this perspective from a modelling
exercise carried out in isolation, therefore, as a complementary approach for use with a
more focused modelling exercise, the Delphi could place the modelling output into
context. Delphi investigation outputs would also be useful in guiding more targeted
research, focusing resources on strategies that have good prospects for developing
appropriate systems that are adopted by commercial operators.
The approaches employed in this study proved useful in highlighting possible
In constraints and potential opportunities associated with the development of ho 'zontally
237

integrated aquaculture. However, as with other modelling approaches, the findings should
be interpreted with caution; they may best be used to guide the development of pilot-scale
systems in association with commercial aquaculture, prior to the development of full-scale
commercial systems. Such an approach would facilitate the testing of the proposed strategy
under a range of operating conditions and permit an assessment of the likely risks
associated with the system. When dealing with ecologically based wastewater treatment
approaches the possible impact of unexpected perturbati and where 'K' ions must be considered,
possible, included in the planning of the proposed system. The development of pilot-scale
systems would also permit other aspects of horizontally integration, such as the
perceptions of the commercial operators, to be assessed and consumer acceptance of
products tested.
7.3. Implications of findings
From the review presented in Chapter 1 it is apparent that concerns regarding the impact of
aquaculture wastewater have been addressed through several approaches. Effluent loads
have been significantly reduced through careful feed management, the formulation of
energy-dense and low pollution diets, and through more efficient sludge collectors and
mechanical filters. Furthermore, farm managers have developed guidelines to promote
good management practices that reduce negative environmental impacts associated with
aquaculture (Gavine et al., 1996). However, the potential benefits of improved
management strategies in reducing waste discharges are constrained by practical
considerations. The effectiveness of current approaches to aquaculture wastewater
treatment, such as settlement and mechanical filtration, is limited, and should stricter
discharge standards be introduced it is unlikely that they could be met. Conventional
approaches to treatment also result in the production of sludge that requires disposal and
may ultimately represent a source of pollution.
238

As well as meeting the demands of regulators, aquaculture producers should also
be conscious of the concerns expressed by the public regarding the ongins of products they
consume and their environmental credentials. Wasteful producers may find themselves at a
disadvantage while products from operators employing environmentally friendly options
may command a premium; it has been suggested that market perceptions and
environmental attributes will increasingly drive future growth within the aquaculture
industry (Young et al, 1999). Therefore, the proactive development of management
approaches that address problems associated with discharging aquaculture wastewater
could confer a significant advantage on operators.
The prospect of stricter discharge consents, pollution taxes and increased
preference of consumers for environmentally friendly goods was seen as justification for
further research into improved treatment strategies for aquaculture wastewater.
Furthennore, there is a growing recognition that nutrients entrained in aquaculture
wastewater represent a potentially valuable resource. Treatment options that facilitate the
exploitation of this resource to culture aquatic species, whilst ameliorating the negative
impacts associated with aquaculture wastewater, could be attractive to both consumers and
operators. This was the rationale proposed in support of horizontally integrated
aquaculture.
The review in Chapter 2 identified a range of strategies investigated or
demonstrating potential for horizontal integration with semi-intensive and intensive
aquaculture. However, few examples of full-scale systems associated with commercial
aquaculture were noted. From this, it was inferred that although technically viable in a
number of settings, addition financial, economic, managerial, social, institutional and
environmental factors might be constraining commercialisation.
The development and application of the ADEPT model permitted some of these
potential constraints to be evaluated, including the treatment perforinance and reliability of
239

horizontally integrated systems, and the managerial and financial demands associated with
particular case studies. The first of these considered prospects for the integration of a
constructed wetland and trout fishery to treat the wastewater from a commercial smolt unit
in Scotland. Outputs from the modelling exercise were II in general agreement with the
treatment potential observed in the comparable system, however, further work is required
to calibrate the model.
Despite the potential limitations to adopting the integrated trout fishery and
reedbed, it was concluded that such an approach to horizontal integration may have a role
to play in facilitating the reuse of wastewater from a commercial smolt fan-n in Scotland:
achieving higher treatment standards, generating additional income and creating
employment opportunities. However, the specific nature of the scenario developed
suggests that the potential of this particular approach is likely to be limited for operators in
remote locations where demand for angling is low. A further limitation was also identified:
the reduction of DO levels in surface-flow wetlands to low levels may represent an
intractable problem. A potential solution would be to reconfigure the design so that the
reedbed precedes the fishery, although, this could in turn result in elevated SS levels in the
final discharge. However, if it were possible to convince the regulatory authorities that the
overall impact of the wetland treatment systems was positive, and that SS generated in the
wetland were mainly complex organic matter that would only have a limited impact on the
receiving environment, then such an approach may still be feasible. Further work is
required to substantiate this argument.
Although horizontally integrated aquaculture may offer several advantages, two
constraints identified in the case studies were the land required and the initial capital
expenditure. Where land and capital are available for development, in most cases the
financial returns generated by the most promising systems were only considered
marginally attractive. Small returns predicted through the financial assessment could be
240

subsidised by other potential benefits, such as a premium for products from the primary
aquaculture activity, the sale of additional treatment capacity through a tradable pen-nit
scheme or a reduction in pollution tax. However, where such additional benefits were
perceived, the task of assessing their likely impact on the financial returns in the proposed
case studies requires further investigation. The ADEPT model provides a useful
framework from which to develop such assessments, although the actual estimation of the
likely magnitude of any potential benefits would require a more wide ranging assessment
undertaken at a regional or national level.
Expanding the diversity of farmed aquaculture products by the adoption of
horizontal integration could disperse financial, enviromnental and disease risks associated
with intensive monoculture-based aquaculture. Culturing a range of products with varying
production cycles presents opportunities to market products throughout the year,
contributing to a more even distribution of cash-flows and making more efficient use of
infrastructure, the workforce and marketing channels.
Horizontal integration does however, result in additional management demands and
increased workloads; in the scenarios developed here, this factor has been accounted for by
costing additional labour into the model. However, on existing farms, managers may be
reluctant to employ more staff and the existing workforce may be required to perform
additional tasks. The distribution of this labour demand may not be uniform and potential
synergies and conflicts with workloads associated with the operation of the primary
aquaculture facility would require further investigation. Where generated financial returns
are sufficient, managers may be more willing to engage extra employees to operate and
maintain the system; such an increase in the size of the workforce could represent an
important source of employment in remote or deprived areas.
Another area requiring further consideration is the assessment of risks associated
with horizontal integration, in particular where systems depend on ecologically based
241

wastewater treatment processes that may be susceptible to external factors, such as
environmental perturbations. However, examples such as the traditional approaches
developed in pen-urban Calcutta suggest that ecologically based systems can represent a
viable and resilient wastewater treatment and reuse option.
The limited scope of previous studies considering horizontal integration was
considered here as a major constraint to developing commercial systems. This failing was
addressed in this study through the application of the Delphi technique with a range of
stakeholders. The findings of this assessment would also be useful in indicating where the
priorities for subsequent research and development lie, and could contribute to focusing
resources on formulating design and management plans that meet the demands and
expectations of the diverse stakeholder groups that exert an influence on the decision-
making process. The role of the Delphi investigation in providing guidance on the nature
and diversity of factors requiring further consideration was regarded as a critical aspect of
the work presented in this thesis.
7.4. Conclusions and recommendations
This study presents an assessment concerning the potential of horizontally integrated
aquaculture, with outcomes assessed from a systems-based perspective. The development
and application of the ADEPT bioeconomic model to assess the potential of using a
constructed wetland and trout fishery to treat the wastewater from a commercial smolt unit
in Scotland was generally effective in predicting the composition of wastewater outputs
from the farm, and the effect of the selected treatment strategies. The model was also
successfully applied to two further case studies: the potential of treating wastewater from
shrimp farms in Thailand using a constructed mangrove wetland, and the possible
advantage of a rational design approach to lagoon-based wastewater treatment and reuse,
as opposed to a conventional design and traditional practices developed in pen-urban
242

Calcutta. For all case studies, it was possible to simulate the general treatment and
financial perforinance of the proposed scenarios with a relatively good degree of
agreement between the model outputs and observed data.
A Delphi investigation permitted the modelling outputs, and hon I "zontally
aquaculture in general, to be considered from a systems-based perspective. It was
concluded that horizontal integration could have a role to play in developing more
sustainable aquaculture practices, however, further work will be required to assess the
prospects for such an approach based on the local setting and production system in
question.
From this study several key recommendations may be suggested. Although the
prospects for specific approaches to horizontal integration were considered here, further
alternatives require investigation as the likely demand for the specific products and
services generated by horizontal integration proposed in this thesis e. g. angling, may be
limited. The diverse environments in which aquaculture operates suggests that a
reassessment of the strategies proposed here would be required to truly test their prospects
in particular settings. Assumptions made for the case studies presented here may be
expected to change over time, as might the results of a Delphi investigation with
stakeholders. Therefore, the assessment of horizontally integrated systems should not be
static, but an ongoing process. This process should become more refined through the
assimilation of additional information and validation of assumptions, leading to more
robust assessments that have greater potential to facilitate the development of appropriate
and sustainable approaches to horizontal integration.
243

References
Ackefors, H., Enell, M., 1990. Discharge of nutrients from Swedish fish fanning to
adjacent sea areas. Ambio 119,28-35.
Adler, P. R., 1998. Phytoremediation of aquaculture effluents. Aquaponics Journal 4,10-
15.
Alaerts, G. J., Mahbubar, R., Keldennan, P., 1996. Performance analysis of a full-scale
duckweed-covered sewage lagoon. Water Research 30,843-852.
Alandrd, A., 1992. The effect of time-restricted demand feeding on feeding activity,
growth and feed conversion in rainbow trout (Oncorhynchus mykiss). Aquaculture
1081 357-368.
Alandrd, A., Bergheim, A., Cripps, S. J., Eliassen, R., Kristiansen, R., 1994. An integrated
approach to aquaculture wastewater management. Journal of Applied Ichthyology
105 389.
Allan, J. D., 1976. Life history patterns in zooplankton. American Naturalist 110,165-180.
Allcock, R., Buchanan, D., 1994. Agriculture and Fish Fanning. In: Maitland, P. S., Boon,
P. J., McLusky, D. S. (Eds. ), The Fresh Waters of Scotland. John Wiley & Sons, pp.
365-384.
Anon, 1996. Uses and markets for seaweed products - Malaysia and Thailand. Inf6fish
Intemational 4,22-26.
Anon, 1997. Aquaculture: a solution, or source of new problems? Nature 386,109.
Anon, 1999. Forget the shellfish. New Scientist 163(2197), 5.
Armillas, P. 1971. Gardens on swamps. Science 174,653-661.
Arthington, A. H., Bluhdorn, D. R., 1996. The effect of species introductions resulting from
aquaculture operations. In: Baird, DT, Beveridge, M. C. M., Kelly, L. A., Muir, JR
(Eds. ), Aquaculture and Water Resource Management. Blackwell Science, pp. 114-
139.
244

Arzul, G., Clement, A., pinier, A., 1996. Effects on phytoplankton growth of dissolved
substances produced by fish farming. Aquatic Living Resources 9,95-102.
Austin, B., 1985. Antibiotic pollution from fish farms: effects on aquatic microflora.
Microbiological Sciences 2,113-117.
Bailey-Watts, A. E., 1994. Eutrophication. In: Maitland, P. S., Boon, P. J., McLusky, D. S.
(Eds. ), The Fresh Waters of Scotland. John Wiley & Sons, pp. 385-411.
Baird, D. J., 1994. Pest control in tropical aquaculture: an ecological hazard assessment of
natural and synthetic control agents. Mitt. Internat. Verein. Limnol. 24,285-292.
Baldwin, C., 2000. Wetland filters-a useful option for fish farmers? Fish Fanner 23(l), 30-
31.
Barash, H., Plavnik, I., Moav, R., 1982. Integration of duck and fish farming: experimental
results. Aquaculture 27,129-140.
Bardach, J. E., 1997. Aquaculture, pollution and biodiversity. In: Bardach, J. E. (Ed. ),
Sustainable Aquaculture. John Wiley & Sons, pp. 87-99.
Bayes, C. D., Bache, D. H., Dickson, R. A., 1989. Land-treatment systems: design and
performance with special reference to reed beds. Journal of the Institute of Water and
Environmental Management 3,588-598.
Beardmore, J. A., Mair, G. C., Lewis, R. I., 1997. Biodiversity in aquatic systems in relation
to aquaculture. Aquaculture Research 28,829-839.
Benefield, L. D., Randall, C. W., 1980. Biological Process Design for Wastewater
Treatment. Englewood Cliffs London; Prentice-Hall, 526 p.
Berg, H., Michelsen, P., Troell, M., Folke, C., Kautsky, N., 1996. Managing aquaculture
for sustainability in tropical Lake Kariba, Zimbabwe. Ecological Economics 18,141-
159.
Berge, D., Fjeld, E., Hindar, A., Kaste, 0., 1997. Nitrogen retention in two Norwegian
watercourses of different trophic status. Ambio 26,282-288.
245

Bergheim, A., Asgard, T., 1996. Waste production from aquaculture. In: Baird, D. J.,
Beveridge, M. C. M., Kelly, L. A., Muir, J. F. (Eds. ), Aquaculture and Water Resource
Management. Blackwell Science, pp. 50-80.
Bergheim, A., Cripps, ST, Liltved, H., 1998. A system for the treatment of sludge from
land-based fish-farms. Aquatic Living Resources 11,279-287.
Bergheim, A., Ronhovde, J., Mundal, H., 1997. Efficient sludge treatment for land-based
fish farms. Fish Farming International 24(4), 30-32.
Bergheim, A., Sanni, S., Indrevik, G., Holland, P., 1993. Sludge removal from salmonid
tank effluent using rotating microsieves. Aquacultural Engineering 12,97-109.
Bergheim, A., Seymour, E. A., Sanni, S., Tyvold, T., Fivelstad, S., 1991. Measurements of
oxygen consumption and ammonia excretion of Atlantic salmon (Salmo salar L. ) in
commercial- scale, single-pass freshwater and seawater landbased culture systems.
Aquacultural Engineering 10,251-267.
Bergheim, A., Tyvold, T., Seymour, E. A., 1991. Effluent loadings and sludge removal
from land-based salmon farming tanks. In: De Pauw, N., Joyce, J. (Eds. ),
Aquaculture and the Environment, Special Publication No. 14. European
Aquaculture Society, Bredene, Belgium, pp. 27.
Beveridge, M. C. M., 1984. Cage and Pen Fish Fanning: Carrying Capacity Models and
Environmental Impact. FAO Fisheries Technical Paper 255,131 pp.
Beveridge, M. C. M., 1996. Cage Aquaculture (2 d Ed. ). Fishing News Books, Blackwell
Science, 346
Beveridge, M. C. M., Phillips, MT, 1993. Environmental impact of tropical inland
aquaculture. In: Pullin, R. S. V., Rosenthal, H., Maclean, J. L. (Eds. ), Enviromnent and
Aquaculture in Developing Countries. ICLARM, Conf, Proc., 31., pp. 213-236.
Beveridge, M. C. M., Phillips, MT, Clarke, R. M., 1991. A quantitative and qualitative
assessment of wastes from aquatic animal production. In: Brune, D. E., Tomasso, J. R.
246
(Eds. ), Aquaculture and Water Quality. Advances in World Aquaculture, Vol. 3. The
World Aquaculture Society, pp. 506-533.
Beveridge, M. C. M., Phillips, M. J., Macintosh, D. J., 1997. Aquaculture and the
envirom-nent: the supply and demand for environmental goods and services by Asian
aquaculture and the implications for susta'nability. Aquaculture Research 28,797-
807.
Beveridge, M. C. M., Ross, L. G., Kelly, L. A., 1994. Aquaculture and biodiversity. Ambio
23ý 497-502.
Binh, C. T., Phillips, M. J., Demaine, H., 1997. Integrated shrimp-mangrove fanning
systems in the Mekong Delta of Vietnam. Aquaculture Research 28,599-610.
Bj6rk, S., Graneli, W., 1978. Energy reeds and the environment. Ambio 7,150-156.
Black, E., Gowen, R., Rosenthal, H., Roth, E., Stechy, D., Taylor, F. J. R., 1997. The costs
of eutrophication from salmon fanning: implications for policy -a comment. Journal
of Environmental Management 50,105-109.
Black, K. D., Ezzi, I. A., Kiemer, M. C. B., Wallace, A. J., 1994. Preliminary evaluation of
the effects of long-term periodic subleathal exposure to hydrogen sulphide on the
health of Atlantic salmon (Salmo salar L). Journal of Applied Ichthyology 10,362-
367.
Blancheton, J. P., Coves, D., 1993. Closed system in intensive marine finfish hatcheries:
state of the art and future prospects. In: Bamabe, G., Kesternount, P. (Eds. ),
Production, Environment and Quality. EAS Special Publication 18, Ghent, Belgium,
pp. 87-94.
Boaventura, R., Pedro, A. M., Coimbra, J., Lencastre, E., 1997. Trout farm effluents:
characterization and impact on the receiving streams. Environmental Pollution 95,
379-387.
247

Bodvin, T., Indergaard, M., Norgaard, E., Jensen, A., Skaar, A., 1996. Clean technology in
aquaculture -a production without waste products? Hydrobiologia 326/327,83-86.
Boj6, J., 1991. Economic analysis of environmental impacts. In: Folk, C., Kdberger, T.
(Eds. ), Linking the Natural Environment and the Economy. Essays from the Eco-Eco
Group, Kluwer Academic Publishers, pp. 43-59.
Bonsdorff, E., Blomqvist, E. M., Mattila, J., Norkko, A., 1997. Coastal eutrophication:
causes, consequences and perspectives in the archipelago areas of the northern Baltic
Sea. Estuarine, Coastal and Shelf Science 44(Supplement A), 63-72.
Borowitzka, M. A., 1993. Products from microalgae. Infofish Intemational 5,21-26.
Boyd, C. E., 1999. Aquaculture sustainability and enviromnental issues. World Aquaculture
30(2), 10-13,71-72.
Boyd, C. E., Gross, A. 2000. Water use and conservation for inland aquaculture ponds.
Fisheries Management and Ecology 7,55-63.
Briggs, M. R. P., Funge-Smith, ST, 1994. A nutrient budget of some intensive marine
shrimp ponds in Thailand. Aquaculture and Fisheries Management 25,789-811.
Briggs, M. R. P., Funge-Smith, ST, 1994. A nutrient budget of some intensive marine
shrimp ponds in Thailand. Aquaculture and Fisheries Management 25,789-811.
Briggs, M. R. P., Funge-Smith, ST, 1996. Coastal Aquaculture and Envirorunent: Strategies
for Sustainability. Final Technical Report, ODA Research Project R601 1, Institute of
Aquaculture, University of Stirling, Stirling, Scotland, 30 p.
Brown, J. H., 1989. Antibiotics: their use and abuse in aquaculture. World Aquaculture
20(2), 34-43.
Brown, J. J., Glenn, E. P., 1999. Reuse of highly saline aquaculture effluent to irrigate a
potential forage halophyte, Suaeda esteroa. Aquaculture Engineering 20,9 1 -111.
Brown, J. J., Glenn, E. P., Fitzsimmons, K. M., Smith, S. E., 1999. Halophytes for the
treatment of saline aquaculture effluent. Aquaculture 175,255-268.
248

Burbridge, P. R., 1994. Integrated planning and management of freshwater habitats,
including wetlands. Hydrobiologia 285,311-322.
Burka, J. F., Harnmell, K. L., Horsberg, T. E., Johnson, G. R., Rainnie, D. J., Speare, D. J.,
1997. Drugs in salmonid aquaculture -a review. J. Vet. Phannacol. Therap. 20,333-
349.
Busch, W. -D. N., Lary, ST, 1996. Assessment of habitat impairments ImpactIng the
aquatic resources of Lake Ontario. Canadian Journal of Fisheries and Aquatic
Science 53(Suppl. 1), 113-120.
Buschmann, A. H., 1996. An introduction to integrated fanning and the use of seaweeds as
biofilters. Hydrobiologia 326/327,59-60.
Buschmann, A. H., Lopez, D. A., Medina, A., 1996a. A review of the environmental effects
and alternative production strategies of marine aquaculture in Chile. Aquacultural
Engineering 15,397-421.
Buschmann, A. H., Mora, O. A., Gomez, P., B6ttger, M., Buitano, S., Retamales, C.,
Vergara, P. A., Gutierrez, A., 1994. Gracilaria chilensis outdoor tank cultivation in
Chile: use of land-based salmon culture effluents. Aquacultural Engineering 13,283-
300.
Buschmann, A. H., Troell, M., Kautsky, N., Kautsky, L., 1996b. Integrated tank cultivation
of salmonids and Gracilaria chilensis (Gracilariales, Rhodophyta). Hydrobiologia
326/3275 75-82.
Butler, J. E., Loveridge, R. F., Ford, M. G., Bone, D. A., Ashworth, R. F., 1990. Gravel bed
hydroponic systems used for secondary and tertiary treatment of sewage effluent.
Journal of the Institution of Water and Environmental Management 4,276-284.
Caffley, R. H., 1998. Quantifying Sustainability in Aquaculture Production. PhD
Dissertation, The School of Forestry, Wildlife, and Fisheries, Louisiana State
University, 218 p.
249

Caffey, R. H., Kazmierczak, R. F., 1998. Developing and using consensus indicators of
sustainability in aquaculture production. Proceedings of the 8th lIFET Biannual
Conference, Tromso, Norway, 8-11 July, 1998.
Chalk, E., Wheale, G., 1989. The root-zone process at Holby sewage-treatment works.
Journal of the Institute of Water and Environmental Management 3,201-207.
Chen, S., 1998. Aquaculture waste management. Aquaculture Magazine 24(4), 63-69.
Chen, S., Ning, Z., Malone, R. F., 1996. Aquaculture sludge treatment using an anaerobic
and facultative lagoon system. Paper presented at the Conference on Successes and
Failures in Commercial Recirculating Aquaculture, Roanoke, Virginia, 19-21 July
1996, Aquaculture Engineering Society, Volume 2, pp. 421-430.
Chen, S., Timmons, M. B., Aneshansley, D. J., Bisogni, Jr., J. J., 1993. Suspended solids
characteristics from recirculating aquacultural systems and design implications.
Aquaculture 112,143-155.
Cho, C. Y., Bureau, D. P., 1997. Reduction of waste output from salmonid aquaculture
through feeds and feeding. Progressive Fish-Culturist 59,155-160.
Christensen, M. S., 1993. An economic analysis of floating cage culture of tinfoil barb,
Puntius schwanenfeldii, in East Kalimantan, Indonesia, using chicken manure and
other fresh feeds. Asian Fisheries Science 6,271-281.
Christensen, M. S., 1994. Growth of tinfoil barb, Puntius schwanenfeldii, fed various feeds,
including fresh chicken manure, in floating cages. Asian Fisheries Science 7,29-34.
Clelland, B., 1998. Reedbeds Created for Waste Water Treatment in Scotland: 1998.
Unpublished Report. Scottish Enviromnental Protection Agency, Perth, 3 p.
Clough, B. F., Boto, K. G., Attiwill, P. M., 1983. Mangroves and sewage: a re-evaluation.
In: Teas, H. J. (Ed. ), Tasks in Vegetation Science. Dr. W. Junk Publishers, Hague, pp.
151-161.
250

Collette, B. B., 1983. Mangrove fishes on New Guinea. In: Teas, H. J. (Ed. ), Tasks in
Vegetation Science. Dr. W. Junk Publishers, Hague, pp. 91-102.
Corea, A., Johnstone, R., Jayasinghe, J., Ekaratne, S., Jayawardene, K., 1998. Self-
pollution: a major threat to the prawn fanning industry in Sri Lanka. Ambio 27,662-
668.
Comel, G. E., Whoriskey, F. G., 1993. The effects of rainbow trout (Oncorhynchus mykiss)
cage culture on the water quality, zooplankton, benthos and sediments of Lac du
Passage, Quebec. Aquaculture 109,101-117.
Costa-Pierce, B. A., 1996. Environmental impacts of nutrients from aquaculture: towards
the evolution of sustainable aquaculture systems. In: Baird, D. J., Beveridge, M. C. M.,
Kelly, L. A., Muir, J. F. (Eds. ), Aquaculture and Water Resource Management.
Blackwell Science, pp. 81-113.
Council of the European Communities, 1991. Council directive of 21 May 1991
concerning urban waste water treatment. Official Journal of the European
Communities L 135ý 40-52.
Cowan, V. J., Lorenzen, K., Funge-Smith, ST, 1999. Impact of culture intensity and
monsoon season on water quality in Thai commercial shrimp ponds. Aquaculture
Research 30,123-133.
Crampton, V., 1987. How to control phosphorus levels. Fish Farmer 10,38.
Cripps, S. J., 1991. Comparison of methods for the removal of suspended particles from
aquaculture effluents. In: De Pauw, N., Joyce, J. (Eds. ), Aquaculture and the
Environment. European Aquaculture Society, Special Publication 14, Bredene,
Belgium, pp. 81-81.
Cripps, ST, 1994. Minimizing outputs: treatment. Journal of Applied Ichthyology 10,284-
294.
251

Cripps, ST, 1995. Serial particle size fractionation and characterisation of an aquacultural
effluent. Aquaculture, 133: 323-339.
Cripps, S. J., Kelly, L. A., 1995. Effluent treatment to meet discharge consents. Trout News
20,15-24.
Cripps, ST, Kelly, L. A., 1996. Reductions in wastes from aquaculture. In: Baird, D. J.,
Beveridge, M. C. M., Kelly, L. A., Muir, J. F. (Eds. ), Aquaculture and Water Resource
Management. Blackwell Science, pp. 166-201.
Davies, I. M., McHenery, J. G., Rae, G. H., 1997. Environmental risk from dissolved
ivermectin to marine organisms. Aquaculture 158,263-275.
De Grave, S., Moore, S. J., Burnell, G., 1998. Changes in benthic macrofauna associated
with intertidal oyster, Crassostrea gigas (Thunberg) culture. Joumal of Shellfish
Research 17,1137-1142.
de Loe, R. C., 1995. Exploring complex policy questions using the policy Delphi. Applied
Geography 15(l), 53-68.
De Pauw, N., Salomoni, C., 1991. Aquaculture systems for wastewater treatment. In: De
Pauw, N., Joyce, J. (Eds. ), Aquaculture and the Environment. EAS Special
Publication 14, Bredene, Belgium, pp. 87-88.
Dempster, P., Baird, D. J., Beveridge, M. C. M., 1995. Can fish survive by filter-feeding on
microparticles? Energy balance in tilapia grazing on algal suspensions. Journal of
Fish Biology 47,7-17.
Diab, S., Kochba, M., Mires, D., Avnimelech, Y., 1992. Combined intensive-extensive
(CIE) pond system. A: inorganic nitrogen transformations. Aquaculture 10 1,3 3 -3 9.
Doughty, C. R., McPhail, C. D., 1995. Monitoring the environmental impacts and consent
compliance of freshwater fish fanus. Aquaculture Research 26,557-565.
252

Drenner, R. W., Day, D. J., Basham, ST, Smith, J. D., Jensen, S. I., 1997. Ecological water
treatment system for removal of phosphorous and nitrogen from polluted water.
Ecological Applications 7,381-390.
Dumas, A., Laliberte, G., Lessard, P., de la Noiie, J., 1998. Biotreatment of fish farm
effluents using the cyanobactenum Phormidium bohneri. Aquacultural Engineering
17,57-68.
Duplisea, D. E., Hargrave, B. T., 1996. Response of meiobenthic size-structure, biomass
and respiration to sediment organic enrichment. Hydrobiologia 339,161-170.
Dvir, 0., van Rijn, J., Neori, A., 1999. Nitrogen transformations and factors leading to
nitrite accumulation in a hypertrophic marine fish culture system. Marine Ecology
Progress Series 181,97-106.
Dwivedi, S. N., Padmakumar, K. G., 1983. Ecology of a mangrove swamp near Juhn Beach,
Bombay with reference to sewage pollution. In: Teas, H. J. (Ed. ), Tasks in Vegetation
Science. Dr. W. Junk Publishers, Hague, pp. 163-170.
Edwards, P., 1980. A review of recycling organic wastes into fish, with emphasis on the
tropics. Aquaculture 21,261-279.
Edwards, P., 1990. An alternative excreta-reuse strategy for aquaculture: the production of
high-protein animal feed. In: Edwards, P., Pullin, R. S. V. (Eds. ), Wastewater-Fed
Aquaculture. Proceedings of the International Seminar on Wastewater Reclamation
and Reuse for Aquaculture, Calcutta, India, 6-9 December 1988. Environmental
Sanitation Inforniation Center, Asian Institute of Technology, Bangkok, Thailand,
pp. 209-221.
Edwards, P., 1992. Reuse of Human Waste in Aquaculture, a Tecfinical Review. UNDP-
World Bank Water and Sanitation Program, World Bank, Washington, 350 p.
Edwards, P., 1993. Enviromnental issues in integrated agnculture-aquaculture and
wastewater-fed fish culture systems. In: Pullin, R. S. V., Rosenthal, H., Maclean, J. L.
253

(Eds. ), Envirom-nent and Aquaculture in Developing Countries. ICLARM Conf
Proc. 3 1, pp. 139-170.
Edwards, P., 1996. Wastewater reuse in aquaculture: socIally and environmentally
appropri e wastewater treatment for Vietnam. Naga 19(l), 36-37.
Edwards, P., 1998. A systems approach for the production of integrated aquaculture.
Aquaculture Economics and Management 2,1-12.
Edwards, P., Demaine, H., Innes-Taylor, N., Turongruang, D., 1996. Sustainable
aquaculture for small-scale farmers: need for a balanced model. Outlook on
Agriculture 25,19-26.
Edwards, P., Hassan, M. S., Chao, C. H., Pacharaprakiti, C., 1992. Cultivation of
duckweeds in septage-loaded earthen ponds. Bioresource Technology 40,109-117.
Edwards, P., Kwe Lin, C., Macintosh, D. J., Leong Wee, K., Little, D., Innes-Taylor, N. L.,
1988. Fish fanning and aquaculture. Nature 333,505-506.
Edwards, P., Little, D. C., Yakupitiyage, A., 1997. A comparison of traditional and
modified inland artisanal aquaculture systems. Aquaculture Research 28,777-788.
Edwards, P., Pacharaprakiti, C., Yomjinda, M., 1994. An assessment of the role of buffalo
manure for pond culture of tilapia. 1. on-station experiment. Aquaculture 126,83-95.
Edwards, P., Sinchumpasak, O. A., 1981. The harvest of microalgae from the effluent of a
sewage fed high rate stabilisation pond by Tilapia nilotica. Part 1: Description of the
system and the study of the high rate pond. Aquaculture 23,83-105.
Edwards, P., Sinchumpasak, O. A., Labhsetwar, V. K., Tabucanon, M., 1981 a. The harvest
of microalgae from the effluent of a sewage fed high rate stabilisation pond by
Tilapia nilotica. Part 3: Maize cultivation experiment, bacteriological studies, and
economic assessment. Aquaculture 23,149-170.
254

Edwards, P., Sinchumpasak, O. A., Tabucanon, M., 1981b. The harvest of microalgae from
the effluent of a sewage fed high rate stabilisation pond by Tilapia nilotica. Part 2:
Studies of the fish ponds. Aquaculture 23,107-147.
Eikebrokk, B., Piedrahita, R., Ulgenes, Y., 1995. Rates of fish waste production and
effluent discharge from a recirculating system (BIOFISH) under commercial
conditions. Aquaculture Research 26,589-599.
Einen, 0., Holmefjord, I., Asgard, T., Talbot, C., 1995. Auditing nutrient discharges from
fish farms: theoretical and practical considerations. Aquaculture Research 26,701 -
713.
Ellner, S., Neori, A., Krom, M. D., Tsai, K., Easterling, M. R., 1996. Simulation model of
recirculating mariculture with seaweed biofilter: development and experimental tests
of the model. Aquaculture 143,167-184.
Enander, M., Hasselstrom, M., 1994. An experimental wastewater treatment system for a
shrimp farm. Infofish Intemational 4,56-61.
FAO, 1995. Aquaculture production statistics 1984-1993. FAO Fisheries Circular 815,
Rev. 7, Fishery Information, Data and Statistics Service, FAO, Rome, 186p.
Ferrante, J. G., Parker, J. I., 1977. Transport of diatom frustules by copepod fecal pellets to
the sediments of Lake Michigan. Limnology and Oceanography 22,92-98.
Firdausy, C., Tisdell, C., 1991. Economic returns from seaweed (Eucheuma cottonii)
fanning in Bali, Indonesia. Asian Fisheries Science 4,61-73.
Fischer, R., 1997. Culture of tilapia in open systems: engineering aspects. Bamidgeh 49(3),
166-170.
Fitzgerald, W., 1999. Integrated mangrove forest and aquaculture systems - Indonesia.
SEAFDEC Asian Aquaculture 21(l), 9.
Folke, C., 1988. Energy economy of salmon aquaculture in the Baltic Sea. Environmental
Management 12,525-537.
255

Folke, C., Kautsky, N., 1989. The role of ecosystems for a sustainable development of
aquaculture. Ambio 18,234-243.
Folke, C., Kautsky, N., Berg, H., Jansson, A., Troell, M., 1998. The ecological footprint
concept for sustainable seafood production: a review. Ecological Applications 8,63-
71.
Folke, C., Kautsky, N., Troell, M., 1994. The costs of eutrophication from salmon fanning:
implications for policy. Journal of Environmental Management 40,173-182.
Folke, C., Kautsky, N., Troell, M., 1997. Salmon farming in context: response to Black et
al. Journal of Environmental Management 50,95-103.
Foy, R. H., Rosell, R., 1991. Loadings of nitrogen and phosphorus from a Northern Ireland
fish farm. Aquaculture 96,17-30.
Frederiksen, T. M., Sorensen, K. B., Finster, K. and Macintosh, D. J., 1998. Implications of
shrimp pond waste in mangrove environments. Aquaculture Asia 3(2), 8-11.
Funge-Smith, ST, Briggs, M. R. P., 1998. Nutrient budgets in intensive shrimp ponds:
implications for sustainability. Aquaculture 164,117-133.
Garg, S. K., 1996. Brackishwater carp culture in potentially waterlogged areas using animal
waste as pond fertilizers. Aquaculture International 4,143-155.
Gavine, F. M., Rennis, D. S., Windmill, D., 1996. Implementing environmental
management systems in the finfish aquaculture industry. Journal of the Chartered
Institute of Water and Environmental Management 10,341-347.
Gersberg, R. M., Gearheart, R. A., Ives, M., 1989. Pathogen removal in constructed
wetlands. In: Hammer, D. A. (Ed. ), Constructed Wetlands for Wastewater Treatment.
Lewis Publishing, pp. 431-445.
Ghobrial, M. G., Siam, E. E., 1998. The use of the water velvet Azolla filiculoides in
wastewater treatment. Journal of the Chartered Institute of Water and Environmental
Management 12,250-253.
256

Ghosh, D., 1990. Wastewater-fed aquaculture in the wetlands of Calcutta - an overview.
In: Edwards, P., Pullin, R. S. V. (Eds. ), Wastewater-fed Aquaculture. Proceedings of
the International Seminar on Wastewater Reclamation and Reuse for Aquaculture, 6-
9 December 1988, Calcutta, India. Environmental Sanitation Information Center,
Asian Institute of Technology, Bangkok, pp. 49-56.
Gilbert, A. J., Janssen, R., 1998. Use of environmental functions to communicate the values
of a mangrove ecosystem under different management regimes. Ecological
Economics 25,323-346.
Gillibrand, P. A., Turrell, W. R., Moore, D. C., Adams, R. D., 1996. Bottom water stagnation
and oxygen depletion in a Scottish sea loch. Estuaries, Coastal and Shelf Science 43,
217-235.
Gnudi, S., Caputo, A., Salomoni, C., 1991. Mass culture of waterfleas fed on microalgae
grown on swine manure during the cold season. In: De Pauw, N., Joyce, J. (Eds. ),
Aquaculture and the Environment. EAS Special Publication 14, Bredene, Belgium,
pp. 120-12 1.
Goodrich-Mahoney, J. W., 1996. Constructed wetland treatment systems applied research
program at the electric power research institute. Water, Air and Soil Pollution 90,
205-217.
Griffin, P., Upton, J., 1999. Constructed wetlands: a strategy for sustainable wastewater
treatment at small treatment works. Journal of the Chartered Institute of Water and
Envirom-nental Management 13,441-446.
Groeneweg, J., Schlifter, M., 1981. Mass production of Ereshwater rotifers on liquid wastes
11. Mass production of Brachionus rubens Ehrenberg 1838 in the effluent of high-
rate algal ponds used for the treatment of piggery waste. Aquaculture 25,25-33.
257

Guerrero, S., Gonzalez, X. O., 1991. Clam nursery (Tapes decussatus) in the effluent of a
fish fann in Ria de Arosa, Spain. In: De Pauw, N., Joyce, J. (Eds. ), Aquaculture and
the Environment. EAS Special Publication 14, Bredene, Belgium, pp. 132-133.
Gtinther, F., 1997. Hampered effluent accumulation process: phosphorous management
and societal structure. Ecological Economics 21,159-174.
Gupta, U. G., Clarke, R. E., 1996. Theory and application of the Delphi technique: a
bibliography (1975-1994). Technological Forecasting and Social Change 53,185-
211.
Habib,, M. A. B., Yusoff, F. M., Phang, S. M., Ang, K. J., Mohamed, S., 1997. Nutritional
values of chironomid larvae grown in palm oil mill effluent and algal culture.
Aquaculture 158,95-105.
Hargrave, B. T., Phillips, G. A., Doucette, L. I., White, MT, Milligan, T. G., Wildish, D. J.,
Cranston, R. E., 1997. Assessing benthic impacts of organic enrichment from marine
aquaculture. Water, Air and Soil Pollution 99,641-650.
Hasson, F., Keeney, S., McKenna, H., 2000. Research guidelines for the Delphi survey
technique. Journal of Advanced Nursing 32,1008-1015.
Hecht, J., 1998. Danger, shrimps at work. New Scientist 157(2122), 11.
Helfrich, L. A., Zimmerman, M., Weigmann, D. L., 1995. Control of suspended solids and
phytoplankton fish fishes and a mussel. Water Resources Bulletin 31,307-316.
Hem, S., Avit, J. B. L. F., Cisse, A., 1995. Acadja as a system for improving fishery
production. In: Symoens, J. J., Micha, J. C. (Eds. ), The Management of Integrated
Freshwater Agro-piscicultural Ecosystems in Tropical Areas. Seminar Proceedings,
16 May-19 May 1994, Technical Centre for Agricultural and Rural Co-operation
(CTA), Royal Academy of Overseas Sciences, Brussels, pp. 423-435.
Henderson, J. P., Bromage, N. R., 1987. Diets to curb pollution. Fish Farmer 10(4), 38-39.
258

Henderson, J. P., Bromage, N. R., 1988. Optimising the removal of suspended solids from
aquaculture effluents in settlement lakes. Aquacultural Engineering 7,167-18 1.
Henderson, J. P., Bromage, N. R., Watret, B., 1989. How to design a settlement pond. Fish
Fanner 12(3), 41.
Hennessy, M., 1991. The efficiency of two aquacultural effluent treatment systems in use
in Scotland. In: De Pauw, N., Joyce, J. (Eds. ), Aquaculture and the Enviromnent.
European Aquaculture Society, Special Publication 14, Bredene, Belgium, pp. 142-
143.
Hennessy, M. M., Wilson, L., Struthers, W., Kelly, L. A., 1996. Waste loadings from two
freshwater Atlantic salmon juvenile farms in Scotland. Water, Air and Soil Pollution
86,235-249.
Holmes, B.,, 1996. Blue revolutionaries. New Scientist 152(2059), 32-36.
Hopkins, J. S., Hamilton, R. D., Sandifer, P. A., Browdy, C. L., 1993. The production of
bivalve mollusks in intensive shrimp ponds and their effect on shrimp production and
water quality. World Aquaculture 24(2), 74-77.
Hussenot, J., Lefebvre, S., Brossard, N., 1998. Open-air treatment of wastewater from
land-based marine fish farms in extensive and intensive systems: current technology
and future perspectives. Aquatic Living Resources 11,297-3 04.
Jana, B. B., 1998. Sewage-fed aquaculture: the Calcutta model. Ecological Engineering 11,
73-85.
Jara-Jara, R., Pazos, AT, Abad, M., Garcia-Martin, L. O., Sanchez, J. L., 1997. Growth of
clam seed (Ruditapes decussatus) reared in the wastewater effluent from a fish farm
in Galicia (N. W. Spain). Aquaculture 158,247-262.
Jimenez del Rio, M., Ramazanov, Z., Garcia-Reina. G, 1996. Ulva rigida (Ulvales,
Chlorophyta) tank culture as biofilters for dissolved inorganic nitrogen from
fishpond effluents. Hydrobiologia 326/327,61-66.
259

Johansson, T., Hakanson, L., Borum, K., Persson, J., 1998. Direct flows of phosphorus and
suspended matter from a fish farm to wild fish in Lake Southern Bullaren, Sweden.
Aquacultural Engineering 17,111-137.
Johnson, W. B., Avault, J. W., 1982. Effects of poultry waste supplementation to nce-
crayfish (Oryza sativa-Procambarus clarkii) culture ponds. Aquaculture 29,109-
123.
Johnston, D., Clough, B., Xuan, T. T., Phillips, M-, 1999. Mixed shrimp-mangrove forestry
farming systems in Ca Mau Province, Vietnam. Aquaculture Asia 4(2), 6-12.
Jones, A. B., Preston, N. P., 1999. Sydney rock oyster, Saccostrea commercialis (Iredale &
Roughley), filtration of shrimp farm effluent: the effects on water quality.
Aquaculture Research 30,51-57.
Jones, J. G., 1990. Pollution from fish farms. Journal of the Institution of Water and
Envirom-nental Management 4,14-18.
Jones, T. O., lwama, G. K., 1991. Polyculture of the Pacific oyster, Crassostrea gigas
(Thunberg), with chinook salmon, Oncorhynchus tshawytscha. Aquaculture 92,313-
322.
Jorgensen, E. H., Jobling, M., 1992. Feeding behaviour and effect of feeding regime on
growth of Atlantic salmon, Salmo salar. Aquaculture 101,135-146.
Jungersen, G., 1991. Environmental benefit from integrating recirculation fish breeding
systems with production of greenhouse crops. In: De Pauw, N., Joyce, J. (Eds. ),
Aquaculture and the Envirom-nent. EAS Special Publication 14, Bredene, Belgium,
pp. 164-165.
Kadlec, R. H., Knight, R. L., 1996. Treatment Wetlands. Lewis Publishers, 893 p.
Kadri, S., Metcalfe, N. B., Huntingford, F. A., Thorpe, J. E., 1991. Daily feeding rhythms in
Atlantic salmon in sea cages. Aquaculture 92,219-224.
260

Karakassis, I., Hatziyanni, E., Tsapakis, M., Plaiti, W., 1999. Benthic recovery following
cessation of fish fanning: a series of successes and catastrophes. Marine Ecology
Progress Series 184,205-218.
Kautsky, N., Berg, H., Folke, C., Larsson, J., Troell, M., 1997. Ecological footprint for
assessment of resource use and development limitations in shrimp and tilapia
aquaculture. Aquaculture Research 28,753-766.
Kautsky, N., Folke, C., 1990. Enviroinmental and ecological limitations for aquaculture. In:
Hirano, R., Hanyu, 1. (Eds. ), The Second Asian Fisheries Foirum. Asian Fisheries
Society, Manila, Philippines, pp. 245-248.
Kelly, L. A., Karpinski, A. W., 1994. Monitoring BOD outputs from land-based fish farms.
Joumal of Applied Ichthyology 10,368-372.
Kenyon, R. A., Loneragan, N. R., Hughes, J. M., Staples, D. J., 1997. Habitat type influences
the microhabitat preference of juvenile tiger prawns (Penaeus esculentus Haswell
and Penaeus semisulcatus De Haan). Estuarine, Coastal and Shelf Science 45,393-
403.
Kibria, G., Nugegoda, D., Fairclough, R., Lam, P., Bradly, A., 1997. Zooplankton: Its
biochemistry and significance in aquaculture. Naga 20(2), 8-14.
Kibria, G., Nugegoda, D., Fairclough, R., Lam, P., Bradly, A., 1999. Utilizaton of
wastewater-grown zooplankton: nutritional quality of zooplankton and performance
of silver perch Bidyanus bidyanus (Mitchell 1838) (Teraponidae) fed on wastewater-
grown zooplankton. Aquaculture Nutrition 5,221-227.
Mapper, H., 1991. Control of Eutrophication in Inland Waters. Ellis Horwood, 337 p.
Knud-Hansen, C. F., Batterson, T. R., McNabb, C. D., 1993. The role of chicken manure in
the production of Nile tilapia, Oreochromis niloticus (L. ). Aquaculture and Fisheries
Management 24,483-493.
261

Kom, M., 1996. The dike-pond concept: sustainable agTiculture and nutrient recycling in
China. Ambio 25,6-13.
Krom, M. D., Ellner, S., van Rijn, J., Neori, A., 1995. Nitrogen and phosphorus cycling and
transformations in a prototype 'non-polluti 1 mariculture system, Eilat,
Israel. Marine Ecology Progress Series 118,25 -3 6.
Tl---
Kronvang, B., Ertebjerg, G., Grant, R., Kristensen, P., Hovmand, M., Kirkegaard, J.,
1993. Nationwide monitoring of nutrients and their ecological effects: state of the
Danish aquatic enviromnent. Ambio 22,176-186.
Kundu, N., 1994. Planning the Metropolis, a Public Policy Perspective. Minerva
Associates, Calcutta, India, 128 p.
Kwei Lin, C., Ruarnthaveesub, P., Wanuchsoontom, P., 1993. Integrated culture of the
green mussel (Perna viridis) in wastewater from an intensive shrimp pond: concept
and practice. World Aquaculture 24(2), 68-73.
Kwei Lin, C., Teichert-Coddington, D. R., Green, B. W., Veverica, K. L., 1997. Fertilization
regimes. In: Egna, H. S., Boyd, C. E. (Eds. ), Dynamics of Pond Aquaculture. CRC
Press, pp. 73-107.
Laihonen, P., Hdnninen, J., Chojnacki, J., Vuorinen, 1., 1997. Some prospects of nutrient
removal with artificial reefs. In: Jensen, A. C. (Ed. ), European Artificial Reef
Research. Proceedings of the I" EARRN Conference, Ancona, Italy, March 1996.
Southampton Oceanography Centre, UK, pp. 85-96.
Landers, D. H., 1982. Effects of naturally senescing aquatic macrophytes on nutrient
chemistry and chlorophyll a of surrounding waters. Limnological Oceanographer 27,
428-439.
Larsson, J., Folke, C., Kautsky, N., 1994. Ecological limitations and appropriation of
ecosystem support by shrimp fanning in Colombia. Environmental Management 18,
663-676.
262

Lefebvre, S., Hussenot, J., Brossard, N., 1996. Water treatment of land-based fish farm
effluents by outdoor culture of marine diatoms. Journal of Applied Phycology 8,
193-200.
Lehman, J. T., 1980. Release and cycling of nutrients between plankton1c algae and
herbivores. Limnology and Oceanography 25,620-632.
Leung, P., EI-Gayar, O. M., 1997. The role of modeling in the managing and planning of
sustainable aquaculture. In: Bardach, J. E. (Ed. ), Sustainable Aquaculture. John Wiley
Sons, pp. 149-175.
Li5 M. S., 1997. Nutrient dynamics of a futian mangrove forest in Shenzhen, South China.
Estuarine, Coastal and Shelf Science 45,463-472.
Li, S. R., Ding, T., Wang, S., 1995. Reed-bed treatment for municipal and industrial
wastewater in Beijing, China. Journal of the Chartered Institute of Water and
Envirom-nental Management 9,5 81-5 8 8.
Little, D., Muir, J., 1987. A Guide to Integrated Warm Water Aquaculture. Institute of
Aquaculture, University of Stirling, Scotland. 238 p.
Little, D. C., 1995. The development of small-scale poultry-fish integration in northeast
Thailand: potential and constraints. In: Symoens, J. J., Micha, J. C. (Eds. ), The
Management of Integrated Freshwater Agro-piscicultural Ecosystems in Tropical
Areas. Seminar Proceedings, 16-19 May 1994, Technical Centre for Agricultural and
Rural Co-operation (CTA), Royal Academy of Overseas Sciences, Brussels, pp. 265-
276.
Little, D. C., Edwards, P., 1999. Alternative strategies for livestock-fish integration with
emphasis on Asia. Ambio 28,118-124.
Little, D. C., Surintaraseree, P., Innes-Taylor, N., 1996. Fish culture in rainfed rice fields of
northeast Thailand. Aquaculture 140,295-321.
263

Loch, D. D., West, J. L., Perlmutter, D. G., 1996. The effect of trout farm effluent on the
taxa richness of benthic macroivertebrates. Aquaculture 147,37-55.
Louis, M., Bouchon, C., Bouchon-Navaro, Y., 1995. Spatial and temporal variations of
mangrove fish assemblages in Martinique (French West Indies). Hydrobiologia 295,
275-284.
Ludlow, J., 1975. Delphi inquiries and knowledge utilization. In: LInstone, H. A., Turoff,
M. (Eds. ), The Delphi Method. Addison-Wesley Publishing Company, London, pp.
102-123.
Lumb, C. M., 1989. Self-pollution by Scottish fish-farms? Marine Pollution Bulletin 20,
375-379.
Lystad, E., Selvik, J. R., 1991. Reducing environmental impact through sludge control in
land-based fish farming. In: De Pauw, N., Joyce, J. (Eds. ), Aquaculture and the
Environment. European Aquaculture Society, Special Publication 14, Bredene,
Belgium, pp. 198-199.
Machiwa, J. F., 1998. Distribution and remineralization of organic carbon in sediments of a
mangrove stand partly contaminated with sewage waste. Ambio 27,740-744.
Maclean, M. H., Brown, J. H., Ang, K. J., Jauncey, K., 1994. Effects of manure fertilization
frequency on pond culture of the freshwater prawn, Macrobrachium rosenbergii (de
Man). Aquaculture and Fisheries Management 25,601-611.
Maddox, J. J., Kingsley, J. B., 1989. Waste treatment for confined swine with an integrated
artificial wetland and aquaculture system. In: Hammer, D. A. (Ed. ), Constructed
Wetlands for Wastewater Treatment. Lewis Publishing, pp. 191-200.
Mai, K., Mercer, j. p., Donlon, J. 1996. Comparative studies on the nutrition of two species
of abalone, Haliotis tuberculata L. and Haliotis discus hannai Ino. V. The role of
polyunsaturated fatty acids of macroalgae in abalone nutrition. Aquaculture 139,77-
89.
264

Makinen, T., Lindgren, S., Eskelinen, P., 1988. Sieving as an effluent treatment method for
aquaculture. Aquacultural Engineering 7,367-377.
Mara, D., 1997. Design Manual for Waste Stabilization Ponds in India. Lagoon
Technology International Ltd., Leeds, 125 p.
Mara, D. D., Edwards, P., Clark, D., Mills, S. W., 1993. A rational approach to the design of
wastewater-fed fishponds. Water Research 27,1797-1799.
Martinez, L. A., Buschmann, A. H., 1996. Agar yield and quality of Gracilaria chilensis
(Gigartinales, Rhodophyta) in tank culture using fish effluents. Hydrobiologia
326/327,341-345.
Massik, Z., Costello, M. J., 1995. Bloavailability of phosphorus in fish fann effluents to
freshwater phytoplankton. Aquaculture Research 26,607-616.
McAllister, P. E., Bebak, J., 1997. Infectious pancreatic necrosis virus in the environment:
relationship to effluents from aquaculture facilities. Journal of Fish Disease 20,201-
207.
McCord, C. L., Loyacano, H. A., 1978. Removal and utilization of nutrients by Chinese
waterchestnut in catfish ponds. Aquaculture 13,143-155.
McKenna, H. P., 1994. The Delphi technique: a worthwhile research approach for nursing?
Journal of Advanced Nursing 19,1221-1225.
Melotti, P., Colombo, L., Roncarati, A., Garella, E., 1991. Use of waste-water from
intensive fish fanning to increase the productivity in north Adriatic lagoons (valli).
In: De Pauw, N., Joyce, J. (Eds. ), Aquaculture and the Environment. European
Aquaculture Society, Special Publication, No. 14, Bredene, Belgium, pp. 214-215.
Millett, M., 1997. WWT and Reedbed Treatment Systems. Unpublished Report, Wildfowl
& Wetlands Trust, Slimbridge, 16 p.
Milstein, A., 1992. Ecological aspects of fish species interactions in polyculture ponds.
Hydrobiologia 231,177-186.
265
&b. -

Mires D., Amit, Y., 1992. Intensive culture of tilapia in quasi-closed water-cycled flow-
trough ponds - the Dekel aquaculture system. Bamidgeh 44,82-86.
Mohoýy, A. M., Aburizaiza, O. S., 1997. Impact assessment of an improper effluent control
system: a Delphi approach. Environmental Impact Assessment Review 17,205-217.
Morrice, C., Chowdhury, N. I., Little, D. C., 1998. Fish markets of Calcutta. Aquaculture
Asia 3(2), 12-14.
Moss, B., 1992. The scope for biomanipulation for Improving water quality. In: Sutcliffe,
D. W., Jones, J. G. (Eds. ), Eutrophication: Research and Application to Water Supply.
Freshwater Biological Association, pp. 73-81.
Msiska, ON., Cantrell, M. A., 1985. Influence of poultry manure on growth of
Oreochromis shiranus chilwae. Aquaculture 44,67-73.
Muir, JR 1996. A systems approach to aquaculture and environmental management. In:
Baird, D. J., Beveridge, M. C. M., Kelly, L. A., Muir, JR (Eds. ), Aquaculture and
Water Resource Management. Blackwell Science, pp. 19-49.
Muir, J. F., 1982. Recirculated water systems in aquaculture. In: Muir, J. F., Roberts, R. J.
(Eds. ), Recent Advances in Aquaculture. Westview Press, pp. 357-447.
Muir, JR, 1994. Water reuse in aquaculture systems. Infofish International 6,40-46.
Muir, JR, Brugere, C., Young, J. A., Stewart, J. A., 1999. The solution to pollution? The
value and limitations of environmental economics in guiding aquaculture
development. Aquaculture Economics and Management 3,43-57.
Muir, J. F, Walker, D., Goodwin, D., 1994. The Productive Re-use of Wastewater:
Potential and Application in India. Report of the ODA Review Mission, Calcutta,
December 1994,1 Op.
Mukherjee, M. D., 1996. Pisciculture and the environment: an economic evaluation of
sewage-fed fishenes in east Calcutta. Science, Technology & Development 14(2),
73-99.
266

Muluk, C., Bailey, C., 1996. Social and environmental impacts of coastal aquaculture in
Indonesia. In: Bailey, C., Jentoft, S., Sinclair, P. (Eds. ), Aquaculture Development:
Social Dimensions of an Emerging Industry. Westview Press, pp. 193-209.
Muratori, M. C. S., de Oliveira, A. L., Ribeiro, L. P., Leite, R. C., Costa, A. P. R., da Silva,
M. C. C. 2000. Edwardsiella tarda isolated in integrated fish fanning. Aquaculture
Research 31,481-483.
Naylor, E., Scholtissek, C., 1988. Fish farming and aquaculture: Naylor and Scholtissek
reply. Nature 333,506.
Naylor, R. L., Goldburg, R. J., Mooney, H., Beveridge, M., Clay, J., Folke, C., Kautsky, N.,
Lubchenco, J., Primavera, J., Williams, M., 1998. Nature's subsidies to shrimp and
salmon farming. Science 282,883-884.
Naylor, R. L., Goldburg, R. J., Primavera, J. H., Kautsky, N., Beveridge, M. C. M., Clay, J.,
Folke, C., Lubchenco, J., Mooney, H., Troell, M., 2000. Effect of aquaculture on
world fish supplies. Nature 405,1017-1024.
NCC, 1990. Fish Fanning and the Scottish Freshwater Enviromnent. NCC, 12 Hope Street,
Edinburgh, 285 pp.
Nelson, S. G., Smith, B. D., Best, R. 198 1. Kinetics of nitrate and ammonium uptake by the
tropical freshwater macrophyte Pistia stratiotes L. Aquaculture 24,11-19.
Neorl, A., Krom, M. D., Ellner, S. P., Boyd, C. E., Popper, D., Rabinovitch, R., Davison,
P. J., Dvir, 0., Zuber, D., Ucko, M., Angel, D., Gordin, H., 1996. Seaweed biofilters
as regulators of water quality in integrated fish - seaweed culture units. Aquaculture
1419 183-199.
Neon, A., Ragg, N. L. C., Shpigel, M., 1998. The integrated culture of seaweed, abalone,
fish and clams in modular intensive land-based systems: 11. Performance and
nitrogen partitioning within an albalone (Haliotis tuberculata) and macroalgae culture
system. Aquacultural Engineering 17,215-239.
267

Neori, A., Shpigel, M., 1999. Using algae to treat effluents and feed invertebrates in
sustainable integrated mariculture. World Aquaculture 3 0(2), 46-49,5 1.
Ng, W. J., Sim, T. S., Ong, S. L., Kho, K., Ho, L. M., Tay, S. H., Goh, C. C., 1990. The effect
of Elodea densa on aquaculture water quality. Aquaculture 84,267-276.
Nielson, S. M., 1990. Sludge de-watering and mineralisation in reed bed systems. In:
Cooper, P. F., Findlater, B. C. (Eds. ), Constructed Wetlands in Water Pollution
Control. Pergamon Press, pp. 245-255.
Njoku, D. C., Ejiogu, C. O., 1999. On-fann trials of an integrated fish-cum-poultry fanning
system using indigenous chickens. Aquaculture Research 30,399-408.
Norberg, J. 1999. Periphyton fouling as a marginal energy source in tropical tilapia cage
farming. Aquaculture Research 30,427-430.
Nwachukwu, V. N. 1999. Periphyton fauna as an alternative live food in the rearing of
Clarias gariepinus (Burchell) fry. Bamidgeh 51,169-171.
Oberdorff, T., Porcher, J. P., 1994. An index of biotic integnty to assess biological impacts
of salmonid farm effluents on receiving waters. Aquaculture 119,219-23 5.
Olaoh, J., Sharangi, N., Datta, N. C., 1986. City sewage fish ponds in Hungary ad India.
Aquaculture 54,129-134.
Ong, J. E., 1982. Mangroves and aquaculture in Malaysia. Ambio 11,252-257.
Oron, G., 1994. Duckweed culture for waste-water renovation and biomass production.
Agricultural Water Management 26(1-2), 27-40.
Padilla, J. E., Lampe, H. C., 1989. The economics of seaweed farming in the Philippines.
Naga 12(3), 3-5.
Paez-Osuna, F., Guerrero-Galvan, S. R., Ruiz-Femandez, A. C., 1998. The enviromnental
impact of shrimp aquaculture and the coastal pollution in Mexico. Marine Pollution
Bulletin 36(l), 65-75.
268

Pal, D., Das Gupta, C., 1992. Microbial pollution in water and its effect on fish. Journal of
Aquatic Animal Health 4,32-39.
Pearce, F., 1996. Deadly blooms reach Britain's rivers. New Scientist 150(2030), 5.
Petit, J., 1989. Water supply, treatment and recycling in aquaculture. In: Barnabe, G. (Ed),
Aquaculture: Volume 1 (2 nd Ed. ). Ellis Horwood, pp. 63-196.
Petrell, R. J., Alie, S. Y., 1996. Integrated cultivation of salmonids and seaweeds in open
systems. Hydrobiologia 326/327,67-73.
Petrell, R. J., Mazhari Tabrizi, K., Harrison, P. J., Druehl, L. D., 1993. Mathematical model
of Laminaria production near a British Columbian salmon sea cage farm. Journal of
Applied Phycology 5,1-14.
Phang, S-M., Shaharuddin, S., Noraishah, H., Sasekumar, A., 1996. Studies on Gracilaria
changii (Gracilariales, Rhodophyta) from Malaysian mangroves. Hydrobiologia
326/327,347-352.
Phillips, MT, Beveridge, M. C. M., Clarke, R. M., 1991. Impact of aquaculture on water
resources. In: Brune, D. E., Tomasso, J. R. (Eds. ), Aquaculture and Water Quality.
Advances in World Aquaculture, Volume 3. The World Aquaculture Society, pp.
568-591.
Phillips, MT, Kwei Lin, C., Beveridge, M. C. M., 1993. Shrimp culture and the
environment: lessons from the world's most rapidly expanding warmwater
aquaculture sector. In: Pullin, R. S. V., Rosenthal, H., Maclean, J. L. (Eds. ),
Enviromnent and Aquaculture in Developing Countries. ICLARM Conf Proc. 3 1,
pp. 171-197.
Porter, C. B., Krost, P., Gordin, H., Angel, D. L., 1996. Preliminary assessment of grey
mullet (Mugil cephalus) as a forager of organically enriched sediments below marine
fish farms. Bamidgeh 48,47-55.
269

Pouliquen, H., Le Bris, H., Pinault, L., 1993. Experimental study on the decontamination
kinetics of seawater polluted by oxytetracycline contained in effluents released from
a fish farm located in a salt-marsh. Aquaculture 112,113-123.
Primavera, J. H., 1995. Mangroves and brackishwater pond culture in the Philippines.
Hydrobiologia 295,303-309.
Primavera, J. H., 1997. Socio-economic impacts of shrimp culture. Aquaculture Research
285 815-827.
Primavera, J. H., 1998. Mangroves as nurseries: shrimp populations in mangrove and non-
mangrove habitats. Estuarine, Coastal and Shelf Science 46,457-464.
Rajendran, N., Kathiresan, K., 1996. Effect of effluent from a shrimp pond on shoot
biomass of mangrove seedlings. Aquaculture Research 27,745-747.
Redding, T., Todd, S., Midlen, A., 1997. The treatment of aquaculture wastewaters -a
botanical approach. Journal of Environmental Management 50,283-299.
Richardson, C. J., 1985. Mechanisms controlling phosphorus retention capacity in
freshwater wetlands. Science 228,1424-1427.
Rivera-Monroy, V. H., Torres, L. A., Bahamon, N., Newmark, F., Twilley, R. R., 1999. The
potential use of mangrove forests as nitrogen sinks of shrimp aquaculture pond
effluents: the role of denitrification. World Aquaculture 30(l), 12-25.
Robertson, A. L, Phillips, M. J., 1995. Mangroves as filters of shrimp pond effluent:
predictions and blogeochemical research needs. Hydrobiologia 295,311-32 1.
Ronnback, P., 1999. The ecological basis for economic value of seafood production
supported by mangrove ecosystems. Ecological Economics 29,235-252.
Ronnback, P., Troell, M., Kautsky, N., Primavera, J. H., 1999. Distribution pattern of
shrimp and fish among Avicennia and Rhizophora microhabitats in the Pagbilao
Mangroves, Philippines. Estuarine, Coastal and Shelf Science 48,223-234.
270

Rowe, G., Wright, G., Bolger, F., 1991. Delphi: a reevaluation of research and theory.
Technology Forecasting and Social Change 39,235-25 1.
Ruddle, K., Christensen, V., 1993. An energy flow model of the mulberry dike-carp pond
fanning system of the Zhujiang delta, Guangdong Province, China. In: V.
Christensen and D. Pauly (Eds), Trophic Models of Aquatic Ecosystems. ICLARM
Conference Proceedings 26, pp. 48-55.
Ruddle, K., Zhong, G., 1988. Integrated Agriculture-Aquaculture in South China: the
Dike-Pond System of the Zhujiang Delta. Cambridge University Press, 173 p.
Ruitenbeek, H. J., 1994. Modelling economy-ecology liknkages in mangroves: economIc
evidence for promoting conservation in Bintuni Bay, Indonesia. Ecological
Economics 10,233-247.
Ruokolahti, C., 1988. Effects of fish farming on growth and chlorophyll a content of
Cladophora. Marine Pollution Bulletin 4,166-169.
Samocha, T. M., Lawrence, A. L., 1997. Shrimp farms' effluent water, environmental
impact and potential treatment methods. In: Keller, BT, Park, P. K., McVey, J. P.,
Takayanagi, K., Hosoya, K. (Eds. ), Interactions Between Cultured Species and
Naturally Occurring Species in the Environment. Report of the US-Japan
Aquaculture Panel Symposium, 8-10 October 1995, Corpus Christi, Texas, pp. 33-
58.
Sansanayuth, P., Phadungchep, A., Ngammontha, S. Ngdngam, S., Sukasem, P., Hoshino,
H., Ttabucanon, M. S., 1996. Shrimp pond effluent: pollution problems and treatment
by constructed wetlands. Water, Science and Technology 34(11), 93-98.
Schluter. ) M., Groeneweg, J., 198 1. Mass production of freshwater rotifers on liquid wastes
the influence of some environmental factors on population growth of Brachionus
rubens Ehrenberg 1838. Aquaculture 25,17-24.
271

Schmidt, R. C., 1997. Managing Delphi surveys using nonparametric statistical techniques.
Decision Sciences 28,763-774.
Scholtissek, C., Naylor, E., 1988. Fish farming and influenza pandemics. Nature 331 ý 215.
Schwartz,, M. F., Boyd, C. E., 1994. Effluent quality during harvest of channel catfish from
watershed ponds. Progressive Fish-Culturist 56,25-32.
Schwartz, M. F., Boyd, C. E., 1995. Constructed wetlands for treatment of channel catfish
pond effluent. Progressive Fish-Culturist 57,255-266.
Selong, J. H., Helfrich, L. A., 1998. Impacts of trout culture effluent on water quality and
biotic communities in Virginia headwater streams. Progressive Fish-Culturist 60,
247-262.
Selvik, J. R., Lystad, E., 1991. Removal of solid wastes from fishfarm effluents. In: De
Pauw, N., Joyce, J. (Eds. ), Aquaculture and the Environment. European Aquaculture
Society, Special Publication 14, Bredene, Belgium, pp. 287-288.
Seymour, E. A., Bergheim, A., 1991. Towards a reduction of pollution from intensive
aquaculture with reference to the farming of salmonids in Norway. Aquacultural
Engineering 10,73-88.
Shaw, P-C., Mark, K-K., 1980. Chironomid farming -a means of recycling farm manure
and potentially reducing water pollution in Hong Kong. Aquaculture 21,155-163.
Sheridan, P., 1997. Benthos of adjacent mangrove, seagrass and non-vegetated habitats in
Rookery Bay, Florida, U. S. A. Estuarine, Coastal and Shelf Science 44,455-469.
Shireman, J. V., Cichra, C. E., 1994. Evaluation of aquaculture effluents. Aquaculture 123,
55-68.
Shpigel, M., Blaylock, R. A. 1991. The Pacific oyster, Crassostrea gigas, as a biological
filter for a marine fish aquaculture pond. Aquaculture 92,187-197.
Shpigel, M., Gasith, A., Kimmel, E., 1997. A biomecanical filter for treating fish-pond
effluents. Aquaculture 152,103-117.
272

Shpigel, M., Neori, A., 1996. The integrated culture of seaweed, abalone, fish and clams in
modular intensive land-based systems: 1. Proportions of size and projected revenues.
Aquacultural Engineering 15,313-326.
Shpigel, M., Neori, A., Popper, D. M., Gordin, H., 1993. A proposed model for
"environmentally clean" land-based culture of fish, bivalves and seaweeds.
Aquaculture 117,115-128.
Shrestha, M. K., Knud-Hansen, C. F., 1994. Increasing attached microorganism biomass as
a management strategy for Nile tilapia (Oreochromis niloticus) production.
Aquaculture 13,101-108.
Slar, S. V., Samonte, G. P. B., Espada, A. T., 1995. PartIcipation of women in oyster and
mussel fanning in Western Visayas, Philippines. Aquaculture Research 26,459-467.
Skladany, M., 1996. Fish, pigs, poultry, and Pandora's Box: integrated aquaculture and
human influenza. In: Bailey, C., Jentoft, S., Sinclair, P. (Eds. ), Aquaculture
Development: Social Dimensions of an Emerging Industry. Westview Press, pp. 263-
281.
Smith, P., Donlon, J., Coyne, R., Cazabon, D. J., 1994. Fate of oxytetracycline in a fresh
water fish farm: influence of effluent treatment systems. Aquaculture 120,319-325.
Solbe, JR de L. G., 1982. Fish farm effluents: a United Kingdom survey. In: Alabaster,
J-S. (Ed), Report of the EIFAC Workshop on Fish-Farining Effluents. EIFAC
Technical Paper 41, FAO, Rome, pp. 29-56.
Song, Y., Ying, H., Wu, W., Jin, Q., Zou, G., Zhu, Q., Zhu, M., Li, K., Li, P. 2000. Study
of agriculture-aquaculture ecological economic system with nutrient flow analysis.
In: Foo, E., Tarcisio Della Senta, T. D., Sakamoto, K. (Eds. ), Proceedings of the
Internet Conference on Material Flow Analysis of Integrated Bio-Systems, March-
October 2000, http: //www. ias. unu. edu/proceedings/icibs/ic-mfa/.
273

Soto, D., Mena, G., 1999. Filter feeding by the freshwater musselý DiPlodon chilensis, as a
biocontrol of salmon farming eutrophication. Aquaculture 171,65-81.
Spedding, C. R. W., 1988. An Introduction to Agricultural Systems (2 nd Ed. ). Elsevier
Applied Science, 189 p.
Stenton-Dozey, J. M. E., Jackson, L. F., Busby, A. J., 1999. Impact of mussel culture on
macrobenthic community structure in Saldanha Bay, South Africa. Marine Pollution
Bulletin 39,357-366.
Stirling, H. P., Dey, T., 1990. Impact of intensive cage fish farming on the phytoplankton
and periphyton of a Scottish freshwater loch. Hydrobiologia 190,193-214.
Stirling, H. P., Okumus, 1., 1995. Growth and production of mussels (Mytilus edulis L. )
suspended at salmon cages and shellfish farms in two Scottish sea lochs. Aquaculture
1345 193-210.
Subandar, A., Petrell, R. J., Harrison, P. J., 1993. Laminaria culture for reduction of
dissolved inorganic nitrogen in salmon farm effluent. Journal of Applied Phycology
55455-463.
Summerfelt, S. T., Adler, P. R., Glenn, D. M., Kretschmann, R. N., 1999. Aquaculture sludge
removal and stabilization within created wetlands. Aquaculture Engineering 19,81-
92.
Surnsion, T, 1998. The Delphi technique: an adaptive research tool. British Journal of
Occupational Therapy 61(4), 153-156.
Sun, G., Gray, K. R., Biddlestone, A. J., 1998. Treatment of agricultural wastewater in
downflow reed beds: experimental trials and mathematical model. Journal of
Agricultural Engineering Research 69(l), 63 -7 1.
Tam, N. F. Y., Wong, Y. S., 1995. Mangrove soils as sinks for wastewater-borne pollutants.
Hydrobiologia 295,231-241.
274

Teichert-Coddington, D. R., Behrends, L. L., Smitherman, R. O., 1990. Effects of manuring
regime and stocking rate on primary production and yield of tilapia using liquid
swine manure. Aquaculture 88,61-68.
Teichert-Coddington, D. R., Rouse, D. B., Potts, A., Boyd, C. E., 1999. Treatment of harvest
discharge from intensive shrimp ponds by settling. Aquaculture Engineering 19,147-
161.
Thompson, A. G., 1990. The danger of exotic species. World Aquaculture 21,25-32.
Thompson, G., 1993. Mathematical models and engineering desIgn. Journal of the
Chartered Institute of Water and Environmental Management 7,18-23.
Thompson, J. L., 1993. Strategic Management: Awareness and Change. Chapman and Hall,
757
Thorpe, J. E., 1980. The development of salmon culture towards ranching. In: Thorpe, J.
(Ed. ), Salmon Ranching. Academic Press, pp. I- 11.
Tidwell, J. H., Coyle, S., Van Amum, A., Weibel, C. 2000. Production response of
freshwater prawns Macrobrachium rosenbergii to increasing amounts of artificial
substrates in ponds. Journal of the World Aquaculture Society 31,452-458.
Tran, T. B., Le, C. D., Brennan, D., 1999. Environmental costs of shrimp culture in the nce-
growing regions of the Mekong Delta. Aquaculture Economics & Management 3,
31-42.
Troell, M., Berg, H., 1997. Cage fish farming in the tropical Lake Kariba, Zimbabwe:
impact and biogeochemical changes in sediment. Aquaculture Research 28,527-544.
Troell, M., Norberg, J., 1998. Modelling output and retention of suspended solids in an
integrated salmon - mussel culture. Ecological Modelling 110,65-77.
Troell, M., Halling, C., Nilsson, A., Buschmann, A. H., Kautsky, N., Kautsky, L., 1997.
Integrated marine cultivation of Gracilaria chilensis (Gracilariales, Rhodophyta) and
275

salmon cages for reduced environmental impact and increased economic output. Aquaculture 156,45-61.
Turner, J. W. D., Sibbald, R. R., Hemens, J., 1986a. Chlorinated secondary domestic sewage
as a fertilizer for marine aquaculture 1. tilapia culture. Aquaculture 53,133-143.
Turner, J. W. D., Sibbald, R. R., Hemens, J., 1986b. Chlorinated secondary domestic sewage
as a fertilizer for marine aquaculture 11. protein-supplemented prawn culture.
Aquaculture 53,145-155.
Turner, J. W. D., Sibbald, R. R., Hemens, J., 1986c. Chlorinated secondary domestic sewage
as a fertilizer for marine aquaculture 111. assessment of bacterial and viral quality and
accumulation of heavy metals and chlorinated pesticides in cultured fish and prawns.
Aquaculture 53,157-168.
Turner, K., 199 1. Economics and wetland management. Ambio 20,59-63.
Upton, J. E., Green, M. B., Findlay, G. E., 1995. Sewage treatment for small communities:
the Severn Trent approach. Journal of the Institute of Water and Environmental
Management 9,64-7 1.
van der Steen, P., Brenner, A., Oron, G., 1998. An integrated duckweed and algae pond
system for nitrogen removal and renovation. Water Science and Technology 3 8,3 35-
343.
van Rijn, J., 1996. The potential for integrated biological treatment systems in recirculating
fish culture -a review. Aquaculture 139,181-201.
Vandenneulen, H., Gordin, H., 1990. Ammonium uptake using Ulva (Chlorophyta) in
intensive fishpond systems: mass culture and treatment of effluent. Journal of
Applied Phycology 2,363-374.
Vymazal, J., 1995. Algae and Element Cycling in Wetlands. Lewis Publishing, 689 p.
276

Wahab, M. A., Azim, M. E., Ali, MR, Beveridge, M. C. M., Khan, S. 1999a. The potential
of peripohyton-based culture of the native major carp calbaush, Labeo calbasu
(Hamilton). Aquaculture Research 30,409-419.
Wahab, M. A., Mannan, M. A., Huda, M. A., Azim, M. E., Tollervey, A. G., Beveridge,
M. C. M. 1999b. Effects of Periphyton grown on bamboo substrates on growth and
production of Indian major carp, rohu (Labeo rohita Ham. ). Bangladesh Journal of
Fisheries Research 3(l), 1-10.
Walsh,, M., 1999. Economic analysis of production of the three most promising energy
crops on Ireland. Online BioBase database, European Energy Crops InterNetwork,
http: //btgsl. ct. utwente. nl/eeci/info/biobase/b10618. html.
Wang, J-Q., Li, D., Dong, S., Wang, K., Tian, X., 1998. Experimental studies on
polyculture in closed shrimp ponds 1. Intensive polyculture of Chinese shrimp
(Penaeus chinensis) with tilapia hybrids. Aquaculture 163,11-27.
Watson, J. T., Reed, S. C., Kadlec, R. H., Knight, R. L., Whitehouse, A. E., 1989.
Performance expectations and loading rates for constructed wetlands. In: Hammer,
D. A. (Ed. ), Constructed Wetlands for Wastewater Treatment. Lewis Publishing, pp.
319-351.
Welcomme, R. L., 1988. International Introductions of Inland Aquatic Species. FAO
Fisheries Technical Paper 294, FAO, Rome, 318 p.
Wenhua, L., Qingwen, M., 1999. Integrated fanning systems an important approach
towards sustainable agriculture in China. Ambio 28,655-662.
Weston, D. P., 1996. Environmental considerations in the use Of antibacterial drugs in
aquaculture. In: Baird, D. J., Beveridge, M. C. M., Kelly, L. A., Muir, J. F. (Eds. ),
Aquaculture and Water Resource Management. Blackwell Science, pp. 140-165.
277

White, P., Labadz, J. C., Butcher, D. P., 1996. The management of sediments ln reservolred
catchments. Journal of the Chartered Institute of Water and Environmental
Management 10,183-189.
WHO, 1989. Health Guidelines for the Use of wastewater in Agriculture and Aquaculture.
Technical Report Series No. 778. World Health Organization, Geneva, 187 p.
Wiesmann, D., Scheid, H., Pfeffer, E., 1988. Water pollution with phosphorus of dietary
origin by intensively fed rainbow trout (Salmo gairdneri Rich. ). Aquaculture 69,
263-270.
Wilson, G., 1999. Mangrove wetlands to clean up on shrimp farm effluent tackled in
Australian project. Fish Farming International 26(12), 10.
Wohlfarth, G. W., Hulata, G., 1987. Use of manures in aquaculture. In: Moriarty, D. J. W.,
Pullin, R. S. V. (Eds. ), Detritus and Microbial Ecology in Aquaculture. ICLARM
Conference Proceedings 14, pp. 353-367.
Wolanski, E., Spagnol, S., Thomas, S., Moore, K., Alongi, D. M., Trott, L., Davidson, A.,
2000. Estuarine, Coastal and Shelf Science 50,85-97.
Wong Chor Yee, A., 1999. New developments in integrated dike-pond agriculture-
aquaculture in the Zhujiang Delta, China: ecological implications. Ambio 28,529-
533.
Wong, Y. S., Lan, C. Y., Chen, G. Z., Li, S. H., Chen, X. R., Liu, Z. P., Tam, N. F. Y., 1995.
Effect of wastewater discharge on nutrient contamination of mangrove soils and
plants. Hydrobiologia 295,243-254.
Woudenberg, F., 1991. An evaluation of Delphi. Technology Forecasting and Social
Change 40,131-150.
Young, J. A., Brugere, C., Muir, J. F., 1999. Green grow the fishes-Oh? Environmental
attributes in marketing aquaculture products. Aquaculture Economics and
Management 3,7-17.
278

Zertuche-Gonzalez, J. A., Garcia-Lepe, G., Pacheco-Ruiz, I., Chee-Barragan, A., Gendrop-
Funes, V., 1999. A new approach to seaweed cultIvatIon 'n Mexico. World
Aquaculture 30(2), 50-51.
Zhu, Y., Yang, Y., Wan, J., Hua, D., Mathias, J. A., 1990. The effect of manure application
rate and frequency upon fish yield in integrated fish fann ponds. Aquaculture 91,
233-251.
Zuboy, J. R., 198 1. A new tool for fishery managers: the Delphi technique. North American
Journal of Fisheries Management 1,53-59.
279

Inputs Summarises input variable required:
input information required by the ADEPT model
jil
Wastewater treatment Calculates the percentage reduction in waste fractions
achieved by the ADEPT system:
the performance criterion for the user defined system should be Lý entered here. d
Z jj Horizontal integration
Estimates the biomass and value of products from the ADEPT system:
the cost of seed, rates of production or the value of products and angling can be entered if known i
Stock model Describes the stocks biomass over one year:
if known, the exact biomass held on the farm can be entered oa monthly basis
if known. exact concentrations can be entered
Financial considerations Calculates the capital costs and operating costs of
adopting the ADEPT system:
the majority of these costs are based on information provided in
. 17% sections 6 and 8 of the Inputs page 4
Zý 3 Cost return
Presents an outline of the initial costs, annual operating costs, income generated and some general financial
indicators:
no inputs are required here
Wastewater output Calculates the concentrations of waste fractions In the
wastewater from the smolt unit:
Outputs Presents a summary of outputs from the scenario
modelled:
outputs include treatment effect, physical characteristics and financial and economic indicators &
Cash flow Displays the projected cash flow during the first ten years
of operation:
discounted cash flow is used to calculate the Net Present Value (NPV) and Internal Rate of Return (IRR) 4

Aquatic Downstream Ecological Production and Treatment for aquaculture, wastewater: inputs
User inputs required by the ADEPT model:
i. tmiure unit management; select and define parameters to describe the stock
Primary aquaculture facility: smolt unit (1) or shrimp farm (2) Number of juveniles stocked in the culture facility (No. ) Expected mortality (%) 100000
Average biomass (g) of stock at harvest 0%
Change in stock biomass based on a calculation from the feeding rate and FCR (0) or observation (1) 70.0
Expected Feed Conversion Ratio (FCR) 0
Maximum feeding rate (% body weight/d) 1.15
N content of the feed (gN/kg feed) 4.0%
P content of the feed (gP/kg feed) 72.0
Dry-matter content of the feed (gDM/kg feed) 12.0 950.0
z. i-nysicai ana economic criaracienstics ot tne cuiture site: define the key economic and physical variables
Estimated capital cost of the culture facility (E '000) 1000 Estimated annual operating costs for the culture facility (E'000/y) 50 Hydraulic volume of culture unit (mý) 1000 Land area occupied by culture facility (M2) 5000 Average flow rate through smolt unit or maximum through shrimp farm (m3/d) 3400 Percentage of culture water flowing to treatment 100%
a. vvabiewaier ired smolt
SS: based on literature (0), observation (1), stock biomass (2)* or mass-balance equation (3) TN: based on literature (0), observation (1) or mass-balance equation (2) TAN: based on observation (0) specific growth rate (1)* or feed input (2)* TP: based on literature (0), observation (1), stock biomass (2)* or mass-balance equation (3) BOD: based on literature (0), observation (1), stock biomass (2)* or feed input (3)* Oxygen consumption: based on observation (0) or temperature (1)*
4. Background and target concentrations: insert values for abstracted water and Dermissible chanae
Mean concentrations (mg/1) in abstracted water: SS 1.75 TAN 0.07 TN 0.00 TP 0.00 BOD 1.25 DO (% saturation) 100% pH 7.2
Permissible change in concentrations (mg/1) i. e. discharge consent standards: SS 5.00 TAN 0.10 BOO 4.00
5. Proposed treatment system configuration: select the i)osition of the water treatment COMDonents
Treatment: absent (0) or present (1) 1 Drum filters: absent (0) or position in treatment stream (1,2,3, etc. ) 1 Fate of sludge produced by the filter: storage tanks (0)* or flowing to other treatment units (1) 0 Settlement pond: absent (0) or position in treatment stream (1,2,3, etc. ) 0 Constructed wetland: absent (0) or position in treatment stream (1,2,3, etc. ) 0 Recreational fishery: absent (0) or position in treatment stream (1,2,3, etc. ) 0
*Note: where storage tanks are stipulated, the filtrate will flow to the ADEPT system
Recreational fishery: trout (1) or coarse fish (2) 0 Catch release (0) or restocking required (1) 0 Cost of stock fish: literature (0) or user defined (1) 0 Expected or actual stocking density in the fishery (no. /ml): recommended (0) or actual (1) 0 Expected value of angling (E/day): literature (0) or user defined (1) 0 Type of macrophyte produced in constructed wetland: common reed (1) or mangrove (2) 0 Macrophyte production in wetland based on: literature (0) or observation (1) 0 Market value of macrophyte biomass based on: literature (0) or user defined (1) 0
t. tconomic considerations tor
Expected value of land (E/ha) Expected cost for site development (F-'/ha) Treatment units connected via.: pipework (0) or open channels (1) Value of time for manager of a smolt unit (E-'/h) or shrimp farm (E/y) Cost of farm worker at a smolt unit (f/h) or shrimp farm (E/y) Infrastructure depreciation period (5,10 or 15 y) Plant and equipment depreciation period (5,10 or 15 y)
(leflne Ine KeY eCOnOIT11C vardmeters conceniinQ wer-duon
E7,400 E49,500
0 f2O. O E10.0
15 10

Aquatic Downstream Ecological Production and Treatment for aquaculture wastewater: outputs
Outputs produced by the ADEPT model:
1. A g)nvsical aescription OT tne treatment
Average water flow through the treatment system (ml/h) Average hydraulic retention time within treatment system (d) Land area required (ha) Mean temperature (*C) at the site
141.7 0.0 0.0 8.5
2. Concentrations of waste discharged from the site: mean concentration (mgA) after deducting background levels
Mean concentration (mg/1) in site discharge: SS -0.57 TAN 0.18
TN 0.15 TP 0.02 BOD 1.04 DO -2.34
3. Treatment performance: indicates the mean percentage change in the various parameters
Mean percentage change in waste concentration due to treatment: SS -111.9% TAN 0.0% TN -46.5% TP -53.5% BOD -10.4% DO 0.0%
4. uenerai maicators: pnysical inaicators oT tne treatment
Ratio of culture unit to treatment system area 0.0 Ratio of culture unit to treatment system hydralic retention time 0.0 Estimated N retention in: harvestable macrophyte biomass (kg/y) 0
extensive aquaculture system (kg/y) 0 Percentage of N released from culture present in harvested biomass 0% Estimated P retention in: harvestable macrophyte biomass (kg/y) 0
extensive aquaculture system (kg/y) 0 Percentage of P released from culture present in harvested biomass 0%
o. tcoioaicai aownstream oroauction:
aescnbes the system as defined bv current i
aescnDes Proauction in ji-le treatment systern
Maximum area required for the constructed wetland (ha) 0.0 Maximum area required for the extensive aquaculture system (ha) 0.0 Macrophyte biomass production (t/y) 0.0 Value of macrophyte biomass produced (E'000/y) 0.0 Coarse fish production (kg/y) 0.0 Value of coarse fish production (E'000/y) 0.0 Number of anglers visiting the site (no. /y) 0.0 Value of angling provided (E'000) 0.0 Annual crayfish production within the aquaculture production/treatment system (kg/y). 0.0 Net value of the crayfish produced within the aquaculture production/treatment system (E'000). 0.0
6. General economic indicators: likely ettects on costs ana returns ot seiectea options
Capital cost (E'000) 16.0 Depreciation on capital investment (E'000/y) 1.5
Annual operating costs (F-'000/y) 1.6
Ratio of culture unit to treatment system capital costs 0.0
Ratio of culture unit to treatment system operating costs 0.0
7. Economic
Net income (E'000/y) Annual profit (F '000) Profit generated per unit area (E '000/ha) Annual rate of return on initial capital cost Annual rate of return on operating costs Pay-back period (y) Residual 10 year NPV: 5%
10% 15% 20%
IRR over: ten years twenty years fifty years
0.0
-1.6 -301.4
-9.9% -100.0%
na -25.9 -22.8 -20.5 -18.6
na na na
broad economic indicators ot

'IT 00 U) 0) r-- v- 00 0 0 1c: r 00 - 6 -T 'IT ui - r-- *- -
N IT (0 ' CY) 06 LO ý Cj C') 04 M U )ý 00 C14 cvl)
LO Cj o cy) 0 0 0 CY) 0 ý (D 0N 06 C5 04 o CN C) ý Cl) 0)
rl- LO rl_ 00 0 LO rl_
00 0 zr LO N (D
ca
C: ) ý0-0 Lr) LO
CY) 0 04 c) C 0 Cl) CD
04 0 m CY) co CO C: ) 00 CD '
C) CD 00 0 -t 2 - U-) I, - U ) rl- (5 C; U*) rl_ (0
OD Nt ,: I- U-) LO Mý -ýt cy) t c) CN (N C-4 04 C) 0 (D
't (Y) m CN 04 r-
LL 04 C) ý a; c6 M 00
6 6 0) 00 CY) 6- 'Cl- LO 'T LO IT LO LO
C: CO -0 - r, - LO
ý LO M qt ce) *-
-: C'4 -N C) C) ce) V- 00
M - CY) cyj
Lb 04 C'. ) (. 00)(00) C)
; CD - (N (D
(0 0) rl_ C; "t "t It 'IT C 6
IRt lq- ICT
L) , -0 0- , Lr) C) P- CY) r-- CY) r- T7 rý- -
C: ) C) P- CY) LO
cy) r, T7 C, 4 CZJ C6 (0 C") (C) C) ; C) r, - - a) CY) (D It 0 1- 'Q- '-t ý: r C= C=; It It 1-41
> 0 0
r, - U') r. - - r, 1- C: ) rý- C) CD ý rl- 0) C) I- CY)
z M cyi I'- CY) C) C) rl_ CY) 0 C) cy) :r CY) 0 0 cy') It
0 (D --0 t LO C)
LO ý Lr)
T7 Cý -o 0 C) LO 00
0 ý CY) 06 (=) - Cý (3) 0) 1, - M r'- 0 C: )
; ý C) C> (Y) r-_ CY) (N (Y) 04 M C Nm CY)
0-
C)
-. -0 q: r LO
LO ý
00 LO OC) LO
q -: m- o C: ) 00 LO r-
cr) ý LO (1) U) 1)
CN 04 cc) m 0) - 0) 1
0 C: ) 0) LO 1: 4 04 04 04 C C) CN 04 04
0) (0 , No C: ) 0 CY) ý
(D 00 Lc) 00 r, -: q- 0)
C) C) U') 00 r- - 0) C) :3
< CY) C) C'4 M CN - C) C) ; CN ý t--
cvi , 04 ý CN C - 04 ý
-0 Lf) LO (0 LO It LO
- t-:
CO C) C)
CD C)
LO LO 0 ý
CY) 04
(C; 04 Lf) CN C) CD
00 o CN 0) LO
(D N
. CY) LO C) "T -: C
- "T (0 LO Cý T7 0c) 00 o C)
C) C)
(0 LO (0 00 00 CY) ý CY) M (C) CN LO C; C5 04 U') Nr
Cl) 0- LO LO OD (0 C) C: ) CC) (0 04 cu
C) C) r- -7 V: m 00
cy) ý CN C)
5 CD 6
V) 00 ý C14 04 C
0
LO
C) CY) LO LO CY) CC) C) C) CY) 00 CY) o -
C CY) cy) C) C) C) CO 04
< cl) ý 6 6 ---
c:
c 0 00 0EE
00 EE
0 0 EE E E 4- 0
4- 0
%4- 04- 0
0 -a
0 0
"On C: cu
C: cu r c (n a) co CD cn a)
cn CD
o 2? '& E
CO cn (n U) X 0 cn (n cn 0)
cn w w U) 0 O)a) cu m '
0 cu m Co Co
-0 - T) EE 5 U) EE EE
.2 4.0 cu a 3: 3:. 2.2 . 0.0 0
(1) 4) Co 0- 'a 0
0 cn -ýd --., 4 a -lic -ýd Uu -ýd -ýe E L) U 0 E E "-a- (L) a) 00 41) - 00 - ' m . 0 0-0
cc 0) C)) t ý; a (l) C/) E 0 U) C: 0 '0 "D of m cu "" cu cu 4) ffilo ý§ E Cu -Cu c u cu
cu 0 4.1
(1) (1) CD a) C)
(1) (D -- >>00 U) - 0 0 3 - a ) 00 ý-- ý-- 2 0 2i U) LL LL LL << i- ý- U)

le U) ý le N r-ý cý 999N 90 le 00 CO 0 r) m Co Co
1 1 0 cý 0 C! 0 o CO - (0 - M C, 4
mý000 ýo P-- Zt (D 00
Z0- -e e 6ä0 7 7 0 c; 00 doooo
CO 00-- 0 cm C, 4 9 NO m
< c4 N 11) (n >
9 (0 9NN CR 9 Ilý 0 C) vý 9 (0 9 0 Co CD (0 -0 --- 00- r2 m 0- x r4 00N zt 0) 0) 9 C) Ci 00 ci 6 N cli
7 c;
m (D 00 (D 0 (0 r) u3
OD 01 -e le m
0 CD 00 x c» C, 4 0
m
m cý CID , c4
d- ul ci c M0-0 CD U)
r4 8- CD 0ö C> 2MM 0 MM 00 'n 'n c > c) 0S
0 c) ý; u3 ýn u3 0N (0 (0 CD 0 c» (» 0 800 m Co ýn CD c 0
OD -e c; cli ai 0 't 9 00 r) (n cý o 00 9 i i
hý r-ý -0 r) ul - . c; (D 00.0
0 cl cl cli c5 m 1) 0) 000m
Co r4 le ci 0- N c4 r- 00 ci 0 (0!
2 ý2 8800 (0 ID
OODOS ocoo u3 0 e) - M0 Co Z; Co 0 OD M OD
r- r- rl_ 9 C> C> '0 0) Co M le 't 0N cgi cö CD 111: Ilý 99 cý (1 g
79 cý (ý . 9 .Mý CD rIlý e C) 00 0000 00000 £2cDooo-
LL cu LL
N, > 30 00 Oo
ö: e ýe
M ul 0 CD 0 r- r-
C, 0- 00 ýo ul OD 0 00 r) m
C In Irý ui C U) Ln C! NN
0) ýL) (n m ýn Vi 9 9 vý N C) cq (li cli Ilý .'99 ý? 0-00 C) r4 r4 . r 0 , 000 0000 00000 40 00C 4
7 cli 9 Cl! U, C> 0 «ý 0 a) r, c, 0 ul (D (0 C) C) m0 (0 00 0 Co Co C. ) r- C, 4 0 CO
`t 0 In r- (» 00 m - 0-(3)0) .0 ,0 , 2 , G, G cý le le Ilý cý NN Z (ý cý 9 le N �et e e ýt m CI) 0 cý lý -
e-- cý .. CD CD 0 00
.9.. 0
.. cý .. CD -00 0 (N r4 . 2-00009 0 0000 0 (D o00
0 (0 rý mN r)
- r- C) 00 CO 0 r-. r) 0 CD
Z r- -- 00 C) C, 0 c4 N
0--- 0
U) 0 r) p 0m
Co 0m u3 V) 0e -e
> vi (5 Cd - ci i 't ce m cý cý 9 cq
0 m CI) v -000 O(DOO 00000
0 > ýn 000 Z c ,
Z
0 r) v)
(D (0 le Ir 0000 00 r_ r_
CD N CD le mm
U) 0 r- N0
OD (3) (0 (0 CD l l
0 (11 me (D
t OD li
m M 't c; (0 le 9 e) V) CD CD Ci N 2
7 (ý cý 9 e e
0--- 0N N
t00 (D 0 -000 0000 0 CD 000 0
0-M0 r4 M 2
OD Vý rý CD 0 CII u3 8 (0 OOC»(» e
0 CY V) cn OMNCY
In 0 (40
10 0 0 CD
10 ", n O ,-ý. CD MM C) r4 cý cý 00--
NM tco 0öc; -e 000 0000 00000 a)
( 000 Co 3 00 0 C0C0 (» (» 8 il 0 OD OD 0 ýo (N r4 0 cm C) 3 m le CD r4 0 cm
,iC, 2
_: - e zý
,2 �i r ci Gd Cd
8 99 c4 N
ý! .
C) cý 90 N . CD (1 CI) . 00 r4 c4 cm CO 0 - (9 -000 0000 00000
0* (D (0 Z 0 008000 0mm OD
C Ci Ui vý 999
c4 0 ui ui 9N i
-000 9... 0000
CD CD 0 C, 4 r4
0 CD (D cli *
<D ýn (0 c> OD 0 r) In 'l 93 U) In 0 vi U) l
m f, - CD CM (D 0 (D co ul c f ", cý le: ý
oD D cn 0 >ý ý
o Lii w) 't lt eQ--
oocl)o) c c
c qoN r4 - (D ( o -
. ý9 ý
c) c
cy Lo ee mm (. 4 (ýi ý. ý9 ý Q 6 ci ö ci ooooo
c -CDOO 0000 00000
-M0ýC, 1 OD 0 Cm 000 !0 r4 CY <D 0 00 c> C) m U) uý U) 0N D0ý r- ý OCO(O Na rý. Gý (D M CD le Co OD DOD zý '
Z C'4 N
, CD r- r- -? c
? C CD CD
oomm cli ry ; i
N0 Ci N : i >,
m r4 tr
mm -ý 9 i 9 ý9
0 00ö0 oc c >� 00c
m (DOO 0000 0000
m (N (N 0 N a) 0 C) 0 C)
V) Z; N (N 2
D3 U) C) C)
(29 -GG822 (14
- r- --- 0 C) .
999 C) C) .9.
-oö6 0o :E6 (D C) ci ä0 CL m r) 00 000 0 000
j
CL
< <
E
0 E c , - CL
0 o 2- E E
L- Em
E 0 0
4. o 0 0 0 r. E MM 4) »- AD
00MZ 0), 0 0- 0 mc - 0 Q, ) L> h g, jý ý5 EEC, 0 ' 9c g. c c 0 . r, 000 c» - pa 3: a) 8 288
m 08 M 0 c.
8 0 0) -3 - CL r- :5 :aý
. r, ýE- r eý- E r- M ý5 E c 0 c i M
c ýB e 5 0E cro ý5 C ý5 0E 5 -
0 0 ý3 E '5 t5 _ä 0l
g m ro .9 ru 2 m cm ý, lýi 'Z 0-% 16 2 :a 3: 2r vp 3: 4) (0 (4 2rr ' 223 CL t2 .0 c2) h 2--9 9 19 a 9 aw g m Z CM
- m
M - k; MM
ti wo t; w Z i m 0 0, m 0 os x
w -E' -m
EZ Z 00 U) <Z CL ý 0mM m Mm
3: 0,
OU) 2 , '. 0.3: 0 0 F0- 3: cn (n F. - k- ý-- m0 02 u
IL u F 0 U) 0GF -1 (75 > 3: _i02 h 0 (1) u- I

Dimensioning and treatment performance of the ADEPT system components Month Apriil May June July Aug Sept Oct Nov Dec Days 30 31 30 31 31 30 31 30 31 Mean temperature 7.1 10.3 12.0 14.4 14.6 12.1 8.6 5.6 4.1 Water flowing to treatment (ml/d) 3400 3400 3400 3400 3400 3400 3400 3400 3400
Dimensioning of treatment compon ents
Summary
Area required by the treatment system components (m2)
Drum Filter 50 50 50 50 50 50 50 50 50 Configuration complete na na na na na na na na na Configuration complete na na na na na na na na na Configuration complete na na na na na na na na na
Total area required (ha) 0.01 0.01 0.01 0.01 0.01 0.01 0.01 0.01 0.01
Hydraulic retention time (d) 0.01 0.01 0.01 0.01 0.01 0.01 0.01 0.01 0.01
Drum filter
Treatment volume (m3/d) 3400 3400 3400 3400 3400 3400 3400 3400 3400 Sludge production (Um' of influent) 20 20 20 20 20 20 20 20 20 Total sludge production (m3/d) 68 68 68 68 68 68 68 68 68 Area for filter and drying beds (M2) 50 50 50 50 50 50 50 50 50 Hydraulic residence time (min) 10 10 10 10 10 10 10 10 10
Settlement pond
Hydraulic loading (ml/d) 0 0 0 0 0 0 0 0 0 Length (m) 0 0 0 0 0 0 0 0 0 Breadth (m) 0 0 0 0 0 0 0 0 0 Depth (m) 0 0 0 0 0 0 0 0 0 Area required (m2) 0 0 0 0 0 0 0 0 0 Hydraulic volume (M3) 0 0 0 0 0 0 0 0 0 Hydraulic retention time (h) 0 0 0 0 0 0 0 0 0
Constructed wetland
Treatment volume (ml/d) 0 0 0 0 0 0 0 0 0 ss na na na na na na na na na TAN na na na na na na na na na BOD na na na na na na na na na N assimilation na na na na na na na P assimilation na na na na na na na Area required Max 0 0 0 0 0 0 0 0 0 Depth (m) 0.30 0.30 0.30 0.30 0.30 0.30 0.30 0.30 0.30 Proportion occupied by plants (%) 0.10 0.10 0.10 0.10 0.10 0.10 0.10 0.10 0.10 Hydraulic loading rate (M3/M2/d) na na na na na na na na na Hydraulic residence time (d) 0.00 0.00 0.00 0.00 0.00 0.00 0.00 0.00 0.00
Extensive fishery
Treatment volume (m3/d) 0 0 0 0 0 0 0 0 0 Target hydraulic loading (M3/M2/d) 0.05 0.05 0.05 0.05 0.05 0.05 0.05 0.05 0.05 Area required (m2) 0 0 0 0 0 0 0 0 0 Depth (m) 1.20 1.20 1.20 1.20 1.20 1.20 1.20 1.20 1.20 Hydraulic residence time (d) 0.00 0.00 0.00 0.00 0.00 0.00 0.00 0.00 0.00
Jan 31
Feb 28
March 31
Max 31
Avg 30 3.6 4A 5.0 15 8 3400 3400 3400 3400 3400
50 50 50 50 50 na na na 0 0 na na na 0 0 na na na 0 0
0.01 0.01 0.01 0.01 0.01
0.01 0.01 0.01 0.01 0.01
3400 3400 3400 3400 3400 20 20 20 20 20 68 68 66 68 68 50 50 50 50 50 10 10 10 10 10
0 0 0 0 0 0 0 0 0 0 0 0 0 0 0 0 0 0 0 0 0 0 0 0 0 0 0 0 0 0 0 0 0 0 0
0 0 0 0 0
na na na na na na na na na na 0 na 0 0 0 0 0 0
0.30 0.30 0.30 0.30 0.30 0.10 0.10 0.10 0.10 0.10
na na na 0.00 0.00 0.00 0.00 0.00 0.00 0.00
0 0 0 0 0 0.05 0.05 0.05 0.050 0.050
0 0 0 0 0 1.20 1.20 1.20 1.20 1.20 0.00 0.00 0,00 0.00 0.00

ss Month
Mass flow from culture (kg)
Concentration (mg/1)
wastewater (+C*) Drum Filter Configuration complete Configuration complete Configuration complete No. of treatment modules Treatment discharge (-C*) Final site discharge
Drum filter
influent (mg/1) Removal efficiency Sludge (mg1l) Filtrate (mg/1)
Settlement pond
influent (mg/1) Removal efficiency Fillrate (mg1l)
Constructed wetland
Influent (mg/1) C. k Filtrate (mg/1)
Extensive fishery
Influent (mg/1) C. k Filtrate (mg/1)
TAN (mg/1)
Month
Mass flows from culture (kg)
Concentration (mg/1)
Wastewater composition (+C*) Drum Filter Configuration complete Configuration complete Configuration complete No. of treatment modules Treatment discharge (-C*) Final site discharge
Drum filter
Influent (mg/1) Removal efficiency Sludge (mg/1) Filtrate (mg/1)
Seftlement pond
Influent (mg/1) Removal efficiency Filtrate (mg/1)
Constructed wetland
Influent (mg/1) C* k Filtrate (mg/1)
Extensive fishery
Influent (mg/1) Filtrate (mg/1)
April May June July Aug Sept oct Nov Dec Jan F b e Match Sum 24.6 128.1 25T6 543.9 847.8 618.3 677.8 582.9 203.5 268 1 775 5 . . 1015.3 5943.3
Max Avg 1.99 2.97 4.28 6.91 9.79 7.81 8.18 7.46 3.68 4 29 9 90 0.36 0.53 0.77 1.24 1.76 1.41 1.47 1.34 0 66 . 0 77 . 1 1ý38 11.38 6.55
na na na na na na na na . na . 1.78 2.05 205 1.18
na na na na na na na na na na na na 0.00 0.00
na na na na na na na na na na na na 0.00 Uo na na na 0.00 0.00
-1.39 -1.22 -0.98 -0.51 0.01 -0.34 -0.28 -0.41 -1.09 -0.98 0 03 0 30 0 30 0 -1.39 -1.22 -0.98 -0.51 0.01 -0.34 -0.28 -0.41 -1 09 -0 98 . 0 03 . . - . 57 . . . 0.30 0.30 -0.57
1.99 2.97 4.28 6.91 9.79 7.81 8.18 7.46 3.68 4.29 9.90 11.38 11 38 6 55 82% 82% 82% 82% 82% 82% 82% 82% 82% 82% 82% 82% . 0 82 . 0 82 81.63 121.57 175.28 283.32 401.52 320.27 335.40 306.06 150.92 176.05 405.73 466.71 . 46671 . 268 71 0.36 0.53 0.77 1.24 1.76 1.41 1.47 1.34 0.66 0.77 1.78 2.05 2.05 . 118
na na na na na na na na na na na na 0.00 0.00 47% 47% 47% 47% 47% 47% 47% 47% 47% 47% 47% 47% 0.47 0.47 na na na na na na na na na na na na 0.00 0.00
na na na na na na na na na na na na 0.00 0.00 na na na na na na na na na na na na 0.00 0.00 1 000 1000 1000 1000 1000 1000 1000 1000 1000 1000 1000 1000 na na na na na na na na na na na na 0.00 0.00
na na na na na na na na na na na na 0.00 0.00 na na na na na na na na na na na na 1 000 1000 1000 1000 1000 1000 1000 1000 1000 1000 1000 1000 na na na na na na na na na na na na 0.00 0.00
April May June July Aug Sept oct Nov Dec Jan Feb Match Sum
0.91 4.72 9.50 20.05 31.25 22.79 24.99 21.49 7.50 9.88 28.59 37.43 219.09
Max Avg
0.079 0.115 0.163 0.260 0.367 0.293 0.307 0.281 0.141 0.164 0.370 0.425 0.425 0.247 0.079 0.115 0.163 0.260 0.367 0.293 0.307 0.281 0.141 0.164 0.370 0.425 0.425 0.247
na na na na na na na na na na na na 0.000 0.000 na na na na na na na na na na na na 0.000 0.000 na na na na na na na na na na na na 0.000 0.000
0.009 0.045 0.093 0.190 0.297 0.223 0.237 0.211 0.071 0.094 0.300 0.355 0.355 0.177 0.009 0.045 0.093 0.190 0.297 0.223 0.237 0.211 0.071 0.094 0.300 0.355 0.355 0.177
0.079 0.115 0.163 0.260 0.367 0.293 0.307 0.281 0.141 0.164 0.370 0.425 0.425 0.247 0.00 0.00 0.00 0.00 0.00 0.00 0.00 0.00 0.00 0.00 0.00 0.00 0.000 0.000
0.000 0.000 0.000 0.000 0.000 0.000 0.000 0.000 0.000 0.000 0.000 0.000 0.000 0.000 0.079 0.115 0.163 0.260 0.367 0.293 0.307 0.281 0.141 0.164 0.370 0.425 0.425 0.247
na na na na na na na na na na na na 0.000 0.000 0.00 0.00 0.00 0.00 0.00 0.00 0.00 o>GO 0,00 0.00 0.00 0.00 0.000 0.000
na na na na (la na na na na na na na 0.000 0.000
na na na na na na na na na na na na 0.000 0.000 0.0 0.0 0.0 0.0 0.0 0.0 0.0 0.0 0.0 0.0 0.0 0.0
10.9 12.3 13.2 14.5 14.6 13.2 11.5 10.2 9.6 9.5 9.8 10.0
na na na na na na na na na na na na 0.000 0.000
na na na na na na na na na na na na 0.000 0.000 na na na na na na na na na na na na 0.000 0.000

TN (mg/1)
Month
Mass flows frorn Cufture (kg)
concentration (mg/1)
wastewater composition (+C*) Drum Filter Configuration complete Configuration complete Configuration complete No. of treatment modules Treatment discharge (-C*) Final site discharge
Drum filter
influent (mg/1) Removal efficiency Sludge (mg/1) Filtrate (mg1I)
Settlement pond
influent (mg/1) Removal efficiency Filtrate (mg/1)
Constructed wetland
Influent (mg/1) C* k Filtrate (mg/1)
Extensive fishery
Influent (mg/1) C. k
Filtrate (mg/1)
TP
Month
Mass flow from culture (kg)
Concentration (mg/1)
Wastewater composition (+C*) Drum Filter Configuration complete Configuration complete Configuration complete No. of treatment modules Treatment discharge (-C*) Final site discharge
Drum filter
Influent (mg/1) Removal efficiency Sludge (mg/1) Filtrate (mg/1)
Settlement pond
Influent (mg/1) Removal efficiency Filtrate (mg/1)
Constructed wetland
Influent (mg/1) C. k Filtrate (mg/1)
Extensive fishery
Influent (mg/1) C. k Filtrate (mg/1)
April May June July Aug Sept oct Nov Dec Jan F b e Match Sum 1.42 7.38 14.84 31.33 47.26 36.80 39.04 33.58 11.72 15.44 49 45 56 60 . ý 344.85
Max Avg 0.014 0.070 0.145 0.297 0.463 0.349 0.370 0.329 0.111 0.147 0 469 0 555 0.007 0.037 0.078 0.159 0.248 0.187 0.198 0.176 0.060 0 078 . 0 251 . 0.555 0-277
na na na na na na na na na . . UP 0.297 0.148 na na na na na na na na na
na na na 0.000 0.000 na na na na na na na na na
na na na 0.000 0.000 na na na 0A00 0.000
0.007 0.037 0.078 0.159 0.248 0.187 0.198 0.176 0.060 0.078 0.251 0297 0 297 0148 0.007 0.037 U78 0.159 0.248 0.187 0.198 0.176 0.060 0.078 0.251 0.297 . 0.297 0.148
0.014 0.070 0.145 0.297 0.463 0.349 0.370 0.329 0.111 0.147 0.469 0.555 0.555 0 277 46.5% 46.5% 46.5% 46.5% 46.5% 46.5% 46ý5% 46.5% 46.5% 46.5% 46.5% 46.5% 0.465 . 0 465 0.323 1.627 3.382 6.911 10.772 8.118 8.612 7.653 2.586 3.407 10.909 12.901 12.901 . 6 433 0.007 0.037 0.078 0.159 0.248 0.187 0.198 0.176 0.060 0.078 0.251 0.297 0.297 . 0.148
na na na na na na na na na na na na 0.000 0.000 0.0% 0.0% 0.0% 0.0% 0.0% 0.0% 0.0% 0.0% 0.0% 0.0% 0.0% 0.0% 0.000 0.000 na na na na na na na na na na na na 0.000 0.000
na na na na na na na na na na na na 0.000 0.000 1.5 1.5 1.5 1.5 1.5 1.5 1.5 1.5 1.5 1.5 1.5 1.5
11.7 13.7 14.9 16.7 16.9 15.0 12.6 10.9 10.1 9.9 10.3 10.6 na na na na na na na na na na na na 0.000 0.000
na na na na na na na na na na na na 0.000 0.000 1.5 1.5 1.5 1.5 1.5 1.5 1.5 1.5 1.5 1.5 1.5 1.5
11.7 13.7 14.9 16.7 16.9 15.0 12.6 10.9 10.1 9.9 10.3 10.6 na na na na na na na na na na na na 0.000 0.000
April May June July Aug Sept oet Nov Dec Jan Feb Match Sum
0.25 1.28 2.58 5.44 8.48 6.18 6.78 5.83 2.04 2.68 7.75 10.15 %43
Max Avg
0.002 0.012 0.025 0.052 0.080 0.061 0.064 0.057 0.019 0.025 0.081 0.096 oý096 0.048 0.001 0.006 0.012 0.024 0.037 0.028 0.030 0.027 0.009 0.012 0.038 0.045 0.045 0.022
na na na na na na na na na na na na 0.000 0.000 na na na na na na na na na na na na 0.000 0.000 na na na na na na na na na na na na 0.000 0.000
0.001 0.006 0.012 0.024 0.037 0.028 0.030 0.027 0.009 0.012 0.038 0.045 0.045 0.022 0.001 0.006 0.012 0.024 0.037 0.028 0.030 0.027 0.009 0.012 0.038 0.045 0.045 0.022
0.002 0.012 0.025 0.052 0.080 0.061 0.064 0.057 0.019 0,025 0.081 0.096 0.096 0.048 53.5% 53.5% 53.5% 53.5% 53.5% 53.5% 53.5% 53.5% 53.5% 53.5% 53.5% 53.5% 0.535 0.535 0.064 0.325 0.675 1.380 2.152 1.621 1.720 1.529 0.517 0.680 2.179 2.577 2.577 1.285 0.001 0.006 0.012 0.024 0.037 0.028 0.030 0.027 0,009 U12 0.038 0.045 0.045 0.022
na na na na na na na na na na na na 0.000 0.000 0.0% 0.0% 0.0% 0.0% 0.0% 0.0% 0.0% 0.0% 0.0% 0.0% 0.0% 0.0% 0.000 0.000
na na na na na na na na na na na na 0.000 0.000
na na na na na na na na na na na na 0.000 0.000 0.0 0.0 0.0 U 0.0 0.0 0.0 0.0 0.0 0.0 0.0 0.0
12.0 12.0 12.0 12.0 12.0 12.0 12.0 12.0 12.0 12.0 12.0 12.0
na na na na na na na na na na na na 0.000 0.000
na na na na na na na na na na na na 0.000 0.000 0.0 0.0 0.0 0.0 0.0 0.0 0.0 0.0 0.0 0.0 0.0 0.0
110 12.0 12.0 12.0 12.0 12.0 12.0 12.0 12.0 12.0 12.0 12.0
na na na na na na na na na na na na 0.000 0.000

SOD (rng/Q
Mass flows (kgid) from smolts 0.19 1.27 2.61 5.40 7.68 4.79 4.96 4.24 1,35 1.79 6 04 7 21 7 68 Wastewaler composidon (+C*) 1.30 1.62 2.02 2.84 3.51 2.66 2.71 2.50 1.65 1 78 . 3 03 . 3 37 . 3.96 Drum Filter 1.24 1.54 1.92 2.70 3.33 2.53 2.57 2.37 1.56 , 1.69 . 2 88 . 3 20
3.51 3 33
2.42 Configuration complete na na na na na na na na na na .
na - na . 0.00
229 0 00 Configuration compFete na na na na na na na na na na na na 0.00 . 0 00 Configuration complete na na na na na na na na na na na na 0 00 . 0 00 Noý of treatment modules 1 . .
Treatment discharge (-C*) -0.01 0.29 0.67 1.45 2.08 1.28 1.32 1.12 0.31 0.44 1.63 1.95 2 08 1 04 Final site discharge -0.01 0.29 0.67 1,45 2.08 1.28 1.32 1.12 0.31 0.44 1.63 1.95 . 2.08 . 1.04
Drum fliter
innuent (mgA) 1.30 1.62 2.02 2.84 3.51 2.66 2.71 2.50 1.65 1.78 3.03 3.37 3.51 2 42 Rernoval efficiency 5% 5% 5% 5% 5% 5% 5% 5% 5% 5% 5% 5% 0.05 . 0 05 Sludge (mgA) 3.26 4.06 5.05 7.10 8.77 6.65 6.77 6.24 4.12 4.44 7.57 8.43 8.77 . 6 04 Fiftrate (M9A) 1.24 1.54 1.92 2.70 3.33 2.53 2.57 2.37 1.56 1.69 2.88 3.20 3.33 . 2.29
Settlement pond
influent (mgll) na na na na na na na na na na na na 0.00 0.00 Removal efficiency 41.7% 41.7% 41.7% 41.7% 41.7% 41.7% 41.7% 41.7% 41.7% 41.7% 41.7% 41.7% 0.42 0.42 Filtrate (rM/l) na na na na na na na na na na na na 0.00 0.00
Constructod wetland
Influent (rngll) na na na na na na na na na na na na 0.00 O. w c. na na na na na na na na na na na na k 16 19 21 25 25 21 17 15 13 13 14 14 Fiftrate (mW1) na na na na na na na na na na na na 0.00 0.00
Extenslve fishery
influent (mgil) na na na na na na na na na na na na 0.00 O. w c. na na na na na na na na na na na na k 16 19 21 25 25 21 17 15 13 13 14 14 Fiftrate (rngli) na na na na na na na na na na na na 0.00 0.00
DO (mgil)
Mass flows (kgid) from smolts -0.33 -0.90 -2.36 -6.91 -13.49 -14.06 -10.95 -8.65 -7.74 -7.64 -9.67 -12.59 -0.33 -7.94 Background oxygen concentration 12.11 11.19 10.75 10.17 10.12 10.72 11.67 12.59 13.10 13.28 13.00 12.79 13.28 11.79 Culture outputs (+C*) 12.02 10.93 10.05 8.14 6.16 6.59 8.45 10.05 10.82 11.03 10.15 9.09 12.02 9.46 Drum Filter 12.02 10.93 10.05 8.14 6.16 6.59 8.45 10.05 10.82 11.03 10.15 9.09 12.02 9.46 Conriguration complete na na na na na na na na na na na na 0.00 0.00 Conriguration complete na na na na na na na na na na na na O. w 0.00 Configuration complete na na na na na na na na na na na na 0.00 0.00 No. of treatment modules 1 Treatment discharge (-C*) -0.10 -0.26 -0.69 -2.03 -3.97 -4.13 -3.22 -2.54 -2.28 -2.25 -2.84 -3.70 -0.10 -2.34 Final site dlscharge -0.10 -0.26 -0.69 -2.03 -3.97 -4.13 -3.22 -2.54 -2.28 -2.25 -2.84 -3.70 -0.10 -2.34
Drum filter
Influent (mgli) 12.02 10.93 10.05 8.14 6.16 6.59 8.45 10.05 10.82 11.03 10.15 9.09 12.02 9.46 Removal efficiency 0% 0% 0% 0% 0% 0% 0% 0o/o 0o/6 0% 0% 0% 0.00 0.00 Sludge (mgll) 0.00 0.00 0.00 0.00 0.00 0.00 0.00 0.00 0.00 0.00 0.00 0.00 0.00 0.00 Fikrate (mgil) 12.02 10.93 10.05 8.14 6.16 6.59 8.45 10.05 10.82 11.03 10.15 9.09 12.02 9.46
Settlement pond
Influent (mgil) na na na na na na na na na na na na 0.00 0.00 Remval effickency 0% 0% 0% 0% 0% 0% 0% 0% 0c/6 0% 0% 0% 0.00 0.00 Fiftrate (mgll) na na na na na na na na na na na na 0.00 0.00
Constructod wetland
Influent (mgll) na na na na na na na na na na na na 0.00 0.00 Fiftrate (mgil) na na na na na na na na na na na na 0.00 0.00
Extenslve fishery
Irifluent (mgil) na na na na na na na na na na na na 0.00 0.00 Flftrate (mg/[) na na na na na na na na na na na na 0.00 0.00

Horizontal integration
Unit cost Units Value
Constructed wetland: na
Dimensions of the constructed wetland
Maximum area occupied by the constructed wetland (ha) Market value of macrophyte biomass (E/kg) Market value of macrophyte biomass (E/kg)
Production in the constructed wetland
Expected production (kg/M2) General production based on the literature (kg/m2) Macrophyte biomass production (kg/ha/y) Total macrophyte biomass production (Vy)
Gross value of the macrophyte biomass produced (E 1000)
Fishery: na
Stocking the fishery
Maximum area occupied by the fishery (ha) Recommended stocking density (fish/m2) Stocking density (fish/M2) Total fish stocked or seeded Cost of stock (F-/fish) Cost of stock (E/fish) The initial stocking cost for the fishery (E '000)
Expected income generated by the extensive fishery
Number of anglers expected at the fishery (anglers/d) Angling days per year (one closed week per year) Total number of angling days provided per year Cost of a days angling from literature (E/angler) Cost of a days angling (E/angler) Gross value of angling provided (E'000/y) Catch limit for anglers (fish/d) Fish required to maintain the stocking density (fish/y) Cost of the fish required to maintain the stocking density (E '000/y)
Net value of the angling provided (E '000/y)
0.00 0.000 0.00
0.00 2.0
20000 0.0
0.00
0.00 0.10 0.00
0 E2.00 F-0.00 0.00
0 358
0 £25 £0
0.00 2 0
0.00
0.00
kh-

Financial considerations: variable and fixed construction and operatin g costs 1. Variable construction costs Unit cost Total units Total cost Land requirements and basin construction
(E) (E-000)
Estimated cost of land (ha) 7400 Estimated cost for site development (ha) 49500 Maximum flow rate through the treatment system (M3 /h)
141.67
Maximum area (ml) required for: drum filter settlement pond
50
constructed wetland 0
extensive aquaculture 0 0
Maximum area required for basins (ha) Additional land required for access
0.0
Total land area required (ha) 5.0% 0.0
Total capital cost of land 7400 0.0 0.0
Basin construction 49500 0.0 0.26
Site development: pipework and infrastructure
Electricity supply 500 1.00 0.50
Drum filters (@ 167 M3 /h) 10000 1.00 10.00 Conical settling tank for 167 ml/h drumfilter 1500 1.00 1.50 Sludge storage tank for 167 M3 /h drumfilter 1500 1.00 1.50 Sludge pump for 167 M3 /h drumfilter 200 1.00 0.20
Concrete, brickwork and control structures (individual structures) 1000 2 2.00
Total cost of site infrastructure and pipework 15.70
Plant and equipment required
Seine net and fish handling equipment 1500 na 0.00 Miscellaneous equipment 5 na 0.00
Total cost of equipment required 0.00
Seed required to establish fishery 0.00
Total cost of land, construction and infrastructure 16.00
2, Variable operational costs
Annual electricity consumption
Drum filter (per 167 M3 /h unit) 200 1.00 0.20 Sludge pump (per 167 M3 /h drumfilter) 50 1.00 0.05
Total electricity consumption 0.25
Labour requirements
Drumfilter maintenance i. e. clean pre-filter and pressure wash screens 10.0 91.3 0.91 Part-time staff required to run a fishery >5 ha 10.0 0.00 Harvest and stocking fisheries <3 ha 10.0 0.00 General maintenance of constructed wetland 10.0 0.00 Harvest of constructed wetland (if fishery <3 ha) 10.0 0.00
Total labour requirement 0.91
Contract harvest of biomass from the reedbed (ha) 41 na 0.00
Stock for extensive aquaculture 0.00
Materials and equipment for infrastructure maintenance 0.16
Total variable operating costs 1.32
3. Fixed operating costs (excluding depreciation)
Operators labour: 10 In +3h for each ADEPT component (h/y) (if fishery <3 ha) 20.0 13.00 0.26 Full-time manager: for fisheries >3 ha 10.0 na 0.00
Total fixed operating costs 0.26
61

Costs and returns
Initial Costs and annual depreciation:
Cost Cost (E'000) Economic life Salvage value Depreciation (f-'000/y)
Land 0.04 na na Basin construction 0.26 na na Seed/fish 0.00 na na Water control structures 2.00 15 0 0.13 Electricity supply 0.50 15 0 0.03 Drum filter, settlement and storage tanks 13.00 10 0 1.30 Pump 0.20 10 0 0.02 Seine nets 0.00 10 0 0.00
Total 16.00 1.49
2. Annual operating costs: Quantity Unit price (E) Cost (f-'000)
Variable costs Seed/fish required 0.00 Labour requirements (h) 91 10 0.91 Reed harvesting 0.0 41 0.00 Electricity 0.25 Maintenance 0.16
Sub-total 1.32
Fixed costs Tax 0.00
Operators labour 0.26 Fisheries manager (fishings >3ha) 0.00
Total labour cost 0.26
Sub-total 0.26
Total cost 1.58
3. Income: Production Unit price (E) Income (E'000)
Angling (d/y) 0.00 25.00 0.00 Coarse fish (kg) 0.00 0.00 0.00 Crayfish (kg) 0.00 0.00 0.00
Macrophyte biomass (kg) 0 0.00 0.00
Total income 0.00
4. Indicators:
Profit including depreciation (E'000) -3.1
Profit excluding depreciation (E '000) -1.6
Rate of return on initial cost -9.9%
Rate of return on operating cost -100%
Pay-back period (y) na
kh,

Cash flow and economic indicators
Cash flow projections for the first ten years of operation (E'000)
Year
0123456789
Cash inflow Gross income (1) 0.0 0.0 0.0 0.0 0.0 0.0 0.0 0.0 0.0 Operators equity 16.0
Total cash inflow (2) 16.0 0.0 0.0 0.0 0.0 0.0 0.0 0.0 0.0 0.0
Cash outflow Investment cost (3) 16.0 0.0 Operating cost (4) 1.6 1.6 1.6 1.6 1.6 1.6 1.6 1.6 1.6
Total cash outflow (6) 16.0 1.6 1.6 1.6 1.6 1.6 1.6 1.6 1.6 1.6
Net cash flow (2-6) 0.0 -1.6 -1.6 -1.6 -1.6 -1.6 -1.6 -1.6 -1.6 -1.6
Cost/Benefit Financial benefit (1) 0.0 0.0 0.0 0.0 0.0 0.0 0.0 0.0 0.0 Cost (3+4) = (7) 16.0 1.6 1.6 1.6 1.6 1.6 1.6 1.6 1.6 1.6
Net benefit (1 -7) -16.0 -1.6 -1.6 -1.6 -1.6 -1.6 -1.6
Cash flow projections for years 10-19 of operation (E '000)
Cash inflow Gross income (1) Operators equity
Year
10 11 12 13 14 15 16 17 18 19
0.0 0.0 0.0 0.0 0.0 0.0 0.0 0.0 0.0 0.0
Total cash inflow (2) 0.0 0.0 0.0 0.0 0.0 0.0 0.0 0.0 0.0 0.0
Cash outflow Investment cost (3) 13.2 2.5 Operating cost (4) 1.6 1.6 1.6 1.6 1.6 1.6 1.6 1.6 1.6 1.6
Total cash outflow (6) 14.8 1.6 1.6 1.6 1.6 4.1 1.6 1.6 1.6 1.6
Net cash flow (2-6) -14.8 -1.6 -1.6 -1.6 -1.6 -4.1 -1.6 -1.6 -1.6 -1.6
Cost/Benefit Financial benefit (1) 0.0 0.0 0.0 0.0 0.0 0.0 0.0 0.0 0.0 0.0 Cost (3+4) = (7) 14.8 1.6 1.6 1.6 1.6 4.1 1.6 1.6 1.6 1.6
Net benefit (1 -7) -14.8 -1.6 -1.6 -1.6 -1.6 -4.1 -1.6 -1.6 -1.6 -1.6

Cash flow projections for years 20-29 of operation (E'000)
Year
20 21 22 23 24 25 26 27 28 29
Cash inflow Gross income (1) 0.0 0.0 0.0 0.0 0.0 0.0 0.0 0.0 0.0 0.0 operators equity
Total cash inflow (2) 0.0 0.0 0.0 0.0 0.0 0.0 0.0 0.0 0.0 0.0
Cash outflow investment cost (3) 13.2 0.0 Operating cost (4) 1.6 1.6 1.6 1.6 1.6 1.6 1.6 1.6 1.6 1.6
Total cash outflow (6) 14.8 1.6 1.6 1.6 1.6 1.6 1.6 1.6 1.6 1.6
Net cash flow (2-6) -14.8 -1.6 -1.6 -1.6 -1.6 -1.6 -1.6 -1.6 -1.6 -1.6 Cost/Benefit Financial benefit (1) 0.0 0.0 0.0 0.0 0.0 0.0 0.0 0.0 0.0 0.0 Cost (3+4) = (7) 14.8 1.6 1.6 1.6 1.6 1.6 1.6 1.6 1.6 1.6
Net benefit (1 -7) -14.8 -1.6 -1.6 -1.6 -1.6 -1.6 -1.6 -1.6 -1.6 -1.6
Cash flow projections for years 30-39 of operation (E'000)
Year
30 31 32 33 34 35 36 37 38 39
Cash inflow Gross income (1) 0.0 0.0 0.0 0.0 0.0 0.0 0.0 0.0 0.0 0.0 Operators equity
Total cash inflow (2) 0.0 0.0 0.0 0.0 0.0 0.0 0.0 0.0 0.0 0.0
Cash outflow Investment cost (3) 13.2 0.0 Operating cost (4) 1.6 1.6 1.6 1.6 1.6 1.6 1.6 1.6 1.6 1.6
Total cash outflow (6) 14.8 1.6 1.6 1.6 1.6 1.6 1.6 1.6 1.6 1.6
Net cash flow (2-6) -14.8 -1.6 -1.6 -1.6 -1.6 -1.6 -1.6 -1.6 -1.6 -1.6
Cost/Benefit Financial benefit (1) 0.0 0.0 0.0 0.0 0.0 0.0 0.0 0.0 0.0 0.0
14.8 1.6 1.6 1.6 1.6 1.6 1.6 1.6 1.6 1.6
Net benefit (1 -7) -14.8 -1.6 -1.6 -1.6 -1.6 -1.6 -1.6 -1.6 -1.6 -1.6

Cash flow projections for years 40-49 of operation (E 1000)
Year
40 41 42 43 44 45 46 47 48 49
Cash inflow Gross income (1) 0.0 0.0 0.0 0.0 0.0 0 00 0 0 0 Operators equity . . . 0.0 0.0
Total cash inflow (2) 0.0 0.0 0.0 0.0 0.0 0.0 0 00 00 0 . . . 0.0 Cash outflow Investment cost (3) 13.2 2 5 Operating cost (4) 1.6 1.6 1.6 1.6 . 1.6 1.6 1.6 1.6 1.6 1.6 Total cash outflow (6) 14.8 1.6 1.6 1R 1AA14 -1 A
Net cash flow (2-6) -14.8 -1.6 -1.6 -1.6 -1.6 -4.1 -1.6 -1.6 -1.6 Cost/Benefit Financial benefit (1) 0.0 0.0 0.0 0.0 0.0 0.0 0.0 0.0 0 0 0 0 Cost (3+4) = (7) 14.8 1.6 1.6 1.6 1.6 4.1 1.6 1.6 . 1.6 .
1.6
Net benefit (11 -7) -14.8 -1.6 -1.6 -1.6 -1.6 -4.1 -1.6 -1.6 -1.6 -1.6

(D. ) einleiedwel ja4eM
--l i-
C3 0 C) C) C) C) 0 C) 0000000 00 (D 0 C) C) CD r-- (C) LO -It co 04 -
(64) ssewolig
2 cz
cu a) CL
E
y)
E 0
(D R
u 0) (1) a) L) 0 _j co
-0 > 0 0
z C) 0
0 cu
0 E 2 a) - C: U) E _0 M
Cl)
C3 0
E
U)
6
(D
LL
a-
(D. ) ainjejedwal jejeAA
co (D 'r N0
C c)
. 27)
Cl
.0 I a) LL -5 2
CZ M
(1) co
.
LL
C cm
U)
cu a)
0
L)
> 0 z
E
co a) E
0 CL
C:
2
I-
. 0)
-, -
V) V) 04 04
(P/lt46lom Apoq %) Indul pea: j

0
LL co
tL (D
U)
0,
a) C :3
>' CD
co 04
a)
LL
.0 0) LL
CD -)
0
a) a
> 0
z
t
CL Q)
0)
CD
00 co "t C'4 0 C, Ii
ýT (9 (1) CN C14 -- CD
606666660
(1/6w) uolluilua3uoo (116w) uolleilue3uoo
I. -
z2 < U) ca
=3
0 E
_0
z
0
CD
E C: 0 co
C) c 0
c
c
04 CD
0) E

U
-0 (1) LL
CD -)
0
0
0
C)
. C:
cn m -0
c
0) >
E U) C: c =3
. LD 0
q) C: m
0
0E
r) - c
0 co
cu
cu m (D =3
. 2) LL
Cý M C14 C) Cý C?
(1/6w) UOIlejluaouoo
C-) CD
U-
C0 -�
(L)
C)
> 0
z
Iý6 0
cf)
C3, 1D
(1)
>' Co
L
1*: 14: (1 Cl) " CN ooooooooo
(I/BW) uoileilua3uoo
-0 (lö c3)
75 >
r_ -0
E

Appendix 2
Correspondence for the Delphi investigation

Appendix 2a
First round questionnaire
Institute of Aquaculture University of Stirling Stirling FK9 4LA Scotland Fax: 01786 472133 email: swbl@stir. ac. uk
4 th September 1999
Dear
I would like to invite you to participate in this investigation regarding the management of wastewater from aquaculture.
There are two sections to this questionnaire; Section 1 asks for your opinion on the current status of aquaculture wastewater treatment and management. Section 2 represents the first round of a Delphi investigation into the potential of horizontally integrated aquaculture in treating wastewater from commercial aquaculture.
I would ask everyone who wishes to participate to complete Section 1; but to only complete Section 2 if they are willing to participate in the Delphi investigation. This will entail completing up to 3 more questionnaires over the following 2-3 months. Following a pilot- study, it is anticipated that the first questionnaire should take approximately 15 minutes to answer.
The results of this study will be distributed to all participants helping focus interest and resources on high potential systems, and that the publication of results will help raise awareness of horizontally integrated aquaculture, including the real world constraints to developing these systems and their potential.
Your time and effort in carrying out this research is much appreciated.
Yours sincerely,
Stuart Bunting

Horizontally integrated aquaculture:
For the purposes of this questionnaire the term 'horizontally integrated aquaculture' refers to the culture of aquatic species in the wastewater from commercial aquaculture, reducing the concentration of pollutants and potentially conferring benefits to the operator, environment and stakeholder groups.
Examples include the culture of seaweed and shellfish in the wastewater from shrimp ponds and marine cage facilities and the use of constructed wetlands planted with reeds or mangroves to treat the wastewater from landbased freshwater of marine/brackish aquaculture, respectively.
Section 1
I. From the perspective of which country and aquaculture sector would you like to answer this questionnaire?
a. country .................... b. aquaculture sector .................................
1.2. In general, what impact does the discharge of wastewater from the aquaculture sector selected above have on the environment?
a. very negative
b. negative
c. none
positive
e. very positive
1.3. There is a need to develop improved technologies to treat the wastewater discharged from
aquaculture sector selected above.
a. agree strongly
agree
c. neither agree nor disagree
d. disagree
e. disagree strongly

1.4. Do you consider the regulations governing the discharge of wastewater from the aquaculture sector selected above to be:
a. very excessive
b. excessive
c. correct
d. inadequate
e. very inadequate f. no regulations exist
1.5. Do you believe that the wastewater from the aquaculture sector selected above could be utilised for production in horizontally integrated systems?
a. yes
unsure
c. no
1.6. Do you believe that any economic, social or envirom-nental benefits could be gained from developing horizontally integrated aquaculture systems in association with the aquaculture sector selected above?
a. yes
unsure
c. no
1.7. How would you describe your current position?
a. research
b. commercial
c. regulatory
d. stakeholder
e. other (please specify)
If you would like to participate in the Delphi investigation please proceed to Section 2;
alternatively, please return your answers to Section 1 by the 30 th of September.

Section 2: Delphi investigation
The Delphi technique is employed here in an attempt to develop consensus amongst stakeholders with an interest in wastewater discharged from aquaculture, i. e. regulators, commercial operators, researchers, environmental groups, etc. The survey is conducted over three or four rounds, during the first round all participants are asked to express their individual opinions; these opinions then form the basis of the subsequent rounds.
The research aims of the Delphi investigation are to:
identify the factors that a panel of experts believe have the greatest potential to influence the decision-making process when considering horizontally integrated aquaculture to treat and utilise the wastewater from commercial aquaculture
highlight the relative importance of horizontally integrated aquaculture with respect to alternative strategies for treating wastewater from commercial aquaculture
Answering the questionnaire
Based on your experience of commercial aquaculture, please consider the following questionnaire.
In parts 1 and 2, please state any factors that you consider as potential constraints or benefits, respectively, to developing horizontally integrated aquaculture. Please try and state the factors succinctly under the appropriate category i. e. physical, environmental, management, economic, regulatory, institutional and social.
In part 3 please suggest any alternative strategies that you feel are appropriate to limiting the environmental impact of wastewater from aquaculture.
If you encounter any problems in answering this questionnaire please contact me for more information. Please return the completed questionnaire by the 3 Oth of September.

Delphi questionnaire
Please indicate any potential constraints or problems to developing horizontally integrated aquaculture with commercial aquaculture.
System features Factors
Physical
Enviromnental
Managerial
Institutional
Economic
Social

2. Please indicate any potential benefits or opportunities to developing a horizontally integrated aquaculture with conunercial aquaculture.
System features Factors
Physical
Enviromnental
Managerial
Institutional
conomic
Social

I Please indicate other factors that could help commercial aquaculture limit any negative environmental impacts associated with the discharge of wastewater.
StrateRic area .................. ---- . ........
Factors
Management
Technology
Institutional
Economic/ Social
Thank you for participating in the first round of this Delphi investigation. Please return your completed questionnaire by the 30th of September. Once the results have been collated, I will return a summary of the responses received during this round and the second questionnaire.

Appendix 2b
Second round questionnaire
Dear
Having compiled the responses of participants from the first round, the next stage of the investigation is to assign relative values to the importance of the wide range of factors suggested. Below you will find a list of the responses from the first round together with an indication of the number of respondents (n) suggesting each factor. Please now assign a score between I and 10 relating to the importance that you assign to each factor (I = not important, 10 = very important).
Your continued support in this work is appreciated.
Yours sincerely,
Stuart Bunting
PS: Please try and reply to this round by the 31 St
of November.

a. Constraints associated with horizontally integrated aquaculture
n Score Physical
Facility designed primarily for original aquaculture species I Availability of suitable land or water II Wastewater supply e. g. nutrient flows not optimal or presence of chemicals,
4 antibiotics or pathogens Engineering of wastewater flows difficult e. g. high volumes and distance 2 Biological treatment inconsistent at removing nutrients throughout the growing season I
Environmental Site specific design required e. g. climate vulnerability 4 Discharge requirements; by-products from integrated systems may not comply with 2 regulations Translocation of organisms suitable for integrated production restricted I External pollution could affect the integrated system I
Managenal Lack of skills and training for existing managers and workers 4 Managers lack leadership, resist change and adopt a non-systematic approach 5 Decisions based on short-term financial appraisal I Limited knowledge-base regarding design and management e. g. optimal loading rates, 6 harvesting strategies, disease management Inadequate supplies of seed and inputs for integrated system I
Institutional Absence of instruction and training support I Inertia i. e. a lack of research and development I Constrained by existing paradigms of food production i. e. no structures exist to 2 facilitate systems thinking Environmental laws and planning restrictions constrain integration 3 Lack of structures for monitoring and auditing integrated systems I
Economic Market analysis and stimulation required 3
Limited revenue generated by the integrated system 4
Insufficient techniques for analysis of operating costs and accounting for broader 2
issues such as opportunity costs Holders of economic power not interested Financial costs associated with development
Lack of funding, access to venture capital Costs associated with management and operation
1 8 2 3
Social Public acceptance of produce from integrated systems, perception of "dirty" food 4
Conflicts with stakeholder groups e. g. user groups or environmentalists 4
Limited systems thinking education and information exchange I
Total Count
84 29

b. Opportunlties associated with horizontally integrated aquaculture
n Physical
Better transport around remote areas I Improved efficiency of resource use e. g. nutrients and water 7 More attractive in the landscape than conventional treatment systems 2
Environmental Reduced sediment and nutrient concentration in the wastewater 8 Less energy consumed and waste generated in food production I Increased habitat diversity, providing shelter to endemic species 3 Reduced impact on the environment and downstream users e. g. other farms 8
Managerial Meet expectations of managers regarding environmental protection and waste 2 management Increase opportunities for recirculation I Facilitate the development of a new paradigm for aquaculture and other 2 agricultural sectors Contribute to the skill base of managers I Reduce the potential for farms to self-pollute 2
Institutional Improved discharge standards that reduce penalties e. g. court action or closure 2 New opportunities to develop commercial partnerships 2 Potential site for research and development 2 Enabling more stringent discharge standards to be satisfied in the future 6 Help meet the standards for quality assurance or organic certification I
Economic Reduce wastewater treatment costs I Increased income generated from additional crops based on same inputs 12 Represents a diversification reducing economic risks 5 Reduce the level of any potential pollution tax 6 Contribute to the regional economy, adding to tax base 2
Social Improved public perception; reconciling environmental and economic goals of 6 different groups Represents a good educational resource I Increased employment opportunities 5 Enhanced appeal of the primary aquaculture product to consumers 5 Better places to live I
Score
Total 94
Count 26
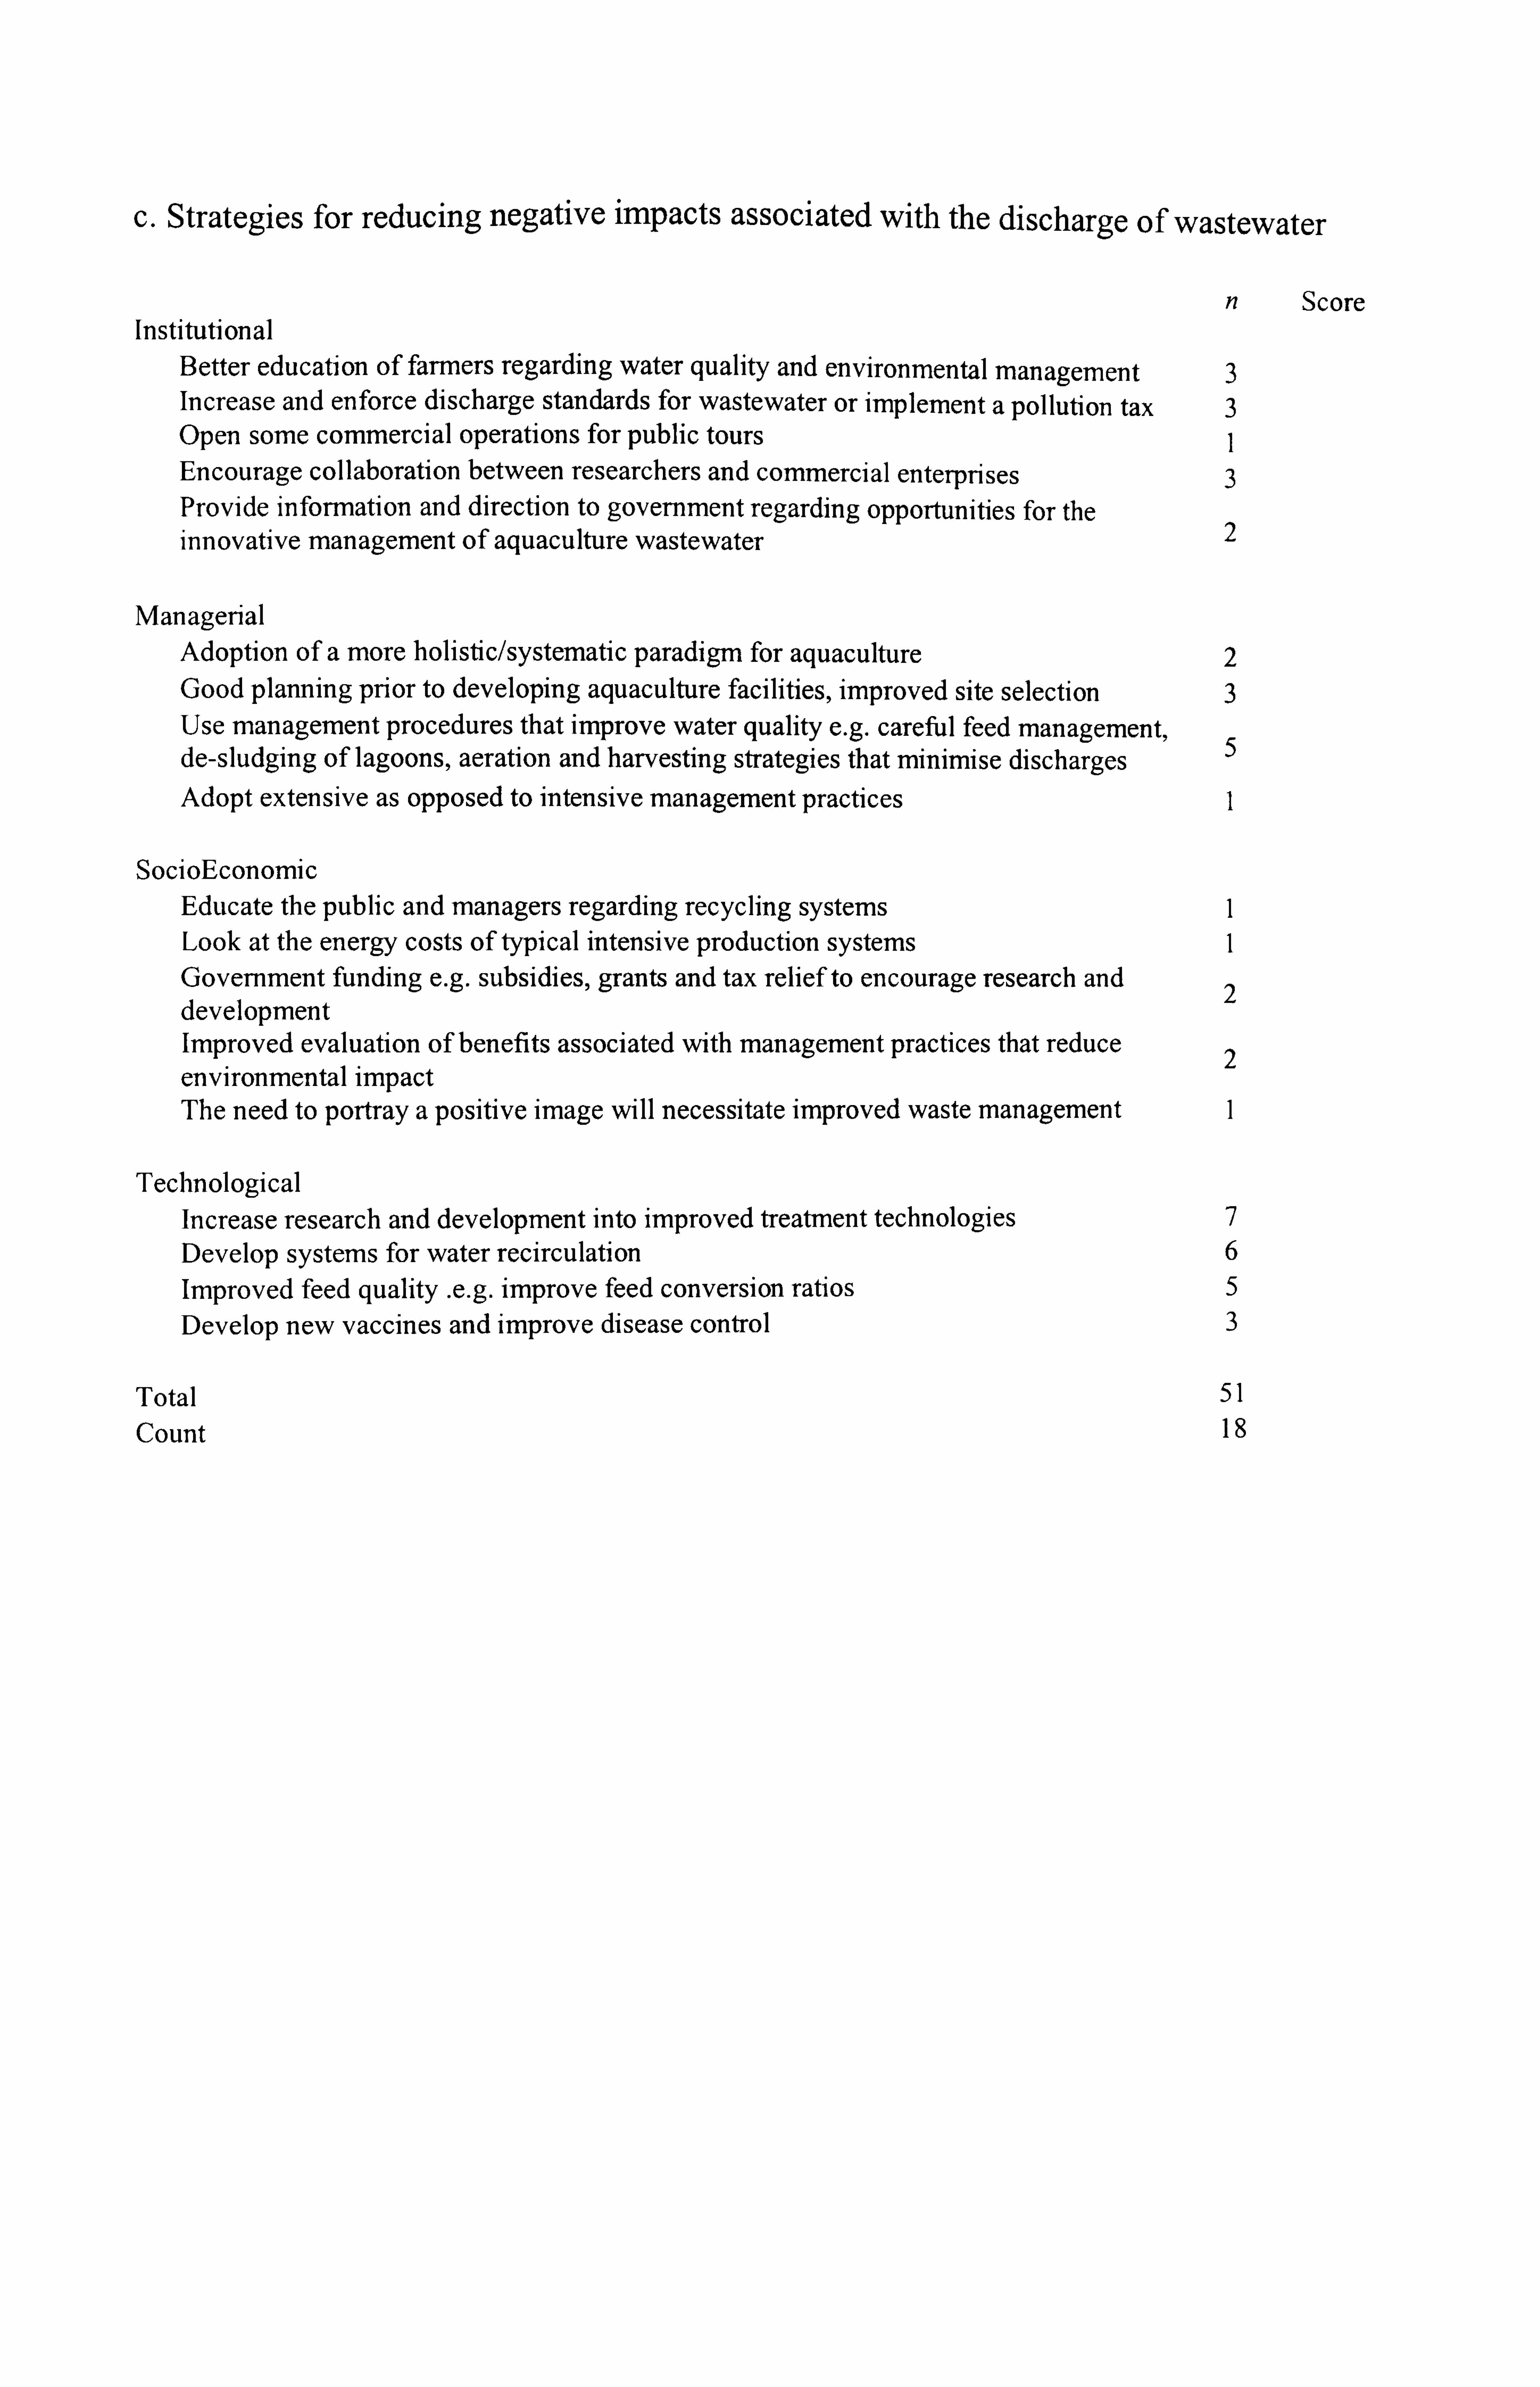
c. Strategies for reducing negative impacts associated with the discharge of wastewater
Institutional Score
Better education of farmers regarding water quality and environmental management 3 Increase and enforce discharge standards for wastewater or implement a pollution tax 3 Open some commercial operations for public tours I Encourage collaboration between researchers and commercial enterprises 3 Provide information and direction to government regarding opportunities for the
2 innovative management of aquaculture wastewater
Managenal Adoption of a more holistic/systematic paradigm for aquaculture 2 Good planning prior to developing aquaculture facilities, improved site selection 3 Use management procedures that improve water quality e. g. careful feed management, 5 de-sludging of lagoons, aeration and harvesting strategies that minimise discharges Adopt extensive as opposed to intensive management practices I
SocioEconomic Educate the public and managers regarding recycling systems I Look at the energy costs of typical intensive production systems I Government funding e. g. subsidies, grants and tax relief to encourage research and 2 development Improved evaluation of benefits associated with management practices that reduce 2 environmental impact The need to portray a positive image will necessitate improved waste management I
Technological Increase research and development into improved treatment technologies 7 Develop systems for water recirculation 6 Improved feed quality e. g. improve feed conversion ratios 5 Develop new vaccines and improve disease control 3
Total 51 Count 18

Appendix 2c
Third round information
Dear
Firstly, thank you for your patience and responses during the second round.
Having compiled responses from the second round the final stage of the investigation is to see whether those participating generally agree on the mean values assigned to the factors being considered.
Below you will find the list of factors first presented in the second round, in addition, the mean value (x) for scores assigned during round two are given together with the 25% and 75% percentiles to provide an indication of the distribution of responses suggested.
If you are willing to accept the mean value (x) then please leave the space for a new score blank, however, if you feel that the mean value is not appropriate please enter your preferred score in the space provided.
If your preferred score lies outside the 25% and 75% percentile values stated, would you please provide a short statement to justify your opinion?
I would like to thank you for your continued support and hope that you have found this
exercise interesting.
Yours sincerely,
Stuart
PS: Although there is no date by which to submit you responses I would encourage you to
respond as soon as possible so that the outcome of this study may be assessed and the findings
disseminated to all participants.

Delphi third round Please remember: I= not important, 10 = very important
a. Constraints associated with horizontally integrated aquaculture x 25% 75% Score
Physical Facility designed primarily for original aquaculture species 4.6 3.0 5.0 Availability of suitable land or water 6.9 5.0 9.5 Wastewater supply e. g. nutrient flows not optimal or presence of chemicals, antibiotics or pathogens 6.8 5.0 8.5 Engineering of wastewater flows difficult e. g. high volumes and distance 5.2 3.0 7.0 Biological treatment inconsistent at removing nutrients throughout the growing season 5.6 5.0 6.5
Environmental Site specific design required e. g. climate vulnerability 5.7 4.0 7.8 Discharge requirements; by-products from integrated systems may not comply with regulations 6.1 5.0 8.0 Translocation of organisms suitable for integrated production restricted 4.3 2.3 6.0 External pollution could affect the integrated system 5.4 4.0 6.8
Managenal Lack of skills and training for existing managers and workers 5.6 3.5 8.0 Managers lack leadership, resist change and adopt a non-systematic approach 6.2 4.0 8.0 Decisions based on short-terin financial appraisal 6.8 5.0 8.0 Limited knowledge-base regarding design and management e. g. optimal loading rates, harvesting strategies, disease management
6.7 5.5 8.0
Inadequate supplies of seed and inputs for integrated system 4.7 2.5 6.5
Institutional Absence of instruction and training support 5.4 3.0 7.0 Inertia i. e. a lack of research and development 5.9 4.3 7.8 Constrained by existing paradigms of food production i. e. no structures exist to facilitate systems thinking
5.5 3.5 8.0
Environmental laws and planning restrictions constrain integration 5.9 5.0 7.8 Lack of structures for monitoring and auditing integrated systems 5.2 3.0 7.0
Economic Market analysis and stimulation required 6.5 4.5 8.0 Limited revenue generated by the integrated system 4.6 3.0 6.0 Insufficient techniques for analysis of operating costs and accounting for broader
4.9 3.0 6.8 issues such as opportunity costs Holders of economic power not interested 5.3 2.0 8.0
Financial costs associated with development 7.2 6.0 8.5
Lack of funding, access to venture capital 6.9 5.0 9.0
Costs associated with management and operation 5.8 5.0 7.5
Social Public acceptance of produce from integrated systems, perception of "dirty" food 5.7 4.0 8.0
Conflicts With stakeholder groups e. g. user groups or environmentalists 5.5 3.5 7.5
Limited systems thinking education and information exchange 5.5 4.0 7.0
Total 167
Count 29

b. Opportunities associated with horizontally integrated aquaculture x 25% 75% Score
Physical Better transport around remote areas 3.8 2.0 5.5 Improved efficiency of resource use e. g. nutrients and water 8.4 8.0 9.5 More attractive in the landscape than conventional treatment systems 6.4 5.0 8.0
Environmental Reduced sediment and nutrient concentration in the wastewater 8.3 8.0 9.0 Less energy consumed and waste generated in food production 8.2 7.5 9.0 Increased habitat diversity, providing shelter to endemic species 6.3 5.0 8.0 Reduced impact on the environment and downstream users e. g. other farms 8.4 7.0 9.5
Managerial Meet expectations of managers regarding environmental protection and waste management
6.9 5.5 8.0 Increase opportunities for recirculation 6.8 6.0 8.0 Facilitate the development of a new paradigm for aquaculture and other agricultural sectors
6.6 5.0 7.8 Contribute to the skill base of managers 5.6 4.0 7.0 Reduce the potential for farms to self-pollute 6.9 6.0 8.0
Institutional Improved discharge standards that reduce penalties e. g. court action or closure
6.0 5.0 7.0
New opportunities to develop commercial partnerships 5.9 4.5 8.0 Potential site for research and development 6.3 5.0 8.0 Enabling more stringent discharge standards to be satisfied in the future 6.6 5.0 8.0 Help meet the standards for quality assurance or organic certification 7.2 6.0 9.0
Economic Reduce wastewater treatment costs 6.9 5.0 8.0 Increased income generated from additional crops based on same inputs 7.3 6.0 8.8 Represents a diversification reducing economic risks 6.4 5.0 8.5 Reduce the level of any potential pollution tax 6.1 5.0 8.0 Contribute to the regional economy, adding to tax base 5.2 3.0 7.5
Social Improved public perception; reconciling environmental and economic goals 7.6 6.5 8.5 of different groups Represents a good educational resource 6.2 4.5 8.5
Increased employment opportunities 6.4 5.0 8.0
Enhanced appeal of the primary aquaculture product to consumers 6.1 4.5 8.0
Better places to live 5.2 2.0 7.5
Total 178
Count 27

c. Strategies for reducing negative impacts associated with the discharge of wastewater
X 25% 75% Score Institutional
Better education of farmers regarding water quality and environmental management
7.0 5.5 8.0
increase and enforce discharge standards for wastewater or implement a pollution tax 6.5 5.5 8.0
Open some commercial operations for public tours 5.6 4.5 8.0 Encourage collaboration between researchers and commercial enterprises 7.5 6.5 9.0 Provide information and direction to government regarding opportunities for the innovative management of aquaculture, wastewater
6.8 5.0 8.5
Managerial Adoption of a more holistic/systematic paradigm for aquaculture 6.3 5.0 8.0 Good planning prior to developing aquaculture facilities, improved site selection
7.6 6.0 10.0
Use management procedures that improve water quality e. g. careful feed management, de-sludging of lagoons, aeration and harvesting strategies that 8.0 8.0 9.0 minimise discharges Adopt extensive as opposed to intensive management practices 4.1 2.0 5.0
SocioEconomic Educate the public and managers regarding recycling systems 6.3 4.5 8.5 Look at the energy costs of typical intensive production systems 6.4 5.0 8.0 Government funding e. g. subsidies, grants and tax relief to encourage 5.9 5.0 7.0 research and development Improved evaluation of benefits associated with management practices that 6.9 6.0 8.0 reduce environmental impact The need to portray a positive image will necessitate improved waste 6.7 5.0 8.5 management
Technological Increase research and development into improved treatment technologies 7.4 6.5 8.0
Develop systems for water recirculation 6.3 5.0 8.0
Improved feed quality e. g. improve feed conversion ratios 7.2 6.5 9.0
Develop new vaccines and improve disease control 5.1 2.0 7.0
Total 118
Count 18