DaSilva_Thesis_2013.pdf - University of Stirling
407
-
Upload
khangminh22 -
Category
Documents
-
view
2 -
download
0
Transcript of DaSilva_Thesis_2013.pdf - University of Stirling


A NOVEL IMAGE ANALYSIS APPROACH TO CHARACTERISE
THE EFFECTS OF DIETARY COMPONENTS ON INTESTINAL
MORPHOLOGY AND IMMUNE SYSTEM IN ATLANTIC SALMON
THESIS SUBMITTED TO THE UNIVERSITY OF STIRLING
FOR THE DEGREE OF DOCTOR OF PHILOSOPHY
POLYANA FERREIRA DA SILVA
DECEMBER 2013
INSTITUTE OF AQUACULTURE


This thesis is dedicated to my parents, without whom
none of this would have been possible…


DECLARATION
This thesis was compiled and written in full by the author, with thorough proofreading
by the supervisors. Unless otherwise indicated in the text or references therein, this thesis
is entirely the product of the author’s research work and it has never been submitted, either
in part or as a whole, for an academic degree at this or any other university or equivalent
institution.
No authorisation is required for the reproduction of the material in this thesis for
personal or educational use. Reproduction of this thesis, in part or as a whole, for
publication purposes, is prohibited, without the written permission of the author.
Author: Polyana F. da Silva
Principal supervisor: Prof. James E. Bron
Professor of Aquatic Animal Health
Head of the Parasitology Research Group
Additional supervisors: Dr. Kim D. Thompson
Senior Research Fellow
Aquatic Vaccine Unit Group
Prof. Alexandra Adams
Research Professor in Aquatic Diseases & Immunology
Head of the Aquatic Vaccine Unit Group

PAGE | ii
ACKNOWLEDGMENTS
Although this thesis bears on its cover only the author’s name, none of this work would
even have been possible to accomplish without the hefty support of quite a large number of
people. I am actually indebted to so many, that I fear I may have unintentionally omitted
someone’s name. If that was the case, please accept my sincere apologies. I do hope that,
anyone who contributed in any way and helped me get so far, will share with me this
particular moment of fulfilment that I am now enjoying!
First, I wish to mention my supervisors: Prof. James Bron, Dr. Kim Thompson and Prof.
Alexandra Adams from whose advice and guidance I benefited. I am especially grateful for
their continous support, and for the insightful discussions and comments we had during the
entire process.
Acknowledgements are also due to the role played by Dr. Charles McGurk and Mrs.
Julia Mullins, co-promoters of this project. Their expertise and understanding added
considerably to my research experience. Moreover, I would like to express my appreciation
to Skretting’s Aquaculture Research Centre (Skretting ARC, Stavanger, Norway), who
financially supported this project. I would also like to acknowledge the staff at both
Skretting’s fish trial station and ARC for their technical assistance during the collection of
the samples.
Special thanks are also extended to the Institute of Aquaculture elements, both
academics and technicians, for their advice and guidance throughout the entire period. To
Mr. Niall Auchinachie, Mrs. Deborah Faichney, Dr. John Taggart and Mr. Linton Brown, I
owe a special word of thanks for their invaluable assistance and support in solving near
infinite issues. Thanks also to those who provided me with statistical advice at times when it
was most needed, namely Dr. Darren Green and Prof. George Gettinby.
I would like to express my sincere appreciation for the service and support provided by
the Veterinary Diagnostics Services from the University of Glasgow, in particular to Mr. Iain
MacMillan and Ms. Lynn Stevenson, for their personal commitment, advice and guidance
from which I have benefited immensely. Moreover, I would like to thank the pathologists
who took time to partake in this study, for the many valuable discussions on routine
assessment of gastrointestinal samples as well as the useful validation process sessions

ACKNOWLEDGMENTS
PAGE | iii
and constructive feedback. In special to Prof. Randolph Richards, Dr. David Knudsen, Dr.
Marianne Pearson, Dr. Dave Cox and Dr. Jorge Del-Pozo.
The successful completion of this project has in no small measure been due to the
outstanding efforts and commitment from a colleague and good friend, who has unflaggingly
encouraged and helped me through all. Nilantha Jayasuriya, few lines are too short to show
my appreciation for everything you and your family have done for me. I cannot thank you
enough for that!
Life away from home can be very hard! Fortunately most of the hardships were
overcome by a very effective, friendly and supportive atmosphere surrounding me. Special
thanks are due to my “Stirling & Stavanger fellowship”: Sofia Morais, Silvia Soares, Laura
Martinez, Gilta Jackel, Thi Luu, Sean Monaghan, Christian Delannoy, Phuoc Nguyen Ngoc,
Christoforos Metochis, Wanna Sirimanapong, Zinan Xu, Juliet Nattabi, Beatrix Berdal,
Nafiha Usman and Seong-Chea Chua for the attention, encouragement and support
provided during these last years. Particular thanks are also extended to my beloved “Africa /
Mozambique”: to my entire clan of friends living there who since the very beginning
provided a warm encouragement to keep going. Natacha Melo, thanks once again for being
such a good friend!
Finally and foremost, I am forever indebted to my family for the unconditional support
they have provided throughout my entire life, and without whose love, motivation and
encouragement I would not have reached so far! Especially, to my grandmother Mª
Soledade and my parents Suzana & Carlos who were always there for me in spite of the
distance! To them: "Mwine, mi nga ni nhica a vutomi ni ti dondro a ku va ni pswi hanya hi
ntsima ntsima, a pswi fanelanga ntsena a ku khensa. Mwine, mi nga vaningaa tindlela ta k
uva ti mphmile, hi li randro ni hi ntsima ntsima a k uva ni nga tali hi ku tchava kamba na ni ni
ku rindrela, a pswi fanelanga ntsena ku khensa. Ku mwine, va tatana hi xi hena ni li randro
a pswi nga fanelanga ku lhaia pswako, a ni na marhito ya ku tlanguela kinkwapsho lepswi
me nga yentchela mine. Ntsena hi pipswi yentchekaka, loku ni djuletela hi stsima ntsima a
ma vonela ya ku komba a ku nyoxa ka ku kala ku nga heli. Kumwe ku nyoxa ka ku kala ku
ngue te lhaiua hi ma ritu. Na mui randra ngopfu!"
Kanimambo / Obrigada / Thanks to you all!

PAGE | iv
TABLE OF CONTENTS
DECLARATION ........................................................................................................................................... i
ACKNOWLEDGMENTS ............................................................................................................................... ii
TABLE OF CONTENTS .............................................................................................................................. iv
LIST OF FIGURES ..................................................................................................................................... ix
LIST OF TABLES ..................................................................................................................................... xiii
ABBREVIATIONS LIST .............................................................................................................................. xiv
ABSTRACT ............................................................................................................................................. xx
LIST OF PUBLICATIONS AND PRESENTATIONS ........................................................................................ xxiv
1. GENERAL INTRODUCTION
1.1. Nutrition, feed and fish health ................................................................................................... 1
1.2. Diet and the gastrointestinal tract of fish ................................................................................... 3
1.3. Gastrointestinal tract structure in salmonids ............................................................................. 4
1.3.1. Intestinal macroscopic anatomy ............................................................................................. 6
1.3.2. Intestinal microscopic anatomy .............................................................................................. 8
1.3.3. Intestinal surface area .......................................................................................................... 11
1.3.4. Anatomical homeostasis of the intestine .............................................................................. 12
1.4. Multifunctional properties of salmonid intestine ...................................................................... 12
1.4.1. Nutrient processing and absorption ..................................................................................... 13
1.4.2. Enteric barrier function ......................................................................................................... 16
1.4.2.1. Extrinsic supra-epithelial barrier ........................................................................................ 16
1.4.2.2. Enteric epithelial barrier ..................................................................................................... 17
1.4.2.3. Intrinsic sub-epithelial barrier ............................................................................................. 17
1.4.3. Osmoregulation and epithelial water transport..................................................................... 20
1.5. Diet mediated modulation and enteric integrity ...................................................................... 21
1.5.1. Evaluation of the effects of nutritional modulation on fish intestinal health .......................... 21
1.5.1.1. Enteritis model in Atlantic salmon ...................................................................................... 26
1.6. Projects’ contextual background ............................................................................................. 27
1.7. Project aims and outline .......................................................................................................... 28
2. DESCRIPTION AND DEVELOPMENT OF A SEMI-AUTOMATED SYSTEM TO ASSESS
INTESTINAL MORPHOLOGY OF ATLANTIC SALMON, BASED ON ADVANCED IMAGE
ANALYSIS
2.1. Introduction ............................................................................................................................. 33
2.2. Material and methods ............................................................................................................. 37
2.2.1. Histological tissue samples .................................................................................................. 37
2.2.2. Digital image acquisition....................................................................................................... 38
2.2.3. Development tools – Image analysis hardware and software ............................................. 40
2.2.4. Image processing and segmentation ................................................................................... 41
2.2.4.1. Edge detection ................................................................................................................... 41
2.2.4.2. Noise removal .................................................................................................................... 42
2.2.4.3. Colour thresholding ............................................................................................................ 42

TABLE OF CONTENTS
PAGE | v
2.2.4.4. Morphological filtering ........................................................................................................42
2.2.4.5. Intensity thresholding .........................................................................................................42
2.2.4.6. Size scrapping and filling ...................................................................................................42
2.2.4.7. Intensity thresholding of inverted images ...........................................................................42
2.2.4.8. Manual object delineation ..................................................................................................43
2.2.5. Histological identification and post-processing overlays ......................................................43
2.2.5.1. Mucosal and submucosal tissues ......................................................................................43
2.2.5.2. Mucous cells .......................................................................................................................43
2.2.5.3. Tissue vacuolisation ...........................................................................................................43
2.2.5.4. Mask overlays ....................................................................................................................43
2.2.6. Feature extraction and output generation .............................................................................45
2.2.6.1. Geometric features .............................................................................................................45
2.2.6.2. Shape features ...................................................................................................................46
2.2.6.3. Position and orientation features ........................................................................................47
2.2.6.4. Output generation ...............................................................................................................47
2.2.7. System performance .............................................................................................................47
2.2.7.1. Efficiency ............................................................................................................................47
2.2.7.2. Accuracy .............................................................................................................................47
2.2.7.3. Reproducibility ....................................................................................................................48
2.2.7.4. Statistical analysis ..............................................................................................................48
2.3. Results and discussion ............................................................................................................48
2.3.1. Standardisation of staining ...................................................................................................49
2.3.2. Image acquisition and pre-processing ..................................................................................50
2.3.3. Development, training and evaluation ..................................................................................52
2.3.3.1. Feature selection ................................................................................................................53
2.3.4. System performance .............................................................................................................54
2.3.4.1. Efficiency ............................................................................................................................55
2.3.4.2. Accuracy .............................................................................................................................56
2.3.4.3. Reproducibility ....................................................................................................................59
2.4. General conclusions ................................................................................................................62
TECHNICAL NOTE A1 ..............................................................................................................................64
3. INTESTINAL RESPONSES TO DIETARY ADDITIVES – APPLICATION OF TOOLS FOR RAPID
SCREENING OF NOVEL DIETARY COMPONENTS
3.1. Introduction ..............................................................................................................................85
3.2. Materials and methods ............................................................................................................89
3.2.1. Experimental fish and fish husbandry ...................................................................................89
3.2.2. Diets and feeding regime ......................................................................................................90
3.2.3. Feed composition..................................................................................................................90
3.2.4. Sampling procedure ..............................................................................................................91
3.2.5. Growth performance and feed efficiencies ...........................................................................92
3.2.6. Haematology and blood biochemistry ..................................................................................92

TABLE OF CONTENTS
PAGE | vi
3.2.7. Respiratory burst activity and phagocytic activity assays .................................................... 94
3.2.8. Histological staining and digital image acquisition ............................................................... 96
3.2.9. Quantitative image analysis ................................................................................................. 96
3.2.10. Statistical analysis ........................................................................................................... 101
3.3. Results .................................................................................................................................. 102
3.3.1. Fish behaviour and feed intake .......................................................................................... 102
3.3.2. Feed chemical composition ................................................................................................ 103
3.3.3. Growth performance and feed efficiencies ......................................................................... 103
3.3.4. Haematology and blood biochemistry ................................................................................ 104
3.3.5. Respiratory burst activity and phagocytic activity assays .................................................. 106
3.3.6. Image analysis performance .............................................................................................. 109
3.3.7. Quantitative variables from image analysis ........................................................................ 110
3.4. Discussion ............................................................................................................................. 118
3.4.1. Growth performance and nutrient intake ............................................................................ 118
3.4.2. Haematology and blood biochemistry ................................................................................ 121
3.4.3. Respiratory burst and phagocytic activity assays .............................................................. 125
3.4.4. Image analysis performance .............................................................................................. 127
3.4.5. Quantitative variables from image analysis ........................................................................ 128
3.5. General conclusions ............................................................................................................. 131
4. HISTOLOGICAL EVALUATION OF ENTERITIS IN ATLANTIC SALMON: QUANTITATIVE
IMAGE ANALYSIS VS SEMI-QUANTITATIVE SCORES
4.1. Introduction ........................................................................................................................... 135
4.2. Materials and methods .......................................................................................................... 137
4.2.1. Fish and rearing conditions ................................................................................................ 137
4.2.2. Diets and feeding regime ................................................................................................... 137
4.2.3. Feed composition ............................................................................................................... 139
4.2.4. Sampling procedure ........................................................................................................... 139
4.2.5. Histological staining and evaluation ...................................................................................... 140
4.2.5.1. Semi-quantitative scoring histological assessment ......................................................... 140
4.2.5.2. Quantitative image analysis histological assessment ..................................................... 140
4.2.6. Statistical analysis .............................................................................................................. 144
4.2.6.1. Semi-quantitative histological data .................................................................................. 144
4.2.6.2. Quantitative image analysis histological data .................................................................. 145
4.2.6.3. Comparison of the quantitative and semi-quantitative systems ...................................... 145
4.3. Results .................................................................................................................................. 146
4.3.1. Semi-quantitative histological assessment ........................................................................ 146
4.3.2. Quantitative histological assessment ................................................................................. 148
4.3.3. Comparison of the quantitative and semi-quantitative systems ......................................... 158
4.4. Discussion ............................................................................................................................. 159
4.5. General conclusions ............................................................................................................. 167
TECHNICAL NOTE A2 ............................................................................................................................ 168

TABLE OF CONTENTS
PAGE | vii
5. QUANTITATIVE IMMUNOSTAINING: DEVELOPMENT OF A BIOMARKER PANEL FOR
ASSESSMENT OF IMMUNE RESPONSE IN THE INTESTINAL TRACT OF ATLANTIC SALMON
PARR FED DIFFERENT DIETS
5.1. Introduction ............................................................................................................................175
5.2. Material and methods ............................................................................................................179
5.2.1. Experimental fish and fish husbandry .................................................................................179
5.2.2. Diets and feeding regime ....................................................................................................179
5.2.3. Sampling procedure ............................................................................................................180
5.2.4. Histology .............................................................................................................................180
5.2.5. Immunostaining assays – Immunolabelling of biomarkers .................................................180
5.2.5.1. Cell proliferation and regeneration (PCNA) .....................................................................181
5.2.5.2. Programmed cell death or apoptosis (TUNEL) ................................................................182
5.2.5.3. Eosinophilic granule cells (Active Caspase-3) .................................................................183
5.2.5.4. T-cell-like cells (CD3ε)......................................................................................................184
5.2.5.5. Mobilisation of stress related proteins for regenerative processes (HSP 70) ..................185
5.2.5.6. Facilitation of nutrient uptake and ion transport (Na+K
+-ATPase) ....................................185
5.2.6. Digital image acquisition .....................................................................................................187
5.2.7. Quantitative image analysis of immunological labelling .....................................................187
5.2.8. Statistical analysis...............................................................................................................190
5.3. Results ...................................................................................................................................190
5.3.1. Intestinal histomorphology ..................................................................................................190
5.3.2. Biomarker immunolabelling – visual observations of labelling pattern ...............................191
5.3.2.1. Cell proliferation and regeneration (PCNA) .....................................................................191
5.3.2.2. Programmed cell death or apoptosis (TUNEL) ................................................................194
5.3.2.3. Eosinophilic granule cells (Active Caspase-3) .................................................................194
5.3.2.4. T-cell-like cells (CD3ε)......................................................................................................197
5.3.2.5. Mobilisation of stress related proteins for regenerative processes (HSP 70) ..................199
5.3.2.6. Facilitation of nutrient uptake and ion transport (Na+K
+-ATPase) ....................................200
5.3.3. Quantitative image analysis of immunohistological labelling ..............................................201
5.3.3.1. Cell proliferation and regeneration (PCNA) .....................................................................201
5.3.3.2. Programmed cell death or apoptosis (TUNEL) ................................................................203
5.3.3.3. Eosinophilic granule cells (Active Caspase-3) .................................................................205
5.3.3.4. T-cell-like cells (CD3ε)......................................................................................................206
5.4. Discussion .............................................................................................................................206
5.4.1. Cell proliferation and regeneration (PCNA) ........................................................................208
5.4.2. Programmed cell death or apoptosis (TUNEL) ...................................................................209
5.4.3. Eosinophilic granule cells (Active Caspase-3) ....................................................................210
5.4.4. T-cell-like cells (CD3ε) ........................................................................................................213
5.4.5. Mobilisation of stress-related proteins for regenerative processes (HSP 70) ......................213
5.4.6. Facilitation of nutrient uptake and ion transport (Na+K
+-ATPase) ......................................215
5.4.7. Technical pitfalls potentially affecting the immunolabelling ................................................216
5.4.8. Quantification of immunohistolabelling ...............................................................................218

TABLE OF CONTENTS
PAGE | viii
5.4.9. Perspectives ....................................................................................................................... 220
5.5. General conclusions ............................................................................................................. 221
TECHNICAL NOTE B ............................................................................................................................. 222
6. CHARACTERISATION OF MAST CELLS / EOSINOPHILIC GRANULE CELLS IN THE
ATLANTIC SALMON INTESTINE
6.1. Introduction ........................................................................................................................... 229
6.2. Material and methods ........................................................................................................... 232
6.2.1. Histochemical and ultrastructural features of intestinal MCs / EGCs ................................ 232
6.2.1.1. Histology tissue samples ................................................................................................. 232
6.2.1.2. Histochemical staining ..................................................................................................... 233
6.2.1.3. Immunohistochemical labelling ........................................................................................ 233
6.2.1.4. Light microscopy examination ......................................................................................... 237
6.2.1.5. Immunofluorescent Antibody Test (IFAT) ........................................................................ 237
6.2.1.6. Confocal laser scanning microscopy (CLSM).................................................................. 238
6.2.1.7. Transmission electron microscopy (TEM) ....................................................................... 239
6.2.1.8. Immunogold labelling (IGL).............................................................................................. 240
6.2.2. Isolation and characterisation of intestinal MCs / EGCs .................................................... 241
6.2.2.1. Tissue sample collection .................................................................................................. 241
6.2.2.2. Isolation of MCs / EGCs .................................................................................................. 241
6.2.2.3. Electrophoresis and western blot .................................................................................... 243
6.3. Results .................................................................................................................................. 245
6.3.1. Anatomical distribution of MCs / EGCs .............................................................................. 245
6.3.2. Histochemical contents ...................................................................................................... 246
6.3.3. Ultrastructure morphology and cytochemistry .................................................................... 249
6.3.3.1. Isolation of intestinal granulocytes and immunoblotting characterisation ....................... 256
6.4. Discussion ............................................................................................................................. 257
6.5. General conclusions ............................................................................................................. 268
7. GENERAL SYNTHESIS
7.1. Introduction ........................................................................................................................... 273
7.2. General study aim ................................................................................................................. 274
7.3. Research approach ............................................................................................................... 275
7.4. Summary of study outcomes ................................................................................................ 276
7.5. Future considerations ........................................................................................................... 281
7.6. Adoption of the developed technology .................................................................................. 282
7.7. Concluding remarks .............................................................................................................. 284
BIBLIOGRAPHIC REFERENCES ............................................................................................................... 287
APPENDIX 1 ......................................................................................................................................... 337
Stock solutions and buffers ............................................................................................................. 337
Histochemical staining protocols ..................................................................................................... 350
APPENDIX 2 ......................................................................................................................... 361
Image sequence generated by the image processing and analysis semi-automates system ........ 361

PAGE | ix
LIST OF FIGURES
Figure 1.1. Gastrointestinal tract of Atlantic salmon illustrating the different intestinal segments ....... 4
Figure 1.2. The organisation of the tissue layers in the teleosts’ gastrointestinal tract ....................... 6
Figure 1.3. Scanning electron microscope (SEM) micrographs of the midgut from Atlantic salmon,
showing the luminal appearance of the mucosal folds ...................................................... 7
Figure 1.4. Photomicrographs of the Atlantic salmon distal intestine illustrating the general tissue
organisation and the morphological tissue variations encountered across two different
histological grades: normal morphology, moderate inflammation to severe enteritis ........ 9
Figure 1.5. Digital-scan photomicrographs of transverse sections of the intestinal tract of Atlantic
salmon, stained with haematoxylin-eosin and with a combination of haematoxylin-eosin
and Alcian blue 8 G .........................................................................................................10
Figure 1.6. Transmission electron microscope micrographs of the midgut from Atlantic salmon,
showing apical cytoplasm of absorptive cells ..................................................................11
Figure 1.7. Schematic diagram showing the intestinal transepithelial transport occurring in fish
intestines ..........................................................................................................................15
Figure 2.1. Images from Atlantic salmon distal intestine specimens showing the morphological
tissue variations encountered across three different histological grades: normal
morphology, mild to moderate inflammation and severe enteritis ...................................39
Figure 2.2. Digitised histological image of distal intestine tissue from Atlantic salmon, at
successively higher magnifation ......................................................................................40
Figure 2.3. Flow diagram illustrating the sequence of image processing, for the proposed image
analysis system ...............................................................................................................41
Figure 2.4. Images generated by the described image analysis algorithms, from which
morphometric features were extracted and employed to quantify the phenotypic
appearance of the specimen’s distal intestine .................................................................44
Figure 2.5. Images generated by the described image analysis algorithms, from which
morphometric features were extracted and employed to quantify the phenotypic
appearance of the specimen’s distal intestine .................................................................45
Figure 2.6. Geometric and shape feature measurements employed in the study .............................46
Figure 2.7. Schematic diagram of the box-counting method used to estimate fractal dimensions ...47
Figure 2.8. Images from Atlantic salmon distal intestine sections used in the comparison of results
derived from the automatic algorithm system, against the manual measurements
obtained by an expert histopathologist ............................................................................58
Figure 2.9. Scatter plots for the performance analysis results obtained by the proposed interactive
image analysis system and an open source image analysis software ............................60
Figure 3.1. Flow chart illustrating the sequence of image processing algorithms .............................98

LIST OF FIGURES
PAGE | x
Figure 3.2. Image outputs generated by the described image analysis algorithms, from which
morphometric features were extracted and employed to quantify aspects of the
specimen’s distal intestine ............................................................................................ 100
Figure 3.3. Effect of feeding the different experimental diets to Atlantic salmon on the mean
differential leucocyte cell percentage ............................................................................ 106
Figure 3.4. Respiratory burst activity of head kidney macrophages from Atlantic salmon stimulated
with 1 mg.mL-1
NBT containing 1 µg.mL-1
PMA, that were fed the different experimental
diets ............................................................................................................................... 107
Figure 3.5. Light micrograph of Atlantic salmon head kidney macrophage cells ............................ 107
Figure 3.6. Phagocytic ability of macrophages from head kidneys of Atlantic salmon fed different
experimental diets ......................................................................................................... 108
Figure 3.7. Phagocytic activity and the phagocytic index of macrophages from head kidneys of
Atlantic salmon fed different experimental diets ........................................................... 109
Figure 3.8. Representative images of morphological variations encountered across the distal
intestine of Atlantic salmon fed different experimental diets ......................................... 109
Figure 3.9. Component plot of the multivariate principal component analysis for the intestinal
morphological features measured in Atlantic salmon fed different treatment diets ...... 115
Figure 4.1. Chart of the main components involved in image analysis of the distal intestine
morphometrics of Atlantic salmon ................................................................................. 144
Figure 4.2. Images of morphological variations encountered across the distal intestine of Atlantic
salmon fed different experimental diets ........................................................................ 147
Figure 4.3. Correlations between the different morphological parameters detailed for the
quantitative assessment analysis .................................................................................. 151
Figure 4.4. Correlations between the different morphological parameters detailed for the
quantitative assessment analysis .................................................................................. 152
Figure 4.5. Component plot of the multivariate principal component analysis and corresponding
loading weights, for the intestinal morphological features measured in Atlantic salmon
fed different treatment diets .......................................................................................... 154
Figure 4.6. Factor plots of the multivariate principal components analysis for the intestinal
morphology of Atlantic salmon fed different treatment diets ......................................... 156
Figure 4.7. Scatterplot of the canonical scores and corresponding dietary group centroids, for a pair
of discriminant functions, based on 9 morphometric features ...................................... 157
Figure 4.8. Correlations between the different morphological parameters detailed for the
quantitative image analysis and the semi-quantitative scoring assessments ............... 160
Figure 5.1. Image outputs generated by the described image analysis algorithms, from which
morphometric features were extracted and employed to quantify and characterise
specific immunohistochemical biomarkers in the specimen’s distal gut ....................... 189

LIST OF FIGURES
PAGE | xi
Figure 5.2. Representative images of morphological variations encountered across the distal
intestine of Atlantic salmon fed different experimental diets .........................................191
Figure 5.3. Immunohistochemical detection of proliferating cell nuclear antigen in distal intestinal
tissue sections of Atlantic salmon fed either a fish meal based control diet, a diet
containing 25 % defatted soybean meal or a diet with inclusion of immunostimulant
ingredients .....................................................................................................................193
Figure 5.4. Apoptosis labelled by a TUNEL assay in distal intestinal tissue sections of Atlantic
salmon fed either a fish meal based control diet, a diet containing 25 % defatted
soybean meal or a diet with inclusion of immunostimulant ingredients .........................195
Figure 5.5. Immunostained eosinophilic granule cells in distal intestinal tissue sections of Atlantic
salmon fed either a ish meal based control diet, a diet with inclusion of immunostimulant
ingredients or diet containing 25 % defatted soybean meal ..........................................195
Figure 5.6. Immunoreactivity to the antibody directed against a CD3ε epitope. Immunoreactive cells
exhibit a pattern suggestive of cell membrane or cytoplasmic staining ........................198
Figure 5.7. Immunohistochemical localisation of heat shock protein 70 immunoreactive cells
recognised by an antibody, which labels both the constitutive and inducible forms of
HSP 70 in various tissues ..............................................................................................199
Figure 5.8. Immunohistochemical detection of Na+K+-ATPase immunoreactive cells recognised by
an antbody against the conserved α-subunit region, in seawater-adapted Atlantic
salmon gill, kidney and intestinal tissue sections ..........................................................200
Figure 5.9. Immunoreactive indices of the histolabelling with four distinct biomarkers, performed in
distal intestinal histological sections from Atlantic salmon fed different experimental diets
.......................................................................................................................................202
Figure 5.10, Immunoreactive indices and relative staining intensity of histolabelling with four distinct
biomarkers, performed in distal intestinal histological sections from Atlantic salmon fed
different experimental diets............................................................................................203
Figure 5.11. Schematic description of a TMA slide ...........................................................................220
Figure 6.1. Granule cells resembling mammalian MCs / EGCs, found in the distal intestine of
Atlantic salmon between the circular muscle layer and the stratum compactum, but also
scattered in the lamina propria and in connective tissue strands of the mucosal folds.
Transverse intestinal sections were stained with either haematoxylin and eosin or a
combination of haematoxylin-eosin and Alcian blue .....................................................245
Figure 6.2. The granules of MCs / EGCs in the distal intestine of Atlantic salmon stained with
different dyes and chromogens .....................................................................................246
Figure 6.3. Photomicrographs of normal distal intestine of Atlantic salmon, showing MCs / EGCs
lying along the stratum granulosum adjacent to the stratum compactum. Transverse
sections were stained with haematoxylin and eosin, haematoxylin-erythrosin-safran,
thionin and Azur A .........................................................................................................247

LIST OF FIGURES
PAGE | xii
Figure 6.4. Photomicrographs of normal distal intestine of Atlantic salmon, showing MCs / EGCs
lying along the stratum granulosum adjacent to the stratum compactum. Transverse
sections were stained with May-Grünwald-Giemsa, toluidine blue, periodic acid Schiff
and haematoxylin, periodic acid Schiff and Alcian blue, haematoxylin-eosin-Alcian blue
and Astra blue ............................................................................................................... 248
Figure 6.5. Photomicrographs showing immunohistochemical labelling of MCs / EGCs using
different antibodies, either in distal intestinal tissue sections of Atlantic salmon or in
mammalian positive control tissue sections known to express the antigens of interest249
Figure 6.6. Atlantic salmon distal intestine MCs / EGCs, staining positively for an antibody directed
against a peptide from the p17 fragment of human caspase-3 .................................... 252
Figure 6.7. Electron micrograph of MCs / EGCs from the distal intestine of Atlantic salmon ......... 253
Figure 6.8. Confocal micrographs showing the immunolocalisation of MC / EGC granules from the
distal intestine of Atlantic salmon, incubated with a caspase-3 FITC-conjugated antibody
and counterstained with a red nuclear stain ................................................................. 254
Figure 6.9. Ultrastructural immunogold labelling of Atlantic salmon intestinal MC / EGC granules,
using a gold-covalently-conjugated antibody directed against a peptide from the p17
fragment of human caspase-3 ...................................................................................... 255
Figure 6.10. Photomicrographs representative of each of the cell fractions recovered from the distal
intestine of Atlantic salmon by means of a Percoll® step gradient centrifugation using
densities of 1.060, 1.070, 1.085, 1.108 and 1.118 g.mL-1
............................................. 256

PAGE | xiii
LIST OF TABLES
Table 1.1. Types of assessment employed in nutritional studies of fish, and their level of suitability
.........................................................................................................................................22
Table 2.1. Image size and resulting image file size of 24-bit digital TIFF images, captured at
different magnifications ....................................................................................................51
Table 2.2. List of measured morphological parameters and computed morphometric ratios used in
the analysis ......................................................................................................................54
Table 2.3. Total mean processing time required to accomplish the intended assessment tasks, by
means of manual, interactive or automated threshold methods for mucous cell
assessment ......................................................................................................................56
Table 2.4. Correlations between measurements derived by using manual, interactive or automated
threshold methods, for mucous cell assessment.............................................................57
Table 2.5. Reproducibility of the semi-automated image analysis system, accounting for intra- and
inter-operator variation .....................................................................................................62
Table 3.1. Formulation and proximate chemical composition of the feeds used in this experimental
study ................................................................................................................................92
Table 3.2. Growth response and feed efficiencies for Atlantic salmon fed the experimental diets.
.......................................................................................................................................103
Table 3.3. Haematological profiles for Atlantic salmon fed the experimental diets ........................105
Table 3.4. Morphometric assessment of the distal intestine from Atlantic salmon fed the
experimental diets ..........................................................................................................112
Table 3.5. Factor loading weights and component score coefficients derived from principal
component analysis, regarding morphometric features measured in the distal intestine of
Atlantic salmon fed with the experimental diets .............................................................114
Table 4.1. Formulation and proximate chemical composition of the feeds used in this experimental
study ..............................................................................................................................138
Table 4.2. Semi-quantitative scoring system according to Knudsen et al. (2008), using different
parameters to assess the degree of histomorphological changes induced by soybean
meal in the distal intestine of Atlantic salmon ................................................................141
Table 4.3. List of measured morphological parameters and computed morphometric ratios used in
the quantitative image analysis approach .....................................................................143
Table 4.4. Semi-quantitative histological assessment of the intestinal sections and schematic
overlapping-ranges of averaged summary scores, for fish fed the different experimental
diets ...............................................................................................................................146
Table 4.5. Quantitative image analysis histological assessment of the intestinal sections ............149
Table 4.6. Percentage of predicted classifications based on the discriminant function scores given
to each individual fish fed the distinct experimental diets ..............................................158
Table 5.1. Summary of immunostaining protocols used in this study ............................................186
Table 6.1. Histochemical methods employed in the evaluation of intestinal mast cells / eosinophilic
granule cells from Atlantic salmon .................................................................................233
Table 6.2. Summary of immunohistochemical staining protocols employed in the evaluation of
intestinal mast cells / eosinophilic granule cells from Atlantic salmon...........................234

PAGE | xiv
ABBREVIATIONS LIST
% Percent sign
Af Main axis of an ellipse
AI Anterior intestine sample
Alb Albumin
AMPs Antimicrobial peptides
ANFs Anti-nutritional factors
ANOVA Analysis of variance
ARC Aquaculture research centre
BBM Brush border membrane
Bf Minor axis of an ellipse
BLM Basolateral membrane
BSA Bovine serum albumin
CD Cluster of differentiation
CD3ε T-cell surface glycoprotein cluster of differentiation epsilon chain
c-kit Transmembrane tyrosine kinase receptor kit
CLSM Confocal laser scaning microscope
cm Centimetre
CRP C-reactive protein
CT (or) Ct Thickness of the connective tissue between the base of the mucosal folds and
the stratum compactum
CTb Collecting tubules
d Day
dg decigram
DAB 3,3'-Diaminobenzidine
DI Distal intestine sample
dL Decilitre
DNA Deoxyribonucleic acid
DT Distal tubule
DTT Dithiothreitol
e.g. Exempli gratia: “for example”
EDTA Ethylenediaminetetraacetic acid
EGCs Eosinophilic granule cells
ELISA Enzyme linked immune-sorbent assay
En Intestinal enterocytes
Epi Epidermis
Epub Electronic publication
et al. Et alia: “and others”
etc. Et cetera: “and other things”
F Statistical F-value

ABBREVIATIONS LIST
PAGE | xv
FAO Food and agricultural organisation
FCR Feed conversion rate
FcRs Cellular receptors for immunoglobulins
FI Feed intake
FITC Fluorescein isothiocynate
fL Femtolitre
FL Fork length
FR Fractal dimension of the perimeter line from the luminal surface
g Gram
GALT Gut associated lymphoid tissue
GB Gigabytes
GI Gastrointestinal
GILT Interferon-gamma-inducible lysosomal thiol redutase
GL Glomerulus
GLM General linear model
GLMM General linear mixed model
h Hours
H&E Haematoxylin and eosin
HES Haematoxylin-erythrosin-safran
H2O Water
H2O2 Hydrogen peroxidase
Hb Haemoglobin
HBSS Hank’s balanced salt solution
Hct Haematocrit
HIER Heat induced epitope retrieval
HLS Hue, lightness and saturation colour model
HRP Horseradish peroxidase
HSC Heat shock cognate protein (a constitutively expressed molecular chaperone)
HSP Heat shock protein
i.a. Inter alia: “among other things”
i.e. Id est: “that is to say”
IFAT Indirect fluorescent antibody test
IFN Interferon
Ig Immunoglobulin
IGL Immunogold labelling
IHC Immunohistochemistry
IL Interleukin
Imm Immunostimulants
IoA Institute of Aquaculture
K Condition factor
kg Kilogram

ABBREVIATIONS LIST
PAGE | xvi
kv Kilovolts
L Litre
LB Lobule of epithelial cells from cutaneous tumour
LM Lumen
Log Logarithm
LP (or) Lp Lamina propria
LW Factor loading weight
Lys Lysozyme
M Molar
Mab Monoclonal antibody
MB Megabytes
MC Mucous cell
MC Ellipse Af Length of the main axis of an ellipse with the same geometric moment of inertia
as the mucous cell
MC Ellipse Bf Length of the secondary axis of an ellipse with the same geometric moment of
inertia as the mucous cell
MC Ellipse Ratio Ratio of the elliptical lengths Af and Bf for the mucous cell
MC Feret Max Mucous cell maximum Feret length
MC Feret Min Mucous cell minimum Feret length
MC Feret Ratio Ratio of the mucous cell Feret lengths
MCA Mucous cell total area
MCA / [MTA-Vac] Ratio between mucous cell total area and the MTA without the vacuolisation
area
MCA / MTA Ratio between the mucous cell area and the mucosal tissue area
MCH Mean corpuscular haemoglobin
MCirc Mucous cell mean circularity index
MCMC Markov Chain Monte Carlo
MCN Mucous cell number
MCN / [MTA-Vac] Ratio between mucous cell number and the MTA without the vacuolisation area
MCN / MTA Ratio between the mucous cell number and the mucosal tissue area
MCs Mast cells
MCT Mast cell tryptase
MCV Mean corpuscular volume
MF Mucosal fold
MF Area Total mean area of four simple mucosal folds
MF Ellipse Af Mean length of the main axis of the ellipses with the same geometric moment of
inertia as four of the simple mucosal folds
MF Ellipse Bf Mean length of the secondary axis of the ellipses with the same geometric
moment of inertia as the four of the simple mucosal folds
MF Ellipse Ratio Mean ratio of the elliptical lengths Af and Bf for four simple mucosal folds
MF Feret Max Maximum Feret lengths mean of four simple mucosal folds

ABBREVIATIONS LIST
PAGE | xvii
MF Feret Min Minimum Feret lengths mean of four simple mucosal folds
MF Feret Ratio Mean ratio of the Feret lengths of four simple mucosal folds
MF Perimeter Total mean perimeter length of four simple mucosal folds
mg Milligram
MGG May-Grünwald-Giemsa
MHz Megahertz
Mi Mitochondria
MI Mid intestine sample
Min Minute
mL Millilitre
ML Mucosal tissue layer
mM Millimolar
MMCA Mean mucous cell area
mRNA Messenger ribonucleic acid
MRXS Image file created by MIRAX-compatible microscope digital slide scanners such
as the Carl Zeiss MIRAX series; multi-file JPEG with proprietary metadata and
indexes.
MTA Mucosal tissue area
MTA / STA Ratio between the mucosal tissue area and the submucosal tissue area
MTA-Vac MTA without the vacuolisation area
MUC Remaining mucosal area
MV Microvilli
MyD Myeloid differentiation primary response gene
n (or) Nº (or) No. Number
N.A. Non applicable
Na+K
+-ATPase Sodium-potassium adenosine triphosphatase
NBT Nitro blue tetrazolium
NCR National research council
NGS Normal goat serum
NIRS Near infrared reflectance spectroscopy
nm Nanometer
ºC Degree Celsius
OD Optical density
P Total perimeter length of the luminal surface
P / MTA Ratio between total perimeter length of the luminal surface and mucosal tissue
area
PA Phagocytic activity
Pab Polyclonal antibody
PAR Protease-activated receptor
PAS Periodic-Acid-Schiff
PBS Phosphate buffered saline solution

ABBREVIATIONS LIST
PAGE | xviii
PC Phagocytic capacity
PCA Principal component analysis
PCNA Proliferating cell nuclear antigen
PCR Polymerase chain reaction
PF Primary gill lamellae
pg Picograms
pH In chemistry is a measure of the acidity or basicity of an aqueous solution
PI Phagocytic index
pi Mean pixel intensity
PMA Phorbol-12-myristate 13-acetate
PT Proximal convoluted tubules
px Pixel
r Correlation co-efficient
R2 Square of the correlation coefficients
RAM Random access memory
RAPD Random amplified polymorphic deoxyribonucleic acid
RBC Red blood cells
RFLP Restriction fragment length polymorphism
RGB Red, green and blue colour model
RNA Ribonucleic acid
ROI Region of interest
RT Room temperature
SB (or) SBM Soybean (or) Soybean meal
SC Component score coefficient
Sc Stratum compactum
SD Standard deviation
SDS-PAGE Sodium dodecyl sulphate – polyacrylamide gel electroforesis
sec Seconds
SEM Scanning electron microscopy
Sg Stratum granulosum
SG Sweat glands
SGR Specific growth rate
SL Primary gill lamellae
SML Submucosa tissue layer
SS Soya saponin
STA Submucosal tissue area
SUB Submucosal area
SUP Above the stratum compactum
TBS Tris(hydroxymethyl)aminomethane buffered saline solution
TCR T-cell receptor
TEM Transmission electron microscopy

ABBREVIATIONS LIST
PAGE | xix
TGF Transforming growth factor
TGGE Temperature gradient gel electrophoresis
TIFF Tagged image file format
TJs Tight junctions
TMAs Tissue microarrays
TN Trypsin neutraliser buffered saline solution
TNPI TN buffer containing a protease inhibitor cocktail
TP Total protein
Tris-HCl Tris(hydroxymethyl)aminomethane hydrochloride buffered saline solution
TUNEL Terminal deoxynucleotidyl transferase dUTP nick end labelling
U Unit
UK United Kingdom
USA United States of America
V Volts
v / v Volume / volume
Vac Supranuclear vacuoles
VC Vacuolisation total area
VC / MTA Ratio between the total vacuolisation area and the mucosal tissue area
vs. Versus: “as oppose to; opposite”
w / v Weight / volume
WBC White blood cells
Wt Weight gain
mg Microgram
μL Microliter
Μm Micrometre
μM Micromolar
ρ Rho, symbol for density
Χ2 Statistical test using chi-squared distribution

PAGE | xx
ABSTRACT
The intestinal tract of salmonids provides a dynamic interface that not only mediates
nutrient uptake but also functions as the first line of defence against ingested pathogens.
Exposure of the immune system to beneficial microorganisms and different dietary
immunostimulants via the intestine has been shown to prime the immune system and help
in the development of immune competence. Furthermore, the morphology and function of
teleostean intestines are known to respond to feed components and to ingested and
resident bacterial communities. Histological appraisal is still generally considered to be the
gold standard for sensitive assessment of the effects of such dietary modulation.
The aim of the present study was to improve understanding of salmonid intestinal
function, structure and dynamics and to use the knowledge gained to develop a model for
analysis, which would allow intestinal health to be assessed with respect to different
intestinal communities and feed components. Virtual histology, the process of assessing
digital images of histological slides, is gaining momentum as an approach to supplement
traditional histological evaluation methodologies and at the same time, image analysis of
digitised histological sections provides a practical means for quantifiable assessment of
structural and functional changes in tissues, being both objective and reproducible. This
project focused on the development of a rapid, practical analytical methodology based on
advanced image analysis, that was able to measure and characterise a range of features of
the intestinal histology of Atlantic salmon in a quantitative manner.
In the first research chapter, the development of a novel histological assessment
system based upon advanced image analysis was described, this being developed with the
help of a soybean feed model known to induce enteropathy in Atlantic salmon. This tool
targeted the evaluation of the extent of morphological changes occurring in the distal
intestine of Atlantic salmon following dietary modulation. The final analytical methodology
arrived at, could be conducted with minimal user-interaction, allowing rapid and objective
assessment of 12 continuous variables per histological frame analysed. The processing
time required for each histological frame was roughly 20-25 min, which greatly improved the

ABSTRACT
PAGE | xxi
efficiency of conducting such a quantitative assessment with respect to the time taken for a
subjective semi-quantitative alternative approach. Significant agreement between the fully
automated and the manual morphometric image segmentation was achieved, however, the
strength of this quantitative approach was enhanced by the employment of interactive
procedures, which enabled the operator / observer to rectify preceding automated
segmentation steps, and account for the specimen’s variations. Results indicated that
image analysis provided a viable alternative to a pathologist’s manual scoring, being more
practical and time-efficient.
In the second research chapter, feeding Atlantic salmon a high inclusion level of
unrefined SBM (25 %) produced an inflammatory response in the distal intestine as
previously described by other authors. The model feed trial successfully generated
differentiable states, although these were not, for the most part, systemically differentiable
through the majority of standard immunological procedures used, being only detectable
morphologically. Quantitation of morphometric parameters associated with histological
sections using the newly developed image analysis tool successfully allowed identification
of major morphological changes. Image analysis was thus shown to provide a powerful tool
for describing the histomorphological structure of Atlantic salmon distal intestine. In turn, the
semi-automated image analysis methods were able to distinguish normal intestinal mucosa
from those affected by enteritis. While individual parameters were less discriminatory, use
of multivariate techniques allowed better discrimination of states and is likely to prove the
most productive approach in further studies.
Work described in the third research chapter sought to validate the semi-automated
image analysis system to establish that it was measuring the parameters it was purported to
be measuring, and to provide reassurance that it could reliably measure pre-determined
features. This study, using the same sections for semi-quantitative and quantitative
analyses, demonstrated that the quantitative indices performed well when compared to
analogous semi-quantitative descriptive parameters of assessment for enteritis prognosis.
The excellent reproducibility and accuracy performance levels indicated that the image
ABSTRACT
PAGE | xxii
analysis system was a useful and reliable morphometric method for the quantification of SB-
induced enteritis in salmon. Other characteristics such as rapidity, simplicity and adaptability
favour this method for image analysis, and are particularly useful where less experienced
interpreters are performing the analysis.
The work described in the fourth research chapter characterised changes in the
morphology of the intestinal epithelial cells occurring as a result of dietary modulation and
aspects of inflammatory infiltration, using a selected panel of enzyme and IHC markers. To
accomplish this, image analysis techniques were used to evaluate and systematically
optimise a quantitative immunolabelling assessment protocol. Digital computer-assisted
quantification of labelling for cell proliferation and regeneration (i.e. PCNA); programmed
cell death or apoptosis (i.e. TUNEL); EGCs and t-cell like infiltrates (i.e. active caspase-3
and CD3 respectively); mobilisation of stress-related protein regenerative processes (i.e.
HSP 70) and facilitation of nutrient uptake and ion transport (i.e. Na+K+-ATPase) provided
encouraging results. Through the description of the intestinal cellular responses at a
molecular level, such IHC expression profiling further characterised the inflammatory
reaction generated by the enteropathic diet. In addition, a number of potential diagnostic
parameters were described for fish intestinal health e.g. the relative levels of antigenicity
and the spatial distribution of antigens in tissues.
Work described in the final research chapter focused on detailed characterisation of
intestinal MCs / EGCs in order to try to elucidate their functional role in the intestinal
immune responses. Through an understanding of their distribution, composition and
ultrastructure, the intention was to better characterise these cells and their functional
properties. The general morphology, histochemical characteristics and tissue distribution of
these cells were explored in detail using histochemical, IHC and immunogold staining /
labelling, visualised using light, confocal and TEM microscopy. Despite these extensive
investigations, their physiological function and the content of their granules still remain
somewhat obscure, although a role as immunodulatory cells reacting to various
exogeneous signals through a finely regulated process and comparable to that causing the

ABSTRACT
PAGE | xxiii
degranulation of mammalian MCs is suggested. The histochemical staining properties
demonstrated for salmonid MCs / EGCs seem to resemble those of mammalian mucosal
mast cells, with both acidophilic and basophilic components in their granules, and a granule
content containing neuromodulator / neurotransmitter-peptides such as serotonin, met-
enkephalin and substance-p. Consequently, distinguishable bio-chromogenic markers have
been identified that are of utility in generating a discriminatory profile for image analysis of
such cells. Haematoxylin-erythrosin-safran (HES) and May-Grünwald-Giemsa (MGG)
histochemical stains, and immunolabelling with anti-serotonin, met-enkephalin, substance-p
and caspases-3 / -7 antibodies proved informative.
PAGE | xxiv
LIST OF PUBLICATIONS
Da Silva, P., McGurk, C., Bron, J.E. (2014). “Description and development of a semi-
automated system to assess intestinal morphology of Atlantic salmon, based on advanced
image analysis” – Manuscript in Preparation.
Da Silva, P., McGurk, C., Jayasuryia, N., Knudsen, D., Bron, J.E. (2014). “Histological
evaluation of enteritis in Atlantic salmon: quantitative image analysis vs semi-quantitative
scores” – Manuscript in Preparation.
Da Silva, P., McGurk, C., Thompson, K.D., Adams, A., Mullins, J.E., Bron, J.E. (2014).
“Characterisation of mast cells / eosinophilic granule cells in the Atlantic salmon intestine” –
Short Communication in Preparation.
LIST OF CONFERENCE PROCEEDINGS AND CONFERENCE PROCEESINGS
Da Silva, P. (26th-28th November 2013). “Quantitative analysis approach to characterise
the effects of dietary components on intestinal morphology in Atlantic salmon”. Nutreco R&D
Science Conference, Cuijk, Netherlands – Poster Presentation.
Da Silva, P., McGurk, C., Thompson, K.D., Adams, A., Mullins, J.E., Bron, J.E. (14th
September 2013). “Development and validation of a semi-automated classification system,
involving advanced image analysis, for assessment of the effects of dietary components on
intestinal morphology of Atlantic salmon”. 16th International Conference on Diseases of Fish
and Shellfish, Tampere, Finland – Oral Presentation.
Da Silva, P., McGurk, C., Thompson, K.D., Adams, A., Mullins, J.E., Bron, J.E. (17th
April 2013). “Semi-automated classification system based on image analysis advanced
image analysis, for assessment of the effects of dietary components on intestinal
morphology of Atlantic salmon”. Skretting’s Nutrition and Fish Health Network Annual
Meeting, Verona, Italy – Oral Presentation.
Da Silva, P., McGurk, C., Thompson, K.D., Adams, A., Mullins, J.E., Bron, J.E. (13th
March 2013). “Histopathological evaluation of enteritis in Atlantic salmon: Quantitative
analysis VS Semi-quantitative scores”. Fish Veterinary Society Spring Meeting, Edinburgh,
UK – Oral Presentation.

LIST OF PUBLICATIONS AND CONFERENCE PROCEEDINGS
PAGE | xxv
Da Silva, P., McGurk, C., Thompson, K.D., Adams, A., Mullins, J.E., Bron, J.E. (24th
October 2012). “Semi-automated classification system based on image analysis to assess
the gut morphology of Atlantic salmon”. 3rd Biennal Postgraduate Research Conference,
Institute of Aquaculture University of Stirling, Scotland, UK – Oral Presentation.
Da Silva, P., McGurk, C., Thompson, K.D., Adams, A., Mullins, J.E., Bron, J.E. (14th
June 2012). “Semi-automated classification system based on image analysis to assess the
gut morphology of Atlantic salmon”. Skretting’s Aquaculture Research Centre, Stavanger,
Norway – Oral Presentation.
Da Silva, P., Thompson, K.D., Adams, A., Bron, J.E. (9th May 2012). “A novel image
analysis approach to characterise the effects of dietary components on intestinal
morphology and immune system in Atlantic salmon”. Institute of Aquaculture Lunchtime
Seminar Series, University of Stirling, Scotland, UK – Oral Presentation.
Da Silva, P., McGurk, C., Thompson, K.D., Adams, A., Mullins, J.E., Bron, J.E. (15th
Sept 2011). “Semi-automated classification system based on image analysis to assess the
gut morphology of Atlantic salmon”. 15th International Conference on Diseases of Fish and
Shellfish, Split, Croatia – Oral Presentation.
Da Silva, P. (16th Feb 2011). “Development of a gut model to examine the effect of
dietary components on Atlantic salmon”. Skretting’s Aquaculture Research Centre,
Stavanger, Norway – Oral Presentation.
Da Silva, P.,Thompson, K.D., Adams, A., Bron, J.E. (28th June 2010). “Development of
a gut model to examine the effect of dietary components on Atlantic salmon”. PhD Research
Conference, Institute of Aquaculture, University of Stirling, Scotland, UK – Poster
Presentation.
Da Silva, P.,Thompson, K.D., McGurk, C., Bron, J.E. (11-15th April 2010).
“Development of a gut model to examine the effect of dietary components on Atlantic
salmon”. 11th Fish Immunology Workshop, Wageningen Institute of Animal Sciences,
Netherlands – Poster Presentation.


1. CHAPTER 1
1. GENERAL INTRODUCTION
The global aquaculture industry sector is developing rapidly (FAO, 2012), and its major
economic losses have, to date, been primarily due to disease, which thus remains a key
constraint to its continued growth (Oliva-Teles, 2012). As the industry’s rate of expansion
intensifies, the benefits of high quality feeds, which offer enhanced fish growth and
improved disease resistance, become more apparent (Trichet, 2010). Hence, over the past
two decades there has been increased attention focusing on understanding the
relationships between dietary formulation, growth efficiency, the immune system, and
prevention / control of disease (Landolt, 1989; Lovell, 1998; Good, 2004; Bricknell & Dalmo,
2005; Ringø et al., 2012; inter alia). It is widely recognised that nutritional modulation can
enhance the fish’s immune system and have a profound effect on their growth (e.g. Zhou et
al., 2010; Dong et al., 2013). It is also accepted that besides satisfying the dietary nutrient
requirements for maximum growth, certain feed additives can provide increased
immunocompetence and in turn increased resistance to disease (e.g. Chang et al., 2012;
Awad et al., 2013; Bui et al., 2014). This highlights the complex interaction between fish
nutrition and fish health (Lim & Webster, 2001; Kiron, 2012).
1.1. Nutrition, feed and fish health
The role of dietary ingredients and selective additives on the function of the immune
system in fish has been investigated since the 1960s, and scientific evidence supports a
direct role for nutrients in providing important cofactors and regulators / augmentation of the
immune response (Blazer, 1992; Waagbø, 1994). Some of the dietary components that
have been investigated include ingredients aimed at enhancing the fish immune response
(e.g. yeast derived, ß-glucans, ω-3 fatty acids), stimulating the establishment of beneficial
gut microbes (e.g. probiotics and some types of prebiotics), stimulating digestive function
(e.g. butyric acid, glucuronic acid, lactic acid, glutamine, threonine, cysteine, and

CHAPTER 1
PAGE | 2
nucleotides) and reducing pathogen load in the gut (e.g. organic and inorganic acids,
essential oils, high levels of zinc oxide, herbs and spices, some types of prebiotics,
bacteriophages, and anti-microbial peptides) – Galeotti, 1998; Sakai, 1999; Gannam &
Schrock, 1999; Sahoo, 2007; Govind & Madhuri, 2012; inter alia. Overall, there are good
indications that changes in current dietary formulations, such as fortification of fish diets with
antioxidant vitamins, various protein and amino acids, lipids and essential fatty acids,
carbohydrates, minerals and dietary supplementation with non-nutritive immunostimulant
compounds, can increase immune function and disease resistance in fish, and may be a
cost effective means for reducing the levels of mortality in aquaculture due to disease
(Lovell, 1998; Sealey & Gatlin, 1999; Oliva-Teles, 2012). Therefore, by definition, such
dietary supplements can be considered as immunostimulants or otherwise functional
ingredients (i.e. products from natural or synthetic origin with different chemical
characteristics and mechanisms of action), that can be employed to enhance innate or non-
specific immune responses by interacting directly with cells and tissues mediating immunity
and activating them (Galindo-Villegas & Hosokawa, 2004).
The specific mode of action in fish of many of these ingredients is often difficult to fully
elucidate, partly due to the complex synergy and multi-factorial relationships between these
and other ingredients in the diet (Barker, 2000). Thus, much of our understanding of the
mechanisms behind functional ingredients comes from mammalian and avian studies.
Some of the modes of action suggested for functional ingredients in teleost fish include:
provision of a source of macro and / or micronutrients and enzymatic contribution to
digestion, action to improve gastric morphology, activities enhancing the immune response,
provision of inhibitory compounds (e.g. chemical substances that have a bactericidal or
bacteriostatic effect on microbial populations, which can alter interpopulation relationships
by influencing the outcome of competition for chemicals or available energy), inhibition of
virulence gene expression or disruption of quorum sensing (Galindo-Villegas & Hosokawa,
2004; Bricknell & Dalmo, 2005; Merrifield et al., 2010; Trichet, 2010). Extensive research is
nevertheless required to provide better comprehensive understanding of the mode of action

General introduction
PAGE | 3
of such dietary factors, and to measure and confirm the benefits accruing from their use in
fish. As better tools and biomarkers are developed, it should be feasible to assess the
benefits of use of these ingredients in a structured manner. Given increased knowledge
concerning mechanisms of action and improved techniques for assessing positive (and
negative) effects, the rational formulation of diets that modulate the immune system and
intestinal microflora, increasingly provides tools that may be employed in the
implementation of preventative health care strategies involving novel feeding practices
(Kiron, 2012).
1.2. Diet and the gastrointestinal tract of fish
The gastrointestinal tract is generally regarded in terms of its function as an organ of
digestion and absorption of nutrients, however, there is currently a great interest in this
organ with respect to its role as a physical and biochemical barrier to the exterior
environment, particularly in preventing attachment and invasion by pathogens, and as an
important immune organ (Urzúa, 2013). The nutritional composition of the fish’s diet and the
intestine’s commensal microflora are closely linked to the development and maintenance of
gastrointestinal structural integrity. One of the unintended consequences of dietary
modulation and the feeding strategies followed, can be the loss of intestinal integrity
(Domeneghini et al., 2006), causing enhanced epithelial permeability that may lead to
enhanced uptake of macromolecules, bacterial products and antigens across the
epithelium. The presence of potentially pathogenic enteric bacteria, the proliferation and
metabolic activity of which may perturb the digestive function, can in turn lead to reduced
performance and susceptibility to disease (Montagne et al., 2003). In addition, enteritis and
poor gut morphology can lead to inefficient feed conversion and at the same time the repair
of damaged enterocytes is an energy-consuming activity, which in turn directs valuable
resources from growth to more urgent tissue repair and maintenance (Sweetman et al.,
2008). Thus the interactions between nutrient uptake, intestinal microflora, gut morphology
and the immune system will have a major influence on the animal’s health and
performance. Therefore, diet formulation to support intestinal health is fast becoming an

CHAPTER 1
PAGE | 4
important consideration for the aquaculture industry, because improvement of intestinal
health is essential for the welfare and growth efficiency of fish, especially when suitable
chemotherapeutants are not available or are not permitted by local guidelines or legal
frameworks (Choct, 2009).
Although Atlantic salmon (Salmo salar, Linnaeus, 1758) is one of the major high-value
fish species produced in aquaculture, knowledge of its gastrointestinal responses is far from
adequate, especially given the potential such knowledge has for understanding diet-induced
pathophysiology, which leads to various intestinal disorders (Chikwati et al., 2013a).
Understanding the effects that dietary manipulation has on the intestine’s structure and
function should increase our knowledge concerning the mechanisms of action involved in
dietary manipulation.
1.3. Gastrointestinal tract structure in salmonids
The gastrointestinal tract (GI) of teleosts consists of several distinct regions that differ
morphologically and histologically, as well as having distinct physiological functions. The GI
tract can be divided into four distinct anatomical regions: the headgut, foregut, midgut and
hindgut (Harder, 1975; Wilson & Castro, 2011; Figure 1.1).
Pyloric stomach
Pyloric caeca
Midgut – 1st segment Midgut – 2nd segment
EsophagusCardiac stomach
Rectum
Foregut Hindgut
Proximal intestine Distal intestine
AI
MI DI
Figure 1.1. Gastrointestinal tract of Atlantic salmon illustrating the different intestinal segments (see
Figure 1.5 for respective micrograph sections). (AI) Anterior intestine sample. (MI) Mid intestine
sample. (DI) Distal intestine sample.
In most carnivorous fishes, including salmon, the GI is a relatively short and simple
tube extending from the headgut. The function of the headgut, is to acquire food and
mechanically process it. The food subsequently passes into the foregut, which comprises a

General introduction
PAGE | 5
short muscular oesophagus leading into a large U-shaped cardiac stomach, where
digestion occurs through chemical and mechanical breakdown of the food. The cardiac
sphincter defines the anterior limits of the stomach in the same way that the pyloric
sphincter defines the posterior extremity, both controlling the rate at which the digesta are
released into the next segment, located just posterior to the stomach. This segment is the
midgut or intestine, beginning with a cluster of finger-like projections called the pyloric
caeca, which provide additional surface area for absorption and may also perform more
specialised functions. The midgut displays a short bend at its anterior end and accounts for
the greatest proportion of the GI length, being the principal site of chemical digestion and
absorption. The final section of the GI is the hindgut, which includes the rectum, a straight
tube to the vent or anus (Burnstock, 1959; Yasutake & Wales, 1983; Guillaume & Choubert,
2001; Rust, 2002; Løkka et al., 2013).
Despite the various specialised regions of the GI tract, cross-sectional tissue
organisation remains fairly similar throughout the tract (Jutfelt, 2006). The teleost’s GI wall
from foregut to hindgut consists of four concentric tissue layers: (1) the tunica mucosa,
comprising the epithelium and the lamina propria, vascularised connective tissue containing
nerves and leucocytes. The epithelium serves as a selectively permeable membrane that
separates the body from the external environment (lumen). Additionally, the capillaries
present in the lamina propria allow the exchange of materials between the host and the
outside environment, using the former epithelium as the site of exchange. (2) The
submucosa, an additional connective tissue layer penetrated by nerves and blood vessels
that supports the mucosa. (3) The tunica muscularis consisting of circular and longitudinal
layers of either striated or smooth muscle, vital for the segmental contractions that mix food
items and the peristaltic contractions that propel the chyme in a distal direction. (4) The
tunica serosa corresponds to an assemblage of mesothelial cells and loose connective
tissue containing blood vessels that cover the alimentary canal and other viscera lying
within the peritoneal cavity (Buddington & Kuz’mina, 2000; Good, 2004; Wilson & Castro,
2011; Urzúa, 2013; Figures 1.2 and 1.4).

CHAPTER 1
PAGE | 6
Mesentery
Visceral peritoneum
Longitudinal muscle
Circular muscle
Muscularis mucosa
Submucosa
Columnar epithelium
Lamina propria
Serosa
Lumen
Figure 1.2. The organisation of the tissue layers in the teleosts’ gastrointestinal tract (adapted from
Buddington & Kuz’mina, 2000).
1.3.1. Intestinal macroscopic anatomy
The intestine of salmonid species is generally divided into two main regions: the
upper anterior portion (also called the small, ascending, ileum, midgut or proximal
intestine), and the lower posterior portion (also called the large, descending, rectum,
hindgut or distal intestine) (Hibiya et al., 1982; Yasutake & Wales, 1983; Rust, 2002). The
terminology used by fish anatomists to describe the intestine segments is therefore
inconsistent (Guillaume & Choubert, 2001). As a result, sections described as anterior,
middle and posterior intestine; duodenum, jejunum and ileum often have different
meanings depending on the author. This confusion arises mainly from the absence of
obvious external anatomical landmarks, which makes the interpretation from different
publications challenging. Nevertheless, for this study authors such as Van den Ingh et al.
(1991), Baeverfjord & Krogdahl (1996), Krogdahl et al. (2003), Sanden et al. (2005),
Bakke-McKellep et al. (2007a), Knudsen et al. (2008) and Penn et al. (2011) were
followed, in naming the anterior portion the “proximal” and the posterior portion the “distal”
intestine. Based on the external gross anatomy, the proximal region is more slender and
its anterior part has generally 50-70 pyloric caeca, while the distal region is radially larger,

General introduction
PAGE | 7
darker and with externally visible transverse blood vessels (Burnstock, 1959; Sundh,
2009; Løkka et al., 2013; Figure 1.1). Internally, the surface area of the intestinal mucosa
is arranged and expanded through a series of folds. However, due to the lack of the
typical crypt structure in comparison to the mammalian intestine, the terms mucosal or
villous folds are currently used to refer to teleosts’ epithelial folding (Jutfelt, 2006). The
innumerable mucosal folds impart a velvety appearance to the mucosa (Figure 1.3).
MF
MF
MF
MF
SML
SML
Figure 1.3. Scanning electron microscope (SEM) micrographs of the midgut from Atlantic salmon,
showing the luminal appearance of the mucosal folds (MF). Note that intestine samples have an
attached muscularis mucosa and so when in fixative solution they tend to curl up with their luminal
mucosa outwards (ML, Mucosa tissue layer). (SML) Submucosal tissue layer.
The depth and complexity of the folds varies across the different regions of the intestine
(Bruno & Poppe, 1996; Buddington & Kuz’mina, 2000). In the first segment of the proximal
intestine the folds are irregular and are longitudinally orientated, and where caeca are
present, small parallel folds can be seen longitudinally orientated along the length of the
caecum. In the same intestinal region, where it is devoid of caeca, the folds have no
particular direction of orientation. In most of the anterior region of the distal intestine, large
circular and complex folds can be seen oriented transversely with respect to the tract
(asterisk in Figure 1.5 C), with simple folds lying in between those oriented longitudinally
with respect to the tract (arrow in Figure 1.5 C). In the posterior region of the tract, there is a
gradual transition from the large circular folds, similar to those seen in the previous region,
to smaller folds with an irregular pattern of folding (Løkka et al., 2013).

CHAPTER 1
PAGE | 8
1.3.2. Intestinal microscopic anatomy
The basic histology of the Atlantic salmon was first described in detail by Gulland
(1898) and has recently been comprehensively reviewed by Løkka et al. (2013). The
intestinal epithelium of salmonids consists of a single-cell layer of columnar absorptive cells
(enterocytes) with a distinctive apical brush border (BBM, Figure 1.6), which greatly extends
the surface of the apical membrane, increasing the area available for absorption and
exposure of membrane-bound digestive and absorptive enzymes (Jutfelt, 2006; Rust,
2002). The enterocytes are generally tall and narrow, with an elongated nucleus located just
below the middle of the cell and are attached to the connective tissue layer of the basement
membrane. Although relatively homogeneous in appearance, they show regional
differentiation, and in the distal intestine, absorptive cells with larger vacuoles in the apical
region are observed (Yamamoto, 1966; Ezeasor & Stokoe, 1981).
Interspersed among the enterocytes are goblet-type mucous cells (Figure 1.4 [4]),
which are filled with secretory granules mainly comprising acidic sialomucin
mucosubstances, although they also contain smaller amounts of sulfomucins (Wilson &
Castro, 2011). The mucus secreted by these cells and other digestive secretions forms a
boundary layer that covers the epithelium and is referred to as a glycocalyx (Buddington &
Kuz’mina, 2000; Figure 1.6). Other cell types present in between the absorptive enterocytes,
especially in the basal region, include immune-associated cells (e.g. lymphocytes and
macrophages), and cells containing cytoplasmic granules which appear to have secretory
functions i.e. eosinophilic granule cells (Holmgren & Olsson, 2009).
Underlying the simple columnar epithelium is the lamina propria, a layer that is largely
comprised of a capillary network embedded in connective tissue (Sundh, 2009; Figure 1.4
[8]). Embedded in the lamina propria is the prominent stratum compactum (Figure 1.4 [5]), a
thick, often folded, layer of non-cellular fibrous material. Under this, is a layer of granule
cells (stratum granulosum; Figure 1.4 [6]), which can vary in thickness within the same
section (Jutfelt, 2006). The remainder of the lamina propria is composed of collagenous
tissue which merges with the inner region of the muscular layer (Figure 1.4 [7 and 8]),

General introduction
PAGE | 9
consisting of a thick inner circular region separated from a thin, outer longitudinal region by
a layer of connective tissue of varying thickness (Bullock, 1963; Figure 1.2).
A
1
2
4
7
5
6
3
I
II
98
B
1
2
4
9
7
5
6
3
I
II
8
Figure 1.4 Photomicrographs of the Atlantic salmon distal intestine illustrating the general tissue
organisation and the morphological tissue variations encountered across two different histological
grades: (A) normal morphology, (B) moderate inflammation to severe enteritis. (I) Mucosa (II)
Submucosa1 (1) Lumen (2) Columnar epithelium (3) Lamina propria (4) Mucous cell (5) Stratum
compactum (6) Stratum granulosum (7) Circular muscle (8) Longitudinal muscle (9) Serosa.
Transverse intestinal sections were stained with a combination of haematoxylin-eosin and Alcian
blue 8 GX.
1 Term commonly used in all fishes, although technically a submucosa is only present in the groups with a mucosal
smooth muscle layer, which excludes the teleost fish (Burnstock, 1959; Wilson & Castro, 2011). However, throughout
this thesis, the muscle layer contributing to the longitudinal primary folds has been described as muscularis mucosa,
whereas the layer of connective tissue separating this musculature from the muscularis has been designated
submucosa, as recently described in the review of Løkka et al. (2013).

CHAPTER 1
PAGE | 10
In the proximal intestine, the epithelium and the lamina propria are organised into small
folds, which have a tendency to branch. The stratum compactum and stratum granulosum
are not part of the folds but rather organised underneath them (Figure 1.5 A). Along the
anterior region of the distal segment, complex circular folds comprise the epithelium, lamina
propria, and a core of circularly-arranged smooth musculature, whereas the stratum
compactum extends a short distance into the base of such folds. The secondary folds of the
complex folds and the simple folds (triangles and arrow in Figure 1.5 C, respectively) are
comprised of epithelium and lamina propria (Figure 1.5 C). The folds at the end of this
segment have the same histological arrangement as in the proximal intestine, although they
are a bit more irregular in appearance (Løkka et al., 2013).
Lastly, the perimeter of the intestine is covered by the serosa, which is a thin layer of
connective tissue continuous with the mesenteric tissue, and may contain adipose tissue
and blood vessels (Bullock, 1963; Figure 1.4 [9]).
A B C
*
500 µm500 µm500 µm
∆
∆
SMLSML
SML
MLML
MF
MF ML
Figure 1.5. Digital-scan photomicrographs of transverse sections of the intestinal tract of Atlantic
salmon, stained with haematoxylin-eosin (A & B) and with a combination of haematoxylin-eosin and
Alcian blue 8 GX (C). (A) Section from the anterior region of the proximal intestine, with pyloric
caeca. (B) Section from the posterior region of the proximal intestine. (C) Section from anterior region
of the distal intestine with complex (asterisk) and simple mucosal folds (arrow). The complex folds
are organised into simple secondary folds (triangles). (ML) Mucosal tissue layer. (SML) Submusocal
tissue layer. (MF) Mucosal folds.

General introduction
PAGE | 11
1.3.3. Intestinal surface area
Salmonids and some other teleost fish have specialised anatomical structures called
pyloric caeca (Figure 1.1) that are blind diverticuli of the most anterior (proximal) part of the
intestine, and are considered to be an extension to the surface area of intestine, the
purpose of which is to increase the absorptive surface area of the digestive tract (Guillaume
& Choubert, 2001). Similarly, the mucosa of the intestine is arranged into complex folds,
which greatly increase the total intestinal surface area, compared to that of a smooth bore
layer (Buddington & Kuz’mina, 2000). Additionally, the enterocyte cellular membrane that
borders the lumen is highly folded into thousands of microvilli (Figure 1.6) forming an apical
brush border that increases the exposed area, relative to areas with unfolded membranes
(Buddington et al., 1997; Rust, 2002). The stated consequence of these distinctive
structural arrangements is that they can accommodate much more membrane than flat
surfaces and have much greater capacity for accommodating various cell types, membrane-
bound transporters and channels that endow the intestinal epithelium with its multifunctional
properties.
A B
BLM
LM
LM
MV
MV
+ +En
Mi
Mi
En
BBM
Figure 1.6. Transmission electron microscope (TEM) micrographs of the midgut from Atlantic salmon,
showing apical cytoplasm of absorptive cells. (A) Section from fish fed a fish meal based control diet.
(B) Fish fed a diet with inclusion of immunostimulant ingredients. (LM) Lumen (Mi) Mitochondria (MV)
Microvilli (BBM) Brush border membrane (BLM) Basolateral membrane (En) Enterocyte (arrows)
Junctional complex (++) Glycocalyx.

CHAPTER 1
PAGE | 12
1.3.4. Anatomical homeostasis of the intestine
Under normal homeostatic regulation of the intestinal epithelium, cells that constitute
the epithelium are constantly being replaced, with controlled cell proliferation and regulated
cell death (apoptosis) being central features in maintaining intestinal integrity (Ronza et al.,
2011). The intestinal epithelium includes three basic cell types (i.e. the enterocytes, mucous
secreting goblet cells and enterochromaffin cells with distinct endocrine functions), all of
which are formed at the base of the mucosal folds from pluripotent stem cells. As they
migrate out from this region, they differentiate and become functionally competent
(Buddington et al., 1997). The fully differentiated cells migrate to the tips of the folds where
they are subsequently shed (Hall et al., 1994a, 1994b; Sanden & Olsvik, 2009).
Consequently, when rates of cell proliferation exceed the rate of shedding, the mucosal
folds grow in length, whereas when the rate of shedding is greater than that of cell
replacement, they shorten.
Perturbation of intestinal homeostasis and damage to the intestinal epithelium has been
suggested to result from apoptosis or necrosis following pathogen entry into the epithelial
cells, but has also been demonstrated to be instigated by anti-nutritional dietary products such
as dietary inulin and copper (e.g. Berntssen et al., 1999; Olsen et al., 2001; Olsvik et al.,
2007; Ringø et al., 2007). Furthermore, it has been shown that a disruption of the epithelial
layer may trigger deregulated inflammatory responses against foreign antigens, which may
eventually lead to chronic intestinal inflammation. These observations emphasise the
importance of preserving the integrity of the intestinal epithelium (Urzúa, 2013). Thus,
although the continuous epithelial cell turnover is costly in terms of energy and nutrient
expenditure, it is justified by the need to remove impaired / compromised cells and maintain
tissue integrity through the proliferation of new cells and remodelling of connective tissue.
1.4. Multifunctional properties of salmonid intestine
The salmonid intestine is a complex, multifunctional organ. In addition to providing
digestive enzymes and other components necessary to ensure optimal digestion of the

General introduction
PAGE | 13
chyme and delivery of nutrients for absorption by the intestinal mucosa, the intestine is
critical for protecting the intestinal mucosa from harmful dietary components as well as from
the alimentary tract’s own acid, alkaline and enzyme secretions. The intestine plays an
important role in protecting the organism against microbes and chemicals that may be
detrimental to the animal’s health and well-being, and in maintaining water and electrolyte
balance (Bakke et al., 2011). Furthermore, it also functions in the elimination of toxins,
waste and other metabolic products. A further aspect that might impact the intestine as
much as any of the previously mentioned properties, is the resident microbiological flora
(e.g. Nayak, 2010; Abid et al., 2013), which was found to stimulate epithelial proliferation,
the promotion of nutrient metabolism and the innate immune response (Navarrete et al.,
2013). Amongst the properties described, three distinct functions i.e. intestinal nutrient
absorption, enteric barrier function and osmoregulation / water uptake, have been
highlighted as areas of interest for investigation in the current thesis.
1.4.1. Nutrient processing and absorption
The intestinal tract is the main site of nutrient absorption in the gastrointestinal system
of teleosts, and it follows that many of the morphological features described reflect the
function of tissues in this process. The outer, apical membrane of the intestinal epithelium,
which is exposed to the luminal contents, contains many different enzymes that complete
the final stages of hydrolyzing water-soluble nutrients, and a set of proteins known as co-
transporters that are responsible for absorbing the constituent building blocks. The other
domain, known as the basolateral membrane (BLM, Figure 1.6 and 1.7), contains another
set of functional proteins, including a different group of carrier proteins involved in the
transport of absorbed nutrients across the basement membrane from whence it reaches the
blood (Buddington & Diamond, 1987; Collie & Ferraris, 1995; Buddington & Kuz’mina,
2000). Ultimately, the ability of the intestine to hydrolyse and absorb dietary protein is, to a
large extent, related to the total amount of surface area and rates of absorption per unit
area. Therefore, the elegant structure of the intestine (i.e. presence of pyloric caeca, more
complex mucosal architecture together with the microvilli of the epithelial cells), greatly

CHAPTER 1
PAGE | 14
extends the surface area of the intestinal epithelium, increasing the interface available for
absorption and quantities of membrane-bound enzymes, both important for enzymatic
breakdown and absorption of feed constituents (Harder, 1975; McLean et al., 1999; Bakke-
McKellep et al., 2000a; Denstadli et al., 2004; Løkka et al., 2013; inter alia).
The mechanisms of nutrient-uptake across the brush border membrane (BBM, Figure
1.7) of the intestinal epithelial cells in fish have been extensively reviewed by Collie &
Ferraris (1995) and more recently by Jutfelt (2006) – Figure 1.7 A and B. In brief, besides
endocytosis2 and paracellular movement3, there are three basic mechanisms of nutrient
absorption by enterocytes. These include: (1) passive diffusion independent of carriers, (2)
transport by carriers that are independent of ion gradients, and (3) transport by energy
dependent carriers that are coupled to ion gradients (Bakke-McKellep et al., 2000a). The
diffusion rate of nutrient molecules increases linearly with their concentration, whereas
transport by membrane transporters becomes saturated at higher concentrations.
Additionally, the energy for nutrient uptake against a charged gradient can be harnessed
from ions (usually Na+) moving within an electrochemical gradient (Jutfelt, 2006).
In carnivorous fish, the intestinal portions of the digestive tract show histological
features that reflect differentiation in nutrient absorption (Abaurrea-Equisoain & Ostos-
Garrido, 1996). The first segment of the proximal intestine is believed to be the main site for
nutrient uptake, whereas the distal region has less nutrient absorptive capacity and more
endocytic activity (Buddington & Diamond, 1987; Hart et al., 1988; Fanning et al., 1999;
Nordrum et al., 2000b). Accordingly, the proximal portion has extensive elongated mucosal
folds that are not apparent in the distal regions, and the mucosal folding further extends the
absorptive surface area (Schep et al., 1997). In addition, the abundance of mitochondria,
well-developed basal folds, and the thickness and complexity of the basal lamina in the
absorptive cells from the anterior region are consistent with proposed active absorption of
2 Endocytosis is the process by which substrates enter a cell through the invagination of the cell membrane and the
formation of intracellular vesicles, all of which takes place without passage through the plasma membrane.
3 Paracellular transport, refers to the transfer of substances across an epithelium by passage through the intercellular
space between the cells. This contrasts to the trans-cellular transport route, where the substances are transferred
through the cell, passing across the apical and basolateral membranes.
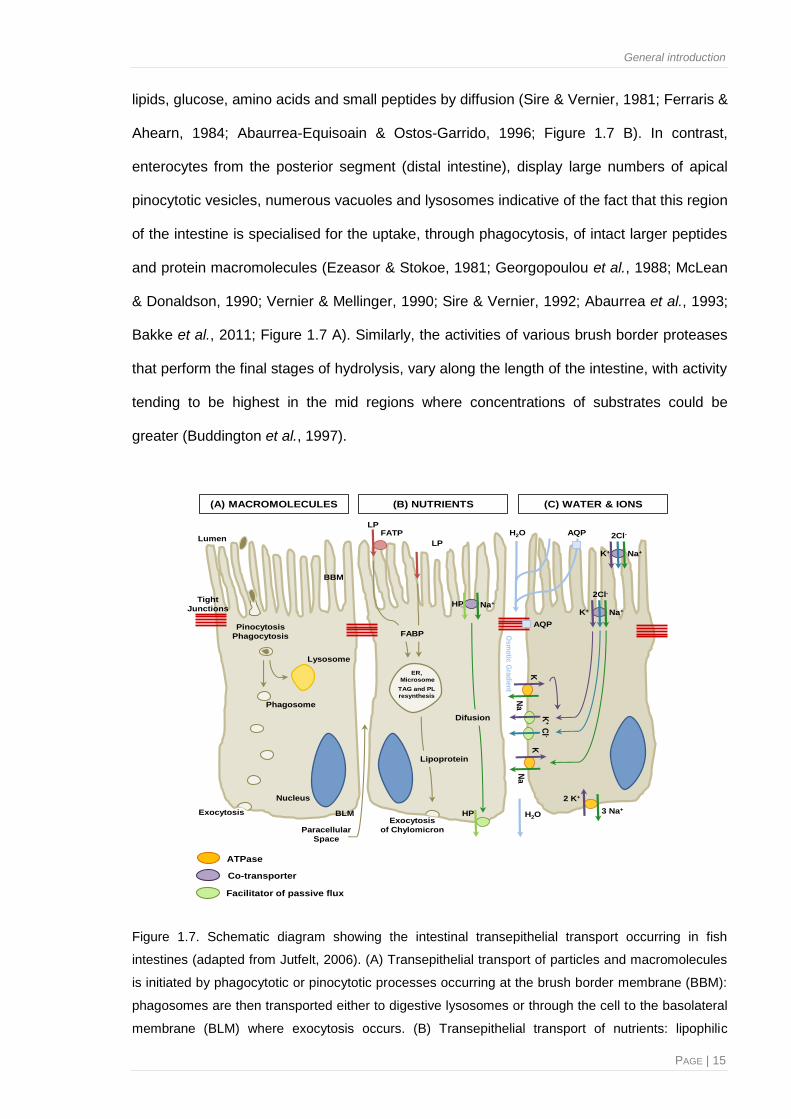
General introduction
PAGE | 15
lipids, glucose, amino acids and small peptides by diffusion (Sire & Vernier, 1981; Ferraris &
Ahearn, 1984; Abaurrea-Equisoain & Ostos-Garrido, 1996; Figure 1.7 B). In contrast,
enterocytes from the posterior segment (distal intestine), display large numbers of apical
pinocytotic vesicles, numerous vacuoles and lysosomes indicative of the fact that this region
of the intestine is specialised for the uptake, through phagocytosis, of intact larger peptides
and protein macromolecules (Ezeasor & Stokoe, 1981; Georgopoulou et al., 1988; McLean
& Donaldson, 1990; Vernier & Mellinger, 1990; Sire & Vernier, 1992; Abaurrea et al., 1993;
Bakke et al., 2011; Figure 1.7 A). Similarly, the activities of various brush border proteases
that perform the final stages of hydrolysis, vary along the length of the intestine, with activity
tending to be highest in the mid regions where concentrations of substrates could be
greater (Buddington et al., 1997).
Co-transporter
Pinocytosis
Phagocytosis
Lysosome
Phagosome
Nucleus
Exocytosis
Tight
Junctions
Lumen
BBM
Paracellular
Space
Exocytosis
of Chylomicron
HP Na+K+
2Cl-
Na+K+
2Cl-
HP
LP FATP
2 K+
3 Na+
LP
ER,
Microsome
TAG and PL
resynthesis
Lipoprotein
(A) MACROMOLECULES (B) NUTRIENTS (C) WATER & IONS
H2O
K
Na
K+
Cl -
K
Na
AQP
AQP
H2O
ATPase
Facilitator of passive flux
BLM
Osm
otic
Gra
die
nt
FABP
Difusion
Na+
Figure 1.7. Schematic diagram showing the intestinal transepithelial transport occurring in fish
intestines (adapted from Jutfelt, 2006). (A) Transepithelial transport of particles and macromolecules
is initiated by phagocytotic or pinocytotic processes occurring at the brush border membrane (BBM):
phagosomes are then transported either to digestive lysosomes or through the cell to the basolateral
membrane (BLM) where exocytosis occurs. (B) Transepithelial transport of nutrients: lipophilic

CHAPTER 1
PAGE | 16
1.4.2. Enteric barrier function4
Adhesion to, and penetration through mucosal surfaces represents the primary portal of
entry for many pathogens. Therefore, the intestine must establish a delicate balance
between efficient absorption of nutrients and prevention of pathogen invasion and ingress of
noxious components present in the diet or environment (Buddington et al., 1997; Fuglem et
al., 2010). To meet these demands, the intestine possesses a selective and complex
epithelial barrier. This barrier function works in conjunction with innate and adaptive immune
responses, that together constitute the mucosal immune system (Cain & Swan, 2011).
1.4.2.1. Extrinsic supra-epithelial barrier. The glycocalyx covering the intestinal
epithelium is predominantly composed of mucin glycoproteins released from epithelial
mucous cells that are scattered along the epithelium (Shephard, 1994), although some
components within the mucus may be produced elsewhere (Niklasson, 2013). Furthermore,
the glycocalyx contains reactive oxygen species, hydrogen peroxidase, lysozyme, pro-
inflammatory cytokines, complement factors and a broad range of secretory
immunoglobulins and antimicrobial peptides (AMPs) (Roberts, 1989; Good, 2004; Urzúa,
2013). Therefore, this viscous layer is able to provide a physical and biochemical barrier
which protects the underlying epithelial layer against mechanical and chemical damage,
natural aggressors and other exogenous harmful agents (Buddington et al., 1997;
Sweetman et al., 2010). It can act as a lubricant, aiding transport between the luminal
contents and the epithelial lining (Cain & Swan, 2011), as well as a diffusion medium that
Figure 1.7. (continued from previous page) molecules (LP) cross the BBM by diffusion over the lipid
bilayer and through fatty acid transport proteins (FATP). Triacylglycerol (TAG) and phospholipid (PL)
resynthesis occurs in the endoplasmic reticulum (ER) before lipoprotein packaging and export of
chylomicrons through exocytosis at the basolateral membrane takes place. Hydrophilic nutrients
(HP), such as amino acids and glucose cross the BBM by secondary active transport (sodium co-
transport is shown) and cross the BLM through the intervention of carrier proteins. (C) Na+K
+-ATPase
activity at the BLM remove intracellular Na+. The NKCC co-transporter carries 2 Cl
-, Na
+ and K
+
across the BBM. Cl- and K
+ exit through ion channels across the BLM. The osmotic gradient created
in the paracellular space, with the highest osmolality, apically drives water diffusion transcellularly
and through tight junctions. Aquaporins (AQP) may increase the BBM and / or BLM water
permeability.

General introduction
PAGE | 17
contents and the epithelial lining (Cain & Swan, 2011), as well as a diffusion medium that
reduces the ability of pathogens to adhere and penetrate the underlying enterocyte cells
(Verlhac & Kiron, 2004; Van der Marel et al., 2014). Other components present in the
mucus e.g. such as AMPs or complement factors, can opsonise pathogens to aid their
uptake by macrophages, or, in the case of inflammatory cytokines and interferons, lead to
the production of anti-viral proteins. These together, help to prevent the brush border
membrane becoming colonised or invaded by infectious agents (Jutfet, 2006; Niklasson,
2013).
1.4.2.2. Enteric epithelial barrier. Intestinal enterocytes are a highly specialised cell
type that not only function as a primary site of nutrient processing and absorption, but act as
a very efficient physical barrier against invasion by a broad spectrum of foodborne
pathogens or enteric resident microbiota, while allowing passage of nutrients to the
systemic circulation (Mooseker, 1985; Torrecillas et al., 2011). Their structure is thought to
contribute to their function in regulating permeability. Adjacent enterocytes are joined
together at the apical end of the lateral surface by several tight junctions (TJs; arrows in
Figure 1.6) consisting mainly of protein complexes (i.e. claudins, occludins and the cytosolic
proteins zonula occludens ZO-1, ZO-2 and ZO-3), which join the transmembrane proteins to
the cytoskeletal actin of the enterocytes, forming a belt of anchoring adhesion that holds the
epithelium together and regulates the permeability of the intestine to hydrophilic molecules
and extraneous organisms (Jutfelt, 2006; Sundh, 2009). Alterations of the TJ protein
formation and distribution through dephosphorylation of occludins, redistribution of ZO or
alterations of actomyosin filaments, may affect the size and charge of the monolayer
membrane pores handling the paracelullar pathway and therefore their absorptive capability
(Niklasson, 2013).
1.4.2.3. Intrinsic sub-epithelial barrier. The intestinal mucosa, particularly the gut
associated lymphoid tissue (GALT), represents one of the first-line defences against
invading microorganisms (Gomez et al., 2013). Although recently, an antigen-sampling cell
phenotype (i.e. cells with mammalian micro-fold dendritic cell morphology; or M-cell

CHAPTER 1
PAGE | 18
analogues) was localised in the base regions of the mucosal folds (Fuglem et al., 2010),
there is no conclusive evidence that teleost fish possess specialised lymph nodes or
Peyer’s patches (Rombout et al., 1993). Nonetheless, it has been suggested that the fish
intestine is immuno-competent irrespective of the presence of such structures. Their enteric
immune system contains no follicular lymphoid structures (Dalmo et al., 1997; Press &
Evensen, 1999), but rather a more diffusely distributed GALT consisting of a unique array of
innate and adaptive cellular and humoral defence mechanisms that act together to protect
the host by eliminating infected cells and attracting other immune cells (Nayak, 2010;
Cerezuela et al., 2013). Immune cells associated with the GALT include: populations of
leucocytes and lymphocytes, plasma cells, macrophages, mast-cells, granulocytes and
neutrophils (Zapata & Amemiya, 2000; Tort et al., 2003; Bakke-McKellep et al., 2007a; an
updated review on the teleost fish GALT, including the description of all the immune cell
types present has recently been published Rombout et al., 2011).
Similar to other intestinal functions, there are regional differences in the distribution of
those immune cells. For instance, in contrast to macrophages, which dominate in the
epithelium of the posterior intestine, basophilic and eosinophilic granulocytes are mainly
found in the connective tissue of the anterior segment (Rombout & Berg, 1989). Structural
evidence suggests that cells in the posterior region of the intestine have higher phagocytic
activity than those in the anterior region of the fish intestine. This also includes higher levels
of antigen sampling by transferring antigen from the lumen to macrophages or neutrophils in
the epithelium and lamina propria (Jutfelt, 2006), suggesting that this might be the primary
site where immune responses are initiated and thus explains why the highest densities of
intraepithelial antigen presenting cells, such as macrophages and neutrophils, are found in
the distal intestine (Buddington et al., 1997; Cain & Swan, 2011).
Cells involved in innate immunity can often recognise common molecular structures on
pathogens and commensal bacteria through interactions with pattern recognition receptors
on their cell surface (Gomez et al., 2013). This cellular intervention requires no antigenic
priming and could be either immediate or induced within a short time following an encounter

General introduction
PAGE | 19
with foreign antigens (Cain & Swan, 2011). Upon activation, it mediates intracellular
signalling cascades resulting in the production of pro-inflammatory cytokines and
chemokines for recruitment of phagocytes such as macrophages, neutrophils and other
granulocytes for clearance of the recognised pathogen (Sundh, 2009). Bacterial pathogens
encountered by macrophages and neutrophils are phagocytosed destroyed (Neumann et al.
2001). Degradation of phagocytosed pathogens can occur via respiratory burst activity, or
phagocytes may produce proteins and peptides that have antimicrobial properties and act
directly on pathogens (Neumann et al. 2001). Furthermore, enzymes and cellular proteins
that are released from damaged host cells can prompt phagocyte influx and an
inflammatory response (Magnadottir, 2010).
Adaptive immunity is critical to long-term protection from specific pathogens. Compared
to the innate response, the adaptive response is much slower to develop, but can be
directed at antigens specific to a pathogen and result in immune memory for that antigen
(Verlhac & Kiron, 2004). Therefore, once a pathogen or other foreign substance is
phagocytosed and digested, its cell surface antigenic epitopes are recognised by B or T
lymphocytes, resulting in cytokine and other humoral factor release, which in turn stimulates
additional T and B cells to the site of damage / infection. Thereafter, B cells will proliferate
and begin to differentiate, resulting in the production of antibody-secreting plasma cells and
memory B cells (Cain & Swan, 2011). Finally, activation of these cells can lead to the
development of antigen-specific antibodies or immunoglobulins (Ig), which can eventually
bind to conforming antigens and eliminate them from the system via neutralisation,
agglutination, opsonisation and activation of the complement system (Gomez et al., 2013).
In fish, IgM is the principal antibody found in the serum and mucosa associated with
intestinal lymphoid tissues, although other isotypes including IgD, IgT, IgZ and chimeric
IgM-IgZ have been identified in various fish species (Hordvik et al., 1999; Hordvik, 2002;
Rombout et al., 2011; Tadiso et al., 2011).

CHAPTER 1
PAGE | 20
Finally, the complement system serves as part of the humoral defences and represents
a biochemical cascade that is involved both in innate and acquired immune system
responses and is often the linking factor connecting both systems (Urzúa, 2013).
1.4.3. Osmoregulation and epithelial water transport
The intestinal epithelium of teleosts has an established role in osmoregulation, and its
ability to effectively (re)absorb fluid is crucial to replenishing losses of water and electrolytes
during routine physiological processes such as digestion and also to coping with
dehydrating hyperosmotic environments (Buddington et al., 1997; Marshall & Grosell, 2006;
Whittamore, 2012).
In the intestine of marine fish, osmotic water absorption across the luminal epithelium
may occur transcellularly and / or paracellularly between enterocytes through distinct
routes: (1) driven by passive diffusion across the lipid bilayers; (2) co-transport of ions with
nutrients, or by (3) diffusion through aquaporins (AQPs) within the membranes (Madsen et
al., 2011; a thorough and detailed review of osmoregulation and epithelial water transport
from the intestine of marine teleost fish, has recently been published by Whittamore (2012);
Figure 1.7 C). Regardless of the pathway used, water absorption is tightly linked to trans-
epithelial monovalent ion transport, which creates a hyperosmotic gradient in the lateral
interspace between enterocytes, causing water diffusion trans-cellularly and through the
tight junctions (Usher et al., 1991; Grosell, 2006, 2011). In addition, AQPs may serve as
passive conduits for water movement in response to a transmembrane osmotic gradient,
reducing the activation energy required for dissolution and diffusion of water molecules
through co-transporters (Whittamore, 2012). Information on the identity, localisation and
regulation of AQP in teleosts is still rather fragmentary. Currently, three AQP isoforms have
been found in the intestinal tract of Atlantic salmon (i.e. Aqp1aa/ab, Aqp8ab and Aq3;
Tipsmark & Madsen, 2012), and only Aqp1aa/ab have been localised in enterocytes and
are thus suggested to be directly associated with water transport (Madsen et al., 2011).

General introduction
PAGE | 21
1.5. Diet mediated modulation and enteric integrity
Stimuli such as fasting (Baeverfjord & Krogdahl, 1996; Krogdahl & Bakke-McKellep,
2005; Ostaszewska et al., 2006), stress (Hall & Bellwood, 1995; Olsen et al., 2002, 2005),
infection (Hemmer et al., 1998; Ringø et al., 2004; Ringø et al., 2007; Del-Pozo et al., 2010;
Ronza et al., 2011) and toxins (Crespo et al., 1986; Kamunde et al., 2001; Berntssen et al.,
2004; Glover et al., 2007) have been shown to cause changes in the turnover of intestinal
epithelial cells, which in turn can result in changes in proliferative activity, migration and
apoptosis of structural and functional cells. A further factor that might impact the intestine as
much as those mentioned above, is the resident microbiological flora and interrelated
dietary modulation, which have also been found to stimulate epithelial proliferation and
promote innate immune responses (e.g. Sanden et al., 2005; Heikkinen et al., 2006; Bakke-
McKellep et al., 2007b; Ringø et al., 2007; Urán et al., 2009a; Dimitroglou et al., 2010;
Nayak, 2010; Merrifield et al., 2010; Abid et al., 2013; Chikwati et al., 2013b; Navarrete et
al., 2013).
1.5.1. Evaluation of the effects of nutritional modulation on fish intestinal health
Intestinal immune responses are multifaceted and involve a broad range of different
effector molecules, receptors and cells (Verlhac & Kiron, 2004). Thus the assessment of
immune modulation in relation to nutrition should be undertaken using a multi-pronged
approach whereby an array of parameters that are indicative of the responses are
evaluated, instead of measurement of only a single cellular function or tissue structural
change (Trichet, 2010).
Fish health can be assessed using morphological, microbiological, haematological and
/ or immunological assays, as well as experimental disease challenges and vaccination.
Various assays have been used to assess changes in physiological status or health of the
intestine of fish that result from dietary modulation. Table 1.1 summarises some of the
different methods that are currently used in nutritional research. Their sensitivity, ease of
application, and rapidity are also mentioned. Depending on the potential target being
examined to assess the effects of dietary modulation, different parameters could be chosen

CHAPTER 1
PAGE | 22
as shown in Table 1.1. Ideally, the assessment of responses should cover a range of
parameters ranging from whole fish response to events occurring at the tissue or cellular
level (Kiron, 2012), selecting appropriate procedures and indices of health condition, which
are objective, sensitive, precise, reproducible, rapid and cost-effective.
Table 1.1. Types of assessment employed in nutritional studies of fish, and their level of suitability
(adapted from Verlhac & Kiron, 2004).
Parameters Assay methodology Sensitivity Variability Ease
Body condition factors - Direct measurement of external body
characteristics
Fair Medium Fair
Organosomic indices - Direct measurement of internal organs
Medium Medium Fair
Microflora - Bacterial culture and phenotypic
identification
- Bacterial culture and genotypic
identification
- DGGE (denaturating gradient gel
electrophoresis) and TGGE (temperature
gradient gel electrophoresis) profiling gels
- Pyrosequencing
Medium
High
High
High
Wide
Fair
Fair
Fair
Fair
Moderate
Complicate
Complicate
Peripherical blood
parameters
- Direct counting of diluted fresh samples
- Staining of smears or cytocentrifuged
cells
- Flow cytometry
- Automatic analyser
Fair
Medium
High
High
Medium
Medium
Medium
Medium
Fair
Fair
Moderate
Fair
Blood cells from mucosa
associated tissues
- Percoll gradients and direct counting
Medium Medium Moderate
Lymphocyte proliferation - Uptake of tritiated thymidine
- Flow cytometry
- Tetrazolium
High
High
High
Wide
Medium
Medium
Fair
Moderate
Moderate
Lymphocyte differentiation - Radioimmuno-assay
- Mitogenesis
Medium
Fair
Medium
Wide
Complicate
Fair
Chemotaxis - Migration test in specific chambers and
macroscopic observation
High Medium Complicate
Phagocytosis
- Staining and microscopy observation
- Flow cytometry
- Fluorescence
High
High
High
Wide
Medium
Medium
Moderate
Moderate
Complicate
Oxidative burst
- Flow cytometry
- Chemiluminescence with isoluminol,
luminol or colorimetric assay
High
High
Medium
Medium
Moderate
Complicate
Non specific cytotoxicity - Chromium release assay
- Time resolved fluorescence
- Flow cytometry
- Lactate dehydrogenase assay
Fair
Fair
Medium
Medium
Wide
Wide
Medium
Wide
Moderate
Moderate
Moderate
Moderate
Lysozyme - Turbidimetry
- Fluorimetry
Medium
Medium
Medium
Medium
Fair
Medium

General introduction
PAGE | 23
Table 1.1. (continued from previous page)
Parameters Assay methodology Sensitivity Variability Ease
Complement - Spectrophotometry
High Wide Fair
Specific antibody - Passive haemolytic assay
- ELISA (enzyme-linked immunosrobent
assay)
- Haemopoesis
- IFAT (indirect fluorescent antibody
techniques)
- IHC (immunohistochemistry)
High
High
Medium
High
Medium
Narrow
Narrow
Medium
Narrow
Medium
Moderate
Moderate
Moderate
Moderate
Moderate
Total immunoglobulin - Spectrophotometry
- Diffusion in gel techniques
Low
Low
Medium
Medium
Moderate
Moderate
Histomorphology - Histochemical / IHC staining, microscopic
observation and qualitative assessment
- Histochemical / IHC staining, microscopic
observation and semi-quantitative scoring
- Histochemical / IHC staining, microscopic
observation and quantitative scoring
High
High
High
Medium
Medium
Narrow
Moderate
Fair
Fair
Carefully designed infection or stress challenge experiments, where fish fed with
different dietary treatments are later exposed to a pathogen or a stressful event (i.e.
resulting in mortalities as an end point or post-exposure stress indication), are a means to
study and to better understand integrated host-defence mechanisms, in terms of the
animal’s ability to resist disease or stress (Kiron, 2012). And, although regulated by the
Animals Scientific Procedures (ASP, Act 1986) that animal experimentation should only be
permitted when no other alternative research technique is available and that the expected
benefits outweigh any possible adverse effects, the above mentioned approach is often
employed in fish nutrition studies. Still, the reliability of such studies is very much dependent
on reproducibility of experimental conditions and outcomes (Kiron, 2012).
Evaluation of fish health condition by observations and measurements of external
characteristics and internal organs, which allow the calculation of generalised condition
factors or organosomic indices is straightforward, however it is limited in terms of sensitivity
and precision (Maita, 2007).
The fish intestinal bacterial community has traditionally been characterised by use of
culture-dependent methods, followed by identification according to phenotypic and
genotypic characteristics (Austin, 2006; Nayak, 2010). However, these methods have been

CHAPTER 1
PAGE | 24
described as labour intensive, poorly reproducible and not suitable for the analysis of
multiple samples. The use of genotyping fingerprint methods (e.g. DGGE, denaturating
gradient gel electrophoresis; TGGE, temperature gradient gel electrophoresis) combined
with culturing methods became extensively used in the past. A current rapid and more
precise classification of large numbers of isolated bacteria has been reported in fish
microbial studies by using random amplified polymorphic DNA (RAPD) and restriction
fragment length polymorphism (RFLP) analyses (Urzúa, 2013).
Measurement of peripheral blood and plasma parameters is relatively easy to perform
and can be carried out without killing the animal. Haematological characteristics such as
haematocrit value (Hct), haemoglobin concentration (Hb) and red blood cell counts (RBC)
have been examined to evaluate requirements for certain dietary micronutrients, and the
quality of feed or feeding strategies (Maita, 2007). Complementary information gathered
through other blood indices such as mean corpuscular volume (MCV), mean corpuscular
haemoglobin (MCH) and mean corpuscular haemoglobin concentration (MCHC) may be
also useful (Blaxhall & Daisley, 1973).
Blood- or serum-based assays constitute yet another battery of measurements that are
frequently used to evaluate primarily innate immune responses. Humoral components
commonly examined include complement activity, lysozyme activity, total immunoglobins,
acute phase proteins and cytokine levels. In teleost fish, alternative complement activity is a
fairly reliable indicator of humoral defence, though its measurement involves a tedious
process (Verlhac & Kiron, 2004). Assessing the function of phagocytes is another measure
of the animal's disease resistance. Phagocytic activity of cells harvested from the immune
organs such as head kidney, spleen or intestine of fish subjected to different dietary
treatments, is usually determined by ingestion of inert or antigenic particles. This can be
measured either by microscopy or flow cytometry. While the former is a simple technique,
the latter is preferred for its sensitivity. Phagocytic killing mechanisms can be assayed
among others by measuring the oxygen radical production either spectro-photometrically or
by flow cytometry (Verlhac & Kiron, 2004; Kiron, 2012), both techniques having very high

General introduction
PAGE | 25
sensitivity. Lysozyme measurements by turbidimetry and fluorimetry on the other hand, tend
to be less consistent or sensitive than the techniques mentioned above (Stolen et al., 1990).
Specific immune responses can be evaluated by measuring antibody production either by
the relatively straightforward technique of passive haemolytic plaque assay or more
quantitatively by determining antibody titres by employing techniques such as agglutination,
precipitation or ELISA (enzyme-linked immunosrobent assay). Although the latter method
measures a response fairly accurately, it has to be standardised thoroughly for the species
and pathogen in question (Verlhac & Kiron, 2004). Lymphocyte proliferation is also a highly
representative assay for acquired immune cell functions and can be employed to determine
the overall responsiveness of T-cells (Kiron, 2012). In addition, as genomic and
transcriptomic resources become more widely available and affordable, evaluation of
inflammatory responses such as cell-specific cytokine profiles and mediators of
inflammation, or even pathogen-recognising toll-like receptors (i.e. TLR) in relation to
antigen presenting cells has become a reality (Kiron, 2012) through the use of quantitative
PCR or real time PCR techniques. These techniques are fairly simple to undertake,
however, they require specialised instruments and reagents which remain relatively costly.
Nevertheless, these are extremely sensitive techniques and can prove extremely reliable.
Despite the increase in use of novel molecular techniques (i.e. assays at the level of
DNA, RNA and proteins) to investigate the relationship between nutrients and gut health
responses of teleost fish, conventional histology and immunohistochemistry remain the gold
standards for monitoring tissue structural and functional alterations (Derde et al., 2012), and
in turn, for confirmation of the intestine’s integrity. Histomorphometry, broadly defined as the
measurement of the shape, area, number or form of a tissue and cells, is considered as an
important tool that can help improve our understanding of dietary influences. It is particularly
suitable for certain types of histological investigation since it offers objectivity and increased
precision compared with direct visual appraisal, and makes statistical analysis easier
(Anderson & Lowe, 1990). Quantitative analysis of intestinal architecture and the
immunoreactivity of specific biomarkers, may provide valuable information for evaluating

CHAPTER 1
PAGE | 26
dietary ingredients, that can either improve intestinal structure or ameliorate the effects of
factors such as infectious diseases or anti-nutritional components that may otherwise
ultimately cause physical disruption (Sweetman et al., 2008, 2010). Besides being a
relatively easy and rapid methodology to employ, it is also relatively cost-effective.
Despite the wide range of methodologies available for assessing the effects of dietary
components on intestinal health, failure to standardise the experimental and assessment
methodologies adopted between studies has limited the ability to compare trials and
therefore draw robust conclusions (Maita, 2007).
1.5.1.1. Enteritis model in Atlantic salmon. As mentioned earlier, many of the assays
currently employed to evaluate the effect that alternative feed ingredients may have on a
fish’s intestinal homeostasis require robust standardisation across studies. In order to
achieve such standardisation, the availability of reproducible and predictable models is
necessary.
Over the past few years, an effective intestinal inflammation model has been investigated
across a number of dietary modulation studies. Specifically, these studies have involved the
replacement of fish meal by soybean meal (SBM), which results in an inflammation of the
distal intestine of Atlantic salmon, usually referred to as SBM-induced enteritis (Van den
Ingh et al., 1991; Krogdahl et al., 2010). The severity of the response seems to be
dependent on the amount and variety of soya employed (Urán, 2008; Knudsen, 2007).
While animals showed normal growth and feed intake, they developed a severe
inflammation in the second gut segment characterised by: shortening of the mucosal folds,
infiltration of inflammatory cells in the lamina propria, widening of the central stroma within
the mucosal folding, increase in the thickness of the connective tissue, a loss of
supranuclear vacuolisation of the absorptive cells in the intestinal epithelium, and an
increase in the number of goblet cells (Baeverfjord & Krogdahl, 1996; Romarhein et al.,
2013a). Moreover, during the inflammation process changes in a variety of immunological
processes occur, including a marked increase of neutrophilic and eosinophilic granulocytes
in the lamina propria (Bakke-McKellep et al., 2000a; Reite & Evensen, 2006), a

General introduction
PAGE | 27
degranulation of the eosinophils (Urán et al. 2009b) and an increased activity of T cell
response based on the expression of clusters of differentiation-3 (Bakke-McKellep et al.,
2007a). Expression of transcripts for the pro-inflammatory cytokines interleukin 17A (IL-
17A), IL-1β, IL-10 interferon α1 (IFNα1) and IFNγ, as well as IL-17A receptor, T-cell
receptor γ (TCRγ), cluster of differentiation 4α (CD4α), CD8β, transforming growth factor β
(TGFβ), protease-activated receptor 2 (PAR2), myeloid differentiation primary response
gene 88 (MyD88) and trypsin are also reported to be significantly up-regulated during early
and / or late inflammation stages, while interferon-γ-inducible lysosomal thiol reductase
(GILT) was down-regulated. Up-regulation of TCRγ from day seven suggests proliferation of
intraepithelial γδ T cells. IL-17A, up-regulated during early inflammation, indicates
involvement of T helper 17 cells in the pathogenesis of the SBM-induced inflammatory
response (Urán et al., 2008; Lilleeng et al., 2007; Marjara et al., 2012; Sahlmann et al.,
2012; Romarheim et al., 2013a).
Therefore SBM is claimed to be a good model for fish nutrition, specifically because it
allows robust phenotypic and biochemical responses to be visualised, making this dietary
model an attractive platform to assist in the development of analyses to identify the best, or
the less harmful, ingredients to be used in the formulation of diets for aquaculture.
1.6. Projects’ contextual background
Conventionally, the formulation of new aquafeed products is based on digestive
efficiencies and animal growth responses (Galindo-Villegas & Hosokawa, 2004). However,
a multidisciplinary approach for evaluating intestinal responses should provide much more
detail concerning the benefits of new feed ingredients.
As described above, intestinal structure can respond rapidly and reversibly to changes
in dietary composition. Consequently, diet-induced changes in intestinal structure can
influence the uptake of nutrients, which in turn may affect the performance of the immune
system. Knowledge of the structural and inter-related functional alterations that occur in
cells or tissues, as part of adaptive or disease processes, can provide a clearer
understanding of the mechanisms underlying various tissue changes and malignancies due
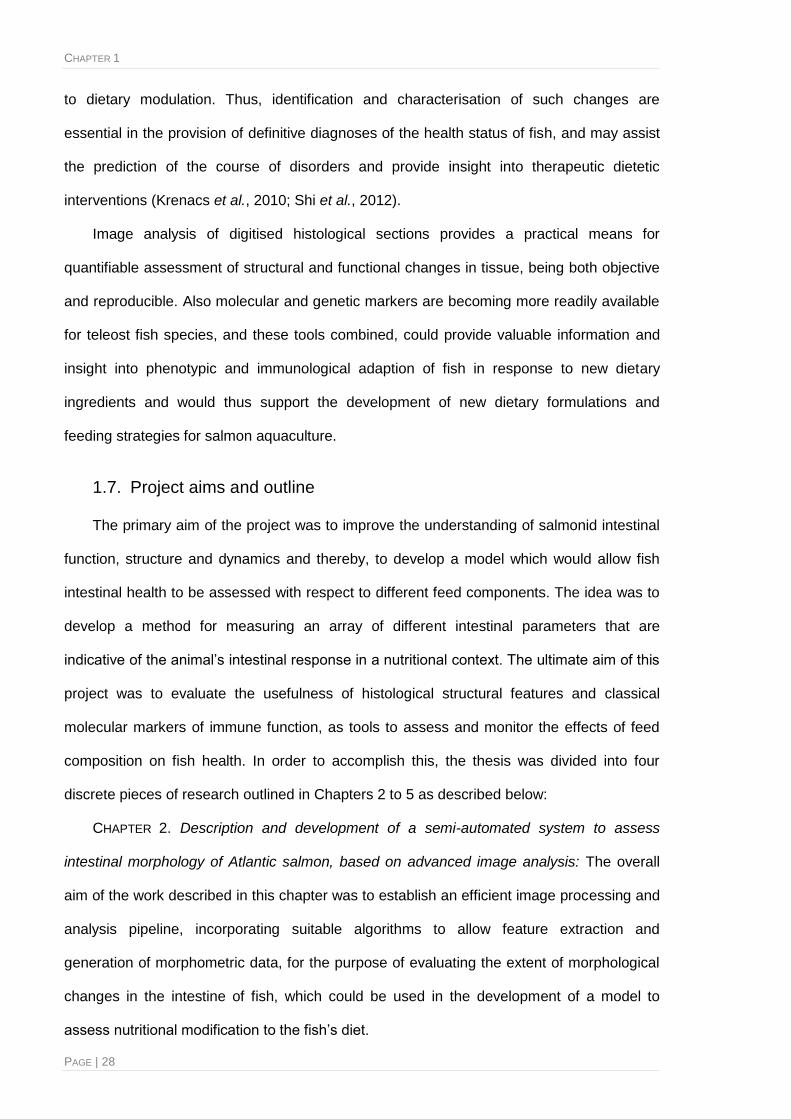
CHAPTER 1
PAGE | 28
to dietary modulation. Thus, identification and characterisation of such changes are
essential in the provision of definitive diagnoses of the health status of fish, and may assist
the prediction of the course of disorders and provide insight into therapeutic dietetic
interventions (Krenacs et al., 2010; Shi et al., 2012).
Image analysis of digitised histological sections provides a practical means for
quantifiable assessment of structural and functional changes in tissue, being both objective
and reproducible. Also molecular and genetic markers are becoming more readily available
for teleost fish species, and these tools combined, could provide valuable information and
insight into phenotypic and immunological adaption of fish in response to new dietary
ingredients and would thus support the development of new dietary formulations and
feeding strategies for salmon aquaculture.
1.7. Project aims and outline
The primary aim of the project was to improve the understanding of salmonid intestinal
function, structure and dynamics and thereby, to develop a model which would allow fish
intestinal health to be assessed with respect to different feed components. The idea was to
develop a method for measuring an array of different intestinal parameters that are
indicative of the animal’s intestinal response in a nutritional context. The ultimate aim of this
project was to evaluate the usefulness of histological structural features and classical
molecular markers of immune function, as tools to assess and monitor the effects of feed
composition on fish health. In order to accomplish this, the thesis was divided into four
discrete pieces of research outlined in Chapters 2 to 5 as described below:
CHAPTER 2. Description and development of a semi-automated system to assess
intestinal morphology of Atlantic salmon, based on advanced image analysis: The overall
aim of the work described in this chapter was to establish an efficient image processing and
analysis pipeline, incorporating suitable algorithms to allow feature extraction and
generation of morphometric data, for the purpose of evaluating the extent of morphological
changes in the intestine of fish, which could be used in the development of a model to
assess nutritional modification to the fish’s diet.

General introduction
PAGE | 29
CHAPTER 3. Intestinal responses to dietary additives – Application of tools for rapid
screening of novel dietary components: Following the development of the semi-automated
system to assess intestinal morphology of Atlantic salmon, the aim of this chapter was to
examine the broader utility of a multivariate / multimodal approach for the screening of
different dietary ingredients, and in turn to ascertain the level and reliability of the
contribution that the developed image analysis system might make in such an assessment.
CHAPTER 4. Histological evaluation of enteritis in Atlantic salmon: Quantitative image
analysis vs semi-quantitative scores: The goal of the work described in this chapter was to
evaluate the consistency of and compare the level of agreement between this newly
developed quantitative microscopic image analysis system with that of an established semi-
quantitative histological grading system.
CHAPTER 5. Quantitative immuno-staining analysis - Development of a biomarker panel
for assessment of immune responses from intestinal tract of Atlantic salmon fed different
diets: The work described in this chapter aimed to evaluate the use of the newly developed
system relative to the integration of biomarkers into the histological assessment.
Specifically, it was intended to assess the image analysis application for the detection of
potentially predictive immunohistochemical biomarkers, and the accurate quantification of
small changes in the spatial distribution of proteins and their relative amounts in the tissue,
through which it might be possible to describe the intestinal cellular responses at a
molecular level.
CHAPTER 6. Characterisation of mast cells / eosinophilic granule cells (MCs / EGCs) in
the Atlantic salmon intestine: while Chapters 3, 4 and 5 highlighted the presence of MCs /
EGCs in the intestine of salmon, no attempt was made to determine their role in immune
responses from the intestinal tract. The purpose of the work presented in the present
chapter was to further characterise those cells and to try to elucidate their functional role in
the intestinal immunity. Through an understanding of their distribution, composition and
ultrastructure, the intention was to provide additional knowledge, so as to better
characterise such cells and their functional properties.

CHAPTER 1
PAGE | 30
Finally in CHAPTER 7, the results of the various studies were summarised and the
significance of these discussed, together with suggestions for future work, and indicators of
adoption of the developed techniques.


2. CHAPTER 2
2. DESCRIPTION AND DEVELOPMENT OF A SEMI-AUTOMATED
SYSTEM TO ASSESS INTESTINAL MORPHOLOGY OF ATLANTIC
SALMON, BASED ON ADVANCED IMAGE ANALYSIS
2.1. Introduction
Knowledge of the structural and functional alterations that occur in cells or tissues as
part of adaptive or disease processes, can provide a clearer understanding of the
mechanisms underlying various tissue changes and pathologies. Thus, identification and
characterisation of such changes are not only essential for understanding the day-to-day
plasticity of tissues but are necessary for the provision of definitive diagnosis of pathological
states, for prediction of the course of disease and for the guidance of therapeutic
interventions (Baak, 1987; True, 1996; Gil et al., 2002; Krenacs et al., 2010; Shi et al., 2012).
Despite the upsurge in use of new molecular techniques in pathology (e.g. molecular
assays at the level of DNA, RNA and proteins), conventional histology remains the gold
standard for monitoring tissue structural alterations, and in turn, for confirmation of the
presence or absence of pathology and grading of pathological progression (Rahman &
Itakura, 1996; Gurcan et al., 2009; Rojo et al., 2010; Derde et al, 2012). The suitability of
the use of histopathology alone has been increasingly questioned (Isse et al., 2012), as it
mainly relies on the visual interpretation of morphological evidence to classify pathologies
and the use of descriptive, linguistic criteria to convey how conclusions are reached
(Hamilton & Allen, 2005; Kriete & Boyce, 2005; Gunduz-Demir et al., 2010). Some authors
regard this approach as “insensitive”, “arbitrary” and “prone to subjective interpretation”
(Wright et al., 2003; Krenacs et al., 2010; Kopec et al., 2011). Traditional histopathology is
also heavily dependent on the learned recognition skills and experience of the assessor,
this being similarly difficult to assess in a reproducible manner (Jarvis, 1992; He et al.,
2012). The sometimes poor reliability and reproducibility of this approach may lead to

CHAPTER 2
PAGE | 34
inaccurate diagnosis and in turn to inappropriate clinical decisions (e.g. on timing and type
of therapy), with many possible clinical consequences (Sertel et al., 2009a). There is
therefore a need for alternative / supplemental methods that could provide a more practical,
quantifiable means of assessing structural changes, and consequently allow the extraction
of objective and accurate prognostic data.
It has long been recognised that the quantitative measurement of histological features
can provide data, which can significantly improve the ability to make diagnostic decisions in
pathology (Chaudhuri et al., 1988; Anderson & Lowe, 1990; Gunduz-Demir et al., 2010;
Grunkin et al., 2011; Kayser & Kayser, 2013). Morphometric quantification of structural
elements has several advantages over conventional visual assessment. It allows
description of the morphological changes in (semi-) continuous numerical terms, which are
likely to be more reproducible than ordinal grading, since they are quantitative data.
Furthermore, it assists the comparison process, as sets of numerical data are easier to
manipulate and compare than a collection of images or descriptive notes. Moreover,
statistical data can be more easily acquired from such quantitative measurements, making
these methods particularly useful for hypothesis testing. Finally, such quantification of the
data can also allow the detection of subtle changes not readily apparent to the unassisted
observer (Baak et al., 1977; Preston & Bartels, 1988; Wied et al., 1989; True, 1996;
Rahman & Itakura, 1996; Hamilton & Allen, 2005; Kriete & Boyce, 2005; Godlewski et al.,
2009; Mandarim-de-Lacerda et al., 2010; Shamir et al., 2010).
Histological sections still, however, pose a formidable challenge in quantitative analysis
(Chubb et al., 2006). Often they comprise a variety of overlapping cells and gross
structures, such that their complex heterogeneous architecture makes the quantification
process more difficult (Ong et al., 1996; Ficsor et al. 2006; Potts et al., 2010). Nonetheless,
quantitative analyses of histological tissue sections are widely performed and continue to
provide meaningful information (Preston & Bartels, 1988).
Currently, quantitative analysis of histological tissue sections can be performed
manually by assessors or (semi-) automatically by computer-based systems. While manual
Description and development of a semi-automated image analysis system
PAGE | 35
measurements are time-consuming, fastidious and error-prone (Mulrane et al., 2008;
Grunkin et al., 2011; Kopec et al., 2011; Derde et al., 2012; Shi et al., 2012), fully automated
operations may provide measurements in a reliable and reproducible manner at a
reasonable speed of execution (Wied et al., 1989; Ong et al., 1996; Benali et al., 2003; He
et al., 2012; Webster et al., 2012), although they may not be suitable for measurement of
complex features. Semi-automated analysis, i.e. that possessing a greater or lesser degree
of user input, can therefore provide a good compromise between speed of execution and
accuracy.
Over the past decade, dramatic increases in computational power and improvement in
image analysis algorithms have allowed the development of powerful computer-assisted
analytical approaches to the capture and analysis of histological data (Loukas & Linney,
2004; Gurcan et al., 2009; Mandarim-de-Lacerda et al., 2010; Grunkin et al., 2011; Derde et
al., 2012; Kayser & Kayser, 2013). Quantitative microscopy based on automated digital
image analysis has come to be considered not just as a useful aid to clinicians, but as an
essential tool for interpreting data, which has major diagnostic value (Leong & Leong, 2004;
Loukas & Linney, 2004; Kuznetsov et al., 2013). Several studies have demonstrated
exceedingly effective automated analysis of histological sections for human pathology
grading and diagnosis applications, including studies of sections relating to prostate (Doyle
et al., 2007; Naik et al., 2007; Nielsen et al., 2012), breast (Gil et al., 2002; Roque & Andre,
2002; Weaver et al., 2003; Petushi et al., 2006; Naik et al., 2008; Chekkoury et al., 2012),
cervix (Keenan et al., 2000; Price et al., 2003; Rahmadwati et al., 2012), lung (Kayser et al.,
2002; Dagnon et al., 2008; Wang & Yu, 2012), bladder (Wester et al., 1999; Goddard et al.,
2002), larynx, gastric and colorectal tissues (Hamilton et al., 1997; Esgiar et al., 1998;
Laitakari et al., 2003; Ficsor et al., 2006, 2008; Gunduz-Demir et al., 2010; Kalkan et al.,
2012), lymphoma and neuroblastoma characterisation (Cambazoglu et al., 2007; Kong et
al., 2007, 2009; Sertel et al., 2009b; Schmitz et al., 2012), melanoma (Ganster et al., 2001;
Orlov et al., 2012), osteoporosis (Shi et al., 2012) and brain (Benali et al., 2003; Glotsos et
al., 2004; Sundstrøm et al., 2013); inter alia. The extent and variety of such studies are

CHAPTER 2
PAGE | 36
themselves an indication of the impact that computer-based systems have had in
quantitative histological analysis (Jarvis, 1992; Preston & Bartels, 1988; Doi, 2007; Giger et
al., 2008; Gurcan et al., 2009).
Even though current systems are technically complex and not easily operated by the
average practising pathologist, automated quantification will increasingly be a part of
standard practice in the future (Leong & Leong, 2003; Park et al., 2012). Also, with the
continuing rapid development of computer technologies and combined cost reductions, it is
suggested that successful computer-based automated image analysis solutions will become
commonplace and lie within the reach of individual pathologists, clinical researchers and
other members of the wide-ranging histological community (McEachron et al., 1989; Leong
& Leong, 2004; Mulrane et al., 2008; Krenacs et al., 2010).
At a time when automated morphological classification of histological images is
increasingly prevalent in routine practice for other disciplines, including human anatomic
and clinical pathology, the use of this methodology is still largely absent from fish health and
veterinary applications. A limited amount of research has been performed on the application
of automated image analysis to fish histopathology. For example, studies on the description
of the progression of amoebic gill disease have employed semi-automated digital image
analysis to evaluate the mean number of branchial mucous and chloride cells (Adams &
Nowak, 2003, 2004). Another study, which monitored stress in fish by examining the effects
that two common environmental states would have on the morphology of skin from sea
bass, Dicentrarchus labrax, employed an automated image analysis system to assess in
particular the number and diameter of skin mucous cells (Vatsos et al., 2010). In order to
evaluate the intestinal lipid absorption and eventual liver hypertrophy in common carp
larvae, Cyprinus carpio, a further study examined anterior intestine and liver histological
sections using a semi-automated image analysis protocol (Fontagné et al., 2000). A further
study described the development of the axial musculature in first-feeding larvae of Atlantic
cod, Gadus morhua, with muscle growth being assessed by determining the number of
muscle fibres (i.e. hyperplasia) and the growth of existing fibres (i.e. hypertrophy), by use of

Description and development of a semi-automated image analysis system
PAGE | 37
a semi-automated image analysis system (Galloway et al., 1999). In quality trait studies of
gilthead sea bream, Sparus aurata, morphometric measurements on the dorsal muscle
were made from transverse sections using an interactive image analysis system (Valente et
al., 2011; Matos et al., 2013). Overall, however, few studies employing automated image
analysis as a tool for fish histopathology exist, particularly when contrasted to the extensive
use in other organisms of commercial, medical or veterinary importance (Ahrens et al.,
1990; Veggetti et al., 1993; Vaughan et al., 1996; Anggraeni & Owens, 2000; Dolapchieva
et al., 2000; Chi & Liang, 2004; De Laat et al., 2013).
Despite the paucity of studies employing automated image analysis on fish health-
associated material, image analysis of histological sections is clearly appropriate to the
requirements of fish pathologists, and the development of (semi-) automated quantitative
tools would be an important advance, adding value to histomorphology-based disciplines.
Therefore, the aim of the present study has been the development of a semi-automated
system to assist pathologists with the histological evaluation of fish intestinal biopsies, while
providing an alternative approach to the semi-quantitative scoring methods currently used
for intestinal health assessment. Thus, the intention was to develop an efficient image
processing and analysis pipeline, incorporating appropriate algorithms, to reliably quantify
the extent of morphological and functional changes occurring in response to dietary and
environmental modulation.
2.2. Material and methods
2.2.1. Histological tissue samples
Tissue samples, all taken from the anterior part of the distal intestine of Atlantic salmon
and fixed in neutral buffered formalin (10 %, pH 7.2, room temperature ~20 °C), were
obtained from Skretting ARC’s histological archives so as to represent a range of
pathological states. Subsequently, all cases were recoded for blind analysis, the samples
dehydrated and embedded in paraffin (Tissue-Tek II Paraffin Wax, 54-57 ˚C, Sakura
Finetek Europe B.V, Netherlands) and transverse sections of 5 µm thickness were cut

CHAPTER 2
PAGE | 38
(Leica RM 2035, Leica Microsystems Ltd., UK). Sections were then dewaxed and stained
with a combination of Harris’ haematoxylin (bluish nuclear / acidic tissue stain), eosin-
yellowish (red cytoplasmic / basic tissue stain) and Alcian blue (8 GX, pH 2.5, a turquoise
stain particularly highlighting acid mucopolysaccharides of mucous cells) (Steedman, 1950;
Lev & Spicer, 1964; see Appendix 1 for modified staining protocol).
The initial slide-review was undertaken using brightfield illumination. Each slide was
evaluated by an expert pathologist and assigned to one of the following histological grades:
(A) normal morphology, (B) mild to moderate inflammation and (C) severe enteritis (Figure
2.1). In order to develop the semi-automated image processing and analysis system, and to
test its accuracy, this process ensured that the selected slides covered most of the
anticipated tissue morphological variations among all three histological grades. Altogether,
105 specimens were selected from the histological archives and 25-30 single representative
slides were designated for each histological grading.
2.2.2. Digital image acquisition
The selected slides were scanned using an automated slide-scanning system (MIRAX
Desk, Carl Zeiss MicroImaging GmbH, Göttingen, Germany) equipped with a 20×
apochromat objective and a SONY DFW-X710 camera. To reduce the differences among
tissue samples, variations in illumination, reflectance and optical transmission over the
microscopic field were normalised and whole-slide digital mosaics captured giving a full
slide image equating to 47104 × 61440 pixels. Thereafter, by use of the MIRAX Viewer
software (Version 1.12, 3DHISTECH, Budapest, Hungary) representative image fields were
randomly selected and a distinct set of frames from different sizes (i.e. 1:1, 47275 × 26813
pixels; 1:2, 23637 × 13406 pixels; 1:4, 11818 × 6703 pixels) used to crop the selected fields
at different software magnifications (i.e. 20×, 40×, 100× and 200×). Twenty-four bit digital
images with a quality resolution setting of 0.23 microns per pixel, were extracted and saved
as individual TIFF images (Figure 2.2).
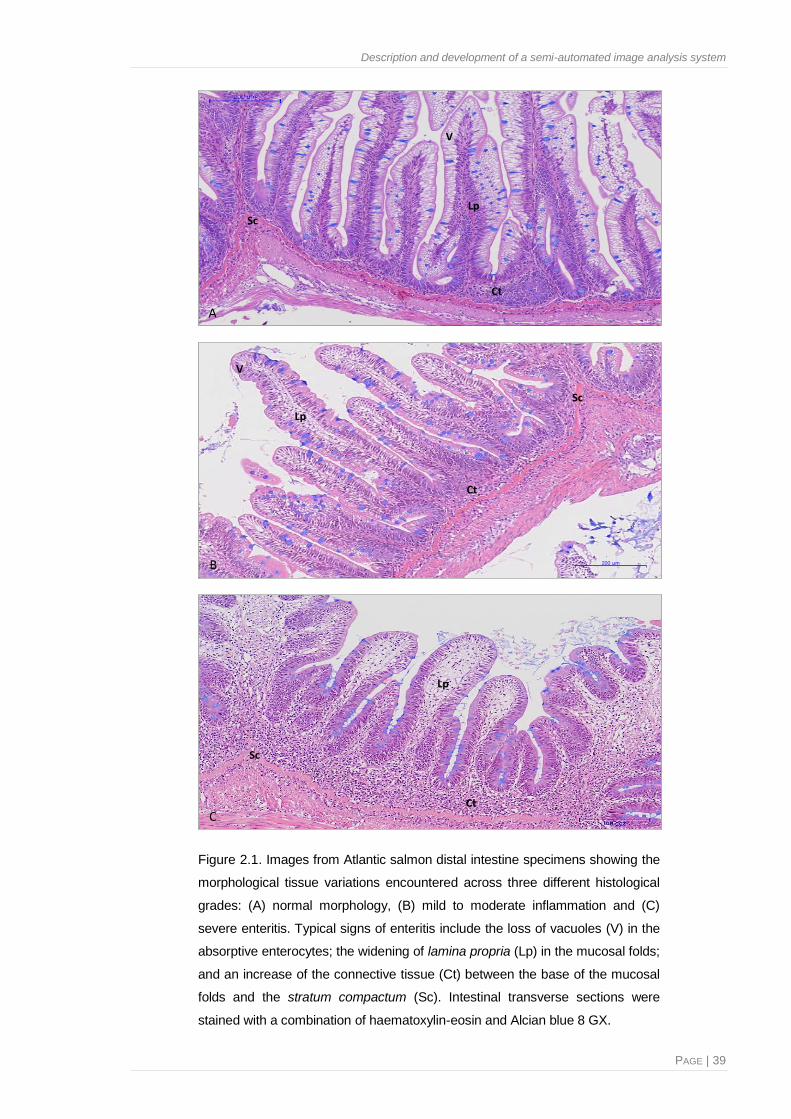
Description and development of a semi-automated image analysis system
PAGE | 39
A
Sc
Lp
V
Ct
Sc
Lp
V
Ct
B 200 μm
Sc
Lp
CtC
Figure 2.1. Images from Atlantic salmon distal intestine specimens showing the
morphological tissue variations encountered across three different histological
grades: (A) normal morphology, (B) mild to moderate inflammation and (C)
severe enteritis. Typical signs of enteritis include the loss of vacuoles (V) in the
absorptive enterocytes; the widening of lamina propria (Lp) in the mucosal folds;
and an increase of the connective tissue (Ct) between the base of the mucosal
folds and the stratum compactum (Sc). Intestinal transverse sections were
stained with a combination of haematoxylin-eosin and Alcian blue 8 GX.

CHAPTER 2
PAGE | 40
A B
D E
C
2000 µm
500 µm
20 µm 50 µm
100 µm
Figure 2.2. Digitised histological image of distal intestine tissue from Atlantic salmon, at successively
higher magnifation. (A) Original full scale image digitised at 20×. (B) A sample cropped image (4.85
MPixels) taken from the original image at 100×, approximately one tenth of the full scale image. (C) A
portion of a cropped sample image visualised at 200×. (D-E) Digitised images visualised at 1200×
and 2000× respectively, yielding incrementally more discriminatory information but giving smaller,
less representative sampling windows. Intestinal sections were stained with a combination of
haematoxylin-eosin and Alcian blue 8 GX.
2.2.3. Development tools – Image analysis hardware and software
The image processing and analysis algorithms described here were developed using
Zeiss’s proprietary macro programming language, deployed through commercially available
image processing and analysis software (KS 300, Execution Environment, Version 3.0, Carl
Zeiss MicroImaging GmbH, Göttingen, Germany). The custom system developed included
algorithms for semi-automatic image segmentation and image identification, as well as for
interactive analysis of images, feature extraction and data storage. Additionally, feedback in
the form of guidance-notes for the operator, and visualisation of the generated images was
made available at each step of the pipeline process (as shown in Technical Note A1).
Evaluation and deployment of the system was performed on a standard personal
computer (Dell Latitude™ D630, Intel Pentium II 350 MHz processor, 128 MB RAM, 2 GB
hard disk, under the environment of Microsoft™ Windows XP) operating the stand-alone
KSRun software platform (Version 3.0, Carl Zeiss Vision GmbH, München-Hallbergmoos,
Germany). In accordance with the MIRAX Viewer guidelines, the system was calibrated and
measurements validated against a slide-graticule image captured at settings identical to
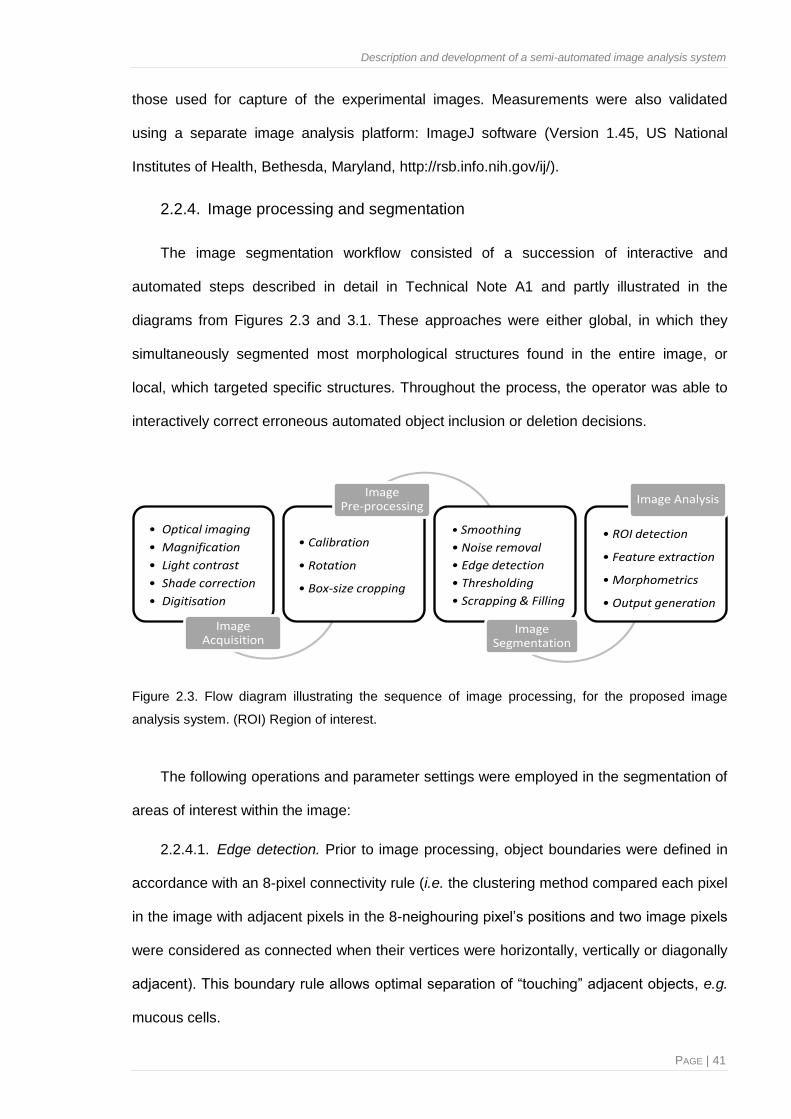
Description and development of a semi-automated image analysis system
PAGE | 41
those used for capture of the experimental images. Measurements were also validated
using a separate image analysis platform: ImageJ software (Version 1.45, US National
Institutes of Health, Bethesda, Maryland, http://rsb.info.nih.gov/ij/).
2.2.4. Image processing and segmentation
The image segmentation workflow consisted of a succession of interactive and
automated steps described in detail in Technical Note A1 and partly illustrated in the
diagrams from Figures 2.3 and 3.1. These approaches were either global, in which they
simultaneously segmented most morphological structures found in the entire image, or
local, which targeted specific structures. Throughout the process, the operator was able to
interactively correct erroneous automated object inclusion or deletion decisions.
• Optical imaging
• Magnification
• Light contrast
• Shade correction
• Digitisation
Image Acquisition
ImagePre-processing
Image Segmentation
Image Analysis
• Calibration
• Rotation
• Box-size cropping
• Smoothing
• Noise removal
• Edge detection
• Thresholding
• Scrapping & Filling
• ROI detection
• Feature extraction
• Morphometrics
• Output generation
Figure 2.3. Flow diagram illustrating the sequence of image processing, for the proposed image
analysis system. (ROI) Region of interest.
The following operations and parameter settings were employed in the segmentation of
areas of interest within the image:
2.2.4.1. Edge detection. Prior to image processing, object boundaries were defined in
accordance with an 8-pixel connectivity rule (i.e. the clustering method compared each pixel
in the image with adjacent pixels in the 8-neighouring pixel’s positions and two image pixels
were considered as connected when their vertices were horizontally, vertically or diagonally
adjacent). This boundary rule allows optimal separation of “touching” adjacent objects, e.g.
mucous cells.

CHAPTER 2
PAGE | 42
2.2.4.2. Noise removal. Following correction of background lighting inhomogeneities,
undesired artefacts were removed by a combination of use of morphological operators and
direct manual tracing of contours.
2.2.4.3. Colour thresholding. Using a Hue, Lightness and Saturation (HLS) colour
model which serves to best resolve observer-perceived colours, the colours associated with
the object of interest (e.g. blue turquoise for mucous cells) were added to give a threshold
range enabling capture of all objects with colours lying within the range.
2.2.4.4. Morphological filtering. Objects segmented by earlier operations were further
filtered using morphological operators (i.e. objects smaller or larger than expected values
for the type of object of interest were removed). The resulting binary (black and white)
object markers / masks were employed to capture sub-images of the individual selected
objects. Adjacent objects were separated using a combination of erosion and dilation steps
and the use of a binary grain recognition algorithm.
2.2.4.5. Intensity thresholding. On the basis of pixel intensity characteristics i.e. lighter
or darker areas within the image, the user interactively defined a greyscale range of pixel
intensity values that encompassed objects of interest. Objects lying above this threshold
were considered in further steps (e.g. tissue) with objects below this threshold being
removed (e.g. background / intestinal lumen).
2.2.4.6. Size scrapping and filling. A sequence of filters was then applied, whereby
small objects were removed by use of size-scrap operators and holes were filled using
erosion and dilation operations and use of binary fills. Following the earlier operations the
image was again filtered to remove specific size range objects. In addition, to reduce the
noise and enhance the contrast of small cellular features, a Gaussian smoothing step
(Gonzalez & Woods, 2002) was applied to the boundaries. Finally, a binary image
incorporating the final regions of interest was created and stored.
2.2.4.7. Intensity thresholding of inverted images. Images were inverted using an
inverse histogram equalisation operation, which provided a negative of the image (black =
Description and development of a semi-automated image analysis system
PAGE | 43
white, white = black). Small objects in the thresholded binary image were then eliminated
and small holes repaired by application of erosion and dilation operations. Ultimately, the
resulting segmented object image was saved.
2.2.4.8. Manual object delineation. Specific regions were defined and selected by
interactive freehand-drawing in the graphics plane of the displayed image.
2.2.5. Histological identification and post-processing overlays
The algorithms below were developed for the purpose of recognising specific
histomorphological structures:
2.2.5.1. Mucosal and submucosal tissues. Intensity thresholding was employed to
interactively segment the peritoneal edge of the muscularis externa and the internal
intestinal lumen. Thereafter, using interactive drawing, the stratum compactum was defined,
which allowed discrimination between different tissue areas (i.e. mucosal and submucosal
tissues, respectively) – Figure 2.4.
2.2.5.2. Mucous cells. Subsequently, using an interactive HLS colour threshold,
stained mucous cells were identified. Additionally, binary grain recognition was used to
separate adjoining mucous cells, and the resulting objects were filtered by size-threshold-
operators so as to ensure removal of artefacts (Figure 2.5 A-D).
2.2.5.3. Tissue vacuolisation. Thereafter, the source image was converted into a
greyscale image and mucosal tissue vacuoles were recognised (Figure 2.5 A, F-H). Finally,
once the tissue regions were defined, a boundary segmentation was performed and the
luminal perimeter captured (Figure 2.4 D).
2.2.5.4. Mask overlays. Regions identified by thresholding ranges were then
highlighted and object markers / masks were stored as binary images. Post-processing
overlay masks deriving from the detected regions of interest were generated and stored as
segmentation mask images (i.e. the original image, with identified objects highlighted by
labels) – (Figures 1-7 from Technical Note A1).

CHAPTER 2 | Description and development of a semi-automated image analysis system
PAGE | 44
CB D E FA
200 µm
Figure 2.4. Images generated by the described image analysis algorithms, from which morphometric features were extracted and employed to quantify the
phenotypic appearance of the specimen’s distal intestine. (A) A portion of a digitised histological image, approximately one eighteenth of the full image used in the
present study as described in Figure 2.3. (B) Greyscale sub-image extracted from the original’s negative image, by use of an inverse histogram equalisation
operation. (C) Binary image created during the image segmentation process, where the empty space was differentiated by inverting the original image to its negative
and use of intensity differentiation, which in turn allows distinction of the peritoneal edge of the muscularis externa and the internal intestinal lumen. (D) Binary image
of the perimeter line from the outside mucosal boundary, captured after appropriate segmentation of the luminal surface. (E, F) Binary images of mucosal and
submucosal tissue areas, obtained by interactive drawing of the stratum compactum over Figure 2.4 A, which allowed discrimination between tissue areas.

Description and development of a semi-automated image analysis system
PAGE | 45
CBA D
GFE H
20 µm
Figure 2.5. Images generated by the described image analysis algorithms, from which morphometric
features were extracted and employed to quantify the phenotypic appearance of the specimen’s
distal intestine. (A) A portion of a digitised histological image, approximately 1:100 of the full image
used in the present study as described in Figure 2.2. (B, C) Binary images obtained for the
segmented and size-filtered mucous cells, after using an HLS colour model to threshold colours
associated with them. (D) Object markers / masks for the objects captured as mucous cells, stored
as a binary image. (E) Inverted greyscale sub-image created during the image segmentation process
by use of an inverse histogram equalisation operation. (F, G) Binary images where the mucosal
tissue vacuolisation was recognised by inverting the original image to its negative and through
intensity differentiation, which in turn allows distinction of the peritoneal edge of the muscularis
externa and the internal intestinal lumen. (H) Object markers / masks for mucosal tissue
vacuolisation, stored as a binary image.
2.2.6. Feature extraction and output generation
The last stage of the developed system involved the extraction of image content
descriptors (i.e. image features), which describe the image content quantitatively. Once a
region of interest was detected using one of the algorithms described above, various
automated arithmetic and geometric algorithms were employed to provide measurements of
a number of morphometric parameters (see Table 2.2).
2.2.6.1. Geometric features. The area of a specific region was measured by direct
counting of the number of pixels within the boundary of the filled region. The perimeter
length was computed as the length of the region’s outside contour estimated as a weighted

CHAPTER 2
PAGE | 46
sum of the number of pixels around the region of interest (Figure 2.6). The lengths of the
main (longest) and secondary (shortest) axes of an ellipse with the same geometric moment
of inertia as the object of interest were measured in pixel numbers. Likewise, the maximal
and minimum numbers of pixels for the Feret lengths of the object (i.e. caliper lengths of
lines passing through the centre of gravity) were measured.
Filled AreaROI Perim Feret Min Feret MaxEllipse Af Ellipse Bf Circ
Figure 2.6. Geometric and shape feature measurements employed in the study. (ROI) Region of
interest. (Filled Area) Number of pixels within the boundary of the filled region. (Perim) Length of the
region’s outside contour estimated as a weighted sum of the number of pixels around the region of
interest. (Ellipse Af) The length of the main axis of an ellipse with the same geometric moment of
inertia as the region of interest measured in pixels. (Ellipse Bf) The length of the secondary axis of an
ellipse with the same geometric moment of inertia as the region of interest measured in pixels. (Feret
Min) Number of pixels for the minimum Feret length of the region of interest. (Feret Max) Number of
pixels for the maximal Feret length of the region of interest. (Circ) Circularity of the region of interest,
estimated as the ratio of the perimeter length from the region of interest, over the perimeter of a circle
with an equivalent area (Images adapted from KS300 electronic user notes).
2.2.6.2. Shape features. Circularity, representing the degree of roundness of the object
(i.e. a value of 1 indicated a perfect circle) was estimated as the ratio of the perimeter of the
object, over the perimeter of a circle with an equivalent area. Fractal dimensions were
measured by use of the box-counting method (Russell et al., 1980; Cross, 1994; Shang et
al., 2000). This method divides the binary image into successive grids of boxes, the boxes
within each grid having a different size (λ) and counting the number of boxes intercepted by
the perimeter line for each grid (N (λ)). Grids with large numbers of small boxes would give
many intercepts while those with a small number of large boxes would show few intercepts
(Figure 2.7). The fractal dimension of the perimeter would then be estimated from the slope
of a regression line fitted to a plot of λ vs. N (λ) on a log-log scale.

Description and development of a semi-automated image analysis system
PAGE | 47
λ1
λ2
λ3
Figure 2.7. Schematic diagram of the box-counting method used to estimate fractal dimensions. The
technique finds the number of boxes, required to cover the perimeter line, by superimposing a
regular grid of boxes on to the image, and counting the number of occupied boxes. The procedure is
then repeated using different box sizes (e.g. λ1 – λ3), up to the size of the image.
2.2.6.3. Position and orientation features. The absolute co-ordinates of the object
centroid (x, y) were also recorded. This allows the user to relocate an object of interest in
the original image.
2.2.6.4. Output generation. The obtained values were then transcribed from pixel
values to SI base units using the image calibration file, and exported to a flat database file
(Figure 8 from Technical Note A1). Quantitative variables were expressed as mean and
standard deviations, unless otherwise specified.
2.2.7. System performance
The performance of the developed system was evaluated in terms of efficiency,
accuracy and reproducibility. In order to do this, 25 additional test images from different
study-cases were randomly selected.
2.2.7.1. Efficiency. First, the extent to which time effort was needed to accomplish the
intended assessment tasks was evaluated. The total average computation times for feature
extraction, feature calculation and output generation were determined for semi-automated
processing as opposed to interactive and manual segmentation.
2.2.7.2. Accuracy. The accuracy of the algorithm denotes the degree to which the
segmentation measurements agreed with the actual values of the region of interest. This

CHAPTER 2
PAGE | 48
has been validated using two different approaches. First, a quantitative comparison
between computational results and manual measurements gathered by experienced
pathologists was conducted. Secondly, the same images were evaluated using an open
source image analysis software, and results from the interactive and the semi-automated
segmentations compared using ImageJ software (Version 1.46r, US National Institutes of
Health, Bethesda, Maryland, USA, http://rsb.info.nih.gov/ij/).
2.2.7.3. Reproducibility. The system was then evaluated in terms of its precision. This
was done by comparing the degree of agreement between measurements obtained for the
same image, when the procedure was conducted by different users and at different time points.
2.2.7.4. Statistical analysis. The system’s accuracy and reproducibility were evaluated
by comparing the continuous variables derived from the developed image analysis
algorithms, with that from the interactive segmentation accomplished by an open source
image analysis software package, and through manual assessment done by an
experienced histopathologist. Thereafter, Pearson’s correlations were carried out on
generated data and statistical significances were evaluated using Minitab (Version 16.1.0.0,
Coventry, UK) statistical software package.
2.3. Results and discussion
In the present study, a novel semi-automated histological image analysis system was
developed to evaluate the extent of morphological changes in the distal intestine of Atlantic
salmon, due to dietary modulation.
Technical Note A1 provides a detailed description of the developed approach. In this
approach, semi-automated image segmentation procedures were used to partition an image
into interpretable regions or objects of interest, an essential process for most subsequent
image analysis tasks, which included several algorithms for feature extraction and
morphometric data generation. To achieve this goal, the overall procedure had to be
standardised with respect to tissue staining, image acquisition, image pre-processing and
image analysis. Moreover, the reliability of the system had to be validated.

Description and development of a semi-automated image analysis system
PAGE | 49
2.3.1. Standardisation of staining
Several researchers have reasoned that standardisation of the staining method is
crucial if an automated image analysis system is to be employed, since computer-assisted
analysis appears to be more susceptible to variations in pixel colour than human visual
recognition would be (Wittekind et al., 1983; Wied et al., 1989; Karlsson et al., 1994; Mesker
et al., 1994; Johansson et al., 2001). Thus, refinement and standardisation of staining
procedures to improve the efficacy of the proposed system were an early concern.
In order to optimise the protocol, during the staining process (i.e. after each of staining
steps) the colour development was visually checked under a microscope. Once the optimal
staining times were established, all slides in series of batches were simultaneously stained
for the same period of time. Also, extra care was taken to use freshly made staining
solutions, or to use the same lot batch number if purchased from commercial sources.
The best staining contrast and minimal background were achieved with the protocol
outlined in Appendix 1. Thereafter the staining variation between slide-batches was
evaluated by comparing images from serial sections (i.e. prepared from the same tissue
paraffin block). Colour coefficients of variation for these control slides, were roughly
estimated between 11.5-15.0 %, 16.5-18.5 % and 19.0-23.0 % for the red, green and blue
channels, respectively. This variation is very similar to that reported by Mosedale et al.
(1996). This variability could, however, be considerably minimised by use of an automated
staining machine as used in high-throughput human and animal health screening. Cost
limitations in the current project did not, for the most part, permit implementation of such
alternatives in this study.
Another matter of concern is that considerable changes in tissue volume may occur
during the process of tissue fixation and dehydration, which may influence the
morphometric results (Aherne & Dunnill, 1966; Denef et al., 1979; Gerdes et al., 1982;
Boonstra et al., 1983). Some investigators have suggested that because this is a constant
feature of fixed material and because all samples will have been treated the same way,
there is no need for correction factors to be applied (Baur, 1973 in Baak et al., 1977; Bouw,

CHAPTER 2
PAGE | 50
1975 in Baak et al., 1977). Nevertheless, in the present study stringent attempts were made
to standardise all procedures (i.e. using the same fixative solutions / identical fixation
periods for all the samples used; and follow optimised protocols for dehydration and
histological tissue processing).
2.3.2. Image acquisition and pre-processing
The influence of routine acquisition and pre-processing capture methods on the ability
of the system to efficiently segment regions of interest and extract image content
descriptors was considered to be an extremely important factor in the outcome of overall
analysis. Image acquisition was initially done by use of a high-resolution digital camera
(Axiocam MRc5, Carl Zeiss, Cambridge, UK) attached to a light microscope (BX51,
Olympus, Hamburg, Germany), although variations / inhomogeneities in the background
intensity often occurred, leading in turn to inaccurate segmentation results. The decision
was then made to use a whole-slide scanning system. This technology not only permitted
capture of high resolution images with high fidelity in respect to the diagnostic material, but
also proved to be highly robust in respect to variations in image illumination, contrast and
brightness. Ultimately, other inherent advantages of using digital slides over glass slides in
terms of the review process were also perceived (e.g. ability to view images simultaneously,
portability and convenience of full slide scans, ease of image sharing and retrieval from
image archives, possibility of provision of an audit trail, suitability of system for training, etc.;
Leong & Leong, 2003, Rocha et al., 2009, Bandyopadhyay, 2011, Pantanowitz et al., 2011).
Another important area for consideration was the optimal image size and resolution to
employ, as the quality and area coverage of the original image is a critical factor in the field
of image analysis (Jeong et al., 2010; Park et al., 2012). Large, high resolution (pixel)
images allow a greater proportion of the tissue to be sampled in a given window providing a
better overview of overall tissue status. Small, high resolution images provide a more
localised sample window and will hence increase variability between “replicate” samples.
Lower resolution images will degrade the capability to resolve objects of interest accurately.
Technical, financial and statistical requirements / constraints, however, mean that there needs

Description and development of a semi-automated image analysis system
PAGE | 51
to be a compromise between high image quality and acceptable speed of image processing.
Various studies have investigated the influence of resolution of digital histological images on
subjective observer perception (Belien et al., 1997; Vidmar et al., 1999; Daniel et al., 2000;
Boellaard et al., 2004). Despite this, there are no standardised thresholds defining minimal
requirements in respect to the image quality needed to assure an assessment’s accuracy.
In the present study, three different frame-sizes (i.e. 1:1, 47275 × 26813 pixels; 1:2,
23637 × 13406 pixels; 1:4, 11818 × 6703 pixels) at four distinct digital capture magnifications
(i.e. 20×, 40×, 100× and 200×) were verified for development and deployment of the proposed
segmentation methods. These specifications resulted in average file sizes of 12 MB to 2.22
GB (Table 2.1). While the use of higher resolution images coupled to larger frames provided
the best tissue sample window and ability to resolve detail, practical constraints such as
memory use and processor speed meant that systems ran too slowly to be of utility in an
analytical / diagnostic context. Consequently, optimised parameters established within the
described work (image size 11818 × 6703 pixels sampled at 100× magnification, resulting in
an image file of 24 MB) were a compromise between processing time requirements, image
quality, file size and computational hardware limitations.
Table 2.1. Image size and resulting image file size of 24-bit digital TIFF images, captured at different
magnifications.
Magnification Size (pixels) File size (MB)
20×
(1:1) 47275 × 26813 2281.3
(1:2) 23637 × 13406 600.4
(1:4) 11818 × 6703 180.1
40×
(1:1) 47275 × 26813 600.4
(1:2) 23637 × 13406 180.1
(1:4) 11818 × 6703 72
100×
(1:1) 47275 × 26813 96.1
(1:2) 23637 × 13406 24
(1:4) 11818 × 6703 12
200×
(1:1) 47275 × 26813 24
(1:2) 23637 × 13406 12
(1:4) 11818 × 6703 12
Footnotes: MB, megabytes.

CHAPTER 2
PAGE | 52
2.3.3. Development, training and evaluation
In the context of automated image analysis, a computer-based pipeline for carrying out
a procedure, i.e. image processing algorithm, may be used to process and analyse the
captured digital slide image, making interpretation more straightforward and permitting a
more objective quantitative assessment. Such algorithms may be incorporated into an
image analysis software package enabling easier implementation by the end user. For the
purposes of the work presented in this thesis, the Zeiss KS300 image analysis system
(Version 3.0, Carl Zeiss MicroImaging GmbH, Göttingen, Germany), a widely recognised
and employed image processing and analysis platform, was used for the majority of
procedures. This system has the advantage of providing an extensive set of image
processing and analysis tools in a uniform environment and a well-developed macro-writing
and application environment as well as being associated with extensive pre-existing
expertise at the Institute of Aquaculture allowing more rapid system development during the
course of the project.
The system developed includes algorithms for semi-automatic image segmentation and
image identification, as well as for interactive analysis of images, feature extraction and
data storage. For the purpose of recognising specific structures, algorithms were developed
to carry out five distinct segmentation of regions of interest: (i) mucosal and submucosal
tissue regions, (ii) mucous cells, (iii) tissue vacuolisation, (iv) intestinal lumen and (v)
luminal surface. Segmentation of these different histological components was carried out
sequentially. Regions within the threshold ranges were highlighted, and the corresponding
measurement values exported to an Excel flat sheet.
As part of the software workflow, marked-up images were provided across all steps
within the pipeline. These, and the x, y coordinates of each detected object allowed
assessment of the degree to which the segmentation algorithms correctly recognised and
segmented the histological features in each image. During the training period, an
experienced histopathologist visually evaluated such marked-up images as part of a quality

Description and development of a semi-automated image analysis system
PAGE | 53
assurance step. This served as an opportunity to determine the accuracy of the algorithm
and to judge the necessity for algorithm refinement.
Most algorithms demanded varying degrees of customisation that could have not been
predicted, a priori. The testing and resetting of the algorithm parameters to converge on an
optimal but flexible segmentation result was laborious and time-consuming. In all, it took just
over eighteen months to develop a system showing optimal performance, illustrating the time
required for development of such systems. In some respects this represents the time taken to
encode the knowledge of the researcher in a computer-based system. The various algorithms
were developed using a “training set” which comprised 6 images of distinct histological
grades. Once the algorithms had been refined, the entire system was evaluated using the
other 105 randomly selected images.
2.3.3.1. Feature selection. When deciding upon the morphometric extraction approach,
the researchers tried to select a set of features that would best describe the different
relevant intestinal morphological changes. For each image frame, the set of features
summarised in Table 2.2 was extracted. The selection was based on the researchers’
personal experience from similar quantitative studies, or review of the relevant literature.
Also algorithms were developed according to the researchers’ ideas about what additional
features could be useful, this being based on experience from visual observation, identifying
features that might express the properties used for visual discrimination between different
histopathological gradings (e.g. fractal dimensions, circularity index, Feret and elliptical lengths).
A large number of image descriptors was used, varying from simple geometric features
(e.g. perimeter, area, size and shape) to other descriptors based on density and texture
content. Although not all features measured might be relevant to description of intestinal
changes, the lack of additional time or computational overhead in their inclusion meant that
the initial analytical steps included them all. The wide variety of initial descriptors were
subsequently winnowed through use of multivariate statistical techniques, which reduced data
dimensionality by ranking the features according to their discriminatory potential (as described
in Chapters 3 and 4).

CHAPTER 2
PAGE | 54
2.3.4. System performance
A priori the system required expert knowledge, provided by experienced pathologists,
who were also involved in the design and validation processes. Once the system had been
developed, an unassisted observer could very easily operate it. No high level knowledge of
histology, pathology diagnosis, mathematics or computing is necessary, this having been
encoded into the developed system. Nevertheless the semi-automated image analysis
system described did require a degree of user learning and training. This learning curve
was not steep, but did exist.
Table 2.2. List of measured morphological parameters and computed morphometric ratios used in
the analysis.
Morphometric feature Description
MTA Mucosal tissue area
MCA Mucous cell total area
MMCA Mean mucous cell area
MCA / MTA Ratio between the mucous cell area and the mucosal tissue area
MCN Mucous cell number
MCN / MTA Ratio between the mucous cell number and the mucosal tissue area
STA Submucosal tissue area
MTA / STA Ratio between the mucosal tissue area and the submucosal tissue
area
MC Feret Min Mucous cell minimum Feret length
MC Feret Max Mucous cell maximum Feret length
MC Feret Ratio Ratio of the mucous cell Feret lengths
MC Ellipse Af Length of the main axis of an ellipse with the same geometric moment
of inertia as the mucous cell
MC Ellipse Bf Length of the secondary axis of an ellipse with the same geometric
moment of inertia as the mucous cell
MC Ellipse Ratio Ratio of the elliptical lengths Af and Bf for the mucous cell
MCirc Mucous cell mean circularity index
P Total perimeter length of the luminal surface
P / MTA Ratio between total perimeter length of the luminal surface and
mucosal tissue area
VC Vacuolisation total area
VC / MTA Ratio between the total vacuolisation area and the mucosal tissue
area
MTA-Vac MTA without the vacuolisation area
MCA / [MTA-Vac] Ratio between mucous cell total area and the MTA without the
vacuolisation area
MCN / [MTA-Vac] Ratio between mucous cell number and the MTA without the
vacuolisation area
FR Fractal dimension of the perimeter line from the luminal surface

Description and development of a semi-automated image analysis system
PAGE | 55
By optimising the implementation of the algorithms, acceptable processing speeds
were achievable, even when using a relatively old personal computer. The average time for
the whole digital slide image acquisition was approximately 4-12 min, depending on the
amount of tissue to scan (with this step being capable of full automation, given an
appropriate slide-loader). Image pre-processing and frame rotation / cropping was little
more than 3 min per slide. The total average computation time from image upload to feature
extraction, measurement and results data output for 12 continuous variables being roughly
20 to 25 min per frame, which greatly improved the efficiency of conducting such
quantitative assessment as opposed to the possible alternative semi-quantitative approach.
2.3.4.1. Efficiency. The performance of the proposed system was evaluated by
comparing the time effort required to accomplish the intended assessment tasks, with that
required for manual assessment performed by an experienced histopathologist.
Of the objects of interest that were measured, parameters corresponding to mucous
cells were selected for validation since these were the most easily established by manual
assessment, by which means an assessor could establish a near “true value”.
Table 2.3 shows the average processing time for each segmentation method up to
feature calculation and output generation. As expected, the longest mean time to view and
morphometrically quantify an image was for the manual assessment (i.e. Count: 1’29’’ ±
24’’, Perimeter & Area: 4’16’’ ± 54’’; also highly correlated to the number of or complexity of
the regions of interest – Count: r = 0.803, p < 0.001; however not correlated to the size of
the regions of interest – Area: r = 0.296, p > 0.05). Automated modes having the shortest
mean times (Interactive mode: Count 0’23’’ ± 07’’, Perimeter&Area 4’16’’ ± 54’’; Fully automated:
Count 0’04’’ ± 00’’, Perimeter&Area 0’01’’ ± 00’’). Furthermore, most images were segmented with
little or no operator interaction, with processing times of the order of less than 4 seconds.
More complicated images required some processing interaction and a total analysis time
varying from 10 to 36 seconds, with most of this time devoted to inspection and comparison.
Results suggest that the proposed assisted computer system can be a viable alternative to
pathologist’s scoring in a manner that is more practical and time-efficient.

CHAPTER 2
PAGE | 56
Table 2.3. Total mean processing time required to accomplish the intended assessment tasks, by
means of manual, interactive or automated threshold methods for mucous cell assessment.
Mucous cell assessment Total average processing time
Count (N°)
Manual 1’29’’ ± 24’’ (Min0’54’’, Max2’34’’)
Interactive 0’23’’ ± 07’’ (Min0’10’’, Max0’36’’)
Automated 0’04’’ ± 00’’ (Always0’04’’)
Perimeter Length (µm) & Filled Area (µm2)
Manual 4’16’’ ± 54’’ (Min2’41’’, Max6’10’’)
Automated 0’01’’ ± 00’’ (Always0’01’’)
Footnotes:
n = 25 Histological frames analysed for each feature measurement and threshold method
employed.
The results obtained agree with previous studies (Sieren et al., 2010; Galarraga et al.,
2012; Pajor et al., 2012; Tapias et al., 2013), which also observed that the automated
process greatly reduces the time spent on appraisal, compared with the traditional manual
process by effectively transferring the load of the assessment process to the computer.
2.3.4.2. Accuracy. To show the robustness of the proposed method, both manual and
(semi-) automated analyses were performed on the same digital image. The quantitative
evaluation was performed using Pearson correlations, and results acquired by both
methodologies are illustrated in Table 2.4. Overall, measurements derived by use of
interactive segmentation methods showed greater agreement with the ones obtained
manually (Manual vs. interactive: rCount = 0.881, pCount < 0.001; Manual vs. automated: rCount
= 0.803, pCount < 0.001; rPerimeter = 0.991, pPerimeter < 0.001; rArea = 1.000, pArea < 0.001). As
expected, the disparity between the automatic and interactive methods was even smaller
(Automated vs. interactive: rCount = 0.924, pCount < 0.001). We found the accuracy values of
the interactive and automated approaches described here to be comparable to those of
other widely accepted systems (Mango, 1994; Einstein et al., 1997; Sims et al., 2002; Naik
et al., 2008; Doyle et al., 2007; Sieren et al., 2010; Galarraga et al., 2012; Nielsen et al.,
2012; Pajor et al., 2012; Shi et al., 2012; Tapias et al., 2013).

Description and development of a semi-automated image analysis system
PAGE | 57
Table 2.4. Correlations between measurements derived by using manual, interactive or automated
threshold methods, for mucous cell assessment.
Comparison for mucous cells Pearson correlation
Count (N°)
Manual vs. interactive r = 0.881, p < 0.001
Manual vs. automated r = 0.803, p < 0.001
Automated vs. interactive r = 0.924, p < 0.001
Perimeter Length (µm)
Manual vs. automated r = 0.991, p < 0.001
Filled Area (µm2)
Manual vs. automated r = 1.000, p < 0.001
Footnotes:
n = 25 Histological frames analysed for each feature measurement and
threshold method employed. Correlations were considered significant if p <
0.05.
Examples of processed images are presented in Figure 2.8, in order to show a direct
and unbiased comparison between the manual counts of a histologist, and the counts
obtained using the proposed image analysis system. Manually assessed cells are marked
with yellow crosses or yellow contour delineations, and multi-coloured overlay masks
identify the cells assessed by the automated system (i.e. without the operator interaction).
The examples show how the proposed system’s count for mucous cells is very similar to
those of the histologist (Table 2.4). In fact, the results of the automated method are close to
the mean values of the manual counts for each image, and fall within the standard deviation
of the manual counting. This also holds true for mucous cell perimeter lengths and filled
areas, this being irrespective of the segmentation threshold method used (i.e. automated or
interactive) – Table 2.4 and Figure 2.8.
Insight into how well the automated assessment agrees with the pathologist’s
assessment was sought through comparisons of image outputs (Figure 2.8). Substantial
agreement (i.e. lacking noteworthy or considerable errors) existed between the fully
automated and the manual morphometric image segmentation. The level of agreement
between human visual and computer-assisted mode was even more robust (images not
shown). A noticeable source of error in the fully automated quantification (see arrow and
star marks in Figure 2.8, as examples), was believed to be the lack of absolute “correction-

CHAPTER 2
PAGE | 58
A
Manual Threshold Automatic ThresholdOriginal Image
Nu
mb
er
Co
un
tP
eri
me
ter
Len
gth
Fille
d A
rea
B
+
++
+
+
+
+
+
++
+
++ +
++
+
+
+
+
+
+ +
++
C
FE
H IG
D
30 µm
40 µm
40 µm
Figure 2.8. Images from Atlantic salmon distal intestine sections used in the comparison of results
derived from the automatic algorithm system, against the manual measurements obtained by an
expert histopathologist. (A, B, C) The first row shows the counting results for mucous cell number,
while the second (D, E, F) and third rows (G, H, I) show the perimeter and filled area of cells,
respectively. The assessed mucous cells are marked by yellow crosses (B, histopathologist‘s
assessment) or by multi-colour overlays (C, automated system counts, without operator
interaction). The arrows are pointing to a specific mucous cell, which was not picked up by the
automated system because of the size thresholds that were implemented. The stars mark the
same mucous cells being assessed with both methodologies therefore having slightly different
perimeter delineations. Sections were stained with a combination of haematoxylin-eosin and Alcian
blue 8 GX.
Description and development of a semi-automated image analysis system
PAGE | 59
steps”, as opposed to the competence of the pathologist viewing the tissue irregularities or
deficiencies in the staining protocol. Most automated systems fail to account for artefactual
specimen variations (Webster et al., 2012). Deviations in tissue orientation, handling,
processing and staining among samples can be sources of segmentation inaccuracies.
Such variations are routinely encountered and the algorithms need to be capable of being
optimised to compensate for such inherent features.
By design, the developed system was not fully automated. Its interactive framework
allows the operator, by manually gating histograms and thus visually checking the marked-
up masks in the images created during the pseudo-segmentation process, to confirm that
the field of the region of interest is acceptable for analysis and thus to accept it or reject it.
While it is true that longer processing times are required for this interactive “correction”
(Table 2.3), we consider these interactive steps have great potential in providing increased
accuracy, as corroborated by the correlation results shown in Table 2.4.
In order to evaluate the proposed software further, the same images were then
evaluated using an open source image analysis system (here we used ImageJ software).
The measurement results for representative measurements comprising the mucous cell
total count, the luminal surface perimeter length and the mucosal tissue area, retrieved with
the proposed image analysis system were plotted against those of ImageJ and shown in
Figure 2.9. The comparison revealed a regression factor of 1.000 (r = 1.000, p < 0.001) for
the counts, a factor of 0.974 (r = 0.987, p < 0.001) for the perimeter length, and 0.978 (r =
0.987, p < 0.001) for the filled area parameter, which suggested that the developed system
is accurate and reliable.
2.3.4.3. Reproducibility. To determine the reproducibility of the system, an evaluation
session was carried out separately and independently by two operators / observers (one
trained histopathologist and one computer scientist). This was achieved by comparing the
degree of agreement between measurements obtained for identical when the procedure
was conducted by different operators and at two distinct time points. Although minor inter-
and intra-operator variations were recorded, these did not influence the outcome. Analysis of

CHAPTER 2
PAGE | 60
R² = 1.000
250
750
1250
1750
2250
250 750 1250 1750 2250
Gu
t H
ealt
h S
em
i-A
uto
mate
d S
yste
m
ImageJ Software
Mucous Cell Number(N )
R² = 0,974
0
50
100
150
200
250
300
0 50 100 150 200
Gu
t H
ea
lth
Se
mi-
Au
tom
ate
d S
ys
tem
ImageJ Software
Perimeter Length(x103 µm)
R² = 0,977
200
300
400
500
600
700
200 300 400 500 600 700
Gu
t H
ealt
h S
em
i-A
uto
mate
d S
yste
m
ImageJ Software
Mucosal Tissue Area(x104 µm2)
Figure 2.9. Scatter plots for the performance analysis results obtained by the proposed interactive
image analysis system and an open source image analysis software (i.e. ImageJ). (A) Comparison of
the total number of mucous cells. (B) Comparison of the total perimeter length of the luminal surface.
(C) Comparison of the total mucosal tissue area. R2 values, representing the square of the
correlation coefficients.
B A
C

Description and development of a semi-automated image analysis system
PAGE | 61
the repeated measures, revealed intra-operator concordance correlations of rCount = 0.935,
pCount < 0.001; rPerimeter = 0.732, pPerimeter = 0.098; rArea = 0.916, pArea < 0.001, while the inter-
operator had a correlation coefficient of rCount = 0.956, pCount < 0.001; rPerimeter = 0.406,
pPerimeter = 0.244; rArea = 0.834, pArea < 0.001. These values indicate high reproducibility for
the developed system, as the correlation scores were overall greater than 0.7, with the
exception of the inter-operator concordance for the perimeter length, which was somewhat
lower (Table 2.5). This was unsurprising, since the pipeline for identification and further
assessment of the perimeter length from the mucosal tissue luminal boundary, is far
lengthier and involves various interactive processing steps, which were not undertaken by
the second operator. For the count of mucous cells and total filled tissue area on the other
hand, more straightforward and comprehensive selection processes are required (see
Technical Note A1). Also for a true evaluation comparison to be performed, specific
encoding rules or guidelines for operator-use should be agreed upon. Accordingly, extra
time should have been allocated as to allow both appropriate discussion / understanding of
the instructions to follow, as well as for the necessary training, which would likely have been
reflected in the reproducibility scores obtained between intra- and inter-observers. It is worth
mentioning that Operator A had considerably more training time than Operator B for the
tasks considered, and therefore more experience using the software, which explains in
some part, the inter-operator differences observed and also the mean time spent per slide
(Table 2.5).
Nevertheless, it is recommended that the same operator should analyse all sections in
a single batch. Choosing a single observer / operator, not only reduces variations but also
allows the analysis to benefit from the operator’s learned skills and experience gained in
working with the system.
Further assessment of the reproducibility of the system should be undertaken in the
future, to determine variation between groups of specimens, e.g. those having diverse body
sizes or different maturation states within the same cohort. It is also imperative to estimate
the consistency and variability that could be expected from the histological analysis within a

CHAPTER 2
PAGE | 62
study group, and the sample size required to obtain meaningful results. Due to time
constraints, such an analysis could not be undertaken for the present study.
Table 2.5. Reproducibility of the semi-automated image analysis system, accounting for intra- and
inter-operator variation.
Footnotes:
* r, Pearson's correlation coefficient
† p, p-value or calculated probability is the estimated probability of rejecting the null hypothesis of the study question
(i.e. that the two factors examined are unrelated), when that hypothesis is true.
n = 10 histological identical frames analysed twice per each operator. Correlations were considered significant if p <
0.05.
2.4. General conclusions
This chapter has described the development of a novel histological assessment system
based upon advanced image analysis. Such a tool can provide a system for evaluation of
the extent of morphological changes occurring in the distal intestine of Atlantic salmon
following dietary modulation.
The analytical methodology can be conducted with minimal user-interaction, thus
allowing rapid and objective assessment of 12 continuous variables per histological frame
analysed. The processing time required for each histological frame was roughly 20-25 min,
which greatly improved the efficiency of conducting such a quantitative assessment with
respect to the time taken for a subjective semi-quantitative alternative approach.
Operator A Operator B
Count (N°) Perimeter
Length (μm)
Filled Area
(μm2)
Count (N°) Perimeter
Length (μm)
Filled Area
(μm2)
Operator A Time average per slide: 11’53’’ ± 1’48’’ (Min8’53’’, Max18’22’’)
Count (N°) r* = 0.935 p
† < 0.001
− − r = 0.739 p = 0.015
− −
Perimeter Length (μm) − r = 0.732 p = 0.098
− − r = 0.406 p = 0.244
−
Filled Area (μm2) − −
r = 0.916 p < 0.001
− − r = 0.834 p < 0.001
Operator B Time average per slide: 15’22’’ ± 1’36’’ (Min12’19’’, Max17’35’’)
Count (N°) r = 0.739 p = 0.015
− − r = 0.946 p < 0.001
− −
Perimeter Length (μm) − r = 0.406 p = 0.244
− − r = 0.740 p = 0.082
−
Filled Area (μm2) − −
r = 0.834 p < 0.001
− − r = 0.905 p < 0.001

Description and development of a semi-automated image analysis system
PAGE | 63
The system was then evaluated in terms of its precision. Significant agreement
between the fully automated and the manual morphometric image segmentation was
achieved. The strength of this quantitative approach was enhanced by the employment of
interactive procedures, which enabled the operator / observer to rectify preceding
automated segmentation steps, and account for the specimen’s variations.
The system also provided significant correlation to other well-established quantitative
approaches. Results suggest that it can be a viable alternative to a pathologist’s manual
scoring, being more practical and time-efficient. This method could therefore reduce the
workload of pathologists and serve to complement / supplement their observations.
The high reproducibility and lack of dependence on high user expertise makes it
suitable for provision of large-scale data archives, providing a robust method to assess
specific aspects of fish intestinal histology samples obtained under different experimental
states and at different times.
Ultimately, it is envisaged that the development of such a tool will greatly assist in the
evaluation of alternative dietary components for aquaculture feeds, leading in turn, to a
more sustainable global industry and improved fish health and welfare.

TECHNICAL NOTE A1
PAGE | 64
TECHNIC AL NOTE A1
USER GUIDELINES FOR OPERATION OF THE GUT HEALTH IMAGE
PROCESSING AND ANALYSIS SEMI-AUTOMATED SYSTEM – PART I
A detailed, comprehensive protocol has been compiled to allow a better understanding of
the image processing and analysis workflow. It provides step-by-step instructions in loading,
initiating and operating the system, which is employed across the analyses presented in this
thesis.
1. KS Run User Interface
The image processing, segmentation and analysis script developed is deployed using the
stand-alone KS Run software platform (Version 3.0, Carl Zeiss Vision GmbH, München-
Hallbergmoos, Germany). Instructions for installing the KSRun software and deploying the
gut analysis script within it are provided in the KS Run user manual (KS Run User Interface
Manual Guide B 40-613, Carl Zeiss Vision GmbH, München-Hallbergmoos, Germany). The
following sections describe the user protocol for the gut image analysis script.
1.1. Image Processing and Analysis Workflow
The image processing, segmentation and analysis pipeline consists of a succession of
interactive and automated operational steps ( ). Feedback in the form of guideline-notes
for the operator ( ), and visualisation of the generated images ( , Appendix 2 and Figures
3.4 and 3.5 from Chapter 3) was made available at each step of the pipeline process, as
well as feature extraction and data generation ( , Figure 8).
1.1.1. Start Up
A. All existing images, overlay masks and temporary databases from previous program
runs are erased.
B. Maximal memory space is made available.

TECHNICAL NOTE A1
PAGE | 65
C. A ‘Message Window’ with written guidelines for the user appears.
1.1.2. Logistical Setup and Data Input
D. An image upload-path is set according to the user.
1 “Enter the path to existing image sub-directory.” e.g. C:\KSRUN\Conf\Images\Gut\Image_Folder\Data_Testing
E. A database download-path is set according to the user.
2 “Enter the path to existing data base sub-directory.” e.g. C:\KSRUN\Conf\Images\Gut\Image_Folder\Data_Testing
F. The appropriate calibration file is uploaded in accordance to the user’s requirements.
3 “Type C4, C10, C20, C40, C100 or Z20× to load the correct calibration file.” e.g. Z20×
G. A name is given to the new database file to allow sample identity to be recorded, and
measurement columns are added to the database.
4 “Enter a name for the new database being generated.”
e.g. S400000_A01.xls

CHAPTER 2
PAGE | 66
H. Object boundaries are defined in accordance to an 8-pixel connectivity rule.
I. An image is selected for analysis. The software expects a non-compressed TIFF image
format.
5 “Enter the sample number.” 6 “Enter the replicate number.” e.g. S400000 e.g. A01
1.1.3. Image Pre-processing
J. Rotation of the image is made possible to assist analysis.
7 “Left click in the middle of the right-hand side box to centre the image and hit ‘Apply’. Use
‘Rotate’ and ‘x / y sliders’ to obtain a centred rotation and then hit ‘Ok’.
Image 1
K. A microscope field is selected by the user and a fixed frame size (pixels) used to crop
a-section from Image 1.
8 “Select a width and height for the cropping-window. Choose an area to copy, by clicking
in the middle of the box and moving it. Be careful not to accidently resize the box by clicking
on an edge.”
e.g. 1500 × 1426 pixels
Image 1A e.g. S400000_A01.CRP.tif

TECHNICAL NOTE A1
PAGE | 67
L. Details on the size of the cropped image are stored and the new image is placed into
position 1 in the ‘Gallery Window’.
1.1.4. Image Segmentation and Processing
M. Mucous cells present in the image are highlighted and segmented by an HLS colour
thresholding operation.
9 “Right click on the small left-hand image and choose ‘Big Display’. Highlight the mucous
cells using ‘square bracket’ depressed (as an initial starting point) and circling the area of
interest. Then, successively add missing areas using ‘+’ depressed (or ‘<’ to undo the
previous selection).”
Image 2

CHAPTER 2
PAGE | 68
N. Tissue is highlighted and segmented using an intensity threshold operation.
10 “Right click on small left-hand image and choose ‘Big Display’. Move the red (right-hand)
boundary line in the data box to highlight tissue (i.e. exclude non-tissue / debris). Try to
include full tissue edges (selected areas will appear in green) leaving the vacuoles
surrounded. Though try not to encroach too much the luminal space.”
Image 3
O. Tissue vacuoles are highlighted and segmented by an inverse-intensity threshold.
11 “Right click on the small left-hand image and choose ‘Big Display’. Move the red (right-
hand) boundary line in the data box, to highlight the vacuolisation. The luminal space will
also be selected but it is fine (selected areas will appear in green)”.
Image 4

TECHNICAL NOTE A1
PAGE | 69
P. The stratum compactum is delineated by interactive freehand-drawing in the graphics
plane of the displayed image-scene.
12 “Hit the ‘Reset’ button and untick the ‘Autoclose’ box, then outline the stratum
compactum (i.e base of the mucosal tissue) only from edge to edge. Press and hold the left
mouse button to draw continuously. Hit ‘OK’ when completed.”
Image 5
Q. The box comprising mucosa and lumen are manually outlined (no drawing is required
to outline the mucosal surface, which is defined by the previously detected tissue
boundary).
13 “Do not hit the ‘Reset’ button, but do untick the ‘Autoclose’ box. Follow the edge of the
‘Display Window’, starting at one end of the stratum compactum and following the window
edge along the tissue and luminal space. Left click and release, to draw from point-to-point.
Double click the left mouse button and check that no extra line is expected (check that by
dragging the cursor across the screen). Hit ‘OK’ to finish. If you make a mistake hit ‘Undo’
and repeat the operation.”
Image 6

CHAPTER 2
PAGE | 70
R. The muscularis externa is manually outlined.
14 “Hit the ‘Reset’ button before submucosal tissue is captured. Outline the peritoneal edge
of the muscularis externa and any other space outside the intestinal wall. Follow the ‘Display
Window’ edge if necessary.”
15 “Hit the ‘Reset’ button only if the captured area is inaccurate, then redo the outline of
muscularis externa. Otherwise hit ‘OK’.”
Image 7
S. Unwanted features such as artefacts created during histological processing or tissue
debris extraneous to the analysis are removed by manual contour delineation.
16 “Hit the ‘Reset’ button, then draw round pieces of tissue or debris you don’t want
measured (especially those touching useful tissue). Make sure you close the drawn
boundary. If any large areas of lumen were filled earlier, draw around the luminal edge to
help discard. Press and hold the left mouse button to draw continuously or to draw from
point-to-point marking successive points with the left mouse button, releasing between
points. To close the polygon hit the right mouse button.”
Image 8
17 “Hit the ‘Reset’ button then draw round pieces of lumen or vacuole you want measured
as tissue. Press and hold the left mouse button to draw continuously or to draw from point-to-

TECHNICAL NOTE A1
PAGE | 71
point, mark successive points with the left mouse button, releasing between points. To close
the polygon hit the right mouse button.”
Image 9
T. Tissue vacuolisation areas are corrected by interactive freehand-drawing in the
graphics plane of the displayed image-scene.
18 “Hit the ‘Reset’ button, then draw polygons around the regions within tissue that are not
vacuolar, or part of the lumen (e.g. tissue rupture and other artefacts). Press and hold the left
mouse button to draw continuously or to draw from point-to-point, mark successive points
with the left mouse button, releasing between points. To close the polygon hit the right
mouse button.”
Image 10
19 “Hit the ‘Reset’ button and untick the ‘Autoclose’ box. Draw continuous lines to close off /
exclude areas of lumen continuous with vacuoles (these will share the same outline colour).
Press and hold the left mouse button to draw continuously. Release the mouse button to
finish the line.”

CHAPTER 2
PAGE | 72
Image 11
U. The luminal area is demarcated by interactive selection.
20 “Hit the ‘Reset’ button then draw small circles in each separate luminal area, marking
them for removal. Press and hold the left mouse button to draw continuously or to draw from
point-to-point, mark successive points with the left mouse button, releasing between points.
To close the polygon hit the right mouse button.”
21 “Hit the ‘Reset’ button then draw continuous lines or polygons, to draw missing areas of
lumen (i.e. add them to the lumen area). Press and hold the left mouse button to draw
continuously. Release the mouse button to finish the line.”
22 “Hit the ‘Reset’ button then draw small circles in each missed luminal area, marking
them for removal. Press and hold the left mouse button to draw continuously or to draw from
point-to-point, mark successive points with the left mouse button, releasing between points.
To close the polygon hit the right mouse button.”
Image 12
1.1.5. Histological Identification and Post-processing Overlays
V. Image frame box is created:
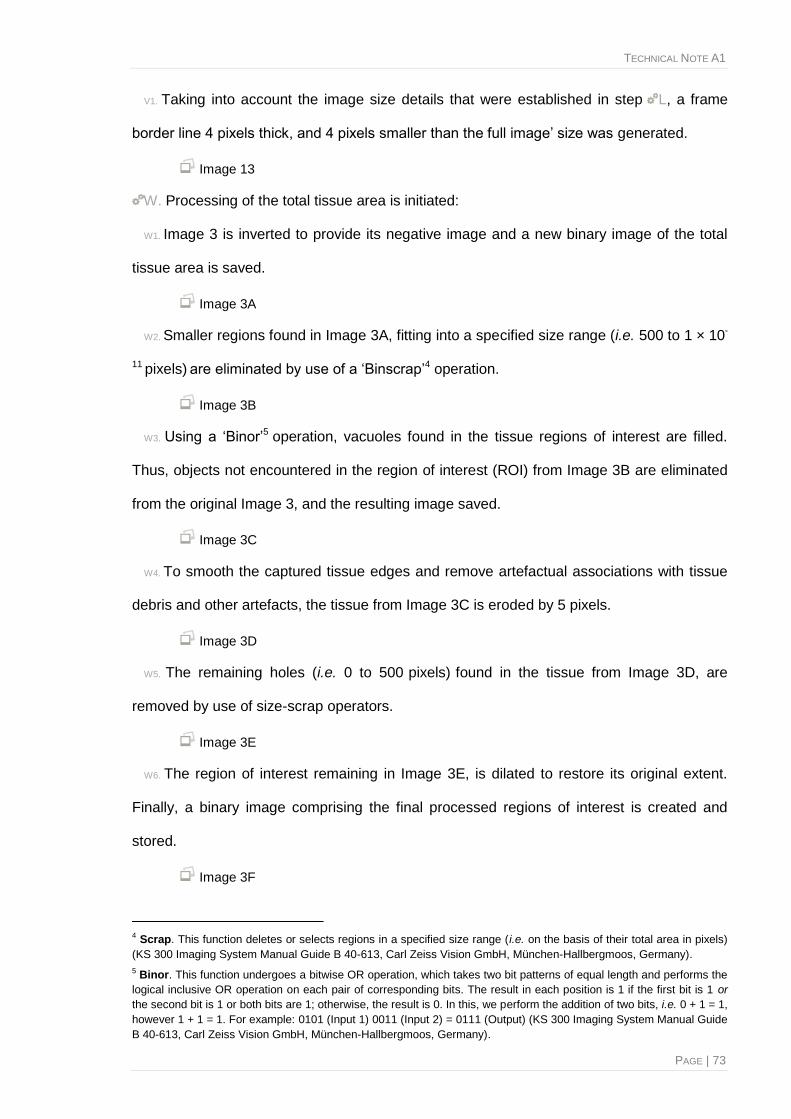
TECHNICAL NOTE A1
PAGE | 73
V1. Taking into account the image size details that were established in step L, a frame
border line 4 pixels thick, and 4 pixels smaller than the full image’ size was generated.
Image 13
W. Processing of the total tissue area is initiated:
W1. Image 3 is inverted to provide its negative image and a new binary image of the total
tissue area is saved.
Image 3A
W2. Smaller regions found in Image 3A, fitting into a specified size range (i.e. 500 to 1 × 10-
11 pixels) are eliminated by use of a ‘Binscrap’4 operation.
Image 3B
W3. Using a ‘Binor’5 operation, vacuoles found in the tissue regions of interest are filled.
Thus, objects not encountered in the region of interest (ROI) from Image 3B are eliminated
from the original Image 3, and the resulting image saved.
Image 3C
W4. To smooth the captured tissue edges and remove artefactual associations with tissue
debris and other artefacts, the tissue from Image 3C is eroded by 5 pixels.
Image 3D
W5. The remaining holes (i.e. 0 to 500 pixels) found in the tissue from Image 3D, are
removed by use of size-scrap operators.
Image 3E
W6. The region of interest remaining in Image 3E, is dilated to restore its original extent.
Finally, a binary image comprising the final processed regions of interest is created and
stored.
Image 3F
4 Scrap. This function deletes or selects regions in a specified size range (i.e. on the basis of their total area in pixels)
(KS 300 Imaging System Manual Guide B 40-613, Carl Zeiss Vision GmbH, München-Hallbergmoos, Germany).
5 Binor. This function undergoes a bitwise OR operation, which takes two bit patterns of equal length and performs the
logical inclusive OR operation on each pair of corresponding bits. The result in each position is 1 if the first bit is 1 or
the second bit is 1 or both bits are 1; otherwise, the result is 0. In this, we perform the addition of two bits, i.e. 0 + 1 = 1,
however 1 + 1 = 1. For example: 0101 (Input 1) 0011 (Input 2) = 0111 (Output) (KS 300 Imaging System Manual Guide
B 40-613, Carl Zeiss Vision GmbH, München-Hallbergmoos, Germany).

CHAPTER 2
PAGE | 74
X. The stratum compactum is outlined:
X1. The contour line extracted from Image 5 is fattened and saved.
Image 5A
X2. The thick line is then saved as an overlay into Image 1A.
Image 5B
e.g. S400000_A01.STCOMP.tif (Figure 1)
Figure 1. Output Image 5B showing the delineated stratum compactum as a yellow overlay.
Y. The mucosal tissue area is delineated:
Y1. The lines captured in Image 6 are merged into Image 5A, and both lines fused by
dilation operations.
Image 6A
Y2. The generated polygon is filled in green (i.e. Image 6B) and saved as an overlay mask
into Image 1A.
Image 6B
Y3. The lines from the polygon saved in Image 6A are eroded back to their original
thickness and a new binary image stored.
Image 6C

TECHNICAL NOTE A1
PAGE | 75
Y4. Through a ‘Binxor’6 operator comparing the regions captured in Images 3F and 14, a
mucosal mask is then generated. In addition, correction of the border lines is achieved by
deducting the objects found in Image 13.
Image 6D
Y5. Polygons captured in Image 8 (e.g. tissue debris or other artefacts) are filled and their
areas deducted from the tissue regions captured in Image 6E.
Image 6F
Y7. Similarly, the polygons caught in Image 9 (e.g. lumen or vacuoles that should be
considered as tissue) are filled and the regions of interest added to the tissue region from
Image 6F.
Image 6G
Y8. The mucosal tissue region is again amended by deduction of the vacuolisation area
from Image (i.e. Image 17A).
Image 6Ha
Y9. Finally the submucosa and muscularis externa regions are deducted from the mucosa
(i.e. Image 7aaa).
Image 6Hb
Y10. Thereafter, the mucosal tissue regions of interest are highlighted and overlay masks
generated on top of Image 1A.
24 “Right click on the small left-hand image and choose ‘Big Display’. All tissue will be selected at
the start (labelled in green), therefore use the left mouse button to deselect (labelled in red) the
unwanted tissue. Use the right mouse button to increase and decrease the image size for better
clarity. If unexpected red or green regions are apparent, zoom into the image to check their
accuracy.”
6 Binxor. This function carries out a bitwise XOR operation by electing two bit patterns of equal length and performs
the logical exclusive OR operation on each pair of corresponding bits. The result in each position is 1 if only the first bit
is 1 or only the second bit is 1, but will be 0 if both are 0 or both are 1. In this we perform the comparison of two bits,
being 1 if the two bits are different, and 0 if they are the same. For example: 0101 (Input 1) 0011 (Input 2) = 0110
(Output) (KS 300 Imaging System Manual Guide B 40-614, Carl Zeiss Vision GmbH, München-Hallbergmoos,
Germany).

CHAPTER 2
PAGE | 76
Image 6I e.g. S400000_A01.TISSUE.tif (Figure 2)
Figure 2. Output Image 6I, revealing the
mucosal tissue delineated by a colour overlay.
Z. The muscularis externa is outlined:
Z1. The polygon captured in Image 7 is filled in green and saved as an overlay mask into
Image 1A.
Image 7A
α. Processing of the submucosal tissue starts:
α1. The region corresponding to the filled polygon from Image 6B is subtracted from the
tissue capture from Image 3F and the resulting area amended by subtraction of Image 13.

TECHNICAL NOTE A1
PAGE | 77
Image 14
α2. A submucosal tissue mask is generated by subtracting the regions demarked in Image
7 from Image 14.
25 “Right click on the small left-hand image and choose ‘Big Display’. All tissue will be
selected at the start (labelled in green), therefore use the left mouse button to deselect
(labelled in red) the unwanted tissue. Use the right mouse button to increase and decrease
the image size for better clarity. If unexpected red or green regions are apparent, zoom into
the image to check their accuracy.”
Image 14A e.g. S400000_A01.SUBM.tif (Figure 3)
Figure 3. Output Image 14A, submucosal
tissue delineated with a coloured overlay.

CHAPTER 2
PAGE | 78
β. Processing lumen region:
β1. Polygons captured in Image 8 (e.g. tissue debris or other artefacts) are filled and the
marked regions added to the luminal region from Image 4.
Image 4A
β2. Concurrently, polygons drawn in Image 9 (e.g. lumen or vacuoles that should be
considered as tissue) are filled and subtracted from the luminal region of Image 4A.
Image 4B
β3. The refractive luminal border from Image 15, which can be confused with mucous cell
staining, is fattened, and subtracted from Image 4B.
Image 4C
β4. The negative inverse of Image 7aa (i.e. submucosal and muscularis externa regions,
Image 7aaa) are extracted from the region of interest captured in Image 4C.
Image 4D
β5. Polygons marking regions within tissue that are not vacuolar (Image 10) are filled and
the corresponding regions of interest, subtracted from the luminal region in Image 4D.
Image 4E
β6. The lines from Image 11 are thickened and subtracted from the luminal area of Image
4E. Subsequently the image is revised and the outlines from Image 6A representing the
stratum compactum and borderlines subtracted.
Image 4F
β7. The user interactively marks contiguous areas of lumen in Image 4F, with small circles
drawn in step U marking areas to be identified as lumen.
Image 4G
β8. The luminal region (i.e. Image 4F) is segmented by an inverse intensity threshold, and
objects (noise) fitting into a specified size range (i.e. 0-10 pixels) are removed by use of a
‘Binscrap’ operation. The resulting region of interest is inverted to its negative image and a
new binary image saved.
Image 4H

TECHNICAL NOTE A1
PAGE | 79
β9. Changes made over the following step (i.e. see guidelines 26) are included to give an
upgraded Image 4H and a new image of the luminal area created.
26 “Hit the ‘Reset’ button then draw polygons around the regions that are not part of the luminal surface. Press and hold the left mouse button to draw continuously or to draw from point-to-point mark successive point with the left mouse button, releasing between points. To close the polygon hit the right mouse button.”
Image 4I e.g. S400000_A01.LUM.tif (Figure 4)
Figure 4. Output Image 4I, luminal regions
being delineated by a colour overlay.
γ. Extraction of the luminal perimeter:
γ1. The edge of the mucosal region captured in Image 6F is eroded twice. First, by removal
of a 1× pixel layer, and thereafter by removal of a 3× pixels layer. The difference between

CHAPTER 2
PAGE | 80
both giving the linear edge that will later be extracted from the luminal region (i.e. step
β3).
Image 15
γ2. A new perimeter line is generated by dilation of the luminal region from Image 4I and
subtraction of the original non-dilated region from it. An overlay mask is saved into Image
A1.
Image 15A e.g. S400000_A01.PERIMETERS.tif (Figure 5)
Figure 5. Output Image 15A, perimeter from
the mucosal tissue being delineated with a
coloured overlay.
δ. Processing of the mucous cells initiated:
δ1. The refractive luminal border is removed from Image 2.
Image 2A
δ2. Small holes appearing in the middle of the objects in Image 2 were filled in, and small
noise features (i.e. 0-3 pixels) around them, removed. The objects of interest are eroded
and larger features extracted (i.e. 0-10 pixels).
Image 2B

TECHNICAL NOTE A1
PAGE | 81
δ3. Adjoining features are separated using a ‘Grainsbin’7 operator, and the resultant objects
dilated to their proper size.
Image 2C
δ4. The cells boundaries are made smoother, by successive erosion and dilation processes
and a final mucous cell image saved.
Image 2D
δ5. The final mucosal tissue image (i.e. Image 6I) is taken and used to mask the
recognised mucous cells within that tissue region (i.e. mucous cells can only occur in
mucosal tissue). Mucous cell overlay mask is merged into Image A1.
Image 2E e.g. S400000_A01.MASKEDCELLS.tif (Figure 6)
Figure 6. Output Image 2E revealing tissue
mucous cells delineated by colour overlays.
ε. Extraction of vacuolar regions:
ε1. The luminal area within Image 12B is chosen and subtracted from the regions present
in Image 4H. Regions of interest resulting from the subtraction are selected and small
objects (i.e. 0 to 3 pixels) excluded.
Image 16A
7 Grainsbin. This function performs grain boundary reconstruction on binary images. According to the selected ‘Mode’,
either the standard or euclidian method is used to generate a distance map from binary image Input. ‘Smooth’ specifies
the strength of a procedure that is used to smooth the distance map. Large values result in a strong smoothing. If the
value is set to 0 in a macro command line, no smoothing is performed (KS 300 Imaging System Manual Guide B 40-
613, Carl Zeiss Vision GmbH, München-Hallbergmoos, Germany).

CHAPTER 2
PAGE | 82
ε2. Vacuolar regions are highlighted, marking overlays generated and stored as a
segmentation mask image when merged with Image 1A.
27 “Right click on the small left-hand image and choose ‘Big Display’. All tissue vacuoles
will be selected at the start (labelled in green), therefore use the left mouse button to
deselect (labelled in red) the unwanted vacuoles. Use the right mouse button to increase and
decrease the image size for better clarity. If unexpected red or green regions are apparent,
zoom into the image to check their accuracy.”
Image 16B e.g. S400000_A01.VACUOLES.tif (Figure 7)
Figure 7. Output Image 16B, vacuolar regions
being delineated by a colour overlay.

TECHNICAL NOTE A1
PAGE | 83
1.1.6. Feature Extraction and Data Generation
ζ. Mucous cells are identified (i.e. Image 2D) and measurements are taken.
Mucous Cell Total Area (MCA, µm2)
Mean Mucous Cell Area (MMCA, µm2)
Mucous Cell Number (MCN, Nº)
Mucous Cell Minimum Feret Length (MC Feret Min, µm)
Mucous Cell Maximum Feret Length (MC Feret Max, µm)
Mucous Cell Feret Ratio (MC Feret Ratio)
Mucous Cell Elliptical Length A (MC Ellipse Af, µm)
Mucous Cell Elliptical Length B (MC Ellipse Bf, µm)
Mucous Cell Ellipse Ratio (MC Ellipse Ratio)
Mucous Cell Mean Circularity Index (MCirc)
η. Mucosal tissue is selected (i.e. Image 6I) and its total area calculated.
Mucosal Tissue Area (MTA, µm2)
θ. Submucosal tissue is elected (i.e. Image 14) and additional assessment undertaken.
Submucosal Tissue Area (STA, µm2)
ι. Tissue luminal surface (i.e. Image 15) extent and intricacy is estimated.
Perimeter Length (P, µm)
Perimeter Convolution (FR, fractal dimension values)
κ. Tissue vacuolisation is recognised (i.e. Image 16A) and further measurements
undertaken.
Total Tissue Vacuolisation Area (Vac, µm2)
1.1.7. Analysis Conclusion
λ. Program terminates with audible warning once the analysis is finished.
28 “Measuring feature properties…”
“Writing data to databases…”
“Analysis finished.”
Figure 8. Output Database, showing all the morphometric parameters that had been measured.


3. CHAPTER 3
3. INTESTINAL RESPONSES TO DIETARY ADDITIVES – APPLICATION
OF TOOLS FOR RAPID SCREENING OF NOVEL DIETARY
COMPONENTS
3.1. Introduction
It is well established that feeding fish with diets that do not meet their nutritional
requirements not only affects their growth and feed conversion, but also increases their
susceptibility to disease and the appearance of signs of nutritional deficiency, resulting in
altered behaviour and pathological changes (Hasan, 2001; Oliva-Teles, 2012). The general
practice of intensive aquaculture can result in physiological responses which can negatively
impact normal health and overall performance, with consequent economic losses for the
fish farmer (Li & Gatlin, 2006; Welker et al., 2011). Thus, the continued assessment of
nutritional requirements for fish, leading to the formulation of balanced diets containing
suitable dietary supplements, is an important area of current research. Such research is not
only fundamental to gaining an understanding of the effects that these dietary supplements
and essential nutrients have in terms of meeting nutritional basic requirements and
enhancing fish growth, but can also contribute towards the maintenance of the overall
health of the fish and improvement of the economic feasibility of commercial aquaculture
production.
By convention, fish meal has been the main source of dietary protein in aquafeeds,
especially for carnivorous fish species. However, in recent years increasing demand, high
cost and inconsistent availability have promoted studies on its partial and complete
substitution with alternative protein sources (Kaushik et al., 1995; Olsen et al., 2007;
Sissener et al., 2009a; Silva et al., 2010). Amongst the potential fish meal substitutions,
plant ingredients appear to be the most promising candidates (Tacon, 1995; Burel et al.,
2000; Kumar et al., 2011a).

CHAPTER 3
PAGE | 86
As a result of its comparatively high protein content and its relatively well-balanced
amino acid profile, taken together with reasonable pricing and ready availability, soybean
meal (SBM) appears to be one of the most cost-effective alternative protein sources for use
in fish feeds. However, the amino acid composition differs significantly from that of fish
meal, and feeding SBM can lead to essential amino acid deficiencies that in turn,
compromise protein utilisation and restrict fish growth (Francis et al., 2001; Hansen et al.,
2007). Alterations in blood chemistry and haematology suggest that SBM diets induce a
physiological response, presumably related to the antigenic potential of the anti-nutritional
factors (ANFs) present in most plant protein sources (Hemre et al., 2005; Kumar et al.,
2010b). In salmonids, such ANFs are known to affect the intestinal integrity, which can lead
to decreased nutrient digestibility and growth performance (Krogdahl et al., 1994, 2003;
Francis et al., 2001).
In Atlantic salmon, enteritis induced by minimally-processed SBM is characterised by a
shortening of the mucosal folds and microvilli, a decrease in the number of absorptive
vacuoles in the intestinal epithelium, a widening of the central stroma within the mucosal
folds, an increase in the connective tissue between the base of the mucosal folds and the
stratum compactum, marked infiltration of inflammatory cells in the lamina propria or
epithelium, and an increase in the number of mucous cells in the epithelium (Van den Ingh
et al., 1991, 1996; Baeverfjord & Krogdahl, 1996; Krogdahl et al., 2000, Urán, 2008).
Although the occurrence of intestinal pathology in fish seems to vary with the degree of
industrial treatment of the SBM, it remains unclear how soybean products cause this
inflammatory response in salmonids. Immunological mechanisms are certainly involved in
this pathogenesis, but the precise causes for the associated inflammatory response have,
as yet, not been identified (Urán et al., 2009a). Nevertheless, some authors suggest that
alcohol-soluble components, such as phytosterols, oligosaccharides and / or soya-
saponins, in synergy with one or more unidentified components play a key role in the onset
of soybean-induced enteritis (Knudsen et al., 2008; Iwashita et al., 2009; Krogdahl et al.,
2010). Consequently, much research has focused on finding maximum levels of inclusion

Rapid screening of new dietary components
PAGE | 87
that do not cause pathology in fish, or mixtures with other ingredients so as to keep the level
of individual AFN low (Olsen et al., 2007).
Biological and synthetic dietary compounds that support normal growth and enhance
fish health are being promoted in aquaculture as a means of overcoming the
immunosuppressive effects that fish may be subjected to when under intensive culture
conditions (Gannam & Schrock, 2001; Galindo-Villegas & Hosokawa, 2004; Li & Gatlin,
2004). It is commonly accepted that such functional ingredients can alter the non-specific
defence mechanisms by acting directly / indirectly through metabolic, neurological or
endocrine pathways (Sealey & Gatlin, 2001; Bricknell & Dalmo, 2005; Meena et al., 2012)
enhancing the level of disease resistance against pathogens commonly associated with
disease outbreaks in fish culture facilities.
The use of immunostimulants as dietary additives has sometimes been met with
scepticism because the actions of these compounds are poorly understood and the results
of feeding trials have been very inconsistent (Sakai, 1999; Meena et al., 2012).
Furthermore, the nature of certain commercial products is unclear and a convincing
explanation for their mode of action, or documentation verifying their efficiency is often not
publically available. Nevertheless, the use of immunostimulant dietary components has
been shown to be an effective means of increasing the immuno-competency and disease
resistance of fish (Hardie et al., 1991; Raa et al., 1992; Thompson et al., 1993; Siwicki et
al., 1994; Verlhac et al., 1996). A number of molecules such as beta-glucans, lactoferrin,
levamisole, chitin (Sakai, 1999; Meena et al., 2012; Vetvicka et al., 2013) and exogenous
nucleotides (Li & Gatlin, 2006) have been shown to exhibit immunodulatory effects. Beta-
glucans in particular appear to be promising immunostimulatory compounds for use in
aquaculture (Gannam & Schrock, 2001; Sealey & Gatlin, 2001; Gatlin, 2002).
Beta-glucans (β-glucans), consisting of glucose polymers, are structural components of
the cell walls of bacteria and plants (Robertsen et al., 1990; Trichet, 2010). As naturally
occurring biomolecules, they are less likely to cause concerns about residues in food fish
(Gannam & Schrock, 2001). The effect of β-glucans on the fish’s growth performance and

CHAPTER 3
PAGE | 88
immune response, and their potential to increase survival in disease states have been
extensively investigated in numerous studies (Chen & Ainsworth, 1992; Raa, 1992;
Matsuyama et al., 1992; Jørgensen et al., 1993; Siwicki, et al., 1994; Dalmo et al., 1996;
Efthimiou, 1996; Jeney et al., 1997; Santarem et al., 1997; Whittington et al., 2005;
Gopalakannan & Arul, 2010; Refstie et al., 2010; Siwicki et al., 2010; Falco et al., 2012;
Miest et al., 2012; Kühlwein et al., 2013; Pionnier et al., 2013).
Nucleotides are low molecular-weight compounds comprising a nitrogenous base, a
five carbon sugar and a phosphate group, which are involved in many biological processes
(Kenari et al., 2013). As essential nutrients, cofactors in cell signaling and metabolism and
precursors of DNA replication (Burrells et al., 2001; Peng et al., 2013), they are particularly
important in cell repair and development since they are the core building blocks of nucleic
acids (Trichet, 2010). To date, there have been few reports about the effects of exogenous
nucleotides on digestion, absorption, metabolism and influences on various physiological
responses especially in the expression of immune genes and modulation of immunoglobulin
production (Leonardi et al., 2003; Glencross & Rutherford, 2010; Tahmasebi-Kohyani et al.,
2011). Despite this, dietary nucleotide supplements have consistently shown beneficial
influences when fed to various fish species (Li & Gatlin, 2006). Research related to
nucleotide nutrition in fish, namely their effects on innate and adaptive immunity, stress
responses and resistance to infectious diseases, has shown that they may improve growth
performance, enhance intestinal morphology and function, aid liver function as well as
modulating innate and adaptive immune responses (Burrells et al., 2001; Sakai et al., 2001;
Low et al., 2003; Malina et al., 2005; Li & Gatlin, 2006; Li et al., 2007; Jha et al., 2007; Lin et
al., 2009; Tahmasebi-Kohyani et al., 2012; Peng et al., 2013).
The suitability of new aquafeed diets should be evaluated not only in terms of growth
performance, but also in terms of impact on fish health, although these two parameters will
inevitably tend to go hand in hand. Appropriate indices of fish health therefore need to be
developed / refined to evaluate the efficacy of novel dietary components and to assist
understanding of how dietary modulation regimes may influence fish health and improve

Rapid screening of new dietary components
PAGE | 89
disease resistance (Maita, 2007). Various parameters have been used to assess changes
in fish physiology and health due to dietary manipulation. These include assessment of
growth performance, calculation of various body condition factors or haematological indices
and measurement of various biochemical, immunological and histopathological parameters
(Adams et al., 1993). Each of these approaches has its own advantages and limitations
depending on the purpose of the assessment. Moreover, because of the complex nature of
the biological responses of vertebrates, it is unlikely that single parameters can accurately
reflect an organism’s response to dietary components. Therefore, evaluation of several
individual factors together, should improve the accuracy of dietary assessment (i.e. the
biological response to the diet) and help to identify suitable dietary components. The
sensitivity, accuracy, ease of application, rapidity and cost-effectiveness of assessment
methodologies are also important criteria for deciding which suite of indicators should be
monitored (Maita, 2007).
The work reported in this chapter sought first, to produce a model feed trial capable of
providing distinct / differentiable tissue and physiological states (e.g. inflammatory vs. non-
inflammatory). Second, it sought to use classical growth assessment, immunological,
haematological and physiological tools to examine and characterise the putative feed-
derived states and third, it sought to deploy the newly developed image analysis tool (see
Chapter 2) and to analyse data provided by it, in order to ascertain the level and reliability of
the contribution that it might make in the assessment of the effects of different dietary
components. The fourth objective of the presented work was to examine the wider utility of
such a multivariate approach to the screening of novel dietary components.
3.2. Materials and methods
3.2.1. Experimental fish and fish husbandry
The feed trial described, was conducted at Skretting’s Fish Trial Station (Lerang,
Jørpeland, Norway). Post-smolt Atlantic salmon (Salmo salar L.) with an initial mean body
weight of 79 ± 2 g and a mean fork-length of 19 ± 2 cm were randomly allocated into six

CHAPTER 3
PAGE | 90
flow-through 100 L circular tanks. The tanks were maintained under a 24 h light photoperiod
and supplied with fresh sand-filtered flow-through seawater at 11 ± 2 ˚C. Dissolved oxygen,
ammonia, nitrate, nitrite and pH levels were monitored and maintained within recommended
limits (Wedemeyer, 1996). Individual tanks were equipped with waste feed collectors and
uneaten feed was collected twice per day. Fish behaviour and cumulative mortalities were
recorded throughout the trial period.
3.2.2. Diets and feeding regime
Three experimental diets, comprising either a fish meal based control diet, a diet
containing 25 % unrefined soybean meal concentrate or a fish meal diet supplemented with
specific functional ingredients, were produced as 3 mm extruded pellets at Skretting’s Feed
Technology Plant (Stavanger, Norway). The diets were formulated to satisfy the nutritional
requirements of salmonids (NCR, 1993) and contained similar amounts of available crude
protein and gross fat. Information on the diet formulation and the commercial source of the
various dietary components is shown in Table 3.1.
Fish were acclimated for a 3 week period, during which time they were maintained on a
commercial fish meal based diet (Protec™, Skretting, Stavanger, Norway). Thereafter,
throughout the 20-week experimental period, the fish were fed one of the three different
experimental diets. The diets were randomly assigned to triplicate tanks prior to starting the
trial. Fish were fed twice a day using automatic feeders. The amount of feed given was
adjusted in accordance with biomass, thus aiming to overfeed by 20 %. Uneaten feed was
collected, separated from faeces and quantified by weight after drying for 12-16 h at 90 ˚C.
3.2.3. Feed composition
The proximate chemical composition of the experimental diets was determined using
Near Infrared Reflectance Spectroscopy (NIRS) technology. In essence, the sample was
illuminated with near infrared light and the spectrum of light reflected by the chemical bonds
between organic molecules recorded. That spectrum was automatically compared with
standard spectra held in a central database. The principle of NIRS technology has been
described by several authors (Corson et al., 1999; González-Martín et al., 2006; Berzaghi &

Rapid screening of new dietary components
PAGE | 91
Riovanto, 2010; Cheli et al., 2012). In this particular study, NIRS analysis was performed in
triplicate ground feed samples of each diet, and results expressed as a percentage of dry
weight (Table 3.1). Spectra were assessed using a FOSS analyser (NIRSystem 6500
devise, Foss Analytical, Hillerød, Denmark), equipped with ISIscan™ (Version 1.26,
Infrasofth International, Port Matilda, USA). The WinISI™ 2 software package (Version
1.04, Infrasofth International, Port Matilda, USA) was used for the chemometric analysis of
data and for calibration of the routine analysis. In-house NIRS analyses, were first
calibrated against official laboratory methods for crude protein content (Nordic Committee
on Food Analysis – NMKL, Method no. 6, 4th edition, 2003; n > 4000, r2 = 0.99), crude fat
(NMKL no. 160, 1998; n > 3700, r2 = 0.99), moisture content (NMKL no. 23, 1991; n > 3000,
r2 = 0.99), and ash (NMKL no. 23, 1991; n > 2400, r2 = 0.93).
3.2.4. Sampling procedure
At the end of the experimental feeding period (i.e. after a 20-week feeding regime), the
fish were starved 24 h prior to sampling. Six fish per experimental tank were randomly
selected and euthanised with an overdose of anaesthetic (50 mg.L-1, MS-222, Tricaine
Methanesulphonate, Argent Chemical Laboratoires, Redmount, WA, USA). Blood was
immediately obtained by caudal venepuncture using heparinised syringes and samples
briefly kept on ice for haematological analysis. Following external assessment of fish
appearance and general body condition, fish weights and fork-length measurements were
taken. Intestinal sections from the distal intestinal region were then excised from the fish.
Transverse intestinal rings of at least 1 cm in length were taken, cut open longitudinally and
fixed in neutral buffered formalin (10 %, pH 7.2) at room temperature (16-20 °C) for at least
24 h before further histological processing. Subsequently, tissue was excised from the
anterior kidney and placed in individual sterile tubes containing Leibowitz L-15 medium
(L5520, Sigma-Aldrich, Ayrshire, UK) supplemented with 10 IU.mL-1 heparin (H3149,
Sigma-Aldrich, Dorset, UK). Kidney samples were kept on ice for the respiratory burst and
phagocytosis activity assays described below.

CHAPTER 3
PAGE | 92
Table 3.1. Formulation and proximate chemical composition of the feeds used in this experimental
study.
Diet A
(Standard) Diet B (SBM)
Diet C (Imm)
Feed ingredients (g.kg-1
)
Fish meal* 250.00 250.00 250.00
Soybean meal† 0.00 250.00 0.00
Soya protein concentrate‡ 200.00 0.00 200.00
Wheat§ 187.30 98.80 187.30
Wheat gluten║ 137.20 158.10 137.20
Pigment¶ 00.50 00.50 00.50
Fish oil** 208.50 229.10 208.50
Minerals and vitamins††
16.50 13.50 16.50
Nucleotides, β-glucans and mix of natural additives‡‡
0.00 0.00 20.50
Chemical composition (% of dry weight)
Crude protein 42.00 42.10 42.00
Crude fat 26.00 27.70 26.00
Ash 92.50 92.80 92.50
Moisture 7.50 7.20 7.50
Footnotes:
Standard, control; SBM, soybean meal; Imm, immunostimulants.
* Scandinavian Fish meal LT (Norsildmel, Fyllingsdalen, Norway).
† Defatted soybean meal (Denofa, Fredriskstad, Norway).
‡ IMCOSOY® (IMCOPA, Parana, Brasil).
§ Wheat (Stakorn, Oslo, Norway).
║ Wheat gluten (Skretting Norway, Stavanger, Norway).
¶ Carophyll Pink (DSM Nutritional Products, Basel, Switzerland).
** South American oil containing 30 % SFA of total fatty acids.
†† Mineral and vitamin premix to meet the National Research Council recommendations (NCR, 1993).
‡‡ Nucleotides, beta-glucans and a mix of natural additives supplied by Skretting Norway (Stavanger, Norway).
3.2.5. Growth performance and feed efficiencies
The specific growth rate (SGR), the feed conversion rate (FCR), the hepatosomatic
index (HIS) and the condition factor (K), were determined for each treatment group
according to the following formulae (Dimitroglou et al., 2010): SGR = [ln (Final Wt / Initial
Wt)] × d-1 × 100; FCR = (FI / Wt) × 100; K = Wt / FL3 × 100; HSI = (LW / Wt) × 100. Where
Wt is the live weight gain (g), FI is the feed intake based on the dry matter quantification of
the waste feed (g), d is the feeding days, FL is fish fork length (cm) and LW is liver weight
(g). All values were expressed as means ± standard deviation (SD).
3.2.6. Haematology and blood biochemistry
Immediately after sampling, haematological analysis and collection of plasma were
performed according to standard haematological techniques (Hesser, 1960; Bain et al.,

Rapid screening of new dietary components
PAGE | 93
2012). After centrifuging the whole blood samples in heparinised micro-haematocrit tubes
on a Hawsksley centrifuge (Haematospin 1300, Sussex, UK) for 4 min at 9300 × g, the
haematocrit levels (Hct) were determined as a percentage of packed red cell volume in
relation to the whole blood volume. For each fish, two blood smears were prepared and
stained with RAPI-Diff (Raymond A. Lamb Ltd, Sussex, UK), a Romanowsky-based
staining kit, following the manufacturer’s instructions. The slides were then examined blind
with an Olympus BX-40 light microscope using a 100× objective. Two hundred white blood
cells were counted for each slide and the cells classified either as lymphocytes,
thrombocytes, granulocytes or monocytes. The total blood haemoglobin (Hb) was
determined on whole blood samples using an automatic analyser (Hb 201+, HemoCue,
Ängelholm, Sweden). The mean number of erythrocytes (RBC, red blood cells) and of
leucocytes (WBC, white blood cells) were taken from whole blood samples diluted in
phosphate buffered saline solution (WBC 1:100; RBC 1:1000; PBS, P4417, Sigma-Aldrich,
Ayrshire, UK). Counts were carried out under a light microscope using a 40× objective, and
an improved Neubauer haemocytometer counting chamber (0.0025 mm2, 0.1 mm Tiefe
Depth Profondeur, Marienfeld, Lauda-Königshofen, Germany). From these parameters the
mean corpuscular volume (MCV), mean corpuscular haemoglobin (MCH) and mean
corpuscular haemoglobin concentration (MCHC) were determined, using the following
formulae (Bain et al., 2012; Sissener et al., 2009b): MCV (fL) = Hct / RBC (106.μL-1); MCH
(pg) = [Hb (g.dL-1) × 10] / RBC (106.μL-1); MCHC (g.dL-1) = [Hb (g.dL-1) × 10] / Hct. The
remaining blood samples were then centrifuged for 7 min at 3000 × g, and aliquots of
plasma immediately stored at -20 ˚C.
Lysozyme activity from plasma was measured using a turbidimetric assay, following the
protocol of Parry et al. (1965). Briefly, lyophilised Micrococcus lysodeikticus (M3770, Sigma-
Aldrich, Steinheim, Germany) was added to a 0.004 M sodium phosphate buffer (SPB, pH
6.2) at a concentration of 0.2 mg.mL−1 bacteria, and the solution incubated at 25 °C for 30
min. Ten microlitres of plasma were added to four replicate wells of a multi-well microplate
(611F96, Sterilin Limited, Newport, UK). Thereafter, 190 μL of the bacterial suspension was

CHAPTER 3
PAGE | 94
added to all 4 wells and another 2 wells used as negative control wells, to which 200 μL of
the bacterial suspension was added. After shaking the plate, the absorbance was recorded
at 540 nm, 1 min after adding the buffer and then again after 5 min using a Synergy HT
plate reader (BioTeck, Bedfordshire, UK). The rate of change of the absorbance was then
calculated and a unit of lysozyme activity (U.min−1.mL−1) expressed as the amount of
sample causing a decrease in absorbance of 0.001 min−1.
The remaining plasma samples were analysed by means of a clinical chemistry
analyser (Konelab-20, Thermo Fisher Scientific, Oslo, Norway), following the
manufacturer’s guidelines. The plasma total protein (g.L-1) was analysed according to the
Biuret method standardised for use with the auto-analyser (Konelab™ method number
TP0100; Konelab™ T-series Total Protein Plus, Ref 981826). Total albumin (g.L-1) was
determined by means of Konelab™ method number BC0100 (Konelab™ Albumin-BCG, Ref
981358), and total creatine kinase (mg.L-1) reported as C-reactive protein quantified
according to Konelab™ method number CKF060 (Konelab™ CRP Plus, Ref 981794).
All haematological values were expressed as means ± standard deviation (SD).
3.2.7. Respiratory burst activity and phagocytic activity assays
Anterior kidney macrophages were isolated using the method described by Secombes
(1990), with modifications. In brief, anterior kidneys placed in Leibowitz L-15 medium
containing 10 IU.mL-1 heparin, were aseptically disrupted by gently teasing the tissue
through a 100 µm sterile mesh (352360, BD Falcon, BD Biosciences, Oxford, UK). The
resulting cell suspension was adjusted to a concentration of 2 × 10⁷ cells.mL-1, from which
macrophage monolayers were prepared. For the respiratory burst assay, aliquots of the
homogenised cell suspension were added to 12 replicate wells of a sterile flat-bottomed 96
multi-well microplate (3801-096, Iwaki Techno Glass Corp., Tokyo, Japan), and allowed to
adhere for 2-3 h at 15 ˚C. Likewise, for the phagocytosis assay, aliquots of the cell
suspension were placed into two large circles drawn on a microscope slide with an
ImmEdge™ Pen (H-4000, Vector Labs, Peterborough, UK). The slides were then placed in
a moist incubation chamber for 1-2 h at room temperature (16-20 ˚C). Thereafter, the non-

Rapid screening of new dietary components
PAGE | 95
adherent cells were removed by gently washing the microscope slides and multi-well
microplates with Hank’s balanced salt solution (HBSS, H6648, Sigma-Aldrich, Ayrshire,
UK). Respiratory burst activity of head kidney macrophages was assess by measuring the
reduction of nitro blue tetrazolium (NBT) into blue formazan, by superoxide anion produced
during this respiratory burst process. In accordance with the method described by
Secombes (1990), the difference in absorbance between un-stimulated and stimulated cells
was used to evaluate superoxide anion production. Macrophages in five replicate wells
were stimulated by adding 100 μL of 1 mg.mL-1 NBT (N6876, Sigma-Aldrich, Ayrshire, UK)
containing 1 µg.mL-1 phorbol-12-myristate 13-acetate (PMA, P8139, Sigma-Aldrich,
Ayrshire, UK), while a further five replicate wells remained un-stimulated, by adding 100 μL
of 1 mg.mL-1 NBT solution. The plate was incubated for 1 h at 15 ˚C before fixing the cells
with methanol, air drying and dissolving the formazan by the addition of 120 μL 2M KOH
and 140 μL dimethyl sulfoxide (DMSO, D2650 Sigma-Aldrich, Ayrshire, UK). Optical
densities (OD) were measured at 630 nm. The two remaining replicate wells were used to
determine the mean number of macrophages attached to the well, by adding 100 μL lysis
buffer (0.1 M citric acid, C0706; 1 % Tween 20, P1379; 0.05 % crystal violet, C3886; Sigma-
Aldrich, Ayrshire, UK) for 2 min, and counting the number of released nuclei using an
improved Neubauer haemocytometer counting chamber. Values for the respiratory burst
assay were expressed as mean NBT reduction (OD 630 nm) per 105 cells ± standard
deviation (SD).
The phagocytic assay was performed in accordance to Wang et al. (2006), with minor
modifications. In brief, 100 μL of Saccharomyces cerevisiae yeast suspension (YSC2,
Sigma-Aldrich, Ayrshire, UK; 5 mg.mL-1 in Leibovitz L-15 medium) was added to one of the
microscope slide circles containing the resultant macrophage monolayer. To the second
circle 100 μL of Leibovitz L-15 medium was added as control. The slides were incubated for
1 h, at room temperature (16-20 ˚C). To remove un-phagocytosed yeast, the macrophage
monolayers were washed with HBSS, fixed with ethanol, air dried and stained with a
Romanowsky-based staining kit (i.e. RAPI-Diff®). Finally, one hundred macrophage cells

CHAPTER 3
PAGE | 96
were examined microscopically using a 100× objective lens. The number of macrophages
containing phagocytosed yeast was recorded, as well as the number of phagocytosed
yeast. From these counts, the phagocytic index (PI), phagocytic activity (PA) and
phagocytic capacity (PC) was calculated as follow (Findlay & Munday, 2000): PI = Total
number yeast cells engulfed / Number of macrophages phagocytosing; PA = (Total number
of macrophages showing phagocytosis / Total number of macrophages counted) × 100; PC
= (Total number of macrophages containing a given number of yeast cells / Total number of
macrophages containing any yeast cell) × 100. The corresponding results were expressed
as mean percentages ± standard deviation (SD).
3.2.8. Histological staining and digital image acquisition
Formalin-fixed intestinal samples from 3 fish per treatment group were dehydrated and
paraffin-embedded according to conventional histological procedures (Bancroft & Stevens,
1982) and three distinct paraffin blocks produced for each individual tissue sample (Tissue-
TekII Paraffin Wax, 54-57 ˚C, Sakura Finetek Europe B.V, Netherlands). Transverse
sections of 5 µm thickness were cut and mounted on glass slides. For each distinct paraffin
block, one histological slide was prepared. After de-paraffinisation, sections were stained
with Alcian blue (8 GX, pH 2.5) followed by standard Harris’ haematoxylin and eosin-
yellowish staining (Steedman, 1950; Lev & Spicer, 1964; see Appendix 1 for modified
staining protocol).
Slides were then scanned using an automated slide-scanning system (MIRAX Desk,
Carl Zeiss MicroImaging GmbH, Göttingen, Germany) and a digitised MRXS image of the
complete section stored at a final magnification of 20×. MIRAX Viewer software (Version
1.12, 3DHISTECH, Budapest, Hungary) was used for visualisation and cropping of the
images. For each into untiled TIFF files with sizes ranging from 13 to 14 MB.
3.2.9. Quantitative image analysis
Cropped images were randomised and evaluated blind. Algorithms for detection and
feature extraction were developed using the KS300 software application module (Execution
Environment, Version 3.0, Carl Zeiss MicroImaging GmbH, Göttingen, Germany).

Rapid screening of new dietary components
PAGE | 97
Evaluation and implementation of the developed system was subsequently performed
on a personal computer running KSRun software (Version 3.0, Carl Zeiss Vision GmbH,
München, Germany). To give the true distance units, the micrometre scale used throughout
the analysis was calibrated according to the MIRAX Viewer’s guidelines, and thereafter
validated against a slide-graticule. The image processing and analysis pipeline comprised a
succession of interactive and automated steps. The operator was able to make decisions
interactively so as to rectify preceding automated object inclusions or deletions (e.g. to
eradicate artefacts created during histology processing or remove tissue debris extraneous
to the analysis). Feedback in the form of guideline-notes for the operator, and visualisation
of generated images was available at each step of the process.
The flow chart for the process pipeline is shown in Figure 2.3 and partly illustrated in
Figures 2.4, 2.5, 3.1 and 3.2. For a more complete description please see Chapter 2. In
brief, following a background correction and noise reduction from the source image, a
binary image was created (Figure 3.2 B). The empty space (i.e. comprising no tissue or
cells; within the area shown in Figure 3.2 B) was segmented by inverting the image to its
negative and through intensity differentiation, which in turn allowed proper segmentation of
the peritoneal edge of the muscularis externa and the internal intestinal lumen. Thereafter,
the stratum compactum was defined by interactive drawing over the displayed tissue image
so as to discriminate different tissue areas (i.e. mucosal and submucosal tissues; Figure 3.2
C-F respectively).
Using the original digitised images, an interactively defined HLS colour threshold (Hue,
Lightness, Saturation: an alternative colour model to RGB providing a better match to
perceived stain colours) was set for detection of Alcian blue staining and subsequent
identification of objects such as mucous cells (Figure 3.2 G-H). Binary grain recognition was
used to separate adjoining mucous cells, and the resulting objects filtered by size-threshold-
operators to ensure removal of artefacts. The source image was then converted to a
greyscale from which mucosal tissue vacuoles could then be visualised (Figure 3.2 I-J).
Lastly, the luminal perimeter was captured (Figure 3.2 K-L) and the level of convolution

CHAPTER 3 | Rapid screening of new dietary components
PAGE | 98
Figure 3.1. Flow chart illustrating the
sequence of image processing algorithms
(for a more complete description, please
see Chapter 2).
HISTOLOGICAL SAMPLING
Dissection Fixation StainingTissue Processing Sectioning
DEVELOPER TOOLS
Image Analysis Apparatus
MIRAX Viewer
KS 300 Imaging System
KS Run User Interface
IMAGE ACQUISITION
Magnification Setup DigitisationShade Correction Light Contrast
IMAGE PRE-PROCESSING
Calibration Database Setup Box-size CroppingImage Input Rotation

CHAPTER 3 | Rapid screening of new dietary components
PAGE | 99
Figure 3.1. (continued from previous page) Flow chart
illustrating the sequence of image processing
algorithms (for a more complete description, please
see Chapter 2).
IMAGE PROCESSING
Tissue Repair Greyscale Model Alcian Blue StainInverted Model Empty Space
Segmentation A Segmentation DSegmentation B Segmentation C
Intensity Thresholding
Debris Deletion Segmentation E
Colour ThresholdingNoise Removal
Amended Image Mucous Cells
Histological Identification & Post-processing Overlays
Mucosal Boundary VacuolisationMucosal Tissue Sub-mucosal Tissue
Histological Identification & Post-processing Overlays
Feature Extraction & Morphometrics Output Generation
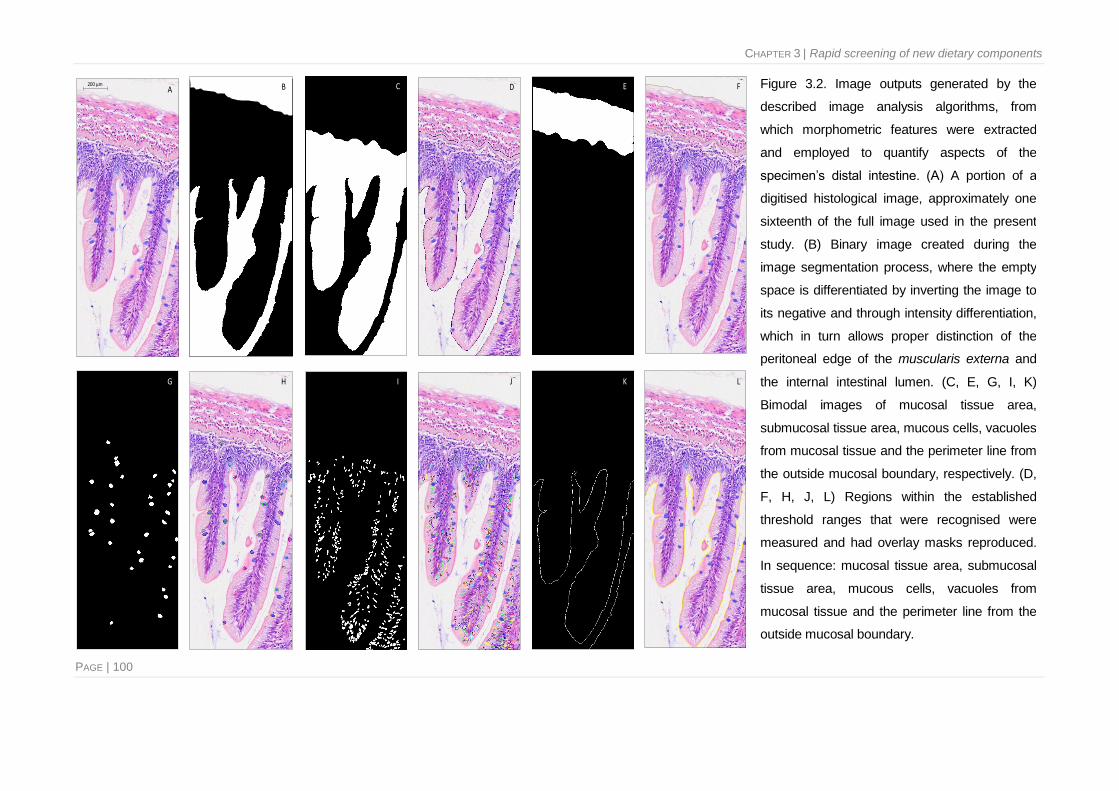
CHAPTER 3 | Rapid screening of new dietary components
PAGE | 100
Figure 3.2. Image outputs generated by the
described image analysis algorithms, from
which morphometric features were extracted
and employed to quantify aspects of the
specimen’s distal intestine. (A) A portion of a
digitised histological image, approximately one
sixteenth of the full image used in the present
study. (B) Binary image created during the
image segmentation process, where the empty
space is differentiated by inverting the image to
its negative and through intensity differentiation,
which in turn allows proper distinction of the
peritoneal edge of the muscularis externa and
the internal intestinal lumen. (C, E, G, I, K)
Bimodal images of mucosal tissue area,
submucosal tissue area, mucous cells, vacuoles
from mucosal tissue and the perimeter line from
the outside mucosal boundary, respectively. (D,
F, H, J, L) Regions within the established
threshold ranges that were recognised were
measured and had overlay masks reproduced.
In sequence: mucosal tissue area, submucosal
tissue area, mucous cells, vacuoles from
mucosal tissue and the perimeter line from the
outside mucosal boundary.
A C D E F
G H I J K L
200 µm B

Rapid screening of new dietary components
PAGE | 101
measured using the fractal box-counting method (Russell et al., 1980; Cross, 1994; Shang
et al., 2000). For this, the number of boxes required to cover the perimeter line was
determined by superimposing a regular grid of boxes over the image, and counting the
number of occupied boxes. The procedure was then repeated using different box sizes, up
to the size of the image. The number of occupied boxes increases with decreasing box size,
as described by the following power law relationship N (λ) = k × λ-D (Sreenivasan et al.,
1989; Wijesekera, 1996), where λ is the box size, N the number of boxes occupied by the
perimeter line, k a constant, and D the fractal dimension. Thereafter, D can then be
estimated from the slope of the linear trend of the log-to-log plot, of N versus lambda. The
endpoint of this process is an estimate of the perimeter convolution (Brooker, 2007).
Segmentation of all these histological components was performed sequentially. Several
image overlays were generated and stored as individual image outputs. Regions within the
threshold ranges were highlighted and object masks produced (Figure 3.2). Various
arithmetic and geometric automated algorithms were simultaneously employed for the
resulting segmented objects and measurements for a number of morphometric parameters
obtained (Table 2.2). Values for these were then transcribed and exported to a flat database
file. Amongst those output variables, nine size parameters, two shape descriptors and one
count variable were used to develop morphometric ratios (Table 2.2). Quantitative variables
were expressed as mean and standard deviations unless otherwise specified.
3.2.10. Statistical analysis
Statistical analyses were conducted using SPSS (Version 19.0.01, IBM, Chicago, USA)
and Minitab (Version 16.1.0.0, Coventry, UK) statistical software packages. Following tests
for normality and homogeneity, analysis of variance (~ANOVA) and Tukey’s post-hoc
multiple comparison tests were employed to determine whether results from the growth
performance and feed efficiencies were significantly different amongst experimental
treatment groups. Group differences were regarded as significant when the probability of
each significance test was less than 5 % (p < 0.05).

CHAPTER 3
PAGE | 102
The results from the various morphological and immunological parameters were
transformed where necessary to normalise the distribution, and the means compared by
use of a hierarchical general linear model (GLM). When multiple groups were compared,
the appropriate Holm-Bonferroni’s significance values were used to compensate for the
number of groups, so as to reduce the probability of detecting spurious differences. In order
to establish which morphometric measurements gave the most information concerning the
differences found in the morphology of the distal intestine from fish of different dietary
groups, a principal component analysis (PCA) was performed. Varimax rotation and a
Kaiser normalisation were employed to aid in obtaining optimal loadings of the parameters
on the principal components and consequently better interpretation of components (Kaiser,
1974). In order to identify important trends in the morphological data set that would not be
evident using univariate techniques, a discriminant function procedure was implemented.
The program default criterion for F values (FEntry: 3.84; FRemove: 2.71) was used to determine
the inclusion or removal of a variable from the analysis. Variables thus selected were
subjected to a reverse stepwise discriminant method. Once the variable selection was
complete, a discriminant model comprising a number of factors, each with its own
coefficient and a constant was generated. A discriminant score was then calculated for each
individual sample, and from this, subjects were automatically allocated to one of the
treatment groups and the overall accuracy of the discriminant model tested.
3.3. Results
3.3.1. Fish behaviour and feed intake
Throughout the experimental trial fish mortalities had a singular mortality being
recorded for fish fed the diet containing the SBM concentrate. No differences in the overall
fish behaviour were observed, and the feeding response was very good irrespective of
dietary treatment (Table 3.2).

Rapid screening of new dietary components
PAGE | 103
Table 3.2. Growth response and feed efficiencies for Atlantic salmon fed the experimental diets.
Diet A
(Standard) Diet B (SBM)
Diet C (Imm)
Mean* SD Mean SD Mean SD p-value
Weight gain (Wt, %) 233.17
27.30 215.41 3.18 224.47 13.82 0.79
Feed Intake (FI, g.d-1
) 33.95 2.20 32.51 1.19 32.25
1.37 0.75
Specific Growth Rate (SGR, %.d-1
) 1.10 0.08 1.04 0.01 1.08 0.05 0.79
Feed Conversion Rate (FCR)† 0.73
a 0.01 0.81
b 0.01 0.72
a 0.02 0.00
Condition Factor (K, %) 1.21 0.02 1.21 0.01 1.18 0.02 0.43
Hepatosomatic Index (HSI, %) 1.06 0.02 1.04 0.09 0.97 0.04 0.58
Footnotes:
Standard, control; SBM, soybean meal; Imm, immunostimulants.
* Data are expressed as mean and standard deviations (SD), n = 3 tanks per treatment group were assessed.
Mean values within the same row, with different superscripts are significantly different (one-way ANOVA, p < 0.05).
† The feed conversion rate could be expressed as kg dry feed kg-1 wet weight gain.
3.3.2. Feed chemical composition
The proximate chemical composition (% of dry weight) of the formulated feeds used in
this experimental study is shown in Table 3.1. No substantial differences were found among
dietary groups in terms of crude protein, ash and moisture contents whereas slight
fluctuations were seen for the crude fat content. The diets contained about 42 % crude
protein and 26 to 27.7 % crude fat. Ash and moisture content were in the range of 92.5 to
92.8 % and 7.2 to 7.5 % respectively.
3.3.3. Growth performance and feed efficiencies
Feed efficiencies and growth performance of fish are presented in Table 3.3.
Throughout the 20-week experimental trial, mean fish weight continuously increased.
Although no significant growth differences were found between the different diets (Wt F[1, 3]
= 0.25, p > 0.05; SGR F[1,3] = 0.24, p > 0.05), there was a slight tendency towards a lower
Wt and SGR as the diet’s percentage of SBM increased. Similarly, fish fed on the diet
containing plant protein displayed significantly lower FCR values (F[1,3] = 17.56, p < 0.05)
varying from 0.79 to 0.82 kg dry feed kg-1 wet weight gain. In contrast, the HIS index
remained unaffected by dietary treatment (F[1,3] = 0.59, p > 0.05), values ranging from 0.97
to 1.06 %. The average daily feed intake exhibited very few changes amongst treatment

CHAPTER 3
PAGE | 104
groups. While not statistically significantly different, the highest feed intake was recorded for
fish from treatment group A, fed the fish meal based control diet (33.95 ± 2.20 g.d-1; F[1,3] =
0.31, p > 0.05). At the end of the feeding period, the body condition factor (overall 1.20 ±
0.02 %), was within the normal range and did not differ significantly between dietary
treatments (F[1,3] = 0.97, p > 0.05).
3.3.4. Haematology and blood biochemistry
The haematological profiles of Atlantic salmon fed the experimental diets are
summarised in Table 3.3. Erythrocyte counts did not differ greatly among the three
treatment groups (F[2, 18] = 0.01, p > 0.05). The highest RBC count was observed for fish
from group A, fed the fish meal based control diet (14.99 ± 1.31 × 10⁸ cells.mL-1). Similarly,
no significant differences were observed for haematocrit (F[2, 18] = 2.53, p > 0.05) and
haemoglobin (F[2, 18] = 0.78, p > 0.05) values among dietary groups. The Hct values for fish
fed the diet containing SBM were greater than for fish fed the other two diets, and the
highest Hb values were attained for the same treatment group.
Soybean meal concentrate in the feed induced a significant effect on the total WBC
count (F[2, 18] = 0.21, p < 0.05). As the plant protein content in diets increased, an increase in
the WBC count was observed. Nonetheless, differential leucocyte counts were not affected
by the diets. Analysis of blood smears from the different treatment groups did not reveal any
significant differences in the differential WBC counts (Figure 3.3; p > 0.05). The group
indices with reference to monocytes and granulocytes were greater for treatment groups A
and C fed on fish meal diets (Diet A, 3.50 ± 0.49 %, 11.11 ± 2.28 %; Diet B, 2.78 ± 0.35 %,
7.22 ± 1.11 %; Diet C, 3.44 ± 0.694 %, 8.278 ± 1.04 % respectively). The percentage of
thrombocytes were higher for treatment group B fed the SBM diet (Diet A, 36.833 ± 2.631
%; Diet B, 40.22 ± 1.691 %, Diet C, 35.83 ± 2.24 %), while lymphocyte percentages were
very similar between diets A and B (Diet A, 48.56 ± 3.50 %; Diet B, 49.78 ± 1.390 %, Diet C,
52.44 ± 2.53%).

Rapid screening of new dietary components
PAGE | 105
Table 3.3. Haematological profiles for Atlantic salmon fed the experimental diets.
Diet A
(Standard)
Diet B (SBM)
Diet C (Imm)
Mean* SD Mean SD Mean SD p-value
Erythrocyte Count (RBC, ×108 cells.mL
-1) 14.99 1.31 14.91 1.48 15.37 1.00 0.10
Leucocyte Count (WBC, ×107 cells.mL
-1) 13.41 13.43 14.56 8.11 14.38 9.63 0.81
Haematocrit (Hct, %) 42.39 0.78 43.80 1.37 40.27 0.75 0.16
Haemoglobin (Hb, g.dL-1
) 9.40
0.19 9.88
0.21 9.22 0.24 0.50
Mean Corpuscular Volume (MCV, fL) 334.17 36.71 346.19 41.40 277.54 17.978 0.80
Mean Corpuscular Haemoglobin (MCH, pg) 867.94 115.44 712.51 46.43 726.08 99.72 0.65
MCH Concentration (MCHC, g.dL-1
) 2.22 0.05 2.28 0.08 2.30 0.06 0.82
Lysozyme (Lys, U.min-1
.mL-1
) 169.99
79.48 153.61
82.96 222.35
94.21 0.26
Total Protein (TP, g.L-1
) 37.51 6.29 38.81 3.45 36.9 3.65 0.46
Albumin (Alb, g.L-1
) 17.29 1.55 17.00 1.06 16.56 1.48 0.29
C-reactive Protein (CRP, mg.L-1
) 16.36a 9.23 10.62
b 6.35 8.96
b 4.43 0.01
Footnotes:
Standard, control; SBM, soybean meal; Imm, immunostimulants.
* Data are expressed as mean and standard deviation (SD), n = 18 individual fish per treatment group were assessed. a,b Mean values within the same row with different superscripts are significantly different (hierarchical GLM: tank
[treatment] fixed factor with 3 levels, p < 0.05).
Higher MCH values were observed for treatment groups fed the fish meal based diets,
and these values, though not statistically different (F[2, 18] = 0.47, p > 0.05), were lower for
the group fed the diet containing SBM concentrate. In comparison greater MCV values were
observed in diet group B, although similarly not statistically different from those in groups A
and C (F[2, 18] = 0.23, p > 0.05). Although statistically similar (F[2, 18] = 0.20, p > 0.05), the
highest MCHC were observed in the group fed functional ingredients as opposed to the
group fed plant protein.
Total plasma protein (TP) concentration in fish fed the SBM diet although not
statistically significant, was slightly higher when compared to fish fed the control fish meal
diet or the immunostimulant diet (F[2, 18] = 0.78, p > 0.05). No statistically significant
differences were observed in lysozyme activity (Lys) in serum taken from fish fed the fish
meal based diet, compared to that measured in fish fed an unrefined SBM diet (F[2, 18] =
1.70, p > 0.05), although fish feed the immunostimulant diet had slightly higher values of
activity. Likewise, the levels of plasma albumin (Alb) between all the experimental diets (F[2,
18] = 1.28, p > 0.05) were fairly similar. C-reactive protein levels (CRP) were negligible in fish

CHAPTER 3
PAGE | 106
fed both experimental diets, but were significantly higher in fish fed the control diet based on
fish meal (F[2, 18] = 5.60, p < 0.05; Table 3.3).
0 %
10 %
20 %
30 %
40 %
50 %
60 %
70 %
80 %
90 %
100 %
Diet A Diet B Diet C
Tota
l Leu
cocy
te P
op
ula
tio
n
Monocytes
Thrombocytes
Granulocytes
Lymphocytes
Figure 3.3. Effect of feeding the different experimental diets to Atlantic salmon on the
mean differential leucocyte cell percentage. Columns represent cumulative mean
percentage values, n = 9 individual fish per treatment group. Significant differences
between treatment groups were not observed (hierarchical GLM: tank [treatment] fixed
factor with 3 levels, p > 0.05). (Diet A) Standard fish meal based feed used as control
diet. (Diet B) Soybean meal based feed. (Diet C) Standard feed with inclusion of
immunostimulant ingredients. Cell photos courtesy of Christoforos Metochis.
3.3.5. Respiratory burst activity and phagocytic activity assays
Macrophage respiratory burst activity, as measured by NBT reduction was unaffected
by the different dietary treatments (F[2, 18] = 0.97, p > 0.05). Diets A and C gave intermediate
levels of response, while the substitution by soya meal resulted in a trend for inhibition of
respiratory burst (Diet A, 1.39 ± 1.12; Diet B, 1.02 ± 0.79; Diet C, 1.25 ± 0.98 abs per 105
cells; Figure 3.4).
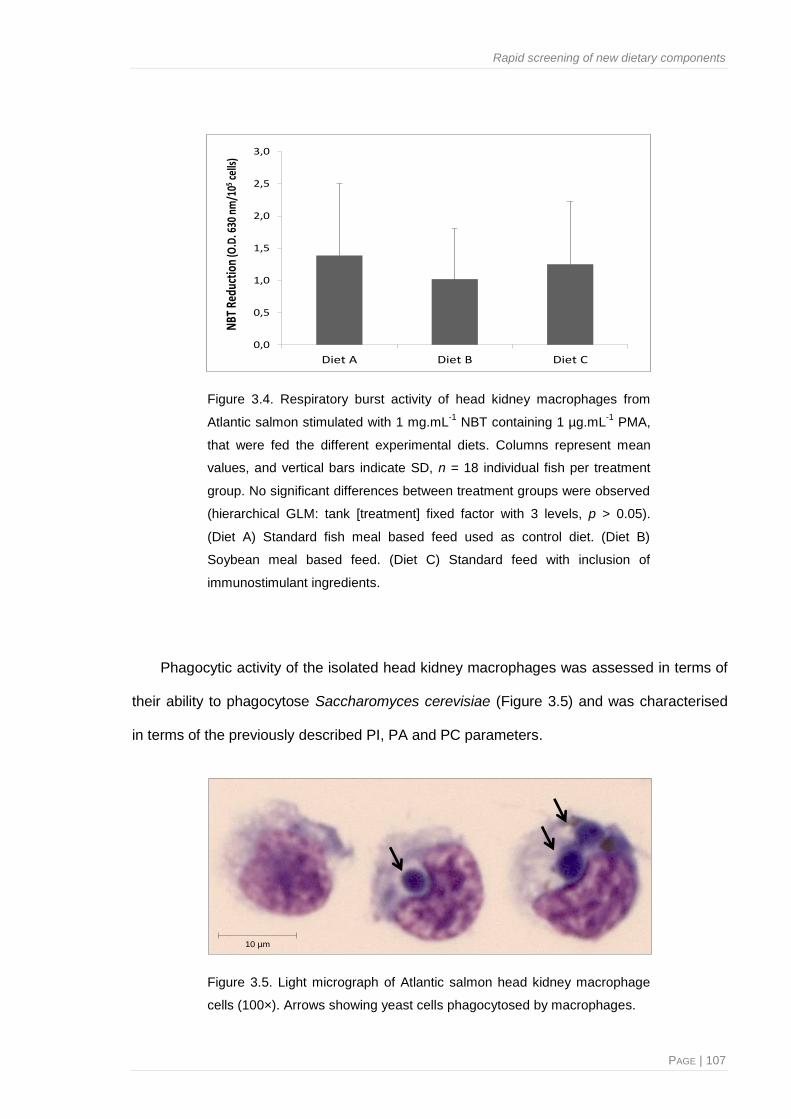
Rapid screening of new dietary components
PAGE | 107
0,0
0,5
1,0
1,5
2,0
2,5
3,0
Diet A Diet B Diet C
NBT
Red
uctio
n(O
.D. 6
30 n
m/1
05ce
lls)
Figure 3.4. Respiratory burst activity of head kidney macrophages from
Atlantic salmon stimulated with 1 mg.mL-1
NBT containing 1 µg.mL-1
PMA,
that were fed the different experimental diets. Columns represent mean
values, and vertical bars indicate SD, n = 18 individual fish per treatment
group. No significant differences between treatment groups were observed
(hierarchical GLM: tank [treatment] fixed factor with 3 levels, p > 0.05).
(Diet A) Standard fish meal based feed used as control diet. (Diet B)
Soybean meal based feed. (Diet C) Standard feed with inclusion of
immunostimulant ingredients.
Phagocytic activity of the isolated head kidney macrophages was assessed in terms of
their ability to phagocytose Saccharomyces cerevisiae (Figure 3.5) and was characterised
in terms of the previously described PI, PA and PC parameters.
10 µm
Figure 3.5. Light micrograph of Atlantic salmon head kidney macrophage
cells (100×). Arrows showing yeast cells phagocytosed by macrophages.

CHAPTER 3
PAGE | 108
As shown in Figure 3.6, there was an increase in the number of yeast cells engulfed
per macrophage in fish fed diet B and C, however this was not significantly different from
values for fish fed the control treatment diet (F[2, 18] = 0.66, p > 0.05). Phagocytic activity
values ranged from 80.95 % to 83.94 %. With regard to the phagocytic index, there were no
major or significant differences between the different treatment groups (Figure 3.7). Fish
from diet group A had a PI of 2.15 ± 0.37, while values for diet B were 2.22 ± 0.48 and diet
C were 2.28 ± 0.58 (F[2,18] = 0.27, p > 0.05). For the macrophage cells isolated from fish fed
diet A, 83.95 % had phagocytosed 1-3 yeast cells and 12.80 % had phagocytosed 4-6 yeast
cells. Thus, for macrophages isolated from fish fed diets B and C, 82.15 % and 80.95 % had
engulfed up to 3 yeast cells and 15.25 % and 16.46 % had engulfed up to 6 yeast cells
respectively.
0
5
10
15
20
25
30
35
40
1 2 3 4 5 6 >7
No
. o
f M
acr
op
ha
ges
Co
nta
inin
g Y
ea
st C
ells
No. of Yeast Cells Phagocytosed
Diet A
Diet B
Diet C
d
dd d
dd
a a
b
bb
c
c
d
dd
c
d
dd
a
Figure 3.6. Phagocytic ability of macrophages from head kidneys of Atlantic salmon fed different
experimental diets. Columns represent mean values, and vertical bars indicate SD, n = 18
individual fish per treatment group. Significant differences between the phagocytic capacity of
different treatment groups are indicated by different superscripts (hierarchical GLM: tank
[treatment] fixed factor with 3 levels, p < 0.05). (Diet A) Standard fish meal based feed used as
control diet. (Diet B) Soybean meal based feed. (Diet C) Standard feed with inclusion of
immunostimulant ingredients.

Rapid screening of new dietary components
PAGE | 109
1,90
2,00
2,10
2,20
2,30
2,40
2,50
2,60
2,70
2,80
2,90
0
10
20
30
40
50
60
70
80
90
100
Diet A Diet B Diet C
Phag
ocyt
ic In
dex
Phag
ocyt
ic A
ctiv
ity
(%)
PA PI
b
a
a
b
ba
Figure 3.7. Phagocytic activity (%, PA) and the phagocytic index (□ PI) of macrophages from head
kidneys of Atlantic salmon fed different experimental diets. Columns represent mean values, and
vertical bars indicate SD, n = 18 individual fish per treatment group. No significant differences
between treatment groups were observed (hierarchical GLM: tank [treatment] fixed factor with 3
levels, p < 0.05). (Diet A) Standard fish meal based feed used as control diet. (Diet B) Soybean meal
based feed. (Diet C) Standard feed with inclusion of immunostimulant ingredients.
3.3.6. Image analysis performance
The average time for the whole digital slide image acquisition was approximately 4-12
min. Image pre-processing and frame rotation / cropping was around 3 min per slide. The
total average computation time from image upload until feature extraction, measurement
and results data output for 12 continuous variables being roughly 20 to 25 min per frame,
which greatly improved the efficiency of conducting such quantitative assessment as
opposed to the semi-quantitative alternative approach. Consequently, the image analysis of
3 pathology cases with 27 individuals for each of which 2 frames were randomly analysed
(representing 162 diagnostic frames in total) was performed over 10 days. The system
described here required a degree of user learning / training to give consistent results.
Overall, the algorithm’s performance and ability to detect objects of interest was very
good (see Chapter 2 for a full discussion of performance). Mucous cells were correctly
segmented, with their selection and separation being very precise on the whole. Similarly,
the algorithm detecting the whole tissue surface and subsequently dividing it into mucosal

CHAPTER 3
PAGE | 110
and submucosal layers also performed accurately. In contrast, the vacuolisation algorithm
was less accurate, showing certain inaccuracy in its identification. Nevertheless, the
interactive amendment-steps permitted the operator to easily correct errors in the
automated selection. Additionally, the success of the interactive algorithm in excluding
artefacts was very good. The overlay masks created by semi-automatic segmentation,
recognising tissue areas, perimeter lines, mucous cells and vacuolisation visually agreed
with the actual extent of these regions, as shown in output display-pictures in Figure 3.2.
Very small discrepancies were observed, clearly illustrating the level of success of the
image analysis system employed here.
Validation of measurements was performed by an experienced histopathologist, using
ImageJ software (Version 1.45, US National Institutes of Health, Bethesda, Maryland,
http://rsb.info.nih.gov/ij/). The results given by ImageJ’s automatic and manual image
segmentation closely mirrored the ones obtained with the developed macro. Correlation
values being greater than 0.87 for most of the parameters measured (see Chapter 2 for full
discussion of these results) suggesting that the proposed system is accurate and reliable.
3.3.7. Quantitative variables from image analysis
The 162 independent histological frame samples were evaluated using their measured
morphometric and tissue cytometric parameters. The morphometric parameters used to
provide an overview of the whole intestinal specimen condition are presented in Table 3.4.
With respect to the histological examination of the distal intestine (Figure 3.8), no
differences in the structure of the epithelial mucosal layers were observed among sections
from different treatment groups (F[3, 36] MTA / STA = 1.51, p > 0.05). Nor were there
significant differences in the key morphometric parameters associated with the mucous
cells. Mean mucous cell circularity indices and the mean elliptical and Feret length ratios
were fairly similar among fish from different dietary groups (F[3, 36] MCirc = 0.01; F[3, 36] MC
Ellipse Ratio = 0.25; F[3, 36] MC Feret Ratio = 0.39; p > 0.05).

Rapid screening of new dietary components
PAGE | 111
A
125 µm
V
CtSc
Lp
B
200 µm
Ct
Sc
Lp
C
V
CtSc
Lp
125 µm
ScCt
MF
MF
MC −
MC−
− MC
− MCMC −
MC −
MC −
− MC
MF
MF
Sc
Ct
Sc
Ct
MF
MF
Figure 3.8. Representative images of morphological variations encountered across the
distal intestine of Atlantic salmon fed different experimental diets: (A) fish meal based
control diet, (B) diet containing 25 % defatted soybean meal and (C) diet with inclusion
of immunostimulant ingredients. The morphology of fish meal fed fish is considered as
being the normal status, whereas that of fish fed soybean meal reflects an
inflammatory response characterised by the loss of vacuoles (V) in the absorptive
enterocytes; the widening of lamina propria (Lp) in the mucosal folds (MF);

CHAPTER 3
PAGE | 112
On the other hand, it should be emphasised that mean mucous cell area showed
significant differences among treatment groups (F[3, 36] MMCA = 7.05, p < 0.05). Fish fed the
fish meal based diet, exhibited significantly larger (µm2) intestinal mucous cells, and
subsequently the highest ratio between mucous cell total area and the mucosal tissue area
(F[3, 36] MCA / [MTA-Vac] = 10.17, p < 0.05). No differences in the overall number of mucous
cells were observed, however, for fish maintained under the various dietary treatment
regimes (F[3, 36] MCN / [MTA-Vac] = 4.39, p > 0.05). 8
Table 3.4. Morphometric assessment of the distal intestine from Atlantic salmon fed the experimental
diets.
Morphometric feature*
Diet A (Standard)
Diet B (SBM)
Diet C (Imm)
Mean† SD Mean SD Mean SD p-value
FR 1.28a 0.048 1.23
b 0.05 1.27
a 0.05 0.04
MTA / STA 3.63
0.26 3.22 0.20 3.01 0.21 0.30
MMCA (µm2) 236.81
a 9.55 206.78
b 5.10 204.33
b 6.26 0.03
MC Feret Ratio 0.74 0.004 0.74 0.01 0.73 0.04×10⁻¹
0.69
MC Ellipse Ratio 1.44 0.01 1.44 0.02 1.45 0.01 0.79
MCirc Index 0.85 0.01 0.85 0.01 0.85 0.01 0.99
P / MTA (µm / µm2) 1.76×10
-2a 0.05×10
-2 1.41×10
-2b 0.05×10
-2 1.67×10
-2a 0.06×10
-2 0.04
VC / MTA 0.05 0.01 0.05 0.01 0.05 0.01 0.87
MCA / [MTA-Vac] 0.13a 0.010 0.09
b 0.01 0.09
b 0.01 0.01
MCN / [MTA-Vac] (nº / µm2) 0.51×10
-3 0.03×10
-3 0.45×10
-3 0.03×10
-3 0.43×10
-3 0.03×10
-3 0.07
Footnotes:
Standard, control; SBM, soybean meal; Imm, immunostimulants.
* Distal intestinal sections were assessed according to the morphometric features listed and described in Table 2.2.
FR, fractal dimension of the perimeter line of the luminal surface, MTA / STA, ratio between the mucosal tissue area
and the submucosal tissue area, MMCA, mean mucous cell area, MC Feret Ratio, ratio of the Feret lengths from
mucous cells, MC Ellipse Ratio, ratio of the elliptical lengths from the mucous cells, MCirc, mucous cell mean
circularity index, P / MTA, ratio between the total perimeter of the luminal surface and the mucosal tissue area, VC /
MTA, ratio between total vacuolisation area and the mucosal tissue area, MCA, mucous cell total area, MTA-Vac,
mucosal tissue area without the vacuolisation area, MCN, mucous cell number.
† Data are expressed as mean and standard deviation (SD), n = 36 histological frames per treatment group were
assessed. a,b Mean values within the same row with different superscripts are significantly different (hierarchical GLM: tank
[treatment] fixed factor with 3 levels, p < 0.05).
Figure 3.8. (continued from previous page) an increase of the connective tissue (Ct) between the base
of the mucosal folds and the stratum compactum (Sc); and an increase in size of mucous cells (MC)
in the epithelium. The morphological profile from fish fed the immunostimulant diet did not differ
substantially from the fish meal fed fish. Intestinal transverse sections were stained with a
combination of haematoxylin-eosin and Alcian blue 8 GX.

Rapid screening of new dietary components
PAGE | 113
The control group exhibited higher vacuolisation per mucosal tissue area, however this
was not significantly different from the other two dietary groups (F[3, 36] V / MTA = 0.14, p >
0.05). In contrast to vacuolisation, the fish fed the diet containing plant protein revealed the
lowest ratio between the perimeter length and the mucosal tissue area (F[3, 36] P / MTA =
6.12, p < 0.05) and its fractal dimension (F[3, 36] FR = 5.96, p < 0.05). Following univariate
analyses, the values of each morphological parameter were multi-dimensionally analysed
by including them all as variables in a multivariate model.
A principal component analysis (PCA) with orthogonal rotation was conducted. The
Kaiser-Meyer-Olkin measure confirmed the sampling adequacy for the analysis, KMO =
0.63 (Hutcheson & Sofriniou, 1999 in Field, 2009), and Bartlett’s test of sphericity χ2 (36) =
752.08, p < 0.001, indicated that correlations between replicates were sufficiently large for a
PCA analysis (Bartlett, 1988). This approach allowed the full set of variables to be reduced
to a smaller set of components (i.e. reduction of the dimensionality of the data). Table 3.5
gives a summary of the loading weightings and score coefficients assigned to each of the
variables for the extracted components.
Four of the extracted components had Eigenvalues exceeding Kaiser’s criterion of 1
(Field, 2009) and in combination they explained 89.28 % of the total variation in individual
intestinal morphology. The two first components accounted for the 64.07 % of variation of
this dataset, with 33.34 % of the variation explained by component 1 (F[3, 36] PC1 = 0.94; p =
0.392; Diet A = Diet B = Diet C; F[3, 36] PC2 = 11.87, p < 0.001, Diet A ≠ Diet B, Diet A ≠ Diet
C, Diet B = Diet C; F[3, 36] PC3 = 2.36; p = 0.098, Diet A = Diet B = Diet C).
The principal components obtained, are entities that can be visualised as a new
classification axis (variable) along which the variables can be plotted, giving an idea of their
relationship with the corresponding principal component (Figure 3.9). The first component
PC1, which appeared to be related to mucous cell shape, was characterised by high
loadings of the variables MC Feret Ratio and MCirc, against a high negative weighting for
MC Ellipse Ratio. Two additional characters, MCA / [MTA-Vac] and MCN / [MTA-Vac],
showed the highest positive relationship within the second component PC2, which related to
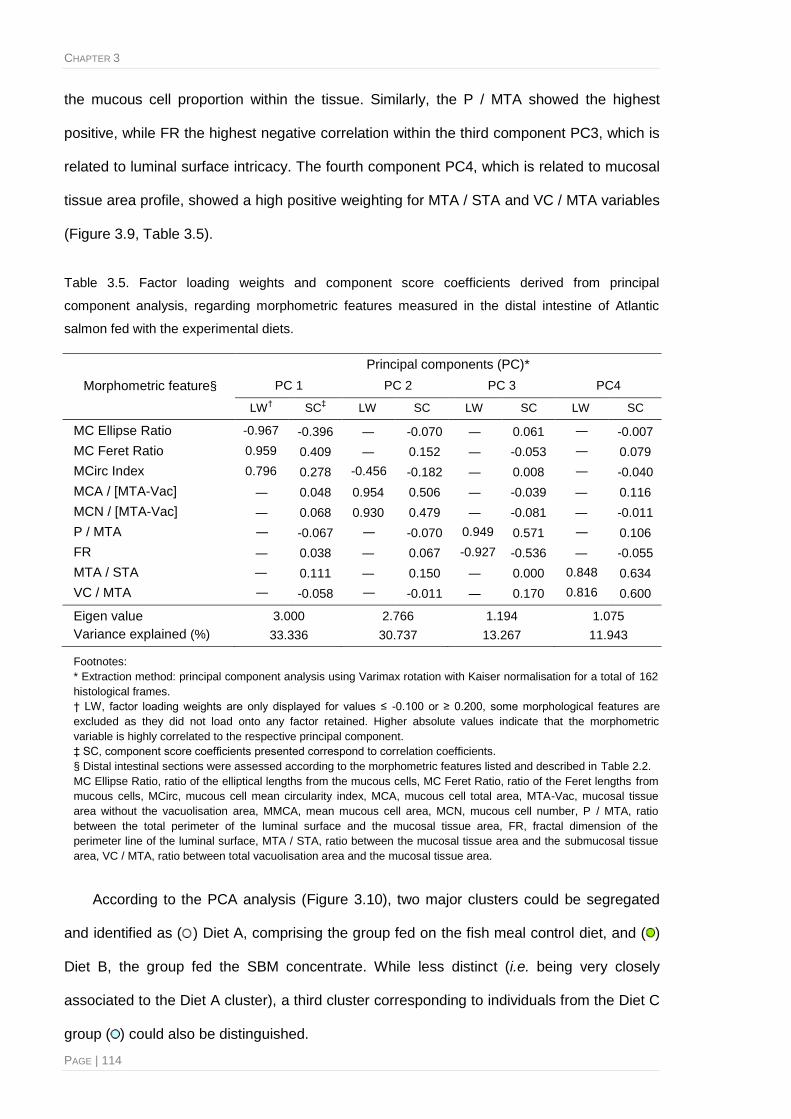
CHAPTER 3
PAGE | 114
the mucous cell proportion within the tissue. Similarly, the P / MTA showed the highest
positive, while FR the highest negative correlation within the third component PC3, which is
related to luminal surface intricacy. The fourth component PC4, which is related to mucosal
tissue area profile, showed a high positive weighting for MTA / STA and VC / MTA variables
(Figure 3.9, Table 3.5).
Table 3.5. Factor loading weights and component score coefficients derived from principal
component analysis, regarding morphometric features measured in the distal intestine of Atlantic
salmon fed with the experimental diets.
Morphometric feature§
Principal components (PC)*
PC 1 PC 2 PC 3 PC4
LW† SC
‡ LW SC LW SC LW SC
MC Ellipse Ratio -0.967 -0.396 ― -0.070 ― 0.061 ― -0.007
MC Feret Ratio 0.959 0.409 ― 0.152 ― -0.053 ― 0.079
MCirc Index 0.796 0.278 -0.456 -0.182 ― 0.008 ― -0.040
MCA / [MTA-Vac] ― 0.048 0.954 0.506 ― -0.039 ― 0.116
MCN / [MTA-Vac] ― 0.068 0.930 0.479 ― -0.081 ― -0.011
P / MTA ― -0.067 ― -0.070 0.949 0.571 ― 0.106
FR ― 0.038 ― 0.067 -0.927 -0.536 ― -0.055
MTA / STA ― 0.111 ― 0.150 ― 0.000 0.848 0.634
VC / MTA ― -0.058 ― -0.011 ― 0.170 0.816 0.600
Eigen value 3.000 2.766 1.194 1.075
Variance explained (%) 33.336 30.737 13.267 11.943
Footnotes:
* Extraction method: principal component analysis using Varimax rotation with Kaiser normalisation for a total of 162
histological frames.
† LW, factor loading weights are only displayed for values ≤ -0.100 or ≥ 0.200, some morphological features are
excluded as they did not load onto any factor retained. Higher absolute values indicate that the morphometric
variable is highly correlated to the respective principal component.
‡ SC, component score coefficients presented correspond to correlation coefficients.
§ Distal intestinal sections were assessed according to the morphometric features listed and described in Table 2.2.
MC Ellipse Ratio, ratio of the elliptical lengths from the mucous cells, MC Feret Ratio, ratio of the Feret lengths from
mucous cells, MCirc, mucous cell mean circularity index, MCA, mucous cell total area, MTA-Vac, mucosal tissue
area without the vacuolisation area, MMCA, mean mucous cell area, MCN, mucous cell number, P / MTA, ratio
between the total perimeter of the luminal surface and the mucosal tissue area, FR, fractal dimension of the
perimeter line of the luminal surface, MTA / STA, ratio between the mucosal tissue area and the submucosal tissue
area, VC / MTA, ratio between total vacuolisation area and the mucosal tissue area.
According to the PCA analysis (Figure 3.10), two major clusters could be segregated
and identified as ( ) Diet A, comprising the group fed on the fish meal control diet, and ( )
Diet B, the group fed the SBM concentrate. While less distinct (i.e. being very closely
associated to the Diet A cluster), a third cluster corresponding to individuals from the Diet C
group ( ) could also be distinguished.

Rapid screening of new dietary components
PAGE | 115
Based upon this multivariate appraisal, one could suggest reducing the number of
required classification features, with the most informative being MC Feret Ratio, MC Ellipse
Ratio, MCA / [MTA-Vac], FR and MTA / STA for the evaluated histological states. A
discriminant analysis undertaken on the data revealed two canonical functions. The first
accounted for 76.8 % (canonical R2 = 0.25) of the group variance, whereas the second
function explained 23.2 % (canonical R2 = 0.09). In combination these discriminant functions
significantly differentiated the treatment groups, λ = 0.68, χ2 (6) = 38.97, p < 0.001. After
removal of the first function there was still highly significant discriminatory power, the second
discriminant function still differentiating the treatment groups λ = 0.91, χ2 (2) = 9.76, p < 0.05.
Thus, the group differences could be explained in terms of two underlying dimensions in
combination, explained by the following linear equations: [a] D1 score = -6.80 + (0.51 × MTA /
STA) + (259.27 × P / MTA) + (9.06 × MCA / [MTA-Vac]) and [b] D2 score = 0.84 + (0.32 × MTA /
MCirc
MC Feret Ratio
FR
MC Ellipse Ratio
P/MTA
VC/MTA
MCA/[MTA-Vac]
MTA/STA
MCN/[MTA-Vac]
Figure 3.9. Component plot of the multivariate principal component analysis for the intestinal
morphological features measured in Atlantic salmon fed different treatment diets. (PC) Principal
component. (MCN) Mucous cell number. (MCA) Mucous cell total area. (MTA-Vac) Mucosal tissue
area without the vacuolisation area. (MC Ellipse Ratio) Ratio of the elliptical lengths from the mucous
cells. (FR) Fractal dimension of the perimeter line of the luminal surface. (MC Feret Ratio) Ratio of
the Feret lengths from mucous cells. (P / MTA) Ratio between the total perimeter of the luminal
surface and the mucosal tissue area. (MTA / STA) Ratio between the mucosal tissue area and the
submucosal tissue area. (VC / MTA) Ratio between total vacuolisation area and the mucosal tissue
area. (MCirc) Mucous cells mean circularity index.

CHAPTER 3 | Rapid screening of new dietary components
PAGE | 116
Figure 3.10. Factor plot of the multivariate principal component analysis for the intestinal morphology of Atlantic salmon fed different diets. (Diet A) Standard fish
meal based feed used as control diet. (Diet B) Soybean meal based feed. (Diet C) Standard feed with inclusion of immunostimulant ingredients.
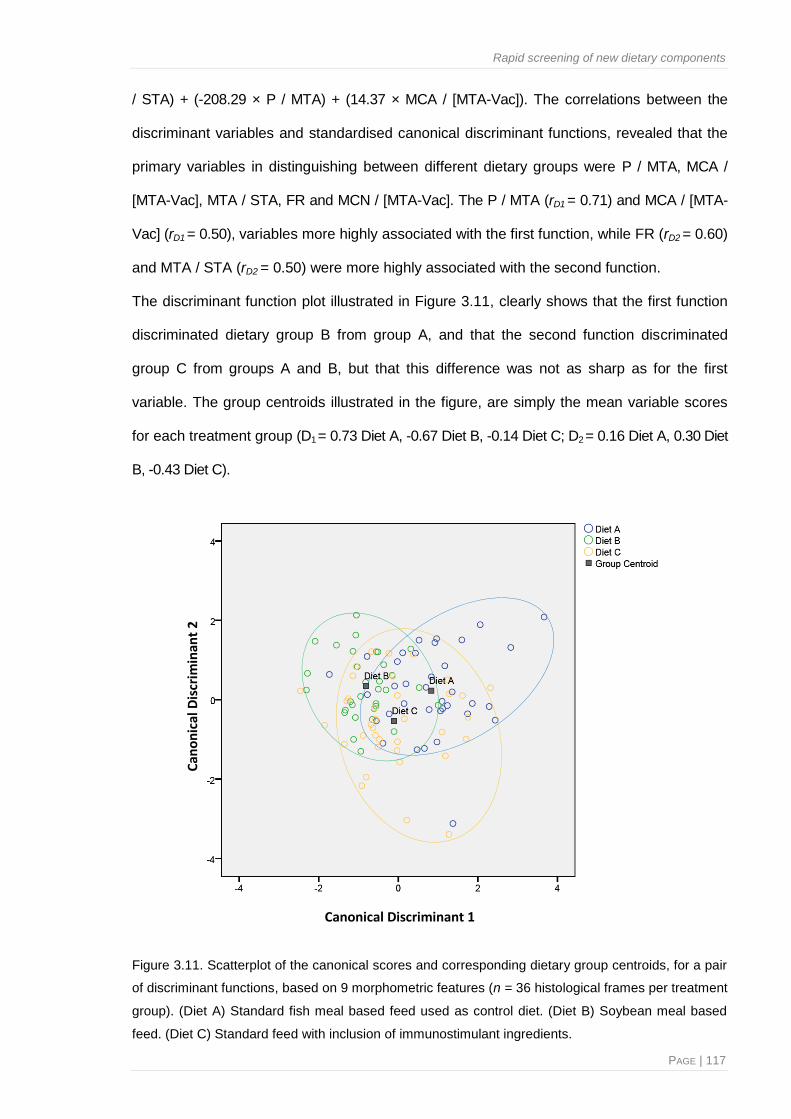
Rapid screening of new dietary components
PAGE | 117
/ STA) + (-208.29 × P / MTA) + (14.37 × MCA / [MTA-Vac]). The correlations between the
discriminant variables and standardised canonical discriminant functions, revealed that the
primary variables in distinguishing between different dietary groups were P / MTA, MCA /
[MTA-Vac], MTA / STA, FR and MCN / [MTA-Vac]. The P / MTA (rD1 = 0.71) and MCA / [MTA-
Vac] (rD1 = 0.50), variables more highly associated with the first function, while FR (rD2 = 0.60)
and MTA / STA (rD2 = 0.50) were more highly associated with the second function.
The discriminant function plot illustrated in Figure 3.11, clearly shows that the first function
discriminated dietary group B from group A, and that the second function discriminated
group C from groups A and B, but that this difference was not as sharp as for the first
variable. The group centroids illustrated in the figure, are simply the mean variable scores
for each treatment group (D1 = 0.73 Diet A, -0.67 Diet B, -0.14 Diet C; D2 = 0.16 Diet A, 0.30 Diet
B, -0.43 Diet C).
Figure 3.11. Scatterplot of the canonical scores and corresponding dietary group centroids, for a pair
of discriminant functions, based on 9 morphometric features (n = 36 histological frames per treatment
group). (Diet A) Standard fish meal based feed used as control diet. (Diet B) Soybean meal based
feed. (Diet C) Standard feed with inclusion of immunostimulant ingredients.
Canonical Discriminant 1
Can
on
ical
Dis
crim
inan
t 2

CHAPTER 3
PAGE | 118
A “leave-one-out” classification analysis (sensitivity analysis) was also employed in
which the analysis was re-run once with each target individual sequentially excluded and
then reassigned to a group based on the resulting discriminant function score. Such re-
assignment classification resulted in 61.1 % of the individuals from group A being correctly
assigned to their group. However, only around 42 to 59 % of individuals from groups B and
C were assigned to the correct group. This gives an overall efficiency of 53.8 % for the
discrimination of the dietary groups. Based on the overall analysis one could reduce the
number of necessary classification features from ten to four, with P / MTA, MCA / [MTA-
Vac], FR and MTA / STA being emphasised.
3.4. Discussion
3.4.1. Growth performance and nutrient intake
The chemical composition of the experimental diets was successfully matched (i.e. in
terms of crude protein, lipid, ash and moisture contents), with optimal levels for salmonids
being achieved (Helland et al., 1991; Einen & Roem, 1997).
Overall, fish performance was good, with growth and feed efficiency being similar to
results previously achieved for Atlantic salmon of comparable size and raised at similar
temperatures (Austreng et al., 1987). For the salmon fed the soybean meal diet, the Wt and
SGR were lower than values reported for studies on the effect of dietary soybean meal on
the growth rate for salmonids fed similar levels of SBM inclusion (Watanabe et al., 1993;
Oliva-Teles et al., 1994; Refstie et al., 1998; Carter & Hauler, 2000; Selden et al., 2001;
Romarheim et al., 2006; Øverland et al., 2009; Collins et al., 2013). These minor differences
were not due to differences in feed intake, as the feeding response was consistent
irrespective of the dietary treatment. However, the use of unrefined soybean meal as an
alternative protein source to fish meal in diets for salmonid has repeatedly been shown to
induce morphological changes in the distal intestinal epithelium (Van den Ingh et al., 1991;
Baeverfjord & Krogdahl, 1996; Buttle et al., 2001; Urán et al., 2008b; Sørensen et al., 2011),
along with reduced feed efficiency and weight gain (Olli et al., 1994; Rumsey et al., 1995;

Rapid screening of new dietary components
PAGE | 119
Bureau et al., 1998; Refstie et al., 1998, 2001; Krogdahl et al., 2003; Øverland et al., 2009)
the magnitude of which depends on the protein source, processing quality and level of
replacement. It has also been suggested that such antigen-related inflammation of the distal
intestinal, results in a distinct decrease in the brush border and mucosal enzyme activity
levels, and thereby may contribute to reduced protein retention and growth in fish (Bakke-
McKellep et al., 2000b; Krogdahl et al., 2003; Chikwati et al., 2013a). Other studies have
shown that the content of digestible energy in plant protein is lower than that of fish meal,
and since utilisation of the feed energy can be predicted from the content of digestible
energy, it is clear that substitution of fish meal with plant protein would reduce growth rates
and impair feed conversion ratios (Sanz et al., 1994; Aksnes & Opstvedt, 1998; Opstvedt et
al., 2003; Mundheim et al., 2004; Sørensen et al., 2011). The results of the present study
are in accordance with other studies on replacement of fish meal by soybean protein
concentrate, suggesting that the soybean protein could partially or totally substitute fish
meal, without resulting in a substantive negative effect on feed intake and growth
performance of the fish (Watanabe et al., 1993; Kaushik et al, 1995; De Francesco et al.,
2004; Kumar et al., 2011b). It was, however, obvious from the results obtained with Diet C
that supplementing fish feed with exogenous nucleotides and β-glucans did not exert the
positive effect on growth and feed efficiency that was anticipated. This contradicts published
studies involving other teleost species, in which enhanced growth performance and feed
uptake has been associated with dietary nucleotide supplementation (Ramadan et al., 1991;
Burrells et al., 2001; Li et al., 2007; Lin et al., 2009; Tahmasebi-Kohyani et al., 2011; Abtahi
et al., 2013; Kenari et al., 2013) and by administration of β-glucan (Cook et al., 2003;
Jaramillo & Gatlin, 2004; Misra et al., 2006). Nevertheless, the growth-promoting effect of
nucleotides and β-glucans has not always been observed (Efthimiou, 1996; Li et al., 2004,
2005; Whittington et al., 2005; Bagni et al., 2005; Kumari & Sahoo, 2006; Welker et al.,
2011). Disparities in the results may be due to observations of different fish species, genetic
backgrounds of strains, life stages, temperatures used, stocking densities and water quality

CHAPTER 3
PAGE | 120
amongst other environmental variables, feeding duration, dosages or even the type of
nucleotide and β-glucan supplemented (Li & Gatlin, 2006).
The results of the present study revealed that despite the fact that there were no
significant differences in growth of fish between the different dietary treatments, the feed
conversion rate remained lower with Diet B. It is difficult to pinpoint which factor(s) in the
dietary formulation adversely affected the salmon, although according to earlier studies it is
likely to have been phytosterols, oligosaccharides and / or soya-saponins in synergy with
one or more unidentified components that follow the same solubility pattern within the
soybean matrix (Knudsen et al., 2008; Iwashita et al., 2009; Krogdahl et al., 2010). On the
other hand, such factor(s) did not appear to be present, or were perhaps present at very low
levels in the soya protein concentrate used in Diets A and C, since the feed conversion
efficiency of fish fed the fish meal based and the immunostimulant diets was significantly
greater. Furthermore, fish body condition and relative liver weights showed no significant
differences between dietary treatments. The condition factor (K) and the hepatosomatic
index (HIS) are commonly used as indirect evidence of the physiological and energy status
of the fish in relation to its welfare (Bolger & Connolly, 1989). Values were similar across
control and experimental groups, the reason for which may have been that fish were
assimilating food efficiently, or, that the tested dietary levels did not affect the K and HIS
values. This is in agreement with results obtained for similar dietary products fed to
salmonids (Olli et al., 1994, 1995; Refstie et al., 1998), but in contrast to that found with
some other fish meal replacement studies (Refstie et al., 2001; Opstvedt et al., 2003;
Hemre et al., 2005; Morris et al., 2005) where HSI appeared to be affected by substitution of
fish meal. Presumably the inclusion of soybean containing ANF in the present experimental
diets was sufficiently low to still allow the detoxification system of the liver to cope efficiently
without impairing liver function. Again, the inconsistencies observed between different
studies may be due to inter-species variations, feeding duration, source of dietary
components or even the level of substitution.

Rapid screening of new dietary components
PAGE | 121
3.4.2. Haematology and blood biochemistry
Haematology and clinical chemistry analysis are an integral part of the methods elected
for examining the health status of the fish, and have a role in feeding trials when evaluating
the effects dietary components may have (Řehulka, 2002; Kopp et al., 2011; Rawling et al.,
2012; Kiron, 2012).
In this study, red blood cell indices (i.e. RBC count, Hct and Hb) did not differ
significantly among the different dietary groups. Consequently, MCV, MCH and MCHC
values remained unchanged, and were within the normal range for healthy Atlantic salmon
(Hardie et al., 1990; Sandnes et al., 1988; Fast et al., 2002; Sissener et al., 2009b),
demonstrating that erythropoietic elements were not affected by the dietary components.
Similarly, Burrells et al. (2001) reported no significant differences in RBC concentration for
Atlantic salmon fed a basal fish meal diet containing a nucleotide supplement. Welker et al.
(2011) and Jha et al. (2007) stated that nucleotide supplementation did not affect RBC, Hct
or Hb levels in channel catfish (Ictalurus punctatus) and catla catla (Cyprinus catla),
respectively. In the same vein, Del Rio-Zaragoza et al. (2011) established that Ht, RBC,
MCV and MCH were unaffected by the dietary levels of β-glucans they fed to fish.
Additionally, Kumar et al. (2010a) reported that SBM diets had no effect on RBC counts, Hct
or Hb concentrations. Whereas in other studies (Hemre et al., 2005; Kumar et al., 2010b),
significant increases in RBC counts, and consequently a reduction in MCV were observed
in SBM-fed groups, possibly linked to an inflammatory reaction due to the presence of ANFs
in soybeans that have an antigenic potential.
The fact that haematocrit levels were un-affected by the diets was anticipated, since it
is very unusual to observe differences amongst fish, except in cases of explicit disease or
extreme nutritional deprivation (Siwicki et al., 1994; Rumsey et al., 1995).
In the present study, leucocyte levels and the proportions of lymphocytes, granulocytes
thrombocytes and monocytes were not significantly affected by the different dietary
treatments. These values differed from values reported in the literature for WBC counts in
healthy salmonids (Sandnes et al., 1988). Fish fed either the SBM or the immunostimulant

CHAPTER 3
PAGE | 122
diets, had slightly more leucocytes than that of the fish fed the fish meal control diet,
although this was not significant. According to various authors (Rumsey et al., 1995) an
increase in the leucocyte count often indicates the beginning of an inflammatory response,
onset of a hypersensitivity reaction, or a response to the immunogen.
The leucocyte counts might have been enhanced due to the ANFs present in the SBM
(Sagstad et al., 2007; Rumsey et al., 1995). Likewise, the tendency towards elevated
lymphocytes levels in the blood from fish fed nucleotides and β-glucans (Leonardi et al.,
2003; Tahmasebi-Kohyani et al., 2011; Del Rio-Zaragoza et al., 2011; Kenari et al., 2013)
may be interpreted as a response of the cellular immune system to such stimulation.
Therefore, the haematological results reported here do not seem to support the findings of
other authors. i.e. a stimulatory effect on the haematological parameters by dietary β-
glucans and nucleotides and a negative effect by ANFs present in the SBM.
The activity of plasma lysozyme has been well documented for a variety of fish species
(Fange et al., 1976; Lie et al., 1989; Engstad et al., 1992). Recognised to be an opsonin,
and capable of activating the complement system and phagocytes, lysozyme contributes to
the innate immunity of animals through its bactericidal and anti-inflammatory properties
(Magnadóttir, 2006). Although not reflecting the values reported for salmonids by other
researchers (Hardie et al., 1990; Thompson et al., 1996; Fast et al., 2002), the results from
the current study show that the lysozyme activity was not statistically different between the
dietary groups. However, higher lysozyme activity was observed in fish fed the
immunostimulant diet (i.e. Diet C) when compared to the control fish meal diet and to the
one containing SBM. Considering the numerous studies that earlier demonstrate the
stimulating effect of glucans (Engstad et al., 1992; Matsuyama et al., 1992; Jørgensen et
al., 1993; De Baulny et al., 1996; Thompson et al., 1995; Paulsen et al., 2001, Bagni et al.,
2005; Paredes et al., 2013) and of dietary nucleotides (Sakai et al., 2001, Jha et al., 2007,
Kenari et al., 2013 and Peng et al., 2013) on lyzosyme activity, the apparent lack of
significant difference for such dietary group and the control treatment group is surprising.

Rapid screening of new dietary components
PAGE | 123
However, this may reflect the number of samples employed, rather than the lack of effect by
the immunostimulant ingredients.
In future feeding trials different dosages and feeding periods should be considered in
order to further dissect the findings of the present study.
The effect of unrefined dietary soybean proteins on the innate response of fish has
been recognised in accordance with previous studies (Burrells et al., 1999; Sitjà-Bobadilla
et al., 2005; Kokou et al., 2012), in which serum lysozyme did not vary significantly.
However, in other reports where SBM was fed to salmonids (Rumsey et al., 1994; Krogdahl
et al., 2000) increased lysozyme activity was reported, which may be interpreted as a
response to the inflammatory effects of plant proteins.
The concentration of total protein in blood is used as a basic index for health and
nutritional status in fish (Kumar et al., 2010b). Proteins such as albumin are important
compounds in the serum and are essential for maintaining a healthy immune system
(Kumar et al., 2005). Significantly lower blood protein levels were normally observed in
groups of fish with known nutritional deficiencies, increased catabolism in acute
inflammation, impaired protein metabolism in the liver, or during disease (Ingram &
Alexander, 1977; Bruno & Munro, 1986; Waagbø et al., 1988; Řehulka, 2002; Kumar et al.,
2010b). In turn, increase in the serum protein and albumin levels are thought to be
associated with a stronger innate response in fish (Jha et al., 2007; Kenari et al., 2013).
In the current study, biochemical parameters such as total protein and albumin content
were not statistically different between treatment groups, but were within the normal range
for protein concentrations found in the serum of salmonids (total protein: 3.3-80 g.L-1;
albumin: 18.3- 24.3 g.L-1; Alexander, 1977; Sandnes et al., 1988) indicating that fish were
apparently healthy and coping with the tested ingredients.
C-reactive protein (CRP) is an acute phase protein, the levels of which may increase in
response to acute infection or inflammatory stimulus. Upon cessation of the stimulus, CRP
levels are known to decline very rapidly. This has made CRP useful as a clinical marker of
the inflammatory process, and measurements of its concentration in serum could help

CHAPTER 3
PAGE | 124
differentiate inflammatory from non-inflammatory conditions (Lund & Olafsen, 1998; Liu et
al., 2004). The CRP levels reported the present study are the first report of CRP acute
phase protein profiles for Atlantic salmon fed soybean meal diets. The interaction between
β-glucan immunostimulants and this acute phase protein has, however, recently been
described by Pionnier et al. (2013) in common carp, where oral administration significantly
increased serum CRP levels up to 2-fold. Studies relating dietary nucleotides and CRP
profiles have not yet been conducted, however.
In this experimental trial, ‘normal’ CRP levels in serum from fish fed the control diet
ranged from 7.13-25.59 mg.L-1. These levels are 7 and 11 times lower than the serum CRP
concentration suggested for healthy Atlantic salmon (~50-300 μg.mL−1) or rainbow trout (83-
105 μg.mL−1) (Lund & Olafsen, 1999; Liu et al., 2004; Kodama et al., 2004). For other fish
species such as common carp (Cyprinus carpio), plaice (Pleuronectes platessa), snake
headed murrel (Channa punctatus), dogfish (Mustelus canis) and lumpsucker (Cyclopterus
lumpus), values were reported to range from 18 μg.mL−1, 55 μg.mL−1, 220 μg.mL−1, 400
μg.mL−1 to 2200 μg.mL−1 respectively (Fletcher et al., 1977; Pepys et al., 1982; Robey et al.,
1983; Mitra & Bhattacharya, 1992; Pionnier et al., 2013). Contrary to what was expected,
fish fed the control diet showed significantly higher CRP levels than those fed the SBM or
the functional diet. The apparent contradiction between serum CRP concentrations might be
explained by the fact that the levels of CRP could have reached an optimal / maximum
circulating concentration and thereafter, by the sampling point, the levels could have
decreased to regain homeostasis. Kodama et al. (2004) reported that exposure of rainbow
trout to anti-ectoparasite chemicals such as formalin and metriphonate was found to cause
a significant increase of CRP levels soon after exposure, but that levels in the treated fish
decreased afterwards to levels lower than those observed in unexposed fish. Another more
reasonable justification might be that different dietary stimulations led to different production
patterns of acute phase proteins in these fish (e.g. a reduction instead of an increase), as
some studies have previously suggested (Pionnier et al., 2013; Liu et al., 2004). For
instance, a decrease was observed in serum CRP levels in channel catfish I. punctatus

Rapid screening of new dietary components
PAGE | 125
during Saprolegnia sp. infection, meanwhile an increase in CRP values was induced by
turpentine injection in the same fish species (Szalai et al., 1994). It is clear that, although
molecular studies of salmonid acute-phase proteins exist (Murai et al., 1991; Jensen et al.,
1997; Lund & Olafsen, 1999), the kinetics of CRP production during inflammation still
require clarification.
Screening haematological parameters for assessing fish health in relation to dietary
changes has been found to be relatively non-specific (Blaxhall & Daisley, 1973; Sandnes et
al., 1988; Filho et al., 1992; Sissener et al., 2009a; Kopp et al., 2011). Individual
haematological variability is influenced by a number of exogenous and endogenous factors,
which must be considered when interpreting the results. Biochemical indices and their
fluctuation have been reported to be a result of variations in blood sampling and
biochemical assays, fish size, age, season, genetic strain, sexual maturation, nutritional
status, infectious disease, environment and stress (Sandnes et al., 1988). Analyses of this
kind should thus be rigorously standardised with respect to fish size, sampling procedures,
analytical methods and designation, in order to make comparisons between different
experimental studies possible (Sandnes et al., 1988; Filho et al., 1992). Nevertheless, for
this particular study it must be concluded that the modulatory effect of the functional
ingredients (i.e. β-glucans and nucleotides) did not substantially affect the blood profile of
experimental fish.
3.4.3. Respiratory burst and phagocytic activity assays
Generation of reactive oxygen intermediates in a process called ‘respiratory burst’, is
recognised as one of the most important early defence mechanisms in fish (Secombes,
1990; Sveinbjørnsson & Seljelid, 1994; Castro et al., 2004; Lundén et al., 2002; Chettri et
al., 2010). This metabolic event plays a crucial role in pathogen eradication, but has also
been shown to be involved in tissue regeneration (Vera-Jimenez et al., 2013).
Consequently, it can be employed to monitor health status in fish and even the efficacy of
distinct dietary ingredients. The respiratory burst activity of fish phagocytes can be
modulated by dietary substances such as functional ingredients (Engstad et al., 1992;
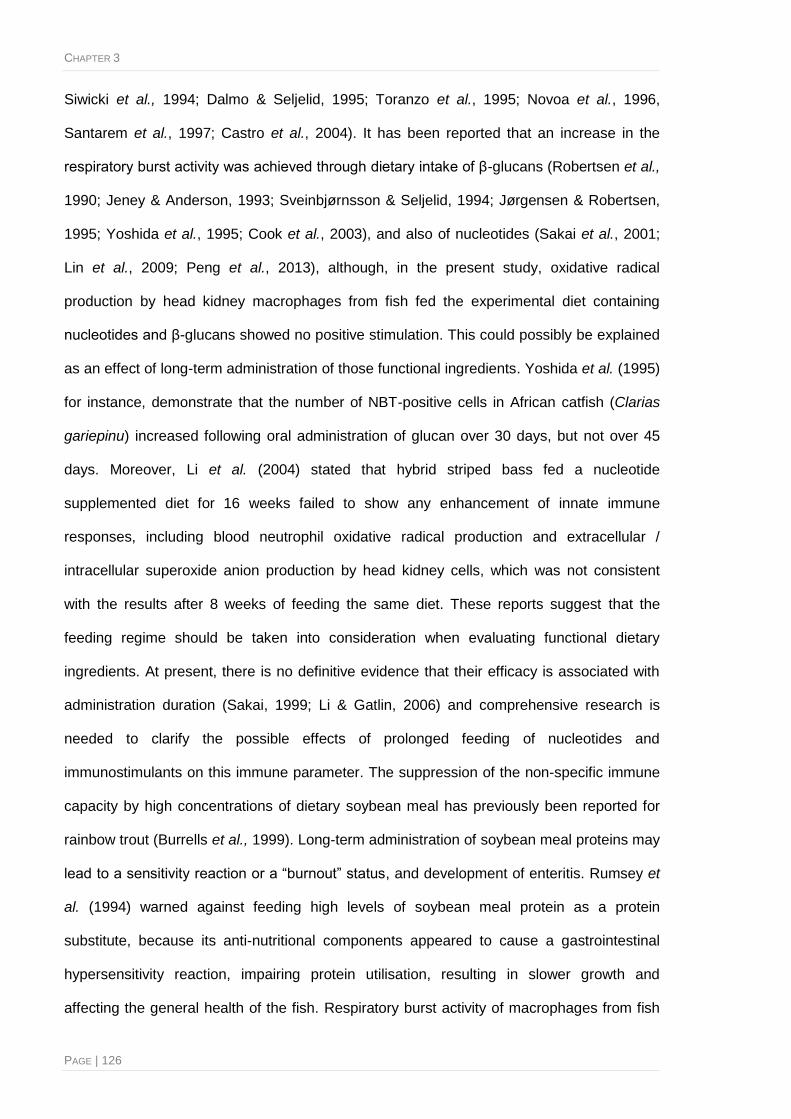
CHAPTER 3
PAGE | 126
Siwicki et al., 1994; Dalmo & Seljelid, 1995; Toranzo et al., 1995; Novoa et al., 1996,
Santarem et al., 1997; Castro et al., 2004). It has been reported that an increase in the
respiratory burst activity was achieved through dietary intake of β-glucans (Robertsen et al.,
1990; Jeney & Anderson, 1993; Sveinbjørnsson & Seljelid, 1994; Jørgensen & Robertsen,
1995; Yoshida et al., 1995; Cook et al., 2003), and also of nucleotides (Sakai et al., 2001;
Lin et al., 2009; Peng et al., 2013), although, in the present study, oxidative radical
production by head kidney macrophages from fish fed the experimental diet containing
nucleotides and β-glucans showed no positive stimulation. This could possibly be explained
as an effect of long-term administration of those functional ingredients. Yoshida et al. (1995)
for instance, demonstrate that the number of NBT-positive cells in African catfish (Clarias
gariepinu) increased following oral administration of glucan over 30 days, but not over 45
days. Moreover, Li et al. (2004) stated that hybrid striped bass fed a nucleotide
supplemented diet for 16 weeks failed to show any enhancement of innate immune
responses, including blood neutrophil oxidative radical production and extracellular /
intracellular superoxide anion production by head kidney cells, which was not consistent
with the results after 8 weeks of feeding the same diet. These reports suggest that the
feeding regime should be taken into consideration when evaluating functional dietary
ingredients. At present, there is no definitive evidence that their efficacy is associated with
administration duration (Sakai, 1999; Li & Gatlin, 2006) and comprehensive research is
needed to clarify the possible effects of prolonged feeding of nucleotides and
immunostimulants on this immune parameter. The suppression of the non-specific immune
capacity by high concentrations of dietary soybean meal has previously been reported for
rainbow trout (Burrells et al., 1999). Long-term administration of soybean meal proteins may
lead to a sensitivity reaction or a “burnout” status, and development of enteritis. Rumsey et
al. (1994) warned against feeding high levels of soybean meal protein as a protein
substitute, because its anti-nutritional components appeared to cause a gastrointestinal
hypersensitivity reaction, impairing protein utilisation, resulting in slower growth and
affecting the general health of the fish. Respiratory burst activity of macrophages from fish

Rapid screening of new dietary components
PAGE | 127
fed the SBM diet, although not significantly different, appeared slightly inhibited. It should be
noted that previous studies were carried out under different experimental conditions so the
present results are not directly comparable.
Phagocytosis (i.e. engulfing and ingestion of bacteria or other foreign bodies by
phagocytes) is also recognised as one of the main mediators of the host’s innate immune
defences against microorganisms, and the effect of the different dietary components on
normal phagocytic activity of macrophage cells is a useful indicator for assessing the effect
of dietary components on fish health (Bennani et al., 1995).
Dietary β-glucans and nucleotides have proven protective in some teleost fish by
enhancing phagocytic activities based on the number of bacteria engulfed and killed per cell
(Chen & Ainsworth, 1992; Matsuyama et al., 1992; Sakai et al., 2001). Rumsey et al. (1995)
also stated that phagocytic activity was higher in soya-fed fish, possibly indicating an
inflammatory or hypersensitivity response. However, in the present study this seemed not to
have been the case. There were no major or significant differences in the phagocytic
activities (i.e. phagocytic index, activity and capacity) between the different dietary groups,
indicating that the killing ability of the phagocytic cells was not greatly influenced by the
composition of the diets. Nonetheless, when comparing results from these assays a range
of different factors should be considered e.g. the temperature range, cell concentrations,
variety of stimulating or inhibiting agents, different concentrations and exposure times, etc.
(Kokou et al., 2012).
3.4.4. Image analysis performance
Image analysis of digitised histological sections provides a practical means for
quantifiable assessment of structural and functional changes in tissues, being both objective
and reproducible. The image analysis work described in this chapter sought to examine the
utility of the developed advanced image analysis tool in helping to characterise and quantify
feed-associated features of the intestinal morphology / histology of Atlantic salmon.
Histological analysis of the fish’s digestive system is considered a good indicator of the
health status of the animal (Krogdahl & Bakke-Mckellep, 2005; Rašković et al., 2011).

CHAPTER 3
PAGE | 128
The method employed in this work comprised a succession of interactive and automated
image segmentation steps (as described in detail in Chapter 2 – Technical Note A1, and
partly illustrated in Figure 3.1). The protocol allows the operator to interact during the workflow
to amend preceding automated decisions, adding to the precision of the final outcome.
Furthermore, the processing time required for each histological image frame was roughly ~25
min (i.e. accounting for 23 distinct parameters being assessed), which greatly improved the
efficiency of conducting such an analysis with respect to a more subjective semi-quantitative
scoring classification, which took around 15-18 min to assess semi-quantitatively only 4
parameters. Tests of the robustness of the proposed algorithms are detailed in Chapters 2
and 4.
Overall, the results indicate that this tool can be used to assist pathologists in quantifying
feed-associated histological changes in intestinal samples. Besides being both rapid and
practical, this approach has been shown to be very accurate, suitable for handling large data
sets and able to deal with a broad set of morphometric features in a highly reproducible
manner. Moreover, it is important to mention the utility of systems such as this, in helping train
pathologists and others to identify particular aspects of change. Since the image analysis
system will highlight particular differences, the user may then look at the original tissue
sections themselves to see if differences are discernible.
3.4.5. Quantitative variables from image analysis
Accurate quantification of morphometric parameters associated with conventional
histology could be a useful addition to haematological and growth data for evaluating the
effect of different dietary components on the overall health status of fish (Rašković et al,
2011). When deciding on morphometric parameters, it is necessary to select a set of features
that best describe the relevant intestinal morphological changes (Figure 3.8). The selection
made here was based on a review of relevant literature relating to morphological parameters
characteristic of inflamed intestinal mucosae (Van den Ingh et al., 1991, 1996; Refstie et al.,
2000; Buttle et al., 2001), and also through appraisal of the parameters used in well-accepted

Rapid screening of new dietary components
PAGE | 129
semi-quantitative scoring systems to assess the degree of enteritis in salmonids (Morris et al.,
2005; Urán, 2008; Penn et al., 2011; Romarheim et al., 2013b).
Based on widely available image analysis tools for histology, researchers have
included other geometrical features (i.e. fractal dimensions, circularity index, Feret
and elliptical lengths) that could perhaps correlate to, and better explain the visual
disparities between different histopathological gradings. For the present study, a
large set of morphometric parameters was selected with a view to incorporating a
range of relevant features, which would provide the necessary information that
expert histopathologists would ordinarily process during histological evaluation of
intestinal sections. Some of the features selected were observed to be redundant or
irrelevant for analysis of the states provided by the specific experiments undertaken
but could nevertheless prove valuable in describing / characterising other intestinal
states.
No significant individual morphological changes were observed in the distal intestine of
fish fed any of the dietary treatments, except for those fed the SBM. As predicted, the
inclusion levels of dietary unrefined soybean meal lead to an inflammatory response in the
distal intestine. Morphological changes were consistent with previously described soy
induced enteritis (Baeverfjord & Krogdahl, 1996; Bakke-McKellep et al., 2007b; inter alia).
Fish fed the SBM diet had a shortening of the mucosal folds, and a widening of the central
stroma within the mucosal folds. An increase of the connective tissue between the base of
the mucosal folds and the stratum compactum was also observed, explained here by
parameters FR and P / MTA lower values. This was not surprising, since shorter and wider
mucosal folds would appear stumpier, and accordingly the luminal surface appeared less
intricate. Additionally, with an increase of the lamina propria and connective tissue, the total
mucosal tissue area (MTA) was seen to increase and consequently the P / MTA ratio
decreased. Even though there were no significant differences between dietary groups,
subtle differences in vacuolisation of the absorptive enterocytes from the intestinal

CHAPTER 3
PAGE | 130
epithelium were noted. Fish fed the SBM appeared to have slightly less enterocyte
vacuolisation (VC / MTA), which agress with the evidence provided by several authors
(Bakke-McKellep et al., 2000a; Nordrum et al., 2000a; Krogdahl et al., 2003; Krogdahl &
Bakke-McKellep, 2005). More recently, Urán et al. (2009b) stated that in salmonids, higher
inclusion levels of dietary SBM causes a marked endocytosis decrease, resulting in the
absence of small vesicles that would customarily fuse into the enterocytes’ supranuclear
vacuoles.
Fish fed the fish meal base diet, appeared to have slightly larger mucous cells (MMCA).
Although, tangential sectioning can sometimes lead to an inaccurate assessment of cell
size, all tissues were cut in the same orientation and should therefore give equivalent
sections. The results suggest that in fish fed with the SBM and the combination of dietary
nucleotides and β-glucans, immunostimulant peptides and other inflammatory mediators
might affect the rate of mucus release or pre-release storage volume, resulting in some
mucous cells having smaller sectional areas. A further possibility could be the triggering of a
more rapid cell turn-over, whereby immature replacement mucous cells might be smaller in
size.
Overall, the morphological changes associated with the functional ingredients, are less
extensive than those seen in fish fed the soybean meal diet, and appear largely
undistinguishable from normal intestinal morphology. This is in contrast to the report by
Peng et al. (2013), who observed that supplementation of nucleotides significantly
increased the distal intestine’s fold height, enterocyte height and microvillus height when
compared to control diets. Similarly, Burrells et al. (2001) and Cheng et al. (2011) reported
that dietary nucleotides significantly enhanced the lateral branching of the intestinal folds,
which could lead to an increase in total intestinal surface area, and improved intestinal
structure.
In this study, the use of FR and P / MTA as parameters to describe the development of
intestinal pathology proved helpful and was able to distinguish between “normal” and
enteritis-affected mucosa. However, it was not possible to distinguish between fish meal-fed

Rapid screening of new dietary components
PAGE | 131
and immunostimulant-fed fish on the basis of these parameters alone. In accordance with
earlier studies (Baeverfjord & Krogdahl, 1996; Urán et al., 2008b), the thickness of the
stratum compactum, the number and dispersion of eosinophilic granule cells, the height and
appearance of the mucosal folds could be valuable markers to assess in future studies, to
identify which fish suffered from nutrition-induced intestinal morphological changes.
As observed by Baeverfjord & Krogdahl (1996), the assessment of individual
parameters is insufficient to describe numerically the variation in cell types and tissue
structure. We, therefore, aimed to evaluate the capacity for synergy between a variety of
distinct histological features to provide resolution of states. It was possible to reduce the
number of required classification features based on a multivariate principal component
analysis, from 10 to 5 parameters, with the most informative being MC Feret Ratio, MC
Ellipse Ratio, MCA / [MTA-Vac], FR and MTA / STA. These appeared to be sufficient to
reliably differentiate between histological states. On the other hand, a discriminant analysis
determining features of importance revealed that P / MTA, MCA / [MTA-Vac], FR and MTA /
STA were capable of discriminating between tissue patterns and could be extended to
screening of nutritional dietary components. The overall accuracy of such a multivariate
model in identifying histological grades of Diets A, B and C was 61.1 %, 42 % and 59 %
respectively. To increase the overall efficiency of the system, use of larger sample numbers
and further refinement of the algorithms are required, possibly with the inclusion of
additional morphological features. Also, it is important to note that that the most meaningful
parameters identified in the present work might be best for examination of the histological
grades described in this study, but not for others.
3.5. General conclusions
Feeding Atlantic salmon a high inclusion level of unrefined SBM (25 %) or a diet
containing β-glucans and extraneous nucleotides as functional ingredients, caused no
apparent differences in growth performance, body and liver condition, feed efficiency or
haematological parameters (i.e. differential leucocyte counts, red blood cells, percentage
and haemoglobin, haematological corpuscular volumes and concentrations, plasma

CHAPTER 3
PAGE | 132
lysozyme, albumin and total protein level). However, dietary inclusion of soybean meal
produced an inflammatory response in the distal intestine as previously described by other
authors. No other individual diet-related haematological differences were detected, nor were
there any differences in the functional immunological parameters measured (i.e. respiratory
burst and phagocytosis assay for head kidney isolated macrophages). The model feed trial
employed therefore successfully generated differentiable states, although these were not,
for the most part, systemically differentiable through the majority of procedures used, being
only detectable morphologically.
Quantitation of morphometric parameters associated with histological sections using
the newly developed image analysis tool successfully allowed identification of major
morphological changes occurring in the distal intestine as a result of feeding different
dietary components. Image analysis has thus been shown to provide a powerful tool for
describing the histomorphological structure of Atlantic salmon distal intestine. In turn, the
semi-automated image analysis methods presented here are able to distinguish normal
intestinal mucosa from those affected by enteritis with a fair amount of accuracy. While
individual parameters were less discriminatory, use of multivariate techniques allowed
better discrimination of states and is likely to prove the most productive approach in further
studies. Furthermore, although the overall efficiency of the imaging system was somewhat
limited by statistical power (i.e. the limited number of samples that were investigated), the
most suitable classification features to be validated further were highlighted (e.g. P / MTA,
MCA / [MTA-Vac], FR and MTA / STA). Nonetheless, the inclusion of additional
morphometric features in future histological assessments might prove productive in better
resolving differences between states.


4. CHAPTER 4
4. HISTOLOGICAL EVALUATION OF ENTERITIS IN ATLANTIC
SALMON: QUANTITATIVE IMAGE ANALYSIS VS SEMI-
QUANTITATIVE SCORES
4.1. Introduction
Finding alternative sources of protein to replace fish meal in fish feeds is crucial to
maintaining a sustainable global aquaculture industry (Tacon, 2008). Protein derived from
plants provides an alternative source of protein to fish meal, however most plant protein
sources contain a variety of anti-nutritional substances (ANFs) capable of affecting the
intestinal integrity of fish, which in turn can lead to decreased nutrient digestibility and
growth performance (Krogdahl et al., 1994; Francis et al., 2001; Waagbø et al., 2013).
Thus, it is important to consider the effects that new dietary ingredients can have on the
fish’s intestinal health, when evaluating new dietary ingredients for the aquaculture feed
market.
Various parameters have been used to evaluate the effect of dietary modulation on the
physiological health of teleosts, nevertheless, the gold standard for this has been
histopathological examination of intestinal tissue. Histological evaluation of gut enteritis is
normally carried out as a qualitative assessment, whereby typical changes in response to
plant-derived protein are described and include: shortening of the mucosal folds, infiltration
of inflammatory cells in the lamina propria, widening of the central stroma within the
mucosal folding, increase in the thickness of the connective tissue and loss of supranuclear
vacuolisation of the absorptive cells in the intestinal epithelium. Alternatively, semi-
quantitative histopathology, a subjective multi-grade scoring system based on the
parameters described above has also been used for assessment of dietary components
(Morris et al., 2005; Baeverfjord & Krogdahl, 1996; Knudsen et al., 2008; Urán et al., 2008b;
Penn et al., 2011; Laporte & Trushenski, 2012).

CHAPTER 4
PAGE | 136
As a tool regularly used to evaluate intestinal morphology and histopathology, semi-
quantitative assessment is a relatively rapid and easy to use method for examining the
extent of histo-morphological changes within tissue sections. However, some authors
consider this approach to be “arbitrary” and “open to subjective interpretation” (Wright et al.,
2003; Krenacs et al., 2010; Kopec et al., 2011). On the other hand, conventional visual
assessment can be time-consuming, fastidious and prone to misinterpretation (Kopec et al.,
2011; Shi et al., 2012).
Semi-quantitative assessment has proven useful for correlating dietary modulation with
the degree of enteritis and / or intestinal morphological changes that occur as a result of
feeding inappropriate dietary ingredients (Knudsen et al., 2008; Urán et al., 2009a; Marjara
et al., 2012; Penn et al., 2011; Chikwati et al., 2013a; Romarheim et al., 2013a), however, it
is prone to the subjective interpretation of observers and does limit the comparison between
different studies. Also it can be difficult to assess subtle changes relating to the enteritis as
a result of feeding novel dietary ingredients, and to analyse the scalar data obtained from
the scoring system statistically (True, 1996; Hamilton & Allen, 2005, Turlin et al., 2009).
Image analysis of digitised histological sections has the potential to provide a practical
means for quantifiable assessment of structural changes in tissues, being both objective
and reproducible with a reasonable speed of execution (He et al., 2012; Webster et al.,
2012). A method to assess the intestinal morphology of Atlantic salmon, based on
advanced image analysis was described in Chapters 2 and 3. This automated image,
analysis system has proven to be a valuable tool for measuring and characterising a range
of features in intestinal tissue sections in a quantitative manner. Such an approach not only
allows comparative analysis of samples to be carried out between different observers, but it
has also been shown to be both accurate and suited for large-scale application.
It is necessary, however, to validate the semi-automated image analysis system to
establish that it is measuring the parameters it is purported to be measuring, and to provide
reassurance that it can reliably measure pre-determined features. Although the accuracy of
the validation technique per se may influence the apparent accuracy of the assessment

Quantitative image analysis VS Semi-quantitative scores
PAGE | 137
technique, it has been recognised that the best way to confirm the validity of a new method
is to compare the results obtained with those from a well-established method (Pilette et al.,
1998; Ricketts et al., 1998). Thus, the aim of work reported in this chapter was to evaluate
the reliability and agreement of our quantitative microscopic image analysis system with that
of an established semi-quantitative histological grading system, by examining their ability to
evaluate the severity of enteritis in Atlantic salmon intestine, using the same set of
histological slides.
4.2. Materials and methods
4.2.1. Fish and rearing conditions
The original feeding trial upon which this study is based was carried out by researchers
Knudsen D. and Koppe W.8 at Skretting’s Fish Trial Station (Lerang, Jørpeland, Norway).
Post-smolt Atlantic salmon (Salmo salar L.), with an initial mean body weight of 80 g ± 2, were
randomly allocated into twelve flow-through 400 L circular tanks at a stocking density of
seventy fish per treatment tank. The tanks were maintained under a 24 h light photoperiod
and continuously supplied with seawater (15 L.min-1 per tank) pumped from 90 m depth in the
adjacent fjord. The inlet water had a salinity of ~34 mg.mL-1 and an oxygen concentration of
~9 mg.mL-1, and was held at a temperature between 8.5 ˚C and 8.7 ˚C. Individual tanks were
equipped with waste feed collectors and uneaten feed was collected twice daily.
4.2.2. Diets and feeding regime
Four isoenergetic experimental diets comprising either a fish meal based control diet
(Fish meal), a diet containing 25 % lupin kernel meal (Lupins), another diet based on 25 %
lupin kernel meal with inclusion of 1.7 g.Kg-1 soya saponin concentrate (Lupins+SSC) or a
diet containing 25 % defatted soybean meal (SBM) were formulated. The diet formulations
8 The original feeding trial was designed for the purpose of a separate study, being partially described in the peer
reviewed article: KNUDSEN, D., JUTFELT, F., SUNDH, H., SUNDELL, K., KOPPE, W. and FRØKIÆR, H., 2008.
Dietary soya saponins increase gut permeability and play a key role in the onset of soyabean-induced enteritis in
Atlantic salmon (Salmo salar L.). British Journal of Nutrition, 100(1), pp. 120-129.

CHAPTER 4
PAGE | 138
and background information on the different commercial sources of the various dietary
components is shown in Table 4.1.
The feeds were produced at Skretting’s Feed Technology Plant (Stavanger, Norway) as 3
mm pellets using a pre-conditioner (DDC; Wenger Manufacturing, Inc., Kansas City, MO, USA)
coupled to a twin-screw extruder (TX57; Wenger Manufacturing, Inc.). The resulting extruded
pellets were then left to dry for 25 min in a single belt dryer supplied with warm air (75 °C) and
finally, under reduced pressure at 60 °C, the dried pellets were coated with fish oil.
Table 4.1. Formulation and proximate chemical composition of the feeds used in this experimental
study.
Diet A Diet B Diet C Diet D
(Fish meal) (Lupins) (Lupins + SSC) (SBM)
Feed ingredients (g.kg-1
)
Fish meal* 620.9 483.5 483.5 456.6
Lupin† 0.0 250.0 250.0 0.0
Soybean meal‡ 0.0 0.0 0.0 250.00
Soya saponin concentrate§ 0.0 0.0 1.7 0.0
Soya saponins║ 0.0 0.03 1.07 1.77
Wheat 80.0 80.0 78.3 80.0
Wheat starch 139.9 158.1 137.2 137.2
Minerals and vitamins¶ 3.5 3.5 3.5 3.5
Pigment** 0.5 0.5 0.5 0.5
Fish oil†† 155.2 182.5 182.5 209.4
Chemical composition (% of dry weight)
Crude protein 454.0 455.0 444.0 467.0
Crude fat 228.0 291.0 283.0 264.0
Ash 91.0 80.0 77.0 84.0
Moisture content 916 969.0 956.0 945.0
N-free extract 133.0 134.0 142.0 118.0
Gross energy (MJ.kg-1
) ‡‡
22.1 24.5 24.1 23.5
Footnotes:
SSC, soya saponin concentrate; SBM, soybean meal.
* Scandinavian Fish meal LT (Norsildmel, Fyllingsdalen, Norway).
† Lupin kernel meal from sweet lupins (Lupinus angustifolius; Agracorp, West Perth, Western Australia).
‡ Defatted soybean meal (Denofa, Fredriskstad, Norway).
§ Soya saponin concentrate, 69 % purity (Organic Technologies, OH, USA).
║Total level of soya saponins calculated based on the soya saponin analysis of dehulled lupins, defatted soybean
meal and soya saponin concentrate (see Knudsen et al., 2008 for detailed description).
¶ Mineral and vitamin premix to meet the National Research Council recommendations (NCR, 1993).
** Carophyll Pink (DSM Nutritional Products, Basel, Switzerland).
†† South American oil containing 30 % SFA of total fatty acids.
‡‡ Calculated by using physiological fuel values of 24, 39 and 17 KJ.g-1 for protein, fat and carbohydrate,
respectively, according to Jobling (1994).
Fish were acclimated for a 2 week period, during which time they were maintained on the
fish meal based diet. Thereafter, the four different experimental diets were randomly assigned

Quantitative image analysis VS Semi-quantitative scores
PAGE | 139
to triplicate tanks and the salmon fed during a 53-day experimental period. The diets were
fed twice a day using automatic feeders. The amount of feed given was adjusted in
accordance with biomass, thus aiming to overfeed by 20 %. Uneaten feed was collected,
separated from faeces and quantified by weight after drying for 12-16 h at 90 ˚C.
4.2.3. Feed composition
The chemical composition of the different experimental diets was determined using
standard techniques for proximate analysis. Analysis was performed on triplicate feed
samples of each diet. Crude protein content was determined by the Kjeldahl nitrogen
analysis method, using a Kjeltec Auto Sampler System (Tecator AB, Hoganas, Sweden) in
accordance with the Nordic Committee on Food Analysis – NMKL, method no. 6, 4th
edition, 2003. To convert total nitrogen to total protein content as a percentage of dry
weight, the factor 6.25 was implemented. Crude fat was measured by acid hydrolysis using
a Soxtec 2050 extraction system (Foss Analytical, Hillerod, Denmark) following the NMKL,
method no. 160, 1998. Moisture content was determined gravimetrically after thermal drying
to constant weight in an oven at 102-105 ˚C for 16 to 18 h. Ash was measured by burning
the samples at 550 ˚C for another 16 to 18 h. Gross energy was calculated according to
Jobling (1994), using physiological fuel values of 24, 39 and 17 KJ.g-1 for protein, fat and
carbohydrate, respectively.
4.2.4. Sampling procedure
At the end of the experimental period, after having fed the experimental diets for 53-
days, the fish were starved (i.e. 24 h prior to sampling) and five fish per experimental tank
randomly selected and euthanised with an overdose of anaesthetic (50 mg.L-1, MS-222,
Tricaine Methanesulphonate, Argent Chemical Laboratories, Redmount, WA, USA).
Intestinal sections from the distal region were then carefully excised from the fish. Rings of
at least 2 cm in length were cut open longitudinally and fixed in phosphate-buffered
formaldehyde (4 %, pH 7.2) at room temperature (16-20 °C), for at least 24 h before further
histological processing.

CHAPTER 4
PAGE | 140
4.2.5. Histological staining and evaluation
Similar to section 3.2.8, formalin-fixed intestinal samples were then dehydrated and
embedded in paraffin, following conventional histological procedures (Bancroft & Stevens,
1982). Transverse sections of 3 µm thickness were cut (Leica RM 2035, Leica Microsystems
Ltd., UK) and mounted on glass slides. For each fish sample, one histological slide was
prepared. After de-waxing, sections were stained with a combination of haematoxylin-eosin and
Alcian blue (8 GX, pH 2.5; Steedman, 1950; Lev & Spicer, 1964) – see Appendix 1 for modified
staining protocol.
4.2.5.1. Semi-quantitative scoring histological assessment. The histological sections
were randomised and evaluated blindly using light microscopy (Leica DM 5000B; Leica
Microsystems GmbH, Wetzlar, Germany) according to the semi-quantitative method
described by Knudsen et al. (2008), which assesses the degree of soybean meal induced
enteritis in the distal intestine of Atlantic salmon in accordance with the following criteria: (1)
the presence and size of supranuclear vacuoles; (2) the degree of widening of the lamina
propria from simple mucosal folds; (3) the thickness of the connective tissue between the
base of the mucosal folds and the stratum compactum; (4) the appearance and length of
the mucosal folds. Each of these parameters was scored on a scale from 1 to 5, including
half values between categories. A score of ‘1-2’ represented normal morphology, a score of
‘3’ was given to distinct morphological signs of inflammation, while a score of ‘5’ was given
to very severe symptoms of enteritis. Finally, an overall description score was calculated for
each individual fish, as the mean score across the four parameters scored. A detailed
description of the histomorphological appearance criteria for each parameter and for the
different scoring values is given in Table 4.2.
4.2.5.2. Quantitative image analysis histological assessment. The same slides
produced for the analysis described in the previous section, were then scanned using an
automated slide-scanning system (MIRAX Desk, Carl Zeiss MicroImaging GmbH,
Göttingen, Germany) and a digitised MRXS image of the complete section stored at a final
magnification of 20×. MIRAX Viewer software (Version 1.12, 3DHISTECH, Budapest,

Quantitative image analysis VS Semi-quantitative scores
PAGE | 141
Hungary) was used for visualisation and cropping of the images. For each slide, two
microscope fields were randomly selected and cropping performed at 60× magnification. A
frame of 9.96 Mpixels was then used to crop the sections. Twenty-four bit digital images
were extracted as individual TIFF images (1:4 magnification, 2048 × 2048 pixels tile size,
3570 × 2790 pixels image size) and saved at a file size of 72 MB with a quality setting of
0.23 microns per pixel. Thereafter, using IrfanView (Version 4.33, Wiener Neustadt, Austria)
batch converter, all uncompressed bitmap tiled TIFF images were converted into untiled
TIFF files with sizes ranging from 36.7 MB.
Table 4.2. Semi-quantitative scoring system according to Knudsen et al. (2008), using different
parameters to assess the degree of histomorphological changes induced by soybean meal in the
distal intestine of Atlantic salmon.
Score Descriptive parameter
Supranuclear vacuoles (Vac)
1 Large vacuoles occupy almost the entire apical part of the enterocytes
2 Medium-sized vacuoles occupy less than half of the enterocytes
3 Small vacuoles are present near the apical membrane in most enterocytes
4 Scattered small vacuoles are still present in some enterocytes
5 No supranuclear vacuoles seem to be present
Lamina propria (LP)
1 Lamina propria is a very thin and delicate core of connective tissue
2 Lamina propria appears slightly more distinct in some of the folds
3 Lamina propria was markedly increased in most of the folds
4 Lamina propria is thick in many folds
5 Lamina propria is very thick in many folds
Connective tissue (CT)
1 Almost no connective tissue between the base of the folds and the stratum compactum
2 Slightly increased amount of connective tissue beneath some of the mucosal folds
3 Clear increase of the connective tissue beneath most of the mucosal folds
4 Thick layer of connective tissue beneath many folds
5 Extremely thick layer of connective tissue beneath some folds
Mucosal folds (MF)
1 Simple and complex folds appear long and thin
2 Simple folds have medium length, while the complex folds appear thicker
3 Simple folds have short to medium length, while the side branches on the complex folds are stubby
4 Simple folds are thick and short, while thick and stubby complex folds are prevalent
5 Both complex and simple folds appear very short and stubby
Cropped randomised images were then evaluated blindly. To automatically quantify the
morphological features described in Table 4.3, several image processing algorithms that have
been brought together in one image analysis application, named “Gut Image Processing &

CHAPTER 4
PAGE | 142
Analysis (GUT-ImA)” were employed (see Chapter 2 and Appendixes A1-A2 for a detailed
description of its development and deployment). Figure 4.1 illustrates the main components of
the application, which were implemented in four three phases: 1) acquisition and pre-
processing of the digital image, 2) processing and segmentation of the pre-processed image, 3)
analysis of the processed image by identification of the regions of interest, feature extraction
and measurement of the morphometric parameters. As described earlier, image processing
and computer operations were performed on a personal computer (Dell Latitude™ D630, Intel
Pentium II 350 MHz processor, 128 MB RAM, 2 GB hard disk, under the environment of
Microsoft™ Windows XP) operating the stand-alone KSRun software platform (Version 3.0,
Carl Zeiss Vision GmbH, München-Hallbergmoos, Germany), through which the original
developed algorithms were implemented. Succinctly, after a background correction of the
irregularities found in the source image, the corrected image was normalised (i.e. by expansion
of its grey level histogram to the full range of available levels) and a binary image created. By
inverting the image to a negative image (black to white and vice versa) and through intensity
differentiation, proper segmentation of the peritoneal edge of the muscularis externa and the
internal intestinal lumen was possible. Then, to discriminate between the mucosal and
submucosal tissues, the stratum compactum was interactively identified by manually drawing a
line over the displayed tissue image. Subsequently, through interactive selection, four individual
simple-mucosal folds were randomly chosen and isolated from the remaining mucosal folds.
The total and partial luminal perimeters were then captured, and the level of convolution
measured using the fractal box-counting method (Russell et al., 1980; Cross, 1994; Shang et
al., 2000; Brooker, 2007). Thereafter, by using the original digitised images, an interactively
defined HLS colour threshold was set for detection of areas specifically stained by Alcian blue,
and consequent identification of objects as mucous cells was conducted. Subsequently, to
separate adjoining mucous cells, binary grain recognition operations were applied and to
ensure removal of artefacts the resulting objects were filtered using size-threshold-operators
(i.e. removal of objects smaller or much larger than the usual size range of mucous cells). The
source image was then converted to a greyscale from which mucosal tissue vacuoles could be

Quantitative image analysis VS Semi-quantitative scores
PAGE | 143
visualised. Finally, the thresholded regions of interest were segmented and automatically
processed by a sequence of mathematical algorithms, extracting several morphometric
measurements (Table 4.3). Values for these were then transcribed and exported to a flat
database file. Quantitative variables were expressed as mean and standard deviations (SD),
unless otherwise specified.
Table 4.3. List of measured morphological parameters and computed morphometric ratios used in
the quantitative image analysis approach.
Morphometric feature Description
MTA Mucosal tissue area
MCA Mucous cell total area
MMCA Mean mucous cell area
MCA / MTA Ratio between the mucous cell area and the mucosal tissue area
MCN Mucous cell number
MCN / MTA Ratio between the mucous cell number and the mucosal tissue area
STA Submucosal tissue area
MTA / STA Ratio between the mucosal tissue area and the submucosal tissue area
MC Feret Min Mucous cell minimum Feret length
MC Feret Max Mucous cell maximum Feret length
MC Feret Ratio Ratio of the mucous cell Feret lengths
MC Ellipse Af Length of the main axis of an ellipse with the same geometric moment
of inertia as the mucous cell
MC Ellipse Bf Length of the secondary axis of an ellipse with the same geometric
moment of inertia as the mucous cell
MC Ellipse Ratio Ratio of the elliptical lengths Af and Bf for the mucous cell
P / MTA Ratio between total perimeter length of the luminal surface and
mucosal tissue area
VC / MTA Ratio between the total vacuolisation area and the mucosal tissue area
MTA-Vac MTA without the vacuolisation area
MCA / [MTA-Vac] Ratio between mucous cell total area and the MTA without the
vacuolisation area
MCN / [MTA-Vac] Ratio between mucous cell number and the MTA without the
vacuolisation area
FR Fractal dimension of the perimeter line from the luminal surface
CT Thickness of the connective tissue between the base of the mucosal
folds and the stratum compactum
MF Area Total mean area of four simple mucosal folds
MF Perimeter Total mean perimeter length of four simple mucosal folds
MF Feret Min Minimum Feret lengths mean of four simple mucosal folds
MF Feret Max Maximum Feret lengths mean of four simple mucosal folds
MF Feret Ratio Mean ratio of the Feret lengths of four simple mucosal folds
MF Ellipse Af Mean length of the main axis of the ellipses with the same geometric
moment of inertia as four of the simple mucosal folds
MF Ellipse Bf Mean length of the secondary axis of the ellipses with the same
geometric moment of inertia as the four of the simple mucosal folds
MF Ellipse Ratio Mean ratio of the elliptical lengths Af and Bf for four simple mucosal folds

CHAPTER 4
PAGE | 144
Figure 4.1. Chart of the main components involved in image analysis
of the distal intestine morphometrics of Atlantic salmon. (Phase I)
Acquisition and pre-processing of the digital image. (Phase II)
Processing and segmentation of the pre-processed image. (Phase
III) Analysis of the processed image by identification of the regions of
interest, feature extraction and measurement of the morphometric
parameters. (ROI) region of interest.
4.2.6. Statistical analysis
4.2.6.1. Semi-quantitative histological data. The histological scoring results were
treated as non-parametric data. Kruskal-Wallis one-way ANOVAs were therefore applied to
test for equality of treatment means. A Student-Newman-Keuls multiple comparisons test
with mean ranks, was then used as a post-hoc test to compare all pairs of mean ranks.
Group differences were regarded as significant when the probability of each significance
test was less than 5 % (p < 0.05). These statistical analyses were performed using
UNISTAT® Statistical package (Version 5.5, Unistat Ltd., London, UK).
Quantitative image analysis VS Semi-quantitative scores
PAGE | 145
4.2.6.2. Quantitative image analysis histological data. The various morphological
parameters were transformed where necessary to normalise the distribution, and the means
compared by use of a hierarchical general linear model (GLM). When multiple groups were
compared by use of Tukey’s HSD post-hoc tests, the appropriate Holm-Bonferroni’s
significance values (Holm, 1979) were used to compensate for the number of groups, so as
to reduce the probability of detecting spurious differences.
To evaluate the relationship between the different morphometric variables, linear
regression models were applied and Pearson’s correlation coefficient values considered as
significant, at intervals of 95 % confidence level (p-value < 0.05, two-tailed). In order to
establish which morphometric measurements gave the most information concerning the
differences found in the morphology of the distal intestine from fish of different dietary
groups, a principal component analysis (PCA) was performed. To aid in obtaining optimal
loadings of the parameters on the principal components and consequently better
interpretation of components, a Varimax rotation and a Kaiser (1974) normalisation were
employed. Moreover, so as to identify important trends in the morphological data set that
would not be evident using univariate techniques, a discriminant function procedure was
implemented. The program default criteria for F values (FEntry: 3.84; FRemove: 2.71) were used
to determine the inclusion or removal of a variable from the analysis. Variables thus
selected were subjected to a reverse stepwise discriminant method. Once the variable
selection was complete, a discriminant model comprising a number of factors, each with its
own coefficient and a constant was generated. A discriminant score was then calculated for
each individual sample, and from this, subjects were automatically allocated to one of the
treatment groups and the overall accuracy of the discriminant model tested.
These statistical analyses were conducted using SPSS (Version 19.0.01, IBM,
Chicago, USA), Minitab (Version 16.1.0.0, Coventry, UK) and Unscrambler® (Version 10.3,
CAMO, Oslo, Norway) statistical software packages.
4.2.6.3. Comparison of the quantitative and semi-quantitative systems. The
performance of both systems was evaluated by comparison of the time / effort required to

CHAPTER 4
PAGE | 146
accomplish the intended assessment tasks. In addition, to assess the differences between
descriptive parameters from both classification systems, the resulting semi-quantitative
scores and the mean continuous variables derived from the image analysis, were correlated
using Spearman’s rank correlation coefficients and statistical significances evaluated using
Minitab (Version 16.1.0.0, Coventry, UK) statistical software package. Correlations were
considered significant if a p-value < 0.05 (two-tailed).
4.3. Results
4.3.1. Semi-quantitative histological assessment
Morphological changes in the distal intestine were evaluated for fifteen fish per
experimental diet. Scoring results are given in Table 4.4.
Table 4.4. Semi-quantitative histological assessment of the intestinal sections and schematic
overlapping-ranges of averaged summary scores, for fish fed the different experimental diets.
Descriptive parameter*
Diet A Diet B Diet C Diet D (Fish meal) (Lupins) (Lupins + SSC) (SBM)
Mean† SD Mean SD Mean SD Mean SD
Supranuclear vacuoles 1.8a 1.1 1.3
a 0.4 2.3
a,b 1.1 4.6
c 0.5
Lamina propria 1.5a 0.6 1.9
a 0.6 2.2
a,b 0.8 4.9
c 0.5
Connective tissue 1.6a 0.5 2.2
a,b 0.7 2.2
a,b 1.0 4.7
c 0.5
Mucosal folds 1.5a 0.4 1.7
a 0.4 2.5
b 0.7 4.8
c 0.4
Average score 1.6a 0.4 1.8
a,b 0.4 2.3
a,b 0.7 4.7
c 0.3
0 1 2 3 4 5
Diet A
Diet A
Diet D
Diet B
Diet C
Footnotes:
SSC, soya saponin concentrate; SBM, soybean meal.
* Distal intestinal sections were assessed according to the morphometric features listed and described in Table 4.2. A score of 1–2 represents “normal” morphology, a score of 3 was given to distinct morphological signs of inflammation, while a score of 5 represents severe symptoms of enteritis. † Data are expressed as mean and standard deviation (SD), n = 15 histological sections per treatment group were
assessed. a,b Mean values within the same row, with similar superscripts are not significantly different (multiple comparisons
test with mean ranks, Student-Newman-Keuls, α = 0.05).
Semi-quantitative scores

Quantitative image analysis VS Semi-quantitative scores
PAGE | 147
Fish fed the fish meal based control diet displayed normal morphology (i.e. scoring
between 1 and 2) while significant enteritis was observed in fish fed 25 % defatted soybean
meal (i.e. scoring close to 5). No morphological changes could be seen in the distal
intestine of fish fed 25 % lupin kernel meal alone (i.e. scoring between 1 and 2), however,
the diet containing soya saponin concentrate in combination with lupin kernel meal had a
significant effect (i.e. scoring close to 3) on all four histological parameters: the size of the
absorptive vacuoles was reduced, thickness of the lamina propria had increased, the
mucosal folds had become shorter and the amount of connective tissue between the base
of the mucosal folds and the stratum compactum had increased. Representative digital
microscopy images showing the morphological changes encountered across the distal
intestine from fish fed the different experimental diets are shown in Figure 4.2.
A
Lp
Lp
Lp
Lp
V
V
Sc
Sc
ScSc
CtCt
Ct Ct
B
C D
MfMf
Mf
Mf
Figure 4.2. Images of morphological variations encountered across the distal
intestine of Atlantic salmon fed different experimental diets: (A) fish meal based
control diet, (B) diet containing 25 % lupin kernel meal, (C) 25 % lupin kernel meal

CHAPTER 4
PAGE | 148
4.3.2. Quantitative histological assessment9
The 120 independent histological frame samples taken from the exact same histological
slides that were evaluated through the semi-quantitative approach were then re-evaluated using
the proposed semi-automated quantification system. The measured morphometric and tissue
cytometric parameters are shown in Table 4.5.
With respect to the quantitative histological examination of the distal intestine, no significant
differences in the key morphometric parameters associated with the mucous cells were observed.
Mucous cell individual mean area, elliptical and Feret length ratios were fairly similar among fish
from different dietary groups (F[4, 30] MMCA = 2.57, F[3, 36] MC Ellipse Ratio = 1.90, F[4, 30] MC Feret
Ratio = 2.24; p > 0.05). Nevertheless, it should be emphasised that mean mucous cell area
showed a dose-response trend, where fish fed the fish meal based diet exhibited significantly
larger (µm2) intestinal mucous cells while fish fed diets containing higher inclusion of soya saponin
(SS) displayed smaller cells. Consequently the highest ratios of mucous cell total area to mucosal
tissue area (F[4, 30] MCA / [MTA-Vac] = 6.18, p < 0.05) were found in fish fed the control diet
whereas fish fed the unrefined soybean meal (SBM) had the lowest ratios. Similarly, dose-
responses in the overall number of mucous cells were observed for fish maintained under the
various dietary treatment regimes (F[4, 30] MCN / [MTA-Vac] = 7.40, p > 0.05). It is noteworthy that
for individuals fed the lupin kernel meal, the mucous cells were less spherical overall (F[4, 30]
MCirc= 4.85, p < 0.05) than those of individuals fed the other treatment diets. Moreover,
significant differences in the generalised structured of the epithelial mucosal layers were observed
among sections from different treatment groups (F[3, 36] MTA / STA = 6.77, p < 0.05). Again a dose
response to SS was observed, where the ratio between the total mucosal and submucosal tissue
areas decreased as the inclusion levels of SS in the fed diets increased. Similarly, the fish fed
Figure 4.2 (continued from previous page) diet with inclusion of 1.7 g.kg-1
soya saponin concentrate, (D)
diet containing 25 % defatted soybean meal. Typical signs of enteritis include the loss of vacuoles (V)
in the absorptive enterocytes; the widening of the lamina propria (Lp) in the mucosal folds (MF); and
an increase of the connective tissue (Ct) between the base of the mucosal folds and the stratum
compactum (Sc). Intestinal sections were stained with a combination of haematoxylin-eosin and
Alcian blue 8 GX.

CHAPTER 4 | Quantitative image analysis VS Semi-quantitative scores
PAGE | 149
Table 4.5. Quantitative image analysis histological assessment of the intestinal sections.
Morphometric feature*
Diet A Diet B Diet C Diet D
(Fish meal) (Lupins) (Lupins + SSC) (SBM)
Mean† SD Mean SD Mean SD Mean SD p-value
MMCA (µm2) 207.291
4.932 205.634 5.521 201.472 4.511 191.655 4.946 0.128
MC Feret Ratio 0.688 0.003 0.681 0.003 0.689 0.002 0.701 0.003 0.161
MC Ellipse Ratio 1.539 0.009 1.569 0.013 1.529 0.008 1.501 0.012 0.206
MCirc 0.861b 0.003 0.844
b 0.004 0.864
a 0.003 0.862
ab 0.004 0.033
MTA / STA 8.464a 0.388 7.865
a 0.438 7.321
ab 0.343 4.859
b 0.232 0.014
P / MTA (µm / µm2) 0.018
a 0.0004 0.017
a 0.0007 0.016
a 0.0004 0.009
b 0.0002 0.001
VC / MTA 0.159 0.005 0.143 0.007 0.140 0.004 0.098 0.004 0.081
MCA / [MTA-Vac] 0.062a 0.004 0.060
a 0.004 0.053
ab 0.003 0.043
b 0.003 0.018
MCN / [MTA-Vac] (nº / µm2) 0.293×10
-3a 0.014×10
-3 0.283×10
-3a 0.016×10
-3 0.255×10
-3ab 0.012×10
-3 0.218×10
-3b 0.012×10
-3 0.011
FR 1.270b
0.007 1.260b 0.010 1.237
b 0.007 1.137
a 0.007 0.001
CT (µm) 26.777b 1.656 30.349
b 1.551 28.106
b 1.238 98.674
a 7.203 <0.001
MF Area (µm2) 1.455×10
5 6.217×10
3 1.572×10
5 6.951×10
3 1.310×10
5 4.441×10
3 1.384×10
5 5.605×10
3 0.192
MF Perimeter (µm) 3.101×10³a
1.013×10² 3.139×10
3a 0.940×10
2 2.753×10
3ab 0.731×10
2 2.326×10
3b 0.557×10
2 0.006
MF Feret Ratio 0.224 0.010 0.235 0.011 0.229 0.009 0.264 0.010 0.113
MF Ellipse Ratio 6.469 0.312 6.122 0.263 6.058 0.220 5.277 0.260 0.114
Footnotes: SSC, soya saponin concentrate; SBM, soybean meal.
* Distal intestinal sections were assessed according to the morphometric features listed and described in Table 4.2. MMCA, mean mucous cell area, MC Feret Ratio, ratio of the
Feret lengths from mucous cells, MC Ellipse Ratio, ratio of the elliptical lengths from the mucous cells, MCirc, mucous cell mean circularity index, MTA / STA, ratio between the
mucosal tissue area and the submucosal tissue area, P / MTA, ratio between the total perimeter of the luminal surface and the mucosal tissue area, VC / MTA, ratio between total
vacuolisation area and the mucosal tissue area, MCA, mucous cell total area, MTA-Vac, mucosal tissue area without the vacuolisation area, MCN, mucous cell number, FR, fractal
dimension of the perimeter line of the luminal surface, CT, connective tissue thickness, MF Area, total area from mucosal folds, MF Perimeter, total perimeter length from mucosal
folds, MF Feret Ratio, ratio of the Feret lengths from mucosal folds, MF Ellipse Ratio, ratio of the Feret lengths from mucosal folds.
† Data are expressed as mean and standard deviation (SD), n = 30 histological frames per treatment group were assessed. a,b Mean values within the same row with the same superscript are not significantly different (hierarchical GLM: tank [treatment] fixed factor with 3 levels, p > 0.05).

CHAPTER 4
PAGE | 150
higher plant protein concentrations showed the lowest ratio between the perimeter length and
the mucosal tissue area (F[4, 30] P / MTA = 19.06, p < 0.05) and its related fractal dimension
(F[4, 30] FR = 16.00, p < 0.05). On the other hand, the thickness of the connective tissue was
only significantly thicker for the SBM fed group (F[4, 30] CT = 50.24, p < 0.05). No significant
differences in the key morphometric parameters associated with the mucosal folds were
observed. Mucosal fold mean area, elliptical and Feret length ratios were fairly similar across
fish from different treatment groups (F[4, 30] MF Area = 2.01; F[4, 30] MF Ellipse = 2.72, F[4, 30] MF
Feret Ratio = 2.75; p > 0.05). However, for the MF perimeter length assessment, significant
differences were observed. The mean perimeter length of the mucosal folds seemed to
decrease as the inclusion levels of SS increased (F[4, 30] MF Perimeter = 9.23; p < 0.05). To
evaluate the relationship between the different morphometric variables, linear regression
models were applied. Parameters showing Pearson’s correlation values higher than 0.7 are
reported, and the square of the correlation coefficient values as shown in Figure 4.3. MC
Ellipse Ratio was negatively related to MC Feret Ratio and MCirc with Pearson’s correlation
coefficients of r = -0.961 and r = -0.801 respectively, which accounted for 93 % of the
variance encountered in MC Feret Ratio (F[119] = 1460.345, p < 0.001) and 62 % in MCirc
(F[119] = 190.070, p < 0.001). Moreover, the MC Feret Ratio was positively related to MCirc (r =
0.718) explaining 51 % of the variation between both variables. Conversely, as the MF Ellipse
Ratio increased the MF Feret Ratio decreased, both being negatively related (F[119] = 813.227,
r = -0.957, p < 0.001, 88 % variation). Also in Figure 4.4, P / MTA accounted for 90 % of the
variation in FR (F[119] = 1032.493, r = -0.964, p < 0.001), 52 % for CT (F[119] = 130.121, r = -
0.774, p < 0.001), and 30 % for MTA / STA (F[119] = 50.633, r = 0.626, p < 0.001). While FR
and CT variables were negatively related to the P / MTA variable, MTA / STA was positively
correlated. Hence, MCN / [MTA-Vac] and MCA / [MTA-Vac] showed a very high correlation
amongst (F[119] = 1542.672, r = 0.968, p < 0.001, 93 % variation), the luminal surface intricacy
parameter was positively interrelated to the connective tissue length (F[119] = 132.708, r =
0.768, p < 0.001, 53 % variation). These correlations describe the indices of similarity
between the different key-parameters (i.e. characterises the extent to which different

Quantitative image analysis VS Semi-quantitative scores
PAGE | 151
parameters would contribute comparable information or meaning for a particular set of features),
allowing the researcher to decide upon which morphometric parameters to select based on their
“discriminatory strength” and lack of “resemblance” to other analogous parameters.
MF
Are
aM
F P
erim
eter
*MF Area MF Perimeter
MF
Ellip
se R
atio
MF Feret Ratio
MC
ric
MC
Fer
etR
atio
MC
Elli
pse
Rat
io
MMCA MCirc MC Feret Ratio
R² = 0,134
R² = 0,0004
R² = 0,006 R² = 0,642
R² = 0,516
R² = 0,924
R² = 0,433 R² = 0,012
R² = 0,197
R² = 0,917R² = 0,249R² = 0,0004
p = 0.004
p = 0.874
p < 0.573
p < 0.001
p < 0.001 p < 0.001
p < 0.001
p = 0.399p < 0.001
p < 0.001p < 0.001p = 0.877
Figure 4.3. Correlations between the different morphological parameters detailed for the
quantitative assessment analysis. R2 values, representing the square of the correlation
coefficients, p-values, the estimated probability of rejecting the null hypothesis of the study
question (i.e. that the two factors examined are unrelated), when that hypothesis is true.
* n = 60 histological frames were quantitatively assessed and data expressed as means.
Correlation coefficient values are not significantly different when p > 0.05. (MF Area) Total
area from mucosal folds. (MF Perimeter) Total perimeter length from mucosal folds. (MF
Feret Ratio) Ratio of the Feret lengths from mucosal folds. (MF Ellipse Ratio) Ratio of the
Feret lengths from mucosal folds. (MCirc) Mucous cell mean circularity index. (MC Feret
Ratio) Ratio of the Feret lengths from mucous cells. (MC Ellipse Ratio) Ratio of the elliptical
lengths from the mucous cells. (MMCA) Mean mucous cell area.
MC
irc

CHAPTER 4 | Quantitative image analysis VS Semi-quantitative scores
PAGE | 152
R² = 0,324 R² = 0,189 R² = 0,233 R² = 0,929
R² = 0,094 R² = 0,134
R² = 0,936
VC
/ M
TAM
CA /
[M
TA-V
ac]
MCN
/ [
MTA
-Vac
] FR
P /
MTA
R² = 0,240
R² = 0,171
R² = 0,599
R² = 0,121
R² = 0,261
R² = 0,209 R² = 0,149
R² = 0,590
p < 0.001 p < 0.001
p = 0.004 p < 0.001
p < 0.001
p < 0.001
p < 0.001
p = 0.002
p = 0.017
p < 0.001
p < 0.001 p < 0.001 p < 0.001p < 0.001p < 0.001
VC / MTA MCA / [MTA-Vac] MCN / [MTA-Vac] FR CT
MTA
/ S
TA
p < 0.001 p < 0.001 p < 0.001p < 0.001p < 0.001
*P/ MTA
p < 0.001 R² = 0,392 R² = 0,166 R² = 0,103 R² = 0,104 R² = 0,429 R² = 0,303
and the mucosal tissue area. (MCA) Mucous cell
total area. (MTA-Vac) mucosal tissue area without
the vacuolisation area. (MCN) Mucous cell number.
(FR) Fractal dimension of the perimeter line of the
luminal surface. (CT) Connective tissue thickness.
(MTA / STA) Ratio between the mucosal tissue area
and the submucosal tissue area.* n = 60 histological
frames were quantitatively assessed and data
expressed as mean. Correlation coefficient values
are not significantly different when p > 0.05.
Footnotes:
(P / MTA), Ratio between
the total perimeter of the
luminal surface and the
mucosal tissue area. (VC
/ MTA) Ratio between
total vacuolisation area
and the
Figure 4.4. Correlations between the different morphological parameters detailed for the
quantitative assessment analysis. R2 values, representing the square of the correlation
coefficients, p-values, the estimated probability of rejecting the null hypothesis of the study
question (i.e. that the two factors examined are unrelated), when that hypothesis is true.

Quantitative image analysis VS Semi-quantitative scores
PAGE | 153
A principal component analysis (PCA) with orthogonal rotation was then conducted on
the 60 individuals (i.e. 120 histological frame replicates). After removal of the MF Area
variable (KMO = 0.383), the Kaiser-Meyer-Olkin measure confirmed the sampling adequacy
for the analysis, KMO = 0.698 (Hutcheson & Sofriniou, 1999 in Field, 2009). Also the Bartlett’s
test of sphericity χ2 (55) = 1148.187, p < 0.001, indicated that correlations between replicates
were sufficiently large for a PCA analysis (Bartlett, 1988). This multivariate approach allowed
the full set of variables to be reduced to a smaller set of components (i.e. reduction of the
dimensionality of the data). Figure 4.5 gives a summary of the loading weightings and score
coefficients assigned to each one of the variables / individuals for the extracted components.
Three of the extracted components had Eigenvalues above Kaiser’s criterion of 1 (Field,
2009) and in combination they described 74 % of the total variation between individuals distal
intestine morphology. The first component accounted for 44 % of such variation (F[4, 30] PC1 =
44.81; p < 0.001; Diet A = Diet B, Diet A ≠ Diet C ≠ Diet D), while only 32 % of variation was
explained by the other two components (F[4, 30] PC2 = 5.35, p = 0.002, Diet A = Diet B, Diet A
≠ Diet C ≠ Diet D; F[4, 30] PC3 = 2.05; p = 0.111, Diet A = Diet B = Diet C = Diet D).
The principal components obtained are entities that can be visualised using new
classification axes (variables) along which the variables can be plotted, giving an idea of
their correlation with the corresponding principal component loading (Figure 4.5). The first
component PC1 which related to the structure of the epithelial mucosal layers and to the
luminal surface intricacy, was characterised by high negative weighting of the variable P /
MTA, against high positive loadings for FR and CT, whereas three additional characters
MCirc, MCN / [MTA-Vac] and MCA / [MTA-Vac] showed the highest correlation within the
second component PC2 which related to the mucous cell circularity and proportion within
the tissue. Similarly, the MC Feret Ratio and VC / MTA showed the highest negatives within
the third component PC3, which related to mucous cell shape and tissue vacuolisation
(Figure 4.5).
According to the PCA analysis (Figure 4.6), two major clusters could be segregated and
identified as Diet A ( ) and B ( ), comprising the fish group fed on the fish meal control diet

CHAPTER 4 | Quantitative image analysis VS Semi-quantitative scores
PAGE | 154
P/MTA
MF Ellipse Ratio
VC/MTA
MCirc
MC Feret Ratio
MTA/STA
MCN/MTA-Vac
MCA/MTA-Vac
CT
FR
(44 %)
(20
%)
P/MTA
MF Ellipse Ratio
VC/MTA
MCirc
MC Feret Ratio
MTA/STA
MCN/MTA-Vac
MCA/MTA-Vac
CT
FR
(44 %)
(12
%)
Figure 4.5. Component plot of the multivariate principal component analysis and corresponding loading weights, for the intestinal morphological features measured
in Atlantic salmon fed different treatment diets. The 2-D plots contain two circumferences that indicate how much variance is taken into account by the model. The
outer circle indicates 100%, while the inner ellipse indicates 50%. (MCirc) Mucous cell mean circularity index. (MC Feret Ratio) Ratio of the Feret lengths from
mucous cells. (MF Ellipse Ratio) Ratio of the Feret lengths from mucosal folds. (P / MTA) Ratio between the total perimeter of the luminal surface and the mucosal
tissue area. (VC / MTA) Ratio between total vacuolisation area and the mucosal tissue area. (MTA / STA) Ratio between the mucosal tissue area and the
submucosal tissue area. (MCN) Mucous cell number. (MCA) Mucous cell total area. (MTA-Vac) Mucosal tissue area without the vacuolisation area. (FR) Fractal
dimension of the perimeter line of the luminal surface. (CT) connective tissue thickness.

Quantitative image analysis VS Semi-quantitative scores
PAGE | 155
and the one fed on lupin kernel meal, and Diet D ( ), the group fed the unrefined SBM.
While less distinct (i.e. being very closely associated to the Diet A cluster), a third cluster
corresponding to individuals from the Diet C group ( ) and comprising fish fed the SSC,
could also be marginally distinguished. Based upon this multivariate appraisal, one could
suggest reducing the number of required classification features, with the most informative
being P / MTA, FR, MCN / [MTA-Vac], MCirc, MC Feret Ratio for the evaluated histological
states.
The PCA analysis was followed up by a reverse stepwise discriminant analysis, which
revealed three canonical functions. The first accounted for 93.2 % (canonical R2 = 0.87) of the
group variance, whereas the second and third functions described 5.7 % (canonical R2 = 0.02)
and 1.1 % (canonical R2 = 0.07) respectively. In combination these discriminant functions
significantly differentiated the treatment groups, λ = 0.087, χ2 (21) = 276.671, p < 0.001. After
removal of the first function there was still highly significant discriminatory power, the
combination of the second and third discriminant functions could still differentiate the
treatment groups λ = 0.662, χ2 (12) = 46.873, p < 0.001. Consequently, the observed
differences among treatment groups could be explained in terms of two underlying
dimensions in combination, explained by the following linear equations: [a] D1 score= 11.711 +
(3.843 × MCA / MTA) + (-42.388 × MC Feret Ratio) + (22.134 × MCirc) + (191.694 × P / MTA)
+ (16.542 × VC / MTA) + (-5.199 × CT); [b] D2 score= -29.474 + (19.376 × MCA / MTA) + (-
52.466 × MC Feret Ratio) + (79.159 × MCirc) + (-179.454 × P / MTA) + (4.591 × VC / MTA) +
(-1.071 × CT) and [c] D3 score= -41.513 + (17.116 × MCA / MTA) + (-7.850 × MC Feret Ratio)
+ (36.072 × MCirc) + (144.448 × P / MTA) + (12.986 × VC / MTA) + (4.374 × CT). The
correlations between the discriminant variables and the standardised canonical discriminant
functions revealed that the primary variables in distinguishing between different dietary groups
were CT, P / MTA, MCirc, MF Perimeter and VC / MTA. The CT (rD1 = -0.697) and P / MTA
(rD1 = 0.551) variables being mostly loaded onto the first function, while MCirc (rD2 = 0.619)
and MF Perimeter (rD2 = -0.421) were more highly loaded on the second function. For the third
function VC / MTA (rD3 = 0.553) and CT (rD3 = 0.503) were the most highly loaded variables.
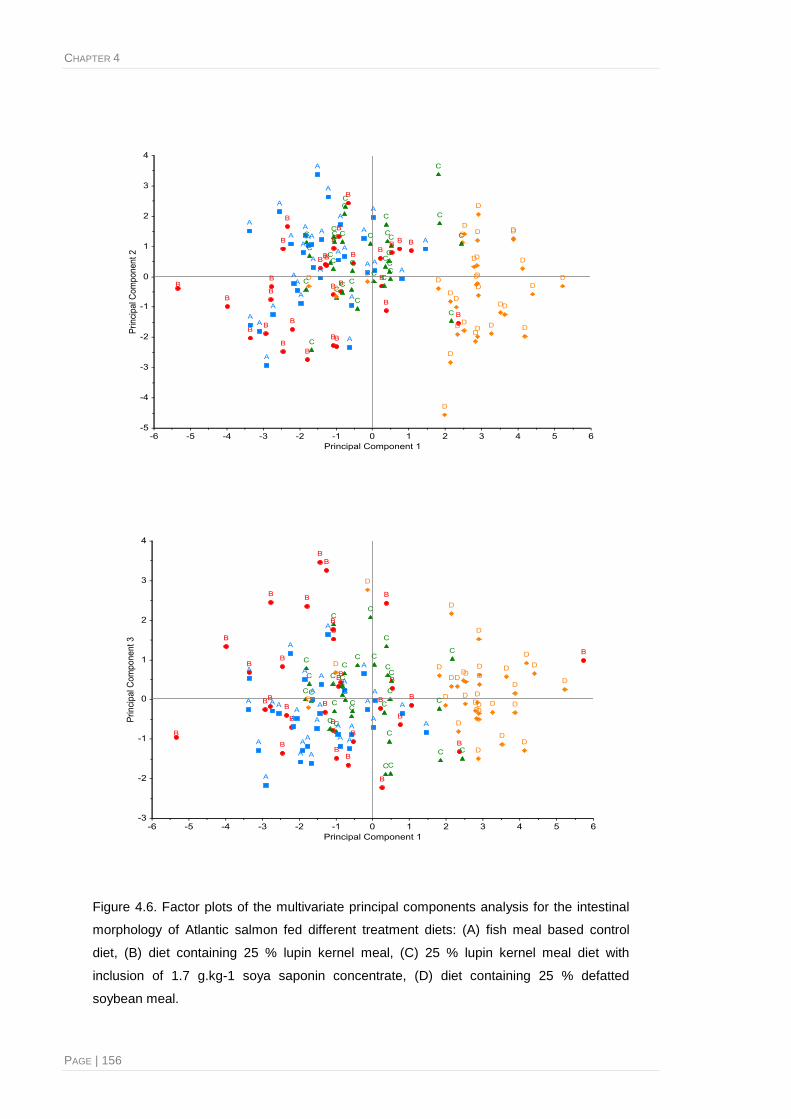
CHAPTER 4
PAGE | 156
Figure 4.6. Factor plots of the multivariate principal components analysis for the intestinal
morphology of Atlantic salmon fed different treatment diets: (A) fish meal based control
diet, (B) diet containing 25 % lupin kernel meal, (C) 25 % lupin kernel meal diet with
inclusion of 1.7 g.kg-1 soya saponin concentrate, (D) diet containing 25 % defatted
soybean meal.

Quantitative image analysis VS Semi-quantitative scores
PAGE | 157
The discriminant function plot illustrated in Figure 4.7, shows that the first function
clearly discriminated dietary group D from groups A, B and C, and that the second function
discriminated group D ( ) from groups A ( ) and C ( ), but this difference was not as
sharp as for the first variable. The group centroids illustrated in the figure, are simply the
mean variable scores for each treatment group (D1 = 2.003 Diet A, 1.285 Diet B, 1.034 Diet
C, -4.322 Diet D; D2 = 0.271 Diet A, -0.990 Diet B, 0.717 Diet C, 0.003 Diet D; D3 = 0.398
Diet A, -0.132 Diet B, -0.332 Diet C, 0.066 Diet D).
Figure 4.7. Scatterplot of the canonical scores and corresponding dietary group centroids, for a pair
of discriminant functions, based on 9 morphometric features (n = 30 histological frames per treatment
group). (A) Fish meal based control diet. (B) Diet containing 25 % lupin kernel meal. (C) 25 % lupin
kernel meal diet with inclusion of 1.7 g.kg-1
soya saponin concentrate. (D) Diet containing 25 %
defatted soybean meal.
A “leave-one-out” classification analysis (sensitivity analysis) was also employed, in
which the analysis was re-run once with each target individual sequentially excluded and
then reassigned to a group based on the resulting discriminant function score. Such re-
Diet C
Diet D
Diet A
Diet B
Canonical Discriminant 1
Can
on
ical
Dis
crim
inan
t 2

CHAPTER 4
PAGE | 158
assignment classification resulted in all the individuals from group D being correctly
assigned to their group. However, only around 67-70 % of individuals from groups A, B and
C were assigned to the correct group. It is notable that among the individuals from these
last groups, none were mis-assigned into group D. This gives an overall efficiency of 75.8 %
for the discrimination of the dietary groups (Table 4.6).
Based on the overall analysis one could reduce the number of necessary classification
features from ten to four, with CT, P / MTA, MCirc and VC / MTA being emphasised.
Table 4.6. Percentage of predicted classifications based on the discriminant function scores given to
each individual fish fed the distinct experimental diets.
Predicted treatment group
Original treatment group Diet A Diet B Diet C Diet D Total
Diet A (Fish meal) 66.7 6.7 26.6 0.0 100.0
Diet B (Lupins) 13.3 66.7 20.0 0.0 100.0
Diet C (Lupins + SSC) 16.7 13.3 70.0 0.0 100.0
Diet D (SBM) 0.0 0.0 0.0 100.0 100.0
Footnotes:
SSC, soya saponin concentrate; SBM, soybean meal.
4.3.3. Comparison of the quantitative and semi-quantitative systems
The semi-quantitative appraisal required expert knowledge, provided by an
experienced pathologist who was used to routinely performing such scoring analysis. It
takes some time and practice to ensure that the observer is differentiating changes in the
same way each time. They would need to read the slides blind, even repeating some of the
analyses to check that the same result would be obtained. The more frequently this was
done, the more confident and accurate the observer would become with his appraisal. In the
present study, the designated experienced histopathologist took on average 13-18 min to
assess 4 different descriptive parameters per histological slide. Scoring one parameter at a
time (i.e. going back and starting again on the same slide scoring the next parameter) and
taking some breaks in between, the observer took approximately 4-5 days to score all 60
histological slides using the described semi-quantitative scoring system.

Quantitative image analysis VS Semi-quantitative scores
PAGE | 159
When using the proposed quantitative image analysis system the processing time
required for each histological image frame was roughly 25 min per histological frame,
accounting for 32 distinct parameters being assessed at a time. Consequently, the image
analysis of all 60 histological slides (representing 120 diagnostic frames in total) was
performed over approximately 7-8 days. No high level understanding of histology or
pathology diagnosis was necessary for the observer to operate such image analysis system.
The current assessment was readily performed by an unassisted observer, nevertheless, a
degree of user learning and training was required.
The final aim of this study was to compare the descriptive parameters from both
quantitative and semi-quantitative assessment systems (Figure 4.8). Such an evaluation
revealed significant correlations between the MF parameter measured by the current scoring
method of assessment and the P / MTA (r = -0.666, p < 0.001) measured by image analysis.
Significant correlations were also observed for the MF and the MTA / STA (r = -0.652, p <
0.001), the FR (r = 0.642, p < 0.001) and the MF Perimeter (r = -0.640, p < 0.001).
Close correlations were further noted for the CT values measured using the two
methods, and P / MTA and FR values (r = 0.619, -0.589, 0.566 respectively; p < 0.001). With
respect to the semi-quantitative parameter LP, there were stronger positive correlations with
the quantitative MF Feret Min, MF Ellipse b and MF Perimeter measurements (r = 0.733,
0.652, 0.648; p < 0.001). Despite weaker correlations, as demonstrated in Figure 4.8, the
semi-quantitative Vac parameter correlated with the P / MTA (r = -0.536, p < 0.001), FR (r =
0.497, p < 0.001) and VC / MTA (r = -0.436, p < 0.001) quantitative descriptive variables. In
summary then, overall correlation between semi-quantitative observer scores and
quantitative image analysis measurements was good.
4.4. Discussion
Soybean meal is now a widely used feed ingredient for a number of fish and other
animal species, and there is extensive knowledge of the potential anti-nutritive factors
present in soybeans. Among these, proteinase inhibitors, saponins, lectins, oligosaccharides,
phytic acid, fibres and phytoestrogens are considered to be the most important

CHAPTER 4 | Quantitative image analysis VS Semi-quantitative scores
PAGE | 160
Footnotes:
(Vac) Supranuclear vacuoles. (LP)
Lamina propria. (CT) Connective
tissue. (MF) Mucosal folds. (P /
MTA) Ratio between the total
perimeter of the luminal surface and
the mucosal tissue are. (MF Feret
Min) Minimum Feret lengths mean of
four simple mucosal folds. (FR)
Fractal dimension of the perimeter
line of the luminal surface. (MF
Ellipse b) mean length of the
secondary axis of the ellipses with
the same geometric moment of
inertia as the four of the simple
mucosal folds. (MTA / STA) Ratio
between the mucosal tissue area
and the submucosal tissue area.
(MF Perimeter) Total perimeter
length from mucosal folds. (MF
Ellipse Ratio. (VC / MTA) Ratio
between total vacuolisation area and
the mucosal tissue area. (MF Feret
max) Maximum Feret lengths mean
of four simple mucosal folds.* n = 60
histological frames were
quantitatively assessed and data
expressed as mean. Correlation
coefficient values are not
significantly different when p > 0.05.
Qu
anti
tati
ve M
F P
erim
p < 0.001p < 0.001
p < 0.001p < 0.001
*Semi-quatitative Vac Semi-quatitative LP
p < 0.001p < 0.001
Qu
anti
tati
ve M
F Fe
ret
Max
p < 0.001p < 0.001
Qu
anti
tati
ve M
F El
lipse
bQ
uan
tita
tive
MF
Fere
tM
in
Qu
anti
tati
ve M
F P
erim
Qu
anti
tati
ve V
C /
MTA
Qu
anti
tati
ve F
RQ
uan
tita
tive
P /
MTA
Qu
anti
tati
ve F
R
p < 0.001p < 0.001
p < 0.001p < 0.001
Semi-quatitative CT Semi-quatitative MF
p < 0.001p < 0.001
Qu
anti
tati
ve M
F P
erim
p < 0.001p < 0.001
Qu
anti
tati
ve M
TA /
STA
Qu
anti
tati
ve P
/ M
TA
Qu
anti
tati
ve F
RQ
uan
tita
tive
VC
/ M
TAQ
uan
tita
tive
P /
MTA
Qu
anti
tati
ve C
T
r = 0.733r = -0.536 r = -0.666r = 0.619
r = 0.652r = -0.497 r = -0.652r = -0.598
r = 0.648r = 0.486 r = 0.642r = 0.566
r = 0.612r = -0.436 r = -0.640r = -0.478
Figure 4.8. Correlations between the different morphological parameters detailed for the quantitative image analysis and the semi-quantitative scoring
assessments. r-values, representing the Spearman’s rank rho correlation coefficients, p-values, the estimated probability of rejecting null hypothesis of the study
question (i.e. that the two factors examined are unrelated), when that hypothesis is true.

Quantitative image analysis VS Semi-quantitative scores
PAGE | 161
(Van den Ingh et al., 1996; Francis et al., 2001). These are thought to be the cause of the
major physiological effects seen with the inclusion of soybean meal in fish diets (e.g.
impairment in digestion and absorption, with alterations in nutrient metabolism or inhibition
of feed intake).
A large number of studies have established the link between oral delivery of SBM and
the onset of a pathological condition in the distal intestine of salmonids (Van den Ingh et al.,
1991; Olli et al., 1995; Refstie et al., 2000; Buttle et al., 2001; Bakke-McKellep et al., 2007a;
Lilleeng et al., 2007; Chikwati et al., 2012). Most of these studies have relied upon expert
histological appraisal to explain the morphological changes encountered. Wageningen
University for instance (Urán et al., 2008a, also available at http://edepot.wur.nl/121985),
has developed a semi-quantitative scoring system through which they have assessed the
degree of SB-induced enteritis in Atlantic salmon. Amongst others (Morris et al., 2005; Penn
et al., 2011) this is one of the most commonly used methodologies for evaluation of dietary
modulation effects in fish. Inherent to such an approach is a dependence on assessment by
experienced pathologists, as significant variability in the interpretation may occur through
use of less experienced readers. The reliance on subjective interpretation by an expert
observer has limited the degree to which results from individual studies could be compared
with other studies (Berman et al., 1998). The use of an accurate and objective quantitative
analysis system would circumvent this problem by increasing the consistency of image
interpretation, making it independent of the observer’s histopathology skills.
The purpose of the current study was to determine the value of the quantitative image
analysis system described in Chapters 2 and 3, for histomorphological assessment of
soybean-induced enteritis in salmon biopsy specimens, and to systematically compare the
results of semi-quantitative scoring with that of the quantitative image analysis. A semi-
quantitative scoring system introduced previously in the thesis was employed to assess the
degree of enteritis from the intestinal histological sections, for which four separate
descriptive parameters were scored on a scale from 1 to 5, where an increasing score
represented a more severe enteritis condition (Table 4.4).

CHAPTER 4
PAGE | 162
As anticipated, the inclusion of soybean and lupin in the diets of Atlantic salmon in the
current study induced classical signs of enteritis in the distal intestine, as previously
described by other authors (Bureau et al., 1998; Krogdahl et al., 2003; Refstie et al., 2001;
Buttle et al., 2001). The difference in response between experimental treatment groups
seemed to be due to the amount of soya saponins (SS) consumed by fish, as the severity of
the changes appeared to be dose-dependent, related to the level of SS inclusion (Tables
4.1 and 4.4). Fish fed the fish meal (SS = 0.00 g.Kg-1) and the 25 % lupin kernel meal (SS =
0.03 g.Kg-1) displayed “normal” intestinal morphology, whereas fish fed 25 % soybean meal
(SS = 1.07 g.Kg-1) developed severe enteritis. Interestingly, when soya saponins were
added to 25 % lupin kernel meal distinct morphological changes were noted, however to a
lower extent than that caused by the SBM inclusion (Figure 4.2), suggesting that the low
levels of SS in the lupin kernel meal can still be tolerated by salmon, whereas the levels
found in SBM are not. Knudsen et al. (2008) pointed out that maybe the activity of the
saponins naturally present in the soybean meal, is greater when compared to their purified
form. Additionally, it is possible that unidentified causative agent(s), which in synergy with
the soya saponins might cause inflammation, are more abundant in SBM than in the lupin
kernel meal.
The mucosal fold (MF) and the lamina propria (LP) appeared to be the most suitable
parameters for perceiving differences in the morphology of the intestine of fish, since larger
differences in these parameters could be distinguished between the different experimental
dietary groups. The smaller variations observed in the scores for other descriptive
parameters may indicate that these alterations occur at a later stage in enteritis
development (Urán et al., 2009a).
The same histological slides that were evaluated through the semi-quantitative
approach were re-evaluated using the image analysis quantification system. The findings of
the quantitative assessment for the histomorphological alterations in the distal intestine of
fish fed the different experimental diets were consistent with those previous descriptions for

Quantitative image analysis VS Semi-quantitative scores
PAGE | 163
the semi-quantitative scoring (Table 4.5). Again, a dose-response with SS seemed to be
supported.
Repair regeneration of the damaged tissue took place, with cells of the same type or
with fibrous connective tissue. During this process, fish fed higher levels of SS appeared to
have a widening of the central stroma within the mucosal folds and consequent shortening
of the mucosal folds. An increase in MF Area, MF Feret Ratio and MF Ellipse Ratio,
reflected the morphological changes observed. Shorter and wider mucosal folds were
evident, and accordingly the intricacy of the luminal surface appeared less irregular
(indicated by lower FR values and P / MTA ratio). Additionally, for fish fed greater dietary
SS concentrations, there was an increase in the length of the connective tissue between the
base of the mucosal folds and the stratum compactum. This, in combination with a widening
of the lamina propria, resulted in an augmentation of the total mucosal tissue area (MTA)
with respect to the total portion of sampled area, and consequently the P / MTA and MTA /
STA ratios decreased.
Furthermore, although there were no significant differences between dietary groups,
variations in vacuolisation of the absorptive enterocytes from the intestinal epithelium were
noted. Fish fed the SBM clearly appeared to have less enterocyte vacuolisation (VC / MTA),
while fish fed the fish meal based diet had more dispersed and intact supranuclear
vacuoles. This could be indicative that particular components of the SS induce concurrent
changes in the brush border membrane, blocking specific receptor sites in the distal
intestine, which would disturb the process of endocytosis, leading to a reduction in the
activity of the digestive enzymes present in the enterocytes and subsequent disappearance
of the supranuclear vacuoles. This is in accordance with the evidence provided by other
authors (i.e. Bakke-McKellep et al., 2000a; Nordrum et al., 2000a; Krogdahl et al., 2003;
Krogdahl & Bakke-McKellep, 2005) and more recently Urán et al. (2009b), who showed that
in salmonids higher inclusion levels of dietary SBM caused a marked reduced endocytosis,
resulting in the absence of small vesicles that would customarily fuse into the enterocytes’
supranuclear vacuoles.

CHAPTER 4
PAGE | 164
The number and size of mucous cells in the mucosal folds (i.e. MCN / [MTA-Vac] and
MCA / [MTA-Vac]) decreased with increasing levels of SS inclusion. Mucous cells are
known to be involved in the innate defence system through the production and secretion of
mucins, which acts as a physical barrier to protect the underlying epithelium of the
gastrointestinal tract against physical and chemical harm (Pajak & Danguy, 1993; Marchetti
et al., 2006). Therefore, if mucous cells consisting of a smaller sectional area are observed
in fish fed higher levels of SS, the evidence suggests that these dietary components may
have triggered mucous release (i.e. where cells that have expelled mucin appear smaller in
size) or a rapid cell turn-over (i.e. immature replacement cells appearing smaller in size).
Overall, these histomorphometric changes agree with the reports of Knudsen et al. (2008)
and Chikwati et al. (2012), who suggested that a combination of soya saponins was capable
of inducing lesions similar to those described for soy enteritis. Also, the increase in
inflammation observed with increasing dietary SBM levels is in agreement with the studies
of Krogdahl et al. (2003) and Urán et al. (2009b). Equally, it provides evidence that the
features selected for the quantitative assessment agree with those previously described for
changes encountered during soy-associated enteropathy. Taking the correlations (Figures
4.3 and 4.4) and interactions (Figures 4.5 and 4.6) among all those variables into account,
MCirc, P / MTA, MTA / STA, MCN / [MTA-Vac], CT, MC Feret Ratio, VC / MTA and MF
Perimeter proved to be the most useful morphometric parameters to describe the
development of intestinal pathology and were able to distinguish between normal / benign
tissue patterns and enteritis. Therefore, these particular parameters could be employed for
screening nutritional dietary components, and by requiring a fairly reduced number of key-
parameters this would considerably simplify the present script. This, in turn, could permit
fuller automation of many analysis tasks, allowing more rapid assessment of larger sets of
samples and freeing time for pathologists to undertake more complex interpretations or
resolve differences turned up by the automated analysis.
In summary, the two histological techniques employed in this study, one of which is
currently considered to be the gold standard for examining fish intestinal enteritis (i.e. the

Quantitative image analysis VS Semi-quantitative scores
PAGE | 165
semi-quantitative), showed clearly correlated outputs. Significant correlations were
observed between the semi-quantitative and quantitative assessment parameters for
intestinal inflammation seen in the cross-sectional comparison (Figure 4.7). The CT, P /
MTA, FR, MTA / STA and MF Perimeter parameters used in the quantitative analysis gave
strong correlations (i.e. r > 0.490, p < 0.050) with the MF, CT, LP and Vac descriptive
parameters used in the semi-quantitative analysis. Furthermore, cross-sectional analysis
demonstrated that the semi-quantitative method gave results on a scale 1-5, which
correlated with the detailed continuous results from quantitative analysis. However, for each
individual score a wide range of quantitative values was noted. For example, samples
allocated a semi-quantitative score of one for LP demonstrated quantitative values ranging
from 191.49 to 353.88 µm, and a semi-quantitative score of two accommodated quantitative
values ranging between 193.94 and 282.89 µm. For the semi-quantitative score of one for
CT, values ranged from 18.06 to 43.80 µm, for a score of two the corresponding values
ranged between 21.65 to 44.18 µm, while for a semi-quantitative score of three quantitative
values ranged from 23.18 up to 65.6 µm. These observations are indicative of a
considerable degree of overlap between histological grading classes but also of subtler
resolution of parameters. However, as shown by the figure displayed as part of Table 4.4, a
fair degree of overlap was similarly observed in the semi-quantitative histological
assessment with Diets A, B and C having a considerable degree of overlap between each
other’s scoring.
Overall, many biological traits exhibit considerable variability and for any
histomorphometric measurement to be useful for determining whether a change has
occurred, for example as a result of dietary modulation, it is important to establish how
reproducible and reliable the results are (Alonzi et al., 2010). Moreover, where minor but
biologically relevant changes are sought, it is imperative that morphometric analysis is
sufficiently sensitive to identify subtle, but biologically significant trends (Youssef et al.,
1998), and the current image analysis quantitative system, appeared proficient with respect

CHAPTER 4
PAGE | 166
to all these essential requirements. The advantages over a semi-quantitative scoring
system are:
(1) Robustness: it produces objective, accurate, reliable and sensitive quantifications of
intestinal enteritis (see Chapter 2), which correlate well with the gold standard semi-
quantitative indices currently used.
(2) Reproducibility: there seemed to be less inter-observer variability following the image
analysis approach than with the semi-quantitative score (as suggested by the study
presented in Chapter 2 from this thesis).
(3) Rapidity: the examination of one histological frame is rapid (approximately 25 min for
32 assessed parameters), and faster than any other quantitative assessment method
for the same number of parameters being evaluated.
(4) Simplicity: operation of the system is relatively easy so that it can be performed by an
unassisted operator. There is no need for a vast knowledge of pathology diagnostics or
computer programming (although greater expertise will clearly assist downstream
interpretation of results). A degree of user learning and training is nevertheless
required. It is estimated that it takes approximately 2-5 h to establish user confidence
according to previous experience.
(5) Exhaustiveness: it can be employed for a large number of samples and it may be
upgraded to provide analysis of the entire intestine section, instead of visualising just
two randomised frames per each section.
(6) Quantitation: the results generated by image analysis are continuous or semi-
continuous variables rather than semi-quantitative scores / gradings. This allows more
reliable comparisons between studies and facilitates statistical analysis.
(7) Adaptability: the image analysis provides for some degree of operator intervention
allowing the adjustment of morphometry thresholds as necessary. This permits an
interactive reflection, which involves a dynamic process that formally incorporates
corrective steps along the way.
However, some difficulties were encountered with this method:
Quantitative image analysis VS Semi-quantitative scores
PAGE | 167
(a) Sample size: observations have shown that a sufficient surface / area extent of the
sample is required for accurate performance of quantitative morphometric analysis.
Also, the quality of biopsy tissue must be adequate (i.e. not too fragmented or
degraded by pathology / fixation / processing procedures). A trained histopathologist
using morphological features is able to ignore or compensate for those irregularities,
while the current image analysis system cannot do this so easily.
(b) Costs: image analysis is still expensive, although as laboratories become better
equipped it will become common place and easily accessible. It is, however, arguable
that commercial diagnostic histopathology services may also be costly and that over
time, this cost could easily surpass the expenses of purchasing the necessary image
analysis software and hardware.
4.5. General conclusions
This is, to the author’s knowledge, the first broad-scale application of quantitative image
analysis to the assessment of nutritionally-induced enteritis in fish, using such a large
number of histomorphometric parameters and biopsy samples, as well as directly
comparing the prognostic value of such a quantitative analysis against that of a semi-
quantitative visual scoring system.
In summary, this study has shown that most quantitative indices performed equally well
when compared to analogous semi-quantitative descriptive parameters of assessment for
enteritis prognosis. The excellent reproducibility and accuracy performance levels indicate
that the image analysis system is a useful and reliable morphometric method for the
quantification of SB-induced enteritis in salmon. Other characteristics such as rapidity,
simplicity and adaptability favour this method for image analysis, and are particularly useful
where less experienced interpreters are performing the analysis. The quantitative
assessment system using the proposed features outlined here, clearly identifies soy-
associated enteropathy in experimental fish, and may thus be recommended for evaluation
of related variations in salmon intestinal histomorphology.

TECHNICAL NOTE A2
PAGE | 168
TECHNIC AL NOTE A2
USER GUIDELINES FOR OPERATION OF THE GUT HEALTH IMAGE
PROCESSING AND ANALYSIS SEMI-AUTOMATED SYSTEM – PART II
A detailed protocol has been compiled to allow a better understanding of the image
processing and analysis workflow. It provides step-by-step instructions for loading, initiating
and operating the image analysis system, which is employed for work presented throughout
the thesis.
1. KS Run User Interface
The image processing, segmentation and analysis script developed is deployed using the
stand-alone KS Run software platform (Version 3.0, Carl Zeiss Vision GmbH, München-
Hallbergmoos, Germany). Instructions for installing the KSRun software and deploying the
gut analysis script within it are provided in the KS Run user manual (KS Run User Interface
Manual Guide B 40-613, Carl Zeiss Vision GmbH, München-Hallbergmoos, Germany). The
following sections describe the protocol for use of the gut image analysis script presented in
Chapter 2.
1.1. Image Processing and Analysis Workflow
The image processing, segmentation and analysis pipeline comprises of a succession of
interactive and automated operational steps ( ). Feedback in the form of guidance notes
for the operator ( ), and visualisation of the generated images ( , Appendix 2 and
Technical Note A1) was made available at each step of the pipeline process, as well as
feature extraction and data generation ( , Figure 8 from Technical Note A1).
1.1.1. Start Up
i. Operational steps A to C from Technical Note A1 (Chapter 2) are followed.

TECHNICAL NOTE A2
PAGE | 169
1.1.2. Logistical Setup and Data Input
ii. Operational steps D to I from Technical Note A1 (Chapter 2) are followed.
1.1.3. Image Pre-processing
iii. Operational steps J to L from Technical Note A1 (Chapter 2) are followed.
1.1.4. Image Segmentation and Processing
iv. Operational steps M to U from Technical Note A1 (Chapter 2) are followed.
v. Individual mucosal folds are interactively selected (based on a selection criterion that
requires the plane of sectioning to pass through the centre of the mucosal fold), and
individually separated from the remainder of the mucosal tissue (Image 6Hb from Appendix 2).
a “Hit the ‘Reset’ button and untick the ‘Autoclose’ box, then draw point-to-point lines either
side of each mucosal fold. If neighbouring mucosal folds merge with the mucosal fold of
interest, draw lines to separate them. Keep the left mouse button depressed and release it to
finish the line. Repeat this step as necessary.”
b “Hit the ‘Reset’ button and untick the ‘Autoclose’ box, then draw point-to-point lines to link
separated / broken mucosal fold fragments. Hit the right mouse button or double click to
close the lines. Repeat this step as necessary.”
Image A1
c “Hit the ‘Reset’ button and then draw circles on each selected mucosal fold. Press and
hold the left mouse button to draw continuously or to draw from point-to-point. Mark
successive points with the left mouse button, releasing between points.”
Image A1

CHAPTER 4
PAGE | 170
vi. The thickness of the connective tissue layer is identified by interactive point-to-point
manual demarcation of lines in the graphics plane of the displayed image.
d “Draw multiple point-to-point lines to measure the depth of the connective tissue at the
ventral extension of the mucosal folds (i.e. between the base of the mucosal folds and the
line of the stratum compactum). Repeat for at least 20 distinct areas.”
Image B
1.1.5. Histological Identification and Post-processing Overlays
vii. Operational steps V to ε from Technical Note A1 (Chapter 2) are followed.
viii. Extraction of selected individual mucosal folds:
viii-1. The lines drawn in Image A (Appendix 2) are subtracted from it and saved as Image A1.

TECHNICAL NOTE A2
PAGE | 171
viii-2. Through a ‘Binand’9 operation, filled objects drawn and merged into Image A1
coinciding with the regions of interest (ROI) from Image 6Hb are highlighted and masked
into Image A2.
Image A2
e.g. S400000_A01.MFALL.tif (Figure 1)
Figure 1. Output Image A2, showing the mucosal folds that
were interactively selected.
viii-3. The edge of the mucosal region captured in Image 15 coinciding with the ROI masked
in Image A2 were merged into Image A3.
Image A3
e.g. S400000_A01.MF_EDGE_ALL.tif (Figure 2)
Figure 2. Output Image A3, luminal surface from the
individual mucosal folds being delineated with a white
coloured line.
9 Binand. This function carries out a bitwise AND operation by electing two bit patterns of equal length and performs
the AND operation on each pair of corresponding bits. The result in each position is 1 if the first bit is 1 and the second
bit is 1, otherwise, the result is 0. In this we perform the multiplication of two bits; 1 × 0 = 0 and 1 × 1 = 1. For example:
0101 (Input 1) 0011 (Input 2) = 0001 (Output) (KS 300 Imaging System Manual Guide B 40-614, Carl Zeiss Vision
GmbH, München-Hallbergmoos, Germany).

CHAPTER 4
PAGE | 172
1.1.6. Feature Extraction and Data Generation
ix. Operational steps ζ to κ from Technical Note A1 (Chapter 2) are followed.
x. Mucosal folds are identified (i.e. Image C) and for each individual fold the following
measurements are taken:
Mucosal Fold Total Area (MF Area, µm2)
Mucosal Fold Perimeter Length (MF Perimeter, µm)
Mucosal Fold Minimum Feret Length (MF Feret Min, µm)
Mucosal Fold Maximum Feret Length (MF Feret Max, µm)
Mucosal Fold Feret Ratio (MF Feret Ratio)
Mucosal Fold Elliptical Length A (MF Ellipse Af, µm)
Mucosal Fold Elliptical Length B (MF Ellipse Bf, µm)
Mucosal Fold Ellipse Ratio (MF Ellipse Ratio)
1.1.7. Analysis Conclusion
xi. Program terminates with audible warning and textual descriptor once the analysis is
finished.
e “Measuring feature properties…”
“Writing data to databases…”
“Analysis finished.”


5. CHAPTER 5
5. QUANTITATIVE IMMUNOSTAINING: DEVELOPMENT OF A
BIOMARKER PANEL FOR ASSESSMENT OF IMMUNE RESPONSE
IN THE INTESTINAL TRACT OF ATLANTIC SALMON PARR FED
DIFFERENT DIETS
5.1. Introduction
‘Immunohistochemistry’ (IHC) is a term which refers to various antibody detection
methods used to identify constituents (i.e. proteins or other molecules) of biological cells in
tissue sections or whole mounts (Brandtzaeg, 1998). As its name suggests, it bridges three
major disciplines: immunology, histology and chemistry (Ramos-Vara, 2011). The principle
which underlies the techniques is that antibodies and antibody conjugates may be
employed to identify explicit targets. The latter are linked to a marker, such as a fluorescent
dye or colloidal gold that can be visualised histologically (Coons, 1971; Starczynski &
Crocker, 2005).
In this context, the potential of immunostaining has been exploited not only to identify
minute changes in the structural organisation of cells, which could not be determined by
conventional analysis with haematoxylin and eosin (H&E) staining, but also to elucidate the
functional events and the basic molecular mechanisms involved in, for instance, the
development of pathological phenotypes (De Matos et al., 2010; Pellicciari et al., 2011).
Despite, in most instances, histomorphological assessment of H&E stained sections
remaining the gold standard procedure practiced by most pathologists in performing
diagnoses, the implementation of refined IHC techniques, has been shown to greatly
improve the diagnostic and prognostic potential of their histological evaluations (Cregger et
al., 2006). The advantages of immunostaining include its wide availability, sensitivity,
reliability, simplicity and relative low cost. Disadvantages include the influence of pre-
analytical issues (including specimen handling, fixation, paraffin embedding, sectioning and

CHAPTER 5
PAGE | 176
deparaffinisation), availability of good quality control samples for comparative analysis, and
most importantly the difficulties of applying a subjective quantification system in the
interpretation of the histological staining (Theodosiou et al., 2007).
Since its inception in the early 30s (Marrack, 1934; Coons, 1971), the technical
capabilities of this technique have improved immensely (Haines & West, 2005), especially
due to a succession of advances in the methodology employed for immunostaining. From
the introduction of non-fluorescent chromogens (Nakane & Pierce, 1966), through the
discovery of antigen retrieval methods (Huang et al., 1976), to the amplification of reaction
detection methods (Hsu et al., 1981), all have provided crucial improvements allowing
immunolabelling methods to become accessible for a wider group of scientists and
histopathologists. In addition, improvements in microscopy, particularly the development of
confocal laser scanning microscopy (CLSM) have provided a step-change in the resolution
achievable using light microscopy labelling techniques. Together these benefits have
resulted in the use of immunolabelling in many research and diagnostic laboratories as a
routine tool in the wider repertoire (Haines & West, 2005). A demonstration of this
widespread adoption is provided by the exponential increase in the number of
immunolabelling / immunostaining publications over recent decades, with this literature not
only appearing in dedicated histochemical or cytochemical journals but being widely
scattered across other journals dealing with cell and molecular biology, biotechnology,
immunology, histopathology, neuroendocrinology, image analysis, forensics, physiology,
nutrition, and toxicology amongst other topics (De Matos et al., 2010; Brandtzaeg, 1998).
The number and scope of publications referencing this technology reflects the key status
that immunostaining currently holds as a highly flexible discipline having relevance both to
basic and applied biological research.
Increasingly since the 1950s, IHC has been recognised as a discipline capable of
relating biochemical changes to the altered histomorphological features characteristic of a
specific disorder. As such, it has assisted histopathologists in determining the most
appropriate measurable cellular, biochemical or molecular alterations, which might serve as

Quantitative immunostaining
PAGE | 177
indices for health / physiology related assessments. Thus the overall aim of IHC analysis
has been previously described in terms of the identification of reliable and unequivocal
diagnostic / prognostic biomarkers that could enable recognition of the earliest signs of a
pathological condition (Pellicciari et al., 2011).
Unfortunately, this approach has proven to be constrained by both the limitations of
intrinsic biomarkers and by the nature / preservation of the tissues being evaluated. The
heterogeneity deriving from multiple protein homologues and the inter-individual variability
in expression of the same gene, are particular limiting factors in the search of potential
unique biomarkers displaying desirable properties for screening, diagnosis, and prognosis
(Pellicciari et al., 2011). Furthermore, very few individual biomarkers have been found to be
sufficient for diagnosis without contribution from other markers or sources of evidence
(Yaziji & Barry, 2006). Research focus has therefore shifted to a model that involves
searching for and testing panels of multiple markers with the hope of improving
performance and robustness.
Nevertheless, the rapid growth of molecular biology has expanded to the point at which
the application of technically advanced genomics, metabolomics and proteomics have
helped in the identification / generation of many candidate biomarkers, showing high
sensitivity and specificity for the target they are expected to identify. Numerous studies have
been published in recent decades, describing either the spatial distribution of specific IHC
biomarkers and / or quantification of their expression in response to a range of perturbing
factors in several organs / tissues from different teleost species. These factors include:
dietary modulation (Himick & Peter, 1994; Berntssen et al., 1999; Bakke-McKellep et al.,
2000b, 2007b; Picchietti et al., 2007; Ostaszewska et al., 2010; Chikwati et al., 2013a),
toxicity (Eggens et al., 1995; Ortego et al., 1995; Goksøyr & Husøy, 1998; Kilemade et al.,
2002), infection or disease (Hemmer et al., 1998; Bermúdez et al., 2006; Silphaduang et al.,
2006; Dezfuli et al., 2011a; Ronza et al., 2011), vaccine administration (Sommerset et al.,
2005; Mosca et al., 2012; Galeotti et al., 2013), stress (Murray & Fletcher, 1976; Poltronieri
et al., 2009; Bernabò et al., 2013), well-being (Sørensen et al., 2012), sex differentiation

CHAPTER 5
PAGE | 178
(Lorenzi & Grober, 2012), and physiology (Stefan & Falkmer, 1980; Byrd & Brunjes, 1995;
Vieira-Lopes et al., 2013).
The interpretation of many IHC stains is frequently qualitative and subjective, with
quantification of the reaction having little or no importance. However, proper interpretation
of most immunostains depends to some extent on an estimation of differential antigen
content between positive and negative results. Numerous methods for visual scoring of IHC
assays have been proposed to improve quantitation. These have been shown to have
better reproducibility than visual estimates and often to be scientifically relevant. However
these scoring systems still suffer from inter-observer discrepancies in reproducibility, and as
a further improvement in quantitation, computer-assisted image analysis has proven
superior to visual estimates in providing quantitative IHC (Seidal et al., 2001).
A review of the literature confirms that to date, no quantitative assessments of teleost
intestinal histo-immunoplasticity have been conducted. The intestinal epithelium of teleosts
provides a dynamic interface that maintains structural and functional integrity in response to
a range of stimuli such as dietary components or commensal microbiota, which have been
shown to cause alterations in the proliferation, migration, differentiation and shedding of
damaged or senescent epithelial cells by apoptosis (Chikwati et al., 2013a). In this study,
changes in the morphology of the intestinal epithelial cells occurring as a result of dietary
modulation were studied and aspects of inflammatory infiltration were characterised using a
panel of enzyme and IHC markers. Image analysis techniques were used to evaluate and
systematically optimise a quantitative immunolabelling assessment protocol. In Chapters 2
and 4 the accuracy and reproducibility of the quantitative method, and the validity of the
resulting protocol in comparison to use of conventional techniques were established. Here
the application of a similar system is described for the detection of predictive protein
biomarkers and for accurate quantification of small changes in the spatial distribution
patterns of such proteins and their relative amounts in the tissue. The immunolabelling of
mucosal fold tissues have been investigated for the distal intestinal region of salmon fed
three different diets, a reference fish meal based control diet, another with inclusion of
Quantitative immunostaining
PAGE | 179
immunostimulants and an experimental enteropathy-causing diet containing unrefined
soybean meal.
5.2. Material and methods
5.2.1. Experimental fish and fish husbandry
The experimental trial was conducted at Skretting’s Fish Trial Station (Lerang,
Jørpeland, Norway). Post-smolt Atlantic salmon (Salmo salar L.) with an initial mean body
weight of 79 ± 2 g and a mean fork-length of 19 ± 2 cm, were randomly allocated into six
flow-through 100 L circular tanks. The tanks were maintained under a 24 h light
photoperiod, and supplied with fresh sand-filtered flow-through seawater at 11 ± 2 ˚C.
Dissolved oxygen, ammonia, nitrate, nitrite and pH levels were monitored and maintained
within recommended limits (Wedemeyer, 1996). Individual tanks were equipped with
automatic disc feeders and feed waste collectors.
5.2.2. Diets and feeding regime
The fish were acclimatised to the experimental conditions for 3 weeks, during which
they received a reference fish meal based diet (Protec™, Skretting, Stavanger, Norway).
Thereafter, three different experimental diets were randomly assigned to triplicate tanks and
the salmon fed during a 20-week experimental period. The three experimental diets were
produced as 3 mm extruded pellets at Skretting Feed Technology Plant (Stavanger,
Norway). The experimental diets comprised either a fish meal based control diet, a diet
containing 25 % unrefined soybean meal concentrate or a fish meal diet supplemented with
functional ingredients. Formulations of the diets are presented in Table 3.1. from Chapter 3.
All the diets were formulated to be approximately iso-nitrogenous and iso-energetic on a
crude protein and gross energy basis, and to satisfy the nutritional requirements of
salmonids (NCR, 1993). Fish were fed twice a day at 20 % biomass using automatic disc
feeders. Uneaten feed was collected, separated from faeces and quantified by weight after
drying for 12-16 h at 90 ˚C.

CHAPTER 5
PAGE | 180
5.2.3. Sampling procedure
Following the twenty week feeding regime, 3 fish were randomly sampled from each
designated replicate tank for each treatment group. All fish were starved 24 h prior to
sampling, and euthanised with anaesthetic (50 mg.L-1, MS-222, Tricaine
Methanesulphonate, Argent Chemical Laboratoires, Redmount, WA, USA). The
gastrointestinal tract was removed and freed of associated adipose tissue. Transverse rings
of at least 1 cm in length were collected from the distal intestine region, cut open
longitudinally and fixed in neutral buffered formalin (10 %, pH 7.2, 3800601, Leica
Biosystems, Bucks, UK) at room temperature for at least 24 h before further histological
processing.
5.2.4. Histology
For histological examination and IHC analyses, samples were processed according to
standard histological methods (Bancroft & Stevens, 1982; Ramos-Vara, 2005, 2011). All
tissue formalin-fixed samples were dehydrated and embedded in paraffin (Tissue-TekII
Paraffin Wax, melting-point: 54-57 ˚C, Sakura Finetek Europe B.V, Netherlands). Three
distinct paraffin blocks were produced for each individual tissue sample, and for each
individual paraffin block, one histological slide was prepared. Transverse sections of 5 µm
thickness were cut (Leica RM 2035, Leica Microsystems Ltd., UK), mounted on glass slides
pre-coated with APES (3’aminopropyl triethoxysilane, A3648, Sigma-Aldrich, Ayrshire, UK)
to improve section adherence and dried overnight at 37 °C.
5.2.5. Immunostaining assays – Immunolabelling of biomarkers
The immunostaining protocols given in Table 5.1 were developed following a series of
troubleshooting and optimisation steps, including comparison of various demasking
procedures and blocking solutions, use of different primary antibody concentrations and / or
diverse chromogenic visualisation systems. The following procedures are those producing
the most consistent results for the selected antigens in terms of compatibility with image
analysis quantitation. In developing protocols, advice was sought from the Veterinary
Diagnostics Service of the University of Glasgow. Mr. Iain MacMillan and Mrs. Lynn
Quantitative immunostaining
PAGE | 181
Stevenson, histologists from this facility, provided practical assistance and specialist advice
during optimisation of some of the protocols described.
All immunoreactivity steps were alternated with washings of the assigned rinsing buffer
and all the incubation steps were carried out in a humidified chamber to avoid desiccation of
the tissue, which could lead to non-specific binding and ultimately high background staining.
Additionally, so as to evaluate the contribution of either non-specific antibody binding to
endogenous Fc receptors (FcRs) or a combination of ionic and hydrophobic interactions
giving background immunostaining, additional tissue sections were included and stained
using an antibody directed to an irrelevant antigen (e.g. BrdU, monoclonal anti-
bromodeoxyuridine antibody, B2531, Sigma-Aldrich, St. Louis, USA) in parallel with the
slides being stained with the antibodies of interest, with the irrelevant antigen having the
same isotype and concentration as the antibody of interest. Along with, or whenever an
isotype control (i.e. using an antibody directed to the irrelevant antigen) was not possible, a
negative antibody control was applied, simply by replacing the primary antibody with the
antibody’s diluent. Also, to ensure that the test antibodies were performing as expected,
positive tissue controls known to contain the expressed antigens of interest (comprising
sections of a canine skin tumour; from a feline brain and colonic carcinomas; from caprine
tonsils and / or from a female rodent mammary gland to which the commercial antibodies
are known to react and with well documented labelling profiles for proliferation,
differentiation and shedding of damaged cells and kindly provided by Mrs. Finlayson and
Mr. MacMillan from Moredun Research Institute and the Veterinary Diagnostics Services
from the University of Glasgow, respectively), were also included in the staining process.
From each biopsy paraffin block a series of 7 serial sections were prepared and stained
as follows (Sections 5.3.5.1 to 5.3.5.7). For one in every ten biopsies, an eighth section was
prepared and stained as a negative control by omitting the primary antibody.
5.2.5.1. Cell proliferation and regeneration (PCNA). Mounted tissue sections were
deparaffinised in Citroclear® (TCS Bioscicences, Buckingham, UK) and rehydrated in a
graded series of ethanol. Slides were then rinsed for 5 min in Tris-buffered saline Tween

CHAPTER 5
PAGE | 182
solution (TBST, 150 mM NaCl, 50 mM Trizma base®, 0.5 % Tween® 20, pH 7.5), and heat
induced epitope retrieval performed using an Antigen Access Unit (MP-2002-CE, A.
Menarini Diagnostics Ltd., Berkshire, UK) with sodium citrate buffer solution (10 mM
Na3C6H5O7, pH 6.0) at 125 °C for 1 min and 40 sec. After rinsing of the slides with TBST,
tissue endogenous peroxidase activity was inhibited by incubation in Peroxidase-Blocking-
Solution (DAKO REAL™, S2023, DAKO, Glostrup, Denmark) for 5 min at room
temperature. Slides were then incubated for 30 min at room temperature with a polyclonal
rabbit antibody raised against proliferating cell nuclear antigen (FL-261, sc-7907, Santa
Cruz Biotechnology, California, USA) diluted 1:1000 in Antibody-Diluent (DAKO REAL™,
S2022, DAKO, Glostrup, Denmark). Subsequent to rinsing twice with TSBT for 5 min each,
sections were incubated with a biotinylated labelled secondary antibody (EnVision™
System HRP labelled Polymer, K4003, DAKO, Glostrup, Denmark) for 30 min and the
immunoreactivity visualised by use of the EnVision™ Peroxidase / DAB+ (K5007, DAKO,
Glostrup, Denmark) for 10 min. Sections were rinsed twice with distilled water for 5 min
each, counterstained for 26 sec with Gill’s haematoxylin (RHS-345, CellPath Ltd., Newtown,
UK), blued for 1 min with Scotts Tap Water Substitute (EGW-0200-23A, CellPath Ltd.,
Newtown, UK) and mounted with Pertex® mounting medium (00811, Histolab, Göteborg,
Sweden), after dehydration through a series of graded ethanols and clearing of the tissue
sections with Citroclear®.
5.2.5.2. Programmed cell death or apoptosis (TUNEL). Apoptotic cells were detected
using a combination of IHC and a terminal deoxynucleotide transferase-mediated deoxy-
UTP nick-end labelling assay, using the ApopTag® Plus Peroxidase In Situ Apoptosis
Detection Kit (S7101, Merck Millipore, Billerica, USA) and following the manufacturer’s
protocol. In brief, the sections were deparaffinised using xylene, hydrated through a graded
series of alcohols and pre-treated with freshly made 20 μg.mL-1 IHC Select® Proteinase K
(21627, Merck Millipore, Billerica, USA) for 15 min at room temperature. Sections were then
washed twice in phosphate buffered saline solution (PBS, 137 mM NaCl, 2.7 mM KCl, 10
mM Na2HPO4, 1.8 mM KH2PO4, pH 7.4) for 2 min each, and the endogenous peroxidase

Quantitative immunostaining
PAGE | 183
activity quenched by using 3 % hydrogen peroxide (H1009, Sigma-Aldrich, Ayrshire, UK) in
PBS for 5 min at room temperature. Slides were then rinsed twice with distilled water for 5
min each, and immediately dipped in ApopTag® Equilibration Buffer for 10-20 sec. The
excess solution was tapped off and the sections incubated with ApopTag® Working Strength
TdT Enzyme at 37 °C for 1 h. The slides were then transferred into a Coplin jar containing
ApopTag® Working Strength Stop / Wash Buffer for 10 min, washed in 3 changes of PBS for
1 min each, and incubated for 30 min at room temperature with the ApopTag® Anti-
digoxigenin Conjugate. Thereafter, the slides were washed with 4 changes of PBS for 2 min
each, and the sections incubated for 5 min in ApopTag® Peroxidase Substrate at room
temperature. The sections were washed three times in distilled water for 1 min each then
counterstained with methyl green (H-3402, Vector Laboratories, Peterborough, UK) for 10
min and washed in distilled water. Finally, the slides were washed in 100 % N-butanol
(B7906, Sigma-Aldrich, Ayrshire, UK), dehydrated through graded alcohols, cleared in
xylene and mounted with Pertex® mounting media. The negative control excluded treatment
with TdT-labeled-deoxynucleotides (i.e. disregarding incubation with ApopTag® Working
Strength TdT Enzyme, but including proteinase K digestion control for nonspecific
incorporation of nucleotides or for nonspecific binding of enzyme conjugate).
5.2.5.3. Eosinophilic granule cells (Active Caspase-3). Paraffin-embedded sections
were subjected to deparaffinisation using xylene and subsequent rehydration in decreasing
concentrations of ethanol. Demasking of the tissue sections was performed by enzymatic
antigen retrieval, using a Universal UNI-TRIEVE® solution (NB325, Innovex Biosciences,
Richmond, USA) for 30 min at 65 °C in a water bath. Slides were rinsed twice in distilled
water and, to inhibit endogenous peroxidase, the sections were then treated with
EnVision™ Dual Endogenous Enzyme Block (K4065, DAKO, Glostrup, Denmark) for 10 min
at room temperature. Without washing, excess solution was blotted off and tissues were
incubated overnight at 4 °C with a rabbit polyclonal antibody against caspase-3 (Anti-
ACTIVE® Caspase-3 Ab, G7481, Promega, Madison, USA) diluted 1:250 in TBST solution.
Thereafter the slides were rinsed twice with TBST for 5 min each, and sections incubated

CHAPTER 5
PAGE | 184
with a biotinylated labelled secondary antibody (EnVision™ HRP Labelled Polymer, K4065,
DAKO, Glostrup, Denmark) for 30 min. Slides were washed twice for 5 min each in TBST
and the peroxidase activity revealed by incubating the tissue sections with in EnVision™
DAB (K4065, DAKO, Glostrup, Denmark) for 7 min. The reaction was stopped by immersing
the slides in distilled water. Finally the sections were counter-stained with Harris’s
haematoxylin for 3 min (RALA361075, Reactifs RAL SA, VWR International Ltd,
Leicestershire, UK) and blued in Scotts Tap Water Substitute by quick dips. Slides were
rinsed in running tap water for 2 to 5 min, sections dehydrated through increasing
concentrations of ethanol, cleared in xylene and mounted with Pertex®.
5.2.5.4. T-cell-like cells (CD3ε). Embedded sections were deparaffinised using
Citroclear® and subsequently rehydrated in decreasing concentrations of ethanol. Sections
were then rinsed for 5 min in TBST solution, and demasking of the sections was performed
by hydrated autoclaving (Menarini Acess Retrieval Unit, MP-2002-CE, Menarini Diagnostics
Ltd., Berkshire, UK) at 125 °C for 1 min and 40 sec in sodium citrate buffer solution.
Endogenous peroxidase activity was quenched with Peroxidase-Blocking-Solution (DAKO
REAL™, S2023, DAKO, Glostrup, Denmark) for 5 min at room temperature, the sections
rinsed with TBST and incubated for 30 min with the primary antibody 1:100 diluted in
Antibody-Diluent (DAKO REAL™, S2022, DAKO, Glostrup, Denmark). The primary
antibody comprised a polyclonal rabbit anti-human T-cell CD3 antibody, produced against a
synthetic peptide from the cytoplasmic part of the ε-chain of the CD3 antigen (A0452,
DAKO, Glostrup, Denmark). After rinsing the sections twice with TBST for 5 min, slides
were incubated for 30 min with the peroxidase labelled polymer conjugated to rabbit
immunoglobulins (EnVision™ System HRP Labelled Polymer, K4003, DAKO, Glostrup,
Denmark), a secondary antibody. Sections were again rinsed twice in TBST and the
peroxidase activity detected using the Peroxidase / DAB+ (K5007, DAKO, Glostrup,
Denmark) provided with the EnVision™ Dual Link System-HRP (DAB+) Detection System
kit from DAKO. The reaction was stopped after 10 min by rinsing the slides in distilled water.
Finally the sections were counter-stained with Gill’s haematoxylin for 26 sec, blued in Scotts

Quantitative immunostaining
PAGE | 185
Tap Water Substitute for 1 min, dehydrated through a graded series of ethanols, cleared
and mounted with Pertex® mounting medium.
5.2.5.5. Mobilisation of stress related proteins for regenerative processes (HSP 70).
For the IHC detection of heat shock protein 70, the slides were deparaffinised in xylene and
rehydrated in decreasing concentrations of ethanol. Demasking of the HSP 70 epitopes was
performed by hydrated autoclaving (Antigen Access Unit MP-2002-CE, A. Menarini
Diagnostics Ltd., Berkshire, UK) with sodium citrate buffer solution at 121 °C for 15 min.
Tissue sections were then incubated in 0.05 % phenyl hydrazine (P26252, Sigma-Aldrich,
Ayrshire, UK) diluted in PBS for 40 min at 37 °C, to inactivate the endogenous peroxidase,
and then treated for 20 min at room temperature, with 5 % bovine serum albumin (A9647,
Sigma-Aldrich, Ayrshire, UK) and 0.5 % normal goat serum (G6767, Sigma-Aldrich,
Ayrshire, UK) diluted in Tris-hydrochloride solution (Tris-HCl, 50 mM Trizma base®, pH 7.6)
to avoid non-specific binding. Excess solution was blotted off and tissues were incubated
overnight at 4 °C, with the mouse monoclonal anti-Heat Shock Protein 70 antibody (H5147,
Sigma-Aldrich, St. Louis, USA) diluted 1:1000 in Tris-HCl. Sections were rinsed twice with
PBS for 5 min each, and antibody binding demonstrated using an EnVision™ Dual Link
System-HRP (DAB+) (DAKO, Glostrup, Denmark) containing a secondary biotinylated
antibody labelled according to the manufacturer’s instructions. Slides were washed twice for
5 min each in PBS and then incubated with Diaminobenzidine (EnVision™ DAB, K4065,
DAKO, Glostrup, Denmark). The reaction was stopped after 20 min by rinsing in tap water.
Finally the sections were counter-stained with Harris’s haematoxylin for 1 min, slides rinsed
in running tap water for 2 to 5 min, sections dehydrated through increasing concentrations
of ethanol, cleared in xylene and mounted with Pertex®.
5.2.5.6. Facilitation of nutrient uptake and ion transport (Na+K+-ATPase). Paraffin-
embedded sections were subjected to deparaffinisation using xylene and subsequently
rehydrated in decreasing concentrations of ethanol. The slides were then rinsed in distilled
water for 15 min, incubated overnight at 4 °C. with a monoclonal antibody against α5-
subunit of chicken Na+K+-ATPase (a5, DSHB, Iowa, USA), diluted 1:200 with PBS containing

CHAPTER 5 | Quantitative immunostaining
PAGE | 186
Table 5.1. Summary of immunostaining protocols used in this study.
Immunostaining assay Antigen retrieval Pre-treatment Primary antibody Secondary antibody Detection system
PCNA Sodium citrate buffer, pH 6;
1 min 40 sec; 125 °C; HIER.
REAL™ Peroxidase-Blocking
solution (S2023, DAKO); 5 min;
RT.
PCNA Polyclonal Rabbit FL-261
(sc-7907, Santa Cruz
Biotechnology); 1:1000; 30 min;
RT.
EnVision™ HRP Rabbit Polymer
(K4003, DAKO); 20 min; RT.
REAL™ EnVision™ DAB+
(K5007, DAKO); 2 x 5 min;
RT.
TUNEL Proteinase K (21627, Merck
Millipore); 20 μL.mL-1; 15
min; RT.
ApopTag® Working Strength TdT
Enzyme (S7101, Merck
Millipore); 1 h; 37 °C.
N.A. ApopTag® Anti-Digoxigenin
Conjugate (S7101, Merck
Millipore); 30 min; RT.
ApopTag® Working
Strength Peroxidase
Substrate (S7101, Merck
Millipore); 5 min; RT.
Active caspase-3 UNI-TRIEVE solution
(NB325, Innovex); 30 min;
65 °C; water bath.
EnVision™ Dual Endogenous
Enzyme Block (K4065, DAKO);
10 min; RT.
Anti-ACTIVE® Caspase-3
Polyclonal Rabbit (G748A,
Promega); 1:250; overnight; 4 °C.
EnVision™ HRP Rabbit Polymer
(K4065, DAKO); 30 min; RT.
EnVision™ DAB (K4065,
DAKO); 7 min; RT.
CD3ε Sodium citrate buffer, pH 6;
1 min 40 sec; 125 °C; HIER.
REAL™ Peroxidase-Blocking
Solution (S2023, DAKO); 5 min;
RT.
CD3 Polyclonal Rabbit Anti-
human (A0452, DAKO); 1:100;
30 min; RT.
EnVision™ HRP Rabbit Polymer
(K4003, DAKO); 20 min; RT.
REAL™ EnVision™ DAB+
(K5007, DAKO); 2 x 5 min;
RT.
HSP 70 Sodium citrate buffer, pH 6;
2 min; 121 °C; HIER.
1 0.05 % Phenyl Hydrazine in
PBS, pH 7.4; 40 min; 37 °C.
2 5 % BSA, 0.5 % NGS in Tris-
HCl, pH 7.6; 20 min; RT.
HSP 70 Monoclonal Mouse
Clone BRM-22 (H5147, Sigma);
1:1000; overnight; 4 °C.
EnVision™ HRP Rabbit Polymer
(K4065, DAKO); 30 min; RT.
EnVision™ DAB (K4065,
DAKO); 7 min; RT.
Na+K
+-ATPase N.A. 1 % BSA; 10 % NGS in PBS, pH
7.4; overnight (with primary
antibody).
Na+K
+-ATPase Monoclonal Anti-
chicken α-Subunit (a5, DSHB);
1:200; overnight; 4 °C.
Peroxidase Conjugate of Goat
Anti-mouse (A4416; Sigma);1 h;
RT.
Vector® DAB Peroxidase
Substrate Kit (SK-4100;
Vector Labs); 10 min; RT.
Footnotes: PCNA, proliferating cell nuclear antigen; HIER, heat induced epitope retrieval; DAKO, Glostrup, Denmark; RT, room temperature (16-20 °C); Santa Cruz Biotechnology Inc.,
California, USA; HRP, horseradish peroxidase; DAB, 3,3'-Diaminobenzidine; TUNEL, terminal deoxynucleotidyl transferase dUTP nick end labelling; Merck Millipore, Billerica, USA; N.A., non
applicable; Active Caspase-3, protein member from the cysteine aspartic acid protease family; Innovex Biosciences, Richmond, USA; Promega, Madison, USA; CD3ε, T-cell surface
glycoprotein cluster of differentiation epsilon chain; PBS, phosphate buffered saline solution, BSA, bovine serum albumin; NGS, normal goat serum; Tris-HCl, tris(hydroxymethyl)aminomethane
hydrochloride; HSP 70, heat shock protein 70; Sigma, Sigma-Aldrich, St. Louis, USA; Na+K+-ATPase, sodium-potassium adenosine triphosphatase; DSHB, developmental studies hybridoma
bank,Iowa, USA; IL, interleukin; TBS, tris(hydroxymethyl)aminomethane buffered saline solution; UK Vector Labs, Vector Laboratories Inc., Peterborough, UK.

Quantitative immunostaining
PAGE | 187
10 % normal goat serum (G6767, Sigma-Aldrich, Ayrshire, UK) and 1 % bovine serum
albumin (A9647, Sigma-Aldrich, Ayrshire, UK). Thereafter the sections were incubated with a
peroxidase conjugated secondary antibody (A10551, Life Technologies Paisley, UK) diluted
1:100 in PBS for 1 h at room temperature, rinsed twice for 10 min each in PBS, and
incubated for another 10 min with freshly prepared Vector® DAB Peroxidase Substrate (SK-
4100, Vector Laboratories Inc., Peterborough, UK). Finally the sections were counter-stained
with Harris’s haematoxylin for 2 min, rinsed in running tap water for 2 to 5 min, dehydrated
through increasing concentrations of ethanol, cleared in xylene and mounted with Pertex®.
5.2.6. Digital image acquisition
Using an automated slide-scanning system (MIRAX Desk, Carl Zeiss MicroImaging
GmbH, Göttingen, Germany) stained slides were scanned and a digitised MRXS image of
the complete section was acquired at a final magnification of 20×. For visualisation and
cropping of the images, MIRAX Viewer software (Version 1.12, 3DHISTECH, Budapest,
Hungary) was used. For each slide, two microscope fields were randomly selected and
cropping performed at 100× magnification. A frame of 4.85 Mpixels was used to crop the
sections and twenty-four bit digital images were extracted as individual TIFF images (1:4
magnification, 2048 × 2048 pixels tile size, 2960 × 1640 pixels image size), and saved to
give a file size of 24 MB with a quality setting of 0.23 microns per pixel. Subsequently, using
IrfanView (Version 4.33, Wiener Neustadt, Austria) batch converter, all uncompressed bitmap
tiled TIFF images were converted into untiled TIFF files with sizes ranging from 13 to 14 MB.
5.2.7. Quantitative image analysis of immunohistological labelling
Cropped images were randomised and evaluated blind. Image processing and computer
operations were performed on a personal computer (Dell Latitude™ D630, Intel Pentium II
350 MHz processor, 128 MB RAM, 2 GB hard disk, under the environment of Microsoft™
Windows XP) operating the stand-alone KSRun software platform (Version 3.0, Carl Zeiss
Vision GmbH, München-Hallbergmoos, Germany), through which the developed algorithms
for detection and feature extraction were implemented. The flow chart for the process pipeline
is shown in Figure 2.3 and partly illustrated in Figures 3.1 and 5.1. For a more complete

CHAPTER 5
PAGE | 188
description please see Chapter 2 and Technical Notes A1 and B. In brief, following a
background correction and noise reduction of the source image, a binary image was created
(Figure 5.1 B). The empty space (i.e. comprising no tissue or cells; within the area shown in
Figure 5.1 B) was segmented by inverting the image to its negative and through intensity
differentiation, which in turn allowed proper segmentation of the peritoneal edge of the
muscularis externa and the internal intestinal lumen. Thereafter, the stratum compactum was
defined by interactive drawing over the displayed tissue image, so as to discriminate different
tissue areas (i.e. mucosal and submucosal tissues; Figure 5.1 E-F respectively).
Subsequently, for detection of the dark brown shades characteristic of the positive
immunohistological reactions, an interactively defined HLS colour threshold (Hue, Lightness,
Saturation: an alternative colour model to RGB providing a better match to perceived stain
colours) was set. Simultaneously, the threshold operation defined the mean average intensity
for the stained brown shades and divided selected thresholded pixels to white, and sub-
threshold, background pixels to black (Figure 5.1 G-H). Thus, the resulting binary image
represented the regions where the antigen protein expression had been detected. Thereafter
the area fraction of positive staining in the tissue was estimated by the number of white pixels
present in three distinct zones: (SUB) submucosal area, (SUP) above the stratum compactum
and up to 15-30 cell thickness above the basal area of the intestinal mucosal folds, and
(MUC) remaining mucosal area / apex of the intestinal folds (Figure 5.1 G-H). 10
Segmentation of all these histological components was performed sequentially. Regions
within the threshold ranges were highlighted, image overlays generated and stored as individual
image outputs. Finally, the thresholded regions of interest were automatically processed by a
succession of mathetical algorithms, extracting the pre-selected measurements (Section
1.1.6 from Technical Note B). Values for these were then transcribed and exported to a flat
Figure 5.1. (following page) Image outputs generated by the described image analysis algorithms, from
which morphometric features were extracted and employed to quantify and characterise specific
immunohistochemical biomarkers in the specimen’s distal gut. (A) A portion of a digitised histological
image, approximately one sixteenth of the full image used in the present study. (B) Binary image
created during the image segmentation process, where the empty space is differentiated by inverting

Quantitative immunostaining
PAGE | 189
F H I JG200 µm
A200 µm
C D EB
Figure 5.1. (continued from previous page) the image to its negative and through intensity differentiation,
which in turn allows accurate recognition of the peritoneal edge of the muscularis externa and the
internal intestinal lumen. (G, H, I) Regions within the established threshold ranges that were
recognised, quantified and had overlay masks reproduced into Figures F and J. Correspondingly, the
total immunohistochemically stained area for the entire tissue area (F, in pink), for the submucosal
tissue (J, in green), for the zone above the stratum compactum (J, in yellow) and for the remaining
mucosa (J, in red).

CHAPTER 5
PAGE | 190
database file. Quantitative variables were expressed as mean and standard deviations (SD), unless
otherwise specified.
5.2.8. Statistical analysis
Prior to statistical analysis, data were checked for normality and homogeneity of
variance by using the Kolmogorov-Smirnov and Levene’s test, respectively. All data
satisfying both assumptions either with or without the need for transformation, were
assessed by generalised linear mixed models (GLMM) with nested random factors, using
the Ime4 package (Bates & Maechler, 2010) provided by the statistical software R (Version
3.0.1, Bell Laboratories, Lucent Technologies, New Jersey, USA). An approximate F test on
the least-square means was used to estimate the significance of difference for each
treatment group in each comparison and Markov Chain Monte Carlo (MCMC) algorithms
employed to give an estimation of probability for the random effect modelling. Thereafter, in
order to determine if particular pairs of values were significantly different from each other
Tukey’s post-hoc multiple comparison tests were employed. Differences were considered
statistically significant when p-value < 0.05.
5.3. Results
5.3.1. Intestinal histomorphology
According to the normal histomorphological features previously described for salmonid
intestines (Bullock, 1963; Løkka et al., 2013), fish fed the fish meal and the
immunostimulant diets exhibited normal histology of the distal intestine, characterised by tall
mucosal folds; thin lamina propria and a submucosa with low to moderate numbers of
intraepithelial leucocytes; presence of well-differentiated enterocytes with highly to
moderate supranuclear vacuolisation and basally located nuclei (Figure 5.2. A-C, I-K). In
contrast, inclusion of soybean meal in the diet induced histopathological changes in the
distal intestine similar to those previously reported (Van den Ingh & Krogdahl, 1990;
Baeverfjord & Krogdahl, 1996). The fish showed a progression of changes consistent with
SBM-induced enteropathy, comprising a reduction of the normal supranuclear vacuolisation

Quantitative immunostaining
PAGE | 191
of the absorptive cells in the intestinal epithelium; shortening of the height of the mucosal
folds with an increased amount of connective tissue: and an increase of the lamina propria
within the mucosal folds due to a prominent mixed leucocyte infiltration, including some
eosinophilic granule cells (Figure 5.2 E-H).11
5.3.2. Biomarker immunolabelling – visual observations of labelling pattern
5.3.2.1. Cell proliferation and regeneration (PCNA). The antibody against proliferating
cell nuclear antigen reacted against a population of dividing epithelial cells at the base of
the mucosal folds, although a few immunoreactive nuclei-proliferating-enterocytes could
also be seen scattered along the entire intestinal fold (Figure 5.3, arrows). The labelling
profile observed for fish fed the immunostimulant diet did not differ substantially from the
fish fed the fish meal control diet (Figure 5.3 G, I). The soybean meal feed seemed to have
caused an increase in the PCNA-positive proliferative compartment at the base of the folds,
since fish fed the SBM diet had longer stretches of PCNA reactive cells than those fed the
other diets (Figure 5.3 J-K).Figure 5.2.
Figure 5.2. (following page) Representative images of morphological variations encountered across
the distal intestine of Atlantic salmon fed different experimental diets: (A-C) fish meal based control
diet, (E-G) diet containing 25 % defatted soybean meal and (I-K) diet with inclusion of
immunostimulant ingredients. The morphology of fish meal fed fish is considered as being the normal
standard, whereas fish fed soybean meal reflect an inflammatory response characterised by the loss
of vacuoles (V) in the absorptive enterocytes; the widening of lamina propria (Lp) in the mucosal
folds; an increase of the connective tissue (Ct) between the base of the mucosal folds and the
stratum compactum (Sc); a relatively increased number of mucous cells (MC) in the epithelium; and
an infiltration of inflammatory cells (e.g. asterisk, eosinophilic granule cells; cross, lymphocytes) in
the lamina propria and submucosa. The morphological profile from fish fed the immunostimulant diet
did not differ substantially from the fish meal fed fish. The first row of figures gives a general overview
of differences in the simple mucosal folds in between the complex folds that are illustrated in Figure
3.8. The second and third rows detail areas along the simple mucosal folds (MF) and the basal fold
area, respectively. Figure D illustrates an intracellular apoptotic body (arrow). Figures H, L and M
from the fourth row, picture a mixed population of inflammatory cells distributed throughout the
intestinal tissue. (Sg) Stratum granulosum. Sections were stained with a combination of
haematoxylin-eosin and Alcian blue 8 GX.

CHAPTER 5
PAGE | 192
125 µm
V
CtSc
Lp
MC −
− MC
A
MF
Ct
Sc
Lp
MC −
MC−
− MC
200 µm
E
MF V
Ct
Lp
MC −
− MCI
MF
Sc
125 µm
V
Lp
MC −
V
Lp
*
MC −
Sg
Sc
Sg
Sc
*
V
Lp
*
− MC
*
Sc
Sg
B JF
C KG
50 µm 25 µm 50 µm
50 µm 25 µm 50 µm
***
*
*
*
*
+
*
Ct
CtCt
D H L M
50 µm 25 µm 25 µm 25 µm
**
**
*
*
*
*
*
+
+
+
+
+

Quantitative immunostaining
PAGE | 193
F100 µm
G100 µm
25 µmD
E
C
25 µm
50 µmA
50 µm
50 µmB
H100 µm
100 µm J
I100 µm
Figure 5.3. Immunohistochemical detection of proliferating cell nuclear antigen (PCNA) in distal
intestinal tissue sections of Atlantic salmon fed either a (B, E, F) fish meal based control diet, a (A, C,
G, I) diet containing 25 % defatted soybean meal or a (D, H, I) diet with inclusion of immunostimulant
ingredients. The antibody directed against PCNA mainly reacted (brown colour) against a population
of dividing epithelial cells at the base of the simple mucosal folds, although a few nuclei proliferating
enterocytes could also be seen scattered along the entire intestinal fold (arrows). Sections were
counterstained with Gill’s haematoxylin.

CHAPTER 5
PAGE | 194
5.3.2.2. Programmed cell death or apoptosis (TUNEL). When intestinal sections from
fish fed the different diets were compared, inclusion of immunostimulant ingredients had no
apparent effect on the staining profile (Figure 5.4 A-C), with scarce apoptotic cells scattered
mostly in the epithelium of the intestinal folds, although some were also seen along the
stratum compactum (Figure 5.4). In contrast, a change of reactivity pattern was observed in
response to SBM, in which fish showed widespread apoptosis (Figure 5.4 G-I, arrows).
5.3.2.3. Eosinophilic granule cells (Active Caspase-3). Immunoreactive cells filled with
strongly stained cytoplasmatic granules, characteristic of eosinophilic granule cells (EGCs),
were distributed along both sides of the stratum compactum (Sc) forming the continuous
layer of the stratum granulosum (Sg), Figure 5.5 D-E. Most cells were embedded in the
external edge (Scext) of the stratum compactum, whereas the internal edge (Scint) and the
sub-epithelial layer of the lamina propria contained noticeably fewer cells (Figure 5.2; Figure
5.5 F and K). In the Sc and the muscularis layer, numerous EGCs were in close contact
with blood capillaries (Figure 5.2 L). In both control and immunostimulant diets the Sg was
rich in EGCs (Figure 5.5 A-C), but numbers seemed to be higher for fish fed the SBM diet.
Besides being prominent in the subepithelial connective tissue along the Sc, the lamina
propria and intestinal submucosa of SBM fed fish became infiltrated with immunostained
cells (Figure 5.5 G-I).12
Figure 5.4. (following page) Apoptosis labelled by a TUNEL assay in distal intestinal tissue
sections of Atlantic salmon fed either a (A, B) fish meal based control diet, a (G-I) diet
containing 25 % defatted soybean meal or a (C) diet with inclusion of immunostimulant
ingredients. The majority of the TUNEL-positive apoptotic cells were dispersed at the uppermost

Quantitative immunostaining
PAGE | 195
A100 µm
B100 µm 100 µm
C
G100 µm
H100 µm 100 µm
I
K25 µm
25 µmJ
25 µmL
25 µm
50 µm
50 µm
E
F
D
Figure 5.4. (continued from previous page) layer of the epithelium of the intestinal folds. (D-F, J-L)
Several intracellular apoptotic bodies showing characteristic features of cell death, i.e. fragmented
nucleus, rounding eosinophilic cytoplasm, chromatin condensation and marginalisation. Note the
debris and detached tissue in the intestinal lumen from Figure A showing strong immunostaining
reaction (brown colour) which is typical of apoptotic fragments. Intestinal sections were
counterstained with methyl green.

CHAPTER 5
PAGE | 196
100 µm
C 100 µm
A 100 µm B
20 µm F
20 µm D
25 µm E
L 100 µm
L
100 µm
H 100 µm
100 µm G
K 25 µm
J I 50 µm
Scint
Scext
Scint
Scext Sc
int
Scext
Scint
Scext
Scint
Scext
Scint
Scext
Figure 5.5. Immunostained eosinophilic granule cells (EGCs) in distal intestinal tissue sections of
Atlantic salmon fed either a (A) fish meal based control diet, (B, C) a diet with inclusion of
immunostimulant ingredients or (G-I) diet containing 25 % defatted soybean meal. A population of
EGCs is observed distributed throughout the intestinal tissue with a relatively high number along
the external edge of the stratum compactum (Scext) forming a continuous layer, the stratum

Quantitative immunostaining
PAGE | 197
5.3.2.4. T-cell-like cells (CD3ε).13Positive immunoreactive cells comprised a population
of lymphocytes, exhibiting a pattern suggestive of cell membrane or cytoplasmic staining
but no nuclear staining (Figure 5.6 A-F). Likewise, in the basal area of the mucosal folds
and along the stratum granulosum where a population of granule cells featured, a week
diffuse reaction was commonly observed (Figure 5.6 H, J, K). The staining profile seen for
fish fed the immunostimulant diet did not differ substantially from the fish fed the fish meal
control diet (Figure 5.6 G-I), where the CD3ε antibody reacted against a cell population
residing along the entire length of the mucosal folds in a basal intraepithelial position.
Occasional reactive cells were found scattered along the lamina propria and submucosa. In
fish fed the SBM, the positively reactive cells had a less regular position in the epithelium,
occupying sites at different heights of the epithelium. Also a moderate increase in the
number of anti-CD3ε reactive cells in the widened lamina propria and submucosa was also
seen (Figure 5.6 J-L).
Figure 5.5. (continued from previous page) granulosum (Sg). Positive cells were rarer between the base
of the epithelium and the stratum compactum (Sc), although some positive cells were found to be
dispersed in the immediate vicinity of the mucosal folds. By contrast, in tissue sections from fish fed
the soybean meal diet these cells seemed to have increased in number, and besides being
prominent in the subepithelial connective tissue along the Sc, the lamina propria and intestinal
submucosa showed highest infiltration with such immunostained cells. (E-D and J-L) Details of
reactive EGCs (brown colour) dispersed in different areas of the intestinal folds and submucosa from
fish fed with fish meal and SBM, respectively. (Scint) Internal edge of the Sc. Intestinal sections were
counterstained with Harris’s haematoxylin, and the immunoreactivity demonstrated by brown
staining.
Figure 5.6. (following page) Immunoreactivity to the antibody directed against a CD3ε epitope.
Immunoreactive cells exihibit a pattern suggestive of cell membrane or cytoplasmic staining. (A-F)
Figure shows distal intestinal tissue sections of Atlantic salmon fed either a (G, H) fish meal based
control diet, a (J-L) diet containing 25 % defatted soybean meal or (I) a diet with inclusion of
immunostimulant ingredients.

CHAPTER 5
PAGE | 198
25 µmE
25 µm B
G50 µm
25 µm C
25 µmA
25 µm
D
F25 µm
H50 µm I50 µm
J50 µm K50 µm L50 µm
Figure 5.6. (continued from previous page) Positively stained cells (brown colour) appear to comprise a
population of leucocytes which was located singularly or in small clusters (arrows) in the basal part of
the intraepithelium along the mucosal folds although a few more were found scattered along the the
lamina propria and submucosa, where a population of granule cells is also evident (yellowish
granules).Intestinal sections were counterstained with Gill’s haematoxylin.

Quantitative immunostaining
PAGE | 199
5.3.2.5. Mobilisation of stress related proteins for regenerative processes (HSP 70).
Immunohistochemical localisation of heat shock protein did not always follow the expected
labelling pattern. Although in appropriately expressing control tissue sections the elected
epitope showed positive staining, the signal was generally weaker than anticipated (Figure
5.7, arrows indicate that immune-expression tended to be most pronounced in the region of
highly differentiated tumour areas).
D EC
200 µm
A
100 µm 100 µm 100 µm
200 µm
B
En
En
En
LB
SG
SG
SG
Epi
Epi
LB
LB
LB
LBLB
LB
Figure 5.7. Immunohistochemical localisation of heat shock protein 70 (HSP 70) immunoreactive
cells recognised by an antibody, which labels both the constitutive (HSP 73) and inducible (HSP 72)
forms of HSP 70 in various tissues. (A, B) Canine cutaneous carcinoma tissues used as positive
controls, showing strong expression in the cytoplasm and nuclei of integumental cancerigeous cells.
Occasionally, immune-expression trended toward highly differentiated tumour areas (arrows) and the
outmost layers of the epidermis (i.e. stratum spinosum and granulosum from the inside out). (C, D, E)
Teleost intestinal sections where immunostaining was expected along a population of epithelial cells
at the tip of the simple mucosal folds, however the immunoreactivity was once again not coherent or
reproducible with respect to that previously obtained by other authors. (LB) Lobule of epithelial cells
from the cutaneous tumour. (SG) Sweat glands. (Epi) Epidermis. (En) Intestinal enterocytes.
Sections were conterstained with Gill’s haematoxylin.

CHAPTER 5
PAGE | 200
Additionally, the antibody occasionally showed inconsistent staining and inappropriate
localisation of signal. Similarly, for Atlantic salmon intestinal sections where immunoreactivity
was expected along a population of epithelial cells at the tip of the simple mucosal folds, the
immunostaining signal was consistently minimal, being confined to less than 5 % of the
mucosal folds and in some cases even being completely absent (Figure 5.7 D-E).
5.3.2.6. Facilitation of nutrient uptake and ion transport (Na+K+-ATPase). The
distribution pattern of the Na+K+-ATPase staining for the control tissues from sea-water
adapted Atlantic salmon, was clear in gill and kidney sections. In fish gills intense
immunoreaction was confined to large spherical cells within the surface interlamellar
regions of the filamental epithelium and the proximal end of the secondary lamellae (Figure
5.8 A, arrows), which correlated with the location of the so-called mitocondrial-rich ionocytes
or chloride cells.
50 µm
A
B
50 µm
C D
100 µm 100 µm
E
100 µm
CT
DT
PF
SL
SL
GL
En
En
En
PT
Figure 5.8. Immunohistochemical detection of Na+K
+-ATPase immunoreactive cells (brown colour)
recognised by an antibody against the conserved α-subunit region, in seawater-adapted Atlantic
salmon gill, kidney and intestinal tissue sections. (A) In gills, intense immunoreaction was confined
to mitocondrial-rich ionocytes or chloride cells (arrows). (B) In kidneys, the antibody stained the
basolateral epithelium of proximal, distal convoluted and collecting tubules.
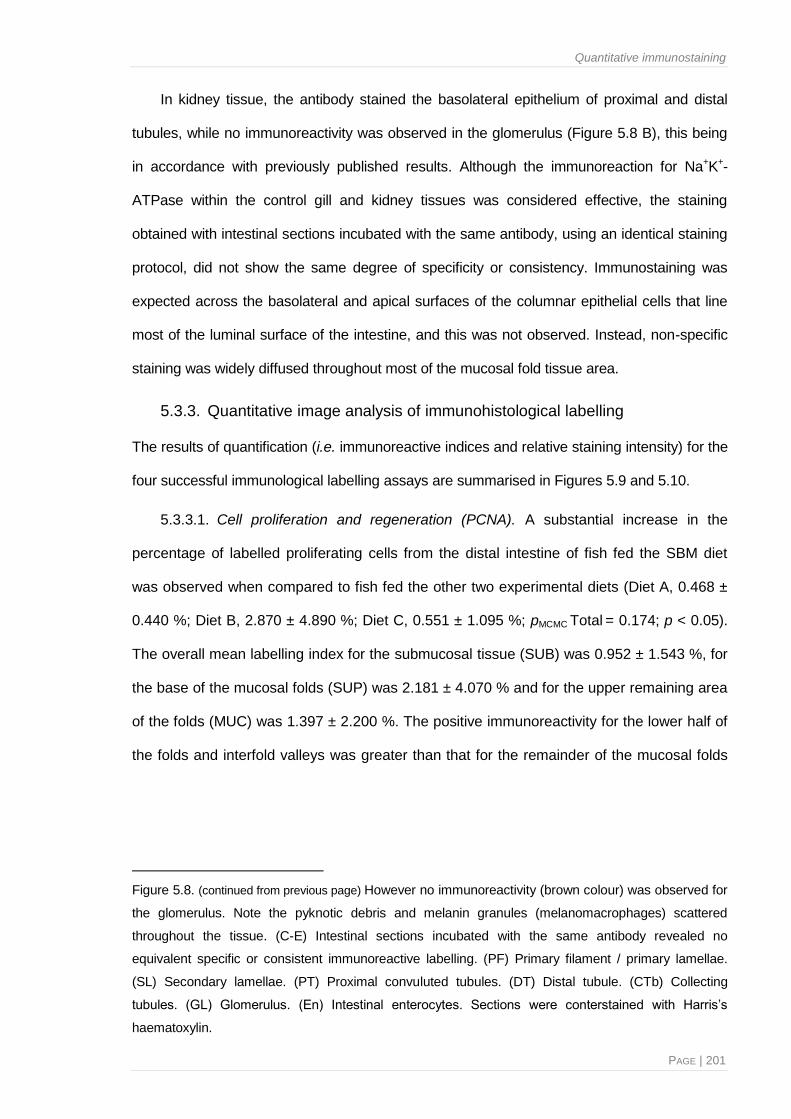
Quantitative immunostaining
PAGE | 201
In kidney tissue, the antibody stained the basolateral epithelium of proximal and distal
tubules, while no immunoreactivity was observed in the glomerulus (Figure 5.8 B), this being
in accordance with previously published results. Although the immunoreaction for Na+K+-
ATPase within the control gill and kidney tissues was considered effective, the staining
obtained with intestinal sections incubated with the same antibody, using an identical staining
protocol, did not show the same degree of specificity or consistency. Immunostaining was
expected across the basolateral and apical surfaces of the columnar epithelial cells that line
most of the luminal surface of the intestine, and this was not observed. Instead, non-specific
staining was widely diffused throughout most of the mucosal fold tissue area.14
5.3.3. Quantitative image analysis of immunohistological labelling
The results of quantification (i.e. immunoreactive indices and relative staining intensity) for the
four successful immunological labelling assays are summarised in Figures 5.9 and 5.10.
5.3.3.1. Cell proliferation and regeneration (PCNA). A substantial increase in the
percentage of labelled proliferating cells from the distal intestine of fish fed the SBM diet
was observed when compared to fish fed the other two experimental diets (Diet A, 0.468 ±
0.440 %; Diet B, 2.870 ± 4.890 %; Diet C, 0.551 ± 1.095 %; pMCMC Total = 0.174; p < 0.05).
The overall mean labelling index for the submucosal tissue (SUB) was 0.952 ± 1.543 %, for
the base of the mucosal folds (SUP) was 2.181 ± 4.070 % and for the upper remaining area
of the folds (MUC) was 1.397 ± 2.200 %. The positive immunoreactivity for the lower half of
the folds and interfold valleys was greater than that for the remainder of the mucosal folds
Figure 5.8. (continued from previous page) However no immunoreactivity (brown colour) was observed for
the glomerulus. Note the pyknotic debris and melanin granules (melanomacrophages) scattered
throughout the tissue. (C-E) Intestinal sections incubated with the same antibody revealed no
equivalent specific or consistent immunoreactive labelling. (PF) Primary filament / primary lamellae.
(SL) Secondary lamellae. (PT) Proximal convuluted tubules. (DT) Distal tubule. (CTb) Collecting
tubules. (GL) Glomerulus. (En) Intestinal enterocytes. Sections were conterstained with Harris’s
haematoxylin.

CHAPTER 5
PAGE | 202
PCNA TUNEL
Active Caspase-3 CD3-ε
*
●
●
* ●
●
Figure 5.9. Immunoreactive indices (i.e. staining ratio per unit area) of the histolabelling with four
distinct biomarkers, performed in distal intestinal histological sections from Atlantic salmon fed
different experimental diets. (Diet A) Standard fish meal based feed used as control diet. (Diet B)
Soybean meal based feed. (Diet C) Standard feed with inclusion of immunostimulant ingredients.
(PCNA) Proliferating cell nuclear antigen. (TUNEL) Terminal deoxynucleotidyl transferase dUTP nick
end labelling. (Active Caspase-3) Protein member from the cysteine aspartic acid protease family.
(CD3ε) T-cell surface glycoprotein cluster of differentiation epsilon chain. The middle line of the box
plot indicates the median for each group, the box edges mark the distribution between the 25th and
75th percentiles, while the whiskers represent the maximum and the minimum values without being
outliers. Different symbols indicate significant mean value differences at p < 0.05 (n = 36 histological
frames per treatment group; Hierarchical GLMM: tank [treatment] fixed factor with 3 levels).
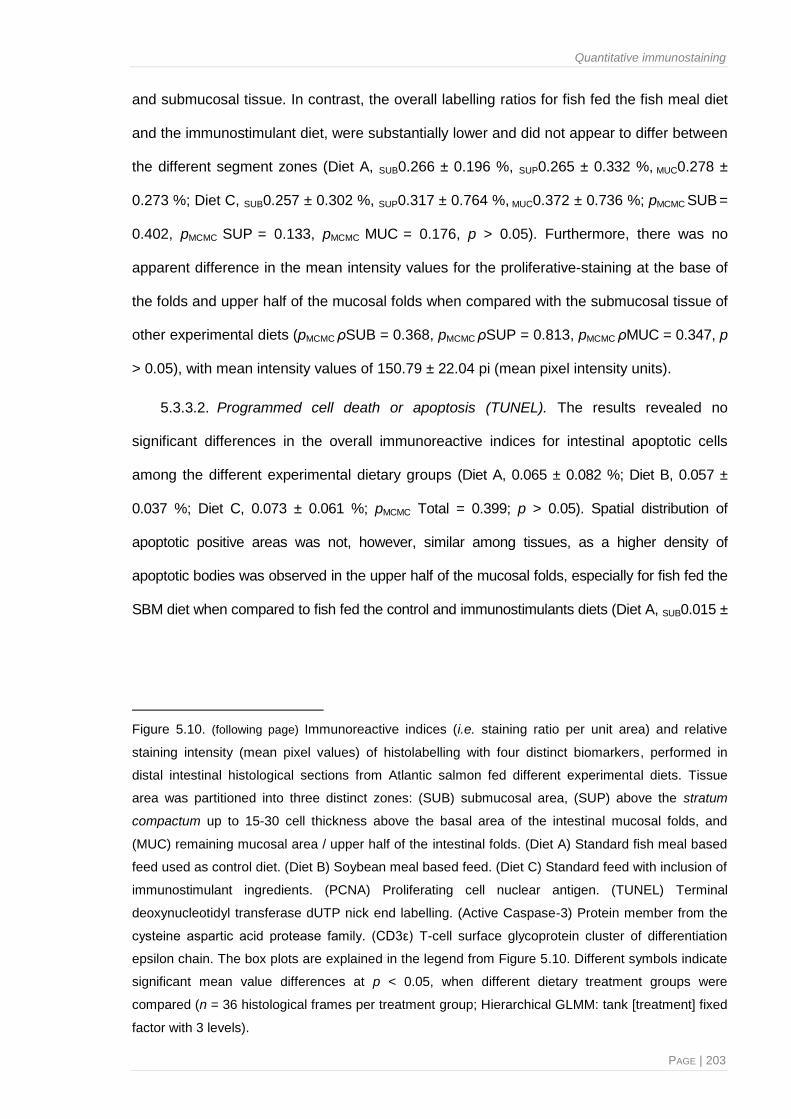
Quantitative immunostaining
PAGE | 203
and submucosal tissue. In contrast, the overall labelling ratios for fish fed the fish meal diet
and the immunostimulant diet, were substantially lower and did not appear to differ between
the different segment zones (Diet A, SUB0.266 ± 0.196 %, SUP0.265 ± 0.332 %, MUC0.278 ±
0.273 %; Diet C, SUB0.257 ± 0.302 %, SUP0.317 ± 0.764 %, MUC0.372 ± 0.736 %; pMCMC SUB =
0.402, pMCMC SUP = 0.133, pMCMC MUC = 0.176, p > 0.05). Furthermore, there was no
apparent difference in the mean intensity values for the proliferative-staining at the base of
the folds and upper half of the mucosal folds when compared with the submucosal tissue of
other experimental diets (pMCMC ρSUB = 0.368, pMCMC ρSUP = 0.813, pMCMC ρMUC = 0.347, p
> 0.05), with mean intensity values of 150.79 ± 22.04 pi (mean pixel intensity units).15
5.3.3.2. Programmed cell death or apoptosis (TUNEL). The results revealed no
significant differences in the overall immunoreactive indices for intestinal apoptotic cells
among the different experimental dietary groups (Diet A, 0.065 ± 0.082 %; Diet B, 0.057 ±
0.037 %; Diet C, 0.073 ± 0.061 %; pMCMC Total = 0.399; p > 0.05). Spatial distribution of
apoptotic positive areas was not, however, similar among tissues, as a higher density of
apoptotic bodies was observed in the upper half of the mucosal folds, especially for fish fed the
SBM diet when compared to fish fed the control and immunostimulants diets (Diet A, SUB0.015 ±
0.015%,SUP0.034 ±Figure 5.10
Figure 5.10. (following page) Immunoreactive indices (i.e. staining ratio per unit area) and relative
staining intensity (mean pixel values) of histolabelling with four distinct biomarkers, performed in
distal intestinal histological sections from Atlantic salmon fed different experimental diets. Tissue
area was partitioned into three distinct zones: (SUB) submucosal area, (SUP) above the stratum
compactum up to 15-30 cell thickness above the basal area of the intestinal mucosal folds, and
(MUC) remaining mucosal area / upper half of the intestinal folds. (Diet A) Standard fish meal based
feed used as control diet. (Diet B) Soybean meal based feed. (Diet C) Standard feed with inclusion of
immunostimulant ingredients. (PCNA) Proliferating cell nuclear antigen. (TUNEL) Terminal
deoxynucleotidyl transferase dUTP nick end labelling. (Active Caspase-3) Protein member from the
cysteine aspartic acid protease family. (CD3ε) T-cell surface glycoprotein cluster of differentiation
epsilon chain. The box plots are explained in the legend from Figure 5.10. Different symbols indicate
significant mean value differences at p < 0.05, when different dietary treatment groups were
compared (n = 36 histological frames per treatment group; Hierarchical GLMM: tank [treatment] fixed
factor with 3 levels).
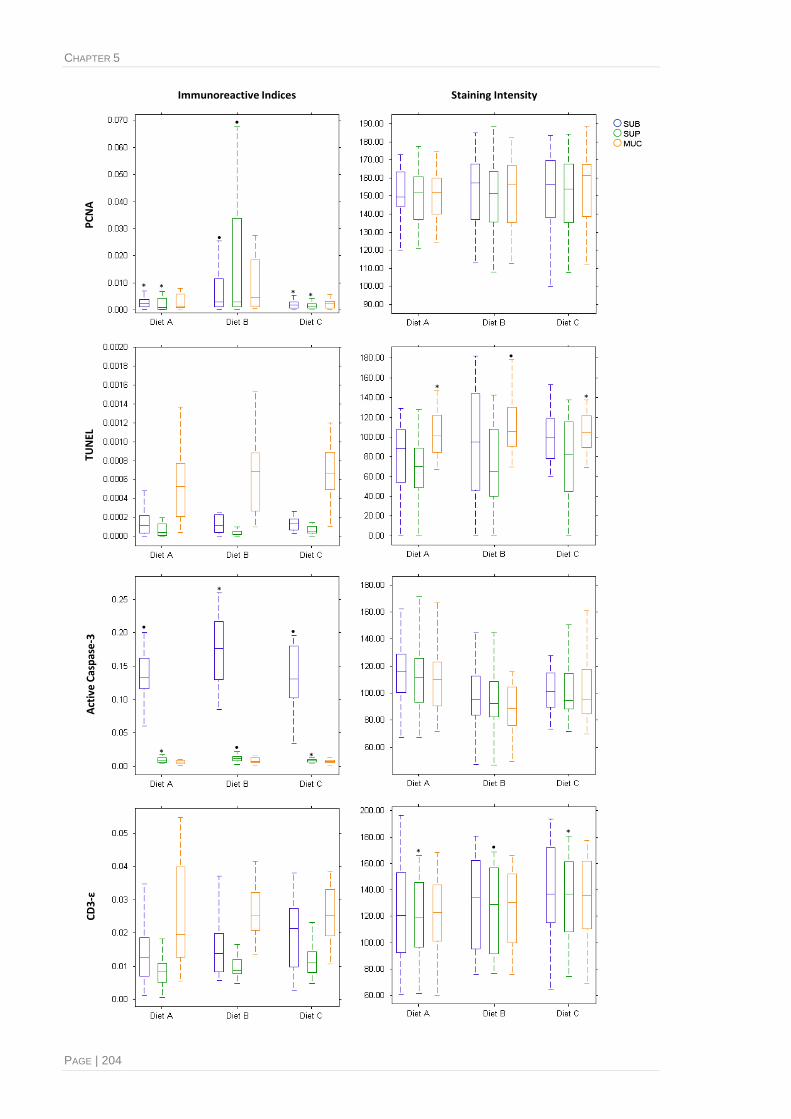
CHAPTER 5
PAGE | 204
Act
ive
Cas
pas
e-3
PC
NA
TUN
ELC
D3-
εImmunoreactive Indices Staining Intensity
CD
3-ε
* ** *
●
*
●
*
●
●
*
*
●
*
●
*●
*

Quantitative immunostaining
PAGE | 205
0.015 %, SUP0.034 ± 0.117 %, MUC0.057 ± 0.040 %; Diet B, SUB0.024 ± 0.036 %, SUP0.004 ±
0.004 %, MUC0.066 ± 0.041 %; Diet C, SUB0.048 ± 0.120 %, SUP0.007 ±0.007 %, MUC0.079 ±
0.062 %; pMCMC SUB = 0.343, p > 0.05; pMCMC SUP = 0.256, p > 0.05; pMCMC MUC = 0.316, p
< 0.05). Moreover, no obvious differences in the mean intensity values for the apoptotic-
staining at the base of the folds and submucosal tissue areas were noticed between the
different dietary groups (pMCMC ρSUB = 0.440, pMCMC ρSUP = 0.468, p > 0.05), although a
trend for more dense staining was perceived for the upper half of the mucosal folds,
especially for fish fed the SBM diet (pMCMC ρMUC = 0.220, p < 0.05), whereas a lighter
staining was apparent for the segmented area above the stratum compactum and across
the base of the folds (Diet A, ρSUB83.39 ± 35.47 pi, ρSUP67.30 ± 47.00 pi, ρMUC103.33 ± 22.67
pi; Diet B, ρSUB93.7 ± 52.10 pi, ρSUP64.5 ± 46.7 pi, ρMUC109.32 ± 28.90 pi; Diet C, ρSUB100.17 ±
25.19 pi, ρSUP76.95 ± 41.45 pi, ρMUC104.30 ± 20.98 pi).
5.3.3.3. Eosinophilic granule cells (Active Caspase-3). Immunoreactive indices were
greater in fish fed the SBM diet, whereas the positive reaction for the intestinal sections
from fish fed the other two diets was significantly lower, although not significantly dissimilar
to one another (Diet A, 5.49 ± 2.15 %; Diet B, 6.91 ± 2.47 %; Diet C, 5.32 ± 2.19 %; pMCMC
Total = 0.102; p < 0.05). Besides having the more prevalent staining in the submucosal
tissue areas of the intestine for all treatment groups, fish fed the SBM diet had the longest
stretches of caspase-3 staining along the basal area of the mucosal folds, and alongside
the internal edge of the stratum compactum (Diet A, SUB14.13 ± 4.56 %, SUP0.886 ± 0.459 %,
MUC0.637 ± 0.414 %; Diet B, SUB17.07 ± 5.03 %, SUP1.228 ± 0.703 %, MUC0.890 ± 0.590 %;
Diet C, SUB13.35 ± 5.02 %, SUP0.847 ± 0.436 %, MUC0.798 ± 0.623 %; pMCMC SUB = 0.104, p <
0.05; pMCMC SUP = 0.112, p < 0.05; pMCMC MUC = 0.239, p > 0.05). While no noteworthy
variations in the immunolabelling intensity were seen within tissue sections from distinct
dietary groups nor across the three tissue segments (pMCMC ρSUB = 0.193, pMCMC ρSUP =
0.158, pMCMC ρMUC = 0.211, p > 0.05), staining for sections from fish fed SBM tended to be
slightly less intense. Mean overall intensity values (i.e. for all experimental groups), were 105.35
± 27.46 pi.

CHAPTER 5
PAGE | 206
5.3.3.4. T-cell-like cells (CD3ε). Whereas the overall staining indices were apparently
higher for fish fed the diet containing immunostimulant ingredients (Diet A, 2.876 ± 1.627 %;
Diet B, 3.023 ± 0.867 %; Diet C, 3.166 ± 1.085 %; pMCMC Total = 0.4180; p > 0.05), this was
shown not to be significantly different since there was substantial overlap from data
obtained for all three tissue segments examined for the two other diets. (Diet A, SUB1.463 ±
0.992 %, SUP1.012 ± 0.714 %, MUC2.450 ± 1.576 %; Diet B, SUB1.598 ± 0.993 %, SUP0.991 ±
0.370 %, MUC2.599 ± 0.696 %; Diet C, SUB2.022 ± 1.051 %, SUP1.163 ± 0.511 %, MUC2.479 ±
0.785 %; pMCMC SUB = 0.175, pMCMC SUP = 0.235, pMCMC MUC = 0.247, p > 0.05). There
seemed to be no differences in the staining intensity of tissue samples observed, except for
the area at the base of the mucosal folds and interfold valleys where fish fed the
immunostimulant diet seemed to have a denser staining profile (Diet A, ρSUB125.18 ± 38.05
pi, ρSUP120.68 ± 29.97 pi, ρMUC121.38 ± 29.39 pi; Diet B, ρSUB132.25 ± 35.16 pi, ρSUP125.41 ±
33.86 pi, ρMUC125.46 ± 32.02 pi; Diet C, ρSUB137.44 ± 41.21 pi, ρSUP133.10 ± 35.88 pi,
ρMUC133.11 ± 35.01 pi; pMCMC ρSUB = 0.612; p > 0.05; pMCMC ρSUP = 0.146, p < 0.05; pMCMC
ρMUC = 0.356, p > 0.05).
5.4. Discussion
The turnover of intestinal cells is a physiological mechanism which helps to ensure the
structural and functional integrity of the intestine, this in turn playing an essential role in
intestinal homeostasis and inflammation (Aherne et al., 2013). Normal homeostasis of the
intestinal epithelium is a dynamic process maintained by a balance between proliferation,
migration, differentiation and apoptosis (Hong et al., 1997). This process is regulated by
numerous luminal nutrients, hormones, growth factors and / or cytokines, which may be
influenced by several dietary elements.
While studies examining intestinal responses to dietary modulation in salmonid fish are
common, information on the relationship between cellular differentiation, shedding and
migration and how the dynamic equilibrium between these processes is influenced by diet is
lacking. Thus, understanding how these cellular responses vary in the presence of different

Quantitative immunostaining
PAGE | 207
dietary ingredients should help strengthen our understanding of the basic mechanisms
involved in intestinal cell turnover and in turn help selection of optimal feed ingredients in
the future. This study therefore attempts to provide a provisional quantitative assessment of
selected functional changes occurring in the intestine during normal and pathological
processes leading to teleost intestinal disorders, with particular emphasis on the
characterisation of inflammation generated by an enteropathy-causing diet (i.e. unrefined
soybean meal diet), through the investigation of quantifiable IHC biomarkers.
Soybean meal induced enteritis in Atlantic salmon, a widely documented inflammation
of the hindgut, is considered to be a suitable model for diet-related mucosal disorders in
teleosts. The condition, in which dietary soya saponins seem to affect the differentiation of
distal intestinal epithelial cells and compromise overall intestinal integrity, seems analogous
to several other pathophysiological intestinal responses. In this study, the morphological
characteristics of the inflamed distal intestine of SBM fed fish were identical to those
previous reported by other authors (Van den Ingh & Krogdahl, 1990; Baeverfjord &
Krogdahl, 1996; Urán, 2008). By contrast the inclusion of immunostimulant in the diets used
here, showed little difference from the control diet.
A number of different biomarkers have been used to visualize responses to various
dietary ingredients (Sveinbjørnsson et al., 1996; Sanden et al., 2005; Bakke-McKellep et al.,
2007a, 2007b; Olsvik et al., 2007; Ronza et al., 2011; Romarheim et al., 2011; Chikwati et
al., 2013a, 2013b; inter alia). In the present study five different features of tissue response
were evaluated to assess the effects of the experimental diets used in the study: (1) cell
proliferation and regeneration (PCNA); (2) programmed cell death or apoptosis (TUNEL);
(3) eosinophilic granule cells (Active caspase-3) and t-cell like infiltration (CD3ε); (4)
mobilisation of stress related protein regenerative processes (HSP 70) and (5) facilitation of
nutrient uptake and ion transport (Na+K+-ATPase).
The selected markers were assessed and initially evaluated based on their assumed
pattern of reactivity within positive control tissue sections that were known to express the
epitopes of interest. Once a satisfactory staining protocol had been optimised (i.e. suitable

CHAPTER 5
PAGE | 208
fixation, blocking, antigen retrieval and antibody incubation) for the postitive tissue controls,
in which a specific and strong reaction should be clearly seen indicating the presence and
location of the antigen, the protocols were standardised for Atlantic salmon intestine.
Despite some of the biomarkers sometimes giving inconclusive staining, most of the
biomarkers assessed showed promising results.
5.4.1. Cell proliferation and regeneration (PCNA)
Proliferating cell nuclear antigen is a highly conserved auxiliary protein directly involved
in DNA synthesis during all phases of the cell cycle, except the resting phase (Wolf &
Dittrich, 1992; Ortego et al., 1994), and is expressed during cell division and proliferation
(Kilemade et al., 2002). Cellular proliferation is a critical biological process (Hall et al.,
1994a), and plays an important role in compensatory cell renewal after loss of cells critically
damaged by apoptosis, and hence is important for maintaining the integrity of fish tissue
(Berntssen et al., 2004).
Although teleost fish have less distinct compartmentalisation with regard to intestinal
cell proliferation compared to higher vertebrates (Hemre et al., 2004), under normal
conditions of homeostasis, proliferating intestinal cells are more restricted to the basal part
of intestinal folds (Ortego et al., 1994; Berntssen et al., 2004; Hemre et al., 2004). The
results from the present study corroborate this, and although proliferating cells were
observed at all levels of the intestinal mucosal folds, labelled PCNA reactive cells were
generally more abundant at the base and lower half of the mucosal folds.
The increased cell proliferation and resulting longer stretches of PCNA reactive cells
seen in the distal intestine of SBM fed fish, are indicative of an increased rate of cell repair
and / or cellular renewal. This may represent an attempt to compensate for an extensive
loss of epithelial cells caused by the anti-nutritional factors present in the soya ingredients,
which are known to induce enteritis in the fish (Bakke-McKellep et al., 2007b; Romarheim et
al., 2011). Sanden et al. (2005) and Chikwati et al. (2013a) reported a similar response in
cell proliferation in the distal intestine of salmon fed SBM. By contrast, the immunostimulant
additives used in the fish feeds in the present study, did not seem to produce a similar level

Quantitative immunostaining
PAGE | 209
of cell regeneration, as the labelling profile in these fish did not differ substantially from the
fish fed the control diet.
5.4.2. Programmed cell death or apoptosis (TUNEL)
As mentioned earlier, intrinsic cell death has a crucial role in the normal development
and homeostasis of multicellular organisms (Takle & Andersen, 2007). Under normal
cellular kinetics, a balance between cell proliferation and regulated cell death maintains the
tissue integrity of the intestine (Hall et al., 1994a, 1994b; Berntssen et al., 2004). Moreover,
cell death is essential for many physiological events, including innate and adaptive immune
defence mechanisms against extraneous agents. Conversely, it also plays an important role
in the pathogenesis of a variety of diseases (Dos Santos et al., 2008). Cell death can be
considered as a normal process by which cell population dynamics are correctly maintained
(Ferrando et al., 2009). There are two types of cell death: necrosis and apoptosis. They
correspond to cell death by extrinsic or intrinsic factors, respectively. Extrinsic factors
include mechanical injury, the actions of infectious organisms, or toxic / anti-nutritional
substances. Nevertheless, extrinsic factors could induce apoptosis indirectly, i.e. via the
action of other intrinsic factors such as cytotoxic agents or hormones (Wyllie et al., 1980;
Bonga & Van der Meij, 1989). Necrosis is structurally characterised by swelling of cells and
cellular compartments, followed by disruption. On the other hand, apoptotic cells show a
characteristic sequence of cellular shrinkage, loss of cell-cell contacts, chromatin
marginalisation and condensation, followed by eventual breakage of the cell into apoptotic
bodies (Rojo & Gonzalez, 1998; Van Cruchten & Van den Broeck, 2002).
Staining of breaks in double or single stranded DNA by terminal transferase mediated
dUTP nick end-labelling technique (TUNEL) can not by itself distinguish between DNA
fragmentation occurring during apoptosis or necrotic cell death (Weber et al., 2002).
However, in the present study TUNEL-positive cells exhibited membrane blebbing and cell
body shrinkage consistent with apoptotic cell morphology. Furthermore, the majority of the
TUNEL-positive cells were non-contiguous, also consistent with apoptosis (Rojo &
Gonzalez, 1998; Saraste & Pulkki, 2000).

CHAPTER 5
PAGE | 210
The labelling pattern visualised by the TUNEL method, both in respect to the
appearance of the cells and their distribution, corroborates previous IHC findings indicative
of apoptosis (Bakke-McKellep et al., 2007b; Ostaszewska et al., 2010). The staining was
not localised to any particular region of the intestine, but a general staining of epithelial cells
scattered along the mucosal folds and across the stratum granulosum was observed. The
relatively increased number of apoptotic cells in SBM fed fish appeared to be a response to
the unidentified anti-nutritional factors in the diet, which induced enteritis. This increase in
TUNEL-positive cells may be an indication of cellular recovery via an apoptotic pathway
(Bakke-McKellep et al., 2007b). This could partially explain the shortening of the mucosal
folds characteristic of the pathological condition in question.
Despite an increasing trend in the number of individual apoptotic cells in the intestine of
SBM fed salmon, the lack of a significant increase in the total area of reactivity when
compared to the other dietary groups, is most likely due to the sample sizes and the fact
that the total stained area was assessed instead of counting individual cells. Denser
staining was seen among cells found in the upper half of the mucosal folds. This is not
entirely surprising, considering that the intestinal cell turn-over is mediated by the formation
of new cells in the crypts of the intestinal folds, which migrate towards the tips of the
intestinal folds where they are lost after regulated cell death (Hall et al., 1994b; Berntssen et
al., 1999). Also, during the apoptotic process, all cellular constituents including fragmented
DNA are packaged into vesicles (i.e. more condensed structures consequently resulting in a
higher staining intensity) forming apoptotic bodies, in order to be absorbed and recycled by
neighbouring tissue and cells (Weber et al., 2002).
5.4.3. Eosinophilic granule cells (Active Caspase-3)
Eosinophilic granule cells (EGCs) are specialised mononuclear cells, which are
considered to have a role in inflammation and the host defense of teleosts, and can be
found in a variety of tissues, including the gastrointestinal tract, skin and gills (Ezeasor &
Stokoe, 1980; Ellis, 1985; Sveinbjørnsson et al., 1996; Murray et al., 2007).
Quantitative immunostaining
PAGE | 211
The general morphology, staining characteristics and tissue distribution together with
discussion of some of the proposed functions of these cells are thoroughly reviewed in the
following Chapter 6 of this thesis and therefore will not be discussed in detail in the present
chapter. The question of the exact physiological function of EGCs and the content of their
prominent granules remains somewhat controversial, however, cytochemical characteristics
and their tissue distribution have led to the suggestion that these cells are analogous to
mammalian mast cells (Powell et al., 1993a; Sire & Vernier, 1995; Matsuyama & Iida, 1999;
Dezfuli et al., 2008). Studies have shown that an increase in the number of these cells is
often associated with chronically-inflamed tissues, whereas acute tissue damage causes
eosinophilic granule cell degranulation and release of mediators of inflammation (Reite &
Evensen, 2006; Manera et al., 2011; Lauriano et al., 2012). Therefore, EGCs may be linked
with immune-hypersensitive responses that occur in the intestine, due to dietary modulation
and hence the quantitative appraisal of their distribution in intestinal tissue would provide
valuable information.
In the present study, the antibody against caspase-3 reacted explicitly with cells
resembling EGCs both in their distribution and their morphology (see Chapter 6 for
additional information relating to this finding). These cells had a granular cytoplasm and
were usually localised in the connective tissue adjacent to the stratum compactum.
Furthermore, for adjacent serial tissue sections, the cytoplasmic granules in those cells
stained red with H&E, blue / bluish violet with MGG stain, and red with phloxine-tartrazine
stain, which according to Sveinbjørnsson et al. (1996) and Reite (1997) confirms that the
cells labelled with the caspase-3 antibody were indeed EGCs.
The anti-ACTIVE® Caspase-3 polyclonal (G7481, Promega, Madison, USA) used here,
is commercially endorsed for its ability to specifically recognize the cleaved active form of
caspase-3, a key component in mediating the execution phase of apoptosis. However, the
role of caspase-3 in regulating EGC degranulation remains unknown, although Wyllie et al.
(1980) suggested that degranulating EGCs are not undergoing apoptosis or necrosis, since
no evidence of changes in the nuclear envelope or the chromatin distribution within the

CHAPTER 5
PAGE | 212
nucleus is evident. Thus, although the epitopes that might be cross-reacting / recognised by
this antibody can not be currently confirmed, data presented in Chapter 6 may help support
the hypothesis that prominent degranulating subcellular features from the cytoplasmic
granules of these cells demonstrate the presence and accumulation of elements positive to
caspase-3.
In the present study, feeding SBM to fish resulted in a significant increase in the
inflammatory cells identified as EGCs (with the anti-caspase 3 antibody), along the basal
area of the mucosal folds and the internal edge of the stratum compactum. Such dynamic
behaviour of EGC-labelled intestinal cells in the inflamed distal intestine of SBM fed Atlantic
salmon, is in accordance with that previously described (Bakke-McKellep et al., 2000b;
Knudsen, 2007) and it is speculated that they play an important role in immune surveillance.
However, given that specific markers of the activation state of these cells in salmonids are
lacking, further studies are needed to determine whether the described dynamics are a
result of / or of themselves induce the perceived changes observed in intestinal mucosal
immunity.
In contrast to the findings of Picchietti et al. (2007), who showed that feeding probiotics
increased the number of these cells in the intestine of Atlantic salmon, the
immunostimulants included in one of the experimental diets used in the present study, did
not seem to influence the mobilisation of EGCs. Nevertheless, it is important to remember
that in this specific study we were looking at constitutive rather than responsive
mobilisation. Therefore, the ideal approach to evaluate the responsiveness of these cells
would have been via in vivo infectious challenge tests. In these differentially fed animals
might have been challenged and / or stimulated under unfavourable environmental
conditions, or confronted with virulent / infectious pathogens. For these reason, the prospect
of including such testing models in future studies (especially in the initial screening phase),
is very appealing.

Quantitative immunostaining
PAGE | 213
5.4.4. T-cell-like cells (CD3ε)
Intestine-associated lymphocytes have been described in fish, but their involvement
and functional relevance in immune responses still remains to be defined (Bernard et al.,
2006; Rombout et al., 2011).
The polyclonal against human Cd3ɛ, part of the T-cell receptor (TCR) complex, used in
this experiment, has been show to cross-react with T cells in teleosts (Liu et al., 2008).
Immunohistochemistry using this antibody indicate the presence of putative T-cells in the
epithelial lining, lamina propria and submucosa of the intestine and suggests that these
cells make up a large proportion of the inflammatory cell infiltrate observed in salmon fed
SBM, as earlier described by Bakke-McKellep et al. (2007a), Lilleeng et al. (2009) and
Ronza et al. (2011). However, contrary to what was expected, the overall staining indices in
the present study did not significantly increase with supplementation of SBM or
immunostimulants in the diet. This may be partly due to the fact that different immune
mechanisms occur at different time points along an immune response profile and that
perhaps the T-cells were sensitised towards the soya antigens earlier on, and were down-
regulated at the time of the sampling. It may be, however, that simply because of the
sample sizes being analysed, such changes might have not have been resolvable.
Nevertheless, it is still uncertain whether this reaction is involved in the induction of
inflammatory processes or as a defence against possibly epithelial injury. The underlying
regulatory mechanisms remain unknown, and again the lack of specific antibodies for T-cell
precursors in fish, constrains further understanding of pathogenesis through the use of
immunomarkers in IHC (Bakke-McKellep et al., 2000b, 2007a; Lilleeng et al., 2009;
Romarheim et al., 2013a). Thus, further studies are again required to detail the T-cell
involvement in the soybean-induced enteropathy.
5.4.5. Mobilisation of stress-related proteins for regenerative processes (HSP 70)
Heat shock proteins (HSPs) are a group of highly conserved intracellular proteins,
classified into several families on the basis of their approximate molecular weight (Mosca et
al., 2012). In teleosts there are constitutive members (e.g. HSC 70), which are required in

CHAPTER 5
PAGE | 214
various aspects of metabolism to maintain cellular homeostasis, and inducible forms (e.g.
HSP 70), which are expressed at detectable levels in response to acute stressors
(Poltronieri et al., 2009; Iwama et al., 1998). HSPs are considered to comprise a regulative
component of the immune system response, being involved in protecting against excessive
inflammatory events by optimising antigen processing and / or inducing the release of
cytokines (Asea et al., 2000; Mosca et al., 2012). They are induced by a wide spectrum of
physical, chemical and biological stimuli, including hyperthermia, osmotic stress, heavy
metal exposure, chemical shock, oxidative stress caused both by anoxia and hypoxia, fever
or inflammation amongst others (Sandnes et al., 1995; Iwama et al., 1998; Gornati et al.,
2004; Maradonna & Carnevali 2007; Fujikawa et al., 2012). Within this context, the
assessment of HSP expression an indicator of stress and animal health status appears very
promising (Iwama et al., 2004; Antonopoulou et al., 2013).
Some authors have also suggested that induction of heat shock protein 70 (HSP 70,
68-73 kDa) during inflammation could reflect an attempt to regulate the apoptotic pathway
and mediate cellular recovery (Bakke-McKellep et al., 2007b; Poltronieri et al., 2009; Mosca
et al., 2012). For this reason, a change of reaction pattern as part of an inflammatory
response, in which the SBM diet was expected to cause an increase in the HSP 70
reactivity over the epithelial cells at the tips of the mucosal folds, was anticipated. However,
the pattern of reactivity seen with the anti HSP 70 was less obvious, and in some cases of
enteropathy even absent. It might thus be speculated that HSP 70 related protein-products
may be short-lived and that maybe affected cells disappear rapidly. In fact, most inducible
HSPs do not contain introns, therefore within a few minutes of exposure to stressors their
mRNA may be translated into protein (Mayer et al., 2000). This may be an explanation as to
why the IHC expression documented in the current study was so unpredictable, unreliable
and inconsistent. Also there are fewer instances where the cellular localisation of HSP70 by
IHC has been described in the literature (Burkhardt-Holm et al., 1998; Kagawa et al., 1999;
Santos et al., 2008; Poltronieri et al., 2009), thus, further work is needed to better define

Quantitative immunostaining
PAGE | 215
and understand the functional significance of HSP 70 in the immune response of fish,
particularly with respect to factors involved in the innate and adaptive immune system.
5.4.6. Facilitation of nutrient uptake and ion transport (Na+K+-ATPase)
Absorption of nutrients depends on the activity of a range of enzymes, in particular
those located in the brush border section of the intestine as Na+K+-ATPase (Tibaldi et al.,
2006; Tresguerres et al., 2010; Zhao et al., 2012). Therefore their expression is essential in
driving a number of transepithelial transport processes important for nutrient uptake (Wilson
& Castro, 2011). This would suggest that measuring the activities of such intestinal
enzymes may represent a sensitive tool to study the influence different dietary ingredients
have on nutrient uptake and to ascertain their individual nutritional status. Since much of the
intestinal nutrient transport across the intestinal enterocytes is facilitated by membrane
anchored Na+ co-transporters, Na+K+-ATPase expression may be utilised to evaluate those
interrelated kinetic activities (Gal-Garber et al., 2003).
Previous studies on the expression of intestinal Na+K+-ATPase, have ascertained that
the fish’s nutritional status could alter the expression and the affinity of the Na+ transporter,
and that a decrease in epithelial Na+K+-ATPase activity was often associated with intestinal
inflammation (Musch et al., 2002). Anti-nutritional factors found in plant ingredients such a
SBM are known to affect certain physiological processes of the gastrointestinal tract and
disrupt particular intestinal regulatory mechanisms (Krogdahl et al., 2010). This diminishes
the carrier-mediated nutrient transport in enterocytes, thus leading to a marked reduction in
the activities of the intestine’s epithelium enzymes (Krogdahl et al., 2003; Bureau et al.,
1998; Bakke-McKellep et al., 2000a; Nordrum et al., 2000a).
Our findings do not fully agree with these studies. The IHC detection of Na+K+-ATPase
was performed using an antibody raised against a synthetic peptide corresponding to a
highly conserved sequence of the Na+K+-ATPase α-subunit, which has been widely used for
the detection of Na+K+-ATPase in gill mitochondria-rich cells in various teleost species with
high specificity (Uchida et al., 1996; Witters et al., 1996; Teranishi & Kaneko, 2010) and has
proven successful for staining chloride cells in gills of fish used for the present study

CHAPTER 5
PAGE | 216
(Nilantha Jayasuriya, personal communication). Despite the findings of earlier work in the
current study the specificity and reproducibility of the reaction pattern was not consistent
throughout the evaluation process. Although the immunoreaction for Na+K+-ATPase within
the control gill and kidney tissues was considered effective, the staining obtained with
intestinal sections incubated with the same antibody, using an identical staining protocol,
did not show the same degree of specificity or consistency. The so-called positive-control
tissues (i.e. sections from fish gills and kidney), should, however, have been fixed and
processed in a manner identical to the rest of the intestinal tissue (same fixative, fixation
time, etc.), however, this was not the case which may explain the discrepancy.
5.4.7. Technical pitfalls potentially affecting the immunolabelling
Although a relatively simple technique, positive staining depends on many factors (De
Matos et al., 2010). One crucial factor is that the antigenicity of the protein recognised by
the antibody is preserved and accessible in the tissue sections. The end result of
immunostaining is therefore reliant on the fixation and handling processes that the tissue
sample undergoes. Moreover, it should not be presumed that one standard procedure can
maintain the structural integrity of different histological tissues, retain all types of antigens,
and still preserve their antigenicity equally (Brandtzaeg, 1998). Therefore, the appropriate
processing method must be adjusted according to the application and the target antigen
being used. As the IHC assay is a multi-step procedure, optimisation of the various steps is
required to maximize the resulting signal. This has proven relatively time-consuming and
requires technical experience.
The basic principle of any immunolabelling technique is that a specific antibody will bind
with its specific antigen to give an exclusive antibody-antigen complex. However, antibody
specificity to the respective antigen is not always exact. For example in the present work,
commercial antibodies developed against mammalian forms of the antigens were employed
on the basis of their cross-reactivity with similar constitutive isoforms in salmonids. These
were initially appraised based on their assumed pattern of reactivity within sections of
positive tissue controls. The reliability and accuracy of the results was continuously

Quantitative immunostaining
PAGE | 217
checked, until satisfactory staining was obtained for the elected intestinal tissue samples.
Unfortunately that was not the case for antibodies tested against HSP 70 and Na+K+-
ATPase, and further optimisation is still necessary to ensure that the selected antibodies
react with the appropriate antigens. It is interesting to note that these antibodies were both
monoclonal, and that all the other antibodies evaluated were polyclonal. There are various
factors to consider when selecting a primary antibody, as there are advantages and
disadvantages of using a monoclonal or polyclonal antibody. Commonly researchers opt for
monoclonal antibodies because batches produced are identical and allow a certain level of
standardisation of the staining procedure. Furthermore, they are less likely to have
background staining and / or cross-react (Ramos-Vara et al., 2008; Boenisch, 2009).
Polyclonal antibodies recognise multiple isoforms (epitopes) on the same antigen, they
have higher affinity and wider reactivity, being more tolerant to minor differences in the
antigen (e.g. polymorphism, heterogeneity of glycosylation or slight denaturation) (Mighell et
al., 1998; Nelson et al., 2000; De Matos et al., 2010) and therefore are the preferred choice
when species-specific antibodies are not available.
As mentioned earlier, interpretation of IHC results requires familiarity with the expected
pattern of immunoreactivity based on the location of the antigen (i.e. nuclear, membrane or
cytoplasmic staining). In order to acquire information about the localisation of antigens, a
comparison of individual IHC staining patterns was therefore performed using a series of
serial sections. The generation of serial sections for this purpose was considered extremely
“laborious” since at least 8 distinct sections were needed for all the antibodies being
evaluated, and challenging, since small structural details are often not present in two
adjacent sequential sections. For this reason among others (e.g. saving time and reagents;
reduction of variability; the possibility of assessing the spatial relationship of targets and
determination of whether such targets are present in different cells, in the same cell or even
in the same cellular compartment (Van der Loos, 2008; Christensen & Winther, 2009),
multiple-staining techniques were also attempted, where two or more antigens would be
detected in the same tissue specimen by use of chromogenic substrates with different

CHAPTER 5
PAGE | 218
colours. However, there was a problem when certain targets were found to co-localise
(because imbalanced colour-mixing made it difficult to evaluate the staining quantitatively),
and also because some of the primary antibodies used were of the same immunoglobulin
isotype subclass making it difficult to use different secondary antibodies. Double-staining
proved to be challenging, and although unsatisfactory results were obtained, it is worth
persisting in optimising this methodology since this could greatly enhance the information
obtained from each slide and reduce the need, and time, to perform single staining of
sequential slides.
5.4.8. Quantification of immunohistolabelling
As the need to quantify immunostaining increases, computer-assisted quantitative
analysis methods for IHC detection have been increasingly pursued (Mesker et al., 1994;
Seidal et al., 2001; Dunstan et al., 2011). The study employed in Chapter 2 to compare
image analysis with manual methods for quantifying the degree of pathology present in
intestinal tissues demonstrated that, even when performed by different observers, the
image analysis was better than manual quantification. It is less time-consuming than other
traditional approaches evaluated and has proven reliable and efficient, especially in terms of
quantification of more than one specific marker. In addition, the imaging techniques
employed allowed important analytical measurements of the total proportion of area stained
and the intensity of the staining, to be performed with greater objectivity and with statistical
confidence being assigned to measurements. Through partition of the tissue into different
zones, one could ensure an accurate description of the pattern of antigen distribution, which
may be useful in providing an understanding of evolving immunological and morphological
responses.
Although within the described work, immuno-labelling distribution patterns measured
between the various treatment groups were not largely found to show significant
differences, the trends in the collected image analysis data nevertheless reflected those
observed by visual observation. It is therefore suggested that by increasing the number of
replicate samples per dietary treatment group analysed, or by further optimising protocols to

Quantitative immunostaining
PAGE | 219
increase consistency, e.g. by using automated processing as occurs in human medicine,
differences would be more easily resolved. Thus a key suggestion for consideration in
future work would be an increase in sample size and consistency of labelling.
Several investigators have argued that standardisation of IHC methods is necessary if
computerised methods are to be adopted (Karlsson et al., 1994; Mesker et al., 1994), in
order to achieve a quantifiable / coherent result with an image analysis system. Therefore
the areas in assay procedure that lead to significant variability (i.e. fixation, sectioning,
antigen retrieval, protocols reagents, tissue controls) were targeted as areas for
improvement, as previously described in Chapter 3. To minimise variations in the staining
intensity of the chromogen produced by differences in incubation time and amounts of
reagent, all tissue sections were stained in a single batch on the same day by the same
person, followed by the analysis of these sections by a single operator. This helped to
provide optimal reproducibility. Another approach, which may have served to further reduce
variability, was the use of an automated staining method as demonstrated for use with
PCNA and CD3 labelling, when compared to the other labelling performed manually (as
shown in Figure 5.11). The accuracy of the system should also be reviewed. It should
account not only for the measurement of the biomarker in a particular section, but also the
ability to repeat the result with the same tissue sample, on a day to day basis, in the same
and in different laboratories, and the ability to obtain the same measurement for different
specimens and cases, again reproducibly (Taylor & Levenson, 2006). In this context,
accuracy (and reproducibility) can be determined only if rigorous quantifiable reference
standards are available and are used to calibrate the system. Perhaps for this purpose, the
use of tissue microarrays (TMAs) may be important. TMAs are constructed from circular
cores extracted from blocks of formalin-fixed paraffin-embedded tissue and arrayed in an
empty paraffin block, resulting in up to 1000 cores from individual biopsies residing in a
single block. As a large number of sections can then be cut from the resulting TMA block,
these sections may be processed alongside the core specimen (Figure 5.11) as quantifiable

CHAPTER 5
PAGE | 220
reference-standards that could be used to calibrate the systems and allow comparison
between different slides with different staining intensities (Saxena & Badve, 2009).
5.4.9. Perspectives
In this chapter a rational and methodical approach was taken in order to select an
appropriate biomarker panel for use in this study. Covering most of the general diagnostic
categories of interest, the selection was based on the morphologic and structural features
described earlier with regard to a given histopathology context. Promising markers have
been identified to predict prognosis and likelihood of response for such diets, and which
might therefore be employed in order to better design dietary treatment regimes in the
future. Following the successful results obtained for this initial panel, one could always add
additional differential diagnosis biomarkers to widen the analysis. Several authors have
reported that the immunocytochemical assays correlate well with transcriptional gene
expression studies (Olsvik et al., 2007; Lilleeng et al., 2009; Skugor et al., 2011; Kortner et
al., 2011; Marjara et al., 2012; Tacchi et al., 2011; Sahlmann et al., 2012; inter alia) and
Figure 5.11. Schematic description of a TMA slide. (A)
Cylindrical cores obtained from 4 distinct formalin fixed,
paraffin embedded tissue blocks. These cores could be
used when performing an immunohistochemical
staining, with cores used to ensure that the staining
procedure actually worked, and as a means to
standardise the variability in staining intensity of the
chromogen. (B) The key sample to be analysed.
B
A

Quantitative immunostaining
PAGE | 221
together, these techniques may help indicate how diet-related enteropathies are triggered,
and thus aid in selecting potential biomarkers for future IHC analysis.
5.5. General conclusions
This chapter described a digital computer-assisted quantification method for a
biomarker panel intended for assessment of the immune response to dietary modulation,
using IHC staining techniques for cell proliferation and regeneration (PCNA); programmed
cell death or apoptosis (TUNEL); EGCs and t-cell like infiltrates (active caspase-3 and CD3
respectively); mobilisation of stress-related protein regenerative processes (HSP 70) and
facilitation of nutrient uptake and ion transport (Na+K+-ATPase). Through the description of
the intestinal cellular responses at a molecular level, such IHC expression profiling further
characterised the inflammatory reaction generated by the enteropathic diet. Also, a number
of potential diagnostic parameters were described for fish intestinal health (e.g. the relative
levels of antigenicity and the spatial distribution of antigens in tissues). Moreover, the
proposed system holds potential for improving the accuracy and reproducibility of
quantitative analysis of IHC reactions, as well as being a practical tool for inter-laboratory
studies.
The introduction of new dietary components and the confirmation of prognosis through
these predictive markers, along with the use of new image analysis screening tools, may
enable pathologists to help tailor specific diets by maximising functional ingredient efficacy
and minimising adverse effects and inclusion of antinutritional factors. Finally, it is
necessary to point out the need for stringent validation of these algorithms by use of larger
cohorts of samples and possibly the use of TMA sections for standardisation of staining.

TECHNICAL NOTE B
PAGE | 222
TECHNIC AL NOTE B
USER GUIDELINES FOR OPERATION OF THE GUT HEALTH IMAGE
PROCESSING AND ANALYSIS SEMI-AUTOMATED SYSTEM
A detailed, comprehensive protocol has been compiled to allow a better understanding of
the image processing and analysis workflow. It provides step-by-step instructions in loading,
initiating and operating the system, which is mentioned across this thesis.
‘Technical Note B’ is an amendment to the previous user guidelines note (see Technical
Note A1 Chapter 2). In this section, description of the procedures established for the
quantification and characterisation of specific immunohistochemical biomarkers (i.e.
measure of the amount, intensity and spatial distribution of immunostaining), by means of
digital image analysis algorithms, are presented.
1. KS Run User Interface
The image processing, segmentation and analysis script developed is deployed using the
stand-alone KS Run software platform (Version 3.0, Carl Zeiss Vision GmbH, München-
Hallbergmoos, Germany). Instructions for installing the KSRun software and deploying the
gut analysis script within it are provided in the KS Run user manual (KS Run User Interface
Manual Guide B 40-613, Carl Zeiss Vision GmbH, München-Hallbergmoos, Germany). The
following sections describe the user continued-protocol for the gut image analysis script
presented in Chapter 2.
1.1. Image Processing and Analysis Workflow
The image processing, segmentation and analysis pipeline comprises of a succession of
interactive and automated operational steps ( ). Feedback in the form of guideline-notes
for the operator ( ), and visualisation of the generated images ( , Appendix 2 and
Technical Note A1) was made available at each step of the pipeline process, as well as
feature extraction and data generation ( , Figure 8 from Technical Note A1).

TECHNICAL NOTE B
PAGE | 223
1.1.1. Start Up
a. Operational steps A to C from Technical Note A1 (Chapter 2) are followed.
1.1.2. Logistical Setup and Data Input
b. Operational steps D to I from Technical Note A1 (Chapter 2) are followed.
1.1.3. Image Pre-processing
c. Operational steps J to L from Technical Note A1 (Chapter 2) are followed.
1.1.4. Image Segmentation and Processing
d. Immunohistochemical positive stained cells present in the image are highlighted and
segmented by an HLS colour thresholding operation.
i “Right click on the small left-hand image and choose ‘Big Display’. Highlight the
immunohistochemical positive cells using ‘square bracket’ depressed (as an initial starting
point) and circling the area of interest. Then, successively add missing areas using ‘+’
depressed (or ‘<’ to undo the previous selection).”
Image I
e. Operational steps N to U from Technical Note A1 (Chapter 2) are followed.

CHAPTER 5
PAGE | 224
1.1.5. Histological Identification and Post-processing Overlays
f. Operational steps V to γ from Technical Note A1 (Chapter 2) are followed.
g. Processing of the immunohistochemical positive stained areas:
g1. The final total tissue image (i.e. Image 3F) is taken and used to mask the recognised
positive stained area (i.e. protein expression can only occur in the mucosal and submucosal
tissues). The regions of interest are highlighted and an overlay mask corresponding to the
total immunostained area is merged into Image A, and Image I-2 generated.
ii “Right click on the small left-hand image and choose ‘Big Display’. All
immunohistochemical positive areas will be selected at the start (labelled in green), therefore
use the left mouse button to deselect (labelled in red) the unwanted areas. Use the right
mouse button to increase and decrease the image size for better clarity. If unexpected red or
green regions are apparent, zoom into the image to check their accuracy.”
Image I-1.

TECHNICAL NOTE B
PAGE | 225
Image I-2
e.g. R110027_P01.TotalEGC.tif (Figure 1)
Figure 1. Output Image I-1, total
immunohistochemical positive stained area
being demarked with a yellow coloured
overlay.
g2. The final submucosal tissue image (i.e. Image 14A) is then taken and used to mask the
recognised immunohistochemical positive areas within that tissue region. Overlay masks
are generated and merged with Image 1A, into Image V as green labelled areas of interest.
Image II
g3. The stratum compactum line from Image 5 is thickened and the corresponding region of
interest in Image I-1 highlighted. Subtracted from this, is the area equivalent to the
submucosal area (i.e. Image 14A), resulting in the identification of immunohistochemical

CHAPTER 5
PAGE | 226
positive areas immediately above the stratum compactum. For the areas of interest
recognised, overlay masks are generated and merged into Image V as yellow labels.
Image III
g4. The remaining immunohistochemical positive areas (i.e. corresponding to the protein
expression in cells infiltrating the intestinal mucosal folds) are highlighted and
corresponding red overlay masks created on top of Image V.
Image IV

TECHNICAL NOTE B
PAGE | 227
Image V
e.g. R110027_P01.ZonedEGC.tif (Figure 2)
Figure 2. Output Image V,
immunohistochemical positive stained areas
being demarked with a yellow coloured overlay
for cells located above the stratum compactum,
in red for cells infiltrated along the mucosal
folds and in green for submucosal cells.
1.1.6. Feature Extraction and Data Generation
h. Immunohistochemical (IHC) positive stained areas are identified (i.e. Images I-1, II-IV)
and for each dispersion level the following measurements are taken:
Total IHC Stained Area (e.g. EGC Area, µm2)
Average Staining Intensity for Total IHC Stained Area (e.g. EGC Intensity, mean pixel value)
Total IHC Stained Area for the submucosa tissue (e.g. EGC Sub, µm2)
Average Staining Intensity for IHC in submucosa (e.g. EGC Sub Intensity, mean pixel value)
IHC Stained Area for zone above the stratum compactum (e.g. EGC Sup, µm2)
Average Staining Intensity for IHC in zone above the stratum compactum (e.g. EGC Sup
Intensity, mean pixel value)
IHC Stained Area for remainder mucosa (e.g. EGC Muc, µm2)
Average Staining Intensity for remainder mucosa (e.g. EGC Muc Intensity, mean pixel value)
i. Operational steps η to θ from Technical Note A1 (Chapter 2) are followed.
1.1.7. Analysis Conclusion
j. Program terminates with audible warning once the analysis is finished.
iii “Measuring feature properties…”
“Writing data to databases…”
“Analysis finished.”


6. CHAPTER 6
6. CHARACTERISATION OF MAST CELLS / EOSINOPHILIC GRANULE
CELLS IN THE ATLANTIC SALMON INTESTINE
6.1. Introduction
The posterior intestine plays an important immunogenic role in teleost fish. Antigens
present in the intestinal lumen that cross the gut epithelium are transported to the gut
associated lymphoid tissue (GALT), which is known to be involved in intestinal mucosal
immune responses (Gomez et al., 2013; Urzúa, 2013).
In teleosts the level of the GALT organisation is lower than in mammals, and although it
has a more diffusely organised immune system, it still comprises many lymphoid cells,
macrophages, neutrophilic and eosinophilic granulocytes (Tort et al., 2003). Generally, these
granulocytes are considered to be important initiators and effectors of the innate immune
response and to play a crucial role in regulating adaptive immune responses in the intestinal
mucosa (Silphaduang & Noga, 2001; Mulero et al., 2008), and are involved in many
pathologic processes such as defence against infectious agents, chronic stress or food
hypersensitivity (Dezfuli et al., 2002; Penissi et al., 2003; Rocha & Chiarini-Garcia, 2007; Urán
et al., 2008; Sundh, 2009). However, data evidence for their function in fish remains sparse.
In the intestine of fish, these granule cells appear morphologically as large ovoid cells
posessing a large eccentric nucleus and showing characteristic large, membrane-bounded
granules in the cytoplasm such that these cells strongly resemble mammalian mast cells
(Ezeasor & Stokoe, 1980; Burka & Powell, 1993; Rombout et al., 2011). These cells are
widely distributed in the subepithelial lamina propria, and distributed on both sides of the
stratum compactum. On the luminal side these cells are found as either single cells or
clustered in small clumps, whereas on the muscle side they form a continuous layer, the
stratum granulosum (Dorin et al., 1993; Sveinbjørnsson et al., 1996; Manera & Borreca,
2012).

CHAPTER 6
PAGE | 230
There remains considerable controversy with respect to the staining properties of their
cytoplasmic granules, which are frequently described as either basophilic, staining blue (i.e.
without showing metachromasia) after application of some of the blue cationic dyes (e.g.
Bolton, 1933; Smith, 1975; Rocha & Chiarini-Garcia, 2007) or eosinophilic, staining red with
eosin (e.g. Gulland, 1898; Ezeasor & Stokoe, 1980). Studies have suggested that this
feature is often fish species dependent and that these cells have both acidophilic and
basophilic components in their granules (Reite, 1996, 1997; Leknes, 2007). It has also been
suggested that some staining properties might be an artefact of fixation of tissues in
aqueous fixatives, and that the use of alcohol based fixatives can, in some cases, retain
basophilic and metachromatic properties of the granules (Schmale et al., 2004). Therefore,
it is sensible not to over-emphasise their staining characteristics (Vallejo & Ellis, 1989), and
hence following the classification of Reite & Evensen (2006) we have chosen to use the
term mast cell / eosinophilic granule cell (MCs / EGCs) throughout the present chapter, to
describe such cells.
The granules of fish MCs / EGCs, have an arginine-rich core and are known to contain
a number of components common to mammalian mast cell granules, including alkaline, acid
phosphatases, leucine aminopeptidase, arysulphatase, 5-nucleotides, tryptase, and a range
of antimicrobial peptides including lysozyme, piscidin and pleurocidin (Ellis, 1985; Ezeasor
& Stokoe, 1980; Powell et al., 1992; Sire & Vernier, 1995; Sveinbjørnsson et al., 1996;
Dezfuli et al., 2000; Silphaduang & Noga, 2001; Dobson et al., 2008; Mulero et al., 2008).
Whether they also contain characteristic metachromatic sulphate glycosaminoglycans,
including heparin and hyaluronic acid, remains unclear (Vallejo & Ellis, 1989; Holland &
Rowley, 1998). From reviews of the literature on this subject (i.a. Reite & Evensen, 2006;
Mulero et al., 2008; Crivellato & Ribatti, 2010) it is evident that the precise granule content
of fish MCs / EGCs and their ensuing physiological function, still remain poorly understood.
It is, however generally accepted that these cells may be involved in defence mechanisms,
and a role in inflammation is suggested (Powell et al., 1993a; Sveinbjørnsson et al., 1996;
Matsuyama & Iida, 1999; Paulsen et al., 2001; Dezfuli & Giari, 2008). These cells are often

Characterisation of intestinal MCs / EGCs
PAGE | 231
located around blood vessels associated with host-environment interfaces such as skin,
gills and intestine (Roberts et al., 1971; Powell et al., 1990). Release of their contents by
cell degranulation occurs in response to acute tissue damage, or when tissues are exposed
to pathological challenges after inoculation with pathogens or certain substances (e.g.
Aeromonas salmonicida and Vibrio anguillarum toxins, compound 48/80, formalin-killed A.
salmonicida, substance-p, capsaicin; Ellis, 1985; Vallejo & Ellis, 1989; Lamas et al., 1994;
Powell et al., 1993a, 1993b; Reite & Evensen, 1994; Holland & Rowley, 1998); their number
increases in regions of active inflammatory response, especially those associated with
bacterial and parasitic infections (Reimschuessel et al., 1987; Sharp et al., 1989; Buchmann
et al., 1999; Dezfuli et al., 2003a; Schmale et al., 2004; Murray et al., 2007; Dezfuli et al.,
2012). In addition to this, vasodilation, migration and accumulation of neutrophils and
macrophage activation have repeatedly been observed at sites where MC / EGC
degranulation has occurred (Reite, 1997; Reite & Evensen, 1994; Matsuyama & Iida, 2001),
suggesting that fish MCs / EGCs are able to contain or generate a variety of mediators that
induce chemical leucocyte-attraction and / or neutrophil chemotaxis, as observed for
mammal counterparts (Reite & Evensen, 2006; Dezfuli & Giari, 2008; Crivellato & Ribatti, 2010).
Overall, the general morphology, tissue distribution and staining characteristics
together with some of the suggested functions have led researchers to postulate that fish
MCs / EGCs are analogous to mammalian mast cells (Ellis, 1985; Powell et al., 1993b; Sire
& Vernier, 1995; Reite, 2005; Dezfuli & Giari, 2008; Mulero et al., 2007; Lauriano et al.,
2012). However, despite bearing structural and functional similarities, some of their
cytochemical characteristics do not support exact homology. For example, with respect to
the two biogenic amines present on the granules of mammalian MCs, namely serotonin and
histamine, all the studies performed to date have shown that fish MCs / EGCs contain the
former but lack the latter (Lamas et al., 1991; Matsuyama & Iida, 1999; Dezfuli et al., 2000;
Mulero et al., 2007; Rombout et al., 2011). Thus the physiological function and the content
of the granules from fish MCs / EGCs is still a matter of debate, as well as their homology to
mammalian mast cells.

CHAPTER 6
PAGE | 232
Chapters 3, 4 and 5 highlighted the presence of MCs / EGCs in the intestine of salmon
but made no attempt to determine their role in immunity. The purpose of the work presented
in the present chapter was to further characterise intestinal MCs / EGCs and to try to
elucidate their functional role in the intestinal immune responses. Through an understanding
of their distribution, composition and ultrastructure, the intention was therefore to provide
additional knowledge, so as to better characterise these cells and their functional properties.
6.2. Material and methods
6.2.1. Histochemical and ultrastructural features of intestinal MCs / EGCs
6.2.1.1. Histology tissue samples
Samples from the anterior part of the distal intestine of Atlantic salmon, fixed in
phosphate-buffered formaldehyde (4 %, pH 7.2), were selected from the histology archives
of Skretting ARC, which represented a range of different pathological states including
soybean meal induced enteritis; damage of the mucosal epithelium of the gut by infection
with an acanthocephalan and samples from fish infected with the infectious salmon
anaemia virus (ISAV), a member of the Orthomyxoviridae. In addition, clinical samples from
a trematode infection of Atlantic salmon, were kindly provided by Prof. Randolph Richards
(Diagnostic Services, Institute of Aquaculture, University of Stirling, UK).
Samples for histological examination were processed according to standard histological
methods (Bancroft & Stevens, 1982; Ramos-Vara, 2005, 2011). All formaldehyde-fixed
samples were dehydrated and embedded in paraffin (Tissue-TekII Paraffin Wax, melting-
point: 54-57˚C, Sakura Finetek Europe B.V, Netherlands). Transverse serial sections of 5
µm thickness were cut (Leica RM 2035, Leica Microsystems Ltd., UK) and mounted onto
SuperFrost Plus® microscope slides (Menzel-Gläser, Braunschweig, Germany).
After deparaffinisation in xylene and rehydration through graded ethanol, some of the
serial sections were histochemically stained (Section 6.2.1.2), while others were subjected
to immunohistochemistry (IHC) methods (Section 6.2.1.3).

Characterisation of intestinal MCs / EGCs
PAGE | 233
6.2.1.2. Histochemical staining
Serial sections were stained with either [1] Haematoxylin-Eosin (H&E), [2]
Haematoxylin-Erythrosin-Safran (HES) [3] Thionin, [4] Azur A, [5] May-Grünwald-Giemsa
(MGG), [6] Toluidine Blue, [7] Periodic-Acid-Schiff-Haematoxylin (PAS-H), [8] Periodic-Acid-
Schiff-Alcian-Blue (PAS-AB), [9] Haematoxylin-Eosin-Alcian blue (H&E-AB) and [10] Astra
blue, according to standard staining procedures specified in Table 7.1 (see Appendix 1 for
further detail of staining protocols). After staining, the sections were briefly rinsed in distilled
water, dehydrated through 70% ethanol and absolute ethanol into xylene, to be mounted
using a synthetic resinous mountant.
Table 6.1. Histochemical methods employed in the evaluation of intestinal mast cells / eosinophilic
granule cells from Atlantic salmon.
Histochemical method
[1] Haematoxylin-Eosin, in Bancroft & Stevens (1982)
[2] Haematoxylin-Erythrosin-Safran, in Gurr (1957)
[3] Thionin, Cook (1961)
[4] Azur A, Hughesdon (1949)
[5] May-Grünwald-Giemsa, May & May (1902), Giemsa (1902)
[6] Toluidine Blue, Schubert & Hammerman (1956)
[7] Periodic-Acid-Schiff-Haematoxylin, in Leblond & Clermont (1952)
[8] Periodic-Acid-Schiff-Alcian-Blue, Mowry & Winkler (1956)
[9] Haematoxylin-Eosin-Alcian blue, in Lillie (1965)
[10] Astra blue, Blaies & Williams (1981)
6.2.1.3. Immunohistochemical labelling
After being dewaxed and rehydrated, the serial sections were subjected to a series of
different affinity-isolated antibodies raised against [a] Tryptase, [b] c-Kit, [c]
Myeloperoxidase, [d] Lysozyme, [e] Substance-p, [f] Met-enkephalin, [g] Chymase, [h]
Serotonin, [i] Pre-caspase 3, [j] Caspase 7, [k] Active caspase-3 using a range of IHC
protocols. A summary of the respective immunostaining protocols is presented in Table 7.2.
Most of the protocols described of here are the result of a series of troubleshooting and
amelioration steps including comparison of various demasking procedures and blocking
solutions, use of different primary antibody concentrations and / or diverse chromogenic
visualisation systems. The procedures presented are those producing the most consistent

CHAPTER 6 | Characterisation of intestinal MCs / EGCs
PAGE | 234
Table 6.2. Summary of immunohistochemical staining protocols employed in the evaluation of intestinal mast cells / eosinophilic granule cells from Atlantic salmon.
IHC assay Antigen retrieval Pre-treatment Primary antibody Secondary antibody Detection system
[a] Tryptase Sodium citrate buffer, pH 6; 1
min 40 sec; 125 °C; HIER.
REAL™ Peroxidase-Blocking
Solution (S2023, DAKO); 5 min;
RT.
Mast Cell Tryptase Monoclonal
Mouse Anti-human Clone AA1
(M7052, DAKO); 1:200; 30 min;
RT.
EnVision™ HRP Mouse Polymer
(K4001, DAKO); 20 min; RT.
REAL™ EnVision™ DAB+
(K5007, DAKO); 2 x 5 min;
RT.
[b] c-Kit Sodium citrate buffer, pH 6; 1
min 40 sec; 125 °C; HIER.
REAL™ Peroxidase-Blocking
Solution (S2023, DAKO); 5 min;
RT.
CD117, c-kit Polyclonal Rabbit
Anti-human (A4502, DAKO);
1:800; 30 min; RT.
EnVision™ HRP Rabbit Polymer
(K4003, DAKO); 20 min; RT.
REAL™ EnVision™ DAB+
(K5007, DAKO); 2 x 5 min;
RT.
[c] Myeloperoxidase Proteinase K Ready-to-Use
(S3020, Dako); 5 min; RT.
REAL™ Peroxidase-Blocking
Solution (S2023, DAKO); 5 min;
RT.
Myeloperoxidase Polyclonal
Rabbit Anti-human (A0398,
DAKO); 1:2000; 30 min; RT.
EnVision™ HRP Rabbit Polymer
(K4003, DAKO); 20 min; RT.
REAL™ EnVision™ DAB+
(K5007, DAKO); 2 x 5 min;
RT.
[d] Lysozyme Proteinase K Ready-to-Use
(S3020, Dako); 10 min; RT.
REAL™ Peroxidase-Blocking
Solution (S2023, DAKO); 5 min;
RT.
Lysozyme Polyclonal Rabbit Anti-
human Clone EC 3.2.1.17
(A0099, DAKO); 1:1000; 30 min;
RT.
EnVision™ HRP Rabbit Polymer
(K4003, DAKO); 20 min; RT.
REAL™ EnVision™ DAB+
(K5007, DAKO); 2 x 5 min;
RT.
[e] Substance-p N.A. 1 0.6 % Hydrogen Peroxide in
1:500 Methanol; 15 min; RT. 2 0.1 % NGS in Tris-HCl, pH 7.6;
30 min; RT.
Substance-p Polyclonal Rabbit
(IHC7451, Peninsula Lab); 1:800;
2 h; RT.
EnVision™ HRP Rabbit Polymer
(K4002, DAKO); 30 min; RT.
0.04 % DAB in Tris-HCl,
pH 7.6 and 0.005 %
Hydrogen Peroxidase; 4
min; RT.
[f] Met-enkephalin N.A. 1 0.6 % Hydrogen Peroxide in
1:500 Methanol; 15 min; RT. 2 0.1 % NGS in Tris-HCl, pH 7.6;
30 min; RT.
Met-enkephalin Polyclonal Rabbit
(IHC8602, Peninsula Lab); 1:150;
2 h; RT.
EnVision™ HRP Rabbit Polymer
(K4002, DAKO); 30 min; RT.
0.04 % DAB in Tris-HCl,
pH 7.6 and 0.005 %
Hydrogen Peroxidase; 4
min; RT.

CHAPTER 6 | Characterisation of intestinal MCs / EGCs
PAGE | 235
Table 6.2. (continued from previous page)
IHC assay Antigen retrieval Pre-treatment Primary antibody Secondary antibody Detection system
[g] Chymase UNI-TRIEVE solution (NB325,
Innovex); 30 min; 65 °C; water
bath.
EnVision™ Dual Endogenous
Enzyme Block (K4065, DAKO);
10 min; RT.
Mast Cell Chymase Monoclonal
Mouse Clone CC1 (ab2377,
abcam); 1:200; overnight; 4 °C.
EnVision™ HRP Mouse Polymer
(K4065, DAKO); 30 min; RT.
EnVision™ DAB (K4065,
DAKO); 7 min; RT.
[h] Serotonin UNI-TRIEVE solution (NB325,
Innovex); 30 min; 65 °C; water
bath.
EnVision™ Dual Endogenous
Enzyme Block (K4065, DAKO);
10 min; RT.
Serotonin Polyclonal Rabbit
(ab938, Merck Millipore); 1:1000;
overnight; 4 °C.
EnVision™ HRP Rabbit Polymer
(K4065, DAKO); 30 min; RT.
EnVision™ DAB (K4065,
DAKO); 7 min; RT.
[i] Pre-caspase 3 UNI-TRIEVE solution (NB325,
Innovex); 30 min; 65 °C; water
bath.
EnVision™ Dual Endogenous
Enzyme Block (K4065, DAKO);
10 min; RT.
Pro Caspase 3 Monoclonal
Rabbit Clone E61 (ab32150,
abcam); 1:10; overnight; 4 °C.
EnVision™ HRP Rabbit Polymer
(K4065, DAKO); 30 min; RT.
EnVision™ DAB (K4065,
DAKO); 7 min; RT.
[j] Caspase 7 UNI-TRIEVE solution (NB325,
Innovex); 30 min; 65 °C; water
bath.
EnVision™ Dual Endogenous
Enzyme Block (K4065, DAKO);
10 min; RT.
Caspase 7 Monoclonal Mouse
Clone 7-1-11 (ab110923, abcam);
10 μg.mL-1; overnight; 4 °C.
EnVision™ HRP Mouse Polymer
(K4065, DAKO); 30 min; RT.
EnVision™ DAB (K4065,
DAKO); 7 min; RT.
[k] Active caspase-3 UNI-TRIEVE solution (NB325,
Innovex); 30 min; 65 °C; water
bath.
EnVision™ Dual Endogenous
Enzyme Block (K4065, DAKO);
10 min; RT.
Anti-ACTIVE® Caspase-3
Polyclonal Rabbit (G748A,
Promega); 1:250; overnight; 4 °C.
EnVision™ HRP Rabbit Polymer
(K4065, DAKO); 30 min; RT.
EnVision™ DAB (K4065,
DAKO); 7 min; RT.
Footnotes: IHC, immunohistochemical; Tryptase, most abundant secretory granule-derived serine proteinase contained in mammalian mast cells; HIER, heat induced epitope retrieval; DAKO,
Glostrup, Denmark; RT, room temperature (16-20 °C); HRP, horseradish peroxidase; DAB, 3,3'-Diaminobenzidine; c-Kit, transmembrane tyrosine protein kinase receptor kit or CD117 is a
protein encoded by the KIT gene, and commonly expressed by mammalian mast cells; CD117, cluster of differentiation 117; Substance-p, neuropeptide that functions as a neurotransmitter
and as a neuromodulator that was found in some teleost fish’s cytoplasmic granulated cells (Dezfuli et al., 2000); N.A., non applicable; NGS, normal goat serum; Tris-HCl,
tris(hydroxymethyl)aminomethane hydrochloride; Peninsula Lab, Belmont, USA; Met-enkephalin, sometimes referred to as opioid growth factor it is a naturally occurring, endogenous opioid
peptide that is a major mediator secreted by mammalian mast cells; Chymase, family of serine proteases found primarily in mammalian mast cells; Innovex Biosciences, Richmond, USA;
abcam, Cambridge, UK; Serotonin, 5-hydroxytryptamine is a monoamine neurotransmitter found in mammalian mast cells; Merck Millipore, Billerica, USA; Myeloperoxidase, peroxidase
enzyme most abundantly expressed in mammalian neutrophil granulocytes; Lysozyme, enzyme capable of damaging the bacterial cell walls that was demonstrated in mammalian
eosinophils, neutrophils, histiocytes, in epithelioid cells, mast cells, and some lining cells of lymph node sinuses; Pre-caspase 3, Caspase 7, Active Caspase-3, protein members from the
cysteine aspartic acid protease family related to the apoptosis process; Promega, Madison, USA.

CHAPTER 6
PAGE | 236
staining results for the selected antigens, at least for mammalian positive control tissues.
The outcome of this work was only possible due to collaboration with the Veterinary
Diagnostic Services at University of Glasgow. Their technical staff are highly skilled in a
wide variety of specialist techniques including histochemistry and immunohistochemistry,
and their support and advice greatly helped in the development and optimisation of the
methodologies outlined here. The serial sections for the tryptase, c-kit, myeloperoxidase
and lysozyme immunostaining were processed in accordance with the protocol outlined in
Section 5.2.5.4. For the first two antibodies, demasking of the antigens was performed by
heat-induced epitope retrieval in a hydrated autoclave. For the next two antibodies,
enzymatic antigen retrieval using Proteinase K Ready-to-Use (S3020, DAKO, Glostrup,
Denmark) was performed for 5 and 10 min incubated at room temperature. The specificity
of reactions was tested by incubating serial sections of the same sample with normal mouse
or rabbit serum (10410 and PLN5001 respectively, Life Technologies Ltd., Paisley, UK)
instead of the primary antibody although at the same dilution as these. Sections of human
colonic carcinoma and tonsils (kindly provided by Mr. MacMillan from the Veterinary
Diagnostics Services, University of Glasgow) were used as positive controls for the target
antigens mentioned above.
Sections employed for the substance-p and met-enkephalin immunostaining, were
kindly processed by Ms. Samantha Squerzanti (Department of Life Sciences and
Biotechnologies, University of Ferrara, Ferrara, Italy). Briefly, following the protocol
published by Dezfuli et al. (2003a), endogenous peroxidase activity and non-specific
staining was blocked by treating the sections with 0.6 % hydrogen peroxide in methanol for
15 min, and in 0.1 % goat normal serum for other 30 min. After 2 h incubation with the
respective primary antibodies (shown in Table 7.2.), the sections were incubated for another
30 min with EnVision™ HRP Rabbit Polymer (K4002, DAKO) and rinsed with Tris-
hydrochloride (Tris-HCl, 50 mM Trizma base®, pH 7.6) for 5 min.
The peroxidase reaction was developed using a solution of 3-3’diaminobenzidine
tetrachloride (0.04 % w/v in Tris-HCl) and 0.005 % hydrogen peroxidase. Thereafter, the

Characterisation of intestinal MCs / EGCs
PAGE | 237
sections were counterstained with Mayer’s haematoxylin (MHS1, Sigma-Aldrich, St. Louis,
USA) and mounted with a synthetic resinous mountant. To confirm the specificity of the
reaction, intestinal tissue sections of Salmo trutta, naturally infected with Cyathocephalus
truncates were used as positive control (Dezfuli et al. 2000). Similarly, negative controls
were prepared by substituting the primary antibody with normal rabbit serum (R9133,
Sigma-Aldrich, Ayrshire, UK) at the same dilution.
The remaining serial sections were subjected to an indirect immunohistochemical
method (described in Section 5.2.5.3) using the chymase, serotonin, pre-caspase 3,
caspase 7 and active caspase-3 affinity isolated antibodies listed in Table 7.2. Nonspecific
staining of the primary antibodies was evaluated by substitution of the former with non-
immune rabbit or mouse serum respectively (PLN5001 and 10410, Life Technologies Ltd.,
Paisley, UK) in serial sections used as negative control, for the rabbit and mouse primary
antibodies, respectively. Sections of human tonsils, sections from a canine small skin
tumour and cytospins for feline isolated lymphocytes (kindly provided by Mr. MacMillan from
the Veterinary Diagnostics Services from the University of Glasgow) were used as
surrogates for the known target antigens and served as positive controls for all the above
mentioned staining.
6.2.1.4. Light microscopy examination
Observations for both histochemical and immunohistochemical slides were made using
a light microscope (Leica DM 5000B, Leica Microsystems GmbH, Wetzlar, Germany), with a
dark field phase contrast and equipped with a high resolution digital camera (DFC320, Leica
Microsystems Imaging Solutions Ltd., Cambridge, UK) for image capturing.
6.2.1.5. Immunofluorescent Antibody Test (IFAT)
Due to the unexpected immunohistochemical staining pattern observed in tissue sections
when subjected to the IHC protocol described in Section 5.2.5.3 using a rabbit polyclonal
antibody against caspase-3 (Anti-ACTIVE® Caspase-3 Ab, G7481, Promega, Madison, USA),
IFAT was undertaken to confirm the immunostaining reaction obtained in IHC.

CHAPTER 6
PAGE | 238
Paraffin-embedded serial sections from the tissue samples mentioned in Section
6.2.1.1, were deparaffinised and rehydrated as described above. Subsequently, the
sections were treated in accordance with the protocol outlined in Section 5.2.5.3, until the
rinsing stage just before incubation with the secondary antibody. The slides were then
incubated at room temperature for 2 h in the dark, with a goat anti-rabbit IgG antibody,
conjugated with fluorescein isothiocynate (FITC; F0382, Sigma-Aldrich, St. Louis, USA)
1:100 diluted in phosphate buffered saline solution (PBS, 137 mM NaCl, 2.7 mM KCl, 10
mM Na2HPO4, 1.8 mM KH2PO4, pH 7.4). Slides were washed twice for 20 min each in
PBS, and incubated at room temperature for 30 min in the dark, with 20 µg mL-1 of the
nuclear counter-stain (Propidium iodide, P4170, Sigma-Aldrich, St. Louis, USA) diluted in
PBS. The slides were cover-slipped and then sealed with a transparent nail varnish
(Avon Products Inc., London, UK) and kept in the dark at 4 °C until visualised.
Control samples for determining the level of auto-fluorescence / non-specific binding
of labelled secondary to tissue sections being used, were prepared in parallel to the test
slides by replacing the primary antibody with PBS.
6.2.1.6. Confocal laser scanning microscopy (CLSM)
Tissue sections were visualised using a Leica TCS SP2 AOBS confocal laser
scanning microscope coupled to an inverted DM TRE2 microscope (CLSM; Leica
Microsystems, Milton Keynes, UK). Through the use of two sequential excitation laser
lines (i.e. at 488 nm for the FITC dye, and at 535 nm for the Propidium iodide dye) and
three photomultiplier channels (blue 411-483 nm, green 498-587 nm and red 600-698
nm), each respective fluorescent dye was excited and serial 1 µm depth-images captured
at a 63× magnification (CSLM’s Leica Confocal Software, Version 6.21, Leica
Microsystems, Milton Keynes, UK). Eight bit serial digital images with a frame size of 1024
× 1024 pixels were taken, and 25 to 30 serial depth-images were automatically stacked
and then saved as a single 3D stereo anaglyph TIFF image or colour coded multiple
channel images.

Characterisation of intestinal MCs / EGCs
PAGE | 239
6.2.1.7. Transmission electron microscopy (TEM)
Samples for electron microscopy, were obtained from the feeding trial described in
Chapter 3 (i.e. intestinal samples from post-smolt Atlantic salmon either feed a fish meal
based control diet - showing normal morphology, or a diet containing 25 % unrefined
soybean meal concentrate – therefore with severe enteritis).
Following the twenty week feeding regime, 15 fish from each designated treatment
group were euthanised using an overdose of anaesthetic (50 mg.L-1, MS-222, Tricaine
Methanesulphonate, Argent Chemical Laboratoires, Redmount, WA, USA), and 1 cm long
transverse portions excised from the distal intestine region. These were cut open
longitudinally, and were fixed in 2.5 % glutaraldehyde in 0.1 M sodium cacodylate buffer
(see Appendix 1 for recipes), at 4 °C for 24-27 h. The fixed tissues were then washed
overnight in the same buffer containing 0.1 M sucrose (S7903, Sigma-Aldrich, Ayrshire,
UK), trimmed into 2 mm3 cubes, and post-fixed at 4 °C for 3 h in 1 % osmium tetroxide
(O5500, Sigma-Aldrich, Ayrshire, UK) in 0.1 M sodium cacodylate buffer (pH 7.3). Samples
were then dehydrated in a graded series of increasing acetones (in 60 %, 90 % and twice
in 100 %, for 30 min each), infiltrated with agar low viscosity resin (AGR1078, Electron
Technology Ltd., Essex, UK) 50 % (v/v) in acetone for 45 min, and finally for another 60
min each in two successive changes of 100 % resin. Infiltrated tissues were then
polymerised (60 °C for 24 h) to give blocks for sectioning.
Ultra-thin sections (70 nm) cut on a Reichert Ultracut-E ultramicrotome (Leica, Leica
Microsystems Ltd., UK) were supported on 200 μm mesh Formvar-coated nickel grids
(G2002, Electron Technology Ltd., Essex, UK) and left to dry overnight, prior to
immunogold labelling (Section 6.2.1.8). Semi-thin sections (2 μm) were also placed into
SuperFrost Plus® microscope slides for use as immunostained control samples to be
examined under light microscopy. These were stained in accordance to the IHC protocol
described above (Section 5.2.5.3), to confirm that the structures stained by IHC were
present in the ultra-thin sections prepared for immunogold labelling.

CHAPTER 6
PAGE | 240
The grids comprising the labelled ultra-thin sections were visualised with a Tecnai G2
Spirit Bio Twin™ transmission electron microscope (Tecnai, Eindhoven, Netherlands),
operated at 120 kV. Micrograph photos were captured and saved as TIFF images.
6.2.1.8. Immunogold labelling (IGL)
In virtue of the fact that immunolocalisation of the antigen reacting against the rabbit
polyclonal antibody for caspase-3 (Anti-ACTIVE® Caspase-3 Ab, G7481, Promega,
Madison, USA) was sought, indirect immunolabelling with colloidal gold particles for the
same primary antibody was pursued. All incubations were carried out in individual 51 mm
Petri dishes, containing water-soaked filter paper with a piece of ParafilmM™ (Pechiney
Plastic Packaging Company, Chicago, USA) placed on top. The grids comprising the ultra-
thin sections, were allowed to float section-side-down on distilled water drops placed on the
ParafilmM™ for 10 min at room temperature. Thereafter, endogenous peroxidase activity
was blocked by floating the grids section-side-down in drops of EnVision™ Dual
Endogenous Enzyme Block (K4065, DAKO, Glostrup, Denmark), for 1 h at room
temperature. They were then placed section-side-up, on a piece of blotting paper for a few
seconds, and immediately transferred to drops of a rabbit polyclonal antibody against
caspase-3 (Anti-ACTIVE® Caspase-3 Ab, G7481, Promega, Madison, USA) diluted 1:250 /
1:500 / 1:1000 in Tris-buffered saline Tween solution (TBST, 150 mM NaCl, 50 mM Trizma
base®, 0.5 % Tween® 20, pH 7.5), and incubated overnight at 4 °C. Subsequently, the
tissue sections were washed extensively by floating the grids on TBST contained within a
24 well plate with occasional agitation for 20 min. The grids were then transferred to fresh
TBST and washed for another 20 min. Subsequently the grids were incubated overnight at
4 °C, section-side-down in drops of 1:16 and 1:32 FluoroNanogold™ goat anti-rabbit IgG
(Nanoprobes Inc., Yaphank, USA) covalently conjugated with uniform 1.4 nm diameter
nanogold particles. Thereafter, the tissue sections were washed as previously described,
twice for 40 min each in 24 multi-well plate (3527, Corning, New York, USA) with TBST.
Then the gold probe was enhanced (i.e. by increasing the size of the 1.4 nm gold particle to
circa 30 – 40 nm) by placing the grids section-side-down on drops of GoldEnhance™

Characterisation of intestinal MCs / EGCs
PAGE | 241
(Nanoprobes Inc., Yaphank, USA) for 12 min. The reaction was stopped by carefully dipping
the grids into distilled water for circa 2 min.
The specificity of reactions was confirmed by incubating serial sections of the same
samples with normal rabbit serum (H 110, TCS Biosciences Ltd, Buckingham, UK) instead
of the primary antibody but using the same dilutions as used for the primary antibody.
Finally the sections were counter-stained using 4 % uranyl acetate for 4 min, and Reynold’s
lead citrate for another 7 min, washing between these with a graded series of decreasing
ethanol up to distilled water (see Appendix 1 for the staining protocol).
6.2.2. Isolation and characterisation of intestinal MCs / EGCs
6.2.2.1. Tissue sample collection
Healthy adult Atlantic salmon, weighting 150-200 g were maintained for 2-3 days, in the
Aquatic Research Facility, Institute of Aquaculture (University of Stirling, UK). Fish were
kept in a 100 L rectangular tank with artificial sea salt water (32 mg.L-1, Tropic Marin Salt®,
Tropic Marine Centre, Bristol, UK) supplied with aeration stones, and maintained at
temperatures of 12 ± 2 ˚C under a 12 h light: 12 h dark photoperiod.
For sampling, individuals were euthanised with an anaesthetic overdose (10 %
benzocaine, E1501, Sigma-Aldrich, Ayrshire, UK). All procedures were conducted in
accordance with the UK Home Office regulations (Animals Scientific Procedures, Act 1986).
Blood was immediately withdrawn by caudal venepuncture, and transverse intestinal
sections from the distal intestinal region aseptically excised from the fish. The associated
adipose tissue was trimmed off, sections cut open longitudinally and kept for no longer than
5 min in ice-cold trypsin neutraliser buffered saline solution (TN, 10 mM Tris-HCl, 137 mM
NaCl, pH 7.5).
6.2.2.2. Isolation of MCs / EGCs
Tissue fragments of ~2 g were then rinsed twice with ice-cold TN and transferred into
25 mL of TN buffer containing 0.37 mg.mL-1 of ethylenediaminetetraacetic acid (EDTA,
EDS, Sigma-Aldrich, Ayrshire, UK) and 0.145 mg.mL-1 diethiothreitol (DTT, D5545, Sigma-
Aldrich, Ayrshire, UK). After incubation at 20 ºC in a shaking water bath set at 150

CHAPTER 6
PAGE | 242
cycles.min-1 for 1 h, the tissue fragments were thoroughly rinsed with 20 mL TN buffer and
incubated for another 2 h, in 25 mL TN buffer containing 0.15 mg.mL-1 collagenase type II
and 0.1 mg.mL-1 deoxyribonuclease (C2674 and D5025 respectively, Sigma-Aldrich,
Ayrshire, UK). The tissue fragments were then aseptically teased through a 100 µm sterile
mesh (352360, BD Falcon, BD Biosciences, Oxford, UK), the cell suspension collected and
centrifuged at 400 × g, for 14 min at 4 ºC. Thereafter the supernatant was discarded and the
cells re-suspended in ice-cold TN buffer containing a protease inhibitor cocktail (TNPI;
04693116001, Complete Protease Inhibitor Tablets, Roche Diagnostics, UK). After a
second pass through the same mesh, the cell suspension was again centrifuged at 600 × g,
for 7 min at 4 ºC, and the cells rinsed two additional times with ice-cold TNPI buffer. The
resulting cell pellet was re-suspended to give a concentration of approximately 2 × 10⁷
cells.mL-1, and the MCs / EGCs isolated as described by Bayne (1986), Dorin et al. (1993)
and McMillan & Secombes (1997). In brief, 2 mL of the adjusted cell suspension was
carefully layered on top of cold Percoll gradient comprising densities of 1.060, 1.070, 1.085,
1.108 and 1.118 g.mL-1 (Percoll®, P1644, Sigma-Aldrich, Ayrshire, UK; see the product
information sheet on how to prepare the continuous density gradient using a 1.5 M NaCl
solution) and centrifuged at 450 × g, for 45 min at 4 ºC. The continuous density gradients
were monitored by means of coloured density marker beads (17-0459-01, Pharmacia
Biotech, Uppsala, Sweden).
The cell homogenates from the different gradients were collected and transferred into
separate tubes with ice-cold TNPI buffer. Thereafter, the cell suspension was centrifuged
at 600 × g, for 7 min at 4 ºC, the supernatant discarded and the cells re-suspended in ice-
cold TNPI buffer. This procedure was repeated twice, by the end of which the cell pellet
was re-suspended and adjusted to give a concentration of 2 × 10⁶ cells.mL-1 with cold TNBI
buffer.
The cell population located in each density fraction was confirmed by microscopic
examination of cytospins stained either with haematoxylin and eosin (H&E, see Appendix
1 for the staining protocol), or by the IHC protocol described in Section 5.2.5.3. For this

Characterisation of intestinal MCs / EGCs
PAGE | 243
purpose, aliquots of 100 µL from each sample were diluted in 1:1 foetal bovine serum
(FB1000, Biosera Ltd., East Sussex, UK), and spun onto cytoslides using a cytocentrifuge
(Shandon Cytospin® 3, Thermo Fisher Scientific Inc., UK) at 1000 × g, for 4 min. The
slides were then fixed for 7 min with 100 % ethanol, allowed to dry and kept at 4 ºC until
used. Meanwhile, the cell suspensions prepared earlier were aliquoted into smaller
volumes and the insoluble fraction of the cells isolated ( i.e. membrane covered granules)
as described by Lindstedt & Kovanen (2001), with some modifications. The cell
suspensions were subjected to mild sonication in a water bath (Bench-top ultrasonic
1210, Geneve, Switzerland) for 30 s at 4 °C, and the samples then centrifuged at 150 × g,
for 10 min at 4 °C. Cell pellets were re-suspended in ice-cold TNPI buffer, and sonication /
centrifugation steps repeated twice. Supernatants containing the soluble remnant were
collected each time, whereas the insoluble remnants were re-suspended. Finally, both
soluble and insoluble fractions were transferred to separate cryogenic vials, to which
equal volumes of sodium dodecyl sulphate (SDS) sample buffer (0.5 M Tris-HCl, 20 %
glycerol, 4 % SDS, 2 mM DTT, 0.02 % bromophenol blue, pH 6.8) were added before
storing at -70 °C, until analysed using polyacrylamide gel electrophoresis under
denaturing conditions (Section 6.2.2.3).
6.2.2.3. Electrophoresis and western blot
Western blot was performed to determined the molecular weight of the antigen that the
rabbit polyclonal antibody against caspase-3 (Anti-ACTIVE® Caspase-3 Ab, G7481,
Promega, Madison, USA) recognises in Atlantic salmon intestinal MCs / EGCs obtained by
the isolation procedure described in Section 6.2.2.2.
After denaturing for 2 min in a boiling water bath, both soluble and insoluble remnants
samples were centrifuged at 16000 × g, for 5 min and each loaded onto an electrophoresis
well of a 12 % polyacrylamide gel (Pro-Pure Next Gel™, M257, AMRESCO, Solon, USA)
with 0.015 % 1,2-bis(dimethylamino)ethane (TEMED, T9281, Sigma-Aldrich, Ayrshire, UK)
and 0.07 % ammonium persulphate (A3678, Sigma-Aldrich, Ayrshire, UK). Precision Plus
Protein™ Kaleidoscope™ prestained standards (161-0375, Bio-Rad Labs Ltd., Hertfordshire,

CHAPTER 6
PAGE | 244
UK) were also loaded into one of the electrophoresis wells, so as to allow the estimation of
the subsequent molecular weight of the unknown proteins being identified. The running
buffer used was Next Gel™ Running (M259, AMRESCO, Solon, USA). Electrophoresis was
carried out at 100 V for 15 min and at 175 V for 1 h (Mini Protean® II Electrophoresis
system, Bio-Rad Labs Ltd., Hertfordshire, UK).
Subsequent to the SDS-PAGE (Sodium Dodecyl Sulphate – Polyacrylamide Gel
Electrophoresis), proteins in the gel slabs were transferred to a nitrocellulose membrane
(GE™ Healthcare Amersham Hybond™ Membranes, 45-000-839 Thermo Fisher Scientific
Inc., UK). After equilibrating the membrane and the gel for 20 min in a transblot buffer (161-
0734, Bio-Rad Labs Ltd., Hertfordshire, UK), they were transferred into a wet blotting
apparatus (SE250 Migthy Small II Mini-vertical Gel Electrophoresis Unit, Hoefer Inc.,
Holliston, USA) before applying 60V for 60 min. The membrane was then incubated for 60
min at room temperature, with 1 % bovine serum albumin (A9647, Sigma-Aldrich, Ayrshire,
UK) in TBST.
Thereafter, the membrane was washed three times, for 5 min each, with TBST and left
to incubate overnight with a rabbit polyclonal antibody against caspase-3 (Anti-ACTIVE®
Caspase-3 Ab, G7481, Promega, Madison, USA), diluted 1:250 in TBST. After this
incubation, the membrane was washed again three times, for 5 min each, before incubating
for 1 h at room temperature, with a peroxidase conjugated anti-rabbit IgG secondary
antibody (Goat Anti-Rabbit IgG-HRP, G21234, Life Technologies Paisley, UK), 1:100 diluted
in PBS. The membrane was washed twice with TBST for 5 min each, and finally the
peroxidase activity was developed with a KLP-kit chromogen / substrate solution (4CN
Membrane Peroxidase Substrate System (2-C) KPL Kit, 507304, Wembley, UK). The
reaction was stopped after 10 min with distilled water.
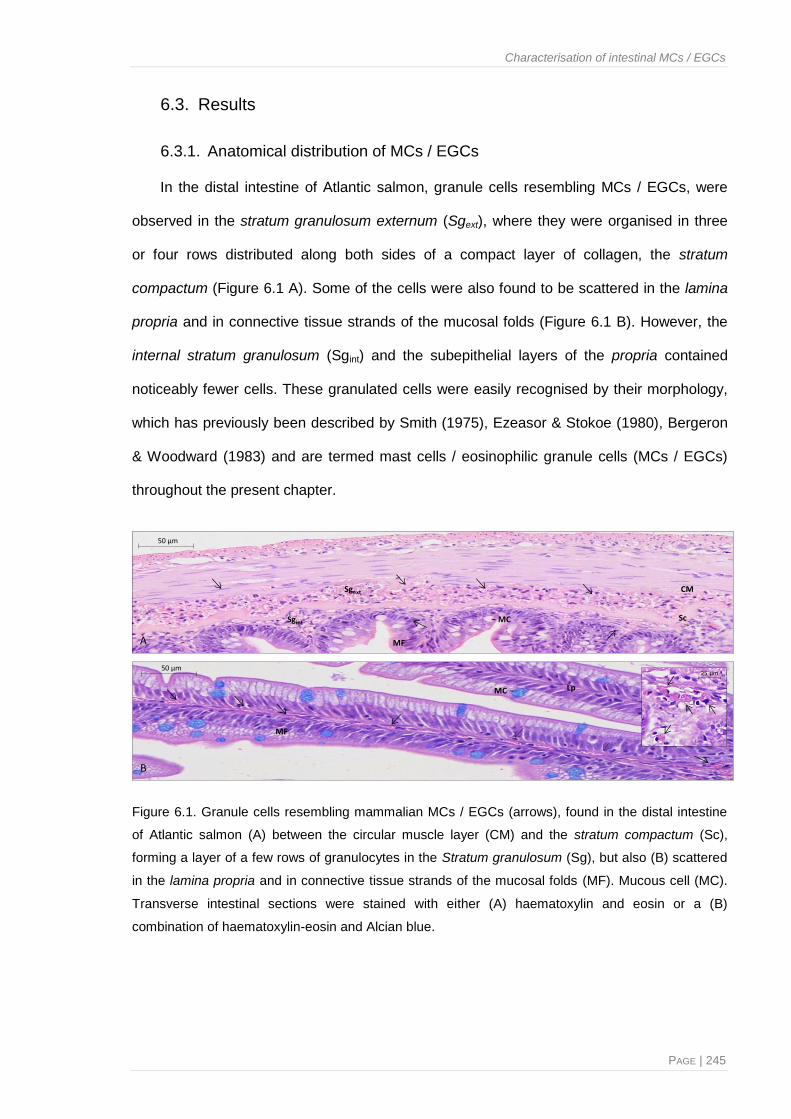
Characterisation of intestinal MCs / EGCs
PAGE | 245
6.3. Results
6.3.1. Anatomical distribution of MCs / EGCs
In the distal intestine of Atlantic salmon, granule cells resembling MCs / EGCs, were
observed in the stratum granulosum externum (Sgext), where they were organised in three
or four rows distributed along both sides of a compact layer of collagen, the stratum
compactum (Figure 6.1 A). Some of the cells were also found to be scattered in the lamina
propria and in connective tissue strands of the mucosal folds (Figure 6.1 B). However, the
internal stratum granulosum (Sgint) and the subepithelial layers of the propria contained
noticeably fewer cells. These granulated cells were easily recognised by their morphology,
which has previously been described by Smith (1975), Ezeasor & Stokoe (1980), Bergeron
& Woodward (1983) and are termed mast cells / eosinophilic granule cells (MCs / EGCs)
throughout the present chapter.
A
50 µm
MF
LpMC −
B
MF
Sgext
− MC
50 µm
Sc
25 µm
Sgint
CM
Figure 6.1. Granule cells resembling mammalian MCs / EGCs (arrows), found in the distal intestine
of Atlantic salmon (A) between the circular muscle layer (CM) and the stratum compactum (Sc),
forming a layer of a few rows of granulocytes in the Stratum granulosum (Sg), but also (B) scattered
in the lamina propria and in connective tissue strands of the mucosal folds (MF). Mucous cell (MC).
Transverse intestinal sections were stained with either (A) haematoxylin and eosin or a (B)
combination of haematoxylin-eosin and Alcian blue.

CHAPTER 6
PAGE | 246
6.3.2. Histochemical contents
Light microscopy showed the identified MCs / EGCs to be around 8-15 μm in length and
5-8 μm wide. They display a range of morphologies, but when unconstrained by surrounding
tissues they were oval, and had a spherical nucleus, sometimes indented (Figure 6.1 B, Figure
6.2 E). When in areas compressed by other tissues, the cells appeared ruptured and the
granules dispersed (Figure 6.2 A-D). In some cells nucleus was not observed (probably
because of the section’s thickness), but they were nevertheless packed with highly refractile
round-granules (Figure 6.2 B-C). Such membrane bounded cytoplasmic granules stained
bright red or pink with haematoxylin-eosin (H&E; Figure 6.3 A), haematoxylin-erythrosin-safran
(HES; Figure 6.3 B) or a combination of haematoxylin-eosin and Alcian blue (H&E-AB; Figure
6.4 E), whereas they stained blue or bluish violet with May-Grünwald-Giemsa (MGG; Figure
6.4 A).
A B C5 µm 5 µm 5 µm D 5 µm
Figure 6.2. The granules of MCs / EGCs in the distal intestine of Atlantic salmon stained with
different dyes and chromogens. (A) a Romanowsky Rapidiff® stain kit, (B) thionin, (C) anti-Caspase
3 antibody with an EnVision™ DAB chromogen and (D) anti-Active Caspase-3® with Vector®Nova
Red™ chromogen.
The MC / EGC granules displayed no affinity for toluidine blue, staining very pale blue
instead of the expected red-purple metachromatic colour seen in mammalian mast cells and
attributed to the heparin content precursor staining (Figure 6.4 B). Likewise, numerous cells
treated with thionin or Azur A (Figure 6.3 C and D respectively), displayed a strongly blue
coloured precipitation instead of purple or deep violet. While they seemed not to stain with
Astra blue (Figure 6.4. F), they proved faintly positive with the combined periodic acid Schiff

Characterisation of intestinal MCs / EGCs
PAGE | 247
(PAS-Alcian Blue and PAS-Haematoxylin; Figure 6.4 B and C respectively), while epithelial
mucous cells stained intensively purplish-pink and blue showing the validity of these methods.
In addition to the histological examination described above, the MCs / EGCs were also
investigated using a number of antibodies known to recognise components of mammalian
mast cells in immunohistochemistry. Figures 6.5 and 6.6 show transverse sections cut
through the distal intestine of Atlantic salmon in parallel with mammalian positive control
tissues staining for the selected antigens. The majority of the anti-mammalian mast cell
antibodies did not show affinity for components of salmon intestinal MCs / EGCs, although
they showed a positive reaction with mammalian control tissues employed alongside (i.e.
Figure 6.5 A, C, E, G, I, K). No reaction was obtained with anti-tryptase (Figure 6.5 B), anti-
myeloperoxidase (Figure 6.5 F), anti-lysozyme (figure 6.5 H) and anti-chymase (Figure 6.5 L)
antibodies against fish MCs / EGCs. On the other hand, whilst incubation of the same
intestinal region with an anti-c-Kit antibody from a CD117 transmembrane tyrosine protein
kinase receptor kit gave a negative reaction with fish MCs / EGCs (Figure 6.5 D), fish rodlet
cells were occasionally positively stained with this antibody.
50 µmA
Azur A
C50 µm
D50 µm
50 µmB
Sc
Sc
Sc
Sc
Figure 6.3. Photomicrographs of normal distal intestine of Atlantic salmon, showing (arrows) MCs / EGCs
lying along the stratum granulosum adjacent to the stratum compactum (Sc). Transverse sections were
stained with (A) haematoxylin and eosin, (B) haematoxylin-erythrosin-safran, (C) thionin and (D) Azur A.

CHAPTER 6
PAGE | 248
A50 µm
C50 µm
D50 µm
B50 µm
F50 µm
E50 µm
Sc
Sc
Sc
Sc
Sc
Sc
Figure 6.4. Photomicrographs of normal distal intestine of Atlantic salmon, showing (arrows) MCs /
EGCs lying along the stratum granulosum adjacent to the stratum compactum (Sc). Transverse
sections were stained with (A) May-Grünwald-Giemsa, (B) toluidine blue, (C) periodic acid Schiff and
haematoxylin, (D) periodic acid Schiff and Alcian blue, (E) haematoxylin-eosin-Alcian blue and (F) Astra
blue.
Immunohistochemical staining of salmon intestinal tissue sections with the antibody
met-enkephalin gave a positive reaction with MC / EGC granules in cells located along the
stratum compactum (Figure 6.5 J; Note that the concentration of antibody for this IHC
should probably be optimised since there seems to be over-staining in some regions),
whereas with the substance-p antibody the cytoplasmic granules appeared negative, while

Characterisation of intestinal MCs / EGCs
PAGE | 249
the cytoplasm of a few MCs / EGCs seemed positive (Figure 6.5 I) – Dr. Bahram Dezfuli
pers. communication.
As shown in Figure 6.6 A-D, the antibody against human caspase-3 reacted specifically
with Atlantic salmon MCs / EGCs cytoplasmic granules. These cells also stained positively
with anti-serotonin (Figure 6.5 N) and anti-caspase 7 (Figure 6.5 P), although very faintly
positive granules were only occasionally observed with an anti-pre-caspase 3 antibody
(Figure 6.5 O). 16
6.3.3. Ultrastructure morphology and cytochemistry
At an ultrastructural level, it could be seen that the granule cells closely resemble those
previously described by Ezeasor & Stokoe (1980). The majority of the intestinal MCs / EGCs
were arranged in a definite layer along both sides of the stratum compactum. Observed
individually or in groups, these cells were invariably ensheathed in fibroblast-like connective
tissue cells (Figure 6.7 A and C). MCs / EGCs were shown to be variable in shape and
contained numerous round granules ranging from 0.4-1.2 μm in size (Figure 6.7 A). With
surrounding perigranular halos (Figure 6.7 B-D), these granules were of
16 Figure 6.5. (following two pages) Photomicrographs showing IHC labelling of MCs / EGCs (brown
colour) using different antibodies, either in distal intestinal tissue sections of Atlantic salmon or in
mammalian positive control tissue sections known to express the antigens of interest. (A) Cytospin
for feline isolated lymphocytes where MCs were positively stained for tryptase. (B) Teleost intestinal
tissue section showing absence of tryptase immunoreactivity in MCs / EGCs. (C) Human colonic
carcinoma tissue section with positive immunoreactive MCs to the anti-c-Kit antibody. (D) Distal
intestine tissue section from a salmonid, showing MCs / EGCs negatively stained for the CD117
transmembrane tyrosine protein kinase receptor kit, whilst (arrows) rodlet cells were occasionally
immunoreactive. (E and G) Human tonsil tissue sections demonstrating a positive reaction for
myeloperoxidase and lysozyme in MCs respectively. (F and H) Serial tissue sections from a salmonid
distal intestine sample displaying no immunoreactivity of MCs / EGCs for anti-myeloperoxidase and
anti-lysozyme antibodies, respectively. (I) Teleost MC / EGC cytoplasmic granules showing negative
labelling for substance-p antibody, while (arrows) the cytoplasm of a few cells are positive. (J)
Salmon intestinal MC / EGC granules showing positive staining with met-enkephalin. (K) Chymase
and (M) serotonin IHC of MCs from tissue sections of a canine skin tumour. (L) Fish intestinal section
showing no MC / EGC immunoreactivity for chymase. (N) Salmonid intestinal MCs / EGCs displaying
immunostaining for (O) serotonin, (P) pre-caspase-3 and (Q) caspase-7.

CHAPTER 6
PAGE | 250
Figure 6.5.
50 µmF
A 35 µm 50 µmB
50 µmE
100 µmD50 µmC
50 µmH50 µmG

Characterisation of intestinal MCs / EGCs
PAGE | 251
200 µmI
200 µmJ
50 µmK
50 µmM
L
O P
N
200 µm
200 µm
200 µm
200 µm
N

CHAPTER 6
PAGE | 252
variable electron densities and frequently compressed the nucleus to one side of the cell
(Figure 6.7 B and D). Based on their ultrastruture, these granule cells were easily
recognised and comparable to those observed in serial (Figure 6.6 E-F) or adjacent (Figure
6.8) semi-thin sections, stained in parallel using IHC and an immunofluorescnce antibody
method with an antibody directed against a peptide from the p17 fragment of human
caspase-3 and where, the ultrastructural granular matrix was consistently found to be
positively stained for caspase 3. Likewise, caspase-3 immunogold-reactivity was found
within the electron-dense core of the cytoplasmic granules (Figure 6.9), in a concentration-
dependent manner.
E F
C D
A B
MF
− MC
Sc
MF
− MC
Sc
MC
Sc
Sc
MC
Sc
Sc
MFMF
MFMF
Figure 6.6. Atlantic salmon distal intestine MCs / EGCs (arrows), staining positively for an antibody
directed against a peptide from the p17 fragment of human caspase-3. Photomicrographs comprising
sections (A-D) 7 μm and (E-F) 2 μm thick observed either under light microscopy with (A, C, E) the sub-
stage condenser removed or with (B, D, F) a dark field phase contrast showing more clearly the
refractive granules. (Sc) Stratum compactum. (MF) Mucosal fold. (MC) Mucous cell. (Lp) Lamina propria.

Characterisation of intestinal MCs / EGCs
PAGE | 253
A B
C D
N
N
α
β
α
β
β
α
Ps
Ps
Ps
β
*
*
*
Ps
β
α
β
βPs
β
*
Figure 6.7. Electron micrograph of MCs / EGCs from the distal intestine of Atlantic salmon (Bar = 5
μm). The cytoplasm of these cells contains several (α) highly dense homogenous core granules, and
(β) low electron density cores or with those having pronounced vacuolisation, that were surrounded
by a filamentous matrix. (N) Nucleus. (Ps) Perigranular halo or space. (arrows) Granules. (asterisk)
Surrounding cells.

CHAPTER 6
PAGE | 254
17
A1
B1 B2
A2
Figure 6.8. Confocal micrographs showing the immunolocalisation of MC / EGC granules from the
distal intestine of Atlantic salmon, incubated with a caspase-3 FITC-conjugated antibody and
counterstained with a red nuclear stain. (A1 and B2). 3D anaglyph images equivalent to the lateral
adjacent 2D coloured micrographs, corresponding to a double fluorescent staining. (A2 and B1)
Cytoplasmic granules labelled in green by FITC dye, and the nucleus in red by Propidium iodide dye.
17 Please make use of the glasses included at the end of this thesis, to visualise the 3D anaglyph image-
micrographs presented in Figure 6.8 A1 and B2.
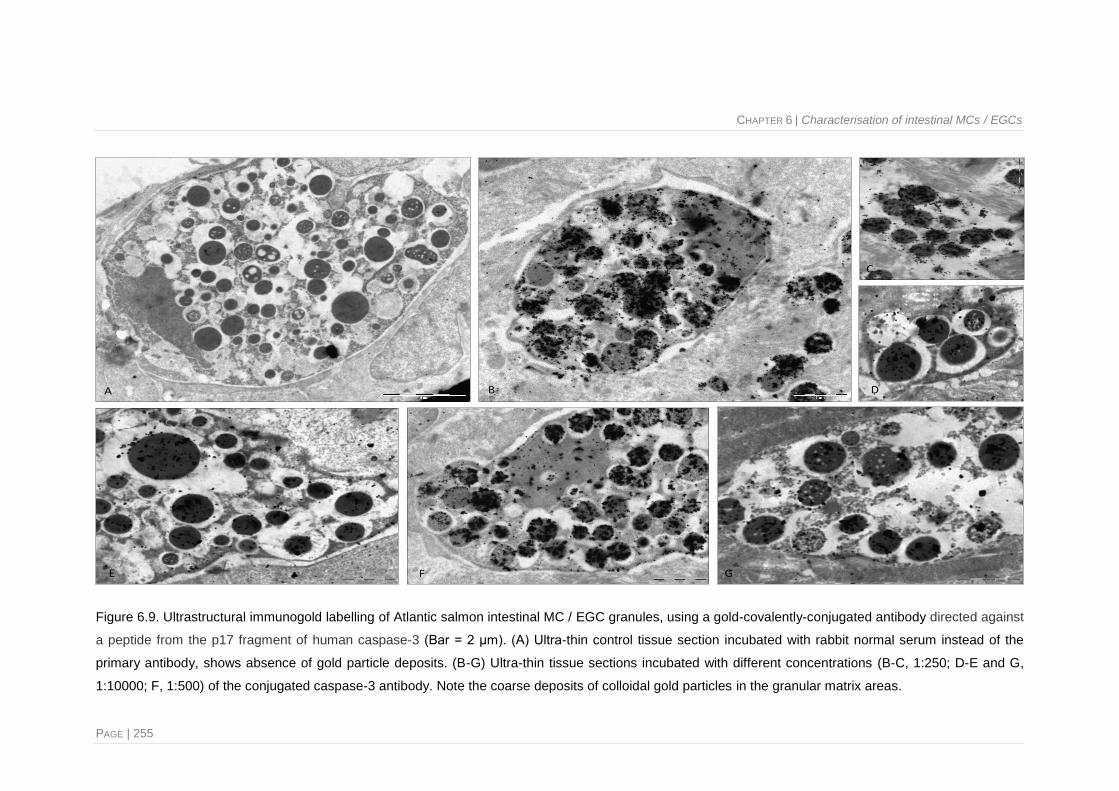
CHAPTER 6 | Characterisation of intestinal MCs / EGCs
PAGE | 255
A B
C
D
E F G
Figure 6.9. Ultrastructural immunogold labelling of Atlantic salmon intestinal MC / EGC granules, using a gold-covalently-conjugated antibody directed against
a peptide from the p17 fragment of human caspase-3 (Bar = 2 μm). (A) Ultra-thin control tissue section incubated with rabbit normal serum instead of the
primary antibody, shows absence of gold particle deposits. (B-G) Ultra-thin tissue sections incubated with different concentrations (B-C, 1:250; D-E and G,
1:10000; F, 1:500) of the conjugated caspase-3 antibody. Note the coarse deposits of colloidal gold particles in the granular matrix areas.

CHAPTER 6
PAGE | 256
6.3.3.1. Isolation of intestinal granulocytes and immunoblotting characterisation
Cell fractions recovered from the intestinal cell suspensions and subjected to a Percoll®
differential density gradient comprised erythrocytes, lymphocytes, macrophages and
granulocytes. The 1.060 g.mL-1 fraction (Figure 6.10 A) was composed mainly of cellular and
epithelial debris, several lymphocytes and some macrophages, whereas fraction 1.070 g.mL-1
comprised granulocytes and several lymphocytes (Figure 6.10 B). While fractions 1.085 g.mL-1
and 1.108 g.mL-1 were composed almost exclusively of granulocytes (Figure 6.10 C and D,
respectively), the 1.118 g.mL-1 fraction contained erythrocytes and rare lymphocytes (Figure
6.10 E). It is worth noting that the vast majority (~60-75 %) of the granulocytes were
immunohistochemically positive for the anti-caspase 3 antibody.
C
A B
E
D
Figure 6.10. Photomicrographs representative of
each of the cell fractions recovered from the
distal intestine of Atlantic salmon by means of a
Percoll® step gradient centrifugation using
densities of (A) 1.060, (B) 1.070, (C) 1.085, (D)
1.108 and (E) 1.118 g.mL-1
. Cytospins were
immunostained with the caspase-3 antibody and
counterstained with haematoxylin (Bar = 50 μm).

Characterisation of intestinal MCs / EGCs
PAGE | 257
The gradients between densities 1.070 g.mL-1 and 1.108 g.mL-1
enabled recovery of a
cell population almost exclusively composed of granule cells resembling those described in
Sections 6.2.1.2 and 6.2.1.3, and were therefore the ones used for the gel electrophoresis
and immunoblotting. Regardless of the incubation time with the caspase-3 antibody or the
blocking agent employed, the protein profile for these MCs / EGCs could not be
demonstrated (i.e. no distinct bands were formed within the lanes, but rather a continuous
smear was noticeable in the stained gels), this being particularly evident for the insoluble
remnant fraction, although for the soluble remnants a similar situation occurred.
6.4. Discussion
One of the principal aims of the work presented in the current chapter was to examine
the cytochemistry and ultrastructure of salmon intestinal MCs / EGCs, as a basis for
understanding their potential function and in order to allow their potential characterisation /
quantification through the use of the image analysis system described in Chapters 1 to 5
presented in this thesis. The latter system was developed to assist pathologists with the
histological evaluation of fish intestinal biopsies, while providing an alternative approach to
the semi-quantitative scoring methods currently used for intestinal fish health assessment.
In this respect, the quantification / description of the presence and spatial distribution of
cells considered to be key mediators of inflammatory responses initiated through food
hypersensitivity or any of a wide range of other physiological and pathological immune
states, that are of particular interest.
The classification system mentioned throughout this thesis has been based on
advanced image analysis techniques that need to be able to discriminate very particular
features of the tissue / cell structure in order to recognise histomorphological and
histochemical changes. Aspects of colour, size, shape or texture, are the features most
easily detected and measured. Thus for the imaging software to be able to identify MCs /
EGCs, or similar cell types, staining / labelling techniques need to be able to highlight these
cells with respect to surrounding tissue.

CHAPTER 6
PAGE | 258
Based on the morphological descriptions gathered for these types of cells from the
literature, discrimination based on regional distribution, texture or size thresholds appeared
feasible. However, for this to be possible, image segmentation using pixel colour was a
principal requirement. Thus, selection of an adequate discriminatory colouring-profile was a
priority.
From a review of the literature it was evident that there is considerable controversy with
respect to the staining properties of fish MC / EGC cytoplasmic granules. Besides variations
between different fish species, the nature of the fixative solution employed is also reported
to have an effect on the staining-profile outcome (Blackstock & Pickering, 1980; Reite,
1997; Jordanova et al., 2007; Schmale et al., 2004). Nevertheless, the review of teleost MC
/ EGC staining properties by Reite & Evensen (2006) provides relevant information on how
to specifically stain such granulocyte cells using techniques that appear suitable for
morphometric analysis using an image analysis system. It should be noted, however, that
staining techniques do not always prove to be ideal for image analysis (Bianchi & Mugnai,
1990), as the human capacity to resolve subtle differences vastly exceeds that of computer
software.
While it is possible to filter original images to enhance the object of interest, such
operations tend to alter the image information and can be highly subjective in application.
Hence the best approach is to start with an original digital image in which the object of
interest is already substantially differentiated from the surrounding tissue. With this in mind,
a panel of ten different histochemical stains (listed in Table 6.1) commonly employed for
MCs / EGCs were screened, with the aim of finding the one most suitable for imaging
identification (i.e. a staining technique of high reproducibility and uniformity in terms of
colour and intensity of staining; providing strong contrast with the surrounding background;
having relatively low time / cost overheads and being simple to perform).
Morphologically, the cells identified as MCs / EGCs in the present study were identical
to those described by other authors for similar salmonid tissues (Bolton, 1933; Smith, 1975;
Ezeasor & Stokoe, 1980; Bergeron & Woodward, 1983; Sire & Vernier, 1995). In common

Characterisation of intestinal MCs / EGCs
PAGE | 259
with these studies cells were scattered in the lamina propria and in the connective tissue
strands of the mucosal folds and were distributed on both sides of the stratum compactum.
These cells appeared round or ovoid-shaped with a large marginally-placed nucleus, in
tissue fixed for light microscopy, and were filled with highly refractile cytoplasmic granules.
In electron micrographs they revealed to be more elongated and showed a large eccentric
nucleus often indented to one side of the cell, with several electron dense membrane-bound
granules contained within.
Histochemically, the cytoplasmic granules stained bright red or pink with H&E, and HES
which demonstrates acidophilic components within the granules, whereas the blue or bluish
violet staining obtained with MGG revealed basophilic components. These staining
properties were as previously reported, and in part might be associated with the use of
buffered formalin as a fixative solution, which may have removed a considerable portion of
the basophilic components from the granules (Roberts et al., 1971; Blackstock & Pickering,
1980; Reite, 1997; Walls et al., 1990; Ostrander, 2000; Rocha & Chiari-Garcia, 2007). This
may explain why the term “eosinophilic granule cell” is not entirely accepted by some
authors as a reference to this cell type and therefore perhaps the term “mast cell”, would be
more appropriate.
The MC / EGC nucleus stained strongly blue, with toluidine blue indicating the
presence of nuclei acid (Bergeron & Woodward, 1983), however the cytoplasmic granules
were metachromatic-negative. The metachromatic properties of the granules are believed to
be due to the heparin and acid sulphated mucopolysaccharide content (Schubert &
Hamerman, 1956) at least in mammalian MCs. Consequently one might conclude from the
present study that these substances are not a key component of the granule cells of
salmonids. This said, other studies have shown metachromatic staining of cells resembling
granule cells for Atlantic salmon and rainbow trout tissues (Reite, 1997; Reite & Evensen,
1994; Mulero et al., 2007). Other studies have demonstrated that this feature is often an
artefact of fixation of tissues in aqueous fixatives such as formalin, as used in the present
study, and that the use of alcohol based fixatives can in some cases allow retention of the

CHAPTER 6
PAGE | 260
basophilic and metachromatic properties of the granules (Schmale et al., 2004; Reite, 1998;
Sigh & Buchmann, 2000). Thus the extent of metachromatic disparity probably depends as
much on the intrinsic properties of the fixative being used as upon the level of the
associated proteins in the granule.
Similarly, the MCs / EGCs gave a negative response to the methachromatic procedure
for the thionin and Azur A reactions, but seemed fairly positive for neutral polysaccharides.
Again, because previous studies showed metachromatic staining of the granules in tissues
of rainbow trout, brown trout and Atlantic salmon fixed in ethanol and stained with thionin
(Reite 1994, 1997; Sigh & Buchmann, 2000), this strengthens the view that different
fixatives may help to retain the metachromatic properties of the granules.
For example, Wingren & Enerbäck (1983) have stated that aldehyde fixation can
adversely affect the staining of mammalian mucosal mast cell granules, by combining with
cationic protein groups such as primary amino groups of lysine and guanidinium groups of
arginine and form cross-links between polypeptide chains that consequently increase the
basophilia of MC granules. Such an increase has also been described by Spicer (1963) as
a blocking of cationic protein groups, which would otherwise have repelled the dye
molecules from anionic glycosaminoglycan sites.
Moreover, whilst the cytoplasmic granules of these cells were not stained with the Astra
blue dye, and a slight positive staining was obtained with the combined PAS procedure, this
may be indicative of the presence of sulphated and neutral glycosaminoglycans in the
granule contents. In contrast, previous studies (Weinreb & Bilstad, 1955; Smith, 1975) have
shown no PAS staining of MC / EGCs. The PAS histochemistry selectively stains
carbohydrates, by the formation of an aldehyde which reacts to the Schiff reagent to form a
magenta colour, and indicates the presence of glycol groups or their amino equivalents
(Bancroft & Stevens, 1982). Therefore, if the precursor substance is diffusible or present in
very low concentrations, no colour will be obtained.
In summary, salmonid MCs / EGCs have shown strong affinity for dyes such as
erythrosine, eosin and methylene blue without background staining, and can therefore be

Characterisation of intestinal MCs / EGCs
PAGE | 261
selectively stained using either H&E, HES or the MGG histological stains for morphometric
appraisal using image analysis. It is worth noting that no variation in the staining of
individual granules was observed, which may suggest that the membrane around the
granules is impervious to most of these stains.
The HES stain proved to be just as effective as the other two stains, but with the added
benefit of discriminating the stratum compactum in orange-yellow, which was a feature
intentionally identified by the image analysis system to allow the morphometric distinction
and formal division of the mucosal and submucosal tissue areas. Also, by combination with
the AB dye, similarly to what has been shown with the H&E-AB staining profile, mucous
cells could provide an additional measurement using the same digital image. Thus, of the
ten staining profiles evaluated, HES+AB was selected as the best stain to evaluate
intestinal histological sections through use of the morphometric image analysis system.
While histochemical stains carry advantages in terms of speed of staining, often they
may be very general in their staining properties and may not reveal extensive information
concerning the functional properties of the MCs / EGCs. An alternative approach is the use
of IHC which, while often slower, more costly and more difficult to perform, can give highly
specific and functionally informative labelling, which is useful both for image analysis and for
the histopathologist. In this chapter, a number of IHC targets were examined (listed in Table
6.2).
The immunocytochemical study showed that salmonid MCs / EGCs were tryptase, c-kit,
myeloperoxidase, lysozyme, chymase negative, whereas the granules seemed met-
enkephalin and serotonin positive. The cytoplasm of some MCs / EGCs appearing positive
for substance-p.
As regards serotonin, a biogenic amine present in the granules of mammalian mast
cells, most of the studies performed with teleost species so far have shown that fish MCs /
EGCs contain it (Reite, 1969; Nilsson & Holmgren, 1992; Khan & Deschaux, 1997; Mulero
et al., 2007; Dezfuli et al., 2008, 2012). Serotonin (5‐Hydroxytryptamine, 5-HT) is one of the
most extensively studied neurotransmitters of the mammalian central nervous system, and
CHAPTER 6
PAGE | 262
it was shown that 5-HT is involved in interactions between the central nervous and immune
systems. Serotonin may mediate interactions of these two systems by T cell and natural
killer cell activation, delayed-type hypersensitivity responses, production of chemotactic
factors, and natural immunity delivered by macrophages (Mösener et al., 1998; Mekori &
Metcalfe, 2000; inter alia). While serotonin is one of the major mediators secreted by
mammalian MCs, little is known about its role in the immune system of fish. By analogy with
mammals, it is possible that 5-HT may influence the functioning of immunocompetent cells.
In fact, metabolism of brain serotonin in fish has been found to be associated with stressful
conditions and hypothesised to influence the functioning of other physiological systems,
notably the immune system (Khan & Deschaux, 1997). Other studies using fish parasite
infection systems, have documented the presence of serotonin in fish MCs / EGCs, and
suggested that it exerts a variety of effects that may favourably affect the survival of the
infected cells (Dezfuli et al., 2000, 2003b, 2005), however, it is mentioned again that further
information on the relationship between serotonin and the fish immune system, is required
(Dezfuli et al., 2011b).
The negative results obtained in the present study showing the absence of chymase
immunoreactivity in MCs / EGCs, substantiates previous findings that this protease is not
present in teleosts (Chiu & Lagunoff, 1972). However, recent reports have indicated the
presence of granzyme-like serine proteases in teleost cytotoxic cells’ granule exocytosis
(Praveen et al., 2006; Wernersson et al., 2006) and it is well established that secretion of
mammalian MCs’ cell-specific serine protease chymase regulates the intestinal barrier
function during disease and homeostasis (Groschwitz et al., 2009).
The failure to demonstrate tryptase, c-kit, myeloperoxidase and lysozyme
histochemically in salmon MCs / EGCs disagrees with the previous reports by Ishizeki et al.
(1994), Sveinbjørnsson et al. (1996) and Dobson (2008). However, the numerous negative
results in the immunohistochemistry, cannot be regarded as conclusive, and whether or not
these differences are truly indicative of salmonid MC / EGC granule composition, cannot be
acertained without more thorough study. Systematic studies on the nature of the protein

Characterisation of intestinal MCs / EGCs
PAGE | 263
components of teleostean MC / EGC granules are lacking, and there are only very few
mentioned in the literature (Reite, 1998), and variation in the fish species being evaluated
and the antibody sources could also be the basis for such differences observed and further
studies are required.
It is worth mentioning that although an anti-c-Kit antibody gave a negative reaction with
MCs / EGCs, fish rodlet cells were occasionally positively stained with this antibody.
Previous immunohistochemical investigations of the latter cells in sunfish scale epidermis
cultures have proven that the rodlet cell cortex was enriched with phosphotyrosine, whose
activity has been implicated in some aspects of muscle contraction, and is suggested to be
involved in triggering the rodlet cells to discharge (DePasquale, 2012).
With regard to met-enkephalin, in mammals this neuropeptide generates proliferative
and / or antiproliferative responses of mucosal lymphocytes and intestinal epithelial cells
and affects cytokine production and immunoglobulin synthesis by immune cells (Sirinek &
O’dorisio, 1991; Genton & Kudsk, 2003). However, although its function is well known in
mammals, the same function has not yet been established in fish (Dezfuli et al., 2011b).
Nonetheless, immunohistochemical staining studies referring to alterations in the
neuroendocrine system of fish alimentary canal due to the presence of parasites,
demonstrated the presence and accumulation MCs / EGCs positive for met-enkephalin
antisera, in close proximity to the infected areas (Dezfuli et al., 2000, 2002, 2005, 2008).
These observations make it reasonable to presume that by increasing the amount of the
met-enkephalin-like substance released by MCs / EGCs degranulation, the inflammation
caused by the parasites would be modulated through a possible array of immunoregulatory
functions involving potential granulocyte effector activities or merely through enhancement
of lymphocyte natural killer activity as happens with their mammalian MCs counterparts
(Payan et al., 1983).
Immunohistochemical screening using an antibody raised against substance-p revealed
a positive reaction for some of the MCs / EGCs cytoplasm. Substance-p is a neuropeptide
secreted by inflammatory cells and has pro-inflammatory effects in immune and epithelial

CHAPTER 6
PAGE | 264
cells (e.g. Payan, 1989; O’Connor et al., 2004). Previous studies performed by Dezfuli et al.
(2008), where immunohistochemical tests were applied on sections of brown trout intestinal
tissue of healthy and parasitised infected fish, revealed a significantly higher number of
positive endocrine cells in the epithelium of infected individuals, as well as the occurrence of
substance-p-like material in cytoplasmic granules of MCs / EGCs. In rainbow trout, it was
reported that Substance-p stimulates MC / EGC degranulation (Powell et al., 1991, 1993b).
Thus, it is not unreasonable to expect that it would have a similar effect on such activity in
Atlantic salmon.
Moreover, a commercial antibody directed against a peptide from the p17 fragment of
human caspase-3, was found to react strongly to intestinal MCs / EGCs. While initially
intended for use as a marker of apoptosis (see Chapter 5), this strong positive reaction from
the majority of MCs / EGCs was not expected, and therefore was later analysed by
immunofluorescent and immunogold techniques, in order to confirm the immuno-localisation
of the antigen reacting with this antibody. Both laser scanning confocal IFAT and electron
TEM visualisation of IGL revealed that the antibody in question reacted strongly with
features from the cytoplasmic granules of the MCs / EGCs. Thus the protein or peptide
being labelled is limited to the granular matrix, and hypothetically could be relevant to the
functional properties of these cells.
For over a century fish histologists and immunologists have attempted to determine the
origin and functions of these cells, however from the review of the literature it is evident that
fish MCs / EGCs still are a conundrum in this context, particularly regarding their functional
properties, which are very unclear. Some consider these granulocyte cells to be a
component of the teleost’s innate immune system and to be involved in active inflammatory
responses, especially those associated with infectious agents, chronic stress or food
hypersensitivity reactions (Dezfuli et al., 2002; Penissi et al., 2003; Rocha et al., 2007; Urán
et al., 2008; Sundh, 2009). Thus, having found a sensitive marker for these enigmatic cells,
it may be possible to try and further elucidate their functional role in intestinal immunity.

Characterisation of intestinal MCs / EGCs
PAGE | 265
Anti-ACTIVE® Caspase-3 antibody (G7481, Promega, Madison, USA) is an affinity-
purified polyclonal antibody intended to detect the active form of caspase-3 that occur in
apoptotic cells, thus making the antibody useful as an in situ marker for apoptosis.
According to the manufacturer, this antibody was generated using an antigenic peptide that
has an identical amino acid sequence in human, mouse, rat and hamster proteins, and
therefore from the start it was anticipated that it could possibly cross-react with other
species.
The same antibody has been reported to successfully detect apoptotic cells in intestinal
tissue from Atlantic salmon (Bakke-McKellep et al., 2007b) and from rainbow trout (Ronza
et al. 2011), this being a key reason why this antibody was selected for screening in the
identification of apoptotic cells for the current project. Surprisingly, in the present study this
antibody cross-reacted with a very specific fish antigen located in the cytoplasmic granules
of intestinal MCs / EGCs from Atlantic salmon. For this reason a western blot was
conducted in order to help identify the molecular weight of the protein this antibody was
labelling in fish. Unfortunately no protein profile was obtained, even after 5 distinct trials and
because of the associated cost and time restrictions the intended analysis could not be
completed.
The failure of the western membrane blotting might have been related to: (1)
purification and concentration of the active enzyme from the cell extract may have been
minimal; (2) during cell isolation, the protease inhibitor cocktail employed was not sufficient
to avoid degradation of the material; (3) sonication step may have been excessive, causing
protein degradation, which resulted in the smear band observed for the gels; or because (4)
as the antibody’s manufacturers stated that this product was not recommended for western
blot (although no further information relating to this could be obtained from the manufacturer
when requested).
Clearly, better optimisation of the isolation process needs to be performed. Besides
testing higher concentrations of the broader protease inhibitor, it might be worth trying some
kind of purification and quantitation procedure (e.g. affinity chromatography column kits for

CHAPTER 6
PAGE | 266
caspase-3 using an appropriate protease inhibitor). Evaluation of different sonication
procedures with frequent microscopic checks of samples, to ensure that the granular
membranes are ruptured, might also be helpful. Another suggestion would be to use a
positive control sample known to express caspase-3 during the electrophoresis and blotting
procedures, e.g. using a cell line undergoing cell-death / apoptosis that should label with the
antibody being tested. According to Herath (2010) salmonid alphavirus-1 virus infected
Chinook salmon embryo cells at 5-6 days might be a good option in this context.
It is worth noting that, according to the manufacturer’s published article (Promega
Notes 75, available online from the authors Riss et al., unknown year), the polyclonal in
question may also detect the large subunit of recombinant active caspase-7. These authors
state that while performing a western blot, although reactivity was much lower than with
active caspase-3, caspase-7 also gave a signal. Such cross-reactivity is not surprising as
caspase-3 and caspase-7 are in the same caspase sub-family and have similarities in their
amino acid sequences. This being the reason it was decided to test a caspase-7 antibody in
serial tissue sections where it was previously shown to be reactive to the caspase-3
antibody, and following IHC intestinal MCs / EGCs were shown to be also positive for
caspase-7.
With respect to the isolation of MCs / EGCs and subsequent identification of the protein
profile through electrophoresis and antigen blotting, the intention was to subsequently
excise bands of interest from the SDS-Page gel, and use them for liquid chromatography-
tandem mass spectrometry (LC MS/MS), in order to identify proteins from caspase-3
positive granules by shotgun proteome analysis. Knowing their composition, it would then
be easier to make tentative hypotheses concerning their functional properties. For this
purpose, contact was established with Dr. Neil Inglis of Moredun Research Institute’s
Proteomic Facility Services, and protocols for sample preparation were discussed.
However, with the restrictions on time left to complete the current study and failure of initial
isolation attempts, this research avenue was forced to be put on hold pending a later
collaborative project.

Characterisation of intestinal MCs / EGCs
PAGE | 267
Nevertheless, the anti-caspase 3 antibody has shown to have clear applications in the
identification and histochemical characterisation of salmon MCs / EGCs, either alone or in
combination with other biomarkers. Caspases are a family of cysteine proteases expressed
as inactive zymogens in virtually all animal cells13. These enzymes play a central role in
most cell death pathways leading to apoptosis, but growing evidence now implicates
caspases in non-apoptotic functions (Schwerk & Schulze-Osthoff, 2003; Launay et al.,
2005). Several of these enzymes play a role in the mammalian innate immune response by
processing some of the cytokines involved in the inflammatory response. Moreover, they
are necessary for terminal differentiation of specific cell types. These enzymes also play a
role in T and B lymphocyte proliferation and, in some circumstances, appear to be required
for cell dispersion. These pleiotropic functions implicate caspases in the “control of life and
death”, however the fine regulation of their dual function remains poorly understood
(Ishizaki et al., 1998; Wilhelm et al., 1998; Sordet et al., 2002; Miura et al., 2004; Rohn et
al., 2004; Launay et al., 2005; Kuranaga & Miura, 2007; Rosado et al., 2006; Siegel, 2006;
Lamkanfi et al., 2006).
Characteristic morphological features of apoptotic cells include cell shrinkage,
condensation of chromatin, fragmentation of DNA, and formation of apoptotic bodies
(Gerbaulet et al., 2006). In this respect it seems clear that the MCs / EGCs being stained by
the caspase-3 and -7 antibodies were not likely to be undergoing cell death in either normal
or inflamed tissue states, or at least not all of them at the same time. Thus the observation
of caspase activity and the identification of caspase substrates in the absence of cell death
13 Cysteine proteases, are synthesised as inactive proenzymes (pre-caspases) and can be classified into two main
groups according to the length of their N-terminal pro-domain. Pre-caspases with a short domain (i.e. pre-caspase 3, 6
and 7) occur in the cells as dimers that require proteolysis at internal aspartate residues to generate two large and two
small subunits. Active enzymes result from heterodimerisation of these subunits, thus include two active sites. These
caspases are the main effectors of apoptotic cell death. Other pre-caspases such as pre-caspase 8, 9 and 10 are
characterised by their long pro-domain, and exist in living cells as monomers and require dimerisation or
oligomerisation for activation that can occur in the absence of any proteolytic cleavage. These are normally the
initiators of a casapse cascade although the main functions of some do not relate to apoptosis (Sordet et al., 2002;
Launay et al., 2005; Lamkanfi et al., 2006).

CHAPTER 6
PAGE | 268
have sparked a strong interest in confirming if what is being labelled is in fact the peptide
caspase-3, and not an instance of cross-reactivity.
Teleosts’ MCs / EGCs are known to have the capability to immediately respond to
appropriate stimuli by degranulating, a process characterised by the extrusion of the
cytoplasmic granule contents into the extracellular space by a process of exocytosis.
Consequently, they have the capacity to release a variety of mediators, which may have a
profound influence on surrounding tissues and could result in a wide array of cellular
responses, including induction of immune and inflammatory responses. For instance,
migration and accumulation of neutrophils and macrophage activation have repeatedly been
observed at sites where MC / EGC degranulation has occurred (Reite, 1997; Reite &
Evensen, 1994; Matsuyama & Iida, 2001), suggesting that fish MCs / EGCs could possibly
contain or generate a variety of mediators, caspase-3 and / or caspase-7 included perhaps,
that could induce cellular dispersion, differentiation or proliferation as observed for
mammalian MCs (Thornberry et al., 1992; Sordet et al., 2002; Rohn et al., 2004; Lamkanfi
et al., 2006; Reite & Evensen, 2006; Dezfuli & Giari, 2008; Crivellato & Ribatti, 2010).
6.5. General conclusions
This study has examined aspects of the general morphology, histochemistry and tissue
distribution of intestinal MCs / EGCs in salmon, as well as discussing proposed functions of
these cells, in a bid to further characterise them and try to elucidate their functional role in
the intestinal immune response. However, the histochemical properties of these cells still
can not be said to have been established without question. Their physiological function and
the content of their granules still remain somewhat obscure, although a role as
immunodulatory cells reacting to various exogeneous signals through a finely regulated
process, comparable to that causing the degranulation of mammalian MCs, has been
suggested.
The histochemical staining properties described here for salmonid MCs / EGCs, seem
to resemble those of mammalian mucosal mast cells, with both acidophilic and basophilic
components in their granules. They also similarly contain neuromodulator /

Characterisation of intestinal MCs / EGCs
PAGE | 269
neurotransmitter-peptides such as serotonin, met-enkephalin and substance-p.
Furthermore, distinguishable bio-chromogenic markers have been identified, which seem to
be of potential use in helping to generate a discriminatory profile for such cells, that could
later be assessed by image analysis systems. Specifically, haematoxylin-erythrosin-safran
(HES) and May-Grünwald-Giemsa (MGG) histochemical staining, and the immunolabelling
with anti-serotonin, met-enkephalin, substance-p and caspases-3 / -7 antibodies show
promise for further studies.
The original hope that this study of specific components of mast cell granules would
lead towards the critical function or functions of these cells has not been wholly realised.
Instead, however, an extreme degree of variability was uncovered that provides an entirely
new set of questions about their function in fish. In particular, the results presented here
demonstrate the reactivity of caspase-3 and -7 with the cytoplasmic granules of MCs /
EGCs, in the absence of apoptosis and cell death. Albeit speculatively, it is suggested that
this is indicative of a novel non-apoptotic function for this enzyme, supporting a possible
involvement in cellular development, activation, proliferation, differentiation or dispersion
indirectly or directly involved in the intestinal immune response, as happens in their
mammalian counterparts. This prompts an interest in further examining and evaluating the
possible roles of caspases in the Atlantic salmon intestinal MCs / EGCs as regulators of
signalling molecules in cells that might control critical biological cellular responses beyond
apoptosis. To achieve this, an attempt to begin identifiying the protein profile for the
granules, through combined electrophoresis and antigen blotting and subsequent use of
liquid chromatography-tandem mass spectrometry was made but had to be curtailed for
lack of available time.
Despite the above comments, from the observations described in this chapter it was
clear that salmonid MCs / EGCs share some of the staining affinities, immunohistochemical
and ultrastructural similarities with mucosal mammalian MCs, and this could therefore be
used to argue in favour of their analogy with mammalian mast cells. Nevertheless, their

CHAPTER 6
PAGE | 270
exact function remains debatable and further research on the granule composition needs to
be conducted to enable them to be considered as homologous to mammalian MCs.


7. CHAPTER 7
7. GENERAL SYNTHESIS
7.1. Introduction
The contribution of aquaculture to world food-production has increased tremendously
over recent decades, and the rapid growth in this sector has highlighted the need to ensure
that development is based on sustainable and responsive practices, this including activities
associated with aquafeed development (FAO, 2012). The aquaculture feed industry
currently aims to optimise the quality of their products and to include ingredients that both
meet the physiological requirements of the animals, as well as having specific health
benefits, minimal environmental impact and being economically viable (Kiron, 2012). Thus,
over the past few years there has been a great deal of research focusing on improving
growth efficiency and resistance to disease in fish through manipulation of dietary
formulations (Cerezuela et al., 2013).
The evidence for successful nutritional modulation, the mechanisms by which it occurs
and the underlying biological reasons for the difficulties associated with demonstrating the
effectiveness of such an approach have been reviewed extensively in a number of recent
articles (Fuentes et al., 2013; Lewis et al., 2013; Martinez-Rubio et al., 2013; Navarrete et
al., 2013; Wu et al., 2013). Numerous studies have shown that whole diets, individual
nutrients and feed components can all influence the functional tissue ultrastructure and
immune response of a number of different organs (Trichet, 2010). Other studies have
provided some guidance as to how best to assess specific physiological functional and
morphological changes in tissues, and what confounding factors and methodological
aspects to consider when assessing changes through dietary manipulation (e.g. Stolen et
al., 1990; Maita, 2007; Verlhac & Kiron, 2004; Rašković et al., 2011). However, it is
generally accepted that the complexity involved in the physiological processes of digestion

CHAPTER 7
PAGE | 274
and immunity has made assessment of the effects of nutritional modulation extremely
challenging (Blazer, 1992; Albers et al., 2013). Consequently, no single method or
biomarker can be employed to predict the effect of a dietary intervention on the overall
physiological and anatomical state of the host, including their immune response. Therefore,
an integrative approach is needed to help standardise the methodologies that are currently
being employed to do this, as well as introducing new, more accurate techniques to assess
changes at the level of the tissues, cells and gene expression. This should assist in
providing a better understanding of the mechanisms involved in changes in fish physiology
related to dietary manipulation. To this end, the overall aim of the present study was to
provide guidance on suitable methods for the assessment and interpretation of the effects
of dietary modulation in Atlantic salmon.
7.2. General study aim
In the past, the teleost gastrointestinal tract has principally been considered in terms of
its role in mediating nutrient uptake, but more recently there has been increased interest in
its physical structure and its role as an immunological barrier, and more importantly its
pivotal role in maintaining and regulating the entire host’s metabolism and physiological
homeostasis (Salinas et al., 2011). This is not surprising considering that it provides a
dynamic interface for nutrient digestion and absorption, as well as comprising the first
barrier against exogenous pathogens which can colonise or enter the host cells and tissues.
In addition, it constantly renews itself through the activity of intestinal stem cells and is
therefore a tissue undergoing constant restructuring (Choct, 2009). In view of this, the
gastrointestinal tract represents a highly intricate system, the functions of which include the
maintenance of macro- and micro-structural integrity, balancing of the intestinal microflora
and controlling the intestinal immune system. The signaling pathways, effector molecules
and regulatory mechanisms involved are not yet fully understood, and knowledge on the
functional outcome of these is somewhat fragmented, except for a few economically
important fish species (Pott & Hornef, 2012). Thus, if one wishes to advocate a method that
ensures that alternate feed ingredients, when added to fish diets do meet the requirements

General synthesis
PAGE | 275
of the animal, and / or demonstrate clear attributes linked to a specific nutrient or additive,
an improvement is needed in the understanding of the physiological dynamics which
maintain intestinal homeostasis in salmonids, and to use this information to characterise
how changes in these dynamics affect the intestine’s physiological function and structure.
To develop a method for assessing this, an array of parameters that are indicative of the
animal’s intestinal response to a nutritional context need to be measured. The main focus of
his thesis, therefore, was to evaluate the usefulness of histological features and specific
molecular markers of immune function, as tools to assess and monitor the effects of feed
composition on fish health.
7.3. Research approach
For the past fifty years, the role of dietary nutrients in determining / modulating the
immune functions of fish has been investigated and a vast amount of information has been
acquired (Lim & Webster, 2001; Halver & Hardy, 2002; Nakagawa et al., 2007). A wide
variety of parameters can be used to assess different aspects of the host’s physiology and
immune system (Stolen et al., 1990, 1992, 1994, 1995; Ostrander, 2000; Maita, 2007).
Nevertheless, monitoring the histological structure of the gastrointestinal system remains
the principal method of choice for assessing the effects of nutritional modulation and this is
still considered to be a good indicator of the physiological status of the fish (Rašković et al.,
2011). Various methods of histological analysis have been used to do this, with semi-
quantitative scoring systems most frequently applied, although morphometric procedures,
stereology and histochemical methods have also been employed.
Traditional histological assessment, based on the use of semi-quantitative scoring
systems, are considered to be less accurate than quantitative approaches, relatively
insensitive and subjective (e.g. Pilette et al., 1998; Kopec et al., 2011; Hall et al., 2013).
Digital imaging analysis on the other hand, appears to provide a more accurate analysis
because histological sections are quantified on a continuous scale and the inter-observer
variability is noticeably reduced (Mandarim-de-Lacerda et al., 2010; Shamir et al., 2010). The
result also appears to correlate well with pathologists’ semi-quantitative evaluations (Hall et

CHAPTER 7
PAGE | 276
al., 2013; Campos et al., 2014). Thus, there is a current trend for the use of digital image
analysis as an alternative or supplementary method of assessment.
Thus an assessment model was developed based on interactive image analysis for
histological sections of the intestine within this project. The intention of this work was to
reliably quantify the extent of morphological and functional changes occurring in response
to dietary and / or environmental modulation. In order to accomplish this goal four
interrelated study phases (presented in Chapters 2-6) were implemented. The outcomes of
the experiments outlined at the start of the project, provided the basis for the subsequent
phases that followed. Thus, the work presented in later chapters included adjustments and
improvements as appropriate, based on the finding of earlier chapters.
7.4. Summary of study outcomes
At the outset of this work, a dietary model was used whereby different levels of
enteropathy were specifically induced, with the purpose of providing a range of extreme
histopathological and immunological states that could be used for developing and assessing
the performance of new tools and assessment methodologies. Chapter 2 focused on the
development of a novel semi-automated image analysis system, providing a template for
the future development of tools to assist pathologists with the histological evaluation of fish
intestinal biopsies. The intention was to deploy an efficient image processing and analysis
pipeline, incorporating appropriate algorithms for feature extraction and morphometric data
generation, for the purpose of evaluating the extent of morphological changes in the
intestine of fish, which could be attributed to the nutritional model employed.
A key aspect of the work described, was the need to develop a highly consistent
methodology with respect to tissue staining and image acquisition. In order to achieve this,
a standardised protocol for staining and image pre-processing was defined, that eliminated
or minimised as many sources of variation as possible. In developing the image analysis
system, a set of features that best describe the different intestinal morphological changes
observed were selected, based on the personal experience of the researcher, input from
fish pathologists or similar quantitative studies reported in the literature. Subsequently, a

General synthesis
PAGE | 277
programming environment was selected, an outline produced of what the envisaged tool
needed to be capable of measuring, and appropriate scripts written to accomplish those
tasks. Once the scripts were written, the accuracy and usability of the system was assessed
i.e. the degree to which the individual measurements agreed with the actual values of the
region of interest, the time and effort required to use the system, and the level of
reproducibility between different observers and the same observer at two distinct time
points. First, a quantitative comparison between computational results and manual
measurements gathered by experienced pathologists was conducted. Second, the same
images were evaluated using open source image analysis software, and results from the
interactive and the semi-automated segmentations compared. The outcome of this initial
work demonstrated that the image analysis method developed could be conducted with
minimal user-interaction, thus allowing rapid and objective assessment of salmon intestinal
histology. This greatly improved the efficiency of conducting quantitative assessment as
opposed to the subjective alternative approach employed during the normal evaluation
procedure. Moreover, a significant degree of agreement was achieved between the
measurements obtained from the semi-automated imaging system and the manual
morphometric image segmentation. Also, the strength of this quantitative approach was
enhanced by the employment of interactive procedures, which enable the operator to rectify
preceding automated segmentation steps, and account for a given specimen’s variations.
Furthermore, the system provided significant correlation to other well-established
quantitative approaches, suggesting that it can be a viable complement / alternative to the
pathologist’s manual scoring, being both more practical and time-efficient, and although
minor inter- and intra-operator variations were recorded, these did not influence the
analytical outcomes. Such high reproducibility and lack of dependence on the user’s
expertise make this approach suitable for delivering large-scale data sets, providing a
robust method to assess the histology of fish intestinal tissue sections, obtained under
different experimental states and different time intervals.

CHAPTER 7
PAGE | 278
In Chapter 3, following development of the new system, and because evaluation of
several individual parameters together should improve the accuracy of dietary assessment,
the newly developed image analysis tool was then used in conjunction with a range of other
techniques (i.e. classical growth assessment, immunological, haematological and
physiological tools). The work reported in this chapter was aimed at examining the broader
utility of a multivariate / multimodal approach to the screening of different dietary
ingredients, and to ascertain the reliability and contribution that such an image analysis
system might make in dietary assessment. This was an attempt to establish its usefulness
in screening a wider range of specific dietary components, and characterising putative feed-
derived histological states. In order to achieve this, a larger set of samples was assessed
(these having different properties to those used earlier for the training of the software and to
define the appropriate parameters incorporated into the imaging system). Through the use
of multivariate statistical techniques, the extensive variety of morphometric descriptors
initially used in the analysis was narrowed down to a few that best described the histological
status portrayed. This fine-tuning would, in turn, improve the time required to perform
subsequent analyses and improve the efficacy of this morphometric approach.
The model feed trial employed in Chapter 3, successfully generated differentiable
histological / immunological states and although these were not, for the most part,
systemically differentiable through the majority of procedures performed they were
detectable morphologically. The newly developed image analysis tool could effectively and
accurately identify and describe the major morphological changes that occurred in the distal
intestine, reflecting the different components fed to the fish. Furthermore, the use of
multivariate techniques, which reduced the dimensionality of the data by ranking the
features according to their discriminatory potential (described both in Chapters 3 and 4)
allowed better discrimination of states and is likely to prove the most productive approach
for further discriminatory studies.
While as a stand-alone method of assessment, the proposed image analysis system
was demonstrated to be useful, it was considered imperative to validate the system’s

General synthesis
PAGE | 279
performance against that of more well-accepted and established methodologies. This was
important not only to establish that the developed system is successfully measuring the
parameters it is purported to be measuring, but also to provide reassurance that it could
reliably measure aspects of the histology that are relevant to histopathological analyses.
Thus, the aim of the work presented in Chapter 4, was to evaluate the consistency and level
of agreement of the newly developed quantitative microscopic image analysis system with
that of an established semi-quantitative histological grading system. This was achieved by
examining the capacity for both methodologies to analyse and assess the same set of
histological slides.
The outcomes of the work described in this chapter indicated that, despite variations in
scoring between the two independent methods, most quantitative image analysis indices
performed at least as well when compared to analogous semi-quantitative descriptive
parameters of assessment. These data indicated that either image analysis or traditional
semi-quantitative scoring can generate accurate data. From this work it was therefore
apparent that it is safe to employ either method depending on the complexity and the
practicality of the task at hand. However, characteristics such as rapidity, simplicity and
adaptability favour the image analysis method, and it can prove particularly useful where
less experienced interpreters perform the analysis.
In Chapter 5, the utility of the newly developed system in relation to integration of
additional modes of assessment was scrutinised. In addition to generalised
histomorphological features, protein markers that might correlate to the functional status of
the fish were assessed for their usefulness and consistency in providing knowledge as to
the state of the fish. Thus, the work covered in Chapter 5 aimed to describe the application
of image analysis to the detection of potentially predictive biomarkers and the accurate
quantification of small changes in the spatial distribution of proteins and their relative
amounts in the tissue. Therefore, this chapter aimed to generate an optimised immuno-
histochemical staining and image analysis protocol, through which a description of intestinal
cellular responses at a molecular level could be undertaken.

CHAPTER 7
PAGE | 280
Various cytological biomarkers for proliferation, migration, differentiation and shedding
of damaged or senescent cells by apoptosis, were tested in an attempt to characterise the
morphological changes of the intestinal epithelial cells and of the inflammatory infiltrate due
to the dietary ingredients being evaluated. Subsequently, the dispersion and area fraction of
positive staining in the tissue, were appraised for three distinct zones: (1) submucosal area,
(2) above the stratum compactum and up to the basal area of the intestinal mucosal folds,
and (3) remaining mucosal area / apex of the intestinal folds.
In brief, the work described in this chapter, led to the development of a digital
computer-assisted quantification method targeting a selected panel of specific
immunohistochemical markers intended for assessment of the immune response to dietary
modulation. Expression profiling of the final selected biomarkers (i.e. PCNA, TUNEL, active
caspase-3 and CD3ε) was shown to be able to assist in further characterising the tissue
responses generated, and the proposed system was demonstrated to provide considerable
potential for improving the sensitivity, accuracy and reproducibility of quantitative analysis of
tissue responses to dietary or environmental modulation.
Chapter 6 emerged as an additional study resulting from the histochemical labelling
results generated by work reported in the previous chapter. In brief, while searching for
appropriate cytological biomarkers to describe the morphological changes occurring in the
intestinal mucosal tissues due to the dietary ingredients being evaluated, histolabelling
protocols for intestinal mast cells / eosinophilic granule cells (MCs / EGCs) were sought.
Teleostean MCs / EGCS are considered to be key mediators of inflammatory
responses initiated through food hypersensitivity and are involved in many pathologic
processes such as the ones related in the defence against infectious agents or towards
chronic stress. In this respect, the quantification / description of the presence and spatial
distribution of such cells is considered to be of particular interest. However, the
physiological function of MCs / EGCs and the content of their prominent granules still
remain somewhat controversial. Therefore in an attempt to further understand their role in
intestinal immune responses, this chapter examined their anatomical distribution in the

General synthesis
PAGE | 281
tissue and their histochemical affinity to different staining procedures and immunolabelling
techniques, and finally provided a description of their ultrastructural features. First,
screening of different functional histological staining protocols was performed, and second,
the identification of putative functional antibodies reacting positively to antigens contained in
the cytoplasmic granules of these cells was sought, and light and electron transmission
microscopy employed for visualisation and ultrastructural investigation.
In terms of staining properties, the examined MCs / EGCs seemed to resemble
mammalian mucosal mast cells, with both acidophilic and basophilic components in their
granules, and containing compatible neuromodulator / neurotransmitter-peptides such as
serotonin, met-enkephalin and substance-p, which, in a way, may strengthen the premise
that fish MCs / EGCs could be considered homologous to mammalian MCs, in terms of their
role in inflammatory mechanisms and immuno-modulatory responses.
Additionally, for these particular granular cells, appropriately discriminatory colouring-
profiles were achieved, and these were apparently efficacious for the evaluation of intestinal
histological sections, through use of the morphometric image analysis tools developed in
this thesis. Staining gave low background and relatively high reproducibility and uniformity
in terms of colour and intensity of staining. Nevertheless, from the present study their
function remains to be elucidated and further research on the granules’ composition,
paritularly using shotgun proteomics techniques, should be performed.
7.5. Future considerations
While the current study has employed a range of multivariate techniques to analyse
and interpret the data, as more data accumulates and new methodologies are incorporated,
the use of artificial neural network classifiers and other machine learning systems11 might
be envisaged as a way to categorise samples e.g. good, medium and poor health (or) high,
medium and low enteropathy based on the features screened. As part of this approach it
11 Machine learning, is a branch of artificial intelligence research that employs a variety of statistical, probabilistic and
optimisation technique that allows computers to learn from past examples and to then use that prior training to classify
new data, identify new patterns or predict novel trends (Mitchell, 1997).
CHAPTER 7
PAGE | 282
will be important to combine as many modes of assessment as possible, including aspects
of haematology, growth, digestibility, histological and molecular parameters, for better
discrimination of individual variability and the performance of different diets being evaluated.
Moreover, an important factor in determining the resolution of different states is the sample
size employed for analysis (Bartlett, 1998). While sample sizes in the current study have
been relatively low, size of future sample sets may be improved through increasing system
automation, and by focusing the assessment on a restricted number of highly discriminative
parameters by use of techniques reducing the dimensionality of the data12. This in turn, is
likely to enable the proposed system and related techniques / analyses to detect even more
subtle responses as a result of dietary change.
Additionally, with the growing interest in assessment applications for fish, it is pertinent
to review the present findings with regards to other fish species and, in terms of an intra-
species approach, it will be pertinent to consider the life-stage (e.g. maturation,
smoltification) as well as other environmental factors (e.g. temperature, salinity).
In regard to the intestinal MC / EGC characterisation, so as to allow identification of the
protein profile through use of mass spectrometry techniques, optimisation of the isolation
protocol is a critical consideration. This would then make it easier to hypothesise upon the
granules’ composition and consequently speculate upon the functional properties of
salmonid MCs / EGCs.
7.6. Adoption of the developed technology
As observed in other health-related disciplines, widespread adoption of digital histology
has been hindered not only by the cost and technical issues, but also largely by the mind-
12 Dimensionality reduction, is the process of transduction of a high-dimensional dataset into a lower-dimensional
space while retaining as much of the information content of the data as possible. As a pre-processing step for
supervised classification algorithms, dimensionality reduction achieves several important goals. It reduces the storage
requirements and algorithm complexity by reducing the input space of the data. It can improve performance of learning
algorithms by rejecting spurious or noisy features prior to training and testing. Dimensionality reduction can also protect
against over-fitting by reducing the number of parameters learned by the classifier (Parrish & Gupta, 2012). Linear
dimensional methods such as principal components analysis (PCA), factor analysis (FA), principal factor analysis
(PFA), projection pursuit (PP), and independent component analysis (ICA) have been extensively used (Fodor, 2002).
General synthesis
PAGE | 283
set of traditional pathologists (Pantanowitz et al., 2012). The cumbersome user interface,
dependence on a mouse and keyboard, rather than the easy to use slide stage without a
slide-holder which allows rapid scanning of slides, has biased existing pathologists towards
continued use of traditional microscopy rather than examining digital slides (Hassell et al.,
2011). Nevertheless, computer-aided diagnosis of digital images offers something more
than traditional microscopy can (Weinstein et al., 2009). This technology is becoming
increasingly important as anatomical histology requires more quantitative image analysis
(Pantanowitz, 2010) and with this emerging imaging tool, digital histology will undoubtedly
allow pathologists to make more accurate and consistent diagnoses in the near future.
Most of the new techniques developed in the current study are now being employed
and expanded upon by the sponsor of this project. Aquatic Animal Health R&D manager Dr.
Charles McGurk, working at Skretting Aquaculture Research Centre (ARC) makes the
following comments with respect to the use of image analysis by Skretting: “At the ARC we
invested in such an approach, and we are now pioneering its use in fish health and nutrition
research, and it is enabling us to generate masses of data with relatively little user input.
This refinement has revealed previously undetectable differences in gut structures. For
example, using such customised image analysis software to extract quantitative data from
tissue sections, a newly developed diet (i.e. Optiline HT, Skretting, Norway) was shown to
reduce subclinical changes in gut morphology in fish reared in water temperatures above
the optimum. And the potential of this approach is not limited to studying intestines!”
The level of enquiry from other fish health professionals whilst presenting the current
work at international meetings and conferences, further suggests that many researchers are
keen to investigate and possibly adopt this type of technology. Thus the prospects for wider
adoption of image analysis techniques in aquaculture health screening are high, and the
technology has great potential to provide a more subtle and sophisticated understanding of
the effects of diet on fish health.

CHAPTER 7
PAGE | 284
7.7. Concluding remarks
Through standardisation of the sampling and preparation methodologies, staining
protocols and digital capture thresholds and techniques, an image analysis system has
been developed that can help pathologists and others screen new dietary components in
terms of effects on intestinal morphology, histochemistry and immunohistochemistry, and
thereby, interpreted function. This assessment system has proven to be an efficient,
accurate and objective method, the data outputs of which do not differ significantly when the
analysis is performed by different observers with varying levels of expertise in
histopathological assessment. Furthermore, by employing multivariate statistical /
classification techniques on data derived from multimodal analyses, the synergy to be
gained through simultaneously assessing a wide range of discrete features (instead of
evaluating each discriminatory feature individually) has been successfully examined and the
tissue features best able to describe the functional and histopathological alterations
observed, identified.
Despite the apparent usefulness of this system for discriminating between
histopathological / immunological states, it is nevertheless clear that in order to fully
understand and exploit the knowledge gained from these tools and techniques and to
rationally develop such system further, it is critical to maintain a close relationship and
continuous involvement of immunologists, feed specialists and histopathologists who are
able to provide a contextual interpretation, not just observe and measure differences.
It is ultimately envisaged that the further development of the tools and techniques
described in this thesis will greatly assist in the evaluation of alternative dietary components
for aquaculture feeds, leading, in turn, to a more sustainable global industry, and improved
fish health and welfare.


PAGE | 287
BIBLIOGRAPHIC REFERENCES
ABAURREA, M., NUÑEZ, M. and OSTOS, M., 1993. Ultrastructural study of the Distal part of the
intestine of Oncorhynchus mykiss. Absorption of dietary protein. Micron, 24(5), pp. 445-450.
ABAURREA-EQUISOAIN, M. and OSTOS-GARRIDO, M., 1996. Enterocytes in the anterior intestine
of Oncorhynchus mykiss: Cytological characteristics related to osmoregulation. Aquaculture,
139(1), pp. 109-116.
ABID, A., DAVIES, S., WAINES, P., EMERY, M., CASTEX, M., GIOACCHINI, G., CARNEVALI, O.,
BICKERDIKE, R., ROMERO, J. and MERRIFIELD, D., 2013. Dietary synbiotic application
modulates Atlantic salmon (Salmo salar) intestinal microbial communities and intestinal
immunity. Fish & Shellfish Immunology, 35(6), pp. 1948-1956.
ABTAHI, B., YOUSEFI, M. and KENARI, A.A., 2013. Influence of dietary nucleotides
supplementation on growth, body composition and fatty acid profile of Beluga sturgeon juveniles
(Huso huso). Aquaculture Research, 44(2), pp. 254-260.
ADAMS, M.B. and NOWAK, B.F., 2003. Amoebic gill disease: sequential pathology in cultured
Atlantic salmon, Salmo salar L. Journal of Fish Diseases, 26(10), pp. 601-614.
ADAMS, M.B. and NOWAK, B.F., 2004. Sequential pathology after initial freshwater bath treatment
for amoebic gill disease in cultured Atlantic salmon, Salmo salar L. Journal of Fish Diseases,
27(3), pp. 163-173.
ADAMS, S. M., A. M. BROWN, and R. W. GOEDE. 1993. A quantitative health assessment index for
rapid evaluation of fish condition in the field. Transactions of the American Fisheries Society,
122: pp. 63-73.
AHERNE, C.M., COLLINS, C.B. and ELTZSCHIG, H.K., 2013. Netrin-1 guides inflammatory cell
migration to control mucosal immune responses during intestinal inflammation. Tissue Barriers,
1: e24957.
AHERNE, W. and DUNNILL, M.S., 1966. Quantitative aspects of placental structure. Journal of
Pathology and Bacteriology, 91(1), pp. 123-139.
AHRENS, P., SCHLEICHER, A., ZILLES, K. and WERNER, L., 1990. Image analysis of Nissl-stained
neuronal perikarya in the primary visual cortex of the rat: Automatic detection and segmentation
of neuronal profiles with nuclei and nucleoli. Journal of Microscopy, 157(3), pp. 349-365.
AKSNES, A. and OPSTVEDT, J., 1998. Content of digestible energy in fish feed ingredients
determined by the ingredient-substitution method. Aquaculture, 161(1–4), pp. 45-53.
ALBERS, R., BOURDET-SICARD, R., BRAUN, D., CALDER, P.C., HERZ, U., LAMBERT, C.,
LENOIR-WIJNKOOP, I., MEHEUST, A., OUWEHAND, A. and PHOTHIRATH, P., 2013.
Monitoring immune modulation by nutrition in the general population: identifying and
substantiating effects on human health. British Journal of Nutrition, 110(S2), pp. S1-S30.
ALEXANDER, J., 1977. Protein concentration in the serum of the Atlantic salmon (Salmo salar) in
North‐west England and Northern Ireland. Journal of Fish Biology, 11(6), pp. 673-679.

BIBLIOGRAPHIC REFERENCES
PAGE | 288
ALONZI, R., TAYLOR, N.J., STIRLING, J.J., D'ARCY, J.A., COLLINS, D.J., SAUNDERS, M.I.,
HOSKIN, P.J. and PADHANI, A.R., 2010. Reproducibility and correlation between quantitative
and semiquantitative dynamic and intrinsic susceptibility‐weighted MRI parameters in the benign
and malignant human prostate. Journal of Magnetic Resonance Imaging, 32(1), pp. 155-164.
ANDERSON, J.M. and LOWE, J., 1990. “Histometry and image analysis” in Bancroft, D. and
Stevens, A. (Eds.). Theory and practice of histological techniques, Chruchill Livingtone
Publisher, Edinburgh, UK, pp. 597-618.
ANGGRAENI, M.S. and OWENS, L., 2000. The haemocytic origin of lymphoid organ spheroid cells
in the penaeid prawn Penaeus monodon. Diseases of Aquatic Organisms, 40(2). pp. 85-92.
ANTONOPOULOU, E., KENTEPOZIDOU, E., FEIDANTSIS, K., ROUFIDOU, C., DESPOTI, S. and
CHATZIFOTIS, S., 2013. Starvation and re-feeding affect Hsp expression, MAPK activation and
antioxidant enzymes activity of European Sea Bass (Dicentrarchus labrax). Comparative
Biochemistry and Physiology Part A: Molecular & Integrative Physiology, 165(1), pp. 79-88.
ASEA, A., KRAEFT, S., KURT-JONES, E.A., STEVENSON, M.A., CHEN, L.B., FINBERG, R.W.,
KOO, G.C. and CALDERWOOD, S.K., 2000. HSP70 stimulates cytokine production through a
CD14-dependant pathway, demonstrating its dual role as a chaperone and cytokine. Nature
Medicine, 6(4), pp. 435-442.
AUSTIN, B., 2006. The bacterial microflora of fish, revised. The Scientific World Journal, 6, pp. 931-
945.
AUSTRENG, E., STOREBAKKEN, T. and ÅSGÅRD, T., 1987. Growth rate estimates for cultured
Atlantic salmon and rainbow trout. Aquaculture, 60(2), pp. 157-160.
AWAD, E., AUSTIN, D. and LYNDON, A.R., 2013. Effect of dietary supplement of black cumin seed
oil (Nigella sativa) and Nettle extract (Quercetin) on enhancement of immunity in rainbow trout,
Oncorhynchus mykiss (Walbaum). Aquaculture, 388-391, pp. 193–197.
BAAK, J., 1987. The principles and advances of quantitative pathology. Analytical and Quantitative
Cytology and Histology, 9(2), pp. 89-95.
BAAK, J.P.A., OORT, J., BOUW, G.M. and STOLTE, L.A.M., 1977. Quantitative morphology:
methods and materials: I. Stereology and morphometry. European Journal of Obstetrics &
Gynaecology and Reproductive Biology, 7(1), pp. 43-52.
BAEVERFJORD, G. and KROGDAHL, Å., 1996. Development and regression of soybean meal
induced enteritis in Atlantic salmon, Salmo salar L., distal intestine: a comparison with the
intestines of fasted fish. Journal of Fish Diseases, 19(5), pp. 375-387.
BAGNI, M., ROMANO, N., FINOIA, M.G., ABELLI, L., SCAPIGLIATI, G., TISCAR, P.G., SARTI, M.
and MARINO, G., 2005. Short- and long-term effects of a dietary yeast β-glucan (Macrogard)
and alginic acid (Ergosan) preparation on immune response in sea bass (Dicentrarchus labrax).
Fish & Shellfish Immunology, 18(4), pp. 311-325.
BAIN, B.J., BATES, I., LAFFAN, M.A., LEWIS, and S.M., 2012. Dacie and Lewis practical
haematology. Churchill Livingstone, London, pp. 668.

BIBLIOGRAPHIC REFERENCES
PAGE | 289
BAKKE, A. M., GLOVER, C. and KROGDAHL Å., 2011. “Feeding, digestion and absorption of
nutrients” in Grosell, M., Farrell, A.P., Brauner, C.J. (Eds.). The multifunctional gut of fish, Wiley-
Backwell, San Diego, USA, pp. 57-111.
BAKKE-McKELLEP, A., NORDRUM, S., KROGDAHL, Å. and BUDDINGTON, R., 2000a. Absorption
of glucose, amino acids, and dipeptides by the intestines of Atlantic salmon (Salmo salar L.).
Fish Physiology and Biochemistry, 22(1), pp. 33-44.
BAKKE-McKELLEP, A., PRESS, C.M., BAEVERFJORD, G., KROGDAHL, Å. and LANDSVERK, T.,
2000b. Changes in immune and enzyme histochemical phenotypes of cells in the intestinal
mucosa of Atlantic salmon, Salmo salar L., with soybean meal-induced enteritis. Journal of Fish
Diseases, 23(2), pp. 115-127.
BAKKE-McKELLEP, A.M., FRØYSTAD, M.K., LILLEENG, E., DAPRA, F., REFSTIE, S.,
KROGDAHL, Å. and LANDSVERK, T., 2007a. Response to soy: T-cell-like reactivity in the
intestine of Atlantic salmon, Salmo salar L. Journal of Fish Diseases, 30(1), pp. 13-25.
BAKKE-McKELLEP, A.M., PENN, M.H., SALAS, P.M., REFSTIE, S., SPERSTAD, S., LANDSVERK,
T., RINGO, E. and KROGDAHL, A., 2007b. Effects of dietary soyabean meal, inulin and
oxytetracycline on intestinal microbiota and epithelial cell stress, apoptosis and proliferation in
the teleost Atlantic salmon (Salmo salar L.). British Journal of Nutrition, 97(4), pp. 699-713.
BANCROFT, J.D. and STEVENS, A. 1982. Theory and Practice of Histological Techniques. 2nd
Edition, Churchill-Livingstone, New York, USA, pp. 436.
BANDYOPADHYAY, S.K., 2011. Digital Pathology: An Electronic environment for performing
pathologic analyses from image. International Journal of Computer Science & Engineering
Technology, 1(3), pp. 127-130.
BARKER, G., 2000. Novel methods to reduce disease in aquaculture. Fish Veterinary Journal, 5, pp.
66-71.
BARTLETT, P.L., 1998. The sample complexity of pattern classification with neural networks: the
size of the weights is more important than the size of the network. Information Theory, IEEE
Transactions on, 44(2), pp. 525-536.
BATES, D. and MAECHLER, M., 2010. Lme4: linear mixed-effects models using S4 classes. R
package version 0.999375-34. Available at: http://CRAN.R-project.org/package=lme4.
BAYNE, C.J., 1986. Pronephric leucocytes of Cyprinus carpio: Isolation, separation and
characterization. Veterinary Immunology and Immunopathology, 12(1–4), pp. 141-151.
BELIEN, J., BAAK, J., VANDIEST, P. and VANGINKEL, A., 1997. Counting mitoses by image
processing in Feulgen stained breast cancer sections: The influence of resolution. Cytometry,
28(2), pp. 125-140.
BENALI, A., LEEFKEN, I., EYSEL, U.T. and WEILER, E., 2003. A computerized image analysis
system for quantitative analysis of cells in histological brain sections. Journal of Neuroscience
Methods, 125(1–2), pp. 33-43.
BENNANI, N., SCHMID-ALLIANA, A. and LAFAURIE, M., 1995. Evaluation of phagocytic activity in a
teleost fish, Dicentrarchus labrax. Fish & Shellfish Immunology, 5(3), pp. 237-246.

BIBLIOGRAPHIC REFERENCES
PAGE | 290
BERGERON, T. and WOODWARD, B., 1983. Ultrastructure of the granule cells in the small intestine
of the rainbow trout (Salmo gairdneri) before and after stratum granulosum formation. Canadian
Journal of Zoology, 61(1), pp. 133-138.
BERMAN, D., KANG, X., VAN TRAIN, K., LEWIN, H., COHEN, I., AREEDA, J., FRIEDMAN, J.,
GERMANO, G., SHAW, L. and HACHAMOVITCH, R., 1998. Comparative prognostic value of
automatic quantitative analysis versus semiquantitative visual analysis of exercise myocardial
perfusion single-photon emission computed tomography. Journal of the American College of
Cardiology, 32(7), pp. 1987-1995.
BERMÚDEZ, R., VIGLIANO, F., MARCACCINI, A., SITJÀ-BOBADILLA, A., QUIROGA, M.I. and
NIETO, J.M., 2006. Response of Ig-positive cells to Enteromyxum scophthalmi (Myxozoa)
experimental infection in turbot, Scophthalmus maximus (L.): A histopathological and
immunohistochemical study. Fish & Shellfish Immunology, 21(5), pp. 501-512.
BERNABÒ, I., BONACCI, A., COSCARELLI, F., TRIPEPI, M. and BRUNELLI, E., 2013. Effects of
salinity stress on Bufo balearicus and Bufo bufo tadpoles: Tolerance, morphological gill
alterations and Na+/K
+-ATPase localization. Aquatic Toxicology, 132–133(0), pp. 119-133.
BERNARD, D., SIX, A., RIGOTTIER-GOIS, L., MESSIAEN, S., CHILMONCZYK, S., QUILLET, E.,
BOUDINOT, P. and BENMANSOUR, A., 2006. Phenotypic and functional similarity of gut
intraepithelial and systemic T cells in a teleost fish. The Journal of Immunology, 176(7), pp.
3942-3949.
BERNTSSEN, M.H., HYLLAND, K., BONGA, W.S.E. and MAAGE, A., 1999. Toxic levels of dietary
copper in Atlantic salmon (Salmo salar L.) parr. Aquatic Toxicology, 46(2), pp. 87-99.
BERNTSSEN, M.H.G., HYLLAND, K., JULSHAMN, K., LUNDEBYE, A.K. and WAAGBØ, R., 2004.
Maximum limits of organic and inorganic mercury in fish feed. Aquaculture Nutrition, 10(2), pp.
83-97.
BERZAGHI, P. and RIOVANTO, R., 2010. Near infrared spectroscopy in animal science production:
principles and applications. Italian Journal of Animal Science, 8(3s), pp. 39-62.
BIANCHI, S. and MUGNAI, L., 1990. Mast cell fixation and staining in image analysis. European
Journal of Basic and Applied Histochemistry, 35(2), pp. 161-174.
BLACKSTOCK, N. and PICKERING, A., 1980. Acidophilic granular cells in the epidermis of the
brown trout, Salmo trutta L. Cell and Tissue Research, 210(3), pp. 359-369.
BLAIES, D.M. and WILLIAMS, J.F., 1981. A simplified method for staining mast cells with astra blue.
Biotechnic & Histochemistry, 56(2), pp. 91-94.
BLAXHALL, P.C. and DAISLEY, K.W., 1973. Routine haematological methods for use with fish
blood. Journal of Fish Biology, 5(6), pp. 771-781.
BLAZER, V.S., 1992. Nutrition and disease resistance in fish. Annual Review of Fish Diseases, 2, pp.
309-323.
BOELLAARD, R., KRAK, N.C., HOEKSTRA, O.S. and LAMMERTSMA, A.A., 2004. Effects of noise,
image resolution, and ROI definition on the accuracy of standard uptake values: A simulation
study. Journal of Nuclear Medicine, 45(9), pp. 1519-1527.

BIBLIOGRAPHIC REFERENCES
PAGE | 291
BOENISCH, T., 2009. “Antibodies” in Kumar, G.L. and Rudbeck, L. (Eds.) Educational guide:
Immunohistochemical (IHC) staining methods. Dako North America, California, pp. 1-10.
BOLGER, T. and CONNOLLY, P., 1989. The selection of suitable indices for the measurement and
analysis of fish condition. Journal of Fish Biology, 34(2), pp. 171-182.
BOLTON, L.L., 1933. Basophile (mast) cells in the alimentary canal of salmonoid fishes. Journal of
Morphology, 54(3), pp. 549-591.
BONGA, W.S.E. and VAN DER MEIJ, C. J. M., 1989. Degeneration and death, by apoptosis and
necrosis, of the pavement and chloride cells in the gills of the teleost Oreochromis
mossambicus, Cell and Tissue Research, 225(1), pp. 235-243.
BOONSTRA, H., OOSTERHUIS, J., OOSTERHUIS, A. and FLEUREN, G., 1983. Cervical tissue
shrinkage by formaldehyde fixation, paraffin wax embedding, section cutting and mounting.
Virchows Archiv A-Pathological Anatomy and Histopathology, 402(2), pp. 195-201.
BRANDTZAEG, P., 1998. The increasing power of immunohistochemistry and immunocytochemistry.
Journal of Immunological Methods, 216(1), pp. 49-67.
BRICKNELL, I. and DALMO, R.A., 2005. The use of immunostimulants in fish larval aquaculture.
Fish & Shellfish Immunology, 19(5), pp. 457-472.
BROOKER, A.J., 2007. Aspects of the biology and behaviour of Lernaeocera branchialis (Linnaeus,
1767) Copepoda: Pennellidae. PhD Dissertation Thesis, University of Stirling, Stirling, UK, pp.
224.
BRUNO, D. and MUNRO, A., 1986. Haematological assessment of rainbow trout, Salmo gairdneri
Richardson, and Atlantic salmon, Salmo salar L., infected with Renibacterium salmoninarum.
Journal of Fish Diseases, 9(3), pp. 195-204.
BRUNO, D.W. and POPPE, T.T., 1996. A colour Atlas of Salmonid Diseases.Academic Press,
London, UK, pp. 194.
BUDDINGTON, R.K. and DIAMOND, J.M., 1987. Pyloric ceca of fish: a "new" absorptive organ.
American Journal of Physiology-Gastrointestinal and Liver Physiology, 252(1), pp. G65-G76.
BUDDINGTON, R.K. and KUZ’MINA, V., 2000. “Digestive system” in Ostrander, G.K. (Eds.). The
laboratory fish, Academic Press, London, UK, pp. 379-384.
BUDDINGTON, R.K., KROGDAHL, A. and BAKKE-McKELLEP, A.M., 1997. The intestines of
carnivorous fish: structure and functions and the relations with diet. Acta Physiologica
Scandinavica Supplementum, 638, pp. 67-80.
BUI, H.T.D., KHOSRAVI, S., FOURNIER, V., HERAULT, M. and LEE, K., 2014. Growth
performance, feed utilization, innate immunity, digestibility and disease resistance of juvenile red
seabream (Pagrus major) fed diets supplemented with protein hydrolysates. Aquaculture, 418–
419(0), pp. 11-16.
BULLOCK, W.L., 1963. Intestinal histology of some salmonid fishes with particular reference to the
histopathology of acanthocephalan infections. Journal of Morphology, 112(1), pp. 23-44.
BUREAU, D.P., HARRIS, A.M. and CHO, C.Y., 1998. The effects of purified alcohol extracts from
soy products on feed intake and growth of chinook salmon (Oncorhynchus tshawytscha) and
rainbow trout (Oncorhynchus mykiss). Aquaculture, 161, pp. 27-43.

BIBLIOGRAPHIC REFERENCES
PAGE | 292
BUREL, C., BOUJARD, T., KAUSHIK, S.J., BOEUF, G., VAN DER GEYTEN, S., MOL, K.A., KÜHN,
E.R., QUINSAC, A., KROUTI, M. and RIBAILLIER, D., 2000. Potential of plant-protein sources
as fish meal substitutes in diets for turbot (Psetta maxima): growth, nutrient utilisation and
thyroid status. Aquaculture, 188(3), pp. 363-382.
BURKA, J. and POWELL, L.H., 1993. Eosinophilic granule cells of Salmonids: A potential target for
anti-inflammatory therapy? Available at: http://vetmed.tamu.edu/common/docs/public/aavpt
/symposia/Burka58-63.pdf.
BURKHARDT-HOLM, P., SCHMIDT, H. and MEIER, W., 1998. Heat shock protein (hsp70) in brown
trout epidermis after sudden temperature rise. Comparative Biochemistry and Physiology Part A:
Molecular & Integrative Physiology, 120(1), pp. 35-41.
BURNSTOCK, G., 1959. The morphology of the gut of the brown trout (Salmo trutta). Quarterly
Journal of Microscopical Science, 3(50), pp. 183-198.
BURRELLS, C., WILLIAMS, P., SOUTHGATE, P. and CRAMPTON, V., 1999. Immunological,
physiological and pathological responses of rainbow trout (Oncorhynchus mykiss) to increasing
dietary concentrations of soybean proteins. Veterinary Immunology and Immunopathology,
72(3), pp. 277-288.
BURRELLS, C., WILLIAMS, P.D., SOUTHGATE, P.J. and WADSWORTH, S.L., 2001. Dietary
nucleotides: a novel supplement in fish feeds: 2. Effects on vaccination, salt water transfer,
growth rates and physiology of Atlantic salmon (Salmo salar L.). Aquaculture, 199(1–2), pp. 171-
184.
BUTTLE, L., BURRELLS, A., GOOD, J., WILLIAMS, P., SOUTHGATE, P. and BURRELLS, C., 2001.
The binding of soybean agglutinin (SBA) to the intestinal epithelium of Atlantic salmon, Salmo
salar and Rainbow trout, Oncorhynchus mykiss, fed high levels of soybean meal. Veterinary
Immunology and Immunopathology, 80(3), pp. 237-244.
BYRD, C.A. and BRUNJES, P.C., 1995. Organization of the olfactory system in the adult zebrafish:
histological, immunohistochemical, and quantitative analysis. Journal of Comparative Neurology,
358(2), pp. 247-259.
CAIN, K. and SWAN, C., 2011. “Barrier function and immunology” in Grosell, M., Farrell, A.P.,
Brauner, C.J. (Eds.). The multifunctional gut of fish, Wiley-Backwell, San Diego, USA, pp. 112-
135.
CAMBAZOGLU, B.B., SERTEL, O. and KONG, J. 2007. Efficient processing of pathological images
using the grid. Proceedings of the Fifth International Workshop on Challenges of Large
Applications in Distributed Environments, Monterey Bay, 25 June, pp. 35-41.
CAMPOS, C., PAIVA, D., PERAZZO, H., MOREIRA, P., ARECO, L., TERRA, C., PEREZ, R. and
FIGUEIREDO, F., 2014. An inexpensive and worldwide available digital image analysis
technique for histological fibrosis quantification in chronic hepatitis C. Journal of Viral Hepatitis,
21(3), pp. 216-222.
CARTER, C.G. and HAULER, R.C., 2000. Fish meal replacement by plant meals in extruded feeds
for Atlantic salmon, Salmo salar L. Aquaculture, 185(3–4), pp. 299-311.

BIBLIOGRAPHIC REFERENCES
PAGE | 293
CASTRO, R., ZARRA, I. and LAMAS, J., 2004. Water-soluble seaweed extracts modulate the
respiratory burst activity of turbot phagocytes. Aquaculture, 229(1), pp. 67-78.
CEREZUELA, R., FUMANAL, M., TAPIA-PANIAGUA, S.T., MESEGUER, J., MORIÑIGO, M.Á. and
ESTEBAN, M.Á., 2013. Changes in intestinal morphology and microbiota caused by dietary
administration of inulin and Bacillus subtilis in gilthead sea bream (Sparus aurata L.) specimens.
Fish & Shellfish Immunology, 34(5), pp.1063-1070.
CHANG, Y., LIU, C., WU, C., CHIANG, C., LIAN, J. and HSIEH, S., 2012. Dietary administration of
zingerone to enhance growth, non-specific immune response, and resistance to Vibrio
alginolyticus in Pacific white shrimp (Litopenaeus vannamei) juveniles. Fish & Shellfish
Immunology, 32(2), pp. 284-290.
CHAUDHURI, B., RODENACKER, K. and BURGER, G., 1988. Characterization and featuring of
histological section images. Pattern Recognition Letters, 7(4), pp. 245-252.
CHEKKOURY, A., KHURD, P., NI, J., BAHLMANN, C., KAMEN, A., PATEL, A., GRADY, L., SINGH,
M., GROHER, M., NAVAB, N., KRUPINSKI, E., JOHNSON, J., GRAHAM, A. and WEINSTEIN,
R., 2012. Automated malignancy detection in breast histopathological images. Medical Imaging
2012: Computer-Aided Diagnosis, 8315, pp. 1-13.
CHELI, F., BATTAGLIA, D., PINOTTI, L. and BALDI, A., 2012. State of the Art in Feedstuff Analysis:
A technique-oriented perspective. Journal of Agricultural and Food Chemistry, 60(38), pp. 9529-
9542.
CHEN, D. and AINSWORTH, A., 1992. Glucan administration potentiates immune defence
mechanisms of channel catfish, Ictalurus punctatus Rafinesque. Journal of Fish Diseases, 15(4),
pp. 295-304.
CHENG, Z., BUENTELLO, A. and GATLIN, D.M., 2011. Dietary nucleotides influence immune
responses and intestinal morphology of red drum Sciaenops ocellatus. Fish & Shellfish
Immunology, 30(1), pp. 143-147.
CHETTRI, J.K., HOLTEN-ANDERSEN, L. and BUCHMANN, K., 2010. Factors influencing in vitro
respiratory burst assays with head kidney leucocytes from rainbow trout, Oncorhynchus mykiss
(Walbaum). Journal of Fish Diseases, 33(7), pp. 593-602.
CHI, F.L. and LIANG, Q., 2004. The quantification of endolymphatic hydrops in an experimental
animal model with guinea pigs. Orl-Journal for Oto-Rhino-Laryngology and its Related
Specialties, 66(2), pp. 56-61.
CHIKWATI, E.M., GU, J., PENN, M.H., BAKKE, A.M. and KROGDAHL, Å., 2013a. Intestinal
epithelial cell proliferation and migration in Atlantic salmon, Salmo salar L.: effects of
temperature and inflammation. Cell and Tissue Research, 353, pp. 123-137.
CHIKWATI, E.M., SAHLMANN, C., HOLM, H., PENN, M.H., KROGDAHL, Å. and BAKKE, A.M.,
2013b. Alterations in digestive enzyme activities during the development of diet-induced enteritis
in Atlantic salmon, Salmo salar L. Aquaculture, 402–403(0), pp. 28-37.
CHIKWATI, E.M., VENOLD, F.F., PENN, M.H., ROHLOFF, J., REFSTIE, S., GUTTVIK, A.,
HILLESTAD, M., KROGDAHL, Å., VAN DEN INGH, T. and KROGDAHL, Å., 2012. Interaction of

BIBLIOGRAPHIC REFERENCES
PAGE | 294
soyasaponins with plant ingredients in diets for Atlantic salmon, Salmo salar L. British Journal of
Nutrition, 107(11), pp. 1570.
CHIU, H. and LAGUNOFF, D., 1972. Histochemical comparison of vertebrate mast cells. The
Histochemical Journal, 4(2), pp. 135-144.
CHOCT, M., 2009. Managing gut health through nutrition. British Poultry Science, 50(1), pp. 9-15.
CHRISTENSEN, N.K. and WINTHER, L., 2009. “Multi-staining immunohistochemistry” in Kumar,
G.L. and Rudbeck, L. (Eds.) Educational guide: Immunhistochemical (IHC) staining methods.
Dako North America, California, pp. 103-108.
CHUBB, C., INAGAKI, Y., SHEU, P., CUMMINGS, B., WASSERMAN, A., HEAD, E. and COTMAN,
C., 2006. BioVision: An application for the automated image analysis of histological sections.
Neurobiology of Aging, 27(10), pp. 1462-1476.
COLLIE, N.L. and FERRARIS, R.P., 1995. Nutrient fluxes and regulation in fish intestine.
Biochemistry and Molecular Biology of Fishes, 4, pp. 221-239.
COLLINS, S.A., ØVERLAND, M., SKREDE, A. and DREW, M.D., 2013. Effect of plant protein
sources on growth rate in salmonids: Meta-analysis of dietary inclusion of soybean, pea and
canola / rapeseed meals and protein concentrates. Aquaculture, (400–401), 85-100.
COOK, H.C., 1961. A modified thionin technique for mast cells in tissue sections. The Journal of
Medical Laboratory Technology, 18, pp. 188-189.
COOK, M.T., HAYBALL, P.J., HUTCHINSON, W., NOWAK, B.F. and HAYBALL, J.D., 2003.
Administration of a commercial immunostimulant preparation, EcoActiva™ as a feed
supplement enhances macrophage respiratory burst and the growth rate of snapper (Pagrus
auratus, Sparidae (Bloch and Schneider) in winter. Fish & Shellfish Immunology, 14(4), pp. 333-
345.
COONS, A.H., 1971. Introduction: the development of immunohistochemistry. Annals of the New
York Academy of Sciences, 177(1), pp. 5-9.
CORSON, D., WAGHORN, G., ULYATT, M. and LEE, J., 1999. NIRS: Forage analysis and livestock
feeding, Proceedings of the Conference - New Zealand Grassland Association, pp. 127-132.
CREGGER, M., BERGER, A.J. and RIMM, D.L., 2006. Immunohistochemistry and quantitative
analysis of protein expression. Archives of Pathology & Laboratory Medicine, 130(7), pp. 1026-
1030.
CRESPO, S., NONNOTTE, G., COLIN, D., LERAY, C., NONNOTTE, L. and AUBREE, A., 1986.
Morphological and functional alterations induced in trout intestine by dietary cadmium and lead.
Journal of Fish Biology, 28(1), pp. 69-80.
CRIVELLATO, E. and RIBATTI, D., 2010. The mast cell: an evolutionary perspective. Biological
Reviews, 85(2), pp. 347-360.
CROSS, S.S., 1994. The application of fractal geometric analysis to microscopic images. Micron,
25(1), pp. 101-113.

BIBLIOGRAPHIC REFERENCES
PAGE | 295
DAGNON, K., HEUDES, D., BERNAUDIN, J. and CALLARD, P., 2008. Computerized morphometric
analysis of microvasculature in non-small cell lung carcinoma. Microvascular Research, 75(1),
pp. 112-118.
DALMO, R. and SELJELID, R., 1995. The immunomodulatory effect of Lps, laminaran and sulfated
laminaran [Beta(1,3)-D-Glucan] on Atlantic Salmon, Salmo salar L, Macrophages In-Vitro.
Journal of Fish Diseases, 18(2), pp. 175-185.
DALMO, R., BOGWALD, J., INGEBRIGTSEN, K. and SELJELID, R., 1996. The immunomodulatory
effect of laminaran [β (1, 3)-D-glucan] on Atlantic salmon, Salmo salar L., anterior kidney
leucocytes after intraperitoneal, peroral and peranal administration. Journal of Fish Diseases,
19(6), pp. 449-457.
DALMO, R., INGEBRIGTSEN, K. and BØGWALD, J., 1997. Non‐specific defence mechanisms in
fish, with particular reference to the reticuloendothelial system (RES). Journal of Fish Diseases,
20(4), pp. 241-273.
DANIEL, D., SCHLESNER, J., WEHRSTEDT, K., HUFNAGL, P. and DIETEL, M., 2000. Influence of
image resolution on image quality in telepathology. Electronic Journal of Pathology and
Histology, 6(3), pp. 1-21.
DE BAULNY, M., QUENTEL, C., FOURNIER, V., LAMOUR, F. and LEGOUVELLO, R., 1996. Effect
of long term oral administration of Beta-glucan as an immunostimulantor an adjuvant on some
non-specific parameters of the immune response of turbot Scophthalmus maximus. Diseases of
Aquatic Organisms, 2, pp.139-147.
DE FRANCESCO, M., PARISI, G., MÉDALE, F., LUPI, P., KAUSHIK, S.J. and POLI, B.M., 2004.
Effect of long-term feeding with a plant protein mixture based diet on growth and body/fillet
quality traits of large rainbow trout (Oncorhynchus mykiss). Aquaculture, 236(1), pp. 413-429.
DE LAAT, M.A., PATTERSON-KANE, J.C., POLLITT, C.C., SILLENCE, M.N. and MCGOWAN, C.M.,
2013. Histological and morphometric lesions in the pre-clinical, developmental phase of insulin-
induced laminitis in Standardbred horses. The Veterinary Journal, 195(3), pp. 305-312.
DE MATOS, L.L., TRUFELLI, D.C., DE MATOS, MARIA GRACIELA LUONGO and DA SILVA
PINHAL, MARIA APARECIDA, 2010. Immunohistochemistry as an important tool in biomarkers
detection and clinical practice. Biomarker Insights, 5, pp. 9-20.
DEL RIO-ZARAGOZA, O., FAJER-ÁVILA, E. and ALMAZÁN-RUEDA, P., 2011. Influence of β-glucan
on innate immunity and resistance of Lutjanus guttatus to an experimental infection of
Dactylogyrid monogeneans. Parasite Immunology, 33(9), pp. 483-494.
DEL-POZO, J., CRUMLISH, M., TURNBULL, J. and FERGUSON, H., 2010. Histopathology and
Ultrastructure of Segmented Filamentous Bacteria–Associated Rainbow Trout Gastroenteritis.
Veterinary Pathology Online, 47(2), pp. 220-230.
DENEF, J.F., CORDIER, A.C., MESQUITA, M. and HAUMONT, S., 1979. Influence of Fixation
procedure, embedding medium and section thickness on morphometric data in thyroid-gland.
Histochemistry, 63(2), pp. 163-171.
BIBLIOGRAPHIC REFERENCES
PAGE | 296
DENSTADLI, V., VEGUSDAL, A., KROGDAHL, Å., BAKKE-McKELLEP, A., BERGE, G., HOLM, H.,
HILLESTAD, M. and RUYTER, B., 2004. Lipid absorption in different segments of the
gastrointestinal tract of Atlantic salmon (Salmo salar L.). Aquaculture, 240(1), pp. 385-398.
DEPASQUALE, J.A., 2012. Tyrosine phosphatase inhibitor triggers rodlet cell discharge in sunfish
scale epidermis cultures. Acta Zoologica, 0: pp. 1-10.
DERDE, M., ANTANAS, L., DE RAEDT, L. and GUIZA GRANDAS, F., 2012. An interactive learning
approach to histology image segmentation. Proceedings of the 24th Benelux Conference on
Artificial Intelligence Pages, Maastricht, 25-26 October, 24, pp. 1-8.
DEZFULI, B. and GIARI, L., 2008. Mast cells in the gills and intestines of naturally infected fish:
evidence of migration and degranulation. Journal of Fish Diseases, 31(11), pp. 845-852.
DEZFULI, B., ARRIGHI, S., DOMENEGHINI, C. and BOSI, G., 2000. Immunohistochemical detection
of neuromodulators in the intestine of Salmo trutta L. naturally infected with Cyathocephalus
truncatus Pallas (Cestoda). Journal of Fish Diseases, 23(4), pp. 265-273.
DEZFULI, B., CASTALDELLI, G., BO, T., LORENZONI, M. and GIARI, L., 2011b. Intestinal immune
response of Silurus glanis and Barbus barbus naturally infected with Pomphorhynchus laevis
(Acanthocephala). Parasite Immunology, 33(2), pp. 116-123.
DEZFULI, B., GIARI, L., SIMONI, E., BOSI, G. and MANERA, M., 2002. Histopathology,
immunohistochemistry and ultrastructure of the intestine of Leuciscus cephalus (L.) naturally
infected with Pomphorhynchus laevis (Acanthocephala). Journal of Fish Diseases, 25(1), pp. 7-
14.
DEZFULI, B.S., GIARI, L., ARRIGHI, S., DOMENEGHINI, C. and BOSI, G., 2003b. Influence of
enteric helminths on the distribution of intestinal endocrine cells belonging to the diffuse
endocrine system in brown trout, Salmo trutta L. Journal of Fish Diseases, 26: pp. 155-166.
DEZFULI, B.S., GIARI, L., KONECNY, R., JAEGER, P. and MANERA, M., 2003a.
Immunohistochemistry, ultrastructure and pathology of gills of Abramis brama from Lake
Mondsee, Austria, infected with Ergasilus sieboldi (Copepoda). Diseases of Aquatic Organisms,
53(3), pp. 257-262.
DEZFULI, B.S., GIARI, L., LUI, A., LORENZONI, M. and NOGA, E.J., 2011a. Mast cell responses to
Ergasilus (Copepoda), a gill ectoparasite of sea bream. Fish & Shellfish Immunology, 30(4), pp.
1087-1094.
DEZFULI, B.S., GIARI, L., SIMONI, E., SHINN, A., MANERA, M. and BOSI, G., 2005.
Histopathology, ultrastructure and immunohistochemistry of Coregonus lavaretus hearts
naturally infected with Ichthyocotylurus erraticus (Trematoda). Diseases of Aquatic Organisms,
66(3), pp. 245-254.
DEZFULI, B.S., GIOVINAZZO, G., LUI, A. and GIARI, L., 2008. Inflammatory response to
Dentitruncus truttae (Acanthocephala) in the intestine of brown trout. Fish & Shellfish
Immunology, 24(6), pp. 726-733.
DEZFULI, B.S., LUI, A., GIARI, L., CASTALDELLI, G., SHINN, A. and LORENZONI, M., 2012. Innate
immune defence mechanisms of tench, Tinca tinca (L.), naturally infected with the tapeworm
Monobothrium wageneri. Parasite Immunology, 34(11), pp. 511-519.

BIBLIOGRAPHIC REFERENCES
PAGE | 297
DIMITROGLOU, A., MERRIFIELD, D.L., SPRING, P., SWEETMAN, J., MOATE, R. and DAVIES,
S.J., 2010. Effects of mannan oligosaccharide (MOS) supplementation on growth performance,
feed utilisation, intestinal histology and gut microbiota of gilthead sea bream (Sparus aurata).
Aquaculture, 300(1–4), pp. 182-188.
DOBSON, J.T., SEIBERT, J., TEH, E.M., DA'AS, S., FRASER, R.B., PAW, B.H., LIN, T. and
BERMAN, J.N., 2008. Carboxypeptidase A5 identifies a novel mast cell lineage in the zebrafish
providing new insight into mast cell fate determination. Blood, 112(7), pp. 2969-2972.
DOI, K., 2007. Computer-aided diagnosis in medical imaging: Historical review, current status and
future potential. Computerized Medical Imaging and Graphics, 31(4–5), pp. 198-211.
DOLAPCHIEVA, S., EGGERS, R. and KÜHNEL, W., 2000. Automatic image analysis of the
postnatal growth of axons and myelin sheaths in the tibial and peroneal nerves of the rabbit.
Annals of Anatomy - Anatomischer Anzeiger, 182(2), pp. 133-142.
DOMENEGHINI, C., DI GIANCAMILLO, A., ARRIGHI, S. and BOSI, G., 2006. Gut-trophic feed
additives and their effects upon the gut structure and intestinal metabolism. State of the art in
the pig, and perspectives towards humans, Histology and Histopathology, 21 (3), pp. 273-283.
DONG, X., GENG, X., TAN, B., YANG, Q., CHI, S., LIU, H. and LIU, X., 2013. Effects of dietary
immunostimulant combination on the growth performance, non‐specific immunity and disease
resistance of cobia, Rachycentron canadum (Linnaeus). Aquaculture Research, [Epub ahead of
print].
DORIN, D., SIRE, M. and VERNIER, J., 1993. Endocytosis and intracellular degradation of
heterologous protein by eosinophilic granulocytes isolated from rainbow trout (Oncorhynchus
mykiss) posterior intestine. Biology of the Cell, 79(3), pp. 219-224.
DOS SANTOS, N., SILVA, M. and VALE, A.D., 2008. Fish and apoptosis: studies in disease and
pharmaceutical design. Current Pharmaceutical Design, 14(2), pp. 170-183.
DOYLE, S., HWANG, M., SHAH, K., MADABHUSHI, A., FELDMAN, M. and TOMASZEWESKI, J.,
2007. Automated grading of prostate cancer using architectural and textural image features. 4th
IEEE International Symposium on Biomedical Imaging: Macro to Nano, Volumes 1-3, New
Jersey, 12-15 April, pp. 1284-1287.
DUNSTAN, R.W., WHARTON, K.A., QUIGLEY, C. and LOWE, A., 2011. The Use of
Immunohistochemistry for Biomarker Assessment - Can It Compete with Other Technologies?
Toxicologic pathology, 39(6), pp. 988-1002.
EFTHIMIOU, S., 1996. Dietary intake of β-1,3/1,6 glucans in juvenile dentex (Dentex dentex),
Sparidae: effects on growth performance, mortalities and non-specific defense mechanisms.
Journal of Applied Ichthyology, 12(1), pp. 1-7.
EGGENS, M., BERGMAN, A., VETHAAK, D., VAN DER WEIDEN, M., CELANDER, M. and BOON,
J.P., 1995. Cytochrome P4501A indices as biomarkers of contaminant exposure: results of a
field study with plaice (Pleuronectes platessa) and flounder (Platichthys flesus) from the
southern North Sea. Aquatic Toxicology, 32(2), pp. 211-225.
EINEN, O. and ROEM, A.J., 1997. Dietary protein/energy ratios for Atlantic salmon in relation to fish
size: growth, feed utilization and slaughter quality. Aquaculture Nutrition, 3(2), pp. 115-126.
BIBLIOGRAPHIC REFERENCES
PAGE | 298
EINSTEIN, A.J., GIL, J., WALLENSTEIN, S., BODIAN, C.A., SANCHEZ, M., BURSTEIN, D.E., WU,
H. and LIU, Z., 1997. Reproducibility and accuracy of interactive segmentation procedures for
image analysis in cytology. Journal of Microscopy, 188(2), pp. 136-148.
ELLIS, A., 1985. Eosinophilic granular cells (EGC) and histamine responses to Aeromonas
salmonicida toxins in rainbow trout. Developmental & Comparative Immunology, 9(2), pp. 251-
260.
ENGSTAD, R.E., ROBERTSEN, B. and FRIVOLD, E., 1992. Yeast glucan induces increase in
lysozyme and complement-mediated haemolytic activity in Atlantic salmon blood. Fish &
Shellfish Immunology, 2(4), pp. 287-297.
ESGIAR, A.N., NAGUIB, R.N., BENNETT, M.K. and MURRAY, A., 1998. Automated feature
extraction and identification of colon carcinoma. Analytical and Quantitative Cytology and
Histology, 20(4), pp. 297-301.
EZEASOR, D. and STOKOE, W., 1980. A cytochemical, light and electron microscopic study of the
eosinophilic granule cells in the gut of the rainbow trout, Salmo gairdneri Richardson. Journal of
Fish Biology, 17(6), pp. 619-634.
EZEASOR, D. and STOKOE, W., 1981. Light and electron microscopic studies on the absorptive
cells of the intestine, caeca and rectum of the adult rainbow trout, Salmo gairdneri, Rich. Journal
of Fish Biology, 18(5), pp. 527-544.
FALCO, A., FROST, P., MIEST, J., PIONNIER, N., IRNAZAROW, I. and HOOLE, D., 2012. Reduced
inflammatory response to Aeromonas salmonicida infection in common carp (Cyprinus carpio L.)
fed with β-glucan supplements. Fish & Shellfish Immunology, 32(6), pp. 1051-1057.
FANGE, R., LUNDBLAD, G. and LIND, J., 1976. Lysozyme and Chitinase in Blood and
Lymphomyeloid Tissues of Marine Fish. Marine Biology, 36(3), pp. 277-282.
FANNING, A.S., MITIC, L.L. and ANDERSON, J.M., 1999. Transmembrane proteins in the tight
junction barrier. Journal of the American Society of Nephrology, 10(6), pp. 1337-1345.
FAO, 2012. The state of world fisheries and aquaculture. FAO Fisheries and Aquaculture
Department, Rome, Italy, pp. 209.
FAST, M.D., ROSS, N.W., MUSTAFA, A., SIMS, D.E., JOHNSON, S.C., CONBOY, G.A., SPEARE,
D.J., JOHNSON, G. and BURKA, J.F., 2002. Susceptibility of rainbow trout Oncorhynchus
mykiss, Atlantic salmon Salmo salar and coho salmon Oncorhynchus kisutch to experimental
infection with sea lice Lepeophtheirus salmonis. Diseases of Aquatic Organisms, 52(1), pp. 57-
68.
FERRANDO, S., FERRANDO, T., GIROSI, L., MAUCERI, A., FASULO, S. and TAGLIAFIERRO, G.,
2009. Apoptosis, cell proliferation and serotonin immunoreactivity in gut of Liza aurata from
natural heavy metal polluted environments: preliminary observations. European Journal of
Histochemistry, 49(4), pp. 331-340.
FERRARIS, R.P. and AHEARN, G.A., 1984. Sugar and amino acid transport in fish intestine.
Comparative Biochemistry and Physiology Part A: Physiology, 77(3), pp. 397-413.

BIBLIOGRAPHIC REFERENCES
PAGE | 299
FICSOR, L., VARGA, V., BERCZI, L., MIHELLER, P., TAGSCHERER, A., WU, M.L., TULASSAY, Z.
and MOLNAR, B., 2006. Automated virtual microscopy of gastric biopsies. Cytometry Part B -
Clinical Cytometry, 70B(6), pp. 423-431.
FICSOR, L., VARGA, V.S., TAGSCHERER, A., TULASSAY, Z. and MOLNAR, B., 2008. Automated
classification of inflammation in colon histological sections based on digital microscopy and
advanced image analysis. Cytometry Part A, 73A(3), pp. 230-237.
FIELD, A., 2009. Discovering statistics using SPSS: (and sex and drugs and rock ‘n’ roll). SAGE
Publications Ltd., London, UK, pp. 822.
FILHO, D.W., EBLE, G.J., KASSNER, G., CAPRARIO, F.X., DAFRÉ, A.L. and OHIRA, M., 1992.
Comparative hematology in marine fish. Comparative Biochemistry and Physiology Part A:
Physiology, 102(2), pp. 311-321.
FINDLAY, V. and MUNDAY, B., 2000. The immunomodulatory effects of levamisole on the
nonspecific immune system of Atlantic salmon, Salmo salar L., Journal of Fish Diseases, 23, pp.
369-378.
FLETCHER, T.C., WHITE, A. and BALDO, B.A., 1977. C-reactive protein-like precipitin and
lysozyme in the lumpsucker Cyclopterus lumpus L. during the breeding season. Comparative
Biochemistry and Physiology Part B: Comparative Biochemistry, 57(4), pp. 353-357.
FODOR, I.K., 2002. A survey of dimension reduction techniques. Lawrence Livermore National
Laboratory technical report (UCRL-ID-148494), U. S. Department of Energy by the University of
California, pp. 26.
FONTAGNÉ, S., BURTAIRE, L., CORRAZE, G. and BERGOT, P., 2000. Effects of dietary medium-
chain triacylglycerols (tricaprylin and tricaproin) and phospholipid supply on survival, growth and
lipid metabolism in common carp (Cyprinus carpio L.) larvae. Aquaculture, 190(3–4), pp. 289-
303.
FRANCIS, G., MAKKAR, H. and BECKER, K., 2001. Anti-nutritional factors present in plant-derived
alternate fish feed ingredients and their effects in fish. Aquaculture, 199(3-4), pp. 197-227.
FUENTES, E.N., SAFIAN, D., EINARSDOTTIR, I.E., VALDÉS, J.A., ELORZA, A.A., MOLINA, A. and
BJÖRNSSON, B.T., 2013. Nutritional status modulates plasma leptin, AMPK and TOR
activation, and mitochondrial biogenesis: Implications for cell metabolism and growth in skeletal
muscle of the fine flounder. General and Comparative Endocrinology, 186, pp. 172-180.
FUGLEM, B., JIRILLO, E., BJERKÅS, I., KIYONO, H., NOCHI, T., YUKI, Y., RAIDA, M., FISCHER,
U. and KOPPANG, E.O., 2010. Antigen-sampling cells in the salmonid intestinal epithelium.
Developmental & Comparative Immunology, 34(7), pp. 768-774.
FUJIKAWA, C., NAGASHIMA, M., MAWATARI, K. and KATO, S., 2012. HSP70 Gene Expression in
the Zebrafish Retina After Optic Nerve Injury: A Comparative Study Under Heat Shock Stresses.
Retinal Degenerative Diseases. Springer, pp. 663-668.
GALARRAGA, M., CAMPION, J., MUNOZ-BARRUTIA, A., BOQUE, N., MORENO, H., ALFREDO
MARTINEZ, J., MILAGRO, F. and ORTIZ-DE-SOLORZANO, C., 2012. Adiposoft: automated
software for the analysis of white adipose tissue cellularity in histological sections. Journal of
Lipid Research, 53(12), pp. 2791-2796.

BIBLIOGRAPHIC REFERENCES
PAGE | 300
GALEOTTI, M., 1998. Some aspects of the application of immunostimulants and a critical review of
methods for their evaluation. Journal of Applied Ichthyology, 14(3–4), pp. 189-199.
GALEOTTI, M., ROMANO, N., VOLPATTI, D., BULFON, C., BRUNETTI, A., TISCAR, P.G., MOSCA,
F., BERTONI, F., MARCHETTI, M.G. and ABELLI, L., 2013. Innovative vaccination protocol
against vibriosis in Dicentrarchus labrax (L.) juveniles: Improvement of immune parameters and
protection to challenge. Vaccine, 31(8), pp. 1224-1230.
GAL-GARBER, O., MABJEESH, S., SKLAN, D. and UNI, Z., 2003. Nutrient transport in the small
intestine: Na+, K
+-ATPase expression and activity in the small intestine of the chicken as
influenced by dietary sodium. Poultry Science, 82(7), pp. 1127-1133.
GALINDO-VILLEGAS, J. and HOSOKAWA, H., 2004. Immunostimulants: Towards temporary
prevention of diseases in marine fish. Simposium Internationale de Nutricion Acuícola, Sonora,
16-19 November, pp. 279-319.
GALLOWAY, T.F., KJORSVIK, E. and KRYVI, H., 1999. Muscle growth and development in Atlantic
cod larvae (Gadus morhua L.) related to different somatic growth rates. Journal of Experimental
Biology, 202(15), pp. 2111-2120.
GANNAM, A.L. and SCHROCK, R.M., 1999. Immunostimulants in fish diets. Journal of Applied
Aquaculture, 9(4), pp. 53-89.
GANNAM, A.L. and SCHROCK, R.M., 2001. “Immunostimulants in fish diets” in Lim, C., Webster,
C.D. (Eds.). Nutrition and fish health, The Haworth Press Inc., Binghamton, USA, pp. 235-266.
GANSTER, H., PINZ, A., ROHRER, R., WILDLING, E., BINDER, M. and KITTLER, H., 2001.
Automated melanoma recognition. IEEE Transactions on Medical Imaging, 20(3), pp. 233-239.
GATLIN, D.M., 2002. “Nutrition and fish health” in Halver, J.E., Hardy, R.W. (Eds.), Fish nutrition,
Academic Press, San Diego, USA, pp. 671-702.
GENTON, L. and KUDSK, K.A., 2003. Interactions between the enteric nervous system and the
immune system: role of neuropeptides and nutrition. The American Journal of Surgery, 186(3),
pp. 253-258.
GEORGOPOULOU, U., DABROWSKI, K., SIRE, M. and VERNIER, J., 1988. Absorption of intact
proteins by the intestinal epithelium of trout, Salmo gairdneri. Cell and Tissue Research, 251(1),
pp. 145-152.
GERBAULET, A., HARTMANN, K. and MEKORI, Y.A., 2006. “Mast cell apoptosis” in Krishnaswamy,
G., Chi, D.S. (Eds.), Mast cells: methods and protocols. Humana Press, New Jersey, USA, pp.
407-423.
GERDES, A., KRISEMAN, J. and BISHOP, S., 1982. Morphometric study of cardiac muscle: the
problem of tissue shrinkage. Laboratory Investigation; a Journal of Technical Methods and
Pathology, 46(3), pp. 271-274.
GIEMSA, G., 1902. Färbemethoden für malariaparasiten. Zentralbl Bakteriol, 31:429-430.
GIGER, M.L., CHAN, H. and BOONE, J., 2008. Anniversary Paper: History and status of CAD and
quantitative image analysis: The role of Medical Physics and AAPM. Medical Physics, 35(12),
pp. 5799-5820.

BIBLIOGRAPHIC REFERENCES
PAGE | 301
GIL, J., WU, H.S. and WANG, B.Y., 2002. Image analysis and morphometry in the diagnosis of
breast cancer. Microscopy Research and Technique, 59(2), pp. 109-118.
GLENCROSS, B. and RUTHERFORD, N., 2010. Dietary strategies to improve the growth and feed
utilization of barramundi, Lates calcarifer under high water temperature conditions. Aquaculture
Nutrition, 16(4), pp. 343-350.
GLOTSOS, D., SPYRIDONOS, P., PETALAS, P., CAVOURAS, D., RAVAZOULA, P., DADIOTI,
P.A., LEKKA, I. and NIKIFORIDIS, G., 2004. Computer-based malignancy grading of
astrocytomas employing a support vector machine classifier, the WHO grading system and the
regular hematoxylin-eosin diagnostic staining procedure. Analytical and Quantitative Cytology
and Histology, 26(2), pp. 77-83.
GLOVER, C.N., PETRI, D., TOLLEFSEN, K., JØRUM, N., HANDY, R.D. and BERNTSSEN, M.H.,
2007. Assessing the sensitivity of Atlantic salmon (Salmo salar) to dietary endosulfan exposure
using tissue biochemistry and histology. Aquatic Toxicology, 84(3), pp. 346-355.
GODDARD, J.C., SUTTON, C.D., FURNESS, P.N., KOCKELBERGH, R.C. and O'BYRNE, K.J.,
2002. A computer image analysis system for microvessel density measurement in solid tumours.
Angiogenesis, 5(1–2), pp. 15-20.
GODLEWSKI, M.M., TUROWSKA, A., JEDYNAK, P., PUG, D.M. and NEVALAINEN, H., 2009.
“Quantitative analysis of fluorescent image: from descriptive to computational microscopy” in
Goldys, E.M. (Ed.). Fluorescence applications in biotechnology and life science, Wiley-Backwell,
New Jersey, USA, pp. 99-116.
GOKSØYR, A. and HUSØY, A., 1998. Immunochemical approaches to studies of CYP1A localization
and induction by xenobiotics in fish. Fish Ecotoxicology. Springer, pp. 165-202.
GOMEZ, D., SUNYER, J.O. and SALINAS, I., 2013. The mucosal immune system of fish: The
evolution of tolerating commensals while fighting pathogens. Fish & Shellfish Immunology,
35(6), pp. 1729-1739.
GONZALEZ, R.C. and WOODS, R.E., 2002. Digital image processing, Prentice-Hall, Inc., New
Jersey, USA, pp. 302.
GONZÁLEZ-MARTÍN, I., ÁLVAREZ-GARCÍA, N. and HERNÁNDEZ-ANDALUZ, J., 2006.
Instantaneous determination of crude proteins, fat and fibre in animal feeds using near infrared
reflectance spectroscopy technology and a remote reflectance fibre-optic probe. Animal Feed
Science and Technology, 128(1), pp. 165-171.
GOOD, J., 2004. Replacement of dietary fish oil with vegetable oils: effects on fish health. PhD
Dissertation Thesis, University of Stirling, Stirling, UK, pp. 381.
GOPALAKANNAN, A. and ARUL, V., 2010. Enhancement of the innate immune system and disease-
resistant activity in Cyprinus carpio by oral administration of β-glucan and whole cell yeast.
Aquaculture Research, 41(6), pp. 884-892.
GORNATI, R., PAPIS, E., RIMOLDI, S., TEROVA, G., SAROGLIA, M. and BERNARDINI, G., 2004.
Rearing density influences the expression of stress-related genes in sea bass (Dicentrarchus
labrax, L.). Gene, 341, pp. 111-118.
BIBLIOGRAPHIC REFERENCES
PAGE | 302
GOVIND, P. and MADHURI, S., 2012. Immunostimulant effect of medicinal plants on fish,
International Research Journal of Pharmacy, 3(3), pp. 112-114.
GROSCHWITZ, K.R., AHRENS, R., OSTERFELD, H., GURISH, M.F., HAN, X., ÅBRINK, M.,
FINKELMAN, F.D., PEJLER, G. and HOGAN, S.P., 2009. Mast cells regulate homeostatic
intestinal epithelial migration and barrier function by a chymase/Mcpt4-dependent mechanism.
Proceedings of the National Academy of Sciences, 106(52), pp. 22381-22386.
GROSELL, M., 2006. Intestinal anion exchange in marine fish osmoregulation. Journal of
Experimental Biology, 209(15), pp. 2813-2827.
GROSELL, M., 2011. “The role of the gastrointestinal tract in salt and water balance” in Grosell, M.,
Farrell, A.P., Brauner, C.J. (Eds.). The multifunctional gut of fish, Wiley-Backwell, San Diego,
USA, pp. 135-164.
GRUNKIN, M., RAUNDAHL, J. and FOGED, N.T., 2011. “Signal transduction immunohistochemistry:
Methods and protocols in Molecular Biology” in Kalyuzhny, A.E. (Ed.). Methods in molecular
biology, Volume 717, Springer-Verlag, New York, USA, pp. 143-154.
GUILLAUME, J. and CHOUBERT, G. (2001) “Digestive physiology and nutrient digestibility in fishes”
in Guillaume, J., Kaushik, P., Bergot, P., Metailler, R. (Eds.). Nutrition and feeding of fish and
crustaceans, Springer-Praxis Publishing, Chichester, USA, pp. 27-56.
GULLAND, G.L., 1898. The minute structure of the digestive tract of the salmon and the changes
which occur in fresh water. Anatomicher Anzeiger, 14, pp. 441-455.
GUNDUZ-DEMIR, C., KANDEMIR, M., TOSUN, A. B. and SOKMENSUER, C., 2010. Automatic
segmentation of colon glands using object-graphs. Medical Image Analysis, 14(1), pp. 1-12.
GURCAN, M. N., BOUCHERON, L. E., CAN, A., MADABHUSHI, A., RAJPOOT, N. M. and YENER,
B., 2009. Histopathological image analysis: A review. Biomedical Engineering, IEEE Reviews, 2,
pp. 147-171.
GURR, G.T., 1957. Biological staining methods. Cornell University, USA, pp. 87.
HAINES, D.M. and WEST, K.H., 2005. Immunohistochemistry: Forging the links between
immunology and pathology. Veterinary Immunology and Immunopathology, 108(1), pp. 151-156.
HALL, A.P., DAVIES, W., STAMP, K., CLAMP, I. and BIGLEY, A., 2013. Comparison of
computerized image analysis with traditional semiquantitative scoring of Perls’ Prussian Blue
stained hepatic iron deposition. Toxicologic Pathology, 41(7), pp. 992-1000.
HALL, K. and BELLWOOD, D.R., 1995. Histological effects of cyanide, stress and starvation on the
intestinal mucosa of Pomacentrus coelestis, a marine aquarium fish species. Journal of Fish
Biology, 47(3), pp. 438-454.
HALL, P., COATES, P., GOODLAD, R. and HART, I., 1994a. Proliferating cell nuclear antigen
expression in non-cycling cells may be induced by growth factors in vivo. British Journal of
Cancer, 70(2), pp. 244.
HALL, P.A., COATES, P.J., ANSARI, B. and HOPWOOD, D., 1994b. Regulation of cell number in
the mammalian gastrointestinal tract: the importance of apoptosis. Journal of Cell Science,
107(12), pp. 3569-3577.
HALVER, J.E. and HARDY, R.W., 2002. Fish Nutrition, Academic Press, San Diego, USA, pp.824.
BIBLIOGRAPHIC REFERENCES
PAGE | 303
HAMILTON, P. W. and ALLEN, D. C., 2005. “Quantitative methods in tissue pathology” in Crocker, J.
and Burnett, D. (Eds.). The science of laboratory diagnosis, 2nd Edition, John Wiley & Sons
Ltd., West Sussex, UK, pp. 69-81.
HAMILTON, P.W., BARTELS, P.H., THOMPSON, D., ANDERSON, N.H., MONTIRONI, R. and
SLOAN, J.M., 1997. Automated location of dysplastic fields in colorectal histology using image
texture analysis. The Journal of Pathology, 182(1), pp. 68-75.
HANSEN, A., ROSENLUND, G., KARLSEN, Ø., KOPPE, W. and HEMRE, G., 2007. Total
replacement of fish meal with plant proteins in diets for Atlantic cod (Gadus morhua, L.) I –
Effects on growth and protein retention. Aquaculture, 272(1), pp. 599-611.
HARDER, W., 1975. The digestive tract. Anatomy of fishes. Part1: Text. Stuttgart: E.
Dvhweizerbart’sche Verlagsbuchhand-lung. pp. 128-186.
HARDIE, L., FLETCHER, T. and SECOMBES, C., 1990. The effect of vitamin E on the immune
response of the Atlantic salmon (Salmo salar, L.). Aquaculture, 87(1), pp. 1-13.
HARDIE, L., FLETCHER, T. and SECOMBES, C., 1991. The effect of dietary vitamin C on the
immune response of the Atlantic salmon (Salmo salar L.). Aquaculture, 95(3), pp. 201-214.
HART, S., WRATHMELL, A.B., HARRIS, J.E. and GRAYSON, T.H., 1988. Gut immunology in fish: A
review. Developmental & Comparative Immunology, 12(3), pp. 453-480.
HASAN, M.R. 2001. “Nutrition and feeding for sustainable aquaculture development in the third
millennium” in Subasinghe, R.P., Bueno, P., Phillips, M.J., Hough, C., McGladdery, S.E., Arthur,
J.R. (Eds.) Aquaculture in the third millennium. Technical. Proceedings of the Conference on
Aquaculture in the Third Millennium, Bangkok, 20-25 February, pp. 193-219.
HASSELL, L.A., FUNG, K. and CHASER, B., 2011. Digital slides and ACGME resident competencies
in anatomic pathology: An altered paradigm for acquisition and assessment. Journal of
Pathology Informatics, 2, pp. 27.
HAYAT, M., 1986. Basic techniques for transmission electron microscopy. Academic Press,
Califormia, USA, pp. 411.
HE, L., LONG, L. R., ANTANI, S. and THOMA, G. R., 2012. Histology image analysis for carcinoma
detection and grading. Computer Methods and Programs in Biomedicine, 107(3), pp. 538-556.
HEIKKINEN, J., VIELMA, J., KEMILÄINEN, O., TIIROLA, M., ESKELINEN, P., KIURU, T., NAVIA-
PALDANIUS, D. and VON WRIGHT, A., 2006. Effects of soybean meal based diet on growth
performance, gut histopathology and intestinal microbiota of juvenile rainbow trout
(Oncorhynchus mykiss). Aquaculture, 261(1), pp. 259-268.
HELLAND, S., STOREBAKKEN, T. and GRISDALE-HELLAND, B., 1991. “Atlantic salmon, Salmo
salar” in Wilson, R.P. (Ed.). Handbook of nutrient requirements of finfish, CRC Press Inc., Boca
Raton, USA, pp.13-22.
HEMMER, N., STEINHAGEN, D., DROMMER, W. and KOERTING, W., 1998. Changes of intestinal
epithelial structure and cell turnover in carp Cyprinus carpio infected with Goussia carpelli
(Protozoa: Apicomplexa). Diseases of Aquatic Organisms, 34(1), pp. 39-44.

BIBLIOGRAPHIC REFERENCES
PAGE | 304
HEMRE, G., DENG, D., WILSON, R.P. and BERNTSSEN, M.H.G., 2004. Vitamin A metabolism and
early biological responses in juvenile sunshine bass (Morone chrysops×M. saxatilis) fed graded
levels of vitamin A. Aquaculture, 235(1–4), pp. 645-658.
HEMRE, G., SANDEN, M., BAKKE-McKELLEP, A., SAGSTAD, A. and KROGDAHL, Å., 2005.
Growth, feed utilization and health of Atlantic salmon Salmo salar L. fed genetically modified
compared to non-modified commercial hybrid soybeans. Aquaculture Nutrition, 11(3), pp. 157-
167.
HERATH, T. K., 2010. Cellular and molecular pathogenesis of salmonid alphavirus 1 in Atlantic
salmon, Salmo salar L. PhD Dissertation Thesis, University of Stirling, Stirling, UK, pp. 263.
HESSER, E. F., 1960. Methods for routine fish hematology. The Progressive Fish-Culturist, 22(4),
pp. 164-171.
HIBIYA, T.,YOKOTE, M.,OGURI, M.,SATO, H.,TAKASHIMA, F. and AIDA, K., 1982. An atlas of fish
histology: Normal and pathological features, Gustav Fischer Verlag., New York, USA, pp.147.
HIMICK, B.A. and PETER, R.E., 1994. CCK/gastrin-like immunoreactivity in brain and gut, and CCK
suppression of feeding in goldfish. American Journal of Physiology-Regulatory, Integrative and
Comparative Physiology, 267(3), pp. R841-R851.
HOLLAND, J.W. and ROWLEY, A.F., 1998. Studies on the eosinophilic granule cells in the gills of
the rainbow trout, Oncorhynchus mykiss. Comparative Biochemistry and Physiology Part C:
Pharmacology, Toxicology and Endocrinology, 120(2), pp. 321-328.
HOLM, S., 1979. A simple sequentially rejective multiple test procedure. Scandinavian Journal of
Statistics, 6, pp. 65-70.
HOLMGREN, S. and OLSSON, C., 2009. “The neuronal and endocrine regulation of gut function” in
Bernier, N.J., Van der Kraak, G., Farrell, A.P., Brauner, C.J. (Eds.). Fish neuroendocrinology,
Academic Press, Amsterdam, Netherland, pp. 467-512.
HONG, M.Y., CHANG, W.L., CHAPKIN, R.S. and LUPTON, J.R., 1997. Relationship among
colonocyte proliferation, differentiation, and apoptosis as a function of diet and carcinogen.
Nutrition and Cancer, 28(1), pp. 20-29.
HORDVIK, I., 2002. Identification of a novel immunoglobulin δ transcript and comparative analysis of
the genes encoding IgD in Atlantic salmon and Atlantic halibut. Molecular Immunology, 39(1),
pp. 85-91.
HORDVIK, I., THEVARAJAN, J., SAMDAL, I., BASTANI, N. and KROSSOY, B., 1999. Molecular
cloning and phylogenetic analysis of the Atlantic salmon immunoglobulin D gene. Scandinavian
Journal of Immunology, 50(2), pp. 202-210.
HSU, S., RAINE, L. and FANGER, H., 1981. The use of antiavidin antibody and avidin-biotin-
peroxidase complex in immunoperoxidase technics. American Journal of Clinical Pathology,
75(6), pp. 816-821.
HUANG, S., MINASSIAN, H. and MORE, J., 1976. Application of immunofluorescent staining on
paraffin sections improved by trypsin digestion. Laboratory Investigation; a Journal of Technical
Methods and Pathology, 35(4), pp. 383-390.
BIBLIOGRAPHIC REFERENCES
PAGE | 305
HUGHESDON, P., 1949. Two uses of uranyl nitrate. Journal of the Royal Microscopical Society,
69(1), pp. 1-8.
INGRAM, G.A. and ALEXANDER, J.B., 1977. Serum protein changes in brown trout (Salmo trutta L.)
after single injections of soluble and cellular antigens. Journal of Fish Biology, 11(3), pp. 283-
291.
ISHIZAKI, Y., JACOBSON, M.D. and RAFF, M.C., 1998. A role for caspases in lens fiber
differentiation. The Journal of Cell Biology, 140(1), pp. 153-158.
ISHIZEKI, K., NAWA, T., TACHIBANA, T., SAKAKURA, Y. and IIDA, S., 1984 Hemopoietic sites and
development of eosinophil granulocytes in the loach, Misgurnus anguillicaudatus. Cell Tissue
Research, 235, pp. 419-426.
ISSE, K., LESNIAK, A., GRAMA, K., ROYSAM, B., MINERVINI, M. I. and DEMETRIS, A. J., 2012.
Digital transplantation pathology: Combining whole slide imaging, multiplex staining and
automated image analysis. American Journal of Transplantation, 12(1), pp. 27-37.
IWAMA, G.K., AFONSO, L.O., TODGHAM, A., ACKERMAN, P. and NAKANO, K., 2004. Are hsps
suitable for indicating stressed states in fish? Journal of Experimental Biology, 207(1), pp. 15-
19.
IWAMA, G.K., THOMAS, P.T., FORSYTH, R.B. and VIJAYAN, M.M., 1998. Heat shock protein
expression in fish. Reviews in Fish Biology and Fisheries, 8(1), pp. 35-56.
IWASHITA, Y., SUZUKI, N., MATSUNARI, H., SUGITA, T. and YAMAMOTO, T., 2009. Influence of
soya saponin, soya lectin, and cholyltaurine supplemented to a casein-based semipurified diet
on intestinal morphology and biliary bile status in fingerling rainbow trout Oncorhynchus mykiss.
Fisheries Science, 75(5), pp. 1307-1315.
JARAMILLO, F. and GATLIN, D., 2004. Comparison of purified and practical diets supplemented with
or without β-Glucan and selenium on resistance of hybrid striped bass Morone chrysops♀× M.
saxatilis♂ to Streptococcus iniae Infection. Journal of the World Aquaculture Society, 35(2), pp.
245-252.
JARVIS, L., 1992. The microcomputer and image-analysis in diagnostic pathology. Microscopy
Research and Technique, 21(4), pp. 292-299.
JENEY, G. and ANDERSON, D.P., 1993. Glucan injection or bath exposure given alone or in
combination with a bacterin enhance the non-specific defence mechanisms in rainbow trout
(Oncorhynchus mykiss). Aquaculture, 116(4), pp. 315-329.
JENEY, G., GALEOTTI, M., VOLPATTI, D., JENEY, Z. and ANDERSON, D.P., 1997. Prevention of
stress in rainbow trout (Oncorhynchus mykiss) fed diets containing different doses of glucan.
Aquaculture, 154(1), pp. 1-15.
JENSEN, L.E., HINEY, M.P., SHIELDS, D.C., UHLAR, C.M., LINDSAY, A.J. and WHITEHEAD, A.S.,
1997. Acute phase proteins in salmonids: evolutionary analyses and acute phase response. The
Journal of Immunology, 158(1), pp. 384-392.
JEONG, W., SCHNEIDER, J., TURNEY, S.G., FAULKNER-JONES, B.E., MEYER, D.,
WESTERMANN, R., REID, R., LICHTMAN, J. and PFISTER, H., 2010. Interactive histology of

BIBLIOGRAPHIC REFERENCES
PAGE | 306
large-scale biomedical image stacks. Visualization and Computer Graphics, IEEE Transactions
on, 16(6), pp. 1386-1395.
JHA, A.K., PAL, A., SAHU, N., KUMAR, S. and MUKHERJEE, S., 2007. Haemato-immunological
responses to dietary yeast RNA, ω-3 fatty acid and β-carotene in Catla catla juveniles. Fish &
Shellfish Immunology, 23(5), pp. 917-927.
JOBLING, M., 1994. “Fish bioenergetics”, Chapman & Hall, London, UK, pp. 328.
JOHANSSON, A.C., VISSE, E., WIDEGREN, B., SJOGREN, H.O. and SIESJO, P., 2001.
Computerized image analysis as a tool to quantify infiltrating leukocytes: A comparison between
high-and low-magnification images. Journal of Histochemistry & Cytochemistry, 49(9), pp. 1073-
1079.
JORDANOVA, M., MITEVA, N. and ROCHA, E., 2007. A quantitative study of the hepatic
eosinophilic granule cells and rodlet cells during the breeding cycle of Ohrid trout, Salmo letnica
Kar. (Teloestei, Salmonidae). Fish & Shellfish Immunology, 23(2), pp. 473-478.
JØRGENSEN J.B., SHARP G.J.E., SECOMBES C.J. and ROBERTSEN B., 1993. Effect of a yeast-
cellwall glucan on the bactericidal activity of rainbow trout macrophages. Fish and Shellfish
Immunology, 3, pp. 315-343.
JØRGENSEN, J.B. and ROBERTSEN, B., 1995. Yeast β-glucan stimulates respiratory burst activity
of Atlantic salmon (Salmo salar L.) macrophages. Developmental & Comparative Immunology,
19(1), pp. 43-57.
JUTFELT, F., 2006. The intestinal epithelium of salmonids: Transepithelial transport, barrier function
and bacterial interactions. PhD Dissertation Thesis, University of Gothenburgh, Sweden, pp. 66.
KAGAWA, N., RYO, K. and MUGIYA, Y., 1999. Enhanced expression of stress protein 70 in the
brains of goldfish, Carassius auratus, reared with bluegills, Lepomis macrochirus. Fish
Physiology and Biochemistry, 21(2), pp. 103-110.
KAISER, H.F., 1974. An index of factorial simplicity.Psychometricka, 39(1), pp. 31-36.
KALKAN, H., NAP, M., DUIN, R.P.W. and LOOG, M., 2012. Automated classification of local patches
in colon histopathology, 21st International Conference on Pattern Recognition, Tsukuba, 11-15
November, pp. 61-64.
KAMUNDE, C.N., GROSELL, M., LOTT, J.N. and WOOD, C.M., 2001. Copper metabolism and gut
morphology in rainbow trout (Oncorhynchus mykiss) during chronic sublethal dietary copper
exposure. Canadian Journal of Fisheries and Aquatic Sciences, 58(2), pp. 293-305.
KARLSSON, M.G., DAVIDSSON, A. and HELLQUIST, H.B., 1994. Quantitative computerized image-
analysis of immunostained lymphocytes. Pathology Research and Practice, 190(8), pp. 799-807.
KAUSHIK, S., CRAVEDI, J., LALLES, J., SUMPTER, J., FAUCONNEAU, B. and LAROCHE, M.,
1995. Partial or total replacement of fish meal by soybean protein on growth, protein utilization,
potential estrogenic or antigenic effects, cholesterolemia and flesh quality in rainbow trout,
Oncorhynchus mykiss. Aquaculture, 133(3), pp. 257-274.
KAYSER, G. and KAYSER, K., 2013. Quantitative pathology in virtual microscopy: History,
applications, perspectives. Acta Histochemica, 115(6), pp. 527-532.

BIBLIOGRAPHIC REFERENCES
PAGE | 307
KAYSER, G., RIEDE, U., WENER, M., HUFNAGL, P. and KAYSER, K., 2002. Towards an
automated morphological classification of histological images of common lung carcinomas.
Electronic Journal of Pathology and Histology, 8(2), pp. 22-30.
KEENAN, S.J., DIAMOND, J., GLENN MCCLUGGAGE, W., BHARUCHA, H., THOMPSON, D.,
BARTELS, P.H. and HAMILTON, P.W., 2000. An automated machine vision system for the
histological grading of cervical intraepithelial neoplasia (CIN). The Journal of Pathology, 192(3),
pp. 351-362.
KENARI, A.A., MAHMOUDI, N., SOLTANI, M. and ABEDIANKENARI, S., 2013. Dietary nucleotide
supplements influence the growth, haemato-immunological parameters and stress responses in
endangered Caspian brown trout (Salmo trutta caspius Kessler, 1877). Aquaculture Nutrition,
19(1), pp. 54-63.
KHAN, N. and DESCHAUX, P., 1997. Role of serotonin in fish immunomodulation. Journal of
Experimental Biology, 200(13), pp. 1833-1838.
KILEMADE, M., LYONS-ALCANTARA, M., ROSE, T., FITZGERALD, R. and MOTHERSILL, C.,
2002. Rainbow trout primary epidermal cell proliferation as an indicator of aquatic toxicity: an in
vitro/in vivo exposure comparison. Aquatic Toxicology, 60(1), pp. 43-59.
KIRON, V., 2012. Fish immune system and its nutritional modulation for preventive health care.
Animal Feed Science and Technology, 173(1–2), pp. 111-133.
KNUDSEN, D. L., 2007. Soybean-induced enteritis in Atlantic salmon. PhD Dissertation Thesis,
Technical University of Denmark, Denmark, pp. 118.
KNUDSEN, D., JUTFELT, F., SUNDH, H., SUNDELL, K., KOPPE, W. and FRØKIÆR, H., 2008.
Dietary soya saponins increase gut permeability and play a key role in the onset of soyabean-
induced enteritis in Atlantic salmon (Salmo salar L.). British Journal of Nutrition, 100(01), pp.
120-129.
KODAMA, H., MATSUOKA, Y., TANAKA, Y., LIU, Y., IWASAKI, T. and WATARAI, S., 2004.
Changes of C-reactive protein levels in rainbow trout (Oncorhynchus mykiss) sera after
exposure to anti-ectoparasitic chemicals used in aquaculture. Fish & Shellfish Immunology,
16(5), pp. 589-597.
KOKOU, F., RIGOS, G., HENRY, M., KENTOURI, M. and ALEXIS, M., 2012. Growth performance,
feed utilization and non-specific immune response of gilthead sea bream (Sparus aurata L.) fed
graded levels of a bioprocessed soybean meal. Aquaculture, 364–365(0), pp. 74-81.
KONG, J., SERTEL, O., SHIMADA, H., BOYER, K.L., SALTZ, J.H. and GURCAN, M.N., 2009.
Computer-aided evaluation of neuroblastoma on whole-slide histology images: Classifying grade
of neuroblastic differentiation. Pattern Recognition, 42(6), pp. 1080-1092.
KONG, J., SHIMADA, H., BOYER, K., SALTZ, J. and GURCAN, M., 2007. Image analysis for
automated assessment of grade of neuroblastic differentiation. 4th IEEE International
Symposium on Biomedical Imaging: Macro to Nano, Volumes 1-3, Ohio, 12-15 April, pp. 61-64.
KOPEC, C. D., BOWERS, A. C., PAI, S. and BRODY, C. D., 2011. Semi-automated atlas-based
analysis of brain histological sections. Journal of Neuroscience Methods, 196(1), pp. 12-19.
KOPP, R., MAREŠ, J., LANG, Š., BRABEC, T. and ZIKOVÁ, A., 2011. Assessment of ranges

BIBLIOGRAPHIC REFERENCES
PAGE | 308
plasma indices in rainbow trout (Oncorhynchus mykiss) reared under conditions of intensive
aquaculture. Acta Universitatis Agriculturae et Silviculturae Mendelianae Brunensis, 59, pp. 24.
KORTNER, T.M., VALEN, E.C., KORTNER, H., MARJARA, I.S., KROGDAHL, Å. and BAKKE, A.M.,
2011. Candidate reference genes for quantitative real-time PCR (qPCR) assays during
development of a diet-related enteropathy in Atlantic salmon (Salmo salar L.) and the potential
pitfalls of uncritical use of normalization software tools. Aquaculture, 318(3), pp. 355-363.
KRENACS, T., ZSAKOVICS, I., MICSIK, T., FONYAD, L., VARGA, S.V., FICSOR, L. and MOLNAR,
B., 2010. “Digital microscopy - the upcoming revolution in histopathology teaching, diagnostics,
research and quality assurance” in MENDEZ-VILAS, A. and DIAZ, J. (Eds.). Microscopy:
Science, technology, applications and education, Volume 2, Formatex Research Center,
Badajoz, Spain, pp. 965-977.
KRIETE, A. and BOYCE, K., 2005. Automated tissue analysis - a bioinformatics perspective.
Methods of Information in Medicine, 44(1), pp. 32-37.
KROGDAHL, Å. and BAKKE-McKELLEP, A., 2005. Fasting and refeeding cause rapid changes in
intestinal tissue mass and digestive enzyme capacities of Atlantic salmon (Salmo salar L.).
Comparative Biochemistry and Physiology Part A: Molecular & Integrative Physiology, 141(4),
pp. 450-460.
KROGDAHL, Å., BAKKE-McKELLEP, A. and BAEVERFJORD, G., 2003. Effects of graded levels of
standard soybean meal on intestinal structure, mucosal enzyme activities, and pancreatic
response in Atlantic salmon (Salmo salar L.). Aquaculture Nutrition, 9(6), pp. 361-371.
KROGDAHL, Å., LEA, T.B. and OLLI, J.J., 1994. Soybean proteinase inhibitors affect intestinal
trypsin activities and amino acid digestibilities in rainbow trout (Oncorhynchus mykiss).
Comparative Biochemistry and Physiology Part A: Physiology, 107(1), pp. 215-219.
KROGDAHL, Å., PENN, M., THORSEN, J., REFSTIE, S. and BAKKE, A.M., 2010. Important anti-
nutrients in plant feedstuffs for aquaculture: an update on recent findings regarding responses in
salmonids. Aquaculture Research, 41(3), pp. 333-344.
KROGDAHL, BAKKE-McKELLEP, RØED and BAEVERFJORD, 2000. Feeding Atlantic salmon
Salmo salar L. soybean products: effects on disease resistance (furunculosis), and lysozyme
and IgM levels in the intestinal mucosa. Aquaculture Nutrition, 6(2), pp. 77-84.
KÜHLWEIN, H., MERRIFIELD, D., RAWLING, M., FOEY, A. and DAVIES, S., 2013. Effects of
dietary β-(1, 3)(1, 6)-D-glucan supplementation on growth performance, intestinal morphology
and haemato-immunological profile of mirror carp (Cyprinus carpio L.). Journal of Animal
Physiology and Animal Nutrition, [Epub ahead of print].
KUMAR, S., SAHU, N., PAL, A., CHOUDHURY, D., YENGKOKPAM, S. and MUKHERJEE, S., 2005.
Effect of dietary carbohydrate on haematology, respiratory burst activity and histological
changes in L. rohita juveniles. Fish & Shellfish Immunology, 19(4), pp. 331-344.
KUMAR, V., MAKKAR, H. and BECKER, K., 2010a. Dietary inclusion of detoxified Jatropha curcas
kernel meal: effects on growth performance and metabolic efficiency in common carp, Cyprinus
carpio L. Fish Physiology and Biochemistry, 36(4), pp. 1159-1170.

BIBLIOGRAPHIC REFERENCES
PAGE | 309
KUMAR, V., MAKKAR, H. and BECKER, K., 2011a. Detoxified Jatropha curcas kernel meal as a
dietary protein source: growth performance, nutrient utilization and digestive enzymes in
common carp (Cyprinus carpio L.) fingerlings. Aquaculture Nutrition, 17(3), pp. 313-326.
KUMAR, V., MAKKAR, H. and BECKER, K., 2011b. Nutritional, physiological and haematological
responses in rainbow trout (Oncorhynchus mykiss) juveniles fed detoxified Jatropha curcas
kernel meal. Aquaculture Nutrition, 17(4), pp. 451-467.
KUMAR, V., MAKKAR, H.P., AMSELGRUBER, W. and BECKER, K., 2010b. Physiological,
haematological and histopathological responses in common carp (Cyprinus carpio, L.)
fingerlings fed with differently detoxified Jatropha curcas kernel meal. Food and Chemical
Toxicology, 48(8), pp. 2063-2072.
KUMARI, J. and SAHOO, P., 2006. Dietary β-1, 3 glucan potentiates innate immunity and disease
resistance of Asian catfish, Clarias batrachus (L.). Journal of Fish Diseases, 29(2), pp. 95-101.
KURANAGA, E. and MIURA, M., 2007. Nonapoptotic functions of caspases: caspases as regulatory
molecules for immunity and cell-fate determination. Trends in Cell Biology, 17(3), pp. 135-144.
KUZNETSOV, V., LEE, H.K., MAURER-STROH, S., MOLNAR, M.J., PONGOR, S., EISENHABER,
B. and EISENHABER, F., 2013. How bioinformatics influences health informatics: usage of
biomolecular sequences, expression profiles and automated microscopic image analyses for
clinical needs and public health. Health Information Science and Systems, 1(2), pp. 1-18.
LAITAKARI, J., HARRISON, D. and STENBACK, F., 2003. Automated image analysis of proliferating
cells in carcinoma of the larynx. Acta Oto-Laryngologica, 123(6), pp. 759-766.
LAMAS, J., BRUNO, D.W., SANTOS, Y., ANADÓN, R. and ELLIS, A.E., 1991. Eosinophilic granular
cell response to intraperitoneal injection with Vibrio anguillarum and its extracellular products in
rainbow trout, Oncorhynchus mykiss. Fish & Shellfish Immunology, 1(3), pp. 187-194.
LAMAS, J., SANTOS, Y., BRUNO, D., TORANZO, A. and ANADON, R., 1994. Non‐specific cellular
responses of rainbow trout to Vibrio anguillarum and its extracellular products (ECPs). Journal of
Fish Biology, 45(5), pp. 839-854.
LAMKANFI, M., FESTJENS, N., DECLERCQ, W., BERGHE, T.V. and VANDENABEELE, P., 2006.
Caspases in cell survival, proliferation and differentiation. Cell Death & Differentiation, 14(1), pp.
44-55.
LANDOLT, M.L., 1989. The relationship between diet and the immune response of fish. Aquaculture,
79(1–4), pp. 193-206.
LAPORTE, J. and TRUSHENSKI, J., 2012. Production performance, stress tolerance and intestinal
integrity of sunshine bass fed increasing levels of soybean meal. Journal of Animal Physiology
and Animal Nutrition, 96(3), pp. 513-526.
LAUNAY, S., HERMINE, O., FONTENAY, M., KROEMER, G., SOLARY, E. and GARRIDO, C.,
2005. Vital functions for lethal caspases. Oncogene, 24(33), pp. 5137-5148.
LAURIANO, E.R., CALÒ, M., SILVESTRI, G., ZACCONE, D., PERGOLIZZI, S. and LO CASCIO, P.,
2012. Mast cells in the intestine and gills of the sea bream, Sparus aurata, exposed to a
polychlorinated biphenyl, PCB 126. Acta Histochemica, 114(2), pp. 166-171.

BIBLIOGRAPHIC REFERENCES
PAGE | 310
LEBLOND, C. and CLERMONT, Y., 1952. Definition of the stages of the cycle of the seminiferous
epithelium in the rat. Annals of the New York Academy of Sciences, 55(4), pp. 548-573.
LEKNES, I.L., 2007. Eosinophilic granule cells and endocytic cells in intestinal wall of pearl gouramy
(Anabantidae: Teleostei). Fish & Shellfish Immunology, 23(4), pp. 897-900.
LEONARDI, M., SANDINO, A. and KLEMPAU, A., 2003. Effect of a nucleotide-enriched diet on the
immune system, plasma cortisol levels and resistance to infectious pancreatic necrosis (IPN) in
juvenile rainbow trout (Oncorhynchus mykiss). Bulletin of the European Association of Fish
Pathologists, 23(2), pp. 52-59.
LEONG, F.J.W. and LEONG, A.S.Y., 2003. Digital imaging applications in anatomic pathology.
Advances in Anatomic Pathology, 10(2), pp. 88-95.
LEONG, F.J.W.M. and LEONG, A.S.Y., 2004. Digital imaging in pathology: theoretical and practical
considerations, and applications. Pathology, 36(3), pp. 234-241.
LEV, R. and SPICER, S.S. 1964. Specific staining of sulphated groups with alcian blue at low pH.
Journal of Histochemistry and Cytochemistry, 12: pp. 309.
LEWIS, M.J., HAMID, N.K.A., ALHAZZAA, R., HERMON, K., DONALD, J.A., SINCLAIR, A.J. and
TURCHINI, G.M., 2013. Targeted dietary micronutrient fortification modulates n-3 LC-PUFA
pathway activity in rainbow trout (Oncorhynchus mykiss). Aquaculture, 412-413, pp. 215-222.
LI, P. and GATLIN, D.M., 2004. Dietary brewers yeast and the prebiotic Grobiotic™AE influence
growth performance, immune responses and resistance of hybrid striped bass (Morone
chrysops×M. saxatilis) to Streptococcus iniae infection. Aquaculture, 231(1–4), pp. 445-456.
LI, P. and GATLIN, D.M., 2006. Nucleotide nutrition in fish: Current knowledge and future
applications. Aquaculture, 251(2–4), pp. 141-152.
LI, P., BURR, G.S., GOFF, J., WHITEMAN, K.W., DAVIS, K.B., VEGA, R.R., NEILL, W.H. and
GATLIN, D.M., 2005. A preliminary study on the effects of dietary supplementation of brewers
yeast and nucleotides, singularly or in combination, on juvenile red drum (Sciaenops ocellatus).
Aquaculture Research, 36(11), pp. 1120-1127.
LI, P., GATLIN, D.M. and NEILL, W.H., 2007. Dietary supplementation of a purified nucleotide
mixture transiently enhanced growth and feed utilization of juvenile red drum, Sciaenops
ocellatus. Journal of the World Aquaculture Society, 38(2), pp. 281-286.
LI, P., LEWIS, D.H. and GATLIN, D.M., 2004. Dietary oligonucleotides from yeast RNA influence
immune responses and resistance of hybrid striped bass (Morone chrysops x Morone saxatilis)
to Streptococcus iniae infection. Fish & Shellfish Immunology, 16(5), pp. 561-569.
LIE, Ø., EVENSEN, Ø., SØRENSEN, A. and FRØYSADAL, E., 1989. Study on lysozyme activity in
some fish species. Diseases of Aquatic Organisms, 6, pp. 1-5.
LILLEENG, E., FROYSTAD, M.K., OSTBY, G.C., VALEN, E.C. and KROGDAHL, A., 2007. Effects of
diets containing soybean meal on trypsin mRNA expression and activity in Atlantic salmon
(Salmo salar L). Comparative Biochemistry and Physiology Part A: Molecular & Integrative
Physiology, 147(1), pp. 25-36.
LILLEENG, E., PENN, M.H., HAUGLAND, Ø., XU, C., BAKKE, A.M., KROGDAHL, Å., LANDSVERK,
T. and FRØYSTAD-SAUGEN, M.K., 2009. Decreased expression of TGF-β, GILT and T-cell
BIBLIOGRAPHIC REFERENCES
PAGE | 311
markers in the early stages of soybean enteropathy in Atlantic salmon (Salmo salar L.). Fish &
Shellfish Immunology, 27(1), pp. 65-72.
LILLIE, R. and FULMER, H., 1965. Histological technique and practical histochemistry, McGraw-Hill,
New York, USA, pp. 942.
LIM, C. and WEBSTER, C.D., 2001 Nutrition and fish health. Taylor & Francis, New York, USA, pp.
365.
LIN, Y., WANG, H. and SHIAU, S., 2009. Dietary nucleotide supplementation enhances growth and
immune responses of grouper, Epinephelus malabaricus. Aquaculture Nutrition, 15(2), pp. 117-
122.
LINDSTEDT, K.A. and KOVANEN, P.T., 2001. Isolation of Mast Cell Granules. Current Protocols in
Cell Biology, 29:3, pp. 16.1–3.16.13.
LIU, Y., IWASAKI, T., WATARAI, S. and KODAMA, H., 2004. Effect of turpentine oil on C-reactive
protein (CRP) production in rainbow trout (Oncorhynchus mykiss). Fish & Shellfish Immunology,
17(3), pp. 203-210.
LIU, Y., MOORE, L., OLAF KOPPANG, E. and HORDVIK, I., 2008. Characterization of the CD3ζ,
CD3γδ and CD3ε subunits of the T cell receptor complex in Atlantic salmon. Developmental &
Comparative Immunology, 32(1), pp. 26-35.
LØKKA, G., AUSTBØ, L., FALK, K., BJERKÅS, I. and KOPPANG, E.O., 2013. Intestinal morphology
of the wild Atlantic salmon (Salmo salar). Journal of Morphology, 274(8), pp. 859-876.
LORENZI, V. and GROBER, M.S., 2012. Immunohistochemical localization of serotonin in the brain
during natural sex change in the hermaphroditic goby Lythrypnus dalli. General and
Comparative Endocrinology, 175(3), pp. 527-536.
LOUKAS, C.G. and LINNEY, A., 2004. A survey on histological image analysis-based assessment of
three major biological factors influencing radiotherapy: proliferation, hypoxia and vasculature.
Computer Methods and Programs in Biomedicine, 74(3), pp. 183-199.
LOVELL, T., 1998. Nutrition and feeding in fish. Kluwer Academic Publishers, Massachussests, USA,
pp.271.
LOW, C., WADSWORTH, S., BURRELLS, C. and SECOMBES, C., 2003. Expression of immune
genes in turbot (Scophthalmus maximus) fed a nucleotide-supplemented diet. Aquaculture,
221(1), pp. 23-40.
LUND, V. and OLAFSEN, J.A., 1998. A comparative study of pentraxin-like proteins in different fish
species. Developmental & Comparative Immunology, 22(2), pp. 185-194.
LUND, V. and OLAFSEN, J.A., 1999. Changes in serum concentration of a serum amyloid P-like
pentraxin in Atlantic salmon, Salmo salar L., during infection and inflammation. Developmental &
Comparative Immunology, 23(1), pp. 61-70.
LUNDÉN, T., LILIUS, E. and BYLUND, G., 2002. Respiratory burst activity of rainbow trout
(Oncorhynchus mykiss) phagocytes is modulated by antimicrobial drugs. Aquaculture, 207(3–4),
pp. 203-212.

BIBLIOGRAPHIC REFERENCES
PAGE | 312
MADSEN, S.S., OLESEN, J.H., BEDAL, K., ENGELUND, M.B., VELASCO-SANTAMARÍA, Y.M. and
TIPSMARK, C.K., 2011. Functional characterization of water transport and cellular localization
of three aquaporin paralogs in the salmonid intestine. Frontiers in Physiology, 2(56), pp.1-14.
MAGNADÓTTIR, B., 2006. Innate immunity of fish (overview). Fish & Shellfish Immunology, 20(2),
pp. 137-151.
MAGNADOTTIR, B., 2010. Immunological control of fish diseases. Marine Biotechnology, 12(4), pp.
361-379.
MAITA, M., 2007. “Fish health assessment” in Nakagawa, H., Sato, M. and Gatlin, D. (Eds.). Dietary
supplements for the health and quality of cultured fish, Cromwell Press, Trowbridge, UK, pp.10-
34.
MALINA, A., TASSAKKA, A. and SAKAI, M., 2005. Current research on the immunostimulatory
effects of CpG oligodeoxynucleotides in fish. Aquaculture, 246(1–4), pp. 25-36.
MANDARIM-DE-LACERDA, C.A., FERNANDES-SANTOS, C. and AGUILA, M.B. 2010. “Image
analysis and qualitative morphology” in Hamilton, T.D. and Darby, I.A. (Eds.). Methods in
molecular biology, Volume 611, Humana Press, New York, USA, pp. 211-225.
MANERA, M. and BORRECA, C., 2012. Assessment of mast cells degranulation in rainbow trout
(Oncorhynchus mykiss Walbaum) by means of gray level and texture analysis (Gray Level
Correlation Matrices). Research in Veterinary Science, 93(2), pp. 886-891.
MANGO, L.J., 1994. Computer-assisted cervical cancer screening using neural networks. Cancer
Letters, 77(2–3), pp. 155-162.
MARADONNA, F. and CARNEVALI, O., 2007. Vitellogenin, zona radiata protein, cathepsin D and
heat shock protein 70 as biomarkers of exposure to xenobiotics. Biomarkers, 12(3), pp. 240-
255.
MARCHETTI, L., CAPACCHIETTI, M., SABBIETI, M.G., ACCILI, D., MATERAZZI, G. and MENGHI,
G., 2006. Histology and carbohydrate histochemistry of the alimentary canal in the rainbow trout
Oncorhynchus mykiss. Journal of Fish Biology, 68(6), pp. 1808-1821.
MARJARA, I.S., CHIKWATI, E.M., VALEN, E.C., KROGDAHL, Å. and BAKKE, A.M., 2012.
Transcriptional regulation of IL-17A and other inflammatory markers during the development of
soybean meal-induced enteropathy in the distal intestine of Atlantic salmon (Salmo salar L.).
Cytokine, 60(1), pp. 186-196.
MARRACK, J., 1934. Nature of antibodies. Nature, 133, pp. 292-293.
MARSHALL, W. and GROSELL, M., 2006. Ion transport, osmoregulation, and acid-base balance.
The Physiology of Fishes, 3, pp. 177-230.
MARTINEZ-RUBIO, L., MORAIS, S., EVENSEN, Ø., WADSWORTH, S., VECINO, J.G.,
RUOHONEN, K., BELL, J.G. and TOCHER, D.R., 2013. Effect of functional feeds on fatty acid
and eicosanoid metabolism in liver and head kidney of Atlantic salmon (Salmo salar L.) with
experimentally induced Heart and Skeletal Muscle Inflammation. Fish & Shellfish Immunology,
34(6), pp. 1433-1545.
MATOS, E., SILVA, T.S., WULFF, T., VALENTE, L.M.P., SOUSA, V., SAMPAIO, E., GONÇALVES,
A., SILVA, J.M.G., DINIS, M.T., RODRIGUES, P.M. and DIAS, J., 2013. Influence of

BIBLIOGRAPHIC REFERENCES
PAGE | 313
supplemental maslinic acid (olive-derived triterpene) on the post-mortem muscle properties and
quality traits of gilthead seabream. Aquaculture, 396-399(1), pp. 146-156.
MATSUYAMA, H., MANGINDAAN, R.E. and YANO, T., 1992. Protective effect of schizophyllan and
scleroglucan against Streptococcus sp. infection in yellowtail (Seriola quinqueradiata).
Aquaculture, 101(3), pp. 197-203.
MATSUYAMA, T. and IIDA, T., 1999. Degranulation of eosinophilic granular cells with possible
involvement in neutrophil migration to site of inflammation in tilapia. Developmental &
Comparative Immunology, 23(6), pp. 451-457.
MATSUYAMA, T. and IIDA, T., 2001. Influence of tilapia mast cell lysate on vascular permeability.
Fish & Shellfish Immunology, 11(7), pp. 549-556.
MAY, R. and MAY, G.L., 1902. Grünwald stain. Zentralbl Für Innere Med, 23, pp. 265.
MAYER, M.P., SCHRÖDER, H., RÜDIGER, S., PAAL, K., LAUFEN, T. and BUKAU, B., 2000.
Multistep mechanism of substrate binding determines chaperone activity of Hsp70. Nature
Structural & Molecular Biology, 7(7), pp. 586-593.
McEACHRON, D.L., HESS, S., KNECHT, L.B. and TRUE, L.D., 1989. Image-processing for the rest
of us - the potential utility of inexpensive computerized image-analysis in clinical pathology and
radiology. Computerized Medical Imaging and Graphics, 13(1), pp. 3-30.
McLEAN, E. and DONALDSON, E.M., 1990. Absorption of bioactive proteins by the gastrointestinal
tract of fish: a review. Journal of Aquatic Animal Health, 2(1), pp. 1-11.
McLEAN, E., RØNSHOLDT, B. and STEN, C., 1999. Gastrointestinal delivery of peptide and protein
drugs to aquacultured teleosts. Aquaculture, 177(1), pp. 231-247.
McMILLAN, D.N. and SECOMBES, C.J., 1997. Isolation of rainbow trout (Oncorhynchus mykiss)
intestinal intraepithelial lymphocytes (IEL) and measurement of their cytotoxic activity. Fish &
Shellfish Immunology, 7(8), pp. 527-541.
MEENA, D., DAS, P., KUMAR, S., MANDAL, S., PRUSTY, A., SINGH, S., AKHTAR, M., BEHERA,
B., KUMAR, K. and PAL, A., 2012. Beta-glucan: an ideal immunostimulant in aquaculture (a
review). Fish Physiology and Biochemistry, 39 (3), pp. 1-27.
MEKORI, Y.A. and METCALFE, D.D., 2000. Mast cells in innate immunity. Immunological Reviews,
173(1), pp. 131-140.
MERRIFIELD, D.L., HARPER, G.M., DIMITROGLOU, A., RINGØ, E. and DAVIES, S.J., 2010.
Possible influence of probiotic adhesion to intestinal mucosa on the activity and morphology of
rainbow trout (Oncorhynchus mykiss) enterocytes. Aquaculture Research, 41(8), pp. 1268-1272.
MESKER, W.E., OUD, P.S., KNEPFLE, C.F., SCHIPPER, N.W. and TANKE, H.J., 1994. Detection of
immunocytochemically stained rare events using image analysis. Cytometry, 17(3), pp. 209-215.
MIEST, J.J., FALCO, A., PIONNIER, N.P.M., FROST, P., IRNAZAROW, I., WILLIAMS, G.T. and
HOOLE, D., 2012. The influence of dietary β-glucan, PAMP exposure and Aeromonas
salmonicida on apoptosis modulation in common carp (Cyprinus carpio). Fish & Shellfish
Immunology, 33(4), pp. 846-856.
MIGHELL, A., HUME, W. and ROBINSON, P., 1998. An overview of the complexities and subtleties
of immunohistochemistry. Oral Diseases, 4(3), pp. 217-223.

BIBLIOGRAPHIC REFERENCES
PAGE | 314
MISRA, C.K., DAS, B.K., MUKHERJEE, S.C. and PATTNAIK, P., 2006. Effect of long term
administration of dietary β-glucan on immunity, growth and survival of Labeo rohita fingerlings.
Aquaculture, 255(1), pp. 82-94.
MITCHELL, T.M., 1997. Machine learning, McGraw Hill, New York, USA, pp. 417.
MITRA, S. and BHATTACHARYA, S., 1992. Purification of C-reactive protein from Channa punctatus
(Bloch). Indian Journal of Biochemistry and Biophysics, 29, pp. 508-511.
MIURA, M., CHEN, X., ALLEN, M.R., BI, Y., GRONTHOS, S., SEO, B., LAKHANI, S., FLAVELL,
R.A., FENG, X. and ROBEY, P.G., 2004. A crucial role of caspase-3 in osteogenic differentiation
of bone marrow stromal stem cells. Journal of Clinical Investigation, 114(12), pp. 1704-1713.
MONTAGNE, L., PLUSKE, J. and HAMPSON, D., 2003. A review of interactions between dietary
fibre and the intestinal mucosa, and their consequences on digestive health in young non-
ruminant animals. Animal Feed Science and Technology, 108(1), pp. 95-117.
MOOSEKER, M. S., 1985. Organization, chemistry, and assembly of the cytoskeletal apparatus of
the intestinal brush border. Annual Review of Cell Biology, 1 (209–241), pp. 209-241.
MORRIS, P. C., GALLIMORE, P., HANDLEY, J., HIDE, G., HAUGHTON, P. and BLACK, A., 2005.
Full-fat soya for rainbow trout (Oncorhynchus mykiss) in freshwater: Effects on performance,
composition and flesh fatty acid profile in absence of hind-gut enteritis. Aquaculture, 248, 147-
161.
MOSCA, F., ROMANO, N., MALATESTA, D., CECCARELLI, G., BRUNETTI, A., BULFON, C.,
VOLPATTI, D., ABELLI, L., GALEOTTI, M. and FALCONI, A., 2012. Heat shock protein 70 kDa
(HSP70) increase in sea bass (Dicentrarchus labrax L., 1758) thymus after vaccination against
Listonella anguillarum. Fish Physiology and Biochemistry, 39(3), pp. 1-12.
MOSEDALE, D.E., METCALFE, J.C. and GRAINGER, D.J., 1996. Optimization of
immunofluorescence methods by quantitative image analysis. Journal of Histochemistry &
Cytochemistry, 44(9), pp. 1043-1050.
MÖSSNER, R. and LESCH, K., 1998. Role of serotonin in the immune system and in neuroimmune
interactions. Brain, Behavior, and Immunity, 12(4), pp. 249-271.
MOWRY, R. and WINKLER, C.H., 1956. The coloration of acidic carbohydrates of bacteria and fungi
in tissue sections with special reference to capsules of Cryptococcus neoformans, pneumococci,
and staphylococci. American Journal of Pathology, 32, pp. 628-629.
MULERO, I., NOGA, E.J., MESEGUER, J., GARCÍA-AYALA, A. and MULERO, V., 2008. The
antimicrobial peptides piscidins are stored in the granules of professional phagocytic
granulocytes of fish and are delivered to the bacteria-containing phagosome upon phagocytosis.
Developmental & Comparative Immunology, 32(12), pp. 1531-1538.
MULERO, I., SEPULCRE, M.P., MESEGUER, J., GARCÍA-AYALA, A. and MULERO, V., 2007.
Histamine is stored in mast cells of most evolutionarily advanced fish and regulates the fish
inflammatory response. Proceedings of the National Academy of Sciences, 104(49), pp. 19434-
19439.

BIBLIOGRAPHIC REFERENCES
PAGE | 315
MULRANE, L., REXHEPAJ, E., PENNEY, S., CALLANAN, J.J. and GALLAGHER, W.M., 2008.
Automated image analysis in histopathology: a valuable tool in medical diagnostics. Expert
Review of Molecular Diagnostics, 8(6), pp. 707-725.
MUNDHEIM, H., AKSNES, A. and HOPE, B., 2004. Growth, feed efficiency and digestibility in
salmon (Salmo salar L.) fed different dietary proportions of vegetable protein sources in
combination with two fish meal qualities. Aquaculture, 237(1–4), pp. 315-331.
MURAI, T., KODAMA, H., NAIKI, M., MIKAMI, T. and IZAWA, H., 1991. Isolation and
characterization of rainbow trout C-reactive protein. Developmental & Comparative Immunology,
14(1), pp. 49-58.
MURRAY, C.K. and FLETCHER, T.C., 1976. The immunohistochemical localization of lysozyme in
plaice (Pleuronectes platessa L.) tissues. Journal of Fish Biology, 9(4), pp. 329-334.
MURRAY, H.M., LEGGIADRO, C.T. and DOUGLAS, S.E., 2007. Immunocytochemical localization of
pleurocidin to the cytoplasmic granules of eosinophilic granular cells from the winter flounder gill.
Journal of Fish Biology, 70, pp. 336-345.
MUSCH, M.W., CLARKE, L.L., MAMAH, D., GAWENIS, L.R., ZHANG, Z., ELLSWORTH, W.,
SHALOWITZ, D., MITTAL, N., EFTHIMIOU, P. and ALNADJIM, Z., 2002. T cell activation
causes diarrhoea by increasing intestinal permeability and inhibiting epithelial Na+/K
+-ATPase.
Journal of Clinical Investigation, 110(11), pp. 1739-1747.
NAIK, S., DOYLE, S., AGNER, S., MADABHUSHI, A., FELDMAN, M. and TOMASZEWSKI, J., 2008.
Automated gland and nuclei segmentation for grading of prostate and breast cancer
histopathology. IEEE International Symposium on Biomedical Imaging: from Nano to Macro,
New Jersey, 14-17 May, pp. 284-287.
NAIK, S., MADABHUSHI, A., TOMASZEWESKI, J. and FELDMAN, M.D., 2007. A quantitative
exploration of efficacy of gland morphology in prostate cancer grading. IEEE 33rd Annual
Northeast Bioengineering Conference, New Jersey, 10-11 March, pp. 58-59.
NAKAGAWA, H., SATO, M. and GATLIN, D., 2007. Dietary supplements for the health and quality of
cultured fish, Cromwell Press, Trowbridge, UK, pp. 244.
NAKANE, P.K. and PIERCE, G.B., 1966. Enzyme-labeled antibodies: preparation and application for
the localization of antigens. Journal of Histochemistry & Cytochemistry, 14(12), pp. 929-931.
NAVARRETE, P., FUENTES, P., LA FUENTE, L., BARROS, L., MAGNE, F., OPAZO, R.,
IBACACHE, C., ESPEJO, R. and ROMERO, J., 2013. Short‐term effects of dietary soybean
meal and lactic acid bacteria on the intestinal morphology and microbiota of Atlantic salmon
(Salmo salar). Aquaculture Nutrition, 19(5), pp. 827-836.
NAYAK, S.K., 2010. Probiotics and immunity: A fish perspective. Fish & Shellfish Immunology, 29(1),
pp. 2-14.
NELSON, P.N., REYNOLDS, G.M., WALDRON, E.E., WARD, E., GIANNOPOULOS, K. and
MURRAY, P.G., 2000. Demystified …: Monoclonal antibodies. Molecular Pathology, 53(3), pp.
111-117.

BIBLIOGRAPHIC REFERENCES
PAGE | 316
NEUMANN, N.F., STAFFORD, J.L., BARREDA, D., AINSWORTH, A.J. and BELOSEVIC, M., 2001.
Antimicrobial mechanisms of fish phagocytes and their role in host defense. Developmental &
Comparative Immunology, 25(8), pp. 807-825.
NIELSEN, B., ALBREGTSEN, F. and DANIELSEN, H.E., 2012. Automatic segmentation of cell nuclei
in Feulgen-stained histological sections of prostate cancer and quantitative evaluation of
segmentation results. Cytometry Part A, 81A(7), pp. 588-601.
NIKLASSON, L., 2013. Intestinal mucosal immunology of salmonids: Response to stress and
infection and crosstalk with the physical barrier. PhD Dissertation Thesis, University of
Gothenburgh, Sweden, pp. 79.
NILSSON, S. and HOLMGREN, S., 1992. “Cardiovascular control by purines, 5-hydroxytryptamine,
and neuropeptides” in Hoar, W.S., Randall, D.J., Farell, A.P. (Eds.) Fish physiology. Academic
Press, London, UK, pp. 301-341.
NORDRUM, S., BAKKE-McKELLEP, A.M., KROGDAHL, Å. and BUDDINGTON, R.K., 2000a. Effects
of soybean meal and salinity on intestinal transport of nutrients in Atlantic salmon (Salmo salar
L.) and rainbow trout (Oncorhynchus mykiss). Comparative Biochemistry and Physiology Part B:
Biochemistry and Molecular Biology, 125(3), pp. 317-335.
NORDRUM, S., KROGDAHL, Å., RØSJØ, C., OLLI, J.J. and HOLM, H., 2000b. Effects of
methionine, cysteine and medium chain triglycerides on nutrient digestibility, absorption of
amino acids along the intestinal tract and nutrient retention in Atlantic salmon (Salmo salar L.)
under pair-feeding regime. Aquaculture, 186(3–4), pp. 341-360.
NOVOA, B., FIGUERAS, A., ASHTON, I. and SECOMBES, C.J., 1996. In vitro studies on the
regulation of rainbow trout (Oncorhynchus mykiss) macrophage respiratory burst activity.
Developmental & Comparative Immunology, 20(3), pp. 207-216.
NRC (National Research Council), 1993. Nutrient Requirements of Fish. National Academy Press,
Washington D.C., USA. pp. 114.
O'CONNOR, T.M., O'CONNELL, J., O'BRIEN, D.I., GOODE, T., BREDIN, C.P. and SHANAHAN, F.,
2004. The role of substance P in inflammatory disease. Journal of Cellular Physiology, 201(2),
pp. 167-180.
OLIVA-TELES, A., 2012. Nutrition and health of aquaculture fish. Journal of Fish Diseases, 35(2), pp.
83-108.
OLIVA-TELES, A., GOUVEIA, A.J., GOMES, E. and REMA, P., 1994. The effect of different
processing treatments on soybean meal utilization by rainbow trout, Oncorhynchus mykiss.
Aquaculture, 124(1–4), pp. 343-349.
OLLI, J.J., KROGDAHL, Å. and VÅBENO, A., 1995. Dehulled solvent-extracted soybean meal as a
protein source in diets for Atlantic salmon, Salmo salar L. Aquaculture Research, 26, pp. 167-
174.
OLLI, J.J., KROGDAHL, Å., VAN, D.I. and BRATTÅS, L.E., 1994. Nutritive value of four soybean
products in diets for Atlantic Salmon (Salmo salar, L.). Acta Agriculturae Scandinavica, Section
A - Animal Science, 44(1), pp. 50-60.

BIBLIOGRAPHIC REFERENCES
PAGE | 317
OLSEN, R., MYKLEBUST, R., KRYVI, H., MAYHEW, T. and RINGØ, E., 2001. Damaging effect of
dietary inulin on intestinal enterocytes in Arctic charr (Salvelinus alpinus L.). Aquaculture
Research, 32(11), pp. 931-934.
OLSEN, R.E., HANSEN, A., ROSENLUND, G., HEMRE, G., MAYHEW, T.M., KNUDSEN, D.L.,
TUFAN EROLDOĞAN, O., MYKLEBUST, R. and KARLSEN, Ø., 2007. Total replacement of fish
meal with plant proteins in diets for Atlantic cod (Gadus morhua, L.) II – Health aspects.
Aquaculture, 272(1), pp. 612-624.
OLSEN, R.E., SUNDELL, K., HANSEN, T., HEMRE, G., MYKLEBUST, R., MAYHEW, T.M. and
RINGØ, E., 2002. Acute stress alters the intestinal lining of Atlantic salmon, Salmo salar L.: An
electron microscopical study. Fish Physiology and Biochemistry, 26(3), pp. 211-221.
OLSEN, R.E., SUNDELL, K., MAYHEW, T.M., MYKLEBUST, R. and RINGØ, E., 2005. Acute stress
alters intestinal function of rainbow trout, Oncorhynchus mykiss (Walbaum). Aquaculture,
250(1), pp. 480-495.
OLSVIK, P., TORSTENSEN, B. and BERNTSSEN, M., 2007. Effects of complete replacement of fish
oil with plant oil on gastrointestinal cell death, proliferation and transcription of eight genes’
encoding proteins responding to cellular stress in Atlantic salmon Salmo salar L. Journal of Fish
Biology, 71(2), pp. 550-568.
ONG, S.H., JIN, X.C., JAYASOORIAH and SINNIAH, R., 1996. Image analysis of tissue sections.
Computers in Biology and Medicine, 26(3), pp. 269-279.
OPSTVEDT, J., AKSNES, A., HOPE, B. and PIKE, I.H., 2003. Efficiency of feed utilization in Atlantic
salmon (Salmo salar L.) fed diets with increasing substitution of fish meal with vegetable
proteins. Aquaculture, 221(1–4), pp. 365-379.
ORLOV, N.V., WEERARATNA, A.T., HEWITT, S.M., COLETTA, C.E., DELANEY, J.D., MARK
ECKLEY, D., SHAMIR, L. and GOLDBERG, I.G., 2012. Automatic detection of melanoma
progression by histological analysis of secondary sites. Cytometry Part A, 81A(5), pp. 364-373.
ORTEGO, L., HAWKINS, W., WALKER, W., KROL, R. and BENSON, W., 1994. Detection of
proliferating cell nuclear antigen in tissues of three small fish species. Biotechnic &
Histochemistry, 69(6), pp. 317-323.
ORTEGO, L.S., HAWKINS, W.E., WALKER, W.W., KROL, R.M. and BENSON, W.H., 1995.
Immunohistochemical detection of proliferating cell nuclear antigen (PCNA) in tissues of aquatic
animals utilized in toxicity bioassays. Marine Environmental Research, 39(1), pp. 271-273.
OSTASZEWSKA, T., DABROWSKI, K., KAMASZEWSKI, M., GROCHOWSKI, P., VERRI, T.,
RZEPKOWSKA, M. and WOLNICKI, J., 2010. The effect of plant protein-based diet
supplemented with dipeptide or free amino acids on digestive tract morphology and PepT1 and
PepT2 expressions in common carp (Cyprinus carpio L.). Comparative Biochemistry and
Physiology Part A: Molecular & Integrative Physiology, 157(2), pp. 158-169.
OSTASZEWSKA, T., KORWIN-KOSSAKOWSKI, M. and WOLNICKI, J., 2006. Morphological
changes of digestive structures in starved tench Tinca tinca (L.) juveniles. Aquaculture
International, 14(1–2), pp. 113-126.
OSTRANDER, G.K., 2000. The Laboratory Fish. Academia Press, London, UK, pp. 645.

BIBLIOGRAPHIC REFERENCES
PAGE | 318
ØVERLAND, M., SØRENSEN, M., STOREBAKKEN, T., PENN, M., KROGDAHL, Å. and SKREDE,
A., 2009. Pea protein concentrate substituting fish meal or soybean meal in diets for Atlantic
salmon (Salmo salar) – Effect on growth performance, nutrient digestibility, carcass composition,
gut health, and physical feed quality. Aquaculture, 288(3–4), pp. 305-311.
PAJAK, B. and DANGUY, A., 1993. Characterization of sugar moieties and oligosaccharide
sequences in the distal intestinal epithelium of the rainbow trout by means of lectin
histochemistry. Journal of Fish Biology, 43(5), pp. 709-722.
PAJOR, G., ALPAR, D., KAJTAR, B., MELEGH, B., SOMOGYI, L., KNEIF, M., BOLLMANN, D.,
PAJOR, L. and SULE, N., 2012. Automated signal pattern evaluation of a bladder cancer
specific multiprobe-fish assay applying a user-trainable workstation. Microscopy Research and
Technique, 75(6), pp. 814-820.
PANTANOWITZ, L., 2010. Digital images and the future of digital pathology. Journal of Pathology
Informatics, 1, pp. 15.
PANTANOWITZ, L., SZYMAS, J., YAGI, Y. and WILBUR, D., 2012. Whole slide imaging for
educational purposes. Journal of Pathology Informatics, 3, pp.46
PANTANOWITZ, L., VALENSTEIN, P.N., EVANS, A.J., KAPLAN, K.J., PFEIFER, J.D., WILBUR,
D.C., COLLINS, L.C., COLGAN, T.J., 2011. Review of the current state of whole slide imaging in
pathology. Journal of Pathology Informatics, 2(36), pp. 1-10.
PAREDES, M., GONZALEZ, K., FIGUEROA, J. and MONTIEL-EULEFI, E., 2013.
Immunomodulatory effect of prolactin on Atlantic salmon (Salmo salar) macrophage function.
Fish Physiology and Biochemistry, 39(5), pp.1215-21.
PARK, S., PANTANOWITZ, L. and PARWANI, A.V., 2012. Digital imaging in pathology. Clinics in
Laboratory Medicine, 32(4), pp. 558-584.
PARRISH, N. and GUPTA, M.R., 2012. Dimensionality reduction by local discriminant Gaussians.
Proceedings of the 29th International Conference on Machine Learning, Edinburgh, Scotland,
UK, pp. 7.
PARRY, R.M., CHANDAN, R.C. and SHAHANI, K.M., 1965. A rapid sensitive assay of Muramidase.
Proceedings of the Society for Experimental Biology and Medicine, 119(2), pp. 384-386.
PAULSEN, S.M., ENGSTAD, R.E. and ROBERTSEN, B., 2001. Enhanced lysozyme production in
Atlantic salmon (Salmo salar L.) macrophages treated with yeast β-glucan and bacterial
lipopolysaccharide. Fish & Shellfish Immunology, 11(1), pp. 23-37.
PAYAN, D.G., 1989. Neuropeptides and inflammation: the role of substance P. Annual Review of
Medicine, 40(1), pp. 341-352.
PAYAN, D.G., BREWSTER, D. and GOETZL, E., 1983. Specific stimulation of human T lymphocytes
by substance P. The Journal of Immunology, 131(4), pp. 1613-1615.
PELLICCIARI, C. and MALATESTA, M., 2011. Identifying pathological biomarkers: histochemistry
still ranks high in the omics era. European journal of histochemistry: European Journal of
Histochemistry, 55(e42), pp.235-238.
PENG, M., XU, W., AI, Q., MAI, K., LIUFU, Z. and ZHANG, K., 2013. Effects of nucleotide
supplementation on growth, immune responses and intestinal morphology in juvenile turbot fed

BIBLIOGRAPHIC REFERENCES
PAGE | 319
diets with graded levels of soybean meal (Scophthalmus maximus L.). Aquaculture, 392–395(0),
pp. 51-58.
PENISSI, A., RUDOLPH, M. and PIEZZI, R., 2003. Role of mast cells in gastrointestinal mucosal
defense. Biocell, 27(2), pp. 163-172.
PENN, M.H., BENDIKSEN, E.Å., CAMPBELL, P. and KROGDAHL, Å., 2011. High level of dietary
pea protein concentrate induces enteropathy in Atlantic salmon (Salmo salar L.). Aquaculture,
310(3–4), pp. 267-273.
PEPYS, M.B., DE BEER, F.C., MILSTEIN, C.P., MARCH, J.F., FEINSTEIN, A. and BUTRESS, N.,
1982. C-reactive protein and serum amyloid P component in the plaice (Pleuronectes platessa
L.), a marine teleost, are homologous with their human counterparts. Biochemistry Biophys
Acta, 704, pp. 123-133.
PETUSHI, S., GARCIA, F., HABER, M., KATSINIS, C. and TOZEREN, A., 2006. Large-scale
computations on histology images reveal grade-differentiating parameters for breast cancer.
BMC Medical Imaging, 6(1), pp. 14.
PICCHIETTI, S., MAZZINI, M., TADDEI, A.R., RENNA, R., FAUSTO, A.M., MULERO, V.,
CARNEVALI, O., CRESCI, A. and ABELLI, L., 2007. Effects of administration of probiotic strains
on GALT of larval gilthead seabream: immunohistochemical and ultrastructural studies. Fish &
Shellfish Immunology, 22(1), pp. 57-67.
PILETTE, C., ROUSSELET, M.C., BEDOSSA, P., CHAPPARD, D., OBERTI, F., RIFFLET, H.,
MAÏGA, M.Y., GALLOIS, Y. and CALÈS, P., 1998. Histopathological evaluation of liver fibrosis:
Quantitative image analysis vs semi-quantitative scores: Comparison with serum markers.
Journal of Hepatology, 28(3), pp. 439-446.
PIONNIER, N., FALCO, A., MIEST, J., FROST, P., IRNAZAROW, I., SHRIVE, A. and HOOLE, D.,
2013. Dietary β-glucan stimulate complement and C-reactive protein acute phase responses in
common carp (Cyprinus carpio) during an Aeromonas salmonicida infection. Fish & Shellfish
Immunology. 34, pp. 819-831.
POLTRONIERI, C., NEGRATO, E., BERTOTTO, D., MAJOLINI, D., SIMONTACCHI, C. and
RADAELLI, G., 2009. Immunohistochemical localization of constitutive and inducible Heat
Shock Protein 70 in carp (Cyprinus carpio) and trout (Oncorhynchus mykiss) exposed to
transport stress. European Journal of Histochemistry, 52(3), pp. 191-198.
POTT, J. and HORNEF, M., 2012. Innate immune signalling at the intestinal epithelium in
homeostasis and disease. EMBO Reports, 13(8), pp. 684-698.
POTTS, S.J., YOUNG, G.D. and VOELKER, F.A., 2010. The role and impact of quantitative
discovery pathology. Drug Discovery Today, 15(21–22), pp. 943-950.
POWELL, M., WRIGHT, G. and BURKA, J., 1990. Eosinophilic granule cells in the gills of rainbow
trout, Oncorhynchus mykiss: evidence of migration? Journal of Fish Biology, 37(3), pp. 495-497.
POWELL, M.D., BRIAND, H.A., WRIGHT, G.M. and BURKA, J.F., 1992. Ultrastructural localisation
of acid phosphatase in intestinal eosinophilic granule cells (EGC) of rainbow trout
(Oncorhynchus mykiss) following degranulation with capsaicin. Histology and Histopathology,
7(2), pp. 301-305.

BIBLIOGRAPHIC REFERENCES
PAGE | 320
POWELL, M.D., BRIAND, H.A., WRIGHT, G.M. and BURKA, J.F., 1993a. Rainbow trout
(Oncorhynchus mykiss, Walbaum) intestinal eosinophilic granule cell (EGC) response to
Aeromonas salmonicida and Vibrio anguillarum extracellular products. Fish & Shellfish
Immunology, 3(4), pp. 279-289.
POWELL, M.D., WRIGHT, G.M. and BURKA, J.F., 1991. Degranulation of eosinophilic granule cells
induced by capsaicin and substance P in the intestine of the rainbow trout (Oncorhynchus
mykiss Walbaum). Cell and Tissue Research, 266(3), pp. 469-474.
POWELL, M.D., WRIGHT, G.M. and BURKA, J.F., 1993b. Morphological and distributional changes
in the eosinophilic granule cell (EGC) population of the rainbow trout (Oncorhynchus mykiss
Walbaum) intestine following systemic administration of capsaicin and substance P. Journal of
Experimental Zoology, 266(1), pp. 19-30.
PRAVEEN, K., LEARY III, J.H., EVANS, D.L. and JASO-FRIEDMANN, L., 2006. Nonspecific
cytotoxic cells of teleosts are armed with multiple granzymes and other components of the
granule exocytosis pathway. Molecular Immunology, 43(8), pp. 1152-1162.
PRESS, C.M. and EVENSEN, Ø., 1999. The morphology of the immune system in teleost fishes.
Fish & Shellfish Immunology, 9(4), pp. 309-318.
PRESTON, K. and BARTELS, P.H., 1988. “Automated image processing for cells and tissue” in
Newhouse, V.L. (Ed.). Progress in medical imaging, Springer-Verlag, New York, USA, pp. 1-
121.
PRICE, G.J., MCCLUGGAGE, W.G., MORRISON, M.L., McCLEAN, G., VENKATRAMAN, L.,
DIAMOND, J., BHARUCHA, H., MONTIRONI, R., BARTELS, P.H., THOMPSON, D. and
HAMILTON, P.W., 2003. Computerized diagnostic decision support system for the classification
of preinvasive cervical squamous lesions. Human Pathology, 34(11), pp. 1193-1203.
RAA, J., ROERSTAD, G., ENGSTAD, R. and ROBERTSEN, B., 1992. The use of immunostimulants
to increase resistance of aquatic organisms to microbial infections. Diseases in Asian
Aquaculture, 1, pp. 39-50.
RAHMADWATI, R., NAGHDY, G., ROS, M. and TODD, C., 2012. Computer aided decision support
system for cervical cancer classification. Applications of Digital Image Processing Xxxv, 8499,
pp. 849919.
RAHMAN, S. and ITAKURA, H., 1996. Morphometry in histopathology - an image analysis
workstation for the pathology laboratory. Analytical and Quantitative Cytology and Histology,
18(6), pp. 471-480.
RAMADAN, A., ATEF, M. and AFIFI, N., 1991. Effect of the biogenic performance enhancer
(Ascogen ”S”) on growth rate of tilapia fish. Acta Veterinaria Scandinavica, 87, S304-S306.
RAMOS-VARA, J., 2005. Technical aspects of immunohistochemistry. Veterinary Pathology Online,
42(4), pp. 405-426.
RAMOS-VARA, J., 2011. “Principles and methods of immunology” in Gautier, J. (Ed.) Drug safety
evaluation: Methods and protocols. Methods in Molecular Biology, 691, pp. 83-96.
RAMOS-VARA, J.A., KIUPEL, M., BASZLER, T., BLIVEN, L., BRODERSEN, B., CHELACK, B.,
WEST, K., CZUB, S., DEL PIERO, F. and DIAL, S., 2008. Suggested guidelines for

BIBLIOGRAPHIC REFERENCES
PAGE | 321
immunohistochemical techniques in veterinary diagnostic laboratories. Journal of Veterinary
Diagnostic Investigation, 20(4), pp. 393-413.
RAŠKOVIĆ, B.S., STANKOVIĆ, M.B., MARKOVIĆ, Z.Z. and POLEKSIĆ, V.D., 2011. Histological
methods in the assessment of different feed effects on liver and intestine of fish. Journal of
Agricultural Sciences, Belgrade, 56(1), pp. 87-100.
RAWLING, M., MERRIFIELD, D., SNELLGROVE, D., KÜHLWEIN, H., ADAMS, A. and DAVIES, S.,
2012. Haemato-immunological and growth response of mirror carp (Cyprinus carpio) fed a
tropical earthworm meal in experimental diets. Fish & Shellfish Immunology, 32(6), pp. 1002-
1007.
REFSTIE, S., KORSØEN, Ø.J., STOREBAKKEN, T., BAEVERFJORD, G., LEIN, I. and ROEM, A.J.,
2000. Differing nutritional responses to dietary soybean meal in rainbow trout (Oncorhynchus
mykiss) and Atlantic salmon (Salmo salar). Aquaculture, 190(1), pp. 49-63.
REFSTIE, S., STOREBAKKEN, T. and ROEM, A.J., 1998. Feed consumption and conversion in
Atlantic salmon (Salmo salar) fed diets with fish meal, extracted soybean meal or soybean meal
with reduced content of oligosaccharides, trypsin inhibitors, lectins and soya antigens.
Aquaculture, 162(3–4), pp. 301-312.
REFSTIE, S., STOREBAKKEN, T., BAEVERFJORD, G. and ROEM, A., 2001. Long-term protein and
lipid growth of Atlantic salmon (Salmo salar) fed diets with partial replacement of fish meal by
soy protein products at medium or high lipid level. Aquaculture, 193(1–2), pp. 91-106.
ŘEHULKA, J., 2002. Aeromonas causes severe skin lesions in rainbow trout (Oncorhynchus
mykiss): Clinical pathology, haematology, and biochemistry. Acta Veterinaria Brno, 71(3), pp.
351-360.
REIMSCHUESSEL, R., BENNETT, R., MAY, E. and LIPSKY, M., 1987. Eosinophilic granular cell
response to a microsporidian infection in a sergeant major fish, Abudefduf saxatilis (L.). Journal
of Fish Diseases, 10(4), pp. 319-322.
REITE, O. and EVENSEN, Ø., 1994. Mast cells in the swimbladder of Atlantic salmon Salmo salar:
Histochemistry and responses to compound 48/80 and formalin-inactivated Aeromonas
salmonicida. Diseases of Aquatic Organisms, 20(2), pp. 95-100.
REITE, O.B. and EVENSEN, Ø., 2006. Inflammatory cells of teleostean fish: a review focusing on
mast cells/eosinophilic granule cells and rodlet cells. Fish & Shellfish Immunology, 20(2), pp.
192-208.
REITE, O.B., 1969. The evolution of vascular smooth muscle responses to histamine and
5‐hydroxytryptamine. Acta Physiologica Scandinavica, 75(1–2), pp. 221-239.
REITE, O.B., 1996. The mast cell nature of granule cells in the digestive tract of the pike, Esox
lucius: similarity to mammalian mucosal mast cells and globule leucocytes. Fish & Shellfish
Immunology, 6(5), pp. 363-369.
REITE, O.B., 1997. Mast cells/eosinophilic granule cells of salmonids: staining properties and
responses to noxious agents. Fish & Shellfish Immunology, 7(8), pp. 567-584.
REITE, O.B., 1998. Mast cells/eosinophilic granule cells of teleostean fish: a review focusing on
staining properties and functional responses. Fish & Shellfish Immunology, 8(7), pp. 489-513.
BIBLIOGRAPHIC REFERENCES
PAGE | 322
REITE, O.B., 2005. The rodlet cells of teleostean fish: their potential role in host defence in relation to
the role of mast cells/eosinophilic granule cells. Fish & Shellfish Immunology, 19(3), pp. 253-
267.
RICKETTS, D., WATSON, T., LIEPINS, P. and KIDD, E., 1998. A comparison of two histological
validating techniques for occlusal caries. Journal of Dentistry, 26(2), pp. 89-96.
RINGØ, E., JUTFELT, F., KANAPATHIPPILLAI, P., BAKKEN, Y., SUNDELL, K., GLETTE, J.,
MAYHEW, T.M., MYKLEBUST, R. and OLSEN, R.E., 2004. Damaging effect of the fish
pathogen Aeromonas salmonicida ssp. salmonicida on intestinal enterocytes of Atlantic salmon
(Salmo salar L.). Cell and Tissue Research, 318(2), pp. 305-311.
RINGØ, E., OLSEN, R.E., VECINO, J.L.G., WADSWORTH, S. and SONG, S.K., 2012. Use of
immunostimulants and nucleotides in aquaculture: a review. Journal of Marine Science:
Research & Development, 1(104), pp.1-22.
RINGØ, E., SALINAS, I., OLSEN, R., NYHAUG, A., MYKLEBUST, R. and MAYHEW, T., 2007.
Histological changes in intestine of Atlantic salmon (Salmo salar L.) following in vitro exposure to
pathogenic and probiotic bacterial strains. Cell and Tissue Research, 328(1), pp. 109-116.
RISS, T., MORAVEX, R. and O’BRIEN, M., (year unknown). Anti-ACTIVE® Caspase-3 pAB for the
detection of apoptosis. High Throughput Systems – Promega Notes 75. Available at:
http://www.promega.com/~/media/files/ resources/ promega%20notes/75.
ROBERTS, R.J., 1989. Fish Pathology.Bailliere Tindall, London, UK, pp. 467.
ROBERTS, R.J., YOUNG, H. and MILNE, J.A., 1971. Studies on the skin of plaice (Pleuronectes
platessa L.). Journal of Fish Biology, 4(1), pp. 87-98.
ROBERTSEN, B., RØRSTAD, G., ENGSTAD, R. and RAA, J., 1990. Enhancement of non-specific
disease resistance in Atlantic salmon, Salmo salar L., by a glucan from Saccharomyces
cerevisiae cell walls. Journal of Fish Diseases, 13(5), pp. 391-400.
ROBEY, F.A., TANAKA, T. and LIU, T.Y., 1983. Isolation and characterization of two major serum
proteins from the dogfish, Mustelus canis, C-reactive protein and amyloid P component. Journal
of Biological Chemistry, 258, pp. 3889-3894.
ROCHA, J.S. and CHIARINI-GARCIA, H., 2007. Mast cell heterogeneity between two different
species of Hoplias sp. (Characiformes: Erythrinidae): Response to fixatives, anatomical
distribution, histochemical contents and ultrastructural features. Fish & Shellfish Immunology,
22(3), pp. 218-229.
ROCHA, R., VASSALLO, J., SOARES, F., MILLER, K. and GOBBI, H., 2009. Digital slides: Present
status of a tool for consultation, teaching, and quality control in pathology. Pathology Research
and Practice, 205(11), pp. 735-741.
ROHN, T.T., CUSACK, S.M., KESSINGER, S.R. and OXFORD, J.T., 2004. Caspase activation
independent of cell death is required for proper cell dispersal and correct morphology in PC12
cells. Experimental Cell Research, 295(1), pp. 215-225.
ROJO, M. and GONZALEZ, M., 1998. In situ detection of apoptotic cells by TUNEL in the gill
epithelium of the developing brown trout (Salmo trutta). Journal of Anatomy, 193(3), pp. 391-
398.

BIBLIOGRAPHIC REFERENCES
PAGE | 323
ROJO, M.G., BUENO, G. and SLODKOWSKA, J., 2010. Review of imaging solutions for integrated
quantitative immunohistochemistry in the pathology daily practice. Folia Histochemica et
Cytobiologica, 47(3), pp. 349-348.
ROMARHEIM, O.H., HETLAND, D.L., SKREDE, A., ØVERLAND, M., MYDLAND, L.T. and
LANDSVERK, T., 2013a. Prevention of soya-induced enteritis in Atlantic salmon (Salmo salar)
by bacteria grown on natural gas is dose dependent and related to epithelial MHC II reactivity
and CD8α intraepithelial lymphocytes. British Journal of Nutrition, 109, pp. 1062-1070.
ROMARHEIM, O.H., LANDSVERK, T., MYDLAND, L.T., SKREDE, A. and ØVERLAND, M., 2013b.
Cell wall fractions from Methylococcus capsulatus prevent soybean meal-induced enteritis in
Atlantic salmon (Salmo salar). Aquaculture, 402-403, pp. 13-18.
ROMARHEIM, O.H., ØVERLAND, M., MYDLAND, L.T., SKREDE, A. and LANDSVERK, T., 2011.
Bacteria grown on natural gas prevent soybean meal-induced enteritis in Atlantic salmon. The
Journal of nutrition, 141(1), pp. 124-130.
ROMARHEIM, O.H., SKREDE, A., GAO, Y., KROGDAHL, Å., DENSTADLI, V., LILLEENG, E. and
STOREBAKKEN, T., 2006. Comparison of white flakes and toasted soybean meal partly
replacing fish meal as protein source in extruded feed for rainbow trout (Oncorhynchus mykiss).
Aquaculture, 256(1–4), pp. 354-364.
ROMBOUT, J. and BERG, A., 1989. Immunological importance of the second gut segment of carp. I.
Uptake and processing of antigens by epithelial cells and macrophages. Journal of Fish Biology,
35(1), pp. 13-22.
ROMBOUT, J.H., TAVERNE-THIELE, A.J. and VILLENA, M.I., 1993. The gut-associated lymphoid
tissue (GALT) of carp (Cyprinus carpio L.): An immunocytochemical analysis. Developmental &
Comparative Immunology, 17(1), pp. 55-66.
ROMBOUT, J.H.W.M., ABELLI, L., PICCHIETTI, S., SCAPIGLIATI, G. and KIRON, V., 2011. Teleost
intestinal immunology. Fish & Shellfish Immunology, 31(5), pp. 616-626.
RONZA, P., BERMÚDEZ, R., LOSADA, A.P., ROBLES, A. and QUIROGA, M.I., 2011. Mucosal CD3+
cell proliferation and gut epithelial apoptosis: implications in rainbow trout gastroenteritis
(RTGE). Journal of Fish Diseases, 34(6), pp. 433-443.
ROQUE, A.C. and ANDRE, T.C.S.S., 2002. Mammography and computerized decision systems - A
review. Techniques in Bioinformatics and Medical Informatics, 980, pp. 83-94.
ROSADO, J.A., LOPEZ, J.J., GOMEZ‐ARTETA, E., REDONDO, P.C., SALIDO, G.M. and
PARIENTE, J.A., 2006. Early caspase‐3 activation independent of apoptosis is required for
cellular function. Journal of Cellular Physiology, 209(1), pp. 142-152.
RUMSEY, G., ENDRES, J., BOWSER, P., EARNEST-KOONS, K., ANDERSON, D. and SIWICKI,
A., 1995. “Soy protein in diets of rainbow trout: effects on growth, protein absorption,
gastrointestinal histology, and nonspecific serologic and immune response” in LIM, C.E., Sessa,
D.J. (Eds.) Nutrition and utilization technology in aquaculture, AOCS Press, Champaign, USA,
pp. 166-188.

BIBLIOGRAPHIC REFERENCES
PAGE | 324
RUMSEY, G.L., SIWICKI, A.K., ANDERSON, D.P. and BOWSER, P.R., 1994. Effect of soybean
protein on serological response, non-specific defense mechanisms, growth, and protein
utilization in rainbow trout. Veterinary Immunology and Immunopathology, 41(3–4), pp. 323-339.
RUSSELL, D.A., HANSON, J.D. and OTT, E., 1980. Dimension of strange attractors. Physical
Review Letters, 45(14), pp. 1175-1178.
RUST, M., 2002. “Nutritional physiology” in Halver, J., Hardy, R. (Eds.) Fish nutrition, Academic
Press, London, UK, pp. 368-446.
SAGSTAD, A., SANDEN, M., HAUGLAND, Ø., HANSEN, A., OLSVIK, P. and HEMRE, G., 2007.
Evaluation of stress and immune response biomarkers in Atlantic salmon, Salmo salar L., fed
different levels of genetically modified maize (Bt maize), compared with its near-isogenic
parental line and a commercial suprex maize. Journal of Fish Diseases, 30(4), pp. 201-212.
SAHLMANN, C., SUTHERLAND, B.J., KORTNER, T.M., KOOP, B.F., KROGDAHL, Å. and BAKKE,
A.M., 2012. Early response of gene expression in the distal intestine of Atlantic salmon (Salmo
salar L.) during the development of soybean meal induced enteritis. Fish & Shellfish
Immunology, 34(2), pp. 599-609.
SAHOO, P., 2007. Role of immunostimulants in disease resistance of fish. CAB reviews:
Perspectives in Agriculture. Veterinary Science, Nutritional and Natural Resources, 2(45), pp.
18.
SAKAI, M., 1999. Current research status of fish immunostimulants. Aquaculture, 172(1), pp. 63-92.
SAKAI, M., TANIGUCHI, K., MAMOTO, K., OGAWA, H. and TABATA, M., 2001. Immunostimulant
effects of nucleotide isolated from yeast RNA on carp, Cyprinus carpio L. Journal of Fish
Diseases, 24(8), pp. 433-438.
SALINAS, I., ZHANG, Y. and SUNYER, J.O., 2011. Mucosal immunoglobulins and B cells of teleost
fish. Developmental & Comparative Immunology, 35(12), pp. 1346-1365.
SANDEN, M. and OLSVIK, P.A., 2009. Intestinal cellular localization of PCNA protein and CYP1A
mRNA in Atlantic salmon Salmo salar L. exposed to a model toxicant. BMC Physiology, 9(3), pp.
1-11.
SANDEN, M., BERNTSSEN, M., KROGDAHL, Å., HEMRE, G. and BAKKE‐MCKELLEP, A., 2005.
An examination of the intestinal tract of Atlantic salmon, Salmo salar L., parr fed different
varieties of soy and maize. Journal of Fish Diseases, 28(6), pp. 317-330.
SANDNES, K., LIE, Ø. and WAAGBØ, R., 1988. Normal ranges of some blood chemistry parameters
in adult farmed Atlantic salmon, Salmo salar. Journal of Fish Biology, 32(1), pp. 129-136.
SANTAREM, M., NOVOA, B. and FIGUERAS, A., 1997. Effects of β-glucans on the non-specific
immune responses of turbot (Scophthalmus maximus, L.). Fish & Shellfish Immunology, 7(6),
pp. 429-437.
SANTOS, H., THOMÉ, R., ARANTES, F., SATO, Y., BAZZOLI, N. and RIZZO, E., 2008. Ovarian
follicular atresia is mediated by heterophagy, autophagy, and apoptosis in Prochilodus
argenteus and Leporinus taeniatus (Teleostei: Characiformes). Theriogenology, 70(9), pp. 1449-
1460.

BIBLIOGRAPHIC REFERENCES
PAGE | 325
SANZ, A., MORALES, A.E., DELAHIGUERA, M. and CARDENETE, G., 1994. Sunflower meal
compared with soybean-meal as partial substitutes for fish-meal in rainbow-trout (Oncorhynchus
mykiss) diets – protein and energy-utilization. Aquaculture, 128(3–4), pp. 287-300.
SARASTE, A. and PULKKI, K., 2000. Morphologic and biochemical hallmarks of apoptosis.
Cardiovascular Research, 45(3), pp. 528-537.
SAXENA, R. and BADVE, S., 2009. “Tissue microarray – Construction and quality assurance” in
Kumar, G.L. and Rudbeck, L. (Eds.) Educational guide: Immunohistochemical (IHC) staining
methods. Dako North America, California, pp. 43-50.
SCHEP, L., TUCKER, I., YOUNG, G. and BUTT, A., 1997. Regional permeability differences
between the proximal and distal portions of the isolated salmonid posterior intestine. Journal of
Comparative Physiology B, 167(5), pp. 370-377.
SCHMALE, M.C., VICHA, D. and CACAL, S.M., 2004. Degranulation of eosinophilic granule cells in
neurofibromas and gastrointestinal tract in the bicolor damselfish. Fish & Shellfish Immunology,
17(1), pp. 53-63.
SCHMITZ, A., SCHÄFER, T., SCHÄFER, H., DÖRING, C., ACKERMANN, J., DICHTER, N.,
HARTMANN, S., HANSMANN, M. and KOCH, I., 2012. Automated image analysis of Hodgkin
lymphoma. Seminar on “Structure Discovery in Biology: Motifs, Networks & Phylogenies",
Dagstuhl, 14 September, pp. 1-12.
SCHUBERT, M. and HAMERMAN, D., 1956. Metachromasia; chemical theory and histochemical
use. Journal of Histochemistry & Cytochemistry, 4(2), pp. 159-189.
SCHWERK, C. and SCHULZE-OSTHOFF, K., 2003. Non-apoptotic functions of caspases in cellular
proliferation and differentiation. Biochemical Pharmacology, 66(8), pp. 1453-1458.
SEALEY, W. and GATLIN, D., 2001. “Overview of nutritional strategies affecting the health of marine
fish” in Lim, C. and Webster, C.D. (Eds.), Nutrition and fish health, Haworth Press, Binghamton,
USA, pp. 103-118.
SEALEY, W.M. and GATLIN, D.M., 1999. Overview of nutritional strategies affecting health of marine
fish. Journal of Applied Aquaculture, 9(2), pp. 11-26.
SECOMBES, C.J., 1990. “Isolation of salmonid macrophages and analysis of their killing activity” in
Stolen, J. S., Fletcher, T.C., Anderson, D.P., Roberston, B.S., Van Muiswinkel, W.B. (Eds).
Techniques in fish immunology – FITC1, SOS Publications, New Jersey, USA, pp. 137-154.
SEIDAL, T., BALATON, A.J. and BATTIFORA, H., 2001. Interpretation and quantification of
immunostains. The American Journal of Surgical Pathology, 25(9), pp. 1204-1207.
SELDEN, G.L., BROWN, P.B., OSTROWSKI, A.C., FLORES, R.A. and JOHNSON, L.A., 2001.
Evaluation of soybean meal-red blood cell coextruded feed ingredient in diets fed to rainbow
trout Oncorhynchus mykiss. Journal of the World Aquaculture Society, 32(4), pp. 409-415.
SERTEL, O., KONG, J., CATALYUREK, U. V., LOZANSKI, G., SALTZ, J. H. and GURCAN, M. N.,
2009a. Histopathological image analysis using model-based intermediate representations and
color texture: Follicular lymphoma grading. Journal of Signal Processing Systems for Signal
Image and Video Technology, 55(1–3), pp. 169-183.

BIBLIOGRAPHIC REFERENCES
PAGE | 326
SERTEL, O., KONG, J., SHIMADA, H., CATALYUREK, U.V., SALTZ, J.H. and GURCAN, M.N.,
2009b. Computer-aided prognosis of neuroblastoma on whole-slide images: Classification of
stromal development. Pattern Recognition, 42(6), pp. 1093-1103.
SHAMIR, L., DELANEY, J.D., ORLOV, N., ECKLEY, D.M. and GOLDBERG, I.G., 2010. Pattern
recognition software and techniques for biological image analysis. Plos Computational Biology,
6(11), pp. e1000974.
SHANG, C.J., DALY, C., MCGRATH, J. and BARKER, J., 2000. Analysis and classification of tissue
section images using directional fractal dimension features. International Conference on Image
Processing, Volume 1, Vancouver, 10-13 September, pp. 164-167.
SHARP, G., PIKE, A. and SECOMBES, C., 1989. The immune response of wild rainbow trout, Salmo
gairdneri Richardson, to naturally acquired plerocercoid infections of Diphyllobothrium
dendriticum (Nitzsch, 1824) and D. ditremum (Creplin, 1825). Journal of Fish Biology, 35(6), pp.
781-794.
SHEEHAN, D.C. and HRAPCHAK, B.B. 1980. Theory and practice of histotechnology. 2nd Edition,
Mosby Company, St. Louis, USA, pp. 481.
SHEPHARD, K.L., 1994. Functions for fish mucus. Reviews in Fish Biology and Fisheries, 4(4), pp.
401-429.
SHI, L., LIU, S., WANG, D., WONG, H., HUANG, W., WANG, WANG, Y., GRIFFITH, J., LEONG, P.
and AHUJA, A. T., 2012. Computerized quantification of bone tissue and marrow in stained
microscopic images. Cytometry Part A, 81A(10), pp. 916-921.
SIEGEL, R.M., 2006. Caspases at the crossroads of immune-cell life and death. Nature Reviews
Immunology, 6(4), pp. 308-317.
SIEREN, J.C., WEYDERT, J., BELL, A., DE YOUNG, B., SMITH, A.R., THIESSE, J., NAMATI, E.
and MCLENNAN, G., 2010. An automated segmentation approach for highlighting the
histological complexity of human lung cancer. Annals of Biomedical Engineering, 38(12), pp.
3581-3591.
SIGH, J. and BUCHMANN, K., 2000. Associations between epidermal thionin-positive cells and skin
parasitic infections in brown trout Salmo trutta. Diseases of Aquatic Organisms, 41, pp. 135-139.
SILPHADUANG, U. and NOGA, E.J., 2001. Antimicrobials: peptide antibiotics in mast cells of fish.
Nature, 414(6861), pp. 268-269.
SILPHADUANG, U., COLORNI, A. and NOGA, E., 2006. Evidence for widespread distribution of
piscidin antimicrobial peptides in teleost fish. Diseases of Aquatic Organisms, 72(3), pp. 241.
SILVA, J.M.G., ESPE, M., CONCEIÇÃO, L.E.C., DIAS, J., COSTAS, B. and VALENTE, L.M.P.,
2010. Feed intake and growth performance of Senegalese sole (Solea senegalensis Kaup,
1858) fed diets with partial replacement of fish meal with plant proteins. Aquaculture Research,
41(9), pp. e20-e30.
SIMS, A., BENNETT, M. and MURRAY, A., 2002. Comparison of semi-automated image analysis
and manual methods for tissue quantification in pancreatic carcinoma. Physics in Medicine and
Biology, 47(8), pp. 1255.

BIBLIOGRAPHIC REFERENCES
PAGE | 327
SIRE, M. and VERNIER, J., 1995. Partial characterization of eosinophilic granule cells (EGCs) and
identification of mast cells of the intestinal lamina propria in rainbow trout (Oncorhynchus
mykiss). Biochemical and cytochemical study. Biology of the Cell, 85(1), pp. 35-41.
SIRE, M., LUTTON, C. and VERNIER, J., 1981. New views on intestinal absorption of lipids in
teleostean fishes: an ultrastructural and biochemical study in the rainbow trout. Journal of Lipid
Research, 22(1), pp. 81-94.
SIRE, M.F. and VERNIER, J.M., 1992. Intestinal absorption of proteins in teleost fish. Comparative
Biochemistry and Physiology 103A, 771-781.
SIRINEK, L. and O'DORISIO, M., 1991. Modulation of immune function by intestinal neuropeptides.
Acta Oncologica, 30(4), pp. 509-517.
SISSENER, N., SANDEN, M., BAKKE, A.M., KROGDAHL, Å. and HEMRE, G., 2009a. A long term
trial with Atlantic salmon (Salmo salar, L.) fed genetically modified soy; focusing general health
and performance before, during and after the parr–smolt transformation. Aquaculture, 294(1),
pp. 108-117.
SISSENER, N.H., BAKKE, A.M., GU, J., PENN, M.H., EIE, E., KROGDAHL, A., SANDEN, M. and
HEMRE, G.I., 2009b. An assessment of organ and intestinal histomorphology and cellular stress
response in Atlantic salmon (Salmo salar L.) fed genetically modified Roundup Ready (R) soy.
Aquaculture, 298(1–2), pp. 101-110.
SITJÀ-BOBADILLA, A., PEÑA-LLOPIS, S., GÓMEZ-REQUENI, P., MÉDALE, F., KAUSHIK, S. and
PÉREZ-SÁNCHEZ, J., 2005. Effect of fish meal replacement by plant protein sources on non-
specific defence mechanisms and oxidative stress in gilthead sea bream (Sparus aurata).
Aquaculture, 249(1–4), pp. 387-400.
SIWICKI, A., ANDERSON, D. and RUMSEY, G., 1994. Dietary intake of immunostimulants by
rainbow trout affects non-specific immunity and protection against furunculosis. Veterinary
Immunology and Immunopathology, 41(1–2), pp. 125.
SIWICKI, A.K., ZAKĘŚ, Z., TERECH-MAJEWSKA, E., KAZUŃ, K., LEPA, A. and GŁĄBSKI, E.,
2010. Dietary Macrogard reduces Aeromonas hydrophila mortality in tench (Tinca tinca) through
the activation of cellular and humoral defence mechanisms. Reviews in Fish Biology and
Fisheries, 20(3), pp. 435-439.
SKUGOR, S., GRISDALE‐HELLAND, B., REFSTIE, S., AFANASYEV, S., VIELMA, J. and
KRASNOV, A., 2011. Gene expression responses to restricted feeding and extracted soybean
meal in Atlantic salmon (Salmo salar L.). Aquaculture Nutrition, 17(5), pp. 505-517.
SMITH, H., 1975. Eosinophilic granular cells of salmonids. MSc Thesis, University of Stirling, Stirling,
UK, pp. 36.
SOMMERSET, I., SKERN, R., BIERING, E., BLEIE, H., FIKSDAL, I.U., GROVE, S. and NERLAND,
A.H., 2005. Protection against Atlantic halibut nodavirus in turbot is induced by recombinant
capsid protein vaccination but not following DNA vaccination. Fish & Shellfish Immunology,
18(1), pp. 13-29.

BIBLIOGRAPHIC REFERENCES
PAGE | 328
SORDET, O., RÉBÉ, C., PLENCHETTE, S., ZERMATI, Y., HERMINE, O., VAINCHENKER, W.,
GARRIDO, C., SOLARY, E. and DUBREZ-DALOZ, L., 2002. Specific involvement of caspases
in the differentiation of monocytes into macrophages. Blood, 100(13), pp. 4446-4453.
SØRENSEN, C., NILSSON, G.E., SUMMERS, C.H. and ØVERLI, Ø., 2012. Social stress reduces
forebrain cell proliferation in rainbow trout (Oncorhynchus mykiss). Behavioural Brain Research,
227(2), pp. 311-318.
SØRENSEN, M., PENN, M., EL-MOWAFI, A., STOREBAKKEN, T., CHUNFANG, C., ØVERLAND,
M. and KROGDAHL, Å., 2011. Effect of stachyose, raffinose and soya-saponins
supplementation on nutrient digestibility, digestive enzymes, gut morphology and growth
performance in Atlantic salmon (Salmo salar, L). Aquaculture, 314(1), pp. 145-152.
SPICER, S., 1963. Histochemical properties of mucopolysaccharide and basic protein in mast cells.
Annals of the New York Academy of Sciences, 103(1), pp. 322-333.
SREENIVASAN, K.R., PRASAD, R.R., MENEVEAU, C. and RAMSHANKAR, R., 1989. The Fractal
geometry of interfaces and the multifractal distribution of dissipation in fully turbulent flows. Pure
and Applied Geophysics, 131(1–2), pp. 43-60.
STARCZYNSKI, J. and CROCKER, J., 2005. “Immunohistochemistry” in Crocker, J. and Burnett, D.
(Eds.). The science of laboratory diagnosis, 2nd Edition, John Wiley & Sons Ltd., West Sussex,
UK, pp. 35-44.
STEEDMAN, H.F., 1950. Alcian blue 8GS; a new stain for mucin. Quarterly Journal of Microscopic
Science, 91, pp. 477-479.
STEFAN, Y. and FALKMER, S., 1980. Identification of four endocrine cell types in the pancreas of
Cottus scorpius (Teleostei) by immunofluorescence and electron microscopy. General and
Comparative Endocrinology, 42(2), pp. 171-178.
STOLEN, J.S., FLETCHER, T., ANDERSON, R., KAATTARI, S. and ROWLEY, S., 1992.
Techniques in fish immunology; 2. SOS Publications, Fair Haven, USA, pp. 196.
STOLEN, J.S., FLETCHER, T., ANDERSON, R., ROBERSON, B. and VAN MUISWINKEL, W.,
1990. Techniques in fish immunology; 1. SOS Publications, Fair Haven, USA, pp. 197.
STOLEN, J.S., FLETCHER, T., ANDERSON, R., ROWLEY, S., ZELIKOFF, J. KAATTARI, S. and
SMITH, S., 1994. Techniques in fish immunology; 3. SOS Publications, Fair Haven, USA, pp.
190.
STOLEN, J.S., FLETCHER, T., SMITH, S., ZELIKOFF, J., ANDERSON, R., SODERHALL, K.,
KAATTARI, S. and., WEEKS-PERKINS, A., 1995. Techniques in fish immunology; 4. SOS
Publications, Fair Haven, USA, pp. 190.
SUNDH, H., 2009. Chronic stress and intestinal barrier function: Implications for infection and
inflammation in intensive salmon aquaculture. PhD Dissertation Thesis, University of
Gothenburgh, Sweden, pp. 75.
SUNDSTRØM, T., DAPHU, I., WENDELBO, I., HODNELAND, E., LUNDERVOLD, A., IMMERVOLL,
H., SKAFTNESMO, K.O., BABIC, M., JENDELOVA, P., SYKOVA, E., LUND-JOHANSEN, M.,
BJERKVIG, R. and THORSEN, F., 2013. Automated tracking of nanoparticle-labeled melanoma

BIBLIOGRAPHIC REFERENCES
PAGE | 329
cells improves the predictive power of a brain metastasis model. Cancer Research, 78(8), pp.
2445-2456.
SVEINBJØRNSSON, B. and SELJELID, R., 1994. Aminated β-1,3-d-polyglucose activates salmon
pronephros macrophages in vitro. Veterinary Immunology and Immunopathology, 41(1–2), pp.
113-123.
SVEINBJØRNSSON, B., OLSEN, R. and PAULSEN, S., 1996. Immunocytochemical localization of
lysozyme in intestinal eosinophilic granule cells (EGCs) of Atlantic salmon, Salmo salar L.
Journal of Fish Diseases, 19(5), pp. 349-355.
SWEETMAN, J., DIMITROGLOU, A., DAVIES, S. and TORRECILLAS, S., 2008. Nutrient Uptake –
Gut morphology a key to efficient nutrition. International Aquafeed, 1-2, pp. 26-30.
SWEETMAN, J.W., TORRECILLAS, S., DIMITROGLOU, A., RIDER, S., DAVIES, S.J. and
IZQUIERDO, M.S., 2010. Enhancing the natural defences and barrier protection of aquaculture
species. Aquaculture Research, 41(3), pp. 345-355.
SZALAI, A.J., BLY, J. and CLEM, L., 1994. Changes in serum concentrations of channel catfish
(Ictalurus punctatus Rafinesque) phosphorylcholine-reactive protein (PRP) in response to
inflammatory agents, low temperature-shock and infection by the fungus Saprolegnia sp. Fish &
Shellfish Immunology, 4(5), pp. 323-336.
TACCHI, L., BICKERDIKE, R., DOUGLAS, A., SECOMBES, C.J. and MARTIN, S.A., 2011.
Transcriptomic responses to functional feeds in Atlantic salmon (Salmo salar). Fish & Shellfish
Immunology, 31(5), pp. 704-715.
TACON, A.G. and METIAN, M., 2008. Global overview on the use of fish meal and fish oil in
industrially compounded aquafeeds: Trends and future prospects. Aquaculture, 285(1), pp. 146-
158.
TACON, A.G., 1995. Feed ingredients for carnivorous fish species: alternatives to fishmeal and other
fishery resources. Sustainable Fish Farming, pp. 89-114.
TADISO, T.M., LIE, K.K. and HORDVIK, I., 2011. Molecular cloning of IgT from Atlantic salmon, and
analysis of the relative expression of τ, μ and δ in different tissues. Veterinary Immunology and
Immunopathology, 139(1), pp. 17-26.
TAHMASEBI-KOHYANI, A., KEYVANSHOKOOH, S., NEMATOLLAHI, A., MAHMOUDI, N. and
PASHA-ZANOOSI, H., 2011. Dietary administration of nucleotides to enhance growth, humoral
immune responses, and disease resistance of the rainbow trout (Oncorhynchus mykiss)
fingerlings. Fish & Shellfish Immunology, 30(1), pp. 189-193.
TAHMASEBI-KOHYANI, A., KEYVANSHOKOOH, S., NEMATOLLAHI, A., MAHMOUDI, N. and
PASHA-ZANOOSI, H., 2012. Effects of dietary nucleotides supplementation on rainbow trout
(Oncorhynchus mykiss) performance and acute stress response. Fish Physiology and
Biochemistry, 38(2), pp. 431-440.
TAKLE, H. and ANDERSEN, Ø., 2007. Caspases and apoptosis in fish. Journal of Fish Biology,
71(sc), pp. 326-349.

BIBLIOGRAPHIC REFERENCES
PAGE | 330
TAPIAS, V., GREENAMYRE, J.T. and WATKINS, S.C., 2013. Automated imaging system for fast
quantitation of neurons, cell morphology and neurite morphometry in vivo and in vitro.
Neurobiology of Disease, 54(0), pp. 158-168.
TAYLOR, C. and LEVENSON, R., 2006. Quantification of immunohistochemistry – issues concerning
methods, utility and semiquantitative assessment II. Histopathology, 49(4), pp. 411-424.
TERANISHI, K. and KANEKO, T., 2010. Spatial, cellular, and intracellular localization of Na+/K
+-
ATPase in the sterically disposed renal tubules of Japanese eel. Journal of Histochemistry &
Cytochemistry, 58(8), pp. 707-719.
THEODOSIOU, Z., KASAMPALIDIS, I.N., LIVANOS, G., ZERVAKIS, M., PITAS, I. and LYROUDIA,
K., 2007. Automated analysis of FISH and immunohistochemistry images: A review. Cytometry
Part A, 71A(7), pp. 439-450.
THOMPSON, I., WHITE, A., FLETCHER, T., HOULIHAN, D. and SECOMBES, C., 1993. The effect
of stress on the immune response of Atlantic salmon (Salmo salar, L.) fed diets containing
different amounts of vitamin C. Aquaculture, 114(1), pp. 1-18.
THOMPSON, K.D, CACHOS, A. and INGLIS, V., 1995. Immunomodulating effects of glucans and
oxytetracycline in rainbow trout, Oncorhynchus mykiss, on serum lysozyme and protection.
Diseases in Asian Aquaculture, 11, pp. 433-439.
THOMPSON, K.D., TATNER, M.F. and HENDERSON, R.J., 1996. Effects of dietary (n-3) and (n-6)
polyunsaturated fatty acid ratio on the immune response of Atlantic salmon, Salmo salar L.
Aquaculture Nutrition, 2(1), pp. 21-31.
THORNBERRY, N.A., BULL, H.G., CALAYCAY, J.R., CHAPMAN, K.T., HOWARD, A.D., KOSTURA,
M.J., MILLER, D.K., MOLINEAUX, S.M., WEIDNER, J.R. and AUNINS, J., 1992. A novel
heterodimeric cysteine protease is required for interleukin-1βprocessing in monocytes. Nature,
356(6372), pp. 768-774.
TIBALDI, E., HAKIM, Y., UNI, Z., TULLI, F., DE FRANCESCO, M., LUZZANA, U. and HARPAZ, S.,
2006. Effects of the partial substitution of dietary fish meal by differently processed soybean
meals on growth performance, nutrient digestibility and activity of intestinal brush border
enzymes in the European sea bass (Dicentrarchus labrax). Aquaculture, 261(1), pp. 182-193.
TIPSMARK, C.K. and MADSEN, S., 2012. Tricellulin, occludin and claudin-3 expression in salmon
intestine and kidney during salinity adaptation. Comparative Biochemistry and Physiology Part
A: Molecular & Integrative Physiology, 162(4), pp. 378-385.
TORANZO, A., DEVESA, S., ROMALDE, J., LAMAS, J., RIAZA, A., LEIRO, J. and BARJA, J., 1995.
Efficacy of intraperitoneal and immersion vaccination against Enterococcus sp. infection in
turbot. Aquaculture, 134(1), pp. 17-27.
TORRECILLAS, S., MAKOL, A., BENÍTEZ-SANTANA, T., CABALLERO, M.J., MONTERO, D.,
SWEETMAN, J. and IZQUIERDO, M., 2011. Reduced gut bacterial translocation in European
sea bass (Dicentrarchus labrax) fed mannan oligosaccharides (MOS). Fish & Shellfish
Immunology, 30(2), pp. 674-681.
TORT, L., BALASCH, J. and MACKENZIE, S., 2003. Fish immune system. A crossroads between
innate and adaptive responses. Inmunología, 22(3), pp. 277-286.

BIBLIOGRAPHIC REFERENCES
PAGE | 331
TRESGUERRES, M., LEVIN, L.R., BUCK, J. and GROSELL, M., 2010. Modulation of NaCl
absorption by [HCO3−] in the marine teleost intestine is mediated by soluble adenylyl cyclase.
American Journal of Physiology-Regulatory, Integrative and Comparative Physiology, 299(1),
pp. R62-R71.
TRICHET, V.V., 2010. Nutrition and immunity: an update. Aquaculture Research, 41(3), pp. 356-372.
TRUE, L., 1996. Morphometric applications in anatomic pathology. Human Pathology, 27(5), pp. 450-
467.
TURLIN, B., RAMM, G.A., PURDIE, D.M., LAINÉ, F., PERRIN, M., DEUGNIER, Y. and
MACDONALD, G.A., 2009. Assessment of hepatic steatosis: comparison of quantitative and
semiquantitative methods in 108 liver biopsies. Liver International, 29(4), pp. 530-535.
UCHIDA, K., KANEKO, T., YAMAUCHI, K. and HIRANO, T., 1996. Morphometrical analysis chloride
cell activity in the gill filaments and lamellae and changes in Na+, K
+‐ATPase activity during
seawater adaptation in chum salmon fry. Journal of Experimental Zoology, 276(3), pp. 193-200.
UNKNOWN a, 1998. KS Run User Interface (User Guide B 40-613), Carl Zeiss Vision GmbH,
München-Hallbergmoos, Germany, pp. 1-39.
UNKNOWN b, 1999. KS 300 Imaging System (User Guide B 40-614), Carl Zeiss Vision GmbH,
München-Hallbergmoos, Germany, pp. 1-855.
URÁN, P., SCHRAMA, J., JAAFARI, S., BAARDSEN, G., ROMBOUT, J., KOPPE, W. and
VERRETH, J., 2009a. Variation in commercial sources of soybean meal influences the severity
of enteritis in Atlantic salmon (Salmo salar L.). Aquaculture Nutrition, 15(5), pp. 492-499.
URÁN, P.A., 2008. Etiology of soybean-induced enteritis in fish. PhD Dissertation Thesis,
Wageningen University, The Netherlands, pp. 175.
URÁN, P.A., AYDIN, R., SCHRAMA, J.W., VERRETH, J.A.J. and ROMBOUT, J.H.W.M., 2008a.
Soybean meal-induced uptake block in Atlantic salmon Salmo salar distal enterocytes. Journal
of Fish Biology, 73(10), pp. 2571-2579.
URÁN, P.A., SCHRAMA, J.W., ROMBOUT, J.H.W.M., OBACH, A., JENSEN, L., KOPPE, W. and
VERRETH, J.A.J., 2008b. Soybean meal-induced enteritis in Atlantic salmon (Salmo salar L.) at
different temperatures. Aquaculture Nutrition, 14(4), pp. 324-330.
URÁN, P.A., SCHRAMA, J.W., ROMBOUT, J.H.W.M., TAVERNE-THIELE, J.J., OBACH, A.,
KOPPE, W. and VERRETH, J.A.J., 2009b. Time-related changes of the intestinal morphology of
Atlantic salmon, Salmo salar L., at two different soybean meal inclusion levels. Journal of Fish
Diseases, 32(9), pp. 733-744.
URZÚA, F., 2013. Intestinal microbiota and transcriptomic responses in Atlantic salmon (Salmo
salar) fed soybean meal and microbial ingredients. PhD Dissertation Thesis, Norwegian
University of Life Sciences, Ås, Norway, pp. 210.
USHER, M., TALBOTT, C. and EDDY, F., 1991. Intestinal water transport in juvenile Atlantic salmon
(Salmo salar L.) during smolting and following transfer to seawater. Comparative Biochemistry
and Physiology Part A: Physiology, 100(4), pp. 813-818.
VALENTE, L.M.P., CORNET, J., DONNAY-MORENO, C., GOUYGOU, J.P., BERGÉ, J.P.,
BACELAR, M., ESCÓRCIO, C., ROCHA, E., MALHÃO, F. and CARDINAL, M., 2011. Quality

BIBLIOGRAPHIC REFERENCES
PAGE | 332
differences of gilthead sea bream from distinct production systems in Southern Europe:
Intensive, integrated, semi-intensive or extensive systems. Food Control, 22(5), pp. 708-717.
VALLEJO, A. N. and ELLIS, A. E., 1989. Ultrastructural study of the response of eosinophil granule
cells to Aeromonas salmonicida extracellular products and histamine liberators in rainbow trout
Salmo gairdneri Richardson. Developmental and Comparative Immunology. 13, pp. 133–148.
VAN CRUCHTEN, S. and VAN DEN BROECK, W., 2002. Morphological and biochemical aspects of
apoptosis, oncosis and necrosis. Anatomia, Histologia, Embryologia, 31(4), pp. 214-223.
VAN DEN INGH, T., OLLI, J. and KROGDAHL, Å., 1996. Alcohol-soluble components in soybeans
cause morphological changes in the distal intestine of Atlantic salmon, Salmo salar L. Journal of
Fish Diseases, 19(1), pp. 47-53.
VAN DEN INGH, T.S. and KROGDAHL, A., 1990. Negative effects of anti-nutritional factors from
soybeans in Salmonidae. Tijdschrift Voor Diergeneeskunde, 115(20), pp. 935-938.
VAN DEN INGH, T.S.G.A.M., KROGDAHL, Å., OLLI, J.J., HENDRIKS, H.G.C.J.M. and KONINKX,
J.G.J.F., 1991. Effects of soybean-containing diets on the proximal and distal intestine in Atlantic
salmon (Salmo salar): a morphological study. Aquaculture, 94(4), pp. 297-305.
VAN DER LOOS, C. M., 2008. Multiple immunoenzyme staining: methods and visualizations for the
observation with spectral imaging. Journal of Histochemistry & Cytochemistry, 56(4), pp. 313-
328.
VAN DER MAREL, M., PRÖPSTING, M., BATTERMANN, F., JUNG‐SCHROERS, V., HÜBNER, A.,
ROMBOUT, J. and STEINHAGEN, D., 2014. Differences between intestinal segments and
soybean meal–induced changes in intestinal mucus composition of common carp Cyprinus
carpio L. Aquaculture Nutrition, 20(1), pp.12-24.
VATSOS, I.N., KOTZAMANIS, Y., HENRY, M., ANGELIDIS, P. and ALEXIS, M.N., 2010. Monitoring
stress in fish by applying image analysis to their skin mucous cells. European Journal of
Histochemistry, 54(2), pp. 107-111.
VAUGHAN, L., FITZPATRICK, E., BOLAND, M.P. and ROCHE, J.F., 1996. A histological study of
corpora lutea from superovulated beef heifers. Animal Reproduction Science, 43(1), pp. 1-14.
VEGGETTI, A., MASCARELLO, F., SCAPOLO, P., ROWLERSON, A. and CARNEVALI, M.C., 1993.
Muscle growth and myosin isoform transitions during development of a small teleost fish,
Poecilia reticulata (Peters) (Atheriniformes, Poeciliidae): a histochemical, immunohistochemical,
ultrastructural and morphometric study. Anatomy and Embryology, 187(4), pp. 353-361.
VERA-JIMENEZ, N.I., PIETRETTI, D., WIEGERTJES, G.F. and NIELSEN, M.E., 2013. Comparative
study of β-glucan induced respiratory burst measured by nitroblue tetrazolium assay and real-
time luminol-enhanced chemiluminescence assay in common carp (Cyprinus carpio L.). Fish &
Shellfish Immunology, 34(5), pp. 1216-1222.
VERLHAC, V. and KIRON, V., 2004. Nutrition and immune modulation in aquatic animals. Aqua
Feeds: Formulation & Beyond, 1, pp. 5-9.
VERLHAC, V., GABAUDAN, J., OBACH, A., SCHÜEP, W. and HOLE, R., 1996. Influence of dietary
glucan and vitamin C on non-specific and specific immune responses of rainbow trout
(Oncorhynchus mykiss). Aquaculture, 143(2), pp. 123-133.
BIBLIOGRAPHIC REFERENCES
PAGE | 333
VERNIER, J. and MELLINGER, J., 1990. Intestine ultrastructure in relation to lipid and protein
absorption in teleost fish. Comparative Physiology, 5, pp. 166-175.
VETVICKA, V., VANNUCCI, L. and SIMA, P., 2013. The effects of β-glucan on fish immunity. North
American Journal of Medical Sciences, 5(10), pp. 580-588.
VIDMAR, D.A., CRUESS, D., HSIEH, P., DOLECEK, Q., PAK, H., GWYNN, M., MAGGIO, K.,
MONTEMORANO, A., POWERS, J., RICHARDS, D., SPERLING, L., WONG, H. and YEAGER,
J., 1999. The effect of decreasing digital image resolution on teledermatology diagnosis.
Telemedicine Journal, 5(4), pp. 375-383.
VIEIRA-LOPES, D.A., PINHEIRO, N.L., SALES, A., VENTURA, A., ARAÚJO, F.G., GOMES, I.D.
and NASCIMENTO, A.A., 2013. Immunohistochemical study of the digestive tract of Oligosarcus
hepsetus. World Journal of Gastroenterology, 19(12), pp. 1919-1929.
WAAGBØ, R., 1994. The impact of nutritional factors on the immune system in Atlantic salmon,
Salmo salar L.: a review. Aquaculture Research, 25(2), pp. 175-197.
WAAGBØ, R., BERNTSSEN, M., DANIELSEN, T., HELBERG, H., KLEPPA, A., BERG LEA, T.,
ROSENLUND, G., TVENNING, L., SUSORT, S. and VIKESÅ, V., 2013. Feeding Atlantic salmon
diets with plant ingredients during the seawater phase – a full‐scale net production of marine
protein with focus on biological performance, welfare, product quality and safety. Aquaculture
Nutrition, 19(4), pp. 598-618.
WAAGBØ, R., SANDNES, K., ESPELID, S. and LIE, Ø., 1988. Haematological and biochemical
analyses of Atlantic salmon, Salmo salar L., suffering from coldwater vibriosis (‘Hitra disease’).
Journal of Fish Diseases, 11(5), pp. 417-423.
WALLS, A., ROBERTS, J., GODFREY, R., CHURCH, M. and HOLGATE, S., 1990. Histochemical
heterogeneity of human mast cells: disease-related differences in mast cell subsets recovered
by bronchoalveolar lavage. International Archives of allergy and Immunology, 92(3), pp. 233-
241.
WANG, C.W. and YU, C.P., 2012. Automated morphological classification of lung cancer subtypes
using H&E tissue images. Machine Vision and Applications, 24, pp. 1383-1392.
WANG, W., WANG, Y., HU, W., LI, A., CAI, T., ZHU, Z. and WANG, J., 2006. Effects of the "all-fish"
growth hormone transgene expression on non-specific immune functions of common carp,
Cyprinus carpio L. Aquaculture, 259(1–4), pp. 81-87.
WATANABE, T., PONGMANEERAT, J., SATO, S. and TAKEUCHI, T., 1993. Replacement of fish
meal by alternative protein sources in rainbow trout diets. Bulletin of the Japanese Society of
Scientific Fisheries, 59(9), pp.1573-1579.
WEAVER, D.L., KRAG, D.N., MANNA, E.A., ASHIKAGA, T., HARLOW, S.P. and BAUER, K.D.,
2003. Comparison of pathologist-detected and automated computer-assisted image analysis
detected sentinel lymph node micrometastases in breast cancer. Modern Pathology, 16(11), pp.
1159-1163.
WEBER, L.P., KIPARISSIS, Y., HWANG, G.S., NIIMI, A.J., JANZ, D.M. and METCALFE, C.D., 2002.
Increased cellular apoptosis after chronic aqueous exposure to nonylphenol and quercetin in

BIBLIOGRAPHIC REFERENCES
PAGE | 334
adult medaka (Oryzias latipes). Comparative Biochemistry and Physiology Part C: Toxicology &
Pharmacology, 131(1), pp. 51-59.
WEBSTER, J.D., MICHALOWSKI, A.M., DWYER, J.E., CORPS, K.N., WEI, B., JUOPPERI, T.,
HOOVER, S.B. and SIMPSON, R.M., 2012. Investigation into diagnostic agreement using
automated computer-assisted histopathology pattern recognition image analysis. Journal of
Pathology Informatics, 3, pp. 18-18.
WEDEMEYER, G. A., 1996. Physiology of fish in intensive culture systems. Chapman & Hall, New
York, pp. 326.
WEINREB, E. L. and BILSTAD, N. M., 1955. Histology of the digestive tract and adjacent structures
of a rainbow trout, Salmo gairdneri irideus. Copeia, 3, 194-204.
WEINSTEIN, R.S., GRAHAM, A.R., RICHTER, L.C., BARKER, G.P., KRUPINSKI, E.A., LOPEZ,
A.M., ERPS, K.A., BHATTACHARYYA, A.K., YAGI, Y. and GILBERTSON, J.R., 2009. Overview
of telepathology, virtual microscopy, and whole slide imaging: prospects for the future. Human
Pathology, 40(8), pp. 1057-1069.
WELKER, T.L., LIM, C., YILDIRIM-AKSOY, M. and KLESIUS, P.H., 2011. Effects of dietary
supplementation of a purified nucleotide mixture on immune function and disease and stress
resistance in channel catfish, Ictalurus punctatus. Aquaculture Research, 42(12), pp. 1878-
1889.
WERNERSSON, S., REIMER, J.M., POORAFSHAR, M., KARLSON, U., WERMENSTAM, N.,
BENGTÉN, E., WILSON, M., PILSTRÖM, L. and HELLMAN, L., 2006. Granzyme-like
sequences in bony fish shed light on the emergence of hematopoietic serine proteases during
vertebrate evolution. Developmental & Comparative Immunology, 30(10), pp. 901-918.
WESTER, K., RANEFALL, P., BENGTSSON, E., BUSCH, C. and MALMSTROM, P.U., 1999.
Automatic quantification of microvessel density in urinary bladder carcinoma. British Journal of
Cancer, 81(8), pp. 1363-1370.
WHITTAMORE, J.M., 2012. Osmoregulation and epithelial water transport: lessons from the intestine
of marine teleost fish. Journal of Comparative Physiology B, 182(1), pp. 1-39.
WHITTINGTON, R., LIM, C. and KLESIUS, P.H., 2005. Effect of dietary β-glucan levels on the
growth response and efficacy of Streptococcus iniae vaccine in Nile tilapia, Oreochromis
niloticus. Aquaculture, 248(1), pp. 217-225.
WIED, G.L., BARTELS, P.H., BIBBO, M. and DYTCH, H.E., 1989. Image-Analysis in Quantitative
Cyto-Pathology and Histopathology. Human Pathology, 20(6), pp. 549-571.
WIJESEKERA, H.W., 1996. Fractal dimension as an indicator for turbulent mixing in the thermocline.
Journal of Geophysical Research-Oceans, 101(C7), pp. 16,703-16,709.
WILHELM, S., WAGNER, H. and HÄCKER, G., 1998. Activation of caspase‐3‐like enzymes in
non‐apoptotic T cells. European Journal of Immunology, 28(3), pp. 891-900.
WILSON, J.M. and CASTRO, L.F.C., 2011. “Morphological diversity of the gastrointestinal tract in
fishes” in Grosell, M., Farrell, A.P., Brauner, C.J. (Eds.). The multifunctional gut of fish, Wiley-
Backwell, San Diego, USA, pp. 2-55.

BIBLIOGRAPHIC REFERENCES
PAGE | 335
WINGREN, U. and ENERBÄCK, L., 1983. Mucosal mast cells of the rat intestine: a re-evaluation of
fixation and staining properties, with special reference to protein blocking and solubility of the
granular glycosaminoglycan. The Histochemical Journal, 15(6), pp. 571-582.
WITTEKIND, D., REINHARDT, E., KRETSCHMER, V. and ZIPFEL, E., 1983. Influence of staining on
fast automated cell segmentation, feature-extraction and cell image-analysis. Analytical and
Quantitative Cytology and Histology, 5(1), pp. 55-60.
WITTERS, H., BERCKMANS, P. and VANGENECHTEN, C., 1996. Immunolocalization of Na+, K
+-
ATPase in the gill epithelium of rainbow trout, Oncorhynchus mykiss. Cell and Tissue Research,
283(3), pp. 461-468.
WOLF, H. and DITTRICH, K., 1992. Detection of proliferating cell nuclear antigen in diagnostic
histopathology. Journal of Histochemistry & Cytochemistry, 40(9), pp. 1269-1273.
WRIGHT, M., THURSZ, M., PULLEN, R., THOMAS, H. and GOLDIN, R., 2003. Quantitative versus
morphological assessment of liver fibrosis: Semi-quantitative scores are more robust than digital
image fibrosis area estimation. Liver International, 23(1), pp. 28-34.
WU, P., JIANG, J., LIU, Y., HU, K., JIANG, W., LI, S., FENG, L. and ZHOU, X., 2013. Dietary choline
modulates immune responses, and gene expressions of TOR and eIF4E-binding protein2 in
immune organs of juvenile Jian carp (Cyprinus carpio var. Jian). Fish & Shellfish Immunology,
186, pp. 172-180.
WYLLIE, A.H., KERR, J.F. and CURRIE, A.R., 1980. Cell death: the significance of apoptosis.
International Review Cytology, 68: pp. 251-306.
YAMAMOTO, T., 1966. An electron microscope study of the columnar epithelial cell in the intestine of
fresh water teleosts: Goldfish (Carassius auratus) and rainbow trout (Salmo irideus). Zeitschrift
für Zellforschung und mikroskopische Anatomie, 72(1), pp. 66-87.
YASUTAKE, W.I. and WALES, J.H., 1983. Microscopic Anatomy of Salmonids: An Atlas. Resource
Publication ISO, Washington DC, USA, pp. 189.
YAZIJI, H. and BARRY, T., 2006. Diagnostic immunohistochemistry: what can go wrong? Advances
in Anatomic Pathology, 13(5), pp. 238-246.
YOSHIDA, T., KRUGER, R. and INGLIS, V., 1995. Augmentation of non‐specific protection in African
catfish, Clarias gariepinus (Burchell), by the long‐term oral administration of immunostimulants.
Journal of Fish Diseases, 18(2), pp. 195-198.
YOUSSEF, P.P., SMEETS, T.J., BRESNIHAN, B., CUNNANE, G., FITZGERALD, O., BREEDVELD,
F. and TAK, P.P., 1998. Microscopic measurement of cellular infiltration in the rheumatoid
arthritis synovial membrane: a comparison of semiquantitative and quantitative analysis.
Rheumatology, 37(9), pp. 1003-1007.
ZAPATA, A. and AMEMIYA, C., 2000. Phylogeny of lower vertebrates and their immunological
structures. Origin and Evolution of the Vertebrate Immune System. Springer, pp. 67-107.
ZHAO, J., LIU, Y., JIANG, J., WU, P., CHEN, G., JIANG, W., LI, S., TANG, L., KUANG, S., FENG, L.
and ZHOU, X., 2012. Effects of dietary isoleucine on growth, the digestion and absorption
capacity and gene expression in hepatopancreas and intestine of juvenile Jian carp (Cyprinus
carpio var. Jian). Aquaculture, 368-369(0), pp. 117-128.

BIBLIOGRAPHIC REFERENCES
PAGE | 336
ZHOU, Q., BUENTELLO, J.A. and GATLIN, D.M., 2010. Effects of dietary prebiotics on growth
performance, immune response and intestinal morphology of red drum (Sciaenops ocellatus).
Aquaculture, 309(1), pp. 253-257.

8. APPENDIX 1
PAGE | 337
APPEND IX 1
Stock solutions and buffers
STOCK SOLUTIONS AND BUFFERS
This section provides recipes for the buffers and solutions that were employed for the
protocols described in the previous chapters. When preparing solutions, deionized or
distilled water and reagents of the highest available grade were employed. Sterilisation by
filtration through a 0.22 μm filter or by autoclaving (120 °C for 20 min) was applied to most
of the solutions stored at room temperature (16-20 °C) and was essential for the cell culture
applications. Where storage conditions were not specified, solutions were stored for up to 6
months at room temperature.
1 % ACID ALCOHOL
REAGENTS
Hydrogen chloride (HCl) 1.0 g
Methylated spirit 100.0 mL
PROCEDURE
1. Measure the methylated spirits into a Winchester bottle and carefully add the
hydrochloric acid.
NOTE
The solution should be prepared fresh.
ALCIAN BLUE, PH 2.5
REAGENTS
3 % Glacial acetic acid (C2H4O2) 100.0 mL
Alcian blue 8GX (C56H68Cl4CuN16S4) 1.0 g
PROCEDURE
1. Weigh out the dry reagent and place in a 250 mL conical flask.
2. Add the liquid reagent and stir it very well.
3. Adjust the pH to 2.5, using acetic acid.
4. Filter the solution and add a crystal of thymol as preservative.
NOTE
The solution will be stable for 2 to 6 months at room temperature.

APPENDIX 1
PAGE | 338
1 % ASTRA BLUE SOLUTION
REAGENTS
0.7 M Hydrochloride acid (HCl) 100.0 mL
Astra blue (C47H52CuN14O6S3) 1.0 g
PROCEDURE
1. Dissolve the dry reagent with the hydrochloric acid solution, in a 150 mL conical flask.
2. Filter the solution.
NOTE
The solution will be stable for 6 to 9 months years at room temperature.
0.1 % AZURE A
REAGENTS
Azure A (C14H14ClN3S) 0.1 g
Distilled water 70.0 mL
Ethanol (C2H6O) 30.0 mL
PROCEDURE
1. Dissolve the dry reagent with the distilled water, in a 150 mL conical flask.
2. Add the ethanol and stir it very well.
3. Filter the solution.
NOTE
The solution will be stable for 2 years at room temperature.
EOSIN-ASTRA SOLUTION
REAGENTS
1 % Phloxine B (C20H2Br4Cl4Na2O5) 30.0 mL
1 % Yellowish eosin solution 200.0 mL
95 % Ethanol (C2H6O) 1560.0 mL
Acetic acid (CH3COOH) 6.0 mL
PROCEDURE
1. Mix the liquid reagents by stirring in a 2 L conical flask. Filter the solution.
NOTE
The solution will be stable for 6 to 9 months years at room temperature.

Stock solutions and buffers
PAGE | 339
1 % ERYTHROSINE
REAGENTS
Distilled water 100.0 mL
Erythrosine B (C20H6I4Na2O5) 1.0 g
PROCEDURE
1. Dissolve the dry reagent with the distilled water, in a 150 mL conical flask.
2. Filter the solution.
3. Add a few drops of chloroform as preservative.
NOTE
The solution will be stable for 3 months at room temperature.
GIEMSA WORKING SOLUTION
REAGENTS
Giemsa solution (328840, Sigma-Aldrich, Ayrshire, UK) 25.0 mL
Sorenson’s phosphate buffer solution 190.0 mL
PROCEDURE
1. Mix the liquid reagents by stirring in a 250 mL conical flask.
NOTE
The solution should be prepared fresh.
1.0 M GLACIAL ACETIC ACID
REAGENTS
Distilled water 200.0 mL
98 % Glacial acetic acid (C2H4O2) 12.2 mL
PROCEDURE
1. Weigh out the dry reagent and place in a 250 mL conical flask.
2. Add the liquid reagent and stir it very well.
NOTE
The solution should be prepared fresh.
3 % GLACIAL ACETIC ACID
REAGENTS
99.5 % Acetic acid (CH3COOH) 3.0 mL
Distilled water 100.0 mL

APPENDIX 1
PAGE | 340
PROCEDURE
1. Mix both reagents in a 250 mL conical flask.
2. Adjust the pH to 2.5, using acetic acid.
NOTE
The solution will be stable for 1 year at room temperature.
MAYER’S HAEMATOXYLIN
REAGENTS
Chloral hydrate (C2H3Cl3O2) 50.0 g
Citric acid (C6H8O7) 1.0 g
Distilled water 1000.0 mL
Haematoxylin (C16H14O6) 2.0 g
Potassium alum (2KAl(SO4)) 50.0 g
Sodium iodate (NaIO3) 0.2 g
PROCEDURE
1. Weigh out the Haematoxylin, Potassium alum and Sodium iodate and place in a 2 L
beaker.
2. Add the liquid reagent and stir the solution overnight.
3. Add the rest of the dry reagents and heat the solution until boiling. Keep at boiling point
for another 5 min.
4. Allow the solution to cool and then filter it.
NOTE
The solution will be stable for 6 months at room temperature.
MAY-GRÜNWALD WORKING SOLUTION
REAGENTS
May-Grünwald solution (32856, Sigma-Aldrich, Ayrshire, UK) 25.0 mL
Sorenson’s phosphate buffer solution 190.0 mL
PROCEDURE
1. Mix the liquid reagents by stirring in a 250 mL conical flask.
NOTE
The solution should be prepared fresh.

Stock solutions and buffers
PAGE | 341
4 % PARAFORMALDEHYDE
REAGENTS
Paraformaldehyde (HO(CH2O)nH) 4.9 g
Phosphate buffered saline solution 100.0 mL
PROCEDURE
1. Place the weighed dry reagent into a conical flask and add to it 90 mL of PBS.
2. Cover the flask with ParafilmM™ and transfer it into a fume hood.
3. Place the flask on top of a hotplate set to medium, with moderate stirring.
4. Allow the solution to warm up (when it will turn from being cloudy to clear it will be ready).
5. Keep the stirring while allowing the solution to cool down.
6. When cooled, make up the volume to 100mL and store it at 4 ºC.
NOTE
Inspect regularly to avoid over-heating and consequent spilling.
The solution should be prepared fresh.
0.5 % PERIODIC ACID
REAGENTS
Distilled water 100.0 mL
Periodic acid (H5IO6) 0.5 g
PROCEDURE
1. Dissolve the weighed dry reagent with 90 mL distilled water, in a 100 mL conical flask.
NOTE
The solution will be stable for 1 year at 4 °C.
PHOSPHATE BUFFERED SALINE (PBS), PH 7.4
REAGENTS
Distilled water 1000.0 mL
Potassium chloride (KCl) 0.2 g
Potassium phosphate monobasic (Na2HPO4) 2.4 dg
Sodium chloride (NaCl) 8.0 g
Sodium phosphate dibasic (Na2HPO4) 14.4 dg
PROCEDURE
1. Dissolve the dry reagents in 800 mL of distilled water using a 2 L volumetric beaker.
2. Adjust pH to 7.4 with hydrochloric acid solution.
3. Add the distilled water to prefill the volume of 1 L.

APPENDIX 1
PAGE | 342
NOTE
The solution will be stable for 3 months at room temperature or for longer at 4 °C.
REYNOLD’S LEAD CITRATE
REAGENTS
1 M Sodium hydroxide (NaOH) 8.0 mL
Distilled water 50.0 mL
Lead nitrate (PbNO32-
) 13.3 dg
Sodium citrate (Na3C6H5O7 . 2H2O) 17.6 dg
PROCEDURE
1. Dissolve the weighed dry reagents in 15 mL of distilled water, and mix it very well.
2. Allow the solution to stand for 30 min, then add 8 mL 1M sodium hydroxide and mix.
3. Make up to 50 mL with distilled water.
NOTE
The solution will be stable for 1 month at 4 °C (discard the solution if an apparent precipitate
develops). The solution should be centrifuged prior to use.
2 % SAFFRON
REAGENTS
Distilled water 100.0 mL
Saffron 2.9 g
Formalin (CH2O) 1.0 mL
5 % Tannic acid (C76H52O46) 1.0 mL
PROCEDURE
1. Dissolve the weighed dry reagent with distilled water, in a 150 mL conical flask.
2. Stir it very well and heat it for one hour in boiling water.
3. Filter the solution and add the formalin and the tannic acid.
NOTE
The solution will be stable for only a few weeks at room temperature.
SCHIFF'S REAGENT
REAGENTS
Basic fuchsin (C20H19N3 .·HCl) 10.0 g
Distilled water 1000.0 mL

Stock solutions and buffers
PAGE | 343
Hydrochloric acid (HCl) 10.0 mL
Sodium metabisulphite (Na2S2O5) 18.0 g
PROCEDURE
1. Dissolve the weighed dry reagents with distilled water, in a 1 L dark flask.
2. Stir it very well (overnight or for at least 2 h until the solution turns clear).
NOTE
The solution will be stable for 6 months year at 4 °C.
To test the Schiff’s reagent pour 10 mL of 37 % formalin into a watch glass. To this add a
few drops of the Schiff’s reagent to be tested. A good Schiff reagent will rapidly turn a red-
purple color. A deteriorating Schiff’s reagent will give a delayed reaction and the color
produced will be a deep blue-purple.
SCOTT’S TAP WATER SUBSTITUTE
REAGENTS
Distilled water 1000.0 mL
Magnesium sulphate (MgSO4) 20.0 g
Sodium bicarbonate (NaHCO3) 3.5 g
PROCEDURE
1. Mix both reagents in a 2 L volumetric beaker.
2. Add the distilled water and dissolve the dry reagents by heating.
3. Add crystals of thymol as preservative.
NOTE
The solution will be stable for 3 months at room temperature.
1.0 M SODIUM ACETATE SOLUTION
REAGENTS
Distilled water 200.0 mL
Sodium acetate (CH3COONa) 16.4 g
PROCEDURE
1. Weigh out the dry reagent and place in a 250 mL conical flask.
2. Add the liquid reagent and stir it very well.
NOTE
The solution should be prepared fresh.

APPENDIX 1
PAGE | 344
SODIUM CACODYLATE BUFFER, PH 7.3
REAGENTS
Distilled water 240.0 mL
Sodium cacodylate ((CH3)2AsO2Na . 3H2O) 10.7 g
PROCEDURE
1. Dissolve the weighed dry reagent with 240 mL distilled water, in a 1 L volumetric beaker.
2. Adjust the pH to 7.3 (using a 1 M hydrochloric acid) and final volume to 250 mL.
NOTE
The solution will be stable for 6 to 9 months at 4 °C.
1 % SODIUM CHLORIDE SOLUTION, PH 2.3
REAGENTS
Distilled water 50.0 mL
Sodium chloride (NaCl) 0.5 g
PROCEDURE
1. Dissolve the weighed dry reagent with 40 mL distilled water, in a 100 mL conical flask.
2. Adjust the pH to 2.3 (using a 1 M hydrochloric acid solution) and final volume to 50 mL.
NOTE
The solution should be prepared fresh.
SODIUM CITRATE BUFFER, PH 6.0
REAGENTS
Distilled water 1000.0 mL
Sodium citrate dihydrate (C6H5Na3O7 . 2H2O) 29.4 dg
PROCEDURE
1. Mix both reagents in a 2 L volumetric beaker.
2. Adjust pH to 6.0 with 1 M sodium hydroxide solution.
NOTE
The solution will be stable for 3 months at room temperature or for longer at 4 °C.
SODIUM DODECYL SULPHATE SAMPLE BUFFER, PH 6.8
REAGENTS
0.5 M Tris-hydrocloride (Tris-HCl, pH 6.8) 2.5 mL
10 % Sodium dodecyl sulphate buffer (SDS buffer) 4.0 mL

Stock solutions and buffers
PAGE | 345
Bromophenol blue (C19H10Br4O5S) 2.0 mg
Distilled water 10.0 mL
Dithiothreitol (DTT) 0.31 mg
Glycerol (OCH2CH(OH)CH2OH) 2.0 mL
PROCEDURE
1. Mix all the reagents in a 15 mL Falcon™ tube, and stir it well.
2. Adjust the pH to 6.8 by adding 1 M hydrochloric acid solution, and the final volume to 10 mL.
NOTE
The solution can be aliquoted into small 1.2 mL eppendorf tubes and stored at -20 °C.
SORENSEN’S PHOSPHATE BUFFER, PH 7.2
REAGENTS
0.2 M Sodium phosphate dibasic solution (Na2HPO4) 72.0 mL
0.2 M Sodium phosphate monobasic solution (H2NaO4P) 28.0 mL
Distilled water 100.0 mL
PROCEDURE
1. Mix the liquid reagents by stirring in a 250 mL conical flask.
NOTE
The solution should be prepared fresh.
TEM FIXATIVE
REAGENTS
25 % Glutaraldehyde (OHC(CH2)3CHO) 10.0 mL
Distilled water 45.0 mL
Sodium cacodylate buffer 45.0 mL
PROCEDURE
1. Dilute the sodium cacodylate buffer with distilled water, transfer the solution to a 250 mL
conical flask, and stir it very well.
2. Add the glutaraldehyde and continue the stirring.
3. Dispense 2-3 mL aliquots in glass vials and store in the freezer.
NOTE
The solution will be stable for 6 to 9 months at room temperature 4 °C.

APPENDIX 1
PAGE | 346
THIONIN DYE SOLUTION, PH 4.3
REAGENTS
0.5 % Thionin stock solution 18.0 mL
Acetic acid solution 21.0 mL
Glacial acetic acid (C2H4O2) 12.2 mL
Sodium acetate solution 9.0 mL
PROCEDURE
1. Mix the liquid reagents by stirring in a 100 mL conical flask.
NOTE
The solution should be prepared fresh.
0.5 % THIONIN STOCK SOLUTION
REAGENTS
Distilled water 1000.0 mL
Thionin (C12H9N3S . C2H4O2) 5.0 g
PROCEDURE
1. Weigh out the dry reagent and place in a 1 L conical flask.
2. Add the liquid reagent and stir it very well.
3. Filter the solution.
NOTE
The solution will be stable for 2 to 6 months at room temperature.
TOLUIDINE BLUE STOCK SOLUTION
REAGENTS
70 % Ethanol (C2H6O) 100.0 mL
Toluidine blue O (C15H16ClN3S) 1.0 g
PROCEDURE
1. Weigh out the dry reagent and place in a 200 mL conical flask.
2. Add the liquid reagent and stir it very well.
3. Filter the solution.
NOTE
The solution will be stable for 2 to 6 months at room temperature.

Stock solutions and buffers
PAGE | 347
TOLUIDINE BLUE WORKING SOLUTION, PH 2.4
REAGENTS
1 % Sodium chloride solution (NaCl) 45.0 mL
Toluidine blue stock solution 5.0 mL
PROCEDURE
1. Dissolve the weighed dry reagent with 40 mL distilled water, in a 100 mL conical flask.
2. Adjust the pH to 2.4 (using a 1 M hydrochloric acid solution) and final volume to 50 mL.
3. Filter the solution.
NOTE
The solution should be prepared fresh.
TRIS-BUFFERED SALINE (TBS), PH 7.5
REAGENTS
Distilled water 1000.0 mL
Sodium chloride (NaCl) 87.6 dg
Trizma base® (C4H11NO3) 60.7 dg
PROCEDURE
1. Dissolve the weighed dry reagents with distilled water, in a 2 L volumetric beaker.
2. Adjust the pH to 7.5 with 1 M hydrochloric solution.
3. Make the volume up to 1 L.
NOTE
The solution will be stable for 3 months at room temperature.
TRIS-BUFFERED SALINE TWEEN (TBST), PH 7.5
REAGENTS
Tris Buffered Saline (TBS) 1000.0 mL
Tween® 20 (C58H114O26) 5.0 mL
PROCEDURE
1. Add Tween® 20 to the TBS solution and mix very well.
NOTE
The solution will be stable for 6 months at 4 °C.

APPENDIX 1
PAGE | 348
TRIS-ETHYLENEDIAMINETETRACETIC ACID (TRIS-EDTA), PH 9.0
REAGENTS
Distilled water 1000.0 mL
EDTA (C10H16N2O8) 3.7 dg
Trizma base® (C4H11NO3) 12.1 dg
PROCEDURE
1. Dissolve the weighed dry reagents with 800 mL distilled water, in a 2 L volumetric
beaker.
2. Check the pH of the solution and if necessary adjust it.
NOTE
The solution will be stable for 3 months at 4 °C.
TRIS-HYDROCHLORIDE (TRIS-HCL), PH 7.6
REAGENTS
Distilled water 1000.0 mL
Trizma base® (C4H11NO3) 60.7 dg
PROCEDURE
1. Dissolve the weighed dry reagents with 800 mL distilled water, in a 2 L volumetric
beaker.
2. Add around 30 mL of 1 M hydrochloric acid solution.
3. Adjust the pH to 7.6 and final volume to 1 L.
NOTE
The solution will be stable for 1 year at 4 °C.
TRYPSIN NEUTRALISER BUFFERED SALINE (TN), PH 7.5
REAGENTS
Distilled water 2000.0 mL
Sodium chloride (NaCl) 160.1 dg
Trizma base® (C4H11NO3) 24.3 dg
PROCEDURE
1. Dissolve the weighed dry reagents with 800 mL distilled water, in a 2 L volumetric
beaker.
2. Adjust the pH to 7.6 by adding 1 M hydrochloric acid solution, and adjusting the final volume
to 2 L.

Stock solutions and buffers
PAGE | 349
NOTE
The solution should be prepared fresh and autoclaved.
4 % URANYL ACETATE
REAGENTS
50 % Ethanol (C2H6O) 5.0 mL
Uranyl acetate (UO2(OCOCH3)2 . 2H2O 2.0 dg
PROCEDURE
1. Dissolve the weighed dry reagent with 5 mL distilled water, in an amber bottle.
2. Place the bottle of uranyl acetate solution in a sonicator, under a fume hood, and
sonicate for 1 h.
3. When sonication is completed, wrap some ParafilmM™ around the cover and store in
the dark.
NOTE
The solution will be stable for 1 month at 4 °C.
1 % YELLOWISH EOSIN
REAGENTS
Distilled water 100.0 mL
Eosin (C20H6Br4Na2O5) 1.0 g
PROCEDURE
1. Weigh out the eosin and place in a 250 mL conical flask.
2. Add the liquid reagent and stir it very well.
3. Filter the solution.
NOTE
The solution will be stable for 2 to 4 months at room temperature.
1 % ZINC SULPHATE SOLUTION
REAGENTS
Zinc sulphate (ZnSO4 . 7H2O) 0.1 g
Distilled water 100.0 mL
PROCEDURE
1. Dissolve the dry reagent with the distilled water, in a 150 mL conical flask.
NOTE
The solution should be prepared fresh.

APPENDIX 1
PAGE | 350
Histochemical s tai ning protocols
HISTOCHEMICAL STAINING PROTOCOLS
This section provides a detailed description of the protocols mentioned in the previous
chapters. Different protocols using either different dye stains, exposure timings /
concentrations, stain solution’s pH, rinsing steps, etc., were tried initially. The procedures
being presented here are the ones that produced consistent results for the histological stain.
The described procedures are for formalin fixed paraffin-embedded histological sections.
ALCIAN BLUE & HAEMATOXYLIN-EOSIN
PRINCIPAL
Alcian blue is a group of polyvalent basic dyes that are water soluble. The blue color is due
to the presence of copper in the molecule. The 3 % acetic acid solution (pH 2.5) Alcian blue
stains both sulphated and carboxylated acid mucopolysaccharides and sulphated and
carboxylated sialomucins (glycoproteins). It is believed to form salt linkages with the acid
groups of acid mucopolysaccharides.
PROCEDURE
1. Deparaffinise the sections in xylene and hydrate them through graded alcohols up to
distilled water.
2. Place in acetic acid and thereafter without rinsing, drain the excess diluent on a paper
towel.
3. Stain in Alcian blue pH 2.5 solution.
4. Wash in running tap water until excess stain stops leaching from tissue. Rinse with
distilled water.
5. Counterstain in Mayer’s haematoxylin and 1 % yellowish eosin, with water rinsing in
between stains.
6. Wash in running tap water until excess stain stops leaching from tissue. Rinse with
distilled water.
7. Dehydrate through graded alcohols, clear with xylene and coverslip using a synthetic
resinous mountant.
TIMINGS
a) Deparaffinise in xylene 3 min
b) Deparaffinise in xylene 3 min
c) Clear in alcohol 100 % 2 min
d) Clear in alcohol 100 % 2 min

HIstochemical staining protocols
PAGE | 351
e) Hydrate in alcohol 96 % 2 min
f) Hydrate in alcohol 90 % 2 min
g) Hydrate in alcohol 80 % 2 min
h) Hydrate in alcohol 80 % 2 min
i) Hydrate in distilled water 2 min
j) Hydrate in distilled water 2 min
k) Place in acetic acid 2 min
l) Stain in Alcian blue 30 min
m) Wash in running tap water 2 min
n) Stain in Mayer’s haematoxylin 5 min
o) Wash in running tap water 10 min
p) Stain in yellowish eosin 5 min
q) Dehydrate in alcohol 96 % quick dip
r) Dehydrate in alcohol 100 % 2 min
s) Dehydrate in alcohol 100 % 2 min
t) Dehydrate in alcohol 100 % 2 min
u) Clear in xylene 3 min
v) Clear in xylene 3 min
w) Clear in xylene 3 min
RESULTS
Bright turquoise blue: acid mucopolysaccharides.
Dark bluish violet: nuclei and other basophilic structures.
Lighter pink: collagen.
Deep pink to red: cytoplasm, muscle fibrils, connective tissue fibers and other acidophilic
structures.
HAEMATOXYLIN & EOSIN (H&E)
PRINCIPAL
Mayer’s haematoxylin is an alum haematoxylin which is chemically ripened with sodium
iodate, particularly useful in situations where a nuclear counterstain is needed to emphasise
a cytoplasmic component which has been demonstrated by a special stain, and where the
acid alcohol differentiation might destroy or decolour the stained cytoplasmic component.
Eosin is the most suitable stain to combine with an alum haematoxylin to demonstrate the
general histological architecture of a tissue. Its particular value is its ability, with proper
differentiation, to distinguish between the cytoplasm of different types of cells, and between
the different types of connective tissue fibres and matrices, by staining them differing

APPENDIX 1
PAGE | 352
shades of red and pink.
PROCEDURE
1. Deparaffinise the sections in xylene and hydrate them through graded alcohols up to
distilled water.
2. Stain in Mayer’s haematoxylin.
3. Wash in running tap water until excess stain stops leaching from tissue. Rinse with
distilled water.
4. Differentiate in 1 % acid alcohol.
5. Wash in running tap water until excess stain stops leaching from tissue. Rinse with
distilled water.
6. Counterstain in 1 % yellowish eosin.
7. Wash in running tap water until excess stain stops leaching from tissue. Rinse with
distilled water.
8. Dehydrate through graded alcohols, clear with xylene and coverslip using a synthetic
resinous mountant.
TIMINGS
a) Deparaffinise in xylene 5 min
b) Deparaffinise in xylene 2 min
c) Clear in alcohol 100 % 2 min
d) Clear in alcohol 100 % 2 min
e) Hydrate in methylated Spirit 1½ min
f) Hydrate in distilled water 4 min
g) Stain in Mayer’s haematoxylin 30 min
h) Wash in running tap water 2 min
i) Place in acid alcohol 3 quick dips
j) Wash in running tap water 4 min
k) Scott’s tap water substitute 1 min
l) Wash in running tap water 2 min
m) Stain in yellowish eosin 5 min
n) Wash in running tap water 1 min
o) Dehydrate in methylated spirit 30 sec
p) Clear in alcohol 100 % 2 min
q) Clear in alcohol 100 % 30 sec
r) Clear in xylene 5 min
RESULTS
Blue-black: nuclei.

HIstochemical staining protocols
PAGE | 353
Varying shades of pink: cytoplasm.
Deep pink: fibrin.
Deep pinky red: muscle fibres.
Orange / red: red blood cells and eosinophil granules.
ASTRA BLUE (BLAIES & WILKINS, 1981)
PROCEDURE & TIMINGS
a) Deparaffinise in xylene 8 min
b) Deparaffinise in xylene 5 min
c) Clear in alcohol 100 % 4 min
d) Clear in alcohol 100 % 4 min
e) Hydrate in alcohol 96 % 4 min
f) Hydrate in alcohol 96 % 4 min
g) Hydrate in alcohol 80 % 4 min
h) Hydrate in distilled water 5 min
i) Hydrate in distilled water 5 min
j) Stain in 1 % Astra blue 30 min
k) Place in 0.7 M HCl 5 min
l) Wash in running tap water 2 min
m) Stain in eosin-Astra 2 quick dips
n) Wash in alcohol 95 % 1 min
o) Clear in alcohol 100 % 2 min
p) Clear in alcohol 100 % 30 sec
q) Clear in xylene 5 min
RESULTS
Bright blue: mammalian mast cells.
AZUR A (HUGHESDON, 1949)
PROCEDURE & TIMINGS
a) Deparaffinise in xylene 3 min
b) Deparaffinise in xylene 3 min
c) Clear in alcohol 100 % 2 min
d) Clear in alcohol 100 % 2 min
e) Hydrate in alcohol 96 % 2 min
f) Hydrate in alcohol 90 % 2 min

APPENDIX 1
PAGE | 354
g) Hydrate in alcohol 80 % 2 min
h) Hydrate in alcohol 80 % 2 min
i) Hydrate in distilled water 2 min
j) Hydrate in distilled water 2 min
k) Oxidise in 1% potassium permanganate 5 min
l) Rinse in distilled water 5 min
m) Decolourise with 2% oxalic acid 1 min
n) Wash in running tap water 3 min
o) Rinse in distilled water 1 min
p) Stain in azur A 5 min
q) Differentiate in 1% zinc sulphate until the section is macroscopically pale blue.
r) Rinse in distilled water 5 min
s) Blot, and allow to completely dry.
t) Clear in xylene 3 min
u) Clear in xylene 5 min
RESULTS
Purple: mammalian mast cell granules, sulphated and carboxylated mucins.
Blue: nuclei.
Pale-blue: background.
HAEMATOXYLIN-ERYTHROSIN-SAFRAN (HES)
PROCEDURE & TIMINGS
a) Deparaffinise in xylene 8 min
b) Deparaffinise in xylene 5 min
c) Clear in alcohol 100 % 4 min
d) Clear in alcohol 100 % 4 min
e) Hydrate in alcohol 96 % 4 min
f) Hydrate in alcohol 96 % 4 min
g) Hydrate in alcohol 80 % 4 min
h) Hydrate in distilled water 5 min
i) Hydrate in distilled water 5 min
j) Stain in haematoxylin 2 min
k) Stain in haematoxylin 3 min
l) Wash in running tap water 14 min
m) Rinse in 0.2 % ammonia 30 sec
n) Stain in erythrosine B 4 min

HIstochemical staining protocols
PAGE | 355
o) Place in PBS 3 min
p) Clear in alcohol 100 % 3 quick dips
q) Stain in safran 30 sec
r) Stain in safran 3 min
s) Clear in alcohol 100 % 2 min
t) Clear in alcohol 100 % 30 sec
u) Clear in xylene 5 min
RESULTS
Blue: nuclei.
Red shades: cytoplasm.
Pink: muscle and elastic fibres.
Orange-yellow: collagen.
MAY-GRÜNWALD-GIEMSA (MAY & MAY, 1902; GIEMSA, 1902)
PROCEDURE
1. Fix the air-dried slides in absolute methyl alcohol for 10-20 min.
2. Rinse in Sorensen’s phosphate buffer solution, pH 6.8.
3. Stain in freshly prepared May-Grünwald for 8 min.
4. Drain off the excess stain and stain in freshly prepared Giemsa for 10 min.
5. Differentiate in Sorensen’s phosphate buffer pH 6.8.
6. Allow smears to dry, and if necessary they can be gently blotted before mounting.
TIMINGS
a) Fix in methanol 100 % 2 min
b) Rinse in Sorensen’s buffer 3 min
c) Stain in May-Grünwald 8 min
d) Tap off excess stain
e) Stain in Giemsa 10 min
f) Place in Sorensen’s buffer 5 min
RESULTS
Purple: mammalian mast cell granules, sulphated and carboxylated mucins.
Blue: nuclei.
Pale-blue: background.

APPENDIX 1
PAGE | 356
PERIODIC-ACID-SCHIFF-HAEMATOXYLIN
PROCEDURE & TIMINGS
a) Deparaffinise in xylene 3 min
b) Deparaffinise in xylene 3 min
c) Clear in alcohol 100 % 2 min
d) Clear in alcohol 100 % 2 min
e) Hydrate in alcohol 96 % 2 min
f) Hydrate in alcohol 90 % 2 min
g) Hydrate in alcohol 80 % 2 min
h) Hydrate in alcohol 80 % 2 min
i) Hydrate in distilled water 2 min
j) Hydrate in distilled water 2 min
k) Oxidise in 0.5 % periodic acid 5 min
l) Rinse in distilled water 2 min
m) Place in Schiff reagent 15 min
n) Wash in lukewarm tap water 5 min
o) Stain in Mayer's hematoxylin 1 min
p) Wash in running tap water 5 min
q) Clear in xylene 3 min
r) Clear in xylene 5 min
RESULTS
Red / purple: glycogen, mucin and some basement membranes.
Blue: background.
PERIODIC-ACID-SCHIFF-ALCIAN-BLUE (MOWRY & WINKLER, 1956)
PROCEDURE & TIMINGS
a) Deparaffinise in xylene 3 min
b) Deparaffinise in xylene 3 min
c) Clear in alcohol 100 % 2 min
d) Clear in alcohol 100 % 2 min
e) Hydrate in alcohol 96 % 2 min
f) Hydrate in alcohol 90 % 2 min
g) Hydrate in alcohol 80 % 2 min
h) Hydrate in alcohol 80 % 2 min
i) Hydrate in distilled water 2 min
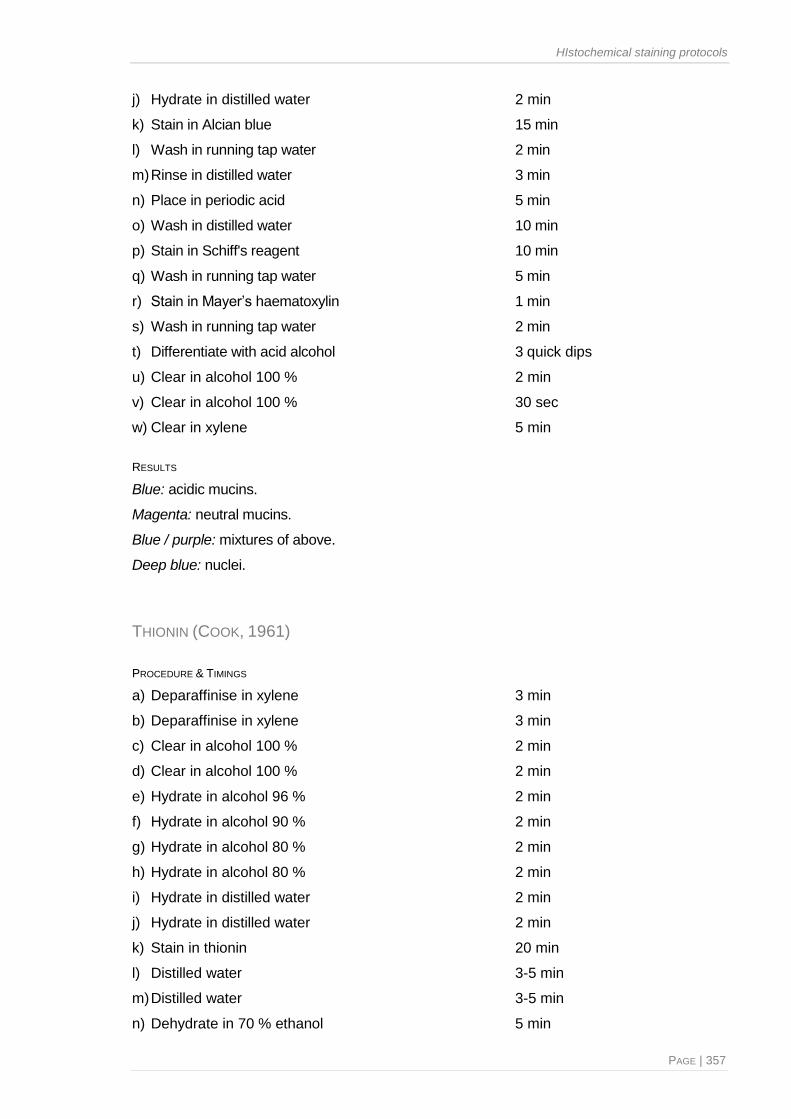
HIstochemical staining protocols
PAGE | 357
j) Hydrate in distilled water 2 min
k) Stain in Alcian blue 15 min
l) Wash in running tap water 2 min
m) Rinse in distilled water 3 min
n) Place in periodic acid 5 min
o) Wash in distilled water 10 min
p) Stain in Schiff's reagent 10 min
q) Wash in running tap water 5 min
r) Stain in Mayer’s haematoxylin 1 min
s) Wash in running tap water 2 min
t) Differentiate with acid alcohol 3 quick dips
u) Clear in alcohol 100 % 2 min
v) Clear in alcohol 100 % 30 sec
w) Clear in xylene 5 min
RESULTS
Blue: acidic mucins.
Magenta: neutral mucins.
Blue / purple: mixtures of above.
Deep blue: nuclei.
THIONIN (COOK, 1961)
PROCEDURE & TIMINGS
a) Deparaffinise in xylene 3 min
b) Deparaffinise in xylene 3 min
c) Clear in alcohol 100 % 2 min
d) Clear in alcohol 100 % 2 min
e) Hydrate in alcohol 96 % 2 min
f) Hydrate in alcohol 90 % 2 min
g) Hydrate in alcohol 80 % 2 min
h) Hydrate in alcohol 80 % 2 min
i) Hydrate in distilled water 2 min
j) Hydrate in distilled water 2 min
k) Stain in thionin 20 min
l) Distilled water 3-5 min
m) Distilled water 3-5 min
n) Dehydrate in 70 % ethanol 5 min

APPENDIX 1
PAGE | 358
o) Dehydrate in 70 % ethanol 3 min
p) Dehydrate in 95 % ethanol 3 min
q) Dehydrate in 100 % ethanol 3 min
r) Clear in xylene 3 min
s) Clear in xylene 5 min
RESULTS
Deep blue with distinct chromatin: nuclei.
Light blue: cytoplasm.
Green: erythrocytes.
Red purple to violet: mucus.
Red purple to violet: cartilage matrix.
Deep violet: mammalian mast cell granules.
TOLUIDINE BLUE (SCHUBERT & HAMMERMAN, 1956)
PROCEDURE & TIMINGS
a) Deparaffinise in xylene 3 min
b) Deparaffinise in xylene 3 min
c) Clear in alcohol 100 % 2 min
d) Clear in alcohol 100 % 2 min
e) Hydrate in alcohol 96 % 2 min
f) Hydrate in alcohol 90 % 2 min
g) Hydrate in alcohol 80 % 2 min
h) Hydrate in alcohol 80 % 2 min
i) Hydrate in distilled water 2 min
j) Hydrate in distilled water 2 min
k) Stain in toluidine blue 3 min
l) Wash in running tap water 3 min
m) Rinse in distilled water 5 min
n) Clear in xylene 3 min
o) Clear in xylene 5 min
RESULTS
Violet / red purple: mammalian mast cells.
Blue: background.

HIstochemical staining protocols
PAGE | 359
URANYL ACETATE & REYNOLD’S LEAD CITRATE
PROCEDURE
1. Cut two pieces of 2 × 2” of ParafilmM™ and place a small Petri dish over each piece.
Under the second dish, place several pellets of sodium hydroxide around the edge as to
allow the absorption of CO2 in the chamber, giving a CO2 free area for staining.
2. Centrifuge at 3000 × g for 10 min equal volumes of uranyl acetate and lead citrate.
3. Place 1 drop of uranyl acetate for each grid onto the first parafilm piece. Float section-
side-down the grid on the drop of stain for 4 min. Cover with aluminium foil a large Petri dish
lid to serve a cover and avoid photosensitive contamination of the uranyl acetate solution.
4. Carefully remove the grid and vigorously rinse it for 15 sec each in 3 sucessive changes
of 50 % ethanol, in 1 change of 25 % ethanol and in 3 sucessive changes of destilled water.
5. Blot the grid and forceps on a paper towel (or wick out the water between the tongs of
the forceps with filter paper) and place the grid in an inverted position, on 1 drop of lead
citrate under the second Petri dish and cover to avoid CO2 contamination. Stain with citrate
for 7 min.
6. Carefully remove the grid and vigorously rinse it for 15 sec each in 4 sucessive changed
of distilled water.
7. Blot the grid and the forceps, and place it in a small appropriated labelled Petri dish.
8. Allow the grid to dry at room temperature for at least 20 min before viewing on the
electron microscope.
TIMINGS
a) Uranyl Acetate 4 min
b) Ethanol 50 % 15 sec
c) Ethanol 50 % 15 sec
d) Ethanol 50 % 15 sec
e) Ethanol 25 % 15 sec
f) Distilled water 15 sec
g) Distilled water 15 sec
h) Distilled water 15 sec
i) Reynold’s Lead Citrate 7 min
j) Distilled water 15 sec
k) Distilled water 15 sec
l) Distilled water 15 sec

APPENDIX 1
PAGE | 360
REFERENCES
BANCROFT, J.D. and STEVENS, A. 1982. Theory and Practice of Histological Techniques.
2nd Edition, Churchill-Livingstone, New York, USA, pp. 436.
BLAIES, D.M. and WILLIAMS, J.F., 1981. A simplified method for staining mast cells with
astra blue. Biotechnic & Histochemistry, 56(2), pp. 91-94.
COOK, H.C., 1961. A modified thionin technique for mast cells in tissue sections. The
Journal of Medical Laboratory Technology, 18, pp. 188-189.
GIEMSA, G., 1902. Färbemethoden für malariaparasiten. Zentralbl Bakteriol, 31:429-430.
HAYAT, M., 1986. Basic techniques for transmission electron microscopy. Academic Press,
Califormia, USA, pp. 411.
HUGHESDON, P., 1949. Two uses of uranyl nitrate. Journal of the Royal Microscopical
Society, 69(1), pp. 1-8.
LEV, R. and SPICER, S.S. 1964. Specific staining of sulphated groups with alcian blue at
low pH. Journal of Histochemistry and Cytochemistry, 12: pp. 309.
MAY, R. and MAY, G.L., 1902. Grünwald stain. Zentralbl Für Innere Med, 23, pp. 265.
MOWRY, R. and WINKLER, C.H., 1956. The coloration of acidic carbohydrates of bacteria
and fungi in tissue sections with special reference to capsules of Cryptococcus
neoformans, pneumococci, and staphylococci. American Journal of Pathology, 32, pp.
628-629.
SCHUBERT, M. and HAMMERMAN, D., 1956. Metachromasia; chemical theory and
histochemical use. Journal of Histochemistry & Cytochemistry, 4(2), pp. 159-189.
SHEEHAN, D.C. and HRAPCHAK, B.B. 1980. Theory and Practice of Histotechnology. 2nd
Edition, Mosby Company, St. Louis, USA, pp. 481.
STEEDMAN, H.F. 1950. Alcian blue 8GS; a new stain for mucin. Quarterly Journal of
Microscopic Science, 91, pp. 477-479.
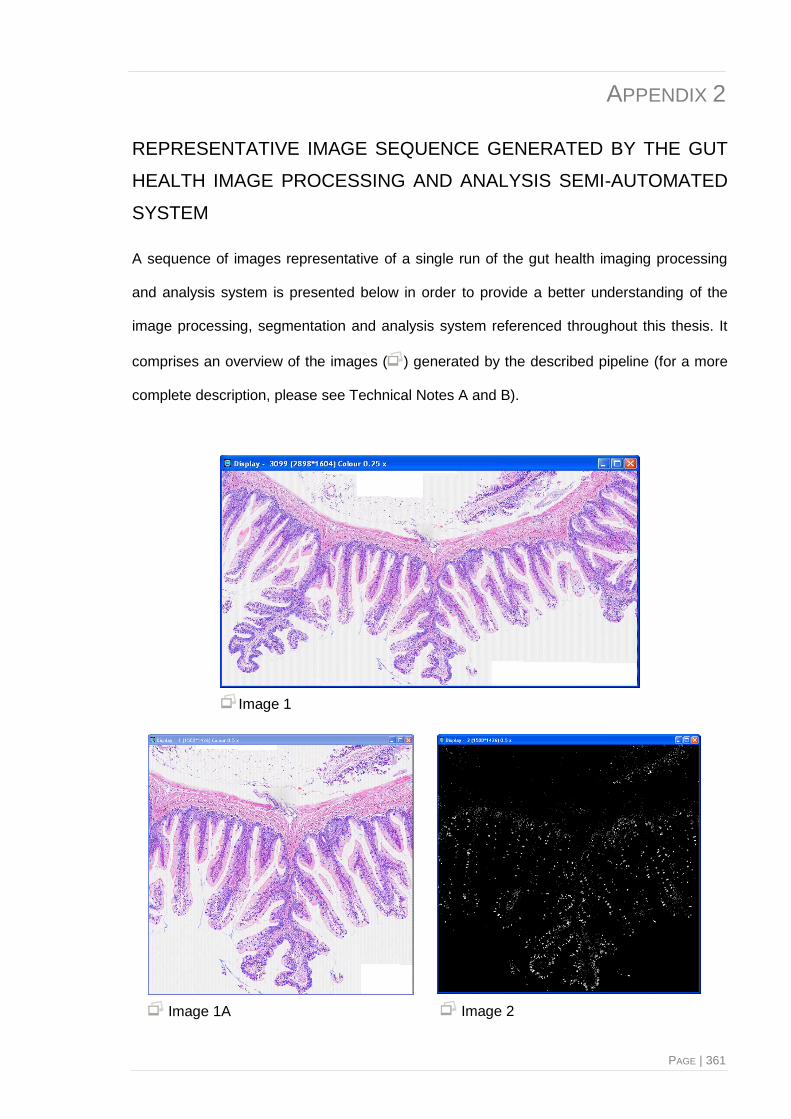
9. APPENDIX 2
PAGE | 361
APPEND IX 2
Image seq uence gener ated by the i mag e pr ocessing and anal ysis semi-automates sys tem
REPRESENTATIVE IMAGE SEQUENCE GENERATED BY THE GUT
HEALTH IMAGE PROCESSING AND ANALYSIS SEMI-AUTOMATED
SYSTEM
A sequence of images representative of a single run of the gut health imaging processing
and analysis system is presented below in order to provide a better understanding of the
image processing, segmentation and analysis system referenced throughout this thesis. It
comprises an overview of the images ( ) generated by the described pipeline (for a more
complete description, please see Technical Notes A and B).
Image 1
Image 1A Image 2

APPENDIX 2
PAGE | 362
Image 2A Image 2B
Image 2C Image 2D
Image 3 Image 3A
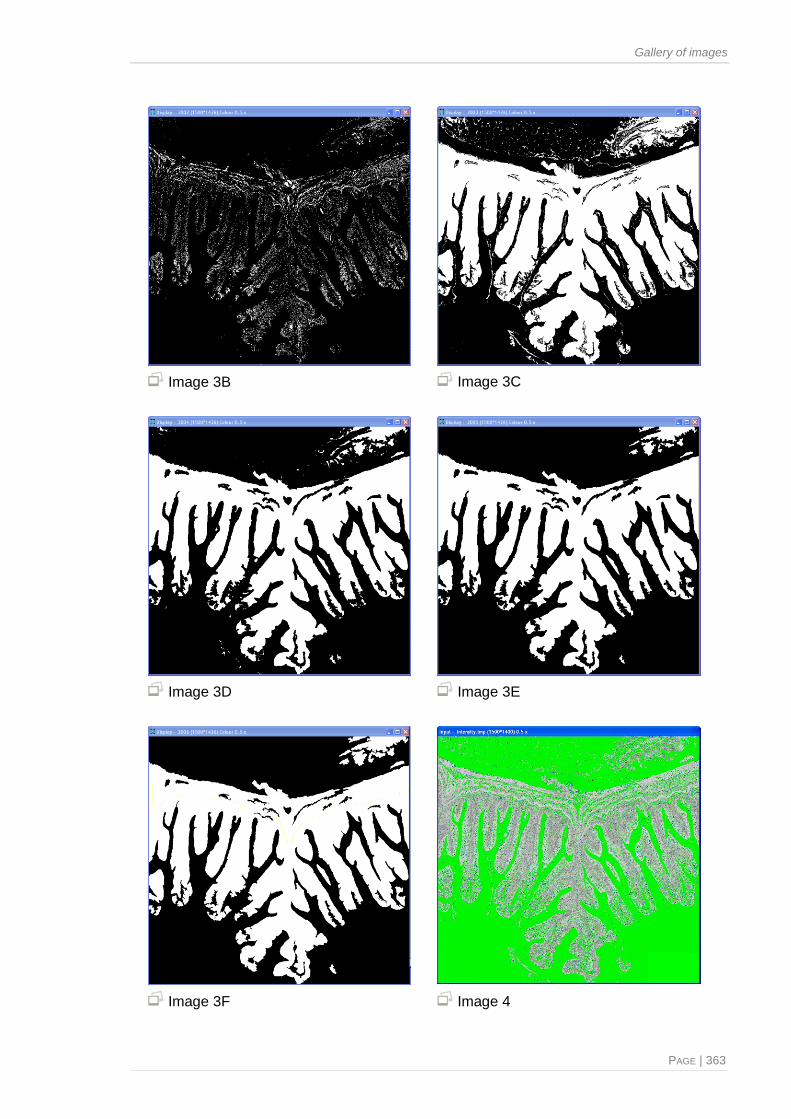
Gallery of images
PAGE | 363
Image 3B Image 3C
Image 3D Image 3E
Image 3F Image 4
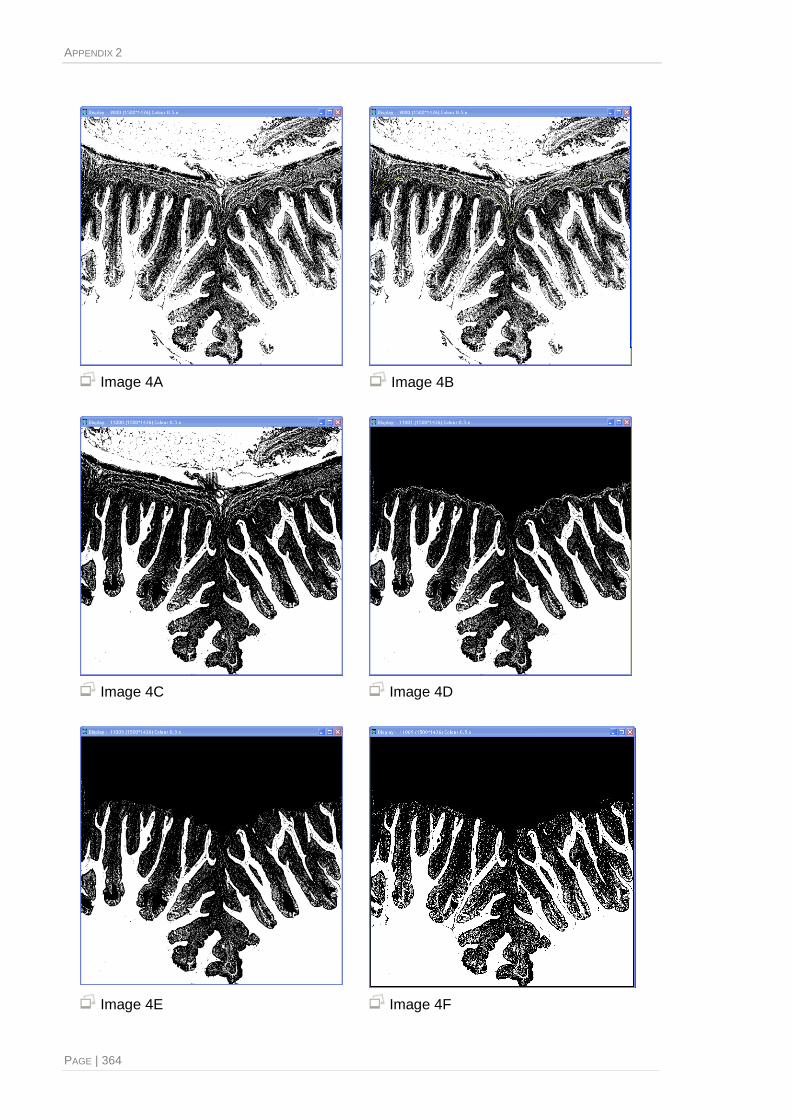
APPENDIX 2
PAGE | 364
Image 4A Image 4B
Image 4C Image 4D
Image 4E Image 4F

Gallery of images
PAGE | 365
Image 4G Image 4H
Image 5 Image 5A
Image 6 Image 6A

APPENDIX 2
PAGE | 366
Image 6B Image 6C
Image 6D Image 6E
Image 6F Image 6G

Gallery of images
PAGE | 367
Image 6Hb Image 7
Image 7aa Image 7aaa
Image 8 Image 8A

APPENDIX 2
PAGE | 368
Image 9 Image 10
Image 10A Image 11
Image 12 Image 12A

Gallery of images
PAGE | 369
Image 12B Image 13
Image 14 Image 14A
Image 15 Image 15A

APPENDIX 2
PAGE | 370
Image 16
Image 16A
Image A
Image A1
Image A2
Image I-1

Gallery of images
PAGE | 371
Image I-2
Image II
Image III
Image IV