44fY Of - University of Stirling
391
44 fY Of VS'i CONTINGENT VALUATION OF RiVER POLLUTION CONTROL AND DOMESTIC WATER SUPPLY IN KENYA by WILSON S. K. WASIKE A Thesis Submitted in Fulfilment of the Requirements for the Degree of DOCTOR OF PHILOSOPHY of the Department of Economics, Umversity of Stirling July, 1996
-
Upload
khangminh22 -
Category
Documents
-
view
2 -
download
0
Transcript of 44fY Of - University of Stirling

44fY Of
VS'i
CONTINGENT VALUATION OF RiVER POLLUTION CONTROL
AND DOMESTIC WATER SUPPLY IN KENYA
by
WILSON S. K. WASIKE
A Thesis Submitted in Fulfilment of the Requirements
for the Degree of
DOCTOR OF PHILOSOPHY
of the
Department of Economics, Umversity of Stirling
July, 1996

"Even when we consider such simple organisms as one-celled protozoa, it certainlymakes perfectly good sense to speak of what benefits or harms them, whatenvironmental changes are to their advantage or disadvantage, and what physicalcircumstances are favourable or unfavourable to them"
Taylor (1986), Respect for Nature, p 66
"Many people . will leave their spouses for a month to do a job they do not likein order to earn some money And yet they will not agree to leave the spouse for thesame month for an offer of money, even a significantly larger sum of money Theywill feel indignant that someone supposes they are willing to trade the company oftheir spouses for money from a stranger The explanation of such reactions isfamiliar First people are sensitive to the motives behind various offers, and to theirsymbolic significance They may, for example, accept money if they believe that it isoffered out of genuine willing friendship, but not otherwise Second, certain actionshave a symbolic significance . . what has symbolic significance is the veryjudgement that companionship is incommensurable with money"
Raz (1986), The Morality of Freedom, p 348f

(iii)
ACKNOWLEDGEMENTS
For any project of this magnitude, for which ideas were nurtured and refined over a
period of time, an author owes a debt of gratitude to a great many people and
institutions I am much indebted to my supervisors, Dr Nick Hanley (Principal) and
Dr Dipak Ghosh (Second), for their patience, invaluable guidance and constructive
supervision in the preparation and writing of this thesis Both my thesis advisors gave
generously of their expertise and encouragement, for all that I say "asante 5afla na
mungu awabariki" I am also grateful to Dr Clive L Spash (now at University of
Cambridge, UK) for earlier comments on this work
Both the Department of Economics and the Environmental Economics Research
Group at University of Stirling has provided an academic home, financial and
technical support, and a lively intellectual environment for me I wish to especially
thank all the staff but mainly members of the Economics Research Workshop
Crucial financial support for the entire doctoral study was generously provided
by the Committee of Vice-Chancellors and Principals of Universities in the United
Kingdom and the University of Stirling under Grant Ref No ORS/94038002 and an
Economics Studentship respectively The data collection phase of this research was
funded by awards from the Scottish Economic Society and the University of Stirling
Graduates' Association In addition the contribution of innumerable individuals in
Kenya who took the time to speak to us (my field assistants and myself) and answer
questions about water pollution in the Nzoia and domestic water supply in Webuye
area is recognized, with thanks, and the cooperation of the Office of the Kenya
President is gratefully acknowledged I am humbly aware that environmental
economics research of this kind is possible only with the help of many other people
(iv)
I especially thank Francis Indoshi, Andrew Nyongesa and Kennedy Wafula for able
assistance in questionnaire administration Furthermore, I am grateful to all those
people, including civil servants and respondents to the main survey, who have kindly
given of their time to inform us about their views or to provide us with information
I am additionally indebted to Professor Dismas A Otieno (Moi University
School of Environmental Studies, MUSES), Oman Amuka (Maseno University
College, Kenya), Peter Akhonya (Bungoma District Statistical Officer), Richard
Kwoma (Secretary to Muchi-Milo Water Project), Mohamud M Mohamed (Webuye
Divisional Officer, DO), Daniel Obiero (Head, Bungoma District Water O&M
Section), Maurice 0 Kubebea (Webuye Divisional Water Officer), and Enock S
Wanyonyi (Bungoma District Hydrologist) for helpful discussions and guidance during
the fieldwork Simon I Lubira and John Olala (Senior Technician and Cartographer
at MUSES) drew the three maps
Finally, I acknowledge the many and often neglected contributions made by
my family and friends -- who shared each step of the study odyssey that saw many
of the ideas expressed in this thesis develop Singled out specially are Mum and Dad
(Agnes and Joash), Uncle David N Wanami, Anne Nyongi and Isabelle (wife and
daughter), Mwalimu John Jenkin of Wales (UK), the Chisikwa and Ogolla families,
and Kepher Simwa Lidundu Without their encouragement, patience, friendship,
confidence, and love, the dissertation never would have been possible Naturally, none
of the above people and institutions bears the slightest responsibility for any
limitations of this work Thanks to all of themt

(v)
TABLE OF CONTENTS
Content Page
ACKNOWLEDGEMENTS.....................................(iii)
TABLEOF CONTENTS ......................................(v)
LISTOF TABLES ..........................................(x)
LISTOF FIGURES .........................................(xvi)
LISTOF APPENDICES .....................................(xvii)
ABSTRACT.............................................(xviii)
CHAPTER 1
INTRODUCTION AND BACKGROUND TO THE STUDY
1.1 Introduction ...........................................1
1.2 The Management of Water Resources in Kenya ..................4
1.3 The Study Area .........................................71.3.1 Location ........................................71.3.2 Human Population .................................81.3.3 Socioeconomic Profile ..............................13
1.4 Webuye Water Resources, Pollution and Services ................141.4.1 The Nzoia River Basin Description .....................141.4.2 Sources of Water Pollution ..........................151.4.5 Domestic Water Supply and Sanitation ..................20
1.5 Statement of the Problem .................................25
1.6 The Research Thesis, Objectives, and Questions .................27
1.7 The Significance of the Study ..............................29
1.8 Defining the "Environment" and the "Household" ................31
1.9 Structure of the Dissertation ...............................33
CHAPTER II
THEORETICAL FRAMEWORK
2.1 Introduction ..........................................40
2.2 Economic Benefits of Environmental and Public Goods ...........41
2.3 Household Decisions on Water Supply Source ..................45

(vi)
CHAPTER III
REVIEW OF THE LITERATURE
3.1 Introduction ..........................................50
3.2 Cost-Benefit Analysis as a Decision-Aid and the Problem ofNon-Market Goods .....................................51
3.3 Methodological Issues Within the Contingent Valuation Technique . . . 553.3.1 Linking Contingent Valuation Theory with Experimental
Frameworks.....................................553.3.2 Structural Biases and the WTAIWTP Disparity ............ 563.3.3 Embedding and the Validity of Contingent Values ..........60
3.4 Applying Contingent Valuation to River Water Quality ............673.4.1 Perceptions, Values and Benefits of Improvements ..........683.4.2 National Benefits and Costs ..........................76
3.5 Developing Country Applications of the Contingent ValuationMethod.............................................79
3.6 Frequency Information as a Dimension in Decision Making .........873.6.1 Frequency Defined ................................873.6.2 Overview of Frequency Knowledge in Consumer Research . . . 893.6.3 Implications for Temporal Dimensions of Payments in Contingent
Valuation.......................................943.7 Domestic Water Supply and Pricing in Developing Countries .......99
3.7.1 The Linkage with River Water Quality ..................1003.7.2 Review of Contingent Valuation Studies on Water Resources
Issues.........................................1063.7.3 The Pricing of Water Services in Developing Countries ......118
3.7.3.1 Common Tariffs, Subsidized Prices, andConnectionCharges .....................119
3.7.3.2 Cross-Subsidization .....................121
3.7.3.3 Metering Decisions and Price Complexity ......123
3.8 Assessment of the Related Literature .........................124

(vii)
CHAPTER IV
METHODOLOGY
4.1 Introduction ..........................................127
4.2 The Four Study Hypotheses ...............................1284.2.1 Nature of Good Hypothesis ..........................1314.2.2 Temporal Dimension of Valuation Hypothesis .............1324.2.3 Embedding Hypothesis .............................1334.2.4 Connection Charge Hypothesis ........................133
4.3 Questionnaire and Survey Structure ..........................1344.3.1 Features of the Hypothetical Markets ...................1344.3.2 Open-Ended Contingent Valuation Model ................1374.3.3 Structure of the Questionnaire ........................139
4.3.3.1 Part A -- Survey Background and Introduction . 140
4.3.3.2 Part B -- Benefit Measures ................141
4.3.3.3 Part C -- Background and Socioeconomic data . 145
4.4 Survey Pre-test, Administration, Sample Design and Field Procedure . 147

(viii)
CHAPTER V
EMPIRICAL ANALYSIS AND RESULTS
5.1 Introduction ..........................................1495.2 Preliminary Empirical Results ..............................150
5.2.1 Household Perception of the Study Problems ...............1505.2.2 Nonmonetary Measures of Relative Importance of Benefits . . . 1545.2.3 Response Rate, and Socio-Economic and Demographic Data . . 164
5.3 The Contingent Valuation Model and Results on Willingness to Pay . . 1665.3.1 Response to the Value Elicitation Question and Screening for
ProtestBids .....................................1675.3.2 Descriptive Statistics and Frequency Distributions for WTP
Measures.......................................1765.3.3 Data Analysis Techniques in Open-Ended Contingent Valuation 205
5.4 The Scope of the Demand Analysis and Estimation Models .........2065.4.1 Results of the Multivariate Analysis ....................2115.4.2 Effect of Household's Socio-Economic Setting .............2275.4.3 Effect of the Presence of People Listening to the Interview . . . 2295.4.4 Effects of Frequency of Payments in Contingent Valuation . . . 2315.4.5 Concluding WTP Estimation Models ....................235
5.5 Definitions and Tests of Differences .........................2375.5.1 Does the Nature of the Good Matter 9 ...................2385.5.2 Do Average WTP Measures Vary with Temporal Dimension (or
Frequency) of Payments in Contingent Valuation Design 7 .....2425.5.3 Embedding in WTP Values for Water Pollution Abatement in the
NzoiaRiver Basin .................................2535.5.4 Does Nature of Connection Charges Influence WTP for Domestic
WaterSupply 7 ...................................258
5.6 Aggregate Benefits at Divisional, District and National Levels .......262

(ix)
CHAPTER VI
DISCUSSION OF THE SURVEY RESULTS
6.1 Introduction .......................................... 275
6.2 Demand for River Pollution Control and Individual HouseholdWaterConnections .....................................276
6.3 Nature of Good and the Validity of Contingent Values ............278
6.4 The Impacts of Frequency of Payments in Contingent Valuation .....281
6.5 Embedding in WTP Values for Water Pollution Abatement in theNzoiaRiver Basin ......................................283
6.6 Initial Charges and WTP for Private Household Water Faucets ......284
6.7 Limitations of the Study .................................288
CHAPTER VII
SUMMARY, CONLUSIONS AND IMPLICATIONS
7.1 Review of the Study Objectives ............................291
7.2 Conclusions ..........................................292
7.3 Implications for Contingent Valuation, Policy and Further Research . . . 294
APPENDICES..............................................299
REFERENCES.............................................327
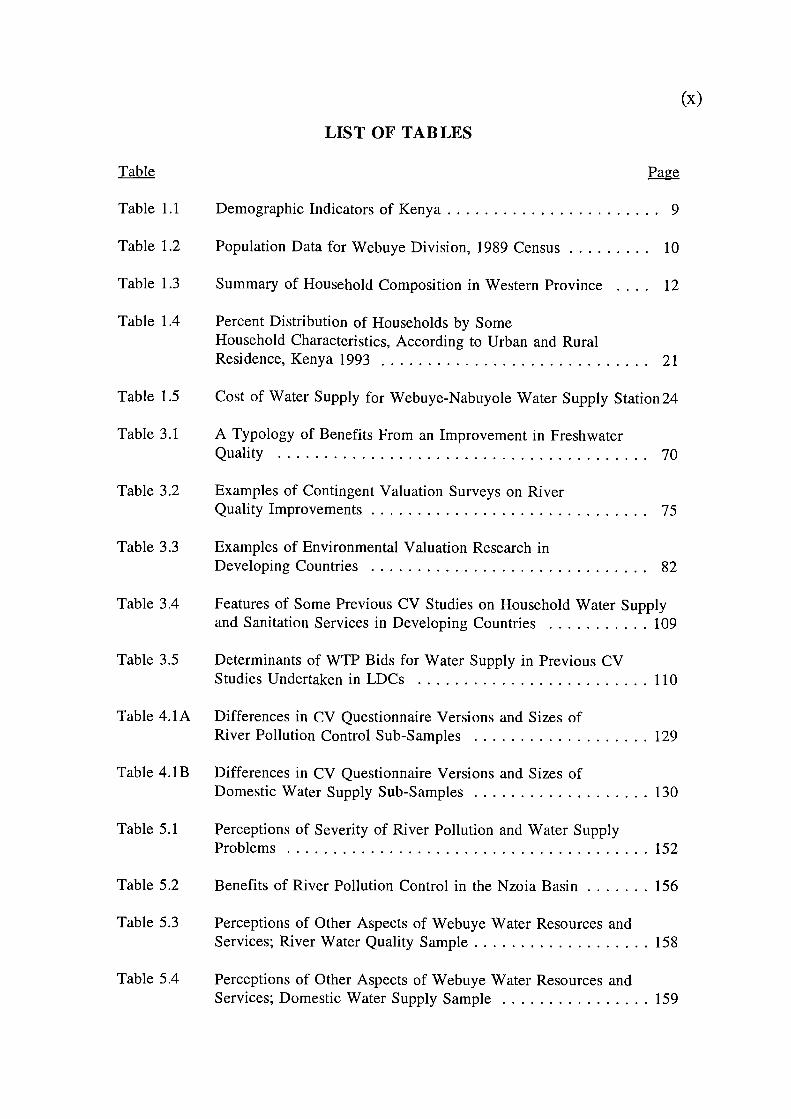
Table 1.5
Table 3.1
Table 5.2
Table 5.3
(x)
LIST OF TABLES
Table Page
Table 1.1
Demographic Indicators of Kenya .......................9
Table 1.2
Population Data for Webuye Division, 1989 Census .........10
Table 1.3
Summary of Household Composition in Western Province . . . . 12
Table 1.4 Percent Distribution of Households by SomeHousehold Characteristics, According to Urban and RuralResidence, Kenya 1993 .............................21
Table 3.2
Table 3.3
Table 3.4
Table 3.5
Cost of Water Supply for Webuye-Nabuyole Water Supply Station 24
A Typology of Benefits From an Improvement in FreshwaterQuality........................................70
Examples of Contingent Valuation Surveys on RiverQualityImprovements .............................. 75
Examples of Environmental Valuation Research inDevelopingCountries ..............................82
Features of Some Previous CV Studies on Household Water Supplyand Sanitation Services in Developing Countries ...........109
Determinants of WTP Bids for Water Supply in Previous CVStudiesUndertaken in LDCs .........................110
Table 4.1A Differences in CV Questionnaire Versions and Sizes ofRiver Pollution Control Sub-Samples ...................129
Table 4.1B
Table 5.1
Table 5.4
Differences in CV Questionnaire Versions and Sizes ofDomestic Water Supply Sub-Samples ...................130
Perceptions of Severity of River Pollution and Water SupplyProblems........................................152
Benefits of River Pollution Control in the Nzoia Basin ...... . 156
Perceptions of Other Aspects of Webuye Water Resources andServices; River Water Quality Sample ...................158
Perceptions of Other Aspects of Webuye Water Resources andServices; Domestic Water Supply Sample ................159

Table 5.10
Table 5.11
(xi)
Table 5.5
Table 5.6
Table 5.7
Table 5.8
Table 5.9
Joint Frequency Distribution of Number of Water Uses andHousehold Water Storage Capacity .....................160
Perceived Water Quality in the Nzoia River by Household Locationin the Basin; The River Water Quality Sample (n = 154) .....162
Perceived Water Quality in the Nzoia River by Household Locationin the Basin; The Domestic Water Supply Sample (n = 157) . . . 163
S ocio-Economic and Demographic Characteristics ofSampleHouseholds .................................165
Willingness to Pay Responses and Nature of ContingentCommodity.....................................169
Willingness to Pay Responses and Socio-Economic Setting . . . . 171
Relationship Between Responses to the Willingness to Pay (?)Question and Temporal Dimension of Payment in Valuation . . . 172
Table 5.12 Number and Percentage of Willingness to Pay Responses onImproved Water Quality in the Nzoia Basin Across Natureof Temporal Dimension of Payment in QuestionnaireVersions, and Extent of Geographic Coverage .............174
Table 5.13 Number and Percentage of Willingness to Pay Responses onImproved Domestic Water Supply Across Nature of TemporalDimension of Payment in Questionnaire Versions, and InitialConnectionCharges ...............................175
Table 5.14 Summary Statistics for Amounts bid as water and sewerage chargeto the Municipal Authority in order to improve the Nzoia Riverwater quality in Kenya shillings by Payment Frequency TypeandGeographic Extent .............................177
Table 5.15 Further Descriptive Statistics on WTP for Pollution Control on theNzoia River, in Kenya shillings .......................178
Table 5.16 Summary Statistics for Amounts bid as water charge to theMunicipal Authority for an In-house Water Connection in Kenyashillings by Type of Payment Frequency and Connection Charges 179
Table 5.17 Further Descriptive Statistics on WTP for an IndividualHousehold Water Connection in Kenya shillings ...........180

(xii)
Table 5.18 Cross Tabulation of Income and Monthly Willingness to Pay forImproved Water Quality in the Nzoia River Basin byType of Questionnaire Version ........................191
Table 5.19 Cross Tabulation of Income and Annual Willingness to Pay forImproved Water Quality in the Nzoia River Basin byTypeof Questionnaire Version ........................192
Table 5.20 Cross Tabulation of Income and Monthly Willingness to Payfor Private Water Supply by Nature of PaymentforConnection Charges ..............................193
Table 5.21 Cross Tabulation of Income and Annual Willingness to Payfor Private Water Supply by Nature of PaymentforConnection Charges .............................194
Table 5.22 Relationship Between Number of River Uses, Domestic WaterUses and Household Monthly Income ...................195
Table 5.23 Pearson's Correlation Coeffiecients Between WTP MeasuresandIncome .....................................196
Table 5.24 Percentage of WTP Bids for Improved Domestic Water SupplyOver and Above Mean WTP and the Existing Water FlatRate(of Ksh9O.00) in Webuye........................200
Table 5.25 Percentage of Mean WTP Values for a Household WaterFaucet to Average Monthly Discretionary Income ..........201
Table 5.26 Percentage of WTP Bids for Improved Water Quality in theNzoia River Basin Over and Above Mean WTP andthe Existing Residential Sewage Fees (of Ksh3O) in Webuye. . . 202
Table 5.27 Percentage of Mean WTP Values for River Pollution Controlto Average Monthly Discretionary Income ................203
Table5.28 Descriptions of Variables ............................210
Table 5.29A Models for Monthly WTP Bids for River Pollution Controlin the Nzoia Basin within Webuye DivisionOnly; Linear Functional Form ........................212
Table 5.29B Models for Monthly WTP Bids for River Pollution Controlin the Nzoia Basin within Webuye DivisionOnly; Semi-Log Functional Form ......................213

(xiii)
Table 5.30A Models for Annual WTP Bids for River Pollution Controlin the Nzoia Basin within Webuye DivisionOnly; Linear Functional Form ........................214
Table 5.30B Models for Annual WTP Bids for River Pollution Controlin the Nzoia Basin within Webuye DivisionOnly; Semi-Log Functional Form ...................... 215
Table 5.31A Models for WTP Bids for River Pollution Controlin the Entire Nzoia Basin upto LakeVictoria; Linear Functional Form ......................216
Table 5.3 lB Models for WTP Bids for River Pollution Controlin the Entire Nzoia Basin upto LakeVictoria; Semi-Log Functional Form ....................217
Table 5.32A Models for Monthly WTP Bids for a Private WaterFaucet; Linear Functional Form .......................218
Table 5.32B Models for Monthly WTP Bids for a Private WaterFaucet; Semi-Log Functional Form .....................219
Table 5.33A Models for Yearly WTP Bids for a Private WaterFaucet; Linear Functional Form .......................220
Table 5.33B Models for Yearly WTP Bids for a PrivateWater Faucet; Semi-Log Functional Form ................221
Table 5.34 Summary of Regression Results on Willingness to Pay forRiver Polution Control and Household Water Connections . . . . 222
Table 5.35 Proportion of Respondents and Associated Mean WTPMeasures by Household Socio-Economic Setting ...........228
Table 5.36 Relationship Between Presence of Listeners to Interviewand Associated Means and Standard DeviationsofWTP Measures .................................230
Table 5.37 Bivariate Table Showing the Relationship BetweenRespondents' Preferred Frequency and the TemporalDimension of Payments in the Valuation ThroughAssociated Means and Standard DeviationsforWTP Measures ................................233
Table 5.38 Relationship between Preferred Frequency of Paymentsand Temporal Dimension of Payment in Valuation byNature of Contingent Commodity ......................243

(xiv)
Table 5.39
Relationship Between Occupation and Preferred FrequencyofPayment ...................................... 245
Table 5.40
Relationship Between Income and Preferred FrequencyofPayment ......................................246
Table 5.41 Percentage Comparisons of Sample HouseholdCharacteristics Between Monthly and Yearly QuestionnaireVersions and Preferred Payment Frequency; RiverPollutionControl Sample ............................247
Table 5.4.2 Percentage Comparisons of Sample HouseholdCharacteristics Between Monthly and Yearly QuestionnaireVersions and Preferred Payment Frequency; DomesticWaterSupply Sample ..............................248
Table 5.43 Results of Tests of the Hypothesis on Temporal Dimensionof Payments; Student t, Mann-Whitney and Wilcoxon tests. . . . 251
Table 5.44 Results of Tests of the Hypothesis on Embedding Effectin the Valuation of Improved Water Quality in the NzoiaRiver Basin; Student t, Mann-Whitney and Wilcoxon tests..... 256
Table 5.45 Results of Tests of the Hypothesis on Paired versusUnpaired Evaluations of Improved Water Quality in the NzoiaRiver Basin in Webuye Division; Student t, Mann-WhitneyandWilcoxon tests ................................257
Table 5.46 Results of Tests of the Hypothesis on Influence ofWater Connection Charges on Household Willingness to Payfor a Faucet; Student t, Mann-Whitney and Wilcoxon tests.....260
Table 5.47 Assumptions and Secondary Data Used in Benefit Aggregation . 264
Table 5.48
Table 5.49
Table 5.50
Table 5.51
Regional Aggregate WTP Calculations for RiverPollutionControl .................................267
Nationwide Aggregate WTP Calculations for RiverPollutionControl .................................268
Regional Aggregate Monthly WTP for a Private WaterConnection by Nature of Initial Connection Charge .........269
Nationwide Aggregate Monthly WTP for a Private WaterConnection by Nature of Initial Connection Charge .........270

(xv)
Table 5.52 Regional Aggregate Annual WTP for a Private WaterConnection by Nature of Initial Connection Charge .........271
Table 5.53 Nationwide Aggregate Annual WTP for a Private WaterConnection by Nature of Initial Connection Charge .........272

(xvi)
LIST OF FIGURES
Figure
Page
Figure 1.1 Webuye Division . 37
Figure1.2 Nzoia River Basin .................................38
Figure 1.3 Water Supply Distribution in Webuye Division ............39
Figure 5.1 Frequency Distributions of Monthly WTP Values forImproved Water Quality in the Part of the Nzoia RiverBasin within Webuye Division ........................182
Figure 5.2 Frequency Distributions of Annual WTP Values forImproved Water Quality in the Part of the Nzoia RiverBasinwithin Webuye Division ........................183
Figure 5.3A Frequency Distribution of Additional Monthly WTP Valuesfor Improved Water Quality in the Entire Nzoia RiverBasinupto Lake Victoria ............................184
Figure 5.3B Frequency Distribution of Additional Annual WTP Valuesfor Improved Water Quality in the Entire Nzoia RiverBasinupto Lake Victoria ............................185
Figure 5.4A Frequency Distribution of Total Monthly WTP Valuesfor Improved Water Quality in the Entire Nzoia RiverBasinupto Lake Victoria ............................186
Figure 5.4B Frequency Distribution of Total Annual WTP Valuesfor Improved Water Quality in the Entire Nzoia RiverBasinupto Lake Victoria ............................187
Figure 5.5 Frequency Distribution of Monthly WTP Valuesfor a Private Water Connection amongst Webuye Residents . . . 188
Figure 5.6 Frequency Distributions of Annual WTP Valuesfor a Private Water Connection amongst Webuye Residents . . . 189
(xvii)
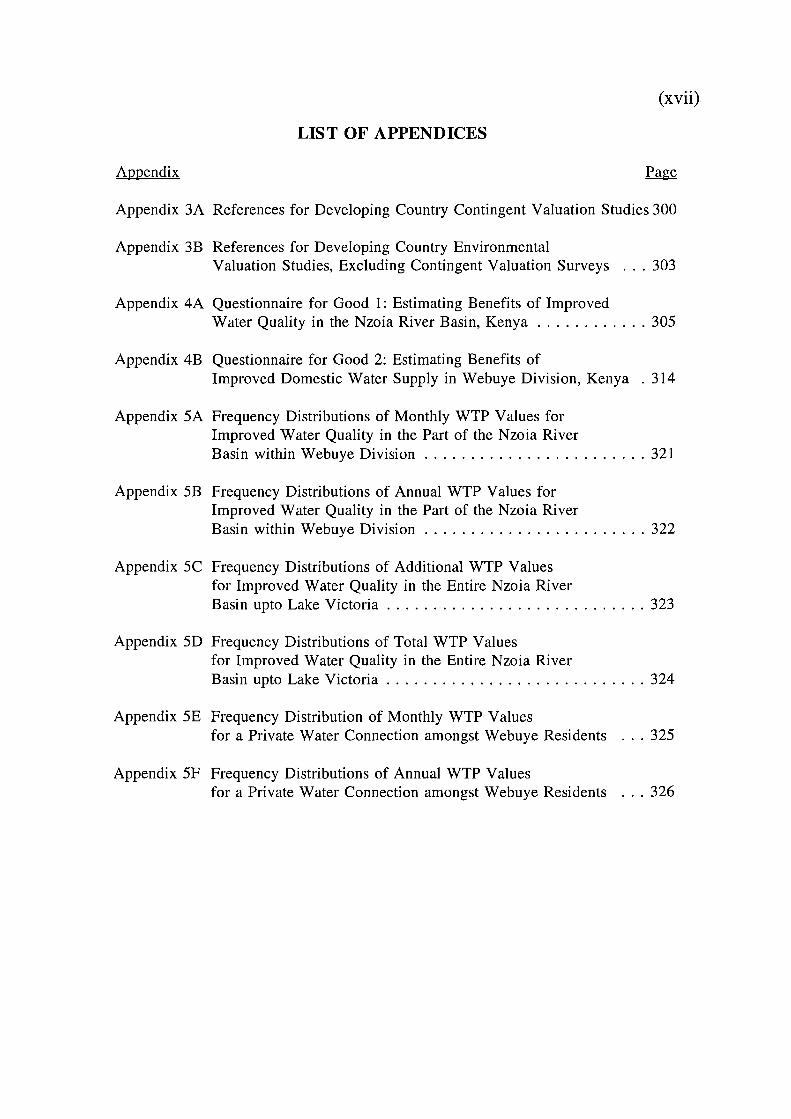
LIST OF APPENDICES
Appendix
Page
Appendix 3A References for Developing Country Contingent Valuation Studies 300
Appendix 3B References for Developing Country EnvironmentalValuation Studies, Excluding Contingent Valuation Surveys . . . 303
Appendix 4A Questionnaire for Good 1: Estimating Benefits of ImprovedWater Quality in the Nzoia River Basin, Kenya ............ 305
Appendix 4B Questionnaire for Good 2: Estimating Benefits ofImproved Domestic Water Supply in Webuye Division, Kenya . 314
Appendix 5A Frequency Distributions of Monthly WTP Values forImproved Water Quality in the Part of the Nzoia RiverBasin within Webuye Division ........................321
Appendix SB Frequency Distributions of Annual WTP Values forImproved Water Quality in the Part of the Nzoia RiverBasin within Webuye Division ........................322
Appendix SC Frequency Distributions of Additional WTP Valuesfor Improved Water Quality in the Entire Nzoia RiverBasinupto Lake Victoria ............................323
Appendix 5D Frequency Distributions of Total WTP Valuesfor Improved Water Quality in the Entire Nzoia RiverBasinupto Lake Victoria ............................324
Appendix SE Frequency Distribution of Monthly WTP Valuesfor a Private Water Connection amongst Webuye Residents . . . 325
Appendix 5F Frequency Distributions of Annual WTP Valuesfor a Private Water Connection amongst Webuye Residents . . . 326

(xviii)
ABSTRACT
The basic theme of this study is that determination of the economic value of water
resources is a necessary condition for rational decision-making and management of
these environmental assets, and their associated public goods, in developing countries
The research particularly evaluates the contingent valuation (CV) method as a
technique for evaluating increments and decrements in environmental and natural
resource service flows, and estimates households' evaluations for improvements in
river water quality and connections to piped water supply for domestic uses
The study objectives were to (a) estimate the economic value of piped water
supply and improved water quality in the Nzoia River Basin, Kenya, (b) evaluate the
feasibility of using the CV technique to value an environmental amenity and its related
quasi-public service in rural settings where respondents have limited education and
monetary resources, (c) examine the role of temporal dimensions of bid payments (i e,
frequency of payments) in contingent values for environmental commodities, (d)
empirically investigate embedding effect bias in contingent valuation of improvements
in nver water quality improvement in a less developed economy, and (e) evaluate the
role of water connection charges in households' willingness to hook onto piped water
supply in Webuye Division, Kenya
Empirical analysis and estimates of the non-market value which local people
assign to water quality in the Nzoia River and a private household water connection
is based on a detailed survey of a representative sample of 311 households in Webuye
Division of Bungoma District, Kenya In an on-site survey carried out in May through
September 1995, contIngent markets were developed for the two goods (1) improved

(xix)
river water quality, and (2) provision of a private connection to water supply The
corresponding willingness to pay (WTP) values are explained using Ordinary Least
Square regression models Whatever the good, the WTP is seen to increase with
income However, the effects of other factors are more specific to the contingent good
In order of strength, the other determinants of WTP "quality" are sex, age, household
ranking of status of domestic water source, distance from river to household residence,
the other factors affecting WTP "connections" are existing source of water supply,
household size, ranking of river water quality, and age of household head On the
whole, residents accepted the exercise of contingent valuation and were willing to pay
important amounts (Ksh 459 and Ksh 386 on average per household per year,
respectively, for goods 1 and 2)
Discussion issues include policy significance of the resulting WTPs in terms
of the demand for river pollution control and individual household water connections,
the effect of the goods upon the CV evaluation process, the "Third World" impacts
of frequency of payments in contingent valuation, including perceived-frequency and
income-smoothing routes, the embedding effect in WTP values for water pollution
abatement in the Nzoia River basin, the importance of pricing influences, specially
payment profiles for initial connection charges, on household decisions to connect to
piped water systems, and limitations of the study

1
CHAPTER I
INTRODUCTION AND BACKGROUND TO THE STUDY
1.1 INTRODUCTION
Information on the value of water availability, quality and application in alternative
uses is relevant to both public and private decision making (Saliba Cf al, 1987, Colby,
1989) Examples of situations in which estimates of water value may be useful include
a famer deciding whether to sell water nghts or to continue to use them for irrigation,
a city or unit of local government evaluating whether to buy senior appropnative
rights to firm up their supplies, a court assessing the monetary damages associated
with impairment of a surface water nght and an environmental organisation seeking
to purchase water rights for instream flow protection
Indeed, comparison of water's value in various uses (t e, instream, agricultural,
municipal and industrial uses) and locations assists public water agencies in making
decisions about the management and allocation of publicly supplied water, and can
contribute to the comprehensive evaluations of benefits and costs of water-related
projects and policies In the absence of such water value estimates, insufficient
resources would be allocated by society to (a) conservation of environmental assets
(such as water quality) which development activities may degrade, and (b) judicious
and integrated management of improved environment-related infrastructure (such as
access to potable domestic water) for the betterment of human life
In the last two decades or so, there has been a lot of discussion on how to
employ economic analysis to value environmental benefits and costs of development
programmes and projects This discourse has been particularly intense owing to the
2
unique aspects that characterise environmental assets like water resources features
which render a smooth operation of a conventional market futile The failure of
markets to achieve efficient allocation of environmental resources is often attributed
to the existence of externalities, the publicness of environmental and ecological goods,
difficulties in enforcing property rights', and difficulty in valuing future entitlements
owing to the absence of intergenerational markets
We can see the failure of markets to allocate environmental resources
efficiently as a result of the impossibility of pricing these resources on markets
properly Consequently, prices of goods and services bought and sold on markets may
not reflect true social costs Hence the basic problem is the failure of the market
incentive system to take environmental aspects into account2
Environmental valuation for decision making is challenging for three reasons
First, many environmental goods (for example, improved domestic water supply) and
bads (for instance, coastal flooding or erosion such as loss of a beach) have no market
prices that can be used to put a value on each of the many consequences Secondly,
whilst economic theory argues that all changes can be valued (Pearce and Markandya,
1989, Pearce et al, 1989, Hanley and Spash, 1993), environmentalists have explicitly
rejected economic approaches to valuation of some environmental changes (Bowers,
1990, Friends of the Earth, 1990, Hopkinson et al, 1990, Holland, 1995) Equally,
'Harthn (1968) has superbly descnbed the tragedy of the commons which is based on thelack of well defined and enfoiteable property nghts When a property right cannot beenforced, an ovemse of that property can be expected In the case of ecological and naturalproperty, this is partly the cause of environmental problems like pollution, soil erosion, andextinction of species of fauna and flora Hardin's arguments have recently been considerablydeveloped by authors like Bmmley (1990) and Ostmm (1990)
2For a deeper discussion on this issue see Maler (1985), chapter 1

3
basic economic theory has itself been subject to increasingly critical review (Sen,
1977, 1987, Lutz and Lux, 1988, Saggoff, 1988, Daly and Cobb, 1990) Thirdly,
choices are difficult because the issues themselves are complex These reasons indicate
that economic analysis should always be used critically as an aid to decision making,
rather than as a substitute for thought
Environmental economics research in the last two decades has greatly extended
the range of techniques available for the monetary evaluation of environmental
damages and benefits The main techniques that have been used in the estimation of
the economic value of ecological and natural resource services are travel costs,
hedonic pricing and the contingent valuation (CV) approach3
This study is a developing country application of the CV approach to assess
willingness to pay for improvements in water resources management CV is seen as
the most suitable methodology for three reasons First of all, people do not travel away
en masse from areas where river pollution is occurring or where there is no water thus
ruling out the travel cost approach (costs of dispersion away from a public 'bad' are
always likely to be more difficult to measure than travel costs towards a public good)
In addition, it is felt that the level of river pollution and poverty of domestic
water supply are not significant arguments in house prices, thus eliminating hedonic
pricing from consideration Lastly, CV is itself is under investigation owing to the fact
3Even though this dissertation selectively discusses aspects of the theory, practice andcomplexities involved in nonmarket valuation in Chapter 3, a fuller discourse is beyond thescope of this chapter However, it can be found in Cummings et al (1986), Mitchell andCarson (1989), Cambridge Economics (1993), and Hanley and Spash (1993) Surveys specificto particular envimnmental media are found in Smith and Desvousges (1986) and Feenbergand Mills (1980) for water quality, and Halvorsen and Ruby (1981) for air pollution

4
that its accuracy is a matter of substantial importance in cost-benefit assessments and
litigation over liability and damages Hedonic pncing and travel costs are inferential
valuation approaches often used when a defensible case can be made that expenditures
for market goods, such as homes and travel-related items, are linked to the value of
the nonmarket amenity being valued4
1.2 THE MANAGEMENT OF WATER RESOURCES ir KENYA
Hirji (1990), in chapter 2, and Wasike (1993) provide a comprehensive discussion of
the overall management of the environment and natural resources in Kenya since
political Independence, this section is restricted to social, legal and institutional
contexts in which water as a natural resource is managed and conserved Lack of
potable water services for rural and urban households as well as water pollution from
industrial development are undoubtedly two key issues that epitomize the planning-
management problem in Kenya's water resource sector (e g Thitai, 1981)
The responsibility for managing and developing natural resources after
Independence followed sectoral lines Water, agriculture, and energy developments,
for instance, are each the responsibilities of individual Government ministnes The
creation of ministries is accomplished in a variety of ways ranging from Presidential
decrees to Acts of Parliament It is important to note here that the mooting of
ministries concerned with particular environmental resources has been a principal
4For instance, statistical analysis of sale pnces for similar homes with and without lakefront access provides infomiation on the additional amount home buyers are willing to payfor lake front amenities Such infonnation would then be useful to developers, real estateprofessionals, and pohcymakers in evaluating the benefits of preserving lakeside environments

5
factor in the prevalence of sectoral legislation in Kenya This has been so because
legislation governing the natural resources has grown out of perceived needs within
each sector Laws have been used to establish binding policies and standards, to
provide a basis for substantive and precedural regulations, and to create institutions
to complement policies and enforce rules (Tolentino, 1986)
There are 15 laws in Kenya relating to the conservation of natural resources5,
and 15 others relating to pollution control 6 Most laws are statutory instruments that
support individual sectoral units (e g, The Water Act, The Agricultural Act, etc) Only
a few emanate from common law doctrine Typically, these laws narrowly define what
should be done, rather than provide broad based programmes to address the
degradation of the environment (Kinyanjui and Baker, 1979) The discussion below
introduces the Ministry and organizations that share water resources management
responsibilities in Kenya Hirji (1990) and UNEP (1987) provide a detailed account
of the institutional framework within which the environment and natural resources are
managed in Kenya
5Laws relating to iesouices conservation include The Water Act, The Agnculturn Act,The Forests Act, The Land Planning Act, The Fish Industiy Act, The Plant Protection Act,The Local Govemnment Act, The Government Fishenes Protection Act, The Lakes and RiversAct, The Town Planning Act, The Keno Valley Development Development Authonty Act,The Lake Basin Development Authority Act, The Tana and Athi River Development AuthontyAct, The Wildlife Conservation and Management Act, and The Grass Fiies Act (UNEP, 198776)
6Laws concerning pollution control include The Water Act, The Public Health Act, TheFactories Act, The Food, Dmgs and Chemical Substances Act, The Pharmacy and PoisonsAct, The Fertilizers and Animal Foodstuffs Act, The Use of Poisonous Substances Act, TheCattle Cleansing Act, The Agncultural Produce Act, The Pest Control Products Act, TheRadiation Act, The Traffic Act, The Penal Code, The Merchant Shipping Act, and The KenyaBureau of Standards Act (UNEP, 1987 760 Note that the Water Act deals with bothconservation and pollution control

6
The Ministry of Water Development (MWD) was created in 1974 by a
Presidential decree Prior to 1974, water management was carried out by the Ministry
of Agriculture The revised Water Act of 1972 provides the Ministry of Water
Development the legal authority to enforce its provisions, and it gives the Minister
total responsibility for controlling the use of Kenya's water resources The Ministry
of Water Development also oversees water withdrawals and water quality protection
The MWD does not, however, implement all water projects, only those involving
national sanitation and water supply Projects for lrngation or power generation are
implemented by specialized agencies, such as the National Irrigation Board and the
river basin authorities
The Ministry of Water Development's Water Pollution Control Department
reviews the water quality aspects of industry applications that are referred to it by the
Ministry of Industry The Water Pollution Control Department is responsible for
protecting water quality in Kenya It monitors and enforces regulations for industrial
and domestic wastewater treatment The Water Pollution Control Department also
reviews the applications for industrial water permits submitted to the Water
Apportionment Board of the Ministry of Water Development7.
7See Thitai (1981) for a complete list of the infoimation requirements of the WaterPollution Contml Department for new industnes

7
1.3 THE STUDY AREA
This section is an overview of background information to a recent contingent valuation
survey undertaken in western Kenya Location, and demographic information are
presented before an outline of the area's socio-economic data Following this section
is Section 1 4 whose focus is on "Webuye Water Resources, Pollution and Services"
1.3.1 LOCATION
The study area, Webuye Division, is situated in Bungoma District of Kenya's Western
Province Kenya covers an area of 582,000 square kilometres and borders Ethiopia in
the north, Sudan in the northwest, Uganda on the west, Tanzania in the south and
Somalia in the east It has 400 km of Indian Ocean shoreline Lying between 30 north
and 5°S latitude and between 34°E and 41°E longitude, it is entirely within the
equatorial zone The country is almost bisected by the equator
Administratively, Kenya is divided into eight provinces each of which is sub-
divided into districts Bungoma District is one of 48 districts, seven of which were
recently delineated The District, itself divided into 10 administrative Divisions and
5 political constituencies, occupies an area of 3,074 km 2 Besides Webuye, the other
Divisions are Kanduyi, Cheptais, Sirisia, Kapsokwany, Kimilili, Tongaren, Central,
Bumula, and Kapsiro whilst the constituencies are Kanduyi, Sirisia, Mt Elgon and
Kimilili (Republic of Kenya, 1994) Webuye is both a Division and a political
constituency Kanduyi Constituency covers Kanduyi and Bumula Divisions, Sirisia
Constituency includes Sirisia and Central Divisions, Kimilili Constituency comprises
Kimilili and Tongaren Divisions and Mt Elgon Constituency embraces Kapsakwony,
Kopsiro and Cheptais Divisions
8
The Webuye Division consists of six locations and 16 sub-locations, two of the
locations, Lugusi and Sitikho, are yet to be gazetted (meaning, official recognition)
The rest of the locations are Bokoli, Misikhu, Ndivisi, and Webuye The Division is
bordered by Kakamega District on the East and South, Tongaren and Kimilili
Divisions in the North and North-West respectively, and Kanduyi Division in the West
and South-West (see Figure 11) The Nzoia River lies to the East and demarcates the
Webuye's divisional boundary with Kakamega Distnct
Figure 11 Goes Here
1.3.2 HUMAN POPULATION
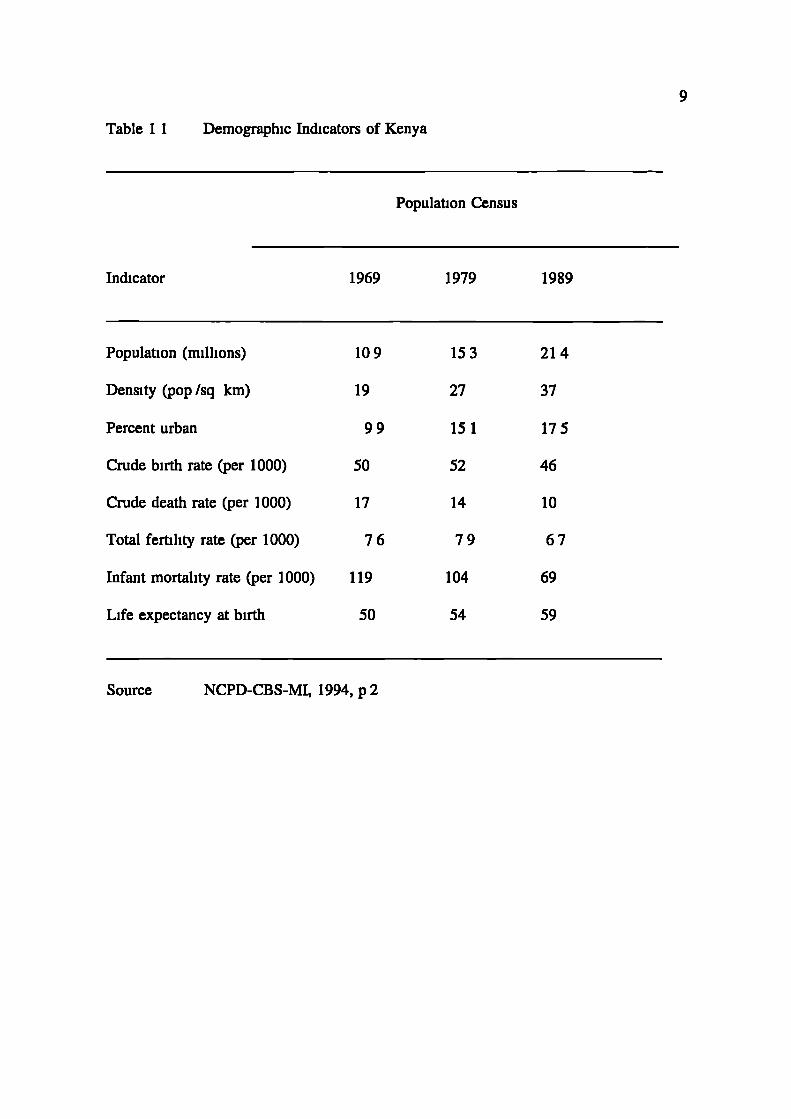
On the basis of census statistics, Kenya's population increased from 5 4 million in
1948 to 15 3 million in 1979 and to 21 4 million in 1989 (NCPD-CBS-MI, 1994) (see
Table 11) Results of the 1989 census indicate that the intercensal population growth
rate of Kenya is 3 4 percent per annum This represents a modest decline from the
growth rate of 3 8 percent per annum estimated from the 1979 population census
(National Council for Population and Development, 1989, Robinson, 1992, Dow, Jr
et al, 1994) If the population continues to grow at this rate, it is estimated that
Kenya's population will increase to 30 million by the year 2000 (NCPD-CBS-MI,
1994)
9
Table 11 Demographic Indicators of Kenya
Population Census
Indicator 1969 1979 1989
Population (millions)
Density (pop Isq km)
Percent urban
Crude birth rate (per 1000)
Crude death rate (per 1000)
Total fertility rate (per 1000)
Infant mortality rate (per 1000)
Life expectancy at birth
109
19
99
50
17
76
119
50
153
21 4
27
37
15 1
175
52
46
14
10
79
67
104
69
54
59
Source NCPD-CBS-MI, 1994, p 2

l0
At the size of 397 km2 and a projected total population of 200,000 persons by
the year 2000 AD (Table 1 2), Webuye will have the highest population density of 503
people per km2 in the region The Division's current population density of 341 ppkm2
is the second highest in the District after Kimilili's 495 ppkm2
Table 1 2 Population Data for Webuye Division, 1989 Census
Location and Sub-location Female Male Total
9,616
18,559
12,685
24,743
24,212
46,459
23,488
46,800
12,309
24,222
5,507
11,324
5,496
11,254
70,001
136,561(17 2)#
Bokoli Location 8,943
Misikhu Location 12,058
Ndivisi Location 22,247
Webuye Location 23,312
Maraka Sub- 11,913
Muchi-Milo Sub- 5,817
Khalumuli Sub- 5,758
Divisional Total 66,560
Divisional Projection for 2000 AD 200,000
Note percent of the total District population
Source Webuye Divisional Office

11
A large majority of households in Kenya are headed by males (67 percent),
with only one-third (33 percent) headed by women (NCPD-CBS-MI, 1994, see Table
1 3) Female-headed households are more common in rural than in urban areas (35 vs
22 percent) The average household size in Kenya is 4 8 people (including children),
but this figure is 5 89 persons for Bungoma District The summary of household
composition in Western Province presented in Table 1 3 is, by and large,
representative of the situation in Webuye

12
Table 1 3 Summary of Household Composition in Western Province' 2,
Percentages
Characteristic Western Total Residence in Kenya
Province for Kenya Urban Rural
Household headship
Male 659 673 785 647
Female 341 327 215 353
Household size
1
2
3
4
5
6
7
8
9+
Mean size
Educational Level3
None4
Primary incomplete
Primary complete
Secondary and above
70
74
113
128
176
10 8
104
66
160
55
229 (252)
43 3 (47 7)
230 (145)
108 (125)
146
113
117
12 1
13 1
112
89
65
105
48
175(281)
46 8 (449)
182 (153)
175(118)
29 1
180
136
118
102
61
44
28
39
34
83(142)
27 8 (31 8)
199(211)
43 9 (32 8)
111
98
112
122
13 8
124
100
74
12 1
51
19 1 (30 1)
50 3 (46 8)
178 (144)
128(87)
NotesI Percernt distribution by sex of head of household, household size and
educational level, according to urban-rural residence and region, Kenya, 19932 This Table is based on de jure members, i e, usual residents
Figures within and outwith parentheses are for females and males respectivelyIncludes missing values in the Kenya Demographic and Health Survey sample
Source Adapted from NCPD-CBS-MI (1994) p 10ff

13
1.3.3 SocioEcoNoMic PROFILE
Like in the rest of Kenya, agriculture is the mainstay of Webuye's economy Rural
areas are characterized by small-scale mixed farming which includes subsistence and
cash crops as well as livestock Maize, being the staple food of the Kenyan people,
is both a subsistence and a cash crop The other cash crops are coffee, sugar-cane,
sunflower, horticultural crops and cotton Apart from maize, sorghum, beans, millet,
potatoes, and cassava are other food crops grown to varying degrees
Sugarcane, like tobacco in the other divisions of Bungoma District (Wasike,
1992), are grown in the Division under contract farming with direct integration with
processing It is the most important cash crop in the Division Cane production is
organized under the Nzoia Sugar Company in the form of a nucleus plantation of
3,500 ha and an outgrowers scheme consisting of small holdings which add up to
14,115 ha in the District The average extent under sugarcane per holding is 0 88 ha
(Republic of Kenya, 1994 43, Webuye Municipal Council, 1994)
Besides the Nzoia Sugar factory and the PanAfrican Paper Mills, the other
sources of cash income are small-scale industrial and commercial concerns, and
informal sector activities as well as Government administration and public service
employment Small-scale industrial enterprises range from engineering works, metal
fabrication and motor-vehicle repairs to maize-milling, furnitute making, tailoring, and
vegetable vending The current five-year Bungoma District Development Plan
(Republic of Kenya, 1994) notes (p 52) "The number [of informal sector ventures]
has increased due to the increasing number of people failing to obtain wage
employment"

14
1.4 WEBUYE WATER RESOURCES, POLLUTION, AND SERVICES
1.4.1 THE NzoIA RiVER BAsIN DESCRIPTION
The Nzoia River Basin, a main drainage area of Lake Victona Basin Development
Authority, spreads across three provinces of Western Kenya Kibisi, Kuywa, Kimilili
and Lwakhakha are the other rivers that drain Lake Victoria Basin It compnses the
area drained by the Nzoia River and its tributanes before discharging into the Lake
Victoria The key tnbutaries of the River include Koitobos, Kipkaren, Kibisi, Kuywa,
and Lusumu (Figure 1 2)
Figure 1 2 Goes Here
The Basin is the only one amongst Kenya river basins 8 that does not arise from
Mt Elgon, its origin is in the Cherangani Hills But still, the Basin has a varied
topography rising from slightly above sea-level (in Yala Swamp area) to about 4200
metres above sea-level The location of the Nzoia River Basin and Webuye Division
on the slopes of Mt Elgon influences rainfall and moderates temperatures The mean
annual temperatures in the southern parts, away from the mountain, are about 21°C to
22°C while the mean annual temperatures in the northern areas close to Mt Elgon are
in the lower range of 5°C to 10°C because of the altitude Webuye Division, and
indeed the whole of Bungoma District, is a high agricultural potential area It
experiences two rainy seasons, the long and the short rain seasons The long rains
normally start in March and continue into June or July, while short rains starts in
8As noted under legislation for managing natural resources, the nver basin developmentauthorities in Kenya are The Keno Valley Development Development Authonty, The LakeVictoria Basin Development Authonty, and The Tana and Athi River Development Authonty
15
August and continue into October The total rainfall ranges between 1,250mm to over
1,800mm per annum This allows rain-fed sugarcane cultivation
Geologically, the Nzoia Basin can be divided into five formations the tertiary
volcanics, granites, the Kavirodian system, the Basement system, the Nyanzian system
A number of young faultlines have been found within the catchment area The relief
and land forms affect the climate and the general development of the Division and the
District
1.4.2 SOURCES OF WATER POLLUTION
Unlike other water catchment areas and river basins in Kenya, the Nzoia River
ecosystem have received dispropotionately less focus of scientific investigation
(Amuka, 1995) The inattention is surprising because, during the last 25 years or so,
anthropogenic alterations or stresses related to non-point pollution from sugarcane
agriculture, municipal water use, and to pollution by toxic substances from industries,
have been applied to the Nzoia River with ever-increasing frequency. The broad suite
of environmental questions that have arisen as a consequence of these stresses has not
been matched by scientific investigations to search for answers
Non-point pollution from agricultural farms and point sources such as
industries (mainly effluents from paper and sugar processing industries, and the East
Afncan Heavy Chemicals factory) and municipalities are the principal sources of water
pollution in Webuye Division (Webuye Municipal Council, 1994) and its surrounding
areas Non-point pollution often poses a series of problems for policy-makers,
primarily because such pollution cannot easily be traced to, for example, a single
waste pipe Shortle and Dunn identify some of the difficult planning problems that

16
arise from the nature of this non-point pollution, these include "determining which
water bodies require protection, establishing the particular activities that are
responsible and identifying appropriate policies to achieve the desired changes in
producer behaviour" (1991 p 30) They convincingly argue that an appropriate mix
of voluntary controls, standards, economic incentives, and research and development
are the best policy options for the problem
In Webuye area, the major source of non-point water pollution is sediment
transported from land through soil erosion Other non-point sources are chemical
fertilizers, manure, pesticides, and salts from agncultural lands Increased use of
chemical fertilizers and pesticides in sugarcane agriculture results in residual inputs
transported by water to endanger stream and groundwater supplies, groundwater
contamination by NO3 and pesticides is of particular concern in areas characterized by
shallow water tables (Kallqvist and Meadows, 1977, Willis et a!, 1991, Southwick et
al, 1995) It also encourages and allows intensified row-crop farming of maize, which
is accompanied by silt exports and the degradation of water supplies The severity of
the situation is compounded by the fact that Webuye Municipality and many others
within the Basin discharge raw waste into the water body
The herbicides used in sugarcane growing in Kenya are ioxynl, Diuron, 2,4-D
and Ametryne There is no standard amount of herbicides to be applied in sugarcane
plantantions (say per acreage) and thence most farmers resort to the broadcasting
application method External costs of these herbicides in Kenya's sugarcane
environments are yet to be evaluated, but one literature review on 2,4-D concludes
"There is a considerable body of evidence which indicates that the phenoxy herbicides
in general, and 2,4-D specifically, pose a substantial threat to environmental and thus
17
human health Extensive research on the effects of 2,4-D on test animals indicates
that the herbicide is teratogenic, carcinogenic and very likely mutagenic" (Warnock
and Lewis, 1978)
Amuka (1995) observes that although the acreage under sugarcane has reduced
over time, application of herbicides has marginally increased The increased
application of the herbicides can be partly attributed to development of resistance in
weed population due to repeated use on sugarcane fields (Paoletti and Pimentel, 1995)
During the dry season (incidentally the fish breeding season), the concentration of
excess herbicides in rivers and streams within the sugarbelt is higher The increased
toxicity leads to fish kills, deltas and estuaries of rivers and streams on Lake Victoria
constitute breeding grounds for most fish species from the Lake Indeed Foxall,
Littenck and Njuguna observe that
The upland water sheds are generally well protected from erosion but theerosion hazard increases considerably in the low land plains east of the[Winam Gulf of Lake Victoria] and river sediment loads increase accordinglyTo this sediment load is added the organic wastes and nutnents fromagricultural, domestic and agrobased industrial souives, especially sugarrefineries These wastes are transported and deposited at the eastern end ofthe Winam Gulf along with the treated and untreated effluents from KisumuMunicipality and increasingly also with the pollutants from the oil storageinstallation in Kisumu port
[Hence thel increasing local concern for the apparent deterioration ofwater quality in the Winam gulf, especially its eutrophication, as evidencedby the extensive blooms of blue-green algae, frequent fish kills, and a steadydecline in fish landings during recent years" (1987 616)
Apart from non-point pollution from agricultural farms, air and water pollutants
within the Nzoia River Basin emanate from manufacturing/processing industries
(Foxall et al, 1987) Key amongst them are sugar industries (the Nzoia Sugar
Companies and the Mumias Sugar Company), as well as the PanAfrican Paper Mill
and East African Heavy Chemicals factory in Webuye Township Save for the ongoing

18
research work by Amuka (1995), no published studies are available on effects of
industrial effluents on the physical, chemical and biological charactenstics of the
Nzoia River However, work done elsewhere shows that effluents from these type of
industries adversely Impact on aquatic environments
Wastewaters from sugar cane processing are not toxic but harmful to the
environment because of the presence of organic substances, in particular carbohydrates
in the form of alcohols and sugars Consequently, biochemical oxygen demand (BOD),
total suspended solids (TSS), and pH are major pollution parameters of sugar industry
wastewaters (Train et al, 1975, Forsyth, 1977) Orgarnc substances discharged into a
nver are decomposed by micro-organisms which use substantial quantities of oxygen
The effects of organic effluents with high BOD are well known (e g Hynes, 1960) but
mostly from temperate zones, and studies on organic pollution in the tropics (e g
Campbell, 1978) are limited However, the discharge of organic effluent from a sugar
mill into tropical streams has been proved to have similar effects on macro-
invertebrate fauna to those found in temperate areas (Pearson and Penridge, 1987)
In a study on the effects of pollution by organic sugar mill effluent on macro-
invertebrates on a tropical stream, Pearson and Penridge (1987) show that increased
pollution led to decreased diversity, and, in heavily polluted situations, the fauna was
dominated by Ohgochaeta and one species of Chironomidae, or in most severe
conditions by that chironomid alone The effects of pollution became apparent as
dissolved oxygen concentration fell below 6 5 mgr', and were most severe below 3 5
mgi' This author's speculation is that dissolved oxygen (DO) concentration is below
the acceptable limit of 3 5mgl' in most sections of the river close to the sugar
industries as well as the PanAfrican Paper Mills at Webuye

19
his well-known that the Webuye Pulp and Paper industry is an important part
of both the Kenyan and regional economies However, while providing welcome
employment and income opportunities for the population, the pulp and paper industry
provides a heavy burden on the environment The fact that the mill is located along
the Nzoia River means that the discharge of suspended solids (fibre) affects both the
behaviour of fish and their ability to grow and breathe It can also create mud banks
which change the structure of the River bed and, thereby, affect fish and other fauna
in the River When oxygen demanding substances, exerting a BOD and COD
(chemical oxygen demand), are discharged into water, the level of oxygen is reduced
Some of these effluents also affect photosynthesis How fast these substances break
down depends on the temperature and on the amount of oxygen in water The warmer
the water is, the faster these substances break down BOD and COD are measures of
how much oxygen is needed to break down the substances
The firms use chlorine in the bleaching process which are latter discharged into
the River It takes a long time for these substances to break down and when they do
so, some may become even more poisonous than before l Since the composition of
bleached pulp mill effluents is very complex, it is almost impossible to characterise
the impact of every substance on the environment It is clear, though, that the effects
are greater close to the factory, but effects can appear far away as up to 50 km from
the source (Leslie et al, 1972, Brannlund et al, 1995) The biological effects of the
discharge of chlorine are injurious to fish spines and changes in their vertebrae There
are also senous physiological effects, such as damage to fish livers and immune
systems Some of these effects, especially lowered reproduction capability, constitute
a senous threat to the survival of the population of some species
20
1.4.5 DOMESTIC WATER SUPPLY AND SANiTATION
Many Webuye residents, like other Kenyans and people in developing countries, face
daily problems in obtaining water for domestic purposes Recognizing the harm to
health, economic productivity, and quality of life that can result from inadequate water
supplies, the Government and nongovernmental organisations (including international
donor agencies) have mounted numerous efforts to correct the problem Figure 1 3
shows the piped water schemes in Webuye The Webuye-Nabuyole Water Supply is
the main water facility in the Division, but it serves only 25 km2 So, like in the rest
of Western Province (Table 1 4), the vast majority of the population obtain their
domestic water from unprotected boreholes, shallow wells, springs, streams and ponds
Many of these sources fail at the end of the dry season and water then has to be
carried for long distances In drought, both urban and rural households draw untreated
water from the Nzoia River and its tributanes

21
Figure 1 3 Goes Here
Table 1 4
Percent Distribution of Households by Some Household Characteristics,
According to Urban and Rural Residence, Kenya 1993
Charactenstic
Western Residence in Kenya Total forProvince Rural Urban Kenya
Electricity:Yes 76 425 34 109No 924 575 966 891
Source of Drinking WaterPiped into residence 144 194 55 8 10 7Publictap 53 132 314 89Well with hand pump 31 2 8 9 09 10 8
Well without hand pump 21 7 122 2 1 146Lake/pond 25 7 1 0 1 87River/stream 23 2 33 6 1 6 41 2Rainwater 11 22 06 26Other 07 34 74 24
Sanitation Facility:Own flush toilet 72 54 23 5 11Shared flush toilet 07 45 214 05Traditional pit toilet 802 65 8 423 71 4Vent impr pit latnne 4 1 6 1 69 5 9No facility/bush 76 16 8 2 1 203Other 03 14 39 08
MeanPersonsPerRoom: 32 28 24 29
Source Adapted from NCPD-CBS-MI (1994) p 14

22
Furthermore, the almost universally inadequate sanitary arrangements in rural
areas cause unprotected water sources to be very liable to pollution During dry season
feacal and non-feacal pollutions are washed into water spnngs, wells and streams
Springs near all villages are covered with stones but dogs and livestock can easily
reach such places The villagers are not careful about the use of streams and often
wash and bathe upstream from the collection of points of drinking and cooking water
Evidence of this pollution of sources of domestic water supply may be seen in the
high incidence of water-borne diseases Though historical data on disease incidence
were not available for the purpose of establishing a trend in cases of illnesses, hospital
attendances for most illnesses is increasing Skin diseases (especially scabbies and
ulcers) and diarrhoea, the second and third most common diseases, represented 8 94%
and 547% of reported cases of diseases in 1992, the indisputably most common
malaria accounted for 52 53% of the 537,763 reported cases (Republic of Kenya,
1994 910 Other cases included, inter aha, cholera, typhoid, and intestinal worms
Epidemiological literature indicates that these infectious diseases, as well as others like
gastroenteritis and shigellosis, can be contracted by human contact with contaminated
water (Rosenberg et a!, 1976, Feachem et al, 1983, Holmes, 1990)
As is common in developing country practice (Porter and Walsh, 1978, Roth,
1987, The World Bank Water Demand Research Team, 1993), technical criteria have
been laid down in Government blueprints for water resources Each water supply
should be technically as simple as possible and consist only of an intake or source
system, the minimum ammount of storage to ensure continuity of supply, and basic
distribution systems Designs are based on a per capita per day consumption The
Webuye-Nabuyole Water Supply (WWS) began operation in 1974 with a service

23
capacity of 10 km2 Even though the water facility now serves 25 km2, it falls well
below demand, the station's total water production of 1600m 3 serves only 2,106
households whilst the regional demand is estimated at 4500m 3 Of the households that
were receiving water from WWS at the time of this survey, 381 (18%) paid a flat rate
of Ksh 90 00 per month Charges for the rest of the households (including licenced
retailers and institutions such as schools) were functions of consumption levels as read
on water meters The cost of water supply at WWS are in Table 1 5

24
Table 1 5 Cost of Water Supply for Webuye-Nabuyole Water Supply Station
Cost element Amount in Kshs
Operation and maintenance (0 & M)
a Salanes for operators and supporting staff 37,845 00
b Transport utilities including telephone and stationery 10,56475
c Repairs, spares, workshop, uniform and replacement
of plants and equipment 9,334 30
Sub-total Kshs 57,74405
2 Water Treatment
a Expenditure on aluminium sulphate 85,200 70
b Expenditure on chlorine 9,671 60
c Expenditure on electricity 55,388 80
Sub-total Kshs 150,261 10
MONTHLY GRAND TOTAL COST OF WATER SUPPLY Kshs 208,00515
AVERAGE ANNUAL COST OF WATER SUPPLY Kshs 2,496,061 80
Source Ministry of Water Development, Bungoma District and Webuye
Divisional Offices
25
1.5 STATEMENT OF ThE PROBLEM
Valuation of changes in water availability and quality is an important issue in Kenya
as agriculture, industry, and population growth exert increasing pressure on limited
water resources The Government of Kenya (specially units of local authorities,
relevant ministries, and river basin management authorities), and non-governmental
organisations (like Kenya Water and Health Organisation, KWAHO) have an active
interest in strategies for both regional pollution abatement and domestic supply
augmentation
The Fifth National Development Plan and other blueprints confirm the
Government's commitment to improve access to water supply and sanitation Like
most sub-Saharan Africa, Kenya embraced the United Nations' Water Decade's (198 1-
90) notion of "Clean water and sanitation for all by 1990" (ROK, 1983) The euphoria
that accompanied the declaration and passage of the Decade notwithstanding, most
rural and urban households in Kenya are still characterised by poor conditions of water
supply and sanitation And in the Sixth Plan, The Government opines "A sessional
paper on environmental management will be prepared during the Plan period as a basis
for the promulgation of a National Environment Enhancement and Management Act
(NEEMA) which will provide a provision for an arbitration tribunal for environmental
disputes" (ROK, 1989 170 Italics original)
Generally, control of pollution of water courses (rivers, streams, lakes,
estuaries, and coastal waters), and improved provision of domestic water supply
represent two integral, essential parts of a strategy towards sustainable development
of water resources in Kenya Yet an apparent limited tax base for provision of water
supply on social welfare basis coupled with the austerity measures recommended by

26
the international donor community have led to inability of the governmental
institutions in providing clean potable water to most residential areas/estates These
also appear to have a constraining effect on public expenditure on environmental
quality improvement and towards pollution control on most water bodies
This investigation is motivated by both methodological and empirical
observations The methodological inspiration is the need to apply and assess the CV
technique on issues pertaining to environmental policy and resources management in
Kenya As noted, the accuracy of CV estimates is a matter of substantial practical
importance in (a) cost-benefit assessments (CBA), and (b) litigation over liability and
damages Consequently, the validity of this technique is of crucial significance to
environmental cases that may be brought under the envisaged NEEMA, or indeed
many other Kenya laws concerning pollution
With regard to CBA, a recent study by Wasike (1993) shows that market
forces, through an economic incentives approach, have not been adequately harnessed
and marshalled towards a more pragmatic system of environmental policy in Kenya
Instead, Kenya has followed a regulative command-and-control model So, therefore,
there appears to be untapped scope for using market mechanisms in environmental
pollution control and natural resources management In the case of domestic water
supply, past approaches to alleviation of the problem of insufficient clean drinking
water and sanitation have tended to overemphasise the supply side of the problem to
the neglect of demand imperatives
This research, therefore, is predicated on the thinking that water policy and
planning, like other sectors of environmental and public utility management, should
be built on a comprehension of what quality and service improvements people really

27
want and are willing to pay for This recent approach has the merit of being able to
(a) mobilise a community's own resources, both financial and non-financial, and (b)
assure that the community is truly in control, that systems remain operating, and that
the limited funds available to governments are directed to wherever they are needed
most Determinants of households demand and willingness to pay for improved water
services and nver quality are vital to future decisions on technical and financial planes
of public policy in Kenya Technical decisions include the choice of appropriate
technology or level of service whilst financial decisions may comprise the monthly
tariffs and connection fees to be charged for private household connections to the
piped water system There is, in addition, the thorny issue of pollution of traditional
household water sources (springs, wells, fl yers, and streams) by industrial and
agricultural activities' Who pays for cleaning up the associated pollutants?
1.6 THE RESEARCH THESIS, OBJECTIVES, AND QUESTIONS
The thesis of this study is that determination of the economic value of water resources
is a necessary condition for rational decision-making and management of these
environmental assets, and their associated public goods, in Kenya This is especially
true for improved nver water quality and piped domestic water supply since the
pricing procedure would help grant proper weight to the benefits of the improvements
to environmental sustainability, and human quality of life respectively
The research has a dual objective, to evaluate properties of the contingent
valuation (CV) method as a technique of economic valuation for increments and
decrements in environmental and natural resource service flows, as well as to estimate
households' evaluations for improvements in the water quality in the River Nzoia,

28
Kenya and connections to piped water supply in Webuye Division, Kenya Contingent
valuation is one approach to measuring benefits of environmental improvements that
has gained currency in environmental economics literature The CV methodological
concerns in this dissertation are nature of the good under valuation, effects of
frequency of payments, the embedding effect, and influence of connection charge
profiles on evaluation of piped water supply for domestic uses
More specifically, the study set out (a) to estimate the economic value of
piped water supply and improved water quality in the Nzoia River Basin, (b) to
evaluate the feasibility of using the contingent valuation (CV) technique to value an
environmental amenity and its related quasi-public service in rural settings where
respondents have limited education and monetary resources, (c) to examine the role
of temporal dimensions of bid payments (i e, frequency of payments) in contingent
values for environmental commodities, (d) to empirically investigate embedding effect
bias in contingent valuation of improvements in river water quality improvement in
a less developed economy, and (e) to evaluate the role of water connection charges
in households' willingness to hook onto a piped water system
This open-ended CV survey has no component value questions Component
value questions are often presented in CVM surveys which are designed to
"breakdown" the value bids into four possible components Actual User Value, Option
of Use Value, Existence Value and Bequest Value The key research questions, and
hence hypotheses, that this study set up to investigate are fourfold (1) Does the
Nature of the Good Matter9 (2) Do Average WTP Measures Vary with Temporal
Dimension (or Frequency) of Payments in CV Design 9 (3) Embedding in WTP Values
for Water Pollution Abatement in the Nzoia River Basin (4) Does Nature of

29
Connection Charges Influence WTP for Domestic Water Supply' We presently deal
with each of these hypotheses, in turn
1.7 THE SIGNIFICANCE OF ThE STUDY
This research has methodological significance and policy relevance The overlapping
literatures on water resources, domestic water supply, and environmental economics
stress the need for values to attach to largely nonmarket interactions of people and the
environment, such as recreation boating, fishing and swiming (e g, Meyer, 1979,
Vaughan and Russell, 1982) So the process of pricing nonmarketed commodities is
crucial As far as methodological issues are concerned, the study findings provide
direct evidence on the performance of CV in deriving economic values for water
resources management In particular, the evaluation of the impacts of nature of good
on WTP estimates, and frequency of payments, as well as the embedding effect in
WTP for nver pollution control and impact of connection charge profiles on WTP for
piped water supply are pertinent for future economic valuation of nonmarket goods in
Kenya and elsewhere
Of late, the quality (reliability) and affordability aspects of water supply
systems are receiving mounting public concern in developing countries (in the case of
domestic water supply), general ignorance is being fed by a mixture of scientific
concern and media hype On the whole, two lines of the debate can be delineated
Most local government authorities and the central government of Kenya perceive
potable and disease-free water as an environmental and public "good" that should be
subsized for the benefit of all and sundry due to its welfare implications On the other
hand, most foreign donor organizations (especially the World Bank and the

30
International Monetary Fund) would like water consumers to pay for the commodity
so as to reduce market distortions that have been blamed for the sorry state of affairs
in government's management of the public sector in LDCs The argument in the latter
viewpoint, as a matter of fact, ties in well with the Kenya Government's current
budget rationalisation policy which is one of the conditionalities under the IMF-World
Bank Structural Adjustment Programmes Once the determinants of household's
economic valuation of improved water service and the potential biases are taken Into
account, the study results provide meaningful indications for formulation of policies
regarding water supply and its pricing
All in all, current received economic wisdom is that pricing water to reflect the
full financial, environmental, and economic costs of supply is necessary for generating
funds to expand services and for promoting efficient and sustainable use (Winpenny,
1994) Investigations on the accuracy of CV and generation of people's values of
environmental and public goods (like nver water quality and deomestic water supply)
in Kenya are useful exercises for understanding the potential for employing "market-
based" policy instruments in the economy which relies mainly on a "command-and-
control" policy framework (albeit with lucklustre enforcement ability)
31
1.8 DEFINING 'THE ENVIRONMENT" AND 'THE HOUSEHOLD"
1.8.1 DEFINm0N OF 'THE ENVIRONMENT"
In seeking to value water in nature and social uses, this survey adopts the broad
definition for the environment Inherently, "the environment" is a broad, potentially
all-encompassing concept Although for analytical and practical reasons it can be
treated as having different dimensions, such as an ecological (ecosystems) dimension,
an economic (resource management) dimension, and a social (quality of life)
dimension, it should be recognized that human activities with regard to one aspect of
the environment (such as air pollution) may have repercussions in many other aspects
(such as forests, soil fertility, buildings, and human well-being) Such impacts may not
always be direct and immediately visible (there may be threshold, sleeper, and
synergistic effects), and they may be cumulative, adding to the complexity of
environmental phenomena
Threshold effects occur only when an activity or influence reaches a certain
level (such as in the case of the eutrophication of lakes because of excessive nutrient
enrichment), sleeper effects become apparent only after a considerable lapse of time
(for instance, the effect of asbestos or many carcinogenic substances on human health),
synergistic effects result from the interaction of different substances or phenomena (for
example, acid rain) (Ehrlich, Ehrlich and Holdren, 1977 119) Another operational
definition regards what constitutes a "household"

32
1.8.2 DEFINING 'THE HOusEHoLD"
Throughout this dissertation, I rely on an intuitive understanding of what a household
actually is a group of individuals who reside together, pool all or most of their
income, and basically share the same water supply This is intentional since the
definition of the household is an intractable theoretical problem (Rogers and
Schlossman, 1990) Given the varied and complex nature of human society, no
definition of the household, however general completely fits all circumstances 9 One
can identify a variety of functions usually associated with the household co-residence,
Joint production, shared consumption, kinship links (Bender, 1967)
Yet these functions often define different sets of individuals In many places,
the unit of Joint production consists of a different set of individuals from the food
consumption unit Moreover, co-residence may not always be associated with shared
production or shared consumption (White, 1980) The definition of co-residence itself
may not be clear where many dwelling units form a single compound Migration of
household members also creates ambiguities, a person may leave the household for
most of the year but return to contribute labour in certain seasons, share in the product
and even drink water of the household of origin, and contribute remittances for the
support of resident household members
Despite the aforementioned complexities of the household which make any
9Current economic modelling of the household follows two schools of thought One schoolassumes the existence of a Joint household utility function (Pitt and Rosenzweig, 1985,Strauss, 1986) Earlier contributions to this approach by Becker (e g, Becker, 1981)demonstrate the conditions under which a multiperson household can be treated as anindividual utility maximizer The other school allows preferences to vary among householdmembers and proposes a bargaining theory to reconcile the differences (Manser and Brown,1980, McElroy and Homey, 1981, Jones, 1983) The bargaining theory model draws heavilyon the woit on co-operative games by Nash (1953)

33
fixed denotation arbitrary and possibly misleading, two aspects are possibly true of the
Kenya household These are
1 It is not an equivalent of the Western concept of the household In Kenya,
and indeed most developing countries, the boundary separating the household from the
community of which it is a part is more fluid than in Western Europe and USA
Essentially then, a Kenya household is unlikely to coincide with the notion of a
nuclear family composed of a husband and wife and their children
2 Regardless of how it is defined, the Kenyan household or any country's
household for that matter, is definitely not a homogeneous unit in which all members
share a common set of preferences It can better be seen as a group of people bound
by an implicit contract which specifies the rights and obligations of each member As
in conventional contracts, the balance of nghts and obligations is determined in part
by the alternatives available for each member and in part by their relative power
1.9 STRUCTURE OF THE DISSERTATION
In Chapter 2, I explore aspects of economic analysis of environmental improvements
at the household level These theoretical considerations are of particular relevance to
economic valuation of non-market goods and household decisions to hook on to a
piped water system, since economic pricing of river water quality and private water
connections present opportunities for the simultaneous pursuit of economic, financial
and environmental objectives (including that of sustainable use) of water resources
management both in nature and social uses Two elements that particularly guide the
CV application throughout the dissertation regard the theoretical basis for contingent
bids denved utilizing survey instruments and discrete choice modelling on how a

34
household decides which water source to use for different purposes
In chapters 3 and 4 an examination of related literature and methodological
aspects of this study's estimation of benefits of river pollution abatement and domestic
water supply improvement in Kenya is, respectively, presented The issues discussed
in Chapter 3 include, amongst others, Cost-Benefit Analysis (CBA) as an aid in
decisionmaking and the problem of non-market goods, methodological issues within
the valuation (CV) technique, and CV applications in evaluating river water quality
improvements Regarding the fact that the project is a developing country CV
application and assessment, the chapter devotes considerable attention to both "Third
World" contingent values of environmental impacts and potential effects of frequency
of payments in CV designs The former includes CV studies on water resources issues
in developing countries, where most of the work in the field of environmental
valuation has been undertaken, whilst the latter is a part of a larger presentation on
frequency information as a dimension in decision making
The literature review shows that few CBA studies have been undertaken in
LDCs particularly those aimed at comprehending potential 'Third World' influences
on CV estimates of benefits of environment and development projects An additional
finding from the evaluation is the paucity of CV surveys on issues that directly relate
to the 'pubhcness proper' of the natural environment (such as water and air quality)
in developing economies, the few surveys on nonmarket environmental commodities
are largely restricted to forestry and wildlife conservation In all, the review shows the
Contingent Valuation (CV) approach as a widely accepted method for valuing both
natural resource damages, and nonmarketed benefits of environmental resources and
improvements The CV method is capable of not only measuring use values but is the

35
only methodology currently available to measure other components of total economic
value such as option, existence, and bequest value
Chapter 4 presents the four study hypotheses whose research rationale is
demonstrated in Chapter 3 (that is, effect of the nature of the good in CV, impacts of
temporal dimension of payments, sensitivity to scope or (embedding effect) in the
contingent valuation scenario, and influence of utility-pricing decisions (mainly
through initial connection charges) on WTP for individual household water
connections) Additionally, details of the questionnaire and survey structure, as well
as a description of the survey pre-test, administration, sample design, and fieldwork
procedure then follow, in that order
Chapter 5 presents empirical analysis and results, including household
perception of the probems studied, nonmonetary measures of relative importance of
benefits, and socio-economic and demographic data Further still, the chapter focuses
on descriptive statistics and frequency distributions of willingness to pay (WTP)
values, as well as WTP estimation models and tests of differences for various WTPs
from different questionnaire versions (or samples) In relation to the tests of
differences for various WTP estimates, this chapter particularly matches the statistical
tests with the four study hypotheses before presenting aggregates benefits of
improvements in river pollution control and a household water connection at
Divisional, District, and National Levels
Chapter 6 discusses the CV survey results Essentially, the Nzoia River Basin
and domestic water supply are integral parts of the natural and human environment of
residents of Webuye Division, Kenya Indeed, residents of the study area are well
informed on the twin problems of river pollution and inadequate water supply for
36
domestic purposes This fact explains the relatively good acceptance of this contingent
valuation (CV) exercise for Webuye Division dwellers The chapter focuses first on
the demand for river pollution control and individual household water faucets It then
moves on to discuss each of the four research hypotheses Effect of Nature of Good
on Contingent Values, Impacts of Frequency of Payments, Embedding Effect, and
Effect of Connection Charge Profiles on Evaluation of Household Water Connections
Limitations of the study close the chapter Finally, chapter 7 presents a review of the
study objectives, conclusions and implications of this CV application for the technique
and for policy

/
WEBUY
VISION
Kimititi
AFRICA
I-
0I-
N di Vt SI
Bokoti
SLugulu
Si risia
10
IMuchi
K and uyi
0 10Km.
- D5WiCt bcunday
D&m bmory
Sovon do
Roads
• Rural centres
Urb centres
Municipal bou'aary
KENYA

/1 13MViVV1 OA3O1/
- - r
= >-
-j_i 8
Z <El/ / Cr r
I 1!
/ / 4.\ </ / p
( a'0/
o/
-J
I 0
,--.\ u_ '2' g- —. — 8'I t-'_I /• 6 2-( i# :( i 1$ z< %4I
siOb1 t•J
t.0 . I
zo
-.
zInm
Ui
0Nz
c..J'-IC11C-,I-I
- az• _J
(I
UO (flDI
.0 II
aE
0
o
Ia
I-/ z
0. '
\r --'-2
\15.0 0 C
'I bi
2I- . '0 -
"I C - 0 .
0 • .•.-.— ' I-= 0.I I Ii oo
' i I I
'.-.., \4<___X5 r.,.Jz.0 f <j\>-c,
=.o •.js;'

FIGURE 1.3 WATER SUPPLY DISTRIBUTION IN WEBUVE DIVISION

40
CHAPTER II
THEORETICAL FRAMEWORK
2.1 INTRODUCTION
This chapter explores aspects of economic analysis of environmental improvements
at the household level These theoretical considerations are of particular relevance to
economic valuation of non-market goods and household decisions to hook on to a
piped water system, since economic pricing of nver water quality and private water
connections present opportunities for the simultaneous pursuit of economic, financial
and environmental objectives (including that of sustainable use) of water resources
management both in nature and social uses
The variety of empincal approaches used to value environmental goods,
whether examining contingent or actual behaviour or market prices, have typically
been based on a particular ad hoc theoretical structure However, Freeman (I 979a, b),
Maler (1974), as well as Schulze and co-workers (1981), provide a consistent
theoretical perspective for the different approaches The second Section of this Chapter
concerns about the theoretical basis for contingent bids derived utilizing survey
instruments whilst Section 2 3 presents a discrete choice model on how a household
decides which water source to use for different purposes

41
2.2 ECONOMIC BENEFiTS OF ENVIRONMENTAL AND PUBLIC GOODS
Lack of a detailed and coherent model specifying how people will respond to
contingent valuation (CV) questions has led to spirited research efforts towards
understanding what determines responses to contingent scenarios Even though Hoehn
and Randall's (1987) analysis of CV estimates of Hicksian consumer surplus appears
to be the first systematic theoretical evaluation of how information and time affect CV
responses, it is Bradford's (1970) aggregate bid function that provides a useful way of
explaining the theoretical antecedent of CV In fact Hanley (1989), following
Bradford, lucidly presents a geometric outline of CV's utility-theoretic foundation
The utility individuals receive from a good can be determined by measuring
their willingness to pay (WTP) for the good WTP was thus adopted to measure the
benefits from both improved water quality in the Nzoia River and private water supply
connections'° Where individuals do not have the nght to a given quality level of a
public good, Mitchell and Carson (1989) argue that a Hicksian compensating surplus
W1'P measure is the correct approach to determining both the value of increased
quality provision as well as the value of avoiding any proposed reduction in the
quality level compared with that currently available
'°This avoids the controversy about whether WTP or willingness-to-accept (WTA) is themost appropriate measure to elicit consumer surplus values The choice between WTA andWTP is a question of property rights do individuals have the right to a certain water qualityin a river and thus have the nght to sell further pollution/use by manufacturing flims, or ifindividuals wish to enjoy an enhanced nver water quality, do they have to buy it To improvewater quality in the Nzoia River, manufacturing industnes operating within the Basin have toinvest in waste-water punfication plants, involving higher prices for their customers, whilstthe Lake Victoria Basin Development Authonty (LBDA) may need to invest in other waterpollution control measures necessitating higher tax payments from the general public ThusWTP is appropriate both as a measure of benefits from enhancing water quality in the NzoiaRiver, by investing in alternative waste-water treatment technologies and undertaking waterpollution abatement/control measures on the Nzoia to improve the present water quality levels,and as a measure of benefits from a pnvate water connection for domestic water requirements

42
CpS = [e(P Q, U0) = Y 03 - [e(P0, Q,, U0) = Y,J (2.1)
CpS=Y0 -Y 1(2.2)
where CpS is the compensating surplus WTP, P0, Q0, U0, Y0, represent initial quality
level price, quality level, utility and income, and Q1 and Y subsequent levels If CpS
is positive, then Q1 is preferred to Q0 and the consumer would be WTP to the point
where his/her utility level was the same as it was before the change If Q1 level of
quality is preferred to Q0, then an individual will be WTP CpS for the change, i e Y1
will be less than Y0 Note also that in this study these measures are also ex ante
measures they are the individual's expected value of the state of the world after the
change in nver water quality or level of domestic water service
The value of environmental and other public goods (such as a piped water
connection) is often derived from the demand for related goods (such as recreation and
housing) using a simple utility function of the form
u = u(X, RH, L)
(23)
where utility (u) depends on the consumption of private goods (X), on-site use (RH),
and on the enhanced environmental quality or amenity (L)
In the case of nver pollution control (and even water connections, albeit
arguably), this theoretical treatment can be expanded to measure the bundle of off-site
satisfactions for improved water quality in the Nzoia River These passive or non-use
benefits are assumed to include option, existence and bequest demands A more
general form of the utility function is (as suggested by Willis and Garrod, 1995),

43
therefore,
U = U /fj(..) f2(°' E, B)]
(2.4)
where individuals also derive benefit from off-site consumption of enhanced flows by
way of option value (0) to guarantee the opportunity of future benefits from the
Nzoia under conditions of uncertain demand or supply, existence value (E) from the
satisfaction an individual derives from knowledge that the water quality of the river
or section of the river is protected, and bequest value (B) from the knowledge that
other individuals will benefit from the environmental acceptable river water quality
This total economic value (TEV) concept was adopted to measure the benefits of both
the Nzoia river pollution control and private water connections in Webuye, Kenya
This research particularly uses the following conceptual framework to describes
a household's" decision on whether or not to agree to pay for nver pollution control
and a private water supply connection Let the representative household's indirect
utility function be
U (Y, P, SDE, Q)
(2.5)
where Y is the monetary income, vector P represents the prices of all other goods and
services, SDE refers to other socio-demographic and economic factors that might
influence the household's ability to pay or constrain its behaviour, and finally Q is the
"At this point I ignom the possibility that households are not homogeneous decisionmaking units Thus I assume that consumption behaviour either reflects household preferencesor the preferences of the dictator in the household

44
character of the commodity of interest (in this case it is improved water quality in the
Nzoia and a household connection to piped water)
Equation (26) the household's WTP for changes in the nature of the
commodity (either river water quality of water supply system) from say Q0 to Q1 (i e,
Hicksian compensating surplus)
U(Y 0 - WTP, P0, SDE, Q,) = U(Y 0, P, SDE, Q0) (26)
Equation (6) implies that WTP is a function of the proposed change in Q and all the
other factors hypothesized to influence a person's value for a change in Q Thus,
WTP = f(Q Q1, Y P0, SDE0) (2.7)
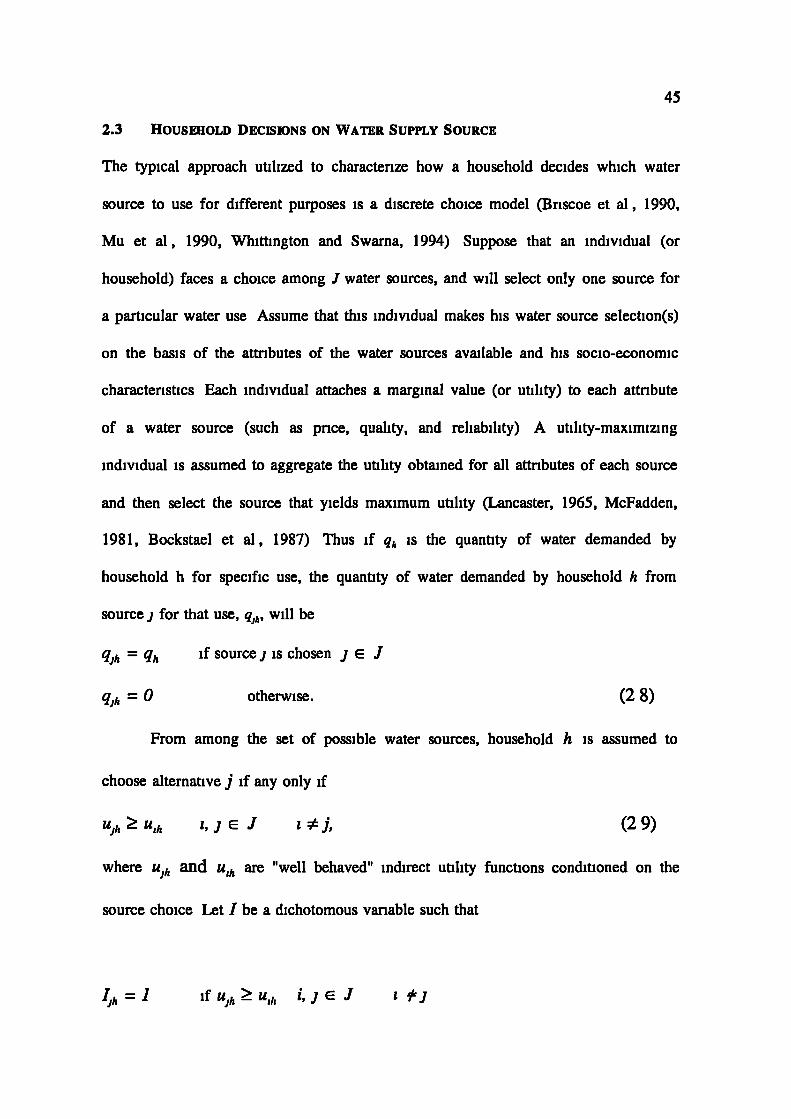
45
2.3 HOUSEHOLD DEcisIoNs ON WATER SUPPLY SOURCE
The typical approach utilized to characterize how a household decides which water
source to use for different purposes is a discrete choice model (Briscoe et al, 1990,
Mu et al, 1990, Whittington and Swarna, 1994) Suppose that an individual (or
household) faces a choice among I water sources, and will select only one source for
a particular water use Assume that this individual makes his water source selection(s)
on the basis of the attributes of the water sources available and his socio-economic
characteristics Each individual attaches a marginal value (or utility) to each attribute
of a water source (such as price, quality, and reliability) A utility-maximizing
individual is assumed to aggregate the utility obtained for all attributes of each source
and then select the source that yields maximum utility (Lancaster, 1965, McFadden,
1981, Bockstael et al, 1987) Thus if q,, is the quantity of water demanded by
household h for specific use, the quantity of water demanded by household h from
source j for that use, qh. will be
q h = q if sourcej is chosen j E J
qh = 0 otherwise. (2 8)
From among the set of possible water sources, household h is assumed to
choose alternative j if any only if
Ujh ^ U ,h i, j E J 1 ^ j, (2 9)
where UJ,1 and U1h are "well behaved" indirect utility functions conditioned on the
source choice Let I be a dichotomous variable such that
= 1 if UJh ^ U,h i,) E I I

46
'jh = 0 otherwise (2.10)
A planner needs to understand why a household selects water source(s) and the
quantity of water it uses, but the indirect utility function is unique to each household
and cannot be known to the analyst To approximate the "true" utility function, the
analyst assumes a known function based on economic theory and attempts to use it to
describe households' water source selection decisions Doing this requires data on
households' water source selection decisions as well as data on attributes of the
alternative sources and socioeconomic characteristics of the households involved
It is impractical for the analyst to collect such data for each household in a
community Instead, data are conventionally collected for a representative sample of
households The behaviour of some households in the sample may appear inconsistent
to the analyst in terms of his assumed model of behaviour Such observed
inconsistencies in water source choice behaviour are assumed to result from random
disturbances (Ben-Akiva and Lerma, 1985) The indirect utility function is thus
typically assumed to have two components a random term and a systematic (or
observed) term The addition of this random term results in "a random utility
function", and the utility a household derives from a water source selection decision
becomes a random variable For example, let V be the systematic term, and e be the
random term The random utility function associated with source i is given by
U ,h = VIh + e,11 (2.11)
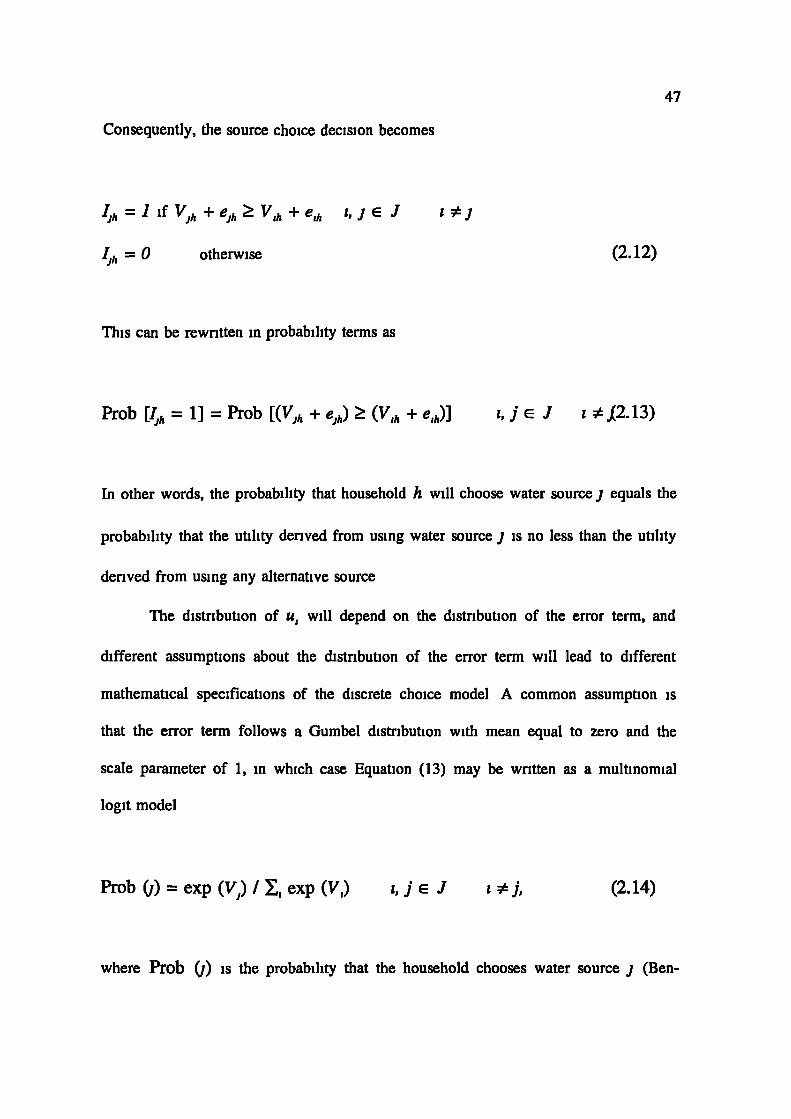
47
Consequently, the source choice decision becomes
'jh = 1 if VJh + ^ V,h + e,h 1, J E J
1^j
= 0 otherwise (2.12)
This can be rewritten in probability terms as
Prob ['jh = 1] = Prob [(VJh + eJh) ^ (V,h + e111)]
i, j E J i ^J2.13)
In other words, the probability that household h will choose water source j equals the
probability that the utility derived from using water source j is no less than the utility
derived from using any alternative source
The distribution of u1 will depend on the distribution of the error term, and
different assumptions about the distribution of the error term will lead to different
mathematical specifications of the discrete choice model A common assumption is
that the error term follows a Gumbel distribution with mean equal to zero and the
scale parameter of 1, in which case Equation (13) may be written as a multinomial
logit model
Prob (j) = exp (Vi) I exp (V,) i, j E 1 i ^ j, (2.14)
where Prob (j) is the probability that the household chooses water source j (Ben-
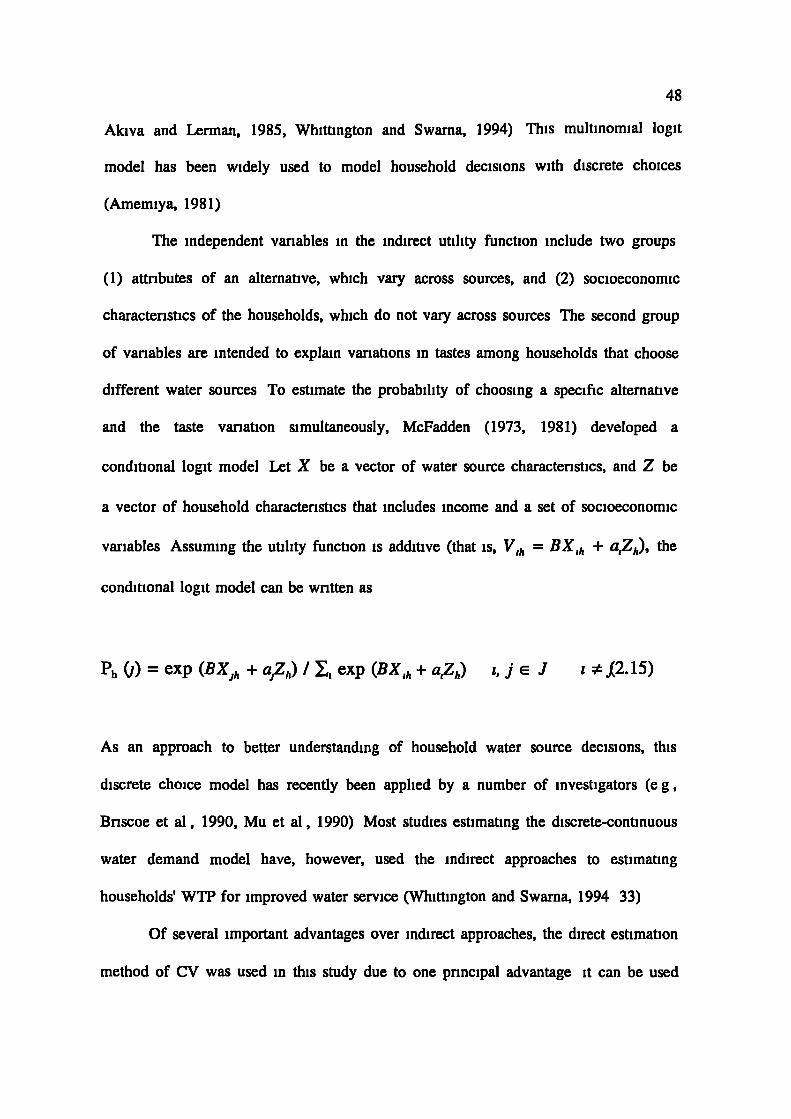
48
Akiva and Lerman, 1985, Whittington and Swarna, 1994) This multinomial logit
model has been widely used to model household decisions with discrete choices
(Amemiya, 1981)
The independent variables in the indirect utility function include two groups
(1) attributes of an alternative, which vary across sources, and (2) socioeconomic
characteristics of the households, which do not vary across sources The second group
of variables are intended to explain variations in tastes among households that choose
different water sources To estimate the probability of choosing a specific alternative
and the taste variation simultaneously, McFadden (1973, 1981) developed a
conditional logit model Let X be a vector of water source characteristics, and Z be
a vector of household characteristics that includes income and a set of socioeconomic
variables Assuming the utility function is additive (that is, V1h = BX 1h ^ a,Zh), the
conditional logit model can be written as
h (3) = exp (BXJh + aZ,1) I exp (BXIh + a,Zh) i, j E J ^ j2.15)
As an approach to better understanding of household water source decisions, this
discrete choice model has recently been applied by a number of investigators (e g,
Briscoe et al, 1990, Mu et al, 1990) Most studies estimating the discrete-continuous
water demand model have, however, used the indirect approaches to estimating
households' WTP for improved water service (Whittington and Swarna, 1994 33)
Of several important advantages over indirect approaches, the direct estimation
method of CV was used in this study due to one principal advantage it can be used
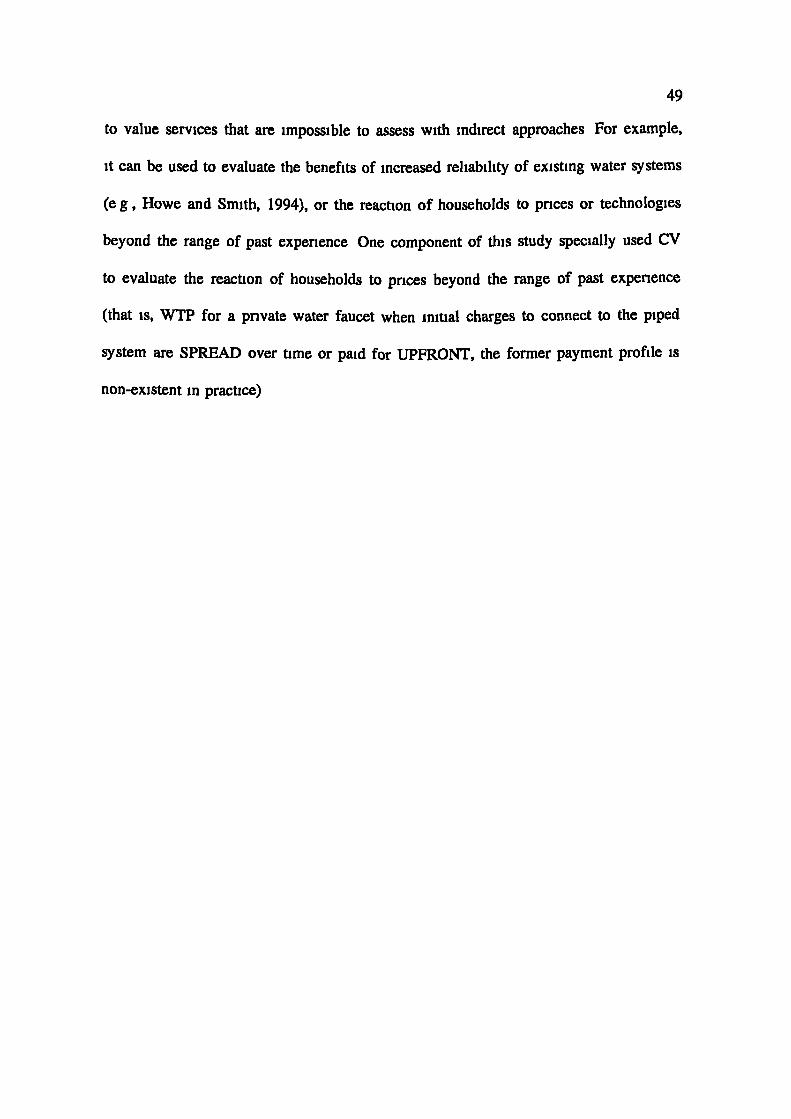
49
to value services that are impossible to assess with indirect approaches For example,
it can be used to evaluate the benefits of increased reliability of existing water systems
(e g, Howe and Smith, 1994), or the reaction of households to prices or technologies
beyond the range of past experience One component of this study specially used CV
to evaluate the reaction of households to prices beyond the range of past experience
(that is, WTP for a private water faucet when initial charges to connect to the piped
system are SPREAD over time or paid for UPFRONT, the former payment profile is
non-existent in practice)

50
CHAPTER ifi
REVIEW OF THE LITERATURE
3.1 INTRODUCTION
In an effort to shed light on the central themes of the study, this chapter reviews
related literature on the topic Cost-Benefit Analysis as an aid in decisionmaking and
the problem of non-market goods is the subject of Section 3 2 This naturally leads to
the consideration of the methodological issues within the valuation (CV) technique,
with particular emphasis on structural biases, WTP/WTA disparity, and embedding
effect (Section 3 3) In Section 3 4, the focus is on CV applications in evaluating river
water quality improvements
As the CV study reported in this dissertation is set in Kenya, Section 3 5
presents developing country applications of the CV method whilst Section 3 6 is on
frequency information as a dimension in decision making Section 3 6 specially deals
with potential "Third World" effects of frequency of payments in CV designs Section
3 7 not only reviews further CV studies on water resources issues in developing
countries, but also discusses elements of pricing water services in such economies The
last section is a brief appraisal of the whole chapter
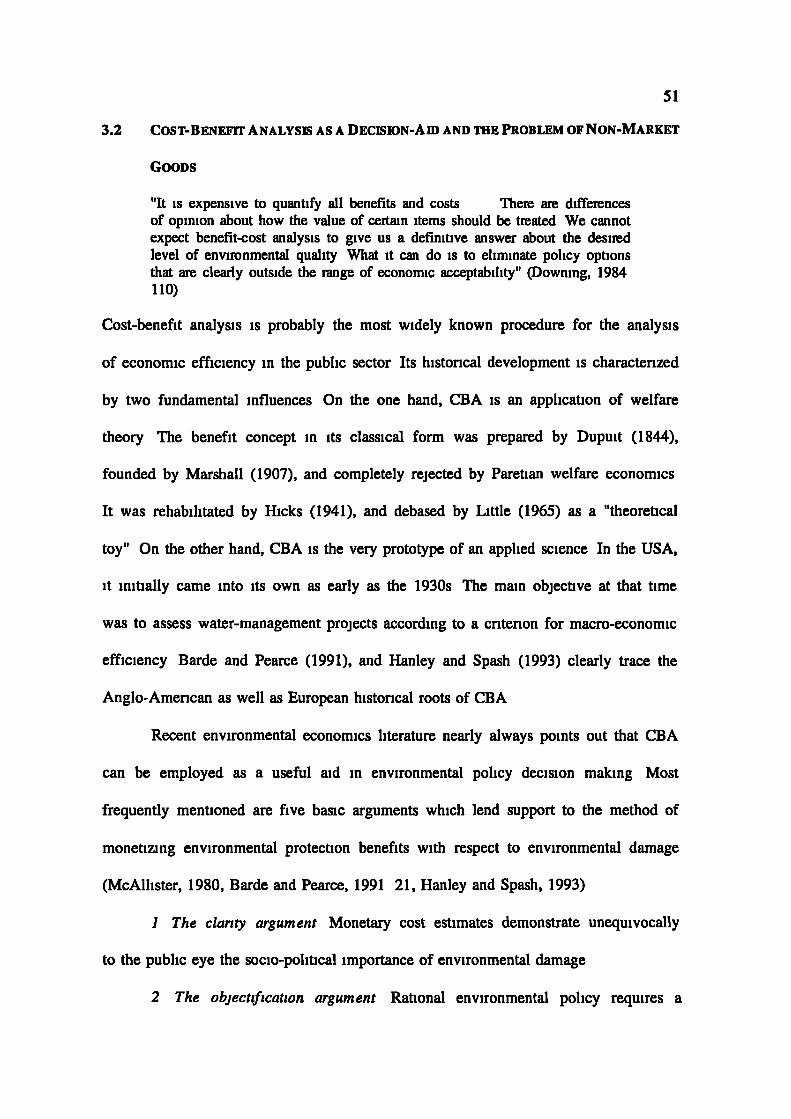
51
3.2 COST-BENEFIT ANALYSIS AS A DEcisIoN-Am AND THE PROBLEM OF NON-MARKET
GOODS
"It is expensive to quantify all benefits and costs There are differencesof opinion about how the value of certain items should be treated We cannotexpect benefit-cost analysis to give us a definitive answer about the desiredlevel of environmental quality What it can do is to eliminate policy optionsthat are clearly outside the range of economic acceptability" (Downing, 1984110)
Cost-benefit analysis is probably the most widely known procedure for the analysis
of economic efficiency in the public sector Its historical development is characterized
by two fundamental influences On the one hand, CBA is an application of welfare
theory The benefit concept in its classical form was prepared by Dupuit (1844),
founded by Marshall (1907), and completely rejected by Paretian welfare economics
It was rehabilitated by Hicks (1941), and debased by Little (1965) as a "theoretical
toy" On the other hand, CBA is the very prototype of an applied science In the USA,
it initially came into its own as early as the 1930s The main objective at that time
was to assess water-management projects according to a criterion for macro-economic
efficiency Barde and Pearce (1991), and Hanley and Spash (1993) clearly trace the
Anglo-American as well as European historical roots of CBA
Recent environmental economics literature nearly always points out that CBA
can be employed as a useful aid in environmental policy decision making Most
frequently mentioned are five basic arguments which lend support to the method of
monetizing environmental protection benefits with respect to environmental damage
(McAllister, 1980, Barde and Pearce, 1991 21, Hanley and Spash, 1993)
1 The clarity argument Monetary cost estimates demonstrate unequivocally
to the public eye the socio-political importance of environmental damage
2 The objectification argument Rational environmental policy requires a
52
careful weighing of the advantages against the disadvantages of environmental
protection Those who advocate less environmental protection do so by heaping
staggeringly high costs on to one side of the scale On the other side, however,
champions of more environmental protection often have only verbal arguments at their
disposal, these scarcely provide a good counterbalance to offset the burgeoning costs
cited by opponents of increased environmental protection
3 The dosage argument Available funds for environmental protection should
be applied (dosed) in such a way as to ensure that the greatest amount of surpluses
(benefits minus costs) will be achieved However, these surpluses can be calculated
only when the amount of the environmental damage costs avoided is known
4 The intemalizability argument Insofar as an economically optimal
internalization of external effects via environmental charges is desirable, then
extensive information is required on the reported net amount in monetary terms of
environmental damage caused
5 Correcting the gross national product (GNP) It is increasingly argued that
the GNP, traditionally the measure of societal affluence and economic growth, should
be supplemented with additional data In keeping with this aim, an expanded system
of national accounting is envisaged which would include environmental as well as
human health damage This kind of national income accounting is only reliable
however if, for instance, environmental damages can be measured in monetary terms
As noted, environmental economics and particularly CBA has recently been
shown to play a seminal role in incorporating environmental imperatives into decision
making and in facilitating more efficient management of natural resources as a
stepping-stone on the path to sustainable development (Munasinghe, 1993, Cropper

53
and Oates, 1992, Lutz and Young, 1992) This is so in so far as the field has
developed techniques for valuing nonmarketed goods, inputs and outputs, and
externalities (especially environmental impacts) Despite this, the extensive theoretical
and empirical literature on economic valuation of environmental programmes and
projects in industrial nations of Western Europe and the USA (e g Hanley and Spash,
1993, Barde and Pearce, 1991) compares very unfavourably with the few studies on
developing nations (LDCs)
The studies by Bojo (1991) and Peters et cii (1989) in Lesotho and on the
Amazonian rainforests of Brazil, respectively, involved the implementation of general
Cost-Benefit Analysis (CBA) principles to environmental management However, in
an apparent support for van Pelt (1993), Meier and Munasinghe (1992) use a
multicritena analysis (MCA) to incorporate nonvalued environmental considerations
into energy decision making in Sri Lanka Van Pelt (1993) shows that although CBA
has been used most frequently, its usefulness in sustainability-oriented project
appraisal in LDCs is limited As MCA can utilize qualitative data (such as knowing
whether a project's impact will be environmentally "good" or "bad"), the author rightly
contends that it (that is, MCA), is a more appropriate alternative or complementary
project appraisal tool in LDCs where data base on environmental impacts is weak,
economic activities are directly dependent on natural resources, and distribution
concerns are strong Operationally, MCA involves adopting a number of criteria for
project selection, which might include efficiency, equity and meeting a sustainabihty
constraint
It is difficult to disagree with van Pelt given the well-known environmental
limits to CBA, namely, valuation of nonmarket goods, institutional capture, ecosystem

54
complexity as well as discounting, uncertainty and irreversibility of environmental
effects (Pearce, 1976, Hanley, 1992, Hanley and Spash, 1993 p 261-74) Nonetheless,
current efforts to refine approaches for estimating costs and benefits related to
consumption or production of environmental/public commodities (such as the travel
cost method, hedonic property method, and contingent valuation, CV) are of vital
importance and should be encouraged Unlike MCA and Environmental Impact
Assessment (EIA) which have often been presented as the alternatives' 2, CBA is a
useful filter in public decision-making machine since it enables the analyst to delineate
both the opportunity cost and the most efficient way of undertaking a particular course
of action Furthermore, the CBA programme offers a formal methodology of laying
out the pros and cons of undertaking a project CBA critiques should take cognisance
of the on-going developments in resolving some of its problem areas The CV method
in particular, is regarded as an aid to the policy process rather than a replacement for
it altogether' 3, its loose purpose is to make the process more participative by drawing
in the 'valuations', 'opinions' and even 'feelings' of a relatively large number of
individuals
' 2The other alternative framewoiks for generating and pmsenting infomiation for policymaking in development and environmental management are nsk-benefit analysis, impactassessment (involving environmental impact analysis and economic impact analysis), costeffectiveness analysis, multicntena analysis, and national and environmentally adjustedeconomic accounts
' 3Critics of CV might believe I have conceded too much hem if ethodologicalpluralism' holds sway and CV is competing with other inputs to the policy process, then thefinal decision will be indeteiminate But if CV was the unique, deteiminate decision processthen it would be (nghtly) labelled 'impenalistic' by the same cntics For policy pulposes, itwould be pointless to propose the grafting of a decision procedure onto existing stnictureswhich ignores the inevitable political cloudiness surrounding final policy choices Thiscloudiness is presumably the mason why no sensible alternative proposed to CV provides adeteim mate decision either

55
3.3 METHODOLOGICAL ISSUES WITH THE CONTINGENT VALUATION TECHNIQUE
3.3.1 LINKING CONTINGENT VALUATION THEORY WiTh EXPERIMENTAL FRAMEWORKS
If one considers the relationship between Chapter 2 and the massive contingent
valuation (CV) literature, one is likely to see that evaluations of estimates of
willingness to pay (WTP) fall into five experimental frameworks' 4 These are
(a) the descriptions used to characterise the change from Q0 to Q1 (Brookshire et
al, 1980, Bergstrom et al, 1989, for Instance),
(b) the consistency over time in WTP values reported by similar individuals for
a given change in Q (e g, Loomis, 1989, 1990, Kealy et a!, 1990, Whittington
etal, 1992),
(c) the procedure used to elicit WTP, such as bidding game, direct question, use
of payment card, etc, or in the case of CV formulations and quantity change,
discrete choice, ranking, or conjoint matching procedures for contingent
behaviour questions (Desvousges et al, 1987, Smith et a!, 1986 as examples),
(d) the other conditions (e g, values for P or SDE) that might influence an
individual's WTP for a change in Q (like Smith and Desvousges, 1987), and
Ce) the temporal dimensions of the valuation (or payments), whether daily, weekly,
'4CV evaluations usually involve one or more of the following seven research protocols(Smith, 1993 80 (a) comparison of indirect and CV estimates of the value of some changein an environmental resource, (b) use of constmcted markets in which commodities notusually sold are offered for sale and the results compared with CV estimates for the samecommodity, (c) evaluation of CV for measuring the demand for actual marketed commoditiesof programmes in comparison with actual demands, (d) test-retest comparisons of the stabilityof CV estimates from the same sample over time, (e) creation of laboratory experiments inwhich hypothetical and actual sales of commodities am undertaken, (f) surveys of purchaseintentions and actual sales of commodities, and (,g) nonparametnc "tests" of the consistencyof CV and travel cost estimates with the strong axioms of revealed preference theory It is onthe basis of these cntena that the perfoimance of CV in eliciting satisfactory estimates ofpublic and environmental goods has shown the methodology to be a progressive scientificresearch programme in the sense of Lakatos (1970)

56
monthly, or annually (Schulze, 1992)
As the last variation has received little attention in CV research, this study's
experimental design explicitly considers its effects on CV estimates of household
WTP Note that the definitions of the terms here are equivalent to those in Chapter 2
Q0and Q1 represent initial and subsequent quality levels, vector P represents the prices
of all other goods and services, SDE refers to other socio-demographic and economic
factors that might influence the household's ability to pay or constrain its behaviour,
and finally Q is the character of the commodity of interest (in this case it is improved
water quality in the Nzoia and a household connection to piped water) The next Sub-
Sections survey structural biases, WTPIWTA disparity and embedding effect as special
CV research questions
3.3.2 STRUCTURAL BIAsFs AND THE WTA/WTP DISPARITY
Structural biases and the disparity between WTP and willingness to accept (WTA) or
demand compensation as measures of valuation are two key areas in CV research
There are four types of structural biases which have been of primary pre-occupation
for researchers involved with experimental studies related to the development of the
CV method The biases have been argued to emanate from such aspects as starting
points, choice of payment vehicles, strategic behaviour and information Consequently,
the potential structural biases in CV-derived value measures are strategic and
hypothetical bias, bias due to choice of starting point and valuation question format,
and influence of variations in information sets and nature of payment vehicle See
Freeman (1979), Cummings et al (1986), Mitchell and Carson (1989), Cambridge
Economics (1992), Hanley and Spash (1993), and Hausman (1993) for details and

57
original research papers
Besides bias due to the structure of CV surveys, much of the earlier criticism
of CV (through the 1970s and 1980s) focused on the disparity between willingness-to-
pay (WTP) and willingness-to-accept (WTA) values in survey instruments involving
the same good In seeking economic valuations or welfare measures, individuals may
be asked to state the maximum they would be willing to pay (WTP) for a particular
good or service Alternatively, they could be asked to state the minimum amount they
would require in compensation (WTA) if the good or service was removed'5
A common interpretation of economic theory suggest that WTP and WTA, in
response to a price or quantity change, should only differ by an income effect
Otherwise, the two measures of welfare change should be similar in magnitude for
most goods (e g, Wilhg, 1976, Just et at, 1982, Freeman, 1979) But, repeated
experimentation has shown that values of WTP and WTA for the same commodity can
be vastly different In fact, WTA values of three to five times W'I'P values have
become a rule rather than the exception This view has become established from
experimentation using hypothetical goods, actual market transactions, goods which are
known to the consumer and priced in a market, and goods which are not traditionally
priced in a market
A variety of possible explanations for the apparent anomaly, between this
interpretation of economic theory and CV empirical results, have been presented in the
literature These range from those which support traditional economic theory and claim
iSwrA iquiics an individual to accept compensation for giving up a good, while for thesame good, WTP requires the individual to decide on a sum that they are willing to pay toacquire the good Adamowicz et at (1993) and Shogren et at (1994) provide satisfactorystarting points for the discussion on WTP/WTA disparity upon which this dissertation Justmentions

58
that the difference is a function of the empincal procedures involved in eliciting WTP
and WTA, to those which accept the empincal findings and then consider explanations
from psychological research For a detailed discussion on the explanations see
Adamowicz et al (1993) and Shogren et al (1994) Briefly however, four groups of
explanations can be discerned
One explanation for the WTP-WTA disparity appeals to problems in data
collection, interviewing technique, or questionnaire design used in administering the
CV method In particular, respondents of CV surveys may not have enough incentives
to give truthful answers A second group of explanations suggests that the WTA
measure is faulty due to two possible explanations One, consumers make cautious
valuations (Hoehn and Randall, 1987) Two, many respondents reject the property
right thesis implied by WTA-type questions on ethical grounds The idea that WTA
is often justified on the proportionately high number of protest bids and/or outliers that
normally characterise empirical work based on its format
The third group of reasons for the observed WTP-WTA differences resides in
the psychology-economics literature (Kahneman and Tversky, 1979, Kahneman et al,
1986) This mainly refers to the prospect theory The Kahneman and Tversky's
hypothesis involves the often observed condition that people may have different values
for losses and gains of the same magnitude "This would suggest, for example, the
separate indifference maps to illustrate acquisition and disposal decisions" (Knetsch
and Sinden, 1984 519f) The additional value attached to possession may be
considered an "instant endowment effect" (Kahneman et al, 1990) In other words, the
numerous protest bids and outliers in WTA formats are indicative of economists being
confronted with a problem that is beyond the conventional utilitanan framework.

59
The substitution-good hypothesis is yet another explanation According to this
theory, the existence of the WTP-WTA disparity can be attributed to lack of
substitutes for the commodity being valued Hanemann (1991 635) argues that "for
quantity changes, there is no presumption that WTP and WTA must be close in value
and, unlike price changes, the difference between WTP and WTA depends not only
on an income effect" He shows that where there is a perfect substitute for the good
being valued, W'l'P and WTA will be equal in the absence of an income effect
Conversely, when there are zero substitutes for the good, the difference between WTP
and WTA can be large Thus the difference depends on a parameter reflecting the
degree of substitutability of the good under valuation In this way, Hanemann
demonstrates that the bounds on compensating and equivalent variation developed by
Randall and Stoll (1980) are "consistent with substantial divergencies between WTP
and WTA" (Hanemann, 1991 636)16
In sum, there exist a number of competing theories which attempt to "explain"
the difference between WTP and WTA Some hold to economic arguments and
criticize the CV approach while others suggest that the phenomenon is a true
expression of valuation Fisher, McClelland and Schulze (1988) suggest that the
disparity is a function of both strategic behaviour and "loss aversion", although they
provide no rigorous empirical backing for this thesis Their argument is that
individuals value a given reduction in entitlements more highly than an equivalent
increase in entitlements As noted in Chapter One, this study uses WTP measure and
' 6Hanemann's model attempts to deal with the observed WTP-WTA disparity thmugh aline of inquiry that is well rooted in economics (i.e, substitute relationships) Although thisdoes not necessarily make Hanemann's theory supenor over the competing theories, itcertainly makes it more amenable to testing within an economic methodology (as inAdamovicz et a! 1993)

60
not WTA
3.3.3 EMBEDDING AND THE VALIDITY OF CONTINGENT VALUATION ESTIMATES
Embedding relates to tests of the validity of CV estimates, namely, to what extent
does the CV method produce different values in situations for which economic theory
suggests different values. For instance, economic theory predicts that respondents,
when valuing environmental goods, will respond to the neoclassical axiom of 'more
will always be better' a larger environmental good will be regarded more valuable
than a smaller one That is, under normal conditions it can be expected that
respondents are willing to pay more to clean up all the nation's lakes than to clean up
one specific lake Besides this, economic theory postulates that for environmental
goods which are substitutes and valued sequentially, the value of a good will be larger,
the earlier it appears in the sequence (Randall and Hoehn, 1989)
Whereas tests of the former assumption are usually labelled 'perfect
embedding', the influence of substitute goods are generally tested under the heading
of 'regular embedding' (Kahneman and Knetsch, 1992b, Hoevenagel, 1995) Carson
and Mitchell (1995) propose an alternative nomenclature that would separate true
embedding effects from other biases that nesting and sequencing appear to cause They
also argue for a set of standards to ensure that amenity mis-specification does not
occur when developing the CV survey instrument, thus reducing the possibility of
rendering the data collected to the embedding effect
The embedding proposition was first put forth by Kahneman (in Cummings et
a!, 1986), who found respondents in a telephone survey were WTP essentially the
same amount for all lakes in Ontario as for lakes in a small area of Ontario It is

61
important to note the distinction between part-whole bias as defined by Mitchell and
Carson (1989) and the embedding problem considered by Kahneman and Knetsch
(1992) Part-whole bias occurs when a respondent values a larger or smaller entity
(e g, geographic location, range of benefits, policy package) than that intended by the
researcher Part-whole bias is a common but avoidable obstacle in designing a CV
survey, and its avoidance is seen by Mitchell and Carson (1989) as a key element in
a survey designer's primary task, ensuring that the respondent is valuing the good
intended
In contrast, Kahneman and Knetsch (1992) seem to see embedding as an
indicator of the inevitable inability of respondents to rationally value public goods It
will be useful to state their definition of embedding "the same good is assigned a
lower value if WTP for it is inferred from WTP for a more inclusive good than if the
particular good is evaluated on its own" This definition is problematic because the
sequence in which goods are valued, substitution effects, and changes in the
composition of the choice set should make a difference in the agent's valuation Thus
embedding can only be seen as a distinct problem with CV if this so-called embedding
effect is much larger than that which can be explained by reference to plausible
economic effects, i e, the CV technique produces the effect while it is not seen in the
actual behaviour of consumers or voters' 7 The recent survey of empirical work on the
17 Because it is difficult to judge what the exact magnitude of these economic effectsshould be, a statistical test of either part-whole bias or embedding often sets out as its nullhypothesis that two related goods (where one encompasses the other) are valued identicallyby the respondents against the alternative that the good which encompasses the other is valuedmore highly (See research hypotheses in Chapter IV) Note however, the Mitchell and Carson(1989) framewoik suggests that while the null hypothesis may be accepted in a poorlydesigned CV study, it should be rejected by a well-designed CV survey The Kahneman andKnetsch framework, because it views the phenomena as "inevitable", suggests that the nullpostulate should always be accepted The difference between the two frameworks is thataccepting the null hypothesis under Mitchell-Carson framework implies a rejection of a

62
issue of scope in CV studies by Carson and Mitchell (1993) shows that sensitivity to
scope of CV estimates is a matter of survey design and administration
When referring to wilderness areas, perfect embedding is said to occur when
respondents' WTP values for preserving area A, are the same as their WTP values for
preserving areas A and B together, and areas A, B and C together (see Hamson, 1992,
Owen and Hanley, 1993) In a recent study, 18 Diamond et a! (1992) sought to obtain
WTP values for 3 wilderness areas, 1 and 2 together, and 1, 2, 3 together, and
individually Respondents were told that in order to lower the deficit, selective logging
nghts were to be sold in over 50 wilderness areas, resulting in requisite roading and
the presence of heavy machinery The Government was considering adding the three
named areas to this list The stated alternative was to impose a Federal income tax
surcharge (implies broad acceptance of the distribution of taxes) designated for
wilderness preservation They test the hypothesis that, "Stated WTP is the same for
preserving one, two or three wilderness areas" Neither parametric nor non-parametric
mean tests rejected this hypothesis
Using data gathered for the same wilderness areas McFadden and Leonard
(1992) test the embedding hypothesis using a double referendum elicitation method,
in which respondents are offered a second bid, conditioned on the response to the first
bid, a number of valuation questions are asked Valuation question DR1 seeks
household WTP regarding a 1 3 million acre area, DR2 seeks household WTP
regarding 57 wilderness areas including the 1 3 million acres, and DR3 seeks a
particular study whilst under the Kahneman and Knetsch framework it implies rejection of theCV methodology in its entirety
' 8The next three studies cited were financed by Exxon

63
valuation regarding the 1 3 million acres and 2 other similarly large areas The authors
could not reject the hypothesis that the value of the three areas was the same
Desvousges et al (1992) also found that the level of natural resource damage
appeared to have no significant effect on open-ended or dichotomous choice WTP
values The hypothetical scenario involved WTP for preventing 2,000, 20,000 and
200,000 migratory waterfowl from dying in waste-oil holding ponds scattered over the
south-western United States' 9 However, as respondents were told that 2000 birds was
much less than 1% of the migratory bird population, and 200,000 birds was about 2%,
it may have lead them to consider the programmes to be essentially the same (Arrow
etal, 1993)
Besides the studies in Cambridge Economics (1992), Owen and Hanley (1994)
test for embedding in the contingent valuation of biodiversity through UK Sites of
Special Scientific Interest (SSSIs) In their case study of Greenham Common SSSI in
Newbury district, the two goods that represent quantitative nesting are Greenham
Common and its unique species/habitat structure being one subset of all local SSSIs
and local biodiversity By comparing the bids for the two goods, A and B, A being
the biodiversity provision of all local SSSIs including the single SSSI and B being the
biodiversity provision of the single SSSI, an external test of component sensitivity is
'9Kahneman and Knetsch (1992) also test for and claim to find an embedding effectHowever, Harrison (1992) convincingly argues that their wodc fails to properly differentiatebetween morn and less inclusive levels of environmental protection such that K and K's lessinclusive good may well have been considered as identical by respondents to the morninclusive good
Hamson's own charactensation of how a rational agent would not increase the valueof a morn inclusive good over her/his WTP for the less inclusive good does not seem to beat all likely He says, Assume X and Y are virtually perfect substitutes for each other, thatX-i-Y = Z and my WTP for 1 unit of Z=$10, 1 unit of X=$10 and 1 unit of Y=$10 "[I]f youasked me to value one unit of Y fter asking me to value one unit of X, then I would valueY at $0" Does this not imply that 1 unit of either X or Y satiates')

64
conducted In conclusion, the CV method "fails the test of component sensitivity
Respondents' valuations of the value of preserving one SSSI were insignificantly
different from valuations of the value of preserving all local SSSIs on the evidence of
both paired tests (parametric and non-parametric), and a bid curve estimated using a
Tobit ML procedure" (p 19)
The evidence of embedding presented in Cambridge Economics (1992) and in
Owen and Hanley (1994) is the most damaging to CV in the recent past As noted, it
clashes with the fundamental proposition of economics, that more of a good is
preferred to less To critics the embedding effect implies that the CV method does not
measure economic preferences and therefore should not be used in natural resource
damage assessments (e g, Desvousges et a!, 1992, 1993, Diamond et al, 1992, 1993,
Kemp and Maxwell, 1993, Binger et al, 1995) Several explanations have been put
forward to explain these findings and three hypotheses can be distinguished Mental
Accounting/Good Causes Dump Hypothesis (attributed to Kahneman and Tversky,
1984), Moral Satisfaction Hypothesis, Misperception Hypothesis Detailed explanations
of these reasons can be found elsewhere (especially in Hanley and Spash, 1993,
Hoevenagel, 1996 or the original articles) Nevertheless, a brief outline of the
explanations follows
1 Mental Accounting-Good Causes Dump Hypothesis According to this
postulate, people have a set of 'mental accounts', one of which may be for
environmental issues or, more generally, for good causes, this explanation stems from
some researchers interpretation of Kahneman and Tversky's (1984) findings Therefore,
respondents, when asked to value a specific environmental good, will dump everything
in their 'good causes account' or 'environmental account' into the required WTP value

65
irrespective of the description of the environmental good of interest
2 Moral Satisfaction Hypothesis This hypothesis has been put forward by
Kahneman and Knetsch (1992) in a way to explain their perfect embedding results
According to these authors, responses in CV surveys represent a willingness to get a
sense of moral satisfaction through the hypothetical payment to the provision of
environmental goods, rather than a measure of economic value As claimed by these
authors, an interesting feature of this hypothesis is that the moral satisfaction related
to payments to an inclusive cause, for example, saving all endangered species, extends
with little loss to any significant subset of that cause, for example saving the Chinese
Panda
3 Misperception Hypothesis Mitchell and Carson (1989) explained perfect
embedding on the basis of respondents' misperception of important aspects of the
constructed market and the environmental good to be valued According to these
authors there is a considerable potential for respondents to ignore (important) details
in a CV scenario because they lack articulated values for many of the goods valued
and because they have "a natural inclination [to] think of a CV survey as an ordinary
public opinion survey" (Mitchell and Carson, 1989 p 250) Only through careful
design, which includes the use of focus groups and pretesting, they argue could such
important misperception biases be overcome
There is a clear difference between the hypotheses defined above whereas the
mental accounting and moral satisfaction hypothesis imply that, because of the
hypothetical character of the CV method, respondents will always express similar
WTP values across related (embedded and inclusive) goods, the misperception
hypothesis claims that perfect embedding can be overcome by improved design

66
Proponents of the CV method generally disregard the studies that have reported perfect
embedding (such as those in Cambridge Economics, 1992) on the basis of improper
design (Smith, 1992, Arrow, 1993, Carson and Mitchell, 1993)
For example, Arrow et al (1993) note that the survey used by Desvousges et
al (1992) and Diamond et al (1992), may not have adequately differentiated between
the goods being valued The survey related to migratory birds dying in oil filled
ponds In this study respondents were told that 2,000 birds was much less than I % of
the migratory bird population, and 200,000 birds was about 2% This could have
resulted in respondents considering both goods to be roughly the same Likewise in
the Diamond et al (1992), the three wilderness areas constituted I in 57 areas
individually and 3 in 57 together To the extent that respondents saw the survey from
this perspective, they may have seen very little difference between the value of 1, 2,
or 3 areas, i e. in each case it is a very small part of the whole

67
3.4 APPLYING CONTINGENT VALUATION TO RIvER WATER QUALITY
Proponents of Cost-benefit analysis (CBA) believe it constitutes a valid decision
support tool for gauging the performance of water policies CBA, they argue,
facilitates decisions that account for economic and political effects through identifying
the value of a policy or expenditure to both direct, intended audience and to any
indirect audiences (Peskin and Seskin, 1975, Dasgupta and Pearce, 1978, Campen,
1986, Hanley and Spash, 1993)
In water resource management, the United States River and Habor Act of 1902
was one of the first impositions of cost-benefit criteria on public water projects The
Act required the Army's Corps of Engineers to evaluate navigation projects in a way
that identified both commercial benefits and their costs The Flood Control Act of
1926 took the River and Harbor Act further by stating explicitly the criteria that
benefits must exceed costs for public projects
However, until the publication of the Proposed Practices for Economic A nalysis
of River Basin Projects (the "Green Book") in 1950 by the US Federal Inter-Agency
River basin Committee subcommittee on benefits and costs, the technical and
theoretical development of CBA had followed an intuitive and political course The
outcome of CBA was not so much aimed at discovering those projects that best served
the affected public, but rather at discovering the approach to a politically desirable
project that was justifiable Identification of costs and benefits and their treatment was
largely a seat-of-the-pants process The Green Book was the first codification of the
economic principles relevant to proper CBA It was superseded by Budget Circular A-
47 in 1952 and later by the US President's Water Resources Council's Policies,
Standards, and Procedures in the Formulation, Evaluation, and Review of Plans for

68
Use and Development of Water and Related Land Resources in 1962
3.4.1 PERCEPTIONS, VALUES, AND BENEFITS OF IMPROVEMENTS
As noted, the fundamental role of CBA is to establish principles by which the costs
and benefits of any public programme are measured However, many of the
components of costs and benefits are not exchanged in markets and thus have no well-
defined prices In addition, many markets contain distortions -- taxes, subsidies,
quotas, monopoly, monopsony -- that make the prices misrepresentative of the
resource-scarcity or shadow pnce of the commodities exchanged
In the field of CBA application in environmental quality, there are many
studies on the problems of measuring abatement costs (e g, Peskin and Seskin, 1975)
On the other hand, measuring benefits from improving environmental quality is
difficult because most of these benefits must be imputed by CBA techniques Some
benefits routinely evaluated for cost benefit studies of pollution are the value of life
(mortality and morbidity), the value of intangibles such as the quality of life, the value
of the natural environment (air and water quality), and property values
The parameters that have been used to measure water quality include the
oxygen demand of organic wastes as they are decomposed, suspended solids, toxic
chemicals, and temperature It is in the relationship between a change in environmental
services and change in economic welfare or benefits of abatement that economic
valuation becomes important (e g, Trihey and Stalnaker, 1985, Cavendish and Duncan,
1986, Priscoli, 1987) For instance, Trihey and Stalnaker (1985) state that the results
of their studies on the value of fisheries resources ultimately will need to be compared
with results of other studies on the value of rnstream and out-of-stream uses

69
Through its capacity to measure total economic value, the Contingent Valuation
(CV) method provides a versatile approach to underpinning such values as well as
enhancing an inter-disciplinary discourse on managing environmental and public
goods Benefits from a change in water quality depend on an individual's utility
function2° Table 3 1 shows the types of benefits which might accrue from improved
water quality In the presence of uncertainty, CV obtains an estimate of the difference
between two planned expenditure functions, an cx ante welfare measure which is
referred to as option price (Smith, 1987) Several benefit categories, particularly those
making up the nonuse (i e, existence) class of benefits, may show no traces in
marketplace transactions There are reasons to believe that this class of benefits may
comprise a sizable portion of total water quality benefits (Fisher and Raucher, 1984)
Among benefit measurement methods, the CV technique is uniquely able to measure
nonuse benefits since it can elicit values from both users and nonusers of a given
amenity
20The utility function, as usual, includes all sorts of things, but economists assume itincludes some measui of water quality, and option and preservation values Option andpreservation values arise when an environmental asset, say a particular wilderness area, hasalternative uses Preservation values include bequest and existence values Bequest values arethe willingness to pay for the satisfaction denved from having one's heirs and futuregenerations in general enjoy environmental services Existence values are what people arewilling to pay just to know that the environmental asset is preserved, even if they do notintend ever to directly consume those services

70
Table 3 1 A Typology of Benefits From an Improvement in Freshwater Quality
Use Instream Recreational (water skiing, fishing, swimming, boating)
Commercial (fishing, navigation)
Withdrawal Municipal (drinking water, waste disposal)
Agriculture (irrigation)
Industrial/commercial (process treatment, waste disposal)
Aesthetic Enhanced near water recreation (hiking, picnicking,
photography)
Enhanced routine viewing (commuting, office/home
views)
Ecosystem Enhanced recreation support (duck hunting)
Enhanced general ecosystem support (food chain)
Nonuse Vicarious Significant others (relatives, close friends)
consumption Diffuse others (American public)
Stewardship Inherent (preserving remote wetlands)
Bequest (family, future generations)
Source Carson and Mitchell (1993) p 2446 Table I

71
Recreational use of water has significant economic value Freeman (1992), for
example, implies that movement from 1972 U S water quality baseline to the level
attainable using best available technology for reducing water pollution would provide
annual benefits of $20 1 billion, with lower and upper bounds of $8 2 and $39 1
billion Freeman's estimates include benefits from commercial use and marine
recreation They are based on a careful synthesis of prior studies (e g, Freeman, 1979),
with some key recreation data dating from 1972
Should technical measures such as biological oxygen demand, suspended
solids, and toxic chemicals be used in the analysis of water use 9 It is most unlikely
that most recreational users will be able to evaluate these measures But does this
matter9 People may not know the precise pollution components of the water but their
perceptions of whatever it is that determines water quality may correspond to the
technical measures David (1971) surveyed individuals in Wisconsin to find their
perception of water quality People tended to look at characteristics such as algae
content (green scum), murkiness, odour, and debris in the water But when people's
perceptions of what constituted "polluted water" (and variations in polluted water)
were matched with scientific determination of degrees of polluted water using
objective criteria, a close correlation resulted Other studies have not had such positive
results
How has water quality and option value been estimated 7 The CV study by
Greenley et al (1981) contains measures of people's willingness to pay for
improvements in water quality and the option and preservation values associated with
a choice of use of a particular recreational site The site is the South Platte River
Basin in Colorado In this case, a hypothetical decision was to be made about whether

72
to continue to use the basin for recreation or to allow mineral and energy
development to occur Mineral development would irreversibly degrade the water
quality of the river
The authors first measure the implicit benefits of water quality improvements
along the basin and then measure option and preservation values The technique used
in each case is sampling of people's willingness to pay A random sample of 202
households in two cities in Colorado were interviewed in the summer of 1976 There
was little evidence of sample bias or any strategic behaviour on the part of the
individuals questioned People were asked what they would be WTP for incremental
improvements in water quality and for the option of maintaining the river at the
highest quality attainable, rather than allowing mineral development to proceed
immediately They were told that the decision to start mining could be made in the
future two types of payment were proposed -- incremental increases in sales taxes for
the state, or an increase in the water and sewer fees paid by all residences The funds
collected were to go improving water quality These fees were chosen because they
were familiar to individuals and seen as a practical means of financing improvements
To determine different levels of water quality, people were shown colour
photographs of three sites that represented the range of quality They were also given
technical information about the pollutants (heavy metals) present in the three sites The
photos allowed people subjectively to evaluate certain aspects of water quality (algae,
debris), but not others (odour) They were asked what they would be WTP to increase
quality to the highest level shown in the photographs by 1983 Eighty percent of those
sampled were willing to pay to increase water quality On average, these people were
willing to incur an additional $57 per year through an increase in the rate of the state

73
sales tax to have water quality at the highest attainable level The amount they were
WTP through an increase in water and sewer fees was much smaller
The authors feel the divergence between the two forms of payment may be due
to considerations of equity (or spreading the payments over a broader group of
people) The sales tax would be paid by residents of the state and by out-of-state
tourists who visited the site Only residents pay the water and sewer fees There had
also been a recent increase in the water and sewer fees, and people were perhaps more
sensitive to that form of financing What is important to note is that the method of
financing changes in water quality will influence WTP for the improvements
To determine option values, people were asked if they preferred preserving the
river basin at the highest quality or permitting mineral development They were told
that if mineral development occurred recreational use of the basin would end If they
chose to preserve the site, they were asked how many additional cents per dollar of
sales tax they would be WTP to postpone any development decision to the future
Eighty percent of the sample expected to use the site for recreation, 60 percent
of the total sample had a positive option value Twenty percent had zero option value
because, although they intended to use the site for recreation, they did not believe that
the pollution would affect their use The remaining 20 percent also had a zero option
value because they did not intend to visit the site for recreation The average option
value for the 80 percent who intended to use the site came to $23 per year
Preservation values were calculated at an average of $42 per year per household
increase in sales taxes when the 20 percent who did not intend to use the site for
recreation were included These people were WTP for the option of having the site
preserved for future generations and simply to have the site there When the

74
preservation values for only those using the site are averaged, the increase in the sales
tax comes to $67 per year per household
When these values are applied to all households near the river basin, the total
benefits of an improvement in water quality came to $61 million per year, of which
$264 million represented direct improvements in water quality, $10 5 million the
option values, $144 million existence value, and $9 8 million bequest value These
benefits suggest a strong WTP for improvements One can criticize the techniques
used to obtain the numbers, but the numbers provide a basis with which to compare
the actual costs of abatement Table 3 2 shows examples of CV studies on river
quality improvements
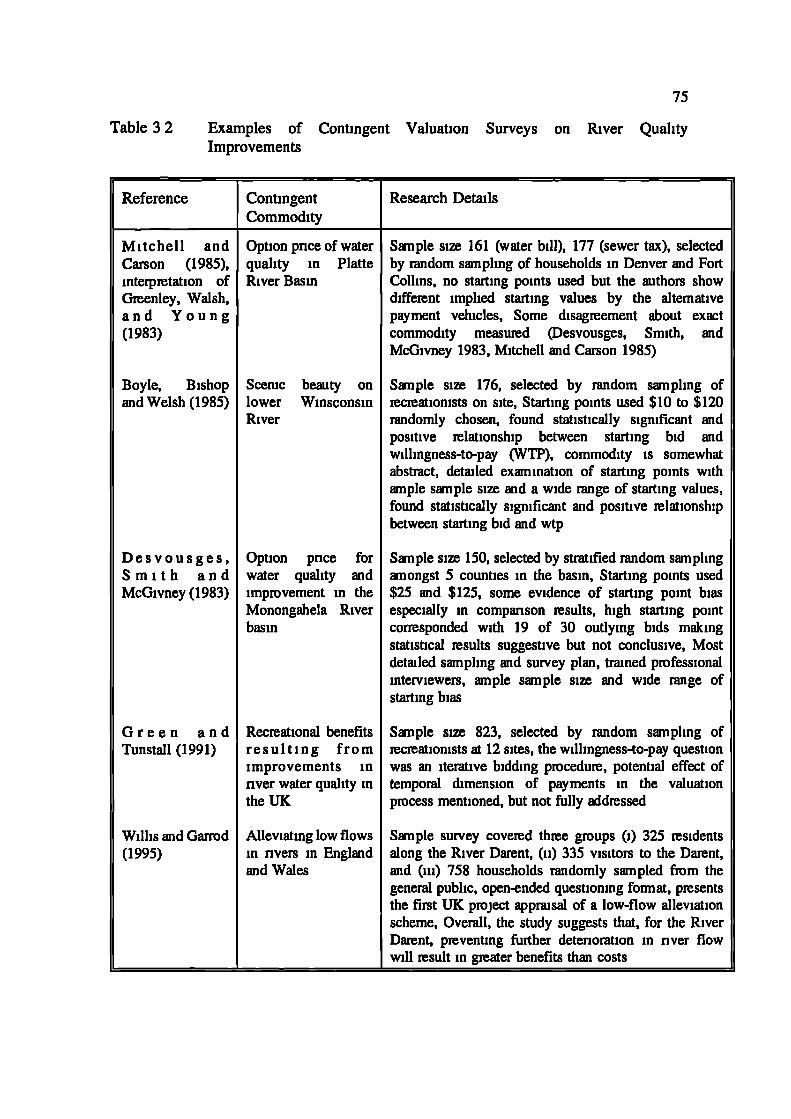
75
on River QualityTable 3 2
Reference
Examples of Contingent Valuation SurveysImprovements
Contingent Research DetailsCommodity
Mitchell andCarson (1985),inteipretation ofGreenley, Walsh,and Young(1983)
Boyle, Bishopand Welsh (1985)
Desvousges,Smith andMcGivney (1983)
Option pnce of water Sample size 161 (water bill), 177 (sewer tax), selectedquality in Platte by random sampling of households in Denver and FortRiver Basin Collins, no starting points used but the authors show
different implied starting values by the alternativepayment vehicles, Some disagreement about exactcommodity measured (Desvousges, Smith, andMcGivney 1983, Mitchell and Carson 1985)
Scenic beauty on Sample size 176, selected by random sampling oflower Win sconsin recreationists on site, Starting points used $10 to $120River randomly chosen, found statistically significant and
positive relationship between starting bid andwillingness-to-pay (WTP), commodity is somewhatabstract, detailed examination of starting points withample sample size and a wide range of starting values,found statistically significant and positive relationshipbetween starting bid and wtp
Option pnce for Sample size 150, selected by stratified random samplingwater quality and amongst 5 counties in the basin, Starting points usedimprovement in the $25 and $125, some evidence of starting point biasMonongahela River especially in comparison results, high starting pointbasin corresponded with 19 of 30 outlying bids making
statistical results suggestive but not conclusive, Mostdetailed sampling and survey plan, trained professionalinterviewers, ample sample size and wide range ofstarting bias
G r e e n a n d Recreational benefits Sample size 823, selected by random sampling ofTunstall (1991) resulting from recreationists at 12 sites, the willingness-to-pay question
improvements in was an iterative bidding procedure, potential effect ofnver water quality in temporal dimension of payments in the valuationthe UK process mentioned, but not fully addressed
Willis and Garrod Alleviating low flows(1995) in nvers in England
and Wales
Sample survey covered three groups (i) 325 residentsalong the River Darent, (ii) 335 visitors to the Darent,and (iii) 758 households randomly sampled from thegeneral public, open-ended questioning fomiat, presentsthe first UK project appraisal of a low-flow alleviationscheme, Overall, the study suggests that, for the RiverDarent, preventing further detenoration in nver flowwill result in greater benefits than costs

76
3.4.2 NATIONAL BENEFiTS AND COSTS
Until recently estimates were unavailable on how much planned investments would
improve river water quality in ecological or other terms and on the economic valuation
that a nation would place on such improvements Those who would estimate the
economic benefits of national water pollution control programmes face a dilemma On
the one hand, data at the national level have thus far been lacking or are untrustworthy
(Dorfman, 1977, Feenberg and Mills, 1980, Freeman, 1982)
On the other hand, studies that have valued "local" water bodies such as river
basins or lakes, while more numerous (e g, Greenley et al, 1982) are at best, of
limited use in determining the benefits of national water quality policy changes
Theoretical work by Hoehn and Randall (1989) demonstrates that independently
derived benefit estimates for geographic locations or categories of benefits which are
potential substitutes or complements for each other can not be aggregated to obtain
national benefits in a straightforward manner Hoehn (1991) provides additional
theoretical discussion on this issue and provides empirical evidence that performing
such an aggregation may result in a significant overestimate of total benefits
However, one approach used by national studies2' (e g, Carson and Mitchell,
1991, 1993) considers a 10-step water quality ladder which relates physical
characteristics of water quality to approximate changes in typical uses that are
21The approach of national CV studies has a number of ments Firstly, it avoids thegeographical aggregation problem by using a survey in which a countiywide probabilitysample of (say, U S, UK or Kenya) households are asked to value a national set of waterquality improvements In teims of the Carson and Mitchell (1991, 1993) study, it avoids theproblem of benefit categoiy (e g, fishing aesthetics) aggregation by asking the same sampleto give the total value of all benefits of for American households for three progressivelyhigher levels of water quality In addition to directly measunng national water quality benefits,the national CV approach also makes it possible to estimate a valuation function whichpredicts willingness to pay as a function of the level of water quality, income, water-basedrecreational use, and environmental attitudes

77
meaningful to people interviewed in these studies For instance, step 2 5 represents
boatable water, step 5 fishable water, step 7 swimmable water, and step 9 5 drinkable
water
Carson and Mitchell (1991, 1993) conducted a nationwide CV study involving
careful in-person interviews with 813 randomly selected adults Expenenced personnel
conducted the interviews, which averaged 40 minutes each Respondents were asked
how much they would be willing to pay through higher taxes or pnces for movements
of all U S freshwater from one step on the ladder to another The survey was
conducted in 1983 Their analysis related WTP for water quality improvements to
survey respondents' household incomes, attitudes toward the environment, and
participation in outdoor recreation
Carson and Mitchell's methodology included pretests of the survey instrument
and other checks to help ensure meaningful responses by survey participants The
exact factors considered by the respondents are unknown but could include
recreational, aesthetic, wildlife, and other benefits Mean values for environmental
attitudes and participation in freshwater recreation were also found by Carson and
Mitchell to affect WTP Carson and Mitchell (1991 p 24, 1993) propose that two-
thirds of household WTP reflects water quality within respondents' states, with the
remaining third reflecting out-of-state waters
A major share of the benefits of clean water programmes is expected to be
received directly by households In a study by Lyon and Farrow (1995), household
WTP for freshwater benefits is estimated using an econometric relationship determined
by Carson and Mitchell (1991 p 20, 1993) Lyon and Farrow (1995) present an
economic analysis of the incremental benefits and costs of clean water programmes
78
In the paper, benefit estimates are principally based on CV research on WTP for clean
freshwater The data are supplemented with estimated benefits for municipal and
industrial water withdrawals and saltwater fishing Cost estimates are largely based on
the US Environmental Protection Agency (1991) "needs" data and on studies of
nonpoint source pollution control practices (specially, Gianessi et al, 1985) The
authors rightly contend that "[a]llocating all benefits within states tends to raise the
net benefits of states with high populations (or reduce their net losses, as these states
also tend to have high estimated costs)" (p 215)
The Lyon-Farrow (1995) analysis suggests that US Clean Water Act
programmes, as currently planned, may have incremental costs that exceed their
incremental benefits as measured by WTP Secondly, the analysis suggests that
untargeted construction of municipal treatment facilities is unlikely to be cost effective
as a national strategy in terms of aggregate removal levels and will not address the
most prevalent sources of impairments and discharges agricultural nonpoint sources
Municipal facilities may have advantages, however, in terms of addressing certain
pollutants or water quality in heavily populated areas The study also suggests that the
concept of "needs" has limitations when viewed in a benefit-cost context
Finally, the United States EPA (1994) in a recent analysis of President
Clinton's Clean Water Initiative, concluded that the undiscounted monetized benefits
of the initiative in urban areas would be of the order of $0 8 to $6 0 billion annually
If benefits are discounted to reflect phased-in controls, they would be somewhat lower
Urban areas are estimated by EPA (1994 p D-8) to have three-quarters of the total
U S population Like the study by Lyon and Farrow (1995), EPA's analysis relies
79
heavily on the Carson and Mitchell (1991, 1993) research22.
3.5 DEVELOPING COUNTRY APPLICATIONS OF THE CONTINGENT VALUATION METHOD
No matter what views one holds about the desirability of cost-benefit analysis, the
extent to which it is used both in developed and less developed countries has increased
and many advocate for its more widespread use (or that of closely related techniques)
as a means to decide whether to commit resources to particular projects or of choosing
between competing projects when resources are scarce Unlike in developed countries
where application of the method to evaluate water-resource projects dates back to the
1950s, efforts to extend its use to project evaluation in LDCs were made in the 1970s
(Tisdell, 1986, Munasinghe, 1993) Indeed, application of techniques for taking
account of environmental factors, and other unpriced or 'inadequately' priced
commodities, is still in its infancy
It is only in the last decade or so that environmental effects of projects have
become important considerations in foreign aid and loans to LDCs The World Bank
and U S AID now undertake environmental assessments in supporting Third World
projects This has helped to stimulate interest in the art of environmental assessment
of projects in the LDCs, environmental assessment, of necessity, includes economic
valuation of natural resources and the environmental impacts
Indeed, studies employing specific valuation techniques have recently began
22 p estimates the annual costs of the initiative for these areas to be $9 9 to $14 billionAbout two-thuds of these costs ($66 to $8 6 billion) would fall on municipalities, mostly forstomi water controls EPA (1994 p ES-i) correctly notes that there can be good masons forpursuing the initiative despite the benefit-cost estimates These masons include theuncertainties in the analysis, the distributional effects of the policy, including the public's rightto enjoy clean waters, and the strong public support for clean water policies

80
to address aspects of environmental policy and resource management in LDCs
(Munasinghe, 1993, see Table 3 3) For instance, Tobias and Mendelsohm (1991)
measured the value of ecotourism at a tropical rainforest site in Costa Rica using the
travel cost method while Brown and Henry (1989) utilised both travel costing and
contingent valuation (CV) to estimate the demand function for viewing elephants on
safaris23 in Kenya The travel cost approach has also been utilised in Nigeria to place
monetary values on recreational centres (Duroyaiye and Ikpi, 1988)
Durojaiye and Ikpi (1988) report a study aimed at quantifying monetary
benefits associated with three recreation centres in Nigeria (the Agodi Gardens,
Ibadan, the University of Ibadan Zoological Garden, Ibadan, and the Luna Amusement
Park, Lagos) Two measures of monetary value were employed -- the total benefit
value and the nondiscnminating monopilist or the maximum collectable gate taking
value Total benefits of the respective centres were N57,297, N479,906, and
N1,146,643 The nondisriminating monopolist values were N13,248, N177,212, and
N382,458, respectively Because these values were not considered insignificant to the
economies of Ibadan and Lagos cities, the authors concluded that there was no
economic justification for the then Nigerian governments "little orphan" attitude to
recreation
Most CV research applications in LDCs, as will be seen shortly, involves
determination of household willingness to pay for improved domestic water
Nevertheless, the CV method has been applied in developing countries to evaluate
quality of electricity services (Munasinghe, 1990), as well as to the problem of
"Safan" is a Kiswahili - Kenya's national language - woni for "tours" "Safari" is thesingular equivalent for "tour"

81
financing education (Thobani, 1983, Tan et al, 1984, Jimenez, 1987) and health
(Jimenez, 1987, Birdstall, 1987) Also, Kramer and co-workers (1995), in a World
Bank project on environmental valuation of forestry development and conservation,
apply CV to determine nonuse values of tropical forests in Madagascar

82
Table 3 3 Examples of Environmental Valuation Research in Developing
Countries
Reference Country, Environmental Commodity, and
Valuation Technique
Adger et a! (1994) Mexico, apply both contingent valuation (CV)
and travel cost (TC) surveys to estimating total
economic value of Mexican forests
Dumyaiye and Ikpi (1988) Nigeria, apply the TC technique to value three
recreational facilities i e, the Agodi Gardens
Ibadan, the University of Ibadan Zoological
Garden Ibadan and the Luna Amusement Park
Lagos
Jimenez (1983) Philippines, uses hedonic property (HP) value
modelling to explain changes in housing prices
in a Manila slum area, upgraded partly due to
water and sanitation service improvements
Maille and Mendelsohn (1993) Madagascar, use the travel cost (TC) technique
to estimate the value of ecotourism from visitors'
observed behaviour
Navmd and Mungatana (1994) Kenya, employ both the TC and the contingent
valuation (CV) methods to estimate the
recreational value of wildlife viewing in Lake
Nakuru National Park
Peters, Gentry and Mendelson (1989) Brazil, determine the value of an Amazonian
rainforest through both CV and TC methods
Swallow and Wouldyalew (1994) Ethiopia, determine willingness to contribute
towards tsetse fly control by a CV survey.

83
The many potential problems in applying CV in developing and transition
economies have been noted by several authors (e g, Tisdell, 1986, Thomas et al,
1991, Boadu, 1992, Krupnick et al, 1993, Munasinghe, 1993, Paulsen, 1993,
Shyamsundar and Kramer, 1993, Whittington and Swarna, 1994, Swallow and
Wouldyalew, 1994) These problems include very low income levels and their impact
on stated WTP, and the emphasis of CV on individual preferences as a guide to
decision-making
Moreover, attempts have been made to discern contextual impacts upon CV
estimates A variable designed to test the effect of the presence of listeners was
included in Whittington et al's (1993a, b) multivariate analyses of WTP bids for
improved sanitation services in Ghana The results are mixed and depend on the
estimator used The effect of listeners is never statistically significant in the ordered
probit models and is statistically significant in only two of the OLS models (both
cases are for water and WC' with sewer connection) The effect of listeners shows
up most strongly in the Stewart maximum likelihood models The direction of the
effect is not consistent In the models of willingness to pay for KVIP, for WC with
sewer, and for sewer, it is positive, but in the models for water and for water and WC
with sewer, it is negative" (Ibid 1553) However, because the parameter estimates are
generally small, the authors interpret the results to mean that the presence of listeners
WC and KVIP stand for water closets and Kumasi ventilated improved pit latnnesrespectively A KVIP is a private, sanitary means of waste disposal It is a diy system whichdoes not use any water A KVIP can be built in different sizes to accommodate vanousmembers of households Each toilet room (or module) has two holes (only one of which isin use at a time) and can be built as a free-standing stmcture with its own roof, or it can bebuilt into an existing mom in a building The excrement falls into one of two adjacent pitsWhen one pit is full, the users switch to the other A pit is not emptied immediately after itbecomes full Rather the users wait for about two years until the excreta is decomposed andis fully safe to handle At this point the stabilized waste can be safely used for fertilizer Fordetails on KVJPs including diagrams see Whittington et a! (1 993a,b)

84
had little, if any, effect on the WTP bids Overall, the results suggest that willingness-
to-pay bids are "not easily manipulated or influenced by contextual issues"
(Whittington et cii, 1993 1553)
An even more distinctive feature of the applications has been the researchers'
hawk-eyedness for possibilities of using (or complementing money with) a different
"item" for evaluating household willingness to "contribute" towards an environmental
improvement rather than Just cash as is normal in CV studies of American and western
Europe persuasion Note that Swallow and Woudyalew (1994) asked respondents if
they were willing to contribute money to a fund for replacing materials and/or labour
time for constructing, monitonng and maintaining tsetsefly control targets Their
results indicate that more people would be willing to contribute labour than money
With respect to the overall purpose of the Ethiopian case study of evaluating the
distributional benefits of tsetse fly control to reduce illness in humans and livestock,
the authors clearly demonstrate the importance of decentralized participation in
ecological management
Another study where a non-monetary unit of value is used due to a limited
cash economy is that by Shyamsundar and Kramer (1993) In their estimation of
welfare losses resulting from land-use restrictions associated with a newly established
national park in rural Madagascar, the researchers denominate contingent valuation
questions in baskets of rice In measuring individuals' WTP for reduced mortality risks
(or WTP for reductions in health or environmental nsks or effects) in developing and
emerging economies, Krupnick and co-workers (Krupnick, 1992, Krupnick et cii,
1993) at the Quality of the Environment Division of Resources for the Future suggest
that WTP questions in CV surveys be framed in terms of time rather than money

85
However, they rightly note that for use in a cost-benefit analysis the analyst will still
face the task of valuing time or whatever unit of account is employed in contingent
valuation
As far as the applicability of the CV approach to LDCs is concerned, the
reviewed research, including that evaluated in Section 3 7 below, suggests (a) that CV
can be applied in such economies albeit with modifications and (b) new insights into
sources of bias Thus one can read
"The results of this study suggest that it is possible to do a contingentvaluation survey among a very poor, illiterate population and obtainreasonable, consistent answers There does not appear to be a major problemwith either starting point or hypothetical bias The evidence with regard tostrategic bias is less conclusive, but neither the admittedly limited test forstrategic bias nor the expenence of the enumerators indicated that it was aproblem" (Whittington et al, 1990 p 307-308)
This research provides additional evidence that [CV] surveys can besuccessfully conducted in cities in developing countries and that usefulinfoimation can be obtained on household demand for public services suchas sanitation From a methodological perspective, however, there was aninteresting aspect about the evidence of starting point bias The resultsrevealed a potential problem with the use of "abbreviated bidding procedurewith follow-up" as an elicitation method When a respondent was offered animproved service at a specified pnce, he could answer "yes" or "no" In thisstudy, if answered "yes", he was not likely to raise his bid above thisspecified pnce in response to an open-ended follow-up question In this casethe open-ended follow-up question did not provide any additional infoimationon the household's preferences On the other hand, if the respondent answered"no" when offered the service at a given price, an open-ended follow-upquestion elicited a wide range of answers below the specified pnce Theapparent reluctance of respondents to offer a bid above the specified pricewill likely result in a downward bias in the mean of the [WTP] responses tothe open-ended questions' (Whittington et al,1993 p 1555-7)
the "translation" of a CV study into the Korean context was mom thana matter of translating a suitable English questionnaire Creating a samplingframe and choosing a target respondent, both key parts of a study requiredsignificant adjustment to the realities of Seoul Focus groups and localtechnical assistance became especially important in a such a more general"translation" exercise While we believe the adjustments we made to theKorean situation described above "worked", we emphasize that all suchadjustments will be country and culture specific In particular, it does notseem feasible at this time to create a generally applicable cookbook of recipesfor doing c v studies in countries around the globe Each effort in a new

86
countly will turn up a new lesson" (Kwak and Russell, 1994 p 524)
Apart from the above, the applicability or otherwise of CV in developing and
emerging economies can be discerned from modifications and innovations undertaken
by the researchers The need for focus groups and local technical assistance has been
given emphasis

87
3.6 FREQUENCY INFORMATION AS A DIMENSION IN DECISION MAKING
How many movies have you seen this year7 If the answer is more than one,which did you see most recently? Where did you sit the last time you wereat your favounte restaurant9 Do more people in the United States die ofbotulism or of emphysema9 Are there more tailors or more lawyers 7 Whichword occurs more frequently in English -bacon or pastrami 9 These questionsare directed at how often events occur, in what temporal order, and in whatspatial contexts (Rasher and Zacks, 1984 1372, onginal italics)
3.6.1 FREQUENCY DEFINED
The term "frequency" denotes the number of times an event or category of events
occurs For consumers, there are several types of events relevant to decision making
that may be subject to "counting" (Hasher and Zacks, 1984, Alba and Marmorstein,
1986) Of particular relevance are three forms of frequency
a) frequency of purchase or average interpurchase time interval (Winer, 1986,
Meghir and Robin, 1992, Kalyanaram and Little, 1994, Moffat, 1995)
b) number of positive or negative attributes possessed by a brand or number of
dimensions on which one brand outperforms another (Bordley, 1985, Alba and
Marmorstein, 1987)
c) frequency of price advantage/promotion or number of items on which a firm
enjoys lower prices over its competitors (Krishna, 1991, Alba et al, 1994)
However, it is as well to note that until recently use of frequency knowledge
as a decision heunstic received little attention in consumer research One reason may
be that decision making is often studied under conditions that suppress frequency
effects (e g, Wnght, 1975, Bettman and Park, 1980, Petty and Cacioppo, 1984,
Kisielius and Sternthal, 1986, Moore et al, 1986, Alba and Marmorstein, 1987)
This section starts by reviewing recent literature on consumer sensitivity to

88
frequency of information The section then moves on to extrapolate implications of
such behavioural and social understanding of purchasing behaviour for temporal
dimensions of payments in contingent valuation (CV) of environmental improvements
CV work often presents subjects (mainly households or individuals) with a fourth form
of frequency information This is because the methodology involves constructing
hypothetical market scenarios with a view to eliciting weekly, monthly, annual or
once-off single payments as willingness to pay (to accept in compensation) for a
welfare gain (loss) due to a given environmental improvement (detenoration)
Temporal dimensions of payments in CV studies are apt to provide cues to
respondents, but this area has received little attention (save for Green and Tunstall,
1991) In the Green and Tunstall's (1991) study on evaluation of river water quality
improvements in UK, respondents were randomly assigned to one of three CV
questionnaire versions Two used payment by month with starting points respectively
of 5Op and £1, the third asked for willingness to pay per year with a starting point of
£6 The findings were as follows " those respondents who replied to the version of
the question where the starting point was £6 00 a year, gave bids which were higher
but on average these were less than twelve times either of the two monthly bids So,
defining the question in terms of a year and a starting point of £6, depressed bids
What is not clear is whether it is the use of a single annual payment or the higher
starting point which apparently had this effect" (Green and Tunstall, 1991 p 11390
As noted by the authors, the results fail to isolate the effect of payment frequency on
WTP bids because the experiment employed different starting points across the
payment frequencies Furthermore, the survey results do not provide any tests of the
significance of the frequency effect in the monthly/yearly W1'P disparity
89
3.6.2 OVERVIEW OF FREQUENCY KNOWLEDGE IN CONSUMER RESEARCH
The utility of frequency information is multifaceted Broadly speaking, however, such
information has a role (a) in mediating memory for events, (b) as a device for
organizing existing knowledge, (c) in decision making, and (d) in both cognitive and
social development This section does not detail all the four categories of uses for
frequency data as such a treatment can be found elsewhere (Hasher and Zacks, 1984
and references cited therein) In a nutshell though, the Hasher and Zacks (1984)
review shows that people from all ages and abilities are sensitive to frequency of
occurrence information, and that encoding of frequency information 25 is uninfluenced
by most task and individual difference variables Indeed, frequency knowledge seems
only unimportant for neurologically impaired individuals
The role of frequency information in decision making is our main concern
People often must make decisions in the face of incomplete, equivocal, or probabilistic
data To do this, individuals rely on preferences and subjective probabilities, all of
which depend to some extent on the encoding of frequency information So the first
way in which frequency information can influence decisions involves affective
responses, including preferences, an example being the assessment of neighbourhood
Until recently, responses to frequency questions relied upon a Sudman-Bradbum memorymodel (see Burton and Blair, 1991) The model presumes that respondents answer frequencyquestions via episode enumeration, in which behavioural episodes are recalled and counted,and that response errors are the result of episode omission and/or episode misplacement(telescoping) dunng the process Recent studies (see Burton and Blair, 1991 and referencestherein), however, have shown that suivey respondents use a variety of content- andprocedure-defined cognitive processes in foimulating answers to frequency questions Possibleprocesses include (1) episode enumeration, in which respondents recall episodes from therelevant time frame and count them, (2) nile-based estimation, in which respondents recall orconstmct an occurrence rule and apply it to the relevant time frame, (3) estimation from anavailability heunstic (Tversky and Kahneman, 1982), in which frequency is estimatedaccoithng to the ease of recalling sample episodes, (4) automatic estimation (Hasher andZacks, 1984), in which estimates are drawn from some innate sense of relative or absolutefrequency, (5) use of other heunstics, and (6) various combinations of these processes

90
safety in a choice of the "best" place to buy a house These are known to be affected
by event frequency Research on the "mere exposure effect" (e g, Zajonc, 1968) has
shown that alternatives to which a person has been frequently exposed are more
important that those to which the person has been infrequently exposed
The second way in which frequency information can influence decision making
has to do with a person's belief in the validity or truth of whatever information is
available (Hasher and Zacks, 1984 1383) Information about event frequency also
plays a crucial role in probabilistic environments, such as predictions of election
outcomes or of gambling events Decisions in such situations are often said to be
determined by an individual's "subjective probabilities". Although there is an extensive
literature on subjective probabilities, recent work (reported in Hasher and Zacks, 1984)
leads to the conclusion that probabilities are not stored directly but are denved from
the more basic knowledge of frequency
Similarly, it has been shown that subjects perceive a change in the incidence
of a probabilistic phenomenon (e g, illness among friends), when simple frequency
changes even if the rate (i e, probability) has remained constant (Hasher and Zacks,
1984) Insofar as people base decisions about the rates of events on frequency rather
than on probability, this creates a potentially serious problem for decision makers
There is a difference between frequency and probability Whereas the foimer refers toabsolute repetitiveness of events, the latter is a rate measure of the likelihood that a givenevent will occur These two teims are easily confused in decision-making Yet, frequencyknowledge is more easily encoded (on the cntenon of sensitivity without intention) regardlessof people's individual differences, such as in age, in motivation, in intelligence, and ineducational attainment, than probability data. For instance, children are able to respondappmpnately to differences on probability, although this ability increases with age (e g,Brainenl, 1981) This increase is not, however, due to age differences in the encoding offrequency mfoimation In agreement with other research, Brainerd found that even theyoungest children tested (4-year-olds) had excellent knowledge of relevant frequencies Therewere, however, developmental differences in the likelihood of retneving stored frequencyinfonnation to make probabilistic predictions When retneval of the relevant frequencies was
91
It must be emphasized, nonetheless, that this does not conflict with demonstrations of
the importance of the Tversky and Kahneman (1973) availability heuristic in making
decisions about frequency In this view, subjects are biased towards judging frequency
on the basis of the availability of events in memory In most instances, frequency and
availability (like frequency and probability) are highly correlated more frequent events
are, ceteris paribus, more recallable or "available" than less frequent events In such
situations, any biasing effects of the availability heuristic will not be seen Use of
availability will bias frequency estimates most clearly when the retrieval cue (i e, the
event to be judged) is a weak one
A growing body of literature attests to the importance of consumer knowledge
in consumer decision making The same literature, however, also suggests that
consumer knowledge is extremely complex and that traditional measures may tap only
a small part of its richness Accordingly, we now examine what attention consumer
researchers have afforded the "frequency" aspect of consumer knowledge Until
recently there were few investigations on consumer sensitivity to frequency of
occurrence information But, of late, there is increasing evidence that this situation is
being remedied (Alba and Marmorstein, 1987, Knshna, 1991, Alba et al, 1994,
Kalyanaram and Little, 1994, Moffat, 1995)
Essentially, emerging investigations can be classified into those that glean
frequency effects from secondary data (the revealed preference type), and those that
seek to understand the effects as well as underlying reasons for such consumer
behaviour through experimental methods Using 1987 UK National Food Survey data
maximized, appropriate predictions occurred at higher levels for all ages Brainerd's researchthus showed that the early onset of the ability to encode frequency provides the basis for theearly development of probability judgment skills

92
Moffat (1995) constructs and estimates a model of household purchase behaviour with
time between purchases or "purchase interval" as the variable of interest His results
suggest that the purchase frequency decision is the result of an optimisation problem
in which considerations such as the value of time are important Like other models of
purchase frequency decisions (e g, Meghir and Robin, 1992), this suggests that
"households with facilities for storage (e g a freezer), with a high value of time and
for whom purchasing is an inconvenience (e g those living in a rural area), have a
higher interval between purchases, ceteris paribus, than households of other types"
(Moffat, 1995 14) This finding notwithstanding, the analysis' assumption that the
interval between purchases is fixed for a given household and a given good is
questionable Although this assumption is justifiable on economic theoretical grounds,
it blocks vision of the whole spectrum of frequency effects on consumer decision
making For instance, it is impossible to see why frequency matters or, more aptly,
how frequency of payments may influence willingness to pay (WTP) for a product
We must hasten to add, however, that this criticism is directed not Just at models of
purchase frequency, but also at revealed preference studies, not much can be seen
beyond the records
Consumer experimental research, on the other hand, provides further insight
into the frequency question Through a set of experiments, Alba and Marmorstein
(1987) examine use of the frequency heuristic as a function of an individual's
motivation and ability to encode, comprehend, and remember decision-relevant
information In each case, frequency is pitted against attribute importance or the size
of the differences between brands on common features Their findings show that
frequency knowledge, being an important component of a consumer's information

93
structure, can influence judgement and choice, particularly when other types of
information have been poorly encoded, poorly remembered, or poorly understood
In a more recent study Alba and co-workers (1994) investigate the relative
effect of prior beliefs, frequency cues, and magnitude cues on consumers' perceptions
of comparative price data The researchers conducted a senes of experiments to
explore the relative persuasiveness of these factors Alba et al's (1994) series of
experiments indicate that prior beliefs affected price perceptions but that the frequency
cue exerted a dominating influence Of all 164 responses, 67 percent were identified
as frequency related This represented 87 percent of all identifiable, nonguessing
responses
Another experiment that comes close to broaching the issue of how payment
frequency may affect willingness to pay (WTP) is that in Krishna's (1991) paper on
the effect of dealing patterns (i e, patterns in price promotions) on consumer
perceptions of deal frequency and WTP The paper's attempt to explore the frequency-
WTP link is evidently predicated on Munroe's (1973) work Krishna's hypothesis is,
when consumers perceive a lower deal frequency for a brand, they are WTP a higher
pnce for that brand Munroe (1973) had earlier suggested that the extent to which
buyers are conscious of the prices that they pay influences the role that price plays in
buyers' choice process, and that buyers consider past prices as a basis for a product's
fair price The author shows that the prices consumers are WTP for a brand is
correlated more highly with perceived deal frequency (that is, frequency with which
the brand is promoted) than with actual deal frequency Thus WTP is affected by the
accuracy of consumer perceptions of deal frequency and by whether the perceptions
are biased upward or downward
94
3.6.3 IMPLICA1IONS FOR TEMPORAL DIMENsIoN OF PAYMEN'1 IN CONTIN GENT VALUATION
Students of preferences differ considerably in the core assumptions they make about
the nature of values (especially nonuse value) that are available for elicitation for
unfamiliar environmental goods At one extreme is what Fischoff (1991) calls the
"philosophy of articulated values", which assumes that people have well-formed
preferences about any relevant topic and can directly retrieve an appropriate response
to an elicitation question Adopting this view leads to a focus in finding the correct
methodology for eliciting values, as has been the emphasis in CV literature (e g,
Hanley, 1989, Mitchell and Carson, 1989, Hanley and Spash, 1993)
At the other extreme is the "philosophy of basic values", which assume that
people have well-defined values only for very familiar topics Given this presumption,
people must denve specific valuations for less familiar topics through some inferential
process This view leads to the conclusion that in many if not most cases, people must
construct their responses at the time they are asked an elicitation question, rather than
retrieve a previously formed value (Slovic et al, 1990) A key implication of a more
constructive view of preferences is severe context dependence of the elicited values
The constructiveness of preferences and beliefs has been attributed to the
limited information processing capacity of humans (Simon, 1955, Kahneman, 1973,
Hasher and Zacks, 1984) According to March "human beings have unstable,
inconsistent, incompletely evoked, and imprecise goals at least in part because human
abilities limit preference orderliness" (1978 598) Several authors have suggested that
the construction of preferences may be common in CV studies (Fischoff and Furby,
1988, Gregory et al, 1993) Mitchell and Carson (1989 249) acknowledge that
"people tend not to have previously well-defined values for many of the goods valued

95
in CV studies" However, they go on to argue that improvements in the method can
overcome the potential biases resulting from this lack of well-defined values
The idea of constructive preferences goes beyond a mere denial that observed
preferences result from retrieving the appropriate value from a mental master list in
memory It also means that preferences are not necessarily generated by some
consistent and invariant algorithm, such as an expected utility calculation (Tversky et
al, 1988, Fischoff, 1991) It appears that people have a repertoire of methods or
strategies, resulting from both experience and training (e g, Larnck et al, 1980), for
identifying their preferences and developing their beliefs
The overview of consumer research in the preceding section has indicated two
aspects The central interest of behavioural decision researchers (especially
psychologists) is in the encoding of information into memory Two fundamental ideas
underlie their framework The first is the concept of encoding itself, which derives
from the view that memory of an event consists of a collection of attributes (e g,
space, time, meaning, mood etc) regarding that event The second is the concept of
automaticity, which derives from the view that the individual's momentary capacity
for cognitive activity is limited (e g, Kahneman, 1973)
Hard on the heels of the first interest is the role that frequency information
plays in decision making amongst consumers Frequency information presents a unique
type of decision heuristic (rule of thumb), it is a simplifying heuristic in decision-
making (Wright, 1975, Kahneman et al, 1982) Many consumer decisions are
simplified by eliminating brands and/or attributes from careful consideration and
concentrating on the remainder Unlike other types of learned information, frequency
knowledge does not contain specific facts about brands and attributes Rather,
96
frequency knowledge is a tally of the number of positive and negative attributes
associated with a brand, irrespective of their meaning or importance Thus, the
frequency heuristic differs from other decision rules that require the decision-maker
to evaluate the performance of a brand(s) on at least one substantive dimension As
a result the frequency heuristic can be applied irrespective of the consumer's product
class knowledge, making it a potentially universal rule
Second, the process by which frequency information is acquired may differ
significantly from other types of information Specifically, evidence suggests that
frequency counts of some classes of information may be acquired with very little
effort, and perhaps unconsciously (Hasher and Zacks, 1984) The significance of this
point is that consumers may learn and remember the frequency aspects of a message
at times when involvement, information load, or other factors inhibit the learning of
its semantic details Thus, frequency knowledge may provide a reasonable basis for
decision making when other data are lacking
The implication of the foregoing review of behavioural decision research for
the impact of temporal dimension of payments in CV is the need for careful design
of hypothetical scenarios with regard to payment frequency As research on the "mere
exposure effect" (e g, Zajonc, 1968) has shown that alternatives to which a person has
been frequently exposed are preferred over those to which the person has been
infrequently exposed, respondents engaged in CV tasks are likely to anchor their WTP
on the extent to which they are comfortable with the temporal dimension of payment
in the value elicitation question
A collorary to this is that WTP values will not only depend on income as
stipulated in demand analysis, in accordance with micro-economic theory, WTP rises
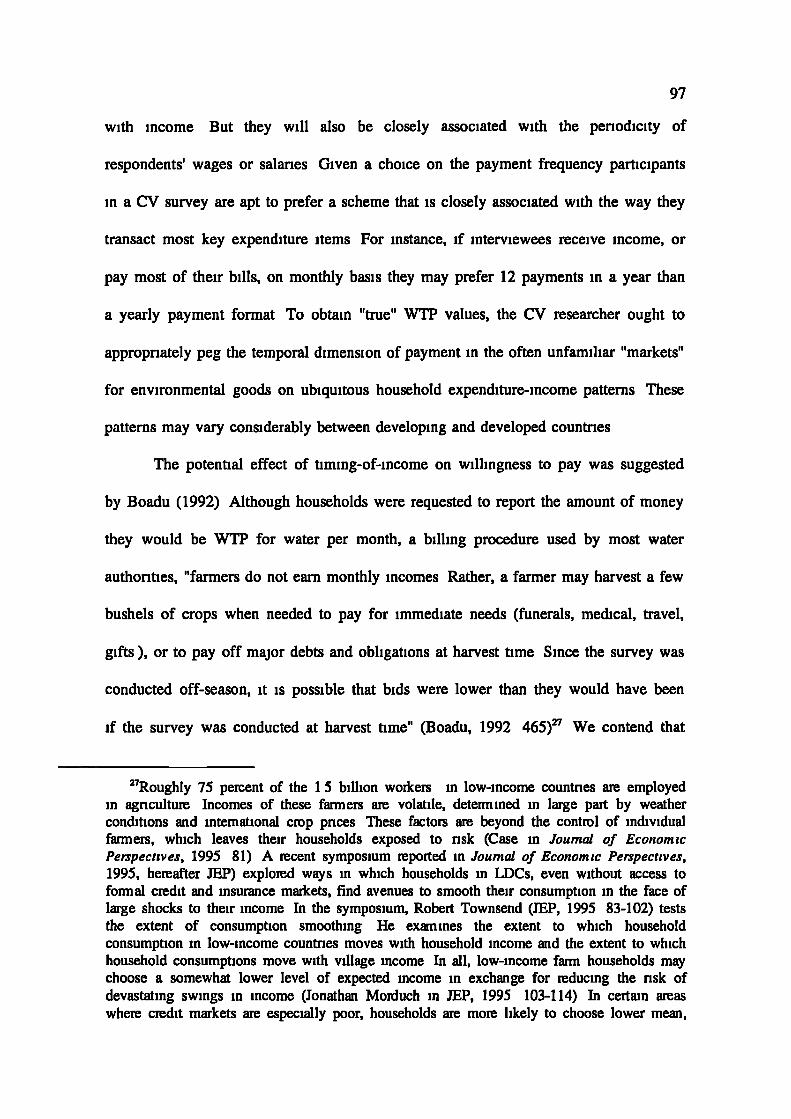
97
with income But they will also be closely associated with the periodicity of
respondents' wages or salaries Given a choice on the payment frequency participants
in a CV survey are apt to prefer a scheme that is closely associated with the way they
transact most key expenditure items For instance, if interviewees receive income, or
pay most of their bills, on monthly basis they may prefer 12 payments in a year than
a yearly payment format To obtain "true" WTP values, the CV researcher ought to
appropriately peg the temporal dimension of payment in the often unfamiliar "markets"
for environmental goods on ubiquitous household expenditure-income patterns These
patterns may vary considerably between developing and developed countries
The potential effect of timing-of-income on willingness to pay was suggested
by Boadu (1992) Although households were requested to report the amount of money
they would be WTP for water per month, a billing procedure used by most water
authorities, "farmers do not earn monthly incomes Rather, a farmer may harvest a few
bushels of crops when needed to pay for immediate needs (funerals, medical, travel,
gifts), or to pay off major debts and obligations at harvest time Since the survey was
conducted off-season, it is possible that bids were lower than they would have been
if the survey was conducted at harvest time" (Boadu, 1992 465)27 We contend that
27Roughly 75 percent of the 1 5 billion workers in low-income countnes are employedin agncultuie Incomes of these farmers are volatile, determined in large part by weatherconditions and international cmp pnces These factors are beyond the contnl of individualfarmers, which leaves their households exposed to nsk (Case in Journal of EconomicPerspectives, 1995 81) A recent symposium reported in Journal of Economic Perspectives,1995, hereafter JEP) explored ways in which households in LDCs, even without access toformal credit and insurance markets, find avenues to smooth their consumption in the face oflarge shocks to their income In the symposium, Robert Townsend (JEP, 1995 83-102) teststhe extent of consumption smoothing He examines the extent to which householdconsumption in low-income countnes moves with household income and the extent to whichhousehold consumptions move with village income In all, low-income farm households maychoose a somewhat lower level of expected income in exchange for reducing the risk ofdevastating swings in income (Jonathan Moniuch in JEP, 1995 103-114) In certain areaswhere credit markets are especially poor, households are more likely to choose lower mean,

98
the timing-of-income and consumption-smoothing argument, when invoked to explain
influences of payment frequency in contingent valuation of environmental goods,
predicts that households in developing economies are not only likely to choose fewer
payments in a year, but that lower WTP values are expected as well
Clearly, this raises two issues The first concerns a potential validity problem
which might arise for the CV method if different temporal dimensions of payment in
design result in different images of the good, and consequently different values The
second is concerned with how much information on payment schedules should be
supplied in CV surveys (e g, Hanley et a!, 1995) Simply refernng to an attnbute may
increase its importance on decisionmaking under conditions of uncertainty (Kahneman
et al, 1982, Keller and Staehn, 1987, van der Plight et al, 1988) The next section
discusses domestic water supply in terms of its linkage with river water quality,
developing country CV studies, and its pncing in developing countries
lower vanance pmduction methods

99
3.7 DOMESTIC WATER SUPPLY AND PRICING IN DEVELOPING COUNTRIES
Existing literature on water resources management shows that the field is replete with
weaknesses which include inter alia underpricing of water and lack of cost recovery,
neglect of public health, water quality and the environment, and inadequate service
delivery to the poor (Feder and Moigne, 1994, Winpenny, 1994) Underpncing water
below its economic value is in fact prevalent worldwide because of either cultural and
religious reasons and/or political expediency For instance farmers in both
industrialised and developing countries often pay little for their publicly supplied
lrngatlon water and so have few incentives for water conservation Similarly industries
and other investment projects, faced with low charges for authorised discharges into
water sources often discharge untreated wastewater into rivers, lakes, and coastal
waters
A key point, however, is that water source quality and domestic water supply
are two of many water resource management sub-sectors that epitomise an important
linkage in humankind's quest for sustainable development The reason for this is
simple, water quality and supply plays Just as critical a role in biogeochemical cycles
as it does to the sustenance of both animal and plant life Basically, water resources
management sits on the interface of ecosystems and sociosy stems The rest of this
section is devoted to showing the connection between river water quality and domestic
water supply (Sub-Section 3 7 1), reviewing developing country CV studies on water
resources issues (Sub-Section 3 7 2), and overviewing the pricing of water services in
developing countries (Sub-Section 3 7 3)

100
3.7.1. THE LINKAGE WiTH RiVER WATER QUALITY
Pollution adversely affects numerous urban and rural water users of water courses such
as rivers, streams, lakes, estuaries and coastal waters Consequently, various public
policy initiatives have been researched and proposed as possible avenues through
which polluters can be induced to reduce discharges of nonpoint pollution Key
amongst these are taxes on water, water conservation subsidies 28, as well as land and
water nghts purchases through, for instance, transferable discharge permit programmes
(Baumol and Oates, 1988, Letson, 1992, Hanley, 1993) The other water pollution
control practice, which has tended to dominate environmental quality management in
industrial economies, is regulation by "consents" given by specific environmental-
resource authonties Consents specify both the quantity and composition of discharges,
and are enforced by monitoring and, if necessary, fines through the courts
Most research in the field of water pollution control economics has centred on,
inter alia (a) modelling optimal enforcement of firm behaviour (i) under imperfectly
enforceable pollution standards and taxes, and (ii) when firms are noncompliant, (b)
analysing the efficiency of the policy instruments in point and nonpoint pollution
situations, as well as in local, regional and international scenarios, and (c) estimating
economic damages of water sources due to contamination by pollutants Although
early research on these issues was essentially theoretical, with only passing references
to empirical-policy applications, environmental economics has recently began to see
more evidence of applied work (e g, Shechter, 1985, Edwards, 1988)
28A water conservation subsidy can, in theory, yield the same pollution reduction as a taxon effluent Applying this idea to inputs, a subsidy paid to reduce irrigation water applicationrates would likely encourage reduced salt discharges This conservation subsidy is analogousto a water rental market, it confronts the user with an opportunity cost for water use at themargin

101
As noted in Chapter 1, this study not only measures the economic benefits of
improved nver quality, but also derives a WTP function for improved domestic water
supply The need to do this was occasioned by three reasons These are
1 As rivers in LDCs, and indeed in the entire human civilisation right from
Mesopotamia, were original lines of settlement and the main water sources for many
years, it is plausible to investigate the link between household's value of the quality
of this source and that of the artificial domestic water supplies subsequently
introduced
2 Anecdotal evidence, and even empirical assignments (such as Ludwig and
Browder, 1992 on South-East Asia, Nyaoro, 1992 on Kenya, and Sangodoyin, 1993
on Nigeria), reveal the fact that most households in LDCs still rely on rivers for water
for (i) gardens and washing clothes, (ii) their livestock, and (iii) even bathing All
these categories of water use fall in the purview of domestic activities
3 More pollution of surface and ground water sources, cetens paribus, leads
to high costs of water purification by domestic water supply utilities McPhail (1994)
refers to this issue when he names initial down-water payment a constraint to
household's decisions to hook up to piped water systems This issue is elaborated upon
below, in Sub-Sections 3 7 2 and 3 7 3
Recently appearing amongst policy statements is the recognition of the need
to see water supply provision in a wider context of resource management For
example, the United Nations Development Programme (1990) states that "Safe water
and proper means of waste disposal are essential for environmental sustainability, and
better human health, and must be at the centre of integrated water resources
management" This sentence points to the possibility of placing "domestic water"
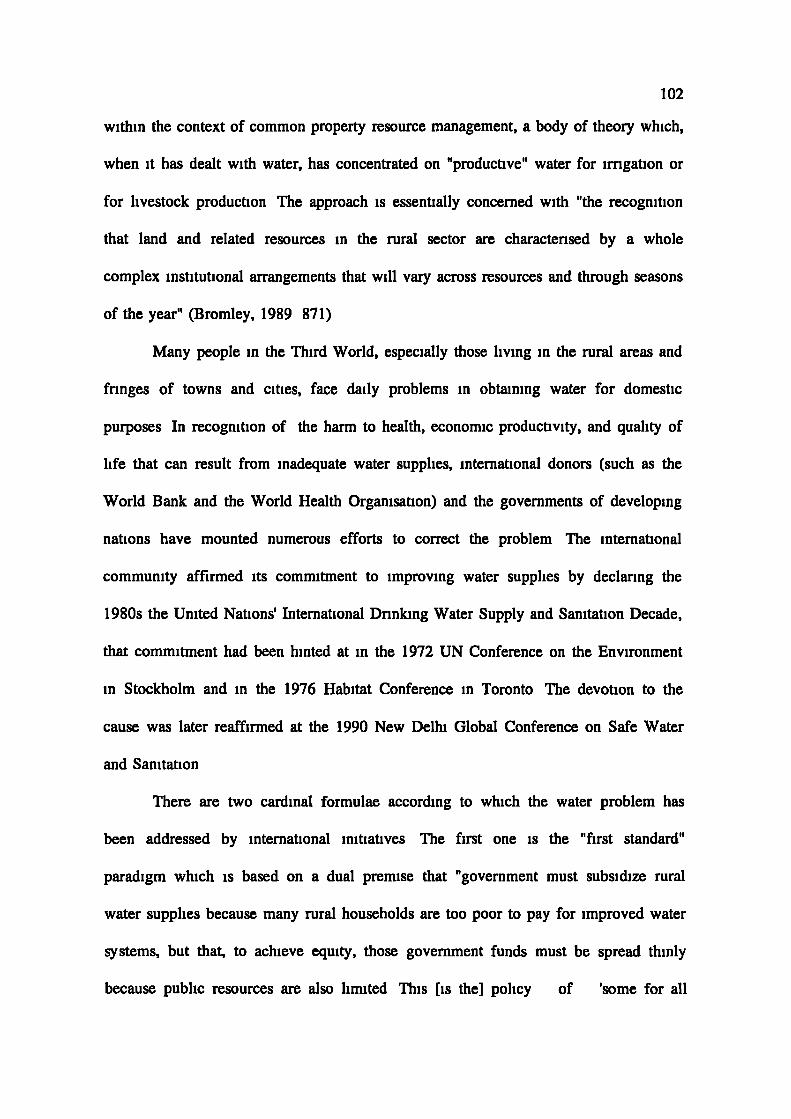
102
within the context of common property resource management, a body of theory which,
when it has dealt with water, has concentrated on "productive" water for irrigation or
for livestock production The approach is essentially concerned with "the recognition
that land and related resources in the rural sector are charactensed by a whole
complex institutional arrangements that will vary across resources and through seasons
of the year" (Bromley, 1989 871)
Many people in the Third World, especially those living in the rural areas and
fringes of towns and cities, face daily problems in obtaining water for domestic
purposes In recognition of the harm to health, economic productivity, and quality of
life that can result from inadequate water supplies, international donors (such as the
World Bank and the World Health Organisation) and the governments of developing
nations have mounted numerous efforts to correct the problem The international
community affirmed its commitment to improving water supplies by declaring the
1980s the United Nations' International Drinking Water Supply and Sanitation Decade,
that commitment had been hinted at in the 1972 UN Conference on the Environment
in Stockholm and in the 1976 Habitat Conference in Toronto The devotion to the
cause was later reaffirmed at the 1990 New Delhi Global Conference on Safe Water
and Sanitation
There are two cardinal formulae according to which the water problem has
been addressed by international initiatives The first one is the "first standard"
paradigm which is based on a dual premise that "government must subsidize rural
water supplies because many rural households are too poor to pay for improved water
systems, but that, to achieve equity, those government funds must be spread thinly
because public resources are also limited This [is the] policy of 'some for all

103
rather than more for some" (World Bank Water Demand Research Team, 1993 48)
The "second standard" paradigm, which has been strongly advocated by the World
Bank and the International Monetary Fund owing to the rather unpalatable "welfare
state" implications inherent in the first approach, contends that as long as the financial
requirements of the chosen technology do not exceed 3% to 5% of household income,
low income communities will choose to abandon their existing water supply in favour
of a new improved system In other words, households can and will pay at least 3 to
5 percent of their disposable income for better services
However, neither of the two methodologies have successfully solved the
problem29 Besides the statistical data in the foregoing footnote, the literature in this
field contains many illustrative testimonies First of all, empincal evidence shows that
many of the water systems established in accordance to these paradigms are either not
functioning at all or not being used For example, McPhail (1993) has shown that the
behavioural response that the "second standard" model assumes is not correct in
Morocco
Secondly, Franceys and Pickford (1989 33) posit "In many communities either
the level of service is too low (that is, the community does not value the improved
service and therefore refuses to pay for it) or the level of service is too high (that is,
the people want service but not at the price that has to be charged) 'Willingness to
pay' must therefore be determined so that the community receives the service at the
standard they desire and at the price they (and the government) can afford" This
29By the mid-point of the Water and Sanitation Decade thete weie nearly as many peoplewithout good water and sanitation as there had been in 1980 Only 16% of the turalpopulation of the developing countnes had adequate sanitation (WHO, 1987) More recently,over 1 0 billion and 1 8 billion people were iepoited as lacking access to safe water andproper sanitation respectively (World Bank, 1992)

104
observation is supported by many authorities in economics of water utility
management (e g, Pickford, 1987, Briscoe and de Ferranti, 1988)
A third illustrative testimony to the inability of the two paradigms in solving
the water supply problem in developing countries relates to surveys on water vending
(e g, Whittington et a!, 1990, 1991 and other studies in Sub-Section 3 72) which
shown that poor households actually pay more than prices charged by water utilities
According to the World Bank (1994 49) "Dunng the mid-1970s to the early 1980s,
people in seventeen cities surveyed were paying private water vendors an average of
twenty-five times the prices charged by the utility. In Nouakchott, Mauritania and
Port-au-Prince, Haiti vendors were charging upto a hundred times the public utility
price".
The complex evidence given above is a manifestation of the intractable nature
of the domestic water supply problem in LDCs Items one and three tend to suggest
that expanding public utility networks so as to give poor households access to piped
water is the way forward, but then item two ostensibly discounts such a course of
action The second aspect one reads from the evidence is the difference between water
management issues in LDCs from those of developed economies, the issues in the
former cohort are clearly unique (Brookshire and Whittington, 1993)
The economics of water utility management in an industrial country is quite
simple (a) all potential users will connect to the system and all will have multiple
taps in their yards and houses, and (b) because the quantity of water used is relatively
inelastic with respect to price, future needs and revenues for a given tariff can be
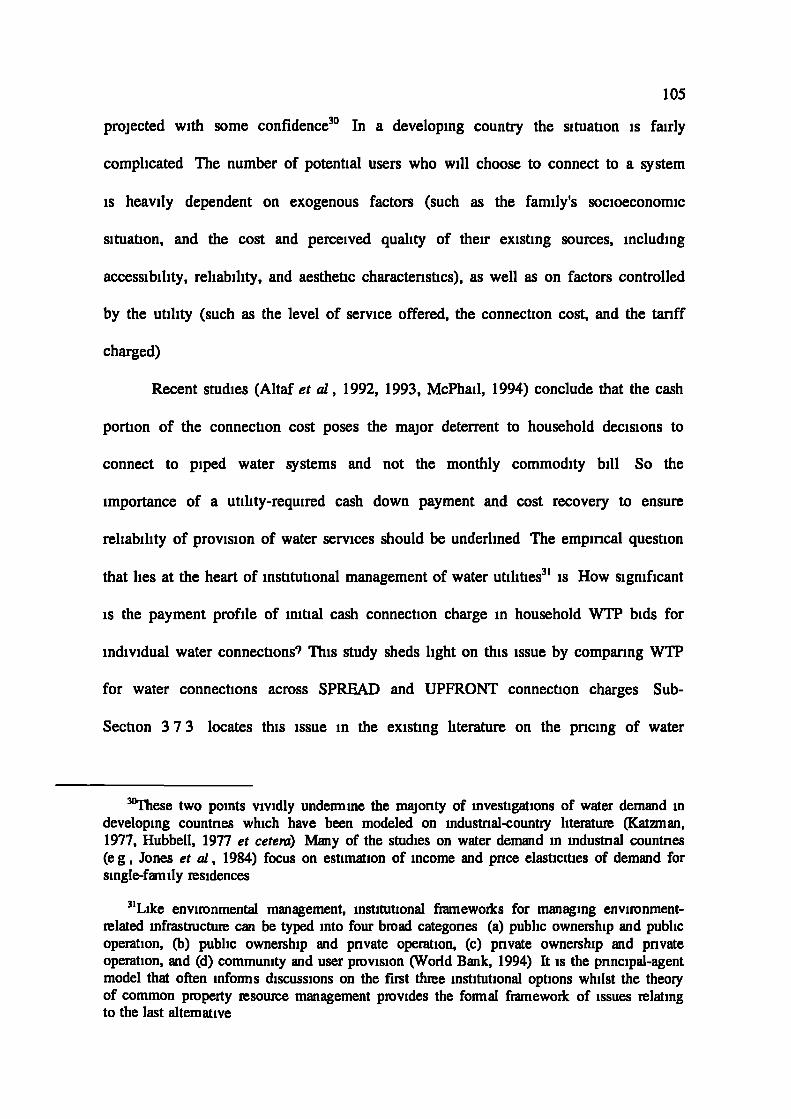
105
projected with some confidence 3° In a developing country the situation is fairly
complicated The number of potential users who will choose to connect to a system
is heavily dependent on exogenous factors (such as the family's socioeconomic
situation, and the cost and perceived quality of their existing sources, including
accessibility, reliability, and aesthetic charactenstics), as well as on factors controlled
by the utility (such as the level of service offered, the connection cost, and the tariff
charged)
Recent studies (Altaf et al, 1992, 1993, McPhail, 1994) conclude that the cash
portion of the connection cost poses the major deterrent to household decisions to
connect to piped water systems and not the monthly commodity bill So the
importance of a utility-required cash down payment and cost recovery to ensure
reliability of provision of water services should be underlined The empirical question
that lies at the heart of institutional management of water utilities 3 ' is How significant
is the payment profile of initial cash connection charge in household WTP bids for
individual water connections9 This study sheds light on this issue by comparing WTP
for water connections across SPREAD and UPFRONT connection charges Sub-
Section 3 7 3 locates this issue in the existing literature on the pricing of water
30These two points vividly undeimine the majority of investigations of water demand indeveloping countries which have been modeled on industnal ..countiy literature (Katzrnan,1977, Hubbell, 1977 et cetera) Many of the studies on water demand in industnal countnes(e g, Jones et al, 1984) focus on estimation of income and price elasticities of demand forsingle-family residences
31Like environmental management, institutional framewodcs for managing environment-related infrastmctuie can be typed into four broad categories (a) public ownership and publicoperation, (b) public ownership and private operation, (c) private ownership and privateoperation, and (d) community and user provision (World Bank, 1994) It is the principal-agentmodel that often infoims discussions on the first three institutional options whilst the theoiyof common property resource management provides the foimal framewoiic of issues relatingto the last alternative

106
services in developing countries
3.7.2 REVIEW OF CONTINGENT VALUATION STUDIES ON WATER RESOURCES ISSUES
The problems associated with water development in developing countries are many
fold Generally speaking, a significant number of the populations in the LDCs do not
have access to satisfactory water supplies The planning process that is utilized for
developing water projects is typically inadequate and results in failed projects In
many cases the results are "monuments" Often the institutional frameworks employed
in the management of the projects, especially in the case of irngation projects, are
flawed In choosing which projects to pursue, there is no serious quantification of
benefits and thus appropriate tradeoffs between alternative projects are not made
Typically, the lack of quantification of benefits is justified on the basis that water is
essential so that any project must be justifiable Finally, financial, equity, and health
issue are often not carefully considered in the planning process
Understanding the number of people in LDCs without adequate water and
sanitation facilities can be difficult First, different countries use different definitions
of what constitutes "improved" or "adequate" service, and often use different data
collection methods for preparing the estimates One could envision incentives by
reporting countries to inflate or deflate their reported estimates This would tend to
distort the planning process Second, estimates of coverage are typically based on the
assumption that people are covered if they are provided access to improved facilities
However, many improved facilities are underutilized, for a variety of reasons
households may choose to continue to use their traditional water sources even after an
improved water source is available (Mu et al, 1990) This would suggest that

107
estimates of coverage are inflated Third, such estimates rarely account for the fact that
millions of people in LDCs purchase water from water vendors (Zaroff and Okun,
1984, Fass, 1988, Whittington et al, 1989, Whittington et al, 1991, Katko, 1991)
Although water purchased from vendors is always very expensive, for households
using vendors, vended water represents an improvement over traditional sources If
water vendors are counted as an improved water source, this would suggest that
figures on coverage are underestimates of the people served However, one must
question whether such sources truly represent a satisfactory water supply institution
As regards quantification of benefits of water supply projects, it is notable that
monetary valuation of environmental and public goods in the developing economies,
particularly applications of the contingent valuation (CV) method, can be attributed
to the work by research groups sponsored by the World Bank to study the demand for
village water supplies and sanitation services in Latin America, Africa, and South Asia
(World Bank Water Demand Research Team, 1993) Tables 3 4 and 3 5 show features
of some of the CV surveys, including socioeconomic characteristics in resultant
willingness-to-pay models
Indeed, the importance of household water services in the developing countries
has been underscored by many governments as well as national and international
institutions Hence, the increased economic and policy research interest in water as an
environmental/public resource is not surprising The interest can also be attributed to
the increasing recognition of water as scarce commodity with an economic value
(Saliba et al, 1987, Winpenny, 1994) The supply of adequate water of the required
quality and through an convenient system is a cardinal challenge to Third World
governments and authorities since most of the communities have come to depend

108
almost entirely upon governments for the provision of the vital resource
Ever since the Whittington et al (1990a) study in the summer of 1986, a
number of researchers have applied contingent valuation (CV) to determine household
willingness to pay for water services Such studies have been conducted in Brazil,
Haiti, India, Nigeria, Ghana, Tunisia, Morocco, Pakistan and Zimbabwe These works
shed some light on the efficacy of CV in evaluating household water supplies in
developing countries, understandably though, water supply is less 'public' than other
environmental amenities such as air and water quality Reliability and accuracy of
results, sources of bias, and the "five-percent" rule for provision of water as a socio-
economic infrastructure are the key distinguishing features of the above empirical
research
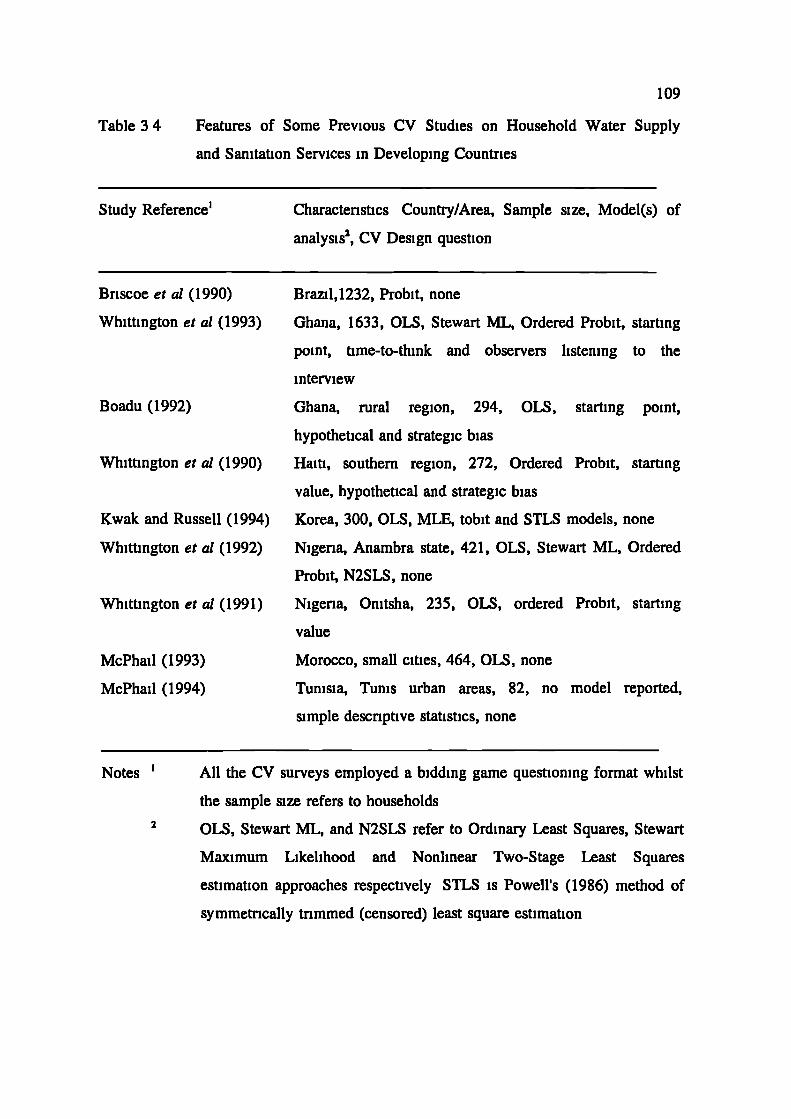
109
Table 3 4
Features of Some Previous CV Studies on Household Water Supply
and Sanitation Services in Developing Countries
Study Reference' Charactenstics Country/Area, Sample size, Model(s) of
analysis2, CV Design question
Briscoe et al (1990) Brazil,1232, Probit, none
Whittington et al (1993) Ghana, 1633, OLS, Stewart ML, Ordered Probit, starting
point, time-to-think and observers listening to the
interview
Boadu (1992)
Whittington et al (1990)
Kwak and Russell (1994)
Whittington et al (1992)
Whittington et al (1991)
McPhail (1993)
McPhail (1994)
Ghana, rural region, 294, OLS, starting point,
hypothetical and strategic bias
Haiti, southern region, 272, Ordered Probit, starting
value, hypothetical and strategic bias
Korea, 300, OLS, MLE, tobit and STLS models, none
Nigeria, Anambra state, 421, OLS, Stewart ML, Ordered
Probit, N2SLS, none
Nigeria, Onitsha, 235, OLS, ordered Probit, starting
value
Morocco, small cities, 464, OLS, none
Tunisia, Tunis urban areas, 82, no model reported,
simple descnptive statistics, none
Notes All the CV surveys employed a bidding game questioning format whilst
the sample size refers to households2 OLS, Stewart ML, and N2SLS refer to Ordinary Least Squares, Stewart
Maximum Likelihood and Nonlinear Two-Stage Least Squares
estimation approaches respectively STLS is Powell's (1986) method of
symmetrically trimmed (censored) least square estimation
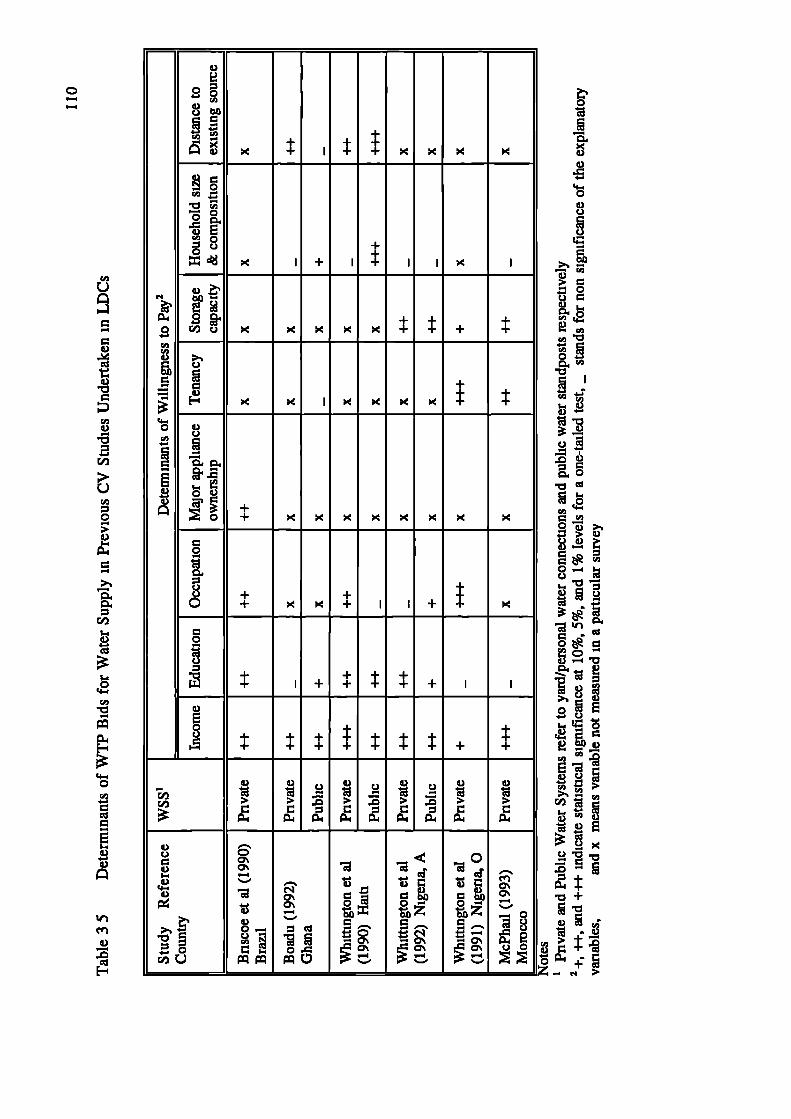
0-U-U
U
C,,
I
a)
2ba4-.
__ __ 1 __ __
— 0H ++
I + I + I I
ri
0 /U < < +4-.
-
a) •1
— a)__ __ __
I-o a)C,,
• O)a)
+
0 + <
0
04
C.) +
+ +
+ < + +
0C.)
__ __ I
a)E
- 1 _ _
4) a) 4)
z
a) 8'C.) 0
' CJ 'cd'm
- .1 -4) • -- 0'
0 C
Z Z
— —o
- •'; a—'
o\ —a
. 6' —o o. a
ri U 0 ...
— — —___________ ____ ____ _____ ___ ___ z
0
04
a)
'4-0a)C.)
C.)
C,, '04-
04-.04
•0
4jI-a)a) 4-
.0 a)
040
•0 '
'4-
-- a) >.iQa)a) -
I- • -a)
-
-
a) — 'O
C.)
C,,
'- 4-a)CI4)
•0+
. +-

111
Whittington et al (1990a) determine households' value of time spent on
collecting water in Ukunda region of Kenya Using revealed preference and random
utility approaches, the authors find that households in the coastal village place as high
a value on the time they spend hauling water as the wage rate for unskilled labour
This suggests that the economic benefits of improved water services in developing
countries may be higher that commonly realized
The research reports by Whittington et al (1991) and Boadu (1992) on the
structure of water vending and WTP for water in the Nigenan town of Onitsha and
on WTP for water in rural Ghana, respectively, have shortcomings The former study
does not consider household size as an explanatory variable for household WTP whilst
the latter's construction of the hypothetical scenario is not divulged Moreover, both
documents do not report any tests for validity and reliability of the survey
instruments32 This is contrary to the recent consensus among economists that these
aspects accompany published work for purposes of facilitating replication and ironing
of any rough methodological edges
Most across-the-board assessments (e g Cummings et al, 1986, Mitchell and
Carson, 1989, Smith, 1993) unequivocally support the fact that CV estimates are
"comparable" in performance to alternative approaches However, CV application in
determining economic value of residential water services inevitably begs two
questions Does the fact that household water is not a conventional environmental
32The question of reliability and accuracy of any CV findings cannot be answered withcertainty without perfoiming controlled experiments Additionally, the ability to exeitise thecontrol limits, in turn, curtails the types of commodities and decisions that can be includedin a CV analysis Therefore, there always remains the possibility of asking oneself whetherthe results are relevant to those situations that could not be considered Consequently, CVresearch has focused on evaluating a wide range of indirect gauges of the validity andreliability of findings

112
amenity in the sense of air and water quality matter 9 Would resultant WTP estimates
possess predictive validity?
Changing the commodity under valuation from environmental amenities like
air and water quality to quasi-private goods such as water does not alter the general
point Of course, it will influence how assumptions affect outcomes For instance, a
study of strawberry sales by Dickie, Fisher, and Gerking (1987) found that demand
curves based on hypothetical sales did not differ significantly from models using
actual sales But, this conclusion was somewhat sensitive to how the analysis treated
interviewer effects and one outlier Again, if the criteria were changed to the predicted
demands for strawberries from the two models, the conclusions would depend on the
treatment of outliers Their analysis does not mention that the relevant variance in the
random variables being considered also changes, so large numerical differences in
predicted quantities may not indicate statistically significant differences All these
issues are not the result of the design (i e, asking quantities) or the specific
commodity used (i e, pints of strawberries) They illustrate the role of judgement in
the analysis
To reduce influence of judgement in analysis, Whittington and several
coauthors (1991b) used the need to value public drinking water supplies in rural
Pakistan to compare the results derived from experience with past connection decisions
for earlier systems versus that derived from a double-bounded CV survey designed to
elicit maximum annual tariffs for the water system After developing economic models
relevant to each type of data, they estimated the implied values for comparable water
systems and evaluated their correspondences Estimates based on CV were closely
related to those from the indirect model (in this case a random utility model, RUM,

113
describing connections) However, the CV estimates were 1 71 times the values
denved with the RUM framework when alternative water supplies were good and 297
when they were poor This difference, however, may be seen as part and parcel of
market behaviour where markedly different prices can persist for long periods
To determine predictive validity and temporal reliability of WTP models it has
become customary to design test-retest comparisons of the stability of CV evaluations
from the same sample over time The papers by Loomis (1989, 1990), Kealy et al
(1990) and Whittington et a! (1992) reveal that length of time between elicitation of
respondents' valuations is critical Loomis considered two samples, interviewed both
groups twice (asking the same valuation or discrete choice question in two rounds of
questionnaires mailed 6 months apart), and tested whether the valuation responses
differed for each group between the first and the second responses Kealy and co-
researchers (1990) compare CV values for a private and public good after about 2
weeks Whittington et a! (1992), on their part elicited no values in the initial interview
from those respondents who were given a one-day duration of time to think The
regression models by Whittington et al (1992) showed the time-to-think variable to be
exceptionally robust across estimators, type of water connection, and model
specification The implication of this result is that giving people time to think
consistently reduces their bids, their implied ratings, and their likelihood of agreeing
to purchase the improved water source in comparison to bids from those who respond
immediately at the time of the interview This finding differs from what Hoehn and
Randall's (1987) analysis would suggest --- that stated WTP should be "nondecreasing"
with time or other informational resources devoted to respondent decision making So
there is no consensus on impact of time-to-think in CV studies for either a type of

114
commodity or socio-economic and cultural setting
Besides tests of CV performance in developing countnes, recent benefit
measurement exercises have employed the CV technique to address unique problems
in the water sector Before presenting the relevant studies, however, one non-CV study
on estimation of benefits of water supply is worth mentioning as it deals with a
pertinent developing country issue in water resources research North and Griffin
(1993) focus on a region of the Philippines and utilize the hedonic pnce method Their
interest lies in the relative valuation households place on diffenng types of water
sources Thus they attempt to value alternative types of infrastructure for providing
water supply As part of the effort, they investigate the role that distance to a public
or communal source has on households willingness to pay They find that a piped in
source is valued high relative to other characteristics of the home They suggest that
the development of more communal sources should be second pnority relative to in-
house piping
Let us now examine the CV applications to some policy aspects in water
supply Singh et al (1993) address the issue of how to get better service and more yard
taps The CV method is used to evaluate the possibility of improving the overall
performance of the systems The setting is three areas of Kerla, India Specifically,
they examine the WTP for yard taps and/or house connections They show that
consumers' welfare, based on responses to the CV question, nses with the increase in
connections and monthly tariff Further, they argue that a cntical element is the nature
of the financing process for new connections focusing on the quality of the service
Altaf et al (1993) use estimates of households' WTP for piped water supplies
(also obtained using the CV method) to explore ways to improve rural water policy
115
in the Punjab, Pakistan They describe communities caught in a kind of "low-level
equilibrium trap" In the Punjab government-provided water systems have been
designed to accommodate an estimated water use of 40 litres per capita per day
Because water connections are not metered, people demand more water than the
existing piped water systems can provide To ration available supplies, the water
authority must reduce the number of hours of service The systems thus become
unreliable, and people are not WTP much for such poor service Because households
are not willing to pay, the water authority cannot charge realistic pnces and thus does
not collect sufficient revenues to manage the system properly Without adequate funds
for operation and maintenance, reliability deteriorates further
Altaf and co-workers (1993) show that the way out of this trap is to install
meters and charge higher prices for water Their results indicate that households' WTP
for reliable water supplies is much higher than is commonly assumed, and that full
cost recovery is quite feasible in many areas of the Punjab They recommend that the
rural water sector be reorganized to reflect a decentralized, demand-driven philosophy
toward the provision of new infrastructure
Bohm (1993) address the financial viability of water systems in rural
Philippines They address two questions First, what are the necessary conditions for
a rural water system to cover costs Second, if such a system does not generate
sufficient revenues to cover costs, what must be the subsidy level? The CV mechanism
is utilized to address these issues They conclude that rural systems such as the one
they studied are unlikely to generate sufficient revenues in order to be sustainable
On direct relevance of WTP estimates to public policy, McPhail (1993) carried
out household WTP survey in five small Moroccan cities with the prime object of
116
testing the "Five Percent Rule" for improved water service often advanced by most
water utilities and international donors, specially the World Bank The paradigm states
that as long as the cost of portable water to the household falls below 5% of
household income, then it is "affordable" and the household will make a connection
to the system and be able to pay the subsequent recurrent expenditure The results
from his 460 sample size revealed that households, even though they had free and
reliable standpoint water service, were willing to spend well in excess of 5% of total
household expenditures to finance an individual metered water connection and the
subsequent monthly commodity charges
While still on the issue of the percentage of its income that a household is
WTP for use of an improved water source, it is important to stress that the evidence
varies widely For example, in the Chihota Distnct in Zimbabwe, where water is
relatively easily available from traditional wells, households are prepared to pay less
than 0 5 percent of their income for an improved well with a handpump (Robinson,
1988) In rural Haiti, households are WTP only about 1 percent of their income for
access to public taps in their villages (Whittington et al, 1990a)
In the sweetwater zones of the Punjab in Pakistan, almost every household has
its own pnvate handpump in its compound These handpumps, manufactured by
pnvate-sector firms, have been installed and maintained without government
involvement Here, despite the relative prosperity of the villages, households are on
average WTP only about 1 percent of their income for a private water connection
(Altaf et al, 1993)
On the other hand, in some places households are WTP an extraordinarily high
percentage of their income for improved water service In the Newala District of

117
Tanzania, households are extremely poor and spend several hours a day collecting
water during the dry season They are WTP about 8 percent of their meagre income
for access to water from public taps located in their village (Whittington et cii, 1988)
In Ukunda, Kenya, a small market town south of Mombasa, the majority of
households are already spending more than 10 percent of their income purchasing
water from water vendors (Whittington et al, 1989b) Fass (1988) found that during
times of drought the poor in Port au Prince, Haiti sometimes pay more than 20 percent
of their income to water vendors Similar results have been found in Sudan (Cairncross
and Kinnear, undated), Honduras (Whittington et cii, 1989b), Mozambique (Katko,
1990), Jakarta in Indonesia (Lovei and Whittington, 1991), and Nigeria (Whittington
et al, 1 990b, 1991) It is thus clear that under some conditions people will pay a very
high percentage of their income for water, and in other circumstances very little The
immediate implication of these statistics is that measures of household W1'P reflect
much more than simply a household's income (World Bank Water Demand Research
Team, 1993, Whittington and Swarna, 1994), however, the entire second part of this
section illustrates how CV has recently been applied to water resources issues in the
developing world

118
3.7.3 THE PRIcING OF WATER SERVICES IN DEVELOPING COUNTRIES
Different water resource pricing principles exist in developing countries due to the co-
existence of the market and non-market sector, the multiple institutions involved in
water supply and, most important, a trade-off between economic, social and
environmental criteria (e g, Arntzen, 1995, Hernngton, 1996) Yet traditionally water
supply pricing policy in most countries has been determined on the basis of financial
or accounting criteria, such as raising sufficient sales revenues to meet operating
expenses and debt service requirements while providing a reasonable contribution
towards the capital required for future system expansion
However, in the recent times several new factors have arisen, including the
rapid growth of demand, increases in supply costs, dwindling availability of cheap
water resources, and the expansion of water supply services into regions of lower
consumer density (especially rural areas) at relatively high unit costs These
developments have led to increasing emphasis being placed on the use of economic
principles in order to produce and consume water efficiently, while conserving scarce
resources and meeting various national objectives 33 Attention has particularly been
paid to the use of marginal cost pricing policies (mainly long-run marginal costs,
LRMC) in the water and sewerage sectors
Recent evidence shows that price is an effective long-run technique of demand
33The modem appmach to water pncing recognizes the existence of several policyobjectives or criteria, not all of which are mutually consistent First, national economicresources must be allocated efficiently not only among different sectors of the economy, butwithin the water sector itself Second, certain principles relating to fairness and equity mustbe satisfied Thmi, water prices should raise sufficient revenues, to meet the financial needsof the sector Fourth, the water tariff stmcture must be simple enough to facilitate meteringand billing customers Finally, other economic and political requirements must also beconsidered, such as subsidized water supply to certain sectors to enhance gmwth or to certaingeographic areas for regional development See Munasinghe (1990b) and Whittington (1992)

119
management (e g, Crew and Kleindorfer, 1979, Postel, 1992, Winpenny, 1994,
Herrington, 1996) As the theory of marginal cost pncing is well known (Hotelling,
1938, Ruggles, 1959a, b, Crew and Kleindorfer, 1979, Gestler, 1985, Lund, 1988) and
its role in water supply detailed by the Organisation for Economic Cooperation and
Development (1987) and Munasinghe (1988a, 1988b, 1990a, 1990b), this section only
overviews three related methods of improving cost recovery in the water sector
subsidized prices and connection charges (starting with common tariff forms), cross-
subsidization, and metering decision and pnce complexity
3.7.3.1 COMMON TARIFFS, SUBSIDIZED PRICES, AND CONNECTION CHARGES
Probably the most common form of tariff is the unit charge based on the consumer's
consumption over a given period of time, typically one month Unit charges may also
be varied according to the volume of water consumed, yielding two basic types of
block structure The use of increasing block water tariffs is widespread throughout
developing countries An increasing block tariff (LBT) is a price structure in which a
commodity is priced at a low initial rate up to a specified volume of use (block), then
at a higher or several increasingly higher rates for additional blocks used The ordinary
household municipal water bill in developing countries is often calculated on some
sort of IBT structure, and donor organisations and consultants continue to recommend
this practice for town and city water systems The majority of World Bank-sponsored
water tariff studies conducted in 1970, for example, have recommended the use of
increasing block water tariffs (Whittington, 1992)
Besides the IBT structure, there is also a decreasing block tariff, for a
discussion on the incorporation of increasing block structure in applying the LRMC-
120
based methodology and arguments for and against decreasing block tariffs see
Munasinghe (1990b) and Whittington (1992) Decreasing block tariff, in which the
initial slab of consumption has the highest price followed by successively cheaper
blocks has been widely used especially for households and small consumers with
simple metering
Fixed charges are most often related to consumer costs In particular, a lump-
sum payment may be levied to cover the initial cost of providing the service
connection, or the repayment period may be spread over several years to provide credit
relief to customers Recurrent fixed costs are often charged to meet the costs of meter
reading, billing, and other repetitive expenses In some cases, the charge based on the
capacity of a consumer's connection is also called a fixed charge, but this is usually
a proxy for the capacity cost which should be included in the variable charge Lastly,
surcharges or adjustment clauses are also becoming increasingly common, this permits
the utility to pass on to the consumer quickly any unforeseen increases in operating
costs34
Socio-political or equity arguments are often advanced in favour of
subsidization or lifeline rates for potable water supply, especially where the costs of
consumption are high in comparison to the relevant income levels In practice, the
magnitude of minimum water consumption block should be based on acceptable
criteria for identifying low income groups and reasonable estimates of their minimum
consumption levels (for instance, sufficient to supply basic requirements for washing,
34Ideally, any changes in relative input would require re-estimation of strict LRMCfollowed by changes in the tariff stmcture, but the legislative procedure to achieve the lattermay take a long time A convenient short-run adjustment clause can, meanwhile, providemuch needed financial relief when cost inflation is significant

121
drinking, cooking and so on) Such tariff structuring is possible when water utilities
act as discriminating monopolists (e g, Munasinghe, 1988b)
3.7.3.2 CROSS-SUBSIDIZATION
The issue of subsidization between different customer groups within a class arises
because urban customers often subsidize rural customers by paying more than the
LRMC of water In this manner, a uniform national tariff can be implemented to help
accomplish certain specific policy goals, based on socio-political reasons such as
maintaining a viable regional, industrial or agricultural base, stemming rural to urban
migration, or alleviating local political discontent For example, in November 1985
Algeria instituted a uniform national water tariff despite the fact that the estimated
average cost of water varied across the country between US$0 23 and $0 58 (in 1987
dollars) (World Bank, 1987) While the national tariff recovered the costs of the sector
as a whole, it also resulted in local water companies having widely varying profits and
losses In Tunisia, the national water company, SONEDE, charges a uniform tariff that
"implies cross-subsidization between centers to avoid prohibitive charges in high-cost
systems" (World Bank, 1992) Meanwhile, in the Hashemite Kingdom of Jordan, the
government provides free water to nomadic populations at a cost up to ten times the
cost in the country's large cities (World Bank, 1986)
While the full economic benefits of such a course of action may be greater
than efficiency costs which arise from any divergence between actual price and strict
LRMC, the rationale for such deviation from efficient prices needs further study For
example, one advantage of cross-subsidization versus, say, taxation, is that rate
structures can be used to develop a direct scheme for transfers among customer

122
groups Tariffs which perform this cross-subsidization within a customer class are
highly useful in redistributing income, provided higher incomes and greater water
consumption are positively correlated Such a tariff is equivalent to a tax on
consumption which can be collected in a discriminatory fashion, with little possibility
of evasion
Pressures to subsidize water supply are likely to be more significant in a
developing country than a developed one because of the high cost of water relative to
incomes in the former Also, the available administrative and fiscal machinery to
redistribute incomes, or achieve regional and industrial development objectives by
other means, is frequently ineffective in developing countries
For the same reasons, it is particularly difficult to reform pncing policy where
low incomes and a tradition of subsidized water supply combine to create extreme
socio-political difficulties in raising prices to anywhere near marginal costs In
practice, price changes have to be gradual, in view of the costs which may be imposed
on those who have already incurred expenditures on equipment and made other
decisions, while expecting little or no change in traditional water pricing policies
Munasinghe (1990b) rights notes "The efficiency costs of gradualism can be seen as
an implicit shadow value placed upon the social benefits that result from that policy
The macroeconomic type argument that water price increases may be inflationary is
rarely valid because the costs of water use are usually a small proportion of household
expenses and of industrial production costs In contrast, the overstimulation of demand
and lack of funds to expand supply, resulting from low water prices are potentially
much more senous long-run problems which should not be ignored"

123
3.7.3.3 METERING DECISIONS AND PRICE COMPLEXiTY
The degree of sophistication of metering depends on the practical problems of
installation and maintenance, and the net benefit of metering based on a cost-benefit
analysis that compares the lower supply costs of reduced consumption with the cost
of metering plus the decrease in net consumption benefits (Gestler, 1985, Lund, 1988,
Munasinghe, 1990a) 35 Currently, advanced solid-state technology (including use of
microprocessors) is being examined as a means to implement sophisticated metering,
automatic meter reading, demand management techniques and pricing structure
(Gestler,1985) In contrast, some developing countnes may lack technically skilled
labour for installation and maintenance of sophisticated meters, or even reliable meter
readers Therefore choice of appropriate metenng is usually very country specific, and
is likely to involve many practical considerations
Despite these country-specific requirements, for urban water systems in
developing countries it is always preferable to meter at both ends of the distribution
system This is because historically the amount of unaccounted for water in those
systems greatly exceeds that found in comparable systems in industrialized countries
Thus, metering provides a reliable method to compare the amount of water produced
to the amount actually delivered to the customers and, thereby, losses can be estimated
and steps taken to reduce them when they exceed a predetermined level It is also
often postulated that metering water use discourages waste, even at standposts where
35Owing to both practical difficulties and the economics of metenng and billing, the tariffstmctuie may have to be simplified Another cnicial factor is that the tariff stiucture must becomprehensible to the average customer Otherwise individuals will not be able to adjust theirconsumption accoithng to the pnce signals Therefore, the number of customer categories,consumption blocks, and fixed charges will have to be limited On the other hand, moredetailed price stn.ictures could indicate price signals to consumers more efficiently

124
money is charged, which in this way acts as a powerful psychological agent to
promote efficient use of resources (Sims, 1978) The next section provides an overall
appraisal of this chapter on literature related to the CV study undertaken in Kenya
3.8 ASSESSMENT OF THE LITERATURE SURVEY
The above literature review as well as that in Bateman (1993), Barbier (1993) and
Walsh et al (1989) points out three related issues First, few CBA studies have been
undertaken in LDCs particularly those aimed at comprehending potential 'Third World'
influences on CV estimates of benefits of environment and development projects The
many potential problems in applying CV in developing and transition economies have
been noted by several authors (e g, Tisdell, 1986, Thomas et al, 1991, Boadu, 1992,
Krupnick et al, 1993, Munasinghe, 1993, Paulsen, 1993, Shyamsundar and Kramer,
1993, Whittington and Swarna, 1994, Swallow and Wouldyalew, 1994) These
problems include very low income levels and their impact on stated WTP, and the
emphasis of CV on individual preferences as a guide to decision-making
Secondly, CV surveys on issues that directly relate to the 'publicness proper'
of the natural environment (such as water and air quality) in developing economies are
few and largely restricted to forestry and wildlife conservation. The diversity in
environmental and public goods in whose valuation the CV method has been
employed in developing countries compares disproportionately to existing literature on
developed countries (e g , those in Cummings et al, 1986, Mitchell and Carson, 1989,
Barde and Pearce, 1991, Hanley and Knight, 1992, Hanley and Spash, 1993,
Hausman, 1993) The total economic value approach has been employed in the USA
and the UK to assess the WTP for a diverse range of public goods from visibility

125
(Schuize et al, 1981), grizzly bears and bighorn sheep (Brookshire et cii, 1983),
endangered species such as the golden eagle and stnped shiner (Boyle and Bishop,
1987), water quality (Smith and Desvousges, 1986), to wilderness areas (Walsh et al,
1984), and wildlife habitats (Willis, 1990) The list of developing country CV studies,
on the other hand, is shorter and restricted to provision of domestic water supply and
sanitation
Finally, apart from the Ukunda study, no other applied work has been
undertaken with a view to understanding household behaviour in respect of valuation
of improved water services in Kenya This investigation is, therefore, an attempt to
redress this situation by applying and assessing the contingent valuation (CV) method
in determining the value that households attach to private water supply and river water
quality in Kenya The measure of welfare change is willingness to pay (WTP) Indeed,
the reference operating conditions (ROCs) 36 for CV studies recommend avoiding a
WTA format So the WTP measure for an improved water service and river water
quality will, on the whole, be utilised with the understanding that it is a probable
conservative approximation of households' WTA compensation for a denial of a
similar service and quality of water in most circumstances
36ROCs essentially define restnctions, warnings or caveats on use of the CV technique tovalue environmental and public non-market goods The Cummings et cii (1986) ROCs are(ROC 1) Subjects or participants in CV must understand, and be familiar with the commodityto be valued, (ROC 2) Subjects must have had or be allowed to obtain pnor valuation andchoice expenence with respect to consumption levels of the commodity, (ROC 3) There mustbe little uncertainty, and (ROC 4) WTP, not WTA, measures are elicited In his comments inthe Palo Alto Conference, Prof Daniel Kahneman (see Cummings et cii, 1986 185-194) addsthree more conditions (ROC 5) The CV method should be used only for problems that havea "purchase stmcture", (ROC 6) The use of CV should be mstncted to user values, rather thanto ideological values, and (ROC 7) Accurate descnption of payment mode is essential to CVAlthough ROCs do not translate directly into testable hypotheses, they do suggest researchquestions that may generate testable postulates This viewpoint has guided the immense WTP-WTA research (e g, Boyle, Welsh and Bishop, 1993)
126
Measurement of benefits of nver water pollution control and domestic water
supply is crucial if we are to evaluate the tremendous costs of reducing pollution (as
well as providing portable water) and make informed judgements about the social
value of improving nver water quality or supply clean water for domestic uses Effect
of the nature of the good in CV, sensitivity to scope or (embedding effect) in the
contingent valuation scenario, effect of temporal dimension of payments, and impact
of initial connection charges on WTP for individual household water connections are
the research concerns in this work
Periodicity of payments in the valuation function for environmental goods is
likely to be crucial in Third World economies due to existence of large subsistence
and informal sectors (Miracle et al, 1980, Gregory, 1980) As Boadu (1992) notes,
CV results are apt to be sensitive to the amount of money respondents have at the
time the survey is conducted It has to be noted that this has to do with periodic
income flow of the interviewees and not simply the general question of the income
constraint which is implicitly addressed by the choice of WTP in preference for WTA
as a welfare measure For instance, the study by Briscoe and co-workers (1990) shows
that being employed in the formal sector raises the probability of hooking up to a yard
water tap by 7 per cent The next chapter, Chapter 1V, presents the research
methodology
The infomial sector pnncipally compnses people who are either self-employed or arein unpaid-family worker capacity

127
CHAPTER IV
METHODOLOGY
4.1 INTRODUCTION
As shown in the review of the literature related to this study, in Chapter 3, the
Contingent Valuation (CV) approach is a widely accepted method for valuing both
natural resource damages, and nonmarketed benefits of environmental resources and
improvements The CV method is capable of not only measuring use values but is the
only methodology currently available to measure other components of total economic
value such as option, existence, and bequest value
Questionnaire design is the most critical task in a contingent valuation study
This paper describes and presents salient methodological aspects of this study's
estimation of benefits of river pollution abatement and domestic water supply
improvement in Kenya There are four sections to the Chapter First, the four study
hypotheses are presented in Section 42 This naturally leads to the questionnaire and
survey structure (Section 4 3) which, in turn, is succeeded by a description of the
survey pre-test, administration, sample design, and fieldwork procedure (Section 44)

128
4.2 THE FOUR STUDY HYPOTHESES
The purpose of this Chapter is to link study hypotheses to the survey instrument and
structure that was utilised in the application and assessment of the contingent valuation
(CV) to estimate the economic value of improved river quality and domestic water
supply in Kenya Tables 4 1A and 4 2B bnefly descnbe each of the six CV
questionnaire versions used in this survey and indicates sizes of the sub-samples
Respondents were randomly assigned one of the six versions See Appendices 4 A and
4 B for the actual questionnaire versions
Before presenting the study hypotheses, however, we need to restate the
purpose of the research The study was designed to serve five objectives (a) to
estimate the economic value of piped water supply and improved water quality in the
Nzoia River Basin, (b) to evaluate the feasibility of using CV to value an
environmental amenity and its related quasi-public service in rural settings where
respondents have limited education and monetary resources, (c) to examine the role
of temporal dimensions of bid payments in contingent values for environmental
commodities, (d) to empirically investigate embedding effect bias in contingent
valuation of improvements in river water quality, and (e) to evaluate the role of water
connection charges in households' willingness to hook onto a piped water system

129
Table 4 1A Differences in CV Questionnaire Versions and Sizes of River Pollution
Control Sub-Samples
Version Contingent Commodity, Temporal Dimension of Payments in the
Valuation, and Size of Sub-Sample (n)
Al BS*sm monthly wtp for improving water quality in the part of the river in
Webuye Division under a questionnaire version (Al, n = 38) eliciting
for values for both the section and the entire basin
Al TBS-bm total amount of monthly wtp for improved nver water quality in the
entire basin upto Lake Victoria, essentially the sum of BS*sm and an
additional amount elicited for within the same questionnaire version,
Al
A2 BS*Sy annual wtp to improve river water quality in only the part within
Webuye area under a questionnaire version (A2, n = 39) eliciting for
values for both section and entire basin
A2 TBS-by total amount of annual wtp for improved water quality in the entire
river basin upto Lake Victoria, essentially the sum of BS*sy and an
additional amount elicited for within the same questionnaire version,
A2
A3 Sect-sm monthly wtp for improved nver quality in the part within Webuye Area
in the questionnaire version (A3, n = 40) asking for "sectional values"
only
A4 Sect-sy yearly wtp for improved water quality in the section within Webuye
area under the questionnaire version (A4, n = 37) asking for "sectional
values" only
Note n stands for realized sub-samples Planned sub-samples were as follows 45
households for each of the four river pollution control questionnaire versions
(total 180 households) and 85 households for each of the two domestic water
supply questionnaire versions (total 170) (cf Table 4 1B) Consequently, 350
respondents was the planned sample size for the entire study
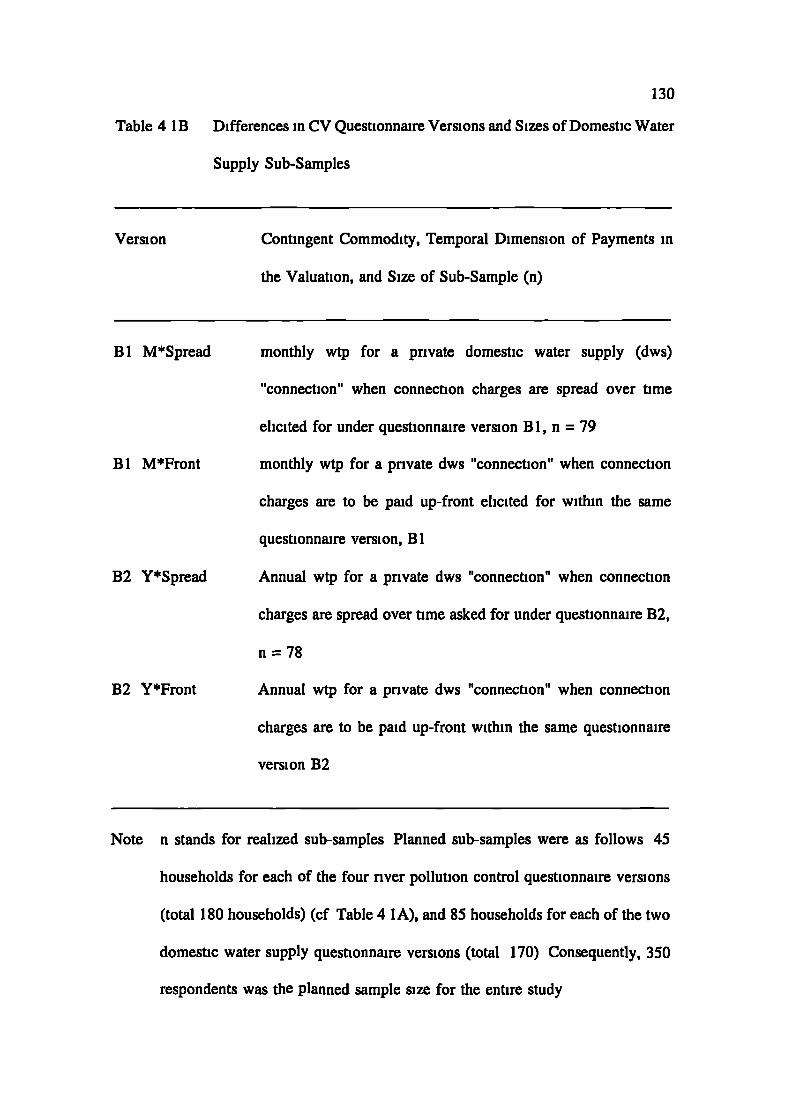
130
Table 4 lB Differences in CV Questionnaire Versions and Sizes of Domestic Water
Supply Sub-Samples
Version Contingent Commodity, Temporal Dimension of Payments in
the Valuation, and Size of Sub-Sample (n)
B! M*Spread monthly wtp for a private domestic water supply (dws)
"connection" when connection charges are spread over time
elicited for under questionnaire version B!, n = 79
BI M*Front
monthly wtp for a private dws "connection" when connection
charges are to be paid up-front elicited for within the same
questionnaire version, B I
B2 y*Spread
Annual wtp for a private dws "connection" when connection
charges are spread over time asked for under questionnaire B2,
n = 78
B2 Y*Front
Annual wtp for a private dws "connection" when connection
charges are to be paid up-front within the same questionnaire
version B2
Note n stands for realized sub-samples Planned sub-samples were as follows 45
households for each of the four river pollution control questionnaire versions
(total 180 households) (cf Table 4 1A), and 85 households for each of the two
domestic water supply questionnaire versions (total 170) Consequently, 350
respondents was the planned sample size for the entire study

131
All questions in the survey instrument were designed to address four research
hypotheses effect of temporal dimension of payments, evaluation of nver pollution
control over diverse geographical extents (a form of embedding effect), and impact of
nature of payment profiles for connection charges in household decisions to hook onto
a piped water supply system The fourth study hypothesis on whether the nature of the
good under valuation matters in hypothetical evaluations should be apparent
Following is a bnef exposition of the hypotheses
4.2.1 NATURE OF GOOD HYPoTHEsIs
The first hypothesis is that contingent values for nver quality would be less reliable
and less accurate predictors of actual willingness-to-pay than those of domestic water
supply because one, piped water is more well defined and concrete, and two, because
respondents are more familiar with domestic water The amorphous nature of
environmental amenities has bred scepticism over the performance of the CV method
Although this doubt was perhaps dispelled by Kealy and her co-workers (1990), it still
lives on in developing country applications since CV surveys there have not involved
environmental amenities proper Hence the two sets of questionnaire versions, A for
river pollution control in the Nzoia Basin and B for domestic water supply
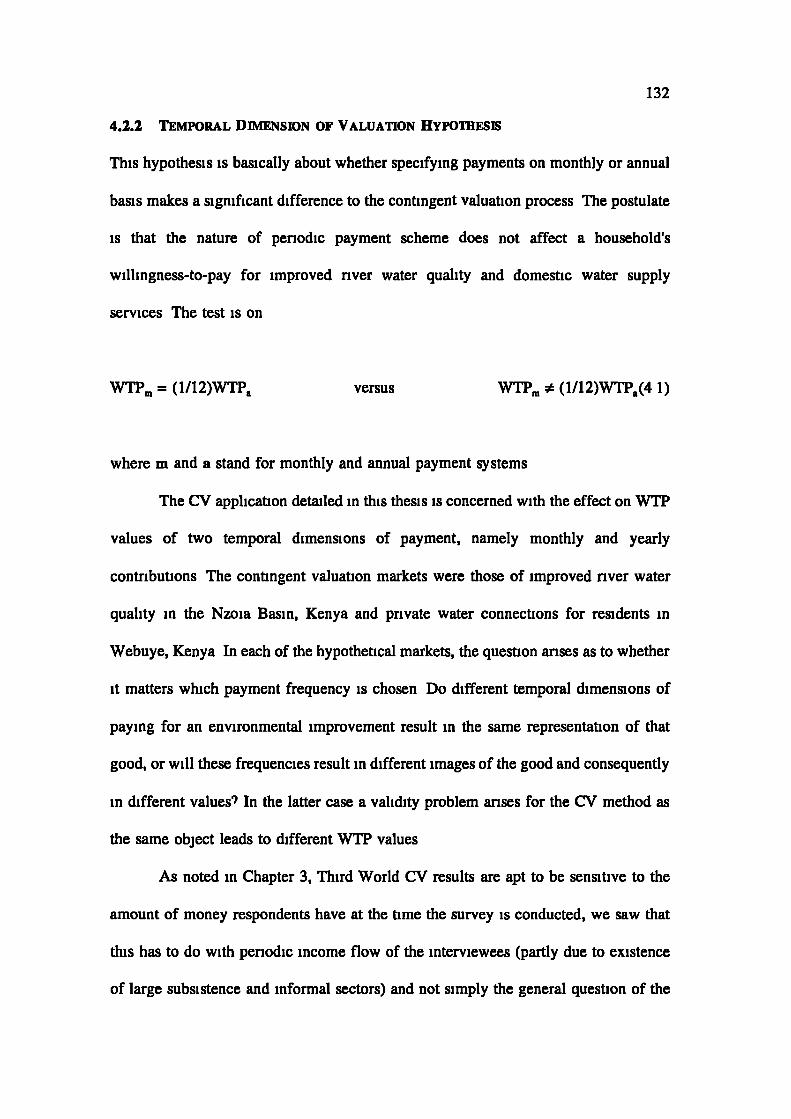
132
4.2.2 TEMPORAL DIMENSION OF VALUATION HYPOTHESIS
This hypothesis is basically about whether specifying payments on monthly or annual
basis makes a significant difference to the contingent valuation process The postulate
is that the nature of periodic payment scheme does not affect a household's
willingness-to-pay for improved nver water quality and domestic water supply
services The test is on
WTPm = (1/12)WTPaversus WTPm ^ (1/12)WTP(4 1)
where m and a stand for monthly and annual payment systems
The CV application detailed in this thesis is concerned with the effect on WTP
values of two temporal dimensions of payment, namely monthly and yearly
contributions The contingent valuation markets were those of improved river water
quality in the Nzoia Basin, Kenya and private water connections for residents in
Webuye, Kenya In each of the hypothetical markets, the question anses as to whether
it matters which payment frequency is chosen Do different temporal dimensions of
paying for an environmental improvement result in the same representation of that
good, or will these frequencies result in different images of the good and consequently
in different values7 In the latter case a validity problem arises for the CV method as
the same object leads to different WTP values
As noted in Chapter 3, Third World CV results are apt to be sensitive to the
amount of money respondents have at the time the survey is conducted, we saw that
this has to do with periodic income flow of the interviewees (partly due to existence
of large subsistence and informal sectors) and not simply the general question of the

133
income constraint which is implicitly addressed by the choice of WTP in preference
for WTA as a welfare measure
4.2.3 EMBEDDING HYPOThESIS
In terms of this study, embedding will occur if the average WTP value for pollution
control in the entire Nzoia River Basin upto Lake Victoria is the same as the WTP
value for pollution control in the section of the Nzoia River Basin within Webuye
Division only In particular, tests for embedding effect relate to statistical equivalence
of average WTP for pollution control over geographic extents of the Nzoia River
Basin (a form of part-whole bias) Hence the four questionnaire versions on nver
pollution control, asking for "sectional" evaluation over nested/paired (Versions Al
and A2) and nonnested/unpaired response modes (Versions A3 and A4)
4.2.4 CONNECTION CHARGE HYPOThESIS
It is expected that in a socio-economic setting of low levels of education and income
the nature of initial connection charges for a household water faucet would influence
willingness to pay for the good This is the hypothesis under test here Does the nature
of initial connection charges affect household willingness-to-pay bids for an individual
connection to the piped water system9
Essentially, the postulate on whether or not average wtp measures for domestic
water supply improvement would vary across profiles of initial connection charges can
be shown as follows
Null hypothesis H0 WTP[SPREAD] (m,y) = WTP[UPFRONT](m.y) (42)

134
Alternative hypothesis Ha WTP[SPREAD] (m.y) > WTP[UPFRONT](m,y) (43)
where (m,y) denote the temporal dimension of payments in the valuation process (that
is monthly or yearly), and SPREAD and UPFRONT represent the two payment
profiles of initial charges for piped water connection
4.3 QUESTIONNAIRE AND SURVEY STRUCTURE
4.3.1 FEATURES OF THE HYPOTHETICAL MARKETS
The basic notion of the CV method is that a realistic but hypothetical market for
"buying" use and/or preservation of a nonmarket natural resource or public good is
described to an individual Then the individual is told to use the market to express his
or her valuation of the good Key features of the market include (1) description of the
good under valuation, (2) means of payment (often called payment vehicle), and (3)
the value elicitation procedure
The two goods to be valued were river pollution control in the Nzoia Basin,
Kenya and household piped water connections for Webuye residents, Kenya The
problems of water pollution in the Nzoia River Basin as well as lack of access to
clean, safe, potable, and convenient water supply for domestic purposes were both
familiar to residents of Webuye Division, Kenya To emphasize the geographical
stretch of the river, however, a map was shown to respondents
The payment vehicle must be realistic and emotionally neutral for the
respondent To improve realism, the payment vehicle should be appropriate for the
resource and market constructed The payment vehicle used in this study's contingent

135
market of the Nzoia River quality was a council charge 38/sewage fees and that for
improved water service (that is, household piped water connections) was a water
charge Although a prima facie look at a council charges shows a simplification of the
economic activities that involve water use owing to its apparent disregard for the
conventional method through which people pay for improved river quality as taxpayers
and consumers of industrial products, it is a familiar method of payment for most
public services in Kenya In the case of piped water connections, the water bill a very
realistic and familiar means of paying for water for most homeowners and persons
renting houses Renters, in general, are aware of payment for water because many do
pay for their water separately and those that do not are often aware that water is a
service paid for in their rent Landlords make use of "utilities included" when
attracting rentors and as a reason for periodically raising the rent when electricity or
water rates increase
The value elicitation procedure can be one of three types, iterative bidding,
open-ended, and closed-ended or dichotomous choice39 Open-ended (or continuous)
willingness to pay (WTP) questions (sometimes aided with a payment card listing
alternative amounts) simply ask the respondent to state their maximum WTP without
any prompts concerning possible answers In the close-ended "iterative bidding" type
question, the interviewer states a monetary (shilling, in this case) amount and the
38These are basically user-charges Use of the term "charge" rather than "price" iecognisesthe administrative, rather than market, detennination of payments Morn specifically, use of"user-charge" itcognises the necessity to exclude internal recharges in onler to avoid multiplecounting For a detailed international comparison of user-charges for urban services see Bailey(1994)
39For more details on these approaches see Cummings et al (1986), Hanley (1989),Mitchell and Carson (1989) and Hanley and Spash (1993)
136
respondent answers "yes" they would pay or "no" they will not pay If a yes is
elicited, the amount is raised and this process is repeated until a no is recorded
Dichotomous Choice (which is also known as "take-or-leave-it", close-ended, discrete,
or referendum4° style bidding) value elicitation approach is where the respondent
answers yes or no to one randomly assigned monetary amount chosen by the
interviewer. Many intermediate questioning formats are also possible, e g bidding
games, bidding games with a budget constraint, and ranked choice
The history of the CV method reveals use of bidding techniques (now called
iterative bidding) in personal interviews (such as Davis, 1961/81) and the use of open-
ended (OE) willingness to pay (WTP) questions in mail surveys (for example, Randall
et al, 1974) and Cummings et a! (1986) prefer iterative bidding over the open-ended
question format due to iterative bidding's more market-like approach and the fact that
the repetition provides the respondent greater opportunity to "research his preferences"
However, the iterative approach is impractical in mail surveys and the OE approach
found much use in such surveys
When Bishop and Herberlern (1979) first explored the use of closed-ended or
dichotomous choice (DC) WTP questions in their validation work, it became apparent
this question format could provide a more market-like setting and yet be performed
in a mail survey With the utility-theoretic foundation established by Hanemann
(1984), the DC question format was quickly adopted as the preferred approach in a
large number of surveys (Loomis, 1990 78)
40The referendum foimat is a dichotomous-choice question with the payment vehicle posedas a referendum vote

137
4.3.2 OPEN-ENDED CONTINGENT VALUATION MODEL
Currently, open-ended and dichotomous-choice questions appear to be the most
popular formats Open-ended questions were one of the earliest questioning formats
(Hammack and Brown, 1974) Dichotomous-choice questions were developed later in
the evolution of contingent valuation (Bishop and Heberlein, 1979) and are the most
commonly employed questions in the literature today
Although there has been growing enthusiasm in the CV literature for using
discrete choice (DC) over open-ended questions due to the NOAA panel's endorsement
of the DC strategy (NOAA, 1993)', one should not be indifferent in the choice of a
questioning format In fact, the debate on whether or not the two approaches yield
different results continues Kealy et al (1988) indicate that DC and open-ended
questions yield similar average estimates of consumer surplus There is also little
evidence suggesting differences in accuracy Kealy et al (1988) and Boyle and Bishop
(1988) found the precision of both their CV estimates to be similar, but Seller et al
(1985) found the open-ended CV estimates were tighter
Unless OE responses are highly skewed toward high values, open-ended data
are likely to yield lower estimates of central tendency and smaller standard errors
Thus, the choice of questioning format can influence the absolute magnitute of welfare
estimates and, perhaps, the outcome of cost-benefit analyses The differences in
standard deviations also can lead to different conclusions from statistical tests of
means
41 Like many others, the NOAA panelists are attracted by the referendum approach - wherepeople are asked whether or not they accept to pay a contnbution of a given amount - sincethis approach lacks an obvious strategic bias All nght, but this approach opens up a Pandora'sbox of other problems related to a worsening of the hypothetical status of the questions
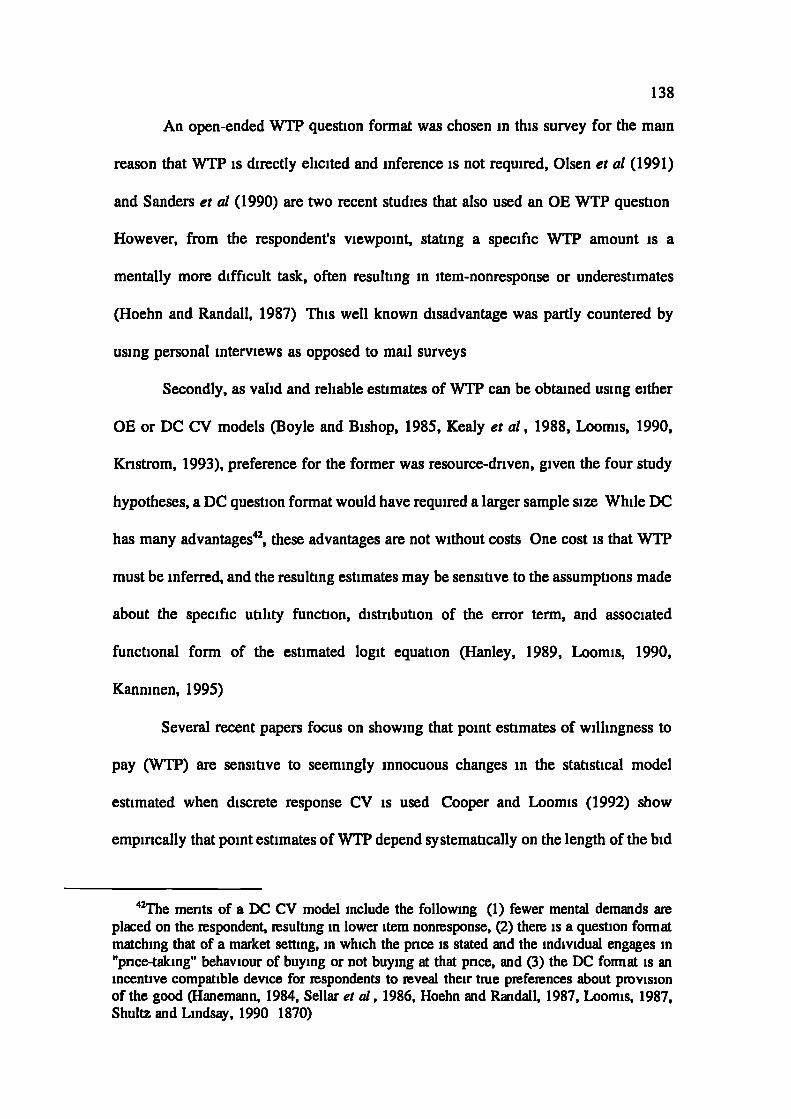
138
An open-ended WTP question format was chosen in this survey for the main
reason that WTP is directly elicited and inference is not required, Olsen et al (1991)
and Sanders et a! (1990) are two recent studies that also used an OE WTP question
However, from the respondent's viewpoint, stating a specific WTP amount is a
mentally more difficult task, often resulting in Item-nonresponse or underestimates
(Hoehn and Randall, 1987) This well known disadvantage was partly countered by
using personal interviews as opposed to mail surveys
Secondly, as valid and reliable estimates of WTP can be obtained using either
OE or DC CV models (Boyle and Bishop, 1985, Kealy et al, 1988, Loomis, 1990,
Kristrom, 1993), preference for the former was resource-driven, given the four study
hypotheses, a DC question format would have required a larger sample size While DC
has many advantages42, these advantages are not without costs One cost is that WTP
must be inferred, and the resulting estimates may be sensitive to the assumptions made
about the specific utility function, distribution of the error term, and associated
functional form of the estimated logit equation (Hanley, 1989, Loomis, 1990,
Kanninen, 1995)
Several recent papers focus on showing that point estimates of willingness to
pay (WTP) are sensitive to seemingly innocuous changes in the statistical model
estimated when discrete response CV is used Cooper and Loomis (1992) show
empirically that point estimates of WTP depend systematically on the length of the bid
42The ments of a DC CV model include the following (1) fewer mental demands areplaced on the respondent, resulting in lower item nonitsponse, (2) there is a question foim atmatching that of a market setting, in which the pnce is stated and the individual engages in"pnce-taking" behaviour of buying or not buying at that pnce, and (3) the DC foimat is anincentive compatible device for respondents to reveal their tnie preferences about pmvisionof the good (Hanemann, 1984, Sellar et a!, 1986, Hoehn and Randall, 1987, Loomis, 1987,Shultz and Lindsay, 1990 1870)

139
vector used They conclude that it is essential to include bid values in the tails of the
WTP distribution in order to obtain an unbiased point estimate of WTP Similarly,
McFadden and Leonard (1992) find that their point estimates of WTP is sensitive to
the inclusion or exclusion of a bid value in the upper tail of the WTP distribution
Boyle et al (quoted in Kanninen, 1995) find that their point estimates of WTP,
estimated using "synthetic" discrete response CV data created by comparing open-
ended responses to a set of bid values, are significantly different from the point
estimates of WTP estimated using the actual open-ended data More recently,
Kanninen (1995) shows that DC responses or yea-saying could inflate a CV study's
"best estimate"
4.3.3 STRUCTURE OF THE QUESTIONNAIRE
The design of the questionnaire (see Appendices 4 1A and 4 1B) centred on two
primary objectives, one, to collect data required for analysis of the research objectives
above, and two, to collect data in a such a way that reliability and validity are
enhanced In meeting these objectives, I reviewed the water quality questionnaire of
Smith and Desvousges (1986) and Green and Tunstall (1991) as well as questionnaires
from early research on improved water supply and sanitation services (e g, McPhail,
1994, Whittington et al, 1992, Whittington et al, 1993) With these as background
and other literature (reviewed in Chapter 3), draft questionnaire versions were
developed The drafts were, of necessity, revised a number of times before the actual
survey

140
4.3.3.1 PART A -- SURVEY BACKGROUND AND INTRODUCTION
A key ingredient in successful CVM research is establishing credibility for the survey
objectives In particular, "[t]he first component of the questionnaire has to achieve this
objective without biasing or offending the respondent" (Smith and Desvousges, 1986
p 82) Therefore, Part A in both versions of the questionnaire attempted to realise
these goals by inquinng about water pollution in the Nzoia River and the respondents's
water supply situation
As for version A (i e, on water quality in the Nzoia River Basin), the first
three questions relate to use or non-use of the River, knowledge of on-going pollution,
and a list of benefits from improved water quality in the River The purpose of this
was, inter aha, to determine if the respondent has used or enjoyed the River in the past
one year and his/her ranking of the various benefits
In version B (i e, domestic water supply connection), the first three questions
pertain to existing water supply system and activities that involve water use as well
as amount of household water storage capacity Recent CVM researches (see
developing country application in Chapter 3) have found household perception of
reliability and quality of water from an existing source and amount of storage capacity
to be significant factors in attitudes on improved water supply situation in developing
economies. Following the existing water source question, a list of activities that
involve water use was presented and a question on water storage was asked The
interviewee was required to state, by "yes/no" answers which of the operations apply
to them
The data collected in Part A achieved two twin sub-objectives, it (a) completed
River use/non-use and water supp ly profiles of the respondent that were later used in

141
the analysis phase, and (b) established a rapport with him/her without influencing the
main objective -- benefit estimation Part A also reinforced the notion that a wide
range of activities are influenced by nver water quality and household water supply
Before this part, however, there was the Identification Information section which
contained two key contextual issues rural and urban settings as well as presence of
people listening to the interview Due to crowded housing conditions in urban areas
and the general behaviour of rural Kenyans (especially the extended family system),
the ideal situation of interviewing a respondent without other people listening is
largely not possible Enumerators, therefore, noted the presence of other adults
listening to the interviews It is possible for the presence of listeners to bias a
respondent's WTP bids, but the direction of the potential bias is unclear Respondents
may be reluctant to indicate their ability to pay a large amount and thus bid low
Alternatively, they may want to demonstrate their ability to pay to their neighbours
and thus bid high in an attempt to gain status
4.3.3.2 PART B -- BENEFiT MEASURES
Between basic questions of putting the respondent in the mood (Part I) and asking a
senes of questions on the household's socioeconomic composition and its physical
structure (Part HI, see next section 4 2 3 3), all questionnaire versions elicited for
responses relating to the economic value of nver pollution control and a household
water faucet in Part H Part II focused on what households would be willing to pay
(WTP) for improved water quality in the Nzoia Basin, Kenya and an individual water
connection in Webuye Division, Kenya
Willingness-to-pay parts or sections of CV questionnaires often begin with a

142
query on whether the respondent would be willing to pay (WTP) anything for the
environmental good in the contingent market The approach in this study was not
dissimilar As noted in Chapters 2 and 3, people's total WTP for increments or
decrements in a natural resource can include current personal use values, possible use
values (option values), and future generation use values (bequest values) Total WTP
can also include nonuse (or existence) values which involve gains people obtain from
the good for various reasons other than their person use (for instance, Brookshire et
a!, 1986)
The objective of this research, however, was to estimate the total WTP for both
nver pollution abatement and water supply improvement without separating the
benefits into individual components Nonetheless, the fact that individuals will be
asked to express a WTP bid for improved water quality in the entire Nzoia river basin
means that they will be expressing expected use values, some option value (associated
with uncertain future use), and existence value This is especially so because Webuye
residents do not conceive of using the entire Nzoia river from its source to the mouth,
it must be assumed that only the section of the river in the Webuye area is part of the
set actually used or planned for future use
Part B of the questionnaire versions established the framework for the
contingent commodities In other words, this part described the hypothetical market,
the commodity to be valued, the payment vehicle and elicits the valuation amounts
The first paragraph of this section introduced the setting for the hypothetical markets
Following the introduction, the interviewee was asked, through an open-ended CV
model, to state their valuations of the two-related contingent commodities Each
Question 5 of the questionnaire variants introduce and address key elements in the "as
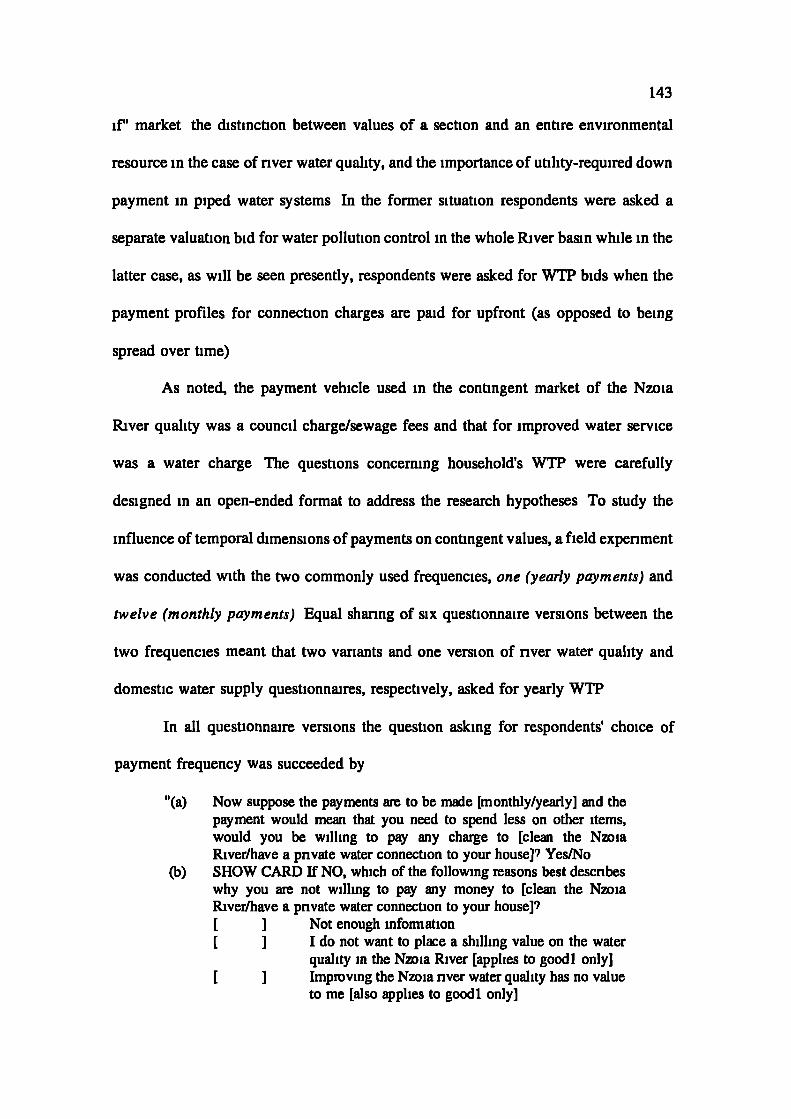
143
if" market the distinction between values of a section and an entire environmental
resource in the case of river water quality, and the importance of utility-required down
payment in piped water systems In the former situation respondents were asked a
separate valuation bid for water pollution control in the whole River basin while in the
latter case, as will be seen presently, respondents were asked for WTP bids when the
payment profiles for connection charges are paid for upfront (as opposed to being
spread over time)
As noted, the payment vehicle used in the contingent market of the Nzoia
River quality was a council charge/sewage fees and that for improved water service
was a water charge The questions concerning household's WTP were carefully
designed in an open-ended format to address the research hypotheses To study the
influence of temporal dimensions of payments on contingent values, a field experiment
was conducted with the two commonly used frequencies, one (yearly payments) and
twelve (monthly payments) Equal sharing of six questionnaire versions between the
two frequencies meant that two variants and one version of river water quality and
domestic water supply questionnaires, respectively, asked for yearly WTP
In all questionnaire versions the question asking for respondents' choice of
payment frequency was succeeded by
"(a) Now suppose the payments are to be made [monthly/yearly] and thepayment would mean that you need to spend less on other items,would you be willing to pay any charge to [clean the NzoiaRiver/have a private water connection to your house] 9 Yes/No
(b) SHOW CARD If NO, which of the following reasons best descnbeswhy you are not willing to pay any money to [clean the NzoiaRiver/have a private water connection to your house]9[ I Not enough information[ ] I do not want to place a shilling value on the water
quality in the Nzoia River [applies to good I only][ ] Improving the Nzoia river water quality has no value
to me [also applies to good 1 only]
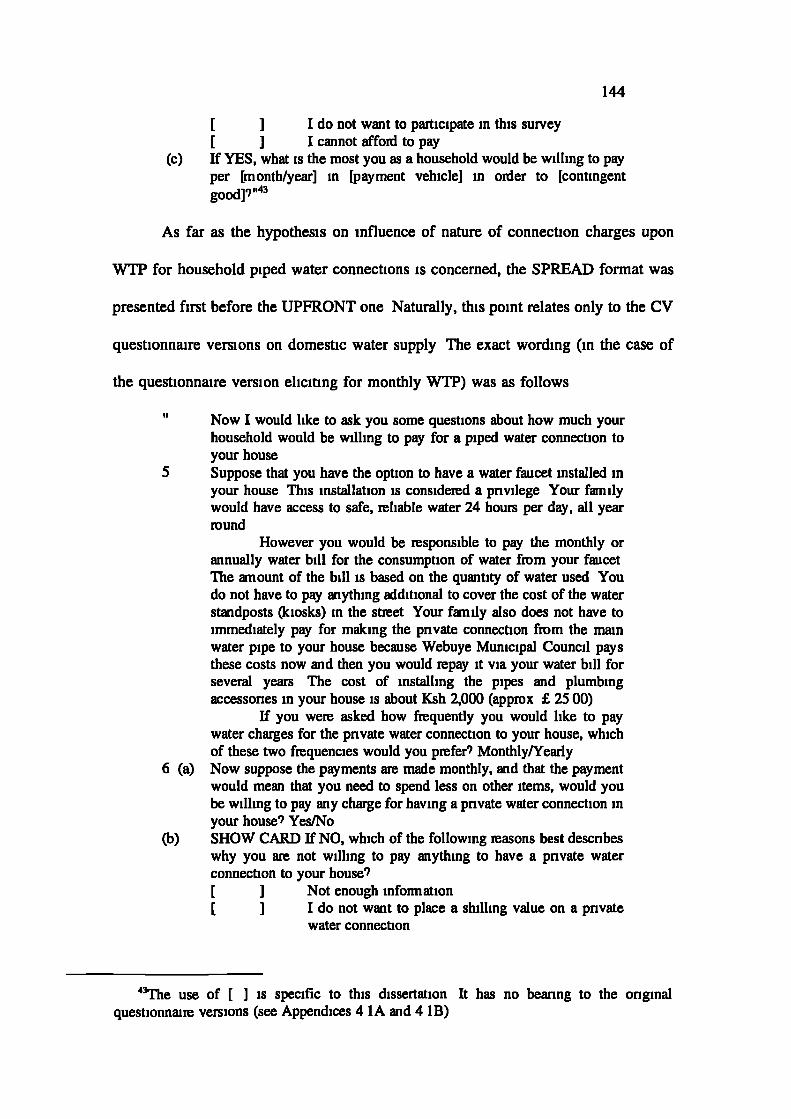
144
[ ] I do not want to participate in this survey[ ] I cannot affoni to pay
(c) If YES, what is the most you as a household would be willing to payper [month/year] in [payment vehicle] in onler to [contingentgood]9"43
As far as the hypothesis on influence of nature of connection charges upon
WTP for household piped water connections is concerned, the SPREAD format was
presented first before the UPFRONT one Naturally, this point relates only to the CV
questionnaire versions on domestic water supply The exact wording (in the case of
the questionnaire version eliciting for monthly WTP) was as follows
Now I would like to ask you some questions about how much yourhousehold would be willing to pay for a piped water connection toyour houseSuppose that you have the option to have a water faucet installed inyour house This installation is considered a pnvilege Your familywould have access to safe, reliable water 24 hours per day, all yearround
However you would be responsible to pay the monthly orannually water bill for the consumption of water from your faucetThe amount of the bill is based on the quantity of water used Youdo not have to pay anything additional to cover the cost of the waterstandposts (kiosks) in the street Your family also does not have toimmediately pay for making the pnvate connection from the mainwater pipe to your house because Webuye Municipal Council paysthese costs now and then you would repay it via your water bill forseveral years The cost of installing the pipes and plumbingaccessones in your house is about Ksh 2,000 (appmx £ 2500)
If you were asked how frequently you would like to paywater charges for the pnvate water connection to your house, whichof these two frequencies would you prefer9 Monthly/Yearly
6 (a) Now suppose the payments are made monthly, and that the paymentwould mean that you need to spend less on other items, would yoube willing to pay any charge for having a pnvate water connection inyour house9 Yes/No
(b) SHOW CARD If NO, which of the following masons best descnbeswhy you are not willing to pay anything to have a pnvate waterconnection to your house7[ ] Not enough infoimation[ ] I do not want to place a shilling value on a pnvate
water connection
43The use of [ ] is specific to this dissertation It has no bearing to the onginalquestionnaire versions (see Appendices 4 1A and 4 1B)

145
[ ] A pnvate water connection has no value to me[ ] I don't want to participate in this survey[ ] I can't afford it
(c) If YES, what is the most you as a household would be willing to payper month in water charges for a pnvate water connection to yourhouse91'
This was followed by another question eliciting for WTP when connection
charges are to be paid for upfront The exact wording was
"7 Upto now we have talked about piped water supply based on theassumption that the Municipal Council makes the pnvate connectionto your home and then charges you for the installation costs throughthe water charges over several years An alternative approach wouldbe for the Municipal Council to insist that each household meets thecost of installing the pipes and plumbing accessones in advanceGiven this condition, what is the most your household would bewilling to pay per month in water charges to have a pnvate waterconnection 9"
4.3.3.3 PART C -- BACKGROUND AND SOCIOECONOMIC DATA
This section of the CVM questionnaire versions aimed at collecting basic socio-
economic and demographic information that may influence households' WTP for
benefits of water pollution abatement on the Nzoia River and Improvement in
domestic water supply The key characteristics asked for here included sex, age, level
of education, occupation, knowledge about river pollution, and status of existing water
supply in terms of quantity, quality, and convenience The other variable sought for
was total monthly income Respondents were not asked to specify precisely the gross
monthly income of family members, but rather to indicate the category into which
their household income fell
Findings from studies on impact of attitudes on WTP for environmental assets
have had a direct influence on the specific socio-economic features that are included
in this CVM study's questions A note on some of the studies is definitely apt at this

146
stage In a study on public attitudes towards water and other environmental issues,
Hamilton (1985a, b) concluded that concern over water contamination was highest
among young respondents, women, and persons with children living at home It has
also been shown that more highly educated people are often more concerned about
protection of the environment (Butel, 1979, Lowe et al, 1980) and that those people
who have greater knowledge of an environmental problem are more likely to be
actively involved in it (van Liere and Dunlap, 1980) Finally, in a recent WTP
experiment in a Third World country, Whittington et al (1992) found that income had
a strong positive effect on the probability of residents WTP for improved water
supplies Chapter 5 details, among other aspects of empirical analysis and results, the
expected signs (that is, directions of influence) of the various variables on WTP for
nver pollution control and improved domestic water supply
Besides the conventional background data mentioned above, Questions 12 and
13 of the survey questionnaires on Nzoia River pollution abatement and water supply
improvement asks for household perception on water supply and water quality on the
Nzoia River respectively The aim here is to examine the effect of a respondent's
water supply status on valuation of benefits of river pollution control and vice versa,
the impact of a household's perception of nver quality on the value of water supply
improvement

147
4.4 SURVEY PRE-TEST, ADMINISTRATION, SAMPLE DESIGN, AND FIELD PROCEDURE
This CV questionnaire was extensively pre-tested with this author as the principal
researcher and three field assistants, all students at Kenya's public universities One
pre-test was conducted by the principal researcher alone using African students at the
University of Stirling as mock-respondents and another was conducted at the study
location over the second half of May 1995 The pre-tests showed the need to modify
some part of the text which flowed badly, to change some of the skip patterns, and to
provide additional cards containing response choices for some questions A number
of minor language changes were made to the contingent scenarios to improve their
understandability The correct income group brackets based on the high-medium-low
income cohorts employed in the Kenya Government surveys were incorporated in
consultation with the Bungoma District Statistical Officer Moreover, since one main
purpose of training for interviewers and pretest was to check language translations, we
practised with interpretations of the English questionnaire versions into Kiswahih and
Luhya languages
The CV survey was administered in June 1995 through August 1995 by this
author and three field assistants Interviews with 311 respondents were completed out
of a target of 350 households Given the Divisional population of 135,561 and the
average household size of 5 89 (this is a Bungoma District figure), the completed
interviews represent 1 4 per cent of the entire population of about 23,015 households
The survey was conducted in-person with one person interviewed in each household
Respondents were selected using a household-based multi-sub-location stratified
random sample of persons 18 years or older Stratification was done at Locational
level, metropolitan/non-metropolitan level and upper/lower levels, upper/lower levels

148
respectively refer to the areas north/south of the Pan Paper Mills (see Figure 11 in
Chapter 1) Within strata, census enumeration blocks were randomly chosen and
households in the blocks were physically listed "linearly on a line as we walked along
paths in the study area" Respondents were randomly assigned one of six versions of
the CV questionnaire Versions contained either RWQ or DWS good combined with
one of the two temporal dimension of payments and/or embedding scenarios [that is,
part (section) or part and the whole (entire) basin of the Nzioa River]
Interviewers received extensive training by attending 10 full-day training
sessions held in different locations throughout Webuye Division, Kenya (Khalumuh,
Maraka, Matulo, Muchi-Milo, Nabuyole Falls, and Webuye Township) The training
emphasized the use of visual aids (SHOW CARDS), need for neutrality, the nature of
the quota selection, and translation of English questionnaire versions into Kiswahili
and Luhya (Bukusu and Tachoni dialects) languages The survey instrument took on
average 30 minutes to complete In an effort to obtain completed interviews,
interviewers occasionally called back to respondents homes in the evenings and
weekends An 88 percent response rate was achieved An interviewer debriefing after
the CV survey suggested that the survey had gone well and had been taken seriously
by interviewers "Empirical Analysis and Results" is the subject of Chapter 5

149
CHAPTER V
EMPIRICAL ANALYSIS AND RESULTS
5.1 INTRODUCTION
The contingent valuation (CV) method offers a direct, intuitively appealing means of
estimating economic benefits of environmental improvements e g, river pollution
control and improved domestic water supply Rather than attempting to infer from
behavioural information how much an individual is willing to pay (WTP) for improved
service or resource (as in revealed preference methods like hedonic property value
approach), the evaluator simply asks outright how much the individual or household
would be willing to pay This Chapter reports empirical results of the Kenya CV
survey undertaken, on river pollution control and improved domestic water supply,
over the period between May 1995 through to September 1995
There are five sections to the Chapter Section 5 2 presents preliminary results,
including household perception of the problems studied, nonmonetary measures of
relative importance of benefits, and socio-economic and demographic data Section 5 3
is on the descriptive statistics and frequency distributions of willingness to pay values,
as well as the analytical framework for WTP findings from open-ended CV design
However, the section starts with a presentation of responses to the value elicitation
question
Estimation models and tests of differences for various WTPs from different
questionnaire versions (or samples) are given in Section 5 4 and Section 5 5
respectively Section 5 5 particularly matches the statistical tests with the four study
hypotheses presented in Chapter 4 Finally, Section 5 6 aggregates benefits of

150
improvements in river pollution control and a household water connection at
Divisional, District, and National Levels
5.2 PRELIMINARY EMPIRICAL RESULTS
The significance of household recognition of environmental and socio-economic
problems has been greatly underscored in the literature on water resources
management (Lichtenberg and Lessley, 1992, Smith and Desvousges, 1986,
Whittington et al, 1990a, 1990b, 1991, 1993, Winpenny, 1994) This section presents
preliminary results, from Kenya, on perceptions of the severity of nver pollution and
inadequate domestic water supplies (Sub-Section 5 1 1) Nonmonetary measures of
relative importance of benefits of river pollution control and improved domestic water
supply are in Sub-Section 5 1 2 Sub-Section 5 1 2 shows that the socio-economic and
demographic statistics of households in the contingent valuation survey correspond
closely to the charactenstics of the underlying population in the Nzoia River Basin
within Webuye Division
5.2.1 HOUSEHOLD PERCEPTIONS OF THE STUDY PROBLEMS
Before directly asking how much respondents would pay for improvements in river
water quality and domestic water supply, it is important to allow them an opportunity
to reflect on why they might care about the nver and a private water supply
connection Cummings, Brookshire and Schuize (1986) call this "researching their
preferences", or in other words, permitting respondents to collect their thoughts on the
topic
The first set of questions therefore asked about the relative gravity of nver

151
pollution and domestic water supply problems countrywide and the study location, and
the relative importance of the Nzoia River for, inter alia, residential water supply, for
use by future generations and as habitat for plants and wildlife A five-point Likert
scale allow individuals to rate the relative seriousness of the problems (Table 5 1), as
well as importance of various reasons for valuing the Nzoia River (explained in Sub-
Section 5 2 2) The neutral response format, preceding the shilling valuation questions,
may aid in understanding the willingness to pay responses that people provide later
in the survey Table 5 1 shows that while Webuye residents recognized the existence
of water quality and supply problems, they tended to believe those problems occur
away from their local area

152
Table 5 1 Perceptions of Severity of River Pollution and Water Supply Problems
The Area and Rating of Severity of the Water Resource Problem'
WaterResource ______________________________________________________
Issue Likert scale Countrywide In Webuye Division
count (%) count (%)
River Water Quality
scale, 1
2
3
4
5
Mean (SD)
Domestic Water Supply
scale, 1
2
3
4
5
Mean (SD)
59(3831)
53 (3442)
25(1623)
17 (11 04)
0( 000)
2.00 (0.99)
27 (17 20)
88(5605)
31(1975)
11( 701)
0( 000)
2.17 (0.79)
42 (27 27)
45 (29 22)
32(2078)
35(2273)
0( 000)
2.39 (1.12)
37 (23 57)
29(1847)
53 (33 76)
32(2038)
6( 382)
2.62 (1.16)
Notes Scale 1 - 5 (1 = serious problem, 5 = no problem), SD figures represent
standard deviations, total counts for nver water quality and domestic water
supply samples are 154 and 157 households respectively

153
Webuye households' perceptions on river water quality and domestic water
supply problems suggest that they may not recognize fully either the extent or location
of the issues in the sources of pollution, including their own contribution to the
destruction, and/or Government policy on industry-environment relations While the
households recognize that the two issues are problems, they tend to associate it more
with other areas of Kenya This may be explained by the ubiquitous and overarching
influence sugarcane agnculture and PPM paper industry has on the local economy
Most sugarcane farmers in the rural areas pointed accusing fingers at the paper factory
and municipal sewage while urbanites employed at the manufacturing concern aimed
theirs at agricultural sources of surface and ground water damages All in all,
respondents in more urbanized sub-locations exhibited more concern about pollution
of the Nzoia River than those in the rural parts of Webuye
These ratings are in contrast with the actual water quality and water supply
problems in the Division, as already been painted in the background to the study The
most plausible speculation for these responses are twofold Firstly, the households
might have strategically underrated the problems with the view to preempt the
purposes of the research with regard to investment or policy decision This reason is,
however, unlikely since most well-structured experiments undertaken in the United
States and Western Europe (Bohm, 1972, Mitchell and Carson, 1989, Hanley and
Spash, 1993) and in developing countries (Whittington et al, 1990b, 1993) fail to
support the hypothesis that individuals will act strategically in answenng contingent
valuation questions Surveys to estimate strategic bias are often structured such that
one group of respondents is told one set of factors about a situation that minimizes
their incentive for strategic behaviour, and another group receives a different set that

154
maximizes their incentive for behaving strategically (e g, Bohm, 1972, Whittington
et al, 1990b, Grossman and Pirozzi, 1993) Assuming there is no strategic behaviour,
one particular implication emerges from this result, most ruralfolk lack knowledge on
environmentally deleterious effects of the agrochemicals that are applied on their
sugarcane fields
The second speculation is that the households put more emphasis on the user
benefits than other categories of economic value of water in nature This fact is seen
in the ratings for motivations for river water pollution abatement (see Sub-Section
5 22)
5.2.2 NONMONETARY MEASURES OF THE RELATIVE IMPORTANCE OF BENEFiTS
People's differences in importance attached to the various economic value categories
influences their attitude towards public investment in river water quality improvement
This issue is examined further in the section on determinants of willingness to pay
The question of "why do they benefit 9" in domestic water supplies can be answered
by the three attributes of piped systems convenience, reliability and quality, listed in
the order of household indications of degree of importance
As noted, a five-point Likert scale allowed respondents in Webuye area to rate
the relative seriousness of the problems, as well as importance of various reasons for
valuing the Nzoia River Table 52 suggests that the main motivation for improved
water quality in the Basin for inhabitants of Webuye is use value This is insofar as
"Contributes towards a cost-effective water supply for personal use and increase
enjoyment by its users" received the higher mean rating as a possible motivation for
improving water quality in the Nzoia River Basin vis-a-vis existence, option and
155
bequest reasons
Household perceptions on other aspects of Webuye water resources and
services were captured through different statements in the CV questionnaire versions
Specifically household predispositions regarding water quality in the Nzoia River
Basin, distance to existing source of domestic water supply (open-ended, but to the
nearest kilometre), time expenditure on hauling water (open-ended, but to the nearest
hour), and exiting domestic water supply status with respect to reliability, quality and
convenience (on Likert scale) were elicited on the corresponding scales Perceptions
of river water quality was based on the Smith-Desvousges (1986) water-quality ladder
These psychographic profile information is presented in Tables 5 3 and 5 4 whilst
Table 5 5 is a Joint frequency distnbution of number of water uses and household
storage capacity In tandem with expectation, the two variables in Table 5 5 have a
positive correlation coefficient of 0 058

156
Table 5 2 Benefits of River Pollution Control in the Nzoia Basin
Variable Distnbution of Responses (Likert scale) Mean (SD)Likert scale Count (%)
Contributes towards a cost-effective water supply forpersonal use and increase enjoyment by its users 3 82 (1 20)
1 7(49)2 14( 99)3 32 (227)4 32 (227)5 56(397)
II Protect the river for use by the future generations 3 10 (1 28)1 19(135)2 26(184)3 40(284)4 32(227)5 24(170)
III Avoid dirty, unsightly and smelly nature of river 2 56 (1 48)1 52(369)2 25 (177)3 14( 99)4 33(234)5 17(121)
IV Contribute towards the improvement of theenvironment in general 2 62 (1 30)
1 27 (192)2 49(348)3 40(284)4 0(00)5 25 (177)
V Conserve wildlife and plants 2 88 (1 44)1 36(255)2 27 (192)3 15 (106)4 44(312)5 19(135)
Notes n = 154Scale 1 - 5 (1 = not important at all, 5 = very important)Figures in brackets are standard deviations

157
In the domestic water supply sub-sample, conscious efforts were made to
interview only households who did not have a private water connection However, 12
(7 6%) respondents in the sub-sample had access to 'almost' private water in the
neighbourhood or in shared compounds Insofar as the households did not possess an
individual water faucet these interviewees were included in the non-market valuation
exercise On the other hand, their psychographics are excluded This is the reason for
the total domestic water supply sub-sample being less than 157 households on some
psychographic items For instance, in reporting an approximate distance to the water
source of less than 0 5 kilometres, such respondents are assumed to behave as if in
possession of a private tap The distance travelled by Webuyians to fetch water
averages at 1 53 km and is positively correlated with time expenditure in hauling
water (0 676) and number of water uses (0 070), it has a negative association with
water storage capacity (with -0 317 as Pearson's correlation coefficient)
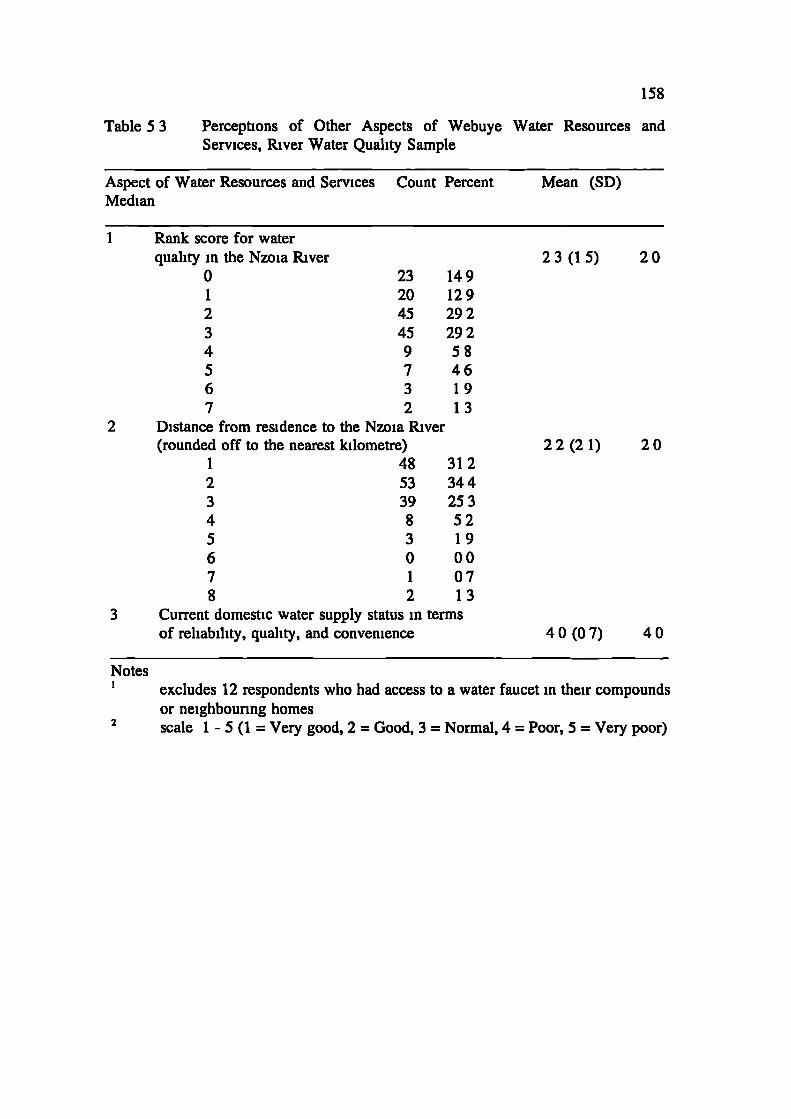
2023(15)
2022(21)
4040(07)
158
Table 5 3 Perceptions of Other Aspects of Webuye Water Resources andServices, River Water Quality Sample
Aspect of Water Resources and Services Count Percent Mean (SD)Median
I
2
3
Notes
Rank score for waterquality in the Nzoia River
0 23 1491 20 1292 45 2923 45 2924 9 585 7 466 3 197 2 13
Distance from residence to the Nzoia River(rounded off to the nearest kilometre)
1 48 3122 53 3443 39 2534 8 525 3 196 0 007 1 078 2 13
Current domestic water supply status in termsof reliability, quality, and convenience
excludes 12 respondents who had access to a water faucet in their compoundsor neighbouring homes
2 scale 1 - 5 (1 = Very good, 2 = Good, 3 = Normal, 4 = Poor, 5 = Very poor)

15 (07)
10
1 8 (09)
30
30
40
40
20
159
Table 5 4 Perceptions of Other Aspects of Webuye Water Resources and
Services, Domestic Water Supply Sample
Aspect of Water Resources
and Services Count Percent Mean (SD) Median
1
2
3
4
Distance to water source
(to the nearest km)'
1 81 559
2 51 352
3 13 89
Time expenditure in hauling
water (to the nearest hour)'
1 68
2 51
3 20
4 6
Status2 existing source of domestic
water supply with respect to
(a) Reliability 3 2 (0 8)
(b) Quality 2 8 (0 7)
(c) Convenience 3 8 (0 8)
Status of water quality in
the Nzoia River 42 (07)
NotesI _._._i.._i_, 1' ..L,. l...J el.....
AI1UU IL IUHUCIILS WIIU II4U LU 4 W4LI iauci III L11II UIIIUUIIU
or neighbounng homes
2 scale I - 5 (1 = Very good, 2 = Good, 3 = Normal, 4 = Poor, 5 = Very poor)

160
Table 55 Joint Frequency Distribution of Number of Water Uses and Household
Water Storage Capacity
Household Storage Capacity (in jericans)'
Water Uses
(in groups)21 2 3 4 TOTALS
1 5 7 1 0 13
2 16 23 5 6 50
3 26 50 11 7 94
TOTALS 47 80 17 13 157
Notes
a jerican is local parlance for a volumetric measure of water, one jerican is
equivalent to 20 litres In areas near Lake Victoria, it is called mbuguru
2 three groups of water uses Group I = Dnnking/cooking/domestic washing,
Group 2 = Watering flowers and imgating vegetables, Group 3 = Watering
livestock
Tables 56 and 57 show summaries of perceptions of water quality in the
Nzoia River by Household Location in the Basin As expected, most residents located
in the upper section of the river (after the Webuye Bridge) gave higher scores for the
river water's quality than those in the lower section, most of the polluting activities
are located in the lower parts of the Basin Of the 90 persons interviewed in the upper

161
section, 21(24 4%) thought the water quality in the Basin was either at 0 or 1 level,
while more than 32% of dwellers of the lower section (sub-sample was 64) agreed
with these rankings Although these findings relate to the river sample, the picture is
similar for the water sample Perceptions of quality of water in the Nzoia River also
varied in accordance with household socio-economic setting In particular, people in
urban areas ranked it low compared to rural folks
Unlike developed country scenarios in which a conceptual problem arises with
within-basin comparisons because individuals with particular preferences for water
quality may locate at specific areas (d'Arge and Shogren, 1989), we submit that this
situation is unlikely in the Kenyan case The reason is as follows Most household
locations in the Basin, except house renters within Webuye Municipality, are on
ancestral lands and therefore peoples' perceptions are well-informed by recent changes
in the river water quality due to various polluting activities d'Arge and Shogren
concede that their "observed difference in values between the lakes may be partially
determined by differences in preferences" (p 254), and not by differences in
perceptions on water quality in the lakes under valuation

162
Table 5 6 Perceived Water Quality in the Nzoia River by Household Location in
the Basin, The River Water Quality Sample (n = 154)
Rank on Smith-Desvousges Socio-Economic Setting
LOCATION
Ladder Rural Urban
Upper
0
11
12
9
14
1
15
5
13
7
2
22
23
29
16
3
23
22
28
17
4
4
5
5
4
5
5
2
3
4
6
2
1
1
2
7
1
1
2
0
Totals
83
71
90
64
Note Upper and Lower locations refer to the household siting in relation to
PanAfrican Paper Mills at Webuye (see Figure 11)

163
Table 5 7 Perceived Water Quality in the Nzoia River by Household Location in
the Basin, The Domestic Water Supply Sample (n = 157)
Rank on the Socio-Economic Setting A d m i n i s t r a t i v e L o c a t i p n
Likert Scale Rural Urban 1 2 3 4 5 6
1 0 0 0 0 0 0 0 0
2 1 2 0 0 1 0 0 2
3 8 8 1 3 1 3 0 8
4 45 39 9 12 9 7 8 39
5 31 23 10 5 4 6 6 23
Totals 85 72 20 20 15 16 14 72
Note The key to the administrative locations follows 1 = Khalumuli, 2 = Maraka,
3 = Matulo, 4 = Milo-Muchi, 5 = Sitikho, 6 = Webuye Town
164
5.2.3 RESPONSE RATE, AND Soclo-EcoNoMic AND DEMOGRAPHIC PROFILE
Data was collected by in-person administration of CV questionnaires to randomly
selected households in Webuye Division of Bungoma District, Kenya The survey was
conducted over a three-month penod, June 1995 to September 1995 Usable
(appropnately completed) questionnaires emerged from 311 respondents, which yielded
a response rate of 88 9 per cent, the planned total sample size was 350 households
Socio-economic and demographic characteristics of the household are shown in Table
58
It should be noted that despite the relatively simple, but not simplistic, sample
selection design the sample attributes which resulted correspond closely to the
characteristics of the underlying basin population (NCPD-CBS-MI, 1994, Republic of
Kenya, 1994) The median bracket of family income in the sample was Ksh 4,000-
5,999 as compared to per capita earnings of Kshs 2,908 from agriculture and livestock
products for Bungoma District, and the recent per capita incomes in wage employment
of Kshs 6,643 30 for Webuye Town (Republic of Kenya, 1994 p 83, 85) The
disjunction between incomes from agnculture/livestock sector and that of wage
employment is mainly explained by the relatively large proportion of the population
engaged in the former sector Median education attainment for both the sample and
the basin was about 8 years (primary school)" Slightly less than one half of the
sample was male
Kenya's fonnal education is based on a three-tier system, known as 8-4-4 system In thissystem primary education consists of 8 years and secondary education 4 years Graduates ofsecondary school may then further their education by enrohng at any of the five nationaluniversities or in any several private universities, or by joining colleges or technical institutesto acquire certain skills necessary for national development The 8-4-4 system was adoptedin 1985, replacing a four-tier system (7-4-2-3) consisting of seven years of primary school,four of secondary, two of higher secondary, and three of university

165
Table 5 8
Socio-Economic and Demographic Characteristics of SampleHouseholds
Variable
River water quality Domestic water supplyn % n
1 Sex Female 89 5779 90 5732Male 65 4221 67 4268
2 Age Under 20 years 8 5 19 14 8 9220-29 years 6 3 90 18 11 4630-39 years 52 3377 60 382240-49 years 58 3766 44 28 0350-59 years 26 1688 18 1146Over 60 years 4 260 2 064median age group 4th 3rd
3 Education No education 25 1623 24 15 29Primary school 69 44 81 68 43 31
Lower Secondary (O'level) 38 2468 54 3439Upper secondary (A'level) 11 7 14 8 5 10College/University 11 7 14 3 1 91Median education bracket 2d 2nd
4 Household size 3 8 519 15 9554 12 779 32 20385 31 2013 39 24846 27 1753 22 14017 42 2727 25 15928 21 1364 17 10839 9 584 5 31810 4 260 2 127
5 Income Under Ksh 1,999 41 2662 24 15 29Ksh2,000-3,999 41 2662 38 2420Ksh 4,000 - 5,999 28 18 18 52 33 12Ksh 6,000 - 7,999 22 1429 29 1847Ksh 8,000 - 9,999 11 7 14 9 5 73Over 10,000 11 7 14 5 3 18Median income group 2 3rd
6 OccupationPublic servant'FarmerInformal sector
7 Home ownershipRenterOwner
Total
44 2857 5251 3312 6259 3831 43
80 5195 7674 4805 81154 10000 157
33 1239492739
4841515910000
Note includes respondents employed in the private sector

166
5.3 THE CONTINGENT VALUATION MODEL AND RESULTS ON WILLINGNESS TO PAY
Between basic questions of putting the respondent in the mood (Part I) and asking a
series of questions on the household's socioeconomic composition and its physical
structure (Part III), all questionnaire versions picked up the gauntlet of determining the
economic value of river pollution control and a household water faucet in Part II Part
II focused on what households would be willing to pay (WTP) for improved water
quality in the Nzoia Basin, Kenya and an individual water connection in Webuye
Division, Kenya All open-ended bid questions were carefully designed to address four
research hypotheses effect of temporal dimension of payments, evaluation of river
pollution control over diverse geographical extents (a form of embedding effect), and
impact of nature of payment profiles for connection charges in household decisions
to hook onto a water supply system The fourth study hypothesis on whether the
nature of the good under valuation matters in hypothetical evaluations should be
apparent Table 4 1, in Chapter 4, describes each of the six CV questionnaire versions
used in this survey and indicates sizes of the sub-samples As noted, respondents were
randomly assigned one of the six versions

167
5.3.1 RSFONSE TO ThE VALUE F1rrA1I)N QUES1I)N AND ThE SCRIFNING FOR PRomsr Bms
Willingness-to-pay parts or sections of CV questionnaires often begin with a query on
whether the respondent would be willing to pay (WTP) anything for the environmental
good in the contingent market The approach in this study was not dissimilar Indeed,
in all questionnaire versions the question asking for respondents' choice of payment
frequency was succeeded by
"(a) Now suppose the payments are to be made [monthly/yearly] and the payment
would mean that you need to spend less on other items, would you be willing
to pay any charge to [clean the Nzoia River/have a pnvate water connection
to your house] 9 Yes/No
(b) SHOW CARD If NO, which of the following reasons best describes why you
are not willing to pay any money to [the contingent good]9
(c) If YES, what is the most you as a household would be willing to pay per
[month/year] in payment vehicle in order to [contingent good]9"
The response to the elicitation question can only be interpreted as reliable
willingness to pay (WTP) if it reflects a true preference for the good being valued
Individuals might adopt various attitudes towards a contingent market The open
debriefing question reveals large differences especially when offers are null due to
bids refusal, or zero due to strategic behaviour or to a strong budgetary constraint
As is typical in CV surveys, numerous individuals stated that they would not
pay for the environmental improvements A check question was asked to ascertain if
these refusal-to-pay were valid "no" responses or protests to some feature of the
hypothetical market As is customary (Mitchell and Carson, 1989), we classified as
non-protest refusals to pay 30 respondents (16 in river quality questionnaire versions

168
and 14 in drinking water questionnaire versions) who indicated they could not afford
to pay and another 9 respondents (all in the nver samples of the CV survey) who
stated the programme was not worthy anything to them See Table 5 9 The dominant
protest refusal-to-pay response was "Not enough information" with 15 people in
versions I and 5 in versions II stating this reason About equal numbers of each
version (on the order of 10 to 8 people) stated they did not want to participate in the
exercise These protest refusals-to-pay are normally not included when CV responses
are analyzed and the practice is followed here Some of these protests may result from
not convincing the respondent that the environmental improvement and response
programmes would work

130 (82 8) 226(72 7%)
5
0
0
8
14
27 (17 2)
20
8
9
18
30
85 (27 3)
14 (51 9)
13(481)( 83)
39 (45 9)
46 (541)
157 311
Notes
23
4
169
Table 5 9 Willingness to Pay Responses and Nature of Contingent Commodity'
Response Good 1 Good 2 Total
Count (%) Count (%) Count (%)
Willing to pay 96 (623)
Would not pay
why not 1 15
2 8
3 9
4 10
5 16
total 58 (377)
Classification of refusals to pay2
True zero's (0's) 325 (43 1)
Protests433 (56 9) (21 4)
(148)
Sample size: 154
Key to Reasons1 Not enough information2 I do not want to place a shilling value on nver water quality/a pnvate water
connection3 River water quality/a private water quality has no value to me4 I do not want to participate in this survey5 I cannot afford
Good 1, Good 2 represent river water quality and domestic watersupply samples respectivelyper cent of refusal-to-pay responses within the categoryTrue zero bids includes respondents who gave Nos 3 and 5 as reasonsfor their refusal to paySecond percentage refers to protest bids as % of all response for eachgood, and for the entire study sample in the case of the last column
170
There appears to be prima facie evidence, in Table 5 9, that Webuye residents
understood the two goods differently owing to their familianty Additionally, Table
5 9 shows that willingness to pay responses were higher in improved domestic water
supply than for river water quality improvement Indeed, number of households not
wtp for rwq improvements was more than double that of those not wtp for a private
water connection (58 versus 27) A closer scrutiny reveals that more of the refusal-to-
pay (rtp) responses in the latter group (51 9%) are true zeros whilst 56 9 per cent of
the former group are protests Second, since a higher proportion of those not wtp for
dws gave "I cannot afford" reason, there were more protest bids in Good 1 valuation
than in that for Good 2
Table 5 10 shows responses to question (a) above, by socio-economic setting,
whilst Table 5 11 cross-tabulates responses to the question on whether the respondents'
would be willing to pay (WTP) for the contingent commodities, as well as reasons
given by those who answered "NO" Clearly, rural areas have more refusals to pay
than urban settings

171
Table 5 10 Willingness to Pay Responses and Socio-Economic Setting
Socio-Economic Setting
Willingness to Pay Response Rural (%) Urban (%) Total
Willing to pay
River water quality sample 50 (52 1) 46 (479) 96
Domestic water supply sample 67 (51 5) 63 (48 5) 130
Total 117 (51 8) 109 (48 2) 226
Refusals-to-pay
River water quality sample
33(569)
25 (43 1)
58
Domestic water supply sample
18(667)
9(33 3)
27
Total
51(600)
34 (400)
85
Note Percentages are, accordingly, ratios of the group sub-sample

Willing to pay9No Good 1
Good 2Good 1Good 2Good 1Good 2
Good 1Good 2Good 1Good 2Good 1Good 2Good 1Good 2Good 1Good 2Good 1Good 2
Yes
Total
If Not, Why"1
2
3
4
5
Total
Temporal Dimension of Payment in EvaluationMonthly (%) Yearly (%) Total (%)
27 (175) 31(201) 58(377)15(96) 12(76) 27(172)51(331) 45(292) 96(623)64 (40 8) 66 (420) 130 ( 82 8)78 (507) 76 (494) 154 (100 0)79 (503) 78 (497) 157 (100 0)
6(103)
9(155)
15 (25 9)2 (74)
3 (11 1)
5(185)4 (69)
4 (69)
8 (13 8)0 (00)
0 (00)
0 (00)6(103)
3 (52)
9(155)0 ( 00)
0 (00)
0 (00)3 (52)
7 (12 1)
10 (17 2)5(185)
3 (11 1)
8 (296)8 (13 8)
8 (13 8)
16 (27 6)8 (296)
6 (222)
14 (51 9)27 (466)
31(535)
58(1000)15(556)
12 (444)
27(1000)
Table 5 11
Response
172
Relationship Between Responses to the Willingness to Pay (9) Questionand Temporal Dimension of Payment in Valuation
Notes Good 1, Good 2 represent nver water quality sample and domestic watersupply respectivelyReasons for refusal to pay1 = Not enough information2 = Do not want to place a shilling value on the good3 = Has no value to me4 = Do not want to participate in the survey5 = Cannot afford it

173
As seen in Table 5 11 the proportion of refusing to state a WTP amount in
both versions are very close, 26 8% compared to 279% for monthly and annual
versions respectively The picture at the Good level, however, is more confused For
Good 1, the percentage of respondents who were not WTP was higher in the annual
payment formats (40 8% versus 346% in monthly versions) whilst for Good 1 these
figures were 15 4% and 18 9% in the annual and monthly version respectively Yet,
most of those who "cannot afford to pay" were in the monthly payment formats
We can even go further and specify the proportion of refusals-to-pay per
questionnaire version This is done in Tables 5 12 and 5 13 An important observation
here concerns the effect of payment profiles of initial water connection charges for a
household water faucet Some households that were wtp on "SPREAD" mode changed
their mind and said they would not afford a pnvate water connection when they were
offered the case of "UPFRONT" connection charges In other words, both rtp and zero
bids increased when respondents were asked to state their maximum wtp for a private
water connection if the connection costs were to be paid upfront
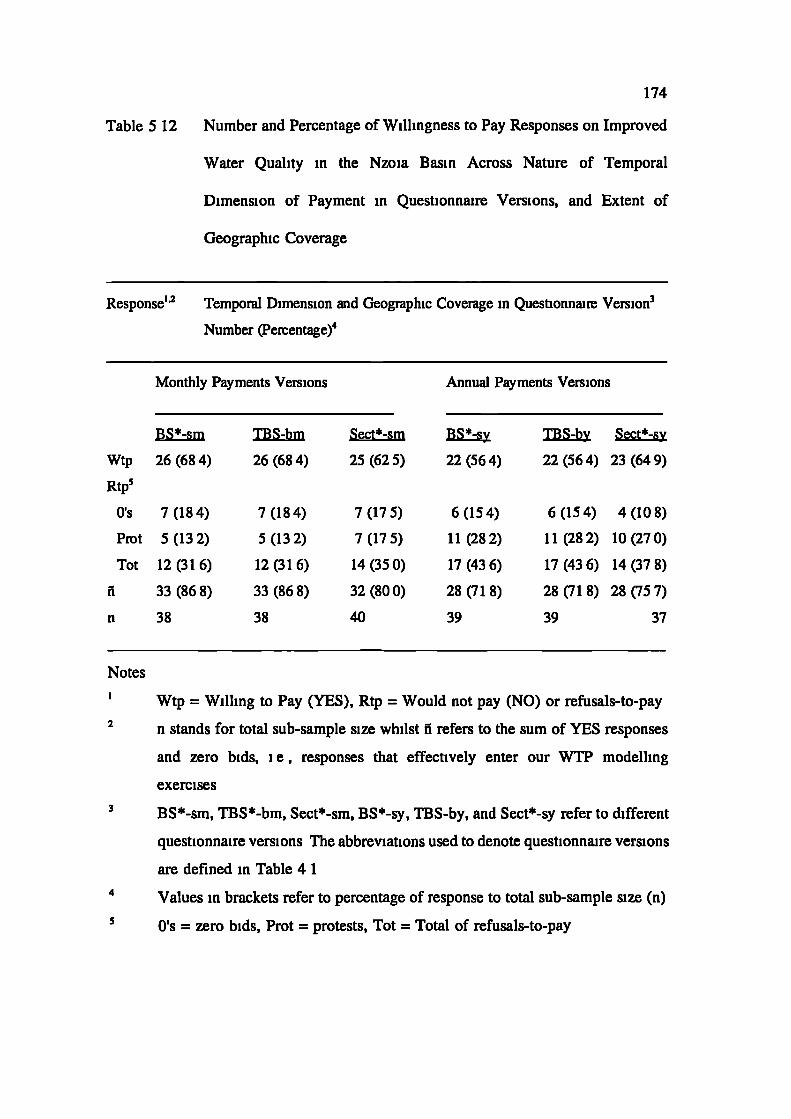
174
Table 5 12 Number and Percentage of Willingness to Pay Responses on Improved
Water Quality in the Nzoia Basin Across Nature of Temporal
Dimension of Payment in Questionnaire Versions, and Extent of
Geographic Coverage
Response Temporal Dimension and Geographic Coverage in Questionnaire Version3
Number (Percentage)4
Monthly Payments Versions Annual Payments Versions
BS*sm TBS-bm Sect*sm BS*sy TBS-by Sect*sy
26 (684) 26 (684) 25 (625)
22 (564) 22 (564) 23 (649)Wtp
Rtp5
0's
Pmt
Tot
n
n
7(184)
5(132)
12 (31 6)
33(868)
38
7(184)
5(132)
12 (31 6)
33(868)
38
7(175)
7(175)
14 (35 0)
32 (800)
40
6 (154)
11(282)
17 (43 6)
28 (71 8)
39
6(154) 4(108)
11 (282) 10(270)
17(436) 14(378)
28(718) 28(757)
39 37
Notes
Wtp = Willing to Pay (YES), Rtp = Would not pay (NO) or refusals-to-pay2 n stands for total sub-sample size whilst ñ refers to the sum of YES responses
and zero bids, i e, responses that effectively enter our WTP modelling
exercises3 BS*sm, TBS*bm, Sect*sm, BS*sy, TBS-by, and Sect*sy refer to different
questionnaire versions The abbreviations used to denote questionnaire versions
are defined in Table 4 14
Values in brackets refer to percentage of response to total sub-sample size (n)5 0's = zero bids, Prot = protests, Tot = Total of refusals-to-pay
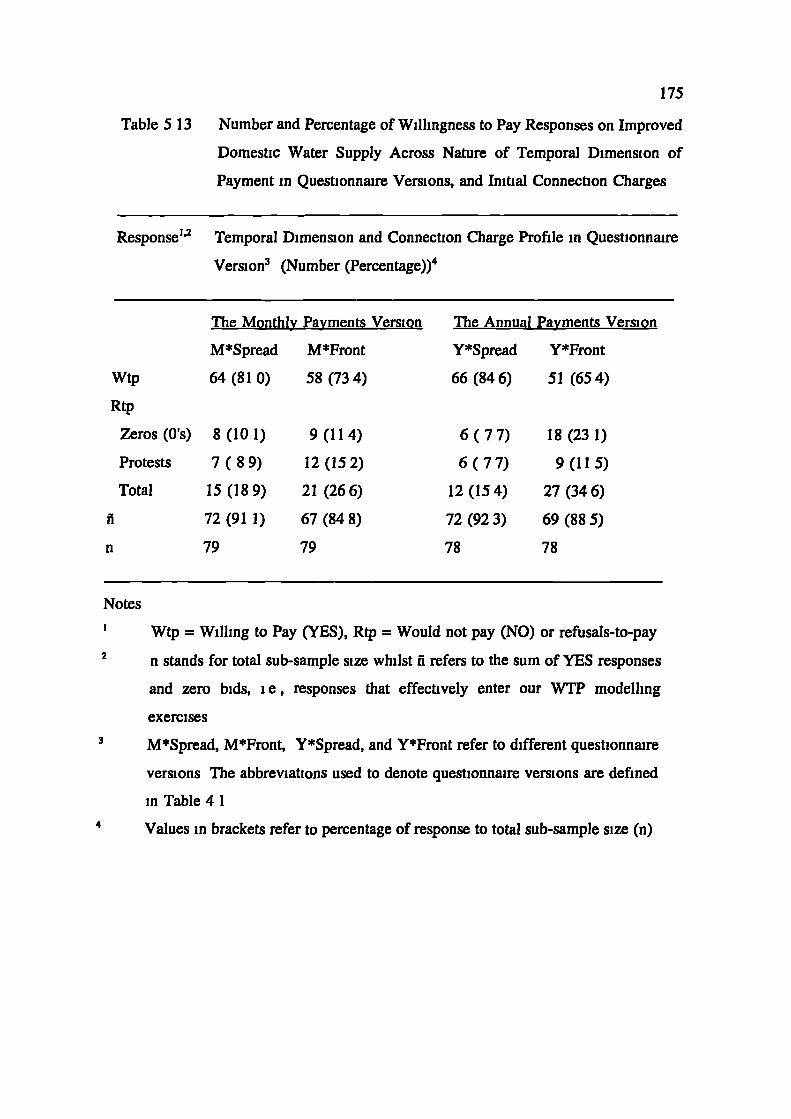
175
Table 5 13 Number and Percentage of Willingness to Pay Responses on Improved
Domestic Water Supply Across Nature of Temporal Dimension of
Payment in Questionnaire Versions, and Initial Connection Charges
Response"2 Temporal Dimension and Connection Charge Profile in Questionnaire
Version3 (Number (Percentage))4
The Monthl y Payments Version The Annual Payments Version
M*Spread M*Front y*Spread y*Front
Wtp 64 (81 0) 58 (734) 66 (846) 51(654)
Rtp
Zeros (0's) 8 (10 1)
9 (11 4)
6 (77)
18 (23 1)
Protests
7 (89)
12(152)
6 (77)
9(115)
Total
15(189)
21(266)
12(154)
27 (346)
n
72 (91 1)
67 (848)
72 (923)
69 (88 5)
n
79
79
78
78
Notes
Wtp = Willing to Pay (YES), Rtp = Would not pay (NO) or refusals-to-pay
2 n stands for total sub-sample size whilst ñ refers to the sum of YES responses
and zero bids, i e, responses that effectively enter our WTP modelling
exercises
M*Spread, M*Front, Y*Spread, and Y*Front refer to different questionnaire
versions The abbreviations used to denote questionnaire versions are defined
in Table 4 1
Values in brackets refer to percentage of response to total sub-sample size (n)

176
Those who answered the "Wl'P in principle" question in the affirmative were
subsequently asked for their maximum WTP, in Kenya shillings, for the
improvements Tables 5 14, 5 15, 5 16, and 5 17 show descnptive statistics of resultant
WTP values and their location in the six questionnaire versions used in the
experiment In tandem with expectation, annual WTP values were greater than
monthly WTPs However, the former are less than twelve times the latter The
arithmetic converse holds too If we assume that the annual payments are to be settled
at the end of the year and that the present value of the highest mean annual WTP in
this dataset (Ksh 754 00) is equal to the lowest mean bid per month (Ksh 71 90),
regardless of the good under valuation, then the effective annual rate of interest at
which households keen on saving would be indifferent to the two payment frequencies
is 949% Only above this discount rate would the households rationally prefer a
monthly payment scheme to single annual payments and vice versa
5.3.2 DESCRIPTIVE STATISTICS AND FREQUENCY DISTRIBUTIONS FOR WTP MEASURES
As noted, Tables 5 14, 5 15, 5 16, and 5 17 provide definitions of and matches
between WTP values with questionnaire versions in the field experiment Moreover,
the Tables provides sample sizes for the respective questionnaire versions, and
descriptive statistics of each of the resultant WTP measures The descriptive statistics
for willingness to pay values, for each questionnaire version, relate to the respondents
who were willing to pay increased water rates and municipal service charges

177
Table 5 14 Summary Statistics for Amounts bid as water and sewerage charge tothe Municipal Authority in order to improve the Nzoia River waterquality in Kenya shillings by Payment Frequency Type and GeographicExtent
WTP Mean Median SD2 Range of bidsacronym' (Kshs) (Kshs) 0 (zero)(%WTP) (Kshs)
I Monthly Frequency1 1 Part of the BasinWTPI (n=33) 9240 7000 8260 0-250WTP5 (ii = 32) 7090 65 00 6600 0 - 300
1 2 The Whole BasindWTP1(ñ=33) 3580 2000 4085(1141%) 0-150WTP2 (fl=33) 12820 10000 10620 0-350
II Yearly Frequency2 1 Part of the BasinWTP3 (fl = 28) 56790 50000 48000 0 - 2000WTP6 (ii = 28) 46070 40000 39570 0 - 1500
2 2 The Whole BasindWTP3(fl=28) 18570 5000 25350(1365%) 0-1000WTP4 (ii = 28) 75400 70000 67900 0 - 3000
Ill Standardized Amounts3WTP7 4730 4170WTP8 6280 5830WTP9 3840 3330
Key to WTP acronyms and their matches with questionnaire versionsWTP1 Ala BS*smdWTP1 Aib dBS*bm additional (to the amounts in Ala above) monthly wtp
to improve river water quality in the entire basin upto Lake VictoriaWTP2 Aic TBS-bmWTP3 A2a BS*sydWTP3 A2b dBS*by additional (to the ones in A2a) annual wtp for improved
water quality in the entire river basin upto Lake VictoriaWTP4 A2c TBS-byWTP5 A3 Sect*smWTP6 A4 Sect*sy
NotesI ñ indicate sample sizes after removing protests, SD is standard deviation,
(%WTP) is percent of mean WTP2 Percentages are Pearsonian coefficients of variation
WTP7 Standardized WTP3 1 e, BS*sy divided by 12WTP8 Standardized WTP4 1 e, TBS-by divided by 12WTP9 Standardized WTP6 ie, Sect*sy divided by 12

178
Table 5 15 Further Descriptive Statistics on WTP for Pollution Control on the
Nzoia River, in Kenya shillings
Factor WTP1 WTP2 WTP3 WTP4 WTP5 WI[6
Standard deviation
(as a % of mean)
Upper 95% CL
Lower 95% CL
Mode
Truncated Mean
894 828 845
12170 16580 75400
6310 9050 38170
0 0 0
8790 12170 53460
90 1
101700
49000
0
69600
93 1
9470
4710
0
6320
85 9
3J73
0
4385
Note Percentages are Pearsonian coefficients of variation Truncated mean is at 95%
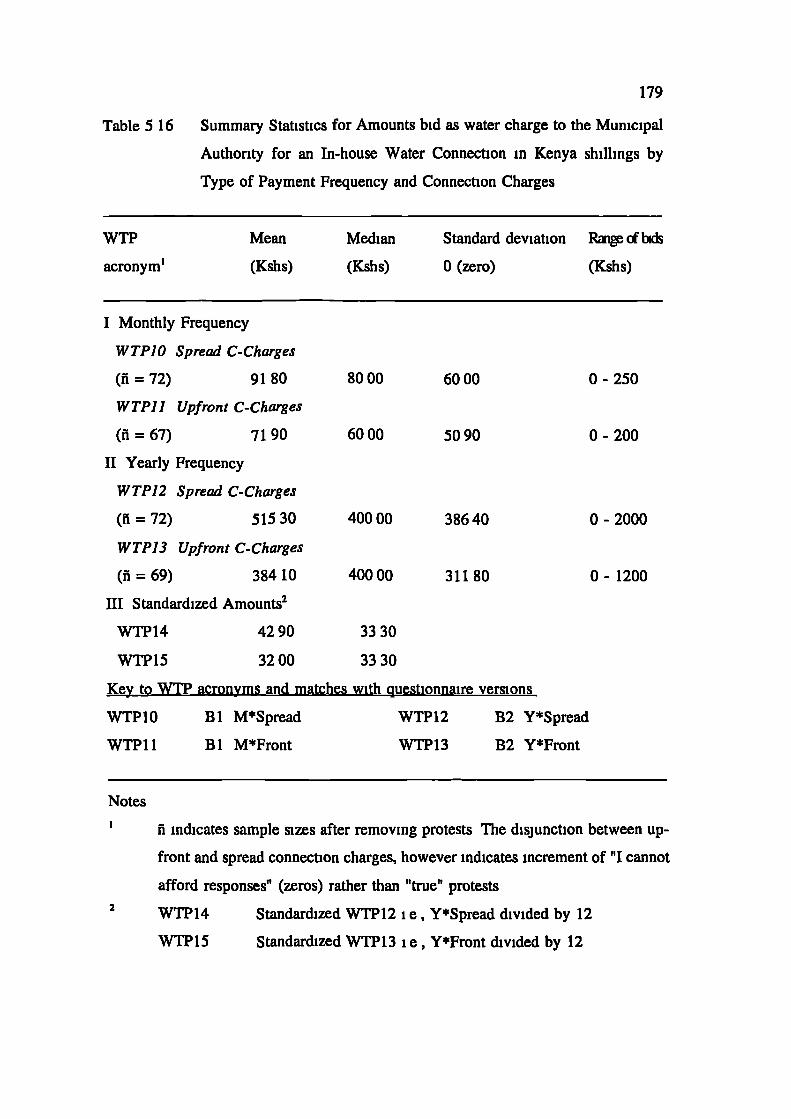
179
Table 5 16 Summary Statistics for Amounts bid as water charge to the Municipal
Authority for an In-house Water Connection in Kenya shillings by
Type of Payment Frequency and Connection Charges
WTP Mean Median Standard deviation Ran of bids
acronym' (Kshs) (Kshs) 0 (zero) (Kshs)
I Monthly Frequency
WTPIO Spread C-Charges
(n = 72) 91 80 8000 6000 0 - 250
WTPII Upfront C-Charges
(ñ=67) 7190 6000 5090 0-200
II Yearly Frequency
WTPJ2 Spread C-Charges
(fl=72) 51530 40000 38640 0-2000
WTPJ3 Upfront C-Charges
(fl=69) 38410 40000 31180 0-1200
III Standardized Amounts2
WTP14 4290 3330
WTP15 3200 3330
Key to W1'P acronyms and matches with questionnaire versions
WTPIO B! M*Spread WTP12 B2 Y*Spread
WTP1 1 B! M*Front WTP13 B2 Y*Front
Notes
ñ indicates sample sizes after removing protests The disjunction between up-
front and spread connection charges, however indicates increment of "I cannot
afford responses" (zeros) rather than "true" protests2 WTP14 Standardized WTP12 i e, Y*Spread divided by 12
WTPI5 Standardized WTP13 i e, Y*Front divided by 12
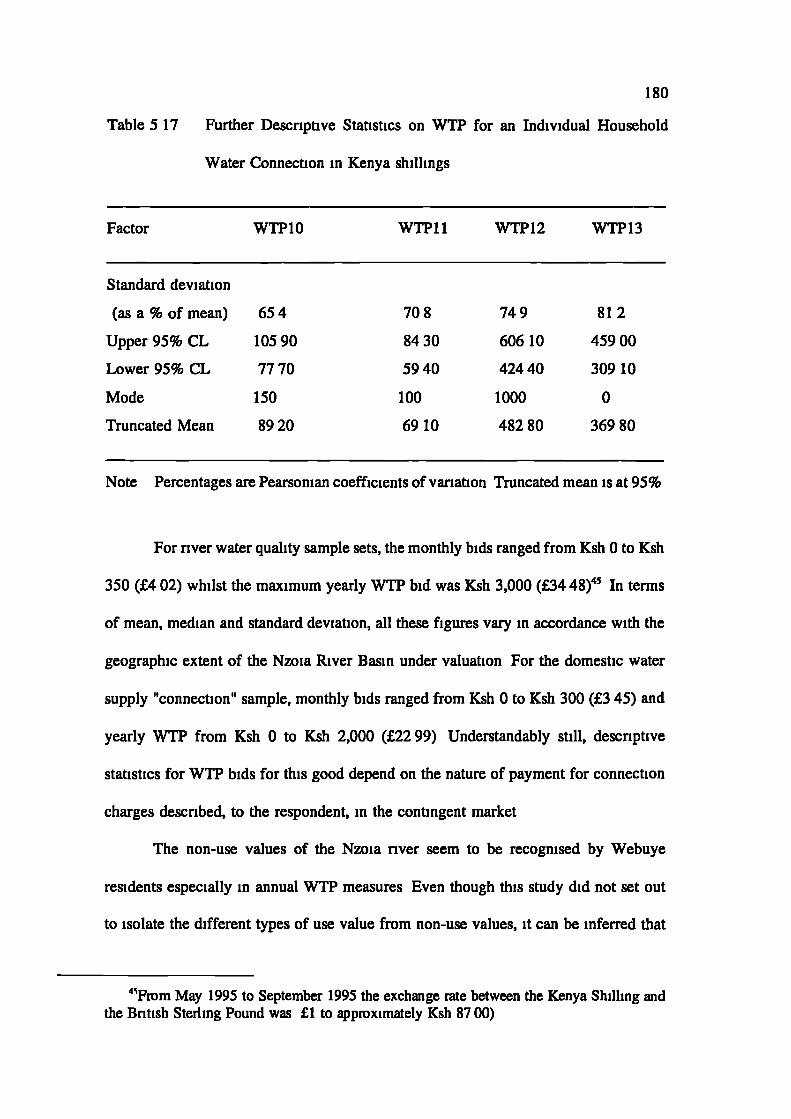
180
Table 5 17
Further Descriptive Statistics on WTP for an Individual Household
Water Connection in Kenya shillings
Factor
WTP 10
WTP11
WTP12
WTP 13
Standard deviation
(as a % of mean)
Upper 95% CL
Lower 95% CL
Mode
Truncated Mean
654
10590
7770
150
8920
70 8
8430
5940
100
6910
749
606 10
42440
1000
48280
81 2
45900
309 10
0
369 80
Note Percentages are Pearsonian coefficients of variation Truncated mean is at 95%
For river water quality sample sets, the monthly bids ranged from Ksh 0 to Ksh
350 (4 02) whilst the maximum yearly WTP bid was Ksh 3,000 (34 48) In terms
of mean, median and standard deviation, all these figures vary in accordance with the
geographic extent of the Nzoia River Basin under valuation For the domestic water
supply "connection" sample, monthly bids ranged from Ksh 0 to Ksh 300 (3 45) and
yearly WTP from Ksh 0 to Ksh 2,000 (22 99) Understandably still, descriptive
statistics for WTP bids for this good depend on the nature of payment for connection
charges described, to the respondent, in the contingent market
The non-use values of the Nzoia nver seem to be recognised by Webuye
residents especially in annual WTP measures Even though this study did not set out
to isolate the different types of use value from non-use values, it can be inferred that
4 From May 1995 to September 1995 the exchange rate between the Kenya Shilling andthe Bntish Sterling Pound was £1 to approximately Ksh 8700)

181
the high levels of wtp for rwq improvement (when compared to WTP for individual
household water taps) could be symptomatic of the residents cognizance of these other
values of nature The mean annual wtp for rwq within Webuye area is Ksh 567 90 and
Ksh 46070 (from the two questionnaire versions) whilst the mean yearly wtp for a
private water faucet is Ksh 515 30 (spread c-charges) and Ksh 384 10 (upfront c-
charges) The median values are equal, but the variance of household valuations for
river quality is higher than that for drinking water
Frequency distributions for the W1'P values from the different questionnaire
versions are shown in Figures 5 1 through Figure 5 6 (whilst the raw data is,
respectively, in Appendices 5A, 5B, 5C for Figures 5 3A and 5 3B, 5D for Figures
5 4A and 5 4B, SE, and SF) As with most CV studies the distributions are highly
skewed The Pearsonian coefficient of variation (shown in Tables 5 14, 5 15, and
5 17), a relative measure of dispersion, shows that the standard deviation varies from
82% to 137% of the mean for the WTP "quality" and from 65% to 81% for the mean
for the WTP "connection" Thus, there is more dispersion in the distribution of the
W1'P for improved water quality in the Nzoia River Conversely, the mean of the
WTP for a household "connection" to water supply system is more representative of
the sample than is the mean WTP for river water "quality"

oz;
0
C."00
0C,,
..
a)
11
0- N
- r0
..
.! a)
C.)
a) .
C')
—en00
•1 •C, rI. I-ia) a)
•2 2C C
004-.
a) a)
nfl
OOE
ocz
ooz
J,. . . .. . oci+
I:.. . .
::' :
I ___
N 'C en — CICounbaTd

en — C
en00
0
a)
I-
-
.- 0- ' N
— 0jo
a)
a)
000z
ooci In*U
0001 C,,
008 0
a)
I jO0L2cn c
I.. .1009>. a)
ooc 0
I,, .'a) >
U,
oct7 bO
. C/,
=
007
2
OOE0
cia)
0c
0
00z
0

184
FIGURE 5.3AFrequency Distribution of Additional Monthly WTP Values forImproved Water Quality in the Entire Nzoia River Basin upto
Lake Victoria
12
10
4
2
0
0 10 20 30 50 100 150
Monthly Willingness to Pay (in Kshs)

185
FIGURE 5.3BFrequency Distribution of Additional Annual WTP Values for
ImprovedWater Quality in the Nzoia River Basin upto Lake Victoria
14
12
10
8
4
2
0
0 100 200 300 400 500 1000
Annual Willingness to Pay (in KShs)

186
FIGURE 5.4AFrequency Distribution of Total Monthly WTP Values for
Improved Water Quality in the Entire Nzoia River Basin uptoLake Victoria
7
6
5
I;1
0o o o o oN C C CN N
Monthly Willingness to Pay (in Kshs)

187
FIGURE 5.4BFrequency Distribution of Total Annual WTP Values for ImprovedWater Quality in the Entire Nzoia River Basin upto Lake Victoria
6
5
4C)
1
0o o 0N '0 N 00 C\ 0 N- - - N fl
Annual Willingness to Pay (in Kshs)

Cl,
C,,
.
0
0
0
4-00
Cl,
.0L)00
U
000U4-0
0Cl,
.0U00
000U
204
C',
0
0000
- Cl,
ClCl,
IL1
r l,4-
- r C.)r
.1
a)
C.)
4-
'... jOL
09
oc
0i7
OE
0z
0
I I
I I
00 '.0 CM © 00 '.0 CM- ._ - - -
ocz
00t
oci
oz I
001
06
08
cL
iC,unbaij

000t
oocT
OOZT
0001
006
I L_008
I 1OçL '
OOL.E
ci009
0
ooc
ocj7
+00
rocE .
I 00E
i_0cz
00z
oci
001
0
C'00
Cl, VUbO$-. c
0o•
C)C) UU
000Q 4•
ci 0
CI)i-J
In 0
. 04-
i_i
C)
U4-
c
I-.
00 0 CI 0 00 C 0— — — — —

190
Both willingness to pay and use of the environmental good under valuation
(number of river and water uses) varied considerably across households On average
only two of the respondents with incomes of less than Ksh 1,999, for example, were
willing to pay more than Ksh 100 per month for either cleanup efforts on the Nzoia
River or a water supply "connection", over 50% of those with incomes over Ksh
10,000 were willing to pay more than Ksh 10000 Further still, the study findings on
WTP for an individual household domestic water connection across SPREAD-
UPFRONT connection charge schemes show the greatest fall from the wtp (YES)
bandwagon in the lower income cohort than in upper income groups Table 520
shows three respondents out of 15 households that belonged to the lowest income
group (G I) changed from willing to pay under SPREAD mode to would not pay if
connection charges are to be made UPFRONT This leaves 12 Gi households in YES
category
The picture over yearly payment formats is not dissimilar A specially striking
result relates to the number of zero bids in the questionnaire version that sort for
yearly WTP bids a water connection, a threefold increment in null bids, from 6 to 18
respondents, across the two types of connection charges (see Table 5 13) Cross
tabulations of income with number of river and water uses, and willingness to pay are
given in Table 5 18 through Table 5 22 Table 21 shows Pearson's correlation
coefficients between WTP measures and household income As we would expect, both
willingness to pay and use increase with income, suggesting that nver quality and an
individual household water connection are "normal goods"

191
Table 5 18 Cross Tabulation of Income and Monthly Willingness to Pay forImproved Water Quality in the Nzoia River Basin by Type ofQuestionnaire Version
Income Group Monthly Willingness to Pay in Kenya Shillings
0-50 51-100 101-150 151-200 201+ Tcdal
GIWTP1BS*sm 8 0 0 1 0 9WTP2 TBS-bm 7 1 0 0 1 9WTP5 Sect*sm 7 1 0 0 0 8G2.WTPI BS*sm 2 4 0 0 0 6WTP2 TBS-bm 1 5 0 0 0 6WTP5 SeCt*sm 3 7 1 1 0 12
WTP1BS-sm 2 0 1 0 0 3WTP2 TS-bm 1 1 1 0 0 3WTP5 Sect*sm 3 4 1 0 0 8
G4WTP1BSsm0 1 2 1 2 6
WTP2 TS-bm 0 0 2 1 3 6WTP5 SeCt-sm 0 0 1 0 1 2
G5.WTP1 B$sm 2 1 1 1 0 5WTP2 TBS-bm 0 1 2 1 1 5WTP5 Sect*sm 1 1 0 0 0 2
G6WTP1 BS*sm 2 0 0 1 1 4WTP2 TBS-bm 1 0 1 0 2 4WTP5 Sect*sm 0 0 0 0 0 0TotalWTP1 BS*sm 16 6 4 4 3 33WTP2 TBS-bm 10 8 6 2 7 33WTP5 Sect*sm 14 13 3 1 1 32
Key to Income GroupsGI Under Ksh 1999, G2 Ksh 2000 - 3999, G3 Ksh 4000 - 5999, G4 Ksh 6000 -7999, G5 Ksh 8000 - 9999, G6 Over Ksh 10000

192
Table 5 19 Cross Tabulation of Income and Annual Willingness to Pay forImproved Water Quality in the Nzoia River Basin by Type ofQuestionnaire Version
Income Group Annual Willingness to Pay in Kenya Shillings
0-400 401-800 801-1200 1201-1600 1601+ Tc.lal
GIWTP3 BS*SY 5 2 1 0 0 8WTP4 TBS-by 5 1 1 1 0 8WTP6 Sect*sy 7 1 0 0 0 8G2WTP3 BS*sy 2 2 0 0 0 4WTP4TBS-by 1 3 0 0 0 4WTP6 SeCt*Sy 6 1 0 1 0 8
WTP3BS*sY 3 3 0 0 0 6WTP4 TWby 2 2 2 0 0 6WTP6 Sect*sy 3 3 1 0 0 7G4WTP3 BS-5)' 1 2 0 1 1 5WTP4TS-bY 1 1 1 0 2 5WTP6 eCt*sy 0 2 1 0 0 3G5WTP3 S*y 0 0 0 0 0 0WTP4TBS-by 0 0 0 0 0 0WTP6 SeCts-sY 0 1 0 1 0 2G6WTP3 BS*sY 1 0 4 0 5WTP4 TBS-by 1 0 3 1 0 5WTP6 SeCt*sy 0 0 0 0 0 0Total.WTP3 BS*sy 12 9 5 1 1 28WTP4 TBS-by 10 7 7 2 2 28WTP6 Sect*sy 16 8 2 2 0 28
Key to Income GroupsGi Under Ksh 1999, G2 Ksh 2000 - 3999, G3 Ksh 4000 - 5999, G4 Ksh 6000 -7999, G5 Ksh 8000 - 9999, G6 Over Ksh 10000

193
Table 5 20 Cross Tabulation of Income and Monthly Willingness to Pay forPrivate Water Supply by Nature of Payment for Connection Charges
Income Group Monthly Willingness to Pay in Kenya Shillings
0-50 51-100 101-150 151-200 201+ TclaI
GiWTP1O Spread 7 4 4 0 0 15WTP11 Upfront 7 3 2 0 0 1202WTP1O Spread 3 11 4 0 1 19WTP11 Upfront 13 7 0 1 0 2103WTP1O Spread 3 11 2 1 0 17WTP11 Upfront 5 8 2 1 0 16
WTP1O Spread 5 3 5 1 0 14WTP11 Upfront 4 5 2 0 0 11
WTP1O Spread 0 1 2 1 0 4WTP1 1 Upfront 0 3 1 0 0 4G6WTPlOSpread 1 0 1 0 1 3WTP1 I Upfront 1 0 1 1 0 3Total.WTPIO Spread 19 30 18 3 2 72WTP11 Upfront 30 26 8 3 0 67
Key to Income Groups01 Under Ksh 1999, 02 Ksh 2000 - 3999, 03 Ksh 4000 - 5999, 04 Ksh 6000 -7999, G5 Ksh 8000 - 9999, 06 Over Ksh 10000
Note 5 respondents (69% of 72 households) changed from willing to pay underSPREAD mode to would not pay if connection charges are to be madeUPFRONT
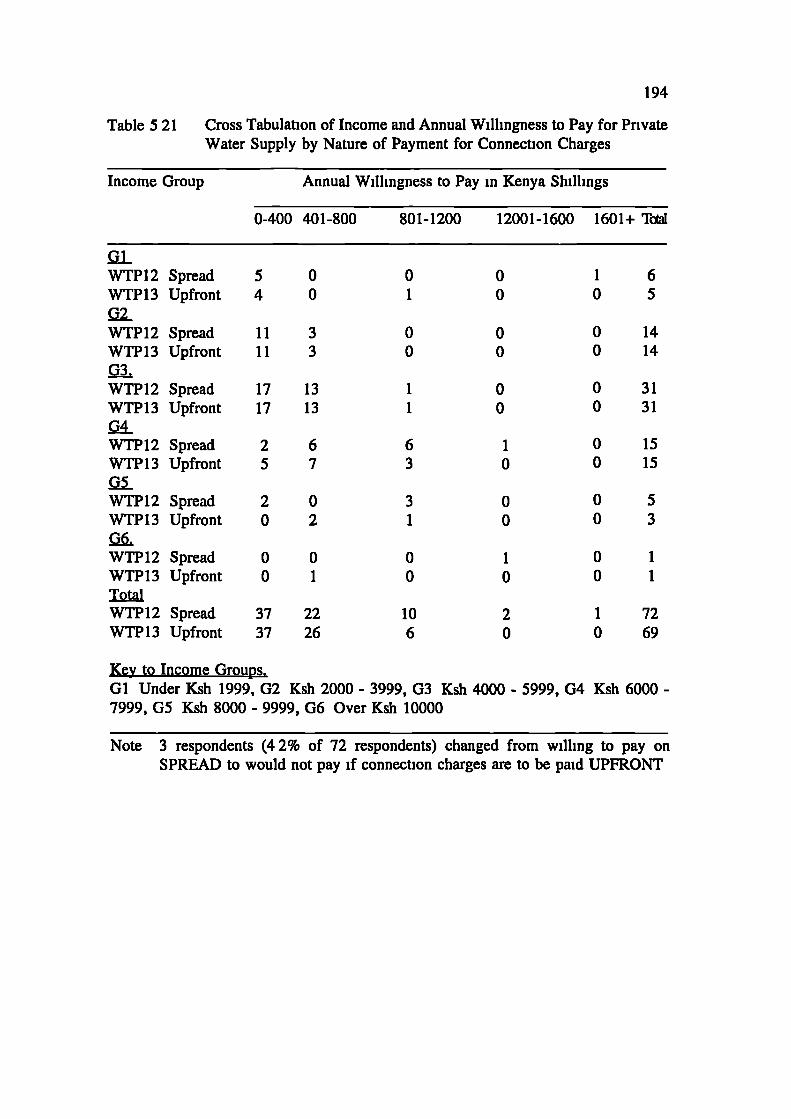
194
Table 5 21 Cross Tabulation of Income and Annual Willingness to Pay for PrivateWater Supply by Nature of Payment for Connection Charges
Income Group Annual Willingness to Pay in Kenya Shillings
0-400 401-800 801-1200 12001-1600 1601+ TwI
GiWTPI2 Spread 5 0 0 0 1 6WTP13 Upfront 4 0 1 0 0 5G2WTP12 Spread 11 3 0 0 0 14WTP13 Upfront 11 3 0 0 0 14QiWTP12 Spread 17 13 1 0 0 31WTP13 Upfront 17 13 1 0 0 31Q4-WTP12 Spread 2 6 6 1 0 15WTPI3 Upfront 5 7 3 0 0 15G5WTP12 Spread 2 0 3 0 0 5WTP13 Upfront 0 2 1 0 0 3
WTP12 Spread 0 0 0 1 0 1WTP13 Upfront 0 1 0 0 0 1TotalWTP12 Spread 37 22 10 2 1 72WTP13 Upfront 37 26 6 0 0 69
Key to Income Groups.GI Under Ksh 1999, G2 Ksh 2000 - 3999, G3 Ksh 4000 - 5999, G4 Ksh 6000 -7999, G5 Ksh 8000 - 9999, G6 Over Ksh 10000
Note 3 respondents (4 2% of 72 respondents) changed from willing to pay onSPREAD to would not pay if connection charges are to be paid UPFRONT

195
Table 5 22 Relationship Between Number of River Uses, Domestic Water Uses andHousehold Monthly Income
Number of River and Domestic Water Uses2Incom&
0 1 2 3 4 5 Total
QjGoodi 15(97) 19 (123) 4(26) 2(13) 1(07) 0 41(266)Good2 0 1(06) 7(45) 17(108) 0 0 25 (159)
Goodl 14(91) 11(71) 9(58) 6(39) 2(13)0 42(273)Good2 0 4(26) 11(701) 23(147) 0 0 38(242)
Goodl 6(39) 6(39) 8(52) 7(46) 1(07)0 28 (182)Good2 0 3 (1 9) 20 (127) 28 (17 8) 0 0 51(325)
Goodl 3(195) 6(39) 2(13) 2(13) 5(33) 3(195) 21(14 )Good2 0 4(26) 7(45) 18 (115) 0 0 29 (185)
Goodi 2(13) 4(26) 0 1(07) 3(19) 1(07) 11(71)Good2 0 1 (06) 3 (1 9) 5 (3 2) 0 0 9 ( 5 7)
Goodi 3(195) 1(07) 1(07) 5(33) 1(07) 0 11 ( 71)Good2 0 0 2 (1 3) 3 (1 9) 0 0 5 ( 3 2)Total.Goodl 43 (27 9) 47 (30 5) 24 (15 6) 23 (149) 13 (8 4) 4(26) 154 (100)Good2 0 13(83) 50(319) 94 (599) 0 0 157 (100)
NotesKey to Income Groups Gi Under Ksh 1999, G2 Ksh 2000 - 3999, G3 Ksh 4000 -5999, 04 Ksh 6000 - 7999, G5 Ksh 8000 - 9999, G6 Over Ksh 10000
2 River uses and domestic water uses, respectively, refer to Good! (river water quality)and Good2 (domestic water supply) samples

^0937
+0962
+0 482
^0520
+0424
^0315
^0487
+0 517
WTP1 BS*sm
WTP2 TBS-bm
WTP3 BS*sy
WTP4 TBS-by
WTP5 Sect*sm
WTP6 Sect*sy
196
Table 5 23 Pearson's Correlation Coefficients Between WTP Measures and Income
A River Water Quality
INCOME WTP1 BS*sm
WTP3 BS*sy
B DomestLc Water Supply INCOME WTP1O M*Spread WTP12 Y*Spread
WTP1O M*Spread +0 237
WTP12 Y*Spread +0 376
WTP11 M*Front +0 299 +0 790
WTP13 Y*Front +0 451 +0 690
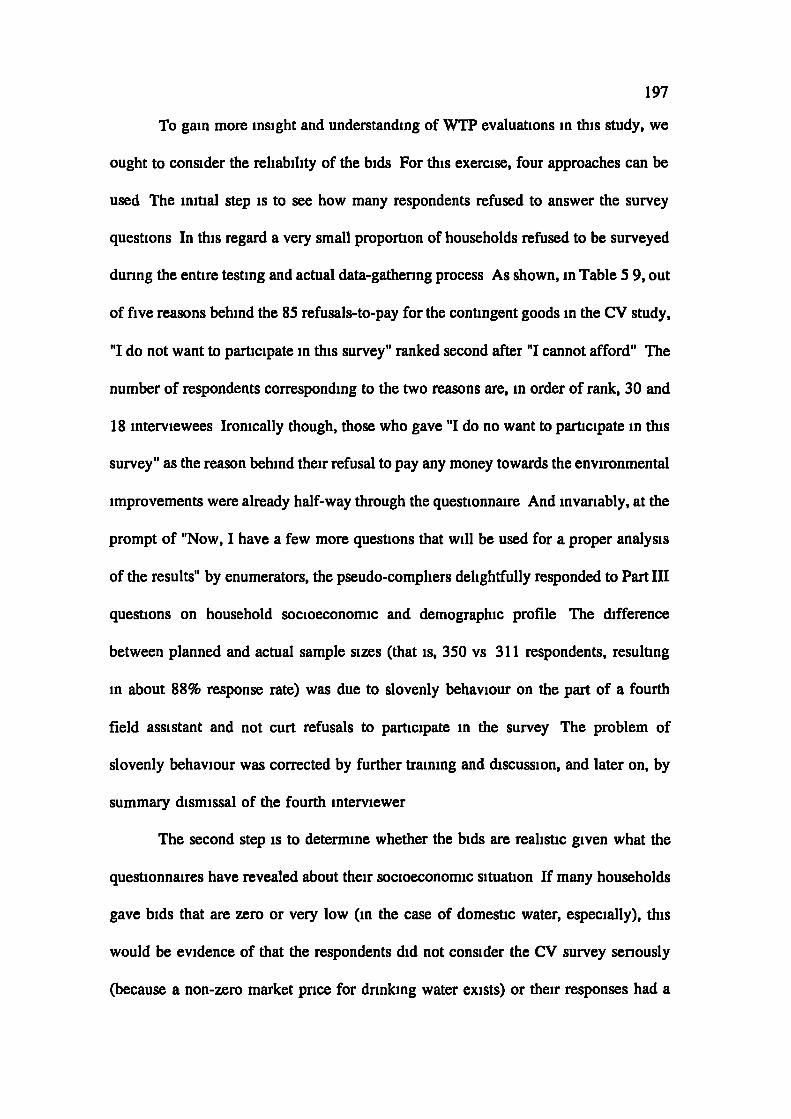
197
To gain more insight and understanding of WTP evaluations in this study, we
ought to consider the reliability of the bids For this exercise, four approaches can be
used The initial step is to see how many respondents refused to answer the survey
questions In this regard a very small proportion of households refused to be surveyed
during the entire testing and actual data-gathering process As shown, in Table 5 9, out
of five reasons behind the 85 refusals-to-pay for the contingent goods in the CV study,
"I do not want to participate in this survey" ranked second after "I cannot afford" The
number of respondents corresponding to the two reasons are, in order of rank, 30 and
18 interviewees Ironically though, those who gave "I do no want to participate in this
survey" as the reason behind their refusal to pay any money towards the environmental
improvements were already half-way through the questionnaire And invariably, at the
prompt of "Now, I have a few more questions that will be used for a proper analysis
of the results" by enumerators, the pseudo-compliers delightfully responded to Part III
questions on household socioeconomic and demographic profile The difference
between planned and actual sample sizes (that is, 350 vs 311 respondents, resulting
in about 88% response rate) was due to slovenly behaviour on the part of a fourth
field assistant and not curt refusals to participate in the survey The problem of
slovenly behaviour was corrected by further training and discussion, and later on, by
summary dismissal of the fourth interviewer
The second step is to determine whether the bids are realistic given what the
questionnaires have revealed about their socioeconomic situation If many households
gave bids that are zero or very low (in the case of domestic water, especially), this
would be evidence of that the respondents did not consider the CV survey senously
(because a non-zero market price for drinking water exists) or their responses had a

198
strategic bias Every household, however, expected that the water connections would
not be free (i e, no one actually bid zero except to mention that they cannot afford it)
and, save for the implied zeros, no respondent bid less than Ksh 20 (the equivalent of
a Kenya Pound) Indeed, the exercise witnessed consistent variation in responses
across the nature of payment for initial connection charges Similarly, respondents
understood that cleanup efforts for the Nzoia River would involve financial
expenditures, refusals-to-pay tended to be a function of who should shoulder the cost
If, on the other hand, people gave bids that were very high, then this could be
a refusal to recognize their budget constraints or again proof of strategic bidding Yet
in the sample this was not the case (for questionnaires asking for monthly bids), as
only nine households bid more than twice the mean bid Tables 5 24, 525, 5 26 and
5 27 show this We must hasten to add, however, that WTPs for an individual water
faucet that are double average WTP or the existing overtly subsidized water flat rates
are not surprising Discussions with the Secretary to Muchi-Milo Water Project, a
major community development effort, revealed that some households were willing to
pay as high as Ksh 500 toward the project's construction (groundwater drilling and
borehole building) phase (Richard Kwoma, 1995) The requisite contribution, by the
Project Committee, was Ksh 40 per household Registered by the Ministry of Culture
and Social Services, the Project has received assistance from the Kenya Government
The community of Webuye and Sitikho locations are required to raise Ksh 90,000 of
the estimated project cost of Ksh 137,000 The project has also received assistance
from KEFINCO (Kenya-Finland Company), a bi-lateral development assistance
programme mainly involved in water- and health-related projects
Tables 5 25 and 5 27 also show the size of the mean WTP values relative to

199
average household income to be quite low, varying between 05% and 3% Average
(mean) discretionary income values are based on midpoints of income groups to which
respondents indicated their household monthly gross income to belong Consequently,
the descriptive statistics for monthly income for the nver pollution sample are Ksh
4,376 (mean), Ksh 2,999 (median) and Ksh 3,047 (standard deviation), the mean
annual income equivalent is Ksh 52,512 For the domestic water supply sample, the
descriptive statistics for monthly income are Ksh 4,668 (mean), Ksh 5,000 (median)
and Ksh 2,500 (standard deviation), the mean annual income equivalent is Ksh 56,016

200
Table 5 24 Percentage of WTP Bids for Improved Domestic Water Supply Over
and Above Mean WTP and the Existing Water Flat Rate (of Ksh9O 00)
in Webuye
A Comparisons with Mean WTP Bids'
WTP and Questionnaire Mean Monthly WTP Bid Mean Yearly WTP Bid
Version % (%> Double)2 % (% > Double)
WTP1O M*Spread 403 (69) NA3
WTP1 1 M*Front 403 (149) NA
WTP12 Y*Spread NA 33 3 (5 6)
WTP13 y*Front NA 58 0 (13 1)
B Comparisons with the Water Flat Rate
Monthly Flat Rate of Ksh 90/= Annual FR "Equivalent"4
% (% > Double) % (% > Double)
WTP1O M*Spread 403 (69) NA
WTP1 1 M*Front 343 (45) NA
WTP12 Y*Spread NA 18 1 (00)
WTP13 Y*Front NA 8 7 (00)
Notes
The mean WTP bids used in the computations accordingly correspond to the
relevant questionnaire versions
2 %> Double refers to proportion of bids which are more than double (twice)
the mean WTP bid and the water flat rate for Webuye
3 NA = not applicable
4 Annual FR "Equivalent" for the Monthly Flat Rate of Ksh 90/= is 1 080/=
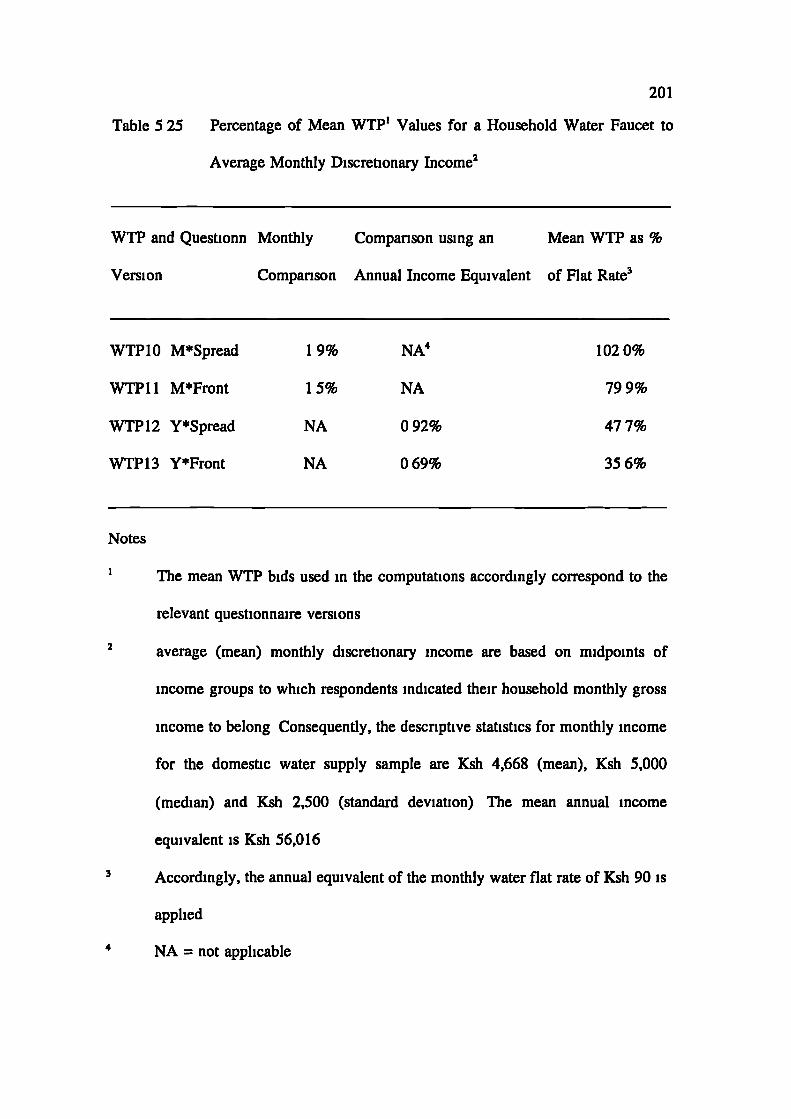
201
Table 5 25 Percentage of Mean WTP' Values for a Household Water Faucet to
Average Monthly Discretionary Income2
WTP and Questionn Monthly Comparison using an Mean WTP as %
Version Comparison Annual Income Equivalent of Flat Rate3
WTP1O M*Spread
19% NA4
102 0%
WTP11 M*Front
15% NA
799%
WTP12 y*Spread
NA 092%
477%
WTP13 YtFront
NA 069%
356%
Notes
The mean WTP bids used in the computations accordingly correspond to the
relevant questionnaire versions
2 average (mean) monthly discretionary income are based on midpoints of
income groups to which respondents indicated their household monthly gross
income to belong Consequently, the descriptive statistics for monthly income
for the domestic water supply sample are Ksh 4,668 (mean), Ksh 5,000
(median) and Ksh 2,500 (standard deviation) The mean annual income
equivalent is Ksh 56,016
Accordingly, the annual equivalent of the monthly water flat rate of Ksh 90 is
applied
NA = not applicable

202
Table 5 26 Percentage of WTP Bids for Improved Water Quality in the Nzoia
River Basin Over and Above Mean WTP and the Existing Residential
Sewage Fees (of Ksh3O) in Webuye
A Comparisons with Mean WTP Bids'
WTP and Questionnaire Mean Monthly WTP Bid Mean Yearly WTP Bid
Version % (% > Double)2 % (% > Double)
WTP1 BS*sm 424 (21 2) NA3
WTP2 TBS-bm 454 (12 1) NA
WTP3 BS*sy NA 393 (7 1)
WTP4 TBS-by NA 429 (7 1)
WTP5 Sect*sm 500 (15 6) NA
WTP6 Sect*sy NA 357 (143)
B Comparisons with Residential Sewage Fees
WTP1 BS*sm
WTP2 TBS-bm
WTP3 BS*sy
WTP4 TBS-by
WTP5 Sect*sm
WTP6 Sect*sy
Monthly Sewage Fees of 301= Annual SF "Equivalent"4
% (% > Double) % (% > Double)
NA727 (424)
NA78 9 (697)
71 4 (28 6)NA
750(393)NA
NA687 (500)
571 (143)NA
NotesU7'T'Yl L.A.. .....A 4k. A .me I11di1 VY ir UiU UU III uic A.IIIIjJULaLIV11 dULU1I117 UL1U1IU LI) L1J.
relevant questionnaire versions2 Double refers to proportion of bids which are more than double (twice) the
mean WTP bid and the residential sewage fees for Webuye3 NA = not applicable4 Annual SF "Equivalent" for Monthly Sewage Fees of 30/= is 360/=
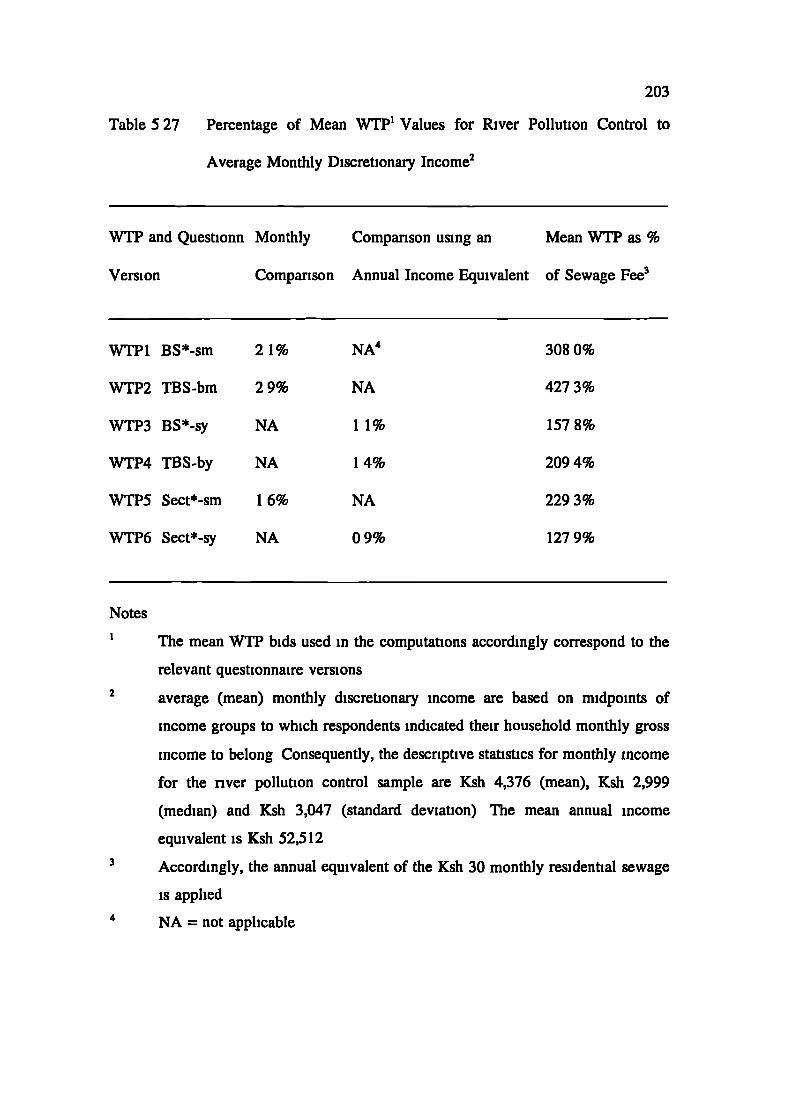
203
Table 5 27 Percentage of Mean WTP' Values for River Pollution Control to
Average Monthly Discretionary Income2
WTP and Questionn Monthly Comparison using an Mean WTP as %
Version Comparison Annual Income Equivalent of Sewage Fee3
WTP1 BS*sm 2 1% NA4 3080%
WTP2 TBS-bm 29%
NA
427 3%
WTP3 BS*sy
NA
11%
157 8%
WTP4 TBS-by
NA
1 4%
2094%
WTP5 Sect*sm 1 6%
NA
229 3%
WTP6 Sect*sy NA
09%
127 9%
Notes
I U7'rrI LJ. -- --------- _____ ______j___1_. ___________.__j '-LI1 I11.dI1 VY ir Dius uSCU 111 LIl UH1jJULdLIUHS w..cU[UiilgIy UITSUI1U LU LHC
relevant questionnaire versions
2 average (mean) monthly discretionary income are based on midpoints of
income groups to which respondents indicated their household monthly gross
income to belong Consequently, the descriptive statistics for monthly income
for the river pollution control sample are Ksh 4,376 (mean), Ksh 2,999
(median) and Ksh 3,047 (standard deviation) The mean annual income
equivalent is Ksh 52,512
3 Accordingly, the annual equivalent of the Ksh 30 monthly residential sewage
is applied
4 NA = not applicable
204
Another test is to compare the WTP bids for river pollution control and
improved domestic water supply to what is being paid for a similar or related service
In this regard, it is the norm for one to examine either wastewater or electricity
charges As the study area included both rural and urban areas, there is no overall, all-
encompassing charge to employ For the flavour, nonetheless, let us apply urban
domestic sewage fees and the water flat rate for urban councils See Tables 5 24, 5 25,
5 26, and 5 27 for the computations In sum, the relationship between WTP bids and
existing residential sewage fees and the water flat rate gives us further confidence that
the bids reflect the respondents' understanding of both their budget constraints and the
relative utility of both river pollution control and improved domestic water supply vis-
a-v is other household expenditures
The final test of reliability of the WTPs is to determine extent to which the
evaluations correspond to the behaviour of households as economic units Essentially,
this involves multivariate modelling of the WTP bids to gain an indication of how the
households' socioeconomic charactenstics influence their Shilling offers After
consideration of data analysis techniques in an open-ended CV design (Sub-Section
5 3 3), the next section (Section 5 4) deals with this aspect
205
5.3.3 DATA ANALYSIS TECHNIQUES IN OPEN-ENDED CONTINGENT VALAUTION
Open-ended WTP responses are customarily analyzed using regression analysis, if the
intention is to identify a demand curve or aggregate bid curve. As no common
consensus exists on the choice of functional form in OE formats, different forms
including linear, quadratic, and double-log have been used by CV researchers.
Household evaluations of the goods in this study are direct estimates of
willingness to pay (that is, open-ended CV format). Consequently, the general
estimation model was specified such that the Hicksian equivalent measure of
willingness to pay (WTP) is related to a set of explanatory variables, X, in the form,
WTP = g (X) .............................................(5.1)
where X is a vector representing level or quality of good/service and respondent
characteristics. Thus, the three sets of variables that were hypothesized to influence
household WTP for river water quality and domestic water supply, can algebraically
be shown as follows
WTP= f(A1 , B 1d , C) ........................................(5.2)
where A stands for socio-economic and demographic variables; B represents CV
design variables; C piped water connections or water quality in the Nzoia River basin;
d is the design variant; i is the household index; and w is the nature of water service
or level of river water quality.
In the linear form, the estimated parameters show the marginal influence of the

206
variable on the stated willingness to pay Since there was no information a priori about
the choice of a functional form, the bid curve (in Equation 5 l)is estimated two ways
linear and semi-logarithmic form Empirical models for the survey bids are presented
in Section 5 4 below
5.4 THE SCOPE FOR DEMAND ANALYSIS AND ESTIMATION MODELS
Modelling WTP bids for Improvements in river water quality and domestic water
supply has a dual purpose First, it facilitates the identification of those factors
influencing WTP, and second it forms part of the overall validation process for the CV
study including overall explanatory power (that is, are WTP responses random ?) The
primary objective is attained through observing which variables in the model have a
statistically significant effect on the prediction of WTP, while the second aim requires
an examination of those variables in the light of theoretical expectations
This section describes model estimates for WTP from the open-ended
questioning format The entire multivariate modelling exercise uses the same four
types of variables for explaining variation in willingness-to-pay bids for a given
environmental improvement (1) characteristics of the questionnaire (e g, whether a
respondent was assigned a monthly or yearly version), (2) characteristics of the
respondent (e g, sex, education), (3) socioeconomic characteristics of the household
(e g, income), and household's existing water supply situation The names and
definitions of the independent variables used in the models of the determinants of the
willingness-to-pay bids for the two goods (that is river pollution control and domestic
water supply connections) are presented in Table 5 28, which also shows the expected
signs of the parameters based on consumer demand theory. In some cases, the

207
expected signs are unknown, which is indicated by question marks
A priori, willingness to pay (WTP) for nver pollution control and private water
connections might be expected to be influenced by the following factors
1 Income Both WTP for nver pollution control and individual household
water faucets might be expected to be positive functions of income All respondents,
including farmers and non-farmers, were shown a SHOW CARD with gross monthly
income groups from which they were asked to indicate which of them most
appropriately encapsulated their household income from all sources
2 Household Size The household includes all persons who are under the direct
responsibility of the household head and reside with him/her for at least half a year
At a given income level, households with many members are less likely to pay for
pnvate connections since the cost of water declines with use in the case of public
standpipes Likewise, household size is likely to have a negative effect on a
respondent's WTP for nver pollution control because larger households may have less
disposable income than smaller ones
3 Education and Occupation From previous-related work (such as Briscoe, et
al, 1990, World Bank Water Demand Research Team, 1993), occupation (that is,
increasing degree of non-formal sector employment) and education (that is, number
of years in full-time education) are, respectively decreasing and increasing functions
of demand for river pollution control and improved domestic water supply More
specially, both formal employment and higher education increase the opportunity cost
of collecting water from outside the house, thereby increasing willingness to pay for
a private water connection A further point on the nexus between water supply and
education is household heads with some formal education are more likely to be aware

208
of the health implications of alternative sources of water Thus a positive relationship
between the level of education of a household head and the WTP for water is
expected
4 Age A negative relationship between age of household head and WTP for
water pollution control in the river basin, as well as water supply for domestic
purposes, is expected With regard to domestic water supply, older household heads
are used to the traditional "free" source of supply (e g ponds and rivers), and may be
less willing to switch to a new source, especially when the switch entails user fees
5 Distance Fmm River and Existing Water Supply Source The expected total
economic value of river pollution control (including use, option, existence and bequest
demands) on a household basis is a declining function of distance from the river to the
household's residence, Just like recreation use values (variable DRESIDE) According
to Sutherland and Walsh (1985 288) "The relationship between preservation values
and distance appears to be a function of whether the household visited the study area
Specifically, the closer a household resides to the study area, the greater the
probability of having visited the area in the past Visitors apparently acquire an
appreciation for water quality in addition to its recreation use value The knowledge
gained by visiting the area is positively associated with willingness to pay for the
preservation values of water quality Gramlich (1977) and Greenley et a! (1981) found
a similar relationship between user and nonuser preservation values" However, there
ought to be a positive link between distance from existing source (variable
DISOURCE) and household demand for water connections Based on results obtained
in other studies (Feacham et a!, 1978, Whittington et a!, 1989, Boadu, 1992),
households located farthest away from existing sources may be more willing to pay

209
for conveniently located water
6 Ranking of River Water Quality and Status of Existing Water Supply
Source QSCORE, RIVTATUS and WTATUS may be taken as proxies for
environmental attitudes The extensive literature on environmental attitude, age,
education and sex (e g, Lovnch et a!, 1986, Arbuthnot, 1977, Christianson and
Arcury, 1992) indicates that younger, better educated liberal individuals have more
positive attitudes towards the environmental movement It was expected that attitudes
of Webuye residents towards existing river water quality in the Nzoia Basin and
existing domestic water supply sources would be picked up via the three variables
(that is, QSCORE, RIVTATUS WTATUS) As noted, the specific sociodemographic
factors of age and education were dealt with separately Household WTP for river
pollution control is expected to be a decreasing function of qscore and a positive
function of wtatus, WTP for household water connections should be positively linked
to rivtatus, as the river is a substitute (albeit, an imperfect one) source of domestic
water to faucets

210
Table 5 28 Descriptions of Variables
Name Expected sign Description
ADULT 9 Dummy for presence of adult listeners to the interviewequals 1 if present and 0 otherwise
SETTING 9 Dummy for the socio-economic standing of theinterview administration, equals 0 for rural andotherwise equals 1
QSCOREGI - Ranking of the Nzoia nver water quality on the Smith-Desvousges ladder (scale 0, 1, , 10, 0=worst, 1 0=best)
DRESIDE°' - Approximate distance, in kilometres, from the NzoiaRiver to the Respondent's residence
WELURST 2+ Dummy for existing source of water supply, equals 1 ifwell/river/stream and 0, otherwise
DISOURCEG2 + Approximate distance, in kilometres to the existingsource of domestic water supply
PAYFRENCY# 7 Dummy for preferred frequency of payments for thegood under valuation, equals 1 if annual and 0,otherwise
SEX 9 Sex of the interviewee (0 = Female, 1 = Male)AGEtm 7 Age of respondent (Groups Gi = Below 20 years, G2
= 20 - 29 years, G3 = 30 - 39 years, 04 = 40 - 49years, G5 = 50 - 59 years, 06 = Over 60 years)
FEDUCATION + Highest level of full-time education completed (in years)HSIZE - Household sizeOCCUPATN 7 Occupation of the respondent (scale 1 = Public servant
including those in official private sector, 2 = Farmer, 3= Informal sector, 4 = other or unemployed)
RIVTATUS G2 9 Ranking of the Nzoia river water quality on a Likertscale (scale 1, 2, , 5, 1 = Very good, 5 = Very poor)
WTATUS°' 7 Ranking of existing status of domestic water supply interms of convenience, quality and reliability (scale 1, 2,
5, 1 = Very good, 5 = Very poor)INCOMEtm+ Monthly discretionary income
Notes °' means variable applies to the river water quality sample only, while G2means the variable applies to the domestic water supply sample only
• refers to preferred form of payment frequency and NOT the temporaldimension of payment employed in the questionnaire versionUsing midpoints of brackets
211
5.4.1 RESULTS OF THE MULTIVARIATE ANALYSES
To test these "expectations" regression analysis was used to predict each of the ten
WTP values elicited by the questionnaire versions Tables 5 29-5 31 present the results
of the multivariate models of willingness to pay bids for river pollution control whilst
Tables 5 32 and 5 33 show estimated WTP models for household water connections
Each table (that is, parts A and B) includes the results of four different models two
models for each of two WTPs For the specific WTP measure, the results are
presented for two functional forms [namely, linear in part A and semi-log (dependent)
in part B] For each of the functional forms only one version of the models is
reported, the one which uses a restricted list of similar independent variables This
approach was used to see how sensitive the model results are to changes in the
functional form Table 5 34 provides an overview of all regressions with regard to
level of significance of each factor and ranges of adjusted R2, by nature of good under
evaluation
Common statistical considerations, such as multicollinearity, autocorrelation,
and heteroskedasticity have been tested for, and these have been judged to present no
overriding problems The Durbin-Watson tests for autocorrelation are not significant,
scatter plots of residuals show no evidence of heteroskedasticity, and simple
correlation matrices indicate reasonably low correlation between independent variables
Further evidence against the existence of a multicollinearity problem is the observation
that regression coefficients and standard errors remain quite stable across the models

212
Table 5 29A Models for Monthly WTP Bids for River Pollution Control in the
Nzoia Basin within Webuye Division Only, Linear Functional Form
Dependent variables WTP1 and WTP5
Independent Part Basin (P or WTPI Part Basin (UP or WTP5
vanables Coef Stdev t-ratio Coef Stdev t4IX)
Constant 447 1268 035 143 38** 5828 246
ADULT" 31 23 3473 090 35 19 2248 157
SETFING 1858 2656 070 -1704 1947 -0.88
QSCORE 1666 1231 135 6202 6810 091
DRESIDE -1128 2000 -056
PAYFRENCY 1286 2843 045 -622 1867 -033
AGE 7180** 2868 250 _3043* 1591 -191
HSIZE -1999 1609 -124 -424 1001 -042
OCCUPATN -3997 1966 -203
WTATUS 3753* -1984 -189 1281 1014 1.26
INCOME 0011677*** 00044 263 0011562** 00047 220
Observations
38
40
R2
621%
591%
Adjusted R2
449%
448%
F Value
3 60
4 15
Prob (>F)
0006
0003
Notes P, U P refer, respectively, to paired and unpaired evaluations **, **, and *
indicate 1, 5, and 10% significance levels, respectively
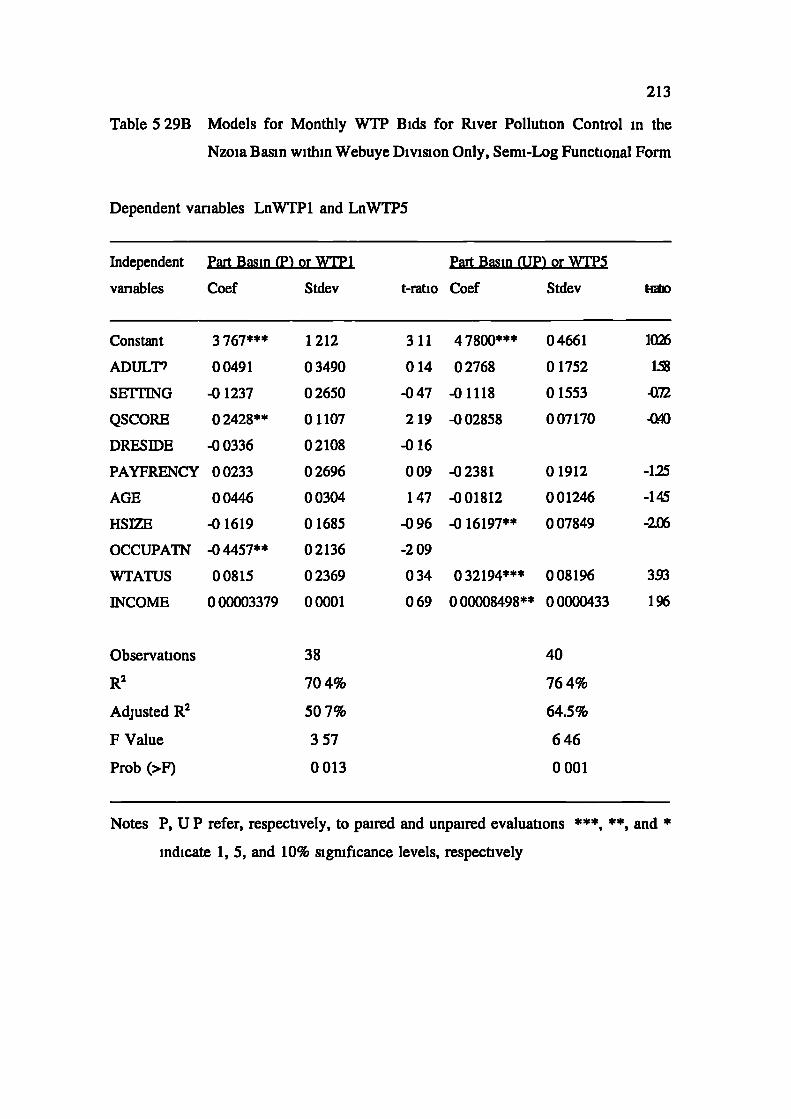
10
158
072
040
213
Table 5 29B Models for Monthly WTP Bids for River Pollution Control in the
Nzoia Basin within Webuye Division Only, Semi-Log Functional Form
Dependent variables LnW1'Pl and LnWTP5
Independent Part Basin (P or WTPI Part Basin (tJP or WTP5
vanables Coef Stdev t-ratio Coef Stdev
311
0 14
-047
2 19
-016
009
147
-096
-209
034
069
Constant 3 7671
ADULT 00491
SErFING -01237
QSCORE 0 2428**
DRESIDE -00336
PAYFRENCY 00233
AGE 00446
HSIZE -01619
OCCUPATN -0 4457**
WTATUS 00815
iNCOME 0 00003379
Observations
R2
Adjusted R2
F Value
Prob (>F)
1212
03490
02650
01107
02108
02696
0 0304
01685
02136
02369
00001
38
704%
507%
3 57
0013
4 7800"
04661
02768
0 1752
-0 1118
01553
-002858
007170
-02381 01912 -125
-001812 001246 -145
016197** 007849 -2fl6
032194*** 008196 3.93
000008498** 00000433 196
40
764%
64.5%
646
0001
Notes P, U P refer, respectively, to paired and unpaired evaluations ", , and *
indicate 1, 5, and 10% significance levels, respectively

214
Table 5 30A Models for Annual WTP Bids for River Pollution Control in the Nzoia
Basin within Webuye Division Only, Linear Functional Form
Dependent variables WTP3 and WTP6
Independent Part Basin (P or WTP3 Part Basin (UP or WTP6
vanable Coef Stdev t-ratio Coef Stdev tnlio
Constant 5782 6299 092 1154 7043 016
ADULT? -1660 1956 -085 -115 1787 -0116
SETI'ING -602 1787 -034 4988** 2167 -230
QSCORE 5013 8549 059 17027* 9138 1.86
DRESIDE 2463* 131 3 -1 88 124 91* 75 14 1.66
PAYFRENCY 634 1784 036 -548 3*** 1642 -334
SEX 377 6** 1685 224 4772** 2253 2.12
AGE 2034 1412 144
HSIZE 2977 6683 045 -2329 8110 -0.
WTATUS -313 1200 -026 -11507 8006 -144
INCOME 004851* 002690 180 0 10778* 005724 1.88
Observations
39
37
R2
617%
626%
Adjusted R2
425%
405%
F Value
3 22
284
Prob (>F)
0017
0028
Notes P, U P refer, respectively, to paired and unpaired evaluations , and *
indicate 1, 5, and 10% significance levels, respectively

215
Table 5 30B Models for Annual WTP Bids for River Pollution Control in the Nzoia
Basin within Webuye Division Only, Semi-Log Functional Form
Dependent variables LnWTP3 and LnWTP6
Independent Part Basin (P or WTP3 Part Basin (UP or WTP6
variable Coef Stdev t-ratio Coef Stdev
853
026
-018
-003
-219
026
207
067
-063
047
Constant 68819***
ADULT?00644
SETFING -00402
QSCORE -0 0042
DRESIDE 03892**
PAYFRENCY 00579
SEX 04268**
AGE
HSJZE 005546
WTATUS -00921
INCOME 0 00002039
08069
02443
02252
0 1220
0 1774
02200
02065
008290
0 1465
000004367
5084***
-00959
-06674
03688**
00923
-0 5736*
1 0091**
002212
00468
-0 1279
00000974
1 313
03128
04112
0 1758
0 1550
03395
04245
002770
01907
0 1427
0000103
3.87
-031
-L62
2.10
05)
-1.69
238
0.80
025
-0.90
095
Observations
39
37
R2
663%
644%
Adjusted R2
410%
348%
F Value
262
2 17
Prob (>F)
0061
0 102
Notes P, U P refer, respectively, to paired and unpaired evaluations *'*, , and *
indicate 1, 5, and 10% significance levels, respectively

216
Table 5 3 1A Models for WTP Bids for River Pollution Control in the Entire Nzoia
Basin upto Lake Victoria, Linear Functional Form
Dependent variables WTP2 and WTP4
Independent Whole Basin (P or WTP2 Whole Basin (P or WTP4
vanable Coef Stdev t-ratio Coef Stdev
Constant 55 1 1645 033 8234 959 1 0.86
ADULT' 1034 4506 023 -3706 281 3 -132
SETTING 3003 3446 087 -2965 265 3 -112
QSCORE 25 11 15 97 1 57 115 1 1187 0.97
DRES1DE -039 2595 001
PAYFRENCY 846 3689 023 66 2635 0.02
SEX 798 6*** 2638 303
AGE 7423** 3721 200
HSIZE -1294 2087 -062 2896 9875 029
OCCUPATN 5313** 2551 -208 -1232 1576 -078
WTATUS 57 12 2575 -222 -1154 1659 -070
INCOME 0016416*** 0005751 285 007832** 003809 2.06
Observations
38
39
R2
61 4%
582%
Adjusted R2
439%
373%
F Value
3 50
278
Prob (>F)
0007
0031
Notes WTP2, WTP4 are monthly and yearly values from questionnaires versions, Al
and A2 ***,**, and * indicate 1, 5, and 10% significance levels, respectively

217
Table 5 31 B Models for W1'P Bids for River Pollution Control in the Entire Nzoia
Basin upto Lake Victoria, Semi-Log Functional Form
Dependent variables LnWTP2 and LnWTP4
Independent Whole Basin (P or WTP2 Whole Basin (P or WTP4
variable Coef Stdev t-ratio Coef Stdev
Constant 35553*** 07926 449 68847' 08511 8LY
ADULT' -0 1464 02282 -064 -0 1648 02466 -0.67
SETTING 01237 01733 071 -03392 02459 -138
QSCORE 0 25044*** 007237 346 00848 0 1190 071
DRESIDE 00805 01378 058
PAYFRENCY -0 1079 0 1763 -061 -00199 02355 -0.08
SEX 07808*** 02599 3.00
AGE 001960 001989 099
HSIZE 00324 01102 029 003850 008784 044
OCCUPATN 03556** 01396 -255 -01843 01928 -0.96
WTATUS -00475 01549 -031 -01258 01737 -072
INCOME 000007523** 000003224 233 000006825* 0000038 178
Observations
38
39
R2
81 6%
686%
Adjusted R2
694%
450%
F Value
667
291
Prob (>F)
0001
0044
Notes WTP2, WTP4 are monthly and yearly values from questionnaires versions, Al
and A2 ***, **, and * indicate 1, 5, and 10% significance levels, respectively

218
Table 5 32A Models for Monthly WTP Bids for a Pnvate Water Faucet, Linear
Functional Form
Dependent variables WTP1O and WTP1 1
Independent CC Spmad Over Time or WTP1O CC Paid Upfront or WTPI I
vanable Coef Stdev t-ratio Coef Stdev
-002
113
007
202
-062
001
1 93
204
-256
1 79
-253
0.52
131
294
Constant -076
ADULT' 1426
SEUING 076
WELL/RST 3056**
DISOURCE -4575
PAYFRENCY 012
AGE 1 3287*
HSJZE 8268**
OCCUPATN 20491**
INCOME 0003753*
Observations
R2
Adjusted R2
F Value
Prob (>F)
4034
1257
1114
1514
7384
1206
06891
4046
8011
0002094
79
544%
470%
7 30
0000
74 87
2956
559
1077
1327
101032 55*** 1108
-1093
1051
1 1457*
06560
8 131**
3621
0003658** 0001923
79
450%
384%
6 19
0000
-1134
175
225
190
Notes Two-tailed tests were used Three asterisks, two asterisks, and one asterisk
indicate 1, 5, and 10% significance levels, respectively

219
Table 5 32B Models for Monthly W1'P Bids for a Pnvate Water Faucet, Semi-Log
Functional Form
Dependent variables LnWTP1O and LnWTP1 1
Independent CC Spread Over Time or W1'PlO CC Paid Upfront or WTPI I
vanable Coef Stdev t-ratio Coef Stdev tiio
Constant 35859*** 03606 994 27784*** 03312 839
ADULT) 01183 01088 109 01992* 01210 1.65
SETF1NG -00171 01007 -017 00850 01124 076
WELLJRST 00585 01431 041 -00254 01449 -018
DISOURCE -004558 006443 -071
PAYFRENCY 00101 0 1063 009 -00033 0 1162 -0.03
AGE 0020991*** 0006313 333 0014305** 0007294 196
HSIZE 006523* 003574 183 010831*** 004071 2.66
OCCUPATN -0 15540** 007107 -2 19
INCOME 000001643 000001914 086 000003442* 0000021 1.66
Observations 79
79
R2
568%
462%
Adjusted R2
487%
386%
F Value
702
6 13
Prob (>F)
0000
0000
Notes Two-tailed tests were used Three asterisks, two asterisks, and one asterisk
indicate 1, 5, and 10% significance levels, respectively

220
Table 5 33A Models for Yearly WTP Bids for a Private Water Faucet, Linear
Functional Form
Dependent variables WTP12 and WTP13
Independent CC Spiead Over Time or WTPI2 CC Paid Upfmnt or WTP13
variable Coef Stdev t-ratio Coef Stdev
Constant -2503
ADULT' -10720
SETTING 1418
WELLIRST -151 13*
DISOURCE 145 73**
PAYFRENCY -3368
SEX 228 01***
AGE
HSIZE -043
OCCUPATN
RIVTATUS 84 71*
INCOME 00447 1**
2496 -100
7781 -138
6633
021
9240 -164
5813
251
6812 -047
7704
296
2221 -002
4916 172
001981 226
-3176
1721
6 14
502
-7245
116 92*
-9951
-1286
-103 12**
181 51***
0 04865***
2616
7105
6091
7725
5946
6865
6583
4291
4422
4555
001761
-121
024
010
0.06
-122
170
-030
-030
-233
3.98
Z76
Observations
78
78
R2
488%
487%
Adjusted R2
407%
399%
F Value
603
551
Prob (>F)
0000
0000
Notes Two-tailed tests were used Three asterisks, two asterisks, and one asterisk
indicate 1, 5, and 10% significance levels, respectively

221
Table 5 33B Models for Yearly WTP Bids for a Private Water Faucet, Semi-Log
Functional Form
Dependent variables LnWTP12 and LnWTP13
Independent CC Sprel Over Time or WTPI2 CC Paid Upfmnt or WTPI3
variable Coef Stdev t-ratio Coef Stdev 110
Constant 42618*** 04521 943 47696*** 06655 717
ADULT? -0 1118 0 1397 -080 00840 0 1733 048
SETTING -00572 01157 -049 -00109 01464 -0.07
WELL/RST 00216 0 1723 0 13 -00348 0 1831 -019
DISOURCE 01378 01038 133
PAYFRENCY 00188 0 1208 0 16 -0 1967 0 1541 -1.28
SEX 03319** 01358 244 01834 01629 113
HSIZE -000192 004136 -005 -00507 01012 -050
OCCUPATN -01910 01215 -1.57
RIVTATUS 022722*** 008818 258 02877** 01296 2.22
INCOME 00001292*** 000003858 335 000004458 0000044 1.02
Observations
78
78
R2
529%
293%
Adjusted R2
446%
11 7%
F Value
638
1 66
Prob (>F)
0000
0 125
Notes Two-tailed tests were used Three asterisks, two asterisks, and one asterisk
indicate 1, 5, and 10% significance levels, respectively

222
Table 5 34
Summary of Regression Results on Willingness to Pay for River
Pollution Control and Household Water Connections
Good Under Valuation Functional Form and Significance of Variablesand factor Linear Form Semi-Log (Dependent)
A River pollution controlADULT (ns) (ns)SET1'ING (1)** (ns)PAYFRENCY (1)*** (1)*QSCOR.E (1)*DRESIDE (2)* (1)**WTATUS (2)** (1)***SEX (3)***
AGE (3)** (ns)HSIZE (ns) (1)**OCCUPATN (1)** (2)**INCOME (6)*** (3)**
range of adjusted R2 (%) 37 3-44 8 34 8-69 4Key variables are income, sex, age, dreside, qscore
B Domestic water supply.ADULTSETTINGPAYFRENCYWELLIRSTDISOURCERIVTATUSSEXAGEHSIZEOCCUPATNINCOMErange of adjusted R2 (%)
(n s)(n s)(n s)(3)***(1)**(2)***(2)***(1)*(2)**(2)**(4)***
384-470
(1)*
(n s)(n s)(n s)(n s)(2)** *
(2)***(2)***(1)**(2)***
11 7-487
Notes Figure in brackets refers to the total number of times (out of 6 and 4 for Good1 and Good 2 respectively) the variable is significant in the regression modelswhilst the asterisk (*) indicates highest level of significance of the factor in themodels For instance, (n s) = not significant in any of the models Threeasterisks, two asterisks, and one asterisk indicate 1, 5 and 10% significancelevels, respectively

223
As may be seen from the estimated bid curves, all WTPs are well-explained
on Mitchell and Carson's (1989) criterion of a minimum adjusted R 2 of 15%, the
values in this case varying between 11.7% and 69 4% In the case of the "water
connection" good, these coefficients of determination for WTP models are within the
range of those obtained in other important Third World surveys, e g Boadu's (1992)
study in Ghana, Whittington et al's (1991, 1993) studies in Ghana and Nigena, and
Kwak and Russell's (1994) study in Korea Adjusted R 2 for WTP models for nver
quality, however, are greater than those obtained in many CV studies, and higher than
R2 values derived by Gramlich (1977) and Desvousges, Smith and McGivney (1983)
in estimating WTP for changes in water quality from boatable to fishable to
swimmable, we know no comparable Third World applications of contingent valuation
High R2 values are not necessarily evidence of theoretical validity there may be much
stochastic variation in the data which overshadows the systematic influence of
variables Nevertheless, high R 2 values do provide evidence of reliability
Overall, the multivanate results from both functional forms are remarkably
robust and consistently show the same independent variables as being statistically
significant The results presented in Tables 5 29-5 33 show conclusively that the
willingness-to-pay information obtained from the contingent valuation survey for all
ten evaluations/levels of improved water-resource service is systematically related to
the socioeconomic charactenstics of the household and the respondent in ways
suggested by consumer demand theory and the relationships posited earlier This is
true regardless of the functional form
The influence of the selected factors on households' willingness to pay for river
pollution control in the Nzoia Basin are shown in Tables 529-5 31 and summanzed

224
in Table 5 34 The range of adjusted R2 were good, from 37 3% to 44 8% for linear
models, and from 348% to 694% for models based on the semi-log (dependent)
functional form The OLS regression results show that household income is a
statistically significant factor (upto 99% level in one case) influencing the willingness
to pay for river pollution control This result is confirmed in all linear models, in only
one model is this rejected in semi-log estimates
The next two important determinants of household willingness to pay for
improved river water quality are respondent's WTATUS (that is, ranking of the status
of domestic water supply with regard to convenience, quality and reliability) and sex
these factors were, respectively, significant in three and two of the six linear models
In all cases, male respondents bid higher amounts than females But there is no
discernible consistency in the effect of ranking of water supply status on willingness
to pay for river pollution control
As may be seen, bid curve coefficients for DRESIDE and OCCUPATION are
both correctly signed, the only one DRESIDE coefficient in semi-log functional form
that is incorrectly signed is not significant Distance from household residence to the
river and occupation (that is, increasing degree of non-formal sector employment)
significantly decrease WTP for river pollution control in three of the 12 bid curve
estimates Even though the age of the household head is statistically significant in
explaining the willingness to pay for river pollution control in three of the six linear
models, the direction of its influence is confused Except in the WTP5 measure, age
appears to increase willingness to pay
The regression results do not suggest that household size and ranking of the
water quality in the Nzoia River has an effect on the wish to control water pollution

225
in the Basin The expected negative relationship between household size and
willingness to pay was not significant in any of the linear models, the effect of
WTATUS was significant at 10% level in one of the linear models, however The
effect of these two factors is projected more in semi-log models than in the linear
ones For instance, in one of the models household size is significant at 5% level
whilst in three cases household ranking of the nver water quality is significant (in one
case, upto 1% level t) In sum, no consistency in the effect of both household size and
household ranking of the river water quality is discernibly significant on willingness
to pay for river pollution control
As noted, the effect of selected socio-economic factors on households'
willingness-to-pay bids for private water connections to their homes are depicted in
Tables 5 32 and 5 33, and summarized in Table 5 34 The overall fits (R2) were
satisfactory, ranging from 384% to 470% (for linear forms) and from 11 7% to 48 7%
(for semi-log functional forms) The expected positive effect of income on households'
WTP the homestead faucets is statistically significant at the 90%, 95% or 99% levels
in all linear models and half of the models in semi-log (dependent) form The dummy
vanable for well, river and stream as an existing source of domestic water,
WELL/RST, had a significant positive effect in three of the four linear WTP models,
the non-significant coefficient had a wrong expected sign Households' ranking of
water quality in the Nzoia River had, in the main, a positive effect on their willingness
to pay for private water connections On statistical grounds, however, the variable
RIVTATIJS, was entered in the modelling of only two of the four WTPs
The expected negative relationship between household size and willingness to
pay for individual family water connections was statistically significant in half of the

226
linear WTP models estimated, in contrast to the lack of statistically significant
relationships for river pollution control
Both sex (female) and occupation (non-formal sector employment) yielded
significant negative OLS coefficients in two linear models, the highest levels of
significance were 1% and 5% for sex and occupation respectively The estimated
coefficient of the effect of distance between a household and existing water sources
was generally poor, in one of the two WTP models in which it is included, distance
to existing water source is inconsistent with the a pnon hypothesis One reason for the
inconsistent result may be that the effect in models is dominated by the dummy
WELLIRST Indeed, on statistical critena, DISOURCE is omitted from two of the four
models for WTP for private household faucets
227
5.4.2 EFFECT OF HOUSEHOLD'S Soclo-EcoNoMic SETrING
To test whether respondents 1 WTP bids were affected by the soclo-economic set-up
of the region (i e, rural versus urban), enumerators indicated RURAL or URBAN on
the questionnaires after every interview Due to logistical and financial considerations
we did not have separate samples Our hypothesis was that respondents in the rural
areas would bid lower than those in the urban areas owing to the fact that urban-
dwellers' high incomes, more environmental knowledge and hence evaluation of
recreation, as well as the positive linkage between personal hygiene and their
occupations in the formal sector employment This dataset, however, shows no
evidence of differences in WTP bids between rural and urban residents, Table 5 35
shows that in only three cases out of 13 WTP measures are mean evaluations for rural
folk less than those of urban households
46Holdrng other factors constant (specially body propoitionahty and height), this authorcontends that beauty is associated with clean clothes and amount of water used in bodycleanliness Though tangential to this work, Hamennesh and Biddle (1993) develop a theoryof sorting across occupations based on looks and denve its implications for testing for thesource of earnings differentials related to looks In part, the paper's abstract reads" Holdingconstant demographic and labour-market charactenstics, plain people earn less than people ofaverage looks, who earn less than the good-looking [However] the impact of individuals'looks on their earnings is mostly independent of occupation"

14(424)
14 (42 4)
15 (53 6)
15(536)
15(469)
14 (50 0)
7790(791)
115 70 (112 6)
56670 (5473)
72670 (765 8)
7070(77 8)
49290 (4996)
32(444)
32 (444)
36(500)
36(500)
126 (405)
8875(623)
7290(579)
536 10 (433 9)
363 90 (3329)
NA
228
Table 5 35 Proportion of Respondents and Associated Mean WTP Measures by
Household Socio-Economic Setting
WTP Households in Rural Setting Households in Urban Setting
Measure Count (%) Mean (Stdev) Count (%) M e a n (S t d e v)
. River pollution control.
WTP1 19 (576) 103 20 ( 85 6)
WTP2 19 (576) 13740 (1033)
WTP3 13 (464) 56920 (411 1)
WTP4 13 (464) 78460 (5928)
WTP5 17(531) 7118(561)
WTP6 14 (500) 42860 (270 8)
& Domestic Water Supply
WTP1O 40 (556) 9425(588)
WTP11 40(556) 7095(449)
WTP12 36 (500) 49440 (3374)
WTP13 36 (500) 40610 (2907)
Total 139 (447) NA
Notes % = percentage of respondents in the sub-sample Figures in brackets are
standard deviations NA = not applicable All values in Kenya shillings

229
Furthermore, the results of the SETTING test from the multivariate analyses
shows that whether or not a household location was in an urban or rural area had no
significant impact on respondents willingness to pay, the only exception was in the
models for WTP6 in Table 5 30 Clearly then, there was no significant influence of
a household's location on the resultant willingness-to-pay
5.4.3 EFFECT OF THE PRESENCE OF PEOPLE LISTENING TO THE INTERVIEW
Ideally, each respondent would have been interviewed without other people listening
However, due to the crowded housing conditions in urban Webuye and extended
family systems in rural areas, many times this was not possible In approximately one-
fifth of the interviews, other adults listened as the interview was conducted (see Table
5 36) This fact was noted by the enumerator It is possible that the presence of
listeners may have biased a respondent's WTP bids, but the direction of the potential
bias is unclear Respondents may have been reluctant to indicate their ability to pay
a large amount and may thus have bid low Alternatively, they may have wanted to
demonstrate their ability to pay to their neighbours and thus have bid high in an
attempt to gain status

28 (84 8)
28 (84 8)
21(750)
21(750)
23 (71 9)
24 (857)
8680(798)
12610 (1094)
60480 (515 2)
79520 (725 6)
7435 (724)
47080 (4144)
48(667)
48 (667)
55 (764)
55 (764)
199 (63 9)
84 80(615)
6965 (529)
54440(4126)
37830(3235)
NA
230
Table 5 36 Relationship Between Presence of Listeners to Interview and
Associated Means and Standard Deviations of WTP Measures
WTP Presence of Listeners Non-Presence of Listeners
Measure Count (%) Mean (Stdev) Count (%) Mean (Stdev)
River Pollution Control.
WTP1 5(152) 12400 (1007)
WTP2 5 (15 2) 14000 ( 962)
WTP3 7 (25 0) 457 10 (3645)
WTP4 7 (25 0) 628 60 (543 8)
WTP5 9 (28 1) 6220 (484)
WTP6 4(143) 40000 (2944)
. Domestic Water Supply
WTP1O 24 (333) 10580(5560)
WTP11 24(333) 7580(4810)
WTP12 17 (23 6) 427 80 (2866)
WTP13 17 (236) 403 10 (2784)
Total 66 (21 2) NA
Notes % = percentage of respondents in the sub-sample Figures in brackets are
standard deviations NA = not applicable All values in Kenya shillings

231
A variable, ADULT", designed to test the effect of the presence of listeners
was included in the multivanate analysis, in all models except in the bid curve for
monthly WTP bids for domestic water supply connections when connection charges
are to be paid upfront [in the semi-log (dependent) functional form, Table 5 32B] the
results clearly show that effect of presence of people listening to the interview was not
significant We interpret this finding to mean that the presence of listeners had little,
if any, effect on the WTP bids This suggests that the WTP bids are robust with
respect to another variation in the interview context, and again increases our
confidence that WTP bids are not easily manipulated or influenced by contextual
issues
5.4.4 EFFECTS OF FREQUENCY OF PAYMENTS IN CONTINGENT VALUATION
As noted, to study the influence of temporal dimensions of payments on contingent
values, a field experiment was conducted with the two commonly used frequencies,
one (yearly payments) and twelve (monthly payments) Equal shanng of six
questionnaire versions between the two frequencies meant that two variants and one
version of river water quality and domestic water supply questionnaires, respectively,
asked for yearly WTP
Ideally, each respondent would have been happy to go by the payment
frequency specified in the CV questionnaire version But the availability of choice of
payment frequency in the CV saw some respondents preferring a different temporal
dimension of payment than the one on offer About 47% and 529% of respondents
in the river water quality and domestic water supply samples, respectively, did express
preference for a different payment frequency format than the one that was on offer

232
To avoid respondents registering protest against the temporal dimension of payment
in the survey instrument, all versions were structured in a manner that asked for
interviewees' preference first before being told what was on offer Table 5 37 shows
that yearly payment formats generally resulted in higher WTPs than the monthly
temporal dimension of payment, the yearly WTPs, however, were less than 12 times
monthly WTPs

233
Table 5 37 Bivariate Table Showing the Relationship Between Respondents'
Preferred Frequency and the Temporal Dimension of Payments in the
Valuation Through Associated Means and Standard Deviations for
WTP Measures
Preferred Frequency Temnoral Dimension of Payments in Valuationof Payments and Monthly Payments Yearly PaymentsW1'P Measure Mean Stdev Mean Stdev
Monthly PaymentsA Good 1, WTP1
WTP2WTP3WTP4WTP5WTP6
B Good 2, WTP1OWTP 11WTP 12WTP 13
Yearly PaymentsA Good 1, WTP1
WTP2WTP3WTP4WTP5WTP6
B Good 2, WTP1OWTP11WTP12WTP 13
989513630NANA6730NA91407910NANA
836011710NANA7410NA92506240NANA
8990111 80NANA5370NA67605620NANA
7390101 00NANA7680NA46904220NANA
NANA
4667063330NA
54500NANA
50660406 80
NANA
6846089230NA
41390NANA
525 00357 80
NANA
52600767 80NA
51120NANA
39250305 80
NANA
4100055750NA
322 10NANA
38520321 60
Note Good 1 and Good 2 relate to river pollution control and domestic water supply
connections respectively NA stands for not applicable All values in Kenya
shillings

234
The models indicate that yearly ones performed comparatively better in terms
of explanatory power than monthly models This was expected given the non-salaried
nature of most Webuye households Indeed our high adjusted R 2 values could be
attributed to the fact that budgetary implications of the contingent schemes were made
more explicit with the requirement for the households to choose a payment frequency
For linear models, adjusted R2 ranges from 384% to 470% (for monthly WTP bids)
and 37 3% to 425% (for yearly WTP bids), for semi-log (dependent) models, the
coefficient of determination ranges from 37 7% to 694% (for monthly WTP bids) and
11 7% to 45 0% (for yearly W1'P bids) The idea that WTPs were not asked for in the
respondents' preferred pf is a moot point as the interviewees would have used the
information to bid appropriately, anyway In addition we see that the dummy variable
for pf, PAYFRENCY, is significant in the multivariate analysis of only one WTP
measure, WTP6 (that is, unpaired annual WTP for river pollution control in Part
Basin, see Table 5 30) The direction of the effect PAYFRENCY variable is
consistently negative, except in one model of monthly WTP bids for river water
quality The dummy indicates that preference for annual payments result in a lower
WTP (since PAYFRENCY = 1 for yearly payments)
Another possible, plausible interpretation of the result on PAYFRENCY effect
to mean that preferred pf had influence on respondents' willingness to pay bids But
the effect in the models is dominated by the income, occupation and "setting" effects
By "setting" we mean the urban-rural dichotomy It is important, though, to reiterate
the point that PAYFRENCY is a dummy for preferred payment frequency and not for
the temporal dimension of payment in the value elicitation exercises

235
5.4.5 CoNCLUDING WTP ESTIMATION MODELS
As this is an open-ended CV study, both the ordinary least squares (OLS) and the
maximum likelihood (ML) procedures are arguably reasonable in terms of yielding
unbiased efficient parameter estimates Consequently, the choice of the OLS procedure
in this analysis was random, though influenced by the statistical capabilities of
MINLTAB ®47 software Cameron and Huppert (1989) assess the potential distortion
introduced into contingent valuation estimates due to the inappropriate application of
OLS regression methods to payment card interval midpoints The authors conclude that
"[diepending upon the design of the payment card, OLS can yield biased parameter
estimates, misleading inferences regarding the effects of different variables on resource
values, and biased estimates of the overall resource value" (p 230) By and large, in
non-open-ended CV studies, the resulting total value of a non-market resource can be
manipulated by intentional decisions regarding estimation procedures The argument
that our regression models are too simple and that more information could be
discerned from use of other estimation techniques is a legitimate concern Yet this
author conjectures that modelling WTP values with non-OLS techniques will not
change any of the conclusions obtained
What emerges from the results of this multivariate analyses of bids is that the
significant factor influencing households' willingness to pay for river pollution control
and domestic water supply connections is family income The effects of other factors
are more specific to the contingent good In particular, the order of strength of
determinants of willingness to pay for nver pollution control are sex, age, household
ranking of status of domestic water source, distance from river to household residence,
®MINITAB is a registered trademark of Minitab Inc

236
the other factors affecting WTP for household domestic water connections are existing
source of water supply, household size, ranking of river water quality, and age of
household head
Perhaps the most surprising finding of these multivariate analyses is how little
effect any of the social or cultural variables had on individuals' willingness to pay for
river pollution control or household water supply connections More educated
respondents generally bid more than less educated respondents, but this effect is
statistically significant in only a few of the models and its magnitude is always small
The sex and occupation of the respondent are almost never significant, and the
direction of these effects if mixed Even though we hypothesized that older
respondents would bid less for the improvements than younger individuals, the overall
effect of age on WTP is confused We must hasten to add, however, that most of the
social and cultural factors were strongly correlated to income levels This explains why
in models where the income effect was small, such factors turned up to be significant
The next section rigorously tests, amongst other hypotheses, the impacts of temporal
dimensions (or frequencies) of payments on average (that is, mean and median) WTPs

237
5.5 DEFINrrI0N AND TESTS OF DIFFERENCES
The natural way to define differences between two evaluation question designs is the
difference in the mean, although difference in median seems as plausible Note that
even though we might find that two distributions generate about the same mean, it is
certainly not true that two distributions are the same An individual may interpret two
contingent valuation designs very differently even if we obtain the same estimated
means (e g, Hanley et al, 1994, Hanley et al, 1995)
Descriptive statistics for the ten measures of WTP have already been given in
Tables 5 14, 5 15, 5 16, and 5 17 In order to tests any hypotheses over these
measures, appropriate statistical examinations must be chosen and conducted One
possible approach, mainly used in discrete response valuation studies, is to calculate
the empirical distribution functions and use a Kolmogorov-Smirnov type of statistic
(Kristrom, 1993) Our open-ended responses and the complications entailed in
determining the relevant degrees of freedom for a Kolmogorov-Smirnov goodness-of-
fit test, nevertheless, make such an approach inadmissible on a cost-benefit evaluation
of resources Therefore, we use a simpler approach, but we are aware that distance-
type test may be applied in comparisons undertaken here
Specific distributional assumptions are made for WTP data in rough
comparisons of means But then we go further and appropriately perform both the
Mann-Whitney U test and the paired-rank Wilcoxon test as well Paired t-tests are
generally ruled out on the grounds that untransformed WTP data is not normally
distributed48, whilst the presence of zeros means that log transformations can not be
48This was shown by calculating nonnal scorns for all WTP vanables, and correlatingthese scorns with the untransfoimed data in each case The correlation coefficients can be usedas test statistics for nonnality, following a version of the Shapiro-Wilk test

238
done The Mann-Whitney test is frequently used in non-normal samples (e g,
Kahneman and Knetsch, 1992), but it assumes independent data sets (Mann and
Whitney, 1947, Kazmier and Pohi, 1987 496) Further, when data sets have skewed
distributions and dependent on each other, a paired-rank Wilcoxon test is used
(Wilcoxon, 1945, Mendenhall et al, 1986 806, Hanley et al, 1994 10)
The key research questions, and hence hypotheses, that this study set up to
investigate are fourfold (1) Does the Nature of the Good Matter ? (2) Do Average
WTP Measures Vary with Temporal Dimension (or Frequency) of Payments in CV
Design? (3) Embedding in WTP Values for Water Pollution Abatement in the Nzoia
River Basin (4) Does Nature of Connection Charges Influence WTP for Domestic
Water Supply? We presently deal with each of these hypotheses, in turn
5.5.1 DOES THE NATURE OF THE GOOD MArrER?
To meaningfully compare the performance of the CV method when applied to the two
goods (that is, river pollution control and domestic water connections), it is necessary
to hold constant all other aspects of the application of the method As already
mentioned, for both goods the CV was applied to the population of Webuye residents
This allows us to isolate commodity-specific characteristics as the source of any
discrepancy in our measures of reliability and validity The proportion of protest and
zero bids, coefficient of variation of WTP measures, and results from the multivariate
analyses are the criteria used to compare the reliability and validity of the contingent
values across the two goods being evaluated On the basis of the first criterion, the
following observation can be made There were more refusals to pay and protests in
Good 1 (rwq) than in Good 2 (dws) The proportion of zero bids, however, were more

239
in the latter contingent good than in the former (51 9% versus 43 1%)
Although the mean monthly WTP for rwq in Webuye area was quite close to
the mean monthly WTP for dws on both types of connection-charges (i e, Ksh 7000
for WTP and Ksh 65 00 for WTP5 vs Ksh 91 80 for WTP1O and Ksh 71 90 for
WTP1 1), the former had a higher standard deviation than the latter The fact that
valuations of water in nature were more dispersed than those of water in social uses
may possibly be explained by the familiarity of the respondents with domestic water
supply as compared with river water quality Indeed, when the respondents were
asked for WTP for nver cleanup in the entire basin, the standard deviation increased
from Ksh 8260 and Ksh 6600 to Ksh 106 20, the mean and median for additional
WTP values was Ksh 35 80 and Ksh 2000 respectively
Secondly, Webuye residents appear to recognise non-use values of the Nzoia
river, specially in their annual WTP bids for water pollution control in the basin Even
though this study did not set out to isolate the different types of use value from non-
use values, it can be inferred that the higher WTP values for rwq improvement could
be symptomatic of the residents recognition of these other values of nature The mean
annual WTP for rwq within Webuye area is Ksh 56790 and Ksh 46070 (from
questionnaire versions A2 and A4) whilst the mean yearly WTP for pnvate water
faucets is Ksh 515 30 (spread c-charges) and Ksh 384 10 (upfront c-charges) The
median values are equal, but the variance of household valuations for river quality is
higher than that for dnnking water Notwithstanding, the strong assumption of no costs
of water supply development in this argument on there being non-use values in the
residents' evaluations of river water quality improvements, water supply is,
understandably, Just one of many benefits from river conservation and management

240
As a relative measure of dispersion, the coefficient of variation (c v) is an
appropriate statistic of comparing two dissimilar groups (Mason, 1970 123) In the
influential paper by Kealy and co-workers (1990), one measure of reliability used is
estimated 'proportionate' variance (or c v) of WTP values as measured within a given
commodity type The standard deviation of the mean as a percentage of the mean
gives a standardized measure of the degree of precision of the estimate Therefore, in
the present context in which a similar CV method is applied to very similar
populations, this is a useful statistic for making comparisons of relative precision of
WTP values across the two goods
Alongside other descriptive statistics, the and coefficients of variation of WTP
for the two commodities are reported in Tables 5 14, 5 15, and 5 17 The c v s for wtp
values for in-house water connection vary between 65% and 81% while those for river
water quality are more unreliable, varying between the range of 82% and 137% The
divergence of these values is consistent with the Cummings et iii, (1986) hypothesis
that welfare measures for public goods will have a higher variance (as a proportion
of the mean) and therefore be less reliable than those for a private good However, the
nature of goods in this experiment do not epitomise polar extremes of the public-
private good continuum found in Kealy et al's (1990) study Indeed, the coefficients
of variation in this study are quite big in both circumstances The Kealy and co-
workers (1990) survey found the "proportionate variance of WTP is 447% for the
public good and 404% for the pnvate good using the full sample When we
recalculate the value for the private good using the random subsample, the
proportionate variance rises to 446%" (p 256) Secondly, Kealy et a! employed the
referendum, or closed-ended method of questioning whilst this one took an open-ended

241
format, this divergence may explain, to a large extent, our high coefficients of
variation
As regards the OLS modelling of WTP evaluations for nver pollution control
and household water connections, it is worth re-iterating a number of points The
range of adjusted R2 for estimated models of WTP for both contingent goods were
satisfactory. For river water quality the values ranged from 37 3% to 44 8% for linear
models, and from 34 8% to 694% for models based on the semi-log (dependent)
functional form For private household water connections, the overall fits (R 2) for
WTP models ranges from 384% to 47 0% (for linear forms) and from 11 7% to 48 7%
(for semi-log functional forms)
The main factor influencing households' willingness to pay for both river
pollution control or household water supply connections is family income No
significant effect of households' 50cm-economic setting, presence of adults, nor social
or cultural variables (such as age, education and sex) was discernible in the
multivanate analysis of bids from evaluation of both goods The regression analyses
also included WTATUS and RIVTATUS, factors that were meant to measure the
extent to which household valuation of river pollution control and individual water
connections are dependent on the status of existing water source and water quality in
the Nzoia River basin respectively In the 16 models in which these variables were
included, they were significant in four of them
Further still, annual payments as a temporal dimension of payments in the CV
design generally resulted in higher W'I'Ps than the monthly temporal dimension of
payment, the yearly WTPs, however, were less than 12 times monthly WTPs This
result equally applied to both goods In sum, therefore, the nature of good being

242
valued in this CV study compromised neither the reliability nor the validity of
resultant W1'P measures
5.5.2 Do AVERAGE WTP MEASURES VARY Wfl'H TEMPORAL DIMENSION (OR EQUENCY)
OF PAYMENTS IN CONTINGENT VALUATION DESIGN?
As noted earlier (in Chapter 4 and in Section 5 44), to study the influence of temporal
dimensions of payments on contingent values, a field experiment was conducted with
the two commonly used frequencies, one (yearly payments) and twelve (monthly
payments) Equal sharing of six questionnaire versions between the two frequencies
meant that two variants and one version of river water quality and domestic water
supply questionnaires, respectively, asked for yearly WTP
Ideally, each respondent would have been happy to accept the payment
frequency specified in the CV questionnaire version But the availability of choice of
payment frequency in the CV saw some respondents prefemng a different temporal
dimension of payment than the one on offer Table 5 38 gives the results About 47%
of respondents in the river water quality sample expressed a preference for a different
payment frequency format than the one that was on offer, contrary to the temporal
dimension of payment in the questionnaire versions to which they responded to, 487%
and 46 1% of the interviewees chose annual and monthly payments respectively
In the domestic water sample, the proportion of respondents who preferred a
different payment frequency from that offered in their assigned questionnaire versions
was also about 47% But 392% of respondents in the monthly questionnaire version
would prefer yearly payments and 55% of those in the version seeking annual WTP
bids would have wanted 12 payments instead To avoid respondents registenng

243
protests against the temporal dimension of payment in the survey instrument, all
versions were structured in a manner that asked for interviewees' preference first
before being told what was on offer, people then bid on the basis of the
interviewers/researchers' preferred structure Owing to this, the above descriptive
statistics can only be interpreted to mean that the respondents' preferences were tilted
in favour of annual payments
Table 5 38 Relationship between Preferred Frequency of Payments and Temporal
Dimension of Payment in Valuation by Nature of Contingent
Commodity
Temporal Dimension of
Preferred Frequency of Payment
Payment in Valuation
Monthly (%) Yearly (%) Total (%)
. River Water Quality
Monthly Versions 40 (25 97) 38 (24 68) 78(5065)
Yearly Versions 35 (22 73) 41(2662) 76(4935)
Total sample size 75 (48 70) 79 (51 30) 154(100 0)
Domestic Water Supply
Monthly Version 48 (30 57) 31(1975) 79(5032)
Yearly Version 43 (27 39) 35 (22 29) 78(4968)
Total sample size 91(5796) 66 (42 04) 157(1000)

244
Tables 5 39 and 5 40 show cross tabulations between payment frequency and
occupation, and payment frequency and income respectively As can be seen,
respondents in the non-salaried employment sectors of agriculture and informal
apprenticeships/activities preferred yearly payments to monthly ones Ostensibly, this
was due to the nature of their income flows, out of 16 respondents in the highest
income category Just 6 expressed preference for annual payments as compared to 50%
of those in the lowest income bracket (Table 5 40)
Tables 5 41 and 5 42 present a comparison of sample characteristics for
monthly payment questionnaire versions and yearly payment questionnaire versions
as well as the socio-economic and demographic data according to respondents'
expressed preference of payment frequency In general the samples are quite similar
Because of the similar sample characteristics, we conclude that any differences in the
responses are due to the temporal dimension of payment
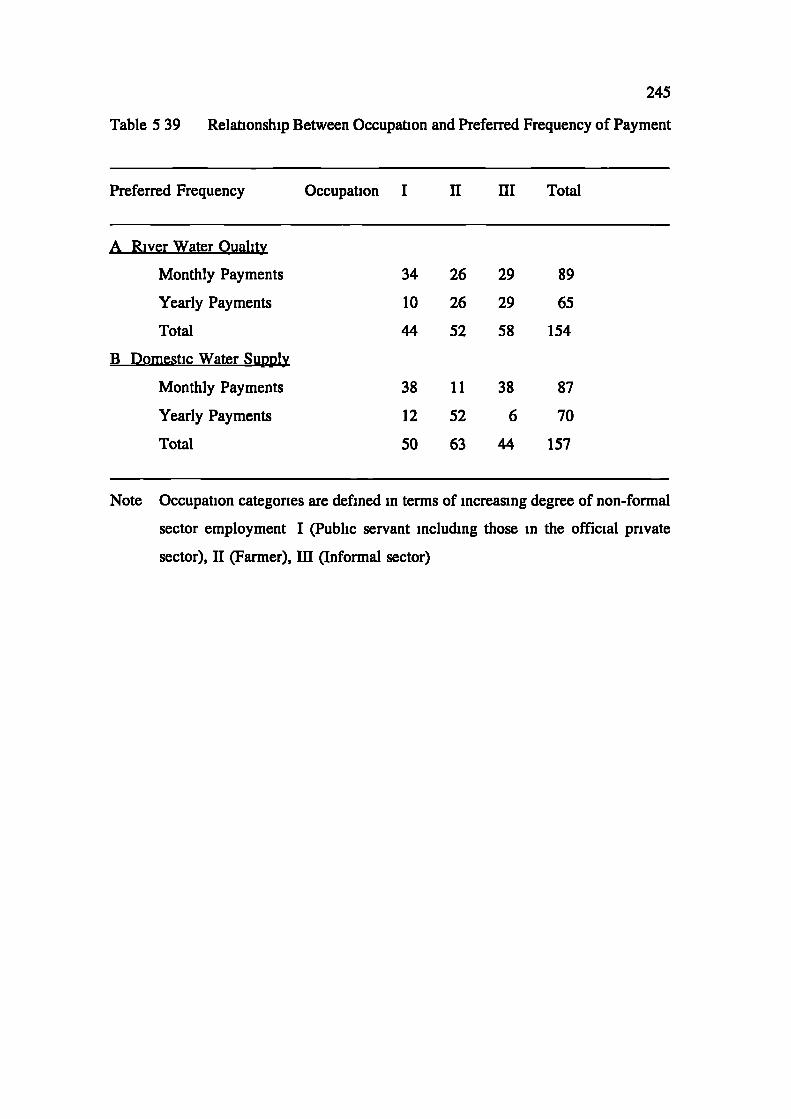
245
Table 5 39 Relationship Between Occupation and Preferred Frequency of Payment
Preferred Frequency Occupation I II III Total
A River Water Quality
Monthly Payments 34 26 29 89
Yearly Payments 10 26 29 65
Total 44 52 58 154
B Domestic Water Supply
Monthly Payments 38 11 38 87
Yearly Payments 12 52 6 70
Total 50 63 44 157
Note Occupation categories are defined in terms of increasing degree of non-formal
sector employment I (Public servant including those in the official private
sector), II (Farmer), III (Informal sector)
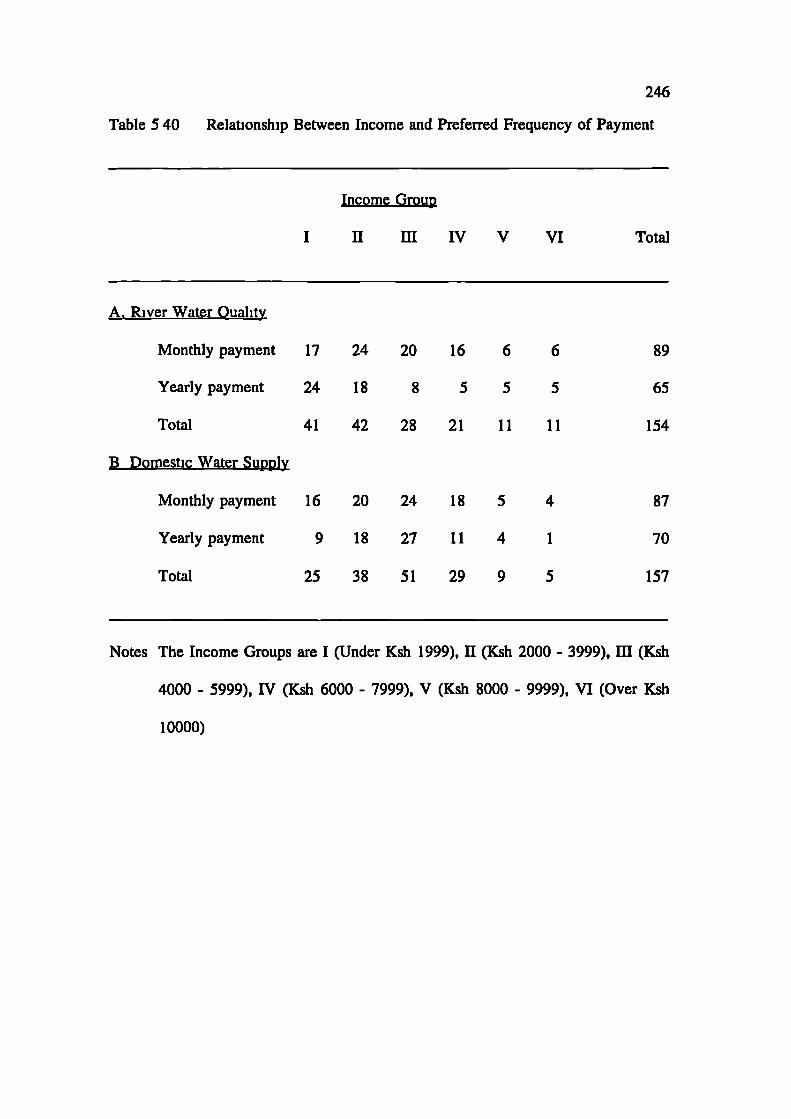
246
Table 5 40 Relationship Between Income and Preferred Frequency of Payment
Income Group
I II III IV V VI Total
A. River Water Ouahty
Monthly payment 17 24 20 16 6 6 89
Yearly payment 24 18 8 5 5 5 65
Total 41 42 28 21 11 11 154
B Domestic Water Supply
Monthly payment 16
20
24
18
5
4
87
Yearly payment 9
18
27
11
4
1
70
Total 25
38
51
29
9
5
157
Notes The Income Groups are I (Under Ksh 1999), II (Ksh 2000 - 3999), III (Ksh
4000 - 5999), IV (Ksh 6000 - 7999), V (Ksh 8000 - 9999), VI (Over Ksh
10000)

2601 95
16881948
8441 30
909227310394553 90
29222143
136416232078
2601 95
17531753
8441 30
7 1422081494
260260
149417531688
260260
19482338
7791 95
844233818 18
3 903 90
220816881883
2601 30
149413 64
909065
7792143
7 143 25260
22731974
64916881883
2273 29222662 2857
247
Table 541
Percentage Comparisons of Sample Household Characteristics Between
Monthly and Yearly Questionnaire Versions and Preferred Payment
Frequency, River Pollution Control Sample
Variable Ouestionnaire VersionMonthly Yearly
Payment PreferenceMonthly Yearly
Sex:Female
31 82
2662
3247
2597Male
1883
2273
2532
1623Age:
Under 20 years20 - 29 years30 - 39 years40 - 49 years50 - 59 yearsOver 60 years
Full-time education:No educationPrimary schoolLower secondaryUpper secondaryCollege/University
Home ownership:RenterOwner
Occupation:Public servant'FarmerInformal sector
Monthly income group:Under Ksh 1,999 1364 1299 1104 1558Ksh 2,000 - 3,999 1494 1234 15 58 11 69Ksh4,000-5,999 779 1039 1299 519Ksh 6,000 - 7,999 5 84 779 1039 3 25Ksh 8,000 - 9,999 5 19 1 95 3 90 3 25Over Ksh 10,000 3 25 3 90 3 90 3 25
Total 5065 4935 5779 4221
Note includes respondents employed in the private sector
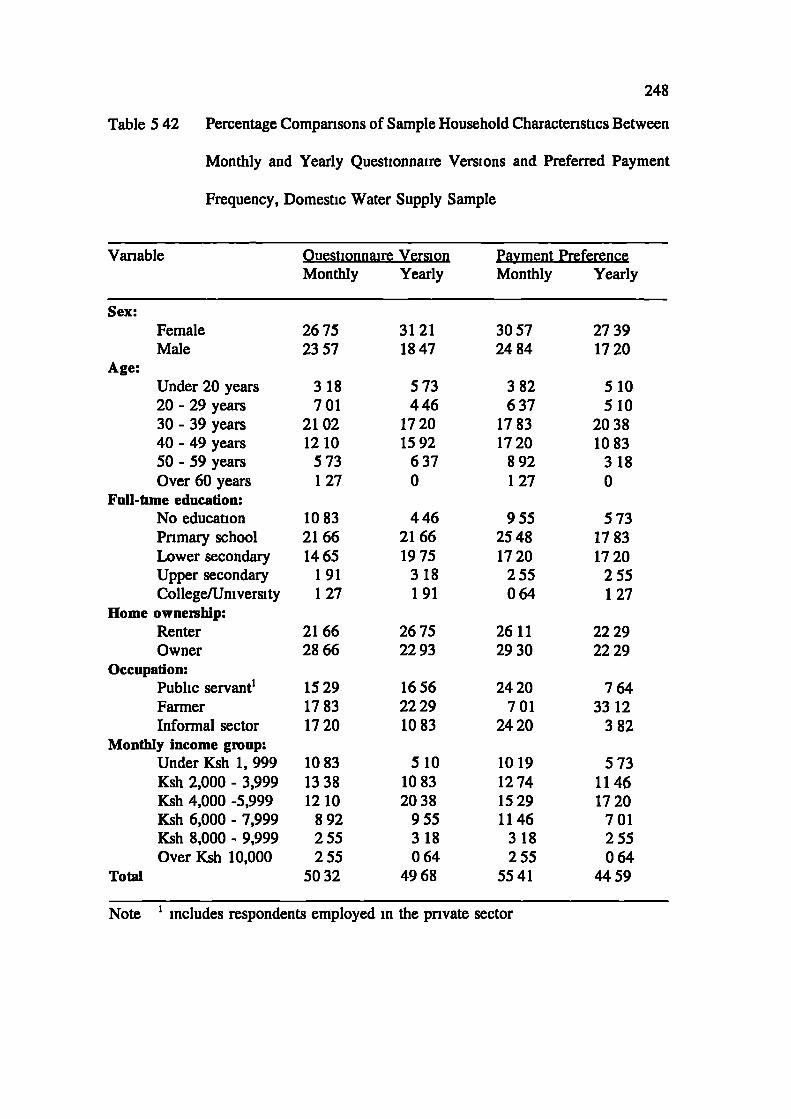
248
Table 542 Percentage Comparisons of Sample Household Characteristics Between
Monthly and Yearly Questionnaire Versions and Preferred Payment
Frequency, Domestic Water Supply Sample
Ouestionnaire Version Payment PreferenceMonthly Yearly Monthly Yearly
Vanable
Sex:FemaleMale
Age:Under 20 years20 - 29 years30 - 39 years40 - 49 years50 - 59 yearsOver 60 years
Full-time education:No educationPrimary schoolLower secondaryUpper secondaryCollege/University
Home owneihip:RenterOwner
Occupation:Public servant1FarmerInformal sector
Monthly income group:Under Ksh 1, 999Ksh 2,000 - 3,999Ksh 4,000 -5,999Ksh 6,000 - 7,999Ksh 8,000 - 9,999Over Ksh 10,000
Total
26752357
3 18701
21021210
5 731 27
108321661465
1 911 27
21662866
152917831720
108313381210
8 92255255
5032
31211847
573446
17201592
6370
44621661975
3 181 91
26752293
165622291083
5 1010832038
9553 18064
4968
30572484
3 82637
17831720
8 921 27
95525481720
255064
26112930
2420701
2420
1019127415291146
3 18255
5541
27391720
5 105 10
20381083
3 180
5 7317831720
2551 27
22292229
76433 12
3 82
5 7311461720
701255064
4459
Note includes respondents employed in the private sector

249
Two points are worth repeating here In tandem with expectation, annual WTP
values were greater than monthly WTPs (see Tables 5 14, 5 15, 5 16, and 5 17)
However, the former are less than twelve times the latter The arithmetic converse
holds too Secondly, the size of the mean WTP values relative to average household
income appears to be quite low, varying between 05% and 3% (see Tables 5 25 and
5 27)
It is important to determine the statistical importance of the difference between
average WTPs across frequency of payments in the value elicitation question To do
this we employed three tests (Student t-test, Mann-Whitney test and a paired-rank
Wilcoxon test) to assess the following hypotheses on temporal dimension of payments
Test 1 H0 wtpl = wtpl
versus
H1 wtpl ^ wtpl
Test 2 H. wtp7 = wtp5
versus
H1 wtp7 ^ wtp5
Test 3 H0 wtp8 = wtp2
versus H1 wtp8 ^ wtp2
Test 4
H0 wtp9=wtpl
versus H1 wtp9 ^ wtpl
Test 5
H0 wtp9 = wtp5
versus
H1 . wtp9 ^ wtp5
Test 6 H0 wtpl4 = wtplO
versus
H1 wtpl4^wtplO
Test 7 H. wtpls = wtpll
versus
H1 wtpl5^wtpll
Table 5 43 shows the results of these tests As may be seen, the null hypothesis is
rejected in each case at the 95% level, except in one instance The only test that fails
falsification involves standardized annual WTP from a paired questionnaire (A2) in
which respondents were asked to bid for improved river water quality in both a section
of and the entire Nzoia Basin, on one hand, and monthly WTP from a non-paired

250
questionnaire version (A3) in which households were asked for bids for the Nzoia
River section in Webuye Division alone, on the other So, therefore, there exits a
possibility that the results from test two are influenced by the paired-unpaired effect
We address this influence in Section 5 5 3 But by a majority of six to one, the tests
show that the two payment frequencies produced statistically different estimates of
WTP for improved river water and a private water connection

251
Table 5 43 Results of Tests of the Hypothesis on Temporal Dimension of
Payments, Student:, Mann-Whitney and Wilcoxon tests
HYPOTHESIS #2 FREQUENCY IMPA CTS
Test
Null Hypothesis
t-statistic Mann-Whitney test Wilcoxon test
No
(H)
Decision (t) Decision (signDeci)n (p-value)
A River Water Quality
Test I WTP7 = WTP1 R (-2 78) R (00484)
Test 2 WTP7 = WTP5 N R (-1 56) N R (02586)
Test 3 WTP8 = WTP2 R (-3 06) R (00115)
Test 4 WTP9 = WTP1 R (-3 45) R (00092)
Test 5 WTP9 = WTP5 R (-2 32) R (00503)
B. Domestic Water Quality
Test 6 WTP14 = WTP1O R (-6 09)
R (00000)
Test 7 WTP15 = WTP1 1 R (-5 72)
R (00000)
R (0005)
R (0054)
R (0002)
R(0001)
R (0003)
R (0000)
R (0000)
Notes
All tests are two-sided and all decisions on H are at 95%, N R, R = cannot
reject, reject hypothesis of equal means in t-test and of equal medians in the
cases of Mann-Whitney and Wilcoxon tests
2
Both the non-parametric tests (Mann-Whitney test and paired-rank Wilcoxon
test) use medians as measures of average WTP.

252
Hypotheses tests thus show that significant reductions in WTP were
forthcoming for all formats involving yearly payments regardless of the good under
investigation It is important to understand whether the reduction was a reflection of
respondents' budget constraints or an undervaluation caused by the CV specification
If the second reason is correct then this result may provide more ammunition for the
criticism offered by Sagoff (1988) of valuation becoming endogenous to the valuation
process
So, what is the explanation for the divergence in WTPs The literature
overview in this paper opened up two lines of analytical focus One from the
behavioural decision research (marketing-related consumer investigations) and the
other from development literature (timing-of-income, consumption and income
smoothing)
The former view is that payment frequency (hereinafter, pf) simplifies
information encodement So in its role as a proxy for information, we would expect
its statement and availability to yield better, reliable estimates than when the choice
is not available to respondents The latter view on the other hand would predict pf
preferences to track/follow the periodicity in a household's income In other words, we
would expect a relationship between a preferred pf with the nature of income flow of
an individual/household's income (determined in part by occupation) More zero bids
given for the reason that the respondent could not afford to pay would be expected
from non-monthly earning households if the payments are to be made on a monthly
basis Chapter 6 continues the discussion on this

253
5.5.3 EMBEDDING N WIP VALUES FOR WA1a lk)ILU1I)N ABA1YMENT IN ThE NzoIA RWER
BASIN
In our experiment on embedding effects six hypotheses were tested The first four
hypotheses relate to statistical equivalence of average WTP for pollution control over
geographic extents of the Nzoia River Basin (a form of part-whole bias) In terms of
this experiment, embedding will occur if the average WTP value for pollution control
in the entire Nzoia River Basin upto Lake Victoria is the same as the WTP value for
pollution control in the section of the Nzoia River Basin within Webuye Division
only Hence the following hypotheses were tested between samples Al, and A2, and
samples A3 and A4
Test 1
Test 2
Test 3
Test 4
WTP1 = WTP2
WTP3 = WTP4
WTP2 = WTP5
WTP4 = WTP9
versus
versus
versus
versus
WTP1 ^ WTP2
WTP3 ^ WTP4
WTP2 ^ WTP5
WTP4 ^ WTP9
The last two hypotheses relate to whether asking for "sectional" evaluation over
paired and unpaired response modes The CV estimates will be invalid if the two
WTPs are not statistically equivalent as, in both paired samples (that is, Al and A2),
we deliberately asked for "sectional" values for river pollution control before those for
water pollution control in the "entire" Nzoia River Basin In other words, the irrelevant
change in the benefit measurement procedure should yield insensitive WTP measures
Specific tests of statistical equivalence of PAIRED versus UNPAIRED valuations of
benefits of the water quality improvement in the Nzoia River section in Webuye

254
division are
Test 5 WTP1 = WTP5 versus WTP1 ^ WTP5
Test 6 WTP3 = WTP9 versus WTP3 ^ WTP9
Tables 544 and 545, respectively, show the results from the two sets of hypotheses
on embedding and paired-unpaired comparisons The differences between "sectional
values" and "basinwide" evaluations within paired questionnaires (represented in Test
1 and Test 2) are not significant at the 5 percent level WTP values for basinwide
cleanup are in the order of the valuations for nver pollution control within Webuye
section alone (i e, Ksh 128 20 versus Ksh 9240 for the monthly version, Al, and Ksh
75400 versus Ksh 56790 for the annual payment format, A2)
Response mode effect (see Table 5 45) The next step is to see the effect of
pairing the two goods (that is, river pollution control within Webuye Division alone
and entire Nzoia River basin cleanup) in the same questionnaire (Test 5 and Test 6)
Respondents asked for wtp for section cleanup and then entire basin cleanup gave
"sectional value" figures which were different but insignificant from WTPs obtained
via questionnaire versions (A3 and A4) which asked for "part basin" evaluations river
pollution control only. The monthly and annual WTPs differed by 303% (Ksh 9240
versus Ksh 7090) and 23 3% (Ksh 567 90 versus Ksh 460 70) respectively So, as
expected, the contingent values for river pollution control in Webuye's Nzoia Basin
were insensitive to the irrelevant (i e, similar) changes posited in the designs
Overwhelmingly, the statistical tests indicate that we cannot reject the hypothesis of
equal average WTPs for water pollution management in the Nzoia river section in
255
Webuye division at both 1 and 5 percent levels
In the light of these tests (that is, Tests 1, 2, 5 and 6), the crucial, relevant tests
for embedding effect in this study are Test 3 and Test 4 (see Table 5 44) The tests
involve comparisons between WTPs from the nested/paired values for entire basin
cleanup and those from nonnested/unpaired values for section cleanup Put differently,
these tests relate to comparisons between WTP for water pollution control in the entire
Nzoia River Basin upto Lake Victoria (samples Al and A2) and WTPs for the river
pollution control within Webuye (Division) section only in questionnaires asking for
direct estimates (samples A3 and A4) Taken together, therefore, our hypotheses tests
suggest no embedding effect in the contingent values for river pollution control in the
Nzoia Basin, Kenya

256
Table 5 44 Results of Tests of the Hypothesis on Embedding Effect in the
Valuation of Improved Water Quality in the Nzoia River Basin, Student
t, Mann-Whitney and Wilcoxon tests
HYPOTHESIS # 3a. EMBEDDING
Test Null Hypothesis t-statistic Mann-Whitney test Wilcoxcin
No (H0)
(Decision (t) Decision (sign level) Decision (p-value)
A. Within Same Sample
1 WTP1 = WTP2 N R (-1 53) NA N R. (0636)
2 WTP3 = WTP4 N R (-1 18) NA N.R. (0112)
B In Independent Samples
3 WTP2 = WTP5
R (273)
R(00175)
R (0003)
4 WTP4 = WTP9
R (1 97)
R(00671)
R(0012)
Notes
All tests are two-sided and all decisions on H0 are at 95% level, N R, R =
cannot reject, reject hypothesis of equal means in t-test and of equal medians
in the cases of Mann-Whitney and Wilcoxon tests, NA = test not applicable
2
Both the non-parametric tests (Mann-Whitney test and paired-rank Wilcoxon
test) use medians as measures of average WTP

257
Table 5 45 Results of Tests of the Hypothesis on Paired versus Unpaired
Evaluations of Improved Water Quality in the Nzoia River Basin in
Webuye Division, Student t, Mann-Whitney and Wilcoxon tests
HYPOTHESIS # 3b PAIRED-UNPAIRED
Test Null Hypothesis t-statistic Mann-Whitney test Wikxxon I
No (H0) Decision (t) Decision (sign level) Decision (p-value)
A Monthly Payments
5 WTP1 = WTP5 N R (1 28) N R (03549) N R. (0140)
B Annual Payments
6 WTP3 = WTP9
NR (091) NR (02980) NR.(0119)
Notes
All tests are two-sided and all decisions on H0 are at 95% level, N R, R =
cannot reject, reject hypothesis of equal means in t-test and of equal medians
in the cases of Mann-Whitney and Wilcoxon tests
2 Both the non-parametric tests (Mann-Whitney test and paired-rank Wilcoxon
test) use medians as measures of average WTP

258
5.5.4 DoEs ThE NATURE OF CONNECrION CHARGES INFLUE'4CE WI? FOR DOMEsnc WAWR
SUPPLY?
The fourth hypothesis of this study was that average wtp measures for domestic water
supply improvement would vary across profiles of initial connection charges
Specially, two sub-hypotheses are tested, one on monthly bids and the other on yearly
WTPs
Test 1 WTP1O = W1'Pl 1 versus WTP1O ^ WTP1 I
Test 2 WTP12 = WTP13 versus WTP12 ^ WTP13
Like in the other study hypotheses, this is tested using differences of means
and medians tests (i e, Student's t-test and Wilcoxon test) Mann-Whitney U test is
inappropriate here due to the survey design, the two WTPs in both temporal
dimensions of payments (monthly and annual bids) are dependent on each other by
virtue of being elicited in B 1 and B2 questionnaire versions (see Table 5 23) On the
surface (Tables 5 16 and 5 17), the bid distributions across nature of connection
charges appear dissimilar, in particular the mean bid or offer amounts of completed
interviews differed (by more than 20 percent) For example the difference within the
annual payments questionnaire version is Ksh 131 20 (i e, Ksh 384 10 and Ksh
51530)
The results of the tests of statistical equivalence of WTP over SPREAD and
UPFRONT initial water connection charge profiles are shown in Table 546 The null
hypothesis H0 WTPESPREAD](,) = WTP[UPFRONT](,) is rejected at the 5 percent
significance level for both the monthly and annual bids for the improvement

259
programme The apparent inability to reject the hypotheses of equal medians in the
Wilcoxon test can be traced to the significance of temporal dimensions (or
frequencies) of payments in the survey (see Sub-Section 5 5 2), consequently, we
exclude the test So, as is shown in Table 5 46, support is given for the alternative
hypothesis that WTP[SPREAD](II) > WTP[UPFRONT](IP.) (i e, greater wtp values
from the SppU inta1 connection charges)
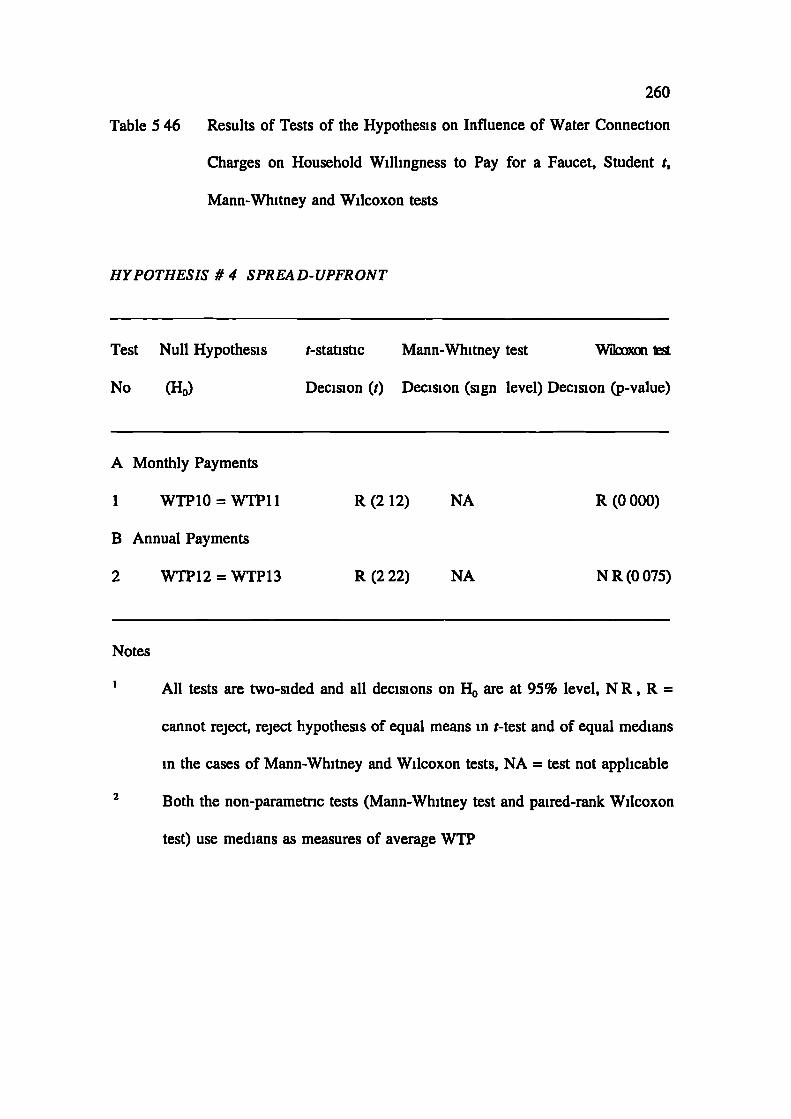
260
Table 5 46 Results of Tests of the Hypothesis on Influence of Water Connection
Charges on Household Willingness to Pay for a Faucet, Student t,
Mann-Whitney and Wilcoxon tests
HYPOTHESIS #4 SPREAD-UPFRONT
Test Null Hypothesis t-statistic Mann-Whitney test Wilcoxcin t
No (H0) Decision (t) Decision (sign level) Decision (p-value)
A Monthly Payments
1 WTP1O = WTP1 1 R (2 12) NA R (0000)
B Annual Payments
2 WTP12=WTP13
R(222) NA
N R (0075)
Notes
All tests are two-sided and all decisions on H0 are at 95% level, N R, R =
cannot reject, reject hypothesis of equal means in t-test and of equal medians
in the cases of Mann-Whitney and Wilcoxon tests, NA = test not applicable
2
Both the non-parametnc tests (Mann-Whitney test and paired-rank Wilcoxon
test) use medians as measures of average WTP

261
Besides assessing the potential utility or otherwise of applying the CV
methodology in Kenya, it is useful to calculate aggregate benefit estimates Indeed, the
overall objective of CV as a tool of Cost-Benefit Analysis is to provide estimates of
aggregate benefits which can then be compared with total costs of environmental
programmes or projects (Hanley and Spash, 1993, Willis and Garrod, 1995) In the
light of this CV survey's WTP values, the next section deals with aggregate benefits
of nver pollution control and private water connections in Kenya
Expanding CV sample evaluations to aggregate benefit estimates often focuses
on accuracy of mean WTP values As a matter of fact, the different methodologies for
aggregating benefits (e g, no adjustment, conservative zero bid, weighted average,
Ordinary Least Squares and Weighted Least Squares) are typed with respect to the
nature of adjustments made on mean WTPs (Loomis, 1987 399) Because this CV
survey employed an open-ended face-to-face questioning format, the difficulty of
dealing with low response rates and self-selection bias was greatly minimized
However, lack of up-to-date, reliable statistics on Kenya's national socio-economic
characteristics militates against use of OLS or WLS willingness-to-pay equations
Instead, we determine aggregate benefits of river pollution control and private water
connections in Kenya by using frequency distributions of the Webuye WTP values,
a form of weighted average approach

262
5.6 AGGREGATE BENEFITS AT D1VLSIONAL, DISTRIcT, AND NATIONAL LEVELS
To recapitulate, the purpose of this Webuye-Kenya survey was to obtain total
economic valuations from households for the impacts of improved river water quality
and domestic water supply The respondents were asked to perceive existing water
quality in the Nzoia Basin and consider the possibility of a monthly/yearly (the
temporal dimensions applied to different sub-samples of the nver quality sample)
charge to improve the water quality standard to the highest level on the Smith-
Desvousges (1986) ladder On the other hand, respondents in the water supply sample
were asked to consider the possibility of getting a pnvate water connection when
initial connection charge is spread over time or paid upfront (in each sub-sample) and
having to pay for it on either monthly or yearly basis (separate sub-samples) The
payment vehicles for nver pollution control and improved water supply would be by
means of additions to council charges/sewerage fees and a water bill respectively As
a result of the open-ended questioning format, household WTP for the changes was
established for each respondent.
Faced with ten wtp distributions as we are in this survey, it is necessary to
make assumptions on which to peg aggregate benefits of the environmental resource
and service flow improvements (Table 5 47) There are six distributions for wtp for
improvements in river water quality In each of the goods, we can identify two
plausible, conservative assumptions A payment-frequency assumption where yearly
wtp values are used instead of monthly ones applies to both goods But specific to
river water improvement, when aggregation is done at the national level, is the idea
that basinwide valuations are apt to be more conservative than area-specific wtp
figures Together with the payment-frequency axiom, this assumption may be called

263
the scale-payment-frequency supposition, because it involves picking on basinwide
evaluations on yearly basis Similarly, in the case of domestic water supply we can
plausibly employ an upfront-payment-frequency assumption For Third World
households in need of water, "markets" with upfront connection charges may represent
something of a "second best" vis-a-vis a pnvate water connection where the initial
charges are spread over time within water bills, the consumer surplus in the former
can a priori be seen as lower than that in the latter's case
Even though Tables 5 48 and 5 49 include calculations of total WTP for the
Kenya using the aforementioned suppositions, regional (Webuye Division and
Bungoma District) consumer surpluses/market benefits of the goods are based on more
elaborate, realistic assumptions Benefits of River water and domestic water
improvements to a regional economy have, of necessity, to take cognizance of the
local demographic and socio-economic profile More specifically, it is useful for
regional wtp evaluations to reflect the complexities of embedding effect and nature of
the payment system for initial connection charges for domestic water supply It is for
these reasons we have computed regional WTP (a) for nver water improvement using
part evaluations and not whole values, distance to the river has been shown to be an
important determinant of household wtp due to use-value implications, (b) for a
private water connection on the basis of both upfront and spread connection charges,
it is often argued that high connection charges are a major factor in Third World
household decisions not to hook onto a water supply system

TBS-bm
TBS-by
Sect*_sm Sect*sy
Upfmnt2
Upfrnnt
264
Table 547 Assumptions and Secondary Data Used in Benefit Aggregation
A. Assumptions' on WTP Distributions.
Good Under Evaluation
River Water Quality Improvements
in the entim River Basin
within the Webuye Division alone
Domestic Water Supply Improvements
Fmquency of Payments
Monthly_ Yearly
B Secondary Data.
Aggregation
Webuye Division
Bungoma District
Western Province
Kenya (National)
Population
135,561
945,677
2,500,000
28,870,000
Household
5 89
5 89
55
48
Number of Households without
households access to poitable watei
23,015 803%
160,555 803%
454,546 803%
6,014,583 5 0 % 6
Notes and sources
refers to conservative assumptions, assumptions that yield the lowest possible
wtp for the improvements in the goods described in the contingent markets
2 refers to upfront connection charges for a private water connection as opposed
to a case where the initial charges are spread over time within water bills
Gould (1995) p 206, Table 1, Republic of Kenya (1994)
NCPD-CBS-MI (1994) p 12
for lack of relevant statistics, we use that of western Province (NCPD-CBS-MI,
1994 p 14) for both Webuye Division and Bungoma District, 803% refers to
proportion of households without access to drinking water piped into residence
nor a public tap
6 a 1992 statistic quoted in UNDP (1994) report, p 133

265
Accepting the survey of the Webuye sub-locations as representative of the
population of Webuye Division, the household responses can then be aggregated and
applied to an eligible population of approximately 135,561 people This is equivalent
to 23,015 households It is as well to note, however, the definitions of eligible
populations at aggregate levels and over the contingent commodities Total WTP
values are calculated over three levels divisionwide, distnctwide, and nationwide All
households over the relevant aggregation levels are assumed to be beneficiaries from
improved river water quality
Arguably, an appropriate aggregation mode would be the population within the
Lake Victoria Development Authority comprising provinces through which the Nzoia
River flows Lack of demographic and socio-economic data, nonetheless, militates
against computations at such a level More importantly, Water Development
Authorities have no legal remit over revenue collection in Kenya (Smoke, 1993)
Local Government authorities, like many forms of administrative boundaries, are
invariably not in the norm of tracing ecological zones let alone nver drainage basins
(King, 1984, Smoke, 1993)
As for a private water connection, the eligible population consists of only the
proportion of households --at the three levels-- without access to clean, safe water
Besides varying across administrative regions, the population of households without
access to a safe water supply is also dependent on an area's social economy For
instance, Kenya's population with access to safe water increased, respectively, from
17% to 50% over the 1975-80 and 1988-91 periods (UNDP, 1994 136) But owing
to rural-urban disparity in the country, the improvement was not evenly realized Over
the 1988-9 1 period, 74% of urban population had access to safe water compared to
266
43% of rural folks (Ibid p 149)
The calculations for total WTP for the Division/region are presented in Table
5 48 (river water quality) and Tables 5 50 and 5 52 (private water supply) Table 5 47,
and Tables 5 51 and 5 53, on the other hand, contain computations of total WTP for
nver pollution control and improved domestic water supply for the entire country

A30025020015010090807060504030200
Total
Monthly Payment Frequency3100319412531631256363639400
21 9100
7130
7132,1632,877
7131,4502,8771,4501,4501,4502,163
05,040
23,015
200015001000800700600500450400350300250200
0Total
Annual Payment Frequency007171007136
10771
14336
1073671179
100
01,6341,634
01,634
8292,4631,6343,291
8292,463
8291,6344,120
23,015
267
Table 5 48 Regional Aggregate WTP Calculations for River Pollution Control'
WTP Percentage of WEBUYE DIVISION BUNGOMA DISTRICTvalue of population2Number Pop WTP NumberPop WTP
213,9000
142,600324,450287,70064,170
116,000201,39087,00072,50058,00064,890
00
1,632,600K 81,630
02,451,0001,634,000
01,143,800
497,4001,231,500
735,3001,316,400
290,150738,900207,250326,800
010,572,500K 528,625
4,977 1,493,1000 0
4,977 995,40015,092 2,263,80020,069 2,006,900
4,977 447,93010,115 809,20020,069 1,404,83010,115 606,90010,115 505,75010,115 404,60015,092 452,760
0 035,162 0
160,55511,391,170K 569,558.50
0 011,39917,098,50011,399 11,399,0000 0
11,399 7,979,3005,780 3,468,000
17,179 8,589,50011,399 5,129,55022,959 9,183,6005,780 2,023,00017,179 5,153,7005,780 1,445,000
11,399 2,279,80028,739 0
160,55573,748,950K 3,687,447.50
Notes
Parts A and B are, respectively, based on monthly and annual wtp forpollution control within the Nzoia River Basin within Webuye sectionalone under Sect*sm and Sectt-sy questionnaire versions
2 Last rows may not add up to 100% due to rounding off

A3503002502001501009070500
Total
B30002000150012001000900800700600500400200
0Total
Monthly Payment Frequency61619161
182152306191
211100
Annual Payment Frequency353671361793636107713610736
21 4100
336,890336,890547,327336,890
1,094,654914,217180,438366,890547,327
1,269,0776,014,583
210,510216,525427,035216,525
1,076,610216,525216,525643,560427,035216,525643,560216,525
1,287,1216,014,583
268
Table 549 Nationwide Aggregate WTP Calculations for River Pollution Control'
WTP value Percentage of Population2 Number of Households Population WTP
117,911,500101,067,000136,831,75067,378,000
164,198,10091,421,70016,239,42025,682,30027,366,350
0648,096,120
K 3,240,480.60
631,530,000433,050,000640,552,500259,830,000
1,076,610,000194,872,500173,220,000450,492,000256,221,000108,262,500257,424,00043,305,000
04,525,369,500
K 226,268,480
NotesIfl..., A ...1 ....l..1. .....J C..
rdIL tt aiiu D [sp.L1VcIy, LIdSU UIL LUL4I UIUI1LI1I dilU dilliUdi WLj) 101
pollution control in the entire Nzoia River Basin upto Lake Victoria accordingto TBS-bm and questionnaire versions
2 Last row may not add up to 100% due to rounding off
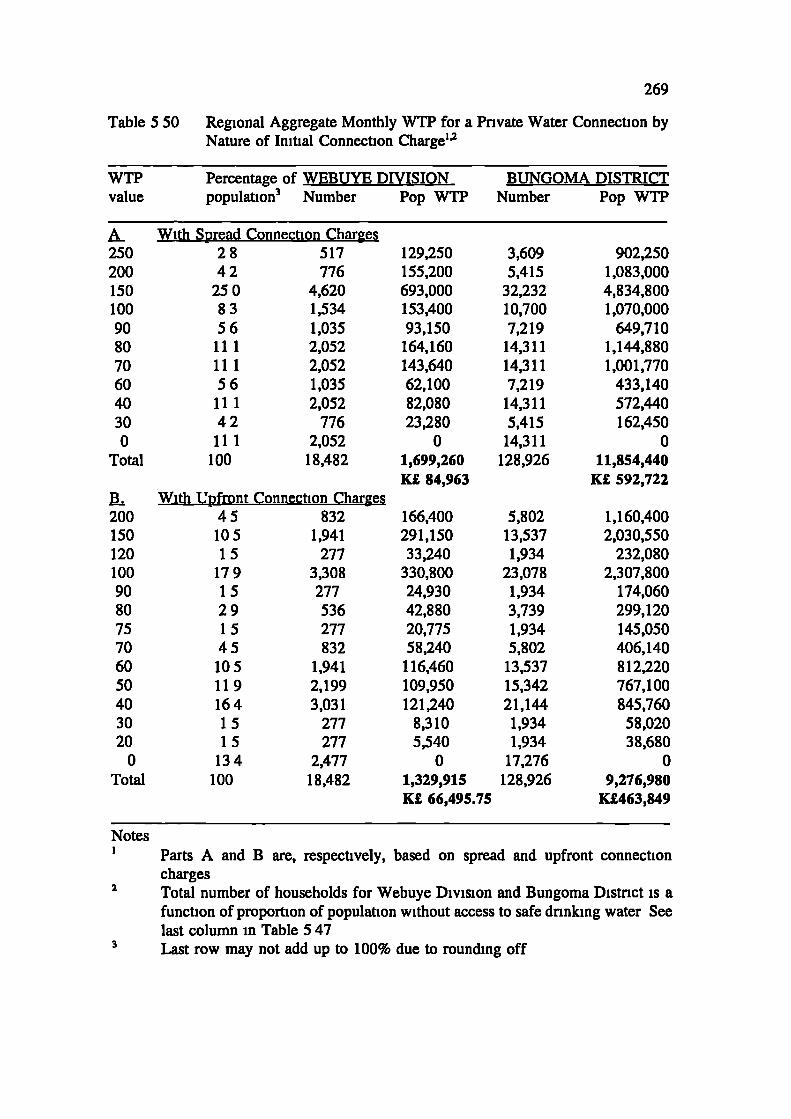
166,400291,15033,240
330,80024,93042,88020,77558,240
116,460109,950121,240
8,3105,540
01,329,915K 66,495.75
5,80213,5371,934
23,0781,9343,7391,9345,802
13,53715,34221,1441,9341,934
17,276128,926
1,160,4002,030,550
232,0802,307,800
174,060299,120145,050406,140812,220767,100845,760
58,02038,680
09,276,980
K463,849
269
Table 5 50 Regional Aggregate Monthly WTP for a Private Water Connection byNature of Initial Connection Charge's
WTP Percentage of WEBUYE DIVISION BUNGOMA DISTRICTvalue population3 Number Pop WTP Number Pop WTP
. With Spread Connection Charges
250 28 517 129,250 3,609 902,250
200 42 776 155,200 5,415 1,083,000
150 25 0 4,620 693,000 32,232 4,834,800
100 83 1,534 153,400 10,700 1,070,000
90 56 1,035 93,150 7,219 649,710
80 111 2,052 164,160 14,311 1,144,880
70 111 2,052 143,640 14,311 1,001,770
60 56 1,035 62,100 7,219 433,140
40 111 2,052 82,080 14,311 572,440
30 42 776 23,280 5,415 162,450
0 111 2,052 0 14,311 0Total 100 18,482 1,699,260 128,926 11,854,440
K 84,963 K 592,722With LTpfront Connection Charges
200
45 832
150
105 1,941
120
15 277
100
179 3,308
90
15 277
80
29 536
75
15 277
70
45 832
60
105 1,941
50
119 2,199
40
164 3,031
30
15 277
20
15 277
0
134 2,477Total
100 18,482
NotesParts A and B are, respectively, based on spread and upfront connectioncharges
2 Total number of households for Webuye Division and Bungoma District is afunction of proportion of population without access to safe drinking water Seelast column in Table 547Last row may not add up to 100% due to rounding off
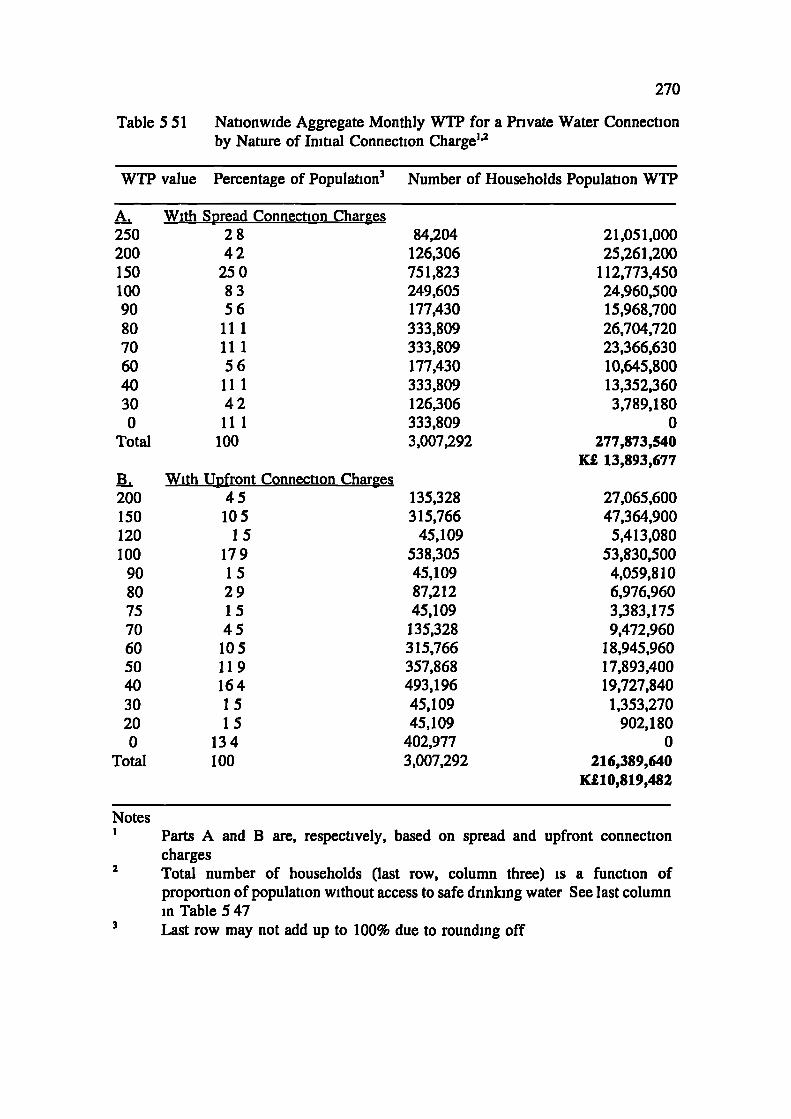
200150120100
9080757060504030200
Total
With Upfront Connection Charges45105
15179152915451051191641515
134100
135,328315,766
45,109538,30545,10987,21245,109
135,328315,766357,868493,19645,10945,109
402,9773,007,292
27,065,60047,364,9005,413,080
53,830,5004,059,8106,976,9603,383,1759,472,960
18,945,96017,893,40019,727,8401,353,270
902,1800
216,389,640K10,819,482
270
Table 5 51 Nationwide Aggregate Monthly WTP for a Private Water Connectionby Nature of Initial Connection ChargeU
WTP value Percentage of Population3 Number of Households Population WTP
A. With Spread Connection Charges250 28 84,204 21,051,000200 42 126,306 25,261,200150 250 751,823 112,773,450100 8 3 249,605 24,960,500
90 56 177,430 15,968,70080 111 333,809 26,704,720
70 111 333,809 23,366,630
60 5 6 177,430 10,645,800
40 111 333,809 13,352,360
30 42 126,306 3,789,180
0 111 333,809 0Total 100 3,007,292 277,873,540
K 13,893,677
NotesParts A and B are, respectively, based on spread and upfront connectioncharges
2 Total number of households (last row, column three) is a function ofproportion of population without access to safe drinking water See last columnin Table 547
3 Last row may not add up to 100% due to rounding off

518,000775,500310,800
2,310,000207,200387,750892,500465,600
1,155,000232,650924,000180,950615,600
64,750410,40038,85051,700
019,703,602K 985,180.1
332,4001,072,000
249,300650,400375,200809,400
2,005,500124,650857,60096,950160,800134,000214,40053,600
07,136,200K 356,810
3,610,00021,466,5002,166,000
16,116,0001,444,000
10,733,2506,227,2003,249,0008,058,0006,439,9506,446,4001,263,5004,293,300
451,2502,862,200
270,750361,000
0954,558,300
K 4,772,915
2,320,8007,478,0001,740,6004,538,4002,617,3005,647,200
13,988,500870,300
5,982,000676,900
1,121,700934,750
1,495,600373,900
049,785,950
K 2,489,297.50
1,80514,3111,805
16,1161,805
14,3118,8965,415
16,11614,31116,1163,610
14,3111,805
14,3111,8053,610
10,701128,926
1,9347,4781,9345,6733,7399,412
27,9771,934
14,9551,9343,7393,7397,4783,739
33,649128,926
271
Table 5 52 Regional Aggregate Annual WTP for a Private Water Connection byNature of Initial Connection Charge2
WTP Percentage WEBUYE DiVISION BUNGOMA DISTRICTvalue of population3 Number Pop WTP Number Pop WTP
£20001500120010008007507006005004504003503002502001501000
Total
120010009008007006005004504003503002502001000
Total
With Spread Connection Charges
14 259
28 517
14 259
125 2,310
14 259
28 517
69 1,275
42 776
125 2,310
28 517
125 2,310
28 517
111 2,052
14 259
111 2,052
14 259
28 517
83 1,534100 18,482
With Upfront Connection Charges
15 277
58 1,072
15 277
44 813
29 536
73 1,349
217 4,011
15 277
116 2,144
15 277
29 536
29 536
58 1,072
29 536
26 1 4,824100 18,482
Notes Parts A and B are, respectively, based on spread and upfmnt connectioncharges2
Total number of households for Webuye Division and Bungoma Distnct is a functionof proportion of population without access to safe drinking water See last column in
Table 547 Last row may not add up to 100% due to rounding off

With Spread Connection Charges142814
125142869421252812528
11114
111142883
100With Upfmnt Connechon Charaes
155815442973
21 715
1161529295829
26 1100
42,10284,20442,102
375,91242,10284,204
207,503126,306375,91284,204
375,9 1284,204
333,80942,102
333,80942,10284,204
249,6053,007,292
45,109174,42345,109132,32087,212
219,532652,58245,109
348,84645,10987,21287,212
174,42387,212
784,9033,007,292
2000150012001000800750700600500450400350300250200150100
0TotalL12001000900800700600500450400350300250200100
0Total
272
Table 5 53 Nationwide Aggregate Annual WTP for a Private Water Connection byNature of Initial Connection ChargeL2
WTP value Percentage of Population 3 Number of Households3Population WTP
84,204,000126,306,00050,522,400
375,912,00033,681,60063,153,000
145,252,10075,783,600
187,956,00037,891,800
150,364,80029,471,400
100,142,70010,525,50066,761,8006,315,3008,420,400
01,552,664,400
K 77,633,22054,130,800
174,423,00040,598,100
105,856,00061,048,400
131,719,200326,291,00020,299,050
139,538,40015,788,15026,163,60021,803,00034,884,600
8,721,2000
1,161,264,500K 58,063,225
Notes Parts A and B are, respectively, based on spread and upfrontconnection charges
2 Total number of households (in last row of third column) is a functionof proportion of population without access to safe drinking water. Seelast column in Table 5 47Last row may not add up to 100% due to rounding off

273
The calculations in the above tables show that the population of Webuye
Division would be prepared to pay approximately Ksh 106 million and Ksh 7 14
million per year for the defined improvements in nver water quality and domestic
water supply For the entire Bungoma District, the household valuation of the benefits
of the improvements are Ksh 73 7 million (or K3 69 million) for improved river
water quality and Ksh 4979 million (K2 49 million) for a private connection to water
supply Note that K1 is equivalent to Ksh 20 These figures represent an average of
approximately Ksh 45940 (K22 97) per household and Ksh 386 10 (KC19 31) per
household, valuations which are limited to the "intangible" aspects of improved nver
water (health, recreation, aesthetics and conservation values) and a private household
connection to water supply (health, convenience, time savings, reliability and quality)
These aggregate evaluations of nver pollution control and domestic water supply, in
turn, represent K1 91 and K1 61 per household per month
Moving on to the republic level, if an arbitrary allocation of a possible average
valuation by the national population for both conserving a resource and providing a
service of national significance is made, an indication of total national WTP could be
calculated The household population of Kenya (minus Bungoma DistruA homesteads)
is approximately 5,854,028 and 2,878,366 for purposes of aggregating benefits of nver
water "salubrity" and a domestic water supply "connection" respectively If KC1 per
year per household is arbitrarily assigned as an average WTP for conserving the water
resources of the Nzoia Basin and a similar amount for providing water supply, then
the total conservation and connection/hook worth to the country of the improvements
would be K5 85 million and K2 88 million per annum
Accepting this somewhat arbitrary accounting, a total worth to the nation of

274
the improvements in river water quality and domestic water supply is approximately
K9 54 million (Ksh 190 8 million) and K5 37 million (Ksh 1074 million) per year
respectively This indication of possible total magnitude is not presented as a definitive
calculation, it is provided merely to stimulate perceptions of the possible relative
magnitude of benefit Indeed, two points need noting The countrywide values are
lower - to the order of a tenth - than calculations of national WTP in Tables 5 49, 5 51
and 5 53 This is expected Secondly the above value for river pollution control
excludes "market" benefits as well as visitor benefit due to water-based recreation
Discussions with the proprietor of Nabuyole Falls Lodge, situated at the main waterfall
on the Nzoia River, revealed that many Kenyan and non-Kenyan tourists visit the
sight, no records were kept at the lodge, however

275
CHAPTER VI
DISCUSSION OF THE SURVEY RESULTS
6.1 INTRODUCTION
The Nzoia River Basin and domestic water supply are integral parts of the natural and
human environment of residents of Webuye Division, Kenya Indeed, residents of the
study area are well informed on the twin problems of nver pollution and inadequate
water supply for domestic purposes This fact explains the relatively good acceptance
of this contingent valuation (CV) exercise for Webuye Division dwellers
This Chapter discusses results from the CV survey, presented in Chapter 5,
with special focus upon three aspects First, we discuss the demand for river pollution
control and individual household water faucets (Section 6 2) Secondly, the section
focuses on each of the main research hypotheses Effect of Nature of Good on
Contingent Values (Section 6 3), Impacts of Frequency of Payments (Section 64),
Embedding Effect (Section 6 5), and Effect of Connection Charge Profiles on
Evaluation of Household Water Connections (Section 6 6) Ultimately, Section 6 6
presents limitations of the study
276
6.2 DEMAND FOR RiVER POLLUTION CONTROL AND IND1VII)UAL HousEHoLD WATER
CONNECTIONS
This research project has gone some way towards determining the economic value of
river pollution control and improved domestic water supply as well as evaluating the
applicability of the Contingent Valuation Method in a developing country, Kenya The
results of the study suggest that it is possible to do a contingent valuation survey in
setting where respondents have limited education and monetary resources and obtain
reasonable, consistent answers The multivanate analyses of the willingness-to-pay
responses compare very favourably with similar analyses carried out in industnalized
countries and other developing countries
The analysis of WTP bids has showed that almost 70% of the families
surveyed would be willing to pay Ksh 30 (0 35)49 per month for pollution control in
the Nzoia River Basin, and over 40% stated that they would pay at least Ksh 60
(0 69) For an individual household water connection, over 30% would be willing to
pay Ksh 90 (1 04) or more per month, and about 5% stated they would pay at least
double the existing water flat rate for Webuye Town Council Therefore, it is clear
that the surveyed households in Webuye Division of Bungoma District, Kenya have
an unmet desire for the control of river pollution, and for individual water connections
The households are willing to contribute significant amounts of money, compared to
existing Webuye residential sewage rates, towards river pollution control in the Nzoia
Basin Further still, Webuye residents without water connections are willing to pay at
least as much as other similar customers who possess them
49Fmm this section onwards, Pound () refers to the UK Sterling Pound and not the KenyaPound equivalent of Ksh 2000

277
Results of ordinary least squares (OLS) regression models show that the
principal factor influencing households' willingness to pay for nver pollution control
and individual water faucets is family income The effects of other factors were more
specific to the contingent good In order of strength, the other determinants of WTP
for river "salubrity" are sex, age, household ranking of status of domestic water
source, distance from river to household residence, the other factors affecting W1'P for
water "connections" are existing source of water supply (in terms of convenience,
quality and reliability), household size, ranking of river water quality, and age of
household head In addition, a strong correlation between education, income and
occupation was noted
In so far as households were willing to place a higher average monetary value
on river pollution control than improved domestic water supply connotes a possible
appreciation of the non-use component of water resources management This is an
inspiring finding when seen in the light of the fact that little environmental valuation
research in Third World economies has directly addressed components of total
economic value Almost exclusively, existing work in this area involves conservation
of biodiversity (e g, Perrings et al, 1992), tropical deforestation (e g, Adger et al,
1993 in Mexico), and wildlife (Brown and Henry, 1989 on Kenya elephants, Thomas
et at, 1991 in Tunisia)
As a matter of fact, we know no Third World CV survey that breaks down
water-related values into the four possible components of Actual User Value, Option
of Use Value, Existence Value and Bequest Value Brookshire et a! (1986) warn the
water analyst about conceptual problems that arise in valuing existence values of water
resources, "existence value may have two components (1) an economic component

278
that is consistent with utility maximizing behaviour and (2) an ethical component that
is inconsistent with normative benefit-cost assumptions" (p 1509) In most state-of-
the-art CV surveys in developing countries, environmental media such as air and water
quality have remained marginalized thereby reinforcing the notion that real
environmental issues are the preserve of the nch, industrialized nations5° Yet this
study suggests otherwise
6.3 NATURE OF THE GOOD AND THE VALIDrrY OF CONTINGENT VALUES
The first question explored in this study was whether the nature of the good being
valued influences the validity of evaluations made using the CV approach in a Third
World setting In particular we hypothesized that contingent values for nver water
control (RWQ) would be less reliable and less accurate than those for a household
connection to piped water (DWS) because the DWS was more well-defined and
concrete, and because of respondents' greater familiarity with it
There appears to be prima facie evidence that Webuye residents understood the
two goods differently owing to their familiarity This is because willingness to pay
responses were higher in improved domestic water supply than for river water quality
improvement In particular, the number of households who would not pay for pollution
control in the Nzoia River Basin was more than double that of those not wtp for a
pnvate water connection (58 versus 27) A closer scrutiny reveals that more of the
50Most economists often argue intuitively that environmental improvement is a luxurygood or a pursuit of the more pnvileged (Pearce, 1980, McFadden and Leonard, 1992) Forinstance, McFadden and Leonard (1992 p 22) wnte "Environmental protection should be a'luxury' good that in poor families is displayed by basic needs for food and shelter, and inwealth families more affordable" However, recent results by Knstrom and Riera (1996) (albeitbased on European data-sets) do not support the economic folklore suggesting thatenvironmental quality is a luxury good

279
refusal-to-pay (rtp) responses in the latter group (51 9%) are true zeros whilst 56 9 per
cent of the former group are protests Second, since a higher proportion of those not
wtp for dws gave "I cannot afford" reason, there were more protest bids in rwq
valuation than in the evaluation of improved water supply
Yet, coefficients of variation (c v s) of mean WTP measures, as well as OLS
models for WTPs did not support the hypothesis Instead these results indicate that
both contingent good scenarios yielded valid and reliable value estimates The c v s
for wtp values for in-house water connection vary between 65% and 81% while those
for river water quality are more unreliable, varying between the range of 82% and
137% The divergence of these values is consistent with the Cummings et a! (1986)
hypothesis that welfare measures for public goods will have a higher variance (as a
proportion of the mean) and therefore be less reliable than those for a private good
However, the nature of goods in this experiment do not epitomise polar extremes of
the public-private good continuum found in Kealy et al's (1990) study Indeed, the
coefficients of variation in this study are quite big in both circumstances The survey
by Kealy and co-workers found the "proportionate variance of WTP is 447% for the
public good and 404% for the private good using the full sample When we
recalculate the value for the private good using the random subsample, the
proportionate variance rises to 446%" (p 256) Secondly, Kealy et al employed the
referendum, or closed-ended method of questioning whilst this one took an open-ended
format, this divergence may explain, to a large extent, our high coefficients of
variation
The experimental design incorporated numerous tests to check the internal
consistency and reliability of the households' willingness-to-pay responses, including
280
a test for effect of bias due to the socio-economic setting, and the effect of effect of
observers listening to the interview (as in Whittington et al, 1993 study on demand
for improved sanitation in Ghana) These tests revealed little reason for serious
concern about the reliability or validity of the willingness-to-pay responses, across the
two commodities
This finding is important for those seeking to apply CV surveys to the
evaluation of environmental and public goods in developing and transition economies
Nonetheless, one experiment can only be suggestive and not conclusive The often
amorphous nature of public goods and the public's frequent lack of familiarity with
them may not be the major impediments to obtaining reliable WTP estimates through
the CV methodology Indeed, recent research in environmental psychology (e g , Hull
and Buhyoff, 1983, Williams, 1985) shows that familiarity does predict preference, but
only in a non-linear inverted U fashion The crucial factor in CV application,
therefore, is careful design and judicious presentation of "sufficient" information in the
hypothetical scenario

281
6.4 THE IMPACTS OF FREQUENCY OF PAYMENTS IN CONTINGENT VALUATION
This CV application has studied, amongst other aspects, the effect on W1'P values of
two temporal dimensions of payment, monthly and yearly contributions The
contingent valuation markets were those of improved nver water quality in the Nzoia
Basin and a private water connection in Kenya
It is well known in psychology and marketing research that alternative methods
of conveying information can have profoundly different impacts in terms of a
consumer's interpretation and perceptions of the content The results of this CV survey
show that different payment frequencies produce statistically different estimates of
WTP for improved river water quality and a pnvate water connection
Which of these temporal dimensions of payment yields values closer to the
"truth" is of course difficult to determine in contingent valuation This is because as
we have already argued, different payment schedules may cause respondents to re-
evaluate their true WTP for the good, through both the perceived-frequency route and
the income-smoothing route These two factors could exert opposing influences on the
difference between the stated value of nver water improvements, or drinking water
connections (in this case)
Clearly, one reason for respondents bidding higher for monthly payments than
for annual ones is that it spreads the payment period and thus potentially can earn
interest on savings However, the necessary implied discount rate if this were to
entirely explain the difference is very high (over 9 49%) Such levels of effective
interest rate are highly unlikely in most developing countries indeed, due to both lack
or insufficient collateral that is acceptable by commercial banks as well as low, erratic
incomes most households often pay informal savings collectors (such as rotating
282
savings and credit associations, moneylenders, moneykeepers) to save and hence
protect their savings from the incessant appeals of food and other basic needs (Steel
and Aryeetey, 1994, Ardener and Burman, 1995) Secondly, the relevance of this
argument depends on the size of WTP amounts relative to average income In this
study, mean WTP bids are less than 3 percent of average household income
A further complication, which has not been considered in this thesis, is whether
changes in the frequency of payment affect the extent of "warm glow" effects in CV
The propensity to respond to CV questionnaires in the context of donations to charity
(which gives rise to warm glow effects) depends on the proportion of the total
economic value of the good in question accounted for by non-use values, which in
turn depends on the position of the good along the pure public-pure private good
continuum (Kealy et al, 1990) In this case, nver water quality lies closer to the
public good end of the continuum, and dnnking water closer to the pnvate good end
Thus, any effect of frequency of payment on warm glow responses should be less
important for the latter than the former
In conclusion, the frequency of payments embodied in a CV survey do seem
to matter for the revealed benefits of goods This is perhaps particularly the case in
developing countries where income flows are erratic than in the developed world
Whether this sensitivity to timing could be avoided by seeking WTP amounts in
alternative forms than money, such as crops (e g, Shyamsundar and Kramer, 1993,
Shyamsundar and Kramer, 1996) or labour (e g Swallow and Woudyalew, 1994)
needs to be established empincally, but it is not obvious why this should be so
283
6.5 EIBFDDING IN Wi? VALUES R WA11R POILU1ION ABAIEMENT IN ThE NzoIA RIvER
BASIN
Amongst other questions, this study has dealt with one specific aspect of the CV
method's validity claim, namely, to what extent does the method produce different
values in situations for which economic theory claims different values A valid
measurement method should be sensitive to relevant changes in applications and
insensitive to irrelevant ones Embedding is a critical test for contingent valuation
(CV) because it involves an objective definition of relevance, namely, magnitude
variation People who value a small amount of a good should assign a greater value
to a much larger amount (although marginal utility is expected to decline)
It is recalled that embedding occurs when the W1'P value for a specific good -
in this experiment, pollution control in Webuye part of the Nzoia River Basin - is
similar to the WTP value for a more inclusive good here pollution control in the
entire Nzoia River Basin upto Lake Victoria
On the basis of nine studies that examined similar effects (Kahneman and
Knetsch, 1992a, Magnussen, 1992, Desvousges et cii, 1993, Diamond et at, 1993,
Fischhoff et cii, 1993, Kemp and Maxwell, 1993, McFadden and Leonard, 1993,
Owen and Hanley, 1994, Hoevenagel, 1996), six hypotheses were formulated and
tested these studies refer to work done since Kahneman's 'Comments' in Cummings
et at, (1986) Embedding did not manifest itself in this experiment Respondents
considered pollution control in the entire Nzoia River Basin more significantly
valuable than pollution control in Webuye part of the Basin only One possible
explanation for this result is that the inclusive good was largely different from the
specific good (McFadden and Leonard, 1993), specially in terms of number of

284
kilometres, the study did not numerically (i e, in kilometres or miles as in Majunder
et al, 1990 or Fischhoff et a!, 1993) specify the length of the river from Webuye to
Lake Victoria Instead, a map of the geographical spread of the Basin was shown to
respondents A second, more reasonable and plausible explanation for non-occurrence
of embedding in this experiment because the environmental goods involved were well-
defined This is in line with Magnussen (1992) and the misperception hypothesis of
Mitchell and Carson (1989) Consequently, it is argued that CV surveys, when
properly designed, can discriminate between different environmental goods in a way
that corresponds to the economic axiom of "more will always be better"
6.6 INITIAL CHARGES AND WTP FOR PRIVATE HOUSEHOLD WATER FAUCETS
The comparatively low WTP estimates for improved domestic water supply (vis-a-vis
existing water flat rate) from this survey appear to underscore the familiar problem of
equity concerns in the provision of improved water services The finding that less than
50% of the households surveyed were willing to pay Ksh 90 and more, in particular,
suggests that conventional water connections with initial connections costs paid up-
front are simply not affordable to the majonty of households in Webuye Division
without massive government subsidies
An alternative interpretation is that some of the households had already made
significant investment in other options (e g, in water storage facilities, construction
of wells, and contributions to the Much-Milo Community water project) and, hence,
focused on the unreliability of the government-provided water service Subsequently,
some households did not perceive any advantage to the government-provided service,
despite interviewers' assurances that the new scheme would work better than the

285
existing one This is particularly so as the residents were well-informed, by local water
supply personnel, of the inadequacy of the Webuye Water Supply facility in covering
the 1973-planned area given the post-1973 population increase that has occurred The
Webuye Water Supply, while giving water of good quality, was unreliable and was
frequently stated to be out of service or suffenng from an elevated demand that
reduced pressure to levels that made it de facto unusable
These interpretations highlight the need for increased household choices in
respect of water services Offering a greater range of services is a vital element of a
demand-dnven strategy to improved domestic water supply as it is a necessary
condition for moving from a "low-level equilibrium trap" (in which a low level of
services is provided, willingness to pay and thus, revenues are low, and the operation
consequently deteriorates) to a "high-level equilibrium" (in which users get a high
level of service, pay for it, and maintain the desired system) (Bnscoe, 1992, World
Bank Water Demand Research Team, 1993)
Results of this survey and the statistical tests on average W1'P measures for
domestic water supply improvement across profiles of initial connection charges
indicate that an inability to afford the cash portion of the conne.Lion charge is the
main reason people do not hook up to the piped water system in Webuye, Kenya This
finding on the role of connection charges in household decisions to hook on to a water
distribution system is supportive of Altaf et al's (1992, 1993) and McPhail's (1994)
results, respectively, from rural areas of Punjab, Pakistan and urban areas of Tunisia
So, therefore, a combination of subsidized public standposts and individual
faucets with "spread" connection charges, but at full cost monthly tanffs, would appear
to be the relevant options Whereas the former offers a partial solution to the equity
286
concern, the latter addresses the financial viability of the piped water system To avoid
the relatively better-off households from interpreting this as a disincentive to connect
to the system (and thus compromise the financial viability of the system), this
arrangement would work if the water utility puts the public taps nearer to areas of
poorer households It is the relatively better-off families in this study area who are
choosing to install pnvate faucets and who are, therefore, the principal beneficiaries
of the subsidies implicit in this service Individual water connections and public taps,
as a matter of fact (Briscoe, 1990, 1992, World Bank Water Demand Research Team,
1993), are not perceived by Third World households as close substitutes Besides pnce
variation between the two systems, families with more income and assets perceive
public taps and any other water source (apart from individual taps and bottled water)
as inferior goods It would appear possible, then, to improve equity in developing
country water supply systems through effective cross-subsidization by charging high
tariffs for the individual taps used mainly by the better-off and providing free or
subsidized public taps that are used mainly by the poor The overall goal of public tap
policy ought to be to provide a basic level of water supply for the poor, not to
generate revenues
Importantly, the piped water system ought to be made more reliable for
households to decide in favour of either using the standpipes or private connections
Parallel to studies elsewhere in the developing world (McPhail, 1993, 1994, Bnscoe,
1990), Webuye residents found reliable dug wells close to homes more attractive than
the alternative of unreliable tap water relatively far from most houses Indeed, this
reason was cited most frequently by interviewees and water officials alike for the
failure of public taps or water kiosks in Webuye Division (e g, Kubebea, 1995,

287
Kwoma, 1995) As McPhail (1992) writes "while . up-front charges discourage
connections to the piped water service, the level and quality of the water company's
service seems to be the important determinant to the role that the monthly tariff plays
in the connection decision Thus, the more the water company can guarantee good
quality and reliable service, then the less the monthly tariff will be a deterrent to
making a connection to the piped water system" (p 195)
Because of the intimate link between financial viability, on one hand, and
reliability and quality of service on the other, however, the often high up-front
connection charges appear to be a key policy area for intervention with regard to
household decisions to hook It might be advisable, therefore, for the Government or
future Webuye water utility to seriously consider either to lower upfront costs (that is,
utility required down payment and connection charges) or eliminate them altogether
and institute a slightly higher monthly water tariff Evidence from this survey and
similar ones (e g , Whittington et a!, 1990, Altaf eta!, 1993, McPhail, 1993, McPhail,
1994) indicate that water bills constitute a small portion of the overall household
budget (typically under 5 per cent), and there would appear to be room for the slight
increase in tariffs necessary to finance the household connection

288
6.7 LIMITATIONS OF THE STUDY
The use of contingent valuation to value river water quality and domestic water supply
improvements in Webuye Division was a test application designed to identify the
potential for general use in non-market valuations in Kenya, as well as an attempt to
inform the procedure on the role of temporal dimensions of payments in WTP values
Problems with the technique have been well documented in other publications, e g
Thaler (1981), Hanley and Spash (1993), Scanlan (1994), and Hanley et al (1994,
1995) This section discusses some limitations associated with the Webuye-Kenya
application
This study is constrained both by generic limitations of cost-benefit analysis
(CBA) and specific shortcomings of clean water data Regarding the first set of issues,
CBA considers economic efficiency criteria that have inherent limitations as a guide
to policy decisions For example, policies that maximize net benefits may yield losers
that are not directly compensated In addition, if people initially have a right to clean
water (clean water in Nzoia river and tap water, in this case), this could suggest that
placing additional emphasis on WTA in place of WTP as a valuation measure 5' WTA
data for river water quality improvements and improved domestic water supply in
Kenya are unavailable for comparison, however
Also, the apparent popularity of nver pollution control in the Nzoia basin and
household connections to piped water supply could be viewed as a revealed preference
51 As noted in Chapters 3 and 4, WTP is a standard approach for cost-benefit analysis Itassumes that the respondent does not own the property nghts for the environmental goodWTA shifts the initial ownership to the respondent Research indicates that WTA can besignificantly more than WTP where goods in question do not have good substitutes and wheredemand is sensitive to income (Hanemann, 1991) Cummings et al (1986, p 35) found thatWTA was roughly 3-5 times WTP in the environmental valuation studies they surveyed
289
by voters that they perceive the benefits as being greater that the costs However,
voting behaviour also may reflect the distribution of benefits and costs, as well as a
lack of good information, so that popular policies do not necessanly have positive
aggregate net benefits
In addition to these conceptual constraints, this economic analysis has specific
limitations related to water quality analysis, As noted in the next chapter, these
limitations suggest a number of directions for further research, including development
of better data linking anticipated policy changes, costs, and nver quality
improvements, comprehensive evaluation of the incremental costs and effectiveness
of point and nonpoint source pollution reduction practices, and further analyses (using
CV and other methods) of the economic benefits of water quality improvements and
policy programmes on other water resources issues Such additional information, on
both national and regional levels, could help guide policy makers toward more
efficient policies
Even more specific limitations to the CV survey relate to its design In this
regard three aspects are discernible order effect, decomposition of Total Economic
Value and potential salience bias
1 Order effects in the evaluation of improved water supply across upfront and
spread payment profiles for initial charges might be the main limitation This may be
particularly so because work by Tversky (1977, Tversky and Gati, 1978), as well as
some recent studies (Fischhoff et al, 1993, Wanke et al, 1995) on judgment of
similarity indicate that comparing A to B may result in different similarity judgments
than comparing B to A The researchers' results demonstrate that the direction of
comparison elicited by a given question wording can have an impact on obtained

290
results
2 In valuing public goods and impacts there is need to give more consideration
to the national benefits of option, existence and bequest values It is possible that the
costs and benefits reflected in these values may be of significant magnitude in relation
to other market and non-market impacts Obviously, to obtain such information would
require a much broader sampling base, increasing survey costs considerably
3 A limitation of any valuation is that it is only valid for a particular point in
time and will change with changing attitudes Environmental consciousness has
increased markedly over the past 25 years and the trend is expected to continue
Individual valuations of environmental resources and service flows will be dependent
on the overall level of consciousness at that time Five years hence, the perceived
worth of many environmental and public goods may have changed considerably

291
CHAPTER VII
SUMMARY, CON CLUS IONS AND IMPLICATIONS
7.1. REVIEw OF THE STUDY OBJECTIVES
This study set out to apply and assess the contingent valuation (CV) method in nver
pollution control and domestic water supply improvements in a developing country,
Kenya The CV method is one approach to measuring benefits of environmental
improvements that has gained currency in the economics literature as well as the
interdisciplinary valuation of environmental and public goods in the Third World The
specific objectives of this research were (a) to estimate the value of improved nver
water quality and a private water supply connection, (b) to evaluate the feasibility of
using the contingent valuation method to value an environmental amenity and its
quasi-public service in rural setting where respondents have limited education and
monetary resources, (c) to empirically investigate the embedding effect in contingent
valuation of river water quality improvement in a less developed economy, and (d) to
examine the role of the temporal dimension of bid payments (i e, frequency of
payments) in contingent values for environmental improvements
Unlike other water catchment areas and nver basins in Kenya, the Nzoia River
ecosystem has received disproportionately less focus of scientific investigation The
inattention is surprising because, during the last 25 years or so, anthropogenic
alterations or stress, especially those related to non-point pollution from sugarcane
agriculture, municipal water use, and to pollution by toxic substances from industries,
have been applied to the Nzoia nver with ever-increasing frequency Non-point
pollution from agricultural farms (especially soil erosion from farms and heavy use of

292
herbicides), raw sewage from the municipalities (such as Webuye) as well as effluents
from paper and sugar processing industries and the East African Heavy Chemicals
Industries at Webuye are the pnncipal sources of pollution for Webuye water
resources and the Nzoia river basin in Webuye administrative division and its
surrounding areas Sediment transported from land through erosion is a major pollutant
of water resources in Webuye Recent increased use of chemical fertilizers and
pesticides in sugarcane agriculture results in residual inputs transported by water to
endanger stream and groundwater supplies It also encourages and allows intensified
row-crop farming of maize, which is accompanied by silt exports and the degradation
of water supplies Generally the pollutants have led to deterioration of river water
quality thereby occasioning eutrophication, as evidenced by the extensive blooms of
blue-green algae, frequent fish kills, and a steady decline in fish landings during recent
years
7.2 CoNcLusioNs
This research project has gone some way towards determining the economic value of
river pollution control and improved domestic water supply as well as evaluating the
applicability of the Contingent Valuation Method in a developing country, Kenya The
results of the study suggest that it is possible to do a contingent valuation survey in
setting where respondents have limited education and monetary resources and obtain
reasonable, consistent answers The multivariate analyses of the willingness-to-pay
responses compare very favourably with similar analyses carried out in industrialized
countries and other developing countries The multivariate analyses indicated that the
principal factor influencing households' willingness to pay for nver pollution control

293
and individual water faucets is family income The effects of other factors were more
specific to the contingent good In order of strength, the other determinants of WTP
for river "quality" are sex, age, household ranking of status of domestic water source,
distance from river to household residence, the other factors affecting WTP for water
"connections" are existing source of water supply (in terms of convenience, quality
and reliability), household size, ranking of flyer water quality, and age of household
head In addition, a strong correlation between education, income and occupation was
noted
The limitations of the technique must be acknowledged and minimized in the
design and implementation stages Inasmuch as undertaking a contingent valuation is
relatively costly, its use should be restricted to major impacts, i e to investigations
involving "non-market" impacts that may be significant in major, large-scale
evaluations The extent of publicness of "non-market" effects need to be the key
element in tilting the balance in favour of the CV approach vzs-a-vis other
methodologies
Benefit transfer is yet another issue related to the expensiveness of CV surveys
It would be advantageous if CV results from one study could be gencralised to other
cases For example, a CV estimate of WTP for a given water quality improvement in
a particular river (nver A) might be capable of being 'transferred' to the measurement
of the benefits of a similar improvement of water quality in a different river (river B),
other things being equal Such a straightforward transfer of benefits is not likely to be
possible, however, since other aspects are typically not equal (Walsh et at, 1989,
Desvousges et at, 1992, O'Doherty, 1995, Willis, 1995) Usually, value estimates have
to be adjusted if transfers are to be made This implies an empirical knowledge of the
294
determinants of WTP
Added advantages of using the survey approach are that additional information
on attitudes, socio-economic parameters, etc , can be obtained at no extra cost, and the
public are made aware that their attitudes and valuations are being acknowledged by
decision-makers These merits, however, are neither restricted to developing country
scenarios nor to Kenya Next we consider the implications of these results for
contingent valuation, policy, and further research
7.3 IMPLICATIONS FOR CONTINGENT VALUATION, POLICY, AND FURTHER RESEARCH
The emerging lessons from this study can be typed into three broad categories
methodological implications, policy implications, and directions for further research
(a) Methodological Implications
The experimental design incorporated numerous tests to check the internal consistency
and reliability of the households' willingness-to-pay responses, including a test for
effect of bias due to the socio-economic setting, and the effect of effect of observers
listening to the interview These tests, as well as those on embedding effcct and the
impact of connection charge profiles on evaluation of piped water connections,
revealed little reason for serious concern about the reliability or validity of the
willingness-to-pay responses From a methodological perspective, however, there was
an interesting aspect about the evidence on the impacts of temporal dimensions of
payments on contingent values
The frequency of payments embodied in a CV survey do seem to matter for
the revealed benefits of goods This is perhaps particularly the case in developing

295
countries where income flows are more erratic than in the developed world Whether
this sensitivity to timing could be avoided by seeking WTP amounts in alternative
forms than money, such as crops or labour needs to be established empirically, but it
is not obvious why this should be so
(b) Policy Implications
From a policy perspective, it is possible to draw several conclusions from the results
of the household surveys performed in Webuye, Kenya and the subsequent analysis
outlined in this report First, an analysis of the WTP bids shows that almost 70% of
the families surveyed would be willing to pay Ksh 30 (0 35) per month for pollution
control in the Nzoia River Basin, and over 40% stated that they would pay at least
Ksh 60 (0 69) For an individual household water connection, over 30% would be
willing to pay Ksh 90 (f1 04) or more per month, and about 5% stated they would pay
at least double the existing water flat rate for Webuye Town Council Therefore, it is
clear that the surveyed households in Webuye Division of Bungoma District, Kenya
have an unmet desire to control nver pollution, and for individual water connections
The households are willing to contribute significant amounts of money, compared to
existing Webuye residential sewage rates, towards nver pollution control in the Nzoia
Basin Further still, Webuye residents without water connections are willing to pay at
least as much as other similar customers who possess them Thus, from a standard
welfare economic perspective, social welfare could possibly be improved by
controlling water pollution in the Nzoia River Basin and extending the existing piped
water system to unconnected households
A second policy conclusion relates to the comparatively low WTP estimates

296
for improved domestic water supply The finding that less than 50% of the households
surveyed were willing to pay Ksh 90 and more suggests that conventional water
connections with initial connections costs paid up-front are simply not affordable to
the majonty of households in Webuye Division without massive government subsidies
In retrospect this is perhaps not so surprising What was less apparent before this
research, however was the residents' understanding of the diverse budgetary
implications of a piped water connection under the hypothetical "Spread" and exiting
"Upfront" connection charges Moreover, it was not clear at the outset whether or not
the households' WTP for nver pollution control would be higher than that for a
individual water connection The results of the CV study showed that most households
were willing to about as much for pollution control in the Nzoia River Basin within
Webuye Division as for a household water faucet The study also indicated that
households' willingness to pay for pollution control in the Nzoia Basin within Webuye
Division and for nver water quality improvement in the entire Nzoia Basin upto Lake
Victoria appear to be of approximately the same order of magnitude and largely
separable
(c) Further Research Directions
Limitations to this CV study have already been raised But on effects of temporal
dimensions (or frequencies) of payments in contingent valuation our experiment is
only a pointer to what mechanisms/factors could erode the validity of resultant WTP
estimates All the factors need a follow up, even via comparative research over
developed and developing/transition economies, as well as regional economies with
different expenditure-income temporal patterns Secondly, there is need for follow-up

297
studies across a vanety of CV questioning formats to discern the direction of the
impacts One possible format is a bidding game for a given contingent commodity,
determine WTP by offering respondents a choice of X per month or I 2X per annum
and relevant discount rates X is the relevant monetary unit
Another area for future work is to do with decomposition of total economic
value of environmental improvements This study has shown that little compromise
on the validity of contingent values due to the nature of the good under valuation
Given this, it would be useful to study components of total economic value in
developing country natural resources service flows Past work in this area has
involved, in the main, tropical deforestation and wildlife conservation Environmental
media such as air quality and water quality have remained on the margin, thereby
reinforcing the notion that real environmental issues are the preserve of the rich
Two further research directions relate to environmental impacts of nver water
pollutants and the role of connection charges in domestic water supply The need for
an environmental impact assessment of water pollutants of the Nzoia River as further
area for investigation may appear to be tangential to this report Yet for better, realistic
resolution of the nver pollution problem, we need to determine the cost side For cost-
benefit analysis (CBA), CV results are meant to be an input in the decision making
process and not an end in themselves For this reason, there is need for (i)
Evaluations of Critical BOD Loadings from Manufactunng Industries especially sugar
mills and the Panafrican Paper Mills, and the East African Chemical Industries, and
(ii) Evaluation of Impact of Standards on Manufactunng Industnes in the River Basin
Ideally COD standards for domestic /municipal and industnal wastewater must be
different Standards specific to industnes may have to be devised, but this will depend
298
on Kenya's inspectorate Pollution regulations generally have the effect of raising
production costs and, hence, product prices Traditionally, many developing countries
like Kenya have feared that regulations and emission standards will result in a loss of
international competitiveness This loss can have a consequent negative effect on
export industries and on the country's trade balance. In view of Kenya's proposed
National Environmental Enhancement and Management A Ct, however, an evaluation
of the Impact of imposing progressively more stringent effluent regulations on the
sugar and paper industries operating in the Nzoia Basin and its trade consequences has
to be carned out to determine the effect of such environmental protection on
competitiveness
The reliability and quality of the water service provided by a water supply
utility is important in household reaction to monthly tariffs as signals to decisions to
hook onto a piped system Owing to the intimate link between financial viability, on
one hand, and reliability and quality of service on the other, however, the often high
up-front connection charges appear to be a key policy area for intervention with regard
to household decisions to hook It might be advisable, therefore, for the Government
or future Webuye water utility to seriously consider either to lower upfront costs (that
is, utility required down payment and connection charges) or eliminate them altogether
and institute a slightly higher monthly water tariff The full implications of this system
for the financial viability of a water system, such as Webuye Water Supply, as well
as mechanisms of collecting payments for water use from public taps need
investigation

299
APPENDICES

300
APPENDIX 3A: REFERENCES FOR DEVELOPING COUNTRY
CONTINGENT VALUATION STUDIES
Altaf, M A, Whittington, D Jamal, H and Smith, V K (1993) Rethinking Rural
Water Supply Policy in the Punjab, Pakistan Water Resources Research 29(7)
1943-54
Altaf, M A, H Jamal, J L Liu, V K Smith and D Whittington (1992) Prices and
Connection Decisions for Public Water Systems in Developing Countries A
Case Study of the Punjab, Pakistan Working Paper of the Infrastructure and
Urban Development Department, World Bank Washington DC
Boadu, F 0 (1992) Contingent Valuation for Household Water in Rural Ghana
Journal of Agricultural Economics 43(3) 458-65
Bohm, R A, Esseburg, T J and Fox, W F (1993) Sustainability of Potable Water
Services in the Philippines Water Resources Research 29(7) 1955-64
Briscoe, R, de Castro, P F, Griffin, C, North, J and Olsen, 0 (1990) Toward
Equitable and Sustainable Water Supplies A Contingent Valuation Study in
Brazil The World Bank Economic Review, 4 115-143
Brown, Jr G, and W Henry (1989) The Economic Value of Elephants Discussion
Paper 89-12, London Environmental Economics Centre London
Kwak, S -J and Russell, C S (1994) Contingent Valuation in Korean Environmental
Planning A Pilot Application to the Protection of Drinking Water Quality in
Seoul Environmental and Resource Economics 4 511-526
McPhail, A A (1993) The Five Percent Rule for Improved Water Service Can
Households Afford More9 World Development, 21(6) 963-974
McPhail, A A (1994) Why Don't Households Connect to the Piped Water System9
Observations from Tunis, Tunisia Land Economics 70(2) 189-96
Robinson, P R (1988) Willingness to Pay for Rural Water the Zimbabwe Case
Study A Report to the Infrastructure and Urban Development Department The
World Bank 72 pages, Zimconsult Harare Zimbabwe
Shyamsundar, P and Kramer, R A (1996) Tropical Forest Protection An Empirical
Analysis of the Costs Borne by Local People Journal of Environmental
Economics and Management 31(2) 129-144

301
Shyamsundar, P and Kramer, R A (1993) Does Contingent Valuation Work in
Nonmarket Economies9 American Journal of Agricultural Economics 75(5)
1309
Singh, B , Ramasubban, R, Bhatia, R, Briscoe, J, Griffin, C C and Kim, C (1993)
Rural Water Supply in Kerala, India How to Emerge From a Low-Level
Equilibrium Trap Water Resources Research 29(7) 193 1-1942
Swallow, B M and Woudyalew, M (1994) Evaluating Willingness to Contribute to
a Local Public Good Application of Contingent Valuation to Tsetse Control
in Ethiopia Ecological Economics 11 153-161
Whittington, D, Lauria, D T, Wright, A M, Choe, K, Hughes, J A and Swarna,
V (1993a) Household Demand for Improved Sanitation Services in Kumasi,
Ghana A Description of Current Practices, Attitudes, and Perceptions World
Development 21(5) 733-748
Whittington, D, Lauria, D T, Wright, A M, Choe, K, Hughes, J A and Swarna,
V. (1993b) Household Demand for Improved Sanitation Services in Kumasi,
Ghana A Contingent Valuation Study Water Resources Research 29(6) 1539-
60
Whittington, D Smith, V K, Okorafor, A , Liu, J L and McPhail, A (1992) Giving
Respondents Time to Think in Contingent Valuation Studies A Developing
Country Application Journal of Environmental Economics and Management
22 205-225
Whittington, D, Lauria, D T and Mu, X (1991) A Study of Water Vending and
Willingness to Pay for Water in Onitsha, Nigeria World Development 19(2/3)
179-98
Whittington, D, Mu, X and Roche, R (1990) Calculating the Value of Time Spent
Collecting Water Some Estimates for Ukunda, Kenya World Development
18(2) 269-80
Whittington, D, Briscoe, J, Mu, X, and Barron, W (1990a) Estimating the Willingness
to Pay for Water Services in Developing Countries A Case Study of the Use
of Contingent Valuation Surveys in Southern Haiti Economic Development
and Cultural Change 38(2) 293-312
Whittington, D, Okorafor, A, Okore, A and McPhail, A A (1990b) Strategy for

302
Cost Recovery in the Rural Water Sector A Case Study of Nsukka District,
Anambra State, Nigeria Water Resources Research 26(9) 1899-19 13
Whittington, D , Mujwahuzi, M , McMahon, G and Choe, K (1989a) Willingness to
Pay for Water in New ala District, Tanzania Strategies for Cost Recovery
WASH Field Report No 246, Washington, D C
Whittington, D, Lauria, D T, Okun, D A and Mu, X (1989b) Water Vending
Activities in Developing Countries A Case Study of Ukunda, Kenya
International Journal of Water Resources Development September, pp 158-
168
Whittington, D, Launa, D T, Okun, D A and Mu, X (1988) Water Vending and
Development Lessons from Two Countries Technical Report No 45,
Washington D C
World Bank Water Demand Research Team (1993) The Demand for Water in Rural
Areas Determinants and Policy Implications World Bank Research Observer
8(1) 47-70
303
APPENDIX 3B: REFERENCES FOR DEVELOPING COUNTRY
ENVIRONMENTAL VALUATION STUDIES, EXCLUDING
CONTINGENT VALUATION SURVEYS
Adger, N, Brown, K, Cervigni, R and Moran, D (1994) Towards Estimating Total
Economic Value of Forests in Mexico Working Paper No GEC 94-21 Center
for Social and Economic Research on the Global Environment University of
East Anglia and University College London, UK
Durojaiyae, B 0 and Ikpi, A E (1988) The Monetary Value of Recreational
Facilities in a Developing Economy A Case Study of Three Centres in
Nigeria Natural Resources Journal 28(2) 3 15-28
Jimenez, E (1983) The Magnitude and Determinants on Home Improvement in Self-
Help Housing Manila's Tondo Project Land Economics 59(1) 70-83
Kramer, R A, Sharma, N and Munasinghe, M (1995) Valuing Tropical Forests
Methodology and Case Study of Madagascar World Bank Environment Paper
No 13 World Bank Publications
Maille, P and Mendelsohn, R (1993) Valuing Ecotourism in Madagascar Journal of
Environmental Management 38 213-218
Navrud, S and Mungatana, B D (1994) Environmental Valuation in Developing
Countries The Recreational Value of Wildlife Viewing Ecological Economics
11 135-151
North, J H and Griffin, C C (1993) Water Source as a Housing Characteristic
Hedonic Property Valuation and Willingness to Pay for Water Water
Resources Research 29(7) 1923-30
Paulsen, C M (1993) Cost-Effective Control of Water Pollution in Central and
Eastern Europe Resources 113 28-31
Peters, C M , Gentry, A H and Mendelson, R 0 (1989) Valuation of an Amazonian
Rainforest Nature 339 655-6
Rao, V (1993) The Rising Price of Husbands A Hedonic Analysis of Dowry
Increases in Rural India Journal of Political Economy 101(4) 666-77
Swallow, B M and Woudyalew, M (1994) Evaluating Willingness to Contribute to
a Local Public Good Application of Contingent Valuation to Tsetse Control
304
in Ethiopia Ecological Economics 11 153-16 1
Tobias, D and Mendelson, R (1991) Valuing Ecotourism in a Tropical Rain-forest
Reserve Ambzo 20(2) 91-3
Whittington, D, Mu, X and Roche, R (1990) Calculating the Value of Time Spent
Collecting Water Some Estimates for Ukunda, Kenya World Development
18(2) 269-80

305
APPENDIX 4A: QUESTIONNAiRE FOR GOOD 1: ESTIMATING BENEFiTS
OF IMPROVED WATER QUALITY IN THE NzoiA RIVER
BASIN, KENYA (Note Six different versions of this
questionnaire were used Each version varies only )
THE CV QUESTIONNAIRE
IDENTIFICATION INFORMATION
A Site/Village ID No B Interviewer ID No
C Interview number D Date / . J 1995
E Interview Start Time . am/pm F Questionnaire Version A
o Presence of Adult Listeners to the H Interview Setting
Interview Yes [ ] No [ ] Rural [ I Urban [ ]
I SURVEY BACKGROUND AND INTRODUCTION
Good morning/afternoon My name is Wilson Wasike I am doing research into
peoples's attitude to water quality in the Nzoia River It would be of great help to me
if you participated in this survey All answers will be treated in strictest confidence
and are for research purposes only
1 To what extent do you think nver water quality is a problem
(a) in Kenya [ ]
1 2 3 4 5
Serious problem No problem
(b) in Webuye Division [ ]
1 2 3 4 5
Serious problem No problem
Please put a value of 5 indicating no problem and a value of 1 for a serious
problem, you may also indicate any value between the two numbers

306
2 (a) What activities does your household engage in that involve use of the Nzoia
River7
Water for drinking/cooking/domestic washing Yes/No,
Watering flowers Yes/No,
Irrigating vegetables (e g sukuma wiki, tomatoes etc) Yes/No,
Watering livestock Yes/No,
Fishing Yes/No,
Other (specify)
Total number of uses [ ]
(b) Are you planning to use it at any other time within the next one year9
Yes [ ] No [ ]
3 (a) Are you aware of any changes in water quality in the Nzoia River in Webuye
Division7
Yes [ ] No [ ]
(b) If YES, where on the following water quality ladder/ranking would you place
the Nzoia River9
Best water quality [ ] 10 A drinkable, swimmable, fishable, boatable
[ ]9
[ ]8
[ ] 7 B swimmable, fishable, boatable
[ ]6
[ 1 5 C fishable, boatable
14
[ ] 3 D boatable
[ ]2
I ] 1 E no activity recommended
Worst water quality [ ] 0
(c) What is the distance (in km) from the Nzoia River to your residence 7 ____ km

307
4 (a) Would you (and your family) benefit from an improvement in water quality in
the River Nzoia from the current level?
Yes [ ] No [ ]
(b) If YES, how would you rank the following benefits of river quality
improvement in order of importance ? Put scores 1 to 5 where 1 stands for "not
important at all", "not very important", "neither important nor unimportant",
"somewhat important", and 5 for "very important"
[ ] Contribute towards a cost-effective water supply for personal
use and increase enjoyment of its users
[ ] Protect the river water for use by the future generations
[ ] Avoid dirty, unsightly and smelly nature of river
[ ] Contribute towards the improvement of the environment in
general
[ ] Conserve wildlife and plants
II. BENEFIT MEASURES
Now I would like to ask you some questions about how much your household would
be willing to pay to improve water quality in the Nzoia River basin to the top most
level on the water-quality ladder
5 Assume that all the households living in the neighbourhood of the Nzoia River
are asked to pay so that they can benefit from a cleaner river The local
authority might have to compensate farmers and industries for the extra
expenditure incurred by them in cleaning their effluents, or spend extra money
policing the cleaning of the Nzoia nver The current Webuye Municipal
Council sewerage fees and charges for domestic use per family are Ksh 30/=
per month, but these service charges would have to be raised to cover the
river-cleaning project
If you were asked how frequently you would like to pay for improved
water quality on the Nzoia River, which of these two frequencies would you
prefer?
Monthly [ ] Yearly [ ]

308
Version Al: Basin and Section on Monthly Payment Scheme
6 (a) Now suppose the payments are to be made monthly and the payment would
mean that you need to spend less on other items, would you be willing to pay
any charge to reducing pollution on the Nzoia river section within Webuye
Yes [ ] No [ ]
(b) SHOW CARD If NO, which of the following reasons best describes why you
are not willing to pay any money to clean the Nzoia River9
[ ] Not enough information
[ ] I do not want to place a shilling value on the water
quality in the Nzoia River
[ ] Improving the Nzoia nver water quality has no value to
me
[ ] I do not want to participate in this survey
[ ] I cannot afford to pay
(c) If YES, what is the most you as a household would be willing to pay per
month in council charges and sewage fees in order to improve the Nzoia nver
quality in Webuye Division (area)?
_____ Kshs/month
(d) The current water quality for the Nzoia River as a whole may vary at different
points along the nver In addition to the amount you have Just told me [READ
THE AMOUNT FROM 6c], how much more monthly council charges and
sewage fees would you be willing to pay to have a cleaner Nzoia River upto
Lake Victoria (i e, the entire nver basin)?
_____ Kshslmonth
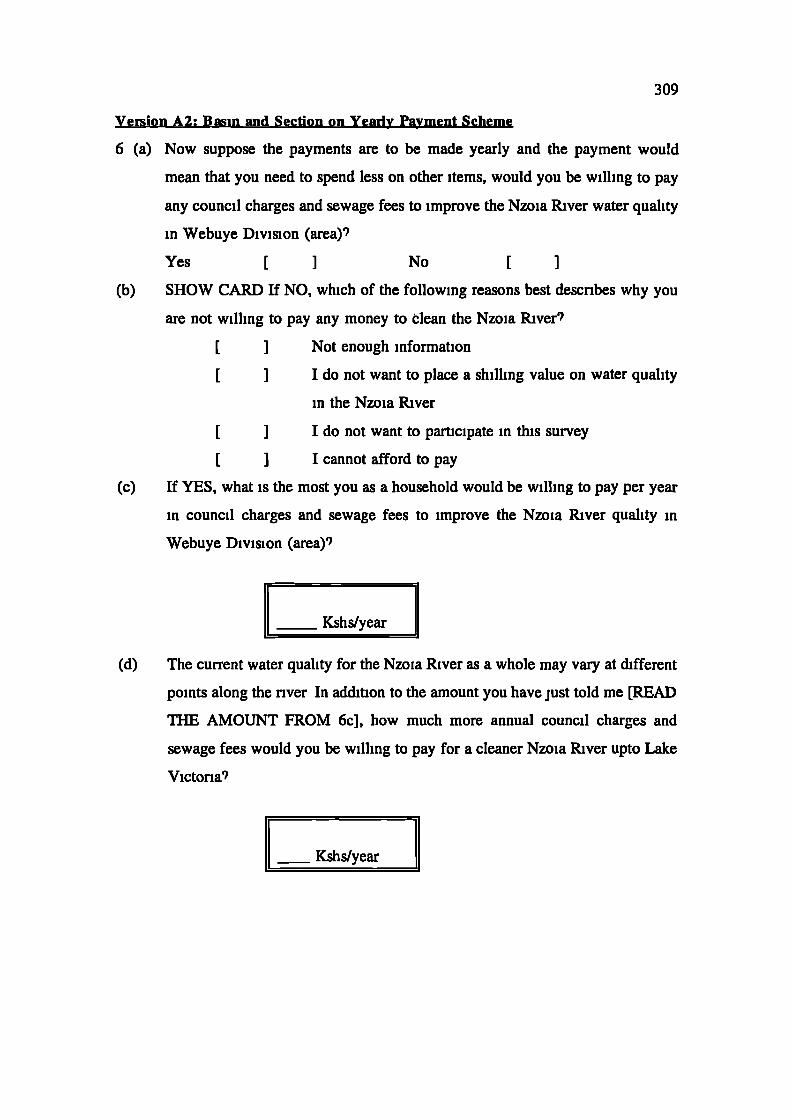
309
Version A2: Basin and Section on Yearly Payment Scheme
6 (a) Now suppose the payments are to be made yearly and the payment would
mean that you need to spend less on other items, would you be willing to pay
any council charges and sewage fees to improve the Nzoia River water quality
in Webuye Division (area)9
Yes [ ] No [ ]
(b) SHOW CARD If NO, which of the following reasons best describes why you
are not willing to pay any money to clean the Nzoia River7
[ ] Not enough information
[ ] I do not want to place a shilling value on water quality
in the Nzoia River
[ ] I do not want to participate in this survey
[ ] I cannot afford to pay
(c) If YES, what is the most you as a household would be willing to pay per year
in council charges and sewage fees to improve the Nzoia River quality in
Webuye Division (area)9
Kshs/year
(d) The current water quality for the Nzoia River as a whole may vary at different
points along the nver In addition to the amount you have Just told me [READ
THE AMOUNT FROM 6c], how much more annual council charges and
sewage fees would you be willing to pay for a cleaner Nzoia River upto Lake
Victoria7
Kshslyear

310
Version A3: Section on Monthly Payment Scheme
6 (a) Now suppose that the payments are to be made monthly and the payment
would mean that you need to spend less on other items, would you be willing
to pay council charges and sewage fees to improve the Nzoia River water
quality in Webuye Division (area)')
Yes [ ] No [ ]
(b) SHOW CARD If NO, which of the following reasons best describes why you
are not willing to pay any money to clean the Nzoia River7
[ ] Not enough information
[ I I do not want to place a shilling value on water quality
in the Nzoia River
[ ] I do not want to participate in this survey
[ ] I cannot afford to pay
(c) If YES, what is the most you as a household would be willing to pay per
month in council charges and sewage fees to improve the Nzoia River water
quality in Webuye Division (area)')
____ Kshslmonth
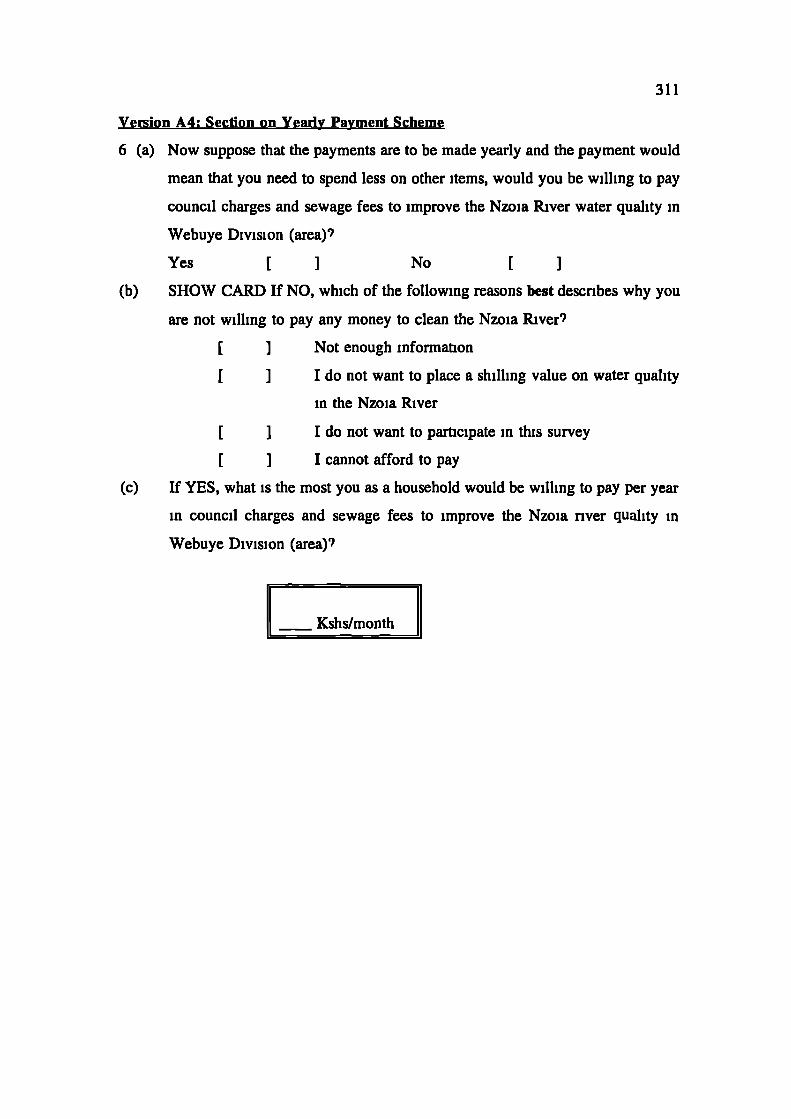
311
Version A4: Section on Yearly Payment Scheme
6 (a) Now suppose that the payments are to be made yearly and the payment would
mean that you need to spend less on other items, would you be willing to pay
council charges and sewage fees to improve the Nzoia River water quality in
Webuye Division (area)?
Yes [ ] No [ ]
(b) SHOW CARD If NO, which of the following reasons best describes why you
are not willing to pay any money to clean the Nzoia River?
[ ] Not enough information
[ ] I do not want to place a shilling value on water quality
in the Nzoia River
[ ] I do not want to participate in this survey
[ ] I cannot afford to pay
(c) If YES, what is the most you as a household would be willing to pay per year
in council charges and sewage fees to improve the Nzoia river quality in
Webuye Division (area)?
____ Kshslmonth

312
III BACKGROUND AND SOCIOECONOMIC DATA
I have a few more questions that will help in a proper analysis of the study results
7 (a) Sex Female [ ] Male [ ]
(b) To which of the following age categories do you belong9
Under 20 Years [ ]
20-29Years [ ]
30-39Years [ ]
40-49Years [ ]
50-59Years [ ]
Over 60 Years [ ]
8
At what level did you complete full-time education9
No education
[
I
Primary/Elementary school
[
]
Lower secondary (O'Level)
[
Upper secondary (A'Level)
[
I
College/ University
[
I
9
Do you rent or own your home/house9
Rent [ ] Own [ ]
10
How many persons, including yourself, are there in your household 9 _____
11
(a) Do you work in a sugar related industry (e g farmer or factory
employee) or the PanAfrican Paper Mills7
Yes [ ] No [ ]
(b)
To which of the following occupations do you belong9
Public servant F 1
Farmer
[ ]
Informal sector/Jua kali
[ ]
Other (specify)

313
12 (a) Where do you obtain most of your domestic water requirements9
Mains supply/private tap [ ]
Water kiosk/vendor [ ]
Well, nver and stream [ I
(b) Which of the following best describes your present water supply status
in terms of quantity, quality and convenience?
Very good [ ]
Good [ ]
Normal [ I
Poor [ I
Very Poor [ ]
13 If you don't mind, could you indicate which of the following brackets
represents your household's gross (pre-tax) income per month from all sources9
Under Ksh 1,999 E I
Ksh 2,000 - 3,999 1 ]
Ksh 4,000 - 5,999 [ ]
Ksh 6,000 - 7,999 [ ]
Ksh 8,000 - 9,999 [ ]
Over Ksh 10,000 [ ]
14 Finally, do you think the present controls on the Nzoia River pollution are
sufficient9
Yes [ ] No [ ]
If NO, what controls would you like to see introduced7
Thank you for taking part in this survey
INTERVIEW STOP TIME . AM/PM
DURATION OF INTERVIEW . MINUTES

314
APPENDIX 4B: QUESTIONNAIRE FOR GOOD 2: ESTIMATING BENEFiTS
OF IMPROVED DOMESTIC WATER SUPPLY IN WEBUYE
DIVISION, KENYA (Note Four different versions of this
questionnaire were used Each version varies only )
THE CV QUESTIONNAIRE
IDENTIFICATION INFORMATION
A Village ID No . B Interviewer ID No
C. Interview number. .. D Date. / J 1995
E Interview Start Time am/pm F Questionnaire Version B
G Presence of Adult Listeners to the H Interview setting
Interview Yes [ ] No [ ] Rural [ ] Urban [ ]
I SURVEY BACKGROUND AND INTRODUCTION
Good morning/afternoon My name is Wilson Wasike and I am conducting a survey
on people's attitudes to water supply I wonder if you would answer a few questions
for me All answers will be treated in strictest confidence and are for research
purposes only
In your opinion, to what extent is domestic water supply a problem
(a) in Kenya [ ]
1 2 3 4 5
Serious problem No problem
(b) in Webuye District [ ]
1 2 3 4 5
Serious problem No problem
Please put a value of 5 to indicate no problem and a value of 1 for a senous
problem, you may also indicate any value between the two numbers

2 (a)
(b)
(c)
3 (a)
(b)
(c)
4 (a)
315
(b)
Where do you obtain your water requirements9
Mains supply/Personal tap [ ]
Water kiosk/vendor [ ]
Well/stream/river [ ]
If WELL or VENDOR, what is the distance to the water source9
______ kilometres
How much time do you spend collecting water per day, including travel
time, queue time and fill time (minutes per day)? minutes per day
How do you rank the reliability of the water source9
1 2 3 4 5
Very Good Good Normal Poor Very Poor
How do you rank the quality of the water from the source9
1 2 3 4 5
Very Good Good Normal Poor Very Poor
How do you rank the convenience of obtaining water from your current
source9
1 2 3 4 5
Very Good Good Normal Poor Very Poor
What activities does your household engage in that involve use of
water?
Drinking/cooking/domestic washing Yes/No,
Watering flowers and Irrigating vegetables Yes/No,
Watering livestock Yes/No,
Other (specify)
(Tick accordingly & indicate total number of uses ______ )
What amount of water storage capacity do you have9
litres

316
II BENEFIT MEASURES
Now I would like to ask you some questions about how much your household would
be willing to pay for a piped water connection to your house
5 Suppose that you have the option to have a water faucet installed in your
house This installation is considered a privilege Your family would have
access to safe, reliable water 24 hours per day, all year round
However you would be responsible to pay the monthly or annually
water bill for the consumption of water from your faucet The amount of the
bill is based on the quantity of water used You do not have to pay anything
additional to cover the cost of the water standposts (kiosks) in the street Your
family also does not have to immediately pay for making the private
connection from the main water pipe to your house because Webuye Municipal
Council pays these costs now and then you would repay it via your water bill
for several years The cost of installing the pipes and plumbing accessories in
your house is about Ksh 2,000 (approx £ 25 00)
If you were asked how frequently you would like to pay water charges
for the private water connection to your house, which of these two frequencies
would you prefer?
Monthly [ ] Yearly [ ]

317
Version B 1: Monthly Payment Scheme
6 (a) Now suppose the payments are made monthly, and that the payment
would mean that you need to spend less on other items, would you be
willing to pay any charge for having a private water connection in your
house?
Yes [ ] No [ ]
(b) SHOW CARD If NO, which of the following reasons best describes
why you are not willing to pay anything to have a private water
connection to your house9
[ ] Not enough information
[ ] I do not want to place a shilling value on a
private water connection
[ ] A private water connection has no value to me
[ ] I do not want to participate in this survey
[ I I cannot afford to pay
(c) If YES, what is the most you as a household would be willing to payper month in water charges for a private water connection to yourhouse9
_____ Kshs/month
7 Upto now we have talked about piped water supply based on the assumption
that the MunlL.ipal Council makes the private connection to your home and
then charges you for the installation costs through the water charges over
several years An alternative approach would be for the Municipal Council to
insist that each household meets the cost of installing the pipes and plumbing
accessories in advance Given this condition, what is the most your household
would be willing to pay per month in water charges to have a pnvate water
connection 9
_____ Kshslmonth

318
Version B2: Yearly Payment Scheme
6 (a) Now suppose the payments are made annually, and that the payment
would mean that you need to spent less on other items, would you be
willing to pay any charge for having a private water connection in your
house9
Yes [ ] No [ I
(b) SHOW CARD If NO, which of the following reasons best describes
why you are not willing to pay anything to have a private water faucet
in your house
[ ] Not enough information
[ ] I do not want to place a shilling value on a
private water connection
[ ] A pnvate water connection has no value to me
[ ] I don't want to participate in this survey
[ ] I can't afford it
(c) If YES, what is the most you as a household would be willing to pay
per year in water charges to have a private water connection in your
house7
Kshslyear
7 Upto now we have talked about piped water supply based on the assumption
that the Municipal Council makes the private connection to your home and
then charges you for the installation costs through the water charges over
several years An alternative approach would be for the Municipal Council to
insist that each household meets the cost of installing the pipes and plumbing
accessories in advance Given this condition, what is the most your household
would be willing to pay per year in water charges to have a private water
connection to your house9
Kshslyear

319
III BACKGROUND AND SocioEcoNoMic DATA
I have a few more questions that will be used for a proper analysis of the results
8 (a) Sex Female [ ] Male [ ]
(b) SHOW CARD To which of the following age categories do you
belong?
Under 20 Years [ ]
20-29Years [ ]
30-39Years [ ]
40-49Years [ ]
50-59Years [ ]
Over 60 Years [ ]
9 At what level did you complete full-time education?
No education [
Primary/Elementary school [ ]
Lower secondary (O'Level) [ ]
Upper secondary (A'Level) [ ]
College/University [ ]
10 Do you rent or own your home?
Rent [ ] Own [ ]
11 How many persons, including yourself, are there in your household?
12 To which of the following occupations do you belong?
Public servant [ ]
Farmer [ ]
Informal sector/Jua kali [ ]
Other (specify) -

320
13 (a) Are you aware of any changes in water quality in the Nzoia River')
Yes [ ] No [ ]
(b) If YES, how would you describe the current water quality in the Nzoia
River9
Very Good [ ]
Good [ ]
Normal [ ]
Poor [ ]
Very Poor [ ]
14 If you don't mind, could you indicate which of the following brackets
represents your household's gross (pre-tax) income per month from all sources9
Under Ksh 1,999 [ ]
Ksh 2,000 - 3,999 [ I
Ksh 4,000 - 5,999 [ ]
Ksh 6,000 - 7,999 [ ]
Ksh 8,000 - 9,999 [ ]
Over Ksh 10,000 [ ]
15 Finally, do you think the present efforts at improving household water supply
are sufficient?Yes [ ] No [ ]
Thank you for taking part in this survey
INTERVIEW STOP TIME AM/PM
DURATION OF INTERVIEW MINUTES

321
APPENDiX 5A: FREQUENCY DISTRIBUTIONS OF MONTHLY WTP
VALUES FOR IMPROVED WATER QUALITY IN THE
PART OF THE NzOIA RiVER BASIN WITHIN WEBUYE
DivIsIoN
Questionnaire-Versi (BS*_sm Ouestionnaire-Vers3 (Sect*_sm)
Value Count (%) Cumpct (%) Count (%) Cumpct (%)
0 7 (21 2) 21 2 7 (21 9) 21 9
20 1 (30) 242 - -
30 1 (30) 273 3 (94) 313
40 1 (30) 303 2 (63) 375
50 6(182) 485 2 (63) 438
60 - - 2 (63) 500
70 3 (91) 576 4(125) 625
80 - - 2 (63) 688
90 - - 1 (31) 719
100 3 (91) 667 4(125) 844
150 4(121) 788 3 (94) 938
200 4 (12 1) 909 1 (3 1) 969
250 3 (91) 1000 - -
300 - - 1(31) 1000
N 33 32

322
APPENDJX 5B: FREQUENCY DISTRIBUTIONS OF ANNUAL WTP
VALUES FOR IMPROVED WATER QUALITY IN THE
PART OF THE NzOIA RIVER BASIN WITHIN WEBUYE
Value
0
200
250
300
350
400
450
500
600
700
800
1000
1500
2000
N
DIVISIoN
Ouestionnaire-Ver2 (BS*_sy')
Count (%) Cumpct (%)
6(214) 214
1 (36) 250
1 (36) 286
4(143)
429
5(179)
607
1 (36)
643
2 (71)
71 4
1 (36)
750
5(176)
929
1 (36)
964
1 (36)
1000
28
Ouestionnaire-Vers4 (Sect*_sy)
Count (%) Cumpct (%)
5(179)
179
2 (71)
250
1(36)
28 6
3(107)
393
1 (36)
429
4(143)
57 1
2 (71)
643
3(107)
75 0
1(36)
78 6
2 (71)
857
2 (71) 929
2 (71) 1000
28

323
APPENDIX SC: FREQUENCY DISTRIBUTIONS OF ADDITIONAL WTP
VALUES FOR IMPROVED WATER QUALITY IN THE
ENTIRE NZOIA RiVER BASIN UPTO LAKE VICTORIA
A From Part to Whole Basin under monthly payment mode (dBS*bm)
Value Count Percent (%) Cumulative percent (%)
0 13 394 394
10 1 30 424
20 3 91 515
30 2 61 576
50 8 242 818
100 5 152 970
150 1 30 1000
N 33
B From Part to entire Basin under yearly payment mode
Value Count Percent (%) Cumulative percent (%)
0 14 500 500
100 3 107 607
200 2 71 679
300 2 71 750
400 1 36 786
500 5 179 964
1000 1 36 1000
N 28

324
APPENDIX SD: FREQUENCY DISTRIBUTIONS OF TOTAL WTP VALUES
FOR IMPROVED WATER QUALITY IN THE ENTIRE
NzOIA RiVER BASIN UPTO LAKE VICTORIA
A Total Monthly W1'P for Pollution Control in the River Basin
Value Count Percent (%) Cumulative percent (%)
0 7 211 21250 3 91 30370 2 61 36490 1 30 394
100 5 152 546150 6 182 727200 2 61 788250 3 91 879300 2 61 939350 2 61 1000N 33
B
Total Annual WTP for Pollution Control in the River Basin
Value
Count
Percent (%) Cumulative percent (%)
0
6
21 4
21 4200
1
36
250400
3
107
357500
1
36
39 3600
2
71
464700
3
107
57 1800
1
36
607900
1
36
6431000
5
179
82 11200
1
36
8571500
2
71
9292000
1
36
9643000
1
36
1000N
28
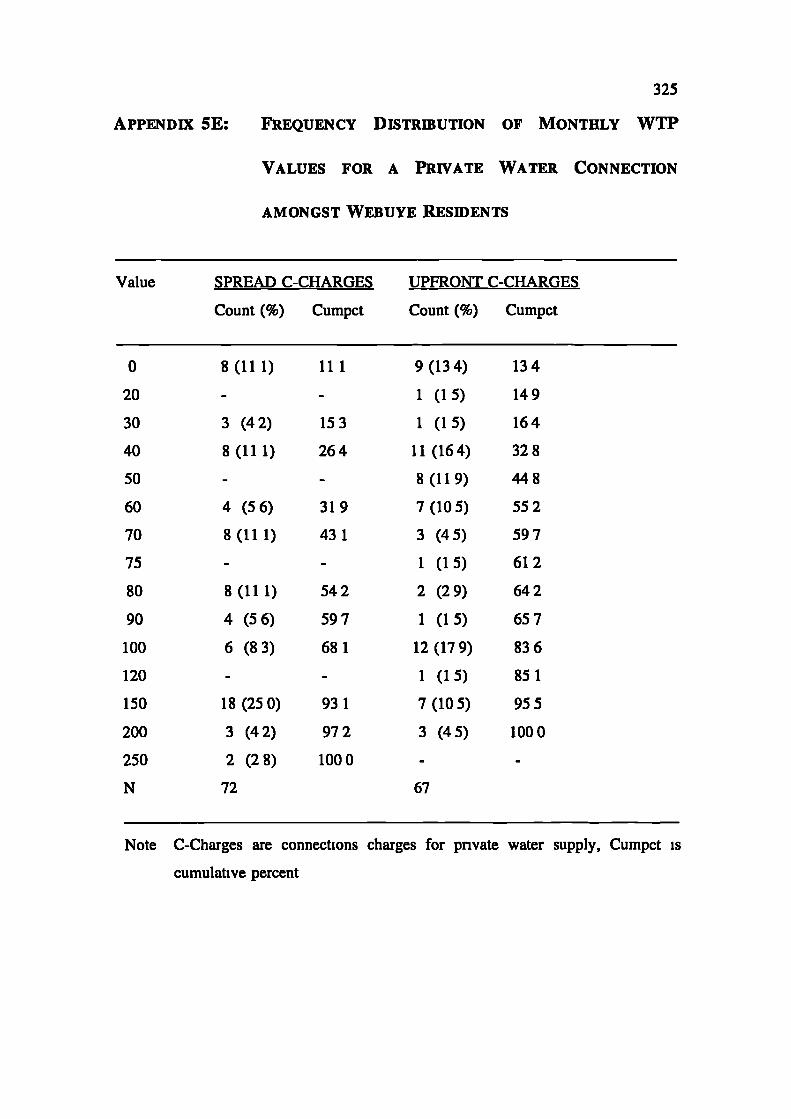
9(134)
1(15)
1(15)
11(164)
8 (11 9)
7(105)
3 (45)
1(15)
2 (29)
1(15)
12(179)
1 (15)
7(105)
3 (45)
134
149
164
32 8
448
55 2
597
61 2
642
65 7
83 6
85 1
95 5
1000
325
APPENDIX SE: FREQUENCY DISTRIBUTION OF MONTHLY WTP
VALUES FOR A PRIVATE WATER CONNECTION
AMONGST WEBUYE RESIDENTS
Value SPREAD C-CHARGES UPFRONT C-CHARGES
Count (%) Cumpct Count (%) Cumpct
0
20
30
40
50
60
70
75
80
90
100
120
150
200
250
N
8(111) 111
3 (42) 153
8(111) 264
4 (56) 319
8(111) 431
8(111) 542
4 (56) 597
6 (83) 681
18(250)
93 1
3 (42)
972
2 (28)
1000
72 67
Note C-Charges are connections charges for private water supply, Cumpct is
cumulative percent

326
APPENDIX SF: FREQUENCY DISTRIBUTIONS OF ANNUAL WTP
VALUES FOR A PRiVATE WATER CONNECTION
AMONGST WEBUYE RESIDENTS
Value
SPREAD C-CHARGES UPFRONT C-CHARGES
Count (%) Cumpct
Count (%) Cumpct
0
100
150
200
250
300
350
400
450
500
600
700
750
800
900
1000
1200
1500
2000
N
6 (83)
2 (28)
1 (14)
8 (11 1)
1 (14)
8 (11 1)
2 (28)
9(125)
2 (28)
9(125)
3 (42)
5 (69)
2 (28)
1 (14)
9(125)
1 (14)
2 (28)
1 (14)
72
83
111
125
23 6
250
36 1
389
51 4
542
667
70 8
77 8
806
81 9
944
95 8
986
1000
18 (26 1)
2 (29)
4 (58)
2 (29)
2 (29)
1 (15)
8 (11 6)
1(15)
15 (21 7)
5 (73)
2 (29)
3 (44)
1 (15)
4 (58)
1 (15)
69
26 1
28 9
348
377
406
420
53 6
55 1
76 8
84 1
869
91 3
92 8
98 6
1000
Note C-Charges are connection charges for private water supply, Cumpct is
cumulative percent

327
REFEREN CES
Adamowicz, W L, Bhardwaj, V and Macnab, B (1993) Experiments on the
Difference Between Willingness to Pay and Willingness to Accept Land
Economics 69(4) 4 16-27
Adger, N, Brown, K, Cervigni, R and Moran, D (1994) Towards Estimating Total
Economic Value of Forests in Mexico Working Paper No GEC 94-21 Center
for Social and Economic Research on the Global Environment University of
East Anglia and University College London, UK
Alba, J W and Marmorstein, H (1987) The Effects of Frequency Knowledge on
Decision Making Journal of Consumer Research 14(1). 14-25
Alba, J W and Marmorstein, H (1986) Frequency Information as a Dimension of
Consumer Knowledge In R J Lutz (ed) Advances in Consumer Research
Vol 13 Association for Consumer Research Provo, UT, pp 446-449
Alba, J W , Broniarczyk, S M, Shimp, T A and Urbany, J E (1994) The Influence
of Prior Beliefs, Frequency Cues, and Magnitude Cues on Consumers'
Perceptions of Comparative Price Data Journal of Consumer Research 2 1(2)
219-235
Altaf, A, Whittington, D and Jamal, H and Smith, V K (1993) Rethinking Rural
Water Supply in the Punjab, Pakistan Water Resources Research 29(6) 1943-
54
Altaf, M A, Jamal, H, Liu, J L, Smith, V K and Whittington, D (1992) Prices
and Connection Decisions for Public Water Systems in Developing Countries
328
A Case Study of the Punjab, Pakistan Working Paper of the Infrastructure and
Urban Development Department, World Bank Washington DC
Amuka, 0 (1995) Personal Communication Oman Amuka was then Head of
Department of Development and Environmental Studies at Maseno University
College His research work includes chemical accumulation in sugarcane
environments in Kenya
Arbuthnot, J (1977) The Roles of Attitudinal and Personal Vanables in the Prediction
of Environmental Behaviour and Knowledge Environment and Behaviour 9
217-232
Ardener, S and Burman, 5 (1995) Money-Go-Rounds The Importance of Rotating
Savings and Credit Associations for Women Berg Publishers Oxford
Arntzen, J (1995) Economic Instruments for Sustainable Resource Management The
Case of Botswana's Water Resources A mbio 24(6) 335-342
Arrow, K, Solow, R, Learner, E, Portney, P, Randner, R and Schuman, H (1993)
Report of the NOAA Panel on Contingent Valuation Federal Register 10(10)
4601-4614
Bailey, S J (1994) User-charges for Urban Services Urban Studies 3 1(4/5) 745-765
Barbier, E B (1993) Valuation of Environmental Resources and Impacts in
Developing Countries In (R K Turner ed) Sustainable Environmental
Economics and Management Beihaven Press London pp 319-37
Barde, J and Pearce, D W (1991) Valuing the Environment Six Case Studies
London, Earthscan
Baumol, W and Oates, W (1988) The Theory of Environmental Policy Cambridge

329
University Press Cambridge
Becker, G (1981)A Treatise on the Family Harvard University Press Cambridge MA
Ben-Akiva, M and Lerman, S (1985) Discrete Choice Analysis Theoty and
Applications to Travel Demand The MIT Press Cambridge, Mass
Bender, B D (1967) A Refinement of the Concept of the Household Families, Co-
residence and Domestic Functions American Anthropologist 69 493-504
Bergstrom, J, Stoll, J and Randall, A (1989) Information Effects in Contingent
Markets American Journal ofAgricultural Economics 71 685-91
Bettman, J R and Park, C W (1980) Effects of Prior Knowledge and Experience
and Phase of the Choice Process on Consumer Decision Processes A Protocol
Analysis Journal of Consumer Research 7 234-248
Binger, B R , Copple, R and Hoffman, E (1995) Contingent Valuation Methodology
in the Natural Resources Damages Regulatory Process Choice Theory and the
Embedding Phenomenon Natural Resources Journal 35(3) 443-460
Birdsall, N (1987) Strategies for Analysing Effects of User Charges in the Social
Sectors Country Policy Department Discussion Paper 1983-9 World Bank
Washington, D C
Bishop, R C, Herberlein, TA and Kealy, M 1 (1983) Contingent Valuation of
Environmental Assets Comparisons with a Simulated Market Natural
Resources Journal 23 372-8 1
Bishop, R C and Heberlein, T A (1979) Measuring Values of Extra-Market Goods
Are Indirect Measures Biased American Journal of Agricultural Economics
61 (December) 926-930
Boadu, F 0 (1992) Contingent Valuation for Household Water in Rural Ghana
330
Journal of A grzcultural Economics 43(3) 458-65
Bockstael, N E, Hanemann, W M and Khng, C L (1987) Estimating the Value of
Water Quality Improvements in a Recreational Demand Framework Water
Resources Research 23(5) 951-960
Bohm, P (1972) Estimating Demand for Public Goods An Experiment European
Economic Review 3 110-30
Bohm, R A, Esseburg, T J and Fox, W F (1993) Sustainability of Potable Water
Services in the Philippines Water Resources Research 29(7) 1955-64
Bowers, J K (1990) Economics of the Environment the Conservationists' Response
of the Pearce Report British Association for Nature Conservation Telford
Boyle, K J, Welsh, M P and Bishop, R C (1993) The Role of Question Order and
Respondent Experience in Contingent Valuation Studies Journal of
Environmental Economics and Management 25(1) 80-99
Boyle, K J and Bishop, R C (1988) Welfare Measurements Using Contingent
Valuation A Comparison of Techniques A merican Journal of Agricultural
Economics 70 20-28
Boyle, K J and Bishop, R C (1989) Commodity specification and the framing of
contingent valuation questions Land Economics 65 57-63
Boyle, K J and Bishop, R C (1987) Valuing Wildlife in a Cost-Benefit Analysis
A Case Study Involving Endangered Species Water Resources Research 23
943-950
Boyle, K J, Bishop, R C and Welsh, M P (1985) Starting Point Bias in Contingent
Valuation Bidding Games Land Economics 61 188-194
Bradford, D (1970) Benefit-Cost Analysis and Demand Curves for Public Goods
331
Kykios 23(4) 775-90
Brainerd, C L (1981) Working Memory and the Developmental Analysis of
Probability Judgment Psychological Review 88 463-502
Branniund, R, Fare, R and Grosskopf, S (1995) Environmental Regulation and
Profitability An Application to Swedish Pulp and Paper Mills Environmental
and Resource Economics 6 23-36
Briscoe, J (1992) Poverty and Water Supply How to Move Forward Finance and
Development 29 (4) 16-19
Bnscoe, J, de Castro, F Griffin, C , North, J and Olsen, 0 (1990). Toward Equitable
and Sustainable Rural Water Supplies A Contingent Valuation Study in Brazil
The World Bank Economic Review 4(2) 115-134
Briscoe, J and de Ferranti, D (1988) Water for Rural Communities World Bank
Washington DC
Brodley, R F (1985) Systems Simulation Comparing Different Decision Rules
Behavioural Science 30(October) 230-239
Bromley, D W (1990) Property Relations and Economic Development The Other
Land Reform World Development 17(6) 867-77
Brookshire, D S and Whittington, D (1993) Water Resources Issues in the
Developing Countries Water Resources Research 29(7) 1883-88
Brookshire, D 5, Eubanks, L S and Randall, A (1983) Estimating Option Values
and Existence Values for Wildlife Resources Land Economics 59 1-15
Brookshire, D S et al (1982) Valuing Public Goods A Comparison of Survey and
Hedonic Approaches American Economic Review 72 165-77
Brookshire, D 5, Eubanks, L S and Sorg, C F (1986) Existence Values and

332
Normative Economics Implications for Valuing Water Resources Water
Resources Research 22 1509-1518
Brookshire, D Ives, B and Schuize, W (1976) The Valuation of Aesthetic
Preferences Journal of Environmental Economics and Management 3 325-46
Brookshire, D 5, d'Arge, R C, Schulze, W D and Thayer, M A (1981)
Experiments in Valuing Public Goods In V K Smith ed, Advances in
Applied Microeconomics, Vol 1, Connecticut, JAI Press, Inc. pp 123-72
Brookshire, D S, Randall, A and Stoll, J R (1980) Valuing Increments and
Decrements in Natural Resource Flows American Journal of Agricultural
Economics 62(3) 478-88
Brown, Jr G, and W Henry (1989) The Economic Value of Elephants Discussion
Paper 89-12, London Environmental Economics Centre London
Burness, H S and Quirk, J P (1980) Water Laws, Water Transfers, and Economic
Efficiency The Colorado River The Journal of Law and Economics 23 111-
134
Burton, S and Blair, C (1991) Task Conditions, Response Formulation Processes,
and Response Accuracy for Behavioural Frequency Questions in Surveys
Public Opinion Quarterly 55 50-79
Butel, F. H (1979) Age and Environmental Concern A Multivariate Analysis Youth
Sociology 10 237-256
Cairncross, S and Kinnear, J (undated) Water Vending in Urban Sudan Working
Paper London School of Hygiene and Tropical Medicine
Cambridge Economics (1992) Contingent Valuation A Critical Assessment

333
Cambridge Economics Inc Cambridge, Mass
Cameron, T A (1989) OLS versus ML Estimation of Non-market Resource Values
with Payment Card Interval Data Journal of Environmental Economics and
Management 17 230-246
Campbell, I C (1978) A Biological Investigation of an Organically Polluted Urban
Stream in Victoria A ustralian Journal of Marine and Freshwater Research 29
275-291
Campen, J T (1986) Benefit, Cost and Beyond The Political Economy of Benefit-
Cost A nalysis Ballinger Publishing Co Cambridge, MA
Carson, R T and Mitchell, R C (1991) The Value of Clean Water The Public's
Willingness to Pay for Boatable, Fishable, and Swimmable Water Quality
Report from University of California, San Diego, May
Carson, R T and Mitchell, R C (1993) The Value of Clean Water The Public's
Willingness to Pay for Boatable, Fishable, and Swimmable Water Quality
Water Resources Research 29(7) 2445-2454
Carson, R T and Mitchell, R. C (1995) Sequencing and Nesting in Contingent
Valuation Surveys Journal of Environmental &onomics and Management
28(2) 155-173
Carson R T and Mitchell, R C (1993) The Issue of Scope in Contingent Valuation
Studies American Journal of A gncultural Economics 75 1263-67
Caulkins, P P, Bishop, R C and Bouwes, N W (1986) The travel cost model for
lake recreation a companson of two methods for incorporating site quality and
substitution effects Am encan Journal of Agricultural Economics 291-297
Cavendish, M G and Duncan, M I (1986) Use of the Instream Flow and Incremental

334
Methodology A Tool for Negotiation Environmental Impact A ssessment
Review 6 347-363
Christianson, E H and Arcury, T A (1992) Regional Diversity in Environmental
Attitudes, Knowledge, and Policy The Kentucky River Authonty Human
Organization 51(2) 99-108
Clawson, M (1959) Methods of Measuring Demand for Outdoor Recreation Reprint
No 10, Resources for the Future Washington DC
Clawson, M and Knetsch, J (1966) Economics of Outdoor Recreation John Hopkins
Baltimore
Colby, B 0 (1989) Estimating the Value of Water in Alternative Uses Natural
Resources Journal 29(2) 5 11-27
Cooper, J and Loomis, J (1992) Sensitivity of Willingness-to-Pay Estimates to Bid
Design in Dichotomous Choice Contingent Valuation Models Land Economics
68(2) 211-24
Coursey, D L, Hovis, J and Schuize, W D (1987) The Disparity Between
Willingness to Accept and Willingness to Pay Measures of Value Quarterly
Journal of Economics 102 679-90
Crew, M A and Kleindorfer, P. R (1979) Public Utility Economics St Martin's
Press New York
Cropper, M L and Oates, W E (1992) Environmental Economics A Survey Journal
of Economic Literature 30 675-40
Cummings, R, Brookshire, D and Schulze, W (1986) Valuing Environmental Goods
An A ssessment of the Contingent Valuation Method Rowman and Allenheld
Totowa, NJ

335
d'Arge, R C and Shogren, J F (1989) Okoboji Experiment Comparing Non-Market
Valuation Techniques in an Unusually Well-Defined Market for Water Quality
Ecological Economics 1 251-259
Daly, HE and J B Cobb (1990) For the Common Good Green Print London
Dasgupta, A K and Pearce, D W (1978) Cost-BenefitAnalysis Theory and Practice
Macmillan, London
David, E L (1971) Public Perceptions of Water Quality Water Resources Research
7 453-457
Department of the Environment (1990) This Common Inheritance London, HMSO
Desvousges, W H, Naughton, M C and Parsons, G R (1992) Benefit Transfer
Conceptual Problems in Estimating Water Quality Benefits Using Existing
Studies Water Resources Research 28(3) 675-83
Desvousges, W H, Smith, V K and McGivney, M (1983) A Comparison of
Alternative Approaches for Estimating Recreation and Related Benefits of
Water Quality Improvements, Environmental Benefits Analysis Senes, EPA-
230-05-83-001 US Environmental Protection Agency Washington, D C
Desvousges, W H, Johnson, F R, Dunford, R W, Boyle, K J, Hudson, S P.
Wilson, K N (1992) Measuring Natural Resource Damages with Contingent
Valuation Tests of Validity and Reliability In Cambridge Economics
Desvousges, W H, Johnson, F R, Dunford, R W, Boyle, K J, Hudson, S P and
Wilson, K N (1993) Measuring Natural Resource Damages with Contingent
Valuation Tests of Validity and Reliability In J A Hausman (ed) Contingent
Valuation A Critical Assessment North-Holland Amsterdam

336
Desvousges, W , Smith, K V , and Fisher, A (1987) Option Price Estimates for Water
Quality Improvements Journal of Environmental Economics and Management
14 248-67
Diamond, P A, Hausman, J A, Leonard, G K and Denning, M A (1993) Does
Contingent Valuation Measure Preferences9 Experimental Evidence In J A
Hausman, (ed) Contingent Valuation A Critical A ssessment North-Holland
Amsterdam
Diamond, P A, Hausman, J A Leonard, G K and Denning, M A (1992) Should
Contingent Valuation Estimates of the Nonuse Value of Natural Resources Be
Used in Public Decision Making and the Liability System7 In Cambridge
Economics
Dickie, M, Fisher, A and Gerking, S (1987) Market Transactions and Hypothetical
Demand Data A Comparative Study Journal of American Statistical
Association 82 69-75
Dorfman, R (1977) Incidence of the Benefits and Costs of Environmental Programs
American Economic Review 67 333-340
Dow, T E, Jr, Archer, L, Khasiam, S and Kekovole, J (1994) Wealth Flow and
Fertility Decline in Rural Kenya Population and Development Review 20(2)
343-364
Downing, P B (1984) Environmental Economics and Policy Little Brown Inc
Boston
Dupuit, J (1844) On the Measurement of the Utility of Public Works International
Economic Papers 2 (1952) 83-110 Also reprinted in English in D Munby
(editor, 1968) Transport Selected Readings Penguin Books Ltd

337
Harmondsworth
Durojaiyae, B 0 and Ikpi, A E (1988) The Monetary Value of Recreational
Facilities in a Developing Economy A Case Study of Three Centres in
Nigeria Natural Resources Journal 28(2) 3 15-28
Edwards, S F (1988) Option Pnces for Groundwater Protection Journal of
Environmental Economics and Management 15(4) 475-87
Ehrlich, P R, Ehrlich, A H and Hoidren, J P (1977) Ecoscience Population,
Resources, Environment W H Freeman and Company San Francisco
Fass, S (1988) Political Economy in Haiti The Drama of Survival Transaction
Books New Brunswick, New Jersey
Feacham, R et al, (1978) Water, Health, and Development An Interdisciplinary
Evaluation Tn-Med Books London
Feachem, R G, Bradley, D J, Garelick, H and Mara, D D (1983) Sanitation and
Disease Aspects of Extreta and Waste Water Management John Wiley and
Sons New York
Feenberg, D and Mills, E S (1980) Measuring the Benefits of Water Pollution
Abatement Academic Press New York
Fischhoff, B, Quadrel, M J, Kamlet, M, Lowenstein, G, Dawes, R, Fischbeck, P,
Klepper, 5, Leland, I and Stroh, P (1993) Embedding Effects Stimulus
Representation and Response Mode Journal of Risk and Uncertainty 6(3) 211-
235
Fischoff, B and Furby, L (1980) Measuring Values A Conceptual Framework for

338
Interpreting Transactions with Special Reference to Contingent Valuation of
Visibility Journal of Risk and Uncertainty 1 147-184
Fischoff, B (1991) Value Elicitation Is There Anything in There 9 Amencan
Psychologist 46 835-847
Fisher, A N and Raucher, R (1984) Intrinsic Benefits of Improved Water Quality
Conceptual and Empirical Perspectives In V K Smith (ed) Advances in
Applied Micro-Economics JAI Press Greenwich, Colorado
Fisher, A, McClelland, 0 H and Schuize, W D (1988) Measures of Willingness to
Pay Versus Willingness to accept Evidence, Explanations and Potential
Reconciliations In G L Peterson, B L Driver and R Gregory (eds) A menily
Resource Valuation Integrating Economics with Other Disciplines, State
College, PA Venture Publishing
Forsyth, D J C (1977) Appropriate Technology in Sugar Manufacturing World
Development 5(3) 189-202
Fox, R C (1991) The Use of Central Place Theory in Kenya's Development
Strategies Journal of Economic and Social Geography 82(2) 106-127
Foxall, C D, Litterick, M R and Njuguna, S G (1987) A Preliminary Study of
Water Quality of Lake Victona, Kenya In W M H Chan, R W M Hoare,
P R Holmes, R J S Law and S B Reed (eds) Pollution in the Urban
Environment Elsevier London
Franceys, R and Pickford, J (1989) Beyond the Water and Sanitation Decade
Science, Technology and Development 7(1) 21-34
Freeman, A M, (1979b) The Benefits of Environmental Improvement Theoiy and
Practice John Hopkins University Press Baltimore, Md
339
Freeman, A M (1979) Approaches To Measuring Public Goods Demands A mencan
Journal of Agricultural Economics 61(5) 915-20
Freeman, A M, (1979a) Hedonic Prices, Property Values and Measuring
Environmental Benefits A Survey of the Issues Scandinavian Journal of
Economics 81(2) 154-173
Freeman, A M (1982) Air and Water Pollution A Benefit-Cost Assessment John
Wiley New York
Friends of the Earth (1990) Beyond Rhetonc Discussion Paper No 2, Friends of the
Earth London
Gestler, D J (1985) Centralized Meter Reading An Overview of Developments to
the Present In Proceedings A WWA Seminar on Customer Metering Practices,
Annual Conference, Washington DC, June 1985 American Water Works
Association, Denver
Gianessi, L P. Peskin, H M and Puffer, C A (1985) A National Data Base of
Nonurban Nonpoint Source Discharges and Their Effect on The Nation's Water
Quality Report Submitted to the U S. EPA Under Cooperative Agreement
CR8 11858-01-0 Resources for the Future, Washington D C, September
Gould, W T S (1995) Ideology and Data Analysis in African Population Policies
The Case of Kenya Applied Geography 15(3) 203-218
Gramlich, F W (1977) The Demand for Clean Water The Case of the Charles River
National Tax Journal 183-94
Green, C H and Tunstall, S M (1991) The Evaluation of River Quality
Improvements by the Contingent Valuation Method Applied Economics 23

340
1135-1 146
Greenley, D A, Walsh, R G and Young, R A (1982) Economic Benefits of
Improved Water Quality Public Perceptions of Option and Preservation
Values Westview, Boulder, Colorado
Greenley, D A, Walsh, R 0 and Young, R A (1981) Option Value Empirical
Evidence from a Case Study of Recreation and Water Quality Quarterly
Journal of Economics 96(4) 657-674
Gregory, P (1980) Assessment of Changes in Employment Conditions in Less
Developed Countries Economic Development and Cultural Change 28(4) 673-
700
Gregory, R, Lichtenstein, S and Slovic, P (1993) Valuing Environmental Resources
A Constructive Approach Journal of Risk and Uncertainty 7 177-198
Grewal, D and Marmorstein, H (1994) Market Price Variation, Perceived Price
Variation, and Consumers' Price Search Decisions for Durable Goods Journal
of Consumer Research 21(3) 253-460
Grossman, P J and Pirozzi, M (1993) An Empirical Test of Free-Rider Behaviour
A ustralian Economic Papers 32(60) 152-160
Haggett, P (1965) LocationalAnalysis in Human Geography Edward Arnold London
Hamermesh, D S and Biddle, J E (1993) Beauty and the Labour Market NBER
Working Paper No 4518 National Bureau of Economic Research, Inc
Cambridge, Massachusetts
Hamilton, L C (1985a) Concerns About Toxic Wastes, Three Demographic
Predictors Sociological Perspective 28 463-486

341
Hamilton, L C (1985b) Who Cares About Water Pollution ? Opinions in A Small-
Town Crisis Sociological Inquiry 55 170-181
Hammack, J and Brown Jr, G M (1974) Waterfowl and Wetlands Towards
B ioeconom ic A nalysis John Hopkins University Press Baltimore, MD
Hanemann, W M (1984) Welfare Evaluations in Contingent Valuation Experiments
With Discrete Responses American Journal of Agricultural Economics
66 332-41
Hanemann, W M (1991) Willingness to Pay and Willingness to Accept How Much
Can They Differ? American Economic Review 81 635-47
Hanley, N D (1992) Are there Environmental Limits to Cost-Benefit Analysis
Envimnmental and Resource Economics 2 33-59
Hanley, N, Spash, C and Walker, L (1994) Problems in Valuing the Benefits of
Biodiversity Protection Discussion Paper in Economics No 94/8 Department
of Economics, University of Stirling, UK
Hanley, N, Spash, C and Walker, L (1995) Problems in Valuing the Benefits of
Biodiversity Protection Environmental and Resource Economics 5 249-272
Hanley, N D (1988) Using Contingent Valuation to Value Environmental
Improvements Applied Economics 20 541-49
Hanley, N D and Knight, J (1992) Valuing the Environment Recent UK Experience
and an Application to Green Belt Land Journal of Environmental Planning and
Management 35(2) 145-161
Hanley, N D (1993) Controlling Water Pollution Using Market Mechanisms Results
from Empirical Studies In (R K Turner ed) Sustainable Environmental
Economics and Management Principles and Practice Belhaven Press London

342
Hanley, N D and Spash, C L (1993) Cost-Benefit Analysis and the Environment
Edward Elgar Adenshoft
Hanley, N D (1989) Valuing Non-Market Goods Using Contingent Valuation
Journal of Economic Surveys 3(3) 235-52
Hardin G (1968) The Tragedy of the Commons Science 162
Harlvorsen, R and Ruby, M (1981) Benefit-Cost A nalysis of A ir Pollution Control
D C Heath Lexington
Hams, B S (1984) Contingent Valuation of Water Pollution Control Journal of
Environmental Management 19(3) 199-208
Hamson, 0 W (1992) Valuing Public Goods with the Contingent Valuation Method
A Critique of Kahneman and Knetsch Journal of Environmental Economics
and Management 23 248-257
Hasher, L and Zacks, R T (1984) Automatic Processing of Fundamental
Information The Case of Frequency of Occurrence American Psychologist
39(12) 1372-1388
Hausman, I A (ed) (1993) Contingent Valuation A Critical Assessment North-
Holland Amsterdam
Herberlein, T A and Bishop, R C (1986) Assessing the Validity of Contingent
Valuation Three Field Expenments Science of Total Environment, 56 99-107
Hemngton, P (1996) Pricing Water Properly Discussion Paper in Public Sector
Economics No 96/6 Public Sector Economics Research Centre, Faculty of
Social Sciences, University of Leicester, UK
Hicks, J R (1941) The Rehabilitation of Consumer Surplus Review of Economic
Studies February 8 108-16

343
Hirji, R F (1990) Institutionalizing Environmental Impact Assessment in Kenya.
Ph D dissertation, Department of Civil Engineering, Stanford University, USA
Hoehn, 1 P and Randall, A (1989) Too Many Proposals Pass the Benefit Cost Test
Amencan Economic Review 79 544-551
Hoehn, J P (1991) Valuing the Multidimensional Impacts of Environmental Policy
Theory and Methods American Journal of Agricultural Economics 73 289-
299
Hoehn, J and Randall, A (1987) A Satisfactory Benefit Cost Indicator from
Contingent Valuation Journal of Environmental Economics and Management
14 226-247
Hoevenagel, R and van der Linden, J W (1993) Effects of Different Descriptions
of the Ecological Good on Willingness to Pay Values Ecological Economics
7 223-238
Hoevenagel, R (1996) The Validity of the Contingent Valuation Method Perfect and
Regular Embedding Environmental and Resource Economics 7 57-78
Holland, A (1995) The Assumptions of Cost-Benefit Analysis - A Philosopher's
View In K Willis and J Corkindale (eds) Environmental Valuation Some
New Perspectives CAB International
Holmes, P R (1989) Research into Health Risks at Bathing Beaches in Hong Kong
Journal of the Institution of Water and Environmental Management 3(5) 488-
495
Holmes, P (1990) Bathing Beach Pollution, Research and Control in Hong Kong
Journal of Institute of Water and Environmental Management London
Hopkinson, P G, Bowers, J K and Nash, C A (1990) The Treatment of Nature

344
Conservation in the Appraisal of Trunk Roads Nature Conservancy Council
Petersborough
Hotelling, H (1938) The General Welfare in Relation to Problems of Taxation and
of Railway and Utility Rates Econometrica 6 242-269
Howe, C W and Smith, M G (1994) The Value of Water Supply Reliability in
Urban Water Systems Journal of Environmental Economics and Management
26(1) 19-30
Hubbell, L K (1977) The Residential Demand for Water and Sewerage Services in
Developing Countries A Case Study of Nairobi Urban and Regional Report
77-14 World Bank Development Economics Department Washington D C
Hull, R B and Buhyoff, G J (1983) Distance and Scenic Beauty A Nonmonotonic
Relationship Environmental Behaviour 15 77-92
Hynes, H B N (1960) The Biology of Polluted Waters Liverpool University Press
Liverpool
ILO/JASPA (1985) Informal Sector in Africa ILO-JASPA Addis Ababa
Jimenez, E (1987) Pricing Policy in the Social Sectors Cost Recovery for Education
and Health in Developing Countries World Bank Washington, D C
Jimenez, B (1983) The Magnitude and Determinants on Home Improvement in Self-
Help Housing Manila's Tondo Project Land Economics 59(1) 70-83
Johnstone, D W M and Horan, N J (1994) Standards, Costs and Benefits An
International Perspective Journal of the Institution of Water and Environmental
Management 8 45

345
Jones, C V Boland, J J Crews, J E, DeKay, C F and Moms, J R (1984)
Municipal Water Demand Statistical and Management Issues Boulder,
Colorado Westview
Jones, C (1983) The Mobilization of Women's Labour for Cash Crop Production A
Game-Theoretic Approach Am encan Journal of A gricultural Economics 65
1049-54
Jordan, J L and Elnagheeb, A H (1993) Willingness to Pay for Improvements in
Dnnking Water Quality Water Resources Research 29(2) 237-245
Journal of Economic Perspectives, JEP (1995) Symposium Report on "Consumption
Smoothing in Developing Countries" Volume 9, No 3, Summer, pp 8 1-128
Just, R E, Hueth, D L and Schmitz, A (1982) Applied Welfare Economics and
Public Policy Englewood Cliffs, NJ Prentice-Hall
Kahneman, D (1986) Comments on the Contingent Valuation Method In R D
Cummings, D S Brookshire and W D Schulze (eds) Valuing Environmental
Goods An A ssessment of the Contingent Valuation Method Rowman and
Allenheld Totowa, NJ
Kahneman, D and Knetsch, J L (1992a) Valuing Public Goods The Purchase of
Moral Satisfaction Journal of Environmental Economics and Management 22
57-70
Kahneman, D and Knetsch, J L (1992b) Valuing Public Goods The Purchase of
Moral Satisfaction Reply Journal of Environmental Economics and
Management 22 90-94
Kahneman, D and Tversky, A (1984) Choices, Values and Frames American
346
Psychologist 39 341-350
Kahneman, D and Tversky, A (1979) Prospects Theory An Analysis of Decisions
Under Risk Econometrica 47 263-91
Kahneman, D , Slovic, P and Tversky, A (eds) (1982) Judgement under Uncertainty
Heuristics and Biases Cambridge University Press, New York, 555pp
Kahneman, D, Knetsch, J L and Thaler, R (1990) The Experimental Tests of the
Endowment Effect and The Coase Theorem Journal of Political Economy
98 1325-48
Kahneman, D , Knetsch, J L and Thaler, R (1986) Fairness as a Constraint on Profit
Seeking Entitlements in the Market American Economic Review 76 728-41
Kahnemann, D, Slovic, P and Tversky, A (1982) Judgement Under Uncertainty
Heuristics and Biases Cambridge University Press New York
Kallqvist, T and Meadows, B S (1977) Pesticide Levels in the Kenyan Rural
Environment African Environment 2(4) 163-170
Kalyanaram, 0 and Little, J D C (1994) An Empincal Analysis of Latitude of Price
Acceptance in Consumer Package Goods Journal of ConsumerResearch 21(3)
408-418
Kanninen, B J (1995) Bias in Discrete Response Contingent Valuation Journal of
Environmental Economics and Management 28(1) 114-125
Katko, T (1990) Reselling and Vending Water Journal of American Water Works
A ssoczation June pp 63-70
Katzman, M (1977) Income and Price Elasticities of Demand for Water in Developing
Countnes Water Resources Bulletin 13 47-55
Kazmier, L J and Pohi, N F (1987) Basic Statistics for Business and Economics

347
McGraw-Hill, Singapore
Kealy, M J, Dovidio, J and Rockel, M (1988) Accuracy in Valuation is a Matter of
Degree Land Economics 64 158-171
Kealy, M J, Mortgomery, M and Dovidio, J F (1990) Reliability and Predictive
Validity of Contingent Values Does the Nature of the Good Matter9 Journal
of Environmental Economics and Management 19 244-63
Keller, K L and Staelin, R (1987) Effects of Quality and Quantity of Information
on Decision Effectiveness Journal of Consumer Research 14 200-2 13
Kemp, M A and Maxwell, C (1993) Exploring a Budget Context for Contingent
Valuation Estimates In J A Hausman (ed) Contingent Valuation A Critical
Assessment North-Holland Amsterdam
King, D (1984) Fiscal Tiers The Economics of Multi-Level Government George
Allen & Unwin London
Kinyanjui, D N and Baker, P R (1980) Report on the Institutional Framework for
Environmental Management and Resource Use in Kenya NES Nairobi
Kisielius, J and Sternthal, B (1986) Examining the Vividness Controversy An
Availability-Valence Interpretation Journal of ConsumerResearch 12 (March)
418-43 1
Kneese, A (1984) Mea&unng the Benefits of Clean Air and Water Resources for the
Future Washington D C.
Knetsch, J L (1989) The Endowment Effect and Evidence of Nonreversible
Indifference Curves American Economic Review 79 1277-84
Knetsch, J L and Sinden, J A (1984) Willingness to Pay and Compensation
Demanded Experimental Evidence of an Unexpected Disparity in Measures

348
of Value Quarterly Journal of Economics 94 507-2 1
Kramer, R A, Sharma, N and Munasinghe, M (1995) Valuing Tropical Forests
Methodology and Case Study of Madagascar World Bank Environment Paper
No 13 World Bank Publications
Krishna, A (1991) Effect of Dealing Patterns on Consumer Perceptions of Dealing
and Willingness to Pay Journal of Marketing Research Vol XXVIII 441-5 1
Kristrom, B (1993) Comparing Continuous and Discrete Contingent Valuation
Questions Environmental and Resource Economics 3 63-71
Knstrom, B and Riera, P (1996) Is the Income Elasticity of Environmental
Improvements Less Than One ? Environmental and Resource Economics 7(1)
45-55
Krupnick, A J, Hamson, K W, Nickell, E J and Toman, M A (1993) Assessing
the Health Benefits of Improved Air Quality in Central and Eastern Europe
Resources 113 7-11
Krupnick, A J (1992) Using Benefit-Cost Analysis to Prioritize Environmental
Problems Resources 106 34-38
Kubebea, M 0 (1995) Personal Communication Maurice Ogutu Kubebea, at the
survey period, was Webuye Divisional Water Officer and an ex-officio member
of the Divisional Development Committee
Kwak, S -J and Russell, C S (1994) Contingent Valuation in Korean Environmental
Planning A Pilot Application to the Protection of Drinking Water Quality in
Seoul Environmental and Resource Economics 4 511-526
Kwoma, R (1995) Personal Communication Richard Kwoma, at the survey period,
was Secretary to Muchi-Milo Water Project and Webuye Divisional

349
Development Officer
Lakatos, I (1970) Falsification and the Methodology of Scientific Research
Programmers In I Lakatos and A Musgrave (eds), Criticism and Growth of
Knowledge Cambndge University Press Cambridge
Lancaster, K J (1965) A New Approach to Consumer Demand Theory Journal of
Political Economy Vol 74
Larnck, R P. Morgan, J N and Nisbett, R E (1990) Teaching the Use of Cost-
Benefit Reasoning in Everyday Life Psychological Science 1 362-370
Lechtenberg, E and Lessley, B V (1992) Water Quality, Cost-Shanng, and
Technical Assistance Perceptions of Maryland Farmers Journal of Soil and
Water Conservation (May-June) 260-64
Leslie, A, Kaufman, E K and Underwood, J (1972) Paper Profits Pollution in the
Pulp and Paper Industty MIT Press Cambridge MA
Letson, D (1992) Investment Decisions and Transferable Discharge Permits An
Empirical Study of Water Quality Management under Uncertainty
Environmental and Resource Economics 2(5) 441-458
Lindh, G (1990) The Need for Integrated Water Management in Large Urban Areas
Nature and Resources 26(3). 29-33
Little, J M D (1965) A Critique of Welfare Economics 2nd Edition Claredon
Press Oxford
Loomis, J B (1989) Test-retest Reliability of the Contingent Valuation Method A
Comparison of General Population and Visitor Response, American Journal of
A gricultural Economics 71 (Feb) 76-84

350
Loomis, J B (1990) Comparative Reliability of the Dichotomous Choice and Open-
Ended Contingent Valuation Techniques Journal of Environmental Economics
and Management 18 78-85
Loomis, J (1987) Expanding Contingent Valuation Sample Estimates to Aggregate
Benefit Estimates Current Practices and Proposed Solutions Land Economics
63(4) 396-402
Loomis, J B (1987) Balancing Public Trust Resources of Mono Lake and Los
Angeles' Water Right An Economic Approach Water Resources Research 23
1449- 1456
Lovei, L and Whittington, D (1991) Rent Extracting Behaviour by Multiple Agents
in the Provision of Municipal Water Supply A Study of Jakarta, Indonesia
Water Resources Research 29(7) 1965-1974
Lovrich, N P, Jr, Pierce, J C, Tsurutani, T and Abe, T (1986) Policy Relevant
Information and Public Attitudes Is Public Ignorance a Barrier to Nonpoint
Pollution Management9 Water Resources Bulletin 22 229-236
Lowe, G D and Dunlap, R E (1980) The Social Bases of Environmental Concern
A Review of Hypotheses, Explanations, and Empirical Evidence Public
Opinion Quarterly 44 181 181-197
Ludwig, H F and Browder, 0 (1992) Appropriate Water Supply and Sanitation
Technology for Developing Countries in Tropical Monsoon Climates The
Environmentalist 12(2) 131-9
Lund, J R (1988) Metering Utility Services Evaluation and Maintenance Water
Resources Research 24(6) 802-881
Lutz, M A and Lux, K (1988) Humanistic Economics The New Challenge

351
Bootstrap Press New York
Lutz, B and Young, M (1992) Integration of Environmental Concerns into
Agricultural Policies of Industrial and Developing Countries World
Development 20(2) 241-53
Lyon, R M and Farrow, S (1995) An Economic Analysis of Clean Water Act
Issues Water Resources Research 3 1(1) 213-223
Maddala, G S (1992) Introduction to Econometrics Macmillan New York
Magnussen, K (1992) Valuation of Reduced Water Pollution Using the Contingent
Valuation Method Methodology and Empirical Results PhD Dissertation,
Norwegian Agricultural Economics Research Institute Oslo
Maille, P and Mendelsohn, R (1993) Valuing Ecotourism in Madagascar Journal of
Environmental Management 38 213-218
Majunder, S K, Miller, E W and Parizek, R R (1990) Water Resources in
Pennsylvania A vailability, Quality, and Management Philadelphia Academy
of Sciences Phillipsburg, NJ
Maler, K -G (1985) Welfare Economics and the Environment In A V Kneese and
J L Sweeney eds Handbook of Natural Resources and Energy Economics
North Holland
Maler, K G (1974) Environmental Economics A Theoretical Inqui,y The John
Hopkins University Press Baltimore, Md.
Mann, H B and Whitney, R (1947) On a Test of Whether One of Two Random
Variables is Stochastically Larger than the Other A nnals of Mathematical
Statistics 18 50-60
352
Manser, M and Brown, M (1980) Mamage and Household Decision-Making A
Bargaining Analysis International Economic Review 21 31-44
March, J G (1978) Bounded Rationality, Ambiguity, and the Engineering of Choice
Bell Journal of Economics 9 587-608
Marshall, A (1907) Principles of Economics 5th edition London
Mason, R D (1970) Statistical Techniques in Business and Economics Richard D
Irwin, Inc Illinois, USA
McAllister, D M (1980) Evaluation in Environmentap Planning MIT Press
Cambridge, MA
McElroy, M B and Homey, M J (1981) Nash-Bargained Household Decisions
Toward a Generalization of the Theory of Demand International Economic
Review 22 333-50
McFadden, D and Leonard, 0 (1993) Issues in the Contingent Valuation of
Environmental Goods Methodologies for Data Collection and Analysis In J
A Hausman (ed) Contingent Valuation A CriticalAssessment North-Holland
Amsterdam
McFadden, D (1981) Econometric Models of Probabilistic Choice In (C Manski and
D McFadden, eds) Structural A nalysis of Discrete Data. MIT Press
Cambridge, Mass
McFadden, D L and Leonard, G K (1992) Issues in the Contingent Valuation of
Environmental Goods Methodologies for Data Collection and Analysis In
Cambridge Economics (ed) Contingent Valuation A Critical A ssessment
Cambndge Economics, Inc Cambridge
McFadden, D (1973) Conditional Logit Analysis of Qualitative Choice Behaviour

353
In (P Zarembra, ed) Frontiers in Economics Academic Press New York
McPhail, A A (1993) The Five Percent Rule for Improved Water Service Can
Households Afford More9 World Development, 2 1(6) 963-974
McPhail, A A (1994) Why Don't Households Connect to the Piped Water System7
Observations from Tunis, Tunisia Land Economics 70(2) 189-196
Meghir, C and Robin, J-M (1992) Frequency of Purchases and the Estimation of
Demand Systems Journal of Econometncs 53 53-85
Meier, P and Munasinghe, M (1992) Incorporating Environmental Concerns into
Energy Sector Decisionmaking", ENV Department, Washington D C World
Bank
Mendenhall, W, Reinmuth, J E, Beaver, R and Dunhan, D (1986) Statistics for
Management and Economics 5th edn Duxbury Press Boston
Meyer, P (1979) Publicly Vested Values for Fish and Wildlife Criteria in Economic
Welfare and Interface with the Law Land Economics 55(2) 223-5
Miracle, M P, Miracle, D S and Cohen, L (1980) Informal Savings Mobilisation
in Africa Economic Development and Cultural Change 28(4) 701-724
Mitchell, R C and Carson, R T (1985) Option Value Empirical Evidence From a
Case Study of Recreation and Water Quality Comments, Quarterly Journal of
Economics 100 29 1-294
Mitchell, R C and Carson, R T (1989) Using Surveys to Value Public Goods The
Contingent Valuation Method Resources for the Future Washington, D C
Moffat, P. G (1995) On the Timing of Household Purchases The Economics
Research Centre Discussion Paper No 9511 School of Economic and Social
Studies, University of East Anglia, UK

354
Moore, D L, Hausknecht, D and Thamodaran, K (1986) Time Compression,
Response Opportunity, and Persuasion Journal of Consumer Research 13
(June) 85-99
Mu, X, Whittington, D and Briscoe, J (1990) Modeling Village Water Demand
Behaviour a Discrete Choice Approach WaterResources Research 26(4) 521-
529
Munasinghe, M (1990b) The Pricing of Water Services in Developing Countries
Natural Resources Forum 14(August) 193-209
Munasinghe, M (1988a) Principles of Water Supply Pncing in Developing Countries
LAC No IDP-19 The World Bank Washington, DC
Munasinghe, M (1988b) Contemporary Water Supply Efficiency and Pncing Issues
in Developing Countries Pmceedings of the International Conference on Cost
and Price of Water in Urban A reas Pans, December
Munasinghe, M (1992) Water Supply Economics and Environmental Management
Westview Boulder, Colorado Chap 1
Munasinghe, M (1990) Electric Power Economics Butterworths Press London
Munasinghe, M (1993) Environmental Issues and Economic Decisions in Developing
Countries World Development 21(11) 1729-48
Munasinghe, M (1990a) Water Supply Economics and Environmental Management
World Bank Washington, D C
Munroe, K B (1973) Buyers' Subjective Perceptions of Price Journal of Marketing
Research 10(February) 70-80
Nash, J F (1953) Two-Person Co-operative Games Econometrica 21 128-40

355
National Council for Population and Development, Central Bureau of Statistics and
Macro International Inc (1994) Kenya Demographic and Health Survey 1993
NCPD, CBS and MI Calverton, Maryland
National Council for Population and Development (1989) Kenya Demographic and
Health Survey 1989 NCPD, Nairobi
Navrud, S and Mungatana, E D (1994) Environmental Valuation in Developing
Countries The Recreational Value of Wildlife Viewing Ecological Economics
11 135-151
NOAA, National Oceanic and Atmosphenc Administration (1993) Natural Resource
Damage Assessments Under the Oil Pollution Act of 1990 Appendix I -
Report of the NOAA Panel on Contingent Valuation Federal Register 58(Jan)
4601-14
Norgaard, R (1989) The Case for Methodological Pluralism Ecological Economics
1 37-58
North, J H and Griffin, C C (1993) Water Source as a Housing Characteristic
Hedonic Property Valuation and Willingness to Pay for Water Water
Resources Research 29(7) 1923-30
Nyaoro, W (1992) Water Supply and Consumption in Eldoret, M Phil thesis, Moi
University School of Environmental Studies, Eldoret
O'Doherty, R K (1995) A Review of Benefit Transfer Why and How" British
Review of Economic Issues 17(43) 1-15
Olsen, D, Richards, J and Scott, D (1991) Existence and Sport Values for Doubling
the Size of Columbia River Basin Salmon and Steelhead Runs Rivers 2(1)

356
44-56
Organisation for Economic Cooperation and Development (1987) Pricing of Water
Services OECD Paris
Oster, S (1977) Survey Results on the benefits of Water Pollution Abatement in the
Merrimack River Basin Water Resources Research 13(6) 882-884
Ostrom, E (1990) Governing the Commons The Evolution of Institutions for
Collective A ction Cambridge University Press Cambndge
Owen, R and Hanley, N D (1994) Embedding and the Contingent Valuation of
SSSIs in the UK Unpublished manuscript Environmental Economics Research
Group, University of Stirling, Scotland, UK
Padgitt, 5 (1989) Farmers' View on Groundwater Qualily Concerns, Practices, and
Policy Preferences Staff Report, U S Office of Technology Assessment
Washington DC
Paoletti, M G and Pimentel, D (1995) The Environmental and Economic Costs of
Herbicide Resistance and Host-Plant Resistance to Plant Pathogens and Insects
Technological Forecasting and Social Change 50 9-23
Paulsen, C M (1993) Cost-Effective Control of Water Pollution in Central and
Eastern Europe Resources 113 28-31
Pearce, D W (1976) The Limits of Cost-Benefit Analysis as a Guide to
Environmental Policy Kyklos, 29(1) 97-112
Pearce, D W (1980) The Social Evidence of Environmental Costs and Benefits In
T O'Riordan and K Turner (eds) Progress in Resource Management and
Environmental Planning, Volume 2 Wiley & Sons Ltd London

357
Pearce, D W, Markandya, A and Barbier, E (1989) Blueprint for a Green Economy
Earthscan London
Pearce, D W and Markandya, A (1989) Environmental Policy Benefits Monetary
Evaluation OECD Paris
Pearce, D, Markandya, A and Barbier, E (1989) Blueprint for a Green Economy
London, Earthscan
Pearce, D W and Nash, C A (1981) The Social Appraisal of Projects A Text in
Cost-Benefit A nalysis Macmillan Press, London
Pearson, R and Penridge, L (1987) The Effects of Pollution by Organic Sugar
Effluent on the Macro-Invertebrates of a Stream in Tropical Queensland,
Australia Journal of Environmental Management 24 205-215
Penning-Rowsell, E C et al (1992) The Economics of Coastal Management A
Manual for Benefit Assessment Techniques Belhaven Press London and
Florida
Pernngs, C, Folke, C and Maler, K -G (1992) The Ecology and Economics of
Biodiversity Loss The Research Agenda Ambio 21(3) 201-211
Peskin, H M and Seskin, E (1975) Cost BenefitAnalysis and Water Pollution Policy
The Urban Institute, Washington DC
Peters, C M , Gentry, A H and Mendelson, R 0 (1989) Valuation of an Amazonian
Rainforest Nature 339 655-6
Petty, R E and Cacioppo, J T (1984) The Effects of Involvement on Responses to
Argument Quantity and Quality Central and Peripheral Routes to Persuasion
Journal of Personality and Social Psychology 46 (January) 69-8 1
Pickford, J (1986) Water and People Developing World Water 1 23-24

358
Pindyck, R S and Rubinfeld, D L. (1991) Econometric Models and Economic
Forecasts McGraw-Hill, London
Pitt, M M and Rosenzweig, M R (1985) Health and Nutrient Consumption Across
and Within Farm Households Review of Economics and Statistics 67 2 12-23
Popper, K R (1968) The Logic of Scientific Discovery Hutchinson London
Porter, R S and Walsh, M R (1978) Cost-Effectiveness in Practice A Case Study
of Domestic Water Supplies in an African Country World Development 6(2)
195-208
Postel, 5 (1992) The Last Oasis Facing Water Scarcity Earthscan, London
Powell, J L (1986) Symmetrically Trimmed Least Squares Estimation for Tobit
Models Econometrics 54 1435-1460
Priscoli, 1 D (1987) Social Science, Engineenng and Water Resources Management
A Perspective In D Baumann and Y Haimes (editors) The Role of Social and
Behavioural Sciences in WaterResources Planning and Management American
Society of Civil Engineers New York pp. 5-39
Ramjeawon, T and Baguant, 1 (1995) Evaluation of Critical BOD Loadings from
Mauritian Sugar Factories to Streams and Standards Setting Journal of
Environmental Management 45(2) 163-176
Randall, A and Stoll, I R (1980) Consumer Surplus in Commodity Space A merican
Economic Review 70 449-55
Randall, A, Ives, B and Eastman, C (1974) Bidding Games for Valuation of
Aesthetic Environmental Improvements Journal of Environmental Economics
and Management 1 132-149
Randall, A and Hoehn, J P (1989) Benefit Estimation for Complex Policies In (H

359
Folmer and E van lerland, eds) Valuation Methods and Policy Making in
Environmental Economics Elsevier Science Publishers Amsterdam
Randall, A and Hoehn, J P (1993) Embedding Effects in Contingent Valuation
Department of Agricultural Economics, Michigan State University Staff Paper
No 93-06 (unpublished), 28 pp
Rao, V (1993) The Rising Price of Husbands A Hedonic Analysis of Dowry
Increases in Rural India Journal of Political Economy 101(4) 666-77
Raz, J (1986) The Morality of Freedom Oxford, Claredon
Renzetti, S (1990) The Economics of a Seemingly Abundant Resource Efficient
Water Pricing in Vancouver, Canada Ph D diss, The University of British
Columbia, Vancouver
Renzetti, S (1992) Evaluating the Welfare Effects of Reforming Municipal Water
Prices Journal of Environmental Economics and Management 22(2) 147-163
Republic of Kenya (1983b) Bun goma District Development Plan, 1983-88
Government Printer Nairobi
Republic of Kenya (1983a) National Development Plan Government Printer Nairobi
Republic of Kenya (1994) Bun goma District Development Plan 1994-1996 Office of
the Vice-President and Ministry of Planning and National Development
Nairobi
Republic of Kenya (1989) National Development Plan, 1989-93 Government Printer
Nairobi
Robinson, P R (1988) Willingness to Pay for Rural Water the Zimbabwe Case
Study A Report to the Infrastructure and Urban Development Department The
World Bank 72 pages, Zimconsult Harare Zimbabwe

360
Robinson, W C (1992) Kenya Enters the Fertility Transition Population Studies
46(3) 445-457
Rogers, L B and Schlossman, N P (eds) (1990) Intra-Household Resource
Allocation Issues and Methods for Development Policy and Planning United
Nations University Press, Tokyo
Rosen, S (1974) Hedonic Prices and Implicit Market Product Differentiation in Pure
Competition Journal of Political Economy 34-35
Rosenberg, M L, Hazlet, K K, Schaefer, J, Wells, J G and Pruneda, P C (1976)
Shigellosis from Swimming Journal of the American Medical Association
230(16) 1849-52 Annex A
Roth, 0 (1987) The Private Provision of Public Services in Developing Countries
Oxford University Press London
Rowe, R D, d'Arge, R C and Brookshire, D S (1980) An Experiment on the
Economic Value of Visibility Journal of Environmental Economics and
Management 7 1-19
Ruggles, N (1959a) The Welfare Basis of the Marginal Cost Pricing Pnnciple
Review of Economic Studies 17 29-46
Ruggles, N (1959b) Recent Developments in the Theory of Marginal Cost Pricing
Review of Economic Studies 17 107-126
Sagoff, M (1988) The Economy of the Earth Cambridge University Press
Cambridge
Sahba, B C, Bush, D B, Martin, W E and Brown, T C (1987) Do Water Market
Prices Appropriately Measure Water Values Natural Resources Journal 27

361
617-65 1
Samples, K , Dixon, J and Gowen, M (1986) Information Disclosure and Endangered
Species Valuation Land Economics 62(3) 306-12
Samuelson, P A (1955) Diagrammatic Exposition of a Pure Theory of Public
Expenditure Review of Economics and Statistics 37
Sanders, L, Walsh, R and Loomis, J (1990) Toward Empirical Estimation of the
Total Value of Protecting Rivers Water Resources Research 26(7) 1345-1358
Sangodoyin, A Y (1993) Women's Role in Rural Water Supply and Development
Trends and Expectations in Nigeria The Environmentalist 13(4) 255-61
Scanlan, M (1994) The Reliability of the Contingent Valuation Method What Can
We Learn from Anomalies in Survey Resu1ts Discussion Papers in
Economics No 94-01 The University of West London Brunel, UK
Schechter, M (1985) An Anatomy of a Groundwater Contamination Episode Journal
of Environmental Economics and Management 12(1) 72-88
Scherr, B A and Babb, E M (1975) Pricing Public Goods An Experiment with Two
Proposed Pricing Systems Public Choice 23 35-48
Schulze, W D, d'Arge, R C and Brookshire, D S (1981) Valuing Environmental
Commodities Some Recent Experiments Land Economics 57(2) 151-172
Schulze, W D (1992) Use of Direct Methods for Valuing Natural Resource Damages
In (R J Kopp and V K Smith, eds) Valuing Natural A ssets Resources for
the Future, Inc Washington D C
Sellar, C, Chavas, J and Stoll, J R (1986) Specification of the Logit Model The
Case of Valuation of Nonmarket Goods Journal of Environmental Economics
and Management 13 382-390

362
Seller, C, Stoll, J and Chavas, J -P (1985) Validation of Empirical Measures of
Welfare Change A Comparison of Nonmarket Techniques Land Economics
61 156-175
Sen, A K (1987) On Ethics and Economics Basil Blackwell London
Sen, A K (1977) Rational fools a critique of the behavioural foundations of
economic theory Philosophy and Public Affairs 6 317-44
Shogren, J F, Shin, S Y, Hayes, D J and Kliebenstein, J B (1994) Resolving
Differences in Willingness to Pay and Willingness to Accept A merican
Economic Review 84(1) 255-270
Shortle, J and Dunn, J (1991) The Economics of Control of Nonpoint Pollution from
Agriculture In N Hanley (ed) Farming and the Countryside An Economic
A nalysis of External Costs and Benefits CAB International, Wallingford,
Oxon pp 29-47
Shultz, S D and Lindsay, B E (1990) The Willingness to Pay for Groundwater
Protection Water Resources Research 29(6) 1869-1875
Shyamsundar, P and Kramer, R A (1996) Tropical Forest Protection An Empirical
Analysis of the Costs Borne by Local People Journal of Environmental
Economics and Management 31(2) 129-144
Shyamsundar, P and Kramer, R A (1993) Does Contingent Valuation Work in
Nonmarket Economies9 American Journal of Agricultural Economics 75(5)
1309
Simon, H A (1955) A Behavioural Model of Rationality Choice Quarterly Journal
of Economics 69 99-118
Sims, J H (1978) The Sociopsychology of Responses to Resource Issues In D Holtz
363
and S Sebastian (eds) Municipal Water Systems Indiana University Press
Bloomington
Singh, B , Ramasubban, R, Bhatia, R, Briscoe, J, Griffin, C C and Kim, C (1993)
Rural Water Supply in Kerala, India How to Emerge From a Low-Level
Equilibnum Trap Water Resources Research 29(7) 1931-1942
Slovic, P Griffin, D and Tversky, A (1990) Compatibility Effects in Judgement and
Choice In R M Hogarth (ed) Insights in Decision Making A Tribute to
Hillel J Einhorn University of Chicago Press Chicago
Smith, V K (1979) Incentive Compatible Experimental Processes for the Provision
of Public Goods In V L Smith (ed), Research in Experimental Economics,
Vol 1, Connecticut, JAI Press, Inc
Smith, V K (1992) Arbitrary Values, Good Causes and Premature Verdicts Journal
of Environmental Economics and Management 22 71-89
Smith, V K (1993) Nonmarket Valuation of Environmental Resources An
Interpretive Appraisal Land Economics 69(1) 1-26
Smith, V K et al (1991) How Reliable are Contingent Valuation Surveys for Policies
in Developing Economies Resource and Environmental Economics Program,
North Carolina State University
Smith, V K and Huang, I C (1993) Hedonic Models and Air Pollution Twenty-Five
Years and Counting Environmental and Resource Economics 3(4) 38 1-94
Smith, V K, Desvousges, W H and Fisher, A (1986) A Comparison of Direct and
Indirect Methods for Estimating Environmental Benefits American Journal of
A gncultural Economics 68 280-90
Smith, V K (1987) Uncertainty, Benefit-Cost Analysis, and the Treatment of Option

364
Value Journal of Environmental Economics and Management 14 283-292
Smith, V K and Desvousges, W H (1986) Measuring Water Quality Benefits
Kluwer-Nihjoff Publishing, Boston
Smith V K and Koaru, Y (1990) Signals and Noise 9 Explaining the Vanation in
Recreation Benefit Estimates American I A gricultural Economics 72 419-33
Smith, V K (1977) The Principal of Unanimity and Voluntary Consent in Social
Choice Journal of Political Economy 85 1125-39
Smoke, P (1993) Local Government Fiscal Reform in Developing Countries Lessons
From Kenya World Development 21(6) 901-923
Southwick, L M, Willis, G H, Johnson, D C, and Selim, H M (1995) Leaching
of Nitrate, Altrazine, and Metribuzin from Sugarcane in Southern Louisiana
Journal of Environmental Quality 24 684-690
Spash, C L (1993) Economics, Ethics and Long-term Environmental Damage7
Environmental Ethics 15(2) 207-20
Spash, C L and d'Arge, R C (1989) The Greenhouse Effect and Intergenerational
Transfers Energy Policy 17(2) 88-96
Stanley, T D and Jarrell, S B (1989) Meta-Regression Analysis A Quantitative
Method of Literature Surveys Journal of Economic Surveys 3(2) 16 1-170
Steel, W F and Aryeetey, E (1994) Informal Savings Collectors in Ghana Can They
Intermediate9 Finance and Development 3 1(1) 36-37
Strauss, J (1986) Does Better Nutrition Raise Farm Productivity Journal of Political
Economy 94 297-320
Sutherland, R J and Walsh, R G (1985) Effect of Distance on the Preservation
Value of Water Quality Land Economics 61 281-291
365
Swallow, B M and Woudyalew, M (1994) Evaluating Willingness to Contribute to
a Local Public Good Application of Contingent Valuation to Tsetse Control
in Ethiopia Ecological Economics 11 153-161
Tan, J et al (1984) User Charges for Education The Ability and Willingness to Pay
in Malawi Staff Working Paper 661, Washington DC The World Bank
Taylor, P (1986) Respect for Nature A Theory of Environmental Ethics Princeton
University Press Princeton
Thayer, M A (1981) Contingent Valuation Techniques for Assessing Environmental
Impacts Further Evidence Journal of Environmental Economics and
Management 8 27-44
Thitai, W (1981) Industrial Development and Environment in Kenya In
GOKJUNDPIUNEP Project on Environment and Development NES Nairobi
Thobani, M (1983) Efficiency and Equity Implications of User Charges in Social
Sector Services The Financing of Education in Malawi Staff Working Paper
572, Washington DC. The World Bank
Thomas, D H L, Ayache, F and Holhs, G E (1991) Use and Non-use Values in the
Conservation of Ichkeul National Park, Tunisia Environmental Conservation
18(2) 119-130
Tisdell, C (1986) Cost-Benefit Analysis, the Environment and Informational
Constraints in LDCs Journal of Economic Development 11 63-8 1
Tobias, D and Mendelson, R (1991) Valuing Ecotourism in a Tropical Rain-forest
Reserve Amb:o 20(2) 91-3
Tolentino, A S (1986) Environmental Legislation and Administration and Its

366
Application in Selected DMC's In Environmental Planning and Management
Asian Development Bank Manila, Philippines
Train, R F, Agee, T L, Gywin, A and Dellinger, R W (1975) Development
Document for Interim Final Effluent Limitations Guidelines and Proposed
New Source Performance Standards for the Raw Cane Sugar Processing
Segment of the SugarPmcesszng Point Source Category EPA-440 11-74-002-C,
USEPA Washington DC
Trihey, E W and Stalnaker, C B (1985) Evolution and Application of Instream Flow
Methodologies to Small Hydropower Developments An Overview of the
Issues In F. Olson, R White and R Hamre (editors) Proceedings on Small
Hydropower and Fisheries American Fisheries Society Bethesda, MD pp
167-183
Tversky, A and Kahneman, D (1973) Availability A Heuristic for Judging
Frequency and Probability Cognitive Psychology 5 207-232
Tversky, A (1977) Features of Similarity Psychological Review 84(4) 327-53
Tversky, A , Sattath, S and Slovic, P (1988) Contingent Weighting in Judgement and
Choice Psychological Review 95 37 1-384
Tversky, A and Gati, I (1978) Studies of Similarity In E Rosch and B Lloyd (eds)
Cognition and Categorization, pp 81-98 Hilisdale, NJ Eribaum
U S Environmental Protection Agency (EPA) (1994) President Clinton's Clean Water
Initiative Analysis of Benefits and Costs Rep EPA 800-R-94-002
Washington DC, March
U S Environmental Protection Agency (EPA) (1991) 1990 Needs Survey Report to

367
Congress Assessment of Needed Publicly Owned Wastewater Treatment
Facilities in the United States--Including Federally-Recognized Indian Tnbes
and A laska Native Villages Report Washington, D C, July.
UNDP, United Nations Development Programme (1994) Human Development Report
1993 Oxford University Press Oxford
UNDP, United Nations Development Programme (1980) Background Papers for
Global Consultation on Safe Water and Sanitation for the 1990s UNDP
UNEP, United Nations Environmental Programme (1987) Kenya National State of the
Environment Report UNEP, Nairobi
van der Plight, J Eiser, J R and Spears, R (1988) Comparative Judgements and
Preferences The Influence of the Number of Response Alternatives British
Journal of Social Psychology 26 269-280
van Pelt, M J F (1993) Ecologically sustainable development and project appraisal
in developing countries Ecological Economics 7 19-42
Vaughan, W J and Russell, C S (1982) Valuing a Fishing Day An Application of
a Systematic Varying Parameter Model Land Economics 58(4) 450-63
Walsh, R G, Johnson, D M and McKean, J R (1989) Issues in Non-Market
Valuation and Policy Application A Retrospective Glance Western J
Agricultural Economics 14 178-88
Walsh, R 0, Loomis, I B and Gilman, R A (1984) Valuing Option, Existence and
Bequest Demands for Wilderness Land Economics 60(1) 14-29
Wanke, M, Schwarz, N and Noelle-Neumann, E (1995) Asking Comparative

368
Questions The Impact of the Direction of Comparison Public Opinion
Quarterly 59(3) 347-372
Warnock, J W and Lewis, J (1978) The Other Face of 2,4-D A Citizens Report
South Okanagan Environmental Coalition Penticton, Bntish Columbia
Wasike, W S K (1993) Environmental Policy and Resource Management in Africa
The Case of Kenya. Unpublished MA dissertation University of Leeds School
of Business and Economic Studies, UK.
Wasike, W S K (1992) A Socio-Economic Assessment of Constraints in Renewable
Energy Options for Tobacco Curing in Bungoma-Busia Region, Kenya
Unpublished MPhil thesis, Moi University School of Environmental Studies,
Eldoret, Kenya
Webuye Municipal Council (1994) Webuye Environment Development Plan and
A ction Plans A Report on Environment and Urban Development Training
Project in cooperation with Webuye Town Council WMC Webuye, Kenya
White, B N F (1980) Rural Household Studies in Anthropological Perspective In
(H -P Binswanger, R E Evenson, C A Florencio and B N F White eds)
Rural Household Studies in Asia Singapore University Press Singapore.
Whittington, D (1992) Possible Adverse Effects of Increasing Block Water Tariffs
in Developing Countries Economic Development and Cultural Change 41(1)
75-87
Whittington, D , Mujwahuzi, M, McMahon, G and Choe, K (1989a) Willingness to
Pay for Water in Newala District, Tanzania Strategies for Cost Recovery
WASH Field Report No 246, Washington, D C
Whittington, D, Lauria, D T, Mu, X (1991) A Study of Water Vending and

369
Willingness to Pay for Water in Onitsha, Nigeria World Development 9(2/3)
179-198
Whittington, D, Briscoe, J, Mu, X and Barron, W (1990) Estimating the
Willingness to Pay for Water Services in Developing Countries A Case Study
of the Use of Contingent Valuation Surveys in Southern Haiti Economic
Development and Cultural Change 38(4) 293-3 11
Whittington, D and Swarna, V (1994) The Economic Benefits of Potable Water
Supply Projects to Households in Developing Countries Economic Staff Paper
Number 53 Economics and Development Resource Center Asian
Development Bank Manila, Philippines
Whittington, D, Lauria, D T, Okun, D A and Mu, X (1989b) Water Vending
Activities in Developing Countries A Case Study of Ukunda, Kenya
International Journal of Water Resources Development September, pp 158-
168
Whittington, D, Mu, X and Roche, R (1990a) Calculating the Value of Time Spent
Collecting Water Some Estimates for Ukunda, Kenya World Development
18(2) 269-80
Whittington, D, Lauria, D T and Mu, X (1991) A Study of Water Vending and
Willingness to Pay for Water in Onitsha, Nigeria World Development 19(2/3)
179-98
Whittington, D and Swarna, V (1994) The Economic Benefits of Potable Water
Supply Projects to Households in Developing Countries Economic Staff Paper
No 53 Economics and Development Resource Center, Asian Development
Bank Manila, Philippines

370
Whittington, D, Lauria, D T, Wright, A M, Choe, K, Hughes, J A and Swarna,
V (1993a) Household Demand for Improved Sanitation Services in Kumasi,
Ghana A Description of Current Practices, Attitudes, and Perceptions World
Development 21(5) 733-748
Whittington, D, Okorafor, A, Okore, A and McPhail, A A (1990b) Strategy for
Cost Recovery in the Rural Water Sector A Case Study of Nsukka District,
Anambra State, Nigeria Water Resources Research 26(9) 1899-1913
Whittington, D, Lauria, D T, Wright, A M, Choe, K, Hughes, J A and Swarna,
V (1993b) Household Demand for Improved Sanitation Services in Kumasi,
Ghana A Contingent Valuation Study Water Resources Research 29(6) 1539-
60
Whittington, D Smith, V K, Okorafor, A, Liu, J L and McPhail, A (1992) Giving
Respondents Time to Think in Contingent Valuation Studies A Developing
Country Application Journal of Environmental Economics and Management
22 205-225
Whittington, D, Lauria, D T, Okun, D A and Mu, X (1988) Water Vending and
Development Lessons from Two Countries Technical Report No 45,
Washington D C
WHO, World Health Organisation (1987) The International Drinking Water Supply
and Sanitation Decade Review of Mid-Decade Pmgress (As at December
1985) WHO, Geneva
Wilcoxon, F (1945) Individual Comparisons by Ranking Methods Biometrics 1 80-3
Williams, S (1985) How Familiarity of a Landscape Affects Appreciation of It
Journal of Environmental Management 21 63-67

371
Williams, R I, Brooke, D N, Matthiessen, Mills, M, Tumbull, A and Hamson, R
M (1995) Pesticide Transport to Surface Waters within an Agricultural
Catchment Journal of the Institution of Water and Environmental Management
9(1) 72-81
Willig, R (1976) Consumer Surplus Without Apology American Economic Review
66 589-97
Willis, K (1995) Benefits Transfer In K Willis and J Corkindale (eds)
Environmental Valuation New Directions CAB International Oxford
Willis, K G (1990) Valuing Non-Market Wildlife Commodities An Evaluation and
Comparison of Benefits and Costs Applied Economics 22 13-30
Willis, G H, Fouss, J L, Rogers, J S. Carter, C E, and Southwick, L M (1991)
System Design for Evaluation and Control of Agrochemical Movement in Soils
Above Shallow Water Tables In R G Nash and Leslie, A R (eds)
Groundwater Residue Sampling Design ACS Symposium Ser 465 American
Chemical Society Washington, DC
Willis, K 0 and Garrod, G D (1995) The Benefits of Alleviating Low Flows in
Rivers International Journal of WaterResources Development 11(3) 243-260
Winer, R 5 (1986) A Reference Pnce Model of Brand Choice for Frequently
Purchased Products. Journal of Consumer Research 13 (September) 250-156
Winpenny, J (1994) Managing Water as an Economic Resource Routledge London
World Bank (1987) A lgeria Second National Water Supply and Sewerage Project.
Staff Appraisal Report No 6582a, Washington, DC
World Bank (1986) Hashemite Kingdom of Jordan, Jordan Water Supply and
Sewerage Project Staff Appraisal Report No 6056-JO, Washington, DC

372
World Bank (1992) Sector Operations Review The Water Supply and Waste Disposal
Program in Tunisia. Report No 4146, Washington, DC
World Bank (1994) World Development Report 1994 Oxford University Press New
York
World Bank Water Demand Research Team (1993) The Demand for Water in Rural
Areas Determinants and Policy Implications The World Bank Research
Observer 8(1) 47-70
Wright, P L (1975) Consumer Choice Strategies Simplifying vs Optimizing Journal
of Marketing Research 12(February) 60-67
Zajonc, R B (1968) Attitudinal Effects of Mere Exposure Journal of Personality and
Social Psychology Monograph Supplement 9(2) 1-28
Zaroff, B and Okun, D A (1984) Water Vending in Developing Countries A qua 5
289-295