Institute for Ergonomics Research - DTIC
367
DEVELOPMENT OF A FEMALE ATLAS OF STRENGTHS 0 0) FINAL REPORT (V) FEBRUARY, 1982 DTIC ft lECTE JUN 20 1990 D M.M. AYOUB C.F. GIDCUMB M.J. REEDER M.Y. BESHIR H.A. HAIFEZ F. AGHAZADEH N.J. BETHEA Institute for Ergonomics Research L? ve Wo, I-bo, ,.oas TEXAS TECH UNIVCRSITY 6.:. , dt12 unon Un. Lubbock, Texas 79409 90 0 ! 093 1
-
Upload
khangminh22 -
Category
Documents
-
view
0 -
download
0
Transcript of Institute for Ergonomics Research - DTIC

DEVELOPMENT OF A FEMALE ATLAS OF STRENGTHS
0
0) FINAL REPORT
(V) FEBRUARY, 1982
DTICft lECTEJUN 20 1990D
M.M. AYOUBC.F. GIDCUMBM.J. REEDERM.Y. BESHIRH.A. HAIFEZF. AGHAZADEHN.J. BETHEA
Institute for Ergonomics Research
L? ve Wo, I-bo, ,.oas TEXAS TECH UNIVCRSITY6.:. , dt12 unon Un.
Lubbock, Texas 79409
90 0 ! 0931

ACKNOWLEDGEHENTS
The authors wish to acknowledge the assistance provided
by several individuals during the course of this work. Elaine
Marshall, collected valuable experimental data; George Calisto
assisted in the entry of data in the computerized data files;
Daphne Jeane contributed in the data reduction and correction,
Tracy Marks assisted in data entry. Steve Morrissey and John
Varner contributed to the experimental design and development
of experimental protocol. Yi Yeh Yen developed most of the
data analysis prograns and aided in the data analysis.
3 any others provided time when needed to help with the
report preparation.
Accesion For
NTIS CRA&/
OTIC TABUnanLoLuncedJusiication
ByAM
Avaiability Codes
cre Y Dist i tA ecia
INSPECTSII

TABLE OF CONTENTS
Page
ACKNOWLEDGEMENTS ........................... i
LIST OF TABLES .............................. v.....
LIST OF TIAURES ................................ .. ... v
INTRODUCTION ... o.. ... .... ..... .. ... . ...... I
Background ....................... 1
Objectives ............ .. .. .. .. .. ..... 2
Scope of Work ....... ............... 2
LITERATU!RE REVIEW ............................ 5
Dynamic Strength of Muscle Groups ............ 5
Static Strength of Muscle Groups............. 13
Relationship Between Muscle Strength and
Endurance. ..... ........ ................. 25
Effect of Training on Muscle Strength........ 30
Effect of Body Composition on Muscle
Strength .................. ....... ......... 33
Effects of Age and Sex on Muscle
Strength.. .. ........................... 36
Testing Procedures........ ................... 50
Summary .. ................. .. ..... .......... 53
METHODS AND PROCEDURES............................ 55
Subjects............. ........ .............. 55
General Procedures ........................... 62
Specific Procedures. ......................... 70
Data Transcription from Chart Pages.......... 95
ii

Page
RESULTS AND DISCUSSION ............................ 101
Static and Isokinetic Maximum Torque
Data, ...... 101
Strength Data ................... ... 110
DataReral................ I
Effect of the Variables on Maximum
Torque ............... 112
Correlation of Static and Dynamic
149
Anthropometry and Strength Distribtion....... 157
Goodness of Fit Test of Torque
Distribution.................. 169
Accommodated Percentage Model ................ 171
Concusin ........................... 172
REFERENCES ................................. 175
Appendix-A. Height and Weight Criteria Used in
Subject Selection ..................... 184
Appendix-B. Subject Health Screening Consent Form.... 186
Appendix-C. Listing of the Accommodated Percentage
Model Program.......................... 189
Appendix-D. Selected Abstracts of the Literature ..... 191
Appendix-E. Selected Bibliography of the Literature.. 341
iii

LIST OF TABLES
TABLE Page
1. Multiple regression equations.................... 11
2. Means and standard deviations for knee extension. 12
3. Isometric maximal muscle strength in the fingersof a sample of healthy men and women............. 15
4. Sinple and partial correlation coefficientsbetween measures of muscle strength and body sizeand tyooy.. .. . ..... ..... .... 23
5. Distribution of maximum weights (Ibs) of lift
acceptable to male and female industrial workers. 24
6. Average static, isotonic, and isokinetic strengthincreases due to three different training
7. Mean value of the different static strength (lbs)measures before and after training (based on 10subjects) .......... ..... ........... ......... 34
8. Comparisons between results at the approximateages of 19 and 30................................ 38
9. Data of old active, old inactive, young active,and young inactive groups........................ 42
10. Isokinetic values by age-sex Groups.............. 43
11. Isometric values by age-sex Groups............... 44
12. Measured combinations of joint, rotation, speed,
and starting angle ............................... 68
13. Format of coding form used for data input into
the computer file. .. . , .......................... 100
14. Summary of strengthdata......................... 102
15. Correlation coefficients for 0 RPM by 0 RPM ...... 150
16. Correlation coefficients for 5 RPM by 5 RPM ...... 151
17. Correlation coefficients for 25 RPM by 25 RPM .... 152
18. Correlation coefficients for 0 RPH by 5 RPM ...... 153
iv

TABLE Page
19. Correlation coefficients for 0 RPM by 25 RPM ..... 154
20. Correlation coefficients for 5 RPM by 25 RPM ..... 155
21. Anthroponetric measures ........ ............ 158
22. Descriptive statistics for anthropometric data... 160
23. Goodness of fit tests of the data for normaldistribution ...... . . . . . . . . . . ........ 170
k

LIST OF FIGURES
FIGURE Page
1. Power vs. time and power vs. angularI-- displacement ................ ......... 8
2. Means and standard deviations of knee extensionsin women having one normal and one injured knee.. 9
3. Distribution of maximum grip strengths for threeinstruction catagories. ... . ....................... 17
4. Hean values with standard deviations for theestimation of subjects' perceived effort......... 21
9. Maximum isometric and dynamic strength andknee extension velocity vs. age .................. 40
6. Maximum isometric and dynamic strength expressedper kilogram body weight vs. age ................. 41
7. The range and mean percentage differences inmuscle strength characteristics between womenand men.......................................... 46
8. Isometric strength in percent of strength of
20-22 year old men in relation to age ............ 48
9. Average height and weight in relation to age..... 49
10. Cybex II isokinetic apparatus.................... 56
11. Cybex II isokinetic apparatus with upper bodyexercise and testing table (UBXT) ................ 58
12. Chair used in measuring tocques at the kneeset in the 0 rotation position.................. 59
13. Chair used in measuring torques at the kneeset in the -30* rotation position ............... 60
14. Cybex II isokinetic apparatus with the attachmentfor measuring back strength...................... 61
15. Wooden platform used with Cybex II isokinetic
apparatus ........*................................ 63
16. Angles of rotation............................ 66
17. Extension of knee at 00 rotation................. 71
18. Alignment of knee joint with dynamometeraxis of rotation ........... ............. 72
vi

3FIGURES Page
19. Extension of knee at -3Q0 rotation.......... 73
20. Extension of hip at 00 rotation .................. 75
321. Extension of hip at -30* rotationo.............. 77
22. Extension of hip showing use of wooden platform
for negative angles of rotation.,o............... 78
1 23. Extension of the hack.o................ 79
24. Extension of the back showing experimenter inIposition to "catch" the subject.......,6.... 81
25. Vertical flexion of the shoulder at 0*rotation.o....................... 82
26. Vertical flexion of the shoulder at 30rotation................. ...0.00......... 84
27. Vertical flexion of the shoulder at -3Q0Irotation....... *......... *.*.* ......... ooo.0.0 85
28. Horizontal flexion of the shoulder at 00 startinganle....................... ... 87
29. Horizontal flexion of the shoulder at 600 starting
3.Abduction of the.shoulder at.0* starting angl... 88
130. Abduction of the shoulder at 30 starting angle.. 90
331. Abducion of the shboul at 30 ro tarti n g anl.... 90
32. Flexion of the elbow at 05 rotation.....*...... 92
533. FCeaio ofe ue t the elbow at recroat ordr*.*.*.. 94
34. Chr pae usdwt teCybex II cecordr..... 96
36o Maximum torque vs speed for ABD and rotation3 ~ ~of 0 degreesa..**..*.............. ..... 113
37. Maximum torque vs speed for BAG and rotation of3 0 degrees.,....,.................. 114
38. Maximum torque vs speed for ELF, and rotation of3 -15 degrees..****&* ................ 115
39o Maximum torque vs speed for ELB and rotation of
vii

FIGURES Page
40. flaxinum torque vs speed for ELB and rotation of0 degrees.*.#*............. ............. 117
41. Naximun torque vs speed for ELB and rotation of15 degrees......... ................ ...... 118
42. Maximum torque vs speed for ELB and rotation of
43. Maximum torque vs speed for HFE and rotationof 0 degrees ............ *... ....... ...... 120
44. Maximum torque vs speed for HIP and rotationof -15 degrees .............. 0.... .... 0........... 121
45. Mlaximum torque vs speed for HIP and rotationof -30 degrees ............ ............. 122
46. flaxinun torque vs speed for HIP and rotation
47. 0aiu togre vs...... spe1fr23notto
48. Maximum torque vs speed for KNE and rotationof -30 degrees.. *................. . 125
49. Mtaxinum torque vs speed for KNE and rotation
59. Mlaximiun torque vs speed for VFE and rotationof -1 degrees ........... .......... 127
50. Maximum torque vs speed for VFE and rotationof -30 degrees. .................... 128
52. Mtaximum torque vs speed for VFE and rotationof 0 degrees......,............. 129
53. Maximum torque vs speed for WFE and rotation
54. Maximum torque vs speed for WFE and rotation
55. Mnl aximum torque vs speed for D and toroanof 30 degrees ................. 135
56. Angle of maximum torque vs speed for BC and
rotation of 0degrees............... 136
viii

FIGURES Page
57. Angle of maximum torque vs speed for ELB androtation of 0 degrees ............................ 137
58. Angle of maximum torque vs speed for HFE androtation of 0 degrees ............... 138
59. Angle of maximum torque vs speed for HIP androtation of 0 Degrees ............................ 139
60. Angle of maximum torque vs speed for KNE androtation of 0 degrees ............................ 140
61. Angle of maximum torque vs speed for VFE androtation of 0 degrees ............................ 141
62. Distance from start to maximum torque vs speedfor ABD and 0 degrees ............................ 142
63. Distance from start to maximum torque vs speedfor BAC and 0 degrees rotation................... 143
64. Distance from start to maximum torque vs speedfor ELB and 0 degrees rotation................... 144
65. Distance from start to maximum torque vs speedfor HFE and 0 degrees rotation................... 145
66. Distance from start to maximum torque vs speedfor HIP and 0 degrees rotation................... 146
67. Distance from start to maximum torque vs speedfor KNE and 0 degrees rotation................... 147
68. Distance from start to maximum torque vs speedfor VFE and 0 degrees rotation................... 148
69. Frequency counts of torque by speed for theABD at 0 rotation..................... ........... 161
70. Frequency counts of torque by speed for theBAC at 0 rotation ................................ 162
71. Frequency counts of torque by speed for theELB at 0 rotationf... 163
72. Frequency counts of torque by speed for the. t 0 rotation. .164
73. Frequency counts of torque by speed for the
HIP at 0 rotation ..................... 165
ix

FIGURES Page
74. Frequency counts of torque by speed for theKNE at 0 rotation........................ . .. 166
75. Frequency counts of torque by speed for teVFE at 0 rotation ......... ................. ...... 167
x

I INTRODUCTION
Background
SThere are many military tasks where forces must be exerted
to perform critical activities. Most of these activities are dyna-
mic in nature and hence require the individual to exert forces in
a range of postures and configurations to complete the task. The
reliance on static strength capability is inadequate in such
cases because of the dyanmic nature of the activity and the
variance in the strength capability as a function of the position ^J
of the limb in space and/or the speeds of movements involved. _ -)
A job which can be used as an exanple is that of manual
lifting. Based on the current literature search and laboratory
work completed by Texas Tech University in this area, it is evi-
dent that dynamic strength rather than static strength data is
required to assess workers' manual materials handling capacity.
During the past decade, relatively new techniques have been
utilized to define acceptable load limits and methods for deter-
mining the suitability of workers for handling tasks. At the
present time, Texas Tech University is defining a general model
structure for manual materials handlng (IHH) activities which
when completely developed can be used to establish the limits in
terms of MHu activities so that individuals can perform these
tasks efficiently, effectively, and without undue stress to the
musculoskeletal system. Such a model will rely heavily on
strength and anthropometry, hence dynamic strength would be of
great value.
I

Dynamic strength will also be of value in job designs using
static strength. Dynamic strength would be better suited than
static strength because of better definition of the strength in
terms of position and speed of shortening of the muscle groups
involved.
L Objectives
The primary objective: of this project were:
) to develop a dynamic strength battery to assess dynamic
strength capabilities of individuals and then to corre-
late static and dynamic strength measures, and
2 establish appropriate strength and anthropometric
distributions and a demonstration of the computer accom-
modated model program.
Scope of Work
The first phase in this project was geared towards the deve-
lopment of a test battery for assessment of dynamic strength of
trunk, arms, and legs for appropriate range of motion. The battery:
1. considers various levels of speed of motion,
2. is simple to administer,
3. has clearly defined, measurable responses, and
4. defines the motions to be studied.
The static strength was measured on the same subject sample
in order to investigate the relationship between dynamic and sta-
tic strength.
Dynamic strength data is badly needed for work-system
design. Most tasks are dynamic in nature, but static strength
2

has been and is being used as a design parameter. This use
introduces large errors especially since the correlation between
I- static and dynamic strength is poor. Therefore, with emphasis on
3the design of physical tasks with demands within the populationcapacities, it was imperative that dynamic strength data be
generated in the three-dimensional space.
The second phase of the project had two goals:
1. to develop an accommodation model and
2) to establish appropriate strength and anthropometric
distributions "
These goals were reache by the foll ng tw phases:
1. Development of an accommodated percentage model for 0
equipment handling. The model identifies the percent of 7'individuals from a specified female population who would
be accommodated by a task based on the strength require-
ments of the task.
2. The establishment of the underlying distribution for
such strength and anthropometric variables as:
a. shoulder strength,
b. arm strength,
c. back strength under a flexed posture and erect
posture,
d. leg strength, and
e. anthropometric postural measures such as weight,
stature, acromial height, arm lengths, and limb and
trunk circumferences.
3 3

I
There exist several well known statistical "goodness-of-fit"
tests which can be used to determine which of several candidate
statistical distributions best describes the strength data. Some
of the best known and widely used tests are the Chi-square,
Kolmogorov-Smirov, and Cramer-Von Mises tests. These are
discussed by Conover, 1971. Each of these tests were applied to
each of the strength data sets listed above. The actual imple-
mentation was performed by means of the computer program GOF
(Phillips, 1972) which is available at the Texas Tech University
Computer Center. This program permits the normal distribution to
be tested for quality of fit. The quality of fit of this distri-
bution to each of the strength data sets was determined by calcu-
lating each of the three statistical test statistics listed
above. The Cramer Von-Mises test statistic was used to break
ties and/or make a final decision.

ILITERATURE REVIEW
Dynamic Strength of Muscle Groups
The measurement of dynamic strength is a strength measure-
ment when muscles are in action. An example would be the
measurement of dynamic strength for elbow flexion from a fully
I extended position to a fully flexed position. The force exerted
3 would be recorded as a function of the range and time of move-
ment. The following sections are a review of the literature
3 which has investigated dynanic strength in different muscle
groups of the body.
I Arm and Elbow
The research on dynamic movement using the arm has shown
some various results. Shaver (1971) found that subjects with the
* greatest dynamic strength had the greatest absolute dynamic
endurance (r = .93), but had a negative correlation with relative
I dynamic endurance (r - -.19). Two studies (Freund and Budingen,
g 1978 and Zahalak, Duffy, Stewart, Litchman, Hawley and Paslay,
1973) found similar results.
3 Freund and Budingen (1978) showed the rate of rise of
tension time was constant which they explained as supportive of
3 the inability to change ballistic movements. Freund and
Budingen's (1978) results were supportive of the Zahalak et al.
(1973) study in which the load and velocity were found to remain
U independent of the EMG while the E1G remained constant with a
maximal effort. Thus, the increasing EHMG represnts the
I increasing tension.
!5

Asmussen, Hansen and Lammert (1965) and Bender and Kaplan
- (1966) both found that isometric measures could indicate dynanic
Istrength. Asmussen et al. (1965) found the force measured during
concentric contractions (the muscles shorten during contraction
3] as in lifting an object) to range from 75 to 80% of the force ob-
trained during isometric contractions. However, the force obtained
from excentric contractions (the muscles lengthen during contrac-
5 tion as in lowering an object) ranged from 110 to 130% of the
force of the isometric contraction. In both of these cases the
3 speed of motion was 60% of the arm length per second or approxi-
mately 30 cm per second. For slower speeds the dyanmic forces
were closer to those obtained for the isometric forces. The
g correlation for the slowest speed (15% of the arm length per
second) and the isometric force was high (r = .80). Singh and
3I Karpovich (1966) study agrees with these results adding that
eccentric force is significantly less than the isometric force
from 1000 to 1400 (0 position consisted of the subject sitting
3l upright with the forearm at a 90* angle and suppinated). Bender
and Kaplan (1966) also developed a strength index found by divid-
-3 ing the number of pounds pulled by the body weight of the subject.
Ikai and Steinhaus (1961) looked at different psychological
Il factors and found gunshots, shouts, hypnosis, post hypnotic sug-
1l gestion and amphetamines to increase performance while alcohol
and adrenaline showed no significant effects. These results show
the importance of a consistent environment for subjects and how
an inconsistent one can affect the individual's strength performance.
6

The elbow has also been used specifically in dynamic arm
neasurements. Several studies (Carlson, 1970; Doss and
Karpovich, 1965; and Shaver, 1973) indicated good correlations
(.72 - .90 in Carlson, 1970) between the isometric and dynamic
strengths. Carlson (1970) also reported the absolute isometric
values were higher than isotonic values. Osternig, Bates and
Janes (1977) found significant correlations (p < .05) between
isokinetic and isometric efforts but no pattern to their distri-
bution. From these results Osternig et al. (1977) stated that
they felt maximal isokinetic strength can be used to predict iso-
metric strength. Danoff's (1978) results reflected the peak
power (ft-lb/sec) was higher at loads 50% of the isometric
contraction with the peak occuring earlier when the load is
lighter (Figure 1). This indicates that the slope of a power
curve depends on the weight of the load being lifted.
Whole Body
The measurement of dynamic strength can be applied to the
whole body in addition to its application to a body segment.
Clarke, Elkins, Martin and Wakim (1950) indicated that a muscle's
greatest power was achieved at the highest muscular tension.
Petrofsky, Rochelle, Rinehart, Burse and Lind (1975) indicated
that isometric endurance is inversely related to the static com-
ponent of dynamic exercise thus allowing for the prediction of
the static component of dynamic strength. Nordesjo and Nordgren
(1978) when comparing injured vs. healthy individuals indicated
that strength does decrease with an injury (Figure 2).
Additionally, the differences that were found in dynamic measures
7

0AL 0
r-. A ap ZAn
4-)
I CUV) 0)
u.
S. CLS
LO C\ OOOn.P 0)L)aL OC9-) "- CD 0%P .c
(oqs/qL-W4d
EIc41 m9
V M "a
00 0 n9~*> 4-.
0
0 inI lit-4' ~-~ EL
u.
LOC)LOCDLnCDLAOC Ln O
3 8

[II
II
1 150
Normal Knee
I Injured Knee
1 100E
O0! I
I I
50 / I N"
"- T,.i I I , Nh . I
/ I II II I[IIN.
900 600 300 00
5I knee flexion (degrees)
FIGURE 2. Means and standard deviations of kneeaxension i n woeni 'IIavi,g one normal and
one injured knee(Nordesjo and Nordgren, 1978)
3 9

I of a healthy individual were also found in injured limbs. Laubach's
(1969) study using trunk and hip show that strength measures were
I correlated with the lean body mass of the subject (Table 1). Also,
when -tature was held constant, the somatotype components correlated
with strength. Carlsoo (1978) and Poulsen (1978) both found high
I correlations between the back strength and load lifted of .7 - .8
kPoulsen, 1978). Carlsoo's (1978) study also indicated a high
5 correlation between the back strength and abdominal muscles.
Leg
An extensive amount of research has been published in the area
3 of dynanic leg strength. Johnson and Siegel (1978) using knee
[ extensions reported data showing a large variability for the first
three days of testing (Table 2). The data was interpreted to show
that the first three trials were not stable and an experimenter
should require warm-up trials in order to obtain stable data.
It Sargeant and Davies (1977) and Pedotti, Krishnan and Stark (1978)
studied the use of both legs simultaneously in bicycling and
II walking, respectively. Sargeant and Davies (1977) found no dif-
ference between the leg power when used together, but the right leg
showed a 3% increase when each leg was used alone in bicycling. The
Pedotti et al. (1978) study showed the force patterns appeared to be
the same in kinematic variables, but had different torques. Both
iI studies must be viewed cautiously as Sargeant and Davies (1977) used
only 4 subjects and Pedotti et al. (1978) used only 2 subjects.
Thorstensson, Larsson, Tesch and Karlsson (1977) looking at
active and sedentary men found skiiers and sprinters/jumpers to
10
I

TABLE 1. Multiple reqresslon equations
TRUNK FLEXION STRENGTH11.6 (Mesomorphy) + 365.6 (Body surface area) - 5.2 (Weight) - 4.8 (Skinfold:
Subscaoular) - 2369.2 (Body density) + 2308.0R u .711 SE est = 18.1
TRUNK EXTENSION STRENGTH
5.2 (Skinfold: MAL X) + 4.1 (Mesomorphy) + 97.1 (Body surface area) - 2.0(Skinfold: Triceps) - 4.3 (Skinfold: Subscaoular) - 92.8R .741 SE est - 20.1
HIP FLEXION STRENGTHI 1.4 (Skinfold: MAL X) + 1.1 (LBM-Averaqo) - .9 (Aqe) - 0.6 (Skinfold:Supraillac) - .8 (Skinfold: SupraDOtelia) + 10.7R a .747 SE est a 9.2
HIP EXTENSION STRENGTH
1.1 (Stature) + 6.2 (Endomorphy) + 6,4 (Mesomorphy) - 1.0 (Skinfold: Suora-patella) - .3 (LB/4-Average) - 158.5
R = .610 SE est v 11.1
TRUNK EXTENSION-FLEXION
3.5 (Skinfold: Juxta nlole) + 8.7 (Mesomorphy) - 3.8 (Skinfold:Subscapular) - 2.1 (SkInfold: Suprailiac) - .5 (LBM-Average) + 90.7R = .627 SE est a 13.8
HIP EXTENSION-FLEXION
.7 (Ape) + 3,5 (Skinfold: MAL X) + 5.9 (L.B-Average) - 5.5 (Mesomorohv)- 314.9 (Body surface area) + 316.0R = .506 SE est= 17#5
Laubach, 1969
II

F-
5 TABLE 2. Means and standard deviations for knee extens ion
5 Trials
5Days 1 2 3 4 5 6
I X 37.70 38.20 37.33 38.65 39.28 39.7021SD 14.38 12.88 122.62 13.41 13.89 14.77
2 X 38.25 39.00 39.58 39.73 39.73 40.23ISD 12.98 12.96 13.23 12.77 13.62 14.26
3 X 38.48 39.03 39.58 40.53 40.48 40.40
SD 13.89 14.36 14.65 15.40 14.48 14.62
Johnson, and Siegei, 1978
312

have the highest peak torque over other active and sedentary sub-
jects. Torque was found to decrease as speed was increased
3 (Ingemann-Hansen and Halkjaer-Kristensen, 1979; Perrine and
Edgerton, 1973; and Thorstensson, Grimby and Karlsson, 1976). In
a study by Ingemann-flansen and Ialkjaer-Kristensen (1979), the
peak torque for the knee was found at a knee extension range of
90' - 200 (Wl is full extension). Thorstensson et al. (1976)
[3 found that the peak torque for knee flexion occurred between 550
and 66, while Wahrenberg, et al. (1978) reported that it
occurred between 800 and 1200 (00 being full extension). More
research could be performed here to determine if there is a con-
sistent peak torque between certain angles. As it appears now,
[I' there is none. Berger and Henderson (1966) and Berger and
HigginbothaM (1978) are both supportive of the use of static
strength for predicting dynamic strength. Berger and Henderson
F (1966) state that static and dynamic measures are both well
correlated for leg strength. The Berger and Higginbotham (1970)
iI study states that the angles of 610, 89, 135% , and 1670 for knee
and hip extension are the best angles for predicting dynamic from
static strengths. Their correlations ranged from .79 -.99 for
these angles (Berger and Higginbotham, 1970).
Static Strength of Different Muscle Groups
5 Static strength is the isometric exertion of force by a
muscle group. Mleasuring static strength in the arm, for example,would entail the individual exerting as much force as possible
13
I! _ _ _ _ _ _

against an instrument which could measure the exerted force.
These measurements can be taken for different muscle groups in
the body such as finger strength, handgrip, arm, trunk, back, or
leg strength. The measurement of static strength has been used
to study predictability of strength regarding other aspects of
3 the human such as anthropometric measurements, endurance, and
different strength measures. This section a review of recent
research findings regarding static strength and different muscle
groups.
Fingers and Hand Grip
3 iThe research of Nordgren, Elmeskog and Nilsson (1979)
on isometric abilities of the fingers reflect a difference in the
appendages. Variation was found to be the largest on the ulnar
rather than the radial side of the hand. This study resulted
in the development of a t Lle which gives the means and standard
deviations for finger strength on 27 men and women (Table 3).
This was the only study which has been found to be limited
3 strictly to the fingers.
Research on handgrip however, has been more abundant
(Caldwell, Chaffin, Dukes-Dobos, Kroemer, Laubach, Snook and
3 Wasserman, 1974; Clarke, Hellon and Lind, 1958; Heyward and
HcCreary, 1977; Lind, Burse, Rochelle, Rinehart & Petrofsky,
1 1978; Petrofsky and Lind, 1975a, 1975b; and Stull and Kearney,
1978). The findings on grip strength have been varied. Clarke
et al. (1958) found that immersion of the arm in water, at tem-
jperatures of 2, 10, 14, 18, 26, 34, or 42*C for 30 minutes
14

TABLE 3. Isometric maximal muscle strength In the fingers of a sample
of healthy persons. X = mean, S = standard deviation In Kp.
MEN WOMEN
Right Left Right Lefti!X S X S X S X O
Opposition
Digit. I-1i 16.5 7.4 14.9 4.9 10.4 3.6 9.9 3.6
Digit, i-Ill 14.2 5.1 15.1 6.1 9.9 3.5 8.9 3.6
Digit. I-IV 12,1 6.4 12.9 6.0 6.7 3.6 6.8 2.5
Digit. I-V 8.9 2,6 9.8 4.0 5.5 2.0 5.2 2,5
Adduction
Digit. I-1I 7.1 2.5 6.7 2.3 5.5 1.5 4.7 1.7
Digit. i-Ill 2.2 1.4 2.6 1.2 2.7 1.5 2.9 2.5
Digit. I-IV 1.4 0.6 1.6 1.0 1.2 0.6 1.9 1.7
Digit. I-V 1,2 0.8 1.3 1.0 1.2 0.5 1.3 0.8
Abduction
Digit. i-1i 1.11 0.55 1.05 0.61 0.92 0.43 0.81 0.50Digit. I-Ill 1.02 0.61 0.97 0.57 0,90 0.37 0.79 0,37
Digit. I-IV 0.63 0,42 0.65 0,45 0.65 0.40 0.67 0,40
Digit. I-V 0.63 0.48 0.60 0.20 0.64 0.33 0,64 0,34
if Nordgren et al. 1979
U 15

affected the endurance of a subject. Eighteen degrees centigrade
was found to be optimum temperature, and any temperature above or
below this was found to reduce endurance. Heyward and McCreary
(1977) found no correlation (r = .00) between maximum strength
and endurance.
The research of Caldwell et al. (1974) dealt with the effect
instructions have on grip strength performance. Each subject was
told to jerk, increase, or hold the grip. The results indicated
that the jerk worked best and is fastest for obtaining the maxi-
mum strength measure (Figure 3). Caldwell et al. (1974) empha-
sized that these results show the importance of instructions on
the subjects' performance. Therefore, the conclusion was that
the instructions given to the subject should be reported in the
research.
Another aspect of methodology was studied by Stull and
Kearney (1978) regarding recovery time. They found, for an endur-
ance test at 50% maximum voluntary contraction, the percentage
recovery was 20% in 5 seconds, 87% after 42 minutes and 40 seconds,
and complete recovery at the end of 4 hours time. This informa-
tion would be a very important consideration to be made if some-
one is considering a design making use of repeating measurements.
Lind et al. (1973) looked at the effect of posture on
strength performance. They measured the subjects on a hand dyna-
noneter while: 1) seated, or on a tilt table; 2) with the table
at a 450 angle, the head up; 3) lying down; or 4) with the table
16

II
12 HolIdq. -- o Increase
1I-A Jerk'I I'
I1 10
8 I
I 7I I
U\-S.Ii
L°|
4/ \
i 31 i/
1 2
i n0 - A0- ro - An 7n34.9 44.9 54.9 64.9 74.9
11 STRENGTH (KP)
FIGURE 3. Distribution of maximum grip strengthsfor three instruction categories(Caldwell, et al., 1974)
1 17

I at a 150 angle, head down. Lind et al. (1978) found that posture
I had no effect on the subjects' grip strength.
Kroll (1971) measured wrist flexion in women and found
fno physiological factors affecting fatigue. He used three groups
of subjects divided into high, medium and low strength. The
high strength group was found to suffer from the greatest loss of
3° strength after a maximum of exertion. They recovered about 86%
of their maximum strength while the low strength group recovered
completely (107 - 108%). The author does point out that the
values given may be somewhat misleading since the first measures
I are usually not the strongest therefore accounting for the 107-
I 108% recovery.
Arm
Handgrip strength and arm strength in combination were used
by Laubach, Kroemer, and Thordsen (1972). They found body weight
to be a good predictor (r = .34 to .49) for the arm force. The
correlation between force exerted on hand operated controls and
grip strength was reported at r = .21 to .36. Laubach's et al.
5 (1972) reaction V- these results was that it could explain 4% to
13% of the variation in the use of controls. Lamphiear and Montoye
lv (1976) studied arm and grip strength also. Their results showed
that strength could be prediced from anthropometric measures.
Svoboda (1973) took measurements on the forearm which indicated the
l correlation between strength and endurance was low. Carlson a
McCraw (1971), however, found a negative correlation ranging from
-.46 to -.60. These two studies leave some disagreement as to
whether endurance can be predicted from strength.
18
I

Back
Poulsen (1970 and 1978) in measuring back strength found
I that neither a fixed standard load nor the weight of the subject
I could be used as predictors. A good predictor appears to be the
relationship between back strength and the maximum load lifted.
5i Poulsen (1970) derived a formula for males and females for pre-
dicting maximum load recommending that men and women lift only up
I to 70% of this maximum.
3 Maximum load (kg) = back muscle strength (kg) (Males)
Maximum load (kg) = back muscle strength (kg) - 3 kg (Females)
3 Leg and Knee
The next group, the leg muscles, has received a large amount
of research in relation to the other muscle groups. Ayoub,
Bethea, Bobo, Burford, Caddel, Morrissey and Intaranont (1980)
have compared isometric leg strength of low coal miners to
i reference populations. Their results indicate the miners have
significantly stronger leg strength than do the comparison popu-
lations. It is felt this is due to the job demands placed on the
miners which has created the occupational differences.
Tesch and Karlsson (1977) and Viitasalo and Komi (1978)
5' found the muscle fiber to be influential on the form of the
force-time curve. Viitasalo and Komi (1978) also reported that
the force-time measurement can be used to indicate the rate of
force production because of its fair reliability. Tesch and
Karlsson (1977) found that lactate concentration correlated well
5 with the number of fast twitch fibers (r = .89). This indicates
that the type of muscle (whether there are more fast twitch or
1

more slow twitch fibers) can affect the isometric strength in
that muscle.
Start, Gray, Glencross and Walsh (1966) found speed and
power appeared to be similar in leg strength but had little asso-
ciation with one another. Currier (1975) found the greatest
force in the quadriceps to occur when the knee was extended,
starting from the position of a 600 angle. He also used a wedge
under the quadriceps to see if there was any effect on the sub-
ject's performance. He found no difference with or without the
wedge.
Kroll and Clarkson (1978), Murray, Baldwin, Gardner, Sepic
and Downs (1977) and Haffajee, Moritz and Svantesson (1972)
looked at the knee extension. Haffajee et al. (1972) found the
maximum dynamic strength occurred at a 40* angle of knee flexion.
Corlett and Bishop (1975) found no significant strength differen-
ces between the right and left leg while using a horizontal foot
pedal. Cooper, Grimby, Jones, and Edwards (1979), looking at
I the psychological perception of muscle strength in the quadri-
ceps, found the perceived maximum strength was in actuality only
a percent of the actual maximum strength (Figure 4).
Edwards and Hyde's (1977) results on quadriceps and hand
grip found the strength of the quadriceps to be equal to 75% of
the body weight. The result of body weight being in any way
related to strength is interesting given there was no relation
with body weight and arm strength. This could be an indication
of how the different uses of arm and leg strength are affected.
20

[I
Io100
90
80
II 70
4-)
40
W 60' 40
tU
I ~ 30
20 * Adductor pollicis
10 o Quadriceps
110 20 30 40 50 60 70 80 90 100
Percentage Maximum Force
FIGURE 4. Mean values with standard deviations for theestimation of subjects' perceived effort(Cooper et al., 1979)
21
I

!
Whole Body
The next studies look at strength measurements involving
large portions of the body. Christensen (1975) using the back
and leg extension, found no difference between the two when
expressed in strength per pound of body weight or lean body
weight. Several studies have looked at overall body strength
(Asmussen and Heeboll-Nielson, 1961; Knapik, Kowal, Riley, Wright
and Sacco, 1979; and Laubach and McConville, 1969). Laubach and
!cConville (1969) developed correlations between body size and
muscle strength. Neither the body size, typology, or compostion
were found to be effective predictors of strength (Table 4).
'Knapik et al. (1979) developed an apparatus for the testing of
SR muscle strength. When using the apparatus, measurements on the
upper body and legs were found to have been more reliable than
the measurements on the trunk.
Ayoub, Bethea, Deivanayagam, Asfour, Bakken, Liles, Mital
and Sherif (1978) also measured back strength. They developed a
simple model to obtain the maximum acceptable weight of lift by
subtracting body weight from a calculated value. The calculated
I value was derived using sex, weight, arm strength, age, shoulder
3 height, back strength, abdominal depth and dynamic endurance.
Lifting norms were developed for males and females (see Table
5). The capacity values are a function of the height of lift at
a frequency of one lift per minute.
i2
3 22

WU82 4. St.e 8 art A cl @M tl eOOfiLclta 1.4r"" um..*.o MOCI Mla. . SMt b~ "M4 . A~ M&L7,S*
" is A9 5- 50 I 3* I 43 * 1 29 40 1- - - - - - -.
1uz 7 20 U3 20 29' 17 13 00 12. 0. 16- 31' 2104 UI -07 .06 07 -04 U0 -12. -11 M2 14 14 -0
Wtd2olo14aTrieap 08 -. 01 23' 02 -)1 04 .04 It. 04 07 -03 04-07 -2.S -0 03 -13' -10 .10 -1.3 04 -M8 -2. -L"' -17
08 :L4 08 210 03. .01. 00 -4 22 03 -05 -01 08-04 .22 -1] 00 -14' -U2 .2 -IS 00 -06 -17 -20 -19
091*1.14 0abfmec -04 -16 03 24' 00 00 09 -0 --n2 .04 .3 -06 01-25' :29' -LS -03 -336 .23' -0 -213 -]It -22 -W4 -12' -31'-04 -14 07 27' 04 02 1.2 -08 -01 -M1 -U3 -03 04-284 .26' -24 09 -34. -]1- -12 -30' -41' -24A -13- -*- -16
09±14.24 Ow'ru±2±a -09 -17 LL 22 10 -00 03 -09 1.8 -03 -07 -0 02-2.3' -2S* -01 -M2 -164 -70 -1.3 -19 -43 -17 -U.3 -32' '240-08 -14 14 260 1.3 -02 03 -0 La 00 -03 44 08.27' .25 -12 -07 -IA -3'1-I -I*'L -10 -1 .19 .2' -1"8
Lmb N"37: -31' 42. w0' 380 4"4 33' 27' 4*1 33' W0 40' 36A:4. 33' 18 03 33' 21' IS 23' 1 204 5 34 0' 3P'
7 4 :0 I up W 22. 30' 31' 28' 22' U-8 42'ft"Mb4RO44Lmpb 00 L53 -0n -L3 04 02 -01 -03 -01 09 02. 10 g0
-0 1 0 :0 1 -1 -03 -06 -04 09 -01 09 -04.11 0 t 2 4 -4 .0 -06 -08 CZ :13 .07 -14
.0 0 9 -4 02-= 00 03 a8 -1 02. -03
Tot" 1amgth 22 32' 23. 33' 28' 23' 235 t 10 L 23' LA 31' 31'0f 26: 01 03 -03 02 -0 -02 .17 08 02 10 0414 :5' a1 2' 07 1t 08 U. 07 17 00 13 Do403 =3' 07 1: -u. 03 .04 07 -42 0f -0 01 07308 it' 10 13 -1.2 -12 02 02 -2.0 00 -11 as 04L4 Ill 284 33' 02 03 14 13 02 go -11 10 2105 14 0LA1 -17 -L2 04 08 -14 -01 -20 -01 04
08m 2rkL mo 9 -02 02 20 27' -0a -01 L.2 1.9 25' 1U LI01 16 -1.2 -L3 09 19 -10 -08 00 Ui 19 04 02I 01 Li -08 -0 08 2 0s -01 07 U, UI 04 0300 Li -10 -1.1 076 23' -10 .02 08 1. Ui 03 02
Am Lgl-, Li 03 1.3 L2 34' 14.08 -02 18 -01 23' 34 is00 -05 -04 -LI1. 3 L9 04 -07 -L2 -02 -14 Ui 20 -04
-03 -22 04 -07 U3 01 .04 -03 12 -22 04 It -04.04 -2 02 -12. u. -02 -08 -0 1.2 .2W 03 IS -07
Mi81tthgt -2 .0$ -04 02 23' -03 -06 -10 03 03 If* 10 00-a.8 :-LI -17 -14 Li2 -14 -LI -L8 -07 -03 23' 00 -14-25 -28 -18 -L3 08 18 -17 -L3 -02 -08 V. -2L -17.24' 4-28 -13 -L2 1.0 -LI -16 -L2 00 -03 18 -10 -14
C&lf L2. : 09 It. 17 .19' 18 14 02 2.2 LI 24' 244 it03 .02 -07 -08 It 02 01 -37 07 04 23' Ui 0100 -1 -01 01 09 06 08 04 04 04 24' 08 0400 -L3 -)I1 01 10 09 06 04 04 04 24' 08 04
~M&TFrvby 10 07 25'4 3 W 3 1 ' 2.1- Li 31' 27' -1. '2 UrT.12 -04 01 14 -14 01 01 00 06 :2 03 -20 0012 09 27' 46' V' 38' 23' 12 33' 2' 25' 14 350
-03 03 -023 U -13 -22 -02 -0 -03 14 153 -13 -)1:330' Z3' t0' 32- 37- 49' 22 22' 47' :0 18 44' 83'z0 20 23' . :0 31' C9 20' 34' 09 08 32. 30'32' 23- 42- 33' 42' 52' 23' 22' 49' 22 :2 30' 49423' :3. 17' 10 25' W1 0f 24 3 LI Li at' no'
2cz, -8 -01 -t4 -09 -01 -20 -08 -17 -24' -10 03 01 -14rA-04. 01 -14 -0 01 -22. -08 -17 -28' .10 04 02 -145-26'.17 - 1?7- -35 -13 -39' -10 -16 -34' -26' -1.9 -24' -IS-
- 1 f~rs t" of cooffi.tanhe an, ero-irdar corT,0*:2ot* 134 atcoed &M4 third raw 02 firic-or4 partiAl corro1*tioasw104 wi44t 104 scature ha04 coutic~ rapctively. 108 the fm-rtb r~w of coafteltco tv. WAWrn04r partIS *110 bth
:619AC m4 004000*ba24 tr0sumt. r*424*1 po181. an &*Icoth.I - 01pI12.~amu 42JL,00*t from surv ac 12* 0.05 le...1z o f ldmo

- ft- - -o m-
0%N -T Ifi P%.' c" V o 4 0
I .-- a V 109 P.Ma C ON on
C4? coP OM m 4 m 4 a
C" P.4 mM I% l0 MI NMP'
41m . N' coo N0% a0 00
P.- V4 . M ' -AT0N N
of0% at .4 O% M.. P.% .4%
q6--~P. S.NoO1 -
40- M?1 P... 00 14N .10 N wlWM fn M n N 4n' mVN -C N
C4P- $A (T.1 P.1 O 'OCN 0r
V) S.. .
u~ 0en -.4 .. - W 010 N . 0( 0 n N
ItN en OM 0.4 IT4M OnN
N1. .00 N1. V% 2 I f%I
In1. N0 "40 c0 ! ! rc ~ ~ ~ ~ N' coN C" 0 4 r , C N M.
4-- f%'T -10% ON M4 r-CI' , N NM1 N
W, n.C C% 'O. ' N M m e. C-4 en. N4a 0% It C !. ! I ,0
enM MN MN0 'I'M m I MNLMC
m ~ ~ ~ ~ M M4 o n l0 4 N .4
W; '010 .- 4 -i 0.-4 P.MV 0.0 IMI U04) '3w 0%0 N 10 .4 M -1.0a 0-? 0 -I
cc Q .4 14 ..4 -4 .4 .-4
W. C4. 4 4 .40 An- M'O MTM4C-
- -: -: -01 W r
%a en In4 . 4 V% m -,C
lua 0
2 .0 L. 4 g 0
0 ( U -u Ac w
0 u. -V) c
cu 9

3 Relationships Between Muscle Strength and Endurance
Fitting the task to the worker can be best achieved by know-
ing both the demands of the task and the worker's capacities. The
E. physical demands of the task can be determined by applying a task
analysis procedure, while the worker's muscular capacity can be
I determined by neasuring his maximal muscle strength and endurance.
luscle endurance is defined by the type of muscle contrac-
tions. If the muscle is doing static contractions, the endurance
" Iwill be defined as static or isometric muscle endurance. On the
other hand, if the muscle is doing dynamic contractions, the
endurance will be defined as dynamic or isotonic muscle
endurance. Another form of dynamic endurance is isokinetic
endurance which has been less commonly investigated.
Dynamic Muscle Endurance
Shaver (1971) measured the absolute isotonic endurance by
3 the number of times a subject could lift a common load equivalent
to 75% of the group's mean maximum isotonic strength. Maximum
I IIstrength was defined as the load with which one complete movement
I could be performed using maximum muscular exertion. He also
measured the relative isotonic endurance by the number of times
3 an individually determined load representing 75% of the subject's
maximum isotonic strength could be lifted. Shaver (1971) found a
high correlation (r = 0.93) between those individuals with the
greatest isotonic strength and those having the greatest absolute
isotonic endurance (p < 0.01). However, the correlation between
3 maximum isotonic strength and relative isotonic endurance
obtained from this study was -.19 (p > 0.01).
*25

Shaver (1973) observed that persons with high maximal iso-
metric strength also have high relative isotonic endurance when
using 35, 40, and 45% of their maximum isometric strength. He
suggested that isotonic endurance tests at given percentage
levels of maximum strength can discriminate between levels of
strength of atheletes.
Isokinetic endurance has not received the attention devoted
to isotonic endurance. Only one study was found in the litera-
ture Patton, Hinson, Arnold, and Lessard (1978), which gave a
definition for isokinetic muscular fatigue, adopted from
material circulated by Lumex, Inc., manufacturers of Cybex and
Orthotron instrumentation. Patton et al. suggest that muscular
fatigue occurs when the torque recorded from a given contraction
is one-half that of the initial torque produced.
Isometric Muscle Endurance
In reviewing the literature, it was found that several indi-
ces have been established for measuring isometric muscle
endurance. Tuttle, Janney, and Thompson (1950) defined the abso-
lute endurance index as the average isometric muscle strength
maintained for a specified time (usually 60 seconds) expressed in
force units (kilograms or pounds). They also defined the percen-
tage of maximum strength maintained for that period (strength
endurance) as the percentage obtained by dividing the absolute
endurance index by the maximum muscle strength. Consequently,
many researchers (Tuttle, Janney, and Salzano, 1955; Caldwell,
1964a; McGlynn, 1969; and McGlynn and Murphy, 1971) used these
definitions in their studies. A third index which is relative
26

i isometric endurance, which is defined as the number of seconds
the muscle group can maintain a tension that is a specific pro-
portion of its maximal isometric strength. This index has been
I used by several investigators (Caldwell, 1963; and 1964b; Start
and Graham, 1964; Carlson and McCraw, 1971; Noble and McCraw,
[1 1973; leyward, 1975; and Hleyward and McCreary, 1977 and 1978).
SI By comparing the absolute endurance index and the relative iso-
metric endurance, Caldwell (1964a) concluded that there is no way
of saying which index is better than the other.
Some investigators were interested in studying the isometric
.3 fatigue curves (i.e., the curves showing the force exerted as a
function of time) either for males (Royce, 1958; and Kroll, 1968)
or for females (Kroll, 1971; and Kearney, et al., 1976). Fatigue
patterns were observed to be different for different levels of
strength. Therefore it was deduced that it is unlikely the same
i factors responsible for muscular fatigue can be operating in the
same manner at different levels of isometric strength (Royce,
1958; and Kroll 1971). The fatigue curves under normal and
I occluded circulatory conditions (Kearney, et al., 1976), were
found to be very similar up to a period of about 50 to 60 seconds
3 Iafter which the curves were significantly different.
In discussing the factors affecting isometric muscle
endurance, many researchers (Start and Graham, 1964; McGlynn,
1969; McGlynn and Murphy, 1971; and Carlson and McCraw, 1971)
claimed that during a maximum isometric contraction the intra-
3 muscular pressure rises above the arterial pressure in the
muscle. The exerted force results in the occlusion of blood to
I27

the muscle. As a result, a major part of the energy for sus-
tained contraction depends upon the amount of anaerobic energy
reserves in the muscle. Accordingly, the factors determining
endurance are the energy available and the demand made upon that
energy. Also, it is assumed that the build-up of biochemical
I fatigue products in isometric contraction is related to the
amount of force exerted by the muscle. Individuals exerting high
i 3levels of maximum strength, therefore, would produce more bioche-mical fatigue products than those of a weaker group. For
Istronger subjects, one could expect an earlier onset of fatigue
1 as a result of the larger amount of fatigue products present in
the muscle (!1cGlynn, 1969; and 11cGlynn and Murphy, 1971).
The point at which the degree of intramuscular tension over-
comes the force of blood pressure and totally occludes intra-
Li muscular circulation is defined as the Critical Occluding Tension
Level (COTL). To determine COTL, many studies have been con-
intact and the second with artificially occluded circulation
(Royce, 1958; icGlynn and Murphy, 1971; Heyward, 1975, Kearney,
et al., 1976; and Heyward and 1cCreary, 1978). Royce (1958)
showed that COTL occurred when the exerted force was 60% of the
maximum voluntary contraction (?WC). Heyward (1975) reported
Sthat COTL occurred at 60% MVC for low strength males and at 45%MVC for high strength males. For female subjects, Kearney, et
Sal., (1976) concluded that COTL occurred at 52% MVC, while
3 Heyward and cCreary (1978) reported that COTL occurred at 60%
28

U
!MVC which is the same as that reported for low strength men by
leyward (1975).
Contradictory results have been reported concerning the
relationship between strength level and relative endurance.
Several researchers (Tuttle, et al., 1950; Tuttle, et al., 1955;
McGlynn, 1969; McGlynn and Murphy, 1971; Carlson and McGraw,
1971; Noble and McCraw, 1973; and Heyward, 1975) emphasized the
I ability of weaker subjects to maintain a higher proportion of
3 their maximum strength than stronger subjects; in other words, a
significant negative correlation between strength and relative
3 endurance exists. However, other investigators (Caldwell, 1963;
1964a; and 1964b; and Start and Graham, 1964) found no signifi-
I cant correlation between strength and relative endurance.
11eyward and 1IcCreary (1977) reported no relationship between
maximal strength and relative endurance (r = .00) for women ath-
letes. They claimed that if the relationship between strength
and relative endurance is a function of changes related to
I hypertrophy of muscle tissue, it might be hypothesized that the
i negative relationship betwen these two factors would not be pre-
sent for women.
I Kroll (1968) observed that a low level of strength group
always demonstrated a fatigue pattern significantly different
I from high and middle level groups. In another study, Kroll
I (1971) concluded that an overall or composite fatigue curve which
has an average set of values for any sizable group of subjects
will seldom represent the actual fatigue patterns expressed by
all the subjects in the sample.
29

Finally, the literature review revealed a lack of infor-
mation concerning muscle endurance for females. Most of the
endurance studies found in the literature utilized males as sub-
jects. Muscle endurance data for females has become of great
importance as the number of females entering the !e rk force is
increasing.
Effect of Training on Muscle Strength
Salter (1955) observed that training of supination of the
left hand of either isometric or isotonic contractions for a
period of four weeks, four days a week improves muscle strength
significantly (p < .01) for both male and female subjects. The
average increase in muscle strength due to these training proce-
dures was found to be approximately 64,%. No correlation was
found between degree of muscle strength improvement and fatigue
experienced in training. Also, the difference in the muscle
strength improvements due to training of isometric or isotonic
contractions was not significant.
Pipes and Uilmore (1975) studied the effect of three dif-
ferent training procedures, i.e., isotonic contractions, isokine-
tic low speed contractions, and isokinetic high speed contractions.
Their results revealed that isokinetic resistance training proce-
dures are significantly better in affecting changes in muscular
strength, body composition, and motor performance tests than
standard isotonic resistance training procedures. The average
percentage increases in isometric strength, isotonic strength,
and isokinetic strength due to the three different training pro-
cedures are given in Table 6.
30

TABLE 6. Average static, isotonic, and isokineticstrength increase due to three different training programs
Type of Percent Increase in Muscle StrengthTraining
Isotonic Isokinetic Isok netic HighType of Training Low Speed Training Speed TrainingStrength
Isometric Strength 6.7 27.5 23.1
Isotonic Strength 14.9 13.8 19.2
Isokinetic Strength 1.3 21.2 39.6
After, Pipes and Wilmore, 1975
£3

The effects of an eight week period of systematic progressive
strength training on the EMG activity of the leg extensor muscles
were investigated by Thorstensson, Karlsson, Viitasalo, Luhtanen,
and Komi (1976). The EMC analyses showed no significant altera-
tions in the investigated leg extensor muscle due to the applied
strength training program.
Pipes (1978) compared the changes in muscle strength, body
composition and anthropometric measures for groups training with
constant resistance (CR) and variable resistance (VR) training
procedures. Strength training was conducted 3 days per week, 45
min per day, for 10 weeks. Pipes reported the percentage strength
improvements assessed by constant resistance testing procedures
to be 25.4 and 8.9 for CR and VR training respectively. The per-
centage strength improvement were 9.5 and 25.5 for CR and VR
training when the strength was assessed by variable resistance
testing procedures. He emphasized that the training groups did
have changes in body composition, lean body weight, absolute and
relative body fat, and increases in the limb circumferences.
=I Asfour (1980) and Asfour and Ayoub (1980) give a description
of a six week training program that successfully increased the
3I maximal oxygen uptake, isometric strength, and the lifting capa-
bility of ten male student subjects. The subjects trained for 5
days per week. The program included training for flexibility,
muscle strength (by applying the concept of progressive
resistance exercise), muscle endurance (by lifting light loads at
a high frequency of lift), and cardiovascular endurance (by exer-
cising on a bicycle ergometer).
32

The results of the training program showed an increase in
the maximal oxygen uptake of the subjects. An increase in back,
arm, leg, and shoulder isometric strength also occurred. The
maximal amount of weight lifted in a compact box, for different
heights of lift, increased significantly by training. Table 7
gives the mean values of the different isometric strength
measures before and after training. Based on the data in Table
7, the authors concluded that most of the increase in isometric
strength took place during the first two weeks of the training
program (the first 10 sessions).
Effect of Body Composition On Muscle Strength
Thorstensson, Grimby, and Karlsson (1976) performed standar-
dized measurements of dynamic strength of the knee extensor
nuscles by means of isokinetic contractions to study force-
velocity relationships. Peak torque was found to decrease with
increased angular velocity and to occur at an approximate knee
angle of 60 degrees, (0 degrees = fully extended knee).
Significant correlations between peak torque values and the rela-
tive area of fast twitch (FT) fibers were found for only the
highest contractile speed (180 degrees/sec). The individual
maximal speeds of contraction were also found to be related not
only to the relative area of FT fibers but also to the percentage
of FT fibers. These correlations indicate a role for muscle
quality in terms of fiber types in determining dynamic strength
in certain situations.
Thorstensson, Larsson, Tesch, Karlsson (1977) studied the
strength performance in athletes of different disciplines and
sedentary men under standardized isokinetic conditions. Slow33

Table 7. Mean Value of the Different Static Strength Iba) MeasuresBefore and After Training Ballsed on 10 Subjects)
Static Strength Strength Percent Strength Percent Streng"h PercentStrength Before After 10 Increase After 20 Increase After 30 Increase
Training Training Training Training
Cibs) Sessions (Ibs) Sessions CIbs) Sessions (Iba)
Shoulder 124.8 135.7 9.14 138.4 10.90 141.9 13.7
Arm 91.0 113.3 24.34 121.6 33.63 123.6 33.8
Comosito 3061 350.9 14.63 339.8 17.54 365.1 19.3
BackStrength I 247.2 305.6 23.62 317.2 28.32 320.2 29.5
BackStrength II 166.9 204.5 22.55 211.8 26.90 216.3 29.6
Leg 336.1 378.1 12.50 391.3 16.46 400.6 19.2
Overall 1269.3 1488.2 17.24 1540,0 21.33 1567.7 23.31
Atfour, 10
34

twitch fibers were found to predominate in endurance athletes.
Thorstensson, et al. (1977) also emphasized that fast twitch
fibers are important for force output during fast contractions
and training does help the development of fast twitch/slow twitch
area ratios, consequently training improves force production.
Tesch and Karlsson (1977) reported that after a short period
of isometric exercise, lactate concentration as expressed by lac-
tate ratio (lactate concentration in FT fibers/lactate con-
centration in ST fibers) was found to be positively correlated to
the percent of FT fibers (r = 0.89). At the onset of isometric
exercise, the increase in lactate concentration was faster in ST
fibers when the muscle was rich in ST fibers and faster in FT
fibers when the muscle was rich in FT fibers. They concluded
that exhaustion is primarily related to whether fast or slow
twitch fibers are innervated by the recruited motor nerve.
Viitasalo and Komi (1978) concluded that force-time measure-
ment in isometric bilateral leg extension movement is fairly
reliable, and can be used to indicate the rate of force produc-
tion. They observed that the time to reach various force levels
is related to the percentage of slow twitch fibers. Athletic
subjects were found to have force-time curves different from the
normal subjects. They emphasized that strength training programs
can influence the form of the force-time curve even for subjects
with similar muscle fiber composition.
Larsson, Grimby, and Karlsson (1979) found that isometric
and isokinetic strength increased with age up to 20-29 year
35

group, then leveled to the 40-49 year group and finally decreased
with the older groups. The biopsy data of their study revealed a
shift toward low percentage fast twitch muscle fibers while slow
twitch muscles increased with an increase in age. Fast twitch
nuscle fibers showed a significant (p < .01 - .001) correlation
with isometric and isokinetic strength. Thus they suggested that
the primary causes of the decline in strength during aging are
the age-dependent decrease in the total number of muscle fibers
together with the muscle fiber atrophy.
Ingemann-11ansen and Tlalkjaer-Kristensen (1979) obtained an
estimate of the peak torque-velocity relationship in an experi-
mental subject from the slope of the regression line. No corre-
lation was demonstrated between the slope and the fiber
composition in the lateral portion of the quadriceps muscle.
Finally, the literature review revealed a lack of infor-
mationi concerning muscle endurance for females. Most of the
endurance studies found in the literature utilized males as sub-
jects. Huscle endurance data for females has become of great
importance as the number of females entering the work force is
increasing.
Effects of Age and Sex on Muscle Strength
Two variables which experimenters often consider are the age
and sex of the subject. Both of these variables affect human
capacities. The following is a review of the literature of each
area; age, sex and a combination of both.
36

Age
Age is a factor that has a significant effect on human capa-
cities. An important consideration then is the change in
strength due to changes in age. The only longitudinal study
dealing with age is recorded by Nylind, Schele and Linroth
(1978). Fifty-five males were measured at the age of 19 on phy-
sical working capacity, muscular strength, blood pressure and
body dimensions. At the age of 30, the subjects showed both a
weight increase and a strength increase while the heart rate
remained the sane as it was at the age of 19 (Table 8). The
strength measurements were taken on handgrip and shoulder pull.
The subjects used would not be considered old thus the increase
in strength is really not surprising.
Petrofsky and Lind (1975) recorded static handgrip for 100
nales. The means were calculated for 4 age groups: 20-29,
30-39, 40-49, and 50 years and above. They found the 50 year old
and above group to have an increase in blood pressure while the
20-29 year olds had the greatest increase in heart rate. An
unexpected finding was the lack of decrease in strength with age.
The reason could be the choice of using handgrip for the strength
comparisons. Everyone uses their hand constantly and unless
there were a debilitating illness, such as arthritis, hand
strength would not be expected to decline rapidly.
The extensors of the knee may be more likely to show age
differences. Kroll and Clarkson (1978), Larsson and Karlsson
(1978), Larsson, Grinby and Karlsson (1979) and Murray, Baldwin,
Gardner, Sepic and Downs (1977) made dynamic and some static
37
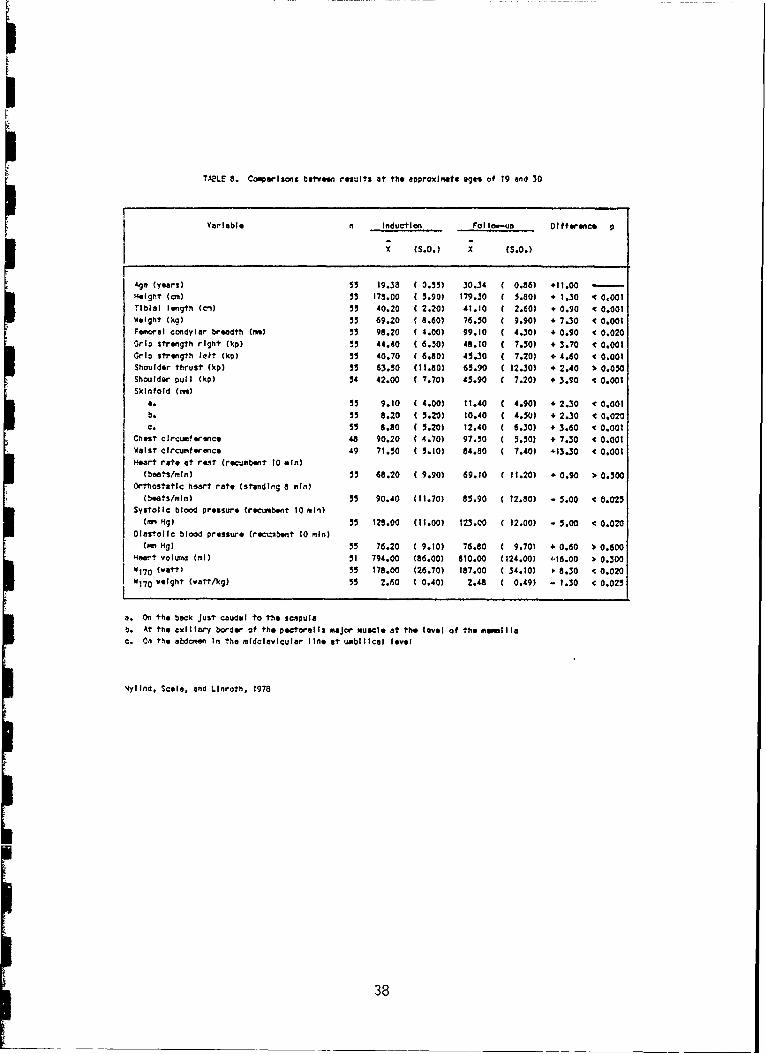
TABLE 8. Comparisons between results at the approxlmete ages of 19 and 30
Variable n induc'fl o __ol Io, -uD Di fference, p
X (S.D.) X (S.D.)
Age (years) 55 19.38 0.55) 30.34 ( 0.86) +11.00 ..-Helght (cm) 55 173.00 5.90) 179..0 ( 5.80) + 1.30 C 0.001Tlblal I gth (cn) 55 40.20 2.20) 41.10 C 2.60) + 0.90 c 0.001Weight (kg) 55 69.20 8.60) 76.50 ( 9.90) + 7.30 - 0.001
Femoral codylar breadth (mw) 55 98.20 4.00) 99.10 ( 4.30) + 0.90 c 0.020Grip strength right kp) 55 44.40 C 6.50) 48.10 C 7.50) + 3.70 - 0.001
Grip strength Iett (kp) 55 40.70 C 6.80) 45.30 ( 7.20) + 4.60 < 0.001Shoulder thrust (klp) 55 63.50 (11.80) 65.90 ( 12.30) + 2.40 > 0.050
Shoulder pull (kp) 54 42.00 C 7.70) 45.90 C 7.20) + 3.90 - 0.001
SkInfold (m)
a. 55 9.10 (4.00) 11.40 C 4.90) + 2.30 - 0.001b. 55 8.20 (5.20) 10.40 C 4.50) + 2.30 1 0.020
c. 55 8.80 ( 5.20) 12.40 ( 6.30) + 3.80 v 0.001Chest clrcumferance 48 90.20 C4.70) 97.50 ( 5.50) + 7.30 • 0.001WaIst Clrcumference 49 71.50 (5.10) 84.80 ( 7.40) +13.30 v 0.001
Heart rete at rest (recumbent 10 min)(beats/min) 55 68.20 C9.90) 69.10 ( 11.20) + 0.90 > 0.500
Orthostatlc heart rate (standlng 8 min)
(beats/min) 55 90.40 (11.70) 85.90 ( 12.80) - 5.00 c 0.025Systolic blood pressure (recumbent 10 ml-0
(Cm Hg) 55 120.00 (11.00) 123.00 ( 12.00) - 5.00 < 0.020Diastolic blood pressure (rect.usbent 10 min)(n Hg) 55 76.20 C 9.10) 76.80 ( 9.70) + 0.60 > 0.600
Heart volum (ml) 51 794.00 (86.00) 810.00 (124.00) '.16.00 > 0.300W170 (watt) 55 178.00 (26.70) 187.00 ( 34.10) " 8.30 < 0.020W170 weight (watt/kg) 55 2.60 C 0.40) 2.48 ( 0.49) - 1.30 < 0.025
a. On the back Just caudal to the scapulab. At the axlllary border of the pectoralls major muscle at the level of the mammillac. On the abdeomn In the mldclelcular line at umbilical level
4lylind, Scale. and LUnroth, 1978
38

measures on knee extensors. Larsson and Karlsson (1978) used
fifty males aged 22-65 years. Their results showed no decrease
in endurance as a function of age, but dynamic strength was found
to decrease with age. Additionally, a decline in dynamic
strength was correlated with a decline in type II fibers (fast
twitch) as age increases. Larsson, Grimby and Karlsson (1979)
i found in their 50-70 year old group a definite decrease in per-
formance on both static and dynamic strength. Subjects aged
3 11-29 reflected an increase of strength followed by a leveling
between 30-49 years of age (Figs. 5 & 6). The results of Murray
.3 et al. (1977) agreed with those of Larsson et al. (1979) as
Mlurray's older group, aged 45-65, had performed at 75 - 80% capa-
city of the younger group, aged 20-35. Kroll and Clarkson (1978)
combined activity level with the age factor. Activity was
divided into high and low categories within each age group (Table
9). The two age groups were 18-38 and 55-79 years. Kroll and
Clarkson (1978) found that while strength decreases with age, this
decrease can be hindered by regular physical activity. The older
group was still below the younger group in performance and the
active older subjects were stronger than the inactive older subjects.
Strength differences due to age can also be found when dyna-
mic and static measures are used on the ankle plantar flexor.
Falkel (1978) used three age groups 6-8, 14-16, and 23-28 years
(Tables 10 & 11). Again age was seen to affect strength dif-
ferences since strength was higher for each succesive age group.
Thus far, age can be seen as a real factor when dealing with
strength measurements. Overall strength appears to increase with
39

I. X PP4 x I 'A3W
LO UUlI) C L O) L O)
c r - r - C *
J~ cpIaC0))
a) S
jejL.0
400

0 ----- 00 rad x 5 "1
5 3.5 b". -- i/ 3
I - 3.0
* x
. 2.5
*-,-
2 2.0 ,
1.5
1.0
10 20 30 40 50 60 70
Age, yr
FIGURE 6. Maximum isometric and dynamic strengthexpressed per Kg body weight vs. age(Larsson et al., 1979)
41

TABLE 9. Age, strength, and resisted response times
Group Variable Mean Standard Deviation
Old Weight 77.12 8.77Active Height 178.14 6.36(N = 15) Age 65.67 6.85
Triceps Skinfold 9.70 3.51Gastrocnemius Skinfold 10.27 4.97Subscapular Skinfold 17.40 7.08M Skinfold 12.46 2.86
Old Weight 84.53 11.71Inactive Height 180.51 6.33(N = 15) Age 63.07 4.35
Triceps Skinfold 11.23 4.29Gastrocnemius Skinfold 9.47 3.48Subscapular Skinfold 21.43 6.18M Skinfold 14.04 3.59
Young Weight 75.03 10.06Active Height 180.85 5.01(N = 15) Age 22.20 3.26
Triceps Skinfold 5.40 2.50Gastrocnemius Skinfold 7.20 3.19Subscapular Skinfold 9.37 2.92M Skinfold 7.32 2.09
Young Weight 76.70 7.52Inactive Height 177.29 6.01(N = 15) Age 21.87 2.10
Triceps Skinfold 10.67 3.74Gastrocnemius Skinfold 13.33 5.59Subscapular Skinfold 16.33 6.36M Skinfoid 13.45 4.57
Kroll and Clarkson 1978
42

TABLE 10. !sokinetic values by age-sex groups
Mean Median RangesAge-Sex Group* SD (ft Ibs) (ft lbs) (ft lbs)
6 - 8 Oys + 2.58 6.60 5.75 4.00 - 13.30
6 - 8 girls + 16.30 11.39 7.45 3.30 - 8.01
14 - 16 boys + 9.42 26.46 24.10 12.60 - 40.60
14 - 16 girls + 7.21 25.08 24.00 14.00 - 36.30
23 - 28 men + 11.37 52.43 50.85 23.60 - 78.40
23 - 28 women + 8.32 33.31 31.00 21.40 - 50.90
* n = 20 in each group
Falkel, 1978
43

TABLE 11. Isometric Values by age-sex groups
Mean Median RangesAqe-Sex Group* SD (ft Ibs) (ft Ibs) (ft Ibs)
6 - 8 boys + 7.44 12.30 11.00 4.00 - 32.00
6 - 8 girls + 4.83 11.03 12.20 3.00 - 20.00
14 - 16 boys + 12.20 39.30 40.40 21.00 - 62.00
14 - 16 qirls + 10.50 35.65 36.50 10.00 - 50.00
23 - 28 men + 17.00 63.88 65.65 28.00 - 90.00
23 - 28 women + 12.30 42.40 41.30 22.60 - 66.00
3! * n = 20 in each qroups.
Falkel, 1978
I4
1 44

age up to approximately the age of 30-39, a leveling of strength
occurs and finally, beginnning approximately at the age of 50,
strength starts to decrease.
Sex
Another variable affecting strength is sex. Mortimer (1974)
used 599 male and female subjects aged 16-89 to determine the
range of foot forces which are exerted by U. S. drivers. Males
were found to exert more force than females. Mortimer's (1974)
study and several others (Amussen and Heeboll-Nielsen, 1961;
Nordgren, 1972; Troup and Chapman, 1969; and Williams and
Stutzman, 1958) were covered in a review of sex differences in
strength by Laubach (1976). Laubach (1976) noted that usually
college age subjects were studied and women performed at lower
strengths than men. The upper body, lower body, trunk and total
body strength for women was 35-70%, 57-86%, 37-70% and 35-86% of
the strength of men respectively (Figure 7).
The same year Lamphiear and Montoye (1976) developed a pre-
£ diction model for male and female strength performance. They
used arm and grip strength as related to anthropometric measures.
!n additional studies Kamon and Goldfuss (1978); Patton, Hinson,
Arnold and Lessard, 1978; and Poulsen, 1978) have all supported
Lauhach's (1976) review findings. Patton et al. (1978) found
that the rate of fatigue was different not only for sex but also
for high and low strength differences. Poulsen's (1978) study
indicated a relationship exists between back strength and the
maximum load lifted since they correlated from .7 to .8. The
review by Ayouh, Grasley, and Bethea (1978) of sex differences in
45

F -T
II1) 0
cn -
WW
S-~
Q) cm(U a a 0 .0
V))ICin.
46c

the literature covered anthropometry, bionechanics and physiolo-
gical responses. The authors stress the need for future research
as the literature thus far is unable to support any ruling based
on sex alone.
Age and Sex
Several studies can be found which deal with both age and
sex. The Kanon and Goldfuss (1978) study mentioned above,
included two age groups: one of 31 years and younger and another
of 31 years and older. They found younger women were stronger
than the older women in back extension, but had the same strength
in back flexion and hand grip. Thus, the results of the hand
grip agree with those mentioned earlier for men regarding age.
Males were also found to be stronger than women. Isometric
strength and body fat appeared to be inversely related to age.
The age and sex differences were also upheld by the Montoye and
Lanphiear (1977) study using 6,508 subjects (82% of a town's
population). A study which also used a large subject pool was
Asmussen and Heeboll-Nielsen (1961) when 360 males (ages 15-65)
and 250 females (ages 15-55) were used. Their findings were con-
sistent with the results of both age and sex differences obtained
by others. Women were found to have only 58% to 66% of the
strength of men; even correcting for height the strength of women
is still only 70% to 80% of men (Figure 8). They also compared
height and weight for their subjects. If height is selected as a
predictor, women should have 92% of the strength of men, a pre-
diction not supported by the data collected (Figure 9).
47

4- 4-
-44
010
0 a O
-~L -r - -i = 0)(U 4-) 0) i
to 4-
tA I 0
S9-
4 - *
Q) 4 .0C0 r_
~ 4J0) M 4)
o w 0)
C6 C
L.-4
EC~ej
M~ co ES..u,
;uao.AadJ UL4 -4U9I
484

CL S
It c a%
tA0
0.S-
cnCc
M C
mu VM - =~9$- J E
cj
aU-0 41C D C004 OD~ LO .O4-ctl
49ai~

Testing Procedures
Standardization of methodology is very important. When dif-
ferent methods are used, it becomes difficult, if not impossible,
to compare the resulting data. Following are testing procedures
Ito be used in static and dynamic measurements. These procedures
I cover the areas of measurement protocol, subjects, experimental
conditions, subject identities, and presentation of the data.
Protocol for Measurement
STATIC DYNAMIC
(1) A maximtm steady exertion (1) A maximum steady state
for a total of 3 seconds range of movement at a
should be performed, given speed should be
*I completed.
(2) The strength score should (2) The strength score is
be taken as the mean or a continuous position
maximum score during the dependent value.
3 seconds. Values at different
3 angular positions (or
similar other identi-
fiers) should be
3 reported.
(3) N/A (3) Speeds are normally
varied to establish
the functional rela-
tionship between dy-
5i nanic strength and
speed of movement.
50

I
Subjects
STATIC DYANMIC
(1) Subjects should be screened prior to selection (can be
3 a function of the purpose).
(2) Subject is usually (2) Subject usually instruct-
I instructed not to jerk, ed not to jerk but
but to increase exertion "pick up" the instrument
to maximum during a 4 or and apply maximum
5 second period, force during the prescribed
movement range.
(3) Provide qualitative feedback to the subject about their
general performance. Elicit any comments about any
problems he/she may have experienced.
(4) Rewards and/or competitive incentives change levels of moti-
vation biasing the strength scores and therefore should be
3 avoided.
(5) Rest periods should be provided. These rest periods should
I not be less than 2 minutes.
3 IExperimental Conditions
(1) Describe the segment of the body involved (or the muscles
I involved). Describe the movement (flexion, extension,
abduction, ..., etc.).
(2) For activities related to outer space, the level of gravity
I should be also described.
(3) Body posture assumed should be described. Is the subject
3I sitting, standing, prone, supine, ... , etc.
51

(4) If the subject is restrained, the experimentor should
describe it.
(5) The device or equipment used should be fully described with
particular reference to how the coupling between the subject
and the device is accomplished.
Subject Identifiers
(1) The sample size, the population it represents and how the
sample was stratified should be reported.
(2) If any screening of subjects was made, the criterion or cri-
teria used for screening should be reported.
(3) Sex and age of the subject, height and weight, or other
characteristics of interest for the study (body build, lean
body mass, ethnic origin, ... etc.) should be reported.
(4) Any training received relating to strength prior to testing
should be discussed.
Data Presentation
(1) Generally, the mean and standard deviation are reported.
Median and mode occasionally reported. Fifth, 50th, and
95th percentiles are occasionally reported.
(2) The underlying distribution should be reported if known. If
assumed normal, this should also be identified. Skewness
should be also reported.
(3) Mfininum and maximum values should also be reported.
A Consideration In Selecting Data for Analysis
One procedure involved in strength testing which varies
among tests is the manner in which the subject's representative
score is determined. Some investigators select the best score
52

LI while others use the average of several trials. Berger and Sweney
(1965) and McCraw and Talbert (1952) report that reliability coef-
ficients change if best scores are correlated rather than average
[u scores. Henry (1967) and Jones (1972) dispute this however.I I gunnery
The literature is in agreement that muscle strength is
increased by training. There is not agreement, however, on the
relative benefits of isokinetic versus static training. Some
researchers find no difference in strength improvements due to
the method of training while others report that isokinetic proce-
:3 dures are better. Part of this controversy may be a bias imposed
by the methods used to assess improvements.
The effect of body composition on muscle strength has been a
fairly recent topic of study, particularly with regard to ath-
letic performance. The relative area and percentage of fast
twitch fibers are related to force output and high speed of
contraction. Endurance atheletes have a predominance of slow
twitch fibers. With aging, the proportion of fast twitch fibers
decreases while slow twitch muscles increase.
Muscular endurance can be defined in terms of dynamic or
static muscle contractions. Dynamic endurance in teris of isoto-
nic contractions has primarily been studied. (With the develop-
nent of an isokinetic testing apparatus, research in this area is
being initiated.) Isotonic endurance has been correlated with
isometric strength. Attempts to correlate it with isotonic
strength have met with mixed success.
53

Several indices have been developed for assessing isometric
endurance hut there is no agreement a6 to which is best. Both
positive and negative correlations between strength and endurance
have been found depending on whether absolute or relative
endurance is studied. The factors felt to be responsible for
muscular fatigue include occlusion of muscle blood flow and the
build up of metabolic waste products.
The literature was found to be very consistent with regard
to age and sex. Females do not have the sane strength capacity
as males. Mean strength of males is higher than that of females.
3 lHowever, there is considerable overlap of the ranges. In addi-
tion, the difference between means is not constant but a function
of the muscle group utilized. Strength is seen to increase with
age during childhood, level off during middle age, and decline
after age 50. The rate of decline is related to the level of
* physical activity.
The dynamic strength of an individual is affected by both
5 environmental and psychological factors such as noise, hypnosis,
and drugs. Power exerted is related to muscle tension and length
and to the physical fitness of the individual. Torque decreases
as the speed of contraction increases.
The literature surveyed reflected a great deal of work on
3 static measures using several different muscle groups. Static
strength is influenced by environmental temperature, testing
instructions, muscle length, and the muscle group tested. The
15 recovery from maximum exertion can take up to four hours with low
strength groups recovering faster than high strength groups.
354

,
5 TIETHODS AND PROCEDURES
ft Subjects
In order to determine an Atlas of Strength for females, a
I sample consisting of 25 female subjects was selected. The subjects
i were drawn from the campus of Texas Tech University. Subjects
were recruited through advertisement in the University paper.
3 This advertisement described the work as requiring strength
meastirements. Basic height and weight restrictions given in
I Appendix I were listed as a prerequisite for participation.
I Subjects responding to the advertisement were interviewed and the
nature, demands, and actual tasks were demonstrated and any
questions answered. Subjects who met the height and weight
criteria and were still interested in participation following the
I interview, were then sent to the University Health Services for a
i physical examination. Subjects passing this examination were
then used as experimental subjects.
5 Apparatus
All. strength measurements were made using the Cybex Il
3 Isokinetic apparatus (mfg. by Cybex Div. of Lymex, Inc., Serial
io, C-30370), shown in Figure 10. This apparatus consists of a
dynamometer and goniometer that picks up the limb produced torque
3 and angle of motion and then transmits an electrical signal to a
two channel strip chart recorder. One channel records torque inI3 foot-pounds and the other channel records degrees of rotation of
the specific joint. Used in conjunction with the Cybex measuring
and recording equipment was a padded top Upper Body Exercise and
155

I
II
=3IIIIIII1I3U
FIGURE 10. Cybex II isokinetic apparatus
1 56
II,

Testing Table (UBXT) built by Cybex (see Figure 11). This bench
has a back rest which is adjustable to either a horizontal posi-
tion or an approximately 450 inclined position. This padded top
bench was used in the measurement of the following body segment
rotation joints:
a. Elbow
b. Shoulder (Proximal Humerous)
c. Hip (Proximal Femur).
The UBXT has a brake that is used to prevent slipping,
however when the torque exerted was large, there was still a
I possibility of slipping. For this reason, a carpet was
installed on the floor and weights added to the UBXT frame.
5' A chair having an adjustable vertical height and a seat pan
that can be rotated horizontally through different angles were
used in the measurements to obtain all torques at the knee. This
I chair was designed and constructed at Texas Tech University and
is shown in Figures 12 and 13.
I A special metal arm designed and constructed by Texas Tech
personnel was used in measurement of torques associated with the
extension of the lower back (Figure 14). This arm attaches to
the dynamometer head and extends upward and parallel to the face
of the dynamometer. The upper end of the arm is forked. At the
3 Iend of each fork, a roller extends perpendicular to the fork.
In lower back measurements, the subject places herself between
U the rollers with one roller in contact with the her chest and the
other roller making contact with the back. The distance between
57

I i
FIGURE 11. Cybex II isokinetic apparatus withupper body exercise and testingtable (UBXT)
58

I.
ri
LuI.IIIIIIIIIIU
FIGURE 12. Chair used in measuring torques at the kneeset in the 30 rotation position
59
II

I
IIII
I
I
* FIGURE 13. Chair used in measuring torques at the kneeset in the -30° rotation position
60
I

IIUUII.1IUIIUIIII* FIGURE 14. Cybex II isokinetic apparatus with the
attachment for measuring back strength
I61
II

the rollers is adjustable to accomodate subjects with different
chest depths.
Used in conjunction with all of the above equipment was a
wooden platform designed and constructed in the Texas Tech shops.
It was used to stabilize and to give extra height to the Cybex
dynamometer and goniometer during shoulder, elbow, and back
measurements, and also to give extra subject height for hip,
shoulder and elbow measurements at different angles of joint
rotation. The platform is shown in Figure 15.
General Procedure
Before any testing began, subjects were required to present
documentation indicating that a complete health examination had
been taken and passed. After this documentation had been
gathered, the test subjects were informed in detail of the type
of testing to be performed and how it would be accomplished. The
subject would then fill out an additional Health Screening con-
sent form given in Appendix 2.
All strength tests were performed in the Ergonomics Labs housed
in the Texas Tech Industrial Engineering building. The lab tem-
perature was 680 + 5°F. Room pressure and humidity were not
controlled. Atmospheric conditions at the time of the test prevailed.
All test subjects were required to wear loose clothing (i.e.,
sweat pants and shirt) during testing, and specifically shorts
when either the knee or the hip joints were tested.
All strength measurements on the arm or leg were made using
the unpreferred limb, that is to say, all right handed subjects
were tested using their left arm and leg, and vice versa.
62

VFV
FIUE1.Woe ltomue ihCbxIismtiIpaau
I6

Strength measurements were taken at the following body
joints: elbow, shouldpr, lower back, hip, and knee. Each of
these five joints were tested for static strength and dynamic
strength at three dynamometer speeds; 0 rpm, (static); 5 rpm, and
25 rpm. Tile torque exertions occurred at different starting
angles relative to the anatomical zero position of the limb. For
stLic measurements, the position at which the torque was exerted
was dei ned as starting angle or starting position even though
the applied force did not cause any motion. For dynamic measure-
ments, the torqus :as exerted from the starting position of
interest until reaching the specified limit for the range of
motion. The range limit used for the elbow and shoulder measure-
nents was 1200 and a range limit of 90' was used for the back,
hip, and knee measurement.
Five planes of motion were defined for those Joints operating
in the sagittal plane; elbow, vertical flexion of the shoulder,
hip, and knee. Abduction of the shoulder and horizonal flexion
of th shoulder were excluded as these two limb movements do not
occur in the sagittal plane. The lower back was excluded to
avoid possible injury to the subjects since no equipment design
was available which would allow measurement away from the sagit-
tal plane without the risk of injury.
The five planes are described as angles of rotation away from
the sagittal plane in the transverse plane. Motion in the sagit-
tal plane was considered to be 0' roLation. The two planes
defined by rotating 150 and 300 medially from the sagittal plane
were considered positive rotations. When the rotation was made
64

laterally, again 150 and 300, from the sagittal plane, the rota-
tion was considered negative (Figure 16).
I Before each measurement, the apparatus was set up, and the
appropriate attachment used for the transmission of the torque
was attached to the dynamometer. The subject was then placed in
the appropriate position and the axis of rotation of the joint of
interest was aligned with the axis of rotation of the dynamo-
I meter. The subject was then strapped in position, whenever
applicable, and the limb was attached to the testing arm.
Each test subject applied force in the sane manner. Subject
position in relation to test equipment is given in the section on
specific procedures. The test administrator described in detail
I the method in which the force was to be applied by each test sub-
ject and then observed that these instructions were followed.
The method of force application followed the steps listed below:
1. Administrator asked subject if she was "ready" to
apply force.
2. When the subject was ready, the administrator stated
I chart on". This statement indicated that the test
equipment was recording and that the administrator
was waiting for the subject to exert a torque.
a. For dynamic testing, the administrator monitored
the position or degree read-out channel of the strip
chart recorder. 11hen the desired angle of sweep
* Ihad been reached, the administrator would then
Ii say "stop".
65

Sagittal Plane
edialTransverse Plane
* 1500
* -300
I FIGURE 16. Angles of rotation
* 66

iI
b. For static testing the administrator monitored the
force read-out on the torque channel of the strip[I chart recorder. When a maximum force was reached and
maintained for approximately 4 seconds the administra-
I tor would then say "stop".
In the dynamic sweep measures, the subject was told to exert
maximum force over the range of movement and continue until the
administrator instructed her to stop. For static strength
measures, the subject was to gradually build up to maximum
force and sustain that level until told to stop.
3 For all strength tests, three measures were taken at each
specified combination of joint, angle of rotation, speed, and
3I starting angle. The three measures were taken at one time with a
short rest between them, usually one to two minutes depending onIthe subject. As shown in Table 12 not all joints were tested at
all possible combinations of the variables. Only the elbow and
shoulder vertical flexion and extension were tested for all five
angles of rotation. The hi:. and knee were tested for the nega-
tive angles of rotation, while the abduction of the shoulder,
horizontal flexion of the shoulder and lower back were tested
only in the sagittal plane or 00 rotation.
Because the hip and knee were measured for extension and the
00 degree position was defined by full extension of the limb, no
measures of strength were made at the 0° degree starting posi-II tion. The measurement of the back was also an extension measure,
I but unlike the hip and knee, hyperextension of the back was
:1 67
I

TABLE 12. Measured combinations of Joint, rotatIonl, speed and starting angle
MAXIMUM RANGE OF
Joint Rotation (DEG) SPEED (RPM) STARTING ANGLE (DEG) MOTION (DEG)
Knee (KNE) -30, -15, 0 0, 5, 25 30, 60, 90 90 - 0
Hip (HIP) -30, -15, 0 0, 5, 25 30, 60, 90 90 - 0
Back (BAC) 0 0, 5, 25 0, 30, 60, 902 90 - 0
Vertical Flexion -30, -15, 0of Shoulder (VFE) 15, 30 0, 5, 25 0, 30, 60, 90 0- 120
Horlontal Flexionof Shouider (HFE) 0 0, 5, 25 0, 30, 60, 90 0 - 120
Abduction ofShoulder (ABD) 0 0, 5, 25 0, 30, 60, 90 0 - 120
Elbow (ELB) -30, -15, 015, 30 0, 5, 25 0, 30, 60, 90 0- 120
'See text for definition of the variable rotation
2The O" starting position was for the static condition only
68

possible allowing a static measure to be obtained for the back at
the 00 starting angle.
A set was defined as three repetitions of a specific com-
bination of joint, rotation angle, speed, and starting angle. A
cycle was defined as four sets performed by a single subject
before she was released to permit testing of the next subject. A
session was the daily period of data collection for the group of
subjects under test.
II Each group of subjects consisted of either one, two or three
subjects. It was preferrable to use more than one subject at
I each test session whenever possible so that one subject can be
tested, then allowed to rest while the remaining subjects were
tested in turn. Each team of subjects whether only one, two or
3 three subjects completed the whole set of experiments together,
i.e. the tean was not chauged throughout the experiments.
I Testing within sessions were scheduled such that joints of
interest would not become fatigued. Generally, the first
neasurement of a test cycle on a joint for zero angles of rota-
tion had a test apparatus set up time of about five minutes,
while the first measurement of a test cycle associated with a
change in rotation angle other than zero, required about ten
minutes of test apparatus set up time. All the measurements in a
test cycle were completed in ten to twenty minutes. A period of
two to three minutes rest was allowed between each successive
measurement contained within a test cycle.
69
I'

Specific Procedures
The position of the test subject in relation to test equip-
ment is described below.
A. Knee Joint (KNE)
1. The subject was seated on the adjustable vertical
3 height backless chair.
2. The subject's hands grasped the bottom of the chair
seat at each side (Figure 17).
S 3. The axis of the dynamometer was adjusted so that it
projected an imaginary line through the lateral side
to the medial side of the knee joint through the
axis of rotation (Figure 18).
4. The distal part of the lower leg, just above the
I ankle, was strapped to the appropriate arm attached
to the dynamometer head, so that the pad rested on
the anterior side of the leg, and the strap on the
posterior side.
1 5. The 0' baseline at the bottom of the position angle
3 channel was adjusted when the subject was positioned
at the anatomical zero position, i.e. with the leg
3 extended horizontally.
6. For negative limb rotation angles, the tested leg
remained in the same position as for 0* rotation,
while the rest of the body was rotated (by rotating
chair seat) through the designated angle, effec-
SI tively rotating the hip (Figure 19).
7. The type of movement was extension of the limb.
70

I
III
IIIIUIIIIUI FIGURE 17. Extension of knee at O~ rotation
I 71
II

UM
II
FIGURE 18. Alignment of knee joint with
II dynamometer axis of rotation
| 72

[
UI[I
IIIIIIIIII
FIGURE 19. Extension of knee at 3Q0 rotatior~
I73
II

B. Hip Joint (HIP)
1. The subject was instructed to lie in a supine posi-
tion on the TJBXT padded table.
2. The hip joint was aligned with the axis of rotation
of the dynamometer so that an extended imaginary
line passed through the hip pivotal point.
3. The lower and upper part of the subject's trunk was
strapped to the UBXT table,with the chest strap just
below the breasts.
4. The dynamometer arm was attached just above the knee.
The pad rested on the anterior side of the leg, while
the strap surrounded the leg from the posterior side.
5. The 00 baseline at the bottom of the position angle
channel was adjusted when the subject was positioned
at the anatomical zero position, i.e. with the leg
resting horizontally on the UBXT (No hyperextension
of the hip was possible due to the table being under
the upper leg).
6. The subject's hands grasped the columns supporting
the surface of the UBXT on which the subject
reclined, one on each side almost below the
subject's hip joints.
• The tested leg was allowed to bend during movement.
P. The other leg was hanging over the end of tl.= JBXT
(Figure 20).
9. Negative limb rotation angles were adjusted by
rotating the head of the dynamometer upwards about
74

II
U e
IIItFGR 0 xeso fhpa *rtt o
I7

I3 its horizontal axis while the tested leg always
remained in the sane position on the UBXT which was
I placed on the wooden platform to adjust the height
of the joint for this position (Figures 21, 22).
10. The type of movement was extension of the limb.
3 C. Back (BAC)
i. The subject was in a standing position.
1 2. The subject's arms were hanging straight beside the
trunk or clasped behind the back.
3. The dynamometer axis was adjusted to the pivotal
3 point at the hip.
4. The subject was positioned between the rollers on
3 the forked arm. The forked arm was rigidly attached
to the dynamometer head (Figure 23).
5. The rollers were adjusted so that they touched the
3 subject's back and chest slightly above the breast.
6. The IJBXT was placed in front of the standing subject
3 and an arm was attached to it so that it touched the
upper part of the thighs horizontally providing the sub-
1 ject support as she bent down.
3 7. A heavy metal block was placed behind the subject's
heels to stabilize her position.
5 8. The O* baseline of the position angle channel was
adjusted when the subject was positioned at the ana-
U- tomical zero position i.e. standing erect.
3 9. Only movement in the sagittal plane was ieasured.
*76
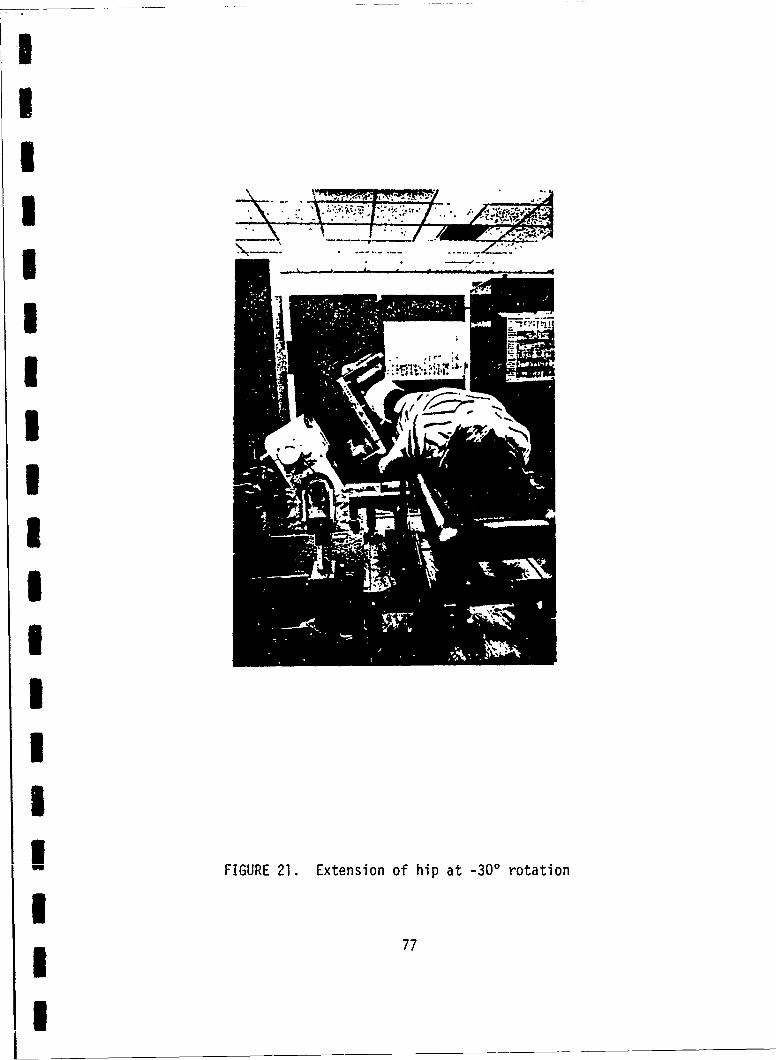
K*
IIUIUIIIII . '.4.
IIIIU FIGURE 21. Extension of hip at ~3Oo rotation
I1 77
I

I
III
I|
I-TO!
I
FIGURE 22. Extension of hip showing use of wooden* platform for negative angles of rotation
* 78
I

Iw.. .....
FIUE2. EtnsoUftebc79

10. The type of movement was extension in the sagittal
plane.
11. For the dynamic measurements, the subject was asked
to start exerting the force front the starting posi-
tion (90, 600 or 300) and continue exerting the
force past the zero position. One of the experi-
menters stood behind the subject to stop her at about
-30* (Figure 24).
D. Shoulder Joint (Vertical Flexion - VFE)
1. The subject was stretched in a supine position on the
UBXT table with the body straight and her arm
parallel to the longitudiual axis of the body.
2. The dynamometer axis was adjusted at the axis of
rotation of the shoulder joint.
3. The body was strapped across the lower trunk as far
as possible towards the legs and across the chest
directly below the breasts.
4. The tested arm was kept straight throughout all the
movements.
S. The hand of the tested arm was half-way between the
supinated and pronated position while gripping the
handle on the dvnamometer arm.
6. The untested hand gripped a stabilizing handle at
the side of the UBXT table (Figure 25).
7. The V baseline of the position angle channel was
adjusted when the subject was positioned at the anatomical
80
'1

I
[UKU
~
UI*HIIII FIGURE 24~ Extension of the back showing experimenter
in position to "catch" the subject
*181
II

- ~~-. -- Poll
FIUE2. Vrialfeino hshudr t0 rtto
.~82

I3 zero position, i.e. the arm was straight by
the side.
3 8. The dynamometer head was tilted on its horizontal
axis to achieve the various limb rotation angles,
and the wooden platform was used to raise the dyna-
5 moneter for the positive angles of rotation, or the
IIBXT for the negative angles of rotation (Figures
3 26, 27).
9. The type of movement was flexion of the limb.
E. Shoulder Joint (Horizontal Flexion - lIFE)
3 1. The subject was stretched in a supine position with her
arm extended perpendicular to the longitudiual axis
3 of the body.
2. The sent of the IIBXT i'is slightly elevated (to the
middle positioi) if required by the subject to
3 improve her comfort.
3. The dyrnamoneter axis was adjusted parallel to the
I longitudinal axis of the subject's body and passing
through the axis of rotation of the shoulder with
the arm in the horizontal position.
4. The body was strapped across the lower trunk as far
as possible towards the legs and across the chest
below the breasts.
5. The hand of the tested arm was halfway between the
I supinated and pronated position while gripping the
3 dynamometer arm.
83

LuIF'
LiF
[IF'IIIUI FIGURE 26. Vertical flexion of the
shoulder at 3Q0 rotation
84
3

FT
IGR /. VrialfeinolthshudraI30rtto
I8

3 ACKNOWLEDGEtHENTS
The authors wish to acknowledge the assistance provided
by several individuals during the course of this work. Elaine
Marshall, collected valuable experimental data; George Calisto
assisted in the entry of data in the computerized data files;
Daphne Jeane contributed in the data reduction and correction,
Tracy Marks assisted in data entry. Steve Morrissey and John
Varner contributed to the experimental design and development
of experimental protocol. Yi Yeh Yen developed most of the
data analysis prograns and aided in the data analysis.
3lany others provided time when needed to help with the
report preparation.
Accesion For
DTIC TAB ElUnannotnced
Justification
Availability Codes
copy DiOst U.. .. V.
,NSPEGT LII Occa6
~A-] L

6. The tested arm was kept straight throughout all the
movements.
7. The untested hand gripped a stabilizing handle at
the side of the UBXT.
8. The 0* baseline of the position angle channel was
I adjusted with the arm stretched horizontally
(Figures 28, 29).
9. The type of movement was flexion of the arm.
F. Shoulder Joint (Abduction - ARD)
1. The IBXT backrest was adjusted to the highest posi-
-i tion and the seat pan to the middle position. The sub-
ject was then in a semi-reclining position with the
legs slightly raised and feet on the footrest.
5 2. The dynamometer head was tilted back 40%
3. The dynamoneter axis of rotation was aligned with
the joint axis of rotation.
4. The body was strapped across the lower trunk and below
I the breasts (Figure 30).
3 5. The tested arm was kept straight throughout the
novement.
5 6. The untested hand gripped a stabilizing handle at
the side of the UBXT (Figure 31).
7. A safety cushion was placed at the lower starting
position to block the shoulder testing accessory tube.
8. The 0* baseline of the position angle channel was
3l adjusted with the arm by the side extended downwards
3 86I °

FIGURE 28. Horizontal flexion of the shoulder
at 0* starting angle
87

IIUIIB 11:
*
IIIIIIIU FIGURE 29. Horizontal flexion of the shdulder
at 900 starting angle
88
I

oI
UU
U
I
II
IIII
I 8
I

[.
IGR 1 buto ftesoleatI*satn nl
±90

9. Limb movement occurred in the frontal plane.
G. Elbow Joint (ELB)
1. The subject stretched in a supine body position on
the IIBXT table with the arm to be tested parallel to
the longitudal axis of the body and a pad supporting
the arm under the elbow.
2. The dynamometer axis was adjusted to the axis of
rotation of the elbow.
3. The subject's body was strapped at the lower trunk
and chest as in case of the shoulder joint.
4. The upper arm was held at a constant position as
much as possible parallel to the longitudinal axis
of the body.
5. Movement of the shoulder joint was discouraged.
6. The hand was midway between supination and pronation
as it gripped the handle of the dynamometer arm.
7. The untested hand gripped a stabilizing handle at
the side of the UBXT.
S. The 0* baseline of the position angle channel was
adjusted with the lower arm fully extended by the
subject's side (Figure 32).
'. The dynamometer head was tilted on its horizontal axis
with respect to the lower arm through the various rota-
tional angles as in the vertical flexion of the shoulder
(upper arm considered as one unit with body). Also the
dynamometer or the UBXT were placed on the wooden plat-
form as required to obtain the measurements.
I 91

LI
III
.1.IIIU[IIIIUI
FIGURE 32. Flexion of the elbowU at 00 rotation
U
III
13I 10. The 0* starting angle in case of the positive angles
of rotation was maintained using a horizontal pad
which was attached to the side of the UBXT. This
pad supported the subjects arm and attachment of the
dynanoneter in the horizontal position. The pad was
not used for 00 or negative angles of rotation since
the arm and arm attachment were supported in the
IE horizontal position by the edge of the 1JBXT (Figure
Ii 33).
11. The novement was flexion at the elbow. The starting
3 position in the case of dynanic measurements was
established by means of the test administrator holding
SI the limb at the proper angle until the subject began
the movement of the limb.
In all the above positions of the subject in relation to
the test equipment, the input arm length was adjusted
according to the subject's limb length. This length was
I recorded and osed whenever the same joint was tested for the
same subject for the remaining movements of that limb.
The different starting angles were determined from the posi-
tion angle channel of the chart recorder relative to the zero
baseline which was set at the beginning of each joint measure-
I ment. The experimenter held the subjects limb in the desired
starting position until the subject initiated the test movement.
For the back and hip measurements, weight had to be placed on
the bottom of the UBXT to stabilize it, since the torques exerted
were of large magnitude and slipping of the UBXT on the floor
|I 93

II
IIIIIIIIII
ii
IIa
FIGURE 33. Flexion of the elbow
at 150 rotation
I 94
1

could have occurred. Weights were also placed on the wooden
platform whenever it was used in conjunction with the hip or back
measurements to eliminate movement of the platform.
Data Transcription from Chart Paper
The chart paper consists of two parts. The upper part is
used for recording torque and the lower part for position angle.
The torque side has three range settings; 0 to 30, 0 to 180, or 0
to 360 ft-lbs. The position scale has two range settings; 00 to
1500 or 0 to 3000 degrees. In this study, all three scale
ranges of the torque and only the 0* to 1500 range of position
scale were used.
For each data set, a stamp was used to facilitate the
recording of the labeling information such as date of the experi-
ment, name of the subject, angle of rotation, joint tested,
speed, starting angle, and sequence number on the chart paper
(Figure 34). The sequence number allowed identification of the
temporal relation of a set to the other sets taken during a given
session. A sequence number consisted of two digits, for example
43. In this example, the 4 represented this subjects fourth
cycle while the three indicated this was the third set of the
present cycle.
A "Cybex II Chart Data Card" was used to interpret the infor-
nation on the chart paper and to determine the appropriate torque
for a specific angle. The card has several grids, A, B, C, D, E
(Figure 35). In this study only grids F (30ft-lbs/150* scales),
D (180 ft-lbs/150* scales) and B (360 ft-lbs/150* scales) were
used. For example grid D was used to interpret the sample data
95

1i
EI
!IDATE TORQUE (FT.-LBS)
lI . JL •j I ' i hL
* H 'zh4'Ti-L' I :O, '..
I1 I iI _ _
3POSI1TION ANGLE (DEG.) PIJNTED IN USA
FIGURE 34. Chart paper used with the Cybex Ii recorder
I P96
I

L. .
rI
mI .2 13
a C20
4: --
* CYBEX 40 210At ' A DIVISION OF LUMEX INC.I0I 100 Spence St., Say Shore, N.Y. 11706
(516)273-2200 0 ISO
120 3
010"OU1PI0q.0 19"!JA ISO01
-1 FIGURE 35. Cybex II chart data card (front view)
97I

LIt
Oc Oc GRID B - 360 ft. lbs.1150* ScalesM
:10 09 Uses of this card:
1 ic 1. Find torqueatfspecific joint angle(s).212.. pat itern. l o ektru rotepcfctru. 3
*3. Find active rang*eof motion ferspecific movementor s
Ot:09 S 4. Find Time Rates of Tension (torque) Development. .
21 Insrcin fo uigz: 1 . Select edge of card with proper Torque and Position34
I 24
00 OV Angle scales for the test being made or evaluated (i.e.,-s30, 180 or 360 1 . lbs. with 150 or 300 degr*es).I2. Decide whether 0' for neutral) joint angle is at bottom
I line of degree, scale grid on chart paper or at midline co C of grid. For example, for knee extension/flexion,1030
7- 0 degrees (full extension) isat bottom line of grid; forankle inversion/eversion, 0 degrees is at midline because 20c 00 11amoeent is possible on both sides of the 0* ! 240I9 neutral position. 6 1 :
aUse shaded degree scale, areas when O* is at midline 2
'Z: J f gid.1 230 120..
35 houldalways bee n chart datar oonylw YXTopcrdpt(back view
I0,1 aesafxdt ae.UoORMTO/YE xrieTeayRcrIt olgad*ale etdt.6
I 98

[3 in Figure 34. This was accomplished by placing grid D (180
ft-lbs/150* scales) across the chart paper aligning the scale
markings and noting the values from the card. The maximum torque
of 73 ft-lbs occurred at 48 degrees. The torqiue at 30 degrees
was 60 ft-lbs.
The data were transcribed in the above fashion and noted on
the chart paper. Then these were transferred to a coding sheet.
I An "IBM| FORTRAN Coding form" was used as the coding sheet. This
form had 30 columns. The columns were assigned as depicted in
Table 13. Later the data were transferred by hand from the
coding sheet to a computer file to facilitate analysis.
I
I9

I I"
Lt. ElT1L~WL ->
4- E
0r 41IQJ4-
r -- ~- .j -,-
0 r_ [4 j4 4 --;i.
4-'
-i *. -WI
0.5
*L 9
I ji
100

RESULTS AND DISCUSSION
The data obtained for the static and isokinetic measures are
combined in this section. A summary of the data is presented
followed by a discussion of the effects each of the independent
variables had upon the maximum torque. A correlational analysis
of the static and isokinetic torques was performed and the
results of that analysis are presented. Also included is a sec-
tion on the distribution of the anthropometric and strength data.
Goodness of fit tests were performed on the strength data and the
results of these tests are discussed. Finally an accommodated
percentage model is described and a sample of its output presented.
Static and Isokinetic Maximum Torque Data
Since the static and isokinetic data were collected at dif-
ferent speeds on a continuum, the data analysis was performed on
the combined data sets. A summary of the data is presented in
Table 14.
Host of the variable combinations are based on 75 obser-
vations (3 observations each for 25 subjects). For some of the
combinations the actual number of data points used was slightly
less than 75 as some of the data was found to be unuseable.
Generally the error was due to the loss of the baseline which
could not be regained even with recalibration. Consultation with
the nanufactuter identified the cause of the problem and the
required equipment repair. Another cause ol the loss of data was
the inability of some subjects to maintain the baseline given in
the initial calibration resulting in the loss of portions of the
101

TABLE 14. Summary of strength data
JCINT ROT SPEED START MAXMN ANGLEMN MAXSG ANGLESO
ABo 9o 0 0 22.320 0.000 5.2044 a.0000ABO RO 0 30 L6.367 30.OCO 3.1380 0.0000ABO RO 0 60 15.627 60.00 3.2994 0.0000ASO R0 0 90 14o360 90.OGC 3*0652 C.6O000
ASO RO 5 30 16080 30*840 Z.6750 8.9120ABO RO 5 30 15.060 62.40C 2.8685 15.220ABO RO 5 60 14.833 91.472 1.C993 12.2163ABO RO 5 90 13.347 114*014 2.567 6.0316ASO AD 25 0 10.960 8L.387 3.2980 16o4316ASO RO 25 30 9*893 IC4.013 3o4468 13*51.62ASO RO 25 60 9*069 118.056 2o!025 Ss.4123A80 RD 25 90 4.493 115.200 3.C$60 23*6735
SAC RO 0 0 823.73 0.000 34.5570 0.0000SAC RO 0 30 94.973 30*OCC X,85154 C.OMOBAC A0 0 60 90.307 60.000 26.8338 0.0000SAC RO 0 90 93.453 O.000 33.0464 0.0000SAC RO 5 30 85.600 5*653 19.5952 5.9297PAC RO 5 60 89.160 28e013 17.8788 16.8703EAC RO 5 30 9.680 48.653 3.615 2390560
8AC RO 25 30 L0.042 00000 1003807 C.COMO
SAC RO 25 60 50.280 0.000 23.4921 0.0000SAC RO 25 90 58.867 14.933 2C.7601 4.4830N-P R-15 0 30 75.573 30.000 1.4298 0.0000hip R-15 0 60 87.947 60.000 24.4689 0.0000hip R-15 0 90 94.236 90.0CC 294.354 C.OCOHIP R-15 5 30 56.427 10.507 12.6792 2.4294HIP R-15 5 60 73.413 29.173 15.$735 7.3436hip 1-L5 5 90 8L.347 52.120 16.2751 10.1262hip R-15 25 30 20.000 3.693 5.4351 32507HIP R-15 25 60 45.733 14.107 8.S130 7.0549HIP R-15 25 90 58.080 20.747 12.0121 .5523NZP R-30 0 30 769640 30.0CC 19.6655 0.CO00HIP R-30 0 60 81.560 60.O00 20.1670 CO0hip A-30 0 90 82.973 0.0GO 22.183S 0.0000HIP R-30 5 30 53.160 10.32C 11.1101 2.2188HIP R-30 5 60 69.253 28.240 14.4494 6.4721hip A-30 5 90 74.453 48o173 16.1415 11.8554hip R-30 25 30 20.120 1.960 5.1076 2.1146HIP R-30 25 60 43.813 12.880 10.2452 4.7333hiP R-30 25 90 54.413 25.28C 12.0482 10.9329HIP RO 0 30 87.520 30.000 19.6698 0.CO0HIP RO 0 60 96.720 60.000 27.3573 0.0000HIP RO 0 90 104.813 90.0CC 30.92! C.0OGOHP RO 5 30 66.493 10.307 17o2966 3.2920hiP RO 5 60 88.680 8.43 19.1926 8.0813HIP RO 5 90 94.253 50.OOC 20.2845 L0.3087hip R0 25 30 21.467 L.267 7.9938 2,3615HIP RO 25 60 43.760 12.5e7 13.5585 7.1718hi? Ro 25 90 61.387 18.640 14.6621 7.3735KNE R-15 0 30 48.720 3C.OCG 10.5354 0.0000KNE R-15 0 60 66.627 60.0CC 16.5823 c.CCCOKNE R-15 0 90 62.280 SO0.000 16.7021 0.00GOME R-15 5 30 29.427 13.2CC 6.8382 3.1451KNE R-15 5 60 48.L07 34.133 10.C466 6o3933KNE R-I5 5 90 57.200 54.160 13.8o759 6.9439INE K-L5 25 30 11.440 0.0C0 3.6027 C.OCOO
102

TABLE 14 CONTINUED. Summary of strength data
JCINT ROT SPEED START MAXMN ANGLEMN XAXSC ANGLESO
8NE R-15 25 60 25.3733 13.560 6.526C 5.7404KNE R-15 25 90 35.6267 32.533 7.4285 8.8887KNE R-30 0 30 47.5694 3.OCG e47899 0.0000KNE R-30 a 60 68.3867 6O.Occ 17*5480 0.00000KNE R-30 0 90 62-2800 90.000 16o;Zll C.0000KNE A-30 5 30 Z908000 13*453 5.3215 1*4456
KNE R-30 5 60 50.6533 35.333 11.8533 5.0466KNE a-30 5 90 57.5467 55.547 15.679C 7.7C58KNE R-30 25 30 9.7733 5.000 3.C693 23.6957KNE R-30 25 60 25.7200 13.027 6.6791 3.9965KNE R-30 25 90 36.8000 29.773 8.Cooc 6.6038KNE RO 0 30 42.3733 30.000 11.0976 0.0000KNE RO 0 60 62.8000 60.OCC 18.0C45 0.0000KNE RO 0 90 64.9600 90.000 1.62490 0.0000XNE RO 5 30 27.4667 11.427 ?.4622 3.5305KNE A0 5 60 46.8133 34.8C0 11.7032 4.6475KNE RO 5 90 59.1867 57.320 15.5161 7.0714KNE RO 25 30 9.5600 0.160 3.3500 0.9732KNE RO 25 60 24.9067 12.400 5.7544 4.0836KNE RO 25 90 36.0133 29.907 9.2173 5.7072ELB R-15 0 0 15.0267 0.000 2.1307 0.o000EL8 R-15 0 30 17.8000 30.000 2.5148 0.0000ELB R-15 0 60 20.1333 60.000 4.0448 0.0000ELB R-15 0 90 21.9600 90.000 35.919 0.0co0EL8 R-LS 5 0 17.5467 83.560 2.7768 15.8775ELi A-15 5 30 19.0533 88.893 3.4520 142037ELS R-15 5 60 20.3600 94.227 3.3997 8.4207EL3 R-LS 5 90 19.1733 115.293 3*163S 4.3520ELB R-15 25 0 14.3733 111.907 2.1547 1Co2009EL8 R-15 Z5 30 14.2267 116.387 2.1281 6.2253ELB 8-L5 25 60 13.5867 1200000 109108 G*OCOOEL8 R-15 25 90 8.4533 I2.000 1o879 C.COo0EL8 R-30 0 0 14.1467 0.000 2.5346 0.0000EL8 R-30 0 30 16.9420 30.038 3.5846 0.4815ELS R-30 0 60 20.0417 60.000 3.1055 C.OCOOEL8 R-30 0 90 21.7200 100000 3.2573 0.0000ELB R-30 5 0 17.5867 87.440 3.1840 21.6078ELS R-30 5 30 18.6933 88.413 2.7995 16.5383EL8 A-30 5 60 20.0133 97.253 3.2278 5.6340EL8 R-30 5 90 19.0000 115.720 2.8141 5.1715La R-30 25 0 14.4133 112.373 2.4555 11.0255ELS A-30 25 30 14.6528 110.611 2c4790 3.6058ELS R-30 25 60 14.0533 118.720 2.4100 5.7576EL8 R-30 25 90 9.2133 119.867 2.8772 0.6844ELB 8O 0 0 15.0400 0.000 3.0907 C00000EL8 RO 0 30 17.7333 30e00 3.1250 COOG OEL8 RO 0 60 20.b667 60.0CC 3.$910 0.c00ELB 80 0 90 22.5467 90.000 3.4 47 C.OCcOEL RO 5 0 18.3333 74.667 2.7279 19.2216ELB ko 5 30 20.2800 80.947 3.1685 14.7024ELS Re 5 60 20.4400 52.Z40 3.2393 11.2770ELa RO 5 90 17.4667 114.68C 3.6404 5.3199EL8 RO 25 0 13.5600 104.400 2.7614 I2.2552EL8 RO 25 30 13.6533 110.*00 2*2986 9.0822EL8 RO 25 60 12.7333 119.64C '.9336 1.5823ELB RO 25 90 7.7222 120.000 2.3806 C.CCCO
103

U
!I TABLE 14 CONTINUED. Summary of strength data
3JCNT ROT SPEED START MAXMN A41GLEMN MAXSD ANGLESO
ELS Ris 0 0 14.3188 0.000 2,89265 040000EL R15 0 30 18o5362 30.000 3.32804 0.0000ELS Ris 0 60 21.4783 60.000 3.54222 0.0000ELB RIS 0 90 21.6087 90.000 3.2$088 000000ELB R15 5 0 17.6944 71.014 2.-5184 19.0178218 R15 5 30 19.5072 75.319 3.82954 12.9915ELS R15 5 60 19.0417 e9.542 3.1189 6.9646ELS RL5 5 90 16.9565 113.44S 2.74631 4.5132ELB R15 25 0 13.3478 104.4C6 2.05674 10o3417ELS R15 25 30 13.5652 111.333 2.03588 8.7324EB RI5 25 60 12,3750 119.458 2.28552 2.1159Eta RIS 25 90 7.3194 120.000 1.5S953 0.0000EL8 R30 0 0 13.3067 0.000 2.74095 0.COOEL8 R30 0 30 15.1200 30*000 3.14497 0.0000EL8 A30 0 60 21,9867 60.000 3.61789 C.O000ELB R30 0 90 21.7733 90.0c0 3.74734 0.0000EL8 R30 5 0 17.8800 71o840 3.27546 1M5483
K'ELB R30 5 30 19.2267 74.747 441348C 12.7312ELS R30 5 60 19.2933 88.387- 3.31977 6.4993ELB R3O 5 90 16.3600 113.573 3.CI404 4.6823ELB R30 25 0 13.3600 104.520 2.21567 1262357ELB R30 25 30 12.8333 111.2S2 18a3855 9.1934ELB R30 25 60 12.2933 114.933 1.0S145 23.6559ELB R30 25 90 7.7733 120.000 1.7SOL6 0.0000k-FE RD 0 0 14.2267 0.000 2.91118 0.00000hFE RO 0 30 16.4667 30.000 3.61802 0.0000hFE RO 0 60 18.0667 60.000 3.50803 0.0000hFE RO 0 90 2o2133 SO.OCC 5.08653 C.0c00hFE RO 5 0 17.6933 98.053 4.57C69 22.0240hFE RO 5 30 20.2533 99.387 4.16255 20.1768hFE AD 5 60 21.d533 104.6eC 4.61400 12.8696PFE RO 5 90 21.9200 115.520 6.23148 5.5052iFE RO 25 0 11.9200 105.987 3e37623 19.4252HFE RO 25 30 14.2533 111.987 3.8453C 1C.0115hFE RO 25 60 14.1867 117.787 3.7S791 4.5539I-FE RD 25 90 9.6267 120.000 3*5C589 0.0000WE R-15 0 0 16.1333 0.000 4.13728 0.0000
VFE R-15 0 30 15.7733 30.000 2.8C238 C00000WE R-15 0 60 19.6133 60.000 3.95206 o0CCOOFE R-15 0 90 23.7733 90.000 5.55214 C60000
VFE R-15 5 0 19.2500 110.5Cc 3.43C39 14.7610WFE A-15 5 30 19.2133 1116347 3.5078e 11.47SIY FE R-15 5 60 20.5733 IC9o733 3*36184 L1.7730VFE R-15 5 90 21.1528 118.694 4.15S12 2.62511VFE R-5 25 0 15.0933 118.747 2.55308 3.2595VFE R-15 25 30 14.9867 119.493 2.5C671 2.0093VFE R-15 25 60 14.5600 ig.96C 2.7C255 0.3464VFE R-L5 25 90 9.,4000 120.000 2.06646 0.0000: FE l -30 0 15.8933 0.0CC 3.51665 0.000FE R-30 0 30 16.0Oc7 30.000 2.52735 COO0
VFE R-30 0 60 19.6400 60.0CC 4.42548 0.0000_FE R-30 0 90 23.0800 90.000 fo°8645G GO00VFE R-30 5 0 18.9867 105.387 3.11706 17.0412VFE k-30 5 30 I98133 103e347 3e54772 16c4617VFE R-30 5 60 20.1600 1C4.48C 3.2922! 12o6131VFE R-30 5 90 20.9200 116.a13 3.88608 4.2835
1104
I

F 3
3I TABLE 14 CONTINUED. Summary of strength data
JCZNT ROT SPEED START MAXMN AhGLEMN MAXSD ANGLESD
VE f-30 25 0 14.9306 116.8es 2.76969 7.3820VFE R-30 25 30 15.2267 118.587 2.06367 4.1528VFE R-30 25 60 14.8400 120.000 2.47168 0.0000F R-30 25 90 9.L200 120.000 2.2!389 G.0000
VFE RD 0 0 15.0933 0430C 4.21443 0.00000VFE RD 0 30 14.9333 3G.000 3.60680 0.0000VF E O U 60 16.7467 60.0cC 3.27601 0.0000VFE RD 0 90 23.0400 90.00C 5.15291 0.0000FE RO 5 0 18.8933 108.827 3.5C896 2M.7143F VFE RD 5 30 19.9733 111.240 3.66124 M5.9567
VFE RO 5 60 21.1867 111.547 4.26707 11.6216WVF RO 5 90 21.8800 119.260 3.51814 1.9902FE RD 25 0 14.8667 114.587 2.63210 10.894
VFE RO 25 30 14.5278 118.167 3.17549 6.1940VFE RD 25 60 13.4800 119.453 2.74285 2.3325VFE RO 25 90 8.4533 120.000 2.56427 0.0000VFE RIS 0 0 15.1389 0.000 4.17000 G.0000FE RIS 0 30 14.8472 30.000 3.28745 0.0000VFE RLS 0 60 18.0278 60.000 3.46805 0.0000VFE RIS 0 90 22.1111 50.000 4.99734 0.0000VFE Ris 5 0 18.047 114.319 3.85453 9.2916WE Ris 5 30 18.5139 112.389 4.00701 13.2373VFE RL, 5 60 19.6111 112.778 3.59795 11.CC99VFE RIS 5 90 20.0972 116.583 4.3C578 6.6157
WFE R15 25 0 13.5833 118.708 2.91464 5.0753VE R3S 25 30 13.5694 118.375 2.12846 4.8424YFE R3S 25 60 13.4028 156.278 2.61986 22.8061VFE R' 25 90 8.7391 120.OCC 2.13274 0.0000'VFE R3U 0 0 15.6267 0.000 3.24984 0.0000V1 'FE R30 0 30 15.9733 30.OCC 3.26725 0.0000VFE R30 0 60 17.3467 60.000 2.94312 C.OCCVFE R30 0 90 21,3067 90.000 4.2C094 0.0000WEE R30 5 0 17.4267 111.467 3.37786 16.0685'VE R30 5 30 1794933 108.427 3.41441 19.3427VFE R30 5 60 18.7867 113.453 3.78934 10.3065WEE R30 5 90 20.0533 118.640 4.3s86 3.1650ovFE R30 25 0 13.5467 117.960 2.5484L1 5.9762VFE R30 25 30 13.o267 119.333 2.74981 2.6321VE R30 25 60 13.3467 120.000 2.67871 0.0000VFE R30 25 90 8.2400 120.0CC 2.3700e 0.0000
105
I

TABLE 14 CONTINUED. Summary of strength data
JOINT ROT SPEED START 14AXMIN MAXMAX NAXSKEW ?AXXURT
AOO Ro 0 1s 40 1.1A84 1.7416ABO RO 0 30 10 28 1.0486 2.4826A4D RO 0 60 10 25 C.a103 0.7086AsO RO 0 90 4 20 -1.Z358 2.3272ASO RO 5 0 10 21 -0.3142 -0.5633ASO RO 5 30 10 21 0o1253 -0.9665ABO AD 5 60 9 25 0.6449 0.8978ASO RO 5 90 7 20 0.2682 -0.0344AO Ao 25 0 3 21 0.3381 1.2301ABO RO 25 30 3 20 0.6C74 0.7507ABO RO 25 60 4 14 -0.0866 -0.6965ABO RO 25 90 0 13 0.6684 0.1792SAC RO 0 0 24 138 -0.2565 -1.1872BAC RO 0 30 23 150 -0.5S67 -0.1479SAC RO 0 60 49 150 0.4785 -0.5198SAC RO 0 90 35 172 0.5428 -0.2015SAC RO 5 30 48 132 0.4648 0.2271SAC RO 5 60 56 138 0.5689 0.1157SAC RO 5 90 3a 214 144181 2.6415SAC Ro 25 30 0 39 1.2529 0.8083BAC RO 25 60 12 107 0.4I04 -0.2346SAC RO 25 90 16 112 0.3 0 -0.1345HIP R-15 0 30 34 110 -0.2848 -0.8938HIP A-L5 0 60 48 140 0.2937 -0.6707HIP R-15 0 90 51 158 0.4553 -0.6531HIP R-15 5 30 33 92 0.6419 03722HIP R-15 5 60 36 114 0.0358 0.0162nIP R-15 5 90 48 120 000169 -0,1815HIP R-15 25 30 11 40 1.1632 2.g533HIP -L5 25 63 24 TO 0.123 0.5827HIP R-15 25 90 30 85 -0.1583 -0.4685HIP R-30 0 30 40 130 0.3837 -0.3717
HIP R-30 0 60 48 120 -0.0882 -1.0119HIP R-30 0 90 40 125 -0.1785 -C.7967HIP R-30 5 30 28 82 -0.0922 G.G292HIP R-30 5 60 37 98 0.0123 -0.5100HIP R-30 5 90 44 108 0.4160 -0.7185HIP R-30 25 30 9 36 0.5302 0.C768HIP R-30 25 60 23 65 0.0190 -0.7003HIP R-30 25 90 2 80 -0.2382 -0.6338HIP RO 0 30 54 150 0.9416 1.0744
HIP RO 0 60 41 144 -0.1198 -1.0930HIP R0 0 90 44 174 -0.0435 -0.8657HIP R0 5 30 26 105 0.1612 -0.0274HIP RO 5 60 47 132 G.0S45 -0.2375HIP RO 5 90 53 141 0.0227 -0.2460HIP A0 25 30 6 46 1.1631 1.6692HIP Ro 25 60 12 76 -0.1814 C.2945HIP RO 25 90 25 89 -0.42S6 0.1145KNE R-I5 a 30 30 72 0.2583 -C.8128
#NE R-L5 0 60 36 105 0.1503 -0.8557KNE n-L5 0 90 35 96 0.3910 -0.5725NE R-15 5 30 17 51 I.C!56 C.56C6
KNE A-LS 5 60 27 68 -0.2107 -G.7533KNE R-15 5 90 35 S9 0.4274 -0.0721KNE A-I5 25 30 6 is 0.4C11 -C.5H5
106

I o
TABLE 14 CONTINUED. Sumary of strength data
JOINT ROT SPEED START MAXMIN MAXNAX MAXSKEW MAXKURTKNE R-IS 25 60 15 42 0.5649C -0.6103
KNE R-15 25 90 21 54 0.59S73 0.3889KNE 9-30 0 30 27 74 0.23431 007524
KNE R-30 0 60 42 114 0.86583 -0.0045KNE R-30 0 90 32 99 0.31492 -0.3645KNE R-30 5 30 L9 44 0.05800 -0.5920KNE K-30 5 60 24 92 0.71025 1.9029KNE R-30 5 90 30 102 0.37760 -0.06,8
KNE K-30 25 30 4 LS -0.01060 -0.0804KNE R-30 25 60 18 49 1.51617 2.8309A NE A-30 25 90 21 54 0.21577 -0.7149
KNE RO '0 30 20 72 0.43536 0.0350
KNE Ro 0 60 31 106 0.3!o24 -0.4860KNE Ao 0 90 15 106 -0.29991 0.1897KNE Ao 5 30 17 5o 0.71510 -. o2600KNE RO 5 60 L4 78 -0.23569 0.3504
KNE RO 5 90 30 108 0.72083 0.9238
KNE RO 25 30 2 18 0.37727 C.3CO4KNE AO 25 60 16 40 0.63964 -c.iC$KNE Ro a5 s0 17 50 -0.31921 -0.9745ELa A-15 0 0 L0 20 0.03319 -0.5344
ELG R-L5 0 30 13 24 0.45253 -0.4767ELS i-is 0 60 12 29 0.26426 -0.5663ELS R-15 0 90 14 31 -0.14708 -0.4580ELa R-15 5 0 13 25 0.61OL G.1700ELB R-15 s 30 10 28 0.16232 0.2466Et. R-15 5 60 13 28 0.0!081 -G.5041ELS R-15 5 90 12 27 0.18913 0.3457ELB R-15 25 0 10 22 1.2S655 3.1880ELS R-I 25 30 9 20 0266 100995EL8 R-L5 25 60 8 17 -0961427 0.4994ELS A-30 25 90 6 12 0.35830 -0.3375FELS A-30 0 0 a 19 0.13779 -005998
SELB A-30 0 30 11 26 0.8239g C°2237ELB R-30 0 60 12 28 -0.0343 -0.5421ELB R-30 0 so 15 27 -0.32616 =1.0269ELB g-30 5 0 12 26 0.81489 0.6687ELi R-30 5 30 12 27 0.31659 0.3065
ELS A-30 5 0 15 30 0.73327 1.0466ELS A-30 5 90 13 27 0.26167 1.0665ELB R-30 25 0 9 22 0.74872 0.9520
ELO A-30 25 30 9 21 0.145A# C.2610U ELS A-30 25 60 a 20 0.10239 C.7e13ELB R-30 25 s0 4 i8 1198 1 .9023ELa Ro 0 0 8 23 0.27471 0.2039ELB RO 0 30 10 24 -0.00475 -C.3098ELS RO Q 60 03 33 G.63674 1.4510i LB AC a 90 L5 20 -002370! -C.4153ELB AO 5 0 15 26 O6732 0.0395ELS RQ 5 30 L3 26 -00C!S71 -CeS841
ELS AO 5 60 L4 27 C.08972 -0.7947
LB 0A 5 ;G 24 -,3653L5 C.3662ELS RO 25 30 7 it -a.13747 -4,L405ELB AO 25 60 8 11 0.11234 0.0053
ENS R0 25 so 3 L6 0,-7241 1.0338
107Im

TABLE 14 CONTINUED. Summary of strength data
JOINT ROT SPEED START MAX14IN MAXXAX MAXSKEh MAXXURT
ELS R15 0 0 9 24 0.50S03 0o5178
ELS R15 0 30 13 29 0.80725 0.4603EL8 RL5 0 60 16 31 0.4156 -0.1188EL8 RI5 0 so 15 27 -0.07324 -101086
ELB R15 5 0 12 25 C.31304 0.4068ELS Ris 5 30 14 30 C.73037 -0.0290EL& R15 5 60 12 25 -0.18606 -004653ELS R 15 5 so 9 22 -0.35681 CO3504EL3 K15 25 0 10 19 1.1576 1.3282
ELS R15 25 30 9 19 0.42241 0.3142ELS R15 25 60 4 20 0.00967 3.5526ELS R15 25 90 2 10 -0.77678 1.3304
ELS R30 0 0 5 19 -0.5452C 0.6332ELB R30 0 30 12 z8 0.5670 1.1870ELa R30 0 60 17 34 1.28512 2W5304
ELB R30 0 90 L5 33 0.53887 1.2417
EL8 R30 5 0 13 29 1.61468 30668ELS R30 5 30 13 31 0.87827 C,7463
ELS R30 5 60 14 30 1o2853 1.5313
ELd R30 5 90 10 25 0.2CO$7 0.4414ELB R30 25 0 9 20 0.16242 1.1472
ELB R30 25 30 9 18 0.72806 10891ELS R30 25 60 7 1? 00.6193 C.4702EL3 R30 25 90 4 14 1.12082 2.7646HFE RO 0 0 6 21 -0.40648 0.5986HFE RO 0 30 8 25 0.71562 0.4863
HFE RO 0 60 10 26 0000863 0.3248HFE RO 0 90 14 39 0.44266 0.5322HFE RO 5 0 10 27 0.46200 -C*8250HFE Ro 5 30 13 31 0.43492 -0.3518HFE RO 5 60 12 32 -0.14541 -C.8421HFE RO 5 90 12 36 0.38280 -0.6906
HFE RO 25 0 5 19 0.10768 -0.7698mFE Ro 25 30 6 22 -f..o6393 -0.4386MFE RO 25 60 7 22 -C.07051 -C,5603HFE RO 25 90 3 18 0.15866 -0.4215VFE P-15 0 0 9 27 1.07182 0.83V7VFE R-15 0 30 12 23 0.73497 -0.1634VFE R-15 0 60 13 28 0.33380 -0.8554VFE R-i5 0 90 16 38 0.90424 0.0539VFE R-L5 5 0 12 28 0.52455 0.5934VFE R-15 5 30 14 29 1.1S731 1.Q8C8VFE R-L5 5 60 16 29 0.76967 -0.0925VFE R-15 5 90 16 36 1.73424 4.0353
VFE R-L5 25 0 8 23 0.35364 1.6302VFE R-15 25 30 11 23 1.07853 1,9571VFE R-15 25 60 a 21 0.44SS -0.0475VFE R-iS 25 90 6 15 0.64192 -0.1119
VFE R-30 0 0 10 26 0,66943 0.49r6
VFE R-30 0 30 10 22 0.04682 0.2!C2VFE R-30 0 60 13 36 1.34244 2.6190VFE R-30 0 90 13 36 1.00173 1.2350vFE R-30 5 11 2 .ic7f: 1.42'0
VFE R-30 5 30 13 30 0.80346 0.6071
VFE R-30 5 60 14 28 0.54575 -C.38C4VFE R-30 5 90 12 29 0.32036 -0,5904
108

iI
U jTABLE 14 CONTINUED. Summary of strength dataII
JCINT ROT SPEED START MAXMIN MAXMAX MAXSKEW MAXKURT
VE R-30 25 0 8 21 0.12716 -0.10121_FE R-30 25 30 10 21 0.51156 0.62695VFE R-30 25 60 9 20 0.08947 -0423604VFE R-30 25 90 3 14 -0.21155 -0.3645FE RO a 0 5 32 1.48-324 64C0675VFE RO .3 30 a 28 1,44562 3619840VFE k0 0 60 it Z5 0.48149 -0.16842VFE RO 0 90 13 34 0436055 -0.50803WFE R0 5 0 12 30 0*87S'73 0*99215YFE RO 5 30 L4 32 1.02232 1*25541VFE RO 5 60 13 3Z 0.67279 -0.19229wFe RO 5 90 is 29 0.CS656 -0*66562VFE RO 25 0 10 21 0*52702 -Ce41386
VFE RO 25 30 6 20 -0.35930 0.C75701FE RO 25 0 7 22 0.54670 2.565
WE RO Z5 90 3 14 0.32710 -0.14200YFE RIS 0 0 7 26 0.18208 -C.11842
ISE A 0 30 8 22 0.25401 -0.1g922VFE R15 0 60 13 26 0.43662 -0.33453VFE R15 0 90 14 36 1.10171 0.75290Wi RIS 5 0 13 32 1.64$12 2.9496VFE A15 5 30 12 28 0.90604 0.03612
SFE RI 5 60 14 30 0.97458 0.96757FE R15 5 90 L4 36 L.80552 4.42551VE RIS 25 0 8 23 1.2S784 2.4414SV Kis 25 30 9 19 0.57724 0.36422
i VFE RIS 25 60 9 20 0.81165 0.50224WE K15 Z5 90 5 16 0.55779 0.89400VFE R30 0 0 10 25 0.43413 -0.21205VFE A30 0 30 9 24 0.37785 0.27265IFE R30 0 60 13 24 0.61663 -C.170 9VFE R30 0 90 16 33 1.15483 0.93420WE R30 5 0 12 28 1.44645 2.13222VFE R30 5 30 13 28 1.50844 2.12183VFE R30 5 6C 13 30 1.01S30 0.57070VE R30 5 90 13 31 0.87S42 0.27430WE R30 25 0 9 21 0*58602 0.47379
VFE R30 25 30 8 20 0.52657 -0.25424VFE R30 25 60 1o 21 1.06517 C*.3115VFE R30 25 90 4 is 0.93195 0.49438
I-3
3109Il

range of notion being measured. Rescheduling was made difficult
due to the lag time of the data collection and the discovery of
the data error. Many of the subjects were unavailable as the
semester had ended or as in other cases they had graduated and
moved away from the campus.
The Strength Data
A summary of the strength data is presented in Table 14.
The data are listed according to joint first (column 1). The
other variables are the angle of rotation (ROT), speed of motion
(SPIEED) and lastly the starting angle of the motion (START) in
colu ,s 2 through 4 respectively. Each line of the table is uni-
auoly defined by a combination of joint, rotation angle, speed,
and starting angle.
The data is split into two parts. The first part is con-
tamned in the first fou. pages while the next four pages contain
the second part. Each line of data in the first part consists of
the mean torque in foot pounds, the mean angle at which maximum
torque occurred, the standard deviation of the torque, and the
standard deviation of the angle at which the maximum torque
occiirred (columns 5, 6, 7 and 8 respectively). In the second
part the data in each line consists of the ninimum and maximum
values in foot pounds defining the range of the maximum torques,
a measure of skewness of the maximum torque data, and finally a
measure of kurtosis of the maximum torque data (columns 5, 6, 7
and 8 respectively).
110

F
Data Retrieval
The information desired must be identified according to the
identification format used in the table. As an example, say the
torque of the elbow in the sagittal plane starting from an angle
of 30 degrees above a fully extended arm is desired for a speed
of five RPM. The selection must be identified as ELB, RO, 25, 30
or in other words elbow, rotation of 0, speed of 25 RPMI, and
starting angle of 30 degrees.
Using this defintion, the user would enter the table first
at column 1 with the joint: elbow. Having found ELB in column-
one, move to RO in column two followed by 25 in column 3.'
Finally moving to 30 in column 4 would identify the "data line
desired. The data for this combination of variables is as
follows:
MAXI!N (mean maximum torque) 13.6533 ft-lb
ANGLEHN (mean angle of max. T.) = 110.800'
ZAXSP (standard dev. of the max. T.) = 2.2986 ft-lb
ANGLSD (standard dev. of the max. T.) = 9.08220
5 AXIIII! (smallest maximun torque) = 7 ft-lb
TIAXMAX (largest maximum torque) 18 ft-lb
"I ?fAXSKEW (skewness measure of max. T.) = -0.13747
IfAXKIIRT (kurtosis measure of max. T.) = -0.1405
ill

I Effect of the Variables on Maximum Torque
Each of the independent variables are discussed separately.
The data contained in Table 14 is the source for all discussion
I in this section. Plots of the maximum torque as a function of
speed with the four starting angles as treatment conditions for
jall joint rotation combinations are presented in Figures 36-54.
Note that differences smaller than 1.5 ft-lb for torques less
than 180 ft-lbs and 3 ft-lb. for torques larger than 130 ft-lbs
3 should be interpreted with caution since the smallest division of
the two most often used scales, namely 180 ft-lb and 360 ft-lb,
were 6 ft-lb and 12 ft-lb respectively (see the figures 34 and 35
in the procedure section showing the sample data record and
IU scaling card).
i Speed Variable
In general the maximum torque appears to decrease as the
3 motion increases. Three exceptions are observed. The first is
for the elbow joint (Figures 38-42). For all cases, the sta-
I tic measure at the zero degree start is relatively low although
I the values for the 30 degree start are very close, about 1.5
ft=lb, to those values for the next sneed. These differences
should be most probably interpreted as negligible due to the
limited accuracy of the data decoding process itself. The most
I probable reason for the relatively low values at the zero start
position is the required full extension of the arm which places
the elbow joint at a very poor mechanical advantage. The second
3 exception are the zero, 30 and 60 degree starting positions for
112

25-
20-
1x3T
E
N
N
0S
511

I 9p.
80-
0 0
7c
Iu0
U
E
S0 .
N0 30l
!,,* 24
201
0 i s0 35 20 25
SPEED IN RPM (SAC AND RO)
LEGEND: tREAT 0 . 3 6 6 I 9
FIGURE 37 MAXIMUM TORQUE VS SPEEDFOR BAC AND ROT OF 0 DEGREES
1 114

I
II
r-
~201
0
SIE*N*F
0a
N0S
S !c i 5 20 25
SPEEO !N RPM CELB RNO R-1S)
LEGEND: !REqT a s 9 3 6
FIGURE 38 MAXIMUM TORQUE VS SPEEDFOR ELB AND ROT OF -15 DEGREES
115

I I'I
IAj x
PS 0
IuINi 2P
IU
0-
I *1
I 5 20 i5 20 25
SPEED IN RPM (ELB AND R-30)
LEGEND- TREAT -- a0 9
FIGURE 39 MAXIMUM TORQUE VS SPEEDFOR ELB AND ROT OF -30 DEGREES
116

IF
!LIR
1x
T0 5
RIu5E
IT
I a
U
N
03 !5 1 20 25
SPEED !N RPM (ELB AND P.0)ILEGEND: rREAT s- - 0 '~. 3 6 9
FIGURE 40 MAXIMUM TORQUE VS SPEEDI FOR ELB AND ROT OF 0 DEGREESii 117

20-
R
IN
a
.. . . . 10i 02
SPESNRM(L N !5
FO EL ADRTO 15 20GR 25
3 118

[m 25
R
i
i
I 2
* 01
R
E
F~0
P°u
SPE N RP -EAD90
FO EL N-O F3 ERE
IIS
1
*m C 5 30 S 20 25SPEED !N RPM {ELe RND R30)
LEGEND: rP.E T ~-0 +-. 3 - 6
FIGURE 42 MAXIMUM TORQUE VS SPEEDIFOR ELB AND ROT OF 30 DEGREES
1 119

1
-I[Iq
UT
PUN
s
5 .i 0 is 2 0 2 5SiPEED !TN RPM Wl~E A NO RO)
LEGEND: ERTq - 0 3 6 9I|FIGURE 43 MAXIMUM TORQUE VS SPEED
FOR HFE AND ROT OF 0 DEGREES!120

C;I-
IiI0
ro-IP
* q'C 20-'
!c
.
~12

I
NE
P
21
i 20! ! 212
S -I
SPEED IN RPM (HIP SNO R-15)
ULEGEND: MPEAT
FIGURE 45 MAXIMUM TORQUE VS SPEED* FOR HIP AND ROT OF -30 DEGREES
1 122

xU0LI4
3uN
Tcc
1 504
0 i 20 i 5 20 25
SPEED IN RPM CHIP 9ND RG)
L.EGEN: 7REAT 3 -.- 9
*FIGURE 46 MAXIMUM TORQUE VS SPEEDFOR HIP AND ROT OF 0 DEGREES
* 123

v-1
A
r.
m0
LII
IRu
- 1-1
E0
IF
) *1
ir
I I
C5 !a 2 20 25
SPEEO IN RP.M (KNE FINO R-15)
LEGEND! rTP , a 3 6 6 & 9
FIGURE 47 MAXIMUM TORQUE VS SPEEDFOR KNE AND ROT OF -15 DEGREES
J1 124

0 4
FFI ~0-
!C1
C-]I;, ... , ------...
12

70-
R
o 40-uE
!35-N
Fo 30-
P 25-0uN0 20-S
10
05 i0 i5 20 25
SPEED IN RPM (KNE R;ND RO)
LEGEND: TRERT 69
FIGURE 49 MAXIMUM TORQUE VS SPEEDFOR KNE AND ROT OF 0 DEGREES
126

IRauE
F
T
P0
U
1 5 0 i5 20 25
SPEED IN RPM WYE AND R-15)
LEGEND: TREAT 13-s-s0 3-.-+9
FIGURE 50 MAXIMUM TORQUE VS SPEEDFOR VFE AND ROT OF -15 DEGREES
127

X
I
u
I
1
i
II
I 200]
*128
* A*X
ILE0N: REr s-0-
FIUE5 AIU OQEV PE
1 FR VE AD RT O -3 DEREE
12

Ix
C.-1
1129

-s I
S
4
20i2
SPEED IN RPM WVE RND R!5)
LEGEND: 'REqT a a 90 a;; 69
FIGURE 53 MAXIMUM TORQUE VS SPEEDFOR WFE AND ROT OF 15 DEGREES
130

11 0 1
IX[ R
u
p
0
3EEO 7RLI03FIUE5 AIU OQEV PE
FO IEADRT F3 ERE
13

the lIFE static condition. Again the limb position is such that
the mechanical advantage of the limb is poor. This point is
especially clear since the angle at which the maximum torque
occurred for the dynamic conditions is very near 100 degrees,
considerably beyond the positions which are under question. The
third exception involves the zero, 30 and 60 degree starting
positions for the VFE static position. The most probable expla-
nation for this deviation from the decrease in torque as the
speed increases is again the poor mechanical advantage afforded
the arm at these low angles. As with the HFE exception noted
above, the angle of maximum torque for the dynamic conditions
occurs around the 100 degree position.
Rotation and Joint
The various angles of rotation produced no substantial dif-
ferences in maximum torque. Only the hip showed any effect with
the maximum torque decreasing as the hip was abducted from the
sagittal plane.
M!aximum torques associated with the joints reflected the
size of the muscle groups acting on them. Those joints in which
muscles of larger mass were used were observed to have larger
torques (BAC, HIP, KNE). Similarly, the joints which involve
muscles of smaller mass yielded smaller torques (ELB, ARD, HFE,
VFE).
Starting angle
The effect of the various starting angles is to reduce the
range of motion allowed to the subject. For the elbow and
132

shoulder motions (ELB, ABD, 1IFE, VFE), the range of motion
decreased as the starting angle changed from 0 to 30 to 60 to 90
degrees. For the remaining conditions (BAC, HIP, KNE) the range
of motion decreased as the starting angle changed from 90 to 60
to 30 degrees.
A definite trend toward decreasing torques was observed as
the range of motion decreased for the BAC, HIP, and KNE. A simi-
lar trend was also seen for the ABD although the amount of the
torque decrease was much smaller. For the ELB, HFE, and VFE con-
ditions there seems to be no consistent trend. The torques
increase as the range of motion decreases for the static con-
dition. This can most probably be attributed to the limb posi-
tion being nearer the optimum position for mechanical advantage.
The changes for the highest dynamic speed are very small
generally until the angle giving the smallest range of notion is
achieved. For the smallest range this is an angle of only 30
degrees and in conjunction with the high speed doess not allow
the subject much time to catch the resistance of the apparatus
which allows the torque to be registered. In other words the
subject uses most of the range to develop a measurable torque
leaving only a small part of the range to develop the maximum
torque. The slow dynamic speed seems to show a slow increase in
the torque as the range of notion is decreased, however, the
torque differences between the adjacent ranges are often negli-
gible making the definition of a trend most difficult to
133

establish. The torques for the longest range of motion and the
shortest are too large to be considered negligible however.
Maximum Torque Angle
As the speed of motion increased, the angle at which the
subject attained the naximum torque approached the termination
point of the range of motion (Figures 55 - 61). An explanation
is that the subject must use more of the range of motion to
"catch" the dynamometer arm before he can register any torque.
This means she must travel farther before her is able to reach her
maximum torque.
Additionally the angle of the maximum torque also moves
closer to the finish of the range of motion as the range of
motion is decreased. The obvious explanation is that the range
of motion is limited by moving the starting position closer to
the terminal end of the range of motion. This of course forces
the maximum torque to be confined in smaller ranges which are
closer to the finish of the range of motion.
The difference in degrees between the angle at which the
maximum torque occurred and the starting angle is defined as the
engiiar displacement for the body segment being tested. The
angular displacement was observed to increase when the speed of
motion increased. (Figures 62-68). This observation seems to
stem from the increased displacement required to catch the
apparatus to produce a measured torque. Also the angular displa-
cement was seen to decrease as the starting position approached
the finish of the range of motion.
134

00
E 90-]
C.
E ?O
S 30
o N
2 0-i
oo is0-2
0
m E 0
SPEEO IN RPM (RED AND RO)
FIGURE 55 ANGLE OF MAXIMUM TORQUE VS SPEEDFOR ABD AND ROT OF 0 DEGREES
135

0=3u4
.C4
GS 30-1
'U j
20s 20
G
E
12q01IG
150 S 25 20 25
SPEED !N RPM (BAC AND R0
LEGEN r EG u + {a- 0 0 ; 3 6 9
FIGURE 56 ANGLE OF MAXIMUM TORQUE VS SPEEDFOR BAC AND ROT OF 0 DEGREES
136

90
G
E 0
p
E
c 5 02520 25
SPEED !N RPM1 ZELE AND RO)
LEGEND: !REAT z a 0 3 6 6 6*
FIGURE 57 ANGLE OF MAXIMUM TORQUE VS SPEEDFOR ELB AND ROT OF 0 DEGREES
1 37

.......
A
L
01
E
c .. .. i0 25 20 25
S~PEED IN RPM W~iE AND RO)
rvlEN%: TPcli ~ ~ -~C 4--T
FIGURE 58 ANGLE OF MAXIMUM TORQUE VS SPEEDFOR HFE AND ROT OF 0 DEGREES
138

L I
12 0-3
;.C I
II
G -
L
I 331 1
701
1 !P. -O_,' 4
E 5.S 30
C 30 !5 20 2S
* SPEEO IN RPM (HIP RNO RO)
ULEGEND: TRERT s--e 3 .-.- +- 6 &--- B
3 FIGURE 59 ANGLE OF MAXIMUM TORQUE VS SPEEDFOR HIP AND ROT OF 0 DEGREES
1 139

.1
.4
c4
4
7-
,04
N -:S .
E 4
T i
03
£ 14-2
.0-
05 !0 20 25
SPEED !N RPM (KNE SNO RO)
LEGEN' TPEQT r . . .
FIGURE 60 ANGLE OF MAXIMUM TORQUE VS SPEED
FOR KNE AND ROT OF 0 DEGREES
140

G
L
IF
R
uI E
E 0-IRIE
0 510 Is 20 25SPEEO IN RPM WYE ANO RO)
3 L.EGENO: !REAT -s- 0 .- + 3 *--- op-.-q 9
* FIGURE 61 ANGLE OF MAXIMUM TORQUE VS SPEEDI FOR VWE AND ROT OF 0 DEGREES
1 141

120~
T 0 -
I R7O
m Li-N 3IG
NPE INRPG(D AD O
20142

I
G -
It~ 120-
5F
M BM 80
S
T -
A
R 70r
r
so-:ANG
0
0 5GF
3MMR
N 30-
0
G20-
- 5 10 15 20 25
SPEEO IN RPM (SRC RNO RO)
LEGENO: rREA - 0 - 3 * 6 - 9
FIGURE 63 DISTANCE FROM STARTTO MAXIMUM TORQUE VS SPEED FOR
BAC AND 0 DEGREES ROTATION
143

T 90IF
R 0 :
r
1 60-N
oso-
X 40-
ITTEG
0 S 0 '520 25
SPEED IN RPM (ELB AND R0)
rfLGEND TOCOT f
FIGURE 64 DISTANCE FROM STARTTO MAXIMUM TORQUE VS SPEED FOR
ELB AND 0 DEGREES ROTATION144

.....3 201-
T4R .70-£T
S
0
20-:
o
£ ii15202
* 145

0IsT
0
N
0 s-F
0
0 5 0 is 20 25
3SPEED IN RPM (HiIP RNG RO)
LEGEND: TRERT 3-s-e9
FIGURE 66 DISTANCE FROM STARTITO MAXIMUM TORQUE VS SPEED FOR
HIP AND 0 DEGREES ROTATION146

!9
! R
1cc.
s c-
sr
R 70-r
0E3G0 50-
N130 1
G
I
ft 0 5 10 15 20 25
SPEEO IN RPM LKNE ANO RO)
* LEGENO: TREAT" 3 6 A 9
I| FIGURE 67 DISTANCE FROM START
ii TO MAXIMUM TORQUE VS SPEED FORIKNE AND 0 DEGREES ROTATION
jI 147

*15 0
R 7C-
60r
10F
G
c 5 i0 is 20 25
SPEED IN RPM (VFE AND RO)
LEGEND: rPES 0 3 6
FIGURE 68 DISTANCE FROM STARTTO MAXIMUM TORQUE VS SPEED FOR
VFE AND 0 DEGREES ROTATION
148

Correlation of Static and Dynamic Strength
The set of correlation matrices used in this analysis are
presented in Tables 15 through 20. Entries are by joint/speed
combinations, ELB at 0 RPM by VFE at 0 RPMI produced a Pearson
Product Hfoment Correlation coefficient of .33162 (Table 15).
Three values are given for each correlational component; the
value of r, the probability associated with that r, and the
nunber of observations used in computing r. Thus, for the entry
points described above (ELB/O and VRD/0), the tabled values are
.33162 for r, .0001 as the probability the null hypothesis is
true, and 300 is the number of observations used in the com-
putation of r.
Miany of the correlations are statistically significant in
that their probabilities are less than the .05 criterion yet the
value of r is small, some less than .3. This is attributed to
the large numbers of observations used. For this analysis only
the values of r> .3 were considered worth noting. The coef-
ficient of determination, the square of the correlation coef-
Nicient, for values of r = .3 is .09. This indicates only 9% of
the variance is associated. Anything less than this amount is
simply too small to be of any practical consideration.
Correlations of Strengths Within Speeds
There was no true pattern of correlations in the static con-
dition (Table 15). The ELB correlated significantly with two of
the shoulder motions (VFE and lIFE) and two of the extensions (HIP
and KNE). Both the VFE and HFE correlated well with the hip
while VFE also correlated with the KITE also. Of the three
149

0 WIn n-dN ( 4' - ALe m 4% 4r4I:
Iua0r 0 0001z , 00N'0 N 0N p 0
-4 K o0 ro p-00.L10. 00' NO -ON ON .0 0-4
0 u I ~0O -0 tO N .0,0N O0% N 00%0 r 0,0L. O0.O z Om0 z ml 0N N.O0N IkO N 00,0 r- 0 1co x 0A 00 00 OQ I 00 o-'0
.0 In0 .0 '0 0 .0%
W 0 0 0 0 -4 0
LL 8 0 04 00 - -
0 m-4 NY- 0%*%0 o 0.0 tn 04I nin 0 .0 .1 % 0 . 0 0 .0% 00 0 a .40O
< N 0 NAl 7-4 0 @4Nmc N C N r-0N f-0I0%00 00 clO0 tA~00 ' NON -
- 40 0O 00 00N 60N4J 00 .. * . 00
10-v MO 0.00 0 m.0 0%.0aIn t NI
0 0 0 ? 0 Noca 0 0-% 0 10 N c'o4 0N
Nr 0 m -r a In - 0 m I oN soN %00. 00'N4-W 0- NO tAO N~ 4 00 N
a) ) N *4 0 0 0 030 0
0 C
0
0)C 0a£o0 I 0 0 C3 ,.
%0 -4e 00 go W 0 0-
U 4-0
110 0 n%0e:In0 1

zW~. LA''~ OT4 ?ON Ud'- C N C0f orin
I- I Ir O'' r- N~ .O CP-cC 10 N m -O?_ O0
z 0. N ~- 0 0 Col' -O N0- OON Ot-. 0 0 %. to 0'C '?ON fN nC.ON W O' 00>. .0 -40 (n0 0 a .0 %Q0 0
N' 0. 00 0. 0. 00 0
ca4 i j U "4,~ 91O 0107% N44 -04 t 0 a'CN0P4ifCL N UO f* ' 1- 0% N .40 M OO610N 0 0t-O n U0 FN
3 aN 0 M 0' -.4 . 00 k 400 *0 en 9 M0 0 %. 0 0 .0a
iiJ 0 0 0 0 -
04 0 U'N %0J'VN -4 0 N %r N M 4 ON 6n 0 N 10 0 NM N o tn0N 0%0N . 0N O N % 0 N 00O
Nu .u0Q 0 n 0 0 0% 0 0 .0C., W M 0 0 0 0 0
0. NO wa0 0 0 00O 0 -6 0404-n -_ 0. 0~ 0.00.**0 A- 0 0 00 00 00
.0 a 0 0 0 0 . 0>1
0L U Ch 0 0 0 .4k-d 0.t NU 0* -4N -O-Nco _ Wm _11 0 0 0 rO 100) N ?O3N %tOI- N O"-0ce_ :) 0 N 0 lj% -00 -4 0~~0-4 00- -M r'1 NO0'40 .0 . . 0 .3~ 0 A 0 4 0 0
C) .n OON 4*4C -0 -44 It N -4A '-4 - .4 N3: 00 z.*0 - a'o NO* coa ,% t0 N N0 0 *tN Pa . f0.4 t %: C0~ en 0% N Ln 0N 4010 -0.0~-L ,.A 00- r3- NO N 0A0 (nO 00N_. 0. .1- :mJ NO -4
W 1 0 - mC -4N 0 7 c 0 0 0 0
L6 0 t, (V 9 n .4 -
0Iu
"II~

Y'LAJ '0 OD a N~ L -40 ' N N4 N 00,0 00,
LAO 0 LAOP 0W~ -IO OO 003 LAOI> id' N0 ( 1" 0 0 0 0t
N 4 00 C )J. 0 00 * 000 0 0 0 . 0 .
U) 0 0 0 r n .0 0 N 0 0f. t
0 CL LOn NO .0 0' OI rN CDO0N !1- 0N 004 0010Q t 10 00 oa -16 .0 00 P40 -
(I 0 .0 .0 * .r0 .0 0 ODcc ~ 0 00 00 0 00.0 0 0 0
N W i -0 -'.1n 0' N V0 LA 1.cr .4 OOr0N0Lt N 0LL.q I N 00 -4 N 1 0 ~ 0 L%-0cm r C
00 fe 0 04 -4 4 0 1* 0
Li W 0O4 0 4 't N N O N A .
c in Ln-4 00- NO.4r 0 0 LAr"O NC oeN > q 0 - U 0 1. o . .P L r ..=0 0 n0 N.0 M.0 N 0 0 0 .0 .0.
0o -4 C) 0o 00
4-)Lc) 00 00 -40NA N -ON L O0 O'
CL) 010 .0 . 0 1.0 .00 0l 0 0
I0 z0N MNn - -N O N N 1nL N -.cx NL W% :) No. 0.
to -u 4j
r O c L. 1a)Ijci n0 LS- S-0oo A 0 0 0152

IzuI -A)0 0 0 ?- MO PftwNO .0N L 0 0 00P
- C% @0 O tn )0O'0 1OON -r ON 'tO aN 000 0 '0 %O10 00 0 0 0 c 4> %r 0' 't00 -dO M'O *0 fnC. 9 4)
cl . ., ) 0 .000ui 00 0 0 0 0
ONN P- 0f4 N 0ON %0 .4N %0 ON mO' 0 1 ON fLL 00%0 tO '00 00 C14 %In IO n0N %a1 of 10 ) na L" 0.4 m0 'n 0 1 4..
T *0 en0 %r0 . 0 .0r 0 %II 00 0 0 0 '
00
U- 0 0 'OM n N O -4 0N 10' 0%.00orc
I *aO 0. 000 0 0 0
00I) Ln3 - -0 P-Pr . 4' 4 4' r.O IV 0. r 0% l zo r ."m 00-r0 ;A~N -4 M0 -I 0 P L %.cOr 000 rON N -N
- 40 -'0 00-O -4.A 0 LtnN n0 % rN .h 0NC w- ~NCL 0 - O Q- -40 0 m
4.O C)4 . 0. M . N0L.. .0 0 00 0 00 C0 .0
AU 0 0 0 0
0OI N-0 N00 r4. WON..0 PO4W0 L o X%' l.1 0 -400 r- 1- '~ 0 -.0% t N .
2/i 'n - -n0 0
-I4~ MAi f-d0 wt -4.-iQ1 -It0 cc 0'
0-CD - 'tIn 00 # M0 N00 N aS0 90 0 &
oo 0A 0 0 0
1L 5300 10 vIj00 9

0 n N -4 0 M -4 LIM ~I-4~ In 7 UA ~LR M - OD r- - NI * 4 11010 C% I:) - r0 N - ON M ''tN -7 O0 M0 -u-* P- ~0Q 0 (D OON CON -4 M N co0 10 0 0'%04 Zo 00 inO 0 Q r 0? 0%0 P-4> !d In s 0 In I N0 -0 .N0 .n0
w4 00 0 00 00 0
u Ln 4) '0-ON Ln M-4 N QM n 0 N- r w -NN w ry
NON 0 0Nf. CO0N Ln0N = -0N 00% fl-Nu. tz 0ON '00% CON r-0 OIn0N r- %ON ~0
NO 00 ? Ir0 .0 MO 0? " 0N
90 0 00 0 0 0M U% 'rO P4 N '0O 4N M0' N -N .4 - N - -4N NN -40 N ( - c 3N NM0 N P- 0~- NtU -4 Nu .n0 N .r0 .0 -ra 0 cm 4 0 .Ci n0 .c%0N
A 0 0 0 0 0 0 03
4-- 0
.eW in t - N4-4~ r- -4P r Mt' -4fl NNa 0 N N Nu ~ N '*O' .0 0 -4 0 L" 0 .1% NI ~0 N -4 N %a N-r- fl N0. N o MOOaN QOO N I*-tO In .1Un e0 I ~N
4)LO" C0- M' '-4 'r 00 t-0ci Li. .0 0 .m .0 00 .0 0 *0
W 0U 0 0 0 0 0 0
M In tn I
S-4
oo A 0 0 0 0 0
WU >=4I 40-j *
03 0 154

- li N 0 10r r- CO &nN ( 4 O"0N 001'. 0 tr.
u- I- r-t*. MO. (n0 0 %nON M N - ON D0a -4.010
- .410 N * 0 0. 3. %00 c-
X~00
0 LA % C.O n -4 -N .4' t O. CD.. On.%U0 i n.4 n n .mN '0 N f- M N MOP- N 0 NONs0. OON 0O-N")PLL a. %00, 40% 0O N LAN10N N 0N -4 0 Q rOON
O 0 .-t0 .n0 .0 0 %00 .40N 0 0 Q 0 l 0
W.o LA Nr -4 -. N C r-4r M-4 0.NN %0 aN N. % 4 N04 -4 M M (%O1 MON. 0U p" f 0N 0 0 -Y 0 N
04L N 0 N lN Q a N InO N IWON OP.N "eNNA N~ -4 n r %0 CD40
W0 M0 s 0 0 % 0 L 0 %00 I0z0
ULA %h N-A W- 1-4.. M-eL :QA N sL- W r0M (P t O-L . 0 -4 " WO Al-N OO-N
WON Lm r4 NON LAOn MON N0 V 40 N.l4.-
5.S. 0 . 0 0 00 0 0>1 0
tn L m -4' 0 fl-hM0 .4 0 r. N-4- Lrn M (4N '0-4NrUlN m. 0 00.?n OON0 t-h 0 0 -4N .0 O0 N '-'N
W o') M 9 )0 en LA M0 M.- 00 '*.04 .0 *0 .00 .
oo0 0 0 0 0 0 0
LA '04 -. - M 'D-4 r N -4 f NN a~o r--4N LA 0 --. 4 0O.0 -40%9 G%~ 0 71 N o0**-0 MO.3
UL . r no .0s It coN s 0 N -4 -. N 0 4 -0 O0LL O m-eL fOn '0- MO P.- 0 -0-'I >. .j 0 0 .M0 -d0 *0
0cc 0 *0
< 0
N -- 0 a ̂4 0 U
-5- 0 0 0
0IIni ntU l .
'3 155

shoulder notions the HFE and VFE correlated very well with each
other, but failed to have any significant correlation with ABD.
In fact, ABD had no significant correlation with any other joint
in the static condition. All of the extension motions (BAC, HIP,
and K!E) correlated with each other. However, the BAC correlated
only with the other extensions while the HIP and KNE correlated
with some of the flexion combinations.
=3I A similar situation seems to exist in the slow speed, 5 RPM,
condition; one of no true pattern (Table 16). The ELB now corre-
lates only with VFE and ABD. The VFE and lIFE both correlate with
Ii AC and 1111 while IFE correlates with KNE. Again within the
-houlder combinations VFE and liFE corelate, but neither correlate
I with ABD whose only correlation was with ELB. Again the exten-
sions (BAC, 1IP, KNE) had good correlations with each other and
some of the flexion group.
3f A pattern which seems to be emerging in the high speed dyna-
mic condition (Table 17) is a negative correlation between the
flexion and extension motions. Individually some of the joint
combinations performed better than in previous conditions. The
ABD correlated with the other two shoulder combinations, the
5I elbow, and both HIP and KNE failing to develop a significant
correlation with BAC. ELB showed an even better performance by
3 correlating well with all six of the other joint combinations.
While back correlated well with the other flexions, it onlyII correlated with the ELB outside of the flexion group. Simiarly,
lIFE correlated with the other upper extremities, but failed to
correlate with any of the lower extremities (BAC, HIP, KNE).
156

Correlation of Strengths Between Speeds
One general tendency was for a joint to correlate with
itself across the speeds (Tables 18, 19, 20). However, when the
difference in the speed was greatest the tendency is less noticeable.
The greatest speed difference, static to high speed dynamic,
the flexion combinations correlated best with the extension com-
binations. However, the static extension combinations did not
correlate well with the high speed flexion combination.
Additionally, correlations within motion groups was the poorest.
No real pattern is observed in the slow speed condition.
The extension combinations, however, did continue to correlate
well within themselves.
Anthroponetric and Strength Distributions
Raw data for anthropometric measures are presented in Table
21. The first entry in Table 21 is the subject's weight in
kilograms. The next two are subject height and acromion height
in centimeters. Lengths in centimeters for the shoulder to
elbow, forearm-hand length, hand length, and foot length are the
next four entries. The remaining entries in Table 21 are circum-
ferences meajured in centimeters.
Descriptive statistics are presented in Table 22 for the
anthropometry data. Means and standard deviations are included
-s well as the minimum and maximum values.
Hlistograms of the distributions of torques for the seven
joint combinations at a rotation of zero by the three speeds, 0,
5, and 25 RPM, are presented in Figures 69-75.
157

%r<IN%
(3 *o e@0 * . *ee0 99 00 04 0 *ii %T -r -4 N N %r 0 -4 i %rmw 4 c(% T 40
L6 It sts rI Vr% T4%
0 * ** OO O 0 @ 06 *0 0
0 %0- .4 4- 4.44 4 . -44
O 0. r .. 0 NO L 0 .0 0 0 0 ' 0~ 0 D N
uj ~ ~ LA' LA 10 '0 0 0 LA 101 LM '0 %A' tn %0L.A n L n
-- -4- 4-d-1- 4P 4 " -4 -4 -4 --U' ~.1CA
I01N00 0 OOOC O1~rp 158IN04Mrr~"- WNNINOO*N 0O m Mnt

cc ONu~cr-- hNOOO lo l-OM-4000 N~C *S O* *@ rn' 0 T1 n% c c...
O y NN N N N N N i N N N NN N N N N
CL
0. 0 (0U 0 -P %-4 QN0N L
Qw 4N nN , noww r- P- o o N dUu-
LL g0. . .Ne eDt 0s 0g.... wU Nf-m LA0%
eu~~r .N~ m ~ N cJr
u'J % .. ee .O %Q - - NC, 1 4e4
S.. 6L n noooL 4 kOO 0 N nOtn n n -EL
0
S..
C ~NIAON4ttNO 0%flWnt ONel-4 0- e coffe ee ee3c..... C1,4 00m4mt O O - O 1. O .: J
wo W a.d*- ww mo , ow w.4
LirI fl n- 44m Kmr tA
.3 n mf cecn m~c eng Ie m. eeMcn..M^1le
M -0 (1) %t- %.C 3 -4 - tt -4 r- ZO ON
159

cw N 0 * q N 0 r 9 r 0 - N N 0 l 0 O*
4 4 -W -t 0% -mU
I 0 0 0 0 * 0 0 0 0 00 * 0 0
CL -.
IJ (V400to 4z
4-.U 4 >
.I- E-
4.- S-
I LL.
0 00 0*0 0 090)0 0
* LU
M I. oZI-- - .az- X. - .40O NC OO ) 0LLO i 4I~ NC Nl N: N N N N N N N Nj N z.
Il j- X=4=<"
16

I--4rz~
161

EIcn 00E
162

II
4t
I 163

r~ir
164~

F.
E4~
Un U)
165)

gF.
I0 z
U q4
F,-4
1 166

C/2
00
ci-n
ZE
QI',
167

The distribution in Figure 69 appear to be normally distri-
buted. The range of torques is visibly much larger for the sta-
tic condition than either of the dynamic conditions. The
statistical mode of the distributions shifts toward lower torque
values as the speed of motion increases.
The torques for the static condition in Figure 70 appear to
he normally distributed as do the slow speed dynamic. However,
the slow dynamic condition has three outliers which give it a
skewed look. There appearss to be a small shift to the lower
torque values ad the Ppeed was increased from static to five RPM.
The high speed dynamic is most definitely skewed with the mode
occurring in the lowest cell. Most noticeable is the shift to
lower torques for the high speed dynamic condition.
In Figure 71 the torques for all three speed conditions do
not appear normally distributed. The torques in the static con-
dition are skiewed, but the spread is remarkably even. The slow
dynamic condition shows an even more balanced spread. The high
speed condition is almost a complete reverse with almost all the
scores occurring in the range of the lowest cell falling sharply
in the next two cells. The shift to lower torques with
increasing speed does not show up between the static and slow
dynamic, but does appear in the change from slow to fast dynamic.
The distribution of torques in Figure 72 look very much like
those in Figure 71. The static condition is more skewed with the
spread less evenly divided. The slow dynamic and fast dynamic
167

I3 appear to be distributed almost exactly the same as those in
Figure 71.
In Figure 73 only the slow dynamic is apparently normal in
the distribution of torques. The static condition is bi-modal
and could be considered a skewed normal distribution. The fast
I dynamic is highly skewed with the greatest frequency occurring in
the lowest cell falling off almost linearly to the fifth cell.
3 The only shift in mode toward lower torques appears to be between
the slow and fast dynamic conditions.
I A different pattern of distributions appears in Figure 74.
3 The static condition looks as if it is normally distributed
although very slightly skewed. The slow dynamic is tri-modal
3~with most of the data points falling between and including the
lowest and highest modes. Cell frequencies outside of this range
I are very low. The high speed dynamic shows a skewed distribution
with the high frequency count falling in the lowest cell. The
frequencies within each cell gradually decrease in a linear
I fashion to zero by the sixth cell. The torques again appearto
decrease in general as the speed of movemen increases for all
U three conditions.
i The distribution of static scores in Figure 75 are a high
skewed normal distribution by appearance. The slow dynamic
I condition also appears to be normally distributed but with only a
small aount of skewness. The high speed condition appears to be
II a skewed normal distribution. The torques in this joint appear
to increase as speed went to the slow dynamic from static and
then decrease to the high speed dynamic.
1 168
I

Coodness of Fit Test of Torque Distributions
Tests were conducted only on the data obtained at the 00
rotation. Only this rotation angle was used since no substantial
difference between the rotations was observed in earlier analy-
sis. Also the starting angle having the largest range of motion
was used as a second selection criterion. This choice would
allow subjects plenty of time to reach their maximum torque thus
eliminating the reported effects of starting angle on maximum
torque. For the upper extremeties (ELB, ABD, lIFE, VFE) the
starting angle was 0%, while 900 was the starting angle for the
rest of the joints (BAC, HIP, KNE).
The program described by Phillips (1972) was used to test
the torque distribution against the normal distribution. Three
statistical tests were used. The Kolmogorow-Smirnov with the
nunber of cells equal to the number of observations was the first
obtained. Next used was the Cramer-Von Ilises with the number of
cells again set to be equal to the number of observations. Finally
the Chi-Square test was used with the number of cell determined by
the program. Most often there were 6 or 7 cells but the range was
from 5 to 12. Three tests were used to provide multiple estimates
of the match of the data to the normal distribution.
No joint combination waq found to be normally distributed
for all three speeds. Only the lIFE combination had two speeds
testing out as normal distribution. Four jointl5 (ABD, ELB, HIP,
and KNE) were found to have one speed containing normally distri-
buted data. The remaining joints (VFE and BAC) had no data found
169

Table 23. Goodness of fit testsof the data for normal distribution
KOLMOGOROV- CHI- CRAIERJOINT/SPEED/START ANG SMIRNOV SQUARE VON MISES
ABD / 0 / 0 0.128 12.33283 14.75710p>.05 p<.05
ABD / 5 / 0 0.128 32.14293 20.25354p>. 0 5 p<.05
ABD /25 / 0 0.119 8.61119 16.58411p>.0 5 p>.05
ELB I 0 / 0 0.125 11.19034 15.74089p>.0 5 p>.05
ELB I 5 / 0 0.137 19.q5447 17.60681p>.05 p<.05
ELB /25 I 0 0.136 27.19200 18.13098p>.05 p<.05
lIFE / 0 / 0 0.089 5.35505 13.41273p>.05 p>. 05
lIFE 5 5 I 0 0.151 21.83849 14.16133p>.05 p<.05
IFE /25 / 0 0.114 6.80859 16.29636p>.O5 p>.O5
VFE I 0 / 0 0.165 17.62537 11.53932p<. 05 p<. 0 5
VFE / 5 I 0 0.147 20.06895 14.09665p>.O5 p<.05
VFE /25 / 0 0.146 20.81548 17.60851p>.05 p<.05
BAC / 0 /90 0.111 14.72731 4.70193p>. 0 5 p<. 05
BAC / 5 /90 0.184 25.51317 5.00648p<.O5 p<.05
BAC /25 /90 0.077 13.22795 5.01808p>.()5 p<.05
1111 / o /go 0.108 14.39661 4.71943p>.05 p<.05
PIP / 5 /90 0.049 2.42638 4.10810p>.O5 p>.05
ITP /25 /90 0.0797 12.91264 5.13113p>.05 p<.O5
KINE / 0 /90 0.078 13.89836 5.01171p>.05 p<.05
KNE / 5 /90 0.138 17.85992 7.14109
p>.05 p<.05KNE /25 /90 0.129 14.92005 12.19122
p<.05 p>.05
170

to be normally distributed. Although the fast dynamic condition
had more normally distributed data that the other speeds across
joints, it obtained only three of the possible seven joints.
Next came the static with two of seven and last the slow dynamic
with one of seven possible joints.
Accommodated Percentage Model
This model generates data for a set of psuedo-subJects.
The data consist of a vector of scores for each of the variables
specified for the model. This vector is then tested one com-
ponent at a time against a pair of cutoff criterion. When the
data for a pseudo-subject satisfies all criterion, that psuedo
subject is tallied as being accomodated by the task conditions
represented by the cutoff criterion.
The pseudo-subjects are generated as normal variate data by
a subroutine from the International Math and Statistics Library
(IISL). Using the correlation matrix for the data on actual sub-
jects as a covariance matrix, the (INSL) subroutine produces a
random normal variate and stores the data in an array. Data for
any number of psuedo-subjects can be generated by this IMSL
subroutine.
The subroutine requires the input of the correlation matrix,
the number of variables to be included in the output vector for
each pseudo-subject, and the number of psuedo subject vectors to
be generated. A vector array of length equal to the number of
pseudo subjects to be generated is output from the subroutine.
171

The vector for each psuedo-subject is tested one member a
tine against the high and low cutoff for that member. Failing to
[3 meet one cutoff eliminates that psuedo-subject from the accomoda-
tion sum. Once all psuedo-subject vectors have been tested, the
percentage of these psuedo-subjects accomodated is calculated.
This percentage is the model output.
Appendix 3 contains the FORTRAN Program which represents the
model. Included with the model are the input parameters, the
number of variables, the desired number of psuedo-subjects to be
generated, and the high and low cutoff values for the variables.
The high and low cutoff values are given in standard deviation
units since the values of vector members are normal deviate in
nature. Values for the matrix were taken from the larger matrix
found in Table 15. The variables used were: ELB/O, BAC/0, and
KNE/O. The last line gives the percent of the psuedo-subject
-5 sample accomodated by the criterion specified.
Conclusions
The data obtained in this study indicates that strength
across a joint decreases as the speed of movement increases about
that joint. Therefore when designing a task requiring rapid
3 movement the load to be moved should be small. ?lore time must be
allowed for the movement of heavier load.
3 Additionally, the starting position in the range of motion
appears to be a factor. The larger the range of motion the
I larger will be the maximum torque obtained. Reducing the range
3I of notion would therefore reduce the maximum torque the worker
could obtain.
1172

Motions in planes deviating slightly from the sagittal plane
appear to have negligible effect on the strength which can be
brought to bear. Such a finding simply means that workers do not
nessarily need to turn the whole body to line up a load in sagit-
tal plane before it can be lifted. However, this applies to
loads to be lifted with the arms only. The data in this study
are not sufficient to make any declarations about loads in which
the najor effort is with the legs and back. Extension of the leg
at the hip did show some effect of rotation away from the sagit-
tal plane suggesting that the lifting of heavier loads may
require the turning of the body to align the plane of lifting
notion with the sagittal plane of the body.
Correlations of the static measures with dynamic measure
were not high. Such a finding suggests that determination of
dynanic strength capabilities from static strength measures is
not a recommended practice. In addition, the slower speeds of
notion did not correlate well with higher speeds suggesting that
the available strengths must be determined at the same speed of
notion as that required by the task. However, more research
needs to be done in this area before very definitive statements
can be made.
Although data collection in this study was fairly extensive,
time constraints did not permit as close a look at some variables
as is needed to be more definitive regarding dynamic strength.
Only three speeds of motion were examined in this study; static
or 0 RPIM, 5 RPM, and 25 RPM. Data collection using 5 RPM speed
173

increments would give a finer look at the relationship of torque
and speed.
Arbitrary ranges of motion were used in this study; 1200 for
FB, IFE. VFI', and ABD, and 900 for BAC, HIP, and KNE. While
Iany subjeccs had difficulty reaching the 900 position for theBAC, most suhjects were able to go far beyond the 1200 limit for
the shoulder motions. Future work looking at torques throughout
the whole range of motion are needed to enable a more complete
picture of the torques available at the extreme range of motion.
To couplete the atlas of strengths, data should be collected
in opposing directions to those used here as well, ie. extension
at the elbow as well as flexion. The choices made in this study
were limited to those most closely involved in the lifting of a
box. Other work tasks would obviously have different notion
3 requirements.
I The effect of starting position also needs further examina-
tion. In this study, the effect of the starting angle was con-
founded by the time required to "catch" the Cybex dynamometer
before torques could be measured. A system without this lag
needs to be used or a means of compensating for the confounding
3developed.
174

REFERENCES
1. Asfour, S. S Energy cost prediction models for manuallifting and lowering tasks. Doctoral dissertation, TexasTech University, 1980.
2. Asfo.ir, S. S. and Ayoub, H. M. Effects of training onmanual lifting. Paper presented at the American HygieneConference; May, 1980.
3. Ayoub, M. M., Bethea, N. J., Deivanyagam, S., Asfour, S. S.,Bakken, C. M., Liles, D., Mital, A., and Sherif, f.Determination of Modeling of Lifting Capacity, 1978,Grant Nos. IR010H00545-OISOH, Health Education andWelfare Final Report.
4. Asnussen, E., 11ansen, 0., and Lammert, 0. The relationbetween isometric and dynamic muscle strength in man.Communications from the Testing and Observation Instituteof the Danish National Association for Infantile Paraly-sis; 1965, 20, 3-12.
5. Asmussen, E. and Ifeeboll-Nielsen, K. Isometric musclestrength of adult men and women. Communications from theTesting and Observation Institute of the Danish NationalAssociation for Infantile Paralysis; 1961, 11, 1-44.
6. Ayoub, 1. H., Bethea, N. J., Bobo, U. M., Burford, C. L.,Caddel, D. K., Morrissey, S. and Intaranont, K.Bionechanics of Low Coal, Institute of BiotechnologyTexas Tech University, 1979.
7. Ayoub, 'I. M., Bethea, N. J., Deivanayagam, S., Asfour, S. S.,Liles, D., Hital, A. and Sherif, M. Determination and1lodeling of Lifting capacity. Institute forBiotechnology Texas Tech University, September, 1978,
8. Ilender, .1. A. and Kaplan, H. M. Determination of successor failure in dynmic (isotonic) movements by isometricmethods. The Reserach Quarterly; 1966. 37(l), 3-8.
9. Berger, R. A. and Henderson, J. H. Relationship of power tostatic and dynamic strength. The Research Quarterly;1966, 37(l), 9-13.
10. Berger, R. A, and Higginbotham, R. B. Prediction ofdynamic strength from static strength in hip and kneeextension. American Corrective Therapy Journal; 1970,24, 118-120.
175

11. Berger, R. A. and Sweney, A. B. Variance and correlationcoefficients. Research Quarterly; 1965, 36, 368-369.
12. Caldwell, L. S. The load-endurance relationship for staticmanual response. Human Factors; 1964, 6(l), 71-79.
13. Caldwell, L. S. Measurement of static muscle endurance.Journal of Engineering Psychology; 1964, 3, 16-22.
14. Caldwell, L. S. Relative muscle loading and endurance.Journal of Engineering Psychology; 1963, 2, 155-161.
15. Caldwell, L. S., Chaffin, D. B., Dukes-Dobos, F. N.,Kroemer, K. H. E., Laubach, L. L., Snook, S. I., andWasserman, D. E. A proposed standard procedure for sta-tic nuscle strength testing. An. Ind. Hyg. Assoc.Journal; 1974, 35(4), 201-206.
16. Carlson, B. R. Relationship between isometric and isotonicstrength. Archives of Physical Medicine and Rehabili-tation; 1970, 51, 176-179.
17. Carlson, R. B. and 11cCraw, L. W. Isometric strength andrelative isometric endurance. The Research Quarterly;1971, 42(3), 244-251).
18. Carlsoo, S. Testing the back and lifting capacity. Scand.J. Rehabil. Med. (SE); 1978, 10(6), 164-168.
19. Christensen, C. S. Relative strength in males and females.Atheletic Training; 1975, 10(4), 189-192.
20. Clarke, H. H., Elkins, E. C., Martin, C. H. and Wakim, K.G.Relationship between body position and the application ofmuscle power to movements of the joints. Archives ofPhysical Medicine; Feb. 1950, 81-89.
21. Clarke, R. S. J., flellon, R. F., and Lind, A. R. Theduration of sustained contractions of the human forearmat different muscle temperature. J. Physiology; 1958,143, 454-473.
22. Conover, U. J., Practical Nonparanetric Statistics, John.3 Wiley, 1971.
23. Cooper, ). F., Crimby, C., Jones, D. A., and Edwards, R. 11. T.Perception of effort in isometric and dynamic muscularcontraction. Eur. .. Appl. Physiology; 1979, 41(3),173-180,
24. Corlett, E. N. and Bishop, R. P. Foot pedal forces forseated operators. Ergonomics; 1975, 18(6), 687-692.
176

25. Currier, D. P. Maxinal isometric tension of the elbowextensors at varied positions; Part I. Assessment bycable tensiometer. Phys, Ther.; 1972, 52(10), 1043-1049.
26. Currier, D. P. Maximal isometric tension of the elbow
extensors at varied positions: Part 2. Assessment ofextensor components by quantitative electromyography.Physical Therapy; 1972, 52(12), 1265-1276.
27. Currier, 1). P. Evaluation of the use of a wedge in quadri-ceps strengthening. Physical Therapy; August, 1975,55(), 870-874.
2. Danoff, J. V. Power produced by maximal velocity elbow
flexion. Journal of Biomechanics; 1978, 11(10-12),481-486.
90. Doss, W. S. and Karpovich, P. V. A comparison of con-centric, eccentric and isometric strength of elbowflexors. Journal of Applied Physiology; 1965, 20,
35,1-353.
30. Edwards, R. H. T. and Hyde, S. Methods of measuring musclestrength and fatigue. Physiotherapy; 1977, 63(2), 51-55.
31. Falkel, .3. Planter flexor strength testing using the cybex
isokinetic dynanometer. Phys. Ther.; 1978, 58(7),
847-850.
32. Freund, H. J. and Budingen, H. J. The relationship between
speed and amplitude of the fastest voluntary contractionsof human arm muscles. Experimental Brain Research; 1978,
31(1), 1-12.
33. Crasley, C., Ayoub, I. 11. and Bethea, N. J. Hale-femaledifferences in variables affecting performance.Proceedings of the Human Factors Society, 22nd annualmeeting; 1978, 416-420.
34. Iaffajee, D., foritz, U. and Svantesson, 0. Isometric kneeextension strength as a function of joint angle, musclelength and motor unit activity. Acta Orthop. Scand.;1972, 43(2), 138-147.
35. Henry, F. H. Best vs average individual scores. ResearchQuarterly; 1967, 38, 317-320.
36. Heyward, V. Relationship between static muscle strengthand endurance: An interpretive review. AmericanCorrectional Therapy Journal; 1975, 29(3), 67-72.
177

37. Heyward, V. and McCreary, L. Analysis of the staticstrength and relative endurance of women athletes; TheResearch Quarterly; 1977, 48(4), 703-719.
3. Heyward, V. and McCreary, L. Comparisons of the relativeendurance and critical occluding tension levels of men
and women. Research Quarterly; 1973, 49(3), 301-307.
39. Ikai, 'M. and Steinhaus, A. 1T. Some factors modifying theexpression of htman strength. Journal of AppliedPhysiology; 1961, 16, 157-163.
40. Ingemann-1lansen, T. and lalkjaer-Kristensen, J. Force-ve]ocity relationships in the human quadriceps muscles.Scand. 3. Rehab. Ifedicine; 1979, 11(2), 85-89,
41. International tiathematical and Statistical Libraries, Inc.Sixth Floor, NBC Building 7500 Bellaire Boulevard,Houston, Texas 77036.
42. Jones, R. E. Reliability of muscle strength testing undervarying maturational condition. Journal of AmericanPhysical Therapy; 1962, 42, 240-243.
43. Johnson, J. and Siegel, D. Reliability of an isokineticmovement of the knee extensors. The Research Quarterly;
1978, 40(1), 88-90.
44. Kamon, E. and Coldfuss, A. J. In-plant evaluation of themuscle strength of workers. Am. Ind. Hyg. Assoc.Journal; 1978, 38(10), 801-807.
45. Kearney, J. T., Stull, G. A. and Kirkendall, D. Isometricgrip-flexion fatigue in females under c)nditions ofnormal and occluded circulation. Anerican CorrectiveTherapy Journal; 1976, 30(1), 7-11.
46. Knapik, J., Kowal, D., Riley, P., Wright, J. and Sacco, M.Development and description of a device for staticstrength measurement in the armed forces examination andentrance station. U.S. Army Research Institute ofEnvironmental Itedicine, Natick, MA. Technical Report.January 9, 1979.
47. Kroll, U1. "Isometric fatigue curves under variedintertrial recuperation periods." Research Quarterly;1968, 39(1), 106-115.
410. t_ ,o v, ill. Reovry patterns after local musciular fatiguefor different levels of isometric strength in college age
females. American Corrective Therapy Journal; 1971,
25(5), 132-138.
178
I .... ... ..

49. Kroll, U. and Clarkson, P.H. Age, isometric knee extensionstrength and fractionated resisted response time.Experimental Aging Research; 1978, 4(5), 389-409.
50. Lanphicar, D.E. and tiontoye, H.J. Muscular strength and
body size. Human Biology; 1976, 48(1), 147-160.
51. Larsson, L., Grimby, G., and Karlsson, J. Mfuscle strengthand speed of movement in relation to age and musclemorphology. Journal of Applied Physiology; March, 1979,46(3), 451-456.
52. Larsson, L. and Karlsson, J. Isometric and dynamicendurance as a function of age and skeletal musclecharacteristics. Acta Physiol. Scandanavia; 1978,
104(2), 129-136.
53. Laubach, L.L. Comparative muscular strength of men andwomen: A review of the literature. Aviation, Space and
Environmental Medicine; 1976, 47(5), 534-542.
54. Laubach, L. L., Kroemer, K. H. E., and Thordsen, It. L.Relationships among isometric forces measured in aircraftI control locations. Aerospace Medicine; 1972, 43,738-742.
55. Laubach, L. L. and McConville, J. T. The relationship ofstrength to body size and typology. Medicine and Sciencein Sports; 1969, 1(4), 189-194.
1 56. Lind, A. R., Burse, R., Rochelle, R. Ht., Rinehart, J. S. andPetrofsky, J. S. Influence of posture on isometric fati-gue. Journal of Applied Physiology; 1978, 45(2),270-274.
57. McCraw, L. U. and Talbert, U. I. A comparison of thereliability of methods of scoring tests of physical abi-
lity. Research Quarterly; 1952, 23, 73-81.
5.9. McClynn, G.H. The relationship between maximun strength
and endurance of individuals with different levels ofstrength research quarterly; 1969, 40(3), 529-535.
Il 59. Mcrlynn, G.H. and Ifurphy, L.E. The effects of occludedcirculation on strength and endurance at different levelsof strength. American Corrective Therapy Journal; 1971,31 25(2), 42-47.
60. Mortimer, R. 0. Foot brake pedal force capability of dri-Ivers. Ergonomics; 1974, 17(4), 509-513.
3 179

61. lurray, M. P., Baldwin, J. M., Gardner, C. It., Sepic, S. B.,p and Downs, 14. J. Maximum isometric knee flexor andextensor muscle contractions: Normal patterns of torqueversus time. Physical Therapy; June, 1977, 57(6),
637-643.
62. Noble, L. and McCraw, L. 11. Comparative effects of iso-
metric and isotanic training programs on relative-loadendurance and work capacity. Research Quarterly; 1973,44(l), 96-108.
A3. desjo, L.O. and Nordgren, B. Static and dynamicreasuring of muscle function; Scand. Journal ofRehabilitative Medicine; 1978, 10(6), 33-42.
64. Ilordgren, B. Anthropometric measures and muscle strength
in young women. Scand. J. of Rehabil. Medicine; 1972, 4,165-169.
65. flordpren, B., Elmeskog, A., and Nlilsson, A. Method forrieasurerient of maximal isometric muscle strength withspeci:al reference to the fingers. Upsala Journal IedicalScience; 1079, 84(2), 188-194.
66. ylind, R., Schele, R., and Linroth, K. Changes in maleexercise performance and anthroponetric variables between
the ages of 11 and 30. European Journal of Applied
Physiology and Occupational Physiology; 1q78, 38(2),
145-150.
67. Oternig, L. R. Optimal isokinetic loads and velocitiesproducing muscular power in human subjects. Archives ofP'hy;. fled. and Rehab. 1975; 56(4), 152-155.
63. Osternig, L. R., Bates, B. T., and James, S. L. Isokineticand Isometric torquo force relationships. Archives Phys.tied. Rehab., 1977, 58(6), 254-257.
69. Patton, R. W., Hinson, 11. H., Arnold, B. R., Jr., andLessard, B. Fatigue curves of isokinetic contractions.Arch. Phys. led. Rehabil; 1978, 59(11), 507-509.
70. Pedotti, A., Krishnan, V.V., and Stark, L. Optimization of
muscle-force sequencing in human locomotion.Mathematical Biosciences; 1978, 38(1-2), 57-76.
71. Perrine, J. J. and Edgerton, V. R. Muscle force-velocityand power-velocity relationships under isokineticloading. Medicine and Science in Sports; 1978, 110"',159-166.
180

F
72. Petrofsky, J.S. and Lind, A.R. Aging, isometric strengthand endurance and cardiovascular responses to staticeffort. Journal of Applied Physiology; 1975, 38(l),I 91-95.
73. Petrofsky, J. S. and Lind, A. R. Isometric strength,
endurance, and the blood pressure and heart rate respon-ses during isometric exercise in healthy nen and women,with special reference to age and body fat content.Pf]ugers Arch. European .1. of Physiology; 1975, 360(1),49-61.
74. Petrofsky, J. S., Rochelle, R. R., Rinehart, J. S., Burse,R. L., and Lind, A. R. The assessment of the static con-ponent in rhythmic exercise. Europ. J. Appl. Physiology;1975, 34(1), 55-63.
75. Phillips, D. T., Applied Goodness of Fit Testing,Publication No. 1, Operations Resaerch Division, AmericanInstitute of Industrial Engineers, Inc., 1972.
76. Pipes, T. V. Variable resistance versus constant resistance
strength training in adult males. European Journal ofApplied Physiology and Occupational Physiology; 1978,
390(), 27-35.
77. Pipes, T. V. and Wilmore, J. H1. Isokinetic vs. isotonicstrength training in adult men. Med. and Science inSports. 1975, 7(4), 262-274.
7S. Poulsen, E. Prediction of naximum loads in lifting fromneasurement of back muscle strength. Prog. Phys.Therapy; 1970, 1(2), 146-149.
-3 79. Poulsen, E. Studies of back load, tolerance limits duringlifting of burdens. Scand. J. Rehabil. fled. (SE); 1978,10(6), 169-172.
80. Royce, J. Isometric fatigue curves in human muscle with
normal and occluded circulation. Research Quarterly;I1 1958, 29(2), 204-212.
81. Salter, N. The effect on muscle strength of maximum iso-metric and isotonic contractions at different repetitionIrates. Journal of Physiology. 1955, 130, 109-113.
3 82. Sargeant, A. J. and Davies, C. T. It. Forces applied to
cranks of a bicycle ergometer during one-and two-legcycling. Journal of Applied Physiology; 1977, 42(4),1 514-518.
3 181

33. Shaver, L. G. tlaximun dynamic strength, relative dynamicendurance, and their relationships. Research Quarterly;1971, 42(4), 460-465.
84. Shaver, L. G. The relationship between maximum isometricstrength and relative isotonic endurance of athletes withvarious degrees of strength. Journal of Sports Medicineand Physical Fitness; 1973, 13(4), 231-237.
85. Singh, N1. and Karpovich, P. V. Isotonic and isometric for-ces of forearm flexors and extensors. Journal of AppliedPhysiology; 1966, 21, 1435-1437.
86. Start, K. B. and Graham, .1. S. Relationship between therelative and absolute isometric endurance of an isolatedmuscle group. Research Quarterly; 1964, 35(2),193-204.
'7. Start, K. B., Gray, R. K., Glencross, D. J. and Walsh, A.A factorial investigation of power, speed, isometricstrength and anthroponetric measures in the lower limb.The Research Quarterly; 1966, 37(4), 553-559.
88 Stull, G. A. and Kearney, J. T. Recovery of muscularendurance following submaximal, isometric exercise.Medicine and Science in Sports, 1973, 10(2), 109-112.
"9. Svoboda, H. Influence of dynamic muscular fatigue and
recovery on static strength. The Research Quarterly;1973, 44(4), 389-396.
90. Tesch, P. and Karlsson, J. Lactate in fast and slow twitchskeletal muscle fibres of man during isometric contrac-tion. Acta Physiol. Scand.; 1977, 99(2), 230-236.
91. Tesch, P. and Karlsson, J. Isometric strength performanceand muscle fiber type distribution in man. Acta Physiol.Scand. 1978, 103(l), 47-51.
92. Thorstensson, A., Grimhy, G., and Karlsson, J. Force-velocity relations and fiber composition in human kneeextensor muscles. J. Appl. Physiology, 1976, 40(1),12-16.
93. Thorstensson, A., Karlsson, J., Viitasalo, J. H. T.,Luhtanen, P., and Koni, P. V. Effect of strengthtraining on EMG of human skeletal muscle. Acta Physiol.Scand.; 1976, 98(2), 232-236.
94. Thorstensson, A., Larsson, L., Tesch, P., and Karlsson, J.Muscle strength and fiber composition in athletes andsedentary men. Medicine and Science in Sports; 1977,9(1), 26-30.
182

95. Troup, J. D. G. and Chapman, A. E. The strength of the
flexor and extensor muscles of the trunk. J.Biomechanics; 1969, 2, 49-62.
96. Tuttle, 11. U., Janney, C. D. and Salzano, J. V. Relationof maximum back and leg strength endurance. The ResearchQuarterly; 1955, 26(1), 96-106.
97. Tuttle, W. U., Janney, C. D., and Thompson, C. 11.Rela1tion of maximum grip strength to grip strengthendurance, Journal of Applied Physiology; 1950, 2,663-670.
q8. Viitasalo, J. T. and Koni, P. V. Force-time charac-teristics and fiber composition in human leg extensormuscle. European J. Appl. Physiol.; 1978, 40(l), 7-15.
1~i 99. 1illians, H. and Stutzman, L. Strength variation through
the range of joint motion. The Phys. Ther. Rev.; 1958,339(3), 145-152.100. Zahalak, G. I., Duffy, J., Stewart, P. A., Litchman, H. H.,
Hawley, R. H. and Paslay, P. R. Force-velocity-IG dataIfor the skeletal muscles of athletes. Technical Report.Center for Biophysical Sciences and BiomedicalEngineering. Brown University, Providence, RI. November,1973.
I
I,
183

[I
IAPPENDIX A
Height and Weight Criteria Used
in Subject Selection
184

Height and Weight Criteria Used
in Subject Selection
82.05
0 1/2 1/2 1.5 2.5
63.73
112 1.0 1.0 1.0 1.5
59.12
4.)
1/2 1.0 2.0 1.0 1/2
~ 55.5
1.5 1.0 1.0 1.0 1/2
51.41
2.5 1.5 1/2 1/2 0
42 .36 " '
148.2 156.8 160.4 163.6 167.2 178.1
Height (cm)
185

Ik
FtI
I APPENDIX B
1 Subject Health Screening Form
IIIIIIII3
U
I1 186
I

PERSONAL DATA AND CONSENT FORM DATE:
Texas Tech University TIME:_Institute for BiotechnologyDevelopment of an Atlas of Strengths SUBJ. NO.:and Establishment of an AppropriateModel Structure
NAME: AGE:
SEX: HEIGHT:" ' _WEIGHT:_
CHECK IF SUSCEPTIBLE TO:
Shortness of Breath: dizzyness: headaches:fatigue: chest shoul'der: arm pain:If so, explain:
Have you ever had a heart attack? If so, give history:
Are you currently taking any type of medicine? If so, explain:
Have you had or do you now have any problem with your blood pressure?If so, explain:In the last six months, have you had any type of surgery or serious illness?
If so, explain:In the last six months, have you had any back pain, particularly in the lowerback? If so, explain:Have you had or do you now have a hernia?Corrective date:Have you ever suffered an injury to your knees, hips, shoulders,or elbows? If so, explainHave you ever pulled, strained, or otherwise injured the muscles of the legs,back, arms, or shoulders? If so, explain
PLEASE READ CAREFULLY
I have truthfully answered the questions to the best of my knowledge, per-taining to my personal data. I hereby give my consent for ny participation inthe project entitled: Development of an Atlas of Strengths and Establishmentof an Appropriate Model Structure. I understand that the person responsiblefor this project is Dr. M. M. Ayoub (806) 742-3407. He or his authorizedrepresentative (806) 742-3543 has explained that these studies Are pna of a
project that has the objective: to develop an atlas of strength for use inimproving the design of work stations.
187

PERSONAL DATA AND CONSENT FORM (Continued)
3l Dr. M. M. Ayoub or his representative has agreed to answer any inquiries I mayhave concerning the procedures and has informed me that I may contact the TexasTech University Institutional Review Board for the Protection of Human Sub.iecT-by writing them in care of the Office of Research Services, Texas TechUniversity, Lubbock, Texas 79409, or by calling (806) 742-3884.
He or his authorized representative has (1) explained the procedures to befollowed and identified those which are experimental and (2) described theattendant discomforts and risks; and (3) described the benefits to be expected.During the course of this study, you will be asked to move your limbs or trunkagainst a static and a dynamic resistance in order to measure your static anddynamic voluntary strength. You will be expected to exert your maximum volun-tary strength, the most strength that you can possibly give, on all the tests.To measure votir static strength, you will be asked to try to move a fixed objectthat is connected to a measurement device. To measure your dynamic strength youwill be asked to move a bar exerting your maximum strength while moving it.This will be done for three different speeds of movement. While there will beno conditioning training, enough practice will be provided to ensure that youare familiar with the task and motions required to obtain reliable data. Therisks have been explained to me as possible sore muscles, muscle strain,headaches, hernia, dizziness and fatigue. There are also possible changessuch as abnormalities of blood pressure or heart rate, or ineffective "heartfunction," and in rare instances "heart attacks," or "cardiac arrest," strokes,or pulmonary embolism.
If this research project causes any physical injury to you, treatment is notnecessarily available at Texas Tech University or at the Student HealthCenter, or any program of insurance applicable to the institution and itspersonnel. Financial compensation must be provided through your own insuranceprogram. Further information about these matters may be obtained from Dr. J.Knox Jones, Jr., Vice President for Research and Graduate Studies, (806)742-2152, Room 118 Administration Building. Texas Tech University, Lubbock,Texas 79409.
I understand that I will not derive any therapeutic treatment from par-ticipation in this study. I understand that I may discontinue my par-ticipation in the study at any time I choose without prejudice.
I I understand that all data will be kept confidential and that my name will not
he used in any reports, written or unwritten.
SIGNATURE OF SUBJECT: DATE:
Signature of Project Director'- Is authcrize-1 representat1ve:
Signature of Witness to Oral Presentation:
188

APPENDIX C
Listing of the Accommodated Percentage
Model Program
189

THE MODEL
C SET UP THE IMSL SUBROUTINEC NR=THE NUMBER OF SUBJECTS TO BE GENERATEDC K=THE NUMBER OF VARIABLES TO BE CHECKED FOR EACH SUBJECTC L=THE NUMBER OF ENTRIES INTO SIGMA, THE INPUT MATRIXC IR=THE ROW DIMENSION OF RVEC THE IR BY K OUTPUT MATRIX
INTEGER NR,K.IR,IERREAL SIGMA(6),RVEC(2000,3),WKVEC(3),XH(3),XL(3)DOUBLE PRECISION DSEEDDSEED = 466364003.DONR 2000K = 3L= ( K* (K + 1) ) / 2IR = 2000WKVEC(0) = 0.0
C READ IN THE CORR MATRIX TO SIGMAREAD(5,5) (SIGMA(I),I=I,L)
5 FORMAT (1OF8.5)C GET THE IMSL SUBROUTINE
CALL GGNSM (DSEED,NR,K,SIGMA,IR,RVEC,WKVEC,IER)C SET THE UPPER, XH(JVAR), AND LOWER, XL(JVAR) CUTOUFF LIMITS
FOR EACH VARIABLEC VAR 1 = ELBO, VAR 2 = BACD, VAR 3 =KNE
XH(1) = 2.XL(1) = -2.XH(2) = 2.XL(2) = -.2XH(3) = 2.XL(3) = -2.
C TEST EACH PSUEDO SUBJECT ON EACH VARIABLE, COUNT THOSE THAT PASS ALLTOT=O.ODO 20 1 = 1 ,NRDO 25 JVAR = 1,KIF (RVEC(IJVAR).GT.XH(JVAR)) GO TO 20IF (RVEC(I,JVAR).LT.XL(JVAR)) GO TO 20
25 CONTINUETOT=TOT+I.
20 CONTINUEANR = NREXC = ( TOT / ANR ) * 100.
C OUTPUT THE NUMBER OF SUBJECTS ACCEPTABLE AND THE PERCENTWRITE (6,8) TOT,EXC
8 FORMAT(' TOTAL PASSED =',F9.4,' MODEL ACCOMMODATES ';F10.6,,' )STOPEND
THE INPUT
1.00000 0.18405 1.00000 0.19762 0.20288 1.00000
THE OUTPUT
TOTAL PASSED = 1052.0000 MODEL ACCOMMODATES 52.599991 %
190

IIIIIIII
APPENDIX D
1 Selected Abstracts of the Literature
II
IIU
U191
I

STUDY: Andersson, G., Ortengren, R. and Nachemson, A. Quantitativestudies of the load on the back in different working-postures. Scand. J. Rehabil. Med. (SE); 1978, 10(16),173-181.
KEYWORDS: Low back .ain, back load, intra-abdominal pressure, discpressure.
METHODS: The purpose of this study was to obtain knowledge about themagnitude of low back stress under standardized conditions ofloading, to evaluate and compare different methods to measurethese stresses. Studies of the mqvoelectric activity wereperformed on groups of either ten or fifteen subjects.Simultaneous measurements of the myoelectric back muscleactivity, the intra-discal pressure, and the intra-abdominalpressure were performed on four subjects.
RESULTS: When the subjects were loaded with lOON in each hand and theangle of forward flexion was increased, there was an increaseia intra-discal pressure and in intra-abdominal pressure.The increase in the myoelectric activity was comparativelylarger in the thoracic than in the lumbar region. The intra-discal pressure and the intra-abdominal pressure bothincreased when a) the externally applied load was increasedat a thirty degree angle of flexion, and b) the trunk wasloaded in lateral flexion as well as in rotation. Consistentdifferences were found in the levels of myoelectric activityrecorded on the lift and right side of the back. Duringlifting of lOON load from 45 cm above the floor to an uprightposition, the FRA values at all levels of the back and thedisc pressure increased considerably, whereas the intra-abdominal pressure increased only slightly.
SUMMARY: The myoelectric back muscle activities, intra-abdominalpressure and disc pressure all appear to relate to turningmoments acting on the spine: the measurement values increasewhen the trunk moment increases. In the static studies,linear relationships were obtained between each of the para-meters and the moment acting on the spine.
CITATIONS: Eleven references.
192

STUDY: Asfour, S.S. and Ayouh, M.M. Effects of training on manual
lifting. Paper presented at the American Hygiene Conference,May, 1980.
KEYWORDS: Training, lifting.
METHODS: Back injuries resulting from manual materials handling areone of the major sources of lost time and compensationclaims. One of the possible means of reducing theindividual's susceptibility to musculoskeletal injuries is byincreasing his/her lifting capability through training.
The paper gives a description of a six week training programthat successfully increased the maximal oxygen uptake, staticstrength, and the lifting capability of ten male studentsubjects.
The program that the subjects had to undergo, trained themfor flexibility, muscle strength (by applying the concept ofprogressive resistance exercise) muscle endurance (by liftinglight loads at high frequency of lift), and cardiovascularendurance (by exercising on a bicycle ergometer).
RESULTS: The results of the training program showed an increase in themaximal oxygen uptake of the subjects. An increase in back,arm, leg, and shoulder static strength also occured. Themaximal amount of weight lifted in a compact box, for dif-ferent heights of lift, increased significantly by training.
SUMMARY: Training was seen to increase the lifting capacity of thesubjects.
CITATIONS: 18 references.
193

STUDY: Ashton, T.E.J. and Singh, M. Relationship between erectoresspinae voltage and back-lift strength for isometric, con-centric and eccentric contractions. Res. 0. Am. Assoc.Health. Physical Education; 1975, 46(3), 282-286.
KEYWORDS: Isometric strength, concentric strength, eccentric strength.
METHODS: Forty male student volunteers were tested maximally on iso-
metric, concentric, and eccentric back-lift strength with thebhck 200 from vertical. Each type of contraction, admi-nistered in random order, took approximately 3 sec. Ahydraulic back dynamometer, cable, load cell, and bar wereused for the strength measures; an electrogoniometer measuredhip angle and surface EMG's (measured in microvolts) deter-mined degree of activity in the lumbar erectores spinae.
RESULTS: For maximal isometric, concentric, and eccentric back-liftstrength, the means were 304.69, 222.94, and 315.31 lb.,respectively. ANOVA with repeated test showed that theeccentric and isometric means were significantly greater thanthe concentric mean. Corresponding mean peak voltage meanswere 352.21, 389.72 and 384.81 my. Here, ANOVA with repeatedmeasures did not produce a significant difference betweenmeans. Newman-Keuls test demonstrated a significant dif-ference between the concentric voltage per pound force ratioand the ratios of the other two types of contraction.
SUMMARY: ANOVA results yielded significant differences between themean voltage per pound force ratio for isometric, concentric,and eccentric contractions (p<.01). Neuman-Keuls test showedthat the maximal concentric strength voltage per pound forforce ratio (muscle shortening) was significantly higher thanthe ratios for both the isometric (no appreciable shortening)
and eccentric (some lengthening) cases (p<O.01).
CITATIONS: Ten references.
194

STUDY: Asmussen, E., Hansen, 0., and Lammert, 0. The relation bet-ween isometric and dynamic muscle strength in man.Communications from the Testing and Observation Institute ofthe Danish National Association for Infantile Paralysis;
E J1965, 20, 3-12.
KEYWORDS: Isometric muscle strength, dynamic muscle strength.1 METHODS: The subjects were 18 men, 18 to 30 years. All 18 underwent
concentric and isometric tests, but only 6 of them wentL through excentric tests also. The experiments called for
maximum efforts in every test. When plotted, the results, asmooth curve drawn along the upper limit of the mass ofpoints, was taken to represent the maximum values.
RESULTS: The study demonstrated that if the isometric strength at anyposition of the arm is set to 100%, the dynamic strength1during concentric or excentric contractions of differentvelocities through the same positions can be expressed rela-tive to the isometric strength. It was found that the dyna-mic strength during concentric contractions is lower than theisometric strength, and that the strength during excentriccontractions surpasses the isometric strength. The higher3the velocity, the larger the differences.
SUMMARY: Maximal contractions were performed with the arm-shouldermuscles in a pull on a handle under the following conditions:1) isometric, 2) concentric, and 3) excentric. It was foundthat the maximum force was less during concentric contrac-tions, and higher during eccentric contractions than duringisometric contractions. The differences increased withincreasing velocity of the movement. There was a high degreeof correlation (r = 0.8) between a person's isometric anddynamic strength, independent of his athletic fitness.
CITATIONS: Seven references.
I
Ui

STUDY: Asmussen, E. and Heeboll-Nielsen, K. Isometric musclestrength of adult men and women. Communications from theTesting and Observation Institute of the Danish National
Association for Infantile Paralysis; 1961, 11, 1-44.
KEYWORDS: Isometric muscle strength, age differences, sex differences.
METHODS: As standard subjects about 360 normal men and 250 normalwomen were measured with respect to 25 different musclegroups. Each test was performed at least 3 times and thebest values chosen as the standard. The subjects weregrouped together according to age, so that each decennium wasrepresented by 20 to 40 single subjects for each of the twosexes.
RESULTS: Curves representing the actual heights and weights in rela-tion to age of the present study show that the older men andwomen tend to be somewhat shorter and heavier. On theaverage, the heiqht of the women is about 92% of that of themen. The average strength value for all women, from all themuscle tests is only 58 to 66% of that of men ofcorresponding age. Even corrected for body height, women'smuscular strength is still only 70 to 80%. The results ofthe measurements of isometric muscular strength in differentages are given in a series of tables.
SUMMARY: Values for isometric muscle strength, with respect to 25 dif-ferent muscle groups, of adult men and women in the range of15 to 65 years for men, and 15 to 55 years for women are pre-
sented in a tabular form. The description of muscle tests,is also given.
CITATIONS: Three references.
196

STUDY: Ayoub, M.M., Bethea, N.J., Bobo, W.M., Burford, C.L., Caddel,D. K., Morrissey, S. and Intaranont, K. Biomechanics of LowCoal. Institute of Biotechnology Texas Tech University; 1979.
KEYWORDS: Anthropometry, sex differences, occupational differences,body strength, energy expenditure.
METHODS: The purpose was to evaluate job demands of low coal minessuch that job and work station design could be optimized.Most data was collected at actual mining sites. Tasks analy-sis, photographs and ventilation data for estimating energydemands of specific tasks were taken in the actual mines.Above ground, anthropometric, strength and physical workcapacity data was collected on the miners. 77 males and 25female miners were used. Therefore, data collections coveredcharacteristics of the miners and selected jobs and the jobdemand.
RESULTS: Anthropometrically, the low coal miners tend to he larger inthe trunk, upper arms and upper legs than the populationthey were compared to. Their back strength however, waslower than the industiral population. The oxygen uptake ofminers was not significantly different than the industrialpopulation. Average energy expenditures of the holter, minerhelpers and timbermen exceeds 5 kcal/min.
SUMMARY: To date this researc indicates the job task affects miner'sstrength in the torso, upper arms and upper legs while backstrength is less than that of an industrial population. Someof the jobs selected as demanding proved to be exactly thatgiven that they exceed the average of 5 kcal/min. Furtherfield studies are being performed.
CITATIONS: 32 references.
197

STUDY: Ayoub, M.M., Bethea, N.J., Deivanayagam, S., Asfour, S.S.,Liles, D., Mital, A. and Sherif, M. Determination andmodeling of lifting capacity. Institute for BiotechnologyTexas Tech University, September, 1q78.
KEYWORDS: Sex differences, lifting capacity, age difference, job stressindex.
METHODS: The purpose of this study was to generate information whichwould be useful in designing Manual Materials Handling (MMH)tasks and/or the assignment of workers to said tasks. Thiswould include generating lifting capacity data in regards tomaximum acceptable lift, developing prediction models anddetermining job stress ratio to the physical lifting demandand individual's lifting capacity. The laboratory datacollection phase used 73 males and 73 females divided into 3age groups (20-29, 30-39, 40-49). These subjects were allrecruited from industry and had MMH experience. Each subjectlifted at the rate of 2, 4, 6, or 8 lifts per minute from 6different levels, floor to knuckle, floor to shoulder, floorto reach, knuckle to shoulder, knuckle to reach and shoulderto reach. 3 box sizes (12" x 7" x 12", 12" x 7" x 18" and12" x 7" x 24") were used. Each subject adjusted the load inthe boxes to what they considered was their maximum thenlifted the box a designated number of times using their ownfreestyle method of lifting. The field data collection con-sisted of obtaining historical lifting injury data for dif-ferent MMH jobs, the work loss due to injury on the job, Jobdemands on a certain number of jobs and develop a job stressindex. Twenty-two private companies, which covered 63 jobs,were surveyed.
RESULTS: Male and female differences for lifting capacity were signi-ficantly different. As vertical height of the lift increasedthen lifting capacity decreased. The same held true for thefrequency of lift and box size, as they increased, liftingcapacity decreased. Age did nct affect lifting capacity.Anthropometric data and ismetric strength data are used inthe lifting capacity model developed. Eighty-five to 88% ofthe variance was explained in the lifting capacity models.Work rate was found to be very important when looking at jobseverity, not just the weight lifted. Additionally as thejob severity increases the job injury increases also.
SUMMARY: Sex differences were significant while age was not. Liftingcapacity is afFected by the vertical height, weight ofobject, frequency of lift and size of the object. Liftingcapacity predictions models were developed using static andanthropometric data. Work rate was found to be very impor-tant in determining job severity. The authors contend it isvery important to match the worker with the job.
CITATIONS: 138 references.
198

STUDY: Bender, J.A. and Kaplan, H.M. Determination of success orfailure in dynamic (isotonic) movements by isometric methods.The Research Quarterly; 1166, 37(1), 3-8.
KEYWORDS: Dynamic Strength, isometric measurements.
METHODS: The purpose was to determine if performance on isometrictests can predict for performance on dynamic strength. Pull-ups were selected such that the effort could be judged as a
success or failure. Subjects were tested on an isometrictest, then were tested on pull-ups. Those failing to pull-upwere then given exercises to develop pull-up ability.Retesting of these subjects would validate the premise of the
study. One hundred twenty-eight males aged 10 to 18 yearswere used.
RESULTS: The pounds pulled by the subject when divided by his bodyweight gave a strength index. Successful subjects had astrength index of greater than 1.00, while unsuccessfulsubjects' index was less than 1.00. The various points inthe movement reflected a variability of 19% indicatingchanges in muscle groups.
SUMMARY: The results reflect the fact that isometric measures canindicate dynamic strength. Additionally, failure at one areaof movement does not mean there will be failure in otherareas.
CITATIONS: Two references.
199

STUDY: Berger, R.A. and Henderson, J.M. Relationship of power tostatic and dynamic strength. The Research Quarterly; 1966,37(l1), 9-13.
KEYWORDS: Static strength, dynamic strength, leg power.
METHODS: The purpose was to see which, static or dynamic strength, ismore related to leg power. Sixty-six males aged 18 to 21years were each given a static and dynamic leg strength test,and a leg power test. Administration of tests were ran-domized. A dynamometer was used to measure static legstrength. Dynamic strength was obtained by having each sub-ject lift, from a squatting position, the greatest amount ofweight they could. Leg power was measured by taking the dif-ference in height from a stationary position and an upwardjump.
RESULTS: Leg power and static strength were significant at p<.01. Legpower and dynamic strength were significant (p<.O1) with acorrelation of .71.
SUMMARY: The authors contend that the high correlations do not meanstatic strength could predict dynamic strength or vice-versa,as the correlation between the two was .60 leaving accuracyof prediction is 36 percent. The static and dynamic areequally related to leg power.
CITATIONS: Ten references.
200

STUDY: Berger, R.A. and Higginbotham, R.B. Prediction of dynamicstrength from static strength in hip and knee extension.American Corrective Therapy Journal, 1970, 24, 118-120.
KEYWORDS: Dynamic and static strength, knee extension.
METHODS: The purpose was to determine dynamic and static strength ofthe knee during knee and hip extension and which staticscores predict dynamic strength at angles of 350, 520, 900,1350, and 1700 of the knee. Twenty-four males aged 17through 24 years, were tested at knee angles 350, 620, 900,1350, and 1708 for static and dynamic strength. A goniometerwas used to find knee angle. Test for strength and dynamicstrength was taken with the use of a Universal Gym Machine.
RESULTS: Correlations for static and dynamic measures at the angleswere .79 at 35, .96 at 61, 99 at 89, and .99 at 1670.Static strength angles at 610, 890, 1350, and 1670 were thebest predictors for dynamic strength. For predicting dynamic
I strength at 350 the static strength measure at 610 should be used.
SUMMARY: The study indicates significantly high relationship betweendynamic and static knee angles. The best predictors of dyna-mic strength is static strength at the same angles of 610,890, 1350, and 1670 with the best dynamic strength angle of350is the static strength at 610.
I CITATIONS: Three references.
2
I
~201

STUDY: Bigland-Ritchie, B. and Woods, J.J. Integrated EMG andOxygen uptake during dynamic contraction of human muscles.Journal of Applied Physiology; 1974, 36(4), 475-479.
KEYWORDS: Positive (concentric) work, dynamic EMG/force relationship;motorized ergometer.
METHODS: The authors are attempting to repeat and extend experiments
using a bicycle ergometer and to measure oxygen consumptionsimultaneously. A special ergometer designed by Bigland,Ritchie, Graichen and Words (1973) was used to minimize thecontractions of auxiliary muscles. The bicycle seat wasreplaced with an adjustable chair which was mounted behindthe bicycle seat. EMG recordings were taken on both legs.One electrode was placed near the patellar tendon and one wasplaced over the bel-ly of the lateral surface of the quadra-ceps. Oxygen uptake was measured and oxygen expired was ana-lyzed by a Beckman F3 analyzer.
Three subjects (two male and one fenmale) were used forrepeated measures taken on separate days. Forces exertedwere randomly selected and ranged from 0-3 kgs for males and1-2.5 kq for the females, all at 50 rpm, Rest was 15 minutesbetween each test. Values for EMG tensors and 02 consumptionare given in averages of 1 minute intervals of a completecycle revolution.
RESULTS: Oxygen consumption and integrated electrical activity arelinearly related to force exerted at a correlation of .98 and.92 respectively. Variation in the EMG to force relationshipwas due to charges in electrode placement each test period.The counts per minute per kg of exerted force varied betweenthe male and female subjects. This is thought to be sobecause of her smaller size. Female subject also showed legdominance in each experiment. For each 100 countsmin -1 increase in muscle fiber activity it is required about.430 liters of additional oxygen supply.
SUMMARY: The relationship of the linear EMG/force contractions can befound everytime if standardized conditions are used. Withany measurement of this kind, they warn that any change invelocity will change the linear EMG/force scale. With theuse of the oxygen uptake data and the EMG/fiber can give theinformation the fiber energy expenditure.
CITATIONS: Twenty-three references.
202

STUDY: Caldwell, L.S. Relative muscle loading and endurance.Journal of Engineering Psychology; 1963, 2, 155-161.
KEYWORDS: Muscle strength, endurance, sex differences, dynamometer.
METHODS: The purpose was to compare endurance abilities of males andfemales and different loads. An isometric dynamometer
handle, strain gages, strain amplifies and a display to indi-cate to the subject the force they were applying was theequipment used. Eighteen male and 18 females, aged 17 to 21years, were used. Each was seated in the aparatus andadjusted according to the subjects measurements. Subjectswere given practice for strength and endurance tests. Eachsubject was tested on 6 days each 24 hours apart withendurance loadings of 25, 40, 55, 70, 85 and 100% of theirmaximum strength.
RESULTS: No sex differences were found. Mean endurance loads were74.4 sec. for males, and females had 69.8 seconds. The maleshad twice as much weight of the females. The strengthmeasures did not overlap. The males mean strength was 155lbs and the female mean strength was 85 lbs.
SUMMARY: As load increased in endurance trials the maximum strengthresponse decreased. There was no sex differences.
CITATIONS: Seven references.
20
203

aSTUDY: Caldwell, L.S. The load-endurance relationship for static
- manual response. Human Factors; 1964, 6(1), 71-79.
3 KEYWORDS: Manual pull, endurance, arm.
METHODS: The maximum strength of manual pull was determined for 64male college students at two arm positions known to yield
U different mean strengths. Each subject was then required tomaintain 50%, 60%, 70% and 80% of his own maximum strength atthe two arm positions as long as possible.
RESULTS: The main results of this study were: 1) The mean strength ofmanual pull was 119.6 lb. at the 80 degree elbow-angle, and162.0 lb. at the 150 degree angle. At the arm position whichyielded the greatest response strength the subjects pulled anaverage of 103% of their body weight. Two-thirds of the sub-jects pulled between 86% and 120% of their body weight. 2)An essentially linear relationship was obtained between therelative load and the endurance of the response within therange of relative loads employed. As the load was increasedfrom 50% to 80% of maximum strength mean endurance decreasedfrom 63.3 sec. to 21.4 sec. 3) Force X endurance (theresponse force multiplied by endurance) was much better atthe 150 degree angle than at the 80 degree angle. Theinfluence of arm position, or the control force, on the Forcex endurance scores decreased with an increase in load. 4)While stature, weight, and the arm dimensions were related tostrength, they were not so clearly related to endurance. Atthe optimal elbow-angle (1500) there were no statisticallysignificant correlations between the aforementioned bodymeasurements and endurance. Thus, when differences in:3 strength were removed by use of relative loading, endurancewas apparently unrelated to body size. 5) With the use ofrelative loading, individual differences in endurance wereunrelated to differences in strength. That is, relativeloading apparently compensated for gross differences instrength sufficiently that the residual subject differencesmay be related to such factors as motivation or physical con-ditioning.
SUMMARY: Subjects exerted maximum pulls and then held the arm positionat 50%, 60%, 70% and 80% of the individuals maximum strength.The subjects greatest pull averaged 103% of their bodyweight. As the load on subjects was increased, meanendurance decreased in a linear fashion. Endurance appearsto be unrelated to body size.
CITATIONS: Eight references-
3 204

STUDY: Caldwell, L.S. Measurement of static muscle endurance.-journal of Engineering Psychology; 1964, 3, 16-22.
KEYWORDS: Manual pull, endurance, static strength.
METHODS: Definition: Absolute endurance index, percentage of maximumstrength held and relative endurance.
Fifty-six male college undergraduates were employed in thisinvestigation. The subject's maximum strength was measuredfirst and the total duration of the strength trial was 7
seconds. Two types of endurance tests were applied. In onetest subject was instructed to pull as hard as possible for aperiod of 70 seconds in order to measure the absoluteendurance index and the percentage of maximum strength held.In the second type of endurance test the time which the sub-ject can maintain one-half of his maximum strength wasmeasured as indicates of his relative endurance.
RESULTS: The main results of the study were: 1) a highly significantcorrelation (r = 0.7, p<.O01) was obtained between maximumstrength and the absolute endurance index, thus indicating atendency for the stronger subjects to maintain greater forceduring a sustained contraction; 2) a non-significant correla-tion was obtained between strength and the mean percentage ofstrength sustained for 60 seconds. Thus, there was no evi-dence in support of the stat-ment by Tuttle et. al. thatthere is a tendency for stronger subjects to experiencegreater relative decrement in strength during a sustainedmaximum contraction; 3) a highly significant correlation wasobtained between the relative strength assumed at thebeginning of the exertion and the decline in relativestrength during the period of exertion. Thus, decline instrength was shown to be more closely related to initialeffort than to strength, since a non-significant correlationwas obtained between strength and decrement in relativestrength; 4) the two tests of endurance (relative enduranceand absolute endurance index) measured little in common.
SUMMARY: Two methods of measuring endurance were compared. Maximumforce and force endurance were found to be correlated signi-ficantly. It was not supported that stronger subjects wouldshow a greater decrement in strength than the weaker sub-jects. The decline of strength was highly correlated to theinitial effort rather than being correlated to strength. The
.two endurance tests proved to measure little in common.
CITATIONS: Eight references,
205

STUDY: Caldwell, L.S., Chaffin, D.B., Dukes-Dobos, F.N., Kroemer,K.H.E., Laubach, L.L., Snook, S.H., and Wasserman, D.E. Aproposed standard procedure for static muscle strengthtesting. Am. Ind. Hyg. Assoc. Journal; 1974, 35(4),201-206.
KEYWORDS: Static muscle strength, muscle strength testing.
METHODS: The maximum voluntary strength of handgrip was measured.Three instruction conditions were given; namely, jerk,increase, and hold. A pair of trials separated by a restperiod of two minutes was given for each instruction con-dition. No informal feedback was provided.
RESULTS: The results indicated that the time needed to reach maximumoutput was depending on the instruction used. For allinstruction conditions, the times-to-maximum data were skewedtoward the longer times. For jerk, increase, and hold, thevalues were 1.54, 1.84, and 1.67 respectively. There waslittle difference in the measure obtained with the variousinstruction: mean strength was 55.4 kp. for the jerk andincrease conditions and 52.4 kp for hold.
SUMMARY: The results of this study emphasize the necessity for expli-cit instructions to subjects in strength assessment studies,and the importance of reporting in detail all factors whichinfluence the generation of force and its application of atransducer.
CITATIONS: Twenty references.
206

STUDY: Carlson, B.R. Relationship between isometric and isotonicstrength. Archives of Physical Medicine and Rehabilitation;1970, 51, 176-179.
KEYWORDS: Isotonic, isometric, elbow.
METHODS: The purpose was to examine the isometric and isotonic scoresrelationship and determine if an isotonic test can predictisometric values. Thirty-six males were subjects. Testswere administered for isometric and isotonic strength of theright elbow. Eight sessions for each measure were given overa six week period.
RESULTS: Reliability between and within testing days was .93 and .94respectively. Correlations between isotonic and isometricstrength ranged from .72 to .90. The raw score values forthe tests did differ significantly. Training affected scoresof the first and second half of the testing sessions.
SUMMARY: There is a significant relationship between isometric andisotonic measures for the elbow. Absolute values of iso-metric strength are significantly higher than isotonicstrength.
U CITATIONS: Fourteen references.
1II
I
1I 207

>1STUDY: Carlson, R.B. and McGraw, L.W. Isometric strength and rela-
tive isometric endurance. The Research Quarterly; 1971,42(3), 244-250.
I KEYWORDS: Muscle strength, endurance, right arm flexor, tensiometer.
METHOD: The purpose was to look at the strength and endurance rela-tionship of the right forearm flexor. Thirty-six males, meanage of 20.3 years, were tested over a 6 week period on iso-metric strength and endurance on 8 different days. Each testwas administered twice with strength at 30, 45, 60, and 75%.This included 3 strength and one endurance trial. A bell wasused to help warn subjects when they were falling below theirpercentage and a light alerted them to going above the per-centage to be maintained. A tensiometer 's used andcalibrated.
1 RESULTS: Test-retest for strength was .94. The endurance was signifi-cant on the test-retest at .56, .73, .51 and .48 for 30, 45,60 and 75% respectively. Negative correlation betweenstrength and endurance were found for each trial, 30% = -.47,45% = -.46, 60% = -.60 and 75% = -.56. When subjects weredivided into 3 equal groups according to strength values adifference in endurance was found with the weakest group per-forming best.
SUMMARY: A significant difference was found between the strength andendurance capabilities of the subject.
CITATIONS: 17 references.
IIIIU
IU208
I

STUDY: Carlsoo, S. Testing the back and lifting capacity. Scand.J. Rehabil. Med. (SE); 1978, 10(6), 164-168.
KEYWORDS: Lifting capacity, back muscle strength, abdominal musclestrength.
METHODS: The capacity of the deep back musculature was measured with aDarcus Dynamnmeter. In order to obtain some idea of thestrength of the abdominal musculature, the magnitude of anactive abdominal wall protrusion was measured, also employinga Darcus Dynamometer. The subjects then performed a seriesof lifts on a box whose weight was successively increaseduntil the subject reached his/her limit. Electromyographicactivity in the erector spinae, rectus abdominis and obliquusabdominal musculature were also recorded in testing of backstrength, abdominal muscle strength, and during lifts.Thirty-three men and twenty-three women were utilized.
RESULTS: The results indicated that there is no direct correlationbetween body weight and the strength of the erector spinae.On the other hand, there was good correlation between backstrength and lifting capacity and between back strength andabdominal muscle strength.
SUMMARY: In order to prevent or reduce the incidence of backcomplaints in people whose daily work calls for lifting, therelationships between lifting capacity and back musclestrength and abdominal muscle strength were studied. A goodrelationship between back strength and lifting capacity andbetween back strength and muscle strength were observed.
CITATIONS: None.
209

STUDY: Chaffin, D. B. Graphical prediction of human strengths for-, two-handed IV/EVA Tasks, Phase I Report Industrial
Engineering Human Performance Group, The University ofMichigan, for Biomedical Division - NASA - / MSC underContract NAS9 - 10973, Ann Arbor, Michigan, April 1971.
KEYWORDS: Lifting, pushing, pulling, strength, gravity space suit,biomechanical model.
METHODS: A biomechanical model was used to predict the two handedstrengths for shirt-sleeved activities as a function of handpositions, population size and strength, and gravityconditions. The body was considered to be composed of eightsolid links: the feet, lower legs, upper legs, pelvis,trunk, upper arms, lower arms, and hands. The mass of eachlink was based on the segment-mass/body-mass ratios. Thelink lengths were established from over-the-body measure-ments using a reference landmark. Five Inputs, variablewere systematically varied in this project to determinetheir effects on two-handed force capabilities. Thevariables were: a) hand placement (relative to the ankles,b) hand force direction (lift, push, pull), c) gravity(1.g., 0.2g., 0.7g.), d) clothing (shirt sleeved, A > Lspace suit with backpack), e) size and strength ofpopulation.
RESULTS: The following conclusions were observed:1. The best hand heights for lifting, pushing pulling wereat knee height, hip height, and mid-thigh heightrespectively.2. The space suit and backpack reduced the average liftingand pulling capability in most cases. The spacesuit andbackpack reduced the area in which a person could reach/lift,3 push, and pull within specific boundries.
SUMMARY: A computerized biomechanical model was used to predict voli-tional force that a person can produce with both hands whilestatically and symmetrically loading the body in sagittalplane.
3 CITATIONS: Twenty-four references.
2
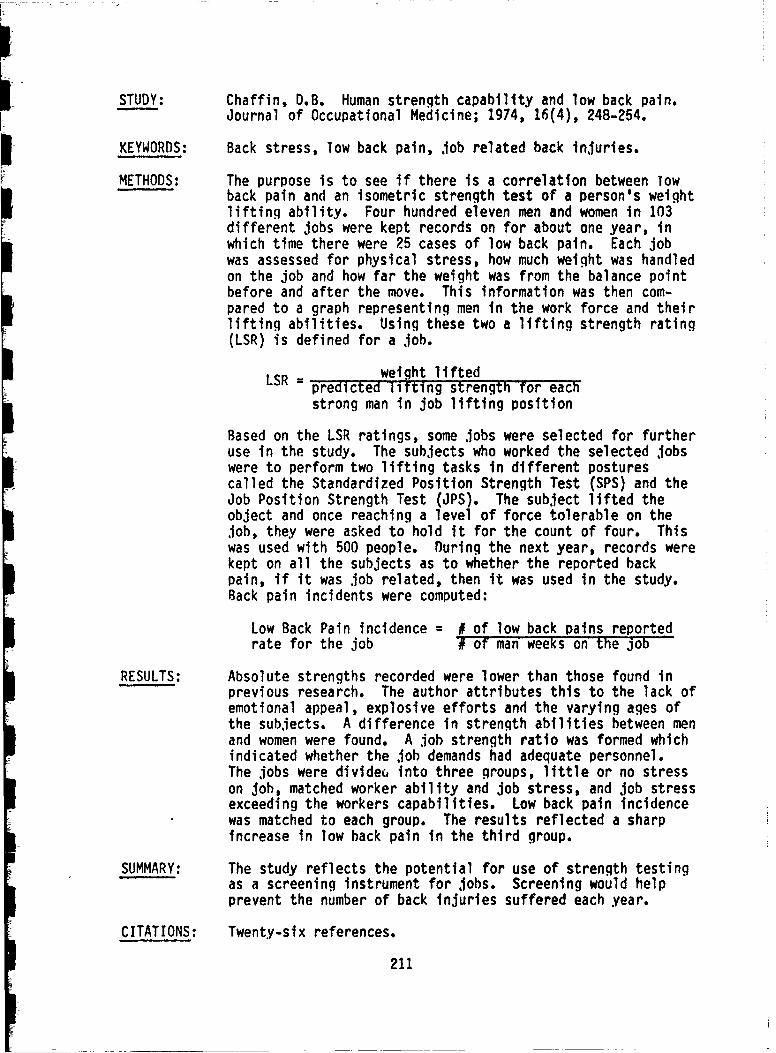
STUDY: Chaffin, D.B. Human strength capability and low back pain.~Journal of Occupational Medicine; 1974, 16(4), 248-254.
KEYWORDS: Back stress, low back pain, job related back injuries.
METHODS: The purpose is to see if there is a correlation between lowback pain and an isometric strength test of a person's weightlifting ability. Four hundred eleven men and women in 103different jobs were kept records on for about one year, inwhich time there were 25 cases of low back pain. Each jobwas assessed for physical stress, how much weight was handledon the job and how far the weight was from the balance pointbefore and after the move. This information was then com-pared to a graph representing men in the work force and theirlifting abilities. Using these two a lifting strength rating(LSR) is defined for a Job.
LSR = weight liftedS predicted lifting strength for eacstrong man in job lifting position
Based on the LSR ratings, some jobs were selected for furtheruse in the study. The subjects who worked the selected jobswere to perform two lifting tasks in different posturescalled the Standardized Position Strength Test (SPS) and theJob Position Strength Test (JPS). The subject lifted theobject and once reaching a level of force tolerable on theJob, they were asked to hold it for the count of four. Thiswas used with 500 people. During the next year, records werekept on all the subjects as to whether the reported backpain, if it was job related, then it was used in the study.Back pain incidents were computed:
Low Back Pain incidence = # of low back pains reportedrate for the job # of man weeks on the job
RESULTS: Absolute strengths recorded were lower than those found inprevious research. The author attributes this to the lack ofemotional appeal, explosive efforts and the varying ages ofthe subjects. A difference in strength abilities between menand women were found. A job strength ratio was formed whichindicated whether the job demands had adequate personnel.The jobs were divideG into three groups, little or no stresson Job, matched worker ability and job stress, and job stressexceeding the workers capabilities. Low back pain incidencewas matched to each group. The results reflected a sharpincrease in low back pain in the third group.
SUMMARY: The study reflects the potential for use of strength testingas a screening instrument for jobs. Screening would helpprevent the number of back injuries suffered each year.
CITATIONS: Twenty-six references.
211

I
STUDY: Chaffin, D.B. Ergonomics guide for the assessment of humanstatic strength. Am. Ind. Hyg. Assoc. Journal; 1975, 36(6),505-511.
3 KEYWORDS: Static muscle strength, muscle strength testing.
METHODS: This paper has been prepared to assist persons performingstrength assessments to better assess human static strengthin the future. It is mainly, recommendations for staticstrength assessment procedure.
RESULTS: The following are the main recommendations given in thepaper: a) the voluntary exertion should be maintained for aperiod of four to six seconds, b) the measurement deviceshould be capable of time averaging the force or torque pro-duced by the person during the steady state, c) the forcemeasuring device should not Influence a person's exertion dueto it causing localized discomfort at the point where itcouples to the body, d) adequate rest periods betweenrepeated exertions are necessary to avoid fatigue, a minimumof 30 seconds should be given if only a few measurements areto be made, e) body position must be specified andcontrolled, f) subject instructions should be given inwriting, and after discussion, a signed statement ofunderstanding should be acquired, q) to enable the comparisonand further development of population norms, it is imperativethat the reporting of strength values include a good descrip-tion of the test conditions, h) the following strength sta-tistics should be reported: mean and/or median, mode;standard deviations; skewness or histogram; and minimum and3 maximum values.
SUMMARY: Recommendations for static strength assessment procedure aregiven in the paper to assist persons performing strengthassessments to better assess human static strength in thefuture.
I CITATIONS: Twenty-one references.
21
I
121

STUDY: Chaffin, D.B., Herrin, G.D., and Keyserling, W.M.Preemployment strength testing. J. Occup. Med. (US); 1978,20(6), 403-408.
KEYWORDS: Strength testing, low-back injury.
1 METHODS: Over 900 jobs in six different plants were included in the
study. All jobs chosen had at least a 35-pound equivalentweight lifting requirement. During the 18 months follow-up
I period, 551 people were strength tested for these jobs withall resulting medical and supervision data reported for ana-lysis. Of these people, 446 were men and 105 were women.
RESULTS: Medical incidents were classified by the plant physiciansinto three groups: 1) back pain, 2) musculoskeletalinjuries, and 3) contact injuries such as lacerations,bruises, or abrasions of a traumatic nature. An analysis ofthese incidents revealed that a worker's likelihood ofsustaining a back injury of musculoskeletal illness increaseswhen job lifting requirements approach or exceed the strengthcapability demonstrated by the individual on an isometricsimulation of the job.
SUMMARY: This investigation was conducted to evaluate the practicalityand potential effectiveness of preemployment strength testingin reducing the severity of musculoskeletal and back problemsin materials handling jobs. The authors concluded thatindustry should implement specific employee selection and
I placement programs using a strength performance criterion.
CITATIONS: Ten references.
II!
I
213
Il

ISTUDY: Chapman, A.E. and Belanger, A.Y. Electromyographic methods
of evaluating strength training. Electromyographic Clin. ofNeurophysiology; 1977, 17(3-4), 265-280.
KEYWORDS: EMG, Hallux Muscle, abduction.
METHODS: The purpose was to see how changes in "Efficiency ofElectrical Activity (EEA)", maximal integrated electromyogram(IEMG) and mean square deviation (MSD) of the force/EMG rela-I tionship may affect the variability in force. Four males andtwo females were subjects. Isometric forces of the abduc-tion. Hallux muscle were recorded. Natural foot movementwas prevented by adjustable pieces of angle iron. A forcetransducer recorded the force of abduction which was picked upby attached electrodes to the skin. All subjects weretrained to increase the force of the abduction Hallux muscle.Of the training trials, the one with the greatest maximumforce was selected from each half at the trials.
I RESULTS: All subjects were able to increase force and IEMG duringtraining. EEA increased in five of the eight subjects andMSD decreased in six of the eight. Variability in force isthought to be a combination of EEA and IEMG as the mean requals .781.
SUMMARY: Great variability for individuals can be accounted for whenusing IEMG and EEA and 60% can be accounted for when subjectsare grouped. Increased force was produced by increasing3 recruitment or EEA depending on the subject.
CITATIONS: Five references.
2I
II
II
214I

F
STUDY: Christensen, C.S. Relative strength in males and females.
Atheletic Training; 1975, 10(4), 189-192.
KEYWORDS: Relative strength, sex differences.
METHODS: Twenty-four male and twenty-four female subjects were uti-lized to measure both back and leg static extension strength.Total body weight (TBW) and lean body weight (LBW) of eachsubject were assessed at a second testing session. Each ofthe hack and leg strength tests was administrated twice andthe best effort was recorded. At the completion of testing,female and male leg and back strengths were calculated inabsolute terms (raw score in pounds) and in relative terms(absolute strength/TBW and absolute strength/LBW).
RESULTS: Males were found to be significantly (.01 level) strongerthan females in absolute terms. Leg strength/TBW and legstrength/LBW for males and females were significantly dif-ferent (.05 level) while the hack strength/TBW and backstrength/LBW ratios produced no significant differences.
SUMMARY: The present study demonstrated that there is a significantdifference between male and female leg extension strength asexpressed in both absolute and relative terms, but no dif-ference in back extension strength when expressed as strengthper pound of body weight or lean body weight.
CITATIONS: Nine references.
21I
IJ 1

i1
STUDY: Clarke, H.H., Elkins, E.C., Martin, G.M. and Wakim, K.G.HI Relationship between body position and the application ofmuscle power to movements of the joints. Archives ofPhysical Medicine; Feb. 1950, 81-89.
KEYWORDS: Muscle strength, body position, muscle power, muscle length.METHODS: The purpose of this experiment is to study: 1) the effect of
changing body position on muscle strength, and 2) evaluatingmuscle power throughout range of movements of joints. Forthe first part of the experiment, sixty four nondisahledcollege men were tested to compare the amount of muscle
strength applied at two different body positions. For thesecond part, the muscle power exerted throughout the fullrange of motion for fourteen of the movements of joints wasstudied.
RESULTS: The results of the first part indicated that body positionhas a significant effect on muscle strength. The second partshowed that the curves representing the muscle power exertedthroughout the range of motion of the joints tested can beclassified as: 1) ascending curves, that is, increase instrength on motion of joint from angles of 0 to 180 degrees,2) descending curves, and 3) ascending-descending curves,with greatest strength exhibited in the center of the range.
SUMMARY: These studies provide objective evidence for the statementthat, other factors being equal, a muscle exerts its greatestpower when it functions at its greatest tension; that theangle at which the muscle pulls is of importance but probablyis not of as great importance as the tension, that there pro-bably is an optimal position at which each muscle functionsbest, and that this position may be one in which the tensionis optimal (not necessarily maximal) and in which the angleof pull provides for the greatest rotary force.
CITATIONS: Two references.
216

STUDY: Clarke, R.S.J., Hellon, R.F., and Lind, A.R. The duration ofsustained contractions of the human forearm at differentmuscle temperature. J. Physiology; 1958, 143, 454-473.
KEYWORDS: Sustained contractions, muscle temperature, EMG.
METHODS: Sustained contractions were made on a simple hand-gripdynamometer located in water. Four healthly young men,trained in the use of the dynamometer, acted as subjects.Each immersed his forearm in the water-bath and immediatelymade two brief (13 sec) maximal contractions: 1/3 of themean of these contractions became the target tension for thesubsequent sustained contractions. The arm remained in thebath throughout each experiment. After 30 minutes of immer-sion, the first of five successive contractions to fatigue wasmade. No subject performed more than one experiment in any24 hr. period. Water-bath temperatures of 2, 10, 14, 18, 26,34, and 420C were used in random order. Muscle temperaturewas measured approximately midway between the skin and thecenter of the forearm, i.e. about 4 cm in a distal directioninto the brachioradialis muscle at the elbow, using a ther-mocouple of 40 s.w.g. copper-constantan wire.
RESULTS: The mean duration of contractions revealed that the optimumwater temperature for sustained contractions was 180C. Higheror lower water temperatures resulted in a marked reduction inthe duration of the contractions. The optimal muscle tempera-ture for all sustained contractions was between 25 and 29*C,measured at a vertical depth of 2 cm from the skin. Immersionof the forearm in water at 180C for 30 minutes resulted in amuscle temperature of about 270C. The subjects were able toexert the same or nearly the same tension after 30 minute immer-sion in water at 180C or above. In water cooler than this,the maximum tension exerted fell to a value of 40% of themaximum in water at 2%. The post-exercise hyperaemic responsewas greater for a given duration of contraction in water at34 and 42% than at lower temperatures. The rate of bloodflow through the muscle during contractions also increased bya greater amount when the water temperature was higher. Finally,the integrated muscle action potentials showed that at the term-ination of the contraction there was no difference in electricalactivity (EMG) over the muscle when its temperature was 27 or35*C, when it was reduced to 200C there was considerably lesselectrical activity at the end of the contraction.
SUMMARY: It is considered l1kely that as muscle temperature increasesabove 270C, the rate of metabolism increases and results inthe earlier accumulation of metabolites so as to cause fatigue.At muscle temperatures below 27*C a proportion of the moresuperficial muscle fibers do not contract as a result of inter-ference in nervous or neuromuscular transmission due to cooling.
CITATIONS: Thirty three references.
217

L STUDY: Cooper, D.F., Grimby, G., Jones, D.A., and Edwards, R.H.T.
Perception of effort in isometric and dynamic muscularcontraction. Eur. 3. App1. Physiology; 1979, 41(3), 173-180.
KEYWORDS: Perception, isometric contraction, dynamic contraction,
METHODS: The perception of muscular effort was studied using estima-tion and production methods in the adductor pollicis andquadriceps. A psychometric scale (percentage magnitude) wasused. Static contractions were studied in the adductorpollicis, and both dynamic (isokinetic) and static contrac-tions were studied in quadriceps.
RESULTS: Linear and logarithmic equations were fitted for the per-ceived effort as a percentage of the maximum in relation tothe produced percentage maximal force or torque. Thelogarithmic exponent was around or above 1.0. No significantdifference was found between mean exponent and interceptvalues for the adduc, )r pollicis and the quadriceps, or-whenestimated or produced values for the two muscles were com-pared. There was no difference in the same subjects betweenthe equations for static and dynamic contractions with lowangular velocity of the quadriceps.
SUMMARY: The present study demonstrates that, aswith dynamic bicycleexercise (Borg, 1970, 1972), there is a high correlation bet-ween perceived exertion and the produced force. Both linearand logarithmic equations could describe the results with ahigh correlation coefficient. The logarithmic exponent,which was around unity, indicated that the perception ofeffort for a certain increase in force is the same at low andhigh forces.
CITATIONS: Twelve references.
218

1l
STUDY: Corlett, E.N. and Bishop, R.P. Foot pedal forces for seated
operators. Ergonomics; 1975, 18(6), 687-692.
KEYWORDS: Foot pedal, isometric.
METHODS: Maximum isometric force produced by a subject was measuredwhen applied to a horizontal foot pedal. This informationwas used in a design for foot controls to be used inindustrial settings, specifically here, soot welde's. A
IF horizontal foot pedal was located between two foot rests.
The pedal contained a load meter used to register the forceexerted on the pedal. The meter was hand reset each trial.An adjustable seat with backrest was used. Twenty males andfemales, ages 22 to 60 years old, were selected as represen-tative of industrial workers based on height and weight.Four pedal conditions were used; a) leg axis and pedal axisFI at 9o, b) adjusted seat height for the fifth maximum percen-
tile, c) adjusting seat height for the fifth minimum percen-tile and d) the seat located such that the pedal was 10 cm.in front of the operator's knee. Both legs were used toobtain data in each of the four conditions.I RESULTS: No significance in leg strength for the four conditions was
found. Condition B did result in greated strength measure-ments than did condition C. Males significantly exerted morestrength than females.
SUMMARY: Condition B, although the most favorable, is only the mostfavorable of the four conditions used. The authors feel theadvantage of this position lies in the maximum forcesgenerated with less fatigue than other positions. Theauthors remind the reader not to make forces greater than
* 1those exerted by the weakest user.
CITATIONS: Eight references.
i
I ?19

STUDY: Crosby, P.A. Use of surface electromyogram as a measure ofdynamic force in human limb muscles. Med. and Biol. Eng. andComput.; 1978, 16, 519-524.
KEYWORDS: Convolution, dynamic force, electromyogram, muscle.
METHODS: Digital convolution of the input signal and the direct con-volution of the impulse response is used as an alternative tousing analogue computation. Convolution is defined byequation. The subject lay with his elbow flexed at 90degrees and wrist immobilized. He was attached to a rod on aforce transducer. Electrodes were attached over and parallelto the linea maxima of the medial head of the triceps.Another e- troe w-Fe-was placed above the olecranon of the ulna.Where the subject pressed against the force transducer, thesignals were recorded as a ten bit digital signal and stored.
RESULTS: Convoluted E.M.G. was fit to the force record in a linearregression. The fit was a good one-and was consistentlyfound using thirteen different subjects.
SUMMARY: The author found that in order to use a rectified filter sur-face E.M.G., the frequencies must be limited to low limits,maximum being about 30 Hz. The rectification allows bi- ortri-phasic impulses (due to several electrodes) to be groupedinto a menophasic pulse. The author has made no specificstatements regarding gain or offset constants, although-therewas a correlation between connoluted E.M.G. and mechanicalforce.
CITATIONS: Twenty-six references.
220

STUDY: Crowninshield, RD, Use of optimization techniques to pre-dict muscle forces. Transactions of the ASME; 1978, 100(2),
88-92.
KEYWORDS: EMG, elbow, joint, muscle force.
METHODS: The purpose was to attempt to correlate EMG with predictedmuscle activity. Models were developed which includedequality and inequality constraints, which worked with musclestress to predict force in the muscles. For the elbow a pla-nar model was developed which involved the origins and inser-tions of three muscles. The predicted muscle forces werecompared to EMG activity.
RESULTS: The model which produced an elbow flexion moment resulted ih
a linear relationship when compared to the EMG produced.
SUMMARY: The authors work indicates a good relationship between thepredictive models and the real muscle force. However, theauthor does warn the models may predict higher force thanactually occurs because of the movement in the arm causingchanges in magnitude. The models correlate with the muscleforce quite well.
CITATIONS: Eleven references.
221

STUDY: Currier, D.P. Maximal isometric tension of the elbow exten-sors at varied positions: Part 1. Assessment by cable ten-siometer. Phys, Ther.; 1972, 52(10), 1043-1049.
KEYWORDS: Maximal isometric contraction, elbow extensors, cabletensiometer.
METHODS: The tension of the elbow extensors of the dominant arm offourty-one normal male subjects was measured on two differentoccassions by cable tensiometer during maximal isometriccontractions. The elbow positions were varied randomly bet-ween 60, 90 and 120 degrees from full extension. Each iso-metric contraction was maintained by the subject for periodsof two to five seconds. A minimum of fifteen seconds wasallowed to transpire between contractions. A total of twelvecontractions was required of every subject during each testsession. Each subject was invited to return to a retestsession one week following the initial test session.
RESULTS: The post hoc test revealed significant differences betweenthe 60, 90, and 120 degree positions. The mean of the 60degree position was lowest [35.8 lb (16.2 kg), S.D. - 7.91(3.6 kg)], while the 90 degree position [mean = 48.8 lb (22.1kg), S.D. = 14.83 lb (6.7 kg)] was the greatest computedamong the three different angles. The reliability coef-ficients (test-retest) for the cable tensiometer method were.775, .749, and .723 for the 120, 90, and 60 degree posi-tions, respectively.
SUMMARY: The data analysis of this study revealed that varying theelbow position altered the tension of the muscles. Themuscle tension recorded at the 60 degree position was lessthan that recorded at the 90 and 120 degree elbow position,and the tension at 90 degrees was greater than at 120degrees. The test-retest correlation coefficients rangedfrom .723 to .775 for the cable tensiometer method.
CITATIONS: Twenty-six references.
222

STUDY: Currier, D.P. Maximal isometric tension of the elbow exten-sors at varied positions: Part 2. Assessment of extensorcomponents by quantitative electromyography. PhysicalTherapy; 1972, 52(12), 1265-1276.
KEYWORDS: Maximal isometric contractions, elbow extensors,electromyography.
METHODS: An electromyography analysis was performed on the three headsof the right triceps brachii and anconeus muscles of 41 malesuhjects while performing maximal isometric contractions at60, 90, and 120 degrees from full elbow extension. All sub-jects were tested twice with a one-week interval between
RESULTS: The data analysis revealed that varying the elbow positionaltered both the electrical activity and tension of themuscles. The 600 elbow position resulted in less electricalractivity than the 900 and 1200 positions while the 900 and1200 positions did not differ significantly from each other.The test-re-test correlation coefficient ranged from .440 to.682 for electrical activity of the different muscle sectionsand muscle tension evaluated were generally low ranging from
SUMMARY: The quantitative electromyographic method did not demonstrateits value as a valid method of assessing maximal muscularforce, nor did electrical activity of any individual musclesection seem to be a valid predictor of strength.
CITATIONS: Forty-one references.
I
I22

STUDY: Currier, D.P. Evaluation of the use of a wedge in quadricepsstrengthening. Physical Therapy, August, 1975, 55(8),870-874.
KEYWORDS: Quadriceps, isometric.
METHODS: This study was developed to help decide whether the use of awedge for the strengthening of quadriceps was really advan-tageous. Twenty female subjects were tested on the isometriccontraction of the left quadriceps. A goniometer was usedfor measurements of four knee positions. The subject sat ona N-K table (hip angel 80-100 degrees) during testing. Theankle was anchored with the use of an ankle cuff. Each sub-ject was told to contract the quadriceps muscles for fiveseconds. Each test was taken at the different angles, withand without the wedge, repeating eight times.
RESULTS: The greatest force was recorded of 60 degree knee position,the least at 0 degrees with and without the wedge. No signi-ficant differences were found which would indicate using ornot using the wedge.
SUMMARY: The results of knee forces recorded agree with other studies.The use of a wedge or no wedge was not indicated either wiy.However, the mean forces recorded with the wedge wereslightly higher though not significant. The authors feelthat the wedge of the size named used could not be advan-tageous for quadriceps strengthening. This is based on theauthors conclusions that the wedge places excessive pressureon the posterior-distal thigh during exercises and thus couldactually be painful. Therefore, the use of a wedge remains,still, with the subjective decision of the therapist.
CITATIONS: Thirteen references.
1 224

STUDY: Davis, P.R. and Stubbs, D.A. Safe levels of manual forcesfor young males (this is a three-part series). AppliedErgonomics. Part (1): 1977, 8(3), 141-150; Part (2): 1977,8(4), 219-228; Part (3): 1978, 9(l), 33-37.
KEYWORDS: Safe load levels for manual work, intra-abdominal pressure,acramonial grip length.
METHODS: A large series of observation on some 200 ft. serving malesoldiers was carried out. Subjects were asked to applymeasured forces in a variety of positions within the normalreach envelope when standing, sitting and kneeling whiletheir peak intra-abdominal pressures were recorded. Thesubject's weights, heights and grip lengths were recorded. Acomputer-based method was used to obtain those points withinthe reach envelope at which a given manual force gave thesame abdominal pressures and thus by interference the sametrunk stresses.
RESULTS: The data were used to calculate values for the various posi-tions which would result in maximal peaks in intra-truncalpressures of 90 mm Hg in the weakest soldiers, larger andstronger individuals having smaller values. Whereappropriate the 90 mm Hg values were incorporated in contourmaps, and in other cases, in simple diagrams.
SUMMARY: Contour maps for 90 mm Hg intra-truncal pressure, were given.These allow a task designer to establish safe limits ofapplied force for young males when planning work environmentsin which the operator is required to handle occassionalloads, or if the operator needs to handle repeatedly, then70% of the values can be used. When necessary, two sets ofdiagrams are presented for a given type of activity, allowingfull three-dimensional appreciation of forces within thereach envelope.
CITATIONS: Ten references listed in part (1).
225

STUDY: Doss, W.S. and Karpovich, P.V. A comparison of concentric,eccentric and isometric strength of elbow flexors. Journalof Applied Physiology; 1965, 20, 351-353.
KEYWORDS: Force during movement, isotonic continuous force, electrogo-niometer, force, maximum.
METHODS: The purpose was to compare continuous movement of elbowflexor with isotonic measures at the same angles. A dynamo-meter and electrogoniometer were used for measurement withthe information being recorded on an oscillograph. Elbowangle was measured with an elgen attached to the elbow.Thirty-seven males, aged 19 to 23, were each tested threetimes with three repeats each time.
RESULTS: The eccentric force at angles 75 to 1650 was greater thanconcentric force. The greatest force for concentric movementwas reached at 1250 and at 1050 for eccentric movement. Thecorrelation between the mean force and mean weight was .90.Comparison of isometric forces significantly corresponded toangles of concentric and eccentric force. Parabolic curveswere used for comparison with the data and matched quitewell.
SUMMARY: Maximum force obtained during a concentric movement is a goodindicator of force determined when lifting weights. Theresults agree fairly well with previous research.
CITATIONS: Eight references.
226

STUDY: Duncan, G., Lambie, D.G. and Johnson, R.H. Ventilatoryresponses to sustained static forearm exercise in man. NewZealand Med. Journal; 1978, 88(618), 169.
KEYWORDS: Static exercise, ventilatory responses.
METHODS: Five healthy subjects were used to study the stimulus forhyperventilation which occurs during sustained static exer-cise in man and its mode of action.
RESULTS: When the forearm circulation was occluded, end-tidal C02, V(increase in minute ventilation), and ventilatory equivalentremained elevated for as long as arterial occlusion was main-tained but oxygen consumption returned to normal at the endof exercise. The limb became painful durinq exercise andremained painful until the cuff was deflated. In one patientwith a Brown-Sequard lessions of the spinal cord, increasedrespiration during exercise was not as marked as with thehealthy subjects and pain and post-exercise hyperventilationdid not occur when the forearm was occluded.
SUMMARY: The results support the suggestion that proprioceptive sen-sory pathways from active muscles may be involved in thehyperventilation associated with isometric exercise. Theyindicate however that a substantial proportion of therespiratory response is probably due to chemical factors sti-mulating pain receptors within exercising muscle.
CITATIONS: None.
227

STUDY: Edwards, R.H.T. and Hyde, S. Methods of measuring musclestrength and fatigue. Physiotherapy; 1977, 63(2), 51-55.
KEYWORDS: Muscle strength tests, male and female differences.
METHODS: Two methods of measuring muscle strength were used. First, amyometer was used as a simple hand-held instrument whichwould register the peak force applied by the examiner inresisting contraction of a muscle group in the course of aconventional clinical neuromuscular examination. Second, thequadriceps force was measured with a strain gauge while thesubject was seated in a specially designed chair.
RESULTS: The range of usefulness of the -.,cmcter was limited largelyby the strength of the examiner in resisting the contractionsof the patient's muscles. For this reason the myometer wasnot suitable for measuring minor degrees of weakness inadults. It can, however, be used to measure strength in nor-mal children and children with muscle diseases. By using thestrain gauge, it was found that an adult's predicted normalmaximum voluntary contraction (MVC) of quadriceps (in kgforce) is equal to 75% of his body weight (in Kg.). Nosignificant difference between males and females has been
I found in the population studied.
SUMMARY: There are no quantitative methods for measuring muscle func-tion in clinical use today for the diagnosis and managementof patients complaining of weakness or fatigue. The systema-tic and intelligent use of appropriate muscle function testscan be expected to help in the design of rehabilitationprograms and evaluation of alternative forms of phar-macological and physical treatments. Two methods formeasuring muscle strength were given. The first was found tohe inappropriate for adults.
CITATIONS: Fifteen references.
II'
I

STUDY: Elliott, J. Assessing muscle strength isokinetically. JAMA;1978, 240(22), 2408-2410.
KEYWORDS: Cybex II, isokinetic, isometrics.METHODS: A review of the abilities of the Cybex II.
SUMMARY: Cybex II is a machine used to test isokinetic strength. This
unit can measure dynamic strength throughout a range ofmotion. The harder the subject applies force, the instrumentwill move no faster than its preset velocity. The machinecan be used as a diagnostic tool to assess muscle damagewhich is printed out on a continuous sheet from a electrogo-niometer. When there is no previous record of a mvscle groupperformance as an injured subject, the uninjured muscle groupperformance can be compared to assess injury, time needed forrehabilitation, and type of injury involved. Additionally,the Cybex II may be used for athletic training and as ascreening device for weaknesses in an athlete.
CITATIONS: None.
229

STUDY: Falkel, J. Planter flexor strength testing using the cybexisokinetic dynamometer. Phys. Ther.; 1978, 58(7), 847-850.
KEYWORDS: Planter flexor strength, isokinetic exercise, sex difference,age difference, Cybex isokinetic dynamometer, isometric test.
METHODS: Twenty male subjects and twenty female subjects in each ofthree age categories, 6 to 8 years, 14 to 16 years, and 23 to28 years, were tested on the Cybex Isokinetic Dynamometer toobtain normative strength values for the ankle planter flexormuscle group. The muscle strength test was performed usingthe Lovett method. This method requires the subject to standbarefoot on his preferred extremity, then rise on the ball ofthis foot up to an angle of at least 45 degrees of ankleplanter flexion for ten repetitions.
RESULTS: In the isokinetic test, the 6 to 8 year old girls had asignificantly higher mean than did their male counterparts;the 14 to 16 year old boys had a slightly higher mean thandid the 14 to 16 year old girls; and the adult men weresignificantly stronger than the adult women. In the iso-metric test, the male subjects in all age groups had highermeans, and the difference in strength between male and femalesubjects increased with age. The results of this studyshowed that age and weight were the only significantvariables in determining strength scores.
SUMMARY: By using isokinetic and isometric tests, the standarddeviations, means, medians, and ranges were established formale and female subjects in each of three age categories 6 to8 years, 14 to 16 years, and 23 to 28 years. Results showedthat the significant differences in scores were due to weightand age of the subjects, and not due to the sex or height ofthe individuals.
CITATIONS: Fourteen references.
230
li,

STUDY: Fay, O.F., Jones, N.B., Porter, N.H. and Wood, R.A.Developments in apparatus for dynamic in vitro testing ofhuman muscle: Part 1. Mechanical design, environment controland stimulation. Medical and Biological Engineering; 1974,12(5), 647-653.
KEYWORDS: Dynamic in vitro testing of human muscle.
SUMMARY: Some apparatus and instrumentation have been developed forimproving the relevance of dynamic test data obtained fromhuman muscle specimens. In the first part of this paper, thebackground is given and a special clamping and mountingarrangement is described which allows a small specimen to hemade ready for test in less than a minute. The second partdescribes a new timing and sequencing instrument for regu-lating the electrical and mechanical stimulations applied tothe specimen. The mechanical displacements are controlled bya type of servomechanism which can be driven from an f.m.tape recorder.
CITATIONS: Four references.
.... 231

STUDY: Fisher, B. A Biomechanical Model for the Analysis of DynamicActivities. M.S.I.E. Thesis; University of Michigan AnnI Arbor, Michigan, 1967.
KEYWORDS: Biomechanical model, dynamic activities, strength, stress,
lifting.
METHODS: A biomechanical model was developed for symmetric motionsperformed in the sagittal plane. The model is concerned withnon-repetitive, short duration lifting and the stress inthe region of the last two lumbar discs. In order to deve-lope the model, the reactive forces and torques on the sixarticulations of the body (wrist, elbow, shoulder, hip, kneeand ankle) were resolved. Next, the spinal considerationswere added to the model. The model is an extension of theprevious models, and is programmed for the computer. Thereare two types of input to the model:
(1) The mass and length of the links of the body,(2) A description of the motion of each link for the
activity being analyzed.The subject data can either be measured directly using thedescribed method or be obtained from the available data. Thedescription of the motion is obtained by photographing a sub-.Ject with neon lights attached to the point of reference thatflashed at a given rate.
3 RESULTS: The available data from the literature was used to develope abiomechanical model. The model was applied to two types oflifting, a leg lift and a back lift. It was concluded thatlifting should be done smoothly and slowly and that the trunkshould be kept as erect as possible. It was shown that thestresses on the spine can he compared to the maximumstrengths of the components. Based on the strengths of thevertebral end-plates, even lifting a ten pound weight mightcause a fracture in persons under fifty. Lifting fiftypounds (which causes a normal force on the S-I vertebrae of568 kg) would he very dangerous for anyone over fifty yearsof age. In regard to subject differences it was demonstratedthat the stresses for the particular lift performed were asmuch as 15% to 20% higher for the average for woman as com-pared to the average man.
SUMMARY: A biomechanical model was developed for non-repetitive shortduration lifting in the sagittal plane. The model inputswere the mass and lengths of the links of the body and thedescription of their motion. The model was applied to a par-
* ticular lifting condition and the data were analyzed.
CITATIONS: Forty-two references.
232

STUDY: Freund, H.J. and Budingen, H.J. The relationship betweenspeed and amplitude of the fastest voluntary contractions ofhuman arm muscles. Experimental Brain Research; 1978, 31(1),1-12.
KEYWORDS: Voluntary contractions, speed control, synergistic inner-vation, open-loop movements.
METHODS: The purpose is to study the fastest voluntary contractionswith the hand and fore-arm muscles. Six males, aged 24-40years, were used as subjects. Each subject sat in a chairand was presented with a display to which they were to makeisometric contractions or isotonic movements as quickly aspossible. Any angle could be used during the achievement ofthe contraction. Additionally, each subject was on anotheroccasion given a target force or angle to achieve. Thisrequired their moving on oscillascope trace onto another.The tension and angle were varied in eight steps and sixsteps, respectively. A d.c. strain gauge was used to measuretension. The gauge could be used in three positions on theforefinger. Readings from the strain gauge were amplifiedonto an oscillascope. For the isotonic measures the hand orforefinger were placed in a rigid sleeve and was measured byan angular position transducer, based on the axis of rota-tion.
RESULTS: The voluntary isometric contractions during the non-targetconditions were the fastest at 2.3 kg. In the target con-dition the rate of rise of tension (RRT) curves were fairlyconstant. There was no significant difference between targetand nontarget contraction times. The target conditionrevealed a linear relation between the RRT and increasingstrength of a contraction. The same was not found for thenon target condition. Comparison between three muscles andthe RRT force revealed no time difference between them. Threedifferent stages of positional movements were identified.The speed for stages one and three was 40 msec. and stage 2takes 20 msec. with the RRT being twice as fast. RRT andtime of contraction appear to be independent of the exertedforce. No significance was found between extension andflexion time. EMG recordings and the duration of contractionwere found to take the same amount of time. Antagonistic andagonist muscles were found to be activated simultaneously.
SUMMARY: The study revealed a consistency in the rise time regardlessof strength, therefore, it appears speed is controlled by theamplitude dependent regulation of contraction velocity. Thisconsistent rise time also helps to explain the ballisticmovement in an open loop system. The action occurs and can-not be corrected or changed as the rise time does not change.Thus, one is the reflection of the other.
CITATIONS: Twenty references.
233

STUDY: Grasley, C., Ayoub, M.M. and Bethea, N.J. Male-female dif-ferences in variables affecting performance. Proceedings ofthe Human Factors Society, 22nd annual meeting, 1978,416-420.
KEYWORDS: Male and female differences, anthropometry, biomechanics,physiology.
METHODS: The purpose was to review male and female differences asreflected in the literature. The areas under specific con-sideration were anthropometry, bmomechanics and physiologicaldifferences and how the differences affect occupational per-formance.
RESULTS: When anthropometry was lookd at the literature reflects faultin design of equipment rather physical capacities.Biomechanical differences between males and females was notfound to be as clear cut as the anthropometric measures.Biomechanicaly the females appeared to function at a lowerrate of performance than the males. Physiologically themales and females varied greatly. The responses were similarwhile the physical differences were seen in oxygen uptake,physical conditioning and heat stress.
SUMMARY: The authors stress the need for future research as they statethe literature does not give enough ground to base rules onsex alone.
CITATIONS: Thirty-seven references.
234

STUDY: Haffajee, D, Moritz, U. and Svantesson, G. Isometric kneeextension strength as a function of joint angle, musclelength and motor unit activity. Acta Orthop. Scand.; 1972,43(2), 138-147.
KEYWORDS: Maximum isometric contraction, EMG, knee extensor, angle offlexion.
METHODS: Simultaneous recording of isometric knee extensor torque,integerated electromyogram from quadriceps muscles, and jointangle was performed in 19 healthy subjects (15 females and 4males). Fifteen subjects were studied at maximum voluntarycontraction; 6 performed contractions with constant EMGoutput.
RESULTS: The individual torque values of 6 subjects tend to coincide!n at 50 degrees of flexion, where all subjects show a definite
maximum. At 10 degrees of flexion, the average torque isreduced to about 50% of maximum value. At constantmyoelectrical activity the torque has its maximum at about 40degrees of flexion. In the nearly extended position and at9o degrees of flexion the torque is reduced by about 50 per-
* cent.
SUMMARY: At maximum voluntary contraction of the quadriceps, theaverage amplitude of the integrated electromyogram increasedas the knee was held in a more flexed position, but the quan-titative relationship between different subjects varied con-siderably. In contrast to the shape of the torque curve, thecurves of the integrated EMG show an increase through thewhole range of motion tested.
3 CITATIONS: Nine references.
UII
II
235
.1 .... .. ..... ....

STUDY: Hatze, H. The complete optimization of a human motion.Mathematical Biosciences; 1976, 28, 99-135.
KEYWORDS: Human movement, modeling.
METHODS: A subject is placed in a restrictive upright position. Hispelvis is fixed by a leather belt to a steel frame and hisright foot is weighted. The subject is to hit a target withthe weighted foot from a relaxed start position. The move-ment is timed. A mathematical model is developed to predictthe optimal performance. The model would then be compared tothe living organism.
RESULTS: The trajectories of the model and the human were found to bevery close to one another. The controls of the model andhuman reflect differences where the human exhibits sen-sitivities of the controls.
SUMMARY: The author has shown that accurate models can be developed todescribe human movement and motion.
CITATIONS: 45 references.
236

STUDY: Heyward, V. Relationship between static muscle strength andendurance: An interpretive review. American CorrectionalTherapy Journal; 1975, 29(3), 67-72.
KEYWORDS: Static strength and absolute endurance, and muscles.
METHODS: A summary of each type of muscle endurance is discussed.Tables are presented for inter-study comparisons.
Static strength and absolute endurance: The results betweenstatic strength and endurance for men has been a negativerelationship which may be accounted for by differences inmuscle fiber contraction and intramuscular occlusion. Thereis no data equitable regarding women.
Static strength and static, intermittant endurance:Depending on the conditions, stronger subjects may fatiguefaster than low strength subjects. Again, intramuscular ten-sion may occlude intramuscular circulation depending on thesubject strength capabilities leaving an imbalance of energydepletion and replenishment.
Static strength and relative endurance: Measurements at dif-ferent tension levels show low strength subjects to endurelonger than high strength subjects, up to 80% tension werethe groups appear to perform the same. Occlusion of muscularmass is seen here as a possible cause for the difference bet-ween the groups.
SUMMARY: The literature review revealed: 1) the mean force maintainedfor a period of time is significant between static strengthand absolute endurance. 2) Negative correlations between thestatic strength and endurance have been recorded. 3) Formaximal strength measurements at intermittent endurancetasks, stronger subjects exert a smaller force.
CITATIONS: Twenty-seven references.
237

STUDY: Heyward, V. and McCreary, L. Analysis of static strength andrelative endurance of women athletes. Research Quarterly,1977, 48(4), 703-719.
KEYW4ORDS: Static maximal strength, endurance time, female subjects.
METHODS: Women athletes (50 subjects), age 18 to 30 years, served assubjects for this study to investigate the relationship bet-ween static maximal strength and relative endurance of theqrip squeezing muscles. Three maximal grip strength trialswith a one minute rest between trials, and one relativeendurance test were performed by the subject, while seated,for the preferred hand. For the relative endurance test,each subject sustained a submaximal force representing 30% ofher maximal grip strength (x of the three strength trials)for a long as possible.
RESULTS: The means and standard deviations for a maximal grip strength(kg) were 39.29 and 5.51 respectively while for endurancetime (sec.) were 247.2 and 62.3. The results indicated norelationship between maximal strength and endurance time (r =.00). A comparison of the endurance times of women athleteswith previously reported scores for college-age malesrevealed that the nean endurance time for women athletes(247.2 sec.) was significantly greater than that for men(200.3 sec).
SUMMARY: The relationship between maximal strength and endurance timefor women athletes was r = .00. The results were discussedin light of evidence that suggests possible sex differencesin muscle hypertrophy, capillarization of muscle tissue, cri-tical occluding tension level, and intramuscular occlusion.
CITATIONS: Forty-one references.
238

FiSTUDY: Heyward, V. and McCreary, L. Comparisons of the relative
endurance and critical occluding tension levels of men and
women. Research Quarterly; 1978, 49(3), 301-307.
KEYWORDS: Sex differences, endurance, maximal voluntary contractions.
METHODS: The purpose of the study was two fold, first, male and female
related endura.'re was compared and the critical occludingtension level (COTL) of males and females during endurancewas compared. Eighteen males and 18 females were used. Each1subject performed six endurance tests for a 2 x 3 design.Three tension levels (45, 60 and 75% of maximal voluntarycontraction) and two arm circulation conditions (artificallyoccluded or intact) were the six different conditions. Asphygomanometer cuff was used to produce the artificialocclusions.
i RESULTS: The analysis revealed occulsions of the forearm did affectendurance of males and females on grip strength. When brokendown between the men and women the women were more affectedby the occlusion than the males. For women the COTL was 60%of the maximum voluntary contractions. Men did not show dif-ferences in the endurance times for either occluded or
I nonoccluded conditions.
SUMMARY: The authors explain the womens higher (60% MVC) COTL to bedue to the less muscle mass found in womens arms. Therefore,it would take greater contractions of the muscle to producethe equivalent occlusion in men (45% MVC). COTL is higher inwomen than men. Previous research by Heyward (1975) reflectedCOTL differences between lowered high strength men, thereforethe differences in this study were not attributed to sex.
3 CITATIONS: Twenty-one references.
I
-I

STUDY: Hight, T.K., Piziali, R.L., and Nagel, D.A. A dynamic nonli-near finite-element model of a human leg. Journal ofBiomechanical Engineering - Trans. of ASME; 1979, 101(3),176-184.
KEYWORDS: Finite-element model.
METHODS: A computer model of the human leg was designed to respond toexperimentally measured forces registered at a specificallyinstrumented ski binding during actual downhill skiingmaneuvers, and to predict both leg motion and internal loadsand stress levels. In addition, the physical characteristicsof sample legs have been measured, including the geometriesof the relevant bones and the nonlinear force-displacementrelationships of the knee.
RESULTS: Numerical examples are presented which demonstrate the nonli-near capabilities of the model. In addition, a brief exampleillustrates the ability of the model to respond to a complexloading history measured during a downhill skiing maneuverand to predict cross-sectional stress levels.
SUMMARY: A dynamic, nonlinear finite-element model of human leg hasbeen presented which is capable of representing the three-dimensional motion of a passive leg, including knee nonli-nearities, subjected to static or dynamic loading. The modelis specifically formulated to permit the calculation ofrigid-body motions and elastic deformities, and to facilitatethe economic evaluation of bone cross section states ofstress.
CITATIONS: Twenty-nine references.
II
3 240

STUDY: Hulten, B.; Thorstensson, A.; Sjodin, B.; and Karlsson, J.Relationship between isometric endurance and fibre types inhuman leg muscles. Acta Physiol. Scand., 1975, 93(1),5 135-138.
KEYWORDS: Isometric contraction, endurance muscle fibre composition.
I METHODS: To investigate how fibre composition is related to isometricendurance, 19 subjects were examined at 50% of MVC, andmuscle biopsies were obtained for fibre-typing. The experi-ments were performed in an isometric chair by pressing thefeet against an immovable bar whereby activating mainly thethigh muscles.
i RESULTS: Individual MVC ranges 195-400 kp (mean 245 kp) and fibre com-position 38-69% slow twitch fibre (ST) (mean 54% ST). Norelationship was found between MVC and fibre type com-position. Endurance time at 50% MVC ranged 56-94 seconds andwas related to the individual fibre type composition,demonstrating an increased performance with a higher percen-tage ST fibres.
SUMMARY: Relationship between isometric endurance performance at 50%MVC and skeletal muscle fibre composition has been elucidatedin 19 subjects. This was found to be linear and the equationcorresponded to: Y - 9.35 + 1.093x; r = 0.70 (endurance timeexpressed in seconds and fibre composition as percent slowtwitch fibres (ST) for the vastus lateralis muscle). It issuggested that lactate formed in fast twitch muscle fibres(FT) is released and stored in nonrecruited ST fibres. Theability to sustain isometric tension would then depend on howlarge the fraction of ST fibres is that can serve as a lac-tate recipient for lactate producing FT fibres.
I CITATIONS: Eleven references.
2I

STUDY: Huston, R.L, Passerello, C.E., Hessel, R.E., and Harlow, M.W.On human body dynamics. Annals of Biomedical Engineering;1976, 4(l), 25-43.
KEYWORDS: Human body dynamics.
METHODS: In this paper, the foregoing theories and in particular theworks on chain systems, were used to develop a generalapproach and procedure for studying the dynamics of a human-body model.
RESULTS: Techniques and algorithms were presented which efficientlylead to a full set of governing dynamical equations for a34-degrees-of-freedom model. These equations were developedso that limb motions may be either specified or left free.The unknown moments or displacement were then determined. Asimple illustrative example was also given.
SUMMARY: A full set of governing dynamical equations for Hanavan'shuman body model were developed. The model consists ofellipsoids, elliptical cylinders, and frustrums of ellipticalcones. It contained 34 degrees of freedom. The model wasconsidered to be in an arbitrary force field and the limbmotions may be either specified or left free. The governingequations then determine the internal limb moments (muscleforce), the limb displacements, and the displacement of themodel itself in an int rnal reference frame. An examplemotion representing the model response to an impulsive forceloading was also presented.
CITATIONS: Thirty-two references.
242

STUDY: Ikai, M. and Steinhaus, A.H. Some factors modifying theexpression of human strength. Journal of Applied Physiology;1961, 16, 157-163.
KEYWORDS: Muscle capacity, forearm flexors.
METHODS: The purpose was to explore what causes and how to change thepsychologic limit of human capacity. The forearm flexors weremeasured with a cable tensiometer and was recorded on the ten-siometer dial, then converted to pounds by reference to a cal-ibration curve. The subject performed the movement every timethe second hand on a clock passed the one. One group of tensubjects exerted effort every minute for thirty minutes, theperformance of the group was averaged to get one curve whichdecreased over the thirty minutes irregularly. The ten sub-jects plus 15 more each exerted maximum effort every minutefor 35 trials. Occasionally a .22-caliber starter's gun wasfired behind the unaware subject at intervals of 2, 4, 6, 8,or 10 seconds before the subject was to exert effort. On thelast session, the subject was to shout as loud as possiblewhile exerting the final pull. The original ten subjects werealso subjected to hypnosis. Once sufficiently hypnotized thesubject was told he could pull with maximum strength for fivetrials, then become very weak for five trials, then very strongagain for five trials and finally return to sleep. When thesubject was awakened he was instructed to pull maximally againfive times. He was put to sleep again, told he would feelwonderful, awakened and asked to pull five more times. Again,the same ten subjects were tested before and after consump-tion of 15-30 ml of 95% ethyl alcohol in water. The subjectthen exerted pulls once every minute for 25 minutes. Inanother session, the subjects were administered three 10 mg.tablets of amphetamine sulfate orally. After a 25 minutewaiting period the subjects performed pulls once a minute for30 minutes.
RESULTS: When shots were fired behind the subject, there was a signifi-cant (p = .001) increase of 7.4% in the next pull performance.The average of the shout pulls compared to the average pulls
showed a significant (p = .001) 12.2% increase in performance.Under hypnosis when strength suggestions were given, perfor-mance increased (p = .01) an average of 18.3 lb and 15.5 lb.during post hypnotic suggestion. The change in performancewhile under alcohol and adrenaline was not significant.Amphetamines significantly affected subjects performance 13.5%.
SUMMARY: The results are suppported by other similar research reflectinghuman strength is affected by psychological inhibitions as canbe seen with the hypnotized subjects. The authors feel thesefindings in agreement with other research, lead them toquestion the estimates and testing of fitness programs.
CITATIONS: Ten references.
243

STUDY: Ingemann-Hansen, T. and Halkjaer-Kristensen, J. Force-velocity relationships in the human quadriceps muscles.Scand. J. Rehab. Medicine; 1979, 11(2), 85-89.
U KEYWORDS: Isokinetic contractions, knee extensor, muscle fibrecomposition.
METHODS: Fifteen male soccer players participated in this study torelate force-velocity properties and muscle fibre compositionin knee extensors. Muscle tissue was obtained from thelateral portion of the quadriceps femoris muscle by needlebiopsies. At least 200 muscle fibres in each section wereclassified as Type I and Type II. The cross-sectional fibrearea was determined by planimetry of 20 fibre of each type.Maximal voluntary knee extensions (torques) at constant anqu-lar velocity was measured by means of isokinetic dynamometer.
RESULTS: In the range of motion the angular velocity was constant from900 to 200 of knee flexion. The angular velocity could bevaried from 30 to 360*/s. The average knee anqles (SE) atwhich peak torque occured were 66.6' (1.3) and 43.41 (1.8) at69 and 3100/s respectively. The peak torque was found todecrease linearly with increasing angular velocity in a semi-
logarithmic scale. The present soccer players mobilized 773MVC at a knee angular velocity of 1800/s.SUMMARY: An estimate of the peak torque-velocity relationship in an5 experimental subject was obtained from the slope of the
regression line. No correlation was demonstrated between theslope and the fibre composition in the lateral portion of the
i3 quadriceps muscle.
CITATIONS: Twenty references.
2
IU
I
I3 244
I

L STUDY: Jackson, A.S. and Frankiewicz, R.J. Factorial expressions of
muscular strength. Research Quarterly; 1975, 46(2),206-217.
KEYWORDS: Legs, arms, static, dynamic, explosive, force, power, work.
METHODS: The purpose was to clarify the factors in human strength bylooking at individual differences. Fifty males were admi-nistered 16 different tests. The tests were combinations oftype of contraction (static, explosive, and dynamic),biomechanical quality (force, power and work), and bodysegment (arms and legs) resulting in a 3 x 3 x 2 design. Auniversal gym was used to obtain work measures and photoelectric cells were used in some of the tests to obtain thesubject's elapsed time.
RESULTS: The four confirmed models were 1) Static-Force-Arms, 2) Static-Force-Legs, 3) Explosive-Power-Arms, and 4) Dynamic-Work-Arms.When height and weight were controlled, their Explosive-Work-Legs and Explosive-Power-Legs were supported tentatively.
SUMMARY: While arm work and force are indicated to be independentconstructs which conflicts with other research. An addi-tional 40 subjects were run on the arm tests and results werenot significant. The authors feel movement should be con-sidered an important variable in these tests. Leg and armstatic forces were seen as independent of one another.
CITATIONS: Thirty-six references.
I2IIIi
I25
I

r1
STUDY: Jensen, R.K. Dynamometer for static and dynamic measurementsof rotational movements. The Research Quarterly; 1976,
47(1), 56-61.
KEYWORDS: Static and dynamic, rotation movements, shoulder andforearms.
METHODS: The purpose was a presentation of a dynamometer which
measures static and dynamic loads and evaluation of theequipment. The dynamometer made from was a rotary torqueactuater where the axbe rotation was controlled throughpressurized fluid through valves. When the valves wereblocked completely, the measure taken was static, when open(depending on how much) the measure was dynamic. Straingauges measured the bending strain and angular displacementmeasured by linear variable differential transformer. Thesignals were amplified recorded on tape, the tape played toan analogue to distal computer for analysis. Arm extensionat the shoulder and forearms extension at the elbow wastested for both static and dynamic strength. Forty-two malesages 8-11 years, were allowed two practice sessions three tosix weeks before the test. The test was four maximum trialsin each angle.
3 RESULTS: Tests of validity and reliability held. Instrumentalaccuracy was measured and found to be correct. Weights andscales used were tested and found accurate. Calibrationrelationships were linear.
SUMMARY: The dynamometer constructed shows potential for further usewith static and dynamic measurements. The accuracy and pre-cision of the instrument were high and test vaildity andreliability are adequate.
CITATIONS: Five references.
IIII
I 246
:1

ISTUDY: Johnson, J. and Siegel, D. Reliability of an isokineticmovement of the knee extensors. The Research Quarterly;1978, 49(1), 88-90.
I KEYWORDS: Isokinetic movemant and knee extensors.
-METHOD: To develop a table which could be consulted for procedures touse to obtain reliable measures, the authors used isokineticmovement of the knee extensors. Forty females, ages 17-50,were used to take readings of the knee at 90% A Cybex IIwas used set at 180*/sec. Force was recorded by the Cybex IIrecords in foot pounds. The peak of each trial was taken asthe score. Six trials on each of three consecutive days wasrecorded.
RESULTS: An ANOVA was used with nested trials in days and days nestedin subjects. A significant (p<.01) trend was found relatingto the first three test trials of each day. With thesetrials removed resulted in the major amount of variance wasbetween subjects. A table is given showing the expectedI reliability coefficients for each trial on each test day.
SUMMARY: While the sources of variance are small, the authors warn theproblem with this study lies in the small sample size. Theauthors recommend to obtain reliability, the protocol shouldconsist of three submaximal trials, then three maximal warm-up trials before getting your measurements.
CITATIONS: Four references.
IIi
I
I
i 247
-ii

ISTUDY: Jonsson, B. and Hagberg, M. The effect of different working
heights on the deltoid muscle. Scand. J. Rehab. Med.; 1974,9(Suppl. 3), 26-32.
KEYWORDS: EMG, deltoid muscle.
METHODS: The effect of different working heights on the myoelectricoutput from the clavicular portion of the deltoid muscle wasinvestigated in 10 healthy adult males. Surface electrodeswere used. The rectified and smoothed myoelectric siqnal was[I tested both with respect to the amplitude distribution andthe mean value during the test.
RESULTS: The results of the investigation clearly show that the leastmyoelectric activity from the clavicular portion of thedeltoid muscle occurred, on an average, when the object to hehandled was placed on a working level of 110 cm. Compared tothe anthropometric data, this level was approximatelycorresponded to that working level where the elbow was keptat an angle of approximately 900 - 1000 of flexion.
SUMMARY: The amplitude distribution of the rectified and smoothed EMGand its mean voltage indicate that the working level of 110cm was that which gave the least load on the muscle. The
n amplitude distribution of the rectified and smoothedmyoelectric signal can be used to indicate whether the muscleis working statically or dynamically.
CITATIONS: Twenty-four references.
I
I 248

STUDY: Kamen, G. Serial isometric contractions under imposed myota-tic stretch conditions in high-strength and low-strength men.European J. of Appl. Physiol. and Occup. Physiology; 1979,41(2), 73-82.
KEYWORDS: Fatigue, reflex, eccentric contraction, negative work,elastic energy.
METHODS: Male subjects (N=24) were divided into two groups of 12 sub-jects each as high-strength and low-strength men, based onmaximal voluntary contractile strength (MVC) of the rightknee extensors. The experiment was designed to compare sub-ject response to two different regimens which were intendedto produce local muscular fatigue. One exercise regimeninvolved only isometric contraction, while the other exercisecondition involved the administration of an imposed nyotaticstretch upon a muscle group which was already contractingmaximally.
RESULTS: Under nonfatigued pre-exercise conditions, significant ten-sion increases at 6.5% for the high-strength and 11.0% forlow-strength subjects were observed as a result of theimposed stretch. The fatiguing exercise resulted in signifi-cant decrements in strength on the order of 28.0% and 18.5%for the high-strength and low-strength groups, respectively.When a Is imposed myotatic stretch during each trial wasincluded, a greater strength decrement for the low-strengthgroup (26.4%) than for the high-strength group (15.0%) wasobserved.
SUMMARY: High-strength individuals, who may be at a disadvantage inisometric endurance when compared to a low-strength group,are seen to be superior in endurance when an exerciseinvolving serial isometric contractions with an imposedstretch is administered. A neural factor involving thestretch reflex is tentatively suggested as a plausible expla-nation accounting for the observation of that high-strengthsubjects fatigue faster than low-strength subjects under con-ditions of isometric exercise, while low-strength subjectsfatigue faster than high-strength individuals in isometricexercise which is performed with an imposed stretch.
CITATIONS: Twenty-four references.
249

STUDY: Kamon, E. and Goldfuss, A.J. In-plant evaluation of themuscle strength of workers. Am. Ind. Hyg. Assoc. Journal;1978, 38(10), 801-807.
KEYWORDS: Isometric back extension, elbow flexion, grip strength, maleand female workers.
METHODS: The isometric (static) muscular strength of the back exten-sors, arm flexors and handgrip were measured, by using a spe-cial device, on industrial workers (463 male and 139 female)involved in physically demanding jobs. In the staticstrength measurement each group of muscles was measured forfour seconds. Two trials were given with at least two minu-tes rest in between, for each muscle group tested. Thehighest value (in kg.) was recorded as the measured isometric(static) strength. Photographic pictures are given to indi-cate the subject posture while performing each test.
RESULTS: The average strength values for men were 23 kg., 11.9 kg.,and 18.4 kg. higher, respectively for back extension, elbowflexion and hand grip, as compared to the women. Women'sstrength, in general, was about 60% of men's strength. Theyounger men (31 years and below) were significantly strongerthan the older men (above 31 years) for all three strengthvariables measured. The younger women were significantlystronger than the older only for back extension.
SUMMARY: Men and women employed in physically demanding jobs inindustry were measured for strength in back extension, elbowflexion and grip. The results showed that women were about60 percent as strong as men; men below age 31 were strongerthan those older, and finally the strength was similar amongworkers employed on different strength demanding jobs.
CITATIONS: Twelve references.
250

STUDY: Katch, F.I., McArdle, W.D., Pechar, G.S. and Perrine, J.J.Measuring leg force-output capacity with an isokineticdynamometer-bicycle ergometer. Research Quarterly: 1974,45(1), 86-91.
KEYWORDS: Dyanamometer, isokinetic, leg muscles, ergometer.
METHODS: A new apparatus is described which all extend the usefullnessof the isokinetic dynamometer to measure force and work ratecapacities of the leg. A Monark bicycle ergometer wasmounted to a dynamometer. This formed the IsokineticDynamometer-Ergometer System. The subject sat at an angle onthe ergometer to prevent mechanical advantage during theforce output tests. A preset speed of 60 rpm was used duringa trial of three or four pedal revolutions for eight to tensecond periods. Three trials were given with one minute restperiods. The values obtained from the Cybex records werecorrected with a value of .592. Forty-three men were tested.
RESULTS: Analysis of the force-output was checked for reliability bet-ween days, r = .94 and for the trials r = .96 and .91. Theforce output increased between trials, day 1, trials 2 and 3were significant at p<.05 and day 2, trials 2 and 3, p<.01.Day 2 trials were higher than day 1 (p<.01) and average scoresof day 2 were higher than day 1 (p<.01).
SUMMARY: Practice trials should be allowed to reduce the differencebetween the days. The equipment appears to satisfactorilymeasure the force-output of the work rates of themusculature.
CITATIONS: Nine references.
I
1 251

Il STUDY: Kitagawa, K. and Miyashita, M. Muscle strengths in relation
to fat storage rate in young men. European Journal ofApnlied Physiology; 1978, 38(3), 189-196.
KEYWORDS: Body compositions, obese men, percent fat, threshold of obe-sity.
METHODS: The purpose was to compare obese and non-obese men in rela-tion to muscle strength and fat storage rate. 59 Japanesemen aged 18 to 22 were used as subjects. The underwaterweighing method was used to determine body density. Electric(speedy type) and spring dynamometers were used to measurehand-grip, elbow flexion, trunk extension and knee extensionIstrength. Testing was bilateral excepting trunk extension.
RESULTS: Body weight and lean body mass (LBM) correlated significantly.An increase with percentage of fat was seen with body weight,I LBM, and fat. These were not significant differences inmuscle strength between the 6 groups. Elbow flexion was the
* only measurement to reflect a difference between the groups.
SUMMARY: The obese men appear to have lower muscle strength for theirLRM than the non-obese men. Additionally the obese male hasless muscle strength than the non-obese male.
CITATIONS: 16 references.
IIIII
SI 252

STUDY: Knapik, J., Kowal, D., Riley, P., Wright, J. and Sacco, M.Development and description of a device for static strength
measurement in the armed forces examination and entrance sta-tion. U.S. Army Research Institute of EnvironmentalMedicine, Natick, MA. Technical Report; January 9, 1979.
KEYWORDS: Static strength, upper body, trunk, legs.
METHOD: The purpose was to develop a test for static strength to beused for the AFEES. The parts of the body tested involvedthe upper body, legs and trunk. A testing seat was developedand used with a tensiometer. Anthropometric measures weretaken 948 male and 496 female recruits were tested in thisdevice.
RESULTS: Test-retest trials given one day apart resulted in signifi-cant findings for the upper body and legs. The trunk showeda large variance with increasing strength from day 1 to day2. Testing time on all groups was approximately 10 minutes.
SUMMARY: An aparatus to test static strength of the upper body, trunkand legs was developed. Reliability was found for the upperbody and legs while work is still on-going for the trunk.
CITATIONS: 38 references.
253

STUDY: Kroemer, K.H.E. Human Strength: Terminology, measurement,and interpretation of data. Human Factors; 1970, 12(3),297-313.
KEYWORDS: Muscle strength, isometric, isotonic, concentric, eccentric.
METHODS: The purpose was to clarify terminology, measurements andinterpretation of data such that static and dynamic workcould be properly related.
RESULTS: Terminology: Strength, isometric and isotonic, effort, work,dynamic, static, concentric, eccentric, phasic pulse, weredefined and principles underlying some of them were given.Formulas for predicting dynamic performance from staticstrength were given but not without warning of the phy-siological problems involved. The author doubts the realpredictability of dynamic from static measure.
Measurement: Equipment is usually meant to be used in onlyone way, the authir feels the method should be fully described.Time of measurement should he 10 seconds or less. For oscil-lating pointers the peak reading is usually taken as the offi-cial reading. It should always he indicated whether peak ormean readings were used as maximal readings. The authorsdeveloped a check list which should be used in experiments tohelp insure the use of consistant and proper procedures.
Interpretation of the Data: Maximum and optimum exertion aredefined as two separate and different meanings. The authordiscredits the use of the central nervous system as a measureof fatigue. While the use of CO2 as a measure of energy con-sumption is considered very good its validity weakens theless dynamic the movement becomes. The use of circulatorysystem (heart rate) is recommended only in conjunction withenergy consumption. Subject rating of strain related to workis said to he reliable enough for use: Measurements of workoutput may be used but it has been found to be indirect inthe results yielded. For predictors of dynamic strengthefforts the following may be considered. Research indicatesthat rankings of weight lifted were similar whether they werethe subjects opinion or heart rate change.
SUMMARY: The amount of force exerted by a person is controlled byinternal forces as well as by subject motivation and theexperimenter. Therefore, standardization of techniques isvery important if different research is in any way to be com-Dared. This standardization includes the instructions givento the subject, equipment used to measure and the recordingme ,ods and equipment used. There has got to be a great needto have the relationship between static and dynamic strengthestablished.
CITATIONS: Seventy-six references.
254

STUDY: Kroemer, K.H.E. Muscle strength as a criterion in controldesign for di vrse populations. A. Chapanis (Ed.) in EthnicVariables in Human Factors Engineering. Baltimore: TheJohns Hopkins Press, 1975, 67-89.
KEYWORDS: Muscle strength, control design, lifting, population
steriotypes.
METHODS: A review of literature dealing with the use of musclestrength in control design. Strength is defined and factorsaffecting it are listed. It is emphasized the necessity ofmatching the control and operator requirements together atthe onset. Recommended weights to be lifted are hard todetermine from the literature because of different popula-tions, designs and sources in the research. Populationsteriotypes presently the author feels must be adhered toresulting in some problems with international design. Forpositioning controls the author suggests designing on the useof linear distances from reference points and ranges found
i within the population.
RESULTS: A procedure for designing equipment based on operatorstrength is given.
SUMMARY: Strength capabilities of an operator and force required tooperate controls must be considered when designing equipment.The variables involved may include nationality or race, han-diness, population steriotypes, control locations andbiomechanical principles.
* CITATIONS: 49 references.
II
-II
I
I 25

STUDY: Kroemer, K.H.E. and Howard, T.M. Toward standardization ofmuscle strength testing. Medicine and Science in Sports;1970, 2(4), 224-230.
KEYWORDS: Isometric, isotonic, posture.
METHODS: The purpose was to see if strength tests are significantlyaffected by their method of muscle contraction and second,
whether strength measurement is affected by the index whichrepresents the subjects selection. A force measuring deviceusing strain gauges from a wooden adjustable footrest. 24males of college age were used. Two postures were used.One, where the subject was standing upright and bracedagainst a wall pushing with his hand and two, the subjectplaced both hands on the force plate and pushed while leaningforward. The force was applied in 3 manners, a) reach themaximum and hold, b) gradually increase, then release and c)jerk or apply force suddenly repeating once. Body postureand force were applied in random order. All tests were given
* in one test session.
RESULTS: Most subject's peak force during the hold force was during thesecond effort. Peak force for the increasing force wasduring a 4 1/2 to 7 seconds spread. The jerk force in thesecond thrust revealed a higher peak than the first. Theupright posture resulted in about equal peaks for all threeforces. The leaning posture revealed the highest forceexerted during the jerk force.
SUMMARY: The authors feel the differences in the measures indicate thedifficulty which occurs when attempting to compare research.The authors agree there needs to be a standardization ofexperimental procedures. The authors suggest for performanceevoluation these indexes should be used:
(a) Use the average of the middle second if forceis exerted for 3 or more seconds. Use the peak ifthe score exceeds 110% of the average at any time.(b) Use the peak (i.e. the largest instantaneous
amplitude) occurring anytime during the exertionperiod, if force is exerted for less than 3seconds.
CITATIONS: 27 references.
256

I ,
i STUDY: Kroll, W. "Isometric fatigue curves under varied intertrial
recuperation periods." Research Quarterly; 1968, 39(1),106-115.
U KEYWORDS: Wrist flexors, endurance, fatigue curve.
i METHODS: Endurance: The same definitions of absolute endurance andpercent maximum strength held as defined by Tuttle, et al.(1955).
3• Fatigue Curve: Any fatigue curve represents the simple sum-mation of energy depletion and energy recovery.
I Steady State Condition: The appearance of a steady stateimplies a blance between the metabolic requirements forcontraction and recovery under the conditions imposed.
1, Three experimental groups of 45 subjects each were given 30repeated isometric wrist flexion trials. Each trial con.-sisted of 5 sec of exertion followed by a rest period whichdiffered for each group. The intertrial rest period was 5sec in one group, 10 sec in the second group, and 20 sec inthe third group.
In each experimental group subjects were ranked on the basisof the first two trials and divided into three subgroups of 15each, representing high, middle, and low levels of wristflexion strength.
RESULTS: Low level of strength groups always demonstrated a fatiguepattern significantly different from high and middle levels.High and middle levels displayed similar patterns differingonly on absolute level of strength.
The analysis of the results of the five sec rest periodsgroup suggests that both high and middle groups were able tolevel off from the dominent linear decline trend and displaya less prominent but statistically significant quadratic pat-tern. The low level group, however, was not able toestablish a steady state during the trial seriesdemonstrating only a significant linear trend.
Kroll (1968) claimed that the same factors responsible formuscular fatigue cannot be operating to the same magnitude atdifferent levels of absolute isometric strength.
He speculated that the causes of trend differences betweenl~~evels ofin ~,, may res-ide in, considerations o' local
circulatory efficiency and a possible differing use of aero-bic and anaerobic energy reserves.
i 257

Kroll 1968 Cont.
RESULTS CONT: Finally, he emphasized that investigations considering muscu-lar fatigue at levels of rtrength rather than a compositefatigue curve may be helpful in unraveling the ball ofconflicting evidence of muscular endurance.
SUMMARY: Although females were not as strong as males they did showthe same fatigue patterns as the men. Right and left hands(except one set) also reflected the same fatigue patterns.The author states that while the patterns were similar theuse of one composit pattern in reporting data is not repre-sentative of the data.
CITATIONS: 11 references.
258

STUDY: Kroll, W. Recovery patterns after local muscular fatigue fordifferent levels of isometric strength in college age females.American Corrective Therapy Journal; 1971, 25(5), 132-138.
KEYWORDS: Wrist flexion, isometric, sex differences, fatigue.
METHODS: Isometric wrist flexion strength was measured by the use ofstrain gauges. 645 degree dorsi flexion was kept by all sub-jects during testing. Each subject was tested 6 days. Five5 second exertion trials with a rest of one minute were admi-nistered each session to determine strength on days 1 and 2.The testing schedule ran two tests 48 hours apart. Then aweek between the next two tests. Thirty-three women, averageage 19.7 years, were separated into 3 groups of low, mediumand high strength.
RESULTS: While other research has indicated that psychiological fac-tors affect fatigue series tests this was not found to be soin this study. The recovery patterns extended up to thequadratic degree components with statistical significance.The low strength group exhibited low trend recovery.
_ _ Percentage of fatigue was highest for the high strengthgroup and lowest for the low strength group.
SUMMARY: Since the recovery pattern appears to be affected by manyfactors the author feels an equation to describe this wouldnot be successfully arrived at. The variables to be con-sidered include level of strength, subject's sex and musclegroup. The comparisons of male and female data showed signi-ficant differences.
CITATIONS: Eleven references.
25

STUDY: Kroll, W. and Clarkson, P.M. Age, isometric knee extensionstrength and fractionated resisted response time.Experimental Aging Research; 1978, 4(5), 389-409.
KEYWORDS: Knee extension, Age, rectus femoris muscle, registeredresponse.
METHODS: The purpose was to look at the effect of age and activitylevel affecting isometric knee extension strength andresponse time. Sixty male subjects, ages 18-38 and 55-79,were divided into young and old, inactive and active groups.Each subject was tested two separate days on right kneeI extension trials. A strain gauge was attached to a BeckmanType R Dynograph which was used for strength measurements.The motor point of each subject was found by applyingelectrodes to the subject right of the rectus femoris muscle.The older subjects motor point was found anatomically. Eachsubject was exposed to a board containing three lights. Thesubjects were to respond to the signal light by kicking apadded target located below the light. Resisted response wasproduced by placing the heel of a steel plated shoe againstan electromagnet, which was set at 10% of the subject's knee
i strength. When the subject pulled away, reacting to asignal, the response was clocked at the electrodes whichtransmitted the signal to oscillioscope to read the muscleaction potential. The removal of the heel from the magnetset another clock to measure total reaction time.
3 RESULTS: Inactive subjects had a higher body fat than active subjects.Reliability for knee extension strength was .94 knee strengthfor the old active was greater than the old inactive group.Reaction time for the slowest to fastest was old inactive,old active, young inactive, young active with each groupslowing during simple resisted reaction time while choice
* response time increased.
SUMMARY: Decrease in knee extension strength appears to be hindered byconsistent physical activity. The increase in total reactiontime is the resisted reaction time is apparantly due to anincrease in length of motor time component. The authors feelthat the use of resisted reaction time should be employed in
* future research.
CITATIONS: Twenty-four references.
U

STUDY: Lamphiear. D.E. and Montoye, H.J. Muscular strength and bodysize. Human Biology; 1976, 48(1), 147-160.
KEYWORDS: Sex differences, arm strength, grip strength, anthropometricmeasures.
METHODS: The study looks at the relation between anthropometricmeasurement and arm and grip strength in men and women. Agesranged from 10 to 60, and subjects were normal and healthy.A Stoeling grip dynamometer was used to take grip strength.The grip was adjustable to account for size. Recorded wasthe greatest of two readings for each hand. Arm strength ofthe upper flexors of the arm was taken. The elbows were at900 angles with the upper arm parallel to the floor, thehands, at shoulder width, grasped a bar and pulled. Theforce in kilograms was read from the dynamometer. The largerof two scores was recorded. The twelve size variables foundin relation to age, the summed grip strengths, and the armstrength were taken to enable the development of a regressionmodel.
RESULTS: The strength variables and five of the size variables werefound to be of primary importance for the regressionequation. Strength was found to be predictable from the sizevariables, arm and grip strength being equal. Regressionequations were developed to estimate the strength index fromthe size variables for sex and age was given in table form.
SUMMARY: The use of few size variables and strength enabled theauthors to develop a simple and generalizable model for pre-diction. It is felt that the results are not as specific asthose of Tecumseh's population. The observed strength can bedivided by standard strength index which will give a linearresult of the percentage duration from the mean.
CITATIONS: Twenty-three references.
261

STUDY: Larsson, L., Grimby, G., and Karlsson, J. Muscle strengthand speed of movement in relation to age and muscle morpho-logy. Journal of Applied Physiology; March, 1979, 46(3),451-456.
KEYWORDS: Isokinetic; isometric and dynamic strength, human skeletalmuscle, muscle fiber types.
METHODS: One hundred fourteen males, ages 11-70 years were used.anthropometric measurements were taken. Mechanical measure-ments were made using an isokinetic dynamometer. The maximum
isometric and dynamic strength and MEV were measured on theleft knee extensor muscles. The peak isometric values wasused as the definition for each individual's maximumstrength. Maximum knee extension velocity was taken byhaving the subject extend the leg as quickly as possible.Histochemical analysis was made on all subjects ages 20-65.Biopsies were taken and kept frozen until analysis. Thesewere used to assess the fiber diameter.
U RESULTS: For comparison of age changes in isometric and dynamicstrength, it was necessary to use curvilinear regressionfitted to each individual's data. Differences in anthropo-metric varaibles were found in the 10-19 year olds to besmaller than the adults (age 20-49) group and old (50-69)group. No difference was found between the 50-60 year oldsand 70 year olds. Isometric and dynamic strength increasedwith age up to 20-29. Then, leveled to the 40-49 year groupand finally decreasing with the older groups. The biopsydata revealed a shift toward low percentage fast-twitchmuscle fibers while slow-twitch muscles increased with anincrease in age. Fast twitch muscle fibers showed a signifi-cant (P<.01-.001) correlation with strength, isometric anddynamic power. Where fast-twitch fiber was eliminated fr.manalysis the strength decline was still significant, whichreflects the idea of other factors being related other thanmuscle atrophy.
SUMMARY: Changes in isometric and dynamic strength was definately seenoccurring with age. The authors feel the data cannot begeneralized due to the nonrandom selection of subjectsexcepting the 70 year old group. Most studies in strengthperformance, usually using hand grip, show the peak strengthin the 25 to 30 year olds. Although research on muscle fiberchange regarding age is scarce, it appears that the findingsof this study regarding muscle twitch fibers conforms toavailable research.
CITATIONS: Thirty-eight references.
262

STUDY: Larsson, L. and Karlsson, J. Isometric and dynamic enduranceas a function of age and skeletal muscle characteristics.Acta Physiol. Scandanavia. 1978, 104(2), 129-136.
KEYWORDS: Fiber area, fiber type distribution, himan skeletal muscle,isokinetic, lactate dehydrogenase.
METHODS: Fifty male subjects aged 22 to 65 years who were all clerksby occupation were used. The maximum isometric strength andendurance were taken on both legs simultaneously while thesubject pressed against a bar. Maximum dynamic strength andendurance were taken with the use of a dynamometer. Thismeasure was made on knee extensions. Results from a previous(Larrson, et al., 1978 a, b) are used here for correlation.The subjects are the identical with these. Previously, biop-sies were taken to get data on fast and slow twitch fibers,enzimes, and chemical present in the muscle tissued. Biopieswere also taken here.
RESULTS: There was a decrease in Type II (fast twitch) A, and B fiberswith increasing age, additionally, the area Type II coveredalso decreased. Anaerobic activity decreased with age whilethe aerobic remained the same. Declines in maximum isometricand dynamic strength correlates significantly. (P<.O01) withthe decrease in Type II fibers as seen in old age. Isometricand dynamic endurance was seen to increase with age, but thiswas not significant. Relative force decline was seen toincrease with Type II, and fiber area significantly atP<.05-.01.
SUMMARY: Previous research has indicated a decrease in endurance withage. This was not supported here, even when corrections fordecreases in maximum strength were made. The author doeslist some research which is in agreement with the resultshere. With the change in fiber area, the hypothesis por-pocting that Type I (slow twitch) acts as a recipient of lac-tarte produced by Type II fibers was upheld in this study.Finally, maximum strength did decrease with age as expected.
CITATIONS: Thirty-six references.
263

STUDY: Laubach, L.L. Body composition in relation to musclestrength and range of joint motion. Journal of SportsMedicine and Physical Fitness; 1969, 9(2), 89-97.
KEYWORDS: Anthropometric measures, hip, trunk, flexors, extensors,tensiemeter.
METHODS: The purpose was the investigation of body composition andphysical performance. Forty-five males, aged 17 to 35 yearswere used. Anthropometric measures were taken, along withskin fold, lean body mass (LBM) body density and surfacearea. For the physical performance strength and range ofjoint motion for hip and trunk flexors and extensors. Acable tensiometer was used tc measure muscle strength.
RESULTS: One hundred and twenty-six zero-order coefficients werecomputed resulting in 44 being significant beyond .05. Thehighest correlation was .698 for hip flexion and LBM -suprailiac. The 4 strength measures and the LBM2 were allsignificantly correlated. When stature was constant thensignificant correlations were reached between physical per-formance and somatotype components. Range of jint measure-ments did not correlate with any anthropmetri. measures orbody composition. Second order correlations did producesignificance in some of the measures when stature and weightwere constant with physical performance, anthropometry andbody composition.
SUMMARY: Stature, LBM body surface and mesomorphy were significant withmuscle streng*h. With stature constant then the somatypecomponents would correlate significantly with the musclestrength measurements. Physical performance and anthropo-metric or body composition with body weight out reach signi-ficance. Six significant correlations were found among therange of joint and anthropometry or body compositions withweight and stature constant. The use of multiple regressionsto predict physical performance from anthropometry and bodycomposition were found to account for 26% to 56% of the per-formance variance.
CITATIONS: Twenty-two references.
264

STUDY: Laubach, L.L. Comparative muscular strength of men andwomen: A review of the literature. Aviation, Space andEnvironmental Medicine; 1976, 47(5), 534-542.
KEYWORDS: Male and female, muscular strength.
METHODS: The purpose is to review studies dealing with comparison ofstatic and dynamic muscle capacities in men and women.
RESULTS: All but one study used college students, the other usedindustrial workers. Women's leg strengths appear to becloser to that of the men than the arm strength does. Womenhave 35 to 79% upper body strength, 57 to 86% lower bodystrength, trunk strength was 37 to 70%, and total bodystrength was 35 to 86% that of men.
SUMMARY: Women have approximately 2/3 the strength of men. The authordoes state that because of the broad ranges found, he recom-mends that the designer refer to individual data when morespecific information is needed. A step process is offered tothe designer so he may derive the fifth percentile from thedata.
CITATIONS: Twelve references.
265

STUDY: Laubach, L.L., Kroemer, K.H.E., and Thordsen, M.L.Relationships among isometric forces measured in aircraftcontrol locations. Aerospace Medicine; 1972, 43, 738-742.
KEYWORDS: Isometric force, force on hand-operated equipment.
METHODS: The purpose was to measure the peak forces exerted on hand-operated aircraft controls. A strain guage force transducerand Brush Mark 200 recorder were used. Six differentcontrols were used to take measurements on anthropometricmeasurements on 51 paid male subjects were taken. Eachsubject took a seat and was then instructed as to the move-ments he should make.
3 RESULTS: For estimating ferce exertion, body weight was thought to bethe single best prediction with r = .34 to .49. The correla-tions for grip strength and force exertions was .21-.36 whichaccounted for 4-13% of variation.
SUMMARY: The authors state weight was the best single prediction forarm force.
CITATIONS: Seventeen references.
I26Ui
I,I
I
3 266

II
STUDY: Laubach, L.L. and McConville, J.T. The relationship ofstrength to body size and typology. Medicine and Science inSports; 1969, 1(4), 189-194.
KEYWORDS: Static strength, anthropometric measurements.
METHODS: The purpose of this study was to examine the correlation bet-ween muscle strength measured by the static-contractionmethod and various body size characteristics. Elever cable-tension tests of body strength were conducted. These testsincluded the flexion of hips, trunk, elbow, shoulder, kneeand ankle; the extension of hip, trunk, knee and ankle(planter flexion); and the shoulder inward rotation. Thestrength score used was the maximum amount of force (withoutjerking) that the subject could exert against the resistanceof the pulling assembly. The strength testing was unila-teral, right side only, with the exception of trunk flexorsand extensors.
RESULTS: Body weight correlated significantly with all of the static-strength measures except hip extension and knee extension.The computed measure of lean body mass correlated signifi-cantly with all of the muscle strength measurements. Themean and the standard deviation of the thirteen staticstrength measurements are given in tabular form. The totallever arm linkage of torso length produced several signifi-cant correlations with muscle strength. The somatotype com-ponents for endomorphy and mesomorphy both produced severalsignificant correlations with the measures of musclestrength.
SUMMARY: The results of the present study indicated that the measuresof body size, typology and composition used in this analysisare not effective predictors of static strength.
3 CITATIONS: Thirty-one references
26II
IU
i 267

STUDY: Less, M., Krewer, S.E., and Eickelberg, W.W. Exercise effecton strength and range of motion of hand intrinsic muscles andjoints. Arch. Phys. Med. Rehabil.; 1977, 58(8), 370-374.
KEYWORDS: Finger joints, hand, joints, motion, motor activity, muscles.
METHODS: The purpose of the study was to study the effects of hand
exercises on hand strength and range of motion. Twelve menparticipated in a 3 session per day for four wees program.An adjustable isometric hand gym was used for the exercises.Four sets of exercises were given, one for stretching and
three were isometric. Strength was measured with adynamometer.
RESULTS: Seven of twelve strength measurements significantly improvedwith exercise. The little finger appeared to improve morethan the others. There was a significant improvement in therange of motion after exercise.
SUMMARY: This evidence shows the increase in strength L *irred quiterapidly and the weaker the hand the more the increase.
CITATIONS: Eleven references.
i 268

STUDY: Lind, A.R., Burse, R., Rochelle, R.H., Rinehart, J.S. andPetrofsky, J.S. Influence of posture on isometric fatigue.
Journal of Applied Physiology; 1978, 45(2), 270-274.
KEYWORDS: Isometric strength, isometric endurance, fatigue.
METHODS: The purpose was to examine how posture influences muscularstrength and endurance and cardiovascular changes. Four menages 25-37 years, were trained for 1 week on handgrip iso-metric contractions and then trained 3 times per week foranother 2 to 3 weeks. A Hand dynamometer was used while -hesubject was in a seated position, 3 positions on a tilt tableand in a 450 head-up, recumbant or 150 head down position.Strength was measured at maximum, endurance at 25 and 40% ofmaximum and with tension at 40%. Forearm blood flow andheart rate (ECG) was measured throughout the experiment.
RESULTS: Repeated contractions and posture did not affect hand gripstrength. There was significant occlusion of blood flow at40% and 25% of strength. There was no significant changes inblood pressure although heart rate did increase some.
SUMMARY: While posture did not affect performance there was found tobe a significant affect in blood flow of the working area.
CITATIONS: 13 references.
269

STIDY: Lindh, M. Increase of muscle strength from isometric quadri-ceps exercises at different knee angles. ScandinavianJournal of Rehab. Medicine; 1979, 11(1), 33-36.
KEYWORDS: Static and dynamic strength, quadricep muscle.
METHODS: The purpose was to see if training position had an effect onisometric strength on the quadricep muscle and dynamicstrength of this muscle. Ten females, aged 20 to 35 yearswere used. A Cybex II modified with a strain-gauge was usedfor dynamic and static measurements. Isometric tests weretaken at 150 and 600 and isokinetic measures were recorded ina range from 900 to position. Training was on the Orthotron,each subject being trained for 150 on one leg and 600 on theother. Training lasted three times per week, lasting 11 to19 times.
3 RESULTS: Isometric exercise showed increase in torque for both legs ata significance of p<.O1. The angles produced increases intorque also, and each was significant. Dynamic force at180 0/sec. was not changed but there was significant increases(p<.O1) at the 300/sec. curve.
SUMMARY: Overall, exercise in the 600 position was improved strengthat that position while exercise in the 150 position did notaffect either. Position effect does appear to have an affecton training which agrees with previous research.
CITATIONS: Sixteen references.
I27
Ii
I 270

I
STUDY: MacIntosh, D. The structure and nature of strength. Journalof Sports Medicine; 1974, 14(3), 168-177.
KEYWORDS: Strength.
METHODS: To review and analyze research in strength.
RESULTS: Speed and strength have been found to not be predictive ofone another. While some of the research conflicts with thisstatement, the author feels more up to date equipment cansettle the disagreement. Relationships between limb speedand strength appears to be relatively high where the subjecthas to move the body itself or some other substantial mass.Studies in strength training programs and effect on speedhave conflicting results. While weight training programsdeveloped claim success with improvement in certain sports
the author points out that the lack of controls in theseexperiments limits their claims.
SUMMARY: Strength tests should not be used when assessing speed per-formance of a limb. Up to 50% of variance in limb pefor-mance may be attributable to movement of total body mass orwhen mass is added to the iib moving. When strenqth impro-ves it does not correlate with improvement in performance.There are no existing group of tests which can yet measure
general strength factors and the author contends the test
batteries which do exist should be revised.
CITATIONS: 86 references.
2I
III
1 271
I

STUDY: McClements, L.E. Power relative to strength of leg and thigq>muscles. The Research Quarterly; 1966, 37(1), 71-78.I KEYWORDS: Body power, muscle strength, flexors, extensors.
* METHODS: The purpose is to compare body power as determined by jumpingheight with strength of leg and flexor and extensor musclesin the thigh. Secondly, to compare power strength effects anagonistic uAd antagonistic muscle groups. Eighty-six men weremeasured on a vertical jump test and leg strength measured bythe Clark cable-tension technique. Two measurements weretaken for each test. The group was divided into fourtraining groups each emphasizing training of a special musclegroup (i.e. extensors) and one group was a control.
RESULTS: Reliability of jumping scores was .86 and strength scores hada reliability of .90. The treatment groups were not signifi-cantly different to begin with, hut achieved significanceafter training. There was no difference between trainingqroups. A correlation between initial-strength and initialpower were significant excepting the flexor group. The gainsin power were not significantly related to the agonistic orantagonistic strength.
SUMMARY: All training programs were equally effective and strength,while related to power, the gains of each were not related.
CITATIONIS: Eleven references.
737
~1
I2
I
1 272

3 STUDY: McGlynn, G.H. The relationship between maximum strength andendurance of individuals with different levels of strength.Research Quarterly; 1969, 40(3), 529-535.
I KEYWORDS: Flexors of wrist, endurance, training.
METHODS: Endurance: Endurance in this study is defined by the defini-tion used by Tuttle (1955) for the Absolute Endurance Index.
Percentage of Maximum Strength Held: Defined by the samedefinition used by Tuttle (1955).
The total number of subjects tested was 60 males, rangingfrom 18 to 21 years of age. They were randomly divided intotwo groups, experimental (E) and control (C). On the basisof maximal strength scores, the 30 subjects in group E wasdivided further into two subgroups, high level strength andlow level strength. The high level strength group consistedof 15 subjects with the highest strength of 24-39 kg, the lowlevel group of subjects with maximal strength scores of 23 kgand below. The subjects were asked to make a maximal volun-tary effort in the flexion of the wrist for 100 sec. Group Etook a training program of 20 days.
RESULTS: The relationship between endurance and maximum strength forgroup E before training was significant (r = 0.77) as wasthat between maximum strength and endurance for group C (r0.72). Relationships between maximum strength and enduranceduring and after training period were also significant. Thevalues of r for the tests performed every 5 days were 0.8,0.74, .78, .80 and .73 in sequence of order.
The relationship between maximum strength and percentage ofmaximum strength held demonstrated the ability of the lowlevel strength group to maintain a higher percentage of theirmaximal strength than the high level group. The correlationsobtained in this study were negative, with tests performed3 before training, after 5 days of the training program, andafter completion of training significant. (r = -.42*, -.36*,-.2, -.29 and -.63*; * = significant correlation).
Factors Affecting Endurance: During a maximum isometric
contraction the intramuscular pressure rises above thearterial pressure in the muscle. The exerted force resultsin the occlusion of block to the muscle. As a result a majorpart of the energy for sustained contraction depends upon theamount of aerobic energy reserves in the muscle. Thus, thefactors determining endurance are the energy available andthe demand made upon it.
1 273

McGlynn 1969 Cont.
RESULTS CONT: It may be assumed that the build-up in biochemical fatigueproducts in an isometric contraction is related to the iountof force exerted by the muscle. Individuals exerting highlevels of maximum strength therefore would produce more fati-gue elements than those of a weaker group.
In the case of the stronger group one could expect on earlieronset of fatigue as a result of the larger amount of fatigueproducts present in the muscle.
SUMMARY: Subjects who exerted greatest strength were found to beunable to maintain as large a percentage of the strengthduring endurance as those subjects with a less maximumstrength. Training was found to produce no significant dif-ference between the two groups. The low strength group madea larger improvement in maximum strength than the highstrength group did.
CITATIONS: 13 references.
274

ISTUDY: McGlynn, G.H. and Murphy, L.E. The effects of occluded cir-
culation on strength and endurance at different levels ofstrength. American Corrective Therapy Journal; 1971, 25(2),1 42-47.
KEYWORDS: Wrist flexors, endurance, isometric strength.
3 METHODS: Definitions: the same definitions of absolute enduranceindex and percent maximum endurances held as defined byTuttle, et. al., 1955.
The subjects (60 males ranging from 18-21 years of age) weredivided into two groups, non-occluded and occluded. On thebasis of strength scores they were further divided into twosubgroups, high and low level strength. The subjects weretested for maximum isometric strength and endurance of thewrist flexors for 100 seconds. Subjects in the occludedgroup had a sphygmomanometer placed around the upper arm.The cuff was inflated to a pressure 15 mmHg. above thesubject's systolic pressure immediately before testing and3 remained above this level until the end of the test.
RESULTS: The reliability coefficient for test-retest of the non-occluded group was 0.9. A significant relationship was foundbetween maximum strength and absolute endurance index forboth groups. A negative and in most cases, significant rela-tionship was existed between maximum strength and percentageof maximum strength held. The correlation coefficient forthe occluded group was (r = -.28) which was not significant.However, the correlation coefficient for the non-occludedgroup was negative and significant (r = -.43). The absoluteendurance of the high level strength subgroups was not signi-ficantly different between the occluded and non-occludedgroups despite the artificial occlusion of blood supply inone group. This was also true for the two low level strengthsubgroups. The results indicated that individuals with greatstrength cannot maintain as large a percentage of it as indi-viduals with less maximum strength.
The Factors Affecting Endurance are: 1) maximum strength andabsolute endurance, and 2) maximum strength and percentage ofmaximum held. For the first, the muscular contraction ismaximal, the intramuscular pressure rises above the arterialpressure in the muscle. The exerted force results in theocclusion of blood to the muscle. As a result, a major partof the energy reserve for sustained contractions depends uponthe amount of anaerobic energy reserves in the muscle. When3occlusion occurred, the factors determining endurance are theenergy available and the demands made upon it. If tensioncreated by an isometric contraction is not sufficient to
2I 275
'I

McGlynn and Murphy 1971 Cont.
RESULTS CONT: occlude blood and cannot pr.vent replenishment of energyreserve, endurance should not be affected. However, in theoccluded muscle, whether the occlusion is produced artifi-cially or naturally, endurance should be related to the forceof contraction.
The maximum stren gth and percentage of maximum held may beassumed that the build-up in bio-chemical fatigue products inan isometric contraction is related to the amount of forceexerted by the muscle. Individuals exerting high levels ofmaximum strength therefore would produce more fatigue ele-ments than those of a weaker group.
SUMMARY: Four groups of subjects, divided by high and low strength,and occluded and unoccluded strength, were tested forstrength and endurance. A significant positive relationshipwas found between maximum strength and endurance. Thestrength differences between the two high strength groups andthe two low strength groups was not significantly differentdespite the artificial occlusions.
CITATIONS: Fourteen references.
I2IIe
.I
I .. .. .

STUDY: Mendler, H.M. The hydraulic isometric force testing unit
K-100. Physical Therapy; 1972, 52(4), 393-398.
KEYWORDS: Isometric force testing.
METHODS: This paper describes the hydraulic isometric force testingunit K-1O0.
RESULTS: The description of the unit included a list of the parts ofthe table in the order of their assembly, the function of theparts, and the advantage and limitations of the unit. Abrief background survey of the factors leading to the deve-lopment of the unit is also included.
SUMMARY: A well-designed, self-contained hydraulic force testing unitwith excellent stabilization features has made possible thetesting of maximum isometric force of muscle groups withgreat accuracy. The relative expense of the unit was out-weighed by a design which allowed testing of all major musclegroups of the body except fingers and toes.
CITATIONS: Eight references.
277

STUDY: Moffroid, M.T. and Kusiak, E.T. The power struggle:Definition and evaluation of power of muscular performance.Physical Therapy; 1975, 55(10), 1098-1104.
KEYWORDS: Muscle power, muscle performance, isotonic and isometric.
METHODS: The purpose was to discuss five different kinds of muscularperformance.
RESULTS: Measurement of power can be made with the use of an isokine-tic device which measures the power through an electricdevice.
Power: work done as measured by the rate performed. Acomputation which can be used is: work
where work = force x distance. Using an instrument tomeasure the power, the experimenter then has the ability torelate torque to any point in the range of motion. Work canthen be calculated using the readings from such a. measurementdevice.
Peak Power: found by: peak torquetime
and it is the highest level of torque produced during thecontraction. This measure can be used as a measure of work,thus eliminating the duraction of the range of motion. Itmust be understood that peak torque is not the same as work,but a substitute for it. Peak power cannot be made from iso-tonic contractions, only isometric because the work load isreflected only in the weakest point of the range instead ofthe maximum point in isometric movement.
Average Power: This is endurance in the averaging of manywork repetitions over a selected period of time.
Instantaneous Power: This is the power exerted between theinitiation of thmovement and the peak torque. The formulais: Peak Torque
timeInstantaneous power cannot be used when the peak torque hasbeen displaced due to velocity changes.
Contractile Power: "The ability of the muscle to developforce in a specified period of time and the ability to main-tain the tension at velocities which are within the ranges offunctional activities."
SUMMARY: Definitions have been given to five measures of power withsuggested measures.
CITATIONS: Eight references.
278

STUDY: Montoye, H.J. and Lamphiear, D.E. Grip and arm strength inmales and females, age 10 to 69. The Research Quarterly;1977, 48(1), 109-120.
KEYWORDS: Grip strength, arm strength, males and females.
METHODS: Arm and grip strength data was collected in the community ofTecumseh, Michigan. This was to give a more representativesample of the American Population. Six thousand, fivehundred eight townspeople (82% of the population) weretested. All subjects were healthy and normal. A stoeltinggrip dynamometer was used for grip strength and for measure-ment. Upper arm strength was taken by the subject by pullinga bar downward. The bar was connected to a cable which helda dynamometer. Scores were grouped depending on age and sex.A canonical analysis was used to remove the effects of bodysize and fatness from the strength scores as correlated withanthropometric measurements. Relative strength index was asum of the arm and grip strengths after adjustment.
RESULTS: Tables for percentile scores were given for force values inkg, for strength, scores divided by body weight, and relativestrength scores.
SUMMARY: The authors feel these tables represent, more accurately thanany previously published, the strength values of healthyAmericans. Little decrease in strength can be seen betweenthe ages of 20 to 50. Ten to 12 year olds were seen to havelower scores than older children. This was attributed tosize. For girls, pull-ups were not seen as an adequate fit-ness test because more than half are unable to exert moreforce than that equal to their body weight.
CITATIONS: Thirteen references.
279

STUDY: Morris, J.R.W. Accelerometry - A technique for the measure-ment of human body movements. Journal of Biomechanics; 1973,6(6), 729-736.
KEYWORDS: Lower limbs, accelerometer, movement.
METHODS: The purpose is to develop a measurement of the lower legmovement which was simple and interfered minimally with thegait so as to be used outside the laboratory. Five accelero-meters are mounted on a platform which is then mounted ontothe antero-medial surface of the tibia which is held in placeby a cast. Signals are recorded on a portable recorder.Analysis of the signals is performed by a digital computer.,The computer can give a true-speed moving picture of thelimb, a graphical and numerical representation of themeasured movement.
SUMMARY: This measuring instrument can be helpful in making forceestimates of the joints, muscles and ligaments. The recor-dings offered the experimenter graphs of angular velocity,directional cosine, translational acceleration, velocity,position, and a visual representation.
CITATIONS: Twelve references.
280

STUDY: Mortimer, R.G. Foot brake pedal force capability of drivers.
Ergonomics; 1974, 17(4), 509-513.
KEYWORDS: Foot pedal, foot force.
METHODS: The purpose was to determine the range of foot forcesexerted by U.S. drivers and is compared to three other simi-lar studies. Five hundred ninety-nine male and females, aged16-89 years, were used as subjects. All subjects were seatedon an adjustable pedal angled within the common range forbrake pedals. Each subject was seated and adjustments weremade, then each subject exerted maximum force for threeseconds, this was performed twice. The second time usingmotivation instructions. The same was performed for bothlegs.
RESULTS: There was a high force correlation (r=.93) between the rightand left feet. For the fifth and 50th percentiles at stan-dard instructions and motivation instructions were 311N,681N, 454N and 863N respectively for females. Males at thefifth and 50th percentiles on standard instructions had forcevalues of 592N and 1241N and motivation instructions at thefifth percentile were 840N. The 50th percentile was notmeasured as many of the males exceeded the 1334N limit of theforce gauge.
SUMMARY: The results indicate the level of force needed to stop avehicle should not exceed 400N thus covering 95% of femalesand 99% males will be able to brake sufficiently. The authorbelieves the evidence is sufficient to assist in making revi-sions of brake pedal standards.
CITATIONS: Nine references.
281

I.
STUDY: Murray, M.P., Baldwin, J.M., Gardner, G.M., Sepic, S.B., andDowns, W.J. Maximum isometric knee flexor and extensormuscle contractions: Normal patterns of torque versus time.Physical Therapy; June, 1977, 57(6), 637-643.
KEYWORDS: Isometric, knee, muscle contractions.
METHODS: Twenty-four normal males, ages 20-35 and twenty-four healthynormal males, ages 45-65 were used. A Cybex dynomometer wasused to record torque and an electrogoniometer was used tomeasure knee joint. Electrogoniometer was secured to theknee, the pivot point was placed over the lateral epicondyleof the femus allowing the plastic arms to be parallel to theaxis of the leg and thigh. Recording was done on a Grassmodel, F polygraph. Subject was seated and stabalized, thentold to flex or extend according to the instructions given.Torque was taken at 30, 45, and 60 degrees. Full extensionwas defined as 0 degrees. Torque produced from weight of theIsubjects leg was subtracted from flexor torque and added toextensor torque readings.
3 RESULTS: Patterns of torques during a five second contraction resultedshowing no single pattern, only one peak (84%) maintained forless than 1 second. The other 10% had more than one peak or
11 a peak of longer than 1 second. Knee joint position has theeffect on knee flexor and extensor muscles of affecting theextensor muscles more reflected in the higher torque reading.Sequence of testing angles did not affect the torque. Agehad the influence of the-higher the torque the younger theman. The older group averaged 75-80% torque of the younger
man. Torque differences were seen between week 1 and week 2,leaving week 2 showing a higher measure.
SUMMARY: Although many studies have looked at the knee flexor andextensor muscles, time has not been one of the factors lookedat. As reflected in this study, the time varied greatly fromsubject to subject although the peak was always less than onesecond. The decrease in muscle strength with age agrees withI the findings of Cuddingan's (1973). The subject responsesfor knee joint curve do not follow the previously publishedmaterial, but peaked at points where the peak was notexpected.
CITATIONS: Thirty-three references.
I
i

STUDY: Noble, L. and McCraw, L.W. Comparative effects of isometricand isotanic training programs on relative-load endurance andwork capacity, Research Quarterly; 1973, 44(1), 96-108.
KEYWORDS: Isometric and isotonic muscular strength, endurance, leg,bench press repititions.
METHODS: Isotonic Strength: Isotonic strength in both the bench pressand leg press movements was assessed by determining the maxi-mum amount of weight that could be lifted through onecomplete range of movement (1-RM).
Isotonic Endurance: Was measured by the number of repeti-tions the subject could complete while maintaining a cadenceof 30 repetitions per minute against a relative loading of1/2 of 1-RM for the bench press and 2/3 of 1-RM for the legpress.
Relative Isometric Endurance: (Same definition used by~Carlson and McCraw and Start and Graham) was assessed by
determining the time (in seconds) the subject could hold aprescribed weight while in position of 900 at the elbow andknees. A relative load of 1/2 isometric strength was usedfor the bench press test and 2/3 was used for the leg press.
The subjects were college males (N = 64), ages 17-31 years.Subjects trained for a period of 9 weeks, three days a week.Two different training programs were used: isometrictraining and isotonic training. Tests of both Isometric andisotonic strength and isometric and isotonic endurance wereadministrated before and after the 9-week training period.Each subject was given the isotonic tests on one day and thefour isometric tests the following day. A 5-min rest inter-val was allowed between successive measurements on each day.
RESULTS: The correlations between isometric strength and isometricendurance ranged from -0.51 to .06 on the pretests and from-0.39 to -.14 on the post test with only one coefficient oneach of the testing administrations reaching statisticalsignificance. It therefore appears that a stronger indivi-dual cannot continue sustained contractions with a loadadjusted as a percent of his maximum strength as long as anindividual who is weaker.
The data analysis revealed that:
(1) The isotonic training program was superior to the Iso-metric program with respect to its effect on relative-loadisornet-ic bench press endurance, isometric bench press workcapacity, and isotonic bench press work capacity.
(2) The effects of the two training programs on the otherendurance and work capacity measures were not different.
283

3oble and McCraw 1973 Cont.RESULTS CONT: (3) Neither of the training programs affected the rela-
tionship between isometric strength and relative-load iso-metric endurance and btween isotonic strength andrelative-load isotonic endurance.
SUMMARY: The following conclusions are supported by the data of thisstudy:
LI (1) The development of muscular endurance is not necessarilyproportional to the development of muscular strength, but isa function of the method of training. In other words, anincrease in strength does not guarantee a proportionateincrease in endurance.
(2) Work capacity is better improved by training with a
program of progressive resistance weight training exercisesthan by training with a comparable program of maximumresistance isometric exercise.
(3) The relationship between strength and relative-loadendurance is not different in trained and untrained
I individuals.
CITATIONS: 21 references.
I
3 8
II

STUDY: Nordesjo, L.O. and Nordgren, B. Static and dynamic measuringof muscle function. Scand. Journal of RehabilitativeMedicine; 1978, 10(6), 33-42.
KEYWORDS: Static, dynamic, muscle function.
METHODS: Review of literature for measuring isometric muscle functionbefore and after injury, amputation, and disease. Theliterature covered regards strength changes in, a) older menbefore and after surgery dealing with the prostate, b)rheumatic arthritis patients and normals, c) muscle strengthand work output of mentally retarded, d) myasthemia gravispatients and normals, e) above knee amputations and, f)fibrile infections resulting in partial imparement. Militaryresearch has shown a reliability of .8-.93 over a short timeand a reliability of .6 when repeated after months and years.
Static and Dynamic muscle strength are easier to measure, asthere are more ways to take the measurements. The use of theCybex II with supplemental devices allows for this kind offlexability.
Presently, the authors have begun a study dealing with iso-metric and dynamic strengths and endurance with normals andpatients with chrodromalacia of the patella with varyingdegrees of arthrosis. Cybex II was used for measurements.
RESULTS: Reproducibility is .88 and .86 for static and dynamic
strength respectively. As degree of injury increases, themaximal isometric strength in knee extension decreases.Differences found in dynamic measurements are the same bet-ween healthy and injured limbs.
SUMMARY: Because of the high correlation between right and left, theauthors recommend comparisons be run in a series when lookingat a healthy vs. unhealthy limb to eliminate individual dif-ferences between subject.
CITATIONS: Twenty-one references.
285

STUDY: Nordgren, B. Anthropometric measures and muscle strength inyoung women. Scand. J. of Rehabil. Medicine; 1972, 4,165-169.
KEYWORDS: Isometric muscle strength, anthropometric measurements, sexV- __differences.
METHODS: Twenty-three women aged 17 to 24 years were utilized. Theskeletal width and the skinfold thickness were measured (inmm) with a vernier calipp-. The lengths of the following
bones were measured: humerus, radius, femur, and tibia. Thecircumferences of the chest and the abdomen were measured.The skinfold thickness is a composite of two layers, eachincluding skin and subcutaneous adipose tissue. The measure-ments in this study included all four layers. The maximalisometric muscle strength was measured by means of a press-ductor transducers. Each test component comprised threemaximum efforts with a duration of at least three secondseach, and the highest value was recorded.
RESULTS: The anthropometric data and the isometric muscle strengthmeasurements are given in tabular forms. A comparison withcorresponding data for a group of young men were given. Themuscle strength was lower (more pronounced in the upperextremities) in the female group. Except for the skinfoldthickness, which was significantly larger in the women, thedifferences in anthropometric data between the two groups wasmuch less than the difference in muscle strength. Mostanthropometric measurements were smaller in the female group.When predicting body weight, the width of the femoral condylewas found to be preferable to the body height.
SUMMARY: This investigation had two aims, namely to obtain normalvalues of anthropometric measurements and maximal isometricmuscle strength for women using a standard method, and tocompare these values with corresponding values for men.
CITATIONS: Six references.
286
I

STUDY: Nordgren, B., Elmeskog, A., and Nilsson, A. Method formeasurement of maximal isometric muscle strength with specialreference to the fingers. Upsala Journal Medical Science;1979, 84(2), 188-194.
KEYWORDS: Isometric muscle strength, fingers.
METHODS: The use of a mechano-elastic transduscer was employed as apressure transducer. Adjustments were made for measuringfinger strength by adjusting to a pressure of 20 kp, thus therange was -20 kp to +20 kp. Abduction and adduction weretested in the metacarpo-phalangial joint at 00 (an extendedposition).
RESULTS: Reproducibility of muscle strength on the equipment wasobserved through repeated measures. Variation was found tobe greater on the ulnar than on the radial side. Fingermuscle strength in normal persons using 27 subjects wasobserved. This produced a table giving measurements ofhandedness for men and women, mean and standard deviationpertaining to each digit in opposition, adduction andabduction.
SUMMARY: The experiments presented a method for measuring maximal iso-metric muscle strength. The apparatus was designed withavoidance of hysteresis in mind. Results produced values forfingers muscle strength for normal people.
CITATIONS: Nine references.
287

STUDY: Nylind, B., Schele, R., and Linroth, K. Changes in maleexercise performance and anthropometric variables between theages of 19 and 30. European Journal of Applied Physiologyand Occupational Physiology; 1978, 38(2), 145-150.
KEYWORDS: Longitudinal study, physical working capacity, muscularstrength, physical activity, growth.
METHODS: The purpose is to conduct a longitudinal study in an effortto look at age and effects on physical working capacity,muscular strength, body dimensions, and blood pressure.Fifty-five male subjects were measured on isometric musclestrength, submaximal exercise performance anthropometricmeasurements and health data. All subjects were examined in1957-1959 and then reexamined with the same methods at alater date.
RESULTS: The subjects height and weight had increased. Increase inmuscular strength for grip of both hands and shoulder pullbut not shoulder thrust were recorded as significant. Heartrate declined. The subjects were divided into active andinactive groups upon the reexamination, there were differencesin the before and after heart rate measures. Going fromincreasing to decreasing heart rate were four groups, theactive-active, inactive-active, active-inactive and inactive-inactive. The first and last groups showed increases inweight and skinfold measures of the abdomen, while the othertwo groups remained about the same.
SUMMARY: The weight increase was the largest change of the subject dueevidently to fat tissue increase. In agreement with earlierresearch, there was the same increase in strength. Heartrate was as good at 30 as at 19. The authors suspect thesubjects used may have been a self select group of indivi-duals who are more interested in their health than those whodeclined.
CITATIONS: Twelve references.
288

STUDY: Nyquist, G.W. and Murton, C.J. Static bending response ofthe human lower torso. Proc. Stapp Car Crash Conference,19th; 1975, 513-541.
KEYWORDS: Saggital fleximent extension.
METHODS: The purpose was to define bending responses of the lowertorso to aid in designing dummies and for response defini-tions for mathematical modeling. Six male subjects wereadministered a battery of 72 tests. The tests were to definethe response characteristics for saggital flexion and exten-sion. This included muscle tensing and knee bending. Theequipment consisted of immobilizing the subjects legs leavingthe torso free. All subjects were placed on their side, withthe torso lying on a dolly to allow movement. In relationto the skeletal structure, film analysis targets wereattached to the subject and filmed during the experimentalsession. Each subject had a force applied to their shoulderscausing the torso to bend at the hip and joint which wasanalyzed.
RESULTS: All subjects were found to bend through two designated pointsof the r3le pelvic crest when struck from behind on theshoulders. As representative of the population, the subjectsrepresented the 18 to 98 percentiles.
SUMMARY: Different responses are obtained depending on whether thelower torso is relaxed or tensed. Bending the knees at rightangles to the legs as opposed to having the legs straightsignificantly increased the range of motion from 1200 to 1430in the thorax-pelvis range and from 440 to 680 in the pelvis.Subjects could withstand a maximum flexion of 5,450 lb. in.(616 N m) and maximum extension of 2,170 lb. in. (240) N m).
CITATIONS: Three references.
289

STUDY: Olson, V.L., Smidt, G.L. and Johnston, R.C. The maximumJtorque generated by the eccentric, isometric, and concentric
contractions of the hip abductor muscles. Physical Therapy
Journal; 1977, 52(2), 149-158.
KEYWORDS: Maximum torque, eccentric contraction, isometric contraction,concentric contraction, hip abductor muscle.
METHODS: The right hip abductor muscles of thirty normal male subjectswere tested for maximum voluntary eccentric, isometric, and3 concentric muscle contractions. Two trials Were run for eachcontraction type and the mean of the two trials was multi-plied by 55 percent of the thigh length. The result was thetorque produced by the abductor muscle for each type ofcontraction. The three types of contractions were comparedat 10 degree (0.17 rad) intervals. Twelve of the thirty sub-jects had roentgenograms taken at each of the 10 degreeintervals so that the moment arm distance of the abductormuscles could be determined and tension calculated.
RESULTS: The maximum torque produced by an eccentric contraction wa1180.9 kg.cm. at 10 degrees (0.17 rad) of adduction. Maxiumtorque produced by an isometric contraction was 1054.1 kg.cm.at 10 degrees of adduction. For a concentric contraction,'1i maximum torque was 730.7 kg.cm. The maximum tension producedby eccentric, isometric and concentric contraction was 278.1,224.7, and 154.4 kg. respectively at 10 degrees of adductionfor eccentric and isometric contraction and zero degree for
concentric contraction.
SUMMARY: Measurement of torque generated by the hip abductor musclesduring eccentric, isometric, and concentric muscle contrac-tions were obtained for thirty male subjects. The resultsindicated that: 1) a shortened muscle produces less tensionthan a muscle in a lengthened position, and 2) the eccentriccontraction develops the greatest tension, then isometric andfinally concentric contractions.
m CITATIONS: Twelve references.
I
Il

STUDY: Osternig, L.R. Optimal isokinetic loads and velocities pro-ducing muscular power in human subjects. Archives of Phys.Med. and Rehab. 1975; 56(4)., 152-155.
KEYWORDS: Extremities; muscle contraction
METHODS: The purpose of the research was to determine the maximalpower of load and velocity during isokinetic muscular
contractions. Additionally, the author wished to relatethese values to isometric effort. Sixteen males, aged 18 to24 from the University of Oregon football team were subjects.A Cybex Dynamometer was used to take the measurements ofmaximum isokinetic and isometric torque values during legextension. Velocities used were 5, 7.5, 10, 12.5, 15, 17.5,20, 22.5 and 25 rpm for isokinetic torque while isometricmeasures were taken at angles of 500, 550, 600, 65, 700,750, 80, and 850. The peak value for each angle was used torepresent that particular point in the arc of motion. Thepower was calculated using the equation:
Power = TX rpm/5252T = torque : with results in units of horserpm = speed power5252 = a constant
RESULTS: Mean isometric torque decreased from a high 172.30 ft. poundsat 850 to a low of 101.44 foot pounds at 500 Different pat-terns of velocity resulted depending on the angle of exten-sion. Maximum torque at each joint angle increased withvelocity as the leg became more vertical.
SUMMARY: The maximum power produced was found with decrease in theknee angle. Maximum isometric loads varied up to 40.89%through the same arc. A plateau of isokinetic torque wasreached at the speeds of 17 to 24 rpm. Thus, there may beuniform isokinetic torque values which result in a maximumpower at certain ranges of limb movement. The authorbelieves it is possible for the leg momentum helped to over-come leg weight during leg extension thus resulting in higherpeak torques during decreasing angles.
CITATIONS: Fifteen references.
291

STUDY: Osternig, L.R., Rates, B.T., and James, S.L. Isokinetic andisometric torque force relationships. Archives Phys. Med.Rehab., 1977, 58(6), 254-257.
KEYWORDS: Elbow joint, exercise test, exercise, muscle contraction.
METHODS: The purpose was to look at the forces generated during isoki-netic and Isometric efforts to determine the relationshipbetween the two. Twenty-eight male football players, ages18-22 years, were used. Maximum isometric and isokineticmeasures were taken on the elbow using a dynamometer. Anglesof the elbow measured were 100, 20, 300, 400, 500, 60, 700,800, 900 at speeds of 5, 7.5, 12.5, 15, 17.5, 20, 22.5, and25 rpm. The elbow angle was flexed at 1550 and pushed tofull extension. Correlations were calculated between themaximum isometric torque and corresponding isokinetic torqueangles.
RESULTS: Thirteen of the 81 correlations were significant at the p<.05level. There was no pattern found regarding distribution ofthe correlations. A tendancy for the higher coefficients ofthe slower isokinetic speeds clustered toward the large elbowangles.
SU14MARY: The results are in agreement with those found in previousresearch. Why the cluster is found toward the greater anglesis not understood. The author speculates the cause may be aresult of the greater muscle tension generated when musclesare stretched. The author feels that measures of maximalisokinetic cannot predict isometric strength.
CITATIONS: Twenty references.
292

STUDY: Patton, R.W., Hinson, M.M., Arnold, B.R., Jr., and Lessard,B. Fatigue curves of isokinetic contractions. Arch. Phys.Med. Rehabil; 1978, 59(11), 507-509.
KEYWORDS: Sex differences, isokinetic, fatigue, elbow flexors.
METHODS: The purpose was to study isokinetic fatigue curves and ifthere was sex differences in the curves at different strengthlevels. Sixteen men and sixteen women, aged 18 to 24 wereused. The equipment used was Orthotron. Based on torqueproduced, each group was evenly divided into high strength(HS) and low strength (LS) groups. The LS males and HS fema-les were found to be equal on the testing of elbow flexion ofthe preferred arm. The flexions were continued by the sub-ject to exhaustion (when the subject was unable to performanother contraction).
RESULTS: Each of the four groups developed significantly (p<.O1) dif-ferent rate of fatigue. The mean torque values were the samefor the HS females and the low strength males. Fatigue wasseen as the torque differed significantly from the subjectsinitial torque position. All groups except the LS femalesshowed this change.
SUMMARY: The isokinetic exercise was seen to follow a curvilinear pat-tern until sex and strength levels were controlled, whichresulted in negative linear slopes. The use of 50% torquefor the inducement of fatigue seems appropriate.
CITATIONS: Seven references.
293

STUDY: Pearn, J. Two early dynamometers: An historical account of[U the earliest measurements to study human muscular strength.
Journal of the Neurological Sciences; 1978, 37(1-2), 127-134.
3 KEYWORDS: Dynamometer, muscle strength measurement.
SUMMARY: This paper is a review of two of the earliest dynamometers,together with results of the first experiments attained withthem. The Graham-Desaguliers dynamometer was developed inLondon in 1763 to measure human muscular force, in such a waythat synergistic muscles could not impart a false mechanicalI advantage to the test. The Regnier dynamometer was inventedin Paris in 1798 to measure the traction properties ofartillery-horses, but was designed as an all-purpose instru-ment to measure specific human muscle groups as well.Dynamometers were developed to record human strength along a
continuum, to remove the need for a dead-weight or biologicalstandard, and to measure many different groups of muscles,not just those of lifting or pushing.
CITATIONS: Seventeen references.
I
I
I3 294

STUDY: Pedotti, A., Krishnan, V.V., and Stark, L. Optimization ofmuscle-force sequencing in human locomotion. MathematicalBiosciences; 1978, 31(1-2), 57-76.
KEYWORDS: Muscular knematics, gait, leg.
METHODS: The purpose was to look at sequence of muscles used in agait. The problem is first stated mathematically for torque,muscular knematics, alternative of instantaneous maximalforce in the muscle, constraints and performance criteria. Asubject walked over a 15 meter walkway using his own usualgait. Markers were placed at the hip, knee, ankle and meta-torsophalangeal joints. A film photographed the gait. Aforce plate measured ground reaction which was converted on acomputer. Muscle EMGs were recorded. Two subjects wereused, AC and WM.
RESULTS: The performance of AC and WM were compared. The EMG data forboth subjects show agreement with force patterns of earlierresearch. Descriptions for 11 muscle actions are given.Force patterns were compared to the EMG recordings whichresulted in eliminating some of the mathematical equations.Basically, the force measurements were in good agreement withthe EMG. The subjects showed similar kinematic variables,but different torques causing different motion between thetwo. Individual muscle differences between the two subjectsare pointed out.
SUMMARY: The force patterns when compared showed similar charac-teristics. The use of EMG, torque, and kinematic data on thesame subject is thought to eliminate many errors in the datawhen using the three together. The study cannot be genera-lized to prosthetic devices or patterns of gait other thannormal walking.
CITATIONS: Thirty-two references.
295

STUDY: Perrine, J.J. and Edgerton, V.R. Muscle force-velocity andpower-velocity relationships under isokinetic loading.Medicine and Science in Sports; 1978, 10(3), 159-166.
KEYWORDS: Force-velocity vs. load-velocity, position and velocity-specific forces, instantaneous power output, excitationintensity, neuromuscular inhibition.
METHODS: The purpose is to measure acceleration rates such that muscleforce may be determined at given positions. Using an isoki-netic dynomometer then, direct measurements may be made atlower-velocities of the force velocity relationships of somemuscles in-vivo. Ten male and female subjects, aged 18 to 38years, were tested on knee extensions at a 30* angle andvelocities of movement ranging from 0-2880/sec. A Cybex II
dynomometer was used for measurement. Subjects wereencouraged to reach their maximum force before reaching the300 angle. Two testing sessions were conducted each onseparate days.
RESULTS: The range each subject produced in the 300 torque-velocityoutputs was found to be essentially the same. When the speedwas low, the mean torque level was fairly uniform with theisometric measurements. For the three highest velocities,the mean torques fell with the velocity. As velocityincreased, the knee-extensor power increased.
SUMMARY: The in-vivo muscle relationship appears to have a curve quitesimilar to that found in previous studies using isolatedmuscle. The lower speeds were found to result in relativelythe same torque values at the 300 angle. The authors believethat man inhibits himself in his force-velocity relationshipsuch that without this inhibition, isolated muscles mayappear to perform at higher levels.
CITATIONS: Nine references.
296
I

STUDY: Petrofsky, J.S. and Lind, A.R. Aging, isometric strength andendurance and cardiovascular responses to static effort.Journal of Applied Physiology; 1975, 38(1), 91-95.
KEYWORDS: Age, heart rate, blood pressure.
METHODS: The purpose was to assess changes in heart rate and bloodU pressure of men while performing a static effort and how agemay have an effect on this. One hundred men, screened forcardiovascular and blood-pressure problems, participated.Each subject performed two trials of maximum static effort ona hand dynomometer. He then exerted 40% of his maximumstrength as long as he could maintain tension. Heart ratewas. continually recorded on ECG and blood pressure wasmeasured at one minute intervals. The men were divided intofour age groups.
3 RESULTS: No difference in strength was found among the groups. Nosignificant difference regarding endurance was found. Heartrate increased in all four groups during exercise, hut thelargest increase was in the 20-29 year-old groups. Systolicblood pressure increased significantly (p<.05) for the oldestgroup (age 50 years and above). Cardiac work (a product ofheart rate and blood pressure) and time-tension index (themyocardial oxygen consumption) increased with work andreturned to normal after the exercise was completed.
3SUMMARY: The results of strength ability do not agree with theexisting literature which indicates a decline in strengthwith an increase in age. The author feels this may be due tothe homogeneity of the subjects. The previous results may bedone to subject self-selection of occupation, the choosing ofless demanding work with age increase. The results found inthe systalic blood pressure are thought to be due to thedecrease in elasticity found with age.
CITATIONS: Sixteen references.
297
I

STUDY: Petrofsky, J.S. and Lind, A.R. Isometric strength,endurance, and the blood pressure and heart rate responses
during isometric exercise in healthy men and women, with spe-cial reference to age and body fat content. Pflugers Arch.European J. of Physiology; 1975, 360(1), 49-61.
KEYWORDS: Isometric strength, endurance, aging, exercise performance,blood pressure, heart rate, sex differences.
METHODS: One hundred male and 83 female acted as subjects. Isometricstrength and endurance were measured on a portable strain-gauge and hand dynamometer. Strength was taken to be thelarger of two brief (2-3S) maximal voluntary contractions(MVC). After a rest of 5 minutes, isometric endurance wasmeasured as the duration of a sustained hand grip contractionat a tension of 401 MVC.
RESULTS: Isometric hand-grip strength was greater in men than inwomen. In both sexes, age was inversely related to isometricstrength, particularly in women. Body fat content, however,was directly related to strength. In contrast, both male andfemale subjects aging was directly related to isometricendurance while body fat content was now inversely related toisometric endurance. The increase in heart rate throughout afatiguing contraction at 40% MVC was strikingly similar inmen and women. The blood pressure at the end of the 40% MVCwas directly related to the resting blood pressure. However,aging and body fat content both increased the resting systo-lic blood pressure in men and women.
SUMMARY: The relationship of sex, age and body fat content wereassessed on the maximal voluntary strength (MVC), theendurance of a sustained contraction held at 40% of thesubject's maximal strength, and the associated changes inblood pressure and heart rate.
CITATIONS: Twenth-one references.
298

STUDY: Petrofsky, J.S., Rochelle, R.R., Rinehart, J.S., Burse. R.L.,and Lind, A.R. The assessment of the static component inrhythmic exercise. Europ. J. Appl. Physiology; 1975, 34(1),55-63.
KEYWORDS: Exertion, static exercise, dynamic exercise, mechanical effi-ciency, isometric endurance.
METHODS: Three young, healthy men volunteered to act as subjects. Thesubjects worked on a bicycle ergometer at known fractions oftheir maximal aerobic capacity (max V02). The rate of theirpedalling was varied from 30 to 90 rpm, so that for a givenpercent of max V02, the belt tension varied inversely withthe speed of cycling.
RESULTS: At any one speed of cycling, isometric endurance decreased as
the belt tension increased. Following exercise at 30 rpm,
the isometric endurance was 25 to 50% lower than that foundat the most advantageous speed of cycling for the subjects;at these faster rates of cycling two subjects showed leaststatic component following exercise at 90 rpm while theremaining subject performed best after cycling at 50 rpm.
SUMMARY: A new approach has been devised to assess the static com-ponent of dynamic exercise. This technique involves themeasurement of the isometric endurance of muscles which havejust taken part in rhythmic exercise and depends on therepeatability of trained subjects in isometric effort, Thepremise is that isometric endurance will be inversely relatedto the static component of the preceeding dynamic exercise.
CITATIONS: Nineteen references.
299

mL
STUDY: Pipes, T. V. Variable resistance versus constant resistancestrength training in adult males. European Journal ofApplied Physiology and Occupational Physiology; 1978, 39(1),27-35.
KEYWORDS: Strength, strength training, constant resistance (CR),variable resistance (VR), body composition changes withtraining, concept of specificity.
METHODS: The purpose was to research constant resistance and variableresistance differences in training and how these differencesmay affect body composition, anthropometric measures, andmuscular strength. Thirty-six males, ages 18 to 26 yearsIwere each assigned to one of three groups. The groups(constant resistance, variable resistance and control) wereeach from a weight training program. Training lasted ten|weeks. The two groups who were actually working were workingat 75% of their strength. Anthropometric measures, fat, bodydensity and body weight were taken before and after theprogram.
RESULTS : The CR and VR groups increased significantly over the controlgroup with the CR group increasing the most. When a variableUresistance procedure was used to assess stength changes, theVR group had the most change. The training groups did havechanges in body composition, lean body weight, absolute andrelative body fat, and increases in limb circumferences.
SUMMARY: For strength increases, there was found to be a difference inthe training methods. The training did produce expected bodychanges and these changes were about the same for each group.
CITATIONS: Twelve references.
3!K[I
iI
I 30

STUDY: Pipes, T.V. and Wilmore, J.H. Isokinetic vs. isotonicstrength training in adult men. Med. and Science in Sports;
1975, 7(4), 262-274.
KEYWORDS: Isokinetic strength, isotonic strength, strength training,body composition changes with training.
METHODS: Thirty-six male volunteers were randomly assigned to one offour groups: isotonic, isokinetic low speed contraction,isokinetic high speed contraction, and control. Each of thetraining groups performed the bench press, biceps curl, legpress and bent rowing. Training frequency averaged threedays per week, with an average duration of 40 min. per day.A series of anthropometric measurements were taken at theheginning and at the end of the training period, includingseven skinfold thicknesses (mm) and 10 circumferences (cm).Five motor performance tests were administered.
RESULTS: The results demonstrated a clear superiority of the isokinetictraining procedure over the isotonic procedures relative tostrength, anthropometric measures and motor performancetasks. The three training groups exhibited similar changesin body composition. The isokinetic high speed groupdemonstrated the greatest gains overall.
SUMMARY: The present study has revealed that isokinetic resistancetraining procedures are significantly better in affectingchanges in muscular s* .. ngth, body composition, and motorperformance tests than standard isotonic resistance trainingprocedures.
CITATIONS: Twenty-six references.
3
301

STUDY: Poppen, N.K. and Walker, P.S. Forces at the glenohumeraljoint in abduction. Clinical Orthopaedic and RelatedResearch; September, 1978, 135, 165-170.
3 KEYWORDS: Clenohumeral joint, abduction, muscles.
METHODS: Three fresh upper quarter cadaver specimens from normal maleswere used. Speciman one was clamped upright with a rec-tangular metal bar fixed in the elbow. This allowed the armto be held at each angle of abduction. An anteriorradiograph was taken at each angle with location of bone71 was marked with pins. Muscles were stripped with originsand insertions being marked with pins. Elastic wires werereplaced for the muscles, the angles were taken withradiographs. This allowed lines of action to be drawn on theradiograph. The same was done for specimens two and three,except the wires were sutured to the centers of the musclesand their radiographs were taken. The angles were comparedto those of normal living subjects.
RESULTS: Supraspinatus was found to act as an elevator of the arm and3compressed the humeral ball into the center of the glenoid.Anterior and middle deltoids increased their lever arms withabduction, thus at high angles they were good elevators. Theposterior deltoids role was that of a compressor. Forces atthe glenohumeral joint was found to increase linearly withabduction reaching a maximum of .89 times body weight at 900of abduction. After 900 abduction, there is a reduction ofEl force to .4 times body weight at 15n0 abduction. The humeralhead at 0' subluxed downwards, at 30-600 it had a tendency tosublux upward at 900, the ball pressed directly into thecenter of the glenoid. External rotations caused increase incompression and decrease in shearing while, internal rotationshowed a magnitude increase while angles to the glenoid face3 were decreased.
SUMMARY: This study determined the forces in the glenohumeral jointfor isometric abduction. This was in the plane of the sca-pula. Three specimens were used to obtain lines for actions."The main assumption made in analysis was that the force in amuscle was proportional to its area times the integratedelectromyographic signal."
CITATIONS: Sixteen references.
Im 302
I

STUDY: Poulsen, E. Prediction of maximum loads in lifting frommeasurement of back muscle strength. Prog. Phys. Therapy;1970, 1(2), 146-149.
I KEYWORDS: Maximum lifting capacity, back muscle strength, Fex differen-ces,
METHODS: The validity of the predictive formula of the maximum weightto be lifted = 1.4M-1/2 body weight (where M can be measured byhaving the subject pull maximally on a dynamometer), has beentried out in a series of experiments performed on 25 womenand 21 men, aged 17 to 62 years, weighing from 40 to 90 kg.In all subjects body weight and back muscle strength weremeasured. From these data the theoretically predicted maxi-mum weight was calculated. A wooden box 30 x 35 x 25 cm wasloaded with approximately the predicted weight. By adding orsubtracting weight on the box, the maximum weight that couldbe lifted was found.
RESULTS: The results indicated that men can, at all body weights, liftmore than women. For identical back muscle strength, men canlift more than women by 8 to 10 kg. Also, the men are ableto lift heavier burdens than the women at identical predictedlifts. The author concluded that neither a fixed standardload, nor a load related only to body weight, will be satis-Ufactory. A maximum lift predicted from the back musclestrength, however, seems to give realistic values.
SUMMARY: For occasional lifting, it may be recommended that both menand women lift up to 70% of the maximum, which can be deter-mined from the simplified formulas:
Maximum Load = Back Muscle Strength (for men)Maximum Load = Back Muscle Strength-8kg (for women).
For repetitive lifts, an upper limit of 40-50% of the maximumload should be recommended.
CITATIONS: Five references.
I2IN

STUDY: Poulsen, E. Studies of back load, tolerance limits duringlifting of burdens. Scand. J. Rehabil. Med. (SE); 1978,10(6), 169-172.
KEYWORDS: Maximum lifts, maximum acceptable load, male and femaleworkers.
METHODS: Fifty men and women of different ages were tested for themaximum isometric muscle strength they could exert on astrain gauge dynamometer. The subjects lifted a box withapproximately the maximum load less 5 kg. They used theknee-action technique in lifting. By adding or subtractingloads to the box, the actual maximal load which the subjectcould just lift from the floor to an upright position wasfound.
RESULTS: It was found that correlation between body weight and themaximum load the subject could lift was low (r=O.1 - 0.3),while there was good agreement between the maximum load andthe back muscle strength (r=O.7 - 0.8). The regression linesfor maximum strength and maximum load were different for menand women, men being able to lift heavier loads than womenwith the same measured back muscle strength. Maximum per-missible single lifts have been given for women and men ofvarious ages and body heights.
SUMMARY: The relationship between maximum lifting capacity and theback muscle strength had been established. Also, the maximumacceptable loads for lifting by male and female workers weregiven. The investigator concluded that muscles rather thanligaments should overcome the gravitational pull, and thestrength of the back muscles, in particular of the lumbarerectores spinae consequently must be of great importance forthe magnitude of the weights that a person can lift from thefloor.
I CITATIONS: Seven references.
304

STUDY: Rasch, P.J. and Pierson, W.R. Some relationships of iso-metric strength, isotonic strength, and anthropometricmeasures. Ergonomics; 1963, 6, 211-215.
KEYWORDS: Elbow strength, isotonic, isometric, anthropometric measure-ment.
METHODS: The purpose is to look at the relationship of isometricscores, weight lifting ability before and after training andanthropometric measurements. Twenty seven men had their
upper arm measured by plethysmoqraphy and isometric strengthof the elbow flexors and extensors was made using aBaldwin-Lima SR-4 load cell. Each subject was trained forone week, then exercised three days a week for six weeksincreasing weight lifted when they felt they could.
RESULTS: Weight fell out as an important determinant of arm volumn andgirth, with height being minor. The increase in weightlifted before and after training was significant (t = 7.64)hut not in isometric tension (t = 1.05).
SUMMARY: The correlation between weight and arm strength is lower inuntrained men than trained men. There was no relation bet-ween upper arm girth and elbow strength.
CITATIONS: Eleven references.
305

STUDY: Rohmert, W. Problems in determing rest allowances. Part 1:Use of modern methods to evaluate stress and strain in staticmuscular work. Appl. Ergonomics; 1973, 4(2), 91-95.
KEYWORDS: Static muscular work, muscular fatigue, rest allowances.
METHODS: The rest allowance was determined as the time required toremove any remainder fatigue resulting from static muscularwork (i.e., where different working periods of holding 50% ofthe maximal torque (f/Fmax,) of the lower arm alternated withdifferent resting periods).
RESULTS: A sufficient rest allowance (R.A.) in static muscular workwas found to depend on force (f/Fmax) and duration (t/Tmax)of muscular contraction in the manner of an exponential func-tion according to the formula:
R.A. = 18.() I14 • (f" 0.15)0.5 . 100 percentT F
3 if f/F < 0.5.
SUMMARY: Definitions were given for the terms of fatigue, recovery anddegree of fatigue. The rest allowance necessary in staticmuscular work was given in the manner of an exponentialequation as well as by means of graphs.
CITATIONS: Seven references.
I'

STUDY: Royce, J. Isometric fatigue curves in human muscle withnormal and occluded circulation. Research Ouarterly; 1958,29(2), 204-212.
KEYWORDS: Grip squeezing muscles, static strength, endurance, occlusionof blood flow, hand dynomometer.
METHODS: Twenty-four young men were tested four times in a balancedseries, twice while the blood flow to forearm was occludedwith a pressure cuff around the arm, and twice without occlu-sion. The experiment time was 90 sec.
RESULTS: The initial strength averaged 43.3 kg. No difference wasfound between the shape of the fatigue curves under the twoconditions during the first fifty seconds of the isometriccontraction, where the tension had not yet dropped as low as26 kg., From this factual observation, it may be concludedthat virtually no circulation can have occurred in thecontracted muscle up to this time. Thus, a tension of 26 kgis visualized as defining the point where internal musclepressure and blood pressure just balance each other (at 60nercent of maximal force). Below this critical level, cir-culation does flow through the non-occluded muscle, sincethere is relatively little fatigue beyond this point. InI contrast, the occluded muscle continues to fatigue.
SUMMARY: By observing the fatigue curve under isometric contraction,no difference was found between the two conditions. Theauthor concludes the lack of difference indicates there is nocirculation occurring in the contracted muscle during thefirst 50 seconds. After this point the occluded musclebegins to fatigue while the unoccluded muscle does not.
CITATIONS: Seven references.
307

STUDY: Salter, N. The effect on muscle strength of maximum iso-metric and isotonic contractions at different repetitionrates. Journal of Physiology; 1955, 130, 109-113.
KEYWORDS: Isometric and isotonic, male and female, muscle strength.
METHODS: The purpose was to compare effects of training on isometriccontractions with training of isotonic contractions.Isometric contractions were measured with a strain gaugedynamometer and modified for isotonic measurements. Twelvemales and eight females, ages 17 to 48 years, were used forfour weeks, four days a week. A test for muscle strengthimprovement was performed once each testing day.
RESULTS: Training produced significant improvement in muscle strength,but there was no difference between the different methods.The test contractions alone were not sufficient to producesignificant change in muscle strength.
SIIM14ARY: Training resulted in improvement of muscle strength and nocorrelation was found between degree of muscle strengthimprovement and fatigue experienced in training.
t CITATIONS: Seven references.
308
I

STUDY: Sargeant, A.J. and Davies, C.T.M. Forces applied to cranksof a bicycle ergometer during one-and two-leg cycling.Journal of Applied Physiology; 1977, 42(4), 514-518.
KEYWORDS: Exercise, muscle.
METHODS: The purpose is to compare one and two leg cycling in regardsto force applied and work performed. Four males were used.Each pedaled on a Van Dobelin-type bicycle ergometer at 50rpm. Oxygen uptake (V02 and cardiac frequency (Fh)) weremeasured continuously. Force was measured on each pedal andmeasurements were taken from the first peak over the last twominutes, thus making the mean peak force (MPF). A secondmethod of measuring force was used on the 150 marker posi-tions. The area between these positions was then calculatedon the assumption of a constant speed and mean force.
I RESULTS: V02 was higher in the one-leg condition than the two leg con-dition consistently. The right and left legs exerted nosignificant difference in the MPF when running simulta-neously. However, where each leg was run individually theright tended (3% greater peak force) to exert more force thanthe left. Work on the cranks reflect a positive force on thefirst 1800 and a negative force in the second 1800 exceptduring high work load.
SUMMARY: All subjects can be considered a part of the normal popula-tion as all had cycled as children and none were professionalcyclists. Work load was arrived from the work exerted onthe pedal (the first 1600) and the work to lift the leg inflexion (the second 1600). This work load did not changebetween one and two leq work. It is proposed that theincreased force used in the one-leg pedaling is less effi-cient than two leg pedaling.
CITATIONS: Seventeen references.
I3
309

STUDY: Seireg, A. and Arvikar, R. J. A mathematical model for eval-uation of forces in lower extremeties of the musculo-skeletalsystem. Journal of Biomechanics; 1973, 6(3), 313-326.
KEYWORDS: Lower extremities.
METHODS: The purpose was to develop a model which would be used topredict forces produced in the lower extremeties duringvarious postures. A list of 29 muscles of the lower extreme-ties were considered important. Some muscles had to bemodeled as two parts because of a muscles dual connector orinsertion points. Heights of each part of the lower extreme-ties including their center of gravity were also used.Equations for each body segment for force and moment weregiven. Objectives were formulated to help in selecting thebest equations to use.
RESULTS: A numerical value can be obtained which indicates whether thesubject is standing erect, leaning forward or leaning back-ward. Verification of the models was obtained by gatheringEMG data on a subject in different postures. Values werealso obtainable for the stooping posture.
SUMMARY: A pattern of EMG signals can be used as a qualitative measureof the muscle forces. Weighting factors were developed andpresented in table form. The developed mathematical model isfound to be consistant with anatomical observations.
CITATIONS: Thirty nine references.
310

STUDY: Shaver, L.G. Maximum dynamic strength, relative dynamic
endurance, and their relationships. Research Quarterly;K1971, 42(4), 460-465.
KEYWORDS: Maximum dynamic strength, endurance time.
METHODS: Forty male college students were tested for maximum dynamicstrength, absolute dynamic endurance, and relative dynamicendurance on the bench press lift. Maximum strength was theload with which one complete movement could be performedusing maximum muscular exertion. Absolute dynamic endurancewas measured by the number of times a common load of three-fourths of the group's mean maximum dynamic strength could belifted. Relative dynamic endurance was measured by thenumber of times an individually determined load representingthree-fourths of the subject's maximum dynamic strength couldbe lifted.
RESULTS: The study indicated that the individuals with the greatestdynamic strength significantly (p<.01) have the greatestabsolute dynamic endurance (coefficient of correlation =.93). The correlation between maximum dynamic strenath andrelative dynamic endurance obtained from the present data was-.19 (P<.01).
SUMMARY: The data in the present investigation reveal a strong corre-lation between maximum dynamic strength and absolute dynamicendurance. The data also indicate that when subjects wererequired to lift a load equivalent to 75% of their maximumstrength as many times as possible, there was no relationshipwith the maximum dynamic strength. The definitions ofstrength and endurance in relation to methodology and type ofequipment used by previous researchers were given in tabularform.
CITATIONS: Eight references.
311

STUDY: Shaver, L.G. The relationship between maximum isometric
strength and relative isotonic endurance of athletes withvarious degrees of strength. Journal of Sports Medicine andPhysical Fitness; 1973, 13(4), 231-237.
KEYWORDS: Isotonic and isometric strength, endurance, elbow.
METHODS: The purpose of the study was to study the relationship bet-ween maximum isometric strength and muscular endurance of theelbow, to study the relationship between people having lowor high maximal strength in relation to isotonic endurance,and to graph the patterns of isotonic endurance of differentgroups. Thirty-eight males divided into two groups of thestrongest and weakest subjects were used. Each were testedfor maximum isometric strength and isotonic endurance of theelbow. The isometric strength was taken by a Clarkes cabletensiometer method. A modified arm-lever ergometer was usedto test isotonic strength with the range of motion between450 and 1600 (as measured from the horizontal plane) at 35
rpm rotated on percentage of strength at 35, 40 and 45% ofmaximum isometric strength.
RESULTS: Athletes with the highest maximum strength had the highestendurance. The high and low groups differed significantly(p<.05) in strength. There was a significant correlation forthe entire group between isometric strength and isotonicendurance.
SUMMARY: The study indicates that persons with high maximal isometricstrength have also high isotonic endurance when using 35, 40and 45% of this maximum strength. It is suggested that iso-tonic endurance tests at given percentage levels can dif-ferentiate between groups of athletes.
CITATIONS: Fourteen references.
312

STUDY: Shephard, R.J. A brief bibliography in fatigue and fitness.Journal of Occupational Medicine; 1974, 16(12), 804-808.
KEYWORDS: Physiological fatigue, psychological fatigue, neuromuscularimpulses, physical fitness.
METHOD: The purpose is to cover the aspects of physical fitness which
help to prevent psychological and physiological fatigue.
Physiological fatigue: Possible causes may be attributed tobuildup of lactic acid, blockage of neuromuscular impulses atthe junctions and/or a breakdown of electrical impulse. Itis suggested that aids be used if necessary in working equip-ment such that no more than 40-50% of the operators energy isin use. In addition when the work load is figured otheraspects of the work environment such as temperature, highpeak rate, posture and use of small muscle groups should beconsidered.
To prevent physiological fatigue fitness can be improvedthrough aerobic power, strength gains, improved posture,changing body fuel and improving thermoregulation.Psychological fatigue is noted as the worker asking for a
change in work rather than a rest period. The causes may beboredom or tediousness of the task. Those have been recordedphysiological reactions to psychological fitigue which inclu-des such symptoms as sweating, discomfort associated to taskaversion and listleness, lack of vigor, drive and deter-mination was associated with lack of motivation. Fitness,training such as habituality to discomfort, exercise to ele-vate depressed moods, arousal and motivation can help tocounteract the psychological aspects.
SUMMARY: While fatigue is caused by several factors these can bechanged with physical fitness program.
CITATIONS: 63 references.
313

SIUDY: Singh, M. and Buck, T.M. Leg-lift strength test withelectrogoniometric analysis of knee angle. Arch. Phys. Med.Reliabil.; June, 1975, 56(6), 261-264.
KEYWORDS: Extremities, knee, muscles, physical medicine, physical
therapy, rehabilitation.
METHODS: An electrically operated dynamometer with attachments wasused. An electrogoniometer was attached to the subject'sknee for measurement of angle. The equipment was connectedin a way to eiiable continuous recording of leg left score andknee angle. Four test methods were used: a) no restrictionon backward lunging and usual reduction bar and belt, b) pre-vent lunging, c) prevent lunging and eliminate use of hands,and d) experimental bar and belt used, prevent lunging andallowed use of hands. Four trials on each test method with
one minute rests were given, each subject was tested on fourdifferent days.
RESULTS: Most accurate scores (least variability) was found in methodC. An ANOVA reflected differences in knee angle changes dueto a) type of belt, and b) no restriction of lunging.
SUMMARY: Authors feel the leg-lift strength test is feasible for useas a diagnostic test to assess the condition of the legextensor muscles. A physical therapy plan could then beestablished using the test results.
CITATIONS: Eleven references.
314

STUDY: Singh, M. and Karpovich, P.V. Isotonic and isometric forcesof forearm flexors and extensors. Journal of AppliedPhysiology; 1966, 21, 1435-1437.
KEYWORDS: Dynamometer, electrogoniometer, strength test.
METHODS: The purpose was to design an electrical dynamometer whichcould record and measure isotonic and isometric forces andstudy isometric forces of the forearm to determine rela-tionship between forces and prediction of one force fromanother. The dynamometer had a force of 150 ft-lb and used 4
SR-4 type strain gauges. The subject can be stabalized inposition. An electrogoniometer was attached to the axis ofrotation to measure angles form 40 to 5.0 The force exertedwould be continuously recorded every 20* from 50 to 140° forthe forearm flexors and extensors. Twenty males were sub-
jects tested twice not more than 24 hours apart. The maximumaffective eccentric, isometric and concentric forces of theforearm were recorded.
RESULTS: The eccentric force of the forearm flexors is significantlyI -greater that isometric and concentric forces throughout the
range of movement. The concentric and eccentric forcescorrelated significantly at the .01 level. The eccentricforce is significantly less than the isometric force from 100to 1400.I SUMMARY: The forearm flexors at various angles was significantly
related to concentric, eccentric and isometric forces. Theresults of the study agree with previous research. Sixequations for the force curves were developed.
CITATIONS: Five references.
315

STUDY: Smidt, G.L. Biomechanical analysis of knee flexion and
extension. Journal of Biomechanics; 1973, 6(l), 79-92.
KEYWORDS: Knee joint, extension, flexion.
METHODS: The purpose is to look at torque generated at the knee exten-
sors and flexors for concentric, eccentric, and isometricmuscle contractions. Twenty-six men, mean age 28 years, wereused. Serial lateral radiographs were taken on the kneejoint and torque generated by the knee flexors and extensors.The x-rays were taken in a series of seven, starting with theknee angle at full extension, continuing at 1500 intervalsand ending at 900. Each subject performed both tasks whilelying on a table with the leg supported by sandbags. A load
cell dynagraph and tape recorder were used to obtain theforce data. Moment equilibrium equations were used to obtainthe measure of tension in the flexors and extensors.Anthropometric measuraments were taken.
RESULTS: Reliability was obtained on the same day by test-retestmeasures. The peak correlations for eccentric extension was.69, .72 for eccentric flexion, .72 for concentric extension,and .69 for concentric flexion. The range for isometricextension was .64-.92 and .60-.80 for isometric flexion. Thex-ray film measurements were .80 or above for flexion andextension. Torque generated knee extensors was always higher
than that of knee flexors. Eccentric and isometric contrac-tions produced about the same amount of torque.
SUMMARY: The measurements taken allowed for analysis of the knee joint
regarding flexion and extension.
CITATIONS: Twenty-two references.
316

STUDY: Soechting, J.F. and Roberts, W.J. Transfer characteristicsbetween EMG activity and muscle tension under isometric con-ditions in man. J. Physiol. Paris; 1975, 70(6), 779-793.
KEYWORDS: EMG, isometric contractions, transfer function.
METHODS: Four male subjects, ranging in weight from 43 to 89 kg. wereused. The subjects were to exert tension charges whichvaried sinusoidally about non-zero mean, using either theflexors or extensors of the upper arm. An audible signal,consisting of a frequency modulated plus train, was also pro-vided to aid the tracking task at the higher modulation fre-quencies. Surface electrodes were taped on the skin overeither the biceps brachii or the long head of the tricepsbrachii or both. The reference electrode was located on theskin at the cubital fossa. The data were calculated in termsof the gain and phase difference of the motor activity(input) and tension (output) relationship, the gain being thelogarithmic ratio of the amplitudes of the output and inputsinusoids.
RESULTS: It was found that an increase in the modulation amplitude ofthe motor unit activity was required to produce the sameamount of modulation of the output tension as the modulationfrequency was increased. It was found that the maximum ten-sion which could be produced voluntarily during brief jerksat 5 Hz was the same as the maximum sustained tension whichcould be attained.
SUMMARY: The relationship between motor unit activity and a volun-tarily produced, sinusoidally modulated isometric tension wasevaluated as a function of the modulation frequency. Thefindings of the study emphasized the importance of recruit-ment and especially synchronization of motor unit activity tothe graduation of output tension.
CITATIONS: Twenty-two references.
317

STUDY: Start, K.B. and Graham, J.S. Relationship between therelative and absolute isometric endurance of an isolatedmuscle group. Research Quarterly; 1964, 35(2), 193-204.
KEYWORDS: Elbow flexors, isotonic, isometric, endurance.
METHODS: Isotonic Contractions: Occured when the distance between theorigin and insertion alters during the development of muscu-lar tension (either concentrically or eccentrically).
Isometric Contractions: Occurred when the distance betweenmuscle origin and insertion remains constant for the periodof tension.
Isotonic Endurance (I.T.E.): Measured as work done againstgravity in terms of the load and the distance through whichthe load is moved. In practice I.T.E. is measured as thefunction of the work done in a simple isotonic effort and thenumber of times this simple movement is repeated.
Isometric Endurance (I.M.E.): Is the ability of the musclegroup to maintain a given tension for .a period of time andinvolves a continuous effort by the muscle rather than aseries of repeated efforts.
Absolute Isometric Endurance (A.I.M.E.): Can be defined (ormeasured) as the number or seconds the muscle group can main-tain a fixed tension.
Relative Isometric Endurance (R.I.M.E.): Can he measured asthe number of seconds the muscle group can maintain a tensionthat is a specific proportion of its maximum isometricstrenqth.
This study used 30 males with an age range of 18-26 years.The body position during measuring the I.M.E. was as indi-cated in the figure. The angle at elbow was 1150. Twomeasures of endurance were taken. The first was A.I.M.E.used a common load of 50 lbs. (approx. 5/8 of the mean of themaximum strength of the group). The second was R.I.M.E. usedan individual load of 5/8 of the maximum strength recordedfor each particular member in the group.
RESULTS: A significant (.01 level) correlation between the M.I.M.S.and A.I.M.E. was +0.749 (+0.08). The correlation betweenM.I.M.S. and R.I.M.E. was--O.356 (+.159). This was notsignificant at the .01 level.
318

Start and Graham 1964 Cont.
RESULTS CONT: Start and Graham (1964) suggested the following formula torepresent the factors affecting endurance:
E = f(S) + f(L.C.E.) + f(t)
:1I where:
E = muscular endurancef = function ofS = muscular strengthL.C.E. = Local Circulatory EfficientyT = tolerance of muscle to katabolites.
Factors Affecting Endurance: The intramuscular pressure,LI probably in the normal muscle, and almost certainly in thetrained muscle, rises above the arterial pressure in thatmuscle. As a result, occlusion occurs of the arteries,capillaries, and veins within the muscle and the energy forany sustained contraction comes aerobically from whateveroxygen reserve there is in the muscle and anaerobically aslong as glucose is available and the muscle tissue cantolerate the build-up of the resultant anaerobic katabolicproducts. It is clear that greater debt occurs in isometricexercise than in isotonic effort of the same magnitude. Thusthe measures of isometric endurance are probably estimates ofthe energy reserve available within the muscle and its neuro-logical organization.
3 In low load conditions the intramuscular pressure neverexceeds systolic pressure and arterial blood enters themuscle, making additional glycogen and oxygen available tothe contracting fibers. Because of the valvular constructionof the veins, blood also leaves the muscle, taking with itthe waste products of the contraction and thereby reducingthe local chemical irritation of the muscle issue. At thislevel of loading, muscle endurance would be determined by thelocal reserves of the muscle, the intramuscular circulation,and the local tissue tolerance'to katabolites. Once theoverall reserves are exhausted or the build-up of katabolitesreaches a critical concentration, "local muscular fatigue"would occur.
As the muscle has to endure increasing loads the tension ithas to develop correspondingly increases and this produces arise In the intramuscular pressure until circulatory occlu-sion occurs and local ischaemia results. From this point of
3
I

Start and Graham 1964 Cont.
RESULTS CONT: intramuscular circulatory occlusion, the amount of energy themuscle has available is fixed by the aerobic reserves at thetime of occlusion, the anaerobic reserves, and the tissuetolerance limitation on anaerobic release. Thus if theischaemic muscle is considered, it has a fixed amount ofenergy available and can use this slowly or quickly accordingto demands. The time taken to use this energy is what ismeasured as endurance and, in the ischaemic muscle, endurancebecomes related to the energy available and the demands madeon it.
SUMMARY: The authors looked at differences in measures between iso-metric and endurance strength. Each subject was measured forstrength of the group mean and individual mean. The authorssuggest that isometric exertions cause vascular occlusion.Thus when dynamic exertion allow circulation then the rela-tionship between isometric and dynamic strength decreases.
CITATIONS: 24 references.
I
I
U
l 320

STUDY: Start, K.B., Gray, R.K., Glencross, D.J. and Walsh, A. Afactorial investigation of power, speed, isometric strengthand anthropometric measures in the lower limb. The ResearchQuarterly; 1966, 37(4), 553-55q.
KEYWORDS: Anthropometric measures, isometric strength, strength inleqs.
METHODS: The purpose is to look at measures of strength, speed, power,and gross lever dimensions of the legs to investigate theelement of muscle power. Sixty-three males were given aseries of physical measures on the legs, ranging from anthro-pometric to power jumps and a speed test on a bicycleergometer.
RESULTS: Intercorrelations between measures ranged from .54 to .82.Varimax factors ordered the measurements with the tests forpower and speed being Factor 1. Factor 2 was predominatelythe anthropometric measurements. Factors 3, 4, and 5 werestrength tests on the joints. Factor 6 was foot length andmalleolus to heel measure. Factor 7 was thigh and limblength and Factor 8 was weight and speed. The second orderfactors are reviewed.
SUMMARY: Speed and power appear to be most similar with little asso-ciation with strength.
CITATIONS: Twenty references.
321

STUDY: Stern, J.T., Jr. Computer modelling of gross muscle dyna-mics. J. Biomech; 1974, 7(5), 411-428.
KEYWORDS: Moment arm, exerted force, velocity of contraction, anglebetween bones, time elapsed.
METHODS: A mathematical model incorporating mechanical and physiologi-cal parameters of an idealized bone-muscle system has beendevised. When the model is numerically integrated by digitalcomputer, the movement of a lin. under the action of a muscleis simulated.
RESULTS: It is found that for most comparisons the model predicts anoptimum set of attachment sites for maximizing anyone givendynamic movement parameter. The optimum moment arm for highvelocity of movement is relatively small, that for greatestpower somewhat larger, and that for producing a specifiedmotion in the least time larger still. These and other pre-dictions of the model are compared to the actual dispositionof muscles in living organisms.
SUMMARY: Based on the premise that the physiological attributes ofmuscle must play an important role in determining its dynamicfunctions in the body, an attempt has been made to integratemechanics and physiology into a mathematical model that, whenused in conjunction with a digital computer, allows one tosimulate the movement of a limb under the action of anidealized muscle. This method of analysis has been used toinvestigate the suggested dichotomy between adaptation forspeed or strength in the disposition of muscles about joints.
CITATIONS: Seventy references.
322

STUDY: Stull, G. A. and Kearney J. T. Recovery of muscular endurancefollowing submaximal isometric exercise. Medicine andScience in Sports; 1978, 10(2), 109-112.
KEYWORDS: Isometric endurance, isometric fatigue, muscular endurance,muscular fatigue recovery, rhythmic exercise, staticexercise, submaximal endurance.
METHODS: The purpose was to assess submaximal endurance recovery withvarious rest intervals 22 males mean age 21.8 + 4.09 yearswere used. Each subject was tested 11 times wTth intervalsof 3 days between trials. Each subject was to squeeze a handdynamometer which was connected to a Baldwin-Lima-HamiltonU-1 load cell and a Beckman Type RS Dynograph recorderrecorded the readings. A maximum voluntary contraction (MVC)was taken on each subject and then with feedback the subjectattained 50% of the MVC. Each subject held the 50% MVC withrest intervals of 5, 10, 20, 40, 80, 160, 320, 640, 1280, and2560 seconds.
RESULTS: Recovery time of the muscles 20% in 5 seconds, 50% in 80seconds and 87% in 42 minutes 40 seconds. a mathematicalequation on recovery time was offered. Correlation betweenobserved and expected times was .997.
SUMMARY: The recovery followed a three component exponential patterns.For complete recovery after a submaximal test, such as thisone, then 4 hours would be needed for complete recovery.
CITATIONS: Nineteen references.
323

STUDY: Svoboda, M. Influence of dynamic muscular fatigue and reco-very on static strength. The Research Quarterly; 1973,44(4), 389-396.
KEYWORDS: Static strength, endurance, forearm flexors, arm ergometer.
METHODS: The purpose was to look at fatigue effects on two muscle
groups of a task and to observe recovery of the subjects. AHenry frictions-loaded arm ergometer was used to measure thedynamic strength. The subject performed as long as possible.Static strength was taken three times before the subject
began dynamic work. A control group was used which restedduring the work cycle. Subjects were their own controls. 60male college students were used.
RESULTS: From start to finish in the dynamic work there was a 33% dropoff in work rate. A low significant relationship found bet-ween static strength and endurance.
SUMMARY: The work rate dropoff the endurance was not parallel to thestatic strength dropoff although they both reflected a signi-ficant relationship, although minor.
CITATIONS: Fifteen references.
324

STUDY: Tesch, P. and Karlsson, J. Lactate in fast and slow twitchskeletal muscle fibres of man during isometric contraction.
Acta Physiol. Scand.; 1977, 99(2), 230-236.
KEYWORDS: Fiber Composition, isometric strength.
METHODS: Concentrations of the lactate in fast and slow twitch fibreswere determined in the quadriceps femoris muscle aftersustained contractions at 25%, 50% and 75% of maximal volun-tary isometric contraction (MVC) until exhaustion as well asafter interrupted exercises at 25% and 50% MVC. Biopsies fordetermination of muscle fibre lactate concentration weretaken immediately after termination of exercise (within 3-5seconds) with the subject still sitting in the chair.
RESULTS: The mean performance time at 75, 50, and 25% MVC, respec-tively, averaged .55 (range .46-.7) minutes, 1.7 (range.92-1.42) minutes and 4.63 (range 3.4-5.9) minutes. Withexhaustive exercise mean lactate concentration was highestafter 50% MVC in ST as well as FT fibres, 86 (range 37-128)and 96 (range 44-130) in moles kg- 1 dry weight respectively.Lactate concentration was higher in slow twitch (ST) fibresat 50% MVC compared to it in ST fibres at 25% MVC and higherin fast twitch (FT) fibres at 50% MVC compared to in FTfibres at 75% MVC.
SUMMARY: After short time, isometric exercise (i.e., 75% to exhaustionand 50% and 25% performed for the same period of time as 75%MVC) lactate concentration, expressed as lactate ratio(lactate concentration in FT fibres/lactate contration in STfibres) was found to he positively correlated to percent FTfibres (r=0.89). Lactate ratio ranged 0.51-0.99, i.e., atonset of isometric exercise, lactate concentration increasewas faster in ST fibres in the muscle rich in ST fibres andfaster in FT fibres when the muscle was rich in FT fibres.
CITATIONS: Twenty-four references.
325

STUDY: Tesch, P. and Karlsson, J. Isometric strength performanceand muscle fibre type distribution in man. Acta Physiol.Scand; 1978, 103(1), 47-51.
KEYWORDS: Fast twitch, slow twitch, muscle fiber, maximal isometricstrength.
METHODS: The purpose was to study one-leg maximal isometric strength
(MIS) using Hultin et al. (1975) experimental model. 31males average age 21 years, were used. Biopsies of the leftleg vaslus lateralis muscle were taken and slow twitch (ST)and fast twitch (FT) muscles were identified. Subjects weretested for strength (where biopsies were takers again) usinga strain gauge.
RESULTS: A correlation between FT and ST distribution and the one-legMIS was found.
SUMMARY: The results indicate the use of FT fibres during high iso-metric tensions. The study does not support the idea thatconcentrations of FT muscles fibre mean more strength.
CITATIONS: Nineteen references.
326

STUDY: Thorstensson, A., Grimby, G., and Karlsson, J. Force-velocity relations and fiber composition in human knee exten-sor muscles. J. Appl. Physiology; 1976, 40(1), 12-16.
KEYWORDS: Isokinetic contraction, isometric and dynamic muscle tension,human skeletal muscle fiber type distribution, knee extensormuscles.
METHODS: Standardized measurements of dynamic strength of the kneeextensor muscles were performed in 25 healthy male subjects(17-37 yr.) by means of isokinetic contractions, i.e., kneeextension with constant angular velocity. Muscle fibers wereclassified as fast twitch (FT) and slow twitch (ST) fibers.
RESULTS: Overall variation between double determinations of maximaltorque throughout the 90 degrees are of motion (0degrees=fully extended leg) averaged 10% for the differentconstant velocities chosen. At any given angle of the kneethe torque produced was higher for isometric than for dynamiccontractions. Dynamic torque decreased gradually withincreased speed of shortening. Peak dynamic torque wasreached at knee angles in the range: 55-66 degrees, with adisplacement toward smaller knee angles with higher angularvelocities. Correlations were demonstrated between peaktorque produced at the highest speed of muscle shortening andpercent as well as relative area of fast twitch fibers in thecontracting muscle. In addition, muscles with a high percen-tage of fast twitch fibers had the highest maximal contrac-tion speeds.
SUMMARY: The use of the isokinetic principle proved to he a valid wayof studying force-velocity relations. Peak torque was foundto decrease with increased angular velocity, and to occur atan approximate knee angle of 60 degrees. The correlationpresent between peak torque produced at the highest angularvelocity and the portion fast twitch fibers indicates a rolefor muscle quality in terms of fiber types, in determingdynamic strength in certain situations.
CITATIONS: Twenty-five references.
3
3 327

STUDY: Thorstensson, A., Karlsson, J., Vittasalo, J.H.T., Luhtanen,P., and Komi, P.V. Effect of strength training on EMG ofhuman skeletal muscle. Acta Physiol. Scand.; 1976, 98(2),
232-236.
KEYWORDS: Strength training, isometric muscle strength, EMG, fibrecomposition.
METHODS: The effects of an 8 weeks period of systematic progressivestrength training on the EMG activity of the leg extensormuscles (vastus lateralis and rectus femoris) were investi-gated in 8 healthy male subjects (22-31 years).
RESULTS: After training there were indications (not significant) of adecline in integrated EMG (IEMG) during maximal isometricknee extension as well as in the IEMG vs. isometric force
relationship. The averaged motor unit potential (AMUP) didnot demonstrate any significant changes due to the strengthtraining regimen. In conformity with earlier findings no oronly minor alterations were observed in anthropometrics,muscle enzyme activities and fibre composition. The fibrearea ratio indicated a specific effect of the training sti-muli on the fast twitch (FT) muscle fibre.
SUMMARY: EMG-analysis, as employed in the present study, did not pro-vide any conclusive additional explanation as to the mecha-nisms behind the well established gains in muscle strengthperformance induced b ' the applied strength training program.
CITATIONS: Fifteen references.
328

STUDY: Thorstensson, A., Larsson, L., Tesch, P., and Karlsson, J.Muscle strength and fiber composition in athletes and seden-tary men. Medicine and Science in Sports; 1977, 9(1), 26-30.
KEYWORDS: Isokinetic contractions, static and dynamic muscle tension,muscle fiber type distribution, trained and untrained humanmuscle.
METHODS: The authors propose to look at strength performance in athletesof different disciplines and sedentary men under standardizedisokinetic conditions. Subjects used were track and field,downhill skiing, racewalking, orienteering and a sedentary group.Measurements were taken in post season time for all athletesexcept the skiers. Biopsies from m. vastus lateralis were taken.Muscle strength measurements were taken using the seated subjectsleft leg attached to the lever arm of a Cybex II isokinetic dyna-mometer. Two maximal contractions at six different velocitiesand six different knee angles were taken. All strength measure-ments are given in kg. of body weight or percent of the individ-ual maximal isometric force.
RESULTS: The sprinters/jumpers had the highest percent of fast twitchfibers (x=61%) while the sedentary men had a mean of 56%. Therace walkers and orienteers showed the lowest percentage, fasttwitch being 41% and 33% respectively. The fast twitch to slowtwitch ratio was a significant difference between the sprinters/jumpers and sedentary/orienteers only. A difference between thegroups was found in the torque-velo-velocitv curves, with thegreatest peak torque in the downhill skiiers and sprinter/jumpers(3.9 & 3.BNm/kg bw) with the orienters being lowest (3.1 Nm/kgbw) at isometric contractions. At the 180 degree velocity, thetrack athletes recorded the highest peak (2.7 Nm/kg bw) and theorienters were lowest at 1.7 Nm/kg bw. For the highest speeds,the track athletes again produced the highest torque values(73%). It was found that the relative peak torque production fortrack athletes was highest at the fast velocity than as indicatedby their fiber compositions.
SUMMARY: Slow twitch fibers were found to be predominate in enduranceathletes which agrees with previous reports. The reasons forthe skiiers and sprinters/jumpers to have higher peak torquecannot be stated conclusively as due to training and/or gene-tic predisposition. It can be stated that: 1) the percen-tage distribution of the two fiber types is geneticallydetermined as stated by previous research and, 2) fast twitchfibers are used in high speed movements for high force pro-duction. It does appear that training does help the develop-ment of fast twitch/slow tWitch area ratios. Although thetrack and field athletes were superior to others on thehighest speed, the difference disappeared when compared toisometric strength.
CITATIONS: Twenty-one references.
329

STUDY: Troup, J.D.G. and Chapman, A.E. The strength of the flexorand extensor muscles of the trunk. J. Biomechanics; 1969, 2,49-62.
KEYWORDS: Muscle strength, flexor and extensor muscles of trunk, sexdifferences, static strength, dynamic strength.
METHODS: The forces exerted by the males were significantly greate,than those exerted by the females, both in absolute terms andwhen expressed as a proportion of the body weights of the twosexes. Flexor forces were consistently less in magnitudethan extensor forces and flexor turning moments were simi-larly less than extensor turning moment. The mean distancesbetween fingertips and the plantar surface of the feetachieved in the performance of this test were closely similarin the two sexes. The mean vertical distances moved at theseventh cervical vertebra (C7) in the performance of prone,trunk raising tests were 35.6 cm for both sexes. It was alsofound that all the forces and all the turning moments in thestatic tests of strength correlated significantly with eachother for both sexes. Finally, the individual measurementsof static strength were significantly related to subjects'weight, particularly with the male subject.
SUMMARY: The ratios of flexor to extensor forces in the standingposture were found to be of the order of 3:4 which is inaccord with previous studies. The flexor forces exerted andthe flexor turning moments were both greater in standingposture than sitting posture. This follows the expected pat-tern that muscles can transmit greater forces when in alengthened position. The extensor turning moments on thetrunk in the two postures showed no significant differencealthough the extensor forces were markedly greater whensitting. The relationship between the individual results ofthe sit and reach, inclined test and the flexor momentsitting, and between those of the prone, trunk raising testand the extensor moment, standing were statisticallysignificant.
CITATIONS: Forty references.
330

STUDY: Tuttle, W.W., Janney, C.D., and Thompson, C.W. Relation ofmaximum grip strength to grip strength endurance", Journal ofApplied Physiology; 1950, 2, 663-670.
KEYWORDS: Grip force, endurance, dynomometer.
METHODS: Strength Endurance Index: Is defined as the average strengthfor one minute expressed as pounds.
Percentage of Maximum Strength Held: Is defined as the per-centage of the maximum strength maintained for the one-minuteperiod to the maximum strength.
A dynomometer for measuring and recording maximum gripstrength and strength endurance was developed. Data werecollected from 200 university men between the ages of 20 and30 years.
RESULTS: A correlation of maximum strength with the strength enduranceindex gave a coefficient of 0.67 for the right hand, and 0.66for the left. This indicates that the individuals withgreater maximum strength have a greater strength enduranceindex.
The percentage of the maximum grip strength which was main-tained for one minute (strength endurance) was correlatedwith maximum grip strength. The coefficient for the righthand was -.40 and for the left hand -.41. This suggests thatstronger individuals can maintain a smaller proportion oftheir maximum strength than those with less initial strength.
SUMMARY: Maximum grip strength and maximum endurance was correlated.Measurements were taken on the right and left hands. Theresults indicate that stronger individuals have lowerendurance times in relation to their strength than do theweaker individuals.
CITATIONS: Six references.
331

STUDY: Velsher, E. Performance feedback effect on results of iso-metric exercise. Physiotherapy Canada; 1977, 29(4), 185-189.
KEYWORDS: Isometric contraction, performance feedback.
METHODS: This investigation was designed to study whether knowledge ofresults would influence the amount of strength in the quadri-ceps femoris muscle over a two-week training period. Twenty-four female undergraduate (17-20 yrs.) were required toperform a six-second maximal isometric contraction with threerepetitions per day for ten days. They were divided intofour experimental groups, each on a different performancefeedback schedule.
RESULTS: Although an analysis of convariance did not show a signifi-cant effect, inspection of the post-test means did revealthat with regular feedback more strength was developed.
SUMMARY: The results of this investigation reveal that more strengthis developed with the use of visual feedback. Although theredoes not seem to be any direct relationship between the fre-
quency of knowledge of results and strength increase, itwould seem that extrinsic feedback is not necessary at eachisometric exercise session in order to provide guidance orincentive.
CITATIONS: Fifteen references.
332

STUDY: Viitasalo, J.T. and Komi, P.V. Force-time characteristicsand fiber composition in human leg extensor muscle. EuropeanJ. Appl Physiol.; 1978, 40(1), 7-15.
KEYWORDS: Muscle mechanism, fiber composition, force production, legextensor muscle.
METHODS: To further understand the problems involved in force produc-tion during voluntary contraction, the force-time (F-T) curvewas registered during maximal voluntary isometric extensionof both legs performed in the sitting position with the kneeangle at 107 degrees and a hip angle of 120 degrees. Thirty-eight athletes representing various sport events, five pairsof monozygous, and ten pairs of eight normal men. Each sub-ject had three trials, of which the two best were taken foranalysis on the basis of the maximum force level.
RESULTS: In trial-to-trial comparison the reproducibility was r=O.80for force level below 0.9XPo but only r=0.38 at Po.Similarly the day-to-day comparison in which the intervalbetween the tests was 3-9 days, showed r=0.66-0.76 for theforce levels of O.1XP ° to 0.9P ° At Po however, the reprodu-cibility coefficient was almost zero (r=0.03). In the maleathlete groups the time to reach the various force levels wasrelated to the % ST fibers. In this analysis the ocrrelationcoefficient was significant (p<0.05) up to the level ofO.9XPo. The athletic groups had F-T curves different fromthe other subjects. Genetic factors had only slightinfluence on the F-T measurement.
SUMMARY: Force-time measurement in isometric bilateral leg extensionmovement is fairly reliable, and can be used to indicate therate of force production. Skeletal muscle fiber compositioninfluences the form of this F-T curve.
CITATIONS: Twenty-two references.
333

STUDY: Wahrenberg, H., Lindbeck, L., and Ekhold, J. Dynamic load inthe human knee joint during voluntary active impact to lowerleg. Scand. J. of Rehab. Medicine; 1978, 10(2), 93-98.
KEYWORDS: Dynamic load, knee joint.
METHODS: The aim of the study was to get insight into the nature ofthe dynamic load in a joint caused by impacts of physiologi-cal magnitude to the distal part of an extremity of normal,live human subjects. A method was developed by the calcula-tion of two components of the impulse reaction (parallel andperpendicular to the lower leg) as a measure of the dynamicload in the knee. A theoretical model regarding the lowerlimb as a double pendulum was chosen and equations developed.Five male subjects (20-35 yrs.) were used.
RESULTS: The range of the mass moment of inertia of the lower leg is0.46-0.64 kg.m 2 and for the thigh, 0.39-0.54 kg.m2. Thekinematic data and the calculated components of the impulsereaction in the knee joint are given in tabular form.
SUMMARY: With a normal kicking motion, pattern the direction of thecomponents of the impulse reaction in the knee joint causedby the impact to the lower leg are usually distal andanterior. The impulse reaction thus tends to cause a frac-tion of the lower leg from the thigh and an anterior displa-cement of the proximal part of the lower leg in relation tothe distal part of the thigh.
CITATIONS: Thirteen references.
334

STUDY: Wahrenberg, H., Lindbeck, L., and Elkholm, J. Knee muscularmovement, Tendon tension force and EMG during a vigorousmovement in man. Scand. J. Rehab. Medicine; 1978, 10(2),99-106.
KEYWORDS: Knee muscular movement, tendon tension force, EMG, dynamicload.
METHODS: Six male subjvcts, 20-35 years old, were instructed to give ahard kick to an ordinary soccer football (A), a heavy (3 kg)ball (B), and a ball fixed to a wall (C). The subjects wereinstructed to kick in the sagittal plane. EMG were recordedby means of surface electrodes from m. quadriceps femoris (m.rectus femoris), the hamstring muscles (in. biceps femoris)and m. gastrocnemius. The angular change between thigh andlower leg recorded by an electrogoniometer.
RESULTS: The range of the moments of inertia of the lower leg is0.456-0.642 kg.m2. The m. quadriceps produced a maximummoment of magnittude around 200 Nm with respect to the kneeaxis. The maximum muscular moment occurred early in thesequence of motion in all subjects, when the angle of flexionwas 80-120* (mean 990). The highest extending muscularmoment obtained was 26 Nm (the mean of the highest maximalvalues of the subjects was 180 Nm). The corresponding calcu-lated highest tension force in the patellar tendon was 5200 Nand the mean 3633 N.
SUMMARY: The strength of the muscle tissue appears to he low, and thusthe weakest link in the extensor apparatus of the knee mightbe the muscle. It experiences the same tension as the ten-don, i.e., 7 times body weight. This fits in with clinicalobservation of athletes-partial muscular ruptures are common.
CITATIONS: Nineteen references.
335

STUDY: Watson, A.W.S. The relationship of muscular strength to bodysize and somatype in post-puberal males. Irish J. of Med.Science; 1977, 146(9), 307-308.
KEYWORDS: Muscular strength, body size, body shape.
METHODS: The subjects were 52 post-puberal male school boys aged 16 to18 years. Strength was measured as the sum of left and righthand grip and back strength. Level of habitual activity wasassessed from activity diary entries and the somatotype ofeach subject was determined photoscopically.
RESULTS: Strength was significantly related to all the anthropometricmeasurements studied (i.e., height, weight, humerus diameter,femur diameter, arm circumference, calf circumference, thighcircumference, chest circumference, BA diameter, BI diameter,BSA, thigh volume, and thigh (mtb) volume. When the bodyweight of the subjects was statistically held constantstrength was positively related to arm circumference, thighmuscle + bone volume, fat free weight and bicondylar diame-ters of humerus and femur and negatively related to percen-tage of fat. Strength was related to somatotype componentsbut not to level of habitual activity.
SUMMARY: Multiple regression analysis indicated that about 57 percentof the variance in strength is accounted for by measures ofoverall size and 26 percent by body shape. The best over-allprediction of strength is given by the equation (R = 0.874):
Strength = 1.01 humerus diameter + 3.61 femur diameter+ 0.733 arm circumference + 11.17 mesomorphy- 0.425 calf circumference - 307.22.
CITATIONS: None.
336

STUDY: Watson, A.W.S. A three-year study of the effects of exerciseon active young men. Eur. J. Appl. Physiology; 1979, 40(2),107-115.
KEYWORDS: Physical working capacity, percent fat, isometric strength,
motor ability, somatotype.
METHODS: The subjects were 20 highly active young males aged between18 and 19 years at the start of the study. The followingdata was collected on each subject at intervals of six monthsover a three-year period: height, body weight, hand gripstrength, hack strength, standing long jump score (S.L.,J.),alternate hand wall toss score (A.H.W.T.), Physical WorkingCapacity at a heart rate of 170 beats per minute (PWC170 ) andskinfold thickness on four sites. Somatotype was determinedonce at the beginning of the study.
RESULTS: Body weight and estimated percentage of fat increased overthe three-year period but there were no significant changesin the other variables. Within the three-year period, physi-cal working capacity and relative leanness-fatness showedsignificant variations where are attributed to the state oftraininq of the subjects. Strength was found to be highlyrelated to somatotype, but was apparently not influenced bythe state of training; changes in relative leanness-fatnessoccurring with training were found to be influenced bysomatotype.
RESULTS: It is not clear to what extent the present results can beapplied to other groups of post-puberal males, since althoughthe body fat content of the present subjects was average theyhad higher than normal physical working capacities. Andbeing students of physical education they might be expectedto be above average in motor ability.
CITATIONS: Twenty-one references.
337

STUDY: Williams, R. and Seirig, A.A. Interactive computer modelingof the musculoskeletal systems. IEEE Transactions onFBiomedical Engineering; 1977, BME-24(3), 213-219.
KEYWORDS: Computer, musculoskeletal structure, jaw.
METHODS: A computer program was developed which is programmed with amodel of the human musculoskeletal structure. The user maymodify the model and then can get a printout of what theeffects on the system would be with the modifications. Themodel can calculate forces on muscles and joint reactions.The results are given in formula and graphic display. Thejaw is given as an explanation of the system.
SUMMARY: The program, the author feels, gives great versatility as thebody can be looked at as a whole, or as independent parts.The program has been made as machine independant as possible.It provides simple and manipulative program for the user andadds speed to the tedious task of working with modeling.
CITATIONS: Five references.
338

STUDY: Williams, M. and Stutzman, L. Strength variation through therange of joint motion. The Phys. Ther. Rev.; 1958, 39(3),145-152.
KEYWORDS: Maximum isometric contraction, angle of flexion, sex dif-ference, age difference.
METHODS: There were approximately 10 subjects in each of the adultgroups tested, and 20 in the childrens' group, 10 boys and 10girls. Forces were measured at 30 degree intervals throughthe range of motion of the joint in most cases. A slingattached to a tensiometer was applied to the distal end ofthe segment.
RESULTS: Isometric joint torque curves were given for: elbow flexion,knee extension, knee flexion, shoulder flexion, shoulderhorizontal adduction, and hip adduction. Comparison of men,women and children was also given for knee flexion and hipflexion. The results revealed that in the children's groupthe boys were stronger than the girls, however, the dif-ference was not statistically significant. The difference inmagnitude of the forces between women and children is muchless than between men and women.
SUMMARY: Most isometric joint torque curves studies show a continuousdrop in strength from the elongated position of the primemovers through their range of motion. Among the exceptionare elbow flexion, knee extension, and shoulder adduction.Plateaus or levelling off of force variation occur in some ofthe curves, notably in arm elevation movements.
CITATIONS: Eleven references.
II

STUDY: Zahalak, G.I., Duffy, J., Stewart, P.A., Litchman, H.M.,Hawley, R.H. and Paslay, P.R. Force-velocity-EMG data forthe skeletal muscles of athletes. Technical Report. Centerfor Biophysical Sciences and Biomedical Engineering; BrownUniversity, Providence, RI. November, 1973.
KEYWORDS: Arm flexion and extension, EMG, static and dynamic musclestrengths.
METHODS: A load was applied to the subjects wrist such that the sub-ject could rotate the arm but not move it in any direction.Constant-force springs were used to apply the force. angularpositions of the arm was recorded. EMG was used on thebiceps and triceps muscles and processed through a model 7Driver amplifier. Computer was used to record and storedata. Six males, 18-19 years old were used. Each subjectwas oriented with the procedure one day and tested the next.Static and dynamic tests were made.
RESULTS: Load and velocity were found to remain constant within thesampling interval while the scales of EMG for biceps and tri-ceps were different. Increase in EMG found in the isometricconditions was attributed to fatigue. The research indicatesan increase of EMG with force.
SUMMARY: While EMG was found to increase with force and velocity itremained independent with velocity in arm extension.
CITATIONS: Eighteen references.
340

APEDXE
Seetd ilogah
34

SELECTED BIBLIOGRAPHY
1. Asmussen, E., Hansen, 0., and Lammert, 0. The relationbetween isometric and dynamic muscle strength in man.Communications from the Testing and Observation Instituteof the Danish National Association for Infantile Paraly-sis; 1965, 20, 3-12.
2. Asmussen, E. and Heeboll-Nielsen, K. Isometric musclestrength of adult men and women. Communications from theTesting and Observation Institute of the Danish NationalAssociation for Infantile Paralysis; 1961, 11, 1-44.
3. Ayoub, M. M., Bethea, N. J., Bobo, W. M., Burford, C. L.,Caddel, D. K., Morrissey, S. and Intaranont, K.Biomechanics of Low Coal, Institute of BiotechnologyTexas Tech University, 1979.
4. Ayoub, M. M., Bethea, N. J., Deivanayagam, S., Asfour, S. S.,Liles, D., Mital, A. and Sherif, M. Determination andModeling of Lifting capacity. Institute forBiotechnology Texas Tech University, September, 1978.
5. Bender, J. A, and Kaplan, H.M. Determination of success orfailure in dynamic (isotonic) movements by isometricmethods. The Research Quarterly; 1966, 37(1), 3-8.
6. Berger, R. A. and Henderson, J. M. Relationship of power tostatic and dynamic strength. The Research Quarterly;1966, 37(1), 9-13.
7. Berger, R. A. and Higginbotham, R. B. Prediction ofdynamic strength from static strength in hip and kneeextension. American Corrective Therapy Journal; 1970,24, 118-120.
8. Bigland-Ritchie, 8. and Woods, J. J. Integrated EMG and
Oxygen uptake during dynamic contraction of humanmuscles. Journal of Applied Physiology; 1974, 36(4),475-479.
9. Caldwell, L. S. Relative muscle loading and endurance.Journal of Engineering Psychology; 1963, 2, 155-161.
10. Caldwell, L. S. The load-endurance relationship for staticmanual response. Human Factors; 1964, 6(l), 71-79.
. "dwe, L. . .,13 ..... I',,,su ,, en ol static muscle endu.......
Journal of Engineering Psychology; 1964, 3, 16-22.
342

12. Caldwell, L. S., Chaffin, D. B., Dukes-Dobos, F. N.,Kroemer, K. H. E., Laubach, L. L., Snook, S. H., andWasserman, D. E. A proposed standard procedure for sta-tic muscle strength testing. Am. Ind. Hyg. Assoc.Journal; 1974, 35(4), 201-206.
13. Carlson, B. R. Relationship between isometric and isotonicstrength. Archives of Physical Medicine and Rehabili-tation; 1970, 51, 176-179.
14. Carlson, R. B. and McCraw, L. W. Isometric strength andrelative isometric endurance. The Research Quarterly;1971, 42(3), 244-250.
15. Carlsoo, S. Testing the back and lifting capacity. Scand.J. Rehahil. Med. (SE); 1978, 10(6), 164-168.
16. Chaffin, D. B. Graphical prediction of human strengths fortwo-handed IV/EVA Tasks, Phase I Report IndustrialEngineering Human Performance Group, The University ofMichigan, for Biomedical Division - NASA - / MSC underContract NAS9 - 10973, Ann Arbor, Michigan, April 1971.
17. Chaffin, D. B. Human strength capability and low backpain. Journal of Occupational Medicine; 1974, 16(4),248-254.
18. Chaffin, D. B. Ergonomics guide for the assessment ofhuman static strength. Am. Ind. Hyg. Assoc. Journal;1975, 36(6), 505-511.
19. Chaffin, D. B., Herrin, G. D., and Keyserling, W.M.Preemployment strength testing. J. Occup. Med. (US);
1978, 20(6), 403-408.
20. Chapman, A. E. and Belanger, A. Y. Electromyographicmethods of evaluating strength training.Electromyographic Clin. of Neurophysiology; 1977,17(3-4), 265-280.
21. Christensen, C. S. Relative strength in males and females.Atheletic Training; 1975, 10(4), 189-192.
22. Clarke, H. H., Elkins, E. C., Martin, G. M. and Wakim, K.G.Relationship between body position and the application ofmuscle power to movements of the joints. Archives ofPhysical Medicine; Feb. 1950, 81-89.
23. Clarke, R. S. J., Hellon, R. F., and Lind, A. R. Theduration of sustained contractions of the human forearmat different muscle temperature. J. Physioloqy; 1958,143, 454-473.
343

24. Cooper, D. F., Grimby, G., Jones, D. A., and Edwards, R. H. T.Perception of effort in isometric and dynamic muscularcontraction. Eur. J. App,. Physiology; 1979, 41(3),173-180.
25. Corlett, E. N. and Bishop, R. P. Foot pedal forces forseated operators. Ergonomics; 1975, 18(6), 687-692.
26. Crosby, P. A. Use of surface electromyogram as a measureof dynamic force in human limb muscles. Med. and Biol.Eng. and Comput.; 1978, 16, 519-524.
27. Crowninshield, R. D. Use of optimization techniques topredict muscle forces. Transactions of the ASME; 1978,100(2), 88-92.
28. Currier, D. P. Maximal isometric tension of the elbowextensors at varied positions; Part I. Assessment bycable tensiometer. Phys, Ther.; 1972, 52(10), 1043-1049.
29. Currier, D. P. Maximal isometric tension of the elbowextensors at varied positions: Part 2. Assessment ofextensor components by quantitative electromyography.Physical Therapy; 1972, 52(12), 1265-1276.
30. Currier, D. P. Evaluation of the use of a wedge in quadri-ceps strengthening. Physical Therapy; August, 1975,55(8), 870-874.
31. Danoff, J. V. Power produced by maximal velocity elbowflexion. Journal of Biomechanics; 1978, 11(10-12),481-486.
32. Davis, P. R. and Stubbs, D. A. Safe levels of manual for-ces for young males (this is a three-part series).Applied Ergonomics. Part (1): 1977, 8(3), 141-150; Part(2): 1977, 8(4), 219-228; Part (3): 1978, 9(1), 33-37.
33. Doss, W. S. and Karpovich, P. V. A comparison of con-centric, eccentric and isometric strength of elbowflexors. Journal of Applied Physiology; 1965, 20,351-353.
34. Duncan, G., Lambie, D.G. and Johnson, R.H. Ventilatoryresponses to sustained static forearm exercise in man.New Zealand Med. Journal; 1978, 88(618), 169.
35. Edwards, R. 1. T. and Htyde, S. Methods of measuring musclestrength and fatigue. Physiotherapy; 1977, 63(2), 51-55.
36. Elliott, J. Assessinq muscle strength isokinetically.Jama; 1978, 240(22), 2408-2410.
344

24. Cooper, D. F., Grimby, G., Jones, D. A., and Edwards, R. H. T.Perception of effort in isometric and dynamic muscular
contraction. Eur. J. Appl. Physiology; 1979, 41(3),173-180.
25. Corlett, E. N. and Bishop, R. P. Foot pedal forces forseated operators. Ergonomics; 1975, 18(6), 687-692.
26. Crosby, P. A. Use of surface electromyogram as a measureof dynamic force in human limb muscles. Med. and Biol.Eng. and Comput.; 1978, 16, 519-524.
27. Crowninshield, R. D. Use of optimization techniques topredict muscle forces. Transactions of the ASME; 1978,100(2), 88-92.
28. Currier, D. P. Maximal isometric tension of the elbowextensors at varied positions; Part I. Assessment bycable tensiometer. Phys, Ther.; 1972, 52(10), 1043-1049.
29. Currier, D. P. Maximal isometric tension of the elbowextensors at varied positions: Part 2. Assessment ofextensor components by quantitative electromyography.Physical Therapy; 1972, 52(12), 1265-1276.
30. Currier, D. P. Evaluation of the use of a wedge in quadri-ceps strengthening. Physical Therapy; August, 1975,55(8), 870-874.
31. Danoff, J. V. Power produced by maximal velocity elbowflexion. Journal of Biomechanics; 1978, 11(10-12),481-486.
32. Davis, P. R. and Stubbs, D. A. Safe levels of manual for-ces for young males (this is a three-part series).Applied Ergonomics. Part (1): 1977, 8(3), 141-150; Part(2): 1977, 8(4), 219-228; Part (3): 1978, 9(1), 33-37.
33. Doss, W. S. and Karpovich, P. V. A comparison of con-centric, eccentric and isometric strength of elbowflexors. Journal of Applied Physiology; 1965, 20,351-353.
34. Duncan, G., Lambie, D.G. and Johnson, R.H. Ventilatoryresponses to sustained static forearm exercise in man.New Zealand Med. Journal; 1978, 88(618), 169.
35. Edwards, R. H. T. and Hyde, S. Methods of measuring musclestrength and fatigue. Physiotherapy; 1977, 63(2), 51-55.
36. Elliott, J. Assessing muscle strenqth isokinetically.Jama; 1978, 240(22), 2408-2410.
344

37. Falkel, J. Planter flexor strength testing using the cybexisokinetic dynamometer. Phys. Ther.; 1978, 58(7),847-850.
38. Fay, D.F., Jones, N.B., Porter, N.H. and Wood, R.A.Developments in apparatus for dynamic in vitro testing ofhuman muscle: Part 1. Mechanical design, environmentcontrol and stimulation. Medical and BiologicalEngineering; 1974, 12(5), 647-653.
39. Fisher, B. A Biomechanical Model for the Analysis ofDynamic Activities. M.S.I.E. Thesis, University ofMichigan Ann Arbor, Michigan, 1967.
40. Freund, H. J. and Budingen, H. J. The relationship betweenspeed and amplitude of the fastest voluntary contractionsof human arm muscles. Experimental Brain Research; 1978,31(1), 1-12.
41. Grasley, C., Ayoub, M. M. and Bethea, N. J. Male-femaledifferences in variables affecting performance.Proceedings of the Human Factors Society, 22nd annualmeeting; 1978, 416-420.
42. Haffajee, D., Moritz, U. and Svantesson, G. Isometric kneeextension strength as a function of joint angle, musclelength and motor unit activity. Acta Orthop. Scand.;1972, 43(2), 138-147.
43. Hatze, H. The complete optimization of a human motion.Mathematical Biosciences; 1976, 28, 99-135.
44. Heyward, V. Relationship between static muscle strengthand endurance: An interpretive review. AmericanCorrectional Therapy Journal; 1975, 29(3), 67-72.
45. Heyward, V. and McCreary, L. Analysis of the staticstrength and relative endurance of women athletes; TheResearch Quarterly; 1977, 48(4), 703-719.
46. Heyward, V. and McCreary, L. Comparisons of the relativeendurance and critical occluding tension levels of menand women. Research Quarterly; 1978, 49(3), 301-307.
47. Hight, T. K., Piziali, R. L., and Nagel, D. A. A dynamicnonlinear finite-element model of a human leg. Journalof Biomechanical Engineering - Trans. of ASME; 1979,101(3), 176-184.
48. Hulten, B., Thorstensson, A., Sjodin, B., and Karlsson, J.Relationship between isometric endurance and fibre typesin human leg muscles. Acta Physiol. Scand.; 1975, 93(1),135-138.
345

49. Huston, R. L, Passerello, C. E., Hessel, R. E., and Harlow,M. W. On human body dynamics. Annals of BiomedicalEngineering; 1976, 4(l), 25-43.
50. Ikai, M. and Steinhaus, A. H. Some factors modifying theexpression of human strength. Journal of AppliedPhysiology; 1961, 16, 157-163.
51. Ingemann-Hansen, T. and Halkjaer-Kristensen, J. Force-velocity relationships in the human quadriceps muscles.
Ii Scand. J. Rehab. Medicine; 1979, 11(2), 85-89.
52. Jackson, A. S. and Frankiewicz, R. J. Factorial expressionsof muscular strength. Research Quarterly; 1975, 46(2),206-217.
53. Jensen, R. K. Dynamometer for static and dynamic measure-ments of rotationel movements. The Research Quarterly;1976, 47(1), 56-61.
54. Johnson, J. and Siegel, 0. Reliability of an isokineticmovement of the knee extensors. The Research Quarterly;1978, 49(1), 88-90.
3 55. Jonsson, B. and Hagberg, M. The effect of differentworking heights on the deltoid muscle. Scand. J.Rehab. Med.; 1974, 9(Suppl. 3), 26-32.
56. Kamen, G. Serial isometric contractions under imposedmyotatic stretch conditions in high-strength and low-strenqth men. European J. of Appl. Physiol. and Occup.Physiology, 1979, 41(2), 73-82.
57. Kamon, E. and Goldfuss, A. J. In-plant evaluation of themuscle strength of workers. Am. Ind. Hyg. Assoc.Journal; 1978, 38(10), 801-807.
58. Katch, F. I., McArdle, W. D., Pechar, G. S. and Perrine, J.J.Measuring leg force-output capacity with an isokineticdynamometer-bicycle ergometer. Research Quarterly;1974, 45(1), 86-91.
59. Kitagawa, K. and Miyashita, M. Muscle strengths in rela-tion to fat storage rate in young men. European Journalof Applied Physiology; 1978, 38(3), 189-196.
60. Knapik, J., Kowal, D., Riley, P., Wright, J. and Sacco, M.Development and description of a device for staticstrength measurement in the armed forces examination andentrance station. U.S. Army Research Institute ofEnvironmental Medicine, Natick, MA. Technical Report.January 9, 1979.
3 346

61. Kroemer, K. H. E. Human Strength: Terminology, measure-ment, and interpretation of data. Human Factors, 1970,12(3), 297-313.
62. Kroemer, K.H.E. Muscle strength as a criterion in controldesign for diverse populations. A. Chapanis (Ed.) inEthnic Variables in Human Factors Engineering.Baltimore: The Johns Hopkins Press, 1975, 67-89.
63. Kroemer, K.H.E. and Howard, T.M. Toward standardization ofmuscle strength testing. Medicine and Science in Sports;1970, 2(4), 224-230.
64. Kroll, W. "Isometric fatigue curves under variedintertrial recuperation periods." Research Quarterly;1968, 39(1), 106-115.
65. Kroll, W. Recovery patterns after local muscular fatiguefor different levels of isometric strength in college agefemales. American Corrective Therapy Journal; 1971,25(5), 132-138.
66. Kroll, W. and Clarkson, P.M. Age, isometric knee extensionstrength and fractionated resisted response time.Experimental Aging Research; 1978, 4(5), 389-409.
67. Lamphiear, D.E. and Montoye, H.J. Muscular strength andbody size. Human Biology; 1976, 48(1), 147-160.
68. Larsson, L., Grimby, G., and Karlsson, J. Muscle strengthand speed of movement in relation to age and musclemorphology. Journal of Applied Physiology; March, 1979,46(3), 451-456.
69. Larsson, L. and Karlsson, J. Isometric and dynamicendurance as a function of age and skeletal musclecharacteristics. Acta Physiol. Scandanavia; 1978,104(2), 129-136.
70. Laubach, L. L. Body compostion in relation to musclestrength and range of joint motion. Journal of SportsMedicine and Physical Fitness, 1969, 9(2), 89-97.
71. Laubach, L.L. Comparative muscular strength of men andwomen: A review of the literature. Aviation, Space andEnvironmental Medicine; 1976, 47(5), 534-542.
72, Laubach, L. L.- Kroemer, K_ Hz E., and Thordsen, M_ L:Relationships among isometric forces measured in aircraftcontrol locations. Aerospace Medicine; 1972, 43,738-742.
347

73. Laubach, L. L. and McConville, J. T. The relationship ofstrength to body size and typology. Medicine and Sciencein Sports; 1969, 1(4), 189-194.
74. Less, M., Krewer, S. E., and Eickelberg, W. W. Exerciseeffect on strength and range of motion of hand intrinsicmuscles and joints. Arch. Phys. Med. Rehabil.; 1977,58(8), 370-374.
75. Lind, A. R., Burse, R., Rochelle, R. H., Rinehart, J. S. andPetrofsky, J. S. Influence of posture on isometric fati-gue. Journal of Applied Physiology; 1978, 45(2),270-274.
76. Lindh, M. Increase of muscle strength from isometricquadriceps exercises at different knee angles.Scandinavian Journal of Rehab. Medicine; 1979, 11(l),33-36.
77. MacIntosh, D. The structure and nature of strength.Journal of Sports Medicine; 1974, 14(3), 168-177.
78. McClements, L. E. Power relative to strength of leg andthiqh muscles. The Research Quarterly; 1966, 37(1),71-78.
79. McGlynn, G.H. The relationship between maximum strengthand endurance of individuals with different levels ofstrength research quarterly; 1969, 40(3), 529-535.
80. McGlynn, G.H. and Murphy, L.E. The effects of occludedcirculation on strength and endurance at different levelsof strength. American Corrective Therapy Journal; 1971,25(2), 42-47.
81. Mendler, H. M. The hydraulic isometric force testing unitK-100. Physical Therapy; 1972, 52(4), 393-398.
82. Moffroid, M. T. and Kusiak, E. T. The power struggle:Definition and evaluation of power of muscular perfor-mance. Physical Therapy; 1975, 55(10), 1098-1104.
83. Montoye, H. J. and Lamphiear, D. E. Grip and arm strengthin males and females, age 10 to 69. The ResearchQuarterly; 1977, 48(1), 109-120.
84. Morris, J. R. W. Accelerometry - A technique for themeasurement of human body movements. Journal ofBiomechanics; 1973, 6(6), 729-736.
85. Mortimer, R. G. Foot brake pedal force capability of dri-vers. Ergonomics; 1974, 17(4), 509-513.
348

86. Murray, M. P., Baldwin, J. M., Gardner, G. M., Sepic, S. B.,
and Downs, W. J. Maximum isometric knee flexor andextensor muscle contractions: Normal patterns of tnrqueversus time. Physical Therapy; June, 1977, 57(6),637-643.
87. Noble, L. and McCraw, L. W. Comparative effects of iso-metric and isotanic training programs on relative-loadendurance and work capacity. Research Quarterly; 1973,44(1), 96-108.
88. Nordesjo, L.O. and Nordgren, B. Static and dynamicmeasurirg of muscle function; Scand. Journal ofRehabilitative Medicine; 1978, 10(6), 33-42.
89. Nordgren, B. Anthropometric measures and muscle strengthin young women. Scand. J. of Rehabil. Medicine; 1972, 4,165-169.
90. Nordgren, B., Elmeskog, A., and Nilsson, A. Method formeasurement of maximal isometric muscle strength withspecial reference to the fingers. tIpsala Journal MedicalScience; 1979, 84(2), 188-194.
91. Nylind, B., Schele, R., and Linroth, K. Changes in maleexercise performance and anthropometric variables betweenthe ages of 19 and 30. European Journal of AppliedPhysiology and Occupational Physiology; 1978, 38(2),145-150.
92. Nyquist, G. W. and Murton, C. J. Static bendinq response ofthe human lower torso. Proc. Stapp Car Crash Conference,19th; 1975, 513-541.
93. Olson, V. L., Smidt, G. L. and Johnston, R. C. The maximumtorque generated by the eccentric, isometric, and con-centric contractions of the hip abductor muscles.Physical Therapy Journal; 1977, 52(2), 149-158.
94. Osternig, L. R. Optimal isokinetic loads and velocitiesproducing muscular power in human subjects. Archives ofPhys. Med. and Rehab. 1975; 56(4), 152-155.
95. Osternig, L. R., Bates, B. T., and James, S. L. Isokineticand isometric torque force relationships. Archives Phys.Med, Rehab., 1977, 58(6), 254-257.
96. Pattor R. W., Hinson, M. M., Arnold, B. R., Jr., andLessdrd, B. Fatigue curves of isokinetic contractions.Arch. Phys. Med. Rehabil; 1978, 59(11), 507-509.
349

97. Pearn, J. Two early dynamometers: An historical accountof the earliest measurements to study human muscularstrength. Journal of the Neurological Sciences; 1978,
98. Pedotti, A., Krishnan, V.V., and Stark, L. Optimization ofmuscle-force sequencing in human locomotion.Mathematical Biosciences; 1978, 38(1-2), 57-76.
99. Perrine, J. J. and Edgerton, V. R. Muscle force-velocityand power-velocity relationships under isokineticloading. Medicine and Science in Sports; 1978, 10(3),159-166.
100. Petrofsky, J.S. and Lind, A.R. Aging, isometric strengthand endurance and cardiovascular responses to staticeffort. Journal of Applied Physiology; 1975, 38(1),91-95.
101. Petrofsky, J. S. and Lind, A. R. Isometric strength,endurance, and the blood pressure and heart rate respon-ses during isometric exercise in healthy men and women,with special reference to age and body fat content.Pflugers Arch. European J. of Physiology; 1975, 360(1),49-61.
I12. Petrofsky, J. S., Rochelle, R. R., Rinehart, J. S., Burse,R. L., and Lind, A. R. The assessment of the static com-ponent in rhythmic exercise. Europ. J. Appl. Physiology;1975, 34(1), 55-63.
103. Pipes, T. V. Variable resistance versus constant resistancestrength training in adult males. European Journal ofApplied Physiology and Occupational Physiology; 1978,39(1), 27-35.
104. Pipes, T. V. and Wilmore, J. H. Isokinetic vs. isotonicstrength training in adult men. Med. and Science inSports. 1975, 7(4), 262-274.
105. Poppen, N. K. and Walker, P. S. Forces at the glenohumeraljoint in abduction. Clinical Orthopaedic and RelatedResearch; September, 1978, 135, 165-170.
106. Poulsen, E. Prediction of maximum loads in liftinq frommeasurement of back muscle strength. Prog. Phys.Therapy; 1970, 1(2), 146-149.
107. Poulsen, E. Studies of back load, tolerance limits duringlifting of burdens. Scand. J. Rehabil. Med. (SE); 1978,10(6), 169-172.
350

108. Rasch, P. J. and Pierson, W. R. Some relationships of iso-metric strength, isotonic strength, and anthropometricmeasures. Ergonomics; 1963, 6, 211-215.
1 109. Rohmert, W. Problems in determing rest allowances. Part1: Use of modern methods to evaluate stress and strainin static muscular work. Appl. Ergonomics; 1973, 4(2),91-95.
110. Royce, J. Isometric fatigue curves in human muscle withnormal and occluded circulation. Research Quarterly;1958, 29(2), 204-212.
111. Salter, N. The effect on muscle strength of maximum iso-metric and isotonic contractions at different repetitionrates. Journal of Physiology. 1955, 130, 109-113.
112. Sargeant, A. J. and Davies, C. T. M. Forces applied ton cranks of a bicycle ergometer during one-and two-leg
cycling. Journal of Applied Physiology; 1977, 42(4),514-518.
113. Seireg, A. and Arvikar, R. J. A mathematical model form evaluation of forces in lower extremeties of the musculo-
skeletal system. Journal of Biomechanics; 1973, 6(3),313-326.
114. Shaver, L. G. Maximum dynamic strength, relative dynamic
endurance, and their relationships. Research Quarterly;1971, 42(4), 460-465.
5 115. Shaver, L. G. The relationship between maximum isometricstrength and relative isotonic endurance of athletes withvarious degrees of strength. Journal of Sports Medicineand Physical Fitness; 1973, 13(4), 231-237.
116. Shephard, R. J. A brief bibliography in fatigue andfitness. Journal of Occupational Medicine; 1974,16(12), 804-808.
117. Singh, M. and Buck, T. M. Leg-lift strength test withI electrogoniometric analysis of knee angle. Arch. Phys.
Med. Rehabil., June, 1975, 56(6), 261-264.
118. Singh, M. and Karpovich, P. V. Isotonic and isometric for-ces of forearm flexors and extensors. Journal of AppliedPhysiology; 1966, 21, 1435-1437.
* 119. Smidt, G. L. Biomechanical analysis of knee flexion and
extension. Journal of Biomechanics; 1973, 6(1), 79-92.
1~351

120. Soechting, J. F. and Roberts, W. J. Transfer charac-teristics between EMG activity and muscle tension underisometric conditions in man. J. Physiol. Paris; 1975,70(6), 779-793.
121. Start, K. B. and Graham, J. S. Relationship between therelative and absolute isometric endurance of an isolatedmuscle group. Research Quarterly; 1964, ?5(2),193-204.
122. Start, K. B., Gray, R. K., Glencross, D. J. and Walsh, A.A factorial investigation of power, speed, isometricstrength and anthropometric measures in the lower limb.The Research Quarterly; 1966, 37(4), 553-559.
123. Stern, J. T., Jr. Computer modelling of gross muscle dyna-mics. J. Biomech; 1974, 7(5), 411-428.
124. Studd, G. A. and Kearney, J. T. Recovery of muscularendurance following submaximal, isometric exercise.Medicine and Science in Sports, 1978, 10(2), 109-112.
125. Svohoda, M. Influence of dynamic muscular fatigue andrecovery on static strength. The Research Quarterly;1973, 44(4), 389-396.
126. Tesch, P. and Karlsson, J. Lactate in fast and slow twitchskeletal muscle fibres of man during isometric contrac-tion. Acta Physiol. Scand.; 1977, 99(2), 230-236.
127. Tesch, P. and Karlsson, J. Isometric strength performanceand muscle fiber type distribution in man. Acta Physiol.Scand. 1978, 103(1), 47-51.
5 128. Thorstensson, A., Grimby, G., and Karlsson, J. Force-velocity relations and fiber composition in human kneeextensor muscles. J. Appl. Physiology, 1976, 40(1),
5I 12-16.
129. Thorstensson, A., Karlsson, J., Viitasalo, J. H. T.,Luhtanen, P., and Komi, P. V. Effect of strengthtraining on EMG of human skeletal muscle. Acta Physiol.Scand.; 1976, 98(2), 232-236.
130. Thorstensson, A., Larsson, L., Tesch, P., and Karlsson, J.Muscle strength and fiber composition in athletes andsedentary men. Medicine and Science in Sports; 1977,
19(l), 26-30.
131. Troup, J. D. G. and Chapman, A. E. The strength of theflexor and extensor muscles of the trunk. J.Biomechanics; 1969, 2, 49-62.
5 352
I

132. Tuttle, W. W., Janney, C. 0., and Thompson, C. W.Relation of naximum grip strength to grip strengthendurance, Journal of Applied Physiology; 1950, 2,663-670.
133. Velsher, E. Performance Feedback effect on results of iso-metric exercise. Physiotherapy Canada; 1977, 29(4),185-189.
134. Viitasalo, J. T. and Komi, P. V. Force-time charac-teristics and fiber composition in human leg, extensormuscle. European J. Appl. Physiol.; 1978, 40(1), 7-15.
135. Wahrenberg, H., Lindbeck, L., and Ekhold, J. Dynamic loadin the human knee joint during voluntary active impact tolower leg. Scand. J. of Rehah. Medicine; 1978, 10(2),93-98.
136. Wahrenberg, H., Lindbeck, L., and Elkholm, J. Knee muscularmovement, tendon tension force and EMG during a vigorousmovement in man. Scand. J. Rehab. Medicine; 1978, 10(2),99-106.
137. Watson, A. W. S. The relationship of muscular strength tobody size and somatype in post-puberal males. Irish J.of Med. Science; 1977, 146(9), 307-308.
138. Watson, A. W. S. A three-year study of the effects ofexercise on active young men. Eur. J. Appl. Physioloqy;1979, 40(2), 107-115.
139. Williams, M. and Stutzman, L. Strength variation throughthe range of joint motion. The Phys. Ther. Rev.; 1958,39(3), 14-152.
140. Williams, R. and Seirig, A. A. Interactive computermodeling of the musculoskeletal systems. IEEETransactions on Biomedical Engineering; 1977, BME-24(3),213-219,
141. Zahalak, G. I., Duffy, J., Stewart, P. A., Litchman, H. M.,Hawley, R. H. and Paslay, P. R. Force-velocity-EMG datafor the skeletal muscles of athletes. Technical Report.Center for Biophysical Sciences and BiomedicalEngineering. Brown University, Providence, RI. November,1973.
353