Instituciones políticas y el colapso del crecimiento
29
Inter-American Development Bank Banco Interamericano de Desarrollo (BID) Research department Departamento de investigación Working Paper #419 Political Institutions and Growth Collapses Alejandro Gaviria Ugo Panizza Jessica Seddon Ernesto Stein inter-american development bank May 2000
Transcript of Instituciones políticas y el colapso del crecimiento

Inter-American Development Bank
Banco Interamericano de Desarrollo (BID)
Research department
Departamento de investigación
Working Paper #419
Political Institutions and Growth Collapses
Alejandro GaviriaUgo Panizza
Jessica SeddonErnesto Stein
inter-american development bank
May 2000

2
Cataloging-in-Publication data provided by theInter-American Development BankFelipe Herrera Library
Political institutions and growth collapses / Alejandro Gaviria … [et al].
p. cm. (Research Dept. Working paper series ; 419)Includes bibliographical references.
1. Economic development--Effect of Conflict management on. 2. Crisismanagement in government. I. Gaviria Trujillo, Alejandro. II. Inter-AmericanDevelopment Bank. Research Dept. III. Series.
303.69 P86--dc21
82000Inter-American Development Bank1300 New York Avenue, N.W.Washington, D.C. 20577
The views and interpretations in this document are those of the authors and should not beattributed to the Inter-American Development Bank, or to any individual acting on itsbehalf.
The Research Department (RES) publishes the Latin American Economic PoliciesNewsletter, as well as working papers and books, on diverse economic issues. To obtain acomplete list of RES publications, and read or download them please visit our web site at:http://www.iadb.org/res/32.htm

3
Abstract*
This paper tests whether Rodrik’s (1999) results that institutions for conflict management areassociated with the ability to react to economic shocks are robust to different ways of defining thequality of such institutions. We measure the quality of conflict management institutions with twodifferent indices. The first is an index of political constraints on the ability of the executive toimpose its will. These constraints limit the ability of the government to arbitrarily change the rulesof the game and therefore may reduce redistributive struggles. The second index measures thedegree of political particularism. We define political particularism as the policymakers’ ability tofurther their career by catering to narrow interests rather than broader national platforms. Theindices used in this paper solve the endogeneity and subjectivity biases that affect Rodrik’smeasure of institutional quality. We find strong support for the idea that high levels of politicalconstraints and intermediate levels of political particularism are associated with a quick recoveryfrom economic shocks.
JEL Codes: K1; O1; D74.Keywords: Growth; Institutional efficiency; Political particularism; Conflict and conflictresolution.
* Gaviria, Panizza, and Stein are at the Research Department of the Inter-American Development Bank,1300, New York Ave. NW, 20577 Washington, D.C. Email: [email protected];[email protected]; [email protected]. Seddon is in the Political Economics program at theGraduate School of Business, Stanford University. Email: [email protected] would like to thank Witold Henisz for useful comments and sharing his data with us and JeffreyFrieden, Stephan Haggard, Dani Rodrik, and participants in seminars at Harvard University’s Center forBasic Research in the Social Sciences, the Inter-American Development Bank, and the LACEA-PEGmeeting in Cartagena for useful comments.

4

5
1. Introduction
In a series of recent papers, Rodrik (1999, 2000a, 2000b) asks the question, “Why did so many
countries that grew at a satisfactory rate during the 1960s and early 1970s experience collapses in
their growth rates after the economic shocks of the mid 1970s?” In these papers, Rodrik argues
that the ability to recover from external shocks depends on the level of latent social conflict and on
the quality of a country’s institutions for conflict management. According to Rodrik, countries that
have low levels of latent social conflict and good institutions for conflict management can
implement policies that minimize the effects of the shock on the economy and quickly resume their
growth process. The opposite is true in countries with high latent social conflict and poor
institutions where, in the best case, necessary reforms will be delayed and, in the worst case, the
shock will generate distributional conflicts that may lead to an economic collapse. Rodrik
illustrates this point with the example of how South Korea, Brazil, and Turkey reacted to the oil
shock of the mid-1970s. While Korea, thanks to its adjustment policies, was able to quickly resume
growth, Brazil and Turkey experienced an economic collapse. Rodrik attributes these diverse
experiences to the fact that Korea lacked latent social conflict and had better institutions for
conflict management. The importance of these institutions extends to windfalls as well as shocks:
the experience of, among others, Nigeria and Venezuela show that distributional conflicts that lead
to bad policies can also arise from positive terms of trade shocks (Tornell and Lane, 1999).
Rodrik (1999) tests his hypothesis by regressing changes in growth over a set of standard
control variables plus a measure of terms of trade shock, a measure of latent social conflict, and an
indicator of the quality of institutions for conflict management (to this purpose he uses both an
index of institutional quality and a measure of democracy).
In this paper, we suggest that the indicator of institutional quality used by Rodrik suffers
from two sources of bias and we propose a set of alternative measures of institutional quality.
Rodrik (1999) uses the International Country Risk Guide (ICRG) index of quality of government
institutions to measure institutional quality. There are two possible problems with this measure.
First, the ICRG index is partly based on the subjective perceptions of a country’s level of
institutional quality.1 This subjective index may be influenced by a country’s overall economic
condition (the subjectivity bias). Also, since the ICRG index of institutional quality is not
1 In particular, the political risk assessments are made on the basis of subjective analysis of the availableinformation, the financial risk assessments on a mix of subjective analysis and objective data, and theeconomic risk solely on the basis of objective data.
6
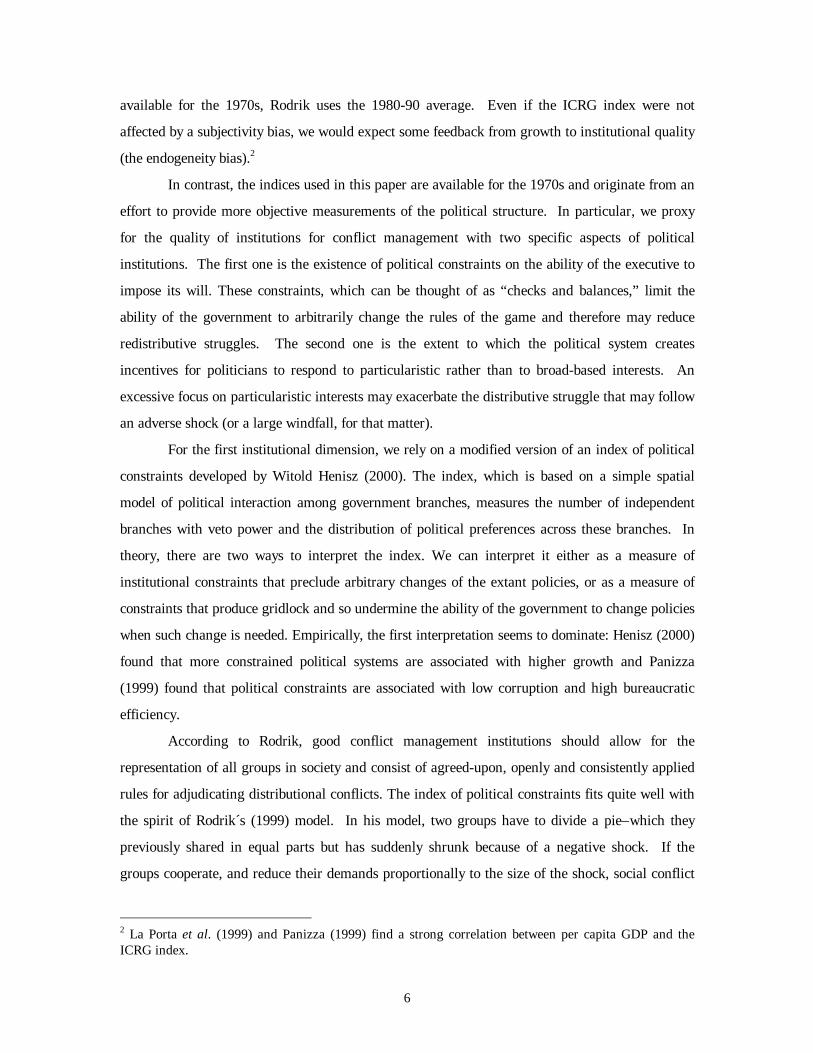
available for the 1970s, Rodrik uses the 1980-90 average. Even if the ICRG index were not
affected by a subjectivity bias, we would expect some feedback from growth to institutional quality
(the endogeneity bias).2
In contrast, the indices used in this paper are available for the 1970s and originate from an
effort to provide more objective measurements of the political structure. In particular, we proxy
for the quality of institutions for conflict management with two specific aspects of political
institutions. The first one is the existence of political constraints on the ability of the executive to
impose its will. These constraints, which can be thought of as “checks and balances,” limit the
ability of the government to arbitrarily change the rules of the game and therefore may reduce
redistributive struggles. The second one is the extent to which the political system creates
incentives for politicians to respond to particularistic rather than to broad-based interests. An
excessive focus on particularistic interests may exacerbate the distributive struggle that may follow
an adverse shock (or a large windfall, for that matter).
For the first institutional dimension, we rely on a modified version of an index of political
constraints developed by Witold Henisz (2000). The index, which is based on a simple spatial
model of political interaction among government branches, measures the number of independent
branches with veto power and the distribution of political preferences across these branches. In
theory, there are two ways to interpret the index. We can interpret it either as a measure of
institutional constraints that preclude arbitrary changes of the extant policies, or as a measure of
constraints that produce gridlock and so undermine the ability of the government to change policies
when such change is needed. Empirically, the first interpretation seems to dominate: Henisz (2000)
found that more constrained political systems are associated with higher growth and Panizza
(1999) found that political constraints are associated with low corruption and high bureaucratic
efficiency.
According to Rodrik, good conflict management institutions should allow for the
representation of all groups in society and consist of agreed-upon, openly and consistently applied
rules for adjudicating distributional conflicts. The index of political constraints fits quite well with
the spirit of Rodrik´s (1999) model. In his model, two groups have to divide a pie–which they
previously shared in equal parts but has suddenly shrunk because of a negative shock. If the
groups cooperate, and reduce their demands proportionally to the size of the shock, social conflict
2 La Porta et al. (1999) and Panizza (1999) find a strong correlation between per capita GDP and theICRG index.

7
will be avoided and both groups will be able to maintain their pre-shock shares. Distributive
struggle can instead arise if the groups decide to fight in order to keep their pre-shock incomes. In
this framework, weak institutions for conflict resolution may give the various social groups the
hope that they will be likely to win in a distributive fight, thus providing an incentive against
cooperation. So, in Rodrik’s model, good institutions for conflict management are those that yield
an equilibrium in which the payoff of cooperation is higher than that of fighting. In other words, a
well-defined set of rules and constraints and a wide range of interests represented in policymaking
reduce the scope for distributive conflict because people realize they can “kick and scream and
yell” but their share of the pie will not change. In this ideal world, fighting does not pay and all
parties will moderate their demands to avoid the costs of a distributive struggle.
Political constraints, on the other hand, may lead to gridlock and inaction, thus preventing
the adoption of necessary adjustment policies. This is an issue of credibility of policy changes
versus flexibility and, as theorists say, it is essentially an empirical question. However, it should be
pointed out that the fact that reforms are more difficult to implement is a consequence of having
more representation.3 Graham et al. (1999) find that reforms that are implemented through formal
institutions and accepted after negotiations with many groups by a majority of society are more
likely to be successful. To the extent that high political constraints increase the participation
process and make it difficult to arbitrarily change distributionally sensitive policies, the index
should be a very appropriate proxy for Rodrik’s idea of “institutions that adjudicate distributional
contests within a framework of rules and accepted procedure–that is, without open conflict and
hostilities” (Rodrik, 1999, p. 386).
According to Rodrik, good institutions of conflict resolution should not only
provide credible checks on arbitrary bendings of the rules of the game, but also guarantee
an open and participatory discussion of public matters (this is why he emphasizes the role
of democracy). So, according to Rodrik, credibility and democracy are the main yardsticks
against which we should measure the ability of a country’s institutions to mediate potential
distributional struggles. We think that the index of political constraints incorporates these
two elements: the index provides both an adequate measure of democracy and, for
3 The index of political constraints can also be thought of as a measure of the number of interests that theexecutive has to take into account when making a decision and a high value of the index means that awider variety of interests are formally represented.

8
countries with the same level of democracy, a compelling measure of the credibility of
public policy.
For the second institutional dimension, we use data on electoral rules to create an index of
political particularism. Following theoretical work on the subject by Carey and Shugart (1995)
and Shugart (1999), we define political particularism as the ability of policymakers to further their
careers by catering to narrow interests rather than to broader national platforms. The index can be
seen as a measure of one type of particularistic incentives: those that arise from legislators’ efforts
to build personal bases of support in geographically defined constituencies.4 A high score of the
index indicates that the system is “candidate-centered,” with strong incentives for politicians to
cater to narrow geographical interests. A low score, however, is more ambiguous, as “party-
centered” only indicates low particularism to the extent that parties themselves have broad national
interests.
The relationship between particularism and the ability to recover from an economic shock
is ambiguous. If we assume that the main distributional struggle following the shock will arise
along a regional dimension, then we should find that a high value of our index leads to poor
conflict management policies, and to slow recovery. The opposite should be true if the main
conflict is between groups that are homogeneously represented across regions (say workers versus
capitalists, or public sector employees). In the latter case, party-centered systems with narrow
party interests could exacerbate the distributional conflict.
Furthermore, while particularistic systems may be affected by excessive “pork barrel”
policies, these systems have a definite advantage in terms of representation and in terms of building
incentives for legislators to gather information on the preferences of their constituencies.
Particularistic systems can also generate mechanisms of yardstick competition among legislators
and improve the efficiency of the political process. On the basis of these ideas, Shugart (1999)
characterizes political systems as ranging from personalistic to camarillian (a system where the
party’s oligarchy, or camarilla,5 has complete control over the individual members) and argues
persuasively that both extremes are bad:
4 Geographically defined particular interests are the most easily recognized, and, so far, the mostcommonly modeled in the literature. (Weingast et al., 1981; Baqir, 1999). The influence of sectorally-defined particular interests, such as labor unions, is harder to identify without detailed knowledge of thecountry and its informal policymaking procedures.5 The word “camarilla” was originally used to refer to the closed group of advisors that surrounded theSpanish kings.

9
Personalistic systems fail to provide elections that turn primarily on collective
policy, because of the incentives individual members have to collect personal
votes, which are better captured through small-scale service provision
(clientelism). Camarillian systems fail to connect parties with collective policy
preferences because individual members have no incentive to find out what
voters want. Efficient systems, on the other hand, place members in a position
where they must balance the interests of both voters and party leaders. (Shugart,
1999).
Since the index of particularism increases when we move from party-centered to
personalistic systems, we may expect that the most efficient systems are those where the index
takes intermediate values. If in fact systems where politicians must balance the interests of voters
and party leaders are the ones that allow better management of distributional conflict, we should
find a non-linear relationship between our index of particularism and the reaction to economic
shocks.
The paper is organized as follows. Section 2 describes the indices of political constraints
and political particularism. Section 3 looks at the correlation between these indices and the ability
to react to economic shocks. Section 4 discusses the use of composite conflict indicators. Section
5 concludes.
2. The Data
This section describes the indices of political constraints and political particularism and discusses
the methodology used to compute them, as well as the main ideas behind their construction.
The Index of Political Constraints
The index of political constraints, first developed by Henisz (2000), attempts to capture the ability
of political institutions to prevent arbitrary changes of the status quo. The idea underlying the
index is simple: the existence of multiple independent branches with veto power over policy
initiatives increases the predictability of policies by restricting the range of discretion of
policymakers to change the status quo. If government branches can veto each other’s initiatives,

10
politicians will be forced to propose alternative policies that are palatable to each of the
independent branches. In addition to the existence of independent branches with veto power, the
distribution of political preferences matters in this context. Thus, if the preferences of the
legislature were perfectly aligned with those of the executive, the existence of an independent
legislature would not restrict the discretion of the executive in any way. The larger the number of
independent veto points, and the farther the preferences of these branches from those of the
executive, the greater the constraints on the ability of policymakers to modify regulatory policy, tax
policy, and other relevant policies.
We use a simple spatial model in the spirit of Henisz to study how the degree of political
constraints varies as the political preferences of the independent branches of government become
more alike. We restrict the analysis to the case of two independent branches. The initial setup is
simple. There are two distinct political actors–the executive and the legislature in this case–that
have the ability to veto each other’s initiatives. Both actors have well-defined preferences over
policy outcomes, and both are trying to find a viable alternative to change the status quo.
If both actors have very different preferences over policy outcomes, the points of
coincidence will be few, and the status quo will be likely to prevail as the default policy. By
contrast, if the executive and the legislature have similar preferences, the points of coincidence will
be many, and there is a high probability that viable alternatives to the status quo will be found.
Thus, political constraints will increase as the preferences of the executive and the
legislature become less aligned. Little can be said, however, about the exact nature of the
relationship between political constraints and the preferences of political actors in the absence of
extra assumptions. Here, we follow Henisz (2000) and make some specific assumptions concerning
the nature of the political interaction between the executive and the legislature.
In Henisz’s model, the political space is the unit interval, and both the status quo (Xo) and
the preferences of the executive and legislature (Xe and Xl) are independent draws from a uniform
distribution. Figure 1 shows two typical draws of the model. In Figure 1a, the preferences of both
actors are to the left of the status quo. The bold line shows the set of policy outcomes preferred by
the executive to the status quo, the thin line shows the set of policy outcomes preferred by the
legislature to the status quo, and the dotted line shows those policies preferred by one actor but not
by the other. In our terminology, the dotted line represents the range of political constraints, which
in this case spans approximately one third of the policy space.
In Figure 1b, the preferences of the executive are to the left of the status quo and the
11
preferences of the legislature to the right. As before, the bold and thin lines show the set of policy
outcomes preferred by the executive and the legislature to the status quo. Here, however, there is
no overlapping of bold and thin, and the range of political constraints spans the whole policy space.
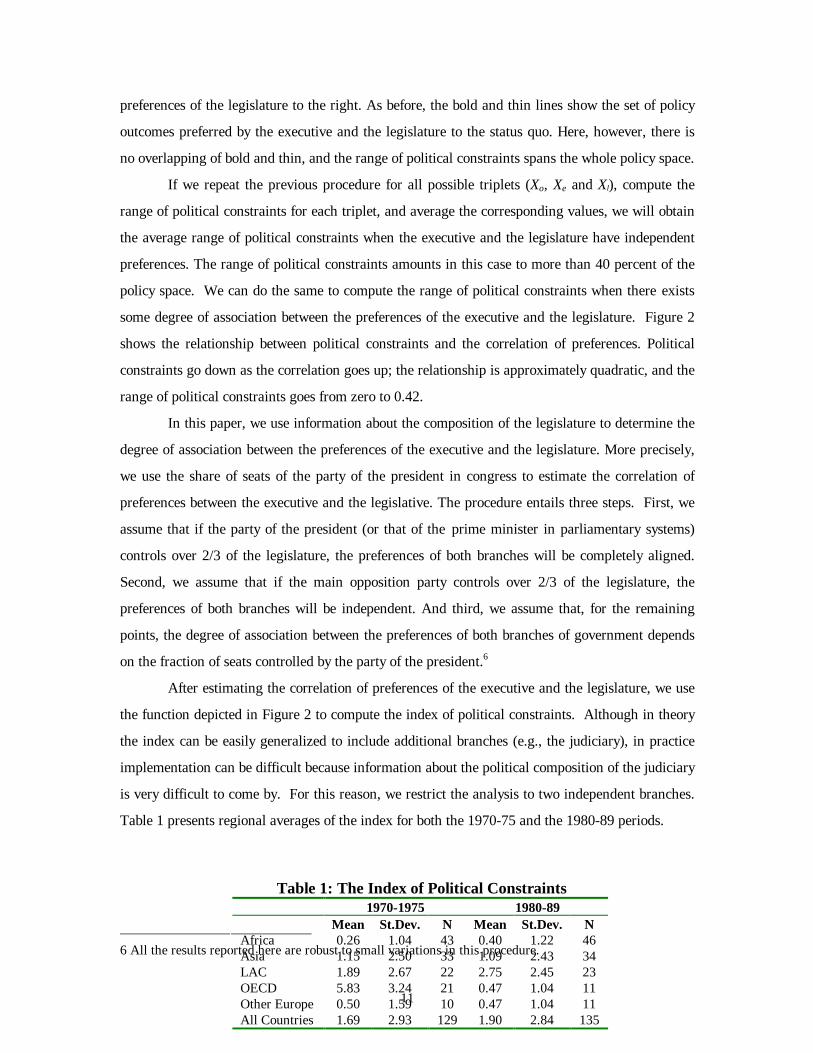
If we repeat the previous procedure for all possible triplets (Xo, Xe and Xl), compute the
range of political constraints for each triplet, and average the corresponding values, we will obtain
the average range of political constraints when the executive and the legislature have independent
preferences. The range of political constraints amounts in this case to more than 40 percent of the
policy space. We can do the same to compute the range of political constraints when there exists
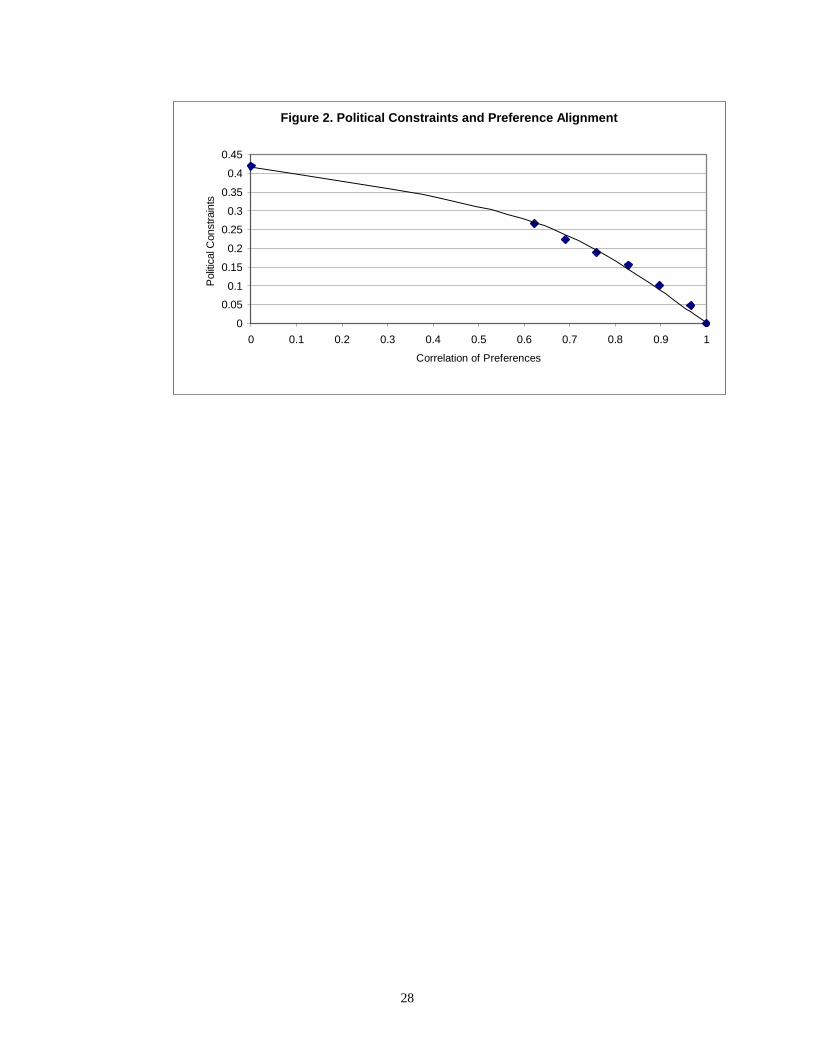
some degree of association between the preferences of the executive and the legislature. Figure 2
shows the relationship between political constraints and the correlation of preferences. Political
constraints go down as the correlation goes up; the relationship is approximately quadratic, and the
range of political constraints goes from zero to 0.42.
In this paper, we use information about the composition of the legislature to determine the
degree of association between the preferences of the executive and the legislature. More precisely,
we use the share of seats of the party of the president in congress to estimate the correlation of
preferences between the executive and the legislative. The procedure entails three steps. First, we
assume that if the party of the president (or that of the prime minister in parliamentary systems)
controls over 2/3 of the legislature, the preferences of both branches will be completely aligned.
Second, we assume that if the main opposition party controls over 2/3 of the legislature, the
preferences of both branches will be independent. And third, we assume that, for the remaining
points, the degree of association between the preferences of both branches of government depends
on the fraction of seats controlled by the party of the president.6
After estimating the correlation of preferences of the executive and the legislature, we use
the function depicted in Figure 2 to compute the index of political constraints. Although in theory
the index can be easily generalized to include additional branches (e.g., the judiciary), in practice
implementation can be difficult because information about the political composition of the judiciary
is very difficult to come by. For this reason, we restrict the analysis to two independent branches.
Table 1 presents regional averages of the index for both the 1970-75 and the 1980-89 periods.
6 All the results reported here are robust to small variations in this procedure.
Table 1: The Index of Political Constraints1970-1975 1980-89
Mean St.Dev. N Mean St.Dev. NAfrica 0.26 1.04 43 0.40 1.22 46Asia 1.15 2.50 33 1.09 2.43 34LAC 1.89 2.67 22 2.75 2.45 23OECD 5.83 3.24 21 0.47 1.04 11Other Europe 0.50 1.59 10 0.47 1.04 11All Countries 1.69 2.93 129 1.90 2.84 135

12
The Index of Political Particularism
Our second institutional dimension is an index of political particularism originally conceptualized
by Carey and Shugart (1995) and Shugart (1999) and operationalized by Gaviria et al. (1999).
Carey and Shugart (1995) define particularism as policymakers’ ability to further their career by
catering to narrow interests rather than broader national platforms.
In creating the index, we are limited by data availability. Although, we would like to
follow Shugart (1999) to describe particularism due to extreme party-centeredness as well as
particularism due to candidate-centeredness, our data does not allow us to differentiate between
those party-centered systems where politicians must cater to a broad party platform from those
where they have incentives to cater to a narrow party leadership clique, or camarilla. For this
reason, we base our index on Carey and Shugart (1995), where all party-centered systems are
placed in the same category. Even with this caveat our results agree with Shugart’s (1999) finding
that the middle range of the index is the most efficient for policymaking.
The index has three components: (i) ballot; (ii) pool; and (iii) vote. Each component is
described in greater detail in the Appendix.
Ballot describes the ease with which someone could get her name on the ballot in a
position that makes winning a seat likely. Closed-list systems where parties determine the
candidates as well as their order on the ballot make this access difficult and are therefore scored as
0. Systems where party nominations are required for a viable candidacy, but where voters can
determine the order of candidates on the party’s list, are scored as 1. Electoral systems where party
nomination is not required for a successful campaign make access the easiest, and are scored as 2.
Pool measures the extent to which a candidate can benefit from the votes of other
candidates from her own party. The assumption here is that candidates who do not expect to
receive “spillover” votes from co-partisans will try harder to build personal reputations.
Proportional representation systems where votes are pooled across candidates are scored as 0,
systems where parties present multiple lists are scored as 1, and systems where votes accrue only
to individual candidates are scored as 2.
Vote measures whether voters cast votes primarily for candidates or parties. Systems
where voters can only choose among parties are scored as 0. Systems where voters can express
preferences for multiple candidates either within party lists, across parties, or through a two-stage

13
election (i.e., primaries or run-offs) are scored as 1. Finally, systems where voters cast only one
vote, either for a candidate or a party faction, are scored as 2.
We follow Shugart (1999) in averaging the scores of these three variables to create a
summary index of particularism for each set of legislators who are elected via a certain electoral
system.7 In unicameral systems this summary index corresponds to the whole legislature, in
bicameral systems to each house, and in mixed systems to each subset of legislators. Each house is
given a weight of 0.5, regardless of the relative numbers of seats. Within each house, each group
of legislators chosen under similar rules is given a weight according to its proportion of total
legislators in that house.
We were able to build a panel of measure of particularism covering 144 countries for a
period of up to twenty years.8 Table 2 presents regional averages for the 1978-1987 and 1978-
1997 periods.
Carey and Shugart (1995) and Shugart (1999) assert that district magnitude can also
affect the incentives to cater to narrow interests. While Milesi-Ferretti et al. (1999) assume that
smaller districts increase geographical particularism, Carey and Shugart (1995) claim that there is
not a univocal relationship between district magnitude and particularism. If ballots are closed and
list order fixed, party-centeredness should rise with district magnitude. If ballots are open, on the
other hand, we expect the importance of personal reputation to rise with district magnitude.
Ideally, we would like to include district magnitude in our index of political particularism, but
because of the non-univocal relationship between district magnitude and particularism, we build
the index using only the first three components and enter district magnitude in our regressions
separately from the index of particularism (we also interact district magnitude with ballot).
7 An alternative would be to build an index using principal component analysis.
Table 2: The Index of Political Particularism1978-1987 1978-1997
Mean St.Dev. N Mean St.Dev. NAfrica 4.34 2.44 35 4.10 2.54 44Asia and Pacific 5.66 2.75 25 5.21 2.55 36LAC 2.87 2.51 27 2.72 2.57 30OECD 3.48 2.00 17 3.42 2.00 17Other Europe 4.99 1.97 11 3.73 2.19 17Whole Sample 4.22 2.68 115 3.97 2.57 144The original 0-2 index was re-scaled into a 0-10 range.

14
3. Empirical Analysis
In this section, we test the impact of political constraints and political particularism on a country’s
ability to recover from economic shocks. Following Rodrik (1999), we use the change in per
capita GDP growth between the 1960-1975 and 1975-1989 periods as our dependent variable.
These periods are chosen because the large terms of trade shocks of the mid-1970s had very
different effects on different countries. While in Latin America and Africa the terms of trade
shocks were followed by growth collapses, East Asia was able to quickly recover from the shocks
and sustain high rates of growth. Following Rodrik, we explain these differences in growth on the
basis of two main factors: latent social conflict and poor institutions for conflict management.
As Rodrik, we measure latent social conflict with an index of ethno-linguistic
fractionalization.9 Unlike Rodrik, who measures the quality of conflict management institutions
using either the ICRG index or an index of democracy, we use the indices of political constraints
and political particularism described above. We also use the same set of control variables used by
Rodrik (1999): three regional dummies (Latin America, East Asia, and Africa); growth in the
1960-1975 period (to capture convergence effects); log of per capita GDP in 1975 (to control for a
country’s level of development); a measure of external shock (computed as openness times the
standard deviation of the first log-difference of the terms of trade).
Our measures of conflict management institutions have clear advantages over the ICRG
index. First, they are less subjective because they are based on political institutions and electoral
laws rather than on perceptions. Second, as they available for the 1970s, they are not affected by
the endogeneity bias discussed in the introduction.
Political Constraints and Growth Collapses
In this section, we compute an average of the index of political constraints for the 1970-1975
period and use this average as a predictor for the change in growth between the 1960-1975 and
1975-1989 periods. As mentioned before, this should minimize the endogeneity bias that affects
8 Most of the data comes from the Parline online data set.9 Rodrik also uses, as an alternative to ethno-linguistic fractionalization, income inequality. We preferethno-linguistic fractionalization because it is available for a larger set of countries and it is not affectedby endogeneity problems.

15
the ICRG index.
The results of the regressions are reported in Table 3. We find that average political
constraints in 1970-1975 are positively and significantly associated with changes in growth. As in
Rodrik (1999), we also find that ethnic fragmentation and terms of trade shocks are negatively
associated with changes in growth (although the latter variable is not statistically significant)
Table 3: Changes in Growth and Political ConstraintsDependent variable: per capita growth 1975-1989 minus per capita growth 1960-1975
Political Constraints ICRG1970-1975 1980-1989 1980-1989
LAC -2.16 *** -2.34 *** -1.39 **(0.49) (0.48) (0.53)
E-ASIA 3.56 *** 3.64 *** 2.77 ***(0.54) (0.56) (0.44)
AFRICA -1.84 *** -1.86 ** -2.42 ***(0.66) (0.69) (0.56)
GR60-75 -87.64 *** -95.02 *** -93.24 ***(9.67) (9.68) (7.45)
GDP75 -0.77 *** -0.62 ** -1.69 ***(0.26) (0.24) (0.35)
SHOCK -0.05 -0.05 -0.02(0.04) (0.04) (0.03)
POLITICAL CONSTRAINTS 0.19 ** 0.15 **(0.07) (0.07)
ICRG 0.74 ***(0.17)
ELF -1.41 * -1.49 ** -1.03(0.73) (0.75) (0.61) *
CONSTANT 8.06 *** 7.19 *** 10.83 ***(1.81) (1.67) (0.71)
R2 0.71 0.70 0.76N 87 87 87White’s standard errors in parenthesis. * statistically significant at 10%, ** statistically significant at 5%,*** statistically significant at 1%.
To evaluate the role of endogeneity bias, we use average political constraints for the 1980-
89 period (this is the period for which the ICRG data used by Rodrik are available). Once again,
we find that higher political constraints are positively associated with changes in growth, which
suggests that Rodrik’s results survive even after we resolve the endogeneity problem.
To make sure that our results do not depend on a particular sample, the third column of
Table 3 reproduces Rodrik’s findings about the effect of the ICRG index on changes in growth.10
The effects of the ICRG index and the index of political constraints are qualitatively similar, but
10 Our results are very close (both qualitatively and quantitatively) to the results of Table 4, column 5 inRodrik’s paper.
16
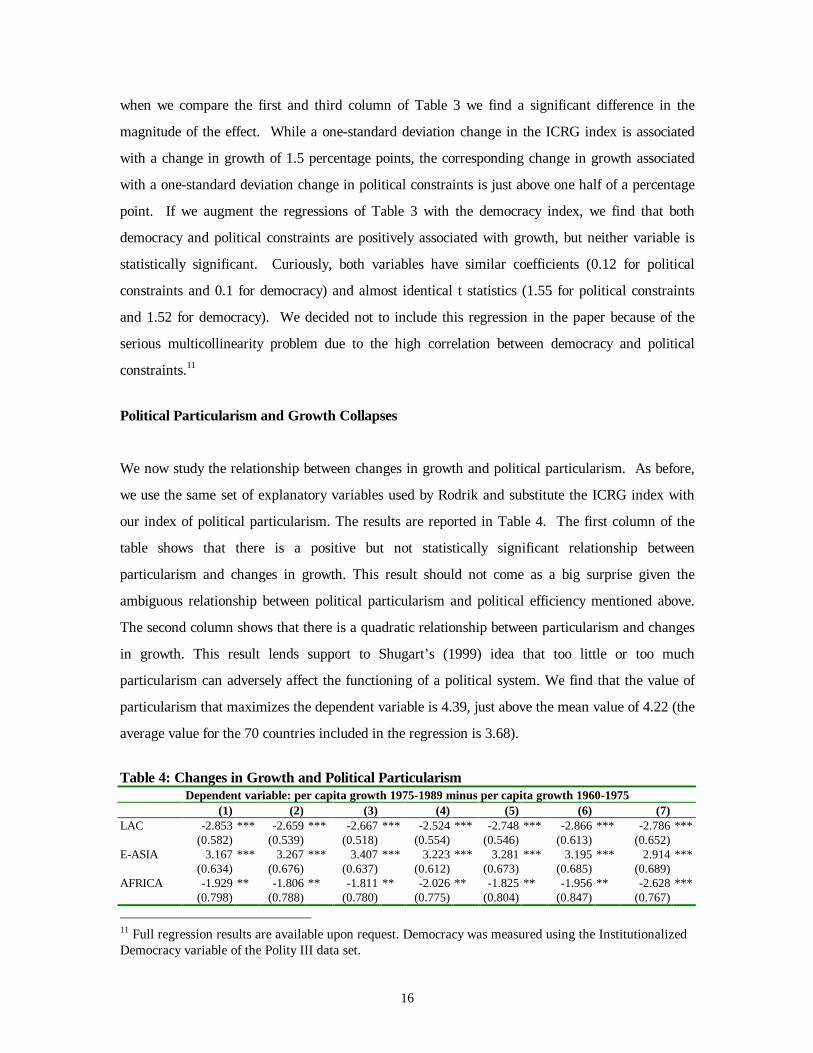
when we compare the first and third column of Table 3 we find a significant difference in the
magnitude of the effect. While a one-standard deviation change in the ICRG index is associated
with a change in growth of 1.5 percentage points, the corresponding change in growth associated
with a one-standard deviation change in political constraints is just above one half of a percentage
point. If we augment the regressions of Table 3 with the democracy index, we find that both
democracy and political constraints are positively associated with growth, but neither variable is
statistically significant. Curiously, both variables have similar coefficients (0.12 for political
constraints and 0.1 for democracy) and almost identical t statistics (1.55 for political constraints
and 1.52 for democracy). We decided not to include this regression in the paper because of the
serious multicollinearity problem due to the high correlation between democracy and political
constraints.11
Political Particularism and Growth Collapses
We now study the relationship between changes in growth and political particularism. As before,
we use the same set of explanatory variables used by Rodrik and substitute the ICRG index with
our index of political particularism. The results are reported in Table 4. The first column of the
table shows that there is a positive but not statistically significant relationship between
particularism and changes in growth. This result should not come as a big surprise given the
ambiguous relationship between political particularism and political efficiency mentioned above.
The second column shows that there is a quadratic relationship between particularism and changes
in growth. This result lends support to Shugart’s (1999) idea that too little or too much
particularism can adversely affect the functioning of a political system. We find that the value of
particularism that maximizes the dependent variable is 4.39, just above the mean value of 4.22 (the
average value for the 70 countries included in the regression is 3.68).
Table 4: Changes in Growth and Political ParticularismDependent variable: per capita growth 1975-1989 minus per capita growth 1960-1975
(1) (2) (3) (4) (5) (6) (7)LAC -2.853 *** -2.659 *** -2.667 *** -2.524 *** -2.748 *** -2.866 *** -2.786 ***
(0.582) (0.539) (0.518) (0.554) (0.546) (0.613) (0.652)E-ASIA 3.167 *** 3.267 *** 3.407 *** 3.223 *** 3.281 *** 3.195 *** 2.914 ***
(0.634) (0.676) (0.637) (0.612) (0.673) (0.685) (0.689)AFRICA -1.929 ** -1.806 ** -1.811 ** -2.026 ** -1.825 ** -1.956 ** -2.628 ***
(0.798) (0.788) (0.780) (0.775) (0.804) (0.847) (0.767)
11 Full regression results are available upon request. Democracy was measured using the InstitutionalizedDemocracy variable of the Polity III data set.

17
GR60-75 -100.214 *** -96.286 *** -99.233 *** -92.552 *** -95.218 *** -96.585 *** -93.265 ***(11.734) (9.648) (9.732) (10.649) (9.504) (10.160) (11.560)
GDP75 -0.305 -0.387 * -0.447 * -0.369 -0.449 * -0.341 -0.257(0.219) (0.215) (0.227) (0.222) (0.242) (0.242) (0.232)
SHOCK -0.038 -0.043 -0.042 -0.046 -0.038 -0.042 -0.036(0.037) (0.036) (0.036) (0.039) (0.037) (0.037) (0.035)
PART 0.064 0.413 ** 0.625 *** 0.491 ** 0.518 **(0.090) (0.200) (0.192) (0.242) (0.231)
PART2 -0.047 * -0.072 *** -0.052 * -0.060 *(0.026) (0.024) (0.028) (0.030)
DIS. MAG. 0.247(0.179)
PROPORT -0.048 0.451(0.382) (0.503)
PRESID 0.548 0.300(0.551) (0.504)
ELF -1.703 ** -1.719 ** -1.660 * -1.858 ** -1.671 * -1.693 * -1.012(0.875) (0.912) (0.944) (0.821) (0.917) (0.967) (0.808)
CONST 5.330 *** 5.505 *** 5.370 *** 5.800 *** 5.528 *** 4.848 ** 4.675 **(1.810) (1.825) (1.848) (1.744) (1.803) (2.092) (1.928)
R2 0.647 0.664 0.678 0.607 0.669 0.675 0.605N 70 70 70 87 70 69 82White’s standard errors in parenthesis. * statistically significant at 10%, ** statistically significant at 5%,*** statistically significant at 1%.
Column 3 shows that district magnitude does not have an effect on the changes in growth
rates between the periods under analysis, but its inclusion increases both the magnitude and
precision of the coefficient attached to political particularism.12 Columns 4 to 7 show that the non-
linear relationship between particularism and change in growth is robust to the inclusion of other
political variables. In particular, we augment the regressions with dummies for proportional and
majoritarian electoral systems and for parliamentary and presidential electoral systems (Persson
and Tabellini, 1999, find that these variables are associated with the size and composition of public
expenditure). The inclusion of these dummies does not alter the relationship between particularism
and growth in any substantial way.
While the index of particularism is built using information on a country’s political
constitution and electoral laws and, therefore, we are confident in the fact that the index does not
suffer from any subjectivity bias, we cannot claim that the index is completely exogenous. Since
we do not have observations prior to 1978 (and between 1978 and 1980 the index covers fewer
than 80 countries), we use an average of the index for the 1978-87 period.13 This can be a problem
12 In order to test Carey and Shugart’s (1995) idea that the effect of district magnitude depends onwhether or not ballots are closed, we interact these two variables. We do not find any significant resultsand we still find a significant quadratic relationship between particularism and changes in growth.13 We obtain similar results, but with smaller samples, by considering any shorter period including at least1981.

18
because economic crises often trigger constitutional reforms (or at least major political overhauls).
If that were the case, our index would be endogenous.
However, we believe that endogeneity bias is less serious in this case than it is in the case
of the ICRG index. While it is clear that a crisis will lower the ICRG index (and hence cause an
overestimation of its effect on growth), it is not so clear that a crisis will cause electoral laws to
move toward a more efficient arrangement. Moreover, changes in electoral rules are fairly rare. In
the 20 years covered by our panel, only 33 (out of 144) countries had significant changes in any
aspects of the electoral law that we consider here. Furthermore, electoral laws are subject to fads
and fashions. If movements in the electoral laws tend to be of similar nature across countries of
the same region, controlling for regional dummies could capture part of these movements in the
index of particularism.
Even though electoral laws may not change much over time, their relevance may change as
countries move from dictatorships to more democratic regimes or vice versa. Because during
periods of dictatorship or military rule electoral laws are seldom respected, we expect electoral
laws to have a much greater effect on economic outcomes in democratic regimes. To test this
hypothesis, we take into account the level of democracy in the early 1970s and interact this
variable with our index of particularism. We do this in two different ways. First, we add the
1970-1975 average of the Polity III index of democracy as well as its interaction with our index of
particularism to our basic specification (column 3 of Table 5). Second, we add a democracy
dummy that takes a value of 1 for countries that averaged 4 or more in the Polity III index for the
1970-1975 period. As before, we interact this dummy with particularism in the regression (column
6 of Table 5).

19
Table 5: Changes in Growth, Political Particularism, and Democracy
Dependent variable: per capita growth 1975-1989 minus per capita growth 1960-1975(1) (2) (3) (4) (5) (6) (7)
LAC -2.387 *** -2.741 *** -2.652 *** -2.318 *** -2.779 *** -2.759 *** -1.514 ***(0.525) (0.534) (0.505) (0.507) (0.540) (0.508) (0.576)
E-ASIA 3.004 *** 3.077 *** 3.392 *** 3.237 *** 3.161 *** 3.073 *** 2.514 ***(0.652) (0.692) (0.785) (0.696) (0.675) (0.681) (0.560)
AFRICA -2.147 *** -2.376 *** -2.302 *** -2.156 *** -2.441 *** -2.536 *** -2.560 ***(0.687) (0.666) (0.645) (0.698) (0.668) (0.642) (0.749)
GR60-75 -87.710 *** -99.288 *** -96.240 *** -88.977 *** -102.573 *** -100.250 *** -87.737 ***(9.533) (8.302) (8.646) (9.806) (8.869) (8.976) (8.889)
GDP75 -0.879 *** -0.558 ** -0.604 ** -0.775 *** -0.403 -0.603 ** -1.732 ***(0.283) (0.252) (0.247) (0.269) (0.272) (0.266) (0.480)
SHOCK -0.041 -0.033 -0.038 -0.043 -0.033 -0.034 -0.020(0.035) (0.034) (0.033) (0.034) (0.033) (0.030) (0.034)
PART 0.282 -0.074 0.352 0.122(0.219) (0.307) (0.220) (0.274)
PART2 -0.029 0.031 -0.037 -0.011(0.029) (0.040) (0.029) (0.035)
DEMO 0.148 ** 0.058 -0.004(0.062) (0.052) (0.086)
D*PART 0.158 **(0.071)
D*PART2 -0.029 **(0.013)
DEMO1 1.070 ** 0.352 -0.849(0.494) (0.531) (1.019)
D1*PART 1.425 **(0.670)
D1*PART2 -0.232 **(0.104)
ICRG 0.719 ***(0.213)
ELF -1.649 ** -1.183 * -1.385 * -1.591 ** -1.156 -1.313 * -1.272 *(0.704) (0.688) (0.714) (0.725) (0.708) (0.722) (0.703)
CONST 8.890 *** 6.675 *** 7.133 *** 8.334 *** 5.731 *** 7.480 *** 11.365 ***(1.945) (1.963) (1.957) (1.929) (2.060) (2.101) (2.562)
R2 0.687 0.724 0.744 0.684 0.721 0.746 0.673N 90 72 72 90 72 72 70
White’s standard errors in parenthesis. * statistically significant at 10%, ** statistically significant at 5%, *** statistically significant at
1%.
Rodrik (2000a, 2000b, 2000c) claims that conflicts are better solved under democratic
regimes. Like Rodrik, we find that democracy is positively associated with changes in growth
(columns 1 and 4), but the effect of democracy disappears when we control for particularism.
Even more interestingly, we find that, after controlling for democracy, particularism alone loses its
explanatory power, but it becomes highly significant when interacted with democracy. The two

20
regressions of Column 3 and 6 give the same answer: political particularism does not matter in
dictatorships, but it is very important in democracies.14
Figure 3 plots the partial correlation between political particularism and changes in growth
for the whole sample of countries used in this paper, the sample of democracies, and the sample of
dictatorships. This figure shows that there are striking differences among the three groups of
countries. When we consider the whole sample, we find a quadratic, but rather flat, relationship
between particularism and changes in growth. When we only consider dictatorships, the curvature
almost completely disappears, but when we consider only democracies, the quadratic relationship
becomes very strong. So, we conclude that particularism is relevant only in democratic regimes.
4. Conflict Variables
The key idea in Rodrik’s paper is that the social conflict that presumably caused the collapse in
growth of the mid-1970s originated from a combination of the severity of the external shock, the
presence of latent social conflict, and the quality of conflict management institutions. To test this
idea, Rodrik builds several composite indicators of social conflict. He then finds that these
indicators have a strong negative correlation with economic performance, which, in his opinion,
confirms his hypothesis.
We follow Rodrik and use our indices of political constraints and political particularism to
build indicators of the type:
CONFPCON = Shock*ELF*(10-PCONST) (1)
CONFPART = Shock*ELF*(|PART|-10) (2)
14 The null hypothesis that PART+D1*PART>0 is not rejected with a p value of 0.011 and the null thatPART2+D1*PART2<0 is not rejected with a p value of 0.015. We find that the variability of politicalconstraints is lower in democracy than in dictatorships, but the difference between the two groups is not asdramatic as in the case of the index of political constraints. The coefficient of variation of the index ofpolitical particularism is 0.7 for the whole sample, 0.9 for dictatorships, and 0.5 for democracies. In thecase of political particularism, the ratio between the coefficient of variation of dictatorships and coefficientof variation of democracies ratio is 1.28. For the index of political constraints, this ratio is 4.8.

21
Like Rodrik, we find a strong negative correlation between the composite indicators and changes in
growth.15 However, the results of a Monte Carlo simulation cast some doubts on the validity of
this experiment. We build a series of conflict indicators using the following formula:
CONFRAND = X1*X2*RAND (3)
where X1 and X2 are any two of the following: (i) Shock; (ii) ELF; and (iii) P-CONST or PART
and RANDOM is a uniformly distributed random variable that ranges from 0 to 10. Then we use
CONFRAND to run 10,000 replications of a regression similar to the ones reported in Table 5 of
Rodrik (1999) and find that the coefficient attached to CONFRAND is highly significant in six out
of seven simulations.16 This suggests that in most cases (and in all cases when one of the elements
is ethnic fractionalization) two of the three elements are sufficient to get a significant impact of the
composite variable. The simulation also indicates that, as we already found in Tables 3, 4, and 5,
terms of trade shocks are weakly associated with change in growth.
It should be pointed out that this experiment does not affect the validity of our main results
(or Rodrik’s for that matter). By separately entering the three variables in the regression, we do
find that they each have a strong impact on the dependent variable. However, we believe that the
regressions of Tables 3, 4, and 5 provide stronger support for Rodrik’s model than the regression
with the composite indicator.
5. Conclusions
In this paper, we examine whether Rodrik’s (1999) results that the ability of a country to recover
from economic shocks depends on the quality of institutions for conflict management survive when
we use measures of institutional quality that are not affected by subjectivity and endogeneity
biases. We use a modified version of the index of political constraints developed by Henisz (2000)
and an index of political particularism originally conceptualized by Carey and Shugart (1995) and
Shugart (1999) and coded by Gaviria et al. (1999). We claim that these indices are appropriate
measures of institutions for conflict management as described by Rodrik. With respect to the
ICRG and democracy indices used by Rodrik, our two indices have the advantage of being built on
15 Results available upon request.
22
objective criteria and, for the index of political constraints, being available for the early 1970s. We
find that Rodrik’s results are robust to the use of these new indices. In particular, we find that
countries with higher levels of political constraints and intermediate levels of particularism were
the most successful in reacting to the external shocks of the mid 1970s.
16 The coefficient is not significant when the two non-random variables are terms of trade shocks and theindex of political particularism.

23
References
Baqir, R. 1999. “Districts, Spillovers, and Government Overspending.” Berkeley, United States:University of California at Berkeley. Mimeographed document.
Cain, B., Ferejohn, J. and Fiorina, M. 1987. The Personal Vote: Constituency Service andElectoral Independence. Cambridge, United States: Harvard University Press.
Carey, J. and Shugart, M. 1995. “Incentives to Cultivate a Personal Vote: A Rank Ordering ofElectoral Formulas.” Electoral Studies 14: 417-439.
Cox, G. 1997. Making Votes Count: Strategic Coordination in the World’s Electoral Systems.Cambridge, United Kingdom: Cambridge University Press.
Gaviria, A., Panizza, U., Seddon, J., and Stein, E. 1999. “Political Institutions and EconomicOutcomes. ” Washington, DC, United States: Inter-American Development Bank, ResearchDepartment. Mimeographed document.
Graham, C., Grindle, M., Lora, E. and Seddon, J. 1999. Improving the Odds: Political Strategiesfor Institutional Reform in Latin America. Washington, DC, United States: Inter-AmericanDevelopment Bank.
Henisz, W. 2000. “The Institutional Environment for Economic Growth.” Economics and Politics.Forthcoming.
La Porta, R. Lopez de Silanes, F., Andrei Shleifer, et al. 1998. “The Quality of Government.”NBER Working Paper 6727. Cambridge, United States: National Bureau of Economic Research.
Mainwaring, S. and Scully, T. 1995. Building Democratic Institutions: Party Systems in LatinAmerica. Stanford, United States: Stanford University Press.
Milesi-Ferretti, G.M., Perotti, R. and Rostagno, M. 1999. “Electoral Systems and theComposition of Public Spending.” Washington, DC, United States: International Monetary Fund.Mimeographed document.
Myerson, R. 1999. “Theoretical Comparisons of Electoral Systems.” European Economic Review.43: 671-697.
Panizza, U. 1999. “Political Determinants of Institutional Quality.” Washington, DC, UnitedStates: Inter-American Development Bank, Research Department. Mimeographed document.
Persson, T. and Tabellini, G. 1999. “The Size and Scope of Government: Comparative Politicswith Rational Politicians.” European Economic Review. 43: 699-735.
Reynolds, A. 1997. International IDEA Handbook of Electoral System Design. Stockholm,Sweden: International Institute for Democracy and Electoral Assistance.

24
Rodrik, D. 1999. “Where Did All the Growth Go? External Shocks, Social Conflict and GrowthCollapses.” Journal of Economic Growth. 4: 385-412.
----. 2000a. “Participatory Politics, Social Cooperation, and Economic Stability.” Cambridge,United States: Harvard University. Mimeographed document.
----. 2000b. “Development Strategies for the Next Century.” Cambridge, United States: HarvardUniversity. Mimeographed document.
----. 2000c. “Institutions for High Quality Growth: What they Are and How to Acquire Them.”NBER Working Paper 7540. Cambridge, United States: National Bureau of Economic Research.
Shugart, M. 1999. “Efficiency and Reform: A New Index of Government Responsiveness and theConjunction of Electoral and Economic Reform.” San Diego, United States: University ofCalifornia at San Diego. Mimeographed document.
Taagepera, R. and Shugart, M. 1989. Seats and Votes: The Effects and Determinants of ElectoralSystems. New Haven, United States: Yale University Press.
Tornell, A. and Lane, P. 1998. “The Voracity Effect.” American Economic Review. 89 (1): 22-46.
Weingast, B., Shepsle, K. and Johnsen, C. 1981. “The Political Economy of Benefits and Costs: ANeoclassical Approach to Distributive Politics.” Journal of Political Economy. 89: 642-64.
25
Appendix
This appendix describes the details of the construction of the various components of the index of
political particularism.
Ballot describes the ease with which someone could get his or her name on the ballot in a
position that makes winning a seat likely. Closed-list systems where parties determine the
candidates as well as their order in the ballot make this access difficult, and are therefore scored as
0. Systems where party nominations are required for a viable candidacy, but voters can determine
the order of candidates on the party’s list are scored as 1. Electoral systems where party
nomination is not required for a successful campaign make access the easiest, and are scored as 2.
In addition to the party nomination procedures, in coding this component we considered the
feasibility of winning a seat by running as an independent candidate. In particular, we use this
criterion to differentiate between scores of 1 and 2. Independent campaigns were considered
“feasible” (leading to a score of 2) in countries where more than 10% of the legislature were
independents, and “unfeasible” (leading to a score of 1) in other countries. Countries where
legislative seats were divided among a multitude of small parties that changed from election to
election were also coded as 2.
Pool measures the extent to which candidates from the same party “share” the votes that
they attract. The assumption is that candidates who do not need to share votes and do not expect to
receive spillover votes from party colleagues will compete harder to create personal support bases.
A score of 0 means vote pooling across the whole party, as in proportional representation systems;
1 means vote-sharing among subsets of the party, as in systems where parties present multiple lists,
or voters designate a certain number of alternates if their first-choice candidate already has enough
votes; and 2 means that the candidate cannot expect to benefit from votes cast for other members
of the party. We follow Carey and Shugart (1995) in coding candidates in single member districts
as pool=0 because each candidate is presented as a “list” of 1. While this assumption is consistent
with the previous literature’s view of single member districts (Taagepera and Shugart, 1989), we
are not entirely comfortable with this coding. The description of a candidate in a single member
district as a list of one whose “fortunes depend on the ability of her entire party to attract votes”
rather than an individual is a assumption that may not apply to countries where parties are less
cohesive and local races are more isolated from national debates. Cain et al. (1987) have argued
that, all else equal, the personal vote is likely to be more important in single-member districts than

26
in other cases. Although we follow the Carey and Shugart (1995) coding scheme to generate pool,
we offset this potential bias toward party-centered scores in our coding of vote, below.
Vote measures the extent to which citizens have to limit their votes to one individual.
The values range is of 0 for the least candidate-centered single vote for a party, 1 for multiple votes
across candidates who may or may not have to be from the same party, and 2 for a single vote for a
single candidate. Unlike Carey and Shugart (1995), single-member districts are coded as 2, as
people are voting for a single candidate. To say that they are voting for the party of which the
candidate is a representative is an alternative interpretation, but one that favors party-centrism.
Since the equally ambiguous choice about pool favors party-centrism, this interpretation of vote
acts as an offset in the calculation of the overall index.
District Magnitude. We compute district magnitude as the average district magnitude
the each member of the legislature faces. This method is used in Cox (1997) and leads to slightly
different answers than the more usual method of dividing the size of the legislature by the number
of district, but we feel that it is more in line with our focus on individual legislators’ incentives.

27
XE
XE
XL
XOXL
XO
Political Constraints
Political Constraints
Policy Space
Policy Space
Figure 1a. Political Constraints and Preferences
Figure 1b. Political Constraints and Preferences
E=Executive, L=Legislative, O=Status Quo,
28
Figure 2. Political Constraints and Preference Alignment
0
0.05
0.1
0.15
0.2
0.25
0.3
0.35
0.4
0.45
0 0.1 0.2 0.3 0.4 0.5 0.6 0.7 0.8 0.9 1
Correlation of Preferences
Pol
itica
l Con
stra
ints

29
Figure 3: Political Particularism and Changes in Growth
DIF
FGR
|X
Index of Particularism0 2 4 6 8
-6
-4
-2
0
2
4
All countries
Dictatorships
Democracies