Ayuda y crecimiento: La política importa
31
Inter-American Development Bank Banco Interamericano de Desarrollo (BID) Research Department Departamento de Investigación Working Paper #601 Aid and Growth: Politics Matters by Matteo Bobba Andrew Powell Inter-American Development Bank January 2007
-
Upload
independent -
Category
Documents
-
view
2 -
download
0
Transcript of Ayuda y crecimiento: La política importa
Inter-American Development Bank
Banco Interamericano de Desarrollo (BID) Research Department
Departamento de Investigación Working Paper #601
Aid and Growth: Politics Matters
by
Matteo Bobba Andrew Powell
Inter-American Development Bank
January 2007
3
Cataloging-in-Publication data provided by the Inter-American Development Bank Felipe Herrera Library
Bobba, Matteo.
Aid effectiveness : politics matters / by Matteo Bobba, Andrew Powell. p. cm. (Research Department Working paper series ; 601) Includes bibliographical references.
1. Economic assistance—Political aspects. 2. Economic assistance—Evaluation. I. Powell, Andrew (Andrew Phillip). II. Inter-American Development Bank. Research Dept. III. Title. IV. Series.
HC60 .B83 2007 338.91 B83----dc-22 ©2007 Inter-American Development Bank 1300 New York Avenue, N.W. Washington, DC 20577 The views and interpretations in this document are those of the authors and should not be attributed to the Inter-American Development Bank, or to any individual acting on its behalf. This paper may be freely reproduced provided credit is given to the Research Department, Inter-American Development Bank. The Research Department (RES) produces a quarterly newsletter, IDEA (Ideas for Development in the Americas), as well as working papers and books on diverse economic issues. To obtain a complete list of RES publications, and read or download them please visit our web site at: http://www.iadb.org/res.

4
Abstract1
The literature on aid effectiveness has focused more on recipient policies than the determinants of aid allocation yet a consistent result is that political allies obtain more aid from donors than non-allies. This paper shows that aid allocated to political allies is ineffective for growth, whereas aid extended to countries that are not allies is highly effective. The result appears to be robust across different specifications and estimation techniques. In particular, new methods are employed to control for endogeneity. The paper suggests that aid allocation should be scrutinized carefully to make aid as effective as possible. JEL classification: O1; O2; O4; C23 Keywords: Aid impact; Economic growth; Instrumental Variables; Generalized method of moments; Panel data
1 Both authors are in the Research Department of the Inter American Development Bank. The views expressed in this paper are solely the views of the authors and do not necessarily reflect the views of the Inter-American Development Bank or any other institution. We are very grateful to Simon Scott at the OECD for answering many questions on the data. All mistakes naturally remain our own. Further comments are welcome at matteob(at)iadb.org and andrewp(at)iadb.org.
5
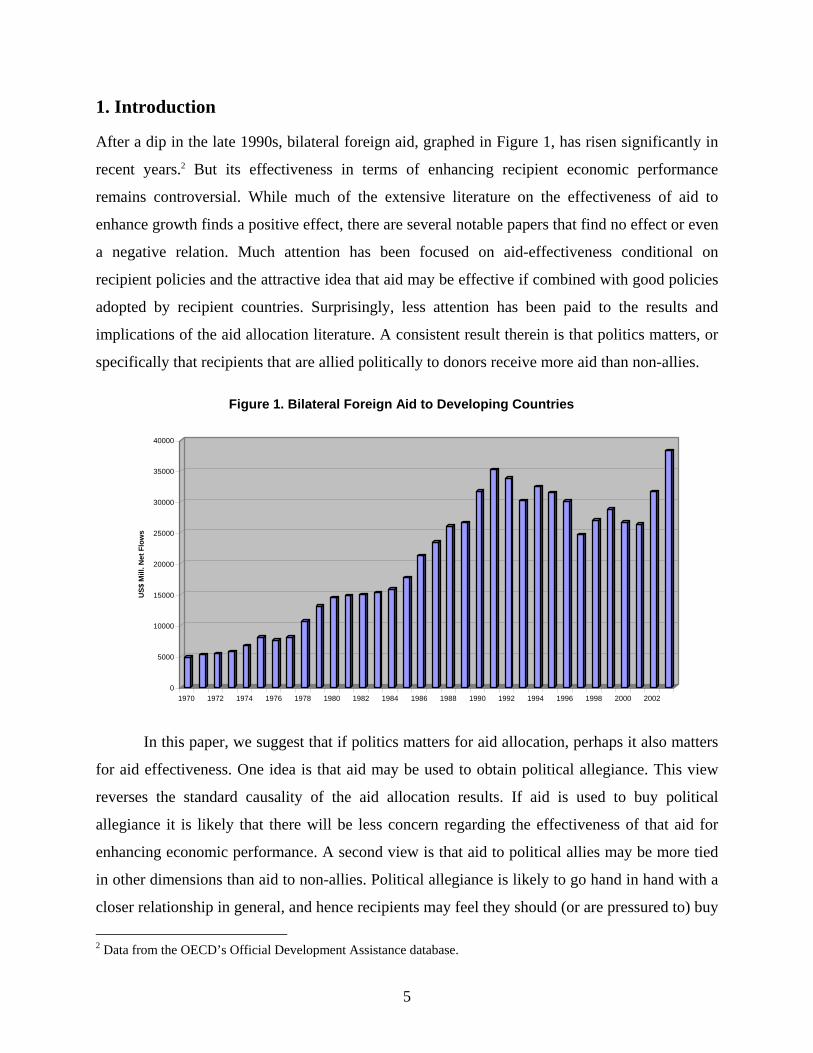
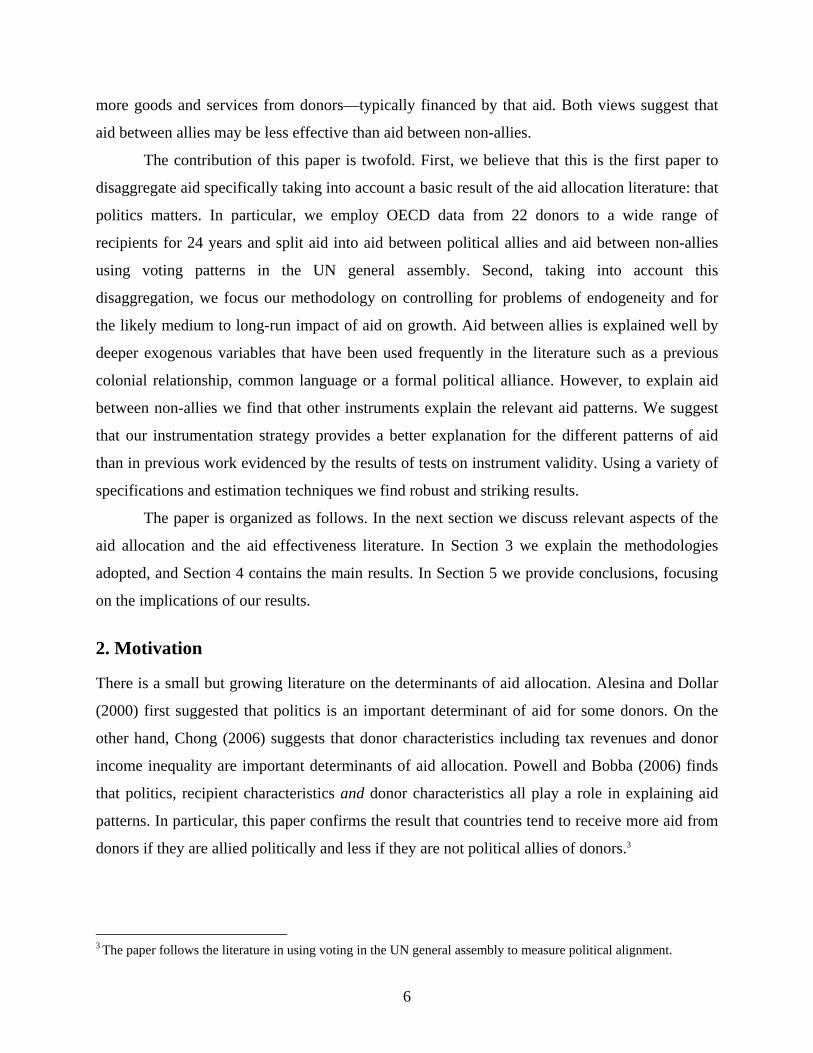
1. Introduction After a dip in the late 1990s, bilateral foreign aid, graphed in Figure 1, has risen significantly in
recent years.2 But its effectiveness in terms of enhancing recipient economic performance
remains controversial. While much of the extensive literature on the effectiveness of aid to
enhance growth finds a positive effect, there are several notable papers that find no effect or even
a negative relation. Much attention has been focused on aid-effectiveness conditional on
recipient policies and the attractive idea that aid may be effective if combined with good policies
adopted by recipient countries. Surprisingly, less attention has been paid to the results and
implications of the aid allocation literature. A consistent result therein is that politics matters, or
specifically that recipients that are allied politically to donors receive more aid than non-allies.
0
5000
10000
15000
20000
25000
30000
35000
40000
US$
Mill
. Net
Flo
ws
1970 1972 1974 1976 1978 1980 1982 1984 1986 1988 1990 1992 1994 1996 1998 2000 2002
Figure 1. Bilateral Foreign Aid to Developing Countries
In this paper, we suggest that if politics matters for aid allocation, perhaps it also matters
for aid effectiveness. One idea is that aid may be used to obtain political allegiance. This view
reverses the standard causality of the aid allocation results. If aid is used to buy political
allegiance it is likely that there will be less concern regarding the effectiveness of that aid for
enhancing economic performance. A second view is that aid to political allies may be more tied
in other dimensions than aid to non-allies. Political allegiance is likely to go hand in hand with a
closer relationship in general, and hence recipients may feel they should (or are pressured to) buy 2 Data from the OECD’s Official Development Assistance database.
6
more goods and services from donors—typically financed by that aid. Both views suggest that
aid between allies may be less effective than aid between non-allies.
The contribution of this paper is twofold. First, we believe that this is the first paper to
disaggregate aid specifically taking into account a basic result of the aid allocation literature: that
politics matters. In particular, we employ OECD data from 22 donors to a wide range of
recipients for 24 years and split aid into aid between political allies and aid between non-allies
using voting patterns in the UN general assembly. Second, taking into account this
disaggregation, we focus our methodology on controlling for problems of endogeneity and for
the likely medium to long-run impact of aid on growth. Aid between allies is explained well by
deeper exogenous variables that have been used frequently in the literature such as a previous
colonial relationship, common language or a formal political alliance. However, to explain aid
between non-allies we find that other instruments explain the relevant aid patterns. We suggest
that our instrumentation strategy provides a better explanation for the different patterns of aid
than in previous work evidenced by the results of tests on instrument validity. Using a variety of
specifications and estimation techniques we find robust and striking results.
The paper is organized as follows. In the next section we discuss relevant aspects of the
aid allocation and the aid effectiveness literature. In Section 3 we explain the methodologies
adopted, and Section 4 contains the main results. In Section 5 we provide conclusions, focusing
on the implications of our results.
2. Motivation There is a small but growing literature on the determinants of aid allocation. Alesina and Dollar
(2000) first suggested that politics is an important determinant of aid for some donors. On the
other hand, Chong (2006) suggests that donor characteristics including tax revenues and donor
income inequality are important determinants of aid allocation. Powell and Bobba (2006) finds
that politics, recipient characteristics and donor characteristics all play a role in explaining aid
patterns. In particular, this paper confirms the result that countries tend to receive more aid from
donors if they are allied politically and less if they are not political allies of donors.3
3 The paper follows the literature in using voting in the UN general assembly to measure political alignment.
7
The extensive literature on aid effectiveness has tended to focus more on recipient
characteristics than donor characteristics or ties between the two, and has paid little attention to
determinants of the pattern of aid as potential explanations of aid effectiveness.4 Excellent
reviews of the aid effectiveness literature are included in Clemens, Radelet and Bhavnani (2004),
Hansen and Tarp (1999) and Cassens (1994) to name but three. The first and most recent review
cited, considers the work of Boone (see Boone 1994) as central in sparking an industry of growth
regressions. Boone found that aid was largely ineffective in enhancing growth. A series of papers
including Burnside and Dollar (2000), Collier and Dollar (2002), Collier and Hoeffler (2002),
Islam (2003) and Ovaska (2003) then argued that aid is effective, but conditional on recipient
characteristics. Relevant characteristics include inflation, budget balance, openness, an overall
indices of the quality of policies and institutions, warfare, totalitarian government and economic
freedom. However, there has been a lively debate regarding the robustness of these results; see
especially the contributions by Easterly, Levine and Roodman (2003) and (2004).
On the other hand, Clemens, Radelet and Bhavnani (2004) disaggregate aid and suggest
that only certain types of aid are likely to be effective in promoting growth. They also favor a
non-linear effect of aid on growth and find that, accounting for diminishing returns, aid tends to
be effective independently of recipient policies. Finally, they stress that most aid can only be
expected to have effects on growth over the medium to longer run.5
The underlying problem of endogeneity is that while aid may affect recipient economic
performance, that performance may well affect the quantity of aid received. Rajan and
Subramajan (2005) argue in favor of a careful treatment of this issue, and their results take the
literature right back to Boone. The conclusion is that, when including instruments that explain
the pattern of aid but that are unrelated to recipient performance, aid is not effective for growth.
However, the consistent result that donors extend more aid to recipients that are political
allies than to other countries, leads us to question whether aid to political allies may have a
different nature than aid to non-allies. There are at least two broad justifications for thinking that
aid between political allies may be different than aid between non-allies. The first is that aid may
be used to influence recipient countries. This explanation would reverse the causality considered
4 See for example Radelet’s primer on aid (Radelet 2006a) where he states “to date there has been very little systematic research connecting specific donor practices to aid effectiveness.” 5 These results underline the idea that aid may come in different flavors and hence suggest that a somewhat richer instrumentation strategy than otherwise may be required to do justice in explaining aid patterns.
8
in the aid allocation literature.6 If some aid is used to buy political allegiance then there may be
less emphasis on ensuring that that aid is effective for growth.7 A second view is that aid that is
extended to political allies may be more tied in other dimensions than aid to non-allies.
Specifically, if political allegiance implies a closer relation between donor and recipient in
general then recipients may either feel that they should (or be forced to) buy goods or services
from the donor country (typically financed by the aid) whether they be of the highest quality or
not.8 In both cases, our hypothesis is that aid extended to political allies may be rendered less
effective for growth.
To some extent, using instruments to control for endogeneity may indirectly harness the
determinants of aid allocation to explain aid effectiveness. The time-invariant instruments
employed by Rajan and Subramajan (2005) include whether a country was a colony of a donor,
whether there is a common language between recipient and donor and whether the countries had
entered into a political alliance. While these variables appear to be adequate instruments for total
aid by standard tests, we suspect that they will explain better aid to political allies rather than aid
to non-allies. We suggest here that the more altruistic donor characteristics suggested by Chong
(2006), including the equality of donor societies and the size of tax revenues, may better explain
aid to non-allies.
In order to test our hypotheses, we need to separate aid to political allies from aid to non
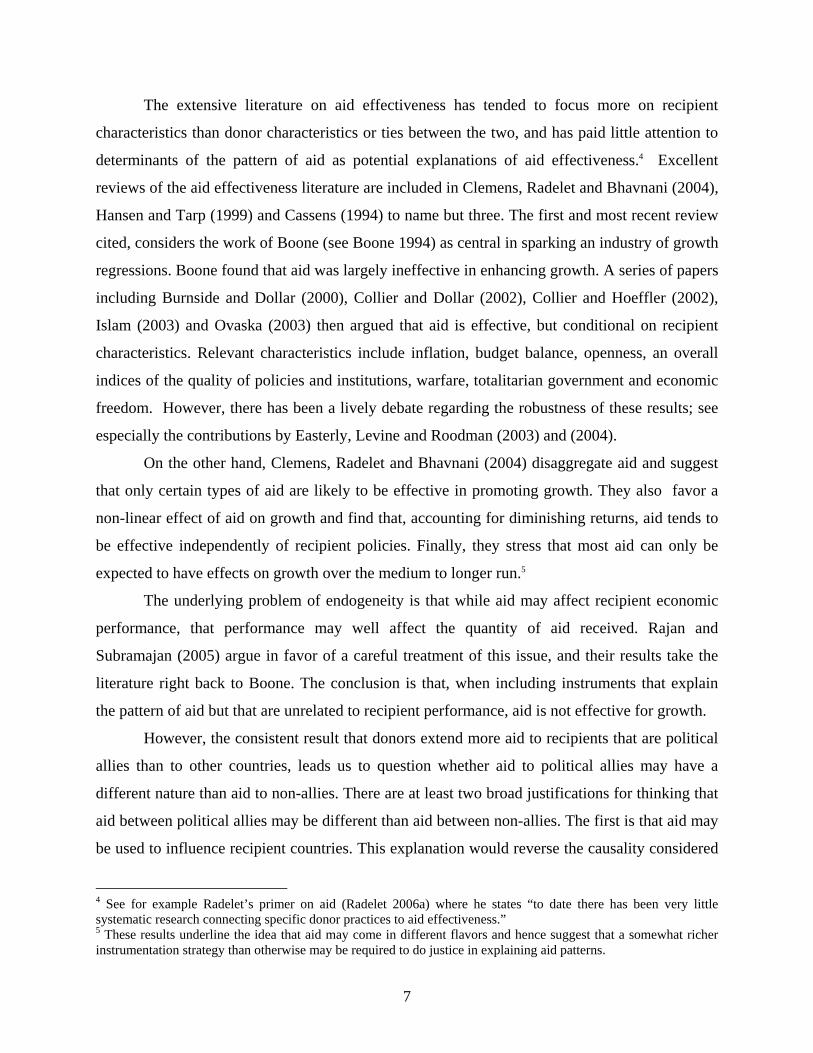
allies. As in previous papers, we use the voting correlations in the UN general assembly to
measure political allegiance. Specifically, we use an indicator variable for the voting behavior of
the countries in our database developed by Voeten (2005). Whenever a country votes in favor of
a resolution that attracts a 1, if it abstains a 2 and when it votes against then the value is 3. We
then calculate the correlation coefficient between each donor-recipient pair for each year of our
sample. In Figure 2, we plot the distribution of the correlation of UN voting for selected donors.
As can be seen from the graph different donors have different distributions. The United States
6 Much of the literature on aid allocation established the correlation between these variables but not necessarily the causality. 7 In the general direction of this view, Kuziemko and Werker (2006) argue that recipient countries that are members of the UN security council obtain more US foreign aid. 8 The OECD data on aid splits aid into tied, partially tied and untied according to the destination of each loan or grant. However, there is some controversy and skepticism regarding the quality of this disaggregation and hence we were unwilling to employ this variable directly; see Roodman (2004) for a discussion. Still, the correlation between aid to political allies and the OECD tied aid series is 0.7 providing some support for the view that aid between allies may be more tied in other dimensions too.

9
and Switzerland have distributions with wide dispersion reflecting that they have many allies
among potential aid recipients but also that there are many potential recipients that vote against
them at the United Nations. The United Kingdom, Norway and Denmark have distributions with
a lower dispersion, suggesting greater independence between their voting and that of potential
aid recipients.
-0.7
3
-0.6
2
-0.5
2
-0.4
1
-0.3
0
-0.1
9
-0.0
9
0.02
0.13
0.24
0.35
0.45
0.56
0.67
0.78
0.89
0.99
DenmarkNorway
UKUSSwitzerland
Figure 2. Frequency Domains for UN Alignment across Recipientsfor Various Donors
Denmark Norway UK US Switzerland
To be as clean and objective as possible, we simply considered two countries that
displayed a voting correlation greater than the overall sample median in a particular year as allies
for that period, whereas if the correlation was less than the median then they are considered as
non-allies.9 Splitting aid in this manner implies that about 49 percent of the volume of aid was
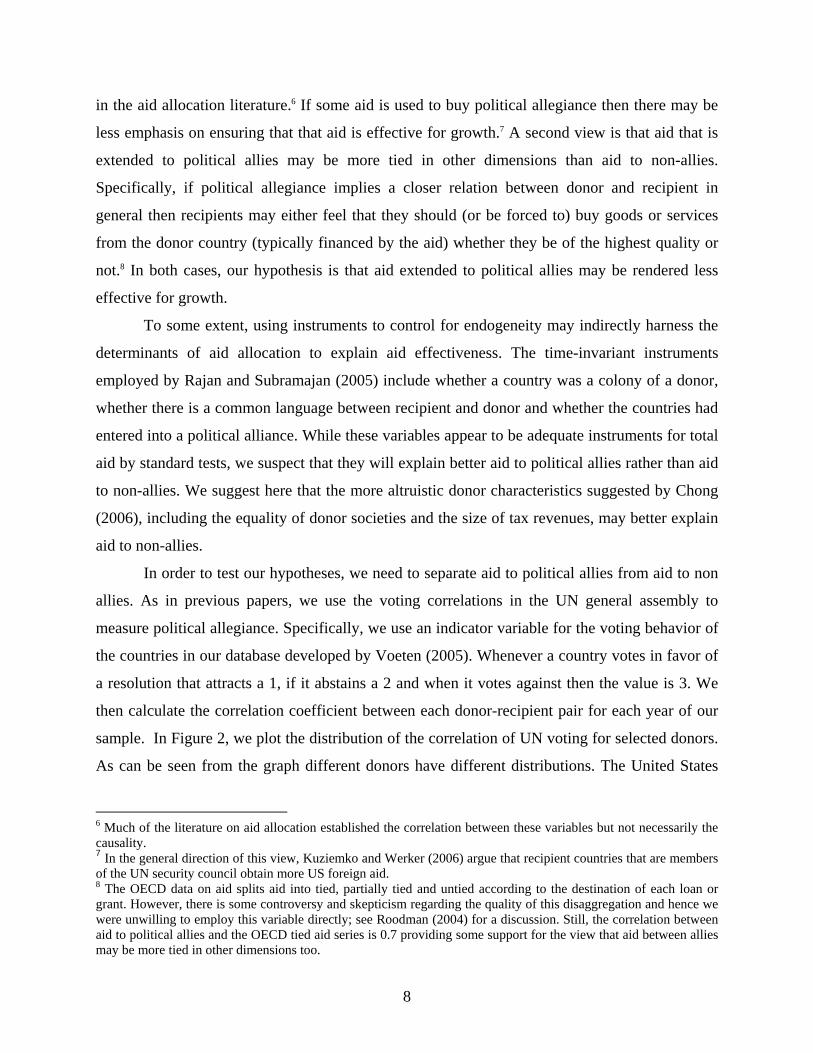
extended to political allies across our sample. In Figure 3, we plot total aid extended and aid
extended to political allies, both as a percentage of donor GDP. In general, countries that extend
9 We have tested the sensitivity of our results to the choice of this threshold for our splitting rule. In particular, we chose the 33rd and 66th percentile of the distribution of UN voting as alternative thresholds. Results are shown in Appendix 2.
10
a larger share of aid as a percentage of GDP extend less aid to allies. Greece gives the largest
proportion of aid to allies, followed by Switzerland and then New Zealand and Australia.
Countries that give little aid to allies as a proportion of total aid include Ireland, Denmark and
the United Kingdom.
Figure 3. Aid to Political Allies:Period Averages
0.00%
0.05%
0.10%
0.15%
0.20%
0.25%
0.30%
0.35%
0.40%
NLDNOR
SWEDNK
FRAAUS
BELLU
XDEU FIN
CANCHE
NZLJP
NGBR
AUTITA
PRTUSA
ESP IRLGRC
% o
f Don
or G
DP
Aid to Allies Total Aid
3. Data and Methodology The data on aid are drawn from the OECD database on Official Development Assistance (ODA).
These data cover aid extended from 22 donors to a wide number of individual recipient
countries.10 In the analyses that follow we consider net flows. As discussed above, an important
consideration is whether aid has a long-run or a medium-run impact on growth. In order to seek
robustness we decided to consider both possibilities. We employ a cross-section with time-
averages and to maximize the consistency of the panel we choose to consider the period 1980-
2003 inclusive. We believe a 24-year period should be sufficient to capture the effects of aid on 10 A caveat is that we do not consider aid from countries that are not members of the OECD. China, for example, has become an important source of finance for several developing countries.

11
growth, and over this period we can include some 133 recipient countries.11 However, we also
employ a panel analysis. Here we calculate five-year averages to consider what might be termed
medium-run impacts, and to maximize the information used we consider the all the information
available 1970-2003 and use unbalanced panel techniques. In the following subsections we
discuss instrumentation strategies to control for endogeneity and provide further detail on the
estimation techniques used to consider the medium and longer term impact of aid on growth.
3.1. Tackling Endogeneity: Instrumentation Strategies Our methodology for addressing endogeneity follows Frankel and Romer (1999) and Rajan and
Subramanian (2005), however the crucial difference compared to the latter paper is that we split
aid into aid between allies and aid to non-allies and choose instruments accordingly. We believe
that this not only allows us to estimate separate coefficients for what may be potentially different
effects of different types of aid, but also improves dramatically the statistical quality of the
instrumentation strategy.
For aid between allies we employ similar instruments to those used by Rajan and
Subramanian (2005). However, here we also take into account the results from Alesina and
Dollar (2000) and Powell and Bobba (2006) that different donors may behave differently. We
therefore introduce interaction terms between some of the explanatory variables and country
dummies such that, for example, the effect of a recipient being a colony may differ across
donors. Specifically, we derive our instrument for Allies’ Aid from the following regression for
the bilateral (donor-recipient) aid allocation decision,
(1) ijttjijiijijtijt COMMLANGDONORCOLONYENTENTE ενηγδβαϑ ++++++= *
where ijtϑ is the share of donor i’s aid allocated to recipient j at time t if recipient j is an ally.
ENTENTE is a dummy that takes the value of 1 if the donor and recipient are common members
of an entente or alliance in any given time period.12 COLONY and COMMLANG are dummies
representing, respectively, a former colonial relationship and common language between donor
and recipient. jη are recipient country dummies that control for other unobservable factors that
11 For some countries the data go back to 1970, and we exploit these additional data using an unbalanced panel below. 12 See Appendix 1 for description and sources.
12
might affect aid allocation decision, and tν are time dummies controlling for potential common
trends.13
We derive our instrument for aid between non-allies using the following equation,
(2) ijttijitititijt dTAXREVcGINIbGDPa ενησ ++++++=
where ijtσ is the share of recipient j’s aid received from donor i at time t where i is not a political
ally. The explanatory variables are now the donor characteristics, as proposed by Chong (2006),
that represent more altruistic determinants for aid and are hence excellent candidates for
explaining aid allocations to non-allies.
We have a bilateral (donor-recipient) panel data set with five-year intervals spanning the
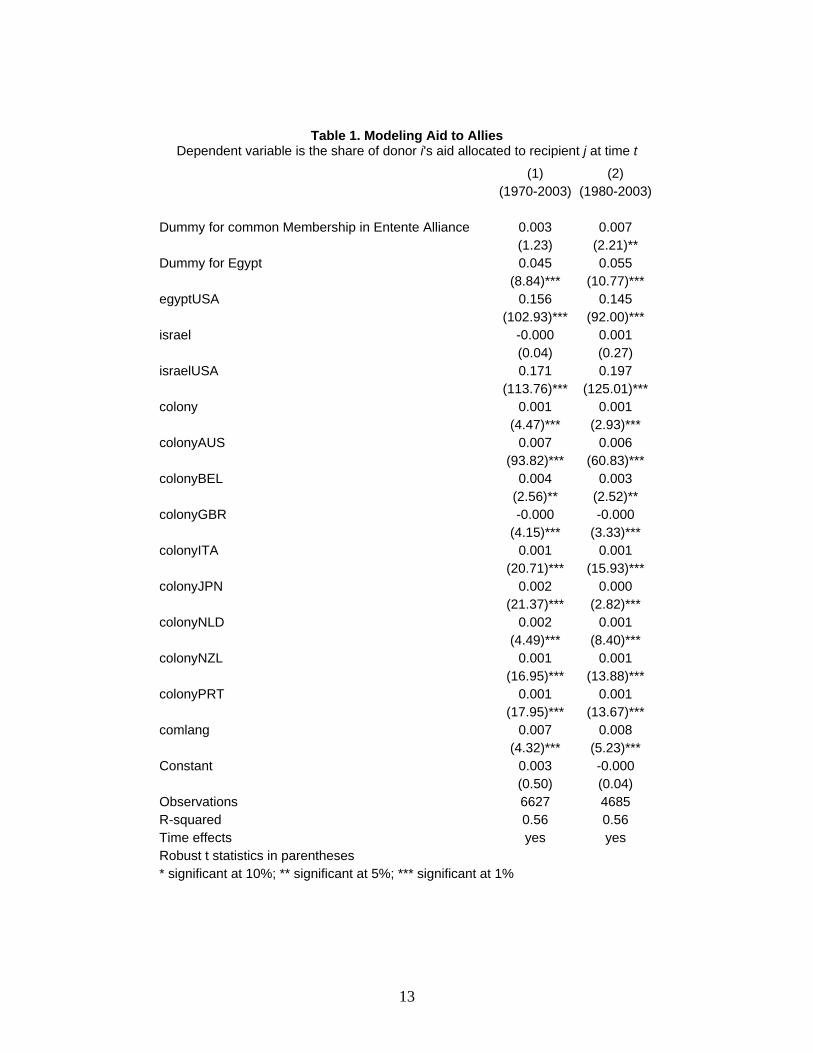
period 1970-2003. Estimation results of equation (1) and (2) are shown in Table 1 and 2.
Viewing Table 1, the reader will note that all variables are highly statistically significant and
display the expected signs; between them they account for a substantial share (56 percent) of the
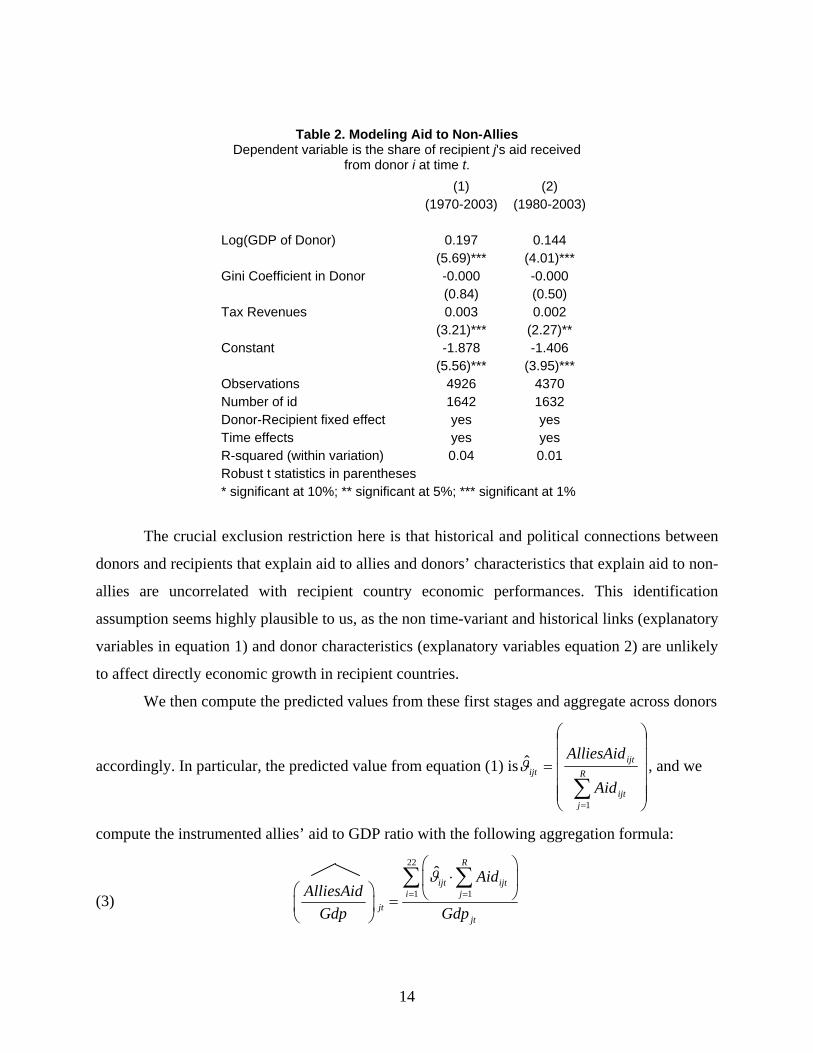
variation in donor allocation decision of aid to allies. In Table 2 we see donor size and tax
revenues are significant determinants of the amount of aid received by non-allies.14
14 We estimate equation with bilateral (donor-recipient) fixed effects; nevertheless when we take the predicted value we only consider the portion of variation explained by our regressors.
13
Table 1. Modeling Aid to Allies Dependent variable is the share of donor i's aid allocated to recipient j at time t
(1) (2) (1970-2003) (1980-2003) Dummy for common Membership in Entente Alliance 0.003 0.007 (1.23) (2.21)** Dummy for Egypt 0.045 0.055 (8.84)*** (10.77)*** egyptUSA 0.156 0.145 (102.93)*** (92.00)*** israel -0.000 0.001 (0.04) (0.27) israelUSA 0.171 0.197 (113.76)*** (125.01)*** colony 0.001 0.001 (4.47)*** (2.93)*** colonyAUS 0.007 0.006 (93.82)*** (60.83)*** colonyBEL 0.004 0.003 (2.56)** (2.52)** colonyGBR -0.000 -0.000 (4.15)*** (3.33)*** colonyITA 0.001 0.001 (20.71)*** (15.93)*** colonyJPN 0.002 0.000 (21.37)*** (2.82)*** colonyNLD 0.002 0.001 (4.49)*** (8.40)*** colonyNZL 0.001 0.001 (16.95)*** (13.88)*** colonyPRT 0.001 0.001 (17.95)*** (13.67)*** comlang 0.007 0.008 (4.32)*** (5.23)*** Constant 0.003 -0.000 (0.50) (0.04) Observations 6627 4685 R-squared 0.56 0.56 Time effects yes yes Robust t statistics in parentheses * significant at 10%; ** significant at 5%; *** significant at 1%
14
Table 2. Modeling Aid to Non-Allies Dependent variable is the share of recipient j's aid received
from donor i at time t. (1) (2) (1970-2003) (1980-2003) Log(GDP of Donor) 0.197 0.144 (5.69)*** (4.01)*** Gini Coefficient in Donor -0.000 -0.000 (0.84) (0.50) Tax Revenues 0.003 0.002 (3.21)*** (2.27)** Constant -1.878 -1.406 (5.56)*** (3.95)*** Observations 4926 4370 Number of id 1642 1632 Donor-Recipient fixed effect yes yes Time effects yes yes R-squared (within variation) 0.04 0.01 Robust t statistics in parentheses * significant at 10%; ** significant at 5%; *** significant at 1%
The crucial exclusion restriction here is that historical and political connections between
donors and recipients that explain aid to allies and donors’ characteristics that explain aid to non-
allies are uncorrelated with recipient country economic performances. This identification
assumption seems highly plausible to us, as the non time-variant and historical links (explanatory
variables in equation 1) and donor characteristics (explanatory variables equation 2) are unlikely
to affect directly economic growth in recipient countries.
We then compute the predicted values from these first stages and aggregate across donors
accordingly. In particular, the predicted value from equation (1) is
⎟⎟⎟⎟⎟
⎠
⎞
⎜⎜⎜⎜⎜
⎝
⎛
=
∑=
R
jijt
ijtijt
Aid
AlliesAid
1
ϑ̂ , and we
compute the instrumented allies’ aid to GDP ratio with the following aggregation formula:
(3)
22
1 1
ˆR
ijt ijti j
jtjt
AidAlliesAid
Gdp Gdp
ϑ= =
⎛ ⎞⋅⎜ ⎟
⎛ ⎞ ⎝ ⎠=⎜ ⎟⎝ ⎠
∑ ∑
15
Similarly, the predicted value from equation (2) is ⎟⎟⎟⎟
⎠
⎞
⎜⎜⎜⎜
⎝
⎛
=
∑=
D
iijt
ijtijt
Aid
idNonAlliesA
1
σ̂ , and we compute the
instrumented Non-allies’ aid to GDP ratio with the following aggregation formula:
(4)
22
1 1
ˆD
ijt ijti i
jtjt
AidNonAlliesAid
Gdp Gdp
σ= =
⎛ ⎞⋅⎜ ⎟⎛ ⎞ ⎝ ⎠=⎜ ⎟
⎝ ⎠
∑ ∑.
These computations then allow us to estimate growth equations using the above as instruments.
For example, we can estimate a panel growth regression of the following form,
(5) jtjtjtjt
jtjt CONTROLSGdp
idNonAlliesAGdp
AlliesAidyGROWTH εγφβλα ++⎟⎟⎠
⎞⎜⎜⎝
⎛+⎟⎟
⎠
⎞⎜⎜⎝
⎛++= −1
where 1−ity is the conditional convergence term, namely the initial level of income per capita and
CONTROLS is a vector of standard growth determinants. We may then instrument the terms
including AlliesAid and NonAlliesAid using the instruments derived above from equations (3)
and (4).
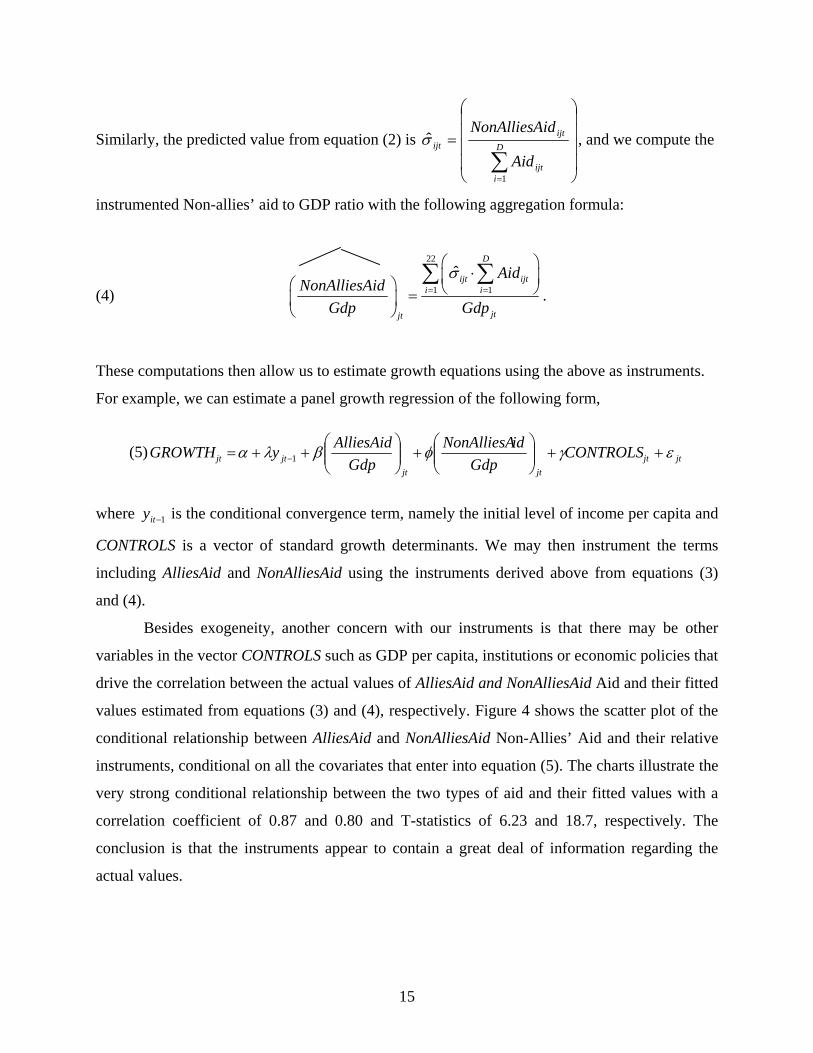
Besides exogeneity, another concern with our instruments is that there may be other
variables in the vector CONTROLS such as GDP per capita, institutions or economic policies that
drive the correlation between the actual values of AlliesAid and NonAlliesAid Aid and their fitted
values estimated from equations (3) and (4), respectively. Figure 4 shows the scatter plot of the
conditional relationship between AlliesAid and NonAlliesAid Non-Allies’ Aid and their relative
instruments, conditional on all the covariates that enter into equation (5). The charts illustrate the
very strong conditional relationship between the two types of aid and their fitted values with a
correlation coefficient of 0.87 and 0.80 and T-statistics of 6.23 and 18.7, respectively. The
conclusion is that the instruments appear to contain a great deal of information regarding the
actual values.

16
Figure 4. Conditional Relations between Estimated and Fitted Aid Types
-.05
0.0
5.1
.15
e( N
onA
lliesA
id |
X )
-.05 0 .05 .1 .15e( NonAlliesAid_fitted | X )
coef = .80991909, (robust) se = .04320467, t = 18.75
-.01
0.0
1.0
2.0
3e
( Allie
sAid
| X
)
-.01 0 .01 .02 .03 .04e( All iesAid_fitted | X )
coef = .8677346, (robust) se = .13923504, t = 6.23

17
There has been a substantial debate in the literature regarding the appropriate estimation
of equation (5). There are perhaps three main methodological caveats. The first refers to a
standard problem of growth empirics, namely the fact that the equation is dynamic due to the
conditional convergence term, hence any attempt to control for the problem of unobservable
heterogeneity by incorporating country fixed effects would produce inconsistent estimates. One
way to overcome this problem is averaging the data over the whole period and estimating a pure
cross-section; alternatively, one can estimate the equation in a panel with a pooled OLS
estimator and hence without specifying the fixed effects. Both estimators have the drawback that
we can never be sure whether we are controlling for all possible ways in which countries might
differ. A further possibility is to employ the Blundell-Bond GMM system estimator. This
estimator addresses both the problem of the endogeneity of standard growth controls (through
the use of instruments and corresponding moment restrictions) and implicitly incorporates fixed
effects.15
The second caveat refers to the time horizon at which it is appropriate to evaluate the
effect of aid on economic growth. While much of the literature studies the aid-growth
relationship over the shorter run (with a panel dataset of time windows ranging from three to five
years), others stress that the impact of aid on economic performance will likely take longer to
materialize, and hence growth equations with cross-sectional averages taken over longer time
horizons may be more appropriate.16
The third concern is model specification, particularly the choice of controls. Temple
(1999) summarizes several widespread concerns regarding the fragility of cross-country growth
regressions. More specifically, Roodman (2004) tests the robustness of the relationship between
aid and growth by replicating and assessing the validity of the most influential studies in the
literature and performing a number of specification tests. He concludes that the results are indeed
fragile. However, he does not split aid according to the results of the aid allocation literature.
Given these methodological issues, we present estimates of equation (5) using i) time average
cross sections (OLS, 2SLS and 3SLS) over the whole period, ii) a pooled panel OLS estimator
using 5 year time averages and again employing with OLS, 2SLS and 3SLS estimators, and iii)
15 Hauk and Wacziarg (2004) argue, based on Monte Carlo simulations, and taking account of all the advantages and limitations of the different estimation procedures, that the pure cross-section OLS estimator that averages data over long periods is the most inefficient. However, their simulations do not consider the Blundell-Bond estimator. 16 Again see Clemens et al. (2004) for a review of this point.
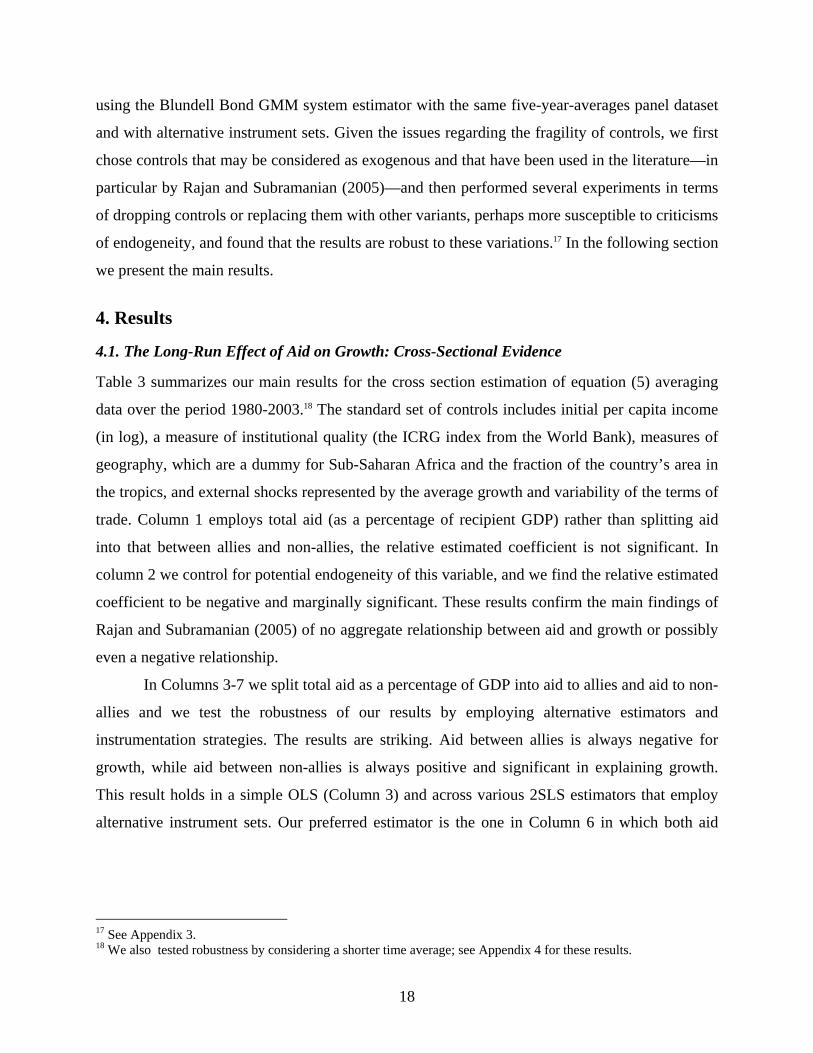
18
using the Blundell Bond GMM system estimator with the same five-year-averages panel dataset
and with alternative instrument sets. Given the issues regarding the fragility of controls, we first
chose controls that may be considered as exogenous and that have been used in the literature—in
particular by Rajan and Subramanian (2005)—and then performed several experiments in terms
of dropping controls or replacing them with other variants, perhaps more susceptible to criticisms
of endogeneity, and found that the results are robust to these variations.17 In the following section
we present the main results.
4. Results 4.1. The Long-Run Effect of Aid on Growth: Cross-Sectional Evidence Table 3 summarizes our main results for the cross section estimation of equation (5) averaging
data over the period 1980-2003.18 The standard set of controls includes initial per capita income
(in log), a measure of institutional quality (the ICRG index from the World Bank), measures of
geography, which are a dummy for Sub-Saharan Africa and the fraction of the country’s area in
the tropics, and external shocks represented by the average growth and variability of the terms of
trade. Column 1 employs total aid (as a percentage of recipient GDP) rather than splitting aid
into that between allies and non-allies, the relative estimated coefficient is not significant. In
column 2 we control for potential endogeneity of this variable, and we find the relative estimated
coefficient to be negative and marginally significant. These results confirm the main findings of
Rajan and Subramanian (2005) of no aggregate relationship between aid and growth or possibly
even a negative relationship.
In Columns 3-7 we split total aid as a percentage of GDP into aid to allies and aid to non-
allies and we test the robustness of our results by employing alternative estimators and
instrumentation strategies. The results are striking. Aid between allies is always negative for
growth, while aid between non-allies is always positive and significant in explaining growth.
This result holds in a simple OLS (Column 3) and across various 2SLS estimators that employ
alternative instrument sets. Our preferred estimator is the one in Column 6 in which both aid
17 See Appendix 3. 18 We also tested robustness by considering a shorter time average; see Appendix 4 for these results.

19
between allies and between non allies are instrumented with their respective fitted values derived
from equations (1) and (2).19
Table 3. Cross Section Analysis for Period 1980-2003 (Dependent Variable is average annual growth rate of per capita GDP)
(1) (2) (3) (4) (5) (6) (7) Model OLS 2SLS OLS 2SLS 2SLS 2SLS System of eq Total Aid(% GDP) -0.803 -1.587 (1.95)* (1.67)* NonAlliesAid(% GDP) 1.765 1.618 1.985 1.912 1.780 (2.19)** (2.19)** (2.48)** (2.22)** (1.84)* AlliesAid(% GDP) -5.956 -5.790 -6.533 -6.539 -6.914 (3.66)*** (3.75)*** (3.43)*** (3.45)*** (3.99)*** log(Initial Per Capita GDP) -0.083 -0.091 -0.096 -0.096 -0.098 -0.098 -0.101 (3.62)*** (3.92)*** (4.45)*** (4.77)*** (4.75)*** (4.80)*** (6.00)*** Dummy for Sub-Saharan Africa -0.135 -0.124 -0.163 -0.162 -0.166 -0.165 -0.162 (3.70)*** (3.57)*** (4.86)*** (5.13)*** (5.22)*** (5.12)*** (5.04)*** Institutional quality (ICRG Index) 0.010 0.010 0.011 0.011 0.011 0.011 0.011 (3.24)*** (3.59)*** (3.61)*** (3.88)*** (3.92)*** (3.93)*** (5.51)*** Fraction of area in the tropics -0.017 -0.009 0.026 0.025 0.031 0.031 0.034 (0.44) (0.24) (0.65) (0.67) (0.78) (0.79) (0.96) Terms of Trade Growth 0.215 0.205 0.121 0.125 0.109 0.109 0.102 (1.41) (1.43) (0.82) (0.91) (0.78) (0.78) (0.84) St. deviation of Terms of Trade Growth -0.038 -0.028 -0.062 -0.060 -0.063 -0.062 -0.060
(0.96) (0.71) (1.51) (1.58) (1.61) (1.58) (1.16) Constant 0.144 0.187 0.199 0.199 0.205 0.208 0.220 (1.11) (1.52) (1.57) (1.70)* (1.72)* (1.76)* (1.72)* Observations 67 67 65 65 65 65 65 R-squared 0.44 0.40 0.53 0.53 0.53 0.56
Instrumented Variables Total Aid (% GDP) NonAlliesAi
d(% GDP)AlliesAid(% GDP)
AlliesAid and
NonAlliesAid
Growth, AlliesAid
and NonAlliesAid
Instruments Rajan et al Fitted Aid (% GDP)
Fitted NonAlliesAi
d Aid(% GDP)
Fitted AlliesAid(% GDP)
Fitted AlliesAid
and Fitted
NonAlliesAid
Fitted AlliesAid and Fitted
NonAlliesAid
F Test of Excluded iv 8.12 193.71 27.56 Craigg-Donald Test for Weak iv 53.81 Robust t statistics in parentheses * significant at 10%; ** significant at 5%; *** significant at 1%
19 Note that the correlation between aid to allies and to non-allies is only 0.46. Moreover, the correlation between the fitted values of aid between allies and non-allies estimated from equations 1 and 2 is around zero. We conclude that these results are not driven by any high positive correlations between the regressors. See Appendix 5 for the correlation matrix.
20
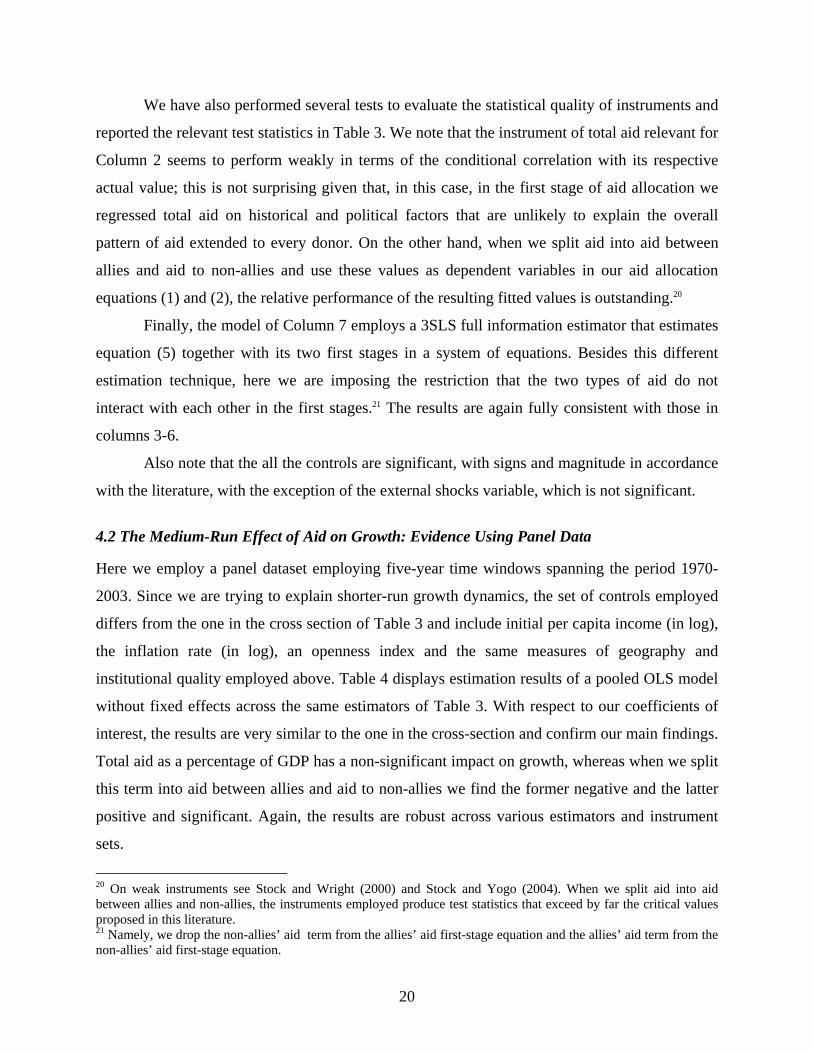
We have also performed several tests to evaluate the statistical quality of instruments and
reported the relevant test statistics in Table 3. We note that the instrument of total aid relevant for
Column 2 seems to perform weakly in terms of the conditional correlation with its respective
actual value; this is not surprising given that, in this case, in the first stage of aid allocation we
regressed total aid on historical and political factors that are unlikely to explain the overall
pattern of aid extended to every donor. On the other hand, when we split aid into aid between
allies and aid to non-allies and use these values as dependent variables in our aid allocation
equations (1) and (2), the relative performance of the resulting fitted values is outstanding.20
Finally, the model of Column 7 employs a 3SLS full information estimator that estimates
equation (5) together with its two first stages in a system of equations. Besides this different
estimation technique, here we are imposing the restriction that the two types of aid do not
interact with each other in the first stages.21 The results are again fully consistent with those in
columns 3-6.
Also note that the all the controls are significant, with signs and magnitude in accordance
with the literature, with the exception of the external shocks variable, which is not significant.
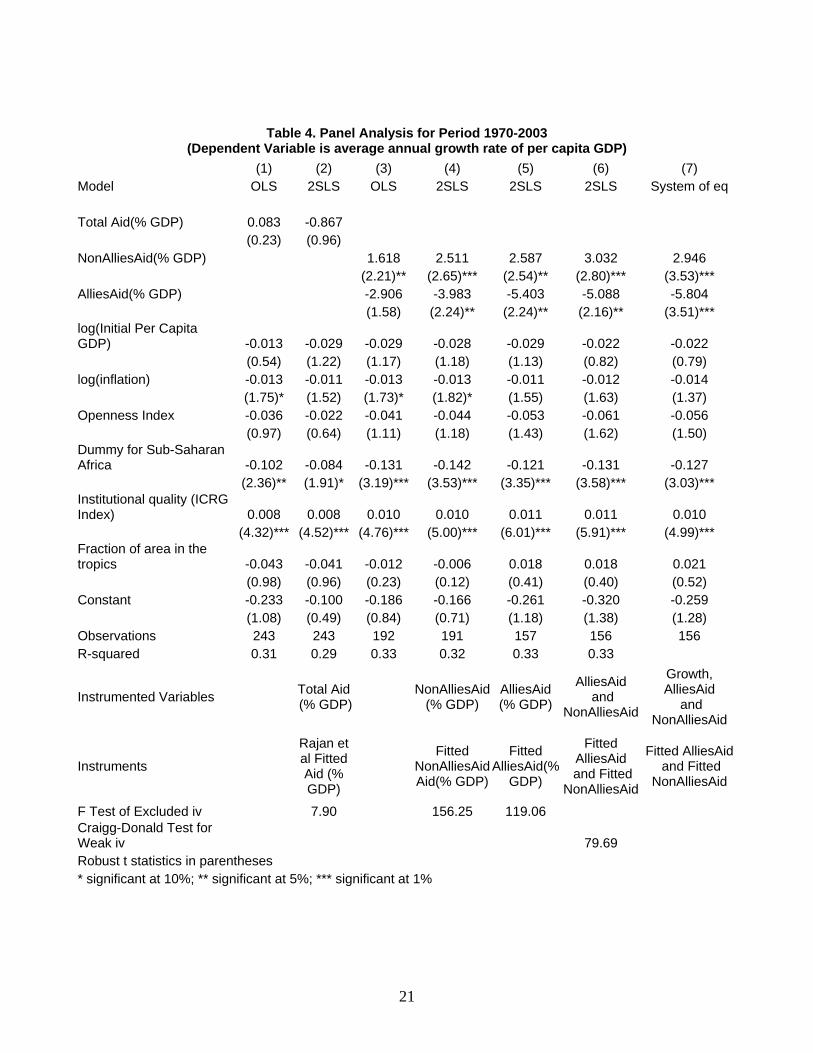
4.2 The Medium-Run Effect of Aid on Growth: Evidence Using Panel Data Here we employ a panel dataset employing five-year time windows spanning the period 1970-
2003. Since we are trying to explain shorter-run growth dynamics, the set of controls employed
differs from the one in the cross section of Table 3 and include initial per capita income (in log),
the inflation rate (in log), an openness index and the same measures of geography and
institutional quality employed above. Table 4 displays estimation results of a pooled OLS model
without fixed effects across the same estimators of Table 3. With respect to our coefficients of
interest, the results are very similar to the one in the cross-section and confirm our main findings.
Total aid as a percentage of GDP has a non-significant impact on growth, whereas when we split
this term into aid between allies and aid to non-allies we find the former negative and the latter
positive and significant. Again, the results are robust across various estimators and instrument
sets.
20 On weak instruments see Stock and Wright (2000) and Stock and Yogo (2004). When we split aid into aid between allies and non-allies, the instruments employed produce test statistics that exceed by far the critical values proposed in this literature. 21 Namely, we drop the non-allies’ aid term from the allies’ aid first-stage equation and the allies’ aid term from the non-allies’ aid first-stage equation.
21
Table 4. Panel Analysis for Period 1970-2003 (Dependent Variable is average annual growth rate of per capita GDP)
(1) (2) (3) (4) (5) (6) (7) Model OLS 2SLS OLS 2SLS 2SLS 2SLS System of eq Total Aid(% GDP) 0.083 -0.867 (0.23) (0.96) NonAlliesAid(% GDP) 1.618 2.511 2.587 3.032 2.946 (2.21)** (2.65)*** (2.54)** (2.80)*** (3.53)*** AlliesAid(% GDP) -2.906 -3.983 -5.403 -5.088 -5.804 (1.58) (2.24)** (2.24)** (2.16)** (3.51)*** log(Initial Per Capita GDP) -0.013 -0.029 -0.029 -0.028 -0.029 -0.022 -0.022 (0.54) (1.22) (1.17) (1.18) (1.13) (0.82) (0.79) log(inflation) -0.013 -0.011 -0.013 -0.013 -0.011 -0.012 -0.014 (1.75)* (1.52) (1.73)* (1.82)* (1.55) (1.63) (1.37) Openness Index -0.036 -0.022 -0.041 -0.044 -0.053 -0.061 -0.056 (0.97) (0.64) (1.11) (1.18) (1.43) (1.62) (1.50) Dummy for Sub-Saharan Africa -0.102 -0.084 -0.131 -0.142 -0.121 -0.131 -0.127 (2.36)** (1.91)* (3.19)*** (3.53)*** (3.35)*** (3.58)*** (3.03)*** Institutional quality (ICRG Index) 0.008 0.008 0.010 0.010 0.011 0.011 0.010 (4.32)*** (4.52)*** (4.76)*** (5.00)*** (6.01)*** (5.91)*** (4.99)*** Fraction of area in the tropics -0.043 -0.041 -0.012 -0.006 0.018 0.018 0.021 (0.98) (0.96) (0.23) (0.12) (0.41) (0.40) (0.52) Constant -0.233 -0.100 -0.186 -0.166 -0.261 -0.320 -0.259 (1.08) (0.49) (0.84) (0.71) (1.18) (1.38) (1.28) Observations 243 243 192 191 157 156 156 R-squared 0.31 0.29 0.33 0.32 0.33 0.33
Instrumented Variables Total Aid (% GDP) NonAlliesAid
(% GDP) AlliesAid(% GDP)
AlliesAid and
NonAlliesAid
Growth, AlliesAid
and NonAlliesAid
Instruments
Rajan et al Fitted Aid (% GDP)
Fitted
NonAlliesAid Aid(% GDP)
Fitted AlliesAid(%
GDP)
Fitted AlliesAid
and Fitted NonAlliesAid
Fitted AlliesAid and Fitted
NonAlliesAid
F Test of Excluded iv 7.90 156.25 119.06 Craigg-Donald Test for Weak iv 79.69 Robust t statistics in parentheses * significant at 10%; ** significant at 5%; *** significant at 1%
22
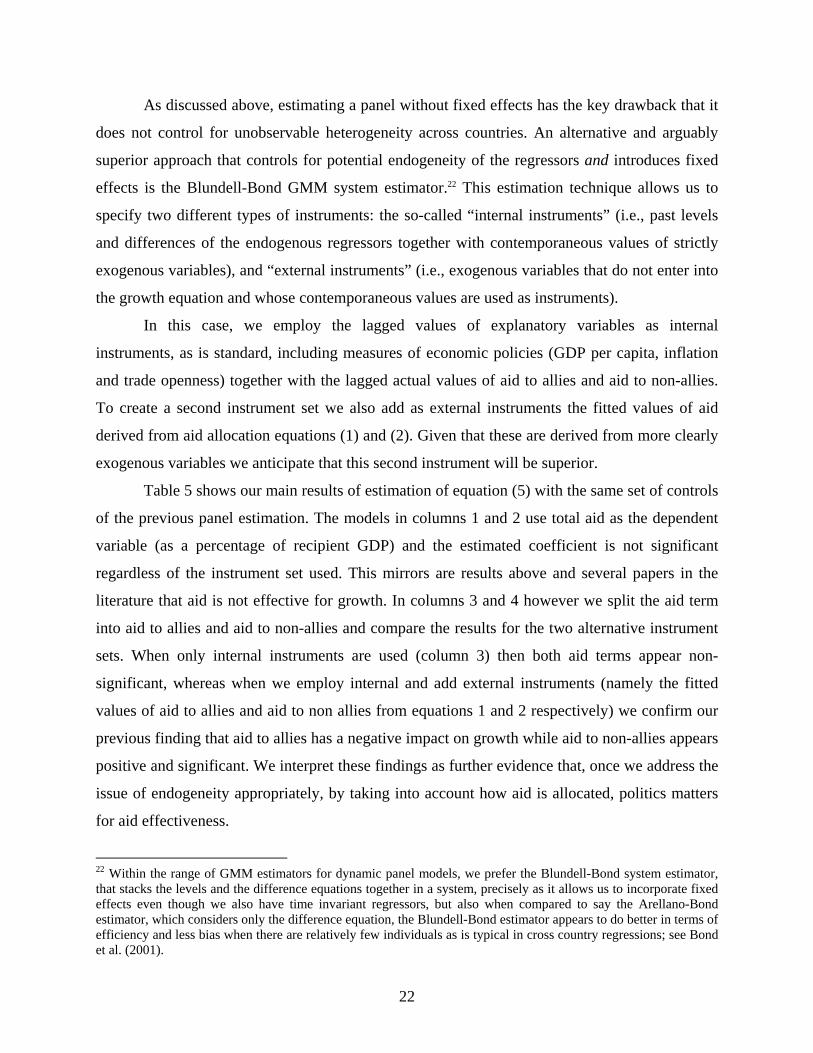
As discussed above, estimating a panel without fixed effects has the key drawback that it
does not control for unobservable heterogeneity across countries. An alternative and arguably
superior approach that controls for potential endogeneity of the regressors and introduces fixed
effects is the Blundell-Bond GMM system estimator.22 This estimation technique allows us to
specify two different types of instruments: the so-called “internal instruments” (i.e., past levels
and differences of the endogenous regressors together with contemporaneous values of strictly
exogenous variables), and “external instruments” (i.e., exogenous variables that do not enter into
the growth equation and whose contemporaneous values are used as instruments).
In this case, we employ the lagged values of explanatory variables as internal
instruments, as is standard, including measures of economic policies (GDP per capita, inflation
and trade openness) together with the lagged actual values of aid to allies and aid to non-allies.
To create a second instrument set we also add as external instruments the fitted values of aid
derived from aid allocation equations (1) and (2). Given that these are derived from more clearly
exogenous variables we anticipate that this second instrument will be superior.
Table 5 shows our main results of estimation of equation (5) with the same set of controls
of the previous panel estimation. The models in columns 1 and 2 use total aid as the dependent
variable (as a percentage of recipient GDP) and the estimated coefficient is not significant
regardless of the instrument set used. This mirrors are results above and several papers in the
literature that aid is not effective for growth. In columns 3 and 4 however we split the aid term
into aid to allies and aid to non-allies and compare the results for the two alternative instrument
sets. When only internal instruments are used (column 3) then both aid terms appear non-
significant, whereas when we employ internal and add external instruments (namely the fitted
values of aid to allies and aid to non allies from equations 1 and 2 respectively) we confirm our
previous finding that aid to allies has a negative impact on growth while aid to non-allies appears
positive and significant. We interpret these findings as further evidence that, once we address the
issue of endogeneity appropriately, by taking into account how aid is allocated, politics matters
for aid effectiveness.
22 Within the range of GMM estimators for dynamic panel models, we prefer the Blundell-Bond system estimator, that stacks the levels and the difference equations together in a system, precisely as it allows us to incorporate fixed effects even though we also have time invariant regressors, but also when compared to say the Arellano-Bond estimator, which considers only the difference equation, the Blundell-Bond estimator appears to do better in terms of efficiency and less bias when there are relatively few individuals as is typical in cross country regressions; see Bond et al. (2001).

23
Table 5. Panel GMM for Period 1970-2003 (Dependent Variable is average annual growth rate of per capita GDP)
(1) (2) (3) (4) Model SYS GMM SYS GMM SYS GMM SYS GMM growth rate (t-1) 0.843 0.856 0.960 0.879 (7.14)*** (7.44)*** (7.62)*** (8.50)*** Total Aid(% GDP) -0.023 -0.240 (0.08) (0.60) NonAlliesAid(% GDP) 0.161 1.24 (0.24) (2.86)*** AlliesAid(% GDP) -0.501 -1.78 (0.32) (1.83)* log(Initial Per Capita GDP) -0.139 -0.106 -0.159 -0.125 (2.59)*** (2.04)** (2.69)*** (2.14)** log(inflation) 0.014 0.014 0.005 0.004 (1.36) (1.40) (0.45) (0.39) Openness Index 0.015 0.036 0.018 -0.001 (0.29) (0.73) (0.34) (0.02) Dummy for Sub-Saharan Africa -0.119 -0.081 -0.143 -0.154 (2.17)** (1.49) (2.18)** (2.77)*** Institutional quality (ICRG Index) 0.019 0.017 0.018 0.017 (5.68)*** (5.65)*** (5.18)*** (4.91)*** Fraction of area in the tropics -0.048 -0.042 -0.028 -0.024 (1.42) (1.20) (0.82) (0.73) Constant 0.129 -0.050 0.387 0.185 (0.33) (0.12) (0.97) (0.50) Observations 242 242 191 155 Number of id 66 66 63 63
Endogenous variables used as instruments
Total Aid, loggdppc,
loginfl, open_index
loggdppc,loginfl,
open_index
Tied Aid, Untied Aid, loggdppc
loginfl open_index
loggdppc loginfl
open_index
Exogenous variables used as Instruments Rajan et al
Fitted Aid(% GDP)
Both Fitted Tied and Untied Aid
Hansen test of overid. restrictions (p-value) 0.17 0.15 0.48 0.37 Arellano-Bond test for AR(1) in first diff 0.00 0.00 0.02 0.02 Arellano-Bond test for AR(2) in first diff 0.92 1.00 0.71 0.74 Robust z statistics in parentheses * significant at 10%; ** significant at 5%; *** significant at 1%
24
5. Conclusions In this paper we have revisited the debate on whether foreign aid is effective in enhancing
economic performance in recipient countries and in particular in spurring growth. Our main
hypothesis is that the way aid is allocated is important in determining aid effectiveness. A
consistent result of the aid allocation literature is that politics matters and hence it seems natural
to question whether politics also matters for aid effectiveness.
Our main finding is that aid extended to non-allies has a strong positive impact on
recipient countries’ economic growth, whereas aid to political allies has a negative impact. These
results are robust across different samples, model specifications, time horizons, estimators and
instrumentation strategies. While there are always caveats that must accompany any empirical
analysis of this nature, our results do appear to be striking in terms of both quantitative impact
and robustness. In particular, we feel our instruments more adequately explain the pattern of aid
than standard donor-recipient time-invariant factors that may explain the pattern of aid between
allies but not between non-allies. We remain agnostic regarding the precise mechanism behind
our results but consider two likely possibilities supported by additional evidence: i) aid is used to
buy political allegiance and hence its effectiveness for growth may be at best a secondary
consideration, and ii) aid between allies may be more tied in other dimensions than aid between
non-allies.
These results carry strong policy conclusions. They show that foreign aid can be very
beneficial to economic development around the world independent of recipient policies. Indeed,
the results stress the role played by donors rather than by recipients. This emphasis stands in
contrast to much of the recent debate regarding aid effectiveness, which has focused on recipient
policies. We suggest here that donors’ allocation policies should be seen as a leading determinant
of aid effectiveness.

25
References Alesina, G., and D. Dollar. 2000. “Who Gives Foreign Aid to Whom and Why?” Journal of
Economic Growth 5(1): 33-63.
Blundell, R., and S. Bond. 1998. “Initial Conditions and Moment Restrictions in Dynamic Panel
Data Models.” Journal of Econometrics 87(1): 115-43.
Bond, S.R., A. Hoeffler and J. Temple. 2001. “GMM Estimation of Empirical Growth Models.”
CEPR Discussion Paper 3048. London, United Kingdom: Centre for Economic Policy
Research.
Boone, P. 1994. “Aid and Growth.” London, United Kingdom: London School of Economics.
Mimeographed document.
Burnside, C., and D. Dollar. 2000. “Aid, Policies and Growth.” American Economic Review
90(4): 847-868.
Cassen, R. 1994. Does Aid Work? Oxford, United Kingdom: Oxford University Press.
Chong, A. 2006. “Who’s Afraid of Foreign Aid: The Donors’ Perspective.” Research
Department Working Paper 556. Washington, DC, United States: Inter-American
Development Bank.
Clemens, M.A., S. Radelet and R. Bhavnani. 2004. “Counting Chickens when They Hatch: The
Short Term Effect of Aid on Growth.” Working Paper 44. Center for Global
Development.
Collier, P., and D. Dollar. 2002. “Aid Allocation and Poverty Reduction.” European Economic
Review 45(1): 1-126.
Collier, P., and A. Hoeffler. 2002. “Military Expenditure: Threats, Aid and Arms Races.” World
Bank Policy Research Working Paper 2927. Washington, DC, United States: World
Bank.
Easterly, W. 2004. “Can Foreign Aid Buy Growth?” Journal of Economic Perspectives 17(3):
23-48.
Easterly, W., R. Levine and D. Roodman. 2003. “New Data, New Doubt: Revisiting Aid,
Policies and Growth.” Washington, DC, United States: Center for Global Development.
Mimeographed document.
----. 2004. “New Data, New Doubts: A Comment on Burnside and Dollar’s ‘Aid, Policies and
Growth’ (2000).” American Economic Review 94(3): 774-780.
26
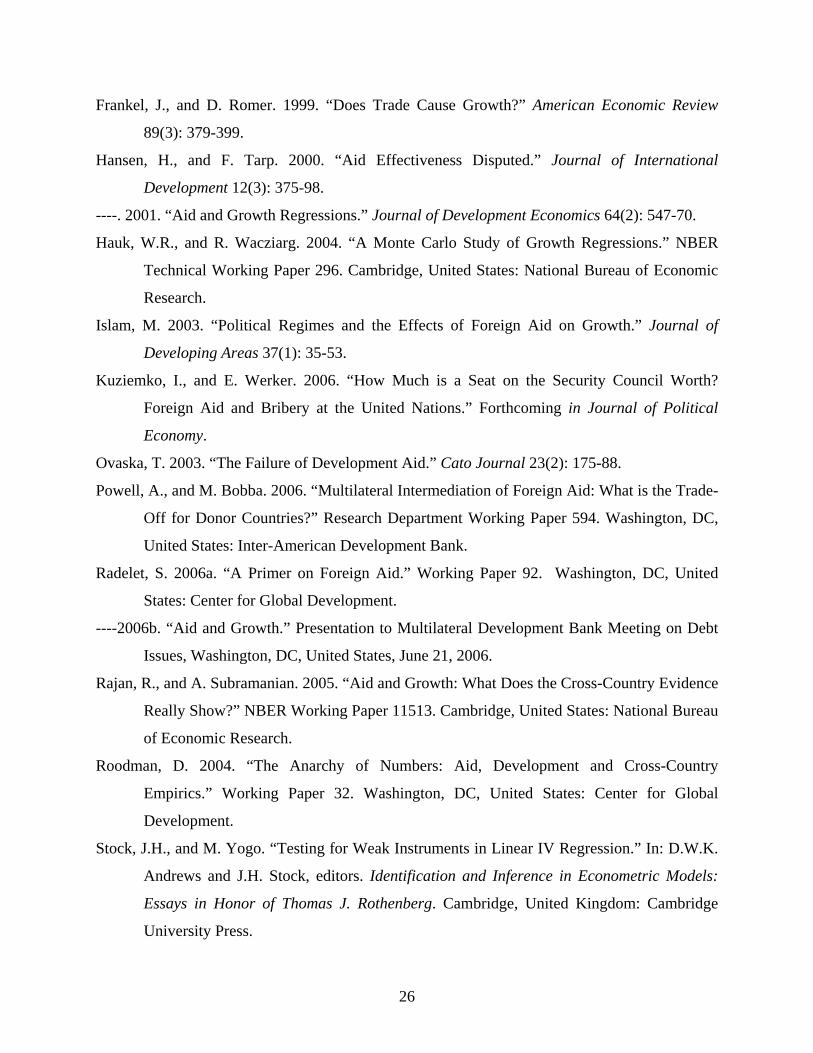
Frankel, J., and D. Romer. 1999. “Does Trade Cause Growth?” American Economic Review
89(3): 379-399.
Hansen, H., and F. Tarp. 2000. “Aid Effectiveness Disputed.” Journal of International
Development 12(3): 375-98.
----. 2001. “Aid and Growth Regressions.” Journal of Development Economics 64(2): 547-70.
Hauk, W.R., and R. Wacziarg. 2004. “A Monte Carlo Study of Growth Regressions.” NBER
Technical Working Paper 296. Cambridge, United States: National Bureau of Economic
Research.
Islam, M. 2003. “Political Regimes and the Effects of Foreign Aid on Growth.” Journal of
Developing Areas 37(1): 35-53.
Kuziemko, I., and E. Werker. 2006. “How Much is a Seat on the Security Council Worth?
Foreign Aid and Bribery at the United Nations.” Forthcoming in Journal of Political
Economy.
Ovaska, T. 2003. “The Failure of Development Aid.” Cato Journal 23(2): 175-88.
Powell, A., and M. Bobba. 2006. “Multilateral Intermediation of Foreign Aid: What is the Trade-
Off for Donor Countries?” Research Department Working Paper 594. Washington, DC,
United States: Inter-American Development Bank.
Radelet, S. 2006a. “A Primer on Foreign Aid.” Working Paper 92. Washington, DC, United
States: Center for Global Development.
----2006b. “Aid and Growth.” Presentation to Multilateral Development Bank Meeting on Debt
Issues, Washington, DC, United States, June 21, 2006.
Rajan, R., and A. Subramanian. 2005. “Aid and Growth: What Does the Cross-Country Evidence
Really Show?” NBER Working Paper 11513. Cambridge, United States: National Bureau
of Economic Research.
Roodman, D. 2004. “The Anarchy of Numbers: Aid, Development and Cross-Country
Empirics.” Working Paper 32. Washington, DC, United States: Center for Global
Development.
Stock, J.H., and M. Yogo. “Testing for Weak Instruments in Linear IV Regression.” In: D.W.K.
Andrews and J.H. Stock, editors. Identification and Inference in Econometric Models:
Essays in Honor of Thomas J. Rothenberg. Cambridge, United Kingdom: Cambridge
University Press.

27
Stock, J.H., and J.H.Wright. 2000. “GMM with Weak Identification.” Econometrica 68(5):
1055–1096.
Temple, J. 1999. “The New Growth Evidence.” Journal of Economic Literature 37(1): 112-156.
Voeten, E. 2005. “The Political Origins of the UN Security Council’s Ability to Legitimize the
Use of Force.” International Organization (Summer): 527-57.
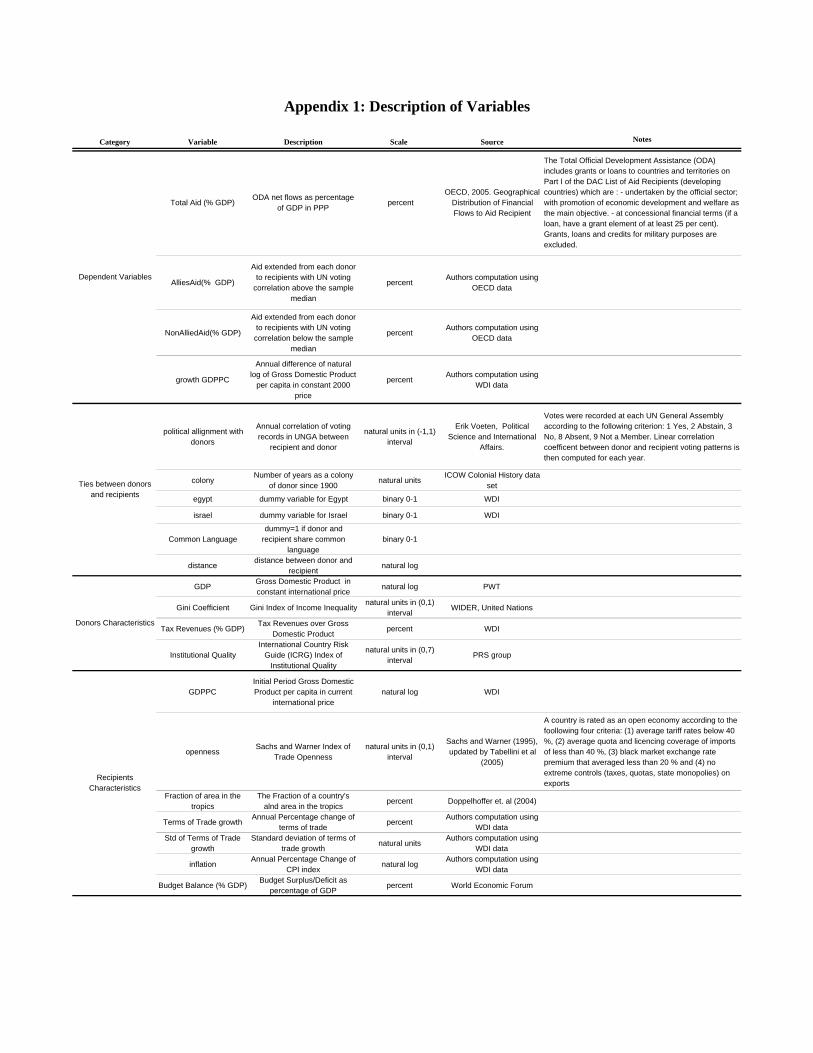
Category Variable Description Scale Source Notes
Total Aid (% GDP)ODA net flows as percentage
of GDP in PPP percent
OECD, 2005. Geographical Distribution of Financial Flows to Aid Recipient
The Total Official Development Assistance (ODA) includes grants or loans to countries and territories on Part I of the DAC List of Aid Recipients (developing countries) which are : - undertaken by the official sector; -with promotion of economic development and welfare as the main objective. - at concessional financial terms (if a loan, have a grant element of at least 25 per cent). Grants, loans and credits for military purposes are excluded.
AlliesAid(% GDP)
Aid extended from each donor to recipients with UN voting
correlation above the sample median
percentAuthors computation using
OECD data
NonAlliedAid(% GDP)
Aid extended from each donor to recipients with UN voting correlation below the sample
median
percentAuthors computation using
OECD data
growth GDPPC
Annual difference of natural log of Gross Domestic Product
per capita in constant 2000 price
percentAuthors computation using
WDI data
political allignment with donors
Annual correlation of voting records in UNGA between
recipient and donor
natural units in (-1,1) interval
Erik Voeten, Political Science and International
Affairs.
Votes were recorded at each UN General Assembly according to the following criterion: 1 Yes, 2 Abstain, 3 No, 8 Absent, 9 Not a Member. Linear correlation coefficent between donor and recipient voting patterns is then computed for each year.
colonyNumber of years as a colony
of donor since 1900natural units
ICOW Colonial History data set
egypt dummy variable for Egypt binary 0-1 WDI
israel dummy variable for Israel binary 0-1 WDI
Common Languagedummy=1 if donor and
recipient share common language
binary 0-1
distancedistance between donor and
recipientnatural log
GDPGross Domestic Product in constant international price
natural log PWT
Gini Coefficient Gini Index of Income Inequalitynatural units in (0,1)
intervalWIDER, United Nations
Tax Revenues (% GDP)Tax Revenues over Gross
Domestic Productpercent WDI
Institutional QualityInternational Country Risk
Guide (ICRG) Index of Institutional Quality
natural units in (0,7) interval
PRS group
GDPPCInitial Period Gross Domestic Product per capita in current
international pricenatural log WDI
opennessSachs and Warner Index of
Trade Opennessnatural units in (0,1)
interval
Sachs and Warner (1995), updated by Tabellini et al
(2005)
A country is rated as an open economy according to the foollowing four criteria: (1) average tariff rates below 40 %, (2) average quota and licencing coverage of imports of less than 40 %, (3) black market exchange rate premium that averaged less than 20 % and (4) no extreme controls (taxes, quotas, state monopolies) on exports
Fraction of area in the tropics
The Fraction of a country's alnd area in the tropics
percent Doppelhoffer et. al (2004)
Terms of Trade growthAnnual Percentage change of
terms of tradepercent
Authors computation using WDI data
Std of Terms of Trade growth
Standard deviation of terms of trade growth
natural unitsAuthors computation using
WDI data
inflationAnnual Percentage Change of
CPI indexnatural log
Authors computation using WDI data
Budget Balance (% GDP)Budget Surplus/Deficit as
percentage of GDPpercent World Economic Forum
Recipients Characteristics
Ties between donors and recipients
Dependent Variables
Appendix 1: Description of Variables
Donors Characteristics
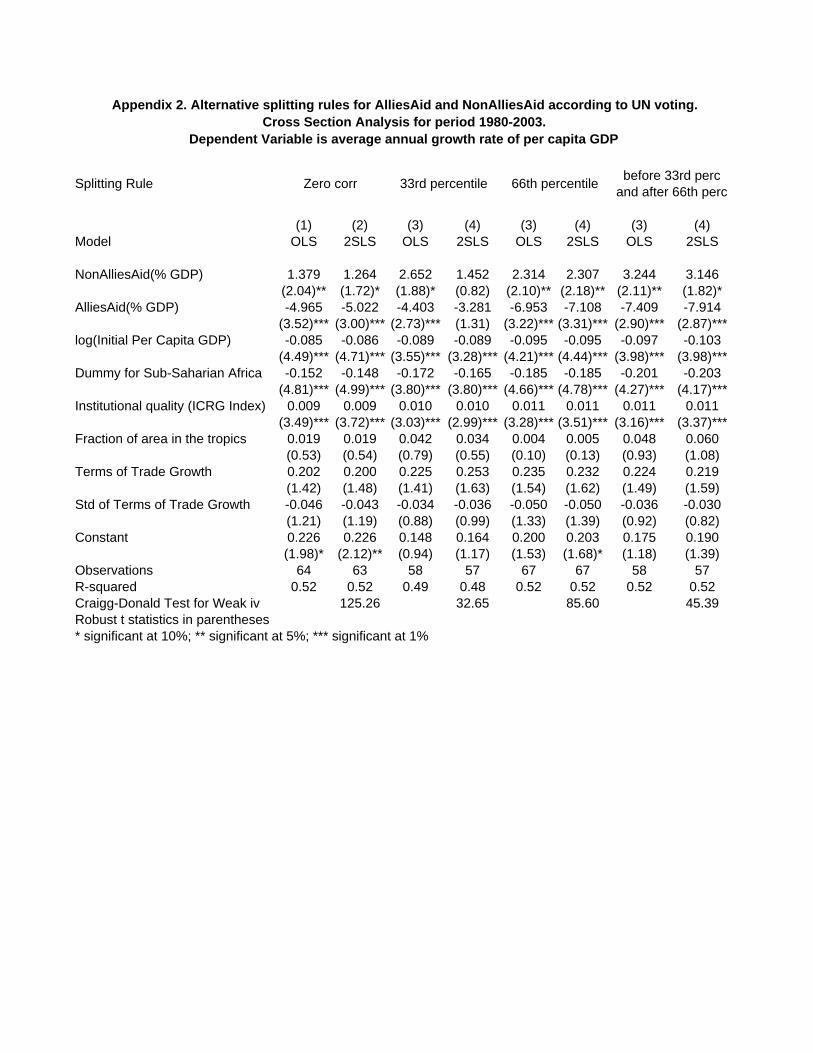
(1) (2) (3) (4) (3) (4) (3) (4)Model OLS 2SLS OLS 2SLS OLS 2SLS OLS 2SLS
NonAlliesAid(% GDP) 1.379 1.264 2.652 1.452 2.314 2.307 3.244 3.146(2.04)** (1.72)* (1.88)* (0.82) (2.10)** (2.18)** (2.11)** (1.82)*
AlliesAid(% GDP) -4.965 -5.022 -4.403 -3.281 -6.953 -7.108 -7.409 -7.914(3.52)*** (3.00)*** (2.73)*** (1.31) (3.22)*** (3.31)*** (2.90)*** (2.87)***
log(Initial Per Capita GDP) -0.085 -0.086 -0.089 -0.089 -0.095 -0.095 -0.097 -0.103(4.49)*** (4.71)*** (3.55)*** (3.28)*** (4.21)*** (4.44)*** (3.98)*** (3.98)***
Dummy for Sub-Saharian Africa -0.152 -0.148 -0.172 -0.165 -0.185 -0.185 -0.201 -0.203(4.81)*** (4.99)*** (3.80)*** (3.80)*** (4.66)*** (4.78)*** (4.27)*** (4.17)***
Institutional quality (ICRG Index) 0.009 0.009 0.010 0.010 0.011 0.011 0.011 0.011(3.49)*** (3.72)*** (3.03)*** (2.99)*** (3.28)*** (3.51)*** (3.16)*** (3.37)***
Fraction of area in the tropics 0.019 0.019 0.042 0.034 0.004 0.005 0.048 0.060(0.53) (0.54) (0.79) (0.55) (0.10) (0.13) (0.93) (1.08)
Terms of Trade Growth 0.202 0.200 0.225 0.253 0.235 0.232 0.224 0.219(1.42) (1.48) (1.41) (1.63) (1.54) (1.62) (1.49) (1.59)
Std of Terms of Trade Growth -0.046 -0.043 -0.034 -0.036 -0.050 -0.050 -0.036 -0.030(1.21) (1.19) (0.88) (0.99) (1.33) (1.39) (0.92) (0.82)
Constant 0.226 0.226 0.148 0.164 0.200 0.203 0.175 0.190(1.98)* (2.12)** (0.94) (1.17) (1.53) (1.68)* (1.18) (1.39)
Observations 64 63 58 57 67 67 58 57R-squared 0.52 0.52 0.49 0.48 0.52 0.52 0.52 0.52Craigg-Donald Test for Weak iv 125.26 32.65 85.60 45.39Robust t statistics in parentheses* significant at 10%; ** significant at 5%; *** significant at 1%
before 33rd perc and after 66th perc
Appendix 2. Alternative splitting rules for AlliesAid and NonAlliesAid according to UN voting. Cross Section Analysis for period 1980-2003.
Dependent Variable is average annual growth rate of per capita GDP
Splitting Rule Zero corr 33rd percentile 66th percentile

(1) (2) (3) (4) (5) (6) (7)
Total Aid(% GDP) 0.545 0.060(2.05)** (0.10)
NonAlliesAid(% GDP) 1.818 2.327 2.411 2.730 2.602(2.72)*** (3.06)*** (3.06)*** (3.23)*** (2.94)***
AlliesAid(% GDP) -2.168 -2.781 -3.901 -3.617 -3.997(1.53) (1.97)** (2.12)** (2.03)** (2.30)**
log(Initial Per Capita GDP) 0.054 0.043 0.046 0.046 0.048 0.055 0.049(1.60) (1.29) (1.28) (1.38) (1.27) (1.44) (1.51)
Institutional quality (ICRG Index) 0.007 0.007 0.007 0.007 0.006 0.006 0.007(3.55)*** (3.70)*** (3.43)*** (3.66)*** (3.06)*** (3.00)*** (3.35)***
log(inflation) -0.003 -0.002 -0.001 -0.001 -0.004 -0.004 -0.005(0.29) (0.21) (0.13) (0.13) (0.48) (0.49) (0.50)
Openness Index -0.048 -0.038 -0.047 -0.050 -0.066 -0.075 -0.054(1.14) (0.89) (1.02) (1.12) (1.31) (1.46) (1.35)
Budget Balance(% GDP) 0.393 0.247 0.666 0.773 0.731 0.836 0.800(0.83) (0.53) (1.60) (1.92)* (1.66)* (1.84)* (1.15)
Constant -0.595 -0.550 -0.399 -0.463 -0.396 -0.411 0.000(2.01)** (1.94)* (1.42) (1.77)* (1.52) (1.51) (.)
Observations 217 217 174 173 144 143 143R-squared 0.43 0.42 0.42 0.42 0.41 0.41
Instrumented Variables Total Aid (% GDP)
NonAlliesAid
(% GDP)
AlliesAid(% GDP)
AlliesAid and
NonAlliesAid
Growth, AlliesAid
and NonAlliesAid
F Test of Excluded iv 8.38 119.66 112.58Craigg-Donald Test for Weak iv 162.81Robust t statistics in parentheses* significant at 10%; ** significant at 5%; *** significant at 1%
2SLS 2SLS System of eqOLS 2SLS OLS 2SLS
Appendix 3. Robustness Check. Panel Analysis for period 1970-2003. Dependent Variable is average annual growth rate of per capita GDP
Fitted NonAlliesAid Aid(%
GDP)
Fitted AlliesAid(% GDP)
Fitted AlliesAid
and Fitted NonAllies
Fitted AlliesAid
and Fitted NonAlliesAid
Instruments
Rajan et al Fitted Aid (% GDP)
Model

(1) (2) (3) (4) (5) (6) (7)
Total Aid(% GDP) -0.641 -2.309(0.93) (1.30)
NonAlliesAid(% GDP) 2.759 3.225 3.765 4.014 3.124(2.17)** (2.61)*** (2.35)** (2.45)** (1.71)*
AlliesAid(% GDP) -7.714 -8.293 -10.329 -10.231 -9.499(3.18)*** (3.41)*** (2.99)*** (3.02)*** (2.82)***
log(Initial Per Capita GDP) -0.094 -0.113 -0.114 -0.114 -0.122 -0.120 -0.122(3.00)*** (3.22)*** (3.49)*** (3.76)*** (3.90)*** (3.84)*** (3.52)***
Dummy for Sub-Saharian Africa -0.178 -0.156 -0.230 -0.236 -0.244 -0.247 -0.235(3.20)*** (2.90)*** (4.10)*** (4.47)*** (4.34)*** (4.36)*** (3.61)***
Institutional quality (ICRG Index) 0.018 0.018 0.018 0.018 0.018 0.018 0.018(3.25)*** (3.55)*** (3.22)*** (3.46)*** (3.52)*** (3.50)*** (4.56)***
Fraction of area in the tropics -0.044 -0.030 0.033 0.036 0.051 0.050 0.046(0.58) (0.42) (0.39) (0.46) (0.62) (0.61) (0.63)
Terms of Trade Growth 0.379 0.288 0.295 0.294 0.256 0.267 0.259(1.45) (1.14) (1.13) (1.21) (1.04) (1.09) (1.39)
Std of Terms of Trade Growth 0.099 0.093 0.068 0.065 0.056 0.056 0.060(0.88) (0.84) (0.60) (0.62) (0.52) (0.52) (0.60)
Constant -0.207 -0.081 -0.110 -0.111 -0.065 -0.079 -0.066(0.66) (0.28) (0.35) (0.38) (0.22) (0.27) (0.24)
Observations 71 71 67 67 67 67 67R-squared 0.39 0.36 0.44 0.44 0.44 0.44
Instrumented VariablesTotal Aid
(% GDP)
Untied Aid
(% GDP)
Tied Aid(% GDP)
Both Tied and Untied
Aid
Growth, AlliesAid
and NonAlliesAid
F Test of Excluded iv 5.82 213.97 109.19Craigg-Donald Test for Weak iv 59.90Robust t statistics in parentheses* significant at 10%; ** significant at 5%; *** significant at 1%
2SLS 2SLS System of eqOLS 2SLS OLS 2SLS
Appendix 4. Cross Section Analysis for period 1990-2003. Dependent Variable is average annual growth rate of per capita GDP
Instruments
Rajan et al Fitted Aid to GDP
Fitted Untied Aid(% GDP)
Fitted tied
Aid(% GDP)
Both Fitted Tied
and Untied Aid
Both Fitted Tied
and Untied Aid
Model

AlliesAid 0.4662 0.4783AlliesAid Fitted 0.0892 0.0155
AlliesAid 0.4856 0.6081AlliesAid Fitted -0.0251 -0.016
Appendix 5: Correlation MatricesA. Cross Section Database (1980-2003)
NonAlliesAid Non Allies Aid Fitted
B. Panel Database (1970-2003)
NonAlliesAid Non Allies Aid Fitted