Insights on the 2009 South Pacific tsunami in Samoa and Tonga from field surveys and numerical...
11
This article appeared in a journal published by Elsevier. The attached copy is furnished to the author for internal non-commercial research and education use, including for instruction at the authors institution and sharing with colleagues. Other uses, including reproduction and distribution, or selling or licensing copies, or posting to personal, institutional or third party websites are prohibited. In most cases authors are permitted to post their version of the article (e.g. in Word or Tex form) to their personal website or institutional repository. Authors requiring further information regarding Elsevier’s archiving and manuscript policies are encouraged to visit: http://www.elsevier.com/copyright
-
Upload
unitedstatesgeologicalsurvey -
Category
Documents
-
view
0 -
download
0
Transcript of Insights on the 2009 South Pacific tsunami in Samoa and Tonga from field surveys and numerical...

This article appeared in a journal published by Elsevier. The attachedcopy is furnished to the author for internal non-commercial researchand education use, including for instruction at the authors institution
and sharing with colleagues.
Other uses, including reproduction and distribution, or selling orlicensing copies, or posting to personal, institutional or third party
websites are prohibited.
In most cases authors are permitted to post their version of thearticle (e.g. in Word or Tex form) to their personal website orinstitutional repository. Authors requiring further information
regarding Elsevier’s archiving and manuscript policies areencouraged to visit:
http://www.elsevier.com/copyright

Author's personal copy
Insights on the 2009 South Pacific tsunami in Samoa and Tonga from field surveysand numerical simulations
Hermann M. Fritz a,⁎, Jose C. Borrero b,c, Costas E. Synolakis c,d, Emile A. Okal e, Robert Weiss f,Vasily V. Titov g, Bruce E. Jaffe h, Spyros Foteinis d, Patrick J. Lynett i, I.-Chi Chan j, Philip L.-F. Liu j
a School of Civil and Environmental Engineering, Georgia Institute of Technology, Savannah, GA 31407, USAb ASR Limited, Raglan 3225, New Zealandc Department of Civil and Environmental Engineering, Univ. of Southern California, Los Angeles, CA, USAd Department of Environmental Engineering, Technical University of Crete, Chanea 73100, Greecee Department of Earth and Planetary Sciences, Northwestern University, Evanston, IL, USAf Department of Geology and Geophysics, Texas A&M University, College Station, TX, USAg Pacific Marine Environmental Laboratory, NOAA, Seattle, WA, USAh Pacific Science Center, US Geological Survey, Santa Cruz, CA, USAi Department of Civil Engineering, Texas A&M University, College Station, TX, USAj School of Civil and Environmental Engineering, Cornell University, Ithaca, NY, USA
a b s t r a c ta r t i c l e i n f o
Article history:Received 16 July 2010Accepted 3 March 2011Available online 10 March 2011
Keywords:tsunamiearthquakeSouth PacificSamoaTonga
An Mw≈8.1 earthquake south of the Samoan Islands on 29 September 2009 generated a tsunami that killed189 people. From 4 to 11 October, an International Tsunami Survey Team surveyed the seven major islands ofthe Samoan archipelago. The teammeasured locally focused runup heights of 17 m at Poloa and inundation ofmore than 500 m at Pago Pago. A follow-up expedition from 23 to 28 November surveying the three mainislands of Tonga's northernmost Niua group revealed surprising 22 m runup and 1 km inundation. We analyzethe extreme tsunami runup and complex impact distribution based on physical and societal observationscombined with numerical modeling. That an outer rise/outer trench slope (OR/OTS) event is responsible for atsunami disaster in the Pacific calls for care in identifying and defining tsunami hazards. Evacuation exercisesconducted in Samoa in the preceding year may have limited the human toll; however, cars were identified aspotential death traps during tsunami evacuations. This event highlights the extreme hazards from near sourcetsunamis when the earthquake's shaking constitutes the de facto warning, and further underscores theimportance of community based education and awareness programs as essential in saving lives.
© 2011 Elsevier B.V. All rights reserved.
Contents
1. Event overview . . . . . . . . . . . . . . . . . . . . . . . . . . . . . . . . . . . . . . . . . . . . . . . . . . . . . . . . . . . . . 672. Post-tsunami reconnaissance . . . . . . . . . . . . . . . . . . . . . . . . . . . . . . . . . . . . . . . . . . . . . . . . . . . . . . . 673. Observations in the Samoan archipelago . . . . . . . . . . . . . . . . . . . . . . . . . . . . . . . . . . . . . . . . . . . . . . . . . . 674. Observations in the Tongan archipelago . . . . . . . . . . . . . . . . . . . . . . . . . . . . . . . . . . . . . . . . . . . . . . . . . . 695. Tsunami modeling . . . . . . . . . . . . . . . . . . . . . . . . . . . . . . . . . . . . . . . . . . . . . . . . . . . . . . . . . . . . 69
5.1. Tsunami source models . . . . . . . . . . . . . . . . . . . . . . . . . . . . . . . . . . . . . . . . . . . . . . . . . . . . . . 695.2. Model results: Tutuila . . . . . . . . . . . . . . . . . . . . . . . . . . . . . . . . . . . . . . . . . . . . . . . . . . . . . . . 715.3. Model results: Far field . . . . . . . . . . . . . . . . . . . . . . . . . . . . . . . . . . . . . . . . . . . . . . . . . . . . . . 72
6. Conclusions . . . . . . . . . . . . . . . . . . . . . . . . . . . . . . . . . . . . . . . . . . . . . . . . . . . . . . . . . . . . . . . 75. Author contributions . . . . . . . . . . . . . . . . . . . . . . . . . . . . . . . . . . . . . . . . . . . . . . . . . . . . . . . . . . . 75
Acknowledgements . . . . . . . . . . . . . . . . . . . . . . . . . . . . . . . . . . . . . . . . . . . . . . . . . . . . . . . . . . . . . . 75References . . . . . . . . . . . . . . . . . . . . . . . . . . . . . . . . . . . . . . . . . . . . . . . . . . . . . . . . . . . . . . . . . . 75
Earth-Science Reviews 107 (2011) 66–75
⁎ Corresponding author. Tel.: +1 912 966 7947.E-mail address: [email protected] (H.M. Fritz).
Author contributions . .
0012-8252/$ – see front matter © 2011 Elsevier B.V. All rights reserved.doi:10.1016/j.earscirev.2011.03.004
Contents lists available at ScienceDirect
Earth-Science Reviews
j ourna l homepage: www.e lsev ie r.com/ locate /earsc i rev

Author's personal copy
1. Event overview
On September 29, 2009 at 17:48:10 UTC (6:48:10 local time), anMw≈8.1 earthquake struck ~200 km S of the main Samoan Islandschain and ~75 km E of Tonga's Niua Group. This is the most significantearthquake on the northern bend of the Tonga trench since 1917 (Okalet al., 2004). This event does not represent simple subduction of thePacific plate into the Tonga trench, but rather started as a normalfaulting rupture expressing a lateral tear in the plate as it slides past theNorthernbendof the plate boundary (Okal et al., 2010). It then triggereda smaller, but still substantial episodeof interplate thrusting, asmodeledby Li et al., 2009 and later Lay et al., 2010. Such events are knownelsewhere (Govers and Wortel, 2005), but their recurrence is, ifanything, even more poorly understood than for great subductionearthquakes; five large OR/OTS events versus 59 mega-thrusts havebeen identified since 1900 (Kirby et al., 2009). That another non-subduction source mechanism is responsible for yet another tsunamidisaster in the South Pacific is a call for care in identifying and definingtsunami hazards.
The ensuing tsunami killed 9 in Tonga, 146 in Samoa, and 34 inAmerican Samoa, the highest tsunami death toll on US territory since1964. The damage in Samoa alone exceeded $150 million (UN-OCHA). Atsunami warning issued 16 min after the earthquake was too late formany, as the tsunami arrived within 15 min at some of the hardest hitvillages. Fortunately, many Samoans and Tongans knew to get to highground after experiencing an earthquake, a behavior enhanced byeducation and evacuation exercises initiated throughout the SouthPacific over the past decade; in Samoa, the latter had taken place in thepreceding year.
2. Post-tsunami reconnaissance
The surveys we report took place from 4 to 11 October coveringthe entire Samoan archipelago, including the islands of Upolu, Savai'i,Manono, Tutuila, Aunu'u, Ofu and Olosega, and from 23 to 28November focusing on the Niua group (Niuatoputapu, Tafahi andNiuafo'ou islands) of the Tongan archipelago. The survey teamsdocumented tsunami runup, flow depth and inundation; waveinduced deposition or erosion, structural damage and interviewed
eyewitnesses according to protocols reviewed by Synolakis and Okal(2005). The recorded combined Samoa and Tonga survey database iscomposed of 444 tsunami runup and flow depth measurements (Okalet al., 2010). Eyewitnesses described between one and four mainwaves with an initial recession, interpreted as a leading depressionN-wave (Tadepalli and Synolakis, 1994). Several eyewitnessesreported evacuating only after watching others do so or uponobserving the first wave. Most drivers did not feel the earthquakeinside their cars. There were also cases of victims killed in cars,overcome by the wave while stopped in traffic during the evacuation.This was an unfortunate occurrence possibly attributable to confusionresulting from conflicting official statements recently issued in Samoaon the use of vehicles during a tsunami evacuation. Indeed, part ofthe rationale for Samoa changing from left to right hand drive on 7September 2009, just 3 weeks before the tsunami, was justified as astep to reduce greenhouse gases, through the availability of used carsfrom Australia and New Zealand, and to allow more citizens to owncars and thus escape from the sea shore (WSJ, 2009). Similarly, sevenof the victims on Niuatoputapu were riding a truck that wassubsequently caught by the tsunami while heading back to thehigh-school to pick-up the principal who had, in the meantime,already evacuated. An additional Tongan victim at Hihifo returned tohis house to close a shop between tsunami waves. Only the keeper ofthe Palm Tree Island Resort located across the tidal channel fromHihifo on Hunganga Island, which was totally submerged by tsunamiwaves, was an unpreventable fatality in the Kingdom of Tonga.
3. Observations in the Samoan archipelago
Fig. 1 shows themeasuredflowdepths and runupheights throughoutthe Samoan archipelago. The data exhibit pronounced extrema andsignificant variation on all main islands. On Tutuila, a maximum runupspike exceeded 17 m at Poloa, near the western tip, where damage wasextensive and reminiscent of the impact of the 2004 tsunami in manylocales in Sri Lanka (Liu et al., 2005). The tsunami wrackline and rafteddebris at Poloa along a relatively steep transect with a short 100 mdistance from shoreline to maximum runup are shown Fig. 2c–e. Runupdecreased somewhat along Tutuila from west to east reaching 12 m atFagasa, on the central north coast and 9 m at Tula in the east. Pago Pago,
Fig. 1. Samoan Islands withmeasured tsunami runup (blue) and tsunami height z+h (red) at survey locations on south and north coasts. Runup and tsunami height z+h are relativeto the sea level at time of tsunami arrival with z terrain elevation and h flow depth above terrain.
67H.M. Fritz et al. / Earth-Science Reviews 107 (2011) 66–75
Author's personal copy
central south coast, represents an unfortunate example of a town andharbor whose geometry is ideal for protection against storm waves butleaves it vulnerable to tsunami inundation, similar to villages on BabiIslandnear Flores, Indonesia (Yeh et al., 1994) andRendovaHarbor in theSolomon Islands (Fritz andKalligeris, 2008). Theharbor geometry at PagoPago (Fig. 3) amplified the tsunami from just a fewmeters at the entranceto 8 m at the head, causing extensive flooding and structural damageover 500 m inland up the Vaipito River. Several large boats and tens ofvehicles were swept inland (Fig. 2). Overlandflow speeds of the tsunamifront were estimated from security camera footage to 2.5 m/s about200 m onshore. This is similar to the initial-front speeds measured fromamateur videos near the Grand Mosque in Banda Aceh during the 2004tsunami, about 3 km inland (Fritz et al., 2006). One eyewitness describedthe flooding at Pago Pago as much more violent than during the 1960Chilean tsunami, which had arrived in the evening.
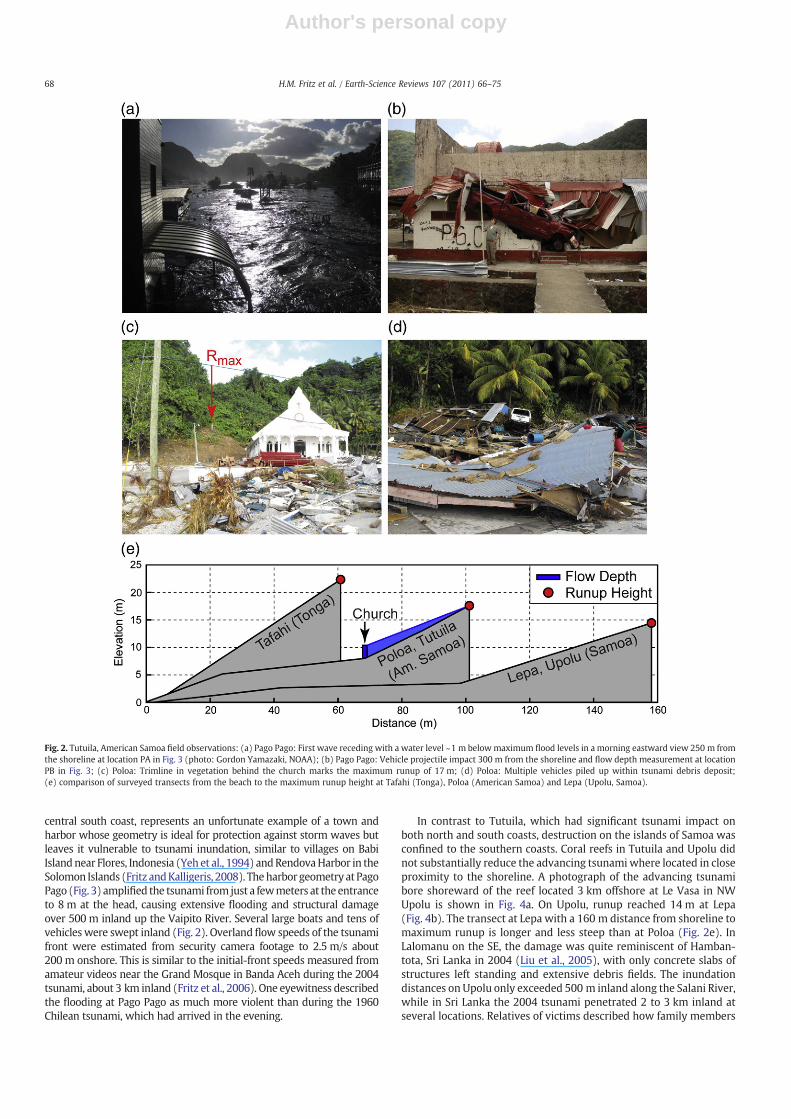
In contrast to Tutuila, which had significant tsunami impact onboth north and south coasts, destruction on the islands of Samoa wasconfined to the southern coasts. Coral reefs in Tutuila and Upolu didnot substantially reduce the advancing tsunamiwhere located in closeproximity to the shoreline. A photograph of the advancing tsunamibore shoreward of the reef located 3 km offshore at Le Vasa in NWUpolu is shown in Fig. 4a. On Upolu, runup reached 14 m at Lepa(Fig. 4b). The transect at Lepa with a 160 m distance from shoreline tomaximum runup is longer and less steep than at Poloa (Fig. 2e). InLalomanu on the SE, the damage was quite reminiscent of Hamban-tota, Sri Lanka in 2004 (Liu et al., 2005), with only concrete slabs ofstructures left standing and extensive debris fields. The inundationdistances on Upolu only exceeded 500 m inland along the Salani River,while in Sri Lanka the 2004 tsunami penetrated 2 to 3 km inland atseveral locations. Relatives of victims described how family members
Fig. 2. Tutuila, American Samoa field observations: (a) Pago Pago: First wave receding with a water level ~1 m belowmaximum flood levels in a morning eastward view 250 m fromthe shoreline at location PA in Fig. 3 (photo: Gordon Yamazaki, NOAA); (b) Pago Pago: Vehicle projectile impact 300 m from the shoreline and flow depth measurement at locationPB in Fig. 3; (c) Poloa: Trimline in vegetation behind the church marks the maximum runup of 17 m; (d) Poloa: Multiple vehicles piled up within tsunami debris deposit;(e) comparison of surveyed transects from the beach to the maximum runup height at Tafahi (Tonga), Poloa (American Samoa) and Lepa (Upolu, Samoa).
68 H.M. Fritz et al. / Earth-Science Reviews 107 (2011) 66–75

Author's personal copy
had been trapped in their cars while trying to evacuate. On Savai'i,maximum runup exceeded 8 m at Nuu. At nearby Taga, a 6 m runupand ~200 m inundation left behind a boulder deposit field extendingup to 100 m inland (Fig. 4c). The tsunami deposit's grain diametersrange from medium cobble to boulder size. No obvious sorting couldbe observed from the shoreline toward the maximum runup. Cobblesand boulders are made up of chunks from the nearby lava flow. Theporosity varies greatly, resulting in very different bulk densities withestimates varying between 2.0 t/m3 and 1.4 t/m3 depending onporosity. Similar deposits remained on the same roadway along thebeach after a smaller tsunami in 1981 (Solov'ev et al., 1986).
4. Observations in the Tongan archipelago
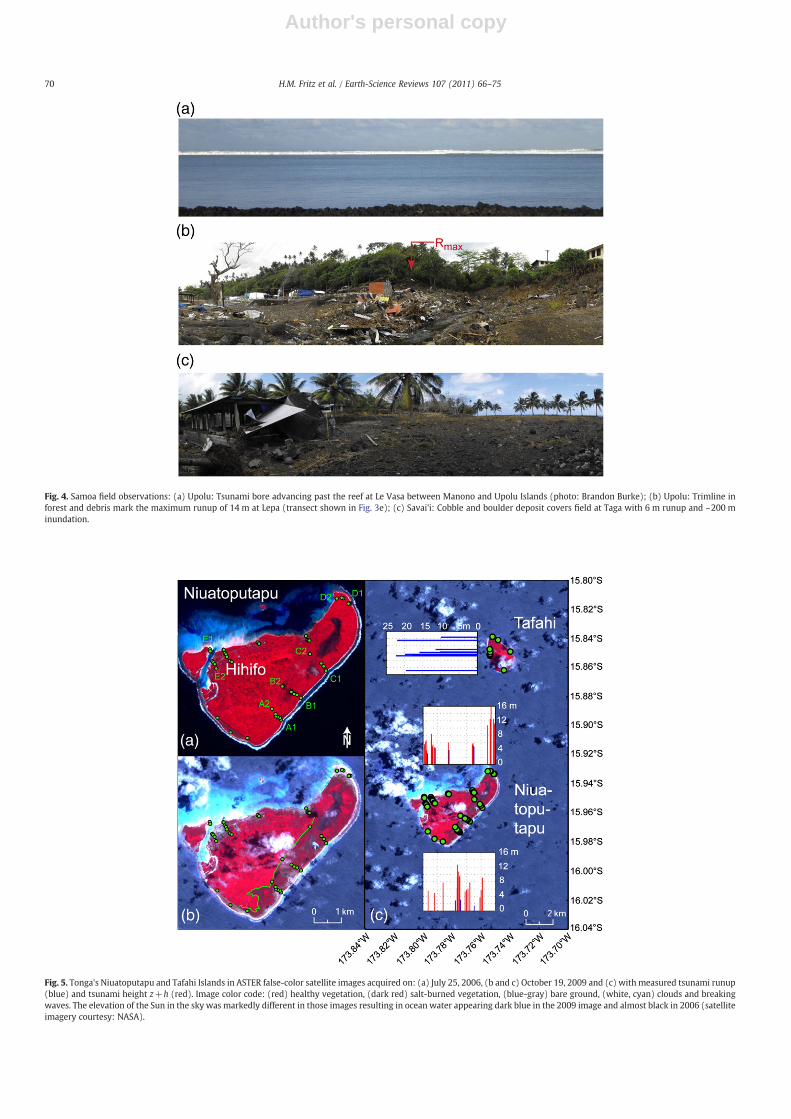
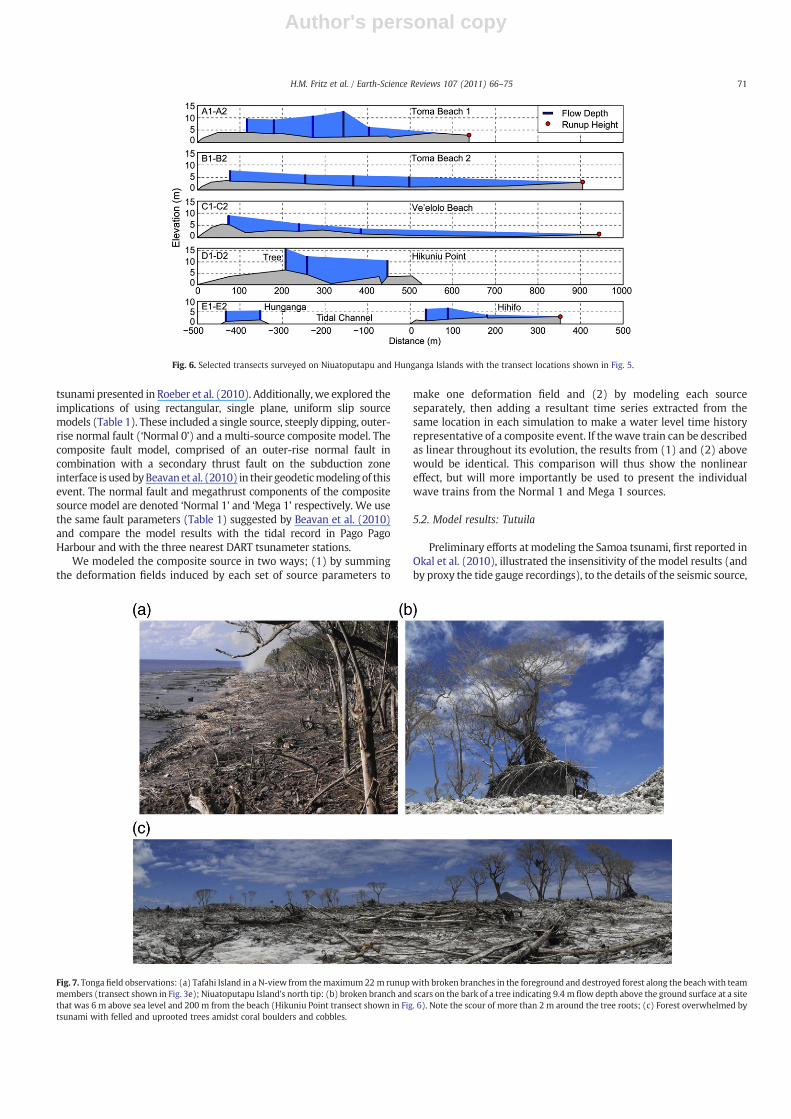
The tsunami impact on Tonga's Niua group (Fig. 5) surprisinglyeclipsed the Samoan observations in all aspects with maximum runupof 22 m on both the east and west coasts of Tafahi Island as well asflow depth of 15 m and inundation of 1 km on Niuatoputapu Island'seast coast, which was reminiscent of the impact of the 2006 Javatsunami on Nusa Kambangan Island (Fritz et al., 2007). Tafahirepresents tsunami impact on a volcanic island characterized bysteep hill slopes up to 1 V:3 H (V: vertical, H: horizontal) and fringingreefs within 100 m of the shoreline. The transect with the maximumrunup for the entire event at Tafahi is significantly shorter and steeperthan both transects at Poloa and Lepa (Fig. 2e). Niuatoputapu's flatcoastal topography and near shore fringing reefs allowed for massiveinland penetration of the tsunami waves along the south and eastcoasts (Fig. 6). While forests may provide some tsunami attenuation
at flow depths below 5 m, the forests on the south coast werecompletely overwhelmed by local flow depths of up to 10 m above theground surface (Fig. 7). Fortunately, the coral reefs and tidal flatsextending between 1 and 2 km offshore along Niuatoputapu's northshore reduced the tsunami impact for the villages located there.Nevertheless, 89 out of the 225 houses on Niuatoputapu were totallydestroyed and 56 were damaged. The Tongan Government estimatesthe total cost of damage to US $ 9.5 million.
5. Tsunami modeling
To simulate the regional tsunami we used the model MOST (Titovand Gonzalez, 1997). Simulations were carried out on two sets ofnumerical grids to investigate both the near and far-field aspects of thetsunami. For the far field investigations, MOSTwas run as a propagationmodel only. Modeling was carried out on a bathymetry grid derivedfrom the GEBCO global bathymetry dataset with a spatial resolution of2 arcmin. For modeling the detailed inundation on Tutuila, a series ofnested grids were created from a 3-arcsec DEM of American Samoa(NOAA-NGDC). The resolution of the innermost grid for the simulationspresented in this study was 6-arcsec or approximately 180 m.
5.1. Tsunami source models
Five different source models were used to initialize the tsunamimodel (Fig. 8). These included a source model based on the USGS finitefault model (Hayes, 2009) which was used in initial simulationspresented in Okal et al. (2010) as well as in simulation of the Samoa
Fig. 3. Pago Pago, American Samoa in post-tsunami Quickbird satellite imagery with measured tsunami heights at survey locations inside the harbor and town with the locations ofthe tide gauge and photos PA and PB in Fig. 2. Runup and tsunami height z+h are relative to the sea level at time of tsunami arrival with z terrain elevation and h flow depth aboveterrain.
69H.M. Fritz et al. / Earth-Science Reviews 107 (2011) 66–75
Author's personal copy
Fig. 4. Samoa field observations: (a) Upolu: Tsunami bore advancing past the reef at Le Vasa between Manono and Upolu Islands (photo: Brandon Burke); (b) Upolu: Trimline inforest and debris mark the maximum runup of 14 m at Lepa (transect shown in Fig. 3e); (c) Savai'i: Cobble and boulder deposit covers field at Taga with 6 m runup and ~200 minundation.
Fig. 5. Tonga's Niuatoputapu and Tafahi Islands in ASTER false-color satellite images acquired on: (a) July 25, 2006, (b and c) October 19, 2009 and (c) with measured tsunami runup(blue) and tsunami height z+h (red). Image color code: (red) healthy vegetation, (dark red) salt-burned vegetation, (blue-gray) bare ground, (white, cyan) clouds and breakingwaves. The elevation of the Sun in the sky was markedly different in those images resulting in ocean water appearing dark blue in the 2009 image and almost black in 2006 (satelliteimagery courtesy: NASA).
70 H.M. Fritz et al. / Earth-Science Reviews 107 (2011) 66–75
Author's personal copy
tsunami presented in Roeber et al. (2010). Additionally, we explored theimplications of using rectangular, single plane, uniform slip sourcemodels (Table 1). These included a single source, steeply dipping, outer-rise normal fault (‘Normal 0’) and a multi-source composite model. Thecomposite fault model, comprised of an outer-rise normal fault incombination with a secondary thrust fault on the subduction zoneinterface is usedbyBeavan et al. (2010) in their geodeticmodeling of thisevent. The normal fault and megathrust components of the compositesource model are denoted ‘Normal 1’ and ‘Mega 1’ respectively. We usethe same fault parameters (Table 1) suggested by Beavan et al. (2010)and compare the model results with the tidal record in Pago PagoHarbour and with the three nearest DART tsunameter stations.
We modeled the composite source in two ways; (1) by summingthe deformation fields induced by each set of source parameters to
make one deformation field and (2) by modeling each sourceseparately, then adding a resultant time series extracted from thesame location in each simulation to make a water level time historyrepresentative of a composite event. If the wave train can be describedas linear throughout its evolution, the results from (1) and (2) abovewould be identical. This comparison will thus show the nonlineareffect, but will more importantly be used to present the individualwave trains from the Normal 1 and Mega 1 sources.
5.2. Model results: Tutuila
Preliminary efforts at modeling the Samoa tsunami, first reported inOkal et al. (2010), illustrated the insensitivity of the model results (andby proxy the tide gauge recordings), to the details of the seismic source,
Fig. 6. Selected transects surveyed on Niuatoputapu and Hunganga Islands with the transect locations shown in Fig. 5.
Fig. 7. Tonga field observations: (a) Tafahi Island in a N-view from themaximum 22 m runupwith broken branches in the foreground and destroyed forest along the beachwith teammembers (transect shown in Fig. 3e); Niuatoputapu Island's north tip: (b) broken branch and scars on the bark of a tree indicating 9.4 m flow depth above the ground surface at a sitethat was 6 m above sea level and 200 m from the beach (Hikuniu Point transect shown in Fig. 6). Note the scour of more than 2 m around the tree roots; (c) Forest overwhelmed bytsunami with felled and uprooted trees amidst coral boulders and cobbles.
71H.M. Fritz et al. / Earth-Science Reviews 107 (2011) 66–75

Author's personal copy
with the same general findings replicated in this updated modelingeffort. A comparison of the tide gauge recording from inside Pago PagoHarbor to the model simulations is shown in Fig. 9a–e. Panels a and bshow the results from each component of the composite source. Whilethe computed time series from the Normal 1 source match fairly wellwith the recorded data, there is a more significant difference betweenpredicted andmeasured for theMega 1 source (Fig. 9b). The time seriesfor the component sources are compared in Fig. 9c, which shows thatthe two signals are nearly perfectly out of phase relative to each other. Itis worth noting that a relative shift of 1 to 3 min of either time series, assuggested in recent investigations into the complex nature of the source(Beavan et al., 2010; Lay et al., 2010) would not bring the model resultsinto phase with each other. Fig. 9d then combines the two events andcompares the result to themeasured data. It is clear from this figure thatinitializing the tsunami computation with a composite source (blue
trace) does not produce a time series significantly different from theresult obtained by summing the individual time series from thecomponent sources (red trace). However, both results produce a fit tothemeasured data that is arguablyworse than for theNormal 1 scenarioon its own. Finally, the results from the Normal 0 and USGS finite faultsources are shown in Fig. 9e and f. Both of these sources produce areasonably good fit to themeasured data, particularly for the amplitudeand duration of the first major fall, rise and fall of the water surface.However, the small rise in sea level prior to the sudden withdrawal is avexing component of the measured time series that is not representedwell in any of the simulations.
In an attempt to improve the fit between the modeled andmeasured water levels at Pago Pago, we shifted the time series causedby the Mega 1 relative to the Normal 1 source. The time shifts coveredthe range in temporal offset between the two sources suggested byboth Beavan et al. (2010) and Lay et al. (2010). In our convention, apositive shift puts the Mega 1 source prior to the Normal 1 source andvice versa. The results from these time shifts are shown in Fig. 10.While there is no clear improvement in the fit to the measured datafor any of the shifts, the −0:27 and −0:54 shift cases (Fig. 10b, redand blue traces) show some promise, particularly with the presence ofthe small positive surge prior to the first large withdrawal.5.3. Model results: Far field
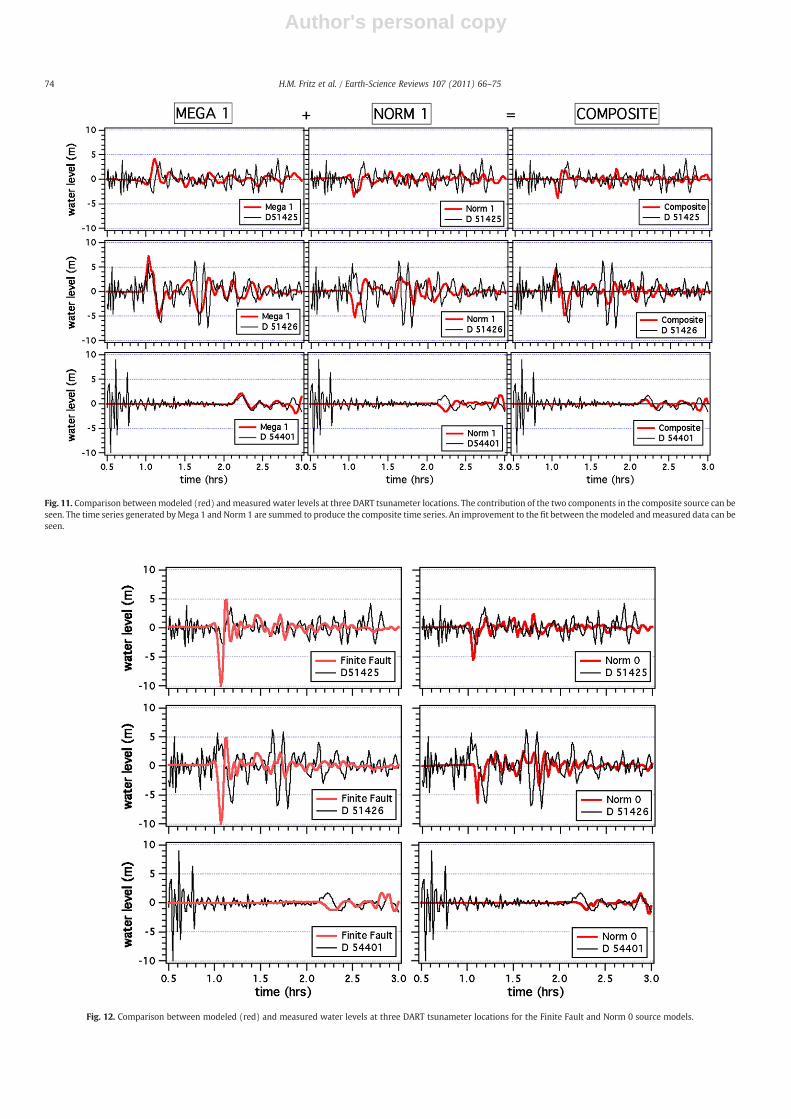
The tsunami sources described above were also used to investigatethe far-field signature of the tsunami as recorded on three DARTtsunameters located in the southwestern Pacific Ocean (Fig. 8), atdistances of 750 to 1900 km. Figs. 11 and 12 compare the modeledtime series from the 5 sources to the DART data. Individually, the
Fig. 8. The five earthquake deformation scenarios used to initialize the tsunami propagation model. (top row) Mega 1 and Normal 1, combined they make the composite source.(bottom row, left) the idealized normal fault scenario used by Beavan et al. (2010) meant to be a rough equivalent to the USGS finite fault model. (bottom row, middle) The USGSfinite fault model used for initial tsunami modeling presented in Okal et al. (2010) and Roeber et al. (2010). (lower right) Propagation modeling domain with locations of the threenearest DART buoys.
Table 1Fault parameters for the single fault plane models used to initialize the tsunamipropagation model.
Normal 0 Normal 1 Mega 1
Length (km) 120 114 110Width (km) 15 28 90Dip (deg) 55 48 16Rake (deg) −60 −41 85Strik (deg) 338 352 175Slip (m) 9.9 8.6 4.1Latitude (S) 15.940 15.34 15.542Longitude (E) 187.282 187.96 187.763
72 H.M. Fritz et al. / Earth-Science Reviews 107 (2011) 66–75

Author's personal copy
Mega 1 source produces a very good fit to the measured data,particularly on gauges 51426 and 54401. The Normal 1 source doesnot fit as well overall, but does do a good job at reproducing theinitial drawdown seen on DART 51425. The composite time seriesdoes not provide a clear improvement of the fit between the
modeled and measured data. The Normal 0 and Finite Fault cases(Fig. 12) produce similarly bad results in comparison to themeasured data. The modeled initial wave at station 51426 is overlysteep and with a significantly larger negative amplitude while onstations 51426 and 54401, the modeled signal has an inverse
Fig. 9. Comparison between measured and modeled tsunami wave heights in Pago Pago Harbour. (a and b) Comparison between each component of the composite source proposedby Beavan et al. (2010) to the measured tide gauge record. (c) The two components time series on the same plot showing the relative contribution of each. (d) The red trace is thesummation of the time series from each source while the blue trace is the time series extracted from a simulation using the composite source model. The thin black trace is the tidegauge data. (e and f) Time series from the USGS finite fault and the Normal 0 case compared to the tide gauge record.
Fig. 10. The result of time-shifting the Mega 1 source time series relative to the Normal 1 time series. A positive shift means the Mega 1 source preceded the Normal 1 source. Nosignificant improvement is obvious for the positive shift, whereas some improvement is evident with a small negative time shift.
73H.M. Fritz et al. / Earth-Science Reviews 107 (2011) 66–75
Author's personal copy
Fig. 11. Comparison between modeled (red) andmeasured water levels at three DART tsunameter locations. The contribution of the two components in the composite source can beseen. The time series generated byMega 1 and Norm 1 are summed to produce the composite time series. An improvement to the fit between the modeled andmeasured data can beseen.
Fig. 12. Comparison between modeled (red) and measured water levels at three DART tsunameter locations for the Finite Fault and Norm 0 source models.
74 H.M. Fritz et al. / Earth-Science Reviews 107 (2011) 66–75
Author's personal copy
polarity relative to the DART data. It should be noted that theseresults are very similar to the results presented in Roeber et al.(2010).
6. Conclusions
Based on our modeling, a single normal fault source mechanism,with or without descriptions of the detailed slip distribution, is able tosatisfactorily explain the tsunami behavior in Pago Pago Harbour. Theaddition of a megathrust source, as suggested by seismological andGPS data does not improve the model results there. Shifting therelative timing of the two sources offers some improvement, howeverthese results are still not as good as the single, normal fault source. Inthe far-field, the megathrust source produces a very good fit to theobserved initial wave signal on DART station 51426 and 54401 with aless good fit on station 51425. The normal fault sources alone do notprovide a good fit to the observed data, except for the timing andmagnitude of the initial drawdown seen on DART 51525. Combiningthe two time series does not significantly improve the fit between themodeled and measured data.
The 2009 South Pacific tsunami highlights yet again the extremehazards from near source tsunamis where the earthquake is the‘official’warning. From the eyewitness accounts we infer that tsunamisignage installed on Tutuila only months before the event helped savelives, and that misinformation and confusion regarding evacuationroutes led to unnecessary casualties on Upolu and Niuatoputapu.We thus conclude that community-based education and awarenessprograms are essential in saving lives.
Author contributions
All authors participated in the Samoan archipelago tsunami fieldsurvey. H.M.F. and E.A.O. surveyed the tsunami in Tonga. J.C.B. conductedthe numerical modeling.
Acknowledgements
This research was supported by the National Science FoundationNSF RAPID-award OCE-1000694.
References
Beavan, J., Wang, X., Holden, C., Wilson, K., Power, W., Prasetya, G., Bevis, M., Kautoke,R., 2010. Near-simultaneous great earthquakes at Tongan megathrust and outerrise in September 2009. Nature 466, 959–964. doi:10.1038/nature09292.
Fritz, H.M., Kalligeris, N., 2008. Ancestral heritage saves tribes during1April 2007 SolomonIslands tsunami. Geophys. Res. Lett. 35, L01607. doi:10.1029/2007GL031654.
Fritz, H.M., Borrero, J.C., Synolakis, C.E., Yoo, J., 2006. 2004 Indian Ocean tsunami flowvelocity measurements from survivor videos. Geophys. Res. Lett. 33, L24605.doi:10.1029/2006GL026784.
Fritz, H.M., Kongko, W., Moore, A., McAdoo, B., Goff, J., Harbitz, C., Uslu, B., Kalligeris, N.,Suteja, D., Kalsum, K., Titov, V., Gusman, A., Latief, H., Santoso, E., Sujoko, S.,Djulkarnaen, D., Sunendar, H., Synolakis, C.E., 2007. Extreme runup from the 17 July2006 Java tsunami. Geophys. Res. Lett. 34, L12602. doi:10.1029/2007GL029404.
Govers, R., Wortel, M.J.R., 2005. Lithosphere tearing at STEP faults: response to edges ofsubduction zones. Earth Plan. Sci. Lett. 236, 505–523.
Hayes, G., 2009. http://earthquake.usgs.gov/earthquakes/eqinthenews/2009/us2009mdbi/finite_fault.php.
Kirby, S.H., Hino, R., Geist, E.L., Wright, D.J., Okal, E.A., Wartman, J.M., 2009. Tectonicsettings of great outer-rise/outer-trench-slope (OR/OTS) earthquakes in theinstrumental record. Eos Trans. AGU 90, 52 Fall Meet. Suppl., Abstract U21D-06.
Lay, T., Ammon, C.J., Kanamori, H., Rivera, L., Koper, K.D., Hutko, A.R., 2010. The Samoa–Tonga great earthquake triggered doublet. Nature 466, 964–968. doi:10.1038/nature09214.
Li, X., Shao, G., Ji, C., 2009. Rupture process of Mw=8.1 Samoa earthquake constrainedby joint inverting teleseismic body, surface waves and local strong motion. EosTrans. AGU 90, 52 Fall Meet. Suppl., Abstract U21D-03..
Liu, P.L.-F., Lynett, P., Fernando, J., Jaffe, B., Fritz, H., Higman, B., Morton, R., Goff, J.,Synolakis, C., 2005. Observations by the International Tsunami Survey Team in SriLanka. Science 308 (5728), 1595.
Okal, E.A., Borrero, J.C., Synolakis, C.E., 2004. The earthquake and tsunami of 1865November 17: evidence for far-field tsunami hazard from Tonga. Geophys. J. Int.157, 164–174.
Okal, E.A., Fritz, H.M., Synolakis, C.E., Borrero, J.C., Weiss, R., Lynett, P.J., Titov, V.V., Foteinis,S., Jaffe, B.E., Liu, P.L.-F., Chan, I.-C., 2010. Field survey of the Samoa tsunami of 29September 2009. Seismol. Res. Lett. 81, 577–591. doi:10.1785/gssrl.81.4.577.
Roeber, V., Yamazaki, Y., Cheung, K.F., 2010. Resonance and impact of the 2009 Samoatsunami around Tutuila. AS. Geophys. Res. Lett. 37, L21604. doi:10.1029/2010GL044419.
Solov'ev, S.L., Go, Tch.N., Kim, Kh.S., 1986. Katalog tsunami v tikhom okeane, 1969–1982gg. Akad. Nauk SSSR 164 pp., Moskva.
Synolakis, C.E., Okal, E.A., 2005. 1992–2002: perspective on a decade of post-tsunamisurveys. In: Satake, K. (Ed.), Tsunamis: case studies and recent developments: Adv.Natur. Technol. Hazards, 23, pp. 1–30.
Tadepalli, S., Synolakis, C.E., 1994. The run-up of N-waves on sloping beaches. Proc.R. Soc. Lond. A Math. Phys. Sci. 445 (1923), 99–112.
Titov, V.V., Gonzalez, F., 1997. Implementation and Testing of the Method of SplittingTsunami (MOST) Model. NOAA Technol. Memo. ERL PMEL-112.
Wall Street Journal, 2009. http://online.wsj.com/article/SB125086852452149513.html.Yeh, H., Liu, P.L.-F., Briggs, M., Synolakis, C.E., 1994. Propagation and amplification of
tsunamis at coastal boundaries. Nature 372 (24), 353–355.
75H.M. Fritz et al. / Earth-Science Reviews 107 (2011) 66–75