Insect Fragments in Flour: Relationship to Lesser Grain Borer (Coleoptera: Bostrichidae) Infestation...
10
STORED-PRODUCT Insect Fragments in Flour: Relationship to Lesser Grain Borer (Coleoptera: Bostrichidae) Infestation Level in Wheat and Rapid Detection Using Near-Infrared Spectroscopy JOEL PEREZ-MENDOZA, 1 JAMES E. THRONE, 2 ELIZABETH B. MAGHIRANG, 2 FLOYD E. DOWELL, 2 AND JAMES E. BAKER 2 J. Econ. Entomol. 98(6): 2282Ð2291 (2005) ABSTRACT We determined that the number of insect fragments, quantiÞed using the standard ßotation method, in ßour milled from wheat infested with larvae, pupae, or preemergent adults of the lesser grain borer, Rhyzopertha dominica (F.), was proportional to infestation level. Wheat infested with a single preemergent adult contributed 28 and 10 as many fragments as wheat infested with a single larva or pupa, respectively. Using regression models that were developed from these data, we predicted that the maximum infestation level that would result in ßour with fragment counts below the Food and Drug Administration defect action level (75 fragments/50 g of ßour) was 0.95 and 1.5% (380 Ð 640 infested kernels/kg of wheat) for pupae and larvae, but it decreased to 0.05% (20 infested kernels/kg) when the grain was infested with preemergent adults. We also reexamined the accuracy and sensitivity of near-infrared spectroscopy (NIRS) for detecting insect fragments in ßour by testing three different NIR spectrometers. NIRS-predicted numbers of insect fragments were correlated with the actual number of fragments. NIRS is less precise than the standard ßotation method, but it is rapid, nondestructive, does not require extensive sample preparation, and could easily be automated for a more sophisticated sampling protocol for ßour based on prescreening samples with NIRS followed up by use of the standard ßotation method when necessary. KEY WORDS Rhyzopertha dominica, stored products, ßour, insect fragments, near-infrared spec- troscopy THE FOOD AND DRUG Administration (FDA) has es- tablished a defect action level (DAL) of 75 insect fragments per 50 g of ßour as the regulatory standard for quality control (FDA 1997). The presence of live insects is considered an adulteration if found in stored bulk grains by the FDA. Excessive insect feeding dam- age in grain may indicate that the grain has been stored under poor sanitary conditions, and the grain may be classiÞed as adulterated and unÞt for human or animal consumption. For example, if 32 insect-damaged kernels (IDKs) are found per 100 g of wheat, the wheat is classiÞed as sample grade (FGIS 1999). IDK is caused by the emergence hole that internal adult insects leave when they emerge from infested kernels. Most U.S. grain mills use the IDK method to determine insect contamination of grain and to predict presence of insect fragments in ßour milled from that grain. However, this visual inspection method does not cor- relate with actual insect infestation levels or with the number of insect fragments that are produced in ßour milled from that grain (WingÞeld and Pedersen 1985), mainly because it does not detect hidden insect in- festation in wheat (Brader et al. 2002, Perez-Mendoza et al. 2004). Therefore, millers cannot rely on wheat grade standards or the number of IDKs as absolute predictors of the number of insect fragments that will be found in the ßour. Instead, the number of insect fragments present in wheat ßour depends more on the percentage of internal insect infestations in the grain before milling (Sachdeva 1978, Brader 1997). The lesser grain borer, Rhyzopertha dominica (F.), is a common and destructive pest of stored wheat in the United States (Hagstrum et al. 1994). This pest that develops and feeds inside grain kernels is the main source of insect fragments in wheat ßour (Pedersen 1992). Eggs are laid on the surface of grain kernels, and after hatching, the Þrst instars bore into the grain (Elek 1994). Larvae pupate inside the kernels, and adults remain inside the kernels for several days after eclosion (Hagstrum and Flinn 1994). We refer to these newly eclosed adults still in the kernel as preemergent adults. Immature stages and preemergent adults of internal grain feeding insects are not removed from the grain Mention of trade names or commercial products in this publication is solely for the purpose of providing speciÞc information and does not imply recommendation or endorsement by Montana State University or the USDA. 1 Department of Entomology, Montana State University, Bozeman, MT 59717. 2 USDAÐARS Grain Marketing and Production Research Center, 1515 College Ave., Manhattan KS 66502.
Transcript of Insect Fragments in Flour: Relationship to Lesser Grain Borer (Coleoptera: Bostrichidae) Infestation...

STORED-PRODUCT
Insect Fragments in Flour: Relationship to Lesser Grain Borer(Coleoptera: Bostrichidae) Infestation Level in Wheat and Rapid
Detection Using Near-Infrared Spectroscopy
JOEL PEREZ-MENDOZA,1 JAMES E. THRONE,2 ELIZABETH B. MAGHIRANG,2
FLOYD E. DOWELL,2 AND JAMES E. BAKER2
J. Econ. Entomol. 98(6): 2282Ð2291 (2005)
ABSTRACT We determined that the number of insect fragments, quantiÞed using the standardßotation method, in ßour milled from wheat infested with larvae, pupae, or preemergent adults of thelesser grain borer, Rhyzopertha dominica (F.), was proportional to infestation level. Wheat infestedwith a single preemergent adult contributed 28 and 10� as many fragments as wheat infested witha single larva or pupa, respectively. Using regression models that were developed from these data, wepredicted that the maximum infestation level that would result in ßour with fragment counts belowthe Food and Drug Administration defect action level (75 fragments/50 g of ßour) was 0.95 and 1.5%(380Ð640 infested kernels/kg of wheat) for pupae and larvae, but it decreased to 0.05% (20 infestedkernels/kg) when the grain was infested with preemergent adults. We also reexamined the accuracyand sensitivity of near-infrared spectroscopy (NIRS) for detecting insect fragments in ßour by testingthree different NIR spectrometers. NIRS-predicted numbers of insect fragments were correlated withthe actual number of fragments. NIRS is less precise than the standard ßotation method, but it is rapid,nondestructive, does not require extensive sample preparation, and could easily be automated for amore sophisticated sampling protocol for ßour based on prescreening samples with NIRS followed upby use of the standard ßotation method when necessary.
KEY WORDS Rhyzopertha dominica, stored products, ßour, insect fragments, near-infrared spec-troscopy
THE FOOD AND DRUG Administration (FDA) has es-tablished a defect action level (DAL) of 75 insectfragments per 50 g of ßour as the regulatory standardfor quality control (FDA 1997). The presence of liveinsects is considered an adulteration if found in storedbulk grains by the FDA. Excessive insect feeding dam-age in grain may indicate that the grain has been storedunder poor sanitary conditions, and the grain may beclassiÞed as adulterated and unÞt for human or animalconsumption. For example, if �32 insect-damagedkernels (IDKs) are found per 100 g of wheat, thewheat is classiÞed as sample grade (FGIS 1999). IDKis caused by the emergence hole that internal adultinsects leave when they emerge from infested kernels.Most U.S. grain mills use the IDK method to determineinsect contamination of grain and to predict presenceof insect fragments in ßour milled from that grain.However, this visual inspection method does not cor-
relate with actual insect infestation levels or with thenumber of insect fragments that are produced in ßourmilled from that grain (WingÞeld and Pedersen 1985),mainly because it does not detect hidden insect in-festation in wheat (Brader et al. 2002, Perez-Mendozaet al. 2004). Therefore, millers cannot rely on wheatgrade standards or the number of IDKs as absolutepredictors of the number of insect fragments that willbe found in the ßour. Instead, the number of insectfragments present in wheat ßour depends more on thepercentage of internal insect infestations in the grainbefore milling (Sachdeva 1978, Brader 1997).
The lesser grain borer, Rhyzopertha dominica (F.),is a common and destructive pest of stored wheat inthe United States (Hagstrum et al. 1994). This pest thatdevelops and feeds inside grain kernels is the mainsource of insect fragments in wheat ßour (Pedersen1992). Eggs are laid on the surface of grain kernels, andafter hatching, the Þrst instars bore into the grain(Elek 1994). Larvae pupate inside the kernels, andadults remain inside the kernels for several days aftereclosion (Hagstrum and Flinn 1994). We refer to thesenewly eclosed adults still in the kernel as preemergentadults.
Immature stages and preemergent adults of internalgrain feeding insects are not removed from the grain
Mention of trade names or commercial products in this publicationis solely for the purpose of providing speciÞc information and does notimply recommendation or endorsement by Montana State Universityor the USDA.
1 Department of Entomology, Montana State University, Bozeman,MT 59717.
2 USDAÐARS Grain Marketing and Production Research Center,1515 College Ave., Manhattan KS 66502.

by ordinary grain cleaning machinery used beforemilling. As a result, these stages are the main source ofinsect fragments in wheat ßour (Brader et al. 2002).However, the relationship between the initial per-centage of internal infestation of wheat kernels andthe number of insect fragments produced in the ßouris complex and may be inßuenced by several factors,such as the insect species infesting the grain andwhether they are alive or dead, the type of wheat, thetype of sieve used, and the milling process itself (Har-ris et al. 1952, Sachdeva 1978). Preemergent adultinsects are likely to produce more insect fragments inßour than the immature stages; however, this relation-ship has been poorly studied, and only Sachdeva(1978) reported that wheat infested with granary wee-vil adults produced 3x more fragments than wheatinfested with weevil larvae.
The current standard method used by the FDA fordetection of insect fragments (AOAC 1996) is verylabor-intensive and expensive because it involves mill-ing, extracting, and microscopically examining thenumber of insect fragments produced (Glaze andBryce 1994). Thus, development of a fast and reliablealternative method is needed by the milling industry.
In a previous study, we found that a diode-arraynear-infrared (NIR) spectrometer with a spectralrange of 400Ð1,700 nm was able to predict accuratelywhether ßour samples contained less than or �130insect fragments (Perez-Mendoza et al. 2003). Al-though that study had limited success detecting insectfragments below the FDA defect action level, NIRspectrometers with extended wavelength regions andhigher sensitivity ranges are now available and mayimprove detection accuracy. In this study, we reex-amined this method with instruments that extend thenear infrared region tested to 2500 nm.
The objectives of this study were to 1) characterizethe relationship between different levels of internalwheat infestation with larvae, pupae, or preemergentadults of R. dominica and the number of insect frag-ments produced in the ßour milled from that wheat; 2)to develop regression models to predict the maximumlevel of internal infestation for each insect stage thatcan be accepted by millers to produce ßour withnumbers of insect fragments below the FDA defect
action level; and3)compare theaccuracyof threeNIRspectrometers for determining number of insect frag-ments in the ßour produced from the infested wheat.
Materials and Methods
Insect Cultures.Whole kernels infested with lessergrain borers were obtained from a laboratory strainreared on whole kernel, hard red winter wheat, Triti-cum aestivum L. (2002 crop). Insect cultures werestarted by placing 200 unsexed adults into 200 g ofwheat, adjusted to 13.5% moisture content by addingdistilled water as needed, in 800-ml glass jars cappedwith screen/Þlter paper lids. Jars were held in a rear-ing chamber at 30 � 1�C and 70 � 5% RH with aphotoperiod of 12:12 (L:D) h. All founding adultswere removed by sieving after 7 d. After 21 d, kernelscontaining larvae, pupae, or preemergent adults weredetected by x-ray analysis (Throne 1994). Infestedwheat kernels containing each insect stage wereplaced in aluminum dishes that were placed in a me-chanical convection oven (Precision ScientiÞc Inc.,Chicago, IL) maintained at 130�C for 30 min to kill theinsects.Aftercoolingat roomtemperature, thedesirednumber of infested kernels with each life stage wasadded to batches of uninfested wheat to complete100-g samples. Samples were conditioned to 15% mois-ture content for 1 wk before milling.Levels of Insect Infestation. Ten levels of grain in-
festation were tested to determine the fragment con-tribution of each stage of insect development (Table1). The level of infestation was adjusted according tothe insect stage and the expected fragment contribu-tion based on a preliminary study (data not shown).The infestation levels used produced ßour sampleswith fragment counts below and above the FDA de-fect action level.Milling. Individual wheat samples (100 g) were
milled on an experimental Bradender Quadrumat Sr.mill (type 12-10-N87, C.W. Brabender Instruments,Hackensack, NJ) at the USDAÐARS Grain Marketingand Production Research Center, Hard Winter WheatQuality Laboratory, Manhattan, KS. Temperature ofthe rolls was maintained at 31.1Ð32.2�C during milling.The milling efÞciency (percentage of ßour yield) of
Table 1. Mean � SEM (n � 5) number of insect fragments recovered in flour from wheat samples (100 g) infested with three stagesand different infestation levels of R. dominica
Larvae Pupae Preemergent adultsa
%infestation
No. of infestedkernels/100 g
Fragmentcounts
%infestation
No. of infestedkernels/100 g
Fragmentcounts
%infestation
No. of infestedkernels/100 g
Fragmentcounts
0 0 0 � 0 0 0 0 � 0 0 0 0 � 00.25 10 8.6 � 1.1 0.125 5 10.6 � 1.0 0.025 1 14.0 � 1.60.50 20 12.0 � 1.8 0.250 10 17.6 � 2.0 0.050 2 38.2 � 2.41.00 40 28.8 � 2.8 0.375 15 25.4 � 3.9 0.075 3 65.8 � 4.91.50 60 66.8 � 3.6 0.500 20 37.6 � 2.2 0.100 4 94.6 � 6.42.00 80 78.8 � 7.7 0.750 30 50.2 � 3.8 0.125 5 135.4 � 6.02.50 100 110.0 � 8.5 1.000 40 71.8 � 7.3 0.150 6 167.4 � 5.83.00 120 126.2 � 9.7 1.250 50 97.8 � 7.3 0.175 7 201.2 � 3.93.50 140 144.2 � 6.2 1.500 60 100.6 � 3.7 0.200 8 225.4 � 11.04.00 160 178.0 � 8.3 1.750 70 131.6 � 8.7 0.225 9 276.8 � 8.5
a Inside wheat kernels.
December 2005 PEREZ-MENDOZA ET AL.: INSECT FRAGMENTS IN WHEAT FLOUR 2283

this mill was �60%. Therefore, milling produced ßoursamples of �60 g each.Determination of Insect Fragments by Using theStandard FlotationMethod. The current standard ßo-tation method used by the FDA (AOAC 1996) wasused to determine the number of fragments producedin the ßour samples. This method was scaled up tocollect insect fragments in 60 � 5 g of ßour samples(Perez-Mendoza et al. 2003). Fragments in Þve rep-licates of each infestation level for each insect stagewere determined.Detection of Insect Fragments by Using NIRS.
Three near-infrared spectrometers were used to col-lect spectral data from wheat ßour samples containingvarying levels of insect infestation: 1) Perten DiodeArray (DA) 7000 (Perten Instruments Inc., Spring-Þeld, IL), 2) Cognis-QTA Bruker Optics FT-NIR(Cognis, Cincinnati, OH), and 3) Foss NIRSystems6500 (Foss NIRSystems, Silver Spring, MD).Perten Diode Array 7000. The DA 7000 is able to
collect absorbance spectra over a range of 400-1690nm. This spectrometer uses both silicon (Si) and in-dium-gallium-arsenide (InGaAs) photodiodes with ahigh-intensity tungsten halogen lamp. Each entireßour sample was poured into a 12.5-cm-diameter sam-ple ring above the 125-mm Þxed sample viewing areaat room conditions. The thickness of the ßour samplewas �1.2 cm. The light beam comes from below thesample viewing area and penetrates the ßour sample.Each spectrum saved was an average of 15 spectracollected in �3 s.Cognis-QTA FT-NIR. The QTA system is based on
Bruker OpticsÕs MATRIX Fourier Transform Near In-frared (FT-NIR) interferometer. A PbS detector wasused to collect spectra in the 12,000Ð4,000-cm�1
(830Ð2500-nm) wavelength range every 8 cm�1. En-tire ßour samples were placed directly in the rotatingcup. Two replicates were collected for each ßour sam-ple. The instrument was set to automatically averagethe spectra of 100 scans into one spectrum for eachsample being scanned. Before development of thecalibration model, the resulting spectra from the tworeplicates of each sample were averaged, yielding onespectrum that represented that speciÞc sample.Foss NIR Systems 6500. The Foss NIR Systems 6500
scanning monochromator is able to collect spectrafrom 400 to 1098 nm (visible to short-wave NIR re-gions) with a silicon detector and from 1,100 to 2,500nm (NIR region) with a PbS detector. The instrumentcomes equipped with a sample transport device thatallows the sample in the quarter cup to be movedvertically past the light source. Flour samples werepoured and leveled in a quarter cup and secured ßushby using a white board material before placing thesample in the transport device. Each sample wasscanned 64 times for the entire wavelength region andsaved as a single spectrum.Statistical Analysis. Equations describing the rela-
tionship between infestation level and the number ofinsect fragments produced in ßour recovered with thestandard ßotation method were Þt to the data usingTableCurve 2D (SYSTAT Software Inc. 2002). Selec-
tion of an equation to describe the data was based onthe magnitude and the pattern of residuals, lack-of-Þttests, and r2 values (Draper and Smith 1981). We alsoensured that the shape of the curve was reasonable fordescribing the data. We used 95% prediction limits ofthe Þtted equations to determine the maximum num-ber of infested kernels that could be milled and still bebelow the FDA defect action level; this was deter-mined as the lowest number of infested kernels whoseupper 95% prediction limit was below 90 fragments in60 g of ßour (�75 fragments in 50 g ßour).
NIR spectra were analyzed by partial least squares(PLS) regression (Martens and Naes 1989) by usingPLSPlus/IQ software (Galactic Industries 2003). ThecoefÞcient of determination (r2), standard error ofcross-validation (SECV), and beta coefÞcients wereused to evaluate the potential of the NIRS technique.The SECV was used to determine the “best” numberof independent variables in building a calibrationequation. Beta coefÞcients indicated the wavelengths(positive and negative peaks in the plot) that are moreheavily weighted. For any given wavelength, the ab-solute value of the beta coefÞcient indicates how im-portant that wavelength was for classiÞcation. Thus,beta coefÞcient plots can be compared with NIR ab-sorption spectra of speciÞc ßour and insect fragmentcomponents, such as protein, starch, lipids, or chitin toindicate which components cause unique NIR absorp-tions between ßour samples with and without insectfragments (Dowell 2000). An insect fragment predic-tion is obtained by multiplying the absorbance at eachwavelength by the corresponding beta coefÞcient andthen summing each of those products across all wave-lengths. Thus, the beta coefÞcients represent the cal-ibration model. The optimum number of factors usedfor each model was determined by combined exami-nations of the prediction residual error sum of squares(PRESS) plot, r2, SECV, and beta coefÞcient plot,which were all generated by the PLSPlus/IQ software.
Calibration models for each insect stage infestingthe grain (larvae, pupae, or preemergent adults) andfor each NIR spectrometer were developed using PLS(nine individual models). Five test samples of eachinsect-stage infestation level were scanned (n� 150).Finally, a calibration model that included combineddata from the three insect stages (larvae � pupae �adults) was developed. Cross-validation was appliedto optimize calibration models and detection of out-liers by using PLSPlus/IQ software (Galactic Indus-tries 2003). Outliers were excluded from Þnal calibra-tion models. Cross-validation attempts to predictunknown samples by using the training data set itself.To do this, one sample was removed from the data set,and a calibration was developed with the rest of thesamples. Then, the removed sample was predicted.This was repeated for all samples.
The relationship between NIRS-predicted numberof insect fragments and actual number of fragments inthe ßour samples (as estimated by the ßotationmethod) was determined by using TableCurve 2D(SYSTAT Software Inc. 2002). Selection of an equa-tion to describe the data was as described for infes-
2284 JOURNAL OF ECONOMIC ENTOMOLOGY Vol. 98, no. 6

tation levels versus actual fragment counts. We usedinverse prediction to estimate the actual number offragments in a sample based on NIRS estimates, in-cluding 95% CL on the estimates. We used these con-Þdence limits from the inverse predictions to deter-mine the maximum number of fragments that could bepresent in ßour based on NIRS predictions and still bebelow the FDA defect action level; this was deter-mined to be the lowest number of actual fragmentswhose upper 95% conÞdence limit was below 90 frag-ments in 60 g of ßour (�75 fragments in 50 g ßour).
Results
Effects of Insect Infestation Level on FragmentCounts. Fragments Contributed by Larvae.Larvae pro-duced the lowest fragment counts as determined withthe standard ßotation method (Table 1). The pre-dicted number of insect fragments produced by asingle wheat kernel infested with one larva was 0.6[95% CL � 0.23Ð0.93; 95% prediction limits (PL) �0Ð27.2]. The number of insect fragments increasedwith increasing infestation levels. This relationshipwas described by the equation (SEs in parentheses):
y � 0.5775 (�0.175)* x1.126 (�0.0627) [1]
where y is number of fragments and x is number ofinfested kernels (r2 � 0.95) (Fig. 1A). Based on the95% prediction limits for this equation, the maximumnumber of infested wheat kernels with larvae thatmillers can accept to produce ßour that meets theFDA defect action level is 64 infested kernels in 100 gof wheat (�1.5% infested kernels) (95% PL � 35.3Ð89.8 fragments in 60 g of ßour). Although a linearequation also described this relationship without sig-niÞcant lack of Þt, we used a nonlinear equation todescribe the data because of a better residual pattern.Fragments Contributed by Pupae. Fragment counts
in ßour prepared from wheat samples infested withdifferent numbers of kernels infested with pupae wereintermediate between those produced by wheat sam-ples infested with larvae or adults (Table 1). Thepredicted number of insect fragments produced froma single wheat kernel infested with one pupa was 1.6(95% CL � 0.90Ð2.4; 95% PL � 0Ð22.1). The relation-ship between the number of kernels infested withpupae and the number of insect fragments producedin ßour was described by the following equation:
y � 1.646 (�0.372)* x1.025 (�0.0568) [2]
where y is number of fragments and x is number ofinfested kernels (r2 � 0.95) (Fig. 1B). Based on the95% prediction limits for this equation, the maximumnumber of infested wheat kernels with pupae thatmillers can accept to produce ßour that meets theFDA defect action level is 38 infested kernels in 100 gof wheat (�0.95% infested kernels) (95% PL � 47.7Ð89.2 fragments in 60 g of ßour). Although a linearequation also described this relationship without sig-niÞcant lack of Þt, we used a nonlinear equation todescribe the data because of a better residual pattern.
Fragments Contributed by Preemergent Adults.Fragment counts for ßour prepared from wheat sam-ples infested with different numbers of kernels in-fested with preemergent adults were the highest com-pared with those produced in wheat samples infestedwith larvae or pupae (Table 1). The mean number ofinsect fragments produced by an individual infestedwheat kernel containing one adult was 14.0 � 1.6(predicted number of insect fragments � 16.7; 95%
Fig. 1. Relationship between number of infested ker-nels/100 g of wheat with larvae (A), pupae (B), and preemer-gent adults (C), and number of insect fragments detected inmilled ßour samples by using the standard ßotation method.Solid lines are from equations 1, 2, and 3.
December 2005 PEREZ-MENDOZA ET AL.: INSECT FRAGMENTS IN WHEAT FLOUR 2285

CL � 13.8Ð19.6; 95% PL � 0Ð42.8). The relationshipbetween the levels of internal wheat infestation withadults and the number of insect fragments producedin ßour was described by the following equation:
y � 16.69 (�1.43)* x1.273 (�0.0430) [3]
where y is number of fragments and x is number ofinfested kernels (r2 � 0.98) (Fig. 1C). Based on the95% prediction limits for this equation, the maximumnumber of wheat kernels infested by newly eclosedadults that millers can accept to produce ßour thatmeets the FDA defect action level is two infestedkernels in 100 g of wheat (�0.05% infested kernels)(95% PL � 14.0Ð66.7 fragments in 60 g of ßour). Alinear equation was not appropriate for these databecause of signiÞcant lack of Þt.Prediction of Insect Fragments in Flour by NIRS.
Cognis-QTA FT-NIR. NIR spectra generated with thisspectrometer correlated strongly with the actual num-ber of insect fragments present in ßour samples pro-duced from wheat infested with larvae, pupae, ornewly eclosed adults of the lesser grain borer (Table2; Fig. 2). The range of r2 was 0.88Ð0.92 for the fourmodels. Based on inverse predictions, a 60-g ßoursample that had a maximum of 56, 59, 44, or 45 insectfragments based on NIRS predictions for larvae, pu-pae, preemergent adults, or all stages combined, re-spectively, would be below the FDA defect actionlevel of 75 fragments in 50 g ßour (upper 95% conÞ-dence limit would be below 90 fragments in 60 g ßour).Samples with 125, 116, 145, or 136 insect fragments ormore based on NIRS predictions for larvae, pupae,preemergent adults, or all stages combined, respec-tively, would be above the FDA defect action level of75 fragments in 50 g ßour (lower 95% conÞdence limitwould be above 90 fragments in 60 g ßour). It followsthat one would not be able to determine whether thenumber of insect fragments in a sample was above orbelow the action level when NIRS predicts 57Ð124,60Ð115, 45Ð144, or 46Ð135 insect fragments in samplescontaining larvae, pupae, preemergent adults, or allstages combined, respectively.
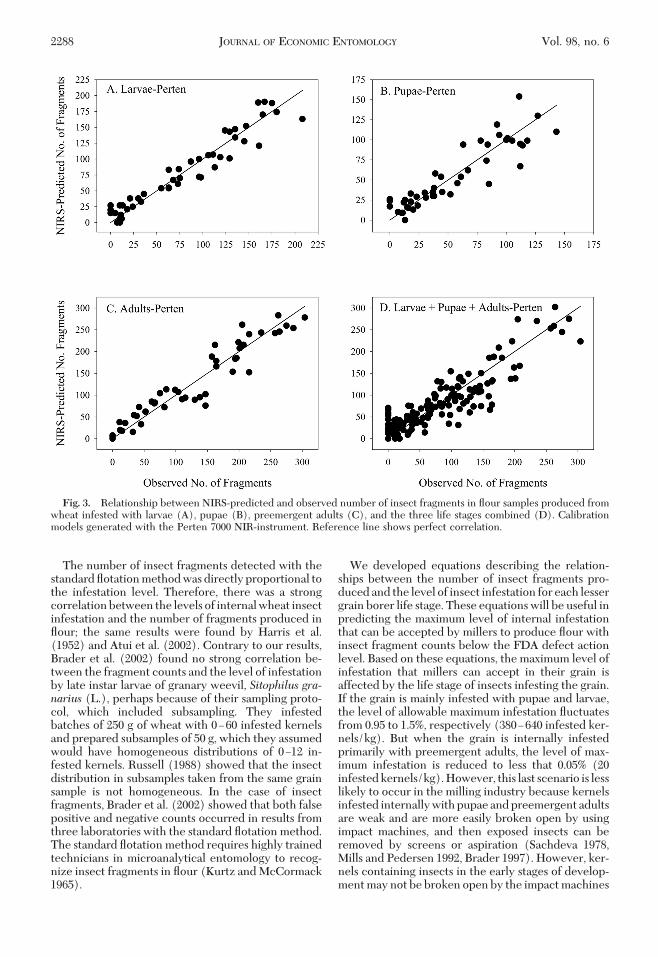
Perten Diode Array 7000. NIR spectra generatedwith this spectrometer correlated well with the actualnumber of insect fragments present in ßour samples(Table 2; Fig. 3). The range of r2 was 0.80Ð0.93 for thefour models. Based on inverse predictions, a 60-g ßoursample that had a maximum of 56, 51, 39, or 29 insectfragments based on NIRS predictions for larvae, pu-pae, preemergent adults, or all stages combined, re-spectively, would be below the FDA defect actionlevel of 75 fragments in 50 g ßour (upper 95% conÞ-dence limit would be below 90 fragments in 60 g ßour).Samples with 122, 121, 147 or 147 insect fragments ormore based on NIRS predictions for larvae, pupae,preemergent adults, or all stages combined, respec-tively, would be above the FDA defect action level of75 fragments in 50 g ßour (lower 95% conÞdence limitwould be above 90 fragments in 60 g ßour). It followsthat one would not be able to determine whether thenumber of insect fragments in a sample was above orbelow the action level when NIRS predicts 57Ð121,52Ð120, 40Ð146, or 30Ð146 insect fragments in samplescontaining larvae, pupae, preemergent adults, or allstages combined, respectively.Foss NIR Systems 6500. NIR spectra generated with
this spectrometer correlated well with the actual num-ber of insect fragments present in the ßour samples(Table 2; Fig. 4). The range of r2 was 0.36Ð0.88 for thefour models (Table 2). Based on inverse predictions,a 60-g ßour sample that had a maximum of 49, 51, 19,or 8 insect fragments based on NIRS predictions forlarvae, pupae, preemergent adults, or all stages com-bined, respectively, would be below the FDA defectaction level of 75 fragments in 50 g ßour (upper 95%conÞdence limit would be below 90 fragments in 60 gßour). Samples with 132, 119, 181, or 165 insect frag-ments or more based on NIRS predictions for larvae,pupae, preemergent adults, or all stages combined,respectively, would be above the FDA defect actionlevel of 75 fragments in 50 g ßour (lower 95% conÞ-dence limit would be above 90 fragments in 60 g ßour).It follows that one would not be able to determinewhether the number of insect fragments in a sample
Table 2. Equations describing the relationship between the number of insect fragments present in flour and the number of insectfragments predicted by using NIRS
NIRspectrometer
StageWavelength
range used inmodel (nm)
SECVa nEquation parametersb
a � SE b � SE r2
Cognis-QTA Larvae 1,055Ð2,500 18.9 47 12.54 � 3.97 0.8684 � 0.0402 0.91Pupae 13.9 48 5.644 � 3.26 0.9087 � 0.0487 0.88Adults 26.6 50 13.73 � 5.84 0.9016 � 0.0384 0.92Larvae � pupae � adults 26.2 146 14.10 � 2.84 0.8478 � 0.0261 0.88
Perten 7000 Larvae 550Ð1,700 16.5 48 6.152 � 3.82 0.9224 � 0.0387 0.93Pupae 17.4 46 7.514 � 4.15 0.8649 � 0.0612 0.82Adults 26.8 49 9.722 � 6.40 0.9241 � 0.0417 0.91Larvae � pupae � adults 34.9 141 14.25 � 3.78 0.8171 � 0.0348 0.80
Foss 6500 Larvae 650Ð2,250 21.7 46 11.47 � 5.01 0.8818 � 0.0497 0.88Pupae 17.0 48 7.881 � 3.74 0.8473 � 0.0571 0.83Adults 44.8 48 31.29 � 9.52 0.7742 � 0.0622 0.77Larvae � pupae � adults 58.3 145 51.22 � 4.87 0.3933 � 0.0438 0.36
a Standard error of cross validation.b Relationship is y � a � bx, where y is NIRS-predicted number of fragments, x is actual number of fragments, and r2 is the percentage of
variation in y accounted for by using a linear model.
2286 JOURNAL OF ECONOMIC ENTOMOLOGY Vol. 98, no. 6

was above or below the action level when NIRS pre-dicts 50Ð131, 52Ð118, 20Ð180, or 9Ð164 insect frag-ments in samples containing larvae, pupae, preemer-gent adults, or all stages combined, respectively.Wavelength Regions of Interest. Beta coefÞcients
obtained with the QTA spectrometer were moststraightforward to interpret (Fig. 5). The wavelengthsresponsible for the ability to detect insect fragments inwheat ßour by using NIRS may correspond to the Þrstand second CH absorption overtones of CH, CH2, andCH3 groups and the Þrst combination CH absorptionovertones (1,140, 1,180, 1,360, 1,446, 1,665, 1,730, and2,283 nm), the Þrst and second OH absorption over-tones (1,840, 1,905, and 2,380 nm), and the second NHabsorption overtones (2,061 and 2,240 nm) (Murrayand Williams 1990, Shenk et al. 1992, Osborne et al.1993).
Discussion
Wheat kernels infested with a single preemergentadult contributed �28 and 10� as many fragments aswheat kernels infested with a single larva or pupa,respectively. This may be because the larval and pupalexoskeletons are weakly sclerotized, compared with
the adult stage, and only the most heavily sclerotizedstructures of their bodies are able to resist the millingprocess or the hydrochloric acid used for the standardßotation method. Although we cannot identify thesource of all the fragments found, the most commonlarval fragments found were the mandibles (�75% oflarval fragments), head capsule parts, and parts of thelabrum and the epistoma. Sachdeva (1978) also foundthat 75Ð80% of the fragments observed in ßour pre-pared from wheat infested with rice weevil larvaewere mandibles and genae. In the ßour samples pre-pared from wheat infested with pupae, the most com-mon fragments observed were the mandibles, parts ofthe head capsule, eyes, antennae, and legs. The mostcommon insect fragments observed in ßour preparedfrom wheat infested with preemergent adults were themandibles, portions of antennae, eyes, legs, labrum,labium, maxillae, furcae, and dorsal and ventral partsof the thorax and elytra. Gentry et al. (1991) alsoreported these parts of the body as the most commoninsect fragments in ßour infested with lesser grainborer. Although we can detect the body part fromwhich some fragments arise, FDA treats all fragmentsequally.
Fig. 2. Relationship between NIRS-predicted and observed number of insect fragments in ßour samples produced fromwheat infested with larvae (A), pupae (B), preemergent adults (C), and the three life stages combined (D). Calibrationmodels generated with the Cognis-QTA NIR-instrument. Reference line shows perfect correlation.
December 2005 PEREZ-MENDOZA ET AL.: INSECT FRAGMENTS IN WHEAT FLOUR 2287
The number of insect fragments detected with thestandard ßotation method was directly proportional tothe infestation level. Therefore, there was a strongcorrelation between the levels of internal wheat insectinfestation and the number of fragments produced inßour; the same results were found by Harris et al.(1952) and Atui et al. (2002). Contrary to our results,Brader et al. (2002) found no strong correlation be-tween the fragment counts and the level of infestationby late instar larvae of granary weevil, Sitophilus gra-narius (L.), perhaps because of their sampling proto-col, which included subsampling. They infestedbatches of 250 g of wheat with 0Ð60 infested kernelsand prepared subsamples of 50 g, which they assumedwould have homogeneous distributions of 0Ð12 in-fested kernels. Russell (1988) showed that the insectdistribution in subsamples taken from the same grainsample is not homogeneous. In the case of insectfragments, Brader et al. (2002) showed that both falsepositive and negative counts occurred in results fromthree laboratories with the standard ßotation method.The standard ßotation method requires highly trainedtechnicians in microanalytical entomology to recog-nize insect fragments in ßour (Kurtz and McCormack1965).
We developed equations describing the relation-ships between the number of insect fragments pro-duced and the level of insect infestation for each lessergrain borer life stage. These equations will be useful inpredicting the maximum level of internal infestationthat can be accepted by millers to produce ßour withinsect fragment counts below the FDA defect actionlevel. Based on these equations, the maximum level ofinfestation that millers can accept in their grain isaffected by the life stage of insects infesting the grain.If the grain is mainly infested with pupae and larvae,the level of allowable maximum infestation ßuctuatesfrom 0.95 to 1.5%, respectively (380Ð640 infested ker-nels/kg). But when the grain is internally infestedprimarily with preemergent adults, the level of max-imum infestation is reduced to less that 0.05% (20infested kernels/kg). However, this last scenario is lesslikely to occur in the milling industry because kernelsinfested internally with pupae and preemergent adultsare weak and are more easily broken open by usingimpact machines, and then exposed insects can beremoved by screens or aspiration (Sachdeva 1978,Mills and Pedersen 1992, Brader 1997). However, ker-nels containing insects in the early stages of develop-ment may not be broken open by the impact machines
Fig. 3. Relationship between NIRS-predicted and observed number of insect fragments in ßour samples produced fromwheat infested with larvae (A), pupae (B), preemergent adults (C), and the three life stages combined (D). Calibrationmodels generated with the Perten 7000 NIR-instrument. Reference line shows perfect correlation.
2288 JOURNAL OF ECONOMIC ENTOMOLOGY Vol. 98, no. 6

because they have not been sufÞciently weakened bythe insect (Sachdeva 1978, Mills and Pedersen 1992).As a result, several researchers have reported thatmost of the insect fragments present in ßour are pro-duced by the immature stages of the internal feedinginsects. Our equations will be useful in sampling pro-grams to determine how many insect fragments wouldbe expected to be produced in ßour milled from asample of wheat, based on the number of internalinsects of each stage detected in that sample of wheat.
NIR spectra generated using the three spectrome-ters were correlated with the actual number of insectfragments present in ßour samples prepared fromwheat infested with larvae, pupae, or preemergentadults. This indicates that NIRS is capable of predict-ing the degree of contamination by insect fragments inßour. The QTA spectrometer gave the best estimatesof insect fragment levels in ßour samples in our tests.For the model combining data for all life stages, theQTA spectrometer would not be able to determinewhether fragment counts were above or below thedefect action level when actual fragments in a 60-gsample were between 46 and 135; similar levels for thePerten and Foss spectrometers were 30Ð146 and9Ð164. The QTA spectrometer may have yielded thebestpredictionsof thenumberof fragments in samples
compared with the calibration models generated withthe other two spectrometers because the QTA spec-trometer continuously mixed the ßour sample whilecollecting spectra, whereas the other spectrometerssampled a static sample. In addition, the QTA andPerten spectrometers collect spectra for the wholesample, whereas the Foss spectrometer collects spec-tra for only a portion of the sample. Although thespectrometers are not highly accurate in determiningnumber of insect fragments in ßour samples, theyprovide results very quickly and could be used toscreen a large number of ßour samples. When thespectrometers indicate that either small numbers orlarge numbers of fragments are present, the standardßotation method would not need to be used. If thespectrometers are not able to determine whether thenumber of insect fragments is above or below thedefect action level, then the standard ßotation methodcould be used as a follow-up test.
Based on beta coefÞcients, absorbance regions(peaks) corresponding to C-H, O-H, and N-H groupswere the most important for NIRS detection of insectfragments in wheat ßour (Murray and Williams 1990,Shenk et al. 1992, Osborne et al. 1993). Differences inabsorption in the C-H regions may be attributed to thepresence of insect cuticle in the ßour samples. Cuticle
Fig. 4. Relationship between NIRS-predicted and observed number of insect fragments in ßour samples produced fromwheat infested with larvae (A), pupae (B), preemergent adults (C), and the three life stages combined (D). Calibrationmodels generated with the Foss 6500 NIR-instrument. Reference line shows perfect correlation.
December 2005 PEREZ-MENDOZA ET AL.: INSECT FRAGMENTS IN WHEAT FLOUR 2289

contains both chitin and lipids, and several researchershave reported previously the inßuence of these com-ponents on the C-H absorption region to detect thepresenceof insects insidewheatkernels (RidgwayandChambers 1996; Ghaedian and Wehling 1997; Dowellet al. 1998, 1999; Maghirang et al. 2003). Differences inthe wavelengths corresponding to O-H regions mightcorrespond to differences in starch and cellulose con-tents (Williams and Norris 1990, Shenk et al. 1992,Osborne et al. 1993) as a result of insect feeding dam-age to the kernels. Finally, differences in absorptionsin the N-H regions most likely correspond to differ-ences in protein content (Williams and Norris 1990),perhaps because of the protein content of the insect
or digestion by the insect of proteins in the kernel.Therefore, the ability of NIRS to detect the presenceof insect fragments in ßour may primarily be becauseof differences in protein, lipids, and starch in ßoursamples as number of fragments changes.
Both the standard ßotation method and the NIRSmethods can detect and quantify the number of insectfragments produced by the lesser grain borer in wheatßour. The ßotation method is more precise, but it isdestructive, time-consuming, expensive, and requireshighly trained technicians. In contrast, although NIRSis less precise, it is rapid, nondestructive, does notrequire extensive sample preparation, and could easilybe automated for a more sophisticated sampling pro-tocol for large ßour bulks.
Acknowledgments
We thank Laura McLaughlin and the Grain Quality andStructure Research Unit (GMPRC) for milling the wheatsamples, and Ann Redmon for excellent technical assistance.We gratefully acknowledge Perten Instruments, Cognis, andFoss NIRSystems for providing instrumentation for thisstudy. We also thank Donghai Wang (Department of Agri-cultural Engineering, Kansas State University), MichaelToews (USDAÐARSÐGMPRC), David K. Weaver (Depart-ment of Entomology, Montana State University), and Rich-ard T. Arbogast (USDAÐARSÐCMAVE) for comments andsuggestions on an earlier version of the manuscript.
References Cited
[AOAC] Association of Official Analytical Chemists. 1996.16.5.11 AOAC OfÞcial method 972.32, Light Þlth (pre-and post-milling) in ßour (white), p. 18. InOfÞcial Meth-ods of Analysis of AOAC International, 16th ed. AOACInternational, Gaithersburg, MD.
Atui, M. B., S.M.N. Lazzari, F. A. Lazzari, and P. W. Flinn.2002. ComparisonofELISAand fragmentcountmethodsfor detection of insects in wheat ßour, pp. 135Ð138. InP. E.Credland, D. M. Armitage, C. H. Bell, P. M. Cogan, and E.Highley [eds.], Proceedings of the 8th InternationalWorking Conference on Stored Product Protection,22Ð26 July, 2002, York, United Kingdom. CAB Interna-tional, Wallingford, United Kingdom.
Brader, B. 1997. Are food sanitation assays meaningful? Ce-real Foods World 42: 759Ð760.
Brader, B., R. C. Lee, R. Plarre, W. Burkholder, G. B. Kitto,C. Kao, L. Polston, E. Dorneanu, I. Szabo, B. Mead, B.Rouse, D. Sullins, and R. Denning. 2002. A comparisonof screening methods for insect contamination in wheat.J. Stored Prod. Res. 38: 75Ð86.
Dowell, F. E. 2000. Differentiating vitreous and nonvitre-ous durum wheat kernels by using near-infrared spec-troscopy. Cereal Chem. 77: 155Ð158.
Dowell,F.E., J.E.Throne, andJ.E.Baker. 1998. Automatednondestructive detection of internal insect infestation ofwheat kernels by using near-infrared spectroscopy. J.Econ. Entomol. 91: 899Ð904.
Dowell, F. E., J. E. Throne, D. Wang, and J. E. Baker. 1999.Identifying stored-grain insects using near-infrared spec-troscopy. J. Econ. Entomol. 92: 165Ð169.
Draper, N. R., and H. Smith. 1981. Applied regression anal-ysis, 2nd ed. Wiley, New York.
Elek, J. A. 1994. Methods for collecting eggs and monitoringegg-hatch and immature development of Rhyzopertha
Fig. 5. Beta coefÞcients showing spectral wavelengthbands used by partial least square calibrations to detect insectfragments in wheat ßour with three different spectrometers.
2290 JOURNAL OF ECONOMIC ENTOMOLOGY Vol. 98, no. 6

dominica (F.) (Coleoptera: Bostrichidae). J. Stored Prod.Res. 30: 261Ð265.
[FDA] Food and Drug Administration. 1997. 578.450Wheat ßour Ðadulteration with insect fragments and ro-dent hairs (CPG 7104.06). Compliance policy guidesmanual, chapter 5, Foods, color and cosmetics, Subchapter 578 Ðprocessed grain (http://www.fda.gov/ora/compliance_ref/cpg/default.htm#1998).
[FGIS] Federal Grain Inspection Service. 1999. OfÞcialUnited States standards for grain subpart M: UnitedStates Standards for wheat (http://www.usda.gov/gipsa/reference-library/standards/810101.pdf).
Galactic Industries. 2003. Algorithms: partial least squares(http://www.galactic.com/ algorithms/pls.htm).
Gentry, J. W., K. L. Harris, and J. W. Gentry, Jr. 1991.Microanalytical entomology for food sanitation control.Association of OfÞcial Analytical Chemists, Melbourne,FL.
Ghaedian, A. R., andR. L.Wehling. 1997. Discrimination ofsound and granary-weevil-larva-infested wheat kernelsby near-infrared diffuse reßectance spectroscopy. J.AOAC Int. 80: 997Ð1005.
Glaze, L. E., and J. R. Bryce. 1994. Extraction of light Þlthfrom whole-wheat ßour, ßotation method: collaborativestudy. J. AOAC Int. 77: 1150Ð1152.
Hagstrum, D.W., and P.W. Flinn. 1994. Survival of Rhyzo-pertha dominica (Coleoptera: Bostrichidae) in storedwheat under fall and winter temperature conditions. En-viron. Entomol. 23: 390Ð395.
Hagstrum, D. W., A. K. Dowdy, and G. E. Lippert. 1994.Early detection of insects in stored wheat using stickytraps in bin headspace and prediction of infestation level.Environ. Entomol. 23: 1241Ð1244.
Harris, K. L., J. F. Nicholson, L. K. Randolph, and J. L.Trawick. 1952. An investigation of insect and rodentcontamination of wheat and wheat ßour. J. AOAC 35:115Ð157.
Kurtz, O. L., and T. H. McCormack. 1965. Comparison ofAACC and AOAC methods for extraneous materials inßour. J. AOAC 48: 554Ð558.
Maghirang, E. B., F. E. Dowell, J. E. Baker, and J. E. Throne.2003. Automated detection of single wheat kernels con-taining live or dead insects using near-infrared reßec-tance spectroscopy. Trans. ASAE 46: 1277Ð1282.
Martens, H., and T. Naes. 1989. Multivariate calibration.Wiley, Chichester, United Kingdom.
Mills, R., and J. Pedersen. 1992. A ßour mill sanitation man-ual. Eagan Press, St. Paul, MN.
Murray, I., and P. C.Williams. 1990. Chemical principles ofnear-infrared technology, pp. 17Ð34. InP. C. Williams andK. H. Norris [eds.], Near-infrared technology in the ag-
ricultural and foods industries. American Association ofCereal Chemists, St. Paul, MN.
Osborne, B. G., T. Fearn, and P. H. Hindle. 1993. PracticalNIR spectroscopy with applications in food and beverageanalysis. Longman ScientiÞc & Technical, Harlow,United Kingdom.
Pedersen, J. 1992. Insects: IdentiÞcation, damage, and de-tection. InD. B. Sauer [ed.], Storage of cereal grains andtheir products. American Association of Cereal Chemists,St. Paul, MN.
Perez-Mendoza, J., J. E.Throne,F.E.Dowell, and J.E.Baker.2003. Detection of insect fragments in wheat ßour bynear-infrared spectroscopy. J. Stored. Prod. Res. 39: 305Ð312.
Perez-Mendoza, J., P. W. Flinn, J. F. Campbell, D. W. Hag-strum, and J. E. Throne. 2004. Detection of stored-graininsect infestation in wheat transported in railroad hop-per-cars. J. Econ. Entomol. 97: 1474Ð1483.
Ridgway, C., and J. Chambers. 1996. Detection of externaland internal insect infestation in wheat by near-infraredreßectance spectroscopy. J. Sci. Food Agric. 71: 251Ð264.
Russell, G. E. 1988. Evaluation of four analytical methods todetect weevils in wheat: granary weevil, Sitophilus gra-narius (L.), in soft white wheat. J. Food Protect. 51:547Ð553.
Sachdeva, A. S. 1978. Effect of infestation stage, form andtreatment on fragment count in ßour. M.S. thesis, KansasState University, Manhattan.
Shenk, J. S., J. J. Workman, Jr., andM. O.Westerhaus. 1992.Application of NIR spectroscopy to agricultural products,pp. 383Ð431. In D. A. Burns and E. W. Ciurczak [eds.],Handbook of near-infrared analysis. Marcel Decker, NewYork.
SYSTAT Software Inc. 2002. TableCurve 2D version 5.01.SYSTAT Software Inc., Richmond, CA.
Throne, J. E. 1994. Life history of immature maize weevils(Coleoptera: Curculionidae) on corn stored at constanttemperatures and relative humidities in the laboratory.Environ. Entomol. 23: 1459Ð1471.
Williams, P. C., and K. H. Norris. 1990. Qualitative appli-cations of near-infrared reßectance spectroscopy, pp.241Ð288. In P. C. Williams and K. H. Norris [eds.], Near-infrared technology in the agricultural and foods indus-tries. American Association of Cereal Chemists, St. Paul,MN.
Wingfield, J., and J. Pedersen. 1985. Insect fragment levelsin ßour milled from selected commercial wheat blends.Bull. Assoc. Oper. Millers, April 1985.
Received 31 March 2005; accepted 20 August 2005.
December 2005 PEREZ-MENDOZA ET AL.: INSECT FRAGMENTS IN WHEAT FLOUR 2291