Innovativeness, operations priorities and corporate performance: An analysis based on a taxonomy of...
19
Innovativeness, operations priorities and corporate performance: An analysis based on a taxonomy of innovativeness Kemal Kilic a, *, Gunduz Ulusoy a , Gurhan Gunday b , Lutfihak Alpkan c a Sabanci University, Manufacturing Systems Engineering, Istanbul, Turkey b Turkish Telecom, Istanbul, Turkey c Istanbul Technical University, Istanbul, Turkey Introduction In an early literature review on innovativeness, Midgley and Dowling (1978) posit that for the majority of existing research at the time, innovativeness is conceptualized as the degree to which an individual adopts an innovation relatively earlier than others. This temporal conception of J. Eng. Technol. Manage. 35 (2015) 115–133 A R T I C L E I N F O Keywords: Innovation management Operations priorities Corporate performance Taxonomy A B S T R A C T The paper analyzes the relations among the manufacturing firm’s innovativeness, operations priorities, and corporate performance. As opposed to common practice in the literature in which these relations are analyzed on a dichotomous (high vs. low) classification of innovativeness mostly based on product and/or process innovations, a taxonomy based approach is used here. Our findings demonstrate that leading innovators simultaneously compete effectively on multiple operations priorities and obtain the best corporate performance. This research also demonstrate that incorporating shades of grey via the more elaborate taxonomy based approach reveals hidden relations that were otherwise buried in the data. ß 2014 Elsevier B.V. All rights reserved. * Corresponding author. Tel.: +90 216 483 9596; fax: +90 216 483 9550. E-mail addresses: [email protected] (K. Kilic), [email protected] (G. Ulusoy), [email protected] (G. Gunday), [email protected] (L. Alpkan). Contents lists available at ScienceDirect Journal of Engineering and Technology Management journal homepage: www.elsevier.com/locate/jengtecman http://dx.doi.org/10.1016/j.jengtecman.2014.09.001 0923-4748/ß 2014 Elsevier B.V. All rights reserved.
-
Upload
independent -
Category
Documents
-
view
1 -
download
0
Transcript of Innovativeness, operations priorities and corporate performance: An analysis based on a taxonomy of...

J. Eng. Technol. Manage. 35 (2015) 115–133
Contents lists available at ScienceDirect
Journal of Engineering andTechnology Management
journal homepage: www.elsevier.com/locate/jengtecman
Innovativeness, operations priorities
and corporate performance: An analysisbased on a taxonomy of innovativenessKemal Kilic a,*, Gunduz Ulusoy a, Gurhan Gunday b,Lutfihak Alpkan c
a Sabanci University, Manufacturing Systems Engineering, Istanbul, Turkeyb Turkish Telecom, Istanbul, Turkeyc Istanbul Technical University, Istanbul, Turkey
A R T I C L E I N F O
Keywords:
Innovation management
Operations priorities
Corporate performance
Taxonomy
A B S T R A C T
The paper analyzes the relations among the manufacturing firm’s
innovativeness, operations priorities, and corporate performance.
As opposed to common practice in the literature in which these
relations are analyzed on a dichotomous (high vs. low) classification
of innovativeness mostly based on product and/or process
innovations, a taxonomy based approach is used here. Our findings
demonstrate that leading innovators simultaneously compete
effectively on multiple operations priorities and obtain the best
corporate performance. This research also demonstrate that
incorporating shades of grey via the more elaborate taxonomy
based approach reveals hidden relations that were otherwise
buried in the data.
� 2014 Elsevier B.V. All rights reserved.
Introduction
In an early literature review on innovativeness, Midgley and Dowling (1978) posit that for themajority of existing research at the time, innovativeness is conceptualized as the degree to which anindividual adopts an innovation relatively earlier than others. This temporal conception of
* Corresponding author. Tel.: +90 216 483 9596; fax: +90 216 483 9550.
E-mail addresses: [email protected] (K. Kilic), [email protected] (G. Ulusoy), [email protected] (G. Gunday),
[email protected] (L. Alpkan).
http://dx.doi.org/10.1016/j.jengtecman.2014.09.001
0923-4748/� 2014 Elsevier B.V. All rights reserved.
K. Kilic et al. / Journal of Engineering and Technology Management 35 (2015) 115–133116
innovativeness later changed and other conceptualizations became more popular. For example,Hurley and Hult (1998) define innovativeness as the notion of openness to new ideas as an aspect of afirm culture and propose an input based operationalization of innovativeness, i.e., innovativeness ismeasured based on its antecedents. In contrast, Damanpour and Evan (1984) assert that an innovationis realized after implementation of a new idea. In line with this assertion, Damanpour (1991) definesinnovativeness as the rate of adoption of innovations and indicates that it is operationalized in manystudies as the number of innovations adopted within a given period. This conceptualization ofinnovativeness has led to numerous studies that have an output based measure of innovativeness(Ellonen et al., 2008; Tellis et al., 2009; Man, 2009), i.e., innovativeness is measured based on realizedinnovations.
Even though earlier researchers in innovation management literature have mostly focused on twotypes of innovations, namely product and process innovations, recently other types of innovationsbegan to receive more attention. The OECD Oslo Manual (2005) defines four different innovationtypes: product, process, marketing, and organizational innovations. Furthermore, the productinnovation is considered in two components: incremental and radical product innovations. This recentmulti dimensional approach to innovation has enriched discussions and enhanced its role particularlyin corporate performance and strategic management.
On the other hand, there has been a broad agreement on the composition of the operationspriorities, namely, cost, quality, flexibility and delivery/dependability (Hayes and Wheelwright, 1984;Voss, 1995; Boyer and Lewis, 2002). Even though Leong et al. (1990) introduced innovation as the fifthoperations priority, it is yet to receive the same level of attention by the research community as havethe former four dimensions (Nair and Boulton, 2008; Avella et al., 2011). Therefore, in this research weadopt the more general approach which positions innovativeness out of the operations priorities setyet nevertheless investigates their interactions.
Business researchers acknowledge both innovativeness and operations priorities among the mostattractive subject areas of corporate performance and strategic management (Damanpour, 1987;Hayes et al., 1988; Boyer and Lewis, 2002; Sum et al., 2004). Some researchers have focused on the roleof innovativeness on firm performance (e.g., Zahra and Sidhartha, 1993; Damanpour et al., 1989;Gunday et al., 2008; Man, 2009; Bolıvar-Ramos et al., 2012). On the other hand, another stream ofresearch investigates the relationship between operations priorities and innovativeness (Utterbackand Abernathy, 1975; Baldwin and Johnson, 1996; Alegre-Vidal et al., 2004). Nevertheless, therelationship between operations priorities and firm performance has been the most widely studied;foundations have been laid by seminal works such as Skinner (1969, 1978), Hayes and Wheelwright(1984) and Miller and Roth (1994).
The literature regarding the first two relationships (namely, (1) innovativeness and performance(2) innovativeness and operations priorities) utilizes the traditional dichotomous approach (highinnovativeness/low innovativeness) where innovativeness is operationalized with a singledimensional measure in their analysis. However, as discussed earlier, the multidimensional natureof innovativeness makes treating it with a single dimensional measure actually problematic. Forexample, there can be firms that are highly innovative in terms of various dimensions, say,incremental product innovations and process innovations but nonetheless perform badly in othertypes of innovations. A reductionist approach would lead to categorize such firms (which can besummarized as average innovative) together with firms that actually perform on average in allinnovation types. Therefore, a taxonomical approach based on multi dimensional clustering has thepotential to not only better represent reality than do the more traditional single dimensional anddichotomous approaches but also reveal otherwise hidden relations.
As a matter of fact, such studies which are based on taxonomy of operations priorities do exist andfocus on the relationship between operations priorities and firm performance (Miller and Roth, 1994;Kathuria, 2000; Sum et al., 2004; Prajogo et al., 2014). However, even though some taxonomies ofinnovativeness are available in the literature (Avermaeta et al., 2004; Lehtoranta, 2005; Balcerowiczet al., 2009), they are not used to determine the relationship between innovativeness and operationspriorities or how the firms perform in different innovativeness clusters. Furthermore, the taxonomiesof innovativeness available in the literature are based on only product and process innovations, andonly one of them (namely, Balcerowicz et al., 2009) utilizes formal cluster analysis. Hence, there is

K. Kilic et al. / Journal of Engineering and Technology Management 35 (2015) 115–133 117
actually a lack of taxonomy of innovativeness based on formal cluster analysis of all types ofinnovations.
In this research, we will first of all address this gap and develop taxonomy of innovativeness. Later,this taxonomy will be used in order to determine how firms in different innovativeness clusters ranktheir operations priorities and how they perform in terms production, marketing and financialperformance. Such an analysis based on taxonomy would be invaluable particularly for topmanagement while developing strategies regarding to their innovativeness. Note that taxonomybased analysis of the relationship between innovativeness and operations priorities also contributesto the ongoing debate between the two competing models proposed in order to understand thedynamics of operations priorities, namely, Skinner’s (1969, 1974) trade-off (focused factory) model,the sand cone (cumulative) model (Nakane, 1986; Ferdows and De Meyer, 1990) to a degree.
The paper has six sections. The review of the relevant literature in detail and the research questionsare presented next. The third section describes the data collection phase and the measurement of thevariables. Analyses are presented in section four. The results and the discussions are introduced in thefifth section. The paper concludes with final remarks in section six.
Literature review and hypothesis development
In order to enhance the understanding and communication of various concepts, the determinationof typologies and taxonomies is an integral approach in strategy research (Martin-Pena and Diaz-Garrido, 2008). Unlike the typologies, which refer to the ideal types, the taxonomies are based onempirical classification of the companies, which are mutually exclusive and collectively exhaustive(Bozarth and McDermott, 1998). For example, Hill’s (1999) five process types, i.e., project, job shop,batch, line and continuous process is a notable example of typologies. Typologies refer to aclassification system from a theoretical perspective, i.e., based on a conceptual framework developed apriori. On the other hand, taxonomies differ from typologies since they lack the a priori theoreticalframework, are based on a posteriori approach, and emerge from empirical analysis (Martin-Pena andDiaz-Garrido, 2008).
Various taxonomies in the context of operations priorities are available. An extensive literaturereview is presented by Martin-Pena and Diaz-Garrido (2008). One example of taxonomy is proposedby Miller and Roth (1994), which is based on operations priorities and yields three strategy types:Caretakers, Innovators and Marketers. A different taxonomy of operations priorities is proposed bySum et al. (2004) and according to their taxonomy, companies are classified into three groups: All-Rounders, Efficient Innovators and Differentiators. A third taxonomy based on the operationspriorities is further proposed by Kathuria (2000), which classifies the companies into four groups,namely, Starters, Efficient Conformers, Speedy Conformers, and Do Alls.
The taxonomy of innovativeness by clustering firms according to their innovativeness pertaining tovarious innovation types (i.e., product, process, marketing and organizational) is non-existent to date.Avermaeta et al. (2004) are among the first researchers who propose a taxonomy of innovativenessbased on an empirical analysis of 177 small food firms from the UK, Belgium and the Republic ofIreland. Rather than a formal cluster analysis, the authors set specifications and group the firmsregarding these conditions. They conclude that firms can be grouped into four homogenous categoriessuch as Non Innovators, Traditional, Followers, and Leaders. Note that preset specifications focus onlyon the product and process innovations. Lehtoranta (2005) utilizes Finnish VTT Sfinno Database inorder to determine what type of SMEs are innovative. In the analysis, the taxonomy of theinnovativeness based on innovation intensity was proposed, which suggests three groups ofcompanies, namely, intensive innovators, persistent innovators and innovators with one innovation.Again these categories are formed based on preset specifications (e.g., firms that have commercializedfive or more innovations between 1980 and 1999 are labeled as intensive innovators, etc.) rather thanformal cluster analysis. Note that the focus of this study is also limited to product and processinnovations.
A taxonomy based on formal cluster analysis is developed by Balcerowicz et al. (2009). In theiranalysis, data collected from 58 companies from various industries in the Czech Republic, Hungary,Poland and Spain were utilized. Two different taxonomies, one regarding low and medium technology

K. Kilic et al. / Journal of Engineering and Technology Management 35 (2015) 115–133118
(LMT) firms and the other regarding high technology (HT) firms, are provided. The LMT firms aregrouped into six groups based on linkages and beneficial cooperation, low profile, short termcompetitiveness strategy, hunters for product innovation, and high profile. Similarly the HT firms aregrouped into four, namely, benefiting from cooperation, high profile, hunters for product innovation,and in-house backed by cooperation. Note that the current research limits its focus only to productinnovations.
The literature hints usage of taxonomies in the context of innovation management research.However, the existing taxonomies are based on product and/or process innovations and only one ofthem is based on formal cluster analysis. Nevertheless, a taxonomy of innovativeness thatincorporates all types of innovations and utilizes formal cluster analysis would provide an invaluableframework for the researchers and decision makers. Therefore, a taxonomy established on the firmlevel innovativeness pertaining to various innovation types by utilization of cluster analysis isrequired, thus, leading to the first research objective of the paper.
Another research challenge in the scope of the paper is the linkage between operations prioritiesand innovation. Utterback and Abernathy (1975) are among the first to study the relationship betweenproduct and process innovations and operations priorities. The researchers conclude that those firmsthat undertake more product innovations should focus on quality and flexibility; however, those thatundertake more process innovations mostly focus on cost. Baldwin and Johnson (1996) investigate thedifferences in the strategies of more and less innovative companies in a Canada based on the surveyconducted by Statistics Canada. The analysis reveals that more innovative companies focus ondelivery, flexibility and quality significantly more than do less innovative companies. In this research,innovativeness was measured based on various antecedents of innovations (i.e., competitiveorientation, innovation strategy, investment devoted to R&D, etc.). Alegre-Vidal et al. (2004) study thelink between product innovation and operations priorities based on an empirical survey conductedamong Spanish ceramic tile manufacturers. There firms are classified as more innovative or lessinnovative firms based on the number of new product developments. Somewhat parallel to theexisting literature, their results indicate that more innovative firms emphasize flexibility and qualitysignificantly to a greater extent than do less innovative firms.
Note that the above mentioned research exhibits significant gaps in the literature. First of all, theirattention is only limited to product and process innovations (rather than other types of innovations,i.e., organizational and marketing). Furthermore, this research uses the dichotomous classification ofinnovativeness (such as high innovativeness and low innovativeness) which is operationalized with asingle dimensional measure of innovativeness as opposed to a taxonomy based on natural groupings(i.e., multidimensional clusters). In order to address this gap in the literature, the first researchhypothesis is stated as follows:
H1. Different innovation clusters put different emphasis on different operations priorities (cost efficiency,flexibility, delivery and quality).
One of the active research areas in operations strategy literature is the selection and/orcombination of the most appropriate operations priorities for better performance. Although the trade-off model (Skinner, 1969, 1974) and the sand-cone model (Nakane, 1986; Ferdows and De Meyer,1990) are the two competing proposals that suggest how firms should align their operations prioritieswith their industrial ecosystems, some researchers perceive the two models as complementary ratherthan competing and suggest an integrative model (Schroeder et al., 2011; Avella et al., 2011). Thesand-cone model asserts that as opposed to the trade-off model, which assumes that there isincompatibility among the priorities, the priorities are accumulative in nature; hence, it is possible tobuild up a balanced strategy, i.e., the multiple concentration approach is viable.
The ambidexterity literature also supports the multiple concentration approach. According to thisliterature, the combination or reconciliation of seemingly contradictory – but in the long term in essencecomplementary – alternatives contribute to firm performance better than does selecting only onealternative (e.g., Duncan, 1976; Tushman and O’Reilly, 1996; Menguc and Auh, 2008). However, in mostof the empirical studies, if not all, this linkage is tested via relational analyses (i.e., regression, pathmodels, etc.) but not via direct comparison of firm clusters according to their strategic choices.

K. Kilic et al. / Journal of Engineering and Technology Management 35 (2015) 115–133 119
Our analysis on the first research hypothesis will contribute to this ongoing debate in theoperations strategy literature. As a result of the analysis, we can observe: if the innovativeness clustersadopt a multiple concentration approach; if the innovation clusters concentrate on only some of theoperations priorities; or, lastly, if both are possible, i.e., an integrative model in which some firmsadopt multiple concentration and some others focus only on some of the priorities. Note that becausethe data set utilized in this paper is cross sectional, our conclusions will thus be limited. For a moreconclusive result, particularly for the validation of the sand-cone model which implies an orderingamong the operations priorities, a longitudinal study might be more appropriate.
Various taxonomies of the organizations based on operations priorities suggest that many firmsseem to simultaneously focus on multiple operations priorities (Miller and Roth, 1994; Kathuria,2000; Avella et al., 2011), a finding/an approach which more fits the sand-cone model. The results ofsuch taxonomies raise the question of how these companies focusing on multiple prioritiessimultaneously perform when compared with others that don’t. Kathuria (2000) demonstrates thatdifferent groups of companies perform better on certain performance measures that are consistentwith their focus. The results suggest that those companies, which simultaneously emphasize all fouroperations priorities, perform well. Miller and Roth (1994) report performance differences amongdifferent organizations with different operations priorities. Based on an empirical study, Noble (1997)demonstrates that manufacturing strategies of high-performing firms are unlike low-performingfirms. Their findings support that high performing firms are more probable to concurrentlyconcentrate on multiple capabilities and are more likely to possess clearly defined competitivestrategies.
The above mentioned literature suggests an indirect linkage between innovativeness andcorporate performance via operations priorities. Several researchers have attempted to explicitlyrepresent the positive impact of innovations on corporate performance. Damanpour et al. (1989)introduces a typology that consists of four different types of companies based on their adoption oftechnical and administrative innovations (i.e. high technical and high administrative, low technicaland high administrative, etc.). Based on this typology, they demonstrate that high levels of adoption ofboth administrative and technical innovations lead to higher organizational performance. Zahra andSidhartha (1993) also conclude that innovation strategy is an important major predictor of financialperformance. Gunday et al. (2008, 2011) report that innovative firms are rewarded by highercorporate performance including financial, production, and marketing performance(s). Even thoughthe majority of research hints that more innovative firms have better performance, there is alsocontradictory evidence in the literature. For example, based on an empirical analysis of SMEs, Man(2009) concludes that there is no evidence to support that more innovative firms have betterperformance. Note that there is virtually no research that investigates firm performance based ontaxonomy of companies with respect to their innovativeness. On the other hand, one reasons for thecontradictory results in the literature might stem from the dichotomous classification of companiesbased on their innovativeness. This gap in the literature leads us to the following research hypothesis:
H2. Different innovation clusters demonstrate different corporate performance levels (financial, produc-tion, market).
Methodology
Data collection
A questionnaire consisting of 311 individual questions was developed for the upper managers ofmanufacturing companies. The questionnaire is designed to assess a firm’s business strategy,innovativeness efforts, competitive priorities, market and technology strategy, in-firm environment,market conditions, and corporate performance. The initial survey draft was discussed with firms’executives and pre-tested through 10 pilot interviews to ensure appropriate wording, format, andsequencing of questions.
Data was collected over a 7-month period using a self-administered questionnaire distributed tofirms’ upper level managers operating in six different manufacturing sectors (textile, chemical, metal

K. Kilic et al. / Journal of Engineering and Technology Management 35 (2015) 115–133120
products, machinery, domestic appliances, and automotive industries) in the Northern Marmararegion in Turkey. Because of the diversity of the organizational structures, where corporate strategiesare developed, manufacturing was selected as the unit of analysis.
A total of 1674 firms were selected randomly, from the database(s) of the Union of Chambers andCommodity Exchange (TOBB) and Istanbul, Kocaeli, Tekirdag, Cerkezkoy and Sakarya IndustryChambers, as well as member lists of various Industry Parks in Northern Marmara region. The numberof firms selected from each sector and province covered in the study represents the number of firms inthat sector and province. Randomly selected face-to-face structured interviews with the samequestionnaire were concurrently arranged with the mail application. The dispersion of the firms to thesectors and firm characteristics such as firm size were considered in order to obtain a true randomizedand representative sample when arranging for interview appointments. From 120 invitationsextended, a total of 101 interviews were performed. Together with the responses from the mail survey,we obtained 184 usable questionnaires resulting in a response rate of 11%. All respondents completingthe questionnaire were from top or middle management (CEO/Owner (7%), General Director (24%),Assistant General Director (5%), Plant Director (15%), Production Director (22%), R&D Director (12%),Finance Director (8%), Quality Director (4%), Sales Director (2%) and Marketing Director (1%)).
Implementing a series of comparative tests regarding firm distributions according to sectorsascertains the degree to which the sample represents the population. For each sector, the number offirms in the sample emerged as representative since no significant difference has been detectedbetween the population and sample percentages.
The data is also controlled with t-test procedure for non-respondent bias; there is no significantdifference (p�0.05) between the interview and mailing data sets responses both in terms of thequestionnaire items and constructs, i.e., innovation and firm performance variables as well as in termsof firm characteristics such as firm size, firm age, total sales, ownership status and the existence ofsome level of foreign investment in the company. Note that this result also suggests the absence of amixed mode effect due to the multiple mode approach undertaken during the data collection stageand enabled us to safely merge the data from face-to-face interviews and mailing application (DeLeeuw, 2005).
The Common Method Variance (CMV) bias was also addressed. Procedural precautions such asusing established scales, some methodological separation of measurement, counterbalancingquestion order, improving scale items and protecting anonymity were taken prior to the research.Furthermore, Harman’s single factor test (Harman, 1967) is also applied as suggested in the literature(Kathuria, 2000; Podsakoff et al., 2003; Zu et al., 2010; Wei et al., 2014). In the single factor test, allfactors in a study are subject to exploratory factor analysis (EFA). Then, CMV is assumed to exist if (1) asingle factor emerges from unrotated factor solutions, or (2) a first factor explains the majority of thevariance in the variables (Podsakoff and Organ, 1986). Neither condition is observed as the result of theEFA; hence, a strong evidence against CMV bias in the results is revealed.
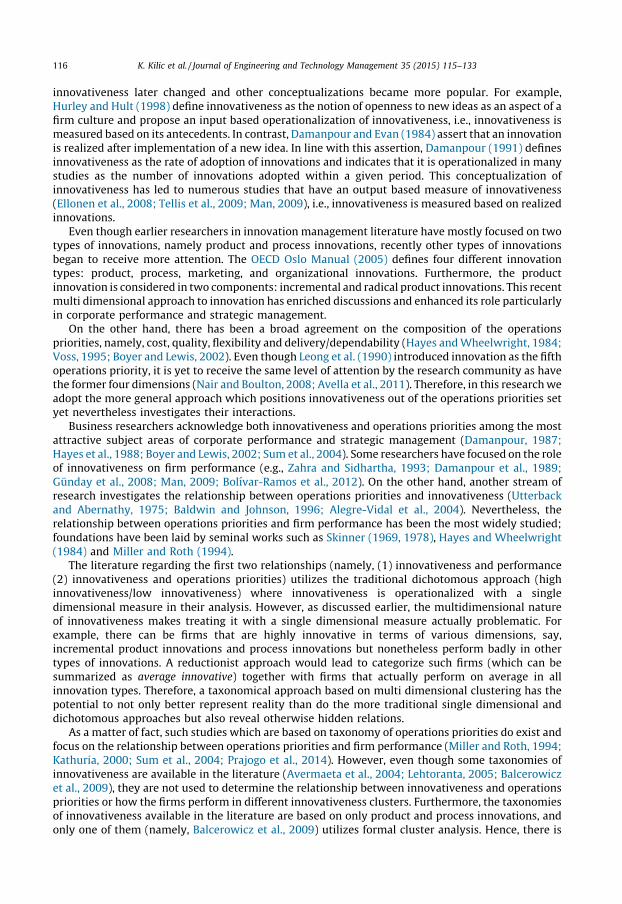
The resulting sample profile is displayed in Fig. 1. Firm size was determined by the number of full-time employees (up to 50: small; between 50 and 250: medium; more than 250: large) and firm age bythe year a firm started production (earlier than 1975: old; between 1975 and 1992: moderate; laterthan 1992: young).
After the data collection stage, multivariate statistical analyses via SPSS v13 software package wereconducted in order to validate the research framework. Occasional missing data were randomlydistributed (MAR) on items and handled by list wise deletion.
Measurement of variables
The questionnaire form is prepared by considering recent questionnaire forms used in similarstudies and commonly accepted measures met in the current literature.
The questions about innovativeness are asked by employing a 5-point Likert scale. The respondentsare asked to indicate ‘‘to what extent the innovations implemented in their organization in the lastthree years related to the following kinds of activities’’ ranging from 1=‘not implemented’,2= ‘imitation from national markets’, 3=‘imitation from international markets’, 4=’current products/processes are improved’, 5=‘original products/processes are implemented’. Such subjective measures
Fig. 1. Sample profile.
K. Kilic et al. / Journal of Engineering and Technology Management 35 (2015) 115–133 121
possibly bring in respondent bias but are nonetheless widespread research practice (Khazanchi et al.,2007).
Based on the Oslo Manual, five different innovation types are employed: Incremental product,radical product, process, marketing and organizational innovations. Each innovation construct ismeasured by its original measurement items, which are developed accordingly. Therefore, theinnovation measures used in this research are new for the literature and hence require validation. Theitems of the innovativeness are presented in Table 1.
Questions regarding the importance of each operations priority for a firm use a 5-point Likert scaleranging from 1=extremely unimportant to 5=extremely important. Here we adopt the widely usedstatements of the competitive dimensions of manufacturing as the operations priorities of cost,quality, flexibility and delivery/dependability. In the questionnaire, these operations priorities arefurther subdivided into their relevant components. The scales of the four different operationspriorities’ measures are adapted from the existing OM literature with six, six, seven, and six criteria,respectively, for cost, quality, flexibility, and delivery/dependability. The base of items asked regardingthese priorities is adapted mainly from the literature (Vickery et al., 1993; Noble, 1997; Ward et al.,1998; Kathuria, 2000; Boyer and Lewis, 2002; Alpkan et al., 2003). Table 2 presents these items.
Three different performance measures are employed to expose the effects of realized innovationson firm performance, namely, financial, production, and market performances. Productionperformance, market performance, and financial performance scales are adapted from existingacademic literature with four, three and four criteria, respectively. The base of items asked regardingthese performance criteria is adapted mainly from the literature (Barringer and Bluedorn, 1999;Hornsby et al., 2002; Narver and Slater, 1990; Yilmaz et al. (2005)). The items are tabulated in Table 3.

Table 1PCA of innovativeness.
Factors Factor
loads
Eigen-
value
Cum. %
variance
explained
Cronbach
aAVE
Factor 1: organizational innovations 9.027 37.613 0.896 0.783
Renewing the organization structure to facilitate
teamwork
0.763
Renewing the organization structure to facilitate
coordination between different functions such
as marketing and manufacturing
0.736
Renewing the organization structure to facilitate
project type organization
0.736
Renewing the routines, procedures and processes
employed to execute firm activities in innovative
manner.
0.711
Renewing the human resources management system. 0.679
Renewing the production and quality management
system.
0.685
Renewing the supply chain management system. 0.629
Renewing the organizational structure to facilitate
strategic partnerships and long-term business
collaborations
0.501
Renewing the in-firm management information
system and information sharing practice
0.494
Factor 2: marketing innovations 2.181 46.700 0.835 0.785
Renewing the distribution channels without changing
the logistics processes related to the delivery of the
product
0.720
Renewing the product pricing techniques employed for
the pricing of the current and/or new products
0.709
Renewing the product promotion techniques employed
for the promotion of the current and/or new products
0.700
Renewing the design of the current and/or new products
through changes such as in appearance, packaging,
shape and volume without changing their basic
technical and functional features
0.638
Renewing general marketing management activities. 0.632
Factor 3: process innovations 1.803 54.214 0.820 0.830
Determining and eliminating non value adding activities
in delivery related processes
0.713
Decreasing variable cost and/or increasing delivery speed
in delivery related logistics processes
0.681
Decreasing variable cost components in manufacturing
processes, techniques, machinery and software
0.675
Determining and eliminating non-value adding activities
in production processes
0.648
Increasing output quality in manufacturing processes,
techniques, machinery and software
0.634
Factor 4: incremental product innovations 1.251 59.426 0.701 0.774
Introducing innovations in components and materials of
current products to increase product quality
0.666
Introducing innovations in current products leading to
improved ease of use and improved customer
satisfaction
0.658
Introducing innovations in components and materials
of current products to decrease product cost
0.656
Factor 5: radical product innovations 1.036 63.741 0.799 0.854
Developing new products with technical specifications
and functionalities totally different from the current
ones
0.800
Developing new products with components and materials
totally different from the current ones
0.714
KMO measure of sampling adequacy=0.902; Bartlett test of sphericity=2188.3; p<0.000.
K. Kilic et al. / Journal of Engineering and Technology Management 35 (2015) 115–133122

Table 2PCA of operations priorities.
Factors Factor
loads
Eigen-
value
Cum. %
variance
explained
Cronbach
aAVE
Factor 1: cost efficiency 6.423 32.114 0.843 0.750
Decrease in total cost of manufacturing processes 0.763
Decrease in total cost of internal and external logistics
processes
0.738
Decrease in operating costs 0.728
Increase in personnel productivity 0.686
Decrease in input costs 0.644
Decrease in waste and scrap 0.579
Decrease in defective intermediate and end products 0.558
Factor 2: flexibility 1.708 52.927 0.796 0.759
Increase in ability of flexible use of current personnel
and hardware for non-standard products
0.826
Increase in ability of producing non-standard products 0.799
Decrease in declining product orders with different
specifications
0.720
Ability to change machine and equipment priorities
when necessary
0.657
Increase in ability of flexible production 0.484
Factor 3: dependability/delivery 2.454 44.385 0.823 0.805
Increase in delivery speed of products 0.788
Decrease the makespan from start of manufacturing
process to the completion of delivery
0.744
Increase in ability to meet the delivery commitments 0.718
Decrease the makespan from taking the orders to the
completion of delivery
0.707
Increase in just in time delivery 0.631
Factor 4: quality 1.426 60.058 0.770 0.806
Increase in product and service quality according to
customers’ perception
0.809
Increase in product and service quality compared to
rivals
0.782
Decrease in customer complaints 0.725
KMO measure of sampling adequacy=0.838; Bartlett test of sphericity=1557.127; p<0.000.
K. Kilic et al. / Journal of Engineering and Technology Management 35 (2015) 115–133 123
The questions about firm performance attempt to reveal the managers’ perception of the firmperformance in the last 3 years compared to the previous years’ performance. A 5-point Likert scale isused with the scale ranging from 1=extremely unsuccessful to 5=extremely successful. The rationalefor this subjective scale is reluctance of both firms to disclose exact performance records, as well asmanagers to share objective performance data (Boyer et al., 1997; Ward and Duray, 2000). Conversely,top managers, who are well-acquainted with performance data, can provide more precise subjectiveevaluations (Choi and Eboch, 1998).
Analyses
The multivariate data analysis is performed in two stages. In the first stage, principal componentanalysis (PCA) with varimax rotation is applied in order to reduce the larger set of variables into a moremanageable set of scales (Flynn et al., 1990). The factors are named to represent as closely as possiblethe included variables. This stage is concluded by exploring internal consistency and reliability(content validity) among items of each construct via Cronbach a (Carmines and Zeller, 1979).Moreover, convergent validity between the innovation constructs is also examined and verified by theaverage-variance extracted (AVE) test (Fornell and Larker, 1981). The second stage corresponds to thecluster analysis of firms according to the five innovation types stated above. The resulting innovation

Table 3PCA of corporate performance.
Factors Factor
loads
Eigen-
value
Cum. %
variance
explained
Cronbach
aAVE
Factor 1: financial performance 4.699 42.716 0.930 0.932
Return on assets (profit/total assets) 0.920
General profitability of the firm 0.915
Return on sales (profit/total sales) 0.900
Cash flow excluding investments 0.790
Factor 2: market performance 1.954 60.475 0.766 0.732
Customer satisfaction 0.807
Market share 0.715
Total sales 0.708
Factor 3: production performance 1.121 70.666 0.711 0.636
Production (volume) flexibility 0.760
Production cost 0.750
Production and delivery speed 0.702
Conformance quality 0.553
KMO measure of sampling adequacy=0.837; Bartlett test of sphericity=1132.258; p< .000.
K. Kilic et al. / Journal of Engineering and Technology Management 35 (2015) 115–133124
clusters are then compared regarding operations priorities and corporate performance using ANOVAand post-hoc tests.
Stage 1: Factor structures
For the PCA of innovativeness (there are 24 variables), Bartlett’s test is conducted to assess theoverall significance of the correlation matrix. As a result, the Chi-square score is 2188.3 with276 degrees of freedom and the p-value is <0.01. Therefore, we reject the null hypothesis thatvariables are uncorrelated in the population. The KMO score is 0.902, which validates that correlationmatrix is appropriate. The PCA on innovations extracted 5 factors with eigenvalues>1 (Table 1).Moreover, none of the items are eliminated since communality is over 0.5. The total varianceexplained is 63.741%. The Cronbach a values are �0.7 suggesting construct reliability (Saunila andUkko, 2014). In our case, the smallest AVE score is found as 0.774 indicating an adequate convergentvalidity since it is above the threshold value of 0.5 proposed by Fornell and Larker (1981).
Similarly, for the PCA of operations priorities (there are 25 variables), Bartlett’s test is implementedto assess the overall significance of the correlation matrix. As a result, the Chi-square score is1557.1 with 190 degrees of freedom and p<0.01. We therefore reject the null hypothesis thatvariables are uncorrelated in the population. The KMO score of 0.838 validates the appropriateness ofthe correlation matrix (Table 2). After omitting five variables with communalities <0.5, PCA produced4 factors with latent root criterion and the average of communalities was 0.601. Here, the smallest AVEscore is 0.750 which is again greater than the above mentioned threshold value of 0.5 indicatingadequate convergent validity and Cronbach a values range from 0.843 to 0.770, suggestingsatisfactory levels of construct reliability.
In the Bartlett’s test for PCA of corporate performance (there are 11 variables), the chi-square score isfound as 1132,258 with 55 degrees of freedom and the p-value is <0.01 (Table 3). We therefore reject thenull hypothesis that variables are uncorrelated in the population. The KMO score is 0.837 validating theappropriateness of the correlation matrix. The PCA on corporate performance results in three factorswith eigenvalues>1. PCA results in three factors with eigenvalues>1 and the average of communalitiesis 0.707. The smallest AVE score is 0.636 suggesting adequate convergent validity and the Cronbach avalues range from 0.930 to 0.711 suggesting satisfactory levels of construct reliability.
Stage 2: Cluster analysis
A five dimensional cluster analysis is then performed in order to form a taxonomy of the firmsbased on their innovativeness. A hierarchical procedure based on Ward’s agglomerative method is

K. Kilic et al. / Journal of Engineering and Technology Management 35 (2015) 115–133 125
used with the squared Euclidian distance measure. The elbow criterion is employed as a stopping rule(Hair et al., 2006) and the inspection of percentage change in clusters suggests a four-cluster solution.These four clusters are then examined according to their differences and managerial interpretability.The ANOVA is performed to test differences across the clustering variables by group mean. Theclusters obtained are labeled as: Followers (82 firms), Inventors (35 firms), Leading Innovators(41 firms) and Laggers (22 firms).
After firms are clustered based on their innovativeness, resulting clusters are compared regardingthe operations priorities and corporate performance (Tables 4–6, respectively). Note that thesecomparisons involve ANOVA test with Bonferroni post-hoc pair-wise comparison test aiming to clarifywhich groups significantly differ from each other in terms of their priorities and firm performance.
Results and discussions
Cluster analysis of innovativeness
The cluster means of each resulting category in terms of five innovation types are tabulated inTable 4. The ANOVA analysis yields that the cluster means of the categories significantly differ in termseach innovation type. Furthermore, the Bonferroni test indicates that even the pair-wise comparisonssignificantly differ for each cluster mean with respect to the innovation types—with two exceptions(Followers and Inventors in terms of Incremental Product and marketing innovations). A strikingobservation is the relatively low levels of marketing and organizational innovations except in the caseof Leading Innovators. Ignoring a few exceptions, these innovation types are either not implementedor based on imitation. Fig. 2 also depicts the distribution of the innovativeness values for each clusterin each innovation type.
On the other hand, the clusters are also tested against the control variables, namely, firm age, totalsales, firm size, ownership status and existence of some level of foreign investment. Kruskal–WallisTest is used for the former two control variables and Chi-Square Test is used for the latter three controlvariables. Note that both of the tests are nonparametric and does not assume normality and applicableto data sets that are nominal or ordinal (Berenson et al., 2011). The results reveal that in terms of firm
Table 4Innovation clusters and their innovativeness.
Innovativeness Leading
innovators
(Cluster 1)
Followers
(Cluster 2)
Inventors
(Cluster 3)
Laggers
(Cluster 4)
F (or K)
Incremental product
innovations
Cluster mean 3.80a (2,3,4)b 3.29 (1,4) 3.14 (1,4) 1.44 (1,2,3) 45.89c
p<0.000
Radical product
innovations
Cluster mean 4.17 (2,3,4) 1.71 (1,3,4) 3.74 (1,2,4) 1.14 (1,2,3) 130.10d
p<0.000
Process innovations
Cluster mean 4.17 (2,3,4) 3.04 (1,3,4) 2.27 (1,2,4) 1.67 (1,2,3) 41.09c
p<0.000
Marketing innovations
Cluster mean 3.88 (2,3,4) 2.40 (1,4) 2.11 (1,4) 1.28 (1,2,3) 64.26c
p<0.000
Organizational
innovations
Cluster mean 3.92 (2,3,4) 2.93 (1,3,4) 2.21 (1,2,4) 1.62 (1,2,3) 67.15c
p<0.000
Underlined values indicate significance at a=0.01.a Mean based on comparing the last 3 years’ innovativeness performance with the previous years’ innovativeness performance.b Numbers in parentheses indicate the cluster groups from which this cluster is significantly different at a=0.05.c F and corresponding p-values based on ANOVA test.d Radical product innovation test statistic is based on Kruskal Wallis test.

Table 5Innovation clusters and their operations priorities.
Operations
priorities
Leading
innovators
(Cluster 1)
Followers
(Cluster 2)
Inventors
(Cluster 3)
Laggers
(Cluster 4)
F (or K)
Cost
Cluster mean 4.50a 4.40 4.30 4.18 1.96c
p<0.121
Flexibility
Cluster mean 4.01 (2,4) 3.61 (1) 3.87 3.55 (1) 3.67c
p<0.013
Delivery
Cluster mean 4.55 (2) 4.29 (1) 4.30 4.29 2.18c
p<0.092
Quality
Cluster mean 4.80 (3,4)b 4.69 4.55 (1) 4.53 (1) 3.14d
p<0.042
Underlined values indicate significance at a=0.1.a Mean based on comparing the last 3 years’ operations performance with the previous years’ operations performance.b Numbers in parentheses indicate the cluster groups from which this cluster is significantly different at a=0.1.c F and corresponding p-values based on ANOVA test.d Quality test statistic is based on Kruskal Wallis test.
K. Kilic et al. / Journal of Engineering and Technology Management 35 (2015) 115–133126
age, firm size, ownership status and existence of some level of foreign investment there is nostatistically significant difference among the clusters. On the other hand, in terms of total sales thedifference among the clusters is statistically significant (with p=0.10). Note that, the difference amongthe clusters in terms of the total sales is discussed in more detail later in Section 5.3.
Leading innovators
Leading Innovators outclass others in every aspect of innovativeness trying to nurture allinnovation types, even the incremental product innovations, where their mean score is the lowest(3.80). They give in particular higher importance to radical product and process innovations.
Table 6Innovation clusters and their corporate performance.
Corporate performance Leading
innovators
(Cluster 1)
Followers
(Cluster 2)
Inventors
(Cluster 3)
Laggers
(Cluster 4)
F (or K)
Production performance
Cluster mean 4.01 (4) 3.85 3.91 3.51 (1) 2.18c
p<0.094
Market performance
Cluster mean 3.99 (4) 3.86 3.91 3.39 (1) 2.23c
p<0.087
Financial performance
Cluster mean 3.42 3.32 3.06 3.13 1.23c
p<0.300
Total sales
Cluster mean 60.8Ms (3,4) 26.8Ms 7.3Ms (1) 13.0 Ms (1) 11.557d
p<0.009
Growth of total sales
Cluster mean 24.4% 22.4% 30.9% 12.5% 1.99d
p<0.573
Underlined values indicate significance at a=0.1.a Mean based on comparing the last 3 years’ operations performance with the previous years’ operations performance. Numbers
in parentheses indicate the cluster groups from which this cluster is significantly different at a=0.1.c F and corresponding p-values based on ANOVA test.d Total sales and growth of total sales test statistics are based on Kruskal Wallis test.

Fig. 2. Box-plots of innovativeness.
K. Kilic et al. / Journal of Engineering and Technology Management 35 (2015) 115–133 127
Followers
The Followers cluster is arguably the second most innovative cluster except for their very lowradical product innovations capability (1.71), which is nearly equal to that of Laggers and far belowthat of Inventors. Clearly, Followers prefer to develop incremental product innovations (their highestscore with 3.29) rather than radical ones. They are also relatively strong at process and organizationalinnovations.
Inventors
Inventors perform significantly better than Laggers and significantly worse than LeadingInnovators in terms of all the innovation types. Inventors, however, have very strong radical productinnovativeness. It appears that a key characteristic of Inventors is their focus on radical product

K. Kilic et al. / Journal of Engineering and Technology Management 35 (2015) 115–133128
innovations. They differ significantly from Followers in that respect. However, Followers performsignificantly better than do Inventors in terms of the process and organizational innovations.
Laggers
The Laggers constitute the least innovative cluster. They have the lowest scores in all innovationtypes among the clusters. In all types of innovations Laggers either do not implement any innovationsor imitate innovations from national and/or international markets. It can be said that Laggers seem notto prefer innovativeness as a component of firm strategy and do not rely primarily on innovations forcompetitive advantage.
Analysis regarding to operations priorities
As stated earlier, the first hypothesis is whether the different innovation clusters adopt differentoperations priorities. Thus, the null hypothesis of the corresponding ANOVA analysis is that mean scores forthe operations priorities of the resulting clusters are equal. Table 5 tabulates the operations priorities of theresulting innovation clusters as well as the results of the ANOVA analysis and the pair-wise tests. Thesignificant difference in terms of quality, flexibility and delivery with respect to the four distinct innovationclusters supports H1 that different innovation clusters adopt different operations priorities.
Fig. 3 displays the box-plots of the operations priorities in terms of the clusters. The vertical axesrepresent the 95% confidence intervals of operations priorities scale and the horizontal axes signifythe clusters of Leading Innovators, Followers, Inventors, and Laggers, respectively. The little circles onthe box-plots represent the cluster means. Note that the resulting box-plots also visually reveal thesignificance of the innovativeness for operations priorities, since more innovative clusters tend to havehigher scores on operations priorities.
Fig. 3. Box-plots of operations priorities.

K. Kilic et al. / Journal of Engineering and Technology Management 35 (2015) 115–133 129
Based on the results tabulated in Table 5, we can state that Leading Innovators distinguishthemselves in all categories of operations priorities. Their average scores are the highest amonginnovation clusters in terms of each operations priority. This result supports the sand-cone model andthe ambidexterity literature and suggests that the companies that have the highest innovativenessalso have multiple concentrations of operations priorities. Furthermore, the pair-wise comparisonsindicate that they emphasize quality (4.80) and flexibility (4.01) significantly more than do Laggers.Note that this result parallels those of earlier researches (Alegre-Vidal et al., 2004). Leading Innovatorsalso focus on flexibility and delivery (4.55) significantly more than do Followers and significantly focuson quality more than do Inventors.
Followers differentiate themselves from Inventors and Laggers on the average, in terms of costefficiency and quality rather than flexibility and delivery, which is again in line with the existingresearch (Utterback and Abernathy, 1975; Baldwin and Johnson, 1996; Alegre-Vidal et al., 2004).Followers have both high quality and high cost efficiency capabilities (4.69 and 4.40, respectively), buttheir delivery level is one of the lowest (4.29) among the clusters. They focus most on quality but careless for flexibility (3.61).
Quality (4.55) is the most focused on operations priority for Inventors as it is the case for otherinnovation clusters. However, as opposed to Followers, Inventors attach the same level of importanceto delivery (4.30) and cost efficiency (4.30). Note that Inventors are at the second place for delivery andflexibility and at the third place in cost efficiency and quality. Thus, with respect to each other,Followers focus more on cost efficiency and quality; Inventors, on flexibility and delivery. The box-plots presented in Fig. 3 also demonstrate that firms in the Inventors cluster emphasize flexibilitymore than the firms in the Followers cluster. Given that Inventors have higher radical productinnovativeness than the Followers, focusing on flexibility is an appropriate selection for thosecompanies.
The Laggers are the weakest cluster in terms of the cluster means with respect to each one of theoperations priorities. The Laggers compare with the Followers and the Inventors only in delivery,where the clusters all have very similar scores. One interesting observation is the fact that Laggers givemore importance to delivery (4.29) than cost efficiency (4.18) on the average as opposed to theFollowers.
In general, the box-plots presented in Fig. 3 display an increasing confidence interval when movingfrom the Followers cluster to the Laggers cluster over all operations priorities. Note that smallerconfidence intervals imply more uniform performance among the firms within a cluster.
Analysis regarding to corporate performance
As stated earlier, the second hypothesis regards whether the different innovation clusters alsodiffer in terms of the corporate performance. Table 6 tabulates the performance of the resultinginnovation clusters in terms of three performance factors as well as the results of the ANOVA analysisand the Bonferroni tests. The null hypothesis of the ANOVA tests is that mean scores of the resultinginnovation clusters are equal for production, market, and financial performances. Note that twoadditional independent variables based on objective data are introduced to complement the financialperformance component. These are total sales (Million Euro—Ms) and growth of total sales (%). Thesevariables are tested by Kruskal–Wallis Test, since normality assumption does not hold for thesevariables. Fig. 4 displays the box-plots of corporate performance constructs with respect to theresulting innovation clusters. The vertical axes represent 95% confidence intervals of the performanceitems; horizontal axes signify different clusters.
The differences in production and market performances, total sales and growth on total sales ofinnovation clusters support H2, different innovation clusters achieve different operational andfinancial performance levels.
In terms of the cluster means of the corporate performance measures, Leading Innovators havebetter production, market, and financial performance levels. Their total sales are significantly higherthan those of Inventors and Laggers and on the average doubles those of Followers. The growth in totalsales of Leading Innovators is second best following Inventors. Followers have attained the second bestlevel for financial performance and total sales after the Leading Innovators. They have a strong market

Fig. 4. Box-plots of corporate performance factors.
K. Kilic et al. / Journal of Engineering and Technology Management 35 (2015) 115–133130
and production performance (3.90 and 3.85, respectively). Their growth rate in total sales is alsoacceptable with 22.4% annually. Inventors are the second highest performers after Leading Innovatorsin terms of market and production performance. More importantly, Inventors have the highest annualgrowth rate in total sales (30.9%). Laggers not only have a relatively weak position in terms ofinnovativeness and operations priorities but also have the worst performance scores in terms of themarket and production performances as well as the growth rate for total sales, which is only 12.5%annually. Note that the mean growth rate of the remaining three clusters is 25.9%.
The box-plots in Fig. 3 also confirm the association of higher innovativeness with higherperformance. For instance, for the market performance of all, three innovation clusters are muchbetter than the Laggers cluster. The Followers cluster outperforms the Inventors cluster only infinancial performance. Finally, the Leading Innovators cluster is again the dominant cluster withhighest performance results in all aspects of the corporate performance. Similar to the operationspriorities case, the confidence intervals here increase as well when moving from the Followers to theLaggers.
Conclusions
The findings substantiate that manufacturing firms can be clustered according to theirinnovativeness; moreover, the clusters can provide a taxonomy of innovativeness which revealshow innovation clusters adopt and develop different operations priorities and attain diverse corporateperformance levels.
The results obtained led us to managerial insights around which various strategies might evolve.The majority of the innovation and operations strategy literature affirm that operations priorities and

K. Kilic et al. / Journal of Engineering and Technology Management 35 (2015) 115–133 131
innovations are the crucial components of corporate strategies and are among the primary driversbehind different performance levels (Damanpour, 1987; Hayes et al., 1988; Boyer and Lewis, 2002;Sum et al., 2004; Gunday et al., 2008). Our results support the notion that innovativeness is associatedwith better corporate performance. More precisely, Laggers cluster does not rely on innovativenessand also has the lowest operations and performance results. In the other extreme, the most innovativecluster, Leading Innovators, exploits all aspects of the operations priorities and demonstrates the bestoverall corporate performance.
The need for pervasive innovation within a firm becomes clear with the positioning of LeadingInnovators. As suggested earlier, they outclass others in every aspect of innovativeness trying tonurture all innovation types. To excel both in technological (product and process) and non-technological (marketing and organizational) innovations, the philosophy of belief in innovationmust diffuse in all aspects of an organization and not be limited to certain groups and/or departmentsin the firm.
As Innovation and innovativeness are so vital for corporate performance and competitiveness,there is a need to approach them in the context of an innovation strategy, which conceivesmanufacturing strategy as a component of business strategy. Innovation and innovativeness in afirm should also be nurtured based on an innovation strategy with a 3–5 years rolling time horizon.When managing and directing such a strategy, a crucial requirement among others would be toemploy well defined and transparent performance criteria and input and output innovationmetrics (Chan et al., 2008).
All these findings show the vital role of innovativeness for manufacturing firms as closely linkedwith operations priorities and corporate performance. Leading Innovators compete effectively onsimultaneously prioritizing multiple operations. Hence, firms must excel in multiple priorities andinnovations in their market rather than concentrate on a single operations priority and innovationtype. These findings strengthen the results presented earlier by Ferdows and De Meyer (1990), Rothand Miller (1992), Miller and Roth, (1994), Kathuria (2000) and Avella et al. (2011) suggesting thatfirms may be competent in multiple operations priorities. On the other hand, Followers on the averagefocus on cost and quality more than do Inventors, who focus on delivery and flexibility more than doFollowers, yet there is no significant difference in terms of their performance. That is to say, theco-existence of a focused factory approach also hints that the two models are not competing butcomplementary, thus supporting the integrative model.
Alternative strategies provide diverse levels of benefits to the enterprises; thus, there arealternative ways to compete in the market even within the same industry. The comparison ofFollowers and Inventors in terms of their operations priorities and corporate performance suggests inparticular that each aspect of the innovative capability is important and offers some degree ofcompetitive advantage. Recall that Inventors emphasize more the development of radical productinnovations, they focus on the flexibility more than do Followers and are the leaders in total salesgrowth rate and the second best performer in production and marketing performance. On the otherhand, Followers do not prefer to develop radical products but give balanced importance to process,organizational, and incremental product innovations.
A conclusion concerning the benefit of an analysis based on taxonomy is that it allowed us to revealthe shades of grey as opposed to the more monochromatic dichotomous approach to innovativeness,and thus suggest the reason for the contradictory results available in the literature. For example,consider a possible dichotomous analysis (high vs. low innovativeness) based on only productinnovativeness. In such an analysis, the majority of Followers and Inventors would be classified ashighly innovative firm(s) together with Leading Innovators (Table 4). On the other hand, Laggerswould be classified as firms with lower innovativeness. Since Followers and Inventors woulddominate the High Innovative firms set (in terms of numbers), the results regarding firm performancewould differ; the conclusion would be that no statistical significance exists between High vs. Lowinnovativeness in terms of the firm performance. However, an analysis based on more elaboratetaxonomy, reveals the statistically significant distance between Leading Innovators and Laggers.
There are some limitations of our study. First, the survey reflects the current environment. Alongitudinal study may lead to more accurate taxonomy of innovativeness and its impact onoperations priorities and firm performance. Secondly, the study is conducted across the

K. Kilic et al. / Journal of Engineering and Technology Management 35 (2015) 115–133132
manufacturing industries. It would be worthwhile to conduct a comparative cross-sector analysis ofthe manufacturing sectors involved by employing a larger sample. Thirdly, the study is limited only tothe manufacturing sector and excludes other sectors such as primary ones such as mining, forestry andservice. Finally the data set in the study is gathered from a single country. It would be valuable toconduct the study in different countries for a comparative study.
References
Alegre-Vidal, J., Lapiedra-Alcamı, R., Chiva-Gomez, R., 2004. Linking operations strategy and product innovation: an empiricalstudy of Spanish ceramic tile producers. Res. Policy 33 (5), 829–839.
Alpkan, L., Ceylan, A., Aytekin, M., 2003. Performance impacts of operations strategies: a study on Turkish manufacturing firms.Int. J. Agile Manuf. 6 (2), 57–65.
Avella, L., Vazquez-Busteloa, D., Fernandeza, E., 2011. Cumulative manufacturing capabilities: an extended model and newempirical evidence. Int. J. Prod. Res. 49 (3), 707–729.
Avermaeta, T., Viaene, J., Morgan, E.J., Pitts, E., Crawford, N., Mahon, D., 2004. Determinants of product and process innovation insmall food manufacturing firms. Trends Food Sci. Technol. 15, 474–483.
Balcerowicz, E., Peczkowski, M., Wziatek-Kubiak, A., 2009. The innovation patterns of firms in low and high technologymanufacturing sectors in the New Member States. In: Working Paper, CASE Network Studies and Analyses 0390, 20 July.CASE Network.
Baldwin, J., Johnson, J., 1996. Business strategies in more and less-innovative firms in Canada. Res. Policy 25, 785–804.Barringer, B.R., Bluedorn, A.C., 1999. The relationship between corporate entrepreneurship and strategic management. Strateg.
Manage. J. 20, 421–444.Berenson, M., Levine, D., Krehbiel, T., 2011. Basic Business Statistics: Concepts and Applications, 12th ed. Prentice Hall, Upper
Saddle River, NJ.Bolıvar-Ramos, M.T., GarcıA-Morales, V.J., GarcıA-SaNchez, E., 2012. Technological distinctive competencies and organizational
learning: effects on organizational innovation to improve firm performance. J. Eng. Tech. Manage. 29 (3), 331–357.Boyer, K.K., Leong, G., Ward, P.T., Krajewski, L., 1997. Unlocking the potential of advanced manufacturing technologies. J. Oper.
Manage. 15 (4), 331–347.Bozarth, C., McDermott, C., 1998. Configurations in manufacturing strategy: a review and directions for future research. J. Oper.
Manage. 16 (4), 427–439.Boyer, K.K., Lewis, M.W., 2002. Competitive priorities: investigating the need for trade-offs in operations strategy. Prod Oper.
Manage. 11 (1), 9–20.Carmines, E.G., Zeller, R.A., 1979. Reliability and Validity Assessment, Series Quantitative Applications in the Social Sciences.
Sage University Paper 17, Sage University, Thousand Oaks, CA.Chan, V., Musso, C., Shankar, V., 2008. McKinsey global survey results: Assessing innovation metrics. McKinsey Q. 37 (10), 1–11.Choi, T.Y., Eboch, K., 1998. The TQM paradox: relations among TQM practices, plant performance and customer satisfaction. J.
Oper. Manage. 17 (1), 59–75.Damanpour, F., 1987. The adoption of technological, administrative, and ancillary innovations: impact of organizational factors.
J. Manage. 13 (4), 675–688.Damanpour, F., 1991. Organizational innovation: a meta-analysis of effects of determinants and moderators. Acad. Manage. J. 34
(3), 555–590.Damanpour, F., Evan, W.M., 1984. Organizational innovation and performance: the problem of organizational lag. Adm. Sci. Q.
29 (3), 392–409.Damanpour, F., Szabat, K.A., Evan, W.M., 1989. The relationship between types of innovation and organizational performance. J.
Manage. Stud. 26 (6), 587–601.Duncan, R.B., 1976. The ambidextrous organization: designing dual structures for innovation. Manage. Org.: Strategy Imple-
mentation 1, 167–188.De Leeuw, E.D., 2005. To mix or not to mix data collection modes in surveys. J. Off. Stat—Stockh. 21 (2), 233–255.Ellonen, R., Blomqvist, K., Puumalainen, K., 2008. The role of trust in organizational innovativeness. European Journal of
Innovation Management 11 (2), 160–181.Ferdows, K., De Meyer, A., 1990. Lasting improvements in manufacturing performance: in search of a new theory. J. Oper.
Manage. 9 (2), 168–184.Flynn, B.B., Sakakibara, S., Schroeder, R., Bates, K.A., Flynn, J.E., 1990. Empirical research methods in operations management. J.
Oper. Manage. 9 (2), 250–284.Fornell, C., Larker, D.F., 1981. Evaluating structural equation models with unobservable variables and measurement error. J.
Market. Res. 18 (2), 39–50.Gunday, G., Ulusoy, G., Kılıc, K., Alpkan, L., 2008. Modeling innovation: determinants of innovativeness and the impact of
innovation on firm performance. In: Proceedings of the 4th IEEE International Conference on Management of Innovationand Technology. Piscataway, NJ (776-771).
Gunday, G., Ulusoy, G., Kılıc, K., Alpkan, L., 2011. Effects of innovation types on firm performance. Int. J. Prod. Econ. 133, 662–676.Hair, J.F., Anderson, R.E., Tatham, R.L., Black, W.C., 2006. Multivariate Data Analysis: With Readings, sixth ed. Pearson Prentice
Hall, Upper Saddle River, NJ.Harman, H.H., 1967. Modern Factor Analysis, second ed. University of Chicago Press, Chicago, IL.Hayes, R.H., Wheelwright, S.C., 1984. Restoring Our Competitive Edge. Wiley, New York, NY.Hayes, R.H., Wheelwright, S.C., Clark, K., 1988. Dynamic Manufacturing. Free Press, Granville, NY.Hill, T.J., 1999. Manufacturing Strategy: Text and Cases, third ed. McGraw-Hill/Irwin, Boston, Mass.Hornsby, J.S., Kuratko, D.F., Zahra, S.A., 2002. Middle managers’ perception of the internal environment for corporate
entrepreneurship: assessing a measurement scale. J. Bus. Venturing 17, 253–273.

K. Kilic et al. / Journal of Engineering and Technology Management 35 (2015) 115–133 133
Hurley, R.F., Hult, G.T.M., 1998. Innovation, market orientation, and organizational learning: an integration and empiricalexamination. J. Market. 64 (3), 42–54.
Kathuria, R., 2000. Competitive priorities and managerial performance: a taxonomy of small manufacturers. J. Oper. Manage. 18,627–641.
Khazanchi, S., Lewis, M.W., Boyer, K.K., 2007. Innovation-supportive culture: the impact of organizational values on processinnovation. J. Oper. Manage. 25 (4), 871–884.
Lehtoranta, O., 2005. A comparative micro-level analysis of innovative firms in the CIS Surveys and in the VTTs SfinnoDatabaseIn: Working Paper, VTT Working Papers 24. .
Leong, G., Snyder, D., Ward, P.T., 1990. Research in process and content of manufacturing strategy. Omega 18 (2), 109–122.Man, M.M.K., 2009. The relationship between distinctive capabilities, innovativeness, strategy types and the performance of
small and medium-size enterprises (SMEs) of Malaysian manufacturing sector. Int. Bus. Econ. Res. J. 8 (11), 21–34.Martin-Pena, M.L., Diaz-Garrido, E., 2008. Typologies and taxonomies of operations strategy: a literature review. Manage. Res.
News 31 (3), 200–218.Menguc, B., Auh, S., 2008. The asymmetric moderating role of market orientation on the ambidexterity-firm performance
relationship for prospectors and defenders. Ind. Market. Manage. 37 (4), 455–470.Midgley, D.F., Dowling, G.R., 1978. Innovativeness: the concept and its measurement. J. Consum. Res. 4 (4), 229–242.Miller, J.G., Roth, A.V., 1994. A taxonomy of manufacturing strategies. Manage. Sci. 40, 285–304.Nair, A., Boulton, R.W., 2008. Innovation-oriented operations strategy typology and stage-based model. Int. J. Oper. Prod.
Manage. 28 (8), 748–771.Nakane, J., 1986. Manufacturing Futures Survey in Japan. A Comparative Survey 1983–1986. Waseda University, System Science
Institute, Tokyo.Narver, J.C., Slater, S.F., 1990. The effect of a market orientation on business profitability. J. Market. 54, 20–35.Noble, M.A., 1997. Manufacturing competitive priorities and productivity: an empirical study. Int. J. Oper. Prod. Manage. 17 (1),
85–99.OECD, 2005. Oslo Manual: Guidelines for Collecting and Interpreting Innovation Data, third ed. OECD Publishing, Paris, France.Podsakoff, P.M., Organ, D.W., 1986. Self-reports in organizational research: problems and prospects. J. Manage. 12, 531–544.Podsakoff, P.M., MacKenzie, S.B., Lee, J.Y., Podsakoff, N.P., 2003. Common method biases in behavioral research: a critical review
of the literature and recommended remedies. J. Appl. Psychol. 88, 879–903.Prajogo, D.I., McDermott, C.M., Jayaram, J., 2014. The role of technological intensity in services on the capability to performance
relationships—an examination in the Australian context. J. Eng. Tech. Manage. 31, 58–72.Roth, A., Miller, J.G., 1992. Success factors in manufacturing. Bus. Horiz. 35 (4), 73–81.Saunila, M., Ukko, J., 2014. Intangible aspects of innovation capability in SMEs: impacts of size and industry. J. Eng. Tech.
Manage. 33, 32–46.Schroeder, R.G., Shah, R., Xiaosong Peng, D., 2011. The cumulative capability ‘sand cone’model revisited: a new perspective for
manufacturing strategy. Int. J. Prod. Res. 49 (16), 4879–4901.Skinner, W., 1969. Manufacturing: the missing link in corporate strategy. Harv. Bus. Rev. 47 (3), 136–145.Skinner, W., 1974. The focused factory. Harv. Bus. Rev. 52, 113–121.Sum, C., Kow, L.S., Chen, C., 2004. A taxonomy of operations strategies of high performing small and medium enterprises in
Singapore. Int. J. Oper. Prod. Manage. 24 (3), 321–345.Tellis, G.J., Prabhu, J.C., Chandy, R.K., 2009. Radical innovation across nations: the preeminence of corporate culture. J. Market.
73, 3–23.Tushman, M., O’Reilly, C., 1996. Ambidextrous organizations. Calif. Manage. Rev. 38 (4), 8–30.Utterback, J.M., Abernathy, W.J., 1975. A dynamic model of process and product innovation. Omega 3 (6), 639–656.Vickery, S.K., Droge, C., Markland, R.E., 1993. Production competence and business strategy: do they affect business
performance? Decis. Sci. 24 (2), 435–455.Voss, C.A., 1995. Alternative paradigms for manufacturing strategy. Int. J. Oper. Prod. Manage. 15 (4), 5–16.Ward, P.T., Mccreery, J.K., Ritzman, L.P., Sharma, D., 1998. Competitive priorities in operations management. Decis. Sci. 29 (4),
1035–1046.Ward, P.T., Duray, R., 2000. Manufacturing strategy in context: environment competitive strategy and manufacturing strategy. J.
Oper. Manage. 18 (3), 123–138.Wei, Z., Zhao, J., Zhang, C., 2014. Organizational ambidexterity, market orientation, and firm performance. J. Eng. Tech. Manage.
33, 134–153.Yilmaz, C., Alpkan, L., Ergun, E., 2005. Cultural determinants of customer- and learning-oriented value systems and their joint
effects on firm performance. J. Bus. Res. 58, 1340–1352.Zahra, S.A., Sidhartha, R.D., 1993. Innovation strategy and financial performance in manufacturing companies: an empirical
analysis. Prod. Oper. Manage. 2 (1), 15–37.Zu, X., Robbins, T.L., Fredendall, L.D., 2010. Mapping the critical links between organizational culture and TQM/six sigma
practices. Int. J. Prod. Econ. 123 (1), 86–106.