Innovative GTFS Data Application for Transit Network Analysis ...
20
Journal of Public Transportation, Vol. 19, No. 4, 2016 18 Innovative GTFS Data Application for Transit Network Analysis Using a Graph-Oriented Method Philippe Fortin, Catherine Morency, Martin Trépanier CIRRELT/Polytechnique Montréal Abstract Public transit networks are constantly evolving in the face of frequent economic and social challenges. ere exists a large knowledge base on travel demand; however, there is a shortage of information on travel supply and networks. To our knowledge, no analysis tool can, at this point, systematically characterize a network and observe changes over time in a structured and automated manner. is paper addresses this issue and proposes a graph-oriented method for developing an analysis tool that will characterize a single network and then provide the necessary means to compare two distinct networks. A time-expanded model was applied to import General Transit Feed Specification (GTFS) data into a graph database. With built-in algorithms, shortest paths were computed and indicators were derived from these paths. A small case study demonstrates the applicability of the method. is approach still needs to be optimized to process networks that are more complex. Keywords: GTFS data, Transit Network, Graph eory, Optimization, Monitoring Introduction In many cities, bus network geometry often changes through the addition, withdrawal, or simply modification of an existing bus line. Likewise, schedules and levels of service change through seasons and years. To our knowledge, no analysis tool can, at this point, systematically characterize a network and observes changes over time in a structured and automated manner. Smart card systems provide large quantities of information. ey can assist transit agencies in gaining more insights into transit demand. However, to benefit from these rich datasets, transit agencies need up-to-date information and analysis tools to understand transit supply as well.
-
Upload
khangminh22 -
Category
Documents
-
view
0 -
download
0
Transcript of Innovative GTFS Data Application for Transit Network Analysis ...
Journal of Public Transportation, Vol. 19, No. 4, 2016 18
Innovative GTFS Data Application for Transit Network Analysis
Using a Graph-Oriented Method
Philippe Fortin, Catherine Morency, Martin TrépanierCIRRELT/Polytechnique Montréal
Abstract
Public transit networks are constantly evolving in the face of frequent economic and social challenges. There exists a large knowledge base on travel demand; however, there is a shortage of information on travel supply and networks. To our knowledge, no analysis tool can, at this point, systematically characterize a network and observe changes over time in a structured and automated manner. This paper addresses this issue and proposes a graph-oriented method for developing an analysis tool that will characterize a single network and then provide the necessary means to compare two distinct networks. A time-expanded model was applied to import General Transit Feed Specification (GTFS) data into a graph database. With built-in algorithms, shortest paths were computed and indicators were derived from these paths. A small case study demonstrates the applicability of the method. This approach still needs to be optimized to process networks that are more complex.
Keywords: GTFS data, Transit Network, Graph Theory, Optimization, Monitoring
Introduction
In many cities, bus network geometry often changes through the addition, withdrawal, or simply modification of an existing bus line. Likewise, schedules and levels of service change through seasons and years. To our knowledge, no analysis tool can, at this point, systematically characterize a network and observes changes over time in a structured and automated manner. Smart card systems provide large quantities of information. They can assist transit agencies in gaining more insights into transit demand. However, to benefit from these rich datasets, transit agencies need up-to-date information and analysis tools to understand transit supply as well.
Innovative GTFS Data Application for Transit Network Analysis Using a Graph-Oriented Method
Journal of Public Transportation, Vol. 19, No. 4, 2016 19
Understanding the influence of transportation networks on urban life represents an important research topic (Derrible and Kennedy 2011). The interactions between economy, society, land-use, and urban design are critical. As in many areas across the world, Quebec’s transit agencies are continuously looking for innovative approaches to improve their services and increase their market share. In this context, many are discussing strategic ways to optimize public transit systems (Société de Transport de Laval 2013).
Derrible and Kennedy (2009, 2011) demonstrated the potential of both graph and network theories for transit network optimization. In addition, Pajor (2009) reported progress on the development of different models to conceptualize transit networks based on a multimodal (car, train, and plane) path calculator (time-expanded model, time-dependent model). Many studies demonstrate the value of graph and network theories. However, very few incorporate both and illustrate their potential when combined. It is important to add that network theories are not completely separated from graph theory and are considered more as a branch of the main subject. Graph theory mainly explores arbitrary questions about graphs, whereas network theory offers a more practical view and is more interested in the interactions among the different components of the graph.
The main objective of this research was to develop a set of indicators for the systematic analysis of transit networks using data from the General Transit Feed Specification (GTFS), structured within a graph-oriented method. These indicators and methodology can assist in characterizing a network and observe changes over time in a structured and automated way.
This paper is divided into four sections. Following this introduction, key concepts are defined through a literature review on transit networks, GTFS, key performance indicators (KPIs), and more advanced indicators derived from the graph theory. Then, the graph-oriented method is described and illustrated through a case study of a local transit network in the Greater Montreal Area (GMA); results from this network are presented and discussed. Finally, a conclusion with research perspectives closes the paper.
Background
The literature review provides a precise context to this research with background information. It describes the importance of transit networks and how dedicated studies can help improve them. It also shows how the GTFS can constitute an efficient source of information for network analysis. A portrait of classical indicators (KPI) and more advanced indicators is also drawn.
Transit Networks
Public transit plays an important role in the mobility of people in all major urban areas. Typical planning processes aim to define the necessary transit supply to fulfill

Innovative GTFS Data Application for Transit Network Analysis Using a Graph-Oriented Method
Journal of Public Transportation, Vol. 19, No. 4, 2016 20
traveler needs while minimizing operational costs. Two international guidelines have been identified to implement optimal service (Ceder 2015; Kittelson and Associates et al. 2013). These guidelines define measures to describe issues and factors that may result from operational decisions. However, due to the specificity of each service area, some items cannot be applied directly and need to be adapted after an in-depth analysis of the context. Prior research conducted by Fu and Xin (2007) proposed a new performance index for evaluating transit quality of service. Their approach is based on the notion of level of service introduced in earlier versions of the Transit Capacity and Quality of Service Manual (Kittelson and Associates et al. 2013) and integrates a number of performance measures.
Voyer (2007) identified some specific features of the GMA and confirmed the major role public transit plays in the planning and development of land use and activity locations. The influence that an efficient public transport network can assert on its environment, including on the travel behaviors of residents, certainly explains the amount of research conducted on the subject.
Still, these studies rely on a rather traditional approach, typically involving post-processing of demand-related data. Several focus on the performance of transit systems, often reflected by the accessibility and equity of the service by population segments (Godin 2012). Studies on network typology remain rare and, according to our understanding, such a concept can provide a new way of looking at the optimization of transit networks.
A study in Beijing highlights a methodology to analyze bus reliability based on three interesting levels of analysis of the public transit supply: stop, route and network (Chen et al. 2009). Although research conducted by these authors has followed mainly the traditional demand-based approach, the analytical levels remain relevant for our research. Some standard key performance indicators have been proposed for diagnosis and monitoring of public transit systems, mostly based on these same levels. TCRP Report 88 (Kittelson and Associates et al. 2003) provides guidelines for developing a transit performance measurement system, including measures focusing primarily on the assessment of service availability (e.g., service density, stop spacing, stop accessibility, hours of operation). Both Shah (2012) and the Institut de la Gestion Déléguée (2008) propose a list of transportation indicators based on urban policy goals to evaluate the impacts and contribution of the transit system in different areas. Finally, Metrolinx, a transportation agency in Ontario, Canada, developed performance network-based indicators. These indicators assess the accessibility and monitor the progress made according to the goals outlined in their Regional Transportation Plan (Metrolinx 2013).
General Transit Feed Specification (GTFS)
This section introduces the GTFS by providing both background and a description of the files defined by the specification. Current studies using GTFS data also are explored along with their limitations.
Innovative GTFS Data Application for Transit Network Analysis Using a Graph-Oriented Method
Journal of Public Transportation, Vol. 19, No. 4, 2016 21
The GTFS was introduced in 2005 as part of a collaboration between Google and the Portland, Oregon, public transit agency (TriMet). To facilitate data sharing and access to information for users, Google defined a publishing standard for transit agency operational data (e.g., stops, stop times, routes). Due to its simplicity, small transit agencies as well as larger ones can publish their data at a low cost (McHugh 2013).
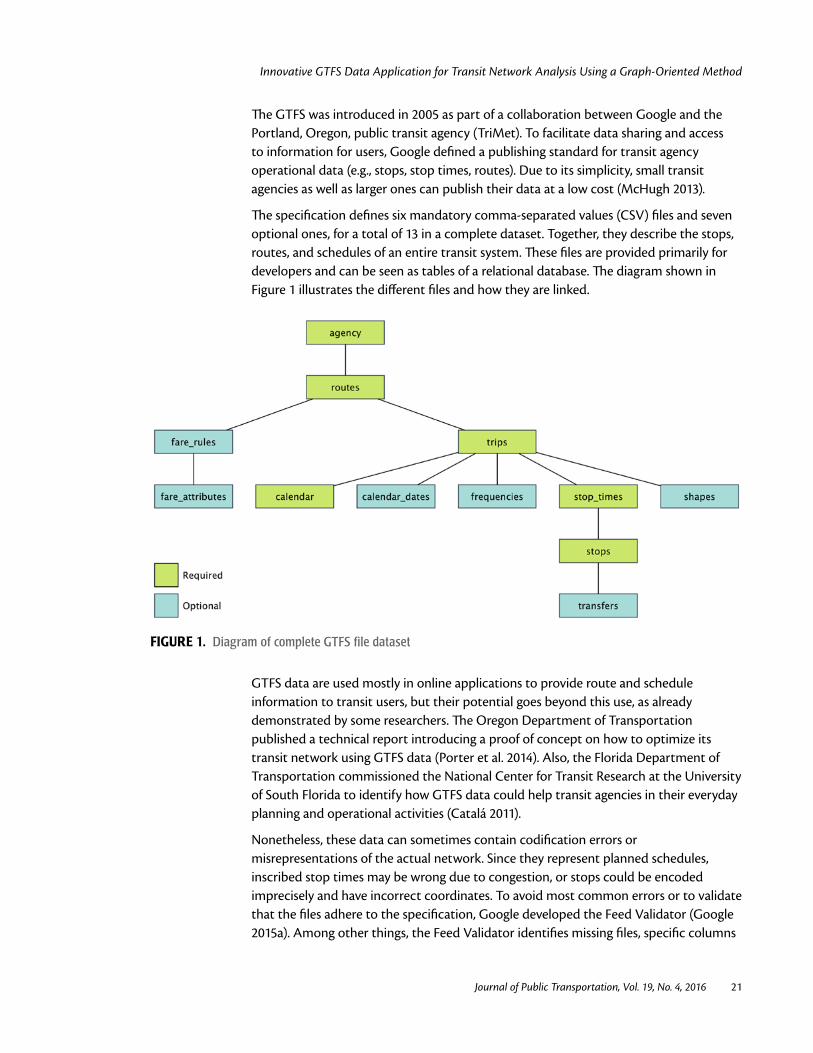
The specification defines six mandatory comma-separated values (CSV) files and seven optional ones, for a total of 13 in a complete dataset. Together, they describe the stops, routes, and schedules of an entire transit system. These files are provided primarily for developers and can be seen as tables of a relational database. The diagram shown in Figure 1 illustrates the different files and how they are linked.
FIGURE 1. Diagram of complete GTFS file dataset
GTFS data are used mostly in online applications to provide route and schedule information to transit users, but their potential goes beyond this use, as already demonstrated by some researchers. The Oregon Department of Transportation published a technical report introducing a proof of concept on how to optimize its transit network using GTFS data (Porter et al. 2014). Also, the Florida Department of Transportation commissioned the National Center for Transit Research at the University of South Florida to identify how GTFS data could help transit agencies in their everyday planning and operational activities (Catalá 2011).
Nonetheless, these data can sometimes contain codification errors or misrepresentations of the actual network. Since they represent planned schedules, inscribed stop times may be wrong due to congestion, or stops could be encoded imprecisely and have incorrect coordinates. To avoid most common errors or to validate that the files adhere to the specification, Google developed the Feed Validator (Google 2015a). Among other things, the Feed Validator identifies missing files, specific columns
Innovative GTFS Data Application for Transit Network Analysis Using a Graph-Oriented Method
Journal of Public Transportation, Vol. 19, No. 4, 2016 22
or values, overlapping stops, unused shapes or stops, and invalid service dates (Derrible and Kennedy 2011). Prior to any research, a comparison between measures calculated using GTFS data and observed by the agency also should be performed, using a method similar to that proposed by Wong (2013).
GTFS-Realtime
Real-time GTFS is defined as an extension to the general specification. Agencies can provide three different types of live feed—trip updates (delays, cancellation, changed routes), service alerts (stop relocation, events affecting a station, route, or entire network), or vehicle positions (Google 2015b). In our point of view, the vehicle positions feed provides the most useful information. Standard GTFS provides planned schedules and can include codification errors or even planning errors if travel times are overestimated or underestimated. Knowing this, GTFS-Realtime represents the most accurate source of information to compute classic measures and indicators. Most of the transit agencies in the GMA do not yet publish these live feeds of information, and they are not included in this research. They also are more challenging to integrate into a graph database.
Typical Use of GTFS Data
The main purpose of the GTFS standard is to share public transit information. As such, some pre-processing steps are required before it can be used for other needs. Most commonly, a GTFS data set will be imported into a relational database (e.g., MySQL, PostgreSQL, Oracle) from which a developer will be able to query any schedule information to provide it to the end user. Searching the data in a deeper way requires the database to be spatially enabled. A spatially-enabled database has additional features and functions to perform queries using objects (points, lines, shapes) as one would do with any Geographic Information System (GIS). The most common way to do this is to install and activate PostGIS as an extension to the PostgreSQL database system.
Accessibility Assessment
Different measures and indicators of accessibility can be evaluated using GTFS data. These measures assess the proximity of the population or activity locations to the transit network. The proximity typically is estimated using the distance to the nearest transit stop.
Most commonly, a buffer (e.g., 500 m or 0.31 mi as the average acceptable walk distance) is applied around the transit stops. The number or the proportion of individuals living within a certain distance from the transit network then can be identified. This measure can be replicated for various population segments or types of locations to assess the level of accessibility among them and pinpoint where improvements should occur.
Innovative GTFS Data Application for Transit Network Analysis Using a Graph-Oriented Method
Journal of Public Transportation, Vol. 19, No. 4, 2016 23
The most important identified limitation of such an approach is that it does not account for the travelers’ needs (origin-destination). It also does not include service frequency, which clearly affects the level of accessibility—a transit stop with buses every 10 minutes provides a higher level of accessibility than one with service only once per hour. Due to those limitations, some authors have proposed much more complex accessibility measures. For instance, Godin (2012) proposed a typology of accessibility measures as well as new dynamic indicators changing through space and time. Using the shortest path tree from a specific location, Gandavarapu (2012) introduced a different method to compute accessibility measures of the population and employment to each of the traffic analysis zones. Bertolaccini and Lownes (2015) also developed an automated method to evaluate the changes in transit accessibility through the day using only GTFS and population data to make it easier to find relevant datasets. Al Mamun and Lownes (2011) reviewed different methods and proposed weighting factors for individual methods to formulate a composite index of public transit accessibility.
It is generally difficult to include dynamic elements of transit service (e.g., transfers between routes or stops and a bus following a specific route) in most classic indicators. These are based mostly on static data (e.g., stops, schedules, routes) provided by the GTFS and cannot take into account the reachable areas from origin, the paths a user followed, or the variability of service throughout the day, week, and seasons. To render more insights into how transit service can be improved, indicators should provide a way to properly measure the connectivity between the different stops and consider the different stop times and headway for each stop or route.
Graph Theory
Graph theory has been applied in different research fields since its introduction in the 18th century by Leonhard Euler. Today, the foundation of this theory has been proven, and it is now recognized as a mature discipline (Biggs et al. 1986). Therefore, algorithms and indicators calculated using graph theory generally have been optimized and perform well on large graphs.
Graph theory is used to represent real-world situations by a diagram consisting of a set of points with lines joining certain pairs of these points. A graph is made up of vertices (or nodes) connected by edges (lines). The edges may or not be directed, depending if a flow direction is imposed. In the case of a transit network, all edges are directed, as is the global graph (Bondy and Murty 1976).
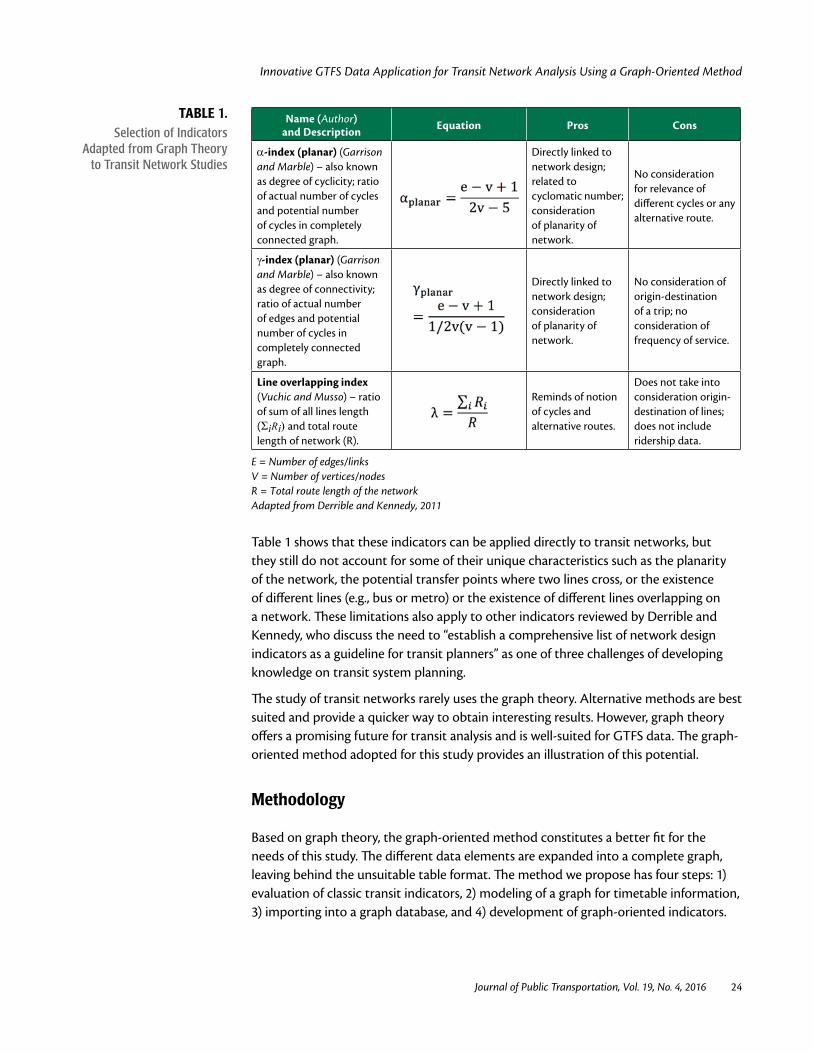
As part of their literature review, Derrible and Kennedy (2011) proposed a review of all indicators and measures that address the problem of network design using the graph theory. Through time, these indicators have become more complex, implementing the full capability of the graph theory. Some of them can be easily applied to the context of this study—α-index and γ-index (planar, as the graph holds in only two dimensions) and the line overlapping index. Table 1 describes them, along with their pros and cons.
Innovative GTFS Data Application for Transit Network Analysis Using a Graph-Oriented Method
Journal of Public Transportation, Vol. 19, No. 4, 2016 24
Name (Author) and Description Equation Pros Cons
α-index (planar) (Garrison and Marble) – also known as degree of cyclicity; ratio of actual number of cycles and potential number of cycles in completely connected graph.
Directly linked to network design;related to cyclomatic number; consideration of planarity of network.
No consideration for relevance of different cycles or any alternative route.
γ-index (planar) (Garrison and Marble) – also known as degree of connectivity; ratio of actual number of edges and potential number of cycles in completely connected graph.
Directly linked to network design; consideration of planarity of network.
No consideration of origin-destination of a trip; no consideration of frequency of service.
Line overlapping index (Vuchic and Musso) – ratio of sum of all lines length (ΣiRi) and total route length of network (R).
Reminds of notion of cycles and alternative routes.
Does not take into consideration origin-destination of lines; does not include ridership data.
E = Number of edges/linksV = Number of vertices/nodesR = Total route length of the networkAdapted from Derrible and Kennedy, 2011
Table 1 shows that these indicators can be applied directly to transit networks, but they still do not account for some of their unique characteristics such as the planarity of the network, the potential transfer points where two lines cross, or the existence of different lines (e.g., bus or metro) or the existence of different lines overlapping on a network. These limitations also apply to other indicators reviewed by Derrible and Kennedy, who discuss the need to “establish a comprehensive list of network design indicators as a guideline for transit planners” as one of three challenges of developing knowledge on transit system planning.
The study of transit networks rarely uses the graph theory. Alternative methods are best suited and provide a quicker way to obtain interesting results. However, graph theory offers a promising future for transit analysis and is well-suited for GTFS data. The graph-oriented method adopted for this study provides an illustration of this potential.
Methodology
Based on graph theory, the graph-oriented method constitutes a better fit for the needs of this study. The different data elements are expanded into a complete graph, leaving behind the unsuitable table format. The method we propose has four steps: 1) evaluation of classic transit indicators, 2) modeling of a graph for timetable information, 3) importing into a graph database, and 4) development of graph-oriented indicators.
TABLE 1. Selection of Indicators
Adapted from Graph Theory to Transit Network Studies
Innovative GTFS Data Application for Transit Network Analysis Using a Graph-Oriented Method
Journal of Public Transportation, Vol. 19, No. 4, 2016 25
Evaluation of Classic Transit Indicators
The purpose of classic transit indicators is to provide a general description and some basic information on a network. These indicators come in various forms and are widely used in different research fields. In the context of this research, classic indicators were evaluated using GTFS data previously imported into a spatially-enabled PostgreSQL database. Using SQL queries adapted from an extensive work by the World Bank (2013), selected indicators were globally analyzed.
Modeling of a Graph for Timetable Information
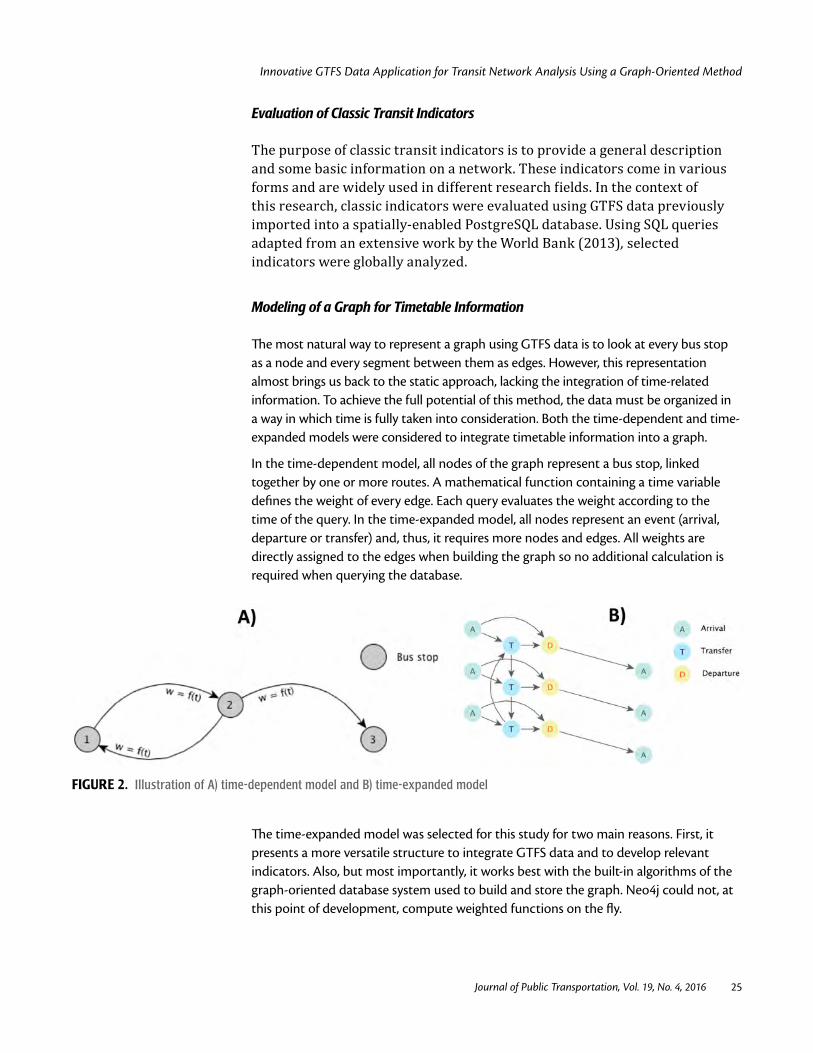
The most natural way to represent a graph using GTFS data is to look at every bus stop as a node and every segment between them as edges. However, this representation almost brings us back to the static approach, lacking the integration of time-related information. To achieve the full potential of this method, the data must be organized in a way in which time is fully taken into consideration. Both the time-dependent and time-expanded models were considered to integrate timetable information into a graph.
In the time-dependent model, all nodes of the graph represent a bus stop, linked together by one or more routes. A mathematical function containing a time variable defines the weight of every edge. Each query evaluates the weight according to the time of the query. In the time-expanded model, all nodes represent an event (arrival, departure or transfer) and, thus, it requires more nodes and edges. All weights are directly assigned to the edges when building the graph so no additional calculation is required when querying the database.
FIGURE 2. Illustration of A) time-dependent model and B) time-expanded model
The time-expanded model was selected for this study for two main reasons. First, it presents a more versatile structure to integrate GTFS data and to develop relevant indicators. Also, but most importantly, it works best with the built-in algorithms of the graph-oriented database system used to build and store the graph. Neo4j could not, at this point of development, compute weighted functions on the fly.
Innovative GTFS Data Application for Transit Network Analysis Using a Graph-Oriented Method
Journal of Public Transportation, Vol. 19, No. 4, 2016 26
Time-Expanded Model
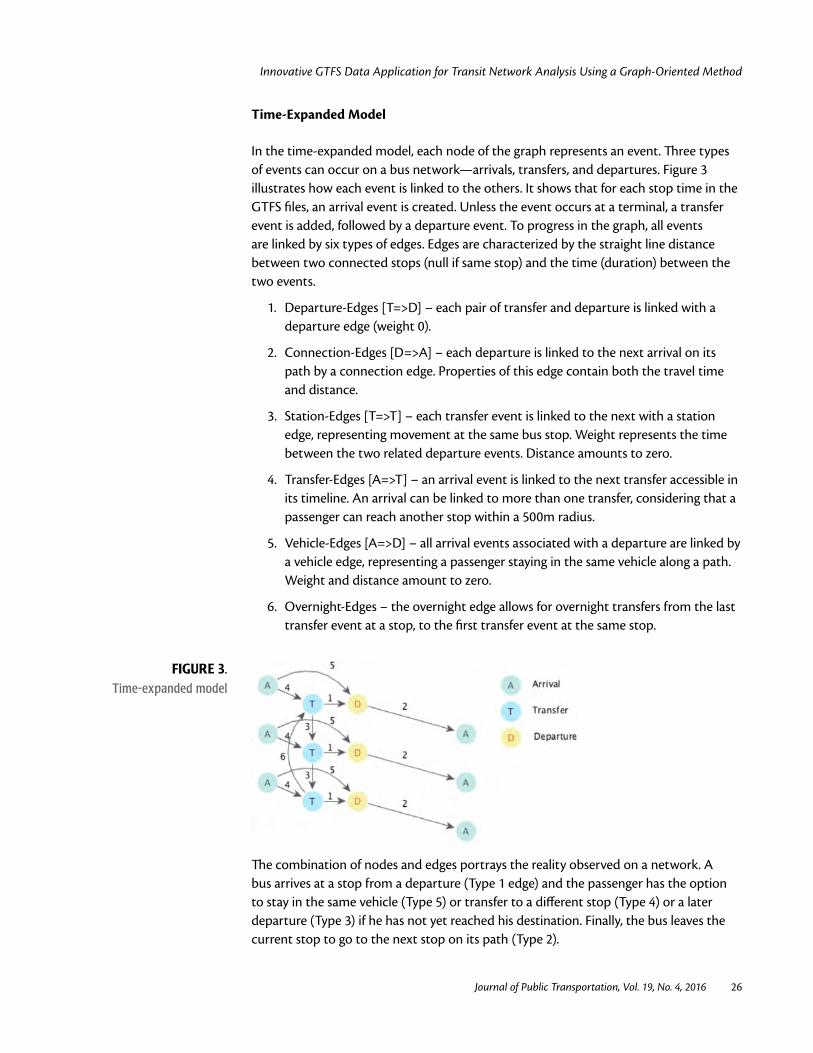
In the time-expanded model, each node of the graph represents an event. Three types of events can occur on a bus network—arrivals, transfers, and departures. Figure 3 illustrates how each event is linked to the others. It shows that for each stop time in the GTFS files, an arrival event is created. Unless the event occurs at a terminal, a transfer event is added, followed by a departure event. To progress in the graph, all events are linked by six types of edges. Edges are characterized by the straight line distance between two connected stops (null if same stop) and the time (duration) between the two events.
1. Departure-Edges [T=>D] – each pair of transfer and departure is linked with a departure edge (weight 0).
2. Connection-Edges [D=>A] – each departure is linked to the next arrival on its path by a connection edge. Properties of this edge contain both the travel time and distance.
3. Station-Edges [T=>T] – each transfer event is linked to the next with a station edge, representing movement at the same bus stop. Weight represents the time between the two related departure events. Distance amounts to zero.
4. Transfer-Edges [A=>T] – an arrival event is linked to the next transfer accessible in its timeline. An arrival can be linked to more than one transfer, considering that a passenger can reach another stop within a 500m radius.
5. Vehicle-Edges [A=>D] – all arrival events associated with a departure are linked by a vehicle edge, representing a passenger staying in the same vehicle along a path. Weight and distance amount to zero.
6. Overnight-Edges – the overnight edge allows for overnight transfers from the last transfer event at a stop, to the first transfer event at the same stop.
FIGURE 3.Time-expanded model
The combination of nodes and edges portrays the reality observed on a network. A bus arrives at a stop from a departure (Type 1 edge) and the passenger has the option to stay in the same vehicle (Type 5) or transfer to a different stop (Type 4) or a later departure (Type 3) if he has not yet reached his destination. Finally, the bus leaves the current stop to go to the next stop on its path (Type 2).

Innovative GTFS Data Application for Transit Network Analysis Using a Graph-Oriented Method
Journal of Public Transportation, Vol. 19, No. 4, 2016 27
Importing into a Graph Database
To compute the desired indicators, the GTFS data was modeled using the time-expanded model and imported into a graph database. A graph database, as opposed to a relational database, explicitly stores the links between all elements to scan them more efficiently. It also keeps the context around each node and link, so it does not have to scan all the data, only the relevant parts of the graph. Data are accessed accordingly and returned faster, even with large datasets (Robinson et al. 2013).
Neo4j is a graph database system widely used in the industry (Wolpe 2014). It offers a stable environment with embedded algorithms based on the graph theory, notably to compute the shortest path between two nodes and an application programming interface (API) used by third-party drivers developed for multiple programming languages (e.g., Java, Python, Ruby).
Other experts developed or studied more advanced stand-alone algorithms. Khani et al. (2012) proposed a simple but efficient algorithm for finding the optimal path in an intermodal urban transportation network based on the generalized cost. Dibbelt et al. (2013) introduced a novel algorithm framework called Connection Scan Agorithm that organizes data as a single array of connections, which it scans once per query. This algorithm is simple and versatile, according to the authors.
As opposed to more advanced algorithms, those proposed by Neo4j are not built specifically for computing the shortest path in a transit network. As part of our research, we also wanted to test Neo4j’s algorithm and see how it performs in a different environment.
Development of Graph-Oriented Indicators
Most of the indicators presented in the next section are based on the shortest path calculations. All path computations were calculated between a departure node and an arrival node as specified by the time-expanded model. The Neo4j’s built-in algorithm for shortest path calculation does not store queries and, thus, must compute an entire cost tree for each run of the Dijkstra algorithm. The time-dependency was taken into account in the GTFS. Travel times were adjusted by the operator with observed values. In peak hours, some inter-stop travels are longer and, thus, return more accurate estimations when using Dikjstra algorithm than when using instantaneous travel time.
Due to the large quantity of departure-arrival pairs, computing all shortest paths in that manner would take an extended amount of time, even for a small network such as the one chosen for the case study. This computation method must be optimized to analyze large networks.
Demonstration
To illustrate the aforementioned concepts, a small network was used from the Conseil Intermunicipal de Transport de Chambly-Richelieu-Carignan (CITCRC), a transit agency
Innovative GTFS Data Application for Transit Network Analysis Using a Graph-Oriented Method
Journal of Public Transportation, Vol. 19, No. 4, 2016 28
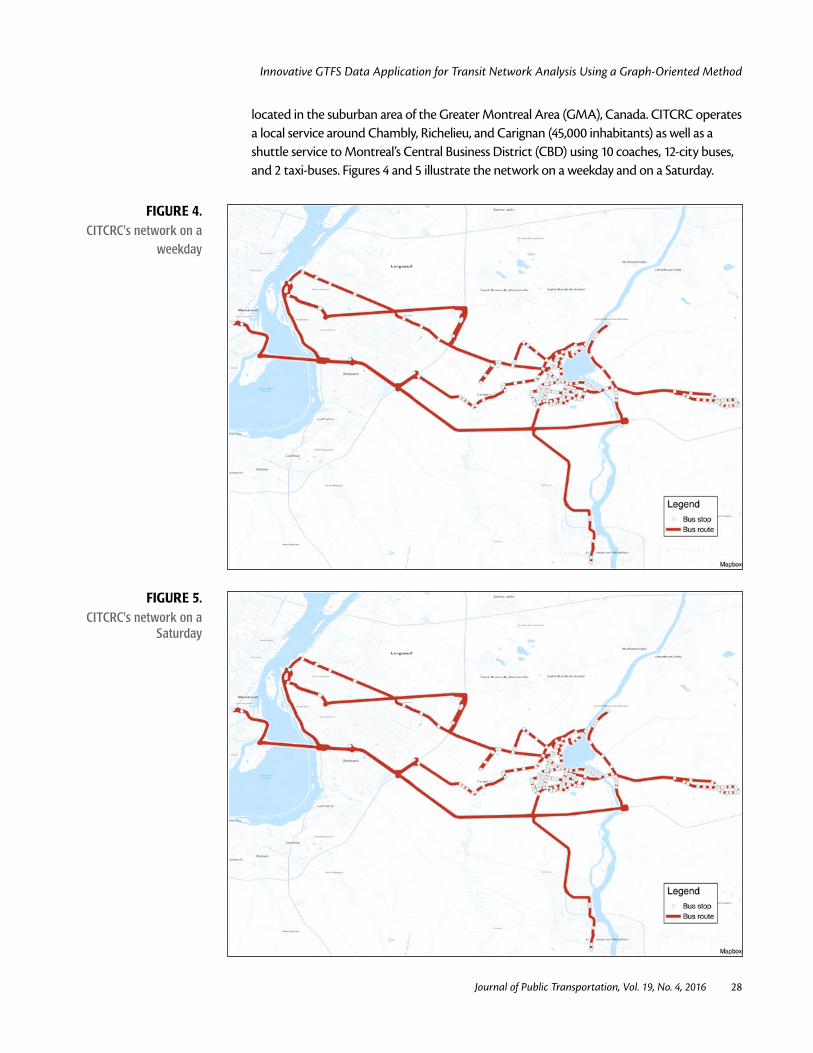
located in the suburban area of the Greater Montreal Area (GMA), Canada. CITCRC operates a local service around Chambly, Richelieu, and Carignan (45,000 inhabitants) as well as a shuttle service to Montreal’s Central Business District (CBD) using 10 coaches, 12-city buses, and 2 taxi-buses. Figures 4 and 5 illustrate the network on a weekday and on a Saturday.
FIGURE 4.CITCRC's network on a
weekday
FIGURE 5.CITCRC's network on a
Saturday
Innovative GTFS Data Application for Transit Network Analysis Using a Graph-Oriented Method
Journal of Public Transportation, Vol. 19, No. 4, 2016 29
The network’s Saturday service is easily processed since the service level is low on this day. However, the weekday service presents more than 7 million departure-arrival pairs. In this context, the analysis relies on a sampling strategy: samples of 1,000 bus stop pairs were randomly drawn from the entire set of pairs and the shortest path for all possible departure-arrival pairs is computed.
All results from the computation of the Saturday and weekday services were then analyzed following the three levels introduced earlier—stop, route, and network.
Classical Transit Indicators
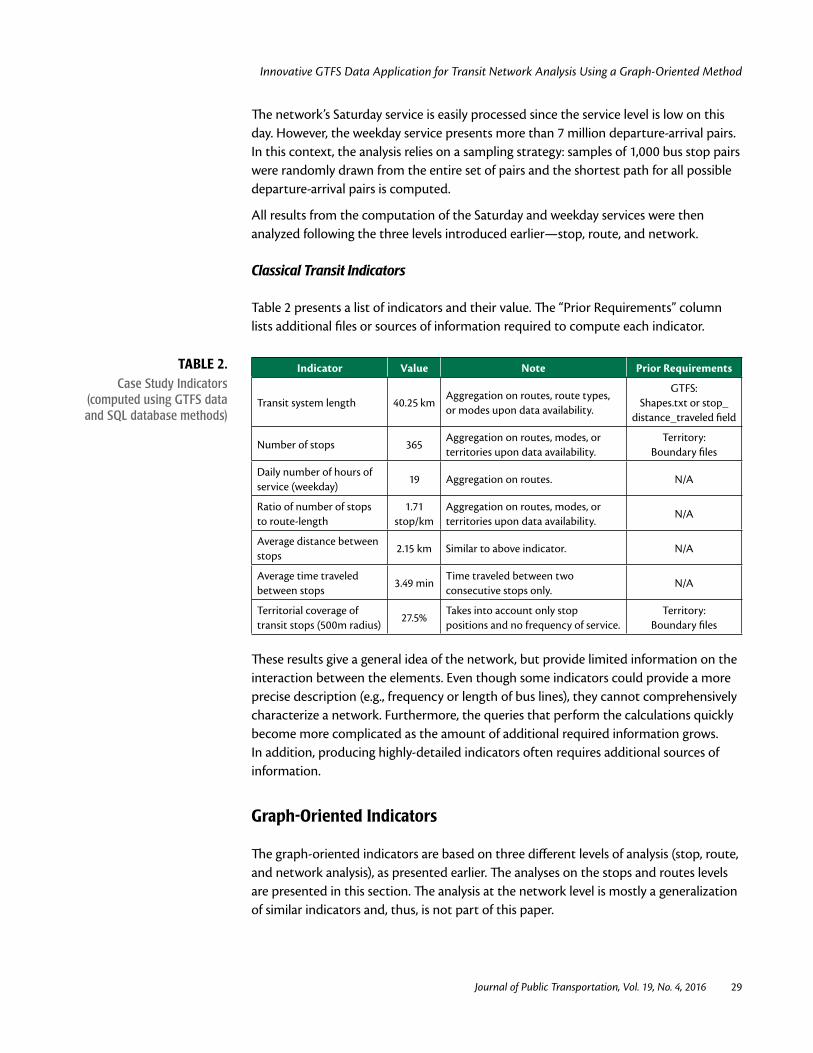
Table 2 presents a list of indicators and their value. The “Prior Requirements” column lists additional files or sources of information required to compute each indicator.
TABLE 2.Case Study Indicators
(computed using GTFS data and SQL database methods)
Indicator Value Note Prior Requirements
Transit system length 40.25 kmAggregation on routes, route types, or modes upon data availability.
GTFS:Shapes.txt or stop_
distance_traveled field
Number of stops 365Aggregation on routes, modes, or territories upon data availability.
Territory:Boundary files
Daily number of hours of service (weekday)
19 Aggregation on routes. N/A
Ratio of number of stops to route-length
1.71 stop/km
Aggregation on routes, modes, or territories upon data availability.
N/A
Average distance between stops
2.15 km Similar to above indicator. N/A
Average time traveledbetween stops
3.49 minTime traveled between two consecutive stops only.
N/A
Territorial coverage of transit stops (500m radius)
27.5%Takes into account only stop positions and no frequency of service.
Territory:Boundary files
These results give a general idea of the network, but provide limited information on the interaction between the elements. Even though some indicators could provide a more precise description (e.g., frequency or length of bus lines), they cannot comprehensively characterize a network. Furthermore, the queries that perform the calculations quickly become more complicated as the amount of additional required information grows. In addition, producing highly-detailed indicators often requires additional sources of information.
Graph-Oriented Indicators
The graph-oriented indicators are based on three different levels of analysis (stop, route, and network analysis), as presented earlier. The analyses on the stops and routes levels are presented in this section. The analysis at the network level is mostly a generalization of similar indicators and, thus, is not part of this paper.

Innovative GTFS Data Application for Transit Network Analysis Using a Graph-Oriented Method
Journal of Public Transportation, Vol. 19, No. 4, 2016 30
Stop Level
Bus stops (or any other station) represent the access point for all public transit travelers. As users interact with these stops, often on a daily basis, it is important to understand their impact on the efficiency and productivity of the network. We focused on two main concepts: connectivity and frequency.
First, we developed the dynamic connectivity between pairs of stops throughout the day. In this case, a pair of stops was defined as the combination of any two bus stops in the network, regardless of their position, the routes they serve, or their connectivity to one another. Two distinct stops actually can generate two pairs, as direction is considered (e.g., Stop A/Stop B and Stop B/Stop A). A pair of stops was determined to be active if the stops are linked by at least one path. A maximum duration of two hours was set as the threshold for inclusion in the indicator. The maximum duration was set according to the period of validity of a single ticket sold by the STO. The results were then assembled according to departure time. The percentage of active stop pairs was computed upon the subset of data. Figure 6 illustrates the proportion of active stop pairs across a typical weekday (using estimations from 10 independent samples) and a Saturday.
FIGURE 6. Active pairs of stops throughout day
Figure 6 highlights some interesting observations:
• Weekday samples presented a similar pattern with some variability.
• As expected, the weekday line exposed the two peak periods; the morning peak was more concentrated than the afternoon peak. The observation is consistent with typical profiles of weekday travel demand in the GMA.
• The variation of active pairs on Saturday evenings was due to a sparse service.
Innovative GTFS Data Application for Transit Network Analysis Using a Graph-Oriented Method
Journal of Public Transportation, Vol. 19, No. 4, 2016 31
Due to headways being unevenly distributed, a drop in service for certain hours is visible.
• Bus stops are mostly located in one of the three municipalities, with some in Downton Montreal. When the percentages of active pairs of stops on the graph were high, a better local transit service is offered, whereas lower percentages indicated more direct lines to Montreal and less passages at local stops.
• Percentages peak at almost 40% during the week and 6% on Saturday. Considering that this is a small network that mostly connects travelers from small cities to Montreal’s CBD, it indicates that many local stops are not interconnected, reducing global connectivity.
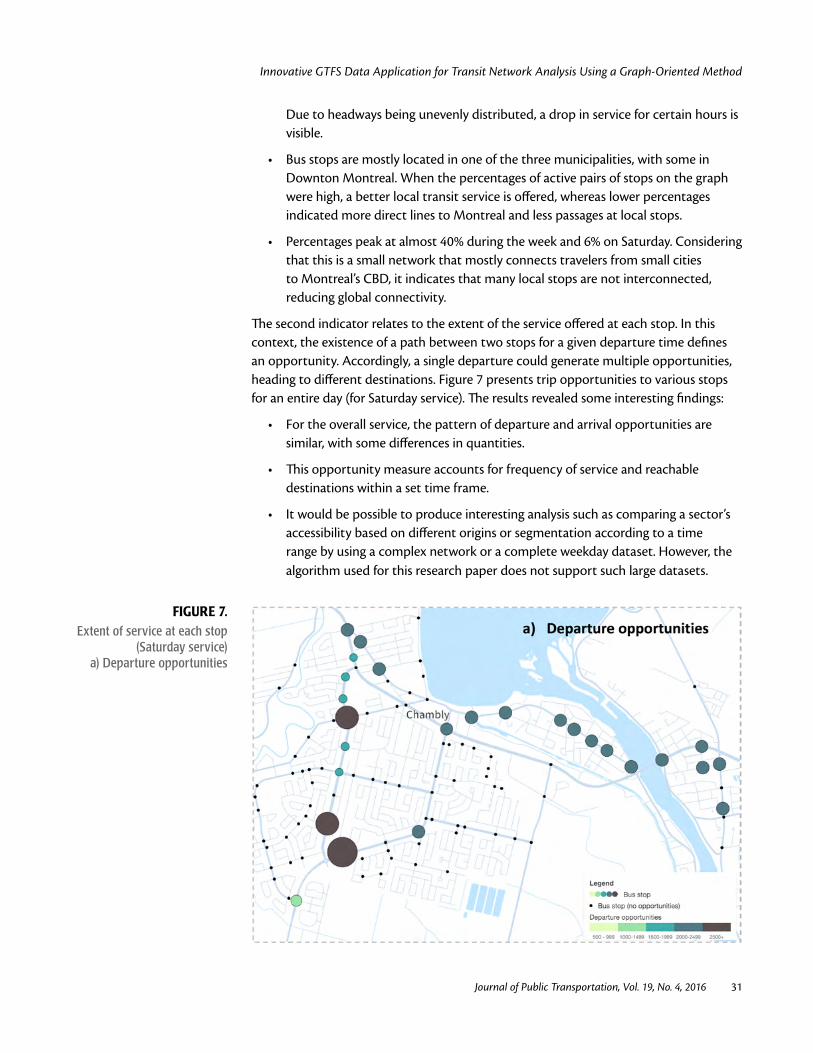
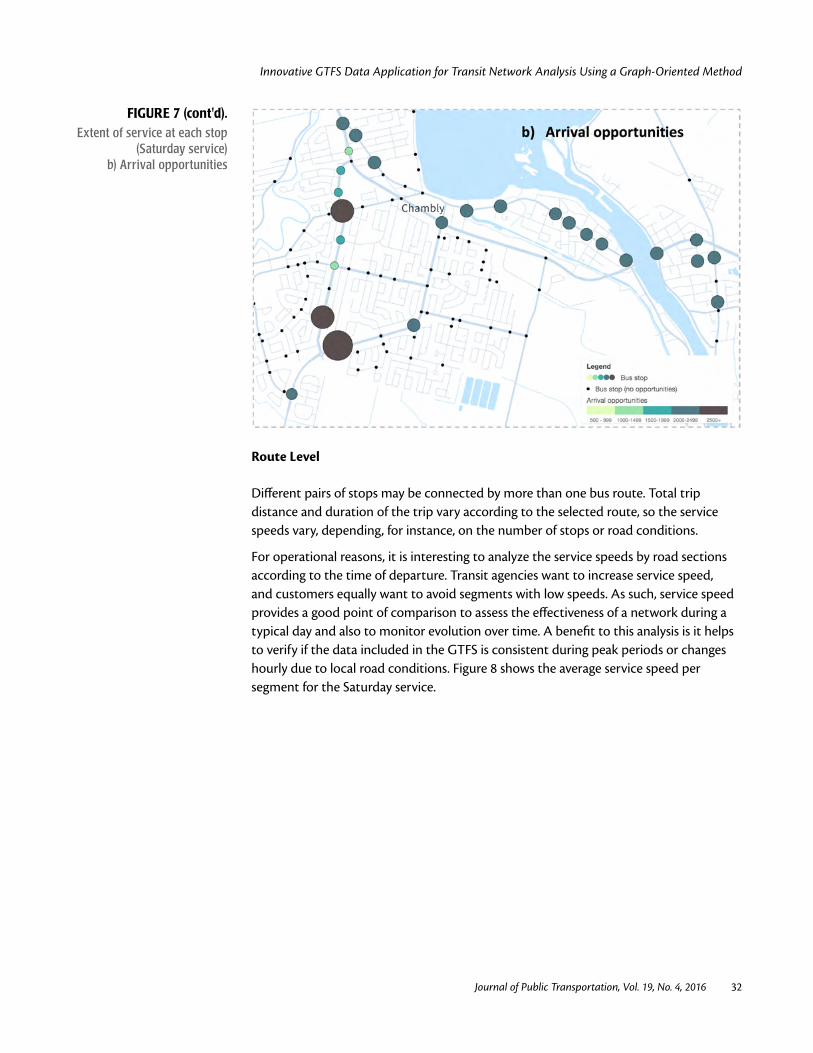
The second indicator relates to the extent of the service offered at each stop. In this context, the existence of a path between two stops for a given departure time defines an opportunity. Accordingly, a single departure could generate multiple opportunities, heading to different destinations. Figure 7 presents trip opportunities to various stops for an entire day (for Saturday service). The results revealed some interesting findings:
• For the overall service, the pattern of departure and arrival opportunities are similar, with some differences in quantities.
• This opportunity measure accounts for frequency of service and reachable destinations within a set time frame.
• It would be possible to produce interesting analysis such as comparing a sector’s accessibility based on different origins or segmentation according to a time range by using a complex network or a complete weekday dataset. However, the algorithm used for this research paper does not support such large datasets.
FIGURE 7.Extent of service at each stop
(Saturday service) a) Departure opportunities
Innovative GTFS Data Application for Transit Network Analysis Using a Graph-Oriented Method
Journal of Public Transportation, Vol. 19, No. 4, 2016 32
FIGURE 7 (cont'd).Extent of service at each stop
(Saturday service) b) Arrival opportunities
Route Level
Different pairs of stops may be connected by more than one bus route. Total trip distance and duration of the trip vary according to the selected route, so the service speeds vary, depending, for instance, on the number of stops or road conditions.
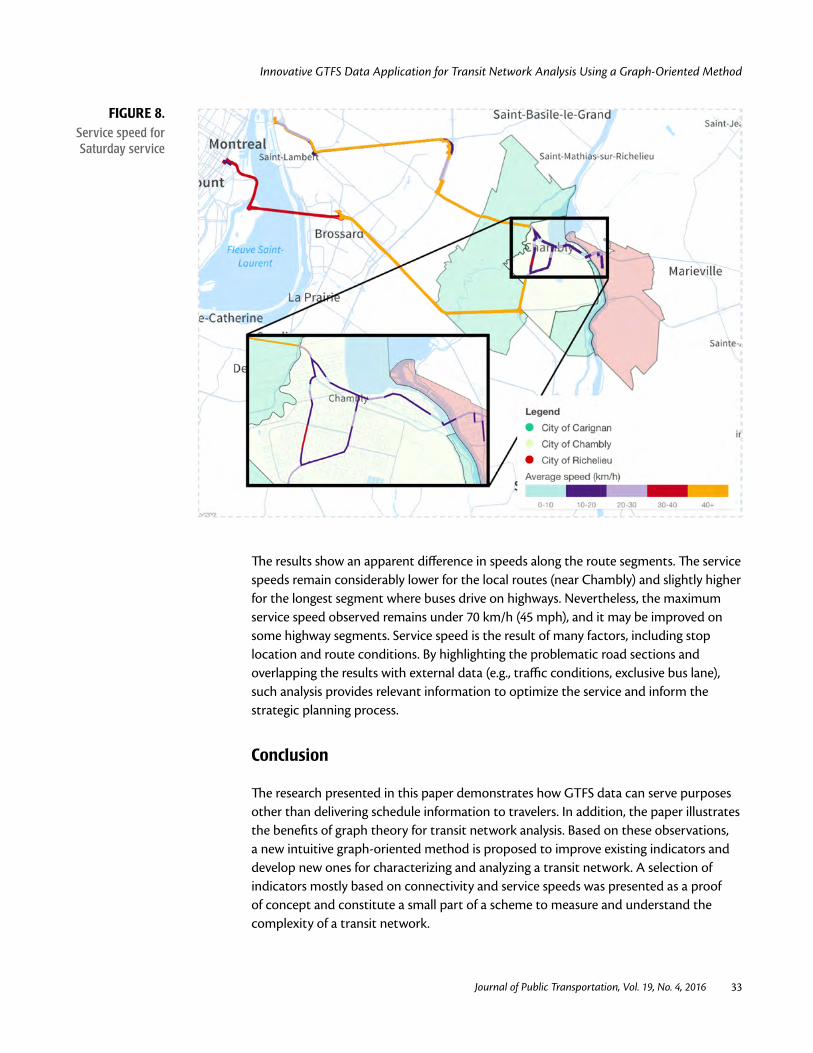
For operational reasons, it is interesting to analyze the service speeds by road sections according to the time of departure. Transit agencies want to increase service speed, and customers equally want to avoid segments with low speeds. As such, service speed provides a good point of comparison to assess the effectiveness of a network during a typical day and also to monitor evolution over time. A benefit to this analysis is it helps to verify if the data included in the GTFS is consistent during peak periods or changes hourly due to local road conditions. Figure 8 shows the average service speed per segment for the Saturday service.
Innovative GTFS Data Application for Transit Network Analysis Using a Graph-Oriented Method
Journal of Public Transportation, Vol. 19, No. 4, 2016 33
FIGURE 8.Service speed for Saturday service
The results show an apparent difference in speeds along the route segments. The service speeds remain considerably lower for the local routes (near Chambly) and slightly higher for the longest segment where buses drive on highways. Nevertheless, the maximum service speed observed remains under 70 km/h (45 mph), and it may be improved on some highway segments. Service speed is the result of many factors, including stop location and route conditions. By highlighting the problematic road sections and overlapping the results with external data (e.g., traffic conditions, exclusive bus lane), such analysis provides relevant information to optimize the service and inform the strategic planning process.
Conclusion
The research presented in this paper demonstrates how GTFS data can serve purposes other than delivering schedule information to travelers. In addition, the paper illustrates the benefits of graph theory for transit network analysis. Based on these observations, a new intuitive graph-oriented method is proposed to improve existing indicators and develop new ones for characterizing and analyzing a transit network. A selection of indicators mostly based on connectivity and service speeds was presented as a proof of concept and constitute a small part of a scheme to measure and understand the complexity of a transit network.
Innovative GTFS Data Application for Transit Network Analysis Using a Graph-Oriented Method
Journal of Public Transportation, Vol. 19, No. 4, 2016 34
The experimentation helps put forward current limitations of the graph-oriented method. Even though graph theory is promising for the study of transit networks, its implementation into a graph database raises some issues. The way the shortest path algorithms are built into Neo4j increases computation burden since previous results are not stored. Graph database technology is quite new; hence, third-party drivers are of unequal quality among programming languages and documentation remains limited. Moreover, at this time, the graph-oriented method does not take into account the quality of transfers from a bus line or bus stop to another. Safety, ease of transfer, transfer location, or universal accessibility could influence the choice to transfer or not when other options are available.
Future research will focus on validating GTFS data with planned and real-time data. Additionally, two options are being examined to reduce computation time: 1) a hybrid solution—modifying the Neo4j algorithm to change the way it stores and publishes its results; all intermediate routes calculated when computing the shortest path query can be stored externally in a cost matrix, which would limit the computation burden on the system and overall calculation time should be substantially reduced; and 2) a conventional path calculator using a relational database; the graph database would then be used to pre-compute some parameters.
Finally, we are currently developing other, more precise indicators on various spheres of analysis, including connectivity, stop location, and accessibility. These indicators will facilitate the characterization of a global transit network and its comparison with other networks. For the long term, our objective is to integrate all these components into a transit network analysis tool that will allow systematic network analysis and monitoring, as well as observe changes through time in a structured and automated way. Although this proof of concept is set on a specific state of the network, further analyses will focus on the comparison of networks after a change in supplied service.
Acknowledgment
This research project is supported by Thales and the Natural Sciences and Engineering Research Council of Canada (NSERC, project RDCPJ 446107-12). The authors also wish to thank collaborators from the CITCRC who provided access to the data for research purpose.
References
Al Mamun, M., and N. E. Lownes. (2011). “A Composite Index of Public Transit Accessibility.” Journal of Public Transportation, 14(2), 69–87. doi:10.5038/2375-0901.14.2.4.
Bertolaccini, K., and N. E. Lownes. (2015). “Using GTFS Data to Measure and Map Transit Accessibility.” Paper presented at Transportation Research Board 94th Annual Meeting, Washington DC. Retrieved from http://docs.trb.org/prp/15-6045.pdf.

Innovative GTFS Data Application for Transit Network Analysis Using a Graph-Oriented Method
Journal of Public Transportation, Vol. 19, No. 4, 2016 35
Biggs, N., E. Lloyd, and R. Wilson. (1986). Graph Theory, 1736-1936. Oxford: Oxford University Press.
Bondy, J. A., and U. S. R. Murty. (1976). Graph Theory with Applications. Oxford: Elsevier Science Ltd.
Catala, M. (2011). “Expanding the Google Transit Feed Specification to Support Operations and Planning.” Report No. BDK85 977-15, 1-64. Tampa, FL: University of South Florida.
Ceder, A. (2015). Public Transit Planning and Operation, 2nd ed. Boca Raton, FL: CRC Press.
Chen, X., L. Yu, Y, Zhang, and J. Guo. (2009).” Analyzing Urban Bus Service Reliability at the Stop, Route, and Network Levels.” Transportation Research Part A, 43(8), 722–734. doi:10.1016/j.tra.2009.07.006.
Derrible, S., and C. Kennedy. (2009). “Network Analysis of World Subway Systems using Updated Graph Theory.” Transportation Research Record, 2112, 17–25. doi:10.3141/2112-03.
Derrible, S., and C. Kennedy. (2011). “Applications of Graph Theory and Network Science to Transit Network Design.” Transport Reviews, 31(4), 495–519. doi:10.1080/01441647.2010.543709.
Dibbelt, J., T. Pajor, B. Strasser, and D. Wagner. (2013). “Intriguingly Simple and Fast Transit Routing.” Experimental Algorithms, 7933, 43–54). doi:10.1007/978-3-642-38527-8_6
Fu, L., and Y. Xin. (2007). “A New Performance Index for Evaluating Transit Quality of Service.” Journal of Public Transportation, 10(3), 47–69. doi:10.5038/2375-0901.10.3.4.
Gandavarapu, S. (2012). “Using Google Transit Feed Specification in Travel Modeling.” Submitted for presentation at 4th Transportation Research Board Conference on Innovations in Travel Modeling. http://onlinepubs.trb.org/onlinepubs/conferences/2012/4thITM/Papers-R/0117-000113.pdf.
Godin, A. (2012). “L'accessibilité en Transport: Méthodes et Indicateurs.“ Master’s thesis, Polytechnique Montréal, Montréal, Canada. http://search.proquest.com/docview/1080972521.
Google. (2015a). “Feed Validator: Errors and Warnings.” https://github.com/google/transitfeed/wiki/FeedValidatorErrorsAndWarnings.
Google. (2015b). “What is GTFS-realtime?” https://developers.google.com/transit/gtfs-realtime/.
Khani, A., S. Lee, M. Hickman, H. Noh, and N. Nassir. (2012). “Intermodal Path Algorithm for Time-Dependent Auto Network and Scheduled Transit Service.” Transportation Research Record, 2284, 40–46. doi:10.3141/2284-05.
Innovative GTFS Data Application for Transit Network Analysis Using a Graph-Oriented Method
Journal of Public Transportation, Vol. 19, No. 4, 2016 36
Kittelson and Associates, Parsons Brinckerhoff, KFH Group, Texas A&M Transportation Institute, and Arup. (2013). Transit Capacity and Quality of Service Manual, 3rd ed. Washington, DC: Transit Cooperative Research Program.
Kittelson and Associates, Urbitran, LKC Consulting Services, MORPACE International, Queensland University of Technology, and Y. Nakanishi. (2003). “A Guidebook for Developing a Transit Performance-Measurement System.” TCRP Report No. 88. Washington, DC: Transit Cooperative Research Program.
Institue de la Gestion Déléguée. (2008). “Indicateurs de Performance des Services de Transport Public.“ http://www.fondation-igd.org/files/pdf/IGD_transport_collectif.pdf.
McHugh, B. (2013). “Pioneering Open Data Standards: The GTFS Story.” In Goldstein, B., and L. Dyson, Eds. Beyond Transparency: Open Data and the Future of Civic Innovation. San Francisco: Code for America Press.
Metrolinx. (2013). “The Big Move Baseline Monitoring Report, Appendix A: Monitoring Handbook.” http://www.metrolinx.com/en/regionalplanning/bigmove/The_Big_Move_Baseline_Monitoring_Appendix_A_EN.pdf.
Pajor, T. (2009). “Multi-modal Route Planning.” Master’s thesis, Universität Karlsruhe (TH), Germany. http://i11www.iti.uni-karlsruhe.de/extra/publications/p-mmrp-09.pdf.
Porter, D. J., D. S. Kim, and S. Ghanbartehrani. (2014). “Proof of Concept: GTFS Data as a Basis for Optimization of Oregon's Regional and Statewide Transit Networks.” FHWA-OR-RD-14-12, 1–72. Salem, OR: Oregon Department of Transportation.
Robinson, I., J. Webber, and E. Eifrem. (2013). Graph Databases, 2nd ed. Sebastopol, CA: O'Reilly Media.
Shah, Y. M. (2012). “Diagnosing Transportation: Developing Key Performance Indicators to Assess Urban Transportation Systems.” Master’s thesis, McGill University, Montréal, Canada. http://tram.mcgill.ca/Teaching/srp/documents/Yousaf.pdf.
Société de Transport de Laval. (2013). “Étude d’optimisation du Réseau de Transport en Commun de la Ville de Laval.“ http://www.stl.laval.qc.ca/userfiles/files/pdf/Sommaire_executif_optimisation_reseau(2013).pdf.
World Bank. (2013). “Open Source Tools for Transport Planning: Indicator Calculation Methodology Report.” https://drive.google.com/file/d/0B5Ot4FPs1rW6TDV2bWNuRVFZNTA/.
Voyer, É. (2007). “Le Benchmarking: Expérimentations Appliquées à L'étude du Transport Urbain à Montreal.“ Master’s thesis, Polytechnique Montréal, Montréal, Canada. http://search.proquest.com/docview/304718604.
Wolpe, T. (2014). “Look at What Google and Amazon are Doing with Databases: That's Your Future.” Zdnet. http://www.zdnet.com/article/look-at-what-google-and-amazon-are-doing-with-databases-thats-your-future/.
Innovative GTFS Data Application for Transit Network Analysis Using a Graph-Oriented Method
Journal of Public Transportation, Vol. 19, No. 4, 2016 37
Wong, J. C. (2013). “Use of the General Transit Feed Specification (GTFS) in Transit Performance Measurement.” Master’s thesis, Georgia Institute of Technology, Atlanta, GA. http://www.nctspm.gatech.edu/sites/default/files/u60/WONG-THESIS-2013.pdf.
About the Authors
Philippe Fortin ([email protected]) received a bachelor’s degree in Civil Engineering in 2014 and a Master’s degree in 2016, both from Polytechnique Montréal. His current research interests include public transportation systems and transportation planning. In 2014, he was the recipient of Alain Lamoureux scholarship awarded by the Association of Municipal Engineers of Quebec.
Dr. Catherine Morency ([email protected]) is professor in Civil Engineering at Polytechnique Montreal. She is head of a research Chair on sustainable mobility and holds a Canada Research Chair on Personal Mobility. Her researches focus on the modelling of travel behaviors including the use of active and alternative modes of transportation such as carsharing, bikesharing or taxi.
Dr. Martin Trépanier ([email protected]) is professor in Industrial Engineering at Polytechnique Montréal. His main research field is the valorization and the processing of transportation data. He is codirector of the Interuniversitary Research Centre on Entreprise Network, Logistics and Transportation (CIRRELT).