Innovative Food Product Development using Molecular ...
276
Technological University Dublin Technological University Dublin ARROW@TU Dublin ARROW@TU Dublin Doctoral Tourism and Food 2013 Innovative Food Product Development using Molecular Innovative Food Product Development using Molecular Gastronomy: a Focus on Flavour and Sensory Evaluation Gastronomy: a Focus on Flavour and Sensory Evaluation Mark Traynor Technological University Dublin, [email protected] Follow this and additional works at: https://arrow.tudublin.ie/tourdoc Part of the Food Chemistry Commons, and the Food Microbiology Commons Recommended Citation Recommended Citation Traynor, M. (2013).Innovative food product development using molecular gastronomy: a focus on flavour and sensory evaluation. Doctoral thesis. Technological University Dublin. doi:10.21427/D7BG85 This Theses, Ph.D is brought to you for free and open access by the Tourism and Food at ARROW@TU Dublin. It has been accepted for inclusion in Doctoral by an authorized administrator of ARROW@TU Dublin. For more information, please contact [email protected], [email protected]. This work is licensed under a Creative Commons Attribution-Noncommercial-Share Alike 4.0 License
-
Upload
khangminh22 -
Category
Documents
-
view
2 -
download
0
Transcript of Innovative Food Product Development using Molecular ...
Technological University Dublin Technological University Dublin
ARROW@TU Dublin ARROW@TU Dublin
Doctoral Tourism and Food
2013
Innovative Food Product Development using Molecular Innovative Food Product Development using Molecular
Gastronomy: a Focus on Flavour and Sensory Evaluation Gastronomy: a Focus on Flavour and Sensory Evaluation
Mark Traynor Technological University Dublin, [email protected]
Follow this and additional works at: https://arrow.tudublin.ie/tourdoc
Part of the Food Chemistry Commons, and the Food Microbiology Commons
Recommended Citation Recommended Citation Traynor, M. (2013).Innovative food product development using molecular gastronomy: a focus on flavour and sensory evaluation. Doctoral thesis. Technological University Dublin. doi:10.21427/D7BG85
This Theses, Ph.D is brought to you for free and open access by the Tourism and Food at ARROW@TU Dublin. It has been accepted for inclusion in Doctoral by an authorized administrator of ARROW@TU Dublin. For more information, please contact [email protected], [email protected].
This work is licensed under a Creative Commons Attribution-Noncommercial-Share Alike 4.0 License
Innovative Food Product Development using
Molecular Gastronomy; A Focus on Flavour and
Sensory Evaluation
THESIS SUBMITTED TO DUBLIN INSTITUTE OF TECHNOLOGY IN
FULFILMENT OF THE REQUIREMENTS FOR THE DEGREE OF
DOCTOR OF PHILOSOPHY
Mark Traynor, BA
School of Culinary Arts and Food Technology,
College of Arts and Tourism,
Dublin Institute of Technology.
Supervisors: Dr. Róisín Burke & Dr. Catherine Barry-Ryan

i
ABSTRACT
The primary goal of this research was to develop novel ice cream products using
the principles of molecular gastronomy. An ice cream model system (emulsion) was
developed, in which the effects of ingredient levels on stability and formation were
investigated and optimised using Response Surface Methodology (RSM). Two
characteristic volatiles of banana (isoamyl acetate and furfuryl acetate) were added to the
optimised emulsion, and their headspace emission was quantified using Solid Phase
Microextraction with Gas Chromatography Mass Spectrometry. RSM was used to
investigate the main and interactive effects of ingredient, salt and pH levels on the
headspace emission of these volatiles. Salt was found to significantly influence (p ≤ 0.05)
headspace emission of isoamyl acetate.
The pairing of novel foods (banana and bacon (B+BN), banana and basmati rice
(B+R), and banana and olive oil (B+O)) was investigated as an important sensory
phenomenon with a key interest in determining how different components in the selected
food pairings (both volatile and non-volatile) affect and interact with other components to
influence sensory perception. Consumer sensory evaluation (n = 85) showed that B+R and
B+BN were significantly more acceptable (p ≤ 0.05) pairings than B+O. Correlation of
descriptive sensory analysis (n = 28) and organic volatile profiling was conducted to try to
elucidate the hedonic results. Two ice cream product recipes were formulated to provide a
matrix for the two preferred novel food pairings (B+R and B+BN). Product acceptability
was assessed using two consumer panels representing general and specific markets.
Significant differences (p ≤ 0.05) between hedonic results of the two panels suggest that
the B+R ice cream may be more suited to a general retail product, whereas the B+BN ice
cream may be more suited to a selective culinary market.

ii
DECLARATION
I certify that this thesis which I now submit for examination for the award of Doctor of
Philosophy, is entirely my own work and has not been taken from the work of others,
save and to the extent that such work has been cited and acknowledged within the text
of my work.
This thesis was prepared according to the regulations for postgraduate study by research
of the Dublin Institute of Technology and has not been submitted in whole or in part for
another award in any Institute or University. The work reported in this thesis conforms
to the principles and requirements of the Institute's guidelines for ethics in research.
The Institute has permission to keep, lend or copy this thesis in whole or in part, on
condition that any such use of the material of the thesis be duly acknowledged.
Signature __________________________________ Date _______________

iii
ACKNOWLEDGMENTS
Firstly I would like to thank my two supervisors, Dr. Róisín Burke and Dr.
Catherine Barry Ryan. Thank you for seeing potential in me and guiding me through
this PhD with great patience and understanding. I could not have asked for better
supervisors, you both went above and beyond for me, I owe a debt of gratitude to you
both. A very special thanks to Dr. Jesus Maria Frías Celayeta (DIT), Dr. Nigel Brunton
(UCD) and Dr. Maurice O’Sullivan (UCC), without your expertise, guidance and
assistance I would certainly not have completed this work.
I would like thank all the postgraduate and postdoctoral, past and present, whom
which offered assistance and friendship when needed. I am also very grateful to the
technical staff that assisted me throughout the PhD; Noel Grace, Tony Hutchinson,
Jyothi Nair and Plunkett Clarke. A very special word of thanks to Denis Benson, for his
technical support, but more so for his friendship and for making me laugh. You are a
very good friend to me, stay well. I would like to thank a very special friend, whom
without her support and friendship through thick and thin. I would certainly not have
gotten to where I am today, thank you Dr. Sabrina Cox, I owe you so much. I would
also like to thank the Steve Doody and Warren Kelly of TRX studios, thank you for
getting me into incredible physical shape and keeping my mind focused throughout the
writing of the dissertation. What you are doing in your gym is ground breaking and
unique.
Many thanks to some very special friends for their support and for the laughs.
Thanks to Ubi, Bren, Crispy, Conor, Tina and Willy. You are the best friends anyone
could have asked for, the laughs we had kept me going through it all. A very special
thanks to my best friends who are currently down under, Timo and Phil, thanks for all

iv
the encouragement and support (via Skype). To a very special person, Catherine
Truman, thank you for being a second mother to me, I’d be lost without you. My
deepest thanks to my two best friends, Neill Brennan and Claire Rodden, thank you for
all the good times, long may they continue.
I would like to convey my life long gratitude to the people who are closest to
me. Thanks to my uncles and aunts, in particular John O’Dea and Anne O’Dea, you
have been so good to me throughout my entire life. I would like to thank my
grandmother Maeve O’Dea for your continuous support, also to my grandparents who
have passed, Paddy O’Dea, Francis Traynor and Betty Traynor, our time spent together
has influenced me greatly. To my nieces and nephews, Colm, Cian, Lexi, Patrick and
Chloe, I love you very much, you are very special to me and provided me with the
distractions I needed to keep going. A very special thanks my sister Laura Hoey for
being the best sister I could have asked for. To my brother Stephen, thank you and to
my sisters in law, Cheryl and Elena, you are like sisters to me and I love you very much.
Last but not least, to my parents, words cannot convey my gratitude. You have done so
much for me, I hope I have made you proud and continue to. I could not have completed
this PhD without the support of all these people mentioned, I am very lucky.
v
List of abbreviations
A Absorbance
AAS Absorption spectrometry
ANOVA Analysis of variance
AOAC Association of Official Analytical Chemists
APLSR ANOVA-partial least squares regression
Asym Final emulsion droplet diameter
aw Water activity
B Banana
BN Bacon
B+BN Banana and bacon food pairing
B+R Banana and basmati rice food pairing
B+O Banana and extra virgin olive oil food pairing
CA California
CAR Carboxen
CCF Central Composite Faced Centred experimental design
cm Centimetre
C5 Carbon number 5
C6 Carbon number 6
C9 Carbon number 9
DIT Dublin Institute of Technology
DDW Distilled deionized water
vi
DS Mean emulsion droplet diameter
DVB Divinylbenzene
D32 Sauter number
e Slope
EU European Union
eV Electron volt
FAO Food and Agricultural Organisation
FCP Free Choice Profiling
FEMA Flavour and Extract Manufacturers Association
FDA Food and Drugs Administration
F-value Fisher test value
g Gram
g/ 100 g Grams per 100 grams
g/ Kg Grams per kilogram
GC/MS Gas chromatography mass spectrometry
GMF Genetically modified food
GPA Generalised Procrustes Analysis
GRAS Generally recognised as safe
H Height
HC Height of cream layer in emulsion
HE Initial emulsion height in the tube
HS Height of sedimentation phase in emulsion
HS-SPME Headspace solid-phase microextraction

vii
HNO3 Nitric acid
Inc. Incorporated
INRA French National Institute of Agricultural Research
ISO International Organisation for Standardisation
k Number of factors in RSM
l Path length
L Litre
LLE Liquid-liquid extraction
lrc Natural logarithm transformation of first order rate
constant
LSD Fishers Least Squared Difference
Ltd. Limited
M Molar
m Metre
MA Massachusetts
MCO Multi criterion optimisation
mg Milligram
ml Millilitre
mL/minute Millilitres per minute
mm Millimetre
MSG Monosodium glutamate
n Number of subjects
NaCl Sodium chloride

viii
NaOH Sodium hydroxide
NC North Carolina
NIST National Institute of Standards and Technology
Nls Nonlinear least squares
O Extra virgin olive oil
OVAT One variable at a time
O.D. Container diameter
P Probability
PA Pennsylvania
PDMS Polydimethylsiloxane
pH Power of hydrogen
pKa Acid dissociation constant
plc Private limited company
ppb Parts per billion
ppm Parts per million
PTFE Polytetrafluoroethylene
QDA Quantitative Descriptive Analysis
R Basmati rice
R2 Co-efficient of determination
R0 Initial emulsion droplet diameter
RMSE Root mean square error
rpm Revolutions per minute
RSD Residual standard deviation

ix
RSM Response surface methodology
s Seconds
SE Standard error
SD Standard deviation
SPME Solid-phase microextraction
SR Emulsion stability ratio
SS Sum square error
s-1 Unit of shear rate measurement
TIC Total ion chromatogram
UK United Kingdom
USA Unites States of America
v/v Volume per volume percentage
W Watts
w/v Weight (mass) per volume
α Alpha
β Beta
χ2 Chi square
% Percentage
-α Low setting for variables in experimental design
+α High setting for variables in experimental design
α Medium setting for variables in experimental design
oC Degrees Celsius
µg Microgram

x
Error term
2-AP 2-acetyl-1-pyrroline
< Less than
≤ Less than or equal to
> Greater than
xi
Table of Contents
ABSTRACT i
DECLARATION ii
ACKNOWLEDGEMNETS iii
List of abbreviations v
Table of contents xi
List of Tables xvii
List of Figures xx
Chapter 1 - Introduction 1
1.1 General introduction 2
1.2 Molecular gastronomy 3
1.2.1 Background and history of molecular gastronomy 4
1.2.2 Molecular gastronomy research and application 5
1.3 Dispersion science 6
1.3.1 Food dispersions 6
1.3.2 Food emulsions 7
1.3.3 Ice cream as a complex dispersed system 11
1.4 Food system and process investigation through response
surface methodology 14
1.5 Sensory perception of food 16
1.5.1 The major senses involved in the sensory evaluation of foods 17
1.5.2 Multisensory flavour perception 20
1.5.3 Food sensory analysis 22
1.5.3.1 Consumer tests 23

xii
1.5.3.2 Descriptive analysis 23
1.5.4 Hedonic reactions to unfamiliar foods 24
1.6 Flavour chemistry 26
1.6.1 Organic volatile compound emission from food 26
1.6.1.1 Volatile-lipid interactions 28
1.6.1.2 Volatile-carbohydrate interactions 29
1.6.1.3 Volatile-protein interactions 30
1.6.1.4 Physicochemical interactions 30
1.6.2 Flavour volatile profiles of foods 32
1.6.2.1 Flavour volatile profile of banana 33
1.6.2.2 Flavour volatile profile of basmati rice 34
1.6.2.3 Flavour volatile profile of extra virgin olive oil 34
1.6.2.4 Flavour volatile profile of bacon 35
1.6.3 Volatile analysis of foods 36
1.6.3.1 Headspace solid phase microextraction (HS-SPME) 36
1.7 Food pairing 39
1.8 Food innovation 42
1.8.1 Innovative food product development 42
1.8.2 The importance of food innovation to the Irish economy 43
1.8.3 Gastronomy as a driver for food innovation 44
1.9 Proposed study 45
1.9.1 Motivation 45
1.9.2 Research process 47
1.9.3 Research aims and objectives 49
Chapter 2 - Materials and Methods 52
xiii
2.1 Ethical considerations 54
2.2 Optimisation of emulsion formation and stability 54
2.2.1 Emulsion raw materials 54
2.2.2 Experimental design 55
2.2.3 Preparation of emulsions 57
2.2.4 Analysis of emulsion stability 57
2.2.5 Analysis of mean droplet diameter by image analysis 58
2.2.6 Statistical analysis of emulsion formation and stability data 60
2.2.6.1 Regression modelling 60
2.2.6.2 Multicriteria optimisation 62
2.2.7 Validation of optimal conditions for emulsion stability and
droplet diameter 62
2.3 Optimisation of flavour emission from the emulsion 63
2.3.1 Flavour emission raw materials 63
2.3.2 Experimental design 63
2.3.3 Preparation of flavoured emulsions 65
2.3.4 Analysis of volatile emissions from the emulsion 65
2.3.4.1 Emulsion headspace volatile analysis 65
2.3.4.2 Gas chromatography mass spectrometry (GC/MS) conditions 66
2.3.5 Statistical analysis of volatile emission data 67
2.3.6 Validation of optimal conditions for headspace volatile emission 68
2.4 Volatile and sensory evaluation of novel food pairings 69
2.4.1 Food pairing raw materials 70
2.4.2 Screening of food pairings by focus groups 71
2.4.2.1 Selection of food pairings 71
xiv
2.4.2.2 Conducting the focus groups 71
2.4.2.3 Preparation of samples for orthonasal sensory evaluation 72
2.4.2.4 Orthonasal sensory evaluation of food pairings 73
2.4.3 Consumer sensory evaluation of food pairings 74
2.4.4 Descriptive sensory analysis (Free Choice Profiling) 75
2.4.5 Organic volatile compound profile analysis 77
2.4.5.1 Headspace volatile analysis for volatile profiling of food pairings 77
2.4.5.2 GC/MS conditions for volatile profiling of food pairings 78
2.4.6 Statistical analysis of food pairing data 79
2.4.6.1 Orthonasal sensory evaluation data 79
2.4.6.2 Consumer sensory evaluation of food pairings data 80
2.4.6.3 Descriptive sensory and volatile profiling data 80
2.5 Development of novel ice creams 82
2.5.1 Ice cream raw materials 83
2.5.2 Preparation of ice creams 83
2.5.2.1 Banana and basmati rice ice cream preparation 84
2.5.2.2 Banana and bacon ice cream preparation 84
2.5.3 Determination of preferred flavour concentration ratios 85
2.5.4 Salt (sodium chloride) measurement of preferred ice creams 86
2.5.4.1 Moisture content measurement 86
2.5.4.2 Preparation of samples for atomic absorption spectrometry 87
2.5.4.3 Atomic absorption spectrometry 87
2.5.5 pH measurement 88
2.5.6 Evaluation of consumer acceptance and market suitability 88
2.5.7 Statistical analysis of novel ice cream data 89

xv
2.5.7.1 Determination of optimum flavour concentrations data 89
2.5.7.2 Salt and pH measurement data 90
2.5.7.3 Consumer acceptance and market suitability evaluation data 90
Chapter 3 - Optimisation of Emulsion Model System Formation and Stability 91
3.1 General introduction 92
3.2 Fitting of the response surface models and repeatability 92
3.3 Stability of emulsions 94
3.4 Emulsion mean droplet diameter 100
3.5 Multi Criteria Optimisation and validation of optimal conditions 109
3.6 Conclusions 111
Chapter 4 - Optimisation of Emulsion Flavour Emission 112
4.1 General introduction 113
4.2 Fitting of the response surface models and repeatability 113
4.3 Effect of independent variables on the responses 117
4.4 Validation of Optimal Conditions 122
4.5 Conclusions 124
Chapter 5 - Volatile and Sensory Evaluation of Novel Food Pairings 125
5.1 General introduction 126
5.2 Focus group 127
5.2.1 Participants’ attitudes and opinions towards the paring of novel foods 127
5.2.2 Orthonasal sensory evaluation of food pairings 129
5.3 Consumer sensory evaluation of food pairings 130
5.4 Descriptive analysis 133
xvi
5.5 Organic volatile compound profile analysis 139
5.6 Volatile interactions 144
5.7 Conclusions 147
Chapter 6 - Development of Novel Flavoured Ice Creams 148
6.1 General introduction 149
6.2 Optimisation of ingredient concentration ratios 150
6.2.1 Banana and basmati rice ice cream concentration ratio 150
6.2.2 Banana and bacon ice cream concentration ratio 152
6.2.3 Salt and pH analysis of optimised ice cream formulations 154
6.3 Consumer acceptance and market suitability 155
6.4 Conclusions 159
Chapter 7 - General Discussion and Key Outcomes 161
7.1 General discussion 162
7.2 Key outcomes 168
References 170
Appendices 216

xvii
List of Tables
Table 1.1 Dispersed system classification with food examples. 7
Table 1.2 Types of interactions that may occur between flavours
and major food components. 28
Table 1.3 Objectives, questions and principal investigations
involved in development of novel ice cream products. 50
Table 2.1 Experimental design with level of factors (low (–α), medium (α) and high
(+α) according to the Box Behnken design. 55
Table 2.2 List of ingredients with quantities and percentage of total weight for 1 kg
basic ice cream formulation. 83
Table 2.3 Flavour concentration ratios for banana and basmati rice and
banana and bacon ice creams. 85
Table 3.1 Experimental design with level of factors (low (–α), medium
(α) and high (+α)), mean values and standard deviation for
responses according to the Box Behnken design. 93
Table 3.2 Regression coefficients and analysis of variance of coded
independent variables for stability ratio (SR). 94
Table 3.3 Regression coefficients and analysis of variance of coded
independent variables for mean droplet diameter (DS). 101
Table 4.1 Experimental design with independent variables (xi) (low (–α),
medium (α) and high (+α)) and response variables (yj)
according to Central Composite Face Centred design (CCF). 114

xviii
List of Tables Continued
Table 4.2 Regression coefficients and analysis of variance of coded
dependent variables. 115
Table 4.3 List of predicted conditions generated by Modde
5.0 RSM software. 123
Table 5.1 Consumer comments (positive and negative) represented
as a percentage (%) of total number of subjects (n = 85) for
the three food pairings. 132
Table 5.2 List of orthonasal (A) and retronasal (F) aroma sensory
descriptive attributes and their frequency represented as a
percentage total (%) number of subjects (n = 28) generated by
Free Choice Profiling (FCP) for the three food pairings. 134
Table 5.3 Correlation coefficients for GPA analysis of the first 2 factors. 137
Table 5.4 Significance of estimated regression coefficients (ANOVA values)
for the relationships between the samples (unpaired and paired)
and the orthonasal (A) and retronasal (F) aroma sensory attributes. 138
Table 5.5 List of organic volatile compounds detected in the food pairings
which were contributed by banana only. 140
Table 5.6 Significance of estimated regression coefficients (ANOVA values)
for the relationships between samples (unpaired and paired) and
volatile compounds detected by SPME GCMS. 141
xix
List of Tables Continued
Table 6.1 Mean hedonic scores with standard deviation and assessor comments
(positive and negative) represented as a percentage (%) of total
number of subjects (n = 34) for the banana and basmati rice
ice cream formulations. 150
Table 6.2 Hedonic scores with standard deviation and assessor comments
(positive and negative) represented as a percentage (%) of total
number of subjects (n = 34) for the banana and bacon ice cream
formulations (B+BNI). 152
Table 6.3 Mean Salt concentration (g/ 100 g) and pH levels of ice creams
and control formulations. 154
Table 6.4 Mean hedonic scores with standard deviation and assessor
comments (positive and negative) represented as a percentage
(%) of total number of subjects (n = 76) for each sensory panel
(panel A and panel B) for banana and basmati rice ice cream and
banana and bacon ice cream. 156
Table D.1 Summary of the results for the assessment of basmati rice flavour transfer
methods from rice to the milk/cream mixture. 234
Table D.2 Summary of the results for the assessment of bacon flavour transfer
methods from bacon to the milk/cream mixture. 235
Table E.1 Volatile compositional analysis of unpaired and paired food samples
including presence (P) and non-presence (NP) in samples with
descriptive terms. 237

xx
List of Figures
Figure 1.1 Schematic diagram of common instability mechanisms that occur
in food emulsions: creaming, sedimentation, flocculation,
coalescence, Ostwald ripening and phase inversion. 8
Figure 1.2 Schematic diagram of depletion flocculation. 9
Figure 1.3 The structure of ice cream viewed by thin section transmission
electron microscopy. 11
Figure 1.4 Fat droplet during ice cream aging process, showing adsorption
of milk proteins and emulsifiers at the surface of the fat droplet and
crystallisation of the fat. 13
Figure 1.5 The taste receptor fields of the human oral cavity. (a) The tongue,
showing the four different types of papillae. (b) A fungiform papilla
containing taste buds. (c) Cross section of a taste bud showing the
taste pore. (d) The taste cell. (e) Receptor sites for bitter, sour, salty,
and sweet substances. 18
Figure 1.6 Olfactory perception via orthonasal route and retronasal routes. 19
Figure 1.7 Summary of perceptual interactions evoked during ingestion. 21
Figure 1.8 Schematic diagram of a commercial solid-phase microextraction
device. 38
Figure 1.9 Headspace solid-phase microextraction gas mass spectrometry
procedure. 39
Figure 1.10 Food pairing tree. 40
Figure 1.11 Flavorstudio online software food pairing tool working screen. 41

xxi
List of Figures Continued
Figure 1.12 Schematic overview of the development process for the novel
ice creams. 47
Figure 2.1 Overview of experiments carried out. 53
Figure 2.2 Images of an emulsion with (a) 100 % SR after 14 days of storage
and (b) an emulsion with phase separation after 14 days of storage. 58
Figure 2.3 Microscopic images of (a) intensity image and (b) binary image of
an oil in water emulsion. 59
Figure 2.4 Schematic overview of procedures used in for the volatile and
sensory evaluation of novel food pairings. 69
Figure 2.5 Commercial banana colour guide. 70
Figure 2.6 Schematic overview of procedures used in for the development of
the ice creams. 82
Figure 3.1 Pareto effects chart for stability ratio (SR). 95
Figure 3.2 Response surface plots for emulsion stability as a function of xanthan
gum and lecithin concentration when sunflower oil is fixed at 0.08. 96
Figure 3.3 Response surface plots for emulsion stability as a function of xanthan
gum and sunflower oil concentration when lecithin is fixed at 0.44. 96
Figure 3.4 Response surface plot for emulsion stability as a function of lecithin
and sunflower oil concentration when xanthan is fixed at -0.27. 98
Figure 3.5 Stability ratio kinetics plot experimental condition 4. 99
Figure 3.6 Stability ratio kinetics plot experimental condition 8. 100
xxii
List of Figures Continued
Figure 3.7 Response surface plots for mean droplet diameter (DS) estimated
parameter R0 (Initial DS) as a function of xanthan gum and
sunflower oil concentration when lecithin was fixed at -0.37. 102
Figure 3.8 Response surface plots for mean droplet diameter (DS) estimated
parameter R0 (Initial DS) as a function of (a) lecithin and sunflower
oil concentration and (b) xanthan gum and lecithin concentration
when sunflower oil was fixed at 0.03. 103
Figure 3.9 Response surface plots for mean droplet diameter (DS) estimated
parameter lrc (log of the first order apparent rate constant) as a function
of xanthan gum and sunflower oil concentration when lecithin was
fixed at 0.32. 104
Figure 3.10 Response surface plots for mean droplet diameter (DS) estimated
parameter lrc (log of the first order apparent rate constant) as a
function of xanthan gum and lecithin concentration when
sunflower oil was fixed at 0.81 105
Figure 3.11 Response surface plots for mean droplet diameter (DS) estimated
parameter lrc (log of the first order apparent rate constant) as a
function of lecithin and sunflower oil concentration when xanthan
gum was fixed at 0.56 106
Figure 3.12 Droplet diameter distribution density plot for (a) emulsion condition
10 and (b) condition 11. 107
Figure 3.13 Mean droplet diameter kinetics plot for (a) experimental condition 7
and (b) experimental condition 12. 108

xxiii
List of Figures Continued
Figure 3.14 Pareto front plot showing the simultaneous optimisation of the
droplet diameter and the stability ratio. 109
Figure 4.1 Main effects and significant parameters on the recovery of isoamyl
acetate from emulsion headspace. 118
Figure 4.2 Main effects plot of isoamyl acetate concentration on isoamyl
acetate response. 119
Figure 4.3 Response surface plot for the effect of salt concentration (%) on
isoamyl acetate response. 120
Figure 4.4 Contour plot of furfuryl acetate release from emulsion as a function
of furfuryl acetate concentration and pH. 122
Figure 5.1 Mean acceptability scores for orthonasal aroma evaluation of food
pairings. 130
Figure 5.2 Mean scores for hedonic ratings of food pairings with banana. 131
Figure 5.3 Percentage of choice of 1st, 2nd and 3rd preference of food pairings
from the consumer panel (n = 85). 133
Figure 5.4 Consensus biplot for orthonasal (A) and retronasal (F) aroma sensory
descriptors and samples generated by Generalised Procrustes Analysis. 136
Figure 5.5 Chromatogram of unpaired banana sample and paired food samples. 142

Chapter 1 Introduction
1
Chapter 1
Chapter 1 Introduction
2
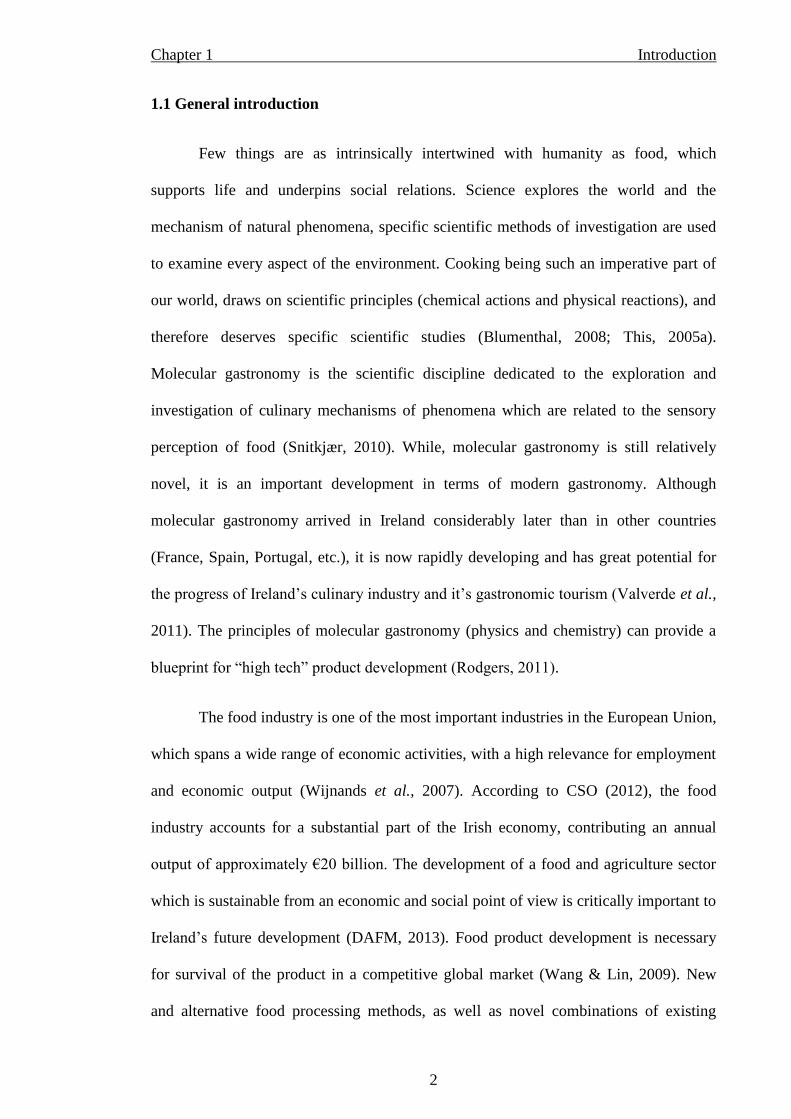
1.1 General introduction
Few things are as intrinsically intertwined with humanity as food, which
supports life and underpins social relations. Science explores the world and the
mechanism of natural phenomena, specific scientific methods of investigation are used
to examine every aspect of the environment. Cooking being such an imperative part of
our world, draws on scientific principles (chemical actions and physical reactions), and
therefore deserves specific scientific studies (Blumenthal, 2008; This, 2005a).
Molecular gastronomy is the scientific discipline dedicated to the exploration and
investigation of culinary mechanisms of phenomena which are related to the sensory
perception of food (Snitkjær, 2010). While, molecular gastronomy is still relatively
novel, it is an important development in terms of modern gastronomy. Although
molecular gastronomy arrived in Ireland considerably later than in other countries
(France, Spain, Portugal, etc.), it is now rapidly developing and has great potential for
the progress of Ireland’s culinary industry and it’s gastronomic tourism (Valverde et al.,
2011). The principles of molecular gastronomy (physics and chemistry) can provide a
blueprint for “high tech” product development (Rodgers, 2011).
The food industry is one of the most important industries in the European Union,
which spans a wide range of economic activities, with a high relevance for employment
and economic output (Wijnands et al., 2007). According to CSO (2012), the food
industry accounts for a substantial part of the Irish economy, contributing an annual
output of approximately €20 billion. The development of a food and agriculture sector
which is sustainable from an economic and social point of view is critically important to
Ireland’s future development (DAFM, 2013). Food product development is necessary
for survival of the product in a competitive global market (Wang & Lin, 2009). New
and alternative food processing methods, as well as novel combinations of existing

Chapter 1 Introduction
3
methods (sous vide cooking etc.), are continually being sought by industry in the pursuit
of producing better quality foods (Rastogi, 2010).
Chefs, culinary experts and food processors have become interested in the
intelligent design of foods with optimal flavour characteristics (Roberts & Taylor,
2000). The modern kitchen is a meeting place where chefs, who are normally
characterised by their artistry, creativity, and craft, can interact with scientists who are
normally characterised by their empiricism, rationality and adherence to the scientific
method (van der Linden et al., 2008). The application of the principles of molecular
gastronomy to the production of food products has great potential for providing
customers with novel and exciting food products, while supplying food manufacturers
with competitive advantages and unique selling points.
1.2 Molecular gastronomy
Molecular gastronomy utilises scientific methods of investigation to better
understand and control the molecular, physicochemical and structural changes that
occur in foods during their preparation and consumption, with a focus on sociology and
enjoyment of food (Barham et al., 2010; van der Linden et al., 2008). It can be
considered a subfield of food science, with an aim of understanding culinary
transformation in the restaurant or domestic kitchen (Snitkjaer, 2010). Chefs struggle to
discover methods that guarantee a perfect outcome for a specific recipe, molecular
gastronomists strive to find perfection for all recipes using scientific methods of
investigation (Blanck, 2007). Hence, the identification of optimum methods of creating
foods with pleasurable flavour and texture is a key component of molecular gastronomy
(This, 2005a).

Chapter 1 Introduction
4
1.2.1 Background and history of molecular gastronomy
In 1988, Nicholas Kurti, the low-temperature physics Professor at Oxford
University (UK), and the French chemist Hervé This co-founded the academic
discipline of molecular gastronomy (This & Rutledge, 2009). Molecular gastronomy
was introduced based on the observation that food science had slowly drifted, over
many decades, towards the investigation and preservation of large scale industrial
processes and production, nutrition, food safety and food composition (Barham et al.,
2010). Conversely, such rational insights had not been deployed in the small scale
culinary realms of the restaurant and home (de Solier, 2010).
There has been a lot of misunderstanding and miscommunication by the public,
the media, professional chefs and scientists regarding the true meaning of molecular
gastronomy (Snitkjaer, 2010). The term “molecular gastronomy” has been misused to
describe a style of cooking which is often more correctly referred to as “molecular
cooking” (van der Linden et al., 2008). Molecular cooking differs from earlier styles of
cooking (haute and nouvelle cuisine) through a reliance on food science and technology
principles, practices and techniques in the kitchen (Vega & Ubbink, 2008). Molecular
cooking is the application of science to technique, and involves applying the results and
knowledge obtained from molecular gastronomy, and for this reason, molecular
gastronomy is not a style of cooking (van der Linden et al., 2008).
Chapter 1 Introduction
5
1.2.2 Molecular gastronomy research and application
For the continuous progression of molecular gastronomy as a scientific
discipline, research within the scientific scope of molecular gastronomy is imperative. A
large scale three year (2002 to 2005) collaborative project called the Introduction of
Innovative Technologies in Modern Gastronomy for Modernisation of Cooking
(INICON) was largely funded by the European Union (Blanck, 2011). INICON has
promoted collaboration between European chefs, scientists, companies and culinary
schools through this European technology transfer programme (Snitkjaer, 2010). This
project combined the efforts of chefs at four restaurants (Au Crocodile, el Bulli, The Fat
Duck, and Grashoff), researchers at educational and research and development
institutions (Ecoles Gregoire-Ferrandi, the Molecular Gastronomy Working Group at
the French National Institute of Agricultural Research (INRA), and TTZ-Bremerhaven-
BIONARD), and members of the food industry (Alpha-Tec, Cosmos Armatica
Internacional, and Iberagar) (Blanck, 2011).
In addition to this large scale collaborative project, numerous smaller scale yet
equally noteworthy studies have concentrated on a wide range of important physical and
chemical culinary phenomena. In particular, recent studies on meat stock have focused
on the preparation (This et al., 2006), the flavour development (Snitkjaer, et al., 2010)
and the effects of wine on meat stock (Snitkjaer et al., 2011). Another area that has been
a key focus of scientific investigation in recent times is low temperature vacuum
cooking (sous vide cooking). In particular, the influence of sous vide cooking on meat
texture (Roldán et al., 2013; Christensen et al., 2012; del Pulgar et al., 2012; Mortensen
et al., 2012; Pakula & Stamminger, 2012). The modifications induced by various
culinary and industrial treatments on pigment systems of immature pods of green beans
(Phaseolus vulgaris L.) has also been explored (Valverde & This, 2008; Valverde et al.,
Chapter 1 Introduction
6
2007). While, the principals of the phenomena food/flavour pairing have likewise been
an emphasis of scientific investigation in the field of molecular gastronomy (Traynor et
al., 2013; Ahn et al., 2011; Kort et al., 2010).
1.3 Dispersion science
1.3.1 Food dispersions
Food materials are on the whole highly non-homogeneous systems. Very few
foods can be characterised as being a single phase, in fact the vast majority of foods are
of a multiphasic nature (Barham et al., 2010). Foods are often characterised by the
simultaneous presence of a diverse range of components dispersed in mixed solutions
(Ettelaie, 2003). Hence, food products are generally complex chemical and physical
systems, typically existing as dispersed systems, formally known as colloids
(Dickinson, 2006). For this reason, dispersion science is of great important and interest
to molecular gastronomists. Disperse systems can be described in terms of a number of
dispersed phases (mesoscale particulate structures), surrounded by a continuous phase
or matrix (Barham et al., 2010).
The dispersed phases can derive from natural food products such as globular
proteins in milk, or be artificially created via food processing such as oil droplets in
mayonnaise (Aguilera & Stanley, 1999). Next to these mesoscale structures of the
dispersed phase, food contains smaller molecular species, like salts, sugars, polyols and
phospholipids, which moderate the properties of the continuous or dispersed phases, or
their interfaces by serving as surface active molecules (surfactants), plasticisers and
humectants (van der Sman & van der Goot, 2009). In general, depending on the
properties of the continuous and dispersed phases, relatively simple food dispersions
Chapter 1 Introduction
7
can be classified into the categories which are outlined in Table 1.1. In order to optimise
the textural and shelf life characteristics of food, it is clear that is important to have an
understanding of colloid science concepts and techniques (Dickinson, 2002). The
molecular gastronomist and food scientist strives to understand how specific
components (proteins, lipids and carbohydrates) can control the stability and rheology
of complex colloidal systems.
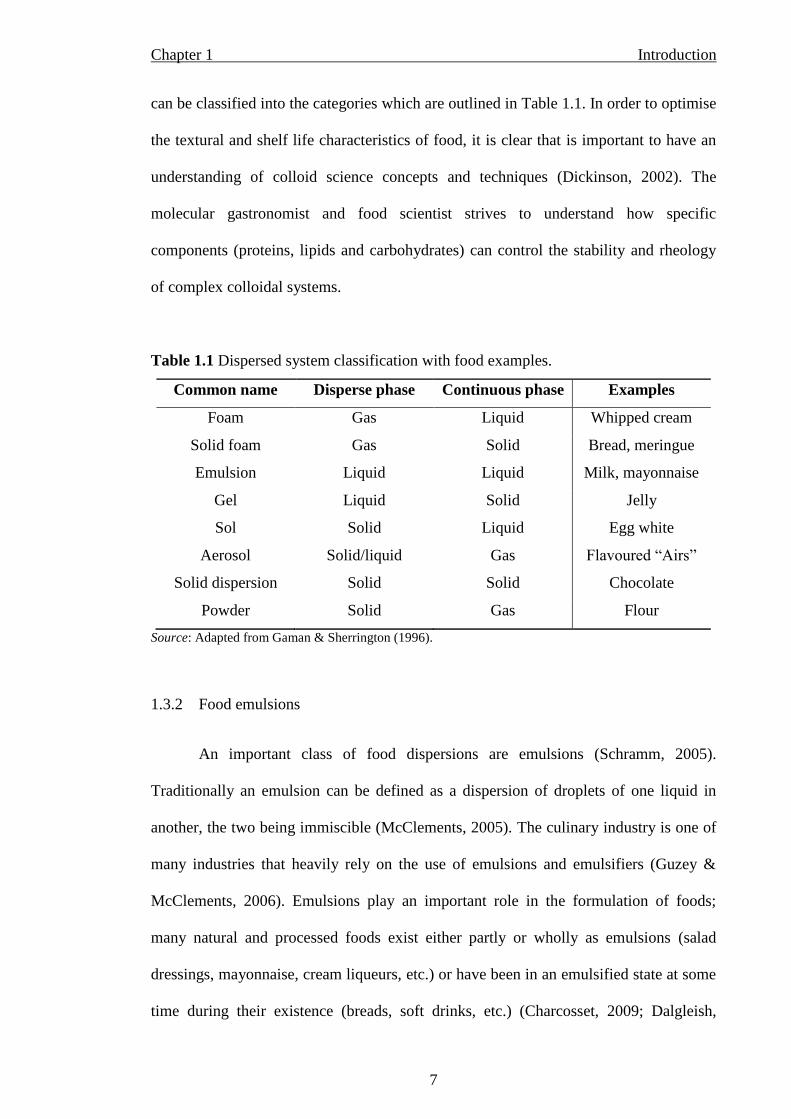
Table 1.1 Dispersed system classification with food examples.
Common name Disperse phase Continuous phase Examples
Foam Gas Liquid Whipped cream
Solid foam Gas Solid Bread, meringue
Emulsion Liquid Liquid Milk, mayonnaise
Gel Liquid Solid Jelly
Sol Solid Liquid Egg white
Aerosol Solid/liquid Gas Flavoured “Airs”
Solid dispersion Solid Solid Chocolate
Powder Solid Gas Flour
Source: Adapted from Gaman & Sherrington (1996).
1.3.2 Food emulsions
An important class of food dispersions are emulsions (Schramm, 2005).
Traditionally an emulsion can be defined as a dispersion of droplets of one liquid in
another, the two being immiscible (McClements, 2005). The culinary industry is one of
many industries that heavily rely on the use of emulsions and emulsifiers (Guzey &
McClements, 2006). Emulsions play an important role in the formulation of foods;
many natural and processed foods exist either partly or wholly as emulsions (salad
dressings, mayonnaise, cream liqueurs, etc.) or have been in an emulsified state at some
time during their existence (breads, soft drinks, etc.) (Charcosset, 2009; Dalgleish,

Chapter 1 Introduction
8
2006). Emulsions can also be ingredients which participate in the formation of more
complex products such as yoghurts, ice creams and whipped products (Leal-Calderon et
al.¸ 2007).
From a physicochemical point of view, emulsions are thermodynamically
unstable systems, rapidly or slowly separating into two immiscible phases over a period
of time (Borwankar et al., 1992). Emulsions have several distinctive properties which
stem partly from the fact that the dispersed phase is usually less dense than the
continuous phase, so that droplets rise (or cream) in a gravitational field (Robins et al.,
2002). Illustrated in Figure 1.1 are the most common processes of emulsion
destabilisation; droplet-droplet coalescence, flocculation, creaming and sedimentation
(Tcholakova et al., 2006).
Figure 1.1 Schematic diagram of common instability mechanisms that occur in food
emulsions: creaming, sedimentation, flocculation, coalescence, Ostwald ripening and
phase inversion.
Source: Piorkowski & McClements (2013).

Chapter 1 Introduction
9
These destabilisation processes greatly influence shelf life and texture of
emulsions (Dickinson & McClements, 1995; Phillips et al., 1994). A major coalescence
mechanism which leads to a gradual coarsening of emulsion droplets is Ostwald
ripening, which by and large has a detrimental effect on the shelf life of these types of
food products (Ettelaie, 2003). The flocculation of emulsions is commonly via the
depletion interactions, which are important in many food systems (Manoj et al., 2000).
Depletion flocculation is an entropic effective attraction in which non-adsorbed species
(polysaccharide molecules, protein aggregates and surfactant micelles) are excluded
from a small lens-shaped region between two droplets (Dickinson, 2002). The osmotic
pressure due to the surfactant molecules in the continuous phase exerts a pressure
driving the droplets together (Figure 1.2) (Robins et al., 2002).
Figure 1.2 Schematic diagram of depletion flocculation.
Source: adapted from Koltay & Feke (1999).
Emulsion stability refers to the ability of an emulsion to resist changes in its
properties over time: the more stable the emulsion, the more slowly its properties

Chapter 1 Introduction
10
change (McClements, 2005). The perceived quality of emulsion based food products is
strongly influenced by their stability, rheology and appearance (Mirhosseini et al.,
2008a). A main indicator of loss of stability is an increase in emulsion droplet mean
diameter, and the growth rate of the droplets can reveal the mechanism responsible
(Silva et al., 2010). Enhancing an emulsion based product’s resistance to destabilisation
can be done by reducing the droplet size (McClements, 2005).
Das & Kinsella (1990) explain that forming a kinetically stable emulsion can be
achieved through the addition of surfactants. Surfactants such as monoglycerides and
phospholipids are common molecules in foods because they are used to stabilise
interfaces. They can be charged or neutral, but in both cases the enthalpy of mixing of
their hydrophilic and the hydrophobic parts is very high, which confers on them their
typical amphiphilic nature (Mezzenga et al., 2005). Emulsifiers are surfactants which
lower surface tension and prevent droplet flocculation by absorption on the droplet
surfaces (Krstonosic et al., 2009). Lecithin is a small molecule surfactant which is one
of the most commonly used emulsifiers in the culinary industry (Whitehurst, 2004).
Legislators classify it as generally recognised as safe (GRAS) and it is accepted as a
natural ingredient by consumers (Bylaite et al., 2001).
Polysaccharides are surfactants employed as thickeners of emulsions which are
commonly added to the aqueous phase of oil in water emulsions to confer long term
emulsion stability (Quintana et al., 2002). Viscosity modification or gelation in the
aqueous continuous phase is the main stabilisation action (Dickinson, 2003). Xanthan
gum has the ability to increase the viscosity of the aqueous continuous phase at
relatively low concentrations, therefore it is one of the most employed thickeners to
stabilise dispersed oil droplets in food emulsions such as pourable salad dressings and
sauces (Hemar et al., 2001).
Chapter 1 Introduction
11
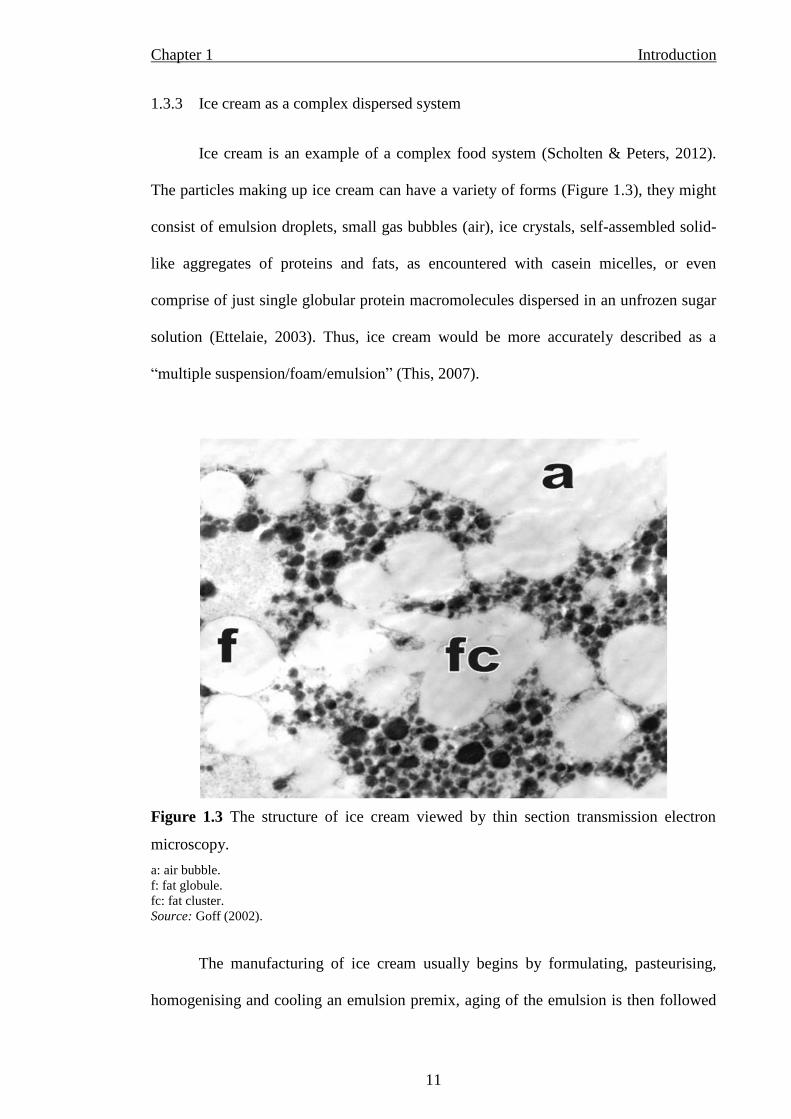
1.3.3 Ice cream as a complex dispersed system
Ice cream is an example of a complex food system (Scholten & Peters, 2012).
The particles making up ice cream can have a variety of forms (Figure 1.3), they might
consist of emulsion droplets, small gas bubbles (air), ice crystals, self-assembled solid-
like aggregates of proteins and fats, as encountered with casein micelles, or even
comprise of just single globular protein macromolecules dispersed in an unfrozen sugar
solution (Ettelaie, 2003). Thus, ice cream would be more accurately described as a
“multiple suspension/foam/emulsion” (This, 2007).
Figure 1.3 The structure of ice cream viewed by thin section transmission electron
microscopy.
a: air bubble.
f: fat globule.
fc: fat cluster.
Source: Goff (2002).
The manufacturing of ice cream usually begins by formulating, pasteurising,
homogenising and cooling an emulsion premix, aging of the emulsion is then followed
Chapter 1 Introduction
12
by aerating and freezing under high shear conditions in a scraped surface freezer
(Schmidt, 2004; Segall & Goff, 2002). In terms of formulation, ice cream is essentially
milk, cream, water, and sugar (Scholten & Peters, 2012). The key to making a good ice
cream is to formulate a mix that will freeze into a balanced structure of ice crystals,
concentrated cream, and air (McGee, 2004). Several of the processing steps contribute
to fat structure development in ice cream (Goff, 1997). Homogenisation of the emulsion
premix converts the bulk fat into finely divided droplets (Patmore et al., 2003).
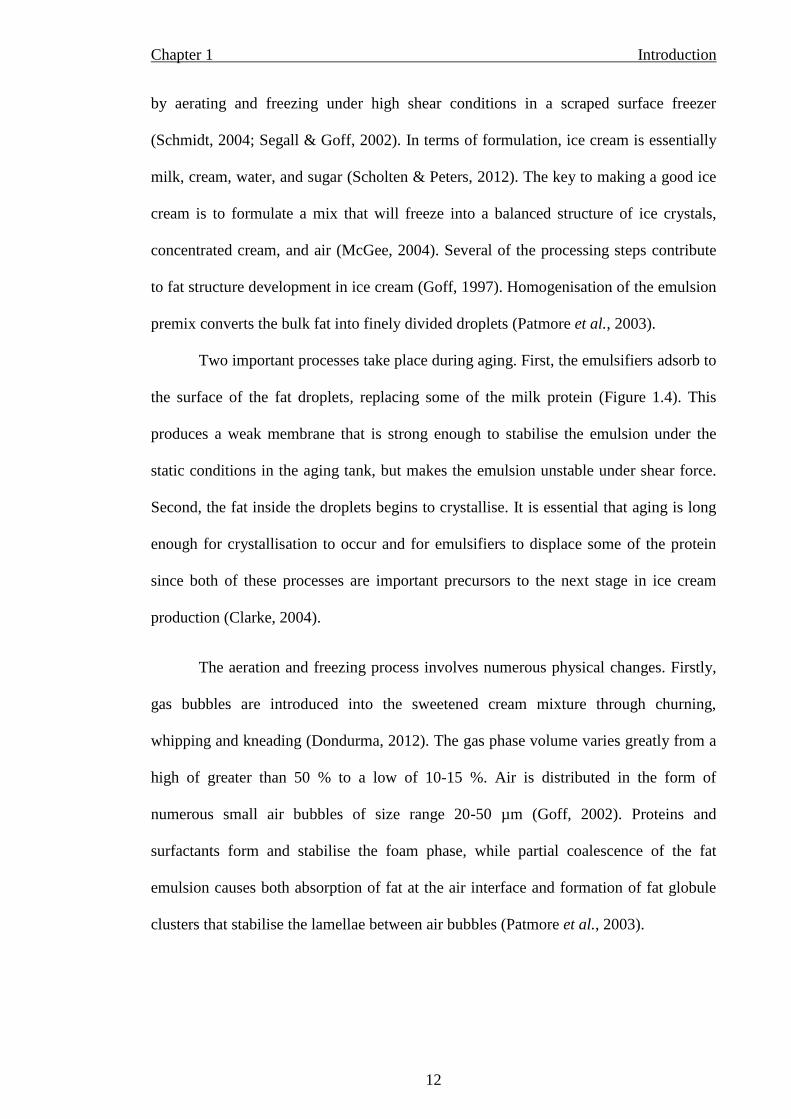
Two important processes take place during aging. First, the emulsifiers adsorb to
the surface of the fat droplets, replacing some of the milk protein (Figure 1.4). This
produces a weak membrane that is strong enough to stabilise the emulsion under the
static conditions in the aging tank, but makes the emulsion unstable under shear force.
Second, the fat inside the droplets begins to crystallise. It is essential that aging is long
enough for crystallisation to occur and for emulsifiers to displace some of the protein
since both of these processes are important precursors to the next stage in ice cream
production (Clarke, 2004).
The aeration and freezing process involves numerous physical changes. Firstly,
gas bubbles are introduced into the sweetened cream mixture through churning,
whipping and kneading (Dondurma, 2012). The gas phase volume varies greatly from a
high of greater than 50 % to a low of 10-15 %. Air is distributed in the form of
numerous small air bubbles of size range 20-50 µm (Goff, 2002). Proteins and
surfactants form and stabilise the foam phase, while partial coalescence of the fat
emulsion causes both absorption of fat at the air interface and formation of fat globule
clusters that stabilise the lamellae between air bubbles (Patmore et al., 2003).

Chapter 1 Introduction
13
Figure 1.4 Fat droplet during ice cream aging process, showing adsorption of milk
proteins and emulsifiers at the surface of the fat droplet and crystallisation of the fat.
Source: Clarke (2004).
During the freezing stage the individual fat globules are partially coalesced into
a three-dimensional network (Berger, 1997). The presence of some fat crystals is critical
for fat structure development as protruding crystals may initiate the interaction between
droplets, thus, helping to hold flocculated fat together (van Boekel & Walstra, 1981).
Sugars have two major functions in ice cream; they make it taste sweet, and they control
the amount of ice formed and hence the softness of ice cream (the higher the ice
content, the harder the ice cream) (Clarke, 2004). When sugar is added to water, the
temperature at which water freezes will be less than 0 oC, which is known as freezing
point depression. Upon freezing, water is removed from the solution as ice, effectively
increasing the sugar concentration in the unfrozen phase (Scholten & Peters, 2012).

Chapter 1 Introduction
14
1.4 Food system and process investigation through response surface methodology
The complex colloidal and polymeric nature of food systems makes their
investigation more difficult (Mezzenga et al., 2005). To allow for reliable interpretation
of the experimental data, the use of model systems remains essential in order to gain
quantitative knowledge (Dickinson, 2002). Traditionally, optimisation in analytical
chemistry has been carried out by monitoring the influence of one variable at a time
(OVAT) on an experimental response (Bezerra et al., 2008). The major disadvantage of
this method is that it does not include the interactive effects among the variables
studied, subsequently the complete effects of the parameter on the response are not
depicted (Lundstedt et al., 1998).
Response Surface Methods (RSM) are designs and models based on the fit of a
polynomial equation to a set of experimental data for working with continuous
treatments when finding the optima or describing the response is a goal (Oehlert, 2000).
Another goal of RSM is to understand how the response changes in a given direction by
adjusting the design variables (Bradley, 2007). Toward these objectives, linear (main)
or squared polynomial (quadratic) functions are employed to describe the system
studied and, consequently, to explore (modelling and displacing) experimental
conditions until its optimisation (Teófilo & Ferreira, 2006). Linear relationship between
independent and dependent variables can be defined by a linear function (first-order
models), while, quadratic relationships with curvature in the response surfaces require
higher degree polynomial (second or third-order models) to be employed. In general, all
RSM problems use either one or the mixture of the both of these models (Bradley,
2007).

Chapter 1 Introduction
15
In addition to analysing the effects of the independent variables, RSM generates
a mathematical model which describes the chemical or biochemical processes (Anjum
et al., 1997). The visualisation of the predicted model equation can be obtained by the
response surface three-dimensional plot and contour two dimensional plot (Baş &
Boyacı, 2007). First-order models are appropriate for describing a flat surface with or
without tilted surfaces, and are not suitable for analysing maximum or minimum points
(Montgomery, 2005). The main advantage of RSM over OVAT is the reduced number
of experimental trials needed to evaluate multiple parameters and to optimise a process
(Mirhosseini et al., 2008b). RSM also takes into account the interactions among
variables unlike OVAT (Leardi, 2009). Thus, RSM is an effective statistical technique
for optimising complex processes because it allows more efficient and easier
arrangement and interpretation of experimental conditions compared to OVAT (Gan &
Latiff, 2011).
Many culinary processes and mechanisms have been studied using RSM for
optimisation and investigation of variable interactions, especially emulsion and flavour
release. Buffo et al. (2002) studied the influence of time and temperature on the
emulsifying properties of gum acacia in oil in water emulsions using RSM.
Gharibzahedi et al. (2012) modelled the optimisation of formulation variables and
physical stability of oil in water emulsions using RSM. While, the optimisation of
headspace concentration of emulsions (Mirhosseini et al., 2009a; Mirhosseini & Tan,
2009) and soursop (Cheong et al., 2011) were also modelled using RSM. Advances in
statistics and computing enable a variety of modelling applications such as temperate
distribution in ovens to predict the rate of Maillard reactions (Rodgers, 2008). The
prediction of the rate of such reactions offers a powerful quantitative tool in terms of
food product development (Martins et al., 2001).
Chapter 1 Introduction
16
1.5 Sensory perception of food
The primary purpose of perception is to seek out objects in our environment,
particularly those that are biologically important (Prescott, 2012). Humans are
decisively influenced by their sense of taste and odour, therefore, human history is
closely tied to the development and usage of flavours (Zieglar & Zieglar, 1998).
Sensory science itself is a relatively young discipline and has only been in existence for
roughly 60 years (Drake, 2007). For a large portion of that time, research on sensory
perception of food has primarily concentrated on taste, flavour, and some simple
mechanical properties of a product such as viscosity, firmness, and hardness.
The International Organisation for Standardisation (ISO) defines flavour as a
complex combination of the olfactory, gustatory and trigeminal sensations perceived
during tasting, the flavour may be influenced by tactile, thermal, painful and/or
kinaesthetic effects (ISO 5492, 2009). Flavour is considered one of the most important
attributes determining the acceptance of food by the consumer (Tromelin et al., 2006).
Flavour is an interaction of the food and the consumer, not a property of the food alone,
so no study of flavour is complete unless the consumer is considered as well as the
chemistry and physics of the food (Piggot, 2000). Although flavour is initially
influenced by the receptors in the eyes, nose, tongue and mouth lining, it is the brain
which interprets the overall sensation occurring in the mouth (Taylor & Hort, 2004).

Chapter 1 Introduction
17
1.5.1 The major senses involved in the sensory evaluation of foods
During gustation, food is first brought into the mouth and subsequently
processed in the oral cavity (Chen, 2009). Taste buds on the tongue, palate, soft palate,
and areas in the upper throat (pharynx and laryngopharynx) located within three types
of papillae (fungiform, foliate, and circumvallate papillae) detect the taste sensations of
bitter, salty, sour, sweet and umami (Figure 1.5) (Barham et al., 2010). In addition to
these sensations, there are a variety of chemical sensations known as the trigeminal
sense (chemesthesis) (Meilgaard et al., 2007). When chemical irritants such as
ammonia, ginger, horseradish, onion, chilli pepper, menthol stimulate these trigeminal
nerves in the mucosa of the eyes, nose, and mouth to give hot, burning, tingling, cooling
or astringent sensations (Kemp et al.¸ 2009). Trigeminal neurons are buried below the
surface in the mouth, for this reason the response to stimuli is slow in onset and long
lasting (Reineccius, 2006). For example, contrary to the sense of taste, which is most
intense for the few seconds the food is in the mouth, pungency typically lasts for
minutes to tens of minutes (Barham et al., 2010).
The tongue and the oral cavity are also sensitive to size, shape, texture,
consistency, and temperature of a food object (Auvray & Spence, 2008). Textural
stimuli originate from the structure and mechanical properties of food and the way these
break down during masticating (Taylor & Hort, 2004). The detection of sensations
related to contact/touch (force, particle size and heat) by tactile receptors of the lips,
tongue and surfaces of the oral cavity is known as somesthesis (Kemp et al., 2009).
Kinesthesis perceptions correspond to the mechanical movement of muscles as a result
from stress exerted by the muscle of the jaw or tongue (hardness, stickiness, etc.), and
the sensations of the resulting strain (compression, shear, etc.) within the food being
masticated (Meilgaard et al., 2007).

Chapter 1 Introduction
18
buds located
Figure 1.5 The taste receptor fields of the human oral cavity. (a) The tongue, showing
the four different types of papillae. (b) A fungiform papilla containing taste buds. (c)
Cross section of a taste bud showing the taste pore. (d) The taste cell. (e) Receptor sites
for bitter, sweet, sour, salty, and umami substances.
Source: adapted from Goldstein (2009).
The largest contribution to the diversity of food flavours comes from their
volatile or airborne molecules (Lawless & Heymann, 2010). It is estimated that up to
80% of the information about our food depends on olfaction (Blake, 2004). To be
perceptible, aroma compounds must be volatile and released into the air and transferred

Chapter 1 Introduction
19
to the olfactory cells located in the olfactory epithelium at the roof of the nasal cavity,
which is directly linked to the olfactory bulb of the brain (de Roos, 2006; Pernollet et
al., 2006). Stimulation of the olfactory receptors can be achieved by two distinct routes
(Figure 1.6): either via the nose by orthonasal olfaction (sniffing), or by retronasal
olfaction via the mouth, during eating and drinking, as volatile chemicals rise up
through the nasopharynx (Auvray & Spence, 2008).
Figure 1.6 Olfactory perception via orthonasal route and retronasal routes.
Source: adapted from Goldstein (2009).
The perceived appearance of food can have a profound impact on expectations
and actual taste and flavour sensory characteristics (Wei et al., 2012). The total
appearance of an object is formed by interaction of the visual appearance properties
(colour, translucency, gloss, and surface texture properties) with the human response
(Caivano & del Pilar Buera, 2012). Such sensory characteristics may include sweetness,

Chapter 1 Introduction
20
pureness, refreshing, freshness, naturalness, flavour intensity, thirst-quenching, and
liking (Zellner & Durlach, 2002).
1.5.2 Multisensory flavour perception
Human perception of food flavour and texture during consumption is a
complicated process in which taste, mouth feel, vision, olfaction, the trigeminal system
and auditory signals contribute to the total appreciation of a food product (Visschers et
al., 2006). Sensory attributes cannot be related to a single physical property of the food
(van Vliet et al., 2009), and are perceived when each of the human sensory receptor
organs interact with the physicochemical properties of the food (Kemp et al., 2009).
Traditionally, the senses involved with the perception of flavour in food were
considered to be limited to olfaction, taste, and the somatosenses (irritation, tactile, and
thermal). However, it is now acknowledged that numerous other sensory inputs are
processed by the brain to result in flavour perception (Reineccius, 2006). As shown in
Figure 1.7, the multiplicity of interactions between taste, smell, touch, sound, vision and
the trigeminal system has led numerous researchers to propose flavour as the term for
the combinations of these systems, unified by the act of eating (Small & Prescott, 2005;
Abdi, 2002; Prescott, 1999; McBurney, 1986).
There is no combination of sensory modalities that excludes taste and smell and
still creates a flavour. Colour, texture, sound, irritation and temperature have all been
definitively demonstrated to influence flavour, either through a perceptual interaction or
a physical one (Delwiche, 2004). The simple notion that flavour involves a wide range
of the well-known taste and aroma modalities has been replaced by a realisation that it
is a multi-modal phenomenon (Taylor & Hort, 2004). Consequently, flavour perception

Chapter 1 Introduction
21
should be used as a term to describe the combinations of taste, smell, the trigeminal
system, and touch, to which visual and auditory cues should be added (Auvray &
Spence, 2008).
Figure 1.7 Summary of perceptual interactions evoked during ingestion.
Source: adapted from Delwiche (2004).
Arrowhead indicates a modality that has been demonstrated to interact with another modality.
The study of the multisensory processes involved in flavour perception is
important for a better understanding of the processes used by consumers to assess the
acceptability and flavour of new products (Shepherd, 2006; Blake, 2004; Gilbert &
Firestein, 2002). A complete flavour experience depends on the combined responses of
the senses and the cognitive processing of these inputs (Auvray & Spence, 2008); the

Chapter 1 Introduction
22
release of flavour chemicals in the mouth, the transport processes to the receptors, the
specificity and characteristics of the receptors, the transduction mechanisms and the
subsequent processing of signals locally and at higher centres in the brain (Taylor &
Hort, 2004).
1.5.3 Food sensory analysis
Sensory or organoleptic evaluation of food has been conducted for as long as
man has evaluated the goodness and badness of food and water (Meilgaard, et al.,
2007). Sensory evaluation can be seen as a link between research and development,
specifically technical aspects of food, and consumer and marketing research, focusing
on consumers’ behaviour and psychology (Dijksterhuis, 1997). The sensory attributes of
food are not necessarily the parameters leading to food acceptance or rejection, but
rather the assessor’s preference for particular levels of the food attributes (Shepherd,
1990).
In the food industry, sensory analysis is the food company’s single most
important analytical tool and an asset for research and development. In particular,
combining both sensory analysis and chemical analysis (flavour analysis) can be a
powerful tool for resolving many types of difficult flavour problems (Kemp et al.,
2009). Sensory and instrumental analysis of food has been successfully employed in
tandem for flavour profiling in tomatoes (Auerswald et al., 1999), fruit smoothies
(Keenan et al., 2012) and blackberries (Du et al., 2010).

Chapter 1 Introduction
23
1.5.3.1 Consumer tests
Consumer tests (affective tests) have been proven to be highly effective as a tool
used to design food products that will sell in larger quantities or command higher prices
(Meilgaard et al., 2007). Consumer testing assesses subjective responses to a product
using both qualitative and quantitative methodologies. Researchers can gain an insight
into consumer preferences, attitudes, opinions, behaviours and perceptions concerning
food products (Kemp et al., 2009). A consumer acceptance test is a panel test usually
involving only 50 to a 100 panellists, and is conducted throughout the different phases
in the product development process. There are two approaches to consumer sensory
acceptance testing: the measurement of preference and the measurement of acceptance.
Acceptance tests measure consumer acceptance or liking (hedonic rating) of a product
(Moskowitz et al., 2012). The consumer acts as a measuring instrument, assigning
numbers or words from a scale. In contrast, preference tests measure the appeal of one
food or food product over another (Stone & Sidel, 2004).
1.5.3.2 Descriptive analysis
Information obtained from the description of the sensory characteristics of food
and beverages enable companies to make more informed business decisions (Stone &
Sidel, 2004). Sensory profiling is increasingly viewed as a way to explain and possibly
anticipate consumer preferences, and is usually carried out by conventional profiling
techniques, such as Quantitative Descriptive Analysis (QDA) (Delarue & Sieffermann,
2004). QDA can be time consuming and expensive due to the need to develop an agreed
vocabulary and to carefully and extensively train the assessors. Free Choice Profiling
Chapter 1 Introduction
24
(FCP) was developed to circumvent some of these problems with the conventional
profiling techniques (Lachnit et al., 2003).
The main benefit of FCP methods is their rapidity and ease of use (Delarue &
Sieffermann, 2004). Another advantage of FCP methods over conventional descriptive
methods is that a defined descriptive vocabulary isn’t required, therefore, untrained
consumers may be used as descriptive assessors (Delahunty et al., 1997). This relatively
recent methodology is attractive because it does not demand a training stage and
individual sessions are possible (Albert et al., 2011). FCP methods have been
previously utilised to describe different foods such as red fruit jams (Dairou &
Siefffermann, 2002), dairy products (Delarue & Siefffermann, 2004), commercial apple
and pear purées (Tarea, et al., 2007), flavour perception of bread odour (Lassoued, et
al., 2008; Poinot et al., 2007), jellies (Blancher et al., 2007) and wines (Perrin et al.,
2008).
1.5.4 Hedonic reactions to unfamiliar foods
A novel product refers to a newly developed product unfamiliar to the
consumers (Stolzenbach et al., 2011). The reluctance to consume or the tendency to
avoid or dislike an unfamiliar food is a hallmark of omnivores known as food
neophobia (Henriques et al., 2009; Martins & Pliner, 2006). On the other hand, food
neophilia is the urge towards novelty, with a tendency to try new and unfamiliar foods
(van Trijp & van Kleef, 2008). However, people can be also in the middle of
continuum, being neutral between neophilia and neophobia (Asperin et al., 2011).

Chapter 1 Introduction
25
There are many factors that influence food neophobia, including; socio-
demographic characteristics such as culture, age, gender, education, economic and
social environments (Olabi, et al., 2009; Flight, et al., 2003). The common interest
among culinary researchers and professionals would be to understand and reduce the
level of food neophobia in a targeted population (Asperin et al., 2011). Generally,
exposure, familiarity, nutritional information, and positive experiences increase food
neophilia and decrease neophobia (McFarlane & Pliner, 1997). For example, the more
exposed an individual is to diverse cultures, the more likely he/she will be more
neophilic (Tourila, et al., 2001).
A framework for understanding acceptance and rejection of both familiar and
unfamiliar foods comes from a taxonomy of basic motivational dimensions identified by
Fallon and Rozin (1983). Each dimension is bipolar, with food near the negative poles
being rejected and foods near the positive poles being accepted (Martins & Pliner,
2006). The three basic motivational dimensions underlying reactions to a food
substance are identified by Martins et al. (1997) as: (1) sensory-affective (liking or
disliking the taste, smell or appearance of a food), (2) anticipated consequences
(expectations about the beneficial or harmful consequences of ingestion), and (3)
ideational (knowledge of the nature or origin of the substance which can lead to it being
positively transvalued or considered disgusting). As a consequence, an unfamiliar food
that does not fall into one’s acceptable category will be rejected (Dovey et al., 2008).
Chapter 1 Introduction
26
1.6 Flavour chemistry
1.6.1 Organic volatile compound emission from food
Release of organic volatile compounds from foods is an essential requirement
for flavour perception (Roberts & Taylor, 2000). Knowledge of volatile-food and
volatile-volatile interactions is important for understanding flavour perception (Plug &
Haring, 1993). Flavour compounds are volatile and odorous at atmospheric pressure,
their retention is a function of the availability of the flavour compounds in the gas phase
and, therefore, of the affinity of these compounds for the food matrix (Voilley &
Souchon, 2006). The perception of the aroma compound at the level of the olfactory
epithelium partly depends on its availability in the vapour phase (Seurve, 2007). This is
dependent on the nature and concentration of volatile compounds present in the food, as
well on as their availability for perception as a result of interactions between the food
matrix components and the aroma compounds in the food (Bakker, 1995). The
solubility of flavour compounds in the different phases (aqueous or lipid) of the foods
has a significant role in the behaviour of the flavours in the matrix and will have an
overriding influence on their sensory perception (Landy et al., 1998).
Flavoursome foods can often contain hundreds of organic volatile compounds,
with interactions between these compounds being complex (Chung et al., 2003). For
example, a mixture of two volatile compounds usually elicits a weaker aroma than the
sum of its parts, the perceived intensity of flavour compounds having a logarithmic
rather than a linear relationship with concentration (Wright, 2010). Other complex
volatile-volatile and volatile-non-volatile (taste) interactions exist. Some taste
compounds (such as Monosodium glutamate (MSG)) can increase the perceived aroma
Chapter 1 Introduction
27
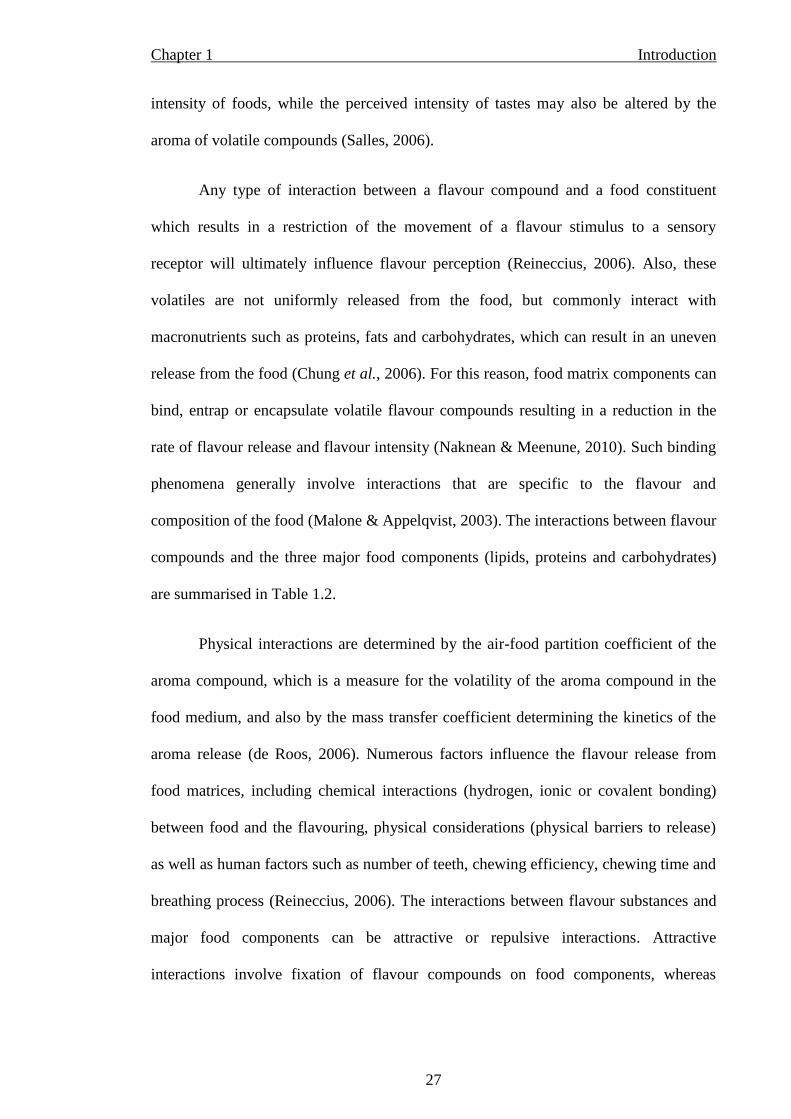
intensity of foods, while the perceived intensity of tastes may also be altered by the
aroma of volatile compounds (Salles, 2006).
Any type of interaction between a flavour compound and a food constituent
which results in a restriction of the movement of a flavour stimulus to a sensory
receptor will ultimately influence flavour perception (Reineccius, 2006). Also, these
volatiles are not uniformly released from the food, but commonly interact with
macronutrients such as proteins, fats and carbohydrates, which can result in an uneven
release from the food (Chung et al., 2006). For this reason, food matrix components can
bind, entrap or encapsulate volatile flavour compounds resulting in a reduction in the
rate of flavour release and flavour intensity (Naknean & Meenune, 2010). Such binding
phenomena generally involve interactions that are specific to the flavour and
composition of the food (Malone & Appelqvist, 2003). The interactions between flavour
compounds and the three major food components (lipids, proteins and carbohydrates)
are summarised in Table 1.2.
Physical interactions are determined by the air-food partition coefficient of the
aroma compound, which is a measure for the volatility of the aroma compound in the
food medium, and also by the mass transfer coefficient determining the kinetics of the
aroma release (de Roos, 2006). Numerous factors influence the flavour release from
food matrices, including chemical interactions (hydrogen, ionic or covalent bonding)
between food and the flavouring, physical considerations (physical barriers to release)
as well as human factors such as number of teeth, chewing efficiency, chewing time and
breathing process (Reineccius, 2006). The interactions between flavour substances and
major food components can be attractive or repulsive interactions. Attractive
interactions involve fixation of flavour compounds on food components, whereas
Chapter 1 Introduction
28
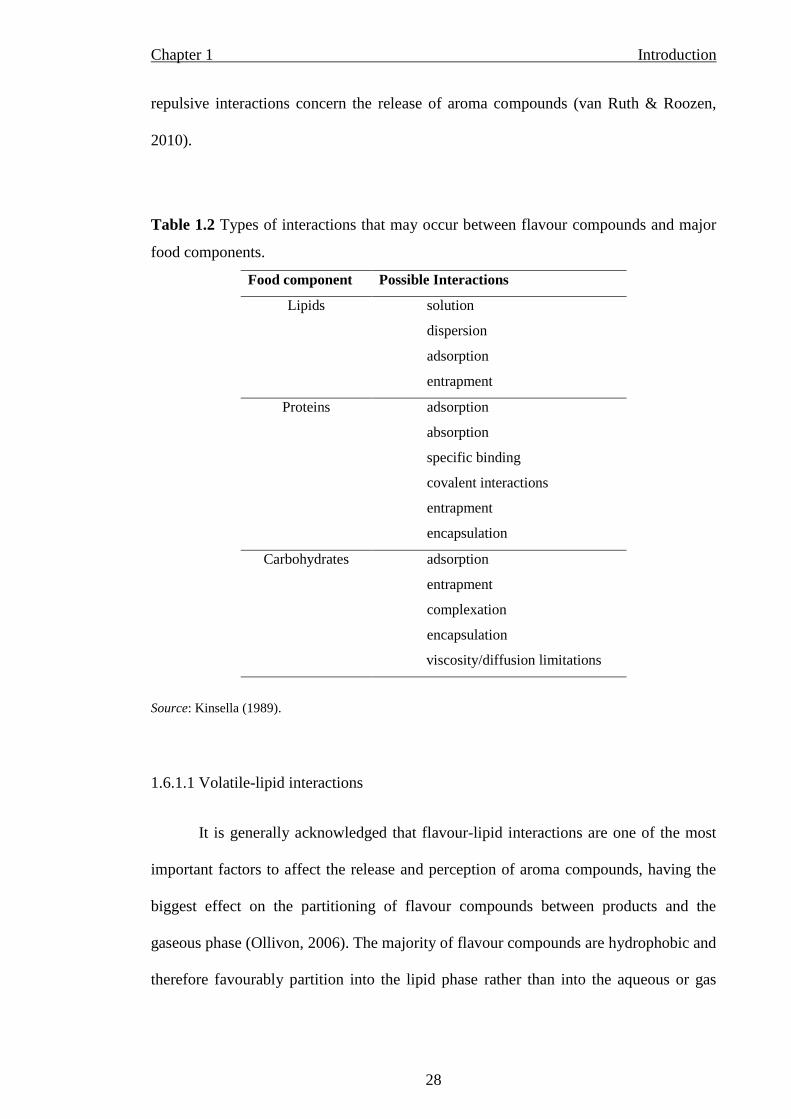
repulsive interactions concern the release of aroma compounds (van Ruth & Roozen,
2010).
Table 1.2 Types of interactions that may occur between flavour compounds and major
food components.
Food component Possible Interactions
Lipids solution
dispersion
adsorption
entrapment
Proteins adsorption
absorption
specific binding
covalent interactions
entrapment
encapsulation
Carbohydrates adsorption
entrapment
complexation
encapsulation
viscosity/diffusion limitations
Source: Kinsella (1989).
1.6.1.1 Volatile-lipid interactions
It is generally acknowledged that flavour-lipid interactions are one of the most
important factors to affect the release and perception of aroma compounds, having the
biggest effect on the partitioning of flavour compounds between products and the
gaseous phase (Ollivon, 2006). The majority of flavour compounds are hydrophobic and
therefore favourably partition into the lipid phase rather than into the aqueous or gas
Chapter 1 Introduction
29
phases, which can alter the balance of the perceived aroma (Wright, 2010). The
overriding effect is the role of lipid as a flavour solvent. Lipids can adsorb and
solubilise hydrophobic flavour compounds (Reineccius, 2006). Lipophilic flavour
compounds bind to the lipid molecules by weak, reversible van der Waals forces (Plug
& Haring, 1993). The generally hydrophobic nature of flavour compounds results in
considerable differences in headspace composition, higher amounts of lipids generally
reduce the volatility of hydrophobic odorants (Kerŝiene et al., 2008). Whereas, in the
absence of lipids, retention of lipophilic flavours is poor, resulting in high headspace
concentrations (Plug & Haring, 1993). In numerous model emulsions and more
complete foods, the differences in headspace concentration and the resulting sensory
intensity due to modifications of the lipid level are well noted (Doyen et al., 2001;
Welty et al., 2001; Gwartney et al., 2000; Haahr et al., 2000; Brauss, et al., 1999).
1.6.1.2 Volatile-carbohydrate interactions
The chemical properties of carbohydrates will determine chemical reactions with
flavour compounds, while the physical properties will determine their influence on
flavour compound mass transport both in the food and from the food (Reineccius,
2006). Some carbohydrates can bind volatiles via hydrogen bonding between
appropriate functional groups, others, such as starch, consist of three-dimensional
structures with hydrophobic regions capable of forming inclusion complexes with
various hydrophobic volatiles (Godshall & Solms, 1992). Hydrocolloids not only
modify viscosity and consistency, but often reduce intensities of odour, taste and
flavour (Delwiche, 2004). This retention of the aroma compound in a food matrix can
be influenced by a decrease of diffusion of the aroma compounds due to an increase of
viscosity and by the presence of interactions between polysaccharides and volatile

Chapter 1 Introduction
30
compounds (Seurve et al., 2007). At lower water content, carbohydrates of various
molecular weights may form a glassy matrix which has excellent retention properties for
aroma compounds (Delarue & Giampaoli, 2006).
1.6.1.3 Volatile-protein interactions
Two types of interactions can occur between flavour compounds and proteins:
(1) reversible physical adsorption via non-covalent interaction and (2) irreversible
chemical reaction via covalent linkages (van Ruth & Roozen, 2010). These interactions
are influenced by the amount of protein and amino acid composition, types of
flavouring components, presence of other food components, ionic strength (salts), pH
(ionic form and conformation), temperature and time (Fischer & Widder, 1997). Bonds
between aroma compounds and proteins are generally weak and include reversible
bonds, van der Waals bonds, hydrogen bonds, and/or hydrophobic interactions
(Kerŝiene et al., 2008). Chemical interactions and mass transfer effects are diverse due
to the wide range of chemical structures available for interaction such as amino acid
chains and hydrophobic pockets, the viscosity and gel structures in proteins (Reineccius,
2006).
1.6.1.4 Physicochemical interactions
The physicochemical behaviour of flavour compounds in food matrices is one of
the most important parameters involved in their activity and sensory perception. Hence,
this behaviour can have pronounced effects on the flavour quality of foods, particularly
emulsions (Mirhosseini et al., 2008a). Physicochemical interactions take place between
Chapter 1 Introduction
31
aroma compounds and food constituents, which modify the partition of these organic
volatile compounds inside the food, thereby influencing the retention and/or the release
of the aroma compounds (Guichard, 2002).
The perception of flavour and aroma volatiles in foods is influenced by the
solubility of volatile compounds, which subsequently can be affected by the level of salt
(NaCl) present in a food (Mitchell et al., 2011). Salt concentrations will have a
significant influence on the ionic strength of a food, which will in turn influence the
solubility of flavour compounds depending on their hydrophobicity (Rabe et al., 2003).
The practice referred to as “salting out”, is a well-known technique for increasing
headspace concentrations of volatile molecules prior to separation and quantification by
headspace gas chromatography (Flores et al., 2007; Pérez-Juan et al., 2007). These
compounds bind considerable amounts of water to build hydration shells during
solubilisation, resulting in reduced water activity (aw) due to the formation of strong
ion-dipole interactions between the salt ions and water (Rabe et al., 2003). This fashions
an increased flavour release from food due to the decreased availability of water
molecules for the solubilisation of flavour compounds (Flores et al., 2007).
When added to aqueous solutions, mono- and di-saccharides interact with water
molecules, producing a “salting out effect” (Delarue & Giampaoli, 2006), whereby the
sugar interacts with water, increasing the concentration of flavour compounds in the
remaining volume of free water (Friel et al., 2000). It has been found that pH has an
impact on the release of some aroma chemicals. At a pH below the acidity constant
(pKa) of a volatile acid, the acid would be in its protonated form (not ionised) and
thereby less soluble in the aqueous phase. This would drive the acid into the headspace,
increasing its contribution to the aroma profile (Reineccius, 2006). In contrast, odorants

Chapter 1 Introduction
32
in the ionized form below their pKa, e.g. amines or pyrazines, are more soluble in water
and therefore exhibit less volatility (Bortnowska, 2010).
1.6.2 Flavour volatile profiles of foods
Approximately 12,000 volatile compounds have been identified in foods
(Grosch, 2001), with some individual foods and beverages such as coffee, chocolate and
bread containing up to 1,000 volatile compounds (Cheetham, 2010). Of these volatile
compounds identified in foods, it is approximated that only around 5 % play a
significant role in the formation of the characteristic aroma of a specific food (Mistry et
al., 1997). These unique chemical substances are known as “character impact
compounds” and contribute the recognisable sensory impression for the particular
flavour or aroma even at low concentrations levels. Examples of which are
benzaldehyde in cherry, vanillin in vanilla and diacetyl in butter (McGorrin, 2012).
In order for an aroma to be active (i.e. be detected by the olfactory cells in the
epithelium), the concentration of the molecule has to be above the specific aroma
threshold for that volatile compound, which varies greatly from molecule to molecule
(Jeleń et al., 2012). The intensity of a flavour is roughly related to its concentration in
the food divided by its threshold for perception (Cheetham, 2010). Flavour quality and
character are known to change with concentration (Wright, 2010). Fisher & Scott (1997)
explained that a chemical such as trans-non-2-enal has more than one recognition
threshold. It possesses a woody character just above its detection threshold of 0.1 ppb.
However, above 8 ppb it elicits fatty notes, and becomes unpleasant at 30 ppb, while at
1000 ppb it has a strong flavour of cucumber.

Chapter 1 Introduction
33
1.6.2.1 Flavour volatile profile of banana
Many studies have focused on the volatiles in fresh banana (Mayr et al., 2003;
Nogueira et al., 2003; Liu & Yang, 2002; Jordán et al., 2001; Ibanez et al., 1998). More
than 250 organic volatile compounds have been identified in banana (Jayanty et al.,
2002). Characteristic volatile esters, alcohols, acids and carbonyls are the four main
compound classes that give strength and character to banana aroma, while amines and
phenols also contribute (Mayr et al., 2003). In particular, esters represent the more
numerous compounds in banana (Jordán et al., 2001), and have been attributed as being
the main contributors to the characteristic fruity banana notes (Imahori et al., 2013;
Vermeir et al., 2009).
Acetates have been noted as being of particular importance due to their high
concentrations and low odour thresholds (Pontes et al., 2012). Specifically, amyl esters
have been accredited with eliciting banana notes, while butyl esters contribute the fruity
notes (Liu & Yang, 2002). Isoamyl acetate and isobutyl acetate have been identified as
being the two most important character impact compounds of banana aroma (Mayr,
2003). Both molecules elicit banana, pear and fruity sensory notes, while isobutyl
acetate also has a slight rum note. Other compounds which elicite typical banana aroma
notes are hexanal, 3-hydroxy-2-butanone, 2-pentanone, 2-pentanol, 3-methyl-1-butanol
and eugenol (Vermier, 2009). Isoamyl alcohol, isobutyl butyrate, butyl butyrate, ethyl
isovalerate, and ethanol have been identified as major volatile compounds of banana
aroma (Liu & Yang, 2002).

Chapter 1 Introduction
34
1.6.2.2 Flavour volatile profile of basmati rice
Studies of rice revealed that among 200 identified organic volatile compounds,
only a few contribute to it’s characteristic aroma (Jezussek et al., 2002; Widjaja et al.,
1996). The characteristic impact compound responsible for the aroma of rice was
reported as 2-acetyl-1-pyrroline (2-AP), a low odour threshold lipophilic compound
contributing to a popcorn-like aroma (Yoshihashi, 2002). Yang et al. (2008) found that
aldehydes and aromatic compounds were the most abundant odour-active compounds in
basmati rice. They listed hexanal, 1-pentanol, (E)-2-hexenal, p-xylene, 2-heptanone,
heptanal, 2-acetyl-1-pyrroline, (E)-2-heptenal, benzaldehyde, 1-octen-3-ol, 2-
pentylfuran, octanal, 3-octen-2-one, (E)-2-octenal, guaiacol, 2-nonanone, nonanal, p-
menthane-3-one, (E)-2-nonenal, naphthalene, dodecane, decanal, (E,E)-2,4 nonadienal,
(E)-2-decenal, and (E,E)-2,4-decadienal as being the most potent odourants in basmati
rice. In addition, alcohols were found to represent 14.89 % of the total aroma of basmati
rice (Paule & Powers, 1989). Hexanol was the major compound detected for this class
of constituents, followed by oct-1-en-3-ol, reported as having a characteristic
mushroom-like aroma (Buttery & Kamm, 1980). Benzyl alcohol, 3-methyl butanol and
2-phenylethanol have also been detected in relatively high amounts in basmati rice
(Tava & Bocchi, 1999).
1.6.2.3 Flavour volatile profile of extra virgin olive oil
The aroma of extra virgin olive oil is composed of over 100 organic volatile
compounds, most of which are present in very low concentrations (Contini & Esti,
2006). C5, C6 and C9 saturated and unsaturated aldehydes and alcohols and their esters
are substances that mainly characterise virgin olive oil aroma (Cavalli et al., 2004;

Chapter 1 Introduction
35
Morales et al., 1995). The “cut grass aromas” of virgin olive oils have been attributed to
several compounds such as nonanal, hexanal (Baccouri et al., 2007), (Z)-3-hexenal, (Z)-
3-hexenyl acetate, hexyl acetate and (Z)-3-hexen-1-ol. So called “green aromas” have
been attributed to (E)-2-hexenal, (E)-3-hexen-1-ol, (E)-2-hexen-1-ol (Angerosa et al.,
2000; Aparicio et al.¸2000), and 3 pentanone (Morales & Tsimidou, 2000). Servili et al.
(1997) found that (E,E)-2-4-heptadienal and ethylbenzaldhyde correlated with the
“green apple” sensory perception in virgin olive oils, while 1-octanol and methyl
salicylate were associated with “fatty” sensory perceptions. The hot spicy flavour of
virgin olive oils has been previously attributed to the active compound pinene
(Ekundayo et al., 1988). Acetic acid, ethanol and ethyl acetate have all been associated
with “vinegar” or “wine” flavours in olive oils (Kalua et al., 2007).
1.6.2.4 Flavour volatile profile of bacon
Approximately 150 organic volatile compounds have been identified in the
headspace volatiles of fried bacon. Of these compounds, hydrocarbons, aldehydes,
ketones and alcohols have been reported in the headspace, while small amounts of
pyrazines, furans, pyridines and other nitrogen and sulphur compounds were also
present (Ramarathnam & Rubin, 1994). Pyrazines such as 2-ethyl-5-methylpyrazine and
2-ethyl-3, 5-dimethylpyrazine have been found to contribute to the characteristic bacon
flavour. Some furans and pyridines such as 2-pentylfuran and 3, 4-dimethylpyridine
have been described as meaty aroma contributors to bacon flavour (Timón et al., 2004).
Sulphur compounds have been noted as being important contributors to meat flavour in
cooked foods due to their low flavour threshold (Flores et al., 1997). Yu et al. (2008)
detected thioethers and thiol compounds in traditional Chinese bacon, which included
dimethyl disulfide, 3-(methylthio) propanal, dimethyl trisulfide and methanethiol. These
Chapter 1 Introduction
36
compounds are considered to be particularly important aroma compounds of bacon
produced through the Maillard reaction during cooking (Mottram & Nobrega, 2002).
Furans and thiophenes with a thiol group in the 3-position, and related disulfides, have
been shown to possess strong meat-like aromas and exceptionally low odour threshold
values (Mottram, 1998). Other thiols and disulfides, containing, 2-furanylmethyl
moieties have also been found in the volatiles of heated meat systems (Madruga &
Mottram, 1995). The aldehyde produced via Strecker degradation 3-methylbutanal has
been found to be a main contributor to the flavour of bacon (Ho et al., 1983).
1.6.3 Volatile analysis of foods
Many methods have been used for flavour volatile analysis. The most typically
utilised methods for extraction and preconcentration are headspace techniques, purge-
and-trap, liquid-liquid extraction, and simultaneous distillation and extraction (Liu &
Yang, 2002). Most of the traditional analytical sample preparation techniques, such as
liquid-liquid extraction (LLE) rely on the exhaustive removal of analyte from the
sample matrix by the use of a large volume of extraction phase (Vuckovic et al., 2010).
This can be time consuming, labour-intensive, involve errors and losses in each stage,
while waste disposal of solvents adds extra costs and creates health hazards (Vas &
Vékey, 2004).
1.6.3.1 Headspace solid-phase microextraction (HS-SPME)
In foods, headspace analysis is one of the options for instrumental determination
of volatile compounds in a sample as the headspace contains all the volatiles that are
responsible for the odour sensation (Chambers & Koppel, 2013). Headspace sampling
Chapter 1 Introduction
37
techniques are frequently used in the determination of the volatile compounds present in
foods (Zhao et al., 2010). A very successful approach to sample preparation for
headspace analysis is solid-phase microextraction (SPME), invented by Pawliszyn and
co-workers in 1989 (Arthur & Pawliszyn, 1990). SPME is a rapid sampling technique
where volatiles interact with a fibre-coated probe inserted into the headspace (Berna et
al., 2005). In comparison to the traditional analytical sample preparation techniques,
SPME is an equilibrium sample preparation technique, where only a small amount of
extraction phase is used so that only a small portion of the analyte is removed from the
sample (Vuckovic et al., 2010). SPME is a sensitive, selective and inexpensive solvent
free method, providing better precision and linearity response with improved detection
limits, which can also save preparation time while being easy to handle (Kataoka et al.,
2000; Marsili, 1999; Zhang & Pawliszyn, 1993). SPME has been routinely used in
combination with gas chromatography mass spectrometry (GC/MS) and successfully
applied to a wide variety of compounds, especially for the extraction of volatile and
semi-volatile organic compounds from food samples (Vas & Vékey, 2004). GC/MS
itself is an excellent method for quantification and identification of aroma compounds
(Berna et al., 2005) and is the single most widely used technique in flavour studies
(Reineccius, 2010).
Figure 1.8 depicts the key component of a SPME device, which is a fused-silica
fibre that is coated on the outside with an appropriate stationary phase such as
polydimethylsiloxane (PDMS) (Yu et al., 2008). There are two typical SPME
applications, sampling gases (headspace SPME (HS-SPME)) or sampling solutions. In
both cases the SPME needle is inserted into the appropriate position through a septum,
the needle protecting the fibre is retracted and the fibre is exposed to the environment
(Ulrich, 2000). Analytes establish equilibria among the sample matrix, the headspace

Chapter 1 Introduction
38
above the sample, and a stationary phase coated on a fused silica fibre (Mirhosseini et
al., 2008b). The technique is based on a sorption procedure (absorption and/or
adsorption, depending on the fibre coating) (Arthur et al., 1992). After sampling, the
fibre (Figure 1.9) is retracted into the metal needle (for mechanical protection), and the
next step is to thermally desorb the analyte from the fibre to a capillary column of the
chromatograph (Vas & Vékey, 2004).
Figure 1.8 Schematic diagram of a commercial solid-phase microextraction device.
Source: Vas & Vékey (2004).
The choice of the fibre coating is a key factor, since the type and amount of
compounds that are extracted from the sample depends on the physical and chemical
characteristics of the fibre stationary phase and on the film thickness (Yu et al., 2008).
The affinity of the fibre for an analyte relies on the principle of ‘like dissolves like’, and
coating fibres having different properties or thicknesses are selected in accordance with
target compounds (Kataoka et al., 2000). HS-SPME has been successfully applied to the
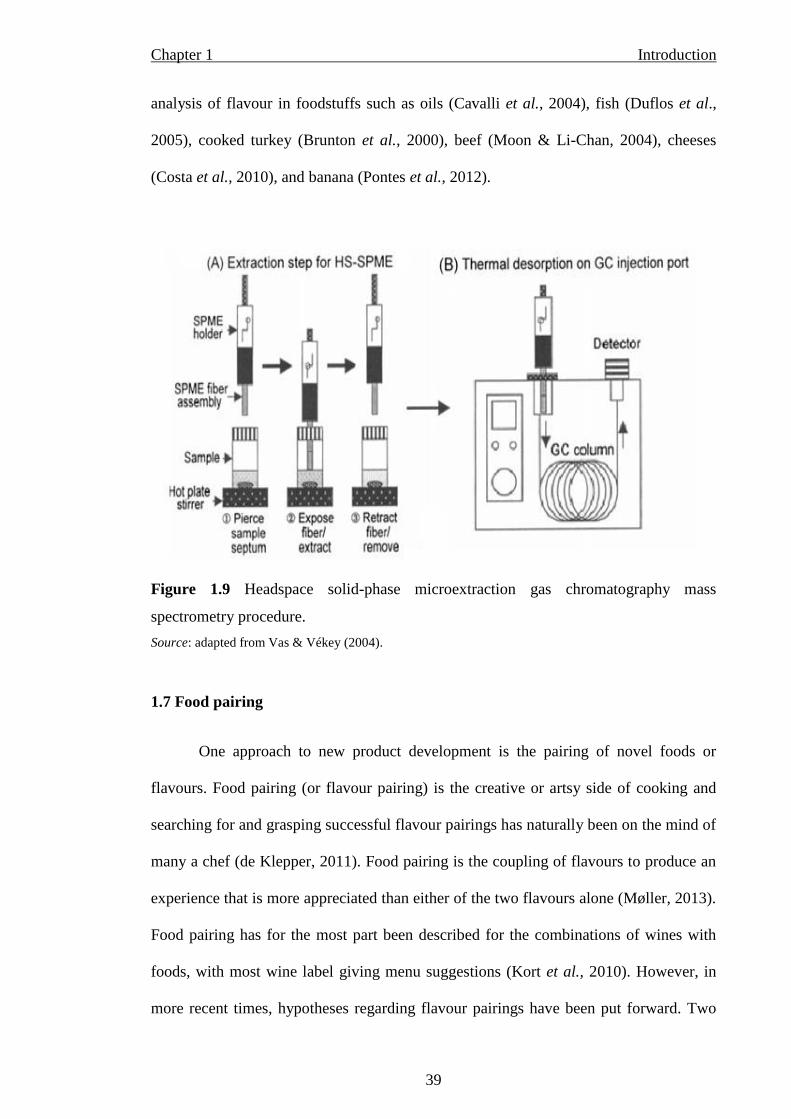
Chapter 1 Introduction
39
analysis of flavour in foodstuffs such as oils (Cavalli et al., 2004), fish (Duflos et al.,
2005), cooked turkey (Brunton et al., 2000), beef (Moon & Li-Chan, 2004), cheeses
(Costa et al., 2010), and banana (Pontes et al., 2012).
Figure 1.9 Headspace solid-phase microextraction gas chromatography mass
spectrometry procedure.
Source: adapted from Vas & Vékey (2004).
1.7 Food pairing
One approach to new product development is the pairing of novel foods or
flavours. Food pairing (or flavour pairing) is the creative or artsy side of cooking and
searching for and grasping successful flavour pairings has naturally been on the mind of
many a chef (de Klepper, 2011). Food pairing is the coupling of flavours to produce an
experience that is more appreciated than either of the two flavours alone (Møller, 2013).
Food pairing has for the most part been described for the combinations of wines with
foods, with most wine label giving menu suggestions (Kort et al., 2010). However, in
more recent times, hypotheses regarding flavour pairings have been put forward. Two

Chapter 1 Introduction
40
food pairing online software tools for research and development support are currently
available; Foodpairing (foodpairing.com, SenseforTaste, Bruges, Belgium) and
Flavorstudio (senspirellc.com, Senspire, CA, USA).
The concept that foods can combine well when they share major flavour
components is one such hypothesis that has been put forward in recent years (Møller,
2013). This hypothesis was first appreciated by the Firmenich scientist François Benzi
in 1992, resulting in the creation of the online software tool Foodpairing.com. This
hypothesis has received considerable attention over the past decade among chefs and
food scientists (Ahn et al., 2011). This food pairing tool is based on the flavour pairing
hypothesis, and is aimed at providing research and development support for
professional chefs and bartenders. Users of the software tool can graphically view the
similarities between food ingredients and food products on a visually interactive “food
pairing tree” (Figure 1.10) (SenseForTaste, 2013).
Figure 1.10 Food pairing tree.
Source: Foodpairing.com (SenseforTaste, Bruges, Belgium).
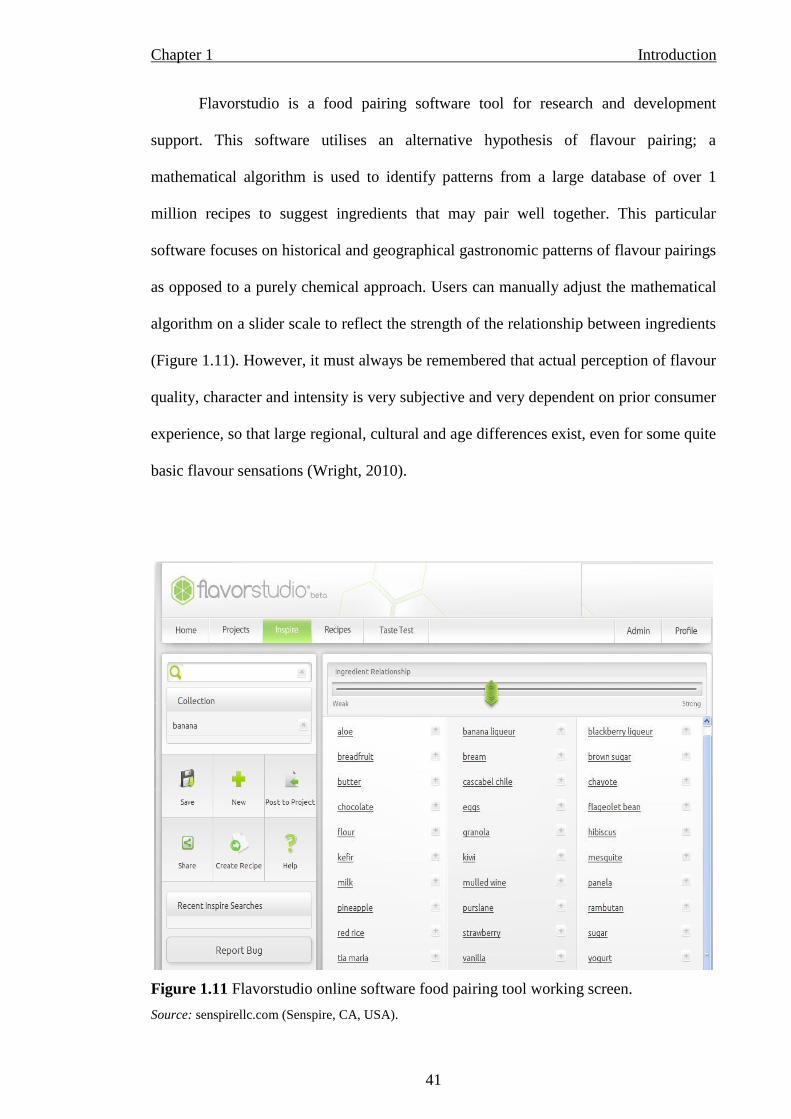
Chapter 1 Introduction
41
Flavorstudio is a food pairing software tool for research and development
support. This software utilises an alternative hypothesis of flavour pairing; a
mathematical algorithm is used to identify patterns from a large database of over 1
million recipes to suggest ingredients that may pair well together. This particular
software focuses on historical and geographical gastronomic patterns of flavour pairings
as opposed to a purely chemical approach. Users can manually adjust the mathematical
algorithm on a slider scale to reflect the strength of the relationship between ingredients
(Figure 1.11). However, it must always be remembered that actual perception of flavour
quality, character and intensity is very subjective and very dependent on prior consumer
experience, so that large regional, cultural and age differences exist, even for some quite
basic flavour sensations (Wright, 2010).
Figure 1.11 Flavorstudio online software food pairing tool working screen.
Source: senspirellc.com (Senspire, CA, USA).

Chapter 1 Introduction
42
1.8 Food Innovation
1.8.1 Innovative food product development
Customers are more demanding and more engaged in the food product
development process and their interests in more differentiated and exciting food
products have been observed in recent years (Stolzenbach et al., 2013; Topp, 2007). It is
clear that a change in the mode of operation of product developers from supply-
orientated activities to demand-orientated activities has developed (van Boekel &
Linnemann, 2011). Developing new and innovative products grants producers the
capability to compete in mature and developed markets. Furthermore, these products
perform several roles: give some protection against price competition, replace products
that face declining sales at the end of their lifecycles, and contribute to creating
customer satisfaction and loyalty (Grunert et al.¸ 2004).
The key to market success lies in a balance between responsiveness and pro-
activeness and in short-term success from incremental innovation and long-term success
from more radical new innovation (van Trijp & van Kleef, 2008). In an increasingly
globalising food market, innovation is an essential strategic tool for food enterprises to
achieve competitive advantage, to stand out from competitors and to fulfil consumer
expectations (Wang & Lin, 2009; Gellynck et al., 2007; Menrad, 2004). However, the
more a food product is differentiated, the more choices have to be made by product
developers, and these choices must be in line with consumer preferences (Grunert et al.,
2011). Thus, successful development of innovative food products requires an excellent
understanding of consumers’ perceptions, expectations and attitudes towards food
products (Linnemann et al., 2006). For this reason, consumer integration in food
innovation and development activities can increase the amount of diversified and

Chapter 1 Introduction
43
customer based knowledge obtained, which helps to reduce the innovation failure rate
(Song et al., 2013). Moreover, customer integration also helps to create innovative ideas
and feedback regarding concepts or prototypes for new products (Prahalad &
Ramaswamy, 2004).
It is commonly acknowledged that risks and difficulties are intrinsic in new
product development (Hoyer et al., 2010). Food innovations are often rejected by
consumers as a result of food neophobia (Barrena & Sánchez, 2013). Nevertheless, the
arrival of new products in the marketplace has created a climate of ambivalence or
insecurity, in which some innovations meet opposition and suspicion (Grunert & Valli,
2001). Many technology-based innovations (e.g., information technology) have been
incorporated into daily life with high levels of consumer acceptance, on the other hand,
others have been met with substantial resistance such as genetically modified foods
(GMFs) and food irradiation (Ronteltap et al., 2007). As a result, 80 % to 90 % of all
newly developed products in the food and beverage market fail (Duber-Smith & Black,
2012).
1.8.2 The importance of food innovation to the Irish economy
The considerable development in research and food innovation has led to an
increase of new foods entering the market and which have a key role to play in the
sustainable development and competitiveness of the sector (Bäckström et al., 2004).
Ireland is striving to create a world-class research system that drives innovation and
economic success (DAFM, 2013). The agriculture and food sectors are extremely
important to the Irish economy. One in seven jobs in Ireland is in the food industry,
with over 300,000 people working in the growing processing and selling of Irish food

Chapter 1 Introduction
44
(Phelan & O’Connell, 2011). It is a well-known fact that high levels of investment in
research and innovation is a major driver of economic growth (Grunert et al., 2008). In
particular, science, technology and innovation are vital to the Irish economic and social
progress. The development of the ‘smart’ or innovation-based economy is the key
challenge facing Ireland, even within the largely uncharted territory of the current
financial crisis (DETE, 2009). For Ireland to become one of the most highly innovative
food countries in the world, Irish food exporters should focus on innovation leading to
brand building based around customer feedback as a means to capturing greater market
value (Bord Bia, 2010). Some steps have already been taken to begin this process. Kerry
Group have begun the construction of a global flagship technology and innovation
research and development centre in Naas, Co. Kildare, which will be operational by
2015 (The Daily Business Post, 2012).
1.8.3 Gastronomy as a driver for food innovation
Gastronomy and the industry of fine dining are becoming major drivers for food
innovation (Aguilera, 2009). Food manufacturers assess marketplace trends, and very
often monitor what trends are currently popular in restaurants in order to develop
concepts for new products (Moskowitz et al., 2009). Chefs are integral in the process of
creating novel food products through actively participating in the generation of ideas,
process development, and final applications (Valdovinos, 2009). For many years now,
chefs have experimented with liquid nitrogen, rotary steamers, thermo-regulators,
ultrasonic mixers and other laboratory type equipment to design radically different food
items such as vodka mayonnaise, transparent pasta stuffed with caviar and others
(Villariano, 2006). Product development centres of food multinationals are listening to
Chapter 1 Introduction
45
chefs and bringing them into their quarters to profit from their approaches, thereby
increasing the dissemination, popularity and use of new products, and subsequently
expanding niches for their products (Valdovinos, 2009). Food product developers
should be alert about this top-down trend of innovation as it may lead to improved
goods with added novelty (Aguilera, 2009). Furthermore, the use of analytical methods
combined with the principles of molecular gastronomy and supported by statistical
predictive models such as response surface methodology can produce outstanding
outcomes in food product development (Rodgers, 2008).
1.9 Proposed study
1.9.1 Motivation
A proactive approach to the modern consumer’s fundamental desires and needs,
where food is appreciated for it’s source of enjoyment and pleasure and not solely for
nutrition and sustenance is required for survival and progression in the current
economic climate. Traditional methods of new product development (especially in large
companies) involve the coordination and cooperation of numerous departments (food
engineering, processing, marketing etc.) at different steps and stages throughout the
development process. Furthermore, technical knowledge and information obtained
through separate scientific experimental investigation of culinary phenomena can also
be applied (usually carried out by a separate party). As molecular gastronomy is a
science, with an aim of obtaining new knowledge through scientific investigation, the
incorporation of a molecular gastronomy approach to new product development would
allow for the direct technical application of newly obtained knowledge. Thus, this
intelligent design of food begins at a molecular level, investigating the chemical and
Chapter 1 Introduction
46
physical interactions between food constituents themselves, and also between the
consumer and the food itself.
Furthermore, food product developers are typically skilled or have experience in
specific areas of the food product development process. These areas are typically either
scientific based (food engineering, food processing, nutrition and diet, food safety etc.)
or culinary based areas (butchery, charcuterie, garde manger, bakery etc.). With a
broader skill set (both culinary and scientific), molecular gastronomists are scientists
who apply their knowledge to culinary products. This knowledge can then be applied to
improve the quality of the gatronomique experience of food products for the retail
sector. Hence, a major advantage of having a molecular gastronomist involved in the
product development process is more efficient communication through having a greater
understanding of both culinary and scientific terminology and specific processes. For
this reason, molecular gastronomists can communicate with all the separate departments
involved in the development process, helping to break down the communication barriers
between science and culinary arts.
Therefore, a molecular gastronomy approach allows for a more holistic
understanding of food products, providing insight on how to manipulate and optimise
new food products to maximise the gastronomic experience of the consumer.
Additionally, a consumer integrated product development approach offers an insight
into the consumer’s perception of the products. Developing novel food products using
qualitative and quantitative methods of scientific investigation in this thesis will
ultimately provide the consumer with high quality novel foods.
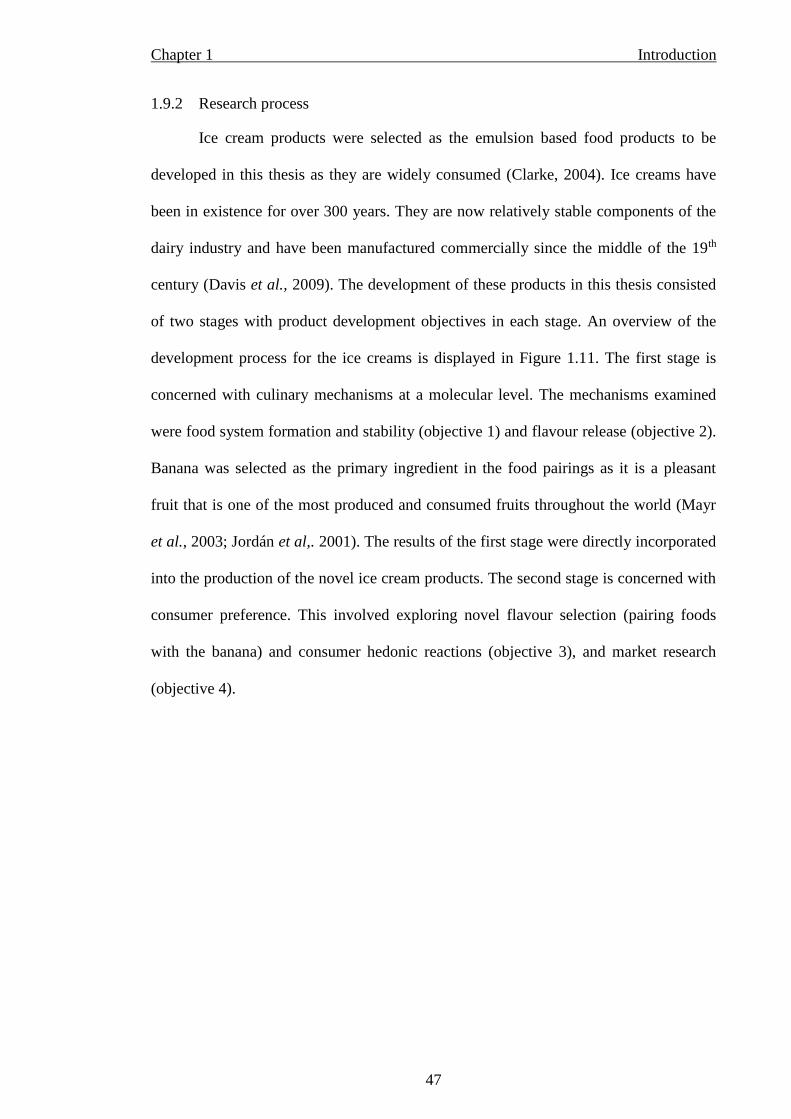
Chapter 1 Introduction
47
1.9.2 Research process
Ice cream products were selected as the emulsion based food products to be
developed in this thesis as they are widely consumed (Clarke, 2004). Ice creams have
been in existence for over 300 years. They are now relatively stable components of the
dairy industry and have been manufactured commercially since the middle of the 19th
century (Davis et al., 2009). The development of these products in this thesis consisted
of two stages with product development objectives in each stage. An overview of the
development process for the ice creams is displayed in Figure 1.11. The first stage is
concerned with culinary mechanisms at a molecular level. The mechanisms examined
were food system formation and stability (objective 1) and flavour release (objective 2).
Banana was selected as the primary ingredient in the food pairings as it is a pleasant
fruit that is one of the most produced and consumed fruits throughout the world (Mayr
et al., 2003; Jordán et al,. 2001). The results of the first stage were directly incorporated
into the production of the novel ice cream products. The second stage is concerned with
consumer preference. This involved exploring novel flavour selection (pairing foods
with the banana) and consumer hedonic reactions (objective 3), and market research
(objective 4).

Chapter 1 Introduction
48
Figure 1.12 Schematic overview of the development process for the novel ice creams.
Objective 2:
Optimise the flavour volatile release of
selective volatiles from the optimised
dispersion model system (chapter 4). Novel ice
cream
products
Objective 4:
Produce innovative food products based
on the findings of the previous
objectives and assess their consumer
acceptability and preference for these
products and their suitability to a
specific market sector (chapter 6).
Objective 1:
Optimise the formation and stability of
a food dispersion model system
(chapter 3).
Objective 3:
Investigate novel flavour combinations
in terms of sensory hedonic responses
and flavour volatile interactions
(chapter 5).
(chapter 5)
Stage 1
Stage 2

Chapter 1 Introduction
49
1.9.3 Research aims and objectives
An overview of the objectives, questions and principal investigations involved in
development of novel food products is listed in Table 1.3. The main aim of this project
was to produce innovative food products based on molecular gastronomy principles.
The main objectives are to:
Optimise the formation and stability of a food dispersion model system.
Optimise the flavour volatile release of selective volatiles from the optimised
dispersion model system.
Investigate novel flavour combinations in terms of sensory hedonic responses
and flavour volatile interactions.
Produce innovative food products based on the findings of the previous
objectives and assess their consumer acceptability and preference for these
products and their suitability to a specific market sector.
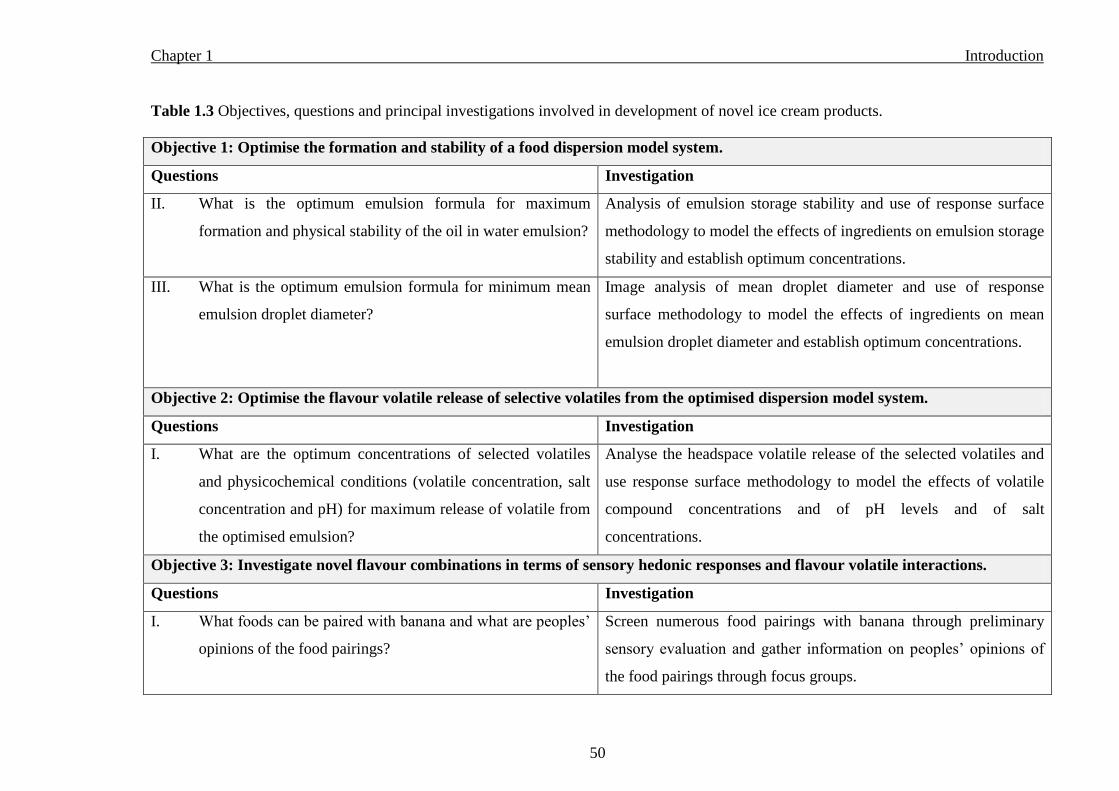
Chapter 1 Introduction
50
Table 1.3 Objectives, questions and principal investigations involved in development of novel ice cream products.
Objective 1: Optimise the formation and stability of a food dispersion model system.
Questions Investigation
II. What is the optimum emulsion formula for maximum
formation and physical stability of the oil in water emulsion?
Analysis of emulsion storage stability and use of response surface
methodology to model the effects of ingredients on emulsion storage
stability and establish optimum concentrations.
III. What is the optimum emulsion formula for minimum mean
emulsion droplet diameter?
Image analysis of mean droplet diameter and use of response
surface methodology to model the effects of ingredients on mean
emulsion droplet diameter and establish optimum concentrations.
Objective 2: Optimise the flavour volatile release of selective volatiles from the optimised dispersion model system.
Questions Investigation
I. What are the optimum concentrations of selected volatiles
and physicochemical conditions (volatile concentration, salt
concentration and pH) for maximum release of volatile from
the optimised emulsion?
Analyse the headspace volatile release of the selected volatiles and
use response surface methodology to model the effects of volatile
compound concentrations and of pH levels and of salt
concentrations.
Objective 3: Investigate novel flavour combinations in terms of sensory hedonic responses and flavour volatile interactions.
Questions Investigation
I. What foods can be paired with banana and what are peoples’
opinions of the food pairings?
Screen numerous food pairings with banana through preliminary
sensory evaluation and gather information on peoples’ opinions of
the food pairings through focus groups.

Chapter 1 Introduction
51
Table 1.3 (continued) Objectives, questions and principal investigations involved in development of novel ice cream products.
II. Do consumers consider the screened food pairings to be
acceptable?
Preform a consumer sensory panel on the food pairings.
III. What are reasons for the consumer panel hedonic response to
the food pairings?
Conduct volatile profile analysis and descriptive sensory analysis on
the food pairings and correlate the results.
Objective 4: Produce innovative food products based on the findings of the previous objectives and assess their consumer
acceptability and preference for these products and their suitability to a specific market sector.
Questions Investigation
I. How can the bacon and basmati rice flavours be successfully
transferred to the ice creams?
Carry out preliminary sensory analysis on various methods of
flavour transfer from bacon and basmati rice.
II. What are the preferred flavour ratios of banana to bacon and
of banana to basmati rice in the ice cream formulations?
Complete sensory analysis on the different formulations of banana
and bacon ice cream and of banana and basmati rice ice cream to
obtain those which are most preferred.
III. What are the pH and salt levels of the ice creams? Are they
in line with the findings from objective 2?
Perform pH and salt determination analysis of the two ice cream
samples.
IV. What is the most suitable market sector for the two ice cream
products and ultimately are they liked by consumer panels?
Conduct quantitative sensory analysis (affective tests) on the two ice
cream products with two sensory panels representing different
markets (general and specific).
V. What was the reason behind panellists’ hedonic responses to
the two ice cream products?
Gather qualitative data through sensory analysis of the two ice
cream products.

Chapter 2 Materials and Methods
52
Chapter 2
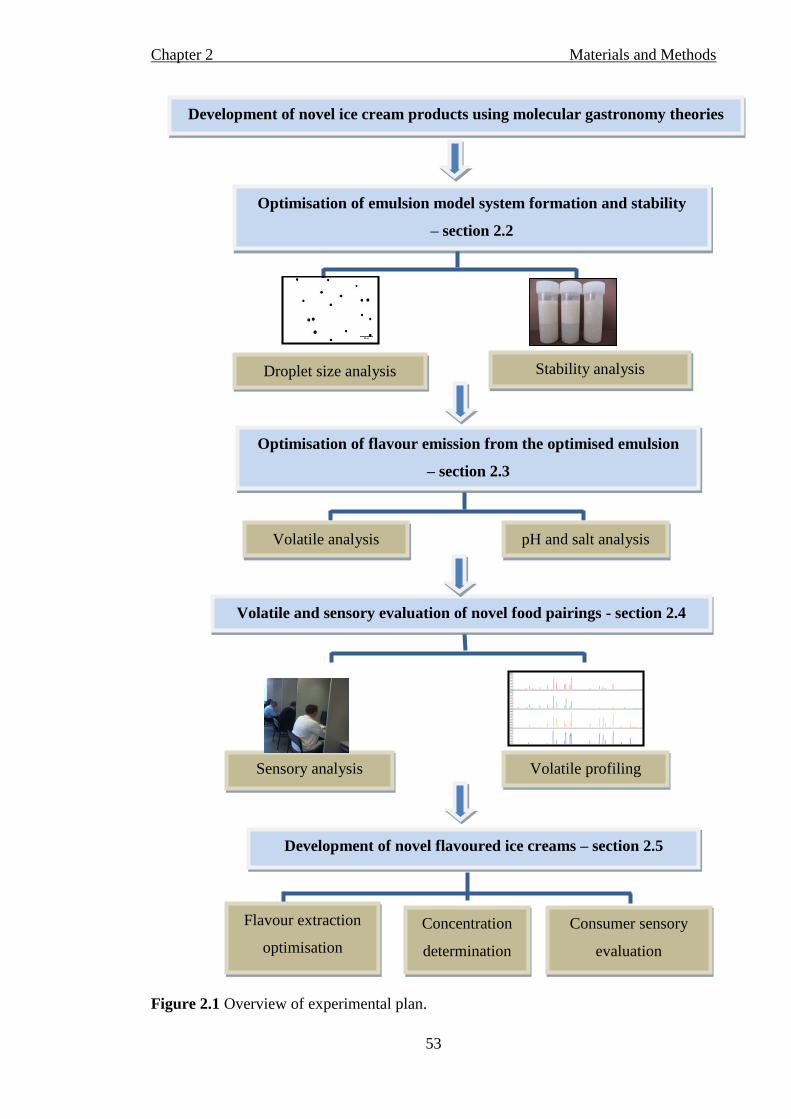
Chapter 2 Materials and Methods
53
Figure 2.1 Overview of experimental plan.
Volatile and sensory evaluation of novel food pairings - section 2.4
Optimisation of flavour emission from the optimised emulsion
– section 2.3
Volatile analysis pH and salt analysis
Stability analysis
Droplet size analysis
Development of novel ice cream products using molecular gastronomy theories
Optimisation of emulsion model system formation and stability
– section 2.2
Sensory analysis Volatile profiling
Flavour extraction
optimisation
Concentration
determination
Consumer sensory
evaluation
Development of novel flavoured ice creams – section 2.5

Chapter 2 Materials and Methods
54
2.1 Ethical considerations
Prior to commencing this study, it was a requirement that ethical clearance be
granted from DIT Research Ethics Committee before conducting any sensory tests using
members of the public. It is believed that sensory testing has the potential to cause
severe illness and even death, e.g. due to food poisoning or the ingestion of toxic
ingredients. Therefore, it was essential all aspects of testing were considered to ensure
all procedures and practices conformed to all legal and ethical requirements. Declaration
of research ethics and risk assessment documentation was sent to the DIT Research
Ethics Committee, outlining procedures for the protection of sensory panellists, safety
of sample ingredients, sample preparation and test protocol. The project was granted
ethical clearance, subject to individuals being fully informed of the project and
completing consent forms (appendix A).
2.2 Optimisation of emulsion formation and stability
2.2.1 Emulsion raw materials
Soy lecithin (Kelkin, Dublin, Ireland) was purchased in a local supermarket
(Dunnes Stores, Dublin, Ireland). Xanthan gum was kindly donated by Chemcolloids
Ltd. (Cheshire, UK). Sunflower oil (Basso Fedele and Figli, Avellino, Italy) was
purchased from a local food supplier.
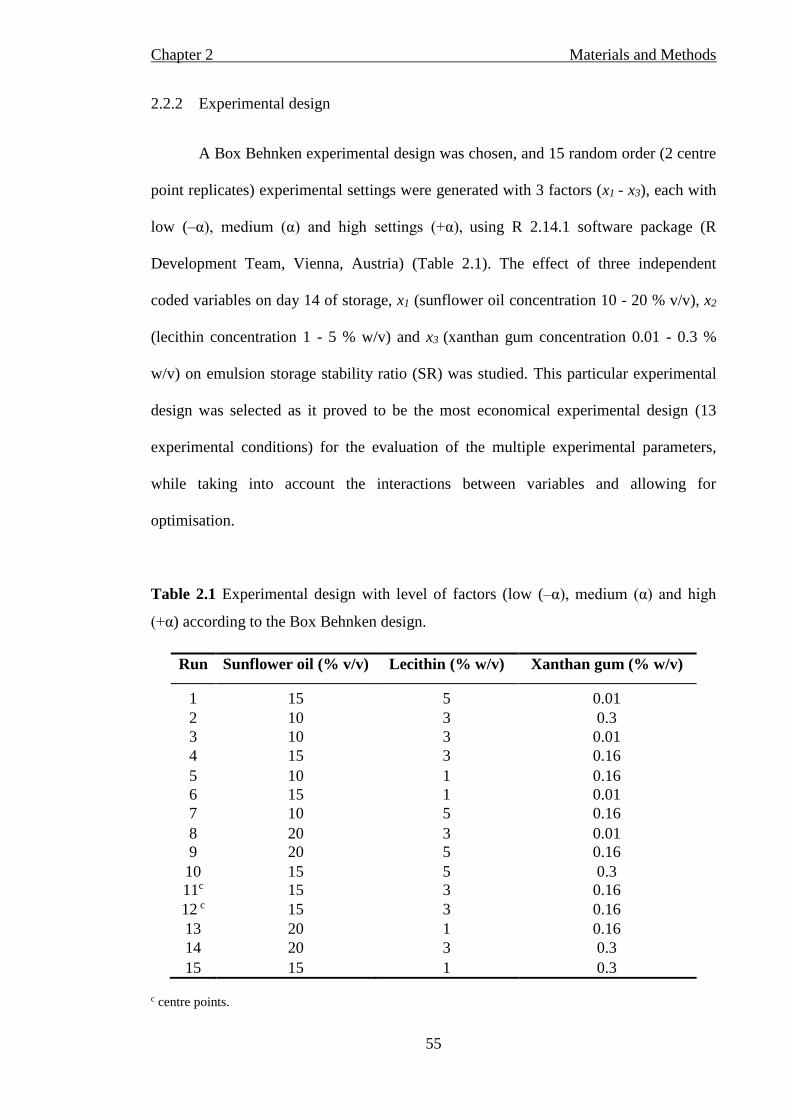
Chapter 2 Materials and Methods
55
2.2.2 Experimental design
A Box Behnken experimental design was chosen, and 15 random order (2 centre
point replicates) experimental settings were generated with 3 factors (x1 - x3), each with
low (–α), medium (α) and high settings (+α), using R 2.14.1 software package (R
Development Team, Vienna, Austria) (Table 2.1). The effect of three independent
coded variables on day 14 of storage, x1 (sunflower oil concentration 10 - 20 % v/v), x2
(lecithin concentration 1 - 5 % w/v) and x3 (xanthan gum concentration 0.01 - 0.3 %
w/v) on emulsion storage stability ratio (SR) was studied. This particular experimental
design was selected as it proved to be the most economical experimental design (13
experimental conditions) for the evaluation of the multiple experimental parameters,
while taking into account the interactions between variables and allowing for
optimisation.
Table 2.1 Experimental design with level of factors (low (–α), medium (α) and high
(+α) according to the Box Behnken design.
c centre points.
Run Sunflower oil (% v/v) Lecithin (% w/v) Xanthan gum (% w/v)
1 15 5 0.01
2 10 3 0.3
3 10 3 0.01
4 15 3 0.16
5 10 1 0.16
6 15 1 0.01
7 10 5 0.16
8 20 3 0.01
9 20 5 0.16
10 15 5 0.3
11c 15 3 0.16
12 c 15 3 0.16
13 20 1 0.16
14 20 3 0.3
15 15 1 0.3

Chapter 2 Materials and Methods
56
Selection of emulsion ingredients and their preliminary experimental ranges
were based on literature research for sunflower oil (Mirhosseini et al., 2008b; Comas et
al., 2006), lecithin (Klinkersorn & McClemnets, 2009; Surh et al., 2008; Thakur et al.,
2007; Malone et al., 2003) and xanthan gum (Mirhosseini et al., 2008a: Sun et al.,
2007; Hemar et al., 2001). Furthermore, the preliminary experimental ranges were
narrowed down to the experimental ranges based on preliminary experimentation where
emulsion gravitational stability was measured.
Box Behnken designs are 3 levels factorial designs that have all points as
centroids of the faces of a hypercube with dimensions equal to the number of factors
(Box & Behnken, 1960). Thus, all these treatments lay on a single hyper-sphere and are
equally distant from the centre. Box Behnken designs are especially useful for
experiments in 3 to 7 experimental factors (Schrevens & Portier, 2006). Box Behnken
experimental designs has previously been employed to investigate emulsion stability
(Martinez et al., 2011).
For statistical analysis the variables were centred in the interval [-1, 1] by:
xn = x - xmin / ((xmax - xmin) / 2) (Equation 2.1)
Where x and xn are the original and the coded variable respectively and xmax and
xmin are the maximum and minimum of the variable x. SR measurements were taken on
day 14, measurements were repeated three times, and experiments were conducted in
triplicate, resulting in nine measurements in total for each experimental condition for
SR. DS was measured at day 0, 1, 7 and 14, and experiments were conducted in
triplicate. The optimal level of three independent variables (x1, x2 and x3) which led to
the desirable multi response goals (minimise DS and maximise SR) was determined by

Chapter 2 Materials and Methods
57
graphical and numerical optimisation procedures. Contour plots and canonical analysis
were employed in order to deduce workable optimum conditions.
2.2.3 Preparation of emulsions
Surfactant solutions were prepared by dispersing the lecithin (1 - 5 % w/v) and
xanthan gum (0.01 - 0.3 % w/v) in distilled water and mixing for 1.5 hours at 60 oC
(Sznitowska et al., 2002) using a magnetic stirring bar and magnetic stirrer hotplate
(Stuart CB162, Bibby-scientific, Staffordshire, UK). Sunflower oil (10 - 20 % v/v) was
then heated to 60 oC and slowly added to the aqueous phase while stirring. This pre-
emulsion was allowed to mix for a further 5 minutes before being homogenised with a
high shear blender (Silverson L4R, Silverson Machines Ltd., Chesham, UK) for 3
minutes at 8,000 rpm. The resulting emulsion was allowed to cool to room temperature.
Thirty mL of emulsion sample was transferred to a graduated 40 mL plastic test tube
(84 × 30 mm polypropylene with screw cap, Sarstedt Ltd., Wexford, Ireland), tightly
sealed with a plastic cap, and stored in a dark incubator (Innova 42, New Brunswick
Scientific, Enfield, CT, USA) for 14 days at ambient room temperature (23 oC +/- 1 oC).
2.2.4 Analysis of emulsion stability
Emulsion stability ratio (SR) was calculated as a percentage of the initial
emulsion height in the tube (HE), height of cream layer (HC) and height of
sedimentation phase (HS) (Mirhosseini et al., 2008b):
𝑆𝑅 =(𝐻𝐸−(𝐻𝐶+𝐻𝑆))
𝐻𝐸 × 100 Equation 2.2

Chapter 2 Materials and Methods
58
Emulsion stability measurements were taken on day 14, experimental
determinations were carried out in triplicate and each measurement was recorded three
times resulting in nine measurements in total for each sample. Images of emulsions
during storage are presented in Figure 2.2.
Figure 2.2 Images of an emulsion with (a) 100 % SR after 14 days of storage and (b) an
emulsion with phase separation after 14 days of storage.
2.2.5 Analysis of mean droplet diameter by image analysis
Image acquisition was conducted using an optical microscope (Olympus BH2,
Olympus, Southend-on-Sea, UK) with a 400 magnification coupled with a digital
camera (Canon DSLR EOS D30, Canon Ireland, Dublin, Ireland). The images were
then transferred to a personal computer, and were processed following the method
sequence of other studies involving binarization and droplet quantification (Silva et al.,
2010; Trindade et al., 2008; Freire et al., 2005). The image processing procedure was
developed using an automated program developed in MATLAB 7.0 (The Math Works,
Inc., Natick, MA, USA). The Image J software (Version 1.451, U.S National Institute of
Health, Bethesda, MD, USA) and a stage micrometer (OB-M stage micrometer,
a b
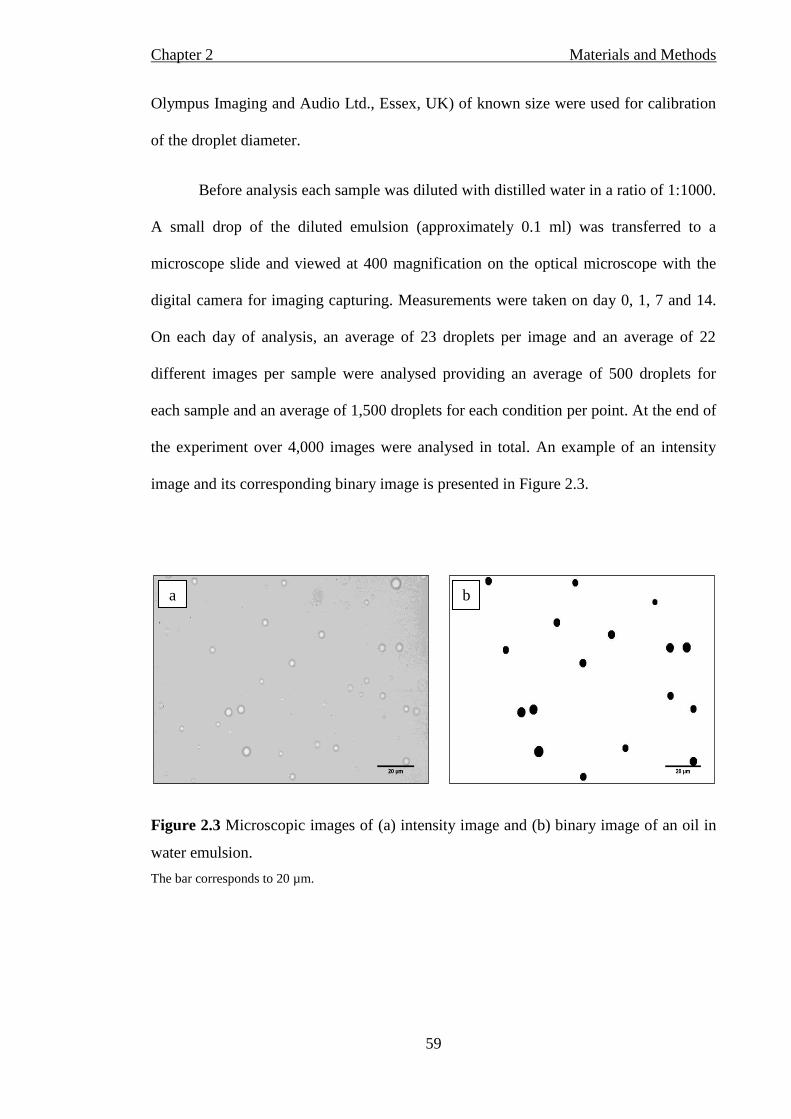
Chapter 2 Materials and Methods
59
Olympus Imaging and Audio Ltd., Essex, UK) of known size were used for calibration
of the droplet diameter.
Before analysis each sample was diluted with distilled water in a ratio of 1:1000.
A small drop of the diluted emulsion (approximately 0.1 ml) was transferred to a
microscope slide and viewed at 400 magnification on the optical microscope with the
digital camera for imaging capturing. Measurements were taken on day 0, 1, 7 and 14.
On each day of analysis, an average of 23 droplets per image and an average of 22
different images per sample were analysed providing an average of 500 droplets for
each sample and an average of 1,500 droplets for each condition per point. At the end of
the experiment over 4,000 images were analysed in total. An example of an intensity
image and its corresponding binary image is presented in Figure 2.3.
Figure 2.3 Microscopic images of (a) intensity image and (b) binary image of an oil in
water emulsion.
The bar corresponds to 20 µm.
a b
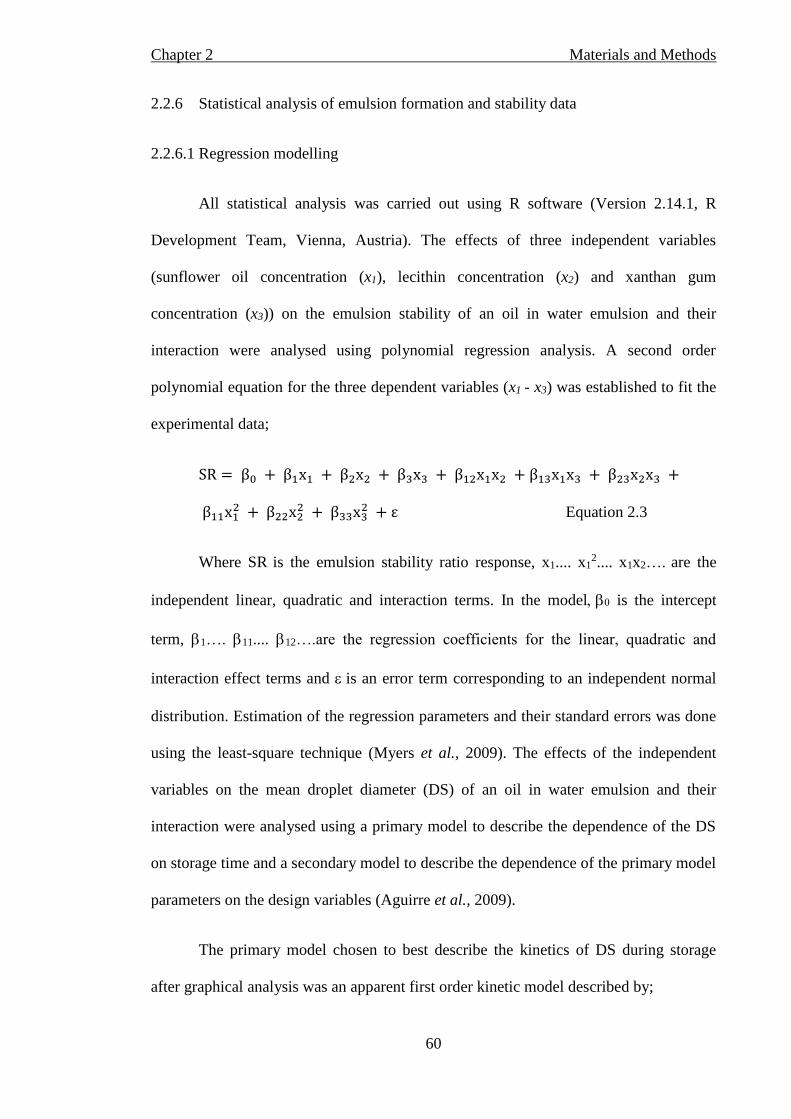
Chapter 2 Materials and Methods
60
2.2.6 Statistical analysis of emulsion formation and stability data
2.2.6.1 Regression modelling
All statistical analysis was carried out using R software (Version 2.14.1, R
Development Team, Vienna, Austria). The effects of three independent variables
(sunflower oil concentration (x1), lecithin concentration (x2) and xanthan gum
concentration (x3)) on the emulsion stability of an oil in water emulsion and their
interaction were analysed using polynomial regression analysis. A second order
polynomial equation for the three dependent variables (x1 - x3) was established to fit the
experimental data;
SR = β0 + β1x1 + β2x2 + β3x3 + β12x1x2 + β13x1x3 + β23x2x3 +
β11x12 + β22x2
2 + β33x32 + ε Equation 2.3
Where SR is the emulsion stability ratio response, x1.... x12.... x1x2…. are the
independent linear, quadratic and interaction terms. In the model is the intercept
term, 1…. 11.... 12….are the regression coefficients for the linear, quadratic and
interaction effect terms and is an error term corresponding to an independent normal
distribution. Estimation of the regression parameters and their standard errors was done
using the least-square technique (Myers et al., 2009). The effects of the independent
variables on the mean droplet diameter (DS) of an oil in water emulsion and their
interaction were analysed using a primary model to describe the dependence of the DS
on storage time and a secondary model to describe the dependence of the primary model
parameters on the design variables (Aguirre et al., 2009).
The primary model chosen to best describe the kinetics of DS during storage
after graphical analysis was an apparent first order kinetic model described by;

Chapter 2 Materials and Methods
61
DS = Asym + (R0 + ( R0 − Asym))e−elrctime + ε Equation 2.4
Where Asym, R0 and lrc are the asymptotic DS at long storage time, R0 is the
initial droplet diameter, Asym is the final droplet diameter, lrc is the natural logarithm
transformation of the apparent first order rate constant (Day-1) and is an error term
corresponding. The secondary modelling of the three parameters Asym, R0 and lrc was
done using a second order polynomial dependence on the coded variables x1, x2 and x3.
The building procedure to obtain a model with a minimum set of dependence of the
three parameters with the experimental variables followed these steps:
1. An initial model was built using a second order polynomial dependence of the
parameters Asym, R0 and lrc with the normalised variables x1, x2 and x3.
2. A summary of the model was produced with t-statistics for each individual
model coefficient.
3. Based on the t-test statistics of significance, non-significant terms of the model
were eliminated (Pinheiro & Bates, 2000) and a new model was built.
4. A summary of the new model was produced with new t-statistics for each model
term.
5. A logarithm likelihood ratio test (Bates & Watts, 1988) was employed to
compare the new model with the previous one and decide if the simplification
obtained was statistically significant or not in terms of capacity to describe the
data (i.e. the log-likelihood).
6. Steps 1 - 5 were repeated with new simplifications proposed until a satisfactory
model reduction was achieved.
The adequacy of the model was determined using graphical analysis and
examining the coefficient of determination (R2) (Lee et al., 2000). It is suggested that R2

Chapter 2 Materials and Methods
62
should be at least 0.80 for a good global fit of a model (Joglekar & May, 1987).
Analysis was performed in triplicate and data was reported as the estimated parameter ±
standard error (SE). To determine the significance of a model parameter, the student’s t-
test was used. Differences were considered to be statistically significant at p ≤ 0.05. The
RSM libraries (Lenth, 2009) and nls (nonlinear least squares) from the R software
(Version 2.14.1, R Development Team, Vienna, Austria) were used.
2.2.6.2 Multicriteria optimisation
The optimal conditions for the targeted responses were generated by R 2.14.1
software package. The NSGA II MOEA numeric optimisation algorithm from the R
library MCO (Multi Criterion Optimisation) (Trautmann et al., 2010) was employed to
study the simultaneous optimisation of SR and DS. A Pareto front from the multiple
response optimisations was defined to maximise the SR and minimise the DS within the
experimental range studied.
2.2.7 Validation of optimal conditions for emulsion stability and droplet diameter
The adequacy of response surface models for predicting optimum response
values was verified by conducting experiments under one of the sets of optimum
conditions devised in the Pareto front (sunflower oil (x1) 19.02 %, lecithin (x2) 1.2 %,
xanthan gum (x3) 0.28 %). The experimental predicted values of the responses were
compared in order to check the validity of the models.

Chapter 2 Materials and Methods
63
2.3 Optimisation of flavour emission from the emulsion
2.3.1 Flavoured emulsion raw materials
Sunflower oil, soy lecithin and xanthan gum were sourced as outlined in section
2.2.1. Isoamyl acetate, furfuryl acetate, citric acid, hydrogen sodium carbonate, SPME
fibre, 20 mL glass vial and Teflon coated rubber septa and aluminium screw caps were
purchased from Sigma Aldrich (Sigma Aldrich Ireland Ltd., Dublin, Ireland).
2.3.2 Experimental design
A Central Composite Faced Centred experimental design (CCF) was employed
to (1) study the main effect and combined effect of these independent variables on the
volatile emission of isoamyl acetate (Y1) and furfuryl acetate (Y2) from the oil in water
emulsion, (2) create empirical models between the variables and (3) optimise the
physicochemical conditions for maximum volatile emission. The effect of four
independent variables namely, x1 (isoamyl acetate concentration 50 - 90 ppm), x2
(furfuryl acetate concentration 20 - 30 ppm), x3 (pH 5 - 7) and x4 (salt concentration 0.1
- 2 %) on the volatile emission from an oil in water emulsion were studied using RSM.
Experimental ranges for isoamyl acetate and furfuryl acetate were selected based
on the Flavour and Extract Manufacturers Association (FEMA) reported uses in
literature (Burdock, 2010). In addition, preliminary sensory analysis (n = 12) was
conducted, during which panellists successfully ranked emulsions containing various
concentrations of isoamyl acetate and furfuryl acetate in order of concentration.
Experimental ranges for salt and pH were selected bases on typical salt and pH levels in
food products.
Chapter 2 Materials and Methods
64
Central Composite Designs (CCD) are experimental designs that are composed
of a Factorial Design (the points at the vertices of the cube) and by a Star Design which
allow for estimation of curvature (Leardi, 2009). The star points represent new extreme
values (low and high) for each factor in the design (Schrevens & De Rijck, 1999). CCF
is a subset of CCD in which the location of the star points corresponds to the centre of
the faces of the cube and 3 levels of each factor are required (Leardi, 2009). CCD
designs have been employed by previous authors for the investigation of ingredient
interactions on the headspace release of volatile compounds from emulsion model
systems (Mirhosseini & Tan, 2009; Mirhosseini et al., 2008c; Mirhosseini et al.,
2008d).
A CCF with 27 random order settings (3 centre point replicates) was chosen
using Modde 5.0 software (Umetrics UK, Cheshire, UK) as this particular experimental
design proved to be the most economical design for this particular experimental work.
The volatile release of each flavour compound was expressed by the peak area recorded
by using GC/MS. The concentration of each volatile in the headspace above the
emulsion was considered as response variables. This was calculated by comparing the
response for both of the volatiles to that of an aqueous standard calibration curve. The
response values were calculated as the concentration (in ppm) in the headspace of the
emulsions (calculated based on a standard curve constructed using an aqueous solution
of isoamyl acetate and furfuryl acetate) divided by the concentration of the
corresponding aqueous solution.

Chapter 2 Materials and Methods
65
2.3.3 Preparation of flavoured emulsions
Emulsions were prepared as described in section 2.2.3 with the following
modifications: surfactant solutions were prepared by dispersing the lecithin and xanthan
gum in distilled water and mixing for 1.5 hours at 60 oC using a magnetic stirring bar
and magnetic stirrer hotplate (Stuart CB162, Bibby-scientific, Staffordshire, UK). The
lipid phase was then heated to 60 oC and the flavour compounds were then added by
micro pipette. The lipid phase was then slowly added to the aqueous phase while
stirring. This pre-emulsion was allowed to mix for a further 5 minutes before being
homogenised with a high shear blender (Silverson L4R, Silverson Machines Ltd.,
Chesham, UK) for 3 minutes at 8,000 rpm. NaCl was then added to the emulsion and
allowed to dissolve under gentle stirring for 1 - 2 minutes. The pH was adjusted within
the range of pH 5 - 7 using a pH meter (Thermo scientific, Orion 2 Star, Essex, UK)
with 0.1 M citric acid and 0.5 M sodium hydrogen carbonate.
2.3.4 Analysis of volatile emission from the emulsion
2.3.4.1 Emulsion headspace volatile analysis
A solid phase microextraction (SPME) device (Supelco, Bellefonte, PA, USA)
with a pre-conditioned 10 mm SPME fibre coated with 65 µm Polydimethylsiloxane-
Divinylbenzene (PDMS/DVB) was used for the extraction of the headspace volatiles.
Ten mL aliquots of the emulsion were transferred into 20 mL headspace glass vials
(O.D 2.25 mm x H 75 mm) which were sealed with a stainless steel magnetic screw cap
fitted with a Polytetrafluoroethylene (PTFE)/silicone septum (septum thickness 1.3
mm). A PTFE coated micro stirring bar (13 mm × 8 mm) was used to simulate shear
stress in the mouth. A shear rate of approximately 150 s-1 was achieved by stirring at
Chapter 2 Materials and Methods
66
450 rpm (Rabe et al., 2003). The vials were placed in a water bath set at 40 oC for a pre-
equilibrium time of 5 minutes and the SPME fibre was exposed to the headspace of the
samples for an extraction time of 30 minutes. To determine optimal extraction time, the
SPME fibre was exposed to the headspace above the emulsions containing different
concentrations of the flavour compounds for various lengths of time (5 - 60 minutes) at
40 oC. Results from this preliminary experiment indicated that an extraction time of 30
minutes was sufficient to facilitate equilibration. At these concentrations, the volatiles
were deemed to be at equilibrium and extending sample time beyond this point was
unwarranted.
2.3.4.2 Gas chromatography mass spectrometry (GC/MS) conditions
Analysis of the volatile compounds absorbed on the fibre was carried out using a
Varian 3800 GC coupled to a Varian Saturn 2000 ion trap mass spectrometer (Varian
Chromatography Systems, Walnut Creek, CA, USA). Separation of the volatiles was
accomplished on a ZB-wax column (ZB-5MS- 15 m × 0.25 mm i.d., 0.25 µm film,
Torrance, CA, USA). Helium, at a flow rate of 1 mL/minute was used as the carrier gas.
Thermal desorption of the compounds took place in the GC injection port (1079
Programmable Temperature Vaporising (PTV) injector), equipped with a 0.75 mm i.d.
splitless glass linear, at 250 oC. The split valve was initially closed, after 5 minutes it
was opened (ratio 1:100) for the remainder of the run. The SPME fibre was removed
from the headspace of the samples and thermally desorbed at 250 oC in the GC injection
port for 3 minutes. The fibre was cleaned after every two extractions to ensure no carry-
over between samples. The stirrer bar was cleaned after every extraction by soaking it in
acetone for at least 15 minutes and then rinsing with 40 % ethanol before re-use (Lay-
Keow, 1998).

Chapter 2 Materials and Methods
67
Oven temperature was programmed at 40 oC for 1.5 minutes, then ramped to 80
oC at 4 oC/minute and finally raised to 250 oC at 20 oC/minute and held for 5 minutes.
The MS transfer line temperature was set to 260 oC. The mass spectrometer was tuned
using autotune procedures and masses from m/z 40 to 180 were recorded after electron
impact ionization (EI) under EI auto mode. Isoamyl acetate and furfuryl acetate were
initially identified using a Varian 450-GC equipped with a Varian 320-MS triple
quadrupole (Varian Chromatography Systems, Walnut Creek, CA, USA) and CombiPal
Autosampler (CTC Analytics, Zwingen, Switzerland). Compounds were also identified
by use of authenticated standards and by matching mass spectra with the data stored in
the National Institute of Standards and Technology (NIST) library of standard
compounds. The data reported was the mean of three extraction replicates for each
individual peak in the total ion chromatogram (TIC). Compounds were quantified by
reference to external calibration curves constructed using the same authenticated
standards. The response values were calculated as the concentration (in parts per million
(ppm)) in the headspace of the emulsions (calculated based on a standard curve
constructed using an aqueous solution of isoamyl acetate and furfuryl acetate) divided
by the concentration of the corresponding aqueous solution. The standard curves had R2
values of 0.996 and 0.976 for the isoamyl acetate and furfuryl acetate respectively.
2.3.5 Statistical analysis of volatile emission data
All statistical analysis was carried out using Modde 5.0 (MKS Instruments UK
Ltd., Umetrics UK, Cheshire, UK) software. The effects of the independent variables on
the volatile flavour release of isoamyl acetate (Y1) and furfuryl acetate (Y2) from an oil
in water emulsion and their interaction were analysed using polynomial regression

Chapter 2 Materials and Methods
68
analysis and analysis of variance (ANOVA). A second order polynomial equation for
dependent variables was established to fit the experimental data.
The proposed generalised second order polynomial equation is given as;
SR = β0 + β1x1 + β2x2 + β3x3 + β4x4 + β12x1x2 + β13x1x3 + β14x1x4 +
β23x2x3 + β24x2x4 + β34x3x4 + β11x12 + β22x2
2 + β33x32 + β44x4
2 + ε
Equation 2.5
Where Yi is the predicted response, x1.... x12.... x1x2…. are the independent
linear, quadratic and interaction terms. In the model is the intercept term, 1….
11.... 12….are the regression coefficients for the linear, quadratic and interaction effect
terms and is an error term corresponding to an independent normal distribution.
Determination of the different multiple regression parameters was achieved by
employing the least-square technique (Myers et al., 2009). The adequacy of the model
was determined using graphical analysis, lack of fit test and coefficient of determination
(R2) (Lee et al., 2000). Analysis was performed in triplicate and data was reported as the
mean ± standard error (SE). To determine the significance of a model parameter, the
student t-test was used. Differences were considered to be statistically significant at p ≤
0.05.
2.3.6 Validation of optimal conditions for headspace volatile emission
The adequacy of response surface models for predicting the optimum response
values was verified by conducting experiments under the recommended optimum
conditions devised in the optimiser function of the Modde 5.0 software (isoamyl acetate
90 ppm (x1), furfuryl acetate 30 ppm (x2), salt 2 % w/v (x3) and pH 6.02 (x4)). The
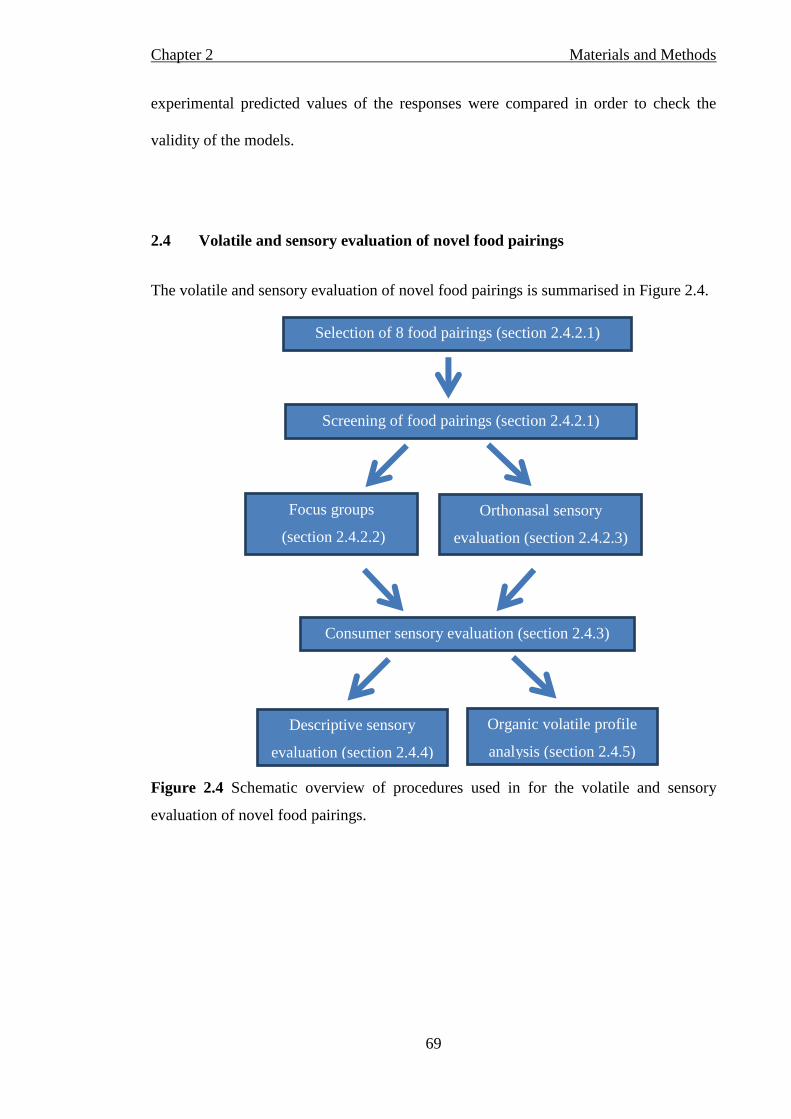
Chapter 2 Materials and Methods
69
experimental predicted values of the responses were compared in order to check the
validity of the models.
2.4 Volatile and sensory evaluation of novel food pairings
The volatile and sensory evaluation of novel food pairings is summarised in Figure 2.4.
Figure 2.4 Schematic overview of procedures used in for the volatile and sensory
evaluation of novel food pairings.
Selection of 8 food pairings (section 2.4.2.1)
Consumer sensory evaluation (section 2.4.3)
Screening of food pairings (section 2.4.2.1)
Focus groups
(section 2.4.2.2)
Orthonasal sensory
evaluation (section 2.4.2.3)
Descriptive sensory
evaluation (section 2.4.4)
Organic volatile profile
analysis (section 2.4.5)
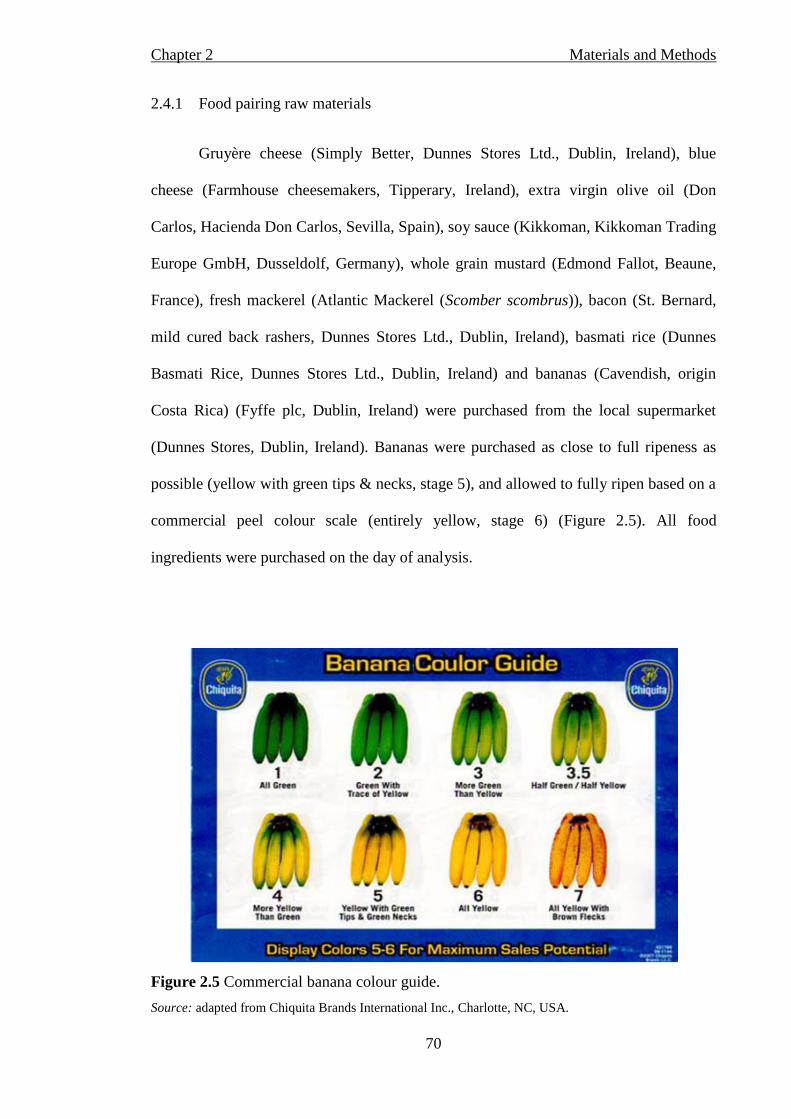
Chapter 2 Materials and Methods
70
2.4.1 Food pairing raw materials
Gruyère cheese (Simply Better, Dunnes Stores Ltd., Dublin, Ireland), blue
cheese (Farmhouse cheesemakers, Tipperary, Ireland), extra virgin olive oil (Don
Carlos, Hacienda Don Carlos, Sevilla, Spain), soy sauce (Kikkoman, Kikkoman Trading
Europe GmbH, Dusseldolf, Germany), whole grain mustard (Edmond Fallot, Beaune,
France), fresh mackerel (Atlantic Mackerel (Scomber scombrus)), bacon (St. Bernard,
mild cured back rashers, Dunnes Stores Ltd., Dublin, Ireland), basmati rice (Dunnes
Basmati Rice, Dunnes Stores Ltd., Dublin, Ireland) and bananas (Cavendish, origin
Costa Rica) (Fyffe plc, Dublin, Ireland) were purchased from the local supermarket
(Dunnes Stores, Dublin, Ireland). Bananas were purchased as close to full ripeness as
possible (yellow with green tips & necks, stage 5), and allowed to fully ripen based on a
commercial peel colour scale (entirely yellow, stage 6) (Figure 2.5). All food
ingredients were purchased on the day of analysis.
Figure 2.5 Commercial banana colour guide.
Source: adapted from Chiquita Brands International Inc., Charlotte, NC, USA.

Chapter 2 Materials and Methods
71
2.4.2 Screening of food pairings by focus groups
2.4.2.1 Selection of food pairings
Selection of the food pairing samples was performed through preliminary
research and experimentation (focus groups and sensory panels). This preliminary work
involved selecting eight food pairings with banana (bacon, basmati rice, extra virgin
olive oil, blue cheese, Gruyère cheese, mackerel, soy sauce and whole grain mustard)
which were generated using the online software package provide on Foodpairing.com
(Sense for Taste, Bruges, Belgium). The food pairing software suggested over 40 foods
to be paired with banana. In order to reduce this number to a more manageable quantity
(for experimental purposes), factors such as the availability and expense of the foods
were taken into account. Furthermore, the foods were ranked based on the quantity of
suggested pairings each food had with one another (in addition to their pairings with
banana). The eight foods with the highest quantity of food pairings were subsequently
selected. For example, it was found that bacon was paired with 14 other foods, while
tomato only had 10 pairings, thus tomato was subsequently not selected for further
analysis. These eight food pairings were then subjected to further screening tests to
reduce the sample number to allow for sensory and instrumental work (focus groups and
sensory evaluation).
2.4.2.2 Conducting the focus groups
Three separate focus groups (n = 19 in total) were conducted, during which
information regarding the participant’s attitudes and opinions towards the pairing of
novel foods were explored. Participants involved were students from the School of
Culinary Arts and Food Technology and from the School of Food Science and
Chapter 2 Materials and Methods
72
Environmental Health, Dublin Institute of Technology, Dublin. The focus groups were
conducted according to standard procedures (Krueger & Casey, 2009; Morgan, 1998;
Morgan & Scannell, 1998). The setting was a conference room, and audio recordings of
the focus groups were conducted on personal computers using sound recording and
editing software (Audacity 1.3, The Audacity Development Team). Each focus group
lasted between 90 - 120 minutes and was guided by a moderator. Participants were
provided with information regarding the general rules for performing each session, and
were familiarised with the subject matter ‘‘food pairings’’ via a short presentation
performed by the moderator. A topic guide was developed prior to the field work and
consisted of open discussions on: (1) the concept of pairing foods based on flavours, (2)
traditional/known food pairings that are successful and (3) novel food pairings. Visual
cues (pictures of food pairings) were used throughout the focus groups sessions to relate
to the food pairings being discussed. Following this participants were asked to evaluate
the orthonasal aroma of the food pairings (section 2.4.2.4). A final open discussion
regarding the food pairing samples that were evaluated took place following the sensory
evaluation session.
2.4.2.3 Preparation of samples for orthonasal sensory evaluation
Prior to conducting the focus groups, the bacon was cooked in an oven (Rational
Combi Dämpfer, Rational UK, Luton, UK) at 190 oC for 9 minutes and then turned and
cooked for a further 9 minutes. Basmati rice was cooked in water at a ratio of 1.5:1
water: rice (Limpawattana et al., 2008) until deemed cooked (tender with a little bite).
The mackerel was baked in an oven (Rational Combi Dämpfer, Rational UK, Luton,
UK) at 190 oC for approximately 8 minutes until the centre of the fish reached ≥ 70 oC
for over 2 minutes (Cox & Abu-Ghannam, 2013). Once the bacon, basmati rice and

Chapter 2 Materials and Methods
73
mackerel were cooked, they were allowed to cool to below 5 oC. Ten grams (g) of
Gruyère cheese, blue cheese, cooked basmati rice, olive oil, soy sauce, 5 g of mustard, 4
g of bacon and 2.5 g of cooked mackerel were place separately in the individual sample
containers with lids on and were then stored below 5 oC until the sensory evaluation
took place (approximately one hour). Sample quantities were selected based on
preliminary testing, where a perceived aroma balance was achieved through preliminary
sensory analysis (n = 5). To reduce oxidation of the bananas, they were prepared by
slicing only as required, 5 g of banana was sliced up and placed in the sample
containers.
2.4.2.4 Orthonasal sensory evaluation of food pairings
The orthonasal aroma of the food pairings was evaluated through sensory
analysis according to ISO 5496:2006 (ISO, 2006). Sensory analysis was carried out in a
sensory laboratory under guidelines and conditions according to ISO 8589:2010 (ISO,
2010). The panellists worked in a single booth under defined conditions of 22 oC and
white light. Samples prepared at least 30 minutes before the test to allow time for
vapour pressure to reach equilibrium at ambient temperature. The food pairings were
placed in three-digit random number coded opaque plastic containers with opaque lids
so that respondents could smell them without seeing. Five minutes before the
presentation of the food, small holes were made with a needle, through which the
aromas were released (Raz et al., 2008). Panellists were presented with samples of
banana to which they retained for the entire evaluation session. The 8 samples to be
paired with the banana were presented in a monadic sequential randomised order.
Panellists were instructed to evaluate the banana sample and the paired sample together
Chapter 2 Materials and Methods
74
(three short sniffs with the mouth closed). Panellists evaluated the orthonasal aroma
acceptability of the food pairings on a 9 point hedonic scale, where 9 = “like
extremely”, 5 = “neither like nor dislike” and 1 = “dislike extremely” (see appendix B).
2.4.3 Consumer sensory evaluation of food pairings
From the results of this preliminary sensory work, it was found that the banana
food pairings of basmati rice (B+R), bacon (B+BN) and extra virgin olive oil (B+O)
scored the highest mean acceptability scores for orthonasal aroma (see section 5.2.2).
Hence, these samples were used for the consumer sensory panel, descriptive sensory
analysis and organic volatile compound profiling. Untrained panellists (n = 85) were
asked to evaluate the taste of the three food pairings with banana. The consumer panel
consisted of staff and students from the School of Culinary Arts and Food Technology
and from the School of Food Science and Environmental Health, Dublin Institute of
Technology, Dublin. Sensory analysis was carried out in a sensory laboratory under
guidelines and conditions according to ISO 8589:2010 (ISO, 2010). The panellists
worked in a single booth under defined conditions of 22 oC and white light.
Prior to conducting the consumer panel, bacon and basmati rice were prepared
as described in section 2.4.2.3. Sample quantity ratios were selected based on
preliminary sensory testing (n = 5), where a perceived flavour balance was achieved.
Cooked bacon and cooked rice were heated separately in a microwave oven (Sharp
Plutonium Collection FR957, Cheshire, UK) at 600 W to above 63 oC, and were held
above this temperature in a bain maire until required (less than five min). To reduce
oxidation of the bananas, they were prepared by slicing freshly as required. Twenty
grams of both cooked bacon and cooked rice were served separately with 20 g of sliced
Chapter 2 Materials and Methods
75
banana in the sample containers. Twenty grams of sliced banana were served in the
sample containers with 10 ml of the olive oil. Samples were coded with three-digit
random numbers and were presented in a monadic sequential randomised order to the
panel. Panellists were instructed to consume unsalted crackers and mineral water to
rinse their mouths between evaluating each sample (Bárcenas et al., 2001).
For the hedonic tests, consumers were instructed to evaluate taste acceptability
of the paired samples on a 9 point hedonic scale, where 9 = “like extremely”, 5 =
“neither like nor dislike” and 1 = “dislike extremely” (see appendix B). Additionally,
the panellists were also asked to rank the samples in order of preference, from most
preferred to least preferred (see appendix B). Panellists were encouraged to write
comments regarding their opinion of the food pairings, these comments were coded
(both positive and negative comments).
2.4.4 Descriptive sensory analysis (Free Choice Profiling)
Assessors (n = 28, 11 males, 17 females, aged 20 - 40) were recruited for
orthonasal and retronasal aroma evaluation of seven food samples (banana (B), bacon
(BN), rice (R), extra virgin olive oil (O), banana and rice (B+R) and banana and bacon
(B+BN), and banana and extra virgin olive oil (B+O)) using Free Choice Profiling
(FCP). Assessors were recruited from staff and students from the School of Culinary
Arts, Food Technology and from the School of Food Science and Environmental
Health, Dublin Institute of Technology, Dublin, and from the School of Food and
Nutritional Sciences, University College Cork, Cork. All assessors had previous
experience in sensory evaluation. The assessors were separated into three groups of 10,
10 and 8, a total of two sessions were carried out with each group; the first session was

Chapter 2 Materials and Methods
76
a training session and the second session was a data collection session. Each session
took place on separate days and took approximately 60 - 90 minutes to complete.
In the training session the assessors got a brief introduction into the procedure of
FCP, during which descriptive lexicons were developed and defined for each sample
with the help of some previously developed descriptive lexicons from the literature (see
appendix C) (Delgado & Guinard, 2011; Sekhon, et al., 2010; Limpawattana et al.,
2008; Kanavouras et al., 2005; Timón et al., 2004; Jordán et al., 2001; Maw et al.,
2001; Angerosa et al., 2000; Civille & Lyons, 1996; Jeremiah et al., 1996; Morales et
al., 1995). Basmati rice and bacon samples were prepared as described in section
2.4.2.3. The paired samples (banana and basmati rice (B+R), banana and bacon (B+BN)
and banana and extra virgin olive oil (B+O)) were served to assessors as described in
section 2.4.3.
For the unpaired samples (banana, basmati rice, bacon and extra virgin olive
oil); 20 g of heated cooked basmati rice, 20 g of heated cooked bacon, 10 ml of extra
virgin olive oil and 20 g of sliced banana were placed separately in sample containers.
All seven samples were coded with three-digit random numbers and were presented in a
monadic sequential order during each session. Breaks between each sample evaluation
were provided, during which assessors were instructed to consume unsalted crackers
and mineral water to rinse their mouths.
Assessors were asked to evaluate the orthonasal aroma, followed by the
retronasal aromas of the samples, and describe their sensory perception in their own
words with the help of the descriptors provided. Assessors were asked to evaluate the
intensity of the sensory attributes of the samples using a 15 cm line scale, anchored with
the terms “weak/mild” and “strong” (Appendix C). Based on the individual descriptors,

Chapter 2 Materials and Methods
77
personalised score sheets were created, and a consensual description list was generated
from each panellist for each sample. At the beginning of the second session the
assessors were asked to take a moment to read the consensual description list and to
update their own list if desired. The assessors then proceeded to evaluate the intensity of
the sample’s attributes as described in the first session.
2.4.5 Organic volatile compound profile analysis
2.4.5.1 Headspace volatile analysis for volatile profiling of food pairings
Sample introduction was accomplished using a CTC Analytics Combipal
Autosampler (Agilent, Cork, Ireland). A single 1 cm SPME device (Supelco,
Bellefonte, PA, USA) with a 10 mm fibre coated with a 50/30 µm StableFlex
Divinylbenzene/CarboxeNPolydimethylsiloxane (DVB/CAR/PDMS) fibre (Sulpelco,
Bellafonte, PA, USA) was used for the extraction of the headspace volatiles. Sample
preparation was as described in section 2.4.2.3. Initially, unpaired foods (banana,
basmati rice, bacon and extra virgin olive oil) were analysed by HS-SPME GC/MS to
assess the range of volatile compounds present in each sample and the response detected
by the MS. Also this allowed for the determination of the quantities to be used during
extraction of the food mixtures to ensure that the response of each individual food was
within the same range. The quantities used for extraction of the individual foods were as
follows: 5 g of bacon, 1 g of banana, 5 g of rice or 1 g of oil. These were weighed
individually into 20 ml headspace SPME glass vials (O.D 2.25 mm x H 75 mm (Apex
Scientific Ltd., Maynooth, Kildare, Ireland) which were sealed with a stainless steel
magnetic screw cap fitted with a Polytetrafluoroethylene (PTFE)/silicone septum
(septum thickness 1.3 mm).
Chapter 2 Materials and Methods
78
For evaluation of the paired samples (banana and basmati rice (B+R), banana
and bacon (B+BN) and banana and extra virgin olive oil (B+O)) the quantities used for
extraction were as follows; banana 1 g: basmati rice 4 g (B+R), banana 1 g: bacon 4 g
(B+BN) and banana 1 g: extra virgin olive oil 1 g (B+O). The choice of the ratios used
for the paired samples analysis were established based on the preliminary volatile
analysis of the individual food samples as discussed above. To determine optimal
extraction time, the SPME fibre was exposed to the headspace above the samples for
various lengths of time (5 - 60 minutes) at 40 oC. Results from these preliminary
experiments indicated that an extraction time of 20 minutes was sufficient to facilitate
equilibration, and extending extraction time beyond this point was unwarranted. Sample
mixtures were weighed into the vials and were placed in an incubation shaker chamber
at 40 oC with pulsed agitation of 4 s at a shear rate of 150 s-1. Following a pre-
equilibration step at 40 oC for 10 minutes the volatile compounds present in the
headspace were extracted for 20 minutes.
2.4.5.2 GC/MS conditions for volatile profiling of food pairings
Analysis of the organic volatile compounds absorbed onto the fibre was carried
out using a Varian 450 Gas Chromatograph (Varian Analytical Instruments, Harbour
City, CA, USA) with temperature programmable split/splitless injector, oven
cryogenics, equipped with a Varian 320 triple quadrupole Mass Spectrometer (Varian
Chromatography Systems, Walnut Creek, CA, USA). Separation of the volatiles was
accomplished on an Elite 5 MS column (60 m X 0.25 µm, 0.25 µm film thickness,
Perkin Elmar, MA, USA). Helium, at a flow rate of 1.2 mL/minute was used as the
carrier gas. Thermal desorption of the compounds took place in the GC injection port at
Chapter 2 Materials and Methods
79
250 oC in splitless mode. The fibre remained in the injection port for 2 min. Oven
temperature was programmed at -60 oC for 2 minutes, then ramped to 20 oC at 50
oC/minute, then to 110 oC at 4 oC/minute, and finally raised to 250 oC at 25 oC/minute
and held for 7 minutes. The transfer line temperature was set to 260 oC. The mass
spectrometer was tuned using autotune procedures and operated in the scan mode within
a mass range of m/z 29 to 350 at 2.5 scans/s. Ionisation was performed by electron
impact at 70 eV. Peak areas were analysed and quantified using the Varian Star MS
chromatography workstation software, version 6.9.2 (Varian Analytical Instruments,
Harbour City, CA, USA). Individual compounds were assigned quantification and
qualifier ions to ensure that only the individual compounds were identified and
quantified. Individual compounds were identified using mass spectral comparisons to
the NIST 2005 mass spectral library. Quantification was performed by integrating the
peak areas of the extracted ions using the Varian MS workstation, version 6.9.2 (Varian
Analytical Instruments, Harbour City, CA, USA). The comparative semi-quantifiable
results were recorded as the average of triplicate analysis with a mean percentage
residual standard deviation (RDS %) of 8.52 %. An autotune was performed at the start
of the analysis to ensure that the mass spectrometer was performing optimally.
2.4.6 Statistical analysis of food pairing data
2.4.6.1 Orthonasal sensory evaluation data
To analyse the sensory data from the focus group the Friedman rank sum test
was performed, using a significance level (p ≤ 0.05) to determine whether samples were
significantly preferred over one another. Follow-up pair wise comparisons were
conducted using a Wilcoxon signed rank test and controlling for the Type I errors across

Chapter 2 Materials and Methods
80
the comparisons at the p ≤ 0.05 level using the Fishers Least Squared Difference (LSD)
procedure to ascertain where significant differences were. The analysis was performed
using SPSS program for Windows (version 19.0, SPSS Inc., Chicago, Il, USA).
2.4.6.2 Consumer sensory evaluation of food pairings data
To analyse the consumer hedonic test, the Friedman rank sum was performed,
using significance level (p ≤ 0.05) to determine whether samples were significantly
preferred over one another. Follow-up pair wise comparisons were conducted using a
Wilcoxon signed rank test and controlling for the Type I errors across the comparisons
at the p ≤ 0.05 level using the Fishers Least Squared Difference (LSD) procedure to
ascertain where significant differences were. The data from the preference test was
analysed using the Pearson’s chi squared test and cross-tabulation test. The analysis was
performed using SPSS program for Windows (version 19.0, SPSS Inc., Chicago, Il,
USA).
2.4.6.3 Descriptive sensory and volatile profiling data
Descriptive sensory analysis (Free Choice Profiling (FCP)) data was analysed
using Generalised Procrustes Analysis (GPA) using XLSTAT system software, version
2013.4.03, (Addinsoft, Paris, France). GPA has been successfully used to rationalise
individual sensory descriptive information from FCP by numerous authors (Rodrigues
& Teixeira, 2013; Lassoued, et al., 2008; Tarea, et al., 2007; Delarue & Siefffermann,
2004). This method, extracts a common structure from multiple data sets composed of
non-identical variables among the data sets (Dijksterhuis, 1996). A consensus plot is
Chapter 2 Materials and Methods
81
generated that matches the configuration among the multiple data sets by centring,
rotating, and adjusting scales of each data set.
APLSR has been used by numerous authors to understand relationships between
instrumental (x) and sensory (y) data (Shi et al., 2013; Shiqing et al., 2012; Mitchell et
al., 2011). APLSR not only tries to provide solutions for both X and Y variables but
also simultaneously attempts to find the ‘best’ solution of X that will explain the
variation of the Y-variable set (Chung et al., 2003). Hence, it compromises between
giving weight to the analytical variables and maximising the variance explained
(MacFie & Hedderley, 1993).
The first two factors of the GPA analysis completed 59.88 % of the variance.
ANOVA-partial least squares regression (APLSR) was used to interpret the raw data
accumulated from the 28 test subjects for the descriptive sensory evaluation and data
acquired by volatile analysis. The X-matrix was designed as 0/1 design variables for the
individual food samples and the food pairing samples. The Y-matrix was designed as
descriptive sensory (orthonasal and retronasal aroma) and volatile analysis variables.
The optimal number of components in the APLSR models presented was determined to
be four principal components. The validated explained variance for the model
constructed was 17 % and the calibrated variance was 45 %. APLSR was performed
using Unscrambler Software, version 9.7 (CAMO ASA, Trondheim, Norway).

Chapter 2 Materials and Methods
82
2.5 Development of novel ice creams
The development of the novel ice creams is summarised in Figure 2.5.
Figure 2.6 Schematic overview of procedures used in for the development of the ice
creams.
Basic Ice cream recipe development (section 2.5.2)
Optimisation of flavour concentration ratios (section 2.5.3)
Evaluation of consumer acceptance and market suitability
(section 2.5.4)
Determination of flavour transfer method (appendix D)
Banana and basmati rice ice
cream (section 2.5.2.1)
Banana and bacon ice
cream (section 2.5.2.2)
Panel A
General retail market Panel B
Culinary educated market

Chapter 2 Materials and Methods
83
2.5.1 Ice cream raw materials
Basmati rice, bacon and banana were sourced as described in section 2.4.1. Full
fat milk (3 % fat) (Dunnes stores, Dublin, Ireland), single cream (38 % fat) (Dunnes
stores, Dublin, Ireland), eggs (Dunnes stores, Dublin, Ireland) and caster sugar (Gem
Pack Foods Ltd., Dublin, Ireland) were purchased from the local supermarket (Dunnes
Stores, Dublin, Ireland). The development of the novel ice creams is summarised in
Figure 2.5.
2.5.2 Preparation of ice creams
The preparation of the basic ice cream to which the banana, bacon and basmati
rice flavours were incorporated was adapted from a preparation set out by McGee
(2004) for a premium standard ice cream (Table 2.2). The milk to cream ratio (39.2:35
% (v/v)) was established to produce a final lipid content of approximately 19 % (v/v)
based on the results of optimised emulsion stability (see section 3.5). Incorporation of
the flavours to the ice cream was achieved through preliminary research, where
different methods were tested to establish the most efficient method (Appendix D).
Table 2.2. List of ingredients with quantities and percentage of total weight for 1 kg
basic ice cream formulation.
Ingredient Quantity Percentage of total weight
Milk 392 ml 39.2 % (v/w)
Cream 350 ml 35 % (v/w)
Egg yolk 108 g 10.8 % (w/w)
Sugar 150 g 15 % (w/w)
Chapter 2 Materials and Methods
84
2.5.2.1 Banana and basmati rice ice cream preparation
Raw basmati rice was cooked for 15 minutes in the mixture milk and cream. The
rice was then strained, and the cooking liquid reserved. To account for absorption of
moisture by the rice and evaporation, the cooking liquid was restored to 1 L with milk.
The rice flavoured cooking liquid was added to a mixture of egg yolk and sugar and
mixed with a whisk by hand to create a smooth mixture. The mixture was heated to 76
oC for 10 minutes in a pot with constant stirring to create a custard. The custard was
placed in a blast chiller (Zanussi Blast Chiller BCF 28kg, Zanussi Professionals,
Pordenone, Italy) and chilled to 4 oC. The banana was incorporated into the custard
using a hand held blender (Bamix Mono, ESGE Ltd., Mettlen, Switzerland) at full speed
for approximately 1 minute. The mixture was placed in an ice cream machine (Musso
4080 Lussino, Musso Lussino, Conegliano, Italy) for approximately 20 minutes until
frozen (-4 oC). The ice cream stored in a commercial freezer at -18 oC until further use.
2.5.2.2 Banana and bacon ice cream preparation
Bacon was cooked in an oven (Rational Combi Dämpfer, Rational UK, Luton,
UK) at 190 oC for 9 minutes and then turned and baked for another 9 minutes. The
cooked bacon was cut into small pieces (approximately 2 cm × 3 cm) and soaked in the
milk and cream mixture for 24 hours. The soaking liquid was strained and the bacon
was discarded. The ice cream was made using the bacon flavoured soaking liquid as
described in section 2.5.2.1.
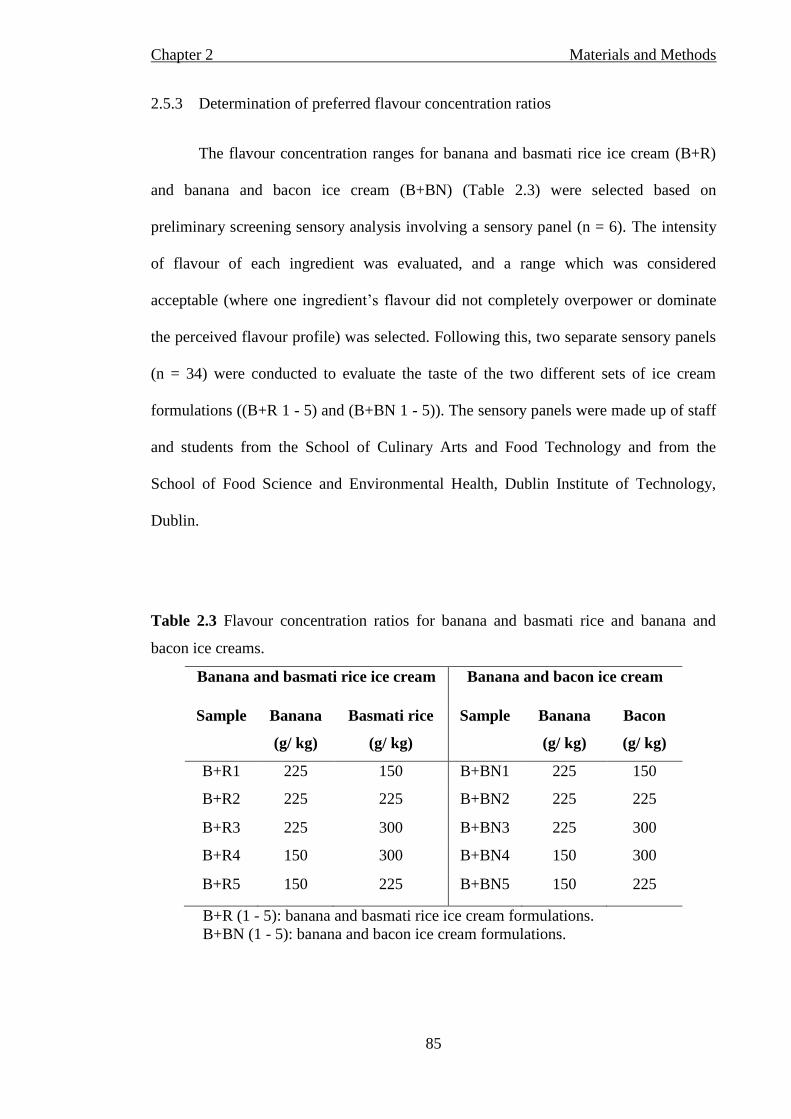
Chapter 2 Materials and Methods
85
2.5.3 Determination of preferred flavour concentration ratios
The flavour concentration ranges for banana and basmati rice ice cream (B+R)
and banana and bacon ice cream (B+BN) (Table 2.3) were selected based on
preliminary screening sensory analysis involving a sensory panel (n = 6). The intensity
of flavour of each ingredient was evaluated, and a range which was considered
acceptable (where one ingredient’s flavour did not completely overpower or dominate
the perceived flavour profile) was selected. Following this, two separate sensory panels
(n = 34) were conducted to evaluate the taste of the two different sets of ice cream
formulations ((B+R 1 - 5) and (B+BN 1 - 5)). The sensory panels were made up of staff
and students from the School of Culinary Arts and Food Technology and from the
School of Food Science and Environmental Health, Dublin Institute of Technology,
Dublin.
Table 2.3 Flavour concentration ratios for banana and basmati rice and banana and
bacon ice creams.
Banana and basmati rice ice cream Banana and bacon ice cream
Sample Banana
(g/ kg)
Basmati rice
(g/ kg)
Sample Banana
(g/ kg)
Bacon
(g/ kg)
B+R1 225 150 B+BN1 225 150
B+R2 225 225 B+BN2 225 225
B+R3 225 300 B+BN3 225 300
B+R4 150 300 B+BN4 150 300
B+R5 150 225 B+BN5 150 225
B+R (1 - 5): banana and basmati rice ice cream formulations.
B+BN (1 - 5): banana and bacon ice cream formulations.
Chapter 2 Materials and Methods
86
Evaluation was carried out in a sensory laboratory under guidelines and
conditions according to ISO 8589:2010 (ISO, 2010). Each panellist worked in a single
booth under defined conditions of 22 oC and white light. Approximately 30 g of each
ice cream was placed in sample containers coded with three-digit random numbers and
were presented in a monadic sequential and randomised order to the panellists and were
served at between -11 oC and -13 oC (Aime et al., 2001). Panellists were instructed to
evaluate the taste of the banana and rice ice cream on a 9 point hedonic scale, where 9 =
“like extremely”, 5 = “neither like nor dislike” and 1 = “dislike extremely”. Panellists
were instructed to consume mineral water to rinse their mouths between evaluating each
sample (Bárcenas et al., 2001). In addition, qualitative data was also recorded; panellists
were encouraged to write comments regarding their opinion on the intensity of the
banana, rice and bacon flavours in the ice creams. These comments were coded as
positive, negative or neutral comments. Evaluation of each ice cream (banana and
basmati rice and banana and bacon) took place on separate days.
2.5.4 Salt (sodium chloride) content of preferred ice creams
2.5.4.1 Moisture content measurement
Moisture content of banana and basmati rice (B+RI), banana and bacon (B+BNI,
banana (Control 1) and plain (Control 2) ice creams was determined by the AOAC
method 925.098 (AOAC, 1990). Ten grams samples of each ice cream were weighed
and then dried in an oven (Universal Oven, Memmert, Schwabach, Germany) at 105 oC
for 24 hours. Following this, the samples were removed from the oven, cooled in a
desiccator to room temperature and weighed. Percentage moisture (Equation 2.6) was
calculated using the following equation as described by Bradley (2010);
Chapter 2 Materials and Methods
87
% 𝑀𝑜𝑖𝑠𝑡𝑢𝑟𝑒 =𝑤𝑒𝑖𝑔ℎ𝑡 𝑙𝑜𝑠𝑠(𝑔)
𝑤𝑒𝑡 𝑤𝑒𝑖𝑔ℎ𝑡(𝑔) × 100 Equation 2.6
2.5.4.2 Preparation of samples for atomic absorption spectrometry
Analytical grade reagents were used throughout. Distilled, deionized water
(DDW) from a Milli-Q water purification system (Millipore, Bedford, MA, USA), was
used for the preparation of the solutions. All containers and glassware were washed
with 69 % nitric acid (HNO3) and rinsed with DDW before use. Fifty mL of HNO3 (69
%) was added to 3 g of dried ice cream in a glass beaker and the contents was swirled
gently. The solution was then heated to 120 oC on a hotplate. After approximately 40
minutes, the content of beaker was reduced to near dryness producing a clear orange
solution. The beaker was removed from the hotplate and allowed to cool to room
temperature. During cooling, 50 mL of HNO3 was added to obtain a final digestate
solution of approximately 64 mL. Fifteen mL of the digestate solution was pipetted into
a 100 mL volumetric flask and topped up with DDW.
2.5.4.3 Atomic absorption spectrometry
All measurements were carried out using a model AAS 6 Varion atomic
absorption spectrometer (Analytik Jena AG, Jena, Germany). A sodium hollow cathode
lamp (Photron pty Ltd., Melbourne, Australia) operating at 7 mA was used as the
radiation source. The atomisation was carried out in an air-acetylene flame. The
acetylene flow rates and the burner height were adjusted in order to obtain the
maximum absorbance signal. High purity argon was used as a carrier gas. Three
replicates of each sample were prepared and the experiment was repeated three times. A

Chapter 2 Materials and Methods
88
calibration curve using NaCl as a standard was constructed and used for quantification
of NaCl content. The standard curve had an R2 value of 0.999. NaCl concentration was
calculated using the following:
𝑠𝑎𝑙𝑡 𝑐𝑜𝑛𝑐. = (𝐴
𝑒𝑙) × 2.5 Equation 2.7
Where A is the absorbance, e is the slope, l is the path length and results were
expressed as g/ 100 g.
2.5.5 pH measurement
The pH of banana and basmati rice (B+RI), banana and bacon (B+BNI, banana
(Control 1) and plain (Control 2) ice creams at room temperature were determined using
an Orion Model 520A pH metre (AGB Scientific Ltd., Dublin, Ireland). The pH of 30
mL of ice cream sample was measured at 20 oC. Three replicates of each sample were
prepared and the experiment was repeated three times.
2.5.6 Evaluation of consumer acceptance and market suitability
To evaluate the acceptability of the ice cream products to two selected markets,
two groups of subjects were selected representing each separate markets; a general retail
market (panel A) and a culinary educated market (panel B). The rationale for assessing
the two ice cream samples with two sensory panels representing different markets was
based on findings from the focus groups (section 5.2), where certain participants with
no professional culinary background displayed partial neophobic behaviour towards
some of the food pairings. In contrast, participants with professional culinary education

Chapter 2 Materials and Methods
89
appeared to display neophilic behaviour towards some of the food pairings. In addition
to this, the naturally lower levels of salt in banana and basmati rice ice cream than in
banana and bacon ice cream also allowed for assessment of two contrasting products in
light of this partial neophobic behaviour.
Panel A was made up of staff and students from the School of Culinary Arts and
Food Technology and from the School of Food Science and Environmental Health,
Dublin Institute of Technology, Dublin. Panel B was made up solely of culinary
students from the School of Culinary Arts and Food Technology, Dublin Institute of
Technology, Dublin. In total, 171 females and 133 males who ranged in age from 18 to
45 years of age evaluated the taste acceptability of the two ice cream samples (B+R and
B+BN) in four separate sensory panels, with 76 participants in each (n = 304). The ice
creams (B+R and B+BN) were evaluated separately on different days, and also
separately by each panel (panel A and panel B) on different days (4 separate days in
total). Sensory evaluation was conducted as described in section 2.5.3. Panellists were
instructed to evaluate the taste of the banana and rice ice cream on a 9 point hedonic
line scale, where 9 = “like extremely”, 5 = “neither like nor dislike” and 1 = “dislike
extremely”.
2.5.7 Statistical analysis of novel ice cream data
2.5.7.1 Determination of optimum flavour concentrations data
The Friedman rank sum was performed, using a significance level (p ≤ 0.05) to
determine whether samples were significantly preferred over one another. Follow-up
pair wise comparisons were conducted using a Wilcoxon signed rank test and

Chapter 2 Materials and Methods
90
controlling for the Type I errors across these comparisons at the 0.05 level were
controlled using the Fishers Least Squared Difference (LSD) procedure to ascertain
where significant differences where. The analysis was performed using SPSS program
for Windows (version 19.0, SPSS Inc., Chicago, Il, USA).
2.5.7.2 Salt and pH measurement data
To analyse the salt and pH measurement data from the four separate ice cream
samples, one-way analysis of variance (ANOVA) was performed, using a significance
level of p ≤ 0.05. This was followed by Fisher's least significant differences (LSD) test
to ascertain where significant differences were. The analysis was performed using SPSS
program for Windows (version 19.0, SPSS Inc., Chicago, Il, USA).
2.5.7.3 Consumer acceptance and market suitability evaluation data
The consumer evaluation data from the four separate sensory panels, was
analysed as in section 2.5.7.2.

Chapter 3 Optimisation of Emulsion Model System Formation and Stability
91
Chapter 3
Chapter 3 Optimisation of Emulsion Model System Formation and Stability
92
3.1 General introduction
This chapter involved the optimisation of the formation and stability of an oil in
water emulsion food model system containing lecithin, xanthan gum and sunflower oil.
Even in a simple model food system a vast array of factors can influence formation and
storage stability (Ribeiro et al., 2011). Obtaining knowledge of the formation and
stability properties of emulsion ingredients is vital for the formulation of emulsion
based model systems. This also enables the further investigation of other culinary
mechanisms of phenomena like flavour release from such model systems. Response
surface methodology and nonlinear regression were applied as statistical tools to (1)
model and optimise the emulsion ingredient levels (lecithin (x1), xanthan gum (x2) and
sunflower oil (x3)) leading to maximum emulsion storage stability ratio and minimum
mean droplet diameter and (2) study the linear, quadratic and interactive effects of
emulsion ingredient concentration on storage stability ratio and mean droplet diameter.
3.2 Fitting of the response surface models and repeatability
The independent variables and experimental design factor setting for the Box
Behnken design including the mean values and corresponding standard deviations of the
two responses: emulsion storage stability ratio (SR) and mean droplet diameter (DS) for
each experimental condition are illustrated in Table 3.1. The regression coefficients and
analysis of variance of the coded independent variables for SR are presented in Table
3.2. Besides showing the optimal conditions for maximum SR and minimum DS, the
mathematical model was able to identify and describe significant effects of the
independent variables, their relative sensitivity and some interesting interactions
between the variables on both responses.

Chapter 3 Optimisation of Emulsion Model System Formation and Stability
93
Table 3.1 Experimental design with level of factors (low (–α), medium (α) and high
(+α)), mean values and standard deviation for responses according to the Box Behnken
design.
c centre points.
SD: standard deviation. SR: emulsion storage stability ratio.
DS: mean droplet diameter.
The R2 statistic indicated that the response surface model accounted for 89 % of
the variation for SR and 86 % for DS. When the residual plots were investigated, they
appeared to follow a normal distribution and to be independent from any of the
variables. The repeatability of the experimental procedure was evaluated by calculating
the relative standard deviation percentage (RSD %) of three replicates of each
experimental condition. The RSD % for SR ranged from 0 to 8.8, with a RSD %
average of 2.6, while the RSD % for average DS ranged from 0.2 up to 5.7, with a RSD
Run Sunflower
oil (% v/v)
Lecithin
(% w/v)
Xanthan
gum
(% w/v)
SR
(%)
SD DS
(µm)
SD
1 15 5 0.01 67.8 ± 6.0 5.74 ± 0.24
2 10 3 0.3 100 ± 0 4.94 ± 0.11
3 10 3 0.01 88.9 ± 1.0 5.4 ± 0.05
4 15 3 0.16 51.0 ± 2.8 5.31 ± 0.05
5 10 1 0.16 92.1 ± 1.6 5.24 ± 0.04
6 15 1 0.01 81.3 ± 1.8 5.13 ± 0.08
7 10 5 0.16 54.3 ± 2.8 5.08 ± 0.18
8 20 3 0.01 71.0 ± 1.1 6.05 ± 0.35
9 20 5 0.16 62.9 ± 2.0 5.26 ± 0.29
10 15 5 0.3 100 ± 0 4.69 ± 0.21
11c 15 3 0.16 48.5 ± 2.9 5.48 ± 0.15
12 c 15 3 0.16 50.7 ± 2.0 5.41 ± 0.09
13 20 1 0.16 100 ± 0 5.28 ± 0.12
14 20 3 0.3 100 ± 0 4.91 ± 0.12
15 15 1 0.3 100 ± 0 4.96 ± 0.12
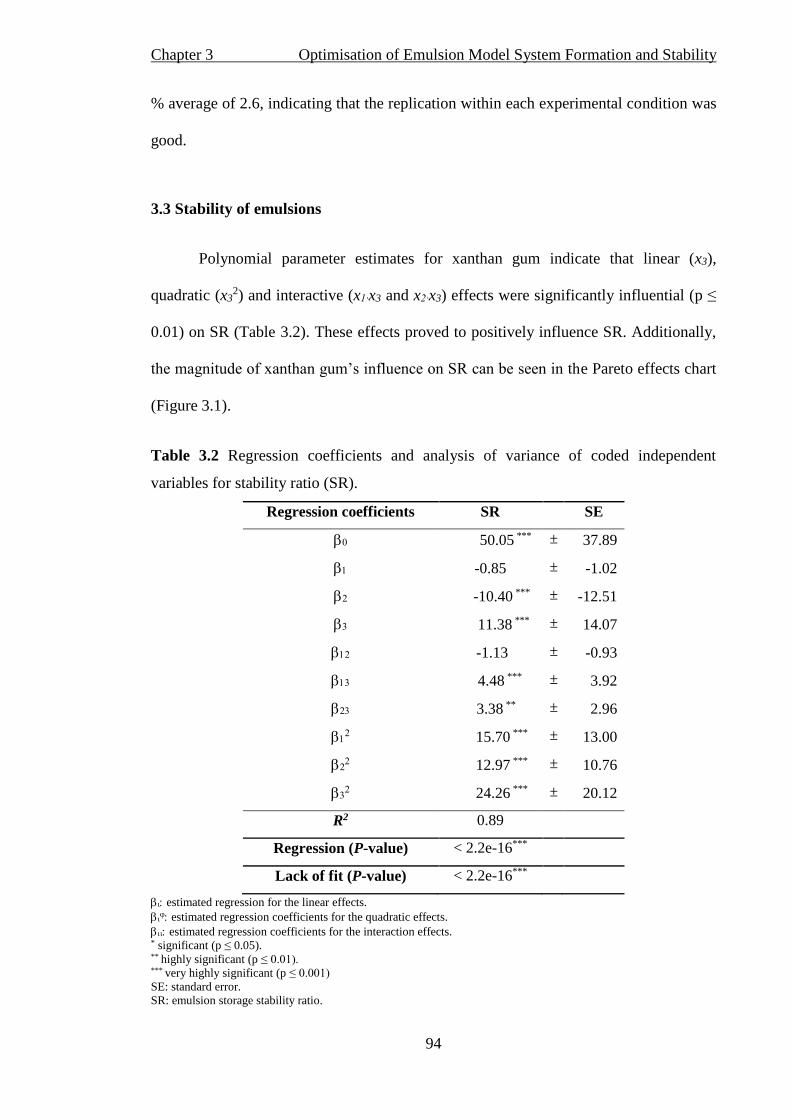
Chapter 3 Optimisation of Emulsion Model System Formation and Stability
94
% average of 2.6, indicating that the replication within each experimental condition was
good.
3.3 Stability of emulsions
Polynomial parameter estimates for xanthan gum indicate that linear (x3),
quadratic (x32) and interactive (x1∙x3 and x2∙x3) effects were significantly influential (p ≤
0.01) on SR (Table 3.2). These effects proved to positively influence SR. Additionally,
the magnitude of xanthan gum’s influence on SR can be seen in the Pareto effects chart
(Figure 3.1).
Table 3.2 Regression coefficients and analysis of variance of coded independent
variables for stability ratio (SR).
Regression coefficients SR SE
50.05 *** ± 37.89
-0.85 ± -1.02
-10.40 *** ± -12.51
11.38 *** ± 14.07
-1.13 ± -0.93
4.48 *** ± 3.92
3.38 ** ± 2.96
15.70 *** ± 13.00
12.97 *** ± 10.76
24.26 *** ± 20.12
R2 0.89
Regression (P-value) < 2.2e-16***
Lack of fit (P-value) < 2.2e-16***
estimated regression for the linear effects.
estimated regression coefficients for the quadratic effects.
estimated regression coefficients for the interaction effects. * significant (p ≤ 0.05). ** highly significant (p ≤ 0.01). *** very highly significant (p ≤ 0.001)
SE: standard error.
SR: emulsion storage stability ratio.
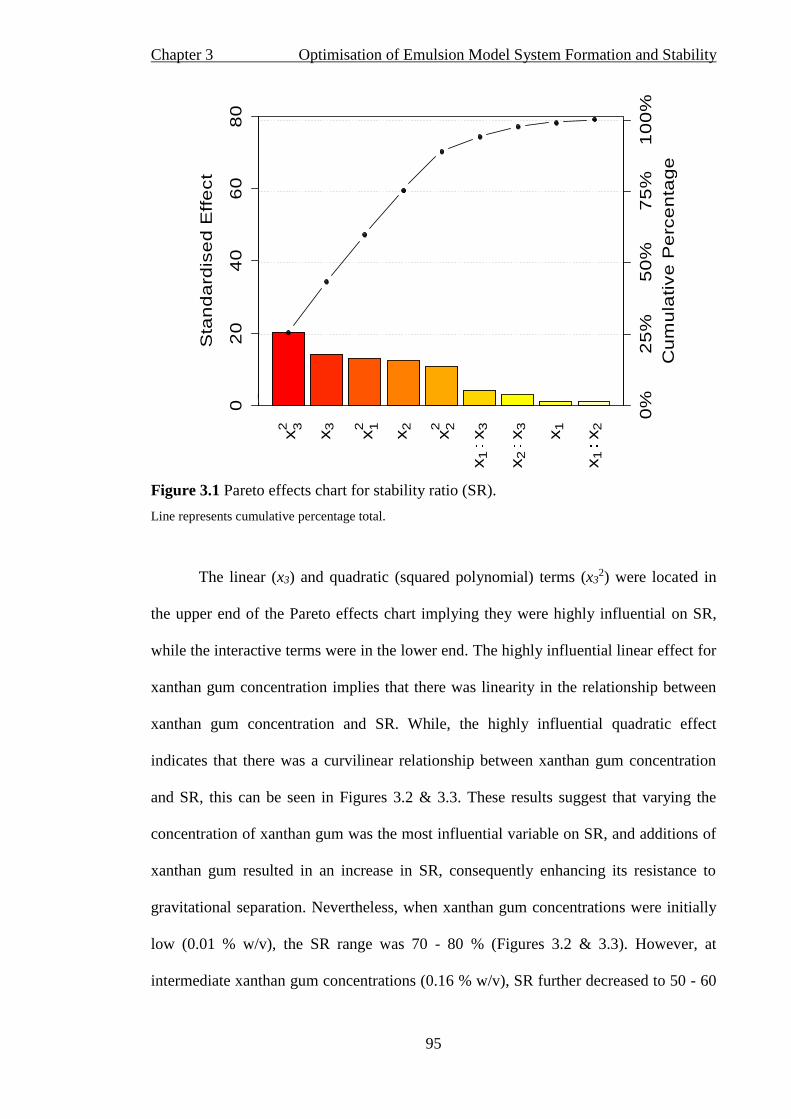
Chapter 3 Optimisation of Emulsion Model System Formation and Stability
95
Figure 3.1 Pareto effects chart for stability ratio (SR).
Line represents cumulative percentage total.
The linear (x3) and quadratic (squared polynomial) terms (x32) were located in
the upper end of the Pareto effects chart implying they were highly influential on SR,
while the interactive terms were in the lower end. The highly influential linear effect for
xanthan gum concentration implies that there was linearity in the relationship between
xanthan gum concentration and SR. While, the highly influential quadratic effect
indicates that there was a curvilinear relationship between xanthan gum concentration
and SR, this can be seen in Figures 3.2 & 3.3. These results suggest that varying the
concentration of xanthan gum was the most influential variable on SR, and additions of
xanthan gum resulted in an increase in SR, consequently enhancing its resistance to
gravitational separation. Nevertheless, when xanthan gum concentrations were initially
low (0.01 % w/v), the SR range was 70 - 80 % (Figures 3.2 & 3.3). However, at
intermediate xanthan gum concentrations (0.16 % w/v), SR further decreased to 50 - 60
x32
x3
x12
x2
x22
x1
x3
x2
x3
x1
x1
x2
Sta
nd
ard
ise
d E
ffe
ct
02
04
06
08
0
0%
25
%5
0%
75
%1
00
%
Cu
mu
lative
Pe
rce
nta
ge

Chapter 3 Optimisation of Emulsion Model System Formation and Stability
96
%. Once levels of xanthan gum passed this intermediate point (> 0.16 % w/ v), SR
subsequently increased to 100 %.
Figure 3.2 Response surface plots for emulsion stability as a function of xanthan gum
and lecithin concentration when sunflower oil is fixed at 0.08.
Figure 3.3 Response surface plots for emulsion stability as a function of xanthan gum
and sunflower oil concentration when lecithin is fixed at 0.44.
Normalised Lecithin concentration
-1.0
-0.5
0.0
0.5
1.0
Norm
alised X
anthan con
centration
-1.0
-0.5
0.0
0.5
1.0
Sta
bility
Ratio
[%]
50
60
70
80
90
100
Slice at x1 = 0.08
Normalised Oil Concentration
-1.0
-0.5
0.0
0.5
1.0
Norm
alised X
anthan con
centration
-1.0
-0.5
0.0
0.5
1.0
Sta
bility
Ratio
[%]
50
60
70
80
90
100
Slice at x2 = 0.44

Chapter 3 Optimisation of Emulsion Model System Formation and Stability
97
Dickinson (2009) found that at low concentrations, added hydrocolloids (such as
xanthan gum) can have a destabilising influence on emulsion stability due to a
mechanism known as depletion flocculation. This mechanism is induced by the excess
non-absorbing hydrocolloid and/or surfactant forming micelles. In fact, xanthan gum is
known as a common depletion flocculant, with specific critical concentrations for such
mechanisms being reported (Sun et al., 2007). However, Hemar et al. (2001) observed
that although increases in xanthan gum content caused more extensive flocculation of
droplets, overall emulsion stability was subsequently improved. Similarly, Ye et al.
(2004) obtained accelerated droplet flocculation with emulsion re-stabilisation occurring
once xanthan gum concentration exceeded a critical concentration (0.12 % w/v). This
stabilising effect of xanthan gum has been previously attributed to its ability to increase
the viscosity of the continuous phase, thereby minimising droplet mobility and
decreasing droplet collision numbers (Tsaliki et al., 2004; Dickinson, 2003). Hence, it
may be suggested that a critical concentration of xanthan gum (0.16 % w/v) was
present, at which a destabilising effect from xanthan gum was prevalent. Once
surpassed, the apparent viscosity of the continuous phase was increased, thereby
reducing the mobility of the emulsion droplets inhibiting aggregation or coalescence
(Sworn, 2000).
Lecithin was also found to have significant (p ≤ 0.05) linear (x2), quadratic (x22)
and interactive (x2∙x3) effects on SR (Table 3.2). Although lecithin was not found to be
as influential as xanthan gum on SR, the magnitude and importance of its influence on
SR is clear from the Pareto effects chart (Figure 3.1). The linear (x2) and quadratic (x22)
effects of lecithin are positioned high on the Pareto effects chart with a relatively high
magnitude of standardised effect. These linear and quadratic effects demonstrate that
there was a curvilinear effect present. Thus, varying lecithin concentration had an

Chapter 3 Optimisation of Emulsion Model System Formation and Stability
98
important bearing on SR. Figures 3.2 & 3.4 suggest that this influence was negative,
higher levels of lecithin (> 2.5 % w/v) appeared to have a destabilising effect.
Therefore, a similar depletion flocculation mechanism (as was the case with xanthan
gum), where excess non-absorbed surfactant promoted phase separation may have been
a reason for this phenomena.
The interactive effect of sunflower oil with xanthan gum (x1∙x3) was found to be
significant (p ≤ 0.05) with respect to SR (Table 3.2). The quadratic effect of sunflower
oil (x12) was also found to be significant (p ≤ 0.05), which indicates that there was a
certain degree of curvilinear effects present regarding sunflower oil’s relationship with
SR (Table 3.2). Changes in sunflower oil concentration (x1) had less of an influence in
comparison with the other design variables on SR (Figures 3.2 & 3.4).
Figure 3.4 Response surface plot for emulsion stability as a function of lecithin and
sunflower oil concentration when xanthan is fixed at -0.27.
Normalised Oil Concentration
-1.0
-0.5
0.0
0.5
1.0
Norm
alised Lecithin con
centration
-1.0
-0.5
0.0
0.5
1.0
Sta
bility
Ratio
[%]
50
60
70
80
90
100
Slice at x3 = -0.27
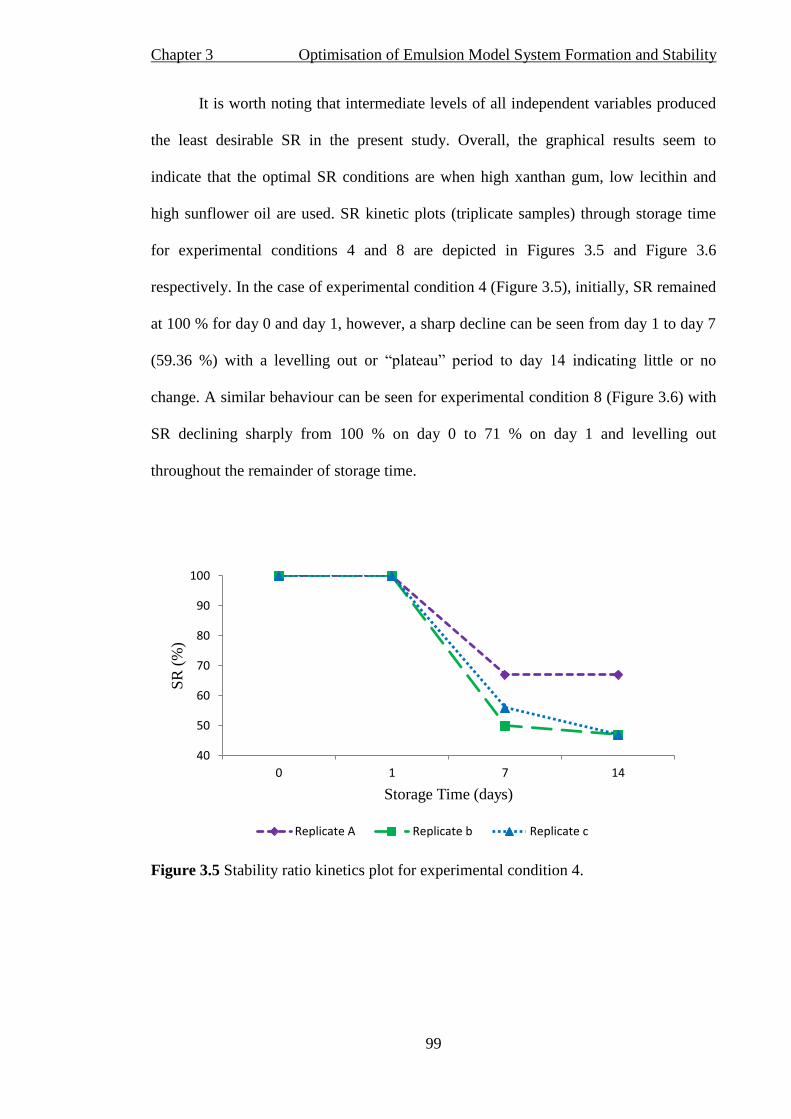
Chapter 3 Optimisation of Emulsion Model System Formation and Stability
99
It is worth noting that intermediate levels of all independent variables produced
the least desirable SR in the present study. Overall, the graphical results seem to
indicate that the optimal SR conditions are when high xanthan gum, low lecithin and
high sunflower oil are used. SR kinetic plots (triplicate samples) through storage time
for experimental conditions 4 and 8 are depicted in Figures 3.5 and Figure 3.6
respectively. In the case of experimental condition 4 (Figure 3.5), initially, SR remained
at 100 % for day 0 and day 1, however, a sharp decline can be seen from day 1 to day 7
(59.36 %) with a levelling out or “plateau” period to day 14 indicating little or no
change. A similar behaviour can be seen for experimental condition 8 (Figure 3.6) with
SR declining sharply from 100 % on day 0 to 71 % on day 1 and levelling out
throughout the remainder of storage time.
Figure 3.5 Stability ratio kinetics plot for experimental condition 4.
40
50
60
70
80
90
100
0 1 7 14
SR
(%
)
Storage Time (days)
Replicate A Replicate b Replicate c

Chapter 3 Optimisation of Emulsion Model System Formation and Stability
100
Figure 3.6 Stability ratio kinetics plot for experimental condition 8.
3.4 Emulsion mean droplet diameter
Statistical significant parameters (p ≤ 0.05) for the secondary model building of
the DS response are listed in Table 3.3. The results for initial DS (R0) showed that all
linear, quadratic and interactive variables for sunflower oil (x1), lecithin (x2) and
xanthan gum (x3) significantly influenced (p ≤ 0.05) R0 (except for the quadratic effect
of xanthan gum (x32) and the interactive effect (x1 x3)). The lack of a significant
quadratic effect for xanthan gum and the presence of a significant linear effect (R0x3) are
depicted in Figure 3.7, where a clear linearity can been seen between the relationship of
xanthan gum concentration and initial DS (R0). Moreover, this linear effect (R0x3) and
interactive effect with lecithin (R0x2∙x3) were found to be negative.
65
70
75
80
85
90
95
100
0 1 7 14
SR
(%
)
Storage Time (days)
Replicate A Replicate b Replicate c

Chapter 3 Optimisation of Emulsion Model System Formation and Stability
101
Table 3.3 Regression coefficients and analysis of variance of coded independent
variables for mean droplet diameter (DS).
Regression Coefficients DS SE
Asym0 5.41 ± 0.04
Asymx3 -0.64 ± 0.04
Asymx3·x2 -0.11 ± 0.05
R00 4.59 ± 0.04
R0x1 0.12 ± 0.03
R0x2 -0.21 ± 0.03
R0x3 -0.30 ± 0.03
R0x12 0.30 ± 0.04
R0x22 -0.11 ± 0.04
R0x1·x2 0.07 ± 0.03
R0x2·x3 -0.27 ± 0.04
lrc0 -1.4 ± 0.2
lrcx3 1.51 ± 0.2
lrcx22 -1.2 ± 0.2
lrcx32 1.2 ± 0.2
lrcx3·x2 -0.38 ± 0.16
lrcx3·x1 -1.8 ± 0.3
R2 0.86
All parameter estimates significant (p ≤ 0.05).
SE: standard error.
Subscripts in parameter estimate name indicate the polynomial dependence term in the final secondary
model building.
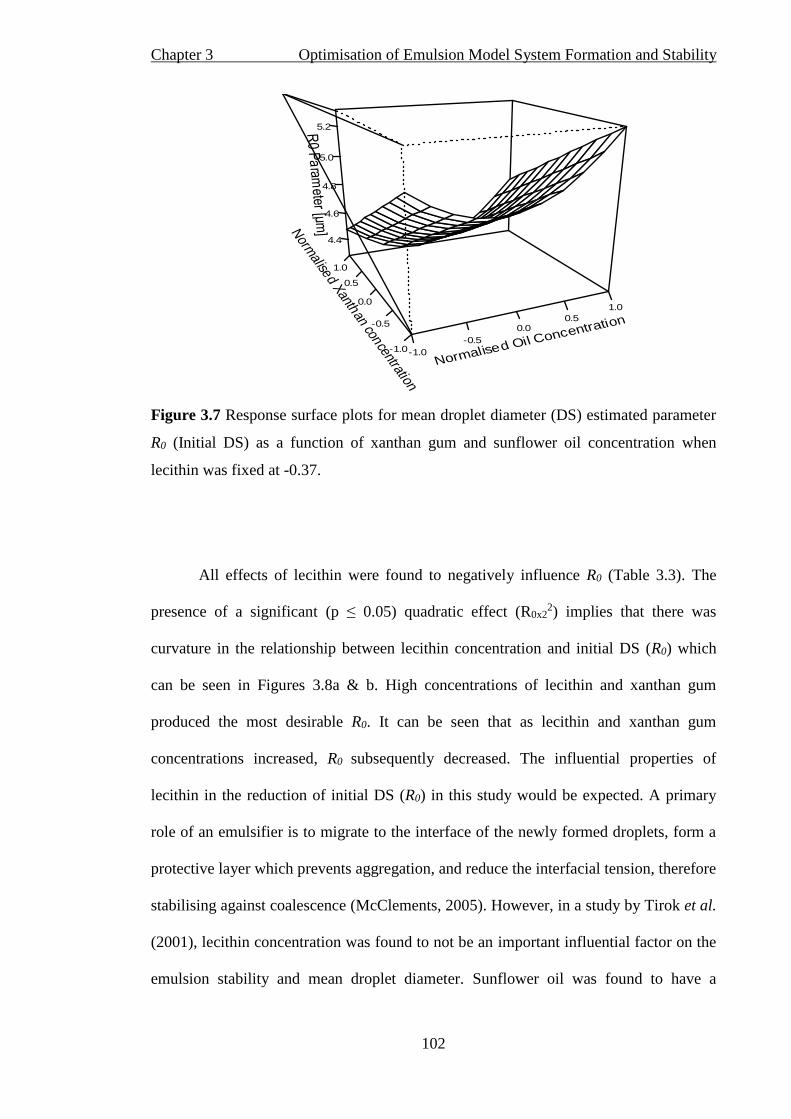
Chapter 3 Optimisation of Emulsion Model System Formation and Stability
102
Figure 3.7 Response surface plots for mean droplet diameter (DS) estimated parameter
R0 (Initial DS) as a function of xanthan gum and sunflower oil concentration when
lecithin was fixed at -0.37.
All effects of lecithin were found to negatively influence R0 (Table 3.3). The
presence of a significant (p ≤ 0.05) quadratic effect (R0x22) implies that there was
curvature in the relationship between lecithin concentration and initial DS (R0) which
can be seen in Figures 3.8a & b. High concentrations of lecithin and xanthan gum
produced the most desirable R0. It can be seen that as lecithin and xanthan gum
concentrations increased, R0 subsequently decreased. The influential properties of
lecithin in the reduction of initial DS (R0) in this study would be expected. A primary
role of an emulsifier is to migrate to the interface of the newly formed droplets, form a
protective layer which prevents aggregation, and reduce the interfacial tension, therefore
stabilising against coalescence (McClements, 2005). However, in a study by Tirok et al.
(2001), lecithin concentration was found to not be an important influential factor on the
emulsion stability and mean droplet diameter. Sunflower oil was found to have a
Normalised Oil Concentration
-1.0
-0.5
0.00.5
1.0
Norm
alised Xanthan concentration
-1.0
-0.5
0.0
0.5
1.0
R0 P
aram
eter [µm]
4.4
4.6
4.8
5.0
5.2
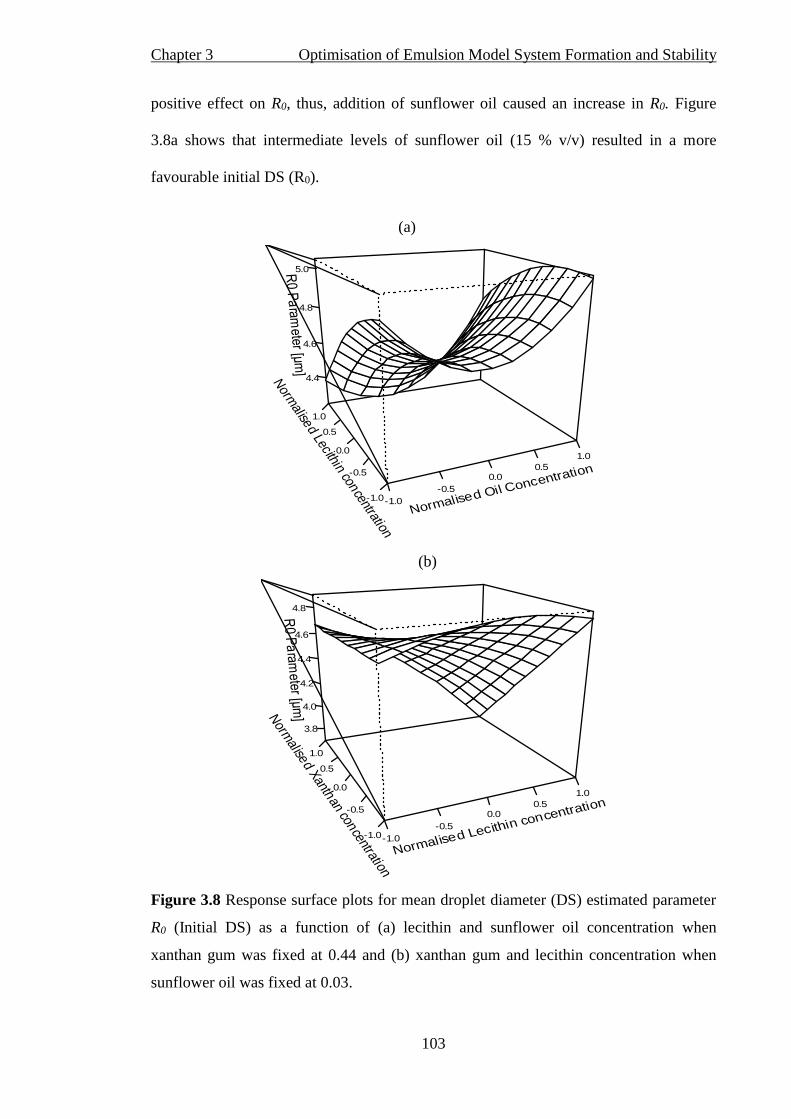
Chapter 3 Optimisation of Emulsion Model System Formation and Stability
103
positive effect on R0, thus, addition of sunflower oil caused an increase in R0. Figure
3.8a shows that intermediate levels of sunflower oil (15 % v/v) resulted in a more
favourable initial DS (R0).
(a)
(b)
Figure 3.8 Response surface plots for mean droplet diameter (DS) estimated parameter
R0 (Initial DS) as a function of (a) lecithin and sunflower oil concentration when
xanthan gum was fixed at 0.44 and (b) xanthan gum and lecithin concentration when
sunflower oil was fixed at 0.03.
Normalised Oil Concentration
-1.0
-0.5
0.00.5
1.0
Norm
alised Lecithin con
centration
-1.0
-0.5
0.0
0.5
1.0
R0 P
aram
eter [µm]
4.4
4.6
4.8
5.0
Normalised Lecithin concentration
-1.0
-0.5
0.00.5
1.0
Norm
alised X
anthan con
centration
-1.0
-0.5
0.0
0.5
1.0
R0 P
aram
eter [µm]
3.8
4.0
4.2
4.4
4.6
4.8
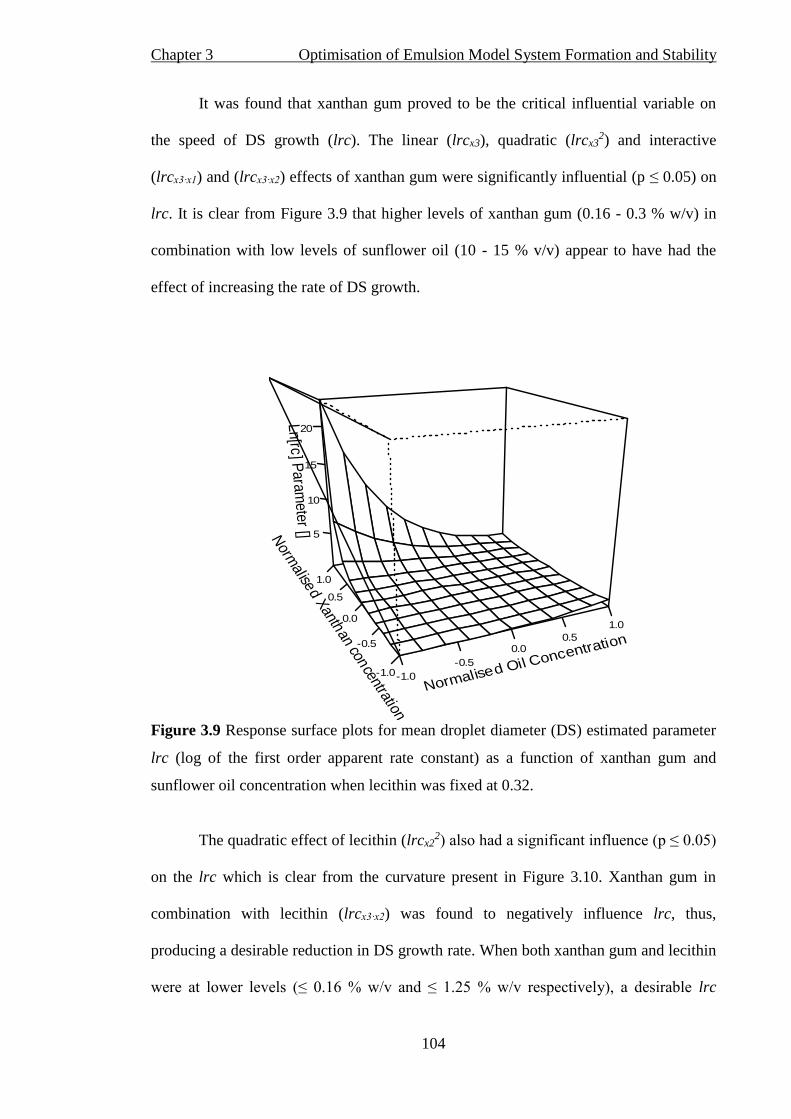
Chapter 3 Optimisation of Emulsion Model System Formation and Stability
104
It was found that xanthan gum proved to be the critical influential variable on
the speed of DS growth (lrc). The linear (lrcx3), quadratic (lrcx32) and interactive
(lrcx3∙x1) and (lrcx3∙x2) effects of xanthan gum were significantly influential (p ≤ 0.05) on
lrc. It is clear from Figure 3.9 that higher levels of xanthan gum (0.16 - 0.3 % w/v) in
combination with low levels of sunflower oil (10 - 15 % v/v) appear to have had the
effect of increasing the rate of DS growth.
Figure 3.9 Response surface plots for mean droplet diameter (DS) estimated parameter
lrc (log of the first order apparent rate constant) as a function of xanthan gum and
sunflower oil concentration when lecithin was fixed at 0.32.
The quadratic effect of lecithin (lrcx22) also had a significant influence (p ≤ 0.05)
on the lrc which is clear from the curvature present in Figure 3.10. Xanthan gum in
combination with lecithin (lrcx3∙x2) was found to negatively influence lrc, thus,
producing a desirable reduction in DS growth rate. When both xanthan gum and lecithin
were at lower levels (≤ 0.16 % w/v and ≤ 1.25 % w/v respectively), a desirable lrc
Normalised Oil Concentration
-1.0
-0.5
0.00.5
1.0
Norm
alised X
anthan con
centration
-1.0
-0.5
0.0
0.5
1.0
Ln[rc
] Para
mete
r [] 5
10
15
20

Chapter 3 Optimisation of Emulsion Model System Formation and Stability
105
resulted (Figure 3.10). However, intermediate levels of lecithin (2.5 % w/v) in
combination with high levels of xanthan gum (0.24 - 0.3 % w/v) proved to produce an
undesirable increase in lrc.
Figure 3.10 Response surface plots for mean droplet diameter (DS) estimated parameter
lrc (log of the first order apparent rate constant) as a function of xanthan gum and
lecithin concentration when sunflower oil was fixed at 0.81.
Figure 3.11 appears to indicate that intermediate levels of lecithin (2.5 % w/v)
regardless of sunflower oil concentrations resulted in an increase in the rate of DS
growth. Hence, the highest rate DS growth was at an intermediate lecithin concentration
(2.5 % w/v).
Normalised Lecithin concentration
-1.0
-0.5
0.00.5
1.0
Norm
alised X
anthan con
centration
-1.0
-0.5
0.0
0.5
1.0
Ln[rc] Param
eter [] 1
2
3
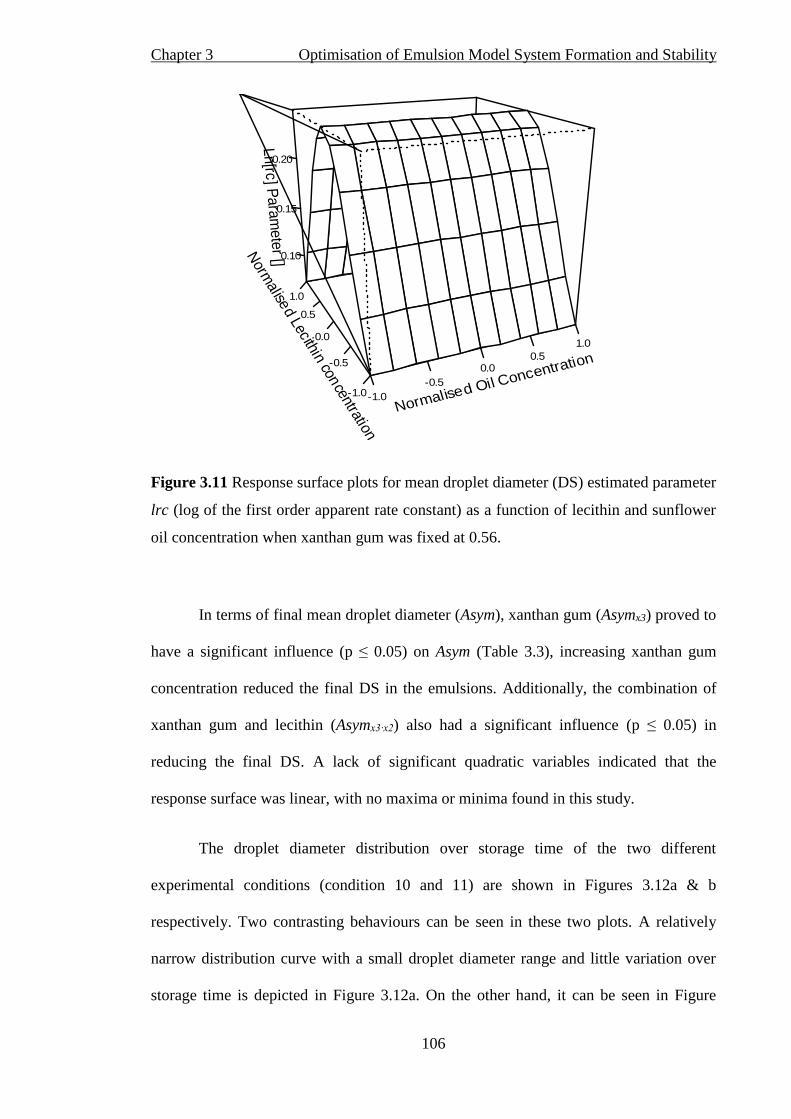
Chapter 3 Optimisation of Emulsion Model System Formation and Stability
106
Figure 3.11 Response surface plots for mean droplet diameter (DS) estimated parameter
lrc (log of the first order apparent rate constant) as a function of lecithin and sunflower
oil concentration when xanthan gum was fixed at 0.56.
In terms of final mean droplet diameter (Asym), xanthan gum (Asymx3) proved to
have a significant influence (p ≤ 0.05) on Asym (Table 3.3), increasing xanthan gum
concentration reduced the final DS in the emulsions. Additionally, the combination of
xanthan gum and lecithin (Asymx3∙x2) also had a significant influence (p ≤ 0.05) in
reducing the final DS. A lack of significant quadratic variables indicated that the
response surface was linear, with no maxima or minima found in this study.
The droplet diameter distribution over storage time of the two different
experimental conditions (condition 10 and 11) are shown in Figures 3.12a & b
respectively. Two contrasting behaviours can be seen in these two plots. A relatively
narrow distribution curve with a small droplet diameter range and little variation over
storage time is depicted in Figure 3.12a. On the other hand, it can be seen in Figure
Normalised Oil Concentration
-1.0
-0.5
0.00.5
1.0
Norm
alised Lecithin con
centration
-1.0
-0.5
0.0
0.5
1.0
Ln[rc
] Para
mete
r [] 0.10
0.15
0.20

Chapter 3 Optimisation of Emulsion Model System Formation and Stability
107
3.12b, that the distribution curve on day 0 is relatively narrow, however as time
increases, the distribution curve becomes wider with a slight shift towards the right
indicating that the droplet diameter increased and also that diameter size became less
homogenous.
(a) (b)
Figure 3.12 Droplet diameter distribution density plot for (a) emulsion condition 10 and
(b) condition 11.
day 0 day 1 day 7 day 14
Figure 3.13a depicts a kinetic plot of DS (triplicate samples) through storage
time for experimental condition 7. It would appear that there was a somewhat linear
relationship between DS and storage time for experimental condition 7, with DS
proportionally increasing through storage time. However, Figure 3.13b depicts
contrasting behaviour for condition 12 in comparison to experimental condition 7. A
more complicated nonlinear relationship between DS and storage time appears to have
been present. After 7 days of storage a “plateau” was reached, in which DS “levels out”
with little or no change. This behaviour appears to be present for the majority of the
experimental conditions.
Droplet Diameter (µm)
0.0
0.1
0.2
0.3
0.4
5 10 15
Droplet Diameter (µm)
0.0
0.1
0.2
0.3
0.4
5 10 15
Dis
trib
uti
on d
ensi
ty
Dis
trib
uti
on d
ensi
ty
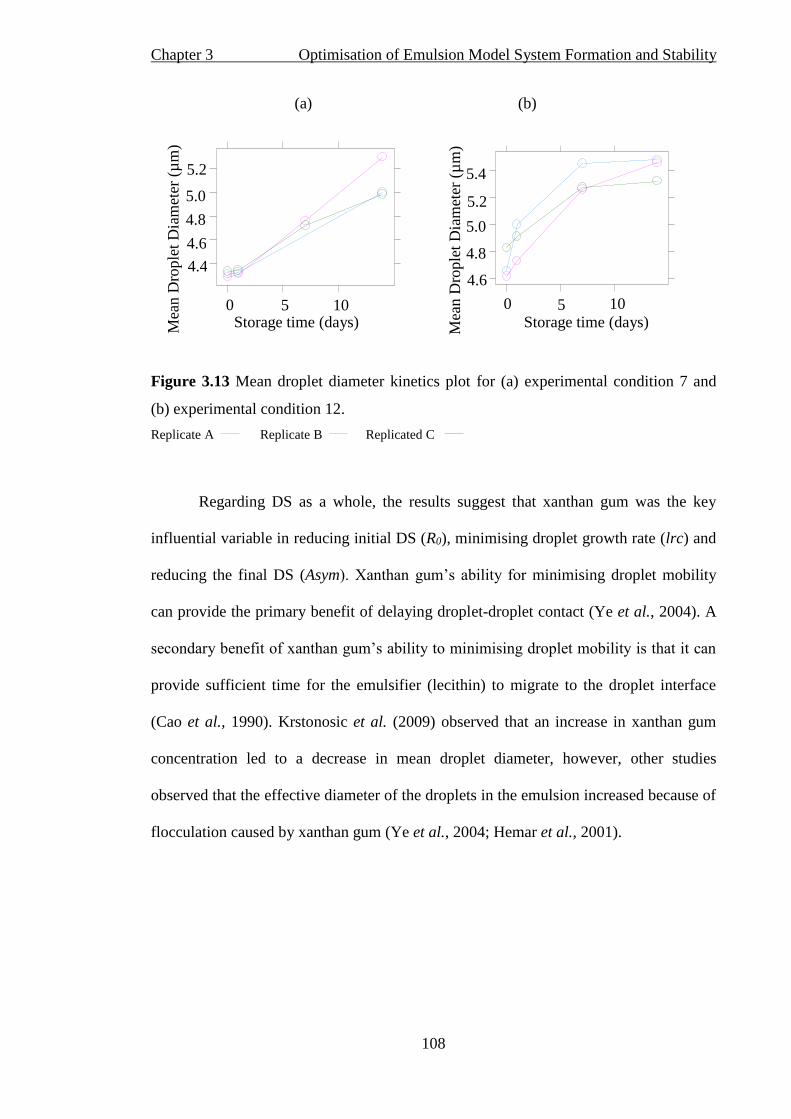
Chapter 3 Optimisation of Emulsion Model System Formation and Stability
108
(a) (b)
Figure 3.13 Mean droplet diameter kinetics plot for (a) experimental condition 7 and
(b) experimental condition 12.
Replicate A Replicate B Replicated C
Regarding DS as a whole, the results suggest that xanthan gum was the key
influential variable in reducing initial DS (R0), minimising droplet growth rate (lrc) and
reducing the final DS (Asym). Xanthan gum’s ability for minimising droplet mobility
can provide the primary benefit of delaying droplet-droplet contact (Ye et al., 2004). A
secondary benefit of xanthan gum’s ability to minimising droplet mobility is that it can
provide sufficient time for the emulsifier (lecithin) to migrate to the droplet interface
(Cao et al., 1990). Krstonosic et al. (2009) observed that an increase in xanthan gum
concentration led to a decrease in mean droplet diameter, however, other studies
observed that the effective diameter of the droplets in the emulsion increased because of
flocculation caused by xanthan gum (Ye et al., 2004; Hemar et al., 2001).
Storage time (days)
4.6
4.8
5.0
5.2
5.4
0 5 10
Storage time (days)
4.4
4.6
4.8
5.0
5.2
0 5 10
Mea
n D
rople
t D
iam
eter
(µ
m)
Mea
n D
rople
t D
iam
eter
(µ
m)

Chapter 3 Optimisation of Emulsion Model System Formation and Stability
109
3.5 Multi Criteria Optimisation and validation of optimal conditions
Multi criteria optimisation was employed to find a compromise between the two
response variables in the study using the library MCO (R 2.14.1 software package). A
Pareto front plot for the two optimised responses was produced after generating a
population of 1,000 individual optimisations (Figure 3.13). The lack of any curvature in
the Pareto front plot, suggests that the optimisation process resulted in no compromise
being achieved between the two responses. Thus, any optimisation that attempts to
improve the emulsion properties from a particular start up point will result in a benefit
in one of the responses that will cause a directly proportional loss in the other response.
Therefore, any decrease in DS resulted in a corresponding linearly correlated decrease
in SR and vice versa. Hence, a 50/50 weighting was found to be the best condition and
was tested to show the ability of the model to optimise the product. These experimental
measures were used to follow the validation study.
Figure 3.14 Pareto front plot showing the simultaneous optimisation of the droplet
diameter and the stability ratio.

Chapter 3 Optimisation of Emulsion Model System Formation and Stability
110
Stability and average droplet diameter analysis were carried out at the optimal
conditions to verify the model. A validation study was conducted employing one set of
the optimal conditions from the Pareto front (sunflower oil (x1) 19.02 %, lecithin (x2)
1.2 %, xanthan gum (x3) 0.28 %). The predicted values were SR ≤ 100 % and DS 4.49
µm, the experimental values were SR 100 % and DS 4.35 µm. It should be noted that
both the asymptotic nonlinear regression and polynomial regressions equation were
only a statistical empirical model in the selected ranges. An alternative modelling
emulsion droplet diameter distribution using the Sauter diameter (D32) was explored,
however due to variability amongst samples, a low R2 value was achieved and this could
not be further examined.
Droplet diameter is a key characteristic of emulsion stability, contributing
greatly to the physical stability and organoleptic properties of emulsions, where large
globules tend to coalesce faster than the small ones as in Ostwald ripening
(McClements, 2005). Stoke’s law states that the velocity at which a droplet moves is
proportional to the square of the droplet size radius (Dłużewska et al., 2006). Thus, in
theory, reducing the size of the droplets should enhance the stability of an emulsion to
gravitational separation (Huang et al., 2001). To achieve a decrease in the coalescence
rate by a factor of 10 - 100, a decrease in mean globule diameter by a factor of two is
required (Bergenstahl & Claesson, 1997). It was found that a decrease in droplet
diameter by 0.02 µm resulted in a decrease in emulsion stability by 8 %, which
translates to a coalescence rate with a factor of 400 (Figure 3.14).

Chapter 3 Optimisation of Emulsion Model System Formation and Stability
111
3.6 Conclusions
Results show that both xanthan gum and lecithin were crucial components for
extending the emulsions shelf life to 14 days at ambient room temperature. A critical
concentration for xanthan gum (0.16 % w/v) was established; at which emulsion storage
stability was at its lowest, once exceeded stability was enhanced. Both initial and final
droplet diameters were minimised with increasing concentrations of xanthan gum.
Although increasing the lecithin concentration promoted desirable mean droplet
diameters, it also induced emulsion instability, thus, lower levels (< 2.5 % w/v) were
found to be optimal. While, sunflower oil was less influential on emulsion storage
stability and mean droplet diameter, its interaction with xanthan gum and lecithin, at
intermediate levels of sunflower oil (15 % v/v), proved to induce undesirable results for
both responses. Optimum conditions were found to be sunflower oil 19.02 % v/v, soy
lecithin 1.2 % w/v and xanthan gum 0.28 % w/v. The optimisation process resulted in
no compromise being achieved between the two responses, a decrease in droplet
diameter by 0.02 µm resulted in a decrease in emulsion stability by 8 %. The knowledge
of the stability properties developed in this work is essential for the formulation of
emulsion based food products such as sauces, ice cream and salad dressings. It is also
important to note the limitations of an emulsion model system especially in terms of the
application of findings to more complex food systems such as ice cream. Emulsification
is a critical initial stage in ice cream production. Hence, producing the most stable
emulsions is an important foundation step in the production of ice cream. However, as
outlined in section 1.3.3, there are numerous ingredients (suspension, emulsion, foam
etc.) and processing steps involved in transforming the initial food emulsion to a more
complex food dispersion (ice cream). The model developed in this work did not
completely represent an ice cream product.

Chapter 3 Optimisation of Emulsion Model System Formation and Stability
112
Chapter 4
Chapter 4 Optimisation of Emulsion Flavour Emission
113
4.1 General introduction
In this chapter, the optimised food emulsion model system was investigated
further to examine which physicochemical conditions would result in maximum volatile
emissions of isoamyl acetate and furfuryl acetate. Both acetates are commonly used
banana flavour compounds, eliciting fruity notes (Burdock, 2010; Yilmaztekin et al.,
2008). The production of foods/dishes in a kitchen or in a food manufacturing plant
involves manipulation of the many physicochemical characteristics of the product,
which can influence the release of volatile molecules during gustation (Traynor et al.,
2012). For example, many foods contain significant levels of added sodium chloride
(NaCl), both to deliver flavour and act as a preservative (Mitchell et al., 2011).
Information on the effect of the characteristics of food matrices with respect to flavour
volatile release is necessary. RSM was employed to (1) model and optimise the pH
conditions and salt concentration (NaCl) leading to maximum volatile emission, and (2)
to study the linear, quadratic and interactive effects of the experimental parameters on
the volatile emission.
4.2 Fitting of the response surface models and repeatability
The independent variables and experimental design factors for the Central
Composite Faced Centred experimental design (CCF), including the mean values and
corresponding standard deviations of the two responses: isoamyl acetate (Y1) and
furfuryl acetate (Y2) emission are outlined in Table 4.1.
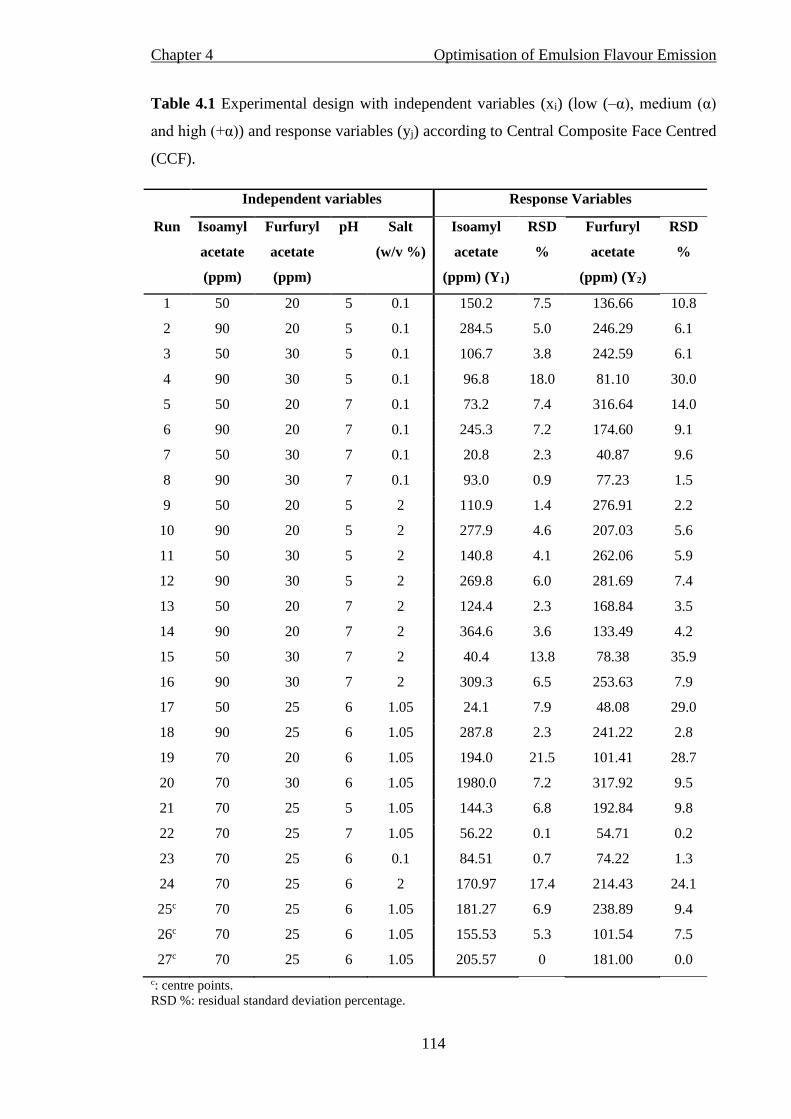
Chapter 4 Optimisation of Emulsion Flavour Emission
114
Table 4.1 Experimental design with independent variables (xi) (low (–α), medium (α)
and high (+α)) and response variables (yj) according to Central Composite Face Centred
(CCF).
c: centre points.
RSD %: residual standard deviation percentage.
Independent variables Response Variables
Run Isoamyl
acetate
(ppm)
Furfuryl
acetate
(ppm)
pH Salt
(w/v %)
Isoamyl
acetate
(ppm) (Y1)
RSD
%
Furfuryl
acetate
(ppm) (Y2)
RSD
%
1 50 20 5 0.1 150.2 7.5 136.66 10.8
2 90 20 5 0.1 284.5 5.0 246.29 6.1
3 50 30 5 0.1 106.7 3.8 242.59 6.1
4 90 30 5 0.1 96.8 18.0 81.10 30.0
5 50 20 7 0.1 73.2 7.4 316.64 14.0
6 90 20 7 0.1 245.3 7.2 174.60 9.1
7 50 30 7 0.1 20.8 2.3 40.87 9.6
8 90 30 7 0.1 93.0 0.9 77.23 1.5
9 50 20 5 2 110.9 1.4 276.91 2.2
10 90 20 5 2 277.9 4.6 207.03 5.6
11 50 30 5 2 140.8 4.1 262.06 5.9
12 90 30 5 2 269.8 6.0 281.69 7.4
13 50 20 7 2 124.4 2.3 168.84 3.5
14 90 20 7 2 364.6 3.6 133.49 4.2
15 50 30 7 2 40.4 13.8 78.38 35.9
16 90 30 7 2 309.3 6.5 253.63 7.9
17 50 25 6 1.05 24.1 7.9 48.08 29.0
18 90 25 6 1.05 287.8 2.3 241.22 2.8
19 70 20 6 1.05 194.0 21.5 101.41 28.7
20 70 30 6 1.05 1980.0 7.2 317.92 9.5
21 70 25 5 1.05 144.3 6.8 192.84 9.8
22 70 25 7 1.05 56.22 0.1 54.71 0.2
23 70 25 6 0.1 84.51 0.7 74.22 1.3
24 70 25 6 2 170.97 17.4 214.43 24.1
25c 70 25 6 1.05 181.27 6.9 238.89 9.4
26c 70 25 6 1.05 155.53 5.3 101.54 7.5
27c 70 25 6 1.05 205.57 0 181.00 0.0
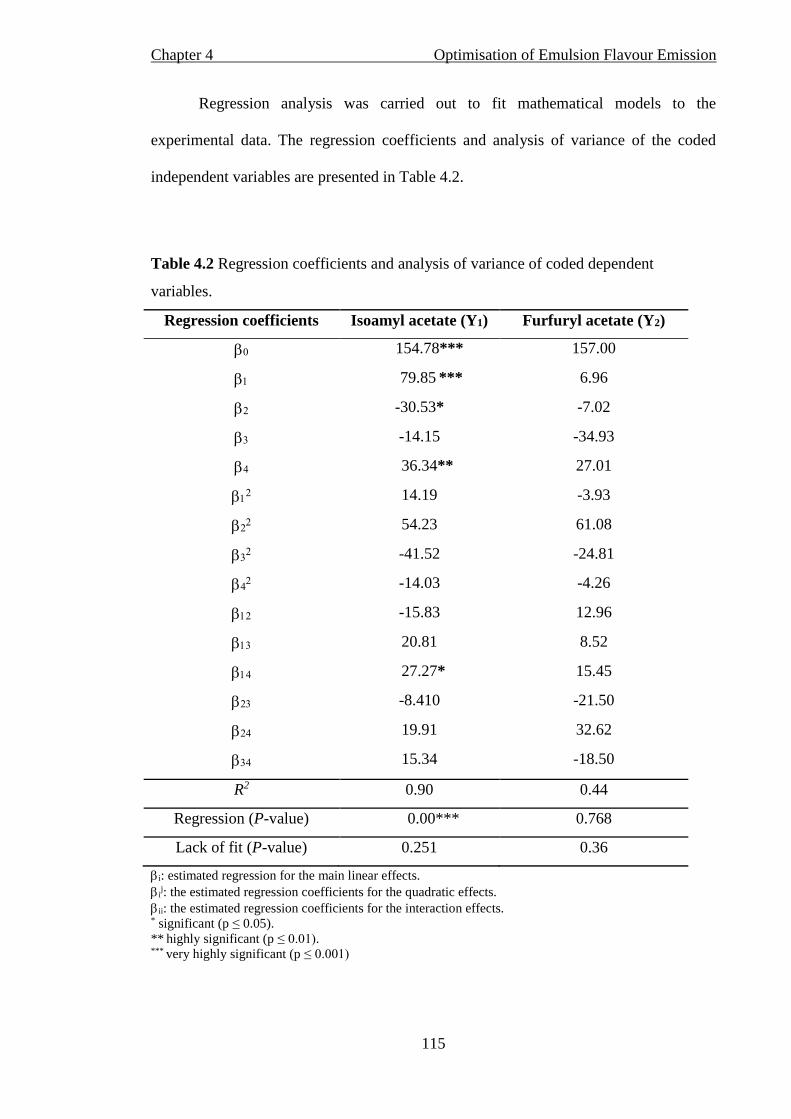
Chapter 4 Optimisation of Emulsion Flavour Emission
115
Regression analysis was carried out to fit mathematical models to the
experimental data. The regression coefficients and analysis of variance of the coded
independent variables are presented in Table 4.2.
Table 4.2 Regression coefficients and analysis of variance of coded dependent
variables.
Regression coefficients Isoamyl acetate (Y1) Furfuryl acetate (Y2)
154.78*** 157.00
79.85 *** 6.96
-30.53* -7.02
-14.15 -34.93
36.34** 27.01
14.19 -3.93
54.23 61.08
-41.52 -24.81
-14.03 -4.26
-15.83 12.96
20.81 8.52
27.27* 15.45
-8.410 -21.50
19.91 32.62
15.34 -18.50
R2 0.90 0.44
Regression (P-value) 0.00*** 0.768
Lack of fit (P-value) 0.251 0.36
i: estimated regression for the main linear effects.
ij: the estimated regression coefficients for the quadratic effects.
ii: the estimated regression coefficients for the interaction effects. * significant (p ≤ 0.05).
** highly significant (p ≤ 0.01). *** very highly significant (p ≤ 0.001)
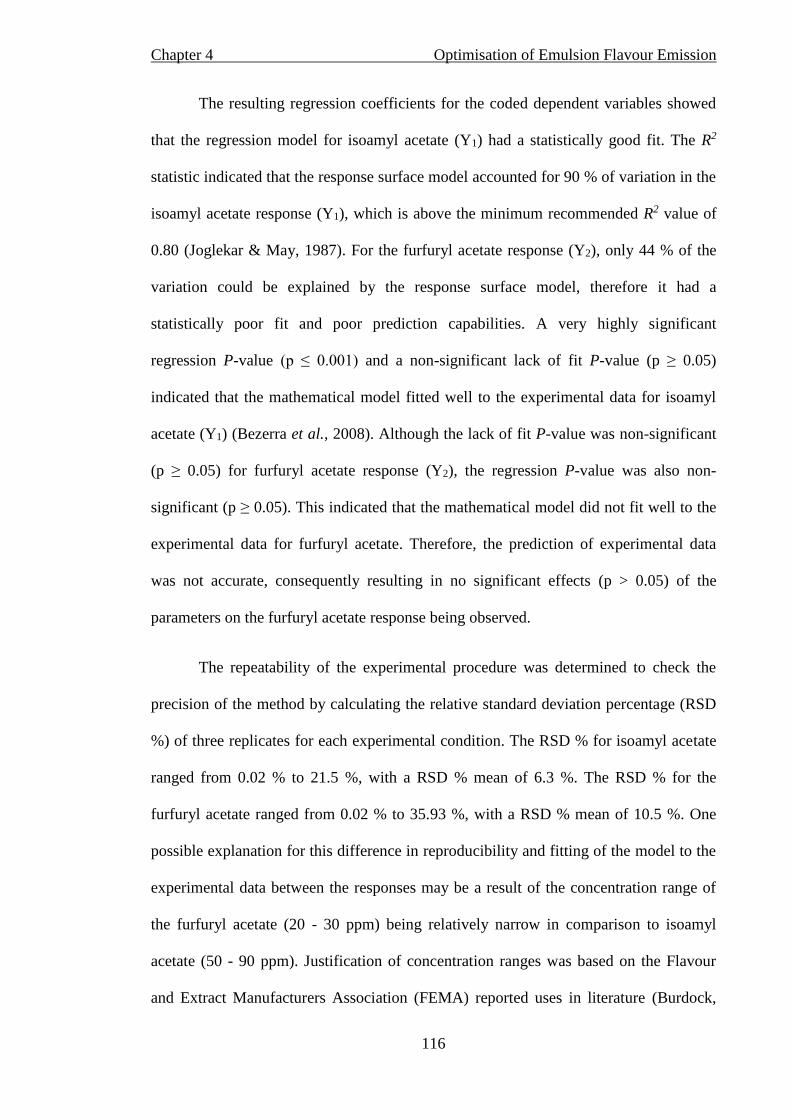
Chapter 4 Optimisation of Emulsion Flavour Emission
116
The resulting regression coefficients for the coded dependent variables showed
that the regression model for isoamyl acetate (Y1) had a statistically good fit. The R2
statistic indicated that the response surface model accounted for 90 % of variation in the
isoamyl acetate response (Y1), which is above the minimum recommended R2 value of
0.80 (Joglekar & May, 1987). For the furfuryl acetate response (Y2), only 44 % of the
variation could be explained by the response surface model, therefore it had a
statistically poor fit and poor prediction capabilities. A very highly significant
regression P-value (p ≤ 0.001) and a non-significant lack of fit P-value (p ≥ 0.05)
indicated that the mathematical model fitted well to the experimental data for isoamyl
acetate (Y1) (Bezerra et al., 2008). Although the lack of fit P-value was non-significant
(p ≥ 0.05) for furfuryl acetate response (Y2), the regression P-value was also non-
significant (p ≥ 0.05). This indicated that the mathematical model did not fit well to the
experimental data for furfuryl acetate. Therefore, the prediction of experimental data
was not accurate, consequently resulting in no significant effects (p > 0.05) of the
parameters on the furfuryl acetate response being observed.
The repeatability of the experimental procedure was determined to check the
precision of the method by calculating the relative standard deviation percentage (RSD
%) of three replicates for each experimental condition. The RSD % for isoamyl acetate
ranged from 0.02 % to 21.5 %, with a RSD % mean of 6.3 %. The RSD % for the
furfuryl acetate ranged from 0.02 % to 35.93 %, with a RSD % mean of 10.5 %. One
possible explanation for this difference in reproducibility and fitting of the model to the
experimental data between the responses may be a result of the concentration range of
the furfuryl acetate (20 - 30 ppm) being relatively narrow in comparison to isoamyl
acetate (50 - 90 ppm). Justification of concentration ranges was based on the Flavour
and Extract Manufacturers Association (FEMA) reported uses in literature (Burdock,

Chapter 4 Optimisation of Emulsion Flavour Emission
117
2010). In addition, preliminary sensory analysis (n = 12) was conducted, during which
panellists successfully ranked emulsions containing various concentrations of isoamyl
acetate and furfuryl acetate in order of concentration.
Besides showing the optimal conditions for isoamyl acetate emission, the
mathematical model identified and described significant effects of the independent
variables and some interesting interactions between the variables on the isoamyl acetate
response. These interactions are substantial and a ‘one variable at a time’ (OVAT)
approach may have proven too complicated for optimisation.
4.3 Effect of independent variables on the responses
The main effects of variables and their significance on the release of isoamyl
acetate from the emulsion into the headspace are shown in Figure 4.1. This plot
provides a quantitative display of relative importance of the different regression
coefficients, and an indication of a positive or negative influence a variable has on the
response. The regression coefficients and analysis of variance of dependent variables
and their level of significance on the release of both responses are displayed in Table
4.2. The regression results demonstrate that isoamyl acetate concentration (x1) had a
very highly significant linear effect (p ≤ 0.001) on the headspace release of isoamyl
acetate (Y1). The influence of this variable on the response proved to be positive, and
was found to be the most influential variable affecting isoamyl acetate headspace
release (Figure 4.1). This linear relationship can be seen in Figure 4.2, which implies
that as isoamyl acetate concentration increases the release of isoamyl acetate from the
emulsion into the headspace proportionally increases.
Chapter 4 Optimisation of Emulsion Flavour Emission
118
Figure 4.1 Main effects and significant parameters on the recovery of isoamyl acetate from emulsion headspace.
* significant (p ≤ 0.05).
** highly significant (p ≤ 0.01). *** very highly significant (p ≤ 0.001)
Error bars display the confidence interval levels at 95%.
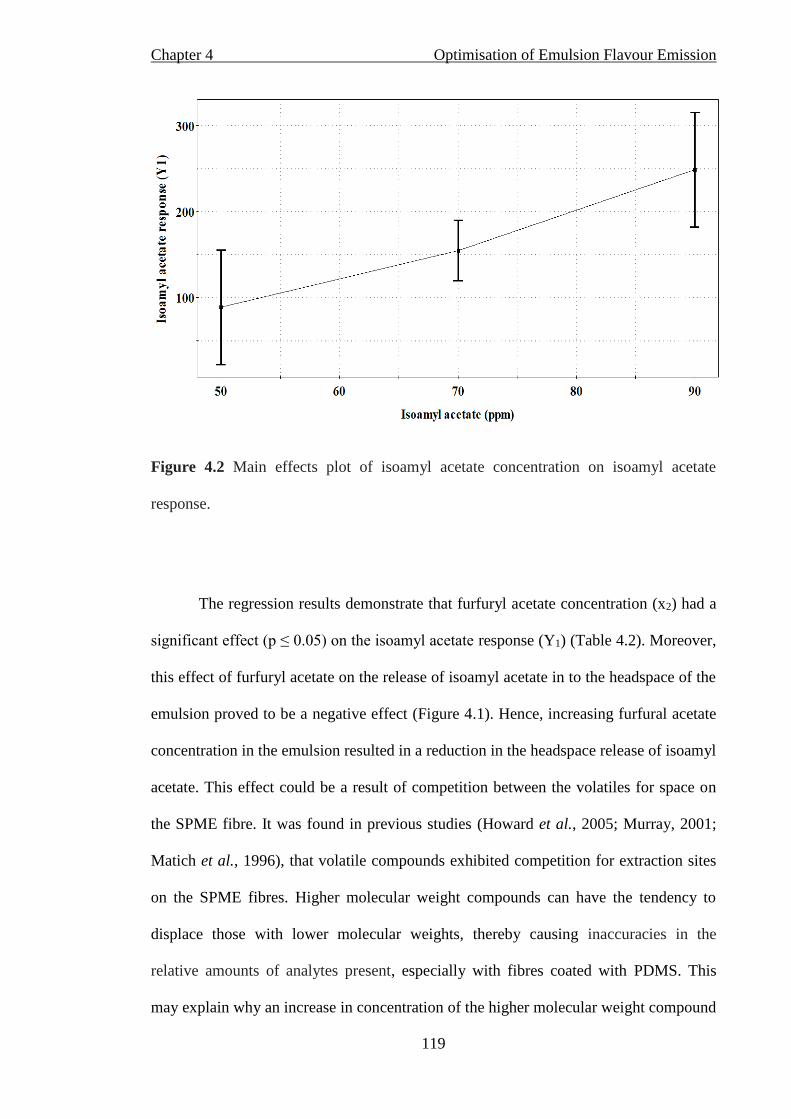
Chapter 4 Optimisation of Emulsion Flavour Emission
119
Figure 4.2 Main effects plot of isoamyl acetate concentration on isoamyl acetate
response.
The regression results demonstrate that furfuryl acetate concentration (x2) had a
significant effect (p ≤ 0.05) on the isoamyl acetate response (Y1) (Table 4.2). Moreover,
this effect of furfuryl acetate on the release of isoamyl acetate in to the headspace of the
emulsion proved to be a negative effect (Figure 4.1). Hence, increasing furfural acetate
concentration in the emulsion resulted in a reduction in the headspace release of isoamyl
acetate. This effect could be a result of competition between the volatiles for space on
the SPME fibre. It was found in previous studies (Howard et al., 2005; Murray, 2001;
Matich et al., 1996), that volatile compounds exhibited competition for extraction sites
on the SPME fibres. Higher molecular weight compounds can have the tendency to
displace those with lower molecular weights, thereby causing inaccuracies in the
relative amounts of analytes present, especially with fibres coated with PDMS. This
may explain why an increase in concentration of the higher molecular weight compound
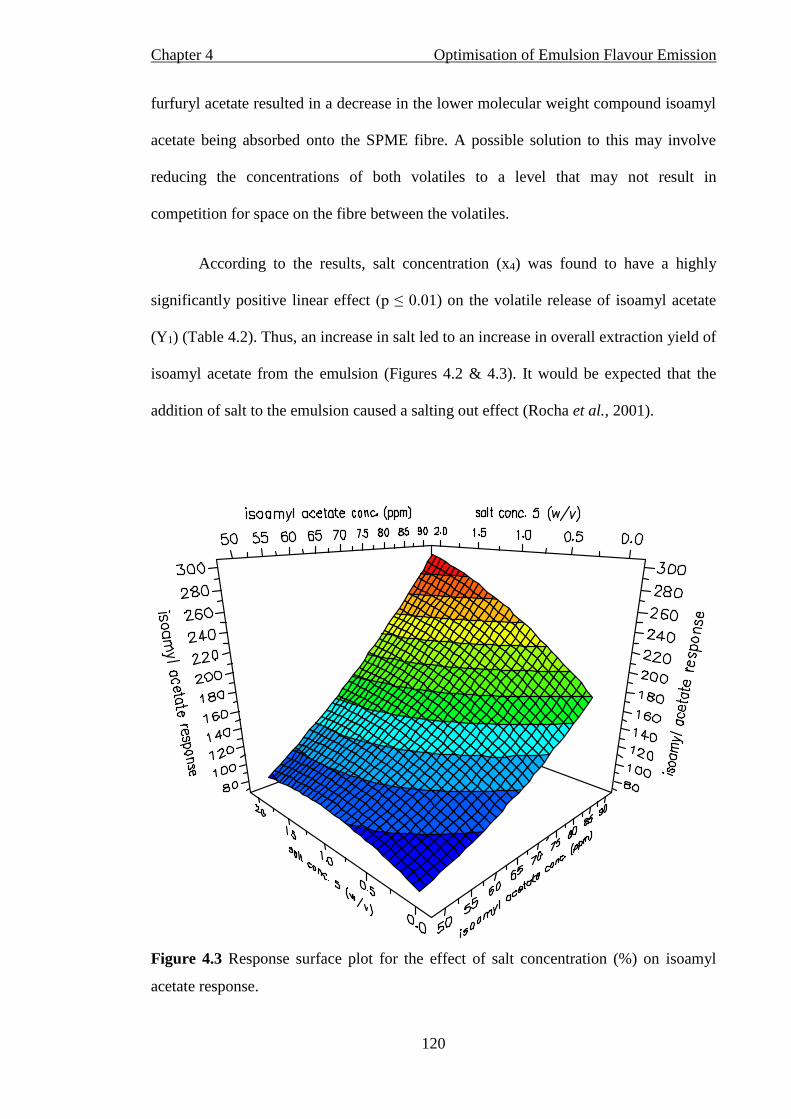
Chapter 4 Optimisation of Emulsion Flavour Emission
120
furfuryl acetate resulted in a decrease in the lower molecular weight compound isoamyl
acetate being absorbed onto the SPME fibre. A possible solution to this may involve
reducing the concentrations of both volatiles to a level that may not result in
competition for space on the fibre between the volatiles.
According to the results, salt concentration (x4) was found to have a highly
significantly positive linear effect (p ≤ 0.01) on the volatile release of isoamyl acetate
(Y1) (Table 4.2). Thus, an increase in salt led to an increase in overall extraction yield of
isoamyl acetate from the emulsion (Figures 4.2 & 4.3). It would be expected that the
addition of salt to the emulsion caused a salting out effect (Rocha et al., 2001).
Figure 4.3 Response surface plot for the effect of salt concentration (%) on isoamyl
acetate response.

Chapter 4 Optimisation of Emulsion Flavour Emission
121
Similar observations were also reported in previous studies (Cheong et al., 2011;
Cheong et al., 2010; Mirhosseini et al., 2007), where extraction efficiency increased
with addition of salt. Cheong et al. (2011) reported that maximum salt concentration (30
% w/v) resulted in optimal conditions for the extraction of volatiles from a Malaysian
soursop pulp sample. Similarly, Mirhosseini et al. (2007) observed that average total
peak areas of 121 volatiles in orange beverage emulsions improved by 47 % to 78 %
when salt was added to the oil in water emulsions. The salting out phenomena was
found to be applicable to more complex foods like vegetable soups, a salt content of 52
% resulted in an increase of overall concentrations of volatiles into the headspace
(Mitchell et al., 2011). These studies investigated the salting out effect in foods at
relatively high levels (0 - 60 %), with a goal for extracting volatiles qualitatively from a
purely technical point of view. In the present study, the model system was based around
common food emulsions, such as cream sauces, ice creams and dressing. Therefore, a
salt concentration range closer to that of the typical level in food products of 0.1 - 2.0 %
was investigated.
No significant effects (p > 0.05) were found for furfuryl acetate concentration on
the release of furfuryl acetate (Y2) from the emulsion. Additionally, the contour plots
for furfuryl acetate release (Figure 4.4) shows a ‘saddle point’, which is a stationary
point of neither a maximum nor minimum response (Myers et al., 2009). This indicates
that the optimum conditions for furfuryl acetate release from the emulsion lie outside
the experimental range investigated in this study. In addition, the pH (x3) proved to have
no significant influence (p > 0.05) on isoamyl acetate (Y1) or furfuryl acetate (Y2)
release from the emulsion. This may be due to the narrow experimental pH range of 5 -
7, which was selected to fit in with the context of the work being undertaken. Food
products such as ice creams and sauces, would be expected to have pH levels within
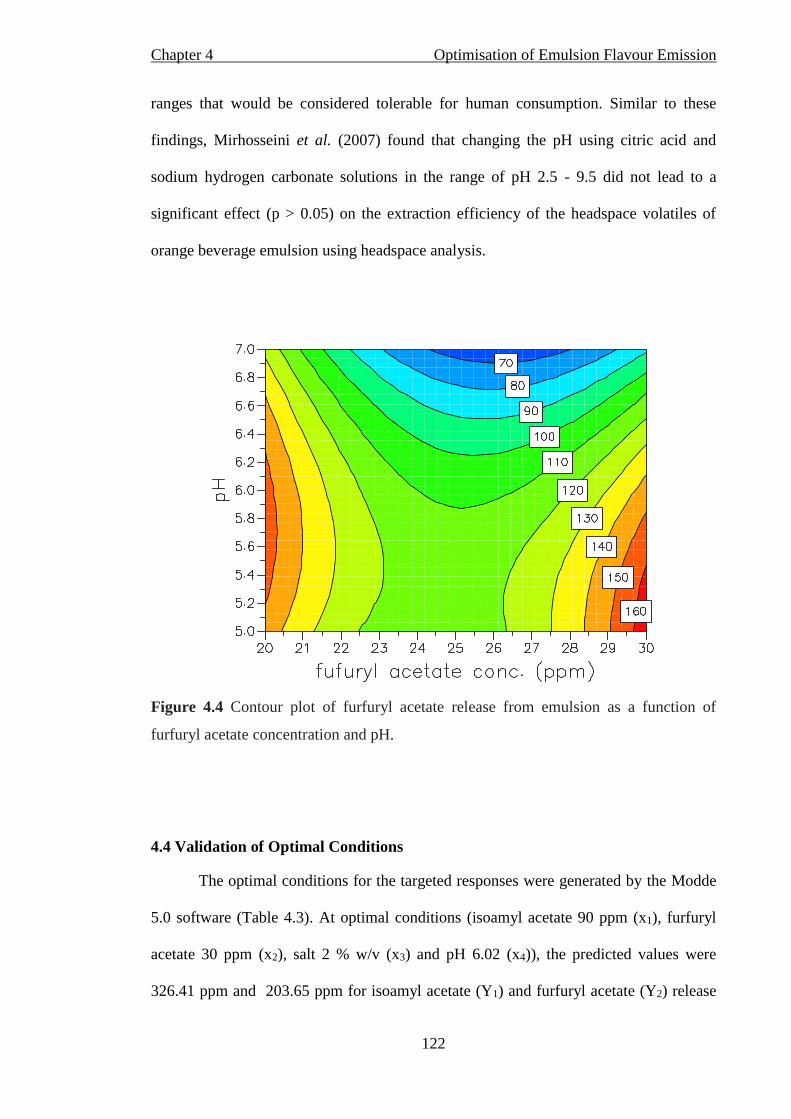
Chapter 4 Optimisation of Emulsion Flavour Emission
122
ranges that would be considered tolerable for human consumption. Similar to these
findings, Mirhosseini et al. (2007) found that changing the pH using citric acid and
sodium hydrogen carbonate solutions in the range of pH 2.5 - 9.5 did not lead to a
significant effect (p > 0.05) on the extraction efficiency of the headspace volatiles of
orange beverage emulsion using headspace analysis.
Figure 4.4 Contour plot of furfuryl acetate release from emulsion as a function of
furfuryl acetate concentration and pH.
4.4 Validation of Optimal Conditions
The optimal conditions for the targeted responses were generated by the Modde
5.0 software (Table 4.3). At optimal conditions (isoamyl acetate 90 ppm (x1), furfuryl
acetate 30 ppm (x2), salt 2 % w/v (x3) and pH 6.02 (x4)), the predicted values were
326.41 ppm and 203.65 ppm for isoamyl acetate (Y1) and furfuryl acetate (Y2) release

Chapter 4 Optimisation of Emulsion Flavour Emission
123
from the emulsion respectively. HS-SPME GCMS analysis was carried out at the
optimal conditions to verify the model. At optimal conditions, the product contained
isoamyl acetate (273.75 ppm) (Y1) and furfuryl acetate (148.40 ppm) (Y2), which was
within the error ranges (241.57 - 404.77 ppm for isoamyl acetate and 85.42 - 334.86
ppm for furfuryl acetate).
Table 4.3 List of predicted conditions generated by Modde 5.0 RSM software.
Isoamyl
acetate
(ppm) (x1)
Furfuryl
acetate
(ppm) (x2)
pH
(x3)
Salt
(w/v %)
(x4)
Isoamyl
acetate
response (Y1)
Furfuryl
acetate
response (Y2)
90 20 5.76 2 369.44 153.76
90 20 5.89 2 375.26 152.45
90 30 5.11 2 280.30 229.85
90* 30 6.02 2 326.18 203.65
90 25.37 5.6 2 279.55 148.37
90 20 5.4 2 345.88 154.42
90 30 5.5 2 306.17 223.47
90 20 5.57 2 358.28 154.58
*optimal condition selected by Modde 5.0 software from the list of generated optimal conditions.
The way in which flavour components modify the perceived flavour of food has
advanced from a stage of simple awareness to an understanding of the interactions
involved at a qualitative and quantitative level (Taylor & Hort, 2007). From a practical
point of view, optimising the release from the food matrix of two flavour compounds
that are strongly associated with positive fruity notes in foods can be a method of
enhancing flavour perception. The perception of aroma and flavour is dependent upon
the concentration and odour threshold of the volatile compounds present in the food
Chapter 4 Optimisation of Emulsion Flavour Emission
124
(Guichard, 2002). Thus, finding the optimum concentration of volatile compounds for
maximum flavour release is a crucial step in the development of flavoursome food
emulsions, which are an important class of food colloids.
4.5 Conclusions
The findings of this chapter provide an insight into the role that salt
concentration can have on the volatile release of isoamyl acetate from oil in water
emulsion based products. Increasing salt content resulted in an increase in headspace
release of isoamyl acetate from the emulsion. Thus, the practical application of such
knowledge could enable chefs and food manufacturers to optimise conditions for
maximum flavour release of volatile compounds which are strongly associated with
fruity notes in food emulsion products. The main effects of isoamyl acetate
concentration and salt concentration should be considered as critical factors when
studying the release of isoamyl acetate from an oil in water emulsion. As previously
discussed in section 3.6, there are limitations to application of knowledge obtained from
food model systems in terms of their transfer to more complex foods. In terms of the
transferability of the findings to an ice cream product, factors such as processing
temperatures (below freezing), sugar content and protein content would also influence
organic volatile release, and must be considered.

Chapter 5 Volatile and Sensory Evaluation of Novel Food Pairings
125
Chapter 5

Chapter 5 Volatile and Sensory Evaluation of Novel Food Pairings
126
5.1 General introduction
This chapter involved the investigation of the pairing of food based on perceived
flavour as an important sensory phenomenon. The palatability of a food is largely
determined by flavour (Breslin & Beaunchamp, 1995), and for this reason, flavour is
one of the most imperative attributes of food in terms of determining consumer
acceptance (Liu & Yang, 2002). In an increasingly globalised food market, the desire
for a competitive advantage has resulted in a search for more unique flavour pairings
becoming a constant preoccupation of food product developers (de Klepper, 2011).
Despite recent advances, the scientific literature on flavour pairing is surprisingly
limited, especially given the enormous scientific and commercial progress towards a
better understanding of flavour pairing (Møller, 2013). Some studies have focused on
the hedonic response to pairing chocolate with a wide range of beverages (teas and
alcoholic beverages) (Donadini et al., 2012) and on preferences for wine and cheese
pairings (Bastian et al., 2010).
A literature search reveals a lack of research papers published which explore the
pairing of foods, only two studies to date were found that explore the impact of volatile
compounds on successfully pairing foods. Kort et al. (2010) used a more sensory driven
approach, exploring food pairings through sensory evaluation in conjunction with a
volatile database. Ahn et al. (2011) explored the impact volatile compounds had on the
selection of ingredients using a volatile database and several food ingredient databases.
Hence, no studies have explored the phenomena of food pairing using the holistic
approach of organic volatile analysis, hedonic response evaluation and descriptive
sensory analysis.
Chapter 5 Volatile and Sensory Evaluation of Novel Food Pairings
127
The aim of this chapter was to investigate food pairings as an important sensory
phenomenon with a key interest in determining how different components in the
selected food pairings (both volatile and non-volatile) affect and interact with other
components to influence sensory perception. While the food pairings investigated in this
chapter can be found in Asian, African and South American countries, they would be
considered novel and unique in a European context, and were therefore of interest. The
selected ingredients comprise a variety of food categories; fish, meat, starchy food, fruit
and lipid. A conjoint approach utilising qualitative (organic volatile analysis, focus
groups and descriptive sensory analysis) and quantitative (comparable semi quantitative
organic volatile analysis and affective sensory tests) methods of analysis was performed
in an attempt to elucidate the success or failure of selected food pairings.
5.2 Focus group
5.2.1 Participants’ attitudes and opinions towards the paring of novel foods
Participants of the focus groups were familiar with the concept of pairing foods
together based on flavours. The majority of daily meals or snacks prepared or consumed
by the participants were based on pairing foods that complement each other from a
flavour perspective. Pairing foods based on flavours was something that participants
considered to be learned from experience and/or exposure through individual
preferences, and cultural and environmental influences (friends, family and personal
experiences) as opposed to being innate. In addition, participants were accustomed to
the known/traditional food pairings that were mentioned by the focus group moderators
(apple and cinnamon, wine and cheeses and steak and onions, etc.). Participants also
discussed other known/traditional personal food pairings (orange and chocolate, mint
and chocolate and strawberries and vanilla, etc.).
Chapter 5 Volatile and Sensory Evaluation of Novel Food Pairings
128
From the discussions about successfully pairing foods, it can be concluded that
combining contrasting foods from different taste categories (sweet, savoury, bitter, salty
and sour) is a common and popular method of producing flavoursome food pairings. In
particular, combining sweet and sour, bitter and sweet and sweet and salty contrasting
tastes were mentioned. This amalgamation of contrasting flavours has been noted as a
pattern that manifests itself in East Asian cuisines. North American and Western
European dishes tend to combine ingredients that share flavour compounds, while East
Asian cuisine avoids those (Ahn et al., 2011). Hence, based on these results, it would
appear that there is a certain degree of influence from the recipes of East Asian cuisines
on the way meals are constructed by the participants (who were predominantly of
Western European origin) in the focus groups.
Many participants had their own personal food pairings which they have tried
and tested themselves, for example fried egg with strawberry jam and bread, jam and
mustard. Although there was a variety of personal food pairings mentioned, the
conclusion reached was that an imperative factor in successfully pairing foods was the
method of cooking and presentation of the foods. For example, egg, bread and jam was
discussed as not being a very appealing food pairing, however, if presented as French
toast (bread soaked in egg and fried) with jam it would be very appealing. A discussion
took place about how many of the food pairings of today have evolved from the
restaurant environment (as menu items) and gained appeal resulting in the food
manufacturing industry producing them as products. It was also made clear that pairing
novel flavours was identified as being a marketing tool of many food companies in
order to create interest in their products, with some products being very successful (for
example cheese and onion crisps). Participants initially liked the aromas of the food
pairings during the blind evaluation. However, once all the foods were identified, many

Chapter 5 Volatile and Sensory Evaluation of Novel Food Pairings
129
of the participant’s attitudes towards them changed from positive to negative,
demonstrating a certain degree of neophobic behaviour. Many participants explained
that they would have to deliberate whether or not to consume some of the novel food
pairings (in particular banana and extra virgin olive oil, banana and bacon and banana
and blue cheese).
5.2.2 Orthonasal sensory evaluation of food pairings
Mean acceptability scores with standard deviations for evaluation of orthonasal
aroma by the focus group panel (n = 19) are displayed in Figure 5.1. A mean
acceptability score of five was considered to be a limit of acceptance (Mitchell et al.,
2013). The pairings of banana and basmati rice (B+R), banana and bacon (B+BN) and
banana and extra virgin olive oil (B+O) with scores of 5.6 ± 1.1, 5.4 ± 1.8 and 6.4 ± 2.2
respectively were the only samples above this limit. In addition, no significant
differences (p > 0.05) in acceptability were found between these three food pairings
(Figure 5.1). Conversely, the pairings of banana and mackerel and banana and blue
cheese were found to be significantly less acceptable (p ≤ 0.05) than all other pairings
with banana (2.2 ± 1.5 and 3.8 ± 2.3 respectively).
Following the evaluation of the food pairings an open discussion regarding the
samples took place, during which a general consensus for ranking of the food pairings
based on preference was conducted and discussed. Banana and basmati rice was
established as being consensually the most preferred food pairing. This food pairing was
considered to be suitable for both a savoury or sweet food product. It was concluded
that banana and bacon was the second preferred food pairing, followed by banana and
extra virgin olive oil.

Chapter 5 Volatile and Sensory Evaluation of Novel Food Pairings
130
Figure 5.1 Mean acceptability scores for orthonasal aroma evaluation of food pairings.
Each value is presented as a mean ± SD (n = 19).
Samples with different letters are significantly different (p ≤ 0.05).
: limit of acceptability.
5.3 Consumer sensory evaluation of food pairings
The mean acceptability scores (n = 85) for the three preferred food pairings
samples are illustrated in Figure 5.2. No significant differences (p > 0.05) were found
between the acceptability scores of banana and basmati rice (B+R) and banana and
bacon (B+BN) which were 6.1 ± 1.6 and 6.2 ± 2.1 respectively. Banana and extra virgin
olive oil (B+O) received a significantly lower (p ≤ 0.05) mean acceptability scoring (3.4
± 2.2) in comparison to B+R and B+BN. The mean acceptability score for B+O was
below the limit of acceptability for this study (< 5), while B+R and B+BN were above
this limit (≥ 5).
0.00
1.00
2.00
3.00
4.00
5.00
6.00
7.00
8.00
9.00
Mea
n a
ccep
tab
ilit
y s
core
s
Foods paired with banana
a
b
aeg bde bfg
adf
c
b
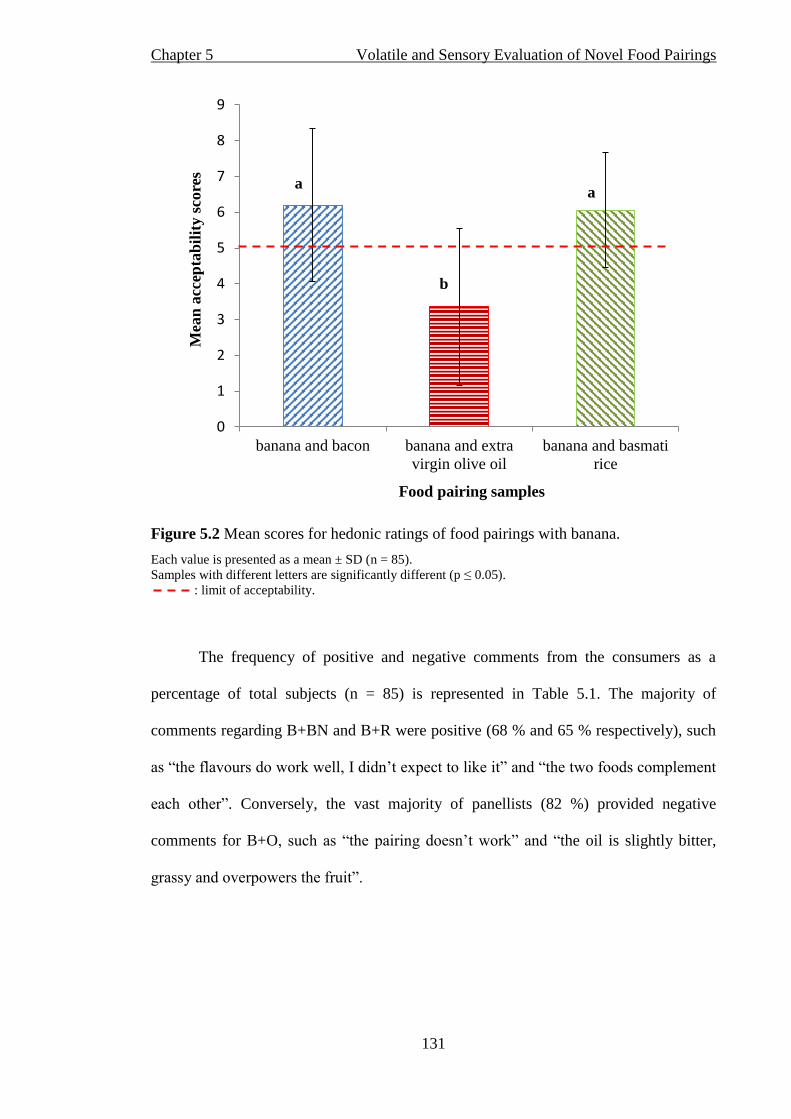
Chapter 5 Volatile and Sensory Evaluation of Novel Food Pairings
131
Figure 5.2 Mean scores for hedonic ratings of food pairings with banana.
Each value is presented as a mean ± SD (n = 85).
Samples with different letters are significantly different (p ≤ 0.05).
: limit of acceptability.
The frequency of positive and negative comments from the consumers as a
percentage of total subjects (n = 85) is represented in Table 5.1. The majority of
comments regarding B+BN and B+R were positive (68 % and 65 % respectively), such
as “the flavours do work well, I didn’t expect to like it” and “the two foods complement
each other”. Conversely, the vast majority of panellists (82 %) provided negative
comments for B+O, such as “the pairing doesn’t work” and “the oil is slightly bitter,
grassy and overpowers the fruit”.
0
1
2
3
4
5
6
7
8
9
banana and bacon banana and extra
virgin olive oil
banana and basmati
rice
Mea
n a
ccep
tab
ilit
y s
core
s
Food pairing samples
a
b
a

Chapter 5 Volatile and Sensory Evaluation of Novel Food Pairings
132
Table 5.1 Consumer comments (positive and negative) represented as a percentage (%)
of total number of subjects (n = 85) for the three food pairings.
Food pairing sample Positive comment % Negative comment %
Banana and basmati rice 65 35
Banana and bacon 68 32
Banana and extra virgin olive oil 18 82
The preference test results (Figure 5.3) showed that B+BN had the highest
percentage of 1st preference choices (55.3 %), B+R had the highest percentage of 2nd
choice preferences (49.4 %) and B+O had the highest percentage of 3rd preference
choices (77.6 %). The cross tabulation results corroborate the results for the hedonic
ratings of the samples, where B+BN and B+R scored significantly higher (p ≤ 0.05)
than B+O. Additionally, results from the Pearson’s Chi-squared were very highly
significant (p ≤ 0.001), and the Cramer’s V coefficient value (0.5) indicated that there
was a high association between the sample type and preference. Based on the
quantitative and qualitative analysis, it can be concluded that banana and basmati rice
(B+R) and banana and bacon (B+BN) were considered to be acceptable food pairings.
What's more, B+BN was preferred the most, while B+R was the second most preferred
food pairing. Banana and extra virgin olive oil (B+O) was deemed to be the least
preferred and an unacceptable food pairing.
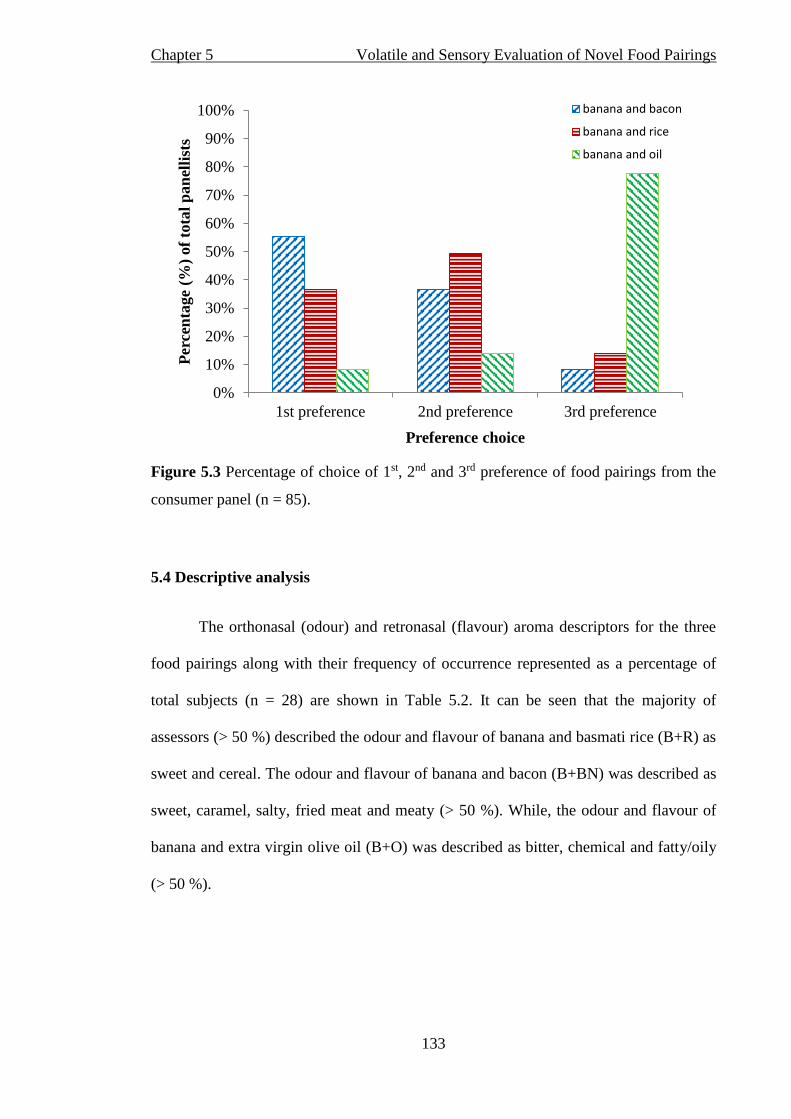
Chapter 5 Volatile and Sensory Evaluation of Novel Food Pairings
133
Figure 5.3 Percentage of choice of 1st, 2nd and 3rd preference of food pairings from the
consumer panel (n = 85).
5.4 Descriptive analysis
The orthonasal (odour) and retronasal (flavour) aroma descriptors for the three
food pairings along with their frequency of occurrence represented as a percentage of
total subjects (n = 28) are shown in Table 5.2. It can be seen that the majority of
assessors (> 50 %) described the odour and flavour of banana and basmati rice (B+R) as
sweet and cereal. The odour and flavour of banana and bacon (B+BN) was described as
sweet, caramel, salty, fried meat and meaty (> 50 %). While, the odour and flavour of
banana and extra virgin olive oil (B+O) was described as bitter, chemical and fatty/oily
(> 50 %).
0%
10%
20%
30%
40%
50%
60%
70%
80%
90%
100%
1st preference 2nd preference 3rd preference
Per
cen
tage
(%)
of
tota
l p
an
elli
sts
Preference choice
banana and bacon
banana and rice
banana and oil

Chapter 5 Volatile and Sensory Evaluation of Novel Food Pairings
134
Table 5.2 List of orthonasal (A) and retronasal (F) aroma sensory descriptive attributes and their frequency represented as a percentage
total (%) number of subjects (n = 28) generated by Free Choice Profiling (FCP) for the three food pairings.
B+R B+BN B+O B+R B+BN B+O
A F A F A F
A F A F A F
Sweet
Empyreumatic
Sweet 62 55 69 97 48 41 Smoky 38 24
Caramel 62 48 Woody 24 7 21
Maple 28 fried meat 66 48
Starchy Floral
Cereal 62 66 Floral 45 10 25 21 38 24
Starchy 41 14 31 14 Herbal 38
Popcorn 28 31 Olive 34 55
Fruit Fat
Fruity 45 31 59 31 28 Fatty/Oily 34 52 55 83
Pear/Apple 7 3 Buttery 10 10
Misc. Savoury
Citric 10 Meaty 66 86
Salty 52 72 Savoury 41 38
Bitter 10 14 3 3 52 72 Umami 28
Chemical/Soapy 3 72 66 Earthy
Acidic 3 3 31 38 Earthy 48 28 7 17 17
Watery 28 41 Pine 17 3
Spicy/Peppery 45 41 Nutty 38 34 24 21 14
Grassy 21 10 7 3 28 28
Italics indicates orthonasal aroma and retronasal aroma (flavour) classification obtained from Fisher & Scott, 1997.
A: indicates orthonasal aroma (odour) descriptive term. F: indicates retronasal aroma (flavour) descriptive term.
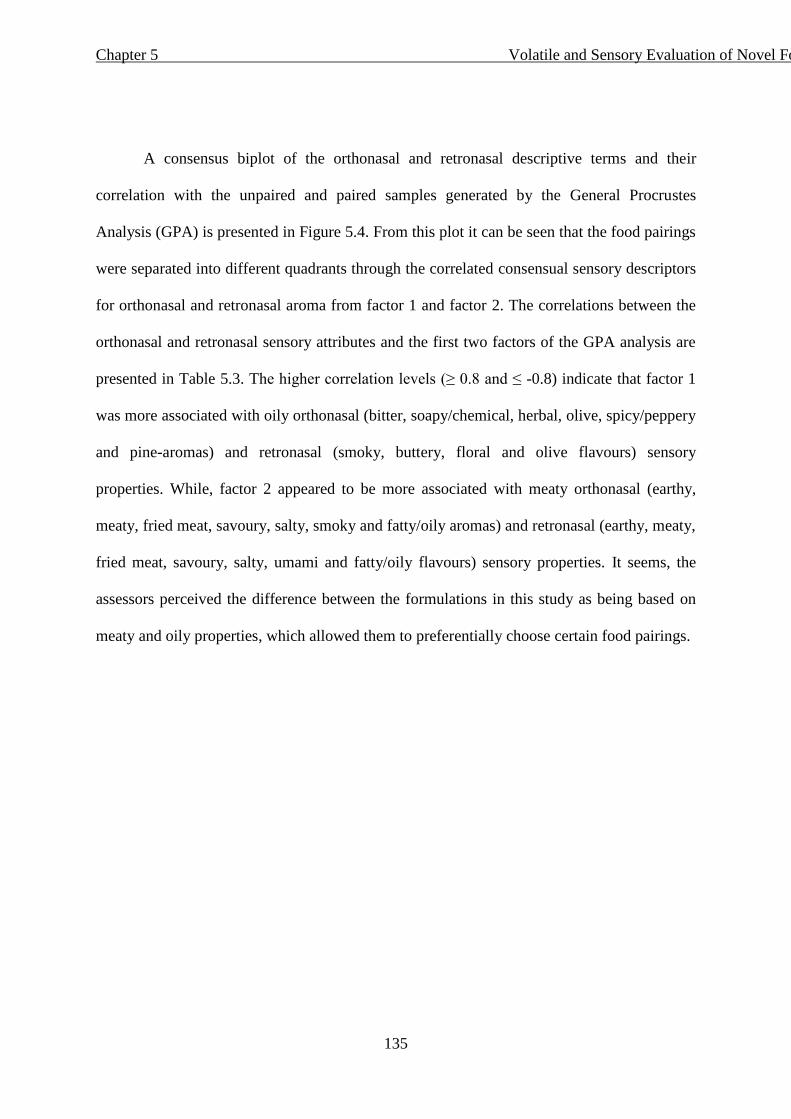
Chapter 5 Volatile and Sensory Evaluation of Novel Food Pairings
135
A consensus biplot of the orthonasal and retronasal descriptive terms and their
correlation with the unpaired and paired samples generated by the General Procrustes
Analysis (GPA) is presented in Figure 5.4. From this plot it can be seen that the food pairings
were separated into different quadrants through the correlated consensual sensory descriptors
for orthonasal and retronasal aroma from factor 1 and factor 2. The correlations between the
orthonasal and retronasal sensory attributes and the first two factors of the GPA analysis are
presented in Table 5.3. The higher correlation levels (≥ 0.8 and ≤ -0.8) indicate that factor 1
was more associated with oily orthonasal (bitter, soapy/chemical, herbal, olive, spicy/peppery
and pine-aromas) and retronasal (smoky, buttery, floral and olive flavours) sensory
properties. While, factor 2 appeared to be more associated with meaty orthonasal (earthy,
meaty, fried meat, savoury, salty, smoky and fatty/oily aromas) and retronasal (earthy, meaty,
fried meat, savoury, salty, umami and fatty/oily flavours) sensory properties. It seems, the
assessors perceived the difference between the formulations in this study as being based on
meaty and oily properties, which allowed them to preferentially choose certain food pairings.
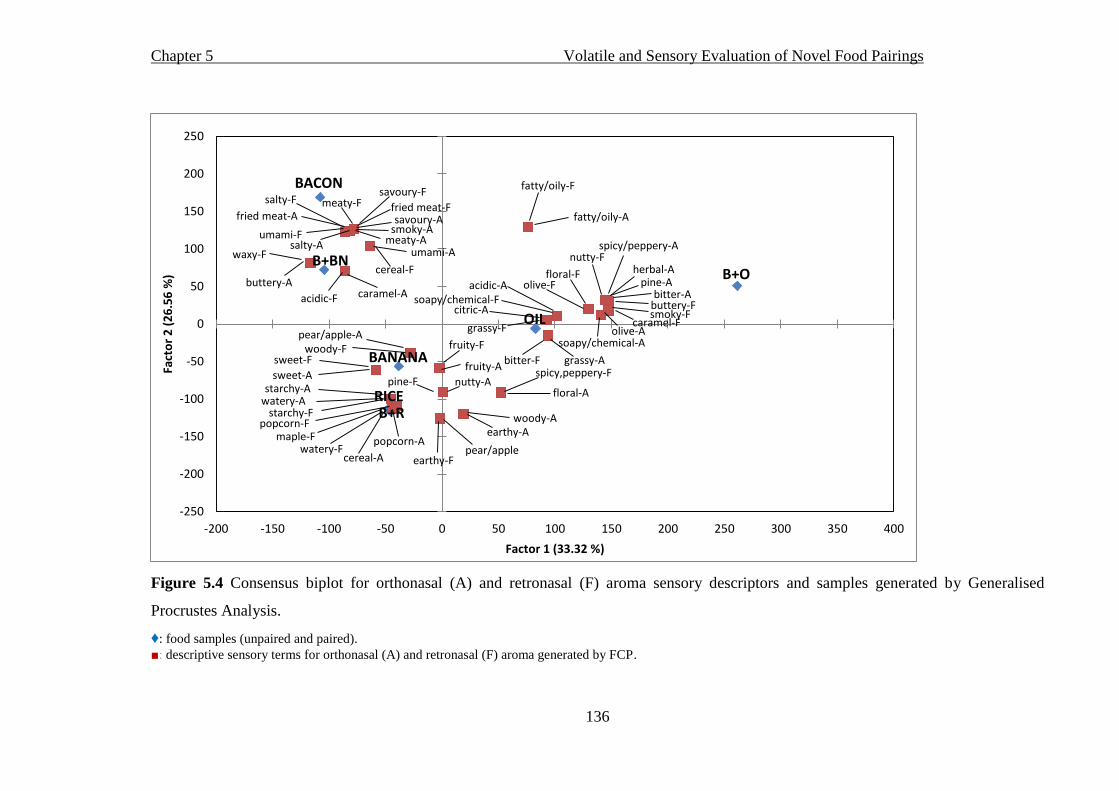
Chapter 5 Volatile and Sensory Evaluation of Novel Food Pairings
136
Figure 5.4 Consensus biplot for orthonasal (A) and retronasal (F) aroma sensory descriptors and samples generated by Generalised
Procrustes Analysis.
♦: food samples (unpaired and paired).
■: descriptive sensory terms for orthonasal (A) and retronasal (F) aroma generated by FCP.
BANANA
OIL
BACON
RICEB+R
B+BNB+O
sweet-A
earthy-A
fruity-A
caramel-A
pear/apple-A
floral-A
woody-A
bitter-A
grassy-A
soapy/chemical-A
acidic-A
herbal-A
fatty/oily-A
olive-A
spicy/peppery-A
citric-A
nutty-A
pine-A
meaty-A
savoury-A
salty-A
smoky-Afried meat-A
umami-A
buttery-A
popcorn-A
cereal-A
starchy-Awatery-A
sweet-F
earthy-F
fruity-F
acidic-F
woody-F
spicy,peppery-F
pear/apple
floral-F
bitter-F
caramel-F
soapy/chemical-F
nutty-F
fatty/oily-F
olive-F
buttery-F
grassy-F
pine-F
smoky-F
meaty-F fried meat-Fsalty-F
savoury-F
umami-F
cereal-F
waxy-F
starchy-Fpopcorn-F
watery-Fmaple-F
-250
-200
-150
-100
-50
0
50
100
150
200
250
-200 -150 -100 -50 0 50 100 150 200 250 300 350 400
Fact
or
2 (
26
.56
%)
Factor 1 (33.32 %)
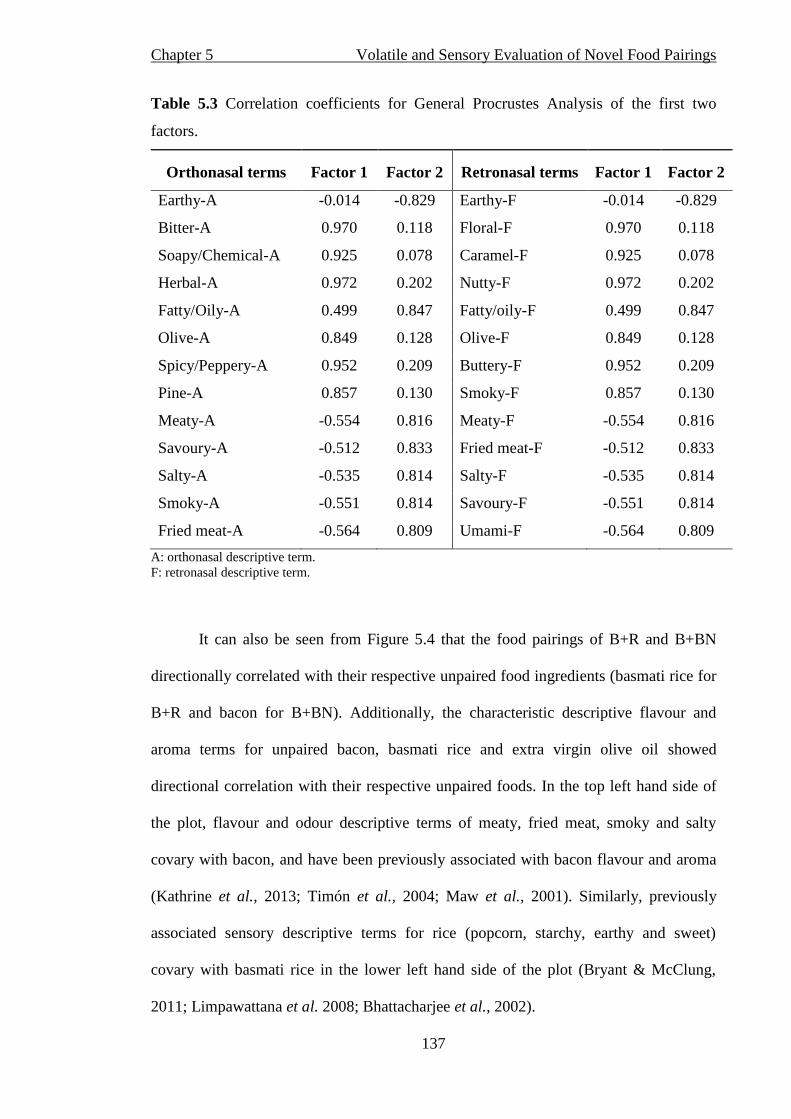
Chapter 5 Volatile and Sensory Evaluation of Novel Food Pairings
137
Table 5.3 Correlation coefficients for General Procrustes Analysis of the first two
factors.
Orthonasal terms Factor 1 Factor 2 Retronasal terms Factor 1 Factor 2
Earthy-A -0.014 -0.829 Earthy-F -0.014 -0.829
Bitter-A 0.970 0.118 Floral-F 0.970 0.118
Soapy/Chemical-A 0.925 0.078 Caramel-F 0.925 0.078
Herbal-A 0.972 0.202 Nutty-F 0.972 0.202
Fatty/Oily-A 0.499 0.847 Fatty/oily-F 0.499 0.847
Olive-A 0.849 0.128 Olive-F 0.849 0.128
Spicy/Peppery-A 0.952 0.209 Buttery-F 0.952 0.209
Pine-A 0.857 0.130 Smoky-F 0.857 0.130
Meaty-A -0.554 0.816 Meaty-F -0.554 0.816
Savoury-A -0.512 0.833 Fried meat-F -0.512 0.833
Salty-A -0.535 0.814 Salty-F -0.535 0.814
Smoky-A -0.551 0.814 Savoury-F -0.551 0.814
Fried meat-A -0.564 0.809 Umami-F -0.564 0.809
A: orthonasal descriptive term.
F: retronasal descriptive term.
It can also be seen from Figure 5.4 that the food pairings of B+R and B+BN
directionally correlated with their respective unpaired food ingredients (basmati rice for
B+R and bacon for B+BN). Additionally, the characteristic descriptive flavour and
aroma terms for unpaired bacon, basmati rice and extra virgin olive oil showed
directional correlation with their respective unpaired foods. In the top left hand side of
the plot, flavour and odour descriptive terms of meaty, fried meat, smoky and salty
covary with bacon, and have been previously associated with bacon flavour and aroma
(Kathrine et al., 2013; Timón et al., 2004; Maw et al., 2001). Similarly, previously
associated sensory descriptive terms for rice (popcorn, starchy, earthy and sweet)
covary with basmati rice in the lower left hand side of the plot (Bryant & McClung,
2011; Limpawattana et al. 2008; Bhattacharjee et al., 2002).
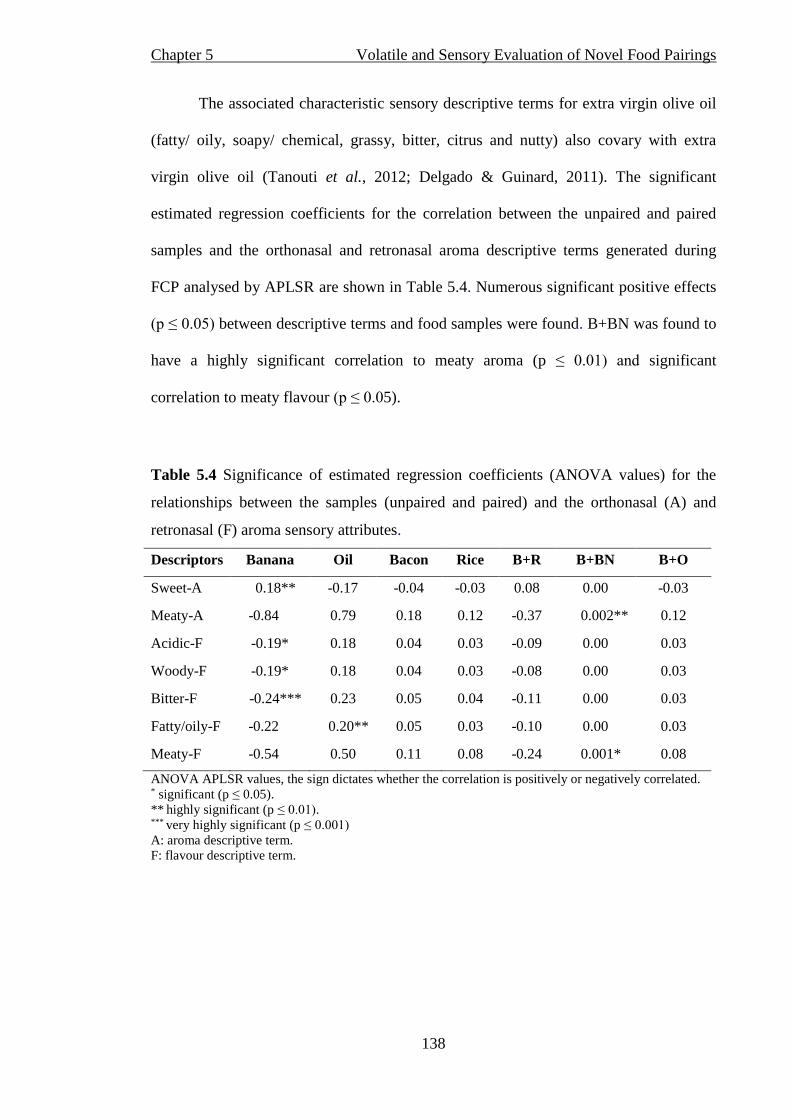
Chapter 5 Volatile and Sensory Evaluation of Novel Food Pairings
138
The associated characteristic sensory descriptive terms for extra virgin olive oil
(fatty/ oily, soapy/ chemical, grassy, bitter, citrus and nutty) also covary with extra
virgin olive oil (Tanouti et al., 2012; Delgado & Guinard, 2011). The significant
estimated regression coefficients for the correlation between the unpaired and paired
samples and the orthonasal and retronasal aroma descriptive terms generated during
FCP analysed by APLSR are shown in Table 5.4. Numerous significant positive effects
(p ≤ 0.05) between descriptive terms and food samples were found. B+BN was found to
have a highly significant correlation to meaty aroma (p ≤ 0.01) and significant
correlation to meaty flavour (p ≤ 0.05).
Table 5.4 Significance of estimated regression coefficients (ANOVA values) for the
relationships between the samples (unpaired and paired) and the orthonasal (A) and
retronasal (F) aroma sensory attributes.
Descriptors Banana Oil Bacon Rice B+R B+BN B+O
Sweet-A 0.18** -0.17 -0.04 -0.03 0.08 0.00 -0.03
Meaty-A -0.84 0.79 0.18 0.12 -0.37 0.002** 0.12
Acidic-F -0.19* 0.18 0.04 0.03 -0.09 0.00 0.03
Woody-F -0.19* 0.18 0.04 0.03 -0.08 0.00 0.03
Bitter-F -0.24*** 0.23 0.05 0.04 -0.11 0.00 0.03
Fatty/oily-F -0.22 0.20** 0.05 0.03 -0.10 0.00 0.03
Meaty-F -0.54 0.50 0.11 0.08 -0.24 0.001* 0.08
ANOVA APLSR values, the sign dictates whether the correlation is positively or negatively correlated. * significant (p ≤ 0.05).
** highly significant (p ≤ 0.01). *** very highly significant (p ≤ 0.001)
A: aroma descriptive term.
F: flavour descriptive term.
Chapter 5 Volatile and Sensory Evaluation of Novel Food Pairings
139
5.5 Organic volatile compound profile analysis
In total, 119 organic volatile compounds were detected in the samples (see
appendix E for full list). Esters were identified as being most abundant, with 50 ester
volatiles detected in total. Alcohols were the second most abundant group of volatiles
detected, with 23 detected. Twenty one aldehydes and 10 ketones were also detected.
Other compounds that were detected in lesser quantities were; sulphurs (four), phenyls
(three), alkenes (three), pyrazines (two), carboxylic acids (two), terpenes (one), phenols
(one) and furans (one). From the 119 organic volatile compounds detected in the
samples, only four of the volatile compounds (3-pentanone and 2, 4-heptadienal (both
absent from B+BN), ethyl hexanoate (absent from B+R) and amyl isovalerate (absent
from B+O)) were not present in the headspace of all the food pairings.
The headspace of the banana was found to contain the most abundant number of
organic volatile compounds with 118 being detected, followed by the extra virgin olive
oil (102 organic volatile compounds), bacon (98 organic volatile compounds) and
finally basmati rice (86 organic volatile compounds). In addition, 11 organic volatile
compounds (mainly esters) were detected only in banana and not in the other unpaired
samples (Table 5.5). The significant ANOVA values for the organic volatile compounds
which were detected in the samples and that are considered to contribute to the
characteristic aroma and flavour of their corresponding foods as suggested by the
literature are presented in Table 5.6. Numerous significant correlations were found
between the organic volatile compounds and the unpaired and paired samples. These
results corroborate the orthonasal and retronasal sensory attribute regression coefficient
values, where banana was found to have a highly significant positive correlation (p ≤
0.01) with sweet aroma (Table 5.4).

Chapter 5 Volatile and Sensory Evaluation of Novel Food Pairings
140
Table 5.5 List of organic volatile compounds detected in the food pairings which were
contributed by banana only.
Volatile compound B O R BN B+BN B+R B+O RT
acetyl valeryl P NP NP NP P P P 16.8
2-methylbutyl propanoate P NP NP NP P P P 21.7
1-methylbutyl butanoate P NP NP NP P P P 24.6
2-methylbutyl butanoate P NP NP NP P P P 25.3
isoamyl butyrate P NP NP NP P P P 25.6
3-methyl, 6-hepten-1-ol P NP NP NP P P P 26.5
amyl isovalerate P NP NP NP P P NP 26.6
butyl pentanoate P NP NP NP P P P 27.1
1-methyl, octyl butanoate P NP NP NP P P P 27.7
3-octen-1-ol acetate P NP NP NP P P P 29.2
hexyl 2-methylbutanoate P NP NP NP P P P 29.8
hexyl 3-methylbutanoate P NP NP NP P P P 29.8
P: compound present in sample, NP: compound not present in sample.
RT: retention time in minutes.
Unpaired samples: B: Banana, O: extra virgin olive oil, BN: bacon, R: basmati rice.
Paired samples: B+R: banana and basmati rice, B+BN: banana and bacon, B+O banana and extra virgin
olive oil.
From the organic volatile compounds analysis results it would seem that banana
contributed greatly to the volatile profiles of the food pairings (Table 5.5 and Figure
5.5). Amyl and butyl esters have been previously identified as being the most abundant
and the most odour active compounds in fresh banana eliciting the characteristic fruity
banana notes (Imahori et al., 2013; Pino & Felbes, 2013; Vermeir et al., 2009;
Boudhrioua et al., 2003; Mayr et al., 2003; Liu & Yang, 2002). Of these esters, acetates
are of particular importance due to their high concentrations and low odour thresholds
(Pontes et al., 2012). In particular, isoamyl acetate, pentyl acetate, isoamyl butyrate, 3-
methylbutyl 3-methylbutanoate, 3-methylbutyl 2-methylbutanoate and isoamyl
isovalerate which were found (Table 5.6) to have a very highly significant positive
correlation with banana (p ≤ 0.001).
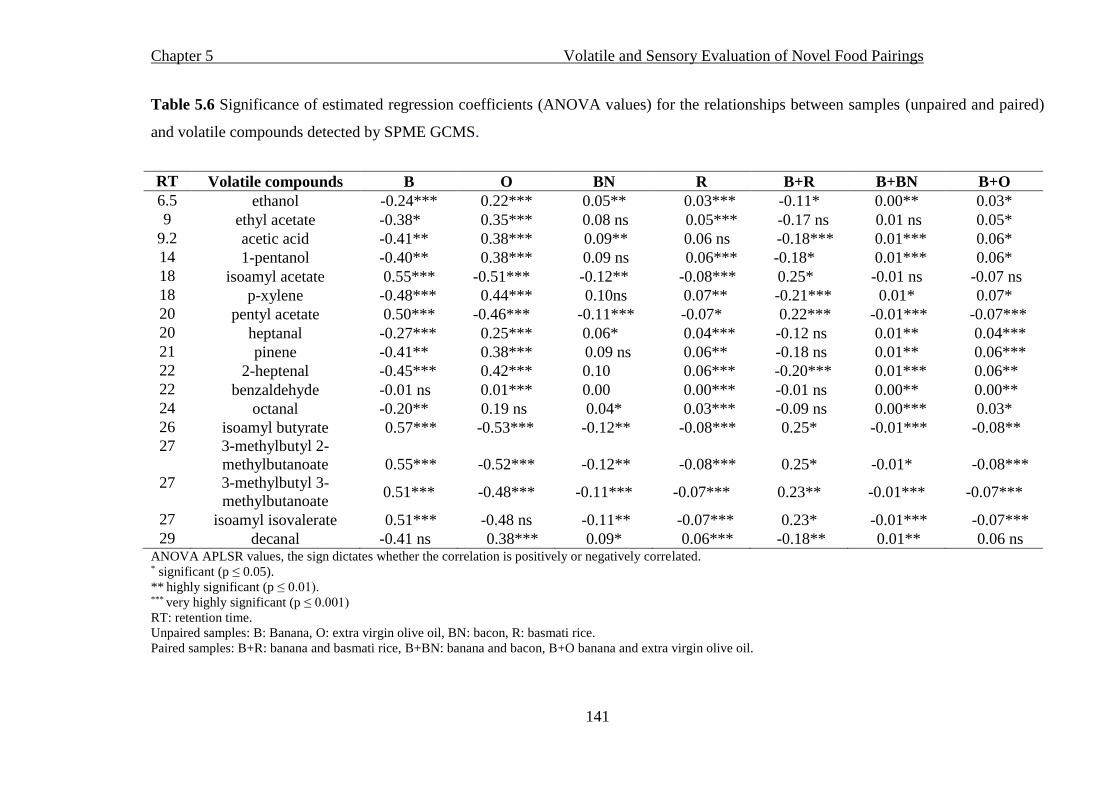
Chapter 5 Volatile and Sensory Evaluation of Novel Food Pairings
141
Table 5.6 Significance of estimated regression coefficients (ANOVA values) for the relationships between samples (unpaired and paired)
and volatile compounds detected by SPME GCMS.
ANOVA APLSR values, the sign dictates whether the correlation is positively or negatively correlated. * significant (p ≤ 0.05).
** highly significant (p ≤ 0.01). *** very highly significant (p ≤ 0.001)
RT: retention time.
Unpaired samples: B: Banana, O: extra virgin olive oil, BN: bacon, R: basmati rice.
Paired samples: B+R: banana and basmati rice, B+BN: banana and bacon, B+O banana and extra virgin olive oil.
RT Volatile compounds B O BN R B+R B+BN B+O
6.5 ethanol -0.24*** 0.22*** 0.05** 0.03*** -0.11* 0.00** 0.03*
9 ethyl acetate -0.38* 0.35*** 0.08 ns 0.05*** -0.17 ns 0.01 ns 0.05*
9.2 acetic acid -0.41** 0.38*** 0.09** 0.06 ns -0.18*** 0.01*** 0.06*
14 1-pentanol -0.40** 0.38*** 0.09 ns 0.06*** -0.18* 0.01*** 0.06*
18 isoamyl acetate 0.55*** -0.51*** -0.12** -0.08*** 0.25* -0.01 ns -0.07 ns
18 p-xylene -0.48*** 0.44*** 0.10ns 0.07** -0.21*** 0.01* 0.07*
20 pentyl acetate 0.50*** -0.46*** -0.11*** -0.07* 0.22*** -0.01*** -0.07***
20 heptanal -0.27*** 0.25*** 0.06* 0.04*** -0.12 ns 0.01** 0.04***
21 pinene -0.41** 0.38*** 0.09 ns 0.06** -0.18 ns 0.01** 0.06***
22 2-heptenal -0.45*** 0.42*** 0.10 0.06*** -0.20*** 0.01*** 0.06**
22 benzaldehyde -0.01 ns 0.01*** 0.00 0.00*** -0.01 ns 0.00** 0.00**
24 octanal -0.20** 0.19 ns 0.04* 0.03*** -0.09 ns 0.00*** 0.03*
26 isoamyl butyrate 0.57*** -0.53*** -0.12** -0.08*** 0.25* -0.01*** -0.08**
27 3-methylbutyl 2-
methylbutanoate 0.55*** -0.52*** -0.12** -0.08*** 0.25* -0.01* -0.08***
27 3-methylbutyl 3-
methylbutanoate 0.51*** -0.48*** -0.11*** -0.07*** 0.23** -0.01*** -0.07***
27 isoamyl isovalerate 0.51*** -0.48 ns -0.11** -0.07*** 0.23* -0.01*** -0.07***
29 decanal -0.41 ns 0.38*** 0.09* 0.06*** -0.18** 0.01** 0.06 ns

Chapter 5 Volatile and Sensory Evaluation of Novel Food Pairings
142
Figure 5.5 Chromatogram of unpaired banana sample and paired food samples.
a: banana and bacon, b: banana and extra virgin olive oil, c: banana and basmati rice, d: unpaired banana.
(d)
(c)
(b)
(a)
Chapter 5 Volatile and Sensory Evaluation of Novel Food Pairings
143
What’s more, the volatile compounds mentioned above that correlated with
banana were also found to have very highly significant positive correlations (p ≤ 0.001)
with B+R while having either no significant correlations (p > 0.05) or very highly
significant negative correlations (p ≤ 0.001) with the other food pairings (B+O and
B+BN). These results corroborate the descriptive sensory results, where B+R and
banana covaried in the biplot (Figure 5.4).
An apparent change in the distribution coefficient appeared to occur at an
approximate retention time of 18 minutes onwards, in which the release of the more non
polar (lipophilic) compounds (mainly esters) appeared to be suppressed (Figure 5.5).
This suppression in lipophilic compounds seemed to be more prominent in B+BN and
B+O, than in B+R. Such a phenomenon is more than likely due to the binding of these
lipophilic compounds to the food matrices. It is well known that food matrix
components can bind, entrap or encapsulate volatile flavour compounds, resulting in a
reduction in the rate of flavour release and flavour intensity (Naknean & Meenune,
2010). Lipid content and the volatile compounds lipophilicity are known key factors
affecting flavour release in foods (Philippe et al., 2006).
The effect of lipids on flavour release and perception is complex, and affects
both the release of stimuli from the food matrix and also the release during oral
processing of foods (Arancibia et al., 2011). For instance, flavour release of lipophilic
aroma compounds was reported to decrease with increasing lipid levels in the food
matrix (Linforth et al., 2010). Thus, a strong affinity of more lipophilic volatile
compounds for the lipid content in both B+BN and in B+O may have resulted in a
retention of such volatiles, thereby influencing the flavour profile and influencing the
perceived sensory perception. As expected, the low fat content of the rice in B+R did
not alter the fruit flavour eliciting compounds.

Chapter 5 Volatile and Sensory Evaluation of Novel Food Pairings
144
5.6 Volatile interactions
The individual foods (unpaired) of banana, basmati rice, bacon and extra
virgin olive oil share the majority of volatile compounds, therefore possible
synergistic and/or antagonistic volatile-volatile interactions occurred resulting in
positive or negative hedonic responses from the assessors. When discussing
combining flavours, odour intensity (compound concentration in the foods and
flavour thresholds) must be taken into account (Ahn et al., 2011). A possible volatile-
volatile interaction regarding odour intensity may have occurred. An increase in the
concentrations of certain volatile compounds (with low initial concentrations) to a level
that exceeds their odour threshold would result in these volatile compounds having
more of a contribution to the flavour profile and thereby altering it (Belitz et al., 2009).
In the case of B+R and B+BN, these interactions were positive as is suggested by
the hedonic results (Figures 5.2 & 5.3 and Table 5.1), whereas with B+O, the
interaction was a negative. Furthermore, the perceived aroma of certain compounds
can be altered as concentrations change. It has been found that hexanal and nonanal in
extra virgin olive oil elicit herb olive odours at low concentrations, changing to rancid
odours at higher concentrations (Aparicio et al., 2000). Therefore in the case of B+O,
compounds which may have initially elicited pleasant aromas in the extra virgin olive
oil may have contributed negatively to the perceived flavour profile of food pairing
once paired with banana due to a cumulative increase in concentration of such
compounds.
Another possible volatile-volatile interaction may have involved the odour
active compounds of the constituents of the food pairings. In the case of B+R
(esters from banana and aldehydes from basmati rice) and B+BN (esters from
Chapter 5 Volatile and Sensory Evaluation of Novel Food Pairings
145
banana and sulphurous and pyrazines from bacon) the pairing of these foods
produced harmonious and pleasant volatile mixtures from a sensory perspective
(Figure 5.2 and Table 5.1). Whereas, in the case of B+O, the combination of odour
active compounds in extra virgin olive oil (mainly aldehydes, ketones and alkenes)
and banana appeared to produce an unpleasantly perceived volatile mixture.
Creating a balanced flavour mixture is another important aspect to take into
consideration when discussing pairing of foods. As the concentration of sharing
volatiles increases, subsequently the volatile concentration ratio can be altered in such a
way that certain compounds predominate the flavour profile (Belitz et al., 2009). It
appears that the pleasant banana eliciting compounds dominated the flavour profile of
B+R more so than in B+BN and B+O. This is clear in Figure 5.4, as B+R covaried with
banana, while being directionally correlated with descriptive terms of fruity, pear/apple,
sweet aromas and flavours. In contrast to this, extra virgin olive oil appears to dominate
the flavour profile of B+O, as B+O is positioned closer to the extra virgin olive oil and
its associated descriptive terms (spicy, soapy/chemical, bitter and oily/fatty) in the
biplot (Tanouti et al., 2012; Angerosa et al., 2000). Moreover, pinene which has
previously been identified as the active compound for the hot spicy flavour in virgin
olive oils (Ekundayo et al,, 1988), was found to have a significant positive correlation
(p ≤ 0.001) with oil and B+O (Table 5.6), suggesting that the lipid content caused an
increase in the hot spicy flavour perceived in B+O. In addition, acetic acid, ethanol and
ethyl acetate which have all previously been associated with vinegar or wine flavours in
olive oils (Kalua et al., 2007), were found to have significant positive correlations with
B+O (p ≤ 0.05).
Chapter 5 Volatile and Sensory Evaluation of Novel Food Pairings
146
Although the foods that were investigated were found to share the majority of
volatile compounds, it would be extremely difficult to support the hypothesis that the
success of the food pairings is based on that fact alone. Although banana and extra
virgin olive oil was found to be an unsuccessful food pairing, it must be noted that the
original food pairing suggested by foodpairing.com was not investigated. This software
suggested that the food pairing of banana and an extra virgin olive oil produced from a
specific variety of olive (‘Family Reserve Arbequina’), the variety of grape used in the
production of the oil used in this study is not specified by the manufacturer. Hence this
exact food pairing was not investigated. It would appear that the pairing of foods is
more complex and complicated than simply pairing foods that share common key
compounds. Positive and negative synergistic and/or antagonistic volatile-volatile and
volatile-matrix (volatile-lipid, volatile-protein and volatile-carbohydrate, etc.)
interactions are important and must be taken into account. Additionally, positive and
negative synergistic and/or antagonistic volatile-volatile interactions (odour intensity
and flavour balance) are important aspects to consider when discussing food pairings.
An alternative hypothesis to the volatile sharing food pairing hypothesis would
be that creating the right balance between odour active volatiles in foods is required to
produce a volatile mixture that is perceived as pleasant or harmonious. It seems that the
volatiles contributed by the banana may have provided bacon and basmati rice with the
flavour and odour notes that they were lacking, and vice versa, producing a complete
complementary flavour profile. In addition to this, the influence of non-volatile
compounds contributing to the taste of the food parings (salty, sour, sweet, bitter and
umami) must also be considered as an influential factor on hedonic evaluation. In
particular, many of the assessors from the consumer panel noted that the “sweetness of
the banana with the saltiness of the bacon worked well together” for B+BN. The

Chapter 5 Volatile and Sensory Evaluation of Novel Food Pairings
147
suitability of ingredients for inclusion in recipes or food pairings depends on a multitude
of ingredient characteristics other than their flavour profile. Flavour is not necessarily
the primary role of ingredients, recipes also rely on ingredients to provide final textures
and overall structure of a given dish (Ahn et al., 2011). In addition, as mentioned by the
participants of the focus groups, the flavour of a dish owes as much to the mode of
preparation (cooking method) as to the choice of particular ingredients (This, 2005a;
McGee, 2004).
5.7 Conclusions
The novel food pairings selected had complex flavour interactions which
appeared to have influenced descriptive sensory evaluation and hedonic evaluation.
Overall, two of the three novel food pairings (B+R and B+BN) were accepted by the
consumer panel. It has been suggested in this chapter that possible complex positive and
negative synergistic and antagonistic volatile interactions in the foods influenced the
hedonic ratings of these food pairings. Based on these findings, it would be difficult to
hypothesise that the success or failure of the food pairings in this chapter from a sensory
perspective was due to the sharing or lack of sharing common volatiles alone. It
appeared that creating certain flavour balances in volatile profiles of food pairings is
important for a positive hedonic response. In addition, a binding phenomenon in the
food matrices was more than likely an influencing factor on the rate of volatile release
and the perceived aromas of the volatiles. Volatile concentration and odour thresholds
are an important aspect to consider when discussing food pairings. Such knowledge
may be exploited in the development of novel food products to produce interesting
flavour combinations with a better understanding of consumer acceptance and rejection.

Chapter 6 Development of Novel Flavoured Ice Creams
148
CHAPTER 6
Chapter 6 Development of Novel Flavoured Ice Creams
149
6.1 General introduction
New product development is a major competitive parameter for producers
competing in mature and developed markets (Chen et al., 2010). However, food
innovations can often be rejected by consumers as a result of a phobia towards novel
foods (Barrena & Sánchez, 2013). Humans principally learn to consume and prefer
certain foods, and avoid and dislike others, with traditions, biological, psychological,
and cultural factors being the main influences (Rozin, 2001). Few food preferences or
aversions are innate; the majority of our food choices are learnt via differing degrees of
exposure to foods (Nicklaus et al., 2004). Similar to food preferences, the development
and maintenance of food acceptances are controlled by affective, personal, cultural and
situational factors (de Klepper, 2011; Martins & Pliner, 2005). Mere exposure, pairing
of foods with positive or negative consequences and a variety of social influences
cultivate a like or dislike for foods (Rozin, 2001). For these very reasons, food
companies testing novel food products should identify the psychographic profiles of
their consumer base to help explain potential variability in consumer response
(Henriques et al., 2009). Consumer insight into the new product development process is
important throughout the process itself (Grunert et al., 2011).
The main objectives of this chapter were to develop an ice cream recipe based
on the results from chapters 3, 4 and 5, optimise the flavour of two novel flavoured ice
creams, assess the consumer hedonic response to the ice cream products and explore
consumer choice and preconceptions. Finally, the acceptability and suitability of these
products for a market was investigated. The application of such knowledge for culinary
industry practitioners and the food industry can be extremely beneficial.

Chapter 6 Development of Novel Flavoured Ice Creams
150
6.2 Optimisation of ingredient concentration ratios
6.2.1 Banana and basmati rice ice cream concentration ratio
Numerous methods of basmati rice flavour transfer to the ice cream were tested
using a preliminary sensory panel (n = 6) to determine the most appropriate method (see
appendix D). It was found that boiling the basmati rice in the milk/cream mixture and
immediately straining produced the most desirable results, and this was subsequently
chosen as the appropriate method. The mean values for the hedonic scores of the five
banana and rice ice creams (B+R) formulations are presented in Table 6.1. A mean
hedonic score of five was considered to be a limit of acceptance, all samples scored
above this limit (> 5).
Table 6.1 Mean hedonic scores with standard deviation and assessor comments
(positive and negative) represented as a percentage (%) of total number of subjects (n =
34) for the banana and basmati rice ice cream formulations.
Banana
comments %
Basmati Rice
comments %
Sample Banana
(g/ kg)
Basmati
rice (g/ kg)
Hedonic
score
SD Positive Negative Positive Negative
B+R1 225 150 7.3ab ± 1.0 15 % 85 % 15 % 85 %
B+R2* 225 225 7.7a ± 1.0 74 % 26 % 74 % 26 %
B+R3 225 300 7.1bd ± 1.4 15 % 85 % 15 % 85 %
B+R4 150 300 7.0bd ± 1.2 26 % 74 % 26 % 74 %
B+R5 150 225 6.5cd ± 1.2 9 % 91 % 9 % 91 %
Samples with the different letters (a - d) are significantly different (p ≤ 0.05).
B+R (1 - 5): banana and basmati rice ice cream formulations.
*: optimum banana and basmati rice ice cream formulation.
SD: standard deviation.

Chapter 6 Development of Novel Flavoured Ice Creams
151
No significant differences (p > 0.05) were found between samples B+R3, B+R4
and B+R5, which received mean hedonic scores of 7.1 ± 1.4, 7.0 ± 1.2 and 6.5 ± 1.2
respectively. As shown in Table 6.1, the lower levels of banana (150 g/kg) in B+R4 and
B+R5 created a banana flavour that was described as ”too mild”, and for this reason was
perceived negatively by the panellists (68 % and 76 % respectively). In contrast, the
basmati rice flavour of B+R4 (300 g/kg) was described as “too intense”, and was
perceived negatively (74 %). Thus, the characteristic banana fruitiness and sweetness
was lacking in this formulation, which appeared to allow for the basmati rice flavour to
overpower and dominate the flavour profile. In contrast to this, the low levels of both
banana (150 g/kg) and basmati rice in B+R5 (225 g/kg) appeared to produce an overall
flavour that was perceived as ‘too mild’ and received negative feedback (91 %).
Conversely, B+R3 was described as having banana (225 g/kg) and basmati rice flavours
(300 g/kg) that were both “too intense” (82 % and 85 % respectively). Hence, a balance
between banana and basmati rice flavour was not reached in these three formulations.
The higher scoring samples B+R1 and B+R2 (7.3 ± 1.0 and 7.7 ± 1.0
respectively) were not found to be significantly different (p > 0.05). Nevertheless, the
qualitative data seemed to indicate that the flavour of B+R1 was unbalanced. The
majority of the assessors (68 %) noted that the flavour from the banana (225 g/kg) was
“too intense”. In contrast, the basmati rice flavour (150 g/kg) was described as “mild”
(85 %). In addition to this, no significant differences were found between B+R1 and the
ice cream formulations B+R3 and B+R4. While, B+R2 was significantly different to all
formulations except for B+R1. What's more, the qualitative results indicate that sample
B+R2 had an apparent balanced combination of banana and basmati rice (both at 225
g/kg). The majority of panellists’ comments were positive (74 %), mainly stating that it
had a “good balance” of flavours.

Chapter 6 Development of Novel Flavoured Ice Creams
152
Although the statistical analysis of the quantitative data could not yield a single
formulation that was the significantly liked, it did offer an insight into directions to
pursue (high banana and medium basmati rice levels) or avoid (lower banana and high
basmati rice levels) in terms of a preferred ice cream formulation. Moreover, it can be
concluded from the qualitative results that the banana content was the deciding factor in
terms of perceived flavour balance with lower levels producing a flavour profile lacking
in characteristic banana notes which, allowed the basmati rice flavour to dominate.
6.2.2 Banana and bacon ice cream concentration ratio
Several methods of bacon flavour transfer to the ice cream were tested using a
preliminary sensory panel (n = 6) to determine the most appropriate method (see
appendix D). The results showed that the method of soaking the cooked bacon in the
milk/cream mixture for 24 hours produced the most desirable results, and was
subsequently chosen as the appropriate method. The mean hedonic scores for the five
different formulations of banana and bacon ice creams (B+BN) are listed in Table 6.2.
No significances were found between samples B+BN3 and B+BN4. Both
samples scored significantly (p ≤ 0.05) lower hedonic scores (5.2 ± 2.3 and 4.8 ± 2.1
respectively) in comparison to the other formulations, with B+BN4 scoring below the
limit of acceptability (< 5). The majority of the panellists provided negative comments
(88 % and 85% respectively) regarding the bacon flavour (300 g/kg for both
formulations), describing it as “too strong or intense” with a “salty” taste. Similarly, the
banana flavour of these formulations (225 g/kg for B+BN3 and 150 g/kg for B+BN4)
received negative feedback (56 % and 88 % respectively), and was described as “too
mild”.
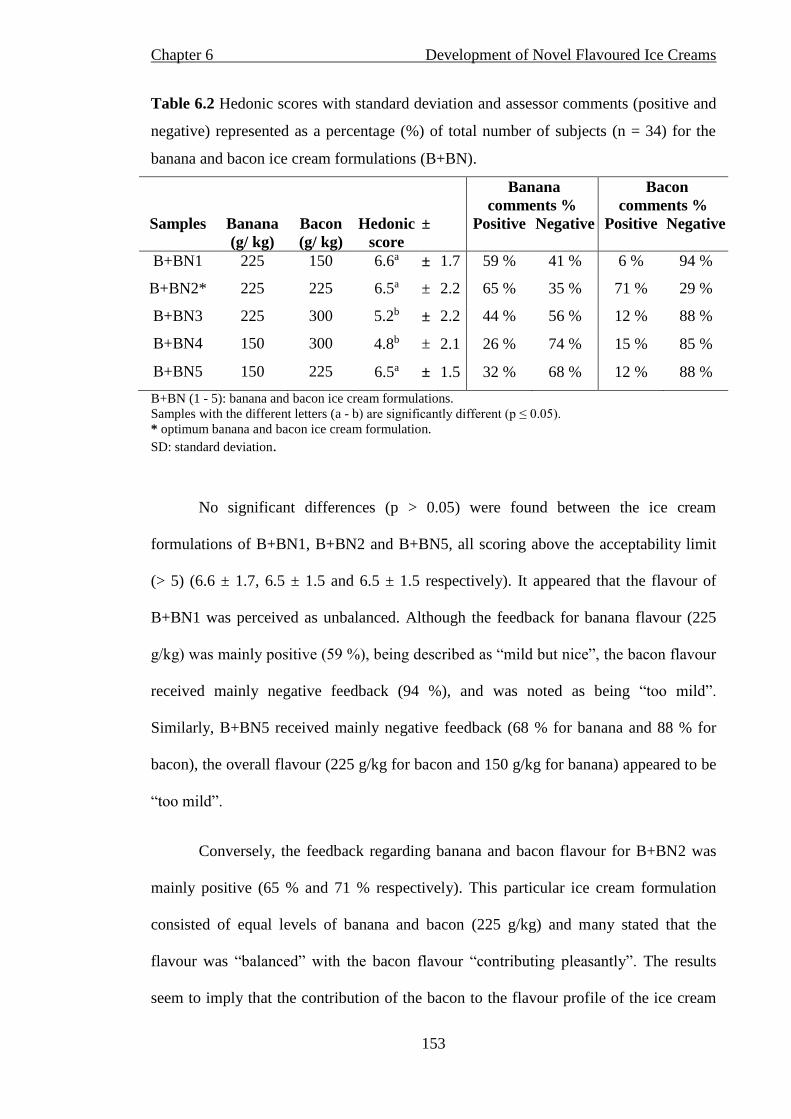
Chapter 6 Development of Novel Flavoured Ice Creams
153
Table 6.2 Hedonic scores with standard deviation and assessor comments (positive and
negative) represented as a percentage (%) of total number of subjects (n = 34) for the
banana and bacon ice cream formulations (B+BN).
Banana
comments %
Bacon
comments %
Samples Banana
(g/ kg)
Bacon
(g/ kg)
Hedonic
score
± Positive Negative Positive Negative
B+BN1 225 150 6.6a ± 1.7 59 % 41 % 6 % 94 %
B+BN2* 225 225 6.5a ± 2.2 65 % 35 % 71 % 29 %
B+BN3 225 300 5.2b ± 2.2 44 % 56 % 12 % 88 %
B+BN4 150 300 4.8b ± 2.1 26 % 74 % 15 % 85 %
B+BN5 150 225 6.5a ± 1.5 32 % 68 % 12 % 88 %
B+BN (1 - 5): banana and bacon ice cream formulations.
Samples with the different letters (a - b) are significantly different (p ≤ 0.05).
* optimum banana and bacon ice cream formulation.
SD: standard deviation.
No significant differences (p > 0.05) were found between the ice cream
formulations of B+BN1, B+BN2 and B+BN5, all scoring above the acceptability limit
(> 5) (6.6 ± 1.7, 6.5 ± 1.5 and 6.5 ± 1.5 respectively). It appeared that the flavour of
B+BN1 was perceived as unbalanced. Although the feedback for banana flavour (225
g/kg) was mainly positive (59 %), being described as “mild but nice”, the bacon flavour
received mainly negative feedback (94 %), and was noted as being “too mild”.
Similarly, B+BN5 received mainly negative feedback (68 % for banana and 88 % for
bacon), the overall flavour (225 g/kg for bacon and 150 g/kg for banana) appeared to be
“too mild”.
Conversely, the feedback regarding banana and bacon flavour for B+BN2 was
mainly positive (65 % and 71 % respectively). This particular ice cream formulation
consisted of equal levels of banana and bacon (225 g/kg) and many stated that the
flavour was “balanced” with the bacon flavour “contributing pleasantly”. The results
seem to imply that the contribution of the bacon to the flavour profile of the ice cream

Chapter 6 Development of Novel Flavoured Ice Creams
154
was the deciding factor in terms of perceived flavour profile. It would appear that at
higher concentrations (300 g/kg), an unpleasant salty taste accompanied the distinctive
bacon flavour, which appeared to prevail regardless of the banana levels.
6.2.3 Salt and pH analysis of optimised ice cream formulations
The salt (NaCl) content of the optimised ice cream formulations from section
6.2.1 (B+R2) and 6.2.2 (B+BN2) was measured as results from chapter 4 showed that
salt content was a significant influencing variable on the emission of volatiles from
emulsion products. In addition to this, the pH levels of the ice cream formulations were
measured to ensure that they were in the optimum ranges (chapter 4). The mean salt
concentrations and pH levels for banana and bacon, banana and rice, control 1 (banana
225 g/kg) and control 2 (plain) ice creams and their significant levels are displayed in
Table 6.3.
Table 6.3 Mean Salt concentration (g/ 100 g) and pH levels of ice creams and control
formulations.
Ice cream formulations Salt conc. (g/ 100 g) SD pH SD
Banana and bacon 3.34a ± 0.08 6.07a ± 0.05
Banana and basmati rice 0.04b ± 0.01 6.24b ± 0.04
Control 1 0.05c ± 0.02 6.05a ± 0.01
Control 2 0.06d ± 0.02 6.38c ± 0.01
Samples with different letters (a - d) have significantly different means within each column (p ≤ 0.05).
Control 1: banana ice cream.
Control 2: plain ice cream.
SD: standard deviation.
Significant differences (p ≤ 0.05) were found between the salt concentrations of
the ice cream samples. Banana and bacon was found to have a significantly higher (p ≤
0.05) salt level (3.34 ± 0.08 g/ 100 g) compared to all other samples as would be
Chapter 6 Development of Novel Flavoured Ice Creams
155
expected due to the relatively high concentration in the bacon itself (3.4 g/ 100 g). In
addition, numerous significant differences were found between the pH levels of the ice
creams. Control 2 (plain ice cream) had a significantly higher (p ≤ 0.05) pH (6.38 ±
0.01) compared to the other ice cream formulations. The addition of banana appeared to
significantly lower (p ≤ 0.05) the pH in control 1 (banana ice cream, 6.05 ± 0.01)
compared to control 2. No significant differences (p > 0.05) were found for the pH of
banana and bacon ice cream and control 1, implying that bacon had no influence on pH.
Conversely, the banana and basmati rice ice cream had a significantly higher pH (p ≤
0.05) (6.24 ± 0.04) to control 1 and banana and bacon ice cream. This would suggest
that the addition of basmati rice influenced the pH of this ice cream formulation by
increasing the pH.
6.3 Consumer acceptance and market suitability
The mean hedonic scores and standard deviations for evaluation of banana and
basmati rice ice cream and banana and bacon ice cream by a sensory panel representing
the general retail market (panel A) and the panel representing the
culinary educated market (panel B) are presented in Table 6.4. Both panels (panels A
and B) provided comparable mean hedonic scores for the banana and rice ice cream
(B+R), with no significant differences (p > 0.05) found (7.2 ± 1.2 and 7.0 ± 1.2
respectively). In addition to this, a relatively narrow range of the hedonic scales were
used by both panels (panel A, 4.5 - 9 from lowest - highest and panel B, 4.2 - 9 from
lowest to highest). The feedback for this ice cream was mainly positive (90.8 % for both
panels), with the many assessors stating that the ice cream had a “pleasant flavour” that
was “unique and interesting”. While, 83 % of panellists from panel A and 82 % from
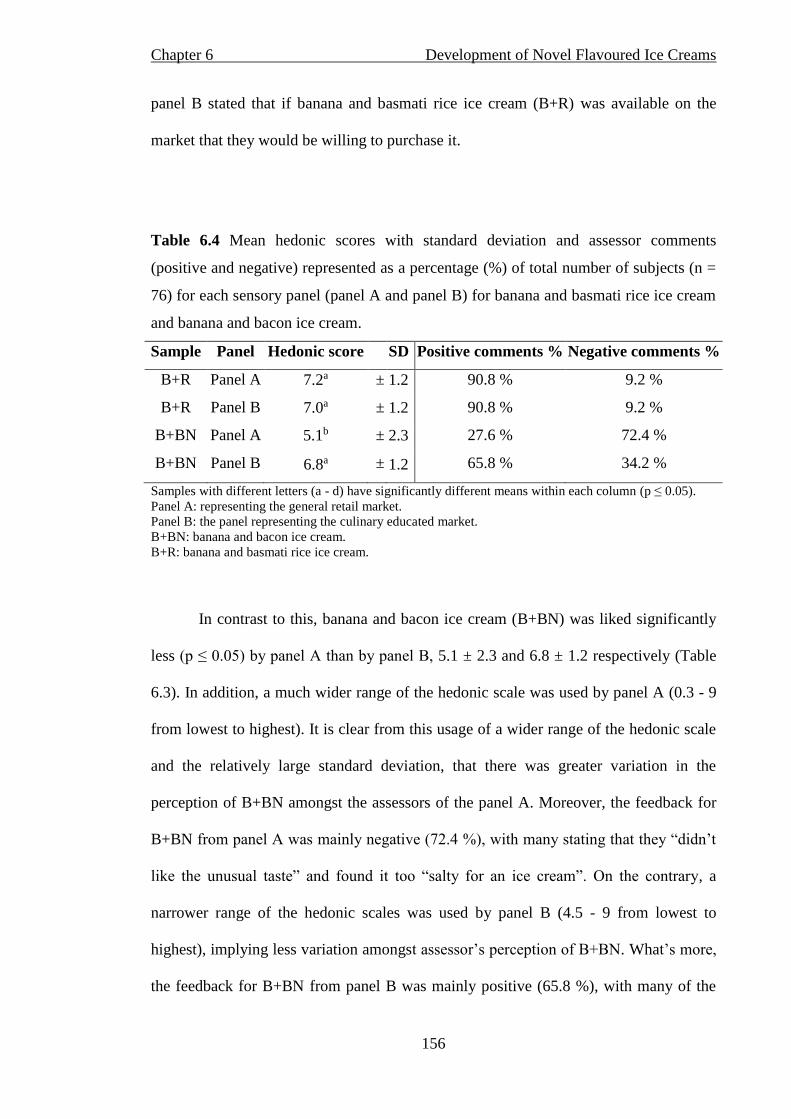
Chapter 6 Development of Novel Flavoured Ice Creams
156
panel B stated that if banana and basmati rice ice cream (B+R) was available on the
market that they would be willing to purchase it.
Table 6.4 Mean hedonic scores with standard deviation and assessor comments
(positive and negative) represented as a percentage (%) of total number of subjects (n =
76) for each sensory panel (panel A and panel B) for banana and basmati rice ice cream
and banana and bacon ice cream.
Sample Panel Hedonic score SD Positive comments % Negative comments %
B+R Panel A 7.2a ± 1.2 90.8 % 9.2 %
B+R Panel B 7.0a ± 1.2 90.8 % 9.2 %
B+BN Panel A 5.1b ± 2.3 27.6 % 72.4 %
B+BN Panel B 6.8a ± 1.2 65.8 % 34.2 %
Samples with different letters (a - d) have significantly different means within each column (p ≤ 0.05).
Panel A: representing the general retail market.
Panel B: the panel representing the culinary educated market.
B+BN: banana and bacon ice cream.
B+R: banana and basmati rice ice cream.
In contrast to this, banana and bacon ice cream (B+BN) was liked significantly
less (p ≤ 0.05) by panel A than by panel B, 5.1 ± 2.3 and 6.8 ± 1.2 respectively (Table
6.3). In addition, a much wider range of the hedonic scale was used by panel A (0.3 - 9
from lowest to highest). It is clear from this usage of a wider range of the hedonic scale
and the relatively large standard deviation, that there was greater variation in the
perception of B+BN amongst the assessors of the panel A. Moreover, the feedback for
B+BN from panel A was mainly negative (72.4 %), with many stating that they “didn’t
like the unusual taste” and found it too “salty for an ice cream”. On the contrary, a
narrower range of the hedonic scales was used by panel B (4.5 - 9 from lowest to
highest), implying less variation amongst assessor’s perception of B+BN. What’s more,
the feedback for B+BN from panel B was mainly positive (65.8 %), with many of the

Chapter 6 Development of Novel Flavoured Ice Creams
157
assessors noting that they “liked the sweet and salty combination” and they found the
flavours to be “very interesting” and “unique”. Only 46 % of panellists from panel A
expressed a willingness to purchase the B+BN if it was available on the market,
whereas, 79 % of panellists from panel B expressed a willingness to purchase B+BN.
From the results, two clear differences can be seen in the hedonic assessment of
the ice creams: (1) a difference between the assessment of B+BN by panel A and panel
B and (2) a difference between the assessment of B+R and B+BN by panel A. The
difference between the assessment of B+BN by panel A and panel B between may be
explained by the type of assessors in panel A. This panel represented the general retail
market, and consisted of subjects who more than likely had varying limited exposure to
novel food pairings, which seems to have triggered neophobic behaviour (Henriques et
al., 2009). In contrast, panel B consisted of subjects who due to their careers and/or
educational background in a culinary discipline, would have more exposure to the
concept of novel food pairings, reducing the likelihood of neophobic behaviour being
triggered. It has been noted that mere exposure and increasing familiarity with
unfamiliar foods may play an important role in the food preference development and
reduction of neophobia (Reverdy et al., 2010). Birch & Marlin (1982) and Pliner (1982)
demonstrated that preference increased with exposure frequency to novel foods.
The differences in hedonic assessment of B+R and B+BN by panel A could be
explained by the main flavour being a food of animal origin (bacon) in B+BN. This may
have caused a neophobic response of dislike, described by Martins et al., (1997) as a
negative pole of the Ideational dimension. Similarly, Martins & Pliner (2005) found that
participants in sensory panels were more neophobic with respect to novel animal foods
than novel non animal foods, with stronger disgust responses and less willingness to try
animal products. Essentially, these foods are rejected because of what they are, where

Chapter 6 Development of Novel Flavoured Ice Creams
158
they come from, or their social history e.g. who touched them or ate them (Martins &
Pliner, 2006). Furthermore, it is likely that this neophobic behaviour was a predisposed
response, formed prior to consumption of the ice cream due to an anticipated dislike of
the ice cream (Raudenbush & Frank, 1999). Arvola et al. (1999) found that neophobic
subjects rated expected and actual taste pleasantness lower to neophilics for unfamiliar
cheeses. Also, it may be the case that the more sweet and savoury tasting B+R was
simply more appealing to panel A than the sweet, salty and meaty flavour of B+BN.
Neophilics are more willing to try products that may be stronger in flavour
characteristics, whereas neophobics tend to select flavours with sweeter flavour profiles
(King et al., 2008).
These results would suggest that if B+BN was released on the general market
that it may not compete successfully with market dominant ice cream brands. In
contrast to this, B+BN would appear to be a product that may perform better in an
environment where novel flavour pairings is more common and expected as a unique
selling point, such as a higher end restaurant or in culinary specialised outlets. The
banana and basmati rice ice cream offered an alternative ice cream product to banana
and bacon ice cream, where the main flavour wasn’t animal based (bacon), thereby
avoiding the possible neophobic reaction related to some products of animal origin. In
addition to this, perception of a strong salt taste related to higher bacon levels (section
6.2.3) proved to be a factor which influenced hedonic rating of the products. Therefore,
banana and basmati rice ice cream offered an alternative to a salty tasting product with
salt levels that were low (0.04 ± 0.01 g/ 100 g). These factors may explain this products
likelihood of being more viable in a competitive general market than banana and bacon
ice cream. Additionally, customers of such establishments would be trusting in the
chef’s ability to successfully pair novel foods in a manner that was appetising and
Chapter 6 Development of Novel Flavoured Ice Creams
159
appealing. It is worth noting that food manufacturers assess marketplace trends, and
very often monitor what trends are currently popular in restaurants in order to develop
concepts for new products (Moskowitz et al., 2009).
6.4 Conclusions
It was found that bacon flavour had a profound influence on the perception of a
banana and bacon ice cream. On the other hand, banana flavour was found to be the
influential factor in the perception of banana and basmati rice ice cream. The banana
and basmati rice ice cream was accepted by a sensory panel representing the general
retail market (panel A) and by a sensory panel representing a culinary educated market
(panel B), suggesting it would perform well in both market places. In contrast, apparent
neophobic behaviour developed during the assessment of banana and bacon ice cream
by panel A which was more than likely a result the panellists lacking exposure to novel
food pairings. For this reason, this product may be more successful in high end
restaurants as opposed to in a commercial market. It is an interesting finding that there
were significant differences between ice creams with ingredients of animal origin
(bacon) and ice creams without. Another important finding is that not only was the
hedonic evaluation of these food products influenced by the actual products being
evaluated (banana and bacon or banana and basmati), but is also influenced by the
subjects and their exposure to such novelty who made up the sensory panels.
The effect of salt concentration on the flavour release and sensory perception in
the ice cream products was not evaluated in this study. Hence, there is potential for this
to be investigated specifically in the banana and basmati rice ice cream product. This
product would be a good candidate for such a study as it has naturally low levels of salt.

Chapter 6 Development of Novel Flavoured Ice Creams
160
Comparison of a sample of little or no salt levels with samples of different levels of salt
may have revealed results that further corroborated the results of chapter 4 where
flavour perception was enhanced by increasing salt levels. In addition to this, it may
have also revealed further mechanisms of phenomena that could have influenced
sensory hedonic responses.

Appendices
161
Chapter 7

Appendices
162
7.1 General discussion
Product development is a process of creativity and discovery that intends to
accumulate knowledge, create something new from trial-and-error and learn from the
errors made (Smith & Eppinger, 1997). Each development activity is responsible for
generating the required product or process knowledge based on the input information
received from other activities. The information evolution of a development activity is
considered as a gradual refinement of the product or process knowledge from its
preliminary form (prototypes) to a final end product (Wang & Lin, 2009). In this work,
a molecular gastronomy approach to food product development using methods of
investigation of the physical and chemical culinary mechanisms of phenomena was
applied to gradual refine the product. This approach allowed for the gradual refinement
of food products and the processing of knowledge obtained from experimental
investigation of fundamental and important culinary phenomena which contribute to
sensory experiences. Two novel ice cream products were developed through a holistic
scientific approach to food product development, where phenomena that occurred on a
molecular level right through to phenomena that occurred on a psychological level were
investigated.
Each results and discussion chapter consisted of an investigation of different but
related culinary mechanisms of phenomena, providing an improved scientific
understanding and insight. Such mechanisms included physical stability (chapter 3),
flavour release (chapter 4), flavour volatile interactions influencing sensory perception
(chapter 5) and consumer perception and acceptance (chapter 6). The common objective
of each chapter was to apply the knowledge obtained through the experimental work to
improve the overall sensory experience of the developed novel food product. Thus, this
study was in line with the aims and objective of molecular gastronomy, where

Appendices
163
maximising the consumer’s sensory experience is paramount (Barham et al., 2010; This
& Rutledge, 2009; van der Linden, 2008; This, 2005a; This 2005b).
The first stage of the development process, described in chapters 3 and 4,
involved the exploration of some of the primary factors which influence the formation
and stability of emulsion based food products, and subsequently the release of two
volatiles from these dispersions. One of the most important factors determining the
commercial viability of food products is the ability to resist changes in their physical
properties after production. Optimising the physical stability of food products is crucial
in order to manipulate textures and flavours, create visually appealing food products and
increase shelf life (Piorkowski & McClements, 2013). For these reasons, one of the
major objectives of food product developers is to establish the factors which determine
the stability of a food product, as well as to elucidate general principles which can be
used to predict the behaviour of new products or processes (McClements, 2005).
Computer modelling techniques have been used to investigate the relationship
among colloidal interactions (Gharibzahedi et al., 2012; Lorenzo et al., 2008;
Mirhosseini et al., 2008a; Mirhosseini et al., 2008b; Pey et al., 2006; Buffo et al., 2002;
Wijmans, et al., 1999). The interactions between emulsion ingredients (sunflower oil,
lecithin and xanthan gum) were investigated using RSM (chapter 3). Optimum
conditions for maximum emulsion storage stability and minimum mean droplet
diameter were established through this regression modelling. The creation of a food
model system that fully represents an extremely complex food product like ice cream is
a difficult challenge. Thus, the creation of a major component (an emulsion) of an ice
cream product allowed for the testing of culinary mechanisms of phenomena which may
occur within this product.

Appendices
164
Colloidal design offers much potential for producing tastier more flavoursome
food. Improvements in understanding emulsion stabilisation and destabilisation is a
means of targeting delivery of flavours (Douaire & Norton, 2013). Hence, once the
formation and stability of emulsion model systems was optimised, the effects of
physicochemical parameters (pH and salt concentration) on the volatile release of
commonly used banana flavour compounds (isoamyl acetate and furfuryl acetate) from
the emulsion were investigated in chapter 4. Flavour is one of the most important
factors determining the perceived quality of foods, and consumers expect that each type
of food product will have its own particular characteristic flavour profile (Gilbert &
Firestein, 2002). McClements (2005) notes that flavour partitioning and mass transport
in emulsions can depend on the physicochemical properties of the component phases
(e.g., polarity, rheology, and physical state). Therefore, establishing the optimum
physicochemical conditions for maximum transfer of volatile compounds to the
olfactory receptors in the human nose is of utmost importance (van Ruth & Roozen,
2000).
Application of static headspace and dynamic methods has given insight into the
partitioning of flavours between the liquid and the gaseous phase (Piggott & Schaschke,
2001). Apart from experimental data, static and dynamic flavour release from food
matrices were successfully modelled (de Roos, 2000). Empirical models can lead to
predictions of volatile partitioning and dynamic flavour release (Taylor & Linforth,
2001; Katritzky et al., 1998). In this work, RSM was employed to model volatile
emission from the food emulsion model system, to examine the interactions between
volatile compounds and physicochemical variables and to establish the optimal
conditions for maximum flavour release. As with the results from chapter 3, they can
only be partially incorporated into the finally product as the model did not completely

Appendices
165
represent an ice cream. The pH of the ice creams (6.07 for banana and rice ice cream
and 6.34 for banana and bacon ice cream) corresponded with the optimal pH (6.02)
levels established in chapter 4. The banana and bacon ice cream had relatively high
levels of salt (3.34 % w/v ± 0.08) which allowed for a significant increase (p ≤ 0.05) in
volatile emission.
The second stage of the development process, described in chapters 5 and 6,
involved building on and integrating the results from chapters 3 and 4 to produce novel
flavoured ice cream products which ultimately were acceptable to the consumer. A food
product developer must ensure that the flavour profile of a product is desirable and that
it conforms to consumer expectations for that kind of product (McClements, 2005).
Results from the consumer evaluation of the novel pairing showed that banana and
basmati rice and banana and bacon were acceptable food pairings while banana and
extra virgin olive oil was not (chapter 5). The work carried out in this chapter involved
looking at the culinary phenomena of food pairing and is of great importance to food
product development which is ultimately concerned with consumer hedonic response to
food. Furthermore, very little work has been published in this area, further reiterating
the importance of the study and the importance of further investigation of the subject
area.
In product development, instrumental measurements (GC/MS) are frequently
coupled with sensory analysis techniques (sensory profiling) to try and determine the
exact volatile responsible for some flavour sensations (Chambers & Koppel, 2013). In
this study, the correlation of descriptive analysis data with instrumental volatile
profiling data provided a better understanding of the hedonic results for the food
pairings and revealed the complexity of the food component interactions influencing
sensory perception. The design of foods with desirable flavour profiles depends on an
Appendices
166
understanding of the relationship between the types and concentrations of flavouring
substances present and the final flavour perceived by consumers (Pothakamury &
Barbosa-Canovas, 1995).
The results thus far led to the production of the final ice cream products, banana
and basmati rice and banana and bacon ice creams (chapter 6). Flavour is more than just
a series of complex chemical interactions in foods, but is also an interaction of the food
and the consumer. For the successful introduction of innovations in traditional food
products like ice creams, it is also important to have a good understanding of
consumers’ perceptions, expectations and attitudes towards innovating traditional food
products (Linnemann et al., 2006). This ensures that the product is in line with
consumer preferences, while all the time being innovative and cutting edge.
Furthermore, the constant generation of new knowledge through scientific
investigation of chemical and physical interactions in food products in tandem with
consumer integration throughout the development process of the ice creams was
important for optimisation and streamlining of the process. This can be extremely vital
for innovation as it accelerates the progress of development projects which can lead to
premium pricing and higher sales volume for a new product (Langerak & Hultink,
2005). Increasing the speed of new product development allows for continuous
reduction in the product life cycle time and increase in competition from technological
advancements and globalisation (Chen et al., 2010). Food companies can achieve
several important benefits from increasing the speed of new product development; first,
increased profitability, margins, and market share (Brown & Eisenhardt, 1995). Second,
companies with faster new product development have a greater chance to establish
industry standards and may lock up distribution channels (Dumaine, 1989). Third, a
company with the capability of developing products rapidly can quickly respond to

Appendices
167
market demands, improving the timeliness of its product entry and customer satisfaction
(Chen et al., 2010).
Food product developers wish to know the type and amount of flavouring
components that must be incorporated into a food during the manufacturing process in
order to produce a desirable flavour profile in the final food product. On the other hand,
a food manufacturer may want to know how to avoid the production of an off-flavour
within a food during manufacture, storage, or usage (McClements, 2005). For these
reasons, consumer testing and market research were required on the final ice cream
products to establish preferred ice cream formulations and to assess their overall
acceptability (chapter 6).
Results showed that not only is the hedonic evaluation of food products
influenced by the actual products being evaluated, but also by the subjects evaluating
them and by their level of exposure to such novelties. Predispostional neophobic
behaviours can be factors which impede the commercial growth of a product in a
general market and must be overcome. This appeared to be the case for banana and
bacon ice cream. However, banana and basmati rice ice cream offered an alternative ice
cream product, one with more potential viability in a competitive general market. This
further reiterates the importance of customer integration in the development process.
The implications of these results to the development of food products can be huge. Food
product developers must not only assess if a product is acceptable or not, but also
investigate the reasons why and address them if the product is considered unacceptable
or is rejected. Moreover, some products may only be initially suitable for specialised
markets, and exposure of the product to broader market may also bring success in a
more general market at a later stage.
Appendices
168
Through using a comprehensive molecular gastronomy approach, the new
product development process in this study was optimised in order to produce high
quality products which satisfy the rapidly evolving and increasing demands of
consumers.
7.2 Key outcomes
Emulsion ingredients had varying degrees of positive and negative influences on
emulsion stability and mean droplet diameter over 14 days of storage.
High levels of xanthan gum (0.28 % w/v), low levels of lecithin (1.2 %
w/v) and high levels of sunflower oil (19.02 % w/v) resulted in optimum
emulsion stability ratio (100 %) and mean droplet diameter (4.35 µm).
Isoamyl acetate, furfural acetate and salt concentrations had significant
influences on the headspace emission of isoamyl acetate from the emulsion.
Increasing salt concentration subsequently resulted in an increased
release of isoamyl acetate into the headspace of the emulsions.
Increasing isoamyl acetate concentration subsequently resulted in a linear
increase of release of isoamyl acetate into the headspace of the
emulsions.
Increasing furfuryl acetate concentration subsequently resulted in a
reduction of isoamyl acetate headspace release.
The novel food pairings selected had complex volatile interactions which
appeared to have influenced descriptive sensory evaluation and hedonic
evaluation.

Appendices
169
Banana and basmati rice and banana and bacon food pairings were
accepted by the panel of consumers, while banana and extra virgin olive
oil was not accepted.
Complex synergistic volatile interactions in the foods appeared to have
influenced the hedonic ratings of these food pairings.
A possible volatile-volatile interaction regarding odour intensity may
have occurred.
A possible volatile-volatile interaction may have involved the odour
active compounds of the constituents of the food pairings
These possible interactions proved to be positive for the pairings of
banana and basmati rice and banana and bacon, resulting in harmonious
and pleasant organic volatile mixture and a positive hedonic response.
These possible interactions proved to be negative for the pairing of
banana and extra virgin olive oil, resulting in unpleasant organic volatile
mixture and a negative hedonic response.
The ice creams were perceived differently by the panels representing different
markets.
Hedonic evaluation was greatly influenced by the subjects who made up
the sensory panels.
Predispositional neophobic behaviour appeared to be present in the
perception of banana and bacon ice creams in the panel representing the
general market.

Appendices
170
References
Appendices
171
Abdi, H. (2002). What can cognitive psychology and sensory evaluation learn from
each other? Food Quality and Preference, 13, 445-451.
Aguilera, J. (2009). Gastronomic Engineering. In: An Integrated Approach to New Food
Product Development). Pp. 318-327. Boca Rotan: CRC Press.
Aguilera, J. & Stanley, D. (1999). Microstructural Principles of Food Processing and
Engineering. Gaithersburg: Aspen Publishers.
Aguirre, L., Frias, J., Barry-Ryan, C. & Grogan, H. (2009). Modelling browning and
brown spotting of mushrooms (Agaricus bisporus) stored in controlled environmental
conditions using image analysis. Journal of Food Engineering, 91 (2), 280-286.
Ahn, Y., Ahnert, S., Bagrow, J. & Barabási, A. (2011). Flavour pairing and network
principles of food pairing. Scientific Reports, 1, 1-7.
Aime, D., Arntfield, S., Malcolmson, L. & Ryland D. (2001). Textural analysis of fat
reduced vanilla ice cream products. Food Research International, 34 (2-3), 237-246.
Albert, A., Varela P., Salvador, A., Hough, G. & Fiszman, S. (2011). Overcoming the
issues in the sensory description of hot served food with a complex texture. Application
of QDA, flash profiling and projective mapping using panels with different degrees of
training. Food Quality and Preference, 22 (5), 463-473.
Angerosa, F., Mostallino, R., Basti, C. & Vito, R. (2000). Virgin olive oil odour notes:
their relationship with colatile compounds from lipoxygenase pathway and secoiridoid
compounds. Food Chemistry, 68 (3), 283-287.
Anjum, M., Tasadduq, I. & Al-Sultan, K. (1997). Response surface methodology: A
neural network approach. European Journal of Operational Research, 101 (1), 65-73.

Appendices
172
AOAC. (1990). Official Methods of Analysis of AOAC International. 15th ed.
Washington, DC: AOAC International.
Aparicio, R., Rocha, S., Delgadillo, I. & Morales, M. (2000). Detection of rancid defect
in virgin olive oil by the Electronic Nose. Journal of Agricultural and Food Chemistry,
48 (3), 853-860.
Arancibia, C., Jublot, L., Costello, E. & Bayarri, E. (2011). Flavor release and sensory
characteristics of o/w emulsions. Influence of composition, microstructure and
rheological behaviour. Food Research International, 44 (6), 1632-1641.
Arthur, C., Killam, L., Buchholz, K. & Pawliszyn, J. (1992). Automation and
optimization of solid phase microextraction. Analytical Chemistry, 64 (17), 1960-1966.
Arthur, C. & Pawliszyn, J. (1990). Solid Phase Microextraction with Thermal
Desorption Using Fused Silica Optical Fibers. Analytical Chemistry, 62 (19), 2145-
2148.
Arvola, A., Lahteenmaki, L. & Tuorila, H. (1999). Predicting the intent to purchase
unfamiliar and familiar cheeses: The effects of attitudes, expected liking and food
neophobia. Appetite, 32 (1), 113-126.
Asperin, A., WooMi, P. & Wolfe, K. (2011). Exploring food neophobia and perceptions
of ethnic foods the case of Chinese and Thai cuisines. International CHRIE Conference.
27-30 July 2011. Colorado: Massachusetts: ScholarWorks@UMass.
Auerswald, H., Peters, P., Brückner, B., Krumbein, A. & Kuchenbuch, R. (1999).
Sensory analysis and instrumental measurements of short-term stored tomatoes
(Lycopersicon esculentum Mill.). Postharvest Biology and Technology. 15 (3), 323-334.

Appendices
173
Auvray, M. & Spence, C. (2008). The multisensory perception of flavor. Consciousness
and Cognition, 17 (3), 1016-1031.
Baccouri, B., Temime, S., Campeol, E., Cioni, P., Daoud, D. & Zarrouk, M. (2007).
Application of solid-phase microextraction to the analysis of volatile compounds in
virgin olive oils from five new cultivars. Food Chemistry, 102 (3), 850-857.
Bäckström, A., Pirttilä-Backman, A. & Tuorila, H. (2004). Willingness to try new foods
as predicted by social representations and attitude and trait scales. Appetite, 43 (1), 75-
83.
Bakker, J. (1995). Flavor Interactions with the Food Matrix and Their Effects on
Perception. In: Ingredient Interactions Effect of Food Quality (edited by A. Gaonkar).
Pp. 411-439. New York: Marcel Dekker.
Bárcenas, P., de San Román, R., Elortondo, F. & Albisu, M. (2001). Consumer
preference structures for traditional Spanish cheeses and their relationship with sensory
properties. Food Quality and Preference, 12 (4), 269-279.
Barham, P., Skibsted, L., Bredie, W., Frøst, M., Møller, P., Risbo, J., Snitkjær, P. &
Mortensen, L. (2010). Molecular Gastronomy: A New Emerging Scientific Discipline.
Chemical Reviews, 4 (110), 2313-2365.
Barrena, R. & Sánchez, M. (2013). Neophobia, personal consumer values and novel
food acceptance. Food Quality and Preference, 27 (1), 72-84.
Baş, D. & Boyacı, I. (2007). Modeling and optimization I: Usability of response surface
methodology. Journal of Food Engineering, 78 (3), 836-845.
Appendices
174
Bastian, S., Collins, C., & Johnson, T. (2010). Understanding consumer preferences for
Shirazwine and Cheddar cheese pairings. Food Quality and Preference, 21 (7), 668-
678.
Bates, D. & Watts, D. (1988). Nonlinear Regression Analysis and Its Applications. New
York: Wiley.
Belitz, H., Grosch, W. & Schieberle, P. (2009). Food Chemistry. 4th ed. Berlin:
Springer.
Bergenstahl, B. & Claesson, P. (1997). Surface forces in emulsions. In: Food Emulsions
(edited by S. Friberg, K. Larsson & J. Sjoblom). Pp. 41-55. New York: Marcel Dekker.
Berger, K. (1997). Ice cream. In: Food Emulsions. 3rd ed. (edited by S. Friberg & K. Larsson)
(3rd ed.). New York: Marcel Dekker, Inc., 413-490.
Berna, A., Lammertyna, J., Buysens, S., Di Natale, C. & Nicolaï, B. (2005). Mapping
consumer liking of tomatoes with fast aroma profiling techniques. Postharvest Biology
and Technology, 38 (2), 115-127.
Bezerra, M., Santelli, R., Oliveira, E., Villar, L., & Escaleira, L. (2008). Response
surface methodology (RSM) as a tool for optimization in analytical chemistry. Talanta,
76 (5), 965-977.
Bhattacharjee, P., Singhal, R. & Kulkarni, P. (2002). Basmati rice: a review.
International Journal of Food Science & Technology, 37 (1), 1-12.
Birch, L. & Marlin, D. (1982). I don’t like it; I never tried it: Effects of exposure on
two-year-old children’s food preferences. Appetite, 3 (4), 353-360.
Appendices
175
Blake, A. (2004). Flavour perception and the learning of food preferences. In: Flavor
Perception (edited by A. Taylor & D. Roberts). Pp. 172-202. Oxford: Blackwell Pub.
Blancher, G., Chollet, S., Kesteloot, R., Nguyen Hoang, D., Cuvelier, G. &
Siefffermann, J. (2007). French and Vietnamese: How do they describe texture
characteristics of the same food? A case study with jellies. Food Quality and
Preference, 18 (3), 560-575.
Blanck, J. (2011). Molecular Gastronomy: Overview of a Controversial Food Science
Discipline. Journal of Agricultural & Food Information, 8 (3), 77-85.
Blanck, J. (2007). Molecular Gastronomy: Overview of a Controversial Food Science
Discipline. Journal of Agricultural & Food Information, 8 (3), 77-85.
Blumenthal, H. (2008). The Big Fat Duck Cookbook. London: Bloomsbury.
Bord Bia (2010). Pathways for growth. Building Ireland’s largest indigenous industry.
Dublin: Bord Bia.
Bortnowska, G. (2010). Influence of thermodynamic and kinetic factors on the retention
and release of aroma compounds in liquid food systems. Polish Journal of Food and
Nutrition Sciences, 60 (4), 301-307.
Borwankar, R., Lobo, L. & Wasan, D. (1992). Emulsion stability-kinetics of
flocculation and coalescence. Colloid and Interface Science. 69 (2). 135-146.
Boudhrioua, N., Giampaoli, P. & Bonazzi, C. (2003). Changes in aromatic components
of banana during ripening and air-dying. Food Science and Technology, 36 (6), 633-
642.
Appendices
176
Box, G. & Behnken, D. (1960). Some new three level designs for the study of
quantitative variables. Technometrics, 2, 455-475.
Bradley, R. (2010). Moisture and Total Solids Analysis. In: Food Analysis. 4th ed.
(edited by S. Nielsen). Pp. 85-104. New York: Springer.
Bradley, N. (2007). The response surface methodology. Msc Thesis. Indiana University
of South Bend.
Brauss, M., Linforth, R., Cayeux, I., Harvey, B. & Taylor, A. (1999). Altering the fat
content affects flavor release in a model yoghurt system. Journal of Agricultural and
Food Chemistry, 47 (5), 2055-2059.
Breslin, P. & Beauchamp, G. (1995). Suppression of bitterness by sodium: Variation
among bitter taste stimuli. Chemical Senses, 20 (6), 609-623.
Brown, S. & Eisenhardt, K. (1995). Product development: past research, present
findings, and future directions. The Academy of Management Review, 20 (2), 343-378.
Brunton, N., Cronin, D., Monahan, F. & Durcan, R. (2000). A comparison of solid-
phase microextraction (SPME) fibres for measurement of hexanal and pentanal in
cooked turkey. Food Chemistry, 68 (3), 339-345.
Bryant, R. & McClung, A. (2011). Volatile profiles of aromatic and non-aromatic rice
cultivars using SPME/GC–MS. Food Chemistry, 124 (2), 501-513.
Buffo, R., Reineccius, G. & Oehlert, G. (2002). Influence of time-temperature
treatments on the emulsifying properties of gum acacia in beverage emulsions. Journal
of Food Engineering, 51 (4), 341-345.

Appendices
177
Burdock, G. (2010). Fenaroli’s Handbook of Flavor Ingredients. 5th ed. Boca Raton:
CRC Press.
Buttery, R. & Kamm, J. (1980). Volatile components of alfalfa: Possible insect host
plant interaction. Journal of Agricultural and Food Chemistry, 28 (5), 978-981.
Bylaite, E., Nylander, T., Venskutonis, R. & Jönsson, B. (2001). Emulsification of
caraway essential oil in water by lecithin and [beta]-lactoglobulin: emulsion stability
and properties of the formed oil-aqueous interface. Colloids and Surfaces B:
Biointerfaces, 20 (4), 327-340.
Caivano, J. & del Pilar Buera, M. (2012). Color in Food Technology and
Psychophysical Aspects. Boca Raton: CRC press.
Cao, Y., Dickinson, E. & Wedlock, D. (1990). Creaming and flocculation in emulsions
containing polysaccharide. Food Hydrocolloids, 4 (3), 185-195.
Cavalli, J., Fernandez, X., Lizzani-Cuvelier, L. & Loiseau, A. (2004). Characterization
of volatile compounds of French and Spanish virgin olive oils by HS-SPME:
identification of quality freshness markers. Food Chemistry, 88 (1), 151-157.
Chambers, E. & Koppel, K. (2013). Associations of Volatile Compounds with Sensory
Aroma and Flavor: The Complex Nature of Flavor. Molecule, 18, 4887-4905.
Charcosset, C. (2009). Preparation of emulsions and particles by membrane
emulsification for the food processing industry. Journal of Food Engineering, 92 (3),
241-249.
Cheetham, P. (2010). Natural sources of flavours. In Food Flavour Technology. 2nd ed.
(edited by Taylor, A. & Linforth. R.). Pp. 127-175. Oxford: Wiley-Blackwell.
Appendices
178
Chen, J. (2009). Food oral processing - A review. Food Hydrocolloids, 23 (1), 1-25.
Chen, J., Damanpour, F. & Reilly, R. (2010). Understanding antecedents of new
product development speed: A meta-analysis. Journal of Operations Management, 28
(1), 17-33.
Cheong, K., Tan, C., Mirhosseini, H., Chin, S., Man, Y., Hamid, N. & Basri, M. (2011).
Optimization of equilibrium headspace analysis of volatile flavour compounds of
Malaysian soursop (Annona muricata): Comprehensive two dimensional gas
chromatography time-of-flight mass spectrometry (GC×GCTOFMS). Food Chemistry,
125 (4), 1481-1489.
Cheong, K., Tan, C., Mirhosseini, H., Hamid, N., Osman, A. & Basri, M. (2010).
Equilibrium headspace analysis of volatile flavor compounds extracted from soursop
(Annona muricata) using solid-phase microextraction. Food Research International, 43
(5), 1267-1276.
Christensen, L., Ertbjerg, P., Løje, H., Risbo, J., van den Berg, F. & Christensen, M.
(2012). Relationship between meat toughness and properties of connective tissue from
cows and young bulls heat treated at low temperatures for prolonged times. Meat
Science, 93 (4), 787-795.
Chung, S., Heymann, H. & Grün, I. (2006). Temporal release of flavor compounds from
low-fat and high-fat ice cream during eating. Journal of Food Science, 68 (6), 2150-
2156.
Chung, S., Heymann, H. & Grün, I. (2003). Application of GPA and PLSR in
correlating sensory and chemical data sets. Food Quality and Preference, 14 (5-7), 485-
495.

Appendices
179
Civille, G. & Lyons, B. (1996). Aroma and flavour lexicon for sensory evaluation:
terms, definitions, references, and examples. Philadelphia: ASTM.
Clarke, C. (2004). The Science of Ice Cream. Cambridge: Royal Society of Chemistry
Publishing.
Contini, M. & Esti, M. (2006). Analytical, nutritional and clinical methods effect of the
matrix volatile composition in the headspace solid-phase microextraction analysis of
extra virgin olive oil. Food Chemistry, 94 (1), 143-150.
Comas D., Wagner J. & Tomas M. (2006): Creaming stability of oil in water (O/W)
emulsions: Influence of pH on soybean protein-lecithin interaction. Food Hydrocolloids,
20, 990-996.
Corzo-Martínez, M., Soria, A. Villamiel, M., Olano, A. Harte, F. & Moreno, F. (2011).
Effect of glycation on sodium caseinate-stabilized emulsions obtained by ultrasound.
Journal of Dairy Science, 94 (1), 51-58.
Costa, N., Hannon, J., Guinee, T., Auty, M., McSweeney, P. & Beresford, T. (2010).
Effect of exopolysaccharide produced by isogenic strains of Lactococcus lactis on half-
fat Cheddar cheese. Journal of Dairy Science, 93 (8), 3469-3486.
Cox, S. & Abu-Ghannam, N. (2013). Enhancement of the phytochemical and fibre
content of beef patties with Himanthalia elongata seaweed. International Journal of
Food Science and Technology, (Accepted for publication July 2013).
CSO (2012). Agriculture and Food Seminar. 4th Business Statistics Seminar. 22
November 2012. Dublin: Central Statistics Office. Available at:
<www.cso.ie/en/newsandevents/conferencesseminars/businessstatisticsseminar/4thbusi
nessstatisticsseminar/> [Accessed 30 March 2013].

Appendices
180
DAFM (2013). Food Research Ireland – meeting the needs of Ireland’s food sector to
2020 through research and innovation. Dublin: Department of Agriculture, Food and
the Marine.
Dairou, V. & Siefffermann, J. (2002). A comparison of 14 jams characterized by
conventional profile and quick original method, the flash profile. Journal of Food
Science, 67 (2), 826-834.
Dalgleish, D. (2006). Food emulsions - their structures and structure forming properties.
Food Hydrocolloids, 20 (4), 415-422.
Das, K. & Kinsella, J. (1990). Stability of food emulsions: physicochemical role of
protein and nonprotein emulsifiers. Advances in Food and Nutrition Research, 34, 81-
201.
Davis, G., Blayney, D., Yen, S. & Cooper, J. (2009). An analysis of at-home demand
for ice cream in the United States. Journal of Dairy Science, 92 (12), 6210-6216.
de Klepper, M. (2011). Food pairing theory: A Eurpoean fad. Gastronomica. The
Journal of Food and Culture, 11 (4), 55-58.
de Roos, K. (2006). Modelling aroma interactions in food matrices. In: Flavour in Food
(edited by A. Voilley, & P. Etievant). Pp. 229-253. Cambridge: Woodhead Publishing.
de Roos, K. (2000). Physicochemical models of flavor release from foods. In: Flavour
Release (edited by D. Roberts & A. Taylor). Pp. 126-141. Washington: American
Chemical Society.
de Solier, I. (2010). Liquid nitrogen pistachios: Molecular gastronomy, elBulli and
foodies. European Journal of Cultural Studies, 13 (2), 155-170.
Appendices
181
del Pulgar, J., Gázquez, A. & Ruiz-Carrascal, J. (2012). Physico-chemical, textural and
structural characteristics of sous-vide cooked pork cheeks as affected by vacuum,
cooking temperature, and cooking time. Meat Science, 90 (3), 828-835.
Delahunty, C., McCord, A., O’Neill, E. & Morrissey, P. (1997). Sensory
characterization of cooked hams by untrained consumers using Free Choice Profiling.
Food Quality and Preference, 8 (5-6), 381-388.
Delarue, J. & Giampaoli, P. (2006). Carbohydrate-flavour interactions In: Flavour in
Food (edited by A. Voilley & P. Etievant). Pp 208-228. Cambridge: Woodhead
Publishing.
Delarue, J. & Sieffermann, J. (2004). Sensory mapping using Flash profile. Comparison
with a conventional descriptive method for the evaluation of the flavour of fruit dairy
products. Food Quality and Preference, 15 (4), 383-392.
Delgado, C. & Guinard, J. (2011). How do consumer hedonic ratings for extra virgin
olive oil relate to quality ratings by experts and descriptive analysis ratings? Food
Quality and Preference, 22 (2), 213-225.
Delwiche, J. (2004). The impact of perceptual interactions on perceived flavor. Food
Quality and Preference, 15 (2), 137-146.
DETE (2009). Science, technology and innovation. Delivering the smart economy.
Dublin: Department of Enterprise, Trade and Employment.
Dickinson, E. (2009). Hydrocolloids as emulsifiers and emulsion stabilizers. Food
Hydrocolloids, 23 (6), 1473-1482.
Dickinson, E. (2006). Colloid science of mixed ingredients. Soft Matter, 2, 642-652.

Appendices
182
Dickinson, E. (2003). Hydrocolloids at interfaces and the influence on the properties of
dispersed systems. Food Hydrocolloids, 17 (1), 25-39.
Dickinson, E. (2002). Food Colloids. Current Opinion in Colloid and Interface Science,
7 (2-3), 410-412.
Dickinson, E. & McClements, J. (1995). Advances in Food Colloids. Glasgow: Blackie
Academic & Professional.
Dijksterhuis, G. (1997). Multivariate Data Analysis in Sensory and Consumer Science.
Connecticut: Food and Nutrition Press.
Dłużewska, E., Stobiecka, A. & Maszewska, M. (2006). Effect of oil phase
concentration on rheological properties and stability of beverage emulsions. Acta
Science Poland Technology Alimentarius, 5, 147-156.
Donadini, G., Fumi, M. & Lambri, M. (2012). The hedonic response to chocolate and
beverage pairing: A preliminary study. Food Research International, 48 (2), 703-771.
Douaire, M. & Norton, I. (2013). Designer colloids in structured food for the future.
Journal of the Science of Food and Agriculture, 93 (13), 3147-3154.
Dovey, T., Staples, P., Gibson, E. & Halford, J. (2008). Food neophobia and
‘picky/fussy’ eating in children: A review. Appetite, 50 (2), 181-193.
Doyen, K., Carey, M., Linforth, R. S., Marin, M. & Taylor, A. J. (2001). Volatile
release from an emulsion: Headspace and in-mouth studies. Journal of Agricultural and
Food Chemistry, 49 (2), 804-810.
Drake, M. (2007). Invited review: Sensory analysis of dairy foods. Journal of Dairy
Science, 90 (11), 4925-4937.

Appendices
183
Du, X., Kurnianta, A., McDaniel, M., Finn, C. & Qian, M. (2010). Flavour profiling of
‘Marion’ and thornless blackberries by instrumental and sensory analysis. Food
Chemistry, 121 (4), 1080-1088.
Duber-Smith, D. & Black. G. (2012). The Process of Product Development. GCI
Magazine. [online] Available at:
<http://www.gcimagazine.com/business/management/innovation/146168195.html>
[Accessed 22 March 2013].
Duflos, G., Moine, F., Coin, V. & Malle, P. (2005). Determination of volatile
compounds in whiting (Merlangius merlangus) using headspace-solid-phase
microextraction-gas chromatography-mass spectrometry. Journal of Chromatographic
Science, 43 (6), 304-312.
Dumaine, B., (1989). How managers can succeed through SPEED. Fortune, 119 (4),
54-59.
Ekundayo, O., Laakso, I., Adegbola, R., Oguntimein, B., Sofowora, A. & Hiltunen, R.
(1988). Essential oil constituents of Ashanti pepper (Piper guineense) fruits (Berries).
Journal of Agricultural and Food Chemistry, 36 (6), 880-882.
Ettelaie, R. (2003). Computer simulation and modeling of food colloids. Current
Opinion in Colloid and Interface Science, 8 (4-5), 415-421.
Fallon, A. & Rozin, R. (1983). The psychological bases of food rejections in humans.
Ecology of Food and Nutrition, 13, 15-26.
Fischer, N. & Widder, S. (1997). How proteins influence food flavor. Food Technology,
51, 68-70.
Appendices
184
Fisher, C. & Scott, T. (1997). Food Flavours: Biology and Chemistry. Tyne and Wear:
Athenaeum Press.
Flight, I., Leppard, P. & Cox, D. (2003). Food neophobia and associations with cultural
diversity and socioeconomic status amongst rural and urban Australian adolescents.
Appetite, 41 (1), 51-59.
Flores, M., Gianelli, M., Pérez-Juan, M. & Toldrá, F. (2007). Headspace concentration
of selected dry-cured aroma compounds in model systems as affected by curing agents.
Food Chemistry, 102 (2), 488-493.
Flores, M., Grimm, C., Toldra, F. & Spanier, A. (1997). Correlations of sensory and
volatile compounds of Spanish “Serrano” dry-cured hams as a function of two
processing times. Journal of Agricultural and Food Chemistry, 45 (6), 2178-2186.
Freire, M., Dias, A., Coelho, M., Coutinho, J. & Marrucho, I. (2005). Aging
mechanisms of perflucorocarbon emulsions using image analysis. Journal of Colloid
and Interface Science, 86 (2), 224-252.
Friel, E., Linforth, R. & Taylor, A. (2000). An empirical model to predict the headspace
concentration of volatile compounds above solutions containing sucrose. Food
Chemistry, 71 (3), 309-317.
Gaman, P. & Sherrington, K. (1996). Science of Food. Oxfard: Elsevier Science
Publishing.
Gan, C. & Latiff, A. (2011). Extraction of antioxidant pectic-polysaccharide from
mangosteen (Garcinia mangostana) rind: optimization using response surface
methodology. Carbohydrate Polymers, 83 (2), 8.

Appendices
185
Gellynck, X., Vermeire, B. & Viaene, J. (2007). Innovation in food firms: Contribution
of regional networks within the international business context. Entrepreneurship &
Regional Development, 19 (3), 209-226.
Gharibzahedi, M., Mousavi, S. & Hamedi, M. & Ghasemlou, M. (2012). Response
surface modeling for optimization of formulation variables and physical stability
assessment of walnut oil-in-water beverage emulsions. Food Hydrocolloids, 26 (1),
293-301.
Gilbert, A. & Firestein, S. (2002). Dollars and scents: Commercial opportunities in
olfaction and taste. Nature Neuroscience, 5, 1043-1045.
Godshall, M. & Solms, J. (1992). How carbohydrates influence flavour. Food
Technology, 46 (1), 140-145.
Goff, D. (2002). Formation and stabilisation of structure in ice-cream and related
products. Current Opinion in Colloid and Interface Science, 7 (5), 432-437.
Goff, H. (1997). Colloidal aspects of ice cream: A review. International Dairy Journal,
7, 363-373.
Goldstein, E. (2009). Sensation and Perception. 8th ed. California: Wadsworth.
Grosch, W. (2001). Evaluation of the key odorants of foods by dilution experiments,
aroma models and omission. Chemical Senses, 26 (5), 533.
Grunert, K., Verbeke, W., Kügler, J., Saeed, F. & Scholderer, J. (2011). Use of
consumer insight in the new product development process in the meat sector. Meat
Science, 89 (3), 251-258.
Appendices
186
Grunert, K., Jensen, B., Sonne, A., Brunso, K., Byrne, D. & Clausen, C. (2008). User-
oriented innovation in the food sector: relevant streams of research and an agenda for
future work. Trends in Food Science & Technology, 19 (11), 590-602.
Grunert, K., Bredahl, L. & Brunsø, K. (2004). Consumer perception of meat quality and
implications for product development in the meat sector: A review. Meat Science, 66
(2), 259-272.
Grunert, K. & Valli, C. (2001). Designer-made meat and dairy products: consumer-led
product Development. Livestock Production Science, 72 (2), 83-98.
Guichard, E. (2002). Interactions between flavour compounds and food ingredients and
their influence on flavour perception. Food Reviews International, 18 (1), 49-70.
Guzey, D. & McClements, J. (2006). Formation, stability and properties of multilayer
emulsions for application in the food industry. Advances in Colloid and Interface
Science, 128, 227-248.
Gwartney, E., Foegeding, E. & Larick, D. (2000). The role of texture and fat. In:
Flavour Release (edited by D. Roberts & A. Taylor). Pp. 351-357. Washington:
American Chemical Society.
Haahr, A., Bredie, W., Stahnke, L., Jensen, B. & Refsgaard, H. (2000). Flavour release
of aldehydes and diacetyl in oil/water systems. Food Chemistry, 71 (3), 355-362.
Hemar, Y., Tamehana, M., Munro, P. & Singh, H. (2001). Influence of xanthan gum on
the formation and stability of sodium caseinate oil-in-water emulsions. Food
Hydrocolloids, 15 (4), 513-519.

Appendices
187
Henriques, A., King, S. & Meiselman., H. (2009). Consumer segmentation based on
food neophobia and its application to product development. Food Quality and
Preference, 20 (2), 83-91.
Ho, C., Lee, K. & Jin, Q. (1983). Isolation and Identification of Volatile Flavor
Compounds in Fried Bacon. Journal of Agricultural and Food Chemistry, 31 (2), 336-
342.
Howard, K., Mike, J. & Riesen, R. (2005). Validation of a solid-phase microextraction
method for headspace analysis of wine aroma components. American Journal of
Enology and Viticulture, 56 (1), 37-45.
Hoyer, W., Chandy, R., Dorotic, M., Krafft, M. & Singh, S. (2010). Consumer
Cocreation in New Product Development. Journal of Service Research, 13 (3), 283-296
Huang, X., Kakuda, Y. & Cui, W. (2001). Hydrocolloids in emulsions: particle size
distribution and interfacial activity. Food Hydrocolloids, 15 (4-6), 533-542.
Ibanez, E., Lopez-Sebastian, S., Ramos, E., Tabera, J. & Reglero, G. (1998). Analysis
of volatile fruit components by headspace solid-phase extraction. Food Chemistry, 63
(2), 281-286.
Imahori, Y., Yamamoto, K., Tanaka, H. & Bai, J. (2013). Residual effects of low
oxygen storage of mature green fruit on ripening processes and ester biosynthesis
during ripening in bananas. Postharvest Biology and Technology, 77 (1), 10-27.
ISO (2010). ISO 8589: Sensory analysis - general guidance for the design of test rooms.
Geneva: International Organisation for Standardization.

Appendices
188
ISO (2009). ISO 5492: Sensory Analysis Vocabulary. Geneva: International
Organization for Standardization.
ISO (2006). ISO 5496: Sensory analysis - Methodology - Initiation and training of
assessors in the detection and recognition of odours. Geneva: International
Organisation for Standardization.
Jayanty, S., Song, J., Rubinstein, N., Chong, A. & Beaudry, R. (2002). Temporal
relationship between ester biosynthesis and ripening events in bananas. Journal of the
American Society for Horticultural Science, 127 (6), 998-1005.
Jeleń, H., Majcher, M. & Dziadas, M. (2012). Microextraction techniques in the
analysis of food flavor compounds: A review. Analytica Chimica Acta, 738 (13), 13-26.
Jeremiah, L., Ball, R., Uttaro, B. & Gibson, L. (1996). The relationship of chemical
components to flavour attributes of bacon and ham. Food Research International, 29 (5-
6), 457-464.
Jezussek, M., Juliano, B. & Schieberle, P. (2002). Comparison of key aroma
compounds in cooked brown rice varieties based on aroma extract dilution analyses.
Journal of Agricultural and Food Chemistry, 50 (5), 1101-1105.
Joglekar, M. & May, A. (1987). Product excellence through design of experiments.
Cereal Foods World, 32 (8), 857-868.
Jordán, J., Tandon, K., Shaw, P. & Goodner, K. (2001). Aromatic profile of aqueous
banana essence and banana fruit by Gas Chromatography-Mass Spectrometry (GC-MS)
and Gas Chromatography-Olfactometry (GC-O). Journal of Agricultural and Food
Chemistry, 49 (13), 4813-4817.
Appendices
189
Kalua, C., Allen, M., Bedgood Jr, D., Bishop, A., Prenzler, P. & Robards, K. (2007).
Olive oil volatile compounds, flavour development and quality: A critical review. Food
Chemistry, 100 (1), 273-286.
Kanavouras, A., Kiritsakis, A. & Hernandez, R. (2005). Olive oil volatile compounds,
flavour development and quality: Comparative study on volatile analysis of extra virgin
olive oil by dynamic headspace and solid phase micro extraction. Food Chemistry, 90
(1), 69-79.
Kataoka, H., Lord, H. & Pawliszyn, J. (2000). Applications of solid-phase
microextraction in food analysis. Journal of Chromatography A, 880 (1), 35-62.
Kathrine, L., Ellen, S., Gunilla, L., Margrethe, H. & Bjørg, E. (2013). Consumer
acceptability of differently processed bacons using raw materials from entire males.
Food Science and Technology, 51 (1), 205-210.
Katritzky, A., Wang, Y., Sild, S., Tamm, T. & Karelson, M. (1998). QSPR studies on
vapor pressure, aqueous solubility and prediction of water-air partition coefficients.
Journal of Chemical Information and Computer Sciences, 38 (4), 720-725.
Keenan, D., Brunton, N., Mitchell, M., Gormley, R. & Butler, F. (2012). Flavour
profiling of fresh and processed fruit smoothies by instrumental and sensory analysis.
Food Research International, 45 (1), 17-25.
Kemp, S., Hollowood, T. & Hort, J. (2009). Sensory Evaluation A Practical Handbook.
Oxford: Wiley-Blackwell.
Kerŝiene, M., Adams, A., Dubra, A., De Kimpe, N. & Leskauskaite, D. (2008).
Interactions between flavour release and rheological properties in model custard

Appendices
190
desserts: Effect of starch concentration and milk fat. Food Chemistry, 108 (4), 1183-
1191.
King, S., Meiselman, H. & Henriques A. (2008). The effect of choice and
psychographics on the acceptability of novel flavors. Food Quality and Preference, 19
(8), 692-696.
Kinsella, J. (1989). Flavor perception and flavor binding to food components. In: Flavor
Chemistry of Lipid Foods (edited by D. Min & T. Smouse). Pp. 376-403. Illinois:
American Oil Chemists' Society.
Klinkesorn, U. & McClements, D. (2009). Influence of chitosan on stability and lipase
digestibility of lecithin-stabilized tuna oil-in-water emulsions. Food Chemistry, 114,
1308-1315.
Koltay, J. & Feke, D. (1999). Depletion Flocculation Strategy for the Fabrication of
Ceramic Powder Coatings on Ceramic Fibers. Journal of the American Ceramic
Society, 82 (10), 2594-2600.
Kort, M., Nijssen, B., van Ingen-Visscher, K. & Donders, J. (2010). Food pairing from
the perspective of the ‘volatile compounds in food’ database. In: Expression of
Multidisciplinary Flavour Science: Proceedings of the 12th Weurman Symposium,
Interlaken, Switzerland (edited by I. Blank, M. Wüst & C. Yeretzian). Pp. 589-592.
Winterthur: Institut of Chemistry and Biological Chemistry.
Krstonosic, V., Dokic, L., Dokic, P. & Dapcevic, T. (2009). Effects of xanthan gum on
physicochemical properties and stability of corn oil-in-water emulsions stabilized by
polyoxyethylene (20) sorbitan monooleate. Food Hydrocolloids, 23 (8), 2212-2218.
Appendices
191
Krueger, R. & Casey, M. (2009). Focus groups a practical guide for applied research,
4th ed. London: Sage publications.
Lachnit, M., Busch-Stockfisch, M., Kunert, J. & Krahl, T. (2003). Suitability of Free
Choice Profiling for assessment of orange-based carbonated soft-drinks. Food Quality
and Preference, 14 (4), 257-263.
Landy, P., Rogacheva, S., Lorient, D. & Voilley, A. (1998). Thermodynamic and
kinetic aspects of the transport of small molecules in dispersed systems. Colloids and
Surfaces B: Biointerfaces, 12 (1), 57-65.
Langerak, F. & Hultink, E. (2005). The impact of new product development
acceleration approaches on speed and profitability: Lessons for pioneers and fast
followers. IEEE Transactions on Engineering Management, 52 (1), 30-42.
Lassoued, N., Delarue, J., Launay, B. & Michon, C. (2008). Baked product texture:
Correlations between instrumental and sensory characterization using Flash Profile.
Journal of Cereal Science, 48 (1), 133-143.
Lawless, H. & Heymann, H. (2010). Sensory Evaluation of Food Principles and
Practices. 2nd ed. New York: Springer.
Lay-Keow, N. (1998). Analysis of vodkas and white rums by SPME-GC-MS. In:
Applications of solid phase microextraction (edited by J. Pawliszyn). Pp. 393-406.
Cambridge: The Royal Society of Chemistry.
Leal-Calderon, F., Thivilliers, F. & Schmitt, V. (2007). Structured emulsions. Current
Opinion in Colloid & Interface Science, 12 (4), 206-212.

Appendices
192
Leardi, R. (2009). Experimental design in chemistry: A tutorial. Analytica Chimica
Acta, 652 (1-2), 161-172.
Lee, J., Ye, L., Landen, W. & Eitenmiller, R. (2000). Optimization of an extraction
procedure for the quantification of vitamin E in tomato and broccoli using response
surface 13-methodology. Journal of Food Composition and Analysis, 13 (1), 45-57.
Lenth, R. (2009). Response Surface Methods in R, using rsm. Journal of Statistical
Software, 32 (7), 1-17.
Limpawattana, M., Yang, D., Kays, S. & Shewfelt, R. (2008). Relating sensory
descriptors to volatile components in flavor of specialty rice types. Journal of Food
Science, 73 (9), 456-461.
Linforth, R., Cabannes, M., Hewson, L., Yang, N. & Taylor, A. (2010). Effect of fat
content on flavour delivery during consumption: An in vivo model. Journal of
Agricultural and Food Chemistry, 58 (11), 6905-6911.
Linnemann, A., Benner, M., Verkerk, R. & van Boekel, M. (2006). Consumer driven
food product development. Trends in Food Science & Technology, 17 (4), 184-190.
Liu, T. & Yang, T. (2002). Optimization of solid-phase microextraction analysis for
studying change of headspace flavor compounds of banana during ripening. Journal of
Agricultural and Food Chemistry, 50 (4), 653-657.
Lorenzo, G., Zaritzky, N. & Califano, A. (2008). Modeling rheological properties of
low-in-fat o/w emulsions stabilized with xanthan/guar mixtures. Food Research
International, 41 (5), 487-494.

Appendices
193
Lundstedt, T., Seifert, E., Abramo, L. Thelin, B., Nyström, A., Pertensen, J. &
Bergman, R. (1998). Experimental Design and Optimization. Chemometrics and
Intelligent Laboratory Systems, 42 (1), 3-40.
MacFie, H. & Hedderley, D. (1993). Current practice in relating sensory perception to
instrumental measurements. Food Quality and Preference, 4 (1), 41-49.
Madruga, M. & Mottram, D. (1995). The effect of pH on the formation of Maillard-
derived aroma volatiles using a cooked meat system. Journal of the Science of Food and
Agriculture, 68 (3), 305-310.
Malone, M. & Appelqvist, I. (2003). Gelled emulsion particles for the controlled release
of lipophilic volatiles during eating. Journal of Controlled Release, 90 (2), 227-241.
Malone, M., Appelqvist, I. & Norton, I. (2003). Oral behaviour of food hydrocolloids
and emulsions. Part 2. Food Hydrocolloids, 17, 775-784.
Manoj, P., Fillery-Travis, A., Watson A., Hibberd D. & Robins, M. (2000).
Characterization of a polydisperse depletion-flocculated emulsion III. Journal of
Colloid Interface Science, 228 (2), 200-206.
Marsili, R. (1999). Comparison of solid-phase microextraction and dynamic headspace
methods for the gas chromatographic-mass spectrometric analysis of light-induced lipid
oxidation products in milk. Journal of Chromatography Science, 37 (1), 17-23.
Martins, Y. & Pliner, P. (2006). “Ugh! That's disgusting!”: Identification of the
characteristics of foods underlying rejections based on disgust. Appetite, 46 (1), 75-85.
Martins, Y. & Pliner, P. (2005). Human food choices: An examination of the factors
underlying acceptance/rejection of novel and familiar animal and nonanimal foods.
Appetite, 45 (3), 214-224.
Appendices
194
Martins, S., Jogen, W. & van Boekel, M. (2001). A review of Maillard reaction in food
and implications to kinetic modelling. Trends in Food Science and Technology, 11 (9-
10), 364-373.
Martins, Y., Pelchat, M. & Pliner, P. (1997). Try it; it’s good and it’s good for you:
Effects of taste and nutrition information on willingness to try novel foods. Appetite, 28
(2), 89-102.
Matich, A., Rowan, D. & Banks, N. (1996). Solid phase microextraction for quantitative
headspace sampling of apple volatiles. Analytical Chemistry, 68 (23), 4114-4118.
Maw, S., Fowler, V., Hamilton, M. & Petchey, A. (2001). Effect of husbandry and
housing of pigs on the organoleptic properties of bacon. Livestock Production Science,
68 (2), 119-130.
Mayr, D., Märk, T., Lindinger, W., Brevard, H. & Yeretzian, C. (2003). Breath-by-
breath analysis of banana aroma by portion transfer reaction mass spectrometry.
International Journal of Mass Spectrometry, 223-224, 743-756.
McBurney, D. (1986). Taste, smell, and flavor terminology: Taking the confusion out of
fusion. In: Clinical Measurement of Taste and Smell (edited by H. Meiselman & R.
Rivkin). Pp. 117-125. New York: Macmillan.
McClements, D. (2005). Emulsions: Principles, Practice and Techniques. 2nd ed. Boca
Raton: CRC Press.
McFarlane, T. & Pliner, P. (1997). Increasing willingness to taste novel foods: Effects
of nutrition and taste information. Appetite, 28 (3), 227-238.

Appendices
195
McGee, H. (2004). On Food and Cooking: An Encyclopedia of Kitchen Science, History
and Culture. London: Hodder & Stoughton.
McGorrin, R. (2012). Character impact compounds: flavors and off flavors in foods. In:
Flavor, Fragrance and Odor Analysis. 2nd ed. (edited by R. McGorrin). Pp. 240-279.
Boca Raton: CRC Press.
Meilgaard, M., Civille, G. & Carr, B. (2007). Sensory Evaluation Techniques. Boca
Raton: CRC press.
Menrad, K. (2004). Innovations in the food industry in Germany. Research Policy, 33
(6), 845-878.
Mezzenga, R., Schurtenberger, P., Burbidge, A. & Michel, M. (2005). Understanding
foods as soft materials. Natural Materials, 4 (10), 729-740.
Mirhosseini, H. & Tan, C. (2009). Response surface methodology and multivariate
analysis of equilibrium headspace concentration of orange beverage emulsion as
function of emulsion composition and structure. Food Chemistry, 115 (1), 324-333.
Mirhosseini, H., Tan, C., Taherian, A. & Boo, H. (2009). Modeling the physicochemical
properties of orange beverage emulsion as function of main emulsion components using
response surface methodology. Carbohydrate Polymers, 75 (3), 512-520.
Mirhosseini, H., Tan, C., Hamid, N. & Yusof, S. (2008a). Optimization of the contents
of arabic gum, xanthan gum and orange oil affecting turbidity, average particle size,
polydispersity index and density in orange beverage emulsion. Food Hydrocolloids, 22
(7), 1212-1223.

Appendices
196
Mirhosseini, H. Tan, C., Aghlara, A., Hamid, N., Yusof, S. & Chern, B. (2008b).
Influence of pectin and CMC on physical stability, turbidity loss rate, cloudiness and
flavor release of orange beverage emulsion during storage. Carbohydrate Polymers, 73
(1), 83-91.
Mirhosseini, H., Tan, C., Hamid, N. & Yusof, S. (2008c). Effect of Arabic gum,
xanthan gum and orange oil on flavor release from diluted orange beverage emulsion.
Food Chemistry, 107 (3), 1161-1172.
Mirhosseini, H. Tan, C., Aghlara, A., Hamid, N., Yusof, S. & Chern, B. (2008d).
Influence of pectin and CMC on physical stability, turbidity loss rate, cloudiness and
flavor release of orange beverage emulsion during storage. Carbohydrate Polymers, 73
(1), 83-91.
Mirhosseini, H., Salmah, Y., Nazimah, S. & Tan, C. (2007). Solid-phase
microextraction for headspace analysis of key volatile compounds in orange beverage
emulsion. Food Chemistry, 105 (4), 1659-1670.
Mistry, B., Reineccius, T. & Olson, L. (1997). Gas chromatography-olfactometry for
the determination of key odorants in foods. In: Techniques for Analyzing Food Aroma
(edited by R. Marsili). Pp 265-291. New York: Marcel Dekker.
Mitchell, M., Brunton, N. & Wilkinson, M. (2013). The influence of salt taste threshold
on acceptability and purchase intent of reformulated reduced sodium vegetable soups.
Food Quality and Preference, 28 (1), 356-360.
Mitchell, M., Brunton, N. & Wilkinson, M. (2011). Impact of salt reduction on the
instrumental and sensory flavor profile of vegetable soup. Food Research International,
44 (4), 1036-1043.

Appendices
197
Møller, P. (2013). Gastrophysics in the brain and body. Flavour, 2 (8), 2-4.
Montgomery, D. (2005). Design and analysis of experiments. 6th ed. New York: Wiley.
Moon, S. & Li-Chan, E. (2004). Development of solid-phase microextraction
methodology for analysis of headspace volatile compounds in simulated beef flavour.
Food Chemistry, 88 (1), 141-149.
Morales, M. & Tsimidou, M. (2000). The role of volatile compounds and polyphenols
in olive oil sensory quality. In: Handbook of Olive oil. Analysis and properties (edited
by J. Harwood & R. Aparicio). Pp. 399-458. Maryland: Aspen Publications.
Morales, M., Alonso, M., Rios, J. & Aparicio, R. (1995). Virgin Olive Oil Aroma:
Relationship between Volatile Compounds and Sensory Attributes by Chemometrics.
Journal of Agricultural and Food Chemistry, 43 (11), 2925-2931.
Morgan, D. (1998). The focus group guidebook. In: The Focus Group Kit. Focus Group
Kit volume 1 (edited by R. Krueger & D. Morgan). Thousand Oaks: Sage Publications.
Morgan, D. & Scannell A. (1998). Planning focus groups. In: The Focus Group Kit.
Focus Group Kit volume 2 (edited by R. Krueger & D. Morgan). Thousand Oaks: Sage
Publications.
Mortensen, L., Frøst, M, Skibsted, L. & Risbo, J. (2012). Effect of time and temperature
on sensory properties in low-temperature long-time sous-vide cooking of beef. Journal
of Culinary Science & Technology, 10 (1), 75-90.
Moskowitz, H., Beckley, J. & Resurreccion, A. (2012). Sensory and Consumer
Research in Food Product Design and Development. 2nd ed. Oxford: Blackwell
Publishing.

Appendices
198
Moskowitz, H., Reisner, M. & Maier, A. (2009). Creating Food Concepts to Guide
Product Development and Marketing. In: An Integrated Approach to New Food Product
Development (edited by H. Moskowitz, I. Saguy & T. Straus). Pp. 176-216. Boca
Rotan: CRC press.
Mottram, D. (1998). Flavour formation in meat and meat a review products: Food
Chemistry, 62 (4), 415-424.
Mottram, D. & Nobrega, I. (2002). Formation of sulfur aroma compounds in reaction
mixtures containing cysteine and three different forms of ribose, 50 (14), 4080-4086.
Murray, R. (2001). Limitations to the use of solid-phase microextraction for
quantitation of mixtures of volatile organic sulfur compounds. Analytical Chemistry, 73
(7), 1646-1649.
Myers, R., Montgomery, D. & Anderson-Cook, C. (2009). Response Surface
Methodology: Process and Product Optimization Using Designed Experiments. New
Jersey: Wiley.
Naknean, P. & Meenune, M. (2010). Factors affecting retention and release of flavour
compounds in food carbohydrates. International Food Research Journal, 17 (1), 23-34.
Nicklaus, S., Boggio, V., Chabanet, C. & Issanchou, S. (2005). A prospective study of
food variety seeking in childhood, adolescence and early adult life. Appetite, 44 (3),
289-297.
Nogueira, J., Fernandes, P. & Nascimento, A. (2003). Composition of volatiles of
banana cultivars from Madeira Island. Phytochemical Analysis, 14 (2), 82-90.
Appendices
199
Oehlert, G. (2000). Design and Analysis of Experiments: Response Surface Design.
New York: W.H. Freeman and Company.
Olabi, A., Najm, N., Baghdadi, O. & Morton, M. (2009). Food neophobia levels of
Lebanese and American college students. Food Quality and Preference, 20 (5), 353-
362.
Ollivon, M. (2006). Lipid-flavour interactions. In: Flavour in Food (edited by A.
Voilley & P. Étiévant). Pp. 133-155. Cambrigde: Woodhead Publishing.
Pakula, C. & Stamminger, R. (2012). Measuring changes in internal meat colour, colour
lightness and colour opacity as predictors of cooking time. Meat Science, 90 (3), 721-
727.
Paule, C. & Powers, J. (1989). Sensory and chemical examination of aromatic and
nonaromatic rice. Journal of Food Science, 54 (2), 343-346.
Pérez-Juan, M., Flores, M. & Toldra, F. (2007). Effect of ionic strength of different salts
on the binding of volatile compounds to porcine soluble protein extracts in model
systems. Food Research International, 40 (6), 687-693.
Pernollet, J., Sanz, G. & Briand, L. (2006). Olfactory receptors and odour coding.
Current Research in Biology, 329 (9), 679-90.
Perrin, L., Symoneaux, R., Maître, I., Asselin, C., Jourjon, F. & Pagès, J. (2008).
Comparison of three sensory methods for use with Napping procedure: Case of ten
wines from Loire valley. Food Quality and Preference, 19 (1), 1-11.
Pey, C., Maestro, A. Solé, I., González, C., Solans, C. & Gutiérrez, J. (2006).
Optimization of nano-emulsions prepared by low-energy emulsification methods at
Appendices
200
constant temperature sing a factorial design study. Colloids and Surfaces A:
Physicochemical and Engineering Aspects, 288 (1-3), 1441-1450.
Phelan, J. & O’Connell, J. (2011). The Importance of Agriculture and the Food Industry
to the Irish economy. Dublin: University City Dublin.
Philippe, E., Seuvre, A., Colas, B., Langendorff, V., Schippa, C. & Voilley, A. (2006).
Behaviour of flavor compounds in model food systems: A thermodynamic study.
Journal of Agricultural and Food Chemistry, 51 (5), 1393-1398.
Phillips, L., Whitehead, D. & Kinsella, J. (1994). Structure-Function Properties of Food
Proteins. San Diego: Academic Press.
Piggott, J. (2000). Dynamism in Flavour science and sensory methodology. Food
Research International, 33 (3), 191-197.
Piggott, J. & Schaschke, C. (2001). Release cells, breath analysis and in-mouth analysis
in flavour research. Biomolecular Engineering, 17 (3), 129-136.
Pinheiro, J. & Bates, D. (2000). Mixed-Effects Models in S and S-PLUS. New York:
Springer.
Pino, J. & Febles, Y. (2013). Odour-active compounds in banana fruit cv. Giant
Cavendish. Food Chemistry, 141 (2), 795-801.
Piorkowski, D. & McClements, D. (2013). Beverage emulsions: Recent developments
in formulation, production, and applications. Food Hydrocolloids, (Accepted for
publication July 2013).
Pliner, P. (1982). The effect of mere exposure on liking for edible substance. Appetite, 3
(3), 283-290.
Appendices
201
Plug, H. & Haring, P. (1993). The role of ingredient-flavour interactions in the
development of fat-free foods. Trends in Food Science and Technology, 4 (2). 150-152.
Poinot, P., Grua-Priol, J., Arvisenet, G., Rannou, C., Semenou, M., Le Bail, A. & Prost,
C. (2007). Optimisation of HS-SPME to study representativeness of partially baked
bread odorant extracts. Food Research International, 40 (9), 1170-1184.
Pontes, M., Pereira, J. & Câmara, J. (2012). Dynamic headspace solid-phase
microextraction combined with one-dimensional gas chromatography-mass
spectrometry as a powerful tool to differentiate banana cultivars based on their volatile
metabolite profile. Food Chemistry. 134 (4). 2509-2520.
Pothakamury, U. & Barbosa-Canovas, G. (1995). Fundamental aspects of controlled
release in foods. Trends in Food Science and Technology, 6 (12), 397-406.
Prahalad, C. & Ramaswamy, V. (2004). Co-creation experiences: The next practice in
value creation. Journal of Interactive Marketing, 18 (3), 5-14.
Prescott, J. (2012). Chemosensory learning and flavour: Perception, preference and
intake. Physiology & Behavior, 107 (4), 553-559.
Prescott, J. (1999). Flavour as a psychological construct: Implications for perceiving
and measuring the sensory qualities of food. Food Quality and Preference, 10 (4), 349-
356.
Quintana, J., Califano, A., Zaritzky, N., Partal, P. & Franco, J. (2002). Linear and
nonlinear viscoelastic behavior of oil-in-water emulsions stabilized with
polysaccharides. Journal of Texture Studies, 33 (3), 215-236.
Appendices
202
Rabe, S., Krings, U. & Berger, R. (2003). Initial dynamic flavour release from sodium
chloride solutions. European Food Research and Technology, 218 (1), 32-39.
Ramarathnam, N. & Rubin L. (1994). The flavour of cured meat. In: Flavour of Meat
and Meat Products (edited by F. Shahidi). Pp. 175-198. London: Blackie Academic and
Professional.
Rastogi, N. (2010). Opportunities and challenges in nonthermal processing of foods. In:
Innovation in Food Engineering, New Techniques and Products (edited by L. Passos &
C. Ribeiro). Pp. 4-26. Boca Raton: CRC press.
Raudenbush, B. & Frank, R. (1999). Assessing Food Neophobia: The Role of Stimulus
Familiarity. Appetite, 32 (2), 261-271.
Raz, C., Piper, D., Haller, R., Nicod, H., Dusart, N. & Giboreau, A. (2008). From
sensory marketing to sensory design: How to drive formulation using consumers’ input?
Food Quality and Preference, 19 (8), 719-726.
Reineccius, G. (2010). Instrumental methods of analysis. In: Food Flavour Technology.
2nd ed. (edited by Taylor, A. & Linforth, R.). Pp. 229-265. Oxford: Blackwell
Publishing.
Reineccius, G. (2006). Flavour Chemistry and Technology. 2nd ed. Boca Raton: Taylor
and Francis Group.
Reverdy, C., Schlich, P., Köster, E., Ginon, E. & Lange, C. (2010). Effect of sensory
education on food preferences in children. Food Quality and Preference, 21 (7), 794-
804.
Appendices
203
Ribeiro, J., Teófilo, R., Augusto, F. & Ferreira, M. (2011). Simultaneous optimization
of the microextraction of coffee volatiles using response surface methodology and
principal component analysis. Chemometrics and Intelligent Laboratory Systems, 102
(1), 45-52.
Roberts, D. & Taylor, A. (2000). Flavour release. 2nd ed. New Orleans: American
Chemical Society.
Robins, M., Watson, A. & Wilde, P. (2002). Emulsions-creaming and rheology. Current
Opinion in Colloid & Interface Science, 7 (5-6), 419-425.
Rocha, S., Ramalheira, V., Barros, A., Delgadillo, I. & Coimbra, M. (2001). Headspace
solid phase microextraction (SPME) analysis of flavor compounds in wines. Effect of
the matrix volatile composition in the relative response factors in a wine model. Journal
of Agricultural and Food Chemistry, 49 (11), 5142-5151.
Rodgers, S. (2011). Food service research: an integrated approach. International
Journal of Hospitality Management, 30 (2), 477-483.
Rodgers, S. (2008). Technological innovation supporting different food production
philosophies in the food service sectors. International Journal of Contemporary
Hospitality Management, 20 (1), 19-34.
Rodrigues, S. & Teixeira, A. (2013). Use of generalized Procrustes analysis (GPA) to
test the effects of sex and carcass weight on sensory quality evaluations of Terrincho
lamb meat, / Meat Science, 93 (3), 485-488.
Roldán, M., Antequera, T., Martín, A., Mayoral, A. & Ruiz, J. (2013). Effect of
different temperature - time combinations on physicochemical, microbiological, textural
and structural features of sous-vide cooked lamb loins. Meat Science, 93 (3), 572-578.
Appendices
204
Ronteltap, A., van Trijp, H., Renes, R. & Frewer, L. (2007). Consumer acceptance of
technology-based innovations: lessons for the future of nutrigenomics. Appetite, 49 (1),
1-17.
Rozin, P. (2001). Food Preference. In: International Encyclopedia of the Social &
Behavioral Sciences (edited by N. Smelser & P. Baltes). Pp. 5719-5722. Oxford:
Elsevier Science Publishing.
Salles, C. (2006). Odour-taste interactions in flavour perception. In: Flavour in Food
(edited by A. Voilley & P. Etievant). Pp 345-368. Cambridge: Woodhead Publishing.
Schmidt, K. (2004). Dairy: Ice cream. Food processing - Principles and Applications,
Iowa, Blackwell Publishing.
Schramm, L. (2005). Emulsions, Foams, and Suspensions: Fundamentals and
Applications. Weinheim: Wiley-VCH.
Schrevens, E. & Portier, K. (2006). Part Q: Modeling, Chapter 143, Experimental
Design in Product Development and Optimisation. In: Handbook of Food Science,
(edited by Y. Hui), Technology and Engineering, Volume 3, Food Science and
Technology, CRC Taylor & Francis, 143-30.
Segall, K. & Goff, H (2002). Modified processing routine for ice cream that promotes
fat destabilization in the absence of added emulsifier, International Dairy Journal, 12,
1013-1018.
Sekhon, R., Schilling, M., Phillips, T., Aikins, M., Hasan, M., Corzo, A. & Mikel, W.
(2010). Effects of phosphine and methyl bromide fumigation on the volatile flavor
profile and sensory quality of dry cured ham. Meat Science, 86 (2), 411-417.
Appendices
205
SenseForTaste (2013). What is Foodpairing?. [online] Available at <
https://www.foodpairing.com/en/what-is-foodpairing/> [Accessed 10 April 2013].
Servili, M., Selvaggini, R., Jalali, F. & Montedoro, G. (1997). Comparison between
different methods for the qualitative and quantitative evaluation of volatile compounds
in virgin olive oil by head-space analysis. Rivista Italiana EPPOS, 8 (22), 311-322.
Seurve, A., Philippe, E., Rochard, S. & Voilley, A. (2007). Kinetic study of the release
of aroma compounds in different model food systems. Food Research International, 40
(4), 480-492.
Shepherd, G. (2006). Smells images and the flavour system in the human brain. Nature,
444 (16), 316-321.
Shepherd, R. (1990). Attitudes and beliefs as determinants of food choice. In:
Psychological Basis of Sensory Evaluation. (edited by R. McBride & H. MacFie).
London: Elsevier Science Publishing.
Shi, X., Zhang, X., Song, S., Tan, C., Jia, C. & Xia, S. (2013). Identification of
characteristic flavour precursors from enzymatic hydrolysis-mild thermal oxidation
tallow by descriptive sensory analysis and gas chromatography-olfactometry and partial
least squares regression. Journal of Chromatography B, 913-914, 69-76.
Shiqing, S., Xiaoming, Z., Zuobing, X., Niu, Hayat, K. & Karangwa, E. (2012).
Contribution of oxidized tallow to aroma characteristics of beeflike process flavour
assessed by gas chromatography–mass spectrometry and partial least squares
regression. Journal of Chromatography A, 1254, 115-124.

Appendices
206
Silva, K., Rocha-Leão, M. & Coelho, M. (2010). Evaluation of aging mechanisms of
olive oil - lemon juice emulsion through digital image analysis. Journal of Food
Engineering, 97 (3), 335-340.
Small, D. & Prescott, J. (2005). Odor/taste integration and the perception of flavor.
Experimental Brain Research, 166, 345–357.
Smith, R. & Eppinger, S. (1997). A predictive model of sequential iteration in
engineering design. Management Science, 43 (8), 1104-1120.
Snitkjær, P. (2010). Investigations of meat stock from a Molecular Gastronomy
perspective. PhD thesis. University of Copenhagen. Denmark.
Snitkjær, P., Risbo, J., Skibsted, L., Ebeler, S., Heymann, H., Harmon, K. & Frøst, M.
(2011). Beef stock reduction with red wine - Effects of preparation method and wine
characteristics. Food Chemistry, 126 (1), 183-196.
Snitkjær, P., Frøst, M., Skibsted, L. & Risbo, J. (2010). Flavour development during
beef stock reduction. Food Chemistry, 122 (22), 645-655.
Song, W., Ming, X. & Xu, Z. (2013). Risk evaluation of customer integration in new
product development under uncertainty. Computers & Industrial Engineering, 65 (3),
402-412.
Stone, H. & Sidel, J. (2004). Sensory Evaluation Practices. 3rd ed. Amsterdam: Elsevier
Academic Press.
Stolzenbach, S. Bredie, W. & Byrne, D. (2013). Consumer concepts in new product
development of local foods: Traditional versus novel honeys. Food Research
International, 52 (1), 144-152.

Appendices
207
Stolzenbach, S., Byrne, D. & Bredie, W. (2011). Sensory local uniqueness of Danish
honeys. Food Research International, 44 (9), 2766-2774.
Sun, C., Gunasekarana, S. & Richards, M. (2007). Effect of xanthan gum on
physicochemical properties of whey protein isolate stabilized oil-in-water emulsions.
Food Hydrocolloids, 21 (4), 555-564.
Surh, J., Jeong, T. & Vladisavljevic, T. (2008). On the preparation of lecithin stabilised
oil in water emulsions by multi stage premix membrane emulsification. Journal of Food
Engineering, 89, 164-170.
Sworn, G. (2000). Xanthan gum. In: Handbook of Hydrocolloids. (edited by G. Phillips
& P. Williams). P. 103. Cambridge: CRC press.
Sznitowska, M., Dabrowska, E. & Janicki, S. (2002). Solubilizing potential of
submicron emulsions and aqueous dispersions of lecithin. International Journal of
Pharmaceutics, 246 (1-2), 203-206.
Tanouti, K., Serghini-Caid, H., Sindic, M., Wathelet, J., Bouseta, A. & Elamrani, A.
(2012). Volatile Compounds, Profiles of Virgin Olive Oils Produced In the Eastern
Morocco: Oxidative Stability and Sensory Defects. Journal of Food Research, 1 (4),
194-206.
Tarea, S., Cuvelier, G. & Siefffermann, J. (2007). Sensory evaluation of the texture of
49 commercial apple and pear purees. Journal of Food Quality, 30 (6), 1121-1131.
Tava, A. & Bocchi, S. (1999). Aroma of cooked rice (Oryza sativa): comparison
between commercial basmati and Italian line B5-3. Cereal Chemistry, 76 (4), 526-529.
Appendices
208
Taylor, A. & Hort, J. (2007). Modifying flavour: An introduction. In: Modifying
Flavour in Food. (edited by A. Taylor & J. Hort). Pp. 1-9. Cambridge: Woodhead
Publishing.
Taylor, A. & Hort, J. (2004). Measuring proximal stimuli involved in flavour
perception. In: Flavour Perception (edited by A. Taylor & D. Roberts). Pp. 1-38.
Blackwell Publishing.
Taylor, A. & Linforth, R. (2001). Modelling flavour release through quantitative
structure property relationships (QSPR). Chimia International Journal for Chemistry,
55 (5), 448-452.
Tcholakova, S., Denkov, D., Ivanov, I. & Campbell, B. (2006). Coalescence stability of
emulsions containing globular milk proteins. Advances in Colloid and Interface
Science, 123, 259-293.
Teófilo, R. & Ferreira, M. (2006). Chemetrics II: Electronic Spreadsheets for
experimental Design Calculations, a Tutorial. Química Nova, 29, 338-350.
Thakur, R, Villette, C., Aubry, J. & Delaplac, G. (2007). Formulation - composition
map of a lecithin-based emulsion. Colloids and Surfaces A: Physicochemical and
Engineering Aspects, 310 (1-3), 55-61.
The Daily Business Post (2012). Kerry to create 900 jobs at new technology centre.
[online] 9 October 2012. Available at
<http://www.businesspost.ie/#!story/Home/News/Kerry+to+create+900+jobs+at+new+t
echnology+centre/id/19410615-5218-5073-e1b9-39d358743878 > [Accessed 21 April
2013].

Appendices
209
This, H. (2007). Formal descriptions for formulation. International Journal of
Pharmaceutics, 344 (1-2), 4-8.
This, H. (2006). Food for tomorrow? How the scientific discipline of molecular
gastronomy could change the way we eat. EMBO reports, 7, 1062 - 1066.
This, H. (2005a). Modelling dishes and exploring culinary ‘precisions’: the two issues
of molecular gastronomy. British Journal of Nutrition, 93 (1), 139-146.
This, H. (2005b). Molecular gastronomy. Nature materials, 4 (1), 5-7.
This, H. & Rutledge, D. (2009). Analytical methods for molecular gastronomy.
Analytical and Bioanalytical Chemistry, 394 (3), 659-661.
This, H., Cazor, A. & Méric, H. (2006). Lavoisier and meat stock. Comptes Rendus
Chimie, 9 (11), 1510-1515.
Timón M., Carrapiso A., Jurado Á. & van de Lagemaat, J. (2004). A study of the aroma
of fried bacon and fried pork loin. Journal of Agricultural and Food Chemistry, 84 (8),
825-831.
Tirok, S., Scherze, I. & Muschiolik, G. (2001). Behaviour of formula emulsions
containing hydrolysed whey protein and various lecithins. Colloids and Surfaces B:
Biointerfaces, 21(1-3), 149-162.
Topp, E. (2007). Building superior R&D organizations. In: Accelerating New Food
Product Design and Development. (Edited by M. Foley, E. Topp, J. Huang &
Prinyawiwatkul, W.). Pp. 41-54. Iowa: Blackwell Publishing
Appendices
210
Tourila, H., Lähteenmäki, L., Pohjalainen, L. & Lotti, L. (2001). Food neophobia
among the Finns and related responses to familiar and unfamiliar foods. Food Quality
and Preference, 12 (1), 29-37.
Trautmann, H., Steuer, D. & Mersmann, O. (2010). mco: multi criteria optimization
algorithms and related functions. R package version 1.0.7 (2010) http://cran.r-
project.org/web/packages/mco/index.html.
Traynor, M., Burke, R, O' Sullivan, M., Hannon, J. & Barry-Ryan, C. (2013). Sensory
and chemical interactions of food pairings (basmati rice, bacon and extra virgin olive
oil) with banana. Food Research International, 54 (1), 569-577.
Traynor, M., Burke, R., Brunton, N. & Barry-Ryan, C. (2012). Response Surface
Methodology Guided Release of Two Acetate Volatiles From an Oil-in-Water
Emulsion. Journal of Culinary Science & Technology, 10 (3), 223-238.
Trindade, J., Freire, M., Amaral, P., Coelho, M., Coutinho, J. & Marrucho, I. (2008).
Aging mechanisms of oil-in-water emulsions based on a bioemulsifier produced by
Yarrowia lipolytica. Colloids and Surfaces A: Physicochemical Engineer Aspects, 324
(1-3), 149-154.
Tromelin, A., Andriot, I. & Guichard, E. (2006). Protein-flavour interactions. In:
Flavour in Food (edited by A. Voilley & P. Etievant). Pp. 172-194. Cambridge:
Woodhead Publishing.
Tsaliki, E., Pegiadou, E. & Doxastakis, E. (2004). Evaluation of the emulsifying
properties of cottonseed protein isolates. Food Hydrocolloids, 18 (4), 631-637.
Ulrich, S. (2000). Review Solid-phase microextraction in biomedical analysis. Journal
of Chromatography A, 902 (1), 167-194.

Appendices
211
Valdovinos, M. (2009). Chef Formulation and Integration: Ensuring that Great Food
and Food Science Work Together. In: An Integrated Approach to New Food Product
Development (edited by H. Moskowitz, S. Saguy & T. Straus). Pp. 303-317. Boca
Rotan: CRC Press.
Valverde, J., Burke, R. & Traynor, M. (2011). Molecular gastronomy in Ireland.
Journal of Culinary Science and Technology, 9 (4), 205-211.
Valverde, J. & This, H. (2008). 1H NMR Quantitative Determination of Photosynthetic
Pigments from Green Beans (Phaseolus vulgaris L.). Journal of Agriculture and Food
Chemistry, 56 (2), 314-320.
Valverde, J., This, H. & Vignolle, M. (2007). Quantitative Determination of
Photosynthetic Pigments in Green Beans Using Thin-Layer Chromatography and a
Flatbed Scanner as Densitometer. Journal of Chemical Education, 84 (9), 1505-1507.
van Boekel, M. & Linnemann, A. (2011). The need for food product design. In: Food
product design: an integrated approach (edited by A. Linnemann, C. Schroën & M.
Boekel). Wageningen: Academic Publishers.
van der Linden, E., McClements, D. & Ubbink, J. (2008). Molecular Gastronomy: A
Food Fad or an Interface for Science-based Cooking? Food Biophysics, 3 (2), 246-254.
van der Sman, G. & van der Goot, A. (2009). The science of food structuring. Soft
Matter, 5, (3) 501-510.
van Ruth, S. & Roozen, J. (2010). Delivery of flavours from food matrices. In: Food
Flavour Technology. 2nd ed. (edited by A. Taylor & R. Linforth). Pp. 190-206. Oxford:
Wiley-Blackwell.

Appendices
212
van Ruth, S. & Roozen, J. (2000). Influence of mastication and saliva on aroma release
in a model mouth system. Food Chemistry, 71 (3), 339-345.
van Trijp, H. & van Kleef, E. (2008). Newness, value and new product performance.
Trends in Food Science & Technology, 19 (12), 562-573.
van Vliet, T., van Aken, G., de Jongh, H. & Hamer, R. (2009). Colloidal aspects of
texture perception, Advances in Colloid and Interface Science, 150 (1), 27-40.
Vas, G. & Vékey, K. (2004). Solid-phase microextraction: a powerful sample
preparation tool prior to mass spectrometric analysis. Journal of Mass Spectrometry, 39
(3), 233-54.
Vega, C. & Ubbink, J. (2008). Molecular gastronomy: a food fad or science supporting
innovative cuisine? Trends in Food Science & Technology, 19 (7), 372-382.
Vermeir, S., Hertog, M., Vankerschaver, K., Swennen, R., Nicolai, B. & Lammertyn, J.
(2009). Instrumental based flavour characterisation of banana fruit. Food Science and
Technology, 42 (10), 1647-1658.
Villariano, M. (2006). “Molecular cuisine”. Foodservice Europe and Middle East, 4,
69.
Visschers, R., Jacobs, M., Frasnelli, J., Hummel, T., Burgering, M. & Boelrijk, A.
(2006). Cross modality of texture and aroma perception is independent of orthonasal or
retronasal stimulation. Journal of Agricultural and Food Chemistry, 54 (15), 5509-
5515.
Appendices
213
Voilley, A. & Souchon, I. (2006). Flavour retention and release from the food matrix:
an overview. In: Flavour in Food (edited by A. Voilley & P. Etievant). Pp 115-133.
Cambridge: Woodhead Publishing.
Vuckovic, D., Zhang, X., Cudjoe, E. & Pawliszyn, J. (2010). Solid-phase
microextraction in bioanalysis: New devices and directions. Journal of
Chromatography A, 1217 (25), 4041-4060.
Wang, J. & Lin, Y. (2009). An overlapping process model to assess schedule risk for
new product development. Computers & Industrial Engineering, 57 (2), 460-474.
Wei, S., Ou, L., Luo, L. & Hutchings, J. (2012). Optimisation of food expectations
using product colour and appearance. Food Quality and Preference, 23 (1), 49-62.
Welty, W., Marshall, R., Grun, I. & Ellersieck, M. (2001). Effects of milk fat, cocoa
butter, or selected fat replacers on flavour volatiles of chocolate ice cream. Journal of
Dairy Science, 84 (1), 21-30.
Whitehurst, P. (2004). Emulsifiers in Food Technology, Cornwall: Blackwell.
Widjaja, R., Craske, J. & Wootton, M. (1996). Comparative Studies on Volatile
Components of Non-Fragrant and Fragrant Rices. Journal Science Food and
Agriculture, 70 (2), 151-161.
Wijmans, C., Whittle, M. & Dickinson, E. (1999). Structure and Rheology of Simulated
Particle Gel Systems. In: Food Emulsions and Foams: Interfaces, Interactions and
Stability (edited by E. Dickinson & J. Patino). Pp. 342. Cambridge: Royal Society of
Chemistry.
Appendices
214
Wijnands, J., van der Meulen, B. & Poppe, K. (2007). Competitiveness of the European
Food Industry, An economic and legal assessment. The Hague: European Commission.
Wright, J. (2010). Creating and formulating flavours. In: Food Flavour Technology. 2nd
ed. (edited by A. Taylor & R. Linforth). Pp. 1-23. Oxford: Wiley-Blackwell.
Yang, D., Lee, K., Jeong, O., Kim, K. & Kays, S. (2008). Characterization of volatile
aroma compounds in cooked black rice. Journal of Agricultural Food Chemistry, 56
(23), 235-240.
Ye, A., Hemar, Y. & Singh, H. (2004). Enhancement of coalescence by xanthan
addition to oil-in-water emulsions formed with extensively hydrolysed whey proteins.
Food Hydrocolloids, 18 (5), 737-746.
Yilmaztekin, M., Erten, H. & Cabaroglu, T. (2008). Production of isoamyl acetate from
sugar beet molasses by Williopsis saturnus var. saturnus. Journal of the Institute of
Brewing, 114 (1), 34-38.
Yoshihashi T. (2002). Quantitative analysis on 2-acetyl-1-pyrroline of an aromatic rice
by stable isotope dilution method and model studies on its formation during cooking.
Journal of Food Science, 67 (2), 619-622.
Yu, A., Sun, B., Tian, D. & Qu, W. (2008). Analysis of volatile compounds in
traditional smoke-cured bacon (CSCB) with different fiber coatings using SPME. Food
Chemistry, 110, 233-238.
Zellner, D. & Durlach, P. (2002). What is refreshing? An investigation of the color and
other sensory attributes of refreshing foods and beverages. Appetite, 39 (2), 185-186.

Appendices
215
Zhang, Z. & Pawliszyn, J. (1993). Headspace solid phase microextraction. Analytical
Chemistry, 65, 1842-1852.
Zhao, Y., Lua, S., Liu, C., Meng, Z., Ni, C., Cao, Q. & Miao, M. (2010). Analysis of
Volatile Compounds in Food and Cosmetic, Using the Purge and Trap Injector Coupled
to a Gas Chromatograph with Photo Ionization Detector. International Journal of
Chemistry, 2 (1), 55-64.
Ziegler, E. & Zieglar, H. (1998). Flavourings: Production, Composition, Applications,
Regulations. New York: Wiley-VCH.
Appendices
216
Appendices

Appendices
217
Appendix A:
Sensory analysis documentation

Appendices
218
Sensory analysis consent form
Researcher’s Name: MARK TRAYNOR Title: Mr.
Faculty/School/Department:
COLLEGE OF ARTS AND TOURISM/SCHOOL OF CULINARY ARTS AND FOOD
TECHNOLOGY
Title of Study:
AN INVESTIGATION INTO THE DEVELOPMENT OF INNOVATIVE FOOD PRODUCTS USING
MOLECULAR GASTRONOMY THEORIES
To be completed by the: volunteer
3.1 Have you been fully informed/read the information sheet about this study? YES/NO
3.2 Have you had an opportunity to ask questions and discuss this study? YES/NO
3.3. Have you received satisfactory answers to all your questions? YES/NO
3.4 Have you received enough information about this study and any associated health and
safety implications if applicable? YES/NO
3.5 Do you understand that you are free to withdraw from this study?
at any time
without giving a reason for withdrawing
without affecting your future relationship with the Institute YES/NO
3.6 Do you agree to take part in this study the results of which are likely to be published?
YES/NO
3.7 Have you been informed that this consent form shall be kept in the confidence
of the researcher? YES/NO
Signed_____________________________________ Date __________________
Name in Block Letters __________________________________________________________
Signature of Researcher ________________________________ Date __________________
Please note:
For persons under 18 years of age the consent of the parents or guardians must be
obtained or an explanation given to the Research Ethics Committee and the assent of
the child/young person should be obtained to the degree possible dependent on the
age of the child/young person. Please complete the Consent Form (section 4) for
Research Involving ‘Less Powerful’ Subjects or Those Under 18 Yrs.
In some studies, witnessed consent may be appropriate.
The researcher concerned must sign the consent form after having explained the
project to the subject and after having answered his/her questions about the project.

Appendices
219
Sensory analysis information sheet
Project aim: To carry out sensory analysis on novel flavour combinations in order to
determine if the products are acceptable to the consumer.
Project information: Our research is being conducted as part of a PhD project on
development of innovative novel food products using the theories and techniques of
molecular gastronomy. You will be assessing the acceptability of three samples of foods
in combination with banana in terms of taste in order to determine if these products are
acceptable to consumers. If you have any allergies with the following foods: bacon,
olive oil, basmati rice and banana please inform the researchers. No extra ingredients
have been added.
If there is any reasonable doubt or uncertainty about the safety of the material you will
not be asked to taste it. Participation in the study is strictly voluntary and participants
can withdraw at any time, without giving a reason. If you are a diabetic, or have a cold
or sinusitis please do not participate in this taste test. If you have any illness which you
feel may compromise your health please do not participate in this test.
The results will be presented in the PhD thesis and are anonymous.
If you have any further questions you can contact Mark Traynor at [email protected],
(01) 402 4373. This project has been approved by the DIT Research Ethics Committee
who can be contacted at [email protected] at any time.

Appendices
220
Appendix B:
Sensory analysis evaluation sheets

Appendices
221
Sensory evaluation of orthonasal acceptability of food pairings test
Instructions:
Read the instructions of this sensory analysis test very carefully.
You will be presented with eight randomly coded samples, one at a time. You are requested not to open the container. Smell the samples
carefully through the holes in the lids, take three short sniffs. Complete the assessment of this odour before proceeding to the next sample.
Please rate the samples aroma acceptability by placing a tick opposite the appropriate term.
Sample Extremely
Like
Like
Very
Much
Moderately
Like
Like
Slightly
Neither
Like or
Dislike
Dislike
Slightly
Moderately
Dislike
Dislike
Very
Much
Extremely
Dislike
170
463
549
774
289
320
953
641

Appendices
222
Sensory evaluation of taste acceptability of food pairings test
Instructions:
Read the instructions of this sensory analysis test very carefully.
You will be presented with three coded samples. The samples will be presented to you separately and one at a time, please only rate the
acceptability of the sample’s flavour by placing a tick opposite the appropriate term. After rating the acceptability, you will be asked to
answer a question on each sample. Once you have assessed a sample, this sample will be removed and the next sample for evaluation will
be presented. Please cleanse your palate with the crackers and water provided in between samples.
Please do not communicate with any other participants while taking part in the sensory analysis. If you have any questions during the
sensory analysis please do not hesitate to ask one of the researchers.
Thank you.

Appendices
223
Sample 321
Please rate the sample acceptability by placing a tick opposite the appropriate term
Do you think the pairing of these two foods works?
Any further comments regarding this food pairing?
Extremely
Dislike
Dislike Very
Much
Moderately
dislike
Dislike
Slightly
Neither Like
or Dislike
like
Slightly
Moderately
like
like Very
Much
Extremely
like
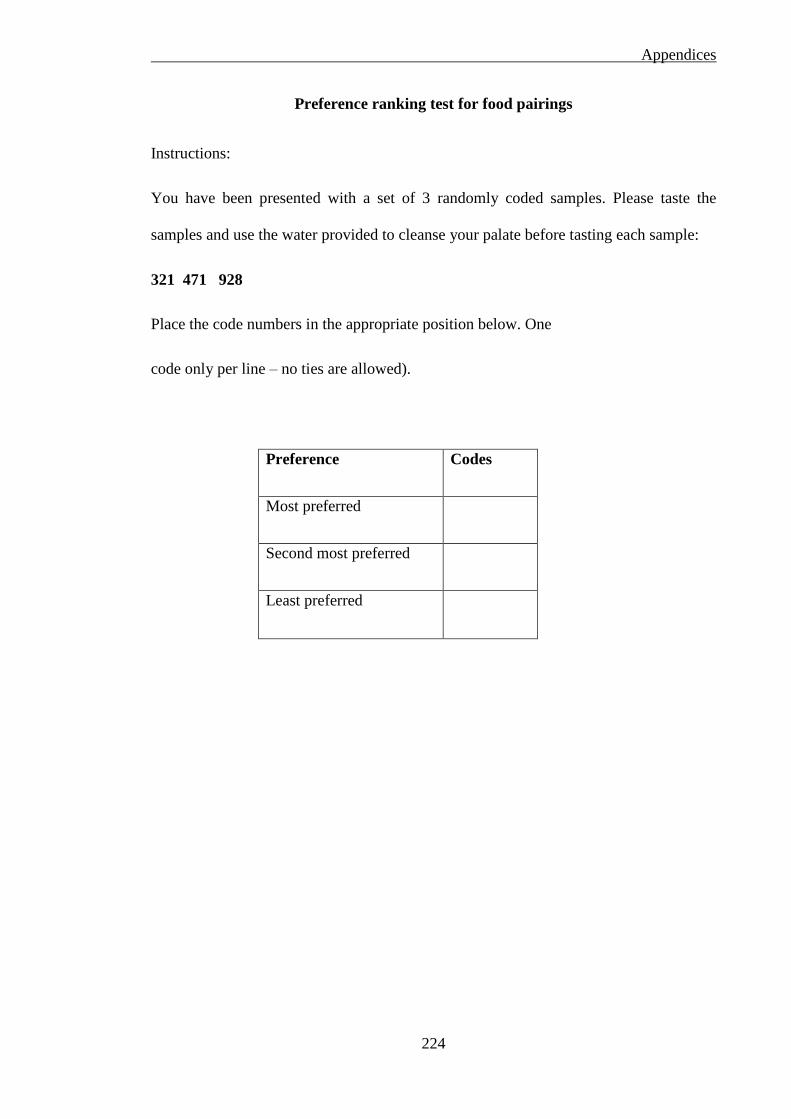
Appendices
224
Preference ranking test for food pairings
Instructions:
You have been presented with a set of 3 randomly coded samples. Please taste the
samples and use the water provided to cleanse your palate before tasting each sample:
321 471 928
Place the code numbers in the appropriate position below. One
code only per line – no ties are allowed).
Preference Codes
Most preferred
Second most preferred
Least preferred

Appendices
225
Appendix C:
Free choice profiling evaluation sheets
and descriptor lexicons

Appendices
226
Orthonasal and retronasal descriptive lexicons for food pairings
BANANA AND BACON
AROMA FLAVOUR
Sweet Sweet
Sugary Sweet, caramel
Caramelised Burnt sugar
sweet caramel Maple
Maple Savoury
Salty Umami
roasted meat Salty
Meat roasted meat
Fried meat Meaty
Umami fried meat
Savoury Fatty
Greasy Oily
Fatty Greasy
Greasy Fruity
Oily Floral
Buttery Lemon
Smoky Sweet, fruity
Popcorn Nutty
Bready Bready
Earthy Popcorn
Floral Cereal
Green floral Smoky
Pear Woody
Pear

Appendices
227
Orthonasal evaluation of food pairings by Free Choice Profiling
PANELLIST NAME:
SAMPLE CODE:
Descriptive term:
WEAK/MILD STRONG
Descriptive term:
WEAK/MILD STRONG

Appendices
228
Appendix D:
Determination of flavour transfer
method for ice creams study
Appendices
229
D.1 Introduction
This appendix comprises of the preliminary study into the determination of the
most appropriate method of flavour transfer for basmati rice and bacon to the respective
ice creams. Numerous methods of flavour transfer were tested for both ice creams. The
flavours were incorporated into a mixture of full fat milk (3 % v/v fat) and cream (38 %
v/v fat) at a ratio of 52.8:47.2 % (v/v). As the milk/cream mixture was the main
ingredient in the ice creams it was evaluated as opposed to actually ice creams. The
selected basmati rice and bacon contents were 225 kg/L for both. A sensory panel (n =
6) was used to assess the milk/cream mixtures. The factors considered were: (1) the
intensity of the basmati or bacon taste, (2) off tastes or undesirable textures, and (3) the
physical state of the mixtures.
D.2 Materials and methods
D.2.1 Materials
Raw materials are as described in section 2.5.1.
D.2.2 Methods
D.2.2.1 Banana and basmati rice ice cream flavour transfer
Six methods of flavour transfer methods for basmati rice to the banana and
basmati rice ice cream were tested in total. The basmati rice to milk/cream mixture ratio
was 225g: 1 L for these tests. The flavour transfer methods were as follows:

Appendices
230
Method R1: Boil and strain: raw basmati rice was cooked for 15 minutes in the
milk/cream mixture. The rice was then strained immediately after boiling and
discarded, and the cooking liquid reserved.
Method R2: Boil and soak: raw basmati rice was cooked for 15 minutes in the
milk/cream mixture. The rice was soaked in the milk/cream mixture for 24 hours at
approximately 4 oC. The rice was then strained and discarded, and the cooking
liquid reserved.
Method R3: Grind, boil and strain: raw basmati rice was ground to a course powder
in a coffee grind (model). The basmati rice coarse powder was then boiled in the
milk/cream mixture for 15 minutes. The rice was strained immediately after boiling
and discarded, and the cooking liquid reserved.
Method R4: Magnetic hotplate stirrer: raw basmati rice was heated in the
milk/cream mixture in a glass beaker on a magnetic stirrer hotplate (Stuart CB162,
Bibby-scientific, Staffordshire, UK) at 100 rpm at 60 oC for 15 minutes. The rice
was then strained immediately after heating and discarded, and the cooking liquid
reserved
Method R5: Incubation agitation: raw basmati rice was heated in the milk/cream
mixture in a glass beaker in an incubator (Innova 42, New Brunswick Scientific,
CT, USA) at 100 rpm at 60 oC for 15 minutes. The rice was then strained
immediately after heating and discarded, and the cooking liquid reserved.
Method R6: Grind and hot plate stirrer: raw basmati rice was heated in the
milk/cream mixture in a glass beaker on a magnetic stirrer hotplate (Stuart CB162,
Bibby-scientific, Staffordshire, UK) at 100 rpm at 60 oC. The rice was then strained
immediately after heating and discarded, and the cooking liquid reserved.
Appendices
231
D.2.2.2 Banana and bacon ice cream flavour transfer
Bacon was cooked as described in section 2.4.2.3. Four methods of flavour
transfer for bacon to the banana and bacon ice cream were tested in total. The bacon to
milk/cream mixture ratio was 225g: 1 L for these tests. The flavour transfer methods
were as follows:
Method B1: Soak and strain: cooked bacon was soaked in the milk/cream mixture
for 24 hours at 4 oC. The bacon was strained and discarded, and the soaking liquid
reserved.
Method B2: Boil and strain: cooked bacon rice was cooked for 15 minutes the
milk/cream mixture. The bacon was then strained immediately after boiling and
discarded, and the cooking liquid reserved.
Method B3: Boil and soak: cooked bacon was cooked for 15 minutes in the
milk/cream mixture. The bacon was soaked in the milk/cream mixture for 24 hours
at approximately 4 oC. The bacon was then strained and discarded, and the cooking
liquid reserved.
Method B4: Salt removal and soak: cooked 225 g of bacon was soaked in 2 litres of
distilled, deionized water (DDW) from a Milli-Q water purification system
(Millipore, Bedford, MA, USA) for 24 hours. The bacon was then strained and
soaked the milk/cream mixture for a further 24 hours at approximately 4 oC. The
bacon was then strained and discarded, and the cooking liquid reserved.

Appendices
232
D.3.2.3 Sensory evaluation of the flavoured milk and cream mixtures
Sensory evaluation of the basmati rice flavoured the milk/cream mixtures and of
the bacon flavour the milk/cream mixture were assessed by a sensory panel (n = 6).
Sensory evaluation was carried out in a sensory laboratory under guidelines and
conditions according to ISO 8589:2010 (ISO, 2010). The panellists worked in a single
booth under defined conditions of 22 oC and white light. Panellists were presented with
10 ml samples a monadic sequential order to the panel. Panellists were instructed to
evaluate taste acceptability of the paired samples on a nine point hedonic scale, where 9
= “like extremely”, 5 = “neither like nor dislike” and 1 = “dislike extremely” (see
appendix B). Additionally, panellists were encouraged to write comments regarding
their opinion of the milk and cream mixtures. Sensory evaluation of the basmati rice and
bacon flavour transfer methods took place on separate days.
D.3.2.4 Physical state assessment
The physical state of the flavoured the milk/cream mixtures was assessed by
visual inspection. The change of the thickness (viscosity) of the samples was assessed
by visual and touch (mouthfeel) inspection. The overall end product yield from 500 ml
of the milk and cream mixture was measured using a graduated cylinder.
Appendices
233
D.3 Results and discussion
D.3.1 Basmati rice flavour results
A summary of the results from the assessment of basmati rice flavours transfer
methods from rice to the milk/cream mixture are presented in Table D.1. Due to the
hydrophilicity of the rice, this method of boiling and soaking the rice (method R2)
produced no end product yield to be assessed, hence this method produced the least
desirable results. Method R4 and method R5 produced slightly viscous end products
with the same approximate yield (300 ml) with mild rice flavours. On the other hand,
the method of grinding the rice to a coarse powder (method R3 and method R6)
produced extremely small yields of end product (50 ml) which were very viscous and
partially solid with mild rice flavours. From the results it was decided that method R1
(boil and strain) was the most appropriate method for transferring the rice flavour to the
milk/cream mixture. It produced the highest mean acceptability scoring (8 ± 1), the
highest overall yield (350 ml), while its thickness only increased slightly. Additionally,
the assessors stated that it had a strong characteristic rice flavour in comparison to the
other samples.

Appendices
234
Table D.1 Summary of the results for the assessment of basmati rice flavour transfer
methods from rice to the milk/cream mixture.
Method Mean hedonic
score
Approx. yield (ml)
from 500 ml
Thickness Summary of
comments
Method R1 8 ± 1 350 ml Slightly viscous Strong rice flavour
Method R2 NA 0 Thick and solid NA
Method R3 5 ± 1 50 ml Thick and semi-solid Mild rice flavour
Method R4 4 ± 1 300 ml Slightly viscous Mild rice flavour
Method R5 3 ± 1 300 ml Slightly viscous Mild rice flavour
Method R 6 ± 1 50 ml Thick and semi-solid Mild rice flavour
D.3.2 Bacon flavour results
A summary of the results from the assessment of bacon flavours transfer
methods from bacon to the milk/cream mixture are presented in Table D.2. From the
results it can be seen that boiling the bacon in the milk/cream mixture (method B2 and
method B3) produced the strongest bacon flavours, however it also produced a strong
and unpleasant salt taste. Due to this, these methods of flavour transfer produced the
lowest mean hedonic scorings (2 ± 1) and the least desirable overall results. In contrast
to these methods, method B4 which involved removal of the salt through soaking in
water produced extremely mild bacon flavour and salt taste, and so this method was not
appropriate. It can be seen that the method of soaking the bacon for 24 hours in the milk
and cream mixture and straining it (method B1) produced a mild bacon and salt taste,
with the highest mean hedonic scoring (7 ± 1), and was therefore the most appropriate
method of transferring the bacon flavour to the milk/cream mixture.

Appendices
235
Table D.2 Summary of the results for the assessment of bacon flavour transfer methods
from bacon to the milk/cream mixture.
Method Mean hedonic
score
Approx. yield
(ml) from 500 ml
Thickness Summary of comments
Method B1 7 ± 1 500 ml No change Mild bacon flavour and salt taste
Method B2 2 ± 1 500 ml No change Strong bacon flavour,
overpowered by salt taste
Method B3 2 ± 1 500 ml No change Strong bacon flavour.
Overpowering salt taste
Method B4 3 ± 1 500 ml No change Little or no bacon flavour or salt
taste
D.4 Conclusions
Results indicated that the method of boiling the basmati rice in the milk/cream
mixture and then straining the rice and retaining the cooking liquid (method R1) was the
most appropriate method for transferring the basmati rice flavour to the ice creams.
Results indicated that the method of soaking the cooked bacon in the milk/cream
mixture and then straining the bacon and retaining the soaking liquid (method B1) was
the most appropriate method for transferring the bacon flavour to the ice creams.
Appendices
236
Appendix E:
Volatile composition table for food
pairing study
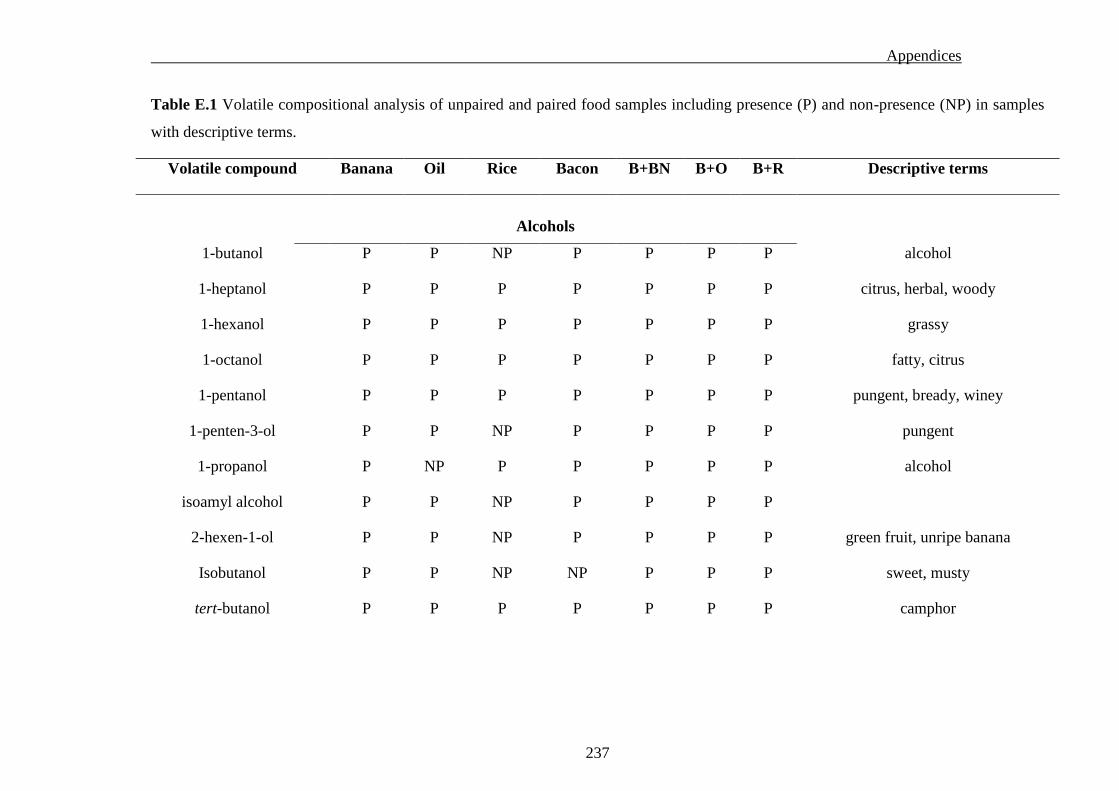
Appendices
237
Table E.1 Volatile compositional analysis of unpaired and paired food samples including presence (P) and non-presence (NP) in samples
with descriptive terms.
Volatile compound Banana Oil Rice Bacon B+BN B+O B+R Descriptive terms
Alcohols
1-butanol P P NP P P P P alcohol
1-heptanol P P P P P P P citrus, herbal, woody
1-hexanol P P P P P P P grassy
1-octanol P P P P P P P fatty, citrus
1-pentanol P P P P P P P pungent, bready, winey
1-penten-3-ol P P NP P P P P pungent
1-propanol P NP P P P P P alcohol
isoamyl alcohol P P NP P P P P
2-hexen-1-ol P P NP P P P P green fruit, unripe banana
Isobutanol P P NP NP P P P sweet, musty
tert-butanol P P P P P P P camphor
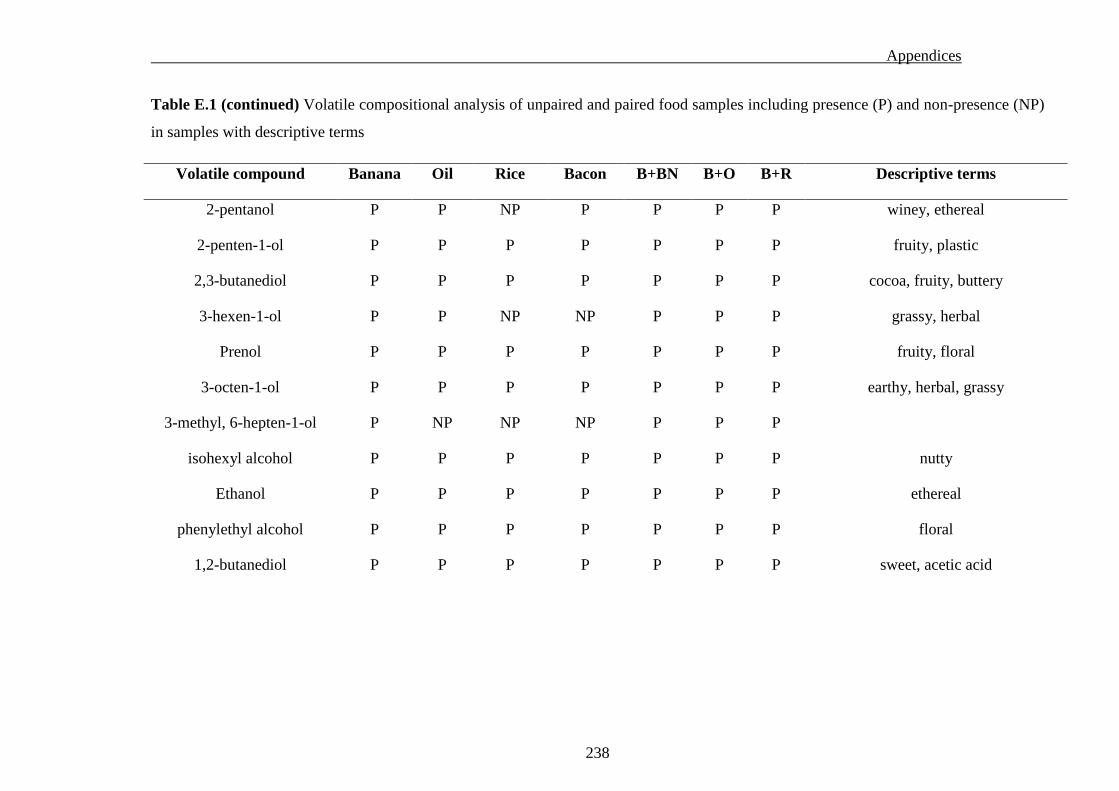
Appendices
238
Table E.1 (continued) Volatile compositional analysis of unpaired and paired food samples including presence (P) and non-presence (NP)
in samples with descriptive terms
Volatile compound Banana Oil Rice Bacon B+BN B+O B+R Descriptive terms
2-pentanol P P NP P P P P winey, ethereal
2-penten-1-ol P P P P P P P fruity, plastic
2,3-butanediol P P P P P P P cocoa, fruity, buttery
3-hexen-1-ol P P NP NP P P P grassy, herbal
Prenol P P P P P P P fruity, floral
3-octen-1-ol P P P P P P P earthy, herbal, grassy
3-methyl, 6-hepten-1-ol P NP NP NP P P P
isohexyl alcohol P P P P P P P nutty
Ethanol P P P P P P P ethereal
phenylethyl alcohol P P P P P P P floral
1,2-butanediol P P P P P P P sweet, acetic acid

Appendices
239
Table E.1 (continued) Volatile compositional analysis of unpaired and paired food samples including presence (P) and non-presence (NP)
in samples with descriptive terms
Volatile compound Banana Oil Rice Bacon B+BN B+O B+R Descriptive terms
Aldehydes
2-butenal P P P P P P P floral
2-heptenal P P P P P P P fatty, herbal
2-hexenal P P P P P P P grassy, fruity apple, herbal
2-methyl-butanal P P NP P P P P cocoa, nutty, musty
isobutyraldehyde P P P P P P P floral
2-pentenal P P P P P P P pungent, fruity
2, 4-heptadienal P P P P NP P P fatty, oily, cinnamon
3-methyl-2-butenal P P P P P P P sweet, fruity, pungent, nutty
3-methyl-butanal P P P P P P P fruity, fatty, almond
acetaldehyde NP P P P P P P fruity, apple, chocolate, musty
benzaldehyde P P P P P P P almond

Appendices
240
Table E.1 (continued) Volatile compositional analysis of unpaired and paired food samples including presence (P) and non-presence (NP)
in samples with descriptive terms
Volatile compound Banana Oil Rice Bacon B+BN B+O B+R Descriptive terms
benzeneacetaldehyde P P P P P P P pungent, floral, sweet
Butanal P NP NP P P P P pungent, cocoa, bready, nutty
Decanal P P P P P P P sweet, floral, citrus
Heptanal P P P P P P P oily
Hexanal P P P P P P P grassy, fruity, sweet
Methional P P P P P P P potato, meaty
Nonanal P P P P P P P fruity, floral, orange, fatty
Octanal P P P P P P P fruit, orange, fatty, waxy
Pentanal P P P P P P P bready, fruity, nutty
Esters
amyl isovalerate P NP NP NP P NP P fruity, apple
1-methylbutyl butanoate P NP NP NP P P P
1-methyloctyl butanoate P NP NP NP P P P

Appendices
241
Table E.1 (continued) Volatile compositional analysis of unpaired and paired food samples including presence (P) and non-presence (NP)
in samples with descriptive terms
Volatile compound Banana Oil Rice Bacon B+BN B+O B+R Descriptive terms
2-methylbutyl butanoate P P P P P P P fruity, buttery, fatty
2-methyl cyclohexyl
butanoatethyl
P P NP NP P P P
sweet, fruity, citrus, apple
hexyl 2-methylbutanoate P NP NP NP P P P fruity, apple, spicy
isobutyl propanoate P NP NP P P P P rum, pineapple
2-methylbutyl butanoate P NP NP NP P P P fruity, buttery, fatty
ethyl 2-methyl butanoate P P P P P P P fruity, apple
Manzanate P P P P P P P fruity, pineapple
2-methylbutyl propanoate P NP NP NP P P P fruity, pineapple
2-pentenyl butanoate P P P P P P P
3-methylbutyl 2-
methylbutanoate
P P P P P P P
sweet, fruity, apple, citrus
isoamyl propanoate P P P P P P P fruity, apricot, pineapple

Appendices
242
Table E.1 (continued) Volatile compositional analysis of unpaired and paired food samples including presence (P) and non-presence (NP)
in samples with descriptive terms
Volatile compound Banana Oil Rice Bacon B+BN B+O B+R Descriptive terms
isoamyl butanoate P P P P P P P fruity, banana
isoamyl valerate P P P P P P P fruity, apple
hexyl isovalerate P NP NP NP P P P sweet, fruity, apple
isobutyl 3-methylbutanoate P P P P P P P
isoamyl isovalerate P P P NP P P P sweet, fruity, apple
isoamyl butyrate P NP NP NP P P P fruity, banana
butyl butanoate P P P P P P P fruity, pineapple
butyl pentanoate P NP NP NP P P P sweet, fruity, apple
butyl propanoate P P P P P P P earthy, sweet
ethyl butanoate P P P P P P P fruity, pineapple
ethyl hexanoate P P P P P P NP sweet, fruity, banana
hexyl butanoate P P P P P P P fruity, pineapple
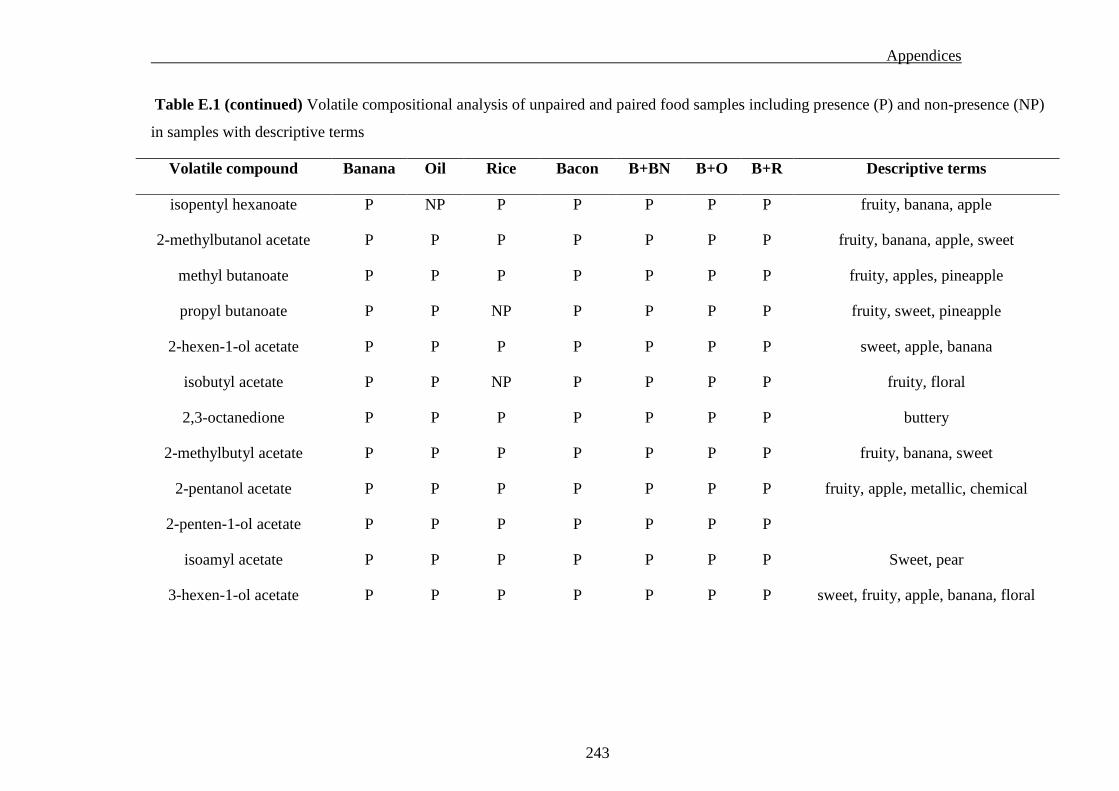
Appendices
243
Table E.1 (continued) Volatile compositional analysis of unpaired and paired food samples including presence (P) and non-presence (NP)
in samples with descriptive terms
Volatile compound Banana Oil Rice Bacon B+BN B+O B+R Descriptive terms
isopentyl hexanoate P NP P P P P P fruity, banana, apple
2-methylbutanol acetate P P P P P P P fruity, banana, apple, sweet
methyl butanoate P P P P P P P fruity, apples, pineapple
propyl butanoate P P NP P P P P fruity, sweet, pineapple
2-hexen-1-ol acetate P P P P P P P sweet, apple, banana
isobutyl acetate P P NP P P P P fruity, floral
2,3-octanedione P P P P P P P buttery
2-methylbutyl acetate P P P P P P P fruity, banana, sweet
2-pentanol acetate P P P P P P P fruity, apple, metallic, chemical
2-penten-1-ol acetate P P P P P P P
isoamyl acetate P P P P P P P Sweet, pear
3-hexen-1-ol acetate P P P P P P P sweet, fruity, apple, banana, floral

Appendices
244
Table E.1 (continued) Volatile compositional analysis of unpaired and paired food samples including presence (P) and non-presence (NP)
in samples with descriptive terms
Volatile compound Banana Oil Rice Bacon B+BN B+O B+R Descriptive terms
prenyl acetate P P P P P P P fruity, banana, sweet, floral
3-octen-1-ol acetate P NP NP NP P P P herbal, fruity, oily
4-hexen-1-ol acetate P P NP NP P P P fruity, apple, banana, waxy
4-methyl-2-pentyl acetate P P P P P P P fruity
4-penten-1-yl acetate P P P P P P P fruity
butyl acetate P P P P P P P fruity, banana
ethyl acetate P P P P P P P pear, acetone, fruity, sweet
hexyl acetate P P P P P P P fruity, sweet, fatty, apple
methyl acetate P P NP NP P P P sweet, fruity
pentyl acetate P P NP NP P P P banana, apples
propyl acetate P P NP P P P P fruity, pear
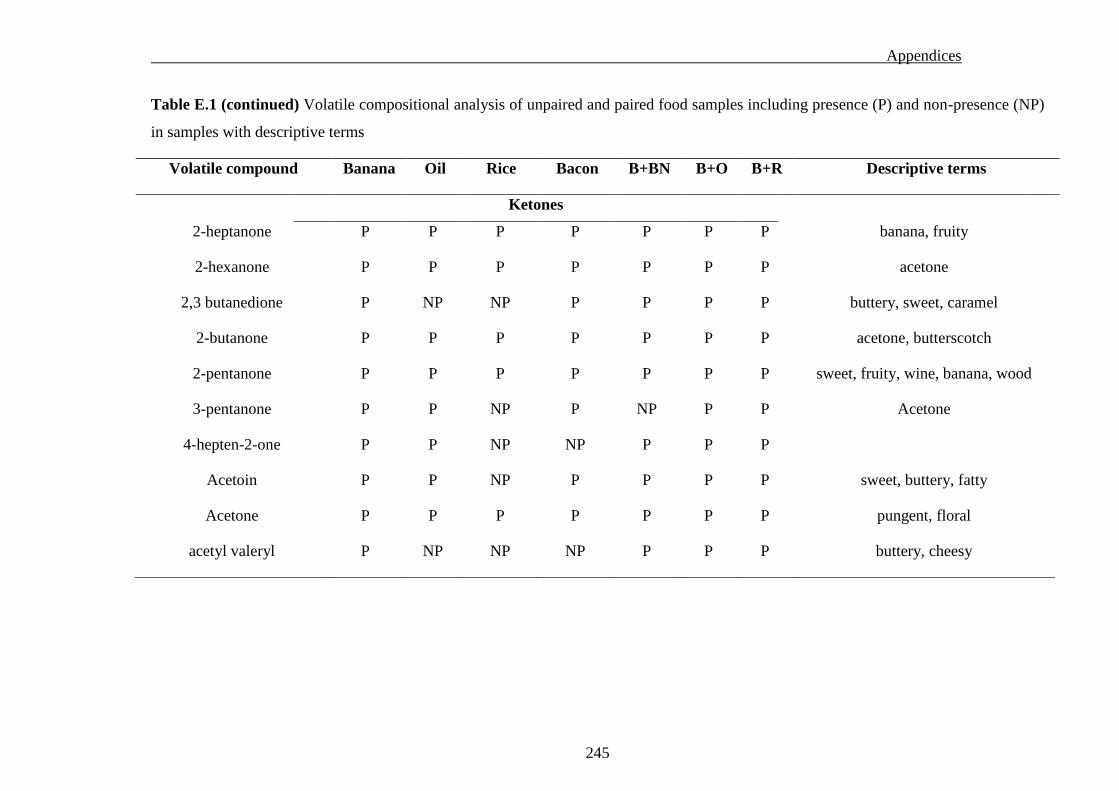
Appendices
245
Table E.1 (continued) Volatile compositional analysis of unpaired and paired food samples including presence (P) and non-presence (NP)
in samples with descriptive terms
Volatile compound Banana Oil Rice Bacon B+BN B+O B+R Descriptive terms
Ketones
2-heptanone P P P P P P P banana, fruity
2-hexanone P P P P P P P acetone
2,3 butanedione P NP NP P P P P buttery, sweet, caramel
2-butanone P P P P P P P acetone, butterscotch
2-pentanone P P P P P P P sweet, fruity, wine, banana, wood
3-pentanone P P NP P NP P P Acetone
4-hepten-2-one P P NP NP P P P
Acetoin P P NP P P P P sweet, buttery, fatty
Acetone P P P P P P P pungent, floral
acetyl valeryl P NP NP NP P P P buttery, cheesy
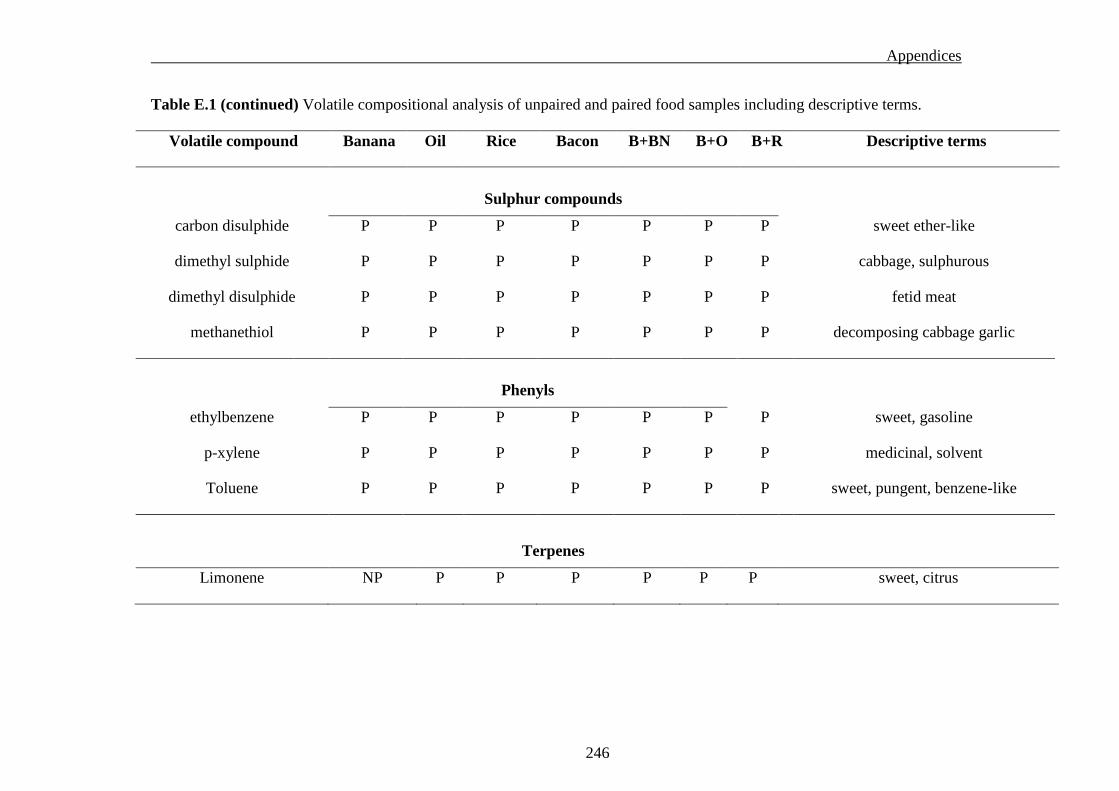
Appendices
246
Table E.1 (continued) Volatile compositional analysis of unpaired and paired food samples including descriptive terms.
Volatile compound Banana Oil Rice Bacon B+BN B+O B+R Descriptive terms
Sulphur compounds
carbon disulphide P P P P P P P sweet ether-like
dimethyl sulphide P P P P P P P cabbage, sulphurous
dimethyl disulphide P P P P P P P fetid meat
methanethiol P P P P P P P decomposing cabbage garlic
Phenyls
ethylbenzene P P P P P P P sweet, gasoline
p-xylene P P P P P P P medicinal, solvent
Toluene P P P P P P P sweet, pungent, benzene-like
Terpenes
Limonene NP P P P P P P sweet, citrus
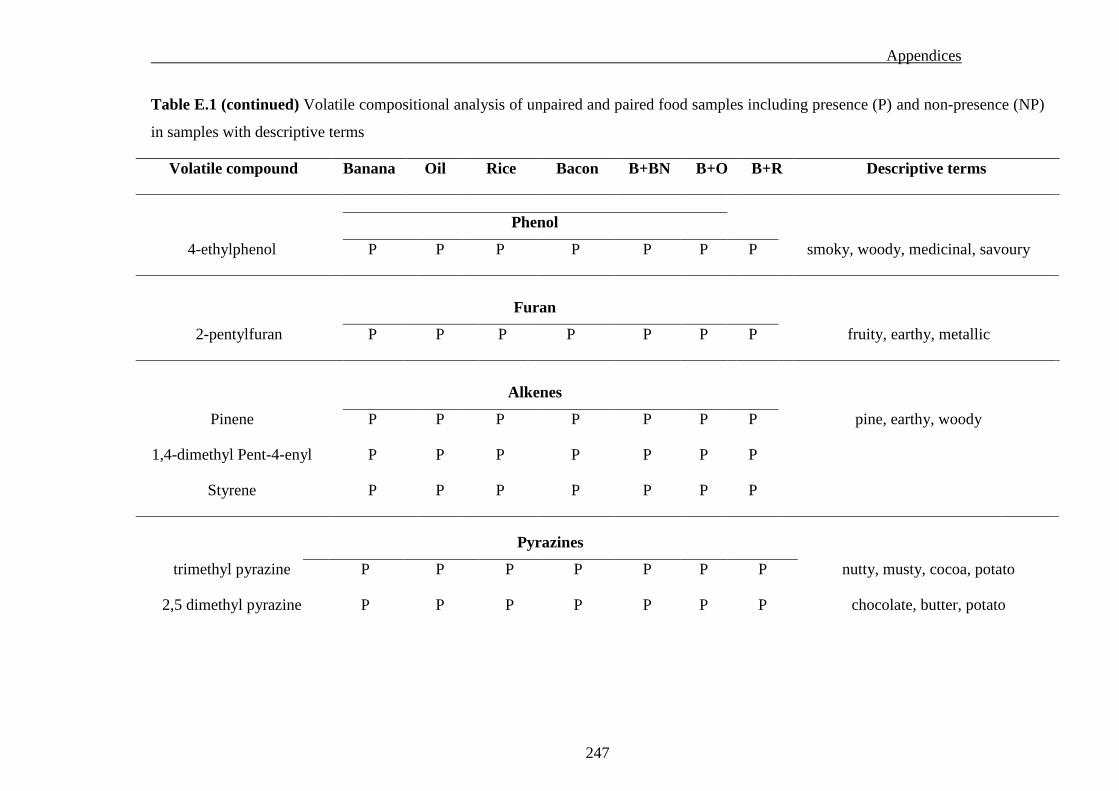
Appendices
247
Table E.1 (continued) Volatile compositional analysis of unpaired and paired food samples including presence (P) and non-presence (NP)
in samples with descriptive terms
Volatile compound Banana Oil Rice Bacon B+BN B+O B+R Descriptive terms
Phenol
4-ethylphenol P P P P P P P smoky, woody, medicinal, savoury
Furan
2-pentylfuran P P P P P P P fruity, earthy, metallic
Alkenes
Pinene P P P P P P P pine, earthy, woody
1,4-dimethyl Pent-4-enyl P P P P P P P
Styrene P P P P P P P
Pyrazines
trimethyl pyrazine P P P P P P P nutty, musty, cocoa, potato
2,5 dimethyl pyrazine P P P P P P P chocolate, butter, potato

Appendices
248
Table E.1 (continued) Volatile compositional analysis of unpaired and paired food samples including presence (P) and non-presence (NP)
in samples with descriptive terms
Volatile compound Banana Oil Rice Bacon B+BN B+O B+R Descriptive terms
Carboxylic acids
acetic acid P P P P P P P pungent, vinegar
hexanoic acid P P P P P P P fatty, cheesy, waxy
P: compound present in sample.
NP: compound not present in sample.

Appendices
249
Appendix F
List of publications and conference
presentations
Appendices
250
List of publications
Traynor, M., Burke, R., Frías, J., Gaston, E. & Barry-Ryan, C. (2013). Formation and
stability of an oil in water emulsion containing lecithin, xanthan gum and sunflower oil.
International Food Research. (Accepted for publication June 2013).
Traynor, M., Burke, R, O' Sullivan, M., Hannon, J. & Barry-Ryan. C. (2013). Sensory and
chemical interactions of food pairings (basmati rice, bacon and extra virgin olive oil) with
banana. Food Research International. 54 (1). 569-577.
Traynor, M., Burke, R., Brunton, N. & Barry-Ryan, C. (2012) Response surface methodology
guided release of two acetate volatiles from an oil-in-water emulsion. Journal of Culinary
Science & Technology. 10 (3). 223-238.
Burke, R., Danaher, P. & Traynor, M. (2012). The development of molecular gastronomy as
a subject discipline at the Dublin Institute of Technology. Dublin Gastronomy Symposium
2012. Dublin. 05/07/2012.
Valverde, J., Burke, R., & Traynor, M. (2011). Molecular gastronomy in Ireland. Journal of
Culinary Science and Technology. 9 (4). 205-211.

Appendices
251
Conference presentations
Traynor, M., Burke, R. & Barry-Ryan, C. (2013). Development of novel flavoured ice
creams: The who and why of consumer acceptability. Annual Research Chefs Conference.
Charlotte. NC. USA. March 6-9, 2013.
Burke, R., Danaher, P. & Traynor, M. (2012). The development of molecular gastronomy as
a subject discipline at Dublin Institute of Technology. Dublin Gastronomy Symposium 2012.
Dublin. June 5-6, 2012.
Traynor, M., Burke, R., Brunton, N. & Barry-Ryan, C. (2011). Effect of Salt Concentration
and pH on the release of two banana volatiles from a model emulsion system. Annual
Research Chefs Conference. San Antonio. TX. USA. March 20-23, 2012.
Traynor, M., Burke, R., Frías, J., Gaston, E. & Barry-Ryan. (2011). Influence of soy lecithin,
xanthan gum and sunflower oil concentrations on the formation and stability of an oil-in-
water emulsion. Annual Research Chefs Conference. Atlanta. GA. USA. March 6-9, 2011.