Standard Republican French and French Nationalism: "Une et Indivisible"
Upload
independentCategory
view
3download
0
GENESADRESINSEE / GENES
The Commercial Success of Innovations: An Econometric Analysis at the Firm Level in FrenchManufacturingAuthor(s): Corinne Barlet, Emmanuel Duguet, David Encaoua and Jacqueline PradelSource: Annales d'Économie et de Statistique, No. 49/50, Économie et Économétrie del'innovation / The Economics and Econometrics of Innovation (Jan. - Jun., 1998), pp. 457-478Published by: GENES on behalf of ADRESStable URL: http://www.jstor.org/stable/20076125 .
Accessed: 09/11/2014 05:27
Your use of the JSTOR archive indicates your acceptance of the Terms & Conditions of Use, available at .http://www.jstor.org/page/info/about/policies/terms.jsp
.JSTOR is a not-for-profit service that helps scholars, researchers, and students discover, use, and build upon a wide range ofcontent in a trusted digital archive. We use information technology and tools to increase productivity and facilitate new formsof scholarship. For more information about JSTOR, please contact [email protected].
.
GENES, ADRES, INSEE / GENES are collaborating with JSTOR to digitize, preserve and extend access toAnnales d'Économie et de Statistique.
http://www.jstor.org
This content downloaded from 193.54.110.35 on Sun, 9 Nov 2014 05:27:58 AMAll use subject to JSTOR Terms and Conditions
ANNALES DECONOMIE ET DE STATISTIQUE. - No 49/50 - 1998
The Commercial
Success of Innovations:
an Econometric Analysis
at the Firm Level
in French Manufacturing Corinne BARLET, Emmanuel DUGUET, David ENCAOUA, Jacqueline PRADEL*
ABSTRACT. - This paper offers some empirical evidence on how do product and process innovations affect manufacturing sales and exports. Accounting for differences in technological
opportunities between industries, and the "market pull" or "technology push" nature of firms' innovations, we explain the share of new products in total sales and exports by the innovation types firms have implemented. The data come from the French Ministry of Industry's Innovation survey 1986-1990. The left-hand variables are the sales revenues and the export revenues of the firms that are attributable to products introduced within the last 5 years. Given that the survey reports only interval data, our estimates were obtained by maximum likelihood on the ordered probit model. The following results are obtained: (i) The contribution of products less than 5 years old is lower to overall exports than to total sales but the innovative content is stronger in exports than in domestic sales; (ii) The greater the underlying technological opportunities, the less successful are product imitations; (iii) Both domestic sales and exports are mostly made of product improvements; (iv) Firm size has a positive effect on innovation output only when the technological opportunity is strong.
De quoi depend le succes commercial des innovations? Une analyse econometrique sur donnees d'entreprises
RESUME. - Cet article se propose de r6pondre sur le plan empirique a la question suivante: Comment les innovations de produits et de procedes affectent-elles les ventes et les exportations de l'industrie manufacturibre ? En tenant compte des differences sectorielles en termes d'opportunit6s technologiques et des differences entre entreprises selon que leurs innovations sont induites par le marche ou par la technologie, nous expliquons la part des ventes et des exportations en
produits innovants par les diff6rents types d'innovations que les entreprises ont mis en ceuvre. Les donnees proviennent de l'Enquete Innovation realisee par le Ministere de l'Industrie sur la p6riode 1986-1990. Les variables expliquees, la part des ventes et des exportations en produits de
moins de cinq ans sont disponibles dans cette enquete sous forme qualitative. L'utilisation de ce type de variable expliquee n6cessite la mise en oeuvre de methodes econom6triques specifiques. Les estimations, par le maximum de vraisemblance, d'un modele probit polytomique ordonne nous permettent de parvenir aux conclusions suivantes: (i) La part des produits de moins de cinq ans est plus faible dans les ventes a l'exportations que dans les ventes totales mais le contenu de ces produits est plus novateur; (ii) plus les opportunites d'innovation technologique d'un secteur sont elev6es, moins les entreprises ont la possibilit6 de recourir a l'imitation; (iii) I'amelioration de produit, innovation intermediaire entre l'imitation et la mise sur le marche d'un produit nouveau, joue de maniere gen6rale un r6le dominant dans les ventes et les exportations; (iv) la taille des entreprises n'affecte positivement l'innovation que dans les activites de haute technologie.
* C. BARLET: CEME-Universite de Paris 1, CRESE-Universit6 de Besan,on; E. DUGUET: CEME-Universit6 de Paris 1, INSEE-DMSE. D. ENCAOUA et J. PRADEL: CEME-Universit6 de Paris 1.
We thank W. J. ADAMS, B. H. HALL, N. IUNG, F. LAISNEY, F. MELESE and two anonymous referees for helpful suggestions and comments as well as the participants at the Xth
ADRES Conference on the Economics and Econometrics of Innovation (Strasbourg, June 1996) and at the XlVth Journ6es de Micro6conomie Appliqu6e (Marrakech,
May 1997). The usual disclaimer applies.
This content downloaded from 193.54.110.35 on Sun, 9 Nov 2014 05:27:58 AMAll use subject to JSTOR Terms and Conditions

1 Introduction
Economic effects of innovation are often appraised in the context of labor or total factor productivity (GRILICHES, [1986]; HALL and MAIRESSE, [1995]). This permits the evaluation of the impact of innovation on productive efficiency, but it ignores the degree to which an innovation is received favorably in the marketplace. Yet, commercial success is a crucial aspect of product innovations. Potential innovators often face considerable product market risk as they make their R&D decisions. In fact, it is precisely
the existence of product market risk that distinguishes product innovation from product invention. Such risk explains why product innovators seek linkages with potential customers well before their innovations are ready for market. The success of an innovator's R&D project depends heavily on acceptance in the marketplace. In the case of a firm that produces a large number of products, introduced at various points in time, the commercial success of these innovations can be measured in terms of the sales revenue of the firm that is attributable to products introduced relatively recently -
say, within the last five years. We shall refer to this measure, defined as
a fraction of total revenue, as the new product ratio (NPR) of the firm.
Although business enterprises attach a great deal of importance to NPR, it
has received little attention in the applied econometric literature given the
relative scarcity of data. The purpose of this paper is to study the determinants of commercial
success of various product innovation strategies using NPR as the measure
of commercial success. It is important to know why firms differ in the
commercial success they derive from their innovations. On the one hand, such an understanding reveals the compatibility of research incentives and
market performance. It reveals how the ex ante market risk of product innovation gets resolved after innovation occurs. On the other hand, NPR
is a unique feature of business enterprises. At any given moment, each firm
offers a variety of products for sale, each one conceived and introduced in a different period. NPR can be interpreted as a measure of the firm's ability to replenish its stock of products. The larger NPR, the greater the degree to which the firm has replenished its stock of products, and the lower the
average age of its products.
The first question of interest is whether different types of innovation enjoy different degrees of commercial success. Innovations can be distinguished on the basis of their degree of novelty. Novelty is a concept difficult to define precisely, but the intuition behind it is quickly understood by
exploring some of its properties. To begin with, the degree of novelty is an
ordinal concept, implying a value judgment on the degree of novelty of the
innovation. Second, this judgment might differ depending on whether one's
point of view is that of the innovator or that of the marketplace. Let us
examine three types of product innovations, ranked in order of increasing
novelty from the consumer's point of view.
First, a firm can launch a product that is new for the firm but not for
the market. In other words the firm can launch a product that has close
458
This content downloaded from 193.54.110.35 on Sun, 9 Nov 2014 05:27:58 AMAll use subject to JSTOR Terms and Conditions

substitutes already offered by other firms. For example, a pharmaceutical firm might introduce a new antihistamine. The firm is seeking to broaden
its product line to include antihistamines, but very similar antihistamines are already offered by other pharmaceutical companies.
Second, a firm can launch a product that represents considerably higher quality than other versions of the product that already exist in the
marketplace. The other versions of the product might be those of the
firm itself. Returning to the example presented in the previous paragraph, a
pharmaceutical company might introduce a new antihistamine that represents considerable therapeutic improvement over the other antihistamines already offered by the firm. From the firm's perspective, such an innovation might be considered a product improvement; from the market's perspective, it
might be considered a real novelty.
Third, a firm can launch a product that is new both for the firm and for
the market. This is the most novel of all new products.
This categorization of new products can also be used in the context of
new methods of production. Some new methods represent improvements on existing methods. Others embody greater novelty such as a technological breakthrough in production methods.
With these categories in mind, the first goal of the paper is to explore the effects of product novelty on the degree of commercial success. A priori, one can imagine two distinct and opposite effects. The first, which one
might call the inertia effect, suggests that the greater the novelty the greater the risk. The market's acceptance of novel products will occur only very gradually over time. The second effect, which one might call the efficiency effect, suggests that novelty is valued, at least to the extent to which it
responds to market demand. Knowledge of how these two effects balance out in practice will improve our understanding of innovative strategy.
One can also evaluate the effects of innovations on commercial success
using other schemes of categorization. These include whether the innovation is product or process in nature, and whether the innovation is market- or
knowledge- driven (demand- pull or technology push in nature, SCHMOOKLER [1966]).
The effect of different types of innovation on commercial performance likely depends on the specific economic environment facing the firm. For example, underlying technological opportunities differ among industries. Technological opportunity is another concept that is difficult to define precisely but easy to describe intuitively. Technological opportunity of an industry relates to its innovative potential. The innovative potential of an industry depends on the stock of, and rate of change of the corresponding scientific base. It also depends on the level and rate of change of the demand for differentiated products embodied in the demand function.
Here we study the effect of novelty on commercial performance while
controlling for technological opportunity. If the inertia effect prevails when there are little technological opportunities, while the efficiency effect prevails
when there are abundant technological opportunities, then novelty is likely to reduce commercial performance in the former case and increase it in the latter.
THE COMMERCIAL SUCCESS OF INNOVATIONS 459
This content downloaded from 193.54.110.35 on Sun, 9 Nov 2014 05:27:58 AMAll use subject to JSTOR Terms and Conditions

Until now, commercial success has been defined in terms of NPR - the value of new products as a fraction of total sales. But total sales include both domestic and foreign sales. It may well be that the determinants of commercial success differ between the two markets. Foreign markets can either be more or less receptive to novelty than their domestic counterpart. If the domestic market is the more receptive to novelty, one would expect the firm to concentrate sales of its newest products at home. If this is the case, then the existence of a domestic market ready to absorb new products could be a crucial prerequisite to high levels of export performance.
To study these questions we use the Innovation Survey in French manufacturing firms that covers the period 1986-1990. Most of the data in the survey are available only in ordinal form. For example, NPR is not
measured continuously in the interval [0,1]; rather, the interval is divided arbitrarily into several sub- intervals, and each firm is then assigned to answer
in one of those sub- intervals. As a result, it is necessary to use ordered
probit methods, applied to transforms of the primitive ordinal variables.
The article is organized as follows: section 2 describes the dataset and the economic specification of the model. Section 3 descri-bes the estimation procedure. Section 4 presents the empirical results regarding the determinants of NPR. Section 5 presents the empirical results regarding the determinants of export NPR. Conclusions appear in section 6.
2 Types of Innovation, Technological Opportunities and the New Product Ratio
2.1. Sources, Data and Variables Definitions
The main variables used in this paper come from the Innovation Survey,
gathered by the French Ministry of Industry in 1991. The survey consists of
a qualitative questionnaire on the different types of innovation implemented by manufacturing firms in France over the period 1986- 90. Unf6rtunately, no yearly information was collected for the period.
The first question focused on the different types of product and process
innovations introduced by firms over the five-year period from January 1986 to December 1990. Product and process innovations are distinguished according to their degree of novelty. Each firm was asked to answer the
following three questions with a "yes" or a "no":
During the last five years, has the firm:
- substantially improved, from a technological viewpoint, on existing products?
("yes" or "no")
460
This content downloaded from 193.54.110.35 on Sun, 9 Nov 2014 05:27:58 AMAll use subject to JSTOR Terms and Conditions

- launched new products embodying technological innovations (excluding packaging) that were:
- new for the firm but not for the market? ("yes" or "no")
- new for the firm and for the market? ("yes" or "no")
Two additional questions are related to the process innovation types which occurred during the same five-year period:
- has the firm implemented a technological breakthrough? ("yes" or "no") - has the firm substantially improved, from a technological viewpoint, on existing production methods? ("yes" or "no")
Thus, five innovation types are introduced in the analysis. From the market point of view, the degree of novelty allows a ranking of product innovations from products new for the firm and for the market, followed by products substantially improved and products which are new for the firm but not for the market.
The other questions are related to "market pull", "technology push" and the innovative potential of the firm's activity. At the firm level, market pull and technology push variables are provided through the answers to the following questions:
Does your firm estimate that innovation is determined by: - market impetus (relationships with customers, competitors) ("no", "weakly", "moderately" or "strongly")
- the own dynamics of technology ("no ", "weakly ", "moderately" or "strongly")
The question regarding the innovative potential of the firm's activity, which Dasgupta (1986) calls "technological opportunity" of the industry is:
Do you consider that your activity is technologically: - not innovative - weakly innovative - moderately innovative - strongly innovative
The technological opportunities for undertaking innovations are clearly linked to advances in basic scientific knowledge. ROSENBERG [1974] has emphasized the importance of progress in the underlying scientific base for facilitating innovative possibilities. We have grouped the first two levels of responses (" no " and " weakly ") so that we classify firms into three categories '.
Our dependent variable is the New Product Ratio (NPR). In the Innovation survey, it is a categorical variable, given into four classes: 0-10%, 10-30%, 30-70% and 70-100%. NPR is defined as the share of sales revenues attributable to product innovations introduced within the last five years.
1. This question is an assessment of the technological opportunities of the activity of the firm, not of the firm itself. Indeed, the questionnaire includes two questions about technological opportunities: one on the activity of the firm and one on the firm itself. Since our innovation variables already assess the innovation level of the firm, we have kept the environment variable
only.
THE COMMERCIAL SUCCESS OF INNOVATIONS 461
This content downloaded from 193.54.110.35 on Sun, 9 Nov 2014 05:27:58 AMAll use subject to JSTOR Terms and Conditions

2.2. Description of the Sample and Preliminary Evi dence
In order to assess the importance of NPR we have selected the responses of
firms which were product innovators. Moreover, as the whole questionnaire is related to the 5-year period 1986-1990, we have kept the firms that were
present in the same period. After these two selections, our sample includes 5402 manufacturing firms.
The median firm in the sample is relatively small with sales of
FRF 43 millions 2 in 1989 (table 1). However, since the mean is much
higher than the median (293 millions of FRF), the distribution of firm size in the sample is skewed. Moreover, the median and average firm sizes
vary according to innovation types. The largest firms have implemented the
most innovative products and processes. For instance, firms that claim to have implemented a technological breakthrough have median sales of 60 FRF millions and average sales of 600 FRF millions. A difference of the
same order of magnitude exists between firms that launched new products in the market and those that didn't. As a result, we have to control for
differences in firm size when we estimate the model. Since similar data
exists for industries, along with our measure of firm size, we include 18
industry dummies in each of our regressions.
The first table shows the distribution of the New Product Ratio for total
sales. Firms that have implemented process breakthroughs or launched new
products appear to have a higher NPR. But since they also have a different
size and operate in different industries, only a regression that controls for
these two effects can tell us if these innovation types explain the success
of innovation in the marketplace.
The second part of table 1 shows the marginal and conditional frequencies for each innovation type. These frequencies are similar to the correlation
analysis for qualitative data (although the frequencies are not symmetric). More common innovations tend to be less innovative, which is not surprising. More interesting is the finding that the introduction of the most novel
innovations - either product or process - are strongly correlated. But the
relation is not symmetric: while 43% of the firms that launched a new
product on the market also implemented a process breakthrough, 75% of
process breakthrough firms also launched a new product on the market.
These results suggest that it is harder to change a process without changing
the product than to change the product while improving on the production
process. Globally, the data exhibit imperfect correlations between product and process innovations. This explains why we introduce both product and
process innovations in our model when explaining the commercial success
of product innovations. A more innovative process may contribute to the
success of a new product by, say, lowering its price or allowing for stronger scale economies. It may also be the only way to produce the new good.
2. About 8.6 USD millions (1 USD 5 FRF).
462
This content downloaded from 193.54.110.35 on Sun, 9 Nov 2014 05:27:58 AMAll use subject to JSTOR Terms and Conditions
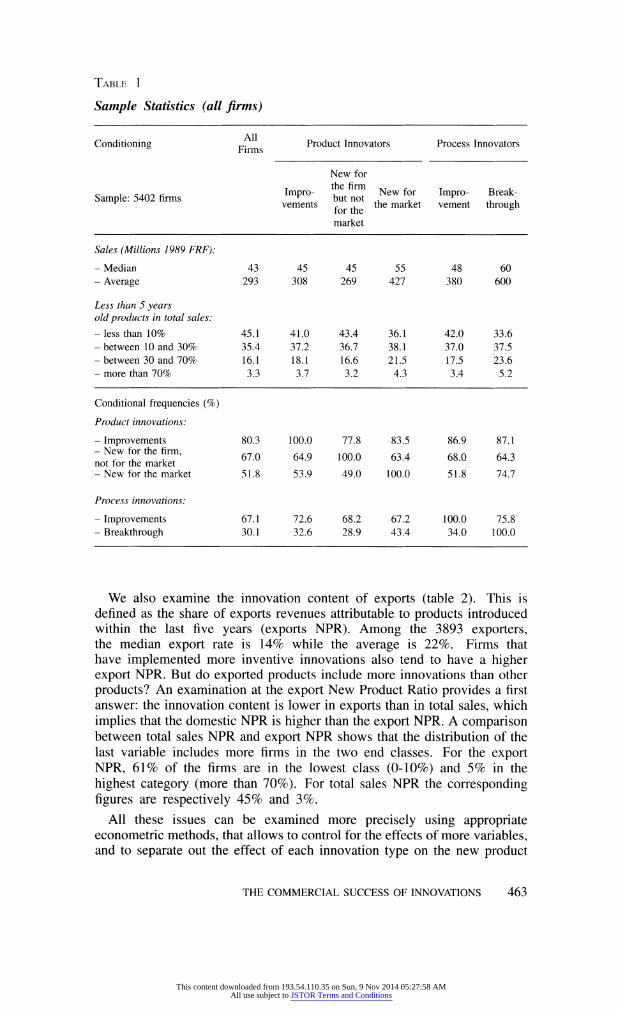
TABLE 1
Sample Statistics (all firms)
Conditioning FAlls Product Innovators Process Innovators
New for
Impro- the firm
New for Impro- Break Sample: 5402 firms mpo but notNefo Imr- Bak vements for the the market vement through
market
Sales (Millions 1989 FRF):
- Median 43 45 45 55 48 60 - Average 293 308 269 427 380 600
Less than 5 years
old products in total sales:
- less than 10% 45.1 41.0 43.4 36.1 42.0 33.6 - between 10 and 30% 35.4 37.2 36.7 38.1 37.0 37.5 - between 30 and 70% 16.1 18.1 16.6 21.5 17.5 23.6 - more than 70% 3.3 3.7 3.2 4.3 3.4 5.2
Conditional frequencies (%)
Product innovations:
- Improvements 80.3 100.0 77.8 83.5 86.9 87.1 - New for the firm, 67.0 64.9 100.0 63.4 68.0 64.3 not for the market - New for the market 51.8 53.9 49.0 100.0 51.8 74.7
Process innovations:
- Improvements 67.1 72.6 68.2 67.2 100.0 75.8 - Breakthrough 30.1 32.6 28.9 43.4 34.0 100.0
We also examine the innovation content of exports (table 2). This is defined as the share of exports revenues attributable to products introduced within the last five years (exports NPR). Among the 3893 exporters, the median export rate is 14% while the average is 22%. Firms that have implemented more inventive innovations also tend to have a higher export NPR. But do exported products include more innovations than other products? An examination at the export New Product Ratio provides a first answer: the innovation content is lower in exports than in total sales, which
implies that the domestic NPR is higher than the export NPR. A comparison between total sales NPR and export NPR shows that the distribution of the last variable includes more firms in the two end classes. For the export
NPR, 61% of the firms are in the lowest class (0-10%) and 5% in the
highest category (more than 70%). For total sales NPR the corresponding
figures are respectively 45% and 3%.
All these issues can be examined more precisely using appropriate econometric methods, that allows to control for the effects of more variables, and to separate out the effect of each innovation type on the new product
THE COMMERCIAL SUCCESS OF INNOVATIONS 463
This content downloaded from 193.54.110.35 on Sun, 9 Nov 2014 05:27:58 AMAll use subject to JSTOR Terms and Conditions

TABLE 2
Sample Statistics (exporters)
Conditioning Exporter Product Innovators Process Innovators
New for
Impro- the firm
New for Impro- Break Sample: 3893 exporters vmpro but not Ne for Impro Break vements for the the market vement through
market
Exports (Millions 1989 FRF)
- Median 9 9 9 12 10 14 - Average 137 143 120 197 179 213
Export rate (%):
- Median 14.4 15.2 14.3 16.1 15.1 17.7 - Average 22.0 20.9 20.5 23.5 22.6 25.3
Less than 5 years
old products in exports:
- less than 10% 60.9 57.6 59.6 53.9 58.9 49.2 - between 10 and 30% 21.4 22.8 22.7 23.5 22.8 25.5 - between 30 and 70% 12.9 14.2 13.1 16.3 13.4 17.5 - more than 70% 4.8 5.4 4.6 6.3 4.9 7.8
Conditional frequencies (%)
Product innovations:
- Improvements 81.6 100.0 79.9 84.3 87.9 87.1 - New for the firm, 67.8 66.4 100.0 64.5 64.6 69.2 not for the market - New for the market 55.9 57.8 53.3 100.0 76.5 55.5
Process innovations:
- Improvements 68.4 73.0 69.8 67.9 100.0 36.1 - Breakthrough 32.2 34.7 30.7 44.0 76.7 100.0
ratio (NPR). The next section presents the estimation method applied. The following sections present the results.
3 An Econometric Model of Commer cial Success of Innovations
In this section we construct an empirical model of NPR which attempts
to unravel the relative importance of the different variables presented above
and their specific effect on the commercial success of innovations.
464
This content downloaded from 193.54.110.35 on Sun, 9 Nov 2014 05:27:58 AMAll use subject to JSTOR Terms and Conditions

3.1. The Model
The left hand variable is the NPR in 1990 (f). In order to insure that
this proportion lies between 0 and 1, we set:
exp (xib + u-)
l + exp (x-b + vi) z 1
where xi is the vector of explanatory variables for firm i, b is the
corresponding vector of coefficients, uv a disturbance that summarizes unobserved firm-level heterogeneity and n the number of firms. The logistic form of the NPR is not a distributional assumption but a mere functional
form assumption. The logistic function assumed is strictly increasing, so that a positive coefficient for b implies a positive effect of the corresponding variable on the ratio. The explanatory variables xi are:
1) size, measured by the logarithm of total sales in 1989 in the total sales
NPR model, or by the logarithm of exports in 1989 in the export NPR model.
2) firm level dummies indicating the implementation of the 5 innovation
types over 1986-1990.
3) firm level dummies indicating the importance of the "demand pull"
and "technology push" (3 levels for each variable).
4) 18 industry dummies.
In order to avoid perfect multicolinearity, we drop the lowest level of the "demand pull" and "technology push" dummies. Since the dependent variable ,o* is only reported with intervals, a discussion of the econometric
method applied is provided.
3.2. Estimation
Our model can also be written in the form:
i ln-1 = xib + vi, i 1,., n
This transformed model is linear, hence the estimation problem comes from the fact that we do not observe W but only the interval it lies in, namely
10,0.1], ]0.1,0.3], ]0.3,0.7] or ]0.7,1]. Therefore, some knowledge of the distribution of the disturbances is needed. We assume that the disturbances are independently and identically normally distributed:
vi i.i.d. N(0, U2)1 i= J, ***, n
We do not observe p* but the qualitative variable pi:
I 1 if aO < p* < a,
| 2 if a, < pi < a2
;3 if a2 < Pi* < a3
t 4 if a3 < Pi < a4
THE COMMERCIAL SUCCESS OF INNOVATIONS 465
This content downloaded from 193.54.110.35 on Sun, 9 Nov 2014 05:27:58 AMAll use subject to JSTOR Terms and Conditions

with ao = {-oc}, a, lnO.1/0.9, a2 = lnO.3/0.7, a3 = lnO.7/0.3 and
a4 { {+oo}. The log-likelihood of the sample comes directly from the underlying model and is given by:
n 4
lnL(pjx; b, 2) = diklnPr [pi k]
i=l k=1
with
, if Pi = k dik- otherwise == 1, , n, k = 1, 2,3,4
Pr [Pi = k] = Pr [ak-l <P* < ak] = Pr [ak-l < xib + ui < ak]
= Pr[ i<ak xib U< ak -xib] au 07u 0.u
= ___[ak -
Xib_ 1ak -
x-b]
where ID is the cdf of the standard normal 3 distribution. Notice that, when the thresholds are known, the standard error of the disturbances au
is identified. We estimate this model by maximum likelihood under SAS IML 4. Two goodness-of-fit measures are provided: the Mc Fadden Rf2 and the Rf2 of the underlying linear model (denoted R2), defined here as:
R 2 - Ve(fi*)
Ve (R)+ `2
where au is the maximum likelihood estimate of au, and Ve denotes the 5 empirical variance
3.3. Direct Impact of Each Innovation Type
The relationship between the innovation ratio fo* and the explanatory
variables xi is not linear (because of the logistic transformation) so that
we need to evaluate the impact of each innovation type, firm by firm. We
proceed as follows: let ISi be a dummy equal to 1 if firm i implemented
3. Taking the limits, we obtain the specific cases:
Pr [pi 1] 4 [(a, - xb)la,] and Pr [pi 4] - 1- [(a3 - x b) la,
4. We make the parameter change h = 11/a, and 13 = b/lu so that the log-likelihood is concave in
h and : (MADDALA, 1992). We use a Newton-Raphson algorithm with the analytical Hessian,
which is used to estimate the covariance matrix of the parameters. The original parameters
and their covariance are calculated from Slutsky's theorem once the maximum is reached. The
estimation program we use is a slight extension of %PROBITO, a SAS-IML macro command
presented in a previous working paper (CREPON and DUGUET, 1995).
5. For a discussion of these measures and other goodness-of -fit measures, see the survey by
WINDMEIJER [1995].
466
This content downloaded from 193.54.110.35 on Sun, 9 Nov 2014 05:27:58 AMAll use subject to JSTOR Terms and Conditions

a type s innovation (s 1, 5). The firm's transformed NPR can be
written:
p*=ln1 - , zc + dsIs- + ui, i = 1,
n,
where zi includes all the explanatory variables except 1si. The predicted innovation ratio of firm i when it implements a type s innovation is thus
(Ii= 1):
X exp (zjC + ds)
1+ exp (z-FC+ ds)
If the same firm had not implemented a type s innovation (si = 0), its
innovation ratio would be equal to:
* _ exp (ZiF) 1 + exp (Z-F)
Hence the direct impact of a type s innovation on the innovation ratio of
firm i (everything else equal) is given by:
A/\ *s -=(ps - )is
We compute these quantities for all the firms which have implemented the type s innovation and report the distribution of the direct impacts A`5.
Notice that if the innovation coefficient ds is positive, the direct impact is also positive since *s is strictly increasing with d5.
4 The Results
4.1. Total Sales Innovation Ratio
The estimations are presented in table 3. The first column presents the model estimated from all the observations. The first finding, consistent with
the previous empirical literature on innovation (COHEN and LEVIN, [1989]) is
that industry effects are always significant. Once these effects are controlled
for, we find a size effect that suggests larger firms may have a commercial
advantage in getting their innovations to the market.
Once sector and size differences are controlled for, we find that all
the innovation types contribute to the NPR, except process improvements. The strongest innovation coefficient is for product improvements, but the other innovation types still have a significant effect. We uncover some
other interesting results. One of the reasons why the industry dummies
have been introduced in the regression is that firms may face different
demand conditions and are confronted with different technological bases. The Innovation survey provides proxies for these variables at the firm level, so that we can test whether the industry dummies fully control for these
effects or not.
THE COMMERCIAL SUCCESS OF INNOVATIONS 467
This content downloaded from 193.54.110.35 on Sun, 9 Nov 2014 05:27:58 AMAll use subject to JSTOR Terms and Conditions

More precisely we use three new indicators. The first one, "market pull", indicates whether the innovation arose from a demand impetus and/or from rivalry. The second indicator, "technology push", is related to the importance of the dynamics of technology as a determinant of innovation.
The last indicator, "technological opportunities", reveals whether the firm considers itself to belong to a weakly, a moderately or a strongly innovative activity. The first two indicators are often used at the industry level in previous empirical studies (COHEN and LEVIN, [1989]). However, until now no such measures were available at the firm level. The third indicator is
different. Although the market pull and technology push indicators refer to the nature of the determinants of a firm's innovations, the technological opportunities variable is not a characteristic of the firm but rather of its level of activity. This activity is not identical to the industry. Since the firm answers directly to the question, the activity is closer to the relevant
market definition than the industry to which the firm belongs. Then, we
can examine whether the decomposition in 18 industries 6 is enough to
summarize the sectoral variations in innovation commercial successes or not. We find that they are not: there remains a significant heterogeneity among firms inside the same industry.
TABLE 3
Sales from Innovations.
Left-hand variable: percentage of less than 5 years old products in total sales 1990
Transformation: in [p(l - ()] 18 industry dummies are included in all the regressions
Maximum likelihood estimates on the ordered probit model
(asymptotic t statistic between parentheses)
Firm level innovation Opportunities: All All Weak Moderate Strong Estimates: (1) (2) (3) (4) (5)
Sales logarithm 1989 0.056* 0.066* 0.004 0.046* 0.123* (12.1) (4.0) (0.11) (2.15) (3.57)
Product innovation (dummies):
- Improvement of an existing 0.379* 0.500* 0.518* 0.388* 0.003 product (6.67) (9.03) (5.38) (4.94) (0.02) - New for the firm but not 0.133* 0.148* 0.200 0.193* - 0.119
for the market (3.00) (3.27) (2.21) (3.36) (1.11) - New for the market 0.283* 0.410* 0.259* 0.311* 0.263*
(6.33) (9.03) (2.92) (5.47) (2.18)
Process innovation (dummies):
- Improvement of an existing 0.038 0.077 - 0.041 0.120* 0.013 process (0.82) (1.62) (0.47) (1.96) (0.11) -Technological breakthrough 0.178* 0.303* 0.212 0.120* 0.256*
(3.71) (6.25) (1.93) (1.97) (2.47)
6. This industry classification is the French NAP 40.
468
This content downloaded from 193.54.110.35 on Sun, 9 Nov 2014 05:27:58 AMAll use subject to JSTOR Terms and Conditions

TABLE 3 (continued)
Firm level innovation Opportunities: All All Weak Moderate Strong Estimates (1) (2) (3) (4) (5)
Firm-level market pull (dummies):
- Moderate 0.217* 0.241* 0.284* 0.225* 0.038 (3.04) (3.29) (2.19) (2.32) (0.20)
- Strong 0.349* 0.452* 0.501* 0.381* - 0.004 (5.43) (6.88) (4.26) (4.37) (0.03)
Firm-level Technology push (dummies):
- Moderate 0.169* 0.268* 0.139 0.163* 0.273 (3.45) (5.23) (1.48) (2.63) (1.85)
- Strong 0.212* 0.469* 0.084 0.235* 0.207 (3.78) (8.43) (0.66) (3.24) (1.49)
Firm-level innovation opportunities (dummies):
- Moderate 0.559* - - - (10.88)
- Strong 1.146* - - - -
(16.52) 1.314* 1.358* 1.372* 1.231* 1.393* (62.93) (63.06) (27.05) (47.01) (31.60)
Number of firms 5 402 5 402 1 720 2 715 967
Log-likelihood - 5 628.98 - 5 767.74 - 1 436.13 - 2 940.08 - 1 201.79 Test: sectoral dummies a 649.2 669.0 130.6 280.0 123.5 Mc Fadden R2 0.084 0.062 0.036 0.038 0.047 Latent model R2 0.212 0.161 0.092 0.101 0.133
Estimated o (%):
- 1st quartile 7.3 7.9 4.4 10.1 18.2 - Median 11.5 11.5 5.9 13.2 24.0 - 3rd quartile 17.2 16.6 7.8 16.6 31.6
* Significant at the 5% level.
a. The null hypothesis is that the sectoral dummies can be replaced by a constant term. Under
the null the statistic is chi-square distributed with 17 degrees of freedom. The critical value at
the 5% level is 27.6.
The first column clearly shows that there are significant differences between firms in the same industry: in terms of market pull, technology push, but mostly in terms of technological opportunities. The coefficients of the latter indicator are 5 to 6 times higher than the ones of market pull and technology push. This suggests that it is appropriate to run separate regressions on each of the classes defined by the levels of technological opportunity. In fact, the entire relationship depends on firms' technological opportunities 7. This implies that the different innovation types have returns that depend on the technological environment facing the firms.
7. An interesting comparison could be made between this "technological opportunities" variable
and more disaggregated industry classifications, using data analysis.
THE COMMERCIAL SUCCESS OF INNOVATIONS 469
This content downloaded from 193.54.110.35 on Sun, 9 Nov 2014 05:27:58 AMAll use subject to JSTOR Terms and Conditions

Columns 3 to 5 present the separate regressions 8. Since, the size effect 9
increases with technological opportunities (with no significant effect in the lowest class), the largest firms enjoy an advantage when innovations are commercialized in activities characterized by a high level of technological opportunity. We also find remaining (positive) differences stemming from more favorable demand and technology conditions, except in the highest technological opportunity class. The meaning of this last result may be simply that in this class, both market pull and technology push achieve strong levels for a majority of firms. The performance differences are therefore to be found elsewhere, namely in the type of innovations that the firms have implemented.
The effect of innovation types on the NPR vary according to the level of technological opportunities. First, innovation profiles differ between regressions. When we restrict our attention to comparisons between significant coefficients 10, the remaining coefficients are significantly different at the 5% level l.
Second, our results clearly illustrate the effect of what has been classified as "weak", "moderate" and "strong" technological opportunities. We find significant differences in median predicted 12 NPR between these three classes: 6%, 13% and 24%. The median nearly doubles each time one gets in the upper class.
Under weak technological opportunities, the product innovations sold by the firms are mostly improvements on an existing product, followed
by the more innovative products. Process innovations are not significant at the 5% level. As technological opportunities increase, improvements and new products for the market have an equal contribution to innovative
sales, followed by product imitation (that are new for the firm but not
8. We have kept the sectoral dummies in the model since their coefficients always significantly
differ at the 5% level.
9. Size is measured by total sales, since it is the denominator of the innovation ratio.
10. The specification tests are presented in tables 5 (total sales) and 8 (for exports). We first
test the equality of coefficients among different technological opportunity classes. We always
reject the equality of all coefficients at the 5% level. Sometimes, we find that some innovation
coefficients are equal among regressions, but it is often because one of the coefficients is
not significant (with a large standard error). Following a suggestion by a referee, we have
also performed a second test. We examine if our "known threshold" model is compatible
with the standard ordered probit model (with unknown threshold). We find that the separate
regressions nearly always accept this model: the only exception is for the regression of
total sales NPR under moderate technological opportunities. In this last case, however, the
innovation coefficients are not very different from the ones presented here.
11. When a coefficient is not significant, it has a relatively large standard error, so that the equality
test between this coefficient and the other coefficients are often accepted. It is a misleading
result since one of the coefficient is significant while the other is not. This is why we comment
on the statistics dealing with significant coefficients only.
12. The ratios cannot be observed, but a prediction can be computed for each firm. This comes
from the fact that the variance parameter au, is identified when the truncation thresholds are
known.
470
This content downloaded from 193.54.110.35 on Sun, 9 Nov 2014 05:27:58 AMAll use subject to JSTOR Terms and Conditions

for the market). Moreover, process innovations have a modest although significant contribution to innovation sales. Finally, when technological opportunities are strong, only new products for the market and technological
breakthrough contribute significantly to the NPR. Moreover, these two innovation types have equal effects. To sum up, an innovation of a
given type will not necessarily achieve the same commercial success in different activities. The impact of an innovation type will differ according
to the level of technological opportunity. In strongly innovative activities product imitations or improvements have no significant effect on the NPR. Conversely, in the same activities, real product innovation and process
breakthrough have a significant impact on NPR. Since these regressions do not allow for a direct measurement of the
return on each innovation type, we have performed additional computations to assess the gains from innovation. They are computed for innovation
performers only (defined by type) and presented in table 4.
Table 4 reveals the NPR variations that can be attributed to each innovation
type 13; controlling for size, sector, market pull, technology push, and the
implementation of all the other innovations types. Since these computations must be done for each firm, we report the quartiles of the gains distributions.
The main question to be examined in this table is: when does an innovation
reach its maximum return (i.e., its maximum direct impact)? Product improvements achieve a strong commercial return under moderate
technological opportunities only, with a median gain of 4%. Products that are new for the firm but not for the market never achieve a strong gain. This suggests that, overall, "imitation" is a small contributor to NPR. Its
maximum value lies in moderate technological opportunities, but it is only 2%.
The strongest contribution to the NPR comes from products that are new
for the market: 1.6% under low technological opportunities, 3.7% under moderate technological opportunities and 4.7% when they are strong. This demonstrates that commercial returns on real innovations increase with the technological opportunity basis of a firm's activity.
A comparable result holds for process innovations: improvements make a
small contribution to NPR, and only in activities with moderate technological
opportunities. Conversely, process breakthrough have greater returns: from 1.5% under moderate technological opportunities activities to 4.7% in strong ones.
These results demonstrate that not all innovation types are efficient for a given market environment. In particular, product imitations and
process improvements never contribute much to the commercial success of innovations. Moreover, the commercial impact of real innovations increases
with the level of technological opportunities. Since innovation is often considered as favoring exports, we undertake
a similar analysis for the export NPR, the share of exports attributable to
products introduced within the last five years.
13. The variation is expressed in percentage points, so that it can be added directly to the median
NPR without the corresponding innovation type (also given in the table).
THE COMMERCIAL SUCCESS OF INNOVATIONS 471
This content downloaded from 193.54.110.35 on Sun, 9 Nov 2014 05:27:58 AMAll use subject to JSTOR Terms and Conditions

TABLE 4
Direct Effect of Each Innovation Type on the % of less than 5 years old products in total sales 1990 ((p) (firms with innovations, computed from the estimates in table 3 ceteris
paribus)
Product Innovations Process Innovations
New for
Impro- the firm New for Impro- Break All figures are % vements but not the market vement through
for the
market
Low Innovation Opportunities:
Innovators (1 720 firms) 68.0 66.6 35.2 57.5 17.3 Median o without the direct effect 4.4 5.1 5.7 6.5 6.4 Z\p direct effect: - 1st quartile 0.2 0.8 1.2 - 0.3 1.0 - Median 0.3 1.1 1.6 - 0.2 1.4 - 3rd quartile 0.3 1.4 2.0 - 0.2 1.8
Moderate Innovation Opportunities:
Innovators (2 715 firms) 84.6 67.0 54.5 70.3 29.3 Median p without the direct effect 10.0 11.8 11.9 12.4 14.0 A\p direct effect:
- 1st quartile 3.3 1.7 3.3 1.1 1.3 -Median 4.1 2.2 3.7 1.4 1.5 -3rd quartile 4.9 2.6 4.3 1.6 1.8
Strong Innovation Opportunities:
Innovators (967 firms) 90.2 67.7 73.4 79.0 55.1 Median W without the direct effect 24.3 23.2 21.4 23.8 22.2 A\cp direct effect: - 1st quartile 0.4 - 2.6 4.0 0.2 4.1 - Median 0.5 - 2.1 4.7 0.2 4.7 - 3rd quartile 0.6 - 1.8 5.6 0.3 5.6
4.2. Export Innovation Ratio
Examining the innovation intensity of exports, we retain only firms that export 14. Exporters represent 72% of firms in the sample. Similar regressions are run. Once again we find significant differences in the regressions, although the first two innovation-opportunity classes exhibited similar patterns 15 (tables 6 and 8).The median export NPR is lower than
the one obtained on total sales. Ranked from weak to strong technological
opportunities we get increases in export NPR of 2%, 7% and 14%
respectively. A comparison with figures in table 3 shows that every quartile
14. We keep the firms with an export rate of at least 1%.
15. The rejection of the test comes mostly from the coefficients of the industry dummies.
472
This content downloaded from 193.54.110.35 on Sun, 9 Nov 2014 05:27:58 AMAll use subject to JSTOR Terms and Conditions

TABLE 5
Specification Tests
Model (table 3): (1) (2) (3) (4) (5) Statistics:
LRT: Equality of product
innovation coefficients 14.28* 31.54* 7.72* 4.88 6.44* (df = 2, critical value 5% = 5.99)
LRT: Equality of process
innovation coefficients 4.06* 10.16* 3.04 0.02 2.10 (df = 1, critical value 5% = 3.84)
LRT: Equality with the unknown
thresholds model 37.75* 38.74* 2.70 22.22* 9.41 (df= 3, critical value 5% = 7.81;
2.5% = 11.14)
Equality of all the coefficients: (3)=(4)=(5) (3)=(4) (3)=(5) (4)=(5) LRT Statistic 379.48* 157.88*a 261.68a 157.88* (df, critical value 5%) (56, 78.1) (28, 41.3) (28, 41.3) (28, 41.3)
Equality of all the coefficients
except innovation opportunities LRT Statistic 101.96* - - - (df, critical value 5%) (52, 73.3)
Equality of the innovation
coefficients only: Wald Statistic b 18.98* 3.39 11.95* 14.49* (df, critical value 5%) (10, 18.31) (5, 11.07) (5, 11.07) (5, 11.07)
a. This is not an error, both statistics are found to be equal. b. The estimations are made on separate cross-sections, so that the estimators are independent and the test is straightforward. * We reject the null at the 5% level.
of the export NPR is lower that the one of total sales NPR. This suggests that commercial success in the domestic market precedes the introduction of a corresponding innovation in foreign markets. This result is interesting in the current debate about the relative commercial success of innovations in domestic and foreign markets.
Since the effect of firm size on NPR is greater for export NPRs, this suggests that large exporters are better at commercializing their innovations. Let us now turn to the innovation types that have a significant effect on the export NPR. Two patterns emerge: first, with
weak and moderate technological opportunities, only product improvements and product imitations are significant. Moreover, no process innovation is significant. Thus, most of the innovative products exported by firms in the activities that have low technological opportunities are either improvements or imitations. This profile is representative of 81% of exporters. The previous finding that the domestic market is used as a basis for exports is thus confirmed.
THE COMMERCIAL SUCCESS OF INNOVATIONS 473
This content downloaded from 193.54.110.35 on Sun, 9 Nov 2014 05:27:58 AMAll use subject to JSTOR Terms and Conditions

TABLE 6
Exports from Innovations. Left-hand variable: percentage of less than 5 years old products in total exports 1990
Transformation: ln [o/(1 - so)]
18 industry dummies are included in all the regressions
Maximum likelihood estimates on the ordered probit model
(asymptotic t statistic between parentheses)
Firm level innovation All All Weak Moderate Strong Opportunities: (1) (2) (3) (4) (5) Estimates
Exports logarithm 1989 0.272* 0.288* 0.215* 0.257* 0.358* (13.4) (14.0) (4.75) (9.91) (8.06)
Product innovation (dummies):
- Improvement of an existing 0.429* 0.591* 0.517* 0.420* 0.297 product (3.98) (5.46) (2.82) (2.85) (0.92) - New for the firm but not 0.127 0.128 0.463* 0.258* - 0.112
for the market (1.58) (1.57) (2.60) (2.54) (0.60) - New for the market 0.284* 0.428* 0.147 0.096 0.563*
(3.48) (5.22) (0.88) (0.93) (2.55)
Process innovation (dummies):
- Improvement of an existing - 0.096 - 0.082 - 0.100 - 0.017 - 0.222 process (1.14) (0.96) (0.58) (0.15) (1.08) - Technological breakthrough 0.276* 0.411 * 0.306 0.183 0.404*
(3.30) (4.90) (1.49) (1.75) (2.24)
Firm-level market pull (dummies):
- Moderate 0.136 0.179 0.035 0.237 - 0.004 (0.99) (1.29) (0.14) (1.28) (0.01)
- Strong 0.358* 0.483* 0.403 0.485* - 0.029 (2.89) (3.84) (1.76) (2.88) (0.10)
Finn-level Technology push (dummies):
- Moderate 0.345* 0.455* 0.242 0.398* 0.256 (3.87) (5.07) (1.34) (3.61) (1.01)
- Strong 0.339* 0.614* 0.292 0.488* - 0.007 (3.33) (6.14) (1.21) (3.75) (0.03)
Firm-level innovation opportunities (dummies):
- Moderate 0.638* - - - - (6.60)
- Strong 1.243* - - - -
(9.95) 1.880* 1.920* 1.967* 1.747* 1.991* (43.0) (43.0) (17.8) (32.4) (21.9)
Number of firms 3 893 3 893 1 166 1 991 736 Log-likelihood - 3 681.82 - 3 732.40 - 807.43 - 1 959.98 - 874.29 Test: sectoral dummies a 1 040.4 1 051.0 224.7 483.6 178.4 Mc Fadden R2 0.093 0.080 0.044 0.064 0.088 Latent model R2 0.236 0.210 0.156 0.172 0.246
474
This content downloaded from 193.54.110.35 on Sun, 9 Nov 2014 05:27:58 AMAll use subject to JSTOR Terms and Conditions

TABLE 6 (continued)
Firm level innovation All All Weak Moderate Strong Opportunities: (1) (2) (3) (4) (5) Estimates
Estimated (%
- 1st quartile 2.8 2.9 1.5 4.0 7.5 - Median 5.6 5.6 2.3 6.9 14.4 - 3rd quartile 10.9 10.5 3.7 11.1 25.6
* Significant at the 5% level.
a. The null hypothesis is that the sectoral dummies can be replaced by a constant term. Under
the null the statistic is chi-square distributed with 17 degrees of freedom. The critical value at
the 5% level is 27.6.
The remaining 19% of exporters, from activities with strong technological opportunities, exhibit entirely different results. For these firms, products that are new to the market are the only significant contributors to the export NPR. Process breakthroughs are also significant with a comparable coefficient. In those activities, firms do tend to export 'high-tech' goods, thus contributing to the diffusion of up-to-date products in the other countries.
The commercial gains associated to innovation are low for improvements and imitations (table 7): from 1% to 2%. In contrast, firms that bring strong innovations to the market make strong gains under strong technological opportunities: the median is 6.6% for new products and 5.4% for process
breakthroughs. Clearly, nearly all gains accrue to the strongest innovators located in activities with strong technological opportunities.
These results undermine the usual view that imitations of innovations are always successful. ROSENBERG and STEINMUELLER [1986] also argue against this view. In fact, our results clearly demonstrate that there are two
types of activities in an economy: ones with strong underlying technological opportunities, and ones with weak or moderate underlying technological opportunities. In the first category, only product innovations that appear as new products to the market are successful. In the second category, only imitations and improvements have a significant effect on the NPR. The
dynamics of manufacturing in France thus results from a combination of these two types of activities. The figures obtained for the French industry show that 19% of the exporters fall in the first category while 81% belong the second category. Further research efforts that would provide a comparison
with other countries would be very valuable.
Finally, if one assumes that firms in the different technological opportunities classes do not export their production to the same countries, the results of this paper support the view that exporters of product improvements contribute to the diffusion of innovations by exporting to countries with a lower innovation level. By contrast, firms with strong technological
opportunities would tend to be more involved in intra-industry trade between
developed countries where the diffusion of innovations involves more innovative products.
THE COMMERCIAL SUCCESS OF INNOVATIONS 475
This content downloaded from 193.54.110.35 on Sun, 9 Nov 2014 05:27:58 AMAll use subject to JSTOR Terms and Conditions

TABLE 7
Direct Effect of Each Innovation Type on the % of less than 5 years old products in total exports 1990 (yo) (firms with innovations, computed from the estimates in table 6 ceteris
paribus)
Product Innovators Process Innovators
New for
Impro- the firm New for Impro- Break All figures are % vements but not the market vement through for the
market
Low Innovation Opportunities:
Innovators (1 166 firms) 68.0 67.8 37.9 61.0 18.4 Median o without the direct effect 1.7 1.7 2.4 2.7 2.6 AXc direct effect: - 1st quartile 0.7 0.6 0.2 - 0.4 0.5 - Median 1.1 1.0 0.4 - 0.3 0.9 - 3rd quartile 1.7 1.4 0.6 - 0.2 1.3
Moderate Innovation Opportunities:
Innovators (1 991 firms) 86.0 67.6 58.3 70.6 31.0 Median p without the direct effect 5.0 6.6 6.4 7.3 7.8 ZVp direct effect: - 1st quartile 1.5 0.4 1.1 - 0.1 0.9 - Median 2.4 0.6 1.7 - 0.1 1.4 - 3rd quartile 3.7 0.9 2.7 - 0.1 2.1
Strong Innovation Opportunities:
Innovators (736 firms) 91.0 68.2 78.1 73.9 57.1 Median a without the direct effect 12.1 15.1 10.7 17.0 13.8 Z\p direct effect: - 1st quartile 1.9 - 0.2 3.9 - 4.3 3.1 - Median 3.5 - 0.1 6.6 - 2.9 5.4 - 3rd quartile 5.2 - 0.1 9.8 - 1.6 7.7
5 Conclusion
The French Ministry of Industry's innovation survey provides much of
new information on the outputs of innovation. Besides the usual measures of innovation, such as patents and R&D expenditures, this survey offers the possibility of examining the commercial success of different types of innovations. Although the Innovation survey provides only qualitative
variables, based on subjective answers to objective questions, the careful
use of these variables yields sensible results.
476
This content downloaded from 193.54.110.35 on Sun, 9 Nov 2014 05:27:58 AMAll use subject to JSTOR Terms and Conditions

TABLE 8
Specifications Tests (Exports)
Model (table 6): (1) (2) (3) (4) (5) Statistics:
LRT: Equality of product
innovation coefficients 5.61 + 14.46* 2.64 3.60 6.43* (df = 2, critical value 5% = 5.99)
LRT: Equality of process
innovation coefficients 9.00* 15.51* 2.12 1.64 4.70* (df = 1, critical value 5% = 3.84)
LRT: Equality with the unknown
thresholds model (df = 3, critical value 5% = 7.81; 3.93 4.40 0.69 2.67 2.77
2.5% = 11.14)
Equality of all the coefficients: (3)=(4)=(5) (3)(4) (3)=(5) (4)=(5) LRT Statistic 181.40*' 74.56* 112.60* 84.89 (df, critical value 5%) (56, 78.1) (28, 41.8) (28, 41.3) (28, 41.3)
Equality of all the coefficients
except innovation opportunities LRT Statistic 80.24* (df, critical value 5%) (52, 73.3) - - -
Equality of the innovation
coefficients only: Wald Statistic a 11.89 3.91 9.58 + 6.16 (df, critical value 5%) (10, 18.31) (5, 11.07) (5, 11.07) (5, 11.07)
a. The estimations are made on separate cross-sections, so that the estimators are independent
and the etest is straightforward. * We reject the null at the 5% level. + We reject the null at the 10% level.
This study suggests that the commercial success of an innovation depends on the following factors. First, large firms have an advantage in selling their new products, and this size effect increases with the scope of underlying technological opportunities. Second, the contents of innovative sales and exports are different and both depend on the level of technological opportunities. A new product is not always the best way to
penetrate a market, our results suggest that this strategy only works under
strong technological opportunities. But in activities with low technological opportunities, product improvements and imitations contribute significantly to increase both total sales and export NPRs. Thus the efficiency effect is dominant in the former activities while the inertia effect dominates the
latter. This does not mean that new product innovation don't prevail in
low technological opportunities activities. It only means that this type of innovation does not constitute a commercial success in these activities, possibly because the demand for variety is low or because the technology does not allow for important changes. Indeed these last two elements characterize the level of technological opportunities.
THE COMMERCIAL SUCCESS OF INNOVATIONS 477
This content downloaded from 193.54.110.35 on Sun, 9 Nov 2014 05:27:58 AMAll use subject to JSTOR Terms and Conditions

Finally, our results tend to support the view that commercial success in the domestic market precedes the introduction of a corresponding innovation in foreign markets. However, this interpretation points the need for additional theoretical and empirical research.
* References
COHEN, W., LEVIN, R. (1989). - "Innovation and Market Structure". In R. Schmalensee and R. Willing eds., Handbook of Industrial Organization, vol. 2, ch. 18, pp. 1060-1107.
CREPON, B., DUGUET, E. (1995). - "Une bibliotheque de macro commandes pour l'econometrie des donnees de comptage et des variables qualitatives". CREST
working paper 9525.
DASGUPrA, P. (1986). - "The Theory of Technological Competition". In J. Stiglitz and F. Mathewson eds., New Developments in the Analysis of Market Structure. The MIT Press
FRANGOIS, J.-P. (1991). - "Une enquete sur l'innovation". Courrier des Statistiques, no 57.
GRILICHES, Z. (1986). - "Productivity, R&D and Basic Research at the Firm Level in the 1970's", American Economic Review, vol. 76, n? 1, pp. 141-154.
HALL, B. H., MAIRESSE, J. (1995). - "Exploring the Relationship between R&D and Productivity in French Manufacturing Firms". Journal of Econometrics, vol. 65, pp. 263-293.
MADDALA, G. (1992). - Limited Dependent and Qualitative Variables in Econometrics, Econometric Society Monograph, n?3, Cambridge University Press.
ROSENBERG, N. (1974). - "Science, Innovation and Economic Growth". Economic Journal, 84, pp. 90-108.
ROSENBERG, N., STEINMUELLER E. (1988). - "Why are Americans such poor imitators?", American Economic Review, Papers and Proceedings, vol. 78, pp. 229-234.
SCHMOOKLER, J. (1966). - "Invention and Economic Growth". Harvard University Press.
WINDMEIJER, F. (1995). - "Goodness-of-Fit Measures in Binary Choice Models". Econometric Reviews, Vol. 14, n? 1, pp. 101-116.
478
This content downloaded from 193.54.110.35 on Sun, 9 Nov 2014 05:27:58 AMAll use subject to JSTOR Terms and Conditions
Copyright © 2022 FDOKUMEN